Minnesota County Finances - MN State Auditor
115
STATE OF MINNESOTA Office of the State Auditor Patricia Anderson State Auditor Minnesota County Finances 2004 Revenues, Expenditures, and Debt & 2005 and 2006 Summary Budgets
-
Upload
khangminh22 -
Category
Documents
-
view
1 -
download
0
Transcript of Minnesota County Finances - MN State Auditor

STATE OF MINNESOTAOffice of the State Auditor
Patricia AndersonState Auditor
Minnesota County Finances2004 Revenues, Expenditures, and Debt
&
2005 and 2006 Summary Budgets

Description of the Office of the State Auditor
The Office of the State Auditor serves as a watchdog for Minnesota taxpayers by helping to ensure financial integrity, accountability, and cost-effectiveness in local governments throughout the state.
Through financial, compliance, and special audits, the State Auditor oversees and ensures that local government funds are used for the purposes intended by law and that local governments hold themselves to the highest standards of financial accountability.
The State Auditor performs approximately 250 financial and compliance audits per year and has oversight responsibilities for over 4,300 local units of government throughout the state. The office currently maintains five divisions:
Audit Practice - conducts financial and legal compliance audits for local governments;
Government Information - collects and analyzes financial information for cities, towns, counties, and special districts;
Legal/Special Investigations - provides legal analysis and counsel to the Office and responds to outside inquiries about Minnesota local government law; as well as investigates allegations of misfeasance, malfeasance, and nonfeasance in local government.
Pension Oversight - monitors investment, financial, and actuarial reporting for over 700 public pension funds;
Tax Increment Financing (TIF) - promotes compliance and accountability in local governments’ use of TIF through financial and compliance audits;
The State Auditor serves on the State Executive Council, State Board of Investment, Land Exchange Board, Public Employee’s Retirement Association Board, Minnesota Housing Finance Agency, and the Rural Finance Authority Board.
Office of the State Auditor 525 Park Street, Suite 500 Saint Paul, Minnesota 55103 (651) 296-2551 [email protected] www.auditor.state.mn.us
This document can be made available in alternative formats upon request. Call 651-2962551 [voice] or 1-800-627-3529 [relay service] for assistance; or visit the State Auditor’s web site: www.auditor.state.mn.us.

Minnesota County Finances
2004 Revenues, Expenditures, and Debt&
2005 and 2006 Summary Budgets
March 2, 2006
Government Information Division Office of the State Auditor State of Minnesota
Deputy State Auditor Tony Sutton
Staff David Kazeck, SupervisorJohn Jernberg, Research AnalystJill Roberts, Research AnalystAndrea JohnsonWendy MurphyTrudy Specht
Tim Miller Debbie Schultz Rachael Paul (Intern)Missy Graner (Intern)

This page left blank intentionally

TABLE OF CONTENTS
SCOPE . . . . . . . . . . . . . . . . . . . . . . . . . . . . . . . . . . . . . . . . . . . . . . . . . . . . . . . . . . . . . . . . . . . . 1
OVERVIEW
Total Governmental Revenues . . . . . . . . . . . . . . . . . . . . . . . . . . . . . . . . . . . . . . . . . . . . . . . . . . 3Total Governmental Expenditures . . . . . . . . . . . . . . . . . . . . . . . . . . . . . . . . . . . . . . . . . . . . . . . . 4Growth in Government . . . . . . . . . . . . . . . . . . . . . . . . . . . . . . . . . . . . . . . . . . . . . . . . . . . . . . . . . 5Capital Outlay Expenditures . . . . . . . . . . . . . . . . . . . . . . . . . . . . . . . . . . . . . . . . . . . . . . . . . . . . 6Public Service Enterprises . . . . . . . . . . . . . . . . . . . . . . . . . . . . . . . . . . . . . . . . . . . . . . . . . . . . . . 7 Outstanding Long-Term Indebtedness . . . . . . . . . . . . . . . . . . . . . . . . . . . . . . . . . . . . . . . . . . . . 8 Unreserved Fund Balances of the General Fund and Special Revenue Funds . . . . . . . . . . . . . 9
GOVERNMENTAL TABLES
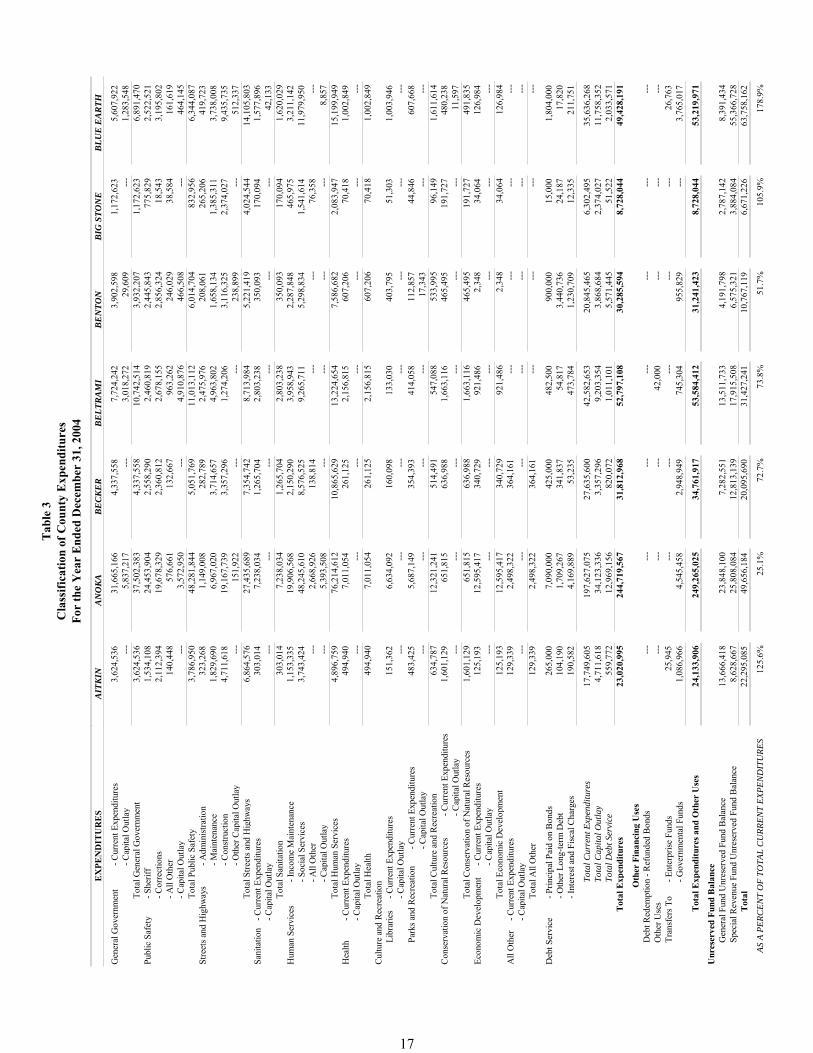
Summary of Revenues and Expenditures Five-Year Change . . . . . . . . . . . . . . . . . . . . . . . . . . 12Classification of County Revenues . . . . . . . . . . . . . . . . . . . . . . . . . . . . . . . . . . . . . . . . . . . . . . 16Classification of County Expenditures . . . . . . . . . . . . . . . . . . . . . . . . . . . . . . . . . . . . . . . . . . . . 17
PUBLIC SERVICE ENTERPRISE TABLES
Analysis of Health Services Operations . . . . . . . . . . . . . . . . . . . . . . . . . . . . . . . . . . . . . . . . . . 44Analysis of Sanitation Operations . . . . . . . . . . . . . . . . . . . . . . . . . . . . . . . . . . . . . . . . . . . . . . . 46Analysis of Housing & Economic Development Operations . . . . . . . . . . . . . . . . . . . . . . . . . . 47Analysis of Other Enterprise Operations . . . . . . . . . . . . . . . . . . . . . . . . . . . . . . . . . . . . . . . . . 49
ENTERPRISE FUND FOOTNOTES . . . . . . . . . . . . . . . . . . . . . . . . . . . . . . . . . . . . 51
Total Outstanding Indebtedness of Counties . . . . . . . . . . . . . . . . . . . . . . . . . . . . . . . . . . . . . . 54
Percent Change of Unreserved Fund Balances in the General Fund and Special RevenueFunds 2003 to 2004 - and 2004 Unreserved Fund Balances as a Percent of 2004 TotalCurrent Expenditures . . . . . . . . . . . . . . . . . . . . . . . . . . . . . . . . . . . . . . . . . . . . . . . . . . . . . . . . . 58
Percent Change of Unreserved Fund Balances in the General Fund and Special RevenueFunds 2003 to 2004 - and 2004 Unreserved Fund Balances as a Percent of 2004 Total CurrentExpenditures - by percentage . . . . . . . . . . . . . . . . . . . . . . . . . . . . . . . . . . . . . . . . . . . . . . . . . . . 62
2005 and 2006 COUNTY BUDGET SUMMARIES
Summary of 2005 and 2006 County Budgeted Revenues and Expenditures . . . . . . . . . . . . . . 692005 and 2006 County Budget Summaries . . . . . . . . . . . . . . . . . . . . . . . . . . . . . . . . . . . . . . . . 70

APPENDIX A - Factors Influencing County Finances . . . . . . . . . . . . . . . . . . . . . . . . . . . . 95
APPENDIX B - County General and Special Revenue Unreserved Fund Balances . . . . . . . . . . . . . . . . . . . . . . . . . . . . . . . . . . . . . . . . . . . . . . 101
GLOSSARY . . . . . . . . . . . . . . . . . . . . . . . . . . . . . . . . . . . . . . . . . . . . . . . . . . . . . . . . . . . . . . 105

Scope This publication is intended to facilitate an understanding of county financial operations by citizens, policy makers and local government officials. The report summarizes, through data tables and charts, the financial operations of Minnesota counties for calendar year 2004. In addition, the report contains supplemental data showing county 2005 and 2006 budgets.
The data presented in this report is divided into governmental funds and proprietary funds. The governmental funds consist of the General, Special Revenue, Capital Projects, Permanent Funds, and Debt Service Funds. The financial operations of these funds are summarized in Table 1. Tables 2 and 3 present the data by each individual county. Appendix A lists factors that affect county finances.
The enterprise or proprietary funds of counties are presented separately from the governmental funds. Minnesota counties operate many types of public service enterprises. These enterprises furnish a variety of services that operate completely, or in large part, from revenues derived from the sale of goods or services. The financial operations of the municipal public service enterprises are presented in Tables 4 through 7. Footnotes used in the analysis of the enterprise operations are described at the end of the enterprise fund section.
Table 8 lists by each individual county the bonded and other long-term debt outstanding as of December 31, 2004. Other long-term debt refers to liabilities such as long-term lease agreements, installment purchase contracts, and notes.
Tables 9 and 10 present an analysis of the 2003 and 2004 unreserved fund balances in the General and Special Revenue Funds of counties. The tables show the actual unreserved fund balances, the percentage change in unreserved fund balances from 2003 to 2004, and a comparison to 2004 total current expenditures. Table 10 classifies unreserved fund balances by the standard issued by the State Auditor. Appendix B provides a more detailed discussion of fund balances.
In addition to this publication, the Office of the State Auditor presents an enhanced analysis of county finances on its website. To provide additional insight into the relative spending and debt level of counties, the website provides tables that show rankings of county per capita expenditures and debt.1 Breakdowns by economic development regions are also presented.
The Office of the State Auditor also maintains an interactive database containing several years of data that can be accessed through its website. The database allows users to customize the presentation of data to their individual needs. For example, a citizen can select a group of counties to compare, and then choose the years and the categories of revenues and expenditures on which to compare them. The query can then be viewed on screen or saved to a file for downloading. The Auditor’s website address is www.auditor.state.mn.us.
The per capita tables do not incorporate the finances of enterprise funds. The inclusion of enterprise fund spending could significantly affect per capita figures for certain counties. Additionally, counties that provide services to other municipalities may have higher per capita expenditures.
1
1

This page left blank intentionally

Overview
Total Governmental Revenues
In 2004, Minnesota counties raised total governmental revenues of $4.46 billion to finance county services. This represents a decrease of 0.3 percent over the amount raised in 2003.
The composition of revenue sources for counties generally varies only slightly from year to year. The two largest sources of revenues for counties continue to be taxes and state intergovernmental revenues, which accounted for 39.8 and 31.7 percent of total revenues, respectively. Over a five-year period, there were some shifts in the composition of county revenues. Taxes as a percent of total revenues increased from 37.3 percent in 2000 to 39.8 percent in 2004. Intergovernmental revenues increased its percentage of total revenues from 42.7 percent to 46.1 percent in 2002, but have decreased over the last two years to 42.1 percent in 2004. Charges for services increased from 9.2 percent to 10.6 percent over the same period.
Between 2003 and 2004, revenue decreased in more categories than it increased. The revenue categories showing the greatest increases were interest earnings (15.5 percent), licenses and permits (9.0 percent), and taxes (5.9 percent). The categories showing the greatest decrease were fines and forfeits (22.9 percent), local units grants (18.3 percent), and federal grants (7.4 percent). In addition, state grant revenue was restructured in 2004, according to Minn. Stat. §477A.0124, resulting in many categories having been collapsed into HACA.
Figure 1 shows the relative shares of total governmental revenues by source. The underlying data for this pie chart is detailed in Table 1.
Figure 1: Total Governmental Revenues
$4,461,830,547
Federal Grants 9.5%
All Other Revenues 4.4%
Licenses and Permits Local Units Grants 0.6%
0.9% Interest Earnings 1.4% Special Assessments
0.8% Fines and Forfeits 0.3%
State Grants 31.7%
Charges for Services 10.6%
*This category includes property, gravel and Taxes* sales tax, as well as tax increments. 39.8%
3

Total Governmental Expenditures
Counties provide a variety of services to their citizens. Most services are accounted for in Governmental Funds. In 2004, Minnesota counties expended $4.61 billion from Governmental Funds to provide county services. This represents an increase of 0.6 percent from 2003 total governmental expenditures. Two of the three types of expenditures that constitute total governmental expenditures increased in 2004. Current expenditures decreased 0.5 percent, while capital outlay expenditures increased 2.6 percent, and debt service expenditures increased 14.7 percent.
Expenditures in the subcategories varied between 2003 and 2004, with five categories seeing an increase in spending and five seeing a decrease in spending. The largest decrease was in the “all other” category at 58.7 percent. The “all other” category is more volatile than other categories because one-time expenditures or expenditures that are hard to classify, are often placed in this category. The next largest decrease was Conservation of Natural Resources, at 8.0 percent. The two largest increases were in Economic Development and Streets and Highways (8.5 and 7.9 percent, respectively). For all other categories of expenditures, the change in spending (increase or decrease) was relatively small, less than a five percent change.
Figure 2 shows the relative shares of total governmental expenditures by function. The underlying data for this pie chart is detailed in Table 1.
Figure 2: Total Governmental Expenditures*
$4,614,517,414
General Government 16.9%
Public Safety 16.4%
Streets and Highways 17.9% Health 4.4%
Culture and Recreation 3.1%
Economic Development 2.4%Sanitation 1.7%Conservation of Nat. Resources 1.4%All Other Expenditures 0.2%
Human Services 31.0%
*Includes current expenditures, capital outlays, and debt service.
4

Growth in Government
During the five-year period of 2000 to 2004, total governmental revenues and total current expenditures increased every year until 2003.2 To place this growth in perspective, Figure 3 below includes a bar showing the growth in per capita personal income for Minnesotans.3 Per capita income is an indicator of the ability of citizens to pay for increased governmental spending. Generally, when expenditures grow faster than per capita personal income, citizens must spend a greater proportion of their income on governmental services. If non-tax sources of revenue keep pace or grow faster than expenditures, however, the increased spending may not result in a greater tax burden for citizens.
Figure 3 compares the change in total current expenditures and total governmental revenues to the change in Minnesota per capita personal income. There is a marked difference for the years 2003 and 2004 compared to previous years. The percent change in revenue and current expenditures has remained relatively flat between 2002 and 2004, though per capita income has fluctuated, growing 6.3% between 2003 and 2004. The growth in revenues has declined mostly due to reductions in state and federal aid. Many county programs are based on aid. Counties have seemingly adjusted their spending to reflect the decrease in revenue.
Figure 3: Percent Change - Total Governmental Revenues, Total Current Expenditures, and Per Capita Income, 2000 to 2004
12.0%
10.0%
Perc
ent C
hang
e
8.0%
6.0%
4.0%
2.0%
0.0%
2000 2001 2002 2003 2004
-2.0%
Per Capita Income Total Governmental Revenues Total Current Expenditures
2 The chart excludes capital outlay, as this category is more prone to yearly fluctuations. The chart also excludes revenues derived from borrowing because counties are prohibited from borrowing for current expenditures. Most capital projects are funded through the issuance of bonds or other types of borrowing such as certificates of participation.
3 Per capita income is calculated by dividing Minnesota total personal income by its total midyear population. The Bureau of Economic Analysis calculates the figure, which is a part of the U. S. Census Bureau.
5

Capital Outlay Expenditures
Counties expended $677 million on capital investments in 2004, representing an increase of 2.6 percent over the level expended in 2003. Capital outlays are more likely than current expenditures to vary significantly from year to year because capital projects tend to be large in size but infrequent in nature. Some of the factors that influence the level of capital investments include the need for infrastructure improvements, public safety concerns, demands for public meeting places and facilities, the need to replace aging infrastructure, and damage to public facilities caused by fire, floods, and storms.
Figure 4 illustrates the trend in capital spending for the years 2000 through 2004.
Figure 4: Total Capital Outlay Expenditures: 2000-2004
200
300
400
500
600
700
800
2000 2001 2002 2003 2004
Mill
ions
($)
6

Public Service Enterprises
In addition to Governmental Funds, many counties establish Enterprise Funds to account for services that are financed and operated in a manner similar to private business enterprises. These enterprises are intended to be self-sustaining through fees and user charges. Although some enterprises generate net income, most have the objective of breaking even. Enterprise Fund accounting is also used to provide more detailed financial information on operations where there are concerns in regard to issues such as public policy, accountability, and management control. The most common enterprises created by counties include hospitals, nursing homes, nursing services, and solid waste.
Public service enterprises provide a good or service for a charge. Most enterprises are designed to recoup the costs of providing the service through charges to the user. Many county enterprises, however, do not recoup all the costs of the service and need to supplement the operating revenues with transfers from other funds and non-operating revenues such as taxes and intergovernmental revenues. In 2004, the operating losses of county enterprises totaled $13.6 million. County enterprise operations received non-operating revenues (taxes, federal and state grants, interest, etc.) of $82.0 million to cover operating losses. The Hennepin County Medical Center strongly affects theses numbers with an operating loss of $19.1 million, and nonoperating revenues of $34.9 million. After the inclusion of non-operating revenues, county enterprises posted a net income of $32.7 million in 2004. Tables 4 through 7 provide detailed financial information on Enterprise Fund operations.
Figure 5 examines the five-year trend in the operating income and net income or loss of municipal enterprises. The gap between the operating income line and the net income line shows the amount that counties contributed in the form of non-operating revenues to county enterprises.
Figure 5: Net Income and Operating Income of County Enterprises, 2000 to 2004
Tho
usan
ds
$40,000
$30,000
$20,000
$10,000
$0
($10,000)
($20,000)
($30,000) 2000 2001 2002 2003 2004
Operating Income
Net Income
7

Outstanding Long-Term Indebtedness
Counties incur long-term debt through the issuance of bonds and notes, certificates of indebtedness, and tax anticipation certificates. Long-term lease agreements are also classified as long-term debt. Counties may only borrow to finance capital projects and purchases because the law restricts them from borrowing for current expenditures. The amount of outstanding debt affects a county’s expenditures because counties must make principal and interest payments to service the debt.
Counties reported a total of $2.07 billion in outstanding long-term debt at the end of 2004. This represents an increase in long-term debt of 6.5 percent over the year 2003. The long-term debt was divided between $1.84 billion in outstanding bonds and $222.5 million in other long-term debt. Counties incurred long-term debt to finance a wide range of capital projects such as roads, light rail transit, government buildings, and other infrastructure improvements. Table 8 details outstanding debt by county.
Figure 6 shows the five-year trend of outstanding long-term debt for Minnesota counties.
Figure 6: Outstanding Long-Term Indebtedness as of December 31, 2004*
$2,500
$2,000
$1,500
$1,000
$500
$0 2000 2001 2002 2003 2004
* Includes bonds and other types of debt such as certificates of participation, long-term leases, and notes
Mill
ions
8

Unreserved Fund Balances of the General Fund and Special Revenue Funds
Counties maintain cash reserves for several reasons. Counties should have relatively large fund balances at the end of the year in order to meet expenditures occurring in the first five months of the next fiscal year, before the first property tax and state aid payments are received. Additional reasons include contingency funds for unforeseen needs and setting aside resources for future capital investments. The unreserved fund balances of counties’ General and Special Revenue Funds totaled $1.77 billion in 2004.4 This represents an increase of 3.2 percent over the level in 2003.
Comparing counties’ unreserved fund balances to their total current expenditures helps put the fund balances in perspective and provides insight on the relative financial health of Minnesota’s counties. County unreserved fund balances as a percent of total current expenditures averaged 47.5 percent in 2004. Among individual counties, unreserved fund balances as a percent of total current expenditures ranged from 22.1 percent (Kanabec County) to 178.9 percent (Blue Earth County). Taken as a whole, Minnesota counties fall within the correct range.
The following table shows the State Auditor’s classifications of county unreserved fund balances in the General and Special Revenue funds and the number of counties within each range. The State Auditor recommends an unreserved fund balance of between 35 and 50 percent of total current expenditures. Tables 9 and 10 list individual counties by their unreserved fund balance as a percent of total current expenditures.
Fund Balance Classification
Range of Unreserved Fund Balance
As a Percentage of Total Current Expenditures
Number of
Counties 2004
Number of Counties Previous
Year
Percent Change 03-04
Extremely Low Fund Balance Below 20% 0 2 -100%
Low Fund Balance 20% to 35% 13 12 8%
Acceptable Fund Balance 35% to 50% 18 15 20%
Moderately High Fund Balance 50% to 65% 17 22 -23%
High Fund Balance 65% to 100% 29 26 12%
Very High Fund Balance 100% to 150% 9 9 0%
Extremely High Fund Balance Above 150% 1 1 0%
Although this section discusses only one type of fund balance, Minnesota counties actually report three different classifications of fund balances in the General and Special Revenue Funds. The unreserved, undesignated fund balances include all funds remaining at the close of the fiscal year for which no legally binding commitment has been made, nor has the governing body passed a resolution designating those funds for a specific purpose. The unreserved, designated fund balances include all funds remaining at the close of the fiscal year for which no legally binding commitment has been made; however, these funds have been designated by the governing body for a specific future use. The reserved fund balances include all funds remaining at the close of the fiscal year for which there is a legally binding external commitment of those funds, such as a signed contract for services or equipment.
9
4

Figure 7 shows the five-year trend of unreserved fund balances as a percent of total current expenditures.
Figure 7: Unreserved Fund Balances of the General and Special Revenue Funds as a Percentage of Total Current Expenditures,
2000 to 2004
50%
48%
46%
44%
42%
40% 2000 2001 2002 2003 2004
10

GOVERNMENTAL TABLES

12
Tab
le 1
Su
mm
ary
of R
even
ues
and
Exp
endi
ture
s5-
Yea
r C
hang
eF
or th
e Y
ears
End
ed D
ecem
ber
31, 2
000
thro
ugh
2004
20
03/2
004
% In
crea
se
5-Y
ear
2000
20
01
2002
20
03
2004
[D
ecre
ase]
Cha
nge
Popu
latio
n (2
004
Popu
latio
n E
stim
ates
) [*
] 4,
919,
479
4,97
7,97
6 5,
033,
661
5,08
8,00
6 5,
145,
106
Net
Tax
able
Tax
Cap
acity
3,
597,
494,
073
3,98
6,58
2,96
3 3,
214,
720,
110
3,53
3,48
9,88
9 3,
910,
458,
667
2003
Net
Tax
Lev
y (C
olle
ctib
le in
200
4)
1,35
4,95
9,04
5 1,
450,
851,
074
1,55
1,03
7,26
0 1,
666,
874,
604
1,75
2,34
8,28
0
RE
VE
NU
ES
AM
OU
NT
%
AM
OU
NT
%
AM
OU
NT
%
AM
OU
NT
%
A
MO
UN
T %
T
axes
1,
516,
958,
772
37.3
%
1,62
4,23
0,44
0 37
.7%
1,
596,
240,
790
35.7
%
1,67
6,68
1,51
4 37
.5%
1,
774,
769,
845
39.8
%
5.9%
17
.0%
Sp
ecia
l Ass
essm
ents
25
,917
,558
0.
6%
28,0
09,0
05
0.6%
28
,686
,953
0.
6%
35,9
60,2
36
0.8%
35
,639
,201
0.
8%
-0.9
%
37.5
%
Lic
ense
s an
d Pe
rmits
19
,064
,032
0.
5%
20,9
56,1
92
0.5%
21
,940
,226
0.
5%
25,0
16,3
86
0.6%
27
,275
,273
0.
6%
9.0%
43
.1%
In
terg
over
nmen
tal R
even
ues
Fede
ral G
rant
s H
ighw
ays
42,8
74,2
82
1.1%
54
,184
,861
1.
3%
43,4
86,2
18
1.0%
54
,809
,926
1.
2%
54,1
67,6
12
1.2%
-1
.2%
26
.3%
H
uman
Ser
vice
s 26
2,86
3,01
1 6.
5%
258,
103,
318
6.0%
28
9,66
1,29
4 6.
5%
284,
469,
074
6.4%
24
7,04
9,82
9 5.
5%
-13.
2%
-6.0
%
Dis
aste
r 6,
662,
537
0.2%
6,
256,
931
0.1%
10
,478
,389
0.
2%
8,00
1,97
6 0.
2%
22,0
82,1
79
0.5%
17
6.0%
23
1.4%
A
ll O
ther
90
,320
,516
2.
2%
113,
227,
665
2.6%
12
6,73
8,84
1 2.
8%
109,
746,
451
2.5%
99
,753
,615
2.
2%
-9.1
%
10.4
%
Tot
al F
eder
al G
rant
s 40
2,72
0,34
6 9.
9%
431,
772,
775
10.0
%
470,
364,
742
10.5
%
457,
027,
427
10.2
%
423,
053,
235
9.5%
-7
.4%
5.
0%
Stat
e G
rant
s H
AC
A
209,
299,
797
5.1%
20
8,71
6,31
9 4.
8%
206,
914,
384
4.6%
13
2,48
3,43
5 3.
0%
119,
913,
016
2.7%
-9
.5%
-4
2.7%
M
anuf
actu
red
Hom
e H
AC
A
2,14
1,06
6 0.
1%
2,02
0,05
8 0.
0%
1,96
9,92
6 0.
0%
2,03
8,73
2 0.
0%
10,1
18
0.0%
-9
9.5%
-9
9.5%
R
esid
entia
l Mar
ket V
alue
Cre
dit
---
---
---
---
146,
337,
081
3.3%
15
1,50
9,95
4 3.
4%
144,
546,
841
3.2%
--
---
---
Agr
icul
tura
l Mar
ket V
alue
Cre
dit
---
---
---
---
3,29
7,71
8 0.
1%
803,
110
0.0%
3,
408,
927
0.1%
--
---
---
Mob
ile H
ome
Mar
ket V
alue
Cre
dit
---
---
---
---
431,
608
0.0%
47
8,31
8 0.
0%
470,
975
0.0%
--
---
---
Loc
al P
erfo
rman
ce A
id
221,
266
0.0%
--
---
---
---
---
---
---
---
---
---
---
Atta
ched
Mac
hine
ry A
id
2,38
1,78
8 0.
1%
2,38
1,79
6 0.
1%
2,38
1,77
6 0.
1%
403,
108
0.0%
--
---
--1
00.0
%
-100
.0%
D
ispa
rity
Red
uctio
n A
id
13,5
28,1
53
0.3%
13
,876
,518
0.
3%
10,1
25,4
70
0.2%
11
,419
,976
0.
3%
11,2
22,2
31
0.3%
-1
.7%
-1
7.0%
H
ighw
ays
385,
346,
186
9.5%
38
2,03
8,69
2 8.
9%
383,
708,
396
8.6%
40
3,14
7,48
0 9.
0%
429,
146,
786
9.6%
6.
4%
11.4
%
Hum
an S
ervi
ces
441,
395,
309
10.8
%
501,
358,
459
11.6
%
525,
073,
661
11.7
%
503,
776,
627
11.3
%
496,
664,
532
11.1
%
-1.4
%
12.5
%
Crim
inal
Jus
tice
Aid
18
,799
,238
0.
5%
20,4
24,4
63
0.5%
30
,249
,960
0.
7%
31,8
49,5
80
0.7%
69
,953
0.
0%
-99.
8%
-99.
6%
PER
A A
id
4,92
1,04
7 0.
1%
4,95
1,47
0 0.
1%
4,96
8,51
3 0.
1%
7,96
9,01
3 0.
2%
8,02
2,42
5 0.
2%
0.7%
--
---
Polic
e A
id
6,83
1,71
5 0.
2%
6,73
7,09
9 0.
2%
7,42
1,51
7 0.
2%
11,0
29,7
38
0.2%
11
,395
,041
0.
3%
3.3%
66
.8%
A
ll O
ther
21
2,84
4,29
8 5.
2%
217,
742,
319
5.0%
23
1,61
0,67
8 5.
2%
234,
113,
539
5.2%
18
8,30
9,04
2 4.
2%
-19.
6%
-11.
5%
Tot
al S
tate
Gra
nts
1,29
7,70
9,86
3 31
.9%
1,
360,
247,
193
31.5
%
1,55
4,49
0,68
8 34
.8%
1,
491,
022,
610
33.3
%
1,41
3,17
9,88
7 31
.7%
-5
.2%
8.
9%
Loc
al U
nits
Gra
nts
37,4
03,7
00
0.9%
48
,674
,200
1.
1%
37,6
84,6
87
0.8%
51
,659
,560
1.
2%
42,2
10,9
26
0.9%
-1
8.3%
12
.9%
Tot
al I
nter
gove
rnm
enta
l Rev
enue
s 1,
737,
833,
909
42.7
%
1,84
0,69
4,16
8 42
.7%
2,
062,
540,
117
46.1
%
1,99
9,70
9,59
7 44
.7%
1,
878,
444,
048
42.1
%
-6.1
%
8.1%
Cha
rges
for S
ervi
ces
375,
101,
759
9.2%
41
2,80
7,13
9 9.
6%
434,
734,
690
9.7%
47
6,74
5,91
7 10
.7%
47
3,36
4,53
2 10
.6%
-0
.7%
26
.2%
Fi
nes
and
Forf
eits
24
,521
,712
0.
6%
20,6
36,5
47
0.5%
20
,448
,379
0.
5%
19,3
98,1
79
0.4%
14
,960
,423
0.
3%
-22.
9%
-39.
0%
Inte
rest
Ear
ning
s 19
3,09
9,31
2 4.
7%
149,
327,
806
3.5%
11
3,66
9,27
6 2.
5%
52,1
45,8
45
1.2%
60
,253
,189
1.
4%
15.5
%
-68.
8%
All
Oth
er R
even
ues
178,
351,
352
4.4%
21
7,15
5,99
9 5.
0%
192,
626,
382
4.3%
18
9,64
7,30
8 4.
2%
197,
124,
036
4.4%
3.
9%
10.5
%
Tot
al R
even
ues
4,07
0,84
8,40
6 10
0.0%
4,
313,
817,
296
100.
0%
4,47
0,88
6,81
3 10
0.0%
4,
475,
304,
982
100.
0%
4,46
1,83
0,54
7 10
0.0%
-0
.3%
9.
6%
Oth
er F
inan
cing
Sou
rces
Bor
row
ing
Bon
ds Is
sued
13
7,98
9,77
7 29
4,23
1,89
4 32
0,07
8,75
6 24
5,32
8,47
5 25
0,39
5,19
4 O
ther
Lon
g-te
rm D
ebt
23,7
27,1
55
19,6
32,2
45
20,9
09,7
26
22,6
32,7
97
24,2
46,9
75
Tot
al B
orro
win
g 16
1,71
6,93
2 31
3,86
4,13
9 34
0,98
8,48
2 26
7,96
1,27
2 27
4,64
2,16
9
Oth
er S
ourc
es
1,36
8,15
7 1,
339,
187
7,81
7,61
3 8,
321,
693
26,3
58,3
03
Tra
nsfe
rs F
rom
- E
nter
pris
e Fu
nds
880,
593
6,37
4,72
2 5,
176,
395
7,05
9,47
0 5,
915,
705
- G
over
nmen
tal F
unds
18
8,95
3,80
9 13
5,22
6,75
4 96
,037
,009
94
,328
,851
95
,809
,949
Tot
al R
even
ues
and
Oth
er S
ourc
es
4,42
3,76
7,89
7 4,
770,
622,
098
4,92
0,90
6,31
2 4,
852,
976,
268
4,86
4,55
6,67
3
Not
e: [*
] The
pop
ulat
ion
estim
ates
are
pro
vide
d by
the
Stat
e D
emog
raph
er.

13
2003
/200
4 20
00
2001
20
02
2003
20
04
% In
crea
se 5
-Yea
r E
XP
EN
DIT
UR
ES
AM
OU
NT
%
AM
OU
NT
%
AM
OU
NT
%
AM
OU
NT
%
A
MO
UN
T %
[D
ecre
ase]
C
hang
e
Gen
eral
Gov
ernm
ent
- Cur
rent
Exp
endi
ture
s 57
3,49
9,96
6 13
.8%
67
1,80
6,97
9 15
.4%
70
3,96
2,91
3 14
.8%
71
1,76
6,40
2 15
.5%
69
9,85
5,44
9 15
.2%
-1
.7%
22
.0%
- C
apita
l Out
lay
49,8
21,3
40
1.2%
79
,075
,602
1.
8%
77,5
14,4
74
1.6%
93
,991
,723
2.
0%
78,0
58,4
48
1.7%
-1
7.0%
56
.7%
T
otal
Gen
eral
Gov
ernm
ent
623,
321,
306
15.0
%
750,
882,
581
17.2
%
781,
477,
387
16.5
%
805,
758,
125
17.6
%
777,
913,
897
16.9
%
-3.5
%
24.8
%
Publ
ic S
afet
y - S
herif
f 26
1,87
7,76
5 6.
3%
275,
538,
852
6.3%
29
4,91
9,52
4 6.
2%
315,
400,
826
6.9%
33
2,14
5,31
6 7.
2%
5.3%
26
.8%
- C
orre
ctio
ns
291,
838,
005
7.0%
30
7,69
0,61
9 7.
1%
332,
243,
430
7.0%
32
8,44
8,68
2 7.
2%
335,
322,
959
7.3%
2.
1%
14.9
%
- All
Oth
er
98,9
57,1
75
2.4%
26
,154
,594
0.
6%
25,1
79,0
67
0.5%
27
,609
,698
0.
6%
37,3
66,0
23
0.8%
35
.3%
-6
2.2%
- C
apita
l Out
lay
85,9
39,2
92
2.1%
54
,174
,324
1.
2%
78,1
42,7
86
1.6%
47
,788
,689
1.
0%
51,3
05,2
37
1.1%
7.
4%
-40.
3%
Tot
al P
ublic
Saf
ety
738,
612,
237
17.8
%
663,
558,
389
15.2
%
730,
484,
807
15.4
%
719,
247,
895
15.7
%
756,
139,
535
16.4
%
5.1%
2.
4%
Stre
ets
and
Hig
hway
s - A
dmin
istra
tion
35,3
42,8
27
0.9%
36
,266
,550
0.
8%
39,9
98,8
87
0.8%
46
,569
,480
1.
0%
51,8
85,9
26
1.1%
11
.4%
46
.8%
- M
aint
enan
ce
242,
288,
557
5.8%
26
1,12
7,83
1 6.
0%
263,
167,
085
5.5%
24
7,22
5,17
7 5.
4%
269,
016,
578
5.8%
8.
8%
11.0
%
- Cap
ital O
utla
y 40
8,95
0,05
7 9.
9%
430,
720,
156
9.9%
46
0,05
9,59
8 9.
7%
473,
569,
572
10.3
%
506,
954,
130
11.0
%
7.0%
24
.0%
T
otal
Stre
ets
and
Hig
hway
s 68
6,58
1,44
1 16
.5%
72
8,11
4,53
7 16
.7%
76
3,22
5,57
0 16
.1%
76
7,36
4,22
9 16
.7%
82
7,85
6,63
4 17
.9%
7.
9%
20.6
%
Sani
tatio
n - C
urre
nt E
xpen
ditu
res
65,1
09,7
31
1.6%
66
,839
,586
1.
5%
68,0
06,9
40
1.4%
74
,373
,036
1.
6%
77,9
53,0
36
1.7%
4.
8%
19.7
%
- Cap
ital O
utla
y 12
,575
,192
0.
3%
10,0
96,8
56
0.2%
3,
674,
716
0.1%
46
8,83
5 --
-63
8,39
4 0.
0%
36.2
%
-94.
9%
Tot
al S
anita
tion
77,6
84,9
23
1.9%
76
,936
,442
1.
8%
71,6
81,6
56
1.5%
74
,841
,871
1.
6%
78,5
91,4
30
1.7%
5.
0%
1.2%
Hum
an S
ervi
ces
- Inc
ome
Mai
nten
ance
42
0,11
3,15
4 10
.1%
44
3,35
4,68
4 10
.2%
47
4,54
3,48
2 10
.0%
40
7,20
4,60
7 8.
9%
425,
271,
855
9.2%
4.
4%
1.2%
- S
ocia
l Ser
vice
s87
1,88
8,92
7 21
.0%
91
6,40
9,54
0 21
.0%
97
8,37
6,85
4 20
.6%
1,
013,
530,
241
22.1
%
928,
111,
471
20.1
%
-8.4
%
6.4%
- A
ll O
ther
52
,208
,365
1.
3%
56,9
91,7
24
1.3%
65
,845
,349
1.
4%
69,4
25,9
83
1.5%
66
,494
,327
1.
4%
-4.2
%
27.4
%
- Cap
ital O
utla
y 15
,477
,863
0.
4%
7,02
7,60
4 0.
2%
17,4
67,5
09
0.4%
6,
920,
345
0.2%
12
,896
,495
0.
3%
86.4
%
-16.
7%
Tota
l Hum
an S
ervi
ces
1,35
9,68
8,30
9 32
.8%
1,
423,
783,
552
32.7
%
1,53
6,23
3,19
4 32
.3%
1,
497,
081,
176
32.6
%
1,43
2,77
4,14
8 31
.0%
-4
.3%
5.
4%
Hea
lth
- Cur
rent
Exp
endi
ture
s 18
1,73
5,76
7 4.
4%
193,
762,
575
4.4%
21
2,42
9,59
4 4.
5%
201,
837,
029
4.4%
20
0,00
5,48
3 4.
3%
-0.9
%
10.1
%
- Cap
ital O
utla
y2,
613,
795
0.1%
6,
348,
396
0.1%
(2
,995
,101
) -0
.1%
1,
111,
652
---
3,53
6,08
8 0.
1%
218.
1%
35.3
%
Tot
al H
ealth
18
4,34
9,56
2 4.
4%
200,
110,
971
4.6%
20
9,43
4,49
3 4.
4%
202,
948,
681
4.4%
20
3,54
1,57
1 4.
4%
0.3%
10
.4%
C
ultu
re a
nd R
ecre
atio
n L
ibra
ries
- Cur
rent
Exp
endi
ture
s 71
,112
,819
1.
7%
74,9
65,3
19
1.7%
78
,922
,196
1.
7%
83,9
12,8
35
1.8%
82
,370
,856
1.
8%
-1.8
%
15.8
%
- Cap
ital O
utla
y 14
,798
,105
0.
4%
10,0
35,7
63
0.2%
16
,362
,638
0.
3%
11,3
53,9
35
0.2%
13
,989
,138
0.
3%
23.2
%
-5.5
%
Park
s an
d R
ecre
atio
n - C
urre
nt E
xpen
ditu
res
41,0
41,3
45
1.0%
43
,848
,450
1.
0%
47,1
46,0
44
1.0%
43
,422
,690
0.
9%
43,0
98,7
21
0.9%
-0
.7%
5.
0%
- Cap
ital O
utla
y 3,
737,
924
0.1%
4,
715,
222
0.1%
7,
353,
034
0.2%
6,
465,
186
0.1%
3,
150,
461
0.1%
-5
1.3%
-1
5.7%
T
otal
Cul
ture
and
Rec
reat
ion
130,
690,
193
3.1%
13
3,56
4,75
4 3.
1%
149,
783,
912
3.2%
14
5,15
4,64
6 3.
2%
142,
609,
176
3.1%
-1
.8%
9.
1%
Con
serv
atio
n of
Nat
ural
Res
ourc
es
- Cur
rent
Exp
endi
ture
s 63
,670
,708
1.
5%
67,6
38,1
47
1.6%
68
,218
,088
1.
4%
68,8
28,5
61
1.5%
65
,770
,481
1.
4%
-4.4
%
3.3%
- C
apita
l Out
lay
1,35
2,27
1 0.
0%
45,6
04
0.0%
27
7,45
2 0.
0%
3,21
0,52
2 0.
1%
535,
453
0.0%
-8
3.3%
-6
0.4%
T
otal
Con
serv
atio
n of
Nat
ural
Res
ourc
es
65,0
22,9
79
1.6%
67
,683
,751
1.
6%
68,4
95,5
40
1.4%
72
,039
,083
1.
6%
66,3
05,9
34
1.4%
-8
.0%
2.
0%
Eco
nom
ic D
evel
opm
ent
- Cur
rent
Exp
endi
ture
s 59
,254
,121
1.
4%
89,2
28,0
78
2.0%
88
,730
,880
1.
9%
96,1
96,6
36
2.1%
10
3,82
8,48
0 2.
3%
7.9%
75
.2%
- C
apita
l Out
lay
2,69
9,13
3 0.
1%
9,68
3,09
1 0.
2%
50,7
81,6
42
1.1%
4,
690,
513
0.1%
5,
622,
191
0.1%
19
.9%
10
8.3%
T
otal
Eco
nom
ic D
evel
opm
ent
61,9
53,2
54
1.5%
98
,911
,169
2.
3%
139,
512,
522
2.9%
10
0,88
7,14
9 2.
2%
109,
450,
671
2.4%
8.
5%
76.7
%
All
Oth
er
- Cur
rent
Exp
endi
ture
s 23
,766
,000
0.
6%
23,9
55,1
13
0.5%
21
,367
,506
0.
4%
6,48
1,66
8 0.
1%
6,35
5,34
4 0.
1%
-1.9
%
-73.
3%
- Cap
ital O
utla
y24
,968
,314
0.
6%
18,7
57,1
10
0.4%
14
,376
,968
0.
3%
10,4
37,4
09
0.2%
63
5,68
5 0.
0%
-93.
9%
-97.
5%
Tot
al A
ll O
ther
48
,734
,314
1.
2%
42,7
12,2
23
1.0%
35
,744
,474
0.
8%
16,9
19,0
77
0.4%
6,
991,
029
0.2%
-5
8.7%
-8
5.7%
Deb
t Ser
vice
- P
rinc
ipal
Pai
d on
Bon
ds
103,
034,
610
2.5%
10
0,46
9,34
8 2.
3%
170,
683,
645
3.6%
95
,434
,926
2.
1%
110,
784,
218
2.4%
16
.1%
7.
5%
- Oth
er L
ong-
term
Deb
t21
,116
,592
0.
5%
19,0
33,4
94
0.4%
33
,469
,956
0.
7%
27,1
83,6
16
0.6%
37
,194
,969
0.
8%
36.8
%
76.1
%
- Int
eres
t and
Fis
cal C
harg
es
50,8
83,1
10
1.2%
54
,553
,523
1.
3%
58,7
94,3
76
1.2%
62
,559
,605
1.
4%
64,3
64,2
02
1.4%
2.
9%
26.5
%
Tota
l Cur
rent
Exp
endi
ture
s 3,
353,
705,
232
80.8
%
3,55
5,57
8,64
1 81
.5%
3,
763,
057,
839
79.2
%
3,74
2,23
3,55
1 81
.6%
3,
724,
852,
305
80.7
%
-0.5
%
11.1
%
Tota
l Cap
ital O
utla
y 62
2,93
3,28
6 15
.0%
63
0,67
9,72
8 14
.5%
72
3,01
5,71
6 15
.2%
66
0,00
8,38
1 14
.4%
67
7,32
1,72
0 14
.7%
2.
6%
8.7%
To
tal D
ebt S
ervi
ce
175,
034,
312
4.2%
17
4,05
6,36
5 4.
0%
262,
947,
977
5.5%
18
5,17
8,14
7 4.
0%
212,
343,
389
4.6%
14
.7%
21
.3%
Tot
al E
xpen
ditu
res
4,15
1,67
2,83
0 10
0.0%
4,
360,
314,
734
100.
0%
4,74
9,02
1,53
2 10
0.0%
4,
587,
420,
079
100.
0%
4,61
4,51
7,41
4 10
0.0%
0.
6%
11.1
%
Oth
er F
inan
cing
Use
s D
ebt R
edem
ptio
n - R
efun
ded
Bon
ds
9,41
5,43
0 3,
060,
607
5,45
5,00
0 29
,996
,802
8,
163,
294
Oth
er U
ses
---
17,5
05
328,
244
789,
377
525,
272
Tra
nsfe
rs T
o - E
nter
pris
e Fu
nds
5,01
1,70
2 8,
356,
480
76,4
84,0
90
16,2
21,4
73
12,6
74,5
75
- Gov
ernm
enta
l Fun
ds
188,
953,
809
135,
226,
754
96,0
37,0
09
94,3
28,8
51
95,8
09,9
49
Tot
al E
xpen
ditu
res
and
Oth
er U
ses
4,35
5,05
3,77
1 4,
506,
976,
080
4,92
7,32
5,87
5 4,
728,
756,
582
4,73
1,69
0,50
4

This page left blank intentionally

CLASSIFICATION OF
REVENUES AND EXPENDITURES
GOVERNMENTAL FUNDS

Tab
le 2
C
lass
ifica
tion
of C
ount
y R
even
ues
For
the
Yea
r E
nded
Dec
embe
r 31
, 200
4
AIT
KIN
A
NO
KA
B
EC
KE
R
BE
LTR
AM
I B
EN
TON
B
IG S
TON
E
BLU
E E
AR
TH
16
Popu
latio
n ( 2
004
Popu
latio
n Es
timat
es)
Net
Tax
able
Tax
Cap
acity
20
03 T
ax L
evy
(Pay
able
200
4)
RE
VE
NU
ES
Taxe
s Sp
ecia
l Ass
essm
ents
Li
cens
es a
nd P
erm
its
Inte
rgov
ernm
enta
l Rev
enue
s Fe
dera
l Gra
nts
Hig
hway
s H
uman
Ser
vice
s D
isas
ter
All
Oth
er
Tota
l Fed
eral
Gra
nts
Stat
e G
rant
s H
AC
A
Man
ufac
ture
d H
ome
HA
CA
R
esid
entia
l Mar
ket V
alue
Cre
dit
Agr
icul
tura
l Mar
ket V
alue
Cre
dit
Mob
ile H
ome
Mar
ket V
alue
Cre
dit
Atta
ched
Mac
hine
ry A
id
Dis
parit
y R
educ
tion
Aid
H
ighw
ays
Hum
an S
ervi
ces
Crim
inal
Jus
tice
Aid
PE
RA
Aid
Po
lice
Aid
A
ll O
ther
T
otal
Sta
te G
rant
s
Loca
l Uni
ts G
rant
s
Tot
al In
terg
over
nmen
tal R
even
ues
Cha
rges
for S
ervi
ces
Fine
s an
d Fo
rfei
ts
Inte
rest
Ear
ning
s A
ll O
ther
Rev
enue
s
Tot
al R
even
ues
Oth
er F
inan
cing
Sou
rces
B
orro
win
g B
onds
Issu
ed
Oth
er L
ong-
term
Deb
t T
otal
Bor
row
ing
Oth
er S
ourc
es
Tran
sfer
s Fr
om
- En
terp
rise
Fund
s
- Gov
ernm
enta
l Fun
ds
Tot
al R
even
ues a
nd O
ther
Sou
rces
16,0
85
316,
830
31,8
13
42,2
71
38,0
18
5,60
3 58
,118
13
,967
,814
23
2,75
4,56
4 21
,002
,147
16
,708
,938
19
,168
,783
3,
195,
098
38,1
86,3
15
8,61
9,31
8 71
,347
,307
13
,306
,591
13
,773
,520
13
,280
,706
2,
246,
034
18,7
99,0
54
7,40
5,58
6 81
,193
,661
12
,397
,318
14
,160
,275
12
,360
,320
2,
185,
709
16,7
37,5
68
7,06
6 --
-58
5,23
8 1,
755,
407
471,
364
192,
570
736,
783
101,
103
837,
543
335,
571
141,
102
169,
328
28,6
20
251,
402
22,9
72
3,61
1,77
7 10
2,52
0 --
-74
9,38
7 24
2,84
1 1,
439,
193
434,
325
13,0
62,8
63
1,44
4,93
2 2,
276,
170
1,09
2,76
5 21
2,59
4 2,
145,
317
38,7
71
2,99
9,43
0 59
,594
45
,959
12
7,62
4 28
,545
85
,341
25
4,82
0 2,
428,
857
207,
302
2,15
8,70
9 94
,414
48
,338
32
,154
75
0,88
8 22
,102
,927
1,
814,
348
4,48
0,83
8 2,
064,
190
532,
318
3,70
2,00
5
1,26
4,28
9 8,
659,
787
581,
742
120,
999
514,
906
637,
390
1,38
7,54
2 --
---
---
---
---
---
---
-95
3,74
2 7,
218,
312
1,25
2,96
8 1,
290,
903
1,32
4,26
7 23
4,43
9 1,
941,
050
---
55,2
01
208,
355
138,
989
875
---
---
---
160,
814
13,3
91
27,3
72
23,7
39
---
29,0
26
---
---
---
---
---
---
---
10,7
39
126
4,15
0 41
2 7,
452
89,3
61
64,5
20
4,84
5,06
4 10
,991
,718
4,
807,
983
3,86
6,91
1 2,
381,
291
2,50
5,28
2 7,
109,
272
2,29
5,18
6 35
,329
,012
4,
314,
447
8,81
9,88
6 4,
081,
133
1,00
1,62
8 7,
683,
928
---
---
---
47,9
35
---
---
---
28,1
65
406,
581
38,1
81
61,1
85
37,9
04
11,4
47
76,7
06
80,4
82
573,
052
93,3
54
130,
633
104,
801
16,3
85
111,
294
1,96
2,32
8 12
,570
,215
45
0,42
7 90
6,01
5 49
7,06
6 17
0,26
1 2,
229,
992
11,4
39,9
95
75,9
64,8
18
11,7
64,9
98
15,4
11,2
40
8,97
3,43
4 4,
666,
193
20,6
33,3
30
41,3
21
4,52
1,46
3 13
,230
38
8,46
2 10
6,01
5 41
,146
96
,644
12,2
32,2
04
102,
589,
208
13,5
92,5
76
20,2
80,5
40
11,1
43,6
39
5,23
9,65
7 24
,431
,979
1,76
3,39
0 29
,409
,841
2,
075,
188
7,07
3,77
7 2,
062,
057
379,
892
4,74
6,73
2 54
,258
1,
776,
972
88,5
16
84,3
46
89,7
53
---
104,
643
359,
811
1,67
8,48
0 83
1,16
3 88
4,31
7 51
0,86
2 14
6,89
9 1,
921,
322
2,61
0,43
3 11
,438
,323
2,
027,
744
1,93
8,30
2 51
1,31
4 15
2,83
8 2,
106,
818
24,5
33,8
51
228,
924,
028
31,9
33,3
14
46,3
18,0
66
27,3
18,6
37
8,32
6,18
5 51
,037
,247
---
14,9
19,7
42
---
4,20
0,00
0 --
---
---
---
-2,
455,
000
---
---
3,08
1,57
4 --
-62
,086
--
-17
,374
,742
--
-4,
200,
000
3,08
1,57
4 --
-62
,086
--
---
---
-33
,594
--
-2,
500
--
---
206,
000
---
---
---
---
--
1,08
6,96
6 4,
545,
458
2,94
8,94
9 74
5,30
4 95
5,82
9 --
-3,
765,
017
25,6
20,8
17
251,
050,
228
34,8
82,2
63
51,2
96,9
64
31,3
56,0
40
8,32
8,68
5 54
,864
,350
---
---
---
---
---
---
---
---
---
---
---
---
---
---
---
---
---
---
---
---
---
---
---
---
---
---
---
---
---
---
---
---
---
---
---
Tab
le 3
C
lass
ific
atio
n of
Cou
nty
Exp
endi
ture
sFo
r th
e Y
ear
End
ed D
ecem
ber
31, 2
004
EX
PE
ND
ITU
RE
S A
ITK
IN
AN
OK
A
BE
CK
ER
B
EL
TR
AM
I B
EN
TO
N
BIG
ST
ON
E
BL
UE
EA
RT
H
17
3,62
4,53
6 31
,665
,166
4,
337,
558
7,72
4,24
2 3,
902,
598
1,17
2,62
3 5,
607,
922
Gen
eral
Gov
ernm
ent
- Cur
rent
Exp
endi
ture
s --
-5,
837,
217
---
3,01
8,27
2 29
,609
--
-1,
283,
548
Tot
al G
ener
al G
over
nmen
t - C
apita
l Out
lay
3,62
4,53
6 37
,502
,383
4,
337,
558
10,7
42,5
14
3,93
2,20
7 1,
172,
623
6,89
1,47
0 Pu
blic
Saf
ety
- She
riff
1,53
4,10
8 24
,453
,904
2,
558,
290
2,46
0,81
9 2,
445,
843
775,
829
2,52
2,52
1 - C
orre
ctio
ns
2,11
2,39
4 19
,678
,329
2,
360,
812
2,67
8,15
5 2,
856,
324
18,5
43
3,19
5,80
2 - A
ll O
the r
14
0,44
8 57
6,66
1 13
2,66
7 96
3,26
2 24
6,02
9 38
,584
16
1,61
9 - C
apita
l Out
lay
---
3,57
2,95
0 --
-4,
910,
876
466,
508
---
464,
145
Tot
al P
ublic
Saf
ety
3,78
6,95
0 48
,281
,844
5,
051,
769
11,0
13,1
12
6,01
4,70
4 83
2,95
6 6,
344,
087
Stre
ets
and
Hig
hway
s - A
dmin
istr
atio
n 32
3,26
8 1,
149,
008
282,
789
2,47
5,97
6 20
8,06
1 26
5,20
6 41
9,72
3 1,
829,
690
6,96
7,02
0 3,
714,
657
4,96
3,80
2 1,
658,
134
1,38
5,31
1 3,
738,
008
- Mai
nten
ance
4,
711,
618
19,1
67,7
39
3,35
7,29
6 1,
274,
206
3,11
6,32
5 2,
374,
027
9,43
5,73
5- C
onst
ruct
ion
---
151,
922
---
---
238,
899
---
512,
337
Tot
al S
tree
ts a
nd H
ighw
ays
- Oth
er C
apita
l Out
lay
6,86
4,57
6 27
,435
,689
7,
354,
742
8,71
3,98
4 5,
221,
419
4,02
4,54
4 14
,105
,803
Sa
nita
tion
- Cur
rent
Exp
endi
ture
s 30
3,01
4 7,
238,
034
1,26
5,70
4 2,
803,
238
350,
093
170,
094
1,57
7,89
6 --
---
---
---
---
---
-42
,133
T
otal
San
itatio
n - C
apita
l Out
lay
303,
014
7,23
8,03
4 1,
265,
704
2,80
3,23
8 35
0,09
3 17
0,09
4 1,
620,
029
Hum
an S
ervi
ces
- Inc
ome
Mai
nten
ance
1,
153,
335
19,9
06,5
68
2,15
0,29
0 3,
958,
943
2,28
7,84
8 46
5,97
5 3,
211,
142
3,74
3,42
4 48
,245
,610
8,
576,
525
9,26
5,71
1 5,
298,
834
1,54
1,61
4 11
,979
,950
- Soc
ial S
ervi
ces
---
2,66
8,92
6 13
8,81
4 --
---
-76
,358
--
- A
ll O
the r
--
-5,
393,
508
---
---
---
---
8,85
7 T
otal
Hum
an S
ervi
ces
- Cap
ital O
utla
y 4,
896,
759
76,2
14,6
12
10,8
65,6
29
13,2
24,6
54
7,58
6,68
2 2,
083,
947
15,1
99,9
49
Hea
lt h
- Cur
rent
Exp
endi
ture
s 49
4,94
0 7,
011,
054
261,
125
2,15
6,81
5 60
7,20
6 70
,418
1,
002,
849
- Ca p
ital O
utla
yT
otal
Hea
lth
494,
940
7,01
1,05
4 26
1,12
5 2,
156,
815
607,
206
70,4
18
1,00
2,84
9 C
ultu
re a
nd R
ecre
atio
n Li
brar
ies
- Cur
rent
Exp
endi
ture
s 15
1,36
2 6,
634,
092
160,
098
133,
030
403,
795
51,3
03
1,00
3,94
6 - C
a pita
l Out
lay
Park
s an
d R
ecre
atio
n - C
urre
nt E
xpen
ditu
res
483,
425
5,68
7,14
9 35
4,39
3 41
4,05
8 11
2,85
7 44
,846
60
7,66
8 --
---
---
---
-17
,343
--
---
-T
otal
Cul
ture
and
Rec
reat
ion
- Ca p
ital O
utla
y 63
4,78
7 12
,321
,241
51
4,49
1 54
7,08
8 53
3,99
5 96
,149
1,
611,
614
Con
serv
atio
n of
Nat
ural
Res
ourc
es
- Cur
rent
Exp
endi
ture
s 1,
601,
129
651,
815
636,
988
1,66
3,11
6 46
5,49
5 19
1,72
7 48
0,23
8 --
---
---
---
---
---
-11
,597
T
otal
Con
serv
atio
n of
Nat
ural
Res
ourc
es
- Ca p
ital O
utla
y 1,
601,
129
651,
815
636,
988
1,66
3,11
6 46
5,49
5 19
1,72
7 49
1,83
5 E
cono
mic
Dev
elop
men
t - C
urre
nt E
xpen
ditu
res
125,
193
12,5
95,4
17
340,
729
921,
486
2,34
8 34
,064
12
6,98
4 - C
a pita
l Out
lay
Tot
al E
cono
mic
Dev
elop
men
t12
5,19
3 12
,595
,417
34
0,72
9 92
1,48
6 2,
348
34,0
64
126,
984
All
Oth
er
- Cur
rent
Exp
endi
ture
s 12
9,33
9 2,
498,
322
364,
161
---
---
---
--
- Ca p
ital O
utla
yT
otal
All
Oth
er
129,
339
2,49
8,32
2 36
4,16
1 --
---
---
---
265,
000
7,09
0,00
0 42
5,00
0 48
2,50
0 90
0,00
0 15
,000
1,
804,
000
Deb
t Ser
vice
- P
rinci
pal P
aid
on B
onds
10
4,19
0 1,
709,
267
341,
837
54,8
17
3,44
0,73
6 24
,187
17
,820
- Oth
er L
ong-
term
Deb
t 19
0,58
2 4,
169,
889
53,2
35
473,
784
1,23
0,70
9 12
,335
21
1,75
1- I
nter
est a
nd F
isca
l Cha
r ges
Tota
l Cur
rent
Exp
endi
ture
s 17
,749
,605
19
7,62
7,07
5 27
,635
,600
42
,582
,653
20
,845
,465
6,
302,
495
35,6
36,2
68
Tota
l Ca p
ital O
utla
y 4,
711,
618
34,1
23,3
36
3,35
7,29
6 9,
203,
354
3,86
8,68
4 2,
374,
027
11,7
58,3
52
Tota
l Deb
t Ser
vice
559,
772
12,9
69,1
56
820,
072
1,01
1,10
1 5,
571,
445
51,5
22
2,03
3,57
1
Tot
al E
x pen
ditu
res
23,0
20,9
95
244,
719,
567
31,8
12,9
68
52,7
97,1
08
30,2
85,5
94
8,72
8,04
4 49
,428
,191
Oth
er F
inan
cin g
Use
s D
ebt R
edem
ptio
n - R
efun
ded
Bon
ds
Oth
er U
ses
---
---
---
42,0
00
---
---
---
Tra
nsfe
rs T
o - E
nter
pris
e Fu
nds
25,9
45
---
---
---
---
---
26,7
63
1,08
6,96
6 4,
545,
458
2,94
8,94
9 74
5,30
4 95
5,82
9 --
-3,
765,
017
- Gov
ernm
enta
l Fun
ds
T
otal
Ex p
endi
ture
s an
d O
ther
Use
s 24
,133
,906
24
9,26
5,02
5 34
,761
,917
53
,584
,412
31
,241
,423
8,
728,
044
53,2
19,9
71
Unr
eser
ved
Fun
d B
alan
ce
Gen
eral
Fun
d U
nres
erve
d Fu
nd B
alan
ce
13,6
66,4
18
23,8
48,1
00
7,28
2,55
1 13
,511
,733
4,
191,
798
2,78
7,14
2 8,
391,
434
Spec
ial R
even
ue F
und
Unr
eser
ved
Fund
Bal
ance
8,62
8,66
7 25
,808
,084
12
,813
,139
17
,915
,508
6,
575,
321
3,88
4,08
4 55
,366
,728
22
,295
,085
49
,656
,184
20
,095
,690
31
,427
,241
10
,767
,119
6,
671,
226
63,7
58,1
62
Tot
al
AS
A P
ER
CE
NT
OF
TOTA
L C
UR
RE
NT
EX
PEN
DIT
UR
ES
125.
6%
25.1
%
72.7
%
73.8
%
51.7
%
105.
9%
178.
9%

Tab
le 2
C
lass
ifica
tion
of C
ount
y R
even
ues
For
the
Yea
r E
nded
Dec
embe
r 31
, 200
4
BR
OW
N
CA
RLT
ON
C
AR
VER
C
ASS
C
HIP
PEW
A
CH
ISA
GO
C
LAY
Popu
latio
n ( 2
004
Popu
latio
n Es
timat
es)
26,9
05
33,7
48
81,6
18
28,4
53
12,6
94
48,4
24
52,9
94
Net
Tax
able
Tax
Cap
acity
15
,478
,950
16
,736
,527
66
,953
,638
33
,308
,199
8,
170,
982
32,7
22,5
27
22,3
61,5
86
2003
Tax
Lev
y (P
ayab
le 2
004)
7,
877,
790
13,0
24,5
08
29,4
61,3
36
13,2
62,8
02
4,94
5,61
9 19
,937
,002
17
,272
,315
RE
VE
NU
ES
18
Taxe
s 6,
851,
882
12,2
03,2
68
32,1
76,6
16
12,2
89,5
58
4,46
1,11
7 18
,691
,391
14
,294
,632
Sp
ecia
l Ass
essm
ents
65
4,98
5 54
5,41
3 10
3,60
6 1,
584,
896
299,
045
596,
693
1,06
0,84
9 Li
cens
es a
nd P
erm
its
31,5
37
111,
471
705,
953
119,
532
11,0
80
858,
963
47,4
78
Inte
rgov
ernm
enta
l Rev
enue
s Fe
dera
l Gra
nts
Hig
hway
s --
-1,
085,
132
493,
640
2,12
5,62
6 --
-4,
198,
399
39,9
53
Hum
an S
ervi
ces
822,
928
1,17
8,60
1 1,
188,
528
1,29
5,25
4 25
1,62
9 89
8,07
3 1,
705,
508
Dis
aste
r 43
,983
57
,877
21
3,28
5 44
,337
46
,303
13
7,42
3 32
7,16
3 A
ll O
ther
1,
059,
733
345,
493
652,
455
718,
437
150,
089
69,1
88
122,
157
Tota
l Fed
eral
Gra
nts
1,92
6,64
4 2,
667,
103
2,54
7,90
8 4,
183,
654
448,
021
5,30
3,08
3 2,
194,
781
Stat
e G
rant
s H
AC
A
836,
816
1,69
5,91
2 2,
647,
780
1,01
3,78
9 83
5,18
4 2,
125,
403
999,
114
Man
ufac
ture
d H
ome
HA
CA
--
---
---
---
---
---
---
-R
esid
entia
l Mar
ket V
alue
Cre
dit
1,13
6,90
8 1,
440,
497
1,89
6,31
7 1,
158,
631
526,
951
1,58
7,69
3 2,
076,
762
Agr
icul
tura
l Mar
ket V
alue
Cre
dit
---
---
75,0
78
---
---
185,
921
---
Mob
ile H
ome
Mar
ket V
alue
Cre
dit
7,74
8 --
---
---
---
-27
,543
--
-A
ttach
ed M
achi
nery
Aid
--
---
---
---
---
---
---
-D
ispa
rity
Red
uctio
n A
id
27,1
81
373,
576
2,63
7 7,
485
117,
810
4,98
5 1,
489,
591
Hig
hway
s 4,
171,
559
3,08
4,78
4 2,
193,
962
4,62
5,63
2 2,
834,
898
5,53
9,93
4 4,
615,
754
Hum
an S
ervi
ces
3,43
1,56
2 5,
897,
454
5,22
9,47
6 4,
966,
736
1,75
1,94
6 4,
761,
457
6,86
3,68
1 C
rimin
al J
ustic
e A
id
---
---
---
---
---
---
---
PER
A A
id
39,3
17
54,8
50
90,8
40
51,8
86
22,7
35
48,8
55
61,2
94
Polic
e A
id
48,4
01
103,
089
347,
933
129,
487
36,9
90
167,
409
150,
780
All
Oth
er
731,
196
886,
473
1,96
3,87
6 70
1,77
4 29
8,79
4 1,
984,
965
728,
838
Tot
al S
tate
Gra
nts
10,4
30,6
88
13,5
36,6
35
14,4
47,8
99
12,6
55,4
20
6,42
5,30
8 16
,434
,165
16
,985
,814
Loca
l Uni
ts G
rant
s 48
3,34
0 12
9,10
9 1,
964,
628
103,
898
101,
515
480,
944
91,9
66
Tot
al In
terg
over
nmen
tal R
even
ues
12,8
40,6
72
16,3
32,8
47
18,9
60,4
35
16,9
42,9
72
6,97
4,84
4 22
,218
,192
19
,272
,561
Cha
rges
for S
ervi
ces
2,15
5,54
5 2,
664,
259
7,49
8,46
6 3,
470,
958
522,
163
4,00
1,26
8 1,
777,
323
Fine
s an
d Fo
rfei
ts
30,2
66
302,
028
484,
997
12,4
43
---
452,
275
1,20
0 In
tere
st E
arni
ngs
236,
811
323,
169
1,87
7,84
2 78
8,62
2 20
3,71
2 48
2,47
4 27
4,55
8 A
ll O
ther
Rev
enue
s 1,
048,
641
2,07
7,13
4 1,
567,
921
3,53
9,60
8 71
6,91
9 2,
164,
171
619,
353
Tot
al R
even
ues
23,8
50,3
39
34,5
59,5
89
63,3
75,8
36
38,7
48,5
89
13,1
88,8
80
49,4
65,4
27
37,3
47,9
54
Oth
er F
inan
cing
Sou
rces
B
orro
win
g B
onds
Issu
ed
---
---
700,
000
---
---
4,00
0,00
0 --
-O
ther
Lon
g-te
rm D
ebt
150,
207
---
79,0
00
---
---
---
---
Tot
al B
orro
win
g 15
0,20
7 --
-77
9,00
0 --
---
-4,
000,
000
---
Oth
er S
ourc
es
---
---
262,
315
---
---
---
---
Tran
sfer
s Fr
om
- En
terp
rise
Fund
s--
---
---
---
---
---
---
- Gov
ernm
enta
l Fun
ds
136,
577
456,
840
2,76
6,68
3 1,
654,
854
---
892,
473
224,
989
Tot
al R
even
ues a
nd O
ther
Sou
rces
24
,137
,123
35
,016
,429
67
,183
,834
40
,403
,443
13
,188
,880
54
,357
,900
37
,572
,943

---
---
---
---
---
---
---
---
---
---
---
---
---
---
---
---
---
---
---
---
---
---
---
---
---
---
---
---
---
---
---
---
---
---
---
---
---
---
---
---
---
---
Tab
le 3
C
lass
ific
atio
n of
Cou
nty
Exp
endi
ture
sFo
r th
e Y
ear
End
ed D
ecem
ber
31, 2
004
EX
PE
ND
ITU
RE
S B
RO
WN
C
AR
LT
ON
C
AR
VE
R
CA
SS
CH
IPP
EW
A
CH
ISA
GO
C
LA
Y
19
2,99
7,45
4 5,
573,
154
13,5
91,3
19
4,96
8,96
1 2,
322,
781
8,04
7,28
5 5,
405,
191
Gen
eral
Gov
ernm
ent
- Cur
rent
Exp
endi
ture
s --
---
---
---
---
-1,
056,
313
279,
509
Tot
al G
ener
al G
over
nmen
t - C
apita
l Out
lay
2,99
7,45
4 5,
573,
154
13,5
91,3
19
4,96
8,96
1 2,
322,
781
9,10
3,59
8 5,
684,
700
Publ
ic S
afet
y - S
herif
f 2,
567,
227
2,82
2,70
0 11
,170
,457
5,
033,
772
889,
181
5,97
4,52
0 3,
004,
744
- Cor
rect
ions
1,
063,
221
2,18
5,31
9 1,
085,
989
171,
768
616,
567
573,
552
2,98
9,50
4 - A
ll O
the r
10
8,51
6 11
0,00
0 44
9,55
2 56
3,44
5 11
9,20
3 95
8,86
7 13
9,34
4 - C
apita
l Out
lay
---
---
---
---
---
222,
342
---
Tot
al P
ublic
Saf
ety
3,73
8,96
4 5,
118,
019
12,7
05,9
98
5,76
8,98
5 1,
624,
951
7,72
9,28
1 6,
133,
592
Stre
ets
and
Hig
hway
s - A
dmin
istr
atio
n 31
5,75
2 45
7,24
9 33
1,12
2 75
9,91
6 15
2,65
7 87
9,64
5 47
0,87
8 1,
948,
219
3,41
5,91
2 3,
005,
626
3,47
6,16
8 1,
306,
556
2,86
2,71
8 3,
648,
399
- Mai
nten
ance
4,
901,
409
2,58
8,66
6 4,
257,
634
7,79
5,75
0 1,
953,
022
11,4
69,2
35
4,64
3,45
3- C
onst
ruct
ion
---
4,66
4,13
5 15
,350
--
---
-19
0,45
5 28
8,20
7 T
otal
Str
eets
and
Hig
hway
s - O
ther
Cap
ital O
utla
y 7,
165,
380
11,1
25,9
62
7,60
9,73
2 12
,031
,834
3,
412,
235
15,4
02,0
53
9,05
0,93
7 Sa
nita
tion
- Cur
rent
Exp
endi
ture
s 91
6,22
4 1,
195,
725
---
1,88
5,06
2 48
8,05
2 56
9,36
9 1,
479
- Cap
ital O
utla
yT
otal
San
itatio
n91
6,22
4 1,
195,
725
---
1,88
5,06
2 48
8,05
2 56
9,36
9 1,
479
Hum
an S
ervi
ces
- Inc
ome
Mai
nten
ance
1,
945,
136
2,61
4,78
0 2,
348,
541
1,99
7,97
0 1,
051,
178
1,91
0,68
7 2,
823,
720
5,16
3,87
3 6,
697,
451
13,9
52,2
60
5,85
0,27
4 2,
694,
396
8,16
2,05
0 12
,667
,281
- Soc
ial S
ervi
ces
491,
831
---
---
697,
125
---
---
--
- All
Oth
e r
- Cap
ital O
utla
yT
otal
Hum
an S
ervi
ces
7,60
0,84
0 9,
312,
231
16,3
00,8
01
8,54
5,36
9 3,
745,
574
10,0
72,7
37
15,4
91,0
01
Hea
lt h
- Cur
rent
Exp
endi
ture
s 1,
306,
740
2,20
8,17
4 3,
011,
243
1,80
9,28
5 10
7,46
3 1,
987,
224
--
---
---
146,
055
---
---
---
---
Tot
al H
ealth
- C
a pita
l Out
lay
1,30
6,74
0 2,
208,
174
3,15
7,29
8 1,
809,
285
107,
463
1,98
7,22
4 --
-C
ultu
re a
nd R
ecre
atio
n Li
brar
ies
- Cur
rent
Exp
endi
ture
s 66
,236
94
,723
3,
073,
714
---
257,
483
608,
706
201,
881
---
---
---
---
---
1,47
1,89
1 --
-Pa
rks
and
Rec
reat
ion
- Cur
rent
Exp
endi
ture
s - C
a pita
l Out
lay
354,
897
212,
660
776,
381
---
64,2
40
314,
648
123,
716
---
---
731,
741
---
---
17,0
65
---
Tot
al C
ultu
re a
nd R
ecre
atio
n - C
a pita
l Out
lay
421,
133
307,
383
4,58
1,83
6 --
-32
1,72
3 2,
412,
310
325,
597
Con
serv
atio
n of
Nat
ural
Res
ourc
es
- Cur
rent
Exp
endi
ture
s 73
6,89
9 73
2,34
3 86
7,83
3 2,
124,
979
285,
605
492,
759
731,
403
- Ca p
ital O
utla
yT
otal
Con
serv
atio
n of
Nat
ural
Res
ourc
es
736,
899
732,
343
867,
833
2,12
4,97
9 28
5,60
5 49
2,75
9 73
1,40
3 E
cono
mic
Dev
elop
men
t - C
urre
nt E
xpen
ditu
res
21,7
55
754,
193
4,80
0 31
,387
50
,609
54
9,93
9 29
9,38
0 - C
a pita
l Out
lay
Tot
al E
cono
mic
Dev
elop
men
t21
,755
75
4,19
3 4,
800
31,3
87
50,6
09
549,
939
299,
380
All
Oth
er
- Cur
rent
Exp
endi
ture
s --
---
---
-41
,101
--
---
---
-T
otal
All
Oth
er
- Ca p
ital O
utla
y --
---
---
-41
,101
--
---
---
285,
000
545,
000
1,06
0,00
0 --
---
-10
2,50
0 2,
598,
132
Deb
t Ser
vice
- P
rinci
pal P
aid
on B
onds
90
,749
85
,808
21
,460
55
,273
--
-46
3,33
1 26
6,74
3- O
ther
Lon
g-te
rm D
ebt
133,
449
156,
903
620,
586
4,15
6 --
-46
0,66
5 57
7,22
4- I
nter
est a
nd F
isca
l Cha
r ges
Tota
l Cur
rent
Exp
endi
ture
s 20
,003
,980
29
,074
,383
53
,668
,837
29
,370
,112
10
,405
,971
33
,891
,969
32
,506
,920
To
tal C
a pita
l Out
lay
4,90
1,40
9 7,
252,
801
5,15
0,78
0 7,
836,
851
1,95
3,02
2 14
,427
,301
5,
211,
169
Tota
l Deb
t Ser
vice
509,
198
787,
711
1,70
2,04
6 59
,429
--
-1,
026,
496
3,44
2,09
9
Tot
al E
x pen
ditu
res
25,4
14,5
87
37,1
14,8
95
60,5
21,6
63
37,2
66,3
92
12,3
58,9
93
49,3
45,7
66
41,1
60,1
88
Oth
er F
inan
cin g
Use
s --
---
-70
0,00
0 --
---
-25
0,00
0 --
-O
ther
Use
s T
rans
fers
To
- Ent
erpr
ise
Fund
s
Deb
t Red
empt
ion
- Ref
unde
d B
onds
---
---
---
---
---
---
557,
018
136,
577
456,
840
2,76
6,68
3 1,
654,
854
---
892,
473
224,
989
- Gov
ernm
enta
l Fun
ds
T
otal
Ex p
endi
ture
s an
d O
ther
Use
s 25
,551
,164
37
,571
,735
63
,988
,346
38
,921
,246
12
,358
,993
50
,488
,239
41
,942
,195
Unr
eser
ved
Fun
d B
alan
ce
Gen
eral
Fun
d U
nres
erve
d Fu
nd B
alan
ce
3,34
4,66
9 5,
235,
741
27,8
90,7
92
15,5
85,5
55
3,77
1,56
0 5,
553,
405
3,94
8,98
3 Sp
ecia
l Rev
enue
Fun
d U
nres
erve
d Fu
nd B
alan
ce5,
127,
979
7,32
4,96
3 12
,144
,166
7,
594,
917
9,20
7,78
0 10
,356
,650
4,
737,
701
8,47
2,64
8 12
,560
,704
40
,034
,958
23
,180
,472
12
,979
,340
15
,910
,055
8,
686,
684
T
otal
AS
A P
ER
CE
NT
OF
TOTA
L C
UR
RE
NT
EX
PEN
DIT
UR
ES
42.4
%
43.2
%
74.6
%
78.9
%
124.
7%
46.9
%
26.7
%

Tab
le 2
C
lass
ifica
tion
of C
ount
y R
even
ues
For
the
Yea
r E
nded
Dec
embe
r 31
, 200
4
CLE
AR
WA
TER
C
OO
K
CO
TTO
NW
OO
D
CR
OW
WIN
G
DA
KO
TA
DO
DG
E
DO
UG
LAS
Popu
latio
n ( 2
004
Popu
latio
n Es
timat
es)
8,45
6 5,
316
11,9
35
59,3
95
383,
076
19,3
55
34,5
90
Net
Tax
able
Tax
Cap
acity
4,
960,
270
8,51
9,26
4 8,
552,
829
62,4
15,7
06
332,
787,
774
11,9
69,6
14
28,6
98,3
87
2003
Tax
Lev
y (P
ayab
le 2
004)
4,
133,
107
4,43
7,12
5 5,
230,
324
20,7
60,2
34
90,1
95,7
68
6,63
1,34
9 14
,648
,150
RE
VE
NU
ES
20
Taxe
s 4,
536,
117
5,67
7,39
9 4,
799,
719
19,5
74,5
36
105,
967,
033
6,14
2,15
8 13
,456
,349
Sp
ecia
l Ass
essm
ents
48
0,34
9 11
,852
45
9,03
0 59
0,60
1 --
-11
5,90
1 72
,195
Li
cens
es a
nd P
erm
its
16,4
83
62,8
20
16,5
13
1,54
0,86
1 78
1,82
4 11
4,87
8 48
3,65
7 In
terg
over
nmen
tal R
even
ues
Fede
ral G
rant
s H
ighw
ays
---
819,
334
633,
525
506,
515
1,09
2,85
4 --
-29
8,57
4 H
uman
Ser
vice
s 64
9,40
2 1,
068,
370
326,
030
2,41
5,21
0 14
,709
,236
43
4,67
9 1,
162,
096
Dis
aste
r 61
,796
75
,974
30
,465
39
3,57
4 39
9,45
3 10
6,14
6 10
1,22
2 A
ll O
ther
21
7,13
2 47
2,62
4 --
-19
1,91
8 5,
729,
564
74,5
88
10,3
09
Tota
l Fed
eral
Gra
nts
928,
330
2,43
6,30
2 99
0,02
0 3,
507,
217
21,9
31,1
07
615,
413
1,57
2,20
1 St
ate
Gra
nts
HA
CA
91
4,95
5 74
2,73
6 63
3,59
1 1,
464,
120
8,10
1,07
0 79
8,37
4 1,
401,
638
Man
ufac
ture
d H
ome
HA
CA
--
---
---
---
---
---
---
-R
esid
entia
l Mar
ket V
alue
Cre
dit
293,
568
272,
298
523,
746
1,80
9,73
8 6,
698,
384
775,
299
1,37
5,47
1 A
gric
ultu
ral M
arke
t Val
ue C
redi
t 82
,413
--
---
---
---
---
-20
1,41
3 M
obile
Hom
e M
arke
t Val
ue C
redi
t --
---
---
---
---
---
-10
,514
A
ttach
ed M
achi
nery
Aid
--
---
---
---
---
---
---
-D
ispa
rity
Red
uctio
n A
id
51,9
14
3,22
0 47
,860
14
,190
1,
880
204,
531
6,07
6 H
ighw
ays
3,04
6,75
0 2,
059,
812
4,62
2,17
3 4,
358,
951
12,4
18,9
03
2,78
4,73
0 3,
743,
229
Hum
an S
ervi
ces
1,47
6,70
2 70
6,74
9 1,
853,
130
7,74
9,07
9 11
,740
,469
1,
362,
786
3,38
3,07
2 C
rimin
al J
ustic
e A
id
---
---
---
---
---
---
---
PER
A A
id
17,7
44
17,8
05
17,4
11
82,9
02
333,
927
30,6
70
47,1
24
Polic
e A
id
33,7
74
56,0
56
28,6
84
168,
392
426,
565
83,7
34
106,
557
All
Oth
er
311,
438
826,
149
454,
229
1,04
1,78
2 9,
526,
608
338,
372
739,
704
Tot
al S
tate
Gra
nts
6,22
9,25
8 4,
684,
825
8,18
0,82
4 16
,689
,154
49
,247
,806
6,
378,
496
11,0
14,7
98
Loca
l Uni
ts G
rant
s 36
,163
24
,734
64
,413
18
8,41
0 7,
791,
615
26,0
68
17,1
93
Tot
al In
terg
over
nmen
tal R
even
ues
7,19
3,75
1 7,
145,
861
9,23
5,25
7 20
,384
,781
78
,970
,528
7,
019,
977
12,6
04,1
92
Cha
rges
for S
ervi
ces
1,16
0,43
2 61
8,06
1 38
7,52
2 3,
255,
800
61,3
71,0
76
2,03
1,72
7 4,
214,
390
Fine
s an
d Fo
rfei
ts
8,21
0 64
,520
--
-16
,244
79
5,13
7 17
,096
11
4,36
4 In
tere
st E
arni
ngs
335,
652
232,
972
162,
414
895,
805
3,38
4,81
7 12
5,76
2 24
5,16
9 A
ll O
ther
Rev
enue
s 54
4,70
0 75
6,31
2 50
3,45
3 3,
517,
438
8,72
5,49
4 31
2,04
7 1,
140,
511
Tot
al R
even
ues
14,2
75,6
94
14,5
69,7
97
15,5
63,9
08
49,7
76,0
66
259,
995,
909
15,8
79,5
46
32,3
30,8
27
Oth
er F
inan
cing
Sou
rces
B
orro
win
g B
onds
Issu
ed
---
---
383,
460
50,8
08,0
49
---
210,
000
---
Oth
er L
ong-
term
Deb
t --
---
---
---
---
-93
0,00
0 36
,300
T
otal
Bor
row
ing
---
---
383,
460
50,8
08,0
49
---
1,14
0,00
0 36
,300
O
ther
Sou
rces
--
-14
,631
--
-11
,318
77
,370
17
,385
50
,000
Tr
ansf
ers
From
-
Ente
rpris
e Fu
nds
67,5
55
---
15,0
00
873,
861
2,00
0,06
8 --
---
- Gov
ernm
enta
l Fun
ds
566,
198
720,
392
147,
984
1,88
7,62
8 9,
743,
607
249,
602
3,37
8,42
7
Tot
al R
even
ues a
nd O
ther
Sou
rces
14
,909
,447
15
,304
,820
16
,110
,352
10
3,35
6,92
2 27
1,81
6,95
4 17
,286
,533
35
,795
,554
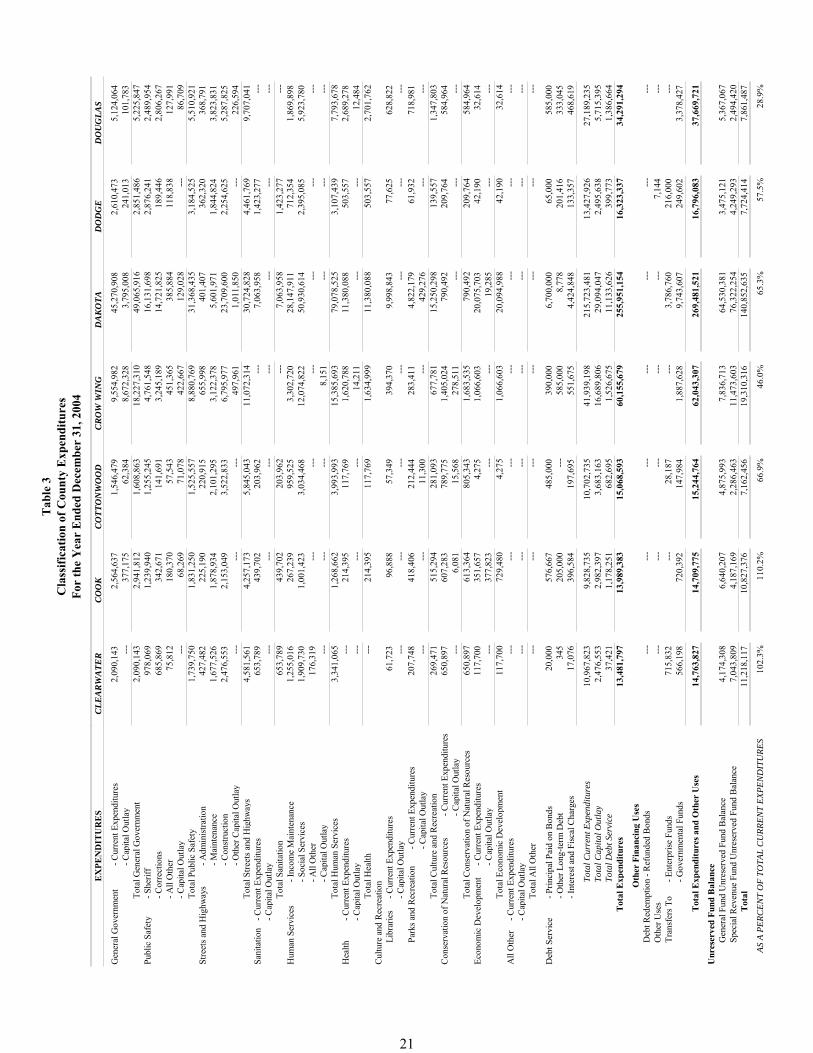
---
---
---
---
---
---
---
---
---
---
---
---
---
---
---
---
---
---
---
---
---
---
---
---
---
---
---
---
---
---
---
---
---
---
---
---
---
---
---
---
---
---
Tab
le 3
C
lass
ific
atio
n of
Cou
nty
Exp
endi
ture
sFo
r th
e Y
ear
End
ed D
ecem
ber
31, 2
004
EX
PE
ND
ITU
RE
S C
LE
AR
WA
TE
R
CO
OK
C
OT
TO
NW
OO
D
CR
OW
WIN
G
DA
KO
TA
D
OD
GE
D
OU
GL
AS
21
2,09
0,14
3 2,
564,
637
1,54
6,47
9 9,
554,
982
45,2
70,9
08
2,61
0,47
3 5,
124,
064
Gen
eral
Gov
ernm
ent
- Cur
rent
Exp
endi
ture
s --
-37
7,17
5 62
,384
8,
672,
328
3,79
5,00
8 24
1,01
3 10
1,78
3 T
otal
Gen
eral
Gov
ernm
ent
- Cap
ital O
utla
y 2,
090,
143
2,94
1,81
2 1,
608,
863
18,2
27,3
10
49,0
65,9
16
2,85
1,48
6 5,
225,
847
Publ
ic S
afet
y - S
herif
f 97
8,06
9 1,
239,
940
1,25
5,24
5 4,
761,
548
16,1
31,6
98
2,87
6,24
1 2,
489,
954
- Cor
rect
ions
68
5,86
9 34
2,67
1 14
1,69
1 3,
245,
189
14,7
21,8
25
189,
446
2,80
6,26
7 - A
ll O
the r
75
,812
18
0,37
0 57
,543
45
1,36
5 38
5,88
4 11
8,83
8 12
7,99
1 - C
apita
l Out
lay
---
68,2
69
71,0
78
422,
667
129,
028
---
86,7
09
Tot
al P
ublic
Saf
ety
1,73
9,75
0 1,
831,
250
1,52
5,55
7 8,
880,
769
31,3
68,4
35
3,18
4,52
5 5,
510,
921
Stre
ets
and
Hig
hway
s - A
dmin
istr
atio
n 42
7,48
2 22
5,19
0 22
0,91
5 65
5,99
8 40
1,40
7 36
2,32
0 36
8,79
1 1,
677,
526
1,87
8,93
4 2,
101,
295
3,12
2,37
8 5,
601,
971
1,84
4,82
4 3,
823,
831
- Mai
nten
ance
2,
476,
553
2,15
3,04
9 3,
522,
833
6,79
5,97
7 23
,709
,600
2,
254,
625
5,28
7,82
5- C
onst
ruct
ion
---
---
---
497,
961
1,01
1,85
0 --
-22
6,59
4 T
otal
Str
eets
and
Hig
hway
s - O
ther
Cap
ital O
utla
y 4,
581,
561
4,25
7,17
3 5,
845,
043
11,0
72,3
14
30,7
24,8
28
4,46
1,76
9 9,
707,
041
Sani
tatio
n - C
urre
nt E
xpen
ditu
res
653,
789
439,
702
203,
962
---
7,06
3,95
8 1,
423,
277
--
- Cap
ital O
utla
yT
otal
San
itatio
n65
3,78
9 43
9,70
2 20
3,96
2 --
-7,
063,
958
1,42
3,27
7 --
-H
uman
Ser
vice
s - I
ncom
e M
aint
enan
ce
1,25
5,01
6 26
7,23
9 95
9,52
5 3,
302,
720
28,1
47,9
11
712,
354
1,86
9,89
8 1,
909,
730
1,00
1,42
3 3,
034,
468
12,0
74,8
22
50,9
30,6
14
2,39
5,08
5 5,
923,
780
- Soc
ial S
ervi
ces
176,
319
---
---
---
---
---
--
- All
Oth
e r
---
---
---
8,15
1 --
---
---
-T
otal
Hum
an S
ervi
ces
- Cap
ital O
utla
y 3,
341,
065
1,26
8,66
2 3,
993,
993
15,3
85,6
93
79,0
78,5
25
3,10
7,43
9 7,
793,
678
Hea
lt h
- Cur
rent
Exp
endi
ture
s --
-21
4,39
5 11
7,76
9 1,
620,
788
11,3
80,0
88
503,
557
2,68
9,27
8 --
---
---
-14
,211
--
---
-12
,484
T
otal
Hea
lth
- Ca p
ital O
utla
y --
-21
4,39
5 11
7,76
9 1,
634,
999
11,3
80,0
88
503,
557
2,70
1,76
2 C
ultu
re a
nd R
ecre
atio
n Li
brar
ies
- Cur
rent
Exp
endi
ture
s 61
,723
96
,888
57
,349
39
4,37
0 9,
998,
843
77,6
25
628,
822
- Ca p
ital O
utla
yPa
rks
and
Rec
reat
ion
- Cur
rent
Exp
endi
ture
s20
7,74
8 41
8,40
6 21
2,44
4 28
3,41
1 4,
822,
179
61,9
32
718,
981
---
---
11,3
00
---
429,
276
---
---
Tot
al C
ultu
re a
nd R
ecre
atio
n - C
a pita
l Out
lay
269,
471
515,
294
281,
093
677,
781
15,2
50,2
98
139,
557
1,34
7,80
3 C
onse
rvat
ion
of N
atur
al R
esou
rces
- C
urre
nt E
xpen
ditu
res
650,
897
607,
283
789,
775
1,40
5,02
4 79
0,49
2 20
9,76
4 58
4,96
4 --
-6,
081
15,5
68
278,
511
---
---
---
Tot
al C
onse
rvat
ion
of N
atur
al R
esou
rces
- C
a pita
l Out
lay
650,
897
613,
364
805,
343
1,68
3,53
5 79
0,49
2 20
9,76
4 58
4,96
4 E
cono
mic
Dev
elop
men
t - C
urre
nt E
xpen
ditu
res
117,
700
351,
657
4,27
5 1,
066,
603
20,0
75,7
03
42,1
90
32,6
14
---
377,
823
---
---
19,2
85
---
---
Tot
al E
cono
mic
Dev
elop
men
t - C
a pita
l Out
lay
117,
700
729,
480
4,27
5 1,
066,
603
20,0
94,9
88
42,1
90
32,6
14
All
Oth
er
- Cur
rent
Exp
endi
ture
s - C
a pita
l Out
lay
Tot
al A
ll O
ther
Deb
t Ser
vice
- P
rinci
pal P
aid
on B
onds
20
,000
57
6,66
7 48
5,00
0 39
0,00
0 6,
700,
000
65,0
00
585,
000
345
205,
000
---
585,
000
8,77
8 20
1,41
6 33
3,04
5- O
ther
Lon
g-te
rm D
ebt
17,0
76
396,
584
197,
695
551,
675
4,42
4,84
8 13
3,35
7 46
8,61
9- I
nter
est a
nd F
isca
l Cha
r ges
Tota
l Cur
rent
Exp
endi
ture
s 10
,967
,823
9,
828,
735
10,7
02,7
35
41,9
39,1
98
215,
723,
481
13,4
27,9
26
27,1
89,2
35
Tota
l Ca p
ital O
utla
y 2,
476,
553
2,98
2,39
7 3,
683,
163
16,6
89,8
06
29,0
94,0
47
2,49
5,63
8 5,
715,
395
Tota
l Deb
t Ser
vice
37,4
21
1,17
8,25
1 68
2,69
5 1,
526,
675
11,1
33,6
26
399,
773
1,38
6,66
4
Tot
al E
x pen
ditu
res
13,4
81,7
97
13,9
89,3
83
15,0
68,5
93
60,1
55,6
79
255,
951,
154
16,3
23,3
37
34,2
91,2
94
Oth
er F
inan
cin g
Use
s D
ebt R
edem
ptio
n - R
efun
ded
Bon
ds
Oth
er U
ses
---
---
---
---
---
7,14
4 --
-T
rans
fers
To
- Ent
erpr
ise
Fund
s 71
5,83
2 --
-28
,187
--
-3,
786,
760
216,
000
--
566,
198
720,
392
147,
984
1,88
7,62
8 9,
743,
607
249,
602
3,37
8,42
7- G
over
nmen
tal F
unds
T
otal
Ex p
endi
ture
s an
d O
ther
Use
s 14
,763
,827
14
,709
,775
15
,244
,764
62
,043
,307
26
9,48
1,52
1 16
,796
,083
37
,669
,721
Unr
eser
ved
Fun
d B
alan
ce
Gen
eral
Fun
d U
nres
erve
d Fu
nd B
alan
ce
4,17
4,30
8 6,
640,
207
4,87
5,99
3 7,
836,
713
64,5
30,3
81
3,47
5,12
1 5,
367,
067
Spec
ial R
even
ue F
und
Unr
eser
ved
Fund
Bal
ance
7,04
3,80
9 4,
187,
169
2,28
6,46
3 11
,473
,603
76
,322
,254
4,
249,
293
2,49
4,42
0 11
,218
,117
10
,827
,376
7,
162,
456
19,3
10,3
16
140,
852,
635
7,72
4,41
4 7,
861,
487
T
otal
AS
A P
ER
CE
NT
OF
TOTA
L C
UR
RE
NT
EX
PEN
DIT
UR
ES
102.
3%
110.
2%
66.9
%
46.0
%
65.3
%
57.5
%
28.9
%

Tab
le 2
C
lass
ifica
tion
of C
ount
y R
even
ues
For
the
Yea
r E
nded
Dec
embe
r 31
, 200
4
FA
RIB
AU
LT
FIL
LMO
RE
F
RE
EB
OR
N
GO
OD
HU
E
GR
AN
T H
EN
NE
PIN
H
OU
STO
N
Popu
latio
n ( 2
004
Popu
latio
n Es
timat
es)
15,6
18
21,3
59
31,9
97
45,6
79
6,18
2 1,
144,
037
19,9
45
Net
Tax
able
Tax
Cap
acity
10
,771
,053
12
,706
,239
19
,359
,233
39
,785
,444
4,
645,
365
1,07
0,68
3,23
0 10
,043
,158
20
03 T
ax L
evy
(Pay
able
200
4)
5,44
7,59
4 5,
889,
283
12,1
77,8
39
22,9
33,7
68
2,85
3,65
3 44
8,10
9,81
6 5,
341,
669
RE
VE
NU
ES
22
Taxe
s 4,
785,
983
5,06
3,27
0 9,
935,
980
21,6
80,7
26
2,60
4,51
6 46
1,27
1,89
7 4,
571,
691
Spec
ial A
sses
smen
ts
466,
229
---
1,13
0,36
9 16
,439
15
2,42
8 --
---
-Li
cens
es a
nd P
erm
its
1,51
0 54
,608
16
0,64
4 66
0,47
8 3,
511
3,02
3,15
7 74
,754
In
terg
over
nmen
tal R
even
ues
Fede
ral G
rant
s H
ighw
ays
578,
150
270,
053
---
762,
360
9,38
1 5,
177,
896
357,
607
Hum
an S
ervi
ces
---
467,
439
1,12
6,99
0 77
2,80
4 19
2,44
5 95
,280
,150
52
7,57
9 D
isas
ter
111,
414
59,2
30
73,7
76
99,4
74
25,1
08
3,09
5,72
0 39
,708
A
ll O
ther
15
9,83
2 12
7,80
6 20
3,30
1 29
5,11
5 22
,165
50
,065
,114
19
4,24
3 To
tal F
eder
al G
rant
s 84
9,39
6 92
4,52
8 1,
404,
067
1,92
9,75
3 24
9,09
9 15
3,61
8,88
0 1,
119,
137
Stat
e G
rant
s H
AC
A
544,
311
653,
365
888,
355
---
509,
252
7,43
0,93
7 70
6,53
5 M
anuf
actu
red
Hom
e H
AC
A
---
---
---
---
---
---
---
Res
iden
tial M
arke
t Val
ue C
redi
t 73
2,98
7 69
9,67
2 1,
557,
022
1,37
8,87
8 31
3,05
1 21
,561
,465
83
1,53
8 A
gric
ultu
ral M
arke
t Val
ue C
redi
t --
-22
8,10
8 --
---
---
---
---
-M
obile
Hom
e M
arke
t Val
ue C
redi
t --
-2,
914
---
---
---
---
---
Atta
ched
Mac
hine
ry A
id
---
---
---
---
---
---
---
Dis
parit
y R
educ
tion
Aid
72
,325
16
5,39
6 50
,192
29
,367
6,
168
---
139,
710
Hig
hway
s 4,
115,
484
5,36
2,21
1 4,
539,
552
5,16
3,85
9 2,
063,
315
19,3
78,0
12
4,77
7,99
8 H
uman
Ser
vice
s 46
,130
1,
406,
980
3,89
0,71
3 3,
727,
476
1,07
2,53
8 62
,636
,378
1,
894,
195
Crim
inal
Jus
tice
Aid
--
---
---
---
---
---
---
-PE
RA
Aid
13
,448
26
,020
44
,126
61
,078
15
,868
2,
730,
102
23,7
74
Polic
e A
id
42,8
59
5,62
1 80
,385
17
9,18
3 25
,367
1,
721,
201
50,2
60
All
Oth
er
212,
388
410,
297
607,
416
983,
362
219,
612
55,4
18,6
21
694,
320
Tot
al S
tate
Gra
nts
5,77
9,93
2 8,
960,
584
11,6
57,7
61
11,5
23,2
03
4,22
5,17
1 17
0,87
6,71
6 9,
118,
330
Loca
l Uni
ts G
rant
s --
-17
0,50
2 40
,248
15
,000
58
,876
6,
847,
185
16,8
77
Tot
al In
terg
over
nmen
tal R
even
ues
6,62
9,32
8 10
,055
,614
13
,102
,076
13
,467
,956
4,
533,
146
331,
342,
781
10,2
54,3
44
Cha
rges
for S
ervi
ces
1,06
1,29
0 2,
126,
392
2,06
8,29
9 4,
986,
375
879,
739
103,
513,
401
1,79
0,91
7 Fi
nes
and
Forf
eits
17
,720
48
,363
17
7,63
1 15
0,90
3 --
-1,
142,
910
51,5
21
Inte
rest
Ear
ning
s 19
2,94
1 10
0,09
3 23
2,44
1 41
5,53
9 47
,176
12
,973
,533
24
5,81
7 A
ll O
ther
Rev
enue
s 1,
512,
050
854,
573
1,11
3,74
8 1,
264,
283
275,
279
37,7
21,0
64
352,
327
Tot
al R
even
ues
14,6
67,0
51
18,3
02,9
13
27,9
21,1
88
42,6
42,6
99
8,49
5,79
5 95
0,98
8,74
3 17
,341
,371
Oth
er F
inan
cing
Sou
rces
B
orro
win
g B
onds
Issu
ed
---
---
---
6,17
2,20
1 21
0,00
0 35
,000
,000
--
-O
ther
Lon
g-te
rm D
ebt
14,7
95
---
---
---
---
---
---
Tot
al B
orro
win
g 14
,795
--
---
-6,
172,
201
210,
000
35,0
00,0
00
---
Oth
er S
ourc
es
---
97,1
69
3,05
0 12
,586
--
-5,
854,
479
37,9
18
Tran
sfer
s Fr
om
- En
terp
rise
Fund
s--
---
---
---
---
---
---
- Gov
ernm
enta
l Fun
ds
222,
873
---
---
578,
353
---
11,5
12,9
74
---
Tot
al R
even
ues a
nd O
ther
Sou
rces
14
,904
,719
18
,400
,082
27
,924
,238
49
,405
,839
8,
705,
795
1,00
3,35
6,19
6 17
,379
,289

---
---
---
---
---
---
---
---
---
---
---
---
---
---
---
---
---
---
---
---
---
Tab
le 3
C
lass
ific
atio
n of
Cou
nty
Exp
endi
ture
sFo
r th
e Y
ear
End
ed D
ecem
ber
31, 2
004
EX
PE
ND
ITU
RE
S F
AR
IBA
UL
T
FIL
LM
OR
E
FR
EE
BO
RN
G
OO
DH
UE
G
RA
NT
H
EN
NE
PIN
H
OU
STO
N
23
2,24
8,75
4 2,
673,
368
4,26
0,46
0 7,
338,
709
1,50
8,18
7 13
4,92
7,97
3 2,
595,
910
Gen
eral
Gov
ernm
ent
- Cur
rent
Exp
endi
ture
s --
-2,
367,
984
1,57
9,13
7 --
---
-27
,872
,295
--
-T
otal
Gen
eral
Gov
ernm
ent
- Cap
ital O
utla
y 2,
248,
754
5,04
1,35
2 5,
839,
597
7,33
8,70
9 1,
508,
187
162,
800,
268
2,59
5,91
0 Pu
blic
Saf
ety
- She
riff
1,54
1,06
5 1,
279,
850
2,37
0,32
8 7,
668,
730
752,
836
39,2
39,1
19
1,67
0,55
9 - C
orre
ctio
ns
204,
779
1,05
5,36
7 2,
091,
180
878,
818
113,
356
106,
091,
871
232,
500
- All
Oth
e r
290,
243
142,
301
99,4
65
358,
931
42,1
89
5,39
8,66
9 14
3,10
1 - C
apita
l Out
lay
---
---
---
---
---
6,13
2,90
3 --
-T
otal
Pub
lic S
afet
y 2,
036,
087
2,47
7,51
8 4,
560,
973
8,90
6,47
9 90
8,38
1 15
6,86
2,56
2 2,
046,
160
Stre
ets
and
Hig
hway
s - A
dmin
istr
atio
n 16
6,08
2 28
5,20
1 24
8,70
8 36
3,23
8 21
4,70
8 5,
721,
355
172,
758
2,64
6,19
6 1,
878,
034
2,62
1,16
2 3,
387,
920
1,46
1,62
9 22
,974
,969
2,
021,
469
- Mai
nten
ance
4,
156,
101
718,
379
2,06
2,88
5 6,
912,
884
1,19
9,25
4 31
,571
,104
3,
487,
810
- Con
stru
ctio
n --
-3,
652,
461
22,5
09
---
---
---
---
Tot
al S
tree
ts a
nd H
ighw
ays
- Oth
er C
apita
l Out
lay
6,96
8,37
9 6,
534,
075
4,95
5,26
4 10
,664
,042
2,
875,
591
60,2
67,4
28
5,68
2,03
7 Sa
nita
tion
- Cur
rent
Exp
endi
ture
s 14
0,64
5 55
9,76
8 37
3,77
6 68
3,52
7 51
0,07
6 --
-70
6,91
6 - C
apita
l Out
lay
Tot
al S
anita
tion
140,
645
559,
768
373,
776
683,
527
510,
076
---
706,
916
Hum
an S
ervi
ces
- Inc
ome
Mai
nten
ance
--
-87
0,66
6 2,
042,
784
2,09
0,71
6 54
5,47
0 21
1,69
7,27
3 65
7,90
7 --
-2,
372,
744
7,13
4,53
8 6,
038,
019
1,71
9,75
8 22
1,51
8,20
1 2,
789,
534
- Soc
ial S
ervi
ces
1,15
1,96
5 --
-8,
378
---
---
---
--
- All
Oth
e r
---
---
---
---
---
6,84
1,56
8 --
-T
otal
Hum
an S
ervi
ces
- Cap
ital O
utla
y 1,
151,
965
3,24
3,41
0 9,
185,
700
8,12
8,73
5 2,
265,
228
440,
057,
042
3,44
7,44
1 H
ealt h
- C
urre
nt E
xpen
ditu
res
---
1,33
8,87
0 1,
242,
427
3,09
1,29
4 41
9,22
4 69
,250
,550
1,
171,
506
---
---
---
---
---
3,25
1,81
8 --
-T
otal
Hea
lth
- Ca p
ital O
utla
y --
-1,
338,
870
1,24
2,42
7 3,
091,
294
419,
224
72,5
02,3
68
1,17
1,50
6 C
ultu
re a
nd R
ecre
atio
n Li
brar
ies
- Cur
rent
Exp
endi
ture
s 19
4,88
3 16
4,90
0 21
4,00
0 27
4,77
3 37
,539
30
,262
,682
64
,228
--
---
---
---
---
-11
,891
,719
--
-Pa
rks
and
Rec
reat
ion
- Cur
rent
Exp
endi
ture
s - C
a pita
l Out
lay
205,
785
750
81,4
49
287,
534
6,88
8 --
-14
6,86
2 - C
a pita
l Out
lay
Tot
al C
ultu
re a
nd R
ecre
atio
n40
0,66
8 16
5,65
0 29
5,44
9 56
2,30
7 44
,427
42
,154
,401
21
1,09
0 C
onse
rvat
ion
of N
atur
al R
esou
rces
- C
urre
nt E
xpen
ditu
res
635,
426
573,
870
1,80
0,80
4 44
1,55
4 20
0,90
1 --
-27
3,31
2 --
---
-21
,848
--
---
---
---
-T
otal
Con
serv
atio
n of
Nat
ural
Res
ourc
es
- Ca p
ital O
utla
y 63
5,42
6 57
3,87
0 1,
822,
652
441,
554
200,
901
---
273,
312
Eco
nom
ic D
evel
opm
ent
- Cur
rent
Exp
endi
ture
s 59
0,08
7 31
,796
11
2,60
7 19
,435
35
,000
18
,938
,395
32
,783
--
---
---
---
---
-4,
257,
207
---
Tot
al E
cono
mic
Dev
elop
men
t - C
a pita
l Out
lay
590,
087
31,7
96
112,
607
19,4
35
35,0
00
23,1
95,6
02
32,7
83
All
Oth
er
- Cur
rent
Exp
endi
ture
s 18
1,30
3 --
---
---
---
---
-53
,860
--
---
-16
3,87
4 --
-17
1,55
0 --
---
-T
otal
All
Oth
er
- Ca p
ital O
utla
y 18
1,30
3 --
-16
3,87
4 --
-17
1,55
0 --
-53
,860
515,
000
---
705,
000
1,87
6,59
6 70
,000
25
,138
,789
--
-D
ebt S
ervi
ce
- Prin
cipa
l Pai
d on
Bon
ds
312,
926
---
329,
000
613,
444
---
3,28
8,60
7 --
- O
ther
Lon
g-te
rm D
ebt
224,
439
137,
114
663,
156
1,03
8,82
2 14
,398
16
,836
,849
9,
639
- Int
eres
t and
Fis
cal C
har g
es
Tota
l Cur
rent
Exp
endi
ture
s 10
,197
,213
13
,227
,485
24
,702
,066
32
,923
,198
7,
567,
761
866,
021,
057
12,7
33,2
05
Tota
l Ca p
ital O
utla
y 4,
156,
101
6,73
8,82
4 3,
850,
253
6,91
2,88
4 1,
370,
804
91,8
18,6
14
3,48
7,81
0 To
tal D
ebt S
ervi
ce1,
052,
365
137,
114
1,69
7,15
6 3,
528,
862
84,3
98
45,2
64,2
45
9,63
9
Tot
al E
x pen
ditu
res
15,4
05,6
79
20,1
03,4
23
30,2
49,4
75
43,3
64,9
44
9,02
2,96
3 1,
003,
103,
916
16,2
30,6
54
Oth
er F
inan
cin g
Use
s --
---
---
-4,
845,
871
---
---
---
Oth
er U
ses
Tra
nsfe
rs T
o - E
nter
pris
e Fu
nds
Deb
t Red
empt
ion
- Ref
unde
d B
onds
---
---
---
---
---
1,40
0,19
0 --
22
2,87
3 --
---
-57
8,35
3 --
-11
,512
,974
--
- G
over
nmen
tal F
unds
T
otal
Ex p
endi
ture
s an
d O
ther
Use
s 15
,628
,552
20
,103
,423
30
,249
,475
48
,789
,168
9,
022,
963
1,01
6,01
7,08
0 16
,230
,654
Unr
eser
ved
Fun
d B
alan
ce
Gen
eral
Fun
d U
nres
erve
d Fu
nd B
alan
ce
1,95
8,16
5 2,
038,
922
4,47
6,08
8 10
,011
,556
1,
019,
317
142,
414,
494
5,49
5,79
8 Sp
ecia
l Rev
enue
Fun
d U
nres
erve
d Fu
nd B
alan
ce2,
201,
845
4,88
8,70
1 6,
575,
623
7,88
5,78
7 1,
617,
186
135,
752,
752
4,07
9,67
2 4,
160,
010
6,92
7,62
3 11
,051
,711
17
,897
,343
2,
636,
503
278,
167,
246
9,57
5,47
0
Tot
al
AS
A P
ER
CE
NT
OF
TOTA
L C
UR
RE
NT
EX
PEN
DIT
UR
ES
40.8
%
52.4
%
44.7
%
54.4
%
34.8
%
32.1
%
75.2
%

Tab
le 2
C
lass
ifica
tion
of C
ount
y R
even
ues
For
the
Yea
r E
nded
Dec
embe
r 31
, 200
4
HU
BB
AR
D
ISA
NTI
IT
ASC
A
JAC
KSO
N
KA
NA
BE
C
KA
ND
IYO
HI
KIT
TSO
N
Popu
latio
n ( 2
004
Popu
latio
n Es
timat
es)
18,8
56
36,5
12
44,2
42
11,2
14
16,0
54
41,3
98
4,85
6 N
et T
axab
le T
ax C
apac
ity
18,0
34,5
81
20,5
93,5
55
34,1
23,4
68
9,36
8,47
8 7,
870,
791
25,4
90,3
82
4,69
5,94
1 20
03 T
ax L
evy
(Pay
able
200
4)
7,26
2,72
4 11
,605
,049
21
,968
,794
6,
173,
579
6,52
5,28
1 20
,067
,340
2,
086,
409
RE
VE
NU
ES
24
Taxe
s 8,
538,
779
10,4
23,5
04
20,0
27,6
42
5,66
4,64
6 5,
962,
250
18,2
37,2
71
1,98
0,94
4 Sp
ecia
l Ass
essm
ents
2,
259,
428
5,37
6 89
5,98
8 40
3,49
7 13
7,73
9 2,
493,
801
148,
556
Lice
nses
and
Per
mits
13
4,99
4 66
9,27
1 52
,300
9,
360
98,8
79
476,
470
4,99
5 In
terg
over
nmen
tal R
even
ues
Fede
ral G
rant
s H
ighw
ays
269,
801
---
1,90
2,22
8 --
-26
3,24
7 39
,633
35
4,35
3 H
uman
Ser
vice
s 66
8,15
2 1,
200,
141
1,17
9,29
0 34
0,52
1 42
6,64
6 1,
737,
363
147,
894
Dis
aste
r 21
,176
12
1,94
4 88
,831
36
,701
51
,313
85
,088
32
,256
A
ll O
ther
40
4,52
2 48
8,43
0 1,
111,
404
566,
454
218,
847
575,
797
165,
983
Tota
l Fed
eral
Gra
nts
1,36
3,65
1 1,
810,
515
4,28
1,75
3 94
3,67
6 96
0,05
3 2,
437,
881
700,
486
Stat
e G
rant
s H
AC
A
694,
972
1,48
1,70
0 1,
452,
833
517,
433
986,
455
1,78
8,66
4 59
0,17
1 M
anuf
actu
red
Hom
e H
AC
A
---
---
---
---
---
---
---
Res
iden
tial M
arke
t Val
ue C
redi
t 73
1,53
7 1,
436,
457
1,93
1,38
3 36
8,25
8 78
6,21
1 1,
994,
534
181,
240
Agr
icul
tura
l Mar
ket V
alue
Cre
dit
---
---
---
167,
630
176,
088
---
---
Mob
ile H
ome
Mar
ket V
alue
Cre
dit
---
---
---
930
9,89
8 --
---
-A
ttach
ed M
achi
nery
Aid
--
---
---
---
---
---
---
-D
ispa
rity
Red
uctio
n A
id
---
40,9
89
163,
228
55,6
58
4,41
9 21
,488
4,
480
Hig
hway
s 3,
660,
343
2,93
4,11
8 7,
705,
321
4,43
4,35
6 1,
901,
264
4,83
9,66
4 3,
228,
204
Hum
an S
ervi
ces
2,28
0,26
4 4,
309,
634
7,28
7,35
9 1,
183,
048
1,71
8,44
6 5,
805,
362
512,
117
Crim
inal
Jus
tice
Aid
--
---
---
---
---
---
---
-PE
RA
Aid
23
,409
37
,531
82
,819
18
,535
21
,501
73
,608
13
,152
Po
lice
Aid
58
,864
79
,183
33
1,28
6 27
,640
41
,913
14
9,29
9 16
,946
A
ll O
ther
40
9,60
0 1,
203,
932
3,37
9,87
2 38
0,44
7 98
1,45
9 1,
371,
352
239,
292
Tot
al S
tate
Gra
nts
7,85
8,98
9 11
,523
,544
22
,334
,101
7,
153,
935
6,62
7,65
4 16
,043
,971
4,
785,
602
Loca
l Uni
ts G
rant
s 6,
800
60,7
89
745,
180
---
---
178,
984
66,0
00
Tot
al In
terg
over
nmen
tal R
even
ues
9,22
9,44
0 13
,394
,848
27
,361
,034
8,
097,
611
7,58
7,70
7 18
,660
,836
5,
552,
088
Cha
rges
for S
ervi
ces
1,19
5,49
0 1,
482,
161
3,92
4,39
9 52
4,65
6 96
6,46
4 10
,635
,915
54
7,36
6 Fi
nes
and
Forf
eits
44
,084
26
9,06
5 55
,550
29
,014
13
2,42
9 15
,047
7,
800
Inte
rest
Ear
ning
s 42
3,81
3 32
9,32
3 75
7,02
2 22
6,34
9 12
7,79
1 67
2,62
1 17
5,22
8 A
ll O
ther
Rev
enue
s 95
3,30
2 1,
780,
099
8,40
8,09
6 64
5,06
3 78
1,89
7 1,
907,
839
334,
371
Tot
al R
even
ues
22,7
79,3
30
28,3
53,6
47
61,4
82,0
31
15,6
00,1
96
15,7
95,1
56
53,0
99,8
00
8,75
1,34
8
Oth
er F
inan
cing
Sou
rces
B
orro
win
g B
onds
Issu
ed
8,52
7,47
2 1,
400,
000
---
---
---
13,1
91,8
39
---
Oth
er L
ong-
term
Deb
t 13
2,25
0 --
---
-11
7,25
9 --
-18
9,52
6 --
-T
otal
Bor
row
ing
8,65
9,72
2 1,
400,
000
---
117,
259
---
13,3
81,3
65
---
Oth
er S
ourc
es
---
4,21
3 --
-38
,125
--
-80
4,90
2 --
-Tr
ansf
ers
From
-
Ente
rpris
e Fu
nds
---
---
---
---
---
---
--
- G
over
nmen
tal F
unds
39
4,21
7 67
9,57
2 4,
807,
329
580,
387
347,
000
1,57
2,90
1 65
1
Tot
al R
even
ues a
nd O
ther
Sou
rces
31
,833
,269
30
,437
,432
66
,289
,360
16
,335
,967
16
,142
,156
68
,858
,968
8,
751,
999

---
---
---
---
---
---
---
---
---
---
---
---
---
---
---
---
---
---
---
---
---
---
---
---
---
---
---
---
Tab
le 3
C
lass
ific
atio
n of
Cou
nty
Exp
endi
ture
sFo
r th
e Y
ear
End
ed D
ecem
ber
31, 2
004
EX
PE
ND
ITU
RE
S H
UB
BA
RD
IS
AN
TI
ITA
SCA
JA
CK
SON
K
AN
AB
EC
K
AN
DIY
OH
I K
ITT
SON
25
2,38
3,86
4 5,
040,
806
7,38
2,95
7 2,
227,
708
2,79
8,56
5 6,
106,
925
1,77
2,82
7G
ener
al G
over
nmen
t - C
urre
nt E
xpen
ditu
res
---
---
541,
593
307,
070
5,55
4 37
7,04
1 --
-T
otal
Gen
eral
Gov
ernm
ent
- Cap
ital O
utla
y 2,
383,
864
5,04
0,80
6 7,
924,
550
2,53
4,77
8 2,
804,
119
6,48
3,96
6 1,
772,
827
Publ
ic S
afet
y - S
herif
f 1,
497,
435
4,37
3,81
3 3,
718,
166
461,
773
1,00
1,58
9 3,
707,
435
550,
073
- Cor
rect
ions
1,
087,
738
516,
386
3,40
7,46
6 72
6,12
8 1,
528,
576
5,68
9,42
6 18
2,58
5 - A
ll O
the r
60
,647
15
5,69
4 57
9,40
3 79
,559
13
3,58
8 24
4,71
8 65
,723
- C
apita
l Out
lay
2,37
1,51
1 3,
259,
050
---
18,7
63
---
577,
218
---
Tot
al P
ublic
Saf
ety
5,01
7,33
1 8,
304,
943
7,70
5,03
5 1,
286,
223
2,66
3,75
3 10
,218
,797
79
8,38
1 St
reet
s an
d H
ighw
ays
- Adm
inis
trat
ion
272,
112
312,
067
521,
405
1,26
0,71
9 16
6,49
5 57
1,47
5 33
8,05
6 3,
150,
079
1,47
3,40
6 9,
761,
018
905,
592
1,70
8,08
9 3,
006,
418
1,77
4,17
1- M
aint
enan
ce
3,19
2,44
8 2,
254,
355
7,76
2,10
2 16
,381
2,
732,
038
4,40
1,67
6 2,
032,
700
- Con
stru
ctio
n --
---
-5,
939
3,99
5,75
7 --
-44
5,77
6 --
-T
otal
Str
eets
and
Hig
hway
s - O
ther
Cap
ital O
utla
y 6,
614,
639
4,03
9,82
8 18
,050
,464
6,
178,
449
4,60
6,62
2 8,
425,
345
4,14
4,92
7 Sa
nita
tion
- Cur
rent
Exp
endi
ture
s 1,
849,
559
329,
459
1,49
8,39
4 24
5,30
5 61
,430
2,
976,
088
90,5
11
---
---
---
---
---
346,
898
---
Tot
al S
anita
tion
- Cap
ital O
utla
y 1,
849,
559
329,
459
1,49
8,39
4 24
5,30
5 61
,430
3,
322,
986
90,5
11
Hum
an S
ervi
ces
- Inc
ome
Mai
nten
ance
1,
102,
650
1,99
4,04
4 2,
588,
759
746,
155
1,21
9,65
9 2,
646,
644
414,
020
4,01
3,29
1 7,
138,
153
12,5
43,0
63
2,51
8,91
8 3,
014,
132
10,7
77,5
58
764,
100
- Soc
ial S
ervi
ces
282,
819
---
---
---
---
---
7,15
7- A
ll O
the r
--
---
---
-6,
236
---
35,8
11
---
Tot
al H
uman
Ser
vice
s - C
apita
l Out
lay
5,39
8,76
0 9,
132,
197
15,1
31,8
22
3,27
1,30
9 4,
233,
791
13,4
60,0
13
1,18
5,27
7 H
ealt h
- C
urre
nt E
xpen
ditu
res
11,8
78
1,24
2,22
2 1,
435,
583
154,
442
966,
540
1,77
1,31
4 36
,567
--
---
-70
,614
--
---
-1,
109
---
Tot
al H
ealth
- C
a pita
l Out
lay
11,8
78
1,24
2,22
2 1,
506,
197
154,
442
966,
540
1,77
2,42
3 36
,567
C
ultu
re a
nd R
ecre
atio
n Li
brar
ies
- Cur
rent
Exp
endi
ture
s 15
2,23
8 27
7,57
4 --
-18
3,05
9 11
2,30
0 38
9,61
3 45
,092
- C
a pita
l Out
lay
Park
s an
d R
ecre
atio
n - C
urre
nt E
xpen
ditu
res
250,
052
146,
570
750,
146
196,
145
5,73
3 44
8,76
1 10
6,09
3 --
-44
0,49
9 --
-12
,065
--
-20
5,53
5 --
-T
otal
Cul
ture
and
Rec
reat
ion
- Ca p
ital O
utla
y 40
2,29
0 86
4,64
3 75
0,14
6 39
1,26
9 11
8,03
3 1,
043,
909
151,
185
Con
serv
atio
n of
Nat
ural
Res
ourc
es
- Cur
rent
Exp
endi
ture
s 1,
471,
903
247,
493
2,97
5,81
1 55
9,57
7 19
2,75
3 82
5,56
1 28
3,00
3 --
---
---
---
---
-19
,867
--
-T
otal
Con
serv
atio
n of
Nat
ural
Res
ourc
es
- Ca p
ital O
utla
y 1,
471,
903
247,
493
2,97
5,81
1 55
9,57
7 19
2,75
3 84
5,42
8 28
3,00
3 E
cono
mic
Dev
elop
men
t - C
urre
nt E
xpen
ditu
res
20,0
00
646,
513
95,0
00
531,
029
---
18,7
65
7,85
6 - C
a pita
l Out
lay
Tot
al E
cono
mic
Dev
elop
men
t20
,000
64
6,51
3 95
,000
53
1,02
9 --
-18
,765
7,
856
All
Oth
er
- Cur
rent
Exp
endi
ture
s --
---
---
---
---
-46
5,20
6 --
--
---
---
-53
,083
--
-35
,276
--
-T
otal
All
Oth
er
- Ca p
ital O
utla
y --
---
---
-53
,083
--
-50
0,48
2 --
---
775,
000
1,06
0,00
0 20
5,00
0 24
5,00
0 1,
600,
000
---
Deb
t Ser
vice
- P
rinci
pal P
aid
on B
onds
25
4,85
9 --
---
-12
5,16
9 10
4,35
2 8,
812,
925
--
- Oth
er L
ong-
term
Deb
t 46
,370
44
3,35
5 36
4,58
8 27
8,65
5 28
7,37
7 2,
578,
010
3,25
3- I
nter
est a
nd F
isca
l Cha
r ges
Tota
l Cur
rent
Exp
endi
ture
s 17
,606
,265
23
,894
,200
47
,257
,171
10
,796
,109
12
,909
,449
39
,645
,907
6,
437,
834
Tota
l Ca p
ital O
utla
y 5,
563,
959
5,95
3,90
4 8,
380,
248
4,40
9,35
5 2,
737,
592
6,44
6,20
7 2,
032,
700
Tota
l Deb
t Ser
vice
301,
229
1,21
8,35
5 1,
424,
588
608,
824
636,
729
12,9
90,9
35
3,25
3
Tot
al E
x pen
ditu
res
23,4
71,4
53
31,0
66,4
59
57,0
62,0
07
15,8
14,2
88
16,2
83,7
70
59,0
83,0
49
8,47
3,78
7
Oth
er F
inan
cin g
Use
s D
ebt R
edem
ptio
n - R
efun
ded
Bon
ds
Oth
er U
ses
---
13,4
43
---
---
---
---
---
Tra
nsfe
rs T
o - E
nter
pris
e Fu
nds
394,
217
679,
572
4,80
7,32
9 58
0,38
7 34
7,00
0 1,
572,
901
- Gov
ernm
enta
l Fun
ds
T
otal
Ex p
endi
ture
s an
d O
ther
Use
s 23
,865
,670
31
,759
,474
61
,869
,336
16
,394
,675
16
,630
,770
60
,655
,950
8,
474,
438
Unr
eser
ved
Fun
d B
alan
ce
Gen
eral
Fun
d U
nres
erve
d Fu
nd B
alan
ce
6,80
7,70
0 5,
135,
143
9,74
1,38
4 5,
895,
560
1,12
1,19
1 4,
565,
417
4,26
2,76
8 Sp
ecia
l Rev
enue
Fun
d U
nres
erve
d Fu
nd B
alan
ce6,
977,
679
4,55
7,51
3 15
,896
,121
3,
640,
115
1,73
5,65
3 32
,054
,091
1,
712,
515
13,7
85,3
79
9,69
2,65
6 25
,637
,505
9,
535,
675
2,85
6,84
4 36
,619
,508
5,
975,
283
T
otal
AS
A P
ER
CE
NT
OF
TOTA
L C
UR
RE
NT
EX
PEN
DIT
UR
ES
78.3
%
40.6
%
54.3
%
88.3
%
22.1
%
92.4
%
92.8
%
651

Tab
le 2
C
lass
ifica
tion
of C
ount
y R
even
ues
For
the
Yea
r E
nded
Dec
embe
r 31
, 200
4
KO
OC
HIC
HIN
G
LAC
QU
I PA
RLE
LA
KE
LA
KE
OF
TH
E W
OO
DS
LE S
UE
UR
LI
NC
OLN
LY
ON
Popu
latio
n ( 2
004
Popu
latio
n Es
timat
es)
13,8
32
7,75
4 11
,229
4,
411
27,4
54
6,17
9 25
,038
N
et T
axab
le T
ax C
apac
ity
6,75
7,98
3 5,
000,
493
8,23
6,61
6 2,
546,
378
18,3
31,0
31
3,81
9,09
2 15
,263
,753
20
03 T
ax L
evy
(Pay
able
200
4)
3,13
0,71
8 2,
686,
582
5,15
6,61
6 1,
891,
746
8,81
2,33
9 2,
900,
211
8,14
0,34
0
RE
VE
NU
ES
26
Taxe
s 2,
789,
643
2,44
1,64
9 6,
306,
890
2,15
8,49
8 7,
869,
872
2,89
1,22
3 7,
363,
510
Spec
ial A
sses
smen
ts
375,
153
143,
875
---
519,
285
167,
997
177,
878
661,
148
Lice
nses
and
Per
mits
16
,358
9,
239
28,5
58
51,9
60
249,
417
15,7
77
27,8
85
Inte
rgov
ernm
enta
l Rev
enue
s Fe
dera
l Gra
nts
Hig
hway
s 2,
165
748,
049
13,9
31
---
363
857,
834
19,8
33
Hum
an S
ervi
ces
540,
005
138,
992
1,35
4,10
4 14
7,71
7 71
2,64
2 --
---
-D
isas
ter
166,
569
99,8
44
63,6
08
157,
215
23,3
94
24,0
48
36,3
68
All
Oth
er
880,
588
70,3
57
611,
619
1,16
6,37
8 10
4,42
2 31
,591
87
,879
To
tal F
eder
al G
rant
s 1,
589,
327
1,05
7,24
2 2,
043,
262
1,47
1,31
0 84
0,82
1 91
3,47
3 14
4,08
0 St
ate
Gra
nts
HA
CA
49
4,86
8 54
6,58
6 66
4,02
5 26
3,33
0 1,
206,
375
477,
716
715,
238
Man
ufac
ture
d H
ome
HA
CA
--
---
---
---
---
---
---
-R
esid
entia
l Mar
ket V
alue
Cre
dit
520,
784
374,
782
483,
781
169,
959
1,21
9,14
7 35
7,06
6 87
1,33
4 A
gric
ultu
ral M
arke
t Val
ue C
redi
t 36
,580
--
---
-25
,826
--
---
---
-M
obile
Hom
e M
arke
t Val
ue C
redi
t 1,
700
---
---
4,25
3 --
---
---
-A
ttach
ed M
achi
nery
Aid
--
---
---
---
---
---
---
-D
ispa
rity
Red
uctio
n A
id
152,
292
51,5
76
165,
608
10,2
44
79,6
89
38,3
98
---
Hig
hway
s 4,
597,
244
4,19
9,71
6 5,
057,
697
3,34
2,41
9 3,
530,
183
2,07
6,84
3 4,
132,
122
Hum
an S
ervi
ces
1,82
4,53
3 88
0,26
2 1,
092,
610
810,
773
2,95
1,68
3 --
---
-C
rimin
al J
ustic
e A
id
---
---
---
22,0
18
---
---
---
PER
A A
id
28,0
34
18,7
94
24,4
75
12,3
02
28,7
07
9,42
8 41
,797
Po
lice
Aid
--
-29
,375
67
,299
24
,376
74
,916
16
,899
56
,863
A
ll O
ther
72
5,38
7 1,
194,
016
2,19
2,02
0 24
1,52
6 43
0,35
6 46
9,60
7 38
7,39
2 T
otal
Sta
te G
rant
s 8,
381,
422
7,29
5,10
7 9,
747,
515
4,92
7,02
6 9,
521,
056
3,44
5,95
7 6,
204,
746
Loca
l Uni
ts G
rant
s --
-35
3,47
1 --
-21
,660
22
,000
10
,430
14
,198
Tot
al In
terg
over
nmen
tal R
even
ues
9,97
0,74
9 8,
705,
820
11,7
90,7
77
6,41
9,99
6 10
,383
,877
4,
369,
860
6,36
3,02
4
Cha
rges
for S
ervi
ces
1,13
3,40
0 30
8,95
6 99
0,34
5 50
6,31
3 1,
283,
442
226,
980
624,
476
Fine
s an
d Fo
rfei
ts
679
---
66,4
37
24,7
41
102,
760
5,82
0 20
,751
In
tere
st E
arni
ngs
195,
516
110,
311
302,
044
32,7
99
467,
139
128,
637
231,
343
All
Oth
er R
even
ues
4,52
4,66
9 22
6,32
8 1,
104,
587
305,
767
819,
375
277,
194
905,
670
Tot
al R
even
ues
19,0
06,1
67
11,9
46,1
78
20,5
89,6
38
10,0
19,3
59
21,3
43,8
79
8,09
3,36
9 16
,197
,807
Oth
er F
inan
cing
Sou
rces
B
orro
win
g B
onds
Issu
ed
---
---
---
---
---
1,75
8,76
9 5,
275,
000
Oth
er L
ong-
term
Deb
t --
---
-73
,356
--
---
---
-18
4,39
7 T
otal
Bor
row
ing
---
---
73,3
56
---
---
1,75
8,76
9 5,
459,
397
Oth
er S
ourc
es
---
127,
513
---
---
---
45,1
35
35,0
51
Tran
sfer
s Fr
om
- En
terp
rise
Fund
s--
---
---
---
---
---
---
- Gov
ernm
enta
l Fun
ds
1,54
3,05
3 15
,263
34
2,84
2 83
,806
76
6,26
0 10
,152
20
6,66
1
Tot
al R
even
ues a
nd O
ther
Sou
rces
20
,549
,220
12
,088
,954
21
,005
,836
10
,103
,165
22
,110
,139
9,
907,
425
21,8
98,9
16
---
---
---
---
---
---
---
---
---
---
---
---
---
---
---
---
---
---
---
---
---
---
---
---
---
---
---
---
---
---
---
---
---
---
---
---
---
---
---
---
---
---
---
---
---
---
---
---
---
Tab
le 3
C
lass
ific
atio
n of
Cou
nty
Exp
endi
ture
sFo
r th
e Y
ear
End
ed D
ecem
ber
31, 2
004
EX
PE
ND
ITU
RE
S K
OO
CH
ICH
ING
L
AC
QU
I P
AR
LE
L
AK
E
LA
KE
OF
TH
E W
OO
DS
LE
SU
EU
R
LIN
CO
LN
L
YO
N
27
3,23
0,35
2 1,
118,
052
3,57
0,86
2 1,
511,
973
3,12
3,69
9 1,
055,
622
2,57
2,66
9G
ener
al G
over
nmen
t - C
urre
nt E
xpen
ditu
res
145,
403
---
---
14,3
35
---
---
---
Tot
al G
ener
al G
over
nmen
t - C
apita
l Out
lay
3,37
5,75
5 1,
118,
052
3,57
0,86
2 1,
526,
308
3,12
3,69
9 1,
055,
622
2,57
2,66
9 Pu
blic
Saf
ety
- She
riff
1,53
3,74
0 56
3,02
4 1,
424,
920
767,
009
1,45
8,56
3 77
0,29
7 2,
502,
367
- Cor
rect
ions
17
6,62
0 25
,463
96
2,33
4 29
,838
1,
146,
665
36,7
52
308,
556
- All
Oth
e r
50,0
45
78,6
69
273,
988
70,0
66
76,1
31
41,9
37
95,5
41
- Cap
ital O
utla
y 11
4,07
3 --
---
-5,
472
---
---
---
Tot
al P
ublic
Saf
ety
1,87
4,47
8 66
7,15
6 2,
661,
242
872,
385
2,68
1,35
9 84
8,98
6 2,
906,
464
Stre
ets
and
Hig
hway
s - A
dmin
istr
atio
n 29
3,38
5 12
7,70
1 28
6,25
8 13
8,94
2 38
8,26
4 21
8,03
5 22
9,69
0 1,
649,
101
1,59
0,63
1 2,
205,
285
1,68
2,22
9 2,
391,
462
1,74
4,54
5 2,
325,
544
- Mai
nten
ance
3,
405,
655
3,98
6,27
9 7,
117,
376
2,35
3,37
2 3,
886,
958
1,32
9,26
4 2,
250,
500
- Con
stru
ctio
n 32
,433
--
---
-34
1,74
6 --
---
---
-T
otal
Str
eets
and
Hig
hway
s - O
ther
Cap
ital O
utla
y 5,
380,
574
5,70
4,61
1 9,
608,
919
4,51
6,28
9 6,
666,
684
3,29
1,84
4 4,
805,
734
Sani
tatio
n - C
urre
nt E
xpen
ditu
res
1,07
3,01
9 94
,834
24
1,28
2 54
4,37
7 14
1,38
6 79
,627
40
8,83
5 10
6,43
1 --
---
---
---
---
---
-T
otal
San
itatio
n - C
apita
l Out
lay
1,17
9,45
0 94
,834
24
1,28
2 54
4,37
7 14
1,38
6 79
,627
40
8,83
5 H
uman
Ser
vice
s - I
ncom
e M
aint
enan
ce
1,04
8,93
5 48
8,22
7 76
1,80
8 35
4,48
4 1,
469,
314
---
--
2,93
1,86
1 1,
204,
246
3,09
0,20
9 89
5,22
9 4,
015,
577
---
--
- Soc
ial S
ervi
ces
---
---
---
14,9
88
205,
272
925,
505
2,20
9,63
6- A
ll O
the r
- C
apita
l Out
lay
Tot
al H
uman
Ser
vice
s3,
980,
796
1,69
2,47
3 3,
852,
017
1,26
4,70
1 5,
690,
163
925,
505
2,20
9,63
6 H
ealt h
- C
urre
nt E
xpen
ditu
res
950,
530
67,0
83
448,
187
65,6
36
1,55
9,81
5 38
,149
16
0,09
0 - C
a pita
l Out
lay
Tot
al H
ealth
95
0,53
0 67
,083
44
8,18
7 65
,636
1,
559,
815
38,1
49
160,
090
Cul
ture
and
Rec
reat
ion
Libr
arie
s - C
urre
nt E
xpen
ditu
res
39,1
78
73,4
92
67,9
71
18,6
90
270,
387
28,5
34
191,
265
- Ca p
ital O
utla
yPa
rks
and
Rec
reat
ion
- Cur
rent
Exp
endi
ture
s12
5,38
2 11
4,77
6 54
2,07
0 13
4,24
2 16
6,94
0 15
2,97
6 20
5,09
2 17
,198
--
---
---
---
---
---
-T
otal
Cul
ture
and
Rec
reat
ion
- Ca p
ital O
utla
y 18
1,75
8 18
8,26
8 61
0,04
1 15
2,93
2 43
7,32
7 18
1,51
0 39
6,35
7 C
onse
rvat
ion
of N
atur
al R
esou
rces
- C
urre
nt E
xpen
ditu
res
1,55
9,89
6 1,
926,
663
809,
836
364,
780
538,
357
623,
805
548,
788
---
---
45,2
08
---
---
---
---
Tot
al C
onse
rvat
ion
of N
atur
al R
esou
rces
- C
a pita
l Out
lay
1,55
9,89
6 1,
926,
663
855,
044
364,
780
538,
357
623,
805
548,
788
Eco
nom
ic D
evel
opm
ent
- Cur
rent
Exp
endi
ture
s 33
7,54
9 41
,025
50
7,93
8 11
0,57
7 2,
673
208,
565
--
- Ca p
ital O
utla
yT
otal
Eco
nom
ic D
evel
opm
ent
337,
549
41,0
25
507,
938
110,
577
2,67
3 20
8,56
5 --
-A
ll O
ther
- C
urre
nt E
xpen
ditu
res
268,
737
---
27,5
00
10,0
00
---
---
--
---
---
---
---
115,
800
---
---
Tot
al A
ll O
ther
- C
a pita
l Out
lay
268,
737
---
27,5
00
10,0
00
115,
800
---
--
---
---
1,21
0,00
0 --
-1,
785,
000
212,
000
155,
000
Deb
t Ser
vice
- P
rinci
pal P
aid
on B
onds
--
-6,
000
136,
654
155,
000
21,9
91
25,2
16
398,
079
- Oth
er L
ong-
term
Deb
t --
-3,
360
263,
708
25,4
28
225,
142
149,
225
277,
383
- Int
eres
t and
Fis
cal C
har g
es
Tota
l Cur
rent
Exp
endi
ture
s 15
,268
,330
7,
513,
886
15,2
20,4
48
6,71
3,06
0 16
,954
,505
5,
924,
349
11,7
58,0
73
Tota
l Ca p
ital O
utla
y 3,
821,
193
3,98
6,27
9 7,
162,
584
2,71
4,92
5 4,
002,
758
1,32
9,26
4 2,
250,
500
Tota
l Deb
t Ser
vice
---
9,36
0 1,
610,
362
180,
428
2,03
2,13
3 38
6,44
1 83
0,46
2
Tot
al E
x pen
ditu
res
19,0
89,5
23
11,5
09,5
25
23,9
93,3
94
9,60
8,41
3 22
,989
,396
7,
640,
054
14,8
39,0
35
Oth
er F
inan
cin g
Use
s D
ebt R
edem
ptio
n - R
efun
ded
Bon
ds
Oth
er U
ses
Tra
nsfe
rs T
o - E
nter
pris
e Fu
nds
1,54
3,05
3 15
,263
34
2,84
2 83
,806
76
6,26
0 10
,152
20
6,66
1- G
over
nmen
tal F
unds
T
otal
Ex p
endi
ture
s an
d O
ther
Use
s 20
,632
,576
11
,524
,788
24
,336
,236
9,
692,
219
23,7
55,6
56
7,65
0,20
6 15
,045
,696
Unr
eser
ved
Fun
d B
alan
ce
Gen
eral
Fun
d U
nres
erve
d Fu
nd B
alan
ce
6,72
1,71
3 3,
669,
178
5,79
1,46
7 1,
129,
352
4,03
9,94
8 2,
178,
878
6,17
7,44
6 Sp
ecia
l Rev
enue
Fun
d U
nres
erve
d Fu
nd B
alan
ce6,
216,
002
4,38
5,37
2 7,
449,
600
1,93
1,14
0 5,
090,
367
3,45
4,20
5 2,
552,
697
12,9
37,7
15
8,05
4,55
0 13
,241
,067
3,
060,
492
9,13
0,31
5 5,
633,
083
8,73
0,14
3
Tot
al
AS
A P
ER
CE
NT
OF
TOTA
L C
UR
RE
NT
EX
PEN
DIT
UR
ES
84.7
%
107.
2%
87.0
%
45.6
%
53.9
%
95.1
%
74.2
%

Tab
le 2
C
lass
ifica
tion
of C
ount
y R
even
ues
For
the
Yea
r E
nded
Dec
embe
r 31
, 200
4
MA
HN
OM
EN
M
AR
SHA
LL
MA
RTI
N
MC
LEO
D
ME
EK
ER
M
ILLE
LA
CS
MO
RR
ISO
N
Popu
latio
n ( 2
004
Popu
latio
n Es
timat
es)
5,07
9 9,
996
21,0
77
36,1
98
23,2
67
25,0
18
32,8
22
Net
Tax
able
Tax
Cap
acity
2,
501,
061
6,47
5,45
1 16
,078
,298
21
,058
,921
14
,183
,823
12
,945
,412
17
,848
,262
20
03 T
ax L
evy
(Pay
able
200
4)
2,89
5,46
5 3,
380,
101
7,21
7,87
9 13
,437
,315
7,
642,
964
10,6
30,5
36
11,2
66,0
80
RE
VE
NU
ES
28
Taxe
s 2,
688,
902
3,08
0,41
8 6,
565,
911
11,9
88,0
05
6,86
4,66
5 9,
716,
805
9,79
5,85
6 Sp
ecia
l Ass
essm
ents
14
9,06
4 19
3,02
0 56
9,97
3 92
,054
68
,727
25
9,07
8 1,
415
Lice
nses
and
Per
mits
7,
664
22,7
69
31,5
30
140,
437
15,8
91
565,
460
265,
074
Inte
rgov
ernm
enta
l Rev
enue
s Fe
dera
l Gra
nts
Hig
hway
s 42
3,87
9 23
1,61
1 30
0,05
0 33
8,78
9 --
-59
0,59
5 --
-H
uman
Ser
vice
s 26
8,02
8 1,
138,
840
---
818,
496
468,
909
808,
332
1,02
7,79
1 D
isas
ter
159,
492
34,5
14
76,7
43
117,
455
106,
441
32,1
33
67,3
80
All
Oth
er
472,
966
13,9
25
168,
787
172,
589
684,
381
99,7
34
264,
174
Tota
l Fed
eral
Gra
nts
1,32
4,36
5 1,
418,
890
545,
580
1,44
7,32
9 1,
259,
731
1,53
0,79
4 1,
359,
345
Stat
e G
rant
s H
AC
A
302,
330
513,
035
454,
029
1,14
9,80
7 99
9,87
1 91
2,36
3 1,
305,
407
Man
ufac
ture
d H
ome
HA
CA
--
---
---
---
---
---
---
-R
esid
entia
l Mar
ket V
alue
Cre
dit
247,
724
247,
869
894,
064
1,64
3,49
1 39
3,78
4 1,
223,
883
1,69
3,26
2 A
gric
ultu
ral M
arke
t Val
ue C
redi
t --
-16
2,25
4 --
---
-47
7,29
7 --
---
-M
obile
Hom
e M
arke
t Val
ue C
redi
t 1,
017
3,59
5 --
---
-3,
216
---
7,27
0 A
ttach
ed M
achi
nery
Aid
--
---
---
---
---
---
---
-D
ispa
rity
Red
uctio
n A
id
66,6
95
4,49
7 35
,817
60
,910
15
,745
24
,904
29
,364
H
ighw
ays
3,48
1,74
7 4,
740,
441
3,87
5,18
6 3,
891,
090
2,46
9,53
6 3,
800,
904
5,82
8,91
6 H
uman
Ser
vice
s 1,
273,
242
410,
370
13,8
34
3,14
1,70
5 2,
007,
129
3,20
4,97
5 3,
648,
821
Crim
inal
Jus
tice
Aid
--
---
---
---
---
---
---
-PE
RA
Aid
10
,235
18
,740
36
,967
36
,151
10
7,40
2 30
,786
48
,267
Po
lice
Aid
45
,784
47
,863
41
,885
94
,261
64
,890
77
,461
64
,721
A
ll O
ther
43
0,96
1 59
6,59
5 50
7,01
6 61
0,05
6 54
3,05
3 57
1,25
2 84
1,41
8 T
otal
Sta
te G
rant
s 5,
859,
735
6,74
5,25
9 5,
858,
798
10,6
27,4
71
7,08
1,92
3 9,
846,
528
13,4
67,4
46
Loca
l Uni
ts G
rant
s 76
,166
4,
428
---
452,
727
134,
130
80,6
84
76,1
94
Tot
al In
terg
over
nmen
tal R
even
ues
7,26
0,26
6 8,
168,
577
6,40
4,37
8 12
,527
,527
8,
475,
784
11,4
58,0
06
14,9
02,9
85
Cha
rges
for S
ervi
ces
373,
791
1,19
8,75
7 1,
104,
814
3,11
5,72
2 3,
888,
167
1,29
8,69
3 4,
809,
625
Fine
s an
d Fo
rfei
ts
22,3
52
---
48,8
39
215,
098
---
90,5
38
78,3
04
Inte
rest
Ear
ning
s 78
,822
40
,473
13
2,74
6 38
1,43
8 68
,762
15
8,55
1 42
1,95
6 A
ll O
ther
Rev
enue
s 46
3,97
7 36
6,11
5 49
6,88
7 62
5,17
1 1,
996,
082
974,
531
1,34
9,40
6
Tot
al R
even
ues
11,0
44,8
38
13,0
70,1
29
15,3
55,0
78
29,0
85,4
52
21,3
78,0
78
24,5
21,6
62
31,6
24,6
21
Oth
er F
inan
cing
Sou
rces
B
orro
win
g B
onds
Issu
ed
---
---
---
---
---
---
---
Oth
er L
ong-
term
Deb
t --
---
-10
5,09
9 --
-32
0,00
0 --
-42
0,00
0 T
otal
Bor
row
ing
---
---
105,
099
---
320,
000
---
420,
000
Oth
er S
ourc
es
186,
670
54,1
38
11,5
87
27,6
72
---
36,2
42
---
Tran
sfer
s Fr
om
- En
terp
rise
Fund
s--
---
---
---
---
---
---
- Gov
ernm
enta
l Fun
ds
170,
275
15,1
79
---
1,69
3,84
3 1,
039,
587
375,
253
---
Tot
al R
even
ues a
nd O
ther
Sou
rces
11
,401
,783
13
,139
,446
15
,471
,764
30
,806
,967
22
,737
,665
24
,933
,157
32
,044
,621

---
---
---
---
---
---
---
---
---
---
---
---
---
---
---
---
---
---
---
---
---
---
---
---
---
---
---
---
---
---
---
---
---
---
---
---
---
---
---
---
---
---
---
---
---
---
---
---
---
---
---
---
---
---
---
---
Tab
le 3
C
lass
ific
atio
n of
Cou
nty
Exp
endi
ture
sFo
r th
e Y
ear
End
ed D
ecem
ber
31, 2
004
EX
PE
ND
ITU
RE
S M
AH
NO
ME
N
MA
RSH
AL
L
MA
RT
IN
MC
LE
OD
M
EE
KE
R
MIL
LE
LA
CS
MO
RR
ISO
N
29
1,39
1,55
2 1,
565,
405
3,02
1,22
0 4,
341,
587
3,88
6,45
3 3,
947,
756
4,51
9,76
8G
ener
al G
over
nmen
t - C
urre
nt E
xpen
ditu
res
---
---
73,2
52
169,
926
665,
552
---
---
Tot
al G
ener
al G
over
nmen
t - C
apita
l Out
lay
1,39
1,55
2 1,
565,
405
3,09
4,47
2 4,
511,
513
4,55
2,00
5 3,
947,
756
4,51
9,76
8 Pu
blic
Saf
ety
- She
riff
1,50
0,08
8 1,
146,
452
1,39
8,09
8 4,
112,
519
2,83
9,44
2 1,
615,
672
1,73
7,34
7 - C
orre
ctio
ns
146,
451
85,7
27
948,
766
339,
270
330,
950
2,83
3,17
0 1,
955,
425
- All
Oth
e r
723,
105
119,
996
174,
674
113,
325
136,
742
114,
878
107,
914
- Cap
ital O
utla
y --
-49
,838
69
,994
--
---
---
---
-T
otal
Pub
lic S
afet
y 2,
369,
644
1,40
2,01
3 2,
591,
532
4,56
5,11
4 3,
307,
134
4,56
3,72
0 3,
800,
686
Stre
ets
and
Hig
hway
s - A
dmin
istr
atio
n 19
5,46
7 24
8,04
7 33
1,18
2 55
2,07
0 61
8,50
3 43
6,25
1 31
5,75
5 1,
268,
407
485,
315
2,27
8,23
0 2,
285,
068
1,68
2,58
8 1,
917,
080
2,87
8,42
7- M
aint
enan
ce
2,55
9,31
3 5,
045,
432
2,08
5,24
6 2,
148,
444
3,91
4,22
4 3,
221,
865
5,82
8,88
4- C
onst
ruct
ion
---
137,
878
337,
005
---
214,
171
---
---
Tot
al S
tree
ts a
nd H
ighw
ays
- Oth
er C
apita
l Out
lay
4,02
3,18
7 5,
916,
672
5,03
1,66
3 4,
985,
582
6,42
9,48
6 5,
575,
196
9,02
3,06
6 Sa
nita
tion
- Cur
rent
Exp
endi
ture
s 22
7,37
1 12
7,25
5 23
3,32
0 1,
377,
017
128,
167
259,
175
1,64
9,92
4 --
-69
,500
--
---
---
---
---
-T
otal
San
itatio
n - C
apita
l Out
lay
227,
371
196,
755
233,
320
1,37
7,01
7 12
8,16
7 25
9,17
5 1,
649,
924
Hum
an S
ervi
ces
- Inc
ome
Mai
nten
ance
66
2,99
6 69
7,14
1 --
-1,
518,
672
1,20
1,61
8 1,
394,
765
2,71
2,95
9 1,
291,
416
1,85
3,47
7 --
-5,
642,
531
3,32
9,77
6 5,
705,
495
5,32
5,73
0- S
ocia
l Ser
vice
s 12
2,84
0 12
,678
1,
748,
740
263,
549
288,
243
---
--
- All
Oth
e r
---
28,1
00
---
---
---
---
---
Tot
al H
uman
Ser
vice
s - C
apita
l Out
lay
2,07
7,25
2 2,
591,
396
1,74
8,74
0 7,
424,
752
4,81
9,63
7 7,
100,
260
8,03
8,68
9 H
ealt h
- C
urre
nt E
xpen
ditu
res
37,7
63
24,0
00
---
1,51
7,09
5 92
7,32
6 61
0,87
6 1,
380,
022
- Ca p
ital O
utla
yT
otal
Hea
lth
37,7
63
24,0
00
---
1,51
7,09
5 92
7,32
6 61
0,87
6 1,
380,
022
Cul
ture
and
Rec
reat
ion
Libr
arie
s - C
urre
nt E
xpen
ditu
res
22,3
53
63,8
17
529,
102
128,
700
115,
726
172,
001
369,
008
- Ca p
ital O
utla
yPa
rks
and
Rec
reat
ion
- Cur
rent
Exp
endi
ture
s53
,721
77
,233
62
,050
25
5,54
7 29
8,51
0 --
-70
,443
- C
a pita
l Out
lay
Tot
al C
ultu
re a
nd R
ecre
atio
n76
,074
14
1,05
0 59
1,15
2 38
4,24
7 41
4,23
6 17
2,00
1 43
9,45
1 C
onse
rvat
ion
of N
atur
al R
esou
rces
- C
urre
nt E
xpen
ditu
res
216,
921
510,
851
719,
098
435,
908
137,
402
160,
338
345,
492
- Ca p
ital O
utla
yT
otal
Con
serv
atio
n of
Nat
ural
Res
ourc
es
216,
921
510,
851
719,
098
435,
908
137,
402
160,
338
345,
492
Eco
nom
ic D
evel
opm
ent
- Cur
rent
Exp
endi
ture
s 24
0,66
6 90
,648
25
,135
2,
183
726,
900
77,8
63
53,0
43
- Ca p
ital O
utla
yT
otal
Eco
nom
ic D
evel
opm
ent
240,
666
90,6
48
25,1
35
2,18
3 72
6,90
0 77
,863
53
,043
A
ll O
ther
- C
urre
nt E
xpen
ditu
res
---
197,
450
---
---
---
---
--
---
---
---
---
---
---
55,0
01
Tot
al A
ll O
ther
- C
a pita
l Out
lay
---
197,
450
---
---
---
---
55,0
01
66,8
00
205,
000
165,
000
1,18
5,00
0 23
0,00
0 24
0,00
0 99
3,00
0D
ebt S
ervi
ce
- Prin
cipa
l Pai
d on
Bon
ds
14,8
94
75,0
00
55,5
89
762,
916
769,
510
140,
000
390,
000
- Oth
er L
ong-
term
Deb
t 38
,996
56
,933
34
,767
20
4,60
8 23
4,38
3 28
3,30
0 44
6,90
5- I
nter
est a
nd F
isca
l Cha
r ges
Tota
l Cur
rent
Exp
endi
ture
s 8,
101,
117
7,30
5,49
2 11
,469
,615
22
,885
,041
16
,648
,346
19
,245
,320
23
,421
,257
To
tal C
a pita
l Out
lay
2,55
9,31
3 5,
330,
748
2,56
5,49
7 2,
318,
370
4,79
3,94
7 3,
221,
865
5,88
3,88
5 To
tal D
ebt S
ervi
ce12
0,69
0 33
6,93
3 25
5,35
6 2,
152,
524
1,23
3,89
3 66
3,30
0 1,
829,
905
T
otal
Ex p
endi
ture
s 10
,781
,120
12
,973
,173
14
,290
,468
27
,355
,935
22
,676
,186
23
,130
,485
31
,135
,047
Oth
er F
inan
cin g
Use
s D
ebt R
edem
ptio
n - R
efun
ded
Bon
ds
Oth
er U
ses
Tra
nsfe
rs T
o - E
nter
pris
e Fu
nds
170,
275
15,1
79
---
1,69
3,84
3 1,
039,
587
375,
253
--
- Gov
ernm
enta
l Fun
ds
T
otal
Ex p
endi
ture
s an
d O
ther
Use
s 10
,951
,395
12
,988
,352
14
,290
,468
29
,049
,778
23
,715
,773
23
,505
,738
31
,135
,047
Unr
eser
ved
Fun
d B
alan
ce
Gen
eral
Fun
d U
nres
erve
d Fu
nd B
alan
ce
1,19
7,69
4 89
7,20
6 2,
793,
738
5,30
4,11
4 4,
324,
129
7,10
2,24
1 5,
872,
719
Spec
ial R
even
ue F
und
Unr
eser
ved
Fund
Bal
ance
2,17
5,93
0 5,
123,
339
5,09
5,70
1 7,
805,
885
5,72
8,93
1 5,
365,
194
8,37
7,88
1 3,
373,
624
6,02
0,54
5 7,
889,
439
13,1
09,9
99
10,0
53,0
60
12,4
67,4
35
14,2
50,6
00
Tot
al
AS
A P
ER
CE
NT
OF
TOTA
L C
UR
RE
NT
EX
PEN
DIT
UR
ES
41.6
%
82.4
%
68.8
%
57.3
%
60.4
%
64.8
%
60.8
%

Tab
le 2
C
lass
ifica
tion
of C
ount
y R
even
ues
For
the
Yea
r E
nded
Dec
embe
r 31
, 200
4
MO
WE
R
MU
RR
AY
NIC
OLL
ET
NO
BLE
S N
OR
MA
N
OLM
STE
D
OTT
ER
TA
IL
Popu
latio
n ( 2
004
Popu
latio
n Es
timat
es)
38,9
84
8,99
2 31
,147
20
,543
7,
128
134,
282
58,6
58
Net
Tax
able
Tax
Cap
acity
20
,378
,731
7,
815,
420
20,8
23,7
87
11,8
13,0
90
4,05
4,44
2 93
,111
,592
42
,279
,911
20
03 T
ax L
evy
(Pay
able
200
4)
8,95
5,58
8 4,
140,
014
10,2
33,4
85
6,73
1,02
2 2,
962,
633
52,7
04,5
30
18,4
91,0
37
RE
VE
NU
ES
30
Taxe
s 7,
687,
020
3,74
0,24
3 9,
201,
312
6,11
1,98
4 2,
771,
342
51,3
25,5
28
16,2
99,8
76
Spec
ial A
sses
smen
ts
762,
285
519,
817
601,
603
108,
228
400,
732
---
37,0
11
Lice
nses
and
Per
mits
57
,253
22
,761
78
,575
13
6,19
4 6,
528
1,77
1,71
2 64
1,32
8 In
terg
over
nmen
tal R
even
ues
Fede
ral G
rant
s H
ighw
ays
20,8
49
501,
206
---
1,33
8,63
6 20
,339
57
9,08
3 2,
066
Hum
an S
ervi
ces
998,
243
147,
552
619,
877
461,
137
192,
919
7,05
4,34
1 2,
557,
615
Dis
aste
r 22
8,03
2 53
,012
85
,820
64
,645
81
,462
15
6,50
0 71
,585
A
ll O
ther
85
,069
66
,706
12
1,72
0 34
4,51
0 25
,882
73
1,29
8 1,
389,
587
Tota
l Fed
eral
Gra
nts
1,33
2,19
3 76
8,47
6 82
7,41
7 2,
208,
928
320,
602
8,52
1,22
2 4,
020,
853
Stat
e G
rant
s H
AC
A
1,23
7,99
5 59
9,01
9 86
8,27
5 71
3,02
3 45
2,74
4 4,
704,
753
2,23
9,20
1 M
anuf
actu
red
Hom
e H
AC
A
---
---
---
---
---
---
---
Res
iden
tial M
arke
t Val
ue C
redi
t 1,
493,
967
458,
303
1,14
2,95
4 55
3,21
1 28
3,89
6 3,
159,
531
2,53
7,24
9 A
gric
ultu
ral M
arke
t Val
ue C
redi
t --
---
---
-17
9,56
4 --
---
---
-M
obile
Hom
e M
arke
t Val
ue C
redi
t --
---
-26
,546
97
0 88
5 --
-13
,004
A
ttach
ed M
achi
nery
Aid
--
---
---
---
---
---
---
-D
ispa
rity
Red
uctio
n A
id
132,
210
30,7
80
11,7
17
72,9
96
15,8
15
16,0
81
13,7
29
Hig
hway
s 3,
969,
669
5,05
1,10
0 2,
738,
525
3,85
8,89
9 4,
695,
285
7,95
9,97
4 8,
778,
853
Hum
an S
ervi
ces
4,29
3,24
2 --
-2,
493,
541
2,42
1,48
7 98
9,20
2 22
,301
,438
6,
982,
375
Crim
inal
Jus
tice
Aid
--
---
---
---
---
---
---
-PE
RA
Aid
40
,232
15
,531
34
,276
28
,842
13
,183
17
7,72
7 64
,946
Po
lice
Aid
95
,439
19
,255
46
,882
37
,074
19
,625
28
9,45
1 --
-A
ll O
ther
92
1,49
0 30
5,43
0 56
2,74
5 83
7,12
6 19
7,11
7 3,
867,
361
1,33
9,92
1 T
otal
Sta
te G
rant
s 12
,184
,244
6,
479,
418
7,92
5,46
1 8,
703,
192
6,66
7,75
2 42
,476
,316
21
,969
,278
Loca
l Uni
ts G
rant
s 2,
151
290,
729
---
253,
684
394
659,
402
47
Tot
al In
terg
over
nmen
tal R
even
ues
13,5
18,5
88
7,53
8,62
3 8,
752,
878
11,1
65,8
04
6,98
8,74
8 51
,656
,940
25
,990
,178
Cha
rges
for S
ervi
ces
2,51
0,67
5 36
3,67
6 1,
463,
192
2,36
1,88
1 24
2,96
8 18
,532
,649
2,
978,
442
Fine
s an
d Fo
rfei
ts
170,
754
75
---
---
300
343,
755
130,
162
Inte
rest
Ear
ning
s 86
8,81
0 17
5,91
9 25
8,08
3 22
1,30
0 80
,541
2,
096,
033
355,
459
All
Oth
er R
even
ues
862,
885
497,
798
856,
448
1,93
8,19
9 37
2,79
4 1,
426,
852
1,60
3,90
6
Tot
al R
even
ues
26,4
38,2
70
12,8
58,9
12
21,2
12,0
91
22,0
43,5
90
10,8
63,9
53
127,
153,
469
48,0
36,3
62
Oth
er F
inan
cing
Sou
rces
B
orro
win
g B
onds
Issu
ed
---
---
2,60
5,00
0 6,
072,
014
---
---
1,05
0,00
0 O
ther
Lon
g-te
rm D
ebt
124,
712
---
569,
509
---
---
---
---
Tot
al B
orro
win
g 12
4,71
2 --
-3,
174,
509
6,07
2,01
4 --
---
-1,
050,
000
Oth
er S
ourc
es
1,25
9,48
0 1,
750
---
---
39,6
10
260,
561
48,0
92
Tran
sfer
s Fr
om
- En
terp
rise
Fund
s--
---
---
---
---
-29
3,91
3 --
- Gov
ernm
enta
l Fun
ds
4,38
9,67
5 77
,151
1,
112,
705
373,
341
---
210,
819
20,0
00
Tot
al R
even
ues a
nd O
ther
Sou
rces
32
,212
,137
12
,937
,813
25
,499
,305
28
,488
,945
10
,903
,563
12
7,91
8,76
2 49
,154
,454

---
---
---
---
---
---
---
---
---
---
---
---
---
---
---
---
---
---
---
---
---
---
---
---
---
---
---
---
---
---
---
---
---
---
---
---
---
---
---
---
---
---
---
---
---
---
---
---
---
---
---
---
---
---
---
---
---
---
---
---
---
---
---
---
---
---
---
---
---
---
Tab
le 3
C
lass
ific
atio
n of
Cou
nty
Exp
endi
ture
sFo
r th
e Y
ear
End
ed D
ecem
ber
31, 2
004
EX
PE
ND
ITU
RE
S M
OW
ER
M
UR
RA
Y
NIC
OL
LE
T
NO
BL
ES
NO
RM
AN
O
LM
STE
D
OT
TE
R T
AIL
31
4,37
1,08
2 1,
790,
538
4,57
7,33
8 3,
017,
798
1,10
9,67
9 17
,370
,362
8,
423,
026
Gen
eral
Gov
ernm
ent
- Cur
rent
Exp
endi
ture
s --
---
-36
,116
--
---
---
-83
7,34
1 T
otal
Gen
eral
Gov
ernm
ent
- Cap
ital O
utla
y 4,
371,
082
1,79
0,53
8 4,
613,
454
3,01
7,79
8 1,
109,
679
17,3
70,3
62
9,26
0,36
7 Pu
blic
Saf
ety
- She
riff
2,11
1,90
5 81
0,10
3 1,
566,
590
1,00
6,93
8 61
3,49
6 6,
239,
016
3,62
5,65
0 - C
orre
ctio
ns
1,99
1,41
7 18
1,76
1 75
7,45
6 1,
894,
057
169,
870
12,8
98,4
92
3,13
1,25
8 - A
ll O
the r
17
4,22
9 10
9,47
4 15
5,79
1 17
6,87
9 30
,171
44
6,20
7 59
9,83
9 - C
apita
l Out
lay
Tot
al P
ublic
Saf
ety
4,27
7,55
1 1,
101,
338
2,47
9,83
7 3,
077,
874
813,
537
19,5
83,7
15
7,35
6,74
7 St
reet
s an
d H
ighw
ays
- Adm
inis
trat
ion
529,
365
250,
732
317,
243
193,
698
337,
457
1,90
3,25
2 39
0,77
0 3,
354,
881
1,86
7,34
6 1,
477,
268
1,56
1,03
0 1,
942,
993
5,04
2,83
4 5,
096,
042
- Mai
nten
ance
2,
454,
487
4,62
0,68
7 3,
805,
499
3,99
2,22
6 3,
856,
779
13,0
87,9
04
6,60
2,01
5- C
onst
ruct
ion
- Oth
er C
apita
l Out
lay
Tot
al S
tree
ts a
nd H
ighw
ays
6,33
8,73
3 6,
738,
765
5,60
0,01
0 5,
746,
954
6,13
7,22
9 20
,033
,990
12
,088
,827
Sa
nita
tion
- Cur
rent
Exp
endi
ture
s 77
4,26
9 41
2,28
2 40
4,03
9 33
4,46
1 32
4,38
0 --
---
- C
apita
l Out
lay
Tot
al S
anita
tion
774,
269
412,
282
404,
039
334,
461
324,
380
---
---
Hum
an S
ervi
ces
- Inc
ome
Mai
nten
ance
2,
057,
880
---
1,86
5,04
8 1,
294,
411
556,
819
7,29
1,15
5 3,
534,
046
5,68
5,83
3 --
-4,
303,
553
2,93
4,74
9 1,
388,
797
45,3
68,3
94
11,1
05,8
86- S
ocia
l Ser
vice
s 36
1,39
5 98
1,64
7 --
---
-11
,949
32
2,30
7 68
3,57
1- A
ll O
the r
- C
apita
l Out
lay
Tot
al H
uman
Ser
vice
s8,
105,
108
981,
647
6,16
8,60
1 4,
229,
160
1,95
7,56
5 52
,981
,856
15
,323
,503
H
ealt h
- C
urre
nt E
xpen
ditu
res
1,81
7,03
5 17
6,34
3 1,
022,
321
1,68
7,05
1 20
5,05
1 7,
877,
019
1,62
0,17
7 - C
a pita
l Out
lay
Tot
al H
ealth
1,
817,
035
176,
343
1,02
2,32
1 1,
687,
051
205,
051
7,87
7,01
9 1,
620,
177
Cul
ture
and
Rec
reat
ion
Libr
arie
s - C
urre
nt E
xpen
ditu
res
226,
322
58,8
38
93,4
94
402,
600
73,0
27
711,
959
320,
156
- Ca p
ital O
utla
yPa
rks
and
Rec
reat
ion
- Cur
rent
Exp
endi
ture
s36
3,58
4 32
2,06
3 13
1,82
5 20
4,89
5 67
,771
1,
909,
555
260,
025
49,3
57
---
---
---
---
---
---
Tot
al C
ultu
re a
nd R
ecre
atio
n - C
a pita
l Out
lay
639,
263
380,
901
225,
319
607,
495
140,
798
2,62
1,51
4 58
0,18
1 C
onse
rvat
ion
of N
atur
al R
esou
rces
- C
urre
nt E
xpen
ditu
res
604,
379
664,
827
373,
706
333,
058
314,
785
504,
748
566,
961
- Ca p
ital O
utla
yT
otal
Con
serv
atio
n of
Nat
ural
Res
ourc
es
604,
379
664,
827
373,
706
333,
058
314,
785
504,
748
566,
961
Eco
nom
ic D
evel
opm
ent
- Cur
rent
Exp
endi
ture
s 26
4,62
8 26
2,62
5 12
1,08
6 38
,026
4,
040
80,4
25
129,
205
- Ca p
ital O
utla
yT
otal
Eco
nom
ic D
evel
opm
ent
264,
628
262,
625
121,
086
38,0
26
4,04
0 80
,425
12
9,20
5 A
ll O
ther
- C
urre
nt E
xpen
ditu
res
---
---
---
---
---
368,
763
--
- Ca p
ital O
utla
yT
otal
All
Oth
er
---
---
---
---
---
368,
763
--
---
270,
000
615,
000
290,
000
50,0
00
475,
000
65,0
00D
ebt S
ervi
ce
- Prin
cipa
l Pai
d on
Bon
ds
40,0
00
---
355,
883
370,
000
---
32,2
89
88,4
96- O
ther
Lon
g-te
rm D
ebt
---
127,
887
288,
103
1,04
6,51
1 1,
671
482,
582
592,
361
- Int
eres
t and
Fis
cal C
har g
es
Tota
l Cur
rent
Exp
endi
ture
s 24
,688
,204
7,
888,
579
17,1
66,7
58
15,0
79,6
51
7,15
0,28
5 10
8,33
4,48
8 39
,486
,612
To
tal C
a pita
l Out
lay
2,50
3,84
4 4,
620,
687
3,84
1,61
5 3,
992,
226
3,85
6,77
9 13
,087
,904
7,
439,
356
Tota
l Deb
t Ser
vice
40,0
00
397,
887
1,25
8,98
6 1,
706,
511
51,6
71
989,
871
745,
857
T
otal
Ex p
endi
ture
s 27
,232
,048
12
,907
,153
22
,267
,359
20
,778
,388
11
,058
,735
12
2,41
2,26
3 47
,671
,825
Oth
er F
inan
cin g
Use
s D
ebt R
edem
ptio
n - R
efun
ded
Bon
ds
Oth
er U
ses
---
---
14,6
13
---
---
---
---
Tra
nsfe
rs T
o - E
nter
pris
e Fu
nds
---
5,24
4 --
---
---
-1,
579,
752
--
4,38
9,67
5 77
,151
1,
112,
705
373,
341
---
210,
819
20,0
00- G
over
nmen
tal F
unds
T
otal
Ex p
endi
ture
s an
d O
ther
Use
s 31
,621
,723
12
,989
,548
23
,394
,677
21
,151
,729
11
,058
,735
12
4,20
2,83
4 47
,691
,825
Unr
eser
ved
Fun
d B
alan
ce
Gen
eral
Fun
d U
nres
erve
d Fu
nd B
alan
ce
16,3
14,9
72
4,37
8,37
5 8,
326,
538
4,07
8,60
8 2,
724,
851
16,4
81,5
01
9,13
2,44
9 Sp
ecia
l Rev
enue
Fun
d U
nres
erve
d Fu
nd B
alan
ce9,
090,
397
3,12
8,75
8 5,
281,
884
6,34
1,71
8 2,
036,
256
25,0
76,8
43
9,75
4,33
0 25
,405
,369
7,
507,
133
13,6
08,4
22
10,4
20,3
26
4,76
1,10
7 41
,558
,344
18
,886
,779
T
otal
AS
A P
ER
CE
NT
OF
TOTA
L C
UR
RE
NT
EX
PEN
DIT
UR
ES
102.
9%
95.2
%
79.3
%
69.1
%
66.6
%
38.4
%
47.8
%

Tab
le 2
C
lass
ifica
tion
of C
ount
y R
even
ues
For
the
Yea
r E
nded
Dec
embe
r 31
, 200
4
PEN
NIN
GTO
N
PIN
E
PIPE
STO
NE
PO
LK
POPE
R
AM
SEY
RE
D L
AK
E
Popu
latio
n ( 2
004
Popu
latio
n Es
timat
es)
13,5
59
28,0
71
9,58
9 31
,092
11
,221
51
5,41
1 4,
298
Net
Tax
able
Tax
Cap
acity
5,
025,
460
16,3
60,2
32
5,46
4,68
9 15
,863
,847
7,
574,
690
383,
824,
549
1,83
8,27
7 20
03 T
ax L
evy
(Pay
able
200
4)
4,66
2,03
1 9,
238,
488
3,41
1,25
1 12
,594
,622
4,
248,
378
168,
472,
660
1,35
9,62
2
RE
VE
NU
ES
32
Taxe
s 4,
239,
054
8,17
7,59
7 3,
716,
217
11,4
67,7
81
3,80
8,69
4 18
7,85
3,80
4 1,
278,
138
Spec
ial A
sses
smen
ts
209,
804
---
124,
581
2,83
1,12
9 27
5,73
5 --
-64
,740
Li
cens
es a
nd P
erm
its
2,65
3 95
,110
8,
871
48,9
84
61,1
51
1,25
8,03
7 1,
905
Inte
rgov
ernm
enta
l Rev
enue
s Fe
dera
l Gra
nts
Hig
hway
s --
-52
9,39
1 78
8,74
3 2,
320,
000
5,19
2 28
,634
--
-H
uman
Ser
vice
s 36
3,94
5 93
2,17
7 16
9,27
4 1,
707,
771
269,
025
35,1
82,6
26
103,
767
Dis
aste
r 28
,973
63
,738
39
,605
99
,369
31
,418
4,
333,
794
45,6
77
All
Oth
er
99,2
67
341,
834
37,0
46
377,
702
19,0
93
9,55
5,87
9 84
,069
To
tal F
eder
al G
rant
s 49
2,18
5 1,
867,
140
1,03
4,66
8 4,
504,
842
324,
728
49,1
00,9
33
233,
513
Stat
e G
rant
s H
AC
A
419,
039
1,11
6,43
4 53
1,57
0 1,
136,
547
648,
619
4,06
6,03
8 47
8,81
8 M
anuf
actu
red
Hom
e H
AC
A
---
---
---
---
---
---
---
Res
iden
tial M
arke
t Val
ue C
redi
t 54
6,92
8 1,
345,
429
364,
359
1,13
4,18
0 54
5,08
6 12
,673
,475
15
9,92
8 A
gric
ultu
ral M
arke
t Val
ue C
redi
t --
---
---
---
---
---
---
-M
obile
Hom
e M
arke
t Val
ue C
redi
t --
---
---
---
---
---
---
-A
ttach
ed M
achi
nery
Aid
--
---
---
---
---
---
---
-D
ispa
rity
Red
uctio
n A
id
96,5
71
1,03
4 80
,146
77
,191
22
,609
26
3,26
2 90
,199
H
ighw
ays
2,99
1,59
8 9,
577,
987
1,97
0,58
1 8,
961,
776
2,99
0,51
6 11
,939
,984
3,
107,
649
Hum
an S
ervi
ces
2,08
4,06
9 2,
637,
746
839,
491
7,11
3,57
3 1,
081,
212
85,1
68,7
87
533,
433
Crim
inal
Jus
tice
Aid
--
---
---
---
---
---
---
-PE
RA
Aid
16
,384
35
,238
14
,804
43
,810
17
,671
76
7,18
4 8,
965
Polic
e A
id
33,6
50
96,8
71
10,2
10
111,
210
24,4
26
1,15
7,69
5 25
,714
A
ll O
ther
20
3,75
0 1,
242,
363
194,
964
848,
761
405,
585
31,6
04,2
47
165,
630
Tot
al S
tate
Gra
nts
6,39
1,98
9 16
,053
,102
4,
006,
125
19,4
27,0
48
5,73
5,72
4 14
7,64
0,67
2 4,
570,
336
Loca
l Uni
ts G
rant
s --
-5,
975
22,0
96
59,5
90
102,
526
4,56
8,40
8 --
-
Tot
al In
terg
over
nmen
tal R
even
ues
6,88
4,17
4 17
,926
,217
5,
062,
889
23,9
91,4
80
6,16
2,97
8 20
1,31
0,01
3 4,
803,
849
Cha
rges
for S
ervi
ces
1,96
8,96
7 1,
426,
847
961,
155
1,62
3,69
2 1,
047,
509
61,6
35,0
81
505,
974
Fine
s an
d Fo
rfei
ts
24,7
96
216,
633
21,8
86
45,6
85
37,8
43
733,
823
9,84
9 In
tere
st E
arni
ngs
56,0
88
395,
144
277,
317
470,
457
196,
134
6,25
4,17
8 14
2,78
3 A
ll O
ther
Rev
enue
s 82
3,80
5 3,
034,
329
454,
762
2,56
7,06
7 31
2,14
9 12
,970
,534
27
9,94
6
Tot
al R
even
ues
14,2
09,3
41
31,2
71,8
77
10,6
27,6
78
43,0
46,2
75
11,9
02,1
93
472,
015,
470
7,08
7,18
4
Oth
er F
inan
cing
Sou
rces
B
orro
win
g B
onds
Issu
ed
837,
534
---
---
3,57
6,12
8 --
-56
,390
,673
--
-O
ther
Lon
g-te
rm D
ebt
---
3,66
5,00
0 --
---
-4,
300
---
---
Tot
al B
orro
win
g 83
7,53
4 3,
665,
000
---
3,57
6,12
8 4,
300
56,3
90,6
73
---
Oth
er S
ourc
es
---
---
3,94
0 --
-47
2,42
2 13
,845
,000
--
-Tr
ansf
ers
From
-
Ente
rpris
e Fu
nds
---
---
---
---
---
---
--
- G
over
nmen
tal F
unds
32
,975
2,
460,
265
---
56,6
12
663,
938
2,11
8,19
9 67
Tot
al R
even
ues a
nd O
ther
Sou
rces
15
,079
,850
37
,397
,142
10
,631
,618
46
,679
,015
13
,042
,853
54
4,36
9,34
2 7,
087,
251

---
---
---
---
---
---
---
---
---
---
---
---
---
---
---
---
---
---
---
---
---
---
---
---
---
---
---
---
---
---
---
---
---
---
---
Tab
le 3
C
lass
ific
atio
n of
Cou
nty
Exp
endi
ture
sFo
r th
e Y
ear
End
ed D
ecem
ber
31, 2
004
EX
PE
ND
ITU
RE
S P
EN
NIN
GT
ON
P
INE
P
IPE
STO
NE
P
OL
K
PO
PE
R
AM
SEY
R
ED
LA
KE
33
1,72
2,95
7 3,
655,
172
2,22
6,74
7 4,
660,
957
2,14
7,79
3 79
,591
,902
72
3,41
9G
ener
al G
over
nmen
t - C
urre
nt E
xpen
ditu
res
---
106,
792
---
13,7
21
1,33
8,94
5 2,
079,
492
---
Tot
al G
ener
al G
over
nmen
t - C
apita
l Out
lay
1,72
2,95
7 3,
761,
964
2,22
6,74
7 4,
674,
678
3,48
6,73
8 81
,671
,394
72
3,41
9 Pu
blic
Saf
ety
- She
riff
1,16
4,52
5 3,
131,
674
987,
568
2,33
3,86
0 98
2,09
6 33
,962
,592
68
9,74
5 - C
orre
ctio
ns
1,63
7,52
1 1,
832,
189
336,
960
1,47
5,83
2 24
0,39
6 50
,761
,263
89
,241
- A
ll O
the r
69
,783
32
2,37
7 11
2,35
4 49
8,44
7 47
,003
1,
675,
780
16,5
71
- Cap
ital O
utla
y --
-8,
767
---
---
---
5,37
7,54
7 --
-T
otal
Pub
lic S
afet
y 2,
871,
829
5,29
5,00
7 1,
436,
882
4,30
8,13
9 1,
269,
495
91,7
77,1
82
795,
557
Stre
ets
and
Hig
hway
s - A
dmin
istr
atio
n 19
7,53
4 82
0,81
8 20
9,27
0 28
7,17
8 20
0,15
6 3,
818,
986
324,
699
1,79
8,30
1 2,
703,
744
1,39
5,69
0 3,
816,
813
1,33
4,92
4 10
,268
,015
80
5,79
8- M
aint
enan
ce
2,10
6,02
1 10
,077
,378
2,
465,
083
11,7
29,8
47
2,43
2,15
9 12
,804
,293
1,
454,
828
- Con
stru
ctio
n --
-44
,688
--
---
---
-20
,483
,463
--
-T
otal
Str
eets
and
Hig
hway
s - O
ther
Cap
ital O
utla
y 4,
101,
856
13,6
46,6
28
4,07
0,04
3 15
,833
,838
3,
967,
239
47,3
74,7
57
2,58
5,32
5 Sa
nita
tion
- Cur
rent
Exp
endi
ture
s 10
6,08
4 12
8,14
2 12
2,56
5 1,
431,
969
280,
092
15,7
42,7
26
128,
489
- Cap
ital O
utla
yT
otal
San
itatio
n10
6,08
4 12
8,14
2 12
2,56
5 1,
431,
969
280,
092
15,7
42,7
26
128,
489
Hum
an S
ervi
ces
- Inc
ome
Mai
nten
ance
1,
136,
822
1,52
4,66
7 72
2,34
4 2,
948,
125
644,
905
28,3
56,3
16
546,
920
3,20
9,19
0 5,
211,
754
1,80
7,22
1 9,
988,
238
1,70
1,16
9 14
4,86
4,91
8 51
5,21
0- S
ocia
l Ser
vice
s 33
,542
--
---
---
---
-92
,475
22
,002
- All
Oth
e r
---
9,82
0 --
---
---
-56
4,44
4 --
-T
otal
Hum
an S
ervi
ces
- Cap
ital O
utla
y 4,
379,
554
6,74
6,24
1 2,
529,
565
12,9
36,3
63
2,34
6,07
4 17
3,87
8,15
3 1,
084,
132
Hea
lt h
- Cur
rent
Exp
endi
ture
s 38
,802
78
9,93
7 22
2,18
6 1,
496,
854
756,
484
24,4
47,7
34
65,3
50
---
---
---
---
---
6,03
3 --
-T
otal
Hea
lth
- Ca p
ital O
utla
y 38
,802
78
9,93
7 22
2,18
6 1,
496,
854
756,
484
24,4
53,7
67
65,3
50
Cul
ture
and
Rec
reat
ion
Libr
arie
s - C
urre
nt E
xpen
ditu
res
60,6
83
199,
545
36,4
37
180,
381
124,
006
7,49
2,45
4 29
,702
--
---
---
---
---
-62
5,52
8 --
-Pa
rks
and
Rec
reat
ion
- Cur
rent
Exp
endi
ture
s - C
a pita
l Out
lay
44,6
19
108,
488
93,3
31
87,0
49
62,0
82
8,64
7,72
2 35
,872
--
---
---
---
---
-1,
213,
182
---
Tot
al C
ultu
re a
nd R
ecre
atio
n - C
a pita
l Out
lay
105,
302
308,
033
129,
768
267,
430
186,
088
17,9
78,8
86
65,5
74
Con
serv
atio
n of
Nat
ural
Res
ourc
es
- Cur
rent
Exp
endi
ture
s 44
4,38
3 1,
249,
232
326,
035
3,26
0,89
8 28
9,00
1 45
8,45
5 28
7,27
2 - C
a pita
l Out
lay
Tot
al C
onse
rvat
ion
of N
atur
al R
esou
rces
44
4,38
3 1,
249,
232
326,
035
3,26
0,89
8 28
9,00
1 45
8,45
5 28
7,27
2 E
cono
mic
Dev
elop
men
t - C
urre
nt E
xpen
ditu
res
21,7
32
---
59,6
14
39,6
88
455,
037
23,1
22,4
28
77,5
51
- Ca p
ital O
utla
yT
otal
Eco
nom
ic D
evel
opm
ent
21,7
32
---
59,6
14
39,6
88
455,
037
23,1
22,4
28
77,5
51
All
Oth
er
- Cur
rent
Exp
endi
ture
s --
---
---
---
-30
,000
--
---
- C
a pita
l Out
lay
Tot
al A
ll O
ther
--
---
---
---
-30
,000
--
---
115,
000
---
70,0
00
4,13
2,00
0 28
0,00
0 11
,295
,000
--
-D
ebt S
ervi
ce
- Prin
cipa
l Pai
d on
Bon
ds
86,7
82
1,03
3,08
4 18
,523
43
9,01
7 --
-22
2,54
1 --
- O
ther
Lon
g-te
rm D
ebt
199,
124
132,
775
11,0
26
616,
165
47,3
49
8,68
9,75
4 3,
027
- Int
eres
t and
Fis
cal C
har g
es
Tota
l Cur
rent
Exp
endi
ture
s 11
,686
,478
21
,677
,739
8,
658,
322
32,5
06,2
89
9,29
5,14
4 43
3,30
3,76
6 4,
357,
841
Tota
l Ca p
ital O
utla
y 2,
106,
021
10,2
47,4
45
2,46
5,08
3 11
,743
,568
3,
771,
104
43,1
53,9
82
1,45
4,82
8 To
tal D
ebt S
ervi
ce40
0,90
6 1,
165,
859
99,5
49
5,18
7,18
2 32
7,34
9 20
,207
,295
3,
027
T
otal
Ex p
endi
ture
s 14
,193
,405
33
,091
,043
11
,222
,954
49
,437
,039
13
,393
,597
49
6,66
5,04
3 5,
815,
696
Oth
er F
inan
cin g
Use
s --
---
---
-22
,423
--
-2,
345,
000
---
Oth
er U
ses
Tra
nsfe
rs T
o - E
nter
pris
e Fu
nds
Deb
t Red
empt
ion
- Ref
unde
d B
onds
---
---
240,
591
---
---
607,
492
--
32,9
75
2,46
0,26
5 --
-56
,612
66
3,93
8 2,
118,
199
- Gov
ernm
enta
l Fun
ds
T
otal
Ex p
endi
ture
s an
d O
ther
Use
s 14
,226
,380
35
,551
,308
11
,463
,545
49
,516
,074
14
,057
,535
50
1,73
5,73
4 5,
815,
763
Unr
eser
ved
Fun
d B
alan
ce
Gen
eral
Fun
d U
nres
erve
d Fu
nd B
alan
ce
2,76
6,48
2 1,
702,
181
5,66
5,68
3 9,
128,
349
2,95
7,97
8 11
8,93
2,26
9 2,
792,
756
Spec
ial R
even
ue F
und
Unr
eser
ved
Fund
Bal
ance
1,27
4,27
2 4,
223,
177
3,32
4,54
8 13
,670
,747
2,
176,
949
40,0
14,4
29
1,85
1,21
0 4,
040,
754
5,92
5,35
8 8,
990,
231
22,7
99,0
96
5,13
4,92
7 15
8,94
6,69
8 4,
643,
966
T
otal
AS
A P
ER
CE
NT
OF
TOTA
L C
UR
RE
NT
EX
PEN
DIT
UR
ES
34.6
%
27.3
%
103.
8%
70.1
%
55.2
%
36.7
%
106.
6%
67

Tab
le 2
C
lass
ifica
tion
of C
ount
y R
even
ues
For
the
Yea
r E
nded
Dec
embe
r 31
, 200
4
RE
DW
OO
D
RE
NVI
LLE
R
ICE
R
OC
K
RO
SEA
U
SCO
TT
SHE
RB
UR
NE
Popu
latio
n ( 2
004
Popu
latio
n Es
timat
es)
16,2
45
16,8
38
60,5
76
9,59
0 16
,303
11
2,62
3 79
,030
N
et T
axab
le T
ax C
apac
ity
11,3
32,5
50
13,8
96,5
38
36,5
13,1
76
7,07
2,31
3 6,
274,
363
95,0
46,6
56
61,3
39,9
31
2003
Tax
Lev
y (P
ayab
le 2
004)
6,
976,
356
7,69
2,13
9 12
,714
,415
3,
075,
548
3,66
6,20
6 31
,941
,002
27
,232
,740
RE
VE
NU
ES
34
Taxe
s 6,
339,
310
7,00
1,69
7 11
,574
,552
2,
740,
495
3,46
0,00
3 34
,731
,262
26
,368
,909
Sp
ecia
l Ass
essm
ents
44
0,92
1 77
4,43
8 93
,243
20
7,15
0 78
4,46
3 --
-61
9,39
7 Li
cens
es a
nd P
erm
its
32,5
48
137,
180
590,
539
166,
066
4,20
5 2,
506,
398
822,
587
Inte
rgov
ernm
enta
l Rev
enue
s Fe
dera
l Gra
nts
Hig
hway
s --
---
-37
,260
29
3,52
0 85
,893
1,
303,
964
3,29
4,15
2 H
uman
Ser
vice
s 49
5,28
9 31
9,93
3 2,
736,
949
161,
145
696,
101
1,27
3,48
3 1,
366,
734
Dis
aste
r 80
,977
48
,351
10
5,34
7 73
,375
62
5,89
2 13
1,49
2 18
1,96
5 A
ll O
ther
30
,207
82
1,07
4 22
2,97
1 99
,316
47
7,56
5 1,
995,
589
148,
936
Tota
l Fed
eral
Gra
nts
606,
473
1,18
9,35
8 3,
102,
527
627,
356
1,88
5,45
1 4,
704,
528
4,99
1,78
7 St
ate
Gra
nts
HA
CA
72
9,11
4 64
4,93
6 1,
079,
738
460,
206
490,
648
3,94
8,75
9 --
-M
anuf
actu
red
Hom
e H
AC
A
---
619
---
---
---
---
---
Res
iden
tial M
arke
t Val
ue C
redi
t 68
5,02
7 76
3,16
4 1,
594,
005
294,
535
602,
940
2,28
6,69
6 2,
009,
883
Agr
icul
tura
l Mar
ket V
alue
Cre
dit
---
---
---
97,7
59
---
---
---
Mob
ile H
ome
Mar
ket V
alue
Cre
dit
---
---
---
572
---
---
---
Atta
ched
Mac
hine
ry A
id
---
---
---
---
---
---
---
Dis
parit
y R
educ
tion
Aid
45
,162
56
,439
30
,950
15
,329
2,
187
10,2
95
5,60
9 H
ighw
ays
4,58
2,98
9 3,
707,
077
4,97
1,42
7 1,
895,
825
5,39
4,10
8 5,
834,
164
5,03
7 H
uman
Ser
vice
s 1,
674,
687
1,91
7,25
5 4,
052,
875
1,00
2,60
0 1,
301,
840
8,88
1,69
7 6,
018,
254
Crim
inal
Jus
tice
Aid
--
---
---
---
---
---
---
-PE
RA
Aid
27
,659
28
,406
50
,501
15
,078
16
,974
10
9,09
8 63
,819
Po
lice
Aid
43
,802
51
,180
10
2,04
4 48
,198
38
,442
20
0,44
4 23
3,65
1 A
ll O
ther
41
4,85
0 1,
055,
101
1,59
1,21
1 43
3,48
8 67
6,72
8 2,
110,
420
2,36
9,87
8 T
otal
Sta
te G
rant
s 8,
203,
290
8,22
4,17
7 13
,472
,751
4,
263,
590
8,52
3,86
7 23
,381
,573
10
,706
,131
Loca
l Uni
ts G
rant
s 35
,718
--
-10
3,47
3 --
-3,
637
2,42
7,33
0 22
,429
Tot
al In
terg
over
nmen
tal R
even
ues
8,84
5,48
1 9,
413,
535
16,6
78,7
51
4,89
0,94
6 10
,412
,955
30
,513
,431
15
,720
,347
Cha
rges
for S
ervi
ces
1,20
5,14
6 2,
219,
834
3,05
6,86
4 1,
238,
388
3,22
2,88
4 7,
416,
000
6,65
8,61
8 Fi
nes
and
Forf
eits
--
-42
,439
23
5,61
0 29
,745
17
,489
43
5,88
6 60
2,56
6 In
tere
st E
arni
ngs
187,
308
335,
813
1,00
1,30
8 84
,747
16
7,86
1 2,
459,
764
1,43
1,07
5 A
ll O
ther
Rev
enue
s 57
9,61
3 65
8,27
7 1,
394,
098
427,
475
485,
571
1,60
4,59
3 2,
194,
432
Tot
al R
even
ues
17,6
30,3
27
20,5
83,2
13
34,6
24,9
65
9,78
5,01
2 18
,555
,431
79
,667
,334
54
,417
,931
Oth
er F
inan
cing
Sou
rces
B
orro
win
g B
onds
Issu
ed
---
---
---
---
---
---
4,89
8,07
1 O
ther
Lon
g-te
rm D
ebt
375,
000
170,
409
---
---
---
---
5,77
9,92
4 T
otal
Bor
row
ing
375,
000
170,
409
---
---
---
---
10,6
77,9
95
Oth
er S
ourc
es
---
---
---
---
---
5,25
2 21
,229
Tr
ansf
ers
From
-
Ente
rpris
e Fu
nds
---
4,09
7 29
5,21
1 --
---
---
-1,
000,
000
- G
over
nmen
tal F
unds
13
8,88
5 86
6,78
6 54
9,00
0 26
,069
20
0,43
5 38
,631
2,
601,
608
Tot
al R
even
ues a
nd O
ther
Sou
rces
18
,144
,212
21
,624
,505
35
,469
,176
9,
811,
081
18,7
55,8
66
79,7
11,2
17
68,7
18,7
63

---
---
---
---
---
---
---
---
---
---
---
---
---
---
---
---
---
---
---
---
---
---
---
---
---
---
---
---
---
---
---
---
---
---
---
---
---
---
---
---
---
---
---
---
---
---
---
---
---
Tab
le 3
C
lass
ific
atio
n of
Cou
nty
Exp
endi
ture
sFo
r th
e Y
ear
End
ed D
ecem
ber
31, 2
004
EX
PE
ND
ITU
RE
S R
ED
WO
OD
R
EN
VIL
LE
R
ICE
R
OC
K
RO
SEA
U
SCO
TT
SH
ER
BU
RN
E
35
2,17
9,23
8 3,
630,
858
5,78
9,53
2 1,
456,
270
2,08
9,61
5 19
,181
,789
11
,468
,525
Gen
eral
Gov
ernm
ent
- Cur
rent
Exp
endi
ture
s --
-33
,908
7,
533
---
---
1,58
6,13
5 5,
831,
842
Tot
al G
ener
al G
over
nmen
t - C
apita
l Out
lay
2,17
9,23
8 3,
664,
766
5,79
7,06
5 1,
456,
270
2,08
9,61
5 20
,767
,924
17
,300
,367
Pu
blic
Saf
ety
- She
riff
1,93
3,89
9 1,
526,
914
2,96
1,13
5 1,
349,
110
1,08
2,29
3 3,
704,
099
4,19
7,99
6 - C
orre
ctio
ns
282,
007
155,
863
202,
473
42,7
67
473,
679
5,29
6,89
8 5,
298,
673
- All
Oth
e r
86,2
29
452,
188
3,50
4,75
3 3,
085
613,
483
1,44
7,90
8 1,
202,
035
- Cap
ital O
utla
y --
-12
4,58
6 38
0,86
6 --
---
-19
,943
,005
36
9,70
0 T
otal
Pub
lic S
afet
y 2,
302,
135
2,25
9,55
1 7,
049,
227
1,39
4,96
2 2,
169,
455
30,3
91,9
10
11,0
68,4
04
Stre
ets
and
Hig
hway
s - A
dmin
istr
atio
n 28
5,73
5 48
4,48
6 22
6,08
5 22
2,29
6 35
8,48
4 1,
299,
370
392,
113
2,73
3,02
4 3,
316,
856
2,63
4,89
7 1,
661,
117
2,44
4,07
7 3,
040,
304
3,03
1,94
1- M
aint
enan
ce
2,57
5,88
6 3,
099,
912
5,97
7,85
6 1,
307,
098
6,62
5,46
1 13
,459
,185
5,
863,
546
- Con
stru
ctio
n --
---
---
---
---
---
-39
4,71
9 T
otal
Str
eets
and
Hig
hway
s - O
ther
Cap
ital O
utla
y 5,
594,
645
6,90
1,25
4 8,
838,
838
3,19
0,51
1 9,
428,
022
17,7
98,8
59
9,68
2,31
9 Sa
nita
tion
- Cur
rent
Exp
endi
ture
s 47
6,85
5 50
4,26
0 31
,660
49
9,22
0 88
5,57
7 --
-4,
502,
258
- Cap
ital O
utla
yT
otal
San
itatio
n47
6,85
5 50
4,26
0 31
,660
49
9,22
0 88
5,57
7 --
-4,
502,
258
Hum
an S
ervi
ces
- Inc
ome
Mai
nten
ance
1,
133,
058
1,22
2,54
2 2,
021,
043
766,
069
664,
029
1,48
3,99
6 2,
840,
706
3,09
1,21
6 3,
486,
789
6,37
7,41
9 1,
397,
512
2,10
3,68
2 12
,163
,009
9,
158,
647
- Soc
ial S
ervi
ces
---
422,
167
---
---
---
1,67
0,69
7 5,
037
- All
Oth
e r
- Cap
ital O
utla
yT
otal
Hum
an S
ervi
ces
4,22
4,27
4 5,
131,
498
8,39
8,46
2 2,
163,
581
2,76
7,71
1 15
,317
,702
12
,004
,390
H
ealt h
- C
urre
nt E
xpen
ditu
res
1,03
1,96
2 1,
275,
409
2,73
2,81
6 56
,676
40
,319
1,
501,
534
1,37
7,00
2 --
-6,
222
---
---
---
---
---
Tot
al H
ealth
- C
a pita
l Out
lay
1,03
1,96
2 1,
281,
631
2,73
2,81
6 56
,676
40
,319
1,
501,
534
1,37
7,00
2 C
ultu
re a
nd R
ecre
atio
n Li
brar
ies
- Cur
rent
Exp
endi
ture
s 81
,174
94
,327
37
8,76
2 80
,007
70
,000
1,
873,
418
978,
976
- Ca p
ital O
utla
yPa
rks
and
Rec
reat
ion
- Cur
rent
Exp
endi
ture
s12
8,04
9 56
,928
22
6,81
4 39
2,38
3 13
8,53
6 1,
277,
443
306,
591
- Ca p
ital O
utla
yT
otal
Cul
ture
and
Rec
reat
ion
209,
223
151,
255
605,
576
472,
390
208,
536
3,15
0,86
1 1,
285,
567
Con
serv
atio
n of
Nat
ural
Res
ourc
es
- Cur
rent
Exp
endi
ture
s 63
5,74
5 1,
141,
506
389,
570
230,
031
527,
791
872,
923
583,
524
- Ca p
ital O
utla
yT
otal
Con
serv
atio
n of
Nat
ural
Res
ourc
es
635,
745
1,14
1,50
6 38
9,57
0 23
0,03
1 52
7,79
1 87
2,92
3 58
3,52
4 E
cono
mic
Dev
elop
men
t - C
urre
nt E
xpen
ditu
res
21,2
05
---
1,99
0,80
0 --
-66
4,21
5 1,
306,
578
548,
410
---
---
---
---
---
967,
876
---
Tot
al E
cono
mic
Dev
elop
men
t - C
a pita
l Out
lay
21,2
05
---
1,99
0,80
0 --
-66
4,21
5 2,
274,
454
548,
410
All
Oth
er
- Cur
rent
Exp
endi
ture
s --
---
---
---
---
-1,
360,
843
--
- Ca p
ital O
utla
yT
otal
All
Oth
er
---
---
---
---
---
1,36
0,84
3 --
---
450,
000
235,
000
---
---
1,02
0,00
0 82
0,00
0D
ebt S
ervi
ce
- Prin
cipa
l Pai
d on
Bon
ds
---
467,
145
140,
000
54,0
15
---
1,92
7,64
1 43
,728
- Oth
er L
ong-
term
Deb
t 9,
953
164,
997
389,
227
25,3
54
2,16
2 2,
765,
986
609,
216
- Int
eres
t and
Fis
cal C
har g
es
Tota
l Cur
rent
Exp
endi
ture
s 14
,099
,396
17
,771
,093
29
,467
,759
8,
156,
543
12,1
55,7
80
57,4
80,8
09
45,8
92,4
34
Tota
l Ca p
ital O
utla
y 2,
575,
886
3,26
4,62
8 6,
366,
255
1,30
7,09
8 6,
625,
461
35,9
56,2
01
12,4
59,8
07
Tota
l Deb
t Ser
vice
9,95
3 1,
082,
142
764,
227
79,3
69
2,16
2 5,
713,
627
1,47
2,94
4
Tot
al E
x pen
ditu
res
16,6
85,2
35
22,1
17,8
63
36,5
98,2
41
9,54
3,01
0 18
,783
,403
99
,150
,637
59
,825
,185
Oth
er F
inan
cin g
Use
s D
ebt R
edem
ptio
n - R
efun
ded
Bon
ds
Oth
er U
ses
2,06
2 --
---
---
---
---
---
-T
rans
fers
To
- Ent
erpr
ise
Fund
s --
---
---
---
---
-43
0,19
5 --
13
8,88
5 86
6,78
6 54
9,00
0 26
,069
20
0,43
5 38
,631
2,
601,
608
- Gov
ernm
enta
l Fun
ds
T
otal
Ex p
endi
ture
s an
d O
ther
Use
s 16
,826
,182
22
,984
,649
37
,147
,241
9,
569,
079
18,9
83,8
38
99,6
19,4
63
62,4
26,7
93
Unr
eser
ved
Fun
d B
alan
ce
Gen
eral
Fun
d U
nres
erve
d Fu
nd B
alan
ce
4,35
3,74
5 3,
926,
779
8,70
1,20
7 2,
886,
096
5,56
3,33
2 16
,512
,386
11
,581
,428
Sp
ecia
l Rev
enue
Fun
d U
nres
erve
d Fu
nd B
alan
ce7,
486,
383
6,44
9,49
8 6,
536,
960
3,60
4,44
8 4,
031,
877
8,78
0,88
7 10
,341
,366
11
,840
,128
10
,376
,277
15
,238
,167
6,
490,
544
9,59
5,20
9 25
,293
,273
21
,922
,794
T
otal
AS
A P
ER
CE
NT
OF
TOTA
L C
UR
RE
NT
EX
PEN
DIT
UR
ES
84.0
%
58.4
%
51.7
%
79.6
%
78.9
%
44.0
%
47.8
%

Tab
le 2
C
lass
ifica
tion
of C
ount
y R
even
ues
For
the
Yea
r E
nded
Dec
embe
r 31
, 200
4
SIB
LEY
STE
AR
NS
STE
ELE
ST
EVE
NS
ST. L
OU
IS
SWIF
T TO
DD
Popu
latio
n ( 2
004
Popu
latio
n Es
timat
es)
15,3
20
140,
841
35,1
66
9,87
4 19
8,26
2 11
,599
24
,657
N
et T
axab
le T
ax C
apac
ity
10,6
10,3
27
82,0
41,4
15
23,2
37,1
84
6,21
8,81
6 10
1,17
4,06
6 7,
388,
718
10,8
60,3
75
2003
Tax
Lev
y (P
ayab
le 2
004)
7,
193,
404
42,0
69,1
78
11,8
91,9
13
3,19
6,42
3 78
,789
,332
4,
540,
972
8,03
2,00
0
RE
VE
NU
ES
36
Taxe
s 6,
670,
662
38,7
70,8
87
10,8
35,4
86
2,89
6,36
9 86
,425
,663
4,
082,
965
7,04
1,41
0 Sp
ecia
l Ass
essm
ents
39
8,84
9 39
5,88
8 14
4,68
2 16
1,31
4 --
-47
8,22
2 11
,560
Li
cens
es a
nd P
erm
its
46,6
69
555,
090
52,9
48
19,8
11
150,
938
4,67
8 18
7,26
6 In
terg
over
nmen
tal R
even
ues
Fede
ral G
rant
s H
ighw
ays
---
610,
200
17,0
47
690,
417
3,90
5,13
4 1,
215,
127
669,
152
Hum
an S
ervi
ces
310,
333
3,61
5,12
1 67
3,15
2 23
3,19
7 10
,376
,284
22
4,49
3 1,
663,
752
Dis
aste
r 38
,572
3,
003,
193
118,
299
41,2
55
235,
514
22,2
43
39,8
31
All
Oth
er
91,3
11
932,
310
346,
347
28,5
92
1,11
2,63
2 44
,611
21
,315
To
tal F
eder
al G
rant
s 44
0,21
6 8,
160,
824
1,15
4,84
5 99
3,46
1 15
,629
,564
1,
506,
474
2,39
4,05
0 St
ate
Gra
nts
HA
CA
53
1,39
4 3,
582,
001
521,
297
869,
228
8,47
8,18
3 72
5,90
8 1,
328,
319
Man
ufac
ture
d H
ome
HA
CA
--
---
---
-39
2 --
---
-5,
992
Res
iden
tial M
arke
t Val
ue C
redi
t 66
8,73
8 4,
528,
665
1,38
2,56
3 34
1,51
5 8,
530,
250
335,
473
1,16
5,18
9 A
gric
ultu
ral M
arke
t Val
ue C
redi
t 22
5,98
7 --
---
---
---
-14
2,20
6 40
,257
M
obile
Hom
e M
arke
t Val
ue C
redi
t 2,
586
---
---
---
---
475
554
Atta
ched
Mac
hine
ry A
id
---
---
---
---
---
---
---
Dis
parit
y R
educ
tion
Aid
56
,616
48
,907
26
,751
50
,560
5,
548,
835
67,2
04
77,7
05
Hig
hway
s 3,
441,
223
7,77
7,59
9 2,
963,
841
2,68
2,98
2 34
,944
,505
2,
914,
844
3,73
6,96
8 H
uman
Ser
vice
s 1,
463,
472
11,2
13,0
93
3,38
6,92
7 98
6,61
3 29
,058
,460
1,
532,
414
3,17
7,68
5 C
rimin
al J
ustic
e A
id
---
---
---
---
---
---
---
PER
A A
id
25,3
85
145,
954
49,3
58
18,4
42
410,
279
36,3
67
26,2
32
Polic
e A
id
38,2
12
218,
540
71,1
49
23,5
87
575,
577
27,3
28
---
All
Oth
er
681,
549
3,52
9,70
6 89
3,24
3 23
6,03
6 2,
240,
429
225,
356
742,
765
Tot
al S
tate
Gra
nts
7,13
5,16
2 31
,044
,465
9,
295,
129
5,20
9,35
5 89
,786
,518
6,
007,
575
10,3
01,6
66
Loca
l Uni
ts G
rant
s 22
,891
2,
320,
546
131,
830
---
3,69
0 66
,341
--
-
Tot
al In
terg
over
nmen
tal R
even
ues
7,59
8,26
9 41
,525
,835
10
,581
,804
6,
202,
816
105,
419,
772
7,58
0,39
0 12
,695
,716
Cha
rges
for S
ervi
ces
1,60
6,49
7 4,
375,
878
2,17
9,63
3 52
5,02
8 10
,586
,660
1,
026,
481
1,73
3,63
1 Fi
nes
and
Forf
eits
13
0,70
7 21
1,92
3 14
3,48
9 21
,738
1,
622,
789
450
3,34
1 In
tere
st E
arni
ngs
226,
967
910,
836
317,
220
271,
390
1,53
4,18
5 80
,364
12
9,87
3 A
ll O
ther
Rev
enue
s 64
4,20
1 3,
695,
760
2,50
8,88
9 22
2,85
8 15
,276
,261
81
7,54
8 1,
395,
206
Tot
al R
even
ues
17,3
22,8
21
90,4
42,0
97
26,7
64,1
51
10,3
21,3
24
221,
016,
268
14,0
71,0
98
23,1
98,0
03
Oth
er F
inan
cing
Sou
rces
B
orro
win
g B
onds
Issu
ed
---
---
---
---
17,7
71,1
20
---
---
Oth
er L
ong-
term
Deb
t 12
,093
--
---
---
-79
,000
53
,877
--
-T
otal
Bor
row
ing
12,0
93
---
---
---
17,8
50,1
20
53,8
77
---
Oth
er S
ourc
es
200,
000
9,57
5 --
---
---
-93
,602
--
-Tr
ansf
ers
From
-
Ente
rpris
e Fu
nds
---
---
---
---
---
---
--
- G
over
nmen
tal F
unds
73
0,95
2 4,
210,
643
---
---
3,77
4,88
7 --
-51
0,17
8
Tot
al R
even
ues a
nd O
ther
Sou
rces
18
,265
,866
94
,662
,315
26
,764
,151
10
,321
,324
24
2,64
1,27
5 14
,218
,577
23
,708
,181

---
---
---
---
---
---
---
---
---
---
---
---
---
---
---
---
---
---
---
---
---
---
---
---
---
---
---
---
---
---
---
---
---
---
---
---
---
---
---
---
---
---
---
---
---
---
---
---
---
Tab
le 3
C
lass
ific
atio
n of
Cou
nty
Exp
endi
ture
sFo
r th
e Y
ear
End
ed D
ecem
ber
31, 2
004
EX
PE
ND
ITU
RE
S SI
BL
EY
ST
EA
RN
S ST
EE
LE
ST
EV
EN
S ST
. LO
UIS
SW
IFT
T
OD
D
37
2,77
5,02
7 12
,668
,469
5,
443,
221
1,64
7,01
9 32
,537
,856
1,
837,
171
3,30
5,56
3G
ener
al G
over
nmen
t - C
urre
nt E
xpen
ditu
res
356,
248
1,50
4,47
7 --
---
-55
,686
--
-98
,970
T
otal
Gen
eral
Gov
ernm
ent
- Cap
ital O
utla
y 3,
131,
275
14,1
72,9
46
5,44
3,22
1 1,
647,
019
32,5
93,5
42
1,83
7,17
1 3,
404,
533
Publ
ic S
afet
y - S
herif
f 1,
470,
809
6,61
9,21
7 1,
884,
287
769,
395
10,4
27,3
64
1,14
2,62
4 1,
527,
861
- Cor
rect
ions
19
7,57
4 11
,340
,319
3,
876,
911
79,1
68
16,2
28,0
66
89,0
66
691,
515
- All
Oth
e r
59,7
45
2,80
4,83
7 12
4,08
6 42
,334
5,
218,
444
31,4
98
6,84
7 - C
apita
l Out
lay
58,0
51
---
54,5
33
---
292,
025
---
168,
964
Tot
al P
ublic
Saf
ety
1,78
6,17
9 20
,764
,373
5,
939,
817
890,
897
32,1
65,8
99
1,26
3,18
8 2,
395,
187
Stre
ets
and
Hig
hway
s - A
dmin
istr
atio
n 30
5,02
6 1,
045,
916
228,
584
448,
678
5,42
1,69
9 30
9,22
8 1,
071,
297
2,07
0,92
2 4,
865,
984
1,84
6,83
1 1,
279,
167
22,0
85,4
08
1,80
4,53
3 1,
008,
824
- Mai
nten
ance
2,
554,
425
7,98
8,75
9 2,
615,
779
2,33
6,57
8 36
,011
,450
2,
756,
807
4,41
4,73
3- C
onst
ruct
ion
157,
990
---
---
---
2,00
1,32
4 --
-18
2,68
9 T
otal
Str
eets
and
Hig
hway
s - O
ther
Cap
ital O
utla
y 5,
088,
363
13,9
00,6
59
4,69
1,19
4 4,
064,
423
65,5
19,8
81
4,87
0,56
8 6,
677,
543
Sani
tatio
n - C
urre
nt E
xpen
ditu
res
211,
160
339,
555
571,
493
162,
512
1,92
4 75
8,26
5 --
- C
apita
l Out
lay
Tot
al S
anita
tion
211,
160
339,
555
571,
493
162,
512
1,92
4 75
8,26
5 --
-H
uman
Ser
vice
s - I
ncom
e M
aint
enan
ce
763,
112
---
1,87
8,68
6 37
9,93
0 11
,430
,260
80
2,02
4 2,
090,
097
2,50
9,58
2 --
-4,
791,
273
1,79
3,89
6 41
,427
,310
2,
365,
724
4,95
3,87
8- S
ocia
l Ser
vice
s 19
,108
27
,606
,801
--
---
-7,
999,
893
---
694,
682
- All
Oth
e r
- Cap
ital O
utla
yT
otal
Hum
an S
ervi
ces
3,29
1,80
2 27
,606
,801
6,
669,
959
2,17
3,82
6 60
,857
,463
3,
167,
748
7,73
8,65
7 H
ealt h
- C
urre
nt E
xpen
ditu
res
1,12
5,22
2 1,
652,
663
1,12
0,96
4 10
1,94
8 6,
482,
829
214,
827
1,92
9,82
3 8,
432
---
---
---
15,4
04
---
3,70
6 T
otal
Hea
lth
- Ca p
ital O
utla
y 1,
133,
654
1,65
2,66
3 1,
120,
964
101,
948
6,49
8,23
3 21
4,82
7 1,
933,
529
Cul
ture
and
Rec
reat
ion
Libr
arie
s - C
urre
nt E
xpen
ditu
res
227,
249
1,61
8,02
8 22
,160
47
,583
46
9,01
1 76
,748
26
1,68
3 - C
a pita
l Out
lay
Park
s an
d R
ecre
atio
n - C
urre
nt E
xpen
ditu
res
25,3
96
1,26
9,52
8 10
0,89
0 35
8,81
3 1,
199,
783
91,6
77
--
- Ca p
ital O
utla
yT
otal
Cul
ture
and
Rec
reat
ion
252,
645
2,88
7,55
6 12
3,05
0 40
6,39
6 1,
668,
794
168,
425
261,
683
Con
serv
atio
n of
Nat
ural
Res
ourc
es
- Cur
rent
Exp
endi
ture
s 1,
016,
509
3,17
9,26
8 56
2,34
7 35
6,98
4 6,
117,
557
518,
100
205,
135
---
---
---
---
135,
672
---
1,10
1 T
otal
Con
serv
atio
n of
Nat
ural
Res
ourc
es
- Ca p
ital O
utla
y 1,
016,
509
3,17
9,26
8 56
2,34
7 35
6,98
4 6,
253,
229
518,
100
206,
236
Eco
nom
ic D
evel
opm
ent
- Cur
rent
Exp
endi
ture
s 18
9,45
7 1,
251,
511
---
57,0
00
3,54
5,61
1 22
7,50
0 53
,712
- C
a pita
l Out
lay
Tot
al E
cono
mic
Dev
elop
men
t18
9,45
7 1,
251,
511
---
57,0
00
3,54
5,61
1 22
7,50
0 53
,712
A
ll O
ther
- C
urre
nt E
xpen
ditu
res
---
---
389,
463
---
---
10,3
97
--
- Ca p
ital O
utla
yT
otal
All
Oth
er
---
---
389,
463
---
---
10,3
97
--
395,
000
3,32
0,00
0 6,
015,
000
---
3,03
1,23
4 69
5,00
0 40
,000
Deb
t Ser
vice
- P
rinci
pal P
aid
on B
onds
--
-1,
668,
132
346,
492
---
2,31
1,75
5 --
-11
0,00
0- O
ther
Lon
g-te
rm D
ebt
262,
431
922,
427
1,29
5,70
2 --
-1,
218,
003
43,5
37
34,6
23- I
nter
est a
nd F
isca
l Cha
r ges
Tota
l Cur
rent
Exp
endi
ture
s 12
,965
,898
76
,262
,096
22
,841
,196
7,
524,
427
170,
593,
015
10,2
79,3
82
17,8
00,9
17
Tota
l Ca p
ital O
utla
y 3,
135,
146
9,49
3,23
6 2,
670,
312
2,33
6,57
8 38
,511
,561
2,
756,
807
4,87
0,16
3 To
tal D
ebt S
ervi
ce65
7,43
1 5,
910,
559
7,65
7,19
4 --
-6,
560,
992
738,
537
184,
623
T
otal
Ex p
endi
ture
s 16
,758
,475
91
,665
,891
33
,168
,702
9,
861,
005
215,
665,
568
13,7
74,7
26
22,8
55,7
03
Oth
er F
inan
cin g
Use
s D
ebt R
edem
ptio
n - R
efun
ded
Bon
ds
Oth
er U
ses
---
---
---
---
---
446,
010
---
Tra
nsfe
rs T
o - E
nter
pris
e Fu
nds
---
---
---
58,9
90
394,
000
100,
000
--
730,
952
4,21
0,64
3 --
---
-3,
774,
887
---
510,
178
- Gov
ernm
enta
l Fun
ds
T
otal
Ex p
endi
ture
s an
d O
ther
Use
s 17
,489
,427
95
,876
,534
33
,168
,702
9,
919,
995
219,
834,
455
14,3
20,7
36
23,3
65,8
81
Unr
eser
ved
Fun
d B
alan
ce
Gen
eral
Fun
d U
nres
erve
d Fu
nd B
alan
ce
4,42
2,25
6 7,
971,
668
4,57
9,34
9 3,
421,
293
21,8
29,8
44
1,29
5,65
1 3,
185,
800
Spec
ial R
even
ue F
und
Unr
eser
ved
Fund
Bal
ance
3,30
2,83
6 9,
605,
479
2,29
6,72
2 4,
097,
260
34,7
54,4
08
5,07
3,29
7 5,
201,
628
7,72
5,09
2 17
,577
,147
6,
876,
071
7,51
8,55
3 56
,584
,252
6,
368,
948
8,38
7,42
8
Tot
al
AS
A P
ER
CE
NT
OF
TOTA
L C
UR
RE
NT
EX
PEN
DIT
UR
ES
59.6
%
23.0
%
30.1
%
99.9
%
33.2
%
62.0
%
47.1
%

Tab
le 2
C
lass
ifica
tion
of C
ount
y R
even
ues
For
the
Yea
r E
nded
Dec
embe
r 31
, 200
4
TRA
VE
RSE
W
AB
ASH
A
WA
DE
NA
W
ASE
CA
W
ASH
ING
TON
W
ATO
NW
AN
W
ILK
IN
Popu
latio
n ( 2
004
Popu
latio
n Es
timat
es)
3,86
6 22
,232
13
,600
19
,450
21
7,43
5 11
,570
6,
837
Net
Tax
able
Tax
Cap
acity
4,
366,
837
13,1
31,6
02
5,57
2,88
2 12
,579
,190
20
2,23
9,24
0 6,
643,
367
5,80
3,15
7 20
03 T
ax L
evy
(Pay
able
200
4)
2,38
3,36
7 6,
903,
505
4,90
8,99
8 6,
904,
391
57,2
25,3
71
5,16
4,55
6 3,
399,
348
RE
VE
NU
ES
38
Taxe
s 2,
224,
961
6,10
1,10
0 4,
267,
767
6,14
1,43
6 67
,217
,857
4,
722,
146
3,07
8,01
2 Sp
ecia
l Ass
essm
ents
57
,905
--
-32
2,54
0 41
1,75
0 72
,411
26
5,16
9 12
9,66
1 Li
cens
es a
nd P
erm
its
1,82
4 19
9,39
9 64
,198
18
5,31
6 3,
084,
784
11,5
41
9,21
0 In
terg
over
nmen
tal R
even
ues
Fede
ral G
rant
s H
ighw
ays
13,3
87
910,
735
22,8
04
---
2,35
5,30
2 96
,414
70
7 H
uman
Ser
vice
s 12
9,32
1 63
4,05
3 59
0,65
5 44
0,55
6 6,
782,
834
367,
698
252,
834
Dis
aste
r 14
,029
60
,991
36
,444
65
,812
91
6,63
5 28
,542
6,
300
All
Oth
er
---
172,
376
32,7
91
135,
066
4,66
3,87
5 36
,684
29
,585
To
tal F
eder
al G
rant
s 15
6,73
7 1,
778,
155
682,
694
641,
434
14,7
18,6
46
529,
338
289,
426
Stat
e G
rant
s H
AC
A
444,
162
530,
059
252,
044
854,
521
4,39
1,56
2 60
5,21
6 78
7,11
3 M
anuf
actu
red
Hom
e H
AC
A
---
---
---
3,11
5 --
---
---
-R
esid
entia
l Mar
ket V
alue
Cre
dit
173,
720
1,02
5,29
4 68
2,42
1 84
4,55
9 3,
808,
727
582,
244
349,
953
Agr
icul
tura
l Mar
ket V
alue
Cre
dit
---
---
---
71,0
44
94,2
48
---
---
Mob
ile H
ome
Mar
ket V
alue
Cre
dit
648
---
2,03
9 --
-26
,108
1,
583
3,36
3 A
ttach
ed M
achi
nery
Aid
--
---
---
---
---
---
---
-D
ispa
rity
Red
uctio
n A
id
18,7
76
21,9
43
53,6
18
13,4
05
363
5,08
2 17
,713
H
ighw
ays
3,44
5,95
2 3,
506,
814
2,46
6,16
8 2,
660,
904
4,57
6,97
0 2,
914,
020
3,36
9,27
8 H
uman
Ser
vice
s 64
8,76
3 1,
658,
408
2,40
5,38
6 1,
802,
977
12,2
97,2
50
1,58
0,72
2 82
1,86
3 C
rimin
al J
ustic
e A
id
---
---
---
---
---
---
---
PER
A A
id
16,4
82
22,6
37
44,3
41
26,3
26
209,
159
19,9
06
14,8
76
Polic
e A
id
12,2
87
62,0
79
29,5
69
55,2
34
431,
420
34,0
77
22,4
37
All
Oth
er
161,
208
747,
873
423,
623
881,
410
7,09
3,44
3 30
1,48
0 16
6,53
4 T
otal
Sta
te G
rant
s 4,
921,
998
7,57
5,10
7 6,
359,
209
7,21
3,49
5 32
,929
,250
6,
044,
330
5,55
3,13
0
Loca
l Uni
ts G
rant
s 10
,306
--
-1,
423
---
4,50
3,56
7 21
,865
23
,124
Tot
al In
terg
over
nmen
tal R
even
ues
5,08
9,04
1 9,
353,
262
7,04
3,32
6 7,
854,
929
52,1
51,4
63
6,59
5,53
3 5,
865,
680
Cha
rges
for S
ervi
ces
297,
144
1,36
8,24
4 1,
005,
083
1,02
5,98
2 11
,572
,266
79
9,17
8 84
7,27
9 Fi
nes
and
Forf
eits
31
8 64
,576
10
5,10
4 52
,488
1,
293,
792
11,7
14
17,0
62
Inte
rest
Ear
ning
s 83
,192
17
3,04
8 77
,394
17
2,99
6 1,
556,
690
115,
302
119,
418
All
Oth
er R
even
ues
438,
625
607,
556
875,
850
903,
440
8,98
8,78
8 80
1,34
0 42
9,04
4
Tot
al R
even
ues
8,19
3,01
0 17
,867
,185
13
,761
,262
16
,748
,337
14
5,93
8,05
1 13
,321
,923
10
,495
,366
Oth
er F
inan
cing
Sou
rces
B
orro
win
g B
onds
Issu
ed
---
---
---
---
---
2,15
3,12
2 --
-O
ther
Lon
g-te
rm D
ebt
---
179,
810
---
---
---
123,
510
105,
000
Tot
al B
orro
win
g --
-17
9,81
0 --
---
---
-2,
276,
632
105,
000
Oth
er S
ourc
es
---
9,76
5 24
3,55
7 --
---
---
---
-Tr
ansf
ers
From
-
Ente
rpris
e Fu
nds
---
---
---
---
1,16
0,00
0 --
---
- Gov
ernm
enta
l Fun
ds
63,9
16
277,
262
474,
021
365,
712
2,41
5,36
0 15
4,04
3 27
4,45
7
Tot
al R
even
ues a
nd O
ther
Sou
rces
8,
256,
926
18,3
34,0
22
14,4
78,8
40
17,1
14,0
49
149,
513,
411
15,7
52,5
98
10,8
74,8
23

---
---
---
---
---
---
---
---
---
---
---
---
---
---
---
---
---
---
---
---
---
---
---
---
---
---
---
---
---
---
---
---
---
---
---
---
---
---
---
---
---
---
---
---
---
---
---
---
---
---
---
---
---
---
---
---
---
---
---
---
---
---
---
---
---
---
---
---
---
---
---
---
---
---
---
---
---
Tab
le 3
C
lass
ific
atio
n of
Cou
nty
Exp
endi
ture
sFo
r th
e Y
ear
End
ed D
ecem
ber
31, 2
004
EX
PE
ND
ITU
RE
S T
RA
VE
RSE
W
AB
ASH
A
WA
DE
NA
W
ASE
CA
W
ASH
ING
TO
N
WA
TO
NW
AN
W
ILK
IN
39
1,15
4,46
7 2,
824,
651
2,67
5,15
4 3,
560,
026
31,0
83,4
66
2,21
9,79
3 1,
388,
371
Gen
eral
Gov
ernm
ent
- Cur
rent
Exp
endi
ture
s --
---
---
-71
,532
2,
464,
545
81,5
85
92,8
47
Tot
al G
ener
al G
over
nmen
t - C
apita
l Out
lay
1,15
4,46
7 2,
824,
651
2,67
5,15
4 3,
631,
558
33,5
48,0
11
2,30
1,37
8 1,
481,
218
Publ
ic S
afet
y - S
herif
f 53
4,31
0 1,
639,
628
1,14
6,12
3 1,
656,
983
20,6
78,2
51
971,
586
937,
613
- Cor
rect
ions
20
3,96
8 1,
619,
974
70,0
00
13,8
47
7,65
9,26
7 64
9,07
1 59
,841
- A
ll O
the r
5,
089
113,
052
49,8
51
109,
208
---
57,9
20
32,6
59
- Cap
ital O
utla
y 22
,468
--
---
-88
7,05
0 --
---
-54
,724
T
otal
Pub
lic S
afet
y 76
5,83
5 3,
372,
654
1,26
5,97
4 2,
667,
088
28,3
37,5
18
1,67
8,57
7 1,
084,
837
Stre
ets
and
Hig
hway
s - A
dmin
istr
atio
n 33
8,69
0 31
0,87
0 31
5,80
4 21
5,28
3 85
5,34
9 34
9,81
0 27
4,67
8 1,
592,
204
1,71
6,75
8 1,
581,
501
1,57
6,78
9 4,
298,
741
1,77
7,65
1 1,
941,
346
- Mai
nten
ance
1,
947,
665
4,23
8,55
1 1,
505,
896
422,
735
9,56
8,90
5 1,
500,
022
2,25
2,51
8- C
onst
ruct
ion
154,
475
---
---
1,86
3,06
9 --
---
---
-T
otal
Str
eets
and
Hig
hway
s - O
ther
Cap
ital O
utla
y 4,
033,
034
6,26
6,17
9 3,
403,
201
4,07
7,87
6 14
,722
,995
3,
627,
483
4,46
8,54
2 Sa
nita
tion
- Cur
rent
Exp
endi
ture
s 42
,965
25
1,51
6 1,
007,
512
517,
746
---
150,
070
288,
083
- Cap
ital O
utla
yT
otal
San
itatio
n42
,965
25
1,51
6 1,
007,
512
517,
746
---
150,
070
288,
083
Hum
an S
ervi
ces
- Inc
ome
Mai
nten
ance
52
6,62
3 77
7,11
4 1,
325,
915
1,00
7,21
7 7,
899,
830
830,
841
567,
791
1,01
4,79
2 3,
175,
749
3,20
8,62
8 2,
770,
284
20,1
08,0
93
2,51
8,24
7 1,
736,
850
- Soc
ial S
ervi
ces
---
---
202,
013
---
13,8
73,8
98
---
--
- All
Oth
e r
- Cap
ital O
utla
yT
otal
Hum
an S
ervi
ces
1,54
1,41
5 3,
952,
863
4,73
6,55
6 3,
777,
501
41,8
81,8
21
3,34
9,08
8 2,
304,
641
Hea
lt h
- Cur
rent
Exp
endi
ture
s 68
,217
1,
236,
360
608,
958
843,
559
---
382,
619
587,
974
- Ca p
ital O
utla
yT
otal
Hea
lth
68,2
17
1,23
6,36
0 60
8,95
8 84
3,55
9 --
-38
2,61
9 58
7,97
4 C
ultu
re a
nd R
ecre
atio
n Li
brar
ies
- Cur
rent
Exp
endi
ture
s 35
,032
11
2,12
9 37
,271
18
6,59
7 5,
032,
872
457,
228
40,4
21
- Ca p
ital O
utla
yPa
rks
and
Rec
reat
ion
- Cur
rent
Exp
endi
ture
s31
,488
27
4,94
0 61
,145
21
6,48
3 2,
058,
233
69,4
79
10,4
00
---
---
---
5,90
0 --
---
---
-T
otal
Cul
ture
and
Rec
reat
ion
- Ca p
ital O
utla
y 66
,520
38
7,06
9 98
,416
40
8,98
0 7,
091,
105
526,
707
50,8
21
Con
serv
atio
n of
Nat
ural
Res
ourc
es
- Cur
rent
Exp
endi
ture
s 27
3,11
3 32
9,14
9 25
6,25
4 41
0,40
4 21
0,26
1 51
7,75
9 32
6,58
7 - C
a pita
l Out
lay
Tot
al C
onse
rvat
ion
of N
atur
al R
esou
rces
27
3,11
3 32
9,14
9 25
6,25
4 41
0,40
4 21
0,26
1 51
7,75
9 32
6,58
7 E
cono
mic
Dev
elop
men
t - C
urre
nt E
xpen
ditu
res
9,86
3 64
,413
3,
403
40,4
51
7,93
8,83
2 13
2,85
9 3,
755
- Ca p
ital O
utla
yT
otal
Eco
nom
ic D
evel
opm
ent
9,86
3 64
,413
3,
403
40,4
51
7,93
8,83
2 13
2,85
9 3,
755
All
Oth
er
- Cur
rent
Exp
endi
ture
s - C
a pita
l Out
lay
Tot
al A
ll O
ther
Deb
t Ser
vice
- P
rinci
pal P
aid
on B
onds
--
---
---
-47
0,00
0 2,
340,
000
80,0
00
20,0
00
200,
567
350,
018
---
68,2
94
143,
431
92,0
68
105,
000
- Oth
er L
ong-
term
Deb
t 19
,881
24
,456
--
-26
0,50
0 2,
408,
543
186,
256
2,01
5- I
nter
est a
nd F
isca
l Cha
r ges
Tota
l Cur
rent
Exp
endi
ture
s 5,
830,
821
14,4
46,3
03
12,5
49,5
32
13,1
24,8
77
121,
697,
093
11,0
84,9
33
8,19
6,36
9 To
tal C
a pita
l Out
lay
2,12
4,60
8 4,
238,
551
1,50
5,89
6 3,
250,
286
12,0
33,4
50
1,58
1,60
7 2,
400,
089
Tota
l Deb
t Ser
vice
220,
448
374,
474
---
798,
794
4,89
1,97
4 35
8,32
4 12
7,01
5
Tot
al E
x pen
ditu
res
8,17
5,87
7 19
,059
,328
14
,055
,428
17
,173
,957
13
8,62
2,51
7 13
,024
,864
10
,723
,473
Oth
er F
inan
cin g
Use
s D
ebt R
edem
ptio
n - R
efun
ded
Bon
ds
Oth
er U
ses
Tra
nsfe
rs T
o - E
nter
pris
e Fu
nds
14,6
16
---
---
---
2,48
7,00
0 --
---
63
,916
27
7,26
2 47
4,02
1 36
5,71
2 2,
415,
360
154,
043
274,
457
- Gov
ernm
enta
l Fun
ds
T
otal
Ex p
endi
ture
s an
d O
ther
Use
s 8,
254,
409
19,3
36,5
90
14,5
29,4
49
17,5
39,6
69
143,
524,
877
13,1
78,9
07
10,9
97,9
30
Unr
eser
ved
Fun
d B
alan
ce
Gen
eral
Fun
d U
nres
erve
d Fu
nd B
alan
ce
651,
366
4,17
1,88
6 1,
645,
837
4,52
9,15
8 30
,982
,597
2,
740,
071
3,88
1,80
6 Sp
ecia
l Rev
enue
Fun
d U
nres
erve
d Fu
nd B
alan
ce64
8,76
7 2,
063,
525
1,84
3,84
4 6,
430,
038
15,6
47,4
70
2,95
3,19
2 79
2,55
3 1,
300,
133
6,23
5,41
1 3,
489,
681
10,9
59,1
96
46,6
30,0
67
5,69
3,26
3 4,
674,
359
T
otal
AS
A P
ER
CE
NT
OF
TOTA
L C
UR
RE
NT
EX
PEN
DIT
UR
ES
22.3
%
43.2
%
27.8
%
83.5
%
38.3
%
51.4
%
57.0
%

---
---
---
---
Tab
le 2
C
lass
ifica
tion
of C
ount
y R
even
ues
For
the
Yea
r E
nded
Dec
embe
r 31
, 200
4
WIN
ON
A
WR
IGH
T YE
LLO
W M
ED
ICIN
E
TOTA
L A
LL C
OU
NTI
ES
Popu
latio
n ( 2
004
Popu
latio
n Es
timat
es)
49,8
27
106,
734
10,6
56
5,14
5,10
6 N
et T
axab
le T
ax C
apac
ity
27,6
48,3
88
78,3
35,7
99
7,06
5,65
6 3,
910,
458,
667
2003
Tax
Lev
y (P
ayab
le 2
004)
13
,655
,137
27
,958
,791
5,
806,
178
1,75
2,34
8,28
0
40
RE
VE
NU
ES
Taxe
s Sp
ecia
l Ass
essm
ents
Li
cens
es a
nd P
erm
its
Inte
rgov
ernm
enta
l Rev
enue
s Fe
dera
l Gra
nts
Hig
hway
s H
uman
Ser
vice
s D
isas
ter
All
Oth
er
Tota
l Fed
eral
Gra
nts
Stat
e G
rant
s H
AC
A
Man
ufac
ture
d H
ome
HA
CA
R
esid
entia
l Mar
ket V
alue
Cre
dit
Agr
icul
tura
l Mar
ket V
alue
Cre
dit
Mob
ile H
ome
Mar
ket V
alue
Cre
dit
Atta
ched
Mac
hine
ry A
id
Dis
parit
y R
educ
tion
Aid
H
ighw
ays
Hum
an S
ervi
ces
Crim
inal
Jus
tice
Aid
PE
RA
Aid
Po
lice
Aid
A
ll O
ther
T
otal
Sta
te G
rant
s
Loca
l Uni
ts G
rant
s
Tot
al In
terg
over
nmen
tal R
even
ues
Cha
rges
for S
ervi
ces
Fine
s an
d Fo
rfei
ts
Inte
rest
Ear
ning
s A
ll O
ther
Rev
enue
s
Tot
al R
even
ues
Oth
er F
inan
cing
Sou
rces
B
orro
win
g B
onds
Issu
ed
Oth
er L
ong-
term
Deb
t T
otal
Bor
row
ing
Oth
er S
ourc
es
Tran
sfer
s Fr
om
- En
terp
rise
Fund
s
- Gov
ernm
enta
l Fun
ds
Tot
al R
even
ues a
nd O
ther
Sou
rces
11,8
34,8
46
26,4
95,6
03
5,23
4,69
9 1,
774,
769,
845
229,
859
1,60
7,29
7 28
4,45
7 35
,639
,201
26
0,19
5 32
4,46
6 25
,686
27
,275
,273
808,
274
680,
795
49,1
39
54,1
67,6
12
1,07
7,96
8 1,
301,
231
300,
664
247,
049,
829
113,
882
66,8
77
111,
523
22,0
82,1
79
382,
039
181,
124
953
99,7
53,6
15
2,38
2,16
3 2,
230,
027
462,
279
423,
053,
235
1,06
6,10
0 1,
992,
275
761,
058
119,
913,
016
---
---
---
10,1
18
1,90
6,40
7 2,
369,
483
583,
787
144,
546,
841
22,9
87
312,
847
---
3,40
8,92
7 --
-56
,702
--
-47
0,97
5
57,5
51
4,69
5 43
,341
11
,222
,231
4,
607,
138
9,33
1,25
7 3,
086,
963
429,
146,
786
6,07
3,52
8 9,
742,
938
1,29
5,13
3 49
6,66
4,53
2 --
---
---
-69
,953
54
,309
81
,912
15
,547
8,
022,
425
82,5
94
479,
406
31,8
30
11,3
95,0
41
811,
528
1,96
1,57
4 28
9,99
2 18
8,30
9,04
2 14
,682
,142
26
,333
,089
6,
107,
651
1,41
3,17
9,88
7
58,6
11
251,
755
72,5
82
42,2
10,9
26
17,1
22,9
16
28,8
14,8
71
6,64
2,51
2 1,
878,
444,
048
3,55
7,28
2 8,
431,
986
579,
626
473,
364,
532
170,
918
694,
597
497
14,9
60,4
23
350,
417
913,
077
131,
841
60,2
53,1
89
980,
053
2,26
5,19
3 56
8,66
7 19
7,12
4,03
6
34,5
06,4
86
69,5
47,0
90
13,4
67,9
85
4,46
1,83
0,54
7
---
8,28
5,00
0 --
-25
0,39
5,19
4 16
8,98
2 4,
485,
000
---
24,2
46,9
75
168,
982
12,7
70,0
00
---
---
274,
642,
169
17,6
94
1,98
1,21
1 --
-26
,358
,303
--
---
---
-5,
915,
705
1,07
0,83
2 1,
705,
303
13,0
14
95,8
09,9
49
35,7
63,9
94
86,0
03,6
04
13,4
80,9
99
4,86
4,55
6,67
3

---
---
---
---
---
---
---
---
---
---
---
---
---
---
---
---
---
---
---
---
---
---
---
---
---
---
---
---
---
---
---
Tab
le 3
C
lass
ific
atio
n of
Cou
nty
Exp
endi
ture
sFo
r th
e Y
ear
End
ed D
ecem
ber
31, 2
004
EX
PE
ND
ITU
RE
S W
INO
NA
W
RIG
HT
Y
EL
LO
W M
ED
ICIN
E
TO
TA
L A
LL
CO
UN
TIE
S
41
Gen
eral
Gov
ernm
ent
- Cur
rent
Exp
endi
ture
s - C
apita
l Out
lay
Tot
al G
ener
al G
over
nmen
t Pu
blic
Saf
ety
- She
riff
- Cor
rect
ions
- A
ll O
the r
- C
apita
l Out
lay
Tot
al P
ublic
Saf
ety
Stre
ets
and
Hig
hway
s - A
dmin
istr
atio
n - M
aint
enan
ce
- Con
stru
ctio
n - O
ther
Cap
ital O
utla
y T
otal
Str
eets
and
Hig
hway
s Sa
nita
tion
- Cur
rent
Exp
endi
ture
s - C
apita
l Out
lay
Tot
al S
anita
tion
Hum
an S
ervi
ces
- Inc
ome
Mai
nten
ance
- S
ocia
l Ser
vice
s - A
ll O
the r
- C
apita
l Out
lay
Tot
al H
uman
Ser
vice
s H
ealt h
- C
urre
nt E
xpen
ditu
res
- Ca p
ital O
utla
y T
otal
Hea
lth
Cul
ture
and
Rec
reat
ion
Libr
arie
s - C
urre
nt E
xpen
ditu
res
- Ca p
ital O
utla
y Pa
rks
and
Rec
reat
ion
- Cur
rent
Exp
endi
ture
s - C
a pita
l Out
lay
Tot
al C
ultu
re a
nd R
ecre
atio
n C
onse
rvat
ion
of N
atur
al R
esou
rces
- C
urre
nt E
xpen
ditu
res
- Ca p
ital O
utla
y T
otal
Con
serv
atio
n of
Nat
ural
Res
ourc
es
Eco
nom
ic D
evel
opm
ent
- Cur
rent
Exp
endi
ture
s - C
a pita
l Out
lay
Tot
al E
cono
mic
Dev
elop
men
t A
ll O
ther
- C
urre
nt E
xpen
ditu
res
- Ca p
ital O
utla
yT
otal
All
Oth
er
Deb
t Ser
vice
- P
rinci
pal P
aid
on B
onds
- O
ther
Lon
g-te
rm D
ebt
- Int
eres
t and
Fis
cal C
har g
es
Tota
l Cur
rent
Exp
endi
ture
s To
tal C
a pita
l Out
lay
Tota
l Deb
t Ser
vice
T
otal
Ex p
endi
ture
s
Oth
er F
inan
cin g
Use
s D
ebt R
edem
ptio
n - R
efun
ded
Bon
ds
Oth
er U
ses
Tra
nsfe
rs T
o - E
nter
pris
e Fu
nds
- Gov
ernm
enta
l Fun
ds
T
otal
Ex p
endi
ture
s an
d O
ther
Use
s
Unr
eser
ved
Fun
d B
alan
ce
Gen
eral
Fun
d U
nres
erve
d Fu
nd B
alan
ce
Spec
ial R
even
ue F
und
Unr
eser
ved
Fund
Bal
ance
T
otal
AS
A P
ER
CE
NT
OF
TOTA
L C
UR
RE
NT
EX
PEN
DIT
UR
ES
6,14
1,67
9
6,14
1,67
9 2,
567,
295
2,11
1,86
3 13
1,57
2 54
9,55
7 5,
360,
287
406,
724
2,41
5,95
7 4,
195,
221
7,01
7,90
2 81
1,26
4
811,
264
2,69
0,54
4 6,
289,
030
8,97
9,57
4 2,
358,
273
2,35
8,27
3
225,
316
173,
652
398,
968
335,
976
335,
976
7,52
4
7,52
4
420,
000
327,
093
440,
363
26,6
66,6
69
4,74
4,77
8 1,
187,
456
32,5
98,9
03
1,07
0,83
2
33,6
69,7
35
9,38
5,74
2 11
,835
,066
21
,220
,808
79.6
%
13,6
02,0
36
2,58
7,43
2 16
,189
,468
10
,372
,805
3,
476,
415
506,
191
14,3
55,4
11
588,
919
4,61
6,74
3 8,
829,
055
14,0
34,7
17
507,
111
73,4
32
580,
543
3,57
1,63
9 12
,500
,012
16,0
71,6
51
2,48
2,08
8
2,48
2,08
8
1,28
2,92
4
1,01
7,04
7
2,29
9,97
1 49
5,70
5
495,
705
38,2
89
38,2
89
10,6
40,0
00
1,31
0,00
0 1,
217,
930
55,0
57,9
24
11,4
89,9
19
13,1
67,9
30
79,7
15,7
73
1,70
5,30
3
81,4
21,0
76
14,8
18,9
13
7,27
4,02
0 22
,092
,933
40.1
%
1,98
0,42
4 69
9,85
5,44
9 --
-78
,058
,448
1,
980,
424
777,
913,
897
669,
042
332,
145,
316
954,
621
335,
322,
959
250,
862
37,3
66,0
23
---
51,3
05,2
37
1,87
4,52
5 75
6,13
9,53
5 20
2,36
2 51
,885
,926
2,
084,
281
269,
016,
578
2,27
1,57
3 46
4,68
8,32
8 --
-42
,265
,802
4,
558,
216
827,
856,
634
82,8
17
77,9
53,0
36
---
638,
394
82,8
17
78,5
91,4
30
850,
889
425,
271,
855
2,34
8,20
6 92
8,11
1,47
1 --
-66
,494
,327
--
-12
,896
,495
3,
199,
095
1,43
2,77
4,14
8 91
,697
20
0,00
5,48
3 --
-3,
536,
088
91,6
97
203,
541,
571
53,2
42
82,3
70,8
56
---
13,9
89,1
38
106,
353
43,0
98,7
21
---
3,15
0,46
1 15
9,59
5 14
2,60
9,17
6 51
9,91
2 65
,770
,481
--
-53
5,45
3 51
9,91
2 66
,305
,934
3,
950
103,
828,
480
---
5,62
2,19
1 3,
950
109,
450,
671
---
6,35
5,34
4 --
-63
5,68
5 --
-6,
991,
029
105,
000
110,
784,
218
41,0
42
37,1
94,9
69
167,
020
64,3
64,2
02
10,1
98,6
58
3,72
4,85
2,30
5 2,
271,
573
677,
321,
720
313,
062
212,
343,
389
12,7
83,2
93
4,61
4,51
7,41
4
---
8,16
3,29
4 --
-52
5,27
2 --
-12
,674
,575
13
,014
95
,809
,949
12,7
96,3
07
4,73
1,69
0,50
4
2,96
0,51
7 87
9,43
4,71
6 5,
587,
003
889,
754,
240
8,54
7,52
0 1,
769,
188,
956
83.8
%
47.5
%

This page left blank intentionally

ANALYSIS OF
PUBLIC SERVICE ENTERPRISES

---
---
---
---
---
---
---
---
---
---
TA
BL
E 4
PU
BL
IC S
ER
VIC
E E
NT
ER
PRIS
ES
AN
AL
YSI
S O
F H
EA
LT
H S
ER
VIC
ES
EN
TE
RPR
ISE
OPE
RA
TIO
NS
FO
R T
HE
YE
AR
EN
DE
D D
EC
EM
BE
R 3
1, 2
004
OP
ER
AT
ING
N
ON
OP
ER
AT
ING
T
rans
fers
D
EB
T S
ER
VIC
E
Net
F
eder
al
Stat
e T
o/(F
rom
) C
apita
l In
tere
st
Prin
cipa
lN
ame
of C
ount
y Po
p.
Rev
enue
s E
xpen
se
Inco
me
Rev
enue
s E
xpen
se
Inco
me
Tax
es
Gra
nts
Gra
nts
Oth
er F
unds
O
utla
y B
orro
win
g Pa
ymen
ts
Paym
ents
44
BE
CK
ER
31
,813
NU
RSI
NG
HO
ME
[3
] 2,
561,
570
2,68
9,62
1 (1
28,0
51)
13,3
97
963
(115
,617
) --
-57
,600
--
---
-1,
240,
116
963
5,43
0
CL
AY
52
,994
NU
RSI
NG
SE
RV
ICE
1,
131,
058
2,73
8,77
6 (1
,607
,718
) 1,
300,
070
---
(307
,648
) --
-43
7,93
2 85
1,15
3 (4
73,3
80)
---
---
---
CL
EA
RW
AT
ER
8,
456
HO
SPIT
AL
12
,237
,943
13
,685
,163
(1
,447
,220
) 2,
996
---
(1,4
44,2
24)
---
---
---
(648
,277
) 1,
153,
414
---
191,
062
186,
415
DO
DG
E
19,3
55
NU
RSI
NG
HO
ME
3,
527,
556
3,78
6,28
6 (2
58,7
30)
21,2
24
21,7
02
(259
,208
) --
---
---
-(2
16,0
00)
5,32
8 33
5,00
0 13
,894
48
,838
DO
UG
LA
S 34
,590
HO
SPIT
AL
57
,293
,147
55
,724
,887
1,
568,
260
301,
968
307,
582
1,56
2,64
6 --
---
---
---
-1,
649,
313
---
223,
388
794,
587
HE
NN
EPI
N
1,14
4,03
7
ME
DIC
AL
CE
NT
ER
HO
SPIT
AL
38
4,34
6,47
7 40
3,46
2,83
5 (1
9,11
6,35
8)
34,8
86,6
51
2,11
3,94
0 13
,656
,353
18
,460
,637
2,
009,
611
17,1
66,0
93
---
10,0
35,3
23
---
1,56
5,89
5 2,
271,
864
HU
BB
AR
D
18,8
56
NU
RSI
NG
HO
ME
[3
] 6,
007,
979
6,16
6,54
4 (1
58,5
65)
29,4
95
146,
444
(275
,514
) --
---
---
---
-58
,119
25
0,00
0 14
6,44
4 28
5,00
0
ITA
SCA
44
,242
NU
RSI
NG
HO
ME
[3
] 7,
012,
301
6,67
1,36
8 34
0,93
3 77
,415
21
4,41
0 20
3,93
8 --
---
-14
,446
--
-3,
917,
577
---
214,
410
150,
000
MED
ICA
L C
AR
E 20
,582
,563
20
,582
,563
--
-94
,387
--
-94
,387
--
---
---
---
---
---
---
---
-
KA
NA
BE
C
16,0
54
HO
SPIT
AL
[5
] 21
,761
,397
20
,759
,522
1,
001,
875
171,
035
---
1,17
2,91
0 --
---
-73
,348
--
-1,
277,
040
---
657,
840
352,
095
LA
KE
11
,229
NU
RSI
NG
HO
ME
[3
] 3,
196,
851
3,13
2,38
1 64
,470
9,
949
937
73,4
82
---
---
---
---
58,6
71
---
937
1,63
4
MA
HN
OM
EN
5,
079
HO
SPIT
AL
[1
] [2]
[5]
5,27
6,62
2 5,
127,
124
149,
498
72,7
14
6,29
2 21
5,92
0 --
---
-59
,258
--
-13
9,76
5 --
-6,
292
73,8
75
NU
RSI
NG
HO
ME
[2
] --
---
---
---
---
---
---
---
---
---
-
ME
EK
ER
23
,267
HO
SPIT
AL
14
,850
,511
14
,073
,875
77
6,63
6 11
3,68
1 --
-89
0,31
7 --
---
---
---
-85
6,72
2 --
---
---
-
MU
RR
AY
8,
992
HO
SPIT
AL
8,
735,
071
8,45
9,37
7 27
5,69
4 88
,135
--
-36
3,82
9 --
---
---
---
-2,
321,
482
---
---
---
PEN
NIN
GT
ON
13
,559
NU
RSI
NG
HO
ME
[3
] 2,
721,
106
2,87
0,89
7 (1
49,7
91)
92,7
18
---
(57,
073)
--
---
-77
,252
--
-40
,822
--
---
---
-
PIPE
STO
NE
9,
589
HO
SPIT
AL
[2
] 14
,795
,429
13
,258
,764
1,
536,
665
114,
022
63,8
61
1,58
6,82
6 --
---
---
-(2
40,5
91)
474,
632
---
290,
364
237,
245
NU
RSI
NG
HO
ME
[2
] --
---
---
---
---
---
---
---
---
---
-
RA
MSE
Y
515,
411
NU
RSI
NG
HO
ME
11
,484
,976
12
,068
,747
(5
83,7
71)
122,
744
12,8
11
(473
,838
) --
---
-33
,778
(4
10,2
94)
17,2
08
---
---
---
RE
NV
ILL
E
16,8
38
HO
SPIT
AL
7,
323,
050
6,97
7,25
8 34
5,79
2 49
,913
10
,839
38
4,86
6 --
---
-11
,639
--
-21
6,27
7 --
-10
,839
27
,239

---
---
45
615,
923,
748
634,
079,
249
(18,
155,
501)
37
,829
,678
3,
183,
636
16,4
90,5
41
18,5
77,0
27
2,50
5,14
3 18
,286
,967
(2
,482
,542
) 26
,447
,672
98
5,00
0 3,
663,
817
4,63
2,87
8
TA
BL
E 4
PU
BL
IC S
ER
VIC
E E
NT
ER
PRIS
ES
AN
AL
YSI
S O
F H
EA
LT
H S
ER
VIC
ES
EN
TE
RPR
ISE
OPE
RA
TIO
NS
FO
R T
HE
YE
AR
EN
DE
D D
EC
EM
BE
R 3
1, 2
004
OP
ER
AT
ING
N
ON
OP
ER
AT
ING
T
rans
fers
Paym
ents
Pr
inci
pal
DE
BT
SE
RV
ICE
Net
F
eder
al
Stat
e T
o/(F
rom
) C
apita
l In
tere
st
Nam
e of
Cou
nty
Pop.
R
even
ues
Exp
ense
In
com
e R
even
ues
Exp
ense
In
com
e T
axes
G
rant
s G
rant
s O
ther
Fun
ds
Out
lay
Bor
row
ing
Paym
ents
ST. L
OU
IS
198,
262
NU
RSI
NG
HO
ME
13
,814
,668
14
,943
,279
(1
,128
,611
) 11
6,49
7 18
,191
(1
,030
,305
) 11
6,39
0 --
---
-(3
94,0
00)
31,4
89
---
15,7
25
95,0
00
STE
EL
E
35,1
66
NU
RSI
NG
HO
ME
7,
032,
617
6,60
0,48
9 43
2,12
8 13
,384
25
8,20
9 18
7,30
3 --
---
---
---
-35
9,55
0 25
8,20
9 55
,000
SWIF
T
11,5
99
HO
SPIT
AL
[5
] 7,
624,
525
7,70
8,01
4 (8
3,48
9)
128,
225
7,45
5 37
,281
--
---
---
-(1
00,0
00)
435,
624
67,5
55
48,6
56
TR
AV
ER
SE
3,86
6
NU
RSI
NG
HO
ME
2,
606,
331
2,59
1,47
9 14
,852
9,
058
---
23,9
10
---
---
---
---
2,15
9,20
0 40
0,00
0 --
---

---
---
---
---
---
---
---
---
TA
BL
E 5
P
UB
LIC
SE
RV
ICE
EN
TE
RP
RIS
ES
AN
AL
YSI
S O
F S
AN
ITA
TIO
N E
NT
ER
PR
ISE
OP
ER
AT
ION
SF
OR
TH
E Y
EA
R E
ND
ED
DE
CE
MB
ER
31,
200
4
OP
ER
AT
ING
N
ON
OP
ER
AT
ING
T
rans
fers
D
EB
T S
ER
VIC
E
Net
F
eder
al
Stat
e T
o/(F
rom
) C
apit
al
Inte
rest
P
rinc
ipal
Nam
e of
Cou
nty
Pop
. R
even
ues
Exp
ense
In
com
e R
even
ues
Exp
ense
In
com
e T
axes
G
rant
s G
rant
s O
ther
Fun
ds
Out
lay
Bor
row
ing
Pay
men
ts
Pay
men
ts
---
BL
UE
EA
RT
H
46
LAN
DFI
LL
1,34
3,21
0 1,
191,
251
151,
959
29,1
65
30,8
62
150,
262
---
---
---
(26,
763)
42
5,56
4 30
,862
17
8,17
3
CA
SS
---
PIN
E R
IVER
AR
EA S
AN
ITA
RY
[5
] 34
3,63
6 39
4,49
7 (5
0,86
1)
1,11
3 11
,278
(6
1,02
6)
---
---
---
---
---
---
11,2
78
70,1
80
CL
AY
--
-
SOLI
D W
AST
E 97
6,26
9 2,
677,
154
(1,7
00,8
85)
1,18
8,84
5 --
-(5
12,0
40)
---
10,2
85
119,
455
---
---
---
---
---
CO
TT
ON
WO
OD
--
-
LAN
DFI
LL
432,
932
610,
543
(177
,611
) 98
,893
14
,574
(9
3,29
2)
88,7
79
---
10,1
14
(13,
187)
--
-36
5,00
0 12
,218
15
0,00
0
CR
OW
WIN
G
---
SER
PEN
T LA
KE
SAN
IT. D
IST.
[5
] 35
3,47
6 31
9,41
4 34
,062
7,
797
18,8
15
23,0
44
---
---
---
---
26,2
49
---
16,1
79
130,
000
SOLI
D W
AST
E 1,
907,
989
1,04
5,28
8 86
2,70
1 96
,041
--
-95
8,74
2 --
---
-59
5 87
3,86
1 56
4,29
2 --
---
---
-
DO
UG
LA
S --
-
SOLI
D W
AST
E [5
] 2,
279,
445
3,89
8,54
6 (1
,619
,101
) 1,
313,
004
---
(306
,097
) --
---
-25
8,89
1 --
-62
8,95
0 --
---
---
-
HE
NN
EP
IN
---
SOLI
D W
AST
E 66
,379
,678
57
,683
,793
8,
695,
885
7,69
6,66
9 3,
311,
191
13,0
81,3
63
406,
655
134,
507
1,75
3,39
3 --
-1,
053,
041
3,31
1,19
1 11
,885
,000
LY
ON
--
-
LAN
DFI
LL
1,97
4,76
8 1,
286,
191
688,
577
40,3
21
---
728,
898
---
---
---
---
266,
078
---
---
OL
MST
ED
--
-
WA
STE
MA
NA
GEM
ENT
12,7
09,0
17
11,0
53,7
21
1,65
5,29
6 43
0,57
8 41
8,00
9 1,
667,
865
16
---
549,
050
(47,
879)
1,
422,
349
---
418,
009
3,08
5,66
0
OT
TE
R T
AIL
--
-
WA
STE
MA
NA
GEM
ENT
4,65
5,57
3 4,
596,
773
58,8
00
364,
192
4,11
1 41
8,88
1 --
---
-27
1,63
9 --
-78
1,24
8 --
---
-
PO
LK
--
-
LAN
DFI
LL
531,
927
610,
698
(78,
771)
20
,007
--
-(5
8,76
4)
---
---
413
33,9
07
137,
159
---
---
RE
SOU
RC
E R
EC
OV
ER
Y
2,85
5,39
3 2,
569,
374
286,
019
87,2
64
---
373,
283
---
---
76,7
28
(33,
907)
47
8,79
5 --
---
-
RIC
E
---
ENV
IRO
NM
ENTA
L SE
RV
ICES
FU
ND
2,
494,
525
2,16
2,81
7 33
1,70
8 54
3,35
4 3,
943
871,
119
---
---
169,
718
295,
211
278,
317
---
---
---
ST. L
OU
IS
---
SOLI
D W
AST
E 5,
441,
373
5,77
8,42
5 (3
37,0
52)
605,
585
---
268,
533
13,0
62
---
451,
261
---
921,
487
---
---
STE
EL
E
---
SOLI
D W
AST
E 1,
093,
811
1,06
5,71
9 28
,092
15
,625
--
-43
,717
--
---
---
---
-61
9,08
6 --
---
-
TO
DD
--
-
SOLI
D W
AST
E 98
6,07
8 1,
440,
849
(454
,771
) 34
4,43
1 69
1 (1
11,0
31)
---
---
57,3
78
---
14,8
89
---
---
---
WA
BA
SHA
--
-
REA
DS
LAN
DIN
G
[5]
56,1
85
80,1
26
(23,
941)
58
2,
567
(26,
450)
--
---
---
---
---
-10
1,00
0 2,
567
972
106,
815,
285
98,4
65,1
79
8,35
0,10
6 12
,882
,942
3,
816,
041
17,4
17,0
07
508,
512
144,
792
3,71
8,63
5 1,
081,
243
7,61
7,50
4 46
6,00
0 3,
802,
304
15,4
99,9
85

TA
BL
E 6
P
UB
LIC
SE
RV
ICE
EN
TE
RP
RIS
ES
AN
AL
YSI
S O
F H
OU
SIN
G A
ND
EC
ON
OM
IC D
EV
EL
OP
ME
NT
EN
TE
RP
RIS
E O
PE
RA
TIO
NS
FO
R T
HE
YE
AR
EN
DE
D D
EC
EM
BE
R 3
1, 2
004
OPE
RA
TIN
G
NO
NO
PER
AT
ING
T
rans
fers
D
EB
T S
ER
VIC
E
Net
F
eder
al
Stat
e T
o/(F
rom
) C
apit
al
Inte
rest
P
rinc
ipal
Nam
e of
Cou
nty
Pop
. R
even
ues
Exp
ense
In
com
e R
even
ue
Exp
ense
In
com
e T
axes
G
rant
s G
rant
s O
ther
Fun
ds
Out
lay
Bor
row
ing
Pay
men
ts
Pay
men
ts
47
---
BE
CK
ER
ED
A
[5] [
13]
158,
941
852,
584
(693
,643
) 78
5,17
3 1,
700
89,8
30
---
418,
578
365,
079
---
262,
970
---
---
---
BL
UE
EA
RT
H
---
EDA
18
3,12
1 75
8,38
6 (5
75,2
65)
549,
715
---
(25,
550)
--
-42
0,40
2 --
---
-96
,633
--
---
---
-
BR
OW
N
---
ECO
NO
MIC
DEV
ELO
PMEN
T PA
RTN
ERS
[5]
---
37,1
12
(37,
112)
17
,808
25
0 (1
9,55
4)
---
---
---
---
---
---
250
---
CA
RV
ER
--
-
HR
A
[5]
4,15
3,45
5 5,
666,
525
(1,5
13,0
70)
2,09
8,28
1 1,
527,
688
(942
,477
) --
-65
3,82
7 --
---
-3,
276,
812
5,73
5,87
9 1,
489,
408
4,46
4,63
4
CA
SS
---
HR
A
[5]
674,
073
511,
700
162,
373
11,4
89
---
173,
862
---
218,
750
---
---
54,8
38
---
---
---
CH
ISA
GO
--
-
HR
A
[5]
292,
070
620,
662
(328
,592
) 2,
313,
674
1,94
2,03
3 43
,049
47
7,67
6 81
,211
57
,033
--
-1,
848,
363
6,74
0,00
0 56
6,90
5 75
4,92
6
DA
KO
TA
--
-
CD
A
[5] [
13]
9,42
8,31
9 9,
158,
731
269,
588
16,5
96,7
20
17,2
27,7
36
(361
,428
) --
-14
,371
,876
--
-(1
,786
,692
) 12
,705
,993
--
-1,
804,
900
2,02
5,00
0
DO
UG
LA
S --
-
HR
A
[5]
2,61
1,21
2 2,
339,
052
272,
160
40,6
42
121,
858
190,
944
205,
542
1,89
6,47
5 --
---
---
---
-12
1,45
3 76
,319
GR
AN
T
---
HR
A
[5]
808,
652
634,
407
174,
245
5,42
6 58
,175
12
1,49
6 35
,000
43
0,60
9 --
---
-20
9,97
9 --
-58
,175
20
,000
KA
ND
IYO
HI
---
HR
A
[5][
13]
1,46
1,60
2 1,
346,
407
115,
195
2,44
9 71
,953
45
,691
11
2,72
8 1,
192,
566
---
---
---
---
71,4
28
28,0
14
LA
KE
--
-
HR
A
[5]
140,
986
128,
834
12,1
52
---
40,5
49
(28,
397)
--
---
---
---
---
---
-40
,549
27
,819
LE
SU
EU
R
---
HR
A
[5] [
3]
179,
061
235,
448
(56,
387)
58
,727
11
,234
(8
,894
) --
-11
3,08
4 --
---
-74
,626
--
---
---
-
MC
LE
OD
--
-
HR
A
[5] [
13]
787,
541
566,
290
221,
251
7,63
6 23
0,15
5 (1
,268
) --
---
---
---
-45
,698
--
-22
8,26
3 84
,129
ME
EK
ER
--
-
ED
A
[5]
513,
866
330,
746
183,
120
921,
935
314,
669
790,
386
---
---
---
---
24,2
74
---
255,
444
91,3
92
HR
A
[5][
13]
64,8
55
345,
204
(280
,349
) 29
0,98
6 --
-10
,637
--
-29
0,32
0 --
---
-37
,052
--
---
---
-
MO
WE
R
---
HR
A
[5][
3]
705,
368
635,
604
69,7
64
29,6
42
43,0
72
56,3
34
---
---
---
---
66,7
87
---
43,0
72
21,9
18
MU
RR
AY
--
-
CO
NG
REG
ATE
HO
USI
NG
25
1,51
8 22
7,57
2 23
,946
4,
601
71,4
98
(42,
951)
--
---
---
-(5
,244
) --
-1,
580,
000
70,2
40
45,0
00
OL
MST
ED
--
-
HR
A
[5]
4,89
9,29
8 5,
085,
714
(186
,416
) 20
6,03
5 57
2,36
5 (5
52,7
46)
---
---
---
---
76,7
83
---
91,7
11
---
RE
NV
ILL
E
---
HR
A /
EDA
[5
][13
] 47
,312
61
4,82
5 (5
67,5
13)
544,
926
8,31
7 (3
0,90
4)
191,
678
351,
156
---
---
39,7
34
---
---
--

TA
BL
E 6
P
UB
LIC
SE
RV
ICE
EN
TE
RP
RIS
ES
AN
AL
YSI
S O
F H
OU
SIN
G A
ND
EC
ON
OM
IC D
EV
EL
OP
ME
NT
EN
TE
RP
RIS
E O
PE
RA
TIO
NS
FO
R T
HE
YE
AR
EN
DE
D D
EC
EM
BE
R 3
1, 2
004
OPE
RA
TIN
G
NO
NO
PER
AT
ING
T
rans
fers
D
EB
T S
ER
VIC
E
Net
F
eder
al
Stat
e T
o/(F
rom
) C
apit
al
Inte
rest
P
rinc
ipal
Nam
e of
Cou
nty
Pop
. R
even
ues
Exp
ense
In
com
e R
even
ue
Exp
ense
In
com
e T
axes
G
rant
s G
rant
s O
ther
Fun
ds
Out
lay
Bor
row
ing
Pay
men
ts
Pay
men
ts
---
SCO
TT
HR
A
[5]
4,23
8,98
1 4,
496,
987
(258
,006
) 50
7,15
3 1,
239,
220
(990
,073
) --
-33
5,81
4 30
,958
(4
30,1
95)
5,94
3,15
7 --
-1,
188,
201
263,
062
STE
AR
NS
---
HR
A
[5][
13]
234,
101
1,18
4,08
1 (9
49,9
80)
973,
673
56,7
10
(33,
017)
--
-96
5,07
2 --
---
-63
7,23
9 --
-56
,584
20
,739
SWIF
T
---
HR
A
[5][
13]
2,12
3,42
8 2,
599,
114
(475
,686
) 19
6,83
7 --
-(2
78,8
49)
---
261,
663
---
---
1,06
9 --
---
-31
,378
TR
AV
ER
SE
---
CO
NG
REG
ATE
HO
USI
NG
22
0,48
0 17
1,10
9 49
,371
--
-81
,982
(3
2,61
1)
---
---
---
(14,
616)
--
---
-81
,982
30
,000
WA
SHIN
GT
ON
--
-
HR
A
[5]
6,92
3,10
9 6,
109,
671
813,
438
2,82
1,79
0 3,
474,
521
160,
707
1,94
8,67
5 --
---
-(1
,327
,000
) 25
4,45
0 --
-2,
823,
880
970,
000
41,1
01,3
49
44,6
56,7
65
(3,5
55,4
16)
28,9
85,3
18
27,0
95,6
85
(1,6
65,7
83)
2,97
1,29
9 22
,001
,403
45
3,07
0 (3
,563
,747
) 25
,656
,457
14
,055
,879
8,
992,
445
8,95
4,33
0
48

TA
BL
E 7
P
UB
LIC
SE
RV
ICE
EN
TE
RP
RIS
ES
AN
AL
YSI
S O
F O
TH
ER
EN
TE
RP
RIS
E O
PE
RA
TIO
NS
FO
R T
HE
YE
AR
EN
DE
D D
EC
EM
BE
R 3
1, 2
004
OP
ER
AT
ING
N
ON
OP
ER
AT
ING
T
rans
fers
D
EB
T S
ER
VIC
E
Net
F
eder
al
Stat
e T
o/(F
rom
) C
apit
al
Inte
rest
P
rinc
ipal
Nam
e of
Cou
nty
Pop
. R
even
ues
Exp
ense
In
com
e R
even
ue
Exp
ense
In
com
e T
axes
G
rant
s G
rant
s O
ther
Fun
ds
Out
lay
Bor
row
ing
Pay
men
ts
Pay
men
ts
---
AIT
KIN
49
CO
NSE
RV
AT
ION
CE
NT
ER
72
3,44
2 86
2,21
4 (1
38,7
72)
11,8
44
---
(126
,928
) --
---
-1,
888
(25,
945)
30
,578
--
---
---
-
AN
OK
A
---
AQ
UA
TIC
CEN
TER
80
5,44
4 68
6,22
7 11
9,21
7 --
-54
,991
64
,226
--
---
---
-23
0,00
0 12
,481
--
---
---
-
GO
LF
CO
UR
SE
718,
413
902,
887
(184
,474
) --
-12
8,80
6 (3
13,2
80)
---
---
---
(24,
000)
51
,460
--
-76
,050
--
-
CA
SS
---
SHIN
GO
BEE
ISLA
ND
WA
TER
& S
EWER
[8
] --
---
---
---
---
---
---
---
---
---
---
---
---
---
-
CL
AY
--
-
FAM
ILY
SE
RV
ICE
CE
NT
ER
1,
222,
764
1,25
2,23
8 (2
9,47
4)
24,3
27
313,
615
(318
,762
) --
---
---
---
---
---
-31
3,61
5 30
2,27
3
JUV
EN
ILE
CE
NT
ER
2,
042,
408
1,75
1,73
7 29
0,67
1 63
,532
12
2,27
6 23
1,92
7 --
-45
,169
--
-(8
3,63
8)
---
---
122,
276
107,
777
CO
OK
--
-
ED
A-G
OL
F C
OU
RSE
[5
] 79
1,97
2 89
6,42
0 (1
04,4
48)
52,2
46
84,1
86
(136
,388
) 50
,000
--
---
---
-13
,446
--
-84
,186
11
8,55
9
DA
KO
TA
--
-
GEO
GR
APH
IC IN
FOR
MA
TIO
N S
YST
EM
51,8
50
45,3
55
6,49
5 --
---
-6,
495
---
---
---
---
---
---
---
---
DO
DG
E
---
FOU
R S
EASO
NS
ICE
AR
ENA
[5
] 21
3,49
4 24
4,41
5 (3
0,92
1)
98,8
63
13,4
01
54,5
41
---
---
---
---
---
---
13,4
01
73,6
97
HE
NN
EP
IN
---
GLE
N L
AK
E G
OLF
CO
UR
SE
941,
102
819,
563
121,
539
---
121,
530
9 --
---
---
---
---
---
-12
1,53
0 15
5,00
0
ME
TR
O H
EA
LT
H P
LA
N
97,5
89,3
64
101,
684,
398
(4,0
95,0
34)
600,
739
---
(3,4
94,2
95)
---
---
---
4,50
6,24
6 30
0,00
3 --
---
---
-
RA
DIO
CO
MM
UN
ICA
TIO
NS
1,56
0,67
8 1,
088,
259
472,
419
---
26,9
64
445,
455
---
---
---
---
---
---
---
---
ITA
SCA
--
-
ITA
SCA
RE
SOU
RC
E C
EN
TE
R
419,
951
475,
226
(55,
275)
--
---
-(5
5,27
5)
---
---
---
---
---
---
---
---
KIT
TSO
N
---
RU
RA
L W
AT
ER
DIS
TR
ICT
[5
] 31
9,12
7 50
3,14
1 (1
84,0
14)
785,
798
128,
325
473,
459
---
82,0
00
---
---
26,2
68
2,28
8,00
0 12
8,32
5 2,
444,
394
OL
MST
ED
--
-
CO
MM
UN
ICA
TIO
NS
1,22
9,30
0 1,
238,
957
(9,6
57)
9,91
1 --
-25
4 --
---
---
---
---
---
---
---
-
RA
MSE
Y
---
LAK
E O
WA
SSO
RES
IDEN
CE
7,71
5,95
1 7,
570,
029
145,
922
23,0
28
217,
292
(48,
342)
--
---
-19
,968
(1
97,1
98)
17,4
61
---
217,
254
145,
000
LA
W E
NFO
RC
EM
EN
T S
ER
VIC
ES
4,55
0,66
7 4,
790,
221
(239
,554
) 26
9,17
4 --
-29
,620
--
---
-25
4,67
4 --
-16
8,28
9 --
---
---
-
PON
DS
ON
BA
TT
LE
CR
EE
K G
OL
F C
OU
RSE
46
0,24
6 51
5,14
2 (5
4,89
6)
---
150,
455
(205
,351
) --
---
---
---
-16
1,34
7 --
-15
0,45
5 23
5,00
0
RO
CK
--
-
RU
RA
L W
AT
ER
DIS
TR
ICT
[5
] 50
0,58
3 59
6,35
7 (9
5,77
4)
109,
719
21,7
65
(7,8
20)
---
---
---
---
30,8
88
---
21,7
65
68,0
00
SHE
RB
UR
NE
--
-
FED
ERA
L PR
ISO
N
7,80
1,61
0 3,
736,
073
4,06
5,53
7 14
3,36
8 19
9,59
3 4,
009,
312
---
---
---
1,00
0,00
0 10
,391
,966
2,
065,
000
199,
593
2,99
0,00
0
ST. L
OU
IS
---
CO
MM
UN
ITY
FO
OD
S 1,
251,
477
1,31
3,78
5 (6
2,30
8)
---
---
(62,
308)
--
---
---
---
---
---
---
---
-
LAU
ND
RY
82
5,90
6 84
5,28
4 (1
9,37
8)
---
---
(19,
378)
--
---
---
---
---
---
---
---
-
SUPE
RV
ISED
LIV
ING
FA
CIL
ITIE
S 1,
112,
660
869,
610
243,
050
---
---
243,
050
---
---
---
---
---
---
---
--

TA
BL
E 7
P
UB
LIC
SE
RV
ICE
EN
TE
RP
RIS
ES
AN
AL
YSI
S O
F O
TH
ER
EN
TE
RP
RIS
E O
PE
RA
TIO
NS
FO
R T
HE
YE
AR
EN
DE
D D
EC
EM
BE
R 3
1, 2
004
OP
ER
AT
ING
N
ON
OP
ER
AT
ING
T
rans
fers
D
EB
T S
ER
VIC
E
Net
F
eder
al
Stat
e T
o/(F
rom
) C
apit
al
Inte
rest
P
rinc
ipal
Nam
e of
Cou
nty
Pop
. R
even
ues
Exp
ense
In
com
e R
even
ue
Exp
ense
In
com
e T
axes
G
rant
s G
rant
s O
ther
Fun
ds
Out
lay
Bor
row
ing
Pay
men
ts
Pay
men
ts
---
STE
EL
E
CIV
IC C
EN
TE
R
325,
919
510,
559
(184
,640
) 71
,082
50
,127
(1
63,6
85)
---
---
---
---
---
---
50,1
27
100,
000
STE
VE
NS
---
AM
BU
LAN
CE
590,
859
784,
037
(193
,178
) 61
,655
--
-(1
31,5
23)
---
14,5
00
---
(58,
990)
11
,553
--
---
---
133,
765,
187
133,
982,
134
(216
,947
) 2,
325,
286
1,63
3,32
6 47
5,01
3 50
,000
14
1,66
9 27
6,53
0 5,
346,
475
11,2
15,7
40
4,35
3,00
0 1,
498,
577
6,73
9,70
0
50

Enterprise Fund Footnotes
[1] The hospital is operated jointly by a municipality and the county.
[2] The nursing home operations are included with the hospital operations.
[3] The operations are for the fiscal year ended September 30.
[4] The enterprise fund discontinued operations during the current year.
[5] The enterprise fund is shown as a component unit in the county financial statements.
[6] The enterprise fund began operations during the current year.
[7] The enterprise fund debt was reclassified to the general long-term debt account.
[8] The enterprise fund operations were reclassified and are shown as a special revenue fund.
[9] The enterprise fund operations were reclassified and are included with other enterprise funds.
[10] The enterprise fund operations were previously classified as a governmental fund type.
[11] The enterprise fund operations were reclassified and are shown as a fiduciary fund.
[12] The clinic operations are included with hospital operations.
[13] The operations are for the fiscal year ended June 30.
[14] The enterprise fund operations were reclassified and are shown as an internal service fund.
[15] The enterprise fund operations were previously classified as an internal service fund.
[99] Failed to report.
51

This page left blank intentionally

ANALYSIS OF
TOTAL OUTSTANDING INDEBTEDNESS

54
Tab
le 8
O
utst
andi
ng In
debt
edne
ss o
f Cou
ntie
sFo
r th
e Y
ear
End
ed D
ecem
ber
31, 2
004
Typ
e of
Bon
d O
ther
G
ener
al
G.O
. Tax
Sp
ecia
l G
.O.
All
Tota
l Bon
ded
Long
-term
C
ompe
nsat
ed
Nam
e of
Cou
nty
Popu
latio
n O
blig
atio
n In
crem
ent
Ass
essm
ent
Rev
enue
R
even
ue
Oth
er [1
] In
debt
edne
ss
Ref
undi
ng [2
] D
ebt
Abs
ence
s
AIT
KIN
16
,085
3,
350,
000
0 0
0 0
0 3,
350,
000
0 91
8,55
2 65
0,18
3 A
NO
KA
31
6,83
0 57
,445
,000
0
3,50
0,00
0 0
17,5
30,0
00
6,80
0,00
0 85
,275
,000
23
,065
,000
15
,620
,333
11
,471
,535
B
ECK
ER
31,8
13
295,
000
0 0
695,
000
0 0
990,
000
990,
000
1,78
6,95
3 1,
705,
146
BEL
TRA
MI
42,2
71
1,04
2,50
0 0
0 0
16,0
45,0
00
0 17
,087
,500
4,
975,
000
49,2
08
1,52
2,07
1 B
ENTO
N
38,0
18
85,0
00
0 6,
205,
000
13,0
45,0
00
0 90
,000
19
,425
,000
6,
385,
000
5,79
5,93
3 1,
383,
214
BIG
STO
NE
5,60
3 0
0 12
0,00
0 0
0 0
120,
000
0 11
4,03
4 39
6,69
3 B
LUE
EAR
TH
58,1
18
3,84
0,00
0 0
1,74
8,00
0 0
0 0
5,58
8,00
0 0
486,
393
1,24
2,95
0 B
RO
WN
26
,905
51
0,00
0 0
0 0
2,29
5,00
0 0
2,80
5,00
0 2,
805,
000
994,
924
990,
367
CA
RLT
ON
33
,748
5,
640,
000
0 0
0 0
0 5,
640,
000
1,42
0,00
0 31
9,54
7 2,
033,
992
CA
RV
ER
81,6
18
5,74
5,00
0 0
14,2
30,6
91
5,13
0,00
0 11
,895
,000
0
37,0
00,6
91
11,5
75,0
00
5,87
6,22
8 4,
138,
093
CA
SS
28,4
53
0 0
0 0
0 0
0 0
2,81
3,11
4 2,
203,
491
CH
IPPE
WA
12
,694
0
0 0
0 0
0 0
0 21
6,54
4 39
6,78
9 C
HIS
AG
O
48,4
24
1,04
5,00
0 0
11,2
00,0
00
14,3
50,0
00
0 0
26,5
95,0
00
710,
000
5,10
1,61
9 2,
684,
868
CLA
Y
52,9
94
0 0
3,61
8,00
0 2,
263,
307
12,5
71,6
94
0 18
,453
,001
9,
260,
001
472,
286
13,5
13,0
76
CLE
AR
WA
TER
8,
456
335,
000
0 0
2,90
0,00
0 0
0 3,
235,
000
0 25
8,80
7 61
6,56
5 C
OO
K
5,31
6 5,
225,
832
1,45
5,00
0 0
0 1,
500,
000
310,
000
8,49
0,83
2 5,
545,
000
4,08
7,06
5 41
0,96
1 C
OTT
ON
WO
OD
11
,935
89
5,00
0 93
0,00
0 2,
280,
000
0 0
0 4,
105,
000
375,
000
1,17
9,45
0 48
9,01
8 C
RO
W W
ING
59
,395
18
,810
,000
0
35,2
30,0
00
1,28
0,00
0 3,
355,
000
0 58
,675
,000
70
0,00
0 2,
738,
958
1,90
3,59
7 D
AK
OTA
38
3,07
6 85
,580
,000
0
0 42
,155
,000
0
5,13
5,00
0 13
2,87
0,00
0 20
,965
,000
1,
304,
921
17,9
56,2
16
DO
DG
E 19
,355
0
0 0
655,
000
335,
000
0 99
0,00
0 16
0,00
0 2,
541,
179
645,
371
DO
UG
LAS
34,5
90
13,0
05,0
00
0 0
670,
000
0 0
13,6
75,0
00
2,63
5,00
0 5,
220,
282
1,24
3,47
7 FA
RIB
AU
LT
15,6
18
3,18
0,00
0 0
905,
000
0 0
0 4,
085,
000
2,85
5,00
0 38
0,85
7 53
7,51
8 FI
LLM
OR
E 21
,359
3,
800,
000
0 0
0 0
0 3,
800,
000
0 68
,351
1,
061,
153
FREE
BO
RN
31
,997
9,
345,
000
2,00
0,00
0 68
0,00
0 7,
280,
000
9,40
0,00
0 0
28,7
05,0
00
680,
000
756,
000
964,
077
GO
OD
HU
E 45
,679
2,
535,
000
0 0
15,2
04,9
93
0 0
17,7
39,9
93
6,14
0,00
0 1,
396,
071
2,85
2,59
8 G
RA
NT
6,18
2 0
0 28
0,00
0 0
1,12
5,00
0 0
1,40
5,00
0 0
101,
500
301,
370
HEN
NEP
IN
1,14
4,03
7 40
2,17
5,00
0 0
0 91
,940
,000
0
0 49
4,11
5,00
0 48
,510
,000
27
,668
,200
10
2,75
9,89
1 H
OU
STO
N
19,9
45
0 0
0 0
0 0
0 0
42,0
00
669,
687
HU
BB
AR
D
18,8
56
235,
000
0 8,
600,
000
2,45
5,00
0 0
0 11
,290
,000
23
5,00
0 14
6,30
0 1,
064,
455
ISA
NTI
36
,512
9,
335,
000
0 0
0 0
0 9,
335,
000
5,52
0,00
0 0
971,
001
ITA
SCA
44
,242
10
,805
,000
0
0 0
4,43
5,00
0 0
15,2
40,0
00
2,72
5,00
0 0
6,37
0,26
5 JA
CK
SON
11
,214
3,
130,
000
0 53
5,00
0 3,
540,
000
0 0
7,20
5,00
0 0
512,
858
502,
923
KA
NA
BEC
16
,054
5,
785,
000
0 0
3,54
0,00
0 6,
660,
000
0 15
,985
,000
0
65,8
92
507,
271
KA
ND
IYO
HI
41,3
98
25,0
95,0
00
0 8,
315,
000
0 1,
456,
119
8,55
0,00
0 43
,416
,119
8,
835,
000
25,7
44,6
52
2,77
1,06
2 K
ITTS
ON
4,
856
0 0
0 2,
283,
606
0 0
2,28
3,60
6 1,
965,
000
0 28
5,20
1 K
OO
CH
ICH
ING
13
,832
0
0 0
0 0
0 0
0 0
734,
570
LAC
QU
I PA
RLE
7,
754
0 0
0 0
0 0
0 0
42,0
00
253,
118
LAK
E 11
,229
1,
728,
962
2,49
0,00
0 0
440,
000
0 0
4,65
8,96
2 1,
295,
000
647,
305
1,22
5,58
6 LA
KE
OF
THE
WO
OD
S 4,
411
0 0
0 0
0 0
0 0
350,
000
209,
585
LE S
UEU
R
27,4
54
4,58
5,00
0 0
0 0
0 0
4,58
5,00
0 0
27,6
54
480,
798
LIN
CO
LN
6,17
9 3,
635,
000
0 21
1,00
0 0
0 0
3,84
6,00
0 1,
865,
000
880,
343
128,
103
LYO
N
25,0
38
5,27
5,00
0 0
1,43
5,00
0 0
0 0
6,71
0,00
0 0
2,87
3,90
7 53
6,07
4 M
AH
NO
MEN
5,
079
0 0
0 70
2,00
0 0
0 70
2,00
0 0
63,7
52
143,
126
MA
RSH
ALL
9,
996
615,
000
0 1,
109,
000
0 0
0 1,
724,
000
0 45
0,00
0 31
7,00
0 M
AR
TIN
21
,077
67
5,00
0 0
0 0
0 0
675,
000
675,
000
306,
408
425,
658
MC
LEO
D
36,1
98
4,52
5,00
0 0
0 0
4,42
9,58
3 0
8,95
4,58
3 0
868,
501
1,04
1,53
5 M
EEK
ER
23,2
67
2,57
5,00
0 0
0 99
5,00
0 5,
017,
630
0 8,
587,
630
0 2,
181,
242
848,
928
MIL
LE L
AC
S 25
,018
4,
055,
000
0 0
0 1,
440,
000
0 5,
495,
000
0 24
5,00
0 1,
038,
841
MO
RR
ISO
N
32,8
22
6,18
2,00
0 1,
465,
000
0 2,
370,
000
0 0
10,0
17,0
00
6,03
5,00
0 64
5,00
0 1,
264,
015

55
Tab
le 8
O
utst
andi
ng In
debt
edne
ss o
f Cou
ntie
sFo
r th
e Y
ear
End
ed D
ecem
ber
31, 2
004
Typ
e of
Bon
d O
ther
G
ener
al
G.O
. Tax
Sp
ecia
l G
.O.
All
Tota
l Bon
ded
Long
-term
C
ompe
nsat
ed
Nam
e of
Cou
nty
Popu
latio
n O
blig
atio
n In
crem
ent
Ass
essm
ent
Rev
enue
R
even
ue
Oth
er [1
] In
debt
edne
ss
Ref
undi
ng [2
] D
ebt
Abs
ence
s
MO
WER
38
,984
0
0 0
0 0
0 0
0 1,
093,
480
868,
786
MU
RR
AY
8,
992
0 0
2,45
5,00
0 1,
580,
000
0 0
4,03
5,00
0 1,
580,
000
2,80
4,09
2 26
8,42
1 N
ICO
LLET
31
,147
5,
915,
000
0 0
0 0
2,04
0,00
0 7,
955,
000
0 1,
504,
243
1,51
0,74
3 N
OB
LES
20,5
43
13,3
00,0
00
2,80
5,00
0 0
0 0
0 16
,105
,000
6,
125,
000
10,7
36,3
31
832,
806
NO
RM
AN
7,
128
0 0
0 0
0 0
0 0
032
0,65
9 O
LMST
ED
134,
282
12,8
55,0
00
0 0
27,3
85,0
00
12,5
55,0
00
0 52
,795
,000
21
,700
,000
2,
225,
536
4,50
6,65
9 O
TTER
TA
IL
58,6
58
2,20
0,00
0 0
0 0
9,99
5,00
0 0
12,1
95,0
00
0 13
5,94
2 3,
737,
071
PEN
NIN
GTO
N
13,5
59
3,03
5,00
0 0
0 0
0 0
3,03
5,00
0 31
0,00
0 1,
530,
419
317,
023
PIN
E 28
,071
0
0 0
0 0
0 0
0 5,
499,
427
484,
483
PIPE
STO
NE
9,58
9 2,
820,
000
0 0
0 0
0 2,
820,
000
0 3,
006,
486
173,
455
POLK
31
,092
77
0,00
0 0
9,06
7,00
0 2,
505,
000
0 3,
200,
000
15,5
42,0
00
6,08
0,00
0 12
4,89
8 91
5,88
6 PO
PE
11,2
21
1,55
0,00
0 0
0 0
0 0
1,55
0,00
0 0
4,30
0 54
5,02
9 R
AM
SEY
51
5,41
1 20
0,33
5,00
0 0
0 0
13,8
45,0
00
0 21
4,18
0,00
0 42
,950
,000
6,
792,
287
32,7
12,4
18
RED
LA
KE
4,29
8 0
0 0
0 0
0 0
0 4,
647
135,
641
RED
WO
OD
16
,245
0
0 0
0 0
0 0
0 55
1,54
0 69
0,90
2 R
ENV
ILLE
16
,838
2,
015,
000
0 0
0 0
0 2,
015,
000
0 1,
657,
532
1,29
4,33
6 R
ICE
60,5
76
2,69
0,00
0 0
0 0
0 0
2,69
0,00
0 36
5,00
0 4,
297,
300
1,04
0,69
0 R
OC
K
9,59
0 29
5,00
0 0
0 0
0 0
295,
000
0 1,
605,
211
403,
716
RO
SEA
U
16,3
03
0 0
0 0
0 0
0 0
067
0,02
4 SC
OTT
11
2,62
3 40
,340
,000
2,
070,
000
0 0
21,9
90,0
00
0 64
,400
,000
3,
675,
000
19,9
31,4
40
3,14
4,45
1 SH
ERB
UR
NE
79,0
30
17,0
65,0
00
0 6,
230,
000
0 12
,025
,000
0
35,3
20,0
00
4,88
0,00
0 6,
159,
172
2,25
7,50
2 SI
BLE
Y
15,3
20
1,50
5,00
0 0
4,29
0,00
0 0
0 0
5,79
5,00
0 1,
250,
000
115,
393
771,
098
STEA
RN
S 14
0,84
1 8,
425,
000
0 16
5,00
0 6,
830,
000
1,03
5,00
0 0
16,4
55,0
00
9,79
0,00
0 4,
114,
984
5,02
6,91
1 ST
EELE
35
,166
18
,045
,000
0
0 0
3,76
5,00
0 0
21,8
10,0
00
5,87
5,00
0 2,
173,
712
1,09
3,28
7 ST
EVEN
S 9,
874
0 0
0 0
0 0
0 0
025
8,90
4 ST
. LO
UIS
19
8,26
2 32
,143
,093
0
0 42
0,00
0 0
0 32
,563
,093
6,
199,
148
10,6
44,6
09
38,7
93,1
42
SWIF
T 11
,599
0
0 86
0,00
0 0
2,34
1,62
2 0
3,20
1,62
2 50
5,00
0 1,
603,
985
606,
206
TOD
D
24,6
57
190,
000
0 0
0 0
0 19
0,00
0 0
495,
000
1,21
0,16
0 TR
AV
ERSE
3,
866
1,31
5,00
0 0
0 4,
145,
000
0 0
5,46
0,00
0 0
583,
288
0 W
AB
ASH
A
22,2
32
0 0
0 0
100,
028
0 10
0,02
8 0
252,
288
906,
787
WA
DEN
A
13,6
00
0 0
0 0
0 0
0 0
064
5,22
4 W
ASE
CA
19
,450
4,
050,
000
0 0
0 0
860,
000
4,91
0,00
0 46
0,00
0 26
,457
75
0,57
5 W
ASH
ING
TON
21
7,43
5 64
,965
,000
0
0 0
57,1
60,0
00
0 12
2,12
5,00
0 81
,155
,000
3,
469,
818
6,12
6,01
3 W
ATO
NW
AN
11
,570
4,
385,
000
0 0
0 0
0 4,
385,
000
2,11
5,00
0 73
4,89
0 74
1,28
5 W
ILK
IN
6,83
7 0
0 0
0 0
0 0
0 0
238,
886
WIN
ON
A
49,8
27
9,44
5,00
0 0
0 0
0 0
9,44
5,00
0 0
653,
413
805,
522
WR
IGH
T 10
6,73
4 12
,800
,000
0
0 10
,460
,000
0
0 23
,260
,000
16
,005
,000
3,
275,
000
2,10
1,94
6 Y
ELLO
W M
EDIC
INE
10,6
56
3,16
0,00
0 0
0 0
0 0
3,16
0,00
0 0
317,
562
372,
519
TOTA
L 5,
145,
106
1,17
7,73
2,38
7 13
,215
,000
12
3,26
8,69
1 26
7,21
8,90
6 23
4,30
1,67
6 26
,985
,000
1,
842,
721,
660
389,
919,
149
222,
484,
805
315,
142,
248
Foot
note
: [1
] A
ll ot
her i
nclu
des b
onds
pay
able
from
cou
nty
stat
e-ai
d st
reet
allo
catio
ns.
[2]
Ref
undi
ng b
onds
are
als
o cl
assi
fied
by ty
pe o
f bon
d an
d in
clud
ed in
the
tota
l bon
ded
inde
bted
ness
.

This page left blank intentionally

ANALYSIS OF
THE FUND BALANCES IN THE
GENERAL AND SPECIAL REVENUE FUNDS

Unr
eser
ved
Des
igna
ted
Unr
eser
ved
Und
esig
nate
dT
otal
Unr
eser
ved
Unr
eser
ved
Des
igna
ted
Unr
eser
ved
Und
esig
nate
dT
otal
Unr
eser
ved
2004
Tot
alC
urre
ntE
xpen
ditu
res
Dec
embe
r 31
, 200
3D
ecem
ber
31, 2
004
2003
/200
4Pe
rcen
tC
hang
e
2004
Unr
eser
ved
asa
Perc
ent o
fT
otal
Cur
rent
Exp
endi
ture
sN
ame
of C
ount
y
TA
BL
E 9
PER
CE
NT
CH
AN
GE
OF
UN
RE
SER
VE
D F
UN
D B
AL
AN
CE
SIN
TH
E G
EN
ER
AL
FU
ND
AN
D S
PEC
IAL
RE
VE
NU
E F
UN
DS
2003
TO
200
420
04 U
NR
ESE
RV
ED
FU
ND
BA
LA
NC
ES
AS
A P
ER
CE
NT
OF
TO
TA
L C
UR
RE
NT
EX
PEN
DIT
UR
ES
AIT
KIN
10,8
16,6
1510
,319
,626
21,1
36,2
4111
,167
,855
11,1
27,2
3022
,295
,085
5.5%
17,7
49,6
0512
5.6%
AN
OK
A54
,799
,560
(4,8
93,5
40)
49,9
06,0
2053
,292
,451
(3,6
36,2
67)
49,6
56,1
84-0
.5%
197,
627,
075
25.1
%
BEC
KER
5,27
4,79
414
,480
,678
19,7
55,4
723,
996,
558
16,0
99,1
3220
,095
,690
1.7%
27,6
35,6
0072
.7%
BEL
TRA
MI
23,6
22,3
976,
948,
488
30,5
70,8
8515
,301
,562
16,1
25,6
7931
,427
,241
2.8%
42,5
82,6
5373
.8%
BEN
TON
1,27
1,90
98,
119,
938
9,39
1,84
71,
536,
684
9,23
0,43
510
,767
,119
14.6
%20
,845
,465
51.7
%
BIG
STO
NE
3,31
9,74
13,
917,
318
7,23
7,05
93,
608,
858
3,06
2,36
86,
671,
226
-7.8
%6,
302,
495
105.
9%
BLU
E EA
RTH
61,5
78,9
55--
-61
,578
,955
63,7
58,1
62--
-63
,758
,162
3.5%
35,6
36,2
6817
8.9%
BR
OW
N2,
358,
392
7,97
4,30
110
,332
,693
1,85
2,64
86,
620,
000
8,47
2,64
8-1
8.0%
20,0
03,9
8042
.4%
CA
RLT
ON
220,
525
10,9
33,0
2711
,153
,552
1,57
512
,559
,129
12,5
60,7
0412
.6%
29,0
74,3
8343
.2%
CA
RV
ER25
,169
,714
10,8
32,1
8636
,001
,900
28,6
55,8
8311
,379
,075
40,0
34,9
5811
.2%
53,6
68,8
3774
.6%
CA
SS19
,256
,736
3,48
8,38
322
,745
,119
19,8
58,9
083,
321,
564
23,1
80,4
721.
9%29
,370
,112
78.9
%
CH
IPPE
WA
7,60
3,09
24,
974,
791
12,5
77,8
837,
297,
560
5,68
1,78
012
,979
,340
3.2%
10,4
05,9
7112
4.7%
CH
ISA
GO
12,4
24,2
171,
203,
931
13,6
28,1
4810
,337
,030
5,57
3,02
515
,910
,055
16.7
%33
,891
,969
46.9
%
CLA
Y11
,705
,674
185,
333
11,8
91,0
078,
470,
277
216,
407
8,68
6,68
4-2
6.9%
32,5
06,9
2026
.7%
CLE
AR
WA
TER
9,84
6,53
21,
204,
664
11,0
51,1
9610
,697
,786
520,
331
11,2
18,1
171.
5%10
,967
,823
102.
3%
CO
OK
1,83
3,13
68,
282,
131
10,1
15,2
671,
585,
059
9,24
2,31
710
,827
,376
7.0%
9,82
8,73
511
0.2%
CO
TTO
NW
OO
D43
4,39
26,
084,
490
6,51
8,88
216
9,16
76,
993,
289
7,16
2,45
69.
9%10
,702
,735
66.9
%
CR
OW
WIN
G16
2,04
120
,378
,913
20,5
40,9
5418
9,61
319
,120
,703
19,3
10,3
16-6
.0%
41,9
39,1
9846
.0%
DA
KO
TA13
7,15
3,42
7--
-13
7,15
3,42
714
0,85
2,63
5--
-14
0,85
2,63
52.
7%21
5,72
3,48
165
.3%
DO
DG
E4,
220,
469
3,78
6,58
18,
007,
050
4,24
3,74
03,
480,
674
7,72
4,41
4-3
.5%
13,4
27,9
2657
.5%
DO
UG
LAS
4,68
1,60
32,
398,
832
7,08
0,43
55,
384,
664
2,47
6,82
37,
861,
487
11.0
%27
,189
,235
28.9
%
FAR
IBA
ULT
2,27
8,90
52,
899,
685
5,17
8,59
02,
067,
518
2,09
2,49
24,
160,
010
-19.
7%10
,197
,213
40.8
%
FILL
MO
RE
4,85
3,84
52,
620,
489
7,47
4,33
42,
152,
072
4,77
5,55
16,
927,
623
-7.3
%13
,227
,485
52.4
%
FREE
BO
RN
7,99
0,93
95,
941,
326
13,9
32,2
657,
634,
244
3,41
7,46
711
,051
,711
-20.
7%24
,702
,066
44.7
%
GO
OD
HU
E4,
373,
854
13,6
77,1
8318
,051
,037
4,38
8,42
213
,508
,921
17,8
97,3
43-0
.9%
32,9
23,1
9854
.4%
58

Unr
eser
ved
Des
igna
ted
Unr
eser
ved
Und
esig
nate
dT
otal
Unr
eser
ved
Unr
eser
ved
Des
igna
ted
Unr
eser
ved
Und
esig
nate
dT
otal
Unr
eser
ved
2004
Tot
alC
urre
ntE
xpen
ditu
res
Dec
embe
r 31
, 200
3D
ecem
ber
31, 2
004
2003
/200
4Pe
rcen
tC
hang
e
2004
Unr
eser
ved
asa
Perc
ent o
fT
otal
Cur
rent
Exp
endi
ture
sN
ame
of C
ount
y
TA
BL
E 9
PER
CE
NT
CH
AN
GE
OF
UN
RE
SER
VE
D F
UN
D B
AL
AN
CE
SIN
TH
E G
EN
ER
AL
FU
ND
AN
D S
PEC
IAL
RE
VE
NU
E F
UN
DS
2003
TO
200
420
04 U
NR
ESE
RV
ED
FU
ND
BA
LA
NC
ES
AS
A P
ER
CE
NT
OF
TO
TA
L C
UR
RE
NT
EX
PEN
DIT
UR
ES
GR
AN
T1,
942,
400
899,
277
2,84
1,67
71,
870,
000
766,
503
2,63
6,50
3-7
.2%
7,56
7,76
134
.8%
HEN
NEP
IN40
,976
,595
233,
840,
741
274,
817,
336
41,3
27,8
5223
6,83
9,39
427
8,16
7,24
61.
2%86
6,02
1,05
732
.1%
HO
UST
ON
4,46
3,37
64,
098,
056
8,56
1,43
24,
757,
611
4,81
7,85
99,
575,
470
11.8
%12
,733
,205
75.2
%
HU
BB
AR
D11
,387
,400
300,
869
11,6
88,2
6912
,796
,172
989,
207
13,7
85,3
7917
.9%
17,6
06,2
6578
.3%
ISA
NTI
194,
820
8,99
4,00
19,
188,
821
225,
043
9,46
7,61
39,
692,
656
5.5%
23,8
94,2
0040
.6%
ITA
SCA
299,
770
24,8
78,2
0125
,177
,971
6,42
2,58
519
,214
,920
25,6
37,5
051.
8%47
,257
,171
54.3
%
JAC
KSO
N8,
196,
693
2,86
8,16
311
,064
,856
6,44
8,81
73,
086,
858
9,53
5,67
5-1
3.8%
10,7
96,1
0988
.3%
KA
NA
BEC
47,4
873,
573,
386
3,62
0,87
3--
-2,
856,
844
2,85
6,84
4-2
1.1%
12,9
09,4
4922
.1%
KA
ND
IYO
HI
2,15
433
,599
,590
33,6
01,7
4417
,807
36,6
01,7
0136
,619
,508
9.0%
39,6
45,9
0792
.4%
KIT
TSO
N4,
502,
158
1,16
8,14
85,
670,
306
3,96
9,11
22,
006,
171
5,97
5,28
35.
4%6,
437,
834
92.8
%
KO
OC
HIC
HIN
G10
,386
,468
2,55
5,58
612
,942
,054
11,4
17,1
321,
520,
583
12,9
37,7
15-0
.0%
15,2
68,3
3084
.7%
LAC
QU
I PA
RLE
4,84
5,23
82,
562,
161
7,40
7,39
94,
845,
238
3,20
9,31
28,
054,
550
8.7%
7,51
3,88
610
7.2%
LAK
E3,
758,
174
9,92
1,33
013
,679
,504
3,91
0,14
79,
330,
920
13,2
41,0
67-3
.2%
15,2
20,4
4887
.0%
LAK
E O
F TH
E W
OO
DS
2,90
0,46
338
0,17
83,
280,
641
2,74
3,49
631
6,99
63,
060,
492
-6.7
%6,
713,
060
45.6
%
LE S
UEU
R8,
461,
648
708,
013
9,16
9,66
18,
534,
978
595,
337
9,13
0,31
5-0
.4%
16,9
54,5
0553
.9%
LIN
CO
LN71
6,34
14,
947,
652
5,66
3,99
397
1,74
34,
661,
340
5,63
3,08
3-0
.5%
5,92
4,34
995
.1%
LYO
N98
4,08
66,
395,
586
7,37
9,67
23,
459,
364
5,27
0,77
98,
730,
143
18.3
%11
,758
,073
74.2
%
MA
HN
OM
EN93
,002
2,66
2,98
52,
755,
987
113,
296
3,26
0,32
83,
373,
624
22.4
%8,
101,
117
41.6
%
MA
RSH
ALL
---
6,01
9,65
16,
019,
651
---
6,02
0,54
56,
020,
545
0.0%
7,30
5,49
282
.4%
MA
RTI
N--
-6,
856,
727
6,85
6,72
7--
-7,
889,
439
7,88
9,43
915
.1%
11,4
69,6
1568
.8%
MC
LEO
D7,
906,
154
1,51
0,66
29,
416,
816
8,47
1,01
44,
638,
985
13,1
09,9
9939
.2%
22,8
85,0
4157
.3%
MEE
KER
3,73
9,59
37,
747,
232
11,4
86,8
255,
687,
476
4,36
5,58
410
,053
,060
-12.
5%16
,648
,346
60.4
%
MIL
LE L
AC
S5,
520,
822
5,44
7,06
710
,967
,889
5,35
9,21
07,
108,
225
12,4
67,4
3513
.7%
19,2
45,3
2064
.8%
MO
RR
ISO
N4,
997,
343
8,73
2,16
813
,729
,511
5,80
7,70
18,
442,
899
14,2
50,6
003.
8%23
,421
,257
60.8
%
MO
WER
16,0
68,7
627,
740,
998
23,8
09,7
6017
,746
,026
7,65
9,34
325
,405
,369
6.7%
24,6
88,2
0410
2.9%
59

Unr
eser
ved
Des
igna
ted
Unr
eser
ved
Und
esig
nate
dT
otal
Unr
eser
ved
Unr
eser
ved
Des
igna
ted
Unr
eser
ved
Und
esig
nate
dT
otal
Unr
eser
ved
2004
Tot
alC
urre
ntE
xpen
ditu
res
Dec
embe
r 31
, 200
3D
ecem
ber
31, 2
004
2003
/200
4Pe
rcen
tC
hang
e
2004
Unr
eser
ved
asa
Perc
ent o
fT
otal
Cur
rent
Exp
endi
ture
sN
ame
of C
ount
y
TA
BL
E 9
PER
CE
NT
CH
AN
GE
OF
UN
RE
SER
VE
D F
UN
D B
AL
AN
CE
SIN
TH
E G
EN
ER
AL
FU
ND
AN
D S
PEC
IAL
RE
VE
NU
E F
UN
DS
2003
TO
200
420
04 U
NR
ESE
RV
ED
FU
ND
BA
LA
NC
ES
AS
A P
ER
CE
NT
OF
TO
TA
L C
UR
RE
NT
EX
PEN
DIT
UR
ES
MU
RR
AY
4,82
4,60
82,
737,
301
7,56
1,90
94,
702,
965
2,80
4,16
87,
507,
133
-0.7
%7,
888,
579
95.2
%
NIC
OLL
ET5,
361,
899
6,30
9,40
611
,671
,305
7,55
5,63
96,
052,
783
13,6
08,4
2216
.6%
17,1
66,7
5879
.3%
NO
BLE
S6,
121,
508
2,90
8,66
29,
030,
170
5,75
1,18
64,
669,
140
10,4
20,3
2615
.4%
15,0
79,6
5169
.1%
NO
RM
AN
839,
281
4,06
2,46
74,
901,
748
808,
945
3,95
2,16
24,
761,
107
-2.9
%7,
150,
285
66.6
%
OLM
STED
29,7
81,9
192,
202,
025
31,9
83,9
4436
,825
,003
4,73
3,34
141
,558
,344
29.9
%10
8,33
4,48
838
.4%
OTT
ER T
AIL
9,62
5,67
16,
467,
307
16,0
92,9
7810
,720
,743
8,16
6,03
618
,886
,779
17.4
%39
,486
,612
47.8
%
PEN
NIN
GTO
N3,
456,
431
389,
519
3,84
5,95
03,
835,
451
205,
303
4,04
0,75
45.
1%11
,686
,478
34.6
%
PIN
E52
6,10
95,
091,
829
5,61
7,93
81,
428,
329
4,49
7,02
95,
925,
358
5.5%
21,6
77,7
3927
.3%
PIPE
STO
NE
114,
753
9,51
2,88
69,
627,
639
115,
846
8,87
4,38
58,
990,
231
-6.6
%8,
658,
322
103.
8%
POLK
5,00
0,00
021
,016
,900
26,0
16,9
005,
000,
000
17,7
99,0
9622
,799
,096
-12.
4%32
,506
,289
70.1
%
POPE
2,74
0,89
82,
534,
469
5,27
5,36
72,
116,
905
3,01
8,02
25,
134,
927
-2.7
%9,
295,
144
55.2
%
RA
MSE
Y12
5,91
8,11
133
,344
,186
159,
262,
297
125,
917,
423
33,0
29,2
7515
8,94
6,69
8-0
.2%
433,
303,
766
36.7
%
RED
LA
KE
2,76
1,58
659
8,59
43,
360,
180
3,02
1,14
41,
622,
822
4,64
3,96
638
.2%
4,35
7,84
110
6.6%
RED
WO
OD
9,33
1,88
51,
196,
829
10,5
28,7
1410
,990
,968
849,
160
11,8
40,1
2812
.5%
14,0
99,3
9684
.0%
REN
VIL
LE1,
705,
933
9,52
5,92
111
,231
,854
2,22
7,74
88,
148,
529
10,3
76,2
77-7
.6%
17,7
71,0
9358
.4%
RIC
E11
,879
,646
4,37
4,25
016
,253
,896
12,2
21,0
993,
017,
068
15,2
38,1
67-6
.2%
29,4
67,7
5951
.7%
RO
CK
6,22
8,84
4--
-6,
228,
844
6,49
0,54
4--
-6,
490,
544
4.2%
8,15
6,54
379
.6%
RO
SEA
U5,
224,
346
3,52
0,93
48,
745,
280
6,78
7,41
92,
807,
790
9,59
5,20
99.
7%12
,155
,780
78.9
%
SCO
TT17
,553
,382
16,0
25,9
0733
,579
,289
23,0
08,1
412,
285,
132
25,2
93,2
73-2
4.7%
57,4
80,8
0944
.0%
SHER
BU
RN
E17
,485
,957
3,79
9,31
821
,285
,275
20,3
37,7
881,
585,
006
21,9
22,7
943.
0%45
,892
,434
47.8
%
SIB
LEY
6,02
4,53
11,
264,
072
7,28
8,60
36,
675,
701
1,04
9,39
17,
725,
092
6.0%
12,9
65,8
9859
.6%
ST. L
OU
IS41
,714
,091
8,35
1,10
450
,065
,195
42,0
83,3
4614
,500
,906
56,5
84,2
5213
.0%
170,
593,
015
33.2
%
STEA
RN
S13
,005
,207
390,
538
13,3
95,7
4516
,127
,814
1,44
9,33
317
,577
,147
31.2
%76
,262
,096
23.0
%
STEE
LE5,
329,
194
1,88
9,80
97,
219,
003
4,89
8,76
31,
977,
308
6,87
6,07
1-4
.8%
22,8
41,1
9630
.1%
STEV
ENS
5,54
6,64
81,
412,
868
6,95
9,51
65,
825,
643
1,69
2,91
07,
518,
553
8.0%
7,52
4,42
799
.9%
60

Unr
eser
ved
Des
igna
ted
Unr
eser
ved
Und
esig
nate
dT
otal
Unr
eser
ved
Unr
eser
ved
Des
igna
ted
Unr
eser
ved
Und
esig
nate
dT
otal
Unr
eser
ved
2004
Tot
alC
urre
ntE
xpen
ditu
res
Dec
embe
r 31
, 200
3D
ecem
ber
31, 2
004
2003
/200
4Pe
rcen
tC
hang
e
2004
Unr
eser
ved
asa
Perc
ent o
fT
otal
Cur
rent
Exp
endi
ture
sN
ame
of C
ount
y
TA
BL
E 9
PER
CE
NT
CH
AN
GE
OF
UN
RE
SER
VE
D F
UN
D B
AL
AN
CE
SIN
TH
E G
EN
ER
AL
FU
ND
AN
D S
PEC
IAL
RE
VE
NU
E F
UN
DS
2003
TO
200
420
04 U
NR
ESE
RV
ED
FU
ND
BA
LA
NC
ES
AS
A P
ER
CE
NT
OF
TO
TA
L C
UR
RE
NT
EX
PEN
DIT
UR
ES
SWIF
T3,
158,
864
2,67
2,94
45,
831,
808
2,86
2,05
83,
506,
890
6,36
8,94
89.
2%10
,279
,382
62.0
%
TOD
D7,
022,
339
818,
863
7,84
1,20
25,
872,
685
2,51
4,74
38,
387,
428
7.0%
17,8
00,9
1747
.1%
TRA
VER
SE63
,916
960,
815
1,02
4,73
1--
-1,
300,
133
1,30
0,13
326
.9%
5,83
0,82
122
.3%
WA
BA
SHA
5,12
4,73
91,
929,
802
7,05
4,54
15,
120,
253
1,11
5,15
86,
235,
411
-11.
6%14
,446
,303
43.2
%
WA
DEN
A1,
518,
535
2,28
5,33
43,
803,
869
1,89
7,12
31,
592,
558
3,48
9,68
1-8
.3%
12,5
49,5
3227
.8%
WA
SEC
A7,
469,
458
3,26
4,55
610
,734
,014
7,66
8,51
73,
290,
679
10,9
59,1
962.
1%13
,124
,877
83.5
%
WA
SHIN
GTO
N14
,874
,165
26,1
03,8
1240
,977
,977
15,9
57,5
7030
,672
,497
46,6
30,0
6713
.8%
121,
697,
093
38.3
%
WA
TON
WA
N3,
343,
288
1,86
9,89
45,
213,
182
3,75
6,61
91,
936,
644
5,69
3,26
39.
2%11
,084
,933
51.4
%
WIL
KIN
1,46
9,71
13,
233,
238
4,70
2,94
91,
758,
086
2,91
6,27
34,
674,
359
-0.6
%8,
196,
369
57.0
%
WIN
ON
A10
,882
,935
8,39
8,43
719
,281
,372
16,7
56,7
084,
464,
100
21,2
20,8
0810
.1%
26,6
66,6
6979
.6%
WR
IGH
T14
,025
,285
5,38
6,86
219
,412
,147
15,5
00,0
126,
592,
921
22,0
92,9
3313
.8%
55,0
57,9
2440
.1%
YEL
LOW
MED
ICIN
E6,
245,
749
1,93
2,26
88,
178,
017
6,46
1,13
12,
086,
389
8,54
7,52
04.
5%10
,198
,658
83.8
%
972,
943,
833
741,
951,
108
1,71
4,89
4,94
11,
014,
488,
066
754,
700,
890
1,76
9,18
8,95
63.
2%3,
724,
852,
305
47.5
%C
ount
y T
otal
s
61

TA
BL
E 1
0PE
RC
EN
T C
HA
NG
E O
F U
NR
ESE
RV
ED
FU
ND
BA
LA
NC
ES
IN T
HE
GE
NE
RA
L F
UN
D A
ND
SPE
CIA
L R
EV
EN
UE
FU
ND
S 20
03 T
O 2
004
2004
UN
RE
SER
VE
D F
UN
D B
AL
AN
CE
S A
S A
PE
RC
EN
T O
F 20
04 T
OT
AL
CU
RR
EN
T E
XPE
ND
ITU
RE
S
Unr
eser
ved
Des
igna
ted
Tot
alU
nres
erve
d
2004
Tot
alC
urre
ntE
xpen
ditu
res
Dec
embe
r 31
, 200
3D
ecem
ber
31, 2
004
Nam
e of
Cou
nty
Unr
eser
ved
Und
esig
nate
dU
nres
erve
dD
esig
nate
dU
nres
erve
dU
ndes
igna
ted
Tot
alU
nres
erve
d
2003
/200
4Pe
rcen
tC
hang
e
2004
Unr
eser
ved
asa
Perc
ent o
fT
otal
Cur
rent
Exp
endi
ture
s
KA
NA
BEC
47,4
873,
573,
386
3,62
0,87
3--
-2,
856,
844
2,85
6,84
4-2
1.1%
12,9
09,4
4922
.1%
Low
Fun
d B
alan
ce
TRA
VER
SE63
,916
960,
815
1,02
4,73
1--
-1,
300,
133
1,30
0,13
326
.9%
5,83
0,82
122
.3%
STEA
RN
S13
,005
,207
390,
538
13,3
95,7
4516
,127
,814
1,44
9,33
317
,577
,147
31.2
%76
,262
,096
23.0
%
AN
OK
A54
,799
,560
(4,8
93,5
40)
49,9
06,0
2053
,292
,451
(3,6
36,2
67)
49,6
56,1
84-0
.5%
197,
627,
075
25.1
%
CLA
Y11
,705
,674
185,
333
11,8
91,0
078,
470,
277
216,
407
8,68
6,68
4-2
6.9%
32,5
06,9
2026
.7%
PIN
E52
6,10
95,
091,
829
5,61
7,93
81,
428,
329
4,49
7,02
95,
925,
358
5.5%
21,6
77,7
3927
.3%
WA
DEN
A1,
518,
535
2,28
5,33
43,
803,
869
1,89
7,12
31,
592,
558
3,48
9,68
1-8
.3%
12,5
49,5
3227
.8%
DO
UG
LAS
4,68
1,60
32,
398,
832
7,08
0,43
55,
384,
664
2,47
6,82
37,
861,
487
11.0
%27
,189
,235
28.9
%
STEE
LE5,
329,
194
1,88
9,80
97,
219,
003
4,89
8,76
31,
977,
308
6,87
6,07
1-4
.8%
22,8
41,1
9630
.1%
HEN
NEP
IN40
,976
,595
233,
840,
741
274,
817,
336
41,3
27,8
5223
6,83
9,39
427
8,16
7,24
61.
2%86
6,02
1,05
732
.1%
ST. L
OU
IS41
,714
,091
8,35
1,10
450
,065
,195
42,0
83,3
4614
,500
,906
56,5
84,2
5213
.0%
170,
593,
015
33.2
%
PEN
NIN
GTO
N3,
456,
431
389,
519
3,84
5,95
03,
835,
451
205,
303
4,04
0,75
45.
1%11
,686
,478
34.6
%
GR
AN
T1,
942,
400
899,
277
2,84
1,67
71,
870,
000
766,
503
2,63
6,50
3-7
.2%
7,56
7,76
134
.8%
RA
MSE
Y12
5,91
8,11
133
,344
,186
159,
262,
297
125,
917,
423
33,0
29,2
7515
8,94
6,69
8-0
.2%
433,
303,
766
36.7
%
Acc
epta
ble
Fund
Bal
ance
WA
SHIN
GTO
N14
,874
,165
26,1
03,8
1240
,977
,977
15,9
57,5
7030
,672
,497
46,6
30,0
6713
.8%
121,
697,
093
38.3
%
OLM
STED
29,7
81,9
192,
202,
025
31,9
83,9
4436
,825
,003
4,73
3,34
141
,558
,344
29.9
%10
8,33
4,48
838
.4%
WR
IGH
T14
,025
,285
5,38
6,86
219
,412
,147
15,5
00,0
126,
592,
921
22,0
92,9
3313
.8%
55,0
57,9
2440
.1%
ISA
NTI
194,
820
8,99
4,00
19,
188,
821
225,
043
9,46
7,61
39,
692,
656
5.5%
23,8
94,2
0040
.6%
FAR
IBA
ULT
2,27
8,90
52,
899,
685
5,17
8,59
02,
067,
518
2,09
2,49
24,
160,
010
-19.
7%10
,197
,213
40.8
%
MA
HN
OM
EN93
,002
2,66
2,98
52,
755,
987
113,
296
3,26
0,32
83,
373,
624
22.4
%8,
101,
117
41.6
%
BR
OW
N2,
358,
392
7,97
4,30
110
,332
,693
1,85
2,64
86,
620,
000
8,47
2,64
8-1
8.0%
20,0
03,9
8042
.4%
62

TA
BL
E 1
0PE
RC
EN
T C
HA
NG
E O
F U
NR
ESE
RV
ED
FU
ND
BA
LA
NC
ES
IN T
HE
GE
NE
RA
L F
UN
D A
ND
SPE
CIA
L R
EV
EN
UE
FU
ND
S 20
03 T
O 2
004
2004
UN
RE
SER
VE
D F
UN
D B
AL
AN
CE
S A
S A
PE
RC
EN
T O
F 20
04 T
OT
AL
CU
RR
EN
T E
XPE
ND
ITU
RE
S
Unr
eser
ved
Des
igna
ted
Tot
alU
nres
erve
d
2004
Tot
alC
urre
ntE
xpen
ditu
res
Dec
embe
r 31
, 200
3D
ecem
ber
31, 2
004
Nam
e of
Cou
nty
Unr
eser
ved
Und
esig
nate
dU
nres
erve
dD
esig
nate
dU
nres
erve
dU
ndes
igna
ted
Tot
alU
nres
erve
d
2003
/200
4Pe
rcen
tC
hang
e
2004
Unr
eser
ved
asa
Perc
ent o
fT
otal
Cur
rent
Exp
endi
ture
s
WA
BA
SHA
5,12
4,73
91,
929,
802
7,05
4,54
15,
120,
253
1,11
5,15
86,
235,
411
-11.
6%14
,446
,303
43.2
%
CA
RLT
ON
220,
525
10,9
33,0
2711
,153
,552
1,57
512
,559
,129
12,5
60,7
0412
.6%
29,0
74,3
8343
.2%
SCO
TT17
,553
,382
16,0
25,9
0733
,579
,289
23,0
08,1
412,
285,
132
25,2
93,2
73-2
4.7%
57,4
80,8
0944
.0%
FREE
BO
RN
7,99
0,93
95,
941,
326
13,9
32,2
657,
634,
244
3,41
7,46
711
,051
,711
-20.
7%24
,702
,066
44.7
%
LAK
E O
F TH
E W
OO
DS
2,90
0,46
338
0,17
83,
280,
641
2,74
3,49
631
6,99
63,
060,
492
-6.7
%6,
713,
060
45.6
%
CR
OW
WIN
G16
2,04
120
,378
,913
20,5
40,9
5418
9,61
319
,120
,703
19,3
10,3
16-6
.0%
41,9
39,1
9846
.0%
CH
ISA
GO
12,4
24,2
171,
203,
931
13,6
28,1
4810
,337
,030
5,57
3,02
515
,910
,055
16.7
%33
,891
,969
46.9
%
TOD
D7,
022,
339
818,
863
7,84
1,20
25,
872,
685
2,51
4,74
38,
387,
428
7.0%
17,8
00,9
1747
.1%
SHER
BU
RN
E17
,485
,957
3,79
9,31
821
,285
,275
20,3
37,7
881,
585,
006
21,9
22,7
943.
0%45
,892
,434
47.8
%
OTT
ER T
AIL
9,62
5,67
16,
467,
307
16,0
92,9
7810
,720
,743
8,16
6,03
618
,886
,779
17.4
%39
,486
,612
47.8
%
WA
TON
WA
N3,
343,
288
1,86
9,89
45,
213,
182
3,75
6,61
91,
936,
644
5,69
3,26
39.
2%11
,084
,933
51.4
%
Mod
erat
ely
Hig
h Fu
nd B
alan
ce
BEN
TON
1,27
1,90
98,
119,
938
9,39
1,84
71,
536,
684
9,23
0,43
510
,767
,119
14.6
%20
,845
,465
51.7
%
RIC
E11
,879
,646
4,37
4,25
016
,253
,896
12,2
21,0
993,
017,
068
15,2
38,1
67-6
.2%
29,4
67,7
5951
.7%
FILL
MO
RE
4,85
3,84
52,
620,
489
7,47
4,33
42,
152,
072
4,77
5,55
16,
927,
623
-7.3
%13
,227
,485
52.4
%
LE S
UEU
R8,
461,
648
708,
013
9,16
9,66
18,
534,
978
595,
337
9,13
0,31
5-0
.4%
16,9
54,5
0553
.9%
ITA
SCA
299,
770
24,8
78,2
0125
,177
,971
6,42
2,58
519
,214
,920
25,6
37,5
051.
8%47
,257
,171
54.3
%
GO
OD
HU
E4,
373,
854
13,6
77,1
8318
,051
,037
4,38
8,42
213
,508
,921
17,8
97,3
43-0
.9%
32,9
23,1
9854
.4%
POPE
2,74
0,89
82,
534,
469
5,27
5,36
72,
116,
905
3,01
8,02
25,
134,
927
-2.7
%9,
295,
144
55.2
%
WIL
KIN
1,46
9,71
13,
233,
238
4,70
2,94
91,
758,
086
2,91
6,27
34,
674,
359
-0.6
%8,
196,
369
57.0
%
MC
LEO
D7,
906,
154
1,51
0,66
29,
416,
816
8,47
1,01
44,
638,
985
13,1
09,9
9939
.2%
22,8
85,0
4157
.3%
DO
DG
E4,
220,
469
3,78
6,58
18,
007,
050
4,24
3,74
03,
480,
674
7,72
4,41
4-3
.5%
13,4
27,9
2657
.5%
63
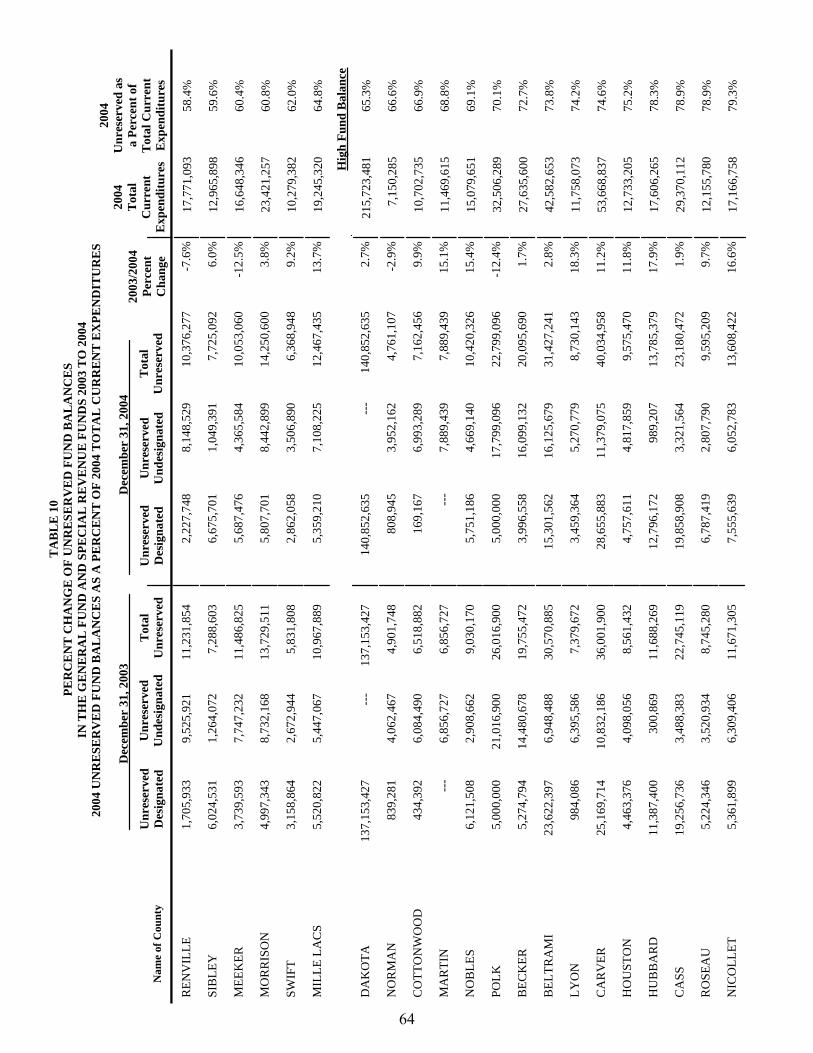
TA
BL
E 1
0PE
RC
EN
T C
HA
NG
E O
F U
NR
ESE
RV
ED
FU
ND
BA
LA
NC
ES
IN T
HE
GE
NE
RA
L F
UN
D A
ND
SPE
CIA
L R
EV
EN
UE
FU
ND
S 20
03 T
O 2
004
2004
UN
RE
SER
VE
D F
UN
D B
AL
AN
CE
S A
S A
PE
RC
EN
T O
F 20
04 T
OT
AL
CU
RR
EN
T E
XPE
ND
ITU
RE
S
Unr
eser
ved
Des
igna
ted
Tot
alU
nres
erve
d
2004
Tot
alC
urre
ntE
xpen
ditu
res
Dec
embe
r 31
, 200
3D
ecem
ber
31, 2
004
Nam
e of
Cou
nty
Unr
eser
ved
Und
esig
nate
dU
nres
erve
dD
esig
nate
dU
nres
erve
dU
ndes
igna
ted
Tot
alU
nres
erve
d
2003
/200
4Pe
rcen
tC
hang
e
2004
Unr
eser
ved
asa
Perc
ent o
fT
otal
Cur
rent
Exp
endi
ture
s
REN
VIL
LE1,
705,
933
9,52
5,92
111
,231
,854
2,22
7,74
88,
148,
529
10,3
76,2
77-7
.6%
17,7
71,0
9358
.4%
SIB
LEY
6,02
4,53
11,
264,
072
7,28
8,60
36,
675,
701
1,04
9,39
17,
725,
092
6.0%
12,9
65,8
9859
.6%
MEE
KER
3,73
9,59
37,
747,
232
11,4
86,8
255,
687,
476
4,36
5,58
410
,053
,060
-12.
5%16
,648
,346
60.4
%
MO
RR
ISO
N4,
997,
343
8,73
2,16
813
,729
,511
5,80
7,70
18,
442,
899
14,2
50,6
003.
8%23
,421
,257
60.8
%
SWIF
T3,
158,
864
2,67
2,94
45,
831,
808
2,86
2,05
83,
506,
890
6,36
8,94
89.
2%10
,279
,382
62.0
%
MIL
LE L
AC
S5,
520,
822
5,44
7,06
710
,967
,889
5,35
9,21
07,
108,
225
12,4
67,4
3513
.7%
19,2
45,3
2064
.8%
DA
KO
TA13
7,15
3,42
7--
-13
7,15
3,42
714
0,85
2,63
5--
-14
0,85
2,63
52.
7%21
5,72
3,48
165
.3%
Hig
h Fu
nd B
alan
ce
NO
RM
AN
839,
281
4,06
2,46
74,
901,
748
808,
945
3,95
2,16
24,
761,
107
-2.9
%7,
150,
285
66.6
%
CO
TTO
NW
OO
D43
4,39
26,
084,
490
6,51
8,88
216
9,16
76,
993,
289
7,16
2,45
69.
9%10
,702
,735
66.9
%
MA
RTI
N--
-6,
856,
727
6,85
6,72
7--
-7,
889,
439
7,88
9,43
915
.1%
11,4
69,6
1568
.8%
NO
BLE
S6,
121,
508
2,90
8,66
29,
030,
170
5,75
1,18
64,
669,
140
10,4
20,3
2615
.4%
15,0
79,6
5169
.1%
POLK
5,00
0,00
021
,016
,900
26,0
16,9
005,
000,
000
17,7
99,0
9622
,799
,096
-12.
4%32
,506
,289
70.1
%
BEC
KER
5,27
4,79
414
,480
,678
19,7
55,4
723,
996,
558
16,0
99,1
3220
,095
,690
1.7%
27,6
35,6
0072
.7%
BEL
TRA
MI
23,6
22,3
976,
948,
488
30,5
70,8
8515
,301
,562
16,1
25,6
7931
,427
,241
2.8%
42,5
82,6
5373
.8%
LYO
N98
4,08
66,
395,
586
7,37
9,67
23,
459,
364
5,27
0,77
98,
730,
143
18.3
%11
,758
,073
74.2
%
CA
RV
ER25
,169
,714
10,8
32,1
8636
,001
,900
28,6
55,8
8311
,379
,075
40,0
34,9
5811
.2%
53,6
68,8
3774
.6%
HO
UST
ON
4,46
3,37
64,
098,
056
8,56
1,43
24,
757,
611
4,81
7,85
99,
575,
470
11.8
%12
,733
,205
75.2
%
HU
BB
AR
D11
,387
,400
300,
869
11,6
88,2
6912
,796
,172
989,
207
13,7
85,3
7917
.9%
17,6
06,2
6578
.3%
CA
SS19
,256
,736
3,48
8,38
322
,745
,119
19,8
58,9
083,
321,
564
23,1
80,4
721.
9%29
,370
,112
78.9
%
RO
SEA
U5,
224,
346
3,52
0,93
48,
745,
280
6,78
7,41
92,
807,
790
9,59
5,20
99.
7%12
,155
,780
78.9
%
NIC
OLL
ET5,
361,
899
6,30
9,40
611
,671
,305
7,55
5,63
96,
052,
783
13,6
08,4
2216
.6%
17,1
66,7
5879
.3%
64

TA
BL
E 1
0PE
RC
EN
T C
HA
NG
E O
F U
NR
ESE
RV
ED
FU
ND
BA
LA
NC
ES
IN T
HE
GE
NE
RA
L F
UN
D A
ND
SPE
CIA
L R
EV
EN
UE
FU
ND
S 20
03 T
O 2
004
2004
UN
RE
SER
VE
D F
UN
D B
AL
AN
CE
S A
S A
PE
RC
EN
T O
F 20
04 T
OT
AL
CU
RR
EN
T E
XPE
ND
ITU
RE
S
Unr
eser
ved
Des
igna
ted
Tot
alU
nres
erve
d
2004
Tot
alC
urre
ntE
xpen
ditu
res
Dec
embe
r 31
, 200
3D
ecem
ber
31, 2
004
Nam
e of
Cou
nty
Unr
eser
ved
Und
esig
nate
dU
nres
erve
dD
esig
nate
dU
nres
erve
dU
ndes
igna
ted
Tot
alU
nres
erve
d
2003
/200
4Pe
rcen
tC
hang
e
2004
Unr
eser
ved
asa
Perc
ent o
fT
otal
Cur
rent
Exp
endi
ture
s
RO
CK
6,22
8,84
4--
-6,
228,
844
6,49
0,54
4--
-6,
490,
544
4.2%
8,15
6,54
379
.6%
WIN
ON
A10
,882
,935
8,39
8,43
719
,281
,372
16,7
56,7
084,
464,
100
21,2
20,8
0810
.1%
26,6
66,6
6979
.6%
MA
RSH
ALL
---
6,01
9,65
16,
019,
651
---
6,02
0,54
56,
020,
545
0.0%
7,30
5,49
282
.4%
WA
SEC
A7,
469,
458
3,26
4,55
610
,734
,014
7,66
8,51
73,
290,
679
10,9
59,1
962.
1%13
,124
,877
83.5
%
YEL
LOW
MED
ICIN
E6,
245,
749
1,93
2,26
88,
178,
017
6,46
1,13
12,
086,
389
8,54
7,52
04.
5%10
,198
,658
83.8
%
RED
WO
OD
9,33
1,88
51,
196,
829
10,5
28,7
1410
,990
,968
849,
160
11,8
40,1
2812
.5%
14,0
99,3
9684
.0%
KO
OC
HIC
HIN
G10
,386
,468
2,55
5,58
612
,942
,054
11,4
17,1
321,
520,
583
12,9
37,7
15-0
.0%
15,2
68,3
3084
.7%
LAK
E3,
758,
174
9,92
1,33
013
,679
,504
3,91
0,14
79,
330,
920
13,2
41,0
67-3
.2%
15,2
20,4
4887
.0%
JAC
KSO
N8,
196,
693
2,86
8,16
311
,064
,856
6,44
8,81
73,
086,
858
9,53
5,67
5-1
3.8%
10,7
96,1
0988
.3%
KA
ND
IYO
HI
2,15
433
,599
,590
33,6
01,7
4417
,807
36,6
01,7
0136
,619
,508
9.0%
39,6
45,9
0792
.4%
KIT
TSO
N4,
502,
158
1,16
8,14
85,
670,
306
3,96
9,11
22,
006,
171
5,97
5,28
35.
4%6,
437,
834
92.8
%
LIN
CO
LN71
6,34
14,
947,
652
5,66
3,99
397
1,74
34,
661,
340
5,63
3,08
3-0
.5%
5,92
4,34
995
.1%
MU
RR
AY
4,82
4,60
82,
737,
301
7,56
1,90
94,
702,
965
2,80
4,16
87,
507,
133
-0.7
%7,
888,
579
95.2
%
STEV
ENS
5,54
6,64
81,
412,
868
6,95
9,51
65,
825,
643
1,69
2,91
07,
518,
553
8.0%
7,52
4,42
799
.9%
CLE
AR
WA
TER
9,84
6,53
21,
204,
664
11,0
51,1
9610
,697
,786
520,
331
11,2
18,1
171.
5%10
,967
,823
102.
3%
Ver
y H
igh
Fund
Bal
ance
MO
WER
16,0
68,7
627,
740,
998
23,8
09,7
6017
,746
,026
7,65
9,34
325
,405
,369
6.7%
24,6
88,2
0410
2.9%
PIPE
STO
NE
114,
753
9,51
2,88
69,
627,
639
115,
846
8,87
4,38
58,
990,
231
-6.6
%8,
658,
322
103.
8%
BIG
STO
NE
3,31
9,74
13,
917,
318
7,23
7,05
93,
608,
858
3,06
2,36
86,
671,
226
-7.8
%6,
302,
495
105.
9%
RED
LA
KE
2,76
1,58
659
8,59
43,
360,
180
3,02
1,14
41,
622,
822
4,64
3,96
638
.2%
4,35
7,84
110
6.6%
LAC
QU
I PA
RLE
4,84
5,23
82,
562,
161
7,40
7,39
94,
845,
238
3,20
9,31
28,
054,
550
8.7%
7,51
3,88
610
7.2%
CO
OK
1,83
3,13
68,
282,
131
10,1
15,2
671,
585,
059
9,24
2,31
710
,827
,376
7.0%
9,82
8,73
511
0.2%
65

TA
BL
E 1
0PE
RC
EN
T C
HA
NG
E O
F U
NR
ESE
RV
ED
FU
ND
BA
LA
NC
ES
IN T
HE
GE
NE
RA
L F
UN
D A
ND
SPE
CIA
L R
EV
EN
UE
FU
ND
S 20
03 T
O 2
004
2004
UN
RE
SER
VE
D F
UN
D B
AL
AN
CE
S A
S A
PE
RC
EN
T O
F 20
04 T
OT
AL
CU
RR
EN
T E
XPE
ND
ITU
RE
S
Unr
eser
ved
Des
igna
ted
Tot
alU
nres
erve
d
2004
Tot
alC
urre
ntE
xpen
ditu
res
Dec
embe
r 31
, 200
3D
ecem
ber
31, 2
004
Nam
e of
Cou
nty
Unr
eser
ved
Und
esig
nate
dU
nres
erve
dD
esig
nate
dU
nres
erve
dU
ndes
igna
ted
Tot
alU
nres
erve
d
2003
/200
4Pe
rcen
tC
hang
e
2004
Unr
eser
ved
asa
Perc
ent o
fT
otal
Cur
rent
Exp
endi
ture
s
CH
IPPE
WA
7,60
3,09
24,
974,
791
12,5
77,8
837,
297,
560
5,68
1,78
012
,979
,340
3.2%
10,4
05,9
7112
4.7%
AIT
KIN
10,8
16,6
1510
,319
,626
21,1
36,2
4111
,167
,855
11,1
27,2
3022
,295
,085
5.5%
17,7
49,6
0512
5.6%
BLU
E EA
RTH
61,5
78,9
55--
-61
,578
,955
63,7
58,1
62--
-63
,758
,162
3.5%
35,6
36,2
6817
8.9%
Ext
rem
ely
Hig
h Fu
nd B
alan
ce
972,
943,
833
741,
951,
108
1,71
4,89
4,94
11,
014,
488,
066
754,
700,
890
1,76
9,18
8,95
63.
2%3,
724,
852,
305
47.5
%C
ount
y To
tals
66

2005 and 2006 COUNTY BUDGET SUMMARIES

This page left blank intentionally

Table 11Summary of 2006 and 2005 County
Budgeted Revenues and Expenditures
2006 2005 Percent Revenues Amount % Amount % Change Property Taxes $2,060,988,482 41.0% $1,940,922,700 41.0% 6.2% All Other Taxes 34,435,721 0.7% 34,208,423 0.7% 0.7% Special Assessments 20,657,160 0.4% 20,938,941 0.4% -1.3% Licenses and Permits 31,191,420 0.6% 27,821,034 0.6% 12.1% Intergovernmental Revenues Federal Grants 642,953,798 12.8% 608,794,484 12.9% 5.6% State General Purpose Aid 287,640,641 5.7% 283,748,846 6.0% 1.4% State Categorical Aid 1,004,191,937 20.0% 944,794,380 20.0% 6.3% Total Intergovernmental Revenues 1,934,786,376 38.5% 1,837,337,710 38.8% 5.3% Charges for Services 466,178,298 9.3% 496,841,949 10.5% -6.2% Fines and Forfeits 7,099,387 0.1% 10,398,763 0.2% -31.7% Interest on Investments 70,767,859 1.4% 62,045,785 1.3% 14.1% Miscellaneous Revenues 403,819,571 8.0% 304,648,708 6.4% 32.6% Total Revenues 5,029,924,274 100.0% 4,735,164,013 100.0% 6.2% Percent of Total Revenues & Other Sources 97.0% 97.5% Proceeds from Bond Sales 64,908,668 1.3% 41,127,791 0.8% 57.8% Other Financing Sources 39,295,526 0.8% 36,570,001 0.8% 7.5% Transfers from Other Funds 52,714,015 1.0% 42,484,936 0.9% 24.1% Total Revenues and Other Sources $5,186,842,483 100.0% $4,855,346,741 100.0% 6.8%
Expenditures General Government $752,009,114 18.2% $711,214,719 17.9% 5.7% Public Safety 821,424,409 19.8% 762,341,486 19.2% 7.8% Streets and Highways 373,538,859 9.0% 363,051,806 9.1% 2.9% Sanitation 91,193,708 2.2% 85,119,078 2.1% 7.1% Human Services 1,618,186,389 39.1% 1,606,362,540 40.4% 0.7%
Health 185,330,034 4.5% 178,924,728 4.5% 3.6% Culture and Recreation 134,684,598 3.3% 127,002,989 3.2% 6.0% Conservation of Natural Resources 69,269,522 1.7% 53,250,208 1.3% 30.1% Economic Development 47,456,291 1.1% 45,367,428 1.1% 4.6% Miscellaneous Current Expenditures 49,333,938 1.2% 45,243,417 1.1% 9.0% Total Current Expenditures $4,142,426,862 100.0% $3,977,878,399 100.0% 4.1% Percent of Total Expenditures & Other Uses 78.8% 80.5% Debt Service Principal $130,330,382 2.5% $121,018,125 2.5% 7.7% Interest and Fiscal Charges 69,542,696 1.3% 65,674,214 1.3% 5.9% Streets and Highways Construction 470,271,888 8.9% 437,489,426 8.9% 7.5%
Capital Outlay 389,416,232 7.4% 284,943,972 5.8% 36.7% Total Expenditures 5,201,988,060 98.9% 4,887,004,136 98.9% 6.4% Other Financing Uses 21,117,367 0.4% 19,997,212 0.4% 5.6% Transfers to Other Funds 36,194,090 0.7% 32,424,260 0.7% 11.6% Total Expenditures and Other Uses $5,259,299,517 100.0% $4,939,425,608 100.0% 6.5%
Reported Increase (Decrease) in Fund Balance ($23,366,269) ($43,963,537) -46.9% Reported Net Unrealized Gain or (Loss) from Investments ($509,294) Net Tax Levy $1,996,942,583 $1,865,558,355 7.0%
69

Name of County: AITKIN
Adopted budgets for the following funds: GF: x R&B: x HS: x OSR: DS: x CP: 2005 2005 2006
Budget Amended BudgetRevenues:
Property Taxes 9,027,037 9,027,037 9,734,644 All Other Taxes 722,550 722,550 824,550 Special Assessments 0 0 0 Licenses and Permits 59,100 59,100 63,360 Federal Grants 2,049,187 2,049,187 2,179,688 State General Purpose Aid 2,067,847 2,067,847 1,744,422 State Categorical Aid 5,427,280 5,427,280 6,163,509 Charges for Services 1,306,710 1,306,710 1,700,438 Fines and Forfeits 49,400 49,400 0 Interest on Investments 250,000 250,000 400,000 Miscellaneous Revenues 88,529 88,529 103,830
Total Revenues 21,047,640 21,047,640 22,914,441 Proceeds from Bond Sales 0 0 0 Other Financing Sources 0 0 0 Transfers from Other Funds 0 0 0
Total Revenues and Other Sources 21,047,640 21,047,640 22,914,441
Name of County: ANOKA Adopted budgets for the following funds: GF: x R&B: x HS: x OSR: x DS: x CP: x
2005 2005 2006 Budget Amended Budget
Revenues: Property Taxes 89,151,880 89,264,830 96,234,209 All Other Taxes 701,300 701,300 754,750 Special Assessments 0 0 0 Licenses and Permits 832,219 832,219 880,980 Federal Grants 34,080,982 34,603,575 43,834,420 State General Purpose Aid 13,906,155 11,920,236 13,016,475 State Categorical Aid 37,955,225 37,561,153 36,977,148 Charges for Services 29,537,511 30,085,331 33,675,353 Fines and Forfeits 891,250 891,250 346,000Interest on Investments 3,397,161 3,397,161 3,041,011 Miscellaneous Revenues 14,669,190 12,443,414 14,964,846
Total Revenues 225,122,873 221,700,469 243,725,192 Proceeds from Bond Sales 19,546,600 22,695,000 12,325,000 Other Financing Sources 0 0 0 Transfers from Other Funds 0 0 568,814
Total Revenues and Other Sources 244,669,473 244,395,469 256,619,006 Current Expenditures
General Government Public Safety Streets and Highways (excluding Const.) SanitationHuman ServicesHealthCulture and RecreationConservation of Natural ResourcesEconomic Development & HousingMiscellaneous Current Expenditures
Total Current Expenditures
Debt Service - Principal Interest and Fiscal Charges Streets and Highways Construction Total Capital Outlay
Other Financing UsesTransfers to Other Funds
3,894,744 3,936,199 2,602,030
360,278 5,146,342
541,322 589,860 253,801 66,981
0 17,391,557
265,000 148,586
2,976,000 763,650
3,894,744 3,936,199 2,602,030
360,278 5,146,342
541,322 589,860 253,801 66,981
0 17,391,557
265,000 148,586
2,976,000 763,650
4,210,377 4,195,306 2,804,212
354,755 5,265,533
550,541 624,614 274,725 66,063
0 18,346,126
275,000 137,111
3,447,600 1,188,304
0 0
Current Expenditures General Government Public Safety Streets and Highways (excluding Const.) SanitationHuman ServicesHealthCulture and RecreationConservation of Natural ResourcesEconomic Development & HousingMiscellaneous Current Expenditures
Total Current Expenditures
Debt Service - Principal Interest and Fiscal Charges Streets and Highways Construction Total Capital Outlay
Other Financing UsesTransfers to Other Funds
33,733,113 42,842,636 19,129,692 8,968,280
72,436,025 7,948,778
11,279,555 573,802
6,217,456 0
203,129,337
10,850,000 4,138,931 8,675,889
23,798,925 0 0
33,757,239 43,431,477 19,067,061 9,038,280
71,664,923 8,007,486
12,807,439 754,749
5,798,953 0
204,327,607 11,800,000 4,532,615 8,675,889
19,546,600 0 0
34,216,903 46,594,481 18,241,081
9,443,834 75,930,931 8,289,257
12,289,982 589,598
5,974,141 0
211,570,208 12,695,000 5,457,397
13,394,322 11,787,850
0 0
0 0 0 0
Total Expenditures and Other Uses 21,544,793 21,544,793 23,394,141
Name of County: BECKER
Adopted budgets for the following funds: GF: x R&B: x HS: x OSR: x DS: CP: 2005 2005 2006
Budget Amended BudgetRevenues:
Property Taxes 13,733,163 0 14,268,181 All Other Taxes 728,184 0 737,293 Special Assessments 575,000 0 223,154 Licenses and Permits 285,060 0 300,160 Federal Grants 4,759,098 0 5,890,198 State General Purpose Aid 1,290,000 0 1,567,467 State Categorical Aid 7,170,576 0 10,579,506 Charges for Services 2,340,885 0 3,051,701 Fines and Forfeits 77,000 0 77,500Interest on Investments 490,000 0 733,000 Miscellaneous Revenues 2,200,250 0 2,284,137
Total Revenues 33,649,216 0 39,712,297 Proceeds from Bond Sales 0 0 0 Other Financing Sources 0 0 0 Transfers from Other Funds 0 0 0
Total Revenues and Other Sources 33,649,216 0 39,712,297
Total Expenditures and Other Uses 250,593,082 248,882,711
Name of County: BELTRAMI Adopted budgets for the following funds: GF: x R&B: x HS: x OSR: x
2005 2005 Budget Amended
Revenues: Property Taxes 14,510,591 14,510,591 All Other Taxes 1,300,000 1,300,000 Special Assessments 1,634,600 1,634,600 Licenses and Permits 118,030 118,030 Federal Grants 5,489,415 5,489,415 State General Purpose Aid 120,998 120,998 State Categorical Aid 3,677,408 3,677,408 Charges for Services 3,969,276 3,969,276 Fines and Forfeits 33,000 33,000Interest on Investments 850,000 850,000 Miscellaneous Revenues 12,984,759 12,984,759
Total Revenues 44,688,077 44,688,077 Proceeds from Bond Sales 0 0 Other Financing Sources 0 0 Transfers from Other Funds 0 0
Total Revenues and Other Sources 44,688,077 44,688,077
254,904,777
DS: x CP:
2006 Budget
13,534,135 875,000
1,727,731 121,330
5,683,116 1,448,000
19,352,050 5,698,537
145,000 739,790
1,931,887 51,256,576
0 20,000
819,741 52,096,317
Current Expenditures Current Expenditures General Government 5,243,592 0 4,773,960 General Government Public Safety 5,444,474 0 5,871,390 Public Safety Streets and Highways (excluding Const.) 4,293,322 0 4,747,922 Streets and Highways (excluding Const.) Sanitation 1,569,611 0 1,662,816 Sanitation Human Services 11,880,976 0 12,025,157 Human Services Health 849,210 0 877,494 Health Culture and Recreation 472,111 0 565,554 Culture and RecreationConservation of Natural Resources 860,486 0 1,005,425 Conservation of Natural Resources Economic Development & Housing 346,823 0 352,214 Economic Development & Housing Miscellaneous Current Expenditures 325,718 0 326,947 Miscellaneous Current Expenditures
Total Current Expenditures 31,286,323 0 32,208,879 Total Current Expenditures
Debt Service - Principal 450,000 0 450,000 Debt Service - Principal Interest and Fiscal Charges 23,875 0 12,840 Interest and Fiscal Charges Streets and Highways Construction 1,805,000 0 6,865,000 Streets and Highways Construction Total Capital Outlay 0 0 2,500,000 Total Capital Outlay
Other Financing Uses 0 0 0 Other Financing Uses Transfers to Other Funds 0 0 0 Transfers to Other Funds
Total Expenditures and Other Uses 33,565,198 0 42,036,719 Total Expenditures and Other Uses
6,650,041 6,305,672 3,948,854 2,799,832
14,046,158 2,259,630
213,941 1,298,071
160,000 288,390
37,970,589
968,791 496,353
4,450,000 802,344
0 0
6,650,041 6,305,672 3,948,854 2,799,832
14,046,158 2,259,630
213,941 1,298,071
160,000 288,390
37,970,589 968,791 496,353
4,450,000 802,344
0 0
7,325,885 7,116,186 5,474,747 2,910,808
14,693,894 2,345,461
487,241 2,583,902
640,806
43,578,930 1,946,787
40,000 5,950,000
0 0
819,741
44,688,077 44,688,077 52,335,458
70
0
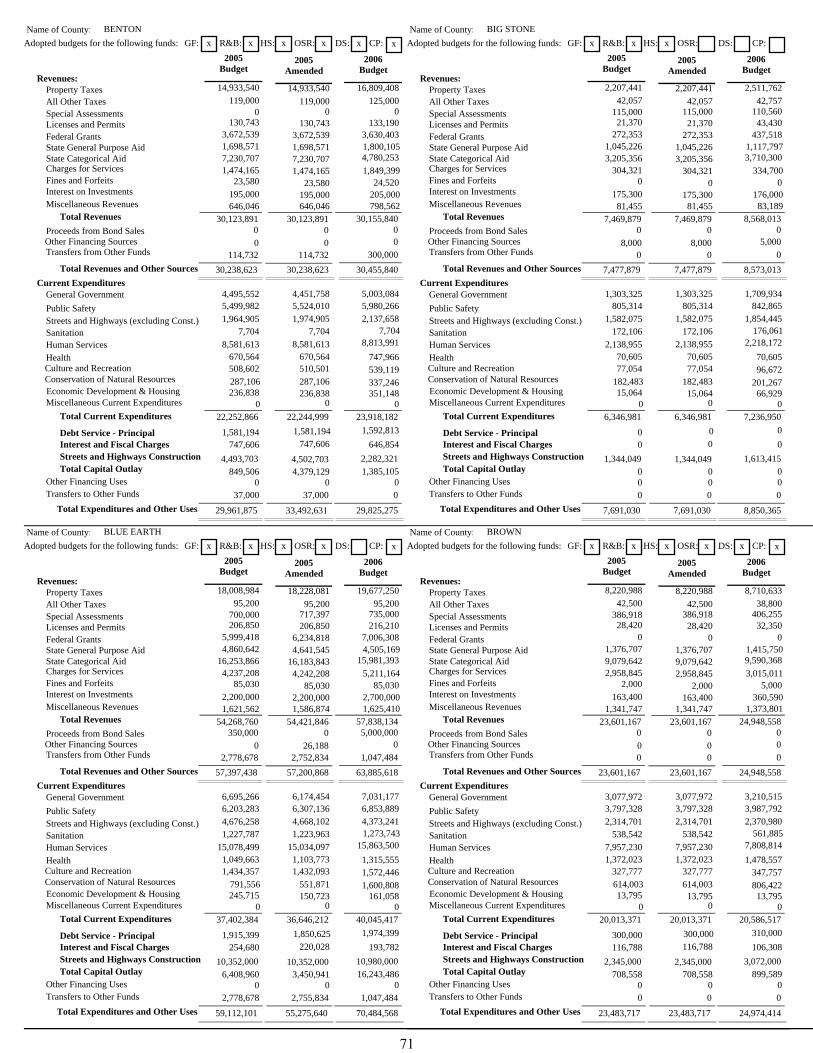
Name of County: BENTON
Adopted budgets for the following funds: GF: x R&B: x HS: x OSR: x DS: x CP: x Name of County: BIG STONE
Adopted budgets for the following funds: GF: x R&B: x HS: x OSR: DS: CP: 2005 2005 2006
Budget Amended BudgetRevenues:
Property Taxes 14,933,540 14,933,540 16,809,408 All Other Taxes 119,000 119,000 125,000 Special Assessments 0 0 0 Licenses and Permits 130,743 130,743 133,190 Federal Grants 3,672,539 3,672,539 3,630,403 State General Purpose Aid 1,698,571 1,698,571 1,800,105 State Categorical Aid 7,230,707 7,230,707 4,780,253 Charges for Services 1,474,165 1,474,165 1,849,399 Fines and Forfeits 23,580 23,580 24,520Interest on Investments 195,000 195,000 205,000 Miscellaneous Revenues 646,046 646,046 798,562
2005 2005 2006 Budget Amended Budget
Revenues: Property Taxes 2,207,441 2,207,441 2,511,762 All Other Taxes 42,057 42,057 42,757 Special Assessments 115,000 115,000 110,560 Licenses and Permits 21,370 21,370 43,430 Federal Grants 272,353 272,353 437,518 State General Purpose Aid 1,045,226 1,045,226 1,117,797 State Categorical Aid 3,205,356 3,205,356 3,710,300 Charges for Services 304,321 304,321 334,700 Fines and Forfeits 0 0 0 Interest on Investments 175,300 175,300 176,000 Miscellaneous Revenues 81,455 81,455 83,189
Total Revenues 30,123,891 30,123,891 30,155,840 Total Revenues 7,469,879 7,469,879 8,568,013 Proceeds from Bond Sales 0 0 0 Proceeds from Bond Sales 0 0 0 Other Financing Sources 0 0 0 Other Financing Sources 8,000 8,000 5,000 Transfers from Other Funds 114,732 114,732 300,000 Transfers from Other Funds 0 0 0
Total Revenues and Other Sources 30,238,623 30,238,623 30,455,840 Total Revenues and Other Sources 7,477,879 7,477,879 8,573,013 Current Expenditures
General Government Public Safety Streets and Highways (excluding Const.) SanitationHuman ServicesHealthCulture and RecreationConservation of Natural ResourcesEconomic Development & HousingMiscellaneous Current Expenditures
Total Current Expenditures
Debt Service - Principal Interest and Fiscal Charges Streets and Highways Construction Total Capital Outlay
Other Financing UsesTransfers to Other Funds
4,495,552 5,499,982 1,964,905
7,704 8,581,613
670,564 508,602 287,106 236,838
0 22,252,866
1,581,194 747,606
4,493,703 849,506
0 37,000
4,451,758 5,524,010 1,974,905
7,704 8,581,613
670,564 510,501 287,106 236,838
0 22,244,999
1,581,194 747,606
4,502,703 4,379,129
0 37,000
5,003,084 5,980,266 2,137,658
7,704 8,813,991
747,966 539,119 337,246 351,148
0 23,918,182
1,592,813 646,854
2,282,321 1,385,105
0 0
Current Expenditures General Government Public Safety Streets and Highways (excluding Const.) SanitationHuman ServicesHealthCulture and RecreationConservation of Natural ResourcesEconomic Development & HousingMiscellaneous Current Expenditures
Total Current Expenditures
Debt Service - Principal Interest and Fiscal Charges Streets and Highways Construction Total Capital Outlay
Other Financing UsesTransfers to Other Funds
1,303,325 805,314
1,582,075 172,106
2,138,955 70,605 77,054
182,483 15,064
0 6,346,981
0 0
1,344,049 0 0 0
1,303,325 1,709,934 805,314 842,865
1,582,075 1,854,445 172,106 176,061
2,138,955 2,218,172 70,605 70,605 77,054 96,672
182,483 201,267 15,064 66,929
0 0 6,346,981 7,236,950
0 0 0 0
1,344,049 1,613,415 0 0 0 0 0 0
Total Expenditures and Other Uses 29,961,875 33,492,631 29,825,275
Name of County: BLUE EARTH
Adopted budgets for the following funds: GF: x R&B: x HS: x OSR: x DS: CP: x
Total Expenditures and Other Uses
Name of County: BROWN
Adopted budgets for the following funds: GF:
7,691,030 7,691,030 8,850,365
x R&B: x HS: x OSR: x DS: x CP: x 2005 2005 2006
Budget Amended BudgetRevenues:
Property Taxes 18,008,984 18,228,081 19,677,250 All Other Taxes 95,200 95,200 95,200 Special Assessments 700,000 717,397 735,000 Licenses and Permits 206,850 206,850 216,210 Federal Grants 5,999,418 6,234,818 7,006,308 State General Purpose Aid 4,860,642 4,641,545 4,505,169 State Categorical Aid 16,253,866 16,183,843 15,981,393 Charges for Services 4,237,208 4,242,208 5,211,164 Fines and Forfeits 85,030 85,030 85,030Interest on Investments 2,200,000 2,200,000 2,700,000 Miscellaneous Revenues 1,621,562 1,586,874 1,625,410
2005 2005 2006 Budget Amended Budget
Revenues: Property Taxes 8,220,988 8,220,988 8,710,633 All Other Taxes 42,500 42,500 38,800 Special Assessments 386,918 386,918 406,255 Licenses and Permits 28,420 28,420 32,350 Federal Grants 0 0 0 State General Purpose Aid 1,376,707 1,376,707 1,415,750 State Categorical Aid 9,079,642 9,079,642 9,590,368 Charges for Services 2,958,845 2,958,845 3,015,011 Fines and Forfeits 2,000 2,000 5,000Interest on Investments 163,400 163,400 360,590 Miscellaneous Revenues 1,341,747 1,341,747 1,373,801
Total Revenues 54,268,760 54,421,846 57,838,134 Total Revenues 23,601,167 23,601,167 24,948,558 Proceeds from Bond Sales 350,000 0 5,000,000 Proceeds from Bond Sales 0 0 0 Other Financing Sources 0 26,188 0 Other Financing Sources 0 0 0 Transfers from Other Funds 2,778,678 2,752,834 1,047,484 Transfers from Other Funds 0 0 0
Total Revenues and Other Sources 57,397,438 57,200,868 63,885,618 Total Revenues and Other Sources 23,601,167 23,601,167 24,948,558 Current Expenditures
General Government Public Safety Streets and Highways (excluding Const.) SanitationHuman ServicesHealthCulture and RecreationConservation of Natural ResourcesEconomic Development & HousingMiscellaneous Current Expenditures
Total Current Expenditures
Debt Service - Principal Interest and Fiscal Charges Streets and Highways Construction Total Capital Outlay
Other Financing UsesTransfers to Other Funds
6,695,266 6,203,283 4,676,258 1,227,787
15,078,499 1,049,663 1,434,357
791,556 245,715
0 37,402,384
1,915,399 254,680
10,352,000 6,408,960
0 2,778,678
6,174,454 6,307,136 4,668,102 1,223,963
15,034,097 1,103,773 1,432,093
551,871 150,723
0 36,646,212
1,850,625 220,028
10,352,000 3,450,941
0 2,755,834
7,031,177 6,853,889 4,373,241 1,273,743
15,863,500 1,315,555 1,572,446 1,600,808
161,058 0
40,045,417 1,974,399
193,782 10,980,000 16,243,486
0 1,047,484
Current Expenditures General Government Public Safety Streets and Highways (excluding Const.) SanitationHuman ServicesHealthCulture and RecreationConservation of Natural ResourcesEconomic Development & HousingMiscellaneous Current Expenditures
Total Current Expenditures
Debt Service - Principal Interest and Fiscal Charges Streets and Highways Construction Total Capital Outlay
Other Financing UsesTransfers to Other Funds
3,077,972 3,797,328 2,314,701
538,542 7,957,230 1,372,023
327,777 614,003 13,795
0 20,013,371
300,000 116,788
2,345,000 708,558
0 0
3,077,972 3,210,515 3,797,328 3,987,792 2,314,701 2,370,980
538,542 561,885 7,957,230 7,808,814 1,372,023 1,478,557
327,777 347,757 614,003 806,422 13,795 13,795
0 0 20,013,371 20,586,517
300,000 310,000 116,788 106,308
2,345,000 3,072,000 708,558 899,589
0 0 0 0
Total Expenditures and Other Uses 59,112,101 55,275,640 70,484,568 Total Expenditures and Other Uses 23,483,717 23,483,717 24,974,414
71

x x Name of County: CARLTON
Adopted budgets for the following funds: GF: x R&B: x HS: x OSR: x DS: x CP: Name of County: CARVER
Adopted budgets for the following funds: GF: x R&B: x HS: x OSR: x DS: CP: 2005 2005 2006
Budget Amended BudgetRevenues:
Property Taxes 14,811,968 14,811,968 16,148,299 All Other Taxes 0 0 0 Special Assessments 390,000 390,000 420,000 Licenses and Permits 77,000 77,000 71,350 Federal Grants 0 0 0 State General Purpose Aid 15,871,151 15,871,151 15,377,851 State Categorical Aid 0 0 0 Charges for Services 1,611,500 1,611,500 1,835,722 Fines and Forfeits 163,778 163,778 35,000Interest on Investments 180,000 180,000 240,000 Miscellaneous Revenues 1,065,164 1,065,164 1,136,942
2005 2005 2006 Budget Amended Budget
Revenues: Property Taxes 36,482,398 36,482,398 38,107,848 All Other Taxes 1,511,134 1,448,084 1,571,584 Special Assessments 213,575 213,575 213,575 Licenses and Permits 696,660 696,660 844,210 Federal Grants 4,565,360 4,739,361 4,953,947 State General Purpose Aid 2,702,765 2,662,609 2,685,583 State Categorical Aid 17,898,912 21,975,982 30,085,444 Charges for Services 7,296,766 7,647,393 9,532,800 Fines and Forfeits 163,750 163,750 166,000Interest on Investments 1,450,925 1,450,925 2,500,925 Miscellaneous Revenues 2,616,317 2,671,739 4,955,218
Total Revenues 34,170,561 34,170,561 35,265,164 Total Revenues 75,598,562 80,152,476 95,617,134 Proceeds from Bond Sales 0 0 0 Proceeds from Bond Sales 0 9,927,555 0 Other Financing Sources 0 0 0 Other Financing Sources 0 0 0 Transfers from Other Funds 0 0 0 Transfers from Other Funds 2,438,143 2,745,868 2,938,640
Total Revenues and Other Sources 34,170,561 34,170,561 35,265,164 Total Revenues and Other Sources 78,036,705 92,825,899 98,555,774 Current Expenditures
General Government Public Safety Streets and Highways (excluding Const.) SanitationHuman ServicesHealthCulture and RecreationConservation of Natural ResourcesEconomic Development & HousingMiscellaneous Current Expenditures
Total Current Expenditures
Debt Service - Principal Interest and Fiscal Charges Streets and Highways Construction Total Capital Outlay
Other Financing UsesTransfers to Other Funds
6,105,780 4,700,929 8,144,256 1,133,901
12,068,406 0
234,334 508,395 483,257
0 33,379,258
652,021 0 0 0 0 0
6,105,780 4,700,929 8,144,256 1,133,901
12,068,406 0
234,334 508,395 483,257
0 33,379,258
652,021 0 0 0 0 0
6,157,226 4,974,423 7,827,329 1,258,833
12,458,759 0
268,673 723,109 505,606
0 34,173,958
1,009,784 0 0 0 0 0
Current Expenditures General Government Public Safety Streets and Highways (excluding Const.) SanitationHuman ServicesHealthCulture and RecreationConservation of Natural ResourcesEconomic Development & HousingMiscellaneous Current Expenditures
Total Current Expenditures
Debt Service - Principal Interest and Fiscal Charges Streets and Highways Construction Total Capital Outlay
Other Financing UsesTransfers to Other Funds
14,523,018 12,806,942 4,455,572
0 17,725,572 2,865,314 3,173,875 2,236,410
0 0
57,786,703
1,195,000 538,240
13,030,000 5,596,619
0 2,488,143
15,531,275 12,996,627 4,741,081
0 17,736,434 3,193,233 3,304,715 2,749,462
0 0
60,252,827 1,195,000
538,240 27,076,312
6,970,741 0
2,438,143
16,769,897 13,446,537 4,777,696
0 18,312,453 2,885,991 3,582,140 2,591,038
0 0
62,365,752 1,648,546
916,405 23,744,000 13,415,200
0 2,809,227
Total Expenditures and Other Uses 34,031,279 34,031,279 35,183,742
Name of County: CASS
Adopted budgets for the following funds: GF: x R&B: x HS: x OSR: x DS: CP: x
Total Expenditures and Other Uses 80,634,705 98,471,263 104,899,130
Name of County: CHIPPEWA
Adopted budgets for the following funds: GF: x R&B: x HS: x OSR: x DS: CP:
Revenues: Property Taxes All Other Taxes Special Assessments Licenses and Permits Federal Grants State General Purpose Aid State Categorical Aid Charges for Services Fines and Forfeits Interest on Investments Miscellaneous Revenues
2005 Budget
14,904,609 547,000
0 63,900
6,185,591 914,434
7,267,649 6,721,583
1,500 675,000
4,078,870
2005 Amended
14,904,609 547,000
0 63,900
6,185,591 914,434
7,267,649 6,721,583
1,500 675,000
4,078,870
2006 Budget
16,216,138 562,000
0 66,900
5,099,930 777,715
6,808,093 7,520,472
1,500 950,000
4,369,176
Revenues: Property Taxes All Other Taxes Special Assessments Licenses and Permits Federal Grants State General Purpose Aid State Categorical Aid Charges for Services Fines and Forfeits Interest on Investments Miscellaneous Revenues
2005 2005 Budget Amended
5,406,889 0 6,500 0
229,292 0 7,425 0
0 0 952,744 0
5,054,733 0 737,963 0
0 0 261,000 0
1,516,244 0
2006 Budget
5,901,302 7,500
235,050 7,625
0 1,081,004 5,530,682
843,514 0
260,000 534,039
Total Revenues 41,360,136 41,360,136 42,371,924 Total Revenues 14,172,790 0 14,400,716 Proceeds from Bond Sales 0 0 0 Proceeds from Bond Sales 0 0 0 Other Financing Sources 0 0 0 Other Financing Sources 0 0 0 Transfers from Other Funds 0 0 350,000 Transfers from Other Funds 0 0 0
Total Revenues and Other Sources 41,360,136 41,360,136 42,721,924 Total Revenues and Other Sources 14,172,790 0 14,400,716 Current Expenditures
General Government Public Safety Streets and Highways (excluding Const.) SanitationHuman ServicesHealthCulture and RecreationConservation of Natural ResourcesEconomic Development & HousingMiscellaneous Current Expenditures
Total Current Expenditures
Debt Service - Principal Interest and Fiscal Charges Streets and Highways Construction Total Capital Outlay
Other Financing UsesTransfers to Other Funds
9,736,609 5,520,406 4,917,072 2,327,000 9,138,399 1,953,025
262,856 1,466,285
0 0
35,321,652
58,250 1,090
5,300,000 943,304
0 0
9,736,609 5,520,406 4,917,072 2,327,000 9,138,399 1,953,025
262,856 1,466,285
0 0
35,321,652 58,250 1,090
5,300,000 943,304
0 0
9,103,485 6,201,104 5,018,983 2,406,924 9,730,349 2,173,012
286,497 1,631,457
35,000 0
36,586,811 37,840
0 3,840,000 1,888,375
0 350,000
Current Expenditures General Government Public Safety Streets and Highways (excluding Const.) SanitationHuman ServicesHealthCulture and RecreationConservation of Natural ResourcesEconomic Development & HousingMiscellaneous Current Expenditures
Total Current Expenditures
Debt Service - Principal Interest and Fiscal Charges Streets and Highways Construction Total Capital Outlay
Other Financing UsesTransfers to Other Funds
2,442,799 1,591,045 1,906,000
180,320 4,444,738
107,463 241,757 637,772 37,905
133,701
0 2,833,558 0 1,720,570 0 2,183,800 0 180,320 0 4,478,212 0 107,463 0 238,068 0 601,450 0 68,605 0 127,881
11,723,500
0 0
3,100,000 712,000
0 0
0 12,539,927 0 0 0 0 0 2,150,000 0 165,500 0 0 0 0
Total Expenditures and Other Uses 41,624,296 41,624,296 42,703,026 Total Expenditures and Other Uses 15,535,500 0 14,855,427
72

x Name of County: CHISAGO
Adopted budgets for the following funds: GF: x R&B: x HS: x OSR: x DS: x CP: Name of County: CLAY
Adopted budgets for the following funds: GF: x R&B: x HS: x OSR: x DS: CP: 2005 2005 2006
Budget Amended BudgetRevenues:
Property Taxes 22,918,798 22,918,798 24,800,308 All Other Taxes 0 0 0 Special Assessments 23,000 23,000 21,500 Licenses and Permits 710,150 710,150 807,150 Federal Grants 4,445,701 4,445,701 9,205,329 State General Purpose Aid 1,807,033 1,807,033 1,763,241 State Categorical Aid 10,353,450 10,353,450 7,701,804 Charges for Services 3,482,287 3,486,487 3,550,848 Fines and Forfeits 437,300 437,300 233,300Interest on Investments 450,000 450,000 450,000 Miscellaneous Revenues 635,000 635,000 1,039,693
2005 2005 2006 Budget Amended Budget
Revenues: Property Taxes 17,455,252 17,455,252 18,662,498 All Other Taxes 290,000 290,000 290,000 Special Assessments 508,500 508,500 508,500 Licenses and Permits 39,980 39,980 95,694 Federal Grants 40,743,195 40,743,195 43,619,801 State General Purpose Aid 2,981,362 2,981,362 3,069,710 State Categorical Aid 44,110,652 44,110,652 48,470,008 Charges for Services 1,940,359 1,940,359 2,117,630 Fines and Forfeits 5,000 5,000 5,000Interest on Investments 256,000 256,000 306,000 Miscellaneous Revenues 947,268 947,268 682,491
Total Revenues 45,262,719 45,266,919 49,573,173 Total Revenues 109,277,568 109,277,568 117,827,332 Proceeds from Bond Sales 0 0 0 Proceeds from Bond Sales 0 0 0 Other Financing Sources 0 0 0 Other Financing Sources 0 0 0 Transfers from Other Funds 0 0 3,025,000 Transfers from Other Funds 0 0 0
Total Revenues and Other Sources 45,262,719 45,266,919 52,598,173 Total Revenues and Other Sources 109,277,568 109,277,568 117,827,332 Current Expenditures
General Government Public Safety Streets and Highways (excluding Const.) SanitationHuman ServicesHealthCulture and RecreationConservation of Natural ResourcesEconomic Development & HousingMiscellaneous Current Expenditures
Total Current Expenditures
Debt Service - Principal Interest and Fiscal Charges Streets and Highways Construction Total Capital Outlay
Other Financing UsesTransfers to Other Funds
7,725,548 7,228,038 4,592,257
308,096 10,718,332 2,431,832
372,000 619,132 65,000
1,812,931 35,873,166
2,153,088 638,720
4,645,000 1,800,000
7,827,152 7,330,278 4,592,257
308,096 10,718,332 2,431,832
372,000 642,858 65,000
2,085,756 36,373,561
2,153,088 638,720
4,645,000 4,377,694
7,914,415 7,666,085 6,393,946
311,334 10,477,656 2,559,103
859,759 656,378 70,000
1,668,835 38,577,511
2,357,000 1,070,932 8,870,825 1,897,000
0 0
Current Expenditures General Government Public Safety Streets and Highways (excluding Const.) SanitationHuman ServicesHealthCulture and RecreationConservation of Natural ResourcesEconomic Development & HousingMiscellaneous Current Expenditures
Total Current Expenditures
Debt Service - Principal Interest and Fiscal Charges Streets and Highways Construction Total Capital Outlay
Other Financing UsesTransfers to Other Funds
5,011,751 6,182,518 4,249,090
0 86,946,188
0 344,416 475,786 364,929 821,985
104,396,663
677,589 499,171
3,085,418 0 0
574,222
5,011,751 6,182,518 4,249,090
0 86,946,188
0 344,416 475,786 364,929 821,985
104,396,663 677,589 499,171
3,085,418 0 0
574,222
5,597,675 6,781,987 4,304,858
0 90,985,220
126,881 363,248 494,550 383,788 811,463
109,849,670 703,062 474,980
5,935,037 0 0
817,782 0 0 0 0
Total Expenditures and Other Uses 45,109,974 48,188,063 52,773,268
Name of County: CLEARWATER
Adopted budgets for the following funds: GF: x R&B: x HS: x OSR: DS: CP:
Total Expenditures and Other Uses 109,233,063 109,233,063 117,780,531
Name of County: COOK
Adopted budgets for the following funds: GF: x R&B: x HS: x OSR: x DS: x CP:2005 2005 2006
Budget Amended BudgetRevenues:
Property Taxes 3,696,786 0 3,738,905 All Other Taxes 208,700 0 216,500 Special Assessments 458,954 0 456,343 Licenses and Permits 12,700 0 11,348 Federal Grants 2,937,514 0 3,135,253 State General Purpose Aid 1,539,368 0 1,715,504 State Categorical Aid 4,938,512 0 4,604,865 Charges for Services 641,317 0 1,136,679 Fines and Forfeits 19,000 0 14,300Interest on Investments 322,500 0 312,520 Miscellaneous Revenues 833,168 0 753,460
2005 2005 2006 Budget Amended Budget
Revenues: Property Taxes 4,344,988 4,344,988 4,562,237 All Other Taxes 124,405 124,405 108,269 Special Assessments 50,000 50,000 50,000 Licenses and Permits 52,000 52,000 77,000 Federal Grants 1,870,839 1,870,839 3,174,026 State General Purpose Aid 976,587 976,587 817,901 State Categorical Aid 2,741,435 2,741,435 2,652,251 Charges for Services 672,589 672,589 723,716 Fines and Forfeits 24,750 24,750 4,200Interest on Investments 230,000 230,000 325,000 Miscellaneous Revenues 346,295 346,295 344,510
Total Revenues 15,608,519 0 16,095,677 Total Revenues 11,433,888 11,433,888 12,839,110 Proceeds from Bond Sales 0 0 0 Proceeds from Bond Sales 0 0 0 Other Financing Sources 0 0 0 Other Financing Sources 0 0 0 Transfers from Other Funds 0 0 0 Transfers from Other Funds 737,848 737,848 715,432
Total Revenues and Other Sources 15,608,519 0 16,095,677 Total Revenues and Other Sources 12,171,736 12,171,736 13,554,542 Current Expenditures
General Government Public Safety Streets and Highways (excluding Const.) SanitationHuman ServicesHealthCulture and RecreationConservation of Natural ResourcesEconomic Development & HousingMiscellaneous Current Expenditures
Total Current Expenditures
Debt Service - Principal Interest and Fiscal Charges Streets and Highways Construction Total Capital Outlay
Other Financing UsesTransfers to Other Funds
13,850,908 0 14,574,648
25,000 0 20,000 15,968 0 14,865
1,769,500 0 2,365,500 490,800 0 517,000
0 0 0 0 0 0
1,998,036 1,940,826 2,126,372
647,639 6,093,003
85,000 316,757 488,788 47,745
106,742
0 2,297,143 0 2,001,437 0 2,236,540 0 699,562 0 6,203,359 0 85,000 0 374,291 0 533,202 0 47,000 0 97,114
Current Expenditures General Government Public Safety Streets and Highways (excluding Const.) SanitationHuman ServicesHealthCulture and RecreationConservation of Natural ResourcesEconomic Development & HousingMiscellaneous Current Expenditures
Total Current Expenditures
Debt Service - Principal Interest and Fiscal Charges Streets and Highways Construction Total Capital Outlay
Other Financing UsesTransfers to Other Funds
2,552,843 1,852,114 2,223,395
430,085 1,337,195
351,908 251,858 120,478 78,306
5,300 9,203,482
871,570 346,516
1,580,277 663,454
0 0
2,552,843 1,852,114 2,223,395
430,085 1,337,195
351,908 251,858 120,478 78,306 5,300
9,203,482 871,570 346,516
1,580,277 663,454
0 0
2,559,679 1,965,155 2,151,218
557,245 1,420,463
362,415 267,603 95,165
109,000 4,456
9,492,399 929,367 291,015
2,744,997 490,566
0 0
Total Expenditures and Other Uses 16,152,176 0 17,492,013 Total Expenditures and Other Uses 12,665,299 12,665,299 13,948,344
73

x Name of County: COTTONWOOD
Adopted budgets for the following funds: GF: x R&B: x HS: x OSR: x DS: x CP: x Name of County: CROW WING
Adopted budgets for the following funds: GF: x R&B: x HS: x OSR: x DS: CP: 2005 2005 2006
Budget Amended BudgetRevenues:
Property Taxes 5,283,164 5,283,164 5,604,999 All Other Taxes 189,500 189,500 7,000 Special Assessments 0 0 0 Licenses and Permits 5,456 5,456 5,500 Federal Grants 931,959 931,959 801,075 State General Purpose Aid 1,571,750 1,571,750 1,907,299 State Categorical Aid 4,431,237 4,431,237 4,233,466 Charges for Services 521,601 521,601 512,870 Fines and Forfeits 20,000 20,000 16,000Interest on Investments 169,650 169,650 185,150 Miscellaneous Revenues 501,155 501,155 474,025
2005 2005 2006 Budget Amended Budget
Revenues: Property Taxes 29,055,074 29,055,074 32,422,710 All Other Taxes 0 0 0 Special Assessments 556,500 556,500 565,000 Licenses and Permits 1,068,160 1,068,160 1,265,760 Federal Grants 6,615,319 6,615,319 7,041,730 State General Purpose Aid 2,141,113 2,141,113 2,083,154 State Categorical Aid 9,922,594 9,922,594 10,272,728 Charges for Services 2,355,663 2,355,663 3,311,879 Fines and Forfeits 10,000 10,000 5,000Interest on Investments 580,000 580,000 1,000,000 Miscellaneous Revenues 3,215,918 3,215,918 3,059,061
Total Revenues 13,625,472 13,625,472 13,747,384 Total Revenues 55,520,341 55,520,341 61,027,022 Proceeds from Bond Sales 0 0 0 Proceeds from Bond Sales 0 0 0 Other Financing Sources 0 0 0 Other Financing Sources 0 0 0 Transfers from Other Funds 0 0 0 Transfers from Other Funds 0 0 0
Total Revenues and Other Sources 13,625,472 13,625,472 13,747,384 Total Revenues and Other Sources 55,520,341 55,520,341 61,027,022 Current Expenditures
General Government Public Safety Streets and Highways (excluding Const.) SanitationHuman ServicesHealthCulture and RecreationConservation of Natural ResourcesEconomic Development & HousingMiscellaneous Current Expenditures
Total Current Expenditures
Debt Service - Principal Interest and Fiscal Charges Streets and Highways Construction Total Capital Outlay
Other Financing UsesTransfers to Other Funds
2,355,981 1,563,252 2,230,313
233,651 4,086,806
1,725 120,233 466,300
7,950 0
11,066,211
185,000 21,000
1,996,735 67,000
2,357,995 1,563,752 2,230,313
251,151 5,517,139
1,725 128,733 471,300
7,950 0
12,530,058 185,000 21,000
1,996,735 39,000
2,290,772 1,469,737 2,591,053
226,028 4,234,876
1,900 137,638 589,379
7,450 0
11,548,833 190,000 21,000
1,694,895 0 0 0
Current Expenditures General Government Public Safety Streets and Highways (excluding Const.) SanitationHuman ServicesHealthCulture and RecreationConservation of Natural ResourcesEconomic Development & HousingMiscellaneous Current Expenditures
Total Current Expenditures
Debt Service - Principal Interest and Fiscal Charges Streets and Highways Construction Total Capital Outlay
Other Financing UsesTransfers to Other Funds
10,188,683 8,064,927 4,749,124
910,575 17,049,758 1,732,052
720,829 1,269,311
0 0
44,685,259
1,463,000 2,896,355 3,847,986 1,040,469
0 0
10,033,903 8,167,942 4,749,124
910,575 17,049,758 1,759,974
723,755 1,270,178
0 0
44,665,209 1,463,000 2,896,355 3,847,986 1,060,519
0 0
11,384,410 9,471,629 5,152,267
904,657 17,916,378 1,950,796
792,416 1,421,493
0 0
48,994,046 3,358,000 2,636,517 3,828,145 1,799,319
0 0
Total Expenditures and Other Uses 53,933,069 53,933,069 60,616,027
Name of County: DODGE
Adopted budgets for the following funds: GF: x R&B: x HS: x OSR: DS: CP: x
Revenues: Property Taxes All Other Taxes Special Assessments Licenses and Permits Federal Grants State General Purpose Aid State Categorical Aid Charges for Services Fines and Forfeits Interest on Investments Miscellaneous Revenues
2005 2005 Budget Amended
7,489,899 0 84,400 0
143,000 0 102,755 0
1,068,914 0 879,929 0
5,061,051 0 2,352,059 0
23,000 0 106,600 0 345,945 0
2006 Budget
8,040,240 83,400
108,903 50,393
1,251,293 967,817
4,340,243 2,577,392
20,900 113,700 377,218
Total Revenues 17,657,552 0 17,931,499 Proceeds from Bond Sales 0 0 0 Other Financing Sources 2,000 0 0 Transfers from Other Funds 478,812 0 357,413
Total Revenues and Other Sources 18,138,364 0 18,288,912
0 0 0 0
Total Expenditures and Other Uses 13,335,946 14,771,793 13,454,728
Name of County: DAKOTA Adopted budgets for the following funds: GF: x R&B: x HS: x OSR: x DS: x CP: x
2005 2005 2006 Budget Amended Budget
Revenues: Property Taxes 107,794,839 107,794,839 112,427,346 All Other Taxes 1,241,000 1,241,000 1,254,685 Special Assessments 0 0 0 Licenses and Permits 770,110 770,110 817,375 Federal Grants 22,755,640 32,281,766 14,617,968 State General Purpose Aid 12,800,000 12,800,000 13,231,163 State Categorical Aid 47,936,953 53,839,355 69,256,205 Charges for Services 55,385,988 55,205,508 60,132,943 Fines and Forfeits 48,000 48,000 48,000Interest on Investments 461,850 461,850 423,350 Miscellaneous Revenues 40,610,074 46,462,135 51,573,402
Total Revenues 289,804,454 310,904,563 323,782,437 Proceeds from Bond Sales 0 6,050,000 0 Other Financing Sources 0 0 0 Transfers from Other Funds 9,289,652 10,025,504 10,378,659
Total Revenues and Other Sources 299,094,106 326,980,067 334,161,096 Current Expenditures
General Government Public Safety Streets and Highways (excluding Const.) SanitationHuman ServicesHealthCulture and RecreationConservation of Natural ResourcesEconomic Development & HousingMiscellaneous Current Expenditures
Total Current Expenditures
Debt Service - Principal Interest and Fiscal Charges Streets and Highways Construction Total Capital Outlay
Other Financing UsesTransfers to Other Funds
53,527,571 31,512,910 8,393,529 8,399,615
92,193,768 12,261,914 13,805,050
619,790 4,121,543
82,595 224,918,285
6,920,000 3,931,502
56,055,619 13,242,056
8,911,934
59,266,155 33,870,217 8,441,116 8,718,186
89,411,406 12,767,087 14,397,185
663,152 3,928,020
82,595 231,545,119
6,920,000 3,931,502
78,828,876 46,155,465
0 0 9,647,786
53,528,946 34,326,246 8,875,398 8,473,825
91,377,583 11,795,476 14,663,960
645,607 3,142,060
82,595 226,911,696
7,185,000 4,096,009
51,442,586 61,096,425
0 10,378,658
3,253,403neral Government Ge 0 3,693,112 3,107,697blic Safety Pu 0 3,271,359 2,218,254eets and Highways (excluding Const.) Str 0 2,307,224
Sanitation 1,291,305 0 1,194,823 3,222,604Human Services 0 3,124,755
548,354 0 617,110 84,965Culture and Recreation
Co0 102,345
213,850nservation of Natural Resources 0 194,244 48,530onomic Development & Housing Ec 0 29,180
0scellaneous Current Expenditures Mi 0 0 Total Current Expenditures 13,988,962 0 14,534,152
Debt Service - Principal 314,416 0 323,496 Interest and Fiscal Charges 86,439 0 49,545 Streets and Highways Construction 2,949,000 0 2,582,000 Total Capital Outlay 685,500 0 726,600
0her Financing Uses Ot 0 0 114,047Transfers to Other Funds 0 0
Total Expenditures and Other Uses 18,138,364 0 18,215,793
Current Expenditures
Health
Total Expenditures and Other Uses 313,979,396 377,028,748 361,110,374
74

Name of County: DOUGLAS Name of County: FARIBAULT Adopted budgets for the following funds: GF: x R&B: x HS: x OSR: x DS: x CP: Adopted budgets for the following funds: GF: x R&B: x HS: x OSR: x DS: x CP: x
2005 2005 2006 2005 2005 2006 Budget Amended Budget Budget Amended Budget
Revenues: Revenues: Property Taxes 15,962,229 15,962,229 16,107,051 Property Taxes 4,918,819 4,918,819 5,363,154 All Other Taxes 57,000 57,000 57,000 All Other Taxes 71,500 71,500 69,500 Special Assessments 0 0 94,768 Special Assessments 358,900 358,900 452,900 Licenses and Permits 476,600 476,600 483,700 Licenses and Permits 970 970 970 Federal Grants 3,062,931 3,134,663 3,175,113 Federal Grants 7,500 7,500 7,500 State General Purpose Aid 5,593,946 5,593,946 6,330,891 State General Purpose Aid 1,638,252 1,638,252 1,516,904 State Categorical Aid 2,198,410 2,126,678 1,887,437 State Categorical Aid 4,474,997 4,474,997 5,914,035 Charges for Services 3,859,684 3,859,684 3,689,366 Charges for Services 501,500 501,500 628,020 Fines and Forfeits 57,500 57,500 61,000 Fines and Forfeits 1,000 1,000 1,000Interest on Investments 202,344 202,344 404,044 Interest on Investments 245,000 245,000 240,000 Miscellaneous Revenues 649,291 649,291 720,190 Miscellaneous Revenues 449,200 449,200 474,200
Total Revenues 32,119,935 32,119,935 33,010,560 Total Revenues 12,667,638 12,667,638 14,668,183 Proceeds from Bond Sales 2,260,000 2,260,000 1,980,000 Proceeds from Bond Sales 0 0 0 Other Financing Sources 0 0 0 Other Financing Sources 500,650 500,650 478,000 Transfers from Other Funds 0 0 0 Transfers from Other Funds 225,000 225,000 168,000
Total Revenues and Other Sources 34,379,935 34,379,935 34,990,560 Total Revenues and Other Sources 13,393,288 13,393,288 15,314,183 Current Expenditures Current Expenditures
General Government 5,556,181 5,558,181 6,168,207 General Government 1,906,152 1,906,152 2,675,730 Public Safety 5,952,513 5,952,513 6,102,356 Public Safety 1,655,540 1,655,540 1,747,290 Streets and Highways (excluding Const.) 3,962,047 3,962,047 3,830,977 Streets and Highways (excluding Const.) 2,429,435 2,429,435 3,293,371 Sanitation 0 0 0 Sanitation 105,500 105,500 123,500 Human Services 7,748,447 7,748,447 8,008,796 Human Services 1,391,486 1,391,486 1,472,179 Health 3,090,748 2,819,930 2,429,190 Health 0 0 0 Culture and Recreation 964,563 1,235,381 1,197,386 Culture and Recreation 478,085 478,085 350,929 Conservation of Natural Resources 285,475 285,475 325,123 Conservation of Natural Resources 420,500 420,500 556,850Economic Development & Housing 41,795 41,795 41,795 Economic Development & Housing 119,350 119,350 122,350Miscellaneous Current Expenditures 0 0 0 Miscellaneous Current Expenditures 906,890 906,890 951,000
Total Current Expenditures 27,601,769 27,603,769 28,103,830 Total Current Expenditures 9,412,938 9,412,938 11,293,199
Debt Service - Principal 754,549 1,245,000 1,570,000 Debt Service - Principal 870,000 870,000 555,000 Interest and Fiscal Charges 996,617 506,166 603,623 Interest and Fiscal Charges 182,480 182,480 164,700 Streets and Highways Construction 5,027,000 5,027,000 4,076,776 Streets and Highways Construction 2,294,200 2,294,200 3,665,700 Total Capital Outlay 0 0 0 Total Capital Outlay 350,000 350,000 355,500
Other Financing Uses 0 0 636,331 Other Financing Uses 0 0 0 Transfers to Other Funds 0 0 0 Transfers to Other Funds 225,000 225,000 168,000
Total Expenditures and Other Uses 34,379,935 34,381,935 34,990,560 Total Expenditures and Other Uses 13,334,618 13,334,618 16,202,099
Name of County: FILLMORE Name of County: FREEBORN Adopted budgets for the following funds: GF: x R&B: x HS: x OSR: x DS: x CP: Adopted budgets for the following funds: GF: x R&B: x HS: x OSR: x DS: x CP: x
2005 2005 2006 2005 2005 2006 Budget Amended Budget Budget Amended Budget
Revenues: Revenues: Property Taxes 6,322,273 5,844,521 6,275,570 Property Taxes 12,940,195 0 14,193,660 All Other Taxes 187,760 187,760 265,323 All Other Taxes 221,600 0 59,300 Special Assessments 0 0 0 Special Assessments 1,052,017 0 777,030 Licenses and Permits 53,740 53,740 48,090 Licenses and Permits 77,700 0 117,700 Federal Grants 1,800,023 1,800,023 1,937,343 Federal Grants 3,987,545 0 3,933,555 State General Purpose Aid 1,295,709 1,773,461 1,692,837 State General Purpose Aid 1,679,438 0 1,672,410 State Categorical Aid 6,356,567 6,356,567 8,103,597 State Categorical Aid 6,581,893 0 8,153,710 Charges for Services 2,153,029 2,153,029 1,926,148 Charges for Services 2,111,074 0 2,235,574 Fines and Forfeits 111,500 111,500 0 Fines and Forfeits 170,500 0 45,500Interest on Investments 95,000 95,000 95,000 Interest on Investments 800,000 0 800,000 Miscellaneous Revenues 526,000 526,000 462,666 Miscellaneous Revenues 1,133,232 0 1,476,624
Total Revenues 18,901,601 18,901,601 20,806,574 Total Revenues 30,755,194 0 33,465,063 Proceeds from Bond Sales 0 0 0 Proceeds from Bond Sales 0 0 0 Other Financing Sources 500,600 500,600 490,100 Other Financing Sources 25,700 0 25,700 Transfers from Other Funds 0 0 0 Transfers from Other Funds 0 0 0
Total Revenues and Other Sources 19,402,201 19,402,201 21,296,674 Total Revenues and Other Sources 30,780,894 0 33,490,763 Current Expenditures Current Expenditures
General Government 2,828,688 2,869,875 2,690,642 General Government 4,494,869 0 4,567,475 Public Safety 3,286,093 3,303,069 2,859,433 Public Safety 3,668,064 0 3,880,096 Streets and Highways (excluding Const.) 2,864,167 2,864,167 2,324,840 Streets and Highways (excluding Const.) 3,245,056 0 3,419,761 Sanitation 562,188 581,375 561,897 Sanitation 389,606 0 389,606 Human Services 3,766,439 3,766,439 3,432,897 Human Services 10,471,016 0 10,505,986 Health 1,374,924 1,374,924 1,414,290 Health 1,271,191 0 1,275,811 Culture and Recreation 209,100 209,100 214,250 Culture and Recreation 494,485 0 471,485 Conservation of Natural Resources 552,414 552,414 616,929 Conservation of Natural Resources 1,229,778 0 988,268Economic Development & Housing 496,188 496,188 497,827 Economic Development & Housing 0 0 28,000Miscellaneous Current Expenditures 198,871 198,871 118,670 Miscellaneous Current Expenditures 0 0 0
Total Current Expenditures 16,139,072 16,216,422 14,731,675 Total Current Expenditures 25,264,065 0 25,526,488
Debt Service - Principal 149,985 149,985 151,871 Debt Service - Principal 1,305,000 0 1,654,000 Interest and Fiscal Charges 125,270 125,270 121,318 Interest and Fiscal Charges 1,157,850 0 732,775 Streets and Highways Construction 3,453,860 3,453,860 5,498,710 Streets and Highways Construction 3,601,582 0 4,837,000 Total Capital Outlay 548,500 689,842 928,100 Total Capital Outlay 130,000 0 680,500
Other Financing Uses 0 0 0 Other Financing Uses 95,000 0 60,000 Transfers to Other Funds 0 0 0 Transfers to Other Funds 0 0 0
Total Expenditures and Other Uses 20,416,687 20,635,379 21,431,674 Total Expenditures and Other Uses 31,553,497 0 33,490,763
75

x Name of County: GOODHUE
Adopted budgets for the following funds: GF: x R&B: x HS: x OSR: x DS: x CP: x Name of County: GRANT
Adopted budgets for the following funds: GF: x R&B: x HS: x OSR: x DS: CP: 2005 2005 2006 2005 2005 2006
Budget Amended Budget Budget Amended BudgetRevenues: Revenues:
Property Taxes 23,660,780 23,660,780 23,660,780 Property Taxes 3,394,318 3,394,318 3,821,148 All Other Taxes 327,500 327,500 331,500 All Other Taxes 71,100 71,100 62,800 Special Assessments 13,000 13,000 13,000 Special Assessments 0 0 0 Licenses and Permits 632,210 613,490 579,245 Licenses and Permits 35 35 6,075 Federal Grants 3,024,197 3,029,463 4,977,816 Federal Grants 736,537 736,537 768,537 State General Purpose Aid 1,755,421 1,755,421 1,745,039 State General Purpose Aid 601,724 601,724 563,324 State Categorical Aid 6,136,836 6,314,999 8,260,191 State Categorical Aid 2,997,703 2,997,703 4,294,558 Charges for Services 5,099,758 5,110,283 5,548,211 Charges for Services 332,927 332,927 287,340 Fines and Forfeits 20,200 20,200 21,200 Fines and Forfeits 0 0 0 Interest on Investments 303,900 303,900 622,800 Interest on Investments 35,000 35,000 40,000 Miscellaneous Revenues 1,139,902 1,199,902 1,220,321 Miscellaneous Revenues 217,330 217,330 319,752
Total Revenues 42,113,704 42,348,938 46,980,103 Total Revenues 8,386,674 8,386,674 10,163,534 Proceeds from Bond Sales 0 0 0 Proceeds from Bond Sales 0 0 0 Other Financing Sources 1,306,159 1,306,159 0 Other Financing Sources 0 0 0 Transfers from Other Funds 584,500 584,500 470,000 Transfers from Other Funds 0 0 0
Total Revenues and Other Sources 44,004,363 44,239,597 47,450,103 Total Revenues and Other Sources 8,386,674 8,386,674 10,163,534 Current Expenditures
General Government Public Safety Streets and Highways (excluding Const.) SanitationHuman ServicesHealthCulture and RecreationConservation of Natural ResourcesEconomic Development & HousingMiscellaneous Current Expenditures
Total Current Expenditures
Debt Service - Principal Interest and Fiscal Charges Streets and Highways Construction Total Capital Outlay
Other Financing UsesTransfers to Other Funds
7,838,882 7,514,484 8,794,840 9,451,298 9,487,507 10,560,804 3,334,743 3,334,743 3,487,473
914,572 914,572 692,162 8,250,713 8,250,713 8,586,989 3,959,943 4,071,976 3,443,837
432,558 493,558 525,883 499,927 726,494 574,853
5,000 5,000 5,000 0 0 0
34,687,636 34,799,047 36,671,841
2,026,701 2,026,701 2,256,807 996,672 996,672 679,058
4,987,454 4,987,454 7,637,739 0 0 0 0 0 0
605,900 605,900 470,000
Current Expenditures General Government Public Safety Streets and Highways (excluding Const.) SanitationHuman ServicesHealthCulture and RecreationConservation of Natural ResourcesEconomic Development & HousingMiscellaneous Current Expenditures
Total Current Expenditures
Debt Service - Principal Interest and Fiscal Charges Streets and Highways Construction Total Capital Outlay
Other Financing UsesTransfers to Other Funds
1,561,951 1,561,951 1,982,349 923,958 923,958 939,809
1,018,000 1,018,000 1,096,860 0 0 0
2,207,428 2,207,428 3,381,846 152,370 152,370 142,850 69,941 69,941 86,884
306,347 306,347 186,625 0 0 0
221,435 221,435 510,556 6,461,430 6,461,430 8,327,779
70,000 70,000 70,000 6,676 6,676 2,765
1,565,884 1,565,884 3,375,000 505,125 505,125 221,500
0 0 0 0 0 0
Total Expenditures and Other Uses 43,304,363 43,415,774 47,715,445
Name of County: HENNEPIN Adopted budgets for the following funds: GF: x R&B: x HS: x OSR: x DS: x CP: x
2005 2005 2006 Budget Amended Budget
Revenues: Property Taxes 503,350,512 503,350,512 525,839,635 All Other Taxes 2,490,860 2,490,860 2,456,563 Special Assessments 0 0 0 Licenses and Permits 5,570,699 5,570,699 6,496,230 Federal Grants 169,880,606 178,630,472 171,590,612 State General Purpose Aid 31,604,399 31,604,399 30,937,946 State Categorical Aid 159,568,890 151,661,916 163,068,478 Charges for Services 124,070,143 124,211,643 66,120,877 Fines and Forfeits 1,349,500 1,347,500 1,362,500Interest on Investments 17,596,374 17,596,374 16,973,514 Miscellaneous Revenues 129,142,501 128,565,682 206,312,250
Total Revenues 1,144,624,484 1,145,030,057 1,191,158,605 Proceeds from Bond Sales 0 0 0 Other Financing Sources 0 0 0 Transfers from Other Funds 0 0 0
Total Revenues and Other Sources 1,144,624,484 1,145,030,057 1,191,158,605 Current Expenditures
General Government 117,063,241 115,583,128 124,146,048 Public Safety 206,463,362 207,302,910 222,944,827 Streets and Highways (excluding Const.) 28,585,811 28,585,811 27,816,511 Sanitation 0 0 0 Human Services 506,964,995 508,915,609 493,281,795 Health 35,747,620 34,843,144 37,443,300 Culture and Recreation 37,776,799 37,776,799 38,938,311 Conservation of Natural Resources 992,569 992,569 1,038,108Economic Development & Housing 0 0 0 Miscellaneous Current Expenditures 14,795,482 14,795,482 16,013,214
Total Current Expenditures 948,389,879 948,795,452 961,622,114
Debt Service - Principal 30,110,000 30,110,000 30,030,000 Interest and Fiscal Charges 19,589,661 19,589,661 21,058,722 Streets and Highways Construction 3,392,944 3,392,944 3,509,149 Total Capital Outlay 143,142,000 143,142,000 174,938,620
Other Financing Uses 0 0 0 Transfers to Other Funds 0 0 0
Total Expenditures and Other Uses 1,144,624,484 1,145,030,057 1,191,158,605
Total Expenditures and Other Uses
Name of County: HOUSTON
Adopted budgets for the following funds: GF:
8,609,115 8,609,115 11,997,044
x R&B: x HS: x OSR: DS: CP:
Revenues: Property Taxes All Other Taxes Special Assessments Licenses and Permits Federal Grants State General Purpose Aid State Categorical Aid Charges for Services Fines and Forfeits Interest on Investments Miscellaneous Revenues
2005 2005 Budget Amended
5,700,402 0 131,200 0
0 0 45,925 0
2,074,327 0 1,107,535 0 7,282,114 0 1,631,300 0
18,000 0 169,050 0 281,835 0
2006 Budget
6,211,402 129,300
0 48,115
2,054,386 1,130,369 5,862,051 1,959,235
18,000 196,600 291,295
Total Revenues 18,441,688 0 17,900,753 Proceeds from Bond Sales 0 0 0 Other Financing Sources 91,853 0 240,447 Transfers from Other Funds 0 0 0
Total Revenues and Other Sources 18,533,541 0 18,141,200 Current Expenditures
General Government Public Safety Streets and Highways (excluding Const.) SanitationHuman ServicesHealthCulture and RecreationConservation of Natural ResourcesEconomic Development & HousingMiscellaneous Current Expenditures
Total Current Expenditures
Debt Service - Principal Interest and Fiscal Charges Streets and Highways Construction Total Capital Outlay
Other Financing UsesTransfers to Other Funds
2,390,033 2,006,339 2,434,889
696,956 3,989,282 1,217,587
191,384 286,256 63,850
216,500
0 2,662,687 0 2,166,270 0 2,828,468 0 830,149 0 4,089,778 0 1,458,434 0 234,689 0 325,565 0 62,955 0 235,600
13,493,076
0 0
5,040,465 0 0 0
0 14,894,595 0 0 0 0 0 3,246,605 0 0 0 0 0 0
Total Expenditures and Other Uses 18,533,541 0 18,141,200
76

x Name of County: HUBBARD
Adopted budgets for the following funds: GF: x R&B: x HS: x OSR: x DS: CP: Name of County: ISANTI
Adopted budgets for the following funds: GF: x R&B: x HS: x OSR: DS: CP: 2005 2005 2006
Budget Amended BudgetRevenues:
Property Taxes 8,356,727 0 9,063,601 All Other Taxes 755,159 0 1,187,359 Special Assessments 1,760,000 0 1,780,000 Licenses and Permits 1,336,463 0 2,030,140 Federal Grants 2,381,138 0 2,514,262 State General Purpose Aid 775,593 0 625,658 State Categorical Aid 5,261,807 0 4,782,605 Charges for Services 547,367 0 1,017,843 Fines and Forfeits 365,000 0 525,600Interest on Investments 350,000 0 400,000 Miscellaneous Revenues 1,066,479 0 1,561,778
2005 2005 2006 Budget Amended Budget
Revenues: Property Taxes 12,294,435 12,294,435 12,966,776 All Other Taxes 82,300 82,300 65,000 Special Assessments 0 0 0 Licenses and Permits 486,725 486,725 540,790 Federal Grants 3,893,626 3,893,626 5,337,182 State General Purpose Aid 1,562,640 1,562,640 1,445,022 State Categorical Aid 7,574,721 7,574,721 8,433,820 Charges for Services 2,089,670 2,089,670 2,815,826 Fines and Forfeits 114,775 114,775 0 Interest on Investments 340,000 340,000 340,000 Miscellaneous Revenues 718,562 718,562 317,253
Total Revenues 22,955,733 0 25,488,846 Total Revenues 29,157,454 29,157,454 32,261,669 Proceeds from Bond Sales 0 0 0 Proceeds from Bond Sales 0 0 0 Other Financing Sources 0 0 0 Other Financing Sources 168,435 168,435 193,382 Transfers from Other Funds 13,750 0 13,750 Transfers from Other Funds 0 0 0
Total Revenues and Other Sources 22,969,483 0 25,502,596 Total Revenues and Other Sources 29,325,889 29,325,889 32,455,051 Current Expenditures Current Expenditures
General Government 3,610,807 0 4,204,910 General Government Public Safety 2,888,125 0 3,386,920 Public Safety Streets and Highways (excluding Const.) 2,875,700 0 4,313,600 Streets and Highways (excluding Const.) Sanitation 1,836,207 0 1,954,150 Sanitation Human Services 6,021,766 0 6,942,689 Human Services Health 6,800 0 6,800 Health Culture and Recreation 362,013 0 311,607 Culture and RecreationConservation of Natural Resources 897,375 0 956,354 Conservation of Natural Resources Economic Development & Housing 20,000 0 50,000 Economic Development & Housing Miscellaneous Current Expenditures 0 0 0 Miscellaneous Current Expenditures
Total Current Expenditures 18,518,793 0 22,127,030 Total Current Expenditures
Debt Service - Principal 0 0 0 Debt Service - Principal Interest and Fiscal Charges 0 0 0 Interest and Fiscal Charges Streets and Highways Construction 3,967,200 0 2,386,500 Streets and Highways Construction Total Capital Outlay 850,560 0 432,500 Total Capital Outlay
Other Financing Uses 0 0 0 Other Financing Uses Transfers to Other Funds 13,750 0 13,750 Transfers to Other Funds
Total Expenditures and Other Uses 23,350,303 0 24,959,780 Total Expenditures and Other Uses
ITASCAName of County: JACKSONName of County: Adopted budgets for the following funds: GF: x xR&B: HS: x OSR: x DS: x CP: x Adopted budgets for the following funds: GF:
5,453,113 4,839,771 1,733,057
191,801 10,220,971 1,248,676
304,423 340,636
0 594,794
24,927,242
550,000 324,487
2,900,150 624,010
0 0
5,453,113 4,839,771 1,733,057
191,801 10,220,971 1,248,676
304,423 340,636
0 594,794
24,927,242 550,000 324,487
2,900,150 624,010
0 0
5,444,685 5,277,534 1,830,386
190,494 10,908,183 1,368,811
524,930 344,215
0 645,686
26,534,924 590,000 363,097
4,301,736 665,294
0 0
29,325,889 29,325,889 32,455,051
x R&B: x HS: x OSR: DS: x CP:
Revenues: Property Taxes All Other Taxes Special Assessments Licenses and Permits Federal Grants State General Purpose Aid State Categorical Aid Charges for Services Fines and Forfeits Interest on Investments Miscellaneous Revenues
2005 Budget
23,045,719 80,000
880,755 48,000
5,179,152 3,995,553
13,728,233 4,304,480
0 650,000 661,000
2005 Amended
23,045,719 80,000
880,755 48,000
5,179,152 3,995,553
13,728,233 4,304,480
0 650,000 661,000
2006 Budget
24,106,731 83,000
828,274 52,000
5,457,781 1,422,833
15,291,007 4,727,315
0 650,000
1,450,006
Revenues: Property Taxes All Other Taxes Special Assessments Licenses and Permits Federal Grants State General Purpose Aid State Categorical Aid Charges for Services Fines and Forfeits Interest on Investments Miscellaneous Revenues
2005 2005 Budget Amended
6,565,960 0 28,700 0
0 0 12,300 0
865,243 0 837,545 0
4,525,194 0 391,000 0
500 0 225,000 0 612,881 0
2006 Budget
6,945,683 28,800
0 12,500
866,675 819,109
4,490,815 387,075
500 225,000 419,276
Total Revenues 52,572,892 52,572,892 54,068,947 Total Revenues 14,064,323 0 14,195,433 Proceeds from Bond Sales 0 0 0 Proceeds from Bond Sales 0 0 0 Other Financing Sources 17,000,000 17,000,000 17,000,000 Other Financing Sources 37,752 0 0 Transfers from Other Funds 11,545,445 11,545,445 11,543,315 Transfers from Other Funds 0 0 0
Total Revenues and Other Sources 81,118,337 81,118,337 82,612,262 Total Revenues and Other Sources 14,102,075 0 14,195,433 Current Expenditures
General Government Public Safety Streets and Highways (excluding Const.) SanitationHuman ServicesHealthCulture and RecreationConservation of Natural ResourcesEconomic Development & HousingMiscellaneous Current Expenditures
Total Current Expenditures
Debt Service - Principal Interest and Fiscal Charges Streets and Highways Construction Total Capital Outlay
Other Financing UsesTransfers to Other Funds
6,301,468 6,861,266 9,695,004 1,429,454
18,366,666 0
584,304 1,833,881
118,750 1,941,190
47,131,983
1,090,000 357,603
3,993,306 1,268,002
17,000,000 11,545,445
6,301,468 6,861,266 9,695,004 1,429,454
18,366,666 0
584,304 1,833,881
118,750 1,941,190
47,131,983 1,090,000
357,603 3,993,306 1,268,002
17,000,000 11,545,445
6,927,689 7,416,979
11,297,454 1,376,973
18,422,914 0
647,652 1,946,320
145,000 1,963,068
50,144,049 1,158,589
325,151 3,441,158
0 17,000,000 11,543,315
Current Expenditures General Government Public Safety Streets and Highways (excluding Const.) SanitationHuman ServicesHealthCulture and RecreationConservation of Natural ResourcesEconomic Development & HousingMiscellaneous Current Expenditures
1,865,184 1,442,085 2,145,000
118,212 3,696,909
162,263 592,214 378,898
3,380 1,168,060
0 1,895,525 0 1,493,906 0 2,256,000 0 116,327 0 3,830,967 0 167,517 0 592,388 0 347,172 0 3,380 0 1,141,494
Total Current Expenditures 11,572,205 0 11,844,676
Debt Service - Principal 255,000 0 265,000 Interest and Fiscal Charges 182,095 0 172,095 Streets and Highways Construction 4,328,000 0 2,699,000 Total Capital Outlay 342,500 0 393,000
0her Financing Uses Ot 0 0 0Transfers to Other Funds 0 0
Total Expenditures and Other Uses 16,679,800 0 15,373,771Total Expenditures and Other Uses 82,386,339 82,386,339 83,612,262
77

2006
x x Name of County: KANABEC
Adopted budgets for the following funds: GF: x R&B: x HS: x OSR: x DS: CP: x Name of County: KANDIYOHI
Adopted budgets for the following funds: GF: x R&B: x HS: x OSR: x DS: CP:
Revenues: Property Taxes All Other Taxes Special Assessments Licenses and Permits Federal Grants State General Purpose Aid State Categorical Aid Charges for Services Fines and Forfeits Interest on Investments Miscellaneous Revenues
2005 2005 Budget Amended
7,867,086 0 73,000 0 65,976 0 68,300 0
1,474,862 0 1,216,441 0 4,119,581 0
507,894 0 50,000 0
159,200 0 1,544,234 0
2006 Budget
8,257,871 182,500
10 66,475
1,718,379 2,299,579 3,056,613
599,739 0
122,962 1,930,045
Revenues: Property Taxes All Other Taxes Special Assessments Licenses and Permits Federal Grants State General Purpose Aid State Categorical Aid Charges for Services Fines and Forfeits Interest on Investments Miscellaneous Revenues
2005 2005 Budget Amended
18,095,774 0 0 0
825,000 0 0 0 0 0
4,410,003 0 14,014,700 0 11,570,619 0
0 0 550,000 0
3,299,282 0
Budget
19,542,715 0
850,000 0 0
3,956,635 15,512,511 12,902,630
0 900,000
4,077,700 Total Revenues 17,146,574 0 18,234,173 Total Revenues 52,765,378 0 57,742,191
Proceeds from Bond Sales 0 0 0 Proceeds from Bond Sales 0 0 0 Other Financing Sources 0 0 194,004 Other Financing Sources 0 0 0 Transfers from Other Funds 347,175 0 350,625 Transfers from Other Funds 0 0 0
Total Revenues and Other Sources 17,493,749 0 18,778,802 Total Revenues and Other Sources 52,765,378 0 57,742,191 Current Expenditures Current Expenditures
General Government 2,862,910 0 3,034,434 General Government Public Safety 2,814,616 0 2,913,156 Public Safety Streets and Highways (excluding Const.) 2,285,175 0 2,433,504 Streets and Highways (excluding Const.) Sanitation 161,594 0 157,491 Sanitation Human Services 4,178,957 0 4,433,582 Human Services Health 1,885,619 0 1,900,993 Health Culture and Recreation 137,803 0 152,488 Culture and RecreationConservation of Natural Resources 140,848 0 148,932 Conservation of Natural Resources Economic Development & Housing 0 0 0 Economic Development & Housing Miscellaneous Current Expenditures 0 0 284,073 Miscellaneous Current Expenditures
Total Current Expenditures 14,467,522 0 15,458,653 Total Current Expenditures
Debt Service - Principal 255,000 0 270,000 Debt Service - Principal Interest and Fiscal Charges 269,300 0 257,751 Interest and Fiscal Charges Streets and Highways Construction 1,597,925 0 1,970,000 Streets and Highways Construction Total Capital Outlay 556,827 0 471,773 Total Capital Outlay
Other Financing Uses 0 0 0 Other Financing Uses Transfers to Other Funds 347,175 0 350,625 Transfers to Other Funds
Total Expenditures and Other Uses 17,493,749 0 18,778,802 Total Expenditures and Other Uses
KITTSONName of County: KOOCHICHINGName of County: Adopted budgets for the following funds: GF: x xR&B: HS: x OSR: x DS: CP: Adopted budgets for the following funds: GF:
5,999,312 0 6,533,850 11,265,700 0 11,987,700 4,014,000 0 3,745,000
0 0 0 12,556,700 0 13,161,400 1,815,000 0 2,262,400
533,550 0 560,700 277,800 0 282,000
1,000 0 0 2,925,916 0 3,392,100
39,388,978 0 41,925,150
2,110,000 0 2,195,000 1,055,800 0 972,100 9,166,000 0 10,967,000 1,680,700 0 2,373,800
0 0 0 0 0 0
53,401,478
x R&B: x HS: x OSR:
0 58,433,050
x DS: CP: 2005 2005 2006
Budget Amended BudgetRevenues:
Property Taxes 1,960,771 0 2,077,779 All Other Taxes 45,400 0 49,410 Special Assessments 63,200 0 92,750 Licenses and Permits 1,725 0 1,950 Federal Grants 428,163 0 1,229,720 State General Purpose Aid 796,487 0 780,668 State Categorical Aid 4,800,254 0 4,341,371 Charges for Services 579,786 0 687,723 Fines and Forfeits 8,500 0 12,600Interest on Investments 151,600 0 201,100 Miscellaneous Revenues 179,420 0 201,582
2005 2005 2006 Budget Amended Budget
Revenues: Property Taxes 2,581,781 2,581,781 2,680,774 All Other Taxes 306,000 306,000 308,000 Special Assessments 0 0 0 Licenses and Permits 15,000 15,000 16,000 Federal Grants 1,654,085 1,654,085 3,624,054 State General Purpose Aid 2,387,271 2,387,271 2,458,915 State Categorical Aid 5,092,135 5,092,135 12,910,033 Charges for Services 2,590,074 2,590,074 2,666,574 Fines and Forfeits 1,600 1,600 1,600Interest on Investments 250,000 250,000 300,000 Miscellaneous Revenues 376,491 379,291 282,000
Total Revenues 9,015,306 0 9,676,653 Total Revenues 15,254,437 15,257,237 25,247,950 Proceeds from Bond Sales 0 0 0 Proceeds from Bond Sales 0 0 0 Other Financing Sources 0 0 0 Other Financing Sources 1,340,000 1,340,000 1,482,000 Transfers from Other Funds 13,864 0 0 Transfers from Other Funds 154,492 154,492 154,492
Total Revenues and Other Sources 9,029,170 0 9,676,653 Total Revenues and Other Sources 16,748,929 16,751,729 26,884,442 Current Expenditures Current Expenditures
General Government 1,334,742 0 1,466,914 General Government Public Safety 837,698 0 903,548 Public Safety Streets and Highways (excluding Const.) 2,139,165 0 2,321,527 Streets and Highways (excluding Const.) Sanitation 86,993 0 78,659 Sanitation Human Services 1,218,106 0 1,188,768 Human Services Health 36,568 0 36,568 Health Culture and Recreation 124,602 0 172,849 Culture and RecreationConservation of Natural Resources 264,194 0 301,660 Conservation of Natural Resources Economic Development & Housing 21,600 0 21,600 Economic Development & Housing Miscellaneous Current Expenditures 47,812 0 0 Miscellaneous Current Expenditures
Total Current Expenditures 6,111,480 0 6,492,093 Total Current Expenditures
Debt Service - Principal 0 0 0 Debt Service - Principal Interest and Fiscal Charges 0 0 0 Interest and Fiscal Charges Streets and Highways Construction 2,798,353 0 3,200,598 Streets and Highways Construction Total Capital Outlay 0 0 0 Total Capital Outlay
Other Financing Uses 0 0 0 Other Financing Uses Transfers to Other Funds 0 0 0 Transfers to Other Funds
2,662,932 2,415,732 2,757,062 1,792,313 1,788,613 1,843,456 2,040,930 2,040,930 1,940,342
995,152 995,152 1,017,287 4,455,979 4,457,759 4,638,609
990,385 1,018,175 890,610 134,779 134,779 184,099
1,315,448 1,315,448 10,058,474 151,172 151,172 330,786
0 0 0 14,539,090
0 0
2,726,467 452,827
0 0
14,317,760 0 0
2,726,467 452,827
0 0
23,660,725 0 0
3,470,556 823,695
0 0
Total Expenditures and Other Uses 8,909,833 0 9,692,691 Total Expenditures and Other Uses 17,718,384 17,497,054 27,954,976
78
x

2006
0
x x Name of County: LAC QUI PARLE
Adopted budgets for the following funds: GF:
Revenues:
x R&B: x HS: x OSR: DS: CP: 2005 2005 2006
Budget Amended Budget
Name of County: LAKE
Adopted budgets for the following funds: GF: x R&B: x HS: x OSR: x DS: CP:
Revenues: Property Taxes All Other Taxes Special Assessments Licenses and Permits Federal Grants State General Purpose Aid State Categorical Aid Charges for Services Fines and Forfeits Interest on Investments Miscellaneous Revenues
2005 2005 Budget Amended
5,890,629 0 1,211,800 0
0 0 20,797 0
1,531,875 0 793,831 0
8,882,815 0 713,280 0 85,250 0
301,500 0 866,299 0
Budget
6,571,173 1,215,300
55,555 1,956,195
697,632 11,224,518
705,903 2,000
387,925 1,164,048
Property Taxes All Other Taxes Special Assessments Licenses and Permits Federal Grants State General Purpose Aid State Categorical Aid Charges for Services Fines and Forfeits Interest on Investments Miscellaneous Revenues
2,900,205 0 3,055,636 42,600 0 113,100
100,000 0 0 23,000 0 3,000
1,497,741 0 1,070,130 1,008,897 0 993,580 3,246,884 0 4,102,145
272,810 0 417,025 11,000 0 11,000
125,000 0 150,000 126,256 0 176,724
Total Revenues 9,354,393 0 10,092,340 Total Revenues 20,298,076 0 23,980,249 Proceeds from Bond Sales 0 0 0 Proceeds from Bond Sales 2,000,000 0 0 Other Financing Sources 0 0 0 Other Financing Sources 0 0 0 Transfers from Other Funds 39,000 0 0 Transfers from Other Funds 239,800 0 1,242,465
Total Revenues and Other Sources 9,393,393 0 10,092,340 Total Revenues and Other Sources 22,537,876 0 25,222,714 Current Expenditures
General Government Public Safety Streets and Highways (excluding Const.) SanitationHuman ServicesHealthCulture and RecreationConservation of Natural ResourcesEconomic Development & HousingMiscellaneous Current Expenditures
1,199,609 0 678,880 0
1,925,500 0 0 0
1,827,415 0 67,539 0 24,150 0
379,986 0 50,000 0
203,314 0
1,231,493 743,136
1,936,400 0
1,875,816 67,539 82,842
398,840 50,000
126,274
Current Expenditures General Government Public Safety Streets and Highways (excluding Const.) SanitationHuman ServicesHealthCulture and RecreationConservation of Natural ResourcesEconomic Development & HousingMiscellaneous Current Expenditures
Total Current Expenditures
Debt Service - Principal Interest and Fiscal Charges Streets and Highways Construction Total Capital Outlay
Other Financing UsesTransfers to Other Funds
3,429,905 0 3,679,959 2,362,662 0 2,575,384 2,840,793 0 2,498,138
333,387 0 346,717 3,757,562 0 3,502,255
368,522 0 402,202 455,418 0 393,199
1,044,142 0 1,156,947 47,396 0 45,051
5,900 0 134,393 Total Current Expenditures
Debt Service - Principal Interest and Fiscal Charges Streets and Highways Construction Total Capital Outlay
Other Financing Uses Transfers to Other Funds
6,356,393 0 6,512,340
0 0 0 0 0 0
2,530,000 0 3,110,000 507,000 0 470,000
0 0 0 0 0 0
14,645,687
550,000 140,085
4,610,800 3,886,858
0 129,800
0 14,734,245 0 615,000 0 266,556 0 7,102,553 0 2,604,724 0 0 0 1,000,000
Total Expenditures and Other Uses
Name of County: LAKE OF THE WOODS Adopted budgets for the following funds: GF:
Revenues:
9,393,393 0 10,092,340
x R&B: x HS: x OSR: x DS: x CP: 2005 2005 2006
Budget Amended Budget
1,901,701 0 2,046,189 470,578 0 488,684 524,228 0 494,608 51,000 0 51,000
547,932 0 889,881 2,045,555 0 1,538,949 3,829,102 0 3,357,895
232,190 0 237,790 10,500 0 10,500 15,000 0 25,000
175,747 0 194,151
Total Expenditures and Other Uses 23,963,230
Name of County: LE SUEUR
Adopted budgets for the following funds: GF: x R&B: x HS: x OSR:
0 26,323,078
x DS: CP:
Revenues: Property Taxes All Other Taxes Special Assessments Licenses and Permits Federal Grants State General Purpose Aid State Categorical Aid Charges for Services Fines and Forfeits Interest on Investments Miscellaneous Revenues
2005 Budget
8,750,752 187,859 100,000 244,800
2,645,410 2,335,779 8,389,844
922,923 374,610 250,602 112,573
2005 Amended
8,750,752 204,746 100,000 244,800
2,253,910 2,335,779 5,305,560
922,923 374,610 390,602 151,789
2006 Budget
9,465,312 188,900 103,500 266,698
2,609,998 2,404,969 6,658,658 1,128,340
507,410 300,300 579,324
Property Taxes All Other Taxes Special Assessments Licenses and Permits Federal Grants State General Purpose Aid State Categorical Aid Charges for Services Fines and Forfeits Interest on Investments Miscellaneous Revenues
Total Revenues 9,803,533 0 9,334,647 Total Revenues 24,315,152 21,035,471 24,213,409 Proceeds from Bond Sales 0 0 0 Proceeds from Bond Sales 1,057,949 2,926,792 2,865,968 Other Financing Sources 0 0 0 Other Financing Sources 231,095 365,095 98,361 Transfers from Other Funds 0 0 300,885 Transfers from Other Funds 916,137 916,137 177,585
Total Revenues and Other Sources 9,803,533 0 9,635,532 Total Revenues and Other Sources 26,520,333 25,243,495 27,355,323 Current Expenditures
General Government Public Safety Streets and Highways (excluding Const.) SanitationHuman ServicesHealthCulture and RecreationConservation of Natural ResourcesEconomic Development & HousingMiscellaneous Current Expenditures
1,663,259 0 1,817,037 806,449 0 788,186
1,906,564 0 1,943,529 535,100 0 541,897
1,353,571 0 1,387,017 59,700 0 61,700
162,640 0 173,676 139,149 0 110,465 133,120 0 104,720
50,170 0 61,870
Current Expenditures General Government Public Safety Streets and Highways (excluding Const.) SanitationHuman ServicesHealthCulture and RecreationConservation of Natural ResourcesEconomic Development & HousingMiscellaneous Current Expenditures
Total Current Expenditures
Debt Service - Principal Interest and Fiscal Charges Streets and Highways Construction Total Capital Outlay
Other Financing UsesTransfers to Other Funds
3,388,496 2,796,816 3,078,326
141,341 5,511,783 1,825,975
508,904 510,582
1,600 0
17,763,823
1,055,000 77,008
7,043,644 1,054,478
0 0
3,427,122 2,796,816 3,150,326
141,341 5,511,783 1,825,975
508,904 510,582
1,600 0
17,874,449 1,355,000
102,008 3,377,192 1,060,478
0 0
3,862,607 2,795,232 2,664,682
212,435 6,258,925 1,634,072
504,392 621,068
3,348 100,400
18,657,161 850,000 250,058
7,120,008 1,119,754
0 0
Total Current Expenditures
Debt Service - Principal Interest and Fiscal Charges Streets and Highways Construction Total Capital Outlay
Other Financing Uses Transfers to Other Funds
6,809,722 0 6,990,097
130,000 0 130,000 7,850 0 2,850
2,660,039 0 2,049,169 4,600 0 0
0 0 0 191,322 0 463,416
Total Expenditures and Other Uses 9,803,533 0 9,635,532 Total Expenditures and Other Uses 26,993,953 23,769,127 27,996,981
79
x

2006
0
Name of County: LINCOLN
Adopted budgets for the following funds: GF: x R&B: x HS: OSR: DS: x CP: Name of County: LYON
Adopted budgets for the following funds: GF: x R&B: x HS: x OSR: x DS: CP:
Revenues: Property Taxes All Other Taxes Special Assessments Licenses and Permits Federal Grants State General Purpose Aid State Categorical Aid Charges for Services Fines and Forfeits Interest on Investments Miscellaneous Revenues
2005 Budget
3,012,365 417,000 284,630 22,742
0 679,563
2,855,072 511,151
0 123,000 166,013
2005 Amended
3,012,365 417,000 284,630 22,742
0 689,563
2,855,072 511,151
0 123,000 166,013
2006 Budget
3,262,590 420,500 82,000 22,550
0 665,500
2,921,627 608,569
0 115,300 348,350
Revenues: Property Taxes All Other Taxes Special Assessments Licenses and Permits Federal Grants State General Purpose Aid State Categorical Aid Charges for Services Fines and Forfeits Interest on Investments Miscellaneous Revenues
2005 2005 Budget Amended
9,100,000 0 55,900 0
336,962 0 52,110 0
2,175,200 0 1,211,248 0 2,290,300 0
904,642 0 0 0
120,750 0 810,508 0
Budget
9,508,510 59,000
352,725 52,520
401,858 1,241,762 3,563,451
959,359
260,750 920,070
Total Revenues 8,071,536 8,081,536 8,446,986 Total Revenues 17,057,620 0 17,320,005 Proceeds from Bond Sales 0 0 0 Proceeds from Bond Sales 0 0 0 Other Financing Sources 0 0 0 Other Financing Sources 2,511,408 0 2,920,300 Transfers from Other Funds 25,000 28,696 75,500 Transfers from Other Funds 396,961 0 733,670
Total Revenues and Other Sources 8,096,536 8,110,232 8,522,486 Total Revenues and Other Sources 19,965,989 0 20,973,975 Current Expenditures
General Government Public Safety Streets and Highways (excluding Const.) SanitationHuman ServicesHealthCulture and RecreationConservation of Natural ResourcesEconomic Development & HousingMiscellaneous Current Expenditures
Total Current Expenditures
Debt Service - Principal Interest and Fiscal Charges Streets and Highways Construction Total Capital Outlay
Other Financing UsesTransfers to Other Funds
1,356,698 922,276
3,562,772 127,856 833,516 36,666
171,265 621,427 45,000
0 7,677,476
212,000 122,475
0 0 0 0
1,381,398 858,201
3,562,772 129,956 833,516 37,091
142,774 578,702 45,000 66,491
7,635,901 212,000 110,432
0 0 0 0
1,707,138 911,466
3,681,300 127,200 833,516 38,666
175,813 640,414 45,000
106,788 8,267,301
142,000 113,185
0 0 0 0
Current Expenditures General Government Public Safety Streets and Highways (excluding Const.) SanitationHuman ServicesHealthCulture and RecreationConservation of Natural ResourcesEconomic Development & HousingMiscellaneous Current Expenditures
Total Current Expenditures
Debt Service - Principal Interest and Fiscal Charges Streets and Highways Construction Total Capital Outlay
Other Financing UsesTransfers to Other Funds
1,977,787 2,797,887 2,546,994
494,683 2,184,291
156,000 362,962 635,230
0 762,397
0 2,237,616 0 2,942,067 0 3,039,267 0 486,344 0 2,184,291 0 221,000 0 385,178 0 671,650 0 52,985 0 816,785
11,918,231
1,056,085 171,080
6,197,828 486,090
0 396,961
0 13,037,183 0 532,236 0 182,836 0 6,245,436 0 376,000 0 0 0 733,670
Total Expenditures and Other Uses
Name of County: MAHNOMEN
Adopted budgets for the following funds: GF:
8,011,951 7,958,333 8,522,486
x R&B: x HS: x OSR: x DS: x CP:
Total Expenditures and Other Uses 20,226,275
Name of County: MARSHALL
Adopted budgets for the following funds: GF: x R&B: x HS: x
0 21,107,361
OSR: DS: CP: 2005 2005 2006
Budget Amended BudgetRevenues:
Property Taxes 3,286,492 3,286,492 3,660,298 All Other Taxes 58,718 58,718 1,700 Special Assessments 197,500 197,500 187,500 Licenses and Permits 7,825 7,825 7,325 Federal Grants 1,589,985 1,589,985 2,242,627 State General Purpose Aid 961,203 961,203 1,123,507 State Categorical Aid 3,747,315 3,747,315 3,220,178 Charges for Services 459,294 459,294 446,387 Fines and Forfeits 23,610 23,610 20,000Interest on Investments 100,000 100,000 100,000 Miscellaneous Revenues 59,599 59,599 131,599
2005 2005 2006 Budget Amended Budget
Revenues: Property Taxes 3,501,413 3,501,413 3,868,691 All Other Taxes 286,700 286,700 284,800 Special Assessments 0 0 0 Licenses and Permits 66,640 66,640 4,500 Federal Grants 2,284,930 2,284,930 3,215,083 State General Purpose Aid 1,530,525 1,530,525 1,571,630 State Categorical Aid 6,705,148 6,705,148 6,771,008 Charges for Services 1,164,131 1,164,131 1,247,354 Fines and Forfeits 0 0 0 Interest on Investments 80,000 80,000 185,000 Miscellaneous Revenues 109,350 109,350 103,150
Total Revenues 10,491,541 10,491,541 11,141,121 Total Revenues 15,728,837 15,728,837 17,251,216 Proceeds from Bond Sales 0 0 0 Proceeds from Bond Sales 0 0 0 Other Financing Sources 134,000 134,000 212,000 Other Financing Sources 0 0 0 Transfers from Other Funds 12,280 12,280 12,270 Transfers from Other Funds 0 0 0
Total Revenues and Other Sources 10,637,821 10,637,821 11,365,391 Total Revenues and Other Sources 15,728,837 15,728,837 17,251,216 Current Expenditures
General Government Public Safety Streets and Highways (excluding Const.) SanitationHuman ServicesHealthCulture and RecreationConservation of Natural ResourcesEconomic Development & HousingMiscellaneous Current Expenditures
Total Current Expenditures
Debt Service - Principal Interest and Fiscal Charges Streets and Highways Construction Total Capital Outlay
Other Financing UsesTransfers to Other Funds
3,009,201 1,812,083
928,157 216,116
1,133,305 109,364 22,353
231,351 326,605 364,900
8,153,435
53,154 34,040
2,488,286 160,000
7,500 12,280
3,009,201 1,812,083
928,157 216,116
1,133,305 109,364 22,353
231,351 326,605 364,900
8,153,435 53,154 34,040
2,488,286 160,000
7,500 12,280
3,361,229 2,059,160
854,521 214,947 973,078 110,545 23,851
216,807 666,024 310,250
8,790,412 52,614 31,647
2,264,095 176,000
7,500 12,270
Current Expenditures General Government Public Safety Streets and Highways (excluding Const.) SanitationHuman ServicesHealthCulture and RecreationConservation of Natural ResourcesEconomic Development & HousingMiscellaneous Current Expenditures
Total Current Expenditures
Debt Service - Principal Interest and Fiscal Charges Streets and Highways Construction Total Capital Outlay
Other Financing UsesTransfers to Other Funds
1,779,565 1,356,772 3,292,314
133,152 2,890,039
28,000 140,229 349,538
0 135,200
10,104,809
226,613 0
4,571,760 97,800
0 0
1,779,565 1,356,772 3,292,314
133,152 2,890,039
28,000 140,229 349,538
0 135,200
10,104,809 226,613
0 4,571,760
97,800 0 0
1,913,683 1,502,153 2,792,999
145,034 2,985,326
28,000 157,434 368,682
20,450 9,913,761
321,991 0
5,807,500 722,450
0 0
Total Expenditures and Other Uses 10,908,695 10,908,695 11,334,538 Total Expenditures and Other Uses 15,000,982 15,000,982 16,765,702
80
0

Name of County: MARTIN Name of County: MCLEOD Adopted budgets for the following funds: GF: x R&B: x HS: x OSR: x DS: x CP: Adopted budgets for the following funds: GF: x R&B: x HS: x OSR: x DS: x CP: x
2005 2005 2006 2005 2005 2006 Budget Amended Budget Budget Amended Budget
Revenues: Revenues: Property Taxes 7,758,087 7,758,087 8,243,599 Property Taxes 14,929,365 14,929,365 16,954,416 All Other Taxes 14,500 14,500 15,000 All Other Taxes 26,000 26,000 33,000 Special Assessments 812,798 812,798 789,273 Special Assessments 0 0 0 Licenses and Permits 39,725 39,725 36,400 Licenses and Permits 83,100 83,100 94,000 Federal Grants 42,040 42,040 57,033 Federal Grants 3,867,410 3,867,410 2,701,233 State General Purpose Aid 1,109,923 1,109,923 1,129,951 State General Purpose Aid 1,879,083 1,879,083 1,910,917 State Categorical Aid 3,812,281 3,812,281 4,437,509 State Categorical Aid 4,362,488 4,362,488 5,842,517 Charges for Services 694,941 694,941 773,614 Charges for Services 3,347,332 3,347,332 4,132,720 Fines and Forfeits 34,750 34,750 27,500 Fines and Forfeits 232,375 232,375 19,875Interest on Investments 204,400 204,400 162,000 Interest on Investments 355,400 355,400 554,250 Miscellaneous Revenues 1,278,959 1,278,959 1,357,942 Miscellaneous Revenues 693,602 693,602 930,397
Total Revenues 15,802,404 15,802,404 17,029,821 Total Revenues 29,776,155 29,776,155 33,173,325 Proceeds from Bond Sales 0 0 0 Proceeds from Bond Sales 0 0 0 Other Financing Sources 0 0 0 Other Financing Sources 218,624 218,624 122,800 Transfers from Other Funds 0 0 0 Transfers from Other Funds 588,714 588,714 38,500
Total Revenues and Other Sources 15,802,404 15,802,404 17,029,821 Total Revenues and Other Sources 30,583,493 30,583,493 33,334,625 Current Expenditures Current Expenditures
General Government 2,424,589 2,424,589 3,203,223 General Government 4,336,621 4,394,534 5,158,174 Public Safety 2,946,089 2,946,089 2,973,084 Public Safety 4,799,198 4,799,198 4,852,893 Streets and Highways (excluding Const.) 4,840,627 4,840,627 5,122,802 Streets and Highways (excluding Const.) 2,448,403 2,448,403 2,449,031 Sanitation 0 0 0 Sanitation 2,170,158 2,170,158 1,934,289 Human Services 1,930,726 1,930,726 2,109,536 Human Services 7,705,007 7,705,007 8,173,205 Health 0 0 0 Health 1,741,313 1,741,313 1,761,118 Culture and Recreation 607,184 607,184 628,606 Culture and Recreation 441,521 441,521 454,470 Conservation of Natural Resources 213,150 213,150 240,205 Conservation of Natural Resources 382,325 382,325 401,119Economic Development & Housing 11,090 11,090 21,090 Economic Development & Housing 2,369 2,369 2,369Miscellaneous Current Expenditures 2,072,652 2,072,652 2,017,421 Miscellaneous Current Expenditures 48,669 48,669 46,669
Total Current Expenditures 15,046,107 15,046,107 16,315,967 Total Current Expenditures 24,075,584 24,133,497 25,233,337
Debt Service - Principal 415,000 415,000 450,000 Debt Service - Principal 1,845,000 1,845,000 1,180,000 Interest and Fiscal Charges 113,478 113,478 52,466 Interest and Fiscal Charges 152,150 152,150 108,458 Streets and Highways Construction 0 0 0 Streets and Highways Construction 3,231,000 3,231,000 3,700,000 Total Capital Outlay 0 0 0 Total Capital Outlay 1,629,787 1,629,787 1,696,114
Other Financing Uses 0 0 0 Other Financing Uses 0 0 0 Transfers to Other Funds 0 0 0 Transfers to Other Funds 0 0 0
Total Expenditures and Other Uses 15,574,585 15,574,585 16,818,433 Total Expenditures and Other Uses 30,933,521 30,991,434 31,917,909
Name of County: MEEKER Name of County: MILLE LACS Adopted budgets for the following funds: GF: x R&B: x HS: x OSR: x DS: x CP: Adopted budgets for the following funds: GF: x R&B: x HS: x OSR: x DS: x CP:
2005 2005 2006 2005 2005 2006 Budget Amended Budget Budget Amended Budget
Revenues: Revenues: Property Taxes 8,798,066 8,798,066 8,447,362 Property Taxes 10,305,243 0 11,068,393 All Other Taxes 27,500 27,500 77,000 All Other Taxes 27,500 0 27,500 Special Assessments 0 0 0 Special Assessments 230,000 0 230,000 Licenses and Permits 10,450 10,450 9,800 Licenses and Permits 420,010 0 475,540 Federal Grants 1,474,102 1,474,102 1,568,836 Federal Grants 2,428,240 0 2,602,201 State General Purpose Aid 1,555,419 1,555,419 2,100,243 State General Purpose Aid 2,575,572 0 2,580,339 State Categorical Aid 4,629,423 4,629,423 4,716,221 State Categorical Aid 5,480,734 0 5,434,969 Charges for Services 1,408,066 1,408,066 1,478,339 Charges for Services 1,616,604 0 1,813,004 Fines and Forfeits 39,785 39,785 40,100 Fines and Forfeits 40,000 0 40,000Interest on Investments 230,000 230,000 233,550 Interest on Investments 125,000 0 147,700 Miscellaneous Revenues 1,132,909 1,132,909 1,705,420 Miscellaneous Revenues 312,021 0 329,750
Total Revenues 19,305,720 19,305,720 20,376,871 Total Revenues 23,560,924 0 24,749,396 Proceeds from Bond Sales 0 0 0 Proceeds from Bond Sales 0 0 0 Other Financing Sources 0 0 0 Other Financing Sources 0 0 0 Transfers from Other Funds 738,228 738,228 887,427 Transfers from Other Funds 0 0 0
Total Revenues and Other Sources 20,043,948 20,043,948 21,264,298 Total Revenues and Other Sources 23,560,924 0 24,749,396 Current Expenditures Current Expenditures
General Government 3,593,448 3,593,448 3,578,088 General Government 4,301,242 0 5,056,380 Public Safety 3,051,441 3,051,441 3,652,749 Public Safety 4,888,766 0 5,918,285 Streets and Highways (excluding Const.) 2,667,260 2,667,260 2,720,124 Streets and Highways (excluding Const.) 2,694,313 0 2,672,585 Sanitation 188,068 188,068 176,843 Sanitation 240,389 0 246,000 Human Services 4,910,568 4,910,568 4,606,984 Human Services 7,220,947 0 7,756,969 Health 943,070 943,070 1,031,010 Health 664,053 0 707,219 Culture and Recreation 316,556 316,556 352,548 Culture and Recreation 200,682 0 225,706 Conservation of Natural Resources 137,340 137,340 160,510 Conservation of Natural Resources 169,914 0 186,845Economic Development & Housing 112,000 112,000 667,237 Economic Development & Housing 0 0 0 Miscellaneous Current Expenditures 342,433 342,433 386,900 Miscellaneous Current Expenditures 290,508 0 213,320
Total Current Expenditures 16,262,184 16,262,184 17,332,993 Total Current Expenditures 20,670,814 0 22,983,309
Debt Service - Principal 690,000 690,000 700,000 Debt Service - Principal 370,000 0 390,000 Interest and Fiscal Charges 209,396 209,396 210,174 Interest and Fiscal Charges 299,487 0 288,257 Streets and Highways Construction 2,144,140 2,144,140 2,243,727 Streets and Highways Construction 2,720,623 0 2,387,830 Total Capital Outlay 0 0 0 Total Capital Outlay 0 0 0
Other Financing Uses 0 0 0 Other Financing Uses 0 0 0 Transfers to Other Funds 738,228 738,228 887,427 Transfers to Other Funds 0 0 0
Total Expenditures and Other Uses 20,043,948 20,043,948 21,374,321 Total Expenditures and Other Uses 24,060,924 0 26,049,396
81

Name of County: MORRISON
Adopted budgets for the following funds: GF: x R&B: x HS: x OSR: DS: CP: Name of County: MOWER
Adopted budgets for the following funds: GF: x R&B: x HS: x OSR: x DS: CP: 2005 2005 2006
Budget Amended BudgetRevenues:
Property Taxes 12,080,628 12,080,628 13,126,529 All Other Taxes 111,500 111,500 114,500 Special Assessments 0 0 0 Licenses and Permits 280,780 280,780 290,280 Federal Grants 3,013,252 3,013,252 3,623,498 State General Purpose Aid 1,676,696 1,676,696 1,686,432 State Categorical Aid 9,338,396 9,338,396 7,535,108 Charges for Services 4,756,209 4,756,209 5,160,455 Fines and Forfeits 0 0 0 Interest on Investments 355,000 355,000 320,000 Miscellaneous Revenues 521,300 521,300 483,500
2005 2005 2006 Budget Amended Budget
Revenues: Property Taxes 9,971,613 9,971,613 10,759,370 All Other Taxes 47,000 47,000 106,000 Special Assessments 580,723 580,723 615,767 Licenses and Permits 81,826 81,826 33,620 Federal Grants 4,900,789 4,930,789 4,701,154 State General Purpose Aid 2,803,026 2,803,026 2,565,932 State Categorical Aid 6,867,463 6,608,754 7,296,517 Charges for Services 2,882,778 2,882,778 2,995,013 Fines and Forfeits 77,275 77,275 65,350Interest on Investments 873,418 873,418 980,988 Miscellaneous Revenues 346,800 346,800 173,380
Total Revenues 32,133,761 32,133,761 32,340,302 Total Revenues 29,432,711 29,204,002 30,293,091 Proceeds from Bond Sales 0 0 0 Proceeds from Bond Sales 0 0 0 Other Financing Sources 0 0 0 Other Financing Sources 3,766,436 3,766,436 2,001,543 Transfers from Other Funds 0 0 0 Transfers from Other Funds 0 0 0
Total Revenues and Other Sources 32,133,761 32,133,761 32,340,302 Total Revenues and Other Sources 33,199,147 32,970,438 32,294,634 Current Expenditures
General Government Public Safety Streets and Highways (excluding Const.) SanitationHuman ServicesHealthCulture and RecreationConservation of Natural ResourcesEconomic Development & HousingMiscellaneous Current Expenditures
Total Current Expenditures
Debt Service - Principal Interest and Fiscal Charges Streets and Highways Construction Total Capital Outlay
Other Financing UsesTransfers to Other Funds
4,747,874 4,131,171 3,292,721 2,922,527 8,179,673 1,432,084
471,956 347,089 80,743 59,428
25,665,266
805,000 343,694
6,773,450 51,000
0 0
4,747,874 4,131,171 3,292,721 2,922,527 8,179,673 1,432,084
471,956 347,089 80,743 59,428
25,665,266 805,000 343,694
6,773,450 51,000
0 0
5,586,471 4,523,159 3,562,372 2,147,242 8,264,876 1,650,450
513,618 381,891 80,743 65,000
26,775,822 825,000 324,455
5,098,360 75,000
0 0
Current Expenditures General Government Public Safety Streets and Highways (excluding Const.) SanitationHuman ServicesHealthCulture and RecreationConservation of Natural ResourcesEconomic Development & HousingMiscellaneous Current Expenditures
Total Current Expenditures
Debt Service - Principal Interest and Fiscal Charges Streets and Highways Construction Total Capital Outlay
Other Financing UsesTransfers to Other Funds
3,645,375 4,583,527 4,729,601
527,923 7,976,204 1,954,019
441,926 964,915 42,400
574,820 25,440,710
40,000 0
4,416,437 3,303,000
0 0
3,723,475 4,664,066 4,729,601
527,923 7,976,204 1,954,019
441,926 964,915 42,400
447,105 25,471,634
40,000 0
4,157,728 3,303,000
0 0
4,339,777 5,484,772 4,314,042
560,823 7,399,635 1,920,966
498,515 929,349 31,800
832,383 26,312,062
40,000 0
3,020,000 2,922,572
0 0
Total Expenditures and Other Uses 33,638,410 33,638,410 33,098,637
Name of County: MURRAY
Adopted budgets for the following funds: GF: x R&B: x HS: x OSR: x DS: CP:
Total Expenditures and Other Uses 33,200,147 32,972,362 32,294,634
Name of County: NICOLLET
Adopted budgets for the following funds: GF: x R&B: x HS: x OSR: x DS: x CP:2005 2005 2006
Budget Amended BudgetRevenues:
Property Taxes 3,880,164 4,140,764 4,692,002 All Other Taxes 5,000 5,000 6,000 Special Assessments 580,039 580,039 518,460 Licenses and Permits 16,350 16,350 14,230 Federal Grants 20,200 20,200 23,675 State General Purpose Aid 1,407,548 1,407,548 1,108,863 State Categorical Aid 3,004,606 3,011,606 3,438,259 Charges for Services 231,530 226,530 318,300 Fines and Forfeits 0 0 0 Interest on Investments 167,250 167,250 227,000 Miscellaneous Revenues 614,068 638,068 685,085
2005 2005 2006 Budget Amended Budget
Revenues: Property Taxes 11,015,512 11,015,512 11,841,675 All Other Taxes 0 0 0 Special Assessments 244,000 244,000 244,000 Licenses and Permits 195,000 195,000 215,000 Federal Grants 2,339,136 2,339,136 2,411,495 State General Purpose Aid 1,361,538 1,361,538 1,418,931 State Categorical Aid 4,549,660 4,549,660 4,664,669 Charges for Services 1,507,207 1,507,207 1,606,464 Fines and Forfeits 20,000 20,000 59,000Interest on Investments 376,000 376,000 386,000 Miscellaneous Revenues 709,064 709,064 762,560
Total Revenues 9,926,755 10,213,355 11,031,874 Total Revenues 22,317,117 22,317,117 23,609,794 Proceeds from Bond Sales 0 0 0 Proceeds from Bond Sales 0 0 0 Other Financing Sources 67,838 67,838 102,081 Other Financing Sources 172,032 172,032 175,000 Transfers from Other Funds 282,750 287,750 221,225 Transfers from Other Funds 0 0 0
Total Revenues and Other Sources 10,277,343 10,568,943 11,355,180 Total Revenues and Other Sources 22,489,149 22,489,149 23,784,794 Current Expenditures
General Government Public Safety Streets and Highways (excluding Const.) SanitationHuman ServicesHealthCulture and RecreationConservation of Natural ResourcesEconomic Development & HousingMiscellaneous Current Expenditures
Total Current Expenditures
Debt Service - Principal Interest and Fiscal Charges Streets and Highways Construction Total Capital Outlay
Other Financing UsesTransfers to Other Funds
1,557,089 900,520
1,777,505 406,756
1,024,158 60,404
482,527 649,123 124,893 609,600
7,592,575
564,933 131,617
1,270,000 428,853
0 40,000
1,616,271 906,189
1,777,505 406,756
1,024,158 60,404
484,852 1,346,294
124,893 609,600
8,356,922 564,933 131,617
1,270,000 850,120
0 40,000
1,745,394 999,162
1,804,451 414,745
1,023,981 60,404
525,641 734,541 137,682 536,200
7,982,201 588,607 119,602
1,740,000 436,448
0 0
Current Expenditures General Government Public Safety Streets and Highways (excluding Const.) SanitationHuman ServicesHealthCulture and RecreationConservation of Natural ResourcesEconomic Development & HousingMiscellaneous Current Expenditures
Total Current Expenditures
Debt Service - Principal Interest and Fiscal Charges Streets and Highways Construction Total Capital Outlay
Other Financing UsesTransfers to Other Funds
4,926,030 3,041,697 4,494,846
0 6,657,832 1,135,964
344,397 75,095
113,463 763,559
21,552,883
936,266 0 0 0 0 0
4,926,030 3,041,697 4,494,846
0 6,657,832 1,135,964
344,397 75,095
113,463 763,559
21,552,883 936,266
0 0 0 0 0
5,512,687 3,146,428 2,021,577
7,024,795 1,226,225
363,324 84,046
123,249 897,419
20,399,750 785,044
0 2,600,000
0 0 0
Total Expenditures and Other Uses 10,027,978 11,213,592 10,866,858 Total Expenditures and Other Uses 22,489,149 22,489,149 23,784,794
82
0

Name of County: NOBLES
Adopted budgets for the following funds: GF: x R&B: x HS: x OSR: x DS: x CP: Name of County: NORMAN
Adopted budgets for the following funds: GF: x R&B: x HS: x OSR: x DS: CP: 2005 2005 2006
Budget Amended BudgetRevenues:
Property Taxes 7,354,981 7,354,981 7,907,206 All Other Taxes 28,250 28,250 11,000 Special Assessments 59,510 59,510 63,678 Licenses and Permits 240,783 240,783 289,473 Federal Grants 2,205,470 2,205,470 2,289,875 State General Purpose Aid 1,104,503 1,104,503 1,090,818 State Categorical Aid 8,189,462 8,189,462 7,498,853 Charges for Services 1,903,614 1,903,614 1,497,551 Fines and Forfeits 0 0 0 Interest on Investments 133,550 133,550 275,150 Miscellaneous Revenues 1,317,723 1,317,723 1,869,368
2005 2005 2006 Budget Amended Budget
Revenues: Property Taxes 2,978,068 2,978,068 3,067,000 All Other Taxes 80,000 80,000 80,000 Special Assessments 215,765 215,765 215,765 Licenses and Permits 600 600 600 Federal Grants 0 0 0 State General Purpose Aid 855,055 855,055 809,357 State Categorical Aid 2,640,750 2,640,750 1,230,000 Charges for Services 10,000 10,000 10,000 Fines and Forfeits 0 0 0 Interest on Investments 50,000 50,000 100,000 Miscellaneous Revenues 3,423,724 3,423,724 9,376,813
Total Revenues 22,537,846 22,537,846 22,792,972 Total Revenues 10,253,962 10,253,962 14,889,535 Proceeds from Bond Sales 0 0 0 Proceeds from Bond Sales 0 0 0 Other Financing Sources 0 0 0 Other Financing Sources 0 0 0 Transfers from Other Funds 38,140 38,140 25,000 Transfers from Other Funds 0 0 0
Total Revenues and Other Sources 22,575,986 22,575,986 22,817,972 Total Revenues and Other Sources 10,253,962 10,253,962 14,889,535 Current Expenditures
General Government Public Safety Streets and Highways (excluding Const.) SanitationHuman ServicesHealthCulture and RecreationConservation of Natural ResourcesEconomic Development & HousingMiscellaneous Current Expenditures
Total Current Expenditures
Debt Service - Principal Interest and Fiscal Charges Streets and Highways Construction Total Capital Outlay
Other Financing UsesTransfers to Other Funds
3,134,424 2,667,209 1,705,924
347,733 5,094,905
117,299 572,128 366,168 50,000 29,249
14,085,039
690,000 967,737
5,268,212 1,022,491
0 13,640
3,144,240 2,667,209 1,705,924
347,733 5,094,905
117,299 572,128 366,168 50,000 29,249
14,094,855 690,000 967,737
5,268,212 1,022,491
0 13,640
4,073,045 2,661,349 1,675,427
351,719 5,372,051
183,966 637,305 865,247 50,000 72,913
15,943,022 725,000 844,414
4,173,765 765,350
0 386,912
Current Expenditures General Government Public Safety Streets and Highways (excluding Const.) SanitationHuman ServicesHealthCulture and RecreationConservation of Natural ResourcesEconomic Development & HousingMiscellaneous Current Expenditures
Total Current Expenditures
Debt Service - Principal Interest and Fiscal Charges Streets and Highways Construction Total Capital Outlay
Other Financing UsesTransfers to Other Funds
1,119,515 780,806
2,724,955 300,279
1,858,069 56,645 91,283
218,297 0
423,156 7,573,005
0 0
2,640,750 0 0 0
1,116,539 780,806
2,724,955 300,279
1,858,069 56,645 91,283
218,297 0
423,156 7,573,005
0 0
2,640,750 0 0 0
1,461,012 835,147
2,607,355 309,908
1,965,761 90,632 94,586
229,176 0
1,345,851 8,939,428
0 0
6,425,980 0 0
500,000 Total Expenditures and Other Uses 22,047,119 22,056,935 22,838,463
Name of County: OLMSTED
Adopted budgets for the following funds: GF: x R&B: x HS: x OSR: x DS: CP:
Total Expenditures and Other Uses 10,213,755 10,213,755 15,865,408
Name of County: OTTER TAIL Adopted budgets for the following funds: GF: x R&B: x HS: x OSR: x DS: x CP: x
2005 2005 2006 Budget Amended Budget
Revenues: Property Taxes 57,082,700 57,082,700 61,239,330 All Other Taxes 355,000 355,000 355,000 Special Assessments 0 0 0 Licenses and Permits 1,609,610 1,520,516 1,674,225 Federal Grants 24,006,276 31,617,062 24,516,886 State General Purpose Aid 5,780,381 5,780,381 5,847,870 State Categorical Aid 19,812,704 20,294,895 19,905,747 Charges for Services 20,624,501 21,350,506 20,175,379 Fines and Forfeits 5,000 9,000 7,000Interest on Investments 1,547,749 1,547,749 2,774,355 Miscellaneous Revenues 1,597,589 1,856,311 3,399,669
2005 2005 2006 Budget Amended Budget
Revenues: Property Taxes 21,006,636 18,404,655 20,280,485 All Other Taxes 417,166 417,166 264,500 Special Assessments 136,000 136,000 129,000 Licenses and Permits 334,300 334,300 365,900 Federal Grants 6,828,388 7,394,638 7,293,779 State General Purpose Aid 2,630,363 5,232,344 5,417,820 State Categorical Aid 16,501,598 16,501,598 17,775,812 Charges for Services 2,085,832 2,085,832 2,893,360 Fines and Forfeits 15,568 15,568 10,000Interest on Investments 465,000 465,000 546,000 Miscellaneous Revenues 2,802,900 2,802,900 3,470,109
Total Revenues 132,421,510 141,414,120 139,895,461 Total Revenues 53,223,751 53,790,001 58,446,765 Proceeds from Bond Sales 0 0 0 Proceeds from Bond Sales 0 0 0 Other Financing Sources 0 0 0 Other Financing Sources 500,000 0 0 Transfers from Other Funds 119,536 512,106 181,516 Transfers from Other Funds 0 35,000 70,000
Total Revenues and Other Sources 132,541,046 141,926,226 140,076,977 Total Revenues and Other Sources 53,723,751 53,825,001 58,516,765 Current Expenditures
General Government Public Safety Streets and Highways (excluding Const.) SanitationHuman ServicesHealthCulture and RecreationConservation of Natural ResourcesEconomic Development & HousingMiscellaneous Current Expenditures
Total Current Expenditures
Debt Service - Principal Interest and Fiscal Charges Streets and Highways Construction Total Capital Outlay
Other Financing UsesTransfers to Other Funds
18,749,658 23,213,976 6,584,898
0 57,065,638 8,609,434 2,626,706
412,404 79,695
0 117,342,409
480,000 469,733
17,255,520 0 0
606,912
18,704,763 31,764,305 6,580,098
0 60,476,539 8,627,434 2,678,008
595,122 79,695
0 129,505,964
480,000 469,733
18,399,657 0 0
1,227,592
19,320,856 24,765,982 7,549,955
0 59,142,306 9,554,744 2,803,106
656,123 88,500
0 123,881,572
490,000 458,808
16,898,419 0 0
804,513
Current Expenditures General Government Public Safety Streets and Highways (excluding Const.) SanitationHuman ServicesHealthCulture and RecreationConservation of Natural ResourcesEconomic Development & HousingMiscellaneous Current Expenditures
Total Current Expenditures
Debt Service - Principal Interest and Fiscal Charges Streets and Highways Construction Total Capital Outlay
Other Financing UsesTransfers to Other Funds
8,750,594 7,088,736 5,652,200
0 15,225,929 1,570,483
469,742 632,436 217,212
1,286,060 40,893,392
990,000 506,319
9,370,200 3,022,197
51,688 0
9,043,154 7,309,257 5,652,200
0 15,225,929 1,570,483
470,720 636,167 783,462 807,200
41,498,572 990,000 506,319
9,370,200 3,125,550
51,688 35,000
9,439,427 8,173,490 6,402,858
16,056,577 1,786,442
695,956 553,935 520,212
1,447,165 45,076,062
625,000 455,891
11,457,700 3,308,379
54,102 70,000
Total Expenditures and Other Uses 136,154,574 150,082,946 142,533,312 Total Expenditures and Other Uses 54,833,796 55,577,329 61,047,134
83
0

x Name of County: PENNINGTON
Adopted budgets for the following funds: GF: x R&B: x HS: x OSR: x DS: x CP: x Name of County: PINE
Adopted budgets for the following funds: GF: x R&B: x HS: x OSR: x DS: CP: 2005 2005 2006
Budget Amended BudgetRevenues:
Property Taxes 4,373,827 4,373,827 4,665,522 All Other Taxes 180,253 180,253 150,980 Special Assessments 150,000 150,000 150,000 Licenses and Permits 2,450 2,450 4,450 Federal Grants 3,518,000 3,512,005 3,625,000 State General Purpose Aid 1,401,585 1,401,585 1,378,061 State Categorical Aid 3,469,165 3,489,180 4,996,298 Charges for Services 1,535,343 1,566,343 1,830,893 Fines and Forfeits 20,000 20,000 23,500Interest on Investments 40,000 40,000 50,000 Miscellaneous Revenues 540,368 1,095,062 594,739
2005 2005 2006 Budget Amended Budget
Revenues: Property Taxes 10,966,374 10,966,374 12,810,943 All Other Taxes 437,200 437,200 74,000 Special Assessments 0 0 0 Licenses and Permits 127,000 127,000 98,000 Federal Grants 2,463,804 2,463,804 3,105,727 State General Purpose Aid 3,664,650 3,664,650 4,526,777 State Categorical Aid 7,235,934 7,235,934 5,821,264 Charges for Services 2,554,640 2,554,640 1,453,547 Fines and Forfeits 1,888,181 1,888,181 1,650,500Interest on Investments 325,750 325,750 820,750 Miscellaneous Revenues 1,150,160 1,150,160 1,299,224
Total Revenues 15,230,991 15,830,705 17,469,443 Total Revenues 30,813,693 30,813,693 31,660,732 Proceeds from Bond Sales 0 0 0 Proceeds from Bond Sales 1,285,000 1,285,000 15,982,700 Other Financing Sources 0 0 0 Other Financing Sources 0 0 0 Transfers from Other Funds 0 0 0 Transfers from Other Funds 0 0 947,535
Total Revenues and Other Sources 15,230,991 15,830,705 17,469,443 Total Revenues and Other Sources 32,098,693 32,098,693 48,590,967 Current Expenditures
General Government Public Safety Streets and Highways (excluding Const.) SanitationHuman ServicesHealthCulture and RecreationConservation of Natural ResourcesEconomic Development & HousingMiscellaneous Current Expenditures
Total Current Expenditures
Debt Service - Principal Interest and Fiscal Charges Streets and Highways Construction Total Capital Outlay
Other Financing UsesTransfers to Other Funds
1,766,713 2,472,295 1,975,102
75,618 4,342,000
53,244 124,686 274,628 10,750 66,700
11,161,736
160,000 114,725
3,105,000 506,000
1,864,313 2,792,395 2,325,102
75,618 4,342,000
53,244 129,686 426,628 10,750
416,700 12,436,436
160,000 114,725
3,105,000 496,800
1,989,249 2,619,850 1,960,302
191,418 4,352,000
53,354 126,800 432,293
5,750 69,000
11,800,016 180,000 101,451
4,670,000 359,400
0 290,000
Current Expenditures General Government Public Safety Streets and Highways (excluding Const.) SanitationHuman ServicesHealthCulture and RecreationConservation of Natural ResourcesEconomic Development & HousingMiscellaneous Current Expenditures
Total Current Expenditures
Debt Service - Principal Interest and Fiscal Charges Streets and Highways Construction Total Capital Outlay
Other Financing UsesTransfers to Other Funds
4,356,032 5,332,506
10,419,486 235,354
7,600,383 0
248,268 1,316,574
295,625 235,085
30,039,313
695,000 88,117
1,285,000 0
150,000 0
4,321,186 5,332,506
10,419,486 235,354
7,600,383 0
248,268 1,316,574
295,625 235,085
30,004,467 695,000 88,117
1,285,000 0
150,000 0
3,806,474 5,508,563 3,629,765
185,258 8,157,889
0 268,500
1,175,700 307,156 250,910
23,290,215 900,103
1,490,665 6,674,410
15,982,700 0 0
0 0 0 0
Total Expenditures and Other Uses 15,047,461 16,312,961 17,400,867
Name of County: PIPESTONE
Adopted budgets for the following funds: GF: x R&B: x HS: x OSR: DS: CP:
Total Expenditures and Other Uses 32,257,430 32,222,584 48,338,093
Name of County: POLK
Adopted budgets for the following funds: GF: x R&B: x HS: x OSR: x DS: x CP:2005 2005 2006
Budget Amended BudgetRevenues:
Property Taxes 3,208,923 3,208,923 3,457,278 All Other Taxes 339,500 339,500 343,500 Special Assessments 120,000 120,000 120,600 Licenses and Permits 15,125 15,125 21,400 Federal Grants 287,961 287,961 388,451 State General Purpose Aid 1,689,143 1,689,143 1,508,263 State Categorical Aid 8,614,577 8,614,577 3,899,107 Charges for Services 933,053 933,053 1,097,728 Fines and Forfeits 21,500 21,500 20,500Interest on Investments 335,000 335,000 330,000 Miscellaneous Revenues 485,020 485,020 489,092
2005 2005 2006 Budget Amended Budget
Revenues: Property Taxes 14,259,069 14,259,069 13,952,379 All Other Taxes 0 0 0 Special Assessments 1,484,058 1,484,058 1,533,826 Licenses and Permits 37,400 37,400 33,000 Federal Grants 8,355,938 8,355,938 5,915,211 State General Purpose Aid 2,931,426 2,931,426 3,427,774 State Categorical Aid 11,323,198 11,323,198 11,579,994 Charges for Services 4,558,156 4,558,156 4,980,605 Fines and Forfeits 28,000 28,000 32,000Interest on Investments 300,000 300,000 385,000 Miscellaneous Revenues 2,049,328 2,049,328 2,027,258
Total Revenues 16,049,802 16,049,802 11,675,919 Total Revenues 45,326,573 45,326,573 43,867,047 Proceeds from Bond Sales 0 0 0 Proceeds from Bond Sales 5,704,992 5,704,992 8,575,000 Other Financing Sources 0 0 0 Other Financing Sources 1,426,300 1,426,300 4,029,586 Transfers from Other Funds 0 0 170,000 Transfers from Other Funds 1,205,503 1,205,503 1,459,994
Total Revenues and Other Sources 16,049,802 16,049,802 11,845,919 Total Revenues and Other Sources 53,663,368 53,663,368 57,931,627 Current Expenditures Current Expenditures
General Government 2,422,375 2,422,375 2,648,328 General Government Public Safety 1,782,799 1,782,799 2,053,075 Public Safety Streets and Highways (excluding Const.) 1,706,656 1,706,656 1,849,358 Streets and Highways (excluding Const.) Sanitation 168,942 168,942 169,265 Sanitation Human Services 2,254,316 2,254,316 2,804,460 Human Services Health 0 0 0 Health Culture and Recreation 125,497 125,497 135,489 Culture and RecreationConservation of Natural Resources 316,278 316,278 369,099 Conservation of Natural Resources Economic Development & Housing 59,820 59,820 61,705 Economic Development & Housing Miscellaneous Current Expenditures 0 0 0 Miscellaneous Current Expenditures
Total Current Expenditures 8,836,683 8,836,683 10,090,779 Total Current Expenditures
Debt Service - Principal 170,000 170,000 110,000 Debt Service - Principal Interest and Fiscal Charges 137,420 137,420 125,090 Interest and Fiscal Charges Streets and Highways Construction 6,905,699 6,905,699 2,303,248 Streets and Highways Construction Total Capital Outlay 0 0 0 Total Capital Outlay
Other Financing Uses 0 0 0 Other Financing Uses Transfers to Other Funds 0 0 170,000 Transfers to Other Funds
Total Expenditures and Other Uses 16,049,802 16,049,802 12,799,117 Total Expenditures and Other Uses
8,939,543 4,595,673 3,458,211
799,721 13,569,748 1,764,959
254,781 348,358
0 1,830,925
35,561,919
0 82,120
9,802,539 8,216,790
0 0
8,939,543 4,595,673 3,458,211
799,721 13,569,748 1,764,959
254,781 348,358
0 1,830,925
35,561,919 0
82,120 9,802,539 8,216,790
0 0
8,813,583 4,822,631 3,523,533 1,972,739
14,164,750 1,939,030
215,831 369,784
0 1,631,992
37,453,873 565,000
1,037,937 5,820,354
13,054,463 0 0
53,663,368 53,663,368 57,931,627
84

x x Name of County: POPE
Adopted budgets for the following funds: GF: x R&B: x HS: x OSR: x DS: x CP: Name of County: RAMSEY
Adopted budgets for the following funds: GF: x R&B: HS: x OSR: x DS: CP: 2005 2005 2006
Budget Amended BudgetRevenues:
Property Taxes 4,712,853 0 5,606,856 All Other Taxes 22,000 0 22,000 Special Assessments 0 0 0 Licenses and Permits 40,300 0 40,000 Federal Grants 773,413 0 866,075 State General Purpose Aid 788,128 0 676,018 State Categorical Aid 4,193,868 0 4,247,314 Charges for Services 1,262,065 0 1,177,641 Fines and Forfeits 0 0 0 Interest on Investments 200,000 0 200,000 Miscellaneous Revenues 205,426 0 222,057
2005 2005 2006 Budget Amended Budget
Revenues: Property Taxes 189,246,416 190,352,309 201,057,523 All Other Taxes 2,235,000 2,235,000 2,235,000 Special Assessments 0 0 0 Licenses and Permits 1,391,328 1,391,328 1,440,483 Federal Grants 79,056,240 83,177,833 86,165,346 State General Purpose Aid 29,295,237 28,189,344 28,087,458 State Categorical Aid 77,200,315 75,374,566 66,314,339 Charges for Services 63,697,926 57,869,077 62,117,668 Fines and Forfeits 473,000 473,000 533,000Interest on Investments 8,440,000 8,440,000 8,475,000 Miscellaneous Revenues 9,694,226 9,796,311 9,801,904
Total Revenues 12,198,053 0 13,057,961 Total Revenues 460,729,688 457,298,768 466,227,721 Proceeds from Bond Sales 0 0 0 Proceeds from Bond Sales 8,875,000 2,500,000 6,750,000 Other Financing Sources 0 0 0 Other Financing Sources 0 0 0 Transfers from Other Funds 165,000 0 0 Transfers from Other Funds 0 0 105,000
Total Revenues and Other Sources 12,363,053 0 13,057,961 Total Revenues and Other Sources 469,604,688 459,798,768 473,082,721 Current Expenditures Current Expenditures
General Government 2,544,588 0 3,032,527 General Government Public Safety 1,660,152 0 1,614,622 Public Safety Streets and Highways (excluding Const.) 1,332,400 0 1,573,700 Streets and Highways (excluding Const.) Sanitation 0 0 0 Sanitation Human Services 2,441,576 0 2,674,963 Human Services Health 801,447 0 674,490 Health Culture and Recreation 74,061 0 96,975 Culture and RecreationConservation of Natural Resources 139,676 0 144,233 Conservation of Natural Resources Economic Development & Housing 0 0 0 Economic Development & Housing Miscellaneous Current Expenditures 289,406 0 479,247 Miscellaneous Current Expenditures
Total Current Expenditures 9,283,306 0 10,290,757 Total Current Expenditures
Debt Service - Principal 342,050 0 427,456 Debt Service - Principal Interest and Fiscal Charges 0 0 0 Interest and Fiscal Charges Streets and Highways Construction 2,441,999 0 2,545,500 Streets and Highways Construction Total Capital Outlay 272,000 0 272,000 Total Capital Outlay
Other Financing Uses 0 0 0 Other Financing Uses Transfers to Other Funds 173,698 0 0 Transfers to Other Funds
Total Expenditures and Other Uses 12,513,053 0 13,535,713 Total Expenditures and Other Uses
RED LAKEName of County: REDWOODName of County: Adopted budgets for the following funds: GF: x xR&B: HS: x OSR: DS: CP: Adopted budgets for the following funds: GF:
79,545,775 86,448,464 12,357,482 17,818,661
177,635,892 27,894,437 16,396,431
1,004,231 20,705,558
2,000,000 441,806,931
12,240,000 9,156,895 2,302,087
12,120,236 0
557,076
79,951,030 86,191,848 12,391,987 18,463,285
173,899,719 27,407,579 16,396,431
958,020 20,684,112 2,000,000
438,344,011 12,240,000 9,156,895 2,334,087 5,745,236
0 557,076
78,844,531 91,397,603 12,971,435 21,007,584
170,893,537 28,595,858 17,081,229 1,029,683
20,840,002 2,000,000
444,661,462 12,653,000 9,174,295 2,877,835
10,447,065 0
557,076
478,183,225 468,377,305 480,370,733
x R&B: x HS: x OSR: x DS: CP: 2005 2005 2006
Budget Amended BudgetRevenues:
Property Taxes 1,551,279 0 1,616,354 All Other Taxes 22,600 0 23,700 Special Assessments 0 0 0 Licenses and Permits 1,300 0 1,300 Federal Grants 202,000 0 210,000 State General Purpose Aid 768,601 0 578,821 State Categorical Aid 1,321,823 0 1,676,721 Charges for Services 291,080 0 116,880 Fines and Forfeits 0 0 0 Interest on Investments 112,513 0 135,916 Miscellaneous Revenues 389,937 0 439,906
2005 2005 2006 Budget Amended Budget
Revenues: Property Taxes 7,414,413 7,414,413 7,766,607 All Other Taxes 43,800 43,800 45,200 Special Assessments 498,000 498,000 323,000 Licenses and Permits 23,200 23,200 22,700 Federal Grants 3,347,444 3,347,444 1,407,409 State General Purpose Aid 874,097 874,097 855,822 State Categorical Aid 7,452,163 7,452,163 6,413,394 Charges for Services 1,224,241 1,224,241 1,302,335 Fines and Forfeits 0 0 0 Interest on Investments 96,500 96,500 189,000 Miscellaneous Revenues 281,314 281,314 315,814
Total Revenues 4,661,133 0 4,799,598 Total Revenues 21,255,172 21,255,172 18,641,281 Proceeds from Bond Sales 0 0 0 Proceeds from Bond Sales 0 0 0 Other Financing Sources 21,503 0 86,668 Other Financing Sources 0 0 0 Transfers from Other Funds 0 0 0 Transfers from Other Funds 0 0 0
Total Revenues and Other Sources 4,682,636 0 4,886,266 Total Revenues and Other Sources 21,255,172 21,255,172 18,641,281 Current Expenditures
General Government Public Safety Streets and Highways (excluding Const.) SanitationHuman ServicesHealthCulture and RecreationConservation of Natural ResourcesEconomic Development & HousingMiscellaneous Current Expenditures
Total Current Expenditures
Debt Service - Principal Interest and Fiscal Charges Streets and Highways Construction Total Capital Outlay
Other Financing UsesTransfers to Other Funds
646,962 762,891
1,276,915 203,708
1,245,890 27,000 59,924
152,539 3,957
177,850
0 676,362 0 743,427 0 1,234,668 0 185,428 0 1,347,860 0 67,382 0 89,794 0 164,741 0 3,963 0 145,141
Current Expenditures General Government Public Safety Streets and Highways (excluding Const.) SanitationHuman ServicesHealthCulture and RecreationConservation of Natural ResourcesEconomic Development & HousingMiscellaneous Current Expenditures
Total Current Expenditures
Debt Service - Principal Interest and Fiscal Charges Streets and Highways Construction Total Capital Outlay
Other Financing UsesTransfers to Other Funds
2,229,646 2,225,907 2,147,000
317,824 4,938,988 1,291,025
111,385 703,628 24,800
1,275,000 15,265,203
0 0
7,058,000 516,389
0 0
2,229,646 2,225,907 2,147,000
317,824 4,938,988 1,291,025
111,385 703,628 24,800
1,275,000 15,265,203
0 0
7,058,000 516,389
0 0
2,578,116 2,297,471 2,250,000
333,646 4,978,981 1,301,245
120,541 704,025 25,300
1,301,000 15,890,325
75,000 11,869
3,990,000 492,980
0 0
4,557,636
0 0 0
125,000 0 0
0 4,658,766 0 0 0 0 0 0 0 227,500 0 0 0 0
Total Expenditures and Other Uses 4,682,636 0 4,886,266 Total Expenditures and Other Uses 22,839,592 22,839,592 20,460,174
85

x Name of County: RENVILLE
Adopted budgets for the following funds: GF: x R&B: x HS: x OSR: x DS: x CP: x Name of County: RICE
Adopted budgets for the following funds: GF: x R&B: x HS: x OSR: x DS: CP: 2005 2005 2006
Budget Amended BudgetRevenues:
Property Taxes 7,751,726 0 8,509,868 All Other Taxes 67,000 0 37,000 Special Assessments 154,000 0 0 Licenses and Permits 101,900 0 104,000 Federal Grants 4,161,754 0 1,701,650 State General Purpose Aid 1,640,317 0 1,684,878 State Categorical Aid 6,900,056 0 6,160,355 Charges for Services 1,309,860 0 1,105,923 Fines and Forfeits 0 0 13,000Interest on Investments 203,100 0 221,120 Miscellaneous Revenues 487,339 0 607,065
2005 2005 2006 Budget Amended Budget
Revenues: Property Taxes 11,793,159 11,793,159 12,758,635 All Other Taxes 277,500 277,500 273,500 Special Assessments 310,000 310,000 310,000 Licenses and Permits 568,070 568,070 602,400 Federal Grants 2,552,175 2,552,175 2,918,495 State General Purpose Aid 3,213,090 3,213,090 4,278,252 State Categorical Aid 7,413,506 7,413,506 6,811,014 Charges for Services 2,998,790 2,998,790 3,287,411 Fines and Forfeits 3,500 3,500 2,000Interest on Investments 890,000 890,000 1,068,996 Miscellaneous Revenues 948,095 948,095 1,253,032
Total Revenues 22,777,052 0 20,144,859 Total Revenues 30,967,885 30,967,885 33,563,735 Proceeds from Bond Sales 48,250 0 1,110,000 Proceeds from Bond Sales 0 0 0 Other Financing Sources 0 0 0 Other Financing Sources 0 0 0 Transfers from Other Funds 0 0 0 Transfers from Other Funds 350,460 350,460 295,460
Total Revenues and Other Sources 22,825,302 0 21,254,859 Total Revenues and Other Sources 31,318,345 31,318,345 33,859,195 Current Expenditures Current Expenditures
General Government 3,956,308 0 4,100,114 General Government Public Safety 1,796,270 0 1,857,406 Public Safety Streets and Highways (excluding Const.) 3,200,398 0 3,448,320 Streets and Highways (excluding Const.) Sanitation 524,177 0 0 Sanitation Human Services 5,122,567 0 5,329,027 Human Services Health 1,336,736 0 1,458,664 Health Culture and Recreation 165,319 0 198,909 Culture and RecreationConservation of Natural Resources 261,869 0 315,274 Conservation of Natural Resources Economic Development & Housing 0 0 0 Economic Development & Housing Miscellaneous Current Expenditures 0 0 0 Miscellaneous Current Expenditures
Total Current Expenditures 16,363,644 0 16,707,714 Total Current Expenditures
Debt Service - Principal 484,400 0 490,000 Debt Service - Principal Interest and Fiscal Charges 14,400 0 69,850 Interest and Fiscal Charges Streets and Highways Construction 5,712,940 0 3,900,695 Streets and Highways Construction Total Capital Outlay 100,000 0 586,600 Total Capital Outlay
Other Financing Uses 0 0 0 Other Financing Uses Transfers to Other Funds 0 0 0 Transfers to Other Funds
Total Expenditures and Other Uses 22,675,384 0 21,754,859 Total Expenditures and Other Uses
ROCKName of County: ROSEAUName of County: Adopted budgets for the following funds: GF: x xR&B: HS: x OSR: x DS: CP:x Adopted budgets for the following funds: GF:
5,898,162 6,633,371 3,771,414
200,000 8,413,844 2,689,289
619,755 500,969 71,541
0 28,798,345
465,000 465,000
2,100,000 0 0 0
5,898,162 6,633,371 3,771,414
200,000 8,413,844 2,689,289
619,755 500,969 71,541
0 28,798,345
465,000 465,000
2,100,000 0 0 0
7,634,354 7,027,959 3,482,496
200,000 8,567,794 2,696,639
645,676 484,215 84,319
0 30,823,452
780,000 428,743
2,137,000 0 0 0
31,828,345 31,828,345 34,169,195
x R&B: x HS: x OSR: x DS: CP: 2005 2005 2006
Budget Amended BudgetRevenues:
Property Taxes 3,261,258 3,261,258 3,349,095 All Other Taxes 0 0 0 Special Assessments 196,327 196,327 184,327 Licenses and Permits 104,725 104,725 107,363 Federal Grants 187,820 187,820 384,066 State General Purpose Aid 941,558 941,558 955,229 State Categorical Aid 0 0 0 Charges for Services 439,353 439,353 294,423 Fines and Forfeits 0 0 0 Interest on Investments 77,800 77,800 82,030 Miscellaneous Revenues 263,399 263,399 340,010
2005 2005 2006 Budget Amended Budget
Revenues: Property Taxes 4,115,048 4,115,048 4,319,192 All Other Taxes 7,000 7,000 7,000 Special Assessments 430,000 430,000 350,000 Licenses and Permits 4,040 4,040 4,040 Federal Grants 1,122,515 822,515 1,087,164 State General Purpose Aid 2,324,544 2,324,544 2,831,206 State Categorical Aid 6,530,502 6,830,502 5,413,519 Charges for Services 1,155,773 1,155,773 1,445,838 Fines and Forfeits 6,800 6,800 7,900Interest on Investments 125,000 125,000 125,000 Miscellaneous Revenues 247,956 247,956 330,040
Total Revenues 5,472,240 5,472,240 5,696,543 Total Revenues 16,069,178 16,069,178 15,920,899 Proceeds from Bond Sales 0 0 0 Proceeds from Bond Sales 0 0 0 Other Financing Sources 3,251,292 3,251,292 3,575,419 Other Financing Sources 0 0 2,000,000 Transfers from Other Funds 0 0 0 Transfers from Other Funds 19,350 19,350 24,207
Total Revenues and Other Sources 8,723,532 8,723,532 9,271,962 Total Revenues and Other Sources 16,088,528 16,088,528 17,945,106 Current Expenditures
General Government Public Safety Streets and Highways (excluding Const.) SanitationHuman ServicesHealthCulture and RecreationConservation of Natural ResourcesEconomic Development & HousingMiscellaneous Current Expenditures
Total Current Expenditures
Debt Service - Principal Interest and Fiscal Charges Streets and Highways Construction Total Capital Outlay
Other Financing UsesTransfers to Other Funds
1,608,005 1,284,485 1,917,828
348,903 2,090,079
75,450 154,081
93,588 0 0
7,572,419
69,489 0 0 0
1,081,624 0
1,608,005 1,284,485 1,917,828
348,903 2,090,079
75,450 154,081 93,588
0 0
7,572,419 69,489
0 0 0
1,081,624 0
2,003,828 1,386,033 1,630,335
365,031 2,232,817
108,703 217,008 103,975
0 0
8,047,730 68,198
0 0 0
1,156,034 0
Current Expenditures General Government Public Safety Streets and Highways (excluding Const.) SanitationHuman ServicesHealthCulture and RecreationConservation of Natural ResourcesEconomic Development & HousingMiscellaneous Current Expenditures
Total Current Expenditures
Debt Service - Principal Interest and Fiscal Charges Streets and Highways Construction Total Capital Outlay
Other Financing UsesTransfers to Other Funds
1,916,458 1,703,547 2,215,579
997,713 2,546,123
7,465 171,116 253,108 66,690
309,482 10,187,281
0 0
4,964,323 1,013,500
0 0
1,938,487 1,792,448 2,279,734 1,022,317 2,546,123
7,465 171,116 254,205 66,690
309,482 10,388,067
0 0
4,984,567 1,013,500
0 0
2,512,059 1,808,067 2,827,560 1,056,946 2,824,734
8,415 173,400 288,347 45,723
333,114 11,878,365
0 0
4,084,639 2,489,150
0 0
Total Expenditures and Other Uses 8,723,532 8,723,532 9,271,962 Total Expenditures and Other Uses 16,165,104 16,386,134 18,452,154
86

Name of County: SCOTT Adopted budgets for the following funds: GF: x R&B: x HS: x OSR: x DS: x CP: x
2005 2005 2006 Budget Amended Budget
Revenues: Property Taxes 39,670,181 39,670,181 43,747,147 All Other Taxes 1,384,008 1,384,008 1,050,000 Special Assessments 0 0 0 Licenses and Permits 2,128,871 2,128,871 2,583,880 Federal Grants 5,633,113 5,633,113 6,242,337 State General Purpose Aid 3,279,234 3,279,234 3,427,853 State Categorical Aid 13,096,004 13,096,004 13,389,946 Charges for Services 6,777,099 6,777,099 13,550,394 Fines and Forfeits 82,863 82,863 119,919Interest on Investments 1,828,000 1,828,000 1,850,969 Miscellaneous Revenues 2,532,837 2,532,837 3,061,402
Total Revenues 76,412,210 76,412,210 89,023,847 Proceeds from Bond Sales 0 0 9,000,000 Other Financing Sources 0 0 0 Transfers from Other Funds 0 0 0
Total Revenues and Other Sources 76,412,210 76,412,210 98,023,847 Current Expenditures
General Government 19,165,465 19,285,465 20,878,067 Public Safety 10,728,597 10,728,597 10,916,958 Streets and Highways (excluding Const.) 6,708,045 6,708,045 7,219,934 Sanitation 0 0 0 Human Services 16,172,067 16,172,067 17,553,633 Health 2,771,362 2,771,362 2,630,892 Culture and Recreation 2,121,292 2,132,409 2,344,686 Conservation of Natural Resources 1,339,331 1,339,331 1,456,056Economic Development & Housing 1,193,879 1,193,879 790,371Miscellaneous Current Expenditures 0 0 0
Total Current Expenditures 60,200,038 60,331,155 63,790,597
Debt Service - Principal 2,590,000 2,590,000 2,667,500 Interest and Fiscal Charges 2,331,064 2,331,064 2,811,067 Streets and Highways Construction 22,689,224 22,569,224 22,672,631 Total Capital Outlay 15,231,775 15,231,775 3,814,335
Other Financing Uses 150,000 150,000 150,000 Transfers to Other Funds 0 0 0
Total Expenditures and Other Uses 103,192,101 103,203,218 95,906,130
Name of County: SIBLEY
Adopted budgets for the following funds: GF: x R&B: x HS: x OSR: DS: x CP: 2005 2005 2006
Budget Amended BudgetRevenues:
Property Taxes 8,295,098 8,295,098 9,027,831 All Other Taxes 83,500 83,500 83,500 Special Assessments 130,000 130,000 130,000 Licenses and Permits 59,260 59,260 62,915 Federal Grants 1,496,251 1,496,251 1,364,130 State General Purpose Aid 694,040 694,040 663,794 State Categorical Aid 3,442,430 3,442,430 3,490,894 Charges for Services 1,092,760 1,092,760 1,056,022 Fines and Forfeits 600 600 1,000Interest on Investments 231,580 231,580 266,263 Miscellaneous Revenues 148,882 148,882 318,318
Total Revenues 15,674,401 15,674,401 16,464,667 Proceeds from Bond Sales 0 0 0 Other Financing Sources 244,698 244,698 0 Transfers from Other Funds 0 0 0
Total Revenues and Other Sources 15,919,099 15,919,099 16,464,667 Current Expenditures
General Government 2,393,550 2,393,550 2,561,811 Public Safety 1,716,072 1,716,072 1,884,055 Streets and Highways (excluding Const.) 2,179,014 2,179,014 2,565,362 Sanitation 169,755 169,755 183,055 Human Services 3,805,796 3,805,796 3,794,567 Health 1,340,348 1,340,348 1,463,599 Culture and Recreation 234,682 234,682 265,911 Conservation of Natural Resources 349,789 349,789 360,840Economic Development & Housing 175,779 175,779 178,024Miscellaneous Current Expenditures 266,313 266,313 330,652
Total Current Expenditures 12,631,098 12,631,098 13,587,876
Debt Service - Principal 410,000 410,000 430,000 Interest and Fiscal Charges 214,840 214,840 202,200 Streets and Highways Construction 1,985,693 1,985,693 1,748,091 Total Capital Outlay 677,468 677,468 566,500
Other Financing Uses 0 0 0 Transfers to Other Funds 0 0 0
Total Expenditures and Other Uses 15,919,099 15,919,099 16,534,667
Name of County: SHERBURNE Adopted budgets for the following funds: GF: x R&B: x HS: x OSR: x DS: x CP: x
2005 2005 2006 Budget Amended Budget
Revenues: Property Taxes 27,234,311 27,119,794 30,493,936 All Other Taxes 659,030 659,030 880,030 Special Assessments 429,850 429,850 440,324 Licenses and Permits 642,970 642,970 668,410 Federal Grants 5,099,119 5,099,119 7,873,278 State General Purpose Aid 4,962,809 5,077,326 4,907,010 State Categorical Aid 5,677,126 5,677,126 7,135,392 Charges for Services 6,025,109 6,385,989 6,090,225 Fines and Forfeits 271,750 271,750 61,000Interest on Investments 1,300,000 1,300,000 1,900,000 Miscellaneous Revenues 1,226,279 1,226,279 1,155,768
Total Revenues 53,528,353 53,889,233 61,605,373 Proceeds from Bond Sales 0 0 0 Other Financing Sources 0 0 0 Transfers from Other Funds 0 1,115,431 649,901
Total Revenues and Other Sources 53,528,353 55,004,664 62,255,274 Current Expenditures
General Government 10,657,097 11,183,200 11,420,035 Public Safety 11,097,164 12,094,227 11,995,687 Streets and Highways (excluding Const.) 4,206,480 5,268,170 4,556,286 Sanitation 2,523,969 2,555,667 4,015,129 Human Services 11,775,438 11,775,438 12,830,048 Health 1,496,573 1,501,866 1,573,893 Culture and Recreation 1,365,281 1,429,007 1,503,850 Conservation of Natural Resources 493,917 493,917 497,896Economic Development & Housing 259,722 618,022 165,203Miscellaneous Current Expenditures 614,101 1,753,532 645,671
Total Current Expenditures 44,489,742 48,673,046 49,203,698
Debt Service - Principal 900,000 900,000 1,470,000 Interest and Fiscal Charges 935,322 935,322 964,557 Streets and Highways Construction 5,243,120 9,150,066 11,262,225 Total Capital Outlay 5,267,885 5,267,885 4,069,155
Other Financing Uses 0 0 0 Transfers to Other Funds 0 0 0
Total Expenditures and Other Uses 56,836,069 64,926,319 66,969,635
Name of County: ST. LOUIS Adopted budgets for the following funds: GF: x R&B: x HS: x OSR: x DS: x CP: x
2005 2005 2006 Budget Amended Budget
Revenues: Property Taxes 75,779,008 75,742,438 80,436,832 All Other Taxes 2,713,968 2,995,669 3,137,669 Special Assessments 0 0 0 Licenses and Permits 148,070 138,400 140,400 Federal Grants 27,022,506 39,932,383 31,597,958 State General Purpose Aid 22,233,572 22,270,142 20,908,334 State Categorical Aid 54,946,072 62,013,929 53,020,897 Charges for Services 9,650,862 9,356,981 10,311,079 Fines and Forfeits 824,150 824,150 3,500Interest on Investments 1,626,050 2,023,652 2,080,364 Miscellaneous Revenues 14,520,210 16,496,511 14,154,143
Total Revenues 209,464,468 231,794,255 215,791,176 Proceeds from Bond Sales 0 6,115,000 1,320,000 Other Financing Sources 0 0 0 Transfers from Other Funds 1,790,000 1,290,000 2,356,700
Total Revenues and Other Sources 211,254,468 239,199,255 219,467,876 Current Expenditures
General Government 31,712,372 32,312,400 30,297,296 Public Safety 31,391,126 34,664,132 33,862,788 Streets and Highways (excluding Const.) 28,567,728 29,263,568 31,107,253 Sanitation 0 0 0 Human Services 61,753,662 60,999,884 64,863,606 Health 6,869,320 7,108,800 7,097,050 Culture and Recreation 814,593 814,593 941,724 Conservation of Natural Resources 6,696,847 6,732,902 7,987,296Economic Development & Housing 4,249,189 9,393,119 5,242,800Miscellaneous Current Expenditures 0 0 0
Total Current Expenditures 172,054,837 181,289,398 181,399,813
Debt Service - Principal 4,973,900 4,973,900 5,527,200 Interest and Fiscal Charges 1,685,892 1,685,892 1,666,018 Streets and Highways Construction 26,655,080 37,859,376 26,251,649 Total Capital Outlay 5,119,845 25,108,340 5,417,657
Other Financing Uses 0 0 0 Transfers to Other Funds 0 0 0
Total Expenditures and Other Uses 210,489,554 250,916,906 220,262,337
87

2006
0
x Name of County: STEARNS
Adopted budgets for the following funds: GF: x R&B: x HS: OSR: DS: CP: Name of County: STEELE
Adopted budgets for the following funds: GF: x R&B: x HS: x OSR: DS: CP:
Revenues: Property Taxes All Other Taxes Special Assessments Licenses and Permits Federal Grants State General Purpose Aid State Categorical Aid Charges for Services Fines and Forfeits Interest on Investments Miscellaneous Revenues
2005 Budget
46,101,623 362,000 325,000 515,600
11,559,903 6,274,225
14,571,576 3,965,374
128,000 766,632
3,776,178
2005 Amended
46,101,623 362,000 325,000 515,600
11,795,449 6,274,225
14,771,882 3,999,374
154,000 766,632
5,293,025
2006 Budget
49,934,321 391,500
1,020,000 545,450
10,887,089 6,568,321
18,023,775 4,304,800
136,000 785,000
4,930,924
Revenues: Property Taxes All Other Taxes Special Assessments Licenses and Permits Federal Grants State General Purpose Aid State Categorical Aid Charges for Services Fines and Forfeits Interest on Investments Miscellaneous Revenues
2005 2005 Budget Amended
13,021,633 0 24,000 0
150,000 0 39,600 0
2,912,052 0 1,828,870 0 5,238,708 0 3,545,460 0
37,000 0 330,000 0
1,042,522 0
Budget
14,314,774 35,000
40,500 3,150,912 1,767,733 5,191,339 4,111,106
27,500 300,000
1,900,071 Total Revenues 88,346,111 90,358,810 97,527,180 Total Revenues 28,169,845 0 30,838,935
Proceeds from Bond Sales 0 0 0 Proceeds from Bond Sales 0 0 0 Other Financing Sources 0 0 0 Other Financing Sources 0 0 0 Transfers from Other Funds 2,050,000 2,677,818 2,295,000 Transfers from Other Funds 256,448 0 315,603
Total Revenues and Other Sources 90,396,111 93,036,628 99,822,180 Total Revenues and Other Sources 28,426,293 0 31,154,538 Current Expenditures
General Government Public Safety Streets and Highways (excluding Const.) SanitationHuman ServicesHealthCulture and RecreationConservation of Natural ResourcesEconomic Development & HousingMiscellaneous Current Expenditures
Total Current Expenditures
Debt Service - Principal Interest and Fiscal Charges Streets and Highways Construction Total Capital Outlay
Other Financing UsesTransfers to Other Funds
15,214,527 19,709,288 5,635,660
0 28,356,310 1,721,948 4,356,150 1,835,905
128,850 0
76,958,638
4,615,000 1,422,164 7,400,309
0 0 0
16,771,738 19,810,389 5,819,013
0 28,919,529 1,734,136 4,432,364 1,929,068
173,984 0
79,590,221 5,065,000
972,164 7,409,243
0 0 0
17,405,716 21,506,704 6,200,330
0 29,479,436 1,940,048 3,587,042 2,409,373
153,935 0
82,682,584 4,760,000 1,480,213
10,899,383 0 0 0
Current Expenditures General Government Public Safety Streets and Highways (excluding Const.) SanitationHuman ServicesHealthCulture and RecreationConservation of Natural ResourcesEconomic Development & HousingMiscellaneous Current Expenditures
Total Current Expenditures
Debt Service - Principal Interest and Fiscal Charges Streets and Highways Construction Total Capital Outlay
Other Financing UsesTransfers to Other Funds
6,788,208 5,579,411 2,188,848
607,318 6,628,378 1,240,733
263,397 539,382 25,000
0
0 6,244,831 0 6,461,468 0 2,383,337 0 626,308 0 7,182,708 0 1,654,074 0 277,006 0 403,117 0 25,000 0 0
23,860,675
735,792 840,567
2,756,059 0 0
233,200
0 25,257,849 0 824,561 0 768,400 0 3,614,125 0 374,000 0 0 0 315,603
Total Expenditures and Other Uses 90,396,111 93,036,628 99,822,180
Name of County: STEVENS
Adopted budgets for the following funds: GF: x R&B: x HS: x OSR: DS: CP:
Total Expenditures and Other Uses 28,426,293
Name of County: SWIFT
Adopted budgets for the following funds: GF: x R&B: x HS: x OSR:
0 31,154,538
x DS: CP:
Revenues: Property Taxes All Other Taxes Special Assessments Licenses and Permits Federal Grants State General Purpose Aid State Categorical Aid Charges for Services Fines and Forfeits Interest on Investments Miscellaneous Revenues
2005 2005 Budget Amended
3,436,369 0 0 0 0 0
31,300 0 300,000 0
1,059,120 0 3,769,174 0
394,615 0 0 0
300,000 0 289,256 0
2006 Budget
3,685,582 53,000 24,357 17,900
734,000 1,036,483 2,725,786
523,300 5,000
350,000 249,200
Revenues: Property Taxes All Other Taxes Special Assessments Licenses and Permits Federal Grants State General Purpose Aid State Categorical Aid Charges for Services Fines and Forfeits Interest on Investments Miscellaneous Revenues
2005 2005 Budget Amended
5,539,300 0 0 0
127,571 0 6,000 0
1,158,150 0 4,335,855 0
115,000 0 2,215,053 0
0 0 146,000 0
1,000 0
2006 Budget
5,892,012 0
127,571 8,500
1,213,600 3,893,219
114,427 2,556,842
0 191,000
2,000 Total Revenues 9,579,834 0 9,404,608 Total Revenues 13,643,929 0 13,999,171
Proceeds from Bond Sales 0 0 0 Proceeds from Bond Sales 0 0 0 Other Financing Sources 0 0 0 Other Financing Sources 0 0 0 Transfers from Other Funds 0 0 0 Transfers from Other Funds 0 0 0
Total Revenues and Other Sources 9,579,834 0 9,404,608 Total Revenues and Other Sources 13,643,929 0 13,999,171 Current Expenditures
General Government Public Safety Streets and Highways (excluding Const.) SanitationHuman ServicesHealthCulture and RecreationConservation of Natural ResourcesEconomic Development & HousingMiscellaneous Current Expenditures
Total Current Expenditures
Debt Service - Principal Interest and Fiscal Charges Streets and Highways Construction Total Capital Outlay
Other Financing UsesTransfers to Other Funds
1,808,170 984,295
1,892,000 97,781
2,422,657 101,948 119,186 255,941 58,500
0
0 1,919,109 0 1,047,382 0 1,722,900 0 97,426 0 2,471,640 0 111,948 0 124,891 0 275,541 0 60,500 0 0
Current Expenditures General Government Public Safety Streets and Highways (excluding Const.) SanitationHuman ServicesHealthCulture and RecreationConservation of Natural ResourcesEconomic Development & HousingMiscellaneous Current Expenditures
Total Current Expenditures
Debt Service - Principal Interest and Fiscal Charges Streets and Highways Construction Total Capital Outlay
Other Financing UsesTransfers to Other Funds
2,190,445 1,324,196 5,546,105
704,300 3,706,462
0 907,019 101,016
0 0
0 2,602,004 0 1,520,542 0 4,647,171 0 739,877 0 3,821,521 0 0 0 860,592 0 166,339 0 0 0 0
7,740,478
0 0
1,550,000 259,500
0 60,000
0 7,831,337 0 0 0 0 0 1,245,660 0 277,811 0 0 0 49,800
14,479,543
0 0 0 0 0 0
0 14,358,046 0 0 0 0 0 0 0 0 0 0 0 0
Total Expenditures and Other Uses 9,609,978 0 9,404,608 Total Expenditures and Other Uses 14,479,543 0 14,358,046
88
x x

Name of County: TODD
Adopted budgets for the following funds: GF: x R&B: x HS: x OSR: DS: x CP: Name of County: TRAVERSE
Adopted budgets for the following funds: GF: x R&B: x HS: x OSR: x DS: CP: 2005 2005 2006
Budget Amended BudgetRevenues:
Property Taxes 7,400,847 7,400,847 8,200,918 All Other Taxes 21,000 21,000 21,000 Special Assessments 0 0 0 Licenses and Permits 145,191 147,391 179,675 Federal Grants 2,195,412 2,135,912 2,177,506 State General Purpose Aid 2,507,149 3,738,682 3,743,527 State Categorical Aid 2,725,716 2,220,793 2,432,026 Charges for Services 1,804,204 1,476,754 1,826,578 Fines and Forfeits 2,000 2,000 2,000Interest on Investments 0 0 0 Miscellaneous Revenues 1,157,748 1,821,248 1,619,951
2005 2005 2006 Budget Amended Budget
Revenues: Property Taxes 2,967,914 2,967,914 3,401,127 All Other Taxes 0 0 0 Special Assessments 50,000 50,000 50,000 Licenses and Permits 2,440 2,440 1,940 Federal Grants 223,490 223,490 266,724 State General Purpose Aid 660,640 660,640 300,599 State Categorical Aid 3,992,805 3,992,805 4,717,237 Charges for Services 227,400 227,400 253,900 Fines and Forfeits 5,500 5,500 5,000Interest on Investments 95,000 95,000 70,000 Miscellaneous Revenues 973,214 973,214 587,766
Total Revenues 17,959,267 18,964,627 20,203,181 Total Revenues 9,198,403 9,198,403 9,654,293 Proceeds from Bond Sales 0 0 0 Proceeds from Bond Sales 0 0 0 Other Financing Sources 0 0 0 Other Financing Sources 0 0 0 Transfers from Other Funds 627,798 500,000 500,000 Transfers from Other Funds 946,255 946,255 942,796
Total Revenues and Other Sources 18,587,065 19,464,627 20,703,181 Total Revenues and Other Sources 10,144,658 10,144,658 10,597,089 Current Expenditures
General Government Public Safety Streets and Highways (excluding Const.) SanitationHuman ServicesHealthCulture and RecreationConservation of Natural ResourcesEconomic Development & HousingMiscellaneous Current Expenditures
Total Current Expenditures
Debt Service - Principal Interest and Fiscal Charges Streets and Highways Construction Total Capital Outlay
Other Financing UsesTransfers to Other Funds
3,724,287 2,049,517 2,500,000
6,268,280 2,186,930
176,019 51,877
0 16,956,910
160,000
725,000 553,536
0 627,798
3,810,922 2,050,517 2,428,348
0 0 6,268,280 2,115,825
0 0 175,019 54,927
0 16,903,838
160,000 0 0
725,000 794,779
3,912,179 2,331,118 2,710,591
0 6,477,119 2,182,337
288,712 184,041 30,495
0 18,116,592
165,000 0
730,000 921,500
0
Current Expenditures General Government Public Safety Streets and Highways (excluding Const.) SanitationHuman ServicesHealthCulture and RecreationConservation of Natural ResourcesEconomic Development & HousingMiscellaneous Current Expenditures
Total Current Expenditures
Debt Service - Principal Interest and Fiscal Charges Streets and Highways Construction Total Capital Outlay
Other Financing UsesTransfers to Other Funds
1,145,774 651,104
1,770,000 47,596
1,270,166 70,638 58,212
162,633 8,375
152,174 5,336,672
10,500 25,300
3,205,000 342,500
0 946,255
1,145,774 651,104
1,770,000 47,596
1,270,166 70,638 58,212
162,633 8,375
152,174 5,336,672
10,500 25,300
3,205,000 342,500
0 946,255
1,397,937 823,433
1,889,000 0
1,334,096 90,638 59,212
167,991 3,375
182,537 5,948,219
0 0
3,500,000 352,200
0 942,796
0 0 0
Total Expenditures and Other Uses 19,023,244 18,583,617 19,933,092
Name of County: WABASHA Adopted budgets for the following funds: GF: x R&B: x HS: x OSR: x DS: x CP: x
Total Expenditures and Other Uses
Name of County: WADENA
Adopted budgets for the following funds: GF:
9,866,227 9,866,227 10,743,215
x R&B: x HS: x OSR: x DS: CP: 2005 2005 2006
Budget Amended BudgetRevenues:
Property Taxes 7,557,560 7,557,560 8,348,063 All Other Taxes 30,600 30,600 27,675 Special Assessments 0 0 0 Licenses and Permits 160,085 160,085 163,095 Federal Grants 1,431,261 1,482,153 1,836,615 State General Purpose Aid 1,168,062 1,168,062 1,175,759 State Categorical Aid 3,784,540 3,784,540 5,467,491 Charges for Services 1,290,609 1,290,609 1,435,962 Fines and Forfeits 6,500 6,500 8,500Interest on Investments 170,000 170,000 200,000 Miscellaneous Revenues 314,872 314,872 382,757
2005 2005 2006 Budget Amended Budget
Revenues: Property Taxes 5,551,541 4,715,458 5,284,541 All Other Taxes 139,136 8,500 9,000 Special Assessments 312,621 312,621 414,510 Licenses and Permits 81,230 57,239 56,352 Federal Grants 3,311,205 3,311,205 1,800,321 State General Purpose Aid 848,539 1,865,320 1,851,648 State Categorical Aid 4,243,620 4,234,620 4,282,814 Charges for Services 830,478 830,478 709,609 Fines and Forfeits 0 0 0 Interest on Investments 65,000 65,000 85,000 Miscellaneous Revenues 1,186,332 952,151 1,239,898
Total Revenues 15,914,089 15,964,981 19,045,917 Total Revenues 16,569,702 16,352,592 15,733,693 Proceeds from Bond Sales 0 0 0 Proceeds from Bond Sales 0 0 0 Other Financing Sources 0 0 0 Other Financing Sources 0 0 0 Transfers from Other Funds 0 0 0 Transfers from Other Funds 55,796 0 0
Total Revenues and Other Sources 15,914,089 15,964,981 19,045,917 Total Revenues and Other Sources 16,625,498 16,352,592 15,733,693 Current Expenditures
General Government Public Safety Streets and Highways (excluding Const.) SanitationHuman ServicesHealthCulture and RecreationConservation of Natural ResourcesEconomic Development & HousingMiscellaneous Current Expenditures
Total Current Expenditures
Debt Service - Principal Interest and Fiscal Charges Streets and Highways Construction Total Capital Outlay
Other Financing UsesTransfers to Other Funds
2,423,559 3,166,398 2,038,047
248,804 3,935,822 1,260,560
223,352 297,639 64,164
353,812 14,012,157
94,249 12,511
1,340,921 384,866
2,474,451 3,166,398 2,038,047
248,804 3,935,822 1,260,560
223,352 297,639 64,164
353,812 14,063,049
94,249 12,511
1,340,921 384,866
3,054,907 3,420,819 2,191,984
250,573 4,086,201 1,347,296
240,447 296,081 114,277 537,911
15,540,496 53,225 7,698
2,904,221 829,950
0 0
Current Expenditures General Government Public Safety Streets and Highways (excluding Const.) SanitationHuman ServicesHealthCulture and RecreationConservation of Natural ResourcesEconomic Development & HousingMiscellaneous Current Expenditures
Total Current Expenditures
Debt Service - Principal Interest and Fiscal Charges Streets and Highways Construction Total Capital Outlay
Other Financing UsesTransfers to Other Funds
2,562,904 1,239,246 2,197,027
940,071 4,700,421 1,055,330
27,789 135,000
0 202,968
13,060,756
0 0
3,273,859 0 0
55,796
2,675,464 1,259,246 2,197,027
878,673 4,700,421
770,330 76,791
135,000 0
202,968 12,895,920
0 0
3,274,859 0 0 0
2,767,156 1,403,156 2,447,518
861,114 4,740,638
795,678 117,990 139,778
2,000 227,698
13,502,726 0 0
1,751,350 0 0 0
0 0 0 0
Total Expenditures and Other Uses 15,844,704 15,895,596 19,335,590 Total Expenditures and Other Uses 16,390,411 16,170,779 15,254,076
89

Name of County: WASECA Name of County: WASHINGTON Adopted budgets for the following funds: GF: x R&B: x HS: x OSR: x DS: x CP: x Adopted budgets for the following funds: GF: x R&B: x HS: x OSR: x DS: x CP: x
2005 2005 2006 2005 2005 2006 Budget Amended Budget Budget Amended Budget
Revenues: Revenues: Property Taxes 7,886,993 7,886,993 8,514,646 Property Taxes 66,520,800 66,520,800 70,343,800 All Other Taxes 49,000 49,000 44,000 All Other Taxes 7,375,300 7,375,300 7,538,300 Special Assessments 313,272 313,272 383,066 Special Assessments 0 0 0 Licenses and Permits 152,185 152,185 165,495 Licenses and Permits 3,074,500 3,080,500 3,393,800 Federal Grants 1,794,801 1,794,801 1,736,446 Federal Grants 12,564,300 17,010,300 14,739,000 State General Purpose Aid 891,705 891,705 959,222 State General Purpose Aid 7,457,100 7,457,100 6,708,300 State Categorical Aid 3,316,228 3,316,228 4,106,033 State Categorical Aid 20,744,800 26,968,400 21,084,300 Charges for Services 916,570 916,570 866,244 Charges for Services 10,910,400 11,866,100 11,755,200 Fines and Forfeits 1,500 1,500 1,500 Fines and Forfeits 741,000 741,000 312,000Interest on Investments 185,000 185,000 235,000 Interest on Investments 1,246,700 1,246,700 2,475,500 Miscellaneous Revenues 532,252 532,252 895,131 Miscellaneous Revenues 7,344,700 7,375,900 7,267,400
Total Revenues 16,039,506 16,039,506 17,906,783 Total Revenues 137,979,600 149,642,100 145,617,600 Proceeds from Bond Sales 0 0 0 Proceeds from Bond Sales 0 0 0 Other Financing Sources 0 0 0 Other Financing Sources 1,461,400 1,478,100 2,053,400 Transfers from Other Funds 225,680 225,680 189,529 Transfers from Other Funds 1,965,600 7,613,800 2,077,200
Total Revenues and Other Sources 16,265,186 16,265,186 18,096,312 Total Revenues and Other Sources 141,406,600 158,734,000 149,748,200 Current Expenditures Current Expenditures
General Government 3,532,255 3,532,255 3,883,355 General Government 29,954,500 31,706,000 31,380,300 Public Safety 2,217,652 2,217,652 2,358,460 Public Safety 28,130,000 28,548,500 29,479,400 Streets and Highways (excluding Const.) 2,307,399 2,307,399 2,170,880 Streets and Highways (excluding Const.) 5,867,000 5,934,400 5,996,700 Sanitation 519,560 519,560 605,307 Sanitation 8,021,900 8,085,700 8,325,700 Human Services 4,167,175 4,167,175 4,321,525 Human Services 29,430,900 29,449,900 30,682,600 Health 819,690 819,690 977,939 Health 4,747,800 4,778,200 4,660,500 Culture and Recreation 347,015 347,015 370,486 Culture and Recreation 7,052,400 7,135,200 7,337,800 Conservation of Natural Resources 247,877 247,877 329,696 Conservation of Natural Resources 553,100 553,100 532,400Economic Development & Housing 46,689 46,689 55,015 Economic Development & Housing 2,630,300 2,980,300 3,035,800Miscellaneous Current Expenditures 69,237 69,237 70,622 Miscellaneous Current Expenditures 0 0 0
Total Current Expenditures 14,274,549 14,274,549 15,143,285 Total Current Expenditures 116,387,900 119,171,300 121,431,200
Debt Service - Principal 315,000 315,000 423,226 Debt Service - Principal 5,979,800 5,886,500 6,510,000 Interest and Fiscal Charges 199,137 199,137 92,476 Interest and Fiscal Charges 2,702,100 2,795,400 2,516,300 Streets and Highways Construction 1,050,000 1,050,000 1,600,000 Streets and Highways Construction 11,703,200 26,765,900 9,000,500 Total Capital Outlay 426,500 426,500 595,300 Total Capital Outlay 4,142,300 29,445,300 8,725,700
Other Financing Uses 0 0 0 Other Financing Uses 1,461,400 1,478,100 2,053,400 Transfers to Other Funds 0 0 242,025 Transfers to Other Funds 0 0 0
Total Expenditures and Other Uses 16,265,186 16,265,186 18,096,312 Total Expenditures and Other Uses 142,376,700 185,542,500 150,237,100
Name of County: WATONWAN Name of County: WILKIN Adopted budgets for the following funds: GF: x R&B: x HS: x OSR: x DS: x CP: x Adopted budgets for the following funds: GF: x R&B: x HS: x OSR: x DS: x CP: x
2005 2005 2006 2005 2005 2006 Budget Amended Budget Budget Amended Budget
Revenues: Revenues: Property Taxes 4,816,042 4,816,042 5,152,581 Property Taxes 3,670,130 0 4,510,391 All Other Taxes 85,032 85,032 86,613 All Other Taxes 30,000 0 30,000 Special Assessments 0 0 0 Special Assessments 0 0 0 Licenses and Permits 10,590 10,590 10,710 Licenses and Permits 6,000 0 10,000 Federal Grants 1,250,572 1,250,572 1,227,719 Federal Grants 954,630 0 426,084 State General Purpose Aid 1,589,763 1,589,763 1,565,160 State General Purpose Aid 740,032 0 701,705 State Categorical Aid 4,075,302 4,075,302 4,623,276 State Categorical Aid 3,870,118 0 2,528,063 Charges for Services 757,046 757,046 1,001,350 Charges for Services 564,500 0 551,695 Fines and Forfeits 9,283 9,283 10,283 Fines and Forfeits 5,000 0 15,000Interest on Investments 126,752 126,752 120,142 Interest on Investments 150,000 0 163,500 Miscellaneous Revenues 561,553 561,553 711,182 Miscellaneous Revenues 954,207 0 2,479,008
Total Revenues 13,281,935 13,281,935 14,509,016 Total Revenues 10,944,617 0 11,415,446 Proceeds from Bond Sales 0 836,257 0 Proceeds from Bond Sales 0 0 0 Other Financing Sources 95,000 95,000 92,000 Other Financing Sources 0 0 0 Transfers from Other Funds 0 0 0 Transfers from Other Funds 191,710 0 2,519,950
Total Revenues and Other Sources 13,376,935 14,213,192 14,601,016 Total Revenues and Other Sources 11,136,327 0 13,935,396 Current Expenditures Current Expenditures
General Government 1,718,076 1,764,093 1,857,330 General Government 1,632,990 0 2,857,025 Public Safety 1,646,566 1,646,566 1,687,421 Public Safety 785,554 0 1,157,632 Streets and Highways (excluding Const.) 1,229,000 1,229,000 1,235,778 Streets and Highways (excluding Const.) 2,381,200 0 2,477,940 Sanitation 186,668 186,668 197,450 Sanitation 289,585 0 315,600 Human Services 3,640,877 3,640,877 3,708,786 Human Services 2,632,588 0 2,664,831 Health 385,046 385,046 404,483 Health 611,646 0 591,009 Culture and Recreation 567,051 567,051 584,743 Culture and Recreation 50,420 0 50,668 Conservation of Natural Resources 488,855 488,855 454,880 Conservation of Natural Resources 152,344 0 144,471Economic Development & Housing 138,335 138,335 140,337 Economic Development & Housing 0 0 0 Miscellaneous Current Expenditures 517,221 517,221 597,700 Miscellaneous Current Expenditures 0 0 0
Total Current Expenditures 10,517,695 10,563,712 10,868,908 Total Current Expenditures 8,536,327 0 10,259,176
Debt Service - Principal 168,000 168,000 160,000 Debt Service - Principal 0 0 0 Interest and Fiscal Charges 137,327 137,327 128,245 Interest and Fiscal Charges 0 0 192,720 Streets and Highways Construction 2,317,449 2,317,449 2,630,901 Streets and Highways Construction 2,600,000 0 1,260,000 Total Capital Outlay 531,035 531,035 1,474,037 Total Capital Outlay 0 0 2,223,500
Other Financing Uses 0 0 0 Other Financing Uses 0 0 0 Transfers to Other Funds 0 0 0 Transfers to Other Funds 0 0 0
Total Expenditures and Other Uses 13,671,506 13,717,523 15,262,091 Total Expenditures and Other Uses 11,136,327 0 13,935,396
90

x Name of County: WINONA
Adopted budgets for the following funds: GF: x R&B: x HS: x OSR: x DS: x CP: Name of County: WRIGHT
Adopted budgets for the following funds: GF: x R&B: x HS: x OSR: DS: CP:
Revenues: Property Taxes All Other Taxes Special Assessments Licenses and Permits Federal Grants State General Purpose Aid State Categorical Aid Charges for Services Fines and Forfeits Interest on Investments Miscellaneous Revenues
2005 Budget
14,701,412 244,500 240,550 228,726
1,329,104 2,404,039 6,317,512 9,144,576
7,000 365,025 294,440
2005 Amended
14,701,412 244,500 240,550 228,726
1,329,104 2,404,039 6,317,512 9,147,676
7,000 365,025 301,120
2006 Budget
15,436,483 212,000 260,000 233,651
1,713,504 2,423,939 7,677,039 7,679,326
7,000 430,025 886,203
Revenues: Property Taxes All Other Taxes Special Assessments Licenses and Permits Federal Grants State General Purpose Aid State Categorical Aid Charges for Services Fines and Forfeits Interest on Investments Miscellaneous Revenues
2005 2005 2006 Budget Amended Budget
30,892,826 30,892,826 34,735,491 558,416 558,416 745,000
0 0 0 31,850 31,850 31,850
9,034,200 9,034,200 10,185,146 1,770,939 1,770,939 3,407,169
13,741,605 13,741,605 12,000,230 15,883,793 15,883,793 11,601,344
520,000 520,000 0 850,000 850,000 850,000
1,160,664 1,160,664 1,679,150 Total Revenues 35,276,884 35,286,664 36,959,170 Total Revenues 74,444,293 74,444,293 75,235,380
Proceeds from Bond Sales 0 0 0 Proceeds from Bond Sales 0 0 0 Other Financing Sources 29,504 29,504 29,504 Other Financing Sources 1,457,722 1,457,722 1,668,231 Transfers from Other Funds 516,699 527,928 697,732 Transfers from Other Funds 0 0 0
Total Revenues and Other Sources 35,823,087 35,844,096 37,686,406 Total Revenues and Other Sources 75,902,015 75,902,015 76,903,611 Current Expenditures
General Government Public Safety Streets and Highways (excluding Const.) SanitationHuman ServicesHealthCulture and RecreationConservation of Natural ResourcesEconomic Development & HousingMiscellaneous Current Expenditures
Total Current Expenditures
Debt Service - Principal Interest and Fiscal Charges Streets and Highways Construction Total Capital Outlay
Other Financing UsesTransfers to Other Funds
6,210,990 4,785,331 3,209,944
885,120 10,567,670 2,483,697
271,416 847,480
2,200 0
29,263,848
752,561 386,979
3,954,888 1,464,811
0 0
5,963,384 4,892,863 3,207,570
898,863 10,565,405 2,530,343
271,416 847,478
2,200 0
29,179,522 752,561 386,979
3,945,056 1,464,811
0 11,229
7,203,497 5,270,331 3,320,307
892,359 10,561,139 2,708,279
272,316 884,091
2,500 0
31,114,819 555,000 370,613
5,635,161 10,813
0 0
Current Expenditures General Government Public Safety Streets and Highways (excluding Const.) SanitationHuman ServicesHealthCulture and RecreationConservation of Natural ResourcesEconomic Development & HousingMiscellaneous Current Expenditures
Total Current Expenditures
Debt Service - Principal Interest and Fiscal Charges Streets and Highways Construction Total Capital Outlay
Other Financing UsesTransfers to Other Funds
13,394,896 13,394,896 13,869,476 13,966,982 13,966,982 15,783,124 5,408,809 5,408,809 9,643,257
0 0 0 17,616,800 17,616,800 17,404,700 2,732,200 2,732,200 2,985,900 2,426,905 2,426,905 2,596,380
286,000 286,000 328,500 0 0 0
2,266,816 2,266,816 2,617,540 58,099,408 58,099,408 65,228,877
3,030,000 3,030,000 3,170,000 666,383 666,383 422,421
13,234,882 13,234,882 5,771,898 2,315,741 2,315,741 2,161,524
0 0 0 0 0 0
Total Expenditures and Other Uses 35,823,087 35,740,158 37,686,406
Name of County: YELLOW MEDICINE
Adopted budgets for the following funds: GF: x R&B: x HS: x OSR: x DS: x CP:2005 2005 2006
Budget Amended BudgetRevenues:
Property Taxes 5,264,078 5,264,078 5,364,606 All Other Taxes 64,000 64,000 88,427 Special Assessments 112,350 112,350 139,000 Licenses and Permits 23,800 23,800 24,250 Federal Grants 1,204,016 1,266,516 1,076,480 State General Purpose Aid 1,442,730 1,442,730 1,446,039 State Categorical Aid 1,903,619 1,984,457 1,798,844 Charges for Services 447,825 448,325 645,240 Fines and Forfeits 0 0 300 Interest on Investments 132,910 132,910 167,960 Miscellaneous Revenues 369,394 580,362 435,914
Total Revenues 10,964,722 11,319,528 11,187,060 Proceeds from Bond Sales 0 0 0 Other Financing Sources 0 0 0 Transfers from Other Funds 0 0 0
Total Revenues and Other Sources 10,964,722 11,319,528 11,187,060 Current Expenditures
General Government 1,817,016 1,870,033 2,007,062 Public Safety 1,792,433 1,822,793 1,911,412 Streets and Highways (excluding Const.) 2,227,106 2,227,106 2,296,772 Sanitation 106,000 106,000 106,500 Human Services 3,172,100 3,485,100 3,354,450 Health 91,297 91,297 91,797 Culture and Recreation 154,206 179,607 173,671 Conservation of Natural Resources 440,075 455,716 487,993Economic Development & Housing 58,320 58,320 60,195Miscellaneous Current Expenditures 0 0 0
Total Current Expenditures 9,858,553 10,295,972 10,489,852
Debt Service - Principal 156,780 141,980 151,060 Interest and Fiscal Charges 163,471 163,471 151,496 Streets and Highways Construction 292,500 292,500 260,000 Total Capital Outlay 677,945 712,058 733,000
Other Financing Uses 0 0 0 Transfers to Other Funds 0 0 0
Total Expenditures and Other Uses 11,149,249 11,605,981 11,785,408
Total Expenditures and Other Uses 77,346,414 77,346,414 76,754,720
Name of County: Total for all Counties Adopted budgets for the following funds: GF: R&B: HS: OSR: DS: CP:
2005 2005 2006 Budget Amended Budget
Revenues: Property Taxes 1,940,922,700 1,776,959,617 2,060,988,482 All Other Taxes 34,208,423 30,056,504 34,435,721 Special Assessments 20,938,941 14,161,138 20,657,160 Licenses and Permits 27,821,034 24,944,089 31,191,420 Federal Grants 608,794,484 618,736,126 642,953,798 State General Purpose Aid 283,748,846 251,605,806 287,640,641 State Categorical Aid 944,794,380 837,259,359 1,004,191,937 Charges for Services 496,841,949 456,643,723 466,178,298 Fines and Forfeits 10,398,763 9,506,513 7,099,387Interest on Investments 62,045,785 56,869,574 70,767,859 Miscellaneous Revenues 304,648,708 294,258,252 403,819,571
Total Revenues 4,735,164,013 4,371,000,701 5,029,924,274 Proceeds from Bond Sales 41,127,791 60,300,596 64,908,668 Other Financing Sources 36,570,001 33,556,673 39,295,526 Transfers from Other Funds 42,484,936 48,515,499 52,714,015
Total Revenues and Other Sources 4,855,346,741 4,513,373,469 5,186,842,483 Current Expenditures
General Government 711,214,719 653,385,655 752,009,114 Public Safety 762,341,486 719,159,836 821,424,409 Streets and Highways (excluding Const.) 363,051,806 306,359,269 373,538,859 Sanitation 85,119,078 75,250,812 91,193,708 Human Services 1,606,362,540 1,497,654,206 1,618,186,389 Health 178,924,728 164,952,179 185,330,034 Culture and Recreation 127,002,989 123,539,282 134,684,598 Conservation of Natural Resources 53,250,208 45,448,449 69,269,522Economic Development & Housing 45,367,428 50,196,822 47,456,291Miscellaneous Current Expenditures 45,243,417 39,761,595 49,333,938
Total Current Expenditures 3,977,878,399 3,675,711,081 4,142,426,862
Debt Service - Principal 121,018,125 114,652,959 130,330,382 Interest and Fiscal Charges 65,674,214 60,934,256 69,542,696 Streets and Highways Construction 437,489,426 427,739,946 470,271,888 Total Capital Outlay 284,943,972 346,885,204 389,416,232
Other Financing Uses 19,997,212 19,918,912 21,117,367 Transfers to Other Funds 32,424,260 31,410,630 36,194,090
Total Expenditures and Other Uses 4,939,425,608 4,677,252,988 5,259,302,517
91

This page left blank intentionally

APPENDIX A
FACTORS INFLUENCING COUNTY FINANCES

This page left blank intentionally

Appendix A
Factors Influencing County Finances
The finances of counties are affected by many different factors. Some of the variation results from decisions made by county officials, and some are due to factors outside the control of the elected officials such as state mandates, county size, economic status of residents, and the proximity of similar services provided elsewhere. The amount of revenue available may be influenced by changes in property values, the use of fee-based services, intergovernmental grants for projects, and other interrelated factors. Expenditures may be affected by the demographic, geographic, historical or political landscape of the county. One-time events such as floods, fires, and tornadoes that create demand for cleanup and reconstruction may cause expenditures to increase significantly for a year or more. Some factors have an on-going effect on county finances, while others might be one-time events.
A. Demographics
Population. Counties with higher populations face different challenges than smaller populated counties. Dealing with high traffic numbers imposes a greater cost depending on the burden carried by an area’s highways. Higher population density is also associated with higher poverty and crime rates.
Population decline. Infrastructure costs do not decrease automatically when population decreases, and even if costs do remain the same; per capita spending will increase because the costs are distributed over a smaller population base.
Income. The average per capita income of a county's residents is related to a county's expenditure level in several ways. Per capita income is indirectly related to a county's ability to raise revenues. Where incomes are lower, property values may also be depressed, which reduces a county's tax capacity. Poverty rates, in turn, will be higher, thus creating greater demand for public services.
B. Geographic location
Different areas of the state often operate within quite different economic environments. The presence of one large business or industry can impact an entire region.
Certain regions of Minnesota mayexperience economic difficulties while other regions may prosper. Declines in industries or companies that dominate local economies may result in a higher level of need for public assistance. Trends in agriculture could result in lower property values and a decline in revenues for counties in regions where the economy is primarily based on agriculture. Counties located in these areas may have more difficulty raising revenues and also may face higher demands for public services.
95

C. Revenue sources
Tax Capacity Per Capita. The amount of money any individual or entity spends is directly related to the amount that is available to spend. Likewise, the costs of doing business are directly related to the amounts of revenue that can be generated to meet the costs. The greater the amount and types of revenue available to a county, the more it will spend. The more it costs to provide services in a county, the more funds the county will need to raise.
Enterprise Funds. The per capita tables do not reflect expenditures accounted for in enterprise funds. The most common enterprise funds provide sanitation, hospital, nursing home, and nursing services. Other enterprises include recreation facilities, housing, and economic development. Counties that offer these services and account for them in the General Fund or Special Revenue Funds will show higher per capita expenditures in the per capita tables than those that provide the services through enterprise funds.
D. Shared services, joint powers agreements
A significant practice among counties is the sharing of services and the use of joint powers agreements to provide necessary services. "Joint exercise of powers" is defined in Minnesota Statutes, section 471.59. Such arrangements allow counties to provide services jointly with other counties and thus pool their resources.
Shared service arrangements are not necessarily formal; some counties provide services to other jurisdictions on an informal basis. The importance of shared services and joint powers agreements on this per capita analysis of county expenditures relates to the population figure used to determine the per capita rates. If a county of 10,000 provides services to neighboring cities or counties with populations totaling 5,000, the size of the population served is actually 15,000. If the county providing the service does not reduce its expenditures by the amount spent providing the service to the other jurisdictions, the calculated per capita rate will be too high. This result occurs because the calculation for the per capita rate uses the population of the county providing the service and not the combined population of all jurisdictions served.
The Office of the State Auditor does not collect information on joint powers agreements such that it would enable us to divide every expenditure by the actual recipient population figure. It is imperative, therefore, that in those instances where one county's expenditures appear higher than the average, the reader exercise caution in interpreting the numbers and investigate further into the possible sharing of services and/or the use of joint powers.
E. Proximity to county, regional, or state-run programs/facilities
If your neighbor has a pool and they are willing to let you use it, you probably won't install one of your own. Counties are subject to the same effect of proximity. Similarly, counties located close to a regional or state park may opt not to develop or expand their own park program.
The degree of isolation experienced bya community, whether geographic or technological (e.g., lack of advanced telecommunications capability), can also affect service needs and costs. Counties that are remote from other communities may not have the opportunity to participate in joint powers
96

arrangements or have access to urban amenities, and thus may need to provide a wider range of services out of their own budgets.
F. Source of labor
The extent to which a county depends upon other than full-time, salaried employees will affect the levels of expenditures. The following types of arrangements can reduce the full-time complement of staff: extensive use of part-time employees, significant reliance on volunteers, and use of contracts for specific projects or general services. Besides lower wages to part-time employees, an important reduction in costs created through these types of arrangements is in the area of fringe benefits, which are not generally paid either to part-time employees, volunteers, or individuals hired on a contract basis.
Some employee arrangements may increase, rather than reduce costs. Some counties' expenditures are affected by the extensive unionization of their work force. Because of the role of the unions, salary costs may be more difficult to control for these counties.
G. Other factors
The effects of weather and natural disasters can significantly affect the expenditures for certain services over a period of time. Counties affected by natural disasters, such as floods, may have higher public safety, streets and highways, and infrastructure costs. There are many other incidental factors not included in this list. Explanations of differences in county expenditures should be pursued with county officials to better understand each county’s per capita expenditures.
97

This page left blank intentionally

APPENDIX B
COUNTY GENERAL AND SPECIAL REVENUEUNRESERVED FUND BALANCES

This page left blank intentionally

Appendix B
County General and Special Revenue Unreserved Fund Balances
Minnesota counties report their fund balances at the close of their fiscal year, which ends December 31. This creates an impression that counties have excessive amounts of revenue held in reserve. In reality, county fund balances should be relatively large at the end of the year because of local government cash-flow cycles. Counties must rely on their fund balances to meet expenses during the first five months of the next fiscal year, until they receive the first property tax payments (May) and aid payments from the state (July).
Unlike state government, which collects income tax withholding and sales tax receipts regularly throughout the year, many counties do not have a constant flow of revenue from which they are able to fund local government operations. Property tax levies, state aid, and property tax credits comprise the majority of county discretionary revenues. Minnesota laws govern the flow of these major revenue sources into county treasuries.
• Counties receive the first half of property taxes from property owners by May 15 of each year.
• Counties receive the first half of their state aid and property tax credits from the state on July 20 of each year.
• Counties receive the second half of property taxes from property owners by October 15 of each year.
• Counties receive the second half of their state aid and property tax credits from the state on December 26 of each year.
Given this state-controlled flow of revenue, county fund balances (which are measured on December 31) are the primary source of funds available to counties for their operating expenses during the first five months of the next fiscal year. An adequate fund balance will provide counties with the cash flow required to finance expenditures and avoid short-term borrowing.
Unique Circumstances of Each County Determine the Size of Fund Balance
While counties must rely on the fund balances for cash flow purposes during the first five months of a year, the unique circumstances of each county will determine the size of a fund balance that must be maintained to avoid the need for short-term borrowing and to operate effectively.
Numerous factors must be considered when determining the level of reserves necessary to avoid short-term borrowing.
101

• If counties receive relatively large amounts of revenue from sources such as fees, fines, charges for services, other intergovernmental grants and aids, or interest on investments during the first five months of the calendar year, then they will be less dependent on their fund balances for cash flow purposes.
• Counties are often able to delay certain purchases until after the initial property tax and state aid payments are received. While payments for employee salaries, wages, and most benefits cannot be delayed during the first five months of the year, purchases of supplies and capital equipment may be delayed.
The individual cash flow needs of a county will determine the minimum fund balance that is necessary for it to operate effectively. Counties may need less reserves in their General and Special Revenue Funds if they have unreserved fund balances in other governmental or proprietary funds from which they may borrow or transfer resources, or if they receive significant revenues from sources other than property taxes and state aid payments (i.e. charges for services). Conversely, counties that rely heavily on property taxes and state aid for the majority of their revenues will need relatively large fund balances to meet their cash flow needs from January 1 through June 1 of every calendar year.
102

GLOSSARY

This page left blank intentionally

GlossaryBORROWING - These revenues reflect the sale of bonds and notes, certificates of indebtedness, and tax anticipation certificates. Counties are restricted by law from borrowing for current expenses.
CAPITAL OUTLAY - These expenditures include the purchase, construction, or permanent improvements ofbuildings, equipment, machinery, and land. Capital outlay varies from year to year based on the needs and resources of the counties.
CAPITAL PROJECTS FUND - A fund created to account for the financial resources that are used for the acquisition or construction of a fixed asset.
CHARGES FOR SERVICES - These revenues represent user charges paid in exchange for a service, exclusive of revenues from proprietary funds. Examples include sanitationcharges, golf fees, court costs, and public safety contracts.
DEBT SERVICE EXPENDITURES - These expenditures reflect the annual costs of servicing the outstanding debt of the localgovernment. These costs include principal, interest, and some fiscal charges.
DEBT SERVICE FUND - A fund to account for the collection of resources designated to pay the interest, fiscal charges, and principal on long-term debt.
ENTERPRISEFUND - A fund established to account for operations financed and operated in a manner similar to private business. Examples include water, sewer, and electric utilities. The expenses of providing services are primarily financed by user charges.
FINES AND FORFEITS - These revenues reflect receipts from the payment of penalties for law violations, non-observance of contracts, and forfeited deposits.
FRANCHISE TAXES - These revenues reflect proceeds fromtaxes imposed on public utilities, usually involving elements of a monopoly, (e.g., electric utilities, gas utilities, cable TV) for use of public property.
GENERAL FUND - The fund used to account for all financial resources not required to be accounted for in another fund. This fund is the main operating fund.
GENERAL GOVERNMENT EXPENDITURES - These expenditures reflect the costs associated with local government functions, such as administration, finance, and elections. Expenditures in this category include salaries, wages, and benefits of legislative, judicial, and administrative personnel, in addition to supplies and building maintenance.
GOVERNMENTAL FUNDS - The funds throughwhichmostgovernmentalactivities are financed. The four governmental fund types are: General, Special Revenue, Debt Service, and Capital Projects.
GRAVEL TAX - These revenues are derived from taxes imposed by the localgovernment for aggregate material removal.
HEALTH - These expenditures are for the maintenance of vital statistics, restaurant inspection, communicable disease control, and various health services and clinics.
105

GlossaryHRA AND ECONOMIC DEVELOPMENT - These expenditures are for development and redevelopment activities in blighted or otherwise economically disadvantaged areas. Activities may include low-interest loans to individuals and businesses, cleanup of hazardous sites, rehabilitation of substandard housing and otherphysicalfacilities,and other assistance to those wanting to provide housing and economic opportunity within a disadvantaged area.
HUMAN SERVICES - These expenditures are for activities designed to provide public assistance and institutional care for individuals economically unable to provide essential needs for themselves.
INTEREST ON INVESTMENTS - These revenues reflect interest earned on checking and savings accounts, CDs, money market funds, and bonds. This category also includes dividends. In addition, the net increase or decrease in the fair value of investments is recorded here.
LICENSES AND PERMITS - These revenues reflect receipts from liquor licenses, cigarette licenses, other business licenses, street use permits, buildings permits, and other non-business licenses and permits.
MISCELLANEOUS EXPENDITURES - These expenditures reflect the costs of activities that were not allocated to a specific function. Some activities included in this category are pension and insurance costs not allocated to a specific department.
MISCELLANEOUS REVENUES - These revenues refer to refunds, reimbursements, donations, and lease payments.
NET TAX LEVY - The net county property taxes, after state property taxreliefaids or grants, required to be paid by the property owners of the county.
OTHER FINANCING SOURCES - These sources include long-term debt proceeds, sales of fixed assets, and transfers from other funds.
OTHER FINANCING USES - These sources include transfers to other funds, the refunding of bond proceeds deposited withanescrowagent and invested until they are used to pay principal and interest on the old debt at a future time, and remittance to other agencies.
OUTSTANDING LONG-TERM DEBT - This category refers to the long-term debt that a local government has incurred to finance its capitalprojects. Examples of long-term debt include various types of bonds and other obligations, such as notes and long-term leases.
PARKS AND RECREATION - These expenditures reflect park maintenance, mowing, planting, and removalof trees. Recreation expenditures include festivals, bands, museums, community centers, baseball fields, organized recreation activities, etc.
PUBLIC SAFETY EXPENDITURES - These expenditures reflect the costs related to the protection of persons and property.
SANITATION - These expenditures reflect the costs of refuse collection and disposal, recycling, as well as weed and pest control. Some local governments provide sanitation services through enterprise funds.
106

GlossarySPECIAL ASSESSMENTS - These revenues refer to levies made against certain properties to defray all or part of the costs of a specific improvement, such as new sewer and water mains, deemed to benefit primarily those properties. The amount includes the penalties and interest paid on the assessments.
SPECIAL REVENUE FUNDS - A fund used to account for the proceeds of specific revenue sources that are restricted to expenditures for a specific purpose.
STREETS AND HIGHWAYS EXPENDITURES - These expenditures reflect the costs assoc-iated with the maintenance and repair of local highways, streets, bridges, and street equipment. Common expenditures include patching, seal coating, and snow removal. Expenditures for road construction are not included in current expenditures but are accounted for as capital outlay.
TAXABLE TAX CAPACITY - The tax capacity less the tax increment district value, less the fiscal disparities contribution value, plus the fiscal disparities distribution value.
TAX CAPACITY - The value assigned to the property used to calculate the property taxes.
TAX INCREMENTS - These revenues refer to the amount of resources local governments generate when they establish tax increment financing (TIF) districts. In a TIF district, the increase in property tax revenues in the redeveloped area are used to pay the costs of development and redevelopment in the district rather than the general services of the county and school district.
TOTAL CURRENT EXPENDITURES - This category reflects the total of all expenses relating to current operations.
TOTALEXPENDITURES - Thiscategoryincludescurrent operating expenses, capitaloutlays,and debt service principal and interest payments.
TOTAL REVENUES - This categoryreflects all sources of revenue that increase the amount ofavailable resources without creating a liability or a future payment. Borrowing and transfers between funds are not included in total revenues.
TRANSFERS - ENTERPRISE FUNDS - The transfer of available resources to or frompublic service enterprises. It is shown separately because proprietary funds are not included in the governmental funds.
TRANSFERS - GOVERNMENTAL FUNDS - The transfer of money between governmental fund types. The revenues and expenditures for these funds are always shown in the same tables.
UNALLOCATED INSURANCE - These expenditures refer to insurance premiums that were not allocated to a specific function of government.
UNALLOCATED PENSION CONTRIBUTIONS - These expenditures refer to contributions to pension plans that were not allocated to a specific function of government.
107

This page left blank intentionally

RECENT ANNUAL REPORTS, SPECIAL STUDIES, AND BEST PRACTICES REVIEWS FROM THE OFFICE OF THE STATE AUDITOR
An Analysis of Minnesota’s Municipal Liquor Store Operations in 2004 This annual report details the sales and profits of Minnesota’s municipally-owned and operated liquor stores. December 2005
2004 Minnesota City Finances – “The State Auditor’s Big Book of Cities” This annual report lists the sources and amounts of revenues, expenditures and outstanding debt for all Minnesota cities for the most recent audited fiscal year (year-ended 2004). It also examines enterprise operations. December 2005
Best Practice Review: Contracting and Procurement in the Public Sector The best practices review provides detailed steps that can help increase accountability, reduce liability, and encourage savings when contracting and procuring in the public sector. November 2005
Minnesota Township Finances This annual report lists the sources and amounts of revenues, expenditures and outstanding debt for Minnesota towns for the most recent fiscal year (2004). October 2005
Annual Summary of Local Government Finances This new annual report provides a summary of all local government finances: counties, cities, school districts, townships and special districts for the most recently audited fiscal year. August 2005
Special District Finances This annual report, issued for the first time in 20 years, lists the sources and amounts of revenues, expenditures and outstanding debt for all special districts in Minnesota for the most recent audited fiscal year. July 2005
Financial Trends of Minnesota School Districts and Charter Schools: 2000 to 2004 This annual report provides five years of data and rankings based on the per pupil revenues, expenditures, and debt for all regular Minnesota school districts and charter schools. The report also provides rankings on student demographics, average teacher salaries, fund balances, and other statistics. June 2005
2004 Local Government Lobbying Expenditures This annual report lists what local government and associations of local governments spend to lobby the Legislature and agencies of the state administration. March 2005 [NOTE: Supplemental report issued July 2005.]
Minnesota County Finances This annual report lists the sources and audited amounts of revenues, expenditures and debt for Minnesota counties during the most recent fiscal year (year-ended 2003). It includes analysis of counties’ enterprise operations and the fund balances for the general and special revenue funds. The report also includes summary budget data for 2004 and 2005. March 2005
Best Practices Review: Cooperative Efforts in Public Service Delivery The best practices review highlights examples of successful local government cooperation and offers guidance to those local governments pursuing cooperative efforts. December 2004
Special Study: Municipal Enterprise Activity This study, requested by a bipartisan group of legislators, examines the financial information of enterprise fund operations of Minnesota cities from 1998 to 2002. March 2004
Special Study: School Superintendent Compensation This special study examined the compensation (salary, benefits, severance, etc.) of Minnesota School Superintendents from 1997 to 2002. September 2003
Special Study: Local Government Aid and its Effect on Expenditures This special study examined the effect the state program known as Local Government Aid has on expenditures for cities over 2,500 in population. February 2003
If you are interested in one of these recent reports, they are available on our web site at www.auditor.state.mn.us. You can also call our office at (651) 297-3688 or email us at
[email protected] to request a copy of the report.
109