State Finances Audit Report of the Comptroller and Auditor ...
162
-
Upload
khangminh22 -
Category
Documents
-
view
0 -
download
0
Transcript of State Finances Audit Report of the Comptroller and Auditor ...


State Finances Audit Report
of the
Comptroller and Auditor General of India
for the year ended March 2019
Government of Maharashtra
Report No. 1 of the year 2020
https://cag.gov.in

iii
Table of Contents Paragraph Page
Preface vii
Executive Summary ix
CHAPTER I - FINANCES OF THE STATE GOVERNMENT
Introduction 1.1 2
Summary of Fiscal Transactions in 2018-19 1.2 3
Financial Resources of the State 1.3 7
Revenue Receipts 1.4 9
Capital Receipts 1.5 19
Public Account Receipts 1.6 20
Application of Resources 1.7 21
Quality of Expenditure 1.8 32
Financial analysis of Government expenditure and investments 1.9 35
Assets and Liabilities 1.10 39
Fiscal Imbalances 1.11 46
Debt Management 1.12 50
Follow Up on Audit Reports 1.13 52
CHAPTER II - FINANCIAL MANAGEMENT AND BUDGETARY CONTROL
Introduction 2.1 53
Summary of Appropriation Accounts 2.2 53
Financial Accountability and Budget Management 2.3 54
Outcome of review of selected Grants 2.4 59
Advances from Contingency Fund 2.5 62
Misclassification of Expenditure 2.6 63
Outcome of Inspection of Treasuries 2.7 64
Chapter III - FINANCIAL REPORTING
Non-submission/delay in furnishing Utilisation Certificates 3.1 69
Non-submission/delay in submission of Accounts by Grantee Institutions 3.2 71
Delay in submission of Accounts/Separate Audit Reports of Autonomous
Bodies and placement of Audit Reports before the State Legislature 3.3 72
Delay in finalisation of Proforma Accounts by departmentally managed
Commercial Undertakings 3.4 73
Misappropriations, losses, defalcations etc. 3.5 73
Reconciliation of receipts and expenditure 3.6 75
Opaqueness in Government Accounts 3.7 75
Pendency in submission of Detailed Contingent Bills against
Abstract Contingent Bills 3.8 76
Table of Contents
iv
No. Appendices Reference to
Paragraph
Pages
1.1 State Profile 79
1.2 Structure and Forms of Government Accounts 1.1 80
1.3 Fiscal Responsibility and Budgetary Management Act and
Rules 1.1 81
1.4 Outcome indicators of the State's own Fiscal Correction Path 1.1 82
1.5 Abstract of Receipts and Disbursements for the year 2018-19 as
compared to 2017-18 1.2 83
1.6 Outcome of analysis of budgetary assumptions during 2018-19 1.2.2 86
1.7 Time series data on State Government Finances 1.4 88
1.8 Details of Government investments and accumulated losses in
Government Companies/Corporations as on September 2019 1.9.2 91
1.9 Summarized financial statement of Departmentally managed
Commercial/Quasi-Commercial Undertakings 1.9.3 93
2.1 Grants/Appropriations closed with excess supplementary
provisions during 2018-19 2.2.1 96
2.2 Grants/Appropriations closed with excess over provisions of
previous years requiring regularisation 2.3.1 98
2.3 Grants/Appropriations closed with excess over provisions
during 2018-19 requiring regularisation 2.3.1.1 99
2.4 Sub-head wise persistent excess over provision 2.3.2 100
2.5 Rush of expenditure during the last quarter and last month of
2018-19 2.3.4 102
2.6
Grants /appropriations which closed with savings of more than
` 10 crore each and more than 20 per cent of the total
provisions
2.3.5 104
2.7 Grants which closed with savings of ` 100 crore each and above 2.3.5 106
2.8 Grants closed with savings of more than ` 100 crore
persistently during 2014-15 to 2018-19 2.3.6 109
2.9 Unnecessary supplementary provisions (` 10 crore or more in
each case) 2.3.7 110
2.10 Cases of surrender of funds in excess of ` 50 crore on 30 and
31 March 2019 2.3.8 112
2.11 Sub-head wise substantial saving under Grants A-09 and Y-02
during 2018-19 2.4.2 115
2.12 Surrender of entire provision under Grants A-09, Y-02 and I-05
during 2018-19 2.4.3 116
2.13 Rush of expenditure in last months of 2018-19 under Grant
Y-02 and I-05 2.4.4 117
2.14 Contingency fund sanction orders and utilisation against
sanction 2.5 118
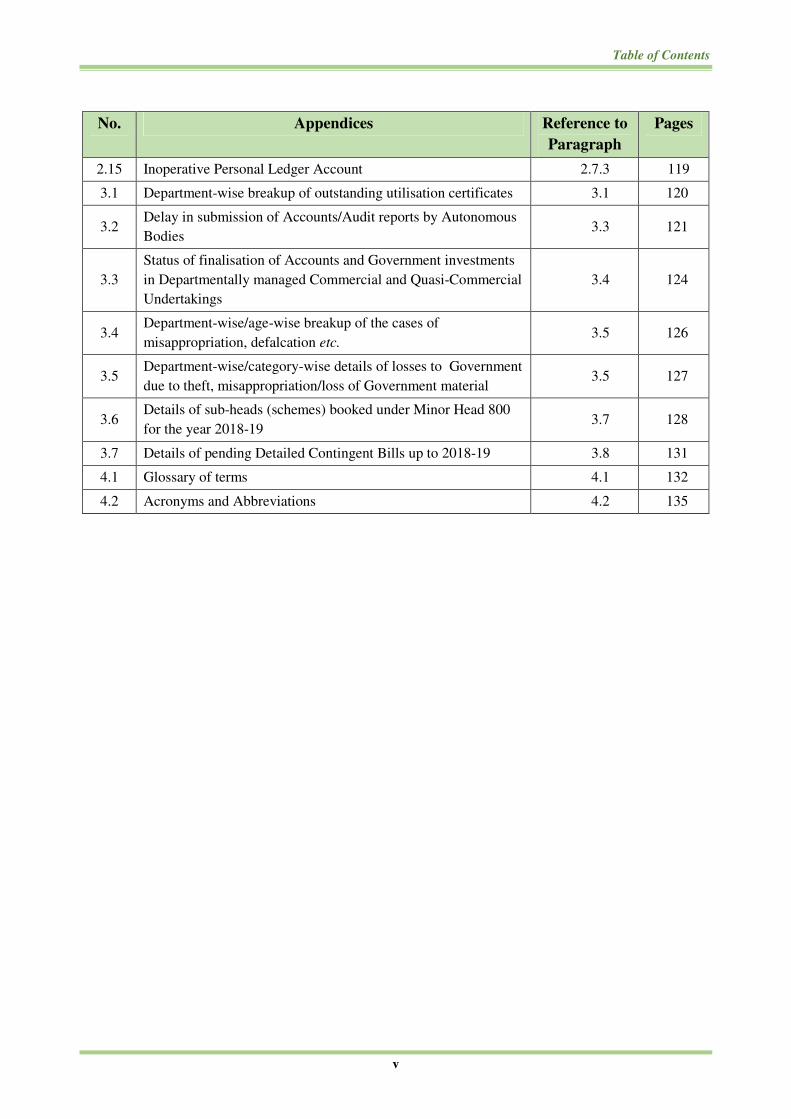
Table of Contents
v
No. Appendices Reference to
Paragraph
Pages
2.15 Inoperative Personal Ledger Account 2.7.3 119
3.1 Department-wise breakup of outstanding utilisation certificates 3.1 120
3.2 Delay in submission of Accounts/Audit reports by Autonomous
Bodies 3.3 121
3.3
Status of finalisation of Accounts and Government investments
in Departmentally managed Commercial and Quasi-Commercial
Undertakings
3.4 124
3.4 Department-wise/age-wise breakup of the cases of
misappropriation, defalcation etc. 3.5 126
3.5 Department-wise/category-wise details of losses to Government
due to theft, misappropriation/loss of Government material 3.5 127
3.6 Details of sub-heads (schemes) booked under Minor Head 800
for the year 2018-19 3.7 128
3.7 Details of pending Detailed Contingent Bills up to 2018-19 3.8 131
4.1 Glossary of terms 4.1 132
4.2 Acronyms and Abbreviations 4.2 135

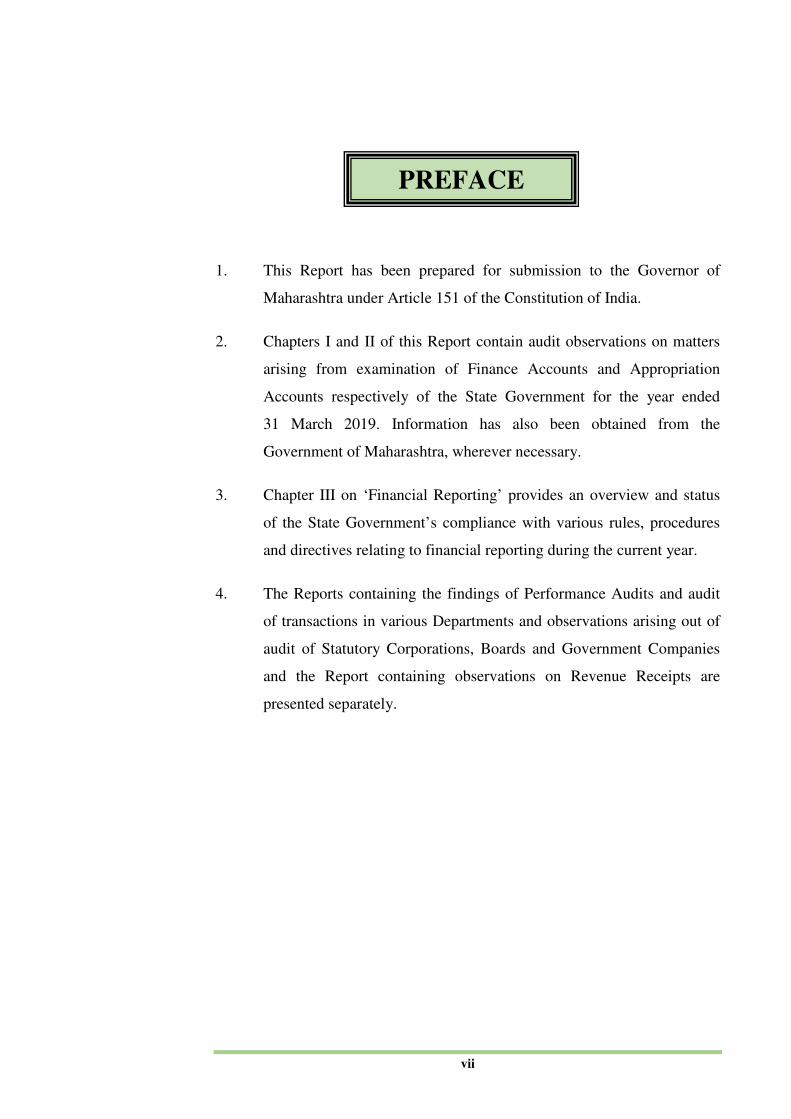
vii
PREFACE
1. This Report has been prepared for submission to the Governor of
Maharashtra under Article 151 of the Constitution of India.
2. Chapters I and II of this Report contain audit observations on matters
arising from examination of Finance Accounts and Appropriation
Accounts respectively of the State Government for the year ended
31 March 2019. Information has also been obtained from the
Government of Maharashtra, wherever necessary.
3. Chapter III on ‘Financial Reporting’ provides an overview and status
of the State Government’s compliance with various rules, procedures
and directives relating to financial reporting during the current year.
4. The Reports containing the findings of Performance Audits and audit
of transactions in various Departments and observations arising out of
audit of Statutory Corporations, Boards and Government Companies
and the Report containing observations on Revenue Receipts are
presented separately.


ix
EXECUTIVE SUMMARY
Background
This Report on the Finances of the Government of Maharashtra is being
brought out with a view to objectively assess the financial performance of the
State during 2018-19 and to provide the State Government and State
Legislature with timely inputs, based on analysis of the financial data. In order
to give a perspective to the analysis, an effort has been made to compare the
achievements with the targets envisaged by the State Government in their
Fiscal Responsibility and Budgetary Management (FRBM) Act, 2005 and the
Budget Estimates of 2018-19.
The Report
Based on the audited accounts of the Government of Maharashtra for the year
ended March 2019, this Report provides an analytical review of the Annual
Accounts of the Government. The Report is structured in three Chapters.
Chapter I is based on the audit of Finance Accounts and makes an
assessment of the State’s fiscal position as on 31 March 2019. It provides an
insight into trends of committed expenditure and the borrowings made by the
State.
Chapter II is based on audit of Appropriation Accounts and gives a
grant-wise description of Appropriations voted for by the Legislature and the
extent to which the allocated resources were managed by the service delivery
Departments of the Government.
Chapter III gives a selected insight into the State Government’s
compliance to various reporting requirements and Financial Rules. The
Report also compiles the data collated from various Government
Departments/Organisations in support of the audit findings.
Audit findings and recommendations
Overview of the Finances of the State Government
The State registered Revenue Surplus (` 11,975 crore) and Primary Surplus
(` 11,006 crore) for the second consecutive year in 2018-19. During 2018-19,
the State achieved all the three major fiscal indicators specified in the
Fourteenth Finance Commission (FFC) Report i.e. (i) the fiscal deficit as
percentage of Gross State Domestic Product (GSDP) stood at 0.87 per cent
which was within the limits of 3.25 per cent recommended by FFC and State’s
Medium Term Fiscal Policy Statement (MTFPS) (1.81 per cent) (ii) the ratio
of debt to GSDP at 16.42 per cent was lower than the FFC target of
23.88 per cent and MTFPS target of 16.52 per cent (iii) the ratio of interest
payment to revenue receipt at 12.19 was lower than the norm prescribed by
FFC (12.27) but slightly higher than the target fixed by the State’s Medium
Term Fiscal Policy Statement (12.02).
The revenue receipt of the State remained between nine per cent and
10.5 per cent of the GSDP during 2014-19. A slight upward surge in the ratio
during 2017-18 and 2018-19 at 10 per cent and 10.5 per cent respectively was
State Finances Audit Report for the year ended 31 March 2019
x
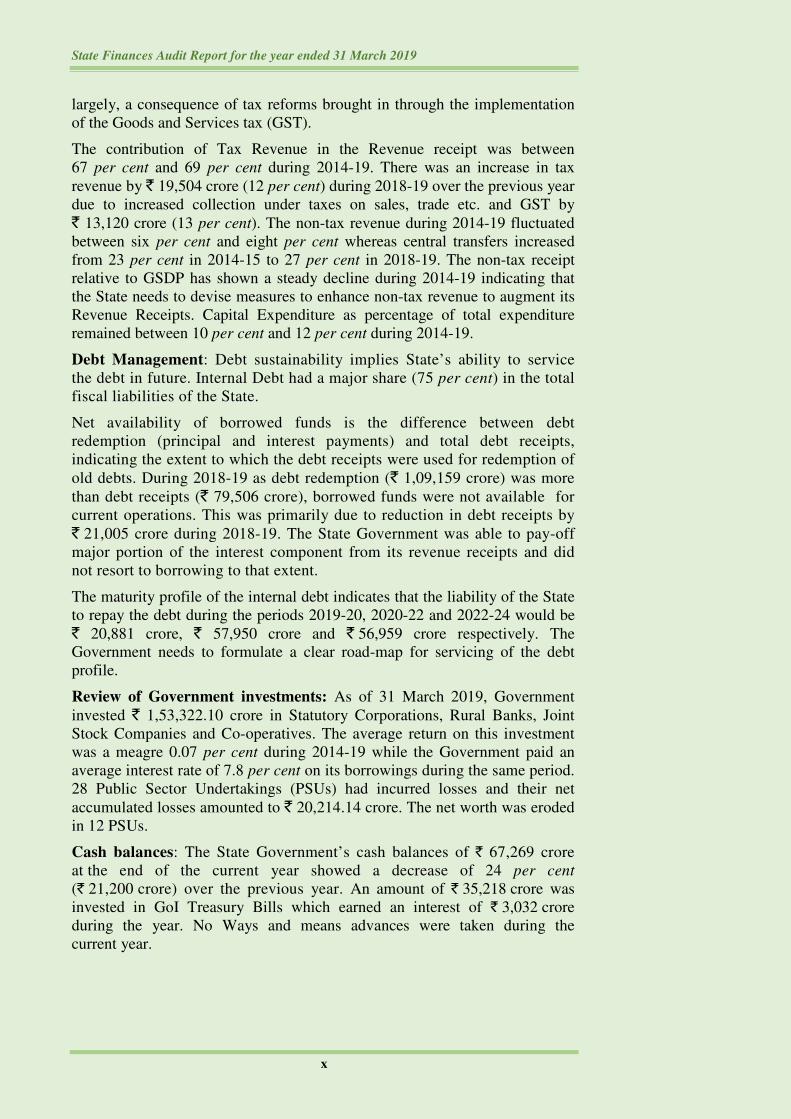
largely, a consequence of tax reforms brought in through the implementation
of the Goods and Services tax (GST).
The contribution of Tax Revenue in the Revenue receipt was between
67 per cent and 69 per cent during 2014-19. There was an increase in tax
revenue by ` 19,504 crore (12 per cent) during 2018-19 over the previous year
due to increased collection under taxes on sales, trade etc. and GST by
` 13,120 crore (13 per cent). The non-tax revenue during 2014-19 fluctuated
between six per cent and eight per cent whereas central transfers increased
from 23 per cent in 2014-15 to 27 per cent in 2018-19. The non-tax receipt
relative to GSDP has shown a steady decline during 2014-19 indicating that
the State needs to devise measures to enhance non-tax revenue to augment its
Revenue Receipts. Capital Expenditure as percentage of total expenditure
remained between 10 per cent and 12 per cent during 2014-19.
Debt Management: Debt sustainability implies State’s ability to service
the debt in future. Internal Debt had a major share (75 per cent) in the total
fiscal liabilities of the State.
Net availability of borrowed funds is the difference between debt
redemption (principal and interest payments) and total debt receipts,
indicating the extent to which the debt receipts were used for redemption of
old debts. During 2018-19 as debt redemption (` 1,09,159 crore) was more
than debt receipts (` 79,506 crore), borrowed funds were not available for
current operations. This was primarily due to reduction in debt receipts by
` 21,005 crore during 2018-19. The State Government was able to pay-off
major portion of the interest component from its revenue receipts and did
not resort to borrowing to that extent.
The maturity profile of the internal debt indicates that the liability of the State
to repay the debt during the periods 2019-20, 2020-22 and 2022-24 would be
` 20,881 crore, ` 57,950 crore and ` 56,959 crore respectively. The
Government needs to formulate a clear road-map for servicing of the debt
profile.
Review of Government investments: As of 31 March 2019, Government
invested ` 1,53,322.10 crore in Statutory Corporations, Rural Banks, Joint
Stock Companies and Co-operatives. The average return on this investment
was a meagre 0.07 per cent during 2014-19 while the Government paid an
average interest rate of 7.8 per cent on its borrowings during the same period.
28 Public Sector Undertakings (PSUs) had incurred losses and their net
accumulated losses amounted to ` 20,214.14 crore. The net worth was eroded
in 12 PSUs.
Cash balances: The State Government’s cash balances of ` 67,269 crore
at the end of the current year showed a decrease of 24 per cent
(` 21,200 crore) over the previous year. An amount of ` 35,218 crore was
invested in GoI Treasury Bills which earned an interest of ` 3,032 crore
during the year. No Ways and means advances were taken during the
current year.

Executive Summary
xi
Financial Management and Budgetary Control
The programme implementation of various social and developmental
programmes in the State left an overall savings of ` 73,856.35 crore set-off by
an excess of ` 946.16 crore. This requires regularisation under Article 205 of
the Constitution of India. There were instances of inadequate provision of
funds. Rush of expenditure at the end of the financial year was another
chronic feature noticed in the State. In many cases, the anticipated savings
were surrendered on the last two days of March 2019.
Supplementary provisions (` 10 crore and above in each case) aggregating to
` 12,990.69 crore obtained during the year proved unnecessary as the actual
expenditure (`1,34,453.22 crore) on these grants did not reach the level of the
original provision (` 1,62,720.96 crore).
Departments surrendered ` 68,721 crore (20 per cent of total voted provision
of ` 3,44,943 crore) on the last two days of March 2019. Surrender of savings
in the last two working days of the financial year indicated inadequate
financial discipline.
As on 31 March 2019, 2,135 Personal Deposit Accounts showed a total
closing balance of ` 10,953.53 crore. Retention of funds in Personal
Deposit/Personal Ledger Accounts not only led to expenditure booked under
the service heads being inflated without actual outgo, but also resulted in
dilution of treasury control over actual expenditure.
Financial Reporting
As on 31 March 2019, Utilization Certificates (UCs) aggregating to
` 47,483.36 crore due in respect of grants released upto 2017-18 were in arrears.
In the absence of the UCs, audit could not ascertain whether the recipients had
utilized the grants for the intended purpose.
Non-reconciliation of 32 per cent (` 78,121 crore) of total expenditure and
six per cent (` 11,369 crore) of total receipts during the year, (excluding
expenditure and receipts adjusted through Transfer Entry and periodical
adjustment) had an impact on the assurance of completeness and correctness of
the receipt and expenditure figures by the Department.
As on 31 March 2019, 2,612 Detailed Contingent (DC) bills amounting to
` 1,964.37 crore against Abstract Contingent (AC) bills drawn, were not
received. To the extent of non-submission of DC bills, the expenditure shown
in the Finance Accounts could not be vouched as correct or final. An effective
monitoring mechanism needs to be put in place in the Departments to adjust
the advances drawn on Abstract Contingent Bills within the stipulated period,
as required under the extant rules.


1
Chapter I
Finances of the State Government
Social Indicators of Maharashtra
Maharashtra occupies the Western and Central part of the country and has a long
coastline along the Arabian Sea. It is the second largest State in India in terms of
population (11.24 crore population as per 2011 census) and has geographical area of
3.08 lakh square kilometres (sq. km). As indicated in Appendix 1.1, the decadal growth
of population is 13.27 per cent against 12.46 in the General Category States1 (GCS) of
the country. The density of population of Maharashtra has also recorded an increase
from 315 persons per square kilometre (sq.km.) (Census 2001) to 365 persons per sq.
km. (Census 2011) as against the All India Average of 382 persons per sq.km.
The percentage of population below the poverty line at 17.4 per cent was lower than the
All India Average of 21.9 per cent as per Economic Survey of Maharashtra
2018-19. The Gross State Domestic Product2 (GSDP) in 2018-19 at current prices was
` 26,60,318 crore (advance estimates). The Compounded Annual Growth Rate (CAGR)
of GSDP for the period 2011-12 to 2018-19 has been 11 per cent as against
12.2 per cent, the GCS average of the country. The State’s literacy rate has increased
from 76.9 per cent (census 2001) to 82.3 per cent (Census 2011). The per capita GSDP
of the State during 2018-19 stood at ` 1,91,827 as against the per capita Gross Domestic
Product (GDP) of India at ` 1,42,719. General data relating to the State is shown in
Appendix 1.1.
Economic Indicators of the State
Gross State Domestic Product is the market value of all officially recognised final goods
and services produced within the State in a given period of time. The growth of GSDP
of the State is an important indicator of the State’s economy as it indicates the standard
of living of the State’s population. The trends in the annual growth rate of GSDP as
compared with India’s GDP at current prices and constant prices are indicated in Table
1.1 and Chart 1.1.
Table 1.1 Trends in annual growth rate of GDP and GSDP
Year 2014-15 2015-16 2016-17 2017-18 2018-19
Current Prices
India’s GDP (` in crore) 12467959 13771874 15362386 17095005 19010164
Growth rate of GDP (percentage) 11.0 10.5 11.5 11.3 11.2
State’s GSDP (` in crore) 1792122 2001223 2257032 2411600# 2660318*
Growth rate of GSDP (percentage) 8.8 11.7 12.8 6.8 10.3
State contribution to GDP 14.4 14.5 14.7 14.1 14.0
Constant Prices
India’s GDP (` in crore) 10527674 11369493 12298327 13179857 14077586
Growth rate of GDP (percentage) 7.4 8.0 8.2 7.2 6.8
State’s GSDP (` in crore) 1524846 1659776 1826296 1942769# 2088835*
Growth rate of GSDP (percentage) 5.7 8.9 10 6.4 7.5
State contribution to GDP 14.5 14.6 14.8 14.7 14.8 #Actuals/*Advance estimates – as per Economic Survey of Maharashtra 2018-19
1 Undivided Andhra Pradesh; Bihar; Chhattisgarh; Goa; Gujarat; Haryana; Jharkhand; Karnataka; Kerala;
Madhya Pradesh; Maharashtra; Orissa; Punjab; Rajasthan; Tamil Nadu; Uttar Pradesh and West Bengal 2 GDP: It is a measure in monetary terms of all the goods and services produced (without duplication) within the
boundaries of any geographical area (Nation) during a given period of time (generally, one year). It is termed as
Gross State Domestic Product if the geographical boundary is State

State Finances Audit Report for the year ended 31 March 2019
2
1.1 Introduction
This Chapter is based on the audit of the Finance Accounts of the State and makes an
assessment of the State’s fiscal position as on 31 March 2019. It provides a broad
perspective of the finances of the State during 2018-19 and analyses critical changes
observed in the major fiscal aggregates in relation to the previous year, keeping in view
the overall trend during the last five years period. The structure and form of
Government Accounts have been explained in Appendix 1.2 (Part A) and the layout of
the Finance Accounts is depicted in Appendix 1.2 (Part B). The methodology adopted
for assessment of the fiscal position and norms/ceilings prescribed by the Maharashtra
Fiscal Responsibility and Budgetary Management (MFRBM) Act, 2005; and the
(Amendment) Act of 2006; MFRBM Rules, 2006 and Amendment Rules 2008, 2011
and 2012 of the State are given in Appendix 1.3. According to the Act, Government
developed its own Fiscal Correction Path (FCP) given in Appendix 1.4. As prescribed
in the Act, Government has laid its Medium Term Fiscal Policy Statement (MTFPS) for
2018-19 in the State Legislature in March 2018.
This chapter is structured in four parts.
• Summary and Review of Fiscal Transactions (Paragraph 1.2)
• Resources of the State covering details of revenue receipts, capital receipts and
public account receipts (Paragraph 1.3 to 1.6)
• Application of resources dealing with quality of expenditure and financial analysis
of Government expenditure and investment (Paragraph 1.7 to 1.9)
• Financial position including assets and liabilities, fiscal imbalances and debt
management (Paragraph 1.10 to 1.12)

Chapter I: Finances of the State Government
3
1.2 Summary of Fiscal Transactions in 2018-19
Summary of Fiscal Operations gives an overview of the fiscal position, comparison of
budget estimates with actuals achieved which are given in detail in sub-paragraphs 1.2.1
to 1.2.2.
Table 1.2 presents the summary of the State Government’s fiscal transactions during the
current year (2018-19) vis-à-vis the previous years (2014-18), while Appendix 1.5
provides details of receipts and disbursements as well as the overall fiscal position
during the current year.
Table 1.2: Summary of Fiscal transactions during 2014-15 to 2018-19
(`̀̀̀ in crore)
Receipts 2014-15 2015-16 2016-17 2017-18 2018-19
Revenue receipts 165415 185036 204693 243654 278996
Tax revenue 115064 126608 136616 167932 187436
Non-tax revenue 12581 13423 12709 16242 15844
Share of Union Taxes/Duties 17630 28106 33715 37219 42054
Grants from Government of India 20140 16899 21653 22261 33662
Miscellaneous Capital Receipts 0 17 0 0 0
Recoveries of Loans and Advances 975 865 1746 1778 1604
Public debt receipts$ 29374 37977 48336 48075 26025
Appropriation from Contingency fund 2350 2962 0 0 1528
Contingency Fund 4360 962 0 0 3528
Public Account Receipts 83022 72747 82466 81877 90665
Opening Cash Balance
a) Sinking Fund 15454 18886 22672 27853 33971
b) Cash balance 31429 30762 32881 40897 54498
Total 332379 350214 392794 444134 490815
(`̀̀̀ in crore)
Disbursements 2014-15 2015-16 2016-17 2017-18 2018-19
Revenue expenditure 177553 190374 213229 241571 267022
General services 60486 64370 71609 78535 84765
Social services 76952 82317 90282 93054 109391
Economic services 37687 38052 43843 54189 52759
Grants-in-aid and Contributions 2428 5635 7495 15793 20107
Capital Outlay 19523 22793 25549 26842 35049
Loans and Advances disbursed 1141 1115 6277 979 1545
Repayment of Public Debt$ 8828 10043 11887 15782 25116#
Appropriation to Contingency fund 4350 962 0 0 3528
Contingency Fund 2350 2962 0 0 1528
Public Account Disbursements 68986 66412 67102 70491* 89758
Closing Cash Balance
a) Sinking Fund 18886 22672 27853 33971 34488
b) Cash balance 30762 32881 40897 54498 32781
Total 332379 350214 392794 444134 490815
(Includes * higher rounding and # lower rounding of figures)
$ Excluding ways and means advances (during 2018-19 Receipt: nil and Disbursement: nil)
(Source: Finance Accounts of respective years)

State Finances Audit Report for the year ended 31 March 2019
4
Composition of sources and application of funds in the Consolidated Fund during
2018-19 is given in Chart 1.2 and 1.3.
(Source: Finance Accounts 2018-19) (Source: Finance Accounts 2018-19)
The following are the major changes in fiscal transactions during 2018-19 over the
previous year:

Chapter I: Finances of the State Government
5
The trends of Revenue Receipts (RR)/Revenue Expenditure (RE)/Capital Outlay (CO)
relative to GDP at current as well as constant prices are presented in Table 1.3.
Table 1.3: Trends of Revenue Receipts, Revenue Expenditure and Capital Outlay at
Current and Constant Prices (`̀̀̀ in crore)
Year 2014-15 2015-16 2016-17 2017-18 2018-19
Revenue Receipts at Current and Constant Prices
Revenue Receipts at current prices 165415 185036 204693 243654 278996
Rate of growth of RR at current
prices (in per cent) 10.4 11.9 10.6 19.0 14.5
Revenue Receipts at constant
prices 140182 152922 163754 187426 206664
Rate of growth of RR at constant
prices (in per cent) 7.6 9.1 7.1 14.5 10.3
Revenue Expenditure at Current and Constant Prices
Revenue Expenditure at current
prices 177553 190374 213229 241571 267022
Rate of growth of RE at current
prices (in per cent) 14.6 7.2 12.0 13.3 10.5
Revenue Expenditure at constant
prices 150469 157334 170583 185824 197794
Rate of growth of RE at constant
prices (in per cent) 11.7 4.6 8.4 8.9 6.4
Capital Outlay at Current and Constant Prices
Capital Outlay at current prices 19523 22793 25549 26842 35049
Rate of growth of Capital Outlay at
current prices (in per cent) (-)2.5 16.7 12.1 5.1 30.6
Capital Outlay at constant prices 16545 18837 20439 20648 25962
Rate of growth of Capital Outlay at
constant prices (in per cent) (-)5.0 13.9 8.5 1.0 25.7
Source: Based on GDP deflator (Current Prices: - 2014-15 118; 2015-16 121; 2016-17 125; 2017-18 130; 2018-19
135; and Constant Prices as 100) for converting Current Prices to Constant Prices
1.2.1 Review of the Fiscal situation
The targets for major fiscal variables provided in the budget are based on the
recommendations of the Fourteenth Finance Commission (FFC) and the Fiscal
Responsibility and Budgetary Management Act of the State. Targets fixed by the State
Government in the MTFPS for the year 2018-19 compared to actual achievements are
depicted in Table 1.4. Table 1.4: Review of the Fiscal situation
Sr.
No.
Fiscal variables 2018-19
FFC targets for
the State in
percentage
Targets
proposed in the
budget/ MTFPS
Actuals
1 Fiscal deficit/GSDP (in per cent) 3.25 1.81 0.87
2 Total outstanding liabilities of the
Government to GSDP (in per cent) 23.88 16.52 16.42
3 Interest Payment/Revenue Receipt
(IP/RR) (in per cent) 12.27 12.02 12.19
4 Revenue Deficit (-)/Surplus (+)
(` in crore) - (-)15375 (+)11975
Source: MTFPS/FFC
From Table 1.4 it can be seen that during 2018-19, State achieved all the three
major fiscal indicators specified in the Fourteenth Finance Commission (FFC) Report i.e.
(i) the fiscal deficit as percentage of Gross State Domestic Product (GSDP) stood at
State Finances Audit Report for the year ended 31 March 2019
6
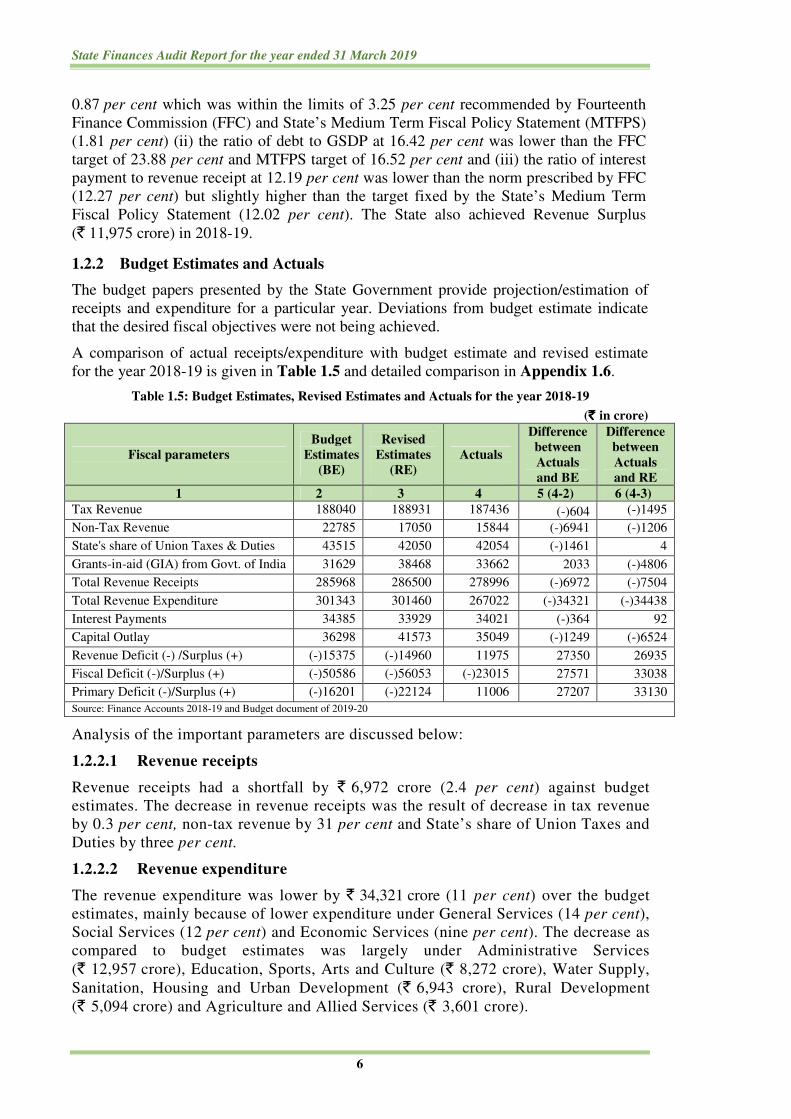
0.87 per cent which was within the limits of 3.25 per cent recommended by Fourteenth
Finance Commission (FFC) and State’s Medium Term Fiscal Policy Statement (MTFPS)
(1.81 per cent) (ii) the ratio of debt to GSDP at 16.42 per cent was lower than the FFC
target of 23.88 per cent and MTFPS target of 16.52 per cent and (iii) the ratio of interest
payment to revenue receipt at 12.19 per cent was lower than the norm prescribed by FFC
(12.27 per cent) but slightly higher than the target fixed by the State’s Medium Term
Fiscal Policy Statement (12.02 per cent). The State also achieved Revenue Surplus
(` 11,975 crore) in 2018-19.
1.2.2 Budget Estimates and Actuals
The budget papers presented by the State Government provide projection/estimation of
receipts and expenditure for a particular year. Deviations from budget estimate indicate
that the desired fiscal objectives were not being achieved.
A comparison of actual receipts/expenditure with budget estimate and revised estimate
for the year 2018-19 is given in Table 1.5 and detailed comparison in Appendix 1.6.
Table 1.5: Budget Estimates, Revised Estimates and Actuals for the year 2018-19
(` ` ` ` in crore)
Fiscal parameters
Budget
Estimates
(BE)
Revised
Estimates
(RE)
Actuals
Difference
between
Actuals
and BE
Difference
between
Actuals
and RE
1 2 3 4 5 (4-2) 6 (4-3)
Tax Revenue 188040 188931 187436 (-)604 (-)1495
Non-Tax Revenue 22785 17050 15844 (-)6941 (-)1206
State's share of Union Taxes & Duties 43515 42050 42054 (-)1461 4
Grants-in-aid (GIA) from Govt. of India 31629 38468 33662 2033 (-)4806
Total Revenue Receipts 285968 286500 278996 (-)6972 (-)7504
Total Revenue Expenditure 301343 301460 267022 (-)34321 (-)34438
Interest Payments 34385 33929 34021 (-)364 92
Capital Outlay 36298 41573 35049 (-)1249 (-)6524
Revenue Deficit (-) /Surplus (+) (-)15375 (-)14960 11975 27350 26935
Fiscal Deficit (-)/Surplus (+) (-)50586 (-)56053 (-)23015 27571 33038
Primary Deficit (-)/Surplus (+) (-)16201 (-)22124 11006 27207 33130
Source: Finance Accounts 2018-19 and Budget document of 2019-20
Analysis of the important parameters are discussed below:
1.2.2.1 Revenue receipts
Revenue receipts had a shortfall by ` 6,972 crore (2.4 per cent) against budget
estimates. The decrease in revenue receipts was the result of decrease in tax revenue
by 0.3 per cent, non-tax revenue by 31 per cent and State’s share of Union Taxes and
Duties by three per cent.
1.2.2.2 Revenue expenditure
The revenue expenditure was lower by ` 34,321 crore (11 per cent) over the budget
estimates, mainly because of lower expenditure under General Services (14 per cent),
Social Services (12 per cent) and Economic Services (nine per cent). The decrease as
compared to budget estimates was largely under Administrative Services
(` 12,957 crore), Education, Sports, Arts and Culture (` 8,272 crore), Water Supply,
Sanitation, Housing and Urban Development (` 6,943 crore), Rural Development
(` 5,094 crore) and Agriculture and Allied Services (` 3,601 crore).

Chapter I: Finances of the State Government
7
1.2.2.3 Capital outlay
The actual capital outlay was lower by ` 1,249 crore (3.4 per cent) against the budget
estimates. The decrease as compared to budget estimates was mainly under Rural
Development (` 3,255 crore) and Welfare of Scheduled Castes and Scheduled Tribes and
Other Backward Classes (` 1,129 crore).
1.2.2.4 Fiscal deficit
Fiscal deficit (` 23,015 crore) was lower than the assessment made in the budget
estimates (` 50,586 crore) by 55 per cent, mainly due to reduced Revenue and Capital
Expenditure.
1.3 Financial Resources of the State
Financial Resources of the State as per Annual Finance Accounts
Revenue and Capital are two streams of receipts of the State. Revenue receipts consist of
Tax Revenues, Non-Tax Revenues, State’s Share of Union Taxes and Duties and
Grants-in-aid from Government of India. Capital receipts include Miscellaneous Capital
Receipts such as proceeds from disinvestments, recoveries of loans and advances, debt
receipts from internal sources (market loans, borrowings from financial
institutions/commercial banks) and loans and advances from Government of India.
Besides, the funds available in the Public Account after disbursement are also utilised by
the Government to finance its deficit.
Table 1.6 presents the trends in growth and composition of total receipts of the State
during 2014-15 to 2018-19.
Table 1.6: Trends in growth and composition of total receipts
(`̀̀̀ in crore)
Source of State’s receipts 2014-15 2015-16 2016-17 2017-18 2018-19
Revenue receipts 165415 185036 204693 243654 278996
Capital receipts 30348 38858 50082 49854 27629
Contingency Fund 4360 962 0 0 3528
Public Account receipts (Gross) 83022 72747 82467 81877 90665
Total receipts 283145 297603 337242 375385 400818
Source: Finance Accounts of respective years
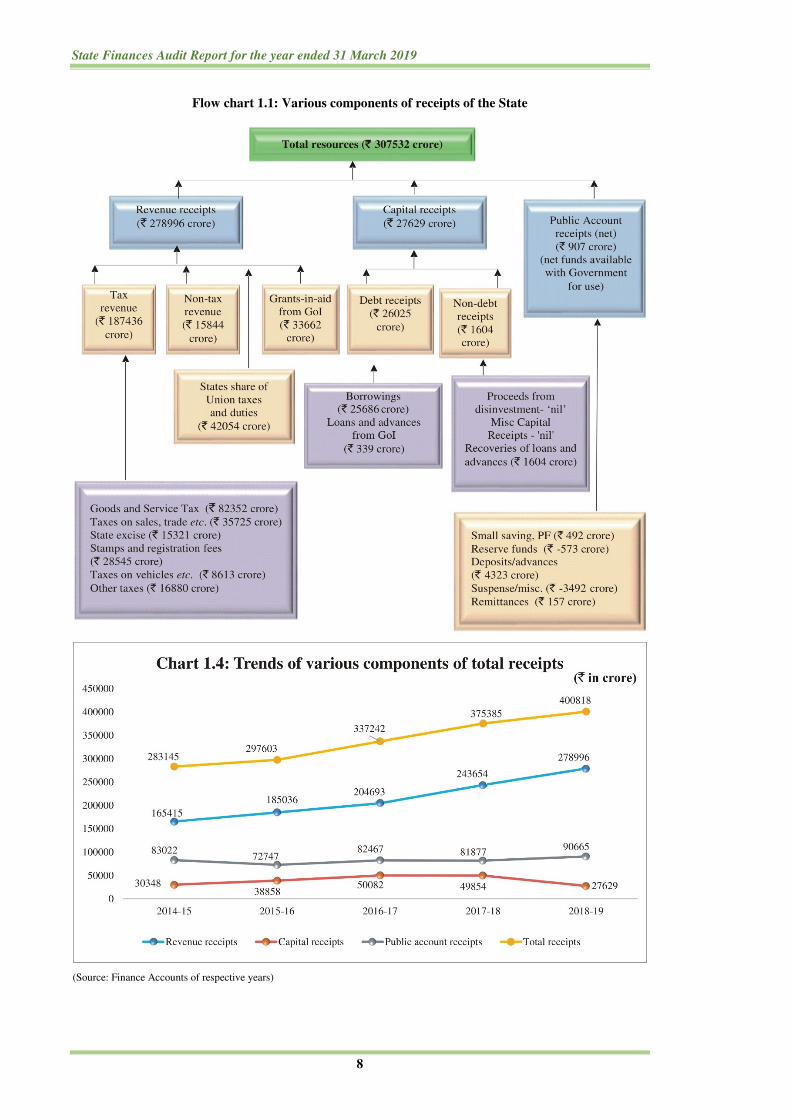
Chart 1.4 depicts the trends in various components of the receipts of the State during
2014-19. Chart 1.5 and Flow chart 1.1 depict the composition of the receipts of the State
during the current year.
State Finances Audit Report for the year ended 31 March 2019
8
Flow chart 1.1: Various components of receipts of the State
(Source: Finance Accounts of respective years)
Chapter I: Finances of the State Government
9
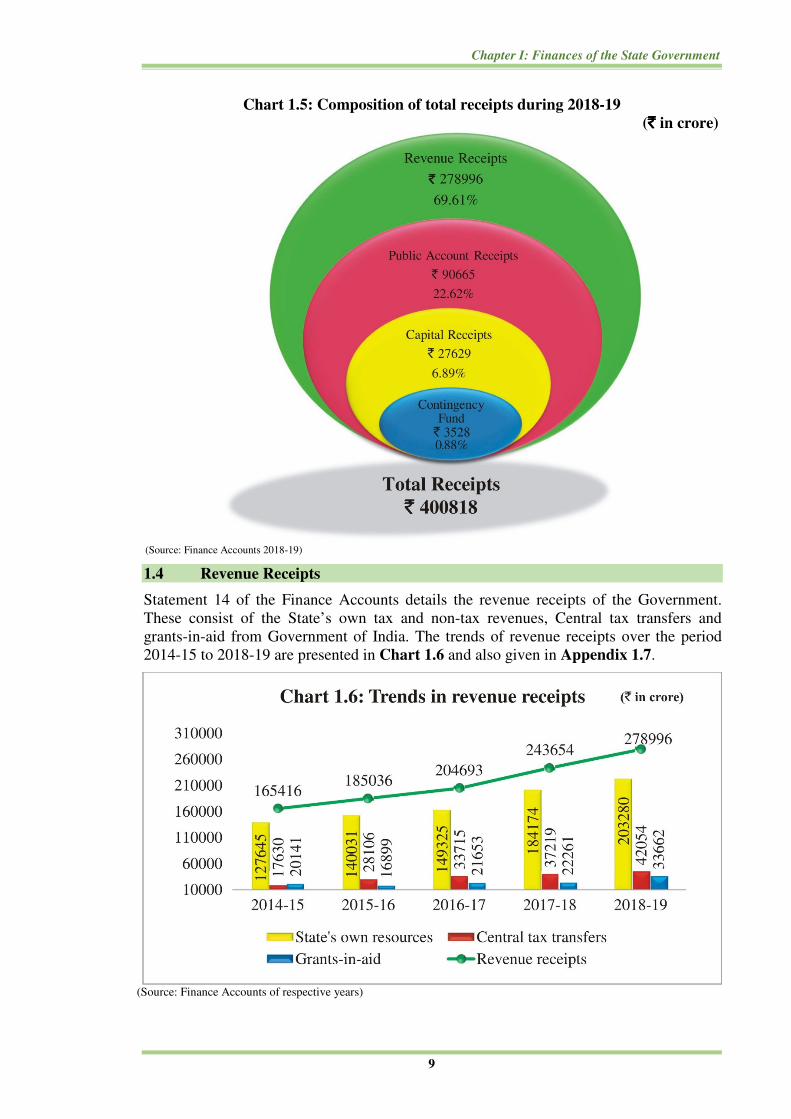
Chart 1.5: Composition of total receipts during 2018-19
(`̀̀̀ in crore)
(Source: Finance Accounts 2018-19)
1.4 Revenue Receipts
Statement 14 of the Finance Accounts details the revenue receipts of the Government.
These consist of the State’s own tax and non-tax revenues, Central tax transfers and
grants-in-aid from Government of India. The trends of revenue receipts over the period
2014-15 to 2018-19 are presented in Chart 1.6 and also given in Appendix 1.7.
(Source: Finance Accounts of respective years)

State Finances Audit Report for the year ended 31 March 2019
10
Revenue receipts grew by ` 35,342 crore (15 per cent) in 2018-19 over
the previous year. The tax revenue increased by ` 19,504 crore (12 per cent),
State’s share of Union Taxes and Duties by ` 4,835 crore (13 per cent) and
Grants-in-aid from Government of India by ` 11,401 crore (51 per cent) set-off by
decrease in non-tax revenue by ` 398 crore (two per cent).
The percentage composition of revenue receipts over the period 2014-15 to 2018-19 are
presented in Chart 1.7.
(Source: Finance Accounts of respective years)
As shown in Chart 1.7, 73 per cent of the Revenue came from the State’s own resources
and the balance was from Government of India in the form of central tax transfer and
Grant-in-aid.
The trends of revenue receipts relative to GSDP at current prices is presented in
Table 1.7.
Table 1.7: Trends in Revenue Receipts relative to Gross State Domestic Product
2014-15 2015-16 2016-17 2017-18 2018-19
Revenue receipts (` in crore) 165415 185036 204693 243654 278996
Rate of growth3 of RR (per cent) 10.4 11.9 10.6 19.0 14.5
RR/GSDP (per cent) 9.2 9.2 9.0 10.1 10.5
Source: Finance Accounts of respective years
The revenue receipt of the State remained between nine per cent and 10.5 per cent of the
GSDP during 2014-19. A slight upward surge in the ratio during 2017-18 and 2018-19 at
10 per cent and 10.5 per cent respectively was largely, a consequence of tax reforms
brought in through the implementation of the Goods and Services tax (GST).
During 2009-10 to 2017-18, the CAGR of revenue receipts (13.8 per cent) was lower
than the growth rate of GCS (15 per cent). The revenue receipts increased
considerably during 2018-19 (14.5 per cent) over 2017-18 and were higher than the
growth rate of GCS (12.8 per cent) as shown in Appendix 1.1.
3 see Glossary at page 132

Chapter I: Finances of the State Government
11
Trends in Buoyancy ratio
Buoyancy ratio indicates the elasticity or degree of responsiveness of a fiscal variable
with respect to a given change in the base variable. The value more than one indicates
high degree of responsiveness of the fiscal variable to the base variable. As GSDP grows,
the ability of the Government to mobilize revenue should also increase. Table 1.8 shows
the buoyancy of revenue receipts with respect to changes in GSDP.
Table 1.8: Buoyancy ratio
2014-15 2015-16 2016-17 2017-18 2018-19
Gross State Domestic Product (` in crore) 1792122 2001223 2257032 2411600 2660318
Revenue receipts buoyancy w.r.t. GSDP 1.182 1.017 0.828 2.794* 1.408
State's own taxes buoyancy w.r.t. GSDP 0.683 0.857 0.617 3.368* 1.126
Revenue receipts buoyancy w.r.t. State's
own taxes 1.733 1.190 1.342 0.830 1.250
Source: Finance Accounts of respective years
* Based on actual GSDP
As can be seen from Table 1.8, the buoyancy of revenue receipts to GSDP as well as
State’s own tax buoyancy to GSDP was greater than one indicating that revenue receipts
and own tax revenue grew at a faster rate than GSDP.
1.4.1 State’s Own Resources
As the State’s share in Central taxes is determined on the basis of recommendations of the
Finance Commission, the State’s performance in mobilization of additional resources is
assessed in terms of its own resources comprising revenue from its own sources (tax and
non-tax revenues).
The State’s actual tax and non-tax receipts for the year 2018-19 vis-à-vis projection given
in the FFC Report and the MTFPS (2018-19) are given in Table 1.9.
Table 1.9: Actual Projections of Tax and Non-Tax Revenue for 2018-19
(` in crore)
FFC
projection
Budget
estimates
MTFPS
projection
Actual
Tax revenue 229031 188040 188040 187436
Non-tax revenue 25212 22785 22785 15844
Source: Finance Accounts/FFC/Budget/MTFPS
1.4.1.1 Tax Revenue
The gross collection in respect of major taxes and duties during 2014-19 are given in
Table 1.10. Table 1.10: Components of State’s Own Tax Revenue
(` in crore)
Revenue Head 2014-15 2015-16 2016-17 2017-18 2018-19
Variation in
2018-19 over previous
year (in per cent)
Goods and Services
Tax4 - - - 50063 82352
12.5 Taxes on sales,
trade etc. 67466 69661 81174 54894 35725
Stamp duty and
registration fees 19959 21767 21012 26442 28545 8.0
4 Implemented w.e.f. 01 July 2017

State Finances Audit Report for the year ended 31 March 2019
12
Revenue Head 2014-15 2015-16 2016-17 2017-18 2018-19
Variation in
2018-19 over previous
year (in per cent)
State excise 11397 12470 12288 13450 15321 13.9
Taxes on vehicles 5405 6017 6741 8665 8613 (-)0.6
Land revenue 1272 1748 1799 2310 2088 (-)9.6
Taxes on goods and
passengers 587 1582 1877 984 837 (-)14.9
Other taxes5 8978 13363 11725 11124 13955 25.5
Total 115064 126608 136616 167932 187436 11.6
Source: Finance Accounts of respective years
The components of tax revenue for the year 2018-19 are presented in Chart 1.8.
(Source: Finance Accounts 2018-19)
Own tax revenue relative to GSDP of the State was seven per cent as compared to
Chhattisgarh (14.4 per cent), Gujarat (5.3 per cent), Karnataka (6.3 per cent) and Madhya
Pradesh (5.2 per cent).
The increase in tax revenue by ` 19,504 crore (12 per cent) over the previous year
was mainly under Taxes on Sales, Trade etc. and GST by ` 13,120 crore
(13 per cent), Stamp Duty and Registration Fees increased by ` 2,103 crore
(eight per cent), State Excise by ` 1,871 crore (14 per cent) and receipt under
Land Revenue decreased marginally since the previous year.
During 2009-10 to 2017-18, the CAGR of tax revenue (13.9 per cent) was lower than the
growth rate of GCS (14.8 per cent). The growth of tax revenue during 2018-19 over
2017-18 (11.6 per cent) was also lower than the growth rate of GCS (12.7 per cent) as
shown in Appendix 1.1.
Goods and Services Tax
The Goods and Services Tax (GST) has three components - Central GST (CGST), State
GST (SGST) and Integrated GST (IGST) on inter-state trade or commerce. Under the
5 Other taxes include taxes on professions; trades, callings and employment; and taxes and duties on electricity
Chapter I: Finances of the State Government
13
GST (Compensation to States) Act, 2017, loss of revenue to the States on account of
implementation of Goods and Services Tax shall be payable during transition period of
five years. Any excess amount released as compensation to a State in any financial year
during the transition period shall be adjusted against the compensation amount payable to
such State in the subsequent financial year. The base year (2015-16) revenue certified by
Audit under GST (compensation to States) Act, 2017 for Maharashtra State was
` 60,504.60 crore. The projected revenue for 2018-19 was ` 89,640.226 crore (2017-18
plus 14 per cent). Government of India released compensation of ` 8,330 crore. The
projected nominal growth rate of revenue subsumed for a state during the transition
period shall be 14 per cent per annum. The total compensation payable in any financial
year shall be difference between the projected revenue for any financial year and the
actual revenue collected by a State.
The revenue from SGST for the financial year 2018-19 of Maharashtra State was
` 82,352 crore. Government of India released the compensation amount of ` 8,330 crore
in the form of grant-in-aid, which was accounted under MH 1601-08-114. The actual
amount of compensation is dependent on adjustments to the GST collection emanating
from recovery of past arrears of subsumed taxes during SGST period of 2018-19 and is
yet to be worked out.
With automation of the collection of Goods and Services Tax (GST) having taken place,
it is essential for Audit to transition from sample checks to a comprehensive check of all
transactions, to fulfil the Comptroller and Auditor General’s constitutional mandate of
certifying the Accounts. The required access to data is yet to be provided. Not having
access to the data pertaining to all GST transactions has come in the way of
comprehensively auditing the GST receipts. The accounts for the year 2018-19 are,
therefore, certified on the basis of test audit, as was done when records were manually
maintained, as a one-time exception.
Government of Maharashtra gave an amount of ` 17,469 crore as ‘Assistance to
Municipal Corporations for loss of Revenue arising due to Implementation of Goods and
Services Tax’.
1.4.1.2 Non-Tax Revenue
The trend in Non-Tax Revenue during 2014-19 is shown in Table 1.11 and actuals for
2018-19 in Chart 1.9.
Table 1.11: Growth rate of Non-Tax Revenue
Revenue head 2014-15 2015-16 2016-17 2017-18 2018-19
Percentage
increase in
2018-19 over
previous year
(` in crore)
Interest receipts$ 3351 3080 3259 4163 4191 1
Dividends and profits 28 57 67* 65* 275* 323
Other non-tax receipts 9202 10286 9383 12014 11378 (-)5
Total 12581 13423 12709 16242 15844 (-)2
Non Tax Revenue/GSDP 0.70 0.67 0.56 0.65 0.60
* Dividend of ` 39 crore (2016-17); ` two crore (2017-18) and ` 255 crore (2018-19) for which details are awaited from
State Government $ Interest receipts shown under MH 0049
Source: Finance Accounts of respective years

State Finances Audit Report for the year ended 31 March 2019
14
(Source: Finance Accounts 2018-19)
Non-tax revenue (` 15,844 crore) which constituted six per cent of revenue
receipts, decreased by two per cent over the previous year. The decrease was
mainly under Miscellaneous General Services (` 964 crore) and
Elections-other receipts (` 629 crore).
During 2009-10 to 2017-18, the CAGR of non-tax revenue (8.7 per cent) was lower than
the growth rate of GCS (9.9 per cent). The growth rate of GCS was 19.8 per cent which
was positive as compared to negative growth rate of 2.5 per cent of non-tax revenue of the
State during 2018-19 over 2017-18 as shown in Appendix 1.1.
Recommendation: The non-tax revenue relative to GSDP has shown a steady decline during 2014-19
indicating that the State needs to devise measures to enhance non-tax revenue to
augment its revenue receipt.
Interest receipts, Dividends and Profits
One of the major sources of interest receipts is interest proceeds out of investment of
surplus cash balances of the State. As per Reserve Bank of India’s regulations, the cash
balance maintained by the State is invested in Government of India’s 14 days Treasury
Bills (TBs). The average rate of interest on these TBs is around five to six per cent.
Excess cash balance, beyond the immediate requirement is invested in Government of
India’s 91 days TBs. Against the budgeted estimates of ` 2,824 crore during 2018-19, the
actual interest realised on Investment of Cash Balances was ` 3,032 crore of which, 14
days TBs yielded ` 762 crore, 91 days TBs yielded ` 2,118 crore and 182 days TBs
yielded ` 152 crore.
The interest realised on Loans and Advances given by the State Government to its
Companies/Corporations etc. stood at ` 394 crore during 2018-19 which worked out to
1.5 per cent of the outstanding balances of Loans and Advances (` 25,746 crore) at the
end of the year.
The return on investment in the form of dividends declared by Companies/Corporations
and credited to Government Account during 2018-19 was ` 275 crore. Dividend
and Profit at ` 275 crore showed an increase of ` 210 crore over previous year. However,
the State Government could not provide details for ` 255 crore, to that extent the

Chapter I: Finances of the State Government
15
amount could not be vouched. Considering the extent of Government investment
(` 1,53,322 crore), the return worked out to a meagre 0.18 per cent on the investment
made (Table 1.39).
Pricing of public utilities – Water Charges
The levy and pricing of water charges in Maharashtra is governed by the provisions of the
Maharashtra Water Resources Regulatory Authority Act, 2005. In case of irrigation and
bulk water, the Authority is required to fix the criteria for water charges based on the
principle that water charges shall reflect the full recovery of the cost of irrigation
management, administration, operation and maintenance (O&M) of water resources
projects. As per the Act, the State should be able to meet the O&M expenditure on
irrigation projects by water charges. In the case of drinking water, the revenue receipts
from water tariff should be at par with cost of production of water i.e. expenditure of
O&M of water supply system.
Maharashtra moved towards fixing the water charges through Maharashtra Water
Resources Regulatory Authority from October 2010. The assessment and recovery of
water charges against the O&M cost during 2014-19 based on the water rates for the
control period6 2010-13 is shown in Table 1.12.
Table 1.12: Details of Operation and Maintenance cost of water resources project,
assessment of water charges and recovery of water charges (`̀̀̀ in crore)
Year
Operation and Maintenance cost
(Establishment + Maintenance and repair) Arrears of water charges
Salary
(Establish-
ment)
Non-salary
(Maintenance
and Repairs)
Total Opening
Balance Assessment
Total
Dues
(5+6)
Recovery
of water
charges
Balance to
be recovered
(7-8)
(1) (2) (3) (4) (5) (6) (7) (8) (9)
2014-15 620 126 746 1309 672 1981 637 1344
2015-16 680 181 861 1347* 740 2087 573 1514
2016-17 652 135 787 1514 664 2178 474 1704
2017-18 702 334 1036 1704 833 2537 688 1849
2018-19 1344 356 1700 1849 1137 2986 1044 1942
Total 3998 1132 5130 4046 3515
* Opening balance was revised after reconciliation
Source: Information furnished by Maharashtra Water Resources Regulatory Authority
From the Table 1.12 it can be seen that the water charges recovered during 2014-19 was
lower than the O&M cost by ` 1,615 crore. Arrears in recovery during 2014-19 was
` 1,942 crore. In addition, there was a gap of ` 1,084 crore between O&M cost and
assessment made during 2014-19.
1.4.2 Transfers from Government of India including State’s share of Union taxes
and Grants-in-aid from Government of India
1.4.2.1 Central Tax Transfers
Comparison of the transfer of taxes (Fourteenth Finance Commission)
Consequent upon acceptance of the recommendations of the Fourteenth Finance
Commission (award period 2015-16 to 2019-20) by Government of India, the transfer to
6 Control period for the purposes of the applicability of tariffs shall be three consecutive water years starting from
01 July 2010 to 30 June 2011, 01 July 2011 to 30 June 2012 and 01 July 2012 to 30 June 2013

State Finances Audit Report for the year ended 31 March 2019
16
States with effect from 2015-16 has increased from 32 per cent to 42 per cent of
the net union tax receipts. Central tax transfers increased by 13 per cent from
` 37,219 crore in 2017-18 to ` 42,054 crore in 2018-19. The transfer of
different components of States share of union taxes during the year 2015-19 of FFC is as
given in Table 1.13.
Table 1.13: Transfer of different components of State’s share of Union Taxes
(`̀̀̀ in crore)
Components of State’s share of Union
taxes
FFC award period Difference
(5 – 4)
Percentage
increase/
decrease 2015-16 2016-17 2017-18 2018-19
(1) (2) (3) (4) (5) (6) (7)
Corporation Tax 8835.19 10790.20 11387.92 14621.85 3233.93 28.4
Customs 4486.57 4641.53 3753.00 2980.37 (-)772.63 (-)20.6
Income Tax 6144.85 7499.22 9616.28 10768.37 1152.09 12
Other taxes and duties on commodities and
services 19.33 0.09 15.87 25.47 9.60 60.5
Other taxes on income and expenditure 0.18 - - 76.15 76.15 100
Service tax 4887.46 5458.92 4246.87 390.29 (-)3856.58 (-)90.8
Taxes on wealth 2.00 24.71 (-)0.34 5.36 5.70 1676.5
Union excise duties 3730.37 5300.23 3923.00 1980.63 (-)1942.37 (-)49.5
Central Goods and Services Tax - - 522.44 10377.52 9855.08 1886.4
Integrated Goods and Services Tax (IGST) - - 3754.16 828.20 (-)2925.96 (-)77.9
Grand Total 28105.95 33714.90 37219.20 42054.21 4835.01 13
Transfer as a percentage of revenue receipts 15.2 16.5 15.3 15.1
Source: Data of Finance Department, Government of Maharashtra and website of Ministry of Finance
Of the total Central Tax transfer, there was a phenomenal increase of ` 9,855.08 crore
under CGST. Tax transfer under IGST decreased by 78 per cent (` 2,925.96 crore) since
the previous year.
1.4.2.2 Grants-in-aid from Government of India
The Grants-in-aid from Government of India increased by 51 per cent from
` 22,261 crore in 2017-18 to ` 33,662 crore in 2018-19. The increase in 2018-19 was
mainly due to grants released under GST Compensation (` 6,842 crore), State Plan
Schemes (` 1,690 crore), Centrally Sponsored Plan Schemes (` 1,892 crore). The trend of
total grants from Government of India as a percentage of revenue receipts ranged between
nine per cent and 12 per cent during 2014-19 is shown in Table 1.14.
Table 1.14: Grants-in-aid from Government of India
(`̀̀̀ in crore)
2014-15 2015-16 2016-17 2017-18 2018-19
Non-plan grants 7304 6080 9073* 7158 8310
Grants for State Plan Schemes 1665 791 455 197 1887
Grants for Central Plan Schemes 1399 688 1657 1086 1326
Grants for Centrally sponsored Plan Schemes 9772 9340 10468 11895 13787
Compensation for loss of revenue arising out of
implementation of GST - - - 1488 8330
Skill Development and Entrepreneurship-Other Schemes - - - - 22
Total 20140 16899 21653 22261$ 33662
Percentage of increase/decrease over previous year 52.1 (-)16.1 28.1 2.8 51.2
Total Grants as a percentage of revenue receipts 12.2 9.1 10.6 9.1 12.1
* Higher rounding $ Includes ` 438 crore, details are not available
Source: Finance Accounts of respective years

Chapter I: Finances of the State Government
17
The composition of Grants-in-aid is shown in Chart 1.10.
(Source: Finance Accounts 2018-19)
Centrally Sponsored Plan Schemes
The increase under grants from Centrally Sponsored Plan Schemes (` 1,892 crore)
was mainly under (a) General Education (` 1,543 crore), (b) Welfare of Schedule
castes, Scheduled Tribes, Other Backward Classes and Minorities (` 1,146 crore),
set-off by a decrease under (c) Civil Supplies (` 571 crore) and (d) Social Welfare and
Child Welfare (` 492 crore).
Central Plan Schemes
The increase under Central Plan Schemes (` 240 crore) was mainly under Mahatma
Gandhi National Rural Employment Programmes (` 498 crore) and Rural
Development (` 210 crore) set-off by decrease under Grants under Proviso to Article
275(1) of the Constitution (` 537 crore).
State Plan
Grants for State Plan Schemes comprise mainly grants under Article 275(1) of the
Constitution of India (these are basically grants for Tribal Sub-Plan) and
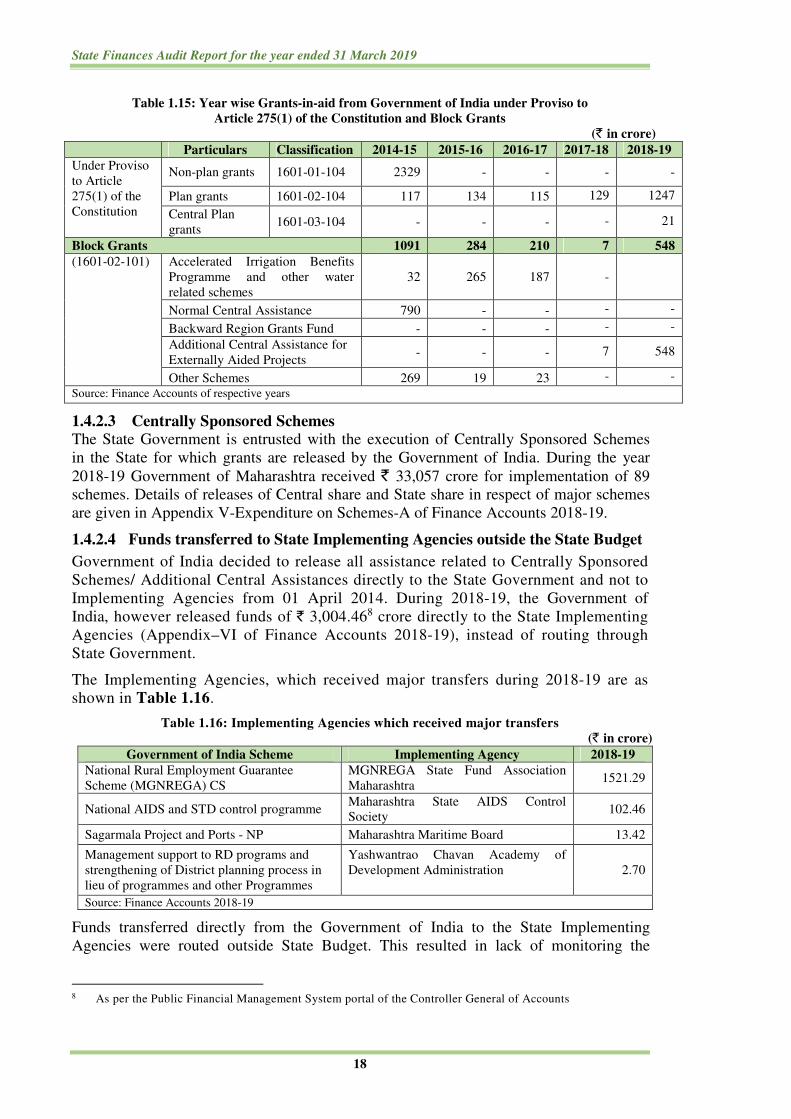
Block Grants7. Table 1.15 shows the Grants-in-aid received from Government of India
under Proviso to Article 275(1) of the Constitution and Block Grants during 2014-15 to
2018-19.
7 A block grant is a lump sum grant provided by the Government of India to the State Government, with only
general provision as the way it is to be spent
State Finances Audit Report for the year ended 31 March 2019
18
Table 1.15: Year wise Grants-in-aid from Government of India under Proviso to
Article 275(1) of the Constitution and Block Grants
(` in crore)
Particulars Classification 2014-15 2015-16 2016-17 2017-18 2018-19
Under Proviso
to Article
275(1) of the
Constitution
Non-plan grants 1601-01-104 2329 - - - -
Plan grants 1601-02-104 117 134 115 129 1247
Central Plan
grants 1601-03-104 - - - - 21
Block Grants 1091 284 210 7 548
(1601-02-101) Accelerated Irrigation Benefits
Programme and other water
related schemes
32 265 187 -
Normal Central Assistance 790 - - - -
Backward Region Grants Fund - - - - -
Additional Central Assistance for
Externally Aided Projects - - - 7 548
Other Schemes 269 19 23 - -
Source: Finance Accounts of respective years
1.4.2.3 Centrally Sponsored Schemes
The State Government is entrusted with the execution of Centrally Sponsored Schemes
in the State for which grants are released by the Government of India. During the year
2018-19 Government of Maharashtra received ` 33,057 crore for implementation of 89
schemes. Details of releases of Central share and State share in respect of major schemes
are given in Appendix V-Expenditure on Schemes-A of Finance Accounts 2018-19.
1.4.2.4 Funds transferred to State Implementing Agencies outside the State Budget
Government of India decided to release all assistance related to Centrally Sponsored
Schemes/ Additional Central Assistances directly to the State Government and not to
Implementing Agencies from 01 April 2014. During 2018-19, the Government of
India, however released funds of ` 3,004.468 crore directly to the State Implementing
Agencies (Appendix–VI of Finance Accounts 2018-19), instead of routing through
State Government.
The Implementing Agencies, which received major transfers during 2018-19 are as
shown in Table 1.16.
Table 1.16: Implementing Agencies which received major transfers
(` in crore) Government of India Scheme Implementing Agency 2018-19
National Rural Employment Guarantee
Scheme (MGNREGA) CS
MGNREGA State Fund Association
Maharashtra 1521.29
National AIDS and STD control programme Maharashtra State AIDS Control
Society 102.46
Sagarmala Project and Ports - NP Maharashtra Maritime Board 13.42
Management support to RD programs and
strengthening of District planning process in
lieu of programmes and other Programmes
Yashwantrao Chavan Academy of
Development Administration
2.70
Source: Finance Accounts 2018-19
Funds transferred directly from the Government of India to the State Implementing
Agencies were routed outside State Budget. This resulted in lack of monitoring the
8 As per the Public Financial Management System portal of the Controller General of Accounts
Chapter I: Finances of the State Government
19
expenditure incurred by them on various schemes and also escaped Legislative scrutiny
through regular process of authorisation.
1.5 Capital Receipts
Capital receipts of the State Government includes non-debt and debt receipts, whose
composition has been discussed in Paragraph 1.3. The trends in composition of capital
receipts are shown in Table 1.17.
Table 1.17: Trends in growth and composition of Capital Receipts
(` in crore)
Sources of State’s receipts 2014-15 2015-16 2016-17 2017-18 2018-19
Capital Receipts (CR) 30348 38858 50082 49854* 27629
Miscellaneous Capital Receipts - 17 - - -
Recovery of Loans and Advances 975 865 1745 1778 1604
Public Debt Receipts 29373 37976 48337 48075# 26025
Rate of growth of debt capital receipts
(per cent) 9.9 29.3 27.3 (-)0.5 (-)45.9
Rate of growth of non-debt capital receipts
(per cent) 33.9 (-)9.5 97.8 1.89 (-)9.8
Rate of growth of CR (per cent) 10.5 28.0 28.9 (-) 0.5 (-)44.6
Source: Finance Accounts of respective years
*Higher rounding # Lower rounding
Capital Receipts (debt and non-debt receipts) of the State increased at an average annual
growth rate of 22.5 per cent from 2014-15 to 2016-17 and decreased at the same average
during 2017-18 and 2018-19. During 2018-19, capital receipts decreased by 45 per cent
over the previous year mainly due to decrease in public debt receipts by 46 per cent. The
share of public debt receipts in capital receipts was 94 per cent.
1.5.1 Recovery of Loans and Advances
The details of loans and advances given by the State Government during 2014-19 are
indicated in Table 1.18.
Table 1.18: Position of Loans and Advances given by the State Government
(` ` ` ` in crore)
Year
Balance of
loans and
advances as
on 1 April
Disbursements
by the
Government
during the year
Recoveries
during the
year
Balance as
on 31
March
(2+3-4)
Percentage of recovery
with reference to
opening balance
(4/2*100)
(1) (2) (3) (4) (5) (6)
2014-15 21656.79 1140.54 975.08 21822.25 4.5
2015-16 21822.25 1114.63 865.11 22071.77 4.0
2016-17 22071.77 6277.21 1745.58 26603.40 7.9
2017-18 26603.40 979.29 1778.01 25804.68 6.7
2018-19 25804.68 1545.17 1604.29 25745.56 6.2
Source: Finance Accounts of respective years
Recoveries of loans and advances decreased by ` 174 crore (9.8 per cent) over the
previous year mainly on account of recoveries under ‘Loans for Co-operation’
(` 114 crore) and ‘Loans for Power Projects’ (` 48 crore). The percentage of recovery
was meagre at four to 7.9 during the last five years. The complete information (Section 3:
Fresh Loans and advances made during the year to the loanee entities from whom
repayment of earlier loans are in arrears) regarding arrears in repayments and loans in
perpetuity (disclosures indicating extraordinary transactions relating to Loans &
Advances under Finance Accounts Statement No.18) was not furnished by the
Government.
State Finances Audit Report for the year ended 31 March 2019
20
1.5.2 Public Debt Receipts
During 2018-19, the public debt receipts decreased considerably by 45.9 per cent
(` 22,050 crore) and public debt repayment increased by 59.1 per cent (` 9,335 crore).
Table 1.19: Time-series data on Public Debt Receipts
(` in crore)
2014-15 2015-16 2016-17 2017-18 2018-19
Open Market Borrowings 25083 32440 44960 44996 20868
(85.4) (85.4) (93.0) (93.6) (80.2)
National Small Savings Fund 2982 4015 - - -
(10.1) (10.6) - - -
Other Financial Institutions 766 937# 2750 2911 4818
(2.6) (2.5) (5.7) (6.1) (18.5)
Loans and Advances from GoI 542 584 627 168 339
(1.8) (1.5) (1.3) (0.35) (1.3)
Public Debt Receipts 29373 37976 48337 48075# 26025
Public Debt Repayments 8828 10043 11887 15782 25117*
Figures in parenthesis indicate percentage to Public Debt receipts # Lower rounding *Higher rounding
Source: Finance Accounts of respective years
The public debt (Market borrowings and Loans from Government of India) receipts
during the year (` 26,025 crore) comprised internal debt of ` 25,686 crore (98.7 per cent)
and loans and advances from Government of India ` 339 crore (1.3 per cent). Market
borrowings (` 20,868 crore) had a predominant share under internal debt comprising
80 per cent followed by loans from financial institutions (` 4,818 crore) as shown in
Table 1.19.
1.6 Public Account Receipts
Receipts and disbursements in respect of certain transactions such as, Small Savings,
Provident Funds, Reserve Funds, Deposits, Suspense, Remittances etc., which do not
form part of the Consolidated Fund of the State, are kept in the Public Account set up
under Article 266(2) of the Constitution of India and are not subject to vote by the
State Legislature. Here, the Government acts as a banker/trustee for custody of public
money, since these transactions are simply pass through transactions. The trend of
net receipts under Public Account covering the period 2014-15 to 2018-19 are indicated
in Table 1.20.
Table 1.20: Trends of receipts under Public Account (` in crore)
Resources under
various heads
2014-15 2015-16 2016-17 2017-18 2018-19
Public Account receipts
a. Small Savings,
Provident Fund etc.
4642.54 4798.96 4947.53 4784.21 4869.26
(1260) (1208)# (1124) (547) (492)
b. Reserve Fund 5908.54 7226.11 8566.92 8898.55 5066.88
(3158) (3465) (5283) (5924) (-573)*
c. Deposits and
Advances
31249.40 34855.80 39356.10 39960.88 45731.93
(4411) (2773) (6841) (3930) (4323)
d. Suspense and
Miscellaneous
17039.01 (-) 569.16 3034.27 541.72 (-)3208.89
(5222) (-876) (2773) (164) (-3492)

Chapter I: Finances of the State Government
21
Resources under
various heads
2014-15 2015-16 2016-17 2017-18 2018-19
e. Remittances 24182.45 26435.49 26561.67 27691.64 38205.39
(14) (-235) (-656) (822) (157)
Total 83021.94 72747.20 82466.49 81877.00 90664.57
(14036) (6335) (15365) (11387) (907)
Figures in parenthesis indicate net receipts #Lower rounding
Source: Finance Accounts of respective years
*Negative figure is due to rectification of misclassification during previous year on account of ‘Redemption
payments of Consolidated Sinking Fund’ (` 6260.26 crore) up to 31/03/2019
Table 1.20 shows that Public Account receipts increased by nine per cent over the period
2014-19. Increase in Public Account receipts by ` 8,788 crore (10.7 per cent) in 2018-19
over the previous year was on account of increase under Remittances (` 10,514 crore) and
Deposits and Advances (` 5,771 crore) and set off by decrease under Reserve Fund
(` 3,832 crore) and Suspense and Miscellaneous (` 3,751 crore). The net public account
receipts available for use to the State Government during 2018-19 was ` 907 crore, a
decrease by 92 per cent (` 10,480 crore) over 2017-18.
1.7 Application of Resources
Analysis of allocation of expenditure assumes significance since major expenditure
responsibilities are entrusted with the State Government at various levels. Within the
framework of fiscal responsibility legislations, there are budgetary constraints in raising
public expenditure financed by deficit or borrowings. It is therefore, important to ensure that
the ongoing fiscal correction and consolidation process at the State level is not at the cost of
expenditure especially directed towards development and social welfare.
1.7.1 Total Expenditure
Chart 1.11 presents the trends in total expenditure over the period of last five years
(2014-19) as well as its composition under revenue, capital and loans and advances.
(Source: Finance Accounts of respective years)
The total expenditure and its composition during 2014-19 are presented in Table 1.21 and
Chart 1.12.

State Finances Audit Report for the year ended 31 March 2019
22
Table 1.21: Total expenditure and its composition
(` in crore)
2014-15 2015-16 2016-17 2017-18 2018-19
Total expenditure 198217 214282 245055 269392 303616
Revenue expenditure 177553 190374 213229 241571 267022
(89.6) (88.8) (87.0) (89.6) (88.0)
of which, Non-Plan revenue expenditure 146245 154318 171140 * *
Capital Outlay 19523 22793 25549 26842 35049
(9.8) (10.7) (10.4) (10.0) (11.5)
Loans and advances 1141 1115 6277 979 1545
(0.6) (0.5) (2.6) (0.4) (0.5)
Figure in parenthesis indicate percentage to total expenditure
* From 2017-18 onwards Plan and Non-plan expenditure has been merged
Source: Finance Accounts of respective years
(Source: Finance Accounts of respective years)
The total expenditure grew by 12.7 per cent over the previous year. The total expenditure
of the State increased at an average growth rate of 11.5 per cent from ` 1,98,217 crore in
2014-15 to ` 3,03,616 crore in 2018-19 but the percentage of capital outlay to total
expenditure remained around at 10 per cent during 2014-18 and increased nominally to
11.5 per cent in 2018-19. The total expenditure, its annual growth rate, the ratio of total
expenditure to GSDP and to revenue receipts and its buoyancy with respect to GSDP and
revenue receipts are indicated in Table 1.22.
During 2009-10 to 2017-18, the CAGR of total expenditure (11.4 per cent) was lower
than the growth rate of GCS (14.2 per cent). The growth of the total expenditure
during 2018-19 over 2017-18 was same as the growth rate of GCS at 12.7 per cent as
shown in Appendix 1.1.

Chapter I: Finances of the State Government
23
Table 1.22: Total expenditure – basic parameters
Particulars 2014-15 2015-16 2016-17 2017-18 2018-19
Total expenditure (TE) (` in crore) 198217 214282 245055 269392 303616
Rate of growth of TE over previous year (per cent) 12.3 8.1 14.4 9.9 12.7
TE/GSDP (per cent) 11.1 10.7 10.8 11.2 11.4
RR/TE (per cent) 83.5 86.4 83.5 90.4 91.9
Buoyancy of Total expenditure with reference to:
GSDP (ratio) 1.398 0.692 1.125 1.456* 1.233
RR (ratio) 1.183 0.681 1.358 0.521 0.876
Source: Finance Accounts of respective years *Based on actual GSDP
The total expenditure remained around 11 per cent of GSDP during 2014-19.
Table 1.22 shows that on an average, 87 per cent of total expenditure were met from
revenue receipts during 2014-19. After decrease in the growth of total expenditure during
2017-18 over the previous year, the growth increased to 12.7 per cent during 2018-19.
1.7.1.1 Total expenditure in terms of activities
In terms of activities, total expenditure could be considered as being composed of
expenditure on General Services including interest payments, Social Services, Economic
Services, Grants-in-aid and Loans and Advances. Relative shares of these components in
the total expenditure are indicated in Table 1.23 and Chart 1.13.
Table 1.23: Components of total expenditure – relative shares
(in per cent)
2014-15 2015-16 2016-17 2017-18 2018-19
General Services 31.0 30.7 29.8 29.5 28.4
of which, Interest Payments 12.1 12.0 11.6 12.3 11.2
Social Services 39.8 39.6 38.2 35.4 37.5
Economic Services 27.4 26.6 26.3 28.8 27.0
Grants-in-aid 1.2 2.6 3.1 5.9 6.6
Loans and Advances 0.6 0.5 2.6 0.4 0.5
Source: Finance Accounts of respective years
(Source: Finance Accounts of respective years)
State Finances Audit Report for the year ended 31 March 2019
24
The increase under grants-in-aid was mainly due to increase in compensation and
assignment to Local bodies and Panchayati Raj Institutions (` 4,314 crore).
Though the share of General and Economic Services in total expenditure had decreased
in 2018-19 over the previous year, the expenditure on these services increased by
` 6,715 crore and ` 4,223 crore respectively.
The increase under Social Services was due to Relief on Account of Natural Calamities
(` 7,521 crore).
1.7.2 Revenue expenditure
Revenue expenditure is incurred to maintain the current level of services and payment
for past obligations and as such, does not result in any addition to the State’s
infrastructure and service network. The revenue expenditure has shown an increasing
trend from ` 1,77,553 crore in 2014-15 to ` 2,67,022 crore in 2018-19. However, the
growth rate of revenue expenditure decreased from 13.3 per cent in 2017-18 to
10.5 per cent in 2018-19 mainly due to decrease in expenditure on the Other
Agricultural Programmes-Chhatrapati Shivaji Maharaj Sanman Yojna-2017 and debt
relief to farmers under Chhatrapati Shivaji Maharaj Shetkari Sanman Yojana 2017
(` 11,313 crore). The overall revenue expenditure, its rate of growth, and buoyancy of
revenue expenditure with GSDP and revenue receipts during the last five years are
indicated in Table 1.24.
Table 1.24: Revenue expenditure – basic parameters
(`̀̀̀ in crore)
2014-15 2015-16 2016-17 2017-18 2018-19
Revenue expenditure (RE) 177553 190374 213229 241571 267022
Rate of Growth of RE (per cent) 14.6 7.2 12.0 13.3 10.5
Revenue Expenditure as percentage to TE 89.6 88.8 87.0 89.7 87.9
Buoyancy of Revenue expenditure with
GSDP (ratio) 1.659 0.615 0.938 1.956* 1.019
Revenue Receipts (ratio) 1.404 0.605 1.132 0.698 0.724
Source: Finance Accounts of respective years * Based on actual GSDP
Revenue expenditure constituted 88 per cent of the total expenditure (Chart 1.12). The
revenue expenditure during 2018-19 (` 2,67,022 crore) was lower than the assessment
made by the State Government in its MTFPS/FCP/Budget estimates by 11 per cent.
The buoyancy ratio of revenue expenditure with reference to both GSDP and revenue
receipts showed a fluctuating trend. The buoyancy of revenue expenditure with revenue
receipts at 0.724 during 2018-19 indicated that as against the revenue receipt of ` one
corresponding revenue expenditure was ` 0.724.
1.7.2.1 Cost of collection
The gross collection in respect of four major heads of revenue receipts, the expenditure
incurred on their collection and the comparative percentage of such expenditure to the
gross collection along with the relevant All India Average percentage of expenditure on
gross collection for the year 2017-18 are given in the Table 1.25.
Table 1.25: Expenditure incurred on collection of taxes
Sr.
No Head of revenue Year
Gross
collection
(` in crore)
Expenditure
on collection
(` in crore)
Percentage of
expenditure to
gross collection
All India Average
percentage for
the year 2017-18
1
GST and Taxes
on Sales, Trade
etc.
2016-17 81174.17 522.25 0.6 0.69
2017-18 104956.87 543.81 0.5 0.69
2018-19 118076.93 551.90 0.5 Not Available

Chapter I: Finances of the State Government
25
Sr.
No Head of revenue Year
Gross
collection
(` in crore)
Expenditure
on collection
(` in crore)
Percentage of
expenditure to
gross collection
All India Average
percentage for
the year 2017-18
2 State Excise
2016-17 12287.91 111.02 0.9 2.01
2017-18 13449.65 114.72 0.9 1.83
2018-19 15320.90 122.02 0.8 Not Available
3 Taxes on
Vehicles
2016-17 6741.21 119.66@ 1.8 2.61
2017-18 8665.38 130.55@ 1.5 2.61
2018-19 8613.19 171.74@ 2.0 Not Available
4 Stamps and
Registration Fees
2016-17 21011.83 138.15 0.7 2.99
2017-18 26441.82 139.96 0.5 2.96
2018-19 28545.05 145.00 0.5 Not Available @ Subsidies excluded ` 1,622.80 crore (2016-17), ` 1,316.77 crore (2017-18) and ` 1,485.00 crore (2018-19)
Source: Finance Accounts of respective years
It would be seen that the cost of collection of revenue in the State is well below the All
India Average in Taxes on Sales, Trade etc., State Excise, Stamps and Registration Fees
and Taxes on Vehicles.
1.7.2.2 Subsidies
The subsidies projected by the Government in the FCP and the actual expenditure
incurred during 2017-18 and 2018-19 are presented in Table 1.26.
Table 1.26: Subsidies vis-à-vis Budget (` in crore)
2017-18 2018-19
Projections in
Budget
Actuals Projections
in Budget
Revised
Estimates
Actuals
Power (Subsidy for reduction in
Agriculture and Power loom Tariff) 4500 6726 4941 7766 7766
General/Others 13449 27169 25430 25023 19632
Total 17949 33894 30371 32789 27398
Source: Finance Accounts and Budget documents of respective years
The subsidies given to Power increased by ` 1,040 crore (15 per cent) during 2018-19
compared to previous year.
Subsidies given by the State Government during 2014-15 to 2018-19 are shown in
Table 1.27. Table 1.27: Expenditure on subsidies
(`̀̀̀ in crore)
Table 1.27 indicates that expenditure under subsidies decreased by 19 per cent from
` 33,894 crore in 2017-18 to ` 27,398 crore in 2018-19. During the current year,
subsidies constituted about 10 per cent of the total revenue expenditure as well as revenue
receipts.
The major schemes which received subsidies during 2018-19 included:
• Distribution/Transmission Licenses for reduction in Agriculture and Powerloom
tariff ` 7,766 crore
• Package Scheme of Incentive ` 3,035 crore
2014-15 2015-16 2016-17 2017-18 2018-19
Subsidies 19753 17766 20984 33894 27398
(12) (10) (10) (14) (10)
Revenue Receipts 165415 185036 204693 243654 278996
Figures in parenthesis indicate percentage to Revenue Receipts
Source: Finance Accounts of respective years

State Finances Audit Report for the year ended 31 March 2019
26
• Pradhan Mantri Crop Insurance Scheme ` 1,724 crore
• Maharashtra Rajya Sahakari ` 1,618 crore
• Transport ` 1,485 crore
1.7.3 Capital expenditure
During 2018-19, Capital outlay (` 35,049 crore) constituted 11.5 per cent of the total
expenditure, an increase by 31 per cent over 2017-18. The increase in capital outlay
during 2018-19 over the previous year was mainly on Roads and Bridges
(` 3,397 crore) and Urban Development (` 1,190 crore). During 2018-19, the Capital
Outlay (` 35,049 crore) was lower than the assessment made by the State Government
in its FCP and projections made in MTFPS/Budget estimates (` 36,298 crore) by
three per cent except in some areas.
Further, out of the total Capital outlay of ` 35,049.05 crore, Government had invested
` 13,118.54 crore9 (37.43 per cent of Capital expenditure) in Statutory Corporations
(` 12,082.48 crore) mainly related to Irrigation Development and Others,
Government Companies (` 960.89 crore) and in Co-operative banks/Societies and
Local bodies (` 75.17 crore).
Out of ` 13,118.54 crore, an amount of ` 853.68 crore was invested in Maharashtra
State Electricity Board (MSEB) Holdings and ` 500 crore in Maharashtra State Road
Transport Corporation (MSRTC) which had accumulated losses of ` 2,137.83 crore
and ` 3,663.21 crore respectively. An amount of ` 0.70 crore was invested in
Maharashtra State Powerlooms Corporation Limited which had accumulated losses of
` 17.38 crore and had eroded its net worth.
Recommendation: As the chance of earning return on investment made in Companies incurring losses, and
where their accumulated losses have resulted in erosion of the net-worth, is remote, the
State Government may consider making future payments to these Companies in the form
of Grants instead of Share Capital, so as to reduce the disparity in investment vis-à-vis
return.
1.7.4 Loans and Advances
Loans and advances constituted around one per cent of the total expenditure during
2014-15 to 2018-19 except 2016-17 (three per cent) and 0.4 per cent during 2017-18
(Chart 1.12). Disbursements of loans and advances during 2018-19 increased by
` 566 crore as compared to 2017-18.
1.7.5 Committed expenditure
The committed expenditure of the State Government on revenue account mainly
consists of interest payments, expenditure on salaries and wages and pensions.
The statement of committed liabilities (Appendix XII-Finance Accounts) was
9 The increase in investments was mainly on account of capital contributions to Vidarbha Irrigation
Development Corporation (` 3,835 crore); Godavari Marathwada Irrigation Development Corporation
(` 3,136 crore); Maharashtra Krishna Valley Development Corporation (` 2,369 crore); Konkan Irrigation
Development Corporation (` 961 crore); Tapi- Irrigation Development Corporation (` 1,077 crore);
Maharashtra State Road Transport Corporation (` 500 crore); Maharashtra Water Conservation
Development Corporation (` 172 crore); Nagpur Metro Railway Project (` 350 crore); and Pune Metro
Railway Project (` 413 crore)

Chapter I: Finances of the State Government
27
incomplete as the data was not made available by the State Government.
Chart 1.14 and Table 1.28 present the trends in the expenditure on these
components during 2014-19.
(Source: Finance Accounts of respective years)
Table 1.28: Components of committed expenditure
(`̀̀̀ in crore)
Components of committed
expenditure 2014-15 2015-16 2016-17 2017-18
2018-19 BE Actuals
Salaries and Wages 62725 69007 72583 75784 93687 80221$
(38) (37) (35) (31) (31) (29)
of which Non-Plan Head 58457 63803 67535
* * * (35) (34) (33)
of which Plan Head** 4268 5204 5048
(3) (3) (2)
Interest Payments 23965 25771 28532 33018 34978 34021
(14) (14) (14) (14) (12) (12)
Pensions 17386 18642 21760 23853 27378 26545
(11) (10) (11) (10) (10) (10)
Total Committed
expenditure
104076 113420 122875 132655 150940 140787
(63) (61) (60) (54) (53) (50)
Other Components10 73477 76954 90354 108916 150403 126235
(44) (42) (44) (45) (47) (45)
Total Revenue Expenditure 177553 190374 213229 241571 301343 267022
Revenue Receipts 165415 185036 204693 243654 285968 278996
Figures in parenthesis indicate percentage to Revenue Receipts
* From 2017-18 onwards Plan and Non-plan expenditure has been merged $ Salaries: ` 76,955 crore + Wages: ` 3,266 crore
** Plan Head also includes the salaries and wages paid under Centrally Sponsored Schemes
Note: Expenditure on Salaries and Wages included grants-in-aid component during 2014-15 (` 38,225 crore),
2015-16 (` 41,254 crore), 2016-17 (` 43,829 crore), 2017-18 (` 45,904 crore) and 2018-19 (` 48,137 crore)
Source: Finance Accounts of respective years
10 Revenue expenditure under General Services, Social Services, Economic Services and Grants-in-aid
(excluding salary and wages, interest payments and pension payments)

State Finances Audit Report for the year ended 31 March 2019
28
1.7.5.1 Salaries and wages
The average annual growth in salaries and wages during 2014-19 was six per cent. The
expenditure on salaries and wages increased by ` 4,437 crore (six per cent) from
` 75,784 crore in 2017-18 to ` 80,221 crore in 2018-19. The expenditure of
` 80,221 crore on salaries and wages during 2018-19 was lower than the projections
made in MTFPS/Budget (` 93,687 crore).
During 2009-10 to 2017-18, the CAGR of salary and wages (10.3 per cent) was lower
than the growth rate of GCS (11.7 per cent). The growth of the salary and wages
during 2018-19 over 2017-18 (7.4 per cent) was also lower than the growth rate of
GCS (11 per cent) as shown in Appendix 1.1.
1.7.5.2 Pension payments
The average annual growth of pensions during 2014-19 was 11 per cent. The expenditure
on pension increased by ` 2,692 crore (11 per cent) during 2018-19 over the previous
year.
During 2009-10 to 2017-18, the CAGR of pension (18.5 per cent) was higher than the
growth rate of GCS (16.1 per cent). The growth of pension during 2018-19 over
2017-18 (11.3 per cent) was lower than the growth rate of GCS (14.3 per cent).
Table 1.29 shows actual pension payments with reference to assessment made by the
FFC, FCP and MTFPS/Budget projections of the State Government.
Table 1.29: Pension payments vis-à-vis FFC assessment and State’s projections
(` in crore)
Year Projection in
MTFPS
Assessment made
by the FFC
Projection in
FCP Actuals
2017-18 25567 19258 25567 23853
2018-19 27378 21184 27378 26545
Source: Finance Accounts, Budget documents and Report of the FFC
New Pension Scheme
The Government of Maharashtra adopted (October 2005) the NPS architecture and
implemented Defined Contribution Pension Scheme11(DCPS) for State Government
employees recruited on or after 1st November 2005. The DCPS was also applicable to
employees recruited in services of recognized and aided Educational Institutions, Non-
Agricultural Universities and affiliated Non-Government Colleges and Agricultural
Universities, Zilla Parishads etc. to whom the existing pension scheme and General
Provident Fund Scheme is applicable.
The State Government joined the New Pension Scheme (NPS) 2005 of the Central
Government in August, 2014 in respect of employees recruited on or after 1st November
2005 in the State Government, Zilla Parishad, Recognised and Aided Educational
Institutions, Agricultural/Non-Agricultural Universities and affiliated Non-Government
Colleges, Corporations under Water Resources Department. The contribution of
employees (10 per cent of basic pay plus dearness allowance) along with matching
contribution of employer (State Government) under Tier I of the scheme and the
employees’ contribution above 10 per cent under Tier II (for which there would be no
11 GR dated 31 October 2005
Chapter I: Finances of the State Government
29
matching contribution by Government) is to be transferred to the designated pension
fund, through the National Securities Depository Limited (NSDL)/Trustee Bank.
However, the detailed procedure for the implementation of NPS issued in April 2015
covered only State Government employees. The orders for implementation of NPS for
other employees (Zilla Parishad, Recognized and Aided Educational Institutions,
Agricultural/Non-Agricultural Universities and affiliated Non-Government Colleges,
Corporations under Water Resources Department) who were part of erstwhile DCPS was
to be issued later. In June 2017, the Rural and Water Conservation Department,
Government of Maharashtra issued detailed instructions for implementation of NPS in
respect of employees in ZPs (excluding teachers).
During the year 2018-19, the Government of Maharashtra deposited ` 3,757.12 crore
being employees’ contribution of ` 1,713.44 crore (` 1,550.31 crore - Tier I and
` 163.13 crore - Tier II) and employers’ contribution of ` 2,043.68 crore into a Fund
created under the Major Head - 8342 – Other Deposits and Minor Head - 117 – Defined
Contribution Pension Scheme for Government Employees in the Public Account, pending
final transfer to the designated Fund Manager. The State Government has transferred
` 2,546.52 crore to the NSDL. As on 31 March 2019, the total un-transferred balances of
earlier years were ` 7,082.67 crore. The interest liability on the un-transferred balance
works out to ` 472.46 crore at the rate of interest applicable to the scheme, of which
` 417.42 crore was paid to NSDL during the year.
The details of funds under NPS and amount transferred to NSDL during 2014-19 are
shown in the table below.
Table 1.30: Contribution made to NPS and transfer of funds to NSDL/Trustee Bank
(` in crore)
The current liability stands deferred to future years. The State Government has incorrectly
used the funds that belongs to its employees, leading to possible uncertainty in the rate of
return to the employees/avoidable financial liability to the Government, and the eventual
failure of the scheme itself.
1.7.5.3 Interest Payments
Interest payments of the State Government increased by 42 per cent from ` 23,965 crore
in 2014-15 to ` 34,021 crore in 2018-19, primarily due to increase in debt liabilities as
shown in Table 1.32. However, the ratio of interest payments to revenue receipts
decreased gradually from 14.5 per cent in 2014-15 to 12.2 per cent in 2018-19 as
indicated in Table 1.50.
Year
Opening
Balance
(OB)
Contribution
Total Transfer
to NSDL
Yet to be
Transferred
(Progressive)
Rate of
Interest
applicable
(GPF)
in per cent
Employee Govt.
2014-15 4145.59 756.25 936.67 1692.92 1411.56 4426.95 8.7
2015-16 4426.95 1150.53 575.10 1725.63 3085.39 3067.19 8.7
2016-17 3067.20 1427.73 1056.79 2484.52 1962.90 3588.82 8.1
2017-18 3588.81 1364.20 2636.34 4000.54 1683.67 5905.68 7.8
2018-19 5905.68 1713.44 2043.68 3757.12 2546.52 7082.67* 7.8
*` 33.61 crore other disbursement during the year

State Finances Audit Report for the year ended 31 March 2019
30
Table 1.31 shows actual interest payments with reference to assessment made in the FFC
Report, FCP and MTFPS of the State Government.
Table 1.31: Interest Payments vis-à-vis FFC, FCP and MTFPS assessments
(`̀̀̀ in crore)
Year Projection in
MTFPS
Assessment made by
the FFC
Projection in
FCP
Actuals
2017-18 31027 34569 31027 33018
2018-19 34385 40070 34385 34021
Source: Finance Accounts, Budget Documents and Report of the FFC
With reference to the projections made in the FCP and MTFPS, interest payments were
higher during 2017-18 and lower during 2018-19. With reference to the projections made
for 2017-19 by FFC, interest payments were lower than the assessment made.
Component-wise details of interest payments made by the State Government during
2014-19 are shown in the Table 1.32.
Table 1.32: Component-wise details of interest payments made by the
State Government during 2014-19
(`̀̀̀ in crore)
Particulars 2014-15 2015-16 2016-17 2017-18 2018-19
Interest payments
of which, interest payment on
23965 25771 28532 33018 34021
1. Internal debt 19001 20816 23553 27827 28403
(i) Market loans 11029 12965 15769 19995 21445
(ii) NABARD 263 299 287 401 517#
(iii) NSSF 7437 7349 7311 7265 6315
(iv) Ways and means 5 - - 1 -
(v) Loans from other financial institutions 236 167 140 111 71
(vi) Management of debt (Payable to
Reserve Bank of India for Open Market
Borrowings)
31 36 45 54 55
2. Loans from GoI 529 490 469 433 416
3. Small savings, PF, Reserve Fund,
Deposits etc. 4435 4465 4509 4758 5202
(i) Small savings, PF 2503 2765 1855 2819 2920
(ii) Reserve funds 5 5 4 5 6
(iii) Deposits 1927 1695 2650 1934 2276
Revenue Receipts 165416 185036 204693 243654 278996
Source: Finance Accounts of respective years # Lower rounding
Interest payments increased steadily from ` 23,965 crore in 2014-15 to ` 34,021 crore in
2018-19. During 2018-19 the interest payments increased by three per cent over the
previous year. The increase was mainly due to increased interest liability (7.25 per cent)
on market loan. During 2018-19, interest payment on market loan stood at 63 per cent of
the total interest payments while interest on special securities issued to NSSF accounted
for 19 per cent of the total interest payments.
The ratio of interest payments to revenue receipts determines the debt sustainability of the
State. During the year, the interest payments to total revenue receipts of the State was
12.19 per cent which was lower than the FFC norm of 12.27 per cent.
1.7.6 Financial assistance by State Government to Local Bodies, educational and
other institutions
Local bodies in Maharashtra consist of Panchayati Raj Institutions and Urban Local
Bodies. In conformity with the provisions of the 73rd and 74th Constitutional

Chapter I: Finances of the State Government
31
Amendment, the State Government established a three-tier system of Panchayati Raj
Institutions comprising 34 Zilla Parishads at the district level, 355 Panchayat Samitis at
the Block level and 27,868 Gram Panchayats at the village level. There are 27
Municipal Corporations, 237 Municipal Councils including Nagar Panchayats for urban
area population in the State. Out of the 29 functions listed in the XI Schedule, 14
functions and 15,480 functionaries were transferred to PRIs. All 18 functions referred to
in XII Schedule of the Constitution of India were assigned to the ULBs.
Article 243(I) of the Constitution of India requires that a State Finance Commission
(SFC) be appointed at the expiry of every fifth year. The Government of Maharashtra
submitted its Action Taken Report on the Fourth SFC, which was placed in State
Legislature in March 2018. The details of recommendations and issue of Government
Resolution to affect the same for implementation are awaited (December 2019).
The Fifth SFC for the period 2019-24 was constituted in March 2018 and was to submit
its report by 27 January 2019 (extended up to 20 April 2019). This report was expected
to be placed in the State Legislature during the Budget session (March 2020).
1.7.6.1 Quantum of assistance
The quantum of assistance provided by way of Grants and Loans to Local Bodies and
other institutions during 2018-19 relative to previous years is shown in Table 1.33.
Table 1.33: Financial assistance to Local bodies, educational and other institutions
(`̀̀̀ in crore)
Sr. No. Institutions 2014-15 2015-16 2016-17 2017-18 2018-19
1
Educational institutions (Aided
Schools, Aided Colleges,
Universities, etc.)
25571 27072 29037 29175 31428
2 Municipal Corporations and
Municipalities 5172 9187 13850 23192 28959*
3 Zilla Parishads and other Panchayati
Raj Institutions 18770* 18240 18627 22113 21124
4 Development agencies 906 252 807 1692 1028*
5 Hospital and other charitable
institutions 3678 4058 5038 5694 5707
6 Social Welfare and Nutrition 7175 5950 4021 - -
7 Agriculture and Allied Activities 825 386 463 707 9248
8 Welfare of SC, ST and OBC 2098 2383 2904 4641 5587
9 Administrative Services 1392 1402 446 144 977
10 Housing 367 58 326 329 1470*
11 Other Institutions 6757 13113 21320 13957 1703512
Total 72711 82101 96839 101644 122563
Assistance as percentage of RE 41 43 45 42 46 *Higher rounding
Source: Finance Accounts, Vouchers compiled by Accountant General (Accounts and Entitlement)-I, Maharashtra, Mumbai
The financial assistance to Local Bodies and other institutions by the State
Government increased from ` 72,711 crore in 2014-15 to ` 1,22,563 crore in 2018-19.
As compared to the previous year, the assistance during 2018-19 increased by
21 per cent. During 2018-19, Financial assistance given to Municipal Corporations and
Municipalities increased by ` 5,767 crore (25 per cent) mainly due to increase in
12 Major recipient- Power ` 2,730 crore
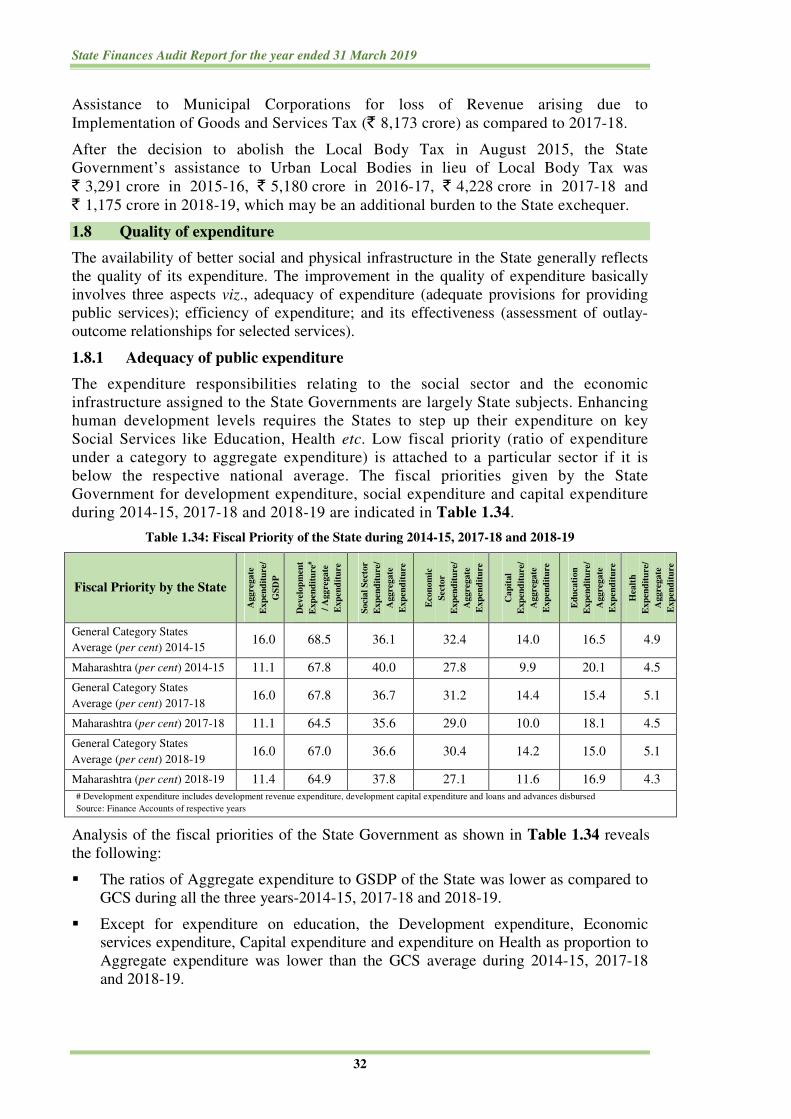
State Finances Audit Report for the year ended 31 March 2019
32
Assistance to Municipal Corporations for loss of Revenue arising due to
Implementation of Goods and Services Tax (` 8,173 crore) as compared to 2017-18.
After the decision to abolish the Local Body Tax in August 2015, the State
Government’s assistance to Urban Local Bodies in lieu of Local Body Tax was
` 3,291 crore in 2015-16, ` 5,180 crore in 2016-17, ` 4,228 crore in 2017-18 and
` 1,175 crore in 2018-19, which may be an additional burden to the State exchequer.
1.8 Quality of expenditure
The availability of better social and physical infrastructure in the State generally reflects
the quality of its expenditure. The improvement in the quality of expenditure basically
involves three aspects viz., adequacy of expenditure (adequate provisions for providing
public services); efficiency of expenditure; and its effectiveness (assessment of outlay-
outcome relationships for selected services).
1.8.1 Adequacy of public expenditure
The expenditure responsibilities relating to the social sector and the economic
infrastructure assigned to the State Governments are largely State subjects. Enhancing
human development levels requires the States to step up their expenditure on key
Social Services like Education, Health etc. Low fiscal priority (ratio of expenditure
under a category to aggregate expenditure) is attached to a particular sector if it is
below the respective national average. The fiscal priorities given by the State
Government for development expenditure, social expenditure and capital expenditure
during 2014-15, 2017-18 and 2018-19 are indicated in Table 1.34.
Table 1.34: Fiscal Priority of the State during 2014-15, 2017-18 and 2018-19
Fiscal Priority by the State
Ag
gre
ga
te
Ex
pen
dit
ure
/
GS
DP
Dev
elo
pm
ent
Ex
pen
dit
ure
#
/ A
gg
reg
ate
Ex
pen
dit
ure
So
cia
l S
ecto
r
Ex
pen
dit
ure
/
Ag
gre
ga
te
Ex
pen
dit
ure
Eco
no
mic
Sec
tor
Ex
pen
dit
ure
/
Ag
gre
ga
te
Ex
pen
dit
ure
Ca
pit
al
Ex
pen
dit
ure
/
Ag
gre
ga
te
Ex
pen
dit
ure
Ed
uca
tio
n
Ex
pen
dit
ure
/
Ag
gre
ga
te
Ex
pen
dit
ure
Hea
lth
Ex
pen
dit
ure
/
Ag
gre
ga
te
Ex
pen
dit
ure
General Category States
Average (per cent) 2014-15 16.0 68.5 36.1 32.4 14.0 16.5 4.9
Maharashtra (per cent) 2014-15 11.1 67.8 40.0 27.8 9.9 20.1 4.5
General Category States
Average (per cent) 2017-18 16.0 67.8 36.7 31.2 14.4 15.4 5.1
Maharashtra (per cent) 2017-18 11.1 64.5 35.6 29.0 10.0 18.1 4.5
General Category States
Average (per cent) 2018-19 16.0 67.0 36.6 30.4 14.2 15.0 5.1
Maharashtra (per cent) 2018-19 11.4 64.9 37.8 27.1 11.6 16.9 4.3
# Development expenditure includes development revenue expenditure, development capital expenditure and loans and advances disbursed
Source: Finance Accounts of respective years
Analysis of the fiscal priorities of the State Government as shown in Table 1.34 reveals
the following:
� The ratios of Aggregate expenditure to GSDP of the State was lower as compared to
GCS during all the three years-2014-15, 2017-18 and 2018-19.
� Except for expenditure on education, the Development expenditure, Economic
services expenditure, Capital expenditure and expenditure on Health as proportion to
Aggregate expenditure was lower than the GCS average during 2014-15, 2017-18
and 2018-19.

Chapter I: Finances of the State Government
33
� The proportion of Social sector expenditure to aggregate expenditure was higher than
the average of GCS during 2014-15 and 2018-19 but was lower during
2017-18.
1.8.2 Efficiency of Expenditure Use
In view of importance of public expenditure on development heads, from the point of
view of social and economic development, it is important for the State Government to
take appropriate expenditure rationalization measures and lay emphasis on provision of
core public and merit goods13. Apart from improving the allocation towards development
expenditure14, the efficiency of expenditure is reflected in the percentage of capital
expenditure to total expenditure and the proportion of revenue expenditure being spent
on O&M in the Social and Economic services. The higher the percentage of these
components to total expenditure, the better would be the quality of expenditure.
Table 1.35 and Chart 1.15 present the trends in Development Expenditure relative to
the total expenditure of the State during the current year vis-à-vis budget estimates of the
current year and the actual expenditure during the previous years.
Table 1.35: Development expenditure
(` in crore)
Components of Development
Expenditure 2014-15 2015-16 2016-17 2017-18
2018-19
BE Actuals
Development expenditure
(a to c)
134131 142415 163685 173441 216071 196634
(67.7) (66.5) (66.8) (64.4) (64) (64.8)
a. Development revenue
expenditure
114639 120369 134124# 147243 181662 162150
(57.8) (56.2) (54.7) (54.7) (54) (53.4)
b. Development capital outlay 18658 21534 24001 25794 33919 33516
(9.4) (10.0) (9.8) (9.6) (10) (11.0)
c. Development Loans and
Advances
834 512 5560 404 490 968#
(0.4) (0.2) (2.3) (0.1) (0.1) (0.3)
Figures in parenthesis indicate percentage to total expenditure # Lower rounding
Source: Finance Accounts of respective years
13 see Glossary at page 132 14 Development Expenditure consists of expenditure on Social and Economic services relating to Revenue Account,
Capital Outlay and Loans and Advances

State Finances Audit Report for the year ended 31 March 2019
34
(Source: Finance Accounts of respective years)
The development expenditure increased from ` 1,34,131 crore in 2014-15 to
` 1,96,634 crore in 2018-19. As percentage of total expenditure, the development
expenditure of the State increased from 64.4 per cent in 2017-18 to 64.8 per cent in
2018-19.
During 2014-19, development revenue expenditure grew by 41 per cent while
Development capital expenditure grew by 80 per cent. The expenditure on development
loans ranged between 0.2 per cent and 0.4 per cent of the total expenditure except for
2.3 per cent in 2016-17 due to loan under UDAY Scheme.
Efficiency of expenditure use in selected Social and Economic Services
Table 1.36 details the percentage share of salary and wages and of O&M in the
revenue expenditure (RE) in selected Social and Economic services. It also indicates
the proportion of capital expenditure (CE) in the total expenditure (TE) of these
selected services during 2017-18 and 2018-19.
Table 1.36: Efficiency of expenditure use in selected social and economic services
(in per cent)
Social/Economic
infrastructure
2017-18 2018-19
CE to
TE
In RE, the share of CE to
TE
In RE, the share of
Salary and
Wages O & M
Salary and
Wages O & M
Social Services (SS)
Education, Sports, Art and
Culture 0.2 81.6 0.2 0.7 81.2 0.1
Health and Family Welfare 4.7 49.4 0.4 8.0 50.9 0.4
Water Supply, Sanitation,
Housing and Urban
Development
7.1 2.7 - 12.4 2.9 2.0
Total (SS) 2.4 54.3 0.7 3.8 48.7 0.7
Economic Services (ES)
Agriculture and Allied
Activities 17.1 15.5 0.1 20.3 22.8 0.01
Irrigation and Flood Control 81.3 40.6 32.9 86.3 48.3 33.1
Energy 8.0 0.1 0.1 4.4 0.14 0.1

Chapter I: Finances of the State Government
35
Social/Economic
infrastructure
2017-18 2018-19
CE to
TE
In RE, the share of CE to
TE
In RE, the share of
Salary and
Wages O & M
Salary and
Wages O & M
Transport 54.9 0.3 15.7 61.3 0 27.8
Total (ES) 30.2 12.5 3.0 35.5 12.7 4.6
Total (SS+ES) 14.9 38.9 1.6 17.0 37.0 2.0
TE: Total expenditure; CE: Capital expenditure; RE: Revenue expenditure; O & M: Operations and Maintenance
Source: Finance Accounts of respective years
Social Services
The percentage of capital expenditure on Social Services to total expenditure
increased from 2.4 per cent in 2017-18 to 3.8 per cent in 2018-19. The increase was
mainly seen under Capital Outlay on Health and Family Welfare. The ratio of
expenditure on Salary and Wages to revenue expenditure in respect of
Education, Sports, Arts and Culture decreased from 81.6 per cent in 2017-18 to
81.2 per cent in 2018-19 while in respect of Health and Family Welfare, it increased
from 49.4 per cent to 50.9 per cent during the period.
Economic Services
The percentage of capital expenditure on Economic Services to the total expenditure
increased from 30.2 per cent in 2017-18 to 35.5 per cent in 2018-19. The increase was
mainly seen under Transport, Irrigation and Flood Control and Agriculture and Allied
Activities. There was increase in share of Salary and Wages to revenue expenditure from
2017-18 to 2018-19 under selected Economic Services. The ratio of O&M to revenue
expenditure increased from 1.6 per cent in 2017-18 to two per cent in 2018-19.
1.9 Financial analysis of Government expenditure and investments
In the post-MFRBM framework, the State is expected to keep its fiscal deficit (and
borrowings) not only at low levels but also meet its capital expenditure/investment
(including loans and advances) requirements. This section presents the broad financial
analysis of investments and other capital expenditure incurred by the Government during
the current year vis-à-vis previous years.
1.9.1 Ongoing projects-Water Resources Department
Expenditure and delays in execution of projects
There were 345 ongoing irrigation projects in five15 Irrigation Development Corporations
(IDCs) under Water Resources Department. Data of all the ongoing projects furnished by
the IDCs were analysed in audit to assess the number of years these projects have been
under execution. The summarized position is given in Table 1.37.
Table 1.37: Age profile of ongoing projects under Water Resources Department
Age Profile
(Since the date of original AA)
Total projects
Major Medium Minor Total
More than 30 years 31 19 19 69
More than 20 years but up to 30 years 11 20 51 82
More than 15 years but up to 20 years 4 12 44 60
More than 10 years but up to 15 years 2 19 61 82
15 Maharashtra Krishna Valley Development Corporation; Konkan Irrigation Development Corporation; Tapi
Irrigation Development Corporation; Vidarbha Irrigation Development Corporation; and Godavari Marathwada
Irrigation Development Corporation
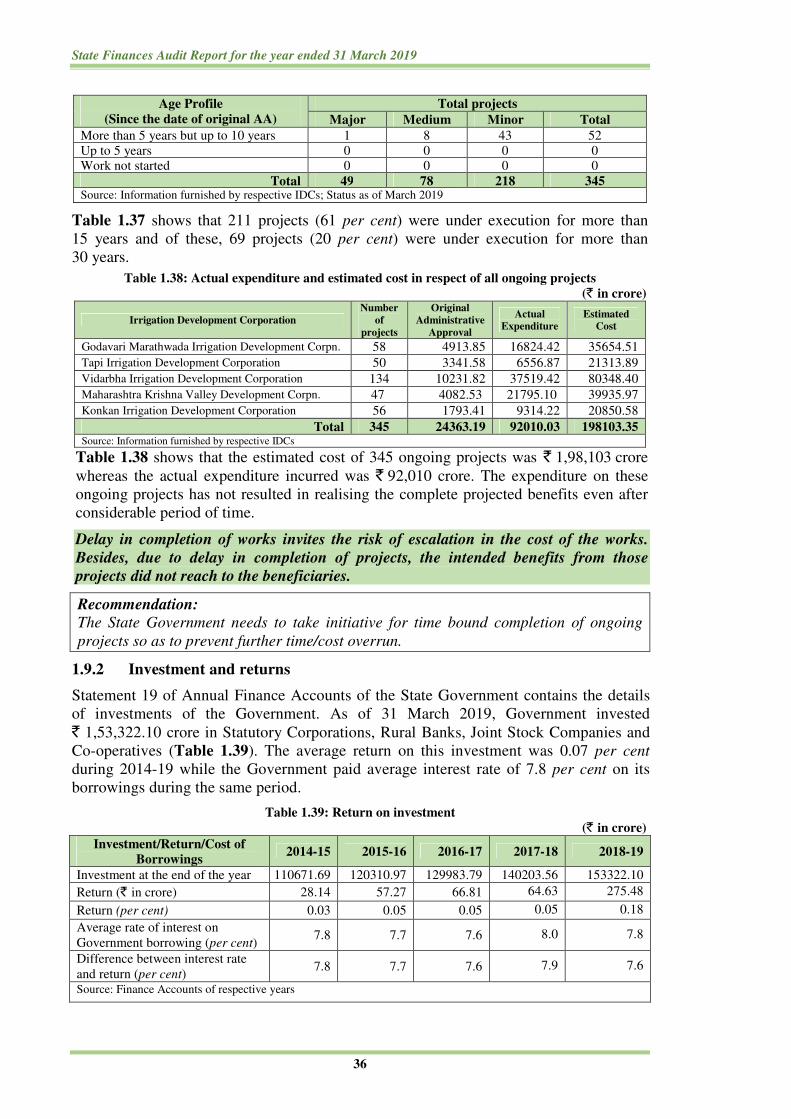
State Finances Audit Report for the year ended 31 March 2019
36
Age Profile
(Since the date of original AA)
Total projects
Major Medium Minor Total
More than 5 years but up to 10 years 1 8 43 52
Up to 5 years 0 0 0 0
Work not started 0 0 0 0
Total 49 78 218 345 Source: Information furnished by respective IDCs; Status as of March 2019
Table 1.37 shows that 211 projects (61 per cent) were under execution for more than
15 years and of these, 69 projects (20 per cent) were under execution for more than
30 years.
Table 1.38: Actual expenditure and estimated cost in respect of all ongoing projects
(` in crore)
Irrigation Development Corporation
Number
of
projects
Original
Administrative
Approval
Actual
Expenditure
Estimated
Cost
Godavari Marathwada Irrigation Development Corpn. 58 4913.85 16824.42 35654.51
Tapi Irrigation Development Corporation 50 3341.58 6556.87 21313.89
Vidarbha Irrigation Development Corporation 134 10231.82 37519.42 80348.40
Maharashtra Krishna Valley Development Corpn. 47 4082.53 21795.10 39935.97
Konkan Irrigation Development Corporation 56 1793.41 9314.22 20850.58
Total 345 24363.19 92010.03 198103.35 Source: Information furnished by respective IDCs
Table 1.38 shows that the estimated cost of 345 ongoing projects was ` 1,98,103 crore
whereas the actual expenditure incurred was ` 92,010 crore. The expenditure on these
ongoing projects has not resulted in realising the complete projected benefits even after
considerable period of time.
Delay in completion of works invites the risk of escalation in the cost of the works.
Besides, due to delay in completion of projects, the intended benefits from those
projects did not reach to the beneficiaries.
Recommendation: The State Government needs to take initiative for time bound completion of ongoing
projects so as to prevent further time/cost overrun.
1.9.2 Investment and returns
Statement 19 of Annual Finance Accounts of the State Government contains the details
of investments of the Government. As of 31 March 2019, Government invested
` 1,53,322.10 crore in Statutory Corporations, Rural Banks, Joint Stock Companies and
Co-operatives (Table 1.39). The average return on this investment was 0.07 per cent
during 2014-19 while the Government paid average interest rate of 7.8 per cent on its
borrowings during the same period.
Table 1.39: Return on investment
(` in crore)
Investment/Return/Cost of
Borrowings 2014-15 2015-16 2016-17 2017-18 2018-19
Investment at the end of the year 110671.69 120310.97 129983.79 140203.56 153322.10
Return (` in crore) 28.14 57.27 66.81 64.63 275.48
Return (per cent) 0.03 0.05 0.05 0.05 0.18
Average rate of interest on
Government borrowing (per cent) 7.8 7.7 7.6 8.0 7.8
Difference between interest rate
and return (per cent) 7.8 7.7 7.6 7.9 7.6
Source: Finance Accounts of respective years

Chapter I: Finances of the State Government
37
The return on investment during 2018-19 was ` 275.48 crore, an increase of
` 210.85 crore over the previous year. However, the nature of increase could not be
ascertained as the State Government did not furnish the details for ` 255.36 crore
(Aug 2019).
As per latest finalised accounts of the State PSUs, as on 31 March 2019, 28 PSUs were
incurring losses and their net accumulated losses amounted to ` 20,214.14 crore. Of these,
the State Government infused funds in the form of equity and long term loans in 11 PSUs
which amounted to ` 94,498.34 crore and ` 776.68 crore respectively (Appendix 1.8).
Further, the net worth was eroded16 in 12 PSUs, primarily in Maharashtra Power
Development Corporation Ltd. (` 1,013.03 crore), Maharashtra State Textile Corporation
Ltd. (` 844.09 crore) and Maharashtra State Financial Corporation (` 625.26 crore).
Information furnished by the Commissioner for Cooperation and Registrar of
Co-operative Societies revealed that of the 23,092 Societies with an aggregate
Government investment of ` 187.81 crore (equity: ` 72.06 crore and loan:
` 115.75 crore), 13,425 Societies had incurred accumulated losses of ` 2,713.49 crore
(31 March 2019) against initial investments (` 36.66 crore) made in these Societies.
Further, 463 Societies were under liquidation where the Government had already
invested ` 89.61 crore as of March 2019.
1.9.3 Departmental Commercial Undertakings
Activities of quasi-commercial nature are also performed by Departmental undertakings
of certain Government Departments. The State Government has 49 Departmental
Commercial Undertakings (DCUs). The position of Department-wise investments by the
Government up to the year for which proforma accounts have been finalised, net
profit/loss as well as return on capital invested in these undertakings are shown in
Appendix 1.9. It was observed that:-
� The State Government had invested ` 2,990.71 crore in the undertakings of
three17 Departments during the financial year up to which their accounts were
finalised (Appendix 3.3).
� Of the three Departments having 49 units, no unit could earn net profit which had
finalised their accounts during 2018-19.
� Of the loss-making DCUs, 2918 DCUs had been incurring losses continuously
since the last five years.
16 Development Corporation of Vidharbha Ltd. (` 7.63 crore); Maharashtra State Handlooms Corporations Ltd.
(` 47.18 crore); Maharashtra Electronics Corporation Ltd. (` 368.38 crore); Maharashtra State Road Development
Corporation Ltd. (` 247.71 crore); Maharashtra State Powerloom Corporation Ltd. (` 2.81 crore);
Maharashtra State Textile Corporation Ltd. (` 844.09 crore); Maharashtra State Finance Corporation
(` 625.26 crore); Development Corporation of Konkan Ltd. (` 6.05 crore); Maharashtra State Farming
Corporation Ltd. (` 191.98 crore); Marathwada Development Corporation Ltd. (` 1.30 crore); Maharashtra Land
Development Corporation Ltd. (` 16.01 crore); and Maharashtra Power Development Corporation Ltd.
(` 1,013.03 crore) 17 Agriculture, Animal Husbandry, Dairy Development and Fisheries; Food, Civil Supplies and Consumer
Protection; and Revenue and Forest 18 Greater Mumbai Milk Scheme, Worli; Mother Dairy, Kurla; Dairy Project, Dapchari; Government Milk Schemes
in Ahmednagar, Akola, Amravati, Aurangabad, Beed, Bhoom, Chalisgaon, Chandrapur, Chiplun, Dhule, Gondia,
Kankavali, Khopoli, Mahabaleshwar, Miraj, Nanded, Nandura, Nashik, Parbhani, Pune, Satara, Solapur, Udgir,
Wani, Wardha and Yavatmal
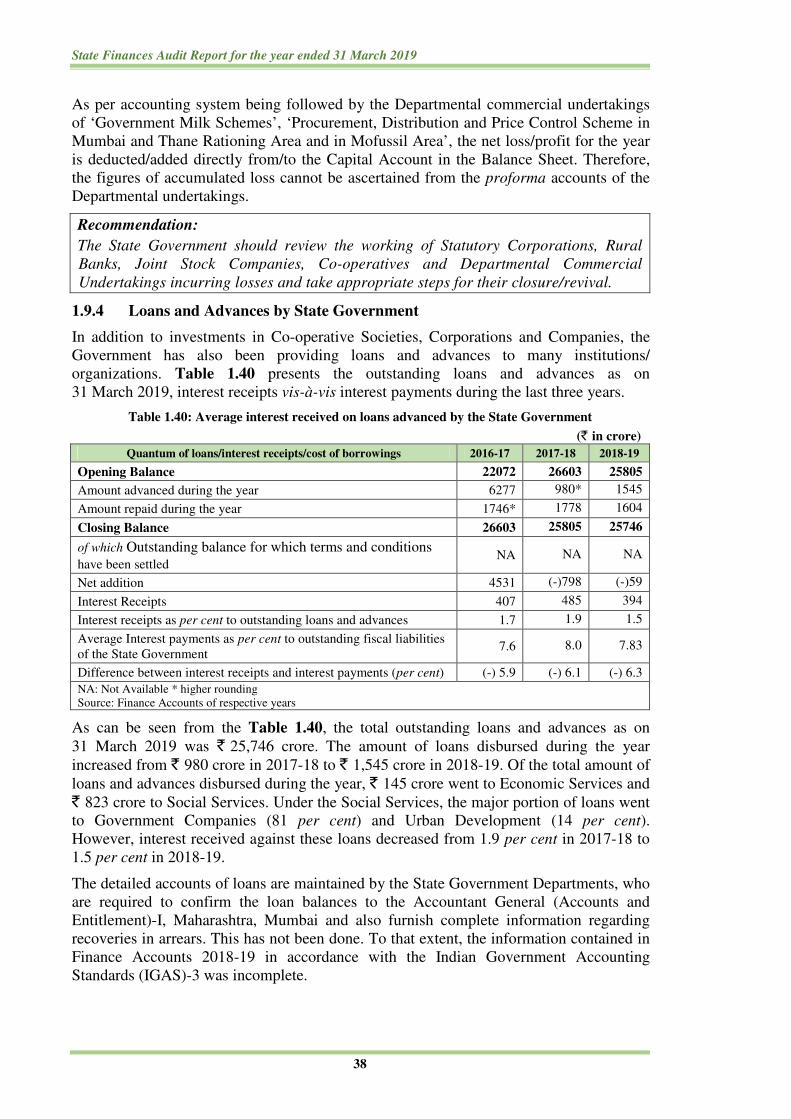
State Finances Audit Report for the year ended 31 March 2019
38
As per accounting system being followed by the Departmental commercial undertakings
of ‘Government Milk Schemes’, ‘Procurement, Distribution and Price Control Scheme in
Mumbai and Thane Rationing Area and in Mofussil Area’, the net loss/profit for the year
is deducted/added directly from/to the Capital Account in the Balance Sheet. Therefore,
the figures of accumulated loss cannot be ascertained from the proforma accounts of the
Departmental undertakings.
Recommendation:
The State Government should review the working of Statutory Corporations, Rural
Banks, Joint Stock Companies, Co-operatives and Departmental Commercial
Undertakings incurring losses and take appropriate steps for their closure/revival.
1.9.4 Loans and Advances by State Government
In addition to investments in Co-operative Societies, Corporations and Companies, the
Government has also been providing loans and advances to many institutions/
organizations. Table 1.40 presents the outstanding loans and advances as on
31 March 2019, interest receipts vis-à-vis interest payments during the last three years.
Table 1.40: Average interest received on loans advanced by the State Government
(` in crore)
Quantum of loans/interest receipts/cost of borrowings 2016-17 2017-18 2018-19
Opening Balance 22072 26603 25805
Amount advanced during the year 6277 980* 1545
Amount repaid during the year 1746* 1778 1604
Closing Balance 26603 25805 25746
of which Outstanding balance for which terms and conditions
have been settled NA NA NA
Net addition 4531 (-)798 (-)59
Interest Receipts 407 485 394
Interest receipts as per cent to outstanding loans and advances 1.7 1.9 1.5
Average Interest payments as per cent to outstanding fiscal liabilities
of the State Government 7.6 8.0 7.83
Difference between interest receipts and interest payments (per cent) (-) 5.9 (-) 6.1 (-) 6.3
NA: Not Available * higher rounding
Source: Finance Accounts of respective years
As can be seen from the Table 1.40, the total outstanding loans and advances as on
31 March 2019 was ` 25,746 crore. The amount of loans disbursed during the year
increased from ` 980 crore in 2017-18 to ` 1,545 crore in 2018-19. Of the total amount of
loans and advances disbursed during the year, ` 145 crore went to Economic Services and
` 823 crore to Social Services. Under the Social Services, the major portion of loans went
to Government Companies (81 per cent) and Urban Development (14 per cent).
However, interest received against these loans decreased from 1.9 per cent in 2017-18 to
1.5 per cent in 2018-19.
The detailed accounts of loans are maintained by the State Government Departments, who
are required to confirm the loan balances to the Accountant General (Accounts and
Entitlement)-I, Maharashtra, Mumbai and also furnish complete information regarding
recoveries in arrears. This has not been done. To that extent, the information contained in
Finance Accounts 2018-19 in accordance with the Indian Government Accounting
Standards (IGAS)-3 was incomplete.

Chapter I: Finances of the State Government
39
Ujwal Discom Assurance Yojana – understatement of liability
As per the Ujwal Discom Assurance Yojana (UDAY), State Governments were to take
over 75 per cent of the State owned power distribution companies debt as on
30 September 2015 in two years i.e. 50 per cent debt in 2015-16 and 25 per cent in
2016-17. The State Government decided (December 2016) to participate in UDAY. The
total outstanding debt of the Maharashtra State Electricity Distribution Company Limited
(MSEDCL, Discom) as on 30 September 2015 was ` 22,097 crore including medium-
term and short-term loans of ` 6,613 crore.
During 2016-17, the State Government took over only 75 per cent of medium-term and
short-term debts (` 6,613 crore) of the DISCOM by issuing Special Bonds for
` 4,959.75 crore and transferred the amount to the MSEDCL in February 2017 as loan.
The amount raised by way of bonds was to be repaid by MSEDCL in five instalments of
` 991.75 crore in the first year (2016-17) and ` 992 crore in subsequent years (2017-18 to
2020-21). Towards the repayment of instalment of loan for 2018-19 by the MSEDCL, the
Government released a grant of ` 992 crore to the DISCOM leaving a balance of
` 1,984 crore.
1.9.5 Outstanding balances under the head ‘Cheques and Bills’
This head is an intermediary accounting head for initial record of transactions which are
to be cleared eventually. When the cheque is issued, the functional head is debited and the
Major Head-8670-Cheques and Bills is credited. On clearance of the cheque by the bank,
minus credit is given to Major Head 8670-Cheques and Bills by crediting the Major Head-
8675-Deposits with Reserve Bank of India and thereby reducing the cash balance of the
Government. Thus, the outstanding balance under the Major Head 8670-Cheques and
Bills represents the amount of un-encashed cheques.
The value of cheques issued by Government but not encashed till 31 March 2019 was
` 12,738.84 crore i.e. the balance under Major head 8670- Cheques and Bills as on
31 March 2019. Thus, the encashment of these cheques would have the effect of
decreasing of the cash balance of ` 32,781 crore by ` 12,738.84 crore as on
31 March 2019. During 2018-19, the total value of lapsed cheques amounted to
` 7.85 crore19.
1.10 Assets and Liabilities
Details regarding Growth and composition of Assets and Liabilities, Fiscal Liabilities,
Cash balances and Investment of cash balances, Transactions under Reserve Funds,
Contingent liabilities and Analysis of Borrowings of the Government are given in sub
paragraphs 1.10.1 to 1.10.5.
1.10.1 Growth and composition of Assets and Liabilities
In the existing cash-based Government accounting system, comprehensive accounting of
fixed assets like land and buildings owned by the Government is not done. However, the
Government Accounts do capture the financial liabilities of the Government and the
assets created out of the expenditure incurred. Table 1.41 gives an abstract of such
liabilities and the assets as on 31 March 2019, compared with the corresponding position
on 31 March 2018. While the liabilities consist mainly of internal borrowings, loans and
advances from the Government of India, receipts from the Public Account and Reserve
19 Pension payments: ` 0.45 crore; Refunds: ` 1.19 crore; Telephone, Electricity and Petrol charges: ` 1.41 crore;
Grant-in-aid (non-salary): ` 0.50 crore; Civil Deposits: ` 2.02 crore; and Others: ` 2.28 crore
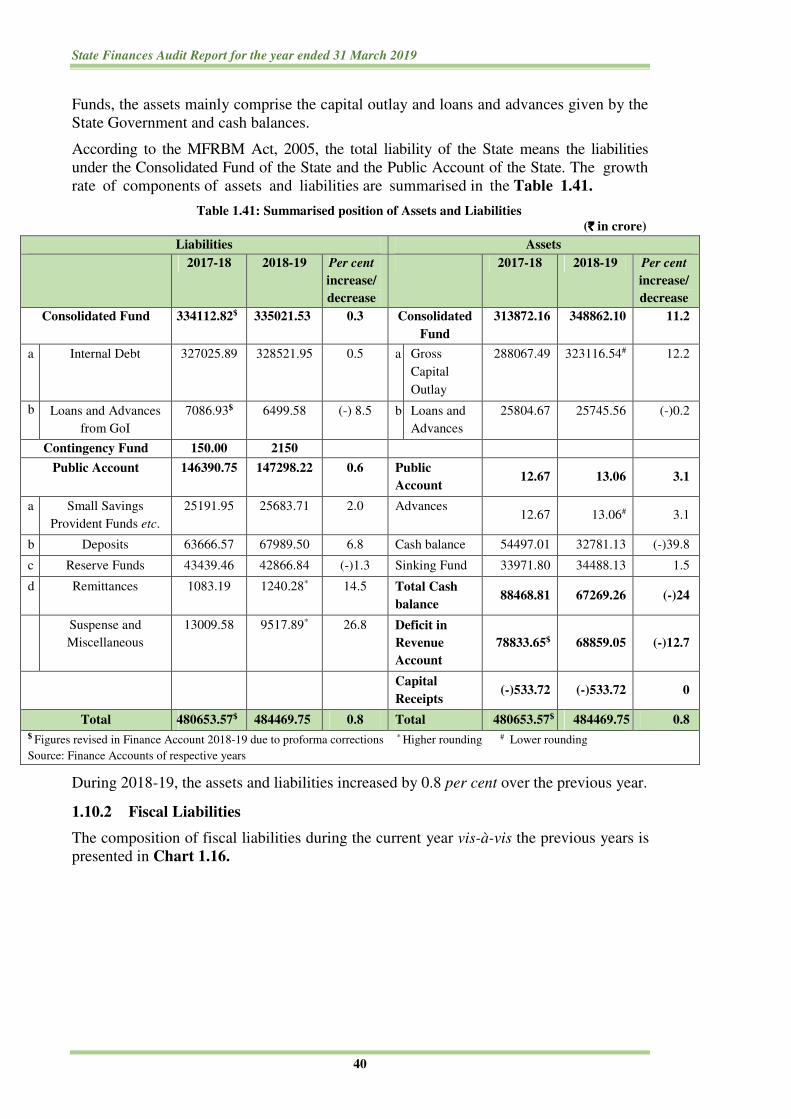
State Finances Audit Report for the year ended 31 March 2019
40
Funds, the assets mainly comprise the capital outlay and loans and advances given by the
State Government and cash balances.
According to the MFRBM Act, 2005, the total liability of the State means the liabilities
under the Consolidated Fund of the State and the Public Account of the State. The growth
rate of components of assets and liabilities are summarised in the Table 1.41.
Table 1.41: Summarised position of Assets and Liabilities
(`̀̀̀ in crore)
Liabilities Assets
2017-18 2018-19 Per cent
increase/
decrease
2017-18 2018-19 Per cent
increase/
decrease
Consolidated Fund 334112.82$ 335021.53 0.3 Consolidated
Fund
313872.16 348862.10 11.2
a Internal Debt 327025.89 328521.95 0.5 a Gross
Capital
Outlay
288067.49 323116.54# 12.2
b Loans and Advances
from GoI
7086.93$ 6499.58 (-) 8.5 b Loans and
Advances
25804.67 25745.56 (-)0.2
Contingency Fund 150.00 2150
Public Account 146390.75 147298.22 0.6 Public
Account 12.67 13.06 3.1
a Small Savings
Provident Funds etc.
25191.95 25683.71 2.0 Advances 12.67 13.06# 3.1
b Deposits 63666.57 67989.50 6.8 Cash balance 54497.01 32781.13 (-)39.8
c Reserve Funds 43439.46 42866.84 (-)1.3 Sinking Fund 33971.80 34488.13 1.5
d Remittances 1083.19 1240.28* 14.5 Total Cash
balance 88468.81 67269.26 (-)24
Suspense and
Miscellaneous
13009.58 9517.89* 26.8 Deficit in
Revenue
Account
78833.65$ 68859.05 (-)12.7
Capital
Receipts (-)533.72 (-)533.72 0
Total 480653.57$ 484469.75 0.8 Total 480653.57$ 484469.75 0.8
$ Figures revised in Finance Account 2018-19 due to proforma corrections * Higher rounding # Lower rounding
Source: Finance Accounts of respective years
During 2018-19, the assets and liabilities increased by 0.8 per cent over the previous year.
1.10.2 Fiscal Liabilities
The composition of fiscal liabilities during the current year vis-à-vis the previous years is
presented in Chart 1.16.

Chapter I: Finances of the State Government
41
(Source: Finance Accounts of respective years)
Table 1.42 gives the fiscal liabilities of the State, their rate of growth, the ratio of these
liabilities to GSDP, to revenue receipts and to the State’s own resources comprising tax
revenue and non-tax revenue of the State as also the buoyancy of fiscal liabilities with
reference to these parameters.
Table 1.42: Fiscal Liabilities – basic parameters
(`̀̀̀ in crore)
2014-15 2015-16 2016-17 2017-18 2018-19
Fiscal Liabilities (` in crore) 319746 351341 395858 432415$ 436783
Rate of Growth (per cent) 8.8 9.9 12.7 9.2 1
Fiscal Liabilities as percentage to
GSDP (per cent) 17.8 17.6 17.5 17.9* 16.4
Revenue Receipts (per cent) 193.3 189.9 193.4 177.5 156.6
Own Resources (per cent) 250.5 250.9 265.1 234.8 214.9
Buoyancy of Fiscal Liabilities with reference to:
GSDP (ratio) 1.002 0.846 0.992 1.353* 0.097
Revenue Receipts (ratio) 0.846 0.832 1.198 0.484 0.069
Own Resources (ratio) 1.372 1.021 1.912 0.394 0.096
* Based on actual GSDP $ proforma correction during 2018-19
Source: Finance Accounts of respective years
During 2018-19, the debt to GSDP ratio at 16.42 per cent was lower than
the projections made in MTFPS (16.52 per cent) and FFC (23.88 per cent). Of the
total Fiscal Liabilities, the share of Internal Debt was maximum (75 per cent),
followed by Public Account Liabilities (24 per cent) and Loans from Government of
India (one per cent).
The outstanding Fiscal liabilities of the State increased from ` 3,19,746 crore in
2014-15 to ` 4,36,783 crore at the end of 2018-19, at an average rate of eight per cent.
However, compared to the previous year, the Fiscal liabilities grew only by
one per cent mainly due to the drastic decrease in market borrowings from
` 45,000 crore in 2017-18 to ` 20,868.85 crore in 2018-19. This was made possible as
the State utilised its surplus cash balance, details of which are given in para 1.10.3.

State Finances Audit Report for the year ended 31 March 2019
42
1.10.2.1 Increasing trend of balance under 8443-Civil Deposits
During 2014-15 to 2018-19, the closing balance at the end of the financial year under the
Major Head 8443–Civil Deposits showed an increasing trend as indicated in Table 1.43.
Table 1.43: Balance under 8443-Civil Deposits
(`̀̀̀ in crore)
Year
Opening
balance
8443-Civil
Deposits as
on 01 April
Receipts Disbursements
Closing balance
of 8443-Civil
Deposits as on
31 March
Net increase
during the
year
Closing balance of
8443-106-Personal
Deposits
as on 31 March in
(percentage)
2014-15 15692.25 22714.76 21665.23 16741.78 1049.54 9726.09 (58)
2015-16 16741.78 26102.23 24579.51 18264.50 1522.72 11160.06 (61)
2016-17 18264.50 29071.87 25471.66 21864.71 3600.21 13334.52 (61)
2017-18 21864.71 27500.34 28287.43 21077.62 (-)787.09 12229.30 (58)
2018-19 21077.62 32065.94 31373.94 21769.62 692.00 10953.53 (50)
Source: Finance Accounts of respective years
It may be seen that under the Major Head 8443-Civil Deposits the balance in
106 – Personal Deposits constituted nearly 58 per cent of the balances during 2014-15 to
2018-19. Further, if funds are transferred to the Personal Deposit Accounts from the
Consolidated Fund of the State, the balances at the close of the financial year should be
transferred back to the Consolidated Fund. The Finance Accounts 2018-19 however,
revealed that the quantum of funds which need to be transferred back to the Consolidated
Fund at the end of the financial year was not ascertainable in the absence of effecting such
transfer through ‘Nil Bill’ procedure. As a result, the actual liabilities under the Major
Head 8443–Civil Deposits were also not ascertainable. The State Government should
ensure that the codal provision is adhered to so that the funds so transferred at the fag end
of the year could be ascertained.
1.10.2.2 Unreconciled differences between closing balances in the accounts and
subsidiary records
As per the Finance Accounts 2018-19, there was an unreconciled balance of
` 891.01 crore under Civil Deposits and Other Civil Deposits pertaining to the period up
to 2018-19. Of the above, ‘8782-Cash Remittance & Adjustments between Officers
rendering Accounts – 103 Forest Remittance’ was the major item pertaining to 2018-19
that remained unreconciled (` 587.95 crore) as of March 2019.
1.10.3 Cash balances and Investment of Cash Balances
Table 1.44 and Chart 1.17 depict the cash balances and investments made by the State
Government out of cash balances during the year.
Table 1.44: Cash balances and investment of cash balances
(`̀̀̀ in crore)
Particulars As on
31 March 2018
As on
31 March 2019
Increase (+)/
Decrease(-)
Cash in treasuries 0.04 0.04 0.00
Deposits with Reserve Bank of India (-)3962.41 (-)3020.51 941.90
Remittances in transit-Local 54.33 54.32 (-)0.01
Cash with the Departmental officers 6.69 236.95 230.26
Permanent advance for contingent
expenditure with Departmental officers 0.67 0.69 0.02
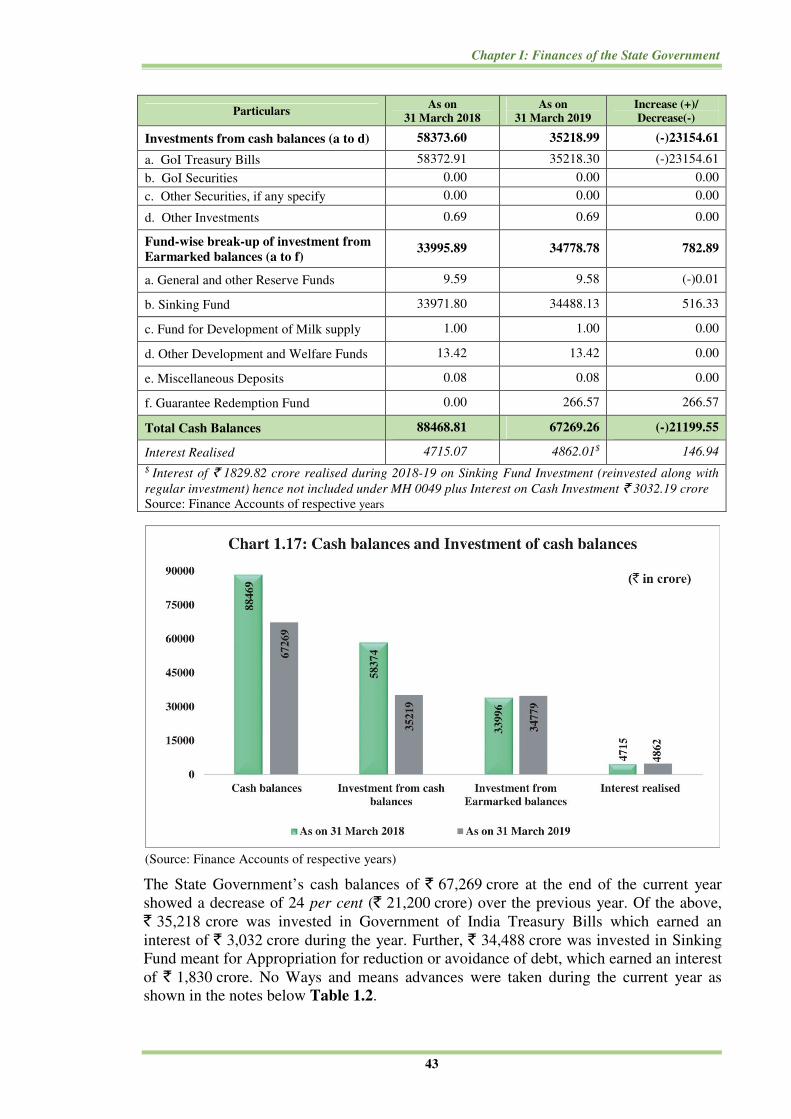
Chapter I: Finances of the State Government
43
Particulars As on
31 March 2018
As on
31 March 2019
Increase (+)/
Decrease(-)
Investments from cash balances (a to d) 58373.60 35218.99 (-)23154.61
a. GoI Treasury Bills 58372.91 35218.30 (-)23154.61
b. GoI Securities 0.00 0.00 0.00
c. Other Securities, if any specify 0.00 0.00 0.00
d. Other Investments 0.69 0.69 0.00
Fund-wise break-up of investment from
Earmarked balances (a to f) 33995.89 34778.78 782.89
a. General and other Reserve Funds 9.59 9.58 (-)0.01
b. Sinking Fund 33971.80 34488.13 516.33
c. Fund for Development of Milk supply 1.00 1.00 0.00
d. Other Development and Welfare Funds 13.42 13.42 0.00
e. Miscellaneous Deposits 0.08 0.08 0.00
f. Guarantee Redemption Fund 0.00 266.57 266.57
Total Cash Balances 88468.81 67269.26 (-)21199.55
Interest Realised 4715.07 4862.01$ 146.94
$ Interest of ` 1829.82 crore realised during 2018-19 on Sinking Fund Investment (reinvested along with
regular investment) hence not included under MH 0049 plus Interest on Cash Investment ` 3032.19 crore
Source: Finance Accounts of respective years
(Source: Finance Accounts of respective years)
The State Government’s cash balances of ` 67,269 crore at the end of the current year
showed a decrease of 24 per cent (` 21,200 crore) over the previous year. Of the above,
` 35,218 crore was invested in Government of India Treasury Bills which earned an
interest of ` 3,032 crore during the year. Further, ` 34,488 crore was invested in Sinking
Fund meant for Appropriation for reduction or avoidance of debt, which earned an interest
of ` 1,830 crore. No Ways and means advances were taken during the current year as
shown in the notes below Table 1.2.

State Finances Audit Report for the year ended 31 March 2019
44
Further there was also an outstanding balance under ‘Cheques and bills’ amounting to
` 12,739 crore. Hence the resultant effective cash balance of the State Government as on
31 March 2019 was ` 20,042 crore which is seven per cent of the total expenditure of the
State Government (` 3,03,616 crore) during the year.
Consolidated Sinking Fund
In terms of the recommendations of the Tenth Finance Commission, the State
Government created (1999-2000), a Consolidated Sinking Fund to be administered by the
Reserve Bank of India for the amortization of all loans. As per the constitution of
Consolidated Sinking Fund of Maharashtra, the State Government is to contribute one to
three per cent of the outstanding open market loans as at the end of the previous year to
the fund. In terms of the revised guidelines (May 2006) of the Reserve Bank of India,
States are required to contribute to the Fund a minimum of 0.5 per cent of their
outstanding liabilities (Public Debt plus Public Account liabilities) as at the end of the
previous year.
During 2018-19, the State Government transferred ` 3,800 crore to the Consolidated
Sinking Fund from the Revenue Account which works out to 1.5 per cent of total
outstanding (Open Market Loans) of ` 2,53,340 crore and to 0.88 per cent of
outstanding liability of ` 4,32,415 crore (Public Debt plus Public Account liabilities) as
on 31 March 2018. There was no expenditure from the fund during the year. The balance
in the Consolidated Sinking Fund as on 31 March 2019 was ` 34,488 crore, which has
been invested.
1.10.4 Transactions under Reserve Funds
Reserves and Reserve Funds are created for specific and well- defined purposes in
the accounts of the State Government (Public Account). These funds are created by
contributions or grants from the Consolidated Fund of State or from outside agencies.
The funds are further divided into two parts (i) Reserve Funds bearing interest and
(ii) Reserve Funds not bearing interest. The funds are created by the sums transferred
by debiting the concerned expenditure head of the Consolidated Fund of the State.
Thereafter, the total expenditure incurred during the year is to be reimbursed from the
concerned Reserve Fund.
In Maharashtra, there were 20 reserve funds earmarked for specific purposes of which, 11
funds were active and nine were inactive. The total accumulated balance as on
31 March 2019 in these funds was ` 42,866.84 crore (` 42,837.83 crore in active funds
and ` 29.01 crore in inoperative funds). However, the investment out of this balance was
only ` 34,778 crore (81 per cent). An account of these funds is included in Statement No.
22 of Finance Accounts 2018-19.
Recommendation:
State Government may take effective steps to review the inoperative Reserve Funds and
necessary action to close these inoperative Reserve Funds.
1.10.5 Contingent Liabilities
Status of Guarantees
Guarantees are liabilities contingent on the Consolidated Fund of the State in case of
default by the borrower for whom the guarantee has been extended. The maximum
amount for which guarantees were given by the State Government and the outstanding

Chapter I: Finances of the State Government
45
guarantees during the last three years as given in the Statement No. 9 of the Finance
Accounts 2018-19 are summarised in Table 1.45.
Table 1.45: Guarantees given by the Government of Maharashtra
(` in crore)
Guarantees 2016-17 2017-18 2018-19
Maximum amount guaranteed 22802 37287 38378
Outstanding amount of guarantees 7306 26658 25135
Percentage of maximum amount guaranteed to total
revenue receipts 11 15 14
Source: Finance Accounts of respective years
Limits on guarantees to be given by the State Government have not been fixed by the
State Legislature. The MFRBM Act, 2005 also does not prescribe any limits. During
2018-19, guarantees of ` 985 crore was given by the State Government to (a) Maharashtra
State Co-operative Marketing Federation Limited, Mumbai (` 630 crore); (b) Vidarbha
Co-operative Marketing Federation Limited, Nagpur (` 30 crore); (c) Mahatma Phule
Backward Development Corporation Limited, Mumbai (` 135 crore); (d) Maharashtra
State Handicapped Finance and Development Corporation Limited, Mumbai (` 70 crore);
(e) Sant Rohidas Leather Industry and Leatherworker Development Corporation Limited,
Mumbai (` 50 crore) and (f) Sahityaratn Lokshahir Annabhau Sathe Development
Corporation Limited, Mumbai (` 70 crore). Outstanding guarantees (` 25,135 crore)
during 2018-19 accounted for nine per cent of the revenue receipts (` 2,78,996 crore) and
0.94 per cent of the GSDP (` 26,60,318 crore).
The State Government charged guarantee fees for guarantees given to institutions and the
same was booked under Major Head 0075- ‘Miscellaneous General Services’. Receipts
under guarantee fees decreased to ` 9.51 crore during 2018-19 from ` 36.80 crore during
2017-18. Against the total estimated guarantee fee receivable (` 1,625.32 crore), only
` 9.51 crore was received during the year.
During 2018-19, Guarantee of ` 174 crore (Co-operative Sugar Factory, Co-operative
Spinning Mill and Agriculture Processing Co-operative Society) was invoked and
discharged by the State Government. The State Government has yet to discharge invoked
guarantee amounting to ` 20.26 crore of Maharashtra State Co-operative Housing Finance
Corporation Ltd.
Guarantee Redemption Fund
In terms of the recommendation of the Twelfth Finance Commission, Government of
Maharashtra (December 2018) created Guarantee Redemption Fund in 2018-19 to meet
contingent liabilities arising from the Guarantees given by the State Government in
respect of bonds issued and other borrowings by the State Level Undertakings or other
bodies and invoked by the 'beneficiaries'. The Fund shall be administered by Central
Accounts Section of the Reserve Bank of India and shall be kept outside the General
Revenues of the Government. The accretions to the Fund shall be invested in the
Government of India Securities, Treasury Bills, Special Securities of Government of India
and State Development Loans of other States of such maturities as the Bank may
determine from time to time in consultation with the Government of Maharashtra. As per
the constitution of the Fund, the State Government is to contribute minimum one per cent
of outstanding guarantees at the end of the previous year from 2018-19 initially.
Thereafter 0.5 per cent of such outstanding amount shall be deposited in the fund every
year to achieve the level of five per cent of total outstanding by 2027-28. During the year,
the State Government has transferred ` 266.57 crore (one per cent of Total outstanding
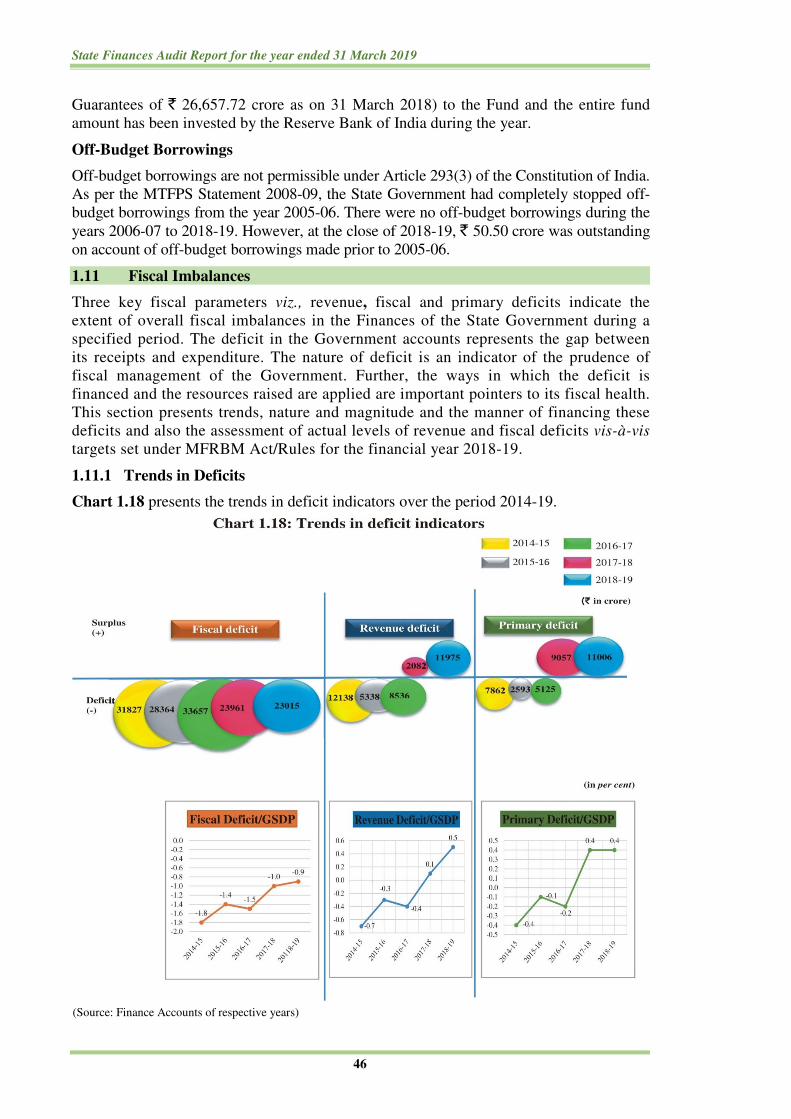
State Finances Audit Report for the year ended 31 March 2019
46
Guarantees of ` 26,657.72 crore as on 31 March 2018) to the Fund and the entire fund
amount has been invested by the Reserve Bank of India during the year.
Off-Budget Borrowings
Off-budget borrowings are not permissible under Article 293(3) of the Constitution of India.
As per the MTFPS Statement 2008-09, the State Government had completely stopped off-
budget borrowings from the year 2005-06. There were no off-budget borrowings during the
years 2006-07 to 2018-19. However, at the close of 2018-19, ` 50.50 crore was outstanding
on account of off-budget borrowings made prior to 2005-06.
1.11 Fiscal Imbalances
Three key fiscal parameters viz., revenue, fiscal and primary deficits indicate the
extent of overall fiscal imbalances in the Finances of the State Government during a
specified period. The deficit in the Government accounts represents the gap between
its receipts and expenditure. The nature of deficit is an indicator of the prudence of
fiscal management of the Government. Further, the ways in which the deficit is
financed and the resources raised are applied are important pointers to its fiscal health.
This section presents trends, nature and magnitude and the manner of financing these
deficits and also the assessment of actual levels of revenue and fiscal deficits vis-à-vis
targets set under MFRBM Act/Rules for the financial year 2018-19.
1.11.1 Trends in Deficits
Chart 1.18 presents the trends in deficit indicators over the period 2014-19.
(Source: Finance Accounts of respective years)
Chapter I: Finances of the State Government
47
As per the MFRBM Rules (Second Amendment), 2011, the revenue deficit was to be
brought down to ‘zero’ by 2011-12 and Revenue Surplus was to be generated thereafter.
Table 1.46 indicates the ratios of Revenue Deficit/ Surplus and Fiscal Deficit to Revenue
Receipts and their trends.
Table 1.46: Ratio of Revenue Deficit/Surplus and Fiscal Deficit to Revenue Receipts
Year 2014-15 2015-16 2016-17 2017-18 2018-19
Revenue Deficit (-)Surplus /
Revenue Receipts (-)7.34 (-)2.89 (-)4.17 0.85 4.29
Fiscal Deficit(-)/ Revenue
Receipts (-)19.24 (-)15.33 (-)16.44 (-)9.83 (-)8.25
Source: Finance Accounts of respective years
Revenue surplus/deficit
The Revenue Deficit (` 12,138 crore) during 2014-15 decreased to ` 5,338 crore in
2015-16 and increased to ` 8,536 crore in 2016-17. Revenue Deficit turned to surplus at
` 2,082 crore in 2017-18 and further increased to ` 11,975 crore in 2018-19. The ratio
of Revenue Surplus to Revenue Receipt has increased from 0.85 per cent in 2017-18 to
4.29 per cent in 2018-19 due to increase in receipts.
Fiscal deficit
The Fiscal Deficit of ` 23,961 crore during 2017-18 decreased to ` 23,015 crore in
2018-19. The Fiscal Deficit to Revenue Receipts ratio has also improved from
(-) 19.24 per cent in 2014-15 to (-) 8.25 per cent in 2018-19.
Primary Surplus/Deficit
Primary Deficit20 during 2014-15 (` 7,862 crore), 2015-16 (` 2,593 crore) and 2016-17
(` 5,125 crore) turned into Primary Surplus of ` 9,057 crore in 2017-18 and
` 11,006 crore in 2018-19 due to Revenue Surplus and decrease in Fiscal Deficit.
During 2018-19, there were transactions outside the Consolidated Fund, budgeting and
booking under incorrect heads, non-provision of interest on reserve funds and deposit
accounts etc. As a result, the Revenue Surplus was overstated by ` 1,432.84 crore.
Control over expenditure coupled with spurt in revenue resulted in Revenue Surplus of
`̀̀̀ 11,975 crore.
1.11.2 Debt Profile
Fiscal Deficit of the State as a proportion of GSDP has declined during the last five years,
from 1.78 per cent in 2014-15 to 0.87 per cent in 2018-19. The State registered Revenue
Surplus as well as Primary Surplus during 2017-18 and 2018-19.
There are various approaches at assessing the debt sustainability, one such approach is
Domar model21.
An analysis on debt sustainability was carried out using this approach. The details are as
follows:
20 see Glossary at page 132 21 E.D. Domar, 1914-1997

State Finances Audit Report for the year ended 31 March 2019
48
g-r (g: real economic growth
rate; r: real interest rate)
called Domar gap
s <0 (Primary Deficit) s >0 (Primary Surplus)
g-r>0 (strong economic growth) Public Debt as percentage of
GSDP should converge to a
stable level greater than zero
Public Debt as percentage of
GSDP should converge to a
stable level less than zero leading
to public savings
g-r<0 (slow economic growth) Public Debt as percentage of
GSDP should increase
indefinitely, without converging
to a stable level
undefined situation
The results of applying the analysis to Maharashtra is shown in the table below:
Year
Real
Growth
(g)
Real
Interest
(r)
g-r
(Domar gap)
Primary Deficit
(-)/ Surplus (s)
(`̀̀̀ in crore)
Remarks
2014-15 5.7 1.8 3.9 (-)7,862 As g-r >0 and s<0;
Public Debt as
percentage of GSDP
should converge to a
stable level
2015-16 8.9 3.2 5.7 (-)2,593
2016-17 10.0 3.1 6.9 (-)5,125
2017-18 6.4 4.2 2.2 9,057 g-r>0 and s>0:
Public Debt as
percentage of GSDP
should converge to a
stable level less than zero
leading to Public savings
2018-19 7.5 4.7 2.8 11,006
Real Growth rate calculated for GSDP at constant rate
Real Interest rate calculated as interest rate minus inflation
Source: Economic Survey of Maharashtra for respective years (GSDP and rate of inflation)
Further, Debt to GSDP ratio stood at 16.42 per cent and the Fiscal Deficit to GSDP ratio
at 0.87 per cent in 2018-19. The corresponding Fourteenth Finance Commission (FFC)
Fiscal target of Debt limit was 23.88 per cent, and Fiscal Deficit ceiling was 3.25 per cent
of GSDP. The capital expenditure of the State has hovered between 10 and 12 per cent
during 2014-19.
In the initial three years of the subject period i.e. 2014-15 to 2016-17, there is a primary
deficit which later got converted to a primary surplus in the years 2017-18 and 2018-19.
However, it is seen that the g-r (Domar gap) is positive during the entire period 2014-15
to 2018-19. Therefore, as per the Domar model, the public debt is stated to be stable. It
is, however, noteworthy that the g-r (Domar gap) has not been registering a stable or
steadily rising trend. Moreover, other factors such as public account liabilities and force
majeure events22and/or any other un-inventoried losses of revenue also have to be
reckoned in assessing the debt sustainability/stability of the State23.
1.11.3 Composition of Fiscal Deficit and its financing pattern
The financing pattern of the fiscal deficit has undergone a compositional shift as reflected
in the Table 1.47.
22 Like current Coronavirus crisis & its effect on GSDP 23 As these cannot be anticipated or determined statistically, they have not been factored in the analysis
Chapter I: Finances of the State Government
49
Table 1.47: Components of Fiscal Deficit and its financing pattern (` in crore)
Particulars 2014-15 2015-16 2016-17 2017-18 2018-19
Composition of Fiscal Deficit(-)/
Surplus (+) (1+2+3) (a)
(-)31827 (-)28364 (-)33657@ (-)23961 (-)23015
(-1.8) (-1.4) (-1.5) (-1.0) (-0.9)
1 Revenue Deficit(-)/ Surplus
(+)
(-)12138 (-)5338 (-)8536 2082 11975
(-0.7) (-0.3) (-0.4) (0.08) (0.5)
2 Net Capital Outlay (-)19524 (-)22776 (-)25549 (-)26842 (-)35049
(-1.1) (-1.1) (-1.1) (-1.1) (-1.3)
3 Net Loans and Advances (-)165 (-)250 428£ 799£ 59£
- - - - -
Financing Pattern of Fiscal Deficit#(b)
1 Market Borrowings 22263 28938 40349$ 36477 3106
(1.2) (1.5) (1.8) (1.5) (0.1)
2 Loans from GoI (-)344 (-)321 (-)343 (-)781 (-)587
- - - - -
3 Special Securities Issued to
National Small Savings Fund
(-)805 (-)286 (-)5078 (-)5176 (-)5309
- - (-0.2) (-0.2) (-0.2)
4 Loans from Financial
Institutions and other Loans
(-)568 (-)397 1521 1774 3699
- - (0.1) (0.1) (0.1)
5 Small Savings PF etc. 1259 1208 1124 547 492
(0.1) (0.1) (0.1) - (0.0)
6 Deposits and Advances 4411 2773 6841 3930 4323
(0.2) (0.1) (0.3) (0.2) (0.2)
7 Suspense and Miscellaneous 5222 (-)876 2773 164 (-)3492
(0.3) - (0.1) - (-0.1)
8 Remittances (-)14 (-)236 (-)656 822 157
- - - - -
9 Reserve Funds 3158 3465 5283 5924 (-)573
(0.2) (0.2) (0.2) (0.2) (0.0)
10 Contingency Fund 2010 (-)2000 - - 2000.00
(0.1) (-0.1) - - (0.1)
11 Appropriation to/ from
Contingency fund
(-)2000 2000 - - (-)2000.00
(-0.1) (0.1) - - (-0.1)
12 Total (1 to 11) (b) 34592 34268 51814 43681 1816
13 Increase(-)/ Decrease (+) in
Cash Balance (a) – (b)
2765 (-)5904 (-)13197 (-)19720 21199
(0.2) (-0.3) (-0.6) (-0.8) (0.8)
14 Overall deficit (12+13) 31827 28364 38616$ 23961 23015
(1.8) (1.4) (1.7) (1.0) (0.9)
Figures in parenthesis indicate the per cent to GSDP #All figures are net of disbursements/outflows during the year; @Net of Ujwal DISCOM Assurance Yojana eligible for exclusion from Fiscal deficit as per GoI’s order; £Included receipts of ` 991.75 crore on account of repayment of loan; $ Includes expenditure of ` 4,959.75 crore incurred on account of taking over of 75 per cent of Medium and
Short term debts of DISCOMs under Ujwal DISCOM Assurance Yojana
Source: Finance Accounts of respective years
During 2018-19, the fiscal deficit decreased by ` 946 crore over the previous year due to
increased revenue receipts (` 35,342 crore). The net capital expenditure as a percentage of
fiscal deficit increased from 112 per cent in 2017-18 to 152 per cent in 2018-19.
The Fiscal Deficit as a percentage of GSDP decreased from 0.99 in 2017-18 to 0.87 in
2018-19, which was well below the target of three per cent as prescribed by FFC and
MTFPS.

State Finances Audit Report for the year ended 31 March 2019
50
1.11.4 Quality of Deficit/Surplus
The ratio of revenue deficit to fiscal deficit and the bifurcation of primary deficit into
primary revenue deficit and capital expenditure (including loans and advances) would
indicate the quality of deficit in the State’s finances. The ratio of Revenue deficit to fiscal
deficit indicates the extent to which borrowed funds were used for current consumption.
Non-debt receipts of the State were sufficient to meet the primary expenditure
requirements in the revenue account. But these were not sufficient to meet the expenditure
requirements under capital account, resulting in primary deficit during
2014-17. The details are indicated in Table 1.48.
Table 1.48: Bifurcation of Primary Deficit/Surplus
(`̀̀̀ in crore)
Year
Non-
debt
receipts
Primary
Revenue
Expenditure
Capital
Outlay
Loans and
Advances
Primary
Expenditure
Primary
revenue
deficit(-)/
Surplus(+)
Primary
deficit (-) /
Surplus (+)
1 2 3 4 5 6 (3+4+5) 7 (2-3) 8 (2-6)
2014-15 166390 153588 19523 1141 174252 12802 (-)7862
2015-16 185918 164603 22793 1115 188511 21315 (-) 2593
2016-17 206439 184697 25549 1318§ 211564 21742 (-) 5125
2017-18 245432 208553 26842 979 236374 36879 9058*
2018-19 280601 233000 35049 1545 269594 47601 11006# §excludes ` 4,959.75 crore given under Ujwal DISCOM Assurance Yojana
Source: Finance Accounts of respective years * Higher rounding # Lower rounding
The capital outlay as a percentage to primary expenditure24 increased from
11 per cent during 2014-15 to 13 per cent during 2018-19.
Non-debt receipts were sufficient to meet the expenditure requirements both under
revenue and capital account, resulting in Primary Surplus of `̀̀̀ 9,058 crore in
2017-18 and `̀̀̀ 11,006 crore in 2018-19.
1.12 Debt Management
Debt Maturity Profile
The Maturity Profile of the Internal Debt (amounts payable in respect of each category of
loans in different years) as on 31 March 2019 is depicted in Table 1.49.
Table 1.49: Maturity profile of Internal Debt
Debt maturity Maturity Profile Internal Debt
(`̀̀̀ in crore) per cent
During 2019-20 0-1 year 20880.71 6.4
Between 2020-21 & 2021-22 Over 1 year to 2 years 57949.67 17.6
Between 2022-23 & 2023-24 Over 2 years to 5 years 56958.77 17.3
Between 2024-25 & 2025-26 Over 5 years to 7 years 67840.20 20.7
2026-27 onwards Over 7 years and above 124892.60 38.0
Total 328521.95 100
Source: Finance Accounts 2018-19
24 Primary expenditure of the State defined as the total expenditure net of the interest payments, indicates the
expenditure incurred on the transactions undertaken during the year

Chapter I: Finances of the State Government
51
The maturity profile of the internal debt indicates that the liability of the State to repay the
debt during the periods 2019-20, 2020-22 and 2022-24 would be ` 20,881 crore,
` 57,950 crore and ` 56,959 crore respectively.
Debt Sustainability
Debt sustainability implies State’s ability to service the debt in future. Apart from the
magnitude of debt of the State Government, it is important to analyse various indicators
that determine the debt sustainability of the State. Analysis of various debt sustainability
indicators for the period from 2014-15 to 2018-19 is given in Table 1.50.
Table 1.50: Debt Sustainability: Indicators and trends
(` in crore)
Indicators of debt sustainability 2014-15 2015-16 2016-17 2017-18 2018-19
Interest Payment 23965 25771 28532 33018 34021
Burden of interest payment in per cent
(IP/RR) 14.5 14.0 13.9 13.6 12.2
Debt repayment 50998 52319 55602 63936 75138
Debt receipts 76939 83914 100118 100511 79506
Debt redemption/Debt Receipt 0.97 0.93 0.84 0.96 1.37
Net availability of borrowed funds 1976 5824 15984 3557 (-)29653
Source: Finance Accounts of respective years
Net availability of borrowed funds
Net availability of borrowed funds is the difference between debt redemption (principal
and interest payments) and total debt receipts, indicating the extent to which the debt
receipts were used for redemption of old debts. During 2018-19 as debt redemption
(` 1,09,159 crore) was more than debt receipts (` 79,506 crore) which indicated that
borrowed funds were not available for current operations. This was primarily due to
reduction in debt receipts by ` 21,005 crore during 2018-19. The State Government was
able to pay-off major portion of the interest component from its revenue receipts and did
not resort to borrowing to that extent.
The ratio of interest payment to revenue receipts is one of the indicators that determines
the debt sustainability of the State. This percentage ranged between 12 per cent and
14 per cent during 2014-19, and was lowest (12.2 per cent) during 2018-19 and within the
fiscal indicator prescribed by FFC.
Servicing of Public Debt
The interest payment and repayment of principal on public debt for the period from
2014-15 to 2018-19 is given in Table 1.51.
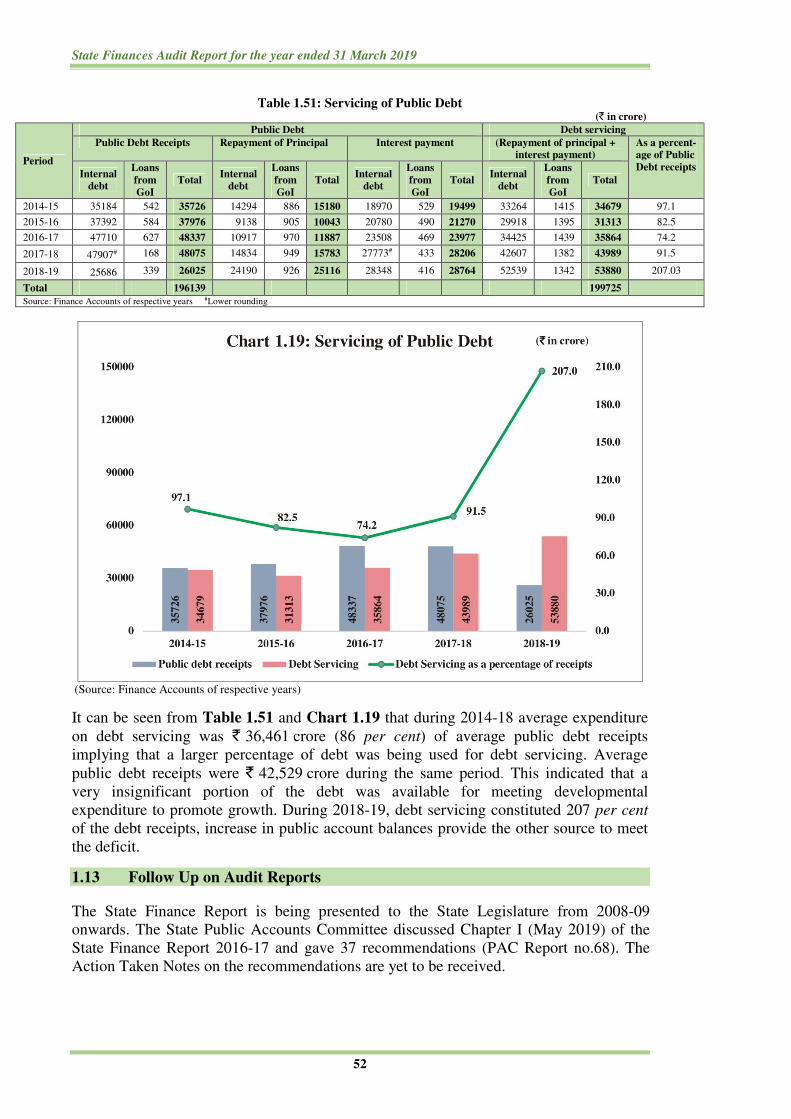
State Finances Audit Report for the year ended 31 March 2019
52
Table 1.51: Servicing of Public Debt (` in crore)
Period
Public Debt Debt servicing Public Debt Receipts Repayment of Principal Interest payment (Repayment of principal +
interest payment) As a percent-
age of Public
Debt receipts Internal
debt
Loans
from
GoI
Total Internal
debt
Loans
from
GoI
Total Internal
debt
Loans
from
GoI
Total Internal
debt
Loans
from
GoI
Total
2014-15 35184 542 35726 14294 886 15180 18970 529 19499 33264 1415 34679 97.1
2015-16 37392 584 37976 9138 905 10043 20780 490 21270 29918 1395 31313 82.5
2016-17 47710 627 48337 10917 970 11887 23508 469 23977 34425 1439 35864 74.2
2017-18 47907# 168 48075 14834 949 15783 27773# 433 28206 42607 1382 43989 91.5
2018-19 25686 339 26025 24190 926 25116 28348 416 28764 52539 1342 53880 207.03
Total 196139 199725
Source: Finance Accounts of respective years #Lower rounding
(Source: Finance Accounts of respective years)
It can be seen from Table 1.51 and Chart 1.19 that during 2014-18 average expenditure
on debt servicing was ` 36,461 crore (86 per cent) of average public debt receipts
implying that a larger percentage of debt was being used for debt servicing. Average
public debt receipts were ` 42,529 crore during the same period. This indicated that a
very insignificant portion of the debt was available for meeting developmental
expenditure to promote growth. During 2018-19, debt servicing constituted 207 per cent
of the debt receipts, increase in public account balances provide the other source to meet
the deficit.
1.13 Follow Up on Audit Reports
The State Finance Report is being presented to the State Legislature from 2008-09
onwards. The State Public Accounts Committee discussed Chapter I (May 2019) of the
State Finance Report 2016-17 and gave 37 recommendations (PAC Report no.68). The
Action Taken Notes on the recommendations are yet to be received.


53
Chapter II
Financial Management and Budgetary Control
2.1 Introduction
2.1.1 Audit of appropriations by the Comptroller and Auditor General of India seeks to
ascertain whether the expenditure actually incurred under various grants is within the
authorisation given under the Appropriation Act and that the expenditure required to be
charged under the provisions of the Constitution is so charged. It also ascertains whether
the expenditure so incurred is in conformity with the law, relevant rules, regulations and
instructions.
2.1.2 As per the Maharashtra Budget Manual (Budget Manual), (Chapter IX), the
Finance Department (FD) is responsible for preparation of the Annual Budget by
obtaining estimates from various Departments. The departmental estimates of receipts
and expenditure are prepared by the Controlling Officers on the advice of the Heads of
Departments and submitted to the FD by prescribed dates. The FD scrutinises the
estimates and prepares the Detailed Estimates called ‘Demand for Grants’. In the
preparation of the Budget, the aim should be to achieve as close an approximation to the
actuals as possible. The budget procedure envisages that the sum provided in an estimate
of expenditure on a particular item must be that sum which can be expended in the year
and neither larger nor smaller. A saving in an estimate constitutes as much of a financial
irregularity as an excess in it. The budget estimates of receipts should be based on the
existing rates of taxes, duties, fees etc.
The findings in the preparation of the Budget, management of expenditure noticed in
audit have been discussed in the subsequent paragraphs.
2.2 Summary of Appropriation Accounts
The summarized position of actual expenditure during 2018-19 against 296 grants/
appropriations is given in Table 2.1.
Table 2.1: Summarized position of actual expenditure vis-à-vis original / supplementary provisions (` ` ` ` in crore)
Nature of
expenditure
Original
grant/
appropri-
ation
Supple-
mentary
grant/
appropri-
ation
Total
Actual
expendi-
ture
Saving(-) /
Excess (+)
Amount
surren-
dered
Amount
surren-
dered on
30 and 31
March
2019
Percentage of
savings
surrendered on
30 and 31
March (9/8)
(1) (2) (3) (4) (5) (6) (7) (8) (9) (10)
Voted
I Revenue 269115.06 25169.13 294284.19 235447.95 (-)58836.24 58972.48 58323.60 98.90
II Capital 38953.61 9884.76 48838.37 38176.12 (-)10662.25 10822.71 10155.38 93.83
III Loans and
Advances 1178.64 641.44 1820.08 1545.26 (-)274.82 312.92 241.91 77.31
Total Voted 309247.31 35695.33 344942.64 275169.33 (-)69773.31 70108.11 68720.89 98.02
Charged
IV Revenue 39489.47 343.53 39833.00 39095.35 (-)737.65 513.26 400.45 78.02
V Capital 8.15 18.08 26.23 25.85 (-)0.38 0.36 0.36 100
VI Public
Debt -
Repayment
28461.51 0.00 28461.51 25116.50 (-)3345.01 3328.67 3303.76 99.25
Total Charged 67959.13 361.61 68320.74 64237.70 (-)4083.04 3842.29 3704.57 96.42
Appropriation to
Contingency fund 3528.00 - 3528.00 3528.00 - - - -
Grand Total 380734.44 36056.94 416791.38 342935.03 (-)73856.35 73950.40 72425.46 97.94
Source: Appropriation Accounts 2018-19 Note: The expenditure excludes the recovery adjusted as reduction of expenditure under revenue expenditure
` 7,521.63 crore and capital expenditure ` 3,152.99 crore as detailed in Appendix II of Appropriation Accounts
State Finances Audit Report for the year ended 31 March 2019
54
2.2.1 Table 2.1 indicates that Administrative Departments obtained Supplementary
provisions amounting to ` 36,056.94 crore during the year which constituted
nine per cent of the original provision as against 21 per cent in the previous year
(2017-18). As may be seen from Appendix 2.1, in 61 grants and two appropriations,
against the original provision of ` 2,34,836.14 crore, expenditure of ` 1,87,285.49 crore
only was incurred and hence supplementary funds of ` 13,047.19 crore were not required.
This also indicated that seeking supplementary provisions was avoidable since the
expenditure had not reached the level of the original budgetary provision.
2.2.2 The overall savings of ` 73,856.35 crore was the result of savings of
` 74,802.51 crore in 144 grants and 60 appropriations under the Revenue Section and 105
grants and nine appropriations under the Capital Section, offset by an excess of
` 946.16 crore in six grants and three appropriations. Though the Departments
surrendered 99 per cent of the savings, ` 72,425.46 crore (98 per cent) of the savings was
surrendered only on the last two days of the financial year.
2.2.3 The savings and excesses were intimated by the offices of the Accountant General
(Accounts & Entitlement) I and II regularly to the Controlling Officers through Monthly
Reports on expenditure. They also took up the matter after closure of the preliminary and
final accounts in May and June 2019, requesting the Controlling Officers to explain the
reasons for the significant variations, but no explanation was received (October 2019).
2.3 Financial Accountability and Budget Management
2.3.1 Excess expenditure during 2015-18 pending regularisation
As per Article 205 of the Constitution of India, it is mandatory for the State Government
to get the excess over a grant/appropriation regularised by the State Legislature.
Although, no time limit for regularisation of expenditure has been prescribed, the
regularization of excess expenditure is done after completion of discussion of
Appropriation Accounts by the Public Accounts Committee. Excess expenditure
amounting to ` 779.66 crore for the year 2015-16 to 2017-18 in respect of 73 grants and
15 appropriations was pending for regularization as on March 2019 as detailed in
Appendix 2.2.
2.3.1.1 Excess over provision during 2018-19 requiring regularisation
The excess expenditure over the budget provision during 2018-19 under six grants and
three appropriations amounting to ` 946.16 crore is required to be regularised under
Article 205 of the Constitution. The details are given in Appendix 2.3.
The excess expenditure over Budget provision increased from ` 47.15 crore in 2017-18 to
` 946.16 crore in 2018-19.
This is in violation of Article 205 of the Constitution.
Recommendation: All the existing cases of excess expenditure need to be regularised at the earliest and in
future such non-voted expenditure may be completely stopped, except in case(s) of dire
and extreme emergency, which cannot be met from the Contingency Fund.
2.3.2 Persistent Excess
During the period from 2016-17 to 2018-19 persistent excess expenditure occurred under
21 sub-heads shown in Appendix 2.4. Though all of these may not have resulted in
excess at Grant level and hence, may not require regularization, special emphasis needs to
be given while monitoring the expenditure under these sub-heads.
Chapter II: Financial Management and Budgetary Control
55
Excess expenditure incurred over budgetary allocation indicates deficient budgetary and
expenditure controls.
2.3.3 Unexplained re-appropriations
Paragraph 165 of the Budget Manual stipulates that the orders sanctioning re-
appropriation of funds which involve some unique or special feature should briefly
specify reasons for the additions to and deductions from the sub-heads affected by them.
However, a scrutiny of re-appropriation orders issued by the Administrative Departments
revealed that out of 2,130 items of re-appropriations made by them during 2018-19, the
specific reasons for 110 items (5.16 per cent) were not furnished. This goes against the
principle of transparency envisaged in Section 6 of the Maharashtra Fiscal Responsibility
and Budgetary Management Act.
2.3.4 Rush of Expenditure
According to the Bombay Financial Rules, 1959, rush of expenditure in the closing month
of the financial year should be avoided. Contrary to this, in 38 Grants as listed in
Appendix 2.5 it was noticed that expenditure in excess of ` 100 crore and consisting of
50 per cent or more of the total provision was incurred only in March 2019. Rush of
expenditure at the end of the year shows poor expenditure control. Further, of the
total expenditure of ` 57,398.74 crore, expenditure to the extent of ` 40,917.62 crore
(71 per cent) was incurred during the last quarter.
2.3.5 Appropriation vis-à-vis allocative priorities
Audit of Appropriation Accounts revealed that out of total saving of ` 73,856.35 crore
during 2018-19, in 68 cases amounting to ` 51,997.49 crore (70 per cent), savings
exceeded ` 10 crore in each case and was 20 per cent or more of the total provision as
shown in Appendix 2.6. The summarized position of savings is shown in Table 2.2.
Table 2.2: Summarised statement showing savings exceeding `̀̀̀ 10 crore and above
Sr.
No.
Range of savings Number of
cases
Total grant
(` ` ` ` in crore)
Savings
(` ` ` ` in crore)
Percentage
1 Upto ` 20 crore 12 497.99 160.70 32.27
2 More than ` 20 crore and up to
` 100 crore
21 3082.59 1057.39 34.29
3 More than ` 100 crore and above 35 119001.03 50779.40 42.67
Total 68 122581.61 51997.49 42.42 Source: Appropriation Accounts 2018-19
Further, against the total savings of ` 73,856.35 crore, savings of ` 72,581.65 crore
(98.27 per cent) occurred in 62 grants/appropriations involving ` 100 crore and above in
each case as detailed in Appendix 2.7.
The Department which registered major savings were School Education, Urban
Development, Rural Development, Social Justice and Special Assistance, Tribal
Development, Co-operation, Marketing and Textile Department and Water Supply and
Sanitation Department.
Reasons furnished by the Departments for the major savings, as reported in the
Appropriation Accounts are given in the succeeding paras.
School Education Department
Under Grant E-02 General Education, Major Head 2202, as against the budget provision
of ` 19,385.42 crore for assistance to Zilla Parishad, an amount of ` 2,370.13 crore was

State Finances Audit Report for the year ended 31 March 2019
56
surrendered in March 2019 due to vacant posts and non-payment of ‘Other Salary Grant’
to Zilla Parishad owing to Government orders to release the grants after assessment and
refund of unspent balance by the concerned Zilla Parishads.
Urban Development Department
Under Grant F-02 Urban Development and Other Advance Services, Major Head 2217
Urban Development, against a budget provision of ` 2,830 crore assigned as Grant-in-aid
to Urban Local Bodies in accordance to the 14th Finance Commission (CSS) an amount of
` 625.63 crore was surrendered/re-appropriated due to non-receipt of functional grants
from the Central Government.
Rural Development Department
Under Grant L-03 Rural Development Programmes, Major Head 2515 Assistance to
Gram Panchayats and Major Head 2501 Integrated Rural Development programme, the
entire budget provision of ` 378.91 crore assigned as Grant in aid to Gram Panchayat for
various Development Schemes as per the recommendation of 14th Finance Commission
was surrendered due to non-release of funds by the Central Government.
Similarly, under Grant L-03 Rural Development Programmes, Major Head 2515 Other
Rural Development Programme, against the budget provision of ` 180 crore allotted for
National Urban Mission (State and Central share) for development of cluster of villages
an amount of ` 168.20 crore was surrendered/re-appropriated due to non-receipt of
installment from the Central Government and due to non-receipt of the Utilisation
Certificate for National Urban Mission Stage I and II from Village Group.
Social Justice and Special Assistance Department
Under Grant N-03 Welfare of Scheduled Caste, Scheduled Tribes and other Backward
Classes and Minorities, Major Head 2235 Welfare of Aged, Infirm and Destitute and
Special Component Plan for Scheduled Castes, as against a budget provision of
` 2,574.01 crore for Sanjay Gandhi Niradhar Anudan Yojana and Shravan Bal Seva
Rajya Nivruti Vetan Yojana, an amount of ` 378.50 crore was surrendered/re-
appropriated without assigning any reason.
Tribal Development Department
Under Grant T-05 Revenue Expenditure on Tribal Areas Development Sub-Plan, Major
Head 2435 Other Agricultural Programmes, against a budget provision of ` 940 crore
funds amounting to ` 922.23 crore was surrendered/reappropriated under Debt relief to
farmers under Chhatrapati Shivaji Maharaj Shetkari Sanman Yojana 2017 due to non-
receipt of proposal for funds from Administrative Department concerned.
Water Supply and Sanitation Department
Under Grant Y-02 Water Supply and Sanitation, Major Head 2215 Sewerage Services
and Special Component Plan for Scheduled Castes, the surrender/re-appropriation of
` 1,973.73 crore was due to non-release of grants by GoI for the Centrally Sponsored
Scheme-Swachh Bharat Mission.
2.3.6 Persistent savings
The persistent savings indicated that budgetary controls in the Departments were not
effective and previous years trends were not taken into account while allocating the funds
for the year.

Chapter II: Financial Management and Budgetary Control
57
On test check of Grant files, audit observed that there were savings of more than
` 100 crore consistently for the last five years in 22 cases (Appendix 2.8) indicating that
either the provisions were in excess or the executive was not successful in implementing
the legislative aspirations.
Savings in each financial year 2014-19 ranged between 52 per cent and 97 per cent of the
total provision under Grant G-02 Other Fiscal and Miscellaneous Services. Similarly,
savings under Grant O-03 Rural Employment ranged between 17.56 per cent and
76.99 per cent, Grant Q-03 Housing ranged between 51.29 per cent and 90.76 per cent
and under Grant Y-02 Water Supply and Sanitation the savings ranged between 42 and
52 per cent of the total provision. The department did not assign specific reasons for
savings during any of the years.
Grant A-09 Capital Outlay on Public works
For construction of the iconic Chhatrapati Shivaji Maharaj statue in the Arabian Sea,
budget provisions were made under Grant A-09 Capital Outlay on Public works Major
Head 4059 from 2015-16 onwards. However, during 2016-17 to 2018-19 more than
80 per cent of the budget provision was re-appropriated for various reasons as detailed
in Table 2.3. Faulty planning and inaccurate estimation resulted in surrender/
re-appropriation of funds during 2016-19.
Table 2.3: Persistent savings under Grant A-09 (`̀̀̀ in crore)
Year Total
Budget
Provision
Actual
Expenditure
Re-
appropriation
Reasons for Re-appropriation
2016-17 100 12.06 87.94 Non-finalization of tender procedure and
non-formation of temporary office owing to
court case
2017-18 150 0 150 Non-finalization of tender process
2018-19 300 0.95 299.05 Surrender of provision of ` 299.05 crore in
March, 2019 was mainly attributed to
decision taken by the Government to incur
the expenditure through Public Works
Department (PWD) and accordingly the
funds were transferred to that department.
However, the expenditure could not be
incurred by PWD due to stay order by
Supreme Court on construction of monument
of Chhatrapati Shivaji Maharaj
Source: Appropriation Accounts of respective years
Persistent savings indicated that the budget allocation was made without considering
the previous years’ expenditure.
Recommendation: The Finance Department needs to review the reasons for non-utilisation of provisions
under various schemes and take steps to make realistic provision in future.
2.3.7 Unnecessary/excessive supplementary provisions
Supplementary provisions aggregating ` 12,990.69 crore obtained in 38 cases (` 10 crore
or more in each case) during the year proved unnecessary as the actual expenditure
(` 1,34,453.22 crore) did not reach the level of the original provision

State Finances Audit Report for the year ended 31 March 2019
58
(` 1,62,720.96 crore) as detailed in Appendix 2.9. Some cases are briefly discussed
below in Table 2.4.
Table 2.4: Grants having savings of more than `̀̀̀ 1,000 crore
where supplementary provision proved unnecessary
(`̀̀̀ in crore)
Grant Number and Description Original
provision Expenditure
Savings out of
original provision
Supplementary
provision
Revenue Section
B01 Police Administration 13652.73 12257.64 1395.09 31.50
D03 Agricultural Services 7211.19 5841.32 1369.87 420.32
F02 Urban Development and Other
Advance Services 12434.10 8920.30 3513.80 502.76
O03 Rural Employment 5064.25 1183.73 3880.53 80.00
T05 Revenue Expenditure on Tribal
Areas Development Sub-Plan 6627.47 3896.44 2731.03 417.43
V02 Co-operation 10149.30 6760.54 3388.75 2134.91
Y02 Water Supply and Sanitation 4650.26 2628.46 2021.80 414.80
Capital Section
O10 Capital Outlay on Other Rural
Development Programmes 4216.70 871.77 3344.93 310.25
Source: Appropriation Accounts of 2018-19
It can be seen that the supplementary provision proved unnecessary since the
expenditure did not even come up to the original provision which clearly indicates
inaccurate estimation of funds.
Recommendation: The Departments need to strengthen the estimation of requirement of funds and review
the basis of supplementary provisions.
2.3.8 Anticipated savings not surrendered
As per Para 173 of the Budget Manual, the spending Departments are required to
surrender grants/appropriations or portions thereof to the FD as and when savings are
anticipated. Further, surrender of funds should be done as soon as these are foreseen
without waiting for the end of the financial year, to enable the FD to efficiently redeploy
the anticipated savings on other needy Schemes.
At the close of 2018-19, as shown in Appendix 2.10 in 96 cases (in excess of ` 50 crore
in each case), Departments surrendered ` 67,356.88 crore (19 per cent of total voted
provision of ` 3,44,942.64 crore).
Surrender of savings in the last two working days of the financial year indicated
inadequate financial discipline.
Recommendation: The departments should ensure that anticipated savings are surrendered on time so that
the funds can be utilized for other development purpose.
2.3.9 Non-surrender of unspent provision
The Maharashtra Budget Manual provides that, all saving should, when they come to
notice, be reported immediately with full details and reasons to the Administrative
Chapter II: Financial Management and Budgetary Control
59
Departments and be surrendered to the department concerned. Government of
Maharashtra (GoM), Medical Education and Drugs Department (MEDD) sanctioned
(March 2016) ` 20.16 crore for purchase of medical equipments and furniture to Indira
Gandhi Medical College and Hospital (IGMCH), Nagpur with the condition that the
purchase of these items would be done by the Nagpur Improvement Trust1 (NIT) on
behalf of the IGMCH. Hence, the entire amount of ` 20.16 crore was to be deposited
(June 2016) with NIT by the IGMCH.
The NIT expressed (November 2016) its inability to procure medical equipments for
want of medical expert.
Hence, the Directorate of Medical Education and Research (DMER), Mumbai purchased
(March 2017) 30 medical equipment costing ` 11.11 crore for which payment was made
by NIT. The NIT also purchased (March 2017) 43 furniture items for ` 5.59 crore. All
the medical equipments and furniture items required by the IGMCH were purchased by
March 2017. NIT informed (November 2017) the IGMCH about the unspent amount of
` 3.46 crore with it. The IGMCH did not take any measures to get back the amount from
NIT for onward credit into the Government account leading to blocking of ` 3.46 crore
for more than two years.
The IGMCH stated that the letter had been issued (August 2019) to the NIT to refund the
unspent balance/savings and after receipt of the unspent balance, it would be credited to
the Government account.
Recommendation: Funds may be surrendered well before the close of the financial year so as to enable
their utilisation for other developmental schemes.
2.4 Outcome of review of selected Grants
The Maharashtra Budget Manual provides that the authority administering a Grant is
responsible for watching the progress of expenditure under its control and for keeping it
within the sanctioned grant or appropriation. The duties and responsibilities of the
authorities include preparing the estimates timely and accurately and also to ensure that
the Grant placed at their disposal is spent only on the objects for which it has been
provided and to surrender savings if no longer required.
With a view to ascertaining how far the authorities were adhering to these instructions,
audit test checked records of the Administrative Department for the period 2016-19 of the
following Grants.
(i) Grant No. A09-Capital Outlay on Public Works: Under this Grant, provision
was made for Construction of Chhatrapati Shivaji Maharaj Monument in Arabian
Sea and Construction of Rajarshi Shahu Maharaj Monument in Shahu Mill at
Kolhapur. This Grant includes two Major Heads namely 4059- Capital Outlay on
Public Works, 4070-Capital Outlay on other Administrative services.
(ii) Grant No. I05- Capital Expenditure on Irrigation : Under this Grant, provision
is made for Soil and Water Conservation, Major, Medium and Minor Irrigation
Project, Flood Control Projects, Power Project and Space Research which covers
six Major Heads namely Capital Outlay on Soil and Water Conservation (4402),
Capital Outlay on Major and Medium Irrigation (4701), Capital Outlay on Minor
1 Nagpur Improvement Trust (NIT) is a development authority of the Nagpur city

State Finances Audit Report for the year ended 31 March 2019
60
Irrigation (4702), Capital Outlay on Flood Control Projects (4711), Capital Outlay
on Power Projects (4801) and Capital Outlay on Space Research (5402).
(iii) Grant No. Y02-Water Supply and Sanitation: Under this Grant, provision was
made for Swachh Bharat Mission, World Bank Assisted-Jalswarajya Project,
Construction of Latrine under Nirmal Bharat Abhiyan and Mukhyamantri Rural
Drinking Water Programme. This Grant consists of one Major Head namely,
2215- Water Supply and Sanitation.
2.4.1 Budget Analysis of Grant Y-02 (Water Supply and Sanitation)
1) Swachh Bharat Mission (CSS): Under this Scheme for the year 2018-19,
original provision was ` 2,816.61 crore and the expenditure incurred was
` 933.89 crore thus surrendering ` 1,882.72 crore due to less release of funds
by the Central Government.
2) Assistance from Loan from NABARD for Liquid Waste Management
Project under RIDF Scheme: Under this Scheme for the year 2018-19, the
entire provision of ` 15.14 crore was surrendered as demands were not
received from Maharashtra Jeevan Pradhikaran.
3) Project Planning and Monitoring Unit (Jalswarajya Project): Under this
scheme for the year 2018-19, original provision was ` 180 crore and the
expenditure incurred was ` 144 crore, and the amount of ` 36 crore had to be
surrendered due to less release of funds by the Finance Department.
4) Mukhyamantri Rural Drinking Water Programme (MRDWP) for
providing pure drinking water supply for rural areas: Under this scheme
for the year 2018-19, original provision was ` 325 crore and the expenditure
incurred was ` 123.89 crore. An amount of ` 62.71 crore was surrendered/re-
appropriated due to less demand from implementing agencies, reason for
surrender/re-appropriation of ` 138.37 crore was not furnished by the
department.
The overall position of budget provision, actual disbursement and savings under the
functional Heads of the Grant for the years 2016-17 to 2018-19 is given in Table 2.5.
Table 2.5: Detail of budgetary provisions and
actual expenditure under Grant No. I-05, A-09 and Y-02
(`̀̀̀ in crore)
Year Original
provision
Supplementary
provision
Total Grant or
Appropriation
Actual
Expenditure
Savings Percentage
of savings
Grant I-05 (Voted) Irrigation
2016-17 8971.69 00 8971.69 8619.67 352.02 4
2017-18 9519.61 1700.00 11219.61 9488.57 1731.04 15
2018-19 9505.01 3117.96 12622.97 11763.57 859.40 7
Grant A-09 (Voted) Capital Outlay on Public Works
2016-17 120.10 0.83 120.93 16.89 104.04 86
2017-18 170.10 0.00 170.10 3.01 167.09 98
2018-19 302.00 0.00 302.00 0.95 301.05 99.7
Grant Y-02 (Voted) Water Supply and Sanitation
2016-17 3377.60 544.69 3922.29 1900.88 2021.41 51.5
2017-18 3989.90 125.00 4114.90 2055.47 2059.43 50.0
2018-19 4650.26 414.80 5065.06 2628.46 2436.60 48.10
Source: Appropriation Accounts of respective years
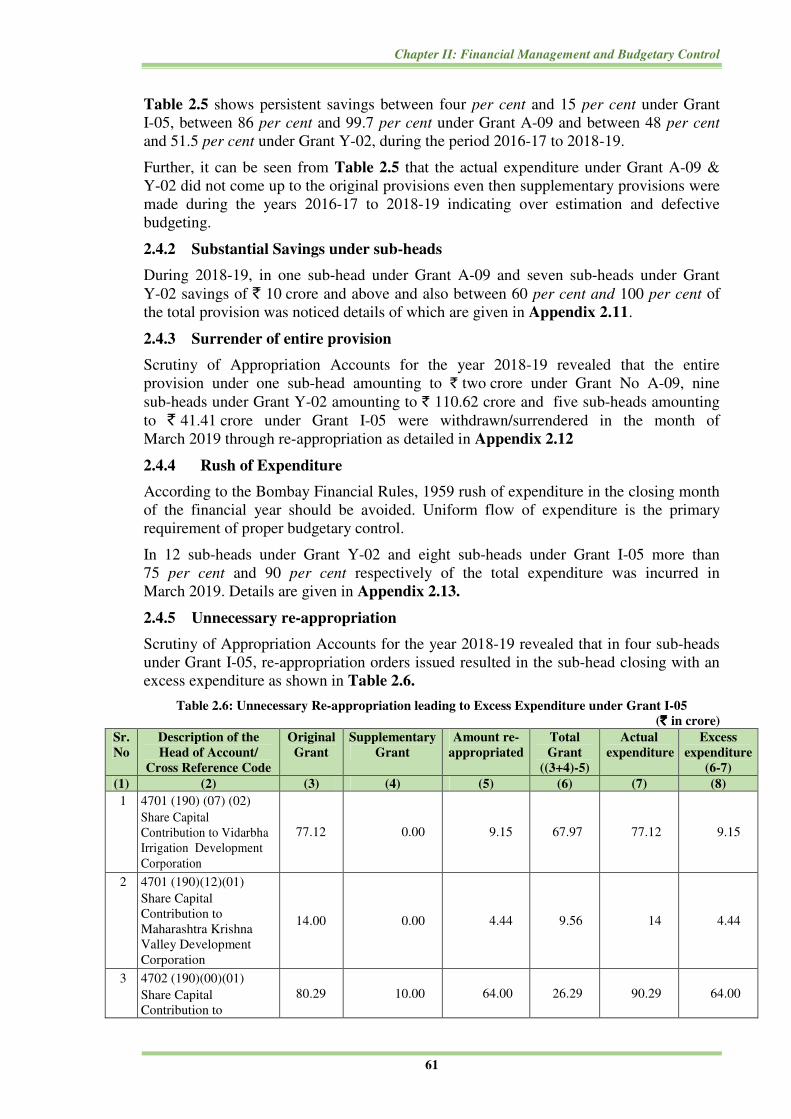
Chapter II: Financial Management and Budgetary Control
61
Table 2.5 shows persistent savings between four per cent and 15 per cent under Grant
I-05, between 86 per cent and 99.7 per cent under Grant A-09 and between 48 per cent
and 51.5 per cent under Grant Y-02, during the period 2016-17 to 2018-19.
Further, it can be seen from Table 2.5 that the actual expenditure under Grant A-09 &
Y-02 did not come up to the original provisions even then supplementary provisions were
made during the years 2016-17 to 2018-19 indicating over estimation and defective
budgeting.
2.4.2 Substantial Savings under sub-heads
During 2018-19, in one sub-head under Grant A-09 and seven sub-heads under Grant
Y-02 savings of ` 10 crore and above and also between 60 per cent and 100 per cent of
the total provision was noticed details of which are given in Appendix 2.11.
2.4.3 Surrender of entire provision
Scrutiny of Appropriation Accounts for the year 2018-19 revealed that the entire
provision under one sub-head amounting to ` two crore under Grant No A-09, nine
sub-heads under Grant Y-02 amounting to ` 110.62 crore and five sub-heads amounting
to ` 41.41 crore under Grant I-05 were withdrawn/surrendered in the month of
March 2019 through re-appropriation as detailed in Appendix 2.12
2.4.4 Rush of Expenditure
According to the Bombay Financial Rules, 1959 rush of expenditure in the closing month
of the financial year should be avoided. Uniform flow of expenditure is the primary
requirement of proper budgetary control.
In 12 sub-heads under Grant Y-02 and eight sub-heads under Grant I-05 more than
75 per cent and 90 per cent respectively of the total expenditure was incurred in
March 2019. Details are given in Appendix 2.13.
2.4.5 Unnecessary re-appropriation
Scrutiny of Appropriation Accounts for the year 2018-19 revealed that in four sub-heads
under Grant I-05, re-appropriation orders issued resulted in the sub-head closing with an
excess expenditure as shown in Table 2.6.
Table 2.6: Unnecessary Re-appropriation leading to Excess Expenditure under Grant I-05
(`̀̀̀ in crore)
Sr.
No
Description of the
Head of Account/
Cross Reference Code
Original
Grant
Supplementary
Grant
Amount re-
appropriated
Total
Grant
((3+4)-5)
Actual
expenditure
Excess
expenditure
(6-7)
(1) (2) (3) (4) (5) (6) (7) (8)
1 4701 (190) (07) (02)
Share Capital
Contribution to Vidarbha
Irrigation Development
Corporation
77.12 0.00 9.15 67.97 77.12 9.15
2 4701 (190)(12)(01)
Share Capital
Contribution to
Maharashtra Krishna
Valley Development
Corporation
14.00 0.00 4.44 9.56 14 4.44
3 4702 (190)(00)(01)
Share Capital
Contribution to
80.29 10.00 64.00 26.29 90.29 64.00

State Finances Audit Report for the year ended 31 March 2019
62
Sr.
No
Description of the
Head of Account/
Cross Reference Code
Original
Grant
Supplementary
Grant
Amount re-
appropriated
Total
Grant
((3+4)-5)
Actual
expenditure
Excess
expenditure
(6-7)
(1) (2) (3) (4) (5) (6) (7) (8)
Maharashtra Krishna
Valley Development
Corporation(Minor
Irrigation(ROM)
(Scheme)
4 4702 (190)(00)(01)
Share Capital
Contribution to Konkan
Irrigation Development
Corporation (Minor
Irrigation)
153.95 22.20 35.78 140.37 176.15 35.78
Source: Appropriation Accounts 2018-19
Control/Monitoring of Expenditure under Grant No. I-5
As per Paragraph 155 (i) and (iv) of Budget Manual, in order to ensure that the amount
allotted to each disbursing officer is not exceeded without permission, the disbursing
officer should submit the statement of his expenditure for the month and total expenditure
up to date to the Controlling Office in Form No. 9 and all Controlling Offices should
maintain a register of expenditure in Budget Manual Form No. 10 for effective control of
expenditure.
On test-check of records of four Controlling Offices2 it was noticed that the disbursing
officers were not submitting statements of expenditure in Form No. 9 and similarly, the Controlling Offices were not maintaining registers of expenditure in Form No. 10.
The Mechanical/Quality Control Circle, Nagpur stated (August 2019) that since monthly
statements of expenditure in Form No. 9 was not submitted by the disbursing officers,
Form No. 10 at Controlling Offices level was not maintained.
Thus non-submission of monthly expenditure in the prescribed formats defeated the
purpose of monitoring the budget and the progress of actual expenditure by Controlling
Offices.
Further, Quality Control Circle, Aurangabad and Mechanical Circle, Nanded have not
submitted the required information till date.
2.5 Advances from Contingency Fund
In terms of provisions of Article 267(2) and 283(2) of the Constitution of India, the
Contingency Fund of the State has been established under the Bombay Contingency Fund
Act, 1956. Advances from the fund are to be made only for meeting expenditure of an
unforeseen and emergent character, postponement of which, till its authorization by the
Legislature, would be undesirable. The Fund is in the nature of an imprest and its corpus
is ` 150 crore.
In April 2018, the corpus of the Fund was temporarily increased to ` 1,678 crore through
an ordinance which lapsed in August 2018. Further, in February 2019, the corpus was
again raised to ` 2,150 crore which was not restored till 31 March 2019.
2 1-Mechanical Circle, Nagpur; 2-Quality Control Circle, Nagpur; 3-Quality Control Circle, Aurangabad
and 4-Mechanical Circle, Nanded
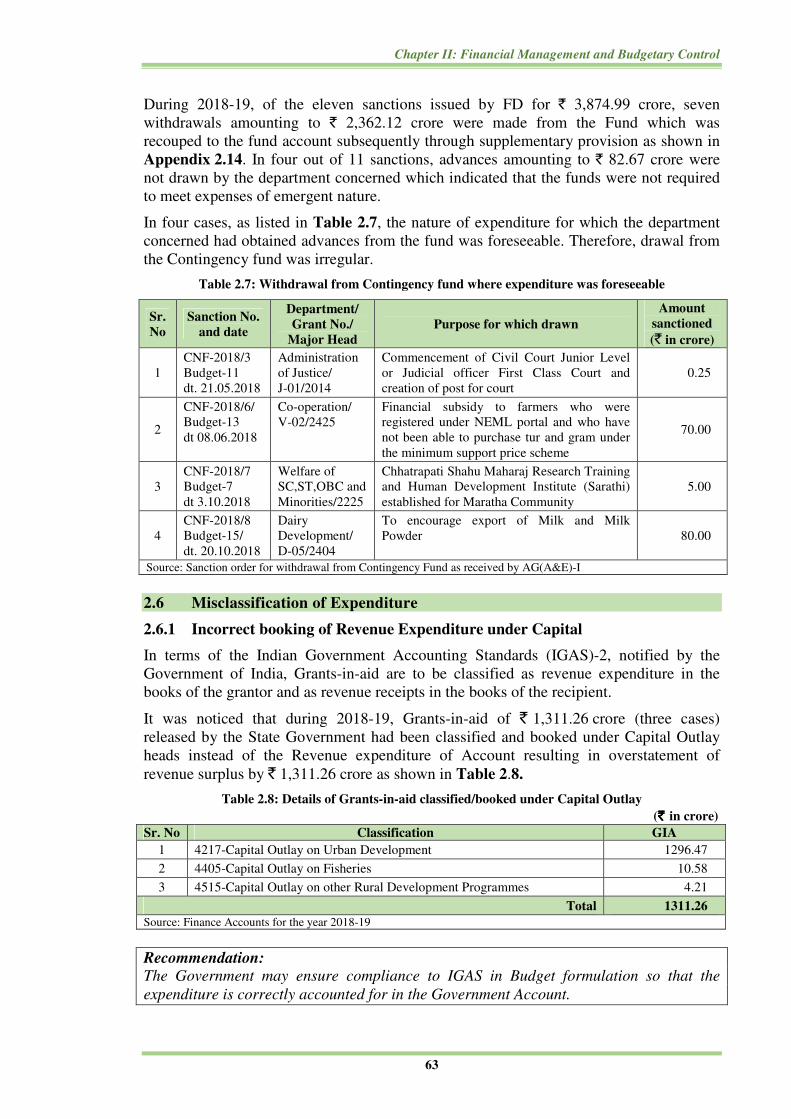
Chapter II: Financial Management and Budgetary Control
63
During 2018-19, of the eleven sanctions issued by FD for ` 3,874.99 crore, seven
withdrawals amounting to ` 2,362.12 crore were made from the Fund which was
recouped to the fund account subsequently through supplementary provision as shown in
Appendix 2.14. In four out of 11 sanctions, advances amounting to ` 82.67 crore were
not drawn by the department concerned which indicated that the funds were not required
to meet expenses of emergent nature.
In four cases, as listed in Table 2.7, the nature of expenditure for which the department
concerned had obtained advances from the fund was foreseeable. Therefore, drawal from
the Contingency fund was irregular.
Table 2.7: Withdrawal from Contingency fund where expenditure was foreseeable
Sr.
No
Sanction No.
and date
Department/
Grant No./
Major Head
Purpose for which drawn
Amount
sanctioned
(` in crore)
1
CNF-2018/3
Budget-11
dt. 21.05.2018
Administration
of Justice/
J-01/2014
Commencement of Civil Court Junior Level
or Judicial officer First Class Court and
creation of post for court
0.25
2
CNF-2018/6/
Budget-13
dt 08.06.2018
Co-operation/
V-02/2425
Financial subsidy to farmers who were
registered under NEML portal and who have
not been able to purchase tur and gram under
the minimum support price scheme
70.00
3
CNF-2018/7
Budget-7
dt 3.10.2018
Welfare of
SC,ST,OBC and
Minorities/2225
Chhatrapati Shahu Maharaj Research Training
and Human Development Institute (Sarathi)
established for Maratha Community
5.00
4
CNF-2018/8
Budget-15/
dt. 20.10.2018
Dairy
Development/
D-05/2404
To encourage export of Milk and Milk
Powder 80.00
Source: Sanction order for withdrawal from Contingency Fund as received by AG(A&E)-I
2.6 Misclassification of Expenditure
2.6.1 Incorrect booking of Revenue Expenditure under Capital
In terms of the Indian Government Accounting Standards (IGAS)-2, notified by the
Government of India, Grants-in-aid are to be classified as revenue expenditure in the
books of the grantor and as revenue receipts in the books of the recipient.
It was noticed that during 2018-19, Grants-in-aid of ` 1,311.26 crore (three cases)
released by the State Government had been classified and booked under Capital Outlay
heads instead of the Revenue expenditure of Account resulting in overstatement of
revenue surplus by ` 1,311.26 crore as shown in Table 2.8.
Table 2.8: Details of Grants-in-aid classified/booked under Capital Outlay
(`̀̀̀ in crore) Sr. No Classification GIA
1 4217-Capital Outlay on Urban Development 1296.47
2 4405-Capital Outlay on Fisheries 10.58
3 4515-Capital Outlay on other Rural Development Programmes 4.21
Total 1311.26
Source: Finance Accounts for the year 2018-19
Recommendation: The Government may ensure compliance to IGAS in Budget formulation so that the
expenditure is correctly accounted for in the Government Account.

State Finances Audit Report for the year ended 31 March 2019
64
2.6.2 Non-transfer of balances to Consolidated Fund
As per Government Resolution (October 2001) of Revenue and Forest Department of
Maharashtra, the balance in the Personal Deposit (PD) account of Inspector General of
Registration was to be credited to Consolidated Fund at the end of every quarter. It was
seen that an accumulated balance of ` 264.57 crore lying in the account over the years as
on 31 March 2019, which was not credited to the Consolidated Fund of the State.
2.7 Outcome of Inspection of Treasuries
The major irregularities noticed by the Accountant General (Accounts and Entitlement)-I,
Maharashtra, Mumbai and the Accountant General (Accounts and Entitlement)-II,
Maharashtra, Nagpur during inspection of 34 District Treasuries (including 323
sub-Treasuries) and the Pay and Accounts Office, Mumbai during 2018-19 are brought
out in the succeeding paragraphs.
2.7.1 Transfer of funds to Personal Deposit Accounts
According to Rule 494 of Maharashtra Treasury Rules, 1968 and Rule 12 of Bombay
Financial Rules 1959, Personal Deposit (PD) Account/Personal Ledger Account (PLA)
can be opened with Treasury Officer for specified purpose on the basis of approval of
Government in consultation with the Accountant General of the State.
The PD accounts, also known as PLA, are in the nature of a banking account kept in the
Treasuries. The Government of Maharashtra (GoM) is authorised to keep funds required
for specific purposes in the PD accounts by transfer of funds from the Consolidated Fund.
Generally, Administrators3 are required to close such accounts on the last working day4 of
the year and transfer the unspent balances back to the Government Accounts
(Consolidated Fund).
As on 31 March 2019, 2,135 PD Accounts showed a total closing balance of
` 10,953.53 crore, which is an improvement over the previous year’s closing balance of
` 12,229.30 crore. The status of PD accounts as on 31 March 2019 is as indicated in
Table 2.9.
Table 2.9: Status of Personal Deposit Accounts during 2018-19
Opening balance Newly opened Closed accounts Closing Balance
Number Amount
(` ` ` ` in crore) Number
Amount
(` ` ` ` in crore) Number
Amount
(` ` ` ` in crore) Number
Amount
(` ` ` ` in crore)
2182$ 12229.30 10 22108.58 57 23384.35 2135 10953.53
$ Differs from previous year due to rectification
Source: Finance Accounts 2018-19
However, the closing balance as per Finance Accounts has not been reconciled by the
Administrators of PD/PLA and therefore, the correct closing balance which should have
been remitted to the Consolidated Fund of the State cannot be ascertained.
Retention of funds in PLAs not only led to expenditure booked under the service heads
being inflated without actual outgo, but also resulted in dilution of treasury control
over actual expenditure.
3 Personal deposit/Personal ledger account holders
4 vide Finance Department’s Government Resolution संक�ण� 1014/� 5/कोषा �शा/5 dated 24 January 2014

Chapter II: Financial Management and Budgetary Control
65
Recommendation: The Finance Department needs to review all PD/PLA accounts and ensure that amounts
transferred from Consolidated Fund lying in the PD accounts at the end of year are
immediately remitted to the Consolidated Fund. Non-reconciliation of balances in PD
accounts periodically and not transferring the unspent balance lying in the PD accounts
to Consolidated Fund before the closure of financial year may entail the risk of misuse
of public fund, fraud and misappropriation.
2.7.2 Non-reconciliation in Personal Deposit/Personal Ledger Accounts balances
As per Paragraph 589 of Maharashtra Treasury Manual, Treasury Officer is required to
obtain a certificate of balance at the end of each year from the Administrator of PLA.
After obtaining such certificate, differences if any, are required to be reconciled with the
Treasury figures and the certificate of balance, after reconciliation with the Treasury,
should be forwarded to Accountant General (Accounts and Entitlement)-I, Maharashtra,
Mumbai and Accountant General (Accounts and Entitlement)-II, Maharashtra, Nagpur for
confirmation of the balances.
Inspection of Treasuries revealed that in 234 Administrators holding PD accounts, there
were differences between the Administrators’ balances and the Treasury/Pay and
Accounts Office balances. In 380 cases, there were differences between the Treasury
balances and the Sub-Treasury balances. In 175 cases, there were differences between the
Sub-Treasury balances and the Administrators’ balances. Besides, 213 Administrators did
not furnish certificates of balances as on March 2018 to Treasury Officers/ Pay and
Accounts Office indicating absence of regular reconciliation. Periodical reconciliation
with the Treasury would have cleared the differences.
2.7.3 Inoperative Personal Ledger Accounts for more than one year not closed
As per Rule 495 of Maharashtra Treasury Rules (MTR), 1968 and 585(2) of Maharashtra
Treasury Manual (MTM), Personal Deposits/Personal Ledger Account which are
inoperative for more than three consecutive accounting years should be closed and the
balances in such accounts are to be credited to the Government Account as Miscellaneous
revenue under Major Head 0075. The time limit was revised5 (January 2014) by
Finance Department, Government of Maharashtra to one year.
It was observed that in the case of 175 accounts, PLAs were not operated by the
Administrators for a period of one year and more, resulting in unutilized balance of
` 75.02 crore lying idle in the PLAs. District-wise details are given in Appendix 2.15. As
per established practice, funds from the Consolidated Fund of the State to PLA should be
transferred through ‘Nil bills’ (non-cash transaction). It was seen that all Treasuries
(except Pune Treasury) did not follow the above practice and instead withdrew large
funds through cheques and credited them to PLA subsequently. The unspent amount so
transferred from the Consolidated Fund and not credited back from the inoperative PLAs
could not be ascertained since the PD accounts included receipts from sources other than
the Consolidated Fund also.
5 vide Finance Department’s Government Resolution संक�ण� 1014/� 5/कोषा �शा/5 dated 24 January 2014

State Finances Audit Report for the year ended 31 March 2019
66
2.7.4 Diversion of funds from PD/PLA
The operation of PD/PLA was authorized exclusively for receipts and expenditure
pertaining to the concerned project for which the PLA was opened. Incurring expenditure
for other purpose was irregular and against the codal provisions of Maharashtra Treasury
Rules,1968 and authorization given by Accountant General (Accounts & Entitlement)-I,
Maharashtra.
(i) Audit scrutiny of the PLA6 records of Public Health Department for the year
2017-18 revealed that ` 57.54 crore were released from 110 Government hospitals’ PLA
under Mahatma Jyotiba Phule Jana Aarogya Yojana7 (MJPJAY).
The payment of insurance premium (` 1,653.09 crore) during July and August 2017 to
State Health Assurance Society was against the inadequate budgeted provision
(` 1,595.55 crore). The Department’s request (January 2018) for authorisation of payment
of ` 66.08 crore8 from PLA was not approved by Accountant General (Accounts &
Entitlement)-I, Maharashtra, Mumbai stating the payment is to be made through regular
budget allocation.
The failure of the Department in making adequate budgetary allocation as well as
non-recoupment of ` 57.54 crore resulted in unnecessary burden on PLA of 110
Government hospitals.
(ii) The Revenue and Forest Department permitted (October 2001) the Inspector
General of Registration (IGR), Pune to open a Personal Ledger account (PLA) in its name
to credit the document charges9 collected and incur expenditure for maintenance of
computer, consumables (toner, paper etc.), and utility expenses like water supply charges,
electricity charges, telephone, internet charges were to be met from this PLA and the
balance amount was to be credited to the Consolidated Fund of the State at the end of
each quarter. Thus by this arrangement, utilization of PLA fund was permitted to be
utilized only to meet the essential office expenses and balance would be part of the
Consolidated Fund of the State.
The Revenue and Forest department (March 2017) introduced E-Property Card
Information System (E-PCIS)10 project for computerization/digitization of land records in
State. As per this GR the expenditure was to be met from the PLA of IGR, Pune. This
sanction permitted the utilization of PLA funds for regular budgeted schemes which was
in contravention to the provisions of Maharashtra Treasury Rules 1968.
6 For retaining fees and other hospital charges received from patients and utilise the same for meeting various
expenses as per the conditions approved by the Government and endorsed by the Accountant General through
authorisation 7 To provide free medical treatment of critical and expensive diseases to the below poverty line and above poverty
line families having orange ration card and income up to ` one lakh per year (excluding Government, semi
Government employees and Income Tax payers) introduced on 04/08/2016 (Implemented 02/10/2016), insurance
premium to be paid on quarterly basis 8 Finance Department’s approval vide Resolution dated 05/07/2017 9 An amount of ` 20 per page with respect to the documents presented for registration by all District Registrars and
sub-registrars Office in Maharashtra State
10 vide GR राभूअ-2016/. �. 350/ल-1
Chapter II: Financial Management and Budgetary Control
67
The said project was to be executed by the Office of Settlement Commissioner and Land
Records, Pune. The total estimated expenditure to be incurred on this project was
` 18.87 crore. As on date (March 2019) a total expenditure of ` 9.79 crore was incurred
from the PLA of IGR.
Thus, the irregular sanction of March 2017 resulted in the expenditure on E-PCIS project
escaping legislative scrutiny and was also against the provisions of Maharashtra Treasury
Rules 1968.
2.7.5 Overpayment of Pension
Overpayment of pensionary benefits of ` 1.24 crore was made by Treasuries during
2018-19 on account of incorrect calculation of dearness relief, non-adjustment of
provisional Death-cum-Retirement Gratuity, non-reduction of family pension from the
specific dates mentioned in the pension payment orders etc.


69
Chapter III
Financial Reporting
A sound internal financial reporting with relevant and reliable information significantly
contributes to efficient and effective governance. Compliance with financial rules,
procedures and directives as well as the timeliness and quality of reporting are some of the
attributes of good governance. Reports on compliance and controls, if effective and
operational, assist the State Government in meeting its basic stewardship responsibilities,
including strategic planning and decision-making. This chapter provides an overview and
status of the State Government’s compliance/non-compliance with various financial rules,
procedures and directives during 2018-19.
3.1 Non-submission/delay in furnishing Utilisation Certificates
The Bombay Financial Rules 1959 provide that for the grants received during a year for
specific purposes, Utilisation Certificates (UCs) should be obtained by the departmental
officers from the grantee institutions and after verification, the UCs should be forwarded to
the concerned Accounting Offices i.e. Accountant General (Accounts and Entitlement)-I,
Mumbai, Accountant General (Accounts and Entitlement) - II, Nagpur and Pay and
Accounts Office, Mumbai within 12 months from the dates of their sanction unless specified
otherwise.
The pending amount of Utilisation Certificates has reduced from ` 65,921.35 crore in
2017-18 to ` 47,483.36 crore in 2018-19. The outstanding amount of pending Utilisation
Certificates constituted 16 per cent of the total expenditure (` 3,03,616 crore) of the
State.
The status of 18,407 UCs aggregating to ` 47,483.36 crore due in respect of grants released
upto 2017-18 is detailed in Appendix 3.1. The age wise position of outstanding UCs is
summarised in Table 3.1.
Table 3.1: Age-wise arrears of UCs
(`̀̀̀ in crore)
Sr. No. Range of delay
(in years)
Utilisation Certificates pending
Number Amount
1 0-1 5859 10544.00
2 1-3 3403 22268.61
3 3-5 1026 5588.46*
4 5-7 869 3350.10
5 7-9 1750 4098.67
6 9 and above 5500 1633.52*
Total 18407 47483.36
Source: Information compiled by the Office of the Accountant General (A&E)-I, Maharashtra, Mumbai
* Higher rounding

State Finances Audit Report for the year ended 31 March 2019
70
The major defaulting departments are Urban Development Department; (59 per cent);
School Education and Sports (nine per cent); Planning (seven per cent); Industries,
Energy and Labour Department (six per cent); Tribal Development (five per cent);
Rural Development and Water Conservation (three per cent); Social Justice and Special
assistance (two per cent) and Public Health (two per cent) in respect of grants disbursed
during 2017-18.
Thus, non-submission of 18,407 utilisation certificates amounting to ` 47,483.36 crore as on
31 March 2019 indicated lack of proper monitoring by the Departments in utilisation of
grants sanctioned for specific purposes. Further, there was no assurance that the money was
actually incurred during the financial year for the purpose it was sanctioned/authorised by
the Legislature. High pendency of UCs may fraught with the risk of misappropriation of
funds and fraud.
Recommendation: Issues holding up submission of Utilisation Certificates may be identified to ensure their
submission within the stipulated time.
3.1.1 Review of utilisation certificates of Public Health Department
Administrative Departments may sanction grants-in-aid (GIA) to an institution or body,
subject to the condition that the sanction is in accordance with the rules or principles
prescribed in the Bombay Financial Rules 1959, or as prescribed with the previous
consent of the Finance Department (FD). As per Appendix 22 Section I of Rule 149 of
the Bombay Financial Rules 1959, every grant made for a specific object is subject to the
implied conditions: (i) the grant will be spent upon the object within a reasonable time i.e
one year from the date of issue of communication of sanction of grant, unless otherwise
specifically stated (ii) that any portion of the amount which is not ultimately required for
expenditure upon that object should be duly surrendered to Government, before the
expiry of the financial year in which it is sanctioned, unless there is a specific provision
to the contrary.
3.1.1.1 Discrepancies in submission of utilisation certificate
As per the provision contained in the Bombay Financial Rules 1959, for grants provided
for specific purposes, Utilisation Certificates should be obtained by the departmental
officer from the grantee institutions and after verification, the Utilisation Certificates
should be forwarded to the concerned accounting offices within 12 months from dates of
their sanction.
During 2016-18 an amount of ` 25.29 crore was released to Vivekanand Medical
Foundation & Research Centre (VMFRC), Latur and ` 23.74 crore released to Rashtra
Sant Tukdoji Regional Cancer Hospital & Research Centre (RSTRCH & RC), Nagpur for
setting up of the Tertiary Care Cancer Centre (TCCC).
Chapter III: Financial Reporting
71
As per the terms and conditions in the grant released order (January 2017), Utilisation
Certificates along with audited statement of accounts were required to be furnished to
the Ministry of Health and Family Welfare, Government of India for each financial year
separately until the grants are fully exhausted by the grantee. The second instalment of
the grant would be released only when the State Government released its share and on
furnishing the Utilisation Certificates of first instalment along with audited financial
statement and copy of asset register duly certified by the competent authority along with
photographs of assets created.
On scrutiny of records it was noticed that the Utilisation Certificates were submitted to
the PAO only in March 2019 for drawal of subsequent GIA for ` 1.62 crore which was
about to lapse at the fag end of the financial year. Further, it was observed from
statement of expenditure that Utilisation Certificates for ` 25.29 crore was submitted
against the actual expenditure of` ` 22.30 crore upto March 2019 in respect of VMFRC,
Latur and Utilisation Certificates for ` 23.74 crore submitted against actual expenditure
of ` 17.57 crore till March 2019 in respect of RSTRCH & RC, Nagpur which indicated
that the Utilisation Certificates were submitted to Pay and Accounts office without
obtaining Utilisation Certificates from grantee institutions as well as making any
verification of the actual utilisation of grant.
3.1.1.2 Non-utilisation of grants
Any unspent balance lying with the grantee on the expiry of one year from the date of
sanction should be surrendered forthwith to Government. Audit observed in respect of
eight1 pending UCs involving grants aggregating ` 58.62 crore disbursed to AYUSH2
during 2017-18 had remained unutilised till March 2019. However, the unspent grants
were not surrendered to the Government and continued to be held by the Controlling
Officers or the implementing agencies under them.
3.2 Non-submission/delay in submission of Accounts by Grantee Institutions
Sections 14 and 15 of the Comptroller and Auditor General’s (CAG) (Duties, Powers and
Conditions of Service) Act, 1971 (DPC Act) envisages audit of accounts of institutions
receiving Government grants, subject to conditions stipulated based on the quantum of
the grants received. In order to identify the institutions which attract audit under the
CAG’s (DPC) Act, 1971 the heads of departments were required to furnish to Audit the
information about the financial assistance given to various institutions, the purposes for
which the assistance was granted and the total expenditure of these institutions/bodies.
The details of such assistance released to the institutions during the year were awaited from
Government Departments (October 2019).
1 Voucher No/dated/amount 382/12-3-18/ ` 0.18 crore ; 386/12-3-2018/ ` 18.56 crore; 1755/31-03-18/ ` 1.46 crore;
2018/31-3-18/ ` 4.72 crore; 1752/31-3-18/ ` 9.06 crore;1753/31-3-18/ ` 13.59 crore; 1998/31-3-18/ `1.83 crore;
and 2019/31-3-18/ ` 9.22 crore 2 Ayurveda, Yoga & Naturopathy, Unani, Siddha and Homoeopathy

State Finances Audit Report for the year ended 31 March 2019
72
Table 3.2 shows age-wise arrears of Annual Accounts due up to 2018-19 in respect of 6,064
Annual Accounts as of August 2019.
Table 3.2: Age-wise arrears of Annual Accounts due from Institutions
Delay in number of years Number of Accounts
0-1 1429
1-3 810
3-5 484
5-7 799
7-9 720
9 and above 1822
Total 6064
Major pendency in submission of Accounts pertained to Higher and Technical Education
Department, School Education and Sports Department.
Non-submission of information regarding Grants and loans paid to various institutions
and non-furnishing of Accounts by them, increase the risk of mis-utilisation of the funds
and the same is brought to the notice of the Government for remedial action.
3.3 Delay in submission of Accounts/Separate Audit Reports of Autonomous
Bodies and placement of Audit Reports before the State Legislature
Several Autonomous Bodies have been set up by the State Government in the fields of
Environment, Housing, Industries, Irrigation, Urban Development, Water Supply and
Sanitation. The audit of Accounts of 25 autonomous bodies in the State has been entrusted
under Section 19 and 20 of CAG’s (DPC) Act, 1971. The status of entrustment of audit,
rendering of Accounts to audit, issuance of Separate Audit Reports (SARs) and their
placement in the Legislature by the Autonomous Bodies are indicated in Appendix 3.2.
The delay in submission of Annual Accounts ranged between one month and 87 months.
The Slum Rehabilitation Authority (Pune and Chinchwad Area) Pune, rendered the accounts
for the period from 2011-12 to 2016-17 in September 2019 after a delay of 87 and 27
months respectively. The Maharashtra Building and other construction Workers Welfare
Board rendered the accounts for 2014-15 to 2015-16 in November 2018 after a delay of 41
months and 29 months respectively and the accounts for 2016-17 and 2017-18 in May 2019
after a delay of 23 months and 11 months respectively. The Compensatory Afforestation
Fund Management and Planning Authority rendered the accounts for the period from
2011-12 to 2014-15 in February 2016 after a delay between eight months and 44 months,
and the accounts for the period from 2015-16 to 2016-17 in August 2018 after a delay of 26
months and 14 months respectively. The Annual Accounts of Maharashtra State Minorities
Commission had been rendered only up to 2012-13. The Annual Accounts from 2016-17
onwards of one3 body is yet to be received. Annual Accounts from 2017-18 onwards of
seven4 bodies were yet to be received. Further, Annual Accounts for 2018-19 of
3 Godavari Marathwada Irrigation Development Corporation 4 Maharashtra Jeevan Pradhikaran; Maharashtra Maritime Board; Maharashtra Water Resources Regulatory Authority;
Maharashtra State Legal Services Authority; Maharashtra State Commission for Protection of Child Rights; Tapi
Irrigation Development Corporation; Maharashtra Water Conservation Corporation
Chapter III: Financial Reporting
73
eight5 bodies were yet to be received. The inordinate delays in submission of Accounts and
their presentation to the State Legislature result in delayed scrutiny of the functioning of
these bodies by the Legislature where Government investments are made.
There were delays in submission/finalisation of Accounts by Autonomous
Bodies/Commercial Undertakings which dilute accountability and defeats the purpose
of preparation of Accounts.
Recommendation: The Controlling Departments may identify the reasons for delay in finalisation of
Accounts of Autonomous Bodies/Undertakings and institute remedial measures to
ensure that arrears in Accounts are cleared in a time bound manner.
3.4 Delay in finalisation of Proforma Accounts by departmentally managed
Commercial Undertakings
As per Rule 18 of Government Accounting Rules, 1990, the Departmental Undertakings
of certain Government Departments, performing activities of Quasi-Commercial nature, are
required to prepare Proforma Accounts in the prescribed format annually showing the
working results of financial operations so that Government can assess their performance.
The finalised Accounts of the departmentally managed Commercial and Quasi-Commercial
Undertakings reflect their overall financial health and efficiency in conducting their
business.
Heads of Government Departments have to ensure that the Undertakings prepare such
Accounts and submit the same to the Principal Accountant General (Audit)-I, Maharashtra,
Mumbai for audit within a specified time frame. As of March 2019, there were 49 such
Undertakings of which, 12 had prepared Accounts up to 2017-18, 19 up to 2016-17, six up
to 2015-16 and six up to 2014-15. In respect of five Undertakings, there was large pendency
in finalisation of Proforma Accounts ranging from 20 to 33 years as these were sick units
and not operational and had stopped preparing Accounts. Government Milk Scheme,
Mumbai, Worli has been closed since 2008-09. The Department-wise position of arrears in
preparation of Proforma Accounts and investments made by the Government are given in
Appendix 3.3.
3.5 Misappropriations, losses, defalcations etc.
The Bombay Financial Rules 1959 provide that misappropriation, fraudulent
drawal/payment or otherwise discovered in a treasury or any other office/department should
be reported immediately by the office concerned to the next higher authority as well as to
the Principal Accountant General (Audit)-I, Maharashtra, Mumbai and Accountant General
(Audit)-II, Maharashtra, Nagpur.
The State Government reported 272 cases of misappropriations, defalcations etc., involving
` 1,017.16 crore up to March 2019 on which final action was pending. First Information
Reports were lodged in all the 272 cases. The Department-wise breakup of pending cases
and age analysis are given in Appendix 3.4. The nature of these cases is given in
Appendix 3.5. The age-profile of the pending cases and the number of cases pending in
each category as emerged from these appendices are summarised in Table 3.3.
5 Maharashtra Krishna Valley Development Corporation; Konkan Irrigation Development Corporation; Maharashtra State
Commission for Women; Maharashtra Pollution Control Board; Slum Rehabilitation Authority, Mumbai; Maharashtra
Khadi and Village Industries Board; Maharashtra State Human Rights Commission; Vidarbha Irrigation Development
Corporation

State Finances Audit Report for the year ended 31 March 2019
74
Table 3.3: Profile of Misappropriations, Losses, Defalcations etc.
Age-profile of the pending cases Nature of the pending cases
Range in
Years
Number of
cases
Amount involved
(`̀̀̀ in crore)
Nature/
characteristic of the
cases
Number of
cases
Amount
involved
(`̀̀̀ in crore)
0-5 18 1.54 Theft 71 1.24
5 - 10 51 23.34
10 - 15 43 981.77*
Misappropriation/
Loss of material 201 1015.92
15 - 20 22 0. 59
20 - 25 43 7.66
25 and above 95 2.26
Total 272 1017.16 Total pending cases 272 1017.16
Source: Data furnished by various Departments and Accountant General (Accounts and Entitlement)-II, Maharashtra,
Nagpur and Pay and Accounts Office, Mumbai
* Higher rounding
Around 92 per cent of the amount involved pertains to Finance Department
(` 937.41 crore). The reasons for which the cases were outstanding have been broadly
categorised in Table 3.4.
Table 3.4: Reasons for the delay/pendency of cases
Reasons for the delay/
pendency of cases
Number
of cases
Amount
(`̀̀̀ in crore)
Departmental and criminal investigation awaited 71 938.72
Departmental action initiated but not finalised 73 62.45
Criminal proceedings finalised but recoveries were
pending
3 3.99
Orders for recovery or write-off were awaited 57 1.68
Pending in the courts of law 68 10.32
Total 272 1017.16
Source: Data furnished by various Departments and Accountant General (Accounts and Entitlement)-II,
Maharashtra, Nagpur and Pay and Accounts Office, Mumbai
It may be seen from Table 3.3 that of 272 cases involving ` 1,017.16 crore, 203 cases
(75 per cent) involving ` 992.27 crore (98 per cent) were pending for more than 10 years.
Further, from Table 3.4 it is seen that 73 cases involving ` 62.45 crore were pending for
final Departmental action and 57 cases involving ` 1.68 crore were pending for want of
recovery or write-off orders.

Chapter III: Financial Reporting
75
3.6 Reconciliation of receipts and expenditure
All Controlling Officers are required to reconcile the receipts and expenditure of the
Government with the figures accounted for by the Offices of the Accountant General
(Accounts and Entitlement)-I, Maharashtra, Mumbai or Accountant General (Accounts and
Entitlement)-II, Maharashtra, Nagpur or the Pay and Accounts Office, Mumbai, as the case
may be. Such reconciliation had been completed only for an expenditure of ` 1,65,613 crore
(68 per cent) against the total expenditure of the Government (` 2,43,734 crore) and
reconciliation of receipts has been completed for ` 1,67,637 crore (94 per cent) against the
total receipts of the Government (` 1,79,006 crore) (excluding expenditure and receipt
adjusted through Transfer Entries and periodical adjustment).
Major defaulting Departments were Parliamentary Affairs, Urban Development;
Maharashtra Legislature Secretariat; General Administration; Public Health;
Industries Energy and Labour; Finance; Water Supply and Sanitation; Housing etc.
Non-reconciliation of Accounts has an impact on the assurance of completeness and
correctness of the receipt and expenditure figures by the Department, which may result in
frauds, defalcation and over drawals etc. remaining undetected.
3.7 Opaqueness in Government Accounts
The omnibus Minor Head 800 relating to ‘Other Receipts/Other Expenditure’ is to be
operated only in cases when the appropriate Minor head has not been provided in the
Account. Indiscriminate booking of receipts and expenditure under Minor Head 800 results
in opaqueness in accounts. During 2018-19, expenditure aggregating ` 18,563.21 crore was
classified under Minor Head ‘800 – Other expenditure’ against 23 Major Heads under
Revenue and Capital sections and revenue receipts aggregating to ` 1,449.12 crore were
classified under omnibus Minor Head ‘800 – Other Receipts’ under 12 Major Heads under
Revenue and Capital Sections.
It was observed that while the expenditure under the Minor Head 800 increased from
`13,397.54 crore in 2017-18 to ` 18,563.21 crore in 2018-19, Revenue receipts under the
Minor Head 800 have decreased from ` 2,645.08 crore to ` 1,449.12 crore.
Details of significant transactions (involving more than ` 20 crore and constituting more
than 20 per cent of the relevant Major Head) of receipts (22 items involving
` 1,449.12 crore) and expenditure (63 items involving ` 18,563.21 crore) at sub-head level
are given in Appendix 3.6.
More efforts are required on the part of Finance Department to classify the
expenditure/receipts under correct respective minor heads instead of Minor Head 800.
Booking of large amounts under the omnibus Minor Head 800 – Other Expenditure/
Receipts affects the transparency in financial reporting as it fails to indicate disaggregated
information on different activities of the Government separately in the accounts.
Recommendation: The Finance Department in consultation with the Accountant General (Accounts &
Entitlement) may conduct a comprehensive review of all items presently appearing
under Minor Head ‘800-Other Expenditure’ and ensure that in future all such receipts
and expenditure are booked under the appropriate heads of accounts to avoid
opaqueness in the accounts.

State Finances Audit Report for the year ended 31 March 2019
76
3.8 Pendency in submission of Detailed Contingent Bills against Abstract
Contingent Bills
As per Rule 302 of Maharashtra Treasury Rules, 1968, read with Resolution of Finance
department (July 2007), a Drawing and Disbursing Officer (DDO) may draw money from
treasury for contingent expenditure through Abstract Contingent (AC) bill in form
MTR 29 and should submit the details of expenditure through Detailed Contingent (DC)
bill (vouchers in support of final expenditure) against the AC bills drawn in form
MTR 30 within one month to the Pay and Accounts Office or Treasury. Further, the
DDOs should obtain a clearance certificate from the respective Accountant General. Also
as per Note(4) below Rule 306, a register of AC bill should be maintained by the DDOs
in the prescribed form in order to watch the submission of DC bills in respect of amounts
drawn on AC bills within stipulated period as specified in Rule 303.
It was seen that of ` 861.82 crore drawn through 2,363 AC bills during 2018-19,
` 210.88 crore through 172 AC bills (24 per cent) was drawn on the last day of the
financial year. Significant drawal through AC bills on the last day indicates that the
drawal was primarily to exhaust the budget provision and reveals inadequate budgetary
control.
As on 31 March 2019, 2,612 DC bills amounting to ` 1,964.37 crore were not received in
the Offices of the Accountant General (Accounts and Entitlement)-I, Maharashtra, Mumbai,
Accountant General (Accounts and Entitlement)-II, Maharashtra, Nagpur, Pay and Accounts
Office, Mumbai. Year-wise details and the Department-wise position are given in Table 3.5
and Appendix 3.7 respectively.
Table 3.5: Pendency in submission of Detailed Contingent Bills against Abstract Contingent Bills
(`̀̀̀ in crore)
Year AC bills drawn DC bills received Outstanding AC bills
Number Amount Number Amount Number Amount
Up to 2016-17 1520 788.11 411 59.51 1109 728.60
2017-18 1075 417.38* 626 10.88 449 406.50*
2018-19 2363 861.82# 1309 32.55 1054 829.27
Total 4958 2067.31 2346 102.94 2612 1964.37$
* Differs from previous years pending DC Bills, due to rectification of error during previous year
# Additions during year 2018-19
$ ` 758.44 crore drawn by the department in respect of service provided by Haffkine Bio-pharmaceutical Corporation
Limited
Source: Finance Accounts 2018-19

Chapter III: Financial Reporting
77
Most of the outstanding Abstract Contingent Bills relate to Home Department (789 bills
amounting to ` 795 crore). Advances drawn and not accounted for, increases the
possibility of wastage/misappropriation/malfeasance etc.
Recommendation: The Government may ensure timely submission of Detailed Contingent Bills by the
Drawing and Disbursing Officers as stipulated in Maharashtra Treasury Rules, 1968,
and disallow drawal of funds on Abstract Contingent Bills to Departments who have not
rendered Detailed Contingent Bills for previous withdrawals.
(S. K. JAIPURIYAR)
Mumbai Principal Accountant General
The (Audit)-I, Maharashtra
Countersigned
(RAJIV MEHRISHI)
New Delhi Comptroller and Auditor General of India
The


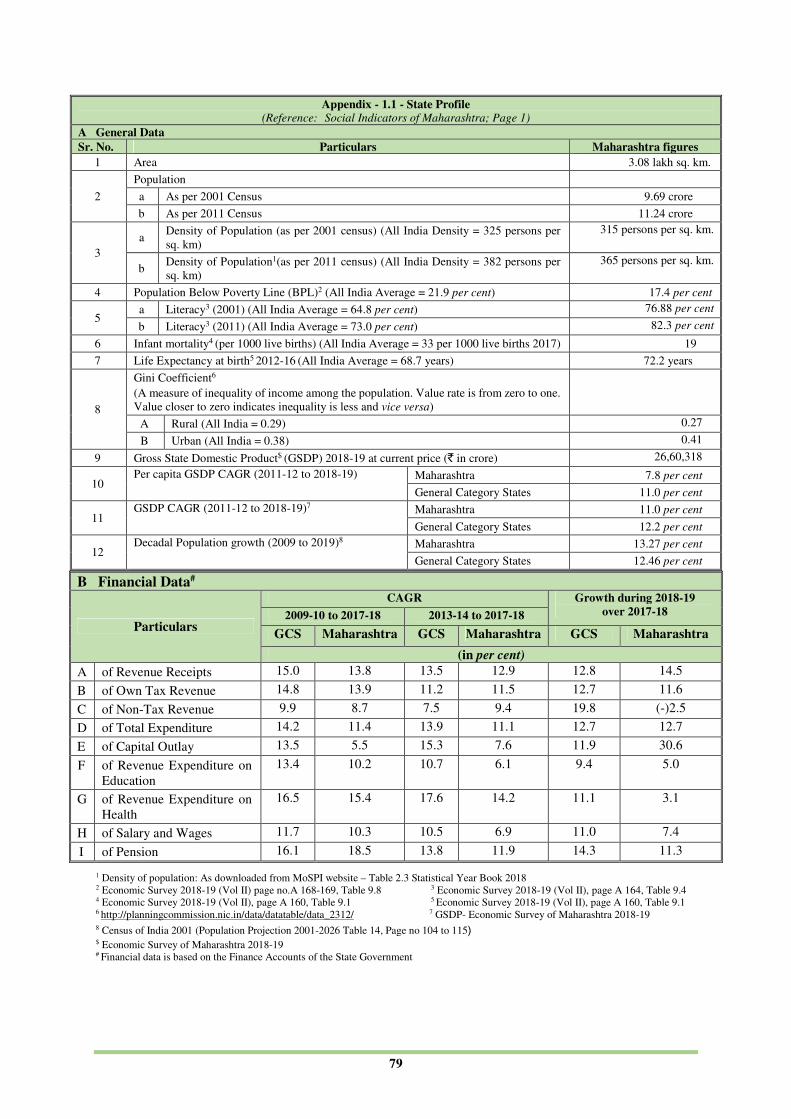
79
B Financial Data#
Particulars
CAGR Growth during 2018-19
over 2017-18 2009-10 to 2017-18 2013-14 to 2017-18
GCS Maharashtra GCS Maharashtra GCS Maharashtra
(in per cent)
A of Revenue Receipts 15.0 13.8 13.5 12.9 12.8 14.5
B of Own Tax Revenue 14.8 13.9 11.2 11.5 12.7 11.6
C of Non-Tax Revenue 9.9 8.7 7.5 9.4 19.8 (-)2.5
D of Total Expenditure 14.2 11.4 13.9 11.1 12.7 12.7
E of Capital Outlay 13.5 5.5 15.3 7.6 11.9 30.6
F of Revenue Expenditure on
Education
13.4 10.2 10.7 6.1 9.4 5.0
G of Revenue Expenditure on
Health
16.5 15.4 17.6 14.2 11.1 3.1
H of Salary and Wages 11.7 10.3 10.5 6.9 11.0 7.4
I of Pension 16.1 18.5 13.8 11.9 14.3 11.3
1 Density of population: As downloaded from MoSPI website – Table 2.3 Statistical Year Book 2018 2 Economic Survey 2018-19 (Vol II) page no.A 168-169, Table 9.8 3 Economic Survey 2018-19 (Vol II), page A 164, Table 9.4 4 Economic Survey 2018-19 (Vol II), page A 160, Table 9.1 5 Economic Survey 2018-19 (Vol II), page A 160, Table 9.1 6 http://planningcommission.nic.in/data/datatable/data_2312/ 7 GSDP- Economic Survey of Maharashtra 2018-19 8 Census of India 2001 (Population Projection 2001-2026 Table 14, Page no 104 to 115) $ Economic Survey of Maharashtra 2018-19 # Financial data is based on the Finance Accounts of the State Government
Appendix - 1.1 - State Profile (Reference: Social Indicators of Maharashtra; Page 1)
A General Data
Sr. No. Particulars Maharashtra figures
1 Area 3.08 lakh sq. km.
2
Population
a As per 2001 Census 9.69 crore
b As per 2011 Census 11.24 crore
3
a Density of Population (as per 2001 census) (All India Density = 325 persons per
sq. km)
315 persons per sq. km.
b Density of Population1(as per 2011 census) (All India Density = 382 persons per
sq. km)
365 persons per sq. km.
4 Population Below Poverty Line (BPL)2 (All India Average = 21.9 per cent) 17.4 per cent
5 a Literacy3 (2001) (All India Average = 64.8 per cent) 76.88 per cent
b Literacy3 (2011) (All India Average = 73.0 per cent) 82.3 per cent
6 Infant mortality4 (per 1000 live births) (All India Average = 33 per 1000 live births 2017) 19
7 Life Expectancy at birth5 2012-16 (All India Average = 68.7 years) 72.2 years
8
Gini Coefficient6
(A measure of inequality of income among the population. Value rate is from zero to one.
Value closer to zero indicates inequality is less and vice versa)
A Rural (All India = 0.29) 0.27
B Urban (All India = 0.38) 0.41
9 Gross State Domestic Product$ (GSDP) 2018-19 at current price (` in crore) 26,60,318
10 Per capita GSDP CAGR (2011-12 to 2018-19)
Maharashtra 7.8 per cent
General Category States 11.0 per cent
11 GSDP CAGR (2011-12 to 2018-19)7
Maharashtra 11.0 per cent
General Category States 12.2 per cent
12 Decadal Population growth (2009 to 2019)8 Maharashtra 13.27 per cent
General Category States 12.46 per cent
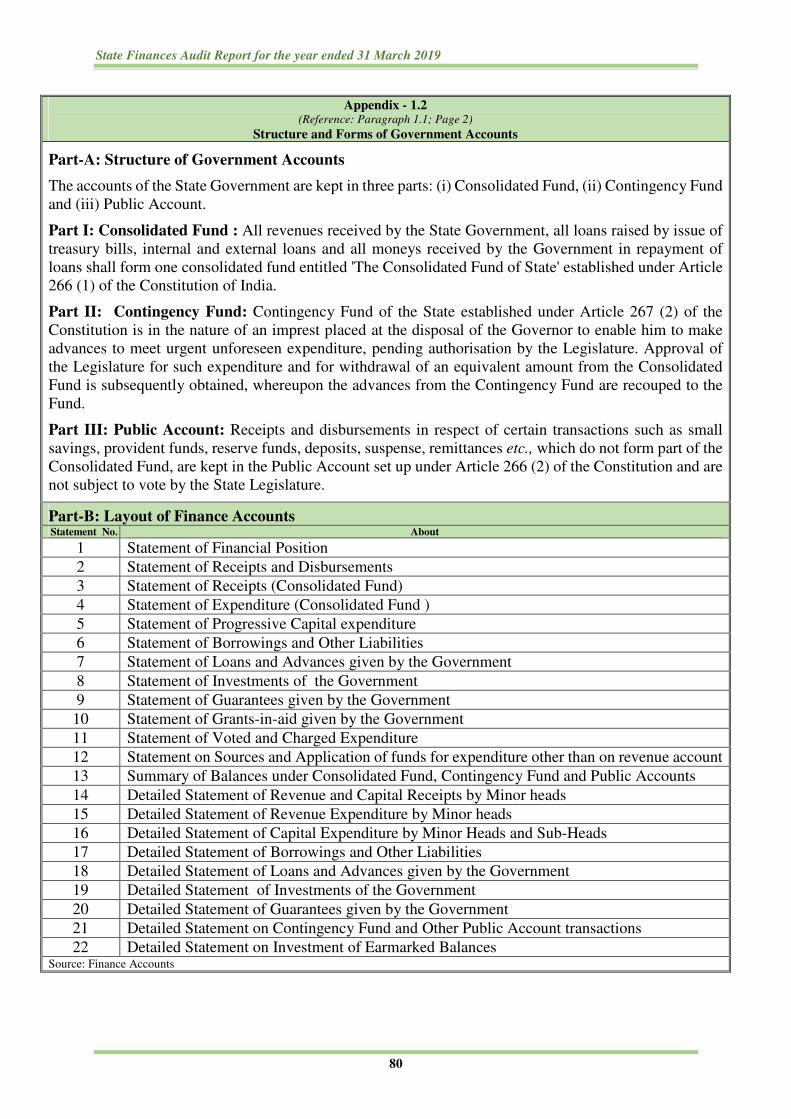
State Finances Audit Report for the year ended 31 March 2019
80
Appendix - 1.2 (Reference: Paragraph 1.1; Page 2)
Structure and Forms of Government Accounts
Part-A: Structure of Government Accounts
The accounts of the State Government are kept in three parts: (i) Consolidated Fund, (ii) Contingency Fund
and (iii) Public Account.
Part I: Consolidated Fund : All revenues received by the State Government, all loans raised by issue of
treasury bills, internal and external loans and all moneys received by the Government in repayment of
loans shall form one consolidated fund entitled 'The Consolidated Fund of State' established under Article
266 (1) of the Constitution of India.
Part II: Contingency Fund: Contingency Fund of the State established under Article 267 (2) of the
Constitution is in the nature of an imprest placed at the disposal of the Governor to enable him to make
advances to meet urgent unforeseen expenditure, pending authorisation by the Legislature. Approval of
the Legislature for such expenditure and for withdrawal of an equivalent amount from the Consolidated
Fund is subsequently obtained, whereupon the advances from the Contingency Fund are recouped to the
Fund.
Part III: Public Account: Receipts and disbursements in respect of certain transactions such as small
savings, provident funds, reserve funds, deposits, suspense, remittances etc., which do not form part of the
Consolidated Fund, are kept in the Public Account set up under Article 266 (2) of the Constitution and are
not subject to vote by the State Legislature.
Part-B: Layout of Finance Accounts Statement No. About
1 Statement of Financial Position
2 Statement of Receipts and Disbursements
3 Statement of Receipts (Consolidated Fund)
4 Statement of Expenditure (Consolidated Fund )
5 Statement of Progressive Capital expenditure
6 Statement of Borrowings and Other Liabilities
7 Statement of Loans and Advances given by the Government
8 Statement of Investments of the Government
9 Statement of Guarantees given by the Government
10 Statement of Grants-in-aid given by the Government
11 Statement of Voted and Charged Expenditure
12 Statement on Sources and Application of funds for expenditure other than on revenue account
13 Summary of Balances under Consolidated Fund, Contingency Fund and Public Accounts
14 Detailed Statement of Revenue and Capital Receipts by Minor heads
15 Detailed Statement of Revenue Expenditure by Minor heads
16 Detailed Statement of Capital Expenditure by Minor Heads and Sub-Heads
17 Detailed Statement of Borrowings and Other Liabilities
18 Detailed Statement of Loans and Advances given by the Government
19 Detailed Statement of Investments of the Government
20 Detailed Statement of Guarantees given by the Government
21 Detailed Statement on Contingency Fund and Other Public Account transactions
22 Detailed Statement on Investment of Earmarked Balances Source: Finance Accounts

Appendices
81
Appendix - 1.3 (Reference: Paragraph 1.1; Page 2)
Fiscal Responsibility and Budgetary Management Act and Rules
Maharashtra Fiscal Responsibility and Budgetary Management Act, 2005 The State Government has enacted the Fiscal Responsibility and Budget Management (FRBM) Act, 2005 to ensure
prudence in fiscal management and to maintain fiscal stability in the State. To improve the fiscal position and to
bring fiscal stability, the Act envisages progressive elimination of revenue deficit, reduction in fiscal deficit and
prudent debt management consistent with fiscal sustainability. To ensure fiscal prudence the Act also provides for
greater fiscal transparency in fiscal operations of the Government and conduct of fiscal policy in a medium term
framework and matters connected therewith or thereto.
The FRBM Act, 2005, was, however, amended in December 2006 and renamed as Fiscal Responsibility and
Budgetary Management (Amendment) Act, 2006. The MFRBMR were further amended in March 2012 and
renamed as Fiscal Responsibility and Budgetary Management (Amendment) Rules, 2012.
The major fiscal targets for the State as amended were as under:
• The fiscal deficit of the State Government shall not exceed three per cent of GSDP in 2010-11 and thereafter.
• The State Government shall maintain the outstanding debt to GSDP up to 25.3 per cent in 2014-15,
17.6 per cent in 2015-16, 15.7 per cent in 2016-17, 16.5 per cent in 2017-18 and 16.5$ per cent in 2018-19.
Medium Term Fiscal Policy Statement
• As prescribed in the Maharashtra FRBM Rules, 2006 (as amended in 2008), the State Government laid a
Medium Term Fiscal Policy Statement (MTFPS) and a Fiscal Policy Strategy Statement along with the budget
before the Legislature on 9th March 2018. As per MTFPS 2018-19,the State Government aims to:
i. maintain the percentage of interest on Government borrowings within 20 per cent of the revenue receipts.
ii. cumulative State borrowings should be within 25 per cent of the state GSDP.
iii. complete 26 incomplete irrigation projects on priority by mobilizing additional investment under Pradhan
Mantri Krishi Sinchayee Yojana through a loan of ` 12,773 crore from NABARD (LITF) and
iv. Maharashtra Electric Vehicle Policy 2018 to promote production of electric vehicles with an investment of
` 25,000 crore aiming at creating one lakh jobs.
• The State Government has developed its own Fiscal Correction Path (FCP) indicating the milestones of
outcome indicators with target dates of implementation during the period from 2013-14 to 2018-19 keeping in
view the fiscal targets laid down in the FRBM Act and/or the rules made thereunder.
Source: Budget 2018-19 $ As per MTFPS 2018-19

State Finances Audit Report for the year ended 31 March 2019
82
Appendix - 1.4
(Reference: Paragraph 1.1; Page 2)
Outcome indicators of the State’s own Fiscal Correction Path
(`̀̀̀ in crore)
Item 2012-13 2013-14 2014-15 2015-16 2016-17 2017-18 2018-19 2019-20
Actuals Actuals RE BE Projections BE BE BE
A STATE REVENUE ACCOUNT
1 States Own Tax Revenue
(SOTR) 103448.38 108640.6 119007.93 130634.71 148923.57 153436.57 188039.84 210824.29
2 States own Non-Tax Revenue
(NONTR) 9984.40 11351.97 13519.70 20664.87 21698.11 20156.32 22784.94 16806.72
3 SOTR + NONTR (1+2) 113432.78 119992.57 132527.63 151299.58 170621.68 173592.89 210824.78 227631.01
4 Share in Central Taxes 15192.12 16587.8 17606.98 29061.95 36897.00 37405.27 43514.60 46630.66
5 Plan Grants 8644.11 7708.86 22058.43 11975.82 11975.82 - - -
6 Non-plan Grants 5678.22 5532.58 8600.85 5893.15 5893.15 32739.39 31628.58 40378.45
7 Total Central Transfer (4+5+ 6) 29514.45 29829.24 48266.26 46930.92 54765.97 70144.66 75143.18 87009.11
8 Total Revenue Receipts (3+7) 142947.23 149821.81 180793.89 198230.50 225387.65 243737.55 285967.96 314640.12
9 Plan Revenue Expenditure 24568.24 25906.74 40593.69 47478.95 52290.09 - - -
10 Non-Plan Revenue Expenditure 114167.74 128995.68 154083.63 154508.94 173667.98 - - -
11 Salary Expenditure 50092.47 56928.16 61682.27 73437.66 85061.21 87147.00 102668.00 115241.00
12 Pension 13429.89 15186.23 17663.41 19929.09 24313.49 25567.00 27378.00 36368.00
13 Interest Payments (Government
Debt) 19075.64 21207.00 24283.25 27662.56 29361.01 31027.00 34385.00 35207.00
Subsidies - Total (14+15) 9952.45 12440.78 20588.59 14687.27 15421.63 17948.93 30371.38 22136.33
14 Subsidies - General 5035.18 7165.26 10088.59 9724.58 10210.81 13448.93 25430.27 16926.33
15 Subsidies - Power 4917.27 5275.52 10500.00 4962.69 5210.82 4500.00 4941.11 5210.00
16 Total Revenue Expenditure
(9+10) 138735.98 154902.42 194677.32 201987.89 225958.07 248248.74 301342.86 334933.06
17 Salaries+Pension+Interest
(11+12+13) 82598 93321.39 103628.93 121029.31 138735.71 143741.00 164431.00 186816.00
18 as percentage of Revenue
Receipts (17/8) 57.78 62.29 57.32 61.05 61.55 58.97 57.50 59.37
19 Revenue Surplus/Deficit (8-16) 4211.25 (-)5080.61 (-)13883.43 (-)3757.39 (-)570.42 4511.19 15374.90 20292.94
B CONSOLIDATED REVENUE ACCOUNT
1 Interest payments(Off-Budget
Debt) - - - - - - - -
2 Consolidated Revenue Deficit
(A19-B1) 4211.25 (-)5080.61 (-)13883.43 (-)3757.39 (-)570.42 4511.19 15374.90 20292.94
C CONSOLIDATED DEBT
1 Outstanding debt and liability
inclusive of off-budget 246691.94 269355.42 302577.99 333159.97 367012.61 413044.00 461807.00 471642.00
2
Total outstanding guarantees of
which guarantee on account of
borrowings and Special
Purpose Vehicle borrowings
9388.19 7709.31 6500.31 6200.31 6000.31 - - -
D CAPITAL ACCOUNT
1 Capital Outlay 17397.97 20020.45 23342.23 27104.23 33386.10 33809.12 36297.86 41659.16
2 Disbursement of Loans and
advances 1415.94 1645.09 1055.29 969.84 1049.89 1695.23 1178.64 2007.45
3 Recoveries of Loans and
advances 862.85 728.03 1034.9 1098.45 1153.37 1226.79 2265.56 2289.61
4 Other Capital Receipts - - - - - - - -
E1 Fiscal Deficit (A19+D1+D2-
D3-D4) 13739.81 26018.12 37246.05 30733.01 33853.03 38788.75 50585.84 61669.94
E2 Gross Fiscal Deficit (E1+B1) 13739.81 26018.12 37246.05 30733.01 33853.03 38788.75 50585.84 61669.94
GSDP at current prices
(Projection) 1322222 1510132 1686695 1889098 2115790 2939924 2796086 2979556
Source: Information received from Finance Department, Government of Maharashtra

Appendices
83
# Lower rounding $ includes ` 437.77 crore, details not available
Appendix - 1.5 (Reference: Paragraph 1.2; Page 3)
Abstract of Receipts and Disbursements for the year 2018-19 as compared to 2017-18
(`̀̀̀ in crore) (`̀̀̀ in crore)
Receipts Disbursements
2017-18 2018-19 2017-18 Total 2018-19
Section-A : Revenue
243653.56 I Revenue receipts 278996.27 241571.07 I Revenue
expenditure 267021.67 267021.67
167931.86 Tax revenue 187436.37 78534.78 General services 84764.50
93054.30 Social services 109390.99
16241.80 Non-tax revenue 15843.57 48476.31 Education, Sports,
Art and Culture 50922.35
11604.72 Health and Family
Welfare 11969.31
59480.90$ State’s share of
Union Taxes 42054.20# 12214.08
Water Supply,
Sanitation, Housing
and Urban
Development
14377.51
71.78 Information and
Broadcasting 142.03
7157.50 Non-Plan grants 8310.04 12438.82
Welfare of
Scheduled Castes,
Scheduled Tribes
and Other Backward
Classes
14234.13
834.39 Labour and Labour
Welfare 882.52
196.71 Grants for State
Plan Scheme 1886.55 7291.45
Social Welfare and
Nutrition 16723.58
122.75 Others 139.56
12980.72
Grants for Central
and Centrally
sponsored Plan
Schemes
15113.50
54189.03 Economic Services 52758.97
26129.61 Agriculture and
Allied Activities 20019.67
6588.72 Rural Development 6997.11
1488.00
Compensation for
loss of revenue
arising out of
implementation of
GST
8330.00 0.58 Special Areas
Programmes 0.63
101 - Skill
Development and
Entrepreneurship-
Other Schemes
22.04 2159.28 Irrigation and Flood
Control 1897.91
8945.73 Energy 11135.17
2438.94 Industry and
Minerals 3579.89
5460.91 Transport 6338.48
224.52 Science, Technology
and Environment 296.58
2240.74 General Economic
Services 2493.54
15792.96 Grants-in-aid and
Contributions 20107.21
II
Revenue deficit
carried over to
Section B 2082.49 II
Revenue Surplus
carried over to
Section B 0.00 11974.60

State Finances Audit Report for the year ended 31 March 2019
84
# Lower rounding
Appendix - 1.5 (contd…)
(`̀̀̀ in crore) (`̀̀̀ in crore)
Receipts Disbursements
2017-18 2018-19 2017-18 Total 2018-19
Section B : Capital and Others
68749.70
III
Opening Cash
balance including
Permanent Advances
and Cash Balance
Investment
88468.81 - III Opening Overdraft
from RBI 0
- IV Miscellaneous
Capital receipts 0.00 26842.18 IV Capital Outlay 35049.05 35049.05
1047.80 General Services 1533.27
2268.45 Social Services 4341.15
106.62 Education, Sports, Art
and Culture 364.12
569.85 Health and Family
Welfare 1036.72
933.86
Water Supply,
Sanitation, Housing
and Urban
Development
2152.45#
575.02
Welfare of Scheduled
Castes, Scheduled
Tribes and Other
Backward Classes
657.49
44.92 Social Welfare and
Nutrition 29.26
38.18 Others 101.11
23525.93 Economic Services 29174.63
5373.65 Agriculture and Allied
Activities 5093.60
1257.56 Rural Development 1336.11
67.02 Special Area
Programme 78.94
9368.43 Irrigation and Flood
Control 11912.33
775.94 Energy 520.92
13.57 Industry and Minerals 20.56
6639.43 Transport 10056.84
30.33 General Economic
Services 155.33
- Science Technology
and Environment 0.00
1778.01 V Recoveries of Loans
and Advances 1604.29 979.29 V
Loans and Advances
disbursed 1545.17
1119.42 From Power Projects 1071.83 31.64 For Power Projects 98.15
327.20 From Government
Servants 348.13 575.53
To Government
Servants 576.13
331.39 From others 184.33 372.12 To Others 870.89
2082.49 VI Revenue surplus
brought down 11974.60 VI
Revenue deficit
brought down

Appendices
85
Appendix - 1.5 (concld…)
(`̀̀̀ in crore) (`̀̀̀ in crore)
Receipts Disbursements
2017-18 2018-19 2017-18 Total 2018-19
48075.50 VII Public Debt
receipts 26025.21 15782.17 VII
Repayment of
Public Debt 25116.49#
- External debt 0 - External debt 0.00
47907.68
Internal debt other
than Ways and
Means Advances
and Overdraft
25686.29 14833.58
Internal debt other
than Ways and
Means Advances
and Overdraft
24190.22
-
Net transactions
under Ways and
Means Advances
including
Overdraft
0.00 -
Net transactions
under Ways and
Means Advances
including Overdraft
0.00
167.82
Loans and
Advances from
Central
Government
338.92# 948.59
Repayment of Loans
and Advances to
Central Government 926.27#
- VIII
Appropriation
from
Contingency
Fund
1528.00 1528.00 - VIII Appropriation to
Contingency Fund 3528.00 3528.00
- IX Contingency
Fund 3528.00 3528.00 - IX Contingency Fund 1528.00 1528.00
81876.99 X Public Account
receipts 90664.57 70490.24 X
Public Account
disbursements 89757.51
4784.21 Small Savings and
Provident Funds 4869.26 4237.56
Small Savings and
Provident Funds 4377.51
8898.55 Reserve Funds 5066.88 2974.65 Reserve Funds 5639.51
541.72 Suspense and
Miscellaneous (-)3208.89 377.81
Suspense and
Miscellaneous 282.80
27691.64 Remittances 38205.39 26869.26 Remittances 38048.30#
39960.87 Deposits and
Advances 45731.93 36030.96
Deposits and
Advances 41409.39
XI
Closing
Overdraft from
Reserve Bank of
India
88468.81 XI Cash Balance at
end 67269.26
0.04 Cash in Treasuries 0.04
XII Inter State
Settlement (-)3962.41
Deposits with
Reserve Bank (-)3020.51
54.33 Local Remittances 54.32
6.69 Departmental Cash
Balance 236.95
0.67 Permanent
Advances 0.69
58373.60 Cash Balance
Investment 35218.99
33995.89 Investment of
earmarked balances 34778.78
202562.69 Total 223793.48 202562.69 Total 223793.48
Source: Finance accounts of respective years # Lower rounding

State Finances Audit Report for the year ended 31 March 2019
86
Appendix - 1.6 (Reference: Paragraph 1.2.2; Page 6)
Outcome of analysis of budgetary assumptions during 2018-19
(`̀̀̀ in crore)
Budget
estimates Actuals
Increase (+)/
Decrease (-)
Increase (+)/
Decrease (-)
(in per cent)
(1) (2) (3) (4 (3-2)) (5)
A) Revenue Receipts of which 285968 278996 (-)6972 (-)2.4
1 Tax Revenue 188040 187436 (-)604 (-)0.3
i State Goods and Service Tax 90140 82352 (-)7788 (-)8.6
ii Taxes on Sales, Trade etc. 35301 35725 424 1.2
iii State excise 15343 15321 (-)22 (-)0.1
iv Taxes on vehicles 7500 8613 1113 14.8
v Stamps and Registration fees 24000 28545 4545 18.9
vi Taxes on Goods and Passenger 2000 837 (-)1163 (-)58.2
vii Land Revenue 3200 2088 (-)1112 (-)34.8
viii Taxes and duties on electricity 8700 10085 1385 15.9
ix Other taxes 1855 3870 2015 108.6
2 Non-Tax Revenue 22785 15844 (-)6941 (-)30.5
i Interest Receipts 3851 4191 340 8.8
ii Miscellaneous General Services 2877 481 (-)2396 (-)83.3
iii Non-ferrous Mining and Metallurgical Industries 3400 4057 657 19.3
iv Other Non-Tax Revenue 12657 7115 (-)5542 (-)43.8
3 Share of Union Taxes and Duties 43515 42054 (-)1461 (-)3.4
4 Grants-in-aid from GoI 31629 33662 2033 6.4
B) Revenue Expenditure of which 301343 267022 (-)34321 (-)11.4
1 General Services 99046 84765 (-)14281 (-)14.4
i Administrative services 33718 20761* (-)12957 (-)38.4
ii Pension and Miscellaneous General Services 20878 20841 (-)37 (-)0.2
iii Appropriation for reduction or avoidance of debt/transfer to RF 3800 3800 - -
iv Interest Payments 34385 34021 (-)364 (-)1.1
v Fiscal Services 3634 3070 (-)564 (-)15.5
vi Organs of State 2631 2272 (-)359 (-)13.6
2 Social Services 123842 109391 (-)14451 (-)11.7
i Education, Sports, Art and Culture 59194 50922 (-)8272 (-)14.0
ii Social Welfare and Nutrition 12109 16724 4615 38.1
iii Welfare of Scheduled Castes, Scheduled Tribes and Other Backward
Classes 17272 14234 (-)3038 (-)17.6
iv Health and Family Welfare 12193 11969 (-)224 (-)1.8
v Water Supply, Sanitation, Housing and Urban Development 21320 14377# (-)6943 (-)32.6
vi Information and Broadcasting 165 142 (-)23 (-)13.9
vii Labour and Labour Welfare 1366 883 (-)483 (-)35.4
viii Others 223 140 (-)83 (-)37.2
# Lower rounding * Higher rounding

Appendices
87
Appendix - 1.6 (concld…)
(`̀̀̀ in crore)
Budget
estimates Actuals
Increase (+)/
Decrease (-)
Increase (+)/
Decrease (-)
(in per cent)
(1) (2) (3) (4 (3-2)) (5)
3 Economic Services 57820 52759 (-)5061 (-)8.8
i Agriculture and Allied Services 23621 20020 (-)3601 (-)15.2
ii Rural Development 12091 6997 (-)5094 (-)42.1
iii Special Area Programme 1 1 - -
iv Irrigation and Flood Control 2007 1898 (-)109 (-)5.4
v Energy 7686 11135 3449 44.9
vi Industry and Minerals 3126 3580 454 14.5
vii Transport and Communication 6178 6338 160 2.6
viii Science, Technology and Environment 334 297 (-)37 (-)11.1
ix General Economic Services 2776 2494 (-)282 (-)10.2
4 Grants-in-aid and contributions 20635 20107 (-)528 (-)2.6
C) Capital outlay 36298 35049 (-)1249 (-)3.4
i Irrigation and Flood Control 9380 11912 2532 27
ii Transport and Communication 8862 10057 1195 13.5
iii Energy 730 521 (-)209 (-)28.6
iv Health and Family Welfare 1257 1037 (-)220 (-)17.5
v Education, Sports, Art and Culture 199 364 165 82.9
vi Water Supply, Sanitation, Housing and Urban
Development 515 2152 1637 317.9
vii Rural Development 4591 1336 (-)3255 (-)70.9
viii Welfare of Scheduled Castes, Scheduled
Tribes and Other Backward Classes 1786 657 (-)1129 (-)63.2
ix Others 8978 7012 (-)1966 (-)21.9
D) Revenue surplus (+)/ deficits (-) (-)15375 11975 27350 (-)177.9
E) Fiscal surplus (+)/ deficits (-) (-)50586 (-)23015 27571 (-)54.5
F) Primary surplus (+)/ deficits (-) (-)16201 11006 27207 (-)167.9
Source: Finance Accounts and Budget for 2018-19

State Finances Audit Report for the year ended 31 March 2019
88
1 includes Ways and Means Advances
Appendix - 1.7
(Reference: Paragraph 1.4; Page 9)
Time series data on State Government Finances
(`̀̀̀ in crore)
2014-15 2015-16 2016-17 2017-18 2018-19
Part A: Receipts
1. Revenue Receipts 165415.46 185035.68 204693.14 243653.56 278996.27
(i) Tax Revenue 115063.90 (69) 126608.11 (69) 136616.32 (67) 167931.87 (69) 187436.37 (67)
Taxes on Agricultural Income - - - - - - - - - -
State Goods and Service Tax - - - - - - 50063.00 (30) 82352.32 (44)
Taxes on Sales, Trade, etc. 67466.29 (59) 69660.82 (55) 81174.17 (60) 54893.51 (33) 35724.61 (19)
State Excise 11397.08 (10) 12469.56 (10) 12287.91 (9) 13449.65 (8) 15320.90 (8)
Taxes on Vehicles 5404.97 (5) 6017.19 (5) 6741.21 (5) 8665.38 (5) 8613.19 (5)
Stamps and Registration fees 19959.29 (17) 21766.99 (17) 21011.83 (15) 26441.82 (16) 28545.05 (15)
Land Revenue 1272.38 (1) 1748.31 (1) 1799.39 (1) 2309.86 (1) 2088.04 (1)
Taxes on Goods and Passengers 586.56 - 1582.13 (1) 1876.71 (1) 984.01 (1) 837.05# -
Other Taxes 8977.33 (8) 13363.11 (11) 11725.09 (9) 11124.64 (6) 13955.21 (8)
(ii) Non-tax Revenue 12580.89 (8) 13423.01 (7) 12709.34 (6) 16241.80 (7) 15843.57 (6)
(iii) State’s share of Union taxes and duties 17630.03 (11) 28105.95 (15) 33714.90 (16) 37219.19 (15) 42054.20# (15)
(iv) Grants-in-aid from GoI 20140.64 (12) 16898.61 (9) 21652.58 (11) 22260.70 (9) 33662.13 (12)
2. Miscellaneous Capital Receipts - 16.89 - - -
3. Recoveries of Loans and Advances 975.08 865.11 1745.58 1778.01 1604.29
4. Total revenue and non-debt capital
receipts (1 + 2 + 3) 166390.54 185917.68 206438.72 245431.57 280600.56
5. Public Debt Receipts 29373.28 37976.41 48336.49 48075.50 26025.21
Internal Debt (excluding Ways and Means
Advances and Overdrafts) 28831.02 37392.47 47709.67 47907.68 25686.29
Net transactions under Ways and Means
Advances and Overdraft - - - - -
Loans and Advances from Government of
India1 542.26 583.94 626.82 167.82 338.92#
6. Appropriation from Contingency Fund 2350 2962 - - 1528.00
7. Inter-State settlement - - - - -
8. Total receipts in the Consolidated Fund
(4+5+6+7) 198113.82 226856.09 254775.22 293507.07 308153.77
9. Contingency Fund Receipts 4360 962 - - 3528.00
10. Public Accounts receipts 83021.94 72747.20 82466.49 81876.99 90664.57
11. Total receipts of the State (8+9+10) 285495.76 300565.29 337241.70 375384.06 402346.34
Part B: Expenditure
12. Revenue expenditure (per cent of 15) 177553.12 (89) 190374.05 (89) 213228.73 (87) 241571.07 (90) 267021.67 (88)
Plan 31308.28 (18) 36056.40 (19) 42088.59 (20) *
Non-Plan 146244.84 (82) 154317.65 (81) 171140.14 (80)
General Services (incl. Interests payments) 60485.77 (34) 64369.76 (34) 71609.42 (34) 78534.78 (33) 84764.50 (32)
Social Services 76952.49 (43) 82317.23 (43) 90281.99 (42) 93054.30 (38) 109390.99 (41)
Economic Services 37686.57 (21) 38051.97 (20) 43842.54 (21) 54189.03 (22) 52758.97 (20)
Grants-in-aid and Contribution 2428.29 (1) 5635.09 (3) 7494.78 (4) 15792.96 (7) 20107.21 (8)
13. Capital outlay (per cent of 15) 19523.47 (10) 22793.16 (10) 25549.27 (10) 26842.18 (10) 35049.05 (12)
Plan 16244.67 (83) 20165.05 (88) 20348.37 (80) *
Non-Plan 3278.80 (17) 2628.11 (12) 5200.90 (20)
General Services 865.31 (4) 1259.28 (6) 1548.23 (6) 1047.80 (4) 1533.27 (4)
Social Services 1957.82 (10) 2584.22 (11) 3266.51 (13) 2268.45 (8) 4341.15 (12)
Economic Services 16700.34 (86) 18949.66 (83) 20734.52 (81) 23525.93 (88) 29174.63 (83)
Figures in parenthesis represent percentages (rounded) to total of each sub-heading
* From 2017-18 onwards bifurcation related to Plan and Non-plan expenditure has been merged # Lower rounding

Appendices
89
2 Includes Ways and Means Advances from GoI 3 Actuals as per Economic Survey of Maharashtra 2018-19 4 Advance estimates as per Economic Survey of Maharashtra 2018-19 5 As per Finance Accounts of respective years 6 Maharashtra Krishna Valley Development Corporation and Konkan Irrigation Development Corporation did not furnish
the information $ Includes four projects amounting to ` 19.55 crore related to Roads, Bridges and Buildings @ Proforma Correction # Lower rounding
Appendix - 1.7 (contd…) (`̀̀̀ in crore)
2014-15 2015-16 2016-17 2017-18 2018-19
14. Disbursement of Loans and Advances
(per cent of 15) 1140.54 (1) 1114.63 (1) 6277.21 (3) 979.29 - 1545.17 -
15. Total (12+13+14) 198217.13 214281.84 245055.21 269392.54 303615.89
16. Repayments of Public Debt 8827.78 10043.10 11886.89 15782.17 25116.49#
Internal Debt (excluding Ways and Means
Advances and Overdrafts) 7941.54 9138.49 10917.34 14833.58 24190.22
Net transactions under Ways and Means
Advances and Overdrafts - - - - 0.00
Loans and Advances from Government
of India2 886.24 904.61 969.55 948.59 926.27#
17. Appropriation to Contingency Fund 4350 962 - - 3528.00
18. Total disbursement out of Consolidated
Fund (15+16+17) 211394.91 225286.94 256942.10 285174.71 332260.38
19. Contingency Fund disbursements 2350 2962 - - 1528.00
20. Public Account disbursements 68985.90 66412.16 67102.50 70490.24 89757.51
21. Total disbursement by the State
(18+19+20) 282730.81 294661.10 324044.60 355664.95 423545.89
Part C: Deficits
22. Revenue Deficit (-)/Surplus (+) (1-12) (-)12137.66 (-) 5338.37 (-)8535.59 2082.49 11974.60
23. Fiscal Deficit (-)/Surplus (+) (4-15) (-)31826.59 (-) 28364.16 (-)33656.74 (-)23960.97 (-)23015.33
24. Primary Deficit (-)/Surplus (+) (23-25) (-)7861.85 (-) 2592.75 (-)5124.82 9057.46 11005.92
Part D: Other Data
25. Interest Payments (included in revenue
expenditure) 23964.74 25771.41 28531.92 33018.43 34021.25
26. Financial Assistance to local bodies etc. 72711 82101 96839 101644 122563
27. Ways and Means Advances/Overdraft availed (days)
Ways and Means availed (days) 27 days nil nil 8 nil
Overdraft availed (days) nil nil nil nil nil
28. Interest on WMA/Overdraft 5.12 - - 1.13 -
29. Gross State Domestic Product (GSDP) 1792122 2001223 2257032 24116003 26603184
30. Outstanding Fiscal liabilities (year-end) 319746 351341 395858 432415@ 436782.79
31. Outstanding guarantees (year-end)5
(including interest) 7999.45 7234.57 7305.77 26657.72 25134.86
32. Maximum amount guaranteed
(year-end) 34563.60 32247.11 22802.04 37287.13 38378.26
33. Number of ongoing projects 592 4606 447 420 349$
34. Capital blocked in ongoing projects 65146.79 49957.036 76840.95 83520.47$ 92029.58

State Finances Audit Report for the year ended 31 March 2019
90
Appendix - 1.7 (concld…) (`̀̀̀ in crore)
2014-15 2015-16 2016-17 2017-18 2018-19
Part E: Fiscal Health Indicators
I Resource Mobilization
Own Tax revenue/GSDP 6.42 6.33 6.05 6.73 7.05
Own Non-Tax Revenue/GSDP 0.70 0.67 0.56 0.65 0.59
Central Transfers/GSDP 0.98 1.40 1.49 1.49 1.58
II Expenditure Management
Total Expenditure/GSDP 11.06 10.71 10.86 10.79 11.41
Total Expenditure/Revenue Receipts 119.83 115.81 119.72 110.56 108.82
Revenue Expenditure/Total Expenditure 89.58 88.84 87.01 89.67 87.95
Expenditure on Social Services/Total
Expenditure 39.81 39.62 38.17 35.38 37.73
Expenditure on Economic Services/Total
Expenditure 27.44 26.60 26.35 28.85
27.03
Capital Expenditure/Total Expenditure 9.85 10.64 10.43 9.96 11.54
Capital Expenditure on Social and Economic
Services/Total Expenditure. 9.41 10.05 9.79 9.58
11.04
Education, Sports, Art and Culture /Total
Expenditure 20.07 20.05 18.53 18.03 16.89
Health & Family Welfare/Total Expenditure 4.52 4.67 4.38 4.52 4.28
III Management of Fiscal Imbalances
Revenue deficit /GSDP (-)0.68 (-)0.27 (-)0.38 0.08 0.45
Fiscal deficit/GSDP (-)1.78 (-)1.42 (-)1.49 (-)0.99 (-)0.87
Primary Deficit (surplus) /GSDP (-)0.44 (-)0.13 (-)0.23 0.36 0.41
Revenue Deficit (surplus)/Fiscal Deficit 38.14 18.82 25.36 (-)8.69 (-)52.03
Primary Revenue Deficit (surplus)/GSDP (-)3.11 (-)2.71 (-)11.9 (-)2.28 1.79
IV Management of Fiscal Liabilities
Fiscal Liabilities/GSDP 17.84 17.56 17.54 17.32 16.42
Fiscal Liabilities/RR 193.30 189.88 193.39 177.48 156.56
Primary deficit vis-à-vis quantum spread
(percentage) (-)275.86 (-)20.32 (-)28.38 (-)204.29 102.63
Debt Redemption (Principal +Interest)/ Total Debt
Receipts 112.85 82.55 74.20 91.61 207.03
V Other Fiscal Health Indicators
Return on Investment 0.03 0.05 0.05 0.05 0.18
Balance from Current Revenue (` in crore) 8224 22119 23573 * *
Financial Assets/Liabilities 0.8 0.8 0.8 0.8 0.9
Source: Finance Accounts of the respective years
* From 2017-18 onwards bifurcation related to Plan and Non-plan expenditure has been merged

Appendices
91
Appendix – 1.8 (Reference: Paragraph 1.9.2; Page 36)
Details of Government investments and accumulated losses
in Government Companies/Corporations as on September 2019
(`̀̀̀ in crore)
Sr.
No. Sector & Name of the Company
Period of
accounts
Year in
which
accounts
finalised
State
Government
Equity
State
Government
Loan
Net loss(-)
before tax
Accumulated
loss (-)
A. Working Government Companies
FINANCE
1 Kolhapur Chitranagri Mahamandal
Limited 1998-99 2013-14 3.24 0.13 (0.14) (1.61)
2 Maharashtra State Handlooms
Corporation Limited 2018-19 2019-20 88.71 23.29 (1.95) (137.79)
Sector wise total 91.95 23.42 (2.09) (139.40)
INFRASTRUCTURE
3 Development Corporation of Konkan Ltd. 2018-19 2019-20 8.81 5.92 (0.26) (15.29)
4 Maharashtra Airport Development
Company 2016-17 2019-20 0.00 0.00 (230.07) (259.29)
5 Maharashtra Satara Kagal Infrastructure
Ltd. 2017-18 2018-19 0.00 0.00 (0.0044) (0.03)
6 Maharashtra State Road Development
Corporation Limited 2016-17 2018-19 773.56 179.02 (141.90) (3794.67)
7 Mihan India Limited 2017-18 2018-19 0.00 0.00 (4.39) (56.21)
8 Nagpur Mumbai Super Communication
Expressway Limited
31.05.2017
to
31.03.2018
2018-19 0.00 0.00 (0.01) (0.01)
Sector wise total 782.37 184.94 (376.63) (4125.50)
MANUFACTURING
9 Haffkine Ajintha Pharmaceuticals Limited 2017-18 2018-19 0.00 0.00 (3.49) (16.55)
10 Mahaguj Collieries Limited 2018-19 2019-20 0.00 0.00 (2.69) (6.43)
11 Maharashtra State Powerlooms
Corporation Limited 2017-18 2018-19 15.27 0.20 (0.84) (17.38)
Sector wise total 15.27 0.20 (7.02) (40.36)
POWER
12 Aurangabad Power Company Limited 2017-18 2019-20 0.00 0.00 (6.25) (6.25)
13 Dhopave Coastal Power Limited 2018-19 2019-20 0.00 0.00 (0.0038) (8.30)
14 Mahagenco Ash Management Services
Limited 2018-19 2019-20 0.00 0.00 (0.42) (1.40)
15 MSEB holding Company Limited 2017-18 2018-19 88684.34 0.00 (34.01) (2137.83)
16 Maharashtra Power Development
Corporation Limited 2018-19 2019-20 0.45 0.00 (0.23) (1013.48)
17 Maharashtra State Power Generation
Company Limited 2018-19 2019-20 0.00 0.00 (325.81) (6848.93)
Sector wise total 88684.79 0.00 (366.72) (10016.19)
SERVICE
18 Mahatourism Corporation Limited 2017-18 2018-19 0.00 0.00 (0.01) (0.07)
Sector wise total 0.00 0.00 (0.01) (0.07)
Total A (All sector wise working Government
companies)
89574.38 208.56 (752.48) (14321.52)

State Finances Audit Report for the year ended 31 March 2019
92
Appendix - 1.8 (concld…)
(`̀̀̀ in crore)
Sr.
No. Sector & Name of the Company
Period of
accounts
Year in
which
accounts
finalised
State
Government
Equity
State
Government
Loan
Net loss(-)
before tax
Accumulated
loss (-)
B. Working Statutory corporations
SERVICE
1 Maharashtra State Road Transport
Corporation 2017-18 2019-20 4643.83 200.00 (1578.67) (3663.21)
Sector wise total 4643.83 200.00 (1578.67) (3663.21)
FINANCE
2 Maharashtra State Finance Corporation 2014-15 2015-16 34.28 136.49 (13.78) (687.90)
Sector wise total 34.28 136.49 (13.78) (687.90)
Total B (All sector wise working Statutory
corporations)
4678.11 336.49 (1592.45) (4351.11)
Grand Total (A + B) 94252.49 545.05 (2344.93) (18672.63)
C. Non-working Government companies
AGRICULTURE & ALLIED
1 Parbhani Krishi Go-sanvardhan Limited 2017-18 2018-19 0.00 0.00 (0.03) (1.15)
2
Vidarbha Quality Seeds Limited
2018-19 2019-20 0.00 0.00 (0.01) (0.41)
2017-18 2018-19 0.00 0.00 0.00 (3.13)
Sector wise total 0.00 0.00 (0.04) (1.56)
MANUFACTURING
3 Godavari Garments Limited 2017-18 2018-19 0.00 0.00 (0.000024) (8.17)
4 Maharashtra Electronics Corporation
Limited 2016-17 2017-18 9.69 57.72 (42.71) (378.07)
5 Maharashtra State Textile Corporation
Limited 2017-18 2018-19 236.16 173.91 (41.95) (1087.13)
6 The Gondwana Paints and Minerals
Limited 2018-19 2019-20 0.00 0.00 (0.01) (1.44)
7 The Pratap Spinning, Weaving and
Manufacturing Company Limited 2018-19 2019-20 0.00 0.00 (0.01) (63.90)
Sector wise total 245.85 231.63 (84.67) (1538.71)
MISCELLANEOUS
8 Vidarbha Tanneries Limited 2018-19 2019-20 0.00 0.00 (0.01) (1.23)
Sector wise total 0.00 0.00 (0.01) (1.23)
Total C (All sector wise non-working
Government Companies) 245.85 231.63 (84.73) (1541.51)
Grand Total (A + B+C) 94498.34 776.68 (2429.66) (20214.14)
Source: Information received from Accountant General (Audit)-III, Maharashtra, Mumbai

Appendix - 1.9 (Reference paragraph 1.9.3; Page 37)
Summarised financial statement of Departmentally managed
Commercial/Quasi-Commercial Undertakings
Sr.
No. Name of the Undertaking
Year of
commencement
Period
of
accounts
Mean
Government
Capital
Block
Assets at
depreciated
cost
Depreciation
provided
during the
year
Turnover
Net
Profit
(+)/Loss
(-)
Interest
on
capital
Total
return
(9+10)
Percentage
return on
capital
(1) (2) (3) (4) (5) (6) (7) (8) (9) (10) (11) (12)
(` ` ` ` in lakh) (in per cent)
Agriculture, Animal husbandry, Dairy development and Fisheries department
Mumbai Region
1 Greater Mumbai Milk Scheme,
Worli 1947 2016-17 0.00 1608.47 65.65 4866.54 (-)3145.13 0.00 (-)3145.13 0.00
2 Milk Transport Scheme, Worli 1951 2006-07 261.62 65.00 6.27 872.07 0.00 27.47 27.47 10.50
3 Mother Dairy, Kurla 1975 2016-17 2356.63 1241.80 31.44 2170.25 (-)1990.07 247.45 (-)1742.62 (-)73.95
4 Central Dairy Goregaon 1951 2015-16 8451.44 629.87 38.19 1354.61 (-)1649.04 887.40 (-)761.64 (-)9.01
5 Unit Scheme, Mumbai 1950 2014-15 3143.95 2508.66 71.17 0.00 61.33 330.11 391.44 12.45
6 Agricultural Scheme, Mumbai 1950 2014-15 991.84 964.64 20.82 0.00 (-)140.14 104.14 (-)36.00 (-)3.63
7 Electrical Scheme, Mumbai 1950 2014-15 419.51 10.52 0.61 0.00 (-)274.60 44.05 (-)230.55 (-)54.96
8 Water Supply Scheme, Mumbai 1950 2014-15 1381.06 838.60 37.61 0.00 (-)605.49 145.01 (-)460.48 (-)33.34
9 Cattle Feed Scheme, Mumbai 1950 2014-15 (-)132.38 17.82 0.61 0.00 413.66 (-)13.90 399.76 (-)301.98
10 Cattle Breeding and Rearing
Farm, Palghar 1979 2015-16 117.80 43.62 2.30 0.00 (-)101.62 12.37 (-)89.25 (-)75.76
11 Dairy Project, Dapchari 1960 2016-17 1098.65 349.79 184.01 35.57 (-)1069.53 115.36 (-)954.17 (-)86.85
12 Government Milk Scheme,
Bhiwandi 1987 2015-16 133.87 24.94 0.03 0.00 (-)30.94 14.06 (-)16.88 (-)12.61
13 Government Milk Chilling Centre,
Saralgaon (Dist.: Thane) 1978 2015-16 42.20 11.11 0.25 0.00 (-)14.21 4.43 (-)9.78 (-)23.18
14 Government Milk Scheme,
Khopoli 1966 2016-17 228.94 100.57 9.20 284.81 (-)171.58 24.04 (-)147.54 (-)64.44
15 Government Milk Scheme Mahad, 1966 2015-16 169.66 64.76 0.94 0.00 (-)46.08 17.81 (-)28.27 (-)16.66
16 Government Milk Scheme,
Chiplun 1966 2016-17 284.64 59.29 5.40 175.80 (-)179.42 29.89 (-)149.53 (-)52.53
17 Government Milk Scheme,
Ratnagiri 1965 2015-16 607.70 97.90 2.88 398.03 (-)219.50 63.81 (-)155.69 (-)25.62
18 Government Milk Scheme,
Kankavali 1966 2016-17 191.31 200.04 5.95 655.05 (-)94.97 20.09 (-)74.88 (-)39.14
TOTAL 19748.44 8837.40 483.31 10812.73 (-)9257.33 2073.59 (-)7183.74 (-)36.38
Ap
pen
dices
93

Appendix - 1.9 (contd..) (` ` ` ` in lakh)
Sr.
No. Name of the Undertaking
Year of
commen
cement
Period of
accounts
Mean
Government
Capital
Block
Assets at
depreciated
cost
Depreciat
ion
provided
during
the year
Turnover Net Profit
(+)/Loss (-)
Interest on
capital
Total
return
(9+10)
Percentage
return on
capital
(1) (2) (3) (4) (5) (6) (7) (8) (9) (10) (11) (12)
Pune Region
19 Government Milk Scheme, Pune 1950 2016-17 0.00 330.98 15.82 1207.70 (-)723.54 0.00 (-)723.54 0.00
20 Government Milk Scheme, Mahabaleshwar 1966 2016-17 137.11 37.47 2.29 0.00 (-)68.48 14.40 (-)54.08 (-)39.44
21 Government Milk Scheme, Satara 1979 2016-17 1167.55 281.29 4.22 2519.82 (-)384.50 122.59 (-)261.91 (-)22.43
22 Government Milk Scheme, Miraj 1961 2016-17 6978.30 421.80 23.73 3323.30 (-)1365.19 732.72 (-)632.47 (-)9.06
23 Government Milk Scheme, Solapur 1960 2016-17 120.13 22.11 1.28 0.00 (-)195.21 12.61 (-)182.60 (-)152.00
TOTAL 8403.09 1093.65 47.34 7050.82 (-)2736.92 882.32 (-)1854.60 (-)22.07
Nashik Region
24 Government Milk Scheme, Nashik 1960 2016-17 12.92 57.42 2.07 32.44 (-)143.57 1.36 (-)142.21 (-)1100.70
25 Government Milk Scheme, Wani (Dist.:
Nashik) 1978 2016-17 25.40 13.46 0.02 0.00 (-)34.54 2.67 (-)31.87 (-)125.47
26 Government Milk Scheme, Ahmednagar 1969 2016-17 281.95 97.30 8.94 0.00 (-)341.41 29.60 (-)311.81 (-)110.59
27 Government Milk Scheme, Chalisgaon 1969 2017-18 144.84 2.09 0.14 0.00 (-)75.47 15.21 (-)60.26 (-)41.60
28 Government Milk Scheme, Dhule 1961 2016-17 551.56 188.97 9.18 0.00 (-)182.29 57.91 (-)124.38 (-)22.55
TOTAL 1016.67 359.24 20.35 32.44 (-)777.28 106.75 (-)670.53 (-)65.95
Aurangabad Region
29 Government Milk Scheme, Aurangabad 1962 2017-18 2751.83 444.04 11.53 1162.03 (-)512.96 288.94 (-)224.02 (-)8.14
30 Government Milk Scheme, Udgir 1971 2017-18 1879.76 608.70 20.74 1703.26 (-)1030.57 197.38 (-)833.19 (-)44.32
31 Government Milk Scheme, Beed 1976 2017-18 2447.13 491.17 10.75 1182.79 (-)556.07 256.95 (-)299.12 (-)12.22
32 Government Milk Scheme, Nanded 1977 2017-18 632.54 82.25 3.92 249.03 (-)322.51 66.42 (-)256.09 (-)40.49
33 Government Milk Scheme, Bhoom 1978 2017-18 873.99 110.92 0.02 332.82 (-)276.60 91.77 (-)184.83 (-)21.15
34 Government Milk Scheme, Parbhani 1979 2017-18 4143.87 68.08 1.95 2603.55 (-)695.39 435.11 (-)260.28 (-)6.28
TOTAL 12729.12 1805.16 48.91 7233.48 (-)3394.10 1336.57 (-)2057.53 (-)16.16
Amravati Region
35 Government Milk Scheme, Amravati 1962 2016-17 1636.18 893.38 6.50 450.83 (-)403.49 171.80 (-)231.69 (-)14.16
36 Government Milk Scheme, Akola 1962 2016-17 1747.64 363.53 40.52 515.23 (-)705.60 183.50 (-)522.10 (-)29.87
37 Government Milk Scheme, Yavatmal 2000 2017-18 1586.49 168.50 4.86 68.27 (-)269.69 166.58 (-)103.11 (-)6.50
38 Government Milk Scheme, Nandura 1979 2017-18 564.83 53.66 1.35 79.77 (-)103.85 59.31 (-)44.54 (-)7.89
TOTAL 5535.14 1479.07 53.23 1114.10 (-)1482.63 581.19 (-)901.44 (-)16.29
94
Sta
te Fin
an
ces A
ud
it Rep
ort fo
r the yea
r end
ed 3
1 M
arch
20
19
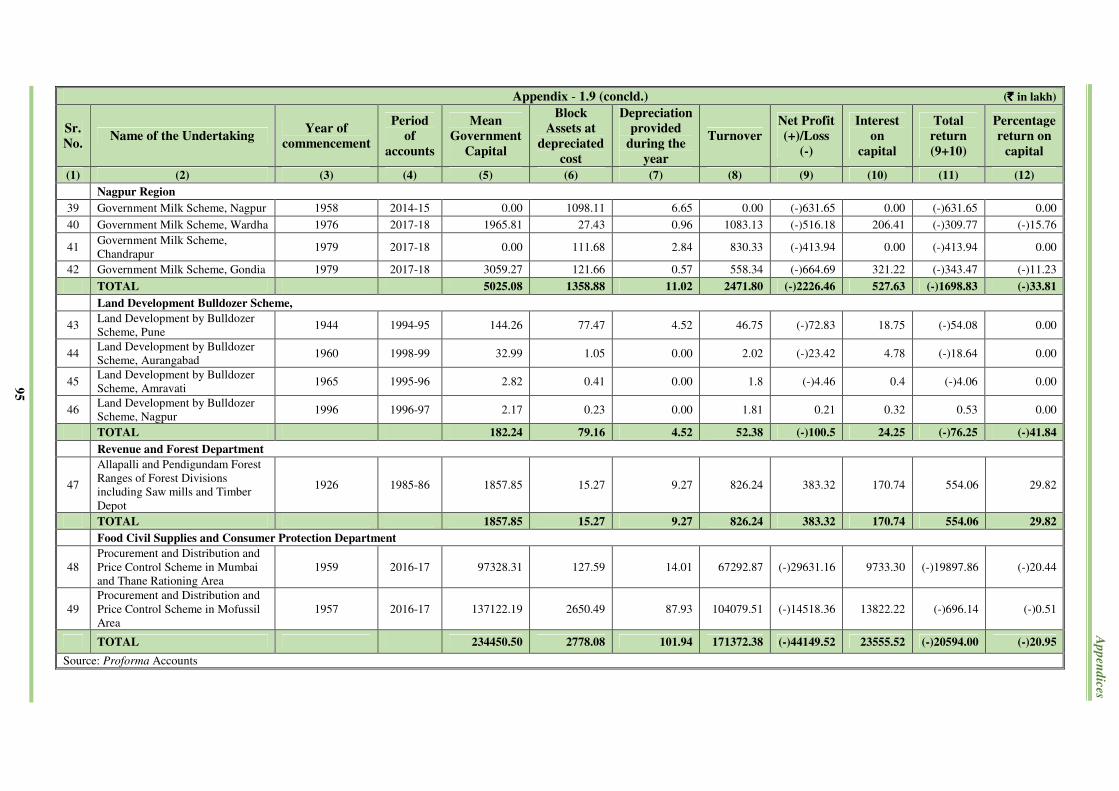
Appendix - 1.9 (concld.) (` ` ` ` in lakh)
Sr.
No. Name of the Undertaking
Year of
commencement
Period
of
accounts
Mean
Government
Capital
Block
Assets at
depreciated
cost
Depreciation
provided
during the
year
Turnover
Net Profit
(+)/Loss
(-)
Interest
on
capital
Total
return
(9+10)
Percentage
return on
capital
(1) (2) (3) (4) (5) (6) (7) (8) (9) (10) (11) (12)
Nagpur Region
39 Government Milk Scheme, Nagpur 1958 2014-15 0.00 1098.11 6.65 0.00 (-)631.65 0.00 (-)631.65 0.00
40 Government Milk Scheme, Wardha 1976 2017-18 1965.81 27.43 0.96 1083.13 (-)516.18 206.41 (-)309.77 (-)15.76
41 Government Milk Scheme,
Chandrapur 1979 2017-18 0.00 111.68 2.84 830.33 (-)413.94 0.00 (-)413.94 0.00
42 Government Milk Scheme, Gondia 1979 2017-18 3059.27 121.66 0.57 558.34 (-)664.69 321.22 (-)343.47 (-)11.23
TOTAL 5025.08 1358.88 11.02 2471.80 (-)2226.46 527.63 (-)1698.83 (-)33.81
Land Development Bulldozer Scheme,
43 Land Development by Bulldozer
Scheme, Pune 1944 1994-95 144.26 77.47 4.52 46.75 (-)72.83 18.75 (-)54.08 0.00
44 Land Development by Bulldozer
Scheme, Aurangabad 1960 1998-99 32.99 1.05 0.00 2.02 (-)23.42 4.78 (-)18.64 0.00
45 Land Development by Bulldozer
Scheme, Amravati 1965 1995-96 2.82 0.41 0.00 1.8 (-)4.46 0.4 (-)4.06 0.00
46 Land Development by Bulldozer
Scheme, Nagpur 1996 1996-97 2.17 0.23 0.00 1.81 0.21 0.32 0.53 0.00
TOTAL 182.24 79.16 4.52 52.38 (-)100.5 24.25 (-)76.25 (-)41.84
Revenue and Forest Department
47
Allapalli and Pendigundam Forest
Ranges of Forest Divisions
including Saw mills and Timber
Depot
1926 1985-86 1857.85 15.27 9.27 826.24 383.32 170.74 554.06 29.82
TOTAL 1857.85 15.27 9.27 826.24 383.32 170.74 554.06 29.82
Food Civil Supplies and Consumer Protection Department
48
Procurement and Distribution and
Price Control Scheme in Mumbai
and Thane Rationing Area
1959 2016-17 97328.31 127.59 14.01 67292.87 (-)29631.16 9733.30 (-)19897.86 (-)20.44
49
Procurement and Distribution and
Price Control Scheme in Mofussil
Area
1957 2016-17 137122.19 2650.49 87.93 104079.51 (-)14518.36 13822.22 (-)696.14 (-)0.51
TOTAL 234450.50 2778.08 101.94 171372.38 (-)44149.52 23555.52 (-)20594.00 (-)20.95
Source: Proforma Accounts
95
Ap
pen
dices
State Finances Audit Report for the year ended 31 March 2019
96
Appendix - 2.1 (Reference: Paragraph 2.2.1; Page 54)
Grants/ Appropriation closed with excess supplementary provisions during 2018-19
(`̀̀̀ in crore)
Sr.
No. Grant Grant Description V/C$ Original
Supple-
mentary
Original +
Supplementary Actuals
Revenue - Charged
1 A01 Governor and Council of Ministers C 14.93 0.91 15.84 13.64
2 J01 Administration of Justice C 310.56 24.37 334.93 285.24
Revenue - Voted
3 A06 Information and Publicity V 158.55 29.00 187.55 135.93
4 B01 Police Administration V 13652.73 31.50 13684.23 12257.64
5 B02 State Excise V 150.68 2.64 153.32 122.01
6 B03 Transport Administration V 1819.43 269.40 2088.83 1755.80
7 B04 Secretariat and Other General Services V 48.71 2.39 51.10 39.78
8 C01 Revenue and District Administration V 2244.26 54.33 2298.59 1660.34
9 C07 Forest V 2353.06 468.91 2821.97 2340.67
10 D03 Agriculture Services V 7211.19 420.32 7631.51 5841.32
11 D04 Animal Husbandry V 1002.28 89.10 1091.38 929.87
12 D07 Secretariat and other Economic Services V 21.27 0.61 21.88 15.90
13 E02 General Education V 49410.16 0.01 49410.17 42091.83
14 E03 Secretariat and Other Social Services V 337.48 75.41 412.89 301.94
15 F02 Urban Development and Other Advance
Services V 12434.10 502.76 12936.86 8920.30
16 F03 Secretariat and Other Social Services V 126.97 0.24 127.21 17.62
17 F04 Compensation and Assignments to Local
Bodies and Panchayati Raj Institutions V 19139.45 186.63 19326.08 18780.19
18 G02 Other Fiscal and Miscellaneous Services V 10136.93 1.10 10138.03 335.33
19 G06 Pensions and Other Retirement Benefits V 20698.66 25.00 20723.66 20445.54
20 G07 Social Security and Welfare V 151.71 16.30 168.01 149.34
21 H03 Housing V 296.03 75.00 371.03 289.04
22 H05 Roads and Bridges V 5272.51 0.45 5272.96 5052.83
23 H06 Public Works and Administrative and
Functional Buildings V 2697.08 0.66 2697.74 2000.86
24 I03 Irrigation, Power and Other Economic
Services V 2008.09 3.02 2011.11 1580.67
25 J01 Administration of Justice V 1772.62 23.32 1795.94 1447.13
26 J02 Secretariat and Other Social and
Economic Services V 114.96 10.00 124.96 97.43
27 K03 Stationery and Printing V 192.84 0.20 193.04 168.45
28 K04 Labour and Employment V 197.94 2.94 200.88 155.30
29 L02 District Administration V 4455.73 48.68 4504.41 3911.69
30 L03 Rural Development Programmes V 6792.63 1347.29 8139.92 6332.66
31 M02 Food Storage and Warehousing V 2367.79 37.46 2405.25 2196.64
32 M03 Secretariat and Other Economic Services V 64.48 2.31 66.79 63.55
33 N03 Welfare of Scheduled Caste, Scheduled
Tribes and Other Backward Classes V 7263.24 1657.30 8920.54 6461.37
34 O01 District Administration V 304.00 50.00 354.00 279.76
35 O03 Rural Employment V 5064.25 80.00 5144.25 1183.73
36 O 07 Secretariat - Economic Services V 256.09 10.00 266.09 184.02
37 O09 Census, Survey and Statistics V 72.79 2.51 75.30 44.29

Appendices
97
Appendix - 2.1 (concld…) (`̀̀̀ in crore)
Sr.
No. Grant Grant Description V/C$ Original
Supple-
mentary
Original +
Supplementary Actuals
38 R01 Medical and Public Health V 8708.12 2104.47 10812.59 8631.07
39 S01 Medical and Public Health V 2931.99 364.63 3296.62 2829.50
40 S03 Secretariat - Social Services V 12.87 1.29 14.16 7.85
41 T05 Revenue Expenditure on Tribal Areas
Development Sub-Plan V 6627.47 417.43 7044.90 3896.44
42 U03 Secretariat - Social Services V 4.61 0.07 4.68 3.40
43 U04 Ecology and Environment V 89.55 12.41 101.96 66.96
44 V02 Co-operation V 10149.30 2134.91 12284.21 6760.54
45 W02 General Education V 6188.42 454.95 6643.37 5560.82
46 Y02 Water Supply and Sanitation V 4650.26 414.80 5065.06 2628.46
47 ZA02 Secretariat and other Social Services V 1949.25 65.18 2014.43 1456.73
48 ZC01 Parliament / State/Union Territory
Legislatures V 202.70 37.86 240.56 169.53
49 ZD02 Art and Culture V 169.02 10.65 179.67 155.66
50 ZE01 Minorities Development V 407.43 0.79 408.22 140.04
51 ZF01 Secretariat - General Services V 12.73 3.00 15.73 10.25
52 ZF02 Art and Culture V 21.12 0.72 21.84 16.84
53 ZH03 Irrigation Power and other Economic
services V 387.61 0.14 387.75 303.58
Capital - Voted
54 B10 Capital Expenditure on Economic
Services V 1545.87 438.32 1984.19 1388.36
55 D09 Capital Expenditure on Fisheries V 88.49 55.75 144.24 27.55
56 H08 Capital Expenditure On Public Works
Administrative and Functional Buildings V 1599.28 294.59 1893.87 1112.93
57 H09 Capital Outlay on Removal of Regional
Imbalance V 65.14 1.00 66.14 24.46
58 K11 Capital Expenditure on Energy V 614.72 69.00 683.72 523.52
59 O10 Capital Outlay on Other Rural
Development Programmes V 4216.70 310.25 4526.95 871.77
60 S04 Capital outlay on Medical and Public
Health V 525.17 222.10 747.27 285.58
61 T10
Capital Outlay on Welfare of Scheduled
Castes, Scheduled Tribes, Other
Backward Classes and Minorities
V 307.24 5.50 312.74 295.49
62 V05 Capital Expenditure on Economic
Services V 110.00 4.00 114.00 46.85
63 ZH05 Capital Outlay on Irrigation V 2634.90 71.31 2706.21 2181.66
Total 234836.14 13047.19 247883.33 187285.49
Source: Information obtained from VLC of Accountant General (A&E)-I, Maharashtra, Mumbai $ Voted/Charged

State Finances Audit Report for the year ended 31 March 2019
98
Appendix - 2.2 (Reference: Paragraph 2.3.1; Page 54)
Grants/Appropriations closed with excess over provisions
of previous years requiring regularisation
(`̀̀̀ in crore)
Years No. of Grants/
Appropriations Grants/Appropriations numbers
Amount of excess
required to be
regularised as
commented in the
Appropriation
Accounts/Audit Report
2015-16 28/4
C-06, C-11, D-01, K-03, L-01, O-15, O-16,
O-17, O-18, O-20, O-23, O-25, O-27, O-28,
O-30, O-31, O-32, O-35, O-36, O-37, O-38,
O-39, O-40, O-41, O-42, O-43, O-46, O-47,
O-48, Q-02, U-01, W-07
564.82
2016-17 30/6
A-01, C-01, C-03, C-11, F-06, H-05, L-01,
O-13, O-16, O-18, O-21, O-23, O-24, O-25,
O-26, O-27, O-28, O-29, O-30, O-31, O-32,
O-33, O-34, O-35, O-36, O-37, O-38, O-39,
O-40, O-43, O-46, O-47, O-48, V-06, W-01,
W-07
167.69
2017-18 15/5
B-01, C-09, C-11, D-01, G-06, L-01, O-22,
O-27, O-31, O-43,O-46, O-47, O-48, O-49,
O-53, O-59,O-74, O-81, T-02, W-07
47.15
TOTAL 73/15 779.66 Source: Appropriation Accounts of respective years
Appendices
99
Appendix - 2.3 (Reference: Paragraph 2.3.1.1; Page 54)
Grants/appropriations closed with excess over provisions
during 2018-19 requiring regularisation (`̀̀̀ in crore)
Sr.
No.
Name and the title of the Voted grant/ Charged
appropriation
Total
grant Expenditure Excess
Revenue Section
1 C06 Relief on account of Natural Calamities 11839.15 12782.33 943.19
2 O18 District Plan – Thane 230.1912 230.1919 0.0007
3 O52 District Plan – Nanded 216.86 216.93 0.07
4 O58 District Plan – Osmanabad 137.3550 137.3572 0.0022
5 O68 District Plan – Chandrapur 190.66 190.82 0.16
6 O78 District Plan – Yavatmal 163.86 163.89 0.03
Charged Appropriation
7 C11 Internal Debt of the State Government (Capital Section) 0.0010 0.0018 0.0008
8 H08 Capital Expenditure On Public Works Administrative
and Functional Buildings 24.9761 24.9762 0.0001
9 L01 Interest Payments (Revenue Section) 1266.74 1269.45 2.71
TOTAL 14069.80 15015.95 946.16
Source: Appropriation Accounts 2018-19
State Finances Audit Report for the year ended 31 March 2019
100
Appendix - 2.4 (Reference: Paragraph 2.3.2; Page 54)
Sub-head wise persistent excess over provision (`̀̀̀ in crore)
Sr.
No. Grant MJH SMH MNH SBH SBH Description V/C$
Excess
2016-17
Excess
2017-18
Excess
2018-19
1 B01-Police
Administration 2055 00 001 066
Recruitment of
Police V 5.06 17.61 1.29
2 C05-Other
Social Services 2235 02 104 319
Financial Assistance
to the heirs of the
farmers who have
committed suicides
V 4.01 3.72 4.61
3
C06-Relief on
account of
Natural
Calamities
2245 02 101 015
Cash Doles,
assistance to family
of deceased persons
and injured persons.
V 7.33 4.43 9.52
4
C06-Relief on
account of
Natural
Calamities
2245 02 117 031
Assistance to small
and marginal farmers
for purchase of
livestock in lieu of
dead animals
V 3.54 2.10 1.73
5 C07-Forest 2406 01 101 857
Creation of
Supernumerary Posts
for Forest Labourers
V 1.26 7.07 5.32
6 C07-Forest 2406 02 110 236
Compensation for the
Losses due to Wild
animals attack
V 4.77 16.66 32.52
7 D05-Dairy
Development 2404 00 207 223
Government Milk
Scheme Satara -
Procurement
V 1.04 2.01 7.82
8 D05-Dairy
Development 2404 00 224 218
Government Milk
Scheme Parbhani -
Procurement
V 2.94 9.91 4.19
9 D05-Dairy
Development 2404 00 224 220
Government Milk
Scheme Parbhani -
Distribution
V 1.05 1.02 3.09
10 D05-Dairy
Development 2404 00 230 153
Government Milk
Scheme Arvi-Wardha
- Distribution
V 1.46 1.07 1.22
11 H05-Roads and
Bridges 3054 80 797 024
Transfer to reserve
fund and deposit
account (subvention
from central road
fund)
V 315.01 95.28 213.91
12
I03-Irrigation,
Power and
Other Economic
Services
2711 03 103 028
Dir. Irrigation.
Research & Dev.
Pune
V 1.77 1.10 1.99
13 O14-District
Plan - Mumbai
City
2217 80 191 833
Grants to Municipal
Corporations for
Maharashtra
Nagrothan Maha-
Abhiyan
V 4.10 2.00 14.88

Appendices
101
Appendix – 2.4 (concld…) (`̀̀̀ in crore)
Sr.
No. Grant MJH SMH MNH SBH SBH Description V/C$
Excess
2016-17
Excess
2017-18
Excess
2018-19
14 R01-Medical
and Public
Health
2210 06 101 061
Malaria Control
Programme -
(State Sector)
V 29.40 10.67 12.76
15
T06-Capital
Expenditure on
Tribal Areas
Development
Sub-Plan
4225 02 796 053
Construction of
English
Medium School
Buildings
V 62.00 9.58 50.00
16
T06-Capital
Expenditure on
Tribal Areas
Development
Sub-Plan
5054 04 796 511
District and
Other Roads
(State Level
Scheme)
V 25.50 69.77 48.73
17 W03-Technical
Education 2203 00 105 276
Introduction of
Double Shift in
Government
Polytechnics
V 9.33 6.40 4.67
18 ZE01-
Minorities
Development
2235 02 200 B02
Commencement
of Second Shift
in Existing
Government
Polytechnics for
Minority
Students.
V 3.32 3.89 2.18
19 D01-Interest
Payments 2049 03 104 121
General
Provident Fund
of Staff in
Agricultural
Universities and
Allied
Institutions
C 7.49 7.29 3.51
20 G03-Interest
Payments and
Debt Servicing
2049 01 101 218
Maharashtra
State
Development
Loan
C 736.28 143.62 902.58
21 L01-Interest
Payments 2049 03 104 077
Interest on
State Provident
Fund
C 4.89 9.34 2.71
Source: Appropriation Accounts of respective years $ Voted/Charged
State Finances Audit Report for the year ended 31 March 2019
102
Appendix - 2.5 (Reference: Paragraph 2.3.4; page 55)
Rush of expenditure during the last quarter and last month of 2018-19 (`̀̀̀ in crore)
Sr. No. Grant
No. Major Head
Total
Expenditure
during the
year
Expenditure during the
last quarter of the year
Expenditure during
March 2019
Amount
Percentage
of total
expenditure
Amount
Percentage of
total
expenditure
01 A04 2052 -Secretariat -
General Services 756.12 434.76 57.50 384.5 50.85
02 A05 2235 -Social Security
and Welfare 553.81 488.65 88.23 466.09 84.16
03 B10 5055 -Capital Outlay on
Road Transport 500.00 420.45 84.09 420.45 84.09
04 C06 2245 -Relief on account
of Natural Calamities 12782.33 8305.28 64.97 6415.33 50.19
05 C10 4406 -Capital Outlay on
Forestry and Wild Life 1147.84 916.99 79.89 792.44 69.04
06 E01 2049 -Interest Payments 1658.00 1649.96 99.52 1646.79 99.32
07 F02 3054 -Roads and Bridges 405.08 308.13 76.07 251.73 62.14
08 F05 4217 -Capital Outlay on
Urban Development 2059.24 1804.24 87.62 1363.32 66.21
09 F07 6217 -Loans for Urban
Development 789.98 609.98 77.21 490.98 62.15
10 G02 2075 -Miscellaneous
General Services 331.33 290.86 87.79 274.08 82.72
11 G03
2048 -Appropriation for
Reduction or Avoidance
of Debt
3800.00 1900.00 50.00 1900.00 50.00
12 H08
4210 -Capital Outlay on
Medical and Public
Health
537.62 404.24 75.19 289.07 53.77
13 I05 4702 -Capital Outlay on
Minor Irrigation 1301.45 808.62 62.13 658.31 50.58
14 K02 2049 -Interest Payments 365.03 365.03 100.00 365.03 100.00
15 K06 2810 -New and
Renewable Energy 534.04 534.04 100.00 534.04 100.00
16 K06 2801 -Power 9847.67 6079.13 61.73 6045.81 61.39
17 L01 2049 -Interest Payments 1269.45 1236.41 97.40 1217.23 95.89
18 L03
2515 -Other Rural
Development
Programmes
4385.18 2832.92 64.60 2750.99 62.73
19 M02 2408 -Food, Storage and
Warehousing 2196.64 2001.74 91.13 1774.83 80.80
20 N03 2801 -Power 200.00 200.00 100.00 200.00 100.00
21 N06
2225 -Welfare of
Scheduled Castes,
Scheduled Tribes, Other
Backward Classes and
Minorities
2290.03 1764.23 77.04 1339.87 58.51
22 O07 3451 -Secretariat -
Economic Services 186.51 150.05 80.45 103.71 55.61

Appendices
103
Appendix - 2.5 (concld…) (`̀̀̀ in crore)
Sr. No. Grant
No. Major Head
Total
Expenditure
during the
year
Expenditure during the
last quarter of the year
Expenditure during
March 2019
Amount
Percentage
of total
expenditure
Amount
Percentage of
total
expenditure
23 O10
4515 -Capital Outlay on
other Rural Development
Programmes
734.45 556.04 75.71 413.97 56.36
24 Q03 2216 -Housing 670.84 596.70 88.95 539.63 80.44
25 R03
4210 -Capital Outlay on
Medical and Public
Health
124.17 123.85 99.74 123.75 99.66
26 S04
4210 -Capital Outlay on
Medical and Public
Health
285.58 284.60 99.66 265.63 93.01
27 T05 2801 -Power 219.43 219.43 100.00 219.43 100.00
28 T05 2215 -Water Supply and
Sanitation 259.45 185.77 71.60 134.91 52.00
29 T06 5054 -Capital Outlay on
Roads and Bridges 498.73 498.73 100.00 411.81 82.57
30 T06
4225 -Capital Outlay on
Welfare of Scheduled
Castes, Scheduled
Tribes, Other Backward
Classes & Minorities
204.96 166.30 81.14 143.55 70.04
31 T09
2225 -Welfare of
Scheduled Castes,
Scheduled Tribes, Other
Backward Classes and
Minorities
2856.78 2033.12 71.17 1566.60 54.84
32 T10
4225 -Capital Outlay on
Welfare of Scheduled
Castes, Scheduled
Tribes, Other Backward
Classes & Minorities
295.49 254.57 86.15 201.73 68.27
33 V03 4425 -Capital Outlay on
Co-operation 155.22 138.07 88.95 136.34 87.84
34 W01 2049 -Interest Payments 345.77 345.77 100.00 345.77 100.00
35 W04 2205 -Art and Culture 306.47 196.37 64.07 189.23 61.75
36 ZD04 3452 -Tourism 362.40 359.19 99.11 322.38 88.96
37 ZH05 4702 -Capital Outlay on
Minor Irrigation 169.30 131.64 77.76 118.49 69.99
38 ZH05
4402 -Capital Outlay on
Soil and Water
Conservation
2012.35 1321.76 65.68 1125.22 55.92
Total 57398.74 40917.62 35943.04
Source: Information obtained from VLC of Accountant General (A&E)-I, Maharashtra, Mumbai

State Finances Audit Report for the year ended 31 March 2019
104
Appendix - 2.6 (Reference: Paragraph 2.3.5; Page 55)
Grants/appropriations which closed with savings of more than ` 10 crore each
and more than 20 per cent of the total provisions
(`̀̀̀ in crore)
Sr. No. Grant
Number Name of the Grant/Appropriation
Total
Grant/Appropriation Savings Percentage
Revenue (Voted)
1 A04 Secretariat and Miscellaneous General Services 1398.56 462.38 33.06
2 A06 Information and Publicity 187.55 51.62 27.52
3 B02 State Excise 153.32 31.31 20.42
4 B04 Secretariat and Other General Services 51.10 11.32 22.15
5 D03 Agriculture Services 7631.51 1790.18 23.46
6 E03 Secretariat and Other Social Services 412.89 110.95 26.87
7 F02 Urban Development and Other Advance Services 12936.86 4016.56 31.05
8 F03 Secretariat and Other Social Services 127.21 109.59 86.15
9 G01 Sales Tax Administration 780.52 202.18 25.90
10 G02 Other Fiscal and Miscellaneous Services 10138.03 9802.70 96.69
11 G04 Secretariat - General Services 41.31 10.66 25.80
12 J02 Secretariat and Other Social and Economic
Services 124.96 27.53 22.03
13 K01 Other Taxes and Duties on Commodities and
Services 53.43 11.69 21.88
14 K04 Labour and Employment 200.88 45.57 22.69
15 K08 Secretariat - Economic Services 28.68 14.14 49.30
16 L03 Rural Development Programmes 8139.92 1807.25 22.20
17 N02 Secretariat and Other Social Services 815.61 170.01 20.84
18 N03 Welfare of Scheduled Caste, Scheduled Tribes
and Other Backward Classes 8920.54 2459.17 27.57
19 O01 District Administration 354.00 74.24 20.97
20 O03 Rural Employment 5144.25 3960.53 76.99
21 O04 Other Rural Development Programmes 505.29 505.23 99.99
22 O06 Other Scientific Research 128.31 38.49 30.00
23 O07 Secretariat-Economic Services 266.09 82.07 30.84
24 O09 Census, Survey and Statistics 75.30 31.01 41.18
25 Q03 Housing 1377.90 706.71 51.29
26 R01 Medical and Public Health 10812.59 2181.51 20.18
27 T05 Revenue Expenditure on Tribal Areas
Development Sub-Plan 7044.90 3148.46 44.69
28 U04 Ecology and Environment 101.96 34.99 34.32
29 V02 Co-operation 12284.20 5523.66 44.97
30 Y02 Water Supply and Sanitation 5065.06 2436.60 48.11
31 ZA02 Social Security and Welfare 2014.43 557.70 27.69
32 ZC01 Parliament / State/Union Territory Legislatures 240.56 71.03 29.53
33 ZD04 Tourism 466.74 104.34 22.36
34 ZE01 Minorities Development 408.22 268.18 65.69
35 ZG02 Secretariat & Other Social Services 16.90 12.70 75.15
36 ZH03 Irrigation, Power & Other Economic Services 387.75 84.16 21.70
Revenue (Charged)
37 B03 Transport Administration 50.00 15.00 30.00
38 G06 Pensions and Other Retirement Benefits 56.97 12.05 21.15
39 V01 Interest Payments 73.00 56.28 77.10
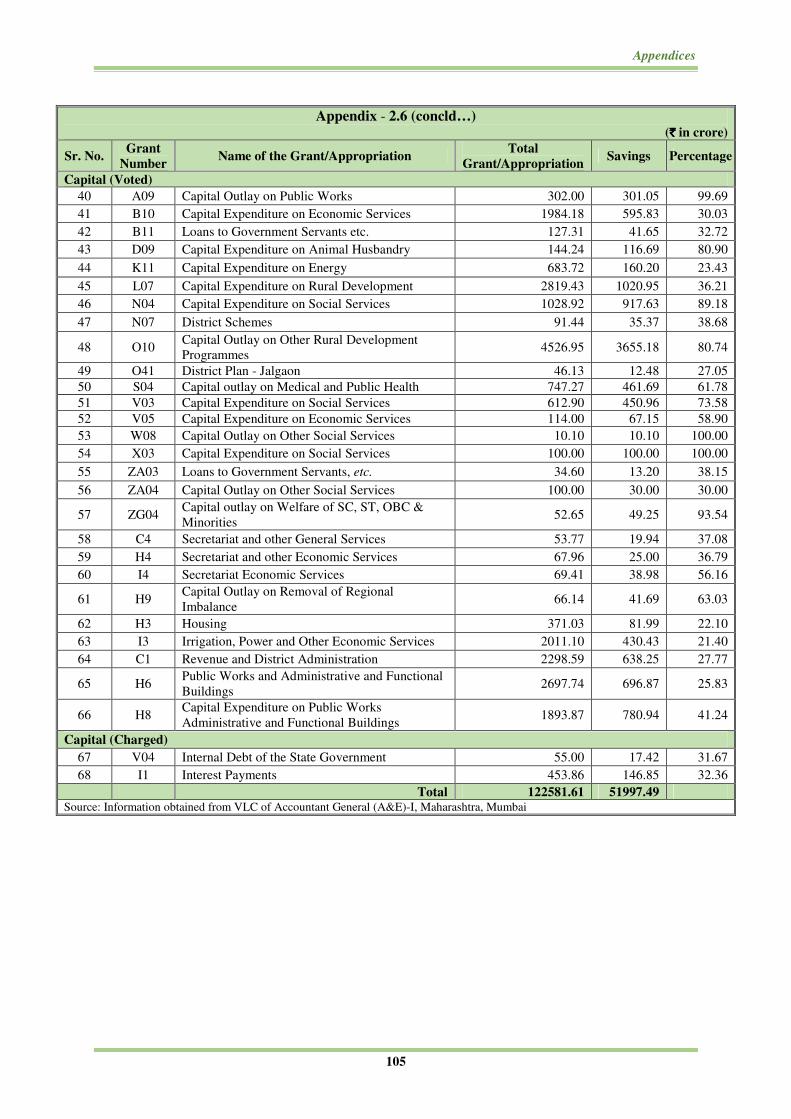
Appendices
105
Appendix - 2.6 (concld…) (`̀̀̀ in crore)
Sr. No. Grant
Number Name of the Grant/Appropriation
Total
Grant/Appropriation Savings Percentage
Capital (Voted)
40 A09 Capital Outlay on Public Works 302.00 301.05 99.69
41 B10 Capital Expenditure on Economic Services 1984.18 595.83 30.03
42 B11 Loans to Government Servants etc. 127.31 41.65 32.72
43 D09 Capital Expenditure on Animal Husbandry 144.24 116.69 80.90
44 K11 Capital Expenditure on Energy 683.72 160.20 23.43
45 L07 Capital Expenditure on Rural Development 2819.43 1020.95 36.21
46 N04 Capital Expenditure on Social Services 1028.92 917.63 89.18
47 N07 District Schemes 91.44 35.37 38.68
48 O10 Capital Outlay on Other Rural Development
Programmes 4526.95 3655.18 80.74
49 O41 District Plan - Jalgaon 46.13 12.48 27.05
50 S04 Capital outlay on Medical and Public Health 747.27 461.69 61.78
51 V03 Capital Expenditure on Social Services 612.90 450.96 73.58
52 V05 Capital Expenditure on Economic Services 114.00 67.15 58.90
53 W08 Capital Outlay on Other Social Services 10.10 10.10 100.00
54 X03 Capital Expenditure on Social Services 100.00 100.00 100.00
55 ZA03 Loans to Government Servants, etc. 34.60 13.20 38.15
56 ZA04 Capital Outlay on Other Social Services 100.00 30.00 30.00
57 ZG04 Capital outlay on Welfare of SC, ST, OBC &
Minorities 52.65 49.25 93.54
58 C4 Secretariat and other General Services 53.77 19.94 37.08
59 H4 Secretariat and other Economic Services 67.96 25.00 36.79
60 I4 Secretariat Economic Services 69.41 38.98 56.16
61 H9 Capital Outlay on Removal of Regional
Imbalance 66.14 41.69 63.03
62 H3 Housing 371.03 81.99 22.10
63 I3 Irrigation, Power and Other Economic Services 2011.10 430.43 21.40
64 C1 Revenue and District Administration 2298.59 638.25 27.77
65 H6 Public Works and Administrative and Functional
Buildings 2697.74 696.87 25.83
66 H8 Capital Expenditure on Public Works
Administrative and Functional Buildings 1893.87 780.94 41.24
Capital (Charged)
67 V04 Internal Debt of the State Government 55.00 17.42 31.67
68 I1 Interest Payments 453.86 146.85 32.36
Total 122581.61 51997.49 Source: Information obtained from VLC of Accountant General (A&E)-I, Maharashtra, Mumbai
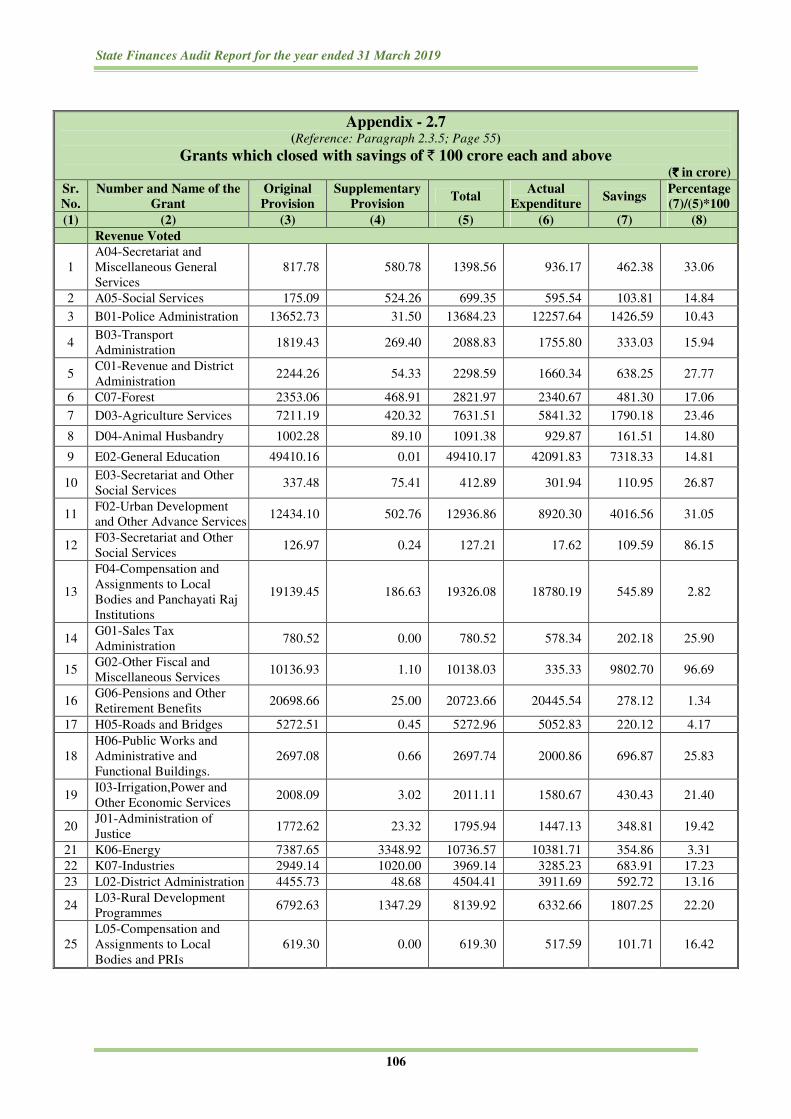
State Finances Audit Report for the year ended 31 March 2019
106
Appendix - 2.7 (Reference: Paragraph 2.3.5; Page 55)
Grants which closed with savings of ` 100 crore each and above (`̀̀̀ in crore)
Sr.
No.
Number and Name of the
Grant
Original
Provision
Supplementary
Provision Total
Actual
Expenditure Savings
Percentage
(7)/(5)*100
(1) (2) (3) (4) (5) (6) (7) (8)
Revenue Voted
1
A04-Secretariat and
Miscellaneous General
Services
817.78 580.78 1398.56 936.17 462.38 33.06
2 A05-Social Services 175.09 524.26 699.35 595.54 103.81 14.84
3 B01-Police Administration 13652.73 31.50 13684.23 12257.64 1426.59 10.43
4 B03-Transport
Administration 1819.43 269.40 2088.83 1755.80 333.03 15.94
5 C01-Revenue and District
Administration 2244.26 54.33 2298.59 1660.34 638.25 27.77
6 C07-Forest 2353.06 468.91 2821.97 2340.67 481.30 17.06
7 D03-Agriculture Services 7211.19 420.32 7631.51 5841.32 1790.18 23.46
8 D04-Animal Husbandry 1002.28 89.10 1091.38 929.87 161.51 14.80
9 E02-General Education 49410.16 0.01 49410.17 42091.83 7318.33 14.81
10 E03-Secretariat and Other
Social Services 337.48 75.41 412.89 301.94 110.95 26.87
11 F02-Urban Development
and Other Advance Services 12434.10 502.76 12936.86 8920.30 4016.56 31.05
12 F03-Secretariat and Other
Social Services 126.97 0.24 127.21 17.62 109.59 86.15
13
F04-Compensation and
Assignments to Local
Bodies and Panchayati Raj
Institutions
19139.45 186.63 19326.08 18780.19 545.89 2.82
14 G01-Sales Tax
Administration 780.52 0.00 780.52 578.34 202.18 25.90
15 G02-Other Fiscal and
Miscellaneous Services 10136.93 1.10 10138.03 335.33 9802.70 96.69
16 G06-Pensions and Other
Retirement Benefits 20698.66 25.00 20723.66 20445.54 278.12 1.34
17 H05-Roads and Bridges 5272.51 0.45 5272.96 5052.83 220.12 4.17
18
H06-Public Works and
Administrative and
Functional Buildings.
2697.08 0.66 2697.74 2000.86 696.87 25.83
19 I03-Irrigation,Power and
Other Economic Services 2008.09 3.02 2011.11 1580.67 430.43 21.40
20 J01-Administration of
Justice 1772.62 23.32 1795.94 1447.13 348.81 19.42
21 K06-Energy 7387.65 3348.92 10736.57 10381.71 354.86 3.31
22 K07-Industries 2949.14 1020.00 3969.14 3285.23 683.91 17.23
23 L02-District Administration 4455.73 48.68 4504.41 3911.69 592.72 13.16
24 L03-Rural Development
Programmes 6792.63 1347.29 8139.92 6332.66 1807.25 22.20
25
L05-Compensation and
Assignments to Local
Bodies and PRIs
619.30 0.00 619.30 517.59 101.71 16.42
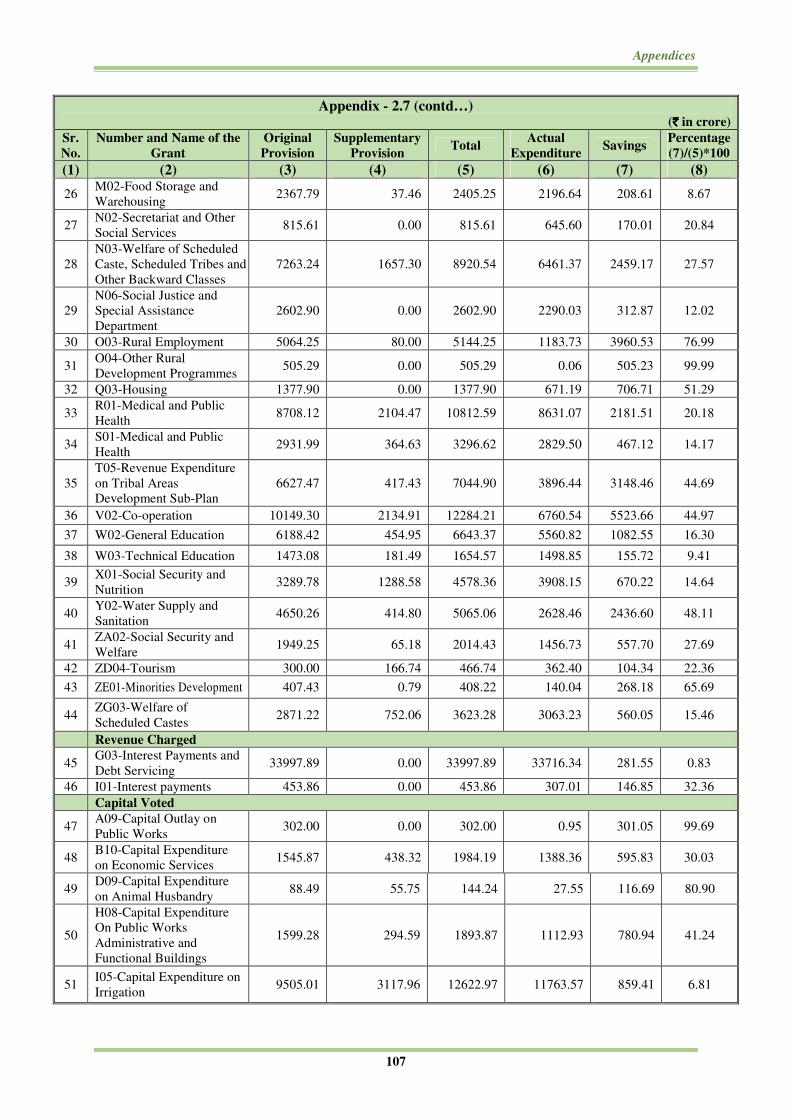
Appendices
107
Appendix - 2.7 (contd…) (`̀̀̀ in crore)
Sr.
No.
Number and Name of the
Grant
Original
Provision
Supplementary
Provision Total
Actual
Expenditure Savings
Percentage
(7)/(5)*100
(1) (2) (3) (4) (5) (6) (7) (8)
26 M02-Food Storage and
Warehousing 2367.79 37.46 2405.25 2196.64 208.61 8.67
27 N02-Secretariat and Other
Social Services 815.61 0.00 815.61 645.60 170.01 20.84
28
N03-Welfare of Scheduled
Caste, Scheduled Tribes and
Other Backward Classes
7263.24 1657.30 8920.54 6461.37 2459.17 27.57
29
N06-Social Justice and
Special Assistance
Department
2602.90 0.00 2602.90 2290.03 312.87 12.02
30 O03-Rural Employment 5064.25 80.00 5144.25 1183.73 3960.53 76.99
31 O04-Other Rural
Development Programmes 505.29 0.00 505.29 0.06 505.23 99.99
32 Q03-Housing 1377.90 0.00 1377.90 671.19 706.71 51.29
33 R01-Medical and Public
Health 8708.12 2104.47 10812.59 8631.07 2181.51 20.18
34 S01-Medical and Public
Health 2931.99 364.63 3296.62 2829.50 467.12 14.17
35
T05-Revenue Expenditure
on Tribal Areas
Development Sub-Plan
6627.47 417.43 7044.90 3896.44 3148.46 44.69
36 V02-Co-operation 10149.30 2134.91 12284.21 6760.54 5523.66 44.97
37 W02-General Education 6188.42 454.95 6643.37 5560.82 1082.55 16.30
38 W03-Technical Education 1473.08 181.49 1654.57 1498.85 155.72 9.41
39 X01-Social Security and
Nutrition 3289.78 1288.58 4578.36 3908.15 670.22 14.64
40 Y02-Water Supply and
Sanitation 4650.26 414.80 5065.06 2628.46 2436.60 48.11
41 ZA02-Social Security and
Welfare 1949.25 65.18 2014.43 1456.73 557.70 27.69
42 ZD04-Tourism 300.00 166.74 466.74 362.40 104.34 22.36
43 ZE01-Minorities Development 407.43 0.79 408.22 140.04 268.18 65.69
44 ZG03-Welfare of
Scheduled Castes 2871.22 752.06 3623.28 3063.23 560.05 15.46
Revenue Charged
45 G03-Interest Payments and
Debt Servicing 33997.89 0.00 33997.89 33716.34 281.55 0.83
46 I01-Interest payments 453.86 0.00 453.86 307.01 146.85 32.36
Capital Voted
47 A09-Capital Outlay on
Public Works 302.00 0.00 302.00 0.95 301.05 99.69
48 B10-Capital Expenditure
on Economic Services 1545.87 438.32 1984.19 1388.36 595.83 30.03
49 D09-Capital Expenditure
on Animal Husbandry 88.49 55.75 144.24 27.55 116.69 80.90
50
H08-Capital Expenditure
On Public Works
Administrative and
Functional Buildings
1599.28 294.59 1893.87 1112.93 780.94 41.24
51 I05-Capital Expenditure on
Irrigation 9505.01 3117.96 12622.97 11763.57 859.41 6.81

State Finances Audit Report for the year ended 31 March 2019
108
Appendix - 2.7 (concld…) (`̀̀̀ in crore)
Sr.
No.
Number and Name of the
Grant
Original
Provision
Supplementary
Provision Total
Actual
Expenditure Savings
Percentage
(7)/(5)*100
(1) (2) (3) (4) (5) (6) (7) (8)
52 K11-Capital Expenditure
on Energy 614.72 69.00 683.72 523.52 160.20 23.43
53 L07-Capital Expenditure
on Rural Development 2819.43 0.00 2819.43 1798.48 1020.95 36.21
54
M04-Capital Expenditure
on Food Storage and
Warehousing
4509.20 0.00 4509.20 4263.37 245.83 5.45
55 N04-Food Storage and
Warehousing 1028.91 0.00 1028.91 111.29 917.63 89.18
56
O10-Capital Outlay on
Other Rural Development
Programmes
4216.70 310.25 4526.95 871.77 3655.18 80.74
57 S04-Capital outlay on
Medical and Public Health 525.17 222.10 747.27 285.58 461.69 61.78
58
T06-Capital Expenditure
on Tribal Areas
Development Sub-Plan
723.36 200.00 923.36 776.12 147.24 15.95
59 V03-Capital Expenditure
on Social Services 111.50 501.40 612.90 161.94 450.96 73.58
60 X03-Capital Expenditure
on Social Services 100.00 0.00 100.00 0.00 100.00 100.00
61
ZH05-Capital Outlay on
Soil and Water
Conservation
2634.90 71.31 2706.21 2181.66 524.56 19.38
Capital Charged
62 G09-Public Debt and Inter
State Settlement 28107.71 0.00 28107.71 24789.91 3317.80 11.80
TOTAL 338722.14 24423.56 363145.70 290564.01 72581.65
Source: Information obtained from VLC of Accountant General (A&E)-I, Maharashtra, Mumbai
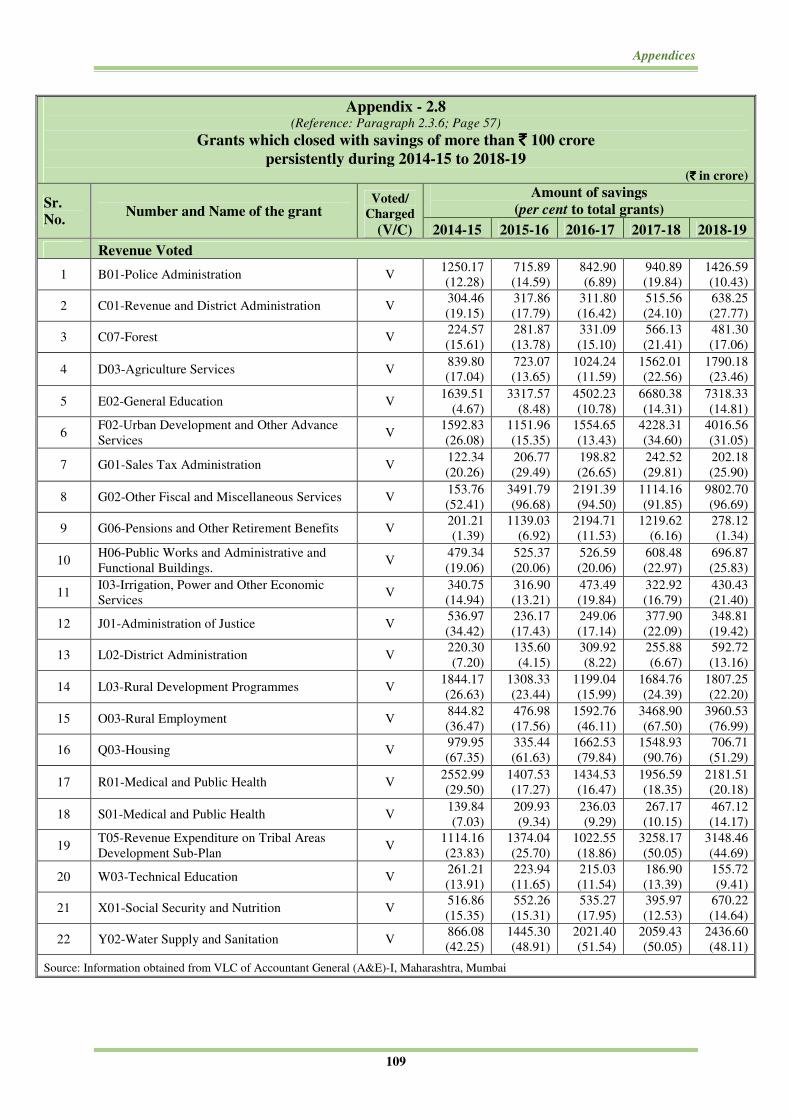
Appendices
109
Appendix - 2.8 (Reference: Paragraph 2.3.6; Page 57)
Grants which closed with savings of more than `̀̀̀ 100 crore
persistently during 2014-15 to 2018-19 (`̀̀̀ in crore)
Sr.
No. Number and Name of the grant
Voted/
Charged
(V/C)
Amount of savings
(per cent to total grants)
2014-15 2015-16 2016-17 2017-18 2018-19
Revenue Voted
1 B01-Police Administration V 1250.17
(12.28)
715.89
(14.59)
842.90
(6.89)
940.89
(19.84)
1426.59
(10.43)
2 C01-Revenue and District Administration V 304.46
(19.15)
317.86
(17.79)
311.80
(16.42)
515.56
(24.10)
638.25
(27.77)
3 C07-Forest V 224.57
(15.61)
281.87
(13.78)
331.09
(15.10)
566.13
(21.41)
481.30
(17.06)
4 D03-Agriculture Services V 839.80
(17.04)
723.07
(13.65)
1024.24
(11.59)
1562.01
(22.56)
1790.18
(23.46)
5 E02-General Education V 1639.51
(4.67)
3317.57
(8.48)
4502.23
(10.78)
6680.38
(14.31)
7318.33
(14.81)
6 F02-Urban Development and Other Advance
Services V
1592.83
(26.08)
1151.96
(15.35)
1554.65
(13.43)
4228.31
(34.60)
4016.56
(31.05)
7 G01-Sales Tax Administration V 122.34
(20.26)
206.77
(29.49)
198.82
(26.65)
242.52
(29.81)
202.18
(25.90)
8 G02-Other Fiscal and Miscellaneous Services V 153.76
(52.41)
3491.79
(96.68)
2191.39
(94.50)
1114.16
(91.85)
9802.70
(96.69)
9 G06-Pensions and Other Retirement Benefits V 201.21
(1.39)
1139.03
(6.92)
2194.71
(11.53)
1219.62
(6.16)
278.12
(1.34)
10 H06-Public Works and Administrative and
Functional Buildings. V
479.34
(19.06)
525.37
(20.06)
526.59
(20.06)
608.48
(22.97)
696.87
(25.83)
11 I03-Irrigation, Power and Other Economic
Services V
340.75
(14.94)
316.90
(13.21)
473.49
(19.84)
322.92
(16.79)
430.43
(21.40)
12 J01-Administration of Justice V 536.97
(34.42)
236.17
(17.43)
249.06
(17.14)
377.90
(22.09)
348.81
(19.42)
13 L02-District Administration V 220.30
(7.20)
135.60
(4.15)
309.92
(8.22)
255.88
(6.67)
592.72
(13.16)
14 L03-Rural Development Programmes V 1844.17
(26.63)
1308.33
(23.44)
1199.04
(15.99)
1684.76
(24.39)
1807.25
(22.20)
15 O03-Rural Employment V 844.82
(36.47)
476.98
(17.56)
1592.76
(46.11)
3468.90
(67.50)
3960.53
(76.99)
16 Q03-Housing V 979.95
(67.35)
335.44
(61.63)
1662.53
(79.84)
1548.93
(90.76)
706.71
(51.29)
17 R01-Medical and Public Health V 2552.99
(29.50)
1407.53
(17.27)
1434.53
(16.47)
1956.59
(18.35)
2181.51
(20.18)
18 S01-Medical and Public Health V 139.84
(7.03)
209.93
(9.34)
236.03
(9.29)
267.17
(10.15)
467.12
(14.17)
19 T05-Revenue Expenditure on Tribal Areas
Development Sub-Plan V
1114.16
(23.83)
1374.04
(25.70)
1022.55
(18.86)
3258.17
(50.05)
3148.46
(44.69)
20 W03-Technical Education V 261.21
(13.91)
223.94
(11.65)
215.03
(11.54)
186.90
(13.39)
155.72
(9.41)
21 X01-Social Security and Nutrition V 516.86
(15.35)
552.26
(15.31)
535.27
(17.95)
395.97
(12.53)
670.22
(14.64)
22 Y02-Water Supply and Sanitation V 866.08
(42.25)
1445.30
(48.91)
2021.40
(51.54)
2059.43
(50.05)
2436.60
(48.11)
Source: Information obtained from VLC of Accountant General (A&E)-I, Maharashtra, Mumbai

State Finances Audit Report for the year ended 31 March 2019
110
Appendix - 2.9
(Reference: Paragraph 2.3.7; Page 58)
Unnecessary Supplementary provisions
(` 10 crore or more in each case) (`̀̀̀ in crore)
Sr.
No.
Grant
Number Name of the Appropriation Original
Actual
expenditure
Savings out
of original
provision
Supplementary
Provision
Revenue Voted
1 A06 Information and Publicity 158.55 135.93 22.62 29.00
2 B01 Police Administration 13652.73 12257.64 1395.09 31.50
3 B03 Transport Administration 1819.43 1755.80 63.63 269.40
4 C01 Revenue and District Administration 2244.26 1660.34 583.92 54.33
5 C07 Forest 2353.06 2340.67 12.39 468.91
6 D03 Agriculture Services 7211.19 5841.32 1369.87 420.32
7 D04 Animal Husbandry 1002.28 929.87 72.41 89.10
8 E03 Secretariat and Other Social Services 337.48 301.94 35.54 75.41
9 F02 Urban Development and Other
Advance Services 12434.10 8920.30 3513.80 502.76
10 F04
Compensation and Assignments to
Local Bodies and Panchayati Raj
Institutions
19139.45 18780.19 359.26 186.63
11 G06 Pensions and Other Retirement
Benefits 20698.66 20445.54 253.12 25.00
12 G07 Social Security and Welfare 151.71 149.34 2.38 16.30
13 H03 Housing 296.03 289.04 6.99 75.00
14 J01 Administration of Justice 1772.62 1447.13 325.49 23.32
15 L02 District Administration 4455.73 3911.69 544.04 48.68
16 L03 Rural Development Programmes 6792.63 6332.66 459.97 1347.29
17 M02 Food Storage and Warehousing 2367.79 2196.64 171.15 37.46
18 N03
Welfare of Scheduled Caste,
Scheduled Tribes and Other
Backward Classes
7263.24 6461.37 801.87 1657.30
19 O01 District Administration 304.00 279.76 24.24 50.00
20 O03 Rural Employment 5064.25 1183.73 3880.53 80.00
21 R01 Medical and Public Health 8708.12 8631.07 77.05 2104.47
22 S01 Medical and Public Health 2931.99 2829.50 102.49 364.63
23 T05 Revenue Expenditure on Tribal
Areas Development Sub-Plan 6627.47 3896.44 2731.03 417.43
24 U04 Ecology and Environment 89.55 66.96 22.59 12.41
25 V02 Co-operation 10149.30 6760.54 3388.75 2134.91
26 W02 General Education 6188.42 5560.82 627.60 454.95
27 Y02 Water Supply and Sanitation 4650.26 2628.46 2021.80 414.80
28 ZA02 Social Security and Welfare 1949.25 1456.73 492.52 65.18
29 ZC01 Parliament / State/Union Territory
Legislatures 202.70 169.53 33.17 37.86
30 ZD02 Art and Culture 169.02 155.66 13.35 10.65
Revenue Charged
31 J01 Administration of Justice 310.56 285.24 25.32 24.37

Appendices
111
Appendix - 2.9 (concld…)
(`̀̀̀ in crore)
Sr.
No.
Grant
Number Name of the Appropriation Original
Actual
expenditure
Savings out
of original
provision
Supplementary
Provision
Capital Voted
32 B10 Capital Expenditure on Economic
Services 1545.87 1388.36 157.51 438.32
33 D09 Capital Expenditure on Animal
Husbandry 88.49 27.55 60.94 55.75
34 H08
Capital Expenditure On Public
Works Administrative and
Functional Buildings
1599.28 1112.93 486.35 294.59
35 K11 Capital Expenditure on Energy 614.72 523.52 91.20 69.00
36 O10 Capital Outlay on Other Rural
Development Programmes 4216.70 871.77 3344.93 310.25
37 S04 Capital outlay on Medical and Public
Health 525.17 285.58 239.59 222.10
38 ZH05 Capital Outlay on Soil and Water
Conservation 2634.90 2181.66 453.24 71.31
Total 162720.96 134453.22 27814.74 12990.69
Source: Information obtained from VLC of Accountant General (A&E)-I, Maharashtra, Mumbai
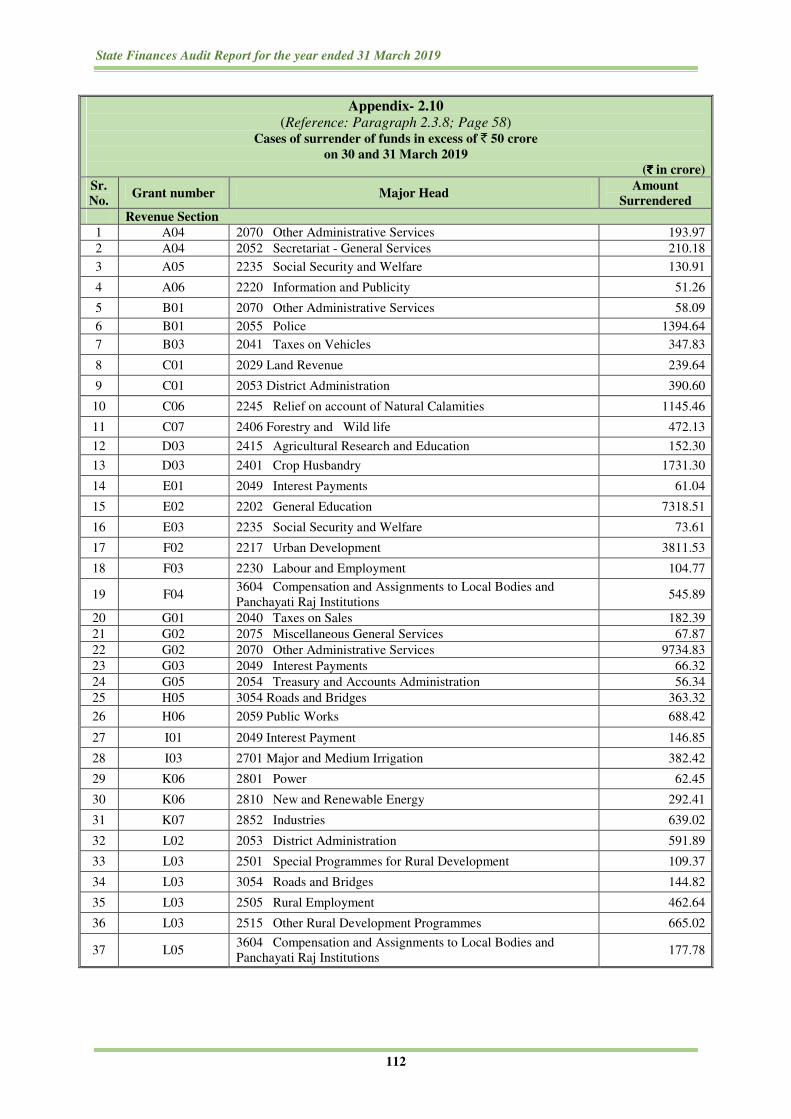
State Finances Audit Report for the year ended 31 March 2019
112
Appendix- 2.10 (Reference: Paragraph 2.3.8; Page 58)
Cases of surrender of funds in excess of ` 50 crore
on 30 and 31 March 2019
(`̀̀̀ in crore)
Sr.
No. Grant number Major Head
Amount
Surrendered
Revenue Section
1 A04 2070 Other Administrative Services 193.97
2 A04 2052 Secretariat - General Services 210.18
3 A05 2235 Social Security and Welfare 130.91
4 A06 2220 Information and Publicity 51.26
5 B01 2070 Other Administrative Services 58.09
6 B01 2055 Police 1394.64
7 B03 2041 Taxes on Vehicles 347.83
8 C01 2029 Land Revenue 239.64
9 C01 2053 District Administration 390.60
10 C06 2245 Relief on account of Natural Calamities 1145.46
11 C07 2406 Forestry and Wild life 472.13
12 D03 2415 Agricultural Research and Education 152.30
13 D03 2401 Crop Husbandry 1731.30
14 E01 2049 Interest Payments 61.04
15 E02 2202 General Education 7318.51
16 E03 2235 Social Security and Welfare 73.61
17 F02 2217 Urban Development 3811.53
18 F03 2230 Labour and Employment 104.77
19 F04 3604 Compensation and Assignments to Local Bodies and
Panchayati Raj Institutions 545.89
20 G01 2040 Taxes on Sales 182.39
21 G02 2075 Miscellaneous General Services 67.87
22 G02 2070 Other Administrative Services 9734.83
23 G03 2049 Interest Payments 66.32
24 G05 2054 Treasury and Accounts Administration 56.34
25 H05 3054 Roads and Bridges 363.32
26 H06 2059 Public Works 688.42
27 I01 2049 Interest Payment 146.85
28 I03 2701 Major and Medium Irrigation 382.42
29 K06 2801 Power 62.45
30 K06 2810 New and Renewable Energy 292.41
31 K07 2852 Industries 639.02
32 L02 2053 District Administration 591.89
33 L03 2501 Special Programmes for Rural Development 109.37
34 L03 3054 Roads and Bridges 144.82
35 L03 2505 Rural Employment 462.64
36 L03 2515 Other Rural Development Programmes 665.02
37 L05 3604 Compensation and Assignments to Local Bodies and
Panchayati Raj Institutions 177.78

Appendices
113
Appendix - 2.10 (contd…) (`̀̀̀ in crore)
Sr.
No. Grant number Major Head
Amount
Surrendered
38 M02 2408 Food, Storage and Warehousing 208.66
39 N02 2216 Housing 141.00
40 N03 2801 Power 50.00
41 N03 2235 Social Security and Welfare 539.80
42 N03 2225 Welfare of Scheduled Castes, Scheduled Tribes, Other
Backward Classes and Minorities 1871.39
43 N06 2225 Welfare of Scheduled Castes, Scheduled Tribes, Other
Backward Classes and Minorities 310.76
44 O01 2053 District Administration 74.24
45 O03 2505 Rural Employment 2504.21
46 O04 2515 Other Rural Development Programmes 505.23
47 O07 3451 Secretariat -Economic Services 85.21
48 Q03 2216 Housing 706.32
49 R01 2211 Family Welfare 61.23
50 R01 2210 Medical and Public Health 2124.12
51 S01 2210 Medical and Public Health 483.73
52 T05 2801 Power 50.00
53 T05 2210 Medical and Public Health 71.79
54 T05 2401 Crop Husbandry 78.37
55 T05 2202 General Education 109.27
56 T05 2235 Social Security and Welfare 123.25
57 T05 2505 Rural Employment 239.74
58 T05 2215 Water Supply and Sanitation 312.81
59 T05 2435 Other Agricultural Programmes 922.23
60 T05 2225 Welfare of Scheduled Castes, Scheduled Tribes, Other
Backward Classes and Minorities 1152.75
61 T09 2225 Welfare of Scheduled Castes, Scheduled Tribes, Other
Backward Classes and Minorities 148.99
62 V02 2425 Co-operation 50.95
63 V02 2851 Village and Small Industries 51.48
64 V02 2435 Other Agricultural Programmes 5412.69
65 W02 2202 General Education 1082.60
66 W03 2203 Technical Education 155.67
67 X01 2235 Social Security and Welfare 241.77
68 X01 2236 Nutrition 427.84
69 Y02 2215 Water Supply and Sanitation 2438.35
70 ZA02 2203 Technical Education 180.16
71 ZA02 2230 Labour and Employment 375.98
72 ZD04 3452 Tourism 100.49
73 ZE01 2235 Social Security and Welfare 268.86
74 ZG03 2225 Welfare of Scheduled Castes, Scheduled Tribes, Other
Backward Classes and Minorities 558.93
75 ZH03 2402 Soil and Water Conservation 63.37
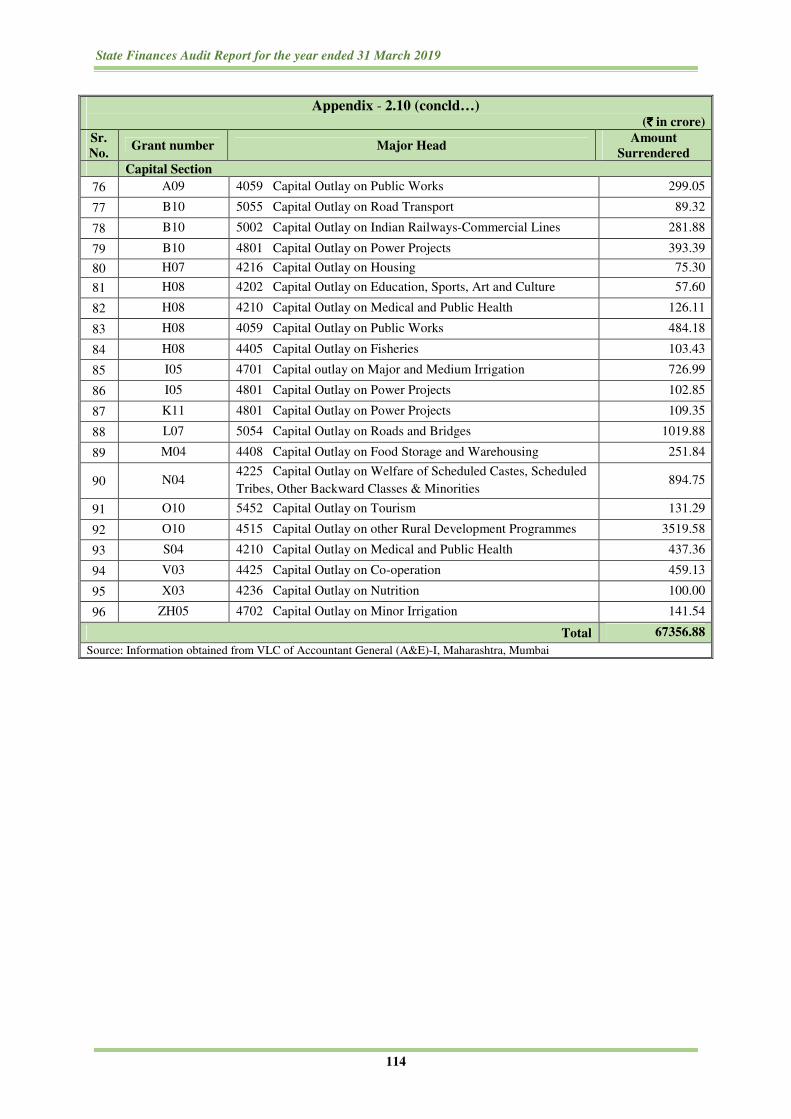
State Finances Audit Report for the year ended 31 March 2019
114
Appendix - 2.10 (concld…) (`̀̀̀ in crore)
Sr.
No. Grant number Major Head
Amount
Surrendered
Capital Section
76 A09 4059 Capital Outlay on Public Works 299.05
77 B10 5055 Capital Outlay on Road Transport 89.32
78 B10 5002 Capital Outlay on Indian Railways-Commercial Lines 281.88
79 B10 4801 Capital Outlay on Power Projects 393.39
80 H07 4216 Capital Outlay on Housing 75.30
81 H08 4202 Capital Outlay on Education, Sports, Art and Culture 57.60
82 H08 4210 Capital Outlay on Medical and Public Health 126.11
83 H08 4059 Capital Outlay on Public Works 484.18
84 H08 4405 Capital Outlay on Fisheries 103.43
85 I05 4701 Capital outlay on Major and Medium Irrigation 726.99
86 I05 4801 Capital Outlay on Power Projects 102.85
87 K11 4801 Capital Outlay on Power Projects 109.35
88 L07 5054 Capital Outlay on Roads and Bridges 1019.88
89 M04 4408 Capital Outlay on Food Storage and Warehousing 251.84
90 N04 4225 Capital Outlay on Welfare of Scheduled Castes, Scheduled
Tribes, Other Backward Classes & Minorities 894.75
91 O10 5452 Capital Outlay on Tourism 131.29
92 O10 4515 Capital Outlay on other Rural Development Programmes 3519.58
93 S04 4210 Capital Outlay on Medical and Public Health 437.36
94 V03 4425 Capital Outlay on Co-operation 459.13
95 X03 4236 Capital Outlay on Nutrition 100.00
96 ZH05 4702 Capital Outlay on Minor Irrigation 141.54
Total 67356.88
Source: Information obtained from VLC of Accountant General (A&E)-I, Maharashtra, Mumbai

Appendices
115
Appendix - 2.11 (Reference: Paragraph 2.4.2 ; Page 61)
Sub-head wise substantial saving under Grant A-09 and Y-02 during 2018-19
(`̀̀̀ in crore)
Sr.
No.
Cross
Reference
Code
Description Total
Grant Actual
Expenditure Savings
Percentage of
savings Reasons for savings
Grant A-09: Capital outlay on Public Works
1 4059-
051(00)(01)
Construction of
Chhatrapati Shivaji
Maharaj Monument
in Arabian sea
300.00 0.95 299.05 99.68
Surrender of provision of
` 299.05 crore was due
to non-construction of
Monument
Grant Y-02 : Water Supply and sanitation
1 2215-
107(02)(10)
Swachha Bharat
Mission (Central
Share) CSS
2816.60 933.88 1882.72 66.84
Surrender of provision of
` 1973.73 crore due to
less release of funds by
Central Government
2 2215-
102(02)(26)
Mukhyamantri Rural
Drinking water
Programme-MRDWP
325.00 123.89 201.11 61.88
Withdrawal of provision
of ` 201.11 crore
attributed to no demand
from implementing
agencies
3 2215-
102(02)(30)
National Rural
Drinking water
programme-Grant to
support and water
quality monitoring
and surveillance
(Central Share 60%)
20.00 0.00 20.00 100.00
Surrender of entire
provision of
` 100.14 crore attributed
to considerable change in
NRDWP as per
government directives,
structural changes in the
scheme and due to no
demand due to stoppage
of Tillari Project
4 2215-
102(02)(31)
National Rural
Drinking water
programme- Grant to
Sustainability
(Central Share 60%)
30.00 0.00 30.00 100.00
5 2215-
102(02)(32)
National Rural
Drinking water
programme- Grant to
Sustainability (State
Share 40%)
10.00 0.00 10.00 100.00
6 2215-
196(02)(02)
Tillari Project Based
Water Supply
Scheme
25.00 0.00 25.00 100.00
7 2215-
107(02)(11)
Assistance from loan
from NABARD for
liquid waste
management project
under RIDF
15.14 00.00 15.14 100.00
Source: Appropriation Accounts 2018-19
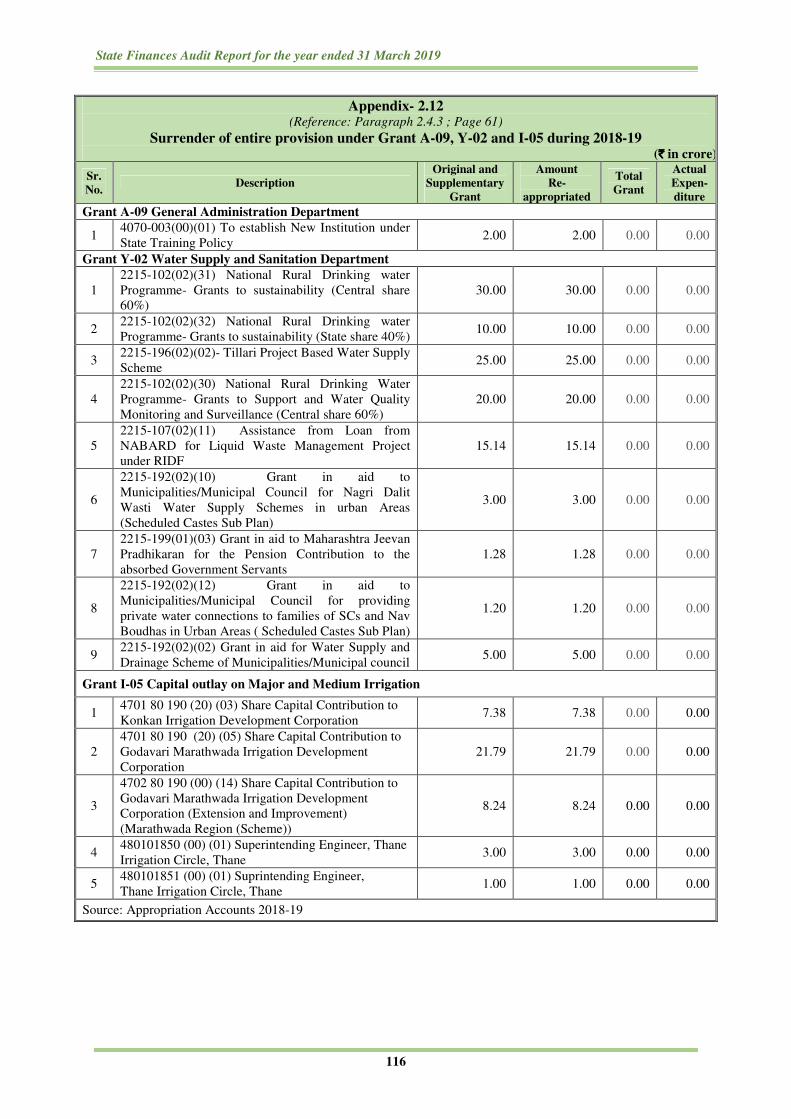
State Finances Audit Report for the year ended 31 March 2019
116
Appendix- 2.12 (Reference: Paragraph 2.4.3 ; Page 61)
Surrender of entire provision under Grant A-09, Y-02 and I-05 during 2018-19 (`̀̀̀ in crore)
Sr.
No. Description
Original and
Supplementary
Grant
Amount
Re-
appropriated
Total
Grant
Actual
Expen-
diture
Grant A-09 General Administration Department
1 4070-003(00)(01) To establish New Institution under
State Training Policy 2.00 2.00 0.00 0.00
Grant Y-02 Water Supply and Sanitation Department
1
2215-102(02)(31) National Rural Drinking water
Programme- Grants to sustainability (Central share
60%)
30.00 30.00 0.00 0.00
2 2215-102(02)(32) National Rural Drinking water
Programme- Grants to sustainability (State share 40%) 10.00 10.00 0.00 0.00
3 2215-196(02)(02)- Tillari Project Based Water Supply
Scheme 25.00 25.00 0.00 0.00
4
2215-102(02)(30) National Rural Drinking Water
Programme- Grants to Support and Water Quality
Monitoring and Surveillance (Central share 60%)
20.00 20.00 0.00 0.00
5
2215-107(02)(11) Assistance from Loan from
NABARD for Liquid Waste Management Project
under RIDF
15.14 15.14 0.00 0.00
6
2215-192(02)(10) Grant in aid to
Municipalities/Municipal Council for Nagri Dalit
Wasti Water Supply Schemes in urban Areas
(Scheduled Castes Sub Plan)
3.00 3.00 0.00 0.00
7
2215-199(01)(03) Grant in aid to Maharashtra Jeevan
Pradhikaran for the Pension Contribution to the
absorbed Government Servants
1.28 1.28 0.00 0.00
8
2215-192(02)(12) Grant in aid to
Municipalities/Municipal Council for providing
private water connections to families of SCs and Nav
Boudhas in Urban Areas ( Scheduled Castes Sub Plan)
1.20 1.20 0.00 0.00
9 2215-192(02)(02) Grant in aid for Water Supply and
Drainage Scheme of Municipalities/Municipal council 5.00 5.00 0.00 0.00
Grant I-05 Capital outlay on Major and Medium Irrigation
1 4701 80 190 (20) (03) Share Capital Contribution to
Konkan Irrigation Development Corporation 7.38 7.38 0.00 0.00
2
4701 80 190 (20) (05) Share Capital Contribution to
Godavari Marathwada Irrigation Development
Corporation
21.79 21.79 0.00 0.00
3
4702 80 190 (00) (14) Share Capital Contribution to
Godavari Marathwada Irrigation Development
Corporation (Extension and Improvement)
(Marathwada Region (Scheme))
8.24 8.24 0.00 0.00
4 480101850 (00) (01) Superintending Engineer, Thane
Irrigation Circle, Thane 3.00 3.00 0.00 0.00
5 480101851 (00) (01) Suprintending Engineer,
Thane Irrigation Circle, Thane 1.00 1.00 0.00 0.00
Source: Appropriation Accounts 2018-19

Appendices
117
Appendix - 2.13 (Reference: Paragraph 2.4.4; Page 61)
Rush of expenditure in last month of 2018-19 under Grant Y-02 and I-05
(`̀̀̀ in crore)
Sr.
No. Sub-head Sub-head Description
Total
Expenditure
Expenditure
during March
2019
Percentage of
total
expenditure
incurred in
March 2019
Grant Y-02 Water Supply and Sanitation
1 221501789 984
National Rural Drinking Water
Programme-(Schedule Caste Sub Plan)
(Central Share)
69.12 40.80 59.02
2 221501196 A02
Grant-in-aid for Water Supply Scheme for
Marathwada Division by Integrated Grid
Process (Scheme)
10.70 7.96 74.11
3 221501102 979 National Rural Drinking Water
Programme (Central Share 50 per cent) 172.78 133.90 77.50
4 221501102 207
Piped Water Supply Schemes-Grants to
National Rural Drinking Water
Programme
207.06 162.06 78.27
5 221501102 930 Project Planning and Monitoring Unit
(Jalswarajya Project) 144.00 124.49 86.45
6 221502789 982 Swachh Bharat Mission
(C.S.S)(SCSP)(Central Share)(Scheme) 293.23 269.89 92.04
7 221502107 198 Execution of Sant Gadge Baba Gram Safai
Mission, Publicity and Reward Scheme 9.56 9.56 100.00
8 221501102 959
Grant-in-aid to Scheduled Caste and Nav-
Bauddha Families for Individual Water
Supply Connections
1.56 1.56 100.00
9 221501102 208 Piped Water Supply Schemes-Grants to
Maintenance and Repair 20.00 20.00 100.00
10 221502107 218 Swachh Bharat Mission (Centrally
Sponsored Scheme) (State Share) 51.00 51.00 100.00
11 221501102 996 Operation and Maintenance of Regional
Water Supply Scheme 8.00 8.00 100.00
12 221501102 997
National Rural Drinking Water
Programme-Grant to support and Water
Quality Monitoring and Surveillance
(State Share 40%)
14.00 14.00 100.00
Grant I-05 Capital Expenditure on Major and Minor Irrigation
1 470180190 J68 Capital Outlay on Major and Medium
Irrigation 115.20 103.04 89.00
2 470180190 J72 Capital Outlay on Major and Medium
Irrigation 33.98 33.98 100.00
3 470180800 H11 Capital Outlay on Major and Medium
Irrigation 15.00 15.00 100.00
4 470280190 479 Capital Outlay on Minor Irrigation 90.29 88.29 98.00
5 470280190 490 Capital Outlay on Minor Irrigation 176.15 170.74 97.00
6 470280190 749 Capital Outlay on Minor Irrigation 15.50 15.50 100.00
7 471101190 A020 Capital Outlay on Flood Control Projects 33.00 30.00 91.00
8 480101999 376 Capital Outlay on Power Projects 16.26 16.26 100.00
Total 1496.43 1316.03 Source: Information obtained from VLC of Accountant General (A&E)-I, Maharashtra, Mumbai

State Finances Audit Report for the year ended 31 March 2019
118
Appendix - 2.14 (Reference: Paragraph 2.5; Page 63)
Contingency Fund Sanction Orders and Utilisation against Sanctions
(`̀̀̀ in crore)
Sr.
No.
Sanction No. &
Date
Department/Grant
No./MH Purpose for which drawn
Sanctioned
Amount
Amount
utilised
Balance
Amount
1
CNF-2018/1
Budget-11
dt: 13.04.2018
Secretariat And
Other General
Services
B-04/2052
Provision for inquiry made by the
court on happening of Koregaon
Bhima riots
0.52 0.52 00.00
2
CNF-2018/2
Budget-13
dt: 04.05.2018
Co-operation
V-02/2425
Provision for Civil Appeal Number
3445/2011 Maharashtra State Co-op.
Bank Ltd. against State Government
and others in accordance with the
order issued by Supreme Court dated
5.4.18
74.00 74.00 00.00
3
CNF-2018/3
Budget-13
dt: 15.05.2018
Agriculture
Services
D-03/2401
Financial assistance to the farmers
and their families who died in
pesticides spraying work
1.70 00.00 1.70
4
CNF-2018/4
Budget-11
dt: 21.05.2018
Administration of
Justice
J-01/2014
Commencement of Civil Court
Junior Level or Judicial Officer first
class court and creation of posts for
court
0.25 00.00 0.25
5
CNF-2018/5
Budget-13
dt: 01.06.2018
Co-operation
V-02/2425
Repayment of the loan guaranteed by
the State Government for purchase
of tur by Maharashtra State Co-
operative Marketing Federation
under Market Intervention Scheme
1528.00 1528.00 0.00
6
CNF-2018/6
Budget-13
dt: 08.06.2018
Co-operation
V-02/2425
Financial subsidy to farmers who
were registered under NEML portal
and who have not been able to
purchase tur and gram under the
minimum support price scheme
70.00 70.00 0.00
7
CNF-2018/7
Budget-7
dt: 03.10.2018
Welfare of
Scheduled Castes,
Schedule Tribes,
Other Backward
Classes and
Minorities
N-03/2225
Chatrapati Shahu Maharaj Research
Training and Human Development
Institute (Sarathi) which was
established for Maratha Community
5.00 5.00 0.00
8
CNF-2018/8
Budget-15
dt: 20.10.2018
Dairy Development
D-05/2404
To encourage export of Milk and
Milk Powder in State 80.00 00.00 80.00
9
CNF-2018/9
Budget-13
dt: 26.10.2018
Co-operation
V-02/2425
To give honorarium and related other
expenditure to two member Claims
Committee appointed by Supreme
Court
0.72 00.00 0.72
10
CNF-2019/10
Budget-13
dt: 15.02.2019
Co-operation
V-02/2425
Grant of Rs.200 per quintal to onion
farmers of State for the year 2018-19 114.80 114.80 0.00
11
CNF-2019/11
Budget-6
dt: 20.02.2019
Relief on Account
of Natural
Calamities.
C-06/2245
To provide immediate relief to
affected farmers in drought affected
talukas
2000.00 569.80 1430.20
Total 3874.99 2362.12 1512.87
Source: Contingency Fund sanction orders from respective Departments and information from Accountant General (Accounts and
Entitlement)-I, Maharashtra, Mumbai

Appendices
119
Appendix - 2.15 (Reference: Paragraph 2.7.3; Page 65)
Inoperative Personal Ledger Account
Sr.
No. Name of Treasury
No. of accounts non-operative for one or
more than one year
Balance as on
31 March 2019
(`̀̀̀ in crore)
1 Ahmednagar 3 0.39
2 Amravati 1 0.01*
3 Aurangabad 3 5.72
4 Bhandara 1 0.00
5 Buldhana 2 0.03
6 Chandrapur 2 0.43
7 Dhule 2 0.02
8 Gadchiroli 1 0.00
9 Jalgaon 1 0.00
10 Jalna 1 0.04
11 Nagpur 1 0.01
12 Nanded 2 0.13
13 Nashik 10 0.02
14 Palghar 23 0.63
15 PAO, Mumbai 1 0.02
16 Parbhani 1 0.02
17 Pune 99 27.72
18 Raigad 4 0.73
19 Sangli 1 0.03
20 Satara 5 35.12
21 Solapur 3 2.64
22 Thane 3 0.02
23 Yavatmal 5 1.29
Grand Total 175 75.02 Source: Information obtained from Accountant General (A&E) I, Mumbai, Accountant General (Audit) II, Nagpur and
Pay and Accounts office
* Higher rounding

State Finances Audit Report for the year ended 31 March 2019
120
Appendix - 3.1 (Reference: Paragraph 3.1; Page 69)
Department-wise breakup of outstanding Utilisation Certificates Sr.
No. Department
Number of
certificates Amount
(`̀̀̀ in crore)
1 Agriculture, Animal Husbandry, Dairy Development and
Fisheries 1408 376.80
2 Co-operation, Marketing and Textiles 76 245.17
3 Environment 80 162.89
4 Finance 5 9.41
5 Food, Civil Supplies and Consumer Protection 21 0.23
6 General Administration 50 19.15
7 Higher and Technical Education 217 480.27
8 Home 203 629.50
9 Housing 16 3.77
10 Industries, Energy and Labour 87 3021.21
11 Law and Judiciary 40 6.65
12 Marathi Language 1 0.46
13 Medical Education and Drugs 32 60.63
14 Minority Development 138 81.21
15 Planning 4566 3403.91
16 Public Health 200 954.90
17 Public Works 126 25.32
18 Revenue and Forests 944 473.42
19 Rural Development and Water Conservation 865 1555.38
20 School Education and Sports 1328 4337.62
21 Skill Development and Entrepreneurship 13 2.64
22 Social Justice and Special Assistance 1753 1084.77
23 Soil and Water Conservation Department 0 0.00
24 Tourism and Cultural Affairs 142 287.86
25 Tribal Development 3823 2238.92
26 Urban Development 1272 27845.16
27 Vimukta Jatis, Nomadic tribes, OBC and SBC Welfare
Department 0 0.00
28 Water Resources 3 0.52
29 Water Supply and Sanitation 154 116.28
30 Women and Child Development 844 59.31
Total 18407 47483.36 Source : Finance Accounts 2018-19
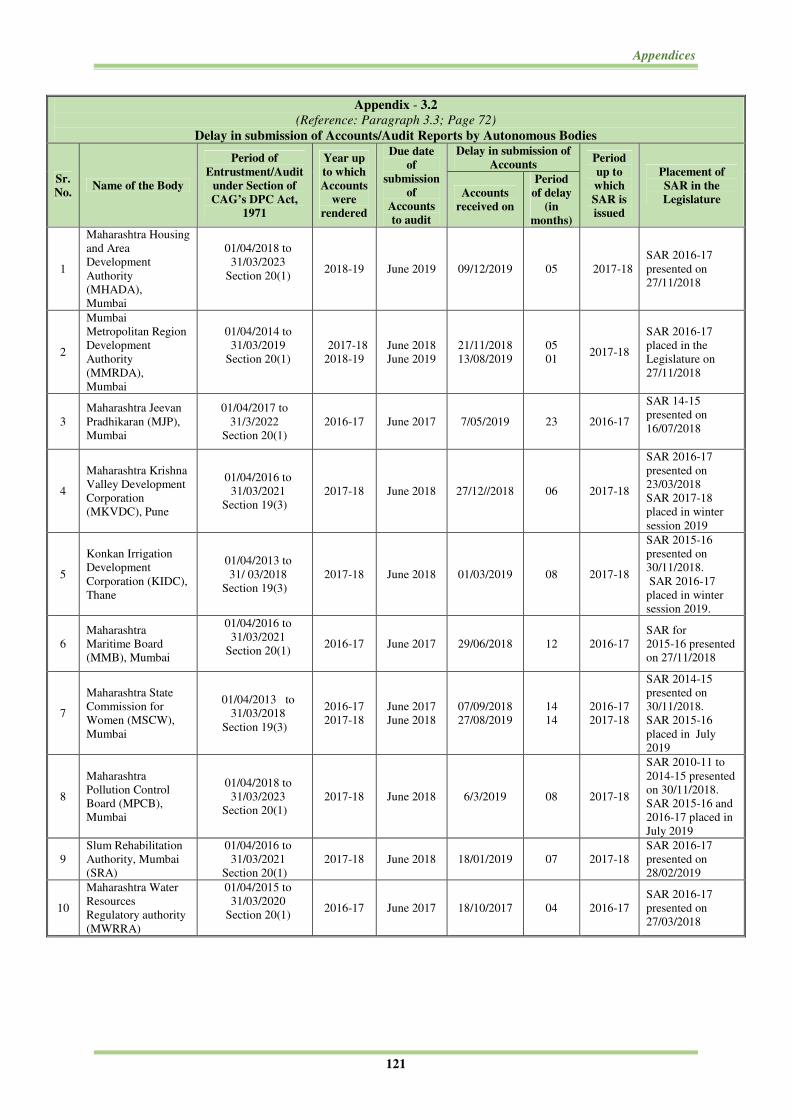
Appendices
121
Appendix - 3.2
(Reference: Paragraph 3.3; Page 72)
Delay in submission of Accounts/Audit Reports by Autonomous Bodies
Sr.
No. Name of the Body
Period of
Entrustment/Audit
under Section of
CAG’s DPC Act,
1971
Year up
to which
Accounts
were
rendered
Due date
of
submission
of
Accounts
to audit
Delay in submission of
Accounts Period
up to
which
SAR is
issued
Placement of
SAR in the
Legislature Accounts
received on
Period
of delay
(in
months)
1
Maharashtra Housing
and Area
Development
Authority
(MHADA),
Mumbai
01/04/2018 to
31/03/2023
Section 20(1)
2018-19 June 2019 09/12/2019 05 2017-18
SAR 2016-17
presented on
27/11/2018
2
Mumbai
Metropolitan Region
Development
Authority
(MMRDA),
Mumbai
01/04/2014 to
31/03/2019
Section 20(1)
2017-18
2018-19
June 2018
June 2019
21/11/2018
13/08/2019
05
01 2017-18
SAR 2016-17
placed in the
Legislature on
27/11/2018
3
Maharashtra Jeevan
Pradhikaran (MJP),
Mumbai
01/04/2017 to
31/3/2022
Section 20(1)
2016-17 June 2017 7/05/2019 23 2016-17
SAR 14-15
presented on
16/07/2018
4
Maharashtra Krishna
Valley Development
Corporation
(MKVDC), Pune
01/04/2016 to
31/03/2021
Section 19(3)
2017-18 June 2018 27/12//2018 06 2017-18
SAR 2016-17
presented on
23/03/2018
SAR 2017-18
placed in winter
session 2019
5
Konkan Irrigation
Development
Corporation (KIDC),
Thane
01/04/2013 to
31/ 03/2018
Section 19(3)
2017-18 June 2018 01/03/2019 08 2017-18
SAR 2015-16
presented on
30/11/2018.
SAR 2016-17
placed in winter
session 2019.
6
Maharashtra
Maritime Board
(MMB), Mumbai
01/04/2016 to
31/03/2021
Section 20(1)
2016-17 June 2017 29/06/2018 12 2016-17
SAR for
2015-16 presented
on 27/11/2018
7
Maharashtra State
Commission for
Women (MSCW),
Mumbai
01/04/2013 to
31/03/2018
Section 19(3)
2016-17
2017-18
June 2017
June 2018
07/09/2018
27/08/2019
14
14
2016-17
2017-18
SAR 2014-15
presented on
30/11/2018.
SAR 2015-16
placed in July
2019
8
Maharashtra
Pollution Control
Board (MPCB),
Mumbai
01/04/2018 to
31/03/2023
Section 20(1)
2017-18 June 2018 6/3/2019 08 2017-18
SAR 2010-11 to
2014-15 presented
on 30/11/2018.
SAR 2015-16 and
2016-17 placed in
July 2019
9
Slum Rehabilitation
Authority, Mumbai
(SRA)
01/04/2016 to
31/03/2021
Section 20(1)
2017-18 June 2018 18/01/2019 07 2017-18
SAR 2016-17
presented on
28/02/2019
10
Maharashtra Water
Resources
Regulatory authority
(MWRRA)
01/04/2015 to
31/03/2020
Section 20(1)
2016-17 June 2017 18/10/2017 04 2016-17
SAR 2016-17
presented on
27/03/2018
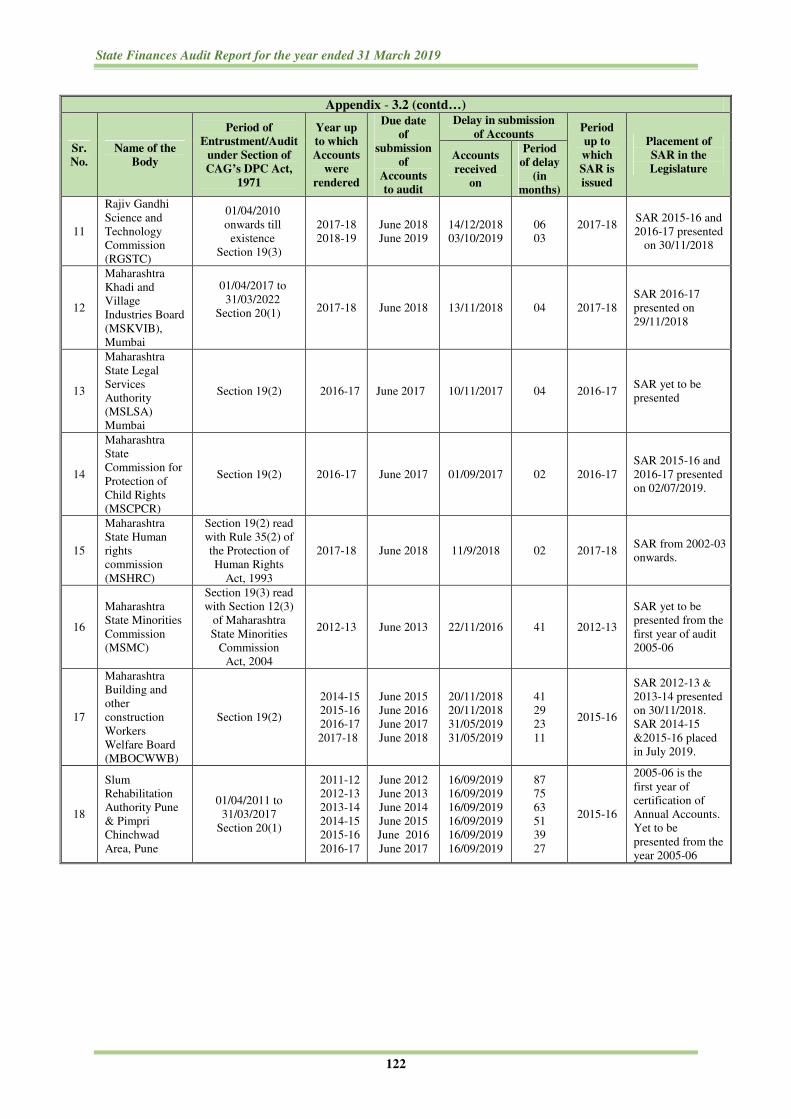
State Finances Audit Report for the year ended 31 March 2019
122
Appendix - 3.2 (contd…)
Sr.
No. Name of the
Body
Period of
Entrustment/Audit
under Section of
CAG’s DPC Act,
1971
Year up
to which
Accounts
were
rendered
Due date
of
submission
of
Accounts
to audit
Delay in submission
of Accounts Period
up to
which
SAR is
issued
Placement of
SAR in the
Legislature Accounts
received
on
Period
of delay
(in
months)
11
Rajiv Gandhi
Science and
Technology
Commission
(RGSTC)
01/04/2010
onwards till
existence
Section 19(3)
2017-18
2018-19
June 2018
June 2019
14/12/2018
03/10/2019
06
03
2017-18
SAR 2015-16 and
2016-17 presented
on 30/11/2018
12
Maharashtra
Khadi and
Village
Industries Board
(MSKVIB),
Mumbai
01/04/2017 to
31/03/2022
Section 20(1)
2017-18 June 2018 13/11/2018 04 2017-18 SAR 2016-17
presented on
29/11/2018
13
Maharashtra
State Legal
Services
Authority
(MSLSA)
Mumbai
Section 19(2) 2016-17 June 2017 10/11/2017 04 2016-17 SAR yet to be
presented
14
Maharashtra
State
Commission for
Protection of
Child Rights
(MSCPCR)
Section 19(2) 2016-17 June 2017 01/09/2017 02 2016-17 SAR 2015-16 and
2016-17 presented
on 02/07/2019.
15
Maharashtra
State Human
rights
commission
(MSHRC)
Section 19(2) read
with Rule 35(2) of
the Protection of
Human Rights
Act, 1993
2017-18 June 2018 11/9/2018 02 2017-18 SAR from 2002-03
onwards.
16
Maharashtra
State Minorities
Commission
(MSMC)
Section 19(3) read
with Section 12(3)
of Maharashtra
State Minorities
Commission
Act, 2004
2012-13 June 2013 22/11/2016 41 2012-13
SAR yet to be
presented from the
first year of audit
2005-06
17
Maharashtra
Building and
other
construction
Workers
Welfare Board
(MBOCWWB)
Section 19(2)
2014-15
2015-16
2016-17
2017-18
June 2015
June 2016
June 2017
June 2018
20/11/2018
20/11/2018
31/05/2019
31/05/2019
41
29
23
11
2015-16
SAR 2012-13 &
2013-14 presented
on 30/11/2018.
SAR 2014-15
&2015-16 placed
in July 2019.
18
Slum
Rehabilitation
Authority Pune
& Pimpri
Chinchwad
Area, Pune
01/04/2011 to
31/03/2017
Section 20(1)
2011-12
2012-13
2013-14
2014-15
2015-16
2016-17
June 2012
June 2013
June 2014
June 2015
June 2016
June 2017
16/09/2019
16/09/2019
16/09/2019
16/09/2019
16/09/2019
16/09/2019
87
75
63
51
39
27
2015-16
2005-06 is the
first year of
certification of
Annual Accounts.
Yet to be
presented from the
year 2005-06

Appendices
123
Appendix - 3.2 (concld…)
Sr.
No. Name of the
Body
Period of
Entrustment/Audit
under Section of
CAG’s DPC Act,
1971
Year up
to which
Accounts
were
rendered
Due date
of
submission
of
Accounts
to audit
Delay in submission
of Accounts Period
up to
which
SAR is
issued
Placement of
SAR in the
Legislature Accounts
received
on
Period
of delay
(in
months)
19
Maharashtra
Real Estate
Regulatory
Authority
(MAHA
RERA)
Section 19(2) 2018-19 June 2019 17/7/2019 01 2018-19
First Year of
certification of
Annual
Accounts. SAR
2017-18 placed
in the Legislature
on 2/7/2019.
20
Maharashtra
Electricity
Regulatory
Commission
(MERC)
Section 20(1) read
with Section 104 of
the Electricity
Act, 2003
2017-18
2018-19
July 2018
July 2019
19/07/2018
01/08/2019 -
2017-18
2018-19
SAR for
2017-18 placed
in the
Legislature on
28/02/2019
21
Tapi Irrigation
Development
Corporation
(TIDC),
Jalgaon
Section 20 (1)
read with Section
104 of the
Electricity Act
2016-17 June 2017 09/05/2018 10 2016-17
SAR for the
year 2015-16
placed on
30/11/2018
22
Vidharba
Irrigation
Development
Corporation
(VIDC),
Nagpur
01/04/2012 to
31/03/2022
Section 19(3)
2016-17
2017-18
June 2017
June 2018 18/03/2019
18/03/2019 21
08 2015-16
SAR for the
year 2014-15
placed on
23/3/2018
23
Godavari
Marathwada
Irrigation
Development
Corporation
(GMIDC),
Aurangabad
01/04/2014 to
31/03/2019
Section 19(3)
2015-16 June 2016 09/05/2018 22 2013-14
SAR for
2013-14
presented on
30/11/2018
24
Maharashtra
Water
Conservation
Corporation
(MWCC),
Aurangabad
From 1/4/2001
Section 19(3) 2016-17 June 2017 1/03/2019 20 2015-16
SAR of
2014-15 placed
in March
2018.
25
Compensatory
Afforestation
Fund
Management
and Planning
Authority
(CAMPA)*
From 1/4/2011
Section 20(1)
2011-12
2012-13
2013-14
2014-15
2015-16
2016-17
June 2012
June 2013
June 2014
June 2015
June 2016
June 2017
20/02/2016
20/02/2016
20/02/2016
20/02/2016
21/08//2018
21/08/2018
44
32
20
08
26
14
- -
Note: Fee Regulatory Authority (FRA) and Admission Regulatory Authority (ARA) excluded as entrustment of audit of Annual
Accounts to this office is pending
* Delay in receiving notification/request for Audit from State Government
Source: Information obtained from the Offices of the Pr. Accountant General (Audit)-I, Mumbai; Accountant General (Audit)-II,
Nagpur; and Accountant General (Audit)-III, Mumbai

State Finances Audit Report for the year ended 31 March 2019
124
Appendix - 3.3 (Reference: Paragraph 3.4; Page 73)
Status of finalisation of Accounts and Government investments in Departmentally
managed Commercial and Quasi-Commercial Undertakings
Sr.
No. Name of Undertaking
Accounts
finalised
up to
Investment
as per the
last
Accounts
(`̀̀̀ in crore)
Remarks/Reasons
for delay in
preparation of
Accounts
Agriculture, Animal Husbandry, Dairy Development and Fisheries Department Mumbai Region
1 Greater Mumbai Milk Scheme, Worli 2016-17 (-)11.67
2 Milk Transport Scheme, Worli 2006-07 2.34 MTS Worli has been
closed vide Government
order dated 17/07/2008 3 Mother Dairy, Kurla 2016-17 31.47 4 Central Dairy, Goregaon 2015-16 78.73 5 Unit Scheme, Mumbai 2014-15 30.33 6 Agricultural Scheme, Mumbai 2014-15 10.45 7 Electrical Scheme, Mumbai 2014-15 5.16 8 Water Supply Scheme, Mumbai 2014-15 15.57 9 Cattle Feed Scheme, Mumbai 2014-15 (-)3.33 10 Cattle Breeding and Rearing Farm, Palghar 2015-16 1.32 11 Dairy Project, Dapchari 2016-17 16.25 12 Government Milk Scheme, Bhiwandi 2015-16 0.61 13 Government Milk Chilling Centre, Saralgaon, Thane 2015-16 0.21 14 Government Milk Scheme, Khopoli 2016-17 2.69 15 Government Milk Scheme, Mahad 2015-16 1.45 16 Government Milk Scheme , Chiplun 2016-17 2.64 17 Government Milk Scheme, Ratnagiri 2015-16 7.22 18 Government Milk Scheme, Kankavali 2016-17 2.24 Pune Region 19 Government Milk Scheme, Pune 2016-17 (-)0.08
20 Government Milk Scheme, Mahabaleshwar 2016-17 0.96
21 Government Milk Scheme, Satara 2016-17 5.50
22 Government Milk Scheme, Miraj 2016-17 15.90
23 Government Milk Scheme, Solapur 2016-17 2.12
Nagpur Region 24 Government Milk Scheme, Nagpur 2014-15 1.25
25 Government Milk Scheme, Wardha 2017-18 23.91
26 Government Milk Scheme, Chandrapur 2017-18 (-)2.48
27 Government Milk Scheme, Gondia 2017-18 31.08
Aurangabad Region 28 Government Milk Scheme, Aurangabad 2017-18 35.75
29 Government Milk Scheme, Udgir 2017-18 39.48
30 Government Milk Scheme, Beed 2017-18 31.08
31 Government Milk Scheme, Nanded 2017-18 12.85
32 Government Milk Scheme, Bhoom 2017-18 10.92
33 Government Milk Scheme, Parbhani 2017-18 54.30
Nashik Region
34 Government Milk Scheme, Nashik 2016-17 2.56
35 Government Milk Scheme, Dhule 2016-17 6.41
36 Government Milk Scheme, Chalisgaon 2017-18 1.82
37 Government Milk Scheme, Ahmednagar 2016-17 4.46
38 Government Milk Scheme, Wani 2016-17 0.49

Appendices
125
Appendix - 3.3 (concld...)
Sr.
No. Name of Undertaking
Accounts
finalised up
to
Investment
as per the
last
Accounts
(`̀̀̀ in crore)
Remarks/Reasons
for delay in
preparation of
Accounts
Amravati Region 39 Government Milk Scheme, Amravati 2016-17 18.68
40 Government Milk Scheme, Akola 2016-17 21.69
41 Government Milk Scheme, Yavatmal 2017-18 17.41
42 Government Milk Scheme, Nandura 2017-18 5.95
Agriculture, Animal Husbandry, Dairy Development and Fisheries Department 43 Land Development by Bulldozer Scheme, Pune 1994-95 4.00
These are sick units with
no operations. Hence
they have stopped
preparing Accounts
44 Land Development by Bulldozer Scheme,
Aurangabad 1998-99 21.93
45 Land Development by Bulldozer Scheme,
Amravati 1995-96 0.01
46 Land Development by Bulldozer Scheme,
Nagpur 1996-97 2.18
Revenue and Forests Department
47 Allapalli and Pendigundam Forest Ranges of
Forest Divisions including Saw mills and
Timber Depot 1985-86 0.00
These are sick units with
no operations. Hence
they have stopped
preparing Accounts Food, Civil Supplies and Consumer Protection Department
48 Procurement, Distribution and Price Control
Scheme in Mumbai and Thane Rationing Area 2016-17 999.74
49 Procurement, Distribution and Price Control
Scheme in Mofussil Area 2016-17 1427.16
Total 2990.71 Source: Proforma Accounts
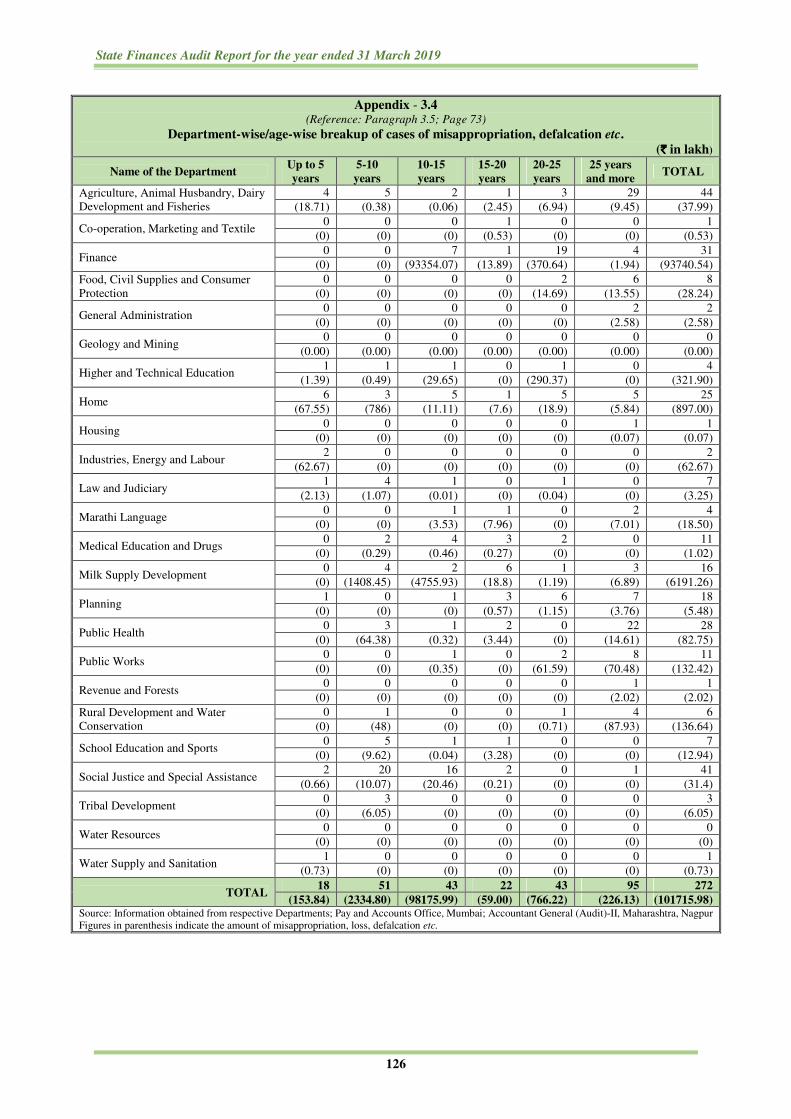
State Finances Audit Report for the year ended 31 March 2019
126
Appendix - 3.4 (Reference: Paragraph 3.5; Page 73)
Department-wise/age-wise breakup of cases of misappropriation, defalcation etc.
(`̀̀̀ in lakh)
Name of the Department Up to 5
years
5-10
years
10-15
years
15-20
years
20-25
years
25 years
and more TOTAL
Agriculture, Animal Husbandry, Dairy
Development and Fisheries
4 5 2 1 3 29 44
(18.71) (0.38) (0.06) (2.45) (6.94) (9.45) (37.99)
Co-operation, Marketing and Textile 0 0 0 1 0 0 1
(0) (0) (0) (0.53) (0) (0) (0.53)
Finance 0 0 7 1 19 4 31
(0) (0) (93354.07) (13.89) (370.64) (1.94) (93740.54)
Food, Civil Supplies and Consumer
Protection
0 0 0 0 2 6 8
(0) (0) (0) (0) (14.69) (13.55) (28.24)
General Administration 0 0 0 0 0 2 2
(0) (0) (0) (0) (0) (2.58) (2.58)
Geology and Mining 0 0 0 0 0 0 0
(0.00) (0.00) (0.00) (0.00) (0.00) (0.00) (0.00)
Higher and Technical Education 1 1 1 0 1 0 4
(1.39) (0.49) (29.65) (0) (290.37) (0) (321.90)
Home 6 3 5 1 5 5 25
(67.55) (786) (11.11) (7.6) (18.9) (5.84) (897.00)
Housing 0 0 0 0 0 1 1
(0) (0) (0) (0) (0) (0.07) (0.07)
Industries, Energy and Labour 2 0 0 0 0 0 2
(62.67) (0) (0) (0) (0) (0) (62.67)
Law and Judiciary 1 4 1 0 1 0 7
(2.13) (1.07) (0.01) (0) (0.04) (0) (3.25)
Marathi Language 0 0 1 1 0 2 4
(0) (0) (3.53) (7.96) (0) (7.01) (18.50)
Medical Education and Drugs 0 2 4 3 2 0 11
(0) (0.29) (0.46) (0.27) (0) (0) (1.02)
Milk Supply Development 0 4 2 6 1 3 16
(0) (1408.45) (4755.93) (18.8) (1.19) (6.89) (6191.26)
Planning 1 0 1 3 6 7 18
(0) (0) (0) (0.57) (1.15) (3.76) (5.48)
Public Health 0 3 1 2 0 22 28
(0) (64.38) (0.32) (3.44) (0) (14.61) (82.75)
Public Works 0 0 1 0 2 8 11
(0) (0) (0.35) (0) (61.59) (70.48) (132.42)
Revenue and Forests 0 0 0 0 0 1 1
(0) (0) (0) (0) (0) (2.02) (2.02)
Rural Development and Water
Conservation
0 1 0 0 1 4 6
(0) (48) (0) (0) (0.71) (87.93) (136.64)
School Education and Sports 0 5 1 1 0 0 7
(0) (9.62) (0.04) (3.28) (0) (0) (12.94)
Social Justice and Special Assistance 2 20 16 2 0 1 41
(0.66) (10.07) (20.46) (0.21) (0) (0) (31.4)
Tribal Development 0 3 0 0 0 0 3
(0) (6.05) (0) (0) (0) (0) (6.05)
Water Resources 0 0 0 0 0 0 0
(0) (0) (0) (0) (0) (0) (0)
Water Supply and Sanitation 1 0 0 0 0 0 1
(0.73) (0) (0) (0) (0) (0) (0.73)
TOTAL 18 51 43 22 43 95 272
(153.84) (2334.80) (98175.99) (59.00) (766.22) (226.13) (101715.98) Source: Information obtained from respective Departments; Pay and Accounts Office, Mumbai; Accountant General (Audit)-II, Maharashtra, Nagpur
Figures in parenthesis indicate the amount of misappropriation, loss, defalcation etc.

Appendices
127
Appendix - 3.5
Department-wise/category-wise details of losses to Government
due to theft, misappropriation/loss of Government material
(`̀̀̀ in lakh)
Name of the Department Theft cases
Misappropriation/loss of
Government material Total
No. of
cases Amount
No. of
cases Amount
No. of
cases Amount
Agriculture, Animal Husbandry,
Dairy Development and Fisheries 7 2.1 37 35.89 44 37.99
Co-operation, Marketing and Textiles 0 0.00 1 0.53 1 0.53 Finance 1 13.89 30 93726.65 31 93740.54 Food, Civil Supplies and Consumer
Protection 0 0.00 8 28.24 8 28.24
General Administration 1 1.29 1 1.29 2 2.58 Geology and Mining 0 0.00 0 0.00 0 0.00 Higher and Technical Education 2 1.88 2 320.02 4 321.90 Home 3 11.12 22 885.88 25 897.00 Housing 0 0.00 1 0.07 1 0.07 Industries, Energy and Labour 2 62.67 0 0.00 2 62.67 Law and Judiciary 3 0.29 4 2.96 7 3.25 Marathi Language 0 0.00 0 0.00 0 0.00 Medical Education and Drugs 0 0.00 4 18.50 4 18.50 Milk Supply Development 1 0.73 0 0.00 1 0.73 Planning 9 0.89 2 0.13 11 1.02 Public Health 0 0.00 16 6191.26 16 6191.26 Public Works 1 0.00 17 5.48 18 5.48 Revenue and Forests 3 3.44 25 79.31 28 82.75 Rural Development and Water
Conservation 2 3.51 9 128.91 11 132.42
School Education and Sports 0 0.00 1 2.02 1 2.02 Social Justice and Special Assistance 0 0.00 6 136.64 6 136.64 Tribal Development 2 1.80 5 11.14 7 12.94 Water Resources 31 14.43 10 16.97 41 31.40 Water Supply and Sanitation 3 6.05 0 0.00 3 6.05
Total 71 124.09 201 101591.89 272 101715.98 Source: Information obtained from respective Departments; Pay and Accounts Office, Mumbai; Accountant General
(Audit)-II, Maharashtra, Nagpur
(Reference: Paragraph 3.5; Page 73)
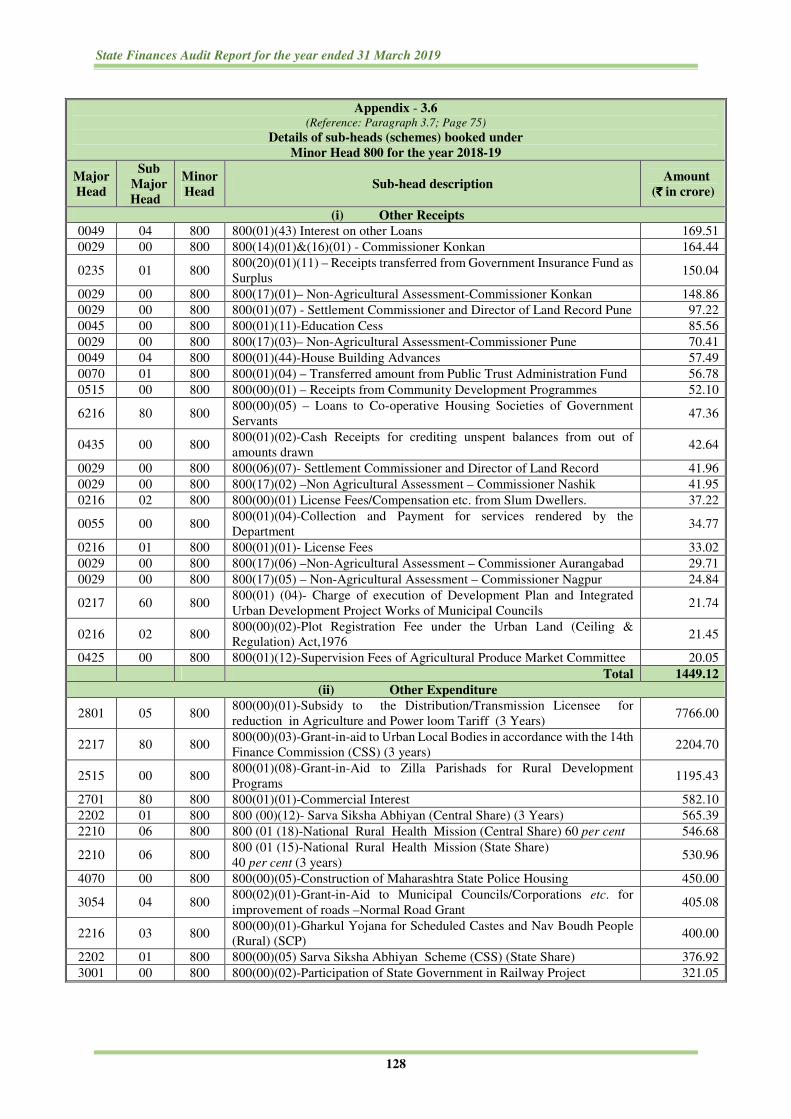
State Finances Audit Report for the year ended 31 March 2019
128
Appendix - 3.6 (Reference: Paragraph 3.7; Page 75)
Details of sub-heads (schemes) booked under
Minor Head 800 for the year 2018-19
Major
Head
Sub
Major
Head
Minor
Head Sub-head description
Amount
(`̀̀̀ in crore)
(i) Other Receipts
0049 04 800 800(01)(43) Interest on other Loans 169.51
0029 00 800 800(14)(01)&(16)(01) - Commissioner Konkan 164.44
0235 01 800 800(20)(01)(11) – Receipts transferred from Government Insurance Fund as
Surplus 150.04
0029 00 800 800(17)(01)– Non-Agricultural Assessment-Commissioner Konkan 148.86
0029 00 800 800(01)(07) - Settlement Commissioner and Director of Land Record Pune 97.22
0045 00 800 800(01)(11)-Education Cess 85.56
0029 00 800 800(17)(03)– Non-Agricultural Assessment-Commissioner Pune 70.41
0049 04 800 800(01)(44)-House Building Advances 57.49
0070 01 800 800(01)(04) – Transferred amount from Public Trust Administration Fund 56.78
0515 00 800 800(00)(01) – Receipts from Community Development Programmes 52.10
6216 80 800 800(00)(05) – Loans to Co-operative Housing Societies of Government
Servants 47.36
0435 00 800 800(01)(02)-Cash Receipts for crediting unspent balances from out of
amounts drawn 42.64
0029 00 800 800(06)(07)- Settlement Commissioner and Director of Land Record 41.96
0029 00 800 800(17)(02) –Non Agricultural Assessment – Commissioner Nashik 41.95
0216 02 800 800(00)(01) License Fees/Compensation etc. from Slum Dwellers. 37.22
0055 00 800 800(01)(04)-Collection and Payment for services rendered by the
Department 34.77
0216 01 800 800(01)(01)- License Fees 33.02
0029 00 800 800(17)(06) –Non-Agricultural Assessment – Commissioner Aurangabad 29.71
0029 00 800 800(17)(05) – Non-Agricultural Assessment – Commissioner Nagpur 24.84
0217 60 800 800(01) (04)- Charge of execution of Development Plan and Integrated
Urban Development Project Works of Municipal Councils 21.74
0216 02 800 800(00)(02)-Plot Registration Fee under the Urban Land (Ceiling &
Regulation) Act,1976 21.45
0425 00 800 800(01)(12)-Supervision Fees of Agricultural Produce Market Committee 20.05
Total 1449.12
(ii) Other Expenditure
2801 05 800 800(00)(01)-Subsidy to the Distribution/Transmission Licensee for
reduction in Agriculture and Power loom Tariff (3 Years) 7766.00
2217 80 800 800(00)(03)-Grant-in-aid to Urban Local Bodies in accordance with the 14th
Finance Commission (CSS) (3 years) 2204.70
2515 00 800 800(01)(08)-Grant-in-Aid to Zilla Parishads for Rural Development
Programs 1195.43
2701 80 800 800(01)(01)-Commercial Interest 582.10
2202 01 800 800 (00)(12)- Sarva Siksha Abhiyan (Central Share) (3 Years) 565.39
2210 06 800 800 (01 (18)-National Rural Health Mission (Central Share) 60 per cent 546.68
2210 06 800 800 (01 (15)-National Rural Health Mission (State Share)
40 per cent (3 years) 530.96
4070 00 800 800(00)(05)-Construction of Maharashtra State Police Housing 450.00
3054 04 800 800(02)(01)-Grant-in-Aid to Municipal Councils/Corporations etc. for
improvement of roads –Normal Road Grant 405.08
2216 03 800 800(00)(01)-Gharkul Yojana for Scheduled Castes and Nav Boudh People
(Rural) (SCP) 400.00
2202 01 800 800(00)(05) Sarva Siksha Abhiyan Scheme (CSS) (State Share) 376.92
3001 00 800 800(00)(02)-Participation of State Government in Railway Project 321.05

Appendices
129
Appendix - 3.6 (contd…)
Major
Head
Sub
Major
Head
Minor
Head Sub-head description
Amount
(`̀̀̀ in crore)
2210 06 800 800 (01)(10)-Establishment of Trauma Care Units- Maharashtra
Emergency Medical Services 258.72
2401 00 800
800(00)(09)- Krishi Unnati Yojna Financial Assistance under Rashtriya
Krishi Vikas Yojna (Schemes under Five Year Plan) (60 per cent Central
share)
183.30
4055 00 800 800(00) (99) Installation of CCTV Surveillance System 179.89
2216 02 800 800(00)(01) Gharkul Yojana for Scheduled Castes and Nav Boudh People
(Urban) (SCP) 159.99
2406 01 800 800(02)(06)-Eco Tourism (State)(3 years) 151.36
2202 01 800 800(00)(10)-Supply of Educational material to students 145.10
2210 06 800 800 (01) (16)-National Rural Health Mission (State Share 40 per cent)
(SCSP) 144.74
2401 00 800
800 (00)(11) Krishi Unnati Yojana -Financial Assistance under Rashtriya
Krishi Vikas Yojana (Schemes under Five Year Plan) (40 per cent State
share) (3 years)
122.19
2235 02 800 800(03) (01)-Grants to Social Welfare Institutions 108.81
2210 06 800 800(01)(19)- National Urban Health Mission Centrally Sponsored Scheme
(Central Share 60 per cent) (3 years) 98.31
2202 01 800 800(00)(06)- Sarva Shiksha Abhiyan Scheme (Special Component
Plan)(Centrally Sponsored Scheme) 85.00
2202 80 800 800(02)(09)- Free ship to students whose or whose parents income does not
exceed ` 15,000 per annum (3 Years) 82.47
2225 01 800 800(01)(02)- Workshop and training programme by Dr. Babasaheb
Ambedkar Research and Training Institute, Pune 80.00
4701 80 800 800(iii)(i)- Works of Mechanical Organisation 72.32
2210 06 800 800 (01) (20)-National Urban Health Mission Centrally Sponsored Scheme
(State Share 40 per cent) (3 years) 65.53
2216 02 800 800(32)(01)- Removal and Rehabilitation of Slum Dwellers(3 years) 64.00
2210 06 800 800(01)(02) – Upgradation of Primary Health Centres into Rural Hospitals
(3 years) 62.61
2210 06 800 800(01)(21) –Revised National Tuberculosis Control Programme (RNTCP)
Centrally Sponsored Scheme (Central Share 60 per cent) 61.90
2070 00 800 800(00)(03) Regional Staff of the Charity Commissioner (3 years) 54.38
2202 02 800 800 (00)(07)- Introduction of Information and Communication Technology
in School (Central Share) 51.70
4070 00 800 800(00)(07)- Expenditure on Land Acquisition and Construction of
Building for Police (Plan) 50.10
2205 00 800 800(01)(01)-Financial Assistance to distinguished persons in Literature,
Arts etc. 48.67
2225 03 800 800(05)(02)-Grant In Aid to Voluntary Agencies (S.C.P) 45.95
2810 60 800 800(00)(01)-Maharashtra Energy Development Agency 42.75
2210 06 800 800(01)(22) –Revised National Tuberculosis Control Programme (RNTCP)
Centrally Sponsored Scheme (State Share 40 per cent) 41.27
2210 06 800 800 (01)(07) Grants for Plan Schemes under Section 187 of the Maharashtra
Zilla Parishads and Panchayat Samities Act, 1961 40.12
4070 00 800 800(00)(11)-Construction of Office Building for Police Department of
Maharashtra State Police Housing 40.00
2225 80 800 800(01)(06) – Increase of amenities in Government and Aided Institutions
(S.C.P.) 34.98
2202 02 800 800(00)(06) - Introduction of Information and Communication Technology
in School (State Share) 34.47
4515 00 800 800(00)(01) - Pradhan Mantri Gram Sadak Yojna 34.45

State Finances Audit Report for the year ended 31 March 2019
130
Appendix - 3.6 (concld…)
Major
Head
Sub
Major
Head
Minor
Head Sub-head description
Amount
(`̀̀̀ in crore)
2216 80 800
800 (00) (02) - Payment to Maharashtra Housing and Area Development
Authority as Government contribution to Mumbai Building Repairs and
Reconstruction Fund
34.20
2216 80 800
800 (00) (05) - Payment of cess collection to Maharashtra Housing and Area
Development Authority for credit to Mumbai Building Repairs and
Reconstruction Fund
34.20
3054 04 800 800(50)(01) – Grants to Zilla Parishad for Development and Strengthening
of Village Roads 33.10
2202 02 800 800(00)(10) – Vocationalisation of Higher Secondary Education
(75 per cent Central Share) 33.01
5054 04 800 800(55)(04) – Development and Strengthening of Other Districts Road 30.70
4055 00 800 800(00)(08)-Construction of Office Building for Forensic Science
Laboratory 29.99
2801 05 800 800 (00)(06) – Grant-in-aid to Maharashtra State Power Distribution
Company Limited for Removal of Regional Imbalance of Agriculture 28.42
3054 04 800 800(37)(02)-Grants to Zilla Parishad for Development and Strengthening of
Village Roads 29.26
2801 05 800 800 (55)(01) – Grant-in- aid to Maharashtra State Electricity Distribution
Company Limited for Development and System Improvement 28.42
2225 01 800 800 (09)(01)-Grant In Aid to Mahatma Phule Backward Development
Corporation Limited 27.25
2202 02 800 800(00)(09)-Rashtriya Madhyamik Shiksha Abhiyan (Central Share) 27.02
2203 00 800 800(00)(02)-Removal of Regional Imbalance 26.29
5054 04 800 800(47)(01)-Development and Strengthening of other District roads 26.26
5054 04 800 800(37)(06)- Development and Strengthening of other District roads 26.09
5054 04 800 800(45)(04)- Development and Strengthening of other District roads 25.22
2217 80 800 800(00)(05) Grant-in-Aid for establishment charges on Amrut Abhiyan
State Abhiyan (100 per cent central Share) 23.52
3054 04 800 800(55)(02)-Grants to Zilla Parishad for Development and Strengthening of
other District roads 23.50
2401 00 800 800(00)(02)-Special component plan-Input subsidy under Special
Component Plan 22.49
2210 06 800 800(00)(45)- Establishment of Trauma Care Units- Maharashtra Emergency
Medical Services 22.31
2202 02 800 800(00)(11)-Vocational Education in Higher secondary Schools
(25 per cent State Share) 22.01
5054 04 800 800(40)(04) - Development and Strengthening of Other District roads 20.56
Total 18563.21 Source: Finance Accounts 2018-19

Appendices
131
Appendix - 3.7 (Reference: Paragraph 3.8; 76)
Details of pending Detailed Contingent Bills up to 2018-19
Sr.
No. Department No. of AC Bills
Amount
(`̀̀̀ in crore)
1 Agriculture, Animal Husbandry, Dairy Development and
Fisheries 23 2.54
2 Co-operation, Marketing and Textiles 46 5.12
3 Employment and Self Employment 42 0.43
4 Environment 1 0.00
5 Finance 67 10.98
6 Food, Civil Supplies and Consumer Protection 34 14.01
7 General Administration 556 130.87
8 Higher and Technical Education 66 1.07
9 Home 789 795.11
10 Housing 12 0.02
11 Industries, Energy and Labour 41 4.64
12 Law and Judiciary 116 152.48
13 Marathi Language Division 13 0.11
14 Medical Education and Drugs 232 328.53
15 Minorities Development 10 0.48
16 Parliament Affairs 1 0.01
17 Planning 62 60.35
18 Public Health 146 427.09
19 Public Works 4 0.05
20 Revenue and Forests 76 0.85
21 Rural Development and Water Conservation 62 2.00
22 School Education and Sports 68 0.23
23 Social Justice and Special Assistance 14 0.32
24 Tourism and Cultural Affairs 66 18.37
25 Tribal Development 27 3.64
26 Urban Development 8 0.07
27 Water Resources 2 0.00
28 Water Supply and Sanitation 10 0.02
29 Women and Child Development 12 0.17
30 Skill Development and Entrepreneur 0 0.00
31 Technical Education 3 0.01
32 Vidhan Mandal 1 4.78
33 Soil and water conservation 1 0.03
34 Vimukta Jatis, Nomadic tribes OBC and SBC Welfare
Department 1 0.01
Grand Total 2612 1964.37 Source: Finance Accounts 2018-19

State Finances Audit Report for the year ended 31 March 2019
132
Appendix - 4.1
Glossary of terms
Terms Basis of calculation
Buoyancy of a parameter Rate of Growth of the parameter/GSDP Growth Rate
Buoyancy of a parameter (X)
With respect to another parameter (Y)
Rate of Growth of parameter (X)/Rate of Growth of parameter (Y)
Rate of Growth (ROG) [(Current year Amount /Previous year Amount)-1]* 100
Development Expenditure Social Services + Economic Services
Average interest paid by the State Interest payment/[(Amount of previous year’s Fiscal Liabilities + Current
year’s Fiscal Liabilities)/2]*100
Interest received as per cent to Loans
Outstanding
Interest Received/ [(Opening balance + Closing balance of Loans and
Advances)/2]*100
Revenue Deficit Revenue Receipt – Revenue Expenditure
Fiscal Deficit Revenue Expenditure + Capital Expenditure + Net Loans and Advances –
Revenue Receipts – Miscellaneous Capital Receipts
Primary Deficit Primary deficit defined as the fiscal deficit net of interest payments
indicates the extent of deficit which is an outcome of the fiscal
transactions of the States during the course of the year
(Fiscal Deficit – Interest payments)
Balance from Current Revenue (BCR) Revenue Receipts minus all Plan Grants and Non-Plan Revenue
Expenditure excluding expenditure recorded under the major head 2048 –
Appropriation for reduction or Avoidance of debt
Debt sustainability The Debt sustainability is defined as the ability of the State to maintain a
constant debt-GSDP ratio over a period of time and also embodies the
concern about the ability to service its debt. Sustainability of debt
therefore also refers to sufficiency of liquid assets to meet current or
committed obligations and the capacity to keep balance between costs of
additional borrowings with returns from such borrowings. It means that
rise in fiscal deficit should match with the increase in capacity to service
the debt
Sufficiency of non-debt receipts Defined as adequacy of incremental non-debt receipts of the State to cover
the incremental interest liabilities and incremental primary expenditure.
Debt sustainability could be significantly facilitated if the incremental
non-debt receipts could meet the incremental interest burden and the
incremental primary expenditure
Net availability of borrowed funds Defined as the ratio of the debt redemption (Principal + Interest Payments)
to total debt receipts and indicates the extent to which the debt receipts are
used in debt redemption indicating the net availability of borrowed funds
Appropriation Accounts Appropriation Accounts present the total amount of funds (Original and
Supplementary) authorised by the Legislative Assembly in the budget
grants under each voted grants and charged appropriation vis-à-vis the
actual expenditure incurred against each and the unspent provisions or
excess under each grant or appropriation. Any expenditure in excess of
the grants requires regularisation by the Legislature
Autonomous bodies Autonomous Bodies (usually registered Societies or Statutory
Corporations) are set up whenever it is felt that certain functions need to
be discharged outside the governmental set up with some amount of
independence and flexibility without day-to-day interference of the
Governmental machinery
Committed expenditure The committed expenditure of the State Government on revenue account
mainly consists of interest payments, expenditure on salaries and wages,
pensions and subsides on which the present executive has limited control

Appendices
133
Appendix - 4.1 (contd...)
Terms Description
State implementing schemes State Implementing Agency includes any Organisation/ Institution
including Non-Governmental Organisation which is authorised by the
State Government to receive the funds from the Government of India for
implementing specific programmes in the State, e.g. State Implementation
Society for Sarva Shiksha Abhiyan and State Health Mission for National
Rural Health Mission, etc.
Contingency Fund Legislature Assembly has by law established a Contingency Fund in the
nature of an imprest into which is paid from time to time such sums as
may be determined by such law, and the said fund is placed at the disposal
of the Governor to enable advances to be made by him out of it for the
purpose of meeting unforeseen expenditure pending authorisation of such
expenditure by Legislature Assembly by law under Article 205 or Article
206 of the Constitution
Consolidated fund of the State The fund constituted under Article 266 (1) of the Constitution of India
into which all receipts, revenues and loans flow. All expenditure from the
CFS is by appropriation: voted or charged. It consists of two main
divisions namely Revenue Account (Revenue Receipts and Revenue
Expenditure) and Capital Account (Public Debt and Loans, etc.)
Contingent liability Contingent liabilities may or may not be incurred by an entity depending
on the outcome of a future event such as a court case
Sinking Fund A Fund into which the government sets aside money over time, in order
to retire its debt
Guarantee Redemption Fund Guarantees are liabilities contingent on the Consolidated Fund of the State
in case of default by the borrower for whom the guarantee has been
extended. As per the terms of the Guarantee Redemption Fund, the State
Government was required to contribute an amount equal to at least 1/5th
of the outstanding invoked guarantees plus an amount likely to be invoked
as a result of the incremental guarantees during the year
Internal Debt Internal Debt comprises regular loans from the public in India, also termed
'Debt raised in India'. It is confined to loans credited to the Consolidated
Fund
Primary revenue expenditure Primary revenue expenditure means revenue expenditure excluding
interest payments
Re-appropriation Means the transfer of funds from one Primary unit of appropriation to
another such unit
Surrenders of unspent provision Departments of the State Government are to surrender to the Finance,
before the close of the financial year, all the anticipated unspent
provisions noticed in the grants or appropriations controlled by them. The
Finance is to communicate the acceptance of such surrenders, as are
accepted by them to the Audit Officer and/or the Accounts Officer, as the
case may be, before the close of the financial year
Supplementary grants If the amount authorised by any law made in accordance with the
provisions of Article 114 of the Constitution to be expended for a
particular service for the current financial year is found to be insufficient
for the purpose of that year or when a need has arisen during the current
financial year for the supplementary or additional expenditure upon some
'new service' not contemplated in the original budget for that year,
Government is to obtain supplementary grants or appropriations in
accordance with the provision of Article 115 (1) of the Constitution

State Finances Audit Report for the year ended 31 March 2019
134
Appendix - 4.1 (concld…)
Terms Description
Suspense and Miscellaneous Items of receipts and payments which cannot at once be taken to a
final head of receipt or charge owing to lack of information as to
their nature or for any other reasons, may be held temporarily under
the major head "8658-Suspense Account" in the sector "L. Suspense
and Miscellaneous" of the Accounts, (Footnotes under the major
head in the list of major/minor heads of account may be referred to
for further guidance). A service receipt of which full particulars are
not given must not be taken to the head "Suspense Account" but
should be credited to the minor head "Other Receipt" under the
revenue major head to which it appears to belong pending eventual
transfer to the credit of the correct head on receipt of detailed
particulars
Public Accounts committee A Committee constituted by the Legislative Assembly for the
examination of the reports of the Comptroller and Auditor General
of India relating to the Appropriation Accounts of the State, the
Annual Financial Accounts of the State or such other Accounts or
financial matters as are laid before it or which the Committee deems
necessary to scrutinize
Block Grant A block grant is a lump sum grant provided by the Government of
India to the State Government, with only general provisions as to
the way it is to be spent.
Core public goods Core public goods are which all citizens enjoy in common in the
sense that each individual's consumption of such a good leads to no
subtractions from any other individual's consumption of that good,
e.g. enforcement of law and order, security and protection of our
rights; pollution free air and other environmental goods and road
infrastructure etc.
Merit goods Merit goods are commodities that the public sector provides free or
at subsidized rates because an individual or society should have
them on the basis of some concept of need, rather than ability and
willingness to pay the government and therefore wishes to
encourage their consumption. The examples of such goods include
the provision of free or subsidized food for the poor to support
nutrition, the delivery of health services to improve quality of life
and reduce morbidity, providing basic education to all, drinking
water and sanitation etc.
Absorptive capacity Absorptive capacity in this case refers to the ability of a State to
implement a developmental scheme in such a way that with given
resources, there is maximum benefit to the people. This is usually
achieved when the design of schemes are well planned with careful
risk mitigation strategy in place, administrative costs are low,
operation, maintenance, monitoring and control mechanisms are in
place etc. so that the state is able to effectively achieve targeted
outcomes

Appendices
135
Appendix - 4.2
Acronyms and abbreviations
Acronyms Full Form
AC Bill Abstract Contingency Bill
AE Aggregate Expenditure
BE Budget Estimates
CAG Comptroller and Auditor General of India
CE Capital Expenditure
DC Bill Detailed Contingency Bill
DE Development Expenditure
FCP Fiscal Correction Path
FFC Fourteenth Finance Commission
FRBM Fiscal Responsibility and Budgetary Management
GoI Government of India
GSDP Gross State Domestic Product
GST Goods and Services Tax
IP Interest Payment
MTFPS Medium Term Fiscal Policy Statement
O and M Operation and Maintenance
PAC Public Accounts Committee
RE Revenue Expenditure
RR Revenue Receipts
S and W Salaries and Wages
SAR Separate Audit Report
SSE Social Sector Expenditure
TE Total Expenditure
TFC Twelfth Finance Commission
ThFC Thirteenth Finance Commission
UC Utilisation Certificate
VAT Value Added Tax