State Finance Audit Report of the Comptroller and Auditor ...
198
State Finance Audit Report of the Comptroller and Auditor General of India Report No.1 of the year 2022 for the year ended March 2021
-
Upload
khangminh22 -
Category
Documents
-
view
2 -
download
0
Transcript of State Finance Audit Report of the Comptroller and Auditor ...

State Finance Audit Report of the Comptroller and Auditor General of India
Report No.1 of the year 2022
for the year ended March 2021


iii
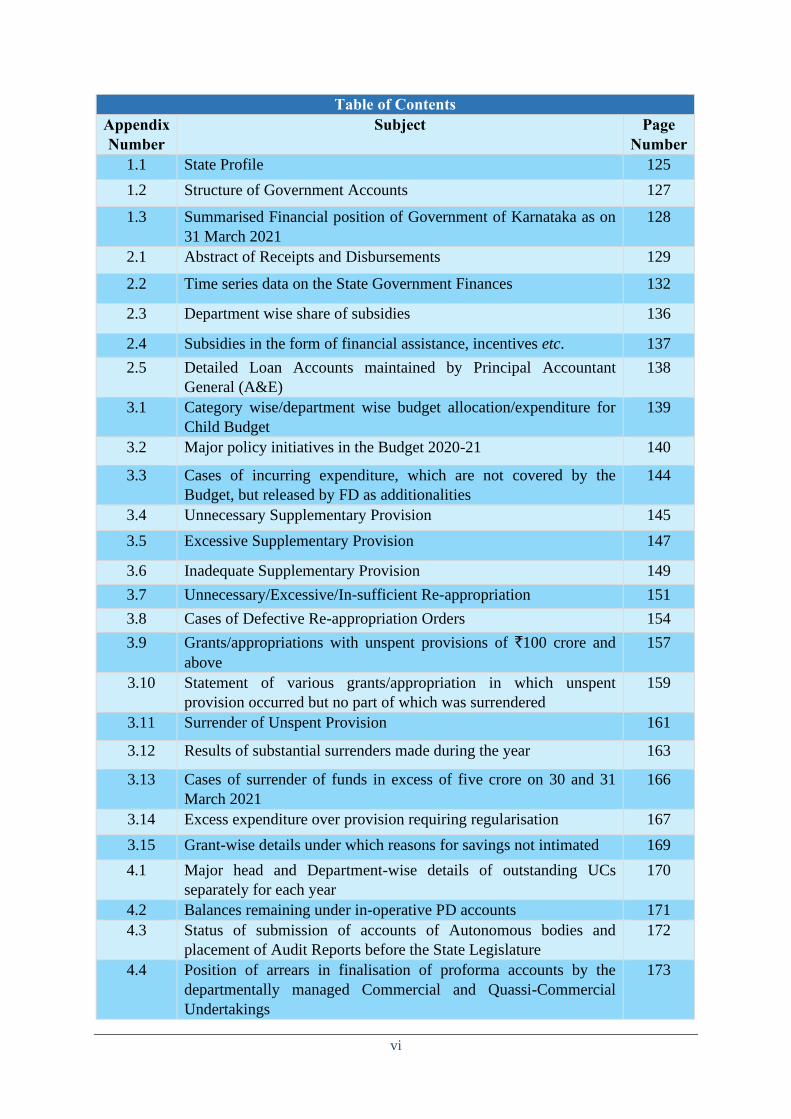
Table of Contents
Paragraph Number
Page No.
Preface ix
Executive Summary xi
Chapter 1 – Overview Introduction 1.1 1 Profile of the State 1.2 1 Gross State Domestic Product of the State 1.2.1 1
Basis and Approach to State Finance Audit Report 1.3 4 Structure of Government Accounts 1.4 5 Budgetary Processes 1.5 7 Snapshot of Finances 1.6 7 Snapshot of Assets and Liabilities of the Government 1.7 8 Fiscal Parameters 1.8 9 Trends in Deficit/Surplus 1.8.1 10
Trends in Fiscal Liabilities and its ratio to GSDP 1.8.2 11
Fiscal situation of the State 1.9 11 KFRA targets on key fiscal parameters and achievements thereon 1.9.1 12
Actuals vis-à-vis projections of Medium Term Fiscal Plan for
2020-21
1.9.2 13
Impact of certain transactions on fiscal indicators during 2020-21
1.10 14
Chapter 2 – Finances of the State
Introduction 2.1 19 Major changes in key fiscal aggregates vis-à-vis 2020-21 2.2 19 Sources and Application of funds 2.3 20 Resources of the State 2.4 21 Revenue Receipts 2.4.1 21
Trends and growth of Revenue Receipts 2.4.2 22
State’s Own Resources 2.4.3 24
Transfers from Centre 2.4.4 28
Grants-in-aid from Government of India 2.4.5 29
Capital Receipts 2.4.6 31
State’s performance in mobilization of resources 2.4.7 32
Application of Resources 2.5 33 Growth and composition of expenditure 2.5.1 33
Revenue Expenditure 2.5.2 34
Capital Expenditure 2.5.3 43
Quality of Capital Expenditure 2.5.4 45
Expenditure priorities 2.5.5 53
Public Account 2.6 54 Net Public Account balances 2.6.1 55
Reserve Funds 2.6.2 56
In-operative Reserve Funds 2.6.3 59
Karnataka Real Estate Regulatory Authority Fund 2.6.4 59
Debt Management 2.7 60

iv
Table of Contents
Paragraph Number
Page No.
Debt profile components 2.7.1 61
Composition of fiscal deficit and its financing pattern 2.7.2 64
Debt Profile: Maturity and Repayment 2.7.3 65
Debt Sustainability Analysis 2.8 66 Utilisation of borrowed funds 2.8.1 68
Status of Guarantees – Contingent Liabilities 2.8.2 68
Management of Cash Balances 2.8.3 69
Conclusion and Recommendations 2.9 74 Chapter 3 - Budget Management
Introduction 3.1 79 Budget Process 3.2 79 Gender Budgeting in Karnataka 3.3 80 Child Budget 3.4 81 Introduction 3.4.1 81
Objectives of CBS 3.4.2 81
Identification and Classification of Child Centric Programme and
Non-Programme
3.4.3 81
Major policy pronouncements in the budget and their actual funding for ensuring implementation
3.5 82
Appropriation Accounts 3.6 84 Summary of total provisions, actual disbursements and savings
during 2020-21
3.6.1 84
Voted and Charged disbursements 3.6.2 85
Audit of Appropriation 3.7 85 Financial Accountability and Budget review 3.7.1 86
Comments on integrity of budgetary and accounting process 3.7.2 86
Comments on effectiveness of budgetary and accounting process 3.7.3 93
Outcome of review of selected Grants 3.8 95 Review of Grant No.10 – Social Welfare 3.8.1 95
Review of Grant No.12 – Information, Tourism and Youth
Services
3.8.2 98
Conclusion 3.9 102 Recommendations 3.10 102
Chapter 4 - Quality of Accounts and Financial Reporting Practices
Funds outside Consolidated Fund or Public Account of the State
4.1 105
Delay in submission of Utilisation Certificates 4.2 106 Abstract Contingent Bills 4.3 108 Personal Deposit Accounts 4.4 109 Trends in the closing balance of PD Account 4.4.1 109
Inoperative and non-reconciled PD Accounts 4.4.2 111
Outstanding balances under suspense and DDR heads 4.5 111 Balances under Major Suspense and DDR heads 4.5.1 111
Adverse Balances under DDR Heads 4.5.2 114

v
Table of Contents
Paragraph Number
Page No.
Non-reconciliation of Departmental figures 4.6 115 Reconciliation of cash balance 4.7 116 Compliance with Accounting Standards 4.8 116 Submission of Accounts and placing of Separate Audit Reports of Autonomous Bodies in the Legislature
4.9 117
Departmental Commercial Undertakings/ Corporations/ Companies
4.10 117
Non-submission of details of grants/ loans given to bodies and authorities
4.11 118
Timelines and Quality of Accounts 4.12 119 Misappropriation, losses, thefts etc. 4.13 119 Follow up action on State Finance Audit Report 4.14 120 Conclusion 4.15 120 Recommendations 4.16 121
vi
Table of Contents
Appendix Number
Subject Page Number
1.1 State Profile 125
1.2 Structure of Government Accounts 127
1.3 Summarised Financial position of Government of Karnataka as on
31 March 2021
128
2.1 Abstract of Receipts and Disbursements 129
2.2 Time series data on the State Government Finances 132
2.3 Department wise share of subsidies 136
2.4 Subsidies in the form of financial assistance, incentives etc. 137
2.5 Detailed Loan Accounts maintained by Principal Accountant
General (A&E)
138
3.1 Category wise/department wise budget allocation/expenditure for
Child Budget
139
3.2 Major policy initiatives in the Budget 2020-21 140
3.3 Cases of incurring expenditure, which are not covered by the
Budget, but released by FD as additionalities
144
3.4 Unnecessary Supplementary Provision 145
3.5 Excessive Supplementary Provision 147
3.6 Inadequate Supplementary Provision 149
3.7 Unnecessary/Excessive/In-sufficient Re-appropriation 151
3.8 Cases of Defective Re-appropriation Orders 154
3.9 Grants/appropriations with unspent provisions of `100 crore and
above
157
3.10 Statement of various grants/appropriation in which unspent
provision occurred but no part of which was surrendered
159
3.11 Surrender of Unspent Provision 161
3.12 Results of substantial surrenders made during the year 163
3.13 Cases of surrender of funds in excess of five crore on 30 and 31
March 2021
166
3.14 Excess expenditure over provision requiring regularisation 167
3.15 Grant-wise details under which reasons for savings not intimated 169
4.1 Major head and Department-wise details of outstanding UCs
separately for each year
170
4.2 Balances remaining under in-operative PD accounts 171
4.3 Status of submission of accounts of Autonomous bodies and
placement of Audit Reports before the State Legislature
172
4.4 Position of arrears in finalisation of proforma accounts by the
departmentally managed Commercial and Quassi-Commercial
Undertakings
173

vii
4.5 Non-receipt of information pertaining to institutions substantially
financed by the Government
175
4.6 Department-wise/duration-wise breakup of cases of theft and mis-
appropriation
176
Glossary 177 Abbreviations 178


ix
PREFACE
1. This Report has been prepared for submission to the Governor of
Karnataka under Article 151 of the Constitution of India for being placed in the
Karnataka Legislature.
2. Chapters 1 of this report contains the basis and approach to State
Finances Audit Report, structure of the Report, structure of Government
Accounts, budgetary processes, trends in key fiscal parameters like revenue
surplus, fiscal deficit, etc. and fiscal correction path.
3. Chapters 2 and 3 of the Report contain audit findings on matter arising
from an examination of the Finance Accounts and Appropriation Accounts
respectively, of the State Government for the year ended 31 March 2021.
Information has been obtained from the Government of Karnataka, wherever
necessary.
4. Chapter 4 provides an overview and status of the State Government’s
compliance with various financial rules, procedures and directives during the
financial year 2020-21.
5. The Report has been prepared by taking into account the
recommendations of the Public Accounts Committee (5th Report-July 2015) to
the Action Taken Report of the State Government in response to its earlier
recommendations (13th Report-December 2011) to the Report on State Finances
for the year ending 31 March 2010.
6. The Reports containing the findings of performance audit and audit of
transactions in various departments and observations arising out of audit of
Statutory Corporations, Boards and Government Companies, Local Bodies,
Panchayat Raj Institutions and the report containing observations on Revenue
Receipts are presented separately.


Executive Summary
xi
Executive Summary
Back ground
The Government of Karnataka prioritised fiscal reforms and consolidation by
enacting the first Medium Term Fiscal Plan (MTFP) for the period 2000-05,
based on the parameters of fiscal correction laid down by the Eleventh Finance
Commission (EFC). MTFP became a rolling annual document and the fiscal
targets and policies set out in MTFP were dovetailed with the annual budgetary
exercise. Karnataka was the first State to enact (September 2002) the Karnataka
Fiscal Responsibility Act (KFRA), providing statutory backing to MTFP. The
KFRA aims at ensuring fiscal stability and sustainability, enhancing the scope
for improving social and physical infrastructure and human development by
achieving revenue surplus, reducing fiscal deficit, removing impediments for
effective conduct of fiscal policy and prudent debt management through limits
on borrowings, debt and deficits and greater transparency in fiscal operations
by the use of medium-term fiscal framework.
The Report
Based on the audited accounts of the Government of Karnataka for the year
ended 31 March 2021, this Report provides an analytical review of the finances
of the State Government. The Report is structured in four chapters.
Chapter 1 - Overview: This Chapter describes the basis and approach to the
Report and the underlying data, provides an overview of structure of
Government Accounts, budgetary processes, macro-fiscal analysis of key
indices and State’s fiscal position including the deficits/surplus.
Chapter 2 – Finances of the State: This Chapter provides a broad perspective
of the finances of the State, analyses the critical changes in major fiscal
aggregates relative to the previous year, overall trends during the period from
2016-17 to 2020-21, debt profile of the State and key Public Account
transactions, based on the Finance Accounts of the State.
Chapter 3 – Budgetary Management: This Chapter is based on the
Appropriation Accounts of the State and reviews the appropriations and
allocative priorities of the State Government. It reports on deviations from
Constitutional provisions and highlight issues affecting transparency.
Chapter 4 – Quality of Accounts and Financial Reporting Practices: This
Chapter provides an overview and status of compliance of the departments of
the State Government with various financial rules, procedures and directions
during the current year.
The Report also includes appendices of additional data collected from several
sources in support of these findings. A glossary of selected terms is given at the
end of the Report.

State Finance Audit Report for the year ended 31 March 2021
xii
Audit findings Fiscal position
The fiscal position of the State is viewed in terms of three key fiscal parameters
– Revenue Surplus/Deficit, Fiscal Deficit and the ratio of Outstanding Debt to
GSDP.
The State which had recorded Revenue Surplus during 2016-17 to 2019-20 saw
revenue deficit during 2020-21. The Revenue deficit was `19,338 crore. The
State was successful in containing the Fiscal Deficit below three per cent of
GSDP in last four years and below five per cent (3.72 per cent) during 2020-
21.
During this period, the outstanding debt (including off budget borrowings) of
the State remained between 18.32 and 22.37 per cent of GSDP (During 2020-
21, the back-to-back loan received in lieu of GST compensation from GoI was
not considered for working out the debt-GSDP ratio), which was consistently
below the norm of 25.00 per cent of GSDP prescribed by the Karnataka Fiscal
Responsibility Act, 2002.
(Chapter 1)
Finances of the State
The State Government registered a decrease of 10.67 per cent in its Revenue
Receipts during 2020-21 compared to the previous year.
The ratio of the State’s tax revenue to GSDP decreased from 6.87 per cent in
2016-17 to 5.38 per cent in 2020-21. Own tax revenue contributed a major part
(62 per cent) of the revenue receipts. Ratio of non-Tax revenue to revenue
receipts increased from 4.35 per cent in 2016-17 to 5.04 per cent during 2020-
21. Its ratio to GSDP was insignificant (0.44 per cent in 2020-21), implying the
need for mobilizing non-tax revenue. During 2020-21, the State’s share of union
Taxes and Duties as well as Grants-in-aid from GoI decreased by 29.84 per cent
and 12.77 per cent respectively when compared to previous year.
Revenue Expenditure
Share of Expenditure under social service (35 per cent) decreased during 2020-
21 when compared to previous year (38 per cent). However, the share of general
services increased from 28 to 31 per cent during 2020-21. Eighty-five per cent
of revenue expenditure consisted of committed expenditure on salaries,
devolutions to local bodies, interest payments, pensions, subsidies,
administrative expenses, grants-in-aid and financial assistance. Subsidies as a
percentage of Revenue Receipts increased from 10 per cent (2019-20) to 12 per
cent during 2020-21.
Quality of Expenditure
The share of capital expenditure (including loans and advances) to total
expenditure (21.45 per cent) during the year 2020-21 increased by 2.93 per cent
when compared to the previous year (18.52 per cent). The return from
investment as on 31 March 2021 in Companies/Corporations was negligible
Executive Summary
xiii
(`80.70 crore). The investment included `42,119.95 crore (62 per cent) in
Companies/Corporations under loss.
Funds and other Liabilities
During the year, Green Tax Cess of `10.86 crore and Road Safety Cess of
`10.92 crore was not transferred to Green Tax Fund and Road Safety Cess Fund
respectively. Though a provision of `50 crore was made under Guarantee
Redemption Fund in the budget estimate, no expenditure was incurred. As a
result, it was not revived.
Debt Sustainability
Open Market Loans had a major share (63 per cent) in the total fiscal liabilities
(including off-budget borrowings) of the State. The net debt available to the
State during the year 2020-21 (`41,946 crore) increased by 4.14 per cent when
compared to the previous year. The burden of interest payment was on an
increasing trend, and the ratio of interest payment to revenue receipts was
highest during 2020-21 at 14.95.
Cash balances
The cash balance (including investment of Earmarked funds and deposits with
RBI) of the State at the end of the year increased by 37 per cent over the previous
year due to excess market borrowings.
(Chapter 2)
Budgetary Management
During 2020-21, against the total provision of `2,65,220.73 crore, expenditure
incurred was `2,42,694.49 crore. This resulted in unspent provision of
`22,526.24 crore (8.49 per cent).
During the year, 80 per cent of the savings were not surrendered. The
controlling officers did not provide explanations for the 80 per cent of the
savings to the Principal Accountant General (A&E) for variations in
expenditure vis-à-vis allocation.
Under 10 Grants, 36 Executive orders were issued for incurring additional
expenditure of `5,281.70 crore without approval of Legislature. These
executive orders were later regularized through the supplementary demands.
Though the number of cases where additional amount released through
executive orders showed decreasing trend during the period 2018-19 to 2020-
21, the amount involved increased during 2020-21 when compared to previous
year.
Significant policy initiatives of the Government such as Science and talent
search programmes, Artificial Intelligence Research Translation Park, Tank
bank for water security, soil health policy etc., were not fulfilled during the year
due to non-release of funds and delay in receipt of information.
Supplementary provision of `391.79 crore in 43 cases was unnecessary and
`1,403.28 crore made under 24 cases proved excessive.

State Finance Audit Report for the year ended 31 March 2021
xiv
Re-appropriation of funds in 51 cases was made injudiciously, resulting in either
un-utilised provision of funds or excess expenditure over provision.
Excess expenditure of `415.90 crore (`402.60 crore under Grant 14 and `13.30
crore under Grant 24) over provisions for the year 2020-21 required to be
regularized under article 206 of the Constitution. In addition, excess expenditure
of `2,409.53 crore relating to the period 2012-13 to 2017-18 required to be
regularized under Article 205 of the Constitution.
An amount of `217.02 crore was misclassified under revenue/capital sections
affecting the fiscal indicators viz., revenue deficit.
(Chapter -3)
Quality of Accounts and Financial Reporting Practices
During 2020-21, the number of outstanding AC bills increased by 13 per cent
when compared to previous year. In terms of amount, it increased by 31 per
cent. In addition, out of 2,247 AC bills drawn during 2020-21, 662 bills (29 per
cent) were pending for want of NDC bills.
Twenty-two Departments had not furnished information relating to institutions
for which grants of `25 lakh or more was received by them.
Retention of large sums of money in Personal Deposit (PD) Accounts, non-
closure of in-operative PD Accounts, non-reconciliation of balances in such in-
operative PD Accounts and non-transferring the unspent balances to
Consolidated Fund were against the principles of Legislative financial control.
The closing balances of PD accounts included unutilised grants of XIII and XIV
Finance Commissions, which was indicative that the PD accounts were used for
parking all unutilised amounts.
(Chapter – 4)


1
1.1 Introduction
This chapter provides a brief profile of the State and describes the basis and
approach to the Report. The underlying data provides an overview of the
structure of Government Accounts, budgetary processes, macro-fiscal analysis
of key indices and State’s fiscal position including the deficits/surplus.
1.2 Profile of the State
• Social Indicators Karnataka is the sixth largest State in India terms of geographical area (1,91,791
Sq. km) and the eighth largest by population. The State’s population was 6.11
crore (2011 census) and recorded a decadal growth of about 16 per cent (2001-
11). The percentage of population below the poverty line was 20.901 compared
to the All-India Average of 21.90 (2011-12). Literacy rate was 75.36 per cent
(2011 Census). The State has 30 districts and 176 taluks as of March 2021.
• Economic Indicators The Gross State Domestic Product (GSDP) in 2020-21 at market prices was
`18,03,609 crore, with a growth rate of 10.72 per cent over the previous year.
GSDP growth rate of Agriculture, Industries and Service Sectors were 10.04 per
cent, (-) 4.66 per cent and 2.34 per cent respectively during 2020-21 over
previous year.
The per-capita GSDP was `2,49,947 against the National per capita GDP of
`1,41,945. The net per capita income of the State at current prices was `2,26,796
against the country average of ̀ 1,26,9682 (as of March 2021 - Economic Survey,
Government of Karnataka (GoK), 2020-21). General and financial data relating
to the State is given in Appendix 1.1.
1.2.1 Gross State Domestic Product of the State
GSDP is the market value of all officially recognized goods and services
produced within the boundaries of the State in a given period of time.
It is important to understand changes in sectoral contribution to the GSDP since
they indicate changing structure of economy. Economic activity is generally
divided into Primary, Secondary and Tertiary sectors, which correspond to the
Agriculture, Industry and Service sectors. The trends in the annual growth of
GDP and that of the State, at current prices are indicated in Table 1.1 and the
growth rate of GDP and GSDP at current prices and constant prices is depicted
in Chart 1.1.
1 As per Economic Survey of India 2020-21. 2 The difference between per capita income of the State and National’s average during 2020-21
was `99,828.
Chapter 1 - Overview

State Finance Audit Report for the year ended 31 March 2021
2
Table 1.1 Trends in GSDP compared to the GDP Year 2016-17 2017-18 2018-19 2019-20 2020-21
India’s GDP* (` in crore)
1,53,91,668 1,70,90,042 1,88,86,959 2,03,51,012 1,94,81,975
Growth rate (in per cent)
11.76 11.03 10.51 7.75 (-)4.27
State’s
GSDP# (` in crore)
12,07,608 13,36,914 14,90,624 16,28,928 18,03,609
Growth rate (in per cent)
15.54 10.71 11.50 9.28 10.72
Source: *All India GDP figures and GSDP (2016-17 to 2019-20) from Economic Survey
2020-21, Government of Karnataka.
#GSDP figures 2020-21, as per Ministry of Statistics and Programme Implementation.
Chart 1.1: Growth of India’s GDP and State’s GSDP
As seen from the Table 1.1 and Chart 1.1, the Karnataka’s GSDP growth rate
at current prices and constant prices is more than that of nation’s growth rate in
most of the years. However, during 2020-21, while GSDP at current price is
more when compared to previous year, GSDP at Constant price registered the
lowest growth rate in five years.
Chart 1.2 reveals that during 2016-17 and 2020-21, while there was a decrease
in the relative share of Industry to Gross State Value Added (GSVA), Product
taxes and subsidies3 to GSDP, there was an increase in the relative share of
Agriculture and Service sector to GSVA.
3 Product taxes or subsidies are paid or received on per unit of product. Some examples of
product taxes are excise tax, sales tax, service tax and import and export duties. Product
15.54
10.71
11.50
9.2810.72
11.7611.03
10.51
7.75
-4.27
13.28
8.616.49
5.00
-2.62
8.266.80 6.53
4.04
-7.75-10
-5
0
5
10
15
20
2016-17 2017-18 2018-19 2019-20 2020-21
in p
er c
ent
GSDP at Current Price GDP at current price
GSDP at Constant price GDP at Constant price

Chapter 1 Overview
3
Chart 1.2: Change in Sectoral contribution to GSVA (2016-17 and 2020-21)
Source: Directorate of Economics and Statistics, Government of Karnataka
^ Sectoral contribution to GSDP
However, when compared to previous year, it shows a different scenario. During
2020-21, there was a decline in the growth rate in all the three sectors as can be
seen in Chart 1.3.
Chart 1.3: Sectoral growth in GSDP
Source: Directorate of Economics and Statistics, Government of Karnataka
subsidies include food, petroleum and fertilizer subsidies, interest subsidies given to farmers,
households, etc. through banks
10.99
24.79
64.23
12.13
1.84
13.15
20.31
66.53
11.20
1.73
0
10
20
30
40
50
60
70
Agriculture Industry Services Product Taxes^ ProductSubsidies^
in p
er c
ent
2016-17 2020-21
2016-17 2017-18 2018-19 2019-20 2020-21
Agriculture 5.92 26.02 2.00 16.72 10.04
Industry 18.52 7.84 9.53 0.41 -4.66
Services 15.26 9.68 14.44 11.26 2.34
-10
-5
0
5
10
15
20
25
30
in p
er c
ent

State Finance Audit Report for the year ended 31 March 2021
4
The decline in Agriculture Sector was mainly due to decline in the growth rate
in Livestock and Fishing. The decline in the growth rate in Mining & quarrying
and Construction sectors contributed to the overall decline in the Industrial
sector when compared to previous year (2019-20).
The Finance Department replied (December 2021) that decline in growth rate of
Agriculture, Industry and Service Sector was attributable to COVID-19
pandemic situation, imposition of lockdown resulting in closure of
manufacturing /trading /service sector and sluggish economic activities.
The sectoral contribution to GSDP of the State during 2020-21 is given in
Chart 1.4.
Chart 1.4: Sectoral contribution to GSDP during 2020-21
Source: Directorate of Economics and Statistics, Government of Karnataka
1.3 Basis and Approach to State Finance Audit Report
The State Finance Audit Report (SFAR) is prepared under Article 151 (2) of the
Constitution of India, which states that the reports of the Comptroller and
Auditor General of India (C&AG) relating to the accounts of a State are to be
submitted to the Governor of the State, who shall cause them to be laid before
the Legislature of the State.
Principal Accountant General (Accounts & Entitlements) {Pr.AG (A&E)}
prepares the Finance Accounts and Appropriation Accounts of the State
annually, from initial and subsidiary accounts rendered by the treasuries, offices
and other departments responsible for maintaining initial accounts and the
statements received from the Reserve Bank of India (RBI). These accounts are
audited independently by the Pr.AG (Audit) and certified by the C&AG.
Finance Accounts and Appropriation Accounts of the State constitute the core
data for this report. Other sources include the following:
11%
17%
55%
17% Agriculture
Industry
Services
Others

Chapter 1 Overview
5
• The State’s Budget for assessing the fiscal parameters and allocative
priorities vis-à-vis projections, as well as for evaluating the effectiveness of
budget’s implementation and compliance with the relevant rules and
prescribed procedures;
• Results of audit carried out by the Office of the Pr.AG (Audit I) and AG
(Audit II);
• Other financial data obtained from various Government departments and
organisations;
• GSDP data and other State related Statistics from Directorate of Economics
and Statistics, Government of Karnataka (GoK);
• Recommendations of XIV and XV Finance Commission (FC);
• Karnataka Fiscal Responsibility Act (KFRA) 2002; and
• Guidelines of the GoI.
1.4 Structure of Government Accounts
The Accounts of the State Government are kept in three parts:
The Budget is to be presented to both the Houses of the Legislature of the State,
in terms of Article 202 of the Constitution of India. The ‘Annual Financial
Statement’ constitutes the main budget document. It includes,
• Revenue receipts consists of tax revenue, non-tax revenue, share of Union
taxes/duties, and grants from GoI.
• Revenue expenditure consists of all those expenditures of the Government,
which do not result in creation of physical or financial assets. It relates to
those expenses incurred for the normal functioning of the Government
departments and various services, interest payments on debt incurred by the
Government, and grants given to various institutions (even though some of
the grants may be meant for creation of assets).
Consolidated Fund
• All receipts and expenditure on Revenue and Capital Account,Public Debt and Loans and Advances form one Consolidated Fundentitled the Consolidated Fund of State established under Article266(1) of the Constitution of India.
ContingencyFund
• Contingency Fund of the State established under Article 267(2) ofthe Constitution is in the nature of an imprest placed at the disposalof the Governor to enable him to make advances to meet urgentunforeseen expenditure, pending authorisation by the Legislature.Fund is recouped by debiting the expenditure to the concernedfunctional major head in the Consolidated Fund of the State.
Public Account
• Receipts and disbursements in respect of certain transactions suchas small savings, provident funds, reserve funds, deposits, suspenseand remittances etc., which do not form part of the ConsolidatedFund are kept in the Public Account set up under Article 266(2) ofthe Constitution and are not subject to vote by the State Legislature.
State Finance Audit Report for the year ended 31 March 2021
6
• Capital receipts consist of:
➢ Debt receipts: market loans, bonds, loans from financial institutions, net
transaction under ways and means advances, loans and advances from
Central Government, etc.;
➢ Non-debt receipts: proceeds from disinvestment, recoveries of loans and
advances.
• Capital expenditure includes expenditure on the acquisition of land,
building, machinery, equipment, investment in shares, and loans and
advances by the Government to the Public Sector Undertakings (PSUs) and
other entities.
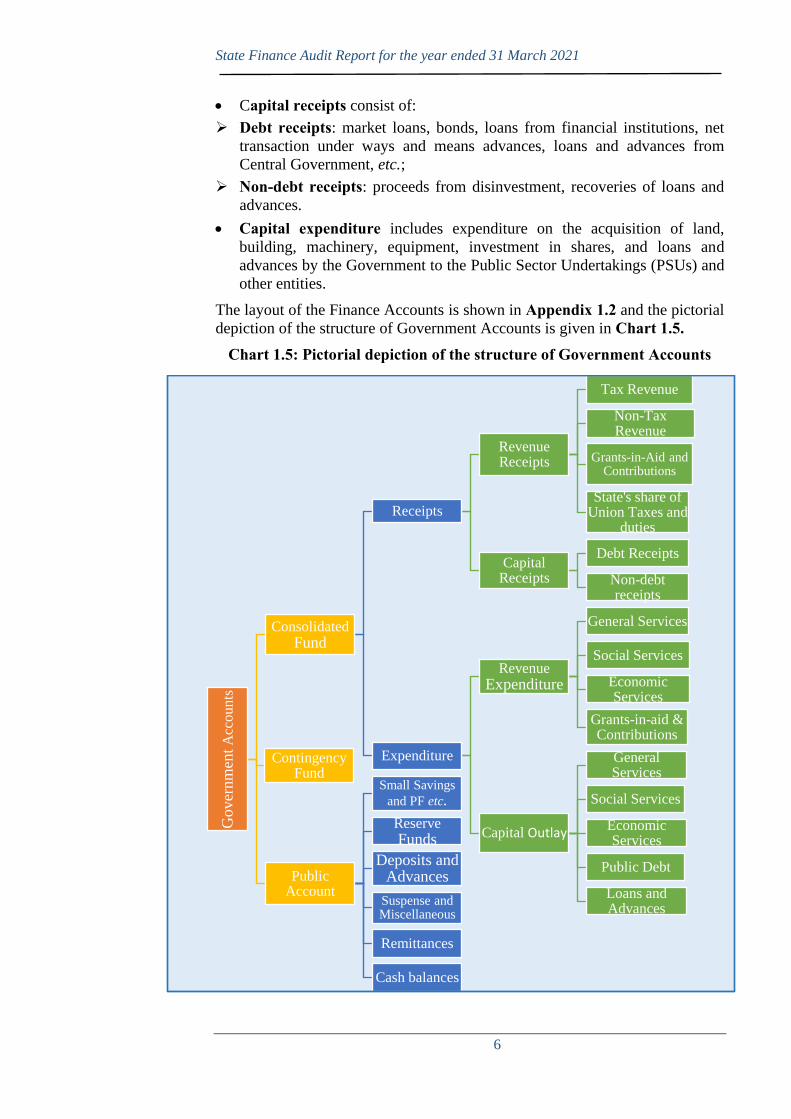
The layout of the Finance Accounts is shown in Appendix 1.2 and the pictorial
depiction of the structure of Government Accounts is given in Chart 1.5. Chart 1.5: Pictorial depiction of the structure of Government Accounts
Gover
nm
ent
Acc
ounts
ConsolidatedFund
Receipts
Revenue Receipts
Tax Revenue
Non-Tax Revenue
Grants-in-Aid and Contributions
State's share of Union Taxes and
duties
Capital Receipts
Debt Receipts
Non-debt receipts
Expenditure
RevenueExpenditure
General Services
Social Services
Economic Services
Grants-in-aid & Contributions
Capital Outlay
General Services
Social Services
Economic Services
Public Debt
Loans and Advances
Contingency Fund
Public Account
Small Savings
and PF etc.
ReserveFunds
Deposits and Advances
Suspense and Miscellaneous
Remittances
Cash balances
Chapter 1 Overview
7
1.5 Budgetary Processes
In terms of Article 202 of the Constitution of India, the Governor of State shall
cause to be laid before the State Legislature, a statement of the estimated receipts
and expenditure of the State for the year 2020-21, in the form of an Annual
Financial Statement. In terms of Article 203, the statement is submitted to the
State Legislature in the form of Demands for Grants/Appropriations. On
approval, the Appropriation Bill is passed by the Legislature under Article 204
to provide for appropriation of the required money out of the Consolidated Fund.
In the State of Karnataka, the budget documents include documents like Gender
Budget (detailed in Chapter 3-Paragraph 3.3), Child Budget (detailed in
Chapter 3-Paragraph 3.4) and document for district wise and scheme wise
allocation to Panchayat Raj Institutions (PRIs) and Urban Local Bodies (ULBs)
etc.
The State Budget Manual prescribes the process of budget formulation and
guides the State Government in monitoring its expenditure activities. Results of
audit scrutiny of budget and implementation of other budgetary initiatives of the
State Government are included in Chapter 3 of this Report.
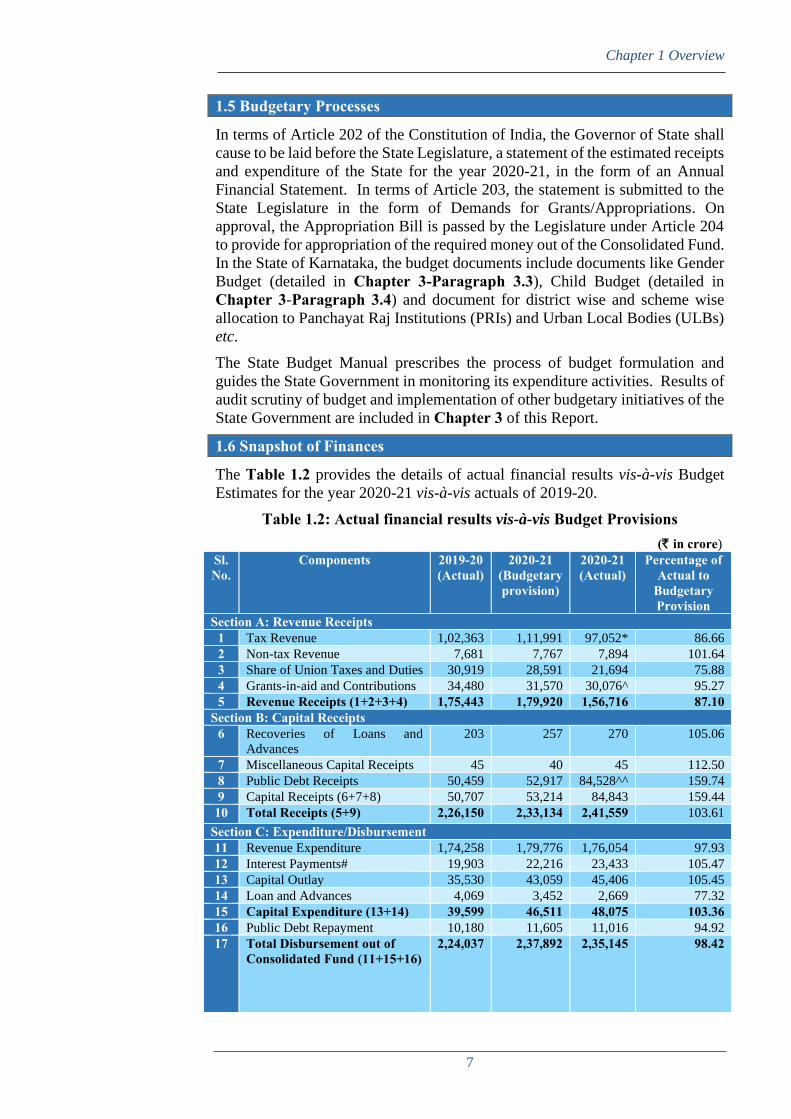
1.6 Snapshot of Finances
The Table 1.2 provides the details of actual financial results vis-à-vis Budget
Estimates for the year 2020-21 vis-à-vis actuals of 2019-20.
Table 1.2: Actual financial results vis-à-vis Budget Provisions (` in crore)
Sl. No.
Components 2019-20
(Actual) 2020-21
(Budgetary provision)
2020-21
(Actual) Percentage of
Actual to Budgetary Provision
Section A: Revenue Receipts
1 Tax Revenue 1,02,363 1,11,991 97,052* 86.66
2 Non-tax Revenue 7,681 7,767 7,894 101.64
3 Share of Union Taxes and Duties 30,919 28,591 21,694 75.88
4 Grants-in-aid and Contributions 34,480 31,570 30,076^ 95.27
5 Revenue Receipts (1+2+3+4) 1,75,443 1,79,920 1,56,716 87.10 Section B: Capital Receipts
6 Recoveries of Loans and
Advances
203 257 270 105.06
7 Miscellaneous Capital Receipts 45 40 45 112.50
8 Public Debt Receipts 50,459 52,917 84,528^^ 159.74
9 Capital Receipts (6+7+8) 50,707 53,214 84,843 159.44
10 Total Receipts (5+9) 2,26,150 2,33,134 2,41,559 103.61
Section C: Expenditure/Disbursement 11 Revenue Expenditure 1,74,258 1,79,776 1,76,054 97.93
12 Interest Payments# 19,903 22,216 23,433 105.47
13 Capital Outlay 35,530 43,059 45,406 105.45
14 Loan and Advances 4,069 3,452 2,669 77.32
15 Capital Expenditure (13+14) 39,599 46,511 48,075 103.36 16 Public Debt Repayment 10,180 11,605 11,016 94.92 17 Total Disbursement out of
Consolidated Fund (11+15+16)
2,24,037 2,37,892 2,35,145 98.42

State Finance Audit Report for the year ended 31 March 2021
8
Sl. No.
Components 2019-20
(Actual) 2020-21
(Budgetary provision)
2020-21
(Actual) Percentage of
Actual to Budgetary Provision
Section D:Fiscal Indicators
18 Revenue Surplus/Deficit
(5-11)
1,185 144 (-)19,338 (-)13,429.17
19 Fiscal Deficit (-)
{(5+6+7)-(11+15)}
38,166 46,070 67,098 145.64
20 Primary Deficit (-) (19-12) 18,263 23,854 43,665 183.05
Source: Finance Accounts, Annual Financial Statement and MTFP 2019-23
*Tax Revenue Includes Major Heads 0005 – CGST (`6,236.01 crore), 0006 – SGST (`37,711.18
crore) and 0008 – IGST (Nil).
# Includes Interest on Off Budget borrowings.
^includes compensation of `13,789 crore for loss of revenue arising out of implementation of GST
^^ Effective Public Debt Receipts would be ` 72,121 crore as the Department of Expenditure, GoI
had decided that GST compensation of ` 12,407 crore given to the state as back-to-back loan under
Debt Receipts would not be treated as debt of the state for any norms which may be prescribed by
the Finance Commission.
The total receipts under GST during 2020-21 were `43,947.19 crore. The state
received total compensation of `26,196.26 crore on account of loss of revenue
arising out of the implementation of GST during 2020-21. Out of this,
` 13,789.26 crore was received by the state as grants under Revenue Receipts.
However, due to inadequate balance in GST compensation fund during the year
2020-21, the state also received back-to-back loan of `12,407 crore under Debt
Receipts of the State Government with repayment obligations from the cess
collected in GST compensation fund and not from any other resources of the
state. Due to this arrangement, the Revenue Deficit of `19,338 crore and the
Fiscal Deficit of `67,098 crore during the year 2020-21 may be read in
conjunction with Debt Receipt of `12,407 crore in lieu of GST compensation.
The State Revenue Expenditure (`1,76,054 crore) was within its budgetary
projection (`1,79,776 crore). However, Revenue receipts (`1,56,716 crore)
received was less by 13 per cent during 2020-21 when compared to Budgetary
provision (`1,79,920 crore), which resulted in Revenue deficit (`19,338 crore).
The Finance Department replied (December 2021) that the decline in revenue
receipts was due to COVID-19/pandemic situation, imposition of lock down
resulting in closure of manufacturing /trading /service sector and sluggish
economic activities and also due to reduction in receipt of State Share of Union
Taxes and Duties and Grants-in-Aid from GoI.
1.7 Snapshot of Assets and Liabilities of the Government
Government accounts capture the financial liabilities of the Government and the
assets created out of the expenditure incurred. The liabilities consist mainly of
internal borrowings, loans and advances from GoI, receipts from public account
and reserve funds, and the assets comprise mainly the capital outlay, loans and
advances given by the State Government and cash balances. The growth rate
components of Assets and Liabilities is given in Table 1.3 and summarised
position of Assets and Liabilities as on 31 March 2021 compared with the
corresponding position as on 31 March 2020 is given in Appendix 1.3.

Chapter 1 Overview
9
Table 1.3: Summarised position of Assets and Liabilities (` in crore)
Liabilities Assets
2019-20 2020-21 Per cent increase
2019-20 2020-21 Per cent increase
Consolidated Fund
A Internal Debt 2,20,337 2,81,140 27.60 a Gross Capital
Outlay
3,05,798 3,51,201 14.85
B Loans and
Advances
from GoI
13,908 26,617* 91.38 b Loans and
Advances
28,847 31,246 8.32
Contingency Fund
80 80 0.00 Contingency Fund - - -
Public Account A Small
Savings,
Provident
Funds etc.
35,179 38,811 10.32 a Advances 7 7 0.00
B Deposits 31,559 30,874 (-)2.17 b Remittance 1,038 1,073 3.37
C Reserve
Funds
37,599 43,873 16.69 c Suspense and
Miscellaneous
- - -
D Suspense and
Miscellaneous
5,297 2,377 (-)55.13 Cash balance (including investment in Earmarked Fund)
34,463 47,143 37
E Remittances - - - Total 3,70,153 4,30,670 16.35 Cumulative
Excess of Receipts over expenditure
26,194 6,898 (-)73.67 Deficit in Revenue Account
- - -
Total 3,70,153 4,30,670 16.35 Total 3,70,153 4,30,670 16.35
Source: Finance Accounts
* Effective Loans and Advances for GoI would be ` 14,210 crore as the Department of
Expenditure, GoI had decided that GST compensation of ` 12,407 crore given to the state as
back-to- back loan under Debt Receipt would not be treated as debt of the state for any norms
which may be prescribed by the Finance Commission.
The growth rate of assets in Consolidated Fund increased from 13 per cent in
2019-20 to 15 per cent in 2020-21, while that of Liabilities exclusive of off-
budget borrowings also increased from 22 per cent in 2019-20 to 28 per cent in
2020-21. The Finance Accounts reflected an amount of `2,81,140 crore as
internal debt outstanding at the end of 2020-21 after taking into account the
difference of `293.82 crore in the accounts of LIC, GIC, NABARD, NCDC etc.
The cash balance (including investment of Earmarked funds and deposits with
RBI) of the State at the end of the year was `47,143 crore. The increase in the
cash balance (including investment of Earmarked funds and deposits with RBI)
was 37 per cent over the previous year.
1.8 Fiscal parameters
The three key fiscal parameters – revenue, fiscal and primary deficits indicate
the extent of overall fiscal imbalances during a specified period.
The nature of deficit is an indicator of the extent of prudence in fiscal
management. Further, the ways in which the deficit is financed and the
State Finance Audit Report for the year ended 31 March 2021
10
application of resources raised are important pointers to its fiscal health. This
section presents trends, nature and magnitude and the manner of financing these
deficits and the assessment of actual levels of revenue and fiscal deficits vis-à-
vis targets set under KFRA for the financial year 2020-21.
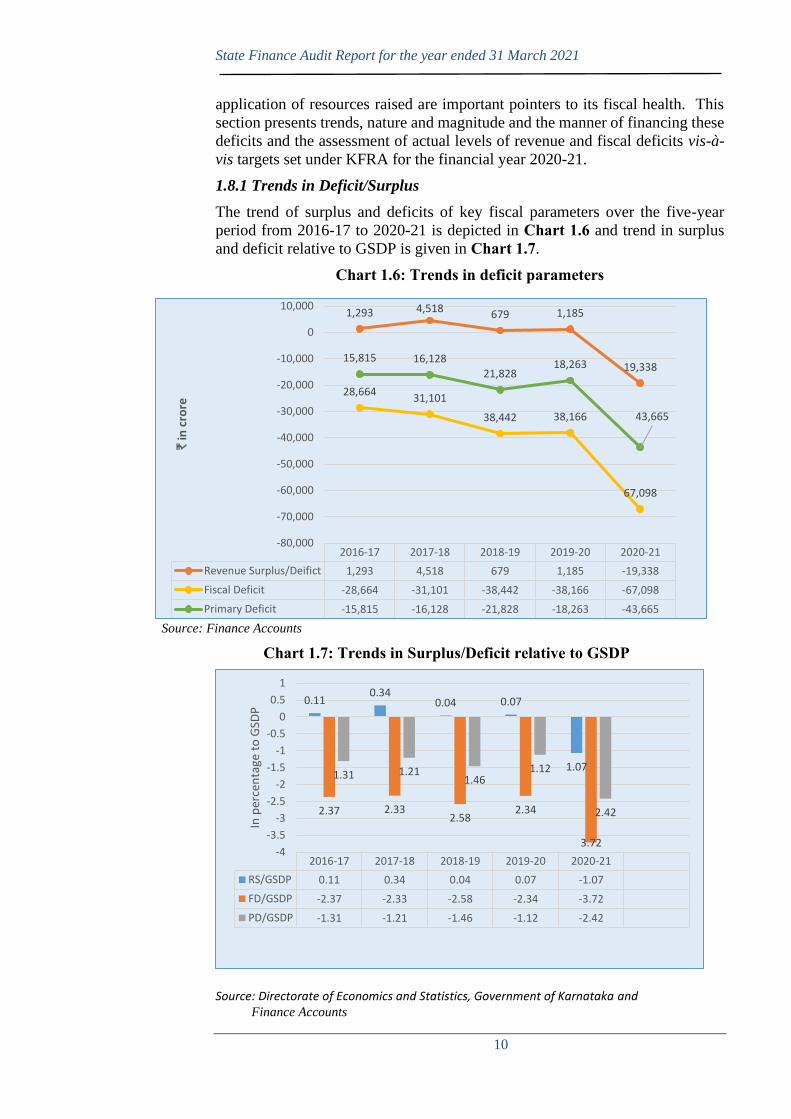
1.8.1 Trends in Deficit/Surplus
The trend of surplus and deficits of key fiscal parameters over the five-year
period from 2016-17 to 2020-21 is depicted in Chart 1.6 and trend in surplus
and deficit relative to GSDP is given in Chart 1.7.
Chart 1.6: Trends in deficit parameters
Source: Finance Accounts
Chart 1.7: Trends in Surplus/Deficit relative to GSDP
Source: Directorate of Economics and Statistics, Government of Karnataka and Finance Accounts
2016-17 2017-18 2018-19 2019-20 2020-21
Revenue Surplus/Deifict 1,293 4,518 679 1,185 -19,338
Fiscal Deficit -28,664 -31,101 -38,442 -38,166 -67,098
Primary Deficit -15,815 -16,128 -21,828 -18,263 -43,665
1,293 4,518 679 1,185
19,338
28,66431,101
38,442 38,166
67,098
15,815 16,128
21,82818,263
43,665
-80,000
-70,000
-60,000
-50,000
-40,000
-30,000
-20,000
-10,000
0
10,000
`in
cro
re
2016-17 2017-18 2018-19 2019-20 2020-21
RS/GSDP 0.11 0.34 0.04 0.07 -1.07
FD/GSDP -2.37 -2.33 -2.58 -2.34 -3.72
PD/GSDP -1.31 -1.21 -1.46 -1.12 -2.42
0.110.34
0.04 0.07
1.07
2.37 2.332.58
2.34
3.72
1.31 1.211.46
1.12
2.42
-4
-3.5
-3
-2.5
-2
-1.5
-1
-0.5
0
0.5
1
In p
erce
nta
ge t
o G
SDP

Chapter 1 Overview
11
During 2020-21, the revenue deficit was on account of decrease in revenue
receipts by 9.64 per cent4 over revenue expenditure. During 2020-21, Fiscal
Deficit increased by 76 per cent (`28,932 crore), as capital expenditure increased
by 21.40 per cent (`8,476 crore).
1.8.2 Trends in Fiscal Liabilities and its ratio to GSDP
Table 1.4 gives details of the composition of outstanding fiscal liabilities of the
State and its ratio to GSDP during the years 2016-17 to 2020-21.
Table 1.4: Trends in Fiscal Liabilities and its ratio to GSDP (` in crore)
Liabilities 2016-17 2017-18 2018-19 2019-20 2020-21
Internal Debt 1,32,489 1,48,581 1,79,309 2,20,337 2,81,140
GoI Loans 13,794 14,555 14,657 13,908 26,617*
Public Account 64,788 69,922 76,410 85,172 89,748
Off-budget borrowings 10,248 13,173 14,862 18,103 18,421
Total Fiscal Liabilities 2,21,319 2,46,231 2,85,238 3,37,520 4,15,926 Total Liabilities to GSDP (in per cent)
18.32 18.42 19.14 20.72 22.37
Target (in per cent) 25.00 25.00 25.00 25.00 25.00 Source: Finance Accounts
* Effective Loans and Advances for GoI would be ` 14,210 crore as the Department of
Expenditure, GoI had decided that GST compensation of ` 12,407 crore given to the state as
back-to-back loan under Debt Receipt would not be treated as debt of the state for any norms
which may be prescribed by the Finance Commission.
The ratio of total outstanding Debt to GSDP (22.37 per cent) has been arrived
at after excluding GST compensation of `12,407 crore given to the state as
back-to-back loan under Debt Receipts form the total outstanding liabilities as
the Department of Expenditure, GoI had decided that it would not be treated as
debt of the state for any norms which may be prescribed by the Finance
Commission.
The fiscal liabilities of the State increased by 88 per cent from `2,21,319 crore
in 2016-17 to `4,15,926 crore in 2020-21 and by 23 per cent over the previous
year. Internal debt which includes market borrowings constituted 68 per cent
and Public Account constituted 22 per cent of the total fiscal liabilities during
2020-21. The total liabilities to GSDP was on an increasing trend from 18.32
per cent during 2016-17 to 22.37 per cent during 2020-21 but well within the
maximum mandated under the KFRA/Medium Term Fiscal Plan (MTFP).
1.9 Fiscal situation of the State
The KFRA, 2002 as amended from time to time was enacted with the objective
of achieving inter-generational equity in fiscal management and long-term
macro-economic stability.
4 Growth rate of Revenue Receipts and Revenue Expenditure for 2020-21 is (-) 10.67 per cent
and 1.03 per cent respectively. The difference between these two is (-) 9.64 per cent.

State Finance Audit Report for the year ended 31 March 2021
12
1.9.1 KFRA targets on key fiscal parameters and achievements thereon
The KFRA, 2002 envisaged sufficient revenue surplus and prudential debt
management through limits on borrowings, debt and deficits. The targets for
revenue and fiscal deficits along with their actual levels are given in Table 1.5. Table 1.5: Compliance with targets of KFRA
Fiscal Parameters
KFRA target Achievement 2016-17 2017-18 2018-19 2019-20 2020-21
Revenue Surplus/Deficit (` in crore)
To maintain
Revenue
Surplus
1,293 4,518 679 1,185 (-)19,338
Revenue
Surplus may
not be attained
during 2020-
21 due to
COVID 19
√ √ √ √ The State
revenue
deficit
may
arise.
Fiscal Deficit (as percentage of GSDP)
3.00 per cent
(upto 2019-20)
28,664
(2.37)
31,101
(2.33)
38,442
(2.58)
38,166
(2.34)
67,098
(3.72)
5.00 per cent
(2020-21)
√ √ √ √ √
Ratio of total outstanding debt to GSDP (in per cent)
25.00 per cent 18.32 18342 19.14 20.72 22.37*
√ √ √ √ √
*The back-to-back Loan (` 12,407 crore) received from GoI in lieu of GST compensation has
not been considered as Debt for working out the indicator.
The ratio of total outstanding Debt to GSDP (22.37 per cent) has been arrived at
after excluding GST compensation of `12,407 crore given to the state as back-
to-back loan under Debt Receipts form the total outstanding liabilities as the
Department of Expenditure, GoI had decided that it would not be treated as debt
of the state for any norms which may be prescribed by the Finance Commission.
By an amendment to KFRA, 2002 in February 2014, the scope of total liabilities
as defined under Section-2(g) was amplified to include the borrowings by PSUs
and Special Purpose Vehicles5 (SPVs) and other equivalent instruments, where
the principal and/or interest are to be serviced out of the State Budget. The State
Government has been amending the KFRA from time to time keeping in view
the parameters prescribed by successive Finance Commissions (FC). The State
Government recorded revenue surplus from 2004-05 to 2019-20 and the fiscal
deficit and debt-GSDP ratio was within the limit of three per cent and 25 per
cent of GSDP as prescribed under the Act.
During the year 2020-21, the State Government amended the KFRA to raise the
fiscal deficit from three per cent to five per cent of the estimated Gross State
Domestic Product as a onetime relaxation due to COVID 19 pandemic. In
addition, the State envisaged revenue deficit due to reduction of receipts as a
result of COVID-19 pandemic. During 2020-21, the State witnessed Revenue
5 Borrowings by PSUs and SPVs are Off-budget borrowings
Chapter 1 Overview
13
deficit, which indicates that the Government borrowings was spent towards
revenue expenditure. However, the fiscal deficit, debt-GSDP ratio were within
the limit of five per cent and 25 per cent of GSDP respectively as prescribed
under the Act.
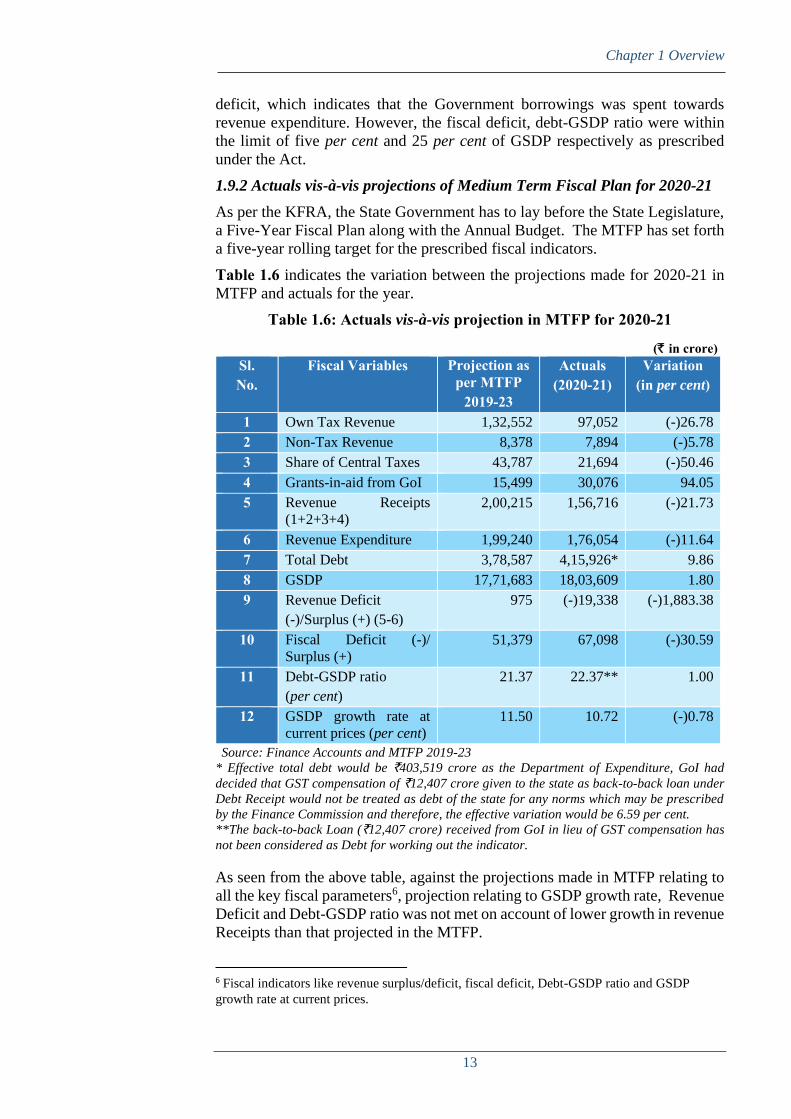
1.9.2 Actuals vis-à-vis projections of Medium Term Fiscal Plan for 2020-21
As per the KFRA, the State Government has to lay before the State Legislature,
a Five-Year Fiscal Plan along with the Annual Budget. The MTFP has set forth
a five-year rolling target for the prescribed fiscal indicators.
Table 1.6 indicates the variation between the projections made for 2020-21 in
MTFP and actuals for the year.
Table 1.6: Actuals vis-à-vis projection in MTFP for 2020-21
(` in crore) Sl. No.
Fiscal Variables Projection as per MTFP
2019-23
Actuals
(2020-21) Variation
(in per cent)
1 Own Tax Revenue 1,32,552 97,052 (-)26.78
2 Non-Tax Revenue 8,378 7,894 (-)5.78
3 Share of Central Taxes 43,787 21,694 (-)50.46
4 Grants-in-aid from GoI 15,499 30,076 94.05
5 Revenue Receipts
(1+2+3+4)
2,00,215 1,56,716 (-)21.73
6 Revenue Expenditure 1,99,240 1,76,054 (-)11.64
7 Total Debt 3,78,587 4,15,926* 9.86
8 GSDP 17,71,683 18,03,609 1.80
9 Revenue Deficit
(-)/Surplus (+) (5-6)
975 (-)19,338 (-)1,883.38
10 Fiscal Deficit (-)/
Surplus (+)
51,379 67,098 (-)30.59
11 Debt-GSDP ratio
(per cent)
21.37 22.37** 1.00
12 GSDP growth rate at
current prices (per cent)
11.50 10.72 (-)0.78
Source: Finance Accounts and MTFP 2019-23
* Effective total debt would be `403,519 crore as the Department of Expenditure, GoI had
decided that GST compensation of `12,407 crore given to the state as back-to-back loan under
Debt Receipt would not be treated as debt of the state for any norms which may be prescribed
by the Finance Commission and therefore, the effective variation would be 6.59 per cent.
**The back-to-back Loan (`12,407 crore) received from GoI in lieu of GST compensation has
not been considered as Debt for working out the indicator.
As seen from the above table, against the projections made in MTFP relating to
all the key fiscal parameters6, projection relating to GSDP growth rate, Revenue
Deficit and Debt-GSDP ratio was not met on account of lower growth in revenue
Receipts than that projected in the MTFP.
6 Fiscal indicators like revenue surplus/deficit, fiscal deficit, Debt-GSDP ratio and GSDP
growth rate at current prices.

State Finance Audit Report for the year ended 31 March 2021
14
The Finance Department reiterated (December 2021) that the decline in revenue
receipts was due to COVID 19 pandemic situation.
1.10 Impact of certain transactions on major fiscal indicators during 2020-21
Scrutiny of certain major transactions during 2020-21 revealed that, revenue
deficit and fiscal deficit were affected by certain accounting adjustments as
brought out in Paragraph 9 of Notes to Accounts of Finance Accounts and as
detailed in Table 1.7.
Table 1.7: Impact of certain major transactions during 2020-21 (` in crore)
Sl. No.
Nature of transaction Revenue Deficit Fiscal Deficit Over-
statement Under-
statement Over-
statement Under-
statement 1 Booking of capital
expenditure instead of
revenue expenditure
- 100.00 - -
2 Utilisation of capital
funds for expenditure of
revenue nature
- 117.02 - -
3 Non-transfer of receipts
under Green Tax Cess to
Reserve Fund
- 10.86 - 10.86
4 Non-transfer of receipts
under Road Safety Cess
- 87.65 - 87.65
5 Interest Adjustment - 11.56 - 11.56
6 Write back of unspent
PRI grants
- 1,621.30 - 1,621.30
Total - 1,948.38 - 1,731.37 Source: Notes to Accounts 2020-21and Post audit analysis
The above transactions are discussed below:
• Expenditure of `100.00 crore relating to Grants-in-aid-General in
Department of Home and Transport was booked under capital instead of
revenue expenditure which is discussed in paragraph 3.7.2.2 of Chapter 3;
• In addition, expenditure of `117.02 crore under Capital head were
utilised towards expenditure of revenue nature (Salaries) which is
discussed in paragraph 3.7.2.3 of Chapter 3;
• Green Tax Cess (`10.86 crore) and Road safety Cess (`87.65 crore)
collected under Consolidated Fund of the State was not transferred to the
fund account in Reserve Fund, which is discussed in paragraph 2.6.2 (b) of Chapter 2;
• The State Government was required to pay interest on the un-invested
balance lying under Reserve Funds and Deposits bearing interest. The
un-invested balances at the beginning of the year was `49.16 crore under
Other Deposits- Defined contribution Pension scheme of Government
Employees and `1,273.30 crore under Reserve Funds-State
Compensatory Afforestation Fund. The interest liability on State
Chapter 1 Overview
15
Compensatory Afforestation Fund is at 4 per cent and 7.1 per cent for
Defined contribution Pension scheme of Government Employees and
interest due worked out to `54.42 crore. Out of `54.42 crore, `11.56
crore was not provided.
• In respect of Sl. No. 6, the State Government through an order in
December 2016 had stipulated that the adjustment of unspent balances
of a particular year would be done in the budget of the year next to the
immediately succeeding year. Accordingly, the State Government in
March 2021 had approved the write back of unspent amount of `882.49
crore in respect of Zilla Panchayats and `738.81 crore in respect of Taluk
Panchayats related to the year 2018-19 from the Public Account (Major
Head 8448), which led to suppression of expenditure during the current
year. This has resulted in understatement of revenue deficit and fiscal
deficit to the extent of `1,621.30 crore.
The Finance Department replied (December 2021) that Funds remaining
unspent in fund II of Zilla Panchayat is written back to consolidated fund
as per provisions of Government Order (December 2016). In addition, it
stated (March 2021) that once Khajane-2 stabilizes, they could build in a
procedure to automate the write back as a year end process. While
reiterating the point Finance Department in Exit conference stated that
as a first step, it would bridge the gap from two years to one year for
writing back the unutilised amount.
However, until the unspent amount of ZP/TP funds were written back
during the same financial year, the fiscal indicators would continue to be
affected.


19
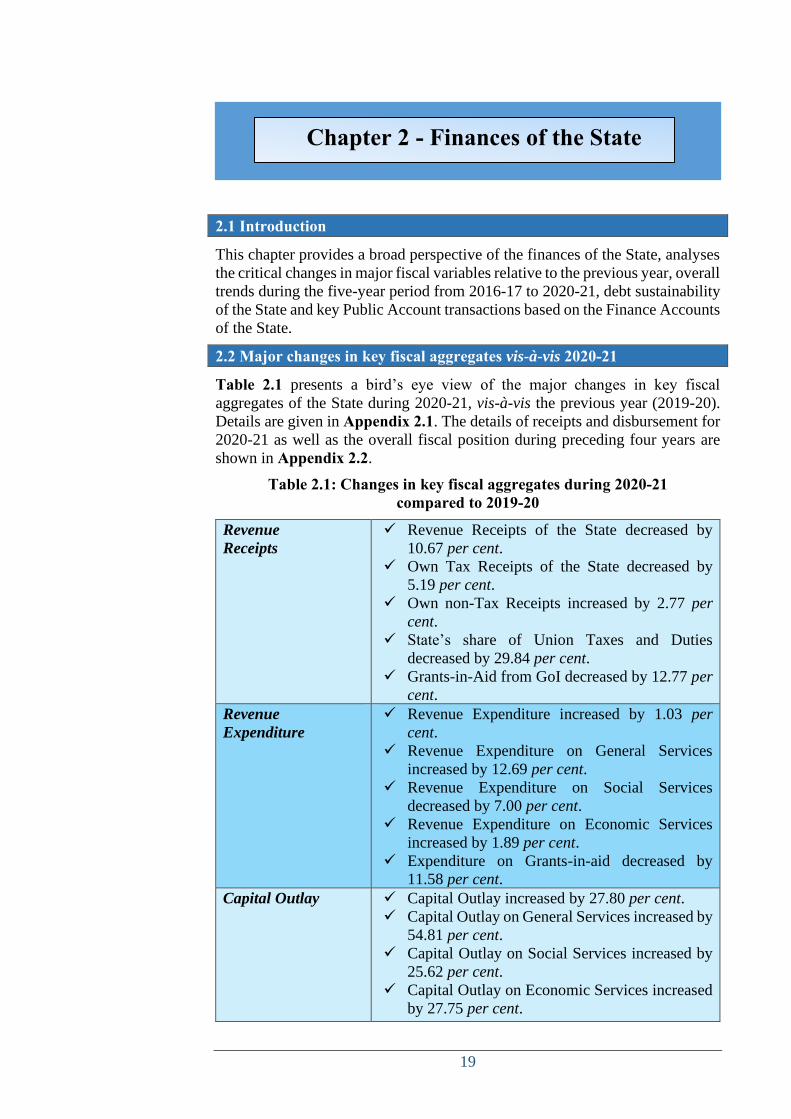
2.1 Introduction
This chapter provides a broad perspective of the finances of the State, analyses
the critical changes in major fiscal variables relative to the previous year, overall
trends during the five-year period from 2016-17 to 2020-21, debt sustainability
of the State and key Public Account transactions based on the Finance Accounts
of the State.
2.2 Major changes in key fiscal aggregates vis-à-vis 2020-21
Table 2.1 presents a bird’s eye view of the major changes in key fiscal
aggregates of the State during 2020-21, vis-à-vis the previous year (2019-20).
Details are given in Appendix 2.1. The details of receipts and disbursement for
2020-21 as well as the overall fiscal position during preceding four years are
shown in Appendix 2.2.
Table 2.1: Changes in key fiscal aggregates during 2020-21 compared to 2019-20
Revenue
Receipts
✓ Revenue Receipts of the State decreased by
10.67 per cent.
✓ Own Tax Receipts of the State decreased by
5.19 per cent.
✓ Own non-Tax Receipts increased by 2.77 per
cent.
✓ State’s share of Union Taxes and Duties
decreased by 29.84 per cent.
✓ Grants-in-Aid from GoI decreased by 12.77 per
cent.
Revenue
Expenditure
✓ Revenue Expenditure increased by 1.03 per
cent.
✓ Revenue Expenditure on General Services
increased by 12.69 per cent.
✓ Revenue Expenditure on Social Services
decreased by 7.00 per cent.
✓ Revenue Expenditure on Economic Services
increased by 1.89 per cent.
✓ Expenditure on Grants-in-aid decreased by
11.58 per cent.
Capital Outlay
✓ Capital Outlay increased by 27.80 per cent.
✓ Capital Outlay on General Services increased by
54.81 per cent.
✓ Capital Outlay on Social Services increased by
25.62 per cent.
✓ Capital Outlay on Economic Services increased
by 27.75 per cent.
Chapter 2 - Finances of the State

State Finance Audit Report for the year ended 31 March 2021
20
Loans and Advances ✓ Recoveries of Loans and Advances increased by
33.00 per cent.
✓ Disbursement of Loans and Advances decreased
by 34.41 per cent.
Public Debt ✓ Public Debt Receipts increased by 67.52 per
cent (Effective increase would be 42.93 per cent
considering the exclusion of the back-to-back
loan received in lieu of GST compensation from
GoI).
✓ Repayment of Public Debt increased by 8.21 per
cent.
Public Account ✓ Public Account Receipts increased by 6.57 per
cent.
✓ Disbursement of Public Account increased by
8.52 per cent.
Cash Balance ✓ Cash Balance (including investment of
Earmarked funds and deposits with RBI)
increased by `12,680.05 crore (36.79 per cent).
Each of the above indicators are analysed in the succeeding paragraphs.
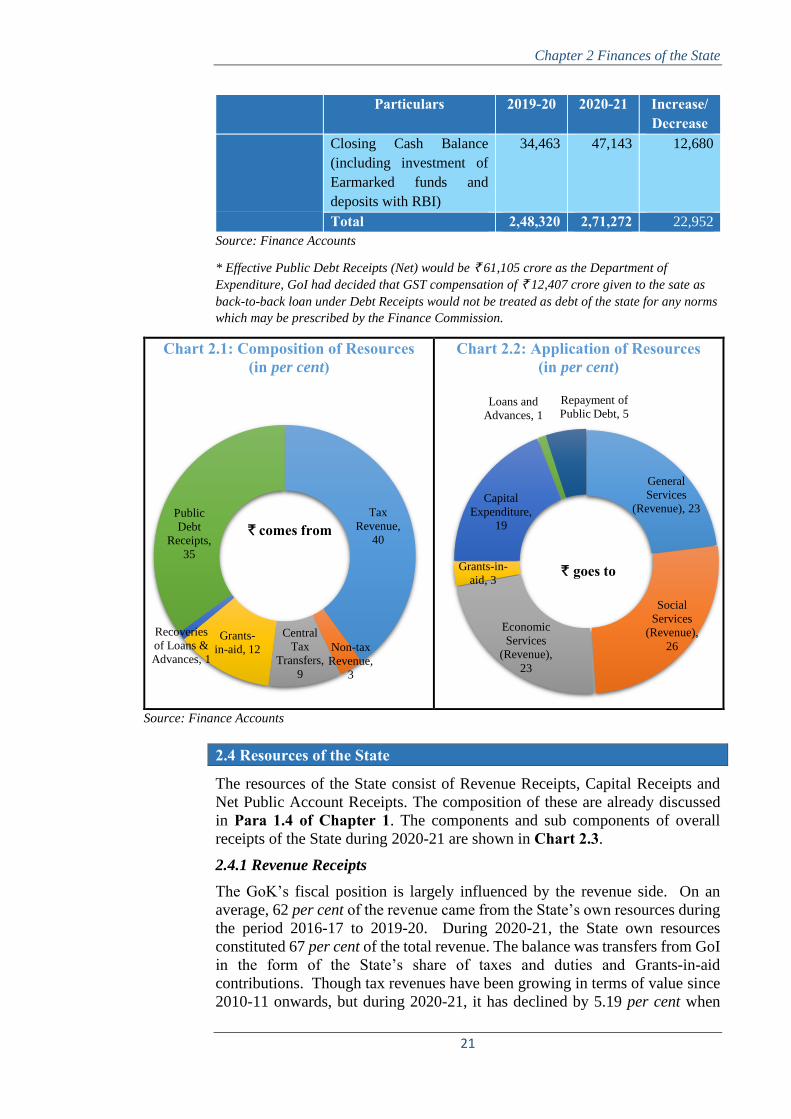
2.3 Sources and Application of funds
Table 2.2 compares the sources and application of funds of the State during
2019-20 with 2020-21, while Chart 2.1 and Chart 2.2 give the details of
receipts into and expenditure from the Consolidated Fund during 2020-21 in
terms of percentages.
Table 2.2: Details of Sources and Application of funds during 2019-20 and 2020-21
(` in crore)
Particulars 2019-20 2020-21 Increase/ Decrease
Sources Opening Cash Balance
(including investment of
Earmarked funds and
deposits with RBI)
22,004 34,463 12,459
Revenue Receipts 1,75,443 1,56,716 (-)18,727
Recoveries of Loans and
Advances
203 270 67
Public Debt Receipts
(Net)
40,279 73,512* 33,233
Public Account Receipts
(Net)
10,346 6,264 (-)4,082
Total 2,48,275 2,71,225 22,950
Application Revenue Expenditure 1,74,258 1,76,054 1,796
Capital Outlay 35,530 45,406 9,876
Disbursement of Loans
and Advances
4,069 2,669 (-)1,400
Chapter 2 Finances of the State
21
Particulars 2019-20 2020-21 Increase/ Decrease
Closing Cash Balance
(including investment of
Earmarked funds and
deposits with RBI)
34,463 47,143 12,680
Total 2,48,320 2,71,272 22,952
Source: Finance Accounts
* Effective Public Debt Receipts (Net) would be ` 61,105 crore as the Department of
Expenditure, GoI had decided that GST compensation of ` 12,407 crore given to the sate as
back-to-back loan under Debt Receipts would not be treated as debt of the state for any norms
which may be prescribed by the Finance Commission.
Chart 2.1: Composition of Resources (in per cent)
Chart 2.2: Application of Resources (in per cent)
Source: Finance Accounts
2.4 Resources of the State
The resources of the State consist of Revenue Receipts, Capital Receipts and
Net Public Account Receipts. The composition of these are already discussed
in Para 1.4 of Chapter 1. The components and sub components of overall
receipts of the State during 2020-21 are shown in Chart 2.3.
2.4.1 Revenue Receipts
The GoK’s fiscal position is largely influenced by the revenue side. On an
average, 62 per cent of the revenue came from the State’s own resources during
the period 2016-17 to 2019-20. During 2020-21, the State own resources
constituted 67 per cent of the total revenue. The balance was transfers from GoI
in the form of the State’s share of taxes and duties and Grants-in-aid
contributions. Though tax revenues have been growing in terms of value since
2010-11 onwards, but during 2020-21, it has declined by 5.19 per cent when
Tax
Revenue,
40
Non-tax
Revenue,
3
Central
Tax
Transfers,
9
Grants-
in-aid, 12
Recoveries
of Loans &
Advances, 1
Public
Debt
Receipts,
35
` comes from
General
Services
(Revenue), 23
Social
Services
(Revenue),
26
Economic
Services
(Revenue),
23
Grants-in-
aid, 3
Capital
Expenditure,
19
Loans and
Advances, 1
Repayment of
Public Debt, 5
` goes to

State Finance Audit Report for the year ended 31 March 2021
22
compared to previous year (2019-20). However, as a percentage share of
Revenue Receipts, they were in a declining trend from 2016-17 to 2019-20.
During 2020-21, there was a slight increase and it constituted 62 per cent of the
total Revenue Receipts. On the other hand, the State has not improved revenues
on the non-tax front. The Non-tax Revenue which was four per cent of Revenue
Receipts during 2016-17 to 2019-20, increased to five per cent during 2020-21.
Chart 2.3: Composition of receipts of the State during 2020-21
* Effective Debt Receipts would be ` 72,121 crore as the Department of Expenditure, GoI had
decided that GST compensation of ` 12,407 crore given to the state as back-to-back loan
under Debt Receipts would not be treated as debt of the state for any norms which may be
prescribed by the Finance Commission and thus, the effective Capital Receipts stand at
` 73,436 crore and effective Total Receipts stand at ` 2,35,416 crore.
2.4.2 Trends and growth of Revenue Receipts
Table 2.3 provides trends in Revenue Receipts as well as revenue buoyancy
with respect to GSDP over the five-year period 2016-17 to 2020-21. Further,
trends in Revenue Receipts relative to GSDP and composition of Revenue
Receipts are given in Chart 2.4 and Chart 2.5 respectively.
Total Receipts (`2,47,823 crore)
Revenue Receipts
(`1,56,716 crore)
Tax Revenue
(`97,052 crore)
1. Taxes on sales, trade etc.
2. State Excise
3. Stamps and Registration
fees
4. Taxes on Vehicles
Non-tax Revenue
(`7,894 crore)
State's share of Union Taxes & Duties
(`21,694 crore)
Grants-in-aid from GoI
(`30,076 crore)
Capital Receipts
(`84,843 crore)
Debt Receipts*
(`84,528 crore)
- Market Loans
- Negotiated Borrowings
- Loans and Advances
from GoI
Non-debt Receipts
(`315 crore) - Proceeds from
disinvestment
- Retirement of capital/
disinvestment of co-
operative societies/banks
- Recoveries of loans and
advances
Public Account
Receipts (Net)
(`6,264 crore)
(i.e. funds available with Govt for use)
- Small Savings, PF
etc.
- Reserve Funds
- Deposits/Advances
- Suspense/
Miscellaneous
Balances
- Remittances

Chapter 2 Finances of the State
23
Table 2.3: Trends and growth in Revenue Receipts
Parameters 2016-17 2017-18 2018-19 2019-20 2020-21
Revenue Receipts (RR) (` in crore)
1,33,214 1,47,000 1,64,979 1,75,443 1,56,716
Rate of growth of RR
(per cent) 12.12 10.35 12.23 6.34 (-)10.67
Own tax Revenue (` in crore)
82,956 87,130 96,830 1,02,363 97,052
Non-tax revenue (` in crore)
5,795 6,477 6,773 7,681 7,894
Rate of growth of Own Revenue (Own tax and Non-tax revenue) (per cent)
9.70 5.47 10.68 6.22 (-)4.63
Gross State Domestic Product (GSDP) (` in crore)
12,07,608 13,36,914 14,90,624 16,28,928 18,03,609
Rate of growth of GSDP (per cent)
15.54 10.71 11.50 9.28 10.72
RR/GSDP (per cent) 11.03 11.00 11.07 10.77 8.69
Buoyancy ratios7 Revenue Buoyancy8 w.r.t GSDP
0.78 0.97 1.06 0.68 (-)0.99
State’s own revenue buoyancy9 w.r.t GSDP
0.62 0.51 0.93 0.67 0.43
Source: Finance Accounts and Economic Survey of GoK
Chart 2.4: Trends of Revenue Receipts
Source: Finance Accounts and Economic Survey of GoK
7 Buoyancy ratio indicates the elasticity or degree of responsiveness of a fiscal variable with
respect to a given change in the base variable. For instance, revenue buoyancy with respect to
GSDP at 0.63 implies that Revenue Receipts tend to increase by 0.63 percentage points, if the
GSDP increases by one per cent. 8 Revenue buoyancy refers to the growth rate of revenue receipts to growth rate of GSDP. 9 Own revenue buoyancy refers to growth rate of tax revenue and non-tax revenue to growth
rate of GSDP. It excludes devolution from GoI.
1,33,2141,47,000
1,64,9791,75,443
1,56,716
11.0311.00 11.07 10.77
8.69
0.00
2.00
4.00
6.00
8.00
10.00
12.00
0
20,000
40,000
60,000
80,000
1,00,000
1,20,000
1,40,000
1,60,000
1,80,000
2,00,000
2016-17 2017-18 2018-19 2019-20 2020-21
(In p
er c
ent)
( `
In c
rore
)
Revenue Receipts As per cent of GSDP

State Finance Audit Report for the year ended 31 March 2021
24
Chart 2.5: Trends of components of Revenue Receipts
Source: Finance Accounts General trends relating to Revenue Receipts of the State are as follows:
• Revenue Receipts increased by 17.64 per cent from `1,33,214 crore in
2016-17 to `1,56,716 crore in 2020-21. The average growth rate for the
period from 2016-17 to 2019-20 was 10.26 per cent. During 2020-21, the
revenue decreased by 10.67 per cent when compared to previous year. The
decrease resulted in Revenue deficit in the current year.
• About 67 per cent of the Revenue Receipts during 2020-21 came from the
State’s own resources, while Central tax transfers and Grants-in-aid together
contributed 33 per cent. This is indicative that Karnataka’s fiscal position is
largely influenced by own resources.
• During the current year, the decrease of 10.67 per cent (`18,727 crore) in
Revenue Receipts was mainly due to decrease of 5.19 per cent, 29.84 per
cent and 12.77 per cent in Own tax revenue, States share of Union taxes and
duties and Grants in aid from GoI respectively.
• The revenue buoyancy of the State, which had inter year variation, turned
negative for the first time in last decade. This was due to negative growth
rate in Revenue Receipts
2.4.3 State’s Own Resources
State’s performance in mobilization of additional resources should be assessed
in terms of its own resources comprising revenue from its Own tax and non-Tax
sources.
Gross collections in respect of major Tax and non-Tax revenue and their relative
share in GSDP during 2016-21 are given in Appendix 2.2.
a) Own tax Revenue Trends of Own tax Revenue of the State during the five-year period 2016-17 to
2020-21 are given in Chart 2.6.
5,795 6,477 6,773 7,6817,894
28,76031,752 35,895
30,91921,69415,703
21,641 25,481
34,480
30,076
82,95687,130
96,8301,02,363
97,052
0
10,000
20,000
30,000
40,000
50,000
60,000
70,000
80,000
90,000
100,000
110,000
2016-17 2017-18 2018-19 2019-20 2020-21
(`in
cro
re)
Non-Tax Revenue Central Tax transfers
Grants-in-aid from GoI Own Tax Revenue

Chapter 2 Finances of the State
25
Chart 2.6: Growth/Decline of Own Tax Revenue during 2016-21
Source: Finance Accounts
The component wise details of State’s Own Tax Revenue collected during 2016-
17 to 2020-21 are given in Table 2.4. Table 2.4: Components of State’s Own tax revenue during 2016-21
(` in crore)
Source: Finance Accounts
Own tax Revenue of the State increased by `14,096 crore from `82,956 crore
in 2016-17 to ̀ 97,052 crore in 2020-21. The average annual growth rate of Own
tax revenue for the period 2016-17 to 2019-20 was 7.92 per cent. However,
during 2020-21, there was decrease in collection of Own tax revenue, which
resulted in a negative growth rate. During the current year, the major
contributors of Tax Revenue were Goods and Service Tax (39 per cent), State
Excise (24 per cent), Taxes on Sales, Trade etc., (17 per cent) and Stamps and
Registration Fees (11 per cent).
The Fiscal Management Review Committee (FMRC) constituted under the
Chairmanship of Chief Secretary to review the fiscal and debt position of the
46,105
25,09314,003 16,424 16,028
24,182 41,956 42,147 37,711
16,48417,949
19,94421,584
23,3325,5946,209
6,5686,763
5,607
7,8069,024
10,77511,308
10,576
6,9674,673
3,5844,137
3,798
0
20,000
40,000
60,000
80,000
100,000
120,000
2016-17 2017-18 2018-19 2019-20 2020-21
(`
in c
rore
)
Taxes on Sales, Trade etc State Goods and Service Tax State Excise
Taxes on vehicles Stamps and Registration Others
82
,95
6
96
,83
0
1,0
2,3
63
97
,05
2
87
,13
0

State Finance Audit Report for the year ended 31 March 2021
26
State and to suggest corrective steps, met during February 2021. The FMRC
acknowledged the huge decline in Revenue Receipts due to COVID - 19
pandemic imposed lockdown and in this backdrop, in order to mobilize more
resources in the near future, suggested to review the Stamps and Registration.
State Goods and Services Tax Actual collection of revenue under State Goods and Service Tax (SGST) during
2019-20 and 2020-21 are shown in Table 2.5.
Table 2.5: SGST receipts of Government of Karnataka (` in crore)
State Goods and Service Tax 2019-20 2020-21 Increase/ Decrease
Tax 24,645 19,003 (-)5,642
Apportionment of Taxes from IGST 331 3,430 3,099
Others 17,171 15,278 (-)1,893
SGST collection 42,147 37,711 (-)4,436 Source: Finance Accounts
As per the GST (Compensation to States) Act, 2017, States will be compensated
for the shortfall in revenue arising on account of implementation of the Goods
and Services Tax considering an annual growth of 14 per cent from the base
year, for a period of five years. During 2020-21, as there was a shortfall in
revenue at the Union level due to COVID 19 pandemic, GoI compensated the
States shortfall in GST by providing back-to-back loans. In addition, the Centre
levies the Integrated GST (IGST) on interstate supply of goods and services and
apportions the State’s share of tax to the State where the goods or services are
consumed.
During 2020-21, the SGST collections was `37,711.18 crore, a decrease of
`4,436 crore (10.53 per cent) over 2019-20. This included Advance
Apportionment of IGST amounting to `3,429.51 crore. In addition, the State
received `6,236.01 crore as its share of net proceeds out of CGST. During
2020-21, the net proceeds out of IGST was Nil. The total receipts under GST
during 2020-21 were ̀ 43,947.19 crore10. The State received total compensation
of `26,196.26 crore on account of loss of revenue arising out of the
implementation of GST during 2020-21. Out of this, `13,789.26 crore was
received by the State as grants under revenue receipts. However, due to
inadequate balance in GST compensation fund during the year 2020-21, the
State also received back-to-back loan of ` 12,407 crore under debt receipts of
the State Government with repayment obligations from the cess collected in
GST compensation Fund and not from any other resources of the State. Due to
this arrangement, the revenue deficit of `19,338 crore and the fiscal deficit of
`67,098 crore during the year 2020-21 may be read in conjunction with debt
receipt of ` 12,407 crore in lieu of GST compensation.
Against projected revenue of `69,592.49 crore for the period 2020-21, actual
taxes collected by the State (pre-GST taxes and SGST) including IGST
apportionment and GST compensation for the year 2020-21 aggregated to
`60,660.32 crore. GST compensation received in short was `8,932.17 crore.
10Under Major Heads 0005 – CGST (`6,236.01 crore), 0006 – SGST (`37,711.18 crore) and
0008 – IGST (Nil).

Chapter 2 Finances of the State
27
b) Non-Tax revenue Non-tax receipts (fees, user charges, interest receipts, etc.) are generally raised
through non-statutory mandates. The sources of non-tax receipts included
receipts from fiscal services like interest receipts from outstanding advances,
dividends and profits from equity investments, royalty fees for allowing use of
assets held as custodian like minerals, forests and wildlife, or other such services
and user charges for various social and economic services provided through the
apparatus of the Government.
The share of non-tax revenue in Revenue Receipts was four per cent during
2016-17 to 2019-20 and increased marginally by one per cent during the 2020-
21. As percentage of GSDP, it was less than one per cent during the years 2016-
17 to 2020-21. The reason for stagnation includes non-revision of user charges
periodically. The FMRC also noted that apart from non-revision of user charges
periodically, lack of regular and periodic monitoring by the Administrative
Departments was major reason for slow growth in non-tax revenue. The return
on investment which forms a part of dividends and profits under non-tax
revenue was very poor during 2020-21 (`80.70 crore), which is discussed in
detail in paragraph 2.5.4.1.
The component wise details of non-tax revenue collected during 2016-17 to
2020-21 is given in Table 2.6.
Table 2.6: Components of State’s non-tax revenue (` in crore)
Source: Finance Accounts The XV Finance Commission (FC) has noted that there needs to be focus on
user charges and these revenues should keep pace with the growth of GSDP of
the State. In addition, the State Finance Audit Reports (SFAR) of the
Comptroller and Auditor General of India since 2009-10, has brought out that
user charges are to be revised regularly in order to improve the State’s finances.
The Expenditure Reforms Commission (ERC), in its fourth report (June 2011)
felt that the Government should articulate a clear policy on user charges. In this
regard, the Finance Department in its reply to SFAR for the year ending March

State Finance Audit Report for the year ended 31 March 2021
28
2019 (August 2021) stated that effort to increase non-tax revenue by revising
user charges was made by conducting meetings with Education, Health,
Tourism, Kannada and Culture Departments. It further stated that other
departments were instructed (February 2020) to review user charges and initiate
action for revising the user charges.
Due to such recommendations in the past few years and due to revisions of user
charges by some departments, non-tax revenue increased nominally by one per
cent during 2020-21.
The Finance Department replied (December 2021) that non-tax revenues
collected by certain departments viz., Forest, Horticulture, Health, Mines and
Geology were not credited to consolidated fund as separate arrangement were
made for its collection and utilization. This was one of the reasons for lesser
non- tax revenue collection.
However, efforts should be made to increase the non-tax revenues by revision
of user charges in the remaining departments.
In the Economic Survey for 2020-21, it was admitted that non-tax revenues are
an important fiscal challenge faced by the State. The State has one of the
lowest non-tax revenues to GSDP ratios in the country. It was also stated that
in many departments, the revision of user charges, fees & fines and other such
non-tax receipts has not taken place for many years. Efforts should be made
to increase non-tax receipts under Forestry and Wildlife, Roads and Bridges,
Animal Husbandry, Medical and Public Health etc., which have recorded low
receipts during 2020-21.
2.4.4 Transfers from Centre
GoI transfers share of the State Government in Union taxes and duties such as
Corporation Tax, Income Tax, Service Tax, Union Excise Duties etc. The trends
in these tax transfers during 2016-17 to 2020-21 are shown in Table 2.7
Table 2.7: Trends in Central Tax transfers
(` in crore)
Head 2016-17 2017-18 2018-19 2019-20 2020-21 Central Goods and Services Tax (CGST)
- 447.56 8,858.76 8,773.82 6,236.01
Integrated Goods and Service Tax (IGST)
- 3,204.72 707.00 - -
Corporation Tax 9,211.05 9,721.29 12,481.94 10,542.17 6,656.01
Taxes on Income other than Corporation Tax
6,401.72 8,208.94 9,192.40 8,260.51 6,837.75
Customs 3,962.25 3,203.80 2,544.18 1,959.84 1,110.05
Union Excise Duties 4,524.54 3,348.80 1,690.77 1,362.62 714.26
Service Tax 4,639.22 3,617.15 331.65 - 119.03
Taxes on Wealth 21.08 (-) 0.29 4.58 0.46 -
Other Taxes on Income and Expenditure
- - 65.01 - -
Other Taxes and Duties and
0.08 (-) 0.01 18.54 19.58 21.00

Chapter 2 Finances of the State
29
Head 2016-17 2017-18 2018-19 2019-20 2020-21 Commodities and Services Total 28,759.94 31,751.96 35,894.83 30,919.00 21,694.11 Percentage of increase over previous year
19.92 10.40 13.05 (-) 13.86 (-)29.84
Percentage of Central Tax transfers to Revenue Receipts
21.59 21.60 21.76 17.62 13.84
Source: Finance Accounts
The XV FC recommended the State’s share in the net proceeds of Central Taxes
to be fixed at 3.646 per cent. During 2020-21, out of the total share of the States’
in divisible pool of Union taxes and duties of `5,94,996.76 crore, the net
devolution of State’s share was `21,694.1111 crore. This also included Service
Tax of `119.03 crore and there was no devolution to the State towards IGST.
2.4.5 Grants-in-aid from Government of India
Grants-in-aid from GoI, which increased from `15,703 crore in 2016-17 to
`34,480 crore in 2019-20, decreased to `30,076 crore during 2020-21 as shown
in Table 2.8.
Table 2.8: Grants-in-aid from GoI (` in crore)
Head 2016-17 2017-18 2018-19 2019-20 2020-21
Non-Plan grants* 7,045 - - - -
Grants for State Plan schemes*
8,102 - - - -
Grants for Central Plan schemes*
116 - - - -
Grants for Centrally Sponsored schemes
440 11,617 10,393 12,214 9,852
Other transfers/ Grants to States12
- 7,316 11,714 17,593 14,667
Finance Commission Grants
- 2,708 3,374 4,673 5,557
Total 15,703 21,641 25,481 34,480 30,076 Percentage of increase/decrease over the previous year
12.74 37.81 17.74 35.32 (-)12.77
Percentage of GIA to Revenue Receipts
11.79 14.72 15.44 19.65 19.19
Source: Finance Accounts
*There are no figures since the nomenclature of plan and non-plan grants was removed with
effect from the year 2017-18 and replaced by Grants for CSS, Finance Commission Grants and
Other Grants to States.
As compared to the previous year, there was a decrease of `4,404 crore during
2020-21. Except for Finance Commission Grants, the decrease was both under
11 Out of the total devolution of `21,694.11 crore, the share of Corporation Tax 3.70 per cent,
Customs Duty 3.52 per cent, Union Excise Duties 3.58 per cent, Income tax 3.71 per cent,
Service Tax 4.54 per cent, CGST was 3.53 per cent and Other Taxes and Duties was at 4.80 per
cent. 12 It includes Grants towards contribution to National Disaster Response Fund and
Compensation for loss of revenue arising out of implementation of GST.

State Finance Audit Report for the year ended 31 March 2021
30
Other transfer/Grants to States (`2,926 crore) and Grants for Centrally
Sponsored schemes (`2,362 crore).
a) Fifteenth Finance Commission Recommendation As per the terms of reference of the XV FC constituted by the President under
Article 280 of the Constitution on 27 November 2017, to give recommendations
for vertical and horizontal devolution of taxes for five years (2020-2025), the
Commission has submitted two reports. While the first report has the
recommendation for the financial year 2020-21, the second and final report
gives recommendation for the period 2021-22 to 2024-25. The first report
recommended the following for the State.
• Inter se shares of Karnataka in the net proceeds of the taxes (divisible pool)
is 3.646 per cent.
• Special Grants `5,495 crore.
• Grants for Nutrition `436 crore.
• Empowering local bodies - `1,549 crore for Urban Local Bodies (ULBs)
and `3,217 crore for Panchayat Raj Institute (PRIs).
• Disaster Risk Management `1,054 crore.
Out of the above recommendations, Special grants and grants for Nutrition
were not released to the State as Ministry of Finance, GoI in its explanatory
memorandum placed before the parliament requested the commission to
reconsider the recommendation. The grants received are discussed below.
• Grants to Panchayat Raj Institutions/Urban Local Bodies The recommendations and transfer to PRIs and ULBS during 2020-21 as
recommended by XV FC are shown in Table 2.9.
Table 2.9: Recommended and actual release of grants during 2020-21 (` in crore)
Source: XV FC Report and Finance Accounts
Out of the total grant of `3,217 crore recommended for PRIs, 50 per cent was
towards Basic grants and 50 per cent towards tied grants for sanitation and
maintenance of ODF status, supply of drinking water, rain water harvesting and
water recycling.
The grants towards ULBs (`1,549 crore) include grants for Million plus cities
(`558 crore) and other than Million plus cities (`991 crore). The grants for
million plus cities are given in two instalments for air quality improvement. The
Year Type of Grant
PRIs ULBs SDRMF
Recom- mended
Actual Short-fall
Recom- mended
Actual Short-fall
Recom- mended
Actual Short-fall(-)/ Excess
(+) 2020-21 Basic
Grants
1,608.50 1,608.50 - 1,549 1,549 - 1,054 1,054 -
Tied
Grants
1,608.50 1,608.50 -
Total Basic Grants
1,608.50 1,608.50 - 1,549 1,549 - 1,054 1,054 -
Tied Grants
1,608.50 1,608.50 -

Chapter 2 Finances of the State
31
grants for other than million plus cities are given in two equal parts, one as Basic
Grant and another as Tied Grants towards drinking water and solid waste
management. During 2020-21, there was no shortfall in receipts of grants under
PRIs and ULBs against the recommendations.
• Releases under Disaster Relief As per the recommendation of XV FC, the disaster mitigation along with
disaster response is the State Disaster Risk Management Fund (SDRMF).
During 2020-21, the allocation to the State was `1,054 crore with `791 crore
from the Central share and `263 crore being the State share. The State received
full recommend amount during 2020-21, the GoI as well as State contribution
were transferred to Fund account under Public Account.
2.4.6 Capital Receipts
Capital Receipts of the State Government consists of public debt receipts, non-
debt receipts like proceeds from disinvestment (under miscellaneous capital
receipts) and recoveries of loans and advances. The net public debt receipts
after discharging of public debt plus other capital receipts is the net Capital
Receipts. The composition of Capital receipts and trend in growth during the
period 2016-17 to 2020-21 are shown in Table 2.10. Table 2.10: Trends in growth and composition of Capital Receipts
(` in crore) Sources of State’s Receipts 2016-17 2017-18 2018-19 2019-20 2020-21
Net Public Debt Receipts 23,736 16,853 30,831 40,279 73,512
Miscellaneous Capital Receipts
27 4 (-) 6 45 45
Recovery of Loans and Advances
100 137 31 203 270
Net Capital Receipts 23,863 16,994 30,856 40,527 73,827 Rate of growth of Capital Receipts (per cent)
37.35 (-) 28.79 81.57 31.34 82.17
Rate of growth of Net Public Debt Receipts (per
cent)
39.94 (-) 29.00 82.94 30.64 82.51
Source: Finance Accounts
Effective net Public Debt Receipts would be ` 61,105 crore as the Department
of Expenditure, GoI had decided that GST compensation of ̀ 12,407 crore given
to the state as back-to-back loan under Debt Receipts would not be treated as
debt of the state for any norms which may be prescribed by the FC. As a result,
the effective net Capital Receipts would stand at ` 61,420 crore, rate of growth
of Capital Receipts would stand at 51.55 per cent and rate of growth of net
Public Debt Receipts would stand at 51.70 per cent.
Net Capital Receipts increased from `23,863 crore in 2016-17 to `73,827 crore
in 2020-21 (210 per cent). Debt receipts had a predominant share in Capital
Receipts and were around 99 per cent during 2016-17 to 2020-21. Out of this,
the recovery towards loans and advances was very meagre during the period.
Recovery amounted to less than one per cent of the outstanding loans and
advances as at the end of 2020-21. On this being noted by the FMRC, the

State Finance Audit Report for the year ended 31 March 2021
32
Finance Department stated that the assets and liabilities management module of
Khajane 2 was being developed to monitor and manage all liabilities. It also
stated that since the module was in developmental stage, the slow recovery
would continue until its operation.
Market borrowings had a major share in public debt receipts comprising 82 per
cent, followed by negotiated loans (two per cent) and GoI loans (16 per cent).
Loans from GoI comprised other loans13 only. During the last four years i.e.,
2016-17 to 2019-20, 24.85 per cent of public debt receipts were utilized for
repayment of public debt taken in earlier years and the remaining 75.15 per cent
was utilized for other purposes. However, during 2020-21, 13 per cent of the
public debt receipts were utilized towards repayment of public debt taken in
earlier years.
2.4.7 State’s performance in mobilization of resources
State’s performance in mobilization of resources is assessed in terms of its own
resources comprising own-tax and non-tax sources. The budget presented by
the State Government indicates projections/estimations of revenue and
expenditure for a particular fiscal year. Deviations from budget estimates are
indicative of non-attainment/ non-optimisation of desired fiscal objectives, due
to a variety of factors, some of which are within the control of the Government
while some are beyond its control. Table 2.11 presents tax and non-tax receipts
vis-à-vis assessment of XV FC and Budget projections during 2020-21.
Table 2.11: Tax and non-tax receipts vis-à-vis projections during 2020-21 XV FC
assessment Budget
Estimates
Actual Percentage variation of actual over
(` in crore) Budget Estimates
XV FC assessment
Own Tax-revenue
1,45,103 1,11,991 97,052 (-)13.34 (-)33.11
Non-Tax revenue
8,780 7,767 7,894 1.63 (-)10.09
Source: XV FC Report and Finance Accounts.
As seen from the above table, the actuals over XV FC assessment in respect of
own tax revenue and non-tax revenue were not achieved with variation being
10 to 33 per cent. However, the variation of actuals over budget projections of
non-tax revenue was 1.63 per cent more than the estimate indicating substantial
attainment of the desired objective. The performance in respect of Own tax
revenue was not attained. This was mainly attributed to COVID 19 imposed
lockdown. In order to protect from revenue shortfall, the State has availed on
market borrowings.
The Finance Department replied (December 2021) that the decline in Revenue
Receipts was due to COVID – 19 pandemic situations.
13 Other loans include back-to-back external loans

Chapter 2 Finances of the State
33
2.5 Application of Resources
Analysis of the allocation of expenditure at the State Government level assumes
significance since major expenditure responsibilities are entrusted with them.
The expenditure are to be within the framework of fiscal responsibility
legislations. It is, therefore, important to ensure that the ongoing fiscal
correction and consolidation process at the State level is not at the cost of
expenditure, especially the expenditure directed towards development of social
and economic sectors.
Prudent fiscal management should aim at creating savings by raising revenue
receipts in excess of revenue expenditure. Use of borrowed funds for either
directly revenue yielding activities or indirectly productive uses create returns
by way of tax or non-tax revenues that can be used for debt servicing and
repayment of loans.
2.5.1 Growth and composition of expenditure
The basic parameters of total expenditure, its composition under revenue,
capital, loans and advances and comparison with GSDP over a five-year period
of 2016-17 to 2020-21 are furnished in the Table 2.12.
Table 2.12: Total expenditure – Trends and composition (` in crore)
Parameters 2016-17 2017-18 2018-19 2019-20 2020-21
Total Expenditure (TE)
1,62,005 1,78,242 2,03,446 2,13,857 2,24,129
Revenue Expenditure (RE)
1,31,921 1,42,482 1,64,300 1,74,258 1,76,054
Capital Outlay (CO) 28,150 30,667 34,659 35,530 45,406
Loans and Advances 1,934 5,093 4,487 4,069 2,669
As percentage of GSDP TE/GSDP 13.42 13.33 13.65 13.13 12.43
RE/GSDP 10.92 10.66 11.02 10.70 9.76
CO/GSDP 2.33 2.93 2.33 2.18 2.52
Loans and Advances/GSDP
0.16 0.38 0.30 0.25 0.15
Source: Finance Accounts.
During the period 2016-17 to 2020-21, on an average, 80 per cent of the total
expenditure was on revenue account. During 2020-21 it was 79 per cent and
the share of capital expenditure (including loans and advances) was 21 per cent.
The share of revenue expenditure, capital outlay and loans and advances for the
years 2016-17 to 2020-21 are shown in Chart 2.7.

State Finance Audit Report for the year ended 31 March 2021
34
Chart 2.7: Total Expenditure – Trends in share of its components
Source: Finance Accounts.
The trends of total expenditure by activities under General, Social, Economic,
Loans and Advances and Grants-in-aid are shown in Chart 2.8.
Chart 2.8: Total expenditure – Expenditure by activities
Source: Finance Accounts.
The relative share of these components exhibited stability during the period
from 2016-17 to 2020-21 with marginal inter year variations.
2.5.2 Revenue expenditure
Revenue expenditure is incurred to maintain the current level of services and
payment for the past obligation.
Revenue expenditure comprises wages and salaries, interest payments,
pensions, expenditure on operation and maintenance of capital works, subsidies
and transfers to local bodies, co-operatives, Non-Government Organisations
(NGOs) and others. Expenditure are also classified into various functional
categories such as General Services, Social Services and Economic Services.
Expenditure on Social and Economic Services is incurred to create physical
81.43 79.93 80.76 81.48 78.55
17.38 17.21 17.03 16.61 20.261.19 2.86 2.21 1.91 1.19
2016-17 2017-18 2018-19 2019-20 2020-21Revenue Expenditure Capital Outlay Loans and Advances
(share in per cent)
19.95 19.90 21.37 23.20 25.09
37.93 37.77 38.20 35.33 32.69
37.42 35.83 35.55 36.57 38.50
1.19 2.86 2.21 1.90 1.193.51 3.64 2.67 3.00 2.53
2016-17 2017-18 2018-19 2019-20 2020-21
(Sha
re in
per
cen
t)
General Services Social Services Economic Services
Loans and Advances Grants-in-aid

Chapter 2 Finances of the State
35
infrastructure and human resource development and, therefore, is considered
productive, whereas expenditure on General Services and debt servicing is
considered unproductive.
The overall Revenue expenditure, its rate of growth, its ratio to total expenditure
and buoyancy vis-à-vis GSDP and Revenue Receipts are indicated in Table 2.13
and the sectoral distribution of Revenue expenditure pertaining to 2020-21 are
shown in Chart 2.9.
Table 2.13: Revenue expenditure – Basic parameters (` in crore)
Parameters 2016-17 2017-18 2018-19 2019-20 2020-21 Total Expenditure (TE)
1,62,005 1,78,242 2,03,446 2,13,857 2,24,129
Revenue Expenditure (RE)
1,31,921 1,42,482 1,64,300 1,74,258 1,76,054
Rate of Growth of RE (per cent)
12.73 8.01 15.31 6.06 1.03
RE as percentage of TE
81.43 79.94 80.76 81.48 78.55
RE/GSDP (per cent) 10.91 10.50 10.64 10.26 9.76
RE as percentage of RR
99.03 96.93 99.59 99.32 112.34
Buoyancy of RE with GSDP (ratio) 0.81 0.65 1.11 0.60 0.10
Revenue Receipts (ratio)
1.05 0.77 1.25 0.96 0.10
Source: Finance Accounts of respective years.
Revenue expenditure increased from `1,31,921 crore in 2016-17 to `1,76,054
crore in 2020-21, an increase of 33 per cent. Compared to the previous year,
the increase was one per cent, due to increase in interest payments (17.74 per
cent), subsidies (5.12 per cent), pensions (2.90 per cent), salaries (1.62 per cent)
etc. Chart 2.9: Sector-wise distribution of revenue expenditure
Source: Finance Accounts.
0.92 1.25
13.42
4.83
10.83
35.06
30.46
3.23
(in per cent)Organs of the State
Fiscal Services
Interest payments and
Servicing of debt
Administrative Services
Pension and
Miscellaneous General
ServicesSocial Services
Economic Services

State Finance Audit Report for the year ended 31 March 2021
36
During 2020-21, Revenue expenditure, as a percentage of GSDP, had dipped
due to decrease in growth rate of Revenue expenditure. However, in absolute
terms there was increase in Revenue expenditure by ̀ 1,796 crore (1.03 per cent)
over the previous year. Revenue expenditure was lower by `23,186 crore vis-
à-vis the assessment made in the MTFP (2019-23) (`1,99,240 crore). During
2020-21, the rate of RE/RR had increased to 112.34 and it was around 99 from
period 2016-17 to 2019-20. As a result, the State witnessed revenue deficit for
the first time since 2004-05.
2.5.2.1 Major changes in Revenue expenditure
Table 2.14 details significant variations under various Heads of Account with
regard to Revenue expenditure of the State during the current year and the
previous year.
Table 2.14: Variation in Revenue expenditure during 2020-21 compared to 2019-20
(` in crore)
Major Heads of Account 2019-20 2020-21 Increase (+)/ Decrease (-) In crore and
per cent
2075-Miscellaneous General Services 123.07 128.18 5.11
4.15
2215-Water Supply and Sanitation 1,736.33 1,495.56 (-)240.77
(-)13.87
2216-Housing 3,223.01 2,076.96 (-)1,146.05
(-)35.56
2225-Welfare of Scheduled Castes, Scheduled Tribes, Other Backward Classes and Minorities
7,167.25 6,292.79 (-)874.46
(-)12.20
2236-Nutrition 1,890.21 1,946.98 56.77
3.00
2501-Special Programme for Rural Development
261.18 335.45 74.27
(28.44)
2505-Rural Employment 1,818.52 1,818.21 (-)0.31
(-)0.02
2515-Other Rural Development Programmes 5,179.96 6,970.56 1,790.60
34.57
2575-Other Special Areas Programmes 225.81 159.45 (-)66.36
(-)29.28
Source-Finance Accounts
While the percentage of revenue expenditure under Housing and Other Special
Areas Programme declined during the year when compared to previous year, it
increased under Special Programme for Rural Development and Other Rural
Development Programme.
2.5.2.2 Object Head wise Expenditure Finance Accounts depict transactions only up to the Minor Head level.
Therefore, out of 117 object heads listed, a drill down view of budgetary
allocation and extent of expenditure (above `100 crore) incurred on the actual
items in 22 Object Head Levels are given in Table 2.15.

Chapter 2 Finances of the State
37
Table 2.15: Object Head-wise expenditure vis-à-vis budget authorization (` In crore)
Head Budget Expenditure Utilisation percentage
Salaries* 16,532.41 14,783 89.41
Daily Wages 220.41 192.42 87.30
Grants for creation of Capital Assets
1,977.42 1,440.98 72.87
Contract/Outsource 1,035.67 887.35 85.68
General Expenses 1,490.71 1,180.93 79.22
Other Expenses 9,583.63 7,877.83 82.20
Building Expenses 387.77 365.36 94.22
Grants-in-Aid Salaries 5,384.72 4,883.45 90.69
Grants-in-Aid General 3,546.73 3,299.23 93.02
Subsidies 18,689.23 18,431.82 98.62
Scholarships and Incentives 554.82 519.27 93.59
Capital Expenses 819.65 814.31 99.35
Major Works 1,496.54 1,608.85 107.50
Transport Expenses 367.57 374.61 101.92
Maintenance Expenditure 3,545.48 3,340.37 94.21
Materials and Supplies 492.86 298.99 60.66
Pension and Retirement benefits 19,235.38 19,216.38 99.90
Source-Finance Accounts
*Includes object heads Consolidated Salary, pay of officers, pay of staff, Interim Relief,
Dearness Allowance, Other allowances, medical allowance and reimbursement of medical
expenses.
Out of total budgetary allocation of `2,65,220.73 crore, the actual expenditure
on various Object Heads during 2020-21 was `2,42,694.49 crore (91.52 per
cent). Out of the 22 Object Heads mentioned above, two of the object heads
had exceeded their budgetary allocation, while 12 object heads utilized more
than 80 to 90 per cent of their allocation, the balance three, Materials and
Supplies, Grants for creation of Capital Assets and General Expenses had
utilised between 61 per cent and 79 per cent.
2.5.2.3 Committed Expenditure Most of the revenue expenditure is in the nature of committed expenditure on
salaries, interest, pension, subsidy etc. In addition to these, expenditure on
certain other items such as pensions under social security schemes, subsidies
arising under various schemes of the Government, grants-in-aid & financial
assistance, administrative expenses, devolution to local bodies etc., are treated
as committed expenditure in MTFP 2020-24. Expenditure on these components
covering the period 2016-17 to 2020-21 is depicted in Table 2.16 and Chart 2.10. An upward trend in committed expenditure affects the maneuverability of
the State in prioritising expenditure and increasing capital investments to meet
growing needs of social and economic infrastructure.
The FMRC also noted that due to reduced receipts and increased committed
expenditure, it would be difficult to adhere to Fiscal Responsibility and
Budgetary Management Act (FRBM) parameters. Hence, it suggested to
rationalize schemes, restructure, merge certain departments and also abolish
certain unnecessary posts across various departments.

State Finance Audit Report for the year ended 31 March 2021
38
Table 2.16: Components of Committed Expenditure (` in crore)
Components 2016-17 2017-18 2018-19 2019-20 2020-21 Salaries 9,790 10,546 13,315 14,561 14,783
Salaries of PRIs (GIA) 11,918 12,412 14,709 16,960 17,250
Interest Payments# 12,850 14,973 16,614 19,903 23,433
Pensions 11,295 11,684 15,109 18,404 18,936
Subsidies@ 14,387 14,148 15,400 17,534 18,432
Grants-in-aid and financial assistance
13,163 11,812 24,888 19,023 18,312
Devolution to local bodies*
23,466 25,131 26,720 27,514 26,537
Social Security Pensions 2,503 4,055 5,460 7,243 7,603
Administrative Expenses 1,966 2,404 2,136 2,467 2,610
Daily wages and Contract/outsourced
- 567 714 923 1,080
Total 1,01,338 1,07,732 1,35,065 1,44,532 1,48,978
As percentage of Revenue Receipts (RR) Salaries 7.35 7.17 8.07 8.30 9.43
Salaries of PRIs (GIA) 8.95 8.44 8.92 9.67 11.01
Interest Payments 9.65 10.18 10.07 11.34 14.95
Pensions 8.48 7.95 9.16 10.49 12.08
Subsidies 10.80 9.62 9.33 9.99 11.76
Grants-in-aid and financial assistance
9.88 8.04 15.08 10.84 11.68
Devolution to local bodies 17.61 17.10 16.20 15.68 16.93
Social Security Pensions 1.88 2.76 3.31 4.13 4.85
Administrative Expenses 1.47 1.64 1.29 1.41 1.67
Daily wages and Contract/outsourced
- 0.39 0.43 0.53 0.69
Total 76.07 73.29 81.86 82.38 95.05 As percentage of Revenue Expenditure (RE) Salaries 7.42 7.40 8.10 8.36 8.40
Salaries of PRIs (GIA) 9.03 8.71 8.96 9.73 9.80
Interest Payments 9.74 10.51 10.11 11.42 13.31
Pensions 8.56 8.20 9.20 10.56 10.76
Subsidies 10.91 9.93 9.37 10.06 10.47
Grants-in-aid and financial assistance
9.98 8.29 15.15 10.92 10.40
Devolution to local bodies 17.79 17.64 16.26 15.79 15.07
Social Security Pensions 1.90 2.84 3.32 4.16 4.32
Administrative Expenses 1.49 1.69 1.30 1.41 1.48
Daily wages and Contract/outsourced
- 0.40 0.43 0.53 0.61
Total 76.82 75.61 82.20 82.94 84.62 Source: Finance Accounts
#includes interest on off-budget borrowings.
@excludes subsidies in the form of financial assistance
*includes non-salary component of PRIs and other expenditure related to PRIs and ULBs.

Chapter 2 Finances of the State
39
Chart 2.10: Share of Committed Expenditure in Revenue Expenditure
Source: Finance Accounts.
As can be seen from the above, committed expenditure ranged between 75 and
85 per cent of revenue expenditure during 2016-17 to 2020-21. The non-
committed expenditure ranged between 15 and 25 per cent during 2016-17 to
2020-21. During 2020-21, the revenue expenditure available for other social
and economic services was 16 per cent and as a percentage of total expenditure,
it was 13 per cent.
2.5.2.4 Salaries and Wages
Expenditure on salaries increased from `21,708 crore in 2016-17 to `32,033
crore in 2020-21. It grew by two per cent over the previous year. It includes
salaries of PRIs but does not include salaries relating to ULBs. Thus, the
expenditure on salaries was under stated. It accounted for 18 per cent of revenue
expenditure during 2020-21. During 2020-21, expenditure on Daily wages and
Contract/Outsourced employees accounted for `1,079.77 crore, an increase of
`157.14 crore over previous year
The Finance Department replied (December 2021) that funds released to ULBs
were in nature of Grants-in-Aid and since Finance Accounts capture
expenditure up to minor head only, salaries of ULBs are not exhibited
separately. In the Exit conference (December 2021), it stated that action would
be taken to capture the salary expenditure of ULB from the financial year
2022-23.
2.5.2.5 Pensions
The expenditure on pension during 2020-21 was `18,936 crore, a marginal
increase of `532 crore over the previous year expenditure.
• New Pension System Defined Contribution Pension Scheme known as New Pension Scheme (NPS),
for all employees who joined the State Government service on or after 01 April
2006, became fully operational from 01 April 2010. A dedicated NPS Cell was
created under the Directorate of Treasuries to operationalise NPS in the State.
7
8
9
8
9
10101011
13
98911
11
1110
1010
11
99
910
10
181816
1615
108
1511
10
2325
181816
2
3
3
4
4
1
1
1
1
1
0% 10% 20% 30% 40% 50% 60% 70% 80% 90% 100%
2016-17
2017-18
2018-19
2019-20
2020-21
Salary Interest
Pension Subsidies
Salaries to PRIs Devolution to Local Bodies
Grants-in-aid and Financial Assistance Non Committed Expenditure
Social security pension Administrative Expenses

State Finance Audit Report for the year ended 31 March 2021
40
The State Government has adopted NPS architecture designed by the Pension
Fund Regulatory Development Authority (PFRDA) and has appointed the
National Securities Depository Limited (NSDL) as the Central Record Keeping
Agency (CRA) for NPS. Axis Bank is the Trustee Bank in charge of operation
of Pension Funds.
The details of the scheme and contributions made by State Government and
employees as furnished by Commissioner of Treasuries (August 2021) are given
below.
• The number of officials allotted Permanent Retirement Account Number
(PRAN) under Government sector and autonomous bodies sector was
2,42,819 and 30,036 respectively;
• During 2020-21, `2.53 crore was paid from the Consolidated Fund as ‘New
Contributory Pension Schemes – Extension of benefit to the cases of
persons/ families who retired/died while in service (2071-01-104-2-07)’ and
are covered under New Defined Pension Scheme.
• During 2020-21, the employee contribution (regular and backlog14) was
`1,036.79 crore and the Government contribution was `1,486.60 crore. The
Government contribution included `3.08 crore as enhancement of
Government contribution from 10 to 14 per cent w.e.f April 2019.
• During the year 2020-21, total contribution to Defined Contribution
Pensions Scheme was `2,474.60 crore. As against the contribution of
`2,474.60 crore, Government transferred `2,442.53 crore to the Public
Account under Major head 8342-117- Defined Contribution Pensions
Scheme
As per the information received from the NPS Cell amount transferred to NSDL
during 2020-21 was `2,343.12 crore whereas as per Pr. AG (A&E) records the
amount was `2,480.22 crore. The difference of `137.10 crore needs to be
reconciled as per the instructions contained in the Government Order (May
2017).
The Finance Department replied (December 2021) that action would be taken
to reconcile difference in the amount transferred to NSDL.
2.5.2.6 Interest Payments Interest payments increased by `10,583 crore (82 per cent) from `12,850 crore
in 2016-17 to `23,433 crore in 2020-21. When compared to 2019-20, the
interest payment increased by 17.74 per cent. Interest payments during 2020-21
constituted interest on internal debt (`18,627 crore), interest on small savings,
provident fund etc., (`2,714 crore), interest on loans and advances from the
Central Government (`532 crore), interest on off-budget borrowings (`1,512
crore) and interest on other obligations (`2 crore).
The interest on internal debt increased by 23 per cent from `15,085 crore in
2019-20 to `18,627 crore in 2020-21, on account of increase in payment of
interest on market loans by `3,795 crore (29 per cent). The interest on small
14 Refers to the contribution the employee had to make from the date of his entry into service
to the date of implementation of the scheme.
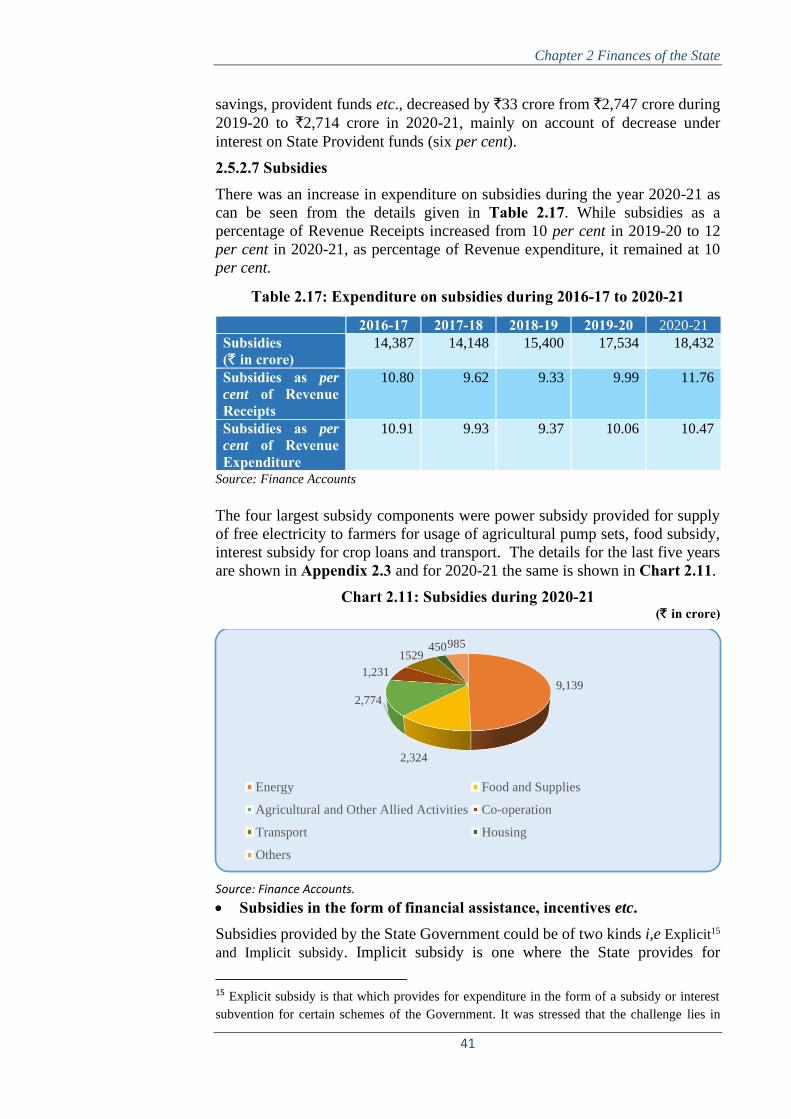
Chapter 2 Finances of the State
41
savings, provident funds etc., decreased by `33 crore from `2,747 crore during
2019-20 to `2,714 crore in 2020-21, mainly on account of decrease under
interest on State Provident funds (six per cent).
2.5.2.7 Subsidies There was an increase in expenditure on subsidies during the year 2020-21 as
can be seen from the details given in Table 2.17. While subsidies as a
percentage of Revenue Receipts increased from 10 per cent in 2019-20 to 12
per cent in 2020-21, as percentage of Revenue expenditure, it remained at 10
per cent.
Table 2.17: Expenditure on subsidies during 2016-17 to 2020-21
2016-17 2017-18 2018-19 2019-20 2020-21
Subsidies (` in crore)
14,387 14,148 15,400 17,534 18,432
Subsidies as per
cent of Revenue Receipts
10.80 9.62 9.33 9.99 11.76
Subsidies as per
cent of Revenue Expenditure
10.91 9.93 9.37 10.06 10.47
Source: Finance Accounts
The four largest subsidy components were power subsidy provided for supply
of free electricity to farmers for usage of agricultural pump sets, food subsidy,
interest subsidy for crop loans and transport. The details for the last five years
are shown in Appendix 2.3 and for 2020-21 the same is shown in Chart 2.11.
Chart 2.11: Subsidies during 2020-21 (` in crore)
Source: Finance Accounts.
• Subsidies in the form of financial assistance, incentives etc. Subsidies provided by the State Government could be of two kinds i,e Explicit15
and Implicit subsidy. Implicit subsidy is one where the State provides for
15 Explicit subsidy is that which provides for expenditure in the form of a subsidy or interest
subvention for certain schemes of the Government. It was stressed that the challenge lies in
9,139
2,324
2,774
1,231
1529450985
Energy Food and Supplies
Agricultural and Other Allied Activities Co-operation
Transport Housing
Others

State Finance Audit Report for the year ended 31 March 2021
42
expenditure in nature of subsidy and the other where grants are provided for
certain schemes of the Government. These subsidies can be indirect, in kind or
take the shape of tax concessions.
These subsidies in the form of financial assistance decreased from `3,714 crore
in 2016-17 to `3,188 crore during 2020-21. They mainly include financial
assistance for supply of seeds, weaver’s package, Ashraya scheme, micro/drip
irrigation, minimum floor price scheme, housing for weaker sections, house
sites for rural landless etc. These subsidies extended during 2016-17 to 2020-21
are detailed in Appendix 2.4. Thus, if the subsidies in the form of financial
assistance were taken into account, the actual expenditure on subsidies would
increase to ̀ 21,620 crore. This was ̀ 3,188 crore higher than which was actually
shown.
The Finance Department stated (December 2021) that though the financial
assistance was not reflected as subsidies it forms part of revenue expenditure.
2.5.2.8 Financial Assistance to Local Bodies and Other Institutions The quantum of assistance provided by way of grants to local bodies and other
institutions during 2016-17 to 2020-21 is presented in Table 2.18 and Table 2.19.
Table 2.18: Financial Assistance to Local Bodies (` in crore)
Name of the Institution
2016-17 2017-18 2018-19 2019-20 2020-21
Panchayat Raj Institutions
29,697.94 31,054.63 35,897.61 38,049.61 38,106.18
Urban Local Bodies 5,685.58 6,489.76 5,425.31 6,424.72 5,681.04
Total 35,383.52 37,544.39 41,322.92 44,474.33 43,787.22 Source: Finance Accounts
As a sequel to the recommendations of the XI FC, grants are released to PRIs
under three distinct programme minor heads namely 196, 197 and 198. The
assistance to PRIs increased from `29,697.94 crore during 2016-17 to
`38,106.18 crore during 2020-21, while the assistance to ULBs decreased from
`5,685.58 crore during 2016-17 to `5,681.04 crore during 2020-21.
Out of the total devolution of `38,106 crore to PRIs during 2020-21, `17,250
crore (45 per cent) was towards salaries. The higher allocation towards Salaries
mainly due to the State Government’s functions viz., education, water supply
and sanitation, housing, health and family welfare etc., were transferred to PRIs.
It also included `3,217.00 crore XV FC grants released to the Zilla Panchayats
(`160.85 crore), Gram Panchayats (`2,734.45 crore) and Taluk Panchayats
(`321.70 crore).
The assistance to ULBs decreased by `743.68 crore over the previous year
which includes salary component also. Out of `5,681.04 crore assistance to
ULBs, `636.04 crore (11 per cent) was towards creation of capital assets. It
ensuring that these subsidies do not become a permanent source of additional support and
thereby deter these sectors from undertaking reforms.

Chapter 2 Finances of the State
43
also includes XIV FC grants released to the State Government (`1,409.50
crore).
Table 2.19: Financial Assistance to Other institutions
(` in crore) Name of the Institution 2016-17 2017-18 2018-19 2019-20 2020-21
Educational Institutions (including Universities)
1,449.75 1,293.70 1,081.29 1,405.90 1,140.43
Co-operative Societies and Co-operative Institutions
1,009.47 1,191.32 1,477.76 1,275.78 1,186.04
Other institutions and bodies (including PSUs, NGOs &Statutory Bodies)
6,656.29 7,067.08 6,720.59 7,446.88 7,656.90
Total 9,115.51 9,552.10 9,279.64 10,128.56 9,983.37 Source: Finance Accounts
During 2020-21, assistance to other institutions (`7,657 crore) included
assistance to Statutory bodies and Development Authorities (`1,865 crore),
NGOs (`1,962 crore), PSUs (`20 crore) and others (`3,810 crore). The
assistance to Education institutions and Co-operatives decreased by `265 crore
and `90 crore respectively and for other institutions there was an increase of
`210 crore as compared to the previous year.
2.5.3 Capital Expenditure
Capital Expenditure includes primarily expenditure on creation of fixed
infrastructure assets, such as buildings, roads, bridges, etc. Capital Expenditure
is met from budgetary support and extra budgetary resources/off-budget. Of
late, the infrastructure requirements have increased manifold and SPVs have
been set up to carry out bulk of Capital Expenditure.
Capital Expenditure (including Disbursement of Loans and Advances) of the
State showed an increase from `30,084 crore in 2016-17 to `39,599 crore in
2019-20. During 2020-21, the Capital Expenditure increased by `8,476 crore
from previous year and was at `48,075 crore.
During the year 2020-21, an amount of `217.02 crore (`100.00 towards grants-
in-aid and `117.02 towards salaries) was released under capital head instead of
revenue head, which resulted in overstatement of capital outlay and thereby
understatement of revenue deficit to that extent (detailed in Chapter 3 Paragraph No.3.7.2.2 & 3.7.2.3). Thus, the actual Capital Expenditure would
be `47,857.98 crore instead of `48,075 crore. Details of Capital Expenditure
vis-à-vis budget during the five-year period 2016-17 to 2020-21 are given in
Chart 2.12.

State Finance Audit Report for the year ended 31 March 2021
44
Chart 2.12: Trend of Capital Expenditure (inclusive of Loans and Advances) over the five-year period from 2016-17 to 2020-21
Source: Finance Accounts
As seen from the above chart, the actual expenditure was more than the
estimated Capital Expenditure during 2016-17, 2017-18 and 2020-21. During
2018-19 and 2019-20, the actual Capital Expenditure was less than the estimate
by five per cent and seven per cent respectively. Table 2.20 highlights the cases
of significant increase or decrease in various Heads of Account in Capital
Outlay during 2020-21 vis-à-vis the previous year.
Table 2.20: Capital Outlay during 2020-21 compared to 2019-20 (` in crore)
Major Heads of Account 2019-20 2020-21 Increase (+)/ Decrease (-) in amount
Variation in
percentage
4059-Capital Outlay on Public Works
420.86 838.53 417.67 99.24
4202-Capital Outlay on Education, Sports, Art and Culture
1,203.17 1,167.87 -35.3 (-)2.93
4210-Capital Outlay on Medical and Public Health
821.96 2,099.44 1,277.48 155.42
4215-Capital Outlay on Water Supply and Sanitation
2,255.91 3,211.90 955.99 42.38
4217-Capital Outlay on Urban Development
1,764.52 3,332.11 1,567.59 88.84
4225-Capital Outlay on Welfare of Scheduled Castes, Scheduled Tribes, Other Backward Classes and Minorities
2,783.45 1,163.80 (-)1,619.65 (-)58.19
4701-Capital Outlay on Medium Irrigation
10,862.48 14,993.82 4,131.34 38.03
4702-Capital Outlay on Minor Irrigation
2,268.59 2,585.90 317.31 13.99
26,341
33,630
41,063 42,584 46,512
30,08435,760
39,146 39,599 48,075
114106
95 93
103
0
20
40
60
80
100
120
0
10,000
20,000
30,000
40,000
50,000
60,000
2016-17 2017-18 2018-19 2019-20 2020-21
(in
per
cen
t)
(` i
n c
rore
)
Budget Expediture Percentage of Utilisation

Chapter 2 Finances of the State
45
Major Heads of Account 2019-20 2020-21 Increase (+)/ Decrease (-) in amount
Variation in
percentage
4711-Capital Outlay on Flood Control Projects
98.19 157.74 59.55 60.65
4801-Capital Outlay on Power Projects
858.35 650.12 (-)208.23 (-)24.26
5054-Capital Outlay on Roads and Bridges
8,343.98 10,548.97 2,204.99 26.43
5055-Capital Outlay on Road Transport
389.17 368.59 (-)20.58 (-)5.29
Source: Finance Accounts
The above table reveals that major variation in Capital Outlay was under
Medical and Public Health (155 per cent) followed by Public Works (99 per
cent).
The Finance Department while agreeing to the point of audit, replied (December
2021) that due to the constraints stated below, the prescribed level of Capital
Expenditure could not be reached;
• Committed expenditure consumed 76 to 94 per cent of Revenue Receipts
during 2017-18 to 2020-21 and there was little scope for reduction of
expenditure under committed category.
• Grants released for creation of assets to autonomous bodies of State
Government were also accounted as Revenue expenditure.
The Expenditure Reforms Commission (ERC) of the State Government, in its first
report (February 2010) had recommended that capital investments be stepped up and
protected from fiscal uncertainties through prudent allocations. It had also
recommended maintaining the capital expenditure (excluding debt servicing) at five
per cent of GSDP. However, the ratio of Capital Expenditure to GSDP was only two
to three per cent during 2016-17 to 2020-21.
2.5.4 Quality of Capital Expenditure
In the post KFRA framework, the Government is expected to keep its fiscal
deficit (borrowing) at low levels and still meet its Capital
Expenditure/investment (including loans and advances) requirements. In
addition, the State Government needs to initiate measures to earn adequate
return on its investments rather than bearing the same in the form of subsidy at
the cost of borrowed funds and take requisite steps to infuse transparency in
financial operations. This section presents the broad financial analysis of
investments and other Capital Expenditure undertaken by the Government
during 2020-21 vis-à-vis previous years.
2.5.4.1 Investments in Companies, Corporations and other bodies As on 31 March 2021, the Government had invested `68,256.68 crore in 8916
Government Companies (`60,731 crore), Nine Statutory Corporations (`2,934
crore), 44 Joint Stock Companies (`4,137 crore) and Co-operative Institutions,
Local bodies and Regional Rural Banks (`455 crore). During 2020-21, the
16Includes investment of `68 crore in 16 non-working Government Companies.

State Finance Audit Report for the year ended 31 March 2021
46
Government invested `443.22 crore as equity in Government Companies
(working) (`272.99 crore), and Statutory Corporations (`170.23 crore). The
investment under Statutory Corporations and Government Companies were
spread under various sectors17.
During 2020-21, the investment account was reduced under ‘Co-operative
Institutions’ by `325 crore, due to retirement of Government investment in the
share capital of institutions, the proceeds of which stand accounted under
‘Miscellaneous Capital Receipts’.
• Return on Investment The details of investment as well as its return for the last five years are indicated
in Table 2.21. It is evident from the table that the return on investment is
negligible.
Table 2.21: Return on Investment
2016-17 2017-18 2018-19 2019-20 2020-21
Investments as at the end of the year (` in crore)
63,115.06 65,145.88 66,518.28 67,816.71 68,256.68
Return (` in crore) 82.50 78.83 38.30 53.64 80.70
Return (in per cent) 0.13 0.12 0.10 0.10 0.12
Average rate of interest on Government borrowings (per cent)
6.35 6.40 6.25 6.39 6.22
Difference between interest rate and return on investment (per cent)
6.25 6.30 6.15 6.29 6.10
Source: Finance Accounts
Though the State Government had accepted (July 2011) that the return on these
investments was meagre, it stated that it would not shy away from investing in
social infrastructure involving long gestation and pay back periods. The PAC
while agreeing (December 2011) with the reply had noted that the Finance
Department had not initiated any mechanism to evaluate the expected yields in
financial terms. Hence, it had recommended for framing guidelines for the
same. The Government further stated that efforts would be made to ensure due
returns. Despite PAC’s recommendations and our consistent observations for
the past ten years, no guidelines had been framed. Further, audit found that
MTFPs placed before the Legislature did not contain a road map for ensuring
proper return on investments.
In the Exit conference (December 2021), Finance Department stated that similar
process as in line with the Union Government for collection of dividends from
the PSUs earning profit would be followed. As a first step, it stated that
department of Public Enterprises has issued guidelines (November 2021) for
payment of dividends not less than 30 per cent of the profits earned by the PSUs.
In addition, Finance Department stated that they have instructed all the officers
of their department who are part of boards of profit making PSUs to monitor
payment of Dividends and repayment of Loans.
17Irrigation (`37,071.31 crore), Power (`11,879.68 crore), Infrastructure (`8,839.21 crore),
Finance (`3,640.60 crore), Transport (`1,583.71 crore), Housing (`1,450.97 crore), Industries
(`908.09 crore) and Other sectors (`2,883.11 crore).

Chapter 2 Finances of the State
47
• Investment in loss making companies The above investment included `42,119.95 crore (62 per cent) in the following
Companies/Corporations, which have significant losses and where the
investments were substantial (Table 2.22).
Table 2.22: Investments made in loss making Companies (` in crore)
Company/Corporation Cumulative loss at the end
of 2017-18
Cumulative loss at the end
of 2018-19
Cumulative loss at the end
of 2019-20
Investment made up to
2020-21
Statutory Corporations
North Western Karnataka Road Transport Corporation (NWKRTC)
792.48 881.55 1,068.00 266.85
North Eastern Karnataka Road Transport Corporation (NEKRTC)
542.42 610.65 699.92 183.43
Karnataka State Financial Corporation Limited (KSFC)
391.20 386.17 361.35 1,278.41
Government Companies
Krishna Bhagya Jala Nigama Limited (KBJNL)
2,587.22 2,811.73 2,946.51 23,745.34
Karnataka Neeravari Nigama Limited (KNNL)
3,492.46 4,469.21 5,149.92 13,034.03
Mysore Sugar Company Limited (Mysugar)
289.42 460.89 460.89 335.78
Mysore Paper Mills Limited (MPM) 425.95 425.95 425.95 237.37
Hubli Electricity Supply Company Limited (HESCOM)
2,645.76 1,955.76 2,637.98 1,261.50
Gulbarga Electricity Supply Company Limited (GESCOM)
1,349.58 1,002.44 1,995.03 969.67
Chamundeswari Electricity Supply Company Limited (CESCOM)
611.06 875.74 1,242.37 807.57
Total 13,127.55 13,880.09 16,987.92 42,119.95 Source: Finance Accounts
Up to 2020-21, the Government invested `42,119.95 crore in these companies
and the cumulative loss accounted for is `16,987.92 crore. The Finance
Department in its reply (Feb 2021) to the SFAR for the year ended March 2020
stated that investment in certain Companies (Irrigation and Energy Sector) was
inevitable despite companies accumulating loss as it results in creation of
infrastructure and employment. During 2020-21, Government had invested a
very smaller amount in HESCOM (`20.94 crore), GESCOM (`5.98 crore) and
CESCOM (`3.68 crore) when compared to previous year.
PAC in its 5th Report (July 2015) recommended to assess the viability of the
loss-making Companies/Corporations and also to identify the
Companies/Corporations not functioning in the core areas for closure as
recommended by XIII FC.
The various SFARs of the C&AG of India has been recommending to review
the working of State Public Sector Undertaking incurring huge losses and to
take appropriate action for disinvestment/revival/closure and during 2019-20,
Finance Department in its reply to SFAR report for the year ending March 2019

State Finance Audit Report for the year ended 31 March 2021
48
(August 2021) stated that the concerned departments would be requested to take
necessary action. Action in this regard is yet to be taken.
2.5.4.2 Loans and advances by the State Government In addition to investments in Companies, Corporations and Co-operative
Institutions, the Government also provided loans and advances to many
institutions. Table 2.23 presents the position of outstanding loans and advances
as on 31 March 2021 and interest receipts vis-à-vis interest payments during the
last five years.
Table 2.23: Quantum of loans disbursed and recovered during the last five years
(` in crore)
2016-17 2017-18 2018-19 2019-20 2020-21
Opening balance of the loans outstanding
13,813 15,578 20,525 24,981 28,847
Amount advanced during the year
1,935 5,092 4,487 4,069 2,669
Amount recovered during the year
100 137 31 203 270
Closing balance of the loans outstanding
15,648 20,533 24,981 28,847 31,246
Net addition 1,835 4,955 4,456 3,866 2,399
Interest received 145 99 108 357 278 Source: Finance Accounts
• The outstanding loans as on 31 March 2021 aggregated `31,246 crore. The
interest in arrears as at the end March 2020 in respect of loans maintained
by Pr.AG(A&E) was ̀ 4,374.90 crore. During 2020-21, the interest received
was `278 crore which works out to 6.35 per cent of the interest due of the
loans maintained by Pr.AG (A&E). The interest in arrears as on March 2021
in respect of loans maintained by Pr.AG (A&E) was `4,904.26 crore.
However, the interest in arrears in respect of loans maintained by State
Government was not available.
• Out of total loans advanced during 2020-21 (`2,669 crore), Social Services
accounted for `1,393 crore (52 per cent), Economic Services for `1,271 (47
per cent) crore and the remaining `5 crore to Government Servants. Within
the Social Services, Water supply, Sanitation, Housing and Urban
Development received major share of `1,367.75 crore and in Economic
Services it was for Industry and Minerals `1,166.11 crore.
• Detailed accounts of recovery of loans in respect of 21 institutions are
maintained by office of the Pr.AG (A&E) and for 842 institutions it is
maintained by Heads of Departments/Chief Controlling Officers of the GoK.
• In respect of loan accounts maintained by Pr.AG (A&E), the recovery of
loans and advances aggregating `9,911.80 crore (Principal: `5,007.54 crore
and Interest: ̀ 4,904.26 crore) were overdue as on 31 March 2021 (Appendix 2.5).
• However, the information in respect of overdue principal and interest in
respect of loans maintained by the Heads of Departments/Chief Controlling
Officers contained in Statement No.7 of Finance Accounts of 2020-21 was

Chapter 2 Finances of the State
49
incomplete, as only eight18 out of 842 institutions, had furnished the required
information.
• Indian Government Accounting Standards (IGAS)-3 requires disclosure of
loans that were sanctioned without specific terms and conditions governing
such loans. Out of the 66 loans valued at `4,063.95 crore sanctioned by the
State Government during 2020-21, 50 loans valued at `2,817.89 crore were
sanctioned without specifying any terms and conditions. Details are
available as additional disclosures under Statement No.18 of the Finance
Accounts.
The Finance Department in its circular (August 2018) had stated that the State
Government had revised the terms and conditions and other procedural aspects
vide GO dated November 2013, that had to be followed by departments relating
to loans sanction. Since the loans sanctioned during 2020-21 did not specify the
terms and conditions, it indicated that the department did not adhere to the
instructions. This in turn would lead to poor monitoring as well as less recovery
of loans.
The meagre recovery of loans as well as sanction of loans without specifying
terms and conditions was being pointed out since 2006-07. The State
Government had issued circulars time and again on revision of terms and
conditions. However, it did not prepare any road map for recovery of
loans/interest or enforced any measures for non-compliance to its circulars by
the various departments.
The FMRC once again in February 2021 noted that there was slow recovery of
loans and advances disbursed by the Government. Finance Department brought
to the notice of the Committee, the steps being taken to recover the loans and
the Assets and Liability Management module of Khajane-2 which was being
developed to monitor and manage all liabilities. Since the module was still in
its development stage, the slow recovery would continue during 2021-22 also.
2.5.4.3 Investments in Government Companies/Corporations and budgetary support The State Public Sector Undertakings (SPSUs) in Karnataka which consists of
State Government Companies and Statutory Corporations are established to
carry out activities of commercial nature keeping in view the welfare of the
people. The GoK has a financial stake in these companies which is mainly in
the form of
18In 2019-20, 16 out of 842 institutions have furnished the information
• Share Capital and Loans : Share capital contribution and financial assistance by way of loans
• Special financial support : Budgetary support by way of grants and subsidies.
• Guarantees : For repayment of loans with interest availed by the SPSUs from financial institutions.

State Finance Audit Report for the year ended 31 March 2021
50
It also occupies important place in the State’s economy as the turnover
(`77,607.6119 crore) of these SPSUs was about 4.30 per cent of the GSDP of
the State for 2020-21.
The figures in respect of equity, loans and guarantees outstanding as per the
records of the SPSUs should agree with that of the figures appearing in the
Finance Accounts of the State. In case the figures do not agree, the SPSUs
concerned and the Finance Department should carry out reconciliation of the
differences. The position in this regard as on 31 March 2021 is given in the
Table 2.24. Table 2.24: Equity, loans and guarantees outstanding as per Finance
Accounts vis-à-vis records of SPSUs (` in crore)
There were differences in respect of eleven Power Sector SPSUs and 98 Other
SPSUs. The major differences were observed in nine20 companies. The
Government and the SPSUs should take concrete steps to reconcile the
differences. The details of stake of the State Government in the SPSUs are
brought out in the subsequent paragraphs.
(i) Share Capital in the SPSUs As at the end of March 2021, there are 12421 SPSUs in the State under the audit
jurisdiction of the C&AG of India. The State Government invested `86,380.69
crore in these SPSUs as at the end of March 2021 as furnished by SPSUs.
In addition to the investments, during 2020-21, while the Central Government
has given Grants/Subsidies amounting to `379.05 crore, the State Government
has given `17,466.44 crore to these 124 SPSUs.
(ii) Disinvestment/Closure of SPSUs The State Government approved and adopted (February 2001) a comprehensive
policy on public sector reforms and privatization of SPSUs in the State. Further,
there were 13 non-working SPSUs out of 113 SPSUs (other than Power sector).
Out of which four SPSUs were under liquidation and closure orders were issued
for eight SPSUs for which liquidation process has not been started. In respect
of one SPSU, Government withdrew the liquidation order in June 2017.
19 Latest finalized accounts as of November 2021 20 Equity: Karnataka Neeravari Nigam Limited, Cauvery Neeravari Nigama Limited, Vishveswaraya
Jala Nigam Limited, Rail Infrastructure Development Corporation (Karnataka) Limited, Karnataka
Power Transmission corporation limited and Krishna Bhagya Jala Nigam Limited,
Loans Mangalore electricity Supply Company limited, Cauvery Neeravari Nigam Limited and KPC
Gas Power Corporation limited.
Guarantees Raichur power Company Limited, Mangalore electricity Supply Company limited KPC
Gas Power Corporation limited.
21 Statutory corporations-6, Working Government companies -105, Non-working Government
companies-13
Sl. No.
Outstanding in respect of
Amount as per Difference Finance Accounts SPSUs
1 Equity 62,179.71 86,380.69 (-)24,200.98
2 Loans 7,105.25 12,476.15 (-)5,370.90
3 Guarantees 28,112.41 26,812.70 1,299.71

Chapter 2 Finances of the State
51
(iii) Returns from Government Companies/Corporations22 During 2016-17 to 2020-21, the number of working SPSUs which earned profits
ranged between 47 and 57, out of which only 10 to 16 SPSUs had declared
dividend. During 2020-21, against the profit of `2,987 crore earned by these
entities, `59.01 crore was paid by them as dividend. The dividend payment as
percentage of paid up capital was very nominal and was 1.98 per cent during
2020-21.
The profitability of a SPSUs is traditionally assessed through return on
investment23, return on equity24 and return on capital employed25.
• The return on the State Government funds (at PV) infused in the eleven
Power Sector SPSUs in the State was less than the return based on historical
cost. The return were in the decreasing trend and was lowest in the year
2016-17.
• While the returns on equity in the eleven Power Sector SPSUs was nil from
2017-18 to 2020-21, the return on the capital employed was 6.13 per cent
during 2020-21.
• All the SPSUs other than the Power Sector had negative return on investment
during 2016-17 to 2020-21.
• Similarly, the returns on equity in the SPSUs other than Power Sector was
negative as the SPSUs incurred losses in all the five years.
• The return on capital employed of the SPSUs other than Power Sector was
on a declining trend except during 2020-21, which was 3.51 per cent
indicating that profitability was not commensurate with the capital employed.
(iv) Losses incurred by the Government companies/Corporations During 2020-21, 50 SPSUs incurred loss of `8,246.47 crore. Out of this, the
Power Sector SPSUs incurred an overall loss of `5,701.76 crore. In respect of
the balance loss, the major contributor was Hubli Electricity Supply Company
Limited (`2,490.26 crore).
(v) Erosion of capital in SPSUs Net worth is a measure of what an entity is worth to the owners. A negative net
worth indicates that the entire investment by the owners has been wiped out by
accumulated losses. As at the end of 2020-21, net worth of `14,903.62 crore of
33 SPSUs was eroded.
While the overall net worth of six Power Sector SPSUs was positive during the
last five years ended 2020-21, the net worth of five SPSUs (`9,441.97 crore)
was eroded.
22 For the purpose of paragraphs(iii),(v) and (vi), subsidiaries companies were also considered
during 2019-20 and 2020-21. 23 Measures the profit or loss made in a fixed year relating to the amount of money invested in the form
of equity and long-term loans and is expressed as a percentage of profit to total investment 24 Measure of performance calculated by dividing net profit by shareholder’s funds 25 Financial ratio that measures the company’s profitability and the efficiency with which its capital is
used and is calculated by dividing the company’s earnings before interest and taxes by capital employed.

State Finance Audit Report for the year ended 31 March 2021
52
Similarly, the overall net worth of 113 SPSUs other than Power Sector was
positive during the last five years. However, the net worth of 28 SPSUs
(`5,461.65 crore) was eroded as at 31 March 2021.
(vi) Analysis of Long-term loans Assessment of the ability of the SPSUs to service the debt owned by them to the
Government, banks and other financial institutions through Interest coverage
ratio and Debt Turnover ratio revealed the following:
• As at 31 March 2021, out of the 11 Power Sector SPSUs, eight had interest
burden. Of these, five had interest coverage ratio of less than one.
• The debt-turnover ratio of 11 Power Sector SPSUs had not improved, as the
compounded annual growth rate of turnover was less than that of Debt
during 2016-17 to 2020-21.
• As at 31 March 2021, 20 out of 42 SPSUs had interest ratio of less than one,
indicating that these SPSUs could not generate sufficient revenues to meet
expenses on interest.
• The debt-turnover ratio of working SPSUs of other than Power Sector had
not improved, as the compounded annual growth rate of Turnover was less
than that of Debt during 2016-17 to 2020-21.
(vii) Accountability framework and submission of accounts by SPSUs and its audit The process of audit of Government Companies are governed by respective
provisions of Section 619 of the Companies Act, 1956 and Sections 139 and
143 of the Companies Act, 2013 (Act). The C&AG of India appoints the
statutory auditors of the Government Company. Further, as per sub-section 7 of
Section 143 of the Act, the C&AG may, in case of any Company covered under
sub-section (5) or sub-section (7) of Section 139, if considered necessary, by an
order, cause test audit to be conducted of the accounts of such Company.
The financial statements of the Government Companies are audited by Statutory
Auditors, who are appointed by the C&AG. These financial statements are
subject to supplementary audit to be conducted by C&AG within 60 days from
the date of receipt of the Audit Report. However, C&AG is sole auditor for four
Statutory Corporations and conducts supplementary audit in respect of two
Statutory Corporations.
During 2020-21, out of 11 SPSUs under Power Sector, four accounts from four
SPSUs were in arrears. In respect of 100 working SPSUs other than Power
Sector, 103 accounts from 66 working SPSUs were in arrears. The arrears
ranged between 1 to 7 years. The State Government had made net investment
of ̀ 18,319.38 crore in 3626 out of 73 SPSUs during the years for which accounts
were not finalized. Hence, audit could not ensure on its accounting and
utilization.
2.5.4.4 Capital locked in incomplete projects
Locking up of funds in incomplete works, which includes works stopped due to
reasons like litigation, etc., impinge negatively on the quality of expenditure.
26 The Ministry of Corporate Affairs has given general extension of time for finalisation of
accounts by SPSUs upto November 2021.

Chapter 2 Finances of the State
53
The year wise age profile of the incomplete projects as on 31 March 2021 are
shown in Table 2.25 and the department-wise information is given in Table 2.26.
Table 2.25: Age profile of incomplete projects which are more than one crore as on
31 March 2021
(` in crore)
Table 2.26: Department wise profile of incomplete projects which are more than one crore as on 31
March 2021
(` in crore) To the end of the Year
No. of incomplete projects
Estimated cost
Expenditure
Works under
No. of incomplete projects
Estimated cost
Expenditure
2012-13 3 5.60 5.21 Roads and Bridges
871 4,951.94 2,463.21
2013-14 7 42.80 41.68
2014-15 15 51.80 50.58 Irrigation
210 1,187.55 942.19
2015-16 30 326.89 251.34 Buildings
42 275.80 184.96
2016-17 58 340.03 275.99 Others 10 54.08 373.79
2017-18 54 358.49 245.76
Total 1,133 6,469.37 3,628.15
2018-19 321 2,067.96 1,053.97
2019-20 296 1,747.93 968.37
2020-21 349 1,527.87 735.25
Total 1,133 6,469.37 3,628.15 Source: Finance Accounts
Against the initial budgeted cost of `6,469.37 crore in respect of 1,133 works,
stipulated to be completed on or before March 2021, the progressive
expenditure was `3,628.15 crore. The delay in the projects was in the range of
more than five years (55), less than five years but greater than one year (729)
and less than one year (349). No reasons for delay in completion of the works
were given by the Public Works, Ports & Inland Water Transport and Irrigation
Departments.
Out of 1,133 projects, which were incomplete as on 31 March 2021, 43 per cent
of the projects remained incomplete for more than three years. FMRC advised
(July 2018) that in order to minimize escalation of time and cost, projects which
were nearing completion were to get funds on priority. However, audit noticed
that the number of incomplete projects had increased from 978 as on 31 March
2020 to 1,133 as on 31 March 2021. This was mainly due to increase in the
number of projects under Roads and Bridges and Irrigation.
Further, the funds borrowed for implementation of these projects during the
respective years proved futile and the State had to share the extra burden in
terms of servicing of debt and interest liabilities. Effective steps need to be
taken to complete all these above projects without further delay to avoid cost
overrun due to time overrun.
The Finance Department replied (December 2021) that concerned departments
would be requested to take suitable action for completion of works and projects.
2.5.5 Expenditure priorities
The expenditure responsibilities relating to the social sector and economic
infrastructure are largely State subjects. Enhancing human development levels
requires the States to step up their expenditure on key social services like
education, health, etc. Low fiscal priority (ratio of expenditure category to

State Finance Audit Report for the year ended 31 March 2021
54
aggregate expenditure) is attached to a particular sector, if the allocation given
to that particular head of expenditure is below the General Category State’s
(GCS)/national average. The higher the ratio of these components to total
expenditure, the quality of expenditure is considered to be better. Table 2.27 analyses the fiscal priority of the State Government with regard to development
expenditure, social expenditure and capital expenditure relative to GCS and
neighboring States in the current year 2020-21.
Table 2.27: Fiscal priority of the States in 2020-21
(in per cent)
AE/ GSDP CE/ AE DE/AE Education/ AE Health/ AE
GCS 16.18 13.03 66.29 15.00 6.74
Kerala 18.30 11.12 56.71 11.87 6.41
Tamilnadu 14.36 13.50 64.90 13.97 6.36
Andhra Pradesh 17.57 11.93 67.39 13.83 5.49
Telangana 15.30 17.86 73.08 8.36 4.24
Maharashtra 12.87 9.35 63.23 17.98 4.99
Madhya Pradesh 21.40 16.09 72.09 14.54 4.93
Karnataka 12.43 21.45 72.38 11.37 5.29
Source: Finance Accounts
AE: Aggregate Expenditure, CE: Capital Expenditure, DE: Development Expenditure (includes
total expenditure under social and economic sectors)
Comparative analysis for the year 2020-21 revealed the following
• The ratio of CE and DE to AE of the State was higher than the ratio of GCS,
which indicated that the State had better quality of expenditure when
compared to other GCS.
• The ratio of capital expenditure to AE of the State was higher than all the
neighboring States, the reason being less AE with respect to GSDP (12.43
per cent).
• The DE/AE ratio of the State was higher when compared to its neighbouring
States (except Telangana). This was mainly due to higher ratio of Economic
Service Sector/AE in the State. • Adequate priority needs to be given to Education sector, as the ratio of
expenditure under the sector to AE is less than all neighboring States (except
Telangana) and GCS.
• Though the ratio of expenditure towards Health to AE has increased during
2020-21 when compared to previous years, priority needs to be given to
Health sector as its ratio is less when compared to the ratio of GCS and its
neighbouring States viz., Kerala, Tamil Nadu and Andhra Pradesh.
2.6 Public Account
Receipts and disbursements in respect of certain transactions, such as Small
Savings, Provident Fund, Reserve Funds, Deposits, Suspense, Remittances etc.,
which do not form part of the Consolidated Fund are kept in the Public Account
set up under Article 266(2) of the Constitution and are not subject to vote by the
State Legislature. The Government acts as a banker/trustee for custody of
public money, since these transactions are mere pass-through transactions.

Chapter 2 Finances of the State
55
2.6.1 Net Public Account balances
The net transactions under Public Account covering the period 2016-17 to
2020-21 are indicated in Table 2.28 and the yearly changes in composition of
Public Account balances are depicted in Chart 2.13.
Table 2.28: Component-wise net balances in Public Account as of 31 March of the year
(` in crore)
Sector Sub Sector 2016-17 2017-18 2018-19 2019-20 2020-21 I. Small Savings, Provident Funds, etc.
Small Savings,
Provident Funds, etc.
2,657 2,811 3,292 4,156 3,632
J. Reserve Funds (a) Reserve Funds
bearing Interest
1,236 (-) 1,194 393 839 (-)99
(b) Reserve Funds
not bearing Interest
4,777 4,212 2,804 3,889 6,374
K. Deposits and Advances
(a) Deposits bearing
Interest
48 (-) 3 62 99 16
(b) Deposits not
bearing Interest
2,994 1,837 3,006 3,074 (-)702
(c) Advances - - - - - L. Suspense and Miscellaneous
(a) Suspense 87 17 (-) 15 178 (-)242 (b) Other Accounts 404 (-) 1,526 (-) 6,072 (-) 1,542 (-)2,679 (c) Accounts with
Governments of
Foreign Countries
- - - - -
(d) Miscellaneous - - - - - M. Remittances (a) Money Orders
and other remittances
(-) 20 (-) 51 (-) 81 (-) 263 (-)53
(b) Inter-
Governmental
Adjustment Account
(-) 18 (-) 25 42 (-) 84 17
Total 12,165 6,078 3,431 10,346 6,264 Source: Finance Accounts
Note: +ve denotes debit balance and –ve denotes credit balances
Chart 2.13: Yearly changes in composition of Public Account balances (` in crore)
Source: Finance Accounts.
-7,000-6,000-5,000-4,000-3,000-2,000-1,000
01,0002,0003,0004,0005,0006,0007,000
2016-17 2017-18 2018-19 2019-20 2020-21
Small Savings, PF etc. Reserve Funds Deposits and Advances
Suspense and Miscellaneous Remittances

State Finance Audit Report for the year ended 31 March 2021
56
The net receipts from the Public Account decreased from `12,165 crore in
2016-17 to `6,264 crore in 2020-21. The decrease in net balance during 2020-
21 (`4,082 crore) over the previous year was due to decrease under Deposits
and Advances (Deposits not bearing interest) and Small Savings, PF etc., Net
availability of funds under Reserve Funds, Small Savings and Provident Fund
had a major share in financing the fiscal deficit. Under Suspense and
Miscellaneous, there was increase in transactions relating to un-encashed
cheques, which amounted to `2,679 crore during 2020-21, when compared to
`1,542 crore during 2019-20.
2.6.2 Reserve Funds
Reserve Funds are created for specific and well defined purposes under the
Sector ‘J’ in the accounts of the State Government (Public Account). These
funds are fed by contributions or grants from the Consolidated Fund of India or
the State or from outside agencies. The contributions are treated as expenditure
under the Consolidated Fund. The expenditure relating to the fund is initially
accounted for under the Consolidated Fund itself for which the vote of the
Legislature is obtained. At the end of the year, at the time of closure of accounts,
the expenditure relating to the fund is transferred to Public Account. The funds
may further be classified as ‘Funds carrying interest’ and ‘Funds not carrying
interest’.
Analysis of certain major reserve funds having a bearing on the liability position
of the Government, its funding and expenditure are detailed below.
a) Consolidated Sinking Fund
The GoK constituted a Consolidated Sinking Fund (CSF) in 2012-13 for the
amortisation of all loans as recommended by the XII FC and transferred `1,000
crore towards its corpus in 2012-13. The fund is administered by the RBI which
had invested the corpus in GoI Securities. As per Government Notification
(February 2013), the State Government may make minimum annual
contributions to the fund at 0.50 per cent of the outstanding liabilities (excluding
off-budget borrowings) at the end of the previous financial year. During
2020-21, against the minimum requirement of `1,597.02 crore, the State
Government contributed `1,700 crore to the Fund under Major Head 2048 –
Contribution to CSF.
The balance under the fund at the end of the year was at `4,820 crore as per
books of accounts. However, as intimated by the State Government the total
balance under CSF as forwarded by the RBI is `6,044.64 crore which included
an accrued interest of `1,224.64 crore from the date of establishment of Fund to
the end of March 2021. However, interest amount did not pass through the
Government books and stands reinvested in CSF.
The Finance Department replied (December 2021) that Pr.AG(A&E) had
already been requested to account for the interest earned on investments of CSF
in the Books of Accounts.

Chapter 2 Finances of the State
57
b) Green Tax
The GoK vide the Karnataka Motor Vehicles Taxation (Amendment) Act, 2002
introduced collection of a Cess called ‘Green Tax’27 to control air pollution.
Vide paragraph 1.3.1.1 of the SFAR of the C&AG of India for the year ending
31 March 2016, on ‘Improper accounting and non-utilisation of Green Tax Cess
collections’, it was stated that the green tax cess collected is to be accounted
under revenue receipt head ‘0041-00-102-0-11 – Green Tax’ and expenditure
under ‘2041-00-001-0-07-Implementation of measures to control air pollution
and other such activities’. A Reserve Fund to transfer the Green tax cess
collected is opened under Development and Welfare Funds – ‘8229-00-200-0-
63 – Green Tax’.
During the year, an amount of `50.47 crore was transferred to the Fund and an
expenditure of `0.30 crore was booked to the Fund. However, receipts
amounting to `10.86 crore accounted during the year 2020-21 were not
transferred to the fund. The closing balance at the credit of the Fund was `50.17
crore as on 31 March 2021.
c) Road Safety Cess
GoK vide the Karnataka State Road Safety Authority Act, 2017 has provided
for the constitution of a Road Safety Authority for the implementation of Road
Safety programmes and for the establishment of a Road Safety Fund. Road
Safety Cess is levied and collected once at the time of vehicle registration at
different rates for different class of motor vehicles
The collection of Road Safety Cess which is initially accounted as revenue
receipts under the head of account 0041-00-102-0-12-Road Safety Cess needs
to be subsequently transferred to the Reserve Fund specially created for the
purpose under the head of account 8229-00-200-0-64-Road Safety Fund
through adjustment entries. There were no transaction for the year 2017-18,
2018-19 and 2019-20. During the year 2020-21, total amount of `480.50 crore
accounted as Road Safety Cess from 2017-18 to 2019-20 was transferred to the
fund and an expenditure of `10.92 crore was booked to the fund. However,
receipts amounting to `87.65 crore accounted during the year 2020-21 were not
transferred to the fund. The closing balance at the credit of the fund was `469.58
crore as on 31 March 2021.
Non-transfer of part of receipts to the Green Tax and Road safety cess Fund in
Public Account resulted in overstatement of revenue receipts and
understatement of revenue deficit.
In reply, the Finance Department (December 2021) stated that the transfers
though depend on fiscal position at the end of the financial year, it would initiate
action through concerned administrative departments to transfer Green Tax
Cess and Road Safety Cess to the respective Reserve Funds.
27 Green Tax Cess is cess on old vehicles which have completed fifteen years in respect of two
wheelers and non-transport vehicles and seven years in respect of transport vehicles at the
time of renewal of Certificate of Registration in addition to the tax levied at the rates specified
for the purpose of implementation of various measures to control air pollution.

State Finance Audit Report for the year ended 31 March 2021
58
d) State Disaster Response Fund (SDRF)
The SDRF constituted under Disaster Management Act, 2005, is operative from
2010-11 under Reserve Fund bearing interest. As per the guidelines the
accretions to the SDRF together with the income earned on the investment of
the SDRF are to be invested in one or more of instruments viz., Central
Government dated securities, auctioned treasury bills and interest earning
deposits and certificates of deposits with Scheduled Commercial Banks.
Natural Calamities such as drought, flood, cyclone, earthquake, fire etc., qualify
for relief under this scheme.
The sharing pattern of 75:25 between Government of India and State
Government of XIV FC continues in the XV FC period also. During 2020-21,
an aggregate amount of `843.20 crore was to be transferred to the fund account
being the contribution from GoI and GoK which is `632.40 crore (75 per cent
of `843.20 crore) and `210.80 crore (25 per cent of `843.20) respectively.
However, against requirement of `632.40 crore, GoI transferred `632.80 crore
i,e., `0.40 crore excess. As a result, the State reduced its contribution by `0.40
crore to the fund and transferred `210.40 crore.
In addition, during 2020-21, the State received an amount of `689.27 crore as
GoI contribution from National Disaster Response Fund (NDRF). The amount
was transferred to the fund account even though no provision was made in the
Budget estimate for transfer of receipts and expenditure.
The entire contribution of `1,532.47 crore (`843.20 crore and `689.27 crore)
was released to the Deputy Commissioners of the districts under the Major Head
‘2245-Relief on account of Natural Calamities’. The balance under this fund
was `2.42 crore. The balance amount was the interest earned at the rate of 8 per
cent received during 2020-21 for the unused amount of ̀ 41.98 crore in the Fund
account during 2017-18.
e) State Disaster Mitigation Fund (SDMF) The fund has been constituted in November 2013 under Section 48(c) of the
Disaster Management Act 2005, in the Public Account under the Reserve Fund
bearing interest in the Major Head 8121 General and Other Reserve Funds.
SDMF provide funds for projects which are of State-level significance,
protecting assets, ecosystems and settlements, promoting a regional approach to
mitigation etc., within the State.
SDMF created under the Reserve Fund is an interest-bearing Reserve Fund.
State Government is to pay interest for the amount not invested in the identified
interest-bearing instruments to the SDMF at the rate applicable to overdrafts
under overdraft Regulation Guidelines of the RBI. The unspent balance in this
account at the end of the financial year 2020-21 is the opening balance of the
account of the financial year 2021-22 and so on till 2025-26. The aggregate size
of the SDMF in each financial year commencing from Financial Year 2020-21
has been recommended by the XV FC. The contribution to the Fund is in the
ratio of 75:25 by GoI and GoK.
During the year 2020-21, the total contribution to SDMF was `210.80 crore
with `158.10 crore being GoI share and `52.70 crore being GoK share. Against
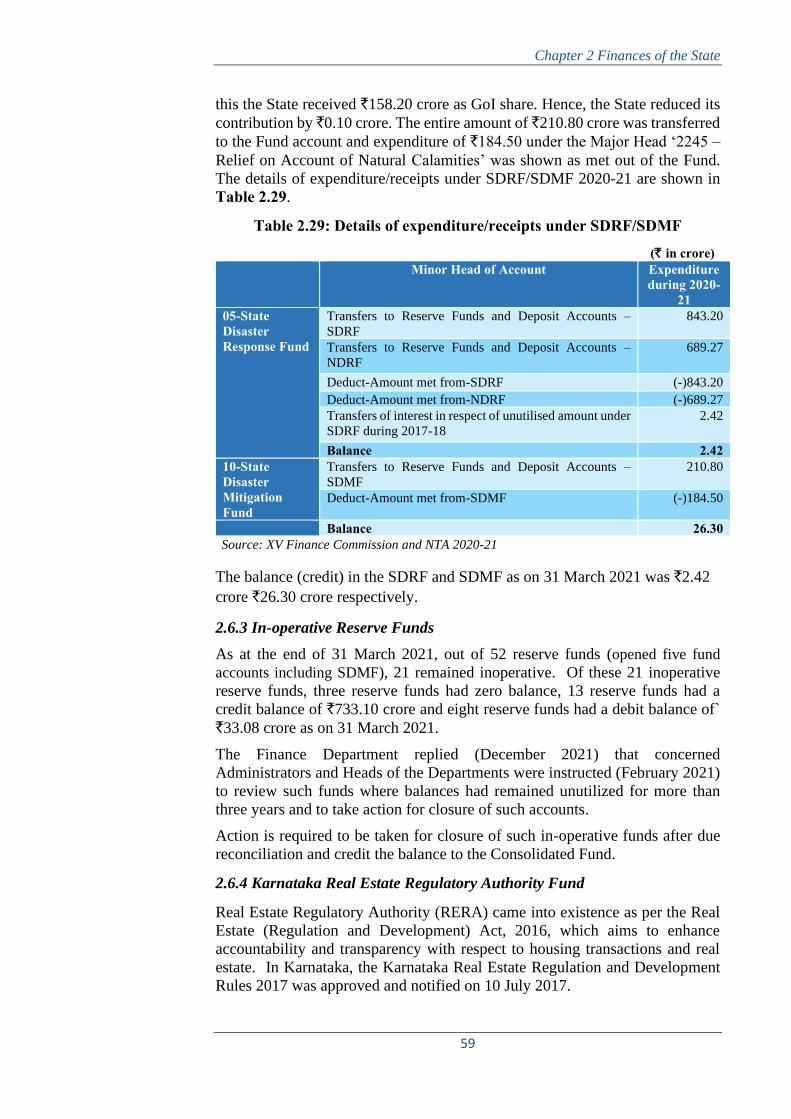
Chapter 2 Finances of the State
59
this the State received `158.20 crore as GoI share. Hence, the State reduced its
contribution by ̀ 0.10 crore. The entire amount of `210.80 crore was transferred
to the Fund account and expenditure of `184.50 under the Major Head ‘2245 –
Relief on Account of Natural Calamities’ was shown as met out of the Fund.
The details of expenditure/receipts under SDRF/SDMF 2020-21 are shown in
Table 2.29.
Table 2.29: Details of expenditure/receipts under SDRF/SDMF
(` in crore) Minor Head of Account Expenditure
during 2020-21
05-State Disaster Response Fund
Transfers to Reserve Funds and Deposit Accounts –
SDRF
843.20
Transfers to Reserve Funds and Deposit Accounts –
NDRF
689.27
Deduct-Amount met from-SDRF (-)843.20
Deduct-Amount met from-NDRF (-)689.27
Transfers of interest in respect of unutilised amount under
SDRF during 2017-18
2.42
Balance 2.42 10-State Disaster Mitigation Fund
Transfers to Reserve Funds and Deposit Accounts –
SDMF
210.80
Deduct-Amount met from-SDMF (-)184.50
Balance 26.30 Source: XV Finance Commission and NTA 2020-21
The balance (credit) in the SDRF and SDMF as on 31 March 2021 was `2.42
crore `26.30 crore respectively.
2.6.3 In-operative Reserve Funds
As at the end of 31 March 2021, out of 52 reserve funds (opened five fund
accounts including SDMF), 21 remained inoperative. Of these 21 inoperative
reserve funds, three reserve funds had zero balance, 13 reserve funds had a
credit balance of `733.10 crore and eight reserve funds had a debit balance of`
`33.08 crore as on 31 March 2021.
The Finance Department replied (December 2021) that concerned
Administrators and Heads of the Departments were instructed (February 2021)
to review such funds where balances had remained unutilized for more than
three years and to take action for closure of such accounts.
Action is required to be taken for closure of such in-operative funds after due
reconciliation and credit the balance to the Consolidated Fund.
2.6.4 Karnataka Real Estate Regulatory Authority Fund
Real Estate Regulatory Authority (RERA) came into existence as per the Real
Estate (Regulation and Development) Act, 2016, which aims to enhance
accountability and transparency with respect to housing transactions and real
estate. In Karnataka, the Karnataka Real Estate Regulation and Development
Rules 2017 was approved and notified on 10 July 2017.
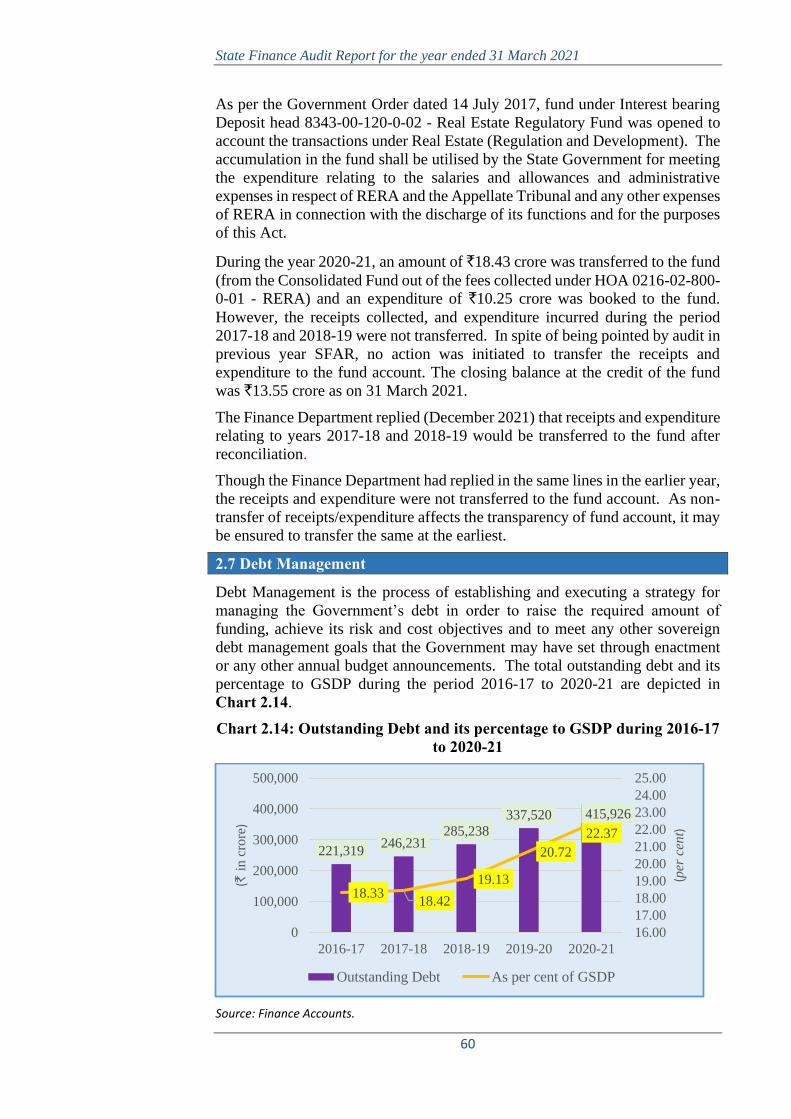
State Finance Audit Report for the year ended 31 March 2021
60
As per the Government Order dated 14 July 2017, fund under Interest bearing
Deposit head 8343-00-120-0-02 - Real Estate Regulatory Fund was opened to
account the transactions under Real Estate (Regulation and Development). The
accumulation in the fund shall be utilised by the State Government for meeting
the expenditure relating to the salaries and allowances and administrative
expenses in respect of RERA and the Appellate Tribunal and any other expenses
of RERA in connection with the discharge of its functions and for the purposes
of this Act.
During the year 2020-21, an amount of `18.43 crore was transferred to the fund
(from the Consolidated Fund out of the fees collected under HOA 0216-02-800-
0-01 - RERA) and an expenditure of `10.25 crore was booked to the fund.
However, the receipts collected, and expenditure incurred during the period
2017-18 and 2018-19 were not transferred. In spite of being pointed by audit in
previous year SFAR, no action was initiated to transfer the receipts and
expenditure to the fund account. The closing balance at the credit of the fund
was `13.55 crore as on 31 March 2021.
The Finance Department replied (December 2021) that receipts and expenditure
relating to years 2017-18 and 2018-19 would be transferred to the fund after
reconciliation.
Though the Finance Department had replied in the same lines in the earlier year,
the receipts and expenditure were not transferred to the fund account. As non-
transfer of receipts/expenditure affects the transparency of fund account, it may
be ensured to transfer the same at the earliest.
2.7 Debt Management
Debt Management is the process of establishing and executing a strategy for
managing the Government’s debt in order to raise the required amount of
funding, achieve its risk and cost objectives and to meet any other sovereign
debt management goals that the Government may have set through enactment
or any other annual budget announcements. The total outstanding debt and its
percentage to GSDP during the period 2016-17 to 2020-21 are depicted in
Chart 2.14.
Chart 2.14: Outstanding Debt and its percentage to GSDP during 2016-17 to 2020-21
Source: Finance Accounts.
221,319246,231
285,238
337,520 415,926
18.3318.42
19.13
20.72
22.37
16.00
17.00
18.00
19.00
20.00
21.00
22.00
23.00
24.00
25.00
0
100,000
200,000
300,000
400,000
500,000
2016-17 2017-18 2018-19 2019-20 2020-21
(per
cen
t)
(` i
n c
rore
)
Outstanding Debt As per cent of GSDP

Chapter 2 Finances of the State
61
The back-to-back Loan (`12,407 crore) received from GoI in lieu of GST
compensation has not been considered as Debt for working out debt-GSDP
ratio.
As seen from the chart above, though the outstanding debt and its per cent to
GSDP was on an increasing trend during the period 2016-17 to 2020-21, they
are within the target as prescribed under KFRA (25 per cent).
2.7.1 Debt profile components
Total debt of the State Government typically comprises internal debt of the State
(Market loans, ways and means advances from RBI, special securities issued to
National Small Savings Fund and loans from financial institutions, etc.,), loans
and advances from the GoI, public account liabilities and off-budget
borrowings.
The component wise details of Debt, their rate of growth, ratio of these liabilities
to GSDP are shown in Table 2.30 and the buoyancy of fiscal liabilities with
respect to Revenue Receipts and own resources are brought out in Appendix 2.2. The fiscal liabilities of the State increased by 88 per cent from `2,21,319
crore in 2016-17 to ̀ 4,15,926 crore in 2020-21. The composition of overall debt
during 2020-21 is presented in Chart 2.15 and the details of internal debt taken
vis-à-vis repayment made during 2016-17 to 2020-21 is shown in Chart 2.16.
Table 2.30: Component wise debt trends
(` in crore) 2016-17 2017-18 2018-19 2019-20 2020-21
Outstanding Overall Debt 2,21,319 2,46,231 2,85,238 3,37,520 4,15,926
Public Debt Internal
Debt
1,32,489 1,48,581 1,79,309 2,20,337 2,81,140
Loans
from GoI
13,794 14,555 14,657 13,908 26,617
Liabilities on Public Account
64,788 69,922 76,410 85,172 89,748
Off-budget Borrowings 10,248 13,173 14,862 18,103 18,421
Rate of growth of Outstanding debt (percentage)
20.73 11.26 15.84 18.33 23.23
GSDP 12,07,608 13,36,914 14,90,624 16,28,928 18,03,609
Debt/GSDP (per cent) 18.32 18.42 19.14 20.72 22.37*
Total Debt Receipts 31,156 25,122 41,914 50,459 84,528
Total Debt Repayments 7,420 8,269 11,083 10,180 11,016
Total Debt available 23,736 16,853 30,831 40,279 73,512
Ratio of Debt Redemption 56.58 79.97 57.54 51.17 35.63
Source: Finance Accounts
*The back-to-back Loan (` 12,407 crore) received from GoI in lieu of GST compensation has not
been considered as Debt for working out the indicator.
Effective outstanding overall debt would be `4,03,519 crore as the Department
of Expenditure, GOI has decided that GST compensation of ̀ 12,407 crore given
to the State as back-to-back loan under debt receipts would not be treated as
debt of the State for any norms which may be prescribed by the Finance
Commission.
• The debt redemption ratio was in decreasing trend from 2018-19 to
2020-21; and
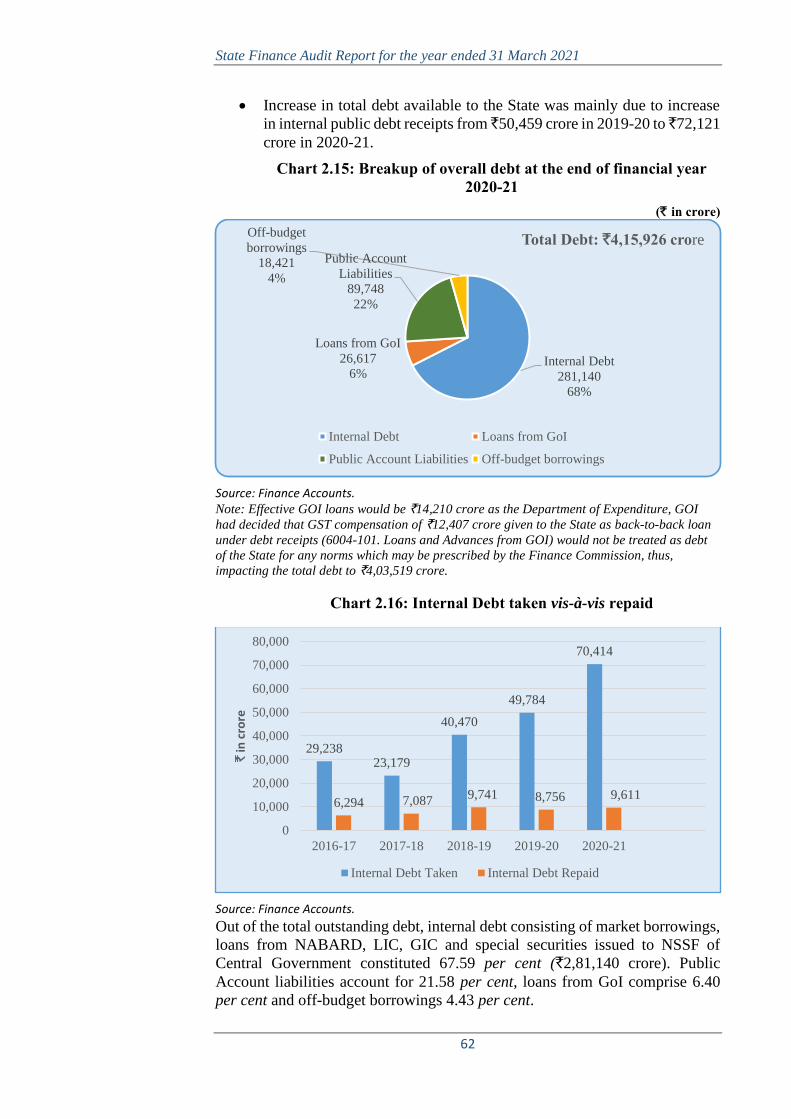
State Finance Audit Report for the year ended 31 March 2021
62
• Increase in total debt available to the State was mainly due to increase
in internal public debt receipts from ̀ 50,459 crore in 2019-20 to ̀ 72,121
crore in 2020-21.
Chart 2.15: Breakup of overall debt at the end of financial year 2020-21
(` in crore)
Source: Finance Accounts. Note: Effective GOI loans would be `14,210 crore as the Department of Expenditure, GOI
had decided that GST compensation of `12,407 crore given to the State as back-to-back loan
under debt receipts (6004-101. Loans and Advances from GOI) would not be treated as debt
of the State for any norms which may be prescribed by the Finance Commission, thus,
impacting the total debt to `4,03,519 crore.
Chart 2.16: Internal Debt taken vis-à-vis repaid
Source: Finance Accounts.
Out of the total outstanding debt, internal debt consisting of market borrowings,
loans from NABARD, LIC, GIC and special securities issued to NSSF of
Central Government constituted 67.59 per cent (`2,81,140 crore). Public
Account liabilities account for 21.58 per cent, loans from GoI comprise 6.40
per cent and off-budget borrowings 4.43 per cent.
Internal Debt
281,140
68%
Loans from GoI
26,617
6%
Public Account
Liabilities
89,748
22%
Off-budget
borrowings
18,421
4%
Total Debt: `4,15,926 crore
Internal Debt Loans from GoI
Public Account Liabilities Off-budget borrowings
29,23823,179
40,470
49,784
70,414
6,294 7,0879,741 8,756 9,611
0
10,000
20,000
30,000
40,000
50,000
60,000
70,000
80,000
2016-17 2017-18 2018-19 2019-20 2020-21
`in
cro
re
Internal Debt Taken Internal Debt Repaid
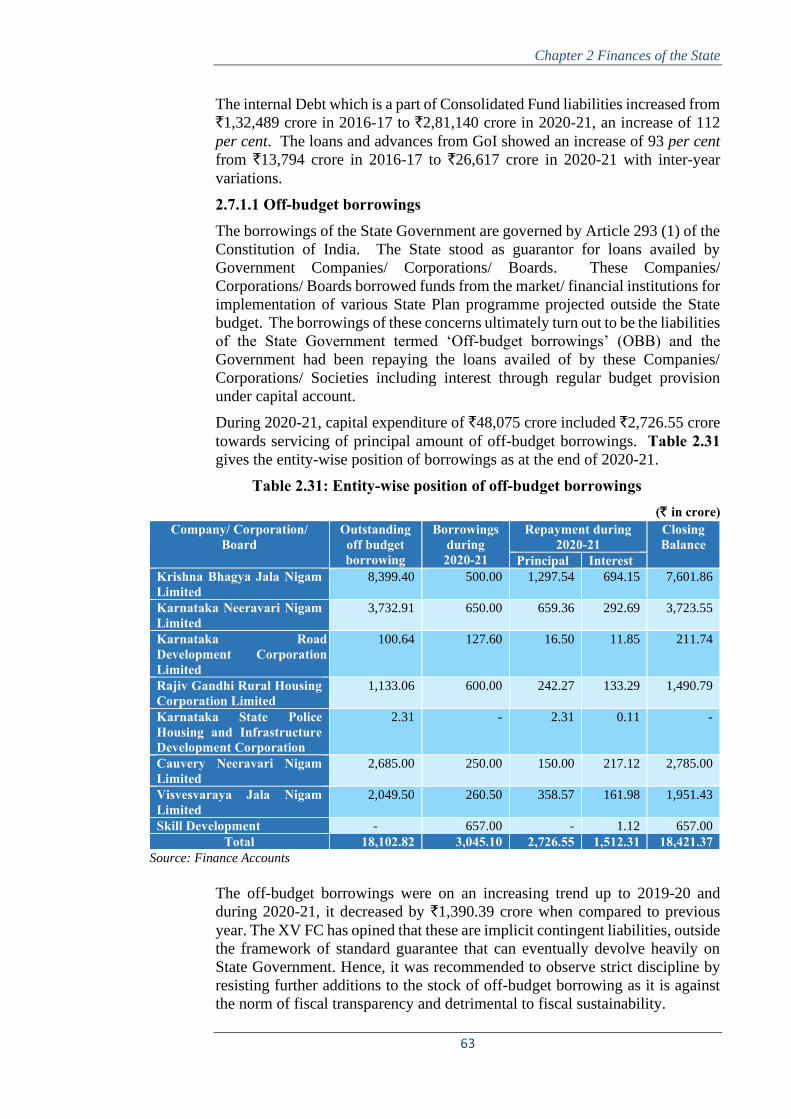
Chapter 2 Finances of the State
63
The internal Debt which is a part of Consolidated Fund liabilities increased from
`1,32,489 crore in 2016-17 to `2,81,140 crore in 2020-21, an increase of 112
per cent. The loans and advances from GoI showed an increase of 93 per cent
from `13,794 crore in 2016-17 to `26,617 crore in 2020-21 with inter-year
variations.
2.7.1.1 Off-budget borrowings The borrowings of the State Government are governed by Article 293 (1) of the
Constitution of India. The State stood as guarantor for loans availed by
Government Companies/ Corporations/ Boards. These Companies/
Corporations/ Boards borrowed funds from the market/ financial institutions for
implementation of various State Plan programme projected outside the State
budget. The borrowings of these concerns ultimately turn out to be the liabilities
of the State Government termed ‘Off-budget borrowings’ (OBB) and the
Government had been repaying the loans availed of by these Companies/
Corporations/ Societies including interest through regular budget provision
under capital account.
During 2020-21, capital expenditure of `48,075 crore included `2,726.55 crore
towards servicing of principal amount of off-budget borrowings. Table 2.31 gives the entity-wise position of borrowings as at the end of 2020-21.
Table 2.31: Entity-wise position of off-budget borrowings (` in crore)
Company/ Corporation/ Board
Outstanding off budget borrowing
Borrowings during 2020-21
Repayment during 2020-21
Closing Balance
Principal Interest Krishna Bhagya Jala Nigam Limited
8,399.40 500.00 1,297.54 694.15 7,601.86
Karnataka Neeravari Nigam Limited
3,732.91 650.00 659.36 292.69 3,723.55
Karnataka Road Development Corporation Limited
100.64 127.60 16.50 11.85 211.74
Rajiv Gandhi Rural Housing Corporation Limited
1,133.06 600.00 242.27 133.29 1,490.79
Karnataka State Police Housing and Infrastructure Development Corporation
2.31 - 2.31 0.11 -
Cauvery Neeravari Nigam Limited
2,685.00 250.00 150.00 217.12 2,785.00
Visvesvaraya Jala Nigam Limited
2,049.50 260.50 358.57 161.98 1,951.43
Skill Development - 657.00 - 1.12 657.00
Total 18,102.82 3,045.10 2,726.55 1,512.31 18,421.37 Source: Finance Accounts
The off-budget borrowings were on an increasing trend up to 2019-20 and
during 2020-21, it decreased by `1,390.39 crore when compared to previous
year. The XV FC has opined that these are implicit contingent liabilities, outside
the framework of standard guarantee that can eventually devolve heavily on
State Government. Hence, it was recommended to observe strict discipline by
resisting further additions to the stock of off-budget borrowing as it is against
the norm of fiscal transparency and detrimental to fiscal sustainability.

State Finance Audit Report for the year ended 31 March 2021
64
Taking into account the off-budget borrowings of the State, the total liabilities
at the end of March 2021 worked out to ̀ 4,15,926 crore. The rate of outstanding
liabilities (including off-budget borrowings) to GSDP works out to 22.37 per
cent at the end of the year, which was exclusive of the back-to-back loan of
`12,407 crore received from GOI in lieu of GST compensation.
The Finance Department replied (December 2021) that out of total off-budget
borrowings of `3,045.10 crore during 2020-21, `2,445.10 crore pertained to
various irrigation corporations. In order to provide funds to complete on going
irrigation projects/works /new works, off budget borrowings by these entities
was necessary. In the Exit conference (December 2021), it further stated that
since the off-budget borrowings formed part of Budget documents, it
maintained transparency.
2.7.2 Composition of fiscal deficit and its financing pattern
The financing pattern of fiscal deficit has undergone a compositional shift as
reflected in Table 2.32 and the financing pattern of fiscal deficit for the year
2020-21 is shown in Table 2.33. Breakdown of fiscal deficit reveals the extent
of various borrowings resorted to by the State to meet its requirement of funds
over and above revenue and non-debt receipts. The component wise trends of
the debt are depicted in Chart 2.17.
Table 2.32: Components of fiscal deficit and its financing pattern (` in crore)
Sl. No.
Particulars 2016-17 2017-18 2018-19 2019-20 2020-21
Composition of Fiscal Deficit (-)28,664 (-)31,101 (-)38,442 (-)38,166 (-)67,098 1 Revenue Surplus 1,293 4,518 679 1,185 (-)19,338
2 Net Capital Outlay 28,123 30,663 34,665 35,485 45,361
3 Net Loans and Advances 1,834 4,956 4,456 3,866 2,399
Financing pattern of Fiscal Deficit*
1 Market Borrowings 24,026 17,348 32,183 42,499 61,900
2 Loans from GoI 791 761 103 (-)749 12,709
3 Special Securities issued to NSSF (-)1,573 (-)1,573 (-)1,595 (-)1,628 (-)1,628
4 Loans from Financial Institutions 491 316 141 156 531
5 Small Savings, PF etc. 2,657 2,812 3,292 4,156 3,632
6 Deposits and Advances 3,041 1,833 3,068 3,174 (-)685
7 Suspense and Miscellaneous 491 (-)1,509 (-)6,087 (-)1,364 (-)2,921
8 Remittances (-)38 (-)76 (-)40 (-)347 (-)35
9 Reserve Funds 6,013 3,019 3,197 4,728 6,275
10 Overall Deficit 35,899 22,931 34,262 50,625 79,778 11 Increase/Decrease in cash balance (-)7,235 8,170 4,180 (-)12,459 (-)12,680
12 Gross Fiscal Deficit 28,664 31,101 38,442 38,166 67,098 Source: Finance Accounts
*All these figures are net disbursement/outflows during the year.

Chapter 2 Finances of the State
65
Table 2.33: Receipts and Disbursements under components financing the fiscal deficit during 2020-21
(` in crore) Sl.No. Particulars Receipt Disbursement Net
1 Market Borrowings 69,000 7,100 61,900
2 Loans from GoI 14,114 1,405 12,709
3 Special Securities issued to NSSF - 1,628 (-)1,628
4 Ways and Means advances from RBI - - -
5 Loans from Financial Institutions 1,414 883 531
6 Small Savings, PF etc. 8,473 4,841 3,632
7 Deposits and Advances 63,575 64,260 (-)685
8 Suspense and Miscellaneous 1,92,098 1,95,018 (-)2,921
9 Remittances (-)2 33 (-)35
10 Reserve Fund 8,314 2,040 6,275
11 Overall Deficit 3,56,986 2,77,208 79,778 12 Increase/Decrease in cash balance 34,463 47,143 (-)12,680
13 Gross Fiscal Deficit 3,91,449 3,24,285 67,098 Source: Finance Accounts
The State had attained revenue surplus since 2004-05 and the surplus on revenue
account along with market borrowings, loans from GoI etc., were utilised to
finance capital expenditure. However, during 2020-21, State witnessed
Revenue deficit due to COVID-19 pandemic, which resulted in utilisation of
borrowing towards revenue expenditure. There was increase in loans from GoI
and Reserve Funds and decrease in Small Savings, PF etc., Deposits and
Advances, Suspense and Miscellaneous balances which comprised transactions
relating mainly to cheques and bills over the previous year.
2.7.3 Debt profile: Maturity and Repayment
Debt maturity and repayment profile indicates commitment on the part of the
Government for debt repayment or debt servicing. The maturity profile of
Public Debt is shown in Table 2.34.
Table 2.34: Maturity profile of Public Debt (` in crore)
Year of Maturity Maturity Profile
Amount Per cent of total Public Debt
Internal Debt
Loans and Advances from GoI
Total
By 2021-22 0-1 year 12,330.41 694.86 13,025.27 4.23
Between 2022-23 & 2023-24
2-3 year 30,355.84 1,391.99 31,747.83 10.32
Between 2024-25 & 2025-26
4-5 year 44,405.33 607.50 45,012.83 14.63
Between 2026-27 & 2027-28
5-6 year 61,622.23 381.43 62,003.66 20.15
Between 2028-29 & 2029-30
6-7 year 61,783.88 267.31 62,051.19 20.16
2030-31 onwards Above 7
years
70,642.50 23,274.28 93,916.78 30.51
Total 2,81,140.19 26,617.37 3,07,757.56 - Source: Finance Accounts

State Finance Audit Report for the year ended 31 March 2021
66
The maturity profile of the Public Debt as on 31 March 2021 indicates that out
of the outstanding public debt of `3,07,757.56 crore, 40.31 per cent belonged
to the maturity bracket of 5-7 years (`1,24,054.85 crore) and 30.51 per cent
(`93,916.78 crore) in the maturity bracket of more than seven years, indicating
no short-term redemption pressure. The State has acknowledged that even
though the additional borrowing was necessary for the State to meet its
expenditure component, it would burden the State with debt repayment in the
near future.
2.8 Debt Sustainability Analysis
Debt is considered sustainable if the borrower, in this case the State, is in a
position to service its debt now and in future. Apart from the magnitude of the
debt of the State Government, it is important to analyse various indicators that
determine the debt sustainability of the State. Debt sustainability indicators
accordingly seek to assess the credit worthiness and the liquidity position of the
State by examining their ability to service the debt through timely interest
payments and repay debt out of current and regular sources of revenue.
This section assesses the sustainability of debt of the State Government in terms
of debt/GSDP ratio, fiscal deficit, burden of interest payments (measured by
ratio of interest payments to revenue receipts) and maturity profile of the State
Government debt.
Table 2.35 shows the debt sustainability of the State according to these
indicators for the five-year period beginning from 2016-17.
Table 2.35: Trends in Debt Sustainability indicators
Debt Sustainability Indicators 2016-17 2017-18 2018-19 2019-20 2020-21
Outstanding Public Debt*
(` in crore) 1,46,283 1,63,136 1,93,966 2,34,245 3,07,758
Rate of growth of Outstanding Public Debt (per cent)
19.37 11.52 18.90 20.77 31.38
GSDP (` in crore)
12,07,608 13,36,914 14,90,624 16,28,928 18,03,609
Rate of growth of GSDP (per cent)
15.54 10.71 11.50 9.28 10.72
Debt/GSDP (per cent)
12.11 12.20 13.01 14.38 16.38^
Fiscal Deficit/GSDP (per cent)
2.37 2.33 2.58 2.34 3.72
Interest Payment (` in crore)
12,850 14,973 16,614 19,903 23,433
Average interest rate on Outstanding public debt (per
cent)
7.59 7.64 7.30 7.30 7.05
Interest payments to Revenue Receipts ratio
9.65 10.18 10.07 11.34 14.95
Percentage of Debt repayment to Debt Receipt
23.82 32.92 26.44 20.17 13.03
Net Debt available to the State (` in crore)
23,736 16,853 30,831 40,279 41,946#

Chapter 2 Finances of the State
67
Debt Sustainability Indicators 2016-17 2017-18 2018-19 2019-20 2020-21
Net Debt available as per cent to Debt Receipts (per cent)
76.18 67.08 73.56 79.82 58.16
Debt Stabilisation (Quantum Spread28 + Primary Deficit)
(-)4,189.91 (-)11,121.33 (-)13,680.96 (-)13,635.33 (-)32,368.09
Source: Finance Accounts
*Outstanding Public Debt is the sum of outstanding balances under the heads 6003-Internal
Debt and 6004-Loans and Advances from Government of India.
#Net debt available to the State Government is calculated as excess of Public Debt receipts over
Public Debt repayment and interest payments on Public Debt and does not include back-to-
back loans received from GoI as GST compensation.
^The back-to-back Loan (` 12,407 crore) received from GoI in lieu of GST compensation has
not been considered as Debt for working out the indicator.
Effective outstanding public debt would be `2,95,351 crore as the Department
of Expenditure, GoI had decided that GST compensation of ̀ 12,407 crore given
to the State as back-to-back loan under debt receipts would not be treated as
debt of the State for any norms which may be prescribed by the Finance
Commission.
The fiscal consolidation roadmap recommended by the XIV & XV FC had set
the following targets relating to debt sustainability for the year 2020-21
• Debt-GSDP ratio should be less than 26.22 and 33.10 per cent
respectively.
• Fiscal Deficit to GSDP should be less than 3.25 and four per cent
respectively and
• Interest payments to Revenue Receipts should be less than 9.15 per cent.
An analysis of the Table 2.36, in the five-year period from 2016-17 to 2020-21
revealed the following.
• The ratio of Debt to GSDP has been stable and well below the 26.22 per
cent and 33.10 per cent recommended by XIV FC and XV FC respectively
and below the target ceiling for debt of 25.00 per cent as per KFRA;
• Fiscal Deficit to GSDP ratio is stable and well below the XIV FC and XV
FC recommendation during 2016-17 to 2020-21;
• The ratio of interest payment to revenue receipts during 2016-17 to 2020-
21 is in an increasing trend between 9.65 and 14.95 per cent. The increase
in ratio indicates the interest burden on revenue receipts.
• The growth rate of outstanding public debt is higher than the GSDP growth,
indicating higher debt to GSDP ratio;
• The percentage of Public debt repayment to Public debt receipts during
2016-17 to 2020-21 is between 13.03 and 32.92 per cent. The decrease in
ratio was mainly due to increase in public debt receipts;
• Increase in net debt available to the State was mainly due to increase in
receipts under Internal Debt. The internal debt increased from ̀ 40,470 crore
28 Quantum Spread is Interest Spread as percentage of debt stock. Interest Spread is the
difference of rate of growth of GSDP and Average interest rate on Outstanding public debt.

State Finance Audit Report for the year ended 31 March 2021
68
in 2018-19 to `49,473 crore in 2019-20 and to `70,414 crore (excluding
back to back loan of `12,407 crore) in 2020-21; and
• The negative sum of quantum spread and primary deficit indicates the
tendency towards unstable debt. 2.8.1 Utilisation of borrowed funds
Borrowed funds should ideally be used to fund capital creation and
developmental activities. Using borrowed funds for meeting current
consumption and repayment of interest on outstanding loans is not sustainable.
However, during 2020-21, due to COVID 19 pandemic there was negative
growth in revenue receipts. As a result, part of the borrowed funds were utilised
towards revenue expenditure. The details of utilisation of borrowed funds
during the period 2016-17 to 2020-21 are given in Table 2.36. Table 2.36: Utilisation of borrowed funds
(` in crore)
Sl. No
Year/Particulars 2016-17 2017-18 2018-19 2019-20 2020-21
1 Total Borrowings 31,156 25,122 41,914 50,459 84,528
2 Repayment of earlier borrowings (Principal)
7,440 8,269 11,083 10,180 11,016
3 Net Capital Outlay 28,123 30,663 34,665 35,485 45,361
4 Net Loans and Advances
1,834 4,956 4,456 3,866 2,399
5 Net availability of borrowed funds (5=1-2-3-4)
(-)6,221 (-)18,766 (-)8,290 928 25,752
Source: Finance Accounts
From the above Table, it is noticed that for the period 2016-17 to 2018-19
borrowed funds were insufficient to service the capital expenditure (including
loans and advances). During 2019-20 and 2020-21, the borrowed funds were
sufficient for the capital expenditure. This indicated that the Government had
borrowed more than the requirement.
The Finance Department replied (December 2021) that as against the budget
provision of `1,79,920 crore for Revenue Receipts during 2020-21, actual
realization was `1,56,716 crore due to sluggish economic activities, COVID 19
pandemic situation, and non-transfer of funds from GoI to the extent of
budgetary provisions. The short fall of the `23,204 crore in Revenue Receipts
was compensated out of the available borrowed funds.
2.8.2 Status of Guarantees – Contingent Liabilities
Guarantees are contingent liabilities on the Consolidated Fund of the State in
case of default by the borrower for whom the guarantee was extended. The
Karnataka Ceiling on Government Guarantees Act, 1999 provides for a cap on
outstanding guarantees extended by the Government as on first day of April of
any year at 80 per cent of the State’s Revenue Receipts of the second preceding
year. The details of the last five years are shown in Table 2.37.

Chapter 2 Finances of the State
69
Table 2.37: Guarantees given by the State Government
(` in crore)
Guarantees 2016-17 2017-18 2018-19 2019-20 2020-21 Maximum amount guaranteed to the end of 31 March of the year
21,115 24,025 30,719 35,694 45,104
Outstanding amount of guarantees including interest at the end of the year
15,392 18,416 24,091 26,830 32,733
Source: Finance Accounts
The outstanding guarantees on 1 April of each year were within the prescribed
limit. The outstanding guarantees amounting to `32,733 crore at the end of the
year 2020-21 (principal + interest) included guarantees extended to 172
institutions/ companies under various sectors29.
Against the total estimated guarantee commission of `550.61 crore receivable
as reported by the State Government, only `281.01 crore was received during
2020-21. The guarantee commission received includes book adjustment made
by the State Government towards the guarantee commission payable to it by
different entities by way of subsidies/grants-in-aid/financial assistance.
In MTFP (2016-20) presented before the Legislature, the Government had
stated that since the guarantees resulted in increase in contingent liability, they
should be examined in the same manner as a proposal for a loan, taking into
account, inter alia, the credit-worthiness of the borrower, the amount and risks
sought to be covered by a sovereign guarantee, the terms of the borrowing, the
justification and public purpose to be served, probabilities that various
commitments will become due and possible costs of such liabilities, etc. The
utility of having a functional Guarantee Reserve Fund and Guarantee Policy is
under consideration with the State Government.
The PAC also recommended (July 2015) that suitable efforts should be made to
operate and continue the Guarantee Reserve Fund.
The Government made a provision of `50.00 crore in the budget 2020-21 for
the operation of the Guarantee Reserve Fund against which no expenditure was
incurred. Hence, the fund remained inoperative.
The Finance Department replied (December 2021) that concerned Departments
would be requested to take action for recovery of Guarantee Commission.
2.8.3 Management of Cash Balances
As per an agreement with the Reserve Bank of India (RBI), State Government
has to maintain a minimum daily cash balance of `2.63 crore with the Bank. If
the balance falls below the agreed minimum on any day, the deficiency is made
good by taking ordinary Ways and Means Advances (WMA)/Special Ways and
Means Advances (SWMA)/Overdrafts (OD) from time to time. The limits for
ordinary WMA to the State Government are revised by the RBI from time to
time.
29 Irrigation (`16,061 crore), Co-operation (`1,175 crore), Finance (`1,251 crore), Power
(`10,855 crore), Housing (`2,439 crore), Transport (`426 crore) and other sectors (`198 crore)

State Finance Audit Report for the year ended 31 March 2021
70
• The RBI grants Normal and Special Ways and Means Advances. Limit for
Normal Ways and Means Advances to the State was raised from `1,985
crore which was with effect from 01 February 2016 to `3,176 crore during
April 2020. Since March 1999, the limits for Special Ways and Means
Advance of the State Government are linked exclusively to their holdings
of Government of India Securities. These advances carry interest at such
rates as may be fixed by the RBI from time to time.
• During 2020-21, the State Government had not availed any ways and means
advances from RBI as it maintained minimum balance required during the
entire year.
It is not desirable that State Government take recourse to market loans despite
having large cash balances leading to further accretion to cash balances without
putting it to productive use. Table 2.38 depicts the cash balances and
investments made by the State Government during 2020-21.
Table 2.38: Cash Balances and their investment (` in crore)
Opening balance on
1 April 2020
Closing balance on 31 March 2021
A. General Cash Balance
Cash in treasuries -
Deposits with Reserve Bank of India 1,659.20 1,583.33
Deposits with other Banks - -
Remittances in transit – Local 0.01 0.01
Sub Total 1,659.21 1,583.34 Investments held in Cash Balance Investment Account
13,634.21 21,744.33
Total (A) 15,293.42 23,327.67 B. Other Cash Balances and Investments
Cash with departmental officers viz, PWP&IWT department officers, Forest department, DCs
2.09 2.09
Permanent Advances for contingent expenditure with departmental officers
2.18 3.18
Investment of Earmarked funds 19,165.44 23,810.24
Total (B) 19,169.71 23,815.51 Total (A+B) 34,463.13 47,143.18 Interest realised 535.10 627.42
Source: Finance Accounts
Cash with treasuries/departments, Deposits with RBI and Remittance in transit
form cash and cash equivalent. In addition to the Treasury bills, cash balance is
also invested in Earmarked funds viz., Consolidated Sinking Fund,
Development and Welfare Funds etc. Out of the investment of `23,810 crore
in earmarked funds, `4,820 crore was invested in the Consolidated Sinking
Fund, `18,965 in Development and Welfare Funds and balance was invested in
General and Other Reserve Funds (`25 crore).
The increase in the cash balance was 53 per cent over the previous year. Cash
balances of the State Government at the end of the year increased significantly
by `8,034.25 crore from `15,293.42 crore in 2019-20 to `23,327.67 crore in
2020-21. The surplus cash balance was mainly due to market borrowings of

Chapter 2 Finances of the State
71
`69,000 crore availed to meet the expenditure commitments in the backdrop of
decline in revenue receipts during 2020-21.
State Government invests its surplus cash balance in short and long-term GoI
Securities and Treasury Bills. The profits derived from such investments are
credited as receipts under the head ‘0049-Interest Receipts’. The State
Government has earned an interest of `627 crore during 2020-21 with an
average interest rate of 1.41 per cent for 14-day Treasury bills and 3.15 per cent
for 91-day Treasury bills against an average rate of 6.38 per cent per annum at
which the borrowings were made.
The cash balance investments of the State during the five-year period 2016-17
to 2020-21 are given in Table 2.39.
Table 2.39: Cash Balance Investment Account (Major Head-8673) (` in crore)
Year Opening Balance
Closing Balance
Increase (+)/ Decrease(-)
Interest earned
2016-17 16,917.13 23,977.48 7,060.35 1,054.16
2017-18 23,977.48 12,655.49 (-)11,321.99 1,078.30
2018-19 12,655.49 5,139.28 (-)7,516.21 936.47
2019-20 5,139.28 13,634.21 8,494.93 535.10
2020-21 13,634.21 21,744.33 8,110.12 627.42
Source: Finance Accounts
The trend analysis of the cash balance investment of the State Government
during 2016-17 to 2020-21 revealed that investment increased significantly
during 2019-20 and 2020-21.
Chart 2.17 compares the balances available in the Cash Balance Investment
Account and the closing balance of Market Loans taken by the State during the
period 2016-17 to 2020-21. Market Loans were taken at higher interest rates
whereas investment in Treasury Bills yielded interest at lower rates.
Chart 2.17: Market Loans vis-à-vis Cash Balance
Source: Finance Accounts.
23,97712,655 5,139 13,634 21,744
108,359125,708
157,890
200,390
262,290
0
50,000
100,000
150,000
200,000
250,000
300,000
2016-17 2017-18 2018-19 2019-20 2020-21
(`in
cro
re)
Cash Balance Investment Account Market Loans

State Finance Audit Report for the year ended 31 March 2021
72
From the Chart 2.17, it is evident that during the last two years i,e., 2019-20
and 2020-21, there was increase in Cash Balance Investment Account due to
increase in Market Loans availed. Chart 2.18 also compares the outgoings of
Cash Balance Investment Account with the Market Loans obtained by the State.
Chart 2.19 compares month-wise movement of Cash balances and net Cash
Balance Investments during the year.
Chart 2.18: Month wise movement of Cash Balance Investment Account and market loans during 2020-21
Source: Office of the Pr.AG(A&E).
Chart 2.19: Month-wise movement of Cash Balances and Net Cash Balance Investments during the year
(` in crore)
Source: Office of the Pr.AG(A&E).
33,64227,901
43,11644,642
34,51730,247
34,286
42,62145,12441,941
57,15761,378
2,000 2,000 3,000 5,000 7,000 10,000 8,000 8,000 10,000
2,000 3,000 9,000
0
10,000
20,000
30,000
40,000
50,000
60,000
70,000
(`in
cro
re)
Cash Balance Market Loan raised
-883-301 -5,153
-2,682
-2,900
-2,739
-4,848-7995
-6,965
1276
1031
24,050
1,550 1,565 2,007 2,896 2,560 3,0152,588
2,9922,061
2,816
2,978
1,583
-8,000-6,000-4,000-2,000
02,0004,0006,0008,000
10,00012,00014,00016,00018,00020,00022,00024,00026,00028,00030,000
Net Cash Balance Investment Cash Balance (At the end of the month)

Chapter 2 Finances of the State
73
The preceding chart indicates that the State Government had taken recourse to
Market Loans on several occasions during the year despite having large cash
balances leading to further accretion to cash balances without putting it to
productive use. During the year 2020-21, the State Government raised `69,000
crore from the market, while at the same time, the Cash Balance Investment
Account increased significantly from ̀ 13,634 crore to ̀ 21,744 crore, indicating
that much of the borrowing was avoidable.
Further, borrowings are normally resorted to, to invest in capital projects and
creation of assets. Though the State saw an increase in Capital Expenditure
during 2020-21 when compared to the previous year in absolute term, as
percentage of GSDP there was a decrease in 2020-21. In addition, as the State
witnessed revenue deficit of `19,338 crore in the current year, the deficit was
met out of the borrowings. The State Government stated that it opted for open
market borrowings based on the expenditure requirement and cash availability.
However, from the above charts it is seen that the State had sufficient cash
balance and hence could have avoided some of the market borrowings availed
during the last quarter and its resultant interest burden.
Successive FCs and RBI have been reiterating that there should be an effort by
State with large balances towards utilizing their existing cash balances before
resorting to fresh borrowings and to manage their cash balance more efficiently.
The XV FC has recommended to the State that the borrowing calendar needs to
be calibrated to achieve the goal of minimizing the cash balance at the end of
the year.
The Finance Department replied (December 2021) that State Government does
not generally borrow funds, during first two quarters of the financial year and
generally, borrowing are made during last two quarters of the financial year. It
further stated that because of the COVID 19 pandemic situation, while there
was decrease in Revenue Receipts, the expenditure increased and having cash
balance of `23,237.67 crore was essential and justified.
The reply of the Finance Department that the borrowing of funds were made
during the last two quarters of the financial year is not acceptable as it is seen
from the Chart 2.18, it is evident that 43 per cent of the borrowings were
availed during the first two quarters of the 2020-21. Further, in the context of
COVID 19, increase in cash balance by 53 per cent was not acceptable as even
the International Monetary Fund in its paper on Government Cash Management
under Fiscal Stress has stated that enhancement of buffer is for Government that
has weaker forecasting capacity. Since the State has a robust forecasting
mechanism, such huge buffer is not desirable. Further, as also seen from the
Revenue Receipts and Revenue expenditure for the month of April and May
2021, it was observed that the excess expenditure was around `2,000 crore
which could have been met out of the cash balance threshold of previous year
itself.

State Finance Audit Report for the year ended 31 March 2021
74
2.9 Conclusion and Recommendations
State’s own resources
The State Government registered a decrease of 10.67 per cent in its Revenue
Receipts during 2020-21, the growth rate of Revenue Receipts showed a
declining trend during 2016-17 to 2020-21 except for the year 2018-19. Own
tax revenue contributed major part (62 per cent) of the revenue receipts of the
State. However, the ratio of State’s tax revenue to GSDP showed a declining
trend. In addition, there was no improvement in the ratio of non-tax revenue to
GSDP and it continued to be less than one per cent of GSDP during 2016-17 to
2020-21 also.
Recommendation: Non-tax revenues require significant thrust by
rationalizing user charges and regular and periodical monitoring
recommended by the FMRC (MTFP 2021-25).
Revenue expenditure
During 2020-21, there was decline in the growth under the social sector over
the previous year (seven per cent) and the share of expenditure on social
services to total revenue expenditure also decreased from 38 per cent in 2019-
20 to 35 per cent in 2020-21. The growth in expenditure on economic services
increased marginally by two per cent during 2020-21.
Eighty-five per cent of revenue expenditure comprised committed expenditure
on salaries, interest payments, pensions, subsidies, Grants-in-aid and financial
assistance, administrative expenditure and devolution to local bodies.
Recommendations: Since the costs of salary, pension and interest are
inflexible, the expenditure on subsidies, Grants-in-aid other than to local
bodies, which are increasing steadily, requires utmost attention from the State
Government through better targeting of beneficiaries.
Quality of expenditure
The share of capital expenditure to total expenditure was 21 per cent during the
current year. Funds aggregating `3,628 crore were locked up in incomplete
projects at the end of 2020-21.
The return from investment of `68,257 crore as of 31 March 2021 in
Companies/Corporations was negligible (`80.70 crore). The investment
included `42,120 crore (62 per cent) to Companies/Corporations which were
under continuous loss.
Recommendations: The State Government should formulate guidelines for
quick completion of incomplete projects and strictly monitor reasons for time
and cost overrun with a view to take corrective action. In addition, it should
give priority to works nearing completion.
The State Government should review the working of State Public Sector
Undertakings incurring huge losses and take appropriate action for
disinvestment/revival/closure.
Chapter 2 Finances of the State
75
Funds and other Liabilities
During the year, Green Tax and Road Safety collections of `10.86 crore and
`87.65 crore respectively were not transferred to fund account.
Recommendations: Rules with regard to administration and investment
pattern of various reserve funds are required to be framed.
Debt sustainability
Open Market Borrowings had a major share (63 per cent) in the total fiscal
liabilities of the State. The burden of interest payments measured by interest
payments to revenue receipts ratio (IP/RR) is in an increasing trend and is 14.95
per cent during 2020-21. The net debt available to the State during 2020-21
(`41,946 crore) increased by 4.14 per cent when compared to the previous year.
Recommendations: The State Government needs to make medium term
corrections on the expenditure side to moderate committed expenditure.
Position of Cash Balance
The cash balance (including investment of Earmarked funds and deposits with
RBI) of the State at the end of the year increased by 37 per cent over the previous
year due to excess market borrowings.
Recommendations: Maintaining idle cash balance is not prudent cash
management. Hence, Government needs to limit the market borrowings to its
requirement.


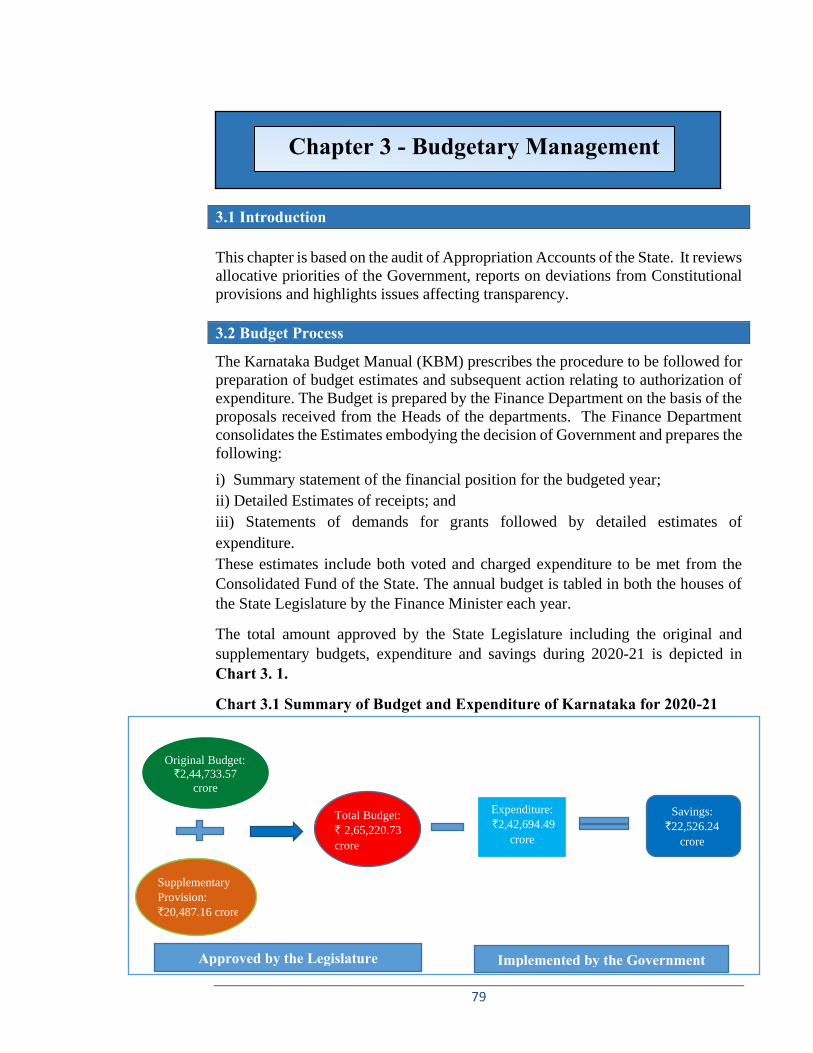
79
3.1 Introduction
This chapter is based on the audit of Appropriation Accounts of the State. It reviews
allocative priorities of the Government, reports on deviations from Constitutional
provisions and highlights issues affecting transparency.
3.2 Budget Process
The Karnataka Budget Manual (KBM) prescribes the procedure to be followed for
preparation of budget estimates and subsequent action relating to authorization of
expenditure. The Budget is prepared by the Finance Department on the basis of the
proposals received from the Heads of the departments. The Finance Department
consolidates the Estimates embodying the decision of Government and prepares the
following:
i) Summary statement of the financial position for the budgeted year;
ii) Detailed Estimates of receipts; and
iii) Statements of demands for grants followed by detailed estimates of
expenditure.
These estimates include both voted and charged expenditure to be met from the
Consolidated Fund of the State. The annual budget is tabled in both the houses of
the State Legislature by the Finance Minister each year.
The total amount approved by the State Legislature including the original and
supplementary budgets, expenditure and savings during 2020-21 is depicted in
Chart 3. 1.
Chart 3.1 Summary of Budget and Expenditure of Karnataka for 2020-21
Supplementary Provision:
`23,058.81
Chapter 3 - Budgetary Management
Expenditure:
`2,42,694.49
crore
Original Budget:
`2,44,733.57 crore
Supplementary
Provision:
`20,487.16 crore
Total Budget:
` 2,65,220.73
crore
Savings:
`22,526.24
crore
Approved by the Legislature Implemented by the Government

State Finance Audit Report for the year ended 31 March 2021
80
3.3 Gender Budgeting in Karnataka
A Gender Budgeting Statement was introduced for the first time as a part of the
expenditure budget in the Union in the year 2005-06. GoK is placing the Gender
Budget document in the Legislature since 2007-08. A Gender Budget Cell in the
Fiscal Policy Institute prepares the Gender Budget in co-ordination with various
departments, Non-Government Organizations and experts. The Department of
Women and Child Development is the Nodal agency for monitoring and evaluation
of Gender Budgeting in collaboration with the Planning Department.
In the SFAR of the C&AG for the year ending March 2020 (Paragraph 3.3), a
review of Gender Budgeting in Karnataka was taken up and the audit findings on
planning and formulation of policy, analysis of Gender budget documents, Gender
Budgeting Processes were brought out in detail. The Finance Department replied
that the issues brought out in the report would be examined and the action would
be taken thereof.
The total allocation earmarked for women across different departments for the
period 2016-17 to 2020-21 under Category A (women specific schemes with 100
per cent allocation for women) and Category B (pro-women schemes with
allocations more than 30 per cent and less than 100 per cent) along with their
percentage to total allocation is indicated in Table 3.1.
Table 3.1 – Category-wise allocation during 2016-17 to 2020-21 (``in crore)
Year Total Allocation
Total Category ‘A’ allocation
Total Category ‘B’
allocation
30 per cent of Category ‘B’
allocation
Percentage of Category ‘A’
to total allocation
Percentage of Category ‘B’(30%) to total allocation
2016-17 1,72,097.16 5,047.45 61,066.96 18,320.09 2.93 10.64
2017-18 1,94,917.19 5,901.83 82,156.54 24,646.96 3.03 12.64
2018-19 2,24,110.77 6,049.41 95,975.37 28,792.61 2.70 12.85
2019-20 2,40,745.86 5,100.95 1,20,868.97 36,260.69 2.12 15.06
2020-21 2,44,733.57 4,732.34 1,10,170.20 33,051.06 1.93 13.50
Source: Gender Budget
From the above table it is evident that percentage of the Category ‘A’ allocation to
total allocation showed decreasing trend except for the year 2017-18.
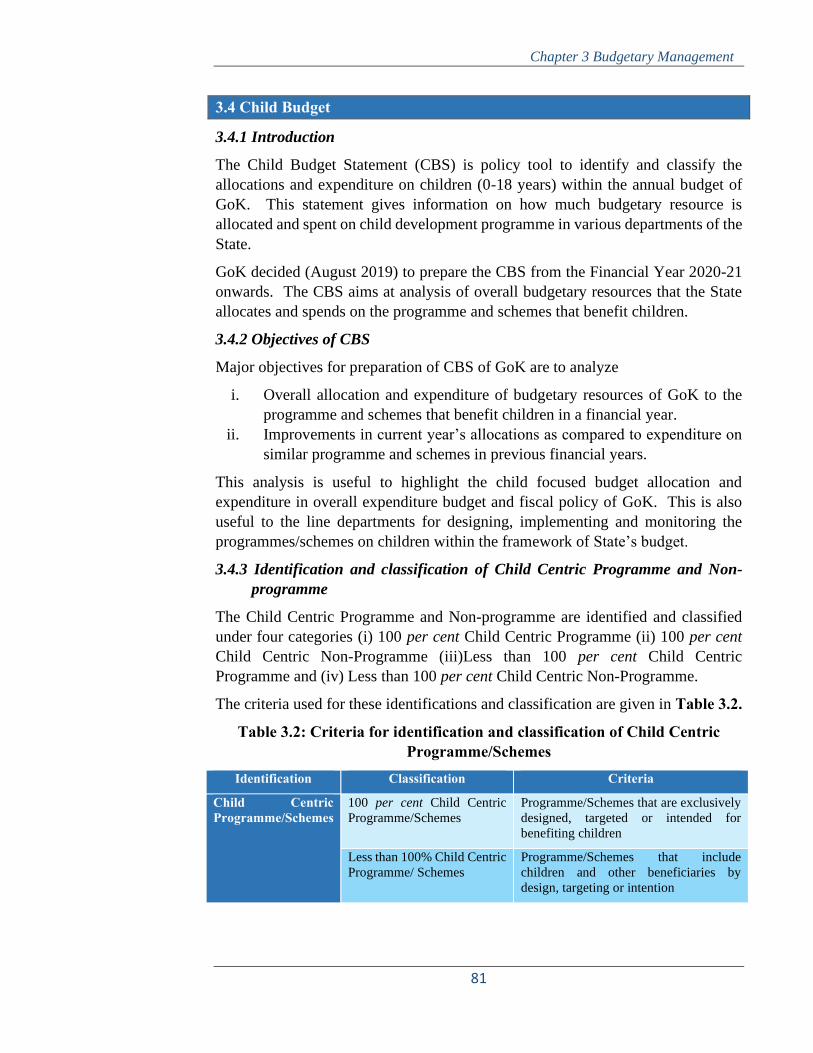
Chapter 3 Budgetary Management
81
3.4 Child Budget
3.4.1 Introduction
The Child Budget Statement (CBS) is policy tool to identify and classify the
allocations and expenditure on children (0-18 years) within the annual budget of
GoK. This statement gives information on how much budgetary resource is
allocated and spent on child development programme in various departments of the
State.
GoK decided (August 2019) to prepare the CBS from the Financial Year 2020-21
onwards. The CBS aims at analysis of overall budgetary resources that the State
allocates and spends on the programme and schemes that benefit children.
3.4.2 Objectives of CBS
Major objectives for preparation of CBS of GoK are to analyze
i. Overall allocation and expenditure of budgetary resources of GoK to the
programme and schemes that benefit children in a financial year.
ii. Improvements in current year’s allocations as compared to expenditure on
similar programme and schemes in previous financial years.
This analysis is useful to highlight the child focused budget allocation and
expenditure in overall expenditure budget and fiscal policy of GoK. This is also
useful to the line departments for designing, implementing and monitoring the
programmes/schemes on children within the framework of State’s budget.
3.4.3 Identification and classification of Child Centric Programme and Non-
programme
The Child Centric Programme and Non-programme are identified and classified
under four categories (i) 100 per cent Child Centric Programme (ii) 100 per cent
Child Centric Non-Programme (iii)Less than 100 per cent Child Centric
Programme and (iv) Less than 100 per cent Child Centric Non-Programme.
The criteria used for these identifications and classification are given in Table 3.2.
Table 3.2: Criteria for identification and classification of Child Centric Programme/Schemes
Identification Classification Criteria
Child Centric Programme/Schemes
100 per cent Child Centric
Programme/Schemes
Programme/Schemes that are exclusively
designed, targeted or intended for
benefiting children
Less than 100% Child Centric
Programme/ Schemes
Programme/Schemes that include
children and other beneficiaries by
design, targeting or intention

State Finance Audit Report for the year ended 31 March 2021
82
Identification Classification Criteria
Child Centric Non-Programme/Schemes
100% Child Centric
Programme/Schemes
Non-programme/ schemes that are
exclusively designed, targeted or
intended for child beneficiaries
Less than 100% Child Centric
Programme/ Schemes
Non-programme/Schemes that include
children and other beneficiaries by
design, targeting or intention
Note: (i) Budgetary allocation and expenditure for Child Centric Non-programme/Scheme comprise
institutional set ups, establishments, infrastructure facilities and administrative support that
benefit children.
(ii) Beneficiaries of 100% Child Centric Programme include pregnant or expectant mothers
and lactating mothers.
During the year 2020-21, GoK allocated `51,084.28 crore (21 per cent) out of the
total budget allocation of `2,44,733.57 crore towards Child Centric
Programme/Schemes. The percentage of allocation and the expenditure incurred
for different categories are shown in the Table 3.3.
Table 3.3: Details of allocation under Child Centric Programme/Schemes (` in crore)
Sl No.
Classification Allocation during 2020-21
Expenditure Savings (in percentage)
1 100% Child Centric
Programme
11,881.94 10,321.61 1,560.33(13)
2 Less than 100% Child
Centric Programme
18,892.79 16,950.08 1,942.71(10)
3 100% Child Centric Non-
programme
15,421.42 13,869.29 1,552.13(10)
4 Less than 100% Child
Centric Non-programme
4,888.13 4,418.79 469.34(10)
Total 51,084.28 45,559.77 5,524.51(11)
Source: Grant Register
As seen from the table, 11 per cent of the allocation under Child Centric Programme
remained unutilized in all categories.
The category wise/department wise budget allocation and expenditure during 2020-
21 are shown in Appendix 3.1.
3.5 Major policy pronouncements in the budget and their actual funding for ensuring implementation
The Government announced major policy initiatives in the Budget 2020-21 (March
2020). An Action Taken Report was brought out along with the budget documents
for 2021-22.

Chapter 3 Budgetary Management
83
In total, the State Government initiated 26 new policies in respect of Departments
of Agriculture and Information Technology and Bio Technology. Audit undertook
a study on the action taken by the Government in respect of 17 initiatives. The
action initiated by the Government concerning major policies is summarized in
Appendix 3.2.
Out of the 17 initiatives, action in case of five initiatives were still in the preliminary
stage. While one initiative was proposed to be implemented from next financial
year, the action in respect of three initiatives were not taken due to Covid-19
Pandemic. In case of three initiatives, action was taken and five initiatives were
fully implemented during 2020-21.
Some of the initiatives which could have been implemented based on the
importance of criticality/materiality which are still in the nascent stage are detailed
in Table 3.4.
Table 3.4: Important initiatives where action was yet to be taken
Sl No
Budgetary Assurance Action taken
Information and Bio-Technology Department
1 ‘Science and Talent Search’ programme would be
started to identify the nurture talented students
studying in Pre-University Colleges. About 500
students will be selected and mentored for two years
by premier science institutes. The selected students
will be given monthly scholarship of `1000/-
The programme was not implemented during
2020-21 due to delay in receipt of list of top 20
selected students form each educational
institution from Pre-University Board. It was
stated that it will be taken up during October
2021 to March 2022.
2 To address the technical challenges of various
important sectors in the development of Karnataka,
Centre of Excellence for Efficiency Augmentation
will be established with collaboration of Software
Technology Parks in India (STPI) with an
expenditure of `30 crore
Though the administrative approval was
accorded in November 2020, the
Memorandum of Agreement (MOA) was
signed on 10.08.2021 between Karnataka
Innovation and Technology Society (KITS),
IIT-B and World Economic Forum (WEF).
The project was not implemented as no funds
were provided for the project during 2020-21.
3 An “Artificial Intelligence Research Translation
Park" will be established in association with Indian
Institute of Science, Bengaluru in order to promote
AI-Innovation, AI-Commercialization, Pilot Project
Implementation along with development of 5G
technology. For this purpose, corpus grant of `60
crore will be provided for next three years.
Though the administrative approval was
accorded during November 2020, The project
was not implemented as no funds were
provided for the project during 2020-21.
4 With an aim to emphasize morality in order to create
a suitable environment, a Centre of Excellence in the
matter of ‘internet of ethical things' will be
established in collaboration with the World
Economic Forum of Davos by including interested
stakeholders. For the said Centre, the State
Government will provide a financial assistance of
The State Government did not release any
funds during 2020-21. Hence, this project was
not implemented during 2020-21.

State Finance Audit Report for the year ended 31 March 2021
84
Sl No
Budgetary Assurance Action taken
`30 crore in five years. A grant of `7.5 crore will be
provided during the year 2020-21 Department of Agriculture
5 To encourage water security, land bank and mass
cultivation, micro irrigation, processing of farm
produce, marketing and also to consider agriculture
and Horticulture as an industry, the Government will
bring a new Agricultural Policy
Though the High Level Committee was
constituted in November 2020 to formulate
guidelines to New Agricultural Policy, the
draft policy is yet to be finalized.
6 The State Government will formulate Soil Health
Programme Policy based on the recommendations of
Land Resource Registry, availability of water and
soil health card to make farmers grow suitable region
wise crops, to use necessary seeds, chemical
fertilizers and micronutrients.
Though the High Level Committee was
constituted during October 2020, the finalized
Agricultural input Policy was submitted on
11.08.2021 which is yet to be approved by the
Cabinet.
3.6 Appropriation Accounts
Appropriation Accounts are accounts of the expenditure of the Government for
each financial year, compared with the amounts of grants voted and appropriations
charged for different purposes as specified in the schedules appended to the
Appropriation Act passed under Article 204 and 205 of the Constitution of India.
Expenditure in Appropriation Accounts are on a Gross basis. These Accounts
depicts the original budget provision, supplementary grants, surrenders and re-
appropriations distinctly and indicate actual capital and revenue expenditure on
various specified services vis-à-vis those authorized by the Appropriation Act in
respect of both Voted and Charged items of the budget. Appropriation Accounts
thus facilitate understanding of utilisation of funds, the management of finances
and monitoring of budgetary provisions and are, therefore, complementary to the
Finance Accounts30.
3.6.1 Summary of total provisions, actual disbursements and savings during
2020-21
The summarized position of budget provision including supplementary budget,
actual expenditure and savings/excess during 2020-21 under 29
grants/appropriation with its further bifurcation into revenue/capital and
voted/charged is given in Table 3.5.
30 Finance Accounts provides broad perspective of finances of GoK during the financial year
which is dealt in the Chapter 1 and 2 of this Report.
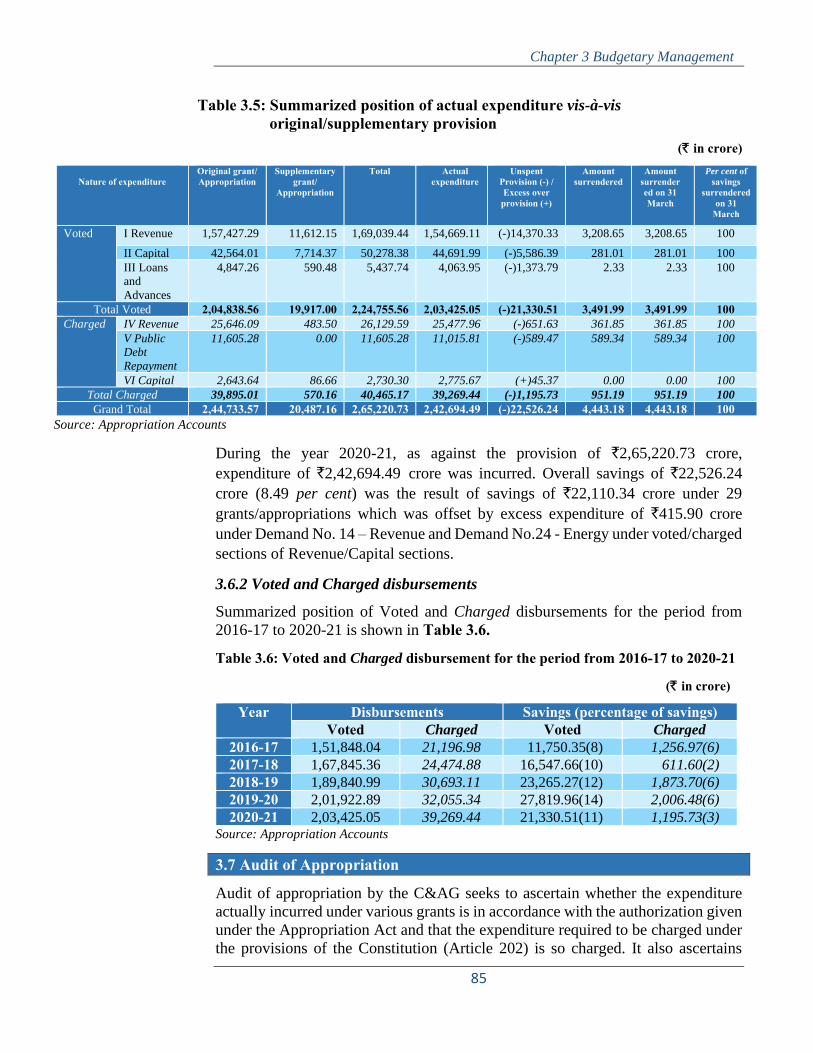
Chapter 3 Budgetary Management
85
Table 3.5: Summarized position of actual expenditure vis-à-vis original/supplementary provision
(` in crore)
Nature of expenditure Original grant/ Appropriation
Supplementary grant/
Appropriation
Total Actual expenditure
Unspent Provision (-) / Excess over
provision (+)
Amount surrendered
Amount surrendered on 31 March
Per cent of savings
surrendered on 31
March
Voted I Revenue 1,57,427.29 11,612.15 1,69,039.44 1,54,669.11 (-)14,370.33 3,208.65 3,208.65 100
II Capital 42,564.01 7,714.37 50,278.38 44,691.99 (-)5,586.39 281.01 281.01 100
III Loans
and
Advances
4,847.26 590.48 5,437.74 4,063.95 (-)1,373.79 2.33 2.33 100
Total Voted 2,04,838.56 19,917.00 2,24,755.56 2,03,425.05 (-)21,330.51 3,491.99 3,491.99 100 Charged IV Revenue 25,646.09 483.50 26,129.59 25,477.96 (-)651.63 361.85 361.85 100
V Public
Debt
Repayment
11,605.28 0.00 11,605.28 11,015.81 (-)589.47 589.34 589.34 100
VI Capital 2,643.64 86.66 2,730.30 2,775.67 (+)45.37 0.00 0.00 100
Total Charged 39,895.01 570.16 40,465.17 39,269.44 (-)1,195.73 951.19 951.19 100
Grand Total 2,44,733.57 20,487.16 2,65,220.73 2,42,694.49 (-)22,526.24 4,443.18 4,443.18 100 Source: Appropriation Accounts
During the year 2020-21, as against the provision of `2,65,220.73 crore,
expenditure of `2,42,694.49 crore was incurred. Overall savings of `22,526.24
crore (8.49 per cent) was the result of savings of `22,110.34 crore under 29
grants/appropriations which was offset by excess expenditure of `415.90 crore
under Demand No. 14 – Revenue and Demand No.24 - Energy under voted/charged
sections of Revenue/Capital sections.
3.6.2 Voted and Charged disbursements
Summarized position of Voted and Charged disbursements for the period from
2016-17 to 2020-21 is shown in Table 3.6.
Table 3.6: Voted and Charged disbursement for the period from 2016-17 to 2020-21
(` in crore)
Year Disbursements Savings (percentage of savings) Voted Charged Voted Charged
2016-17 1,51,848.04 21,196.98 11,750.35(8) 1,256.97(6)
2017-18 1,67,845.36 24,474.88 16,547.66(10) 611.60(2)
2018-19 1,89,840.99 30,693.11 23,265.27(12) 1,873.70(6)
2019-20 2,01,922.89 32,055.34 27,819.96(14) 2,006.48(6)
2020-21 2,03,425.05 39,269.44 21,330.51(11) 1,195.73(3) Source: Appropriation Accounts
3.7 Audit of Appropriation
Audit of appropriation by the C&AG seeks to ascertain whether the expenditure
actually incurred under various grants is in accordance with the authorization given
under the Appropriation Act and that the expenditure required to be charged under
the provisions of the Constitution (Article 202) is so charged. It also ascertains

State Finance Audit Report for the year ended 31 March 2021
86
whether the expenditure incurred is in conformity with the laws, relevant rules,
regulations and instructions. 3.7.1 Financial Accountability and Budget Review
3.7.1.1 Errors in Budgeting (a) Non-provisioning of funds during the budget of 2020-21 During the year 2020-21, an amount of `689.27 crore was transferred to the
National Disaster Response Fund for which provision was not made in the budget
resulting in excess expenditure of `689.27 crore.
(b) New Service Criteria Article 205 of the Constitution provides that expenditure on a ‘New Service’ not
contemplated in the Annual Financial Statement (Budget) can be incurred only after
its specific authorization by the Legislature. The Government issued orders in
August 2015 based on the recommendations of the PAC in the Fourth Report
(Fourteenth Assembly), exempting certain items of expenditure for which ‘New
Service’ criteria shall not be applicable and also prescribed the criteria, for treating
the expenditure as ‘New Service’. The revised criteria for ‘New Service’ became
effective from the financial year 2015-16. As per the above order, the cases already
provided for and approved by the Legislature but where expenditure is subsequently
expected to exceed the amount originally provided in the budget will not be treated
as ‘New Service’ provided the increase over the actual provision does not exceed
twice the provision or `five crore, whichever is more.
During the year 2020-21, under Grant No.14 – Revenue, under head of account
4059-01-201-0-02-132 – Capital expenses, a provision of `five crore was made
against which an expenditure of `53.01 crore was incurred resulting in excess
expenditure of `48.01 crore which should have been treated as ‘New service/New
Instrument of Service’.
The Finance Department in its reply (December 2021) stated that action would be
taken to regularize excess expenditure after recommendation of PAC.
3.7.2 Comments on integrity of budgetary and accounting process
3.7.2.1 Additional amount released through executive orders
Article 266(3) of the Constitution of India prohibits withdrawal of money from the
Consolidated Fund of the State unless relevant Appropriation Acts under the Article
204 and 205 of the Constitution are passed by the Legislature.
During the year 2020-21 audit, it was observed that `5,281.70 crore covering 10
grants under capital/revenue section (this is only illustrative), (Appendix 3.3) was
released through 36 executive orders which were later regularized through the
supplementary demands. It was observed that the expenditure incurred out of these
additionalities included mainly expenditure on routine items viz., subsidies, SCSP/
TSP, improvements, capital expenditure, contract/outsource etc., which did not
qualify as emergent/unforeseen expenditure and could have waited for placement

Chapter 3 Budgetary Management
87
of supplementary demands. The PAC in its fifth report (Fourteenth Assembly) had
recommended that sanctioning of additionality through executive instructions
should be limited to emergent cases (July 2015). However, it is observed that
incurring the expenditure first without the authority of Legislature and later
obtaining the approval in the supplementary demands was continuing despite the
PAC’s recommendations.
The details of additional amount released through the executive orders for the
period 2018-19 to 2020-21 are shown in Table 3.7.
Table 3.7: Additional amounts released through executive orders during 2018-19 to 2020-21
(` in crore)
Year No. of grants covered No. of cases Amount 2018-19 19 77 3,940.35
2019-20 19 78 3,518.84
2020-21 10 36 5,281.70
Source: Appropriation Accounts
Though the number of cases where the additional amount released through
executive orders showed a decreasing trend, the amount involved increased during
2020-21 compared to the previous year. Drawing the amount through executive
order and later obtaining the authority of the Legislature is not a good practice.
The Finance Department in its reply (December 2021) stated that orders releasing
additionalities were issued as expenditure on subsidies, SCSP/TSP, improvements
and contracts/outsource, could not be deferred till obtaining approval in
supplementary estimate.
The reply of the department is not acceptable, as the above expenditure does not
fall under emergent cases.
3.7.2.2. Misclassification of capital expenditure as revenue expenditure and vice-versa
Misclassification of transactions as revenue/capital are characterized by lack of
application of rules of classification of transactions under relevant heads.
Misclassification between revenue and capital expenditure has a bearing on revenue
account and the fiscal indicator viz., revenue surplus/deficit. During the year 2020-
21, `100 crore was misclassified under capital section under the head of account
5055-00-190-3-00-103 – Grants-in-Aid - General instead of revenue section. As
per IGAS – 2, the grants-in-aid disbursed by the grantor to a grantee shall be
classified and accounted as revenue expenditure in the financial statement of the
grantor irrespective of the purpose for which the funds disbursed. This
misclassification has resulted in overstatement of capital expenditure thereby
distorting the fiscal indictor i.e., Revenue Deficit.

State Finance Audit Report for the year ended 31 March 2021
88
3.7.2.3 Utilization of Funds under capital section for expenditure of revenue nature
During the year 2020-21, the State Government (July 2020) released `117.02 crore
for payment of salaries to the officers/officials of four transport corporations
(Karnataka State Road Transport Corporation, Bangalore Metro Transport
Corporation, North-East Karnataka State Road Transport Corporation and North-
West Karnataka State Road Transport Corporation) under certain capital heads of
account as shown in Table 3.8. Table 3.8: Funds released under capital section for payment of salaries
(` in crore) Sl No
Head of Account Budget provision
Expenditure incurred
Amount released
1 5055-00-190-1-00-132 –
Capital Expenses
14.61 14.61 14.61
2 5055-00-190-1-00-133 - SDP 23.75 23.75 23.75
3 5055-00-102-3-01-132 –
Capital Expenses
100.00 100.00 21.00
4 5055-00-190-2-00-132 –
Capital Expenses
8.34 8.34 8.34
5 5055-00-190-2-00-133 – SDP 20.45 20.45 20.45
6 5055-00-190-4-00-132 –
Capital Expenses
12.43 12.43 12.43
7 5055-00-190-4-00-133 - SDP 16.44 16.44 16.44
Total 196.02 196.02 117.02
Source: Grant Register
In the release orders, it was stated that the transport corporations had requested the
Government to release funds for payment of salaries as these corporations were
facing many challenges and had acute revenue deficit due to non-operation of
transport system in full swing on account of Covid -19 Pandemic.
The action of the Government to release the funds under capital head of account
towards payment of salaries (which is of revenue nature) was incorrect as it affects
the fiscal parameters like revenue deficit and fiscal deficit for the year 2020-21.
Though the funds were released for salary purpose, the same was accounted under
capital expenditure in the accounts for the year 2020-21 resulting in overstatement
of capital expenditure. The Government, instead, could have surrendered the
provision under capital head and obtained new provision for payment of salaries in
the Supplementary Demands under revenue account.
The Finance Department in its reply (December 2021) stated that though the funds
were provided under capital head for incurring capital expenditure, due to Covid
19 pandemic, the transport corporations were unable to disburse the salaries of the
employees and hence it was inevitable to incur salary expenditure under capital
heads.

Chapter 3 Budgetary Management
89
The reply of the department is not acceptable. As per Rule 84 read with Rule 98 of
GFR 2017, the capital expenditure is incurred with an object of increasing concrete
assets of a material and permanent character or of reducing permanent liabilities.
In this case, since the expenditure was of revenue nature, provision under capital
head could have been surrendered and fresh provision under revenue head could
have been obtained.
3.7.2.4 Unnecessary /Excessive/Inadequate supplementary grants
During the year 2020-21, supplementary provision of ̀ 531.13 crore provided under
24 grants proved unnecessary.
Test checked cases of supplementary provisions showed instances of
unnecessary/excessive/inadequate provisions (Appendix 3.4, Appendix 3.5. and Appendix 3.6) as detailed in Chart 3.2.
Chart 3.2: Unnecessary/Excessive/Inadequate Supplementary provision
From the above, it was noticed that there were instances where supplementary
provision provided were unnecessary/excessive as original provisions were enough
to take care of the expenditure. Further, it was also noticed that under certain heads
of accounts, the total provision including supplementary provision was insufficient
resulting in excess expenditure.
Unnecessary Supplementary
Provision (In 8 grants with 29 object heads)
Original Provision: `8,587.25 crore
Expenditure: `7,898.56 crore
Suplementary Provision (> 2 crore cases) :
`391.79 crore
Unspent provision `1,080.48 crore. Hence entire
supplementary provision proved unnecessary
(Appendix 3.4)
Excessive Supplementary Provision (In 10 grants
with 12 object heads)
Original Provision: `4,014.65 crore
Expenditure: `4,963.82 crore
Supplementary Provision(>5 crore cases) : `1.403.28
crore
Unspent provision
(> 5 cr cases) : `454.11 crore (Appendix 3.5)
Inadequate Supplementary Provision
(In 14 grants with 17 object heads)
Original Provision: `8,920.33 crore
Expenditure:
`17,399.34 crore
Supplementary Provision
(>2 crore cases)
` 5,398.69 crore
Excess expenditure
( > 1 crore cases : `3,080.32 crore
(Appendix 3.6)

State Finance Audit Report for the year ended 31 March 2021
90
The supplementary estimates should be more realistic and prepared as per actual need to avoid unnecessary/excessive/inadequate provisions.
The Finance Department in reply (December 2021) stated that the supplementary
estimates are determined based on specific proposals/requirement of
Administrative Departments and complying with Budget Manual provisions.
Original Budget provisions already utilized and requirement of funds for the
remaining period of the year, programmes/works not envisaged in original Budget
estimates were considered. Various changes that occur subsequently viz.,
(i) Non filling of vacant posts,
(ii) Non commencement of programmes/activities,
(iii) Non completion/delay in completion of works,
(iv) Non receipt/Non payment of bills in time,
(v) Non receipt of expected Central Assistance and
(vi) Postponement of procurement of goods and services affect utilization of
Budget/Supplementary provisions.
Some of these changes are beyond the control of departments. These changes result
in some of the supplementary estimates becoming excessive/ inadequate. Detailed
instructions were issued (March 2021) to Principal Secretaries/Secretaries and
Heads of the Department.
3.7.2.5 Re-appropriation of funds
A grant or appropriation for disbursement is distributed by functional head/sub-
head /detailed head/object head under which it is accounted for. The competent
executive authority may approve re-appropriation of funds between the primary
units of appropriation within a grant or appropriation before the close of the
financial year to which such grant or appropriation relates. Re-appropriation means
the transfer, by a competent authority, of saving from one unit of
grant/appropriation to meet excess expenditure under another unit within the same
voted grant or charged appropriation. Re-appropriation of funds should be made
only when it is known or anticipated that the appropriation for the unit from which
funds are to be transferred will not be utilized in full or will result in unspent
provision in the unit of appropriation.
During 2020-21, 464 re-appropriation orders for an amount `5,531.05 crore were
issued, as against 420 re-appropriation orders for `5,519.56 crore issued during
2019-20. Review of the orders/cases revealed the following.
(a) Unnecessary/Excessive/inadequate re-appropriation of Funds
In test checked cases of re-appropriation of funds during 2020-21, it was observed
that there were cases of unnecessary/ excessive/inadequate re-appropriation of
funds (Appendix 3.7) as detailed below:
• In 15 cases under six grants, additional funds of `161.36 crore were provided
through re-appropriation (cases more than `three crore) which proved

Chapter 3 Budgetary Management
91
unnecessary, as it resulted in unspent provision (cases more than `three crore)
of `436.19 crore.
• In 19 cases under eight grants, additional funds (cases more than `three crore)
of `653.20 crore provided were excessive resulting in unspent provision (cases
more than `three crore) of `188.27 crore.
• In 15 cases under nine grants, additional funds of `136.93 crore provided
through re-appropriation (cases more than `one crore) were insufficient as it
resulted in excess expenditure (cases more than `one crore) of `164.10 crore.
• In two cases, under two grants, injudicious withdrawal of `61.02 crore through
re-appropriation, where the original provision itself was insufficient, resulted in
excess expenditure of `520.03 crore.
The Finance Department replied (December 2021) that it is the primary
responsibility of grant controlling authorities of departments to monitor utilization
of budget provisions and take suitable measures. It also stated that detailed
instructions have been issued (November 2018) to Principal Secretaries /
Secretaries and Heads of the Department.
The Finance Department has to monitor that all the Heads of the Departments
follow the instructions issued by them in order to avoid unnecessary/excessive Re-
appropriation of funds.
(b) Defective re-appropriation
Article 309, 312 and 315(a) of Karnataka Financial Code (KFC) inter alia
stipulated that no re-appropriation should be made from one grant voted by the
Legislature to another such grant, from voted items of expenditure to charged items
of expenditure, from capital head to revenue head and vice-versa, if the re-
appropriation statement is not self-balanced and not in the prescribed form (Form
22A of KFC). During the year 2020-21, 43 re-appropriation orders for `7.41 crore
(Appendix 3.8) were not accepted by Pr.AG (A&E) for the reasons like difference
in budget provisions, Form 22A not self-balanced and insufficient balance.
The Finance Department replied (December 2021) that remedial action was already
taken through adoption of re-appropriation module. All departments were
instructed (March 2021) to exercise proper checks before issue of re-appropriation
orders and ensure that there would be no defect.
3.7.2.6 Unspent provisions against allocation/large savings/surrenders
(a) Grants having large savings (savings above `100 crore and above) during 2020-21.
There were 32 cases of unspent provisions, each exceeding `100 crore and above
under 23 grants/appropriation, which aggregated `22,211.65 crore. Large unspent
provisions, i.e., more than `1,000 crore were in the areas of Finance, Home and

State Finance Audit Report for the year ended 31 March 2021
92
Transport, Rural Development and Panchayat Raj, Social Welfare, Education,
Urban Development and Water Resources as indicated in the Appendix 3.9.
As per Rule 264 of the Karnataka Budget Manual (KBM), all savings anticipated
by the Controlling Officers should be reported by them with full details and reasons
to the Finance Department immediately after they are foreseen. However, it was
observed that the reasons were either not appropriately explained or furnished by
the departments.
(b) Surrender of Savings
Rule 66(1) of GFR, 2017 states that departments are required to surrender all the
anticipated unspent provision noticed in grants/appropriation controlled by them to
Finance Department by the stipulated date. During 2020-21, there was total
unspent provision of `22,526.24 crore which was around 8.49 per cent of the total
provision. Out the total savings, the amount surrendered was `4,443.18 crore (20
per cent).
In case of 18 grants/appropriations, the entire unspent provision, aggregating
`5,168.09 crore was not surrendered (Appendix 3.10). Further, in 37 cases in 26
grants/appropriations, there was only partial surrender (`4,443.18 crore) and
around 75 per cent (`13,341.58 crore) of the total unspent provision (`17,773.11
crore) was not surrendered. (Appendix 3.11).
There were substantial surrenders (more than 50 per cent ) which included 100 per
cent surrenders in 23 cases (`1,679.24 crore) (Appendix 3.12). Besides, in 17
grants where surrender of funds was in excess of `five crore, `3,961.94 crore (89
per cent of the total surrender) was surrendered on the last two working days of the
financial year indicating inadequate financial control (Appendix 3.13)
3.7.2.7 Excess expenditure over the provision during 2020-21
Excess Expenditure of `415.90 crore under Grant No.14 – Revenue and 24 –
Energy during the year 2020-21 was required to be regularized, the details of which
are given in table 3.9.
Table 3.9: Excess expenditure over the provision during 2020-21 requiring regularization
(Amount in `) Sl No Grant Provision Expenditure Excess
1 14- Revenue
Revenue Voted
1,30,72,40,24,000
1,34,26,99,73,004
3,54,59,49,004
2 14 – Revenue
Capital Charged
5,00,00,000
53,00,88,483
48,00,88,483
3 24 – Energy
Revenue Voted
1,42,82,28,00,000
1,42,95,57,91,400
13,29,91,400
Total 2,73,59,68,24,000 2,77,75,58,52,887 4,15,90,28,887 Source: Appropriation Accounts

Chapter 3 Budgetary Management
93
3.7.2.8 Excess expenditure and its regularization
As per Article 204 of the Constitution of India, no money shall be withdrawn from
the Consolidated Fund except under appropriation made by law by the State
Legislature. Article 205 stipulates that the Government should get the excess
expenditure over a grant/appropriation regularized by the State Legislature.
Although no timeframe for regularization of expenditure was prescribed under the
Article, the regularization of excess expenditure is done after the completion of
discussion of the Appropriation Accounts by the PAC.
Excess expenditure aggregating to `2,409.53 crore for the years from the year 2012-
13 to 2017-18 is yet to be regularized as detailed in Appendix 3.14. For the years
2018-19 and 2019-20, it was observed that there was no excess expenditure under
the grants/appropriations.
The Finance Department in its reply (December 2021) stated that the action would
be taken to regularize excess expenditure after recommendation of PAC. 3.7.3 Comments on effectiveness of budgetary and accounting process
3.7.3.1 Missing/incomplete explanation for variation from budget
Apart from showing the expenditure against the approved budget, Appropriation
Accounts also provide explanation for cases where the expenditure varies
significantly from the budgeted provision including supplementary provision.
The threshold levels for inclusion of detailed comments in the Appropriation
Accounts are as per the limits approved by the PAC. These norms are effective
from the financial year 1983-84.
The norms for selection of sub-heads for comments and for detailed comments in
Appropriation Accounts are as shown below:
Savings Comments are to be made if overall saving is more than two per cent
of Grants/Appropriation and if saving is more than 10 per cent under
any Sub-head.
Excess Comments are to be made if the overall excess is more than 10 per
cent of the Grant/Appropriation and also if excess is more than
`two lakh under any sub-head.
Source: Appropriation Accounts
In the Audit of Appropriation Accounts of 2020-21, it was noticed the Controlling
Officers have not provided explanation/specific reasons for the variations in the
expenditure vis-à-vis budgeted allocation in about 80 per cent of the savings. Of
the 29 grants/appropriations, in 28 grants/appropriations specific reasons for
variation for an amount of `17,629.62 crore was not furnished by the Controlling
Officers of Government Departments. The grant-wise details are shown in
Appendix 3.15.

State Finance Audit Report for the year ended 31 March 2021
94
3.7.3.2 Rush of Expenditure during 2020-21
The monthly flow of receipts to the State’s exchequer and disbursements during
2020-21 is given in Chart 3.3.
Chart 3.3: Monthly Receipts and Disbursements during 2020-21
(` in crore)
Source: Monthly Civil Accounts
It was observed that the State Government incurred an expenditure of `58,964.05
crore constituting 24 per cent of the total expenditure of `2,41,559.45 crore
(including public debt expenditure) during March 2021 alone.
Major cases where more than 50 per cent of the total expenditure was incurred in
March 2021 alone are detailed in Table 3.10.
Table 3.10: Quantum of Expenditure in March 2021
(` in crore) Major Head/Description 1st
Qtr 2nd
Qtr 3rd Qtr
4th
Qtr Total
Expenditure Expenditure
in March Expenditure in
March as a percentage of TE
4055-Capital Outlay on Police
0.00 1.66 59.25 304.85 365.76 245.72 67
4401-Capital Outlay on Crop Husbandry
0.00 205.27 252.1
3
871.42 1,328.82 668.45 50
4702-Capital Outlay on Soil and Water Conservation
47.07 373.71 526.7
7
1,525.
35
2,472.90 1,361.95 55
4801-Capital Outlay on Power Projects
0.00 164.50 0.00 485.62 650.12 321.52 50
4851-Capital Outlay on Village and Small Industries
0.00 26.98 35.75 202.92 265.63 163.52 62
6860-Loans Consumer Industries
26.08 34.83 3.19 152.01 216.11 150.65 70
Source: Monthly Civil Accounts
9,4
13
.02
9,5
49
.09
19
,34
3.0
3
17
,83
6.4
2
17
,67
4.8
8
21
,16
0.6
2
22
,07
2.6
5
23
,79
9.0
8
29
,25
0.7
7
18
,05
4.6
5
18
,73
1.8
0 34
,67
3.4
4
7,2
87
.10
11
,19
4.8
6
21
,30
0.5
0
13
,64
1.4
4
13
,16
7.7
1
16
,30
5.7
9
16
,40
6.1
6
14
,67
7.0
7
26
,87
7.5
1
18
,45
6.5
5
16
,85
0.1
0
58
,96
4.0
5
0
10,000
20,000
30,000
40,000
50,000
60,000
70,000
Apr-20 May-20 Jun-20 Jul-20 Aug-20 Sep-20 Oct-20 Nov-20 Dec-20 Jan-21 Feb-21 Mar-21
Receipts Expenditure

Chapter 3 Budgetary Management
95
As seen from the table, a substantial quantum of expenditure was incurred by the
Government at the fag end of the year indicating inadequate control over
expenditure and poor budgetary management.
The Finance Department stated (December 2021) that efforts would be made to
avoid rush of expenditure during March of the year.
3.8 Outcome of review of selected Grants
A review of Budgetary Procedures followed and methodology employed for control
over expenditure in respect of two selected grants over a three-year period from
2018-19 to 2020-21 showed the following:
3.8.1 Review of Grant No.10 – Social Welfare
3.8.1.1 Introduction
Social Welfare Department is responsible for formulation of various programme
and schemes for the upliftment of Scheduled Castes, Scheduled Tribes, Other
Backward Classes and Minorities especially for their socio-economic and
educational advancement. Grant 10 – Social welfare covers following Major
Heads:
2225 – Welfare of Scheduled Castes, Scheduled Tribes, Other Backward
Classes and Minorities.
4225 - Capital outlay on welfare of Scheduled Castes, Scheduled Tribes,
Other Backward Classes and Minorities.
3.8.1.2 Budget and Expenditure
The overall position of budget provision, actual disbursement and saving under the
above functional major heads for the last three years (2018-19 to 2020-21) is given
in Table 3.11. Table 3.11 : Budget and Expenditure
(` in crore) Year Section Budget
Provision Total Expenditure Unutilized
provision and its percentage
2018-19 Revenue Original 8,782.26 8,932.79 8,677.96 254.83(3)
Supplementary 150.53
Capital Original 3,006.21 3,506.21 3,422.37 83.84
(2) Supplementary 500.00
2019-20 Revenue Original 8,454.51 8,535.99 7,384.92 1,151.07(14)
Supplementary 81.48
Capital Original 2,876.39 3,033.98 2,783.45 250.53
(8) Supplementary 157.59
2020-21 Revenue Original 7,470.02 7,833.09 6,364.02 1,469.07(19)
Supplementary 363.07
Capital Original 1,974.28 1,974.28 1,163.80 810.48
(41) Supplementary 0.00
Source: Appropriation Accounts
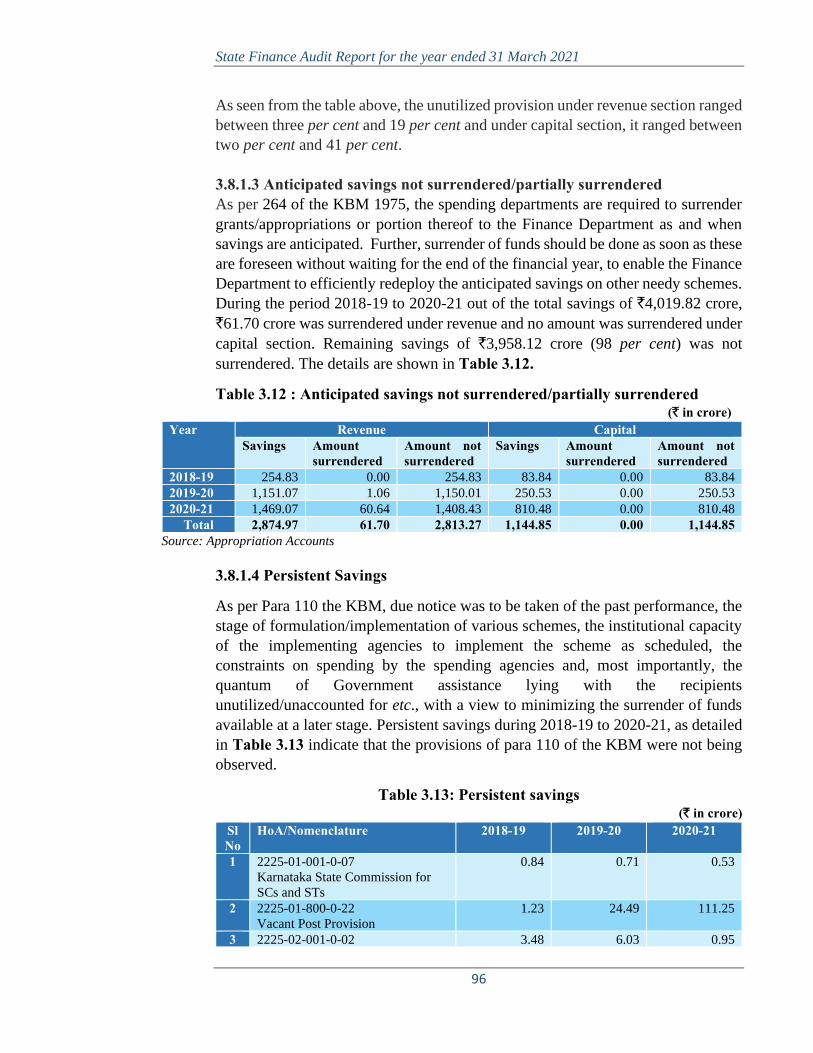
State Finance Audit Report for the year ended 31 March 2021
96
As seen from the table above, the unutilized provision under revenue section ranged
between three per cent and 19 per cent and under capital section, it ranged between
two per cent and 41 per cent.
3.8.1.3 Anticipated savings not surrendered/partially surrendered As per 264 of the KBM 1975, the spending departments are required to surrender
grants/appropriations or portion thereof to the Finance Department as and when
savings are anticipated. Further, surrender of funds should be done as soon as these
are foreseen without waiting for the end of the financial year, to enable the Finance
Department to efficiently redeploy the anticipated savings on other needy schemes.
During the period 2018-19 to 2020-21 out of the total savings of `4,019.82 crore,
`61.70 crore was surrendered under revenue and no amount was surrendered under
capital section. Remaining savings of `3,958.12 crore (98 per cent) was not
surrendered. The details are shown in Table 3.12.
Table 3.12 : Anticipated savings not surrendered/partially surrendered (` in crore)
Year Revenue Capital Savings Amount
surrendered Amount not surrendered
Savings Amount surrendered
Amount not surrendered
2018-19 254.83 0.00 254.83 83.84 0.00 83.84
2019-20 1,151.07 1.06 1,150.01 250.53 0.00 250.53
2020-21 1,469.07 60.64 1,408.43 810.48 0.00 810.48
Total 2,874.97 61.70 2,813.27 1,144.85 0.00 1,144.85 Source: Appropriation Accounts
3.8.1.4 Persistent Savings
As per Para 110 the KBM, due notice was to be taken of the past performance, the
stage of formulation/implementation of various schemes, the institutional capacity
of the implementing agencies to implement the scheme as scheduled, the
constraints on spending by the spending agencies and, most importantly, the
quantum of Government assistance lying with the recipients
unutilized/unaccounted for etc., with a view to minimizing the surrender of funds
available at a later stage. Persistent savings during 2018-19 to 2020-21, as detailed
in Table 3.13 indicate that the provisions of para 110 of the KBM were not being
observed.
Table 3.13: Persistent savings (` in crore)
Sl No
HoA/Nomenclature 2018-19 2019-20 2020-21
1 2225-01-001-0-07
Karnataka State Commission for
SCs and STs
0.84 0.71 0.53
2 2225-01-800-0-22
Vacant Post Provision
1.23 24.49 111.25
3 2225-02-001-0-02 3.48 6.03 0.95

Chapter 3 Budgetary Management
97
Sl No
HoA/Nomenclature 2018-19 2019-20 2020-21
Research and Training
4 2225-01-796-0-02-059
Other Expenditure
0.24 50.88 11.41
5 2225-01-277-0-02-051
General Expenses
12.79 0.46 20.06
6 2225-03-277-2-53-034
Contract/Outsource
0.43 0.27 16.24
7 2225-03-001-0-05-103
GIA - General
1.05 134.74 43.51
Source: Grant Register
3.8.1.5 Misclassification under object head ‘211 – Investment’
Classification of transactions to the correct object code is essential to know the
nature of expenditure and for future budgeting. During the year 2020-21, a
provision of `40 crore was made under the Head of Account 2225-01-190-4-01-
211 – Investment against which an expenditure of `20 crore was incurred. On
examination of the Government Order for release of funds (18 March 2021), it was
noticed that this amount was released to Karnataka Bhovi Development
Corporation for implementation of various programme under non-delegated
scheme for the welfare of Scheduled Caste as “Subsidy”. Hence, the object in the
budget “211 – Investment” was incorrect and affects the transparency of accounts.
Further, in the Payee receipt dated 24 February 2021, the description for payment
was shown as Financial Assistance to Bhovi Development Corporation.
3.8.1.6 Rush of Expenditure
As per paragraph 6 of instruction issued by Finance Department dated 09
September 2004, regarding releases, drawl and accounting of funds, the
Administrative Departments and the heads of Departments were to plan the
expenditure of the financial year with due diligence and within the available grants.
Bunching of bills and rush of expenditure in the month of March was to be avoided.
Administrative orders were to be issued well in advance after obtaining necessary
approvals at the required levels for expenditure likely to be incurred in February
and March. It was observed that there was rush of expenditure in the last quarter
especially in the month of March and the object-head wise details of expenditure
where the percentage of expenditure during last quarter and March is huge
compared to the total expenditure incurred during 2020-21 are detailed in Table 3.14.

State Finance Audit Report for the year ended 31 March 2021
98
Table 3.14: Rush of Expenditure
(` in crore)
Sl No
HoA and Nomenclature
Total Expenditure
Expenditure during last quarter
Expenditure during March
Amount percentage Amount percentage 1 2225-01-190-2-01-103
GIA- General
25.00 25.00 100 25.00 100
2 2225-03-190-0-04-106
Subsidies
80.00 60.00 75 40.00 50
3 2225-03-277-2-51-117
Scholarship and
Incentives
180.00 180.00 100 180.00 100
4 2225-03-277-2-52-117
Scholarship and
Incentives
114.97 114.97 100 99.13 86
5 4225-04-190-0-03-133
Special Development
Plan
50.00 50.00 100 50.00 100
Source: Grant Register
As seen from the table, the percentage of expenditure during March was between
50 to 100 per cent indicating breach of financial propriety.
3.8.2 Review of Grant No.12 – Information, Tourism and Youth Services
Grant No.12 – Information, Tourism and Youth Services covers following
functional major heads:
2204 – Sports and Youth Services
2205 – Art and Culture
2220 – Information and Publicity
3053 – Civil Aviation
3452 - Tourism
4202 – Capital outlay on Education, Sports, Art and Culture
4220 – Capital outlay on Information and Publicity
5452 – Capital outlay on Tourism.
However, for the review on budgetary management and expenditure control of the
grant, it was decided to take up the budgetary review of Tourism department.
3.8.2.1 Introduction Tourism Department is responsible for developing and promoting tourism in
Karnataka. It covers following Heads of Accounts:
3452 – Tourism.
5452 - Capital outlay on Tourism.
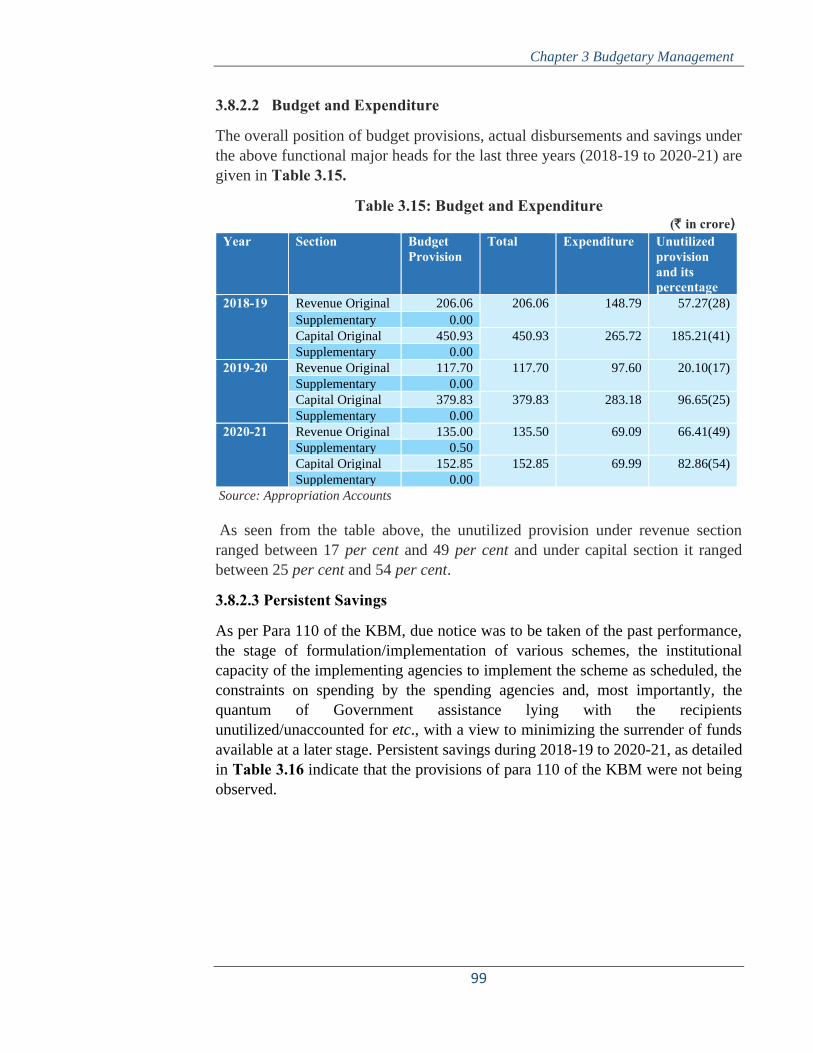
Chapter 3 Budgetary Management
99
3.8.2.2 Budget and Expenditure
The overall position of budget provisions, actual disbursements and savings under
the above functional major heads for the last three years (2018-19 to 2020-21) are
given in Table 3.15.
Table 3.15: Budget and Expenditure (` in crore)
Year Section Budget Provision
Total Expenditure Unutilized provision and its percentage
2018-19 Revenue Original 206.06 206.06 148.79 57.27(28)
Supplementary 0.00
Capital Original 450.93 450.93 265.72 185.21(41)
Supplementary 0.00
2019-20 Revenue Original 117.70 117.70 97.60 20.10(17)
Supplementary 0.00
Capital Original 379.83 379.83 283.18 96.65(25)
Supplementary 0.00
2020-21 Revenue Original 135.00 135.50 69.09 66.41(49)
Supplementary 0.50
Capital Original 152.85 152.85 69.99 82.86(54)
Supplementary 0.00
Source: Appropriation Accounts
As seen from the table above, the unutilized provision under revenue section
ranged between 17 per cent and 49 per cent and under capital section it ranged
between 25 per cent and 54 per cent.
3.8.2.3 Persistent Savings
As per Para 110 of the KBM, due notice was to be taken of the past performance,
the stage of formulation/implementation of various schemes, the institutional
capacity of the implementing agencies to implement the scheme as scheduled, the
constraints on spending by the spending agencies and, most importantly, the
quantum of Government assistance lying with the recipients
unutilized/unaccounted for etc., with a view to minimizing the surrender of funds
available at a later stage. Persistent savings during 2018-19 to 2020-21, as detailed
in Table 3.16 indicate that the provisions of para 110 of the KBM were not being
observed.
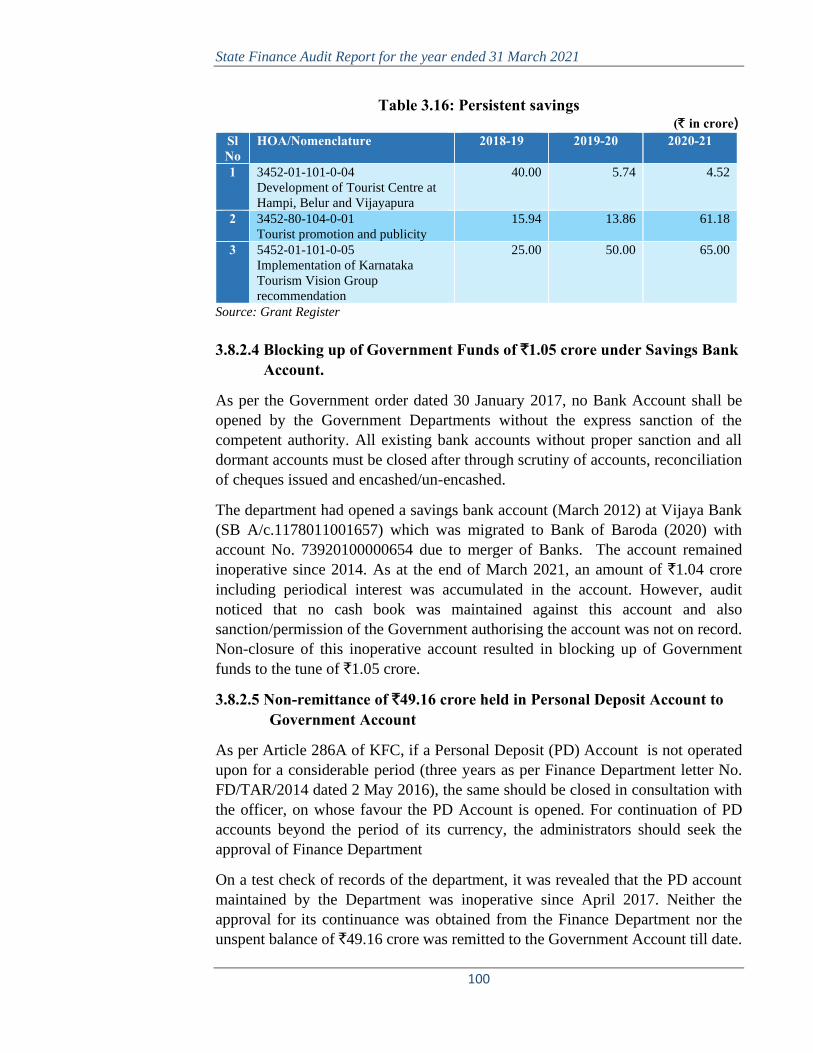
State Finance Audit Report for the year ended 31 March 2021
100
Table 3.16: Persistent savings (` in crore)
Sl No
HOA/Nomenclature 2018-19 2019-20 2020-21
1 3452-01-101-0-04
Development of Tourist Centre at
Hampi, Belur and Vijayapura
40.00 5.74 4.52
2 3452-80-104-0-01
Tourist promotion and publicity
15.94 13.86 61.18
3 5452-01-101-0-05
Implementation of Karnataka
Tourism Vision Group
recommendation
25.00 50.00 65.00
Source: Grant Register
3.8.2.4 Blocking up of Government Funds of `1.05 crore under Savings Bank Account.
As per the Government order dated 30 January 2017, no Bank Account shall be
opened by the Government Departments without the express sanction of the
competent authority. All existing bank accounts without proper sanction and all
dormant accounts must be closed after through scrutiny of accounts, reconciliation
of cheques issued and encashed/un-encashed.
The department had opened a savings bank account (March 2012) at Vijaya Bank
(SB A/c.1178011001657) which was migrated to Bank of Baroda (2020) with
account No. 73920100000654 due to merger of Banks. The account remained
inoperative since 2014. As at the end of March 2021, an amount of `1.04 crore
including periodical interest was accumulated in the account. However, audit
noticed that no cash book was maintained against this account and also
sanction/permission of the Government authorising the account was not on record.
Non-closure of this inoperative account resulted in blocking up of Government
funds to the tune of `1.05 crore.
3.8.2.5 Non-remittance of `49.16 crore held in Personal Deposit Account to Government Account
As per Article 286A of KFC, if a Personal Deposit (PD) Account is not operated
upon for a considerable period (three years as per Finance Department letter No.
FD/TAR/2014 dated 2 May 2016), the same should be closed in consultation with
the officer, on whose favour the PD Account is opened. For continuation of PD
accounts beyond the period of its currency, the administrators should seek the
approval of Finance Department
On a test check of records of the department, it was revealed that the PD account
maintained by the Department was inoperative since April 2017. Neither the
approval for its continuance was obtained from the Finance Department nor the
unspent balance of `49.16 crore was remitted to the Government Account till date.
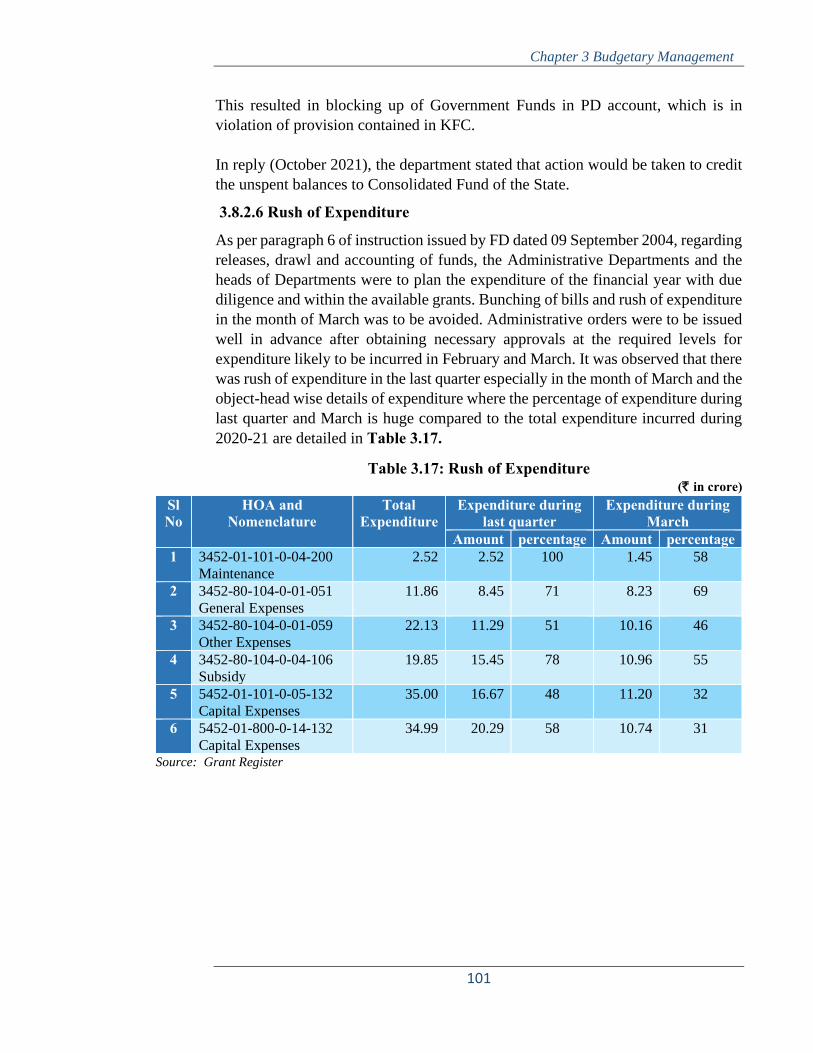
Chapter 3 Budgetary Management
101
This resulted in blocking up of Government Funds in PD account, which is in
violation of provision contained in KFC.
In reply (October 2021), the department stated that action would be taken to credit
the unspent balances to Consolidated Fund of the State.
3.8.2.6 Rush of Expenditure
As per paragraph 6 of instruction issued by FD dated 09 September 2004, regarding
releases, drawl and accounting of funds, the Administrative Departments and the
heads of Departments were to plan the expenditure of the financial year with due
diligence and within the available grants. Bunching of bills and rush of expenditure
in the month of March was to be avoided. Administrative orders were to be issued
well in advance after obtaining necessary approvals at the required levels for
expenditure likely to be incurred in February and March. It was observed that there
was rush of expenditure in the last quarter especially in the month of March and the
object-head wise details of expenditure where the percentage of expenditure during
last quarter and March is huge compared to the total expenditure incurred during
2020-21 are detailed in Table 3.17.
Table 3.17: Rush of Expenditure (` in crore)
Sl No
HOA and Nomenclature
Total Expenditure
Expenditure during last quarter
Expenditure during March
Amount percentage Amount percentage 1 3452-01-101-0-04-200
Maintenance
2.52 2.52 100 1.45 58
2 3452-80-104-0-01-051
General Expenses
11.86 8.45 71 8.23 69
3 3452-80-104-0-01-059
Other Expenses
22.13 11.29 51 10.16 46
4 3452-80-104-0-04-106
Subsidy
19.85 15.45 78 10.96 55
5 5452-01-101-0-05-132
Capital Expenses
35.00 16.67 48 11.20 32
6 5452-01-800-0-14-132
Capital Expenses
34.99 20.29 58 10.74 31
Source: Grant Register

State Finance Audit Report for the year ended 31 March 2021
102
3.9 Conclusion
• The budgetary exercise carried out by the State Government needs to be more
realistic as 8.49 per cent of the total provision remained unutilized. The
supplementary provision constituted 8.37 per cent of the original budget. There
were cases of unnecessary, excessive and inadequate supplementary provision
that resulted in savings/excess expenditure. Further, 80 per cent of the unspent
provision was not surrendered;
• Though Article 264 of the Karnataka Budget Manual specified furnishing
reasons for savings, Departments did not furnish reasons for 80 per cent of
savings;
• Significant policy initiatives of the Government such as Science and talent
search programmes, Artificial intelligence research Translation Park, Tank
bank for water security, soil health policy etc., were not fulfilled during the year
due to non-release of funds and delay in receipt of information;
• Excess expenditure during the current year as well as for the period from 2012-
13 to 2017-18 were required to be regularized under Article 205 of the
Constitution; and
• Re-appropriations were obtained without adequate justification resulting in
savings/excess. In 43 cases, the re-appropriation orders issued were defective
and hence were rejected.
3.10 Recommendation
• The budgetary control should be strengthened in all the departments to avoid
cases of provision remaining utilized.
• The priority should be accorded to regularize the excess expenditure from
2012-13 by bringing those cases before PAC.
• Unnecessary/Excessive Supplementary provision should be avoided.
• The re-appropriation orders should be issued in conformity with the
provisions of KFC.
•


State Finance Audit Report for the year ended 31 March 2021
106
• Non remittance of interest earned out of Government grants
The Government releases funds to Companies, Corporations, Autonomous
Bodies including Statutory Boards and Regional Societies in the form of paid-
up share capital of the organization concerned, grants, subsidies, re-
imbursement of expenditure, loans and funds released for schemes, etc.
The Finance Department vide Government Order (July 2003) directed all
Corporation / Companies /Autonomous Bodies etc., to remit interest earned on
Government funds received by them to the Government account by crediting
the head of account “0049 Interest Receipts”. It also emphasised that the interest
so earned shall not be used for any expenditure by the institutions. This was
reiterated vide its circular in August 2019.
Audit observed that Karnataka Urdu Academy, Bengaluru in contravention to
the above instructions did not remit the interest of ₹ 31.85 lakh to Government
Account earned out of Government grants. The details of interest earned and its
treatment during 2018-19 to 2020-21 are indicated in the Table 4.1:
Table 4.1: Details of interest earned and its treatment
(` in lakhs) Name of the Institution
Interest earned Treatment of the interest amount 2018-19 2019-20 2020-21 Total
Karnataka Urdu Academy, Bengaluru.
14.56
9.37
7.92
31.85 The interest earned for the period
from 2018-19 to 2020-21 was not
remitted to Government and
proposal was sent to the
Government for utilizing the
same due to less sanction of
Budget in the years.
The Government should take action to remit the interest earned on Government
grants, as it would help to increase the non-tax Revenue of the State.
The Finance Department in its reply (December 2021) stated that Karnataka
Urdu Academy would be requested through the administrative department to
remit the interest to Government.
B. Observation relating to transparency
4.2 Delay in submission of Utilisation Certificates Rule 161(5) of the Karnataka Financial Code (KFC), 1958 stipulates Utilisation
Certificates (UCs) should be obtained by the departmental officers from the
Grantees in respect of grants provided for specific purposes and these should be
forwarded to the Pr.AG (A&E) after verification within 18 months from the date
of their sanction unless specified otherwise. Audit observed that 37 UCs
aggregating `38.63 crore were in arrears as on due year 2020-21 as detailed in
Table 4.2. The status of year wise break up of outstanding UCs is given in
Table 4.3.

Chapter 4 Quality of Accounts and Financial Reporting Practices
107
Table 4.2: Pendency of Utilisation Certificate during 2020-21 (` in crore)
Year Opening Balance Addition Clearance Due for Submission
No. Amount No. Amount No. Amount No. Amount 2019-20 110 764.81 79 737.13 138 1,319.45 51 182.49
2020-21 51 182.49 396 1,239.80 410 1,383.66 37 38.63
Source: Office of the Pr.AG(A&E)
Table 4.3: Year wise break up of Outstanding UCs (` in crore)
Year Number of UCs Amount 2002-03 3 1.41
2007-08 1 0.24
2010-11 1 0.11
2015-16 2 1.85
2016-17 2 0.59
2018-19 16 26.52
2019-20 12 7.91
Total 37 38.63 Source: Office of the Pr.AG(A&E)
Further, under Rule 161(5) the form of UC required to be submitted clearly
indicates that the grant unutilised in a year should be surrendered or adjusted
towards the grants payable in the subsequent year. The number of outstanding
UCs of 51 amounting to ₹182.49 crore in the year 2019-20 has reduced to 37
amounting to ₹38.63 crore in the year 2020-21 and hence, the amount of
outstanding UCs showed a decrease of 79 per cent during 2020-21 when
compared to 2019-20. However, since the UCs in the above 37 cases were not
submitted, complete utilisation of grants released could not be ascertained.
Despite the pending UCs, the grants were released to the institutions indicating
lack of control over sanctioning of grants. Hence, Government needs to review
all such UCs pending for more than a year before release of further grants.
(` in crore)
Source: Office of the Pr.AG(A&E)
24.5
12.37
1.41
0.35
0 5 10 15 20 25 30
Medical and Public Health
Sports and Youth Services
Relief on account of Natural Calamities
Information and Publicity
Outstanding value of Utlization Certificates
Nam
e o
f th
e D
epar
tmnet
s
Chart 4.1: Outstanding UCs in respect of 04 Major Department for the grants paid upto 2019-20

State Finance Audit Report for the year ended 31 March 2021
108
As seen in Chart 4.1, majority of cases of non-submission of UCs related to the
Medical and Public Health Department (63.42 per cent) and the Sports and
Youth Services (32.02 per cent). Pendency in submission of UCs not only
indicates absence of assurance on utilisation of grants released for intended
purposes but also lack of monitoring of utilisation of grants released to the
grantees by the departments. Major Head wise and Department-wise details of
outstanding UCs separately for each year is detailed in Appendix 4.1 The Finance Department replied (December 2021) that the Administrative
Departments would be requested to comply with these observations. 4.3 Abstract Contingent Bills Under Rule 36 of the Manual of Contingent Expenditure, 1958, the Controlling
and Disbursing Officers are authorized to draw sums of money by preparing
Abstract Contingent (AC) bills by debiting service heads and are required to
present Non-payment Detailed Contingent (NDC) bills (vouchers in support of
final expenditure) to the Pr.AG(A&E) through the treasuries before the 15th of
the month following the month to which the bill relates. Controlling officers
should also ensure that no amounts are drawn from the treasury through AC
bills unless required for immediate disbursement. Detailed bills aggregating to
`126.34 crore, drawn on 2,221 AC bills, were pending at the end of March 2021
as detailed in Table 4.4. Table 4.4: Year wise progress in submission of NDC bills against the AC bills
(` in crore) Year Opening Balance Addition Clearance Closing Balance
No Amount No Amount No Amount No Amount Upto 2017-18
3,272 84.81 3,094 90.03 3,090 90.84 3,276 84.00
2018-19 3,276 84.00 2,286 188.64 3,467 179.37 2,095 93.27
2019-20 2,095 93.27 2,109 182.90 2,245 179.49 1,959 96.68
2020-21 1,959 96.68 2,247 153.46 1,985 123.80 2,221 126.34
Source- Finance Accounts *Excluding Bills for the Month of March 2021
(` in crore)
Source: Office of the Pr.AG(A&E)
38.02
36.92
31.56
6.18
2.54
1.89
1.66
0 5 10 15 20 25 30 35 40
Other Rural Devolopment Programmes
DPAR
Police
Forestry and Wild Life
Relief on account of Natural Calamities
Urban Devolopment
General Education
Nam
e o
f th
e D
epar
tmen
t
Chart 4.2Pending NDC Bills in respect of major departments

Chapter 4 Quality of Accounts and Financial Reporting Practices
109
Chart 4.2 reveals that 30 per cent of the outstanding NDC bills pertain to Other
Rural Development Department-Major Head 2515 (`38.02 crore), 29 per cent
relate to DPAR Department (Elections) - Major Head 2015 (`36.92 crore), 25
per cent relate to Home department (Police) - Major Head 2055 (`31.56 crore).
The withdrawal of money on an AC bill is accounted for against the functional
Major Head in the Consolidated Fund. Unless the accounts are settled within
the time allotted, the expenditure stands inflated. In reply to the audit
observation at Paragraph 3.6 of the report on State Finances for the year ending
March 2019, the Finance Department stated (August 2021) that the instructions
were issued (February 2021) to all concerned departments for settlement of
outstanding NDC bills and Treasuries were directed to withhold salary bills and
non-salary bills in Khajane-2 of those DDOs who had drawn AC bills but failed
to submit NDC bills as per circular dated 25 October 2019. However, there is
an increase in the number of outstanding bills when compared to previous year.
Bills in support of the claim for the amounts drawn on AC bills are to be
submitted within the period stipulated in the Manual of Contingent Expenditure.
The Finance Department replied (December 2021) that the Administrative
Departments would be requested to comply with these observations. 4.4 Personal Deposit Accounts Article 286 of the KFC,1958 provides for opening of Personal Deposit (PD)
accounts with permission from the Government in cases where the ordinary
system of accounting is not suitable for transactions. PD accounts created by
debit to the Consolidated Fund of the State should be closed at the end of the
financial year. However, this rule is not strictly followed in the State as
significant balances are carried forward to the subsequent year which are
discussed in paragraphs below. Administrators of the accounts should intimate
the Treasury Officer about the balance to be transferred to the Consolidated
Fund. For continuation of PD accounts beyond the period of their currency,
administrators are required to seek the permission of the Finance Department.
Periodical reconciliation of PD accounts with treasury accounts is the
responsibility of the administrators concerned.
4.4.1 Trends in the closing balance of PD Account
The closing balances in the PD Accounts during the last five years i,e from
2016-17 to 2020-21 is indicated in Table 4.5. Table 4.5: Funds kept in PD Accounts
(` in crore)
Year Opening Balance Receipts/Deposits Withdrawals Closing balance
2016-17 2,735.61 5,516.51 5,310.01 2,942.12
2017-18 2,942.12 4,194.46 4,395.06 2,741.52
2018-19 2,741.52 5,350.98 4,007.36 4,085.14
2019-20 4,085.14 6,557.67 6,221.25 4,421.56
2020-21 4,421.56 4,711.16 5,143.49 3,989.23
Source- Finance Accounts
During the year 2020-21, out of the 76 PD Accounts which existed in 2019-20,
five PD Accounts with a balance of ₹2.79 crore were closed and hence, 71 PD
Accounts existed as at the end of the year. During the year 2020-21, out of
₹4,711.16 crore credited to PD Accounts, ̀ 1,358.86 crore was transferred to PD

State Finance Audit Report for the year ended 31 March 2021
110
accounts during March 2021. The closing balance in deposit accounts showed
a decrease of 9.7 per cent during 2020-21 when compared to 2019-20.
The net closing balance in respect of some of the PD accounts of the
administrators having high balances as at the end of 2020-21 are shown in
Table 4.6. Table 4.6: Closing balances in PD Accounts
(` in crore)
Sl.No Administrator Amount
1 Personal Deposits - General 378.12
2 PD Accounts of Deputy Commissioners 8,640.33
3 PD Accounts of Director, Department of Scheduled Tribes 368.66
4 Personal Deposit Assistant Commissioner under the Revenue
Department
265.05
Source- DDR Ledger
During audit of the Offices of the DMA and Food and Civil Supplies (August
2021), Tumakuru, it was observed that the closing balance of the Deputy
Commissioners included the following:
• An amount of ₹20 lakh pertaining to the Department of Food and Civil
Supplies was deposited during September 2003 and is lying idle as on
August 2021 for more than 18 years. However, the purpose for which
the amount was released and deposited in the PD Account was not
forthcoming from the records made available to audit. The Department
in its reply (August 2021) stated that action would be initiated to remit
the amount back to Government Account.
• Out of the XV FC ULB grants of ₹1,549 crore received in the State
during 2020-21, ₹ 991 crore was released to ULBs which were deposited
in the PD Accounts of the Deputy Commissioners. Against the release,
₹80.04 crore was utilized leaving a balance of ₹910.96 crore (92 per
cent) lying unspent in the PD accounts.
• Apart from the XV FC grants, the closing balance of PD accounts
included the unutilized amounts of ₹ 1,405.21 crore indicated in Table-4.7.
Table 4.7: Unutilised amounts of Central and State Finance Commissions and other funds in PD Accounts
(₹ in crore) Sl.No. Type of Grants Unutilised
Amount
1 XIII Finance Commission grants for development works in the
ULBs
12.22
2 XIV Finance Commission grants (Basic and Performance
grants)
773.80
3 State Finance Commission grants i.e., untied grants, special
grants and drinking water scarcity
393.98
4 Other miscellaneous grants viz., Construction of Anganwadi,
Swachh Bharath Mission etc.
225.21
Total 1,405.21
Chapter 4 Quality of Accounts and Financial Reporting Practices
111
Out of the Closing Balance of ₹8,640.33 crore in the PD Accounts of Deputy
Commissioners, around 27 per cent of the amount pertained to unutilized
balances of Finance Commission, schemes etc. which required to be remitted
back to the Government.
The Finance Department stated that (December 2021) Food and Civil Supplies
department would be requested to remit funds of `20 lakh remaining unspent in
their PD account from September 2003 and Urban Development Department
would also be requested to refund Unspent funds of `910.96 crore parked in the
deposit account of the Deputy Commissioners.
However, the department’s reply is silent on the unutilised amounts (₹1,405.21
crore) of Central and State Finance Commissions and other funds in PD
Accounts.
4.4.2 Inoperative and non-reconciled PD Accounts
As per Article 286A of the KFC, the State Government is required to close all
PD accounts remaining inoperative for considerable period of time. As brought
out in Notes to Accounts of Finance Accounts 2020-21, out of 71 PD accounts,
24 PD accounts (14 PD accounts with a credit balance of `50.73 crore and eight
PD accounts with a debit balance of `2.02 crore and two PD accounts with Nil
balance) were inoperative for more than three years (Appendix 4.2). Action
may be taken by the administrators to analyse and duly reconcile the balances,
close the accounts and write back the unspent balances to the Consolidated Fund
of the State.
The Finance Department replied (December 2021) that concerned
Administrators and Heads of the Departments were requested (February 2021)
to review such PD accounts in which balances had remained unutilized for more
than three years and take action for closure of such accounts.
C. Observation relating to measurement
4.5 Outstanding balances under suspense and DDR heads 4.5.1 Balances under Major Suspense and DDR heads
The accounts of the Government are kept on cash basis. Certain
intermediary/adjusting heads of accounts known as ‘Suspense Heads’ are
operated in Government Accounts to reflect transactions of receipts and
payments, which cannot be booked to a final head of account due to lack of
information as to their nature, or for other reasons. These heads of accounts are
finally cleared by minus debit or minus credit when the amounts are booked to
their respective final heads of accounts. If these amounts remain un-cleared,
the balances under the suspense heads would accumulate and would not reflect
the Government’s receipts and expenditure accurately. The balances under
certain major suspense heads of accounts, as recorded in the ledger maintained
by Pr.AG (A&E), are indicated in Table 4.8

State Finance Audit Report for the year ended 31 March 2021
112
Table 4.8: Balances under Suspense and Remittance Head (` in crore)
Source- DDR Ledger
Debt, Deposit and Remittances (DDR) are heads of account for such
transactions where the Government, as a custodian of public money, receives
and holds such money in trust.
The accuracy of the State Finance Accounts 2020-21, was adversely affected by
factors such as;
(i) Large number of transactions under suspense heads awaiting final
classification and
(ii) Increased magnitude and quantum of adverse balances under DDR
heads. The Finance Accounts reflect the net balances under these heads. The
outstanding balances are worked out by aggregating the outstanding debit and
credit separately. The implications of the balances under these heads are
discussed in the succeeding paragraphs:
Minor Head 2018-19 2019-20 2020-21
Major Head 8658-Suspense
Dr Cr Dr Cr Dr Cr
101-PAO Suspense 288.08 16.93 270.30 10.86 283.51 3.40
Net Dr. 271.15 Dr. 259.44 Dr. 280.11 102-Suspense Account-Civil
17.76 296.45 18.14 414.95 18.42 378.75
Net Cr.278.69 Cr. 396.81 Cr. 360.33 107-Cash Settlement Suspense Account
20.53 - 20.53 - 20.53 -
Net Dr. 20.53 Dr. 20.53 Dr. 20.53 110- Reserve Bank Suspense- Central Accounts Office
91.41 183.28 17.59 154.67 72.61 53.35
Net Cr. 91.87 Cr.137.08 Dr.19.26 112- Tax Deducted at source (TDS) suspense
204.16 233.34 0.74 32.77 0.74 4.75
Net Cr.29.18 Cr.32.03 Cr.4.01 123- A.I.S Officers Group Insurance Scheme
9.30 - 1.00 - 1.28 -
Net Dr.9.30 Dr.1.00 Dr.1.28 8782-Cash Remittances
102-01 Public Works Remittances into treasury
82.61 - 82.61 - 82.61 -
Net Dr.82.61 Dr.82.61 Dr.82.61 103-01 Forest Remittance into Treasury
12.13 - 12.13 - 12.13 -
Net Dr.12.13 Dr.12.13 Dr.12.13

Chapter 4 Quality of Accounts and Financial Reporting Practices
113
• Pay and Accounts Office Suspense This head is intended for settlement of transactions between the AG and the
various separate Pay and Accounts Offices (PAO) of GoI. The transactions
initially recorded under this head in the books of the AG are cleared on receipt
of the Cheque/Demand Drafts from the PAO and on the issue of
Cheque/Demand Draft in respect of amounts received in the State Treasuries on
behalf of the PAO. Outstanding debit balance under this head would mean that
payments were made by the AG on behalf of a PAO, which were yet to be
recovered. Outstanding credit balance would mean that payments have been
received by the AG on behalf of a PAO, which were yet to be paid. The net
debit balance under this head showed an increasing trend. On
clearance/settlement of this, the cash balance of the State Government will
increase. The transactions mainly related to National Highways, and payments
made by the State Government to Central Government Civil Pensioners.
• Suspense Account (Civil) Transactions where full particulars of the classification are not available, or
where the relevant vouchers/schedules in support thereof are not available or
where there is some discrepancy between the figures reported in the treasury
schedules of payment/cash accounts and those appearing in the supporting
vouchers, schedules, etc. constitute the major portion of outstanding figure
under this head. Transactions taking place at state treasuries on behalf of
Railways, Defence and Postal and Telecommunication Department are also
initially classified under this head, pending settlement of claims by these
authorities. The net credit balance under this head decreased by `36.48 crore
during the year. In so far as accounts with Railways (`3.15 crore) and accounts
with Defence (`1.85 crore) are concerned, the cash balance will increase on
clearance. There is no impact on cash balance in respect of the rest.
• Reserve Bank Suspense, Central Accounts Office This head is operated for recording inter-governmental transactions where
monetary settlement between the cash balances of two Governments is done by
sending advice to the Central Accounts Section of the RBI. This head is cleared
by transferring the amount to the final head of account on receipt of intimation
of the monetary settlement having been carried out by the RBI. The main
transactions, which get settled through this suspense head are grants, loans
received from the GoI and their repayments, discharge of securities and interest
paid thereon by the Public Debt offices of RBI, and payments made by the
Director General of Supplies and Disposals for materials supplied to
Government Departments. During 2020-21, the debit balance under this head
was `19.26 crore and has decreased by `156.34 crore compared to previous
year.
• Public Works Remittance into Treasury This head is operated to watch whether the Treasury acknowledges amounts
remitted by the divisional officers of Public Works. The debit balance of ₹82.61
crores at the end of year 2020-21 is due to non-reconciliation by the Division
Offices with the Treasury and these differences could lead to non-detection of
cases of defalcation, which may result in loss to Government.

State Finance Audit Report for the year ended 31 March 2021
114
• Forest Remittances into Treasury Collection for Forest Revenues by the divisions and their remittance to the
Government Accounts at treasury initially takes place under this head. The
debits under this head gets cleared by credits appearing in the treasury accounts
when the remittances are acknowledged and accounted by the treasury officers.
Due to time lag between actual realization of revenue and its remittance into the
treasury, the debits appearing in the division accounts under this head would
continue to appear till remittance made is finally accounted in the Treasury
Accounts. There is a debit balance of ₹12.13 crores at the end of 2020-21 under
this head.
The Finance Department replied (December 2021) as follows:
• Pr. AG (A&E) would be requested to take suitable action for clearance of
outstanding balances under pay and account office suspense accounts
(Civil) and Reserve bank suspense Central accounts office.
• With regard to public works and forest remittances into Treasury, these
departments would be requested to reconcile and clear the outstanding
balances.
4.5.2 Adverse Balances under DDR Heads
Adverse balances are negative balances appearing under those heads of
accounts where there should not be a negative balance. For example, against the
accounting head of any loan or advance, a negative balance will indicate more
repayment than the original amount advanced. Table 4.9 indicates adverse
balance under Public Debt and Loans & Advances. The balance under Public
Debt, Head of Account (HoA) 6003-00-108-0-01 – Internal debt of the State
Government Loans from National Co-operative Development Corporation Ltd.
reduced by ₹40.83 crore in the year 2020-21 as compared to year 2019-20 due
to action taken by the Government in clearing the adverse balances under this
HoA. However, under the Loans and Advances, HoA 7610 – Loans and
Advances to Government servants, the balance increased by ₹2.14 crore in the
year 2020-21 as compared to year 2019-20. Hence, necessary action for clearing
the adverse balances in respect of Public Debt and Loans and Advances is
required to be taken.
Table 4.9: Adverse balance under DDR Heads
(` in crore)
Sl. No.
Head of account Description Amount Reason
Public Debt
1 6003-00-108-0-01 Internal debt of the
State Government-
Loans from
National Co-
operative
Development
Corporation Ltd.,
Dr.133.57 Due to non-accounting of loan receipts
from National Co-operative
Development Corporation Ltd., in the
Government accounts; whereas
repayments were made through the
Government accounts.

Chapter 4 Quality of Accounts and Financial Reporting Practices
115
Sl. No.
Head of account Description Amount Reason
2 6004-03 &
6004-04
Loans and
Advances from
Central
Government under
Central Plan
Scheme and
Centrally
Sponsored Scheme
Dr.10.36 This was on account of write-off of
Central Loans on the
recommendations of XIII FC
(balances outstanding as per books of
accounts as on 31 March 2010). The
excess payments made during 2010-12
to various PAOs are to be adjusted
against the dues of the Finance
Ministry, GoI.
Total Dr.143.93 Loans and Advances
3 6202, 6215, 6217,
6401, 6402, 6405,
6408, 6435 6505,
6506, 6701, 7475
& 7615
Loans to State
Institutions
Cr. 90.06 Adverse balance is due to
misclassification, which is under
reconciliation.
4 7610
Loans and
Advances to
Government
servants
Cr. 8.38
Adverse balance is due to
misclassification, which is under
reconciliation.
Total Cr. 98.44
Source- Office of the Pr.AG(A&E)
4.6 Non-reconciliation of Departmental figures To exercise effective budgetary control over revenue/expenditure and to ensure
accuracy in accounts, all Controlling Officers are required to reconcile every
month, the receipts and expenditure recorded in their books with the figures
accounted for by the Pr.AG (A&E). The details of last three years from 2018-
21 revenue and expenditure reconciliation is indicated in Chart 4.3
(` in crore)
Source- Finance Accounts * Excludes loans and advances
1,64,817.41
1,73,687.60
1,56,597.91
1,97,933.22
1,79,098.38
2,18,803.97
1,64,973.15
1,75,487.87
1,56,761.64
1,98,959.17
2,09,786.84
2,21,459.96
0.00 50,000.00 1,00,000.00 1,50,000.00 2,00,000.00 2,50,000.00
2018-19
2019-20
2020-21
2018-19
2019-20
2020-21
Exp
end
itu
reR
ecei
pts
Chart 4.3 Status of reconciliation during the last three years 2018-21
Total Receipts/Expenditure Reconciliated Figures

State Finance Audit Report for the year ended 31 March 2021
116
The details relating to the number of Controlling Officers and the extent of
reconciliation during the last three years are given in Table 4.10. Table 4.10: Status of Reconciliation of Receipts and Expenditure figures` in crore) (` in
crore (` in crore)
Year Total No. of Controlling
officers
Fully reconciled
Partially Reconciled
Not reconciled
at all
CCOs not transacted during the
month
Total Amount
Reconciled Amount
Percent-age
Reciepts
2018-19 92 84 4 4 - 1,64,973.15 1,64,817.41 99.90
2019-20 101 75 18 8 - 1,75,487.87 1,73,687.60 98.97
2020-21 101 86 - 15 - 1,56,761.64 1,56,597.91 99.90
Expenditure
2018-19 331 299 5 26 1 1,98,959.17 1,97,933.22 99.48
2019-20 322 245 50 27 - 2,09,786.84 1,79,098.38 85.37
2020-21 322 289 - 33 - 2,21,459.96 2,18,803.97 98.80
Source- Report on MCA and Finance Accounts
As indicated in the Table 4.10 reconciliation of expenditure which had
decreased to 85 per cent during 2019-20 when compared to 2018-19 (99 per
cent) increased during 2020-21 (98 per cent). No reconciliation was carried out
in respect of receipts and disbursements under loans and advances. Necessary
action for reconciliation in respect of receipts and expenditure under loans and
advances is required to be taken.
The Finance Department stated (December 2021) that departments were
requested to complete the reconciliation. 4.7 Reconciliation of cash balance There should be no difference between cash balance of the State as per books
of Accounts of the Pr.AG (A&E) and the cash balances as reported by RBI.
As on March 2021, there was a difference of {`1,511.17 crore (Dr.)}, between
the figures reflected in the accounts {`1,588.33 crore (Dr.)} and that intimated
by the RBI {`72.16 crore (Dr.)}. The difference pertains to non– reporting and
non- reconciliation of figures by the Agency Banks. It is under reconciliation
in the office of Pr.AG (A&E).
D. Observation relating to disclosure
4.8 Compliance with Accounting Standards The Government Accounting Standards Advisory Board (GASAB) set up in the
office of the C&AG with the support of the GoI is entrusted with the
responsibility of formulating and proposing accounting and financial reporting
standards for Government departments and organisations. On the advice of the
C&AG of India, the President of India has so far notified three Indian
Government Accounting Standard (IGAS).
The details of IGAS and compliance with these by GoK for the year 2020-21
are discussed in Table 4.11.
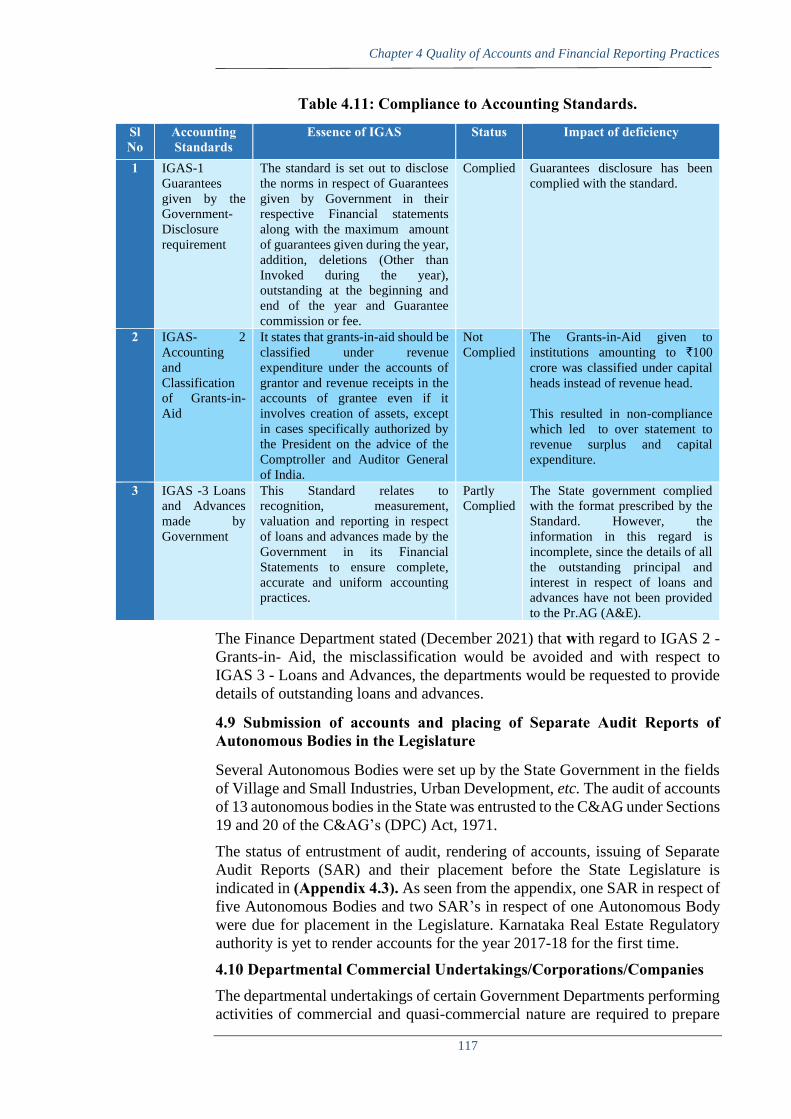
Chapter 4 Quality of Accounts and Financial Reporting Practices
117
Table 4.11: Compliance to Accounting Standards.
Sl No
Accounting Standards
Essence of IGAS Status Impact of deficiency
1 IGAS-1
Guarantees
given by the
Government-
Disclosure
requirement
The standard is set out to disclose
the norms in respect of Guarantees
given by Government in their
respective Financial statements
along with the maximum amount
of guarantees given during the year,
addition, deletions (Other than
Invoked during the year),
outstanding at the beginning and
end of the year and Guarantee
commission or fee.
Complied Guarantees disclosure has been
complied with the standard.
2 IGAS- 2
Accounting
and
Classification
of Grants-in-
Aid
It states that grants-in-aid should be
classified under revenue
expenditure under the accounts of
grantor and revenue receipts in the
accounts of grantee even if it
involves creation of assets, except
in cases specifically authorized by
the President on the advice of the
Comptroller and Auditor General
of India.
Not
Complied
The Grants-in-Aid given to
institutions amounting to `100
crore was classified under capital
heads instead of revenue head.
This resulted in non-compliance
which led to over statement to
revenue surplus and capital
expenditure.
3 IGAS -3 Loans
and Advances
made by
Government
This Standard relates to
recognition, measurement,
valuation and reporting in respect
of loans and advances made by the
Government in its Financial
Statements to ensure complete,
accurate and uniform accounting
practices.
Partly
Complied
The State government complied
with the format prescribed by the
Standard. However, the
information in this regard is
incomplete, since the details of all
the outstanding principal and
interest in respect of loans and
advances have not been provided
to the Pr.AG (A&E).
The Finance Department stated (December 2021) that with regard to IGAS 2 -
Grants-in- Aid, the misclassification would be avoided and with respect to
IGAS 3 - Loans and Advances, the departments would be requested to provide
details of outstanding loans and advances.
4.9 Submission of accounts and placing of Separate Audit Reports of Autonomous Bodies in the Legislature
Several Autonomous Bodies were set up by the State Government in the fields
of Village and Small Industries, Urban Development, etc. The audit of accounts
of 13 autonomous bodies in the State was entrusted to the C&AG under Sections
19 and 20 of the C&AG’s (DPC) Act, 1971.
The status of entrustment of audit, rendering of accounts, issuing of Separate
Audit Reports (SAR) and their placement before the State Legislature is
indicated in (Appendix 4.3). As seen from the appendix, one SAR in respect of
five Autonomous Bodies and two SAR’s in respect of one Autonomous Body
were due for placement in the Legislature. Karnataka Real Estate Regulatory
authority is yet to render accounts for the year 2017-18 for the first time.
4.10 Departmental Commercial Undertakings/Corporations/Companies The departmental undertakings of certain Government Departments performing
activities of commercial and quasi-commercial nature are required to prepare
State Finance Audit Report for the year ended 31 March 2021
118
proforma accounts in the prescribed format annually, showing the working
results of financial operations, so that the Government can assess their working.
The finalized accounts of departmentally managed commercial and quasi
commercial undertakings reflect their overall financial health and efficiency. In
the absence of timely finalization of accounts, the investment of the
Government remains outside the scrutiny of Audit/State Legislature.
Consequently, corrective measures, if any, required for ensuring accountability
and improving efficiency cannot be taken in time. Besides, the delay renders the
system vulnerable to the risk of fraud and leakage of public money.
The Heads of Departments in the Government are to ensure that the
undertakings prepare and submit accounts to the AG for audit within a specified
time-frame. Out of the nine undertakings, which are closed/
transferred/converted into co-operative federations, proforma accounts in
respect of two undertakings were due from 1969-70. The position of arrears in
preparation of proforma accounts by the undertakings is given in Appendix 4.4. As seen in the appendix an investment of ₹8.87 crore has been made in the six
undertakings as per the accounts finalized up to 2008-09 in respect of one
undertaking , 2015-16 in respect of four undertakings and 2016-17 in respect of
one undertaking.
In reply to the audit observation at Paragraph 3.4 of the State Finance Audit
Report for the year ending March 2019, the Finance Department stated (March
2019) that the concerned departments have been requested to furnish Proforma
Accounts to Audit Office. 4.11 Non-Submission of details of grants/ loans given to bodies and authorities Under Section 14 of the C&AG’s (DPC) 1971 whenever anybody or authority
is substantially financed by grants or loans from Consolidated Fund of the State,
the C&AG shall, subject to the provisions of any law for the time being in force
applicable to the body or authority, as the case may be, audit all such receipts
and expenditure of that body or authority and report the receipts and expenditure
audited by him. Under Section 15 of the C&AG’s (DPC) 1971, where any grant
or loan is given for any specific purpose, the C&AG shall scrutinize the
procedures by which sanctioning authority satisfies itself as to the fulfilment of
the conditions.
The institutions/bodies/authorities, which are audited under the above sections
needs to be identified and the heads of the Government Departments are
required to furnish to audit every year information about the institutions to
which financial assistance of ̀ 25 lakh or more was given, the purpose for which
assistance was granted and the total expenditure of the institutions.
Twenty-Two Departments did not furnish the information pertaining to 1,082
institutions receiving grants aggregating `25 lakh or more for periods ranging
from two years to more than 20 years, as detailed in Appendix 4.5. As seen
from the appendix, the major defaulter was the Department of Education.
Though, in reply to the audit observation at paragraph 3.2 of the State Finance
Audit Report for the year ending March 2019, the Finance Department stated
(August 2021) that the concerned departments have been requested (February
2021) to furnish information to Audit Office, it is seen that the number of

Chapter 4 Quality of Accounts and Financial Reporting Practices
119
departments not furnishing the information increased when compared to
previous year.
The Finance Department reiterated that (December 2021) departments would
be requested to furnish details of Institutions that receive financial assistance
/grants of `25 lakh or more.
4.12 Timelines and Quality of Accounts The accounts of the State Government are compiled by the Pr.AG (A&E) from
the initial accounts rendered by 34 Treasuries, 3 Others, 103 Public Works
Divisions and 103 Forest Divisions, apart from RBI advices. Though there was
delay in rendering Monthly accounts in the first three quarters by some of the
sections of the department, the State Government has monitored and ensured
timely rendering of accounts. This timely submission of accounts continued
during 2020-21 and as a result, the Pr.AG (A&E) excluded no accounts from
the Monthly Civil Accounts. 4.13 Misappropriation, losses, thefts etc. There were 33 cases of misappropriation, losses etc. involving Government
money amounting to ̀ 26.40 crore as at the end of 2020-21 on which final action
is pending. The department wise break up of pending cases is given below in
Table 4.12 and age wise break up is indicated in Appendix 4.6.
Table 4.12: Pending cases of misappropriation, losses and thefts etc. (` in lakhs)
Name of the Department
Cases of misappropriation/
losses/ thefts of Government
material
Reasons for the delay in final disposal of pending cases of misappropriation, losses, thefts etc.
Awaiting departmental and
criminal investigation
Departmental action initiated but
not finalised
Criminal proceedings finalised but
recovery of the amount pending
No. of cases
Amount No. of cases
Amount No. of cases
Amount No. of cases
Amount
Public Works 2 1,180.18 - - 2 1,180.18 - -
Home 8 256.09 3 101.93 5 154.16 - -
Food and Civil Supplies
1 525.00 1 525.00 - - - -
Social Welfare 1 9.48 1 9.48 - - - -
Medical Education
2 1.91 2 1.91 - - - -
Animal Husbandry and Vetenary Services
4 643.70 4 643.70 - - - -
Department of Technical Education
1 0.28 1 0.28 - - - -
Forest 2 0.74 2 0.74 - - - -
Health and Family Welfare
10 1.6 10 1.6 - - - -
Labour 1 0.89 - - 01 0.89
Judiciary 1 20.00 1 20.00
Total 33 2,639.87 25 1,304.64 08 1,335.23 - -
Source: Office of the Pr.AG(Audit I) and AG(Audit II)

State Finance Audit Report for the year ended 31 March 2021
120
4.14 Follow up action on State Finance Audit Report The Report of C&AG of India on State Finances for the year 2009-10 was
discussed by the PAC during the period May 2011 to August 2011. The report
containing the recommendations was placed before the Legislature in December
2011. Compliance to the recommendations of the PAC, the Action Taken Note
was placed before the PAC for its consideration during September 2014. The
PAC discussed the Action Taken Note furnished by the Government and made
further recommendations which were placed before the Legislature in July
2015.
Important issues meriting attention of the PAC on the State Finances viz.,
regularisation of excess expenditure from 2012-13 to 2017-18, revision of
enhancing the monetary limits for selection of comments in Appropriation
Accounts have been brought to the knowledge of the August body for their
consideration.
4.15 Conclusion The closing balances in the Personal Deposit accounts showed a slight decrease
in the year 2020-21 compared to last year. Though there was decrease in the
Closing Balances, it included unutilized amounts which were required to be
remitted back to the Government. In addition, there was increase in the number
of inoperative PD accounts. Non-reconciliation of balances in such inoperative
PD accounts and not transferring the unspent balances lying in such PD
accounts to the Consolidated Fund of State is fraught with risk of misuse of
public funds, fraud and misappropriation.
Non-clearance of balances under suspense heads would not reflect
Government’s receipt and expenditure accurately under correct heads of
account. Further, there were adverse balances in certain DDR heads which
required remedial action for clearance.
More than 29 per cent of the AC bills drawn during the year were pending for
want of NDC bills.
In spite of the Finance Department issuing instructions to Administrative
Departments to furnish information to audit about the Institutions which were
substantially financed by the Government, there was increase in number of
Institutions not furnishing the required information. This points to inadequate
internal controls and deficient monitoring mechanism of the State Government.
Chapter 4 Quality of Accounts and Financial Reporting Practices
121
4.16 Recommendations
• Cleaning up of balances in the PD Accounts which have outlived their
utility needs to be examined and steps need to be taken for review of the
status of PD accounts and closure of inoperative ones after reconciliation
of balances and in consultation with the Administrators and Treasury.
• Unutilized amounts of earlier Finance Commission, Schemes etc.,
remaining in PD accounts needs to be remitted back to the Government.
• Review of suspense heads needs to be done to bring the transaction to final
heads in the accounting year itself.
• The government should ensure adjustment of Abstract Contingent bills
within the stipulated period.
• Government needs to ensure that all administrative departments furnish
the information to the office of Pr.AG (Audit) about the institutions which
have been substantially financed by the government. Bengaluru (Shanthi Priya S)
Principal Accountant General (Audit I) Karnataka
Countersigned
New Delhi (Girish Chandra Murmu)
08 March, 2022The
The 09 March, 2022 Comptroller and Auditor General of India


Appendices
125
Appendix 1.1 State Profile
(Reference: Paragraph 1.2; Page 1)
A General Data Sl. No. Particulars Figures
1 Area 1,91,791 sq.km
2 Population
a. As per 2001 Census 5.29 crore
b. As per 2011 Census 6.11 crore
3 1Density of Population (2011 Census)
(All India Density = 382 persons per Sq. Km)
319 persons per sq.km
4 2Population below poverty line (2011 Census)
(All India Average= 21.90 %) 20.90 per cent
5 3Literacy (2011 Census) (All India Average = 73.00 % ) 75.36 per cent
6 4Infant Mortality (per 1,000 live births)
(All India Average = 33 per 1,000 live births)
23 per 1,000 live births
7 5Life Expectancy at birth (All India Average = 69.4 years) 69.4 years
8 6Human Development Index# (2012) (India = 0.587) 0.611
9 7Gross State Domestic Product (GSDP) 2019-20 at current price (in crore) 18,03,609
10 Per capita
GSDP (2020-
21) (Rupee)
Karnataka 2,49,947
All India Average 1,41,945
11 Per capita
GSDP/GDP
CAGR
(2011-12 to
2020-21)
Karnataka 10.91
All India 8.08
12 GSDP/GDP
CAGR
(2011-12 to
2020-21)
Karnataka 12.90
All India 9.48
13 Population
Growth
(2011-21)
Karnataka 9.70
All India 12.30
B Financial Data Particulars Figures in per cent
CAGR General Category States* Karnataka 2011-12 to 2014-15
2015-16 to 2018-19
2019-20 to 2020-21
2011-12 to 2019-20
2015-16 to 2019-20
2019-20 to 2020-21^
a of Revenue Receipts. 13.49 11.85 (-)4.56 10.61 10.30 (-)10.67
b of Own Tax Revenue. 11.86 11.04 (-)4.43 9.65 7.79 (-)5.19
c of Non-Tax Revenue. 14.75 10.88 (-)35.60 8.57 9.35 2.77
d of Total Expenditure. 14.99 10.54 4.54 13.32 11.40 4.83
e of Capital Expenditure. 13.26 3.45 (-)2.36 13.63 16.63 21.40
f of Revenue Expenditure on Education. 13.28 8.89 (-)1.32 8.98 9.16 (-)8.30
g of Revenue Expenditure on Health. 19.11 14.74 14.65 16.10 13.51 17.15
h of Salary and Wages. 10.09 10.33 2.27 11.74 12.64 1.59
i of Pension. 12.99 15.32 6.02 16.91 12.99 2.89 Source: Financial data is based on Finance Accounts
# Human Development Index is a composite index comprising of life expectancy, education and per-capita income.
* GC states figures is adopted from the information sent by Economic Advisor, O/o the CAG, New Delhi.
^2019-20 to 2020-21 figures is arrived by considering the Finance Accounts for the year ended March 2021.

State Finance Audit Report for the year ended 31 March 2021
126
The development indicators relating to the major infrastructures are as follows:
(i) Surfaced roads per 100 sq. km (2019-2020) is 52.60 km. (ii) Unsurfaced roads per 100 sq. km (2019-20) is 0.31 km.
(iii) Percentage of villages electrified (2019-20) is 99.97. (iv) Grossed cropped area (2019-20) is 135.51 hectares.
(v) Number of Primary schools (2019-20) is 62,431. (vi) Number of Primary health centers is 2,359. (vii) Beds per lakh population (2019-20) is 108.
1. Economic Survey, Government of Karnataka 2020-21.
2. Economic Survey 2020-21 (GOI), Vol II, Page No. A 168-169, Table 9.8.
3. Economic Survey 2020-21 (GOI), Vol. II, Page A 164, Table 9.4
4. Economic Survey 2020-21 (GOI), Vol. II, Page A 160, Table 9.1.
5. Economic Survey 2020-21(GOI), Page 514, Table 12.104.
6. Economic Survey Government of Karnataka 2020-21..
7. Census of India 2001 (Population Projection 2001-2026, Table 14, Page 104 to 115).
Note: All India average of General Category States has been calculated on the basis of figures provided by 16 General
Category States such as Andhra Pradesh including Telangana, Bihar, Chhattisgarh, Gujarat, Haryana, Jharkhand,
Karnataka, Kerala, Madhya Pradesh, Maharashtra, Odisha, Punjab, Rajasthan, Tamilnadu, Uttar Pradesh and West
Bengal.

Appendices
127
Appendix 1.2 Structure of Government Accounts
(Reference: Paragraph 1.4; Page 6)
The Layout of Finance Accounts of the State Government is detailed below: Finance Accounts is prepared in two volumes with Volume-I presenting the summarised financial statements of Government and Volume-II presenting the detailed statements. The layout is detailed below. Further, Volume II contains details such as comparative expenditure on salaries and subsidies by major head, grants-in-aid and assistance given by the State Government, externally aided projects, expenditure on plan scheme, direct transfer of Central scheme funds to implementing agencies, summary of balances, financial results of irrigation schemes, commitments on incomplete public works contracts and maintenance expenditure which are brought out in various appendices. Statement number
Layout
1 Statement of Financial Position
2 Statement of Receipts and Disbursements
3 Statement of Receipts (Consolidated Fund)
4 Statement of Expenditure (Consolidated Fund)
5 Statement of Progressive Capital Expenditure
6 Statement of Borrowings and Other Liabilities
7 Statement of Loans and Advances given by the Government
8 Statement of Investments of the Government
9 Statement of Guarantees given by the Government
10 Statement of Grants-in-aid given by the Government
11 Statement of Voted and Charged Expenditure
12 Statement on Sources and Application of funds for expenditure other than on
Revenue Account
13 Summary of Balances under Consolidated Fund, Contingency Fund and Public
Account
14 Detailed Statement of Revenue and Capital Receipts by Minor Heads
15 Detailed Statement of Revenue Expenditure by Minor Heads
16 Detailed Statement of Capital Expenditure by Minor Heads and Subheads
17 Detailed Statement of Borrowings and other Liabilities
18 Detailed Statement on Loans and Advances given by the Government
19 Detailed Statement of Investments of the Government
20 Detailed Statement of Guarantees given by the Government
21 Detailed Statement of Contingency Fund and other Public Account Transactions
22 Detailed Statement on Investment of Earmarked Balances
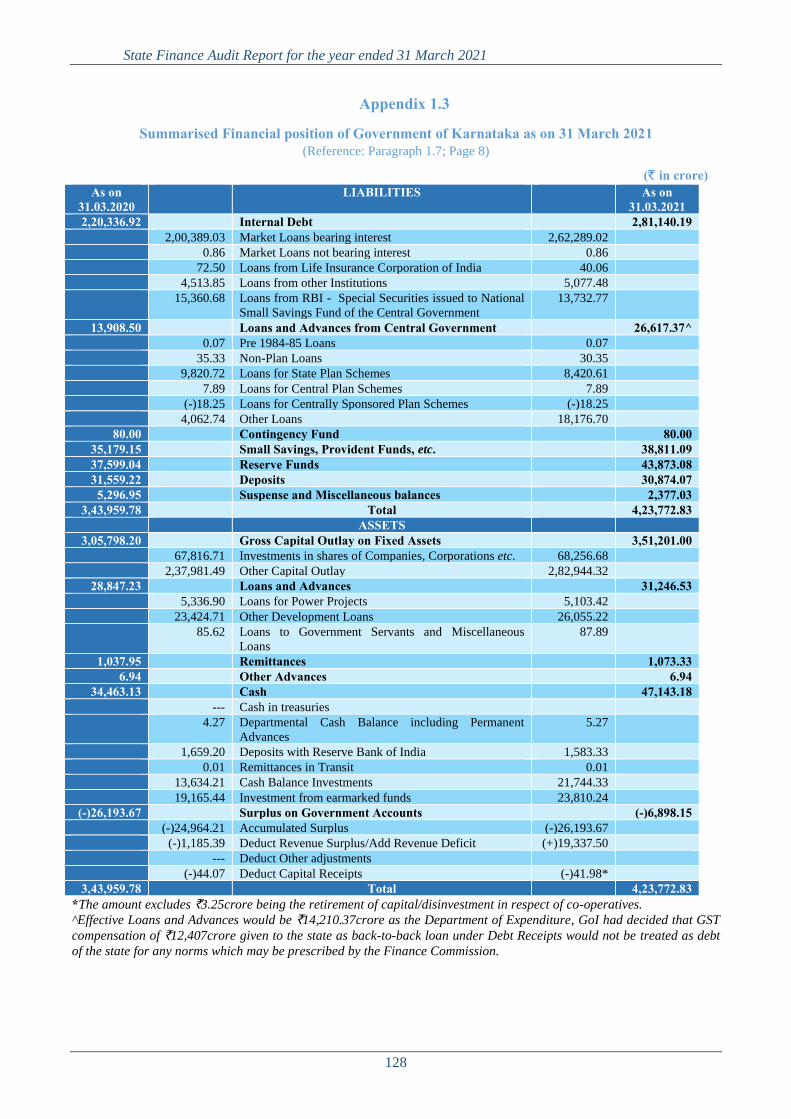
State Finance Audit Report for the year ended 31 March 2021
128
Appendix 1.3
Summarised Financial position of Government of Karnataka as on 31 March 2021 (Reference: Paragraph 1.7; Page 8)
(` in crore) As on
31.03.2020 LIABILITIES As on
31.03.2021 2,20,336.92 Internal Debt 2,81,140.19
2,00,389.03 Market Loans bearing interest 2,62,289.02
0.86 Market Loans not bearing interest 0.86
72.50 Loans from Life Insurance Corporation of India 40.06
4,513.85 Loans from other Institutions 5,077.48
15,360.68 Loans from RBI - Special Securities issued to National
Small Savings Fund of the Central Government
13,732.77
13,908.50 Loans and Advances from Central Government 26,617.37^ 0.07 Pre 1984-85 Loans 0.07
35.33 Non-Plan Loans 30.35
9,820.72 Loans for State Plan Schemes 8,420.61
7.89 Loans for Central Plan Schemes 7.89
(-)18.25 Loans for Centrally Sponsored Plan Schemes (-)18.25
4,062.74 Other Loans 18,176.70
80.00 Contingency Fund 80.00 35,179.15 Small Savings, Provident Funds, etc. 38,811.09 37,599.04 Reserve Funds 43,873.08 31,559.22 Deposits 30,874.07
5,296.95 Suspense and Miscellaneous balances 2,377.03 3,43,959.78 Total 4,23,772.83
ASSETS 3,05,798.20 Gross Capital Outlay on Fixed Assets 3,51,201.00
67,816.71 Investments in shares of Companies, Corporations etc. 68,256.68
2,37,981.49 Other Capital Outlay 2,82,944.32
28,847.23 Loans and Advances 31,246.53 5,336.90 Loans for Power Projects 5,103.42
23,424.71 Other Development Loans 26,055.22
85.62 Loans to Government Servants and Miscellaneous
Loans
87.89
1,037.95 Remittances 1,073.33 6.94 Other Advances 6.94
34,463.13 Cash 47,143.18 --- Cash in treasuries
4.27 Departmental Cash Balance including Permanent
Advances
5.27
1,659.20 Deposits with Reserve Bank of India 1,583.33
0.01 Remittances in Transit 0.01
13,634.21 Cash Balance Investments 21,744.33
19,165.44 Investment from earmarked funds 23,810.24
(-)26,193.67 Surplus on Government Accounts (-)6,898.15 (-)24,964.21 Accumulated Surplus (-)26,193.67
(-)1,185.39 Deduct Revenue Surplus/Add Revenue Deficit (+)19,337.50
--- Deduct Other adjustments
(-)44.07 Deduct Capital Receipts (-)41.98*
3,43,959.78 Total 4,23,772.83 *The amount excludes `3.25crore being the retirement of capital/disinvestment in respect of co-operatives.
^Effective Loans and Advances would be `14,210.37crore as the Department of Expenditure, GoI had decided that GST
compensation of `12,407crore given to the state as back-to-back loan under Debt Receipts would not be treated as debt
of the state for any norms which may be prescribed by the Finance Commission.

Appendices
129
Appendix 2.1
Abstract of Receipts and Disbursements (Reference: Paragraph 2.2; Page 19)
(` in crore)
Receipts Disbursements 2019-20 2020-21 2019-20 2020-21
Part A: Abstract of Receipts and Disbursements for the year 2020-21 Section-A: Revenue
1,75,442.79 I. Revenue receipts 1,56,716.41 1,74,257.40 I. Revenue expenditure 1,76,053.91 # 1,02,362.79 Tax revenue 97,052.54 48,823.84 General Services 55,017.93
7,681.47 Non-tax revenue 7,893.84 Social Services 30,919.00 State’s share of Union
Taxes & Duties
21,694.11 26,517.81 Education, Sports, Art
and Culture
24,315.52
34,479.53 Grants for Central and
Centrally Sponsored
Schemes
30,075.92 8,338.53 Health and Family
Welfare
9,768.46
12,213.55 Centrally Sponsored
Schemes
9,851.89 7,132.91 Water Supply,
Sanitation, Housing and
Urban Development
5,787.61
4,672.91 Finance Commission
Grants
5,557.00 148.12 Information and
Broadcasting
203.99
17,593.07 Other transfer/grants to
State/UT with
Legislature
14,667.03 7,167.25 Welfare of Scheduled
Castes, Scheduled
Tribes, Other Backward
Classes and minorities
6,292.79
525.01 Labour and Labour
Welfare
586.71
16,327.50 Social Welfare and
Nutrition
14,504.39
215.68 Others 266.45
66,372.81 Total Social Services 61,725.92 Economic Services 21,668.56 Agriculture and Allied
Activities
16,686.91
7,276.64 Rural Development 9,144.02
226.42 Special Areas
Programmes
159.69
2,103.15 Irrigation and Flood
Control
2,182.79
12,264.40 Energy 14,277.18
1,473.35 Industry and Minerals 1,735.64
3,566.77 Transport 4,545.09
65.54 Science, Technology
and Environment
58.23
3,991.21 General Economic
Services
4,839.47
52,636.04 Total Economic Services
53,629.02
6,424.71 Grants-in-aid and Contribution
5,681.04
1,185.39 II Revenue Deficit carried over to Sec.-B
(-)19,337.50
1,75,442.79 1,56,716.41 1,75,442.79 Total 1,56,716.41

State Finance Audit Report for the year ended 31 March 2021
130
Receipts Disbursements 2019-20 2020-21 2019-20 2020-21
Section B – Capital and others 22,003.87 II. Opening Cash
Balance including Permanent Advances & Cash Balance Investments & Investments from earmarked funds
34,463.13
45.07 III. Miscellaneous Capital receipts
45.23 35,529.44 III. Capital Outlay 45,406.05*
778.92 General Services 1,206.29 Social Services 1,203.17 Education, Sports, Art
and Culture
1,167.87
821.96 Health and Family
Welfare
2,099.44
4,244.78 Water Supply,
Sanitation, Housing and
Urban Development
6,830.52
3.89 Information and
Broadcasting
(-)3.60
2,783.45 Welfare of Scheduled
Castes, Scheduled
Tribes, Other Backward
Classes and Minorities
1,163.80
75.07 Social Welfare and
Nutrition
167.86
59.49 Other Social Services 121.20
9,191.81 Total Social Services 11,547.09 Economic Services 321.16 Agriculture and Allied
Activities
640.73
64.80 Rural Development 86.53
1,190.16 Special Areas
Programmes
1,574.52
13,342.73 Irrigation and Flood
Control
17,785.17
858.35 Energy 650.12
450.35 Industry and Minerals 480.99
8,896.81 Transport 11,016.83
434.35 General Economic
Services
417.78
25,558.71 Total Economic Services
32,652.67
202.44 IV. Recoveries of Loans and Advances
269.87 4,069.08 IV. Loans and Advances
2,669.17
144.18 From Power Projects 233.48 2,500.00 For Power Projects -
5.14 From Government
Servants
7.09 6.04 To Government Servants 4.80
53.12 From Others 29.30 1,563.04 To Others 2,664.37
50,459.01 V. Public Debt receipts 84,527.94** 10,180.39 V. Public Debt repayment
11,015.81
49,473.26
Internal debt other than
Ways and Means
Advances and Overdraft
70,413.86 8,445.65 Internal debt other than
Ways and Means
Advances and Overdraft
9,610.60

Appendices
131
# Includes expenditure on interest payment in respect of off-budget borrowings etc., under various service heads
(`1,512.31 crore borrowed through Special Purpose Vehicles-General Services (`0.11 crore) Social Services
(`133.29crore) and Economic Services (` 1,378.91 crore).
*Includes expenditure of ` 2,726.55 crore on account of off-budget borrowings.
** Effective Public Debts would be `72,120.94 crore as the Department of Expenditure, GoI had decided that
GST compensation of `12,407crore given to the state as back-to-back loan under Debt Receipts would not be
treated as debt of the state for any norms which may be prescribed by the Finance Commission.
Receipts Disbursements
2019-20 2020-21 2019-20 2020-21 310.49 Ways and Means
Advances from Reserve
Bank of India
310.49 Ways and Means
Advances from Reserve
Bank of India
--
675.26 Loans and Advances
from the Central
Government
14,114.08 1,424.25 Repayment of Loans and
Advances to Central
Government
1405.21
--- VI. Contingency Fund (Recoupment)
--------- --- VI. Contingency Fund Disbursements
---
2,55,637.80 VII. Public Account Receipts
2,72,457.35 2,45,291.54 VII. Public Account Disbursements
2,66,191.81
8,330.44 Small Savings and
Provident Funds, etc.
8,472.64 4,174.71 Small Savings and
Provident Funds, etc.
4,840.70
9,125.73 Reserve Funds 8,313.71 4,398.15 Reserve Funds 2,039.66
60,642.69 Deposits and Advances 63,574.70 57,468.88 Deposits and Advances 64,259.84
1,77,492.99 Suspense and
Miscellaneous
1,92,098.47 1,78,856.40 Suspense and
Miscellaneous
1,95,018.39
45.95 Remittances (-)2.17 393.40 Remittances 33.22
1,185.39 VIII. Revenue Deficit carried over from Sec.-A
(-)19,337.50 34,463.13 VIII. Cash Balance at the end of 31-03-2021
47,143.18
0.01 Cash in Treasuries and
Local Remittances
0.01
1,659.20 Deposits with Reserve
Bank
1,583.33
4.27 Departmental Cash
Balances including
Permanent Advances
5.27
13,634.21 Cash Balance Investment 21,744.33
19,165.44 Investment from
Earmarked Funds
23,810.24
3,29,844.07 Total 3,72,426.02 3,29,844.07 Total 3,72,426.02

State Finance Audit Report for the year ended 31 March 2021
132
Appendix 2.2
Time series data on the State Government Finances (Reference: Paragraph 2.2, 2.4.3, 2.7.1; Page 19, 24, 60 & 61)
(` in crore) 2016-17 2017-18 2018-19 2019-20 2020-21
Part A: Receipts 1. Revenue Receipts 1,33,214 1,47,000 1,64,979 1,75,443 1,56,716
Rate of growth 12.12 10.35 12.23 6.34 (-)10.67 (i) Tax Revenue 82,956(62) 87,130(59) 96,830(59) 1,02,363(58) 97,052(62)
Rate of growth 9.80 5.03 11.13 5.71 (-)5.19 State Goods and Service Tax - 24,182(28) 41,956(43) 42,147(41) 37,711(39)
Taxes on Agricultural Income 1(-) 15(-) - 1(-) ---
Taxes on Sales, Trade, etc. 46,105(56) 25,093(29) 14,003(15) 16,424(16) 16,028(17)
State Excise 16,484(20) 17,949(21) 19,944(21) 21,584(21) 23,332(24)
Taxes on Vehicles 5,594(7) 6,209(7) 6,568(7) 6,763(7) 5,607(6)
Stamps and Registration fees 7,806(9) 9,024(10) 10,775(11) 11,308(11) 10,576(11)
Land Revenue 209(-) 195(-) 144(-) 203(-) 184(-)
Taxes on Goods and Passengers 3,306(4) 1,279(1) 28(-) 65(-) 16(-)
Taxes and Duties on Electricity 1,451(2) 1,485(2) 2,334(2) 2,693(3) 2,433(2)
Other Taxes on Income and Expenditure
901(1) 964(1) 1,057(1) 1,140(1) 1,127(1)
Other Taxes and Duties on Commodities and Services
1,099(1) 736(1) 21(-) 34(-) 38(-)
(ii) Non Tax Revenue 5,795(4) 6,477(4) 6,773(4) 7,681(4) 7,894(5) Rate of growth 8.22 11.77 4.57 13.41 2.77 Interest receipts 1,200 1,178 1,112 895 920
Dividend and profits 83 79 38 54 81
Nonferrous Mining and Metallurgical Industries
2,419 2,747 3,027 3,629 3,893
Medical and Public Health 153 364 330 599 419
Other Administrative Services 131 271 253 305 388
Forestry and Wild Life 292 314 309 267 276
Education, Sports and Culture 193 176 200 183 175
Police 176 253 241 308 367
Roads and Bridges 62 103 105 71 50
Other non-tax receipts 1,086 992 1,158 1,370 1,325
(iii) State’s share of Union taxes and duties
28,760(22) 31,752(22) 35,895(22) 30,919(18) 21,694(14)
Rate of growth 19.92 10.40 13.05 (-)13.86 (-)29.84 (iv) Grants-in-aid from Government
of India 15,703(12) 21,641(15) 25,481(15) 34,480(20) 30,076(19)
Rate of growth 12.74 37.81 17.74 35.32 (-)12.77 Non-Plan grants 7,045 - - - -
Grants for State Plan schemes 8,102 - - - -
Grants for Central plan schemes 116 - - - -
Grants for Centrally sponsored schemes
440 11,617 10,393 12,214 9,852
Other transfers/Grants to States - 7,316 11,714 17,593 14,667
Finance Commission Grants - 2,708 3,374 4,673 5,557
2. Capital Receipts (i) Miscellaneous Capital Receipts 27 4 (-)6 45 45 (ii) Recoveries of Loans and
Advances 100 137 31 203 270
(iii) Public Debt Receipts 31,156 25,122 41,914 50,459 84,528## Rate of growth of Public Debt Receipts 47.85 (-)19.37 66.84 20.39 67.52
Internal Debt (excluding Ways and Means Advances and Overdrafts)
29,238(94) 23,179(92) 40,470(97) 49,473(98) 70,414(83)

Appendices
133
2016-17 2017-18 2018-19 2019-20 2020-21 Net transactions under Ways and Means Advances and Overdrafts
--- --- --- 310(1) -
Loans and Advances from Government of India
1,918(6) 1,943(8) 1,444(3) 675(1) 14,114(17)
3.Total Revenue and Non-debt capital receipts (1+2(i)+2(ii))
1,33,341 1,47,141 1,65,004 1,75,691 1,57,031
4. Total Receipts in the Consolidated Fund (3+2(iii))
1,64,497 1,72,263 2,06,919 2,26,150 2,41,559
5. Contingency Fund Receipts --- --- --- --- --- 6. Public Account Receipts 1,79,318 2,00,615 2,37,760 2,55,638 2,72,457 7. Total Receipts of the State (4+5+6) 3,43,815 3,72,878 4,44,679 4,81,787 5,14,016
Part B: Expenditure/Disbursements 8. Revenue Expenditure 1,31,921 1,42,482 1,64,300 1,74,258 1,76,054
Rate of growth 12.73 8.01 15.31 6.06 1.03 Plan 47,962(36) - - - - Non Plan 83,959(64) - - - - General Services (including interest payments)
31,265(24) 34,484(24) 42,655(26) 48,824(28) 55,018(31)
Social Services 54,549(41) 58,652(41) 67,935(41) 66,373(38) 61,726(35)
Economic Services 40,421(31) 42,856(30) 48,285(29) 52,636(30) 53,629(30)
Grants-in-aid and contributions 5,686(4) 6,490(5) 5,425(4) 6,425(4) 5,681(4)
9. Capital Expenditure 28,150 30,667 34,659 35,530 45,406 Plan 27,684(98) - - - - Non Plan 466(2) - - - - General Services 1,060(4) 977(3) 827(2) 779(2) 1,206(3)
Social Services 6,897(24) 8,677(28) 9,794(28) 9,192(26) 11,547(25)
Economic Services 20,193(72) 21,013(69) 24,038(70) 25,559(72) 32,653(72)
10. Disbursements of Loans and Advances
1,934 5,093 4,487 4,069 2,669
Plan 1,929 - - - - Non Plan 5 - - - - General Services --- --- --- --- -
Social Services 1,674 1,178 2,441 1,061 1,393
Economic Services 254 3,910 2,035 3,002 1,271
Miscellaneous Loans 6 5 11 6 5
11.Total Capital Expenditure (9+10) 30,084 35,760 39,146 39,599 48,075 Rate of growth 40.78 18.87 9.47 1.15 21.40
12. Total Expenditure (8+9+10) 1,62,005 1,78,242 2,03,446 2,13,857 2,24,129 Rate of growth 17.06 10.02 14.14 5.11 4.80
13. Repayment of Public Debt 7,420 8,269 11,083 10,180 11,016 Internal Debt (excluding Ways and Means Advances and Overdrafts)
6,294(85) 7,087(80) 9,741(88) 8,446(83) 9,611(87)
Net transactions under Ways and Means Advances and Overdraft
--- --- --- 310(3) ---
Loans and Advances from Government of India
1,126(15) 1,182(14) 1,342(12) 1,424(14) 1,405(13)
14. Appropriation to Contingency Fund --- --- --- --- --- 15. Total disbursement out of
Consolidated Fund (12+13+14) 1,69,425 1,86,511 2,14,528 2,24,037 2,35,145
16. Contingency Fund disbursements --- --- --- --- --- 17. Public Account disbursements 1,67,154 1,94,537 2,34,330 2,45,292 2,66,193 18.Total disbursement by the State
(15+16+17) 3,36,579 3,81,048 4,48,858 4,69,329 5,01,338
Part C: Surplus/Deficit 19. Revenue Deficit (-)/
Revenue Surplus(+) (1-8) 1,293 4,518 679 1,185 (-)19,338
20. Fiscal Deficit (3-12) 28,664 31,101 38,442 38,166 67,098

State Finance Audit Report for the year ended 31 March 2021
134
2016-17 2017-18 2018-19 2019-20 2020-21 21. Primary Deficit (20-22) 15,814 16,128 21,828 18,263 43,665
Primary Surplus (22-20) --- ---- --- --- - Part D: Other data
22. Interest Payments (included in revenue expenditure)
12,850 14,973 16,614 19,903 23,433#
23. Financial Assistance to local bodies etc.
44,499 47,096 50,603 54,603 53,771
24. Ways and Means Advances/ Overdraft availed (days)
Ways and Means Advances availed (days)
--- --- --- 2 -
Overdraft availed (days) --- --- --- --- - 25. Interest on Ways and Means
Advances/Overdraft --- --- --- 0.05 -
26. Gross State Domestic Product * (GSDP)
12,07,608 13,36,914 14,90,624 16,28,928 18,03,609
27. Rate of growth 15.54 10.71 11.50 9.28 10.72 28 Off Budget Borrowings during the
year 3,005.16 3,500.23 3,523.65 4,435.49 3,045.10
28.(a) Outstanding Fiscal Liabilities (inclusive of off-budget borrowings)
2,21,319 2,46,231 2,85,238 3,37,520 4,15,926^^
29. Rate of growth 20.73 11.26 15.84 18.33 23.23 30. Outstanding guarantees
(year-end) (including interest) 15,392 18,416 24,091 26,830 32,733
31. Maximum amount guaranteed (year-end)
21,115 24,025 30,719 35,694 45,104
32. Number of incomplete projects 341 236 881 978 1,133 33. Capital blocked in incomplete
projects 2,027 967 3,128 4,359 6,469
Part E: Fiscal Health indicators I Resource Mobilization Revenue Receipts/GSDP 11.03 11.00 11.07 10.77 8.69
Own Tax Revenue/GSDP 6.87 6.52 6.50 6.28 5.38
Own Non-Tax Revenue/GSDP 0.48 0.48 0.45 0.47 0.44
Central Transfers/GSDP 3.68 3.99 4.12 4.01 2.87
Non-tax revenue to Revenue Receipts 4.35 4.41 4.11 4.38 5.04
Rate of growth of State’s Own Tax 9.70 5.47 10.68 6.22 4.63
II Expenditure Management Total Expenditure/GSDP 13.42 13.33 13.64 13.13 12.43
Revenue Receipts/Total Expenditure 82.23 82.47 81.09 82.04 69.92
Revenue Expenditure/Total Expenditure
81.43 79.94 80.76 81.48 78.55
Expenditure on Social Services/Total Expenditure
38.96 38.43 39.41 35.83 33.31
Expenditure on Economic Services/Total Expenditure
37.57 38.03 36.55 37.97 39.06
Capital Expenditure/Total Expenditure
18.57 20.07 19.24 18.52 21.45
Capital Expenditure on Social and Economic Services/Total Expenditure
17.91 19.51 18.83 18.15 20.91
III Management of Fiscal Imbalances Revenue Surplus (Deficit)/GSDP 0.11 0.34 0.04 0.07 1.07
Fiscal Deficit/GSDP 2.37 2.33 2.58 2.34 3.72
Primary Deficit (surplus)/GSDP 1.31 1.21 1.46 1.12 2.42
Primary Revenue Balance (in crore) 14,143 19,491 17,293 21,088 4,095
Primary Revenue Balance/GSDP
1.17 1.46 1.16 1.29 0.23

Appendices
135
2016-17 2017-18 2018-19 2019-20 2020-21 IV Management of Fiscal Liabilities Fiscal Liabilities (inclusive of off-budget borrowings)/GSDP
18.32 18.41 19.14 20.72 22.37^
Fiscal Liabilities/Revenue Receipts 166.14 167.50 172.89 192.38 265.40
Fiscal Liabilities/Own Resources 249.37 263.05 275.32 306.71 396.32
V Other Fiscal Health Indicators Return on Investment (` in crore) 82.50 78.83 38.30 53.64 80.70
Financial Assets/Liabilities 1.08 1.10 1.00 1.00 1.00
Revenue Buoyancy** w.r.t GSDP 0.78 0.97 1.06 0.68 1.00
States’ Own Tax 1.24 2.06 1.10 1.11 (-)12.06
State’s own tax Buoyancy w.r.t GSDP 0.63 0.47 0.97 0.62 0.48
Buoyancy of total expenditure with GSDP 1.1 0.94 1.23 0.55 0.44
Revenue receipts 1.41 0.97 1.16 0.82 0.45
Buoyancy of revenue expenditure with GSDP 1.1 0.75 1.33 0.65 0.10
Revenue receipts 1.05 0.10 2.53 0.96 0.10
Buoyancy of capital expenditure with GSDP 2.62 1.76 0.82 0.12 2.00
Revenue receipts 3.36 1.82 0.77 0.18 2.00
Buoyancy ratio of fiscal liabilities with GSDP 1.33 1.05 1.38 1.98 2.17
Revenue Receipts 1.71 1.09 1.30 2.89 2.18
Own Resources 2.14 2.06 1.48 2.95 5.05
Figures in brackets represent percentages (rounded) to total of each sub-heading
#Includes expenditure on interest payment in respect of off-budget borrowings etc., under various service heads
(`1,512.31 crore borrowed through Special Purpose Vehicles-General Services (`0.11 crore) Social Services
(`133.29crore) and Economic Services (` 1,378.91 crore).
*GSDP figures adopted in previous audit report are 2016-17(`12,09,136 crore), 2017-18 (`13,57,579 crore), 2018-19
(`15,44,399 crore) and (2019-20 `16,99,115 crore).
**Buoyancy ratio indicates the elasticity or degree of responsiveness of a fiscal variable with respect to a given
change in the base variable. For instance, revenue buoyancy at 0.4 implies that revenue receipts tend to
increase by 0.4 percentage points, if the GSDP increases by one
^The back to back Loan (` 12,407 crore) received from GoI in lieu of GST compensation has not been
considered as Debt for working out the indicator
## Effective Public Debts would be `72,120.94 crore as the Department of Expenditure, GoI had decided that
GST compensation of `12,407crore given to the state as back-to-back loan under Debt Receipts would not be
treated as debt of the state for any norms which may be prescribed by the Finance Commission.
^^ Effective Outstanding Fiscal Liabilities would be `4,03,519 crore as the Department of Expenditure, GoI had
decided that GST compensation of `12,407crore given to the state as back-to-back loan under Debt Receipts
would not be treated as debt of the state for any norms which may be prescribed by the Finance Commission.

State Finance Audit Report for the year ended 31 March 2021
136
Appendix 2.3
Department wise share of Subsidies (Reference: Paragraph 2.5.2.7; Page 41)
(` in crore) Departments 2016-
17 2017-
18 2018-
19 2019-
20 2020-
21 Remarks
Energy 8,647 7,957 7,593 9,110 9,139 It includes financial assistance to
ESCOMS for supply to IP sets,
Bhagya Jyothi and Kutira Jyothi
consumers. It includes book
adjustment of `2,594.63 crore of
which `2,097.23 crore was tax dues
retained by ESCOMS against power
subsidy due.
Food & Supplies
1,854 1,917 2,404 2,692 2,324 It includes subsidy towards
Annabhagya for BPL and APL
beneficiaries.
Agricultural and Other Allied Activities
1,335 1,455 2,336 2,254 2,774 It includes subsidy towards crop
husbandry, fisheries, forestry, Soil
and Water Conservation and wild
life etc.
Co-operation 818 778 777 1,074 1,231 Represents waiver of overdue loans,
both principal and interest.
Transport 799 757 820 728 1,529 Subsidy is towards fare concession
extended to Students.
Housing 402 362 459 943 450 Subsidy is towards Ashraya scheme.
Others 532 922 1,011 733 985 It includes subsidy under Social
Welfare, Industries and Commerce
department etc.
Total 14,387 14,148 15,400 17,534 18,432 Source: Finance Accounts

Appendices
137
Appendix 2.4
Subsidies in the form of financial assistance, incentives etc. (Reference: Paragraph 2.5.2.7; Page 42)
(` in crore)
Sl. No.
Head of Account Scheme Description 2016-17 2017-18 2018-19 2019-20 2020-21
1 2202-01-109-0-03 Vidya Vikasa Scheme 407.06 501.15 466.27 538.08 266.98
2 2216-02-101-0-07 Vajpayee Urban Housing
Scheme
100.00 336.62 250.00 93.75 150.00
3 2216-02-102-0-02 Housing for weaker section 11.00 1.00 0.00 0.00 0.00
4 2216-03-104-0-01 Ashraya 1,251.55 944.42 654.00 1,461.35 600.00
5 2235-02-102-0-25 Bhagya Lakshmi 338.40 301.90 294.27 294.30 46.82
6 2401-00-103-0-15 Supply of seeds and other
inputs (Agricultural inputs
and Quality Control)
677.57 213.20 559.95 590.85 550.38
7 2401-00-108-1-15 Micro Irrigation(National
Mission for sustainable
Agriculture)
326.56 94.85 440.37 429.57 632.85
8 2401-00-108-2-30 National Mission for
sustainable Agriculture (Drip
Irrigation)
36.97 288.47 364.54 337.19 386.31
9 2405-00-103-0-20 Matsya Ashraya 26.28 15.00 4.00 0.00 0.00
10 2425-00-108-0-57 Yashaswini 170.43 190.79 99.75 0.00 0.00
11 2851-00-103-0-62 Weavers package 114.54 38.75 114.76 127.15 260.10
12 2851-00-103-0-69 Weavers Package- KHDC 24.00 6.02 9.39 20.00 40.00
13 2852-80-103-0-59 Refund of sales tax to Eligible
industries
89.41 80.00 299.46 155.26 195.00
14 3475-00-107-0-20 Minimum Floor Price Scheme 140.00 306.00 220.30 0.00 60.00
Total 3,713.77 3,318.17 3,777.06 4,047.50 3,188.44 Source: Consolidated Abstract of major heads

State Finance Audit Report for the year ended 31 March 2021
138
Appendix 2.5
Detailed Loan Accounts maintained by Principal Accountant General (A&E) (Reference: Paragraph 2.5.4.2; Page 48)
(` in crore) Sl. No.
Head of Account/Institutions Arrears as on 31 March 2021
Principal Interest 1 6215-01-190-2-86: Bangalore Water Supply and Sewerage Board 4,625.79 3,797.90
2 6215-01-190-1-00: Karnataka Urban Water Supply and Drainage Board 211.35 645.14
3 6216-02-201-1-00: Karnataka Housing Board 23.61 97.93
4 6217-60-191-1-03: Bangalore Development Authority (for repayment of
HUDCO Loans)
17.17 36.60
5 6220-01-190-1-00: Karnataka State Film Industries Development Corporation 0.41 1.89
6 6401-00-113-2-00: Karnataka Agro Proteins Limited 0.70 3.85
7 6401-00-103-2-00: Karnataka State Seeds Corporation Limited 2.88 6.72
8 6401-00-103-3-00: Karnataka State Co-operative Oil Seeds Growers Federation 0.75 7.42
9 6851-00-200-0-00: Leather Industries Development Corporation 1.26 4.54
10 6852-02-190-3-00: Dandeli Steel and Ferro Alloys Limited 0.31 1.43
11 6853-02-190-1-00: Hutti Gold Mines Company Limited 0.30 1.77
12 6858-01-190-3-00: Karnataka Implements and Machinery Company 1.10 5.42
13 6858-02-190-1-00: Electro Mobile India Limited 0.61 2.86
14 6858-02-190-0-01: Chamundi Machine Tools 0.18 0.38
15 6858-01-190-2-00: New Government Electric Factory 67.47 210.03
16 6859-01-190-0-01: Karnataka Telecommunication Limited 1.65 6.76
17 6860-04-190-2-01: Mysore Sugar Company 47.00 40.34
18 6860-60-212-1-00: Karnataka Soaps and Detergents Limited 2.25 16.04
19 6860-60-600-3-00: Mysore Tobacco Company Limited 1.34 12.65
20 6885-01-190-3-00: Karnataka State Finance Corporation 0.40 0.83
21 7452-80-190-1-00: Karnataka State Tourism Development Corporation 1.01 3.76
Total 5,007.54 4,904.26 Source: Finance Accounts

Appendices
139
Appendix 3.1
Category wise/department wise budget allocation/expenditure for Child Budget (Reference: Paragraph 3.4.3; Page 82 )
(` in crore) Sl No
Grant Child Centric Programme/Schemes Child Centric Non Programme/Schemes
100% CCP Less than 100% 100% CCP Less than 100% Budget Expr. Budget Expr. Budget Expr. Budget Expr.
1 05- Home and
Transport
0.00 0.00 2,523.88 2,120.49 0.00 0.00 0.00 0.00
2 8 – Forest, Ecology
and Environment
92.65 70.31 25.19 25.19 0.00 0.00 0.00 0.00
3 10- Social Welfare 1,562.59 1,195.99 4,538.31 3,809.71 0.00 0.00 0.00 0.00
4 11- Women & Child
Development
4,210.17 4,157.89 118.48 95.47 5.00 3.54 0.00 0.00
5 12 - Information,
Tourism and Youth
Services
0.00 0.00 315.49 214.60 0.00 0.00 0.00 0.00
6 13 – Food and Civil
Supplies
0.00 0.00 3,257.62 3,103.66 0.00 0.00 0.50 0.00
7 15 – Information
Technology
0.00 0.00 44.26 44.14 0.00 0.00 0.00 0.00
8 17 - Education 5,965.53 4,893.42 71.14 65.60 18,791.18 16,886.35 1,125.81 944.09
9 22- Health and Family
Welfare
47.00 0.00 4,476.18 4,340.78 75.16 57.30 3,507.65 3,259.55
10 23- Labour and Skill
Development
4.00 4.00 6.01 6.01 0.00 0.00 254.17 215.15
11 25 – Kannada and
Culture
0.00 0.00 44.86 43.64 0.00 0.00 0.00 0.00
12 27 - Law 0.00 0.00 0.00 0.00 21.45 2.89 0.00 0.00
Total 11,881.94 10,321.61
15,421.42 13,869.29 18,892.79 16,950.08 4,888.13 4,418.79
Source: Child Budget

State Finance Audit Report for the year ended 31 March 2021
140
Appendix 3.2
Major policy initiatives in the Budget 2020-21 (Reference: Paragraph 3.5 ; Page 83 )
Sl. No.
Para No.
Budget Assurances Action taken on Action Taken Report
Audit Analysis
Information Technology and Biotechnology Department 1 180
In order to consolidate and integrate all innovative
activities of the State, an “Innovation Hub" will be
established with an expenditure of `4 crore.
Administrative
approval has been
accorded vide G.O No:
ITBT 42 ADM 2020,
dated:03.08.2020
Karnataka Digital Economy
Mission was established and
an amount of `9.72 crore was
Transferred to KDEM by
KITS on 22.12.2020.
Hence the assurance is
implemented.
2 184 It is proposed to set up Karnataka Technology
Mission for investment promotion and liaising
with foreign Governments and companies for
attracting foreign investment. `7 crore would be
provided for this.
Administrative
approval has been
accorded vide G.O No:
ITBT 42 ADM 2020,
dated:03.08.2020 3 188 'Acceleration programme' will be launched in
association with the trade to accelerate the speed
of start-ups and to help them to enter into domestic
and foreign markets. A grant of `3 crore will be
provided during the year 2020-21.
Administrative
approval has been
accorded vide G.O No:
ITBT 42 ADM 2020,
dated:03.08.2020 4 181 To address the technical challenges of various
important sectors in the development of
Karnataka, a Centre of Excellence for Efficiency
Augmentation will be established with the
collaboration of STPI with an expenditure of `30
crore.
Administrative
approval has been
accorded vide G.O No:
ITBT 43 ADM 2020,
dated:30.11.2020
The State Government did not
release any funds during
2020-21 due to Covid – 19
Pandemic. Hence this project
was not implemented during
2020-21
5 182 An “Artificial Intelligence Research Translation
Park" will be established in association with Indian
Institute of Science, Bengaluru in order to promote
AI-Innovation, AI-Commercialization, Pilot
Project Implementation along with development
of 5G technology. For this purpose, corpus grant
of `60 crore will be Provided for next three years.
Administrative
approval has been
accorded vide G.O No:
ITBT 44 ADM 2020,
dated:18.11.2020
6 185 Talent Acceleration Programme to be started in
collaboration with Skill Development Department
to impart and upgrade skills for guaranteed
placement of graduate students. 1000 graduates
will be trained in the next two years. A sum of `2
crore wi1l be provided for this.
Administrative
approval has been
accorded vide G.O No:
ITBT 46 ADM 2020,
dated:23.11.2020
An amount of `1 crore was
released on 05.01.2021 for
implementation of Phase 1 –
Identification of domain areas
by Department of Electronics,
ITBT and Science and
Technology to KSDC.
Partially implemented.
7 187 With an aim to emphasize morality in order to
create a suitable environment, a Centre of
Excellence in the matter of ‘internet of ethical
things' will be established in collaboration with the
World Economic Forum of Davos by including
interested stakeholders. For the said Centre, the
State Government will provide a financial
assistance of `30 crore in five years. A grant of
` 7.5 crore will be provided during the Year 2020-
21
Administrative
approval has been
accorded vide G.O No:
ITBT 48 ADM 2020,
dated:17.12.2020
The State Government did not
release any funds during
2020-21 due to Covid – 19
Pandemic. Hence, this project
was not implemented during
2020-21.

Appendices
141
Sl. No.
Para No.
Budget Assurances Action taken on Action Taken Report
Audit Analysis
8 190 'Science and Talent Search' programme would be
started to identify and nurture talented students
studying in Pre-University Colleges. About 500
students will be selected and mentored for 2 years
by premier science institutes. The selected
students will be given monthly scholarship of
`1000.
Administrative
approval has been
accorded vide G.O No:
ITBT 98 STS 2020,
dated:10.11.2020
Programme not implemented
during 2020-21. It was stated
that it will be taken up during
October 2021 to March 2022.
Agriculture Department 9 26 To encourage Water security, land bank and mass
cultivation, micro irrigation, processing of farm
produce, marketing and also to consider
agriculture and horticulture as an Industry, our
Government will bring a new agricultural policy.
A High Level
Committee has been
constituted under the
chairmanship of
Additional Chief
Secretary and
Development
Commissioner vide
GO No. AGRI-
AML/106/2020 dated
20.11.2020 to
formulate guidelines to
new agricultural
policy.
Draft report of the operational
policy was submitted to
Government during
14.09.2021. The new
agricultural policy is yet to be
finalized.
10 27 By announcing an additional assistance, ̀ 4000 has
been given by our government along with `6000
given to small and marginal farmers by the central
government under the ‘Pradhan Mantri Kisan
Samman Scheme’, approximately `825 crore has
been transferred to 41 lakh bank accounts by the
State till date. To continue this scheme, `2600
crore will be provided during 2020-21.
It is an ongoing scheme
GO AGRI
AML/91/2020 dated
16.6.2020 has been
issued.
During 2020-21, an amount
of `500 crore was allotted to
provide Financial Assistance
to farmers (@ `5000/- per
farmer) who cultivated Maize
during 2019-20 and were in
financial crisis due to Covid -
19 Pandemic. Out of this
amount `389.54 crore was
transferred to 8.10 lakh
farmers through DBT.
Further, the Government
transferred `997.54 crore to
49.88 lakh farmers through
DBT mode.
Hence the action has been
taken to implement this
budget assurance.
11 29 In spite of best efforts, farmers are facing loss of
crop due to adverse climate. As our Government is
committed to protect the interests of the farmers,
State’s share of insurance will be released in time.
For this `900 crore has been provided.
It is an ongoing
scheme, GO No. AGRI
AML/91/ 2002 dated
16.06.2020 has been
issued.
During 2020-21, `1,233.84
crore was spent. Further, out
of additional amount of
`46.86 crore, `45.56 crore
has been spent. Hence, this
assurance is fully
implemented.
12 31 At present, quality seeds are being provided to
farmers through Raitha Samparka Kendras. Other
than this, to reduced production costs, to provide
Higher Germination Percentage Seeds, our
Government will provide chemically pre-
processed and polymer smeared seeds.
To supply chemically
pre-processed and
polymer smeared
seeds, this term will be
included in ensuing
tender notification.
E-tender Notification was
generated on 18.01.2021.
Cabinet approval is awaited.

State Finance Audit Report for the year ended 31 March 2021
142
Sl. No.
Para No.
Budget Assurances Action taken on Action Taken Report
Audit Analysis
13 34 Soil health programme is a subject of utmost
priority. The State has distributed 163 lakh Soil
Health Cards to the farmers. The State will
formulate a policy based on the recommendations
of the Land Resource Registry, availability of
water and soil health card to make farmers grow
suitable region wise crops, to use necessary seeds,
chemical fertilizers and micronutrients
High Level Committee
has been constituted
under the
Chairmanship of ACS
and Development
Commissioner vide
GO AGRI
AML/110/2020 dated
09.10.2020
Final Agriculture Input Policy
2021 was submitted for
Cabinet Approval during
August 2021. Cabinet
Approval is awaited.
14 37 The World Bank sponsored Sujala II projects have
been implemented in more than 14 lakh hectares
of rain dependent watershed areas of 12 districts.
Specific arrangement and conservation of
nutrients and water, a detailed item wise register
of land resources has been prepared through
scientific institutions. To propagate these
recommendations, action will be initiated to
conduct training on Land Resource Register in
2500 villages and to distribute cards to more than
one lakh rain dependent farmers at an expenditure
of `10 crore.
GO No. AGRI-
AML/89/2020 dated
14.08.2020 has been
issued.
The guidelines issued to the
project districts for
conducting village level
training to the farmers in the
project area. 2534 trainings
conducted during 2020-21
and survey number wise LRI
cards were distributed.
Assurance implemented fully.
15 38 On the lines of Sujala – III project, the state is also
participating in the World Bank funded new multi-
state Watershed Area Development
Project.(REWARD) for the next six years. This
will assist rain dependent watershed area of 10
lakh hectares and strengthening of Farmers
Producers Organization and the land resource
register in the development of the value chain.
It is an on-going
scheme GO Agri AML
/87/2020 dated
14.09.2020 has been
issued.
The preparatory activities
were initiated to implement
the proposed REWARD
programme from 2021-22.
16 39 The condition of underground water in 76 taluks
of the State is recognized as critical. In these
taluks suffering from water scarcity, for water
conservation and rain water harvesting activities,
100 watershed management projects in 4.75 lakh
hectares have been sanctioned. Moreover, in the
next three years, Jalamrutha projects will be
implemented in 810 very small watersheds in four
lakh hectares.
It is an on-going
scheme GO AGRI-
AML-91/2020 dated
16.06.2020 has been
issued.
Jalamrutha DPRs prepared to
cover 4.05 lakh hectare in 810
mictro watersheds of 143
taluks in the State for next
three years duly converging
MGNREGS with other
schemes of WDD.
Hence action has been
initiated.
17 40 The University of Agricultural and Horticultural
Sciences of Shivamogga, established in the year
2012 is a specialized comprehensive University
involving agricultural, horticultural and Forest
Sciences. This University is catering the needs of
Shivamogga, Chikkamagaluru, Dakshina
Kannada, Udupi, Davanagere, Chitradurga and
Kodagu Districts. The State Government has
allotted 787 acres of revenue land in Iruvakki
It is an on-going
scheme. 60 students
have been allotted by
the Karnataka
Examination Authority
through CET to start
BSc (Agri) degree
programme and all
necessary actions
Out of `155 crore, `136.67
crore was released by the
Government up to 2020-
21.Out of the balance of
`18.66 crore, `9.33 crore was
released during June and
August 2021 and Rs.9.33
crore was yet to be released.

Appendices
143
Sl. No.
Para No.
Budget Assurances Action taken on Action Taken Report
Audit Analysis
village of Sagara Taluk. For the works of this
University, `155 crore has been allotted. During
the year 2020-21, action will be taken to complete
the remaining works and to start the classes at
Iruvakki.
initiated for
commencement of
degree classes at New
Campus, Iruvakki.
Proposals are under
process to release
balance grants of
`28.17 crore for
completion of 1st phase
of work.
Totally an amount of `146
crore was released. The
Works were entrusted to
KHB. The first phase works
are under completion and the
request for release of
additional `100 crore for
implementation of phase -2
works has been submitted.
Hence this assurance is
partially implemented.

State Finance Audit Report for the year ended 31 March 2021
144
Appendix 3.3 Cases of incurring expenditure, which are not covered by the budget,
(Reference: Paragraph 3.7.2.1; Page 86 )
(` in crore)
Sl No
Grant No./Nomenclature No. of cases Amount
1 01 - Agriculture 10 1,059.93
2 02 - Animal Husbandry and Fisheries 8 64.44
3 05 - Home and Transport 5 688.62
4 08 - Forest, Ecology and Environment 3 6.58
5 09 - Co-operation 1 9.21
6 14 - Revenue 3 14.23
7 20 - Public Works 2 2,857.00
8 21 - Water Resources 1 400.00
9 22 - Health and Family Welfare 2 151.69
10 27 - Law and Parliamentary Affairs 1 30.00
Total 36 5,281.70 Source: Appropriation Accounts
but released by FD as addtionalities

Appendices
145
Appendix 3.4
Unnecessary Supplementary Provision (Reference: Paragraph 3.7.2.4; Page 89)
(` in crore) Sl. No
Grant No/ Nomenclature
Head of Account Original Provision
Supplementary (>2 crore)
Total Expenditure Unspent Provision
1 02-Animal
Husbandry
and Fisheries
2405-00-103-0-23-100
Financial Assistance
132.00 30.00 162.00 127.00 35.00
2 04-DPAR 2070-00-115-1-01-195
Transport Expenses
12.00 2.07 14.07 10.96 3.11
3 08-Forest,
Ecology and
Environment
2406-04-103-1-01-139
Major Works
16.00 2.29 18.29 15.41 2.88
4 14-Revenue
2029-00-101-1-01-003
Pay Staff
264.19 4.82 269.01 254.93 14.07
5 2053-00-094-7-01-002
Pay Officers
17.04 3.35 20.39 16.71 3.68
6 2245-80-102-0-01-051
General Expenses
105.40 44.63 150.03 91.19 58.85
7 2245-80-102-0-02-059
Other Expenses
210.80 89.27 300.07 184.50 115.57
8 17-Education 2202-02-197-1-01-401
Bangalore Urban
140.63 3.79 144.42 132.08 12.33
9 2202-02-197-1-01-413
Belagavi
206.29 2.65 208.94 188.90 20.04
10 2202-02-197-1-01-420
Raichur
114.58 2.10 116.68 105.68 11.00
11 2202-02-197-1-01-461
Bagalkot 117.46 2.72 120.18 108.92 11.27
12 2202-02-196-1-01-401
Bangalore Urban 202.70 4.32 207.02 189.74 17.28
13 2202-02-196-1-01-403
Chitradurga 117.80 3.42 121.22 109.96 11.25
14 2202-02-196-1-01-406
Tumakuru 181.14 6.26 187.40 170.08 17.32
15 2202-02-196-1-01-407
Mysuru 77.39 2.71 80.09 73.03 7.06
16 2202-01-197-1-01-401
Bangalore Urban 523.39 5.73 529.12 483.71 45.41
17 2202-01-197-1-01-403
Chitradurga 387.18 3.72 390.90 352.50 38.40
18 2202-01-197-1-01-404
Kolar 346.08 2.77 348.86 315.90 32.96
19 2202-01-197-1-01-407
Mysore 434.85 2.73 437.58 396.87 40.70
20 2202-01-197-1-01-413
Belagavi 948.00 8.30 956.30 865.60 90.70
21 2202-01-197-1-01-414
Vijayapura 565.97 4.16 570.13 516.03 54.10
22 2202-01-197-1-01-416-
Uttara Kannada 398.39 2.39 400.77 362.75 38.02
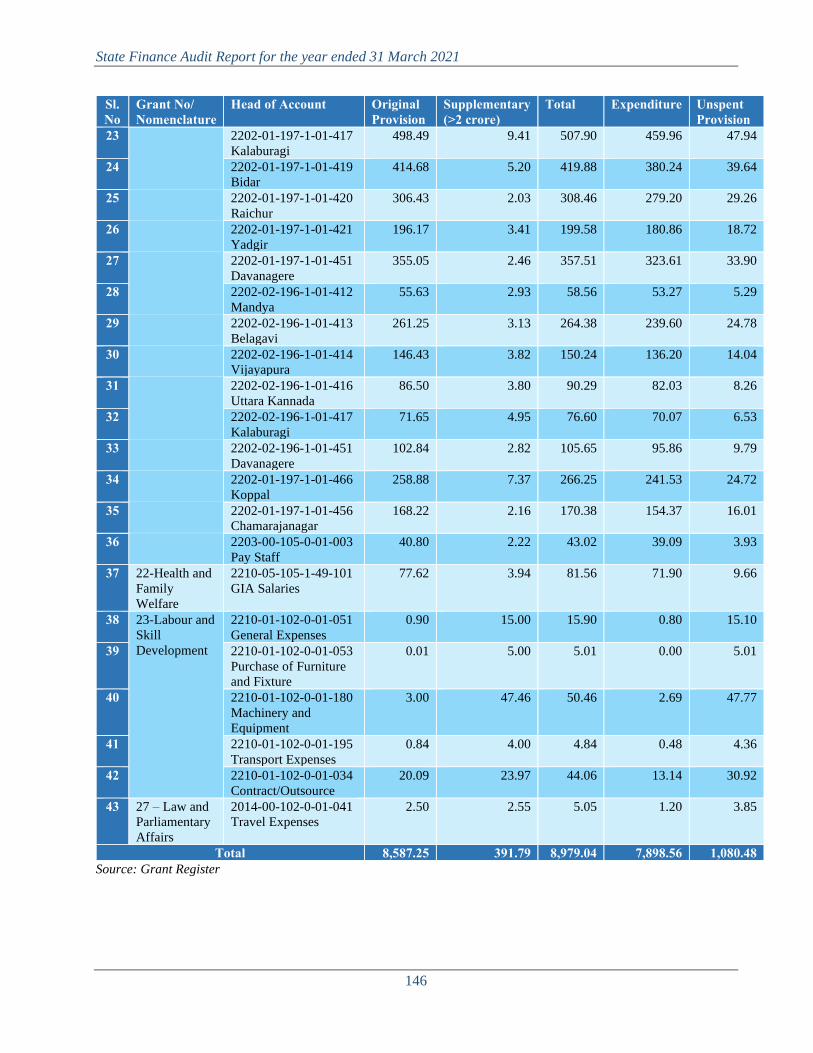
State Finance Audit Report for the year ended 31 March 2021
146
Sl. No
Grant No/ Nomenclature
Head of Account Original Provision
Supplementary (>2 crore)
Total Expenditure Unspent Provision
23 2202-01-197-1-01-417
Kalaburagi 498.49 9.41 507.90 459.96 47.94
24 2202-01-197-1-01-419
Bidar 414.68 5.20 419.88 380.24 39.64
25 2202-01-197-1-01-420
Raichur 306.43 2.03 308.46 279.20 29.26
26 2202-01-197-1-01-421
Yadgir 196.17 3.41 199.58 180.86 18.72
27 2202-01-197-1-01-451
Davanagere 355.05 2.46 357.51 323.61 33.90
28 2202-02-196-1-01-412
Mandya 55.63 2.93 58.56 53.27 5.29
29 2202-02-196-1-01-413
Belagavi 261.25 3.13 264.38 239.60 24.78
30 2202-02-196-1-01-414
Vijayapura 146.43 3.82 150.24 136.20 14.04
31 2202-02-196-1-01-416
Uttara Kannada 86.50 3.80 90.29 82.03 8.26
32 2202-02-196-1-01-417
Kalaburagi 71.65 4.95 76.60 70.07 6.53
33 2202-02-196-1-01-451
Davanagere 102.84 2.82 105.65 95.86 9.79
34 2202-01-197-1-01-466
Koppal 258.88 7.37 266.25 241.53 24.72
35 2202-01-197-1-01-456
Chamarajanagar 168.22 2.16 170.38 154.37 16.01
36 2203-00-105-0-01-003
Pay Staff 40.80 2.22 43.02 39.09 3.93
37 22-Health and
Family
Welfare
2210-05-105-1-49-101
GIA Salaries
77.62 3.94 81.56 71.90 9.66
38 23-Labour and
Skill
Development
2210-01-102-0-01-051
General Expenses
0.90 15.00 15.90 0.80 15.10
39 2210-01-102-0-01-053
Purchase of Furniture
and Fixture
0.01 5.00 5.01 0.00 5.01
40 2210-01-102-0-01-180
Machinery and
Equipment
3.00 47.46 50.46 2.69 47.77
41 2210-01-102-0-01-195
Transport Expenses
0.84 4.00 4.84 0.48 4.36
42 2210-01-102-0-01-034
Contract/Outsource
20.09 23.97 44.06 13.14 30.92
43 27 – Law and
Parliamentary
Affairs
2014-00-102-0-01-041
Travel Expenses
2.50 2.55 5.05 1.20 3.85
Total 8,587.25 391.79 8,979.04 7,898.56 1,080.48 Source: Grant Register

Appendices
147
Appendix 3.5
Excessive Supplementary Provision (Reference: Paragraph 3.7.2.4; Page 89)
(` in crore)
Sl No
Grant No
HOA Original Budget
Supplementary (>5 crore)
Total Expenditure Savings (>5 crore)
1 01 2401-00-108-2-30-422
SCSP
40.23 21.92 62.15 53.09 9.06
2 2401-00-103-0-15-106
Subsidies
313.71 50.00 363.71 320.34 43.37
3 05 3055-00-800-0-15-422
SCSP
3.39 13.17 16.56 10.17 6.39
4 4055-00-207-0-04-386
Construction
30.00 52.47 82.47 72.47 10.00
5 06 4711-02-103-2-02-139
Major Works
0.00 44.17 44.17 23.40 20.77
6 5051-02-201-0-11-139
Major Works
0.00 11.06 11.06 1.30 9.77
7 5051-02-211-0-02-132
Capital Expenditure
0.00 17.03 17.03 0.49 16.54
8 3051-02-102-0-05-200
Maintenance Expenditure
0.00 15.00 15.00 2.70 12.30
9 5051-02-800-0-04-132
Capital Expenses
0.00 108.68 108.68 74.75 33.93
10 10 2225-03-190-0-06-059
Other Expenses
21.50 50.00 71.50 50.00 21.50
11 2225-02-794-0-05-059
Other Expenses
290.00 30.00 320.00 315.00 5.00
12 2225-01-796-0-02-059
Other Expenses
250.00 20.00 270.00 258.59 11.41
13 12 2220-01-105-0-03-059
Other Expenses
1.00 7.50 8.50 3.00 5.50
14 13 2408-01-102-0-01-106
Subsidies
1,241.00 541.62 1,782.62 1,676.60 106.02
15 2408-01-102-0-01-422
SCSP
323.00 120.00 443.00 423.92 19.08
16 2408-01-102-0-01-423
TSP
136.00 50.00 186.00 171.99 14.01
17 14 2235-60-102-2-01-116
Social Security Pensions
816.22 35.35 851.57 845.25 6.32
18 18 2852-08-202-7-01-106
Subsides
151.60 44.76 196.36 189.37 6.99
19 19 2217-05-800-0-10-032
Grants for creation of
Capital Assets
30.00 22.75 52.75 42.75 10.00
20 22 4210-03-105-1-23-386
Construction
150.00 57.37 207.37 165.51 41.86

State Finance Audit Report for the year ended 31 March 2021
148
Sl No
Grant No
HOA Original Budget
Supplementary (>5 crore)
Total Expenditure Savings (>5 crore)
21 4210-03-105-1-23-422
SCSP
0.00 28.08 28.08 18.72 9.36
22 4210-03-105-1-24-386
Construction
0.00 29.58 29.58 18.68 10.90
23 4210-01-110-1-19-437
NABARD - SCSP
6.96 17.85 24.81 10.76 14.05
24 2210-05-105-1-55-101
GIA Salaries
210.04 14.92 224.96 214.99 9.97
Total 4,014.65 1,403.28 5,417.93 4,963.82 454.11 Source: Grant Register

Appendices
149
Appendix 3.6
Inadequate Supplementary Provision (Reference: Paragraph 3.7.2.4 ; Page 89 )
(` in crore)
Sl. No
Grant No
HOA
Budget Original
Supplementary
(>2 crore)
Total Expendi ture
Excess Expenditure
(>1 crore) 1 01 2851-00-107-1-51-106
Subsidies
20.00 15.00 35.00 68.58 33.58
2 2401-00-113-0-02-106
Subsidies
88.96 73.64 162.60 164.76 2.17
3 2401-00-111-0-08-059
Other Expenses
56.11 17.45 73.56 99.33 25.77
4 2401-00-108-2-30-106
Subsidies
193.33 94.92 288.25 294.22 5.97
5 2401-00-108-1-15-106
Subsidies
240.23 130.60 370.83 473.30 102.47
6 2401-00-108-1-15-423
TSP
26.64 14.51 41.15 48.84 7.68
7 03 2054-00-097-0-01-002
Pay Staff
12.16 2.04 14.20 16.72 2.52
8 04 2015-00-106-1-02-059
Other Expenses
2.00 9.81 11.81 14.05 2.24
9 05 2055-00-113-0-06-021
Re-imbursement of
Medical Expenses
57.10 30.00 87.10 110.71 23.61
10 3055-00-190-0-04-106
Subsidies
150.98 128.94 279.92 339.41 59.49
11 3055-00-190-0-05-106
Subsidies
119.19 127.23 246.42 299.89 53.47
12 3055-00-190-0-10-106
Subsidies
225.33 297.96 523.29 525.19 1.90
13 08 2406-02-110-0-01-015
Subsidiary Expenses
13.00 4.93 17.93 21.64 3.71
14 10 2225-04-102-0-05-103
GIA - General
0.00 5.01 5.01 19.99 14.98
15 11 2235-02-102-0-36-103
GIA General
20.00 25.95 45.95 52.80 6.85
16 2235-02-103-0-61-059
Other Expenses
42.18 18.98 61.16 96.75 35.59
17 14 2250-00-103-5-14-103
GIA General
30.00 95.38 125.38 126.55 1.18
18 2053-00-101-0-05-002
Pay officers
0.46 2.03 2.49 3.78 1.29
19 2235-60-102-1-01-116
Social Security Pension
657.25 75.00 732.25 803.19 70.94
20 2245-80-102-0-01-139
Major Works
316.20 586.90 903.10 1,075.94 172.84

State Finance Audit Report for the year ended 31 March 2021
150
Sl. No
Grant No
HOA
Budget Original
Supplementary
(>2 crore)
Total Expendi ture
Excess Expenditure
(>1 crore) 21 17 4202-01-201-1-04-436
NABARD Works
250.00 100.00 350.00 397.20 47.20
22 2203-00-104-0-09-103
GIA General
3.00 3.00 6.00 9.53 3.53
23 18 2851-00-102-0-74-106
Subsidies
30.00 15.84 45.84 105.84 60.00
24 2851-00-103-0-62-422
SCSP
9.36 7.07 16.43 32.81 16.38
25 2851-00-103-0-62-423
TSP
3.83 2.86 6.69 13.39 6.70
26 6860-05-190-1-00-394
Loans
41.68 144.96 186.64 194.31 7.67
27 20 5054-03-337-0-17-154
Improvements
310.00 57.00 367.00 371.50 4.50
28 5054-03-337-0-18-154
Improvements
600.00 825.00 1,425.00 1,725.00 300.00
29 5054-04-337-0-01-154
Improvements
1,048.90 850.00 1,898.90 2,646.97 748.07
30 21
4702-00-101-5-01-139
Major Works
200.00 222.00 422.00 541.27 119.27
31 4701-80-190-4-00-132
Capital Expenses
2,421.27 447.50 2,868.77 3,313.32 444.55
32 4701-80-190-4-00-436
NABARD Works
30.36 250.00 280.36 341.08 60.72
33 4701-80-190-5-00-132
Capital Expenses
1,463.14 412.50 1,875.64 2,363.14 487.50
34 22
4210-03-105-1-24-180
Machinery and
Equipments
0.00 136.16 136.16 185.17 49.01
35 2210-01-110-1-22-034
Contract/Outsource
92.67 12.91 105.58 178.03 72.45
36 23 2501-06-198-6-01-300
Lumpsum - ZP
145.00 155.62 300.62 325.15 24.53
Total 8,920.33 5,398.69 14,319.02 17,399.34 3,080.32 Source: Grant Register

Appendices
151
Appendix 3.7
Unnecessary Re-appropriation (Reference: Paragraph 3.7.2.5(a); Page 90)
(` in crore) Sl No
Grant No
Head of Account Budet including supplementary
Re-appropriation (>3 crore) (+)
Total Expenditure
Savings (> 3 crore) (-)
1 1 2415-80-277-6-01-101
GIA Salaries
77.80 3.84 81.64 74.40 7.24
2 5 2055-00-109-1-01-003
Pay Staff
1,751.78 8.73 1,760.51 1,706.81 53.70
3 2055-00-109-1-01-014
Other Allowances
321.04 8.46 329.50 314.51 14.99
4 17 2202-02-109-0-13-002
Pay Officers
745.69 11.28 756.97 721.60 35.37
5 2202-02-109-0-13-011
Dearness Allowance
186.93 3.22 190.15 85.01 105.14
6 2202-02-110-3-01-101
GIA Salaries
648.75 32.31 681.06 599.54 81.51
7 2203-00-112-0-02-011
Dearness Allowance
11.97 3.64 15.61 11.76 3.85
8 2203-00-105-0-01-011
Dearness Allowance
85.26 24.83 110.09 83.94 26.15
9 22 4210-03-105-1-10-386
Construction
110.00 30.00 140.00 105.00 35.00
10 4210-01-110-1-17-139
Major Works
60.00 11.00 71.00 51.00 20.00
11 2210-01-110-1-22-002
Pay Officers
172.90 3.34 176.24 171.37 4.87
12 23 2230-01-101-0-01-003
Pay Staff
16.45 3.29 19.74 15.90 3.85
13 2230-03-101-0-01-101
GIA Salaries
143.75 5.80 149.55 131.19 18.36
14 27 2014-00-105-0-01-003
Pay Staff
505.28 5.10 510.38 499.62 10.75
15 2014-00-102-0-02-011
Dearness Allowance
29.68 6.52 36.20 20.81 15.40
Total 4,867.28 161.36 5,028.63 4,592.45 436.19
Excessive re-appropriation resulting in savings
Sl No
Grant No.
HOA Budget including
Supplemen tary
Re-approrpriation
(> `3 crore) (+)
Total Expendi- ture
Savings (>`3
crore) (-)
1 1 2851-00-107-1-51-106
Subsidies
35.00 36.90 71.90 68.58 3.32
2 2401-00-800-1-57-103
GIA General
155.18 41.42 196.60 185.87 10.72

State Finance Audit Report for the year ended 31 March 2021
152
Sl No
Grant No
Head of Account Budet including supplementary
Re-appropriation (>3 crore) (+)
Total Expenditure
Savings (> 3 crore) (-)
3 2401-00-800-1-57-106
Subsidies
48.36 68.71 117.07 102.31 14.76
4 2401-00-108-1-15-422
SCSP
102.48 20.29 122.77 103.17 19.59
5 3 2039-00-001-0-01-003
Pay Staff
107.76 30.76 138.52 130.30 8.22
6 2071-01-109-1-02-251
Pension and Retirement
Benefits
0.01 199.61 199.62 172.65 26.97
7 5 2070-00-107-0-01-015
Subsidiary Expenses
30.00 11.43 41.43 38.32 3.11
8 2056-00-101-0-01-003
Pay Staff
84.14 25.13 109.27 106.22 3.05
9 2055-00-108-0-01-014
Other Allowances
337.94 22.06 360.00 353.62 6.38
10 2055-00-108-0-01-015
Subsidiary Allowance
42.90 10.00 52.90 49.56 3.34
11 2055-00-108-0-12-103
GIA General
10.00 7.50 17.50 12.50 5.00
12 5 2055-00-109-1-01-015
Subsidiary Allowances
60.00 20.00 80.00 74.33 5.67
13 2055-00-104-0-01-014
Other Allowances
73.08 5.98 79.06 73.56 5.50
14 7 2515-00-196-1-05-300
Lumpsum - ZP
106.34 100.00 206.34 168.32 38.03
15 8 2406-01-001-2-01-003
Pay Staff
186.46 8.15 194.61 189.92 4.69
16 14 2030-03-001-1-00-003
Pay Staff
31.34 4.88 36.22 32.47 3.75
17 19 3604-00-191-1-51-251 42.97 26.00 68.97 51.97 17.00
18 23 2210-01-102-0-01-002
Pay Officers
33.95 6.75 40.70 37.55 3.15
19 2210-01-102-0-01-014
Other Allowances
29.17 7.64 36.81 30.80 6.00
Total 1,517.08 653.20 2,170.28 1,982.01 188.27

Appendices
153
Inadequate re-appropriation Sl No
Grant No
HOA Budget including
supplementary
Re-appropria tion
(>1 crore) (+)
Total Expendi ture
Excess (>1 crore)
(+)
1 3 2043-00-001-0-01-002
Pay Officers
18.26 4.85 23.11 24.62 1.51
2 4 2052-00-090-0-01-002
Pay Officers
34.56 1.61 36.17 39.85 3.68
3 5 2055-00-118-0-01-003
Pay Officials
87.19 1.08 88.27 90.19 1.92
4 2055-00-113-0-06-021
Reimbursement of
Medical Expenses
87.10 15.00 102.10 110.71 8.61
5 6 5465-01-190-3-05-132
Capital Expenses
211.49 27.66 239.34 284.31 45.16
6 10 2225-04-102-0-05-103
GIA General
5.01 9.99 15.00 19.99 4.99
7 11 2235-02-103-0-61-059
Other Expenses
61.16 32.72 93.87 96.75 2.88
8 17 2202-02-001-0-01-002
Pay Officers
2.01 2.82 4.83 5.85 1.02
9 2202-80-003-0-04-002
Pay Officers
49.16 1.75 50.91 52.07 1.16
10 22 4210-03-105-1-14-386
Constructions
20.00 1.54 21.54 22.83 1.29
11 2210-01-001-0-01-002
Pay Officers
21.97 2.53 24.50 27.72 3.21
12 2210-01-110-1-22-003 346.66 2.71 349.37 388.20 38.84
13 2210-01-110-1-22-014
Other Allowance
145.80 1.53 147.33 150.82 3.49
14 2210-01-110-1-22-034
Contract/Outsource
105.58 30.00 135.58 178.03 42.45
15 23 2230-02-001-0-03-003
Pay Officials
115.49 1.14 116.63 120.53 3.90
Total 1,311.43 136.93 1,448.36 1,612.46 164.10
Injudicisous Re-approriation Sl No
Grant No
Head of Account Provision including supplementary
Re-appropriation (-)
Total Expenditure
Excess (+)
1 5 2055-00-109-1-01-195
Transport Expenses
86.00 0.30 85.70 100.46 14.76
2 21 4701-00-190-4-00-132
Capital Expenses
2,868.77 60.72 2,808.05 3,313.32 505.27
Total 2,954.77 61.02 2,893.75 3,413.78 520.03
Source: Grant Register

State Finance Audit Report for the year ended 31 March 2021
154
Appendix – 3.8
Cases of Defective Re-Appropriation Orders (Reference: Paragraph 3.7.2.5(b); Page 91 )
(` in lakh) Sl No
Grant No.
Government Order No.
Date Amount Issuing Authority Reasons for rejection
1 01
No.ACT/BGT/
2020-21
01.03.2021 9.00 Commissioner,
Agriculture Department,
Bengaluru
Original Budget
provision differs
2 Hort/60/TYK/
2020-21
10.03.2021 49.75 Under Secretary to Government,
Horticulture Department,
Bengaluru
3 Agri/AML/95/
2021
29.03.2021 33.35 Under Secretary to Government,
Agriculture Department
Bengaluru
4 SILK 10 RKV
2021
06.02.2021 26.67 Under Secretary to Government,
Horticulture and Sericulture
Department (Sericulture),
Bengaluru
Form 22 A not
self -balanced
5 SILK/10/RKV/20
21
10.03.201 13.33 Under Secretary to Government,
Horticulture and Sericulture
Department (Sericulture),
Bengaluru
6 04 DPAR 01
Chuhamam 2019
27.08.2020 13.00 Chief Electoral Officer & Ex-
officio Additional Chief
Secretary to Government, DPAR
(Elections), Bengaluru
7 05
DPN/AU-1/02/
2020-21
07.01.2021 0.10 Director, Department of
Prosecution, K.G.Road,
Bengaluru
8 SDRF/04/DGP/
2019-20
19.01.2021 9.67 Director General of Police &
Commandant General, Home
Guards, Bengaluru
9 07
GraAaPa 35 AFN
2020
11.08.2020 19.00 Internal Financial Advisor & Ex-
officio Deputy Secretary, RDPR,
Bengaluru
10 GraAaPa 174
Ukhayo 2019
12.08.2020 4.00
11 Grap 174 Ukhayo
2019
09.11.2020 4.00 Commissioner, Rural
Development & Panchayat Raj,
Bengaluru
12 10
01/Accts-1/
NaHaJaNi
/2020-21
05.09.2020 8.00 Additional Director General of
Police, Directorate of Civil
Rights Enforcement, Bengaluru
13 ASAMANI
/Po.V/CAR-
95/2020-21
26.02.2021 4.80 Director, Directorate of Welfare
of Minorities,
Bengaluru
14 Accts-01/01/
2020-21
03.03.2021 2.00 Additional Director General of
Police, Directorate of Civil
Rights Enforcement, Bengaluru

Appendices
155
Sl No
Grant No.
Government Order No.
Date Amount Issuing Authority Reasons for rejection
15 BCDW/203/BM
VS/2020-21
12.03.2021 20.00 Under Secretary -2 to
Government, Welfare of
Backward Classes Department,
Bengaluru
16 11
WCD 32
MABABA 2021
12.03.2021 50.00 Under Secretary-3 to
Government, Department of
Women and Child Development
and Specially Disabled &
Empowerment of Senior
Citizens, Bengaluru
17 WCD 44
MABABA 2021
22.03.2021 16.00
18 12
FTS 01 Accts
2020-21
19.01.2021 4.47 Director, Government Flying
Training School, Bengaluru
19 VSSM/RA/2020-
21
16.03.2021 4.99 Commissioner, Information
Department, Bengaluru
20 13
FCS 66/IBS/
2020-21
28.10.2020 45.00 Under Secretary to Government,
Food, Civil Supplies, Consumer
Affairs and Legal Metrology
Department, Bengaluru
21 FD 01/ 2020-21 11.01.2021 4.00 Registrar and Administrative
Officer, State Consumer
Redressal Forum, Basava
Bhavan, Bengaluru
22 LMD/Budget/CR
/01/2020-21
15.02.2021 5.00 Controller of Legal Metrology,
Bengaluru
23 14
BMC/Bud/01/
2020-21
05.02.2021 6.00 Director, Bhoomi Monitoring
Cell, Revenue Department,
Bengaluru
24 AB/01/2020-21 03.03.2021 10.00 Inspector General and
Commissioner of Stamps,
Kandaya Bhavan, Bengaluru
25 17
NCA-AC II/ 27/
RA/2020-21
08.12.2020 10.00 AIR Cmd, Deputy Director
General, NCC, Karnataka &
Goa, Bengaluru
26 ACT 2/DME/
Try/CR-03
06.03.2021 3.62 Director, Mass Education,
Bengaluru
27 EP 20/ yoyoka/
2021
10.03.2021 30.00 Special Officer & Ex-officio
Under Secretary (Plan), Primary
& Higher Secondary Education
Department, Bengaluru 28 EP 27/ yoyoka/
2021/Bg
12.03.2021 50.00
29 EP 22/ Yoyoka/
2021
12.03.2021 48.47
30 EP 21/Yoyoka/
2021
12.03.2021 50.00
31 ACT 2/
DME/Try/2021
22.03.2021 1.88 Director, Mass Education,
Bengaluru
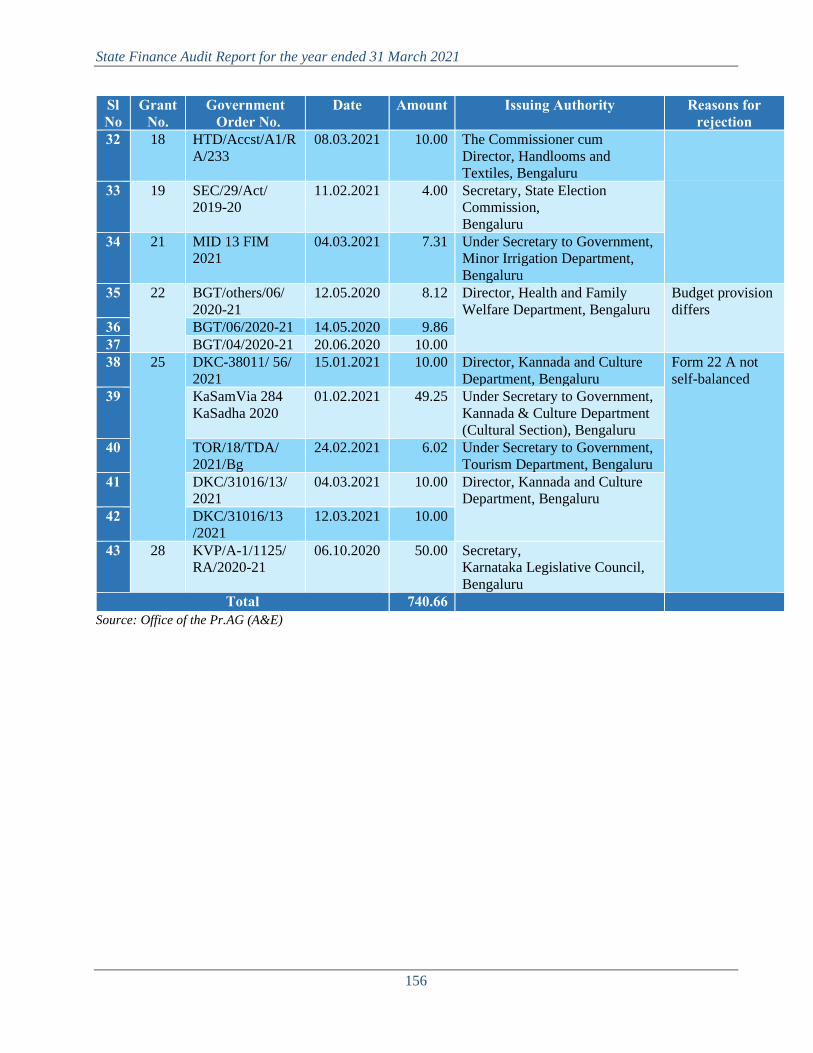
State Finance Audit Report for the year ended 31 March 2021
156
Sl No
Grant No.
Government Order No.
Date Amount Issuing Authority Reasons for rejection
32 18 HTD/Accst/A1/R
A/233
08.03.2021 10.00 The Commissioner cum
Director, Handlooms and
Textiles, Bengaluru
33 19 SEC/29/Act/
2019-20
11.02.2021 4.00 Secretary, State Election
Commission,
Bengaluru
34 21 MID 13 FIM
2021
04.03.2021 7.31 Under Secretary to Government,
Minor Irrigation Department,
Bengaluru
35 22 BGT/others/06/
2020-21
12.05.2020 8.12 Director, Health and Family
Welfare Department, Bengaluru
Budget provision
differs
36 BGT/06/2020-21 14.05.2020 9.86
37 BGT/04/2020-21 20.06.2020 10.00
38 25
DKC-38011/ 56/
2021
15.01.2021 10.00 Director, Kannada and Culture
Department, Bengaluru
Form 22 A not
self-balanced
39 KaSamVia 284
KaSadha 2020
01.02.2021 49.25 Under Secretary to Government,
Kannada & Culture Department
(Cultural Section), Bengaluru
40 TOR/18/TDA/
2021/Bg
24.02.2021 6.02 Under Secretary to Government,
Tourism Department, Bengaluru
41 DKC/31016/13/
2021
04.03.2021 10.00 Director, Kannada and Culture
Department, Bengaluru
42 DKC/31016/13
/2021
12.03.2021 10.00
43 28 KVP/A-1/1125/
RA/2020-21
06.10.2020 50.00 Secretary,
Karnataka Legislative Council,
Bengaluru
Total 740.66 Source: Office of the Pr.AG (A&E)

Appendices
157
Appendix 3.9
Grants/Appropriations with unspent provisions of `100 crore and above (Reference: Paragraph 3.7.2.6 (a); Page 92)
(` in crore) Sl No
Grant Budget Original
Supple mentary
Total Expendi ture
Savings
1. Agriculture and Horticulture 1 Revenue - Voted 7,818.22 1,111.78 8,930.00 8,060.26 869.74
2. Animal Husbandry and Fisheries 2 Revenue - Voted 2,650.33 160.30 2,810.63 2,570.08 240.55
3. Finance 3 Revenue - Voted 25,824.75 194.25 26,019.00 24,169.32 1,849.68
4. Department of Personnel and Administrative Reforms 4 Revenue - Voted 786.37 42.02 828.39 713.73 114.66
5. Home and Transport 5 Revenue - Voted 9,009.75 1,717.71 10,727.46 9,474.20 1,253.26
6. Infrastructure Development 6 Capital - Voted 548.71 210.56 759.27 608.97 150.30
7. Rural Development and Panchayat Raj 7 Revenue - Voted 12,115.66 55.40 12,171.06 11,155.33 1,015.73
8 Capital - Voted 3,479.55 1,293.90 4,773.45 4,275.20 498.25
8. Forest, Ecology and Environment 9 Revenue - Voted 1,492.95 127.49 1,620.44 1,353.66 266.78
10. Social Welfare 10 Revenue Voted 7,470.02 363.07 7,833.09 6,364.02 1,469.07
11 Capital - Voted 1,974.28 0.00 1,974.28 1,163.80 810.48
11. Women and Child Development 12 Revenue - Voted 4,529.53 117.58 4,647.11 4,428.04 219.07
12. Information, Tourism and Youth Services 13 Revenue - Voted 461.30 111.79 573.09 440.50 132.59
13. Food and Civil Supplies 14 Revenue - Voted 2,662.60 715.26 3,377.86 3,209.02 168.84
16. Housing 15 Revenue - Voted 2,753.07 89.24 2,842.31 2,007.02 835.29
17. Education 16 Revenue - Voted 28,319.40 250.31 28,569.71 25,247.16 3,322.55
17 Capital - Voted 1,448.75 100.0 1,548.75 1,101.73 447.02
18. Commerce and Industries 18 Revenue - Voted 1,013.85 466.67 1,480.52 1,360.07 120.45
19. Urban Development 19 Revenue - Voted 8,448.52 475.18 8,923.70 7,682.14 1,241.56
20 Capital - Voted 10,071.67 174.54 10,246.21 8,349.39 1,896.82
20. Public Works
21 Revenue - Voted 2,857.32 0.06 2,857.38 2,646.37 211.1
22 Capital – Voted
8,170.51 1,732.00 9,902.51 9,043.17 859.34

State Finance Audit Report for the year ended 31 March 2021
158
Sl No
Grant Budget Original
Supple mentary
Total Expendi ture
Savings
21. Water Resources 23 Revenue - Voted 1,025.02 10.31 1,035.33 839.70 195.63
24 Revenue - Charged 1,515.75 0.00 1,515.75 1,347.44 168.31
25 Capital - Voted 14,472.12 1,904.36 16,376.48 15,256.55 1,119.93
22. Health and Family Welfare 26 Revenue - Voted 9,141.12 1,005.10 10,146.22 9,626.60 519.62
27 Capital - Voted 980.75 1,451.33 2,432.08 2,099.58 332.50
23. Labour and Skill Development 28 Revenue - Voted 1,319.17 376.53 1,695.70 1,328.93 366.77
26. Planning, Statistics, Science and Technology 29 Capital - Voted 2,057.51 10.00 2,067.51 1,648.23 419.28
27. Law 30 Revenue - Voted 1,105.89 57.33 1,163.22 1,004.16 159.06
29. Debt Servicing 31 Revenue - Charged 23,566.39 402.42 23,968.81 23,620.77 348.04
32 Capital - Charged 11,605.28 0.00 11,605.28 11,015.81 589.47
Total 2,10,696.11 14,726.49 2,25,422.60 2,03,210.95 22,211.65 Source: Appropriation Accounts
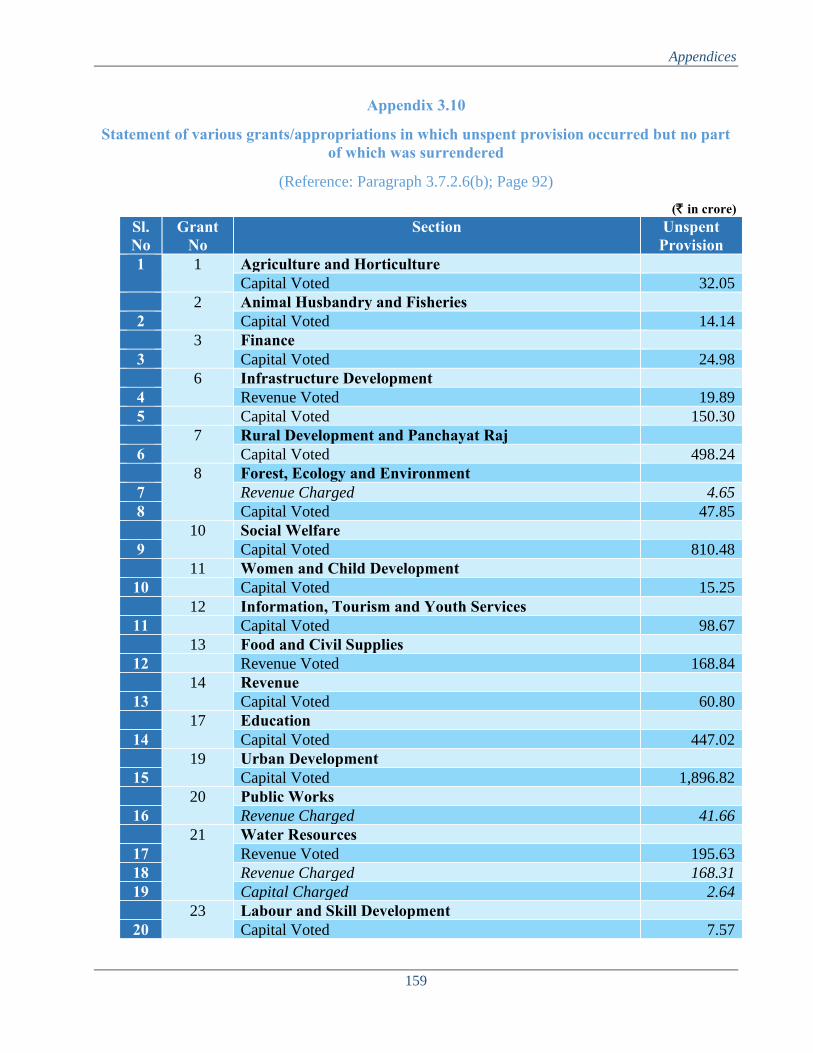
Appendices
159
Appendix 3.10
Statement of various grants/appropriations in which unspent provision occurred but no part of which was surrendered
(Reference: Paragraph 3.7.2.6(b); Page 92)
(` in crore) Sl. No
Grant No
Section Unspent Provision
1 1 Agriculture and Horticulture Capital Voted 32.05
2 Animal Husbandry and Fisheries
2 Capital Voted 14.14
3 Finance
3 Capital Voted 24.98
6 Infrastructure Development
4 Revenue Voted 19.89
5 Capital Voted 150.30
7 Rural Development and Panchayat Raj
6 Capital Voted 498.24
8 Forest, Ecology and Environment
7 Revenue Charged 4.65
8 Capital Voted 47.85
10 Social Welfare
9 Capital Voted 810.48
11 Women and Child Development
10 Capital Voted 15.25
12 Information, Tourism and Youth Services
11 Capital Voted 98.67
13 Food and Civil Supplies
12 Revenue Voted 168.84
14 Revenue
13 Capital Voted 60.80
17 Education
14 Capital Voted 447.02
19 Urban Development
15 Capital Voted 1,896.82
20 Public Works
16 Revenue Charged 41.66
21 Water Resources
17 Revenue Voted 195.63
18 Revenue Charged 168.31
19 Capital Charged 2.64
23 Labour and Skill Development
20 Capital Voted 7.57

State Finance Audit Report for the year ended 31 March 2021
160
Sl. No
Grant No
Section Unspent Provision
25 Kannada and Culture
21 Revenue Voted 23.38
22 Capital Voted 20.55
26 Planning, Statistics, Science and Technology
23 Capital Voted 419.28
Total 5,168.09 Source: Appropriation Accounts

Appendices
161
Appendix 3.11
Surrender of unspent provision (Reference: Paragraph 3.7.2.6 (b); Page 92)
(` in crore) Sl No
Grant/Section Amount of unspent provision
Amount surrendered
Amount not surrendered
1 Agriculture and Horticulture 1 Revenue –Voted 869.74 15.37 854.37
2 Animal Husbandry and Fisheries
2 Revenue –Voted 240.55 17.94 222.61
3 Finance
3 Revenue –Voted 1,849.68 1,409.96 439.72
4 Revenue – Charged 5.09 5.00 0.09
4 Department of Personnel and Administrative Reforms
5 Revenue –Voted 114.66 2.31 112.35
6 Revenue – Charged 32.67 0.95 31.72
5 Home and Transport
7 Revenue –Voted 1,253.26 489.10 764.16
8 Capital –Voted 57.71 5.62 52.09
7 Rural Development and Panchayat Raj
9 Revenue –Voted 1,015.73 9.93 1,005.80
8 Forest, Ecology and Environment
10 Revenue –Voted 266.79 14.83 251.96
9 Co-operation
11 Revenue –Voted 80.25 6.91 73.34
10 Social Service
12 Revenue –Voted 1,469.07 60.64 1,408.43
11 Women and Child Development
13 Revenue –Voted 219.07 18.97 200.10
12 Information, Tourism and Youth Services
14 Revenue –Voted 132.59 0.21 132.38
14 Revenue
15 Revenue –Voted (+)354.59 2.46 0.00
15 Information Technology
16 Revenue –Voted 0.63 0.06 0.57
16 Housing
17 Revenue –Voted 835.29 751.69 83.60
18 Revenue – Charged 1.74 1.74 0.00
17 Education
19 Revenue –Voted 3,322.55 9.23 3,313.32

State Finance Audit Report for the year ended 31 March 2021
162
Sl No
Grant/Section Amount of unspent provision
Amount surrendered
Amount not surrendered
18 Commerce and Industries
20 Revenue –Voted 120.45 68.89 51.56
21 Capital Voted 38.45 24.14 14.31
19 Urban Development
22 Revenue –Voted 1,241.56 151.99 1,089.57
20 Public Works
23 Revenue –Voted 211.01 27.61 183.40
24 Capital Voted 859.34 187.33 672.01
21 Water Resources
25 Capital Voted 1,119.93 33.41 1,086.52
22 Health and Family Welfare
26 Revenue –Voted 519.62 27.07 492.55
27 Capital Voted 332.50 24.60 307.90
23 Labour and Skill Development
28 Revenue –Voted 366.76 106.50 260.26
24 Energy
29 Revenue –Voted (+)13.30 6.38 0.00
30 Capital Voted 8.23 8.23 0.00
26 Planning, Statistics Science and Technology
31 Revenue –Voted 8.04 0.02 8.02
27 Law
32 Revenue –Voted 159.06 10.57 148.49
33 Revenue – Charged 48.12 3.21 44.91
28 Parliamentary Affairs and Legislation
34 Revenue –Voted 34.11 0.02 34.09
35 Revenue – Charged 1.35 0.10 1.25
29 Debt Servicing
36 Revenue – Charged 348.04 350.85 0.00
37 Capital – Charged 589.47 589.34 0.13
Total 17,773.11 4,443.18 13,341.58 Source: Appropriation Accounts
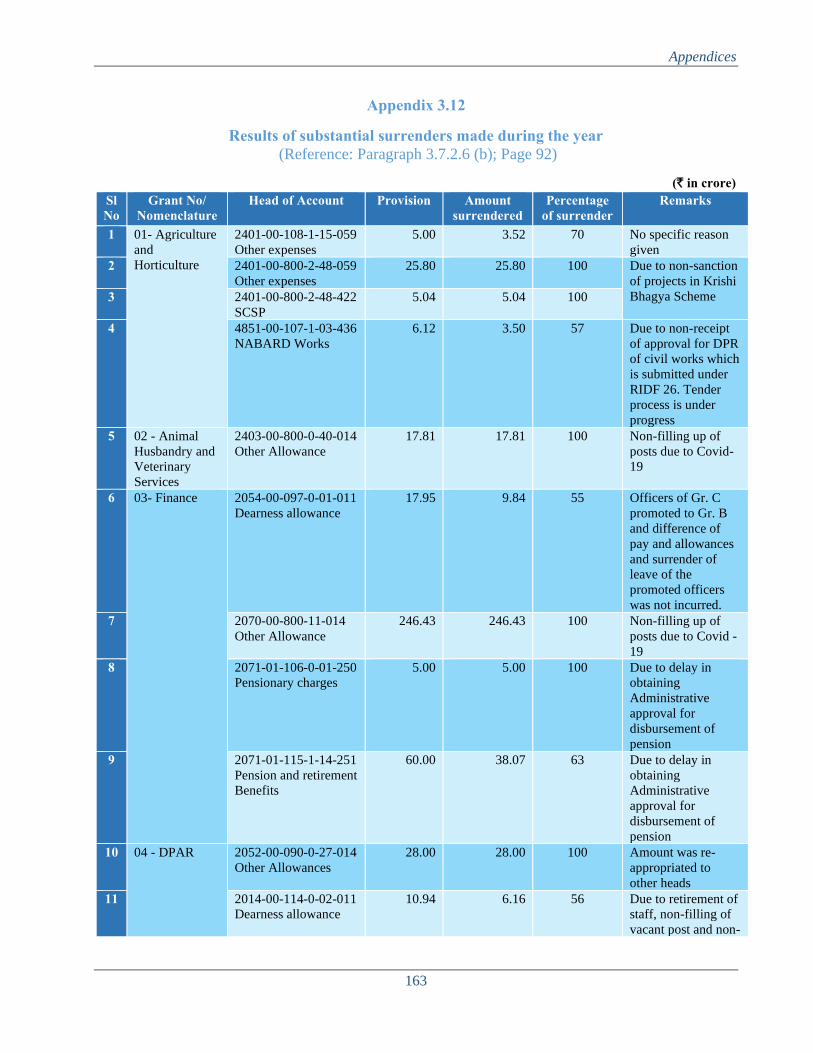
Appendices
163
Appendix 3.12
Results of substantial surrenders made during the year (Reference: Paragraph 3.7.2.6 (b); Page 92)
(` in crore) Sl No
Grant No/ Nomenclature
Head of Account Provision Amount surrendered
Percentage of surrender
Remarks
1 01- Agriculture
and
Horticulture
2401-00-108-1-15-059
Other expenses
5.00 3.52 70 No specific reason
given
2 2401-00-800-2-48-059
Other expenses
25.80 25.80 100 Due to non-sanction
of projects in Krishi
Bhagya Scheme 3 2401-00-800-2-48-422
SCSP
5.04 5.04 100
4 4851-00-107-1-03-436
NABARD Works
6.12 3.50 57 Due to non-receipt
of approval for DPR
of civil works which
is submitted under
RIDF 26. Tender
process is under
progress
5 02 - Animal
Husbandry and
Veterinary
Services
2403-00-800-0-40-014
Other Allowance
17.81 17.81 100 Non-filling up of
posts due to Covid-
19
6 03- Finance 2054-00-097-0-01-011
Dearness allowance
17.95 9.84 55 Officers of Gr. C
promoted to Gr. B
and difference of
pay and allowances
and surrender of
leave of the
promoted officers
was not incurred.
7 2070-00-800-11-014
Other Allowance
246.43 246.43 100 Non-filling up of
posts due to Covid -
19
8 2071-01-106-0-01-250
Pensionary charges
5.00 5.00 100 Due to delay in
obtaining
Administrative
approval for
disbursement of
pension
9 2071-01-115-1-14-251
Pension and retirement
Benefits
60.00 38.07 63 Due to delay in
obtaining
Administrative
approval for
disbursement of
pension
10 04 - DPAR 2052-00-090-0-27-014
Other Allowances
28.00 28.00 100 Amount was re-
appropriated to
other heads
11 2014-00-114-0-02-011
Dearness allowance
10.94 6.16 56 Due to retirement of
staff, non-filling of
vacant post and non-
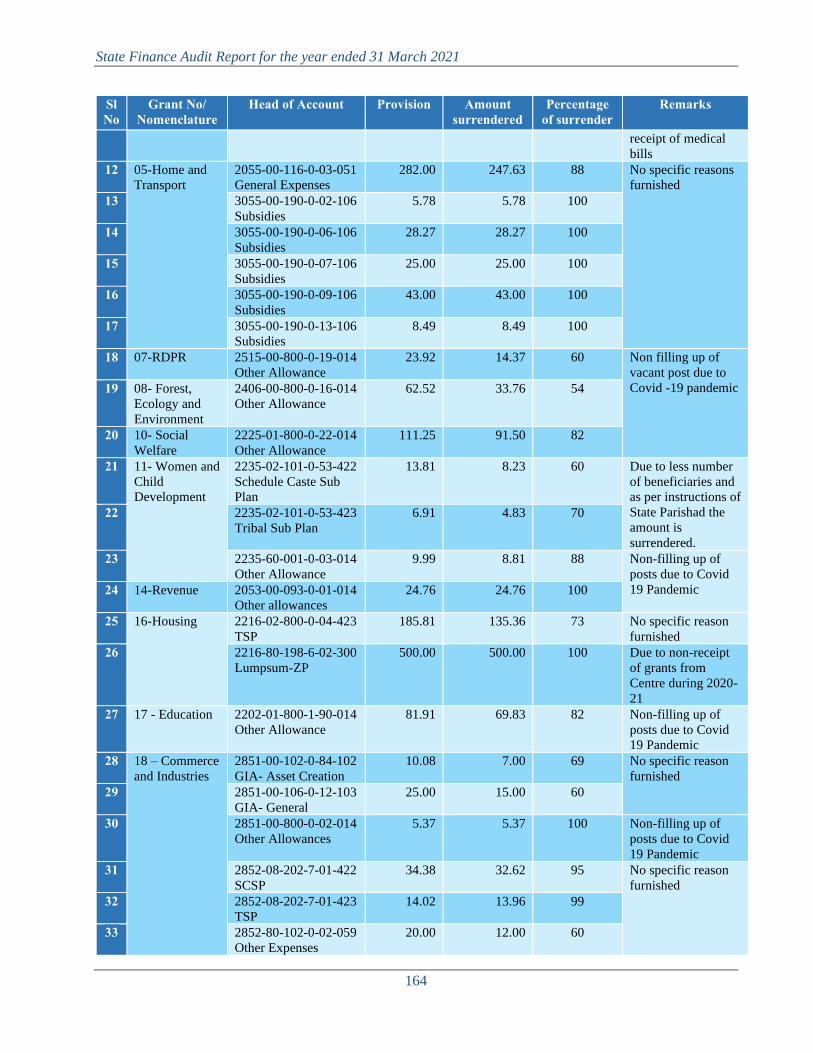
State Finance Audit Report for the year ended 31 March 2021
164
Sl No
Grant No/ Nomenclature
Head of Account Provision Amount surrendered
Percentage of surrender
Remarks
receipt of medical
bills
12 05-Home and
Transport
2055-00-116-0-03-051
General Expenses
282.00 247.63 88 No specific reasons
furnished
13 3055-00-190-0-02-106
Subsidies
5.78 5.78 100
14 3055-00-190-0-06-106
Subsidies
28.27 28.27 100
15 3055-00-190-0-07-106
Subsidies
25.00 25.00 100
16 3055-00-190-0-09-106
Subsidies
43.00 43.00 100
17 3055-00-190-0-13-106
Subsidies
8.49 8.49 100
18 07-RDPR 2515-00-800-0-19-014
Other Allowance
23.92 14.37 60 Non filling up of
vacant post due to
Covid -19 pandemic 19 08- Forest,
Ecology and
Environment
2406-00-800-0-16-014
Other Allowance
62.52 33.76 54
20 10- Social
Welfare
2225-01-800-0-22-014
Other Allowance
111.25 91.50 82
21 11- Women and
Child
Development
2235-02-101-0-53-422
Schedule Caste Sub
Plan
13.81 8.23 60 Due to less number
of beneficiaries and
as per instructions of
State Parishad the
amount is
surrendered.
22 2235-02-101-0-53-423
Tribal Sub Plan
6.91 4.83 70
23 2235-60-001-0-03-014
Other Allowance
9.99 8.81 88 Non-filling up of
posts due to Covid
19 Pandemic 24 14-Revenue 2053-00-093-0-01-014
Other allowances
24.76 24.76 100
25 16-Housing 2216-02-800-0-04-423
TSP
185.81 135.36 73 No specific reason
furnished
26 2216-80-198-6-02-300
Lumpsum-ZP
500.00 500.00 100 Due to non-receipt
of grants from
Centre during 2020-
21
27 17 - Education 2202-01-800-1-90-014
Other Allowance
81.91 69.83 82 Non-filling up of
posts due to Covid
19 Pandemic
28 18 – Commerce
and Industries
2851-00-102-0-84-102
GIA- Asset Creation
10.08 7.00 69 No specific reason
furnished
29 2851-00-106-0-12-103
GIA- General
25.00 15.00 60
30 2851-00-800-0-02-014
Other Allowances
5.37 5.37 100 Non-filling up of
posts due to Covid
19 Pandemic
31 2852-08-202-7-01-422
SCSP
34.38 32.62 95 No specific reason
furnished
32 2852-08-202-7-01-423
TSP
14.02 13.96 99
33 2852-80-102-0-02-059
Other Expenses
20.00 12.00 60

Appendices
165
Sl No
Grant No/ Nomenclature
Head of Account Provision Amount surrendered
Percentage of surrender
Remarks
34 4851-00-190-0-20-422
SCSP
12.79 12.79 100
35 4851-00-190-0-20-423
TSP
5.13 5.13 100
36 6852-02-190-4-00-394
Loans
5.00 5.00 100
37 6885-60-800-3-00-394
Loans
5.00 5.00 100
38 20 – Public
Works
3051-02-102-0-02-200
Maintenance
Expenditure
15.00 15.00 100 Due to transfer of
Ports and Inland
Water Transport
Department to IDD
39 4059-80-051-0-32-386
Construction
200.00 100.00 50 No specific reason
furnished
40 4216-01-700-2-24-386
Construction
42.50 32.00 75
41 2210-01-800-0-07-014
Other Allowances
89.79 48.59 54 Non-filling up of
posts due to Covid
19 Pandemic
42 4210-01-110-1-01-423
TSP
19.82 13.72 69 No specific reason
furnished
43 4210-01-110-1-21-132
Capital Expenses
20.00 16.54 83 Due to non- Receipt
of proposals
44 4210-01-110-1-22-132
Capital Expenses
20.00 10.00 50 No specific reason
furnished
45 4210-03-105-1-02-422
SCSP
7.50 6.75 90
46 23- Labour and
Skill
Development
2230-01-800-0-07-014
Other Allowance
137.89 137.89 100 Non-filling up of
posts due to Covid
19 Pandemic
47 2230-03-196-1-02-300
Lumpsum - ZP
24.54 24.54 100 State share for
NRLM and NRETP
was wrongly
provided under this
head.
48 27 - Law 2014-00-102-0-14-014
Other Allowance
21.67 20.78 96 Non-filling up of
posts due to Covid
19 Pandemic 49 2014-00-102-0-14-014
Other Allowance
5.14 5.14 100
50 29-Debt
Servicing
6003-00-110-0-01-240
Debt servicing
500.00 500.00 100 No specific reason
furnished
Total 3,082.13 2,673.61 87
Source: Grant Register
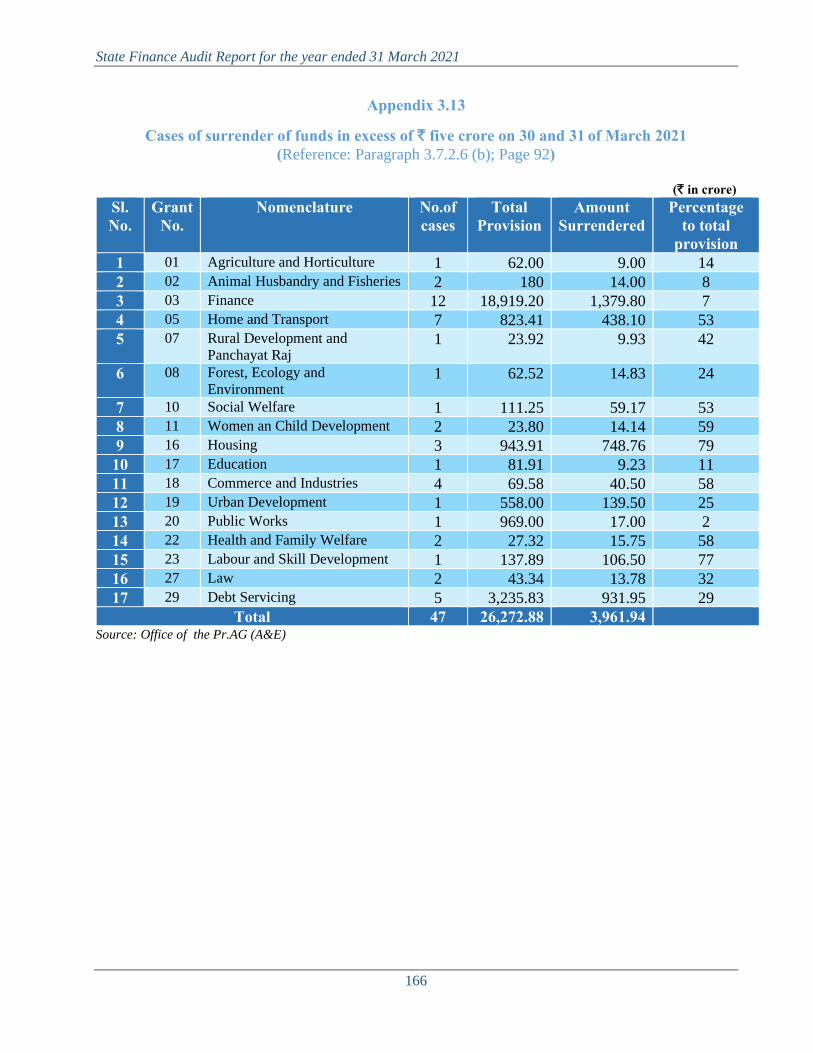
State Finance Audit Report for the year ended 31 March 2021
166
Appendix 3.13
Cases of surrender of funds in excess of ` five crore on 30 and 31 of March 2021 (Reference: Paragraph 3.7.2.6 (b); Page 92)
(` in crore)
Sl. No.
Grant No.
Nomenclature No.of cases
Total Provision
Amount Surrendered
Percentage to total
provision 1 01 Agriculture and Horticulture 1 62.00 9.00 14
2 02 Animal Husbandry and Fisheries 2 180 14.00 8
3 03 Finance 12 18,919.20 1,379.80 7
4 05 Home and Transport 7 823.41 438.10 53
5 07 Rural Development and
Panchayat Raj 1 23.92 9.93 42
6 08 Forest, Ecology and
Environment 1 62.52 14.83 24
7 10 Social Welfare 1 111.25 59.17 53
8 11 Women an Child Development 2 23.80 14.14 59
9 16 Housing 3 943.91 748.76 79
10 17 Education 1 81.91 9.23 11
11 18 Commerce and Industries 4 69.58 40.50 58
12 19 Urban Development 1 558.00 139.50 25
13 20 Public Works 1 969.00 17.00 2
14 22 Health and Family Welfare 2 27.32 15.75 58
15 23 Labour and Skill Development 1 137.89 106.50 77
16 27 Law 2 43.34 13.78 32
17 29 Debt Servicing 5 3,235.83 931.95 29
Total 47 26,272.88 3,961.94 Source: Office of the Pr.AG (A&E)

Appendices
167
Appendix 3.14
Excess Expenditure over Provision requiring regularization (Reference: Paragraph 3.7.2.8; Page 93)
(Amount in `) Year Grant No./Description Excess required to
be regularised as commented in the
AA/AR
Remarks
2012-13 08-Forest, Ecology and
Environment
Revenue Charged
4,94,02,43,684
Excess expenditure of `209.51 crore was on
account of transfer of Forest Development Tax to
Public Account. The receipt was more than
anticipated collection. Further, an amount of
`284.51 crore, which was misclassified, remained
as revenue of Commercial Tax Department and
was transferred to Public Account on rectification
of misclassification.
2013-14 08-Forest, Ecology and
Environment
Revenue Charged
3,55,38,75,841
Excess expenditure was on account of transfer of
Forest Development Tax to Forest Development
Fund in Public Account. The receipt was more
than the anticipated collection.
26-Planning, Statistics,
Science and Technology
Capital Voted
20,41,65,300
Withdrawal of budget provision in the budget
presented in July 2013 in respect of certain heads
for which, budget was included in the Vote on
Account presented during February 2013.
2014-15 08-Forest, Ecology and
Environment
Revenue Charged
1,88,75,14,849
Excess expenditure was on account of transfer of
Forest Development Tax to Forest Development
Fund in Public Account. The receipt was more
than the anticipated collection and also due to
erroneous budgeting.
10-Social Welfare
Revenue Charged
6,36,000
No specific reasons furnished for the excess
2015-16 01 – Agriculture and
Horticulture
Capital Voted
7,93,05,365
This was due to error in budgeting. Provision was
made under Grant No.18 instead of Grant No.1.
However, expenditure was classified under Grant
No.1.
05 – Home and Transport
Revenue Voted
44,94,34,163
No specific reason furnished for the excess.
06 – Infrastructure
Development
Revenue Charged
Capital Voted
17,08,292
4,94,81,312
This was due to error in budgeting. Provision
provided under Voted category instead of under
Charged category. However expenditure was
accounted correctly.
19 - Urban Development
Capital Charged
8,04,77,000
2016-17 01 –Agriculture and
Horticulture
Capital Voted
1,76,74,83,304
This was due to shifting of expenditure (`186.01
crore) from revenue head (MH 2401) to capital
head (MH 4401). Requisite provision was not
made through Supplementary Provision
05 – Home and Transport
Capital Voted
55,36,88,503
This was due to issue of re-appropriation orders
between revenue and capital.

State Finance Audit Report for the year ended 31 March 2021
168
Year Grant No./Description Excess required to be regularised as commented in the
AA/AR
Remarks
14 –Revenue
Revenue Voted
6,32,06,33,666
This was due to release of GOI’s contribution of
`1,235.52 crore towards NDRF on the last day of
Financial year, which was transferred to fund
account during 2016-17 itself.
20 – Public Works
Revenue Voted
59,81,01,797
This was due to transfer of actual receipts
collected under Ports, Light Houses and Shipping
to Port Development Fund. The provision made
for transfer was less than the actual collection. The
excess was also due to entire GOI grants(received
on last day of March 2017) credited to
Consolidated Fund of the State towards Central
Road fund was transferred to Deposit Account of
subvention from Central Road fund under Public
Account.
29– Debt Servicing
Capital Charged
1,61,41,83,927
This was due to the provisions for discharge of
debts, not being made scientifically based on
requirement of funds, but made as per the actuals
of previous years, without consultation from the
beneficiary departments of such loans, assistance
from the funding agencies.
2017-18 03 – Finance
Revenue -Charged
11,99,37,383
This was due to the settlement of claims towards
reimbursement of pension paid to retired High
Court Judges from CPAO, MOF, GOI.
08 – Forest, Ecology and
Environment
Revenue- Charged
80,98,05,156
This was due to the error in budgeting wherein the
provision of `85 crore was made erroneously
under voted category instead of charged category
for transfer of Forest Development Fees to KFDF.
However, expenditure was accounted correctly
under charged category.
24 – Energy
Capital - Voted
12,94,95,000
This was due to adjustment of EAP loans of
`12.95 crore as provided in GO dated 31.03.2018
even though no funds were provided in the Budget
for 2017-18. 29– Debt Servicing
Capital Charged
93,51,25,086
This was due to non-provisioning in the budget to
cover the repayment of Principal and Interest in
respect of EAP Loans released on Back to Back
basis which were initially repaid and accounted by
Controller of Aid Accounts and Audit, MOF, New
Delhi for eventual transfer to State Government
through RBI clearance memos as accounted by
Pr.AG(A&E).
Total 24,09,52,95,328 Source: Appropriation Accounts.

Appendices
169
Appendix 3.15
Grant-wise details under which reasons for savings not intimated (Reference: Paragraph 3.7.3.1; Page 93)
(` in crore) Sl No Grant Savings for which
reasons not furnished
1 1- Agriculture and Horticulture 186.04
2 2- Animal Husbandry and Fisheries 640.65
3 3- Finance 157.85
4 4- Department of Personnel and Administrative Reforms 104.33
5 5- Home and Transport 319.39
6 6- Infrastructure Development 214.72
7 7- Rural Development and Panchayat Raj 1,280.58
8 8- Forest, Ecology and Environment 242.81
9 9- Co-operation 44.20
10 10- Social Welfare 2,122.70
11 11- Women and Child Welfare 180.32
12 12-Information, Tourism and Youth Services 178.65
13 13-Food and Civil Supplies 2.91
14 14- Revenue 594.75
15 16 - Housing 89.74
16 17 - Education 3,394.53
17 18- Industries and Commerce 210.67
18 19- Urban Development 2,986.03
29 20 – Public Works 551.96
20 21 – Water Resources 2,688.84
21 22 – Health and Family Welfare 548.83
22 23- Labour and Skill Development 223.87
23 24- Energy 7.59
24 25- Kannada and Culture 20.25
25 26 – Planning , Statistics, Science and Technology 422.40
26 27 – Law 185.35
27 28 - Parliamentary Affairs and Legislations 29.58
28 29 – Debt Servicing 0.08
Total 17,629.62 Source: Office of the Pr.AG (A&E)

State Finance Audit Report for the year ended 31 March 2021
170
Appendix 4.1 Major Head and Department-wise details of outstanding UCs
separately for each year (Reference: Paragraph 4.2 ; Page 108)
Sl. No.
Head of Account Department Year Number of UCs Amount (` in crore)
1 2204 Sports and Youth Services 2018-19 05 5.01
2019-20 09 7.36
Total 14 12.37 2 2210 Medical & Public Health 2015-16 02 1.85
2016-17 02 0.59
2018-19 11 21.51
2019-20 03 0.55
Total 18 24.50 3 2220 Information & Publicity 2007-08 01 0.24
2010-11 01 0.11
Total 02 0.35 4 2245 Dept. of Relief on account of
Natural Calamities
2002-03 03 1.41
Total 03 1.41 Total 37 38.63
Source: Office of the Pr.AG(A&E)

Appendices
171
Appendix 4.2 Balances remaining under in-operative PD accounts
(Reference: Paragraph 4.4.2; Page 111) (Amount in `)
Sl. No.
P.D. Account Nomenclature Balance as per the Books of Pr.AG (A&E)
Remarks
Credit Balances
1 Cash Order Deposits 10,228.81 Prior to 2000
2 Sugar Surcharge 7,14,048.55 Prior to 1993-94
3 Scholarship Account of BC & Minorities 22,99,172.30 Information not available
4 PD Account of Special DC 49,41,10,228.90 1994-95 onwards
5 PD Account of Deputy Commissioner,
Dharwad
5,95,047.31 Information not available
6 PD Account of Permanent & Temporary
Deposits
28,31,395.86 Information not available
7 Ram Kumar Jalal Memorial Fund 195.00 1994-95 onwards
8 PD Account of Land Compensation 16,82,557.60 Information not available
9 PD Accounts of Ration Shop Depot 49,936.00 1994-95 onwards
10 PD Accounts of Bagalkot Town
Development Authority
49,41,519.93 Information not available
11 Assistant Register of Co-operative
Society, Shivamogga
10,000.00 Information not available
12 PD Account of Superintendent of Central
Prison Kalaburgi
52,684.00 Information not available
13 PD Account of Superintendent of Central
Prison, Shivamogga
34,507.00 Information not available
14 Director of Fiscal Policy 13,057.00 2018-19 onwards
Total 50,73,44,578.26 Debit Balances
1 Harijan Development Welfare Fund 5,18,350.71 Information not available
2 PD A/c of Maharaja College of Education 9,052.00 2008-09 onwards
3 Chief Minister’s Drought Relief Fund 82,45,390.20 Prior to 2000
4 PD A/c pf Municipal Commissioner,
Tumukuru
23,72,940.16 Prior to 2000
5 Deposits of Private Estate under
Commercial Management
75.00 Prior to 2000
6 PD Accounts of Joint Labour
Commissioner
26,059.44 Prior to 2000
7 PD Account of Superintendent of Central
Prison, Belagavi
2,08,757.00 2018-19 onwards
8 PD Account of SLAO, Bengaluru,
Hassan Railway Project
88,41,300.00 2018-19 onwards
Total 2,02,21,924.51 Nil Closing Balance
1 ARCS, Vijayapura 0.00 Prior to 2000
2 PD Account of Superintendent of Central
Prison, Bellary
0.00 2018-19 onwards
Source: Office of the Pr.AG(A&E)/DDR Ledger
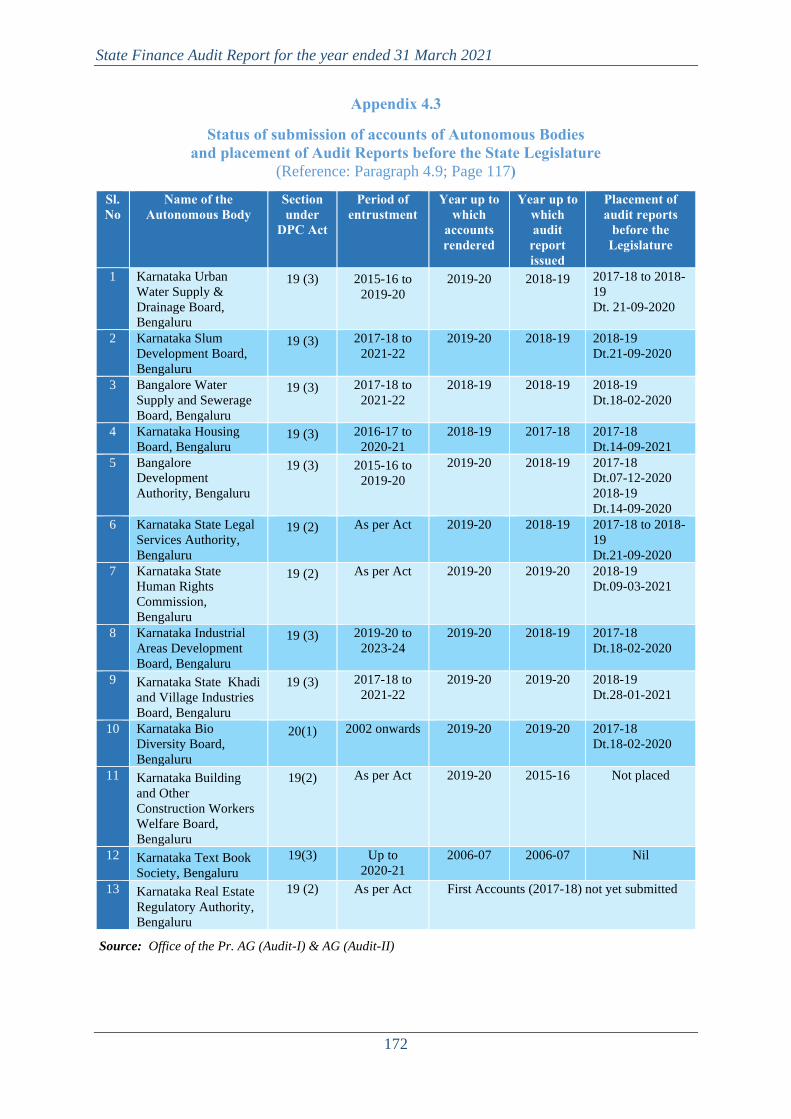
State Finance Audit Report for the year ended 31 March 2021
172
Appendix 4.3
Status of submission of accounts of Autonomous Bodies and placement of Audit Reports before the State Legislature
(Reference: Paragraph 4.9; Page 117)
Sl. No
Name of the Autonomous Body
Section under
DPC Act
Period of entrustment
Year up to which
accounts rendered
Year up to which audit
report issued
Placement of audit reports
before the Legislature
1 Karnataka Urban
Water Supply &
Drainage Board,
Bengaluru
19 (3) 2015-16 to
2019-20
2019-20 2018-19 2017-18 to 2018-
19
Dt. 21-09-2020
2 Karnataka Slum
Development Board,
Bengaluru
19 (3) 2017-18 to
2021-22
2019-20 2018-19 2018-19
Dt.21-09-2020
3 Bangalore Water
Supply and Sewerage
Board, Bengaluru
19 (3) 2017-18 to
2021-22
2018-19 2018-19 2018-19
Dt.18-02-2020
4 Karnataka Housing
Board, Bengaluru 19 (3) 2016-17 to
2020-21
2018-19 2017-18 2017-18
Dt.14-09-2021
5 Bangalore
Development
Authority, Bengaluru
19 (3) 2015-16 to
2019-20
2019-20 2018-19 2017-18
Dt.07-12-2020
2018-19
Dt.14-09-2020
6 Karnataka State Legal
Services Authority,
Bengaluru
19 (2) As per Act 2019-20 2018-19 2017-18 to 2018-
19
Dt.21-09-2020
7 Karnataka State
Human Rights
Commission,
Bengaluru
19 (2) As per Act 2019-20 2019-20 2018-19
Dt.09-03-2021
8 Karnataka Industrial
Areas Development
Board, Bengaluru
19 (3) 2019-20 to
2023-24
2019-20 2018-19 2017-18
Dt.18-02-2020
9 Karnataka State Khadi
and Village Industries
Board, Bengaluru
19 (3) 2017-18 to
2021-22
2019-20 2019-20 2018-19
Dt.28-01-2021
10 Karnataka Bio
Diversity Board,
Bengaluru
20(1) 2002 onwards 2019-20 2019-20 2017-18
Dt.18-02-2020
11 Karnataka Building
and Other
Construction Workers
Welfare Board,
Bengaluru
19(2) As per Act 2019-20 2015-16 Not placed
12 Karnataka Text Book
Society, Bengaluru
19(3) Up to
2020-21
2006-07 2006-07 Nil
13 Karnataka Real Estate
Regulatory Authority,
Bengaluru
19 (2) As per Act First Accounts (2017-18) not yet submitted
Source: Office of the Pr. AG (Audit-I) & AG (Audit-II)
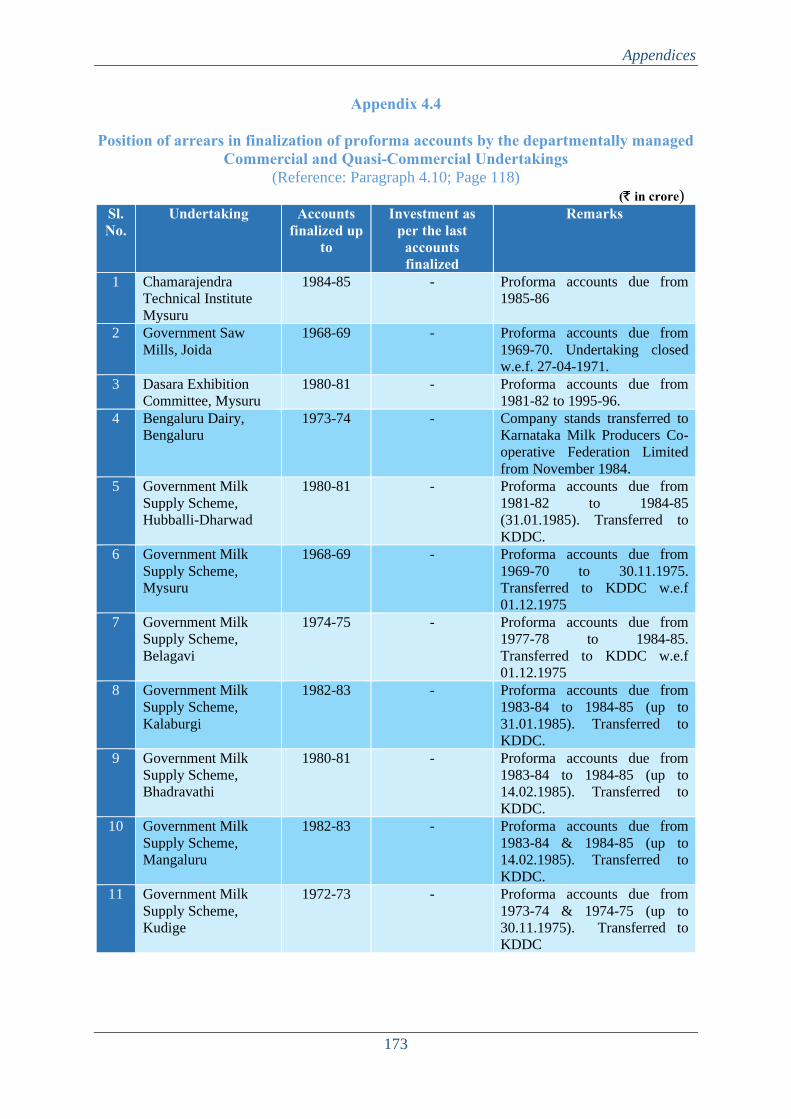
Appendices
173
Appendix 4.4
Position of arrears in finalization of proforma accounts by the departmentally managed Commercial and Quasi-Commercial Undertakings
(Reference: Paragraph 4.10; Page 118)
(` in crore) Sl. No.
Undertaking Accounts finalized up
to
Investment as per the last
accounts finalized
Remarks
1 Chamarajendra
Technical Institute
Mysuru
1984-85 - Proforma accounts due from
1985-86
2 Government Saw
Mills, Joida
1968-69 - Proforma accounts due from
1969-70. Undertaking closed
w.e.f. 27-04-1971.
3 Dasara Exhibition
Committee, Mysuru
1980-81 - Proforma accounts due from
1981-82 to 1995-96.
4 Bengaluru Dairy,
Bengaluru
1973-74 - Company stands transferred to
Karnataka Milk Producers Co-
operative Federation Limited
from November 1984.
5 Government Milk
Supply Scheme,
Hubballi-Dharwad
1980-81 - Proforma accounts due from
1981-82 to 1984-85
(31.01.1985). Transferred to
KDDC.
6 Government Milk
Supply Scheme,
Mysuru
1968-69 - Proforma accounts due from
1969-70 to 30.11.1975.
Transferred to KDDC w.e.f
01.12.1975
7 Government Milk
Supply Scheme,
Belagavi
1974-75 - Proforma accounts due from
1977-78 to 1984-85.
Transferred to KDDC w.e.f
01.12.1975
8 Government Milk
Supply Scheme,
Kalaburgi
1982-83 - Proforma accounts due from
1983-84 to 1984-85 (up to
31.01.1985). Transferred to
KDDC.
9 Government Milk
Supply Scheme,
Bhadravathi
1980-81 - Proforma accounts due from
1983-84 to 1984-85 (up to
14.02.1985). Transferred to
KDDC.
10 Government Milk
Supply Scheme,
Mangaluru
1982-83 - Proforma accounts due from
1983-84 & 1984-85 (up to
14.02.1985). Transferred to
KDDC.
11 Government Milk
Supply Scheme,
Kudige
1972-73 - Proforma accounts due from
1973-74 & 1974-75 (up to
30.11.1975). Transferred to
KDDC

State Finance Audit Report for the year ended 31 March 2021
174
Sl. No.
Undertaking Accounts finalized up
to
Investment as per the last accounts
finalized
Remarks
12 Vaccine Institute, Belagavi 1992-93 - Proforma accounts
due from
1993-94.
13 Government Silk Filature,
Kollegal
2015-16 1.69
Information not
available
14 Government Silk Filature,
Chamarajanagar
2015-16 1.68
15 Government Silk Filature,
Santhemarahalli
2016-17 1.24
16 Government Silk Filature,
Mamballi
2015-16 2.38
17 Government Silk Twisting
and Weaving Factory,
Mudigundam
2015-16 1.81
18 Government Central
Workshop, Madikeri
2008-09 0.07 Proforma accounts
due from 2009-10
19 Karnataka Government
Insurance Department,
Bengaluru
- No Capital Account Information not
available
Source: Office of the Pr. AG (Audit-I) & AG (Audit-II)
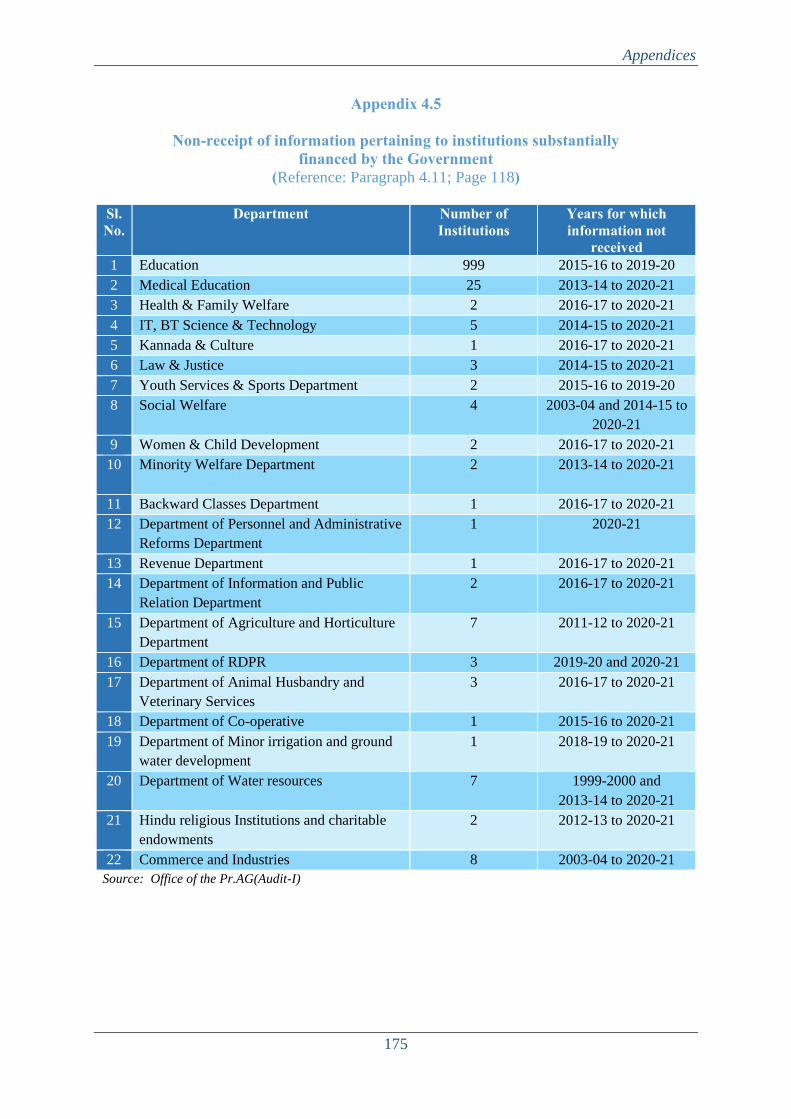
Appendices
175
Appendix 4.5
Non-receipt of information pertaining to institutions substantially financed by the Government
(Reference: Paragraph 4.11; Page 118)
Sl. No.
Department Number of Institutions
Years for which information not
received
1 Education 999 2015-16 to 2019-20
2 Medical Education 25 2013-14 to 2020-21
3 Health & Family Welfare 2 2016-17 to 2020-21
4 IT, BT Science & Technology 5 2014-15 to 2020-21
5 Kannada & Culture 1 2016-17 to 2020-21
6 Law & Justice 3 2014-15 to 2020-21
7 Youth Services & Sports Department 2 2015-16 to 2019-20
8 Social Welfare 4 2003-04 and 2014-15 to
2020-21
9 Women & Child Development 2 2016-17 to 2020-21
10 Minority Welfare Department
2 2013-14 to 2020-21
11 Backward Classes Department 1 2016-17 to 2020-21
12 Department of Personnel and Administrative
Reforms Department
1 2020-21
13 Revenue Department 1 2016-17 to 2020-21
14 Department of Information and Public
Relation Department
2 2016-17 to 2020-21
15 Department of Agriculture and Horticulture
Department
7 2011-12 to 2020-21
16 Department of RDPR 3 2019-20 and 2020-21
17 Department of Animal Husbandry and
Veterinary Services
3 2016-17 to 2020-21
18 Department of Co-operative 1 2015-16 to 2020-21
19 Department of Minor irrigation and ground
water development
1 2018-19 to 2020-21
20 Department of Water resources 7 1999-2000 and
2013-14 to 2020-21
21 Hindu religious Institutions and charitable
endowments
2 2012-13 to 2020-21
22 Commerce and Industries 8 2003-04 to 2020-21
Source: Office of the Pr.AG(Audit-I)

State Finance Audit Report for the year ended 31 March 2021
176
Appendix 4.6 Department-wise/ duration-wise breakup of the cases of theft and mis-appropriation
(Reference: Paragraph 4.13; Page 119) (` in Lakh)
Department <5years <15 years <20 years <25 years >25 years Total No. Amt. No. Amt. No. Amt. No. Amt. No. Amt. No. Amt.
Animal Husbandry and Veterinery Services
04 643.70 - - - - - - - - 04 643.70
Food and Civil Supplies
01 525.00 - - - - - - - - 01 525.00
Medical Education
- - - - - - - - 02 1.91 02 1.91
Department of Technical Education
01 0.28 - - - - - - - - 01 0.28
Forest - - - - - - - - 02 0.74 02 0.74
Home 01 4.68 04 162.46 - - - - 03 88.95 08 256.09 Health and Family Welfare
- - - - - - - - 10 1.6 10 1.6
Labour - - - - - - - - 01 0.89 01 0.89 Social Welfare
- - - - 01 9.48 - - - - 01 9.48
Public Works
- - 02 1,180.18 - - - - - - 02 1,180.18
Judiciary - - 01 20.00 - - - - - - 01 20.00 Total 07 1,173.66 07 1,362.64 01 9.48 - - 18 94.09 33 2,639.87
Source: Office of the Pr.AG (Audit I) and AG(Audit II)

State Finance Audit Report for the year ended 31 March 2021
177
Basis of calculation
Buoyancy of a parameter Rate of Growth of the parameter/GSDP Growth Rate
Buoyancy of a parameter (X) With respect to another parameter (Y)
Rate of Growth of parameter (X)/
Rate of Growth of parameter (Y)
Rate of Growth (ROG) [(Current year Amount/Previous year Amount)-1]*100
Development expenditure Social services + economic services
Average interest rate of Outstanding Debt
[Interest payments/(opening balance of Public debt +
closing balance of Public Debt/2)]
Ratio of Debt Redemption Total debt payment + Interest payment(debt)/total debt
receipts
Revenue Deficit/Revenue Surplus Revenue Receipt – Revenue Expenditure
Fiscal Deficit Revenue Expenditure + Capital Expenditure + Net Loans
and Advances – Revenue Receipts – Miscellaneous
Capital Receipts
Primary Deficit Fiscal Deficit – Interest payments
Balance from Current Revenue (BCR)
Revenue Receipts minus all Plan Grants and Non-Plan
Revenue Expenditure excluding expenditure recorded
under the major head 2048 – Appropriation for reduction
of avoidance of debt.
Glossary

State Finance Audit Report for the year ended 31 March 2021
178
Abbreviations
Sl. No. Abbreviation Full Form 1 AC Bill Abstract Contingent Bill 2 AE Aggregate Expenditure
3 ALM Asset Liability Monitoring
4 AYUSH Ayurveda, Yoga and Naturopathy, Unani, Siddha and Homeopathy
5 BMTC Bengaluru Metropolitan Transport Corporation
6 BPL Below Poverty Line
7 C&AG Comptroller and Auditor General of India 8 CAGR Compounded Annual Growth Rate 9 CAPEX Capital Expenditure
10 CBS Child Budget Statement
11 CE Capital Expenditure
12 CESCOM Chamundeswari Electricity Supply Company
13 CGST Central Goods and Service Tax
14 CHCs Community Health Centres
15 CMRRD Chief Minister’s Rural Road Development Fund 16 CNNL Cauvery Neeravari Nigam Limited
17 CPAO Central Pay and Accounts Office
18 CPS Central Plan Schemes
19 CRA Central Record keeping Agency 20 CRF Central Road Fund
21 CSF Consolidated Sinking Fund 22 CSS Centrally Sponsored Schemes
23 DC Deputy Commissioner 24 DCB Demand Collection Balances
25 DCPS Defined Contribution Pension Scheme
26 DDOs Drawing and Disbursing Officers 27 DDR Debt, Deposit and Remittances 28 DE Development Expenditure 29 DMA Directorate of Municipal Administration
30 DPAR Department of Personnel and Administrative Reforms
31 DPC Duties, Power and Conditions of Service
32 DSA Debt Sustainability Analysis
33 EAP Externally Assisted Project 34 EFC Eleventh Finance Commission 35 ERC Expenditure Reforms Commission 36 ESCOMs Electricity Supply Companies 37 FD Finance Department 38 FMRC Fiscal Management Review Committee 39 FPI Fiscal Policy Institute
40 GASAB Government Accounting Standards Advisory Board
41 GB Gender Budget
42 GCS General Category States
43 GCUs Government Commercial Undertakings
44 GDP Gross Domestic Product 45 GESCOM Gulbarga Electricity Supply Company
46 GIA Grants-In-Aid
47 GFR General Financial Rules
48 GIC General Insurance Corporation

Abbreviations
179
49 GOI Government of India 50 GOK Government of Karnataka 51 GOs Government Orders
52 GP Gram Panchayat
53 GSDP Gross State Domestic Product 54 GST Goods and Service Tax
55 HESCOM Hubli Electricity Supply Company
56 HOA Head of Account 57 HRMS Human Resource Management System
58 IFA Internal Financial Advisor
59 IGAS Indian Government Accounting Standard 60 IGST Integrated Goods and Service Tax
61 ITI Industrial Training Institute
62 KBJNL Krishna Bhagya Jala Nigam Limited
63 KFC Karnataka Financial Code 64 KFDF Karnataka Forest Development Fund
65 KFRA Karnataka Fiscal Responsibility Act 66 KIADB Karnataka Industrial Area Development Board
67 KILT Karnataka Institute of Leather Technology
68 KNNL Karnataka Neeravari Nigam Limited
69 KRDCL Karnataka Road Development Corporation Limited
70 KSFCL Karnataka State Financial Corporation Limited
71 KSCARDB Karnataka State Co-operative Agriculture and Rural Development Bank
72 KSCOMF Karnataka State Co-operative Marketing Federation
73 KSSIDC Karnataka State Small Industries Development Corporation Limited
74 KUWSDB Karnataka Urban Water Supply and Drainage Board
75 LIC Life Insurance Corporation 76 LMMH List of Major and Minor Heads 77 LROT Lease Rehabilitate Operate and Transfer
78 MCE Manual of Contingent Expenditure
79 MOF Ministry of Finance
80 MTFP Medium Term Fiscal Plan 81 NABARD National Bank for Agriculture and Rural Development 82 NCDC National Co-operative Development Corporation 83 NDC Bill Non-Payment Detailed Contingent Bill 84 NDRF National Disaster Response Fund
85 NGOs Non – Government Organisations 86 NPIC New Pension Implementation Cell
87 NPS New Pension Scheme 88 NSDL National Securities Depository Limited 89 NSSF National Small Savings Fund 90 OBB Off-Budget Borrowings
91 OD Over Draft
92 PAC Public Accounts Committee 93 Pr.AG (A&E) Principal Accountant General (Accounts and Entitlement)
94 Pr.AG (Audit) Principal Accountant General (Audit)
95 PAO Pay and Accounts Office 96 PD Personal Deposit 97 PF Provident Fund 98 PFRDA Pension Fund Regulatory Development Authority 99 PF Provident Fund
100 PMAY Pradhan Mantri Awas Yojane
101 PRAN Permanent Retirement Account Number

State Finance Audit Report for the year ended 31 March 2021
180
102 PRIs Panchayat Raj Institutions 103 PSUs Public Sector Undertakings 104 PWP&IWT Public Works, Port and Inland Water Transport
105 RBI Reserve Bank of India 106 RDPR Rural Development and Panchayat Raj 107 RE Revenue Expenditure
108 RERA Real Estate Regulatory Authority
109 RR Revenue Receipts 110 SCSP Special Component Sub Plan 111 SDMF State Disaster Mitigation Fund
112 SDRF State Disaster Response Fund 113 SDL State Development Loans
114 SE Supplementary Estimate
115 SFAR State Finance Audit Report
116 SGST State Goods and Service Tax
117 SLAO Special Land Acquisition Officer
118 SPVs Special Purpose Vehicles 119 SWMA Special Ways and Means Advances
120 TBs Treasury Bills
121 TE Total Expenditure 122 TFC Twelfth Finance Commission 123 TP Taluk Panchayat 124 TSP Tribal Sub Plan 125 UC Utilisation Certificate 126 ULB Urban Local Bodies 127 VJNL Visvesvaraya Jala Nigam Limited
128 WMA Ways and Means Advances
129 XII FC Twelfth Finance Commission
130 XIII FC Thirteenth Finance Commission 131 XIV FC Fourteenth Finance Commission
132 XV FC Fifteenth Finance Commission
133 ZP Zilla Panchayat
www.saiindia.gov.in
https://cag.gov.in/ag1/karnataka/en