Report of the Comptroller and Auditor General of India State ...
236
Report of the Comptroller and Auditor General of India State Finances Audit Report for the year ended March 2021 Government of Odisha Report No. 2 of the year 2022 लोकहिताथ सहिा Dedicated to Truth in Public Interest
-
Upload
khangminh22 -
Category
Documents
-
view
3 -
download
0
Transcript of Report of the Comptroller and Auditor General of India State ...

Report of the
Comptroller and Auditor General of India State Finances Audit Report
for the year ended March 2021
Government of Odisha
Report No. 2 of the year 2022
लोकहितार्थ सत्यहिष्ठा Dedicated to Truth in Public Interest


Report of the Comptroller and Auditor General of India
State Finances Audit Report
for the year ended March 2021
Government of Odisha Report No.2 of 2022


State Finances Audit Report for the year ended March 2021
i
Table of Contents
Paragraph
No.
Contents Reference
Page No.
Preface ix
Executive Summary xi-xiii
CHAPTER I: Overview 1.1 Profile of Odisha 1 1.2 Basis and Approach to State Finances Audit Report 1 1.3 Report Structure 2 1.4 Overview of Government Account Structure and
Budgetary Process 3
1.4.1 Gross State Domestic Product of the State 5 1.4.1.1 Sectoral Composition 5 1.4.2 Snapshot of Finances 7 1.4.3 Snapshot of Assets and liabilities of the Government 8 1.5 Fiscal Balance: Achievement of Deficit and Total Debt
Targets 9
1.5.1 Fiscal parameters 11 1.6 Deficits and Total Debt After Examination by Audit 13 1.6.1 Post Audit Surplus/Deficit 13 CHAPTER II: Finances of the State 2.1 Major Changes in Key Fiscal Aggregates vis-à-vis 2019-20 15 2.2 Sources and Application of Funds 15 2.3 Resources of the State 17 2.3.1 Receipts of the State 17 2.3.2 State’s Revenue Receipts 18 2.3.2.1 Trends and Growth of Revenue Receipts 18 2.3.2.2 State’s Own Resources 20 2.3.2.3 Transfers from the Centre 23 2.3.3 Receipts under Capital Section 26 2.3.4 State’s performance in mobilisation of resources 27 2.4 Application of Resources 28 2.4.1 Growth and Composition of Expenditure 28 2.4.2 Revenue Expenditure 31 2.4.2.1 Major changes in Revenue Expenditure 32 2.4.2.2 Committed Expenditure 33 2.4.2.3 National Pension System 35 2.4.2.4 Subsidies 35 2.4.2.5 Financial Assistance to Local Bodies and other institutions 36 2.4.3 Capital Expenditure (CE) 37 2.4.3.1 Major changes in Capital Expenditure 38

ii State Finances Audit Report for the year ended March 2021
Paragraph
No.
Contents Reference
Page No.
2.4.3.2 Quality of Capital Expenditure in Companies, Corporations and other bodies
39
2.4.4 Expenditure Priorities 41 2.4.5 Object head-wise expenditure 42 2.5 Public Accounts Receipts 42 2.5.1 Net Public Account Balances 42 2.5.2 Reserve Funds 44 2.5.3 Position of loans and advances and interest received/ paid
by the State Government 46
2.6 Debt Management 48 2.6.1 Debt profile: Components of Outstanding Liabilities/Debt 48 2.6.1.1 Composition and Financing pattern of Fiscal Deficit 52 2.6.2 Debt profile, Maturity and Repayment 53 2.6.3 Net availability of borrowed funds 54 2.7 Debt Sustainability Analysis 54 2.7.1 Debt Stabilisation- Debt Sustainability Indicators 55 2.7.2 Utilisation of borrowed funds 56 2.7.3 Status of Guarantees- Contingent Liabilities 57 2.7.4 Cash Balance 58 2.8 Recommendations 62 CHAPTER III: Budgetary Management 3.1 Budget Process 63 3.1.1 Summary of total provisions, actual disbursements and
savings during 2020-21 64
3.1.2 Charged and voted disbursements 65 3.2 Appropriation Accounts 65 3.3 Comments on Integrity of Budgetary and Accounting
Process 66
3.3.1 Misclassification of capital expenditure as revenue expenditure and vice versa
66
3.3.2 Supplementary grants 66 3.3.2.1 Unnecessary or excessive supplementary grants 66 3.3.2.2 Excessive supplementary grants 67 3.3.3 Un-necessary or excessive re-appropriation 67 3.3.4 Savings/Surrenders 67 3.3.4.1 Trends in Utilization of Budgeted Funds 69 3.3.5 Substantial surrenders 70 3.3.5.1 Surrender in excess of savings 70 3.3.5.2 Anticipated savings not surrendered/partially surrender 71 3.3.6 Excess Expenditure and its Regularisation 71 3.3.6.1 Excess expenditure relating to current Financial Year 71 3.3.6.2 Regularisation of excess expenditure of previous financial
years 72

State Finances Audit Report for the year ended March 2021
iii
Paragraph
No.
Contents Reference
Page No.
3.3.7 Grant-in-aid for creation of capital assets 72 3.4 Comments on Effectiveness of Budgetary and Accounting
Process 73
3.4.1 Major policy announcements in budget and their actual funding for ensuring implementation
73
3.5 Cash Management System 73 3.5.1 Rush of expenditure 75 3.6 Review of Selected Grants 76 3.6.1 Grant No.12- Health and Family Welfare Department 76 3.6.1.1 Budget and Expenditure 76 3.6.1.2 Surrender of Savings 77 3.6.1.3 Unnecessary Supplementary Grant 77 3.6.1.4 Programme implementation 78 3.6.2 Grant No. 20- Water Resources Department 79 3.6.2.1 Budget and Expenditure 79 3.6.2.2 Savings 80 3.6.2.3 Unnecessary Supplementary Grant 80 3.6.2.4 Programme implementation 80 3.7 Release of Funds at the end of the Financial Year 82 3.8 Advances from Contingency Fund 83 3.9 Recommendations 84 CHAPTER IV: Quality of Accounts & Financial Reporting Practices 4.1 Funds Outside Consolidated Fund or Public Account of the
State 85
4.2 Funds Transferred Directly to State Implementing Agencies
85
4.2.1 Trends in direct transfers to implementing agencies 86 4.3 Delay in Submission of Utilisation Certificates (UCs) 86 4.3.1 Delay in implementation of Integrated Financial
Management System (IFMS) - UC module 89
4.4 Abstract Contingent Bills 89 4.4.1 Non implementation of DC Bill functionality under
“Online Bill Preparation and Submission” module in IFMS 91
4.5 Personal Deposit (PD) Accounts 91 4.5.1 Personal Deposit Account framework 91 4.5.2 In-operative PD Accounts and Non-reconciliation of PD
Account balances 93
4.6 Indiscriminate use of Minor Head 800 93 4.7 Outstanding Balance Under Major Suspense Heads 95 4.7.1 Pay and Accounts Office (PAO) Suspense (Minor Head
101) 96
4.8 Non-reconciliation of Departmental figures 96 4.9 Reconciliation of Cash Balances 98

iv State Finances Audit Report for the year ended March 2021
Paragraph
No.
Contents Reference
Page No.
4.9.1 Discrepancy of ₹150.31 crore due to non-reconciliation between bank balance and cash book balance
98
4.10 Non-compliance with Accounting Standards 98 4.11 Non-submission of Annual Accounts/Separate Audit
Reports of Autonomous Bodies 98
4.12 Departmental Commercial Undertakings 99
4.13 Non-submission of Details of Grants/Loans Given to Bodies and Authorities
99
4.14 Timeliness and Quality of Accounts 100 4.15 Misappropriations, Losses, Thefts etc. 101 4.16 Opening of New Sub-Heads/Detailed Heads of Accounts
without advice 101
4.17 Follow up Action on State Finances Audit Report 101 4.18 Recommendations 101
CHAPTER V: State Public Sector Enterprises
5.1 Introduction 103
5.1.1 Mandate of Audit 103
5.1.2 What this Chapter contains 103
5.1.3 Number of SPSEs 104
5.1.4 Contribution to the GSDP of the State 104
5.1.5 Budgetary Support to State PSEs 105
5.2 Investment in Government Companies and Corporations and Government controlled other Companies
106
5.2.1 Equity holding 107
5.2.2 Loans given to Government Companies and Corporations 108
5.2.2.1 Computation of long term loans outstanding as on 31 March 2021
108
5.2.2.2 Adequacy of assets to meet loan liabilities 109
5.2.2.3 Interest Coverage 110
5.2.2.4 Age Wise Analysis of interest outstanding on State Government loans
110
5.2.3 Investment in Government controlled other Companies 111
5.3 Returns from the Government Companies and Corporations
112

State Finances Audit Report for the year ended March 2021
v
Paragraph
No.
Contents Reference
Page No.
5.3.1 Profit earned by Government Companies and Corporations 112
5.3.2 Loss incurred by Government companies and Corporations 113
5.3.3 Erosion of capital in Government Companies and Corporations
114
5.3.4 Dividend pay-out by SPSEs 114
5.4 Value of production 115
5.4.1 Return on Capital Employed (ROCE) 116
5.4.2 Return on Equity (ROE) of SPSEs 117
5.4.3 Sales and Marketing 118
5.5 Audit of State Public Sector Enterprises 118
5.6 Appointment of statutory auditors of State Public Sector Enterprises by CAG
118
5.7 Submission of accounts by SPSE 119
5.7.1 Need for timely submission 119
5.7.2 Timeliness in preparation of accounts by Government SPSEs and Government Controlled Other SPSE
119
5.8 CAG’s oversight- Audit of Accounts and Supplementary Audit
121
5.8.1 Financial reporting framework 121
5.8.2 Audit of Accounts of SPSEs by Statutory Auditors 121
5.8.3 Supplementary Audit of accounts of Government Companies
121
5.9 Results of CAG’s oversight role 122
5.9.1 Audit of accounts of Government Companies/ Government Controlled Other Companies under Section 143 of the Companies Act, 2013
122
5.9.1.1 Revision of Auditors Report 122
5.9.1.2 Significant comments of the CAG issued as supplement to the statutory auditors’ reports on Government Companies/Government Controlled Other Companies
122
5.10 Non Compliance with provisions of Accounting Standards/IND AS
133
5.11 Management Letters 134
5.12 Recommendations 135

vi State Finances Audit Report for the year ended March 2021
Paragraph
No.
Contents Reference
Page No.
Appendices
1.1 A brief profile of Odisha 137
1.2 Structure and Form of Government Accounts 138
2.1 Abstract of receipts and disbursements for the year 2020-21
139
2.2 Time Series data on the State Government Finances 142
2.3 Summarised financial position of the Government of Odisha as on 31 March 2021
145
3.1 Details of cases where supplementary provisions (₹ one crore or more in each case) proved unnecessary
147
3.2 Excessive Supplementary Provision during 2020-21(₹ one crore or more in each case)
149
3.3 Unnecessary/Excessive re-appropriation of funds during 2020-21
150
3.4 Re-appropriation of funds on 31st March 2021 (₹ One crore and above in each case)
151
3.5 List of grants having large savings (savings above ₹100 crore) during the year
152
3.6 Surrenders of 100 per cent of total provisions made during the year 2020-21 (₹ 50 crore or more in each case)
155
3.7 Statement showing details of savings of ₹ 100 crore and above and partially surrendered during 2020-21
157
3.8 Details of the schemes for which provision (₹ 10 crore and above) was made but no expenditure was incurred
158
3.9 Rush of Expenditure (100 per cent) during last month of 2020-21 (₹ One crore or more)
160
3.10 Release of funds at the end of the Financial Year 2020-21 162
4.1 Statement showing details of GIA for which utilisation certificates are pending since 2003-04 from different Departments of the State Government at the end of 2020-21
164
4.2 Statement showing details of GIA for which UCs are pending for more than ten years as on 31 March 2021
165
4.3 Department wise Outstanding Report of AC/DC Bills as on 31 March 2021
166
4.4 Department-wise Outstanding Report of AC/DC Bills during the year 2020-21
167
4.5 Statement showing details of Closure of PD Account as on 31 March 2021
168
4.6 Statement of Major Head-Wise Expenditure booked under Minor Head-800- (other expenditure) during 2020-21
169
4.7 Statement of Major Head-Wise Receipts booked under Minor Head-800- (other receipts) during 2020-21
170

State Finances Audit Report for the year ended March 2021
vii
Paragraph
No.
Contents Reference
Page No.
Appendices
4.8 Discrepancies between Cash Book and Pass Book balance as on 31 March 2021
171
4.9 Statement showing pendency of Accounts and delay in preparation of Separate Audit Report in respect of Autonomous Bodies
172
4.10 Pending cases of misappropriation, losses, theft, etc. 173
5.1 Lists of 80 Government SPSEs and Government Controlled Other SPSEs
174
5.2 A Details of accounts in arrears or companies under liquidation - Government Companies and Corporations
177
5.2 B Details of accounts in arrears or company under liquidation/defunct Government controlled other companies
179
5.3 Department wise details of turnover of State PSEs 180
5.4 Loss incurred by 10 SPSEs during 2019-20 and 2020-21 182 5.5 List of SPSEs having negative Net Worth as on 31 March
2021 183
5.6 Shortfall in dividend by Government companies 184 5.7 Value of Production, Total Assets and Capital Employed of
CPSEs 185
5.8 Return on Capital Employed of CPSEs 186
5.9 Return on Equity of CPSEs 189
5.10 List of SPSEs where Comment by CAG issued 192 5.11 Details of Companies where there were non-compliance
with Accounting Standards/Ind AS as reported by the Statutory Auditors
193
5.12 List of SPSEs where Management Letters issued by CAG 194 6.1 Glossary of important Budget related terms 195


State Finances Audit Report for the year ended March 2021
ix
Preface
This Report has been prepared for submission to the Governor of Odisha under Article 151 of the Constitution. The State Finances Audit Report of the Government of Odisha intends to assess the financial performance of the State during 2020-21 and to provide the State Legislature with inputs based on audit analysis of financial data. The Report contains five Chapters. Chapter I Overview: This Chapter describes the basis and approach to the Report and the underlying data, provides an overview of structure of Government Accounts, budgetary processes, macro-fiscal analysis of key indices and State’s fiscal position including the deficits/ surplus. Chapter II Finances of the State: This Chapter provides a broad perspective of the finances of the State, analyses the critical changes in major fiscal aggregates relative to the previous year, overall trends during the period from 2016-17 to 2020-21, debt profile of the State and key Public Account transactions, based on the Finance Accounts of the State. Chapter III Budgetary Management: This Chapter is based on the Appropriation Accounts of the State and reviews the appropriations and allocative priorities of the State Government and reports on deviations from Constitutional provisions relating to budgetary management. Chapter IV Quality of Accounts & Financial Reporting Practices: This Chapter comments on the quality of accounts rendered by various authorities of the State Government and issues of non-compliance with prescribed financial rules and regulations by various Departmental officials of the State Government. Chapter V State Public Sector Enterprises: This Chapter contains Summary of financial performance of State Public Enterprises and Oversight Role of CAG on State Public Sector Enterprises (SPSEs). The audit has been conducted in conformity with the Auditing Standards issued by the Comptroller and Auditor General of India.


EXECUTIVE SUMMARY


Executive Summary
State Finances Audit Report for the year ended March 2021
xi
Chapter I: Overview
Gross State Domestic Product and Sectoral Composition
The Gross State Domestic Product (GSDP) of Odisha in 2020-21 at current prices was ₹ 5,09,574 crore and at constant prices was ₹3,76,998 crore, registering a growth rate of (-2.24) per cent and (-4.92) per cent respectively over the previous year. In 2020-21, Service Sector was the biggest contributor to the GSDP with 37.16 per cent followed closely by Industry Sector at 31.73 per cent while Agriculture Sector contributed 18.61 per cent.
(Paragraph 1.4) Fiscal Position of the State
The State recorded a Revenue Surplus of ₹9,076 crore and Fiscal Deficit of ₹9,786 crore. Revenue Surplus (₹ 9,076 crore) of the State in 2020-21 had significantly increased (273 per cent) from the Revenue Surplus for the previous year (₹2,430 crore). During 2020-21, there was significant decrease in Revenue Expenditure by `3,826 crore, while Revenue Receipts increased by `2,819 crore as compared to last year. Significant reduction of expenditure was noticed under Social Services (`3,616 crore) from `43,517 crore in 2019-20 to `39,901 crore in 2020-21. Fiscal Deficit (₹9,786 crore) was 1.92 per cent of GSDP (₹ 5,09,574 crore).
(Paragraphs 1.5 and 2.4.2.1)
Chapter II: Finances of the State
Sources and Application of Resources
Revenue Receipts (₹ 1,04,387 crore) of the Government constituted 20.49 per cent of the Gross State Domestic Product (GSDP) (₹ 5,09,574 crore) during 2020-21. Revenue Expenditure (₹ 95,311 crore) of the State was 18.70 per cent of GSDP during 2020-21. It decreased by ₹3,826 crore (3.86 per cent) over 2019-20 (₹ 99,137 crore).
Own Tax Revenue (₹34,258 crore) increased by 6.01 per cent over the previous year and Non-Tax Revenue (₹ 19,518 crore) increased by 33.26 per cent over the previous year.
Capital Expenditure (CE) (₹ 17,949 crore) during 2020-21 constituted 15.63 per
cent of Total Expenditure (₹ 1,14,857 crore). It decreased by ₹2,328 crore (11.48 per cent) over the previous year (₹20,277 crore).
(Paragraph 2.3 & 2.4)
Executive Summary

Executive Summary
xii State Finances Audit Report for the year ended March 2021
Committed Expenditure
Committed Expenditure of the Government consists of interest payments (₹ 6,644 crore), salaries and wages (₹21,003 crore) and pensions (₹ 13,629 crore). The Committed Expenditure in 2020-21 was ₹ 41,276 crore and constituted 43.31 per
cent of Revenue Expenditure (₹95,311 crore).
(Paragraph 2.4.2.2)
Loans and Advances given by the State Government
As of 31 March 2021, Loans and Advances given by the Government to Public Sector Companies, Autonomous Bodies and Corporations were ₹ 9,076 crore. Loans and advances outstanding rose from ₹4,708 crore in 2016-17 to ₹9,076 crore in 2020-21. Major portion of loans advanced during 2020-21 was to Indian Oil Corporation Limited (₹ 700 crore).
(Paragraph 2.5.3)
Cash Balance
The cash balance at the end of March 2021 was ₹ 32,636 crore. The closing cash balances in the years 2017-18, 2018-19 and 2019-20 were ₹30,848.11 crore ₹38,134.48 crore and ₹42,437.5 crore respectively. The State Government was maintaining large cash balance on a regular basis, while being a fiscal deficit State.
(Paragraph 2.7.4)
Chapter III: Budgetary Management
Savings
In 2020-21, the total savings were ₹43,554.13 crore, out of which ₹ 32,556.37 crore (74.75 per cent) was surrendered on the last day of the year i.e., 31 March 2021. The remaining savings of ₹10,997.76 crore (25.25 per cent) were not surrendered during 2020-21.
(Paragraph 3.3.4)
Substantial surrenders
Surrenders of 100 per cent of total provision of ₹1,834.31crore were made in 12 cases (₹50 crore or more in each case) under 11 grants.
(Paragraph 3.3.5)
Surrender in excess of savings
In three cases (three grant), the amount surrendered (one crore or more in each case), were in excess of savings, indicating inadequate budgetary control in these Departments. As against savings of ₹4,674.53 crore, the amount surrendered was ₹ 5,053.61 crore, resulting in excess surrender amounting to ₹ 379.08 crore.
(Paragraph 3.3.5.1)

Executive Summary
State Finances Audit Report for the year ended March 2021
xiii
Chapter IV: Quality of Accounts and Financial Reporting Practices
Personal Deposit (PD) Accounts
There were 811 PD Accounts with a closing unspent balance of ₹7,047.28 crore as of 31 March 2021. There was a decrease of 66.28 per cent in unspent balances of PD accounts over the previous year mainly due to opening of separate investment account of Odisha Mineral Bearing Areas Development Corporation (OMBADC) and investing ₹16,758 crore and leaving ₹414.85 crore in PD Account of OMBADC.
(Paragraph 4.5.1)
Outstanding Detailed Contingent bills
It was observed that during the year 2020-21, 14 Departments had drawn an amount of ₹14 crore through 385 Abstract Contingent (AC) bills. However, only an amount of ₹3.35 crore (23.93 per cent) was adjusted by furnishing Detailed Contingent (DC) Bills. Thus, DC bills amounting to ₹ 10.65 crore were not submitted as of 31 March 2021. There is, therefore, no assurance that this amount of ₹ 10.65 crore had actually been utilised for the purpose for which it was sanctioned.
(Paragraph 4.4)
Chapter V: State Public Sector Enterprises
Number of State Public Sector Enterprises(SPSEs)
As on 31 March 2021, there were 80 SPSEs under the audit jurisdiction of the CAG. These included 62 Government Companies, three Statutory Corporations and 15 Government controlled other Companies. Of these, accounts were in arrears for three years or more or were defunct under liquidation in respect of 35 SPSEs (including three Government Controlled other Companies).
(Paragraph 5.1.3)
Timeliness in preparation of accounts by Government SPSEs and
Government Controlled Other SPSEs
SPSEs were not adhering to the prescribed timelines regarding submission of their Financial Statements as per the Companies Act, 2013. As a result, 952 accounts of 54 Government SPSEs and 15 Government Controlled Other SPSEs were in arrears.
(Paragraph 5.7.2)

Executive Summary
xiv State Finances Audit Report for the year ended March 2021

Executive Summary
State Finances Audit Report for the year ended March 2021
xi
Chapter-I
Overview

Executive Summary
State Finances Audit Report for the year ended March 2021
xi

State Finances Audit Report for the year ended March 2021
1
*
1.1 Profile of Odisha
Odisha, a state on the eastern coast of India, is divided into 30 administrative geographical districts. It is the ninth largest State of India in terms of geographical area (1,55,707 sq. km) having 4.87 per cent of total area of the nation. According to the 2011 census of India, the total population of Odisha is 4.20 crore (11th largest state), of which 2.12 crore (50.54 per cent) are male and 2.08 crore (49.46 per cent) are female. The percentage of population below the poverty line was 32.59 per cent, which was higher than the national average of 21.9 per cent. Odisha has a lower literacy rate, lower life expectancy at birth and higher infant mortality rate, when compared to the all-India average. A profile of the State with demographic and other details is at Appendix-1.1.
The structure of Government Accounts is explained in Part A and the layout of Finance Accounts of Government of Odisha is given in Part B of Appendix-1.2.
1.2 Basis and Approach to State Finances Audit Report
In terms of Article 151 (2) of the Constitution of India, the Reports of the Comptroller and Auditor General of India (CAG) relating to the Accounts of a State are to be submitted to the Governor of the State, who shall cause them to be laid before the Legislature of the State. The State Finances Audit Report (SFAR) is prepared and submitted under Article 151 (2) of the Constitution of India.
The Office of the Accountant General (Accounts & Entitlements), Odisha prepares the Finance Accounts and Appropriation Accounts of the State annually, from the vouchers, challans and initial and subsidiary accounts rendered by treasuries, offices and departments responsible for keeping of such accounts functioning under the control of the State Government, and the statements received from the Reserve Bank of India. These Accounts are audited independently by the Office of the Accountant General (Audit-I), Odisha and the Accounts are certified by the CAG.
Finance Accounts and Appropriation Accounts of the State constitute the core data for this Report. Other sources include the following:
Budget of the State for assessing the fiscal parameters and allocative priorities vis-
à-vis projections, as well as for evaluating the effectiveness of its implementation and compliance with the relevant rules and prescribed procedures;
Results of audit carried out by the Office of the Accountant General (Audit);
Overview Chapter
I

Overview
2 State Finances Audit Report for the year ended March 2021
Other data with Departmental Authorities and Treasuries (accounting as well as MIS);
GSDP data and other State related statistics; and
Various Audit Reports of the CAG of India.
The analysis is also carried out in the context of recommendations of the XIV Finance Commission (FC), State Financial Responsibility and Budget Management Act, best practices and guidelines of the Government of India. An exit conference was held in December2021 with Finance Department, Government of Odisha, wherein the issues taken up in the State Finances Audit Report were discussed and the draft Report was forwarded to the State Government for comments. Replies of the Government, wherever received, have been incorporated in this Report at appropriate places.
1.3 Report Structure
The State Finances Audit Report is structured into the following five Chapters:
Chapter – 1 Overview
This Chapter describes the basis and approach to the Report and the underlying data, provides an overview of structure of Government Accounts, budgetary processes, macro-fiscal analysis of key indices and State’s fiscal position including the deficits/ surplus.
Chapter – II Finances of the State
This Chapter provides a broad perspective of the finances of the State, analyses the critical changes in major fiscal aggregates relative to the previous year, overall trends during the period from 2016-17 to 2020-21, debt profile of the State and key Public Account transactions, based on the Finance Accounts of the State.
Chapter – III Budgetary Management
This Chapter is based on the Appropriation Accounts of the State and reviews the appropriations and allocative priorities of the State Government and reports on deviations from Constitutional provisions relating to budgetary management.
Chapter – IV Quality of Accounts & Financial Reporting Practices
This Chapter comments on the quality of accounts rendered by various authorities of the State Government and issues of non-compliance with prescribed financial rules and regulations by various Departmental officials of the State Government.
Chapter – V State Public Sector Enterprises This Chapter discusses financial performance of Government Companies, Statutory Corporations and Government Controlled Other Companies as revealed from their accounts.

Overview
State Finances Audit Report for the year ended March 2021
3
1.4 Overview of Government Account Structure and Budgetary Processes
There is a constitutional requirement in India (Article 202) to present before the House or Houses of the Legislature of the State, a statement of estimated receipts and expenditures of the Government in respect of every financial year. This ‘Annual Financial Statement’ constitutes the main budget document. Further, the budget must distinguish expenditure on the revenue account from other expenditures.
Revenue Receipts consist of Own Tax Revenue, Non-Tax Revenue, share of Union Taxes/ Duties and Grants-in-Aid from Government of India.
Revenue Expenditure consists of all those expenditures of the Government which do not result in creation of physical or financial assets. It relates to those expenses incurred for the normal functioning of the Government departments and various services, interest payments on debt incurred by the Government and Grants-in-Aid given to various institutions (even though some of the grants may be meant for creation of assets).
The main items of Capital Receipts are loans raised by the Government called market borrowings, borrowings by the Government from the Reserve Bank and commercial banks and other financial institutions through the sale of treasury bills, and recoveries of loans granted by the Government. Other items include small savings (Post-Office Savings Accounts, National Savings Certificates, etc.), provident funds and net receipts obtained from the sale of shares in Public Sector Undertakings (PSUs).
Capital Expenditure includes expenditure on the acquisition of land, building, machinery, equipment, investment in shares, and loans and advances by the Government to PSUs and other parties.
Structure of Government Accounts

Overview
4 State Finances Audit Report for the year ended March 2021
The Accounts of the State Government are kept in three parts:
1. Consolidated Fund of the State constituted under Article 266(1) of the Constitution of India. 2. Contingency Fund of the State constituted under Article 267(2) of the Constitution of India. 3. Public Account of the State constituted under Article 266(2) of the Constitution.
At present, we have an accounting classification system in Government that is both functional and economic.
Attribute of transaction Classification Standardised in LMMH by CGA
Function- Education, Health, etc./ Department
Major Head under Grants (4-digit)
Sub-Function Sub Major head (2-digit) Programme Minor Head (3-digit)
Flexibility left for States Scheme Sub-Head (2-digit) Sub- scheme Detailed Head (2-digit) Economic nature/ Activity Object Head-salary, minor works, etc.
(2-digit)
The functional classification lets us know the department, function, scheme or programme, and object of the expenditure. Economic classification helps organise these payments as revenue, capital, debt, etc. Economic classification is achieved by the numbering logic embedded in the first digit of 4-digit Major Heads. For instance, 0 and 1 are for revenue receipts, 2 and 3 for revenue expenditure, etc. Economic classification is also achieved by an inherent definition and distribution of some object heads. For instance, while “salary” object head is revenue expenditure, “construction” object head is capital expenditure. Object head is the primary unit of appropriation in the budget documents.
Budgetary Processes
In terms of Article 202 of the Constitution of India, the Governor of the State causes to be laid before the State Legislature, a statement of the estimated receipts and expenditure of the State for the year, in the form of an Annual Financial Statement. In terms of Article 203, the statement is submitted to the State Legislature in the form of Demands for Grants/ Appropriations and after approval of these, the Appropriation Bill is passed by the Legislature under Article 204 to provide for appropriation of the required money out of the Consolidated Fund. Some States have more than one consolidated Budget – there could be sub-budgets like Child Budget, Agriculture Budget, Weaker sections (SC/ST) Budget, Disability Budget etc.
The State Budget Manual details the budget formulation process and guides the State Government in preparing its budgetary estimates and monitoring its expenditure activities. Results of audit scrutiny of budget and implementation of other budgetary initiatives of the State Government are detailed in Chapter III of this Report.

Overview
State Finances Audit Report for the year ended March 2021
5
1.4.1 Gross State Domestic Product of the State
Gross Domestic Product (GDP) and Gross State Domestic Product (GSDP) refer to the market value of all officially recognised final goods and services produced within the Country and the State respectively in a given period of time, accounted without duplication and are important indicators of the Country and State’s economy. The Gross State Domestic Product (GSDP) of Odisha in 2020-21 at current prices was₹5,09,574 crore. The trends in annual growth of Gross Domestic Product (GDP) of India and GSDP of the State at current prices and constant prices (Base year: 2011-12) are in Table 1.1. Economic growth in Odisha and for India as a whole was adversely impacted during 2020-21, due to the COVID-19 outbreak.
Table 1.1: GDP of India and GSDP of the State
Year 2016-17 2017-18 2018-19 2019-20 2020-21 Current Prices India’s GDP (₹ in crore) 153,91,669 170,90,042 188,86,957 203,51,013 197,45,670 Growth rate (per cent) 11.76 11.03 10.51 7.75 -2.97 State’s GSDP (₹ in crore) 3,92,804 4,40,879 4,87,805 5,21,275 5,09,574
Growth rate (per cent) 19.56 12.24 10.64 6.86 -2.24 Constant Prices (Base Year 2011-12) India’s GDP (₹in crore) 123,08,193 131,44,582 140,03,316 145,69,268 135,12,740 Growth rate (per cent) 8.26 6.80 6.53 4.04 -7.25 State’s GSDP (₹ in crore) 3,37,348 3,61,568 3,76,877 3,96,499 3,76,998 Growth rate (per cent) 15.44 7.18 4.23 5.21 -4.92
Source: GDP- Central Statistical Office (2016-17: Final, 2017-18: Third Revised, 2018-19: Second Revised, 2019-20:
First Revised and 2020-21: Provisional)
GSDP- Directorate of Economics & Statistics, Odisha (2016-17: Final, 2017-18: Third Revised, 2018-19: Second
Revised, 2019-20: First Revised and 2020-21: Advance)
1.4.1.1 Sectoral Composition
In respect of sectoral composition of GSDP, the share of Agriculture and Allied Activities Sector remained more or less the same during 2020-21 as compared to contribution during 2016-17 even after the regular natural calamities such as drought, flood and cyclone.
The share of the Industry Sector was 31.73 per cent of GSDP during 2020-21, which was significantly lower than its share of 35.55 per cent during 2016-17, due to the shut-down and restrictions imposed on operations of industries during the Covid-19 outbreak. This Sector comprises (i) Mining and Quarrying, (ii) Manufacturing, (iii) Electricity, Gas and Water-supply and (iv) Construction activities. Manufacturing is the leading sub-sector, with a 48.40 per cent share under Industry Sector.
The share of Services Sector during 2020-21 was 37.16 per cent of GSDP. This Sector comprises (i) Trade, Repair, Hotels and Restaurants, (ii) Transport, Storage, Communication etc., (iii) Financial Services, (iv) Real estate, OD Professional Services, (v) Public Administration and Defence and (vi) Other Services. Other Services is the leading sub-sector with 23.73 per cent share under Services Sector. Restaurants were

Overview
6 State Finances Audit Report for the year ended March 2021
permitted to operate with limited restrictions during the Covid-19 outbreak, and activities such as transport and storage of goods were not as adversely impacted as other Sectors. There was increased expenditure under Public Administration during the Covid-19 outbreak in the form of various pandemic response measures.
The share of Taxes on Product (less subsidy) showed an increase from 9.63 per cent in 2016-17 to 12.50 per cent share of GSDP in 2020-21.
The changes in sectoral contribution to GSDP and trends in sectoral growth of GSDP over the years 2016-17 to 2020-21 are detailed in Charts 1.1 and 1.2 below.
Chart 1.1: Change in Sectoral Contribution to GSDP (2016-17 to 2020-21)
Source: Directorate of Economics & Statistics, Government of Odisha
Chart 1.2: Sectoral Growth in GSDP (Over Previous Year)
Source: Directorate of Economics & Statistics, Government of Odisha
However, the Sectoral growth rate of all three sectors during 2020-21 witnessed negative growth due to the pandemic. There was a decreasing trend in all three Sectors compared to 2019-20, with the Industry Sector being the most impacted, followed by Services Sector and then the Agriculture and Allied Activities Sector.
20.47
0.93
14.57
16.28
-5.00
25.72
12.84
10.76
1.48
-8.69
7.0512.54
9.41 9.39-0.38
-15.00
-10.00
-5.00
0.00
5.00
10.00
15.00
20.00
25.00
30.00
2016-17 2017-18 2018-19 2019-20 2020-21
In p
er c
ent
Agriculture & Allied Activity Industry Sector Service Sector

Overview
State Finances Audit Report for the year ended March 2021
7
1.4.2 Snapshot of Finances
The following table provides the details of actual financial results vis-à-vis Budget Estimates for the year 2020-21 vis-à-vis actuals of 2020-21.
Table 1.2: Actual Financial Results vis-à-vis Budget Estimates (₹ in crore)
Sl. No.
Components 2019-20 Actual
2020-21 B.E.
2020-21 Actual
Percentage of Actual to B.E.
Percentage of Actual to GSDP
1 Tax Revenue 32,315 38,350 34,258 89.33 6.72 2 Non Tax Revenue 14,647 17,650 19,518 110.58 3.83 3 Share of Union taxes / duties 30,454 36,300 27,543 75.88 5.41 4 Grants-in-Aid and Contributions 24,152 32,000 23,068 72.09 4.53 5 Revenue Receipts (1+2+3+4) 1,01,568 1,24,300 1,04,387 83.98 20.49 6 Recovery of Loans and Advances 287 250 684 273.60 0.13 7 Other Receipts -- 0 0 0.00 0.00 8 Borrowings and other Liabilities (a) 18,818 17,878 9,786 54.74 1.92 9 Capital Receipts (6+7+8) 19,105 18,128 10,470 57.76 2.05 10 Total Receipts (5+9) 1,20,673 1,42,428 1,14,857 80.64 22.54 11 Revenue Expenditure of which 99,137 1,14,791 95,311 83.03 18.70 12 Interest payments 6,063 7,160 6,644 92.79 1.30 13 Grant-in-Aid for creation of capital
assets 7,487
9,102 8,567 94.12 1.68
14 Capital Expenditure of which (b) 21,536 27,637 19,546 70.72 3.84 15 Capital Outlay 20,277 26,263 17,949 68.34 3.52 16 Loan and advances 1,259 1,374 1,597 116.23 0.31 17 Total Expenditure (11+14) 1,20,673 1,42,428 1,14,857 80.64 22.54 18 Revenue Surplus (5-11) 2,430# 9,509 9,076 95.45 1.78 19 Fiscal Deficit {17-(5+6+7)} 18,819# 17,878 9,786 54.74 1.92 20 Primary Deficit (19-12) 12,756 10,718 3,142 29.32 0.62
Source: Finance Accounts & Budget at a Glance
# Difference of ₹ 1 crore is due to rounding off.
(a) Borrowings and other Liabilities: Net (Receipts – Disbursements) of Public Debt + Net of
Contingency Fund + Net (Receipts – Disbursements) of Public Account + Net of Opening and
Closing Cash Balance
(b) Expenditure on Capital Account includes Capital Expenditure and Loans and Advances disbursed
The reason for increase in revenue receipts by ₹2,819 crore over last year was due to an increase in State’s non-tax revenue by ₹4,871 crore and State’s tax revenue by ₹1,943 crore. However, during the year Grants-in-aid and State share of union taxes decreased by ₹1,084 crore and ₹2,911 crore respectively.
GST Compensation is the revenue of the State Government under GST (Compensation to States) Act, 2017. However, in addition to receiving the GST compensation of ₹ 4,361.59 crore as revenue receipts, due to inadequate balance in GST compensation fund during the year 2020-21, Odisha also received back-to-back loan of ₹ 3,822 crore under debt receipts of the State Government, with no repayment liability for the State. Due to this

Overview
8 State Finances Audit Report for the year ended March 2021
arrangement, the revenue surplus of ₹ 9,076 crore and fiscal deficit of ₹ 9,786 crore during the year 2020-21 may be read in conjunction with debt receipt of ₹ 3,822 crore in lieu of GST compensation. Table 1.3 below indicates the trend analysis of receipt vis-a-visexpenditure for the last five years:
Table 1.3: Trends of Receipts vis-à-visExpenditure (₹in crore)
Year Revenue Per cent of Revenue
Expenditure to Revenue
Receipts
Capital Per cent of Capital
Expenditure to Capital Receipts
Receipts Expenditure Receipts Expenditure
2016-17 74,299 65,041 87.54 11,312 21,687 191.72 2017-18 85,204 71,837 84.31 13,119 25,674 195.70 2018-19 99,546 85,356 85.75 10,308 28,592 277.38 2019-20 1,01,568 99,137 97.61 14,966 26,030 173.93 2020-21 1,04,387 95,311 91.31 21,002 28,798 137.12
Source: Finance Accounts of respective years
In 2019-20, for every `100 received as revenue, `97.61 had been on revenue expenditure which was reduced to `91 in 2020-21.
While revenue expenditure increased by `30,270 crore (46.54 per cent) from 2016-17 to 2020-21, capital expenditure increased by `7111 crore (32.79 per cent).
While the percentage of Revenue Expenditure over Revenue Receipts was increasing over the years, the percentage of Capital Expenditure over Capital Receipts declined from 2016-17 to 2020-21.
1.4.3Snapshot of Assets and liabilities of the Government
Government accounts capture the financial liabilities of the Government and the assets created out of the expenditure incurred. The liabilities consist mainly of internal borrowings, loans and advances from GoI, receipts from the public account and reserve funds, and the assets comprise mainly of the capital outlay and loans and advances given by the State Government and cash balances.
Table 1.4: Summarised position of assets and liabilities (₹ in crore)
Liabilities Assets
2019-20 2020-21
Per cent
increase/
decrease
2019-20 2020-21 Per cent increase/ decrease
Consolidated Fund A Internal Debt 60,595.30 67,521.41 11.43 A Gross Capital
Outlay on Fixed Assets
1,61,726.29 1,79,684.79 11.10
B Loans and Advances from GoI
7,842.55 11,981.95 52.78 B Loans and Advances
8,162.72 9,066.17 11.07
Contingency Fund 400.00 229.00 -42.75 Public Account A Small Savings, 24,337.84 24,949.37 A Advances 10.61 16.48 55.32

Overview
State Finances Audit Report for the year ended March 2021
9
Liabilities Assets
2019-20 2020-21
Per cent
increase/
decrease
2019-20 2020-21 Per cent increase/ decrease
Provident Funds etc. B Deposits 29,256.25 16,225.05 -44.54 B Remittance 100.24 82.23 -17.97 C Reserve Funds 21,362.47 20,333.44 -4.76 C Suspense and
Miscellaneous -- -- --
D Suspense and Miscellaneous balances
91.45 117.62 28.62 D Cash Balance (including investment of Earmarked Fund)
42,437.50 32,636.04 -23.10
E Miscellaneous Capital Receipts
698.15 698.15 --
F Cumulative excess of receipts over expenditure
67,853.36 79,429.72 17.06
Total 2,12,437.36 2,21,485.71 4.26 Total 2,12,437.36 2,21,485.71 4.26 Source: Finance Accounts of respective years
The growth rate of assets in Consolidated Fund increased by 11.10 per cent from ₹1,69,889 crore in 2019-20 to ₹1,88,751 crore in 2020-21, while that of liabilities also increased by 16.17 per cent from ₹68,438 crore in 2019-20 to ₹79,503 crore in 2020-21. The cash balance of the state at the end of the year was ₹32,636 crore which marginally decreased by ₹ 9,801 crore (23.10 per cent) over the previous year.
1.5 Fiscal Balance: Achievement of deficit and total debt targets
The Central and individual State Governments have passed Fiscal Responsibility and Budget Management (FRBM) Act with the objective of ensuring prudence in fiscal management by eliminating revenue deficit, reducing fiscal deficit and overall/ outstanding debt to acceptable level, establishing improved debt management and improving transparency in a medium term framework. In this context, the Act provides quantitative targets to be adhered to by the State with regard to deficit measures and debt level.
Achievements vis-à-vis fiscal targets prescribed in the State FRBM Act for the years 2016-21 is detailed in Table 1.5 and comparison of targets for fiscal parameters projected in Medium Term Fiscal Plan (MTFP), 2020 presented to the State Legislature with actuals for the current year is presented in Table 1.6.

Overview
10 State Finances Audit Report for the year ended March 2021
Table 1.5: Compliance with provisions of State FRBM Act
Fiscal Parameters Fiscal targets set in the Act
Achievement (₹ in crore)
2016-17 2017-18 2018-19 2019-20 2020-21
Revenue Deficit (-) / Surplus (+) (₹ in crore)
Revenue Surplus
9,258 13,367 14,190 2,430 9,076
Fiscal Deficit (-) / Surplus (+) (as percentage of GSDP)
3 per cent
(5 per cent for
2020-21)
(-)2.39 (-)2.12 (-)2.08 (-)3.61 (-)1.92 ×
Ratio of total outstanding debt to GSDP (in per cent)
25 per cent 18.23 22.04 22.19 24.19 23.34#
Interest payment as percentage of Revenue Receipts
15 per cent 5.43 5.85 5.83 5.97 6.36
Ratio of Salary to State’s Own Revenue
80 per cent 49.13 48.74 43.50 44.39 39.34
Primary Surplus as a percent of GSDP
2 per cent (-)1.36 (-)0.99 (-)0.89 (-)2.45 (-)0.62 × × × × ×
Source: FRBM Act and Finance Accounts of respective years, Government of Odisha
The fiscal deficit target and annual borrowing limit for the year 2020-21 had increased by two per cent over and above the target fixed in clause (b) of Section 5 of the OFBRM Act, 2005 through Odisha Gazette (Extraordinary) of13 May 2021. The State was able to achieve all the fiscal parameters set out in FRBM Act during 2016-17 to 2020-21, except the target set for achieving Primary Surplus.
Table 1.6: Actuals vis-à-vis projection in MTFP for 2020-21 Sl. No.
Fiscal Variables Projection as per
MTFP Actuals
(2020-21) Variation (in
per cent)
1 Own Tax Revenue 38,350 34,258 (-)10.67 2 Non Tax Revenue 17,650 19,518 (+)10.58 3 Share of Central Taxes 36,300 27,543 (-)24.12
4 Grants-in-Aid from GoI 32,000 23,068 (-)27.91
5 Revenue Receipts (1+2+3+4) 1,24,300 1,04,387 (-)16.02 6 Revenue Expenditure 1,14,791 95,311 (-)16.97 7 Revenue Deficit (-) / Surplus (+) (5-6) 9,509 9,076 (-)4.55 8 Fiscal Deficit (-) / Surplus (+) 17,878 9,786 (-)45.26 9 Debt-GSDP ratio (per cent) 18.99 23.34# (+)26.86 10 GSDP growth rate at current prices (per cent) 11.70 -2.24 (-)119.15
Source: Medium Term Fiscal Plan 2020 and Finance Accounts 2020-21, Government of Odisha.
# This debt does not include ₹3,822.00 crore, which was passed on as back to back loans by Government
of India in lieu of shortfall in GST Compensation, vide GoI’s No. F. No. 40(1) PF-S/2021-22 dated 10-12-
2021.
The effective debt to GSDP ratio (23.34per cent) has been arrived at after excluding GST compensation of ₹ 3,822 crore received as back to back loan under debt receipts from the total outstanding liabilities as the Department of Expenditure, GoI has decided that it will not be treated as debt of the State for any norms which may be prescribed by the Finance Commission.

Overview
State Finances Audit Report for the year ended March 2021
11
It is evident from the above Table 1.6 that the State Government did not achieve its MTFP target for Revenue Surplus and Debt-GSDP Ratio. Even though the State’s projections were adversely impacted by the sudden COVID-19 outbreak, the target for Fiscal Deficit was achieved by the State Government.
1.5.1 Fiscal parameters Three key fiscal parameters viz., (i) Revenue Surplus/Deficit1, (ii) Fiscal Deficit2 and (iii) Primary Deficit3 help in assessing the fiscal situation of the Government. The way these deficits are financed assist in assessing the fiscal health of the Government. Trends in fiscal parameters are shown in Chart 1.3. Trends in Debt Sustainability (i.e., Ratio between Fiscal Liabilities and GSDP in per cent) are shown in Chart 1.4.
Chart 1.3: Trends of Fiscal parameters
Source: Finance Accounts 2020-21, Government of Odisha
1 Revenue Deficit = Revenue Expenditure- Revenue Receipts 2 Fiscal Deficit = Revenue Expenditure + Capital Expenditure + Net Loans and Advances (-) Revenue Receipts (-)
Miscellaneous Capital Receipts 3 Primary Deficit = Fiscal Deficit – Interest Payments.
9,25
8
13,3
67
14,1
90
2,43
0
9,07
6
-9,3
78
-9,3
60
-10,
157
-18,
818
-9,7
86
-5,3
43
-4,3
72
-4,3
57
-12,
755
-3,1
42
-20,000-15,000-10,000
-5,0000
5,00010,00015,00020,000
2016-17 2017-18 2018-19 2019-20 2020-21
`in
cro
re
Revenue Surplus Fiscal Deficit Primary Deficit

Overview
12 State Finances Audit Report for the year ended March 2021
Chart 1.4: Trends in Fiscal Liabilities and GSDP
Source: Finance Accounts 2020-21, Government of Odisha
# Debt includes Internal Debt, Loans and Advances from Government of India (including back to back loan)&
Public Accounts Liabilities.
Some important deficit parameters are discussed below:
Revenue Surplus (₹9,076 crore) of the State in 2020-21 increased (273 per cent) compared to 2019-20 (₹2,430 crore). The State achieved the target of being a Revenue Surplus State as laid out in the State’s FRBM (Amendment) Act 2016. However, the other targets included in the State’s MTFP proved elusive, due to the sudden Covid-19 outbreak.
Fiscal Deficit (₹9,786 crore) in 2020-21 decreased significantly (48 per cent) compared to 2019-20 (₹ 18,819 crore). However, the Fiscal Deficit as a percentage of GSDP was 1.92 per cent and well within the fiscal target set out in its FRBM (Amendment) Act 2021 of maintaining the Fiscal Deficit within 5 per cent of the GSDP.
Primary Deficit (₹ 3,142 crore) in 2020-21 decreased significantly (-75 per cent) compared to 2019-20 (₹ 12,756 crore). Fiscal Deficit as a percentage of GSDP was 0.62 per cent and well within the fiscal target set out in its FRBM Act 2021 of maintaining the Fiscal Deficit within 2 per cent of the GSDP. However, the fact that there was a Primary Deficit indicates that the Non-debt Receipts4 were not sufficient to meet the Primary Expenditure during 2020-21.
The State Government stated (December 2021) that despite the negative effect of Covid-19 pandemic on the economy and short realization of Central transfers, the State could achieve all the fiscal parameters within FRBM limit. As per actuals, the GSDP at current prices contracted by 2.24 per cent which is the primary reason in wide variation of Debt-GSDP ratio against the projections in the MTFP of the State Government.
4 Non-debt receipts = Revenue receipts + Miscellaneous Capital receipts + Recoveries of Loans and Advances.

Overview
State Finances Audit Report for the year ended March 2021
13
1.6 Deficits and Total Debt after examination by Audit
After examination by Audit, there may be identification of certain financial transactions of the State Government whose corresponding accounting entries have resulted in mis-classification of expenditure between revenue and capital heads of account. The following section describes such identified financial transactions.
1.6.1 Post audit Surplus/ Deficit
Misclassification of revenue expenditure as capital expenditure impacts revenue surplus figure. Besides, non-credit of interest to Deposits and Reserve Fund bearing interest, not depositing cess/ royalty to Consolidated Fund etc. also impact the revenue surplus and fiscal deficit figures. In order to arrive at actual deficit figures, the impact of such irregularities need to be reversed.
Audit noticed overstatement of Revenue Surplus by ₹1,390.27 crore and understatement of Fiscal Deficit by ₹342.90 crore for 2020-21, as detailed in Table 1.7:
Table 1.7: Revenue Surplus and Fiscal Deficit, post examination by Audit
Particulars
Impact on Revenue Surplus (₹ in crore)
Impact on Fiscal Deficit (₹ in crore)
Over Statement
Under Statement
Over Statement
Under Statement
Misclassifications between Revenue and Capital Expenditure
1,047.37 -- -- --
Non Credit of Interest to Reserve Fund Deposits (bearing interest)
93.83 -- -- 93.83
Un-recouped Contingency Fund 171.00 -- -- 171.00 Labour Welfare Cess collected but not transferred to Board’s Account
4.49 -- -- 4.49
Non transfer of Land Revenue Cess to Local Bodies 73.58 -- -- 73.58 Total Impact 1,390.27
(Over Statement) 342.90
(Under Statement)
Source: Audited Finance Accounts 2020-21, Government of Odisha
Effectively, as a result of examination of misclassification during post audit, the Revenue Surplus reduced from ₹9,076.39 crore (reported figure of Finance Account) to ₹7,686.12 crore (certified figure of Finance Account) and Fiscal Deficit increased from ₹9,785.54 crore (reported figure in Finance Account) to ₹10,128.44 crore (certified figure of Finance Account) in 2020-21.

Overview
14 State Finances Audit Report for the year ended March 2021
Government stated (December 2021) that it has always given due importance to the advices of Accountant General from time to time for proper classification of expenditures and the best practices in public financial management. Many accounting corrections have already been incorporated in the Annual Budget, 2021-22 as per Audit recommendations in C&AG’s previous State Finances Audit Reports. The fiscal parameters are still within the mandated fiscal targets after due adjustments and proper classifications. Recommendations of Audit would be considered during the next Budget cycle.

State Finances Audit Report for the year ended March 2021
Chapter II
Finances of the State

State Finances Audit Report for the year ended March 2021

Finances of the State
State Finances Audit Report for the year ended March 2021
15
2.1 Major changes in key fiscal aggregates vis-à-vis 2019-20
This section gives a bird’s eye view of the major changes in key fiscal aggregates of the State during 2020-21, as compared to 2019-20. Each of these indicators has been analysed in the succeeding paragraphs.
Table 2.1: Changes in key fiscal aggregates in 2020-21 compared to 2019-20 Revenue Receipts Revenue receipts of the State increased by 2.78 per cent
Own Tax receipts of the State increased by 6.01 per cent Own Non-tax receipts increased by 33.25 per cent State’s Share of Union Taxes and Duties decreased by 9.56
per cent Grants-in-Aid from Government of India decreased by 4.49
per cent Revenue Expenditure
Revenue expenditure decreased by 3.86 per cent Revenue expenditure on General Services decreased by 1.15
per cent Revenue expenditure on Social Services decreased by 8.31
per cent
Revenue expenditure on Economic Services increased by 0.88 per cent
Expenditure on Grants-in-Aid decreased by 7.25 per cent Capital Expenditure
Capital expenditure decreased by 11.48 per cent Capital expenditure on General Services increased by 7.83
per cent
Capital expenditure on Social Services decreased by 14.08 per cent
Capital expenditure on Economic Services decreased by 11.61 per cent
Loans and Advances
Disbursement of Loans and Advances increased by 26.85 per cent
Recoveries of Loans and Advances increased by 138.33 per cent
Public Debt Public Debt Receipts increased by 38.42 per cent Repayment of Public Debt increased by 105.87 per cent
Public Account Public Account Receipts decreased by 15.24 per cent Disbursement of Public Account increased by 17.51 per cent
Cash Balance Cash balance decreased by ₹ 9,802 crore (23.10 per cent) during 2020-21 as compared to previous year
2.2 Sources and Application of Funds
This section compares the components of the sources and application of funds of the State during the financial year 2020-21 as compared to 2019-20. The details of sources and application of funds are given in Appendix 2.1 and Appendix 2.2.
Finances of the State Chapter
II

Finances of the State
16 State Finances Audit Report for the year ended March 2021
Table 2.2: Details of Sources and Application of funds during 2019-20 and 2020-21 (₹ in crore)
Particulars 2019-20 2020-21 Increase / Decrease (% of variation)
Sources Opening Cash Balance 38,134 42,438 4,304(11.29) Revenue Receipts 1,01,568 1,04,387 2,819(2.76) Recoveries of Loans and Advances 287 684 397(138.33) Public Debt Receipts (Net) 10,185 11,066 881(8.65) Public Account Receipts (Net) 11,497 (-)10,911 -22,408(194.90) Total 1,61,671 1,47,664 -14,007(8.66) Application Revenue Expenditure 99,137 95,311 -3,826(3.86) Capital Expenditure 20,277 17,949 -2,328(11.48) Disbursement of Loans and Advances 1,259 1,597 338(26.85) Contingency Fund (Net) (-)1,440 171 1,611(111.88) Closing Cash Balance 42,438 32,636 -9,802(23.10) Total 1,61,671 1,47,664 -14,007(8.66) Source: Finance Accounts of respective years, Government of Odisha
Chart 2.1: Composition of Resources
(in per cent)
Chart 2.2: Application of Resources
(in per cent)
Source: Finance Accounts 2020-21
27.32
15.57
21.97
18.40
0.55
16.20
Tax Revenue
Non Tax Revenue
Central Tax Transfer
Grants in Aid
Recoveries of Loans andAdvances
22.85
34.77
20.44
1.15
16.201.01
3.58
General Services(Revenue)Social Services(Revenue)Economic Services(Revenue)Grants in Aid
Capital Expenditure
Loans and Advances
` goes to`comes from

Finances of the State
State Finances Audit Report for the year ended March 2021
17
2.3 Resources of the State
The resources of the State are described below:
1. Revenue Receipts consist of tax revenue, non-tax revenue, State’s share of Union taxes and duties and Grants-in-Aid from the Government of India (GoI).
2. Capital Receipts comprise miscellaneous capital receipts such as proceeds from disinvestments, recoveries of loans and advances, debt receipts from internal sources (market loans, borrowings from financial institutions/commercial banks) and loans and advances from GoI.
Both revenue and capital receipts form part of the Consolidated Fund of the State.
3. Net Public Account receipts: These are receipts and disbursements in respect of certain transactions such as small savings, provident fund, reserve funds, deposits, suspense, remittances, etc. which do not form part of the Consolidated Fund.
These are kept in the Public Account set up under Article 266 (2) of the Constitution and are not subject to vote by the State Legislature. Here, the Government acts as a banker. The balance after disbursements is the fund available with the Government for use.
2.3.1 Receipts of the State
The overall composition of the State resources (₹1,14,478 crore) in 2020-21 is shown in Chart 2.3:
Chart 2.3: Composition of Resources in 2020-21
Source: Finance Accounts 2020-21, Government of Odisha
Total Resources(₹1,14,478 crore)
Revenue Receipts (₹1,04,387 crore)
Tax Revenue(₹34,258
crore)
1.State Goods and Services Tax (₹13,043crore)
2.Taxes on sales, trade etc. (₹7,777 crore)
3. State Excise (₹4,053 crore)
4.Stamps and registration fees (₹2,942crore)
5.Taxes on vehicles (₹1,526 crore)
6.Others (₹4,917 crore)
Non-Tax Revenue (₹19,518
crore)
State's share of
union taxes and duties (₹27,543
crore)
Grants-in-aid
(₹23,068 crore)
Capital Receipts(₹21,002 crore)
Debt Receipts (₹20,318
crore)
1. Internal Debt(₹ 15,191crore)
2. Loans and advances from GoI (₹5,127crore)
Non-Debt Receipts
(₹684 crore)
1.Recoveries of loans and advances(₹684 crore)
Public Account Receipts Net: (-)₹10,910 crore(i.e. funds available with Government for use)
1. Small Savings, PF etc.
(₹612crore)2. Reserve Funds ((-)₹1,029 crore)3. Deposits/advances ((-)₹13,037 crore)4. Suspense and Miscellaneous ( ₹2526 crore) 5. Remittances(₹18 crore)

Finances of the State
18 State Finances Audit Report for the year ended March 2021
The above Chart shows that out of the total resources of ₹ 1,14,478 crore of the State Government during the year 2020-21, Revenue Receipts (₹1,04,387 crore) constituted 91.19 per cent of total resources. Capital Receipts (₹ 21,002 crore) and Public Account Receipts net {(-) ₹ 10,910 crore} constituted 18.35 per cent and (-)9.53 per cent of the total resources, respectively.
2.3.2 State’s Revenue Receipts
Statement 14 of the Finance Accounts gives details of the Revenue Receipts of the Government. Revenue Receipts (₹ 1,04,387 crore) of the Government constituting 20.49 per cent of the GSDP5 (₹ 5,09,574 crore), increased by 2.78 per cent over the previous year (₹ 1,01,568 crore). Revenue Receipts were, however, lower than the budget estimates (₹ 1,24,300 crore) by ₹ 19,913 crore. The trends and composition of the Revenue Receipts during the years 2016-17 to 2020-21 are shown in Chart 2.4.
Chart 2.4: Trends of Components of Revenue Receipts
Source: Finance Accounts of respective years, Government of Odisha
As can be seen from the above Chart, Own Tax Revenue and Non Tax Revenue have been increasing over the last five years.
Central Tax Transfer followed increasing trend for the period 2016-17 to 2018-19, and started decreasing from 2019-20. The BE for Central Tax Transfer was ₹ 36,300 crore, while the actual receipt was only ₹ 27,543 crore, during 2020-21, which was less than BE by 24.12 per cent (₹8,757 crore).
2.3.2.1 Trends and Growth of Revenue Receipts
This sub-paragraph provides the trends and growth of revenue receipts as well as revenue buoyancy with respect to GSDP over the five-year period.
The trends of Revenue Receipts relative to GSDP are presented in Table 2.3 and Chart 2.5:
5GSDP at current prices
22,852
27,91430,318
32,31534,258
8,043 8,398
14,276 14,647
19,518
28,32231,272
35,354
30,45427,543
15,08217,620
19,598
24,152 23,068
0
5,000
10,000
15,000
20,000
25,000
30,000
35,000
40,000
2016-17 2017-18 2018-19 2019-20 2020-21
(`in
cro
re)
Own Tax Non-Tax Central Tax Transfer Grant in Aid

Finances of the State
State Finances Audit Report for the year ended March 2021
19
Table 2.3: Trends of Revenue Receipts relative to GSDP 2016-17 2017-18 2018-19 2019-20 2020-21
Revenue Receipts (RR) (₹ in crore) 74,299 85,204 99,546 1,01,568 1,04,387 Rate of growth of RR (per cent) 7.77 14.68 16.83 2.03 2.78 Own Tax Revenue 22,852 27,914 30,318 32,315 34,258 Non Tax Revenue 8,043 8,398 14,276 14,647 19,518 State Own Revenue (Own Tax and Non-tax Revenue)
30,895 36,312 44,594 46,962 53,776
Rate of growth of Own Revenue (Own Tax and Non-tax Revenue) (per cent)
(-)1.10 17.53 22.81 5.31 14.51
Gross State Domestic Product (GSDP) (₹ in crore)
3,92,804 4,40,879 4,87,805 5,21,275 5,09,574
Rate of growth of GSDP (per cent) 19.56 12.24 10.64 6.86 -2.24 R R/GSDP (per cent) 18.92 19.33 20.41 19.48 20.49 Buoyancy Ratio6 Revenue Buoyancy with respect to GSDP 0.40 1.20 1.58 0.30 (-)1.24 State’s Own Revenue Buoyancy with respect to GSDP (-)0.06 1.43 2.14 0.77 (-)6.48
Source: GSDP- Directorate of Economics and Statistics, Government of Odisha
Revenue Receipts- Finance Accounts of the respective years.
From the above table, it can be inferred that:
Revenue buoyancy as well as State’s own tax buoyancy with reference to GSDP was above one during last five years, except 2016-17 and 2019-20. During 2020-21, the Revenue Buoyancy was (-)1.24 due to negative growth of GSDP. During 2020-21, the Revenue Buoyancy was (-) 1.24 due to negative growth of GSDP. Revenue Buoyancy above one indicated that for every one per cent increase (or decrease) in GSDP, there was more than oneper cent increase (or decrease) in Revenue, and highlighted the need for adopting policies that encourage economic growth of the State.
Revenue Receipts as a per cent of GSDP for the year 2020-21 (20.49 per cent) increased in comparison to 2019-20 (19.48 per cent) due to the decrease in the denominator, i.e. GSDP (₹5,09,574 crore), as compared to previous year (₹5,21,275 crore). The same is also depicted in Chart 2.5 below.
6Buoyancy ratio indicates the elasticity or degree of responsiveness of a fiscal variable with respect to a given
change in the base variable. For instance, Revenue buoyancy at 0.72 implies that Revenue Receipts tend to
increase by 0.72 percentage points, if the GSDP increases by one per cent.

Finances of the State
20 State Finances Audit Report for the year ended March 2021
Chart 2.5: Trends of Revenue Receipts for last five years
Source: GSDP- DES, Government of Odisha, Revenue Receipts- Finance Accounts of the respective years.
2.3.2.2 State’s Own Resources
The State’s performance in mobilisation of resources is assessed in terms of Tax Revenue and Non-Tax Revenue, not including the State’s share in Central Taxes and Grants-in-Aid which is based on the recommendations of the Finance Commission. State’s Own Revenue (Tax Revenue and Non-Tax Revenue) during 2020-21 grew by 14.51 per cent, which was much higher than the increase (-2.24 per cent) in the economic base measured in terms of GSDP during same period. The Budget Estimates for Own Tax Revenue during 2020-21 was ₹ 38,350 crore.
a) State’s Own Tax Revenue
Components of State’s Own Tax Revenue are shown in Table 2.4.
Table 2.4: Components of State’s Own Tax Revenue (₹ in crore)
Source: Finance Accounts of respective years, Government of Odisha
From the above table, it can be inferred that:
In comparison to the Budget Estimates (₹ 38,350 crore) of 2020-21, the State’s actual Own Tax Revenue in 2020-21 was ₹ 34,258 crore (89.32 per
cent). The shortfall in comparison to Budget Estimates was under SGST by ₹2,426 crore, under Taxes on Sales, Trade, etc. by ₹ 973 crore, under State
74,29985,204
99,546 1,01,568 1,04,387
18.92
19.33
20.41
19.48
20.49
0
20,000
40,000
60,000
80,000
1,00,000
1,20,000
18
18.5
19
19.5
20
20.5
21
2016-17 2017-18 2018-19 2019-20 2020-21
(`in
cro
re)
In p
er c
ent
Revenue Receipts RR as per cent of GSDP
Revenue Head 2016-17 2017-18 2018-19 2019-20 2020-21 Spark Line State Goods and Services Tax (SGST) 0 6,609 11,943 13,204 13,043
Taxes on Sales, Trade, etc 13,402 11,522 7,310 7,455 7,777
State Excise 2,786 3,221 3,925 4,495 4,053
Taxes on Vehicles 1,216 1,535 1,746 1,836 1,526
Stamps and Registration fees 1,364 1,037 1,237 1,435 2,942
Land Revenue 460 542 511 721 603
Taxes on Goods and Passengers
1,760 1,260 182 133 146
Other Taxes 1,864 2,188 3,464 3,036 4,168
Total22,852 27,914 30,318 32,315 34,258

Finances of the State
State Finances Audit Report for the year ended March 2021
21
Excise by ₹ 1,197 crore and under Taxes on Vehicles by ₹ 474 crore. Own tax Revenue constituted 32.82 per cent of total Revenue Receipts for 2020-21.
As per the provision of Odisha Cess Act 1962, collections from Land Revenue Cess are to be distributed among Panchayati Raj Institutions (PRIs) i.e., Gram Panchayats (GPs), Panchayat Samiti (PSs) and Zilla Parishads (ZPs) in the ratio of 60:20:20. However, during 2020-21, an amount of ₹ 73.58 crore was collected towards Land Revenue Cess and not distributed to the PRIs. This had an impact of overstatement of Revenue Surplus and understatement of Fiscal Deficit by ₹73.58 crore. This had also been the case in 2018-19 and 2019-20 when ₹48.07 crore and ₹36.60 crore respectively, were collected and not transferred to PRIs.
The Own Tax revenue of the State during the years 2016-17 to 2020-21 showed increasing trend in absolute terms. However, in terms of growth over previous year, it started declining from 2017-18, which is depicted in Chart 2.6 below. As can be seen in comparison to the last financial year, the growth rate of own tax revenue of the State fell from 6.59 per cent in 2019-20 to 6.01 per cent in 2020-21. During 2020-21, the growth in various economic sectors/ activities and therefore of taxes from those sectors was uneven and was severely impacted due to the Covid-19 outbreak.
Chart 2.6: Growth of Own Tax Revenue during 2016-2020
Source: Finance Accounts of respective years, Government of Odisha
b) State Goods and Services Tax (SGST)
The State Government implemented the Goods and Services Tax (GST) Act from 01 July 2017. According to GST (Compensation to States) Act, 2017, Central Government will compensate the States for loss of revenue arising on account of implementation of GST for a period of five years starting from 2017-18. The compensation payable to the State shall be calculated for every financial year after the receipt of final revenue figures, as audited by the Comptroller and Auditor General of India. The protected revenue for any year of a State shall be calculated
22,85227,914 30,318 32,315 34,258
1.44
22.15
8.616.59 6.01
0
10,000
20,000
30,000
40,000
2016-17 2017-18 2018-19 2019-20 2020-21
0.00
5.00
10.00
15.00
20.00
25.00
(`in
cro
re)
(gro
wth
in p
er c
ent)
Own Tax Revenue Rate of Growth

Finances of the State
22 State Finances Audit Report for the year ended March 2021
applying the projected growth rate (14 per cent per annum) over the base year revenue of that State. The base year for calculation of revenue figures of taxes subsumed under GST was fixed as 2015-16.
In case of Odisha, the revenue in the base year (2015-16) was ₹ 11,049.34 crore. The protected revenue for the year 2020-21 assessed with respect to base year was ₹ 21,274.56 crore. In 2020-21, the State’s receipt of GST (SGST) was ₹13,043 crore and pre-GST taxes on GST goods was ₹165.95 crore. GoO received GST compensation of ₹ 4,361.59 crore as GIA under revenue receipts and ₹ 3,822 crore as back-to-back loan with no repayment liability under debt receipts.
Details of SGST, pre-GST taxes and compensation received by the State during 2020-21 are given in Table 2.5:
Table 2.5: Details of SGST, pre-GST taxes and compensation received by the State during April 2020 to March 2021
Particulars Amount (₹ in crore) Revenue to be Protected (A) 21,274.56 State Goods & Services Tax (including IGST advance apportionment of ₹535.78 crore) (B)
1,30,43.19
Collection of pre-GST Taxes (April 2020 to March 2021) (C) 165.95 Total Collection (D) = (B+C) 13,209.14 Compensation received (E) 4,361.59 Back to back loan towards shortfall in GST Compensation 3,822.00
Source: Finance Accounts, Commercial Tax & GST wing of the Finance Department
Details of State Goods and Service Tax projection vis-à-vis actual receipts for the years 2017-18 to 2020-21 are given in Table 2.6.
Table 2.6: Details of SGST during the years 2017-21 Base Year Projection at a
growth rate of 14per
cent
Actual
2015-16 11,049 - 2016-17 12,596 - 2017-18 14,359 11,229# 2018-19 16,369 12,129 2019-20 18,662 13,330 2020-21 21,275 13,209
Source: Finance Accounts, Commercial Tax & GST wing of the Finance Department #Actual receipts of 9 months was ₹8,422 crore; average of 12 months has been calculated.
It can be seen from the above table that the projection of the GST growth was 14 per
cent per annum over the base year revenue, i.e., 2015-16. However, the actual growth of SGST was much lower than the projected growth of 14 per cent per annum.
c) Non-Tax Revenue Non-Tax Revenue (NTR) accounts for receipts of interest, dividends and profits, mining receipts and other departmental receipts. NTR received during the last five years are shown in Table 2.7:

Finances of the State
State Finances Audit Report for the year ended March 2021
23
Table 2.7: Components of State’s non-tax revenue
Revenue Head 2016-17 2017-18 2018-19 2019-20 2020-21 Non-Ferrous Mining 4926 6,131 10,480 11,020 13,792 Interest Receipts 427 601 1,462 1,487 1,262 Dividends and Profits 566 66 544 321 1,063 Other Non-tax receipts 2,124 1,600 1,791 1,819 3,401 a) Major and Medium Irrigation 722 663 702 669 796
b) Road & Bridges 73 66 67 44 54 c) Education 31 24 26 27 62 d) Misc. General Services 384 240 419 411 1,729 e) Other or Misc. 914 607 577 668 760
Total 8,043 8,398 14,277 14,647 19,518 Source: Finance Accounts of respective years, Government of Odisha
The NTR in 2020-21 was ₹19,518 crore, which constituted 18.70 per cent of Revenue Receipts and increased by ₹ 4,871 crore (33.26per cent) over previous year (₹ 14,647 crore).
2.3.2.3 Transfers from the Centre
The Union Government transfers funds to States in two ways (i) Devolution of Central taxes to States and (ii) Grants in aid given by the Centre. The central taxes devolved to states are untied funds, and states can spend them according to their discretion, whereas grants given by the centre to states and local bodies are meant for specific purpose and used only for the specified scheme or purpose. The transfers to states are dependent on the tax collection of the GoI and the states get their share as per the percentage recommended by the respective Finance Commissions. Trends in transfers from Centre for last ten years are given in Chart 2.7.
Chart 2.7: Trends in Transfers from Centre
Source: Finance Accounts of respective years, Government of Odisha

Finances of the State
24 State Finances Audit Report for the year ended March 2021
As can be seen from the above Chart, Central transfers have been consistently decreasing from 58 per cent in 2016-17 to 48 per cent in 2020-21. Due to high dependence on Central transfers, the State’s overall Revenue Receipts were adversely impacted as Central Tax Transfer and Grants decreased by ₹ 2,911 crore (9.56 per cent) and ₹ 1,084 crore(4.49per cent) respectively during 2020-21 over the previous year.
The BE for Central Tax Transfer was ₹ 36,300 crore, while the actual receipt was only ₹ 27,543 crore during 2020-21. Similarly, the BE for Grants-in-Aid from Government of India was ₹ 32,000 crore, while the actual receipts was only ₹23,068 crore. This shortfall in receipt of Central Transfer contributed to the actual Revenue Receipt (₹ 1,04,387 crore) being lower than budgeted Revenue Receipts (₹ 1,24,300 crore) by ₹ 19,913 crore for the year 2020-21.
a) State’s Share of Union Taxes and Duties
State’s share of Union taxes recommended by Fourteenth Finance Commission (FFC) (2015-16 to 2019-20) and Fifteenth Finance Commission (2020-21 to 2025-26) as compared with actual devolution made by Centre are summarised in Table 2.8.
Table 2.8: State’s share in Union taxes and duties: Actual devolution vis-à-vis projections in Finance Commission Report (FCR)
(₹ in crore)
Year Finance Commission Projections Projections in FCR
Actual Tax Devolution
Difference
1. 2. 3. 4. 5. (4-3) 2015-16 4.642 per cent of net proceeds of all
shareable taxes excluding service tax and 4.744 per cent of net proceeds of shareable service tax (As per recommendations of FFC)
27,001 23,574 (-)3,427 2016-17 31,158 28,322 (-) 2,836 2017-18 36,005 31,272 (-) 4,733 2018-19 41,656 35,354 (-) 6,302 2019-20 48,250 30,454 (-) 17,796
2020-21 4.629 per cent of net proceeds of all shareable taxes (As per recommendations of Fifteenth FC)
39,586 27,543 (-) 12,043
Source: Finance Commission Report, Budget at a Glance & Finance Accounts
As seen from the table above, the gap between FCR projections and actual tax devolution to the State has been consistently widening between the years 2016-17 to 2020-21.
The State’s share of Union Taxes under different components during the years 2016-17to 2020-21 are shown in Table 2.9.
Table 2.9: State’s share of Union Taxes under different components for last five years (₹in crore)
Component of State’s share of Union taxes 2016-17 2017-18 2018-19 2019-20 2020-21 Corporation Tax 9,072 9,575 12,294 10,384 8,328 Customs 3,903 3,156 2,506 1,930 1,447 Income Tax 6,305 8,085 9,054 8,136 8,540 Other Taxes and Duties on commodities and services
-- -- 18 19 21
Service Tax 4,564 3,561 326 -- 124

Finances of the State
State Finances Audit Report for the year ended March 2021
25
Component of State’s share of Union taxes 2016-17 2017-18 2018-19 2019-20 2020-21 Wealth Tax 21 -- 5 1 -- Union Excise Duties 4,457 3,298 1,665 1,342 923 CGST -- 441 8,726 8,642 8,160 IGST -- 3,156 696 -- -- Other Taxes on Income and Expenditure -- -- 64 -- -- Grand total 28,322 31,272 35,354 30,454 27,543 Percentage of increase over previous year 20.14 10.42 13.05 -13.86 -9.56 Component of State’s share as percentage of Revenue Receipts of the State
38 37 36 30 26
Source: Finance Accounts of respective years, Government of Odisha
As can be seen from the above, the receipts of the State’s share of Union taxes has been increasing from 2016-17 to 2018-19. However, it declined by 13.86 per cent during 2019-20 and 9.56 per cent during 2020-21 over the previous year.
b) Grants-in-Aid from Government of India
The details of Grants-in-Aid and its composition during the years 2016-17 to 2020-21 are in Table 2.10.
Table 2.10: Grants-in-Aid from Government of India (₹ in crore)
Particulars 2016-17 2017-18 2018-19 2019-20 2020-21 Non Plan Grants 3,248 -- -- -- -- State Plan Grants 11,769 -- -- -- -- Grants for Central Plan Schemes 65 -- -- -- -- Grants for Centrally Sponsored Plan Schemes 0.1 -- -- -- -- Grants for Centrally Sponsored Schemes -- 12,900 13,025 13,056 12,698 Finance Commission Grants -- 2,406 2,840 3,563 4,949 Other Transfers/Grants to States/Union Territories with Legislatures
-- 2,314 3,733 7,533 5,421
Total 15,082 17,620 19,598 24,152 23,068 Percentage of increase over the previous year Receipts 6.74 16.83 11.23 23.24 -4.49 Total grants as a percentage of Revenue Receipts
20.30 20.68 19.69 23.78 22.10
Source: Finance Accounts of respective years, Government of Odisha
The Government of India decided to give effect to the merger of plan/ non-plan provisions in the Estimates for Budget 2017-18, after conclusion of the 12th Plan period (2012-17). With the removal of the Plan and Non-Plan distinction, Grants-in-Aid from Centre comprises only (i) Finance Commission recommended grants for Local Bodies, (ii) grants for Disaster Response and (iii) grants for Central share of Central Sector and Centrally Sponsored Schemes. Percentage of Grants-in-Aid to Revenue Receipts increased from 19.69 per cent in 2018-19 to 23.78 per cent in 2019-20, however, it declined to 22.10 per cent in 2020-21.
c) Finance Commission Grants
The 73rd Constitutional Amendment requires both the Centre and the States to help Panchayati Raj Institutions to evolve as a unit of self-governance by assigning them

Finances of the State
26 State Finances Audit Report for the year ended March 2021
funds, functions and functionaries. The Finance Commission Grants are the funds provided by the Centre to local bodies, state disaster relief funds and compensates any revenue loss to states after devolution of taxes. The details of FC recommendations vis-a-vis actual receipts are given in Table 2.11.
Table 2.11: Grant-in-aid released by GoI as per recommendation of Finance Commissions (₹ in crore)
Department Sectors 2019-20 2020-21 Increase (+) / Decrease (-)
over last year FCR Actuals FCR Actuals
1 2 3 4 5 6 7 (4-6) Panchayati Raj & Drinking Water Department Rural Local Bodies
Basic Grant 2389.54 2389.54 2,258.00 2,258.00 (-)131.54 Performance Grant 292.05 196.40 -- -- (-)196.40 Total 2,681.59 2585.94 2,258.00 2.258.00 (-)327.94
Housing & Urban Development Urban Local Bodies
Basic Grant 425.39 425.39 1,087.00 1,087.00 (+)661.61 Performance Grant 116.98 -- -- -- -- Total 542.37 425.39 1,087.00 1,087.00 (+)661.61
Revenue and Disaster Management State Disaster Response Fund (SDRF)
818.00 552.00 1,604.00 1,604.00 (+)1,052.00
Grand Total 4041.96 3563.33 4,949.00 4,949.00 (+)1,385.67 Source: Finance Accounts and Finance Commission Recommendations (FCR)
It is evident from the above table that Central Government has released the Fifteenth Finance Commission Grant at par with the recommendation during 2020-21. Fifteenth Finance Commission recommendation for the year 2020-21 under Urban Local Bodies and State Disaster Response Fund has substantially increased over Fourteenth Finance Commission Grants for 2019-20 by 100 per cent and 96 per cent respectively.
State Government stated (December 2021) that Budget Estimates always happen to be tentative in nature and their realization is contingent upon a whole lot of social, political and economic factors. Lower Revenue Receipts during 2020-21 compared to the Budget Estimates were primarily due to short realization of Central Transfers. It is a healthy sign that State’s Own Revenue has been increasing and is now contributing more than 50per cent of the total Revenue Receipts.
Provisions against Central Transfers are made based on the estimates in the Union Budget. However, less transfers against the estimates in Budget puts the State Government in a problematic situation. This in turn affects the fiscal space for incurring development and capital expenditures.
2.3.3 Receipts under Capital Section
Capital receipts comprise miscellaneous capital receipts such as proceeds from disinvestments, recoveries of loans and advances, debt receipts from internal sources (market loans, borrowings from financial institutions/ commercial banks) and loans and advances from Government of India (GoI). The details of Capital Receipts and their composition for the years 2016-17 to 2020-21 are given in Table 2.12.

Finances of the State
State Finances Audit Report for the year ended March 2021
27
Table 2.12: Trends in Growth and Composition of Capital Receipts (₹ in crore)
Sources of State’s Receipts 2016-17 2017-18 2018-19 2019-20 2020-21 Capital Receipts (CR) 11,312 13,119 10,308 14,966 21,002 Miscellaneous Capital Receipts 0 0 0 0 0 Recovery of Loans and Advances 89 257 305 287 684 Public Debt Receipt 11,223 12,862 10,003 14,679 20,318 Net Public Debt Receipts 8,261 10,172 6,063 10,185 11,066 Internal Debt 8,028 10,031 5,837 10,174 6,926 Growth Rate 18.11 24.95 -41.81 74.30 -31.92 Loans and Advances from GoI 233 141 226 11 4,140 Growth rate 109.91 -39.48 60.28 -95.13 37,536.36 Rate of growth of debt Capital Receipts 14.64 14.60 -22.23 46.75 38.42 Rate of growth of non-debt Capital Receipts -60.96 188.76 18.68 -5.90 138.33 Rate of growth of GSDP 19.79 10.47 14.05 7.66 -2.24 Rate of growth of Capital Receipts (per cent) 12.92 15.97 -21.43 45.19 40.33
Source: Finance Accounts of respective years, Government of Odisha
During 2020-21, Capital Receipts (₹21,002 crore) constituted 18.35 per cent of the total receipts (₹ 1,14,478 crore) of the State. The State Government borrowed ₹ 15,191crore from open market and other financial institutions and took loans of ₹ 5,127 crore from GoI. As can be seen from Table 2.12, Public Debt receipts constituted major component of Capital Receipts (96.74 per cent).
2.3.4 State’s performance in mobilisation of resources
Mobilisation of resources allows governments to ensure sustainable funding for social programmes and for public investments to promote economic growth and development. As the State Government does not have control over receipt of Grants in Aid from Government of India and Share of Central Taxes, State Government’s own resources (tax and non-tax) are necessary to sustain its institutions and programmes. Tax and non-tax receipts vis-à-vis Budget Estimates are given in Table 2.13.
Table 2.13: Tax and non-tax receipts vis-à-vis Budget Estimates
Budget Estimates
Actual Percentage of variation of actual over
Budget Estimates
Own Tax Revenue 38,350 34,258 -10.67 Non Tax Revenue 17,650 19,518 +10.58
Source: Finance Accounts, Budget at a Glance of GoO
During 2020-21, the receipts under State’s Own Tax Revenue were less than the assessment by 10.67 per cent. However, the State’s non-tax revenue was higher than the assessment made in MTFP by 10.58 per cent, with main contribution from the increase in Mining Receipts during 2020-21.

Finances of the State
28 State Finances Audit Report for the year ended March 2021
2.4 Application of Resources
The State Government is vested with the responsibility of incurring expenditure within the framework of fiscal responsibility legislations, while at the same time ensuring that the ongoing fiscal correction and consolidation process of the State is not at the cost of expenditure directed towards development of capital infrastructure and social sector. This paragraph along with sub-paragraphs gives the analysis of allocation of expenditure in the State.
2.4.1 Growth and Composition of Expenditure
The total expenditure in 2020-21 was ₹1,14,857 crore. Table 2.14 presents the trends and composition of total expenditure during 2016-17 to 2020-21.
Table 2.14: Total Expenditure and its Composition (₹in crore)
Parameters 2016-17 2017-18 2018-19 2019-20 2020-21 Total Expenditure (TE) 83,766 94,821 1,10,008 1,20,673 1,14,857
Revenue Expenditure (RE) 65,041 71,837 85,356 99,137 95,311
Capital Expenditure (CE) 18,471 21,109 23,482 20,277 17,949
Loans and Advances 254 1,875 1,170 1,259 1,597
As a percentage of GSDP TE/GSDP 21.28 21.81 22.19 22.61 22.54 RE/GSDP 16.53 16.52 17.21 18.57 18.70 CE/GSDP 4.69 4.86 4.74 3.80 3.52 Loans and Advances/GSDP 0.06 0.43 0.24 0.24 0.31 Source: Finance Accounts of respective years, Government of Odisha
As can be seen from the above table, there has been a decline in the Capital Expenditure as a percentage of the GSDP from 2017-18 to 2020-21. However, revenue expenditure as percentage of GSDP has risen during the same period.
The share of various sectors in the overall expenditure of the State is detailed in Table 2.15.
Table 2.15: Relative share of various sectors of expenditure (₹in crore)
Parameters 2016-17 2017-18 2018-19 2019-20 2020-21 General Services 17,089 22,126 25,483 30,106 29,839 Social Services 30,603 33,758 40,972 48,781 44,424 Economic Services 34,972 37,595 42,081 40,244 39,169 Others (Grants to Local Bodies and Loans and Advances) 1,102 1,343 1,472 1,542 1,425
Share of Total Expenditure (in per cent) General Services 20.40 23.33 23.16 24.95 25.98 Social Services 36.53 35.60 37.24 40.42 38.68 Economic Services 41.75 39.65 38.25 33.35 34.10 Others (Grants to Local Bodies and Loans and Advances) 1.32 1.42 1.34 1.28 1.24 Source: Finance Accounts of respective years, Government of Odisha

Finances of the State
State Finances Audit Report for the year ended March 2021
29
Chart 2.8: Relative share of various sectors of expenditure
Source: Finance Accounts of respective years, Government of Odisha
Chart 2.9: Share of Expenditure by Activities
Source: Finance Accounts of respective years, Government of Odisha
From the table and charts above, it is noted that around 83 per cent of the total expenditure in 2020-21 was Revenue Expenditure as compared to 82 per cent during 2019-20. Social Services7 Expenditure took precedence with 38.68 per cent over Economic Services8 (34.10 per cent), General Services (25.98 per cent), and Others (1.24 per cent) in the total expenditure. Capital Expenditure (₹17,949 crore) constituted 15.63 per cent of the total expenditure, as compared to 21.35 per cent during 2018-19 and 16.80 per cent in 2019-20.
7 Refers to welfare activities of the Government and includes (i) Education, Sports, Art and Culture, (ii)
Health and Family Welfare, (iii) Water Supply, Sanitation, Housing and Urban Development, (iv)
Information and Broadcasting, (v) Welfare of Scheduled Castes, Scheduled Tribes and Backward Classes,
(vi) Labour and Labour Welfare, (vii) Social Welfare and Nutrition and (vii) Others.
8 Refers to economic development activity sectors of the Government and includes (i) Agriculture and allied
services, (ii) Irrigation and Flood Control, (iii) Energy, (iv)Industries and Minerals, (v) Transport,
(vi) Science, Technology and Environment and (vii) General Economic Services.
77.65 75.76 77.59 82.15 82.98
22.05 22.26 21.35 16.80 15.63
0.30 1.98 1.06 1.04 1.39
0.00
50.00
100.00
150.00
2016-17 2017-18 2018-19 2019-20 2020-21
(`in
cro
re)
Revenue Expenditure Capital Expenditure Loans and Advances
20.40 23.33 23.16 24.95 25.98
36.53 35.60 37.2440.42 38.68
41.75 39.65 38.25 33.35 34.10
1.32 1.42 1.34 1.28 1.24
0.00
10.00
20.00
30.00
40.00
50.00
60.00
70.00
80.00
90.00
100.00
2016-17 2017-18 2018-19 2019-20 2020-21
(sh
are
in p
er c
ent)
General Services Social Services Economic Services Others

Finances of the State
30 State Finances Audit Report for the year ended March 2021
Component-wise major expenditure incurred under Revenue and Capital sections during 2019-20 and 2020-21 are shown in Table 2.16.
Table 2.16: Major expenditure components under Revenue and Capital
(₹in crore) Revenue Capital
Component Sector 2019-20 2020-21 Component Sector 2019-20 2020-21 Education, Sports, Art and Culture
Social 17,228 17,242 Transport Economic 6,466 6,671
Rural Development
Economic 9,737 11,352 Irrigation and Flood Control
Economic 4,748 3,108
Agriculture and Allied Activities
Economic 10,992 8,569 Water Supply,
Sanitation, Housing and
Urban Development
Social 3,592 2,796
Social Welfare and Nutrition
Social 10,861 7,991 Energy Economic 2,134 1,284
Water Supply, Sanitation, Housing and Urban Development
Social 6,844 4,844 Rural Development
Economic 348 231
Health and Family Welfare
Social 5,681 7,244 Health and Family Welfare
Social 504 631
Welfare of SCs, STs, Minorities and OBCs
Social 2,458 2,113 Welfare of SCs, STs, Minorities and OBCs
Social 153 269
Transport Economic 1,889 2,257 Education, Sports, Art and Culture
Social 759 581 Irrigation and Flood Control
Economic 1,305 1,685
Source: Finance Accounts of respective years, Government of Odisha
From the above table, it can be inferred that:
Revenue Expenditure (₹ 95,311 crore) was lower than the previous year (₹ 99,137 crore) by 3.86 per cent. The decrease over previous year was mainly due to lower outgo on Agriculture and Allied activities (₹ 2,423 crore), Social Welfare and Nutrition (₹ 2,870 crore), Water Supply, Sanitation, Housing and Urban Development (₹ 2,000 crore) and Welfare of SCs, STs, Minorities and OBCs (₹ 345 crore) which was partly set off by increase of expenditure under Rural Development (₹1,615 crore), Health and Family Welfare (₹ 1,563 crore), Transport (₹ 368 crore) and Irrigation and Flood Control (₹ 380 crore).
Capital Expenditure during the current year (₹ 17,949 crore) was lower than the previous year (₹ 20,277 crore) by 11.48 per cent. This was mainly due to decrease under Irrigation and Flood Control (₹ 1,640 crore), Water Supply, Sanitation, Housing and Urban Development (₹ 796 crore), Energy (₹ 850 crore)

Finances of the State
State Finances Audit Report for the year ended March 2021
31
and Education, Sports, Arts & Culture (₹ 178 crore). The decrease was partly set off by increase under Transport (₹ 205 crore) and Health & Family Welfare (₹127 crore).
Major component wise share over Total Expenditure during 2020-21 is depicted in Chart 2.10.
Chart 2.10: Composition of Expenditure
Source: Finance Accounts 2020-21, Government of Odisha
It can be seen from the above chart that Major share of Total Expenditure were under Social Services in Revenue Sector (33.07 per cent), General Services in Revenue Sector (23.43 per cent) and Economic Services in Revenue Sector (21.39 per cent).
The State Government stated (December 2021) that decline in Capital Expenditure during 2020-21 is attributable to strategic lock-downs/ shut-downs imposed both by the Centre and State Government to contain the spread of the pandemic. In contrast, the increase in the share of revenue expenditure is due to the expenditure on livelihood support programmes and social benefit transfers by the State Government under different welfare schemes in order to counter the negative impact of COVID-19 on the vulnerable section of the society.
2.4.2 Revenue Expenditure
Revenue Expenditure is incurred to maintain the current level of services and payment for the past obligation. As such, it does not result in any addition to the State’s infrastructure and service network.
Revenue expenditure during 2020-21 (₹ 95,311 crore) was 18.70 per cent of GSDP. The Revenue Expenditure during the year decreased by 3.86 per cent from 2019-20 (₹99,137 crore). It was, however lower than the budget estimates (₹ 1,14,971 crore) by ₹ 19,660 crore (17.10 per cent).
Social Services (Revenue), 33.07
Economic Serv ices (Revenue),
21.39
General Services (Revenue), 23.43
Grants in Aid, 1.18
Capital Expenditure,
16.80
Loans and Advances, 1.32

Finances of the State
32 State Finances Audit Report for the year ended March 2021
Table 2.17: Revenue Expenditure - Basic Parameters
(₹in crore) Parameters 2016-17 2017-18 2018-19 2019-20 2020-21 Total Expenditure (TE) 83,766 94,821 1,10,008 1,20,673 1,14,857
Revenue Expenditure (RE) 65,041 71,837 85,356 99,137 95,311
Rate of Growth of RE (per cent) 10.60 10.45 18.82 16.14 -3.86 RE as percentage of TE 77.65 75.76 77.59 82.15 82.98 RE/GSDP (per cent) 16.53 16.52 17.21 18.57 18.70 RE as percentage of RR 87.54 84.31 85.75 97.61 91.31
Buoyancy of Revenue Expenditure with GSDP and Revenue Receipt GSDP (ratio) 0.90 0.95 1.79 2.08 1.30 Revenue Receipts (ratio) 1.36 0.71 1.12 7.95 -1.39 Source: Finance Accounts of respective years, Government of Odisha
Revenue Expenditure of GoO consists of General Services (₹28,271 crore), Social Services (₹ 39,901 crore), Economic Services (₹25,809 crore ) and Grants in Aid and Contribution (₹ 1,330 crore). The sector wise composition of Revenue Expenditure was given in Chart 2.11.
Chart 2.11: Composition of Revenue Expenditure
Source: Finance Accounts 2020-21, Government of Odisha
2.4.2.1 Major changes in Revenue Expenditure
Significant variations under various Heads of Account with regard to Revenue expenditure of the State during the current year and the previous year are detailed in Table 2.18.
Table 2.18: Variation in Revenue Expenditure during 2020-21 compared to 2019-20
(₹in crore) Major Heads of Account 2019-20 2020-21 Increase (+) /
Decrease (-) 2071- Pension and Other Retirement Benefits 14,273 13,629 -644 2245 – Relief on account of Natural Calamities 4,290 2,653 -1,637 2401 – Crop Husbandry 7,032 4,185 -2,847 2235 – Social Security and Welfare 6,565 4,171 -2,394 2215 – Water Supply and Sanitation 3,974 2,265 -1,709

Finances of the State
State Finances Audit Report for the year ended March 2021
33
Major Heads of Account 2019-20 2020-21 Increase (+) / Decrease (-)
2210 – Medical and Public Health 5,275 6,822 1,547 2505 – Rural Employment 4,596 6,033 1,437 2049- Interest Payment 6,063 6,644 581 2702- Minor Irrigation 281 846 565
Source: Finance Accounts of respective years, Government of Odisha
Audit noticed that during 2020-21, Revenue Expenditure of the State decreased by ₹3,826 crore, while Revenue Receipts increased by ₹2,819 crore as compared to last year. There was significant reduction of expenditure under Social Services (₹3,616 crore) from ₹43,517 crore in 2019-20 to ₹39,901 crore in 2020-21. Major decrease in expenditure during 2020-21 was noticed under MH 2235- Social Security and Welfare (₹-2,394 crore) due to less expenditure under Pension-Social Security Scheme, Child welfare and other welfare schemes and in MH 2215-Water Supply and Sanitation (₹-1,709 crore) due to less expenditure under sewerage and sanitation services. Other major variations in revenue expenditure were under MH 2401- Crop Husbandry (₹-2,847 crore) due to decrease in expenditure on Farmers’ Welfare scheme – Krushak Assistance for Livelihood and Income Augmentation (KALIA) Yojana and expenditure on Jalanidhi scheme etc. It was also noticed that during 2019-20, substantial expenditure (₹4,290.24 crore) had been incurred under MH 2245-Relief on Account of Natural Calamities due to occurrence of severe cyclonic storm FANI.
Due to these reasons, Revenue Surplus (₹9,076 crore) for the year 2020-21 significantly increased (273 per cent) from the Revenue Surplus of the previous year (₹2,430 crore).
The State Government stated (December 2021) that though Revenue Expenditure does not directly contribute to asset creation, it is critical to the welfare of the population, maintenance of assets and meeting the debt servicing obligations of the State Government. The overall expenditure including Revenue Expenditure was affected during 2020-21 by the outbreak of Covid-19 pandemic and subsequent lock-downs affecting expenditure efficiency of the Government machinery. The fact, however, remains that the Government should make efforts for higher capital expenditure to achieve faster economic growth.
2.4.2.2 Committed Expenditure
Committed Expenditure of Government on revenue account consists of interest payments (₹6,644 crore), salaries and wages (₹ 21,003 crore) and pensions (₹ 13,629 crore). It has first charge on Government resources and therefore, upward trend on committed expenditure leaves the Government with lesser flexibility for development sector. The Committed Expenditure in 2020-21 was ₹ 41,276 crore and constituted 43.31 per cent of Revenue Expenditure (₹ 95,311 crore), as compared to ₹ 41,019 crore (41.38 per cent of Revenue Expenditure) during 2019-20. The details are shown in Table 2.19.

Finances of the State
34 State Finances Audit Report for the year ended March 2021
Table 2.19: Components of Committed Expenditure (₹in crore)
Components of Committed Expenditure
2016-17 2017-18 2018-19 2019-20 2020-21
Salaries & Wages 15,035 17,527 19,399 20,683 21,003 Expenditure on Pensions 6,843 8,693 10,520 14,273 13,629 Interest Payments 4,035 4,988 5,800 6,063 6,644 Total 25,913 31,208 35,719 41,019 41,276
As a percentage of Revenue Receipts (RR) Salaries & Wages 20.24 20.57 19.49 20.36 20.12 Expenditure on Pensions 9.21 10.20 10.57 14.05 13.06 Interest Payments 5.43 5.85 5.83 5.97 6.36 Total 34.88 36.62 35.89 40.38 39.54
As a percentage of Revenue Expenditure (RE) Salaries & Wages 23.12 24.40 22.73 20.86 22.04 Expenditure on Pensions 10.52 12.10 12.32 14.40 14.30 Interest Payments 6.20 6.94 6.80 6.12 6.97 Total 39.84 43.44 41.85 41.38 43.31 Source: Finance Accounts of respective years, Government of Odisha
From the above table, it can be inferred that:
Three items of expenditure i.e., salary, pension and interest payment make up 40 to 43per cent of the committed expenditure of the State Government during last five years. As these expenditures are non-developmental in nature, barely 57 to 60per cent is left over for developmental purposes out of the Revenue Expenditure.
Committed expenditure during 2020-21 increased by ₹ 257 crore (0.63 per
cent) over previous year. However, measured as a percentage of Revenue Receipt of the State, its share decreased in 2020-21.
Committed Expenditure as a percentage of Revenue Expenditure was decreasing since 2017-18, however it increased in 2020-21.
Expenditure on payment of pension during 2020-21 decreased by ₹644 crore (4.51 per cent) over previous year. During 2019-20 payment of pension had abnormally increased over 2018-19, by `3,753 crore due to revision of 7th CPC pension and payment of arrears.
Interest payment (₹ 6,644 crore) as a percentage of Revenue Expenditure constituted rose to 6.97 per cent in 2020-21, from 6.12 per cent during 2019-20. In absolute terms, interest payment has been consistently increasing, with an increase of ₹2,609 crore from₹4,035 crore in 2016-17 to ₹6,644 crore in 2020-21. Interest payment relative to Revenue Receipts (₹ 1,04,387 crore) was however, 6.36 per cent, which was well below the fiscal target of 15 per cent set out in the Odisha FRBM (Amendment) Act, 2016.
The State Government stated (December 2021) that committed Expenditure is an essential item of expenditure in a welfare state, since it ensures better delivery of public services and other development expenditure. In absolute terms, Committed

Finances of the State
State Finances Audit Report for the year ended March 2021
35
Expenditure has gone down compared to previous years. Interest Payment to Revenue Receipts (IP-RR) ratio has remained well within the mandated limit.
2.4.2.3 National Pension System
State Government employees recruited on or after 1 January 2005 are covered under National Pension System (NPS), which is a defined contributory pension scheme. It is mandatory for employees to contribute 10 per cent of basic pay and dearness allowance every month. The State Government has to make equal contribution. The Government has to transfer these contribution amounts along with details to the National Securities Depository Limited (NSDL) and to the fund managers appointed by the NPS Trust, respectively. Though the State Government started collecting pension contribution from the employees from 2006-07, it started transferring to NSDL only in 2010-11(₹ 0.01 crore), leaving a balance of ₹39.62 crore to be transferred to NSDL as on 31 March 2011. Similarly, every year thereafter, there has been a short transfer to NSDL with the last being ₹ 24.18 crore in 2019-20. As of 31 March 2021, there was a cumulative short transfer of ₹ 6.00 crore to the NSDL and the current liability thus stands deferred to future year(s). Further, the State Government has created interest liability on the amount not transferred to NSDL, incorrectly used the funds that belong to its employees and created uncertainty in respect of benefits due to the employees affected/avoidable financial liability to Government in future.
It was observed that during 2020-21, under the NPS, State Government collected from its employees an amount of ₹719.84 crore. The State Government contributed ₹737.65 crore and transferred ₹1,457.49 crore to NSDL. Therefore, the State Government made more contribution of ₹17.81 crore during the current financial year.
The State Government stated (December 2021) that the legacy short transfers have been addressed and already complied with for previous years. However, short transfer of ₹6.00 crore to the NSDL is in fact due to the time-lag in transfer of matching Government contribution and delay in drawal of personal claims in certain instances during the year. However, such short transfers are made good in subsequent period after the closure of a financial year.
2.4.2.4 Subsidies
The State Government in its Medium Term Fiscal Plan (MTFP) for 2007-08, had aimed at rationalisation of general subsidies and reduction at a rate of 10 per cent per annum beginning with 2005-06. However, on the contrary, subsidies have increased over the years and during 2016-21, general subsidy increased from ₹ 2,386 crore to ₹ 4,288 crore. Department-wise subsidies for 2016-17 to 2020-21 are shown in Table 2.20:

Finances of the State
36 State Finances Audit Report for the year ended March 2021
Table 2.20: Department-wise Subsidies during 2016-17 to 2020-21 (₹in crore)
Sl. No.
Departments 2016-17 2017-18 2018-19 2019-20 2020-21
1 Food Supplies & Consumer Welfare
970 886 981 1,088 2,085
2 Revenue & Disaster Management
363 754 468 312 224
3 Co-operation 726 697 1,185 1,344 1,269
4 Agriculture & Farmers’ Empowerment
203 203 207 307 301
5 Industries 27 170 200 178 47
6 Fisheries & Animal Resources Development
10 56 50 50 81
7 Handlooms, Textiles & Handicrafts
46 50 50 42 37
8 Women and Child Development
1 1 1 1 183
9 Micro Small and Medium Enterprises
- - - 35 53
8 Others 40 13 26 9 8 Total Subsidy 2,386 53 3,168 3,366 4,288
Total Revenue Expenditure (RE) 65,041 71,837 85,356 99,137 95,311 Subsidy as a percentage of RE 3.67 3.94 3.71 3.39 4.50
Revenue Receipts (RR) 74,299 85,204 99,546 1,01,568 1,04,387 Subsidy as a percentage of RR 3.21 3.32 3.18 3.31 4.11
Source: Finance Accounts of respective years, Government of Odisha
From the above table, it can be seen that during 2020-21, Subsidies for Department of Food Supplies and Consumer Welfare (₹ 2,085 crore) which accounted for 48.62 per cent of the total subsidies, increased by ₹ 997 crore (91.64 per cent) as compared to previous year due to increase in distribution of subsidised ration under Public Distribution System during COVID-19. Subsidies for Women and Child Development Department substantially increased from ₹1 crore in 2019-20 to ₹183 crore in 2020-21 due to interest subvention subsidy to Women’s Group under the Mission Shakti Programme.
2.4.2.5 Financial Assistance to Local Bodies and other institutions
Financial assistance to the tune of ₹ 27,269 crore was provided by the State Government to local bodies and other institutions by way of grants and loans in 2020-21, as shown in Table 2.21.
Table 2.21: Financial Assistance to Local Bodies and other institutions (₹in crore)
2019-20 2020-21
Educational institutions (Aided Schools, Aided Colleges, Universities, etc.) 6,707 6,633 Municipal Corporations and Municipalities 1,886 2,662 Zilla Parishads and other Panchayati Raj Institutions 4,415 2,509 Development Agencies 2,154 1,483 Other institutions 13,303 13,982
TOTAL 28,465 27,269 Assistance as a percentage of Revenue Expenditure 29 26
Source: Finance Accounts of respective years, Government of Odisha

Finances of the State
State Finances Audit Report for the year ended March 2021
37
From the above table, it can be seen that the grants extended to local bodies and other institutions decreased by ₹ 1,196 crore (4.20 per cent) from ₹ 28,465 crore in 2019-20 to ₹ 27,269 crore in 2020-21. This decrease was mainly due to decrease in assistance to Rural Local Bodies (₹ 1,906 crore), Educational Institutions (₹ 74 crore), Development Agencies (₹ 671 crore). The decrease was partly set off by increase in assistance to Urban Local Bodies (₹ 776 crore) and Other Institutions (₹ 679 crore).
2.4.3 Capital Expenditure (CE)
Capital Expenditure (Capex) is primarily expenditure on creation of fixed infrastructure assets such as roads, buildings etc. Capex in both Centre and State is being met from budgetary support and extra budgetary resources/off budget.
The State Government’s Capital Expenditure has started decreasing from 2019-20 fiscal year. During 2020-21, the Capital Expenditure was ₹17,949 crore, which was nearly 68.34 per cent of Budget Estimate (₹26,263 crore). It decreased both in terms of absolute numbers as well as percentage of the total expenditure over 2019-20. Capex relative to Total Expenditure (₹ 1,14,857 crore) and GSDP (₹5,09,574 crore) during 2020-21 decreased to 15.63 per cent and 3.52 per cent respectively, which was 16.80 per cent and 3.89 per cent in 2019-20. High Capital Expenditure is considered essential for achieving a faster economic growth as it goes into asset creation. Capital expenditure as part of total expenditure/GSDP, is detailed in Chart 2.12.
Chart 2.12: Capital Expenditure as a percentage of GSDP and Total Expenditure
Source: Finance Accounts of respective years, Government of Odisha
The State Government stated (December 2021) that they are committed to creation of Capital Assets by increasing Capital spending. Decrease in Capital expenditure of the Government during 2020-21 is primarily due to COVID-19 induced delay in implementing Capital projects.
18,47121,109 23,482
20,277 17,949
22.05 22.26 21.35
16.80 15.63
4.70 4.79 4.81 3.89 3.52 0
5,000
10,000
15,000
20,000
25,000
0.00
5.00
10.00
15.00
20.00
25.00
2016-17 2017-18 2018-19 2019-20 2020-21
Capex Capex as percentage of TE Capex as percentage of GSDP

Finances of the State
38 State Finances Audit Report for the year ended March 2021
Misclassification of Revenue Expenditure as Capital Expenditure
During the year 2020-21, the State Government had booked ₹17,948.98 crore as Capital Expenditure. Audit examined Sanction Orders and expenditure vouchers from the Office of the Accountant General (A&E) related to this amount and noticed that out of the amount of ₹17,948.98 crore, ₹ 6,735.66 crore was transferred to bank account of Government DDOs or to entities maintaining accounts outside purview of Government. Audit examined Sanction Orders and vouchers for ₹6,735.66 crore and noticed that an amount of ₹366.12 crore had been incurred towards operation, maintenance, repair and renovation etc. As per Rule 31(2)(b) of Government Accounting Rules, 1990, Revenue Accounts should bear all charges relating to maintenance and working expenses. Further, Audit noticed that ₹681.25 crore had been transferred for creation of assets of entities other than Government. In accordance with Note below Rule 30(1) of GAR 1990, ₹ 681.25 crore was required to be classified as Revenue Expenditure instead of Capital Expenditure. Thus, there was mis-classification of ₹1,047.37 crore which resulted in overstatement of Revenue Surplus to that extent. The resulting Capital Expenditure after Audit for the year 2020-21 was ₹16,902 crore (Chart 2.13).
Chart 2.13: Changes in CAPEX after Audit
Source: Audited Finance Accounts 2020-21, Government of Odisha
The State Government stated (December 2021) that issues pertaining to misclassification of revenue expenditure as capital expenditure have already been taken up in the Annual Budget, 2021-22. However, concerned Departments like Commerce & Transport, Rural Development, Housing & Urban Development, Tourism, Planning & Convergence, etc., would be requested to furnish further compliance to the audit observations on the proper classification of the expenditure.
2.4.3.1 Major changes in Capital Expenditure
Capital Expenditure during 2020-21 decreased by ₹ 2,328 crore over previous year, which is detailed in Table 2.22.

Finances of the State
State Finances Audit Report for the year ended March 2021
39
Table 2.22: Variation in Capital Expenditure under various Major Heads during 2020-21 compared to 2019-20
(₹ in crore)
Major Heads of Account 2019-20 2020-21 Increase (+) / Decrease (-)
5475- Capital Outlay General Economic Services 10 637 (+)627
5075- Capital Outlay on Other Transport Services 197 382 (+)185
4217- Capital Outlay on Urban Development 122 276 (+)154
5054- Capital Outlay on Roads and Bridges 6,123 6,252 (+)129
5452- Capital Outlay on Tourism 113 240 (+)127
4210- Capital Outlay on Medical and Public Health
504 631 (+)127
4225- Capital Outlay on Welfare of SC, ST and OBC
153 269 (+)115
4702- Capital Outlay on Minor Irrigation 1,655 815 (-)840
4700- Capital Outlay on Major Irrigation 1,505 949 (-)556
4515- Capital Outlay on Rural Development Programmes
348 17 (-)331
4202- Capital Outlay on Education, Sports, Arts and Culture
758 581 (-)177
4701- Capital Outlay on Medium Irrigation 608 431 (-)177
5055- Capital Outlay on Road Transport 123 10 (-)113
4216- Capital Outlay on Housing 344 239 (-)105 Source: Finance Accounts of respective years, Government of Odisha
Decrease in Capital Expenditure during 2020-21 over previous yearwas mainly due to less expenditure under (1) Capital Outlay on Minor Irrigation by ₹840 crore due to less expenditure under Parvati Giri Mega Lift Project, Mukhyamantri Adibandha Tiyari Yojana and Minor Irrigation Project under State Plan, (2) Capital Outlay on Major Irrigation by ₹556 crore due to less expenditure under Anand Barrage Commercial Project, Upper Indravati Irrigation Project and deduct recovery under Lower Suktel Irrigation Project and (3) Capital Outlay on Rural Development Programme by ₹ 331 crore due to less expenditure under Ama Gaon Ama Vikas Yojana.
2.4.3.2 Quality of Capital Expenditure in Companies, Corporations and Other bodies
Investments by the State Government in Companies, Corporations and other bodies which result in equity infusion are classified as Capital expenditure. Such equity infusion is intended for procurement and use of fixed assets such as land, buildings, plant and machinery, equipment and other infrastructure by these PSUs. Such Capital expenditure in the form of investments by the Government is expected to give rise to income in the form of dividends or capital gains in future periods. Capital

Finances of the State
40 State Finances Audit Report for the year ended March 2021
expenditure in the companies and corporations, which are loss making and whose net worth is completely eroded, is not sustainable. Return on investment in share capital invested in PSUs is therefore, an important determinant of quality of Capital Expenditure.
As of 31 March 2021, the State Government’s investment stood at ₹ 7,288.29 crore in Public Sector Undertakings (PSUs) comprising Government Companies (₹ 5,705.34 crore), Co-operative Societies (₹ 907.74 crore), Statutory Corporations (₹ 673.06 crore) and others9 (₹ 2.15 crore). Details of investment for the years 2016-21 are given in Table 2.23:
Table 2.23: Return on Investment Sl. No.
Details 2016-17 2017-18 2018-19 2019-20 2020-21
1 Investment at the end of the year (₹ in crore)
4,423.02 4,974.21 5,353.76 5,698.65 7,288.29
2 Return in the form of Dividend (₹ in crore)
566.04 66.22 543.94 321.38 1,062.81
3 Rate of Return (RoR) (per cent) 12.80 1.33 10.16 5.64 14.58
4 Average rate of interest on Government borrowing (per cent)
7.62 7.58 7.74 7.09 7.04
5 Difference between RoR (per cent) and interest rate (3-4)
5.18 (-) 6.25 2.42 (-)1.45 7.54
6 Difference between interest on Government borrowings and return on investment (₹ in crore)# 229.11 (-) 310.89 129.56 (-)82.63 549.71
Source: Finance Accounts of respective years, Government of Odisha
# Investment at the end of the year*Difference between interest rate and return
The above table shows that ₹ 1,062.81 crore was received as dividend against total investment of ₹7,288.29 crore during 2020-21, which was much more than the average rate of interest on Government borrowings.
It was observed that out of 147 entities, only 6 entities had paid dividend. These included one Co-operative Society10 and five Government Companies11 (which included one Power Sector Company).
Out of the total investment of ₹ 7,288.29 crore, ₹ 3,809.30 crore (52 per cent)
was invested in four12 Power Sector Companies. Out of these, only one13 company paid dividend of ₹ 30.00 crore (2.75 per cent).
The return on investment was mainly dependent on Odisha Mining Corporation (OMC). OMC paid ₹ 1,000 crore dividend in 2020-21, which was 300 per cent
9 Joint Stock Companies & Partnerships and Rural Banks 10Co-operative Society: Credit Co-operatives ₹4.16 crore 11 Government Companies: Odisha Construction Corporation Limited (OCC) ₹ 20.16 crore, Odisha State
Police Housing and Welfare Corporation Ltd.: ₹ 6.12 crore, Odisha Mining Corporation Limited (OMC)
₹1,000.00 crore, Odisha State Beverage Corporation Limited:₹7.58 crore and Odisha Hydro Power
Corporation (OHPC): ₹30.00 crore. 12 OPGC: ₹1,130.46 crore, OPTCL: ₹1,571.06 crore, GRIDCO: ₹573.44 crore and OHPC: ₹534.34 crore. 13 OHPC: ₹30.00 crore

Finances of the State
State Finances Audit Report for the year ended March 2021
41
more than the previous year (₹250 crore) 2019-20. As a result, return on investment increased from ₹ 321 crore during 2019-20 to ₹ 1,063 crore during 2020-21. OMC was the highest contributor of dividend in 2016-17: ₹ 500 crore, 2018-19: ₹ 500 crore, 2019-20: ₹ 250 crore and 2020-21: ₹ 1,000 crore.
Out of total 147 entities, 72 were inactive. Of the remaining active 75 entities, 69 had not paid any dividend in 2020-21.
The State Government stated (December 2021) that Public Sector Undertakings play a critical role in important economic activities. Majority of Government investment in PSUs is concentrated in power sector. Most of them are incurring losses and thus are not paying dividend. In the mining sector, OMC is the most profit-making PSU in the State.
2.4.4 Expenditure Priorities
Enhancing human development levels requires the States to step up their expenditure on key social services like education, health, etc. Low fiscal priority (ratio of expenditure under a category to aggregate expenditure) is attached to a particular sector, if the allocation is below the respective national average. The higher the ratio of these components to total expenditure, the quality of expenditure is considered to be better.
Chart 2.14 analyses the fiscal priority of the State Government with regard to Development Expenditure14, Social Services Expenditure, Economic Services Expenditure and Capital Expenditure during 2020-21, vis-à-vis the average of the General Category States15.
Chart 2.14: Prioritisation in public expenditure in percentage
14Development Expenditure includes Development Revenue Expenditure, Development Capital Expenditure and
Loans & Advance disbursed 15 Andhra Pradesh, Telangana, Bihar, Chhattisgarh, Goa, Gujarat, Haryana, Jharkhand, Karnataka, Kerala,
Madhya Pradesh, Maharashtra, Odisha, Punjab, Rajasthan, Tamil Nadu, Uttar Pradesh and West Bengal.

Finances of the State
42 State Finances Audit Report for the year ended March 2021
From the above Chart, it can be inferred that the Total Expenditure relative to GSDP in Odisha was better than the General Category States. Odisha fared favourably in its focus on Development Expenditure, Economic Services Expenditure, Capital Expenditure and Expenditure on Education vis-à-vis General Category States. The State, however, lagged behind General Category States in the areas of Healthcare Expenditure and Social Services Expenditure.
2.4.5 Object head wise expenditure
Finance Accounts depict transactions only up to the Minor Head level. Object head wise expenditure gives information about the object/ purpose of the expenditure. The object head wise expenditure of Odisha is depicted Chart 2.15.
Chart 2.15: Object Head wise Expenditure
Source: Finance Accounts 2020-21, Government of Odisha
Note- Object Heads contributing less than one per cent are included in Others
It can be seen from above pie chart that 23 per cent of total expenditure were booked under detailed head grants-in-aid released to local bodies followed by salaries 18 per
cent, pension 12 per cent, interest payment 6 per cent etc.
2.5 Public Account Receipts
Receipts and disbursements in respect of transactions such as Small Savings, Provident Funds, Reserve Funds, Deposits, Suspense, Remittances etc., which do not form part of the Consolidated Fund, are kept in Public Account set up under Article 266(2) of the Constitution. These are not subject to vote by the State Legislature. Government acts as a banker or trustee. The balance after disbursements during the year is the fund available with the Government for its own use.
2.5.1 Net Public Account Balances
Composition of Public Account receipts and disbursements is detailed in Table 2.24:
23%
18%
12%6%
4%
1%1%
1%
2%
1%
31%
Grants-in-Aid
Salaries
Pension
Interest Payment
Subsidies
Scholarship & Stipend
Devolution
Loans
Major Works
Pipe Water Supply
Others

Finances of the State
State Finances Audit Report for the year ended March 2021
43
Table 2.24: Component-wise net balances in Public Accounts as of 31 March 2021
(₹in crore) Sector Sub Sector 2016-17 2017-18 2018-19 2019-20 2020-21 I. Small Savings, Provident Fund etc.
Small Savings, Provident Fund etc. 1,857 1,558 1,748 915 612
J. Reserve Funds a) Reserve Funds bearing interest 1142 -88 -916 6,201 178 b) Reserve Funds not bearing interest 3 2 7,828 1,053 -1,207
K. Deposits and Advances
a) Deposits bearing interest 7 -14 -3 7 -19 b) Deposit not bearing interest 600 13,912 4,206 3,422 -13,013 c) Advances 0 0 0 1 -5
L. Suspense and Miscellaneous
b) Suspense -9 105 -54 -80 26 c) Other Accounts -1 0 0 0 0 d) Accounts with Governments of Foreign Countries 0 0 0 0 0 e) Miscellaneous 0 -27 0 0 2,500
M. Remittances a) Money Orders and other Remittances -53 -7 10 -21 24 b) Inter Governmental Adjustment Account 0 -5 4 0 -6
TOTAL 3,547 15,435 12,821 11,497 -10,910 Source: Finance Accounts of respective years, Government of Odisha
Note: +ve denotes debit balances and –ve denotes credit balances
From the above table, it can be observed that during the year 2020-21, net Public Account receipts {(-) 10,910 crore}, showed negative inflows (more outgo than inflow) and consumed 8.70 per cent of the total revenue and capital receipts (₹ 1,25,389 crore) of the State. The reason for negative net Public Account receipts was due to investment of OMBADC Fund (₹5,955crore), expenditure of OMBADC Fund (₹2,154crore) and disbursal of other funds from Personal Deposit Accounts under Deposit not bearing interest and withdrawal of Consolidated Sinking Fund (₹2,500crore) for repayment of matured loan under Reserve Fund not bearing interest.
Government is liable to pay/adjust interest in respect of interest-bearing Reserve Funds and Deposits. During the year 2020-21, Interest on Defined Contributory Pension Scheme (₹1.22 crore), Deposits on Government Companies (₹1.36 crore) and Miscellaneous Deposit (₹0.02), totalling ₹2.60 crore were not credited to the Public Account which impacted favourably on revenue and fiscal position of the State.

Finances of the State
44 State Finances Audit Report for the year ended March 2021
Chart 2.16: Yearly changes in composition of Public Accounts balances
Source: Finance Accounts of respective years, Government of Odisha
2.5.2 Reserve Funds
Reserve Funds are created for specific and defined purposes under the Public Accounts of the State Government. These funds are met from contribution or grants from Consolidated Fund of India or State. Out of the gross accumulated balances of₹ 20,333 crore lying in these Funds as on 31 March 2021, ₹18,238 crore was invested in Government Stock by Reserve Bank of India, leaving the total net accumulated balance of ₹ 2,095 crore as on 31 March 2021.
The transactions during the year 2020-21 under major Reserve Funds are detailed below:
i) Consolidated Sinking Fund (CSF): As per 12th Finance Commission recommendation, GoO set up Consolidated Sinking Funds for amortisation of outstanding liabilities. The guidelines of the Reserve Bank of India, stipulate a minimum annual contribution of at least 0.5 per cent of the outstanding liabilities at the end of the previous financial year to the CSF during the year. In consultation with RBI, the State Government vide notification dated November 2018 revised the scheme for Constitution and Administration of the Consolidated Sinking Fund of Government of Odisha and inserted that the State Government is at liberty of not contributing to the fund, if the balance in the fund is maintained at a level higher than 5 per cent of the total liability of the State Government at the end of the previous year.

Finances of the State
State Finances Audit Report for the year ended March 2021
45
As on 31 March 2021, the balance in the Consolidated Sinking Fund was ₹ 11,693.75 crore, which was 9.27 per cent (more than the mandated level of 5 per
cent) of the total liability of the State Government at the end of the previous year (₹1,26,084 crore). Accordingly, the State Government had not made any contribution to the Consolidated Sinking Fund in 2020-21. However, interest accrued for the year 2020-21 from investment amounting to ₹1,190.20 crore was credited in the fund and ₹2,500.00 crore was withdrawn by GoO towards redemption of matured debt. The entire outstanding amount of the fund was invested in Government of India securities by the Reserve Bank of India.
ii) Guarantee Redemption Fund (GRF): GRF was constituted in the year 2002-03, with the objective of meeting the payment obligations arising out of default in debt servicing of loans guaranteed by the Government. The State Government is required to contribute an amount equivalent at least to 1/5th of the outstanding invoked guarantees plus amount likely to be invoked as a result of the incremental guarantees issued during the year. No guarantees were invoked and the Government of Odisha had not made any contributions to the Fund during 2020-21. Interest accrued for the year 2020-21 from investment, amounting to ₹ 111.24 crore was accounted for in the fund. The balance at the credit of the fund as on 31 March 2021 was ₹ 1,522.83 crore, which had been invested in Government of India securities by the Reserve Bank of India.
iii) State Compensatory Afforestation Fund Management and Planning (CAMPA) Fund: Opening Balance of CAMPA Fund as on 01 April 2020 was ₹5,656.53 crore. During the year 2020-21, the State Government had not received any fund from National Compensatory Afforestation Fund(NCAF), however, an amount of ₹152.95 crore was received as interest from investment of the fund. The expenditure incurred out of the fund during the year was ₹673.27 crore and the balance in the State CAMPA Fund as on March 2021 was₹5,136.21 crore. Out of this, ₹2,895.00 crore has been taken as loan by GoO and ₹2,566.10 crore invested in RBI Treasury Bills, leaving an amount of₹324.89 crore un-invested. Due to non-investment on regular basis, State Government has to bear `32.19 crore (as per 364 days Treasury Bill interest) towards interest on monthly balance of CAMPA Fund. This had an impact of overstatement of Revenue Surplus and understatement of Fiscal Deficit to the tune of `32.19 crore. iv) State Disaster Response Fund (SDRF): During the year 2020-21, Central Government contributed ₹ 1,604 crore and State Government contributed ₹ 535.00 crore to SDRF. Grants from National Disaster Response Fund (NDRF) amounted to₹ 500.00 crore. Total funds in SDRF amounted to ₹ 3635.02 crore (including Opening Balance ₹991.84 crore and interest earned ₹4.18 crore). Out of this Fund, State Government incurred expenditure of ₹ 1,945.00 crore during the year, leaving a balance of ₹ 1,690.02 crore as on 31 March 2021 as against ₹991.84 crore as on

Finances of the State
46 State Finances Audit Report for the year ended March 2021
March 2020. The entire amount of ₹ 1,690.02 crore remained un-invested as on 31 March 2021. Due to non-investment on regular basis, State Government has to bear ₹58.48 crore (as per 364 days Treasury Bill interest) towards interest on monthly balance of SDRF, which overstated the revenue surplus and understated the fiscal deficit to the tune of `58.48 crore. 2.5.3 Position of loans and advances and interest received/ paid by the State Government In addition to investments in Co-operative societies, Corporations and Companies, State Government has also provided loans and advances to Public Sector Undertakings and autonomous bodies such as Universities, Local Bodies and Urban Development Authorities and Corporations etc. Table 2.25 shows the details of outstanding Loans and Advances for the years 2016-21:
Table 2.25: Position of loans and advances Quantum of Loans/Interest Receipts/
Cost of Borrowings 2016-17 2017-18 2018-19 2019-20 2020-21
Opening Balance (₹ in crore) 4,557 4,708 6,326 7,191 8,163 Amount advanced during the year (₹ in crore)
254 1,875 1,170 1,259 1,597
Amount recovered during the year (₹ in crore)
89 257 305 287 684
Closing Balance (₹ in crore) 4,708* 6,326 7,191 8,163 9,076 Net addition (₹ in crore) (+)151 (+)1,618 (+) 865 (+) 972 (+)913 Interest Receipts (₹ in crore) 36 41 35 64 316 Interest Receipts as a percentage of outstanding loans and advances (in per
cent)
0.76 0.65 0.49 0.78 3.48
Interest Payments (₹ in crore) 4,035 4,988 5,800 6,063 6,644 Outstanding Liabilities/ Debt (₹ in crore)
71,623 97,164 1,08,258 1,26,084 1,22,774
Interest Payments as percentage to total outstanding Liabilities of the State Government (in per cent)
5.63 5.13 5.36 4.81 5.41
Difference between Interest Receipts and Interest Payments (in per cent)
(-) 4.87 (-) 4.48 (-) 4.87 (-) 4.03 (-)1.93
*4722-4708Difference of ₹14 crore was due to conversion of loan to Share Capital Investment Source: Finance Accounts of respective years, Government of Odisha
From the above table, it can be inferred that:
Loans and Advances extended by the State Government increased nearly six times from ₹ 254 crore in 2016-17 to ₹ 1,597 crore in 2020-21. Outstanding Loans and Advances rose from ₹4,708 crore in 2016-17 to ₹ 9,076 crore in 2020-21. Major portion of loans advanced during 2020-21 was to Indian Oil Corporation Limited (₹ 700 crore), Odisha Power Transmission Corporation Limited (₹536.73 crore), Odisha State Co-operative Marketing Federation Ltd. (₹ 125 crore), Odisha State Seeds Corporation (₹ 60 crore) and Odisha Agro Industries Corporation (₹ 10 crore). Government of Odisha had entered into an

Finances of the State
State Finances Audit Report for the year ended March 2021
47
agreement with Indian Oil Corporation Limited for providing fiscal incentive of ₹10,500 crore interest free loan over a period of 15 years for Paradeep Refinery Project, as Viability Gap Funding (VGF16). As a part of this, the State Government disbursed ₹1,400 crore in 2017-18 and ₹ 700 crore each in 2018-19, 2019-20 and 2020-21.
The current recovery of loan (₹ 684 crore) was 42.83 per cent of the advances (₹ 1,597 crore) made during the year and was more than previous year’s (₹ 287 crore) recovery. The actual recovery (₹ 684 crore) for 2020-21 was more than what was estimated in the Budget for recovery (₹ 250 crore) by 173.60 per cent. The recovery of Loans and Advances during the year 2020-21 spiked due to conversion of Bonds worth ₹ 400 crore issued to Odisha Power Transmission Corporation Limited (OPTCL) to equity investment of Government.
Interest receipts increased from ₹36 crore in 2016-17 to ₹316 crore in 2020-21, with percentage of interest received to total outstanding loans and advances increasing from 0.76 per cent in 2016-17 to 3.48 per cent in 2020-21. Interest receipt during 2020-21 (₹316 crore) surged by 393.75 per cent over 2019-20 (₹64 crore) due to conversion of ₹247 crore interest accrued on bonds issued to OPTCL as equity investment of government in OPTCL. As compared to interest receipt of 3.48 per cent on outstanding loans, interest payment (₹6,644 crore) during 2020-21 was 5.41 per cent of its total outstanding liabilities (₹1,22,774 crore). As a result, interest spread of Government borrowings was negative (-1.93 per cent) during the year, which meant that the State’s borrowings are more expensive than the loans advanced by it.
The Government stated (December 2021) that the borrowings are for capital investment in public interest and within Odisha Fiscal Responsibilities framework. Interest Payment against such borrowing is a part of committed expenditure which would always be higher than the interest accrued out of the loans and advances extended by the State Government. This negative spread in no way affects the fiscal performance of the State Government and that comparison of interest rates between Government borrowings and loans and advances extended is not logical.
The reason for specifying the negative spread is to highlight the fact of its existence, which indicates that the loans and advances extended by the State Government carry an implicit element of subsidy, i.e. the loanee entities are enabled to access funds at lower than market rate of interest. In these circumstances, Audit is of the view that the State Government should follow a financially prudent process of due diligence before extending loans and advances to distinct entities.
16Viability Gap Funding means a grant to support projects that are economically justified but not financially
viable.

Finances of the State
48 State Finances Audit Report for the year ended March 2021
2.6 Debt Management
Debt management is the process of establishing and executing a strategy for managing the Government’s debt in order to raise the required amount of funding, achieve its risk and cost objectives, and to meet any other sovereign debt management goals that the Government may have set through enactment or any other annual budget announcement.
Outstanding Debt of the State Government (Internal Debt, Loans and Advances from GoI and Public Account Liabilities) as of 31 March 2021 stood at ₹1,22,774 crore, which was less by 2.62 per cent over the preceding year. Out of ₹1,22,774 crore of Outstanding debt, ₹16,492 crore carried no interest obligations (Deposits not bearing interest ₹16,201 crore and Reserve Fund not bearing interest ₹291 crore), of which ₹14,398 crore of Cash Balance was available with the State Government.
During the year, Internal Debt increased by ₹6,926 crore and Loans from Government of India increased by ₹4,139 crore. However, outstanding liabilities as a whole decreased by ₹3,310 crore, as Government of Odisha took a loan of ₹8,850 crore from Public Accounts (₹5,955 crore from OMBADC and ₹2,895 crore from CAMPA), which had no net impact on outstanding liabilities. This loan reduced the Public Accounts Liabilities and increased the Internal Debt to that extent. GoO repaid market loan of ₹2500 crore from Consolidated Sinking Fund. An abstract of liabilities and assets as on 31 March 2021 compared with corresponding position of last year is given in Appendix 2.3. Trend analysis of the outstanding debt of the State is depicted in Chart 2.17.
Chart 2.17: Outstanding Debt vis-à-vis GSDP
Source: Finance Accounts of respective years, Government of Odisha
2.6.1 Debt profile: Components of Outstanding Liabilities/Debt
The components of Outstanding Liabilities are given in Chart 2.18.
71,623
97,1641,08,258 1,26,084 1,22,774
18.23
22.04 22.1924.19 24.09
0
20,000
40,000
60,000
80,000
1,00,000
1,20,000
1,40,000
0.00
5.00
10.00
15.00
20.00
25.00
30.00
2016-17 2017-18 2018-19 2019-20 2020-21
Outstanding Debt As per cent of GSDP

Finances of the State
State Finances Audit Report for the year ended March 2021
49
Chart 2.18: Components of outstanding liabilities of the State Government
Outstanding Liabilities (₹ 1,22,774 crore)
Internal Debt from Market, financial institutions, etc.
(₹ 67,521 crore)
Loans and Advances from Government of India
(₹ 11,982 crore)
Public Account Liabilities where Government acts as a
banker (₹ 43,270 crore)
Market Loans (₹ 35,031 crore) Loans for Plan Schemes(₹11,970 crore)
Small Savings, Provident Fund, etc. (₹ 24,949 crore)
Loans from Financial Institutions (₹ 15,943 crore)
Non Plan Loans (₹ 12 crore) Reserve Funds bearing Interest (₹1,805 crore)
Special Securities issued to NSSF (₹ 7,408 crore)
Reserve Funds not bearing interest (₹ 291 crore)
Other Loans (₹ 9,139* crore) Deposits bearing interest (₹ 24 crore)
Deposits not bearing interest (₹16,201 crore)
* includes loan taken from OMBADC and CAMPA fund.
Source: Finance Accounts, Government of Odisha.
During the year, Market Loans increased by ₹ 500 crore from ₹ 34,531 crore in 2019-20 to ₹ 35,031 crore in 2020-21. Similarly, Loans from Financial Institutions increased by ₹ 1,483 crore from ₹ 14,589 crore in 2019-20 to ₹15,943 crore in 2020-21.
Debt Sustainability is defined as the ability of the State to service its debt in future. Table 2.26 analyses the debt sustainability of the State during the five-year period 2016-21.
Table 2.26: Debt Sustainability Indicators during 2016-21
Indicators of Debt* Sustainability 2016-17
2017-18
2018-19 2019-20
2020-21
Outstanding Debt (₹ in crore) 71,623 97,164 1,08,258 1,26,084 1,22,774
Public Debt - Internal Debt 34,553 44,584 50,421 60,595 67,521 Public Debt - Loans from Government of India 7,465 7,606 7,832 7,843 11,982 Public Accounts Liabilities 29,605 44,974 50,005 57,646 43,270 Rate of growth of Outstanding Debt (in per cent) 19.87 35.66 11.42 16.47 (-)2.63 GSDP (at current prices) (₹ in crore) 3,92,804 4,40,879 4,87,805 5,21,275 5,09,574 Rate of growth of GSDP 19.56 12.24 10.64 6.86 (-)2.24

Finances of the State
50 State Finances Audit Report for the year ended March 2021
Indicators of Debt* Sustainability 2016-17
2017-18
2018-19 2019-20
2020-21
Debt/GSDP ratio (in per cent) 18.23 22.04 22.19 24.19 23.34#
Total Debt Receipts (₹ in crore) 33,782 61,698 48,103 60,314 60,649
Total Debt Repayment (₹in crore) 21,912 36,157 37,009 42,487 63,960
Net availability of Debt (after payment of interest)
7,835 20,553 5,294 11,764 (-)3,311
Debt Repayment/ Debt Receipts (in per cent) 64.86 58.60 76.94 70.44 105.46 Source: Finance Accounts of respective years, Government of Odisha. *Internal Debt, Loans from GoI and Public Account Liabilities
# This debt does not include ₹3,822.00 crore, which was passed on as back to back loans by
Government of India in lieu of shortfall in GST Compensation, vide GoI’s No. F. No. 40(1) PF-
S/2021-22 dated 10-12-2021
The effective outstanding overall debt would be ₹ 1,18,951.59 crore as the Department of Expenditure, GoI has decided that GST compensation of ₹ 3,822 crore given to the State as back to back loan under debt receipts would not be treated as debt of the State for any norms which may be prescribed by the Finance Commission.
Out of the total outstanding debt of₹1,22,774 crore, Internal Debt constituted major share (55 per cent) followed by Public Account Liabilities (35 per cent) and Loans from Government of India (10 per cent) which is shown in Chart 2.19. Component-wise debt trends are depicted in Chart 2.20.
Chart 2.19: Break up of Outstanding Debt at the end of 2020-21
Source: Finance Accounts 2020-21, Government of Odisha.
Public Account Liabilities,
43,270 crore 35%
Internal Debt, 67,521 crore
55%
Loans from GoI, 11,982crore 10%

Finances of the State
State Finances Audit Report for the year ended March 2021
51
Chart 2.20: Components wise Debt Trends
Source: Finance Accounts of respective years, Government of Odisha.
It can be seen from Chart 2.20 that the decrease in Outstanding Debt was mainly due to decrease in Deposit and advances by ₹13,037 crore, Reserve Fund by ₹1,029 crore, which was compensated by increase of Loans from Financial Institutions by ₹7,310 crore, Loans from Government of India by ₹4139 crore, Small Savings and Provident Fund by ₹ 611 crore and Market Loan by ₹500 crore.
Internal Debt taken vis-a-vis repayment during 2016-17 to 2020-21 is given in Chart 2.21.
2016-17 2017-18 2018-19 2019-20 2020-21
Market Borrowing 6,965 8,438 4,500 6,500 500
Loans from GOI 233 141 226 11 4,139
Special Securities issued toNational Small Savings Fund
-808 -820 -849 -883 -883
Loans from FinancialInstitutions and Others
1,871 2,413 2,186 4,557 7,310
Small Savings ProvidentFunds etc.
1,857 1,558 1,748 915 611
Reserve Fund 1,145 -86 6,912 7,253 -1,029
Deposits and Advances 607 13,897 4,202 3,429 -13,037
Suspense and Miscellaneous -10 78 -54 -80 2,526
Remittances -53 -12 13 -21 18
Contingency Fund 123 0 -1,440 1,440 -171
Increase (-)/Decrease (+) incash balance
-2,552 -16,247 -7,287 -4,303 9,802
Gross Fiscal Deficit 9,378 9,360 10,157 18,819 9,786
-20,000
-15,000
-10,000
-5,000
0
5,000
10,000
15,000
20,000
25,000
(`in
cro
re)

Finances of the State
52 State Finances Audit Report for the year ended March 2021
Chart 2.21: Internal debt taken vis-à-vis repaid
Source: Finance Accounts of respective years, Government of Odisha.
It can be seen from the above chart that Internal Debt taken is consistently increasing since 2018-19 while repayment of Internal Debt is increasing since 2017-18. 2.6.1.1 Composition and Financing pattern of Fiscal Deficit
Fiscal deficit represents the total financing the State requires (predominantly by drawing on its cash and investment balances with the RBI and by borrowing) to meet the excess of the revenue and capital expenditure (including loans and advances) over revenue and non-debt receipts. The composition and financing pattern of fiscal deficit are in Table 2.27.
Table 2.27: Components of Fiscal Deficit and their financing pattern
(₹ in crore) Particulars 2016-17 2017-18 2018-19 2019-20 2020-21
Net Net Net Net Net
A. Composition of Fiscal Deficit (1 to 3)
(-)9,378 (-)9,360 (-) 10,157 (-) 18,819@ (-)9,786
1 Revenue Surplus 9,258 13,367 14,190 2,430 9,076
2 Capital Expenditure (-)18,471 (-)21,109 (-) 23,482 (-)20,277 (-)17,949
3 Net Loans and Advances (-)165 (-)1,618 (-) 865 (-)971 (-)913
B Financing Pattern of Fiscal Deficit
1 Net Borrowings 8,261 10,172 6,063 10,185 11,066
a Market Borrowings 6,965 8,438 4,500 6,500 500
b Special Securities issued to NSSF -808 -820 -849 -883 -883
c Loans from Financial Institutions and Others 1,871 2,413 2,186 4,557 7,310
d Loans from GoI 233 141 226 11 4,139
2 Net Public Account 3,546 15,435 12,821 11,496 (-)10,911
a Small Savings, Provident Fund etc.
1,857 1,558 1,748 914 611
b Reserve Funds 1,145 (-)86 6,912 7,254 (-)1,029
10,320
12,013
9,020
13,72115,191
2,292 1,9823,183 3,547
8,265
0
2,000
4,000
6,000
8,000
10,000
12,000
14,000
16,000
2016-17 2017-18 2018-19 2019-20 2020-21
Internal Debt Taken Internal Debt Repaid

Finances of the State
State Finances Audit Report for the year ended March 2021
53
Particulars 2016-17 2017-18 2018-19 2019-20 2020-21
Net Net Net Net Net
c Deposits and Advances 607 13,897 4,202 3430 (-)13,037
d Suspense and Miscellaneous (-)10 78 (-) 54 -80 2,526
e Remittances (-) 53 (-) 12 13 -22 18
3 Contingency Fund 123 -- (-) 1,440 1,440 (-)171
4 Total (1 to 3) 11,930 25,607 17,444 23,121 (-)16
5 (-) Increase / (+) Decrease in Cash Balance
(-) 2,552 (-)16,427 (-) 7287 (-) 4,303 9,802
6 Overall Surplus/ Deficit (4+5) 9,378 9,360 10,157 18,819@ 9,786 Source: Finance Accounts of respective years, Government of Odisha.
# Includes market borrowings & borrowings from other institutions also *All these figures are net of disbursements/outflows during the year @ difference of ₹one crore is due to rounding off
It can be seen from above Table that the Fiscal Deficit and net outflow of Deposits and Advances, Reserve Funds and Contingency Fund were mainly financed from utilisation of cash balance, loans from Government of India and loans from Financial Institutions.
2.6.2 Debt profile, Maturity and Repayment
Debt maturity and repayment profile indicates commitment on the part of the Government for debt repayment or debt servicing. Table 2.28 and Chart 2.22 show the debt maturity profile of repayment of State Debt.
Table 2.28: Debt Maturity Profile of repayment of State Debt
Period of repayment (Years) Amount (₹ in crore) Percentage (w.r.t. Public Debt)
0-1 19,427 24.44 1-3 20,761 26.11 3-5 11,764 14.80 5-7 6,415 8.07
7-10 5,046 6.35 Above 10 11,795 14.84
Un-matured Loan* 4,295 5.40 Total 79,503 100.00
Source: Finance Accounts 2020-21, Government of Odisha.
*includesloan in lieu of GST compensation/ shortfall

Finances of the State
54 State Finances Audit Report for the year ended March 2021
Chart 2.22: Debt Maturity Profile
Source: Finance Accounts, Government of Odisha.
It can be seen from the Chart 2.22 and Table 2.28 that ₹19,427 crore (24.44 percent) of the outstanding Public Debt will be matured during one year. Out of the ₹19,427 crore, ₹8,850 crore loan was taken from Public Account, which is matured as well as renewed in yearly basis. Further, ₹51,952 crore (65.35 per cent) of the outstanding public debt is going to be matured within five years which create extra burden on the finances of the state. Considering the future financial constraint owing to repayment of ₹51,592 crore in coming five years GoO is required to widened its Revenue Surplus so that the Revenue Surplus is sufficient enough to Service the debt.
2.6.3 Net availability of borrowed funds
The Net availability (-₹9,955 crore) of borrowed funds (₹60,649 crore) after providing for interest payments (₹6,644 crore) and repayment of borrowings (₹ 63,960 crore), was negative (16.41 per cent). The borrowed fund during the year was insufficient to service the debt, which resulted in less expenditure under Capital Head and other developmental purposes even after obtaining ₹9,076 crore of Revenue Surplus. During the year, Government of Odisha took ₹8,850 crore loan from Public Accounts (₹5,955 crore from OMBADC and ₹2,895 crore from CAMPA), which resulted in decrease in Public Accounts Liabilities to the extent of ₹8,850 crore and as a result, the net availability of borrowed funds after payment of interest became negative.
2.7 Debt Sustainability Analysis Debt sustainability is defined as the ability of the State to maintain a constant debt-GSDP ratio over a period of time and also embodies the concern about the ability to service its debt. Debt Sustainability Analysis (DSA) considers the feasibility of meeting debt related financial obligations during a period beginning with the present
19,427 20,761 11,764 6,415 5,046 11,795 4,295
0% 20% 40% 60% 80% 100%
Am
ount
to b
e re
paid
(`in
cro
re)
0-1 years 1-3 years 3-5 years 5-7 years
7-10 years Above 10 years Unmatured Loan

Finances of the State
State Finances Audit Report for the year ended March 2021
55
and is a crucial aspect for assessing financial health of an economy. The cornerstone of DSA is the Debt GSDP ratio. The Debt to GSDP ratio rises mainly because higher levels of debt lead to higher net interest expenditures, and in turn to higher deficits and debt. A sustainable fiscal policy is one where the debt to GSDP ratio is stable or declining over the long term. The sustainability of the debt of the State is analysed through Debt Sustainability Indicators.
2.7.1 Debt Stabilisation- Debt Sustainability Indicators Trends in fiscal variable indicating the progress towards the debt stabilisation are indicted in Table 2.29.
Table 2.29: Trends in debt Sustainability Indicators Debt Sustainability Indicators 2016-17 2017-18 2018-19 2019-20 2020-21
Outstanding Public Debt17 42,018 52,190 58,253 68,438 79,503 Rate of Growth of Outstanding Public Debt 24.47 24.21 11.62 17.48 16.17 GSDP 3,92,804 4,40,879 4,87,805 5,21,275 5,09,574 Rate of Growth of GSDP 19.79 10.47 14.05 7.66 -2.24 Public Debt/GSDP 10.68 12.00 11.75 12.82 15.60 Debt Maturity profile of repayment of State Debt
Interest paid on Public Debt 2,663 3,318 3,986 4,226 4,748 Average interest Rate of Outstanding Public Debt18(per cent) 7.03 7.04 7.22 6.67 6.42 Percentage of Interest payment to Revenue Receipt 5.43 5.85 5.83 5.97 6.36 Percentage of Debt Repayment to Debt Receipt 26.39 20.91 39.39 30.62 45.54 Net Debt available to the State19 5,598 6,854 2,077 5,959 6,318 Net Debt available as per cent of Debt Receipts 49.88 53.29 20.76 40.60 31.10 Interest Spread* 12.76 3.43 6.83 0.99 -8.66 Quantum Spread20 5362 1789 3980 677 -795 Primary Deficit -5,343 -4,372 -4,357 -12,756 -3,142 Debt Stabilisation (Quantum spread + Primary Deficit) 19 -2,583 -377 -12,078 -3,937
Source: Finance Accounts of respective years, Government of Odisha.
* Rate of Growth of GSDP – Average interest rate of outstanding Public Debt.
A necessary condition for stability states that if the rate of growth of economy exceeds the interest rate or cost of public borrowings, the debt-GSDP ratio is likely to be stable provided primary balances are either zero or positive or are moderately negative. Given the rate spread (GSDP growth – interest rate) and quantum spread
17 Outstanding Public Debt is the sum of outstanding balances under the heads 6003- Internal Debt and 6004-
Loans and Advances from the Central Government. 18 Average interest rate - Interest paid / (OB of Public Debt + CB of Public Debt)/2 19 Net debt available to the State Government is calculated as excess of Public Debt receipts over Public debt
repayment and interest payment on Public Debt. 20 Quantum Spread = Outstanding Public Debt X Interest Spread/100

Finances of the State
56 State Finances Audit Report for the year ended March 2021
(Debt x rate spread), debt sustainability condition states that if quantum spread together with primary deficit is zero, debt-GSDP ratio would be constant or debt would stabilise eventually. On the other hand, if primary deficit together with quantum spread turns out to be negative, debt-GSDP ratio would be rising and in case it is positive, debt-GSDP ratio would eventually be falling.
It can be seen from Table 2.29 that during last five years, except 2020-21, all the four years’ rate of growth of economy (rate of growth of GSDP) exceeded the interest rate or cost of public borrowings. However, primary balances (primary deficit) remained negative resulting in non-fulfilment of necessary condition of debt stabilisation.
The primary deficit, the sum of quantum spread and Primary Deficit performed better as compared to previous year even at the time of pandemic which is a good indicator. However, Public debt to GDSP ratio were increasing consistently since 2018-19 and highest in 2020-21, which is a matter of concern.
Chart 2.23: Trends in debt Sustainability Indicators
Source: Finance Accounts of respective years, Government of Odisha.
2.7.2 Utilisation of borrowed funds
Borrowed funds should be used to fund capital creation and developmental activities. Using borrowed funds for meeting current consumption and repayment of interest on outstanding loans is not sustainable.
Table 2.30: Utilisation of borrowed funds Debt Sustainability Indicators 2016-17 2017-18 2018-19 2019-20 2020-21
Total borrowings (₹ in crore) 33,782 61,698 48,103 60,314 60,649 Repayment of earlier borrowings (Principal) (₹ in crore)
21,912 36,157 37,009 42,487 63,960
Repayment of earlier borrowings 64.86 58.60 76.94 70.44 105.46
24.4
7
19.7
9
18.2
3
5.43
26.3
9
24.2
1
10.4
7
22.0
4
5.85
20.9
1
11.6
2
14.0
5 22.1
9
5.83
39.3
9
17.4
8
7.66
24.1
9
5.97
30.6
2
16.1
7
-2.2
4
24.0
9
6.36
45.5
4
-10
0
10
20
30
40
50
Rate of Growth ofOutstanding Public
Debt
Rate of Growth ofGSDP
Debt as per cent ofGSDP
Percentage ofInterest to
Revenue Receipts
Percentage ofPublic Debt
Payment to PublicDebt Receipt
2016-17 2017-18 2018-19 2019-20 2020-21

Finances of the State
State Finances Audit Report for the year ended March 2021
57
Debt Sustainability Indicators 2016-17 2017-18 2018-19 2019-20 2020-21
(Principal) (Percentage) Net Loans and Advances (Percentage) 0.49 2.62 1.80 1.61 -- Net Capital Expenditure (Percentage) 27.27 12.55 19.32 27.95 -- Revenue expenditure met out of net available borrowings (Percentage)
-- -- -- -- --
Surplus of borrowing as Cash Balances (Percentage) 7.38 26.23 1.95 -- (-)5.46
Source: Finance Accounts of respective years, Government of Odisha.
Chart 2.24: Trends of Utilisation of borrowed funds
Source: Finance Accounts of respective years, Government of Odisha.
It is evident from Table 2.30 and Chart 2.24 that entire amount of the borrowed funds and 5.46 per cent of cash balance were consumed for repayment of earlier borrowings.
2.7.3 Status of Guarantees- Contingent Liabilities
Guarantees are liabilities contingent on the Consolidated Fund of the State in case of default by the borrower for whom the guarantee has been extended. Finance Department, Government of Odisha instructed (November 2002) that the total outstanding guarantee as on 1st April every year should not exceed hundred per cent of the State’s Revenue Receipts (excluding Grants-in-Aid) of the 2nd preceding year. The trends of Outstanding Guarantees for the years 2016-17 to 2020-21 are shown in Table 2.31. The outstanding guarantees (₹ 7,086 crore) at the end of 2020-21 stood at 8.86 per cent of total Revenue Receipts less grants in aid of the second preceding
27.2712.55
19.3227.95
64.86
58.6
76.9470.44
105.46
0.49
2.62
1.8 1.617.38
26.23
1.95
-5.46
-20%
0%
20%
40%
60%
80%
100%
2016-17 2017-18 2018-19 2019-20 2020-21
Net Capital Expenditure Repayment
Net loans and advances Forming part of Cash Balance

Finances of the State
58 State Finances Audit Report for the year ended March 2021
year (₹79,948 crore) and was within the ceiling (100 per cent) laid down in the said resolution.
Table 2.31: Guarantees given by the Government (₹ in crore)
Guarantees 2016-17 2017-18 2018-19 2019-20 2020-21 Ceiling applicable to the outstanding amount of guarantees including interest (Criteria)
44,080 54,812 59,217 67,584 79,948
Outstanding guarantees at the beginning of the year
1,290 2,256 1,711 4,170 3,532
Source: Finance Accounts of respective years, Government of Odisha.
Government categorised the guarantees as 100 per cent risk weighted i.e., the risk of default was borne by the State Government. During the year 2020-21, Government extended₹3,553.05 crore guarantees to Grid Corporation of Odisha Limited (GRIDCO). On the other hand, no guarantee was withdrawn or invoked during the year. Out of the total outstanding loans guaranteed by the Government, 98.57 per
cent (₹6,985.30 crore) pertained to Grid Corporation of Odisha Limited (GRIDCO).
In consideration of the guarantees given by the Government, the institutions in some cases are required to pay guarantee commission at rates varying from 0.01 per cent to one per cent. As per Finance Accounts, the State received ₹32.67 crore Guarantee Commission during 2020-21. The cumulative guarantee commission received as on 31 March 2021 was ₹ 340.24 crore as against the receivable amount of ₹ 400.64 crore. The balance guarantee commission of ₹ 59.41 crore is yet to be received. Details are shown in Table 2.32.
Table 2.32: Guarantee Commission received/receivable by the Government (₹ in crore)
Name of the Sector No. of entities
Commission receivable
Commission received
Commission yet to be received
Power 4 329.99 300.54 28.46 Co-operatives 42 4.45 2.24 2.21 State Financial Corporation 7 8.55 2.89 5.66 Housing and Urban Development
86 41.16 28.48 12.68
Roads and Transport 2 1.84 1.84 0.00 Other Infrastructure 15 13.39 4.25 9.14 Others 4 1.26 0.00 1.26
TOTAL 160 400.64 340.24 59.41
Source: Finance Accounts 2020-21, Government of Odisha.
2.7.4 Cash Balance As per an agreement with the Reserve Bank of India, State Governments have to maintain a minimum daily cash balance with the Bank. State Governments invest their surplus cash balance in short and long-term GoI Securities and Treasury Bills. The profits derived from such investments are credited as receipts under the head ‘0049-Interest Receipts’. The cash balances are invested in the Consolidated Sinking Fund and Guarantee Redemption Fund as well.

Finances of the State
State Finances Audit Report for the year ended March 2021
59
It is not desirable that State Government take recourse to market loans despite having large cash balances leading to further accretion to cash balances without putting to productive use. The cash balance at the end of March 2021 was ₹ 32,636.04 crore. Cash balances and investments thereof made by the State Government during 2020-21 are given in Table 2.33.
Table 2.33: Cash Balance and Investment of Cash Balance (₹ in crore)
Closing balance on 31/3/2020
Closing balance on 31/3/2021
(a) General Cash Balance - Cash in Treasuries -- -- Deposits with Reserve Bank 242.18 27.48 Deposits with other Banks -- -- Remittances in transit - Local -- -- Investments held in Cash Balance investment account 24,865.00 14,351.36 Total (a) 25,107.18 14,378.84 (b) Other Cash Balances and Investments Cash with departmental officers viz. Public Works Department Officers, Forest Department Officers, District Collectors
19.86 19.24
Permanent advances for contingent expenditure with departmental officers
0.33 0.33
Investment in earmarked funds (Consolidated Sinking Fund- ₹11,693.75 crore, Guarantee Redemption Fund- ₹1,522.83 and State Compensatory Afforestation Fund ₹ 5,021.05 crore as on 31 March 2021)
17,310.13 18,237.63
Total (b) 17,330.32 18,257.20 Grand total (a)+ (b) 42,437.50 32,636.04
Interest realised 1,422.96 945.88
Source: Finance Accounts 2020-21, Government of Odisha.
During the year 2020-21, GoO opened separate investment account of OMBADC under head of account 8443-106-3521-91357- Government Debt and 8443-106-3521-91358- Treasury Bill and invested ₹5,955.00 crore and ₹9,124.41 crore respectively, which does not form part of cash balance investment account. This resulted in decrease of cash balance by ₹9801.46 crore from ₹42,437.50 crore in 2019-20 to ₹32,636.04 crore in 2020-21.
During the year 2020-21, an amount of ₹1,190.21 crore interest accrued towards investment of Consolidated Sinking Fund, ₹111.24 crore interest accrued towards investment of Guarantee Redemption Fund and ₹152.95 crore interest accrued towards investment of State CAMPA Afforestation Fund were credited in the respective funds under Earmarked Fund.
The Government invested cash balances amounting to ₹ 14,351.36 crore in GoI Treasury Bills (TB) and GoI Stocks. On these investments, the Government earned interest of ₹ 945.88 crore during the year.

Finances of the State
60 State Finances Audit Report for the year ended March 2021
The 13th Finance Commission had recommended that the States with large cash balances should make efforts to utilise their cash balances before resorting to fresh borrowings. As on 31 March 2021 GoO has ₹14,378.84 crore of General Cash Balance. GoO during the year undertook a loan of ₹8,850 crore (₹5,955 crore from OMBADC and ₹2,895 crore from CAMPA Fund) from cash balance. The State, however also borrowed ₹ 6,341.08 crores from Open Market and other financial institutions at interest rates ranging from 7.55 to 8.79 per cent, contrary to the Finance Commission recommendation.
The balances under Cash Balance Investment Account of the State Government for the last five years are given in Table 2.34.
Table 2.34: Cash Balance Investment Account (Major Head 8673)
(₹ in crore)
Year Opening Balance Closing Balance Increase (+) / Decrease (-)
Interest earned
2015-16 3,870.55 5,836.24 (+) 1,965.69 365.34 2016-17 5,836.24 8,738.10 (+) 2,901.86 391.09
2017-18 8,738.10 24,747.97 (+) 16,009.87 559.32 2018-19 24,747.97 23,135.59 (-) 1,612.38 1,427.13 2019-20 23,135.59 24,865.00 (+) 1,729.41 1,422.96 2020-21 24,865.00 14,351.36 (-) 10,513.64 945.88
Source: Finance Accounts of respective years, Government of Odisha.
The Government stated (May 2021) that the surplus cash balance has a negative impact. Accordingly, a new mechanism has been put in place which has been vetted by Accountant General as well as the concerned authority. Under this mechanism, the State Government is now able to avail loan from a portion of the surplus cash balance of the dedicated funds (like OMBADC/CAMPA etc.) at the rate equivalent to 364 days Auctioned Treasury Bill. Thus, the State Government has been able to reduce reliance on open market. This effect has substantially reduced the cash balance. However, since borrowing from these dedicated funds is restricted to only 60 per cent of the surplus investible balance in these funds, there will be still a sizeable cash balance available which would be invested in auction treasury bills.
While the steps taken by Government to borrow from OMBADC and CAMPA funds at rates of interest lower than market rates are financially prudent, Audit is of the view that there still remained significant quantum of untied cash balance of ₹14,351 crore (excluding earmarked fund and OMBADC fund), which could have been optimally utilised before having to raise fresh debt.
Year wise Market loan raised vis-à-vis cash balance available in cash balance investment account for the years 2016-17 to 2020-21 is compared in Chart 2.25 and month wise cash balance available vis-à-vis cash balance invested in cash balance investment account is shown in Chart 2.26.

Finances of the State
State Finances Audit Report for the year ended March 2021
61
Chart 2.25: Market Loans vis-à-vis Cash Balance Investment Account (Major Head 8673)
Source: Finance Accounts of respective years, Government of Odisha.
Chart 2.26: Month wise movement of Cash Balances and net cash balance investments during
the year
Source: Monthly Civil Accounts, Government of Odisha.
It can be seen from the above chart that the cash balance started declining from August 2020. However, Government maintained large (more than ₹14,000 crore) general cash balances throughout the year. The net cash balance investment is moving along with cash balance, which shows that almost all the funds were invested in cash balance investment account.
7,620 8,4385,500
7,500 3,000
15,093 23,531
28,031
34,531 35,031
9,057
25,305
24,760 25,107
14,379
0
5,000
10,000
15,000
20,000
25,000
30,000
35,000
40,000
2016-17 2017-18 2018-19 2019-20 2020-21
Market Loans Raised during the year Outstanding Market Loans
General Cash Balance Available

Finances of the State
62 State Finances Audit Report for the year ended March 2021
2.8 Recommendations
1. It is imperative for the State Government to review the classification of expenditure met out of grants-in-aid and take necessary corrective action in formulating its budget and booking its expenditure in this regard, to ensure that its fiscal parameters like revenue surplus/deficit and fiscal deficit reflect the correct position of its finances.
2. The Government should review the budget preparation exercise, so that the persisting gap between budget estimates and actual may be bridged.

Finances of the State
State Finances Audit Report for the year ended March 2021
1
Chapter-III
Budgetary Management

Finances of the State
0 State Finances Audit Report for the year ended March 2021

Finances of the State
State Finances Audit Report for the year ended March 2021
63
3.1 Budget Process
The Budget process commences with the issue of the Budget circular, normally in August each year, providing guidance to Departments in framing their estimates, for the next financial year. The Budget of the State is based on the Departmental estimates submitted by the controlling officers and these Departmental estimates are themselves mostly based on the estimates submitted by the District officers of the departments. Budget preparation process in the State is given in the Chart 3.1:
Chart 3.1: Flow Chart of Budgetary Process
Budgetary Management Chapter
III

Budgetary Management
64 State Finances Audit Report for the year ended March 2021
The annual financial statement also called general budget is placed prior to the commencement of the financial year in the State Legislature, in accordance with Article 202 of the Constitution. The State Legislature initially approves the annual Budget. When the initial allocation is found to be inadequate or expenditure has to be incurred on a new item, the Government presents supplementary demands (Para 166 of the Budget Manual) before the Legislature. Further, re-appropriation is a mechanism, which allows the State Government to transfer savings from one sub-head (usually a scheme) to another, provided such transfers occur within the same grant21 and under the same section22. Appropriation Accounts captures the data along the entire process of budget formulation and implementation as shown in Chart 3.2.
Chart 3.2: Flow chart of budget implementation
Approval by the Legislature Implementation by the Government Source: Appropriation Accounts 2020-21, Government of Odisha
3.1.1 Summary of total provisions, disbursements and savings during 2020-21
The annual financial statement or Budget, should show expenditure charged on consolidated fund and other expenditure separately. It shall also distinguish expenditure on revenue account from other expenditure. A summarised position of total Budget provision, disbursement and savings/ excess during 2020-21 with its further bifurcation into voted/charged is given in Table 3.1 below:
Table: 3.1 Summarised position of Expenditure vis-à-vis Budget provision. (₹ in crore)
Total Budget (O+S) Provision
Total Disbursements Total Savings Total
Voted Charged Voted Charged Voted Charged 1,50,755.02 16,908.25 1,67,633.27 1,08,063.73 16,045.41 1,24,109.14 42,691.29 862.84 43,554.13
Source: Appropriation Accounts 2020-21, Government of Odisha
21Grant means the amount voted by the Legislative Assembly in respect of a demand for grant. 22 Capital, Revenue or Loans.
Original
Budget₹1,55,963.27
Crore
Supple-mentaryProvision
₹11,700.00 Crore
Total Budget
Approved by
Legislature
₹1,67,663.27Crore
Re-appropriations)
(within Grant)(₹11,629.60
Crore)
Expenditure 1,24,109.14
Savings(₹ 43,554.13 Crore)

Budgetary Management
State Finances Audit Report for the year ended March 2021
65
As can be seen from the table, that utilisation (gross) of budgeted funds was 74.04 per cent in 2020-21. It was 10.04 per cent less than the utilisation of budgeted funds in 2019-20.
3.1.2 Charged and voted disbursements Break-up of total disbursement into charged and voted during the year 2020-21 with trend analysis during the last five years (2016-21) is given in the Table 3.2 below.
Table: 3.2 Break-up of total disbursement into charged and voted during 2016-21 (₹ in crore)
Year Disbursements Savings/ Excess Voted Charged Total Voted Charged Total
2016-17 80,704.34 7,109.33 87,813.67 15,916.53 (19.72)
700.79 (9.86)
16,617.32
2017-18 89,635.62 9,186.48 98,822.1 20,405.17 (22.76)
801.31 (8.72)
21,206.48
2018-19 1,06,767.30 9,850.56 1,16,617.86 18,577.34 (17.40)
318.40 (3.23)
18,895.74
2019-20 1,20,176.20 10,676.63 1,30,852.83 24,046.16 (20.01)
731.55 (6.85)
24,777.71 (18.94)
2020-21 1,08,063.73 16,045.41 1,24,109.14 42,691.29 (39.51)
862.84 (5.38)
43,554.13 (35.09)
Source: Appropriation Accounts of the respective years. Figures inside the bracket denote
percentage of corresponding disbursement.
As can be seen from the table above, the percentage of savings under ‘Voted’ ranged between 17.40 per cent to 39.51 per cent and under ‘Charged’ it ranged between 3.23 per cent to 9.86 per cent during 2016-21. The overall savings of ₹43,554.13 crore during 2020-21 was more than thrice the size of the supplementary budget of ₹11,700.00 crore obtained during the year, which raises questions about the budget formulation process.
Large amount of savings in allotted funds during 2020-21 indicated the disruption to Government activities that had been caused, due to the COVID-19 outbreak.
3.2 Appropriation Accounts
Appropriation Accounts are accounts of the expenditure of the Government for each financial year, as specified in the schedules appended to the Appropriation Act passed under Article 204 and 205 of the Constitution of India. Appropriation Accounts are on Gross basis. It facilitates understanding of utilisation of funds, the management of finances and monitoring of budgetary provisions and are, therefore, complementary to the Finance Accounts.
Audit of appropriation by the C&AG seeks to ascertain whether expenditure actually incurred under various grants is within the authorisation given under the Appropriation Act and that the expenditure required to be charged under the provisions of the Constitution is so charged. It also ascertains whether the expenditure incurred is in conformity with the law, relevant rules, regulations and instructions.

Budgetary Management
66 State Finances Audit Report for the year ended March 2021
3.3 Comments on integrity of budgetary and accounting process
3.3.1 Misclassification of capital expenditure as revenue expenditure and charged expenditure & voted expenditure and vice versa
Odisha financial rules categorise the primary units of appropriation. There are specific object heads meant for obtaining provision for acquisition of Capital Assets and other Capital Expenditure. These object heads pertaining to booking of expenditure of capital nature should correspond with capital major heads only. However, there are instances where object heads of revenue nature are incorrectly operated with capital major heads and vice-versa for example Grants-in-Aid.
Misclassification of expenditures and receipts has a great impact on the integrity of the financial statements. An amount of ₹ 1,047.37 crores has been classified as Capital Expenditure for the year 2020-21 by the State Government. According to established accounting rules and standards, the amount should be classified as Revenue Expenditure (paragraph 2.4.3 refers).
3.3.2 Supplementary grants
As per Article 205 of the Constitution, a Supplementary or Additional Grant or Appropriation over the provision made by the Appropriation Act for the year, can be made during the current financial year but, not after the expiry of the current financial year, as is necessary to meet-
i. Expenditure on Schemes of New Expenditure to be taken up within the current financial year.
ii. Inadequacy of provision. iii. Fresh expenditure but not technically “Schemes of New Expenditure.” iv. Omissions of provision.
When such additional expenditure is found to be inevitable and there is no possibility of effecting savings within the Grant to cover the excess by Re-Appropriation, the Secretary in the Department concerned proposes to the Finance Department for Supplementary or Additional Grant or Appropriation. Audit analysis of utilisation of these supplementary allocations is mentioned below:
3.3.2.1 Unnecessary or excessive supplementary grants
Audit analysis showed that supplementary grant23 (₹ one crore and above) of ₹5,503.29 crore i.e., 47.04 per cent of total supplementary grant was entirely unnecessary in 30 cases relating to 25 grants (Appendix 3.1), as the expenditure did not even reach the threshold of original provision. This indicated wrong estimation of Budget
23 Supplementary grant means a grant voted by the Legislative Assembly on a supplementary statement of
expenditure presented to it within a financial year under Article 205 of the Constitution.

Budgetary Management
State Finances Audit Report for the year ended March 2021
67
3.3.2.2 Excessive supplementary grants
Supplementary provision (₹one crore and above) aggregating ₹6,446.54 crore proved excessive by ₹2,207.13 crore in 11 cases under 10 grants and one appropriation (Appendix 3.2).
3.3.3 Un-necessary or excessive re-appropriation
By definition, Re-appropriations are meant for transfer of savings from one scheme / unit to another within the same grant and under same section (i.e., Capital, Revenue or Loans). During 2020-21, re-appropriation orders amounting to ₹ 11,629.60 crore (566 cases) were issued.
Audit analysis of Re-appropriation Orders showed that the Re-appropriation of funds proved unnecessary/excessive in eight cases, since the amounts were not fully utilised, resulting in less expenditure of ₹ 105.82 crore as detailed in Appendix 3.3.
The Finance Department instructed (04 February 2021) that the deadline of the re-appropriations was 24 February 2021. Despite that, 10 cases of re-appropriation orders amounting to ₹3,433.21crore (₹one crore and above in each case) were issued by five Departments on 31 March 2021 as detailed in Appendix 3.4.
This indicates that the expenditure control mechanism was not adequate and that re-appropriation was not done on the basis of realistic estimates.
The State Government stated (December 2021) that the re-appropriation should be made to meet the additional requirement of funds for expenditure under a unit. Augmented provision through re-appropriation should be fully utilized. In order to ensure that, instructions by Finance Department to the grant controlling authorities are issued from time-to-time. In certain cases of Centrally Sponsored Schemes, funds are released by GoI very late in the year leading to mismatch between budgetary allocation and funds released under various components of the schemes. This necessitates re-appropriation of funds at the fag-end of the financial year in order to ensure release of fund to the scheme account as per the scheme guidelines.
3.3.4 Savings/ Surrenders
Against the overall savings of ₹43,554.13 crore, ₹32,556.37 crore (74.75 per cent) was surrendered on the last day of the year i.e., 31 March 2021. The remaining savings of ₹10,997.76 crore (25.25 per cent) were not surrendered during 2020-21. The details are shown in Chart 3.3:

Budgetary Management
68 State Finances Audit Report for the year ended March 2021
Chart 3.3: Savings and surrenders before close of financial year 2020-21 (₹in crore)
Source: Appropriation Accounts 2020-21, Government of Odisha
Of these overall savings, ₹ 35,821.91 crore (82.25 per cent) pertained to 24 grants and two appropriations with savings of more than ₹100 crore each and by more than 20 per
cent of the total provision (Appendix 3.5).The main Departments with substantial savings were Finance, Panchayati Raj and Drinking Water, Water Resources and Disaster Management. Such large savings during 2020-21 indicated the extent of disruption to Government activities due to the Covid-19 outbreak.
The distribution of the number of Grants/ Appropriations grouped by the percentage of savings along with total savings in each group is detailed in Chart 3.4.
Chart 3.4: Distribution of number of Grants/Appropriation grouped by the Percentage of utilisation of funds/ savings during year 2020-21
Source: Appropriation Accounts 2020-21, Government of Odisha
As can be seen from Chart-3.4 above, out of 46 grants (43 grants and three appropriations) relating to the budget of the State, there were only three grants and two appropriations where the utilisation of funds was more than 90 per cent. Science & Technology (99.24 per cent), Public Enterprise (95.11 per cent), Cooperation (93.53 per cent), Internal Debt of the State Government (all charged) (100 per cent) and Interest Payment (93.53 per cent).
32,556
0.00
43,554
0 10000 20000 30000 40000 50000
Savings surrendered on 31 March 2021
Savings surrendered before close of FY
Total Savings
1
14
26
5
0
463
0
14,685
21,904
6750 0
5
10
15
20
25
30
0
5000
10000
15000
20000
25000
0-10 10-30 30-50 50-70 70-90 90-100 100+
Am
ount
of S
avin
gs (
₹ in
cro
re)
Num
ber
of G
rant
s
Percent of Utilisation
Number of Grants and Appropriations Total Savings

Budgetary Management
State Finances Audit Report for the year ended March 2021
69
Odisha Legislative Assembly (53.10 per cent), Excise (56.56 per cent), Water Resources (57.27 per cent), Agriculture and Farmers' Empowerment (61.25 per
cent), Transport (63.60 per cent) and Labour and Employees State Insurance (62.55 per cent) are amongst the Departments where utilisation of funds was less than 70 per cent.
The State Government stated (December 2021) that savings are surrendered only when the Scheme implementing Departments and authorities are certain that they are not going to incur any further expenditures during the remaining part of the financial year. Additionally, sometimes GoI releases funds under CSS schemes during the last month and on the last day of financial year. This necessitates surrender of savings on the last day of the financial year.
The State Government further stated that large savings are also surrendered due to non-receipt of Central Assistance under CSS schemes provided in the Budget Estimate. As part of a control mechanism, Chief Secretary reviews the expenditure in the All-Secretaries’ Meeting on monthly basis. Necessary instructions are also issued from time to time by Finance Department to expedite (or curtail) expenditure depending on the prevailing priorities.
3.3.4.1 Trends in Utilisation of Budgeted Funds
The extent of utilisation of budget during the five-year period from 2016-17 to 2020-21 is given in Chart 3.5:
Chart 3.5: Budget Utilisation during 2016-17 to 2020-21
Source: Appropriation Accounts 2020-21, Government of Odisha
Large amount of savings in allotted funds indicated both disruption caused due to Covid-19 outbreak, as well as potential inaccuracies in assessment of requirement and lack of capacity to utilise the funds for intended purposes, during the pandemic.
1,04,430.991,20,028.58
1,35,513.59
1,55,630.541,67,663.27
87,813.6798,822.11
1,16,617.861,30,852.83 1,24,109.1484.09% 82.33%
86.06% 84.08%
74.02%
68%
70%
72%
74%
76%
78%
80%
82%
84%
86%
88%
0
20000
40000
60000
80000
100000
120000
140000
160000
180000
2016-17 2017-18 2018-19 2019-20 2020-21
Bud
get U
tilisa
tion(
%)
Bud
get(
O+S
)(₹
in c
rore
)
Budget(O+S)(₹ in crore) Budget Utilisation Budget Utilisation(%)

Budgetary Management
70 State Finances Audit Report for the year ended March 2021
3.3.5 Substantial surrenders
Surrenders of 100 per cent of total provision of ₹ 1,834.31 crore were made in 12 cases (₹ 50 crore or more in each case) under 11 grants. These represented different schemes/ programmes/ projects and activities (Appendix 3.6). The surrenders were mainly attributed to non-release of Central share, non-receipt of permission from Government of India for drawal of funds, non-concurrence for further utilization of funds by the Finance Department, transfer of the responsibility for implementation of programme to other entities within the State Government, new schemes not taken up due to COVID-19, non-operation of schemes due to COVID-19, non-completion of tender processes and surrender of budget provisions related to response to natural disasters other than Covid-19, such as drought etc.
The State Government stated (December 2021) that a sizeable amount of Central Assistance is received towards the fag-end of the financial year. Hence, due to uncertainty in Central Assistance, in many cases, it is not possible to complete the surrender process by end of February. However, as the expenditure reconciliation module of IFMS is more or less stabilized, the Controlling Officers should make use of the facility to ensure that the anticipated savings are surrendered before the closure of financial year.
3.3.5.1 Surrender in excess of savings
In three cases (three grants), the amount surrendered (one crore or more in each case), were in excess of savings, indicating inadequate budgetary control in these Departments. As against savings of ₹ 4,674.53 crore, the amount surrendered was ₹ 5,053.61 crore, resulting in excess surrender amounting to ₹ 379.08 crore. The details are given in Table 3.3.
Table 3.3: Surrender of funds in excess of savings (₹in crore)
Sr. No.
Grant Number Original Supple- mentary
Total Provisions
Savings(-)/ Excess(+)
Amount Surrendered
Excess surrender
Revenue (Charged) 1 12(Health and Family
Welfare) 6,727.12 1,668.77 8,395.89 1,148.52 1,190.23 41.71 2 17(PR&DWD) 14,828.25 2,027.7 16,855.95 3,149.59 3,481.24 331.65 3 22(Forest &
Environment) 1,954.4 21.55 1,975.95 376.42 382.14 5.72 Total 23,509.77 3,718.02 27,227.79 4,674.53 5,053.61 379.08
Source: Appropriation Accounts 2020-21, Government of Odisha
The State Government stated (December 2021) that such cases of excess surrender can be addressed through timely reconciliation of expenditure. To address the issue of generation of correct surrender statement, a system-based monitoring of reconciliation and generation of surrender statement has been developed in the Budget application of the State Government. The fact, however, remains that the issue remains unaddressed even after the system-based monitoring of reconciliation

Budgetary Management
State Finances Audit Report for the year ended March 2021
71
and generation of surrender statements and therefore, the Government needs to check the working of the system.
3.3.5.2 Anticipated savings not surrendered/ partially surrendered
As per Rule 146 of Odisha Budget Manual (OBM), the spending Departments are required to surrender the grants/ appropriations or portion thereof to the Finance Department as and when the savings are anticipated. Finance Department instructions also stipulated that the surrender of unutilised funds should be made on or before 26 February 2021. Audit reviewed savings and surrender figures and noticed that:
Out of total savings of ₹43,554.13 crore, only ₹32,556.37 crore was surrendered. All the surrenders was made only on 31 March 2021.
Some instances where savings were only partially surrendered are detailed in Appendix 3.7. The major Departments where savings were not surrendered well in advance were Water Resources (₹3,213.11 crore) and Finance (₹1,884.84 crore).
In response to Paragraph No. 2.3.10 of the Audit Report on State Finances for the year ended March 2015, the Government had stated (November 2015) that surrender of anticipated savings would be ensured through stabilisation of the expenditure reconciliation module of Integrated Financial Management System (IFMS). However, these issues continued to persist during 2020-21.
3.3.6 Excess Expenditure and its Regularisation
As per Article 205 of the Constitution of India, it is mandatory for a State Government to get excess expenditure over a grant/ appropriation regularised by the State Legislature. The excess expenditure needs to be regularised after discussion of the Appropriation Accounts by the Public Accounts Committee (PAC). For this purpose, the Departments concerned are required to submit Explanatory Notes for excess expenditure to PAC through Finance Department.
3.3.6.1 Excess expenditure relating to current Financial Year
As per Article 204 (3) of the Constitution of India, no money shall be withdrawn from Consolidated Fund of the State except under appropriations made by law passed in accordance with the provisions of this article
It was observed that excess expenditure of ` 9.63 crore was incurred in Grant No.7-Works (Revenue Voted) for the year 2020-21. As against the provision of ` 2009.46 crore under Revenue (Voted) the department incurred expenditure of ` 2019.09 crore during the year 2020-21, resulting in non-compliance with the above Constitutional provision.

Budgetary Management
72 State Finances Audit Report for the year ended March 2021
3.3.6.2 Regularisation of excess expenditure of previous financial years
The State Government, however, failed to get the excess expenditure amounting to ₹253.02 crore over and above the allocation, pertaining to the years 2013-14 to 2018-19, regularised as of March 2021 which are given in Table 3.4.
Table 3.4: Excess Expenditure of previous years
(₹in crore) Year Grant No./
Appro-priation
Grant/ Appropriation details
Amount of excess required to be regularised as commented in the Appropriation Accounts
Status of regularisation
2013-14 22 Forest and Environment 0.29 Not yet regularised 26 Excise 0.27 -do- 31 Handlooms, Textile and
Handicrafts 18.00 -do-
2015-16 22 Forest and Environment 0.25 -do- 26 Excise 0.01 -do-
2016-17 6003 Internal Debt 56.63 -do- 13 Housing and Urban
Development 3.63 -do-
2017-18 8 Odisha Legislative Assembly incurred expenditure
0.52 -do-
2018-19 7 Works 169.77 -do- 8 Odisha Legislative
Assembly incurred expenditure
3.65 -do-
TOTAL 253.02 Source: Appropriation Accounts 2020-21, Government of Odisha
Excess expenditure remaining un-regularised for extended periods dilutes legislative control over the Executive.
The State Government stated (December 2021) that steps are being taken for regularization of the instances of excess expenditure during the current as well as previous years.
3.3.7 Grant-in-aid for creation of capital assets
Grants-in-Aid are payments in the nature of assistance, donations or contributions made by one government to another government, body, institution or individual. Grants-in-Aid are given for specified purpose of supporting an institution including construction of assets. As per IGAS 2, Grant-in-aid disbursed by a grantor to a grantee shall be classified and accounted for as revenue expenditure irrespective of the purpose for which the funds disbursed as Grants-in-Aid are to be spent by the grantee, except in cases where it has been specifically authorised by President on the advice of the Comptroller and Auditor General of India.
As per Appendix-III of Finance Accounts 2020-21, total funds released as Grants-in-Aid during 2020-21 were ₹27,269.36 crore, of which, funds allotted for creation of Capital Assets were₹8,567.39 crore (31 per cent).

Budgetary Management
State Finances Audit Report for the year ended March 2021
73
3.4 Comments on effectiveness of budgetary and accounting process
Efficient management of tax administration/ other receipts and public expenditure holds the balance for achievement of various fiscal indicators. Budgetary allocations based on unrealistic proposals, poor expenditure monitoring mechanism, weak scheme implementation capacities/ weak internal controls lead to sub-optimal allocation among various developmental needs. Excessive savings in some Departments deprives other Departments of the funds which they could have utilised.
3.4.1 Major policy announcements in budget and their actual funding for ensuring implementation
Several policy initiatives/ schemes (₹one crore and above) were initiated by the State Government during 2020-21 and it was seen that these were either partially executed or not executed at all. Details of some Schemes which were not executed are given below:
Table:3.5 New Schemes not executed by State Government during the year 2020-21 Sl. No.
Name of the scheme Grant No. & Department
Budget provision, 2020-21
(₹ in lakh)
Expenditure (₹ in lakh)
1 Odisha e-Hospital Management Information System (OeHMIS)
12-Health & Family Welfare
508.47 0
2 NAT PCR facility in Blood Banks in the State
-do- 2,162.85 0
3 Sickle Cell and Thalasemia -do- 300.00 0 4 Award to Health
Professionals/ Institute -do- 200.00 0
5 Skill Lab -do- 314.37 0 6 Rooftop rain water harvesting and ground
water recharge in 27 Urban Local Bodies (ULBs) and 49 water stressed Block
20-Water Resources Department
3,500.00 0
TOTAL 6,985.69 0 Source: Finance Account (Appendix-11) and Budget Speech and Odisha Budget 2020-21
Further, Audit noticed that under 21 existing sub-schemes approved outlay /revised outlay involving an amount of ₹ 2,063.69 crore (Appendix 3.8) remained completely unutilised during the year 2020-21 as no expenditure was incurred.
This not only deprived beneficiaries of the intended benefits of these schemes, but also deprived other Departments of the funds, where these could have been utilised.
3.5 Cash Management System
Pursuant to the provisions of sub-section (1-a) of Section 8 of the Odisha Fiscal Responsibility and Budget Management Act, 2016, Government of Odisha laid down guidelines for timely spending of Budgetary grants through Cash Management System in 20 Departments during 2020-21.
As per the regulation of expenditure 2020-21 in Cash Management System, the flow of expenditure should be evenly placed. In terms of Finance Department instructions

Budgetary Management
74 State Finances Audit Report for the year ended March 2021
dated 23 March 2020, the level of expenditure at the end of the third quarter should not be less than 60 per cent and during the month of March, the same should not be more than 15 per cent of the gross budget provision.
During 2020-21, cash management system was implemented in 20 Departments. Out of these 20 Departments, three Departments had spent minimum 60 per cent of the original budget provision by the end of third quarter. The Industries Department utilised only 9.80 per cent of the original provision by the end of third quarter. Similarly, 12 Departments exceeded expenditure of 15 per cent of the original budget provision in the month of March 2021 (the excess ranged from 16.37 to 53.96 per
cent) as indicated in table below: Table 3.6: Analysis of Cash Management System
(₹ in crore) Sl. No.
Name of the Department
Original Budget
Provision
Up to December 2020 March 2021 (Pre) Expenditure during first
three quarters
Percentage of Expendi
ture
Expenditure during the
month
Percentage of
Expenditure
The following Departments have followed the guidelines 1 Food Supplies and
Consumer Welfare 1,897 1,144.18 60.32 7.86 0.41
2 School and Mass Education
17,458 10,963.39 62.80 2,367.55 13.56
3 Fisheries & Animal Resources Development
1,211
780.73
64.47
66.29
5.47
The following Departments have not followed the guidelines 4 Department of Social
Security and Empowerment of Persons with Disability
3,024
1,378.11 45.57 81.12 2.68
5 Works 6,431 3,150.97 49.00 1,487.85 23.14 6 Scheduled Tribes &
Scheduled Castes Development, Minorities & Backward Classes Welfare
3,808 890.03 23.37 1,351.84 35.50
7 Health and Family Welfare
7,700 4,793.15
62.25
1,617.00
21.00
8 Housing and Urban Development
6,185 1,850.99 29.93 2,051.72 33.17
9 Industries 575 56.36 9.80 47.96 8.34 10 Water Resources 9,380 2,711.45 28.91 1,535.31 16.37 11 Forest & Environment 1,960 966.21 49.31 339.72 17.34 12 Rural Development 5,549 1,821.55 32.82 1,305.23 23.52 13 Handlooms, Textiles
& Handicrafts 200 67.28 33.70 52.16 26.13
14 Higher Education 2,407 1,236.69 51.39 719.26 29.89 15 Skill Development &
Technical Education 825 280.22 33.97 318.87 38.65
16 Micro, Small & Medium Enterprises
250 114.17 45.67 33.51 13.40
17 Panchyati Raj & 18,106 10,519.88 58.10 2,278.13 12.58

Budgetary Management
State Finances Audit Report for the year ended March 2021
75
Sl. No.
Name of the Department
Original Budget
Provision
Up to December 2020 March 2021 (Pre) Expenditure during first
three quarters
Percentage of Expendi
ture
Expenditure during the
month
Percentage of
Expenditure
Drinking Water 18 Agriculture and
Farmer’s Empowerment
6,759 1,224.22 18.11 1,319.25 19.52
19 Energy 1,861 732.18 39.35 1,004.00 53.96 20 Women and Child
Development and Mission Shakti
4,075 2,146.22 52.67 597.20 14.66
Source: Monthly Appropriation Reports for December 2020 and March (Pre) 2021.
It is evident from the above table that out of 20 Departments only three Departments (Sl. No.01 to 03) had followed the guidelines for timely spending of budgetary grants through the Cash Management System.
Thus, contrary to the spirit of financial regulation, a substantial quantum of expenditure was incurred by the Government at the fag end of the year.
The State Government stated (December 2021) that in view of the prevailing pandemic situation and imposition of expenditure rationalization measures during 2020-21, the cash management system was put on hold during the year vide para-6 of FD Letter No.15275/F dt.15.05.2020. Further, all the Administrative Department including 20 Departments covered under Cash Management System were empowered to sanction expenditure up to ₹15crore at a time under Administrative Expenditure and Transfers from State and ₹30 crore under Programme Expenditure. Since 2020-21 was an abnormal year with uncertainties of impact of COVID-19, such relaxations were allowed to ensure that COVID management was not disrupted.
3.5.1 Rush of expenditure
In terms of Rule 147 of OBM, rush of expenditure in the closing month of the financial year is a breach of financial regularity, which should be avoided. Contrary to this, there were 33 schemes (sub-heads) in seventeen Departments and one appropriation, where 100 per cent of the total expenditure was incurred with one crore or more in each case) in March 2021 as detailed in Appendix 3.9.
High percentage of expenditure in March indicates that uniform flow of expenditure during the year, a primary requirement of budgetary control, was not maintained. This also indicates deficiencies in monitoring the Cash Management System in these Departments. As an example, month-wise expenditure incurred by the Water Resources Department, is given below:

Budgetary Management
76 State Finances Audit Report for the year ended March 2021
Chart 3.6: Month wise Expenditure (Gross) of Water Resources Department during 2020-21
Source: Records of the Office of the Principal Accountant General (A&E), Odisha
As seen from the chart above, contrary to the spirit of financial regulation, a substantial quantum of expenditure (29.24 per cent) of the total expenditure (₹5,384.69 crore) was incurred by the department during March, 2021 indicating inadequate control over expenditure monitoring. The expenditure during June 2020 was negative, due to refund of funds being more than expenditure.
3.6 Review of selected grants
A detailed scrutiny of two grants, viz., (i) Grant No. 12 –Health and Family Welfare Department and (ii) Grant No. 20 – Water Resources Department, was conducted in Audit. Outcome of the Audit is discussed in the succeeding paragraphs.
3.6.1 Grant No. 12-Health and Family Welfare Department
The broad objectives of the Department are to ensure adequate, qualitative, preventive and curative health care to people of the State. It also provides affordable quality health care to the people of State, not only through the allopathic systems of medicine but also through the homeopathic and ayurvedic systems. The policies, programmes and schemes of the Department are implemented through Directorates, Chief Medical Officers of concerned Districts etc. Five Major Heads viz., 2210-Medical and Public Health Public Works, 2211-Family Welfare, 2251- Secretariat-Social Services, 4210- Capital Outlay on Medical and Public Health and 4216-Capital Outlay on Housing are operated under this Grant.
3.6.1.1 Budget and Expenditure
The overall position of budget provision, actual expenditure and savings/ excess under this Grant during the last three years, i.e., 2018-21 is given in Table 3.7 below:
78.01 169.40
-140.68
144.32282.40 213.87
635.38747.19
584.72471.58
624.26
1,574.24Ex
pend
iture
(₹ c
rore
)Monthwise Expenditure: Water Resources Department

Budgetary Management
State Finances Audit Report for the year ended March 2021
77
Table 3.7: Budget provision vis-à-vis Expenditure
(₹ in crore) Particulars 2018-19 2019-20 2020-21 Total Budget provision(Revenue+ Capital) 6582.56 7296.07 9468.61 Expenditure 5800.46 6378.67 7923.25 Savings 782.1 917.4 1545.36 Savings(%) 11.88 12.57 16.32
Revenue (voted & Charge)
Original budget (O) 5,191.96 5,832.85 6,729.84 Supplementary budget (S) 390.60 491.22 1,668.77 Total Budget Provision(O+S) 5,582.56 6,324.07 8,398.61 Expenditure 5,126.02 5,836.67 7,247.92 Savings 456.54 487.4 1,150.69 Surrender 452.72 486.43 1,192.39 Percentage of savings to total provision 8.18 7.71 13.7
Capital (voted & Charge)
Original budget (O) 990.00 972 970 Supplementary budget(S) 10.00 0 100 Total Budget Provision(O+S) 1,000.00 972 1070 Expenditure 674.44 542 675.33 Savings 325.56 430 394.67 Surrender 325.56 430 394.67 Percentage of savings to total provision 32.56 44.24 36.89
Source: Appropriation Accounts 2018-19 to 2020-21, Government of Odisha
As can be seen from the above table, savings as a percentage of total budget provision ranged between 11.88 per cent and 16.32 per cent during 2018-21. Persistent large savings is indicative of incorrect assessment of actual needs and calls for a critical review of budget preparation exercise of the Department. The Department attributed savings to non-receipt of Central Assistance and constraints in the functioning of implementing agencies.
3.6.1.2 Surrender of Savings
The anticipated savings were surrendered mainly under head 4210-03-105-Allopathy-3037-Human Resource in Health & Medical Education (₹62.77 crore), 4210-03-789-(Special Component Plan for Scheduled Castes)– 3037-Human Resource in Health & Medical Education (₹66.67 crore), and 4210-03-796– (Tribal Area Sub-Plan)-3037-Human Resource in Health & Medical Education (₹113.33 crore). The Department stated that funds had been utilized to the extent of actual requirement and the rest of the funds had been surrendered. However, specific reasons for lower actual requirements than those estimated during the budget, were not communicated to Audit (December 2021).
3.6.1.3 Unnecessary Supplementary Grant
From the Table 3.7, it can be seen that under Capital section the entire supplementary provisions during 2020-21 were unnecessary, as the actual expenditure did not come up to the level of original provision.

Budgetary Management
78 State Finances Audit Report for the year ended March 2021
3.6.1.4 Programme implementation
The details of financial targets and achievements under the following Schemes were examined by Audit, on sampling basis:
Table 3.8: Achievement against financial and physical targets
Sl No. Head of Accounts Financial Target (₹in Crore)
Some Reasons of Shortfall stated by department
Funds allotted
Funds utilised
% of expendi- ture
I Name of the Scheme - Biju Swasthya Kalyan Yojana (BSKY)
2210-01-001-3384-BSKY 360.31 241.97 67 Some of the DDOs failed to procure medicines observing financial formalities in time, hence the balance funds were surrendered. Further, due to COVID-19, procurement was substantially reduced and the surplus funds were not utilised by OSMCL Ltd. No reasons for excess expenditure were furnished by the department.
2210-01-796-3384-BSKY 203.31 144.85 71
2210-05-105-3384-BSKY 57.79 103.24 (excess+
45.45)
179
Total -percentage of utilisation-(73 %) 621.41 490.06 II Name of the Scheme - Mukhya Mantri Swasthya Seva Mission (MMSSM) 4210-01-Urban Health Service -001-
3261 – MMSSM 75.59 62.07 82 1. Austerity measures imposed by the
Finance Department due to Covid-19. 2. Tenders for new projects could not be invited on time due to Covid-19. 3. Non-finalisation of land acquisition. 4. Slow progress of ongoing works due to Covid-19 related restrictions.
4210-01 Urban Health Service -800-3261 - MMSSM
50 7.08 14
4210-03(medical education)-105-Allopathy-3261 - MMSSM
229 172.74 75
Total 354.59 241.89 4216-01(Residential Building) -
106(general pool Accommodation)-3261 - MMSSM
19.75 10.10 51
4216-01 Residential Building -800-3261 - MMSSM
63 34.31 54
Total -percentage of utilisation-(65 %) 82.75 44.41 III Name of the Scheme - Human Resource in Health & Medical Education (HRHME) 4210-03-105-3037 - HRHME 170 107.23 63
No specific reasons furnished. 4210-03-789-3037 - HRHME 100 33.33 33 4210-03-796-3037 - HRHME 130 16.67 13 Total percentage of utilisation-(39 %) 400 157.23
IV Name of the Scheme - National Mission on AYUSH including Mission on Medicinal Plants (NMA) 2210-02-001-3039 - NMA 16.2 9.13 56 The Government of India, Ministry of
AYUSH did not communicate approval for the components. Therefore, the funds provided in the budget were surrendered.
2210-02-789-3039 - NMA 14.19 5.82 41 2210-02-796-3039- NMA 15.16 2.08 14
Total percentage of utilisation-(37 %) 45.55 17.03 V 2210-03-103-1092 Field Formation
under Health Department- PHCs 668.61 628.83 94 Retirement as well as non-filling of
vacancy posts, non-fixation of pay of some staff, non-filling of newly created contractual posts and non-drawal of arrear claims of some staff and due to non-submission of TA, LTC bills by some staff.
VI 2211-00-101-1227- Rural Family Welfare sub- centre
232.68 206.40 89
VII 2210-03-110-1016 -Other Hospitals 61.4 62.54
(Excess 102

Budgetary Management
State Finances Audit Report for the year ended March 2021
79
Sl No. Head of Accounts Financial Target (₹in Crore)
Some Reasons of Shortfall stated by department
Funds allotted
Funds utilised
% of expendi- ture
1.14) VIII 2210-04-101-0646-Hospitals &
Dispensaries 49.55
51.11
(Excess 1.56)
103
2210-04-102-0646 Hospitals & Dispensaries
37.42
39.03 (Excess
1.61)
104
148.37 152.68 Total 2,553.9
6 1,938.53
Source: Health & Family Welfare Department, Government of Odisha.
3.6.2 Grant No. 20-Water Resources Department
The Water Resources Department is the nodal department with regard to all matters concerning water resources development and management. The policies, programmes and schemes of the Department are implemented through Engineers in-Chief, Directorates, Executive Engineers etc. Twelve Major Heads viz., 2059- Public Works, 2070- Other Administrative Services, 2700- Major Irrigation, 2701- Medium Irrigation, 2702- Minor Irrigation, 2705- Command Area Development, 2711- Flood Control and Drainage, 3054- Roads and Bridges, 4700- Capital Outlay on Major Irrigation, 4701- Capital Outlay on Medium Irrigation, 4702- Capital Outlay on Minor Irrigation, and 4711- Capital Outlay on Flood Control Projects are operated under this Grant.
3.6.2.1 Budget and Expenditure
The budget provision, actual expenditure and savings under this Grant during the three-year period 2018-21 is given below:
Table 3.9: Budget provision vis-à-vis Expenditure incurred during 2018-21 (₹ in crore)
Particulars 2018-19 2019-20 2020-21 Total Budget provision(Revenue+ Capital) 10,549.03 9,774.56 9402.01 Expenditure 7,495.25 6,127.88 5384.69 Savings 3,053.78 3,646.68 4017.32
Savings (%) 28.95
37.31
42.73
Revenue (Voted & Charged)
Original budget(O) 1,953.55 2,332.59 2,999.67 Supplementary budget (S) 106.00 36.13 22.37 Total budget provision (O+S) 2,059.55 2,368.73 3,022.03 Expenditure 1,776.21 1375.14 1766.00 Savings 283.34 993.58 1,256.03 Surrender 270.33 775.92 418.68 Percentage of savings to total provision 13.76 41.95 41.56
Capital Expenditure (Voted & Charged)
Original(O) 8,267.79 7,405.83 6,379.98 Supplementary(S) 221.69 0.00 0.00 Total budget provision(O+S) 8,489.48 7,405.83 6,379.98 Expenditure 5,719.04 4,752.74 3,618.69 Savings 2,770.44 2,653.09 2,761.29

Budgetary Management
80 State Finances Audit Report for the year ended March 2021
Particulars 2018-19 2019-20 2020-21 Total Budget provision(Revenue+ Capital) 10,549.03 9,774.56 9402.01 Expenditure 7,495.25 6,127.88 5384.69 Savings 3,053.78 3,646.68 4017.32
Savings (%) 28.95
37.31
42.73
Surrender 2,768.34 1,215.32 385.41 Percentage of savings to total provision 32.63 35.82 43.28
Source: Appropriation Accounts 2018-19 to 2020-21, Government of Odisha.
3.6.2.2 Savings
During 2018-21, Savings as a percentage of total provision ranged between 28.95 per
cent and 42.73 per cent. There were persistent savings under both Revenue and Capital Section during 2018-21, which is indicative of deficiencies in budgetary monitoring or lack of utilisation capacity or both.
3.6.2.3 Unnecessary Supplementary Grant
The entire supplementary provisions proved unnecessary during all the three years under both Revenue and Capital sections, as the actual expenditure during those years did not ever reach the threshold of original provision.
3.6.2.4 Programme implementation
Audit examined 18 Schemes on sampling basis, and noticed the following status of implementation.
Table 3.10: Schemes where no expenditure was incurred during the year 2020-21
(₹ in crore)
Sl No. Name of the Scheme Funds Allotted.
(₹ in crore)
Reason for non-utilization of funds furnished by the department.
1. 2702-02-800-0129Rooftop Rain Water Harvesting and Ground Water Recharge in Urban Areas.
32.75 Due to non-approval of the scheme by the Government.
2. 2702-03-102-2606- Sustainable Harnessing of ground water in water deficit areas
16.9 Due to non-approval of the scheme. 3. 2702-03-789-2606-Sustainable Harnessing
of ground water in water deficit areas 35
4. 2702-03-796-2606-Sustainable Harnessing of ground water in water deficit areas
46
5. 2702-03-102-3267-Pradhan Mantri Krushi Sichai Yojana (PMKSY)– Har Khet Ko Pani (HKP)
166.05 Due to non-release of funds by Government of India. 6. 2702-03-789-3267-PMKSY – Har Khet Ko
Pani (HKP) 47
7. 2702-03-796-3267-PMKSY–HKP 58
8. 2705-00-001-0594-Grants-in-Aid to Command Area Development Authority for Construction of field channels
68.86 Due to non-receipt of Central Assistance funds.
9. 2705-00-789-0594-Grants-in-Aid to Command Area Development Authority for Construction of field channels
45.83

Budgetary Management
State Finances Audit Report for the year ended March 2021
81
Sl No. Name of the Scheme Funds Allotted.
(₹ in crore)
Reason for non-utilization of funds furnished by the department.
10. 2705-00-796-0594-Grants-in-Aid to Command Area Development Authority for Construction of field channels
70.31
11. 4701-67-796-2410-Dam Rehabilitation and Improvement Projects (EAP) for Construction of additional spillway of Hirakud Dam and Associated R&R activities, Structural Intervention.
20 The construction of additional spillway of Hirakud Dam and Associated R&R activities, Structural Intervention has been dropped.
12. 4701-80-800-3439-Construction of In-stream Storage Structure
771.15 Delay in finalization of work
13. 4701-80-789-3439-Construction of In-stream Storage Structure
100 No reasons furnished.
14. 4701-80-796-3439-Construction of In-stream Storage Structure
200 No reasons furnished.
Grand Total 1,697.85 Source: Records of Water Resources Department, Government of Odisha.
It could be seen from the table above that the Department released an amount of ₹1,697.85 crore under 14 Schemes, against which no expenditure occurred during the year 2020-21. The entire amount of ₹1,697.85 crore was surrendered due to the reasons as mentioned against each scheme. Reasons furnished by the Department are not tenable due to the fact that budget provisions were sought and made before approval of schemes or finalisation of scope of work. Not taking off of these Schemes despite budgetary provision being in place, was indicative of weak monitoring mechanism of the Department. Schemes / Programmes where funds were partially utilised are described below:
4701-80-(789/796/800)-2951-Water Sector Infrastructure Development Programme (WSIDP) This scheme was started during 2014-15 with an objective to take up new Major & Medium Irrigation Projects and to expedite completion of last mile connectivity for ongoing irrigation projects. During the year, an amount of ₹ 293.13 crore was allotted out of which ₹13.20 crore (4.50 per cent) was utilized. No irrigation potential was created as of January 2021 in Mahendratanaya Anicut Project and Ong Extension Project and Ghatakeswar. The Department stated that due to non-clearance of site, change of scope of work and delay in tendering process the financial and physical targets for the Mahendratanaya Anicut Project could not be achieved. No reasons were furnished for non-achievement of physical and financial targets in respect of Ong Extension Project.
4700-14-789-2160- Accelerated Irrigation Benefit Programme (AIBP) Under this head of account, an amount of ₹24.10 crore was budgeted, out of which ₹4.84 crore (20 per cent) was expended during the year 2020-21 on resettlement and rehabilitation assistance to displaced people, Canals and branches, Dam and

Budgetary Management
82 State Finances Audit Report for the year ended March 2021
Appurtenant works of Kanpur Irrigation Project. No reasons have been furnished for surrender of balance amount. As a result, objectives of the scheme to accelerate implementation of large irrigation projects which are beyond the resource capability of the State Governments, expeditious completion of projects which were in advanced stage of completion remained unfulfilled. 4700-14-796/800-2160-Accelerated Irrigation Benefit Programme (AIBP) Under this head of account, an amount of ₹165.94 crore was budgeted, out of which less than 50 per cent was expended during the year 2020-21. The components of work of the Kanpur Irrigation Project which were not fully implemented were canals and branches, dam and appurtenant work, distributaries, spillway etc. No specific reasons for not meeting the financial and physical targets had been furnished. 4701-67-800-2410-Dam Rehabilitation and Improvement Projects The Project is being implemented at National level through World Bank assistance for rehabilitation of distressed Dams and to improve the safety and operational performance of Dams. Under the head of the scheme, an amount of ₹55.06 crore was allotted, out of which ₹26.80 crore (49 per cent) has been expended during the year 2020-21. The components of work which were not fully implemented were dam and appurtenant work. No specific reasons for not meeting the financial and physical targets had been furnished. 4711-03-(103,789,796)-2955- Drainage Improvement Programme (DIP) The Scheme is being executed through State funded Drainage Improvement Programme for addressing drainage congestion and water logging problems in the State. Under the head, an amount of ₹239.13 crore was provisioned, out of which ₹191.37 crore (80 per cent) was expended during the year 2020-21. The Department attributed the COVID-19 outbreak as the main reason for not meeting the targets. 3.7 Release of funds at the end of the financial year
Timely release of funds to the implementing agencies has a direct bearing on successful implementation of the schemes and avoidance of rush of expenditure. As per Finance Department instructions (04 February 2021), the process of issuance of sanction order for release of funds as well as surrender of provision should be completed by 26 February 2021, in order to avoid rush of expenditure in the last month of the financial year.
An examination of sanction orders issued during the financial year 2020-21 revealed that the Government released ₹ 254.95 crore for implementation of different schemes in six Departments in the last week of March 2021 (Appendix 3.10). Of this, ₹132.91 crore was released on 31 March 2021 (Table 3.11). As such, there was no possibility of utilisation of these funds during the financial year 2020-21.

Budgetary Management
State Finances Audit Report for the year ended March 2021
83
Table 3.11: Department-wise amount released on 31/03/2021 (₹ in crore)
Sl. No
Name of Department
Purpose Sanction order No.
Date Amount released
Total
1
Water Resources
For repair and restoration
Lr. No. 11074 31 March 2021 33.88
36.45
Final allotment of NDRF
Lr. No. 11098 31 March 2021 1.27
Final allotment of NDRF
Lr. No. 11086 31 March 2021 1.30
2
Agriculture and Farmer's Empowerment
For promotion of Millets in Tribal Areas
202019782652 31 March 2021 15.11
17.69 For soil health management
202019777377 31 March 2021 2.58
3
Home For accommodation 202019777390 31 March 2021 0.11
0.52 For tower mast 202019773645 31 March 2021
0.04 For tower mast 202019775481 31 March 2021
0.03 For tower mast 202019776953 31 March 2021
0.34
4
Health and Family Welfare
Towards the scheme NRHM
202019777525 31 March 2021 5.55
78.25
Towards the scheme NRHM
202019777547 31 March 2021 29.07
Towards the scheme NRHM
202019777504 31 March 2021 4.87
Towards the scheme NRHM
202019772756 31 March 2021 1.45
For emergency response
202019773448 31 March 2021 37.31
Total 132.91 132.91 Source: Sanction orders received from respective Departments
As is evident from the above table, Health and Family Welfare Department accounted for 58.87 per cent (₹ 78.25 crore) of the total amount released on the last day of the financial year. Release of funds on the last day indicated that the funds were released primarily to exhaust the budget provision.
3.8 Advances from Contingency Fund
Contingency Fund of the State was established under the Odisha Contingency Fund Act, 1967. Advances from the Contingency Fund are to be made only for meeting expenditure of an unforeseen and emergent character, postponement of which, till its authorisation by the Legislature, would be undesirable. The corpus of the Odisha Contingency Fund is ₹400.00 crore. At the end of 2020-21, ₹171.00 crore remained un-recouped under various heads. The details are as given in Table 3.12 below:

Budgetary Management
84 State Finances Audit Report for the year ended March 2021
Table 3.12: Headwise Details of un-recouped Advance from Contingency Fund during the year 2020-21
(₹in crore) Sl. No.
Major Heads Amount
1 2202-General Education 4.74
2 4210-Capital Outlay on Medical and Public Health
166.26
Total 171.00
Source: Finance Accounts 2020-21, Government of Odisha.
As on 31st March 2021, Contingency Fund had a balance of `229 crore. Due to non-recoupment of the advance amount by the end of 2020-21, there was overstatement of Revenue Surplus and understatement of Fiscal Deficit for the year 2020-21.
The Government stated (December 2021) that provision has been made to recoup this amount during the Supplementary Budget of 2021-22.
3.9 Recommendations
1. Government should be more realistic in its budgetary assumptions and ensure efficient control mechanisms to curtail savings/ excess expenditure.
2. Government should enforce its commitment to achieve its promised/intended objectives for overall development of the State through improved execution, monitoring and financial management of schemes/projects.
3. State Government needs to formulate a realistic budget based on reliable assumptions of the needs of the Departments and their capacity to utilise the allocated resources.

Budgetary Management
94 State Finances Audit Report for the year ended March 2021
Chapter-IV
Quality of Accounts
&
Financial Reporting Practices

Budgetary Management
State Finances Audit Report for the year ended March 2021
95

Quality of Accounts and Financial Reporting Practices
State Finances Audit Report for the year ended March 2021
85
A sound internal financial reporting system with relevant and reliable information significantly contributes to efficient and effective governance by the State Government. Compliance with financial rules, procedures and directives as well as the timeliness and quality of reporting on the status of such compliance is, thus, one of the attributes of good governance. Reports on compliance and controls, if effective and operational, assists the Government in meeting its basic stewardship responsibilities, including strategic planning and decision-making.
4.1 Funds outside Consolidated Fund or Public Account of the State
Article 266 (1) subject to the provisions of Article 267, provides that all revenues received by the Government of a State, all loans raised by that Government by issue of treasury bills, loans or ways and means advances and all moneys received by that Government in repayment of loans shall form one consolidated fund to be titled “the Consolidated Fund of the State”. Article 266 (2) provides that all other public moneys received by or on behalf of the Government of a State shall be credited to the Public Account of the State, as the case may be.
Audit noticed that funds meant to be credited to the Consolidated Fund or the Public Account were instead credited to Bank Accounts, as discussed below.
Labour Cess collected by various agencies were sent through cheques/ drafts to the Odisha Building and Other Construction Workers Welfare Board (OB&OCWWB) or deposited in the Savings Bank Account of the Board opened for this purpose, through District Labour Offices. The Cess amounting to ₹ 406.49 crore collected during 2020-21 was kept outside the Government Account in the shape of Fixed Deposits and Flexi savings account at SBI, Govt. Treasury Branch, in violation of constitutional provisions and Sub Section (2) of the Section 3 of the Building and Other Construction Workers (BOCW) Act, 1996.
Further, Labour Cess amounting to ₹ 4.49 crore collected through treasuries was not transferred to the Workers’ Welfare Board by the Government during the year 2020-21. This resulted in overstatement of Revenue Surplus and understatement of Fiscal Deficit by the same amount.
4.2 Funds transferred directly to State Implementing Agencies
The Union Government transfers substantial funds directly to State Implementing Agencies/ Non-Governmental Organisations for implementation of various schemes and programmes. Since these funds are not routed through the State Budget, these are not reflected in the Accounts of the State Government. These transfers are exhibited in Appendix VI of Volume II of the Finance Accounts 2020-21.
Quality of Accounts & Financial Reporting Practices
Chapter
IV

Quality of Accounts and Financial Reporting Practices
86 State Finances Audit Report for the year ended March 2021
4.2.1 Trends in direct transfers to implementing agencies
With effect from 01 April 2014, GoI decided to release all assistance relating to the Centrally Sponsored Schemes/Additional Central Assistance to the State Government and not directly to implementing agencies. Despite this, during 2020-21, the GoI, released ₹15,415.34 crore directly to the implementing agencies instead of the State Government. Trends of such transfers directly to implementing agencies and under major schemes during the last five years are given in Chart 4.1.
Chart4.1: Transfer of funds directly to implementing agencies during 2016-21
(₹ in crore)
Source: Finance Accounts2020-21 – Appendix VI, Government of Odisha.
As can be seen from the Chart above, the transfer of funds increased by more than 13 times during the last five years from ₹1,110.26 crore in 2016-17 to ₹15,415.34 crore in 2020-21. The major agencies that have received funds directly from the GoI during 2018-21 for implementing various developmental schemes and the quantum of such funds are given in Table 4.1. Table 4.1: Major implementing agencies that received funds directly from GoI during 2018-21
(₹ in crore) Name of the Schemes of
Government of India Name of the
Implementing Agencies Amount transferred
2018-19 2019-20 2020-21 Food Subsidy Odisha State Civil Supplies
Corporation Limited, Bhubaneswar
4,651.01 4,148.50 8,985.73
National Rural Employment Guarantee Scheme (MGNREGA)
Odisha Rural Development and Marketing Society Bhubaneswar
1,624.85 1,660.17 4,413.41
Pradhan Mantri Kisan Samman Nidhi Director of Agriculture & Farmer’s Empowerment, Odisha
170.33 1,634.11 1,483.85
Member of Parliaments Local Area Development Scheme
District Collectors 135.00 137.50 55.00
Source: Finance Accounts, 2020-21 – Appendix VI, Government of Odisha.
Direct transfer of funds to implementing agencies is fraught with the risks of inadequate monitoring by the State Government and potential risk of misutilisation of funds.
4.3 Delay in submission of Utilisation Certificates (UCs) Odisha General Financial Rules (OGFR) provide that every order sanctioning a grant would specify its objective clearly and time limit within which the grant is to be
1110.26
4,669.146,843.63
7,894.26
15,415.34
0
5000
10000
15000
20000
2016-17 2017-18 2018-19 2019-20 2020-21

Quality of Accounts and Financial Reporting Practices
State Finances Audit Report for the year ended March 2021
87
spent. Rule 173 of OGFR states that the Departmental Officers drawing Grants-in-Aid would be primarily responsible for certifying to the Accountant General, where necessary, the fulfilment of the conditions attached to the grant, unless there is any special rule or order to the contrary. The Utilisation Certificate (UC) should be furnished to the Administrative Department by 1st June of the succeeding year of expenditure. A copy of the UC should reach the Accountant General, Accounts and Entitlement (AG(A&E)) and the Head of the Department concerned, by 30th June of that year.
Non submission of the UCs implies that there is a level of administrative failure and that the authorities have not clearly explained as to how these funds were spent over the years. There is also no assurance that the intended objectives of providing these funds have been achieved. This assumes greater importance if such UCs are pending against Grants-in-Aid meant for capital expenditure. Since non-submission of UCs is fraught with the risk of misappropriation, it is imperative that the State Government should monitor this aspect closely and hold the concerned persons accountable for submission of UCs in a timely manner. During the year 2020-21, Government released ₹27,269.36 crore as Grants-in-Aid (42,888 vouchers). Out of this amount, UCs were not received in respect of ₹20,607.85 crore (75.57 per cent) (5,095 vouchers) by 30.06.2021. There is, therefore, no assurance that the expenditure of ₹ 20,607.85 crore had actually been incurred for the purposes for which it was authorised. Further, UCs for an amount aggregating ₹43,412.67 crore remained outstanding against 36 Departments of the State as of March 2021 in the books of the AG (A&E), Odisha from 2003-04 onwards (Appendix4.1). Age wise break-up of pending UCs is summarised in Table 4.2:
Table 4.2: Age wise arrears in submission of UCs (₹ in crore)
Source: Finance Accounts 2020-21, Government of Odisha
242003-04: ₹274.57 crore (1388 nos), 2004-05: ₹229.30 crore (909 nos.), 2005-06:₹117.01 crore (756 nos.), 2006-07:₹126.92 crore (865 nos.), 2007-08:₹297.09 crore (1592 nos.),2008-09: ₹343.70 crore (1884 nos.), 2009-10: ₹398.77 crore (1264 nos.), 2010-11: ₹419.65 crore (2614 nos.), 2011-12: ₹449.29 crore (2257 nos.), 2012-13: ₹507.10 crore (1654 nos.), 2013-14: ₹1653.35 crore (2294 nos.), 2014-15: ₹3171.24 crore (2314 nos.), 2015-16:5498.32 crore (2459 nos.), 2016-17:₹8550.44 crore (3361 nos.) and 2017-18: ₹16391.16 crore (2918 nos.).
Year Opening Balance Addition Total Clearance Closing Balance
No. Amount No. Amount No. Amount No. Amount No. & percentage of outstanding UCs against Total UCs
Amount
Upto 2018-1924
28,529 38,427.91 34,317 25,957.25 62,846 64,385.16 33,708 19,044.27 29,138 (46.36)
45,340.89
2019-20 29,138 45,340.89 38,987 28,465.46 68,125 73,806.35 40,276 37,612.46 27,849 (40.88)
36,193.89
2020-21 27,849 36,193.89 42,888 27,269.36 70,737 63,463.25 43,708 20,050.58 27,029 (38.21)
43,412.68

Quality of Accounts and Financial Reporting Practices
88 State Finances Audit Report for the year ended March 2021
In comparison to 2019-20, the total amount for which the UCs were pending increased by ₹7,218.78 crore25 (19.97per cent) in 2020-21.
Five major defaulting Departments that had not submitted UCs were Panchayati Raj and Drinking Water (₹17,546.69 crore), Housing and Urban Development (₹8,561.90 crore), Planning and Convergence (₹3,333.99 crore), School and Mass Education (₹3,073.60 crore) and Health and Family Welfare (₹2,686.90 crore).
Department-wise position of UCs outstanding for more than 10 years is given in Appendix 4.2. Overall there are17 Departments against which UCs are outstanding for more than 10 years. Of these, the 10 major Departments accounting for 99.46 per cent of the total amount (₹ 1,406.76 crore) of UCs pending for more than ten years as of March 2021 were as detailed in Chart 4.2:
Chart 4.2: Outstanding UCs in respect of 10 major Departments for the grants paid up to 2020-21
Source: Finance Accounts 2020-21, Government of Odisha
Further, it was observed that a major part of the GIA i.e., ₹11,260.34 crore was released in the last quarter of 2020-21, out of which ₹6,405.03 crore was released in the month of March 2021, as detailed in the Table 4.3 below:
Table 4.3: Release of GIA during last quarter of the financial year 2020-21 Name of Month Amount of GIA
released (₹ in crore)
%age to total GIA released
January 2021 1,833.42 6.72 February 2021 3,021.88 11.08 March 2021 6,405.04 23.49
Total 11,260.34 41.29 Source: Finance Accounts 2020-21, Government of Odisha
Thus for the GIAs issued during the month of March, there are hardly two months with the concerned departments to utilise the grants and submit UCs. It is, therefore, unreasonable to expect UCs up to June 2021 for the grants released in March or in the last quarter of the financial year (in terms of Rule 173 of OGFR).
2543,412.67 – 36,193.89
4.97 ( 55 GIA)11.64 (17 GIA)16.21 (116 GIA)19.79 (157 GIA)
51.84 (51 GIA)95.52 (516 GIA)
209.00 (167 GIA)291.97 (533 GIA)
313.76 (1788 GIA)392.06 (3917 GIA)
0 100 200 300 400 500
LawGeneral Administration
Higher EducationOdia Language, Literture and Culture
Electronics & Information TechonologyST & SC Devt, Minorities & Backward…
Revenue & Disaster ManagementPlanning & Convergence
Panchayati Raj & Drinking WaterHousing & Urban Development
Outstanding UCs (₹ crore) more than 10 Years as on 31.03.2021
Nam
e o
f th
e D
ep
artm
ent

Quality of Accounts and Financial Reporting Practices
State Finances Audit Report for the year ended March 2021
89
The State Government stated (December 2021) that Submission of Utilization Certificate is a continuous process. Money from Centre and State go to the implementing agencies. The implementing agencies take some time in spending the money whilst observing the required formalities and then submitting the UC, which enables them to get the next tranche of release of fund. Hence, at any point of time, there would be some pendency in submission of Utilization Certificate.
However, review of Department-wise pendency of Utilization Certificate is being made centrally at the level of Finance Secretary regularly with an objective to improve the UC position. GIA sanction orders are now being generated in IFMS containing the grantee-wise details. The UC submission module of IFMS has also been developed using which the Drawing officers can submit the UCs collected from various grantees. Response of the Government was not tenable, due to the fact that 27,029 UCs at an amount of ₹43,412.67 crore have been pending since 2003.
4.3.1 Delay in implementation of Integrated Financial Management System (IFMS) - UC module Rule 171 (4) read with Note 2 below OGFR provides that a target date should be prescribed for submission of UCs by the grantee institutions to the Accountant General.
In order to have control on submission of UCs, the Finance Department had executed an agreement with Tata Consultancy Services (TCS) (erstwhile M/s CMC Ltd.) on 04 December 2013 to develop and implement the UC module by April 2018.
However, Audit noticed that the UC module was not made operational (December 2021) in the Integrated Financial Management System (IFMS). The UC module was being tested on pilot basis in the Higher Education and Co-operation Departments. After completion of the pilot test, steps would be taken to roll out the module across all the Departments.
In the absence of the UC Module, IFMS is unable to assist in monitoring of pending UCs from grantee entities, by authorities at all levels in the Administrative Departments and the Finance Department of the State.
4.4 Abstract Contingent bills
In terms of Rule 261 of Odisha Treasury Code, advances drawn through Abstract Contingent (AC) bills are required to be adjusted throughdetailed contingent (DC) bills within three months in case of works expenditure and for expenditure incurred on natural calamities, and within one month for other contingent charges.
As of 31 March 2021, 14 Departments of Government of Odisha had not submitted DC bills for ₹ 81.77 crore drawn against 1,092 AC Bills (Appendix 4.3).
The status of major six Departments which accounted for 99.12 per cent of the total outstanding DC bills is given in Chart 4.3.

Quality of Accounts and Financial Reporting Practices
90 State Finances Audit Report for the year ended March 2021
Chart: 4.3 Pending DC Bills in respect of Major Departments
Source: Records of Office of the Accountant General (A&E), Odisha
Year-wise details of pendency of DC bills up to 2020-21 are given in Table 4.4.
Table 4.4: Year wise progress in submission of DC bills against the AC bills upto 2020-21
(₹ in crore)
Source: Finance Accounts 2020-21, Government of Odisha
It was observed that during the year 2020-21, 14 Departments had drawn 385 AC bills for an amount of ₹ 14.00 crore as advances. Of this, 160 AC bills amounting to `4.61 crore (32.97 per cent) were drawn in March 2021. However, only an amount of ₹ 3.35 crore (23.93 per cent) pertaining to six Departments was adjusted against the above advances drawn. Thus, DC bills amounting to ₹ 10.65 crore pertaining to eight Departments were not submitted, as of 31 March 2021 (Appendix 4.4). There is, therefore, no assurance that the amount of ₹ 10.65 crore had actually been utilised for the purpose for which it was sanctioned. Advances drawn but not adjusted indicated the possibility of diversion of end use of funds/ misappropriation and therefore, requires close monitoring by the respective DDOs for ensuring submission of DC bills.
Year Opening Balance of AC Bills
Addition Total Clearance Closing Balance
No. Amount No. Amount No. Amount No. Amount No.& percentage
against total no. of UCs
Amount
Upto 2018-19
1,061 37.21 939 210.19 2,000 247.4 729 34.00 1,271
213.4
2019-20 1,271 213.4 735 23.95 2,006 237.35 567 67.67 1,439
169.68
2020-21 1439 169.68 385 14.00 1824 183.68 732 101.91 1,092 81.77

Quality of Accounts and Financial Reporting Practices
State Finances Audit Report for the year ended March 2021
91
4.4.1 Non-implementation of DC Bill functionality under “Online Bill Preparation and Submission” module in IFMS As per the agreement signed (04 December 2013) between the Finance Department and the vendor (Tata Consultancy Services (TCS) (erstwhile M/s CMC Ltd.), a module was required to be developed in IFMS for tracking and monitoring of AC/DC bills. Audit reviewed the functioning of the “On-line Bill Preparation and Submission” Module of IFMS and noticed that:
i. Form and provision for ‘Abstract Contingent Bill type’ had been implemented in IFMS as intended. However, the corresponding provision for ‘Detailed Contingent Bill type’ had not yet been implemented, as of December 2020, defeating the purpose of the module. The scheduled timeline for implementation of DC Bill type was April 2018, i.e., the completion date of IFMS.
ii. In the absence of ‘DC Bill type’, IFMS is unable to assist in monitoring of pending AC Bills’ status by authorities at all levels in the Administrative Departments, Treasuries and the Finance Department.
The State Government stated (December 2021) that the matter is being reviewed by Finance Secretary regularly. The Financial Advisors and Controlling Officers are also sensitized about timely submission of DC Bills. IFMS presently records the DC bill number at the time of submission of fresh AC bill.
Response of the Government was not tenable, due to the fact that 1,092 DC bills for an amount of ₹81.77 crore were pending since 2003. 4.5 Personal Deposit (PD) Accounts
Personal Deposits (PD) are maintained in the treasuries in the nature of banking accounts. These are commonly known as Personal Deposit Accounts. As per Subsidiary Rule 423 of OTC Volume-I, permission for opening of PD Accounts shall not be granted except after consultation with the Accountant General. It is authorised to open PD accounts to deposit funds required for specific purposes by transfer of funds from the Consolidated Fund. Transfer of funds to PD accounts is booked as final expenditure from the Consolidated Fund under the concerned service Major Heads without any actual cash flow.
4.5.1 Personal Deposit Account framework
During 2020-21, an amount of₹12,304.93 crore was transferred to the PD Accounts. This included₹ 2,040.21crore transferred in March 2021 from the Consolidated Fund of the State. This is 16.58 per cent of the total credit to PD account during the year, of which, ₹122.22 crore was transferred on the last working day of March 2021. There were 811 PD Account holders with an unspent balance of ₹ 7,047.28 crore as of 31 March 2021 as detailed in Table 4.5. There was decrease of 66.28 per cent in unspent balances of PD accounts over previous year mainly due to opening of separate investment account of OMBADC under head of account 8443-106-3521-

Quality of Accounts and Financial Reporting Practices
92 State Finances Audit Report for the year ended March 2021
91357- Government Debt and 8443-106-3521-91358- Treasury Bill and investing₹16,758 crore and leaving ₹414.85 crore in PD Accounts of OMBADC.
Table 4.5: Personal Deposit Account
(₹ in crore) Opening Balance as on 01/04/2020
Addition during the year 2020-21
Number of PD accounts closed
Expenditure during the year including closed PD Accounts
Outstanding Balance as on 31/ 03/2021
Number Amount Number Amount Number Amount Number Amount
830 20,899.85 Nil 12,304.93 19 26,157.50 811 7,047.28
Source: Records of Office of the Accountant General (A&E), Odisha
It can be seen from Table 4.5 that during the year 2020-21, no new PD Account was opened but a sum of ₹12,304.93 crore was transferred to the already existing PD Accounts. There was a net reduction of ₹13,853 crore (66.28 per cent) in the cumulative closing balance at the end of the year 2020-21 as detailed in Chart 4.5:
Chart 4.4: Closing Balance in PD Accounts during 2016-21
Source: Finance Accounts of respective years
The closing balance of ₹ 7,047.28 crore pertained to (i) ₹ 89.22 crore in 290 PD Accounts of Educational Institutions, (ii) ₹ 3,166.19 crore in 112 PD Accounts of Municipal Funds, (iii) ₹1,026.94 crore in 314 PD Accounts of Panchayat Bodies Fund, (iv) ₹ 12.27 crore in four PD Accounts of Medical and Charitable Funds and (v) ₹ 2,752.65 crore in 91 PD Accounts of Other Agencies or Institutions like District Rural Development Agencies, Integrated Tribal Development Agencies, etc. Non-transfer of unspent balances lying in PD Accounts to Consolidated Fund of the State entails the risk of misuse of public fund, fraud and misappropriation.
The State Government stated (December 2021) that they are continuously working with the O/o the Accountant General (A&E) to ensure due compliance in respect of PD accounts. The State has added a number of new features to the PD accounts for improved operability and reporting. Reconciliation of PD accounts is being taken up
1,097
13,509
17,503
20,900
7,047
827
836831
830
811
2016-17 2017-18 2018-19 2019-20 2020-21
795
800
805
810
815
820
825
830
835
840
0
5000
10000
15000
20000
25000
PD
Acc
ou
nts
in N
um
be
r
(` i
n c
rore
)
Closing Balance (₹ in crore) No. of PD Accounts

Quality of Accounts and Financial Reporting Practices
State Finances Audit Report for the year ended March 2021
93
on regular basis to avoid any irregularity in their management. IFMS has been customized to provide a window to the office of Accountant General (A&E), Odisha to withdraw the cheque drawing facility of the PD Administrators who fail to do a timely reconciliation.
4.5.2 In-operative PD Accounts and Non-reconciliation of PD Account balances
As per Subsidiary Rule 423 of OTC Vol-I, if a PD Account remains in-operative for a period of three full financial years after the year of last transaction, the account shall be closed automatically and the balance, if any, lying in the account shall lapse to Government. For this, the Treasury Officer shall submit to the Accountant General immediately after 31 March, a list of such PD Accounts indicating the balances lapsed.
During 2020-21, 19 PD Accounts with an unspent balance of ₹6.10 crore (Appendix-4.5) were closed. However, four in-operative PD Accounts, where no transaction had taken place for over three financial years after the year of last transaction, are yet to be closed. These four Accounts had a total unspent balance of ₹0.38 crore which are detailed in table below.
Table 4.6: In operative PD Accounts as on 31 March 2021 (₹in lakh)
Sl. No
Name of the Administrator of PD Accounts Balance
1 Headmaster, AN High School, Narasinghpur, Cuttack, Pin-751001
1.52
2 Treasurer, Charitable Endowment, Bhubaneswar, Pin-751001
35.65
3 Administrator, Central Provident Fund, H&UD Department, Bhubaneswar, Pin-751001
0.00
4 Headmistress, Government Girls High School, Kuchinda, Sambalpur, Pin-768222
1.07
Total 38.24
The balances in the PD accounts are required to be reconciled annually by the administrator with that of Treasury accounts. Out of a total of 811 PD accounts, 737 PD accounts (90.88 per cent) had been reconciled as of 31 March 2021.
Non-reconciliation of balances in PD accounts and not transferring the unspent balances lying in PD accounts to Consolidated Fund of State is fraught with risks of potential misuse of public funds, fraud and misappropriation.
Finance Department is required to close inoperative PD accounts and ensure that amounts lying in these accounts are transferred back to the Consolidated Fund of the State.
4.6 Indiscriminate use of Minor head 800
Minor head 800 relating to Other Receipts and Other Expenditure is intended to be operated only when the appropriate minor head has not been provided under a Major

Quality of Accounts and Financial Reporting Practices
94 State Finances Audit Report for the year ended March 2021
Head in the accounts. Routine operation of minor head 800 is to be discouraged, since it renders the accounts opaque.
During 2020-21, the State Government booked an expenditure of ₹14,825.22 crore under the Minor Head 800 under 115 revenue and capital Major Heads of Accounts, constituting 13.09 per cent of the total revenue and capital expenditure totalling ₹1,13,259.83 crore. The extent of operation of Minor Head-800 for Other Expenditure, as a percentage of Total Expenditure during 2016-21 is given in Chart 4.5.
Chart 4.5 Operation of Minor Head 800- Other Expenditure during 2016-21
Source: Finance Accounts 2020-21, Government of Odisha.
As seen from Chart 4.5 above, there has been large scale operation of Minor Head- 800 for Other Expenditure, with its share in total expenditure ranging from 13 per
cent to 18 per cent during the period 2016-21. Instances of substantial proportion (50 per cent or more) of the expenditure within a given Major Head, classified under the Minor Head 800 – ‘Other Expenditure’, are given in Appendix 4.6.The main defaulting Departments were Parliamentary Affairs, Water Resources, Transport, Agriculture and Farmer’s Welfare and Housing and Urban Development. The details of operation of Minor Head 800 for other Receipts during the last five years are shown in Chart 4.6below:
Chart 4.6: Operation of Minor Head 800- Other Receipts during 2016-21
Source: Finance Accounts 2020-21, Government of Odisha
As seen from the above Chart, the operation of Minor Head 800-Other Receipts has been lower as compared the use of this Head in expenditure side and ranged between
10,71314,006 14,774
21,479
14,825
13 15
14
18
13
0
5
10
15
20
0
5,000
10,000
15,000
20,000
25,000
2016-17 2017-18 2018-19 2019-20 2020-21
Expenditure ₹ in crore Percentage to total expenditure

Quality of Accounts and Financial Reporting Practices
State Finances Audit Report for the year ended March 2021
95
17.92 per cent of total receipts in 2016-17 to 2.97 per cent of total receipts during 2020-21. During 2020-21, the State Government classified receipts of ₹3,100.34 crore, pertaining to 64 Major Heads, under the Minor Head ‘800 - Other Receipts’. Cases where 100 per cent of receipts were classified under Minor Head 800 – ‘Other Receipts’, are given in Appendix 4.7.The main defaulting Departments are Revenue and Disaster Management, Housing and Urban Development, Panchayati Raj and Industry.
Though the issue of classification of the receipts/ expenditure under Minor Head 800 – Other Receipts/ Expenditure had been continuously reported in the previous reports of the Comptroller and Auditor General of India, there has been little improvement. The fact that such substantial proportions of the receipts/ expenditure under the concerned Major Head are booked under Minor Head 800 is a cause for concern, since it adversely impacts transparency.
The State Government stated (December 2021) that Expenditure and receipts are booked under the minor head ‘800-Other Expenditure’ and ‘800-Other Receipts’, only if the nature of expenditure or receipt do not fit to the minor heads enlisted under a Major Head in the list of Major and Minor heads prescribed by the Controller General of Accounts (CGA). However, the purpose of expenditure in most of such cases is specified below minor heads. While formulating Annual Budget, 2021-22, Budget provision under ‘800-Other Expenditure’ have been duly verified and modified thereby reducing the amount to a great extent.
4.7 Outstanding balance under major Suspense heads
Certain intermediary/ adjusting heads of accounts known as ‘Suspense heads’ are opened in Government accounts to reflect transactions of receipt and payments which cannot be booked to a final head of account due to lack of information such as non-furnishing of Schedule of Settlement by the Treasuries/ PAOs, Non-receipt of clearance memos from RBI, non-receipt of vouchers, etc. These heads of accounts are finally cleared by minus debit or minus credit when the accounts under them are booked to their respective final heads of accounts. Remittances embrace all transactions which are adjusting Heads of Account and the debits or credits under these heads are eventually cleared by corresponding credit or debit within the same or in another circle of accounting.
The Finance Accounts reflect the net balances under Suspense and Remittance Heads. The outstanding balances under these heads are worked out by aggregating the outstanding debit and credit balances separately under various heads. Clearance of suspense and remittance items depends on the details furnished by the State Treasuries/ Works and Forest Divisions, etc. The position of gross figures under major suspense and remittance heads for the last three years is given in Table 4.7.

Quality of Accounts and Financial Reporting Practices
96 State Finances Audit Report for the year ended March 2021
Table 4.7: Balances under Suspense and Remittance Heads (₹ in crore)
Minor Head 2018-19 2019-20 2020-21 Dr. Cr. Dr. Cr. Dr. Cr.
Major Head 8658 - Suspense 101 - PAO suspense 172.40 55.65 210.63 42.91 188.42 25.15 Net Dr. 116.75 Dr.167.72 Dr. 163.27 102- Suspense Account- Civil 16.50 45.94 13.07 44.12 29.07 2.59 Net Cr. 29.44 Cr.31.05 Cr. 26.48 110- Reserve Bank Suspense- CAO 9.30 .. 1.88 .. 3.11 .. Net Dr. 9.30 Dr.1.88 Dr. 3.11 Major Head 8782- Cash Remittances and adjustment 102-P.W. Remittances 17.65 2.35 14.80 2.33 13.46 1.62 Net Dr. 15.30 Dr. 12.47 Dr. 11.84 103- Forest Remittances 59.27 0.17 83.32 - 62.72 .. Net Dr. 59.10 Dr. 83.32 Dr. 62.72
Source: Finance Accounts of respective years, Government of Odisha
Increasing accumulation of balances during 2018-21 under the suspense heads indicated inadequate accounting controls of the Government. The details of the balances under 101-PAO suspense head are discussed below.
4.7.1 Pay and Accounts Office (PAO) Suspense (Minor Head 101) The outstanding debit balance (31 March 2021) under this Minor Head was ₹188.42 and the credit balance was ₹25.15 crore. Major outstanding debit balances were in respect of PAO, Central Pensions, New Delhi (₹170.92 crore) and PAO, Ministry of Surface Transport, Kolkata (₹17.50 crore). Major outstanding credit balances were in respect of Ministry of Shipping and Transport, New Delhi (₹1.03crore), and others (₹26.83 crore). The outstanding balances under PAO Suspense head need to be adjusted.
4.8 Non-reconciliation of Departmental figures
To enable Controlling Officers (COs) of the Departments to exercise effective control over spending, to keep it within the budget grants and to ensure accuracy of their accounts, the OGFR (319) stipulates those receipts and expenditure during the financial year recorded in the books of Controlling Officers need to be reconciled by them every month with the records in the books of the AG (A&E). The status of reconciliation of receipts and expenditure by the COs during the last three years (2018-21) is shown in Chart 4.7 and Chart 4.8 respectively.

Quality of Accounts and Financial Reporting Practices
State Finances Audit Report for the year ended March 2021
97
Chart 4.7: Status of reconciliation of receipts during last three years
Chart 4.8: Status of reconciliation of expenditure during the last three years
The trend of reconciliation of last three years is shown in the table below:
Table 4.8: Status of Reconciliation of Receipts and Expenditure figures (₹ in crore)
Year Total No. of
Controlling
Officers
Fully Reconciled
Partially Reconciled
Not Reconciled at all
Total Receipts/
Expenditure
Reconciled Receipts/
Expenditure
Percentage of Reconciliation
Receipt 2018-19 74 42 - 32 99,546.12 97,008.58 97.45 2019-20 74 52 - 22 1,01,567.75 97,334.68 95.83 2020-21 75 60 15 1,04,387.24 1,02,295.76 98.00
Expenditure 2018-19 170 166 - 7 1,08,838.49 1,07,656.5 98.91 2019-20 173 168 - 5 1,19,414.57 1,15,535.83 96.75 2020-21 172 170 - 2 11,32,59.83 1,12,779.92 99.58 Source: Finance Accounts of respective years, Government of Odisha.
Percentage of reconciliation of the receipts and disbursements ranged between 96 per
cent to 99 per cent during the last three years.
99,546.12
1,01,567.75
1,04,387.24
97,008.58
97,334.68
1,02,295.76
0 20000 40000 60000 80000 100000 120000 140000
2018-19
2019-20
2020-21
in crore
Yea
r
Reconciled Receipts Total Receipts
1,08,838.49
1,19,414.57
1,13,259.83
1,07,656.50
1,15,535.83
1,12,779.92
0 20000 40000 60000 80000 100000 120000 140000
2018-19
2019-20
2020-21
in crore
year
Reconciled Expenditure Total Expenditure

Quality of Accounts and Financial Reporting Practices
98 State Finances Audit Report for the year ended March 2021
4.9 Reconciliation of Cash Balances
As on 31 March 2021, there was a difference of ₹8.13 crore (Net debit), between the Cash Balance of the State Government, as per the books of Accounts of the AG (A&E), and the Cash Balance as reported by the Reserve Bank of India. There was a net difference of ₹8.13 crore (Debit), mainly due to incorrect reporting by Agency Banks to the Reserve Bank of India. Out of this un-reconciled cash balance, 7.84 crore (96 per cent) has been settled by the end of June 2021.
4.9.1 Discrepancy of ₹150.31 crore due to non-reconciliation between bank balance and cash book balance
Reconciliation of bank account figures with those of cash book figures is required to be done regularly at the end of each month in order to ensure accuracy of the transactions entered in the books of accounts. DDOs are required to carry out reconciliation at the end of each month to set right the mismatches, if any. In 21 sampled DDOs, it was observed that there was a difference of ₹150.31 crore (Appendix 4.8) between the balances in cash book and bank pass book as of March 2021. In absence of reconciliation of cash balances, the authenticity of accounts maintained by these DDOs could not be vouched for in audit.
The State Government stated (December 2021) that in order to address the issue, a Scheme Bank Accounts Management System (SBMS) module has now been developed in IFMS and is now operational. This would be effective in tracking the Government funds parked in different bank account on real time basis and helpful in reconciliation and analysis of closing cash by DDOs/Implementing Agencies.
4.10 Non-Compliance with Accounting Standards
Government Accounting Standards Advisory Board (GASAB) set up by the Comptroller and Auditor General of India in 2002, has been formulating standards for government accounting and financial reporting to enhance accountability mechanisms. Till date, three Indian Government Accounting Standards (IGAS) have been notified. The extent of non-compliance with the Standard by the Government of Odisha in its financial statements for the year 2020-21 are given below:
Table 4.9: Non-Compliance with Indian Government Accounting Standards
Sl. No. Accounting Standards
Compliance by State
Government
Impact of deficiency
1.
IGAS-2: Accounting and Classification of Grants- in- Aid
Not complied
I. Certain Grants-in-Aid were classified under Capital Section (Refer Paragraph 2.4.3)
II. No information was available in respect of Grants-in-Aid given in kind by the State Government.
Source: Finance Accounts & Appropriation Accounts2020-21, Government of Odisha.
4.11 Non-Submission of Annual Accounts/ Separate Audit Reports of Autonomous Bodies
Certification of accounts of Autonomous Bodies (ABs) set up by the State

Quality of Accounts and Financial Reporting Practices
State Finances Audit Report for the year ended March 2021
99
Government is conducted under Sections 19 or 20 of “Comptroller and Auditor General of India (Duties, Powers and Conditions of Service Act) 1971” (CAG’s DPC Act).
The ABs coming under the audit purview as per Section 19 or 20 of CAG’s DPC Act are required to submit the annual accounts to Audit before 30 June every year. In respect of 16 Autonomous Bodies, which were to render annual accounts to C&AG, there were delays in submission of accounts ranging from one to more than nine years as shown in Appendix 4.9.
Of these 16 bodies/ authorities, seven bodies / authorities viz. Odisha Electricity Regulatory Commission, Odisha State Legal Services Authority, Odisha State Road Transport Corporation, Odisha Industrial Infrastructure Development Corporation, Orissa Small Industries Corporation Limited, Lokayukta, Odisha, and Odisha Building and Other Construction Workers Welfare Board have submitted their accounts for financial audit for periods ranging from 2013-14 and 2019-20.
Annual accounts for remaining nine bodies/ authorities due up to 2020-21, had not been received as of September 2021. The accounts of these bodies/ authorities were in arrears for more than nine years.
In the absence of annual accounts, the accounting/ utilisation of the grants and loans disbursed to these bodies/ authorities could not be verified in audit.
4.12 Departmental Commercial Undertakings
Government Departments which perform activities of quasi commercial nature are required to prepare proforma accounts in the prescribed format annually showing the working results of financial operations so that the Government can assess their performance. As per Statement 5 of Finance Accounts of 2020-21, out of 15 departmental undertakings/ Schemes, no Department had prepared proforma accounts.
In the absence of timely finalisation of accounts, the investment of the Government remains outside the scrutiny of Audit/State Legislature. Consequently, corrective measures, if any, required for ensuring accountability and improving efficiency cannot be taken in time. Besides, the delay also opens the system to the risk of fraud and leakage of public money.
4.13 Non submission of details of grants / loans given to bodies and authorities
In order to identify institutions/ organisations which attract audit under Sections 14 and 15 of the Comptroller and Auditor General’s (Duties, Powers and Conditions of Service) Act 1971 (C&AG’s DPC Act), the Government/ HODs are required to furnish to Audit every year:
detailed information about the financial assistance given to various institutions,
the purpose for which the assistance is granted and total expenditure of the institutions.

Quality of Accounts and Financial Reporting Practices
100 State Finances Audit Report for the year ended March 2021
Further, Governments and HODs, who sanction grants and/ or loans to bodies or authorities are required to furnish to Audit by the end of July every year, a statement of such bodies and authorities to which grants and/ or loans aggregating ₹10 lakh or more were paid during the preceding year indicating (a) the amount of assistance, (b) the purpose for which the assistance was sanctioned and (c) the total expenditure of the body or authority.
Only 19 out of 43 Departments had furnished the details of Grants-in-Aid given to various bodies and authorities in the year 2020-21. In the absence of the information from remaining 24 Departments26, reasonable assurance could not be provided to the Legislature/ Government about the manner in which the grants sanctioned/ released by them had been utilised. This dilutes the legislative control over the Government expenditure system.
4.14 Timeliness and Quality of Accounts
The accounts of the State Government are compiled by the Accountant General (A&E) from the initial accounts rendered by district treasuries, sub-treasuries, cyber treasury, public works divisions, apart from the RBI advices. During the financial year 2020-21, there were delays in rendition of monthly accounts ranging from 02 to 25 days by treasuries, 07 to 17 days by Public Works Divisions and 15 to 28 days by Forest Divisions. Details of delay (in days) in submission of monthly Civil Accounts are given in Chart 4.9.
Chart 4.9: Delay (in days) in rendition of monthly accounts by Treasuries, Public Works and Forest Divisions
Source: Records of Office of the Accountant General (A&E), Odisha.
26 General Administration and Public Grievance, Law, Finance, Works, Food Supplies and Consumer Welfare,
School and Mass Education, Health and Family Welfare, Housing and Urban Development, Labour & Employees State Insurance, Sports & Youth services, Planning and Convergence, Panchayati Raj and Drinking Water, Public Grievance and Pension Administration, Water Resources, Forest and Environment, Agriculture and Farmers’ Empowerment, Rural Development, Parliamentary Affairs, Public Enterprises, Skill Development and Technical Education, Micro, Small and Medium Enterprises, Social Securities and Empowerment of persons with disabilities Department, Disaster Management and Odia Language, Literature and Culture.

Quality of Accounts and Financial Reporting Practices
State Finances Audit Report for the year ended March 2021
101
Due to the failure of the account rendering units in furnishing timely accounts, 11 accounts27 are excluded from the monthly Civil Accounts by the Accountant General (A&E) during 2020-21. Exclusion of accounts not only distorts the budgetary position of the Government, but also impacts its monitoring of fund flow to the last mile of implementation, its planned pacing of expenditure on developmental programmes, functioning of departments, etc. during the year.
4.15 Misappropriations, losses, thefts, etc.
As per provisions of OGFR Vol. I (Rule-19), Government Officers are empowered to report such cases of loss of money, departmental revenue, stores or other properties to immediate superior officers as well as to the Accountant General, Odisha where the amount is ₹500 or more. Various Departments of the State Government reported that there were 719 cases of loss, misappropriation and defalcation, etc., as detailed in Appendix 4.10. The Government stated (December 2021) the concerned Departments would be requested to initiate appropriate actions and dispose-off pending cases in timely manner.
4.16 Opening of New Sub Heads/Detailed Heads of Accounts without advice
During 2020-21, the Government of Odisha opened 74 new Sub Heads (61 under the Revenue Section and 13 under Capital section) in the budget, without seeking the advice of the Accountant General as required under the provisions of Article 150 of the Constitution of India. The State Government provided budget provisions under these heads and incurred expenditure of ₹8,657.66 crore under the Revenue Section and ₹685.26 crore under the Capital Section in these heads during 2020-21.
4.17 Follow up action on State Finances Audit Report
Separate Report on State Finances is being prepared since the year 2008-09 onwards and presented to the State Legislature. During 2020-21, four28 meetings were held to discuss pending position of paras relating to State Finances Audit Report (SFARs). As of March 2021, total 304 paragraphs related to SFARs, were pending pertaining to the period 2008-09 to 2019-20.
4.18 Recommendations: 1. The Government should bring all the funds lying outside the Consolidated
Fund/ Public Accounts in breach of constitutional provisions, within the fold of Consolidated Fund/ Public Accounts. (Paragraph 4.1)
2. The State Government may consider to give reasonable time for utilisation of funds and submission of UCs by amending the time limit fixed in the OGFR. (Paragraph4.3)
27 01 Treasury Accounts, 02 P.W Accounts, 08 Forest Accounts 28(First meeting was no date and Second Meeting-November 2020, Third Meeting-January 2021 and Fourth Meeting-February 2021)

Quality of Accounts and Financial Reporting Practices
102 State Finances Audit Report for the year ended March 2021
3. The Government should consider carrying out adjustment of Abstract Contingent bills within stipulated period, as required under the Rules. (Paragraph 4.5)
4. The Government should close inoperative PD accounts and review all other PD accounts to ensure that all amounts unnecessarily lying in these PD accounts are immediately remitted to the Consolidated Fund. (Paragraph 4.6)
5. The Government should, in consultation with the Accountant General (A&E) Odisha, conduct a comprehensive review of all items presently appearing under Minor Head 800 and ensure that all such receipts and expenditure are in future booked under the appropriate heads of accounts. (Paragraph 4.7)
6. The Government may consider preparing a time bound framework for taking prompt action including lodging of FIRs in cases of misappropriation, loss, theft, etc., and strengthening the internal control system to prevent recurrence of such cases. (Paragraph 4.12)

Quality of Accounts and Financial Reporting Practices
State Finances Audit Report for the year ended March 2021
87
Chapter-V
State Public Sector Enterprises

Quality of Accounts and Financial Reporting Practices
State Finances Audit Report for the year ended March 2021
87

State Finances Audit Report 103 for the year ended March 2021
Summary of Financial Performance of State Public Sector Enterprises
5.1 Introduction
This Chapter presents the summary of financial performance of Government Companies, Statutory Corporations and Government controlled other Companies. The term State Public Sector Enterprises (SPSEs) encompasses those Government companies in which the direct holding of the State Government is 51 per cent or more and the subsidiaries of such Government companies. The Statutory Corporations set up under Statutes enacted by the Legislature and other companies owned or controlled, directly or indirectly by the State Government have also been categorised as SPSEs.
A Government Company is defined in Section 2 (45) of the Companies Act, 2013 as a Company in which not less than 51 per cent of the paid-up share capital is held by Central Government, or by any State government or governments, or partly by the Central Government and partly by one or more State governments and includes a Company which is a subsidiary of a Government.
Besides, any other company owned or controlled, directly or indirectly, by the Central Government, or by any State Government or Governments, or partly by the Central Government and partly by one or more State Governments are referred to in this Report as Government controlled other Companies.
5.1.1 Mandate of Audit
Audit of Government companies and Government controlled other companies is conducted by the CAG under the provisions of Section143(5) to 143(7) of the Companies Act, 2013 read with Section 19 of the CAG’s (Duties, Powers and Conditions of Service) Act, 1971 and the Regulations made thereunder. Under the Companies Act, 2013, the CAG appoints the Chartered Accountants as Statutory Auditors for companies and gives directions on the manner in which the accounts are to be audited. In addition, CAG has the right to conduct a supplementary audit. The statutes governing some of the Statutory Corporations require their accounts to be audited only by the CAG.
5.1.2 What this Chapter contains
This Chapter gives an overall picture of the financial performance of the State Government companies and Corporations as revealed from their accounts.
State Public Sector Enterprises
Chapter
V

State Public Sector Enterprises
104 State Finances Audit Report for the year ended March 2021
5.1.3 Number of SPSEs
As on 31 March 2021, there were 8029 SPSEs under the audit jurisdiction of the CAG as detailed in Appendix 5.1. These include 62 Government Companies, 03 Statutory Corporations and 15 Government controlled other Companies. Of these, summary of financial performance of 45 SPSEs is covered in this report and the nature of these SPSEs is indicated in the table below:
Table 5.1: Coverage and nature of SPSEs covered in this report Nature of the SPSE Total number of
SPSEs Number of SPSEs covered in the Report Number of
SPSEs not covered in the
Report
Accounts up to 2020-21 2019-20 2018-19 Total
Government Companies
62 13 12 5 30 32
Statutory Corporations 3 0 1 2 3 0
Total Companies/ Corporations
65 13 13 7 33 32
Government Controlled other Companies
15 2 9 1 12 3
Total 80 15 22 8 45 35
(Source: Compiled on the basis of latest finalised accounts of SPSEs)
This Chapter does not include 35 SPSEs (including 03 Government Controlled other Companies) whose accounts were in arrears for three years or more or were defunct/ under liquidation as indicated in Appendix 5.2A and Appendix 5.2B.
5.1.4 Contribution to the GSDP of the State
The table below provides the details of turnover of 33 Government SPSEs and 12 Government Controlled other SPSEs and GSDP of Odisha for a period of three years ending March 2021:
Table 5.2: Details of turnover of State PSEs vis-a-vis GSDP of Odisha (₹ in crore)
Particulars 2017-18 2018-19 2019-20 2020-21
Turnover 18,879.25 20,947.39 21,149.69 23,876.47
Percentage change of Turnover over Previous Year
13.06 10.95 0.97 12.89
GSDP of Odisha at current price 4,40,879 4,87,805 5,21,275 5,09,574.29
Percentage of Turnover to GSDP of Odisha 4.28 4.29 4.06 4.69 (Source: Compiled on the basis of latest finalised accounts of SPSEs.)
29One Government company named Konark Jute Limited went out from the purview of CAG’s audit during 2020-21 due to disinvestment and one Government controlled other Company named Kalinga Bidyut Prasaran Nigam Private Limited went out from the purview of CAG’s audit during 2020-21 due to liquidation.

State Public Sector Enterprises
State Finances Audit Report for the year ended March 2021
105
In 2020-21, the turnover of the SPSEs relative to GSDP was 4.69 per cent and had increased from 4.06per cent in the previous year. The department wise position has been given in Appendix5.3. The compounded annual growth30 of GSDP was 6.72per cent during last four years, while the turnover of Power Public Sector Enterprises and Non-Power Public Sector Enterprises recorded compounded annual growth of 9.66 per cent and 9.03 per cent respectively during the same period. This resulted in increase in the share of turnover of these State PSEs to the GSDP from 4.28 per cent in 2017-18 to 4.69 per cent in 2020-21.
5.1.5 Budgetary Support to State PSEs
The Government of Odisha (GoO) provides financial support to State PSEs in various forms through annual budget. The summarised details of budgetary outgo towards equity, loans, grants/ subsidies, loans written off and loans converted into equity during the year in respect of 3731State PSEs for the last three years ending March 2021 are as follows:
Table 5.3: Details regarding budgetary support to State PSEs (Amount in ₹ crore)
(Source: Compiled based on latest finalised accounts of SPSEs.)
$ One Government SPSE i.e., Odisha Power Transmission Corporation Limited received both equity and loans in
2018-19.
# One Government SPSE i.e., Odisha Power Transmission Corporation Limited received equity, loans and grants in
2019-20 and One Government SPSE i.e., Odisha Hydro Power Corporation Limited received both equity and grants in
2019-20.
* One Government SPSE i.e., Odisha Hydro Power Corporation Limited received equity and grants in 2020-21.
@ GRIDCO Limited.
30 Rate of Compounded Annual Growth [[{(Value of 2020-21/Value of 2016-17) ^ (1/4 years)}- 1] *100] where turnover
and GSDP for the year 2016-17 were ₹8530.83 crore and ₹314363.78 crore respectively. 31 Out of 45 Government SPSE and Government Controlled Other SPSEs, information relating to budgetary support from
State Government could be received from 37 Government SPSEs and Government Controlled Other SPSEs. Out of these 37, budgetary support was given to 09 SPSEs and Government Controlled Other SPSEs only.
32 Amount represents outgo from State Budget only. 33 Closing balance of Government guarantee in respect of SPSEs at the end of a particular year
Particulars32 2018-19 2019-20 2020-21 Number of PSUs
Amount Number of
PSUs
Amount Number of PSUs
Amount
Equity Capital outgo (i) 3 272.42 2 118.70 2 32.54
Loans given (ii) 1 45.48 0 100.05 1 0
Grants/Subsidy provided (iii)
8 95.19 8 1,136.03 9 758.19
Total Outgo (i+ii+iii) 11$ 413.09 8# 1,354.76 9* 790.73
Loan repayment written off 0 0 0 0 0 0
Loans converted into equity 0 0 0 0 0 0
Guarantees issued 1@ 2,350.00 1@ 600.00 1@ 2,000.00
Guarantee33 Commitment 1@ 4,186.00 1@ 913.50 1@ 6233.90

State Public Sector Enterprises
106 State Finances Audit Report for the year ended March 2021
The budgetary assistance of ` 790.73 crore given during the year 2020-21 was in the form of equity and grants/ subsidy. During the year 2020-21, maximum grants/subsidy was provided to Water Corporation of Odisha Limited (` 639.54 crore) and the Agricultural Promotion and Investment Corporation of Odisha Limited (` 67.59 crore).
GoO provides guarantee in accordance with the criteria and guidelines issued (November 2002) by the Government subject to the limits prescribed by the Constitution of India. A guarantee commission is charged at the rate of 0.50 per cent on the maximum of the guarantee sanctioned. Outstanding guarantee commitments of GoO increased during the financial year by 26.87 per cent from `4,913.50 crore in 2019-20 to ` 6233.90 crore in 2020-21. This increase was because GRIDCO Limited sought additional guarantee commitment from GoO to avail loans from banks/financial institutions. GRIDCO Limited paid guarantee commission of `30.94 crore during 2020-21.
The overall summary position of financial performance of SPSEs (Govt. companies &Statutory Corporations) covered in this Report, is summarized in Table below.
Table 5.4: Financial performance of SPSEs for 2020-21 covered in this Report (Government Companies and Statutory Corporations)
5.2 Investment in Government Companies and Corporations and Government controlled other Companies
The amount of equity and loans in 3334 Government companies and Corporations as of 31 March 2021, is given in the table below:
34 (65-32) SPSEs whose accounts were in arrears for more than or equal to three years were
defunct/under liquidation.
Number of SPSEs 65
SPSEs covered 33
Paid up capital (33 SPSEs) ` 5,746.68 crore Long term loans (33 SPSEs) ` 16,007.81 crore Net profit (23 SPSEs) ` 1,937.72 crore Net loss (10 SPSEs) ` 3,568.19 crore Dividend declared (08 SPSEs) ` 1,049.73 crore Total assets (33 SPSEs) ` 66,138.27 crore Value of production (11 SPSEs) ` 4,771.79 crore Net worth (33 SPSEs) ` 7,068.74 crore

State Public Sector Enterprises
State Finances Audit Report for the year ended March 2021
107
Table 5.5: Equity and loans in Government Companies and Corporations (₹ in crore)
(Source: Compiled on the basis of latest finalised accounts of SPSEs)
The amount of equity and loans in 12 Government controlled other companies as of 31 March 2021 is given in the table below.
Table 5.6: Equity and loans in Government controlled other Companies (₹ in crore)
(Source: Compiled on the basis of latest finalised accounts of SPSEs)
5.2.1 Equity holding
During 2020-21, the total equity holding at face value in the 33 SPSEs covered in this Report registered a net increase of ` 204.00 crore due to increase in state government equity share capital of ` 49.00 crore in Odisha Hydro Power Corporation Limited and ` 69.00 crore in Odisha Power Transmission Corporation Limited and increase in equity share capital of holding Sate Government companies of ` 86.00 crore in Odisha Coal Power Limited.
Holding in equity by State Government and others during two years ended 31 March 2021 in Government Companies and Corporations is depicted in the Chart below:
Sources of investment
As on 31.03.2021 As on 31.03.2020 Equity Long term
loans Total Equity Long
term loans
Total
1. State Government 4,116.06 1,245.22 5,361.28 3,998.06 1,272.30 5,270.36
2. State Government Companies/ Corporations/Autonomous Bodies
614.84 595.34 1,210.18 528.84 791.76 1,320.60
3. Central Governments/ Central Government Companies/Corporations
46.75 7,241.53 7,288.28 46.75 6,882.83 6,929.58
4. Financial Institutions and Others
969.04 6,947.77 7,916.81 969.03 4,223.55 5,192.58
Total 5,746.68 16,007.91 21,754.59 5,542.68 13,170.44 18,713.12
Percentage of investment of State Government to total investment
71.60 7.77 24.62 72.13 9.66 28.16
Sources of investment
As on 31.03.2021 As on 31.03.2020 Equity Long
term loans
Total Equity Long term loans
Total
State Government 933.08 23.29 956.37 887.08 23.29 910.37

State Public Sector Enterprises
108 State Finances Audit Report for the year ended March 2021
Chart 5.1: Holding in equity in Government Companies and Corporations
(Source: Compiled on the basis of latest finalised accounts of SPSEs)
Details of significant holding (holding of more than ` 200 crore) of the State Government during 2020-21 in the paid-up capital of the SPSEs is given in the table below:
Table 5.7: Significant holding of the State Government
(₹ in crore)
(Source: Compiled on the basis of latest finalised accounts of SPSEs)
5.2.2 Loans given to Government Companies and Corporations 5.2.2.1 Computation of long-term loans outstanding as on 31 March 2021
Out of the 33 Government Companies and Corporations covered in this report, 11 SPSEs had outstanding long term loans amounting to `16,007.91 crore from all sources as on 31 March 2021. During 2020-21, the long-term loans of Government Companies and
3998.06
1544.62
4116.06
1630.62
0.00
500.00
1000.00
1500.00
2000.00
2500.00
3000.00
3500.00
4000.00
4500.00
By State Government By Others
31-Mar-20 31-Mar-21
Name of the SPSE Name of the Department Amount Percentage of State Government
holding in this individual SPSE
with the total holding of the state
government Statutory Corporation
Odisha State Financial Corporation Micro, Small & Medium Enterprise
342.72 8.35
Odisha State Road Transport Corporation
Commerce and Transport 278.54 6.78
Government Companies
Odisha Power Generation Corporation Limited
Energy 929.47 22.61
Odisha Power Transmission Corporation Limited
Energy 859.77 20.92
Odisha Hydro Power Corporation Limited
Energy 810.65 19.72
GRIDCO Limited Energy 576.71 14.03
`in
cro
re

State Public Sector Enterprises
State Finances Audit Report for the year ended March 2021
109
Corporations registered an increase of `2837.47 crore in three SPSEs viz. GRIDCO Limited, Odisha Hydro Power Corporation Limited and Odisha Power Transmission Corporation Limited.
Year wise details of outstanding long-term loans of Government Companies and Corporations is depicted in the chart below:
Chart 5.2: Long term loans outstanding in Government Companies and
Corporations
(Source: Compiled on the basis of latest finalised accounts of SPSEs)
5.2.2.2 Adequacy of assets to meet loan liabilities
Ratio of total debt to total assets is one of the methods used to determine whether a company can stay solvent. To be considered solvent, the value of an entity’s assets must be greater than the sum of its loans/debts. The coverage of long-term loans by value of total assets in 11 Government SPSEs which had outstanding loans as on 31 March 2021 is given in the table below:
Table 5.8: Coverage of long term loans with total assets
(Source: Compiled on the basis of latest finalised accounts of SPSEs)
Positive Coverage Negative Coverage No. of SPSEs
Long term loans
Assets %age of assets to
loans
No. of SPSEs
Long term loans
Assets %age of
assets to loans
(` in crore) (` in crore) Statutory Corporations 2 99.91 648.78 649.36 - - - -
Government Companies 9 15,907.90 31,713.75 199.36 - - - -
Total 11 16,007.81 32,362.53 - - - -
0.002000.004000.006000.008000.00
10000.0012000.0014000.0016000.00
By State Government By Others
1272.30
14762.69
1245.22
11898.14
`in
cro
re
Long term loans outstanding in Government Companies and Corporations
31-Mar-20 31-Mar-21

State Public Sector Enterprises
110 State Finances Audit Report for the year ended March 2021
From the above table, it is revealed that all the 11 Government Companies and Corporations have positive coverage ratio, which indicates that all the Companies and Corporations possess adequate assets to meet their loan liabilities.
5.2.2.3 Interest Coverage Interest coverage ratio (ICR) is used to determine the ability of a company to pay interest on outstanding debt and is calculated by dividing a company's earnings before interest and taxes (EBIT) by interest expenses of the same period. The lower the ratio, the lesser is the ability of the company to pay interest on debt. An ICR below one indicated that the company was not generating sufficient revenues to meet its expenses on interest. The details of positive and negative interest coverage ratio of SPSEs, which had outstanding loans during the period from 2018-19 to 2020-21 are given in the table below:
Table 5.9: Interest Coverage Ratio
(Source: Compiled on the basis of latest finalised accounts of SPSEs)
It was observed that the number of SPSEs with ICR equal to or more than one has increased in case of Government Companies and decreased in case of Statutory Corporations during 2020-21 as compared to the previous year. 5.2.2.4 Age Wise Analysis of interest outstanding on State Government loans
As on 31 March 2021, interest amounting to ` 1,767.81 crore was outstanding on long term loans of four SPSEs provided by State Government. The age wise analysis of interest outstanding on State Government loans in SPSEs is depicted in the table below:
Year Interest (` in crore)
Earnings before interest and tax (EBIT)
(₹ in crore)
No. of SPSEs
No. of SPSEs having
ICR>= 1
No. of SPSEs having ICR<1
Statutory Corporations
2018-19 1.58 9.53 2 2 -
2019-20 0.47 5.73 1 1 -
2020-21 0.47 -1.59 1 - 1
Government Companies
2018-19 653.60 625.87 6 4 2
2019-20 662.75 911.48 6 4 2
2020-21 1,640.31 70.61 7 5 2

State Public Sector Enterprises
State Finances Audit Report for the year ended March 2021
111
Table 5.10: Interest outstanding on State Government Loans (₹ in crore)
Sl. No. Name of the SPSE Outstanding interest on
State Government
loans
Interest on State
Government loans
outstanding for less than
1 year
Interest on State
Government loans
outstanding for 1 - 3
years
Interest on State
Government loans
outstanding for more
than 3 years 1 GRIDCO Limited 935.64 106.04 212.08 617.52
2 Odisha Hydro Power Corporation Limited
775.32 69.05 144.46 561.81
3 Odisha State Seeds Corporation Limited
1.98 - - 1.98
4 Industrial Development Corporation Limited
54.87 1.86 6.04 46.97
Total 1,767.81 176.95 362.58 1,228.28
(Source: Compiled on the basis of latest finalised accounts of SPSEs)
It is revealed from the above table that the companies failed to pay the interest liabilities which should have been paid within one year, resulting in accumulation of interest on State Government loans year after year.
5.2.3 Investment in Government controlled other Companies
The capital invested by the State Government, Central Government and by Companies and Corporations controlled by them in 1235 Government Controlled other Companies during the year 2020-21 is depicted in the chart below:
Chart 5.3: Composition of share capital in Government controlled other Companies
(Source: Compiled on the basis of latest finalised accounts of SPSEs)
35 15 minus 3 Government controlled other companies whose accounts were in arrears for three
years or more or were defunct/under liquidation.
96%
2% 2%
Paid up CapitalState Government, State Government Companies and Corporations – `896.73 crore
Central Government, Central Government Companies and Corporations – ` 16.22 crore
Others – ` 20.13 crore

State Public Sector Enterprises
112 State Finances Audit Report for the year ended March 2021
As on 31 March 2021, equity in these Government controlled other companies has increased by `46 crore, i.e., from `887.08 crore in 2019-20 to `933.08 crore in 2020-21. Increase was mainly due to increase in equity in one SPSE of Energy sector i.e., Odisha Thermal Power Corporation Limited.
5.3 Returns from the Government Companies and Corporations
5.3.1 Profit earned by Government companies and Corporations
The profit earned by SPSEs increased to `1,937.72 crore in case of 23 profit earned SPSEs in 2020-21 from `1,686.08 crore in case of 24 profit earned SPSEs in 2019-20. The Return on Equity (ROE) of the 23 SPSEs was 20.04 per cent in 2020-21 as compared to 12.51 per
cent in 24 SPSEs in 2019-20. Number of SPSEs that earned profit during the period from 2018-19 to 2020-21 is depicted in the chart below:
Chart 5.4: Number of Profit Earning SPSEs
(Source: Compiled on the basis of latest finalised accounts of SPSEs)
The details of top three departments, which contributed maximum profit during 2020-21 are summarised in the table below:
Table 5.11: Top three departments which contributed maximum profit during the years 2019-20 and 2020-21
Name of the Department 2020-21 2019-20 No. of profit
earning SPSEs
Net profit earned
(₹ in crore)
Percentage of profit to total SPSE
profit
No. of profit
earning SPSEs
Net profit earned
(₹in crore)
Percentage of profit to total SPSE
profit
Agriculture & Farmers Empowerment Government Companies 4 30.63 - 4 21.08 0.07 Water Resources Government Companies 1 49.88 - 1 49.88 3.61 Excise Government Companies 1 20.88 - 1 29.99 2.17
Total 6 101.39 - 6 100.95 7.31 (Source: Compiled on the basis of latest finalised accounts of SPSEs)
3
19
3
21
2
21
0
5
10
15
20
25
Statutory Corporations Government Companies
2018-19 2019-20 2020-2021

State Public Sector Enterprises
State Finances Audit Report for the year ended March 2021
113
The list of Government companies which earned profit of more than ` 50 crore during the year 2020-21 is given in the table below:
Table 5.12: List of SPSEs which earned profit of more than ₹50 crore (₹in crore)
Sl. No. Name of the SPSE Net Profit 1 Odisha Mining Corporation Limited 1,586.27 2 Odisha Hydro Power Corporation Limited 158.06 3 Odisha Construction Corporation Limited 50.13
Total 1,794.46 (Source: Compiled on the basis of latest finalised accounts of SPSEs)
It can be seen that these three SPSEs contributed 92.61 per cent of the total profit earned by 23 SPSEs during 2020-21. Of the 12 Government Controlled other companies, eight companies earned profit of ` 3.78 crore during the year ended 31 March 2021. One Government controlled other companies, Rourkela Smart City Limited earned no profit no loss during 2020-21.
5.3.2 Loss incurred by Government companies and Corporations
There were 10 Government companies that incurred losses during the year 2020-21. These SPSEs incurred loss of ` 3568.19 crore in 2020-21 as compared to profit of ` 340.28 crore earned by these SPSEs during 2019-20 as given in Appendix 5.4. The details of SPSEs that incurred loss from 2018-19 to 2020-21 is given in the table below:
Table 5.13: Number of SPSEs that incurred losses during 2018-19 to 2020-21 Year No of SPSEs incurred
loss Net loss for
the year (` in crore)
Accumulated loss
(` in crore)
Net worth36 (` in crore)
Government Company 2018-19 8 313.26 4,686.92 -3,576.24 2019-20 7 304.52 4,982.95 -3,873.27 2020-21 10 3,568.19 7,453.93 -2,936.07
(Source: Compiled on the basis of latest finalised accounts of SPSEs)
Out of total loss of ` 3,568.19 crore incurred by 10 Government SPSEs, loss of ` 3,200.73 crore was contributed by two SPSEs (GRIDCO Limited & Odisha Mineral Bearing Area Development Corporation Limited) which function in Energy and Steel & Mines sectors respectively. Five companies which incurred major loss during 2020-21 are as follows:
i) IDCOL Ferro Chrome and Alloys Limited (IFCAL): The loss of ` 22.76 crore during 2019-20 was mainly due to expenditure towards Cost of material consumed and Manufacturing expenses.
36 Net worth means the sum total of the paid-up share capital and free reserves and surplus less
accumulated loss and deferred revenue expenditure. Free reserves mean all reserves created out of profits and share premium account but do not include reserves created out of revaluation of assets and write back of depreciation provision.

State Public Sector Enterprises
114 State Finances Audit Report for the year ended March 2021
ii) GRIDCO Limited: Loss of ₹ 1,382.35 crore during 2020-21 was mainly due to the expenditure towards Power Purchase being more than the Revenue from Sale of Power. The other reason being expenditure towards finance costs.
iii) Odisha Power Generation Corporation Limited (OPGC): The loss of ₹ 190.51 crore during 2020-21 was mainly due to expenditure towards Cost of material consumed and Generation expenses.
iv) Odisha Mineral Bearing Areas Development Corporation (OMBADC) Limited: The loss of ₹1,818.38 crore during 2020-21 OMBADC was mainly due to expenditure towards Project expenses.
v) Odisha Power Transmission Corporation Limited (OPTCL): The loss of ₹144.37 crore during 2019-20 was due to decrease in Total revenue and increase in total expenses and tax expenses.
5.3.3 Erosion of capital in Government Companies and Corporations
As on 31 March 2021, out of 33 there were 11 Government companies and corporations with accumulated losses of ` 8,579.06 crore. Of the 11 SPSEs, eight SPSEs incurred losses in the year 2020-21 amounting to `1,559.30 crore, three SPSEs had not incurred loss in the year 2020-21, even though they had accumulated loss of ` 305.96 crore.
Net worth of six out of 11 SPSEs had been completely eroded by accumulated loss and was negative. The net worth of these six was ` (-) 6,999.58 crore against total equity investment of ` 1,208.43 crore in these SPSEs as on 31 March 2021. Out of six SPSEs, whose capital had been eroded (negative net worth), two SPSEs had earned profit of ` 13.00 crore during 2020-21 (Appendix 5.5).
Net worth was less than half of their paid up capital in respect of three37out of 22 SPSEs whose net worth was positive at the end of 31 March 2021, indicating their potential financial sickness. Overall, net worth of all the 33 Government companies and corporations was ` 7,068.74 crore against their total paid up capital of ` 5,746.68 crore.
5.3.4 Dividend pay-out by SPSEs
The State Government had formulated (December 2011) dividend policy under which all profit-making PSUs are required to pay annual dividend of 20 per cent of the State government equity or 20 per cent of the profit after tax, whichever is higher. The minimum dividend pay-out in respect of PSUs in power generation sector should be 30 per cent of profit after tax. Subsequently, GoO issued revised (February 2016) guidelines for payment of dividend at the rate of 30 per cent for all PSUs. However, five SPSEs had not declared dividend prescribed by the Government as given in Appendix5.6. The total shortfall on this account was ` 226.92 crore in 2020-21.
37 Odisha State Road Transport Corporation, Water Corporation of Odisha Limited and IDCOL
Ferro Chrome & Alloys Limited

State Public Sector Enterprises
State Finances Audit Report for the year ended March 2021
115
The details of profit earned and dividend declared/paid by Government companies and corporations is given in the table below:
Table 5.14: Profit earned and dividend declared/paid Category No. of
SPSEs Total Paid up capital
(₹ in crore) Net profit
(₹ in crore) Dividend declared
(₹ in crore) Government Company
8 917.28 1,817.48 1,049.73
(Source: Compiled on the basis of latest finalised accounts of SPSEs)
Out of 33 Government companies and Corporations, eight SPSEs declared dividend in 2020-21. Out of six SPSEs which had declared/paid dividend during 2019-20 three SPSEs had not declared/paid dividend during 2020-21. The dividend declared as a percentage of net profit increased to 57.76 per cent in 2020-21 from 32.98 per cent in 2019-20. In absolute terms, the dividend declared by the SPSEs in 2020-21 increased by ` 779.73 crore compared to previous year. The chart below depicts the dividend declared vis-a-vis net profit earned and paid-up capital of SPSEs which declared dividend during the last three years.
Chart 5.5: Dividend declared vis-a-vis net profit earned and paid up capital (₹ in crore)
(Source: Compiled on the basis of latest finalised accounts of SPSEs)
Out of total dividend of ` 1,049.73 crore declared by eight SPSEs for the year 2020-21, dividend received/ receivable by State Government was ` 1,046.59 crore (99.70 per cent of total dividend declared) in all the eight SPSEs having total equity investment of ` 917.28 crore (State Government equity investment ` 914.07 crore).
Of the 12 Government Controlled Other Companies, eight companies earned profit of `3.78 crore during the year ended 31 March 2021. However, none of these companies declared dividend during 2020-21.
Operating efficiency of Government Companies and Corporations 5.4. Value of production
The summary indicating value of production, total assets and capital employed in Government companies and corporations related to 11 SPSEs over a period of three years is depicted in the chart below:
854.50 68.72917.28
1090.561090.56 1817.48
73.41 559.25 1049.73
0%20%40%60%80%
100%
2018-19 2019-20 2020-21
Paid up Capital Net Profit Dividend

State Public Sector Enterprises
116 State Finances Audit Report for the year ended March 2021
Chart 5.6: Value of Production, Assets and Capital Employed
(Source: Compiled on the basis of latest finalised accounts of SPSEs)
There was an increase in the value of production, total assets and capital employed in the year 2020-21 compared to the previous year. The SPSE wise details of value of production, total assets and capital employed is given in Appendix 5.7. 5.4.1 Return on Capital Employed (ROCE)
ROCE is a ratio that measures a company’s profitability and the efficiency with which its capital is employed. ROCE is calculated by dividing a company’s earnings before interest and taxes (EBIT) by the capital employed38. The SPSE wise details of ROCE are given in Appendix 5.8. The consolidated ROCE of 33 Government companies and corporations during the period from 2018-19 to 2020-21 is given in Table below.
Table 5.15: Return on Capital Employed Year EBIT
(₹in crore) Capital employed
(₹in crore) ROCE
(in percentage) 2018-19 1,909.90 20,303.35 9.41
2019-20 2,776.42 22,905.73 12.12
2020-21 928.02 23,076.55 4.02
(Source: Compiled on the basis of latest finalised accounts of SPSEs)
It was observed that ROCE of 33 Government companies and corporations was lower during the year 2020-21 in comparison to that for the year 2019-20.
38 Capital Employed = Paid up Share capital + Free Reserves and surplus + Long term loans –
Accumulated losses – Deferred Revenue Expenditure

State Public Sector Enterprises
State Finances Audit Report for the year ended March 2021
117
5.4.2 Return on Equity (ROE) of SPSEs
ROE39 is a measure of financial performance of companies calculated by dividing net income by shareholders' equity. The SPSE wise details of ROE are given in Appendix 5.9.
The consolidated ROE of 33 Government companies and corporations during the period from 2018-19 to 2020-21 is given in the table below:
Table 5.16: Return on Equity Year Net Profit after Tax and
Preference Dividend (₹ in crore)
Equity (₹ in crore)
ROE (in %age)
2018-19 873.88 8,571.46 10.20 2019-20 1,394.39 9,733.43 14.33 2020-21 -1,630.46 7,068.15 -23.07
(Source: Compiled on the basis of latest finalised accounts of SPSEs)
It was observed that ROE of 33 Government companies and corporations had decreased to turn negative during the year 2020-21 in comparison to that for the year 2018-19. Sector wise ROE of Government companies and corporations where total equity of the sector is more than ` 50 crore during 2018-19 to 2020-21 is depicted in the table below:
Table 5.17: ROE of sectors with total equity of ₹ 50 crore and more
(In percentage)
(Source: Compiled on the basis of latest finalised accounts of SPSEs)
39 Return on Equity = (Net Profit after Tax and preference Dividend/Equity) *100 where Equity =
Paid up Capital + Free Reserves& Surplus – Accumulated Loss – Deferred Revenue Expenditure 40 The wide fluctuation in the case of Industry Department was mainly due to loss of ` 89.50 crore
by Industrial Development Corporation of Odisha Limited in the year 2018-19 against profit of `2.46 crore in 2020-21. That was again due to compensation paid for illegal mining and additional interest cost on loan taken for payment of VR dues.
Sl. No. Name of the Department 2018-19 2019-20 2020-21
1 Industries40 -66.94 -15.42 -9.58 2 Commerce and Transport 3.97 2.57 2.57 3 Energy -1.26 3.64 -194.59 4 Steels and Mines 14.05 18.00 -3.57 5 Home 13.82 13.82 14.57 6 Water Resources 56.89 33.30 33.30 7 Excise 9.37 9.37 6.32 8 Health & Family Welfare 15.59 15.59 14.32 9 Cooperation 16.34 9.75 13.63

State Public Sector Enterprises
118 State Finances Audit Report for the year ended March 2021
From the above table it can be seen that the Return on Equity has drastically reduced in Energy sector during the year 2020-21.
5.4.3 Sales and Marketing
During 2020-21, the total sales of 20 out of 33 Government Companies was ` 22,902.67 crore as compared to ` 20,567.00 crore in 2019-20. Out of 20 SPSEs, 10 SPSEs sold goods/rendered services worth ` 3,922.86 crore to the Government sector in 2020-21. The overall percentage of sales of these 10 SPSEs to the Government sector with reference to their total sales worked out to 17.13 per cent. No SPSEs exported or imported goods/services during the period.
The details of total sales, sales to Government sector and others thereon in respect of 20 SPSEs for three years are given in the table below:
Table 5.18: Sales details of 20 SPSEs (₹ in crore)
Year Total Sales Sales to Government sector
Sales to others
2018-19 19,866.34 2,524.81 17,341.53 2019-20 20,567.00 3,125.16 17,441.84 2020-21 22,902.67 3,922.86 18,979.81
(Source: Compiled on the basis of latest finalised accounts of SPSEs)
5.5 Audit of State Public Sector Enterprises
Comptroller & Auditor General of India (CAG) appoints the statutory auditors of a Government Company and Government Controlled Other Company under Section 139 (5) and (7) of the Companies Act, 2013. CAG has a right to conduct a supplementary audit and issue comments upon or supplement the Audit Report of the statutory auditor. Statutes governing some corporations require that their accounts be audited by the CAG and a report be submitted to the State Legislature.
5.6 Appointment of statutory auditors of State Public Sector Enterprises by CAG
Sections 139 (5) of the Companies Act, 2013 provides that the statutory auditors in case of a Government Company or Government Controlled Other Company are to be appointed by the CAG within a period of 180 days from the commencement of the financial year.
The statutory auditors of the SPSEs for the year 2020-21 were appointed by the CAG during August and September 2020.

State Public Sector Enterprises
State Finances Audit Report for the year ended March 2021
119
5.7 Submission of accounts by SPSEs
5.7.1 Need for timely submission
According to Section 394 of the Companies Act 2013, Annual Report on the working and affairs of a Government Company is to be prepared within three months of its Annual General Meeting (AGM). As soon as may be after such preparation, the Annual Report shall be laid before State Legislature, together with a copy of the Audit Report and comments of the C&AG upon or as supplement to the Audit Report. Almost similar provisions exist in the respective Acts regulating statutory corporations. This mechanism provides the necessary legislative control over the utilization of public funds invested in the companies from the Consolidated Fund of State.
Section 96 of the Companies Act, 2013 requires every company to hold AGM of the shareholders once in every calendar year. It also states that not more than 15 months shall elapse between the date of one AGM and that of the next. Further, Section 129 of the Companies Act, 2013 stipulates that the audited Financial Statement for the financial year have to be placed in the said AGM for their consideration.
Section 129 (7) of the Companies Act, 2013 also provides for levy of penalty like fine and imprisonment on the persons including directors of a company for noncompliance with the provisions of Section 129 of the Companies Act, 2013.
Despite above, annual accounts of various SPSEs were pending as on 30 September 2021, as detailed in the following paragraph.
5.7.2 Timeliness in preparation of accounts by Government SPSEs and Government Controlled Other SPSEs
As of 31 March 2021, there were 65 Government SPSEs and 15 Government Controlled Other SPSES under purview of CAG’s audit. Out of these 65 Government SPSEs, three are Statutory Corporations.
Accounts for the year 2020-21 were due from all 65 Government SPSEs and 15 Government Controlled Other SPSEs. The details of accounts which are in arrears are indicated in Appendix 5.2A and 5.2B for government companies and government controlled other companies separately. The number of accounts in arrears for the aforesaid two groups are given below:

State Public Sector Enterprises
120 State Finances Audit Report for the year ended March 2021
Table 5.19: Details of submission of accounts of Government Companies
* Includes one Statutory Corporation named Odisha State Financial Corporation. ** Includes two Statutory Corporations viz. Odisha State Road Transport Corporation and Odisha
State Warehousing Corporation.
Particulars Government SPSEs/Government Controlled Other SPSEs
Government SPSEs
Government Controlled Other
SPSEs Total
Total number of SPSEs under the purview of CAG‘s audit as on 31.03.2021
65 15 80
Unlisted 65 15 80 Less: New SPSEs from which accounts for 2020-21 were not due
- - -
Number of SPSEs from which accounts for 2020-21 were due 65 15 80
Number of SPSEs which presented the accounts for CAG’s audit by 30 September 2021 for F Y 2020-21
11 2 13
Number of SPSEs whose accounts are in arrears 54 13 67
Break- up of SPSEs whose accounts are in Arrears
(i) Under Liquidati-on
15 0 15
(ii) Defunct 11 0 11
(iii)First Accounts not submitted
0 0 0
(iv) Others 28 13 41
Number of accounts in arrears 931 21 952
Age–wise analysis of arrears
One year (2020-21)
14* 8 22
Two years (2019-20 and 2020-21)
14** 2 16
Three years and more
903 11 914

State Public Sector Enterprises
State Finances Audit Report for the year ended March 2021
121
Delay in finalisation of accounts carries the risk of fraud and leakage of public money apart from violation of the provisions of the relevant statutes. In view of the above state of arrears of accounts, the actual contribution of the State PSUs to State GDP for the year 2020-21 could not be ascertained and their contribution to State exchequer was also not reported to the State Legislature. Hence, the Administrative Departments should strictly monitor and issue necessary directions to clear the arrears in accounts. The Government may also look into the constraints in preparing the accounts of the PSUs and take necessary steps to clear the arrears in accounts.
5.8 CAG’s oversight- Audit of Accounts and Supplementary Audit
5.8.1 Financial reporting framework
Companies are required to prepare the financial statements in the format laid down in Schedule III to the Companies Act, 2013 and in adherence to the mandatory Accounting Standards prescribed by the Central Government, in consultation with National Advisory Committee on Accounting Standards. The statutory corporations are required to prepare their accounts in the format prescribed under the rules, framed in consultation with the CAG and any other specific provision relating to accounts in the Act governing such corporations.
5.8.2 Audit of accounts of SPSEs by Statutory Auditors
The statutory auditors appointed by the CAG under Section 139 of the Companies Act 2013, conduct audit of accounts of the Government Companies and submit their report thereon in accordance with Section 143 of the Companies Act, 2013.
The CAG plays an oversight role by monitoring the performance of the statutory auditors in audit of public sector undertakings with the overall objective that the statutory auditors discharge the functions assigned to them properly and effectively. This function is discharged by exercising the power:
to issue directions to the statutory auditors under Section 143 (5) of the Companies Act, 2013; and to supplement or comment upon the statutory auditor's report under Section 143 (6) of the Companies Act, 2013.
5.8.3 Supplementary Audit of accounts of Government Companies
The prime responsibility for preparation of financial statements in accordance with the financial reporting framework prescribed under the Companies Act, 2013 or other relevant Act is of the management of an entity.

State Public Sector Enterprises
122 State Finances Audit Report for the year ended March 2021
The statutory auditors appointed by the CAG under section 139 of the Companies Act, 2013 are responsible for expressing an opinion on the financial statements under section 143 of the Companies Act, 2013 based on independent audit in accordance with the Standard Auditing Practices of Institute of Chartered Accountants of India (ICAI) and directions given by the CAG. The statutory auditors are required to submit the Audit Report to the CAG under Section 143 of the Companies Act, 2013.
The certified accounts of selected Government Companies along with the report of the statutory auditors are reviewed by CAG by carrying out a supplementary audit. Based on such review, significant audit observations, if any, are reported under Section 143 (6) of the Companies Act, 2013 to be placed before the Annual General Meeting.
5.9 Results of CAG’s oversight role
5.9.1 Audit of accounts of Government Companies/ Government Controlled Other Companies under Section 143 of the Companies Act, 2013
Financial statements for the year 2020-21 were received from eleven Government Companies and two Government Controlled Other Companies by 30 September 2021. Of these, accounts of eight Government Companies and two Government Controlled Other Companies were reviewed in audit by the CAG.
5.9.1.1 Revision of Auditors Report
As a result of supplementary audit of the financial statements for the year ended 31 March 2021 conducted by the CAG, the statutory auditors of one Government Company namely Odisha Coal and Power Limited (OCPL) revised their report before laying of the financial statements of the Company in its Annual General Meeting.
5.9.1.2 Significant comments of the CAG issued as supplement to the statutory auditors’ reports on Government Companies/Government Controlled Other Companies
Subsequent to the audit of the financial statements by statutory auditors which were received during the period from October 2020 to September 2021, the CAG conducted supplementary audit of the financial statements of the selected Government Companies and Government Controlled Other Companies. The list of SPSEs in respect of whom comments were issued is given in Appendix 5.10. Some of the significant comments issued on financial statements of Government Companies and Government Controlled Other Companies, the financial impact of which on the profitability was, ` 2.12 crore increase in profit and ` 191.22 crore increase in loss as also, increase in assets (` 192.66 crore) and decrease in liabilities (` 8.65 crore). These are detailed in Tables 5.20 to 5.23 below:

State Public Sector Enterprises
State Finances Audit Report for the year ended March 2021
123
Table 5.20: Significant comments on profitability of Government Companies
Sl. No.
Name of the Company
Comments
1 Odisha Hydro Power Corporation Limited (Standalone Financial Statement)
Financial Liabilities (Liability to Others) was understated by ` 9.96 crore with overstatement of Other Income by `9.96 crore due to adjustment of revenue from Water Resource Department (DoWR) which is pending for confirmation in violation to OHPC’s own Significant Accounting Policies. This also resulted in understatement of profit by same extent.
2 Odisha Coal and Power Limited
Expenses (Finance Cost) was understated by` 15.91 crore as the Company has failed to account for the interest on borrowed capital used for acquisition of land after its capitalization. This has also resulted in understatement of Loss for the year and overstatement of Capital Work in Progress by ` 15.91 crore (` 14.14 crore of 2018-19 + ` 1.77 crore in 2019-20). Though the same was pointed out in C&AG comment No. A(1) for the year ended 31 March 2018-19 no corrective action has been taken by the Management.
3. GRIDCO Limited I. Expenses (Cost of Power) was understated by ` 22.21 crore due to non-accounting of energy bills claimed by PGCIL, GKEL, OPGC and OHPC towards cost of power relating to the period 2017-18 to 2019-20, which were received before authentication of annual accounts and should have been accounted for as per Ind AS 10. Non-accounting of the same also resulted in understatement of current liabilities and loss for the year by ` 22.21 crore each.
II. Revenue from Operation was overstated by ` 53.75 crore due to wrong accounting of disputed energy bills of the M/s Vedanta Limited under the head Revenue from Operation in contravention of Ind AS 18. This has also resulted in overstatement of Trade Receivables and understatement of loss by `53.75 crore each.
4 Odisha Mineral Bearing Areas Development Corporation
The Project Expenses (SD& T E Department) were overstated by ₹ 2.52 crore with corresponding understatement of Loans and Advances by the same amount due to erroneous booking of advance given to the Skill Development and Technical Education (SD & TE) Department of Government of Odisha for which no Utilization Certificate has been obtained. This also resulted in overstatement excess of expenditure over income by the same amount.
5. Odisha State Seeds Corporation Limited
The other income (interest on deposit) includes ` 1.57 crore towards interest earned on the corpus fund kept under the ESCROW (Revolving) account. The Government of Odisha in Agriculture Department had constituted (14 May 2015) a corpus fund for Odisha State Seeds Corporation Limited and had sanctioned` 60.00 crore for that purpose. Para 6(xi) of

State Public Sector Enterprises
124 State Finances Audit Report for the year ended March 2021
Sl. No.
Name of the Company
Comments
Government notification regarding constitution of corpus fund stipulates that the interest accruing from this corpus fund would also form a part of the fund and it should be available exclusively for the seeds/quality planting materials business. Hence the interest of ` 1.57 crore earned on the corpus fund (` 60.00 crore) should not have been considered as income of the corporation. This has resulted in overstatement of other income as well as profit by ` 1.57 crore and understatement of short term borrowing to that extent.
6. Odisha State Warehousing Corporation
According to comment no.1 of comments of C&AG of India, issued on the accounts of the Corporation for the year 2017-18, the Corporation was required to account for the misappropriated food grains of ` 1.22 crore at two warehouses viz. Durgapalli and Balasore by the employees during the year 2017-18. In spite of the comment, the Corporation has neither accounted for nor disclosed the misappropriation of food grains by the employees of the Corporation in the accounts for the year 2018-19. This has resulted in understatement of provision for disallowance by the depositor and overstatement of profit by `1.22 crore with corresponding understatement of current liabilities to that extent.
7. Odisha State Beverages Corporation Limited
Other expenses (Go down rent and insurance) is understated by `2.18 crore due to non-accounting of provision for payment of interest on unpaid rent payable to OIL Odisha in respect of Khurda Go down. This has also resulted in understatement of Other Current Liability and overstatement of profit to the same extent.
8. Odisha Power Transmission Corporation Limited
i. Other Income (Deferred income for assets received from customer) is overstated by ` 1.96 crore with corresponding understatement of liability (deferred income) due to wrong recognition of depreciation withdrawn on asset created out of equity support of Government of Odisha as deferred income in the financial statements, by same amount. This also resulted in understatement of loss of the Company by ` 1.96 crore.
ii. Current Liabilities (Provisions) were understated by `2.73 crore due to short provision of obligation towards gratuity to match with actuarial valuation as on 31st March 2020 with corresponding understatement of Employees benefit expenses by the same amount. This also resulted in understatement of loss by `2.73 crore.
iii. Employee benefit expenses (ex-gratia) is understated by `5.20 crore with corresponding understatement of provision by same amount due to non-provision of liability towards payment of one time lump-sum Ex-gratia for the FY 2019-20 to all eligible employees of OPTCL.
9 GRIDCO Limited i. Expenses (Cost of Power) was understated by `4.00 crore due

State Public Sector Enterprises
State Finances Audit Report for the year ended March 2021
125
Sl. No.
Name of the Company
Comments
2020-21 to non-provision of capacity charges payable to Vedanta Ltd as per order of OERC. This has resulted in understatement of cost of power by ` 4.00 crore and corresponding understatement of loss to the same extent. This has also resulted in understatement of current liability by ` 4.00 crore.
ii. Expenses (Cost of Power) is understated by ` 23.26 crore due to non-provision for Delayed Payment Surcharge (DPS) payable to Power Grid Corporation of India Limited (PGCIL). This has resulted in understatement of cost of power by ` 23.26 crore and corresponding understatement of loss to the same extent. This has also resulted in understatement of current liability by ` 23.26 crore.
10 IDCOL Kalinga Iron Works Limited
Other expenses do not include (i) ₹ 2.32 crore towards payment of Royalty, Contributions to District Mineral Foundations (DMF) and National Mineral Exploration Trust (NMET) on the sale of iron ore made out of Roida ‘C’ Mines and (ii) `6.69 crore towards raising contractor’s bill, salary of employees engaged in mining operations and vehicle hiring expenses, for the period from April 2019 to June 2019. This has resulted in understatement of “Other Expenses” and “Losses” by `9.01 crore (` 2.32 crore + ` 6.69 crore) each.
11 Industrial Development Corporation of Odisha Limited
Other expenses were overstated by ` 1.67 crore being inclusion of expenditure on payment of Royalty, DMF and NMET on sales of Iron Ore from Roida ’C’ mines pertaining to IDCOL Kalinga Iron Works Limited (IKIWL) for the period from April 2019 to June 2019. This has resulted in understatement of Profit for the year to the tune of ` 1.67 crore.
Table 5.21: Significant comments on Financial Position of Government Companies
Sl. No.
Name of the Company
Comments
1 Odisha Power Generation Corporation Limited (Standalone Financial Statement)
Non-Current Assets (Building) was understated by ` 16.98 crore due to non-capitalization of assets created and handed over to the management under the expansion project 3 & 4 during the FY 2019-20. This also resulted in overstatement of CWIP to the same extent. Further due to non-capitalization of these assets the depreciation on these fixed assets has been understated to the extent of ` 7.32 lakh with corresponding understatement of loss to the same extent.
2. Odisha Hydro Power Corporation Limited
Current Liabilities (Payable to APGENCO on Machhakund A/C) was understated by ` 1.66 crore due to non-payment of bill of APGENCO i.e. 30 per cent cost towards construction of E-type and F-type blocks in respect of Machhakund Project with

State Public Sector Enterprises
126 State Finances Audit Report for the year ended March 2021
Sl. No.
Name of the Company
Comments
(Standalone Financial Statement)
corresponding understatement of PPE by same amount.
3. Odisha Coal and Power Limited
Non-Current Assets (Other Non-Current Assets) was understated by` 45.66 crore (` 42.05crore of 2018-19 +` 3.61 crore in 2019-20) with corresponding overstatement of Capital Work in Progress by` 45.66 crore due to non-capitalization of borrowing cost. Further, other expenses is understated by` 2.92 crore (` 1.40 crore for 2018-19 +` 1.52 for 2019-20) with corresponding understatement of loss to the same extent due to non-accounting of amortisation of land on the above amount.
4. Odisha Mineral Bearing Areas Development Corporation
Current Assets (Accrued interest) were understated by an amount of ` 291.54 crore due to non-accountal of accrued interest in respect of nine Auction Treasury Bills (ATBs) invested for a period of 364 and 182 days on different dates during 2019-20, in violation of Para No. 2.1 of the Significant Accounting Policy of the Company. This also resulted in understatement of Other Income and Reserve & Surplus by `291.54 crore each.
5. Odisha State Financial Corporation Limited
Capital & Liabilities (Borrowings) does not include ` 4.76 crore being the interest accrued on the default and delayed payment of OTS installment amounting to ₹42 crore in accordance with the OTS agreement made with SIDBI. This has resulted in understatement of “Other Financial Expenses”, “Borrowings” and “Operating Loss” by ` 4.76 crore.
6. Odisha Small Industries Corporation
Current Liabilities (Other Current Liabilities) does not include ₹1.75 crore being the pending dues payable to M/s Cable India Private Limited as per the order (05.12.2018) of MSEFC, Cuttack. This has resulted in understatement of other current liabilities by ₹ 1.75 crore and overstatement of profit to the same extent.
7. Odisha State Medical Corporation Limited
I. Current Liabilities (Short Term Provision) included an amount of ` 3.84 crore towards provision for income tax for the year 2017-18. The Deputy Commissioner of income tax computed the tax on income filed by the company for the financial year 2017-18 and passed (17.11.2019) the summary assessment order of income tax for the Company. So the provision for income tax liability for the financial year 2017-18 should have been written back as the order was passed by the assessing officer in the month of November 2019. The resulted in overstatement of Current Liability by ` 3.84 crore with corresponding overstatement of TDS on Bank interest to the same extent
II. The Additional Chief Secretary to Government of Odisha in Finance Department issued (17 February 2016) guideline for the payment of dividend by the State Public Sector undertaking (SPSU). According to the guidelines, a SPSU would pay the

State Public Sector Enterprises
State Finances Audit Report for the year ended March 2021
127
Sl. No.
Name of the Company
Comments
annual dividend of 30 per cent of the profit after tax (PAT) or 30 per cent equity of the State Government., whichever is higher. The profit of the Company after tax was ` 9.78 crore for the year 2019-20 and the equity share of the Company was ` 1.000 lakh as on 31 March 2020. Accordingly, the Company is liable to pay dividend of ` 3.00 crore and dividend distribution tax of ` 0.62 crore (@ 20.56 % of Dividend) for the year 2019-20. However, in contravention to the above guideline, the company did not make any provision for dividend and dividend distribution tax for the financial year 2019-20. This resulted in overstatement of Reserve and Surplus by ` 3.62 crore with consequential understatement of provision for dividend by ` 3 crore and provision for dividend distribution tax by ` 0.62 crore for the year 2019-20.
8. Odisha State Warehousing Corporation
(i) According to comment no.3 of C&AG of India, issued on the accounts of the Corporation for the year 2017-18, the Corporation was required to make provision of ` 1.57 crore towards doubtful recovery of storage loss of 15 depots for the period from February 2011 to March 2017 under Private Entrepreneur Guarantee (PEG) Scheme. In spite of the comment, the Corporation has not made any provision of doubtful recovery in the accounts for the year 2018-19. This has resulted in understatement of provision for disallowance by depositors and understatement of other liabilities by ` 1.57 crore with corresponding overstatement of profit to the same extent. (ii) As per para 63 of the Accounting Standard (AS)-15
(revised in 2005), an entity shall recognize the net defined benefit liability in the balance sheet. The present value of obligation of the Corporation towards gratuity for the year ended 31 March 2019 was ` 12.53 crore against which the fair value of the plan assets was ` 11.31 crore. Thus, the net liability of ` 1.22 crore should have been recognized in the balance sheet as per gratuity valuation report for the financial year 2018-19. This has resulted in understatement of other liabilities by ` 1.22 crore with corresponding overstatement of profit to the same extent.
(iii) Sundry Debtors (Amount deducted by the FCI for differential H&T rates) was overstated by ` 16.29 crore due to non-provision of doubtful recovery of the amount deducted by Food Corporation of India (FCI) towards excess Handling and Transportation (H&T) charges for non-finalisation of H&T contract during the extended period of contract 2015-17. This has resulted in overstatement of sundry debtors and understatement of Handling and Transport charges by ` 16.29

State Public Sector Enterprises
128 State Finances Audit Report for the year ended March 2021
Sl. No.
Name of the Company
Comments
crore with consequential overstatement of profit to the same extent.
9. Odisha State Beverages Corporation Limited
Capital work in Progress (Intangible assets under development) was overstated by ` 2.90 crore due to wrong accounting of advance given to Bridge & Roof Co. (India) Ltd., NBCC and OCAC for construction of go downs at Khurda and Sonepur respectively. This has also resulted in understatement of advance to contractors to the same extent.
10 Odisha Power Transmission Corporation Limited
Equity (Other Equity) was overstated by ` 15.00 crore with corresponding understatement of loan to the same extent due to wrong accounting of Government loan as other equity in anticipation of the approval of the Government to convert loan into grant.
11 Industrial Promotion and Investment Corporation of Odisha Limited
I. Non-Current Investment includes ` 88.87 crore being impairment value of investment in Neelachal Ispat Nigam Limited (NINL). As per provisions in para no. 1.6.2 of the Significant Accounting Policies (Note-20). On Investments, if audited accounts at the year-end in respect of investee companies are not available, entire investment is to be valued at Rupee 1/-. Hence, the Company should have been impaired entire investment of NINL at ` 1/- as per above policy. This has resulted in overstatement of Non-current Assets and Non-current liabilities by ` 88.87 crore.
II. Long term loans and advances (advance to OSEB (Bond Accounts) includes ` 3.48 crore being the amount spent towards installation of 220KV Transformer and 6 nos. 33KV bays at Duburi Sub-station out of the advance received from state government (Bond Account) which have already been completed. This was in properly accounted under the above head. This has resulted in overstatement of above head as well as non-current liabilities by an equal amount of ` 3.48 crore
Table 5.22: Significant comments on Disclosure
Sl. No.
Name of the Company
Comments
1 Odisha Power Generation Corporation Limited Standalone Financial Statement)
A reference is invited to Paragraph No.2.12 (inventories) of Significant Accounting Policies where in it is stated that “Transit and handling losses/gain arises on physical
verification including carpeting of coal are included in the
cost of coal”. However, as per the Power Purchase Agreement of the Company, the normative transit and handling losses is 0.2% of the coal dispatched by the coal supply company and is to be considered for calculation of Energy Charge. Thus, any loss beyond 0.2% is abnormal loss and as per Para 16(a) of Ind AS-2, should be excluded from the inventory and to be

State Public Sector Enterprises
State Finances Audit Report for the year ended March 2021
129
Sl. No.
Name of the Company
Comments
recognized as expenses. Hence, transit and handling losses should be limited to normative transit and handling losses and the policy needs to be suitably modified accordingly.
Further, as disclosed in Note-30 (ii) and (iii) the quantity of coal consumption for Unit-3 & 4 including shortage has been shown as 29,45,572.18 MT (22,81,522.58 MT+6,64,049.60MT) but as per Physical Verification Report the quantity of coal consumption is 33,10,130.80 MT which needs reconciliation. Similarly, in Note-30 the amount of coal consumption has been shown as ` 869.44 crore but in the detail explanation to Note-30 (Para- i, ii and iii) the total amount shown as ` 870.30 crore (`380.24 crore + ` 378.60 crore + ` 111.46 crore) which needs reconciliation.
2. Odisha Hydro Power Corporation Limited (Standalone Financial Statement)
Disclosure made on contingent Liability is understated by ` 0.83 crore as interest on working capital claimed by APGENCO on Machhkund Project has not been accounted for.
3. Odisha Forest Development Corporation Limited
The Company has disclosed an amount of ` 24.98 crore as Contingent Liability against the total demand of ` 46.42 crore by the Income Tax Department towards tax and interest from the Assessment Year 2009-10 to 2017-18. This has resulted in understatement of Contingent Liability under the head of Income Tax & Penalty by ` 21.44 crore.
4 Odisha Thermal Power Corporation Limited
The coal based thermal power plant proposed to be set up by the Company in one of the identified area (Rengali, Odisha) was cancelled due to restriction imposed by the Ministry of Environment, Forest and Climate Change (MoEF & CC), Govt. of India. Accordingly, the Company decided to stop all the ongoing work and issued a foreclosure notice to one of the ‘consultants’ M/s Visiontek Consultancy Services Pvt. Limited and requested to prefer its claim for payment of work done till the cancellation of the contract. However, the consultant disputed the matter and went into an arbitration for a claim amounting to ` 6.07 crore. The Company paid ` 1.34 crore against the claim of ` 6.07 crore to the consultant and went for a Special Leave Petition before the Hon’ble Supreme Court of India (SCI) in March 2020. Since the balance amount of ` 4.73 crore payable to the consultant is uncertain and dependent on the future decision of the apex court, the amount should have been disclosed as contingent liability in the Financial Statements of the Company as per the provisions of Ind AS 37.
5 GRIDCO (i) M/s Vedanta was not supplied with sufficient quantum

State Public Sector Enterprises
130 State Finances Audit Report for the year ended March 2021
Sl. No.
Name of the Company
Comments
Limited of Linkage Coal to generate state entitlement of power supply to GRIDCO. But IPP was making false submission of Declared Capacity to SLDC during the period from 06.01.2020 to 29.01.2020 in absence of sufficient Linkage Coal supply and raised as usual bill to GRIDCO. The said claim was denied and disputed by GRIDCO vide letter No dated 15.02.2020 and 27.05.2020. M/s Vedanta Ltd. filed petition in OERC on this matter. As the matter is sub-judice, the claim of M/s Vedanta Limited amounting to ` 21.64 crore should have been shown as Contingent Liabilities. (ii) M/s GKEL-IPP filed petition with CERC and the Commission directed (04.02.2020) GRIDCO to pay the capacity charges to GKEL based on the corrected PAFM for the period 01.04.2015 to 31.03.2017 for an amount of ` 117 crore along with late payment surcharges of ` 76 crore. The said order of CERC was challenged by GRIDCO in APTEL. But the Company showed ` 123.76 crore as contingent liability instead of total ` 193.00 crore, resulted in understatement of contingent liabilities by ` 69.24 crore.
6 Odisha State Seeds Corporation Limited
946 quintals of paddy seeds were stolen from the Kotpad godown on 11.5.2017 for which FIR was lodged on 11 March 2018. Police treated it as a false case under 457/380 IPC and the matter is sub-judice before JMFC Kotpad (Case No.GR.82 of 2017). This should have been suitably disclosed in the Notes on Accounts forming part of financial statements. The Notes on Accounts is deficient.
7 Odisha State Warehousing Corporation
(i) Sundry Debtors include ` 0.54 crore receivable from Women and Child Development Department, Government of Odisha towards storage and allied charges since 2009 under the head ‘Outstanding Warehousing Charges against various depositors’. As the Corporation could not produce the debtor’s confirmation certificate for the amount shown as receivable, the same should have been suitably disclosed in the Notes on Accounts forming part of financial statements. The Notes on Accounts is deficient to that extent.
(ii) In OSWC Durgapalli 1,194 bags (597 qtl.) of rice were damaged and decision was taken in the 159th Board of Directors meeting for its disposal. As per proceeding (8 June 2020) of the meeting of the tender committee for disposal of damaged rice stock lying at SWC, Durgapalli decision was taken for disposal of the damaged rice stock @ ` 915 per quintal; the cost of which comes to ` 15,09,371 (@ ` 2,528.26 qtl). This should have been suitably disclosed in the Notes on accounts forming part of financial statements. The Notes on Accounts is therefore, deficient to that extent.

State Public Sector Enterprises
State Finances Audit Report for the year ended March 2021
131
Sl. No.
Name of the Company
Comments
8 Odisha Power Transmission Corporation Limited
As per the Paragraph 39 (b) of Ind AS-20 relating to Accounting for Government Grants and Disclosure of Government Assistance, the nature and extent of Government grants recognized in the financial statements and an indication of other forms of Government assistance from the entity directly benefited should be disclosed in the financial statements. However, fixed assets include assets valuing ` 262.96 crore created out of the Government Grants has not been disclosed to the notes forming part of the financial statements. Further, the depreciation on these assets amounting to ` 12.89 crore has also not been disclosed in the accounts as deferred income.
9 GRIDCO Limited
a. Jindal Stainless Steel Limited (JSSL) has claimed an amount of ` 133.47 crore (` 44.17 crore towards arrear energy bill + ` 89.30 crore for DPS) which was not agreeable to GRIDCO. As a result, JSSL has filed a petition before Hon’ble OERC which is yet to be finalized. As the matter is sub-judice the claim of JSSL amounting to ` 133.47 crore should have been shown under Contingent Liabilities. Non-disclosure of the same has resulted in understatement of the Contingent Liabilities by ` 133.47 crore. b. Appellate Tribunal for Electricity in its judgment dated 15th October 2020 directed GRIDCO to refund an amount of ` 359.69 Crore to NTPC within 7 days towards fixed cost of BARH-II generating units of NTPC. GRIDCO challenged the order of Appellate Tribunal in Supreme Court of India. Due to non-payment of the disputed amount of ` 359.69 crore NTPC charged Late Payment Surcharge (LPSC) of ` 164.17 Crore on the outstanding dues which was recognized by GRIDCO but no accounting effect was given. Considering the Court case, the same should have been shown under Contingent Liabilities. Due to non-disclosure of the claim of LPSC, the Contingent Liabilities have been understated by ` 164.17 Crore. c. Kanti Bijlee Utpadan Nigam Limited claimed outstanding dues of ` 229.46 crore and LPSC on outstanding dues as ` 61.11 crore as on 31.03.2021 as per CERC tariff order. GRIDCO recognized the outstanding electricity bill as ` 229.45 crore and made provision for the same. However, the LPSC on the outstanding dues was not recognized by GRIDCO. As the matter is pending before the Hon’ble OERC and CERC, the same should have been shown under Contingent Liabilities. Due to non-recognition of LPSC, the Contingent Liabilities have been understated by ` 61.11 crore.
10 IDCOL Ferro Chrome And Alloys
A reference is invited to paragraph D3 of Notes on Accounts in which it was specified that, out of total receipt of Government Grant of ` 12,99,99,000,₹ 4,89,06.809 has been utilized till the

State Public Sector Enterprises
132 State Finances Audit Report for the year ended March 2021
Sl. No.
Name of the Company
Comments
Limited (IFCAL)
financial year 2019-20 of which₹.2,25,000,00 (Metal Recovery Plant) is shown under Reserves and Surplus (Note-2) and the balance of ₹ 2,64,06,809 is accounted as fixed assets. As no fixed assets amounting to ₹ 2.64 crore under Govt. Grant is shown in the Asset Schedule (Note-10), the disclosure is deficient to this extent.
11 Industrial Development Corporation of Odisha Limited
The sales tax & GST does not include an amount of ₹ 2.12 crore being Penalty and Interest on Sales Tax & GST in respect of the subsidiary company IDCOL Kalinga Iron Works Limited (IKIWL) as demanded by Tax Authority and subsequent appealing of IKIWL before the 1st Appellate Authority against the demand.
Table 5.23: Significant comments on Auditor’s Report
Sl. No.
Name of the Company
Comments
1. Odisha State Financial Corporation Limited
A reference is invited to the para no. 2 of the report wherein, it is mentioned that, the Corporation’s Management is responsible for the matters stated in Section 134 (5) of the Companies Act, 2013 (“the Act”) with respect to the preparation of these Financial Statements that give a true and fair view of the financial position, financial performance and cash flows of the Corporation in accordance with the accounting standards and principles generally accepted in India including the Accounting Standards specified under Section 133 of the Act, read with Rule 7 of the Companies (Accounts) Rules, 2014. However, the fact is that, the Corporation’s Management neither preparing their financial statements in accordance with the provisions of the above Act nor required to do so as per the earlier clarification of SIDBI vide letter no. 17209 dated 21 May 2012. Hence, the Auditor’s Report is deficient to that extent.
2. Odisha Small Industries Corporation
A reference is invited to the para no. 5 (A) of the Independent Auditor’s Report wherein it is mentioned that, the Company is not maintaining any Fixed Asset Register. However, the Company is maintaining a Fixed Asset Register without recording individual item wise assets nomenclature, which is not proper. Hence, instead of highlighting the faulty procedure adopted in maintaining the requisite register, the qualification of the Independent Auditor on non-maintenance of Fixed Asset Register is not proper. Hence, the Independent Auditor’s Report is deficient to this extent.
3 Odisha State Beverages Corporation Limited
As per Rule 158 of the Odisha Excise Rules 2017, the accounting of issuance and end utilization of EALs on liquor products from manufacturing to retail point is required to be maintained.

State Public Sector Enterprises
State Finances Audit Report for the year ended March 2021
133
Sl. No.
Name of the Company
Comments
The Corporation is responsible for maintaining the data base for supply chain management of all liquor products sold to retailers in the State, and the Excise Department does not maintain any separate database of its own, for this purpose. Under Rule 158, the Corporation has also been assigned the responsibility of requisitioning the number of EALs required to be issued to suppliers from outside the State.
In response to the queries of the Independent Auditor in pursuance of the Sub-Directions issued under Section 143 (5) of the Companies Act 2013, the Corporation has stated that it has not been assigned any responsibility for monitoring the issuance and end utilization of Excise Adhesive Labels (EALs) and hence, has not adopted any internal controls for such monitoring.
In the absence of internal controls for monitoring the utilization of EALs affixed on the liquor products received in the depots of the Corporation, there are material revenue risks to the Corporation (Profit Margin) and to the State Government (Value Added Tax) due to
Direct sale at retail point by liquor suppliers, by affixing unutilized EALs on liquor products, without routing them through the supply chain involving the Corporation.
Diversion of Excise Duty paid liquor products from the depots of the Corporation, in view of the deficient storage and documentation controls reported by the Independent Auditor.
5.10 Non Compliance with provisions of Accounting Standards/IND AS
In exercise of the powers conferred by Section 469 of the Companies Act, 2013, read with Section 129 (1), Section 132 and Section 133 of the said Act, the Central Government prescribed Accounting Standards 1 to 7 and 9 to 29. Besides these, the Central Government notified 41 Indian Accounting Standards (Ind AS) through Companies (Indian Accounting Standards) Rules, 2015 and Companies (Indian Accounting Standards) (Amendment) Rules, 2016.
The statutory auditors reported that six companies as detailed in Appendix 5.11 did not comply with mandatory Accounting Standards/Ind AS.
During the course of supplementary audit, the CAG observed that the following companies had also not complied with the Accounting Standards/Ind AS which were not reported by their statutory auditors as detailed in Table 5.24.

State Public Sector Enterprises
134 State Finances Audit Report for the year ended March 2021
Table 5.24: Non-compliance to Accounting Standards/Ind AS observed during supplementary audit
Accounting Standard/Ind AS Name of the Company
Deviation
AS 12 Wrong accounting of intangible asset acquired out of Grants.
Industrial Promotion and Investment Corporation of Odisha Limited
The Company had wrongly accounted an intangible asset of GO-Swift Software Portal in violation of AS 12 during 2019-20 resulting in understatement of Non-current liabilities and overstatement of Current Liabilities by an amount of ₹ 54.41 lakh.
Ind AS 12
Non-Disclosure of Fixed Assets created out of Government Grants
Odisha Power Transmission Corporation Limited
The company did not disclose fixed assets of ₹ 262.96 crore created out of Government Grants in the notes to accounts forming part of the Financial Statements. Similarly, depreciation of ₹ 12.89 crore on that asset has not been disclosed in the accounts as deferred income.
Ind AS 37
Non-Disclosure of Contingent Liabilities
Odisha Thermal Power Corporation Limited
The Company has not disclosed its contingent liability of ₹ 4.73 crore against a disputed claim of the consultant, the special leave petition of which is pending before Hon’ble Supreme Court.
Ind AS 10
Non accounting of energy bills claimed by the Generating Companies
GRIDCO Limited
The company has not accounted for energy bills claimed by PGCIL, GKEL,OPGC and OHPC towards cost of power relating to the period 2017-18 to 2019-20 in violation of Ind AS 10.
Ind AS18 Wrong accounting of disputed energy bills
GRIDCO Limited
The company has wrongly accounted for disputed energy bills of M/S Vedanta Limited as Revenue from operation in contravention of Ind AS 18 resulting in overstatement of Revenue from operation and Trade Receivables by ₹ 53.75 crore each.
AS 2 Wrong valuation of Inventories
Odisha Small Industries Corporation Limited
The company has valued all its inventories at net realizable value instead of cost or net realizable value whichever is lower in violation of Accounting Standard 2.
5.11 Management Letters
One of the objectives of financial audit is to establish communication on audit matters arising from the audit of financial statements between the auditor and those charged with the responsibility of governance of the corporate entity.
The material observations on the financial statements of PSEs were reported as comments by the CAG under Section 143 (5) of the Companies Act, 2013. Besides these comments,

State Public Sector Enterprises
State Finances Audit Report for the year ended March 2021
135
irregularities or deficiencies observed by CAG in the financial reports or in the reporting process were also communicated to the management through a ‘Management Letter’ for taking corrective action. These deficiencies generally related to:
application and interpretation of accounting policies and practices; adjustments arising out of audit that could have a significant effect on the financial
statements; and inadequate or non-disclosure of certain information on which management of the
concerned PSE gave assurances that corrective action would be taken in the subsequent year.
During the year, CAG issued ‘Management Letters’ to 26 SPSEs as listed in Appendix 5.12.
5.12 Recommendation
State Government may ensure timely submission of Financial Statements of SPSEs, as in the absence of finalisation of accounts, Government investments in such SPSEs remain outside the oversight of the State Legislature.
Bhubaneswar (BIBHUDUTTA BASANTIA)
The 16th March 2022 Principal Accountant General (Audit-I), Odisha
COUNTERSIGNED
New Delhi (GIRISH CHANDRA MURMU)
The 24th March 2022 Comptroller & Auditor General of India


State Public Sector Enterprises
104 State Finances Audit Report for the year ended March 2021
Appendices

State Public Sector Enterprises
State Finances Audit Report for the year ended March 2021
105
APPENDIX 1.1 (Paragraph 1.1)
A brief profile of Odisha

Appendices
State Finances Audit Report for the year ended March 2021
137
Appendix 1.1 (Refer Introductory Para in Chapter I)
A brief profile of Odisha
A. General Data Particulars Figures
1 Area 1,55,707 Sq. Km
2 Population
a. As per 2001 Census 3.68 crore b. As per 2011 Census 4.20 crore
3 Density of Population41 (as per 2011 Census). (All India Density = 382 persons per Sq. Km ) 270 persons per Sq. Km
4 Population below poverty line42 (BPL) (All India Average = 21.9 per cent) 32.59 per cent 5 Literacy43 ( as per 2011 Census) (All India Average = 73.0 per cent ) 72.90 per cent
6 Infant mortality44(per 1000 live births) . (All India Average = 30 per 1000 live births )
38.00
7 Life Expectancy at birth45. (All India Average = 69.4 years) 69.3 years
8 Human Development Index
a. 2018 (All India = 0.642) 0.606 b. 2019 (All India = 0.645) 0.606
9 Gross State Domestic Product (GSDP) 2020-21 at current price 5,09,574
10 Per Capita GSDP CAGR (2011-12 to 2020-21)
Odisha 8.97 General Category States 8.08
11 GSDP CAGR (2011-12 to 2020-21 Odisha 10.01 All India 9.48
12 Population Growth (2011 to 2021) Odisha 8.67
All India 12.30
B. Financial Data Particulars
CAGR 2011-12 to 2019-20 2019-20 to 2020-21
General Category States Odisha General
Category States Odisha
(In per cent) a. of Revenue Receipts. 11.61 12.26 -4.56 2.78 b. of Own Tax Revenue. 9.88 11.59 -4.43 6.01 c. of Non Tax Revenue. 13.20 10.81 -35.60 33.25 d. of Total Expenditure. 12.18 14.88 4.54 -4.82 e. of Capital Expenditure. 10.10 19.68 -2.36 -11.48 f. of Revenue Expenditure on Education. 11.18 12.26 -1.19 -0.01 g. of Revenue Expenditure on Health. 15.33 19.96 14.51 27.50 h. of Salary and Wages. 10.18 11.17 2.27 1.55 i. of Pension. 13.31 14.77 6.02 -4.51
41 Census Info India 2011 Final Population Totals 42 Economic Survey 2020-21 Govt of India 43 Economic Survey 2020-21 Govt of India 44 Economic Survey 2020-21 Govt of India 45 Economic Survey 2020-21 Govt. of India

Appendices
138 State Finances Audit Report for the year ended March 2021
APPENDIX - 1.2 (Paragraph 1.1)
Structure and Form of Government Accounts
Part A: Structure and Form of Government Accounts
Structure of Government Account: The accounts of the State Government are kept in three parts (i) Consolidated Fund, (ii) Contingency Fund and (iii) Public Account. Part I:Consolidated Fund: All revenues received by the State Government, all loans raised by issue of treasury bills, internal and external loans and all moneys received by the Government in repayment of loans shall form one consolidated fund entitled ‘The Consolidated Fund of State’ established under Article 266(1) of the Constitution of India.
Part II: Contingency Fund: Contingency Fund of the State established under Article 267(2) of the Constitution is in the nature of an imprest placed at the disposal of the Governor to enable him to make advances to meet urgent unforeseen expenditure, pending authorisation by the Legislature. Approval of the Legislature for such expenditure and for withdrawal of an equivalent amount from the Consolidated Fund is subsequently obtained, whereupon the advances from the Contingency Fund are recouped to the Fund.
Part III: Public Account: Receipts and disbursements in respect of certain transactions such as small savings, provident funds, reserve funds, deposits, suspense, remittances etc., which do not form part of the Consolidated Fund, are kept in the Public Account set up under Article 266(2) of the Constitution and are not subject to vote by the State Legislature.
PART B: Layout of Finance Accounts Statement No. About
Volume – I
1 Statement of Financial Position
2 Statement of Receipts and Disbursements
Annexure A. Cash Balances and Investment of Cash Balances
3 Statement of Receipts (Consolidated Fund)
4 Statement of Expenditure (Consolidated Fund)
5 Statement of Progressive Capital Expenditure 6 Statement of Borrowings and other Liabilities 7 Statement of Loans and Advances given by the Government 8 Statement of Investments of the Government 9 Statement of Guarantees given by the Government
10 Statement of Grants-in-Aid given by the Government 11 Statement of Voted and Charged Expenditure 12 Statement on Sources and Application of funds for expenditure other than revenue
account
13 Summary of Balances under Consolidated Fund, Contingency Fund and Public
Account
Volume – II
14 Detailed Statement of Revenue and Capital Receipts by Minor heads
15 Detailed Statement of Revenue Expenditure by Minor heads
16 Detailed Statement of Capital Expenditure by Minor heads and Sub heads
17 Detailed Statement of Borrowings and Other Liabilities
18 Detailed Statement of Loans and Advances given by the State Government
19 Detailed Statement of Investments of the Government
20 Detailed Statement of Guarantees given by the Government
21 Detailed Statement on Contingency Fund and Other Public Account transactions
22 Detailed Statement on Investment of Earmarked Funds

Appendices
State Finances Audit Report for the year ended March 2021
139
APPENDIX – 2.1 (Refer paragraph 2.1)
Abstract of receipts and disbursements for the year 2020-21 (` in crore)
2019-20 Receipts 2020-21 2019-20 Disbursements 2020-21 Administ
rative Programme Total
Section A: Revenue 1,01,567.75 I. Revenue
Receipts 1,04,387.24 99,137.30 I. Revenue
Expenditure- 47,151.13 48,159.72 95,310.85
32,315.18 Tax Revenue 34,258.17 28,600.98 General Services 27,853.47 417.78 28,271.25 -- -- 43,516.66 Social Services- 14,892.42 25,008.61 39,901.03
14,647.20 Non-Tax Revenue 19,518.06 17,228.16 Education, Sports, Art and Culture
10,670.06 6,572.38 17,242.43
-- -- 5,681.23 Health and Family Welfare
2,497.63 4,746.01 7243.64
30,453.27 State’s Share of Union Taxes
27,542.67 6,844.49 Water Supply, Sanitation, Housing and Urban Development
883.54 3,960.58 4,844.12
-- -- 89.86 Information and Broadcasting
30.64 41.70 72.34
-- Non-Plan Grants -- 2,457.83 Welfare of Scheduled Castes, Scheduled Tribes and Other Backward Classes
538.89 1,574.47 2,113.36
-- Grants for State Plan Schemes
-- 125.60 Labour and Labour Welfare
66.34 44.89 111.23
-- -- 10,860.76 Social Welfare and Nutrition
42.89 7,947.93 7,990.82
-- Grants for Central and Centrally Sponsored Plan Schemes
-- 228.72 Others 162.43 120.65 283.08
-- -- 25,585.61 Economic Services-
4,405.24 21403.54 25,808.78
13,055.62 Grants for Centrally Sponsored Scheme
12,697.75 10,991.80 Agriculture and Allied Activities
1,340.55 7,228.38 8,568.93
-- -- 9,736.97 Rural Development
34.30 11,309.27 11,343.57
3,563.33 Finance Commission Grants
4,949.00 2.90 Special Areas Programmes
-- 8.38 8.38
-- -- 1,305.47 Irrigation and Flood Control
1,070.61 614.53 1,685.14
7,533.15 Other Transfer/Grants to States
5,421.59 57.10 Energy 7.99 30.46 38.45
-- -- 746.11 Industry and Minerals
123.38 633.65 757.03
-- -- 1,889.23 Transport 1,625.84 631.44 2,257.28 -- -- 75.16 Science,
Technology and Environment
21.30 82.64 103.94
-- -- 780.87 General Economic Services
181.27 864.79 1,046.06
-- -- 1,434.05 Grants-in-aid and Contributions-
-- 1,329.79 1,329.79
II. Revenue deficit carried over to
2,430.45 II. Revenue Surplus carriedover
-- -- 9,076.39

Appendices
140 State Finances Audit Report for the year ended March 2021
2019-20 Receipts 2020-21 2019-20 Disbursements 2020-21 Administ
rative Programme Total
Section B : Capital 38,134.48 III. Opening Cash
balance including Permanent Advances and Cash Balance Investment
42,437.50 -- III. Opening Overdraft from Reserve Bank of India
-- -- --
-- IV. Miscellaneous Capital Receipts
-- 20,277.28 IV. Capital Outlay-
91.66 17,857.32 17,948.98
-- -- 805.56 General Services- 30.09 837.86 867.95 -- -- 5,263.84 Social Services- 0.65 4,522.76 4,523.41
-- -- 758.63 Education, Sports, Art and Culture
(-)0.20 581.57 581.37
-- -- 504.09 Health and Family Welfare
-- 630.92 630.92
-- --
3592.19 Water Supply, Sanitation, Housing and Urban Development
0.85 2,728.71 2,729.56
-- -- -- Information and Broadcasting
-- -- --
-- --
153.30 Welfare of Scheduled Castes, Scheduled Tribes and Other Backward Classes
-- 268.79 268.79
-- -- 23.80 Social Welfare and Nutrition
-- 100.70 100.70
-- -- 231.83 Others -- 212.07 212.07
-- -- 14,207.87 Economic Services-
60.92 12,496.70 12,557.62
-- -- 215.05 Agriculture and Allied Activities
-- 322.72 322.72
-- -- 348.46 Rural Development
-- 17.34 17.34
-- -- 149.37 Special Areas Programmes
-- 214.13 214.13
-- -- 4,748.41 Irrigation and Flood Control
-- 3,108.42 3,108.42
-- -- 2,134.40 Energy -- 1,284.14 1,284.14
-- -- 1.73 Industry and Minerals
-- 1.61 1.61
-- -- 6,465.83 Transport -- 6,670.99 6,670.99
-- -- 144.62 General Economic Services
60.92 877.35 938.27
287.16 V. Recoveries of Loans and Advances-
684.22 1,259.31 V. Loans and Advances disbursed-
95.44 1,501.74 1,597.18
-- From Power Projects
-- 251.39 For Power Projects -- 536.74 536.74
84.09 From Government Servants
400.00 107.73 To Government Servants
95.44 -- 95.44
203.07 -From Others 284.22 900.19 To Others -- 965.00 965.00
2,430.45 VI. Revenue Surplus brought down
9,076.39 -- VI. Revenue Deficit brought down
-- -- --
14,678.86 VII. Public Debt Receipts-
20,317.65 4,493.75 VII. Repayment of Public Debt-
-- -- 9,252.14
-- External debt -- External debt -- -- --

Appendices
State Finances Audit Report for the year ended March 2021
141
2019-20 Receipts 2020-21 2019-20 Disbursements 2020-21 Administ
rative Programme Total
13,720.76 Internal debt other than Ways and Means Advances and Overdrafts
15,191.08 3,546.48 Internal Debt other than Ways and Means Advances and Overdrafts
-- -- 8,264.97
-- Net transactions under Ways and Means Advances
-- -- Net transactions under Ways and Means Advances
-- -- --
-- Net transactions under Overdraft
-- -- Net transactions under Overdraft
-- -- --
958.11 Loans and Advances from Central Government
5,126.57 947.27 Repayment of Loans and Advances to Central Government
-- -- 987.17
-- VIII. Appropriationto Contingency Fund
-- -- VIII. Appropriation to Contingency Fund
-- -- --
1,440.22 IX. Amount transferred to Contingency Fund
-- IX. Expenditure from Contingency Fund
-- -- 171.00
74,574.89 X. Public Account Receipts-
63,210.13 63,078.22 X. Public Account Disbursements-
-- -- 74,120.55
5,117.39 Small Savings and Provident Funds
5,016.68 4,202.61 Small Savings and Provident Funds
-- -- 4,405.15
16,731.87 Reserve Funds 4,098.03 9,478.27 Reserve Funds -- -- 5,127.08 (-)57.88 Suspense and
Miscellaneous 2,514.07 22.38 Suspense and
Miscellaneous -- -- (-)12.10
28,674.50 Remittance 25,896.83 28,695.69 Remittances -- -- 25,878.82 24,109.01 Deposits and
Advances 25,684.52 20,679.27 Deposits and
Advances -- -- 38721.60
XI. Closing Overdraft from Reserve Bank of India
42,437.50 XI. Cash Balance at end-
-- -- 32,636.04
-- -- Cash in Treasuries and Local Remittances
-- -- --
-- 242.18 Deposits with Reserve Bank
-- -- 27.48
-- 20.19 Departmental Cash Balance including permanent Advances
-- -- 19.57
-- 42,175.13 Cash Balance Investment
32,588.99
2,33,113.81 Total 2,40,113.13 2,33,113.81 Total 2,40,113.13

Appendices
142 State Finances Audit Report for the year ended March 2021
APPENDIX – 2.2 (Refer paragraph 2.2)
Time Series data on the State Government Finances
(` in crore) 2016-17 2017-18 2018-19 2019-20 2020-21
Part A. Receipts
1. Revenue Receipts 74,299 85,204 99,546 1,01,568 1,04,387
(i) Tax Revenue 22,852(31) 27,914(33) 30,318(30) 32,315(32) 34,258(33) State Goods and Services Tax (SGST) Nil 6,609(24) 11,943(39) 13,204(41) 13,043(38)
Taxes on Agricultural Income Nil Nil Nil Nil Nil Taxes on Sales, Trade, etc 13,402(59) 11,522(41) 7,310(24) 7,455(23) 7,777(23) State Excise 2,786(12) 3,221(12) 3,925(13) 4,495(14) 4,053(12) Taxes on Vehicles 1,216(5) 1,535(5) 1,746(6) 1,836(6) 1,526(4) Stamps and Registration fees 1,364(6) 1,037(4) 1,237(4) 1,435(4) 2,942(9) Land Revenue 460(2) 542(2) 511(2) 721(2) 603(2) Taxes on Goods and Passengers 1,760(8) 1,260(5) 182(1) 133(1) 146(0) Other Taxes 1,864(8) 2,188(8) 3,464(11) 3,036(9) 4,168(12)
(ii) Non-Tax Revenue 8,043(11) 8,398(10) 14,276(14) 14,647(14) 19,518(19) (iii) State’s share of Union taxes and duties 28,322(38) 31,272(37) 35,354(36) 30,454(30) 27,543(26) (iv) Grants in aid from Government of
India * 15,082(20) 17,620(20) 19,598(20) 24,152(24) 23,068(22)
2. Miscellaneous Capital Receipts Nil Nil Nil Nil Nil 3. Recoveries of Loans and Advances 89 257 305 287 684 4. Total Revenue and Non debt capital
receipts (1+2+3) 74,388 85,461 99,851 1,01,855 1,05,071
5. Public Debt Receipts 11,223 12,862 10,003 14,679 20,318 Internal Debt 10,320 12,013 9,020 13,721 15191 Net transactions under Ways and Means Advances and Overdrafts
Nil Nil Nil Nil Nil
Loans and Advances from Government of India
903 849 983 958 5,127
6. Total Receipts in the Consolidated Fund (4+5)
85,611 98,323 1,09,854 1,16,534 1,25,389
7. Contingency Fund Receipts 123 -- -- 1,440 -- 8. Public Account Receipts 41,627 71,874 62,906 74,575 63,210 9. Total Receipts of the State (6+7+8)
1,27,361 1,70,197 1,72,760 1,92,549 1,88,599
Part B. Expenditure/Disbursement
10. Revenue Expenditure 65,041(78) 71,837(76) 85,356(78) 99,137(82) 95,311(83) Plan/Programme 25,331(39) 34,591(48) 43,144(51) 47,362(48) 48,160(51) Non-Plan/Administrative 39,710(61) 37,246(52) 42,212(49) 51,775(52) 47,151(49) General Services
(including interest payments) 16,715(26) 20,261(28) 24,053(28) 28,601(29) 28,271(30)
Social Services 27,600(42) 29,557(41) 36,427(43) 43,517(44) 39,901(42) Economic Services 19,714(30) 20,757(29) 23,513(27) 25,585(26) 25,809(27) Grants-in-Aid and Contributions 1,012(2) 1,263(2) 1,363(2) 1,434(1) 1,330(1) 11. Capital Expenditure 18,471(22) 21,109(22) 23,482(21) 20,277(17) 17,949(16)
Plan/Program 18,458(100) 21072(100) 23,439(100) 20,236(100) 17,857(99) Non-Plan/Administrative 13 37 43 41 92(1) General Services 374(2) 465(2) 730(3) 805(4) 868(5) Social Services 3,001(16) 4,201(20) 4,545(19) 5,264(26) 4,523(25) Economic Services 15,096(82) 16,443(78) 18,207(78) 14,208(70) 12,558(70)
*aExcludes funds transferred directly to NGOs / VOs in the State.

Appendices
State Finances Audit Report for the year ended March 2021
143
2016-17 2017-18 2018-19 2019-20 2020-21 12. Disbursement of Loans and Advances 254(0) 1,875(2) 1,170(1) 1,259(1) 1,597(1)
13. Total Expenditure (10+11+12) 83,766 94,821 1,10,008 1,20,673 1,14,857
14. Repayments of Public Debt 2,962 2,690 3,940 4,494 9252
Internal Debt (excluding Ways and Means Advances and Overdrafts)
2,292 1,982 3,183 3,547 8265
Net transactions under Ways and Means Advances and Overdraft
Nil Nil Nil Nil Nil
Loans and Advances from Government of India
670 708 757 947 987
15. Appropriation to Contingency Fund Nil Nil Nil Nil Nil 16. Total disbursement out of Consolidated Fund (13+14+15)
86,728 97,511 1,13,948 1,25,167 1,24,109
17. Contingency Fund disbursements Nil Nil 1,440 Nil 171 18. Public Account disbursements 38,080 56,439 50,085 63,078 74,192 19. Total disbursement by the State (16+17+18)
1,24,808 1,53,950 1,65,473 1,88,245 1,98,401
Part C. Deficits
20. Revenue Deficit (-)/Revenue Surplus (+) (1-10)
9,258 13,367 14,190 2,43046 9,076
21. Fiscal Deficit (-)/Fiscal Surplus (+) (4-13)
(-)9,378 (-)9,360 (-)10,157 (-)18,81947 (-)9,786
22. Primary Deficit(-)/Primary Surplus(+) (21+23)
(-)5,343 (-)4,372 (-)4,357 (-)12,756 (-)3,142
Part D. Other data
23. Interest Payments (included in revenue expenditure)
4,035 4,988 5,800 6,063 6,644
24. Financial Assistance to local bodies etc.
19,348 21,780 25,957 28,465 27,269
25. Ways and Means Advances/Overdraft availed (days)
-- -- -- -- --
Ways and Means Advances availed (days)
Nil Nil Nil Nil Nil
Overdraft availed (days) Nil Nil Nil Nil Nil 26. Interest on Ways and Means
Advances/ Overdraft Nil Nil Nil Nil Nil
27 Gross State Domestic Product (GSDP)
3,92,804
4,40,879
4,87,805
5,21,275
5,09,574
28 Outstanding Fiscal liabilities (year end)
71,623 97,164 1,08,258 1,26,084 1,22,774
29. Outstanding guarantees (year end) (including interest)
2,256 1,711 4,170 3,532 7,086
30. Maximum amount guaranteed (year end)
12,281 12,281 15,281 15,206 19,336
31. Number of incomplete projects 267 186 NA NA NA 32. Capital blocked in incomplete
projects 3,602 2,818 NA NA NA
Part E: Fiscal Health Indicators (in per cent)
I Resource Mobilisation
Own Tax Revenue/GSDP 5.82 6.33 6.22 6.20 6.72 Own Non-Tax Revenue/GSDP 2.05 1.90 2.93 2.81 3.83
46 Difference of 1crore is due to rounding off: RR (`1,01,567.75 crore) – RE (` 99,137.30 crore) = ` 2,430.45 47 Difference of 1crore is due to rounding off (`1,01,567.75 crore + ` 287.16 crore) - (`99137.30 crore + ` 20277.28 crore + ` 1259.31 crore)
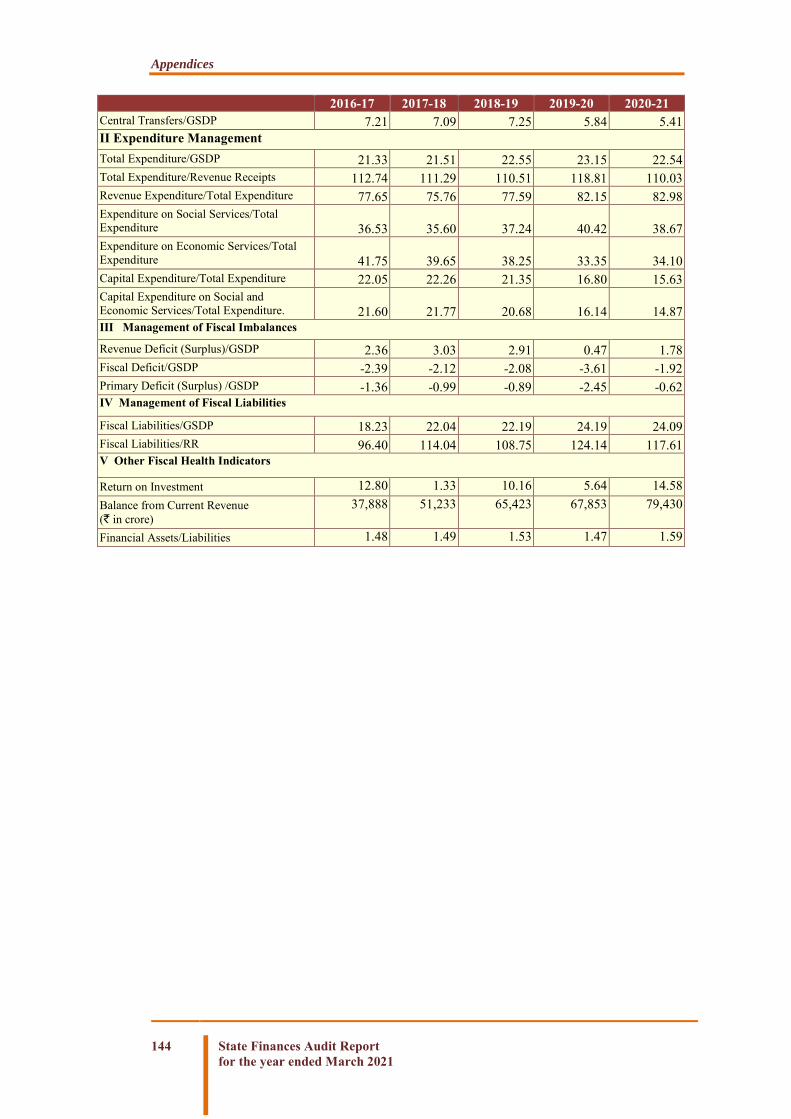
Appendices
144 State Finances Audit Report for the year ended March 2021
2016-17 2017-18 2018-19 2019-20 2020-21 Central Transfers/GSDP 7.21 7.09 7.25 5.84 5.41 II Expenditure Management Total Expenditure/GSDP 21.33 21.51 22.55 23.15 22.54 Total Expenditure/Revenue Receipts 112.74 111.29 110.51 118.81 110.03 Revenue Expenditure/Total Expenditure 77.65 75.76 77.59 82.15 82.98 Expenditure on Social Services/Total Expenditure 36.53 35.60 37.24 40.42 38.67 Expenditure on Economic Services/Total Expenditure 41.75 39.65 38.25 33.35 34.10 Capital Expenditure/Total Expenditure 22.05 22.26 21.35 16.80 15.63 Capital Expenditure on Social and Economic Services/Total Expenditure. 21.60 21.77 20.68 16.14 14.87 III Management of Fiscal Imbalances Revenue Deficit (Surplus)/GSDP 2.36 3.03 2.91 0.47 1.78 Fiscal Deficit/GSDP -2.39 -2.12 -2.08 -3.61 -1.92 Primary Deficit (Surplus) /GSDP -1.36 -0.99 -0.89 -2.45 -0.62 IV Management of Fiscal Liabilities
Fiscal Liabilities/GSDP 18.23 22.04 22.19 24.19 24.09 Fiscal Liabilities/RR 96.40 114.04 108.75 124.14 117.61 V Other Fiscal Health Indicators
Return on Investment 12.80 1.33 10.16 5.64 14.58 Balance from Current Revenue (` in crore)
37,888 51,233 65,423 67,853 79,430
Financial Assets/Liabilities 1.48 1.49 1.53 1.47 1.59

Appendices
State Finances Audit Report for the year ended March 2021
145
APPENDIX – 2.3 (Refer paragraph 2.6)
Summarised financial position of the Government of Odisha as on 31 March 2021
(`in crore) As on 31
March 2020 As on 31 March
2021 Liabilities
60,595.30 Internal Debt - 67,521.41 34,530.82 Market Loans bearing interest 35,030.82
0.08 Market Loans not bearing interest 0.07 0.23 Loans from Life Insurance Corporation of
India 0.07
26,064.17 Loans from other Institutions 32,490.45 -- Ways and Means Advances -- -- Overdrafts from Reserve Bank of India --
7,842.55 Loans and Advances from Central Government -
11,981.95
0.56 Pre 1984-85 Loans 0.38 13.49 Non-Plan Loans 11.60
5,120.15 Loans for State Plan Schemes 4,280.34 -- Loans for Central Plan Schemes --
2.35 Loans for Central Sponsored Schemes 1.61 2,706.00 Loans for State/UTs with Legislature
Schemes 7,688.02
400.00 Contingency Fund 229.00 24,337.84 Small Savings, Provident Funds, etc. 24,949.37 29,256.25 Deposits 16,225.05 21,362.47 Reserve Funds Advances 20333.44
91.45 Suspense and Miscellaneous Balances 117.62 -- Remittance Balances --
698.15 Miscellaneous Capital Receipts 698.15 67853.36 Cumulative excess of receipts over
expenditure 79429.72
2,12,437.36 Total 2,21,485.71
Assets
1,61,726.29 Gross Capital Outlay on Fixed Assets - 1,79,684.79
5,698.65 Investments in shares of Companies, Corporations, etc.
7,288.29
1,56,027.64 Other Capital Outlay 1,72,396.50 8,162.72 Loans and Advances - 9,066.17 3,894.99 Loans for Power Projects 4,031.72 3,833.51 Other Development Loans 4,593.39

Appendices
146 State Finances Audit Report for the year ended March 2021
As on 31 March 2020
As on 31 March 2021
434.22 Loans to Government servants and Miscellaneous loans
441.06
10.61 Advances 16.48 100.24 Remittance Balances 82.23
-- Suspense and Miscellaneous Balances -- -- 42,437.50 Cash - 32,636.04
-- Cash in Treasuries and Local Remittances -- 242.18 Deposits with Reserve Bank 27.48 20.19 Departmental Cash Balance including
Permanent Advances 19.57
-- Security Deposits -- 17,310.13 Investment of Earmarked Funds 18,237.63 24,865.00 Cash Balance Investments 14,351.36
Deficit on Government Account - -- -- (i) Less Revenue Surplus of the current
year --
-- (ii) Appropriation to Contingency Fund -- -- Accumulated deficit at the beginning of
the year --
2,12,437.36 Total 2,21,485.71 ** Included under Suspense and Miscellaneous Note: Closing balance of the contingency fund has been taken under liabilities
Explanatory Notes for Appendices 2.3 The abridged accounts in the foregoing statements have to be read with comments and explanations in the Finance Accounts. Government accounts being mainly on cash basis, the deficit on Government account, as shown in Appendix 2.2, indicates the position on cash basis, as opposed to accrual basis in commercial accounting. Consequently, items payable or receivable or items like depreciation or variation in stock figures, etc., do not figure in the accounts. Suspense and Miscellaneous balances include cheques issued but not paid, payments made on behalf of the State and other pending settlements, etc. There was a difference of ` 8.13 crore (Net Debit) between the figure reflected in the Accounts ` 27.48 crore (Net Debit) and that intimated by the Reserve Bank of India ` 35.61 crore (Net Credit) relating to deposits with Reserve Bank of India included in the Cash Balance

Appendices
State Finances Audit Report for the year ended March 2021
147
APPENDIX – 3.1 (Refer paragraph 3.3.2.1 )
Details of cases where supplementary provisions (₹ one crore or more in each case) proved unnecessary
(₹ in crore) Sl. No. Grant No. &Name of the Grant Original Supplementary
Actual Expenditure
Saving out of provisions
Revenue (Voted)
1 1-Home 4,999.81 121.66 4,266.65 733.16
2 2-General Administration & Public Grievance
255.49 4.66 167.58 87.91
3 4-Law 463.61 44.07 395.64 67.97
4 6-Commerce 77.70 1.05 60.55 17.15
5 10-School and Mass Education 16,849.24 456.50 14,843.70 2,005.54
6 11-ST & SC Development, Minorities & Backward Classes Welfare
3,218.69 41.89 2428.77 789.92
7 13-Housing and Urban Development 5,367.64 1.48 4470.42 897.22
8 15-Sports and youth Services 152.83 4.65 64.92 87.91
9 17-Panchayati Raj and Drinking Water
14,828.25 2,027.70 13,706.36 1,121.89
10 20-Water Resources 2,996.17 22.37 1,765.77 1,230.40
11 21-Transport 187.15 1.07 144.57 42.58
12 22-Forest & Environment 1,954.40 21.55 1,599.53 354.87
13 29-Parliamentary affairs 42.69 7.73 41.17 1.52
14 33-Fisheries & Animal Resources Development
962.66 42.95 765.31 197.35
15 34-Co-operation 1,564.90 4.07 1,513.82 51.07
16 36-Women & Child Development & Mission Shakti
3,905.18 33.81 3,279.18 626.00
17 37-Electronics and Information Technology
236.28 8.70 169.21 67.07
18 38-Higher Education 2,344.51 193.46 2,128.22 216.29
19 39-Skill Development & Technical Education
398.53 4.67 354.80 43.73
20 41- Social Security and Empowerment of Persons with Disability
3,024.26 22.51 2,113.16 911.10
21 42-Disaster Management 6,504.57 1,984.22 4,865.90 1,638.67
22 43-Odia Language, Literature and Culture
148.81 1.92 111.92 36.89
Total 70,483.37 5,052.69 59,257.15 11,226.21
Capital (Voted)
23 1-Home 371.05 108.64 250.61 120.44
24 7-Works 4,419.92 169.85 4,115.55 304.37
25 12-Health and Family Welfare 970.00 100.00 675.33 294.67
26 17-Panchyati Raj and Drnking Water 3,271.00 18.41 1,886.77 1,384.23
27 28-Rural Development 4,321.76 25.95 2,836.80 1,484.96

Appendices
148 State Finances Audit Report for the year ended March 2021
28 33-Fisheries and Animal Resources Development
248.24 19.07 210.31 37.93
29 34-Co-operation 235.50 3.00 176.66 58.84
30 39-Skill Development & Technical Education
426.48 5.68 326.70 99.78
Total 14,263.96 450.60 10,478.72 3,785.23
GRAND TOTAL 84,747.33 5,503.29 69,735.87 15,011.44
Source: Appropriation Accounts 2020-21, Government of Odisha

Appendices
State Finances Audit Report for the year ended March 2021
149
APPENDIX – 3.2 (Refer paragraph 3.3.2.2 )
Excessive Supplementary Provision during 2020-21 (₹ one crore or more in each case)
(₹ in crore)
Sl. No. Grant No./ Name of the Department
Original Provision
Supplementary provision
Total Provision
Actual expenditure
Excess Supplementary provision
Revenue (Voted)
1 9-Food Supplies and ConsumerWelfare 1,260.49 1,078.30 2,338.78 2,297.53 41.25
2 12-Health and Family Welfare 6,727.12 1,668.77 8,395.89 7,247.36 1,148.53
3 27-Science and Technology 100.00 2.21 102.21 101.43 0.78
4 32-Tourism and Culture 97.58 30.00 127.58 126.48 1.10
5 40-Micro, Small and Medium Enterprises 250.00 54.82 304.82 258.54 46.28
Total 8,435.19 2,834.10 11,269.28 10,031.34 1,237.94
Capital (Voted)
6 4-Law 2.50 4.80 7.30 7.05 0.25
7 5-Finance 988.34 450.00 1,438.34 1,293.68 144.66
8 23-Agriculture and Farmers' Empowerment 0.00 257.80 257.80 242.80 15.00
9 30-Energy 1,727.93 956.80 2,684.73 1,883.11 801.62
10 31-Handlooms, Textiles and Handicrafts 12.30 30.00 42.30 34.71 7.59
Total 2,731.07 1,699.40 4,430.47 3,461.35 969.12
Capital (Charged)
11 6003-Internal Debt of the State Government (all charged)
6,352.00 1,913.04 8,265.04 8,264.97 0.07
Total 6,352.00 1,913.04 8,265.04 8,264.97 0.07
Grand Total 17,518.26 6,446.54 23,964.79 21,757.66 2,207.13
Source: Appropriation Accounts 2020-21, Government of Odisha

Appendices
150 State Finances Audit Report for the year ended March 2021
APPENDIX – 3.3 (Refer paragraph 3.3.3)
Unnecessary /Excess re-appropriation of funds during 2020-21 (₹in crore)
Sr. No.
Grant No. and Head of Accounts
Provisions Actual Expenditure
Final Excess (-) Saving ( +)
Original Supplementary Re-appropriation Surrender Total
1 3-2053-00-093-0617-Head Quarter Establishment
158.08 0 1.18 28.14 131.12 129.86 1.26
2 20-2711-01-800-1214-Rivers Embankment Maintenance
120.73 0 3 5.77 117.96 111.95 6.01
3 20-4700-01-796-2160-Accelerated Irrigation Benefit Programme (AIBP)
129.62 0 6.82 1.13 135.31 65.52 69.79
4 30-4801-05-800-2815-Construction of Grid Substation
0 0 14.29 0 14.29 0 14.29
Total (unnecessary) 408.43 0 25.29 35.04 398.68 307.33 91.35
5 12- 2210-01-110-1016-Other Hospitals
453.79 7.4 16.89 19.13 458.95 457.49 1.46
6 20-4700-19-796-2160-Accelerated Irrigation Benefit Programme (AIBP)
46.54 0 13 0.06 59.48 52.47 7.01
7 20-4700-19-800-2160-Accelerated Irrigation Benefit Programme (AIBP)
123.52 0 6 1.21 128.31 123.31 5
8 20-4702-00-800-2252-Minor Irrigation Projects under State Plan
33.3 0 7.3 8.31 32.29 31.29 1
Total (Excess) 657.15 7.4 43.19
28.71 679.03 664.56 14.47
GRAND TOTAL 1,065.58 7.4 68.48
63.75 1,077.71 971.89 105.82
Source: Monthly Appropriation Reports, Govt. of Odisha

Appendices
State Finances Audit Report for the year ended March 2021
151
APPENDIX – 3.4
(Refer paragraph-3.3.3) Re-appropriation of funds on 31st March 2021
(₹ One crore and above in each case) (₹ in crore)
Sl No Name of the Grant/ Name of the Department
Head Name of the Scheme Amount
1 05-Finance 4217-60-800-3478 Scheme for Special Central Assistance to States for Capital Expenditure
83.5
2 2071-01-101-1040 Pension to Government Servants
2,662.69
3 2235-60-102-1044 Pension to unprisoned Freedom Fighters
3.17
4 7-Works 5054-03-337-1994 Odisha State Roads Project-Road Improvement component
12.45
5 12-Health & Family Welfare
2210-(01-80-06-03)-(001-004-101-103-107-110)-(0308-0618-1364-1090-2791-1092-1125-0886-1016)
Medical and Public Health 7.54
6 17-Panchayati Raj and Drinking Water
2215-01-102-0851 Maintenance and Repair 1.3
7 2049- Interest payments 2049-01-101-0754 2049-01-200-0752
Interest payment on Market Loans Interest on Internal Loans
479.81
8 23-Agriculture and Farmers' Empowerment
2401-00-796-3231 Special Programme for Promotion of Millets in Tribal Areas
15.11
9 23-Agriculture and Farmers' Empowerment
2401-00-800-3347 Plant Protection 2.58
10 6004- Loans and Advances from the Central Government
6004-02-101-0432 Back to Back Loans 165.06
Total 3,433.21 Source: Records of the Office of the Principal Accountant General (A&E), Odisha.

Appendices
152 State Finances Audit Report for the year ended March 2021
APPENDIX – 3.5 (Refer paragraph 3.3.4 )
List of grants having large savings (savings above ₹100 crore) during the year ( ₹ in crore)
Sl. No.
Number and Name of the
Grant
Original Supple- mentary
Total Actual Expenditure
Saving/ Excess
Percentage of savings
against total
Provision
Surrender Savings excluding surrender
Revenue (Voted)
1 1-Home 4,999.81 121.66 5,121.47 4,266.65 854.82 16.69 848.13 6.70
2 3-Revenue and Disaster Management
1,141.94 0.00 1,141.94 862.13 279.81 24.50 279.82 0.00
3 4-Law 463.61 44.07 507.68 395.64 112.04 22.07 111.94 0.10 4 5-Finance 20,099.21 0.00 20,099.21 14,966.24 5,132.97 25.54 3,248.14 1,884.84
5 10-School and Mass Education
16,849.24 456.50 17,305.74 14,843.70 2,462.04 14.23 2,459.99 2.04
6 11-ST&SC Development, Minorities & Backward Classes Welfare
3,218.69 41.89 3,260.58 2,428.77 831.81 25.51 829.84 1.97
7 12-Health and Family Welfare
6,727.12 1,668.77 8,395.89 7,247.36 1,148.53 13.68 1,190.23 -41.70
8 13-Housing and Urban Development
5,367.64 1.48 5,369.13 4,470.42 898.71 16.74 828.04 70.67
9 16-Planning and Convergence
945.73 0.00 945.73 774.27 171.46 18.13 171.39 0.07
10 17-Panchyati Raj and Drinking Water
14,828.25 2,027.70 16,855.95 13,706.36 3,149.59 18.69 3,481.24 -331.65
11 19-Industries 550.00 0.00 550.00 97.54 452.46 82.26 452.45 0.00
12 20-Water Resources
2,996.17 22.37 3,018.53 1,765.77 1,252.76 41.50 415.40 837.35
13 22-Forest & Environment
1,954.40 21.55 1,975.95 1,599.53 376.42 19.05 382.14 -5.71
14 23-Agriculture and Farmers’ Empowerment
6,759.33 0.00 6,759.33 4,055.18 2,704.15 40.01 2,702.38 1.78
15 28-Rural Development
1,227.16 0.34 1,227.50 1,043.27 184.23 15.01 184.18 0.05
16 30-Energy 132.80 0.00 132.80 26.28 106.52 80.21 106.51 0.01
17 33-Fisheries and Animal Resources Development
962.66 42.95 1,005.61 765.31 240.30 23.90 225.27 15.03
18 36-Women and Child Development and Mission
3,905.18 33.81 3,938.99 3,279.18 659.81 16.75 660.04 -0.24

Appendices
State Finances Audit Report for the year ended March 2021
153
Shakti
19 38-Higher Education
2,344.51 193.46 2,537.96 2,128.22 409.74 16.14 409.35 0.40
20 41-Social Security and Empowerment of Persons with Disability
3,024.26 22.51 3,046.77 2,113.16 933.61 30.64 933.59 0.02
21 42-Disaster Management
6,504.57 1,984.22 8,488.79 4,865.90 3,622.89 42.68 3,622.82 0.07
Total 1,05,002.28 6,683.28 1,11,685.55 85,700.88 25,984.67 23,542.89 2,441.80
Revenue (Charged)
22 2049-Interest Payment (All Charged)
7,160.00 0.00 7,160.00 6,643.79 516.21 7.21 516.21 0.00
Total 7,160.00 0.00 7,160.00 6,643.79 516.21 516.21 0.00
Capital (Voted)
23 1-Home 371.05 108.64 479.70 250.61 229.09 47.76 229.08 0.00
24 5-Finance 988.34 450.00 1,438.34 1,293.68 144.66 10.06 144.60 0.06
25 7-Works 4,419.92 169.85 4,589.77 4,115.55 474.22 10.33 468.90 5.32
26 10-School and Mass Education
609.00 0.00 609.00 279.99 329.01 54.02 329.01 0.00
27 11-ST&SC Development, Minorities & Backward Classes Welfare
589.66 0.00 589.66 351.04 238.62 40.47 238.63 0.00
28 12-Health and Family Welfare
970.00 100.00 1,070.00 675.33 394.67 36.89 394.67 0.00
29 13-Housing and Urban Development
814.13 0.00 814.13 342.32 471.81 57.97 471.96 0.00
30 17-Panchyati Raj and Drnking Water
3,271.00 18.41 3,289.41 1,886.77 1,402.64 42.64 1,402.57 0.07
31 20-Water Resources
6,339.96 0.00 6,339.96 3,586.50 2,753.46 43.43 377.70 2,375.76
32 21-Transport 657.41 0.00 657.41 425.38 232.03 35.29 232.03 0.00
33 28-Rural Development
4,321.76 25.95 4,347.71 2,836.80 1,510.91 34.75 1,510.91 0.00
34 30-Energy 1,727.93 9,56.80 2,684.73 1,883.11 801.62 29.86 491.82 309.80
35 39-Skill Development & Technical Education
426.48 5.68 432.16 326.70 105.46 24.40 105.46 0.00
Total 25,506.65 1,835.33 27,341.98 18,253.77 9,088.20 6,397.35 2,691.01
Capital (Charged)

Appendices
154 State Finances Audit Report for the year ended March 2021
36 6004-Loan and advance form the central Government(all charged)
1,220.00 0.00 1,220.00 987.17 232.83 19.08 232.83 0.00
Total 1,220.00 0.00 1,220.00 987.17 232.83 232.83 0.00
Grand Total 1,38,888.9 8,518.61 1,47,407.5 1,11,585.6 3,5821.91
30,689.28 5,132.81 Source: Monthly Appropriation Reports 2020-21, Government of Odisha

Appendices
State Finances Audit Report for the year ended March 2021
155
APPENDIX – 3.6 (Refer paragraph 3.3.5)
Surrenders of 100 per cent of total provisions made during the year 2020-21 (₹ 50 crore or more in each case)
Sl. No.
Number and Name of the Grant
Name of the scheme (Head of Account)
Amount surrendered (` in crore)
Percentage of Surrender
Reasons for Surrender
1 02-General Administration and Public Grievances
2052-00-090-3356-Biju Patnaik School of Government and Public Affairs
50 100 Reasons not furnished
2 07-Works 3054-80-797-1361-State Road Fund
430.86 100 Reasons not furnished
3 13-Housing and Urban Development
4217-60-800-2719-EAP Assisted by KFW German for Odisha Urban Infrastructure Development Fund (OUIDF)
60 100 Reasons not furnished
4 17-Panchayati Raj and Drinking Water
2505-60-800-3227-Revolving Fund for MGNREGS
500 100 Due to non-receipt of permission from Government of India for drawal of funds
5 19-Industries 2875-60-190-2222-New Scheme for Promotion of Other Industries
227.06 100 Due to non-appraisal of scheme.
6 23-Agriculture and Farmers'
Empowerment
2401-00-800-2606-Sustainable Harnessing of Ground Water in Water Deficit areas
65.5 100 The scheme was transfer to DOWR
7 30-Energy 2810-00-105-2963-Assistance to GEDCOL
100 100 Reasons not furnished
8 4801-06-789-2153-Rajiv Gandhi Gramin Vidyutikaran Yojana
94 100 Reasons not furnished
9 33-Fisheries and Animal Resources
Development
4405-00-103-3265-Integrated Development and Management of Fisheries
55 100 Due to non-sanction of fund by Government of India
10 37-Electronics and Information Technology
2852-07-202-2453-State Infrastructure of SDC
74.76 100 Due to non-completion of tender process for construction of date center due to out-break of Covid-19 pandemic.

Appendices
156 State Finances Audit Report for the year ended March 2021
11 41-Social Security and Empowerment
of persons with disabilities
2235-60-102-2851-Winter Allowance
116.13 100 Due to disbursement in shape of ex-gratia in lieu of summer and winter allowance under MBPY as per Finance Department observations
12 42-Disaster Management
2245-02-193-1275-World Bank Assisted EAP-Odisha Disaster Recovery Project
61 100 Due to occurrence of less/ no expenditure due to Covid-19 pandemic.
TOTAL 1,834.31 Source: Monthly Appropriation Reports 2020-21, Government of Odisha

Appendices
State Finances Audit Report for the year ended March 2021
157
APPENDIX – 3.7 (Refer paragraph 3.3.5.2)
Statement showing details of savings of ₹100 crore and above and partially surrendered during 2020-21
(₹ in crore)
Sl. No.
Grant No. and name of the department
Original Supple-mentary
Total Provisions Expenditure Savings Amount
Surrendered
Savings which
remained to be
surrendered
Revenue (Voted)
1 1-Home 4,999.81 121.66 5,121.47 4,266.65 854.82 848.13 6.70
2 5-Finance 20,099.21 0.00 20,099.21 14,966.24 5,132.97 3,248.14 1,884.84
3 10-School and Mass Education
16,849.24 456.50 17,305.74 14,843.70 2,462.04 2,459.99 2.04
4
11-ST & SC Development, Minorities and Backward Classes Welfare
3,218.69 41.89 3,260.58 2,428.77 831.81 829.84 1.97
5 13-Housing and Urban Development
5,367.64 1.48 5,369.13 4,470.42 898.71 828.04 70.67
6 20-Water Resources 2,996.17 22.37 3,018.53 1,765.77 1,252.76 415.40 837.35
7
23- Agriculture and Farmers' Empowerment
6,759.33 0.00 6,759.33 4,055.18 2,704.15 2,702.38 1.78
8
33-Fisheries and Animal Resources Development
962.66 42.95 1,005.61 765.31 240.30 225.27 15.03
Total 61,252.76 686.85 61,939.61 47,562.03 14,377.55 11,557.19 2,820.39
Capital (Voted)
9 7-Works 4,419.92 169.85 4,589.77 4,115.55 474.22 468.90 5.32
10 20-Water Resources 6,339.96 0.00 6,339.96 3,586.50 2,753.46 377.70 2,375.76
11 30-Energy 1,727.93 956.80 2,684.73 1,883.11 801.62 491.82 309.80
Total 12,487.81 1,126.65 13,614.46 9,585.16 4,029.30 1,338.43 2,690.87
Grand Total 73,740.57 1,813.50 75,554.07 57,147.19 18,406.85 12,895.62 5,511.26 Source: Appropriation Accounts 2020-21, Government of Odisha

Appendices
158 State Finances Audit Report for the year ended March 2021
APPENDIX – 3.8 (Refer paragraph 3.4.1)
Details of the schemes for which provision (₹ 10 crore and above) was made but no expenditure was incurred
(₹in crore) Sl. No.
Grant No./Name of
the Department
Scheme Name Approved outlay
Revised outlay
Actual expenditure
Savings
1 20-Water Resources
2702-02-800-0129-Rooftop Rain Water Harvesting and Ground Water Recharge in Urban Areas
32.75 0 0 32.75
2 -do- 2702-03-102-2606-Sustainable Harnessing of ground water in water deficit area
169 0 0 169
3 -do- 2702-03-796-2606-Sustainable Harnessing of ground water in water deficit area
46 0 0 46
4 -do- 2702-03-102-3267-Pradhan Mantri Krushi Sichai Yojana - Har Khet Ko Pani(HKP)
166.05 0 0 166.05
5 -do- 2702-03-796-3267-Pradhan Mantri Krushi Sichai Yojana - Har Khet Ko Pani(HKP)
58 0 0 58
6 -do- 2702-03-789-2606-Sustainable Harnessing of ground water in water
35 0 0 35
7 -do- 2702-03-789-3267deficit areas Pradhan Mantri Krushi Sichai Yojana - Har Khet Ko
47 0 0 47
8 -do- 2705-00-001-0594-Grants-in-Aid to Command Area Development Authority for Construction of field channels
68.96 0 0 68.96
9 -do- 2705-00-789-0594-Grants-in-Aid to Command Area Development Authority for Construction of field channels
45.83 0 0 45.83

Appendices
State Finances Audit Report for the year ended March 2021
159
10 -do- 2705-00-796-0594-Grants-in-Aid to Command Area Development Authority for Construction of field channels
70.31 0 0 70.31
11 -do- 4701-67-796-2410-Dam Rehabilitation and Improvement Projects(EAP)
20 0 0 20
12 -do- 4701-80-789-3439-Construction of In-stream Storage Structure
100 0 0 100
13 -do-
4701-80-796-3439-Construction of In-stream Storage Structure
220
0 0 220
14 -do- 4701-80-800-3439-Construction of In-stream Storage Structure
771.5
0 0 771.5
15 -do- 4702-00-789-1186-Renovation Works
18 0 0 18
16 -do- 4702-00-789-3459-Renovation of Panchayat Ponds and Tanks
22 0 0 22
17 -do- 4702-00-796-1186-Renovation Works
20 0 0 20
18 -do- 4702-00-796-3459-Renovation of Panchayat Ponds and Tanks
30 0 0 30
19 -do-
4702-00-800-1186-Renovation Works
32 0 0 32
20 -do- 4702-00-800-3459-Renovation of Panchayat Ponds and Tanks
77 0 0 77
21 30-Energy 4801-05-800-2815-Construction of Grid Substation
0 14.29 0 14.29
TOTAL 2,049.40 14.29 0 2,063.69 Source: Appropriation Accounts 2020-21, Government of Odisha

Appendices
160 State Finances Audit Report for the year ended March 2021
APPENDIX – 3.9 (Refer paragraph 3.5.1)
Rush of Expenditure (100 per cent) during last month of 2020-21 (₹1 crore or more)
Sl No Grant No.
Name of the Department
Head of Accounts
Name of the Scheme Actual Expenditure
during March
(₹ in crore) 1 1 Home 2014-00-
102-0632 High Court Establishment 1.00
2 2055-00-113-2821
Contribution to Police Relief Fund 1.00
3 2055-00-117-2789
Installation and Commissioning of CCTV Surveillance System
50
4 2070-00-108-3378
Emergency Response Support System (ERSS)
1.00
5 2 General Administration and Public Grievance
2052-00-090-3408
Implementation of e-Office 5.74
6 10 School and Mass Education
2202-01-800-3381
State Support for Samagra Shiksha 177
7 2202-02-109-2856
Modernisation of Quality Education 2.00
8 11 Scheduled Tribes & Scheduled Castes Development, Minorities & Backward Classes Welfare
2225-02-796-1891
Institutional Support for Development and Marketing of Tribal Products / Produce
1.61
9 2225-03-277-2418
Post Matric Scholarship and stipend to OBC students
23.27
10 12 Health and Family Welfare
2210-06-101-0622
Headquarters Drugs Control Organisation 1.00
2210-06-101-0622
Headquarters Drugs Control Organisation 2.81
2210-06-789-0622
Headquarters Drug Control Organisation 1.00
11 13 Housing and Urban Development
2217-05-191-2132
Other Urban Development Schemes under State Plan
2.40
2217-05-193-2132
Other Urban Development Schemes under State Plan
1.20
12 2217-05-789-3218
Storm Water Drainage and Development of Water Bodies
20.40
2217-05-796-3218
Storm Water Drainage and Development of Water Bodies
27.60
2217-05-800-3218
Storm Water Drainage and Development of Water Bodies
72
13 3604-00-200-0164
Compensation and Assignments SFC 88.08
14 3604-00- Grant & Assistance under the award of 5th 127.48

Appendices
State Finances Audit Report for the year ended March 2021
161
200-3417 SFC 15 4217-60-
789-3437 New City Development 8.50
4217-60-796-3437
New City Development 11.50
4217-60-800-3437
New City Development 30
16 15 Sports & Youth Services
4202-03-796-2053
Infrastructure Development 2.00
17 17 Panchayati Raj and Drinking Water
3054-04-337-2450
Maintenance of Roads and Bridges 67.95
18 4216-01-700-0182
Construction of Buildings 5.00
19 21 Transport 3055-00-800-0922
Miscellaneous 1.60
20 22 Forest & Environment
2406-01-102-3328
Relocation of villages from Reserve forest and sanctuaries
3.12
21 23 Agriculture and Farmers' Empowerment
2402-00-789-2431
Integrated Watershed Management Programme(IWMP)
1.70
22 30 Energy 2801-80-800-3305
Ama Ghare LED Light" Karyakram 1.00
23 31 Handlooms, Textiles & Handicrafts
2851-00-103-1982
Promotion of Textile Industries 1.00
24 34
Co-operation 2425-00-107-2321
Grants / Assistance to Sugar Co-operatives 15
25 4425-00-190-1276
Share Capital Investment 118
26 37 Electronics & Information Technology
07-202-2852
Incentive under I.T. Policy 2.00
27 07-202-3481
National e-Vidhan Application(NeVA) 8.56
28 41
Social Security & Empowerment of Persons with Disability
2235-02-800-3312
State Fund for implementation of the Rights of Persons with Disabilities (RPD) Act.
2.00
29 2235-60-102-3132
Programmes and Activities for Senior Citizens
2.50
30 2235-60-102-3134
De-Addiction Centre (Non-Clinical) 2.00
31 43
Odia Language, Literature and Culture
2205-00-001-0708
Information, Education and Communication 1.00
32 2205-00-102-1612
Establishment of Kalamandap 1.00
33 6003 (Charged) Internal Debt of the State Government
6003-00-109-1195
Loans 2,895.08
TOTAL 3,787.1 Source: Appropriation Accounts 2020-21, Government of Odisha

Appendices
162 State Finances Audit Report for the year ended March 2021
APPENDIX – 3.10 (Refer paragraph-3.7)
Release of funds at the end of the Financial Year 2020-21
Sl No
Name of the Department Sanction order No.
Date Amount (₹crore)
1 Scheduled Tribes & Scheduled Castes Development, Minorities & Backward Classes Welfare
202019774358 30-Mar-21 41.85 202019771748 30-Mar-21 0.24 202019771746 30-Mar-21 3.83 Total 45.92
2 Water Resources 202019772378 30-Mar-21 0.38 202019774233 30-Mar-21 0.06 202019774198 30-Mar-21 3.27 Lr. No. 11074 31-Mar-21 33.88 Lr. No.11098 31-Mar-21 1.27 Lr. No.11086 31-Mar-21 1.30
Total 40.16 3 Agriculture and Farmer's
Empowerment 202019782652 31-Mar-21 15.11 202019777377 31-Mar-21 2.58 202019773369 30-Mar-21 10.35 Total 28.04
4 Home 202019769101 30-Mar-21 15.00 202019769134 30-Mar-21 15.00 202019769163 30-Mar-21 20.00 202019777390 31-Mar-21 0.11 202019774758 30-Mar-21 0.02 202019772919 30-Mar-21 0.12 202019773645 31-Mar-21 0.04 202019775481 31-Mar-21 0.03 202019776953 31-Mar-21 0.34 Total 50.66
5 Health and Family Welfare 202019777525 31-Mar-21 5.55 202019777547 31-Mar-21 29.07 202019777504 31-Mar-21 4.87 202019772756 31-Mar-21 1.45 202019773448 31-Mar-21 37.31
Total 78.25 6 Women and Child Development 202019747815 30-Mar-21 0.20
202019747834 30-Mar-21 0.06 202019747840 30-Mar-21 0.13 202019747838 30-Mar-21 0.29 202019747832 30-Mar-21 0.16 202019747836 30-Mar-21 0.30 202019747821 30-Mar-21 0.16 202019771028 30-Mar-21 0.23 202019771019 30-Mar-21 0.38 202019771021 30-Mar-21 0.30 202019771024 30-Mar-21 0.26 202019771016 30-Mar-21 0.30 202019771011 30-Mar-21 0.45 202019771014 30-Mar-21 0.30

Appendices
State Finances Audit Report for the year ended March 2021
163
Sl No
Name of the Department Sanction order No.
Date Amount (₹crore)
202019770988 30-Mar-21 0.07 202019771051 30-Mar-21 0.30 202019771049 30-Mar-21 0.45 202019771104 30-Mar-21 0.07 202019771102 30-Mar-21 0.03 202019771026 30-Mar-21 0.45 202019771106 30-Mar-21 0.03 202019771068 30-Mar-21 0.30 202019771066 30-Mar-21 0.45 202019771064 30-Mar-21 0.30 202019771055 30-Mar-21 0.45 202019771076 30-Mar-21 0.30 202019771074 30-Mar-21 0.45 202019771072 30-Mar-21 0.30 202019771070 30-Mar-21 0.30 202019771078 30-Mar-21 0.20 202019771062 30-Mar-21 0.45 202019771060 30-Mar-21 0.45 202019771058 30-Mar-21 0.45 202019771053 30-Mar-21 0.30 202019747819 30-Mar-21 0.23 202019747817 30-Mar-21 0.45 202019772160 30-Mar-21 0.28 202019772149 30-Mar-21 0.10 202019772629 30-Mar-21 0.20 202019772156 30-Mar-21 0.05 202019772158 30-Mar-21 0.03 202019772154 30-Mar-21 0.30 202019772152 30-Mar-21 0.21 202019773782 30-Mar-21 0.45
Total 11.92 Grand Total 254.95
Source: Records of the Respective Departments of Government of Odisha.

Appendices
164 State Finances Audit Report for the year ended March 2021
APPENDIX – 4.1 (Refer paragraph 4.3)
Statement showing details of GIA for which utilisation certificates were pending since 2003-04 from different Departments of the State Government at the end of 2020-21
(₹in crore) Sl. No.
Name of the Department Amount outstanding as on 31.03.2021
No. of GIA Vouchers for which UCs were
awaited 1 Law 189.83 230 2 Commerce 0.00 1 3 Water Resources 243.28 158 4 Transport 82.87 14 5 Energy 98.16 8 6 Handlooms, Textiles & Handicrafts 85.82 98 7 Micro, Small & Medium Enterprises 161.79 149 8 Health and Family Welfare 2,686.90 273 9 Panchayati Raj and Drinking Water 17,546.69 4,522 10 Women & Child Development and Mission Shakti 949.56 866 11 Fisheries & Animal Resources Development 8.58 29 12 School and Mass Education 3,073.60 352 13 Agriculture and Farmers' Empowerment 121.86 17 14 Tourism 2.50 2 15 Higher Education 2,182.39 823 16 Labour & Employees' State Insurance 10.23 16 17 Disaster Management 740.57 47 18 Rural Development 2.29 5 19 Planning and Convergence 3,333.99 1,932 20 Odia Language, Literature and Culture 175.04 614 21 General Administration and Public Grievance 112.01 57 22 Electronics & Information Technology 524.89 212 23 Skill Development & Technical Education 161.70 76 24 Sports & Youth Services 6.66 20 25 Home 0.51 39 26 Finance 0.30 13 27 Parliamentary Affairs 1.76 46 28 Housing and Urban Development 8,561.90 8,749 29 Co-operation 47.27 41 30 Forest & Environment 295.31 1,846 31 Social Security & Empowerment of Persons with
Disability 376.24 1,836
32 Revenue and Disaster Management 329.37 287 33 Scheduled Tribes & Scheduled Castes Development,
Minorities & Backward Classes Welfare 912.34 3,370
34 Science & Technology 280.70 225 35 Food Supplies and Consumer Welfare 36.24 27 36 Industries 69.53 29
Total 43,412.68 27,029 Source: Records of the Office of the Accountant General (A&E), Odisha.
*Amount shown as ₹0.00 against Commerce Department (₹4,200) is due to rounding of the amount

Appendices
State Finances Audit Report for the year ended March 2021
165
APPENDIX – 4.2 (Refer paragraph 4.3)
Statement showing details of GIA for which UCs are pending for more than ten years as on 31-03-2021
(₹in crore)
Source: VLC database
Sl.No Department Name Period for which UC wanting
Outstanding UC amount
No. of GIA Vouchers for
which Ucs were awaited
1 Co-operation 2009-10 0.54 2
2 Electronics and information Technology 2003-11 51.84 51
3 Fisheries and Animal Resources Development
2003-10 1.35 15
4 General Administration 2003-11 11.64 17 5 Handlooms, Textiles & Handicrafts 2010-11 0.34 3 6 Higher Education 2003-10 16.21 116 7 Housing and Urban Development 2003-11 392.06 3917 8 Law 2003-11 4.97 55 9 Micro Small and Medium Enterprises 2008-11 1.12 10
10 Odia Language, Literature and Culture 2003-11 19.79 157 11 Panchayati Raj and Drinking Water 2003-11 313.76 1788 12 Planning and Convergence 2003-11 291.97 533 13 Revenue and Disaster Management 2003-11 209.00 167 14 ST & SC Development, Minorities and
Backward Classes Welfare 2006-11 95.52 516
15 School and Mass Education 2003-11 1.06 17 16 Science and Technology 2003-11 2.64 4 17 Skill Development and Technical
Education 2009-11 0.60 2
Total 1414.41 7370

Appendices
166 State Finances Audit Report for the year ended March 2021
APPENDIX –4.3 (Refer paragraph-4.4)
Department wise Outstanding Report of AC/DC Bills as on 31 March 2021
(₹ in lakh) Sl. No.
Grant No.
Department Name Outstanding Item (Nos.) Period of pendency
1 01 Home 6,898.44 393 2003-2021 2 02 General Administration and Public
Grievance 666.51 58 2015-2021
3 03 Revenue and Disaster Management
0.05 1 2019-2020
4 04 Law 15.59 91 2003-2021 5 11 Scheduled Tribes & Scheduled
Castes Development, Minorities & Backward Classes Welfare
5.00 2 2020-2021
6 13 Housing and Urban Development 1.12 8 2005-2013
7 17 Panchayati Raj and Drinking Water
163.40 84 2005-2021
8 24 Steel & Mines 138.94 196 2019-2021
9 30 Energy 0.05 1 2019-2020
10 34 Co-operation 6.45 1 2013-2014
11 36 Women & Child Development and Mission Shakti
3.48 1 2019-2020
12 38 Higher Education 208.84 242 2004-2021
13 42 Disaster Management 35.00 4 2019-2020
14 43 Odia Language, Literature and Culture
33.83 10 2012-2021
Total 8,176.7 1,092 Source: Records of the Office of the Accountant General (A&E), Odisha.

Appendices
State Finances Audit Report for the year ended March 2021
167
APPENDIX – 4.4 (Refer paragraph 4.4)
Department-wise Outstanding Report of AC/DC Bills during the year 2020-21
(₹in lakh) Sl. No.
Grant No.
Department Name Outstanding Item (Nos)
1 01 Home 853.09 60 2 02 General Administration and Public
Grievance 0.1 1
3 04 Law 1.73 11
4 11 Scheduled Tribes & Scheduled Castes Development, Minorities & Backward Classes Welfare
5.00 2
5 17 Panchayati Raj and Drinking Water 0.79 4 6 24 Steel & Mines 119.59 165
7 38 Higher Education 65.66 107
8 43 Odia Language, Literature and Culture 18.83 9
Total 1,064.79 359 Source: Records of the Office of the Accountant General (A&E), Odisha.

Appendices
168 State Finances Audit Report for the year ended March 2021
APPENDIX – 4.5 (Refer paragraph4.5.2)
Statement showing details of Closure of PD Account as on 31 March 2021
(₹in lakh) Sl.No Name of the Administrator of PD Accounts Balance
1 Asst. Engineer, Soil Conservation, Titilagarh, Bolangir
2.26
2 Soil Conservation Officer, Regudipada, Bolangir 0.02
3 Asst. Soil Conservation Officer, Parlakemundi, Gajapati
3.62
4 Asst. Soil Conservation Officer, Sub-Division, Machhkund, Koraput
0.00
5 Principal, Soil Conservation Training Institute, Koraput
0.00
6 Asst. Soil Conservation Officer, Nayagarh 0.00
7 Soil Conservation Officer, Burla, Sambalpur 0.00
8 Asst. Soil Conservation Officer, Deogarh 0.00 9 Spl. Planning Authority, Parlakhemundi, Gajapati 0.10
10 Director, Agriculture and Food Production Odisha, Bhubaneswar
0.00
11 Principal, Women’s Polytechnic Berhampur 35.40 12 Executive Officer, Notified Area Council, Burla 223.08 13 Executive Officer, Notified Area Council, Hirakud 288.55 14 Principal, Institute of Management & Information
Technology, Cuttack 0.00*
15 Principal, Industrial Training Institute, Puri 28.14 16 Principal, Industrial Training Institute, Rourkela 27.00 17 Headmaster, Daspalla High School, Daspalla,
Nayagarh 1.24
18 Headmaster, Government Boys High School, Chitrakonda, Malkangiri
0.73
19 Asst. Agricultural Engineer, Phulbani 0.00 Total 610.14
Source: Records of the Office of the Accountant General (A&E), Odisha.
*Amount shown as ₹0.00 against Principal, Institute of Management & Information
Technology,Cuttack (₹57,000) is due to rounding of the amount.

Appendices
State Finances Audit Report for the year ended March 2021
169
APPENDIX – 4.6 (Refer paragraph 4.6)
Statement of Major Head-Wise Expenditure booked under Minor Head-800- (other expenditure) during 2020-21
(₹in crore) Sl. No.
Major Head
Description Total Expr Exp 800 %age
1 2013 Council of Ministers 23.99 21.14 88.12
2 2075 Miscellaneous General Services 720.19 729.28 101.26
3 2711 Flood Control and Drainage 167.89 152.16 90.63
4 3055 Road Transport 1.60 1.60 100.00 5 3454 Census Surveys and Statistics 27.48 16.02 58.30
6 4217 Capital Outlay on Urban Development
276.01 253.50 91.84
7 4250 Capital Outlay on Other Services 212.08 177.04 83.48 8 4401 Capital Outlay on Crop
Husbandry 57.80 34.77 60.15
9 4701 Capital Outlay on Medium Irrigation
430.73 231.15 53.67
14 4702 Capital Outlay on Minor Irrigation
815.51 628.96 77.12
15 5054 Capital Outlay on Roads and Bridges
6,252.83 3,314.71 53.01
16 5075 Capital Outlay on Other Transport Services
382.23 382.23 100.00
Total 9,368.34 5,942.56 Source: Records of the Office of the Accountant General (A&E), Odisha.

Appendices
170 State Finances Audit Report for the year ended March 2021
APPENDIX – 4.7 (Refer paragraph-4.6)
Statement of Major Head-Wise Receipts booked under Minor Head-800- (other receipts) during 2020-21
(₹in crore) Sl. No.
Major Head
Description Total Receipts
Minor Head 800 Receipt
% age
1 0217 Urban Development 5.02 5.02 100 2 0220 Information and Publicity 0.09 0.09 100
3 0408 Food Storage and Warehousing 0.06 0.06 100 4 0506 Land Reforms 0.62 0.62 100 5 0515 Other Rural Development
Programmes 0.02 0.02 100
6 0810 Non-Conventional Sources of Energy
0.14 0.14 100
7 0852 Industries 3.57 3.57 100 8 1051 Ports and Light Houses 151.05 151.05 100 9 1053 Civil Aviation 5.44 5.44 100
10 1456 Civil Supplies 3.08 3.08 100
Total 169.09 169.09 Source: Records of the Office of the Accountant General (A&E), Odisha.

Appendices
State Finances Audit Report for the year ended March 2021
171
APPENDIX-4.8 (Refer Paragraph 4.9.1)
Discrepancies between Cash Book and Pass Book balance as on 31 March 2021
(₹ in Crore)
Source: Information received from respective Offices of Government of Odisha
Sl. No.
Name of the DDO Balance as per
Bank pass book
Balance as per Cash
book
Difference
1 The Special Land Acquisition Officer, Anandapur Barrage Project, Salapada, Keonjhar
6.50 40.77 34.27
2 The Special Land Acquisition Officer, Kanupur Barrage Project, Rimuli, Keonjhar
21.15 19.66 1.49
3 The Special Land Acquisition Officer, Rengali Right Canal System, Dhenkanal
81.69 79.78 1.91
4 The Special Land Acquisition Officer, Upper Indravati Irrigation Project, Kusumkhunti, Kalahandi
1.57 1.53 0.04
5 Executive Engineer, R & B Division, Kendrapada 5.66 0.00 5.66 6 District Social Security Officer, Khordha 12.38 12.31 0.07 7 State Commissioner for Persons with Disabilities,
Bhubaneswar 1.02 1.03 0.01
8 Member Secretary, Academy of Tribal Language and Culture, Bhubaneswar
0.97 0.70 0.27
9 General Manager, State Institute of Disability Rehabilitation (SIDR), Bhubaneswar
28.06 76.27 48.21
10 Director, Secondary Education, Bhubaneswar 1.01 0.90 0.11
11 Executive Engineer (Agril), Cuttack Division, Cuttack 11.76 12.18 0.42 12 Commissioner-cum-Secretary, Department of Fishery
and Animal Resources Development, Bhubaneswar 0.02 0.00 0.02
13 Directorate of Fisheries, Odisha, Cuttack 71.21 61.42 9.79
14 District Fisheries Officer, Kausalyaganga, Puri 2.36 2.14 0.22
15 District Fisheries Officer, Khordha 4.56 4.54 0.02 16 Principal Secretary, Energy Department, Government
of Odisha, Bhubaneswar 0.02 0.00 0.02
17 General Manager, Regional Industries Centre, Kalinganagar, Jajpur Road
0.00 8.12 8.12
18 Orissa State Co-operative Handicrafts Corporation Limited (Utkalika), Bhubaneswar.
6.36 12.20 5.84
19 Secretary, Odisha Sahitya Academy, Bhubaneswar 4.11 3.47 0.64
20 General Manager, District Industries Centre, Khurda, Bhubaneswar
4.30 3.53 0.77
21 Odisha Co-operative Tasar & Silk Federation (SERIFED) Limited, Bhubaneswar
26.69 (-)5.72 32.41
TOTAL 291.4 334.83 150.31

Appendices
172 State Finances Audit Report for the year ended March 2021
APPENDIX-4.9 (Refer Paragraph 4.11)
Statement showing pendency of Accounts and delay in preparation of Separate Audit Report in respect of Autonomous Bodies
Source: Information received from respective Offices of Accountant General (Audit-I) and
Principal Accountant General (Audit-II), Odisha
Sl. No.
Name of the Department
Name of the Body/ Authority receiving grants
Audited under section
Year upto which Accounts submitted
to audit
Years upto which SAR
issued 1 Energy Odisha Electricity
Regularity Commission, Bhubaneswar
19(2) 2019-20 2019-20
2 Law Odisha State Legal Services Authority, Bhubaneswar
19(2) 2017-18 2017-18
3 Housing and Urban Development
Bhubaneswar Development Authority, Bhubaneswar
19(3) Accounts not audited since Inception
SAR not issued since inception
4 Cuttack Development Authority, Cuttack
19(3) Accounts not audited since Inception
SAR not issued since inception
5 Rourkela Development Authority, Rourkela
19(3) Accounts not audited since Inception
SAR not issued since inception
6 Sambalpur Development Authority, Sambalpur
19(3) Accounts not audited since Inception
SAR not issued since inception
7 Talcher Angul Development Authority, Angul
19(3) Accounts not audited since Inception
SAR not issued since inception
8 Kalinga Nagar Development Authority, Jajpur
19(3) Accounts not audited since Inception
SAR not issued since inception
9 Puri Konark Development Authority, Puri
19(3) Accounts not audited since Inception
SAR not issued since inception
10 Paradeep Development Authority, Paradeep
19(3) Accounts not audited since Inception
SAR not issued since inception
11 Berhampur Development Authority, Berhampur
19(3) Accounts not audited since Inception
SAR not issued since inception
12 Commerce and Transport
Odisha State Road Transport Corporation, Bhubaneswar
19(2) 2018-19 2018-19
13 Industries Odisha Industrial Infrastructure Development Corporation (IDCO), Bhubaneswar
19(3) 2019-20 N. A.
14 Micro, Small and Medium Enterprise
Orissa Small Industries Corporation Limited (OSIC), Cuttack
20(1) 2018-19 N.A .
15 General Administration and Public Grievance
Lokayukta, Odisha, Bhubaneswar
19(2) 2020-21 2019-20
16 Labour & Employees State Insurance
Odisha Building and Other Construction Workers Welfare Board(OB&OCWWB), Bhubaneswar
19(2) 2013-14 2013-14

Appendices
State Finances Audit Report for the year ended March 2021
173
APPENDIX – 4.10 (Refer paragraph 4.15)
Pending cases of misappropriation, losses, theft, etc. (₹in lakh)
Name of Department
Cases of misappropriation/ losses/ theft of
Government material
Reasons for the delay in final disposal of pending cases of misappropriation, losses, theft, etc.
Awaiting Departmental and
criminal investigation
Departmental action initiated but not
finalised
Criminal Proceedings finalised but
recovery pending Number Amount Number Amount Number Amount
Finance 4 9.89 0 0 0 0 0 0 Revenue & Disaster Management 23 340.08 2 1.39 5 200.42 4 4.1
Law 1 0.16 0 0 1 0.16 0 0 Water Resources 220 263.39 109 167.31 103 84.45 4 11.11 Rural Development 53 94.4 30 77.22 22 17.18 0 0 Energy 6 243.66 1 15.98 4 226.51 0 0 Skill Development & Technical Education
7 11.8 0 0 2 2.53 2 4.39
MSME 3 11.72 1 11.59 1 0.08 1 0.05 ST&SC Development , Minorities and Backward classes Welfare
8 6.88 1 0.73 5 5.2 2 0.95
Health & Family Welfare 27 55.67 0 0 3 6.41 14 16.42
General Administration 2 0.71 0 0 0 0 2 0.71
Works 81 185.17 32 38.48 45 142.28 0 0 Commerce & Transport 8 9.27 4 6.18 2 1.04 1 0.75
School & Mass Education 11 36.67 5 10.65 1 1.31 0 0
Higher Education 5 14.55 2 3.29 0 0 1 0.08 Fisheries & ARD 19 75.39 0 0 6 53.36 9 5.74 Agriculture & Farmers’ Empowerment
64 105.94 5 13.5 19 61.16 13 4.79
Co-Operation 3 4.19 0 0 1 0.94 0 0 Panchayati Raj and Drinking Water 18 33.99 10 21.11 4 10.97 3 1.51
Home (B) Police 2 14.47 0 0 0 0 0 0 Food Supplies & Consumer Welfare 3 3.04 0 0 0 0 1 0.1
Housing & Urban Development 47 68.91 24 39.41 21 26.22 0 0
Information & Public Relations 59 6.32 49 5.53 8 0.64 0 0
Forest & Environment 45 250.88 7 80.66 29 146.78 3 21.04
TOTAL 719 1,847.15 282 493.03 282 987.64 60 71.74 Source: Information received from respective Offices of Government of Odisha
Note: Out of 719 cases 89 cases are sub-judice and 6 certificate cases are pending.

Appendices
174 State Finances Audit Report for the year ended March 2021
APPENDIX – 5.1
(As referred to in Para No. 5.1.3) (Lists of 80 Government SPSEs and Government Controlled Other SPSEs)
Sl. No.
Sector & Name of the PSU Name of the Department
Government Company(GC)/Government Controlled Other Company(DGC)
1 2 3 4 A. Social Sector I. Working Government Companies
1 The Agricultural Promotion and Investment Corporation of Odisha Limited
Agriculture & Farmers' Empowerment GC
2 The Odisha Agro Industries Corporation Limited Agriculture & Farmers' Empowerment GC
3 Odisha State Cashew Development Corporation Limited
Agriculture & Farmers' Empowerment GC
4 Odisha Forest Development Corporation Limited Forest & Environment GC 5 Odisha Lift Irrigation Corporation Limited Water Resources GC 6 Odisha State Seeds Corporation Limited Agriculture & Farmers'
Empowerment GC 7 Odisha Pisciculture Development Corporation
Limited Fisheries & Animal Resources Development GC
8 The Odisha Small Industries Corporation Limited Industries GC 9 Odisha Mineral Bearing Areas Development
Corporation Limited Steel & Mines GC 10 Water Corporation of Odisha Limited Water Resources GC 11 Odisha State Beverage Corporation Limited Excise GC 12 Odisha State Civil Supplies Corporation Limited Food Supplies & Consumer
Welfare GC 13 Odisha State Medical Corporation Limited Health & Family Welfare GC 14 Odisha Sports Development and Promotion
Company Limited Sports & Youth Services GC 15 Brahamani Railways Limited Industries DGC 16 Odisha Rail Infrastructure Development Limited Industries GC
II. Inactive Government Companies
17 Eastern Aquatic Products Limited (under voluntary liquidation since 22 February 1978)
Agriculture & Farmers' Empowerment GC
18 Orissa Fisheries Development Corporation Limited Fisheries & Animal Resources Development GC
B. Competitive Sector I. Working Government Companies
19 The Industrial Promotion and Investment Corporation of Odisha Limited Industries GC
20 The Odisha Film Development Corporation Limited Industries GC
21 Odisha Rural Housing and Development Corporation Limited.
Housing & Urban Development GC
22 Paradip Investment Region Development Limited Industries DGC 23 The Industrial Development Corporation of Odisha
Limited Industries GC

Appendices
State Finances Audit Report for the year ended March 2021
175
24 Odisha Construction Corporation Limited. Water Resources GC 25 Orissa Bridge and Construction Corporation
Limited Works GC 26 IDCO SEZ Development Limited Industries DGC 27 Odisha Electronics Park Limited Industries DGC 28 Baitarani West Coal Company Limited Steel & Mines DGC 29 IDCOL Ferro Chrome & Alloys Limited
(subsidiary of Sl.No.B-23) Industries GC 30 IDCOL Kalinga Iron Works Limited (Subsidary of
Sl. No. B-23) Industries GC 31 The Mandakini B-Coal Corporation Limited Steel & Mines DGC 32 The Odisha Mining Corporation Limited Steel & Mines GC 33 Nuagaon Coal Company Limited Steel & Mines DGC 34 Paradeep Plastic Park Limited Industries DGC 35 Angul Aluminium Park Private Limited Industries DGC 36 Odisha Mineral Exploration Corporation Limited Steel & Mines GC 37 IDCOL Software Limited (Subsidiary of Sl. No.B-
23) Industries GC 38 Lanjigarh Project Area Development Foundation Steel & Mines DGC 39 Odisha Tourism Development Corporation Limited Tourism GC 40 Shamuka Tourism Development Corporation
Limited Tourism DGC 41 Inland Waterways Consortium of Odisha Limited Industries DGC 42 Kalinga Studios Limited (Subsidiary of Sl. No.B-
20) Industries GC
43 Odisha State Financial Corporation Micro, Small & Medium Enterprise
Government Corporation
44 Odisha State Road Transport Corporation Commerce and Transport Government Corporation
45 Odisha State Warehousing Corporation Co-operation Government Corporation
46 Odisha Hydro Power Corporation Limited Energy GC 47 Odisha Power Generation Corporation Limited Energy GC 48 Odisha Thermal Power Corporation Limited Energy GC 49 Green Energy Development Corporation of Odisha
Limited Energy GC 50 GEDCOL SAIL Power Corporation Limited Energy GC 51 Odisha Power Transmission Corporation Limited Energy GC 52 Odisha Coal and Power Limited Energy GC 53 GRIDCO Limited Energy GC
II. Inactive Government Companies
54 ABS Spinning Orissa Limited (Subsidiary of Sl. No.B-23). (Under liquidation) Industries GC
55 Gajapati Steel Industries Limited (Company closed since 1969-70, under voluntary liquidation since 01 March 1974)
Industries GC
56 Hira Steel and Alloys Limited (Subsidiary of Sl. No.B-23). (Under liquidation.) Industries GC
57 IPITRON Times Limited (Subsidiary of Sl.No.B-62). (Under liquidation since 1998) Industries GC
58 Konark Detergent and Soaps Limited (Subsidiary of Sl.No.A-8) Industries GC
59 Konark Television Limited (Defunct since 1999-2000) Industries GC

Appendices
176 State Finances Audit Report for the year ended March 2021
60 Mayurbhanj Textiles Limited Handlooms, Textiles & Handicrafts GC
61 Modern Malleable Casting Company Limited (Closed since 1968. Under voluntary liquidation since 09 March 1976)
Industries GC
62 New Mayurbhanj Textiles Limited Handlooms, Textiles & Handicrafts GC
63 Orissa Boat Builders Limited (under liquidation) Industries GC 64 Orissa Electrical Manufacturing Company Limited Industries GC 65 Orissa Instruments Company Limited Industries GC 66 Orissa Leather Industreis Limited (Subsidiary of Sl.
No. B-64) Industries GC 67 Orissa Textile Mills Limited (Under liquidation
since 2001) Handlooms, Textiles &
Handicrafts GC 68 Orissa State Electronics Development Corporation
Limited Industries GC 69 Orissa State Handloom Development Corporation
Limited (under liquidation) Handlooms, Textiles &
Handicrafts GC 70 Orissa State Leather Corporation Limited (closed
since 18 June 1998) Industries GC 71 Orissa State Textile Corporation Limited Handlooms, Textiles &
Handicrafts GC 72 Orissa Tools and Engineering Company Limited
(619-B) Industries GC 73 Premier Bolts and Nuts Limited (Under liquidation;
assets have been disposed of) Industries GC 74 ELCOSMOS Electronics Limited (Subsidiary of Sl.
No. B-62) Industries GC
75 ELCO Communication and Systems Limited (Subsidiary of Sl.No.B-62 Under liquidation since 1998)
Industries GC
76 ELMARC Limited (Subsidiary of Sl. No. B-62) Industries GC 77 Orissa State Commercial Transport Corporation
Limited Commerce and Transport GC C. Other Sector I. Working Government Companies
78 The Odisha State Police Housing and Welfare Corporation Limited Home GC
79 Bhubaneswar Smart City Limited Industries DGC 80 Rourkela Smart City Limited Industries DGC
(Source: Compiled on the basis of latest finalised accounts of SPSEs)

Appendices
State Finances Audit Report for the year ended March 2021
177
Sl. No. Name of the Sector/SPSE
Year for which Accounts are not received by 30 September 2021
1 2 3 A. Social Sector I. Working Government Companies
1 The Agricultural Promotion and Investment Corporation of Odisha Limited 2019-20 to 2020-21
2 The Odisha Agro Industries Corporation Limited 2019-20 to 2020-21 3 Odisha State Cashew Development Corporation Limited 2019-20 to 2020-21 4 Odisha Forest Development Corporation Limited 2020-21 5 Odisha Lift Irrigation Corporation Limited 2018-19 to 2020-21 6 Odisha State Seeds Corporation Limited 2019-20 to 2020-21 7 Odisha Pisciculture Development Corporation Limited 2017-18 to 2020-21 8 The Odisha Small Industries Corporation Limited 2018-19 to 2020-21 9 Water Corporation of Odisha Limited 2020-21
10 Odisha State Civil Supplies Corporation Limited 2018-19 to 2020-21 11 Odisha State Medical Corporation Limited 2020-21
12 Odisha Sports Development and Promotion Company Limited 2020-21
II. Non-working Government Companies
13 Eastern Aquatic Products Limited Under voluntary liquidation since 22 February 1978
14 Orissa Fisheries Development Corporation Limited Defunct B. Competitive sector I. Working Government Companies
15 The Odisha Film Development Corporation Limited 2018-19 to2020-21
16 Odisha Rural Housing and Development Corporation Limited. 2009-10 to 2020-21
17 The Industrial Development Corporation of Odisha Limited 2020-21
18 Odisha Construction Corporation Limited. 2019-20 to 2020-21 19 Orissa Bridge and Construction Corporation Limited 2020-21 20 IDCOL Ferro Chrome & Alloys Limited 2020-21 21 IDCOL Kalinga Iron Works Limited 2020-21 22 Odisha Mineral Exploration Corporation Limited 2020-21 23 Odisha Tourism Development Corporation Limited 2020-21 24 Kalinga Studios Limited 2018-19 to2020-21
25 The Odisha State Police Housing and Welfare Corporation Limited 2020-21
26 Odisha Hydro Power Corporation Limited 2020-21 27 Odisha Power Transmission Corporation Limited 2020-21
II. Statutory Corporation 28 Odisha State Financial Corporation 2020-21
APPENDIX-5.2A (As referred to in Para No.5.1.3)
Details of accounts in arrears or companies under liquidation - Government Companies and Corporations

Appendices
178 State Finances Audit Report for the year ended March 2021
29 Odisha State Road Transport Corporation 2019-20 to 2020-21 30 Odisha State Warehousing Corporation 2019-20 to 2020-21
III. Non-working Government Companies 31 ABS Spinning Orissa Limited Under liquidation
32 Gajapati Steel Industries Limited
Company closed since 1969-70, under voluntary liquidation since 01 March 1974
33 Hira Steel and Alloys Limited Under liquidation 34 IPITRON Times Limited Under liquidation since 1998 35 Konark Detergent and Soaps Limited Defunct 36 Konark Television Limited Under liquidation 37 Mayurbhanj Textiles Limited Defunct
38 Modern Malleable Casting Company Limited
Closed since 1968. Under voluntary liquidation since 09 March 1976
39 New Mayurbhanj Textiles Limited Defunct 40 Orissa Boat Builders Limited Under liquidation 41 Orissa Electrical Manufacturing Company Limited Under liquidation 42 Orissa Instruments Company Limited Defunct 43 Orissa Leather Industries Limited Defunct 44 Orissa Textile Mills Limited Under liquidation since 2001 45 Orissa State Electronics Development Corporation Limited Defunct
46 Orissa State Handloom Development Corporation Limited Under liquidation
47 Orissa State Leather Corporation Limited Defunct 48 Orissa State Textile Corporation Limited Under liquidation 49 Orissa Tools and Engineering Company Limited (619-B) Defunct
50 Premier Bolts and Nuts Limited Under liquidation; assets have been disposed of
51 ELCOSMOS Electronics Limited Under liquidation 52 ELCO Communication and Systems Limited Under liquidation since 1998 53 ELMARC Limited Defunct 54 Orissa State Commercial Transport Corporation Limited Defunct
(Source: Compiled on the basis of latest finalised accounts of SPSEs)

Appendices
State Finances Audit Report for the year ended March 2021
179
APPENDIX-5.2 B (As referred to in Para No.5.1.3)
Details of accounts in arrears or company under liquidation/defunct Govt. controlled other companies
Sl. No. Name of the SPSEs Year for which Accounts not received by 30 September 2021
1 Brahmani Railways Limited 2020-21
2 IDCO SEZ Development Limited 2020-21
3 Odisha Electronics Park Limited 2020-21
4 Baitarani West Coal Company Limited 2020-21
5 The Mandakini B-Coal Corporation Limited 2016-17 to 2020-21
6 Nuagaon Coal Company Limited 2015-16 to 2020-21
7 Paradeep Plastic Park Limited 2020-21
8 Lanjigarh Project Area Development Foundation 2019-20 to 2020-21
9 Inland Waterways Consortium of Odisha Limited 2018-19 to 2020-21
10 Paradip Investment Region Development Limited 2020-21
11 Bhubaneswar Smart City Limited 2020-21
12 Shamuka Tourism Development Corporation Limited 2020-21
(Source: Compiled on the basis of latest finalised accounts of SPSEs)

Appendices
180 State Finances Audit Report
for the year ended March 2021
APPENDIX-5.3
(As referred to in Para No.5.1.4)
Department wise details of turnover of State PSEs (` in crore)
Sl. No. Particulars 2017-18 2018-19 2019-20 2020-21
1 Energy Department
Turnover 9,601.63 9,641.1 9,974.4 12,335.38
Percentage of Turnover to GSDP of Odisha
2.31 1.98 1.87 2.42
2 Excise Department
Turnover 3,726.7 4,738.36 4,738.36 3,922.33
Percentage of Turnover to GSDP of Odisha
0.90 0.97 0.93 0.73
3 Steel & Mines
Department
Turnover 2,853.14 4,052.3 4,093.2 5,587.27
Percentage of Turnover to GSDP of Odisha
0.69 0.83 0.77 1.10
4 Water Resources
Department
Turnover 867.45 763.35 486.6 486.6
Percentage of Turnover to GSDP of Odisha
0.21 0.16 0.09 0.10
5 Home Department
Turnover 385.31 376.01 376.01 302.58
Percentage of Turnover to GSDP of Odisha
0.09 0.08 0.07 0.06
6 Industries Department
Turnover 233.29 266.78 354.64 166.51
Percentage of Turnover to GSDP of Odisha
0.06 0.05 0.07 0.03
7 Forest & Environment
Department
Turnover 212.41 212.41 195.72 152.03
Percentage of Turnover to GSDP of Odisha
0.05 0.04 0.04 0.03
8 Agriculture & Farmers'
Department
Turnover 175.83 191.65 181.8 548.02
Percentage of Turnover to GSDP of Odisha
0.04 0.04 0.03 0.11
9 Co-operation
Department

Appendices
State Finances Audit Report
for the year ended March 2021
181
(Source: Compiled on the basis of latest finalised accounts of SPSEs)
Turnover 112.84 112.84 100.92 85.93
Percentage of Turnover to GSDP of Odisha
0.03 0.02 0.02 0.02
10 Commerce & Transport
Department
Turnover 85.85 88.07 98.39 98.39
Percentage of Turnover to GSDP of Odisha
0.02 0.02 0.02 0.02
11 Works Department
Turnover 65.01 65.01 96.22 139.83
Percentage of Turnover to GSDP of Odisha
0.02 0.01 0.02 0.03
12 Tourism Department
Turnover 25.96 25.96 44.76 37.72
Percentage of Turnover to GSDP of Odisha
0.006 0.005 0.008 0.007
13 Health & Family
Department
Turnover 12.26 21.81 21.81 11.93
Percentage of Turnover to GSDP of Odisha
0.003 0.004 0.004 0.002
14 Sports & Youth
Department
Turnover 20.84 5 0 0
Percentage of Turnover to GSDP of Odisha
0.005 0.001 0.000 0.000
15 Micro, Small & Medium
Enterprise
Turnover 3.71 6.68 6.68 1.95
Percentage of Turnover to GSDP of Odisha
0.001 0.001 0.001 0.000

Appendices
182 State Finances Audit Report
for the year ended March 2021
APPENDIX – 5.4
(As referred to in Para No. 5.3.2)
Loss incurred by 10 SPSEs during 2019-20 and 2020-21
(` in crore)
Sl. No. Name of SPSEs Profit/Loss
during 2020-21 Profit/Loss during
2019-20
1 Odisha Mineral Bearing Area Development Corporation Limited
-1,818.38 427.20
2 Water Corporation of Odisha Limited -0.25 -0.25
3 IDCOL Ferro Chrome & Alloys Limited -22.76 -8.43
4 IDCOL Kalinga Iron Works Limited -3.45 -4.70
5 Odisha Mineral Exploration Corporation Limited -2.31 0
6 Odisha Sports Development and Promotion Company Limited
-2.35 1.13
7 GRIDCO Limited -1,382.35 -281.05
8 Odisha Power Generation Corporation Limited -190.51 171.48
9 Odisha Power Transmission Corporation Limited -144.37 37.71
10 Odisha Coal and Power Limited -1.46 -2.81
TOTAL -3,568.19 340.28 (Source: Compiled on the basis of latest finalised accounts of SPSEs)

Appendices
State Finances Audit Report
for the year ended March 2021
183
APPENDIX-5.5 (As referred to in Para No.5.3.3)
List of SPSEs having negative Net Worth as on 31 March 2021
(` in crore)
Sl. No. Name of the Company Net Worth Paid-up capital Net Profit after
tax
1 Odisha Forest Development Corporation Limited
-52.14 5.00 10.54
2 The Industrial Development Corporation of Odisha Limited
-11.61 57.12 2.46
3 IDCOL Kalinga Iron Works Limited -16.17 150.10 -3.45
4 Odisha Mineral Exploration Corporation Limited
-1.88 0.43 -2.35
5 Odisha State Financial Corporation -48.49 419.07 -2.35
6 GRIDCO Limited -6,869.29 576.71 -1,382.35
(Source: Compiled on the basis of latest finalised accounts of SPSEs)
Note: Though 06 SPSEs have negative net worth as on March 2021, 02 SPSEs at Sl. No 1 & 2 have
earned profits during the year 2020-21.

Appendices
184 State Finances Audit Report
for the year ended March 2021
APPENDIX- 5.6
(As referred to in Para No.5.3.4)
Shortfall in dividend by Government companies
(` in crore)
Sl.
No.
Name of the
Company
State
Government
equity
Net
Profit
after
tax
Dividend
on
equity
shares
Dividend
30% on
state gov
equity
Dividend
30% on
profit
after tax
Minimum
Dividend
required
to be
declared
Shortfall
1
The Agricultural Promotion and Investment Corporation of Odisha Limited
1.10 0.09 0.03 0.33 0.03 0.33 0.30
2 The Odisha Agro Industries Corporation Limited
38.44 16.55 2.48 11.53 4.97 11.53 9.05
3 Odisha Forest Development Corporation Limited
5.00 10.54 1.58 1.5 3.16 3.16 1.58
4 Orissa Bridge and Construction Corporation Limited
20.00 5.43 1.63 6.00 1.63 6.00 4.37
5 Odisha Hydro Power Corporation Limited
810.65 158.06 31.58 243.20 47.42 243.20 211.62
(Source: Compiled on the basis of latest finalised accounts of SPSEs)

Appendices
State Finances Audit Report
for the year ended March 2021
185
APPENDIX-5.7
(As referred to in Para No. 5.4)
Value of Production, Total Assets and Capital Employed of CPSEs (` in crore)
Sl.
No.
PSU 2020-21 2019-20 2018-19 Value of production
Total Assets
Capital employed
Value of production
Total Assets
Capital employed
Value of production
Total Assets
Capital employed
1
Odisha Hydro Power Corporation Limited
505.91 4,055.53 2,944.06 470.13 3,873.57 2,805.3 478.83 3,666.07 2,805.3
2
Odisha State Cashew Development Corporation Limited
9.06 102.58 48.07 7.71 102.58 48.07 8.02 40.66 40.66
3
The Odisha Agro Industries Corporation Limited
55.18 666.55 112.75 37.1 580.82 85.51 40.74 580.82 85.51
4
Odisha Power Generation Corporation Limited
2,624.15 11,251.47 9,787.21 1,856.83 10,699.68 9,946.28 615.77 10,699.68 8,193.81
5
Green Energy Development Corporation of Odisha Limited
6.93 286.05 78.84 7.5 330.32 73.47 7.28 304.82 67.36
6
Odisha State Seeds Corporation Limited
165.35 238.09 19.3 145.27 278.34 11.45 131.11 220.7 52.67
7
The Odisha Mining Corporation Limited 1,216.84 8,139.96 6,576.64 1,148.59 6,961.35 5,992.54 1,214.06 5,622.14 5,622.14
8
Odisha State Warehousing Corporation 106.94 234.52 150.28 103.33 221.08 135.14 87.95 221.08 126.74
9
The Industrial Development Corporation of Odisha Limited 80.96 356.55 228.89 56.7 334.73 217.62 20.08 347.23 233.6
10
Odisha Hydro Power Corporation Limited
505.91 4,055.53 2,944.06 470.13 3,873.57 2,805.3 478.83 3,666.07 2,805.3
11
IDCOL Ferro Chrome & Alloys Limited 0.47 80.55 5.99 0.42 106.91 28.75 0.81 108.16 28.75
Total 4,771.79 25,309.27 19,952.03 3,833.58 23,489.38 19,344.13 2,604.65 21,811.4 17,256.5
(Source: Compiled on the basis of latest finalised accounts of SPSEs)

Appendices
186 State Finances Audit Report
for the year ended March 2021
APPENDIX-5.8 (As referred to in Para No. 5.4.1)
Return on Capital Employed of CPSEs (` in crore)
Sl.
No.
SPSE 2020-21 2019-20 2018-19
EBIT
Capital
Employed
ROCE
(in %) EBIT
Capital
Employed
ROCE
(in %) EBIT
Capital
Employed
ROCE
(in %)
1 The Agricultural Promotion and Investment Corporation of Odisha Limited
0.22 2.25 9.78 0.21 2.19 9.59 0.21 2.19 9.59
2 The Odisha Agro Industries Corporation Limited
26.12 112.75 23.17 20.31 85.51 23.75 20.31 85.51 23.75
3 Odisha State Cashew Development Corporation Limited
9.01 48.07 18.74 9.01 48.07 18.74 13.99 40.66 34.41
4 Odisha Forest Development Corporation Limited
26.16 -52.14 -50.17 36.74 -58.97 -62.30 37.2 -27.59 -134.83
5 Odisha State Seeds Corporation Limited
6.13 19.30 31.76 0.52 11.45 4.54 4.15 52.67 7.88
6 The Industrial Promotion and Investment Corporation of Odisha Limited
10.69 115.82 9.23 10.09 112.79 8.95 10.09 112.79 8.95
7 The Industrial Development Corporation of Odisha Limited
19.23 228.89 8.40 9.62 217.62 4.42 -79.8 233.6 -34.16
8 Odisha Construction Corporation Limited.
77.40 149.39 51.81 77.4 149.39 51.81 104.23 117.41 88.77
9 Orissa Bridge and Construction Corporation Limited
7.53 35.96 20.94 7.94 34.63 22.93 4.42 30.3 14.59
10 The Odisha State Police Housing and Welfare Corporation Limited
26.82 137.65 19.48 26.3 123.62 21.27 26.3 123.62 21.27
11 Odisha Mineral Bearing Areas Development Corporation Limited
-1,818.38
0.01 -1,81,83,800
427.2 427.21 100.00 0 0.01 0.00

Appendices
State Finances Audit Report
for the year ended March 2021
187
12 Water Corporation of Odisha Limited
-0.25 0.41 -60.98 -0.25 0.41 -60.98 -0.12 0.83 -14.46
13 Odisha Rail Infrastructure Development Limited
0.51 54.74 0.93 2.35 54.45 4.32 1.91 52.78 3.62
14 IDCOL Ferro Chrome & Alloys Limited
-21.35 5.99 -356.43 -6.97 28.75 -24.24 -6.97 28.75 -24.24
15 IDCOL Kalinga Iron Works Limited
-3.45 -16.17 -21.34 -4.7 -12.72 -36.95 -14.35 -8.02 -178.93
16 The Odisha Mining Corporation Limited
2,409.43 6,576.64 36.64 1,137.63 5,992.54 18.98 1,265.06 5,622.14 22.50
17 Odisha State Beverage Corporation Limited
33.02 330.64 9.99 46.52 320.11 14.53 46.52 320.11 14.53
18 Odisha Mineral Exploration Corporation Limited
-2.21 -1.88 -117.55 0 0.43 0.00 0 0.43 0.00
19 IDCOL Software Limited
0.42 3.14 13.38 0.26 2.8 9.29 0.29 2.6 11.15
20 Odisha Tourism Development Corporation Limited
19.68 40.88 48.14 18.09 37.48 48.27 18.8 35.82 52.48
21 Odisha State Medical Corporation Limited
14.28 68.28 20.91 12.95 58.37 22.19 12.95 58.37 22.19
22 Odisha Sports Development and Promotion Company Limited
1.50 20.56 7.30 1.13 19.06 5.93 4.48 17.93 24.99
23 Odisha State Financial Corporation
-1.59 50.12 -3.17 5.73 52.01 11.02 5.73 52.01 11.02
24 Odisha State Road Transport Corporation
1.97 139.17 1.42 1.97 139.17 1.42 3.8 72.71 5.23
25 Odisha State Warehousing Corporation
29.31 150.28 19.50 20.46 135.14 15.14 27.26 126.74 21.51
26 GRIDCO Limited
-951.19 -1,176.02 -80.88 216.32 -479.28 -45.13 0 -1.65 0.00
27 Odisha Hydro Power Corporation Limited
317.78 2,944.06 10.79 300.61 2,805.3 10.72 300.16 2,805.3 10.70
28 Odisha Power Generation
602.02 9,787.21 6.15 272.29 9,946.28 2.74 0 8,193.81 0.00

Appendices
188 State Finances Audit Report
for the year ended March 2021
Corporation Limited
29 Odisha Power Transmission Corporation Limited
-8.82 1,709.62 -0.52 112.11 1,568.78 7.15 89.14 1,379.71 6.46
30 Green Energy Development Corporation of Odisha Limited
10.52 78.84 13.34 14.66 73.47 19.95 14.53 67.36 21.57
31 Odisha Film Development Corporation Limited
0.01 7.27 0.14 0 7.26 0.00 0.01 8.57 0.12
32 Odisha Coal and Power Limited
85.46 1,494.75 5.72 -0.34 992.39 -0.03 -0.16 695.11 -0.02
33 GEDCOL SAIL Power Corporation Limited
0.02 0.04 50.00 0.26 10.02 2.59 -0.23 0.77 -29.87
Total 928.00 23,076.55 4.02 2,776.42 22,905.73 12.12 1,909.91 20,303.35 9.41 (Source: Compiled on the basis of latest finalised accounts of SPSEs)
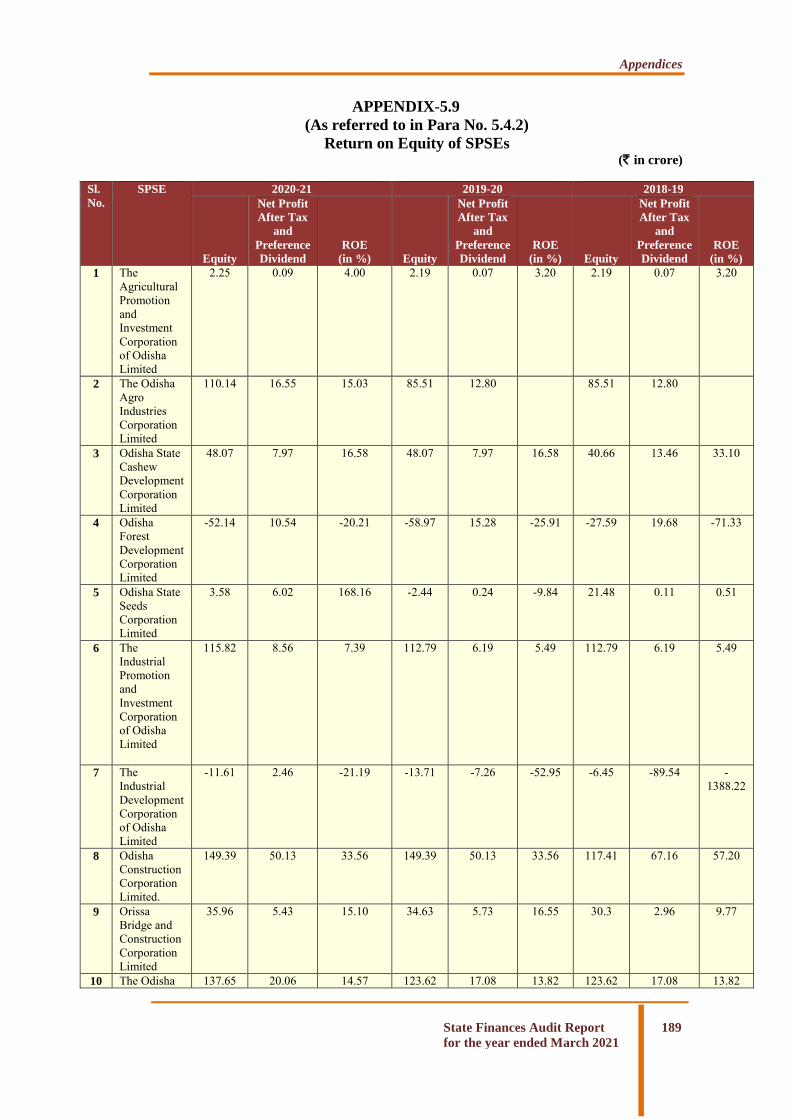
Appendices
State Finances Audit Report
for the year ended March 2021
189
APPENDIX-5.9
(As referred to in Para No. 5.4.2)
Return on Equity of SPSEs (` in crore)
Sl.
No.
SPSE 2020-21 2019-20 2018-19
Equity
Net Profit
After Tax
and
Preference
Dividend
ROE
(in %) Equity
Net Profit
After Tax
and
Preference
Dividend
ROE
(in %) Equity
Net Profit
After Tax
and
Preference
Dividend
ROE
(in %)
1 The Agricultural Promotion and Investment Corporation of Odisha Limited
2.25 0.09 4.00 2.19 0.07 3.20 2.19 0.07 3.20
2 The Odisha Agro Industries Corporation Limited
110.14 16.55 15.03 85.51 12.80 85.51 12.80
3 Odisha State Cashew Development Corporation Limited
48.07 7.97 16.58 48.07 7.97 16.58 40.66 13.46 33.10
4 Odisha Forest Development Corporation Limited
-52.14 10.54 -20.21 -58.97 15.28 -25.91 -27.59 19.68 -71.33
5 Odisha State Seeds Corporation Limited
3.58 6.02 168.16 -2.44 0.24 -9.84 21.48 0.11 0.51
6 The Industrial Promotion and Investment Corporation of Odisha Limited
115.82 8.56 7.39 112.79 6.19 5.49 112.79 6.19 5.49
7 The Industrial Development Corporation of Odisha Limited
-11.61 2.46 -21.19 -13.71 -7.26 -52.95 -6.45 -89.54 -1388.22
8 Odisha Construction Corporation Limited.
149.39 50.13 33.56 149.39 50.13 33.56 117.41 67.16 57.20
9 Orissa Bridge and Construction Corporation Limited
35.96 5.43 15.10 34.63 5.73 16.55 30.3 2.96 9.77
10 The Odisha 137.65 20.06 14.57 123.62 17.08 13.82 123.62 17.08 13.82

Appendices
190 State Finances Audit Report
for the year ended March 2021
State Police Housing and Welfare Corporation Limited
11 Odisha Mineral Bearing Areas Development Corporation Limited
0.01 -1,818.38 -1,81,83,800
427.21 427.2 100.00 0.01 0 0.00
12 Water Corporation of Odisha Limited
0.41 -0.25 -60.98 0.41 -0.25 -60.98 0.83 -0.12 -14.46
13 Odisha Rail Infrastructure Development Limited
54.74 0.29 0.53 54.45 1.67 3.07 58.78 1.38 2.35
14 IDCOL Ferro Chrome & Alloys Limited
5.99 -22.76 -379.97 28.75 -8.43 -29.32 28.75 -8.43 -29.32
15 IDCOL Kalinga Iron Works Limited
-16.17 -3.45 -21.34 -12.72 -4.7 -36.95 -8.02 -14.35 -178.93
16 The Odisha Mining Corporation Limited
6,576.64 1,586.27 24.12 5,992.54 728.72 12.16 5,622.14 789.88 14.05
17 Odisha State Beverage Corporation Limited
330.64 20.88 6.32 320.11 29.99 9.37 320.11 29.99 9.37
18 Odisha Mineral Exploration Corporation Limited
-1.88 -2.31 -122.87 0.43 0 0.00 0.43 0 0.00
19 IDCOL Software Limited
3.14 0.34 10.83 2.8 0.19 6.79 2.6 0.2 7.69
20 Odisha Tourism Development Corporation Limited
40.88 3.40 8.32 37.48 3.47 9.26 35.82 5.89 16.44
21 Odisha State Medical Corporation Limited
68.28 9.78 14.32 58.37 9.1 15.59 58.37 9.1 15.59
22 Odisha Sports Development and Promotion Company Limited
20.56 1.50 7.30 19.06 1.13 5.93 17.93 4.48 24.99
23 Odisha State Financial Corporation
-48.49 -2.35 -4.85 -46.6 5.26 -11.29 -46.6 5.26 -11.29
24 Odisha State Road
137.87 3.54 2.57 137.87 3.54 2.57 62.44 2.48 3.97

Appendices
State Finances Audit Report
for the year ended March 2021
191
Transport Corporation
25 Odisha State Warehousing Corporation
150.28 20.48 13.63 135.14 13.18 9.75 126.74 20.71 16.34
26 GRIDCO Limited
-6,869.29
-1,382.35 -20.12 -4134.8 -281.05 -6.80 -3,853.75
-197.5 -5.12
27 Odisha Hydro Power Corporation Limited
1,987.77 158.06 7.95 1,818.78 144.39 7.94 1,818.78 144.39 7.94
28 Odisha Power Generation Corporation Limited
2,731.27 -190.51 -6.98 3,063.45 171.48 5.60 2713.4 4.79 0.18
29 Odisha Power Transmission Corporation Limited
888.5 -144.37 -16.25 969.7 37.71 3.89 745.41 19.8 2.66
30 Green Energy Development Corporation of Odisha Limited
78.84 5.35 6.79 73.47 6.11 8.32 67.36 9.24 13.72
31 Odisha Coal and Power Limited
373.58 -1.46 -0.39 291.03 -2.81 -0.97 293.84 -3.06 -1.04
32 Odisha Film Development Corporation Limited
5.4 0.01 0.19 5.4 0.01 0.19 5.4 0.01 0.19
33 GEDCOL SAIL Power Corporation Limited
10.07 0.02 0.20 10.02 0.25 2.50 0.77 -0.23 -29.87
Total 7,068.15 -1,630.46 -23.07 9,733.43 1,394.39 14.33 8,571.46 873.88 10.20
(Source: Compiled on the basis of latest finalised accounts of SPSEs)

Appendices
192 State Finances Audit Report
for the year ended March 2021
APPENDIX-5.10
(Referred to in Para No.5.9.1.2)
List of SPSEs where Comment by CAG issued
(Source: Compiled on the basis of latest finalised accounts of SPSEs)
Sl.
No.
Name of the Company Government
Company(GC)/
Government
Controlled Other
Company(DGC)
1 GRIDCO Limited GC
2 IDCOL Kalinga Iron Works Limited GC
3 Industrial Development Corporation of Odisha Limited GC
4 Industrial Promotion and Investment Corporation of Odisha Limited
GC
5 Odisha Coal and Power Limited GC
6 Odisha Mineral Bearing Areas Development Corporation
GC
7 Odisha State Financial Corporation Limited GC
8 Odisha Small Industries Corporation GC
9 Odisha Power Generation Corporation Limited GC
10 Odisha Hydro Power Corporation Limited GC
11 Odisha Forest Development Corporation Limited GC
12 Odisha Thermal Power Corporation Limited DGC
13 Odisha State Seeds Corporation Limited GC
14 Odisha State Warehousing Corporation GC
15 Odisha State Beverages Corporation Limited GC
16 Odisha Power Transmission Corporation Limited GC
17 IFCAL FERRO CHROME AND ALLOYS LIMITED GC
18 Brahmani Railways Limited DGC

Appendices
State Finances Audit Report
for the year ended March 2021
193
APPENDIX-5.11
(Referred to in Para No.5.10)
Details of Companies where there was non-compliance with Accounting
Standards/Ind AS as reported by the Statutory Auditors
(Source: Compiled on the basis of latest finalised accounts of SPSEs)
Sl.
No.
Name of the Company Government
Company(GC) or
Government
Controlled Other
Company (DGC)
Number of Accounting
Standard (AS)/ IND
AS
1 IDCOL Kalinga Iron Works Limited (IKIWL)
GC AS-02
2 Odisha State Medical Corporation Limited (OSMC)
GC AS 09
3 Odisha Thermal Power Corporation Limited(OTPCL)
DGC Ind AS -16
4 GRIDCO Limited GC Ind AS 109, 115
5 Odisha Bridge & Construction Corporation(OBCC)
GC AS 02,15
6 Odisha Film Development Corporation(OFDC)
GC AS-21

Appendices
194 State Finances Audit Report
for the year ended March 2021
APPENDIX-5.12
(Referred to in Para No.5.11)
List of SPSEs where Management Letters issued by CAG
(Source: Compiled on the basis of latest finalised accounts of SPSEs)
Sl.
No.
Name of the Company
1 Odisha Agro Industries Corporation Ltd
2 Odisha State Seeds Corporation Ltd
3 Odisha State Medical Corporation Ltd
4 Lanjigarh Project Area Development Foundation
5 Odisha Bridge & Construction Corporation Ltd
6 Odisha Hydro Power Corporation
7 Odisha Forest Development Corporation
8 Odisha Power Generation Corporation Ltd
9 Odisha Coal and Power Ltd
10 GRIDCO Limited
11 Odisha Mineral Bearing Area Development Corporation
12 Odisha Mineral Exploration Corporation Ltd
13 Agricultural Promotion and Investment Corporation Limited
14 Odisha State Warehousing Corporation
15 Odisha State Beverages Corporation
16 IDCOL Software Ltd
17 Odisha Thermal Power Corporation Ltd
18 IDCOL Kalinga Iron works Ltd
19 Brahmani Railways Ltd
20 Industrial Development Corporation of Odisha Ltd
21 Industrial Promotion and Investment Corporation of Odisha Ltd
22 Paradeep Plastic Park Ltd
23 Kalinga Studios Ltd
24 Odisha Electronic Park Ltd
25 IDCO SEZ Development Ltd
26 Inland Water Ways Consortium of Odisha Ltd

Appendices
State Finances Audit Report
for the year ended March 2021
195
APPENDIX–6.1 Glossary of important Budget related terms
Terms Basis of Calculation
Accounts’ or ‘actuals’ of a year.
Accounts’ or ‘actuals’ of a year. - are the amounts of receipts and disbursements for the financial year beginning on April 1st and ending March 31st following, as finally recorded in the Accounting authority’s books (as audited by C&AG). Provisional Accounts refers to the unaudited accounts.
Administrative approval’ of a scheme, proposal or work
Administrative approval’ is the formal acceptance thereof by the competent authority for the purpose of incurring expenditure. Taken with the provision of funds in the budget, it operates as a financial sanction to the work during that particular year in which the Administrative Approval is issue. Annual financial
statement Annual financial statement means the statement of estimated receipts and expenditure of the Central/State Government for each financial year, laid before the Parliament /State Legislature.
Appropriation Accounts Appropriation Accounts present the total amount of funds(Original and Supplementary) authorised by the Legislative Assembly in the budget grants under each voted grants and charged appropriation vis-à-vis the actual expenditure incurred against each and the unspent provisions or excess under each grant or appropriation. Any expenditure in excess of the grants requires authorization by the Legislature.
Controlling Officer (budget)
Controlling Officer means an officer entrusted by a Department with the responsibility of controlling the incurring of expenditure and/or the collection of revenue.
Drawing and Disbursing Officer’ (DDO)
Drawing and Disbursing Officer’ (DDO) means a Head of Office and also any other Officer so designated by the Finance Department of the State Government, to draw bills and make payments on behalf of the State Government. Public Account Public Account means the Public Account referred to in Article 266(2) of the Constitution. The receipts and disbursements such as deposits, reserve funds, remittances, etc. which do not form part of the Consolidated Fund are included in the Public Account. Disbursements from the Public Account are not subject to vote by the Parliament/State Legislature, as they are not moneys issue out of the Consolidated Fund of India/State.
Major Head Major Head means a Major Head of account for the purpose of
recording and classifying the receipts and disbursements of the State. A Major Head, particularly the one falling within the Consolidated Fund, generally corresponds to a ‘function’ of Government such as Agriculture, Education, Health, etc.

Appendices
196 State Finances Audit Report
for the year ended March 2021
Minor Head Minor Head means a head subordinate to a Major Head or a Sub- Major Head. A Minor Head subordinate to a Major Head identifies a “programme” undertaken to achieve the objectives of the function represented by the Major Head.
Sub Major Head Sub Major Head means an intermediate head of account introduced between a Major Head and the Minor Heads under it, when the Minor Heads are numerous and can conveniently be grouped together under such intermediate Head.
Sub-Head
Sub-Head means a unit of account next subordinate to a Minor Head which normally denotes the scheme or organisation under that Minor Head or programme.
Average interest paid by the State
Interest payment/[(Amount of previous year’s Fiscal Liabilities + Current year’s Fiscal Liabilities)/2] *100.
Balance from Current Revenue(BCR)
Revenue Receipts minus all Plan Grants and Non-Plan Revenue Expenditure excluding expenditure recorded under the majorhead2048– Appropriation for reduction of Avoidance of debt.
Buoyancy of a parameter Rate of Growth of the parameter/GSDP Growth Rate. Buoyancy of a parameter(X) with respect to another parameter (Y)
Rate of Growth of parameter(X)/ Rate of Growth of parameter(Y).
Committed Expenditure The committed expenditure of the State Government on revenue account mainly consists of interest payments, expenditure on salaries and wages, pensions and subsidies on which the present executive has limited control. Consolidated Fund of the
State The fund constituted under Article 266(1) of the Constitution of India into which all receipts, revenues and loans flow. All expenditure from the CFI is by appropriation: voted or charged. It consists of two main divisions namely Revenue Account (Revenue Receipts and Revenue Expenditure) and Capital Account (Public Debt and Loans, etc.). Contingency Fund Legislature Assembly has by law established a Contingency Fund in the nature of an imprest into which is paid from time to time such sums as may be determined by such law, and the said fund is placed at the disposal of the Governor to enable advances to be made by him out of it for the purpose of meeting unforeseen expenditure pending authorization of such expenditure by Legislative Assembly by law under Article 115 or Article 116 of the Constitution. Contingent Liability Contingent liabilities may or may not be incurred by an entity depending on the outcome of a future event such as a court case.

Appendices
State Finances Audit Report
for the year ended March 2021
197
Debt Stabilisation A necessary condition for stability states that if the rate of growth of economy exceeds the interest rate or cost of public borrowings, the Debt-GSDP ratio is likely to be stable provided primary balances are either zero or positive or are moderately negative. Given the rate spread (GSDP growth rate – interest rate) and quantum spread (Debt*rate spread), debt sustainability condition states that if quantum spread together with primary deficit is zero, Debt-GSDP ratio would be constant or debt would stabilize eventually. On the other hand, if primary deficit together with quantum spread turns out to be negative, Debt-GSDP ratio would be rising and in case it is positive, Debt-GSDP ratio would eventually be falling.
Debt sustainability The Debt sustainability is defined as the ability of the State to maintain a constant Debt–GSDP ratio over a period of time and also embodies the concern about the ability to service its debt. Sustainability of debt therefore also refers to sufficiency of liquid assets to meet current or committed obligations and the capacity to keep balance between costs of additional borrowings with returns from such borrowings. It means that rise in fiscal deficit should match with the increase incapacity to service the debt.
Development Expenditure
Social Services + Economic Services. Escrow Account In order to ensure fiscal discipline in public sector
undertaking/Urban Local Bodies/Co-operative Institutions and State-owned Companies etc., and to ensure minimizing the default on payment of Government guaranteed loans the Government in Finance Department vide their Resolution No.11311/F, date-19 March 2004 have issued instructions that all Public Sector Undertakings/Urban Local Bodies/Co-operative Institutions and State-owned Companies etc. who have borrowed against Government guarantee will open an Escrow Account in a nationalized bank for timely repayment of guaranteed loans. The proceeds of this account shall first be utilized for payment of dues of the financial Institutions and it is only after meeting such payments that the surplus amount shall be diverted for other payments including salaries.
Fiscal Deficit Revenue Expenditure + Capital Expenditure + Net Loans and Advances – Revenue Receipts– Miscellaneous Capital Receipts.
Guarantee Redemption Fund
Guarantees are liabilities contingent on the Consolidated Fund of the State in case of default by the borrower for whom the guarantee has been extended. Government of Odisha has constituted a guaranteed redemption fund during the year 2002-2003 with the objective of meeting the payment obligations arising out of the default in discharging the debt servicing for the loans guaranteed by Government.
Internal Debt Internal Debt comprises regular loans from the public in India, also termed ‘Debt raised in India’. It is confined to loans credited to the Consolidated Fund.

Appendices
198 State Finances Audit Report
for the year ended March 2021
Interest received as per cent to Loans Outstanding
Interest Received/ [(Opening balance + Closing balance of Loans and Advances)/2] *100. Primary Deficit Fiscal Deficit – Interest payments.
Primary Revenue Expenditure
Primary revenue expenditure means revenue expenditure excluding interest payments. Public Accounts
Committee A Committee constituted by the Legislative Assembly for the examination of the reports of the Comptroller and Auditor General of India relating to the appropriation accounts of the State, the annual financial accounts of the State or such other accounts or financial matters as are laid before it or which the Committee deems necessary to scrutinise.
Rate of Growth(ROG) [(Current year Amount/Previous year Amount)-1]*100 Re-appropriation Means the transfer of funds from one Primary unit of
appropriation to another such unit. Revenue Deficit Revenue Receipt – Revenue Expenditure.
Sinking Fund A Fund into which the Government sets aside money overtime, in order to retire its debt. Sufficiency of Non-
debt Receipts
Adequacy of incremental non-debt receipts of the State to cover the incremental interest liabilities and incremental primary expenditure. Debt sustainability could be significantly facilitated if the incremental non-debt receipts could meet the incremental interest burden and the incremental primary expenditure. Supplementary Grants If the amount authorized by any law made in accordance with the provisions of Article 114 of the Constitution of India to be expended for a particular service for the current financial year is found to be insufficient for the purpose of that year or when a need has arisen during the current financial year for the supplementary or additional expenditure upon some ‘new service’ not contemplated in the original budget for that year, Government is to obtain supplementary grants or appropriations in accordance with the provision of Article 115 (1) of the Constitution of India. Surrender of unspent
provision Departments of the State Government are to surrender to the Finance Department, before the close of the financial year, all the anticipated unspent provisions noticed in the grants or appropriations controlled by them. The Finance Department is to communicate the acceptance of such surrenders, as are accepted by them to the Audit Officer and/or the Accounts Officer, as the case may be, before the closing of the financial year. State Implementing
Agency State Implementing Agency includes any Organisation/Institution including Non-Governmental Organisation which is authorised by the State Government to receive the funds from the Government of India for implementing specific programmes in the State, e.g. State Implementation Society for Sarva Siksha Abhiyan and State Health Mission for National Rural Health Mission, etc.

Appendices
State Finances Audit Report
for the year ended March 2021
199
Suspense and Miscellaneous
Items of receipts and payments which cannot at once be taken to a final head of receipt or charge owing to lack of information as to their nature or for any other reasons, may be held temporarily under the major head “8658-Suspense Account” in the sector “L. Suspense and Miscellaneous” of the Accounts, (Footnotes under the major head in the list of major/minor heads of account may be referred to for further guidance). A service receipt of which full particulars are not given must not be taken to the head “Suspense Account” but should be credited to the minor head “Other Receipt” under the revenue major head to which it appears to belong pending eventual transfer to the credit of the correct head on receipt of detailed particulars.

Appendices
200 State Finances Audit Report
for the year ended March 2021
Acronyms FullForm AC Abstract Contingency AE Aggregate Expenditure BE Budget Estimates CAG Comptroller and Auditor General of India CE Capital Expenditure CFS Consolidated Fund of the State DCC Detailed Countersigned Contingent DDO Drawing and Disbursing Officer DE Development Expenditure DRDA District Rural Development Agency FCP Fiscal Correction Path FC XIV Fourteenth Finance Commission FRBM Fiscal Responsibility and Budget Management GDP Gross Domestic Product GIA Grants-in-Aid GoI Government of India GSDP Gross State Domestic Product H&UDD Housing and Urban Development Department ITDA Integrated Tribal Development Agency JSSK Janani Shishu Surakshya Karyakram MTFP Medium Term Fiscal Plan NSSF National Small Savings Fund O&M Operation and Maintenance OB&OCWWB Odisha Building and Other Construction Workers Welfare Board OMBADC Odisha Mineral Bearing Areas Development Corporation OBM Odisha Budget Manual OGFR Odisha General Financial Rules ONTR Own Non Tax Revenue OTC Odisha Treasury Code OTR Own Tax Revenue OTS One Time Settlement PIA Project Implementing Agencies PSU Public Sector Undertakings RE Revenue Expenditure RR Revenue Receipts S&W Salaries and Wages SFC State Finance Commission SSE Social Sector Expenditure SDTE Skill Development &Technical Education

Appendices
State Finances Audit Report
for the year ended March 2021
201
ST&SCD, M&BCW
Scheduled Tribes & Scheduled Castes Development, Minorities & Backward Classes Welfare
TE Total Expenditure UC Utilisation Certificates VLC Voucher Level Computerisation W&CD Women & Child Development


Appendices
139
© COMPTROLLER AND AUDITOR GENERAL OF INDIA
www.cag.gov.in
www.agodisha.gov.in