State Finances Audit Report of the Comptroller and Auditor ...
Upload
khangminh22Category
view
0download
0


i
TABLE OF CONTENTS
Particulars Reference to
Paragraph Page
Preface v
Executive Summary vii
CHAPTER-I
OVERVIEW
Profile of the State 1.1 1
Basis and Approach to State Finances Audit
Report 1.2 3
Report Structure 1.3 4
Overview of Government Accounts Structure
and Budgetary Processes 1.4 5
Fiscal Balance: Achievement of deficit and
total debt targets 1.5 10
Deficits and Total Debt after examination in
audit 1.6 15
CHAPTER-II
FINANCES OF THE STATE
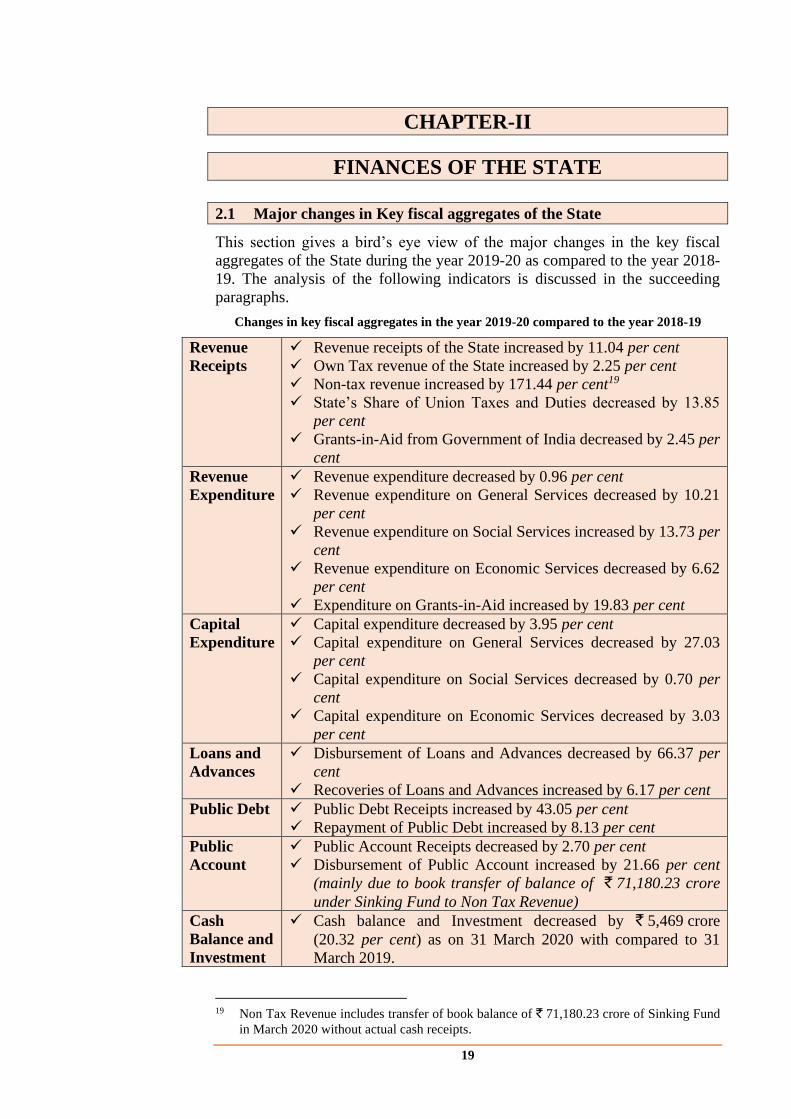
Major changes in Key fiscal aggregates of the
State 2.1 19
Sources and Application of Funds 2.2 20
Resources of the State 2.3 21
Application of resources 2.4 32
Public Account 2.5 46
Debt Management 2.6 51
Components of fiscal deficit and its financing
pattern 2.7 53
Recommendations 2.8 62
CHAPTER-III
BUDGETARY MANAGEMENT
Budget Process 3.1 65
Comments on integrity of budgetary and
accounting process 3.2 68
Comments on effectiveness of budgetary and
accounting process 3.3 76
Recommendations 3.4 84
CHAPTER-IV
QUALITY OF ACCOUNTS AND FINANCIAL REPORTING
PRACTICES
Funds outside Consolidated Fund or Public
Account of the State 4.1 87
Extra-budget borrowings through State owned
PSUs/Authorities not being credited to the
Consolidated Fund
4.2 91
Un-discharged liabilities in Defined
Contribution Pension Scheme 4.3 93
State Finances Audit Report for the year ended 31 March 2020
ii
Particulars Reference to
Paragraph Page
Non-establishment of Uttar Pradesh Road
Transport Accident Relief Fund 4.4 94
Delay in submission of Utilisation Certificates 4.5 95
Abstract Contingent Bills 4.6 97
Personal Deposit/ Personal Ledger Accounts 4.7 98
Indiscriminate use of Minor head 800 4.8 99
Huge expenditure under omnibus Object
Head: ‘42- Other Expenditure’ 4.9 102
Outstanding balances under major Suspense
and Remittance Heads 4.10 103
Adverse balances of loans and advances 4.11 105
Non-reconciliation of Departmental figures 4.12 105
Submission of Accounts/Separate Audit
Reports of Autonomous Bodies/Authorities 4.13 106
Departmental Commercial Undertakings/
Corporation/Companies 4.14 107
Misappropriations, losses, thefts, etc. 4.15 108
Recommendations 4.16 109
CHAPTER-V
FUNCTIONING OF STATE PUBLIC SECTOR UNDERTAKINGS
Introduction 5.1 111
Investments in Public Sector Undertakings 5.2 113
Budgetary support to Public Sector
Undertakings 5.3 113
Reconciliation with Finance Accounts of
Government of Uttar Pradesh 5.4 115
Performance of Public Sector Undertakings 5.5 116
Profit/Loss of PSUs 5.6 116
Erosion of Net Worth 5.7 117
Dividend Payout 5.8 118
Return on Equity 5.9 119
Return on Capital Employed 5.10 120
Analysis of Long terms loans of Public Sector
Undertakings 5.11 121
Interest Coverage Ratio 5.12 121
Age-wise analysis of interest outstanding on
Public Sector Undertakings 5.13 122
Comments on Accounts of Government
Companies 5.14 122
Comments on Accounts of Statutory
Corporations 5.15 123
Submission of accounts by Public Sector
Undertakings 5.16 124
Non-functional Public Sector Undertakings 5.17 126
Follow-up action on State Finances Audit
Report 5.18 127
Recommendations
5.19 127
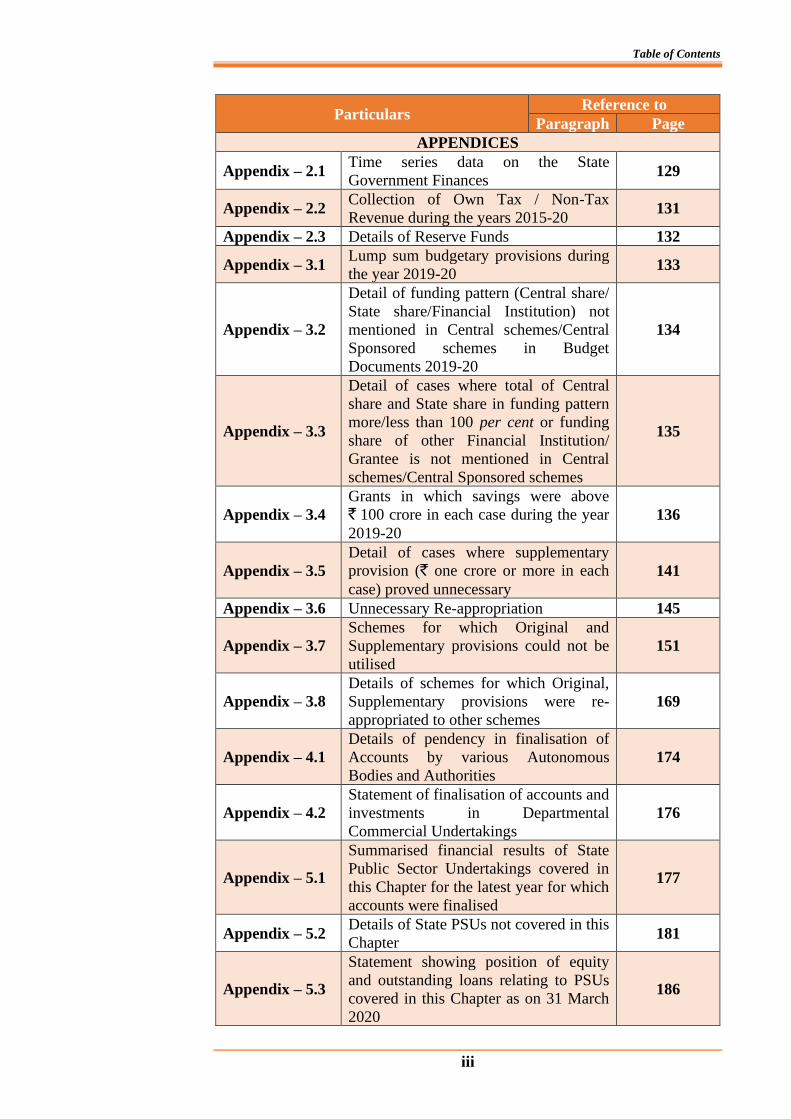
Table of Contents
iii
Particulars Reference to
Paragraph Page
APPENDICES
Appendix – 2.1 Time series data on the State
Government Finances 129
Appendix – 2.2 Collection of Own Tax / Non-Tax
Revenue during the years 2015-20 131
Appendix – 2.3 Details of Reserve Funds 132
Appendix – 3.1 Lump sum budgetary provisions during
the year 2019-20 133
Appendix – 3.2
Detail of funding pattern (Central share/
State share/Financial Institution) not
mentioned in Central schemes/Central
Sponsored schemes in Budget
Documents 2019-20
134
Appendix – 3.3
Detail of cases where total of Central
share and State share in funding pattern
more/less than 100 per cent or funding
share of other Financial Institution/
Grantee is not mentioned in Central
schemes/Central Sponsored schemes
135
Appendix – 3.4
Grants in which savings were above
` 100 crore in each case during the year
2019-20
136
Appendix – 3.5
Detail of cases where supplementary
provision (` one crore or more in each
case) proved unnecessary
141
Appendix – 3.6 Unnecessary Re-appropriation 145
Appendix – 3.7
Schemes for which Original and
Supplementary provisions could not be
utilised
151
Appendix – 3.8
Details of schemes for which Original,
Supplementary provisions were re-
appropriated to other schemes
169
Appendix – 4.1
Details of pendency in finalisation of
Accounts by various Autonomous
Bodies and Authorities
174
Appendix – 4.2
Statement of finalisation of accounts and
investments in Departmental
Commercial Undertakings
176
Appendix – 5.1
Summarised financial results of State
Public Sector Undertakings covered in
this Chapter for the latest year for which
accounts were finalised
177
Appendix – 5.2 Details of State PSUs not covered in this
Chapter 181
Appendix – 5.3
Statement showing position of equity
and outstanding loans relating to PSUs
covered in this Chapter as on 31 March
2020
186
State Finances Audit Report for the year ended 31 March 2020
iv
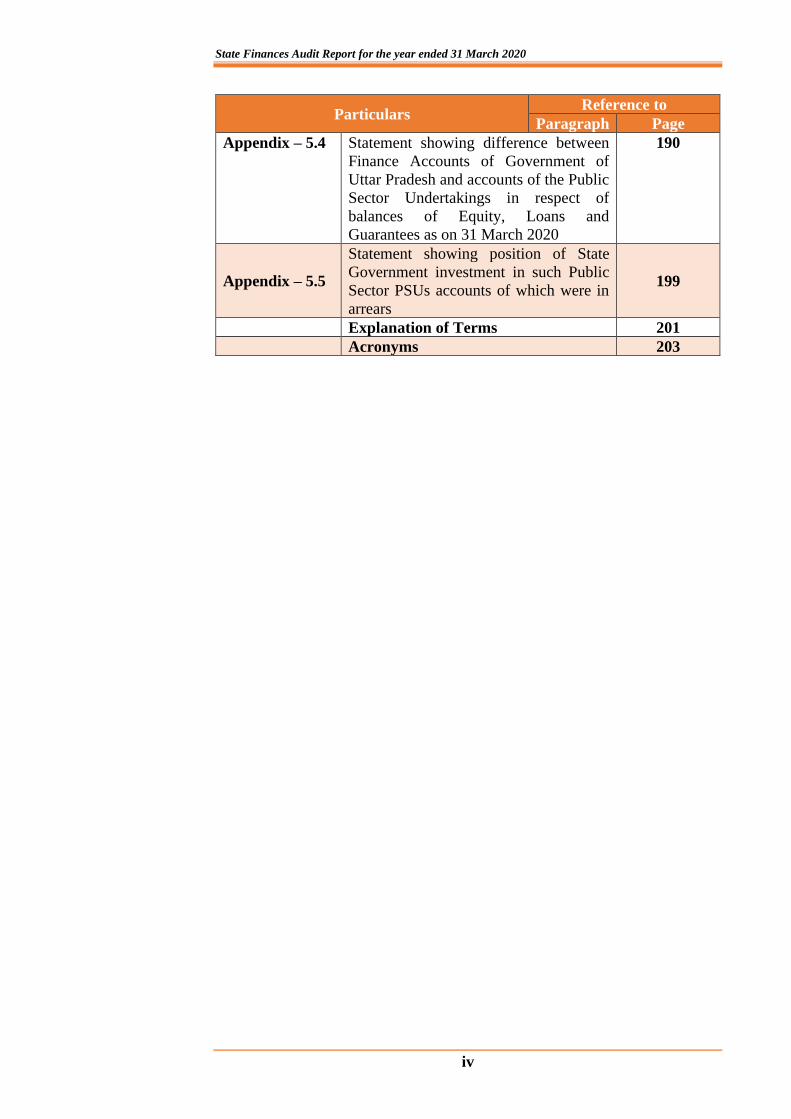
Particulars Reference to
Paragraph Page
Appendix – 5.4 Statement showing difference between
Finance Accounts of Government of
Uttar Pradesh and accounts of the Public
Sector Undertakings in respect of
balances of Equity, Loans and
Guarantees as on 31 March 2020
190
Appendix – 5.5
Statement showing position of State
Government investment in such Public
Sector PSUs accounts of which were in
arrears
199
Explanation of Terms 201
Acronyms 203
v
PREFACE
This Report has been prepared for submission to the Governor of Uttar
Pradesh under Article 151 of the Constitution.
2. Chapter I of this Report describes the basis and approach to the Report
and the underlying data, provides an overview of structure of government
accounts, budgetary processes, macro-fiscal analysis of key indices and State’s
fiscal position including the deficits/surplus.
3. Chapter II of this Report provides a broad perspective of the finances
of the State, analyses the critical changes in major fiscal aggregates relative to
the previous year, overall trends during the period from 2015-16 to 2019-20,
debt profile of the State and key Public Account transactions based on the
Finance Accounts of the State. Information has also been obtained/utilised
from the PSUs, Authorities, Ministry of Statistics and Programme
Implementation, Government of India and other departments of Government
of Uttar Pradesh etc., wherever necessary.
4. Chapter III of this Report is based on the Appropriation Accounts of
the State and reviews the appropriations and allocative priorities of the State
Government and reports on deviations from constitutional provisions relating
to budgetary management.
5. Chapter IV of this Report provides a broad perspective on the quality
of accounts rendered by various authorities of the State Government and status
of compliance with prescribed financial rules, procedures and directives.
6. Chapter V of this Report provides an overview on the financial
performance of State Public Sector Undertakings (PSUs), investment of the
State Government in PSUs, budgetary support to PSUs, position of submission
of accounts by PSUs, return on Equity and capital employed etc.
7. The Reports containing the findings of performance audits and audit
of transactions in various departments and observations arising out of audit of
Statutory Corporations, Boards and Government Companies and the Report
containing observations on Revenue Receipts are presented separately.
The audit has been conducted in conformity with Auditing Standards issued by
the Comptroller and Auditor General of India.

vii
EXECUTIVE SUMMARY
This Report on the finances of the Government of Uttar Pradesh (GoUP)
intends to assess the financial performance of the State during the year
2019-20 and to provide the State Legislature with inputs based on audit
analysis of the financial data. In order to put this analysis in a proper
perspective, a broad comparison of targets envisaged by the Uttar Pradesh
Fiscal Responsibility and Budget Management (UPFRBM) (Amendment) Act,
2016, the Fourteenth Finance Commission Report and the Budget Estimates of
the year 2019-20 have been attempted. The Report is structured in five
Chapters:
Chapter-I is an overview of the finances of the State at a glance.
Chapter-II is based on the audit of the Finance Accounts and makes an
assessment of the fiscal position of GoUP as on 31 March 2020. It provides an
insight into trends in expenditure on interest payments, salaries and wages,
pensions and debt management.
Chapter-III is based on the audit of Appropriation Accounts and gives
grant-wise description of appropriations and the manner in which the allocated
resources were managed by the service delivery departments.
Chapter-IV is an inventory of the GoUP’s compliance to various reporting
requirements and financial rules.
Chapter-V is an overview on the financial performance of State Public Sector
Undertakings (PSUs), Investment of the State Government in PSUs,
Budgetary Support to PSUs, position of submission of accounts by PSUs,
Return on Equity and Capital employed etc.
Audit Findings
Fiscal position of the State
As indicated in the Accounts, during the year 2019-20, the State has achieved
fiscal surplus and revenue surplus of ` 11,083 crore and ` 67,560 crore
respectively. The ratio of total outstanding debt to GSDP (28 per cent) is
below the targets set out in the budget estimates/ Medium Term Fiscal
Restructuring Policy (MTFRP) (29.98 per cent), UPFRBM (Amendment) Act,
2016 (30.00 per cent) and Fourteenth Finance Commission (31.67 per cent).
During the year 2019-20, the State Government transferred the book balance
of ` 71,180.23 crore of Sinking Fund to revenue receipt account. Being
exceptional transaction and without any actual cash receipt, it has impacted the
revenue and fiscal surplus of the State. The revenue surplus of ` 67,560 crore
and fiscal surplus of ` 11,083 crore during the year 2019-20 should, therefore,
be read in conjunction with the transfer of ` 71,180.23 crore from Sinking
Fund as revenue receipt of the State without actual cash receipt.
(Paragraphs 1.4.1, 1.4.2, 1.5 and 1.6.1)
Budget Estimates and Actuals
Revenue receipts (` 3,66,393 crore) were lower than the budget estimates
(` 3,91,734 crore) by ` 25,341 crore. The shortfall in revenue receipts vis-a-vis
budget estimates were due to less receipt of Grants-in-aid from Government of
India (GoI) and less collection of own tax revenue as compared to budget
State Finances Audit Report for the year ended 31 March 2020
viii
estimates/MTFRP. Revenue expenditure (` 2,98,833 crore) was lower by
` 65,124 crore than the budget estimates (` 3,63,957 crore). Further, Capital
outlay (` 59,998 crore) was lower by ` 17,643 crore than the budget estimates
(` 77,641 crore).
(Paragraphs 1.4.1 and 1.5.2)
Sources and Application of Funds
As per Accounts, Revenue Receipts of ` 3,66,393 crore during the year
2019-20 consists of Own Tax Revenue (` 1,22,826 crore), Non-Tax Revenue
(` 81,705 crore), Share of Union Taxes and Duties (` 1,17,818 crore) and
Grants-in-aid from Government of India (` 44,044 crore). Own Tax revenue
(` 1,22,826 crore) of the State increased by 2.25 per cent as compared to
2018-19 mainly due to increase in State Excise, Taxes on vehicles and Taxes
and Duties on Electricity. Non Tax Revenue increased by 171.44 per cent over
the year 2018-19 mainly on account of transfer of book balance of ` 71,180.23
crore of Sinking Fund to Non Tax Revenue. Effectively, the receipt of Non
Tax Revenue (excluding Sinking Fund transfer) during the year 2019-20 was
` 10,525 crore, which was 40 per cent lower than the Non Tax Revenue
during the year 2018-19.
(Paragraphs 2.3.2, 2.3.2.1 2.3.3.1 and 2.3.4)
Revenue expenditure (` 2,98,833 crore) continued to be the dominant
component of the total expenditure and its share increased from 74.31 per cent
in the year 2015-16 to 82.79 per cent in the year 2019-20. Committed
expenditure (` 1,84,604 crore) on salary and wages, pensions and interest
payments was 50.38 per cent of revenue receipt.
(Paragraphs 2.4.2 and 2.4.4)
Capital expenditure (` 59,998 crore) decreased by 3.95 per cent during the
year 2019-20 as compared to the year 2018-19. Further, Capital Expenditure
in all the three sectors, General Sector, Social Sector and Economic Sector,
had shown a decline during the year 2019-20 as compared to the year 2018-19.
(Paragraph 2.4.5)
Consolidated Sinking Fund
The Government constituted (March 2020), a Consolidated Sinking Fund
(CSF) for redeeming its outstanding liabilities, which is to come into force
from financial year 2020-21 and it shall be administered by Reserve Bank of
India (RBI). As per the State Government notification (17 March 2020), the
outstanding balance under the existing Sinking Fund at end-March 2020 was
to be transferred to the Consolidated Sinking Fund. However, the State
Government transferred (30 March 2020) the entire balance of the existing
Sinking Fund amounting to ` 71,180.23 crore as Non Tax Revenue of the
State Government.
The State Government had general cash balance of ` 21,386.75 crore as on 31
March 2020, which was less than the book balance under Sinking Fund
(before transfer to non-tax revenue). As such, the State Government was not in
a position to transfer the book balance of Sinking Fund to Consolidated
Sinking Fund with RBI which would involve actual cash transfer. However,
with the reduction of Sinking Fund balance to zero, the State Government had
Executive Summary
ix
no balance available under Sinking Fund/Consolidated Sinking Fund as on
31.03.2020 for amortisation of its open market loans amounting to
` 2,91,185.86 crore. Further, the credited amount of the existing Sinking Fund
into non-tax revenue could not be utilised for amortisation of borrowings for
which it was created. This lack of financial prudence needs to be addressed to
ensure availability of adequate fund in Consolidated Sinking Fund for
repayment of borrowings.
While closing the existing Sinking Fund, State Government also did not
adhere to the accounting principles laid down in the List of Major and Minor
Heads of Account of Union and States. Further, this transfer of ` 71,180.23
crore was only a book adjustment without actual cash receipt. The revenue
surplus and fiscal surplus of the State during the year 2019-20 should,
therefore, be read in conjunction with the transfer of ` 71,180.23 crore from
Sinking Fund as revenue receipt of the State.
Recommendation: The State Government should ensure that Consolidated
Sinking Fund balances are actually invested with Reserve Bank of India and
are not mere book entries. Availability of adequate fund in Consolidated
Sinking Fund may be ensured and as required under Consolidated Sinking
Fund Scheme, State Government should ensure that annual contribution to the
fund is at least 0.5 per cent of the outstanding liabilities. Further, the transfers
out of the fund are not to be treated as Revenue Receipts and the amount
equivalent to loan repaid should be transferred from Sinking Fund to Major
Head 8680 (Miscellaneous Government Account) on redemption of debt.
(Paragraph 2.5.2.1)
State Disaster Response Fund (SDRF)
Contrary to GoI guidelines that the SDRF should be operated under the
category “Reserve Funds bearing Interest”, State Government operates its
SDRF under the category “Reserve Funds not bearing Interest”. Further, the
balances in the Fund are not invested in the manner as laid down in the SDRF
guidelines. The State Government had not credited interest of ` 116.55 crore
for the year 2019-20 on un-invested balances of the Fund.
Recommendation: The State Government should transfer the SDRF balances
to MH 8121- General and Other Reserve Funds under the category “Reserve
Funds bearing Interest” and remit to the Fund the accrued interest as per
SDRF guidelines. The State Government is also required to invest the fund
balances in the manner prescribed in the SDRF guidelines.
(Paragraph 2.5.2.2)
Contingent Liabilities – Status of Guarantees
For the purpose of redemption of guarantees, the State Government was
required to create a Guarantee Redemption Fund as per the recommendations
of Twelfth Finance Commission. However, State Government has not created
a Guarantee Redemption Fund. The State Government has given guarantees to
23 entities viz. Statutory Corporation, Government Companies and other
institutions for repayment of loans raised by them in the year 2019-20. There
was an outstanding guarantee of ` 1,18,696.49 crore at the end of the year
2019-20. Further, guarantee fee is not being collected/accounted for in the
minor head as provided in the List of Major and Minor Heads of Accounts of
Union and States.
State Finances Audit Report for the year ended 31 March 2020
x
Recommendation: The State Government should create and operate the
Guarantee Redemption Fund as per the recommendations of XII FC. State
Government should also ensure that guarantee fees are realised promptly. The
Government should stop financial support to the institutions which have not
paid the guarantee fees and/or are also in arrears of accounts. Further,
collection/accounting of guarantee fee should be aligned to the List of Major
and Minor Head of Accounts.
(Paragraphs 2.5.2.3 and 2.7.2.2)
Expenditure without legislative authorisation
State Government failed to ensure legislative authorisation of expenditure of
` 51.21 crore incurred by Uttar Pradesh Electricity Regulatory Commission on
purchase of land and construction of office building complex, which was
violation of the provisions contained in Article 204 of the Constitution.
Recommendation: Expenditure incurred without approval of the State
Legislature is against the provisions contained in Article 204 of the
Constitution and therefore it should not be allowed. State Government should
examine the reasons for expenditure without legislative authorisation in case
of construction of UPERC building and fix responsibility.
(Paragraph 3.2.1)
Misclassification of expenditure
Misclassification of expenditure between Revenue as Capital and Capital as
Revenue were noticed in a number of cases during the year 2019-20. The
combined impact of misclassification of expenditure resulted in overstatement
of revenue surplus by ` 85.01 crore.
Recommendation: Classification of some expenditure items as Capital or
Revenue nature included in certain Object heads, as pointed out in paragraph
3.2.2, needs review and redressal to align it with UP Budget Manual (UPBM).
(Paragraphs 3.2.2, 3.2.2.1, 3.2.2.2 and 3.2.2.3)
Lump Sum provisions
Lump Sum provisions of ` 6,767.78 crore under various heads of 18 Grants
were allocated in the Budget in contravention of guidelines contained in UP
Budget Manual (UPBM) and expenditure of ` 6,572.33 crore (97 per cent of
the provision) was incurred against these provisions.
Recommendation: Lump Sum budgetary provisions are in contravention of
Para 31 of the UPBM and may be restricted or dispensed with altogether, in
the light of the provisions of UPBM.
(Paragraph 3.2.3)
Excess expenditure requiring regularisation
There was an excess disbursement of ` 10.71 lakh over the authorisation made
by the State Legislature under Grant No. 55- Public Works Department
(Buildings) during the year 2019-20. Excess expenditure over legislative
authorisation has regularly been pointed out in the previous State Finances
Audit Report of the State. However, cases of excess expenditure of
` 32,525.25 crore under 102 grants and 46 appropriations pertaining to the
years 2005-06 to 2018-19 are yet to be regularised by the State Legislature.
Executive Summary
xi
Recommendation: Excess expenditure over and above legislative
authorisation (pertaining to the period 2005-06 to 2019-20) should be placed
before the State Legislature for regularisation in term of the provisions
contained in Article 205 of the Constitution.
(Paragraphs 3.2.4.1 and 3.2.4.2)
Savings
Savings of ` 1,27,382.47 crore occurred against the total provisions of
` 5,26,809.22 crore during the year 2019-20, which was 24.18 per cent of the
total budgetary provisions. Such large savings are indicative of wide gap
between planning and execution by the State Government. In 71 cases in 49
Grants, there were savings amounting to ` 1,24,946.48 crore in excess of
` 100 crore in each case. Further, provision of unnecessary/excessive
supplementary grants despite savings against original allocations in the Grant
prevents disbursement of funds to other departments.
Recommendation: Supplementary provisions and re-appropriations should
be based on careful assessment of fund requirements. Finance Department
may advice line departments to improve accuracy in cost estimation of
schemes/projects at the time of submitting revised estimates in order to
optimise utilisation of funds.
(Paragraphs 3.3.1, 3.3.2, 3.3.3, 3.3.4 and 3.3.5)
Rush of expenditure
Rush of expenditure in the last month of the financial year is against the
principles of sound management of Public funds. No specific instructions have
been given in the UPBM to prevent rush of expenditure. In four Grants, 50 per
cent and above expenditure of their total budgeted provisions were incurred in
the last month of the financial year 2019-20 i.e. March 2020. Further, out of
` 276.95 crore incurred under Grant No. 44 - Tourism Department during
March 2020, ` 100 crore was transferred to Personal Deposit/Personal Ledger
Account, which was in violation of instructions (March 2018) issued by the
State Government to administrative departments to stop practice of keeping
money under Personal Deposit/Personal Ledger Account after withdrawal
from Consolidated Fund.
Recommendation: The Government may consider issuing guidelines to control
rush of expenditure towards the closing months of the financial year especially
in the month of March in order to maintain a steady pace of expenditure.
(Paragraph 3.3.6)
Delayed surrender of Savings
UPBM provides that the Controlling Officers should surrender all final
Savings to the Finance Department by 25th March. However, only
` 19,658.69 crore was surrendered out of total Savings of ` 1,27,382.47 crore
on the last day of the financial year and rest ` 1,07,723.78 crore lapsed.
Recommendation: Compliance of instructions in Para 141 of UPBM
regarding surrender of funds by 25th March should be ensured for optimising
funds utilisation and ensuring budgetary discipline.
(Paragraph 3.3.8)
State Finances Audit Report for the year ended 31 March 2020
xii
Government receipts kept out of Government Accounts
Due to non-adoption of accountal of Building and Other Construction Workers Welfare cess through Government Accounts, it was not ascertainable from the accounts of the State Government as to how much money was collected on account of cess, fee etc. and how much money was transferred to the U.P. Building and Other Construction Workers Welfare (UPBOCW) Board. As per provisional data provided by the Board, the expenditure on registered works ranged from 3.81 to 7.20 per cent of available funds covering 5.55 to 23.36 per cent of registered workers during 2015-16 to 2019-20.
Recommendation: Sums collected against labour cess by the UP BOCW Board should be part of Public Account of the State and from there it may be transferred to the Board Account. The UP BOCW Board should fulfil its mandate of improving the working condition of building and other construction workers and providing adequate financial assistance to them.
(Paragraph 4.1.1)
State Government did not constitute the State Electricity Regulatory Commission Fund. As a result, receipts of ` 110.16 crore of the Uttar Pradesh Electricity Regulatory Commission were being kept outside the Public Account of the State.
Recommendation: The State Government should constitute the State Electricity Regulatory Commission Fund and credit the fund balance in the Public Account of the State.
(Paragraph 4.1.2)
Loans of the State Government not being credited to the Consolidated
Fund
The State Government resorted to extra-budget borrowings through State owned PSUs/Authorities for meeting expenditure impacting the debt indicators of the State. As a result, Debt-stock increases by ` 5,107.58 crore and stood at ` 5,07,519.60 crore and Debt-stock to GSDP ratio at 28.28 per cent for the year 2019-20 as against ` 5,02,412.02 crore and 28.00 per cent respectively as reported for the year.
Recommendation: The State Government should avoid extra-budget borrowings and credit all loans taken by PSUs/Authorities on behalf of State Government but serviced by the State Government, to the Consolidated Fund.
(Paragraph 4.2)
Un-discharged liabilities in Defined Contribution Pension Scheme
The State Government did not remit ` 2,023.76 crore for the Defined Contribution Pension Scheme to the designated fund manager for its further investment during the year 2019-20. As a result, non-remitted fund did not yield any value appreciation as it could not become the part of corpus of investment of the subscribers.
Recommendation: The State Government should transfer the entire amount of Defined Contribution Pension Scheme to designated fund manager through the National Securities Depository Limited (NSDL)/Trustee Bank so that the un-transferred amount could become the part of corpus of investment of the subscribers and yield value appreciation.
(Paragraph 4.3)
Executive Summary
xiii
Non-establishment of Uttar Pradesh Road Transport Accident Relief
Fund
The State Government did not establish Uttar Pradesh Road Transport
Accident Relief Fund (UPRTARF) to provide relief to the passengers or heirs
of deceased passengers or other persons suffering casualty as mandated by
Uttar Pradesh Motor Vehicle Taxation Act, 1997. As a result, a sum of
` 536.38 crore has not been credited to UPRTARF during 2015-16 to 2019-
20.
Recommendation: Being the statutory requirement, the Government should
create the ‘Uttar Pradesh Road Transport Accident Relief Fund’ so that the
fund could be utilised for benefit of the affected persons.
(Paragraph 4.4)
Delay in submission of Utilisation Certificates (UCs)
There were 41,376 UCs aggregating ` 15,697.94 crore outstanding as on 31
March 2020 for Grants released during the period 2001-02 to 2018-19 (up to
September 2018). In the absence of UCs, there is no assurance that moneys
disbursed have been used for the purposes for which they were
sanctioned/authorised by the Legislature. Moreover, high pendency of UCs
was fraught with the risk of embezzlement, diversion and misappropriation of
funds.
Recommendation: The Government may ensure timely submission of utilisation
certificates by the departments in respect of the grants released for specific
purposes and all pendencies may be reviewed before release of fresh grants to
defaulting grantees.
(Paragraph 4.5)
Abstract Contingent (AC) Bills
In violation of codal provisions for adjustment of AC bills by the end of the
next month of drawl, 1,323 AC bills involving advance of ` 17.06 crore were
pending for adjustment as on 31 March 2020 which included 1,185 AC bills
drawn up to the year 2017-18.
Recommendation: The Finance Department should ensure that all controlling
officer adjust Abstract Contingent bills within stipulated period, as required
under the Rules.
(Paragraph 4.6)
Personal Deposit Accounts
Out of total 781 Personal Ledger Accounts (PLA)/Personal Deposit (PD)
Accounts, 225 PLA/PD Accounts having a balance of ` 11.95 crore were
inoperative during last three years. These inoperative PLA/PD Accounts were
not closed by the State Government in contravention of the codal provisions of
Uttar Pradesh Personal Ledger Account Rules 1998.
Recommendation: The Finance Department should review all PD accounts to
ensure that all amounts unnecessarily lying in these PD accounts are
immediately remitted to the Consolidated Fund. Further, the Finance
Department should reiterate the instructions contained in the financial
State Finances Audit Report for the year ended 31 March 2020
xiv
rules/codal provisions and ensure that appropriate action is taken against
departmental officers who fail to follow the rules.
(Paragraph 4.7)
Indiscriminate use of Minor head 800 and Object Head 42
A sum of ` 36,247.60 crore under 82 Revenue and Capital Major Heads of
Accounts on the expenditure side and on the receipt side, ` 76,255.58 crore
were recorded under minor head 800-Other Expenditure/Receipts under
concerned Major Heads during the year 2019-20. The booking of large
amounts under the Minor Head ‘800-Other Expenditure’ affects the
transparency in financial reporting. Further, expenditure of ` 11,820.86 crore
was made under Object Head ‘42- Other Expenditure’ which was 3.08 per
cent of total expenditure of ` 3,83,351.68 crore under the Consolidated Fund
of the State during the year 2019-20. In 18 grants, the expenditure under
Object Head ‘42- Other Expenditure’ was more than five per cent of total
expenditure of these grants. The classification of large amounts under the
Object Head ‘42- Other Expenditure’ does not give a complete picture in
financial reporting.
Recommendation: The Finance Department should, in consultation with the
Accountant General (A&E), conduct a comprehensive review of all items
presently appearing under minor head 800 and ensure that all such receipts
and expenditure are in future booked under the appropriate heads of account.
Further, at object head level, indiscriminate use of object head 42-Other
expenditure should be minimised.
(Paragraphs 4.8 and 4.9)
Functioning of State Public Sector Undertakings
As on 31 March 2020, Uttar Pradesh had 113 State Public Sector Undertakings
(PSUs) consisting of six Statutory Corporations and 107 Government
companies (including 44 non-functional Government companies) under the
audit jurisdiction of the Comptroller and Auditor General of India. This Report
covers financial performance of 33 PSUs whose accounts were not in arrears
for three years or more and were functional/not under liquidation. These 33
functional PSUs registered an annual turnover of ` 69,786 crore as per their
latest finalised accounts. This turnover was equal to 3.89 per cent of Gross
State Domestic Product (GSDP) of Uttar Pradesh for the year 2019-20.
(Paragraph 5.1)
Stake of Government of Uttar Pradesh and performance of PSUs
As on 31 March 2020, the total investment (equity and long-term loans) in 33
PSUs, whose financial performance is covered in this report, was
` 2,21,303.75 crore. The investment consisted of 59.44 per cent towards
equity and 40.56 per cent in long-term loans. Out of this, GoUP has
investment of ` 1,31,849.34 crore in these PSUs consisting of equity of
` 1,28,647.69 crore and long-term loans of ` 3,201.65 crore.
As per the latest finalised accounts up to the year 2019-20, the overall loss
incurred by 33 PSUs was ` 14,210.90 crore. Out of 33 PSUs, 15 PSUs earned
profit of ` 517.61 crore and 18 PSUs incurred loss of ` 14,728.51 crore. The
top loss-making PSUs were Uttar Pradesh Power Corporation Limited
(` 8,118.80 crore) and Dakshinanchal Vidyut Vitran Nigam Limited
Executive Summary
xv
(` 2,567.16 crore) and the top profit-making PSUs were Uttar Pradesh Avas
Evam Vikas Parishad (` 167.37 crore) and Uttar Pradesh Rajya Vidyut
Utpadan Nigam Limited (` 123.75 crore).
(Paragraphs 5.2 and 5.6)
Reconciliation with Finance Accounts of Government of Uttar Pradesh
The figures in respect of equity, loans and guarantees outstanding as per
records of the State PSUs should agree with that of the figures appearing in the
Finance Accounts of the Government of Uttar Pradesh. However, as on 31
March 2020, differences in equity, loans and guarantee existed in respect of 64
PSUs. These differences between the figures are persisting since last many
years, though the issue of reconciliation of differences was also taken up by
the audit with the concerned PSUs and the Departments from time to time.
Recommendation: The State Government and the respective PSUs should
reconcile the differences in figures of equity, loans and guarantees
outstanding as per records of the PSUs and as per the Finance Accounts of
GoUP in a time bound manner.
(Paragraph 5.4)
Arrears of accounts
Out of 69 functional PSUs, only three PSUs had submitted their accounts for
the year 2019-20 and remaining 66 functional PSUs had arrears of 255
accounts. Out of 44 non-functional PSUs, one PSU viz. Uttar Pradesh State
Yarn Company Limited had submitted its accounts for the year 2019-20, 41
PSUs had arrears of 674 accounts and remaining two PSUs had no arrear of
accounts up to the date of going into liquidation. GoUP had provided
` 59,832.24 crore (Equity: ` 18,681.08 crore, Loan: ` 1,837.27 crore, Grant
` 15,525.07 crore and Subsidies: ` 23,788.82 crore) in 41 out of the 107 State
PSUs during the period for which their accounts were in arrears.
Recommendation: The Administrative Departments should strictly monitor
and issue necessary directions to liquidate the arrears in accounts of PSUs.
The Government may also look into the constraints in preparing the accounts
of the PSUs and take necessary steps to liquidate the arrears in accounts.
(Paragraphs 5.16)


1
CHAPTER-I
OVERVIEW
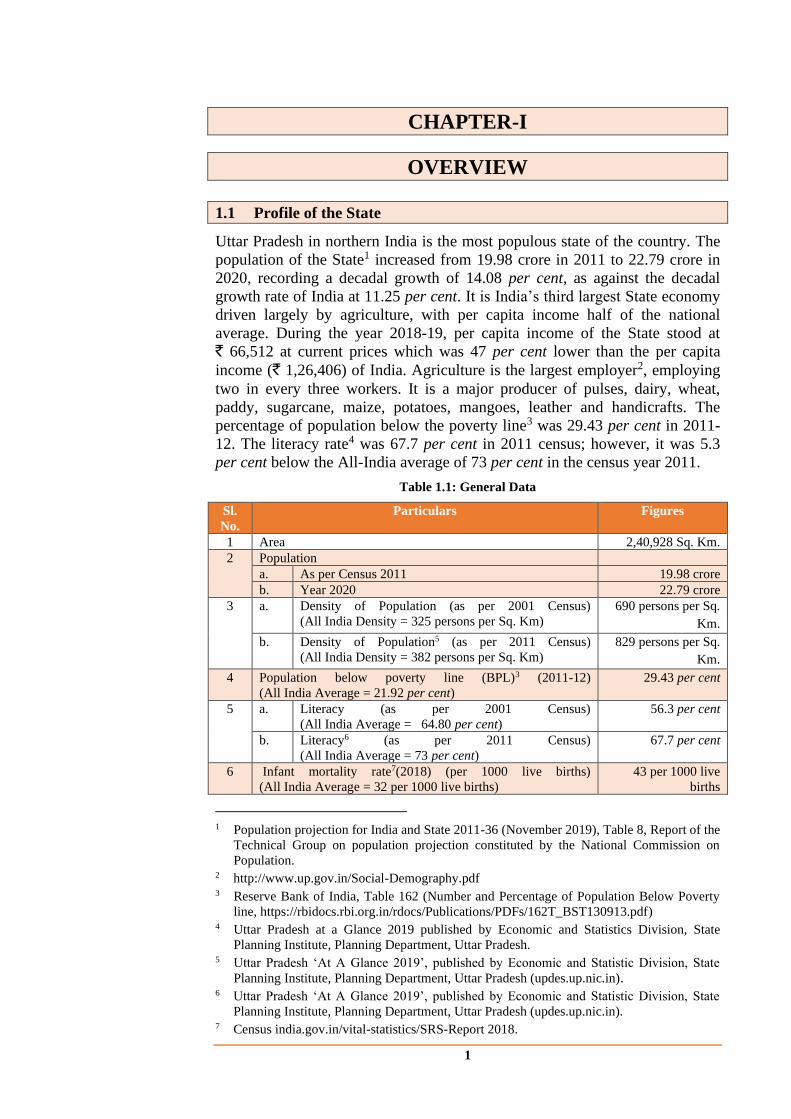
1.1 Profile of the State
Uttar Pradesh in northern India is the most populous state of the country. The
population of the State1 increased from 19.98 crore in 2011 to 22.79 crore in
2020, recording a decadal growth of 14.08 per cent, as against the decadal
growth rate of India at 11.25 per cent. It is India’s third largest State economy
driven largely by agriculture, with per capita income half of the national
average. During the year 2018-19, per capita income of the State stood at
` 66,512 at current prices which was 47 per cent lower than the per capita
income (` 1,26,406) of India. Agriculture is the largest employer2, employing
two in every three workers. It is a major producer of pulses, dairy, wheat,
paddy, sugarcane, maize, potatoes, mangoes, leather and handicrafts. The
percentage of population below the poverty line3 was 29.43 per cent in 2011-
12. The literacy rate4 was 67.7 per cent in 2011 census; however, it was 5.3
per cent below the All-India average of 73 per cent in the census year 2011.
Table 1.1: General Data
Sl.
No.
Particulars Figures
1 Area 2,40,928 Sq. Km.
2 Population
a. As per Census 2011 19.98 crore
b. Year 2020 22.79 crore
3 a. Density of Population (as per 2001 Census)
(All India Density = 325 persons per Sq. Km)
690 persons per Sq.
Km.
b. Density of Population5 (as per 2011 Census)
(All India Density = 382 persons per Sq. Km)
829 persons per Sq.
Km.
4 Population below poverty line (BPL)3 (2011-12)
(All India Average = 21.92 per cent)
29.43 per cent
5 a. Literacy (as per 2001 Census)
(All India Average = 64.80 per cent)
56.3 per cent
b. Literacy6 (as per 2011 Census)
(All India Average = 73 per cent)
67.7 per cent
6 Infant mortality rate7(2018) (per 1000 live births)
(All India Average = 32 per 1000 live births)
43 per 1000 live
births
1 Population projection for India and State 2011-36 (November 2019), Table 8, Report of the
Technical Group on population projection constituted by the National Commission on
Population. 2 http://www.up.gov.in/Social-Demography.pdf 3 Reserve Bank of India, Table 162 (Number and Percentage of Population Below Poverty
line, https://rbidocs.rbi.org.in/rdocs/Publications/PDFs/162T_BST130913.pdf) 4 Uttar Pradesh at a Glance 2019 published by Economic and Statistics Division, State
Planning Institute, Planning Department, Uttar Pradesh. 5 Uttar Pradesh ‘At A Glance 2019’, published by Economic and Statistic Division, State
Planning Institute, Planning Department, Uttar Pradesh (updes.up.nic.in). 6 Uttar Pradesh ‘At A Glance 2019’, published by Economic and Statistic Division, State
Planning Institute, Planning Department, Uttar Pradesh (updes.up.nic.in). 7 Census india.gov.in/vital-statistics/SRS-Report 2018.
State Finances Audit Report for the year ended 31 March 2020
2
Sl.
No.
Particulars Figures
7 Life Expectancy at birth8 (2013-17) (All India Average = 69
years)
65 years
8 Gross State Domestic Product (GSDP) at current prices ` 17,94,508 crore
9 Per capita GSDP CAGR (2011-
12 to 2019-20)
Uttar Pradesh 10.32
General Category States 10.53
10 GSDP CAGR (2011-12 to 2019-
20)
Uttar Pradesh 12.01
General Category States 11.98
11 Decadal Population Growth9
(2011 to 2020)
Uttar Pradesh 14.08 per cent
General Category States 11.13 per cent
1.1.1 Gross State Domestic Product of the State
Gross State Domestic Product (GSDP) is the value of all goods and services
produced within the boundaries of the State in a given time period. Growth of
GSDP is an important indicator of the State’s economy, as it denotes the
extent of changes in the level of economic development of the State over a
period of time.
Changes in sectoral contribution to the GSDP is also important to understand
the changing structure of the economy. Economic activity is generally divided
into Primary, Secondary and Tertiary sectors, which correspond to the
Agriculture, Industry and Service sectors.
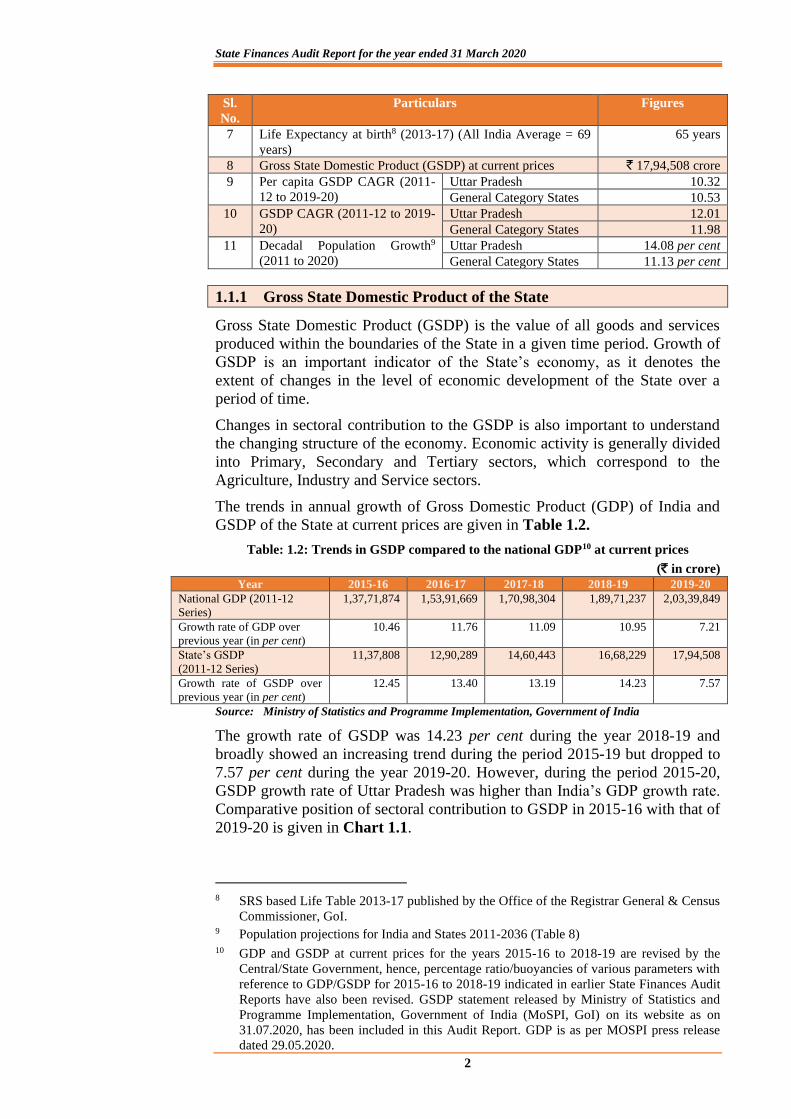
The trends in annual growth of Gross Domestic Product (GDP) of India and
GSDP of the State at current prices are given in Table 1.2.
Table: 1.2: Trends in GSDP compared to the national GDP10 at current prices
(` in crore)
Year 2015-16 2016-17 2017-18 2018-19 2019-20
National GDP (2011-12
Series)
1,37,71,874 1,53,91,669 1,70,98,304 1,89,71,237 2,03,39,849
Growth rate of GDP over
previous year (in per cent)
10.46 11.76 11.09 10.95 7.21
State’s GSDP
(2011-12 Series)
11,37,808 12,90,289 14,60,443 16,68,229 17,94,508
Growth rate of GSDP over
previous year (in per cent)
12.45 13.40 13.19 14.23 7.57
Source: Ministry of Statistics and Programme Implementation, Government of India
The growth rate of GSDP was 14.23 per cent during the year 2018-19 and
broadly showed an increasing trend during the period 2015-19 but dropped to
7.57 per cent during the year 2019-20. However, during the period 2015-20,
GSDP growth rate of Uttar Pradesh was higher than India’s GDP growth rate.
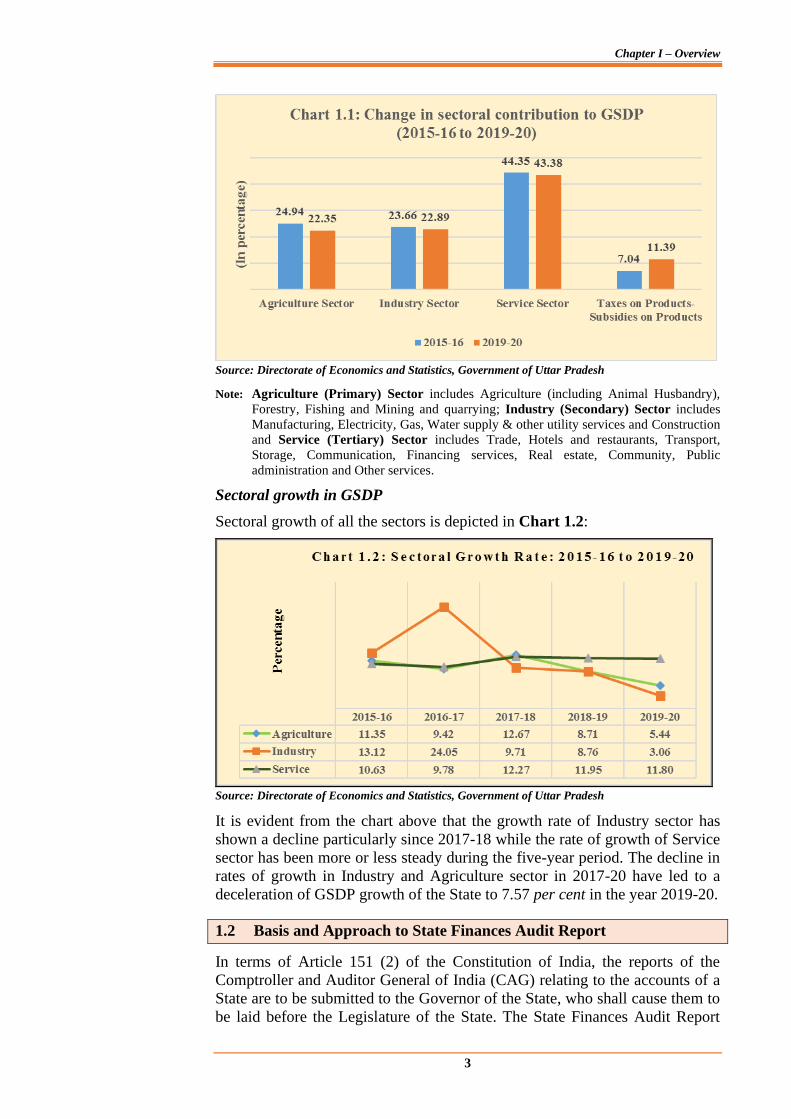
Comparative position of sectoral contribution to GSDP in 2015-16 with that of
2019-20 is given in Chart 1.1.
8 SRS based Life Table 2013-17 published by the Office of the Registrar General & Census
Commissioner, GoI. 9 Population projections for India and States 2011-2036 (Table 8) 10 GDP and GSDP at current prices for the years 2015-16 to 2018-19 are revised by the
Central/State Government, hence, percentage ratio/buoyancies of various parameters with
reference to GDP/GSDP for 2015-16 to 2018-19 indicated in earlier State Finances Audit
Reports have also been revised. GSDP statement released by Ministry of Statistics and
Programme Implementation, Government of India (MoSPI, GoI) on its website as on
31.07.2020, has been included in this Audit Report. GDP is as per MOSPI press release
dated 29.05.2020.
Chapter I – Overview
3
Source: Directorate of Economics and Statistics, Government of Uttar Pradesh
Note: Agriculture (Primary) Sector includes Agriculture (including Animal Husbandry),
Forestry, Fishing and Mining and quarrying; Industry (Secondary) Sector includes
Manufacturing, Electricity, Gas, Water supply & other utility services and Construction
and Service (Tertiary) Sector includes Trade, Hotels and restaurants, Transport,
Storage, Communication, Financing services, Real estate, Community, Public
administration and Other services.
Sectoral growth in GSDP
Sectoral growth of all the sectors is depicted in Chart 1.2:
Source: Directorate of Economics and Statistics, Government of Uttar Pradesh
It is evident from the chart above that the growth rate of Industry sector has
shown a decline particularly since 2017-18 while the rate of growth of Service
sector has been more or less steady during the five-year period. The decline in
rates of growth in Industry and Agriculture sector in 2017-20 have led to a
deceleration of GSDP growth of the State to 7.57 per cent in the year 2019-20.
1.2 Basis and Approach to State Finances Audit Report
In terms of Article 151 (2) of the Constitution of India, the reports of the
Comptroller and Auditor General of India (CAG) relating to the accounts of a
State are to be submitted to the Governor of the State, who shall cause them to
be laid before the Legislature of the State. The State Finances Audit Report
State Finances Audit Report for the year ended 31 March 2020
4
(SFAR) is prepared and submitted under Article 151(2) of the Constitution of
India.
Accountant General (Accounts & Entitlements) prepares the Finance Accounts
and Appropriation Accounts of the State annually, from the vouchers, challans
and initial and subsidiary accounts rendered by the treasuries, offices and
departments responsible for keeping such accounts functioning under the
control of the State Government, and the statements received from the
Reserve Bank of India. These accounts are audited independently by the
Principal Accountant General (Audit) and certified by the CAG.
Finance Accounts and Appropriation Accounts of the State together with the
Budget document of the State constitute the core data for this Report. Other
sources include the following:
• Results of audit carried out by the Office of the Principal Accountant
General (Audit);
• Other data with Departmental Authorities and Treasuries (accounting
as well as MIS),
• GSDP data and other State related statistics; and
• Various Audit Reports of the CAG of India.
The analysis was also carried out in the context of recommendations of the
XIV Finance Commission (FC), State Fiscal Responsibility and Budget
Management Act, best practices and guidelines of the Government of India.
The draft Report was forwarded to the State Government for comments on
22 February 2021. Replies of the State Government are awaited (July 2021).
1.3 Report Structure
The SFAR is structured into the following five Chapters:
Chapter - I Overview
This Chapter describes the basis and approach to the Report
and the underlying data, provides an overview of structure
of government accounts, budgetary processes, macro-fiscal
analysis of key indices and State’s fiscal position including
the deficits/surplus.
Chapter - II Finances of the State
This chapter provides a broad perspective of the finances of
the State, analyses the critical changes in major fiscal
aggregates relative to the previous year, overall trends
during the period from 2015-16 to 2019-20, debt profile of
the State and key Public Account transactions, based on the
Finance Accounts of the State.
Chapter - III Budgetary Management
This chapter is based on the Appropriation Accounts of the
State and reviews the appropriations and allocative priorities
of the State Government and reports on deviations from
constitutional provisions relating to budgetary management.
Observations with respect to integrity of budgetary and
accounting process viz. expenditure without authority of
law, misclassification of expenditure between capital and
revenue and vice versa, unnecessary or excessive
Chapter I – Overview
5
supplementary grants, unnecessary or excessive re-
appropriation, excess expenditure and its regularisation,
transparency and effectiveness of budgetary and accounting
process, have been included.
Chapter - IV Quality of Accounts and Financial Reporting Practices
This chapter comments on the quality of accounts rendered
by various authorities of the State Government and issues of
non-compliance with prescribed financial rules and
regulations by various departmental officials of the State
Government. Observations with respect to completeness,
transparency and measurement of accounts alongwith issues
related to disclosures, have been included.
Chapter - V Functioning of State Public Sector Undertakings
This chapter discussed the financial performance of State
Public Sector Undertakings (PSUs), investment of the State
Government in PSUs, budgetary support to PSUs, position
of submission of accounts by PSUs, return on equity and
capital employed etc.
1.4 Overview of Government Accounts Structure and Budgetary
Processes
The Accounts of the State Government are kept in three parts:
i. Consolidated Fund of the State (Article 266 (1) of the Constitution of
India)
This Fund comprises all revenues received by the State Government, all loans
raised by the State Government (market loans, bonds, loans from the Central
Government, loans from Financial Institutions, Special Securities issued to
National Small Savings Fund, etc.), Ways and Means advances extended by
the Reserve Bank of India and all moneys received by the State Government in
repayment of loans. No moneys can be appropriated from this Fund except in
accordance with law and for the purposes and in the manner provided by the
Constitution of India. Certain categories of expenditure (e.g., salaries of
Constitutional authorities, loan repayments etc.), constitute a charge on the
Consolidated Fund of the State (Charged expenditure) and are not subject to
vote by the Legislature. All other expenditure (Voted expenditure) is voted by
the Legislature.
ii. Contingency Fund of the State (Article 267(2) of the Constitution of
India)
This Fund is in the nature of an imprest which is established by the State
Legislature by law, and is placed at the disposal of the Governor to enable
advances to be made for meeting unforeseen expenditure pending
authorisation of such expenditure by the State Legislature. The fund is
recouped by debiting the expenditure to the concerned functional major head
relating to the Consolidated Fund of the State.
iii. Public Account of the State (Article 266(2) of the Constitution)
Apart from the above, all other public moneys received by or on behalf of the
Government, where the Government acts as a banker or trustee, are credited to
State Finances Audit Report for the year ended 31 March 2020
6
the Public Account. The Public Account includes repayables like Small
Savings and Provident Funds, Deposits (bearing interest and not bearing
interest), Advances, Reserve Funds (bearing interest and not bearing interest),
Remittances and Suspense heads (both of which are transitory heads, pending
final booking). The net cash balance available with the Government is also
included under the Public Account. The Public Account is not subject to the
vote of the Legislature.
There is a constitutional requirement in India (Article 202) to present before
the House or Houses of the Legislature of the State, a statement of estimated
receipts and expenditures of the government in respect of every financial year.
This ‘Annual Financial Statement’ constitutes the main budget document.
Further, the budget must distinguish expenditure on the revenue account from
other expenditures.
Revenue receipts consist of own tax revenue, non-tax revenue, share of Union
Taxes/ Duties, and grants from Government of India.
Revenue expenditure consists of all those expenditures of the government
which do not result in creation of physical or financial assets. It relates to
those expenses incurred for the normal functioning of the government
departments and various services, interest payments on debt incurred by the
government, and grants given to various institutions (even though some of the
grants may be meant for creation of assets).
The Capital receipts consist of:
• Debt receipts: Market Loans, Bonds, Loans from financial
institutions, Net transaction under Ways and Means Advances, Loans
and Advances from Central Government, etc.,
• Non-debt receipts: Proceeds from disinvestment, Recoveries of loans
and advances,
Capital Expenditure includes expenditure on the acquisition of land,
building, machinery, equipment, investment in shares and loans and advances
by the government to PSUs and other parties.
At present, there is an accounting classification system in government that is
both functional and economic.
Attribute of Transaction Classification
Standardised in List
of Major and Minor
Heads (LMMH) of
Account of Union
and States, issued by
Controller General of
Accounts (CGA)
Function- Education, Health,
etc. /Department
Major Head under Grants (4-digit)
Sub-Function Sub Major head (2-digit)
Programme Minor Head (3-digit)
Flexibility left for
States
Scheme Sub-Head (2-digit)
Sub scheme Detailed Head (2-digit)
Economic nature/Activity Object Head-Salary, Minor Works,
etc. (2-digit)
The functional classification helps in identifying the department, function,
scheme or programme, and object of the expenditure. Economic classification
helps organise these payments as revenue, capital, debt, etc. Economic
Chapter I – Overview
7
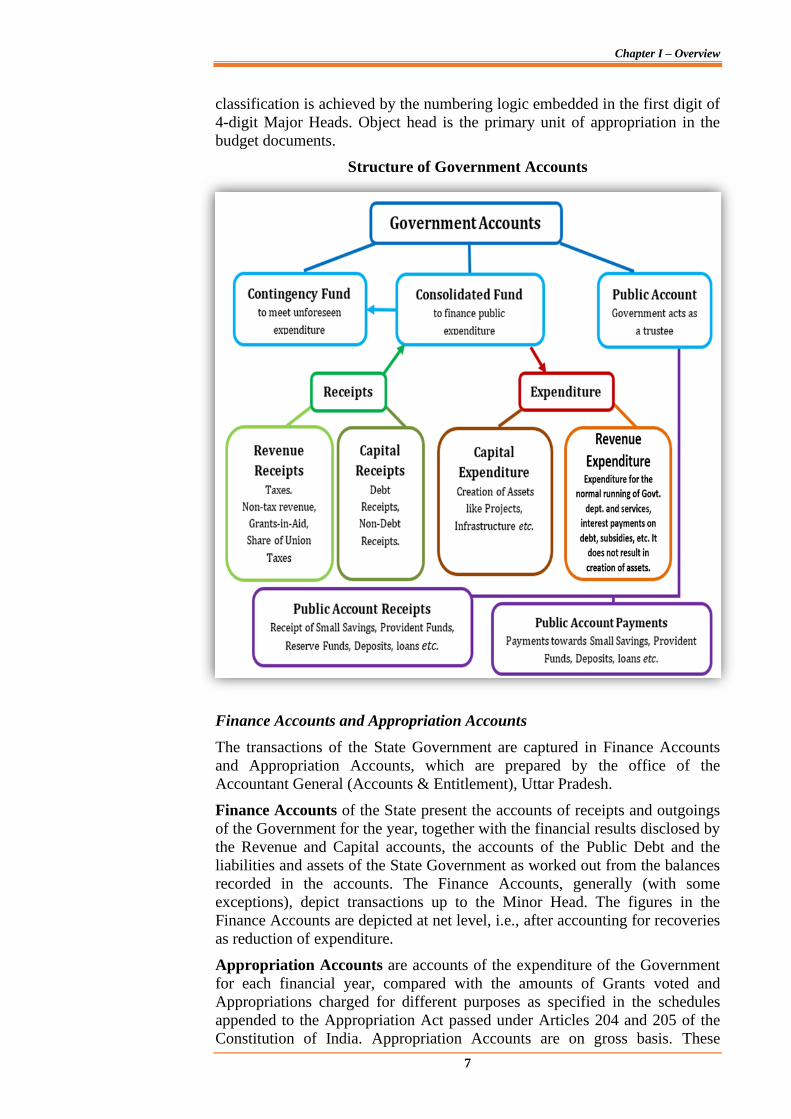
classification is achieved by the numbering logic embedded in the first digit of
4-digit Major Heads. Object head is the primary unit of appropriation in the
budget documents.
Structure of Government Accounts
Finance Accounts and Appropriation Accounts
The transactions of the State Government are captured in Finance Accounts
and Appropriation Accounts, which are prepared by the office of the
Accountant General (Accounts & Entitlement), Uttar Pradesh.
Finance Accounts of the State present the accounts of receipts and outgoings
of the Government for the year, together with the financial results disclosed by
the Revenue and Capital accounts, the accounts of the Public Debt and the
liabilities and assets of the State Government as worked out from the balances
recorded in the accounts. The Finance Accounts, generally (with some
exceptions), depict transactions up to the Minor Head. The figures in the
Finance Accounts are depicted at net level, i.e., after accounting for recoveries
as reduction of expenditure.
Appropriation Accounts are accounts of the expenditure of the Government
for each financial year, compared with the amounts of Grants voted and
Appropriations charged for different purposes as specified in the schedules
appended to the Appropriation Act passed under Articles 204 and 205 of the
Constitution of India. Appropriation Accounts are on gross basis. These
State Finances Audit Report for the year ended 31 March 2020
8
Accounts facilitate understanding of utilisation of funds, the management of
finances and monitoring of budgetary provisions and are, therefore,
complementary to the Finance Accounts.
Budgetary Processes
In terms of Article 202 of the Constitution of India, the Governor of the State
shall cause to be laid before the State Legislature, a statement of the estimated
receipts and expenditure of the State for the year, referred to as the Annual
Financial Statement. In terms of Article 203, the Statement is submitted to
the State Legislature in the form of Demands for Grants/ Appropriations and
after approval of these, the Appropriation Bill is passed by the Legislature
under Article 204 to provide for appropriation of the required money out of
the Consolidated Fund.
The Uttar Pradesh Budget Manual details the budget formulation process and
guides the State Government in preparing its budgetary estimates and
monitoring its expenditure activities. Results of audit scrutiny of budget and
implementation of other budgetary initiatives of the State Government are
detailed in Chapter III of this Report.
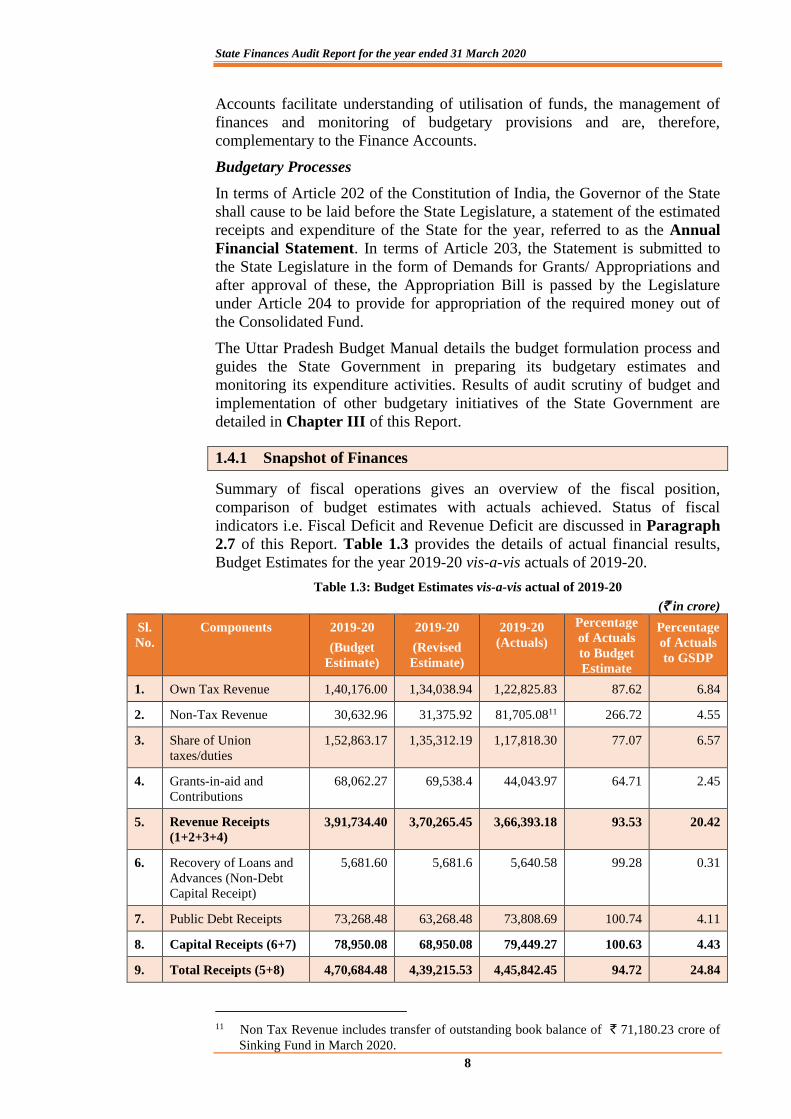
1.4.1 Snapshot of Finances
Summary of fiscal operations gives an overview of the fiscal position,
comparison of budget estimates with actuals achieved. Status of fiscal
indicators i.e. Fiscal Deficit and Revenue Deficit are discussed in Paragraph
2.7 of this Report. Table 1.3 provides the details of actual financial results,
Budget Estimates for the year 2019-20 vis-a-vis actuals of 2019-20.
Table 1.3: Budget Estimates vis-a-vis actual of 2019-20
(` in crore)
Sl.
No.
Components 2019-20
(Budget
Estimate)
2019-20
(Revised
Estimate)
2019-20
(Actuals)
Percentage
of Actuals
to Budget
Estimate
Percentage
of Actuals
to GSDP
1. Own Tax Revenue 1,40,176.00 1,34,038.94 1,22,825.83 87.62 6.84
2. Non-Tax Revenue 30,632.96 31,375.92 81,705.0811 266.72 4.55
3. Share of Union
taxes/duties
1,52,863.17 1,35,312.19 1,17,818.30 77.07 6.57
4. Grants-in-aid and
Contributions
68,062.27 69,538.4 44,043.97 64.71 2.45
5. Revenue Receipts
(1+2+3+4)
3,91,734.40 3,70,265.45 3,66,393.18 93.53 20.42
6. Recovery of Loans and
Advances (Non-Debt
Capital Receipt)
5,681.60 5,681.6 5,640.58 99.28 0.31
7. Public Debt Receipts 73,268.48 63,268.48 73,808.69 100.74 4.11
8. Capital Receipts (6+7) 78,950.08 68,950.08 79,449.27 100.63 4.43
9. Total Receipts (5+8) 4,70,684.48 4,39,215.53 4,45,842.45 94.72 24.84
11 Non Tax Revenue includes transfer of outstanding book balance of ` 71,180.23 crore of
Sinking Fund in March 2020.
Chapter I – Overview
9
Sl.
No.
Components 2019-20
(Budget
Estimate)
2019-20
(Revised
Estimate)
2019-20
(Actuals)
Percentage
of Actuals
to Budget
Estimate
Percentage
of Actuals
to GSDP
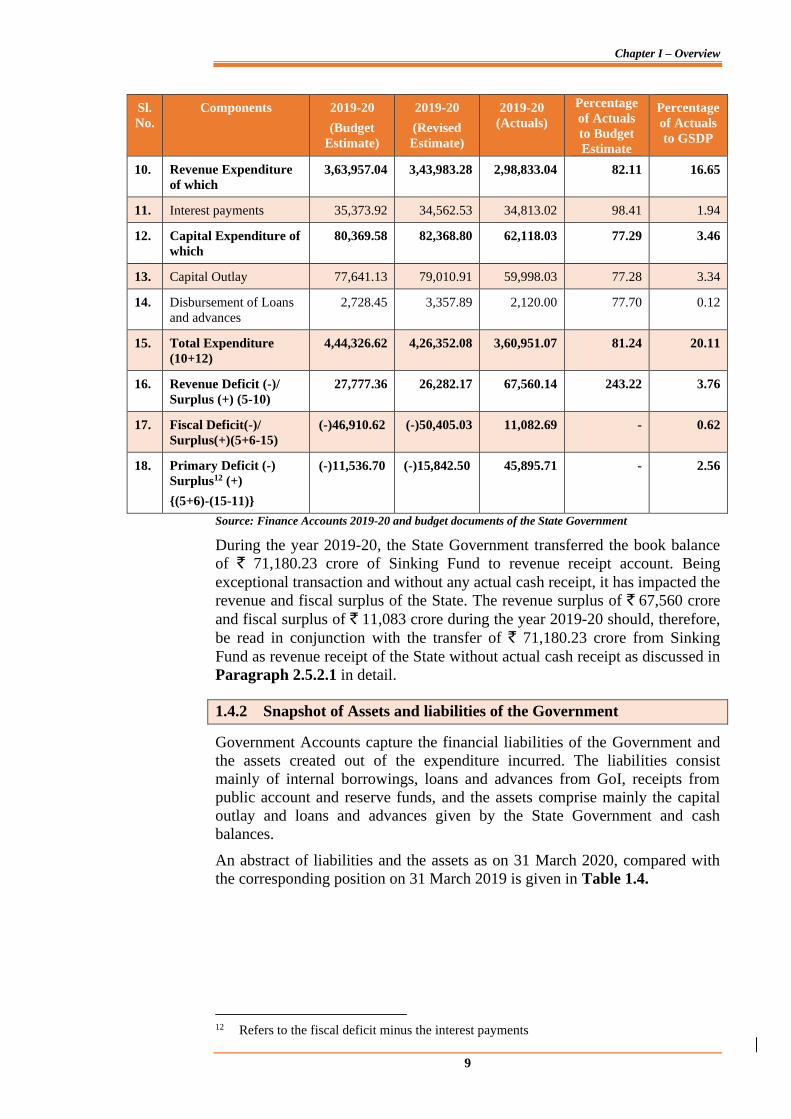
10. Revenue Expenditure
of which
3,63,957.04 3,43,983.28 2,98,833.04 82.11 16.65
11. Interest payments 35,373.92 34,562.53 34,813.02 98.41 1.94
12. Capital Expenditure of
which
80,369.58 82,368.80 62,118.03 77.29 3.46
13. Capital Outlay 77,641.13 79,010.91 59,998.03 77.28 3.34
14. Disbursement of Loans
and advances
2,728.45 3,357.89 2,120.00 77.70 0.12
15. Total Expenditure
(10+12)
4,44,326.62 4,26,352.08 3,60,951.07 81.24 20.11
16. Revenue Deficit (-)/
Surplus (+) (5-10)
27,777.36 26,282.17 67,560.14 243.22 3.76
17. Fiscal Deficit(-)/
Surplus(+)(5+6-15)
(-)46,910.62 (-)50,405.03 11,082.69 - 0.62
18. Primary Deficit (-)
Surplus12 (+)
{(5+6)-(15-11)}
(-)11,536.70 (-)15,842.50 45,895.71 - 2.56
Source: Finance Accounts 2019-20 and budget documents of the State Government
During the year 2019-20, the State Government transferred the book balance
of ` 71,180.23 crore of Sinking Fund to revenue receipt account. Being
exceptional transaction and without any actual cash receipt, it has impacted the
revenue and fiscal surplus of the State. The revenue surplus of ` 67,560 crore
and fiscal surplus of ` 11,083 crore during the year 2019-20 should, therefore,
be read in conjunction with the transfer of ` 71,180.23 crore from Sinking
Fund as revenue receipt of the State without actual cash receipt as discussed in
Paragraph 2.5.2.1 in detail.
1.4.2 Snapshot of Assets and liabilities of the Government
Government Accounts capture the financial liabilities of the Government and
the assets created out of the expenditure incurred. The liabilities consist
mainly of internal borrowings, loans and advances from GoI, receipts from
public account and reserve funds, and the assets comprise mainly the capital
outlay and loans and advances given by the State Government and cash
balances.
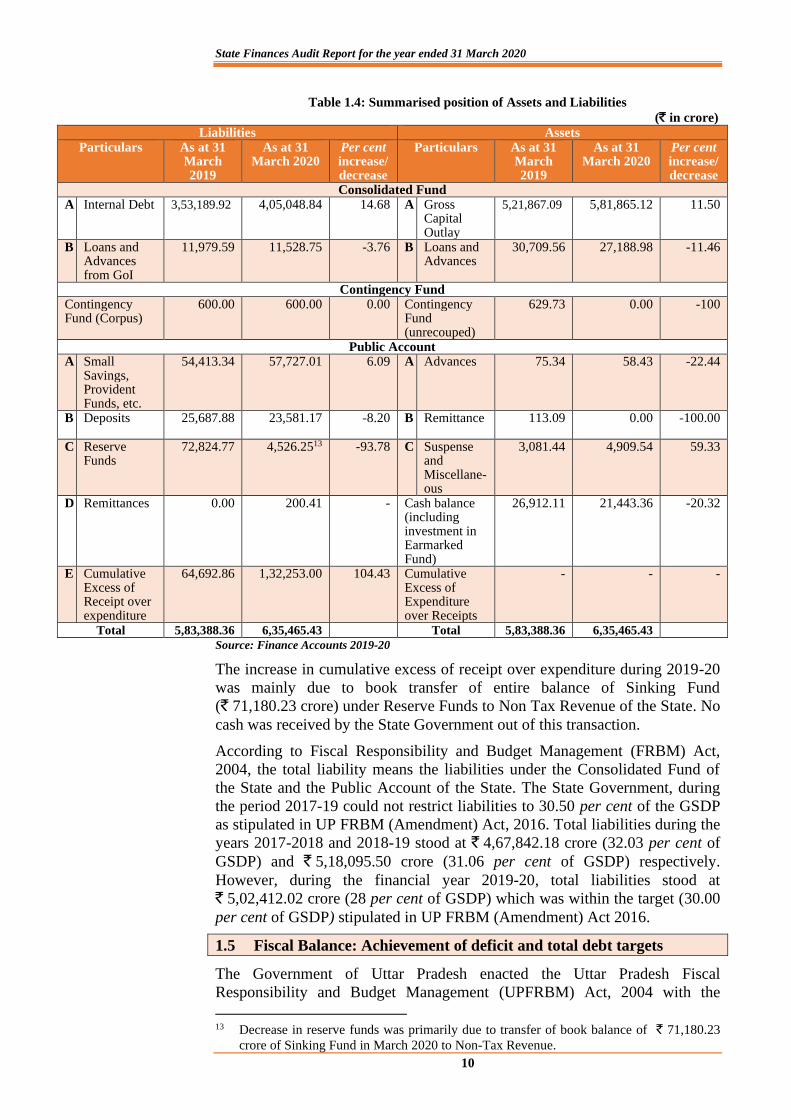
An abstract of liabilities and the assets as on 31 March 2020, compared with
the corresponding position on 31 March 2019 is given in Table 1.4.
12 Refers to the fiscal deficit minus the interest payments
State Finances Audit Report for the year ended 31 March 2020
10
Table 1.4: Summarised position of Assets and Liabilities
(` in crore)
Liabilities Assets Particulars As at 31
March 2019
As at 31 March 2020
Per cent increase/decrease
Particulars As at 31 March 2019
As at 31 March 2020
Per cent increase/decrease
Consolidated Fund A Internal Debt 3,53,189.92 4,05,048.84 14.68 A Gross
Capital Outlay
5,21,867.09 5,81,865.12 11.50
B Loans and Advances from GoI
11,979.59 11,528.75 -3.76 B Loans and Advances
30,709.56 27,188.98 -11.46
Contingency Fund Contingency Fund (Corpus)
600.00 600.00 0.00 Contingency Fund (unrecouped)
629.73 0.00 -100
Public Account A Small
Savings, Provident Funds, etc.
54,413.34 57,727.01 6.09 A Advances 75.34 58.43 -22.44
B Deposits
25,687.88 23,581.17 -8.20 B Remittance 113.09 0.00 -100.00
C Reserve Funds
72,824.77 4,526.2513 -93.78 C Suspense and Miscellane-ous
3,081.44 4,909.54 59.33
D Remittances 0.00 200.41 - Cash balance (including investment in Earmarked Fund)
26,912.11 21,443.36 -20.32
E Cumulative Excess of Receipt over expenditure
64,692.86 1,32,253.00 104.43 Cumulative Excess of Expenditure over Receipts
- - -
Total 5,83,388.36 6,35,465.43 Total 5,83,388.36 6,35,465.43
Source: Finance Accounts 2019-20
The increase in cumulative excess of receipt over expenditure during 2019-20
was mainly due to book transfer of entire balance of Sinking Fund
(` 71,180.23 crore) under Reserve Funds to Non Tax Revenue of the State. No
cash was received by the State Government out of this transaction.
According to Fiscal Responsibility and Budget Management (FRBM) Act,
2004, the total liability means the liabilities under the Consolidated Fund of
the State and the Public Account of the State. The State Government, during
the period 2017-19 could not restrict liabilities to 30.50 per cent of the GSDP
as stipulated in UP FRBM (Amendment) Act, 2016. Total liabilities during the
years 2017-2018 and 2018-19 stood at ` 4,67,842.18 crore (32.03 per cent of
GSDP) and ` 5,18,095.50 crore (31.06 per cent of GSDP) respectively.
However, during the financial year 2019-20, total liabilities stood at
` 5,02,412.02 crore (28 per cent of GSDP) which was within the target (30.00
per cent of GSDP) stipulated in UP FRBM (Amendment) Act 2016.
1.5 Fiscal Balance: Achievement of deficit and total debt targets
The Government of Uttar Pradesh enacted the Uttar Pradesh Fiscal
Responsibility and Budget Management (UPFRBM) Act, 2004 with the
13 Decrease in reserve funds was primarily due to transfer of book balance of ` 71,180.23
crore of Sinking Fund in March 2020 to Non-Tax Revenue.

Chapter I – Overview
11
objective of ensuring prudence in fiscal management by eliminating revenue
deficit, reducing fiscal deficit and overall/ outstanding debt to acceptable level,
establishing improved debt management and improving transparency in a
medium term framework. In this context, the Act provides quantitative targets
to be adhered by the State with regard to deficit measures and debt level.
The performance of the State during the period 2015-20 under key fiscal
indicators provided in the UPFRBM Act as amended from time to time is
depicted in Table 1.5.
Table 1.5: Compliance with provisions of UPFRBM Act
Fiscal Parameters Fiscal
targets set in
the Act
Achievement (` in crore)
2015-16 2016-17 2017-18 2018-19 2019-20
Revenue Deficit (-)/
Surplus (+) (` in
crore)
Revenue
Surplus
14,340 20,283 12,552 28,250 67,560
✓ ✓ ✓ ✓ ✓
Fiscal Deficit (-)/
Surplus (+)14 (as
percentage of GSDP)
Three per
cent
-34,143
3.00
-41,187
3.19
-27,810
1.90
-35,203
2.11
+11,083
0.62
✓ ✗ ✓ ✓ ✓
Ratio of total
outstanding debt15 to
GSDP (in per cent)
31 per cent
during 2015-
16 and 2016-
17, 30.50 per
cent during
2017-18 and
2018-19 and
30.00 per
cent during
2019-20
32.28 32.80 32.03 31.06 28.00
✗ ✗ ✗ ✗ ✓
Source: Budget documents of the State Government, UPFRBM Act, 2004, UPFRBM (Amendment)
Act, 2016 and Finance Accounts of the respective years
As indicated in the Accounts, during the year 2019-20, the ratio of fiscal
deficit to GSDP was within the targets as set out in the budget
estimates/MTFRP, UPFRBM Act and Fourteenth Finance Commission. As
against the target to maintain Fiscal Deficit of not more than three per cent of
estimated GSDP, there was fiscal surplus (` 11,083 crore) which was 0.62 per
cent of GSDP. The ratio of total outstanding debt to GSDP (28.00 per cent)
was below the targets set out in the budget estimates/ MTFRP (29.98 per
cent), UPFRBM Act (30.00 per cent) and Fourteenth Finance Commission
(31.67 per cent). The State revenue surplus has increased from ` 28,250 crore
(1.69 per cent of GSDP) in 2018-19 to ` 67,560 crore (3.76 per cent of GSDP)
in 2019-20.
The State has achieved its target of revenue surplus proposed in the MTFRP
(` 27,777 crore) and in the revised budget (` 26,282 crore) during the year
2019-20. The primary deficit of ` 3,161 crore (0.19 per cent of GSDP) in
2018-19 got converted into primary surplus of ` 45,896 crore (2.56 per cent of
GSDP) in 2019-20. However, these achievement during the year 2019-20
should be viewed in conjunction with the transfer of ` 71,180.23 crore from
Sinking Fund as revenue receipt of the State without actual cash receipt.
14 Excluding expenditure on UDAY during 2015-17. 15 Total outstanding debt during 2015-17 includes borrowings on account of UDAY.
State Finances Audit Report for the year ended 31 March 2020
12
1.5.1 Medium Term Fiscal Restructuring Policy
UPFRBM Act 2004 lays down that the State Government shall in each
financial year lay before both Houses of the Legislature a Medium Term
Fiscal Restructuring Policy (MTFRP) along with the annual budget. The
MTFRP shall set forth a five-year rolling targets for the prescribed fiscal
indicators with specification of underlying assumptions.
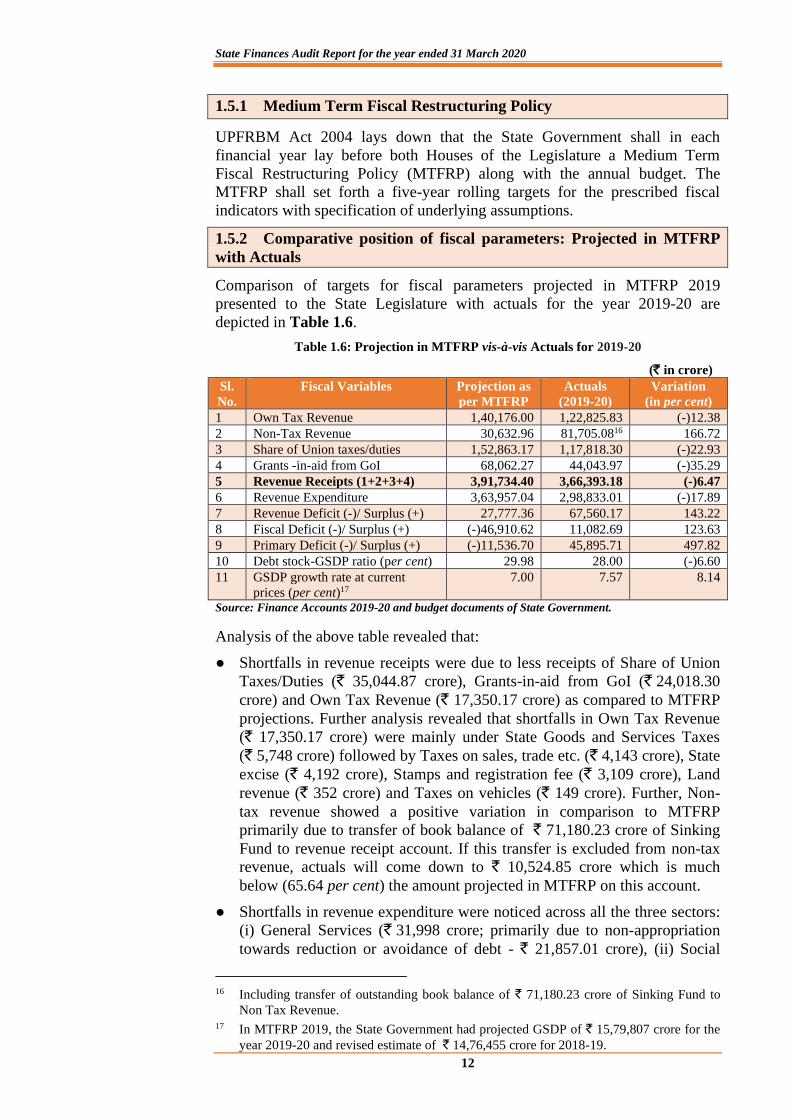
1.5.2 Comparative position of fiscal parameters: Projected in MTFRP
with Actuals
Comparison of targets for fiscal parameters projected in MTFRP 2019
presented to the State Legislature with actuals for the year 2019-20 are
depicted in Table 1.6.
Table 1.6: Projection in MTFRP vis-à-vis Actuals for 2019-20
(` in crore)
Sl.
No.
Fiscal Variables Projection as
per MTFRP
Actuals
(2019-20)
Variation
(in per cent)
1 Own Tax Revenue 1,40,176.00 1,22,825.83 (-)12.38
2 Non-Tax Revenue 30,632.96 81,705.0816 166.72
3 Share of Union taxes/duties 1,52,863.17 1,17,818.30 (-)22.93
4 Grants -in-aid from GoI 68,062.27 44,043.97 (-)35.29
5 Revenue Receipts (1+2+3+4) 3,91,734.40 3,66,393.18 (-)6.47
6 Revenue Expenditure 3,63,957.04 2,98,833.01 (-)17.89
7 Revenue Deficit (-)/ Surplus (+) 27,777.36 67,560.17 143.22
8 Fiscal Deficit (-)/ Surplus (+) (-)46,910.62 11,082.69 123.63
9 Primary Deficit (-)/ Surplus (+) (-)11,536.70 45,895.71 497.82
10 Debt stock-GSDP ratio (per cent) 29.98 28.00 (-)6.60
11 GSDP growth rate at current
prices (per cent)17
7.00 7.57 8.14
Source: Finance Accounts 2019-20 and budget documents of State Government.
Analysis of the above table revealed that:
● Shortfalls in revenue receipts were due to less receipts of Share of Union
Taxes/Duties (` 35,044.87 crore), Grants-in-aid from GoI (` 24,018.30
crore) and Own Tax Revenue (` 17,350.17 crore) as compared to MTFRP
projections. Further analysis revealed that shortfalls in Own Tax Revenue
(` 17,350.17 crore) were mainly under State Goods and Services Taxes
(` 5,748 crore) followed by Taxes on sales, trade etc. (` 4,143 crore), State
excise (` 4,192 crore), Stamps and registration fee (` 3,109 crore), Land
revenue (` 352 crore) and Taxes on vehicles (` 149 crore). Further, Non-
tax revenue showed a positive variation in comparison to MTFRP
primarily due to transfer of book balance of ` 71,180.23 crore of Sinking
Fund to revenue receipt account. If this transfer is excluded from non-tax
revenue, actuals will come down to ` 10,524.85 crore which is much
below (65.64 per cent) the amount projected in MTFRP on this account.
● Shortfalls in revenue expenditure were noticed across all the three sectors:
(i) General Services (` 31,998 crore; primarily due to non-appropriation
towards reduction or avoidance of debt - ` 21,857.01 crore), (ii) Social
16 Including transfer of outstanding book balance of ` 71,180.23 crore of Sinking Fund to
Non Tax Revenue. 17 In MTFRP 2019, the State Government had projected GSDP of ` 15,79,807 crore for the
year 2019-20 and revised estimate of ` 14,76,455 crore for 2018-19.
Chapter I – Overview
13
Services - ` 24,900 crore; primarily in Education, Sports, Art and Culture
segment - ` 6,360.30 crore, in Health and Family Welfare segment -
` 2,982.15 crore and in Water Supply, Sanitation, Housing and Urban
Development segment - ` 7,790.41 crore and under (iii) Economic
Services (` 8,227 crore; primarily in Agriculture & Allied activities -
` 2,228.81 crore, in Rural Development - ` 5,682.05 crore).
● Against the projected figures in MTFRP, revenue surplus and fiscal deficit
reported outturns were positive. This was primarily due to transfer of the
outstanding book balance of ` 71,180.23 crore of Sinking Fund to revenue
receipt account.
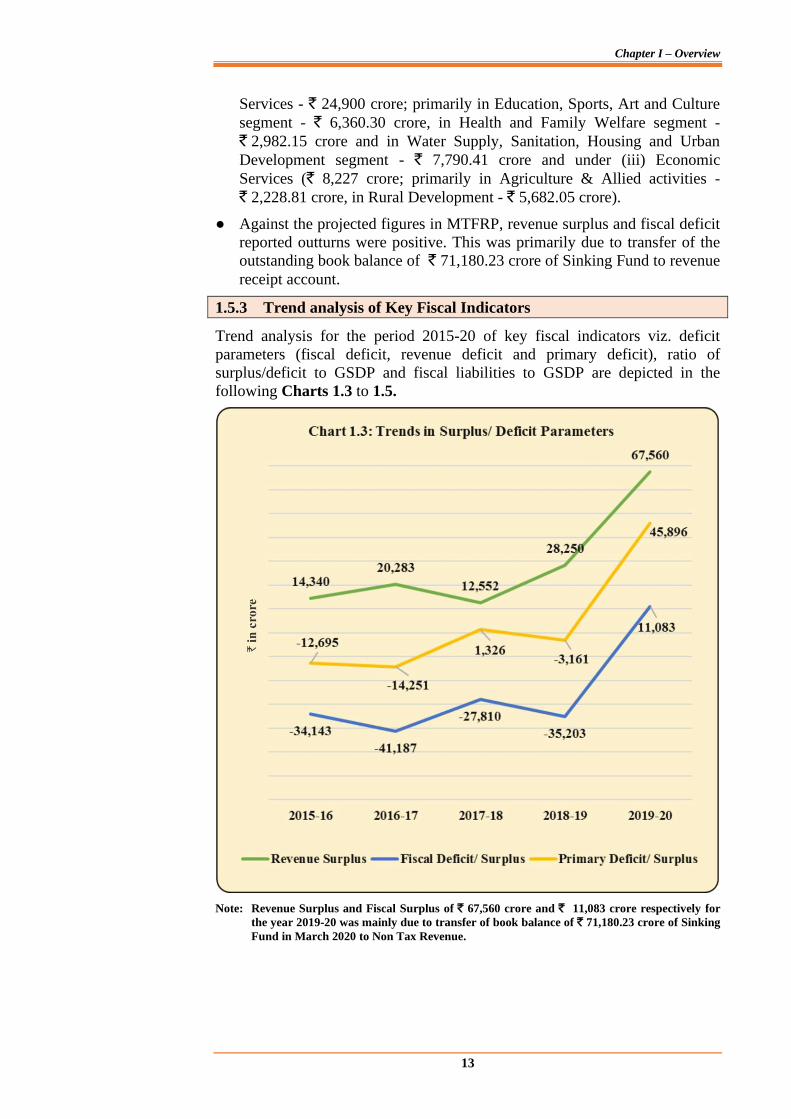
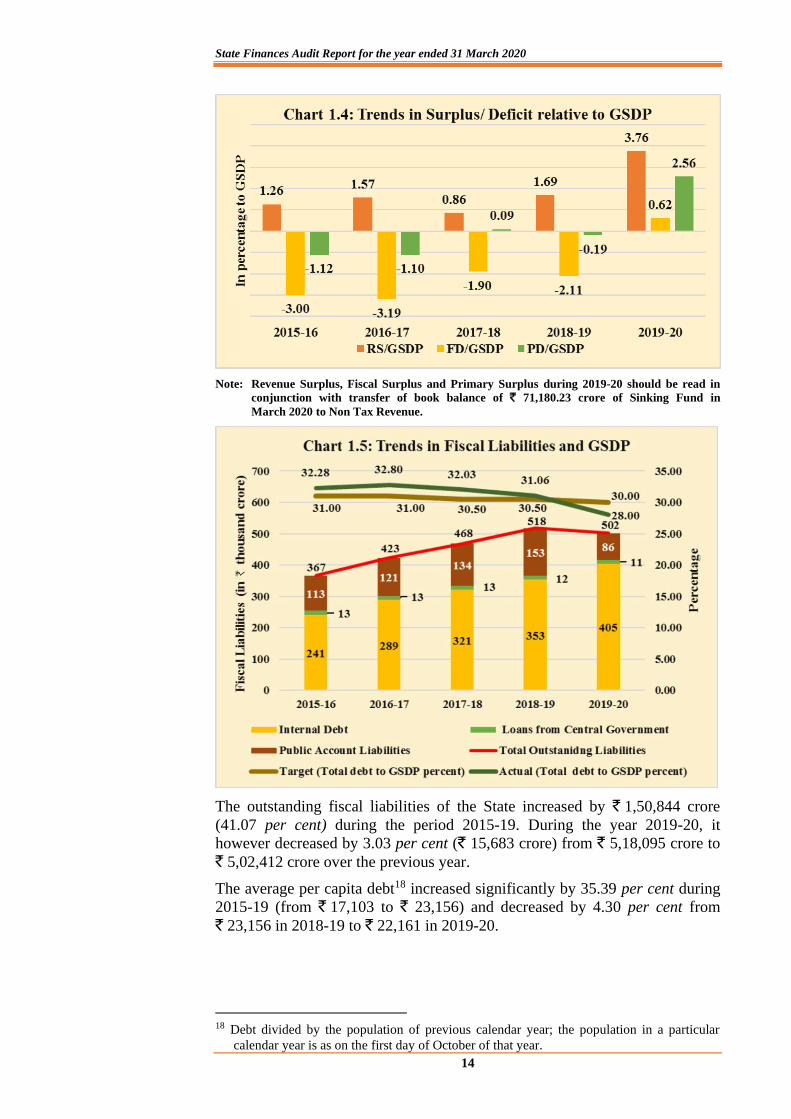
1.5.3 Trend analysis of Key Fiscal Indicators
Trend analysis for the period 2015-20 of key fiscal indicators viz. deficit
parameters (fiscal deficit, revenue deficit and primary deficit), ratio of
surplus/deficit to GSDP and fiscal liabilities to GSDP are depicted in the
following Charts 1.3 to 1.5.
Note: Revenue Surplus and Fiscal Surplus of ` 67,560 crore and ` 11,083 crore respectively for
the year 2019-20 was mainly due to transfer of book balance of ` 71,180.23 crore of Sinking
Fund in March 2020 to Non Tax Revenue.
State Finances Audit Report for the year ended 31 March 2020
14
Note: Revenue Surplus, Fiscal Surplus and Primary Surplus during 2019-20 should be read in
conjunction with transfer of book balance of ` 71,180.23 crore of Sinking Fund in
March 2020 to Non Tax Revenue.
The outstanding fiscal liabilities of the State increased by ` 1,50,844 crore
(41.07 per cent) during the period 2015-19. During the year 2019-20, it
however decreased by 3.03 per cent (` 15,683 crore) from ` 5,18,095 crore to
` 5,02,412 crore over the previous year.
The average per capita debt18 increased significantly by 35.39 per cent during
2015-19 (from ` 17,103 to ` 23,156) and decreased by 4.30 per cent from
` 23,156 in 2018-19 to ` 22,161 in 2019-20.
18 Debt divided by the population of previous calendar year; the population in a particular
calendar year is as on the first day of October of that year.
Chapter I – Overview
15
1.6 Deficits and Total Debt after examination in audit
Deficits and debt position are two important fiscal indicators in assessing the
financial health of the State. These indicators are also critically viewed by
other stakeholders viz. Union Government, Financial Institutions, Banks etc.
while offering any further financial support by way of grant/loan etc. In order
to present a better picture of State Finances, classification of revenue
expenditure as capital expenditure and conducting extra budget fiscal
operations which came to notice of audit are detailed in the following
paragraphs.
1.6.1 Post audit – Deficits/surplus
Certain issues viz. transfer of Sinking Fund balance to revenue receipt
account, misclassification of revenue expenditure as capital and vice versa,
non-appropriation of amount to ‘Uttar Pradesh Road Transport Accident
Relief Fund’, non-credit of interest in interest-bearing reserves, etc. and other
issues which are discussed in the Report in succeeding Chapters have had an
impact on revenue surplus and fiscal surplus indicated in Finance Accounts
2019-20. In order to arrive at actual deficit figures, the impact of the aforesaid
issues needs to be addressed and appropriately factored in to ascertain actual
deficit numbers.
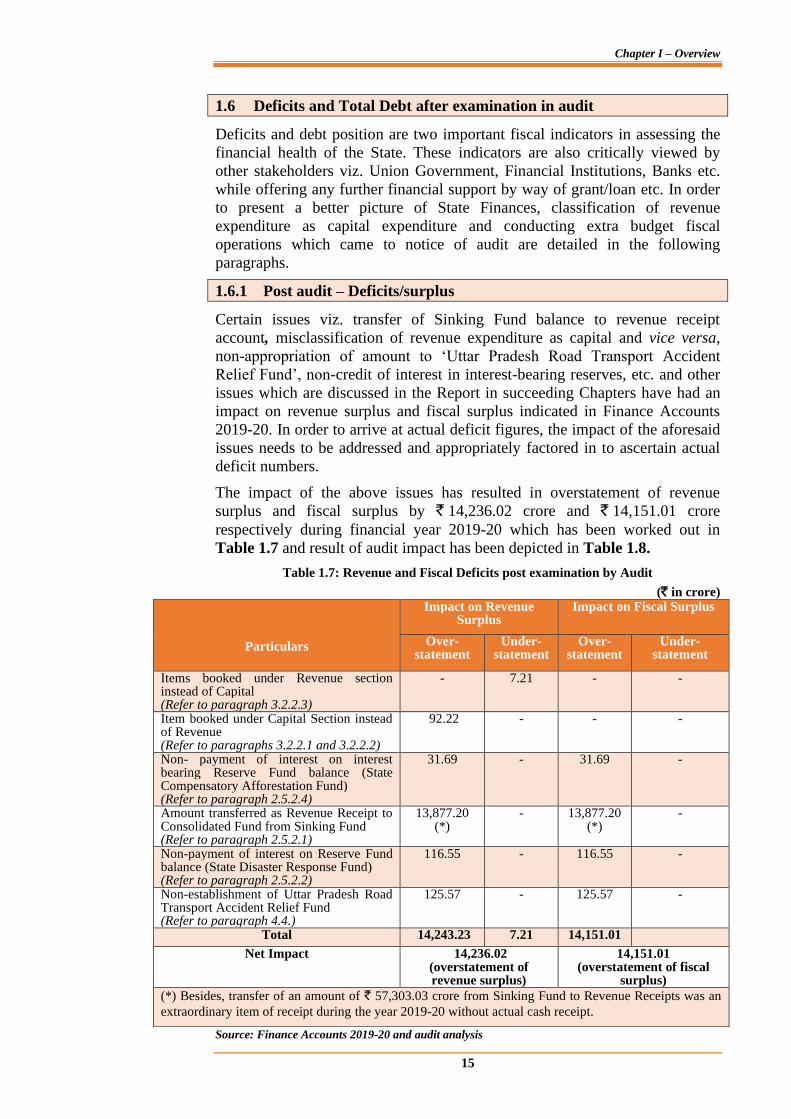
The impact of the above issues has resulted in overstatement of revenue
surplus and fiscal surplus by ` 14,236.02 crore and ` 14,151.01 crore
respectively during financial year 2019-20 which has been worked out in
Table 1.7 and result of audit impact has been depicted in Table 1.8.
Table 1.7: Revenue and Fiscal Deficits post examination by Audit
(` in crore)
Source: Finance Accounts 2019-20 and audit analysis
Particulars
Impact on Revenue Surplus
Impact on Fiscal Surplus
Over-statement
Under-statement
Over-statement
Under-statement
Items booked under Revenue section instead of Capital (Refer to paragraph 3.2.2.3)
- 7.21 - -
Item booked under Capital Section instead of Revenue (Refer to paragraphs 3.2.2.1 and 3.2.2.2)
92.22 - - -
Non- payment of interest on interest bearing Reserve Fund balance (State Compensatory Afforestation Fund) (Refer to paragraph 2.5.2.4)
31.69 - 31.69 -
Amount transferred as Revenue Receipt to Consolidated Fund from Sinking Fund (Refer to paragraph 2.5.2.1)
13,877.20 (*)
- 13,877.20 (*)
-
Non-payment of interest on Reserve Fund balance (State Disaster Response Fund) (Refer to paragraph 2.5.2.2)
116.55 - 116.55 -
Non-establishment of Uttar Pradesh Road Transport Accident Relief Fund (Refer to paragraph 4.4.)
125.57 - 125.57 -
Total 14,243.23 7.21 14,151.01
Net Impact 14,236.02 (overstatement of revenue surplus)
14,151.01 (overstatement of fiscal
surplus)
(*) Besides, transfer of an amount of ` 57,303.03 crore from Sinking Fund to Revenue Receipts was an
extraordinary item of receipt during the year 2019-20 without actual cash receipt.
State Finances Audit Report for the year ended 31 March 2020
16
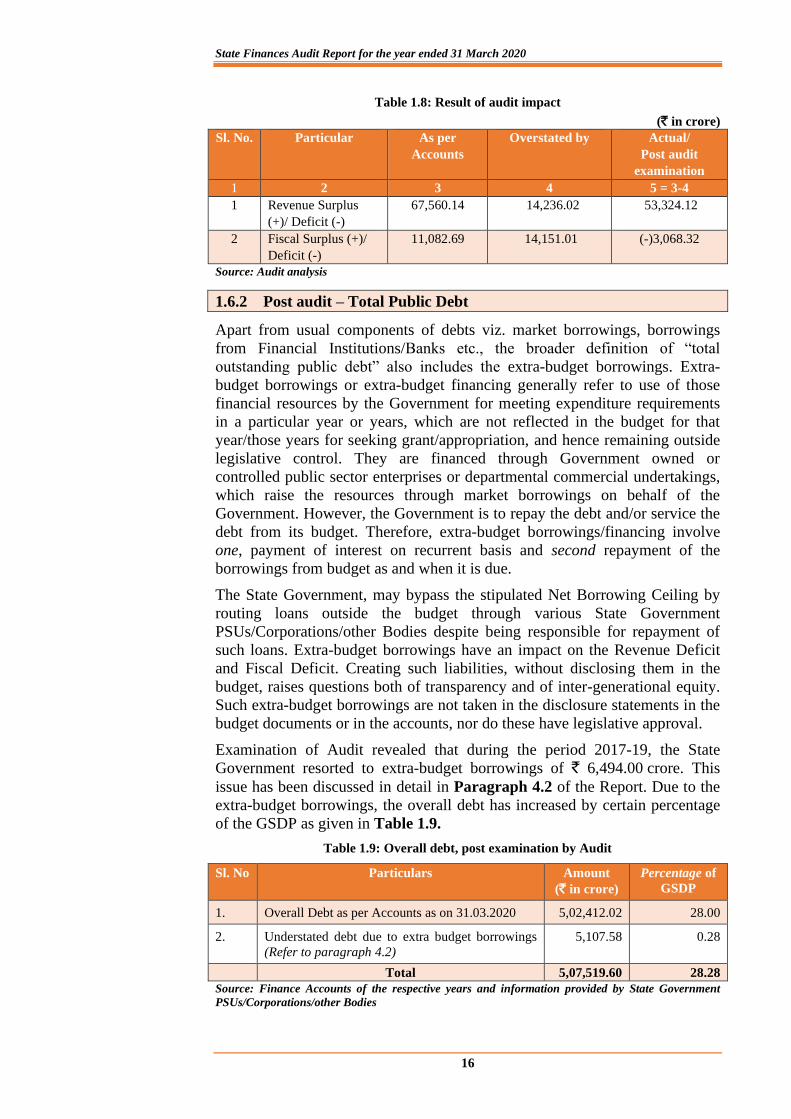
Table 1.8: Result of audit impact
(` in crore)
Sl. No. Particular As per
Accounts
Overstated by Actual/
Post audit
examination
1 2 3 4 5 = 3-4
1 Revenue Surplus
(+)/ Deficit (-)
67,560.14 14,236.02 53,324.12
2 Fiscal Surplus (+)/
Deficit (-)
11,082.69 14,151.01 (-)3,068.32
Source: Audit analysis
1.6.2 Post audit – Total Public Debt
Apart from usual components of debts viz. market borrowings, borrowings
from Financial Institutions/Banks etc., the broader definition of “total
outstanding public debt” also includes the extra-budget borrowings. Extra-
budget borrowings or extra-budget financing generally refer to use of those
financial resources by the Government for meeting expenditure requirements
in a particular year or years, which are not reflected in the budget for that
year/those years for seeking grant/appropriation, and hence remaining outside
legislative control. They are financed through Government owned or
controlled public sector enterprises or departmental commercial undertakings,
which raise the resources through market borrowings on behalf of the
Government. However, the Government is to repay the debt and/or service the
debt from its budget. Therefore, extra-budget borrowings/financing involve
one, payment of interest on recurrent basis and second repayment of the
borrowings from budget as and when it is due.
The State Government, may bypass the stipulated Net Borrowing Ceiling by
routing loans outside the budget through various State Government
PSUs/Corporations/other Bodies despite being responsible for repayment of
such loans. Extra-budget borrowings have an impact on the Revenue Deficit
and Fiscal Deficit. Creating such liabilities, without disclosing them in the
budget, raises questions both of transparency and of inter-generational equity.
Such extra-budget borrowings are not taken in the disclosure statements in the
budget documents or in the accounts, nor do these have legislative approval.
Examination of Audit revealed that during the period 2017-19, the State
Government resorted to extra-budget borrowings of ` 6,494.00 crore. This
issue has been discussed in detail in Paragraph 4.2 of the Report. Due to the
extra-budget borrowings, the overall debt has increased by certain percentage
of the GSDP as given in Table 1.9.
Table 1.9: Overall debt, post examination by Audit
Sl. No Particulars Amount
(` in crore)
Percentage of
GSDP
1. Overall Debt as per Accounts as on 31.03.2020 5,02,412.02 28.00
2. Understated debt due to extra budget borrowings
(Refer to paragraph 4.2)
5,107.58 0.28
Total 5,07,519.60 28.28
Source: Finance Accounts of the respective years and information provided by State Government
PSUs/Corporations/other Bodies
Chapter I – Overview
17
It is evident from Table 1.9 that due to extra-budget borrowings the ratio of
debt-stock to GSDP has increased to 28.28 per cent from 28.00 per cent.
Further, Sinking Fund was not being created for amortisation of these extra-
budget borrowings as these were not included in the overall debt of the State
Government as per Accounts.


19
CHAPTER-II
FINANCES OF THE STATE
2.1 Major changes in Key fiscal aggregates of the State
This section gives a bird’s eye view of the major changes in the key fiscal
aggregates of the State during the year 2019-20 as compared to the year 2018-
19. The analysis of the following indicators is discussed in the succeeding
paragraphs.
Changes in key fiscal aggregates in the year 2019-20 compared to the year 2018-19
Revenue
Receipts
✓ Revenue receipts of the State increased by 11.04 per cent
✓ Own Tax revenue of the State increased by 2.25 per cent
✓ Non-tax revenue increased by 171.44 per cent19
✓ State’s Share of Union Taxes and Duties decreased by 13.85
per cent
✓ Grants-in-Aid from Government of India decreased by 2.45 per
cent
Revenue
Expenditure
✓ Revenue expenditure decreased by 0.96 per cent
✓ Revenue expenditure on General Services decreased by 10.21
per cent
✓ Revenue expenditure on Social Services increased by 13.73 per
cent
✓ Revenue expenditure on Economic Services decreased by 6.62
per cent
✓ Expenditure on Grants-in-Aid increased by 19.83 per cent
Capital
Expenditure
✓ Capital expenditure decreased by 3.95 per cent
✓ Capital expenditure on General Services decreased by 27.03
per cent
✓ Capital expenditure on Social Services decreased by 0.70 per
cent
✓ Capital expenditure on Economic Services decreased by 3.03
per cent
Loans and
Advances
✓ Disbursement of Loans and Advances decreased by 66.37 per
cent
✓ Recoveries of Loans and Advances increased by 6.17 per cent
Public Debt ✓ Public Debt Receipts increased by 43.05 per cent
✓ Repayment of Public Debt increased by 8.13 per cent
Public
Account
✓ Public Account Receipts decreased by 2.70 per cent
✓ Disbursement of Public Account increased by 21.66 per cent
(mainly due to book transfer of balance of ` 71,180.23 crore
under Sinking Fund to Non Tax Revenue)
Cash
Balance and
Investment
✓ Cash balance and Investment decreased by ` 5,469 crore
(20.32 per cent) as on 31 March 2020 with compared to 31
March 2019.
19 Non Tax Revenue includes transfer of book balance of ` 71,180.23 crore of Sinking Fund
in March 2020 without actual cash receipts.

State Finances Audit Report for the year ended 31 March 2020
20
2.2 Sources and Application of Funds
This section compares the components of the sources and application of funds
of the State during the year 2019-20 as compared to the year 2018-19.
Receipts of the State Government can be divided into two categories namely
Revenue Receipts20 and Capital Receipts21. Besides, the funds available in the
Public Account net of disbursement made from it are also utilised by the
Government to finance its deficit.
A time series data on the State Government finances for the period 2015-20
has been given in the Appendix 2.1. The following Table 2.1 depicts the
components and sub-components of the State’s financial resources:
Table 2.1: Comparison of Sources and Application of funds
during the year 2018-19 and 2019-20
Particulars
2018-19
(` in crore)
2019-20
(` in crore)
Increase/
Decrease
(in
percentage)
Sources
Opening Cash Balance and Investment 11,481 26,912 134.40
Revenue Receipts 3,29,978 3,66,393 11.04
Recoveries of Loans and Advances 5,313 5,641 6.17
Public Debt Receipts (Net)22 30,878 51,408 66.49
Public Account Receipts (Net) 19,922 (-) 68,590 (-) 444.29
Contingency Fund 230 662 187.83
Total 3,97,802 3,82,426 (-) 3.87
Application
Revenue Expenditure 3,01,728 2,98,833 (-) 0.96
Capital Expenditure 62,463 59,998 (-) 3.95
Disbursement of Loans and Advances 6,303 2,120 (-) 66.37
Contingency Fund 396 32 (-) 91.92
Closing Cash Balance and Investment 26,912 21,443 (-) 20.32
Total 3,97,802 3,82,426 (-) 3.87
Source: Finance Accounts of the respective years
2.2.1 Component-wise sources and applications of funds under Consolidated
Fund of the State during the year 2019-20 have been depicted in Chart 2.1.
20 Revenue Receipts consist of Own Tax Revenues, Non-Tax Revenues, State’s share of
Union Taxes and Duties and Grants-in-aid from GoI. 21 Capital Receipts comprise of proceeds from disinvestments, recoveries of loans and
advances, debt receipts (market loans, borrowings from financial institutions/commercial
banks) and Loans and Advances from GoI. 22 Public Debt receipts (` 73,808.69 crore) – Repayment of Public Debt (` 22,400.61 crore)
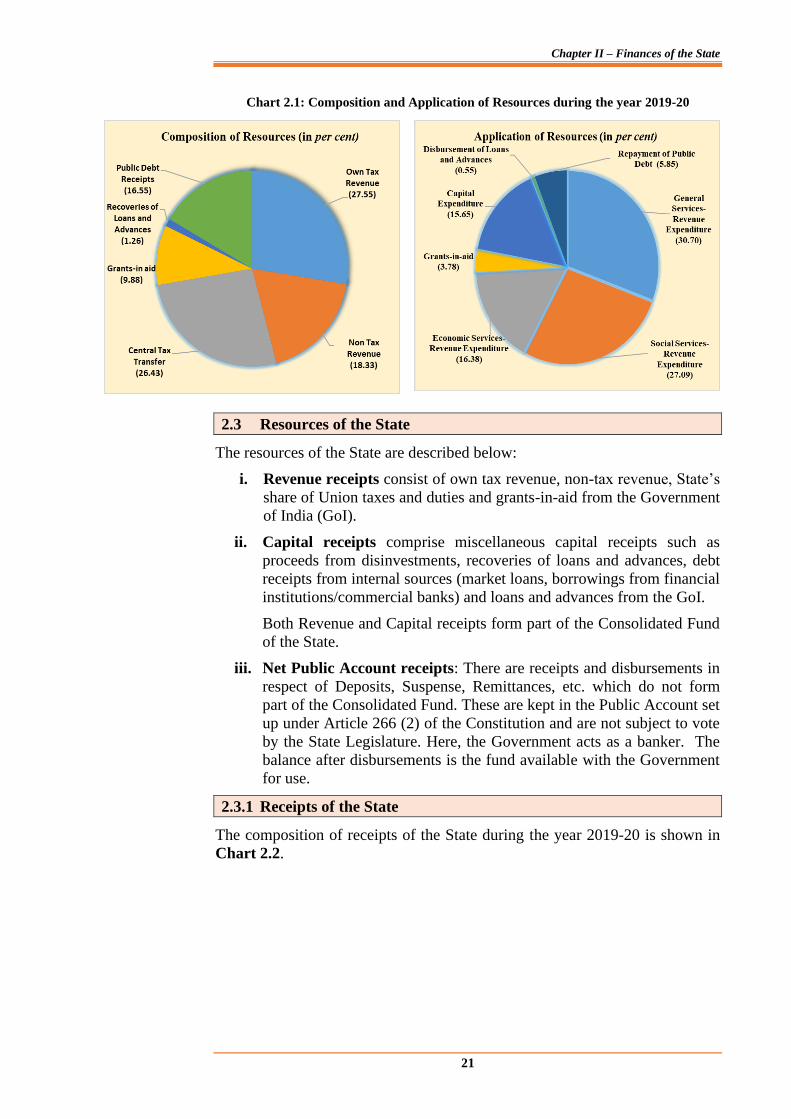
Chapter II – Finances of the State
21
Chart 2.1: Composition and Application of Resources during the year 2019-20
2.3 Resources of the State
The resources of the State are described below:
i. Revenue receipts consist of own tax revenue, non-tax revenue, State’s
share of Union taxes and duties and grants-in-aid from the Government
of India (GoI).
ii. Capital receipts comprise miscellaneous capital receipts such as
proceeds from disinvestments, recoveries of loans and advances, debt
receipts from internal sources (market loans, borrowings from financial
institutions/commercial banks) and loans and advances from the GoI.
Both Revenue and Capital receipts form part of the Consolidated Fund
of the State.
iii. Net Public Account receipts: There are receipts and disbursements in
respect of Deposits, Suspense, Remittances, etc. which do not form
part of the Consolidated Fund. These are kept in the Public Account set
up under Article 266 (2) of the Constitution and are not subject to vote
by the State Legislature. Here, the Government acts as a banker. The
balance after disbursements is the fund available with the Government
for use.
2.3.1 Receipts of the State
The composition of receipts of the State during the year 2019-20 is shown in
Chart 2.2.
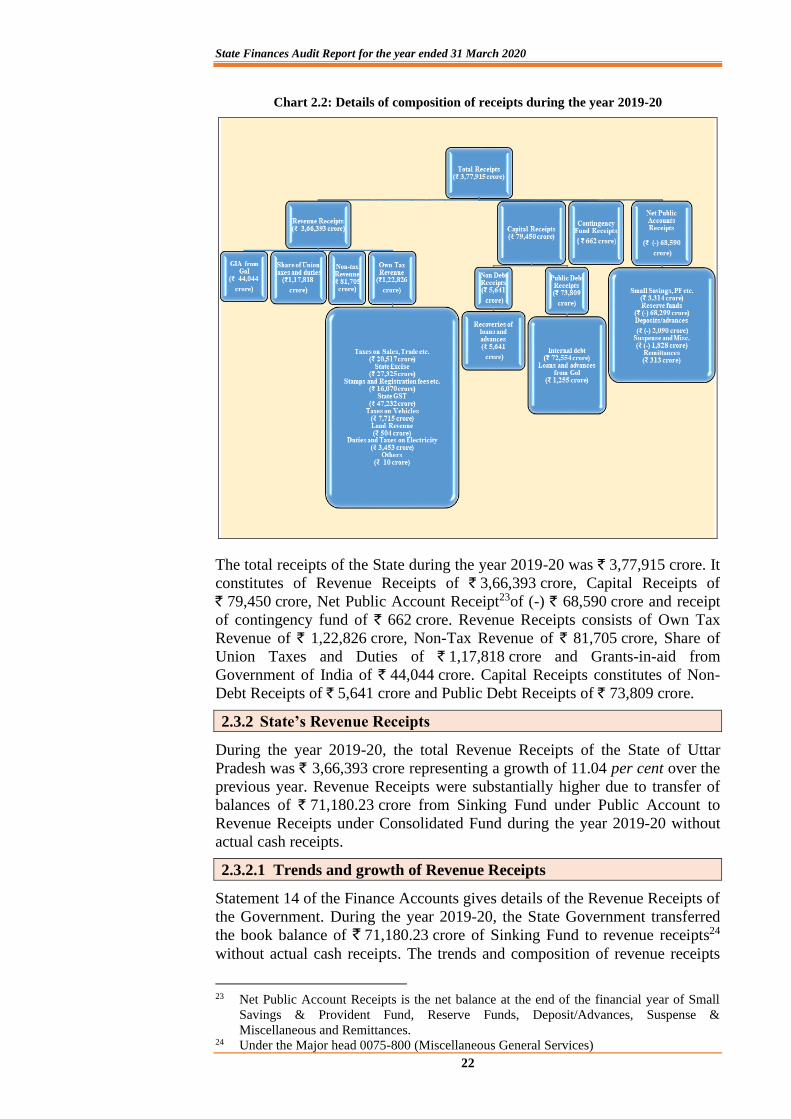
State Finances Audit Report for the year ended 31 March 2020
22
Chart 2.2: Details of composition of receipts during the year 2019-20
The total receipts of the State during the year 2019-20 was ` 3,77,915 crore. It
constitutes of Revenue Receipts of ` 3,66,393 crore, Capital Receipts of
` 79,450 crore, Net Public Account Receipt23of (-) ` 68,590 crore and receipt
of contingency fund of ` 662 crore. Revenue Receipts consists of Own Tax
Revenue of ` 1,22,826 crore, Non-Tax Revenue of ` 81,705 crore, Share of
Union Taxes and Duties of ` 1,17,818 crore and Grants-in-aid from
Government of India of ` 44,044 crore. Capital Receipts constitutes of Non-
Debt Receipts of ` 5,641 crore and Public Debt Receipts of ` 73,809 crore.
2.3.2 State’s Revenue Receipts
During the year 2019-20, the total Revenue Receipts of the State of Uttar
Pradesh was ` 3,66,393 crore representing a growth of 11.04 per cent over the
previous year. Revenue Receipts were substantially higher due to transfer of
balances of ` 71,180.23 crore from Sinking Fund under Public Account to
Revenue Receipts under Consolidated Fund during the year 2019-20 without
actual cash receipts.
2.3.2.1 Trends and growth of Revenue Receipts
Statement 14 of the Finance Accounts gives details of the Revenue Receipts of
the Government. During the year 2019-20, the State Government transferred
the book balance of ` 71,180.23 crore of Sinking Fund to revenue receipts24
without actual cash receipts. The trends and composition of revenue receipts
23 Net Public Account Receipts is the net balance at the end of the financial year of Small
Savings & Provident Fund, Reserve Funds, Deposit/Advances, Suspense &
Miscellaneous and Remittances. 24 Under the Major head 0075-800 (Miscellaneous General Services)
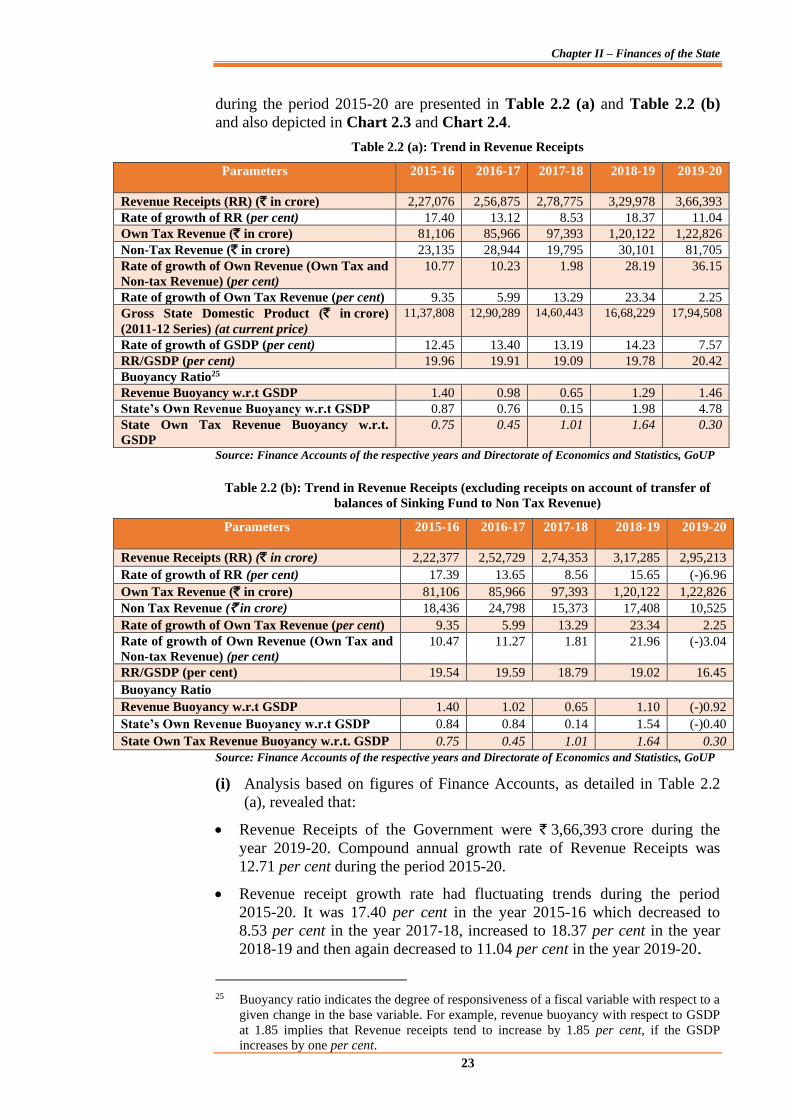
Chapter II – Finances of the State
23
during the period 2015-20 are presented in Table 2.2 (a) and Table 2.2 (b)
and also depicted in Chart 2.3 and Chart 2.4.
Table 2.2 (a): Trend in Revenue Receipts
Parameters 2015-16 2016-17 2017-18 2018-19 2019-20
Revenue Receipts (RR) (` in crore) 2,27,076 2,56,875 2,78,775 3,29,978 3,66,393
Rate of growth of RR (per cent) 17.40 13.12 8.53 18.37 11.04
Own Tax Revenue (` in crore) 81,106 85,966 97,393 1,20,122 1,22,826
Non-Tax Revenue (` in crore) 23,135 28,944 19,795 30,101 81,705
Rate of growth of Own Revenue (Own Tax and
Non-tax Revenue) (per cent)
10.77 10.23 1.98 28.19 36.15
Rate of growth of Own Tax Revenue (per cent) 9.35 5.99 13.29 23.34 2.25
Gross State Domestic Product (` in crore)
(2011-12 Series) (at current price)
11,37,808 12,90,289 14,60,443 16,68,229 17,94,508
Rate of growth of GSDP (per cent) 12.45 13.40 13.19 14.23 7.57
RR/GSDP (per cent) 19.96 19.91 19.09 19.78 20.42
Buoyancy Ratio25
Revenue Buoyancy w.r.t GSDP 1.40 0.98 0.65 1.29 1.46
State’s Own Revenue Buoyancy w.r.t GSDP 0.87 0.76 0.15 1.98 4.78
State Own Tax Revenue Buoyancy w.r.t.
GSDP
0.75 0.45 1.01 1.64 0.30
Source: Finance Accounts of the respective years and Directorate of Economics and Statistics, GoUP
Table 2.2 (b): Trend in Revenue Receipts (excluding receipts on account of transfer of
balances of Sinking Fund to Non Tax Revenue)
Parameters 2015-16 2016-17 2017-18 2018-19 2019-20
Revenue Receipts (RR) (` in crore) 2,22,377 2,52,729 2,74,353 3,17,285 2,95,213
Rate of growth of RR (per cent) 17.39 13.65 8.56 15.65 (-)6.96
Own Tax Revenue (` in crore) 81,106 85,966 97,393 1,20,122 1,22,826
Non Tax Revenue (` in crore) 18,436 24,798 15,373 17,408 10,525
Rate of growth of Own Tax Revenue (per cent) 9.35 5.99 13.29 23.34 2.25
Rate of growth of Own Revenue (Own Tax and
Non-tax Revenue) (per cent)
10.47 11.27 1.81 21.96 (-)3.04
RR/GSDP (per cent) 19.54 19.59 18.79 19.02 16.45
Buoyancy Ratio
Revenue Buoyancy w.r.t GSDP 1.40 1.02 0.65 1.10 (-)0.92
State’s Own Revenue Buoyancy w.r.t GSDP 0.84 0.84 0.14 1.54 (-)0.40
State Own Tax Revenue Buoyancy w.r.t. GSDP 0.75 0.45 1.01 1.64 0.30
Source: Finance Accounts of the respective years and Directorate of Economics and Statistics, GoUP
(i) Analysis based on figures of Finance Accounts, as detailed in Table 2.2
(a), revealed that:
• Revenue Receipts of the Government were ` 3,66,393 crore during the
year 2019-20. Compound annual growth rate of Revenue Receipts was
12.71 per cent during the period 2015-20.
• Revenue receipt growth rate had fluctuating trends during the period
2015-20. It was 17.40 per cent in the year 2015-16 which decreased to
8.53 per cent in the year 2017-18, increased to 18.37 per cent in the year
2018-19 and then again decreased to 11.04 per cent in the year 2019-20.
25 Buoyancy ratio indicates the degree of responsiveness of a fiscal variable with respect to a
given change in the base variable. For example, revenue buoyancy with respect to GSDP
at 1.85 implies that Revenue receipts tend to increase by 1.85 per cent, if the GSDP
increases by one per cent.
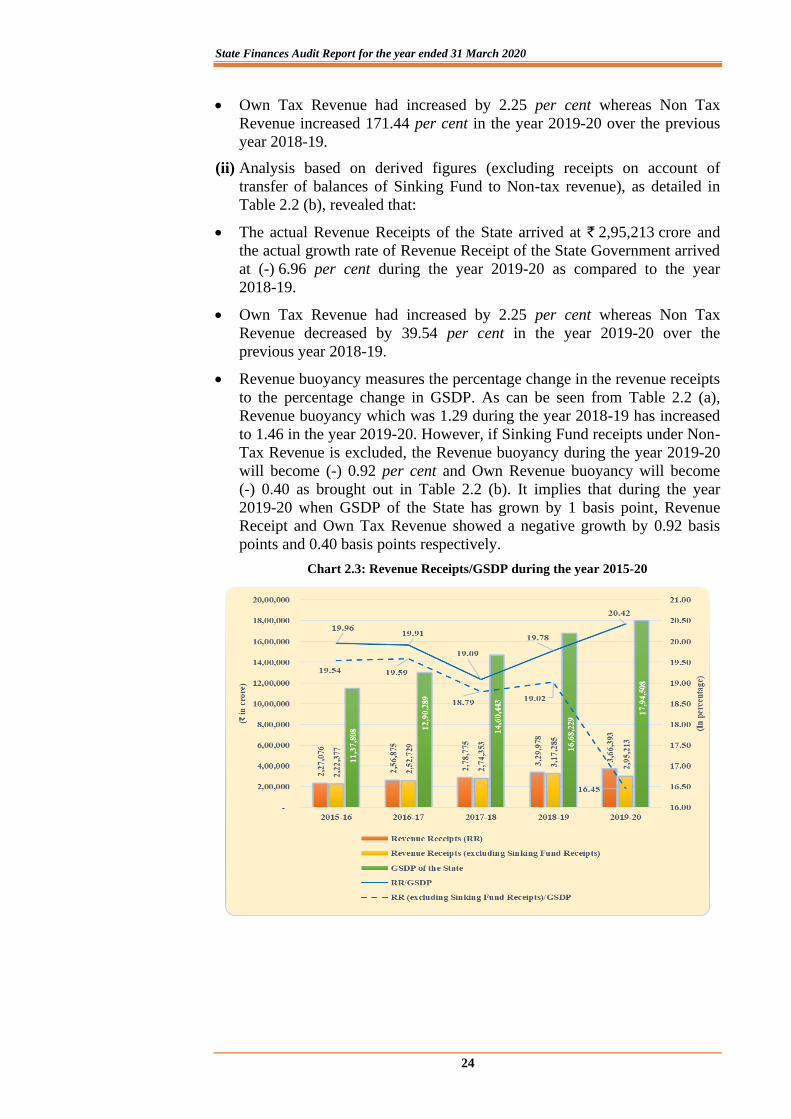
State Finances Audit Report for the year ended 31 March 2020
24
• Own Tax Revenue had increased by 2.25 per cent whereas Non Tax
Revenue increased 171.44 per cent in the year 2019-20 over the previous
year 2018-19.
(ii) Analysis based on derived figures (excluding receipts on account of
transfer of balances of Sinking Fund to Non-tax revenue), as detailed in
Table 2.2 (b), revealed that:
• The actual Revenue Receipts of the State arrived at ` 2,95,213 crore and
the actual growth rate of Revenue Receipt of the State Government arrived
at (-) 6.96 per cent during the year 2019-20 as compared to the year
2018-19.
• Own Tax Revenue had increased by 2.25 per cent whereas Non Tax
Revenue decreased by 39.54 per cent in the year 2019-20 over the
previous year 2018-19.
• Revenue buoyancy measures the percentage change in the revenue receipts
to the percentage change in GSDP. As can be seen from Table 2.2 (a),
Revenue buoyancy which was 1.29 during the year 2018-19 has increased
to 1.46 in the year 2019-20. However, if Sinking Fund receipts under Non-
Tax Revenue is excluded, the Revenue buoyancy during the year 2019-20
will become (-) 0.92 per cent and Own Revenue buoyancy will become
(-) 0.40 as brought out in Table 2.2 (b). It implies that during the year
2019-20 when GSDP of the State has grown by 1 basis point, Revenue
Receipt and Own Tax Revenue showed a negative growth by 0.92 basis
points and 0.40 basis points respectively.
Chart 2.3: Revenue Receipts/GSDP during the year 2015-20

Chapter II – Finances of the State
25
Chart 2.4: Trend of Revenue Receipts during 2015-20
2.3.3 State’s Own Resources
State’s Own Resources are comprising of Own Tax Revenue and Non-Tax
Revenue. Components of Own Tax Revenue of the State of Uttar Pradesh are
State GST (SGST), State Excise, Taxes on Vehicles, Stamp Duty and
Registration fees, Land revenue, Taxes and Duties on electricity, Taxes on
Goods and Passengers etc. The sources of Non-Tax Revenue include receipts
from fiscal services like interest receipts from outstanding loans and advances
given by Government and investment of cash balance, dividends and profits
from equity investments, royalty fees for allowing use of assets held as
custodian like minerals, forests and wild life, or other such services and user
charges for various social and economic services provided through the
apparatus of the Government. The details of collection of Own Tax / Non Tax
Revenue during the period 2015-20 is given in Appendix 2.2.
2.3.3.1 Own Tax Revenue
Own Tax Revenue of the State of Uttar Pradesh was ` 1,22,826 crore during
the year 2019-20. During the period 2015-20, it increased by 51.44 per cent
(` 41,720 crore) from ` 81,106 crore in the year 2015-16 to ` 1,22,826 crore in
the year 2019-20. Major trends of growth of Own Tax Revenue are given in
Chart 2.5.
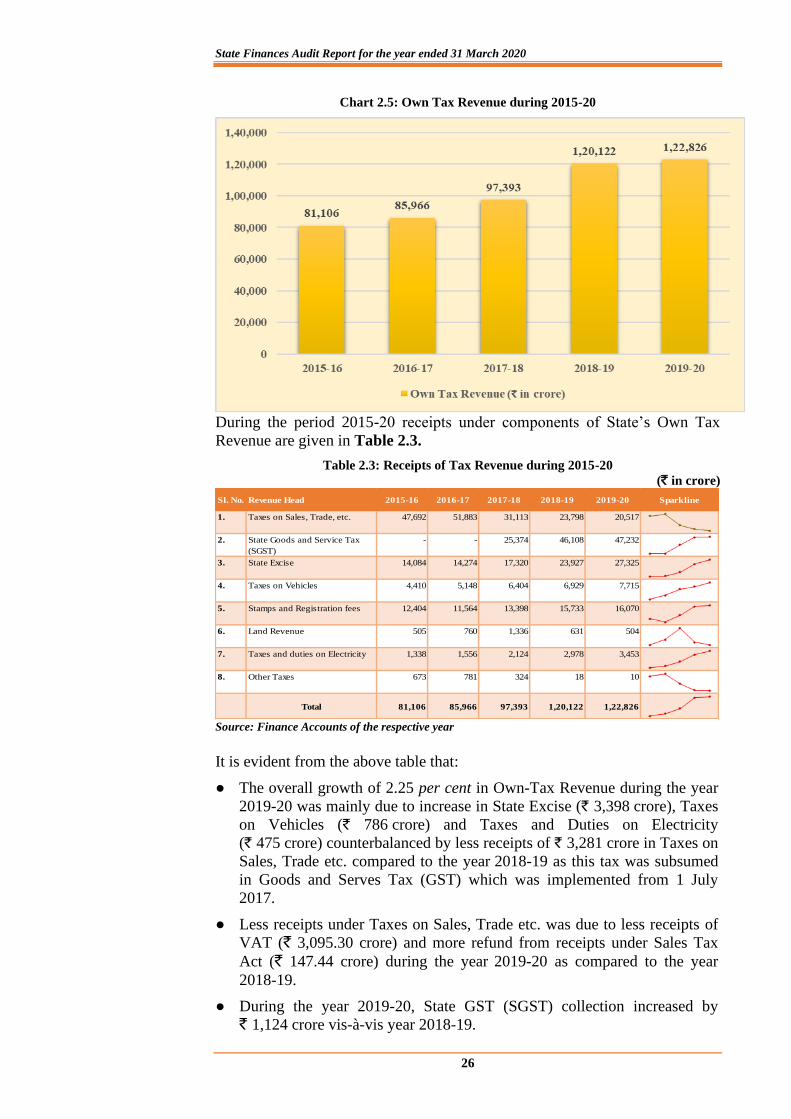
State Finances Audit Report for the year ended 31 March 2020
26
Chart 2.5: Own Tax Revenue during 2015-20
During the period 2015-20 receipts under components of State’s Own Tax
Revenue are given in Table 2.3.
Table 2.3: Receipts of Tax Revenue during 2015-20
(` in crore)
Sl. No. Revenue Head 2015-16 2016-17 2017-18 2018-19 2019-20 Sparkline
1.
Taxes on Sales, Trade, etc. 47,692 51,883 31,113 23,798 20,517
2.
State Goods and Service Tax
(SGST)
- - 25,374 46,108 47,232
3.
State Excise 14,084 14,274 17,320 23,927 27,325
4.
Taxes on Vehicles 4,410 5,148 6,404 6,929 7,715
5.
Stamps and Registration fees 12,404 11,564 13,398 15,733 16,070
6.
Land Revenue 505 760 1,336 631 504
7.
Taxes and duties on Electricity 1,338 1,556 2,124 2,978 3,453
8.
Other Taxes 673 781 324 18 10
Total 81,106 85,966 97,393 1,20,122 1,22,826
Source: Finance Accounts of the respective year
It is evident from the above table that:
● The overall growth of 2.25 per cent in Own-Tax Revenue during the year
2019-20 was mainly due to increase in State Excise (` 3,398 crore), Taxes
on Vehicles (` 786 crore) and Taxes and Duties on Electricity
(` 475 crore) counterbalanced by less receipts of ` 3,281 crore in Taxes on
Sales, Trade etc. compared to the year 2018-19 as this tax was subsumed
in Goods and Serves Tax (GST) which was implemented from 1 July
2017.
● Less receipts under Taxes on Sales, Trade etc. was due to less receipts of
VAT (` 3,095.30 crore) and more refund from receipts under Sales Tax
Act (` 147.44 crore) during the year 2019-20 as compared to the year
2018-19.
● During the year 2019-20, State GST (SGST) collection increased by
` 1,124 crore vis-à-vis year 2018-19.
Chapter II – Finances of the State
27
● Increase in State Excise was mainly due to increase in receipts on account
of sale of country spirit (` 12,890 crore), malt liquor (` 4,072 crore) and
foreign liquor and spirits (` 10,071 crore). The State Government had also
increased the processing fee, renewal fee for retailers and Minimum
Guaranteed Quantity of country liquor, etc. under the State Excise Policy
for the year 2019-20.
● The receipts under Stamp and Registration fee increased due to higher
receipts on account of sale of non-judicial stamps.
● Increase in receipts under Taxes and Duties on Electricity was due to more
collection on account of consumption and sale of electricity.
● Other Taxes include Taxes on Goods and Passengers, Taxes on Hotel
Receipt, Entertainment Tax, Betting Tax, Taxes on Advertisement
exhibited in cinema theaters, etc. The reduction is mainly on account of
subsuming of these taxes under Goods and Service Tax (GST) since 1 July
2017.
2.3.3.2 State Goods and Services Tax (SGST)
The State Government implemented the Goods and Services Tax (GST) Act,
which became effective from 1 July 2017. Under GST (Compensation to
States) Act, 2017, the Central Government will compensate the States for loss
of revenue arising on account of implementation of GST for a period of five
years. A base year (2015-16) revenue figures of taxes subsumed under GST
was finalized under GST Act. The projected revenue for any year in a State
was to be calculated by applying the projected growth rate (14 per cent per
annum) over the base year revenue of the State.
Revenue figure under GST for the year 2019-20 has been depicted in the
Finance Accounts as per nature of receipts i.e. State Goods and Services Tax
(SGST), Input Tax Credit Cross Utilization of SGST and Integrated Goods
and Services Tax (IGST), apportionment of IGST-transfer-in of Tax
Component to SGST and advance apportionment from IGST. In case of Uttar
Pradesh, the revenue from subsumed taxes was ` 33,359 crore during the base
year (2015-16). Thus, projected revenue for the year 2019-20 in accordance
with the base year figure was ` 56,342 crore against which SGST amounting
to ` 47,232 crore was collected. This includes ` 2,457 crore as State’s share in
IGST. From total receipts of SGST, ` 340 crore was transferred to GoI as
settlement of advance apportionment from IGST. State Government also
received compensation of ` 5,180 crore from GoI for loss of revenue arising
out of implementation of GST.
With automation of the collection of GST having taken place, the Government
of India’s decision to provide access to Pan-India data at GSTN premises was
conveyed on 22 June 2020. Further, administrative action to implement the
decision was at different stages of implementation. The accounts of the State
Government for the year 2019-20 have, therefore, been certified on the basis
of test audit, as was done when records were being maintained manually,
pending full implementation of Government of India’s decision to provide
Audit access to GSTN data.
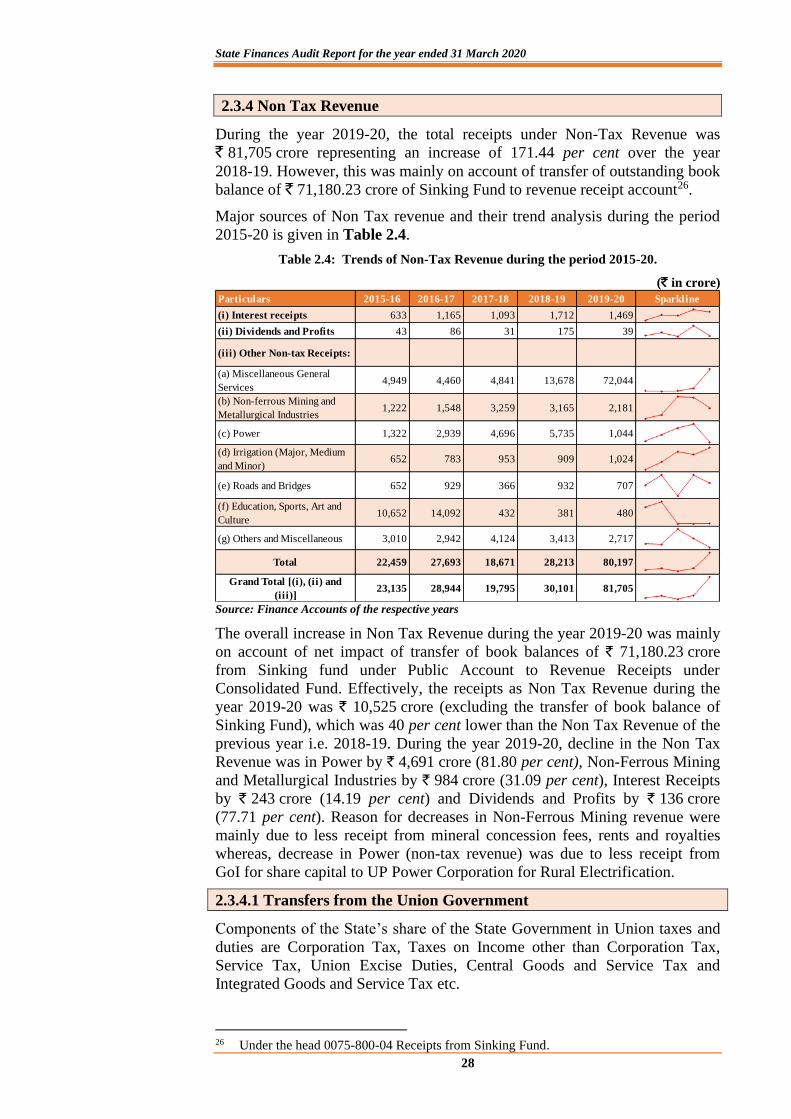
State Finances Audit Report for the year ended 31 March 2020
28
2.3.4 Non Tax Revenue
During the year 2019-20, the total receipts under Non-Tax Revenue was
` 81,705 crore representing an increase of 171.44 per cent over the year
2018-19. However, this was mainly on account of transfer of outstanding book
balance of ` 71,180.23 crore of Sinking Fund to revenue receipt account26.
Major sources of Non Tax revenue and their trend analysis during the period
2015-20 is given in Table 2.4.
Table 2.4: Trends of Non-Tax Revenue during the period 2015-20.
(` in crore)
Particulars 2015-16 2016-17 2017-18 2018-19 2019-20 Sparkline
(i) Interest receipts 633 1,165 1,093 1,712 1,469
(ii) Dividends and Profits 43 86 31 175 39
(iii) Other Non-tax Receipts:
(a) Miscellaneous General
Services 4,949 4,460 4,841 13,678 72,044
(b) Non-ferrous Mining and
Metallurgical Industries 1,222 1,548 3,259 3,165 2,181
(c) Power 1,322 2,939 4,696 5,735 1,044
(d) Irrigation (Major, Medium
and Minor) 652 783 953 909 1,024
(e) Roads and Bridges 652 929 366 932 707
(f) Education, Sports, Art and
Culture 10,652 14,092 432 381 480
(g) Others and Miscellaneous 3,010 2,942 4,124 3,413 2,717
Total 22,459 27,693 18,671 28,213 80,197
Grand Total [(i), (ii) and
(iii)] 23,135 28,944 19,795 30,101 81,705
Source: Finance Accounts of the respective years
The overall increase in Non Tax Revenue during the year 2019-20 was mainly
on account of net impact of transfer of book balances of ` 71,180.23 crore
from Sinking fund under Public Account to Revenue Receipts under
Consolidated Fund. Effectively, the receipts as Non Tax Revenue during the
year 2019-20 was ` 10,525 crore (excluding the transfer of book balance of
Sinking Fund), which was 40 per cent lower than the Non Tax Revenue of the
previous year i.e. 2018-19. During the year 2019-20, decline in the Non Tax
Revenue was in Power by ` 4,691 crore (81.80 per cent), Non-Ferrous Mining
and Metallurgical Industries by ` 984 crore (31.09 per cent), Interest Receipts
by ` 243 crore (14.19 per cent) and Dividends and Profits by ` 136 crore
(77.71 per cent). Reason for decreases in Non-Ferrous Mining revenue were
mainly due to less receipt from mineral concession fees, rents and royalties
whereas, decrease in Power (non-tax revenue) was due to less receipt from
GoI for share capital to UP Power Corporation for Rural Electrification.
2.3.4.1 Transfers from the Union Government
Components of the State’s share of the State Government in Union taxes and
duties are Corporation Tax, Taxes on Income other than Corporation Tax,
Service Tax, Union Excise Duties, Central Goods and Service Tax and
Integrated Goods and Service Tax etc.
26 Under the head 0075-800-04 Receipts from Sinking Fund.
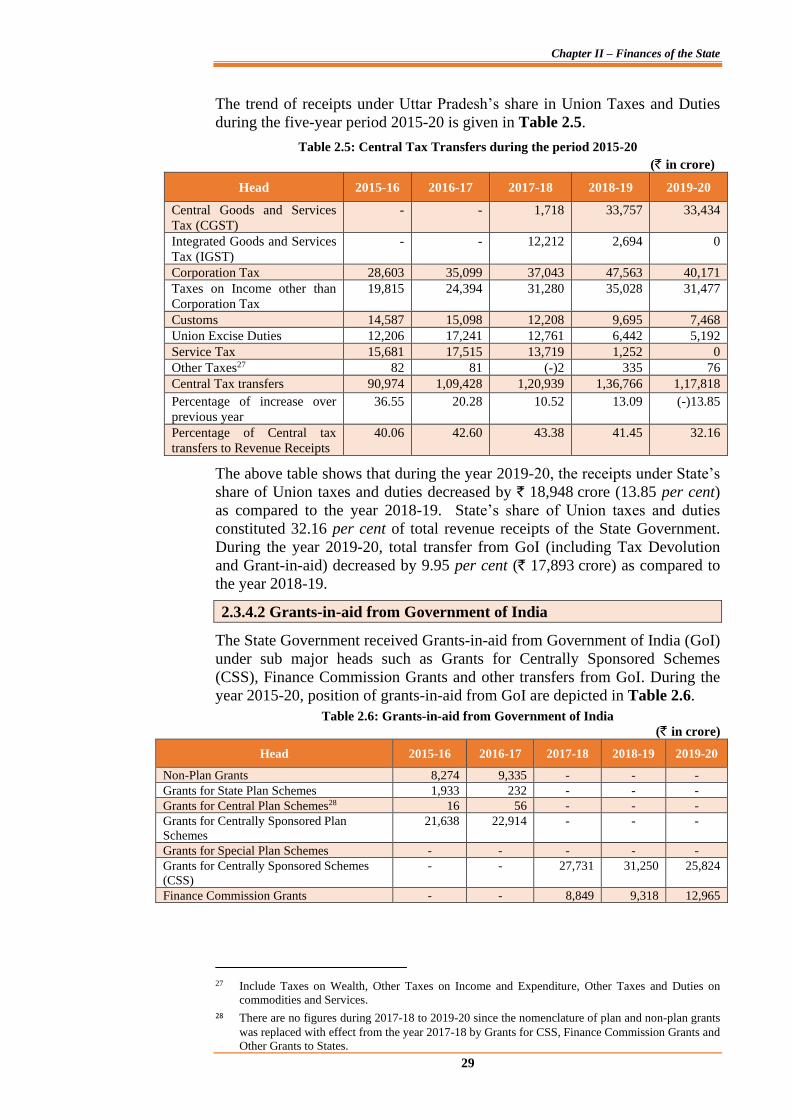
Chapter II – Finances of the State
29
The trend of receipts under Uttar Pradesh’s share in Union Taxes and Duties
during the five-year period 2015-20 is given in Table 2.5.
Table 2.5: Central Tax Transfers during the period 2015-20
(` in crore)
Head 2015-16 2016-17 2017-18 2018-19 2019-20
Central Goods and Services
Tax (CGST)
- - 1,718 33,757 33,434
Integrated Goods and Services
Tax (IGST)
- - 12,212 2,694 0
Corporation Tax 28,603 35,099 37,043 47,563 40,171
Taxes on Income other than
Corporation Tax
19,815 24,394 31,280 35,028 31,477
Customs 14,587 15,098 12,208 9,695 7,468
Union Excise Duties 12,206 17,241 12,761 6,442 5,192
Service Tax 15,681 17,515 13,719 1,252 0
Other Taxes27 82 81 (-)2 335 76
Central Tax transfers 90,974 1,09,428 1,20,939 1,36,766 1,17,818
Percentage of increase over
previous year
36.55 20.28 10.52 13.09 (-)13.85
Percentage of Central tax
transfers to Revenue Receipts
40.06 42.60 43.38 41.45 32.16
The above table shows that during the year 2019-20, the receipts under State’s
share of Union taxes and duties decreased by ` 18,948 crore (13.85 per cent)
as compared to the year 2018-19. State’s share of Union taxes and duties
constituted 32.16 per cent of total revenue receipts of the State Government.
During the year 2019-20, total transfer from GoI (including Tax Devolution
and Grant-in-aid) decreased by 9.95 per cent (` 17,893 crore) as compared to
the year 2018-19.
2.3.4.2 Grants-in-aid from Government of India
The State Government received Grants-in-aid from Government of India (GoI)
under sub major heads such as Grants for Centrally Sponsored Schemes
(CSS), Finance Commission Grants and other transfers from GoI. During the
year 2015-20, position of grants-in-aid from GoI are depicted in Table 2.6.
Table 2.6: Grants-in-aid from Government of India
(` in crore)
Head 2015-16 2016-17 2017-18 2018-19 2019-20
Non-Plan Grants 8,274 9,335 - - -
Grants for State Plan Schemes 1,933 232 - - -
Grants for Central Plan Schemes28 16 56 - - -
Grants for Centrally Sponsored Plan
Schemes
21,638 22,914 - - -
Grants for Special Plan Schemes - - - - -
Grants for Centrally Sponsored Schemes
(CSS)
- - 27,731 31,250 25,824
Finance Commission Grants - - 8,849 9,318 12,965
27 Include Taxes on Wealth, Other Taxes on Income and Expenditure, Other Taxes and Duties on
commodities and Services.
28 There are no figures during 2017-18 to 2019-20 since the nomenclature of plan and non-plan grants
was replaced with effect from the year 2017-18 by Grants for CSS, Finance Commission Grants and
Other Grants to States.
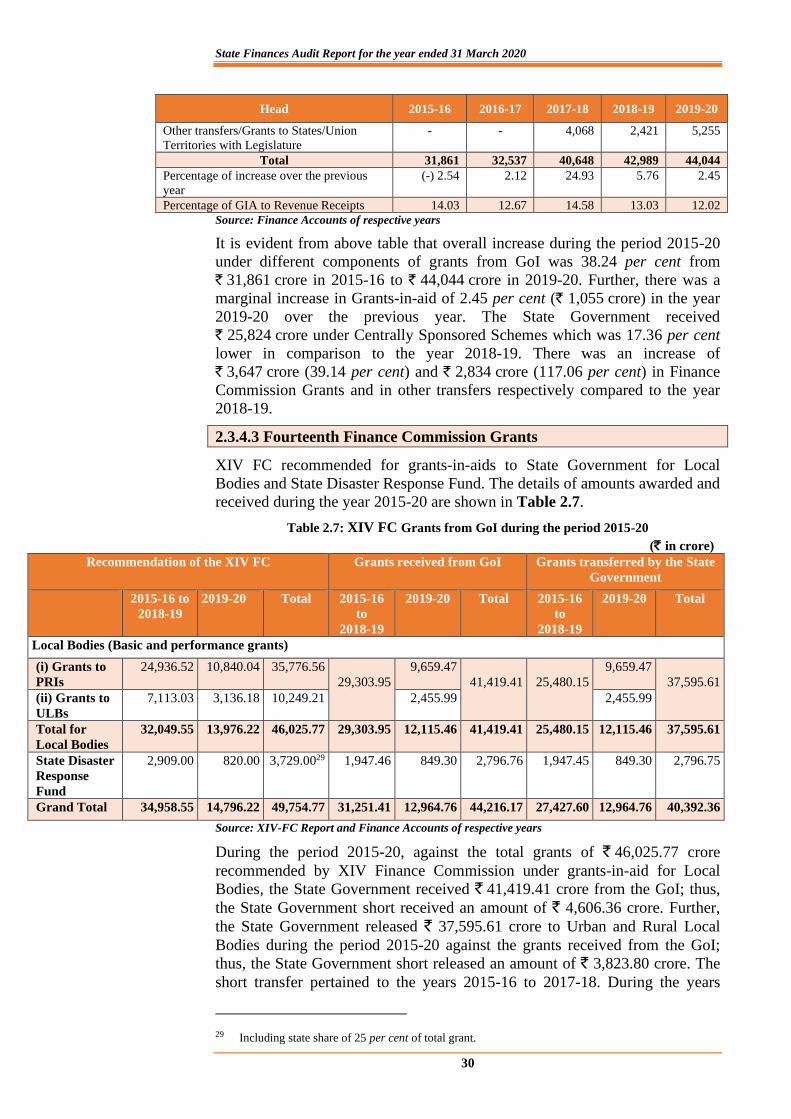
State Finances Audit Report for the year ended 31 March 2020
30
Head 2015-16 2016-17 2017-18 2018-19 2019-20
Other transfers/Grants to States/Union
Territories with Legislature
- - 4,068 2,421 5,255
Total 31,861 32,537 40,648 42,989 44,044
Percentage of increase over the previous
year
(-) 2.54 2.12 24.93 5.76 2.45
Percentage of GIA to Revenue Receipts 14.03 12.67 14.58 13.03 12.02
Source: Finance Accounts of respective years
It is evident from above table that overall increase during the period 2015-20
under different components of grants from GoI was 38.24 per cent from
` 31,861 crore in 2015-16 to ` 44,044 crore in 2019-20. Further, there was a
marginal increase in Grants-in-aid of 2.45 per cent (` 1,055 crore) in the year
2019-20 over the previous year. The State Government received
` 25,824 crore under Centrally Sponsored Schemes which was 17.36 per cent
lower in comparison to the year 2018-19. There was an increase of
` 3,647 crore (39.14 per cent) and ` 2,834 crore (117.06 per cent) in Finance
Commission Grants and in other transfers respectively compared to the year
2018-19.
2.3.4.3 Fourteenth Finance Commission Grants
XIV FC recommended for grants-in-aids to State Government for Local
Bodies and State Disaster Response Fund. The details of amounts awarded and
received during the year 2015-20 are shown in Table 2.7.
Table 2.7: XIV FC Grants from GoI during the period 2015-20
(` in crore) Recommendation of the XIV FC Grants received from GoI Grants transferred by the State
Government
2015-16 to
2018-19
2019-20 Total 2015-16
to
2018-19
2019-20 Total 2015-16
to
2018-19
2019-20 Total
Local Bodies (Basic and performance grants)
(i) Grants to
PRIs
24,936.52 10,840.04 35,776.56
29,303.95
9,659.47
41,419.41
25,480.15
9,659.47
37,595.61
(ii) Grants to
ULBs
7,113.03 3,136.18 10,249.21 2,455.99 2,455.99
Total for
Local Bodies
32,049.55 13,976.22 46,025.77 29,303.95 12,115.46 41,419.41 25,480.15 12,115.46 37,595.61
State Disaster
Response
Fund
2,909.00 820.00 3,729.0029 1,947.46 849.30 2,796.76 1,947.45 849.30 2,796.75
Grand Total 34,958.55 14,796.22 49,754.77 31,251.41 12,964.76 44,216.17 27,427.60 12,964.76 40,392.36
Source: XIV-FC Report and Finance Accounts of respective years
During the period 2015-20, against the total grants of ` 46,025.77 crore
recommended by XIV Finance Commission under grants-in-aid for Local
Bodies, the State Government received ` 41,419.41 crore from the GoI; thus,
the State Government short received an amount of ` 4,606.36 crore. Further,
the State Government released ` 37,595.61 crore to Urban and Rural Local
Bodies during the period 2015-20 against the grants received from the GoI;
thus, the State Government short released an amount of ` 3,823.80 crore. The
short transfer pertained to the years 2015-16 to 2017-18. During the years
29 Including state share of 25 per cent of total grant.
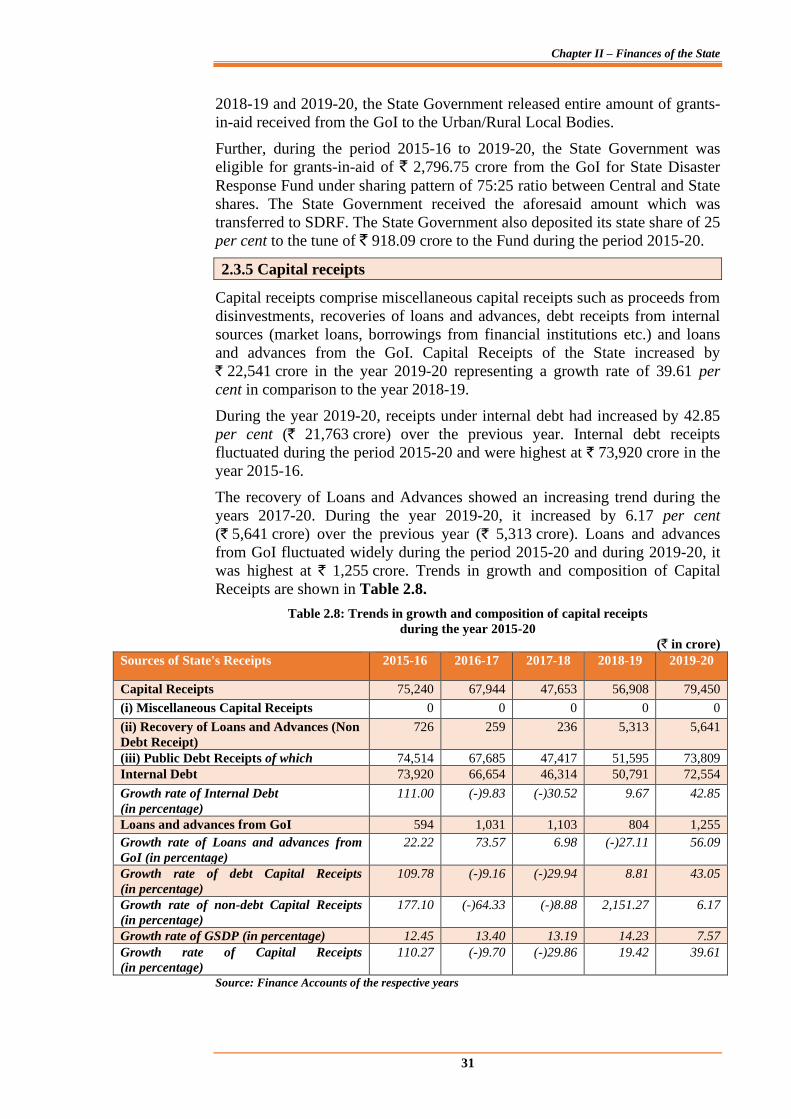
Chapter II – Finances of the State
31
2018-19 and 2019-20, the State Government released entire amount of grants-
in-aid received from the GoI to the Urban/Rural Local Bodies.
Further, during the period 2015-16 to 2019-20, the State Government was
eligible for grants-in-aid of ` 2,796.75 crore from the GoI for State Disaster
Response Fund under sharing pattern of 75:25 ratio between Central and State
shares. The State Government received the aforesaid amount which was
transferred to SDRF. The State Government also deposited its state share of 25
per cent to the tune of ` 918.09 crore to the Fund during the period 2015-20.
2.3.5 Capital receipts
Capital receipts comprise miscellaneous capital receipts such as proceeds from
disinvestments, recoveries of loans and advances, debt receipts from internal
sources (market loans, borrowings from financial institutions etc.) and loans
and advances from the GoI. Capital Receipts of the State increased by
` 22,541 crore in the year 2019-20 representing a growth rate of 39.61 per
cent in comparison to the year 2018-19.
During the year 2019-20, receipts under internal debt had increased by 42.85
per cent (` 21,763 crore) over the previous year. Internal debt receipts
fluctuated during the period 2015-20 and were highest at ` 73,920 crore in the
year 2015-16.
The recovery of Loans and Advances showed an increasing trend during the
years 2017-20. During the year 2019-20, it increased by 6.17 per cent
(` 5,641 crore) over the previous year (` 5,313 crore). Loans and advances
from GoI fluctuated widely during the period 2015-20 and during 2019-20, it
was highest at ` 1,255 crore. Trends in growth and composition of Capital
Receipts are shown in Table 2.8.
Table 2.8: Trends in growth and composition of capital receipts
during the year 2015-20
(` in crore)
Sources of State's Receipts 2015-16 2016-17 2017-18 2018-19 2019-20
Capital Receipts 75,240 67,944 47,653 56,908 79,450
(i) Miscellaneous Capital Receipts 0 0 0 0 0
(ii) Recovery of Loans and Advances (Non
Debt Receipt)
726 259 236 5,313 5,641
(iii) Public Debt Receipts of which 74,514 67,685 47,417 51,595 73,809
Internal Debt 73,920 66,654 46,314 50,791 72,554
Growth rate of Internal Debt
(in percentage)
111.00 (-)9.83 (-)30.52 9.67 42.85
Loans and advances from GoI 594 1,031 1,103 804 1,255
Growth rate of Loans and advances from
GoI (in percentage)
22.22 73.57 6.98 (-)27.11 56.09
Growth rate of debt Capital Receipts
(in percentage)
109.78 (-)9.16 (-)29.94 8.81 43.05
Growth rate of non-debt Capital Receipts
(in percentage)
177.10 (-)64.33 (-)8.88 2,151.27 6.17
Growth rate of GSDP (in percentage) 12.45 13.40 13.19 14.23 7.57
Growth rate of Capital Receipts
(in percentage)
110.27 (-)9.70 (-)29.86 19.42 39.61
Source: Finance Accounts of the respective years
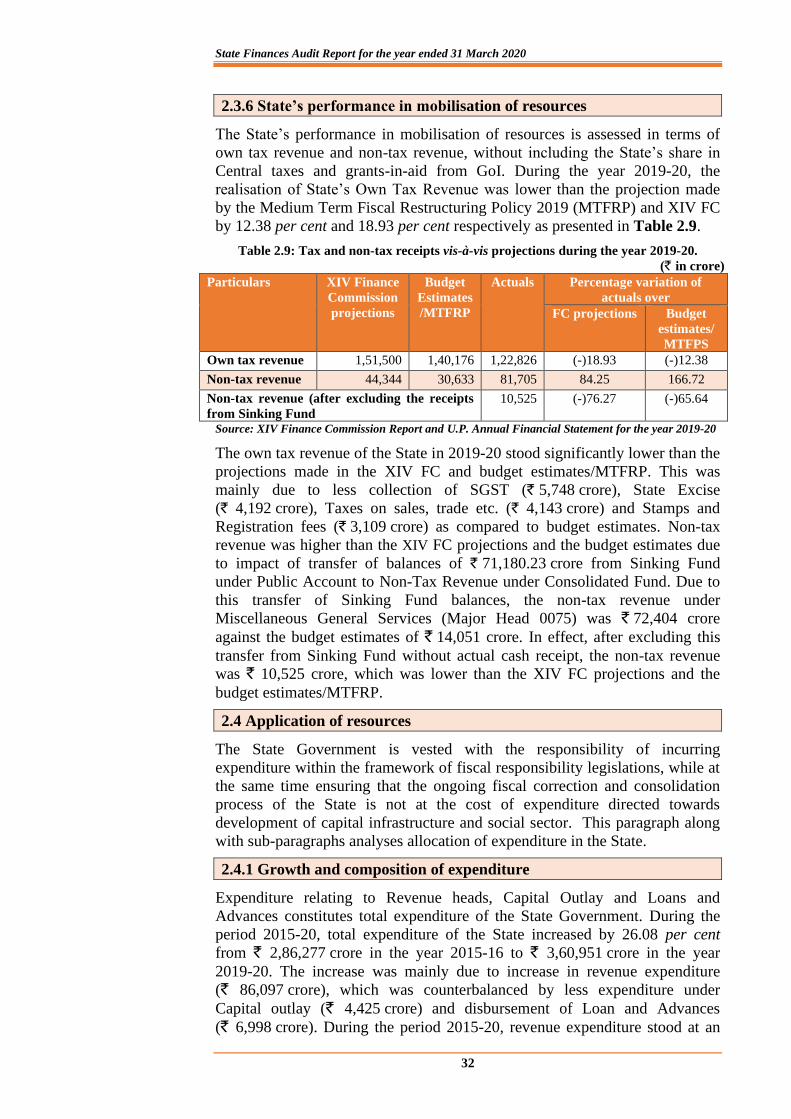
State Finances Audit Report for the year ended 31 March 2020
32
2.3.6 State’s performance in mobilisation of resources
The State’s performance in mobilisation of resources is assessed in terms of
own tax revenue and non-tax revenue, without including the State’s share in
Central taxes and grants-in-aid from GoI. During the year 2019-20, the
realisation of State’s Own Tax Revenue was lower than the projection made
by the Medium Term Fiscal Restructuring Policy 2019 (MTFRP) and XIV FC
by 12.38 per cent and 18.93 per cent respectively as presented in Table 2.9.
Table 2.9: Tax and non-tax receipts vis-à-vis projections during the year 2019-20.
(` in crore)
Particulars XIV Finance
Commission
projections
Budget
Estimates
/MTFRP
Actuals Percentage variation of
actuals over
FC projections Budget
estimates/
MTFPS
Own tax revenue 1,51,500 1,40,176 1,22,826 (-)18.93 (-)12.38
Non-tax revenue 44,344 30,633 81,705 84.25 166.72
Non-tax revenue (after excluding the receipts
from Sinking Fund
10,525 (-)76.27 (-)65.64
Source: XIV Finance Commission Report and U.P. Annual Financial Statement for the year 2019-20
The own tax revenue of the State in 2019-20 stood significantly lower than the
projections made in the XIV FC and budget estimates/MTFRP. This was
mainly due to less collection of SGST (` 5,748 crore), State Excise
(` 4,192 crore), Taxes on sales, trade etc. (` 4,143 crore) and Stamps and
Registration fees (` 3,109 crore) as compared to budget estimates. Non-tax
revenue was higher than the XIV FC projections and the budget estimates due
to impact of transfer of balances of ` 71,180.23 crore from Sinking Fund
under Public Account to Non-Tax Revenue under Consolidated Fund. Due to
this transfer of Sinking Fund balances, the non-tax revenue under
Miscellaneous General Services (Major Head 0075) was ` 72,404 crore
against the budget estimates of ` 14,051 crore. In effect, after excluding this
transfer from Sinking Fund without actual cash receipt, the non-tax revenue
was ` 10,525 crore, which was lower than the XIV FC projections and the
budget estimates/MTFRP.
2.4 Application of resources
The State Government is vested with the responsibility of incurring
expenditure within the framework of fiscal responsibility legislations, while at
the same time ensuring that the ongoing fiscal correction and consolidation
process of the State is not at the cost of expenditure directed towards
development of capital infrastructure and social sector. This paragraph along
with sub-paragraphs analyses allocation of expenditure in the State.
2.4.1 Growth and composition of expenditure
Expenditure relating to Revenue heads, Capital Outlay and Loans and
Advances constitutes total expenditure of the State Government. During the
period 2015-20, total expenditure of the State increased by 26.08 per cent
from ` 2,86,277 crore in the year 2015-16 to ` 3,60,951 crore in the year
2019-20. The increase was mainly due to increase in revenue expenditure
(` 86,097 crore), which was counterbalanced by less expenditure under
Capital outlay (` 4,425 crore) and disbursement of Loan and Advances
(` 6,998 crore). During the period 2015-20, revenue expenditure stood at an
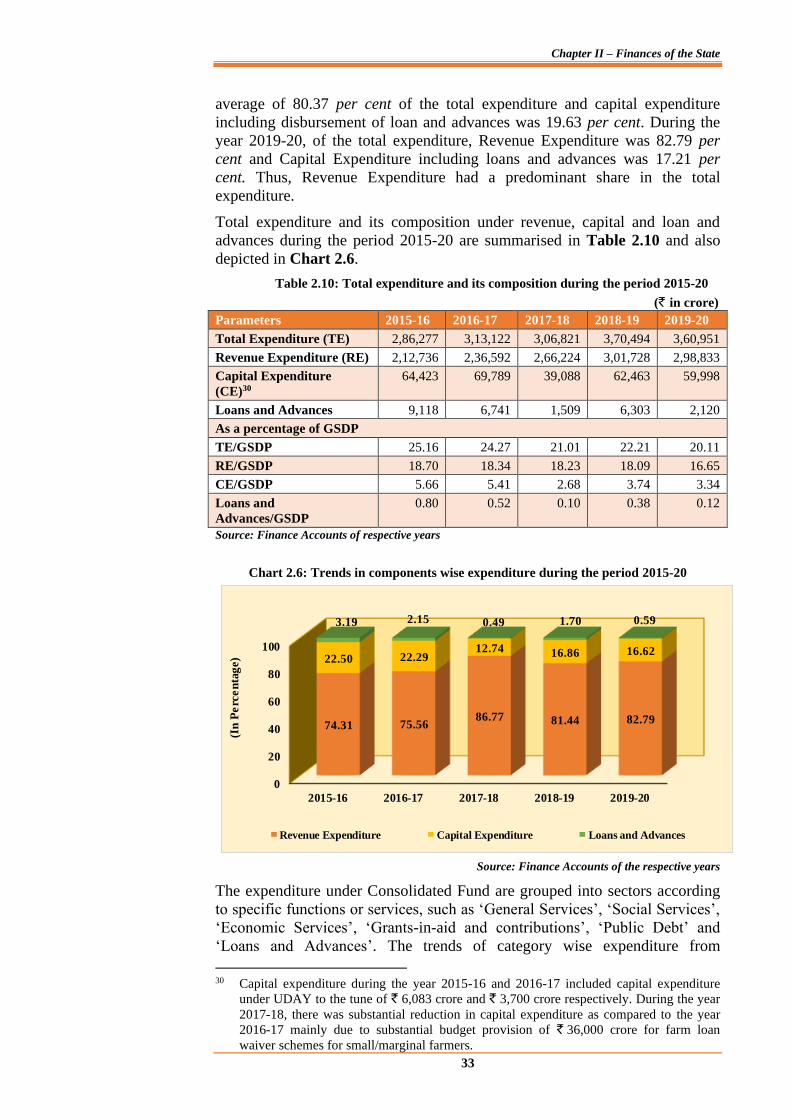
Chapter II – Finances of the State
33
average of 80.37 per cent of the total expenditure and capital expenditure
including disbursement of loan and advances was 19.63 per cent. During the
year 2019-20, of the total expenditure, Revenue Expenditure was 82.79 per
cent and Capital Expenditure including loans and advances was 17.21 per
cent. Thus, Revenue Expenditure had a predominant share in the total
expenditure.
Total expenditure and its composition under revenue, capital and loan and
advances during the period 2015-20 are summarised in Table 2.10 and also
depicted in Chart 2.6.
Table 2.10: Total expenditure and its composition during the period 2015-20
(` in crore)
Parameters 2015-16 2016-17 2017-18 2018-19 2019-20
Total Expenditure (TE) 2,86,277 3,13,122 3,06,821 3,70,494 3,60,951
Revenue Expenditure (RE) 2,12,736 2,36,592 2,66,224 3,01,728 2,98,833
Capital Expenditure
(CE)30
64,423 69,789 39,088 62,463 59,998
Loans and Advances 9,118 6,741 1,509 6,303 2,120
As a percentage of GSDP
TE/GSDP 25.16 24.27 21.01 22.21 20.11
RE/GSDP 18.70 18.34 18.23 18.09 16.65
CE/GSDP 5.66 5.41 2.68 3.74 3.34
Loans and
Advances/GSDP
0.80 0.52 0.10 0.38 0.12
Source: Finance Accounts of respective years
Chart 2.6: Trends in components wise expenditure during the period 2015-20
0
20
40
60
80
100
2015-16 2016-17 2017-18 2018-19 2019-20
74.31 75.5686.77 81.44 82.79
22.50 22.2912.74 16.86 16.62
3.19 2.15 0.49 1.70 0.59
(In
Pe
rce
nta
ge)
Revenue Expenditure Capital Expenditure Loans and Advances
Source: Finance Accounts of the respective years
The expenditure under Consolidated Fund are grouped into sectors according
to specific functions or services, such as ‘General Services’, ‘Social Services’,
‘Economic Services’, ‘Grants-in-aid and contributions’, ‘Public Debt’ and
‘Loans and Advances’. The trends of category wise expenditure from
30 Capital expenditure during the year 2015-16 and 2016-17 included capital expenditure
under UDAY to the tune of ` 6,083 crore and ` 3,700 crore respectively. During the year
2017-18, there was substantial reduction in capital expenditure as compared to the year
2016-17 mainly due to substantial budget provision of ` 36,000 crore for farm loan
waiver schemes for small/marginal farmers.
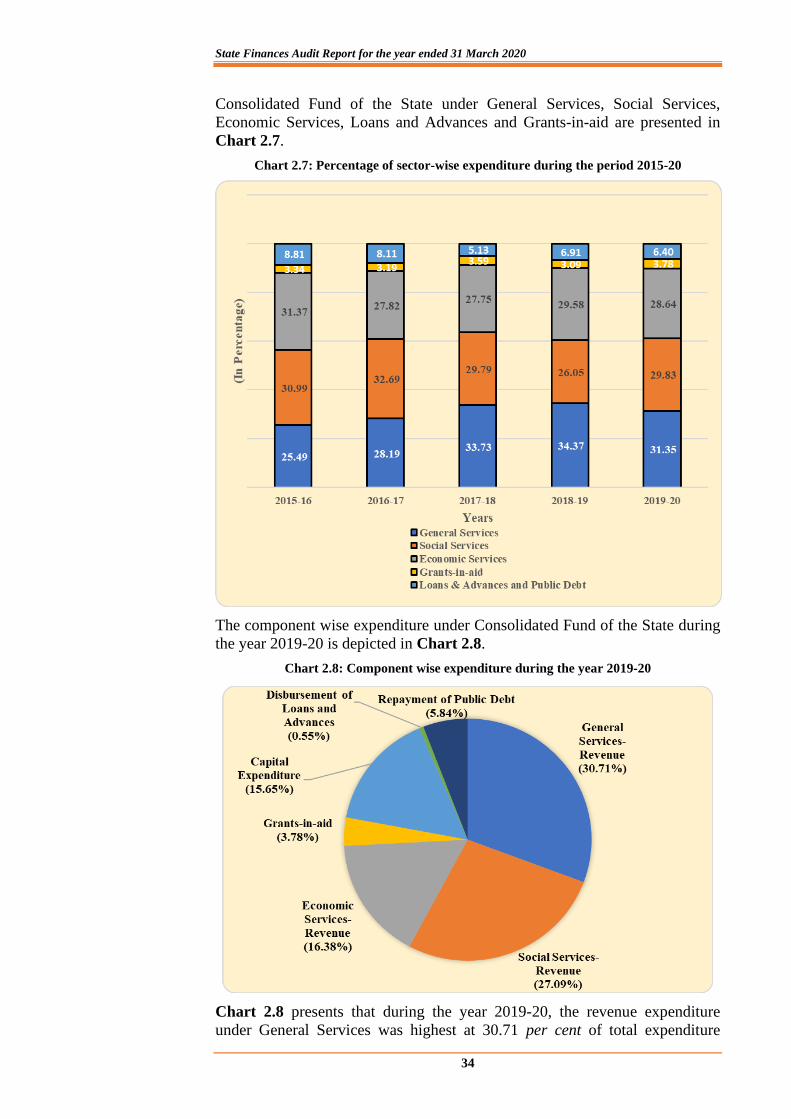
State Finances Audit Report for the year ended 31 March 2020
34
Consolidated Fund of the State under General Services, Social Services,
Economic Services, Loans and Advances and Grants-in-aid are presented in
Chart 2.7.
Chart 2.7: Percentage of sector-wise expenditure during the period 2015-20
The component wise expenditure under Consolidated Fund of the State during
the year 2019-20 is depicted in Chart 2.8.
Chart 2.8: Component wise expenditure during the year 2019-20
Chart 2.8 presents that during the year 2019-20, the revenue expenditure
under General Services was highest at 30.71 per cent of total expenditure

Chapter II – Finances of the State
35
which includes expenditure on Organs of State, Fiscal Services, Interest
Payment, Administrative Services and Pensions. The revenue expenditure on
Social Services was 27.09 per cent of the total expenditure which includes
expenditure on Education, Sports, Art & Culture, Health and Family Welfare,
Social Welfare and Nutrition, Water Supply & Sanitation, etc. The revenue
expenditure on Economic Services was 16.38 per cent which includes
expenditure on Agriculture and allied services, Rural Development, Irrigation
and Flood Control, Energy, Industry and Minerals & Transport etc. The
Capital expenditure (excluding debt servicing) was 15.65 per cent of the total
expenditure.
2.4.2 Revenue Expenditure
Revenue expenditure is incurred to maintain the current level of services and
payment for the past obligation. As such, it does not result in any addition to
the State’s infrastructure and service network. Revenue expenditure comprises
wages and salaries, interest payments, pensions, expenditure on operation and
maintenance of capital works, subsidies and transfers to local bodies, co-
operatives, Non-Government Organisations (NGOs) and others. Basic
parameters of Revenue Expenditure are given in Table 2.11.
Table 2.11: Basic parameters of Revenue Expenditure during the period 2015-20
(` in crore)
Parameters 2015-16 2016-17 2017-18 2018-19 2019-20
Total Expenditure (TE) 2,86,277 3,13,122 3,06,821 3,70,494 3,60,951
Revenue Expenditure (RE) 2,12,736 2,36,592 2,66,224 3,01,728 2,98,833
Rate of Growth of RE
(per cent)
24.39 11.21 12.52 13.34 (-) 0.96
Revenue Expenditure as
percentage of TE
74.31 75.56 86.77 81.44 82.79
RE/GSDP (per cent) 18.70 18.34 18.23 18.09 16.65
RE as percentage of RR 93.68 92.10 95.50 91.44 81.56
Buoyancy of Revenue Expenditure with
GSDP (ratio) 1.96 0.84 0.95 0.94 (-) 0.13
Revenue Receipts (ratio) 1.40 0.85 1.47 0.73 (-) 0.09
Source: Finance Accounts of the respective years.
Revenue expenditure continued to be the dominant component of the total
expenditure and its share increased from 74.31 per cent in the year 2015-16 to
82.79 per cent in the year 2019-20. The rate of growth of revenue expenditure
fluctuated widely between (-) 0.96 per cent in the year 2019-20 to a high of
24.39 per cent in the year 2015-16. The decreases in the revenue expenditure
during the year 2019-20 were mainly on Appropriation for reduction or
avoidance of Debt (` 26,404 crore) under General Services, Water Supply and
Sanitation (` 684 crore) under Social Services, Other Rural Development
Programme (` 6,619 crore) and Crop Husbandry (` 3,774 crore) under the
Economic Sector.
Revenue expenditure as a percentage of GSDP showed a decreasing trend
from 18.70 per cent in the year 2015-16 to 16.65 per cent in the year 2019-20.
Revenue Expenditure buoyancy with GSDP measures the percentage change
in the revenue expenditure to the percentage change in GSDP. As can be seen
from Table 2.11, the Revenue buoyancy which was 0.94 in the year 2018-19
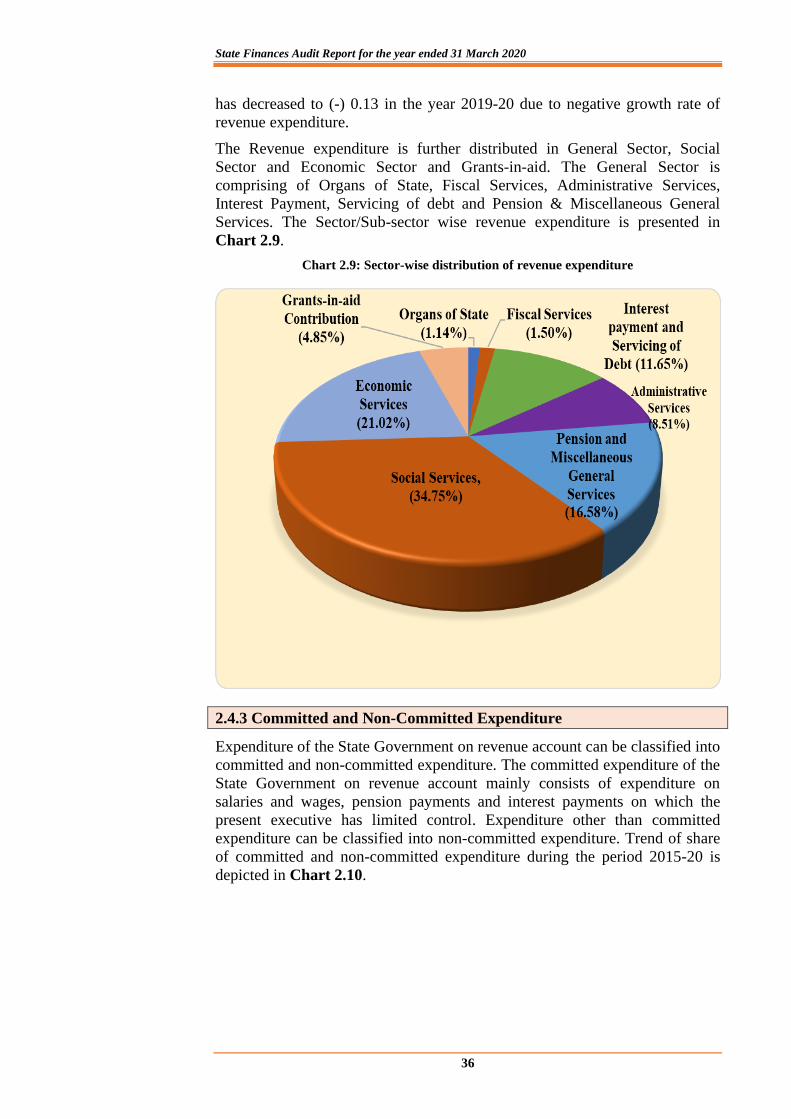
State Finances Audit Report for the year ended 31 March 2020
36
has decreased to (-) 0.13 in the year 2019-20 due to negative growth rate of
revenue expenditure.
The Revenue expenditure is further distributed in General Sector, Social
Sector and Economic Sector and Grants-in-aid. The General Sector is
comprising of Organs of State, Fiscal Services, Administrative Services,
Interest Payment, Servicing of debt and Pension & Miscellaneous General
Services. The Sector/Sub-sector wise revenue expenditure is presented in
Chart 2.9.
Chart 2.9: Sector-wise distribution of revenue expenditure
2.4.3 Committed and Non-Committed Expenditure
Expenditure of the State Government on revenue account can be classified into
committed and non-committed expenditure. The committed expenditure of the
State Government on revenue account mainly consists of expenditure on
salaries and wages, pension payments and interest payments on which the
present executive has limited control. Expenditure other than committed
expenditure can be classified into non-committed expenditure. Trend of share
of committed and non-committed expenditure during the period 2015-20 is
depicted in Chart 2.10.
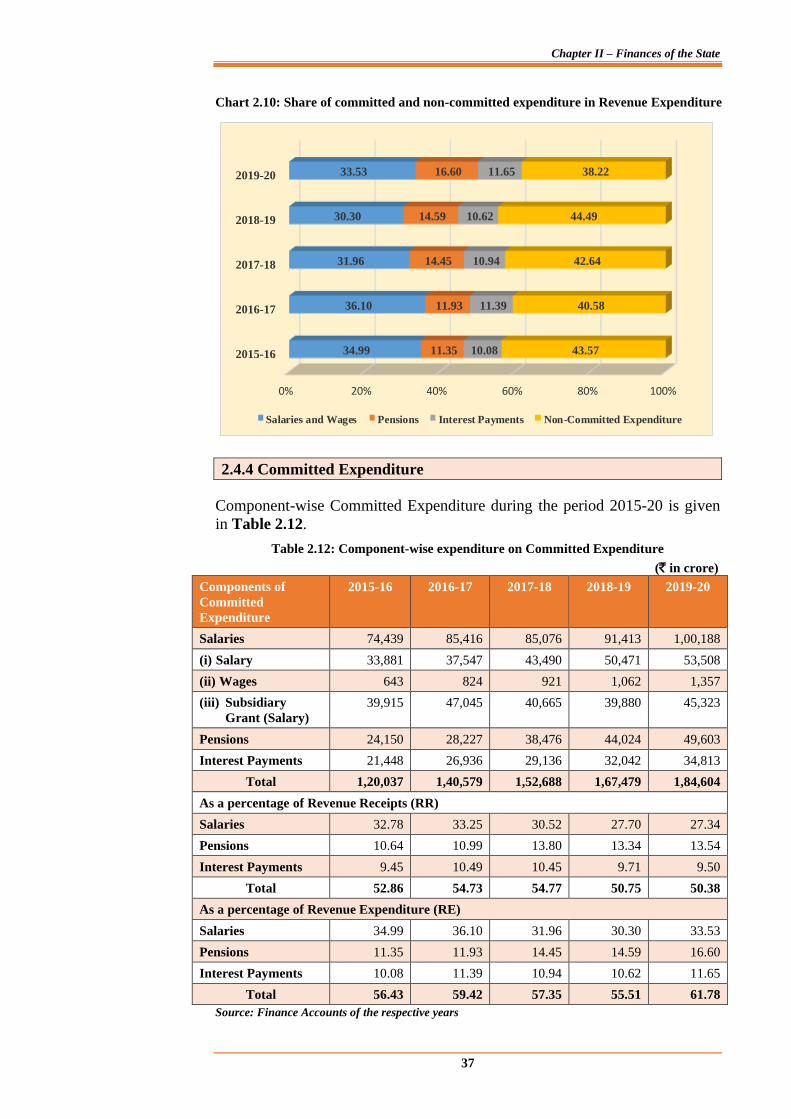
Chapter II – Finances of the State
37
Chart 2.10: Share of committed and non-committed expenditure in Revenue Expenditure
0% 20% 40% 60% 80% 100%
2015-16
2016-17
2017-18
2018-19
2019-20
34.99
36.10
31.96
30.30
33.53
11.35
11.93
14.45
14.59
16.60
10.08
11.39
10.94
10.62
11.65
43.57
40.58
42.64
44.49
38.22
Salaries and Wages Pensions Interest Payments Non-Committed Expenditure
2.4.4 Committed Expenditure
Component-wise Committed Expenditure during the period 2015-20 is given
in Table 2.12.
Table 2.12: Component-wise expenditure on Committed Expenditure
(` in crore)
Components of
Committed
Expenditure
2015-16 2016-17 2017-18 2018-19 2019-20
Salaries 74,439 85,416 85,076 91,413 1,00,188
(i) Salary 33,881 37,547 43,490 50,471 53,508
(ii) Wages 643 824 921 1,062 1,357
(iii) Subsidiary
Grant (Salary)
39,915 47,045 40,665 39,880 45,323
Pensions 24,150 28,227 38,476 44,024 49,603
Interest Payments 21,448 26,936 29,136 32,042 34,813
Total 1,20,037 1,40,579 1,52,688 1,67,479 1,84,604
As a percentage of Revenue Receipts (RR)
Salaries 32.78 33.25 30.52 27.70 27.34
Pensions 10.64 10.99 13.80 13.34 13.54
Interest Payments 9.45 10.49 10.45 9.71 9.50
Total 52.86 54.73 54.77 50.75 50.38
As a percentage of Revenue Expenditure (RE)
Salaries 34.99 36.10 31.96 30.30 33.53
Pensions 11.35 11.93 14.45 14.59 16.60
Interest Payments 10.08 11.39 10.94 10.62 11.65
Total 56.43 59.42 57.35 55.51 61.78
Source: Finance Accounts of the respective years
State Finances Audit Report for the year ended 31 March 2020
38
The committed expenditure affects the State in prioritising expenditure and in
meeting capital investments to meet growing needs of social and economic
infrastructure. The high proportion of committed expenditure to revenue
receipts and revenue expenditure indicates that the State has limited flexibility
in allocation of its resources for new schemes. During the year 2019-20,
committed expenditure increased by 10.23 per cent (` 17,125 crore) over the
year 2018-19. The committed expenditure was fluctuating during the period
2015-20 and highest in the year 2019-20 at 61.78 per cent of the total revenue
expenditure. The component wise details of committed expenditure are
discussed below.
2.4.4.1 Expenditure on Salaries
There were 12,40,155 sanctioned posts in the State Government on 31 March
2019. During the year 2019-20, expenditure on salaries with respect to the
employees of the State Government was ` 53,508 crore. Taking into account
the expenditure under the object head ‘Subsidiary Grant-General (Salary)’31
and ‘Wages’ amounting to ` 45,323 crore and ` 1,357 crore respectively, total
expenditure on salary was ` 1,00,188 crore representing 27.34 per cent of
Revenue Receipts and 33.53 per cent of Revenue Expenditure.
Further, the expenditure on salary on State Government employees has
increased by six per cent (` 3,037 crore) over the year 2018-19. However, it
was lower by ` 10,419 crore against the assessment made by the State
Government in MTFRP (` 63,927 crore). During the year 2019-20, the
expenditure on Salary of the State Government employees was 14.60 per cent
of the Revenue Receipts and 17.91 per cent of the Revenue Expenditure.
2.4.4.2 Interest payments
During the period 2015-20, expenditure on account of payment of interest
increased from ` 21,448 crore to ` 34,813 crore with compound annual
growth rate of 12.87 per cent. As compared to the year 2018-19, interest
payments increased by 8.65 per cent in the year 2019-20 mainly due to
increased interest payment on market loans (by ` 2,898 crore) and small
savings, provident funds etc. (by ` 332 crore). As a percentage of the Revenue
Receipts, expenditure on interest payments shows a marginal increase of 0.05
per cent from 9.45 per cent in 2015-16 to 9.50 per cent in 2019-20. Further, in
addition, State Government had provided financial assistance (Grants-in-aid)
of ` 566.66 crore to State PSUs for the payment of interest on servicing of
extra-budget borrowings taken by PSUs/Authorities as discussed in
Paragraph 4.2.
2.4.4.3 Pension payments
There were 10.85 lakh pensioners in the State as of 31 March 2020. During the
period 2015-20, expenditure on account of pension payment ranged between
` 24,150 crore and ` 49,603 crore. In the year 2019-20, expenditure on
pension was ` 49,603 crore (including ` 1,972.36 crore on account of leave
encashment benefits) increasing by 12.67 per cent over the previous year
(` 44,024 crore). The increases were mainly on account of payment of
superannuation and retirement benefits along with family pensions, gratuities
31 Related to the employees of Primary Education, Secondary Education and Aided
Institutes, Autonomous Bodies, etc.

Chapter II – Finances of the State
39
and Government contribution to Defined Contribution Pension Scheme though
there was less expenditure under commuted value of pension. Expenditure on
pension in the year 2019-20 accounted for 13.54 per cent of the total revenue
receipts and 16.60 per cent of the total revenue expenditure. The State
Government, however, did not discharge its statutory liability towards DCPS,
since government contribution amounting to ` 1,232.29 crore, though booked
as revenue expenditure during 2019-20, was not transferred to the designated
major head 8342 for DCPS during 2019-20, as discussed in Paragraph 4.3.
2.4.4.4 Subsidies
The details of subsidies provided during the period 2015-20 are given in
Table 2.13.
Table 2.13: Expenditure on subsidies during 2015-20
Particular 2015-16 2016-17 2017-18 2018-19 2019-20
Subsidies (` in crore) 7,691 8,045 9,284 14,053 14,092
Subsidies as a percentage of
Revenue Receipts
3.39 3.13 3.33 4.26 3.85
Subsidies as a percentage of
Revenue Expenditure
3.62 3.40 3.49 4.66 4.72
Expenditure on subsidy increased from ` 7,691 crore in 2015-16 to
` 14,092 crore in 2019-20. During the year 2019-20, subsidy of ` 14,092 crore
was 3.85 per cent and 4.72 per cent of revenue receipts and revenue
expenditure respectively. It also includes Central assistance of ` 1,447.69
crore for subsidy under Centrally Sponsored Schemes. The departments with
major portion of subsidy during the year 2019-20 are given in Table 2.14.
Table 2.14: Departments with major portion of subsidy during 2019-20
Grant
No
Name of the
Department
Amount of
Subsidy
(` in crore)
Percentage
of total
Subsidy
Main Purpose
09 Power 7,910.00 56 Compensatory grant to UP Power Corporation Ltd.
(` 4,790 crore), Revenue Compensatory Grant against
amount paid for electric tax to UPPCL (` 3,120 crore).
83 Social
Welfare
1,672.92 12 Special component Plan for Scheduled Caste
(` 1,490.91 crore) and Schedule Tribes (` 182.01 crore).
11 Agriculture 2,202.31 16 On account of grant to UP Power Corporation Ltd for
electricity supply to private tube-wells of farmers for
improvement in agriculture production (` 1,200 crore)
and National crop Insurance Programme (` 413 crore).
2.4.4.5 Financial assistance by the State Government to Local Bodies
and Other Institutions
Financial assistance is provided by the State Government to Local Bodies and
other institutions by way of grants-in-aid and loans. The quantum of assistance
provided by way of grants-in-aid to local bodies and other institutions during
the period 2015-20 is presented in Table 2.15.
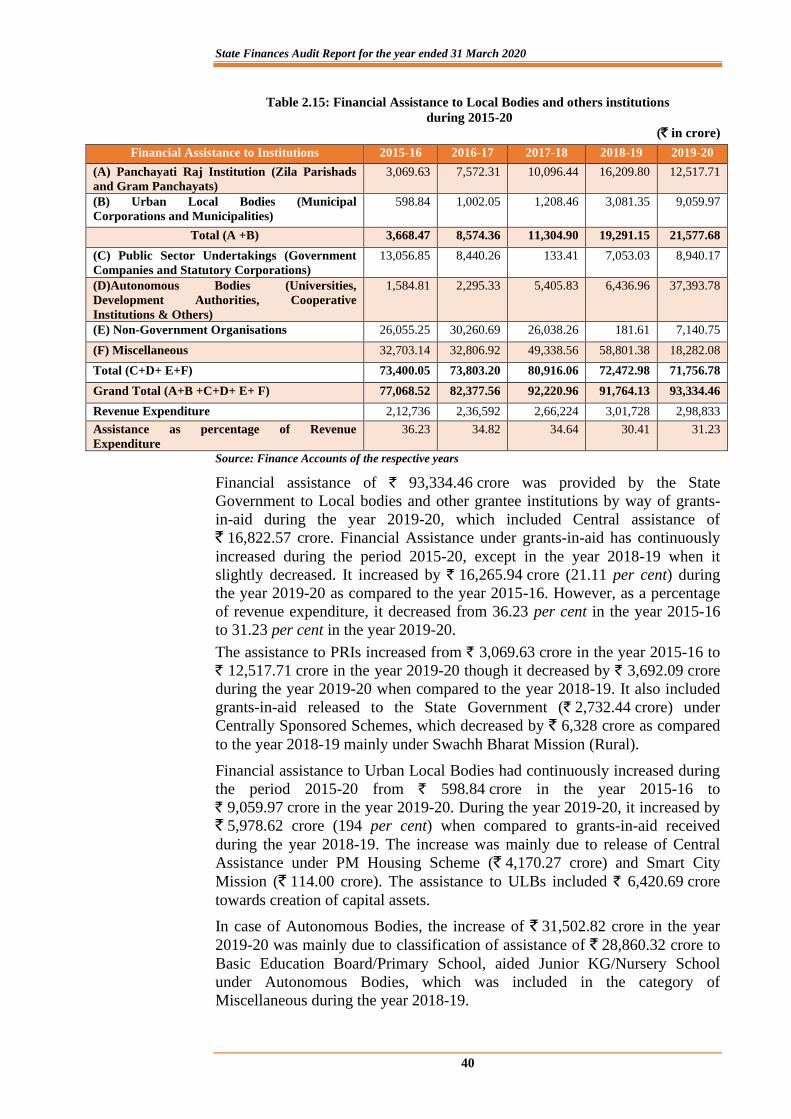
State Finances Audit Report for the year ended 31 March 2020
40
Table 2.15: Financial Assistance to Local Bodies and others institutions
during 2015-20
(` in crore)
Financial Assistance to Institutions 2015-16 2016-17 2017-18 2018-19 2019-20
(A) Panchayati Raj Institution (Zila Parishads
and Gram Panchayats)
3,069.63 7,572.31 10,096.44 16,209.80 12,517.71
(B) Urban Local Bodies (Municipal
Corporations and Municipalities)
598.84 1,002.05 1,208.46 3,081.35 9,059.97
Total (A +B) 3,668.47 8,574.36 11,304.90 19,291.15 21,577.68
(C) Public Sector Undertakings (Government
Companies and Statutory Corporations)
13,056.85 8,440.26 133.41 7,053.03 8,940.17
(D)Autonomous Bodies (Universities,
Development Authorities, Cooperative
Institutions & Others)
1,584.81 2,295.33 5,405.83 6,436.96 37,393.78
(E) Non-Government Organisations 26,055.25 30,260.69 26,038.26 181.61 7,140.75
(F) Miscellaneous 32,703.14 32,806.92 49,338.56 58,801.38 18,282.08
Total (C+D+ E+F) 73,400.05 73,803.20 80,916.06 72,472.98 71,756.78
Grand Total (A+B +C+D+ E+ F) 77,068.52 82,377.56 92,220.96 91,764.13 93,334.46
Revenue Expenditure 2,12,736 2,36,592 2,66,224 3,01,728 2,98,833
Assistance as percentage of Revenue
Expenditure
36.23 34.82 34.64 30.41 31.23
Source: Finance Accounts of the respective years
Financial assistance of ` 93,334.46 crore was provided by the State
Government to Local bodies and other grantee institutions by way of grants-
in-aid during the year 2019-20, which included Central assistance of
` 16,822.57 crore. Financial Assistance under grants-in-aid has continuously
increased during the period 2015-20, except in the year 2018-19 when it
slightly decreased. It increased by ` 16,265.94 crore (21.11 per cent) during
the year 2019-20 as compared to the year 2015-16. However, as a percentage
of revenue expenditure, it decreased from 36.23 per cent in the year 2015-16
to 31.23 per cent in the year 2019-20.
The assistance to PRIs increased from ` 3,069.63 crore in the year 2015-16 to
` 12,517.71 crore in the year 2019-20 though it decreased by ` 3,692.09 crore
during the year 2019-20 when compared to the year 2018-19. It also included
grants-in-aid released to the State Government (` 2,732.44 crore) under
Centrally Sponsored Schemes, which decreased by ` 6,328 crore as compared
to the year 2018-19 mainly under Swachh Bharat Mission (Rural).
Financial assistance to Urban Local Bodies had continuously increased during
the period 2015-20 from ` 598.84 crore in the year 2015-16 to
` 9,059.97 crore in the year 2019-20. During the year 2019-20, it increased by
` 5,978.62 crore (194 per cent) when compared to grants-in-aid received
during the year 2018-19. The increase was mainly due to release of Central
Assistance under PM Housing Scheme (` 4,170.27 crore) and Smart City
Mission (` 114.00 crore). The assistance to ULBs included ` 6,420.69 crore
towards creation of capital assets.
In case of Autonomous Bodies, the increase of ` 31,502.82 crore in the year
2019-20 was mainly due to classification of assistance of ` 28,860.32 crore to
Basic Education Board/Primary School, aided Junior KG/Nursery School
under Autonomous Bodies, which was included in the category of
Miscellaneous during the year 2018-19.
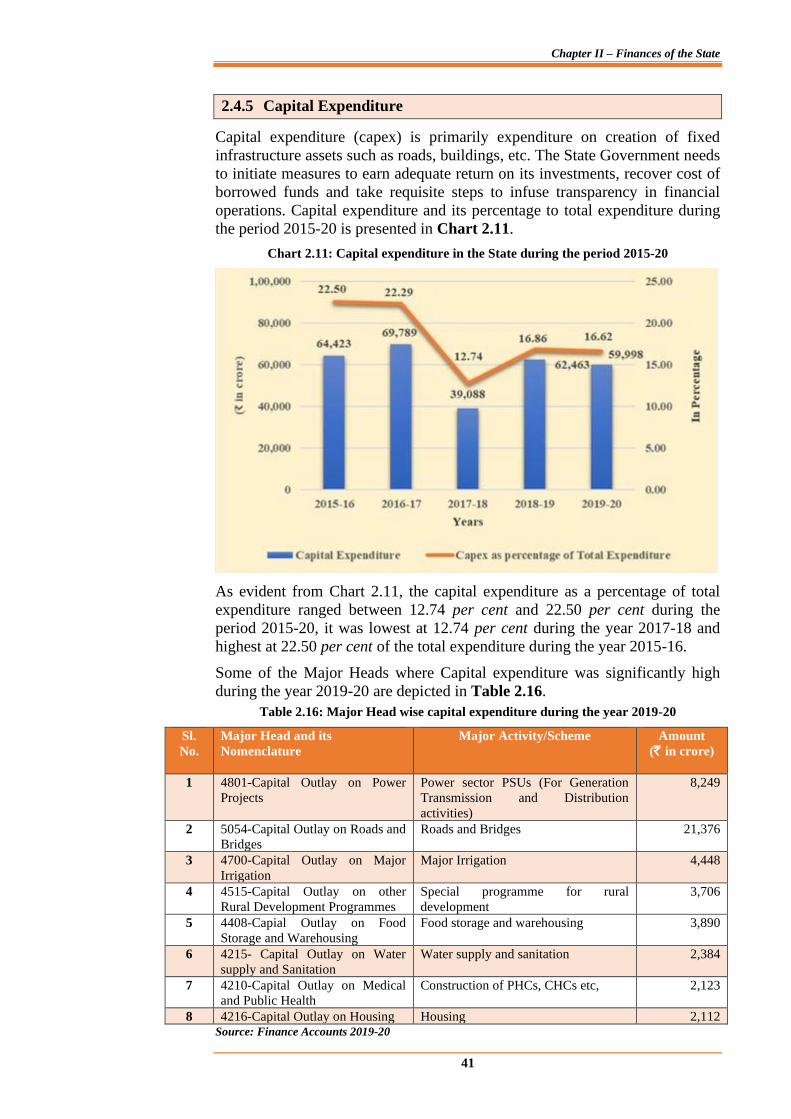
Chapter II – Finances of the State
41
2.4.5 Capital Expenditure
Capital expenditure (capex) is primarily expenditure on creation of fixed
infrastructure assets such as roads, buildings, etc. The State Government needs
to initiate measures to earn adequate return on its investments, recover cost of
borrowed funds and take requisite steps to infuse transparency in financial
operations. Capital expenditure and its percentage to total expenditure during
the period 2015-20 is presented in Chart 2.11.
Chart 2.11: Capital expenditure in the State during the period 2015-20
As evident from Chart 2.11, the capital expenditure as a percentage of total
expenditure ranged between 12.74 per cent and 22.50 per cent during the
period 2015-20, it was lowest at 12.74 per cent during the year 2017-18 and
highest at 22.50 per cent of the total expenditure during the year 2015-16.
Some of the Major Heads where Capital expenditure was significantly high
during the year 2019-20 are depicted in Table 2.16.
Table 2.16: Major Head wise capital expenditure during the year 2019-20
Sl.
No.
Major Head and its
Nomenclature
Major Activity/Scheme Amount
(` in crore)
1 4801-Capital Outlay on Power
Projects
Power sector PSUs (For Generation
Transmission and Distribution
activities)
8,249
2 5054-Capital Outlay on Roads and
Bridges
Roads and Bridges 21,376
3 4700-Capital Outlay on Major
Irrigation
Major Irrigation 4,448
4 4515-Capital Outlay on other
Rural Development Programmes
Special programme for rural
development
3,706
5 4408-Capial Outlay on Food
Storage and Warehousing
Food storage and warehousing 3,890
6 4215- Capital Outlay on Water
supply and Sanitation
Water supply and sanitation 2,384
7 4210-Capital Outlay on Medical
and Public Health
Construction of PHCs, CHCs etc, 2,123
8 4216-Capital Outlay on Housing Housing 2,112 Source: Finance Accounts 2019-20
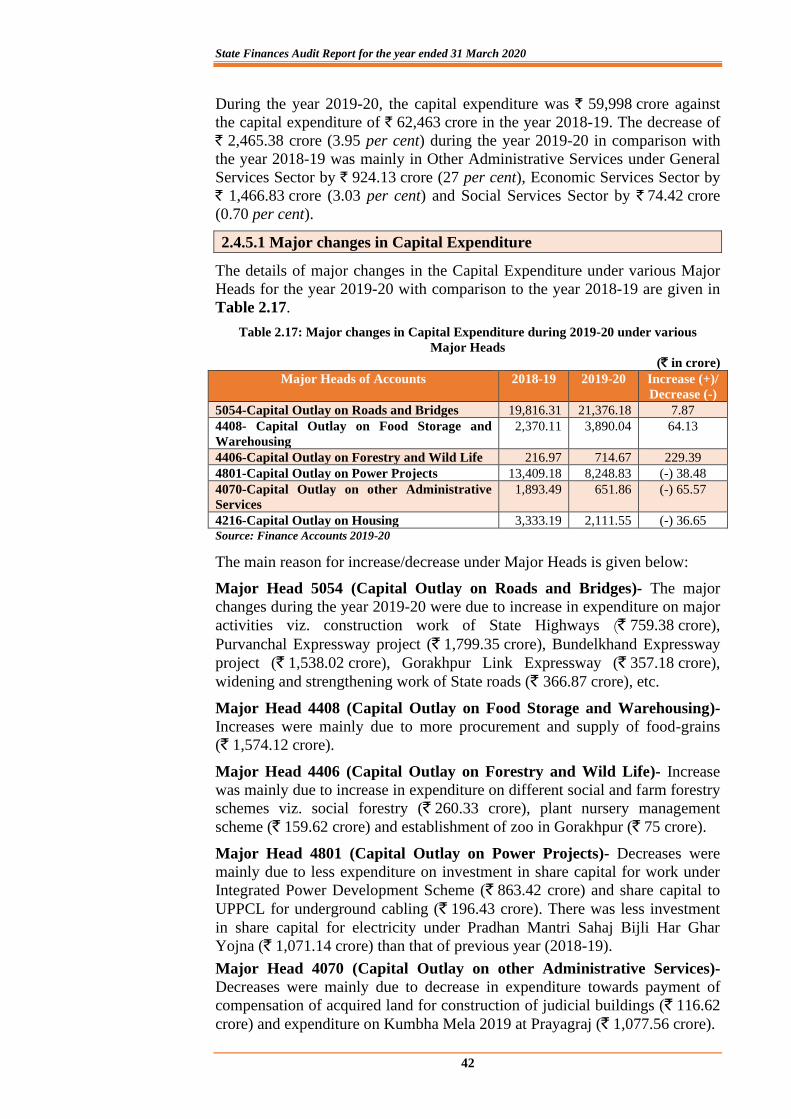
State Finances Audit Report for the year ended 31 March 2020
42
During the year 2019-20, the capital expenditure was ` 59,998 crore against
the capital expenditure of ` 62,463 crore in the year 2018-19. The decrease of
` 2,465.38 crore (3.95 per cent) during the year 2019-20 in comparison with
the year 2018-19 was mainly in Other Administrative Services under General
Services Sector by ` 924.13 crore (27 per cent), Economic Services Sector by
` 1,466.83 crore (3.03 per cent) and Social Services Sector by ` 74.42 crore
(0.70 per cent).
2.4.5.1 Major changes in Capital Expenditure
The details of major changes in the Capital Expenditure under various Major
Heads for the year 2019-20 with comparison to the year 2018-19 are given in
Table 2.17.
Table 2.17: Major changes in Capital Expenditure during 2019-20 under various
Major Heads
(` in crore)
Major Heads of Accounts 2018-19 2019-20 Increase (+)/
Decrease (-)
5054-Capital Outlay on Roads and Bridges 19,816.31 21,376.18 7.87
4408- Capital Outlay on Food Storage and
Warehousing
2,370.11 3,890.04 64.13
4406-Capital Outlay on Forestry and Wild Life 216.97 714.67 229.39
4801-Capital Outlay on Power Projects 13,409.18 8,248.83 (-) 38.48
4070-Capital Outlay on other Administrative
Services
1,893.49 651.86 (-) 65.57
4216-Capital Outlay on Housing 3,333.19 2,111.55 (-) 36.65 Source: Finance Accounts 2019-20
The main reason for increase/decrease under Major Heads is given below:
Major Head 5054 (Capital Outlay on Roads and Bridges)- The major
changes during the year 2019-20 were due to increase in expenditure on major
activities viz. construction work of State Highways (` 759.38 crore),
Purvanchal Expressway project (` 1,799.35 crore), Bundelkhand Expressway
project (` 1,538.02 crore), Gorakhpur Link Expressway (` 357.18 crore),
widening and strengthening work of State roads (` 366.87 crore), etc.
Major Head 4408 (Capital Outlay on Food Storage and Warehousing)-
Increases were mainly due to more procurement and supply of food-grains
(` 1,574.12 crore).
Major Head 4406 (Capital Outlay on Forestry and Wild Life)- Increase
was mainly due to increase in expenditure on different social and farm forestry
schemes viz. social forestry (` 260.33 crore), plant nursery management
scheme (` 159.62 crore) and establishment of zoo in Gorakhpur (` 75 crore).
Major Head 4801 (Capital Outlay on Power Projects)- Decreases were
mainly due to less expenditure on investment in share capital for work under
Integrated Power Development Scheme (` 863.42 crore) and share capital to
UPPCL for underground cabling (` 196.43 crore). There was less investment
in share capital for electricity under Pradhan Mantri Sahaj Bijli Har Ghar
Yojna (` 1,071.14 crore) than that of previous year (2018-19).
Major Head 4070 (Capital Outlay on other Administrative Services)-
Decreases were mainly due to decrease in expenditure towards payment of
compensation of acquired land for construction of judicial buildings (` 116.62
crore) and expenditure on Kumbha Mela 2019 at Prayagraj (` 1,077.56 crore).
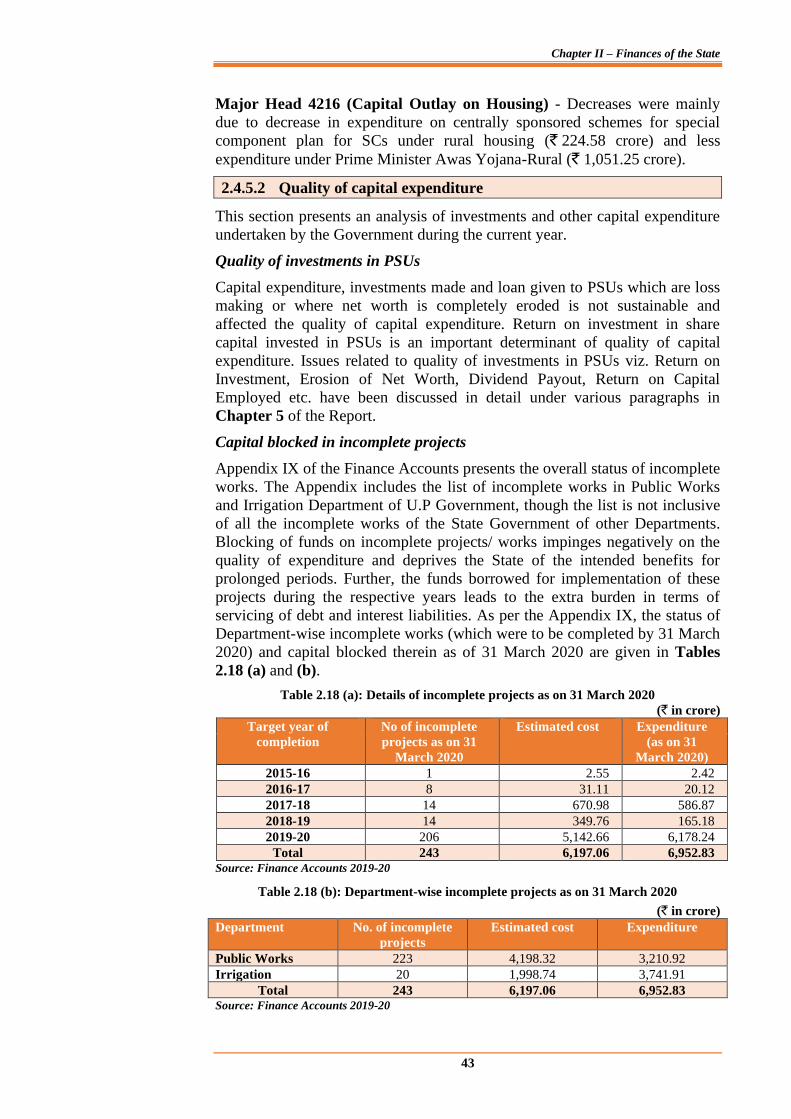
Chapter II – Finances of the State
43
Major Head 4216 (Capital Outlay on Housing) - Decreases were mainly
due to decrease in expenditure on centrally sponsored schemes for special
component plan for SCs under rural housing (` 224.58 crore) and less
expenditure under Prime Minister Awas Yojana-Rural (` 1,051.25 crore).
2.4.5.2 Quality of capital expenditure
This section presents an analysis of investments and other capital expenditure
undertaken by the Government during the current year.
Quality of investments in PSUs
Capital expenditure, investments made and loan given to PSUs which are loss
making or where net worth is completely eroded is not sustainable and
affected the quality of capital expenditure. Return on investment in share
capital invested in PSUs is an important determinant of quality of capital
expenditure. Issues related to quality of investments in PSUs viz. Return on
Investment, Erosion of Net Worth, Dividend Payout, Return on Capital
Employed etc. have been discussed in detail under various paragraphs in
Chapter 5 of the Report.
Capital blocked in incomplete projects
Appendix IX of the Finance Accounts presents the overall status of incomplete
works. The Appendix includes the list of incomplete works in Public Works
and Irrigation Department of U.P Government, though the list is not inclusive
of all the incomplete works of the State Government of other Departments.
Blocking of funds on incomplete projects/ works impinges negatively on the
quality of expenditure and deprives the State of the intended benefits for
prolonged periods. Further, the funds borrowed for implementation of these
projects during the respective years leads to the extra burden in terms of
servicing of debt and interest liabilities. As per the Appendix IX, the status of
Department-wise incomplete works (which were to be completed by 31 March
2020) and capital blocked therein as of 31 March 2020 are given in Tables
2.18 (a) and (b).
Table 2.18 (a): Details of incomplete projects as on 31 March 2020
(` in crore)
Target year of
completion
No of incomplete
projects as on 31
March 2020
Estimated cost Expenditure
(as on 31
March 2020)
2015-16 1 2.55 2.42
2016-17 8 31.11 20.12
2017-18 14 670.98 586.87
2018-19 14 349.76 165.18
2019-20 206 5,142.66 6,178.24
Total 243 6,197.06 6,952.83
Source: Finance Accounts 2019-20
Table 2.18 (b): Department-wise incomplete projects as on 31 March 2020
(` in crore)
Department No. of incomplete
projects
Estimated cost Expenditure
Public Works 223 4,198.32 3,210.92
Irrigation 20 1,998.74 3,741.91
Total 243 6,197.06 6,952.83 Source: Finance Accounts 2019-20
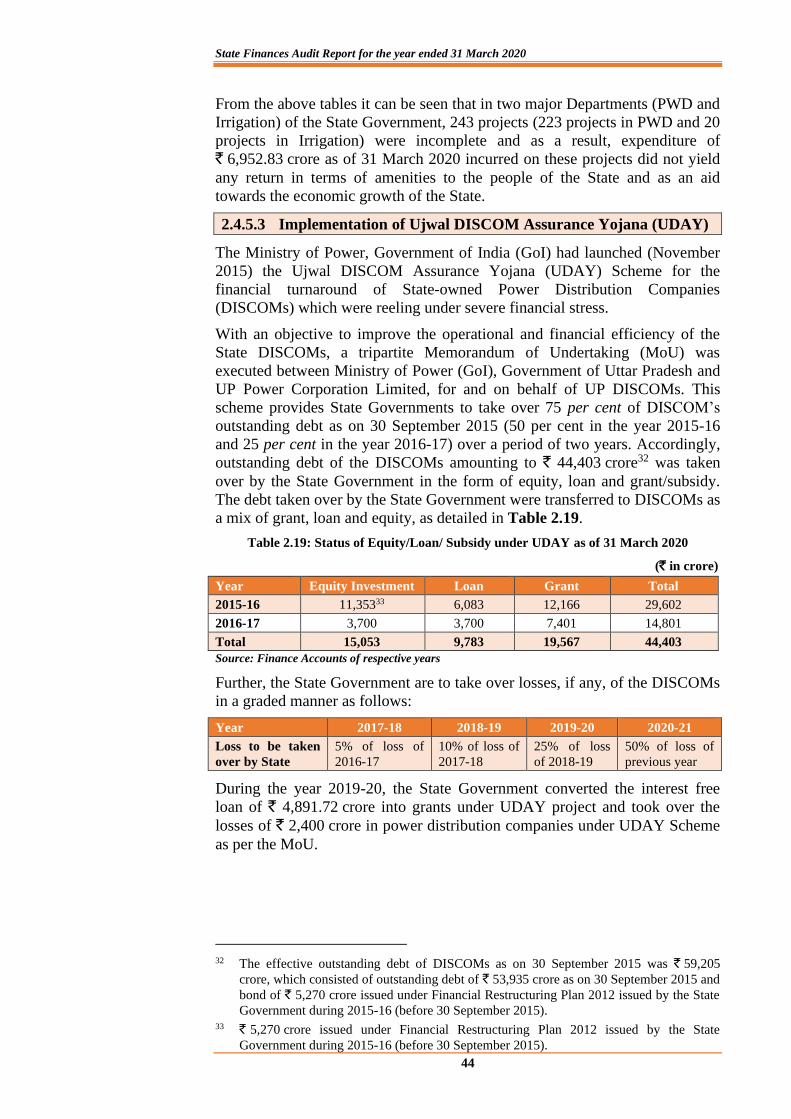
State Finances Audit Report for the year ended 31 March 2020
44
From the above tables it can be seen that in two major Departments (PWD and
Irrigation) of the State Government, 243 projects (223 projects in PWD and 20
projects in Irrigation) were incomplete and as a result, expenditure of
` 6,952.83 crore as of 31 March 2020 incurred on these projects did not yield
any return in terms of amenities to the people of the State and as an aid
towards the economic growth of the State.
2.4.5.3 Implementation of Ujwal DISCOM Assurance Yojana (UDAY)
The Ministry of Power, Government of India (GoI) had launched (November
2015) the Ujwal DISCOM Assurance Yojana (UDAY) Scheme for the
financial turnaround of State-owned Power Distribution Companies
(DISCOMs) which were reeling under severe financial stress.
With an objective to improve the operational and financial efficiency of the
State DISCOMs, a tripartite Memorandum of Undertaking (MoU) was
executed between Ministry of Power (GoI), Government of Uttar Pradesh and
UP Power Corporation Limited, for and on behalf of UP DISCOMs. This
scheme provides State Governments to take over 75 per cent of DISCOM’s
outstanding debt as on 30 September 2015 (50 per cent in the year 2015-16
and 25 per cent in the year 2016-17) over a period of two years. Accordingly,
outstanding debt of the DISCOMs amounting to ` 44,403 crore32 was taken
over by the State Government in the form of equity, loan and grant/subsidy.
The debt taken over by the State Government were transferred to DISCOMs as
a mix of grant, loan and equity, as detailed in Table 2.19.
Table 2.19: Status of Equity/Loan/ Subsidy under UDAY as of 31 March 2020
(` in crore)
Year Equity Investment Loan Grant Total
2015-16 11,35333 6,083 12,166 29,602
2016-17 3,700 3,700 7,401 14,801
Total 15,053 9,783 19,567 44,403
Source: Finance Accounts of respective years
Further, the State Government are to take over losses, if any, of the DISCOMs
in a graded manner as follows:
Year 2017-18 2018-19 2019-20 2020-21
Loss to be taken
over by State
5% of loss of
2016-17
10% of loss of
2017-18
25% of loss
of 2018-19
50% of loss of
previous year
During the year 2019-20, the State Government converted the interest free
loan of ` 4,891.72 crore into grants under UDAY project and took over the
losses of ` 2,400 crore in power distribution companies under UDAY Scheme
as per the MoU.
32 The effective outstanding debt of DISCOMs as on 30 September 2015 was ` 59,205
crore, which consisted of outstanding debt of ` 53,935 crore as on 30 September 2015 and
bond of ` 5,270 crore issued under Financial Restructuring Plan 2012 issued by the State
Government during 2015-16 (before 30 September 2015). 33 ` 5,270 crore issued under Financial Restructuring Plan 2012 issued by the State
Government during 2015-16 (before 30 September 2015).
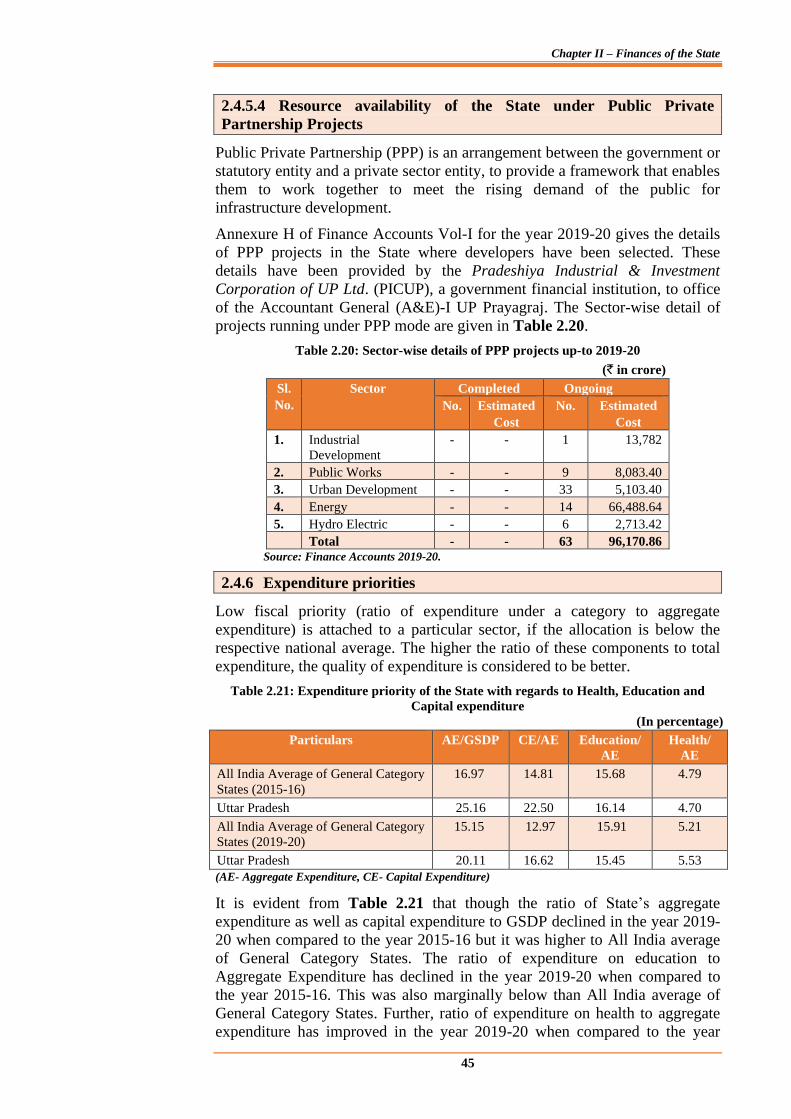
Chapter II – Finances of the State
45
2.4.5.4 Resource availability of the State under Public Private
Partnership Projects
Public Private Partnership (PPP) is an arrangement between the government or
statutory entity and a private sector entity, to provide a framework that enables
them to work together to meet the rising demand of the public for
infrastructure development.
Annexure H of Finance Accounts Vol-I for the year 2019-20 gives the details
of PPP projects in the State where developers have been selected. These
details have been provided by the Pradeshiya Industrial & Investment
Corporation of UP Ltd. (PICUP), a government financial institution, to office
of the Accountant General (A&E)-I UP Prayagraj. The Sector-wise detail of
projects running under PPP mode are given in Table 2.20.
Table 2.20: Sector-wise details of PPP projects up-to 2019-20
(` in crore)
Sl.
No.
Sector Completed Ongoing
No. Estimated
Cost
No. Estimated
Cost
1. Industrial
Development
- - 1 13,782
2. Public Works - - 9 8,083.40
3. Urban Development - - 33 5,103.40
4. Energy - - 14 66,488.64
5. Hydro Electric - - 6 2,713.42
Total - - 63 96,170.86
Source: Finance Accounts 2019-20.
2.4.6 Expenditure priorities
Low fiscal priority (ratio of expenditure under a category to aggregate
expenditure) is attached to a particular sector, if the allocation is below the
respective national average. The higher the ratio of these components to total
expenditure, the quality of expenditure is considered to be better.
Table 2.21: Expenditure priority of the State with regards to Health, Education and
Capital expenditure
(In percentage)
Particulars AE/GSDP CE/AE Education/
AE
Health/
AE
All India Average of General Category
States (2015-16)
16.97 14.81 15.68 4.79
Uttar Pradesh 25.16 22.50 16.14 4.70
All India Average of General Category
States (2019-20)
15.15 12.97 15.91 5.21
Uttar Pradesh 20.11 16.62 15.45 5.53
(AE- Aggregate Expenditure, CE- Capital Expenditure)
It is evident from Table 2.21 that though the ratio of State’s aggregate
expenditure as well as capital expenditure to GSDP declined in the year 2019-
20 when compared to the year 2015-16 but it was higher to All India average
of General Category States. The ratio of expenditure on education to
Aggregate Expenditure has declined in the year 2019-20 when compared to
the year 2015-16. This was also marginally below than All India average of
General Category States. Further, ratio of expenditure on health to aggregate
expenditure has improved in the year 2019-20 when compared to the year
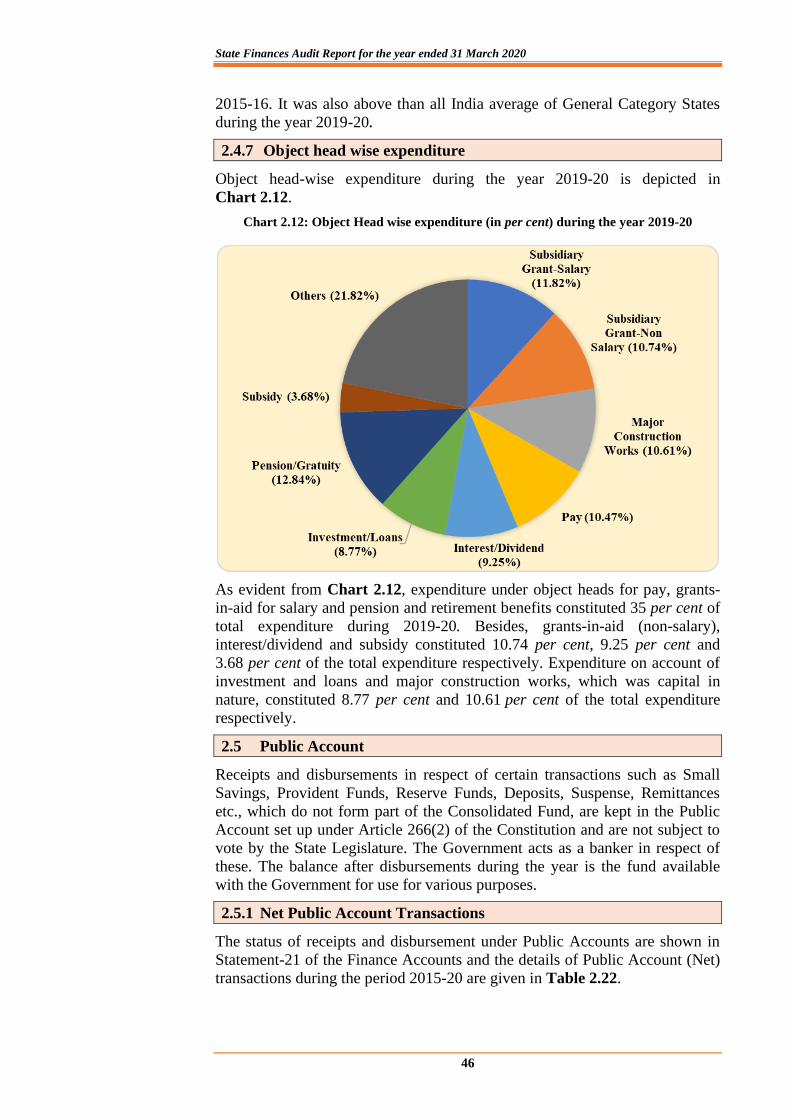
State Finances Audit Report for the year ended 31 March 2020
46
2015-16. It was also above than all India average of General Category States
during the year 2019-20.
2.4.7 Object head wise expenditure
Object head-wise expenditure during the year 2019-20 is depicted in
Chart 2.12.
Chart 2.12: Object Head wise expenditure (in per cent) during the year 2019-20
As evident from Chart 2.12, expenditure under object heads for pay, grants-
in-aid for salary and pension and retirement benefits constituted 35 per cent of
total expenditure during 2019-20. Besides, grants-in-aid (non-salary),
interest/dividend and subsidy constituted 10.74 per cent, 9.25 per cent and
3.68 per cent of the total expenditure respectively. Expenditure on account of
investment and loans and major construction works, which was capital in
nature, constituted 8.77 per cent and 10.61 per cent of the total expenditure
respectively.
2.5 Public Account
Receipts and disbursements in respect of certain transactions such as Small
Savings, Provident Funds, Reserve Funds, Deposits, Suspense, Remittances
etc., which do not form part of the Consolidated Fund, are kept in the Public
Account set up under Article 266(2) of the Constitution and are not subject to
vote by the State Legislature. The Government acts as a banker in respect of
these. The balance after disbursements during the year is the fund available
with the Government for use for various purposes.
2.5.1 Net Public Account Transactions
The status of receipts and disbursement under Public Accounts are shown in
Statement-21 of the Finance Accounts and the details of Public Account (Net)
transactions during the period 2015-20 are given in Table 2.22.
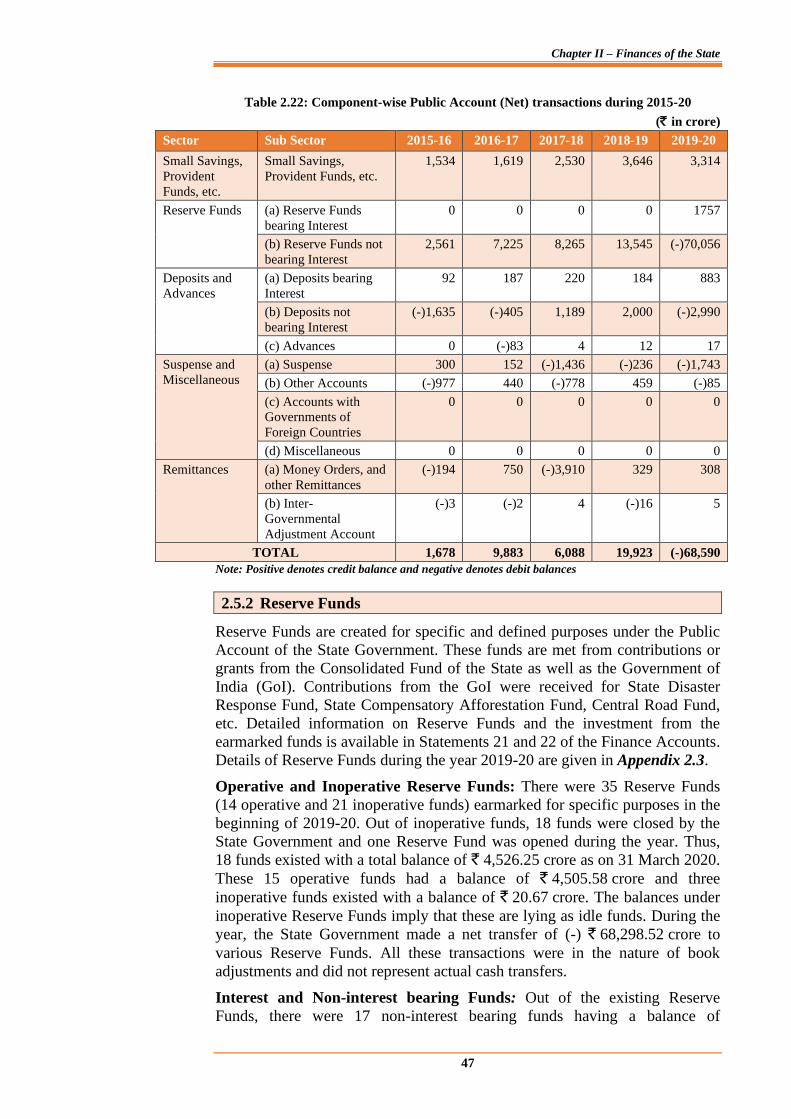
Chapter II – Finances of the State
47
Table 2.22: Component-wise Public Account (Net) transactions during 2015-20
(` in crore)
Sector Sub Sector 2015-16 2016-17 2017-18 2018-19 2019-20
Small Savings,
Provident
Funds, etc.
Small Savings,
Provident Funds, etc.
1,534 1,619 2,530 3,646 3,314
Reserve Funds (a) Reserve Funds
bearing Interest
0 0 0 0 1757
(b) Reserve Funds not
bearing Interest
2,561 7,225 8,265 13,545 (-)70,056
Deposits and
Advances
(a) Deposits bearing
Interest
92 187 220 184 883
(b) Deposits not
bearing Interest
(-)1,635 (-)405 1,189 2,000 (-)2,990
(c) Advances 0 (-)83 4 12 17
Suspense and
Miscellaneous
(a) Suspense 300 152 (-)1,436 (-)236 (-)1,743
(b) Other Accounts (-)977 440 (-)778 459 (-)85
(c) Accounts with
Governments of
Foreign Countries
0 0 0 0 0
(d) Miscellaneous 0 0 0 0 0
Remittances (a) Money Orders, and
other Remittances
(-)194 750 (-)3,910 329 308
(b) Inter-
Governmental
Adjustment Account
(-)3 (-)2 4 (-)16 5
TOTAL 1,678 9,883 6,088 19,923 (-)68,590
Note: Positive denotes credit balance and negative denotes debit balances
2.5.2 Reserve Funds
Reserve Funds are created for specific and defined purposes under the Public
Account of the State Government. These funds are met from contributions or
grants from the Consolidated Fund of the State as well as the Government of
India (GoI). Contributions from the GoI were received for State Disaster
Response Fund, State Compensatory Afforestation Fund, Central Road Fund,
etc. Detailed information on Reserve Funds and the investment from the
earmarked funds is available in Statements 21 and 22 of the Finance Accounts.
Details of Reserve Funds during the year 2019-20 are given in Appendix 2.3.
Operative and Inoperative Reserve Funds: There were 35 Reserve Funds (14 operative and 21 inoperative funds) earmarked for specific purposes in the
beginning of 2019-20. Out of inoperative funds, 18 funds were closed by the
State Government and one Reserve Fund was opened during the year. Thus,
18 funds existed with a total balance of ` 4,526.25 crore as on 31 March 2020.
These 15 operative funds had a balance of ` 4,505.58 crore and three
inoperative funds existed with a balance of ` 20.67 crore. The balances under
inoperative Reserve Funds imply that these are lying as idle funds. During the
year, the State Government made a net transfer of (-) ` 68,298.52 crore to
various Reserve Funds. All these transactions were in the nature of book
adjustments and did not represent actual cash transfers.
Interest and Non-interest bearing Funds: Out of the existing Reserve
Funds, there were 17 non-interest bearing funds having a balance of
State Finances Audit Report for the year ended 31 March 2020
48
` 2,768.94 crore and one interest bearing fund34 viz. “State Compensatory
Afforestation Fund”. It had a balance of ` 1,757.31 crore as on 31 March
2020. Detail of some of the major funds has been discussed below:
2.5.2.1 Consolidated Sinking Fund
The Twelfth Finance Commission (2005-10) recommended (November 2004)
that all states should set up sinking funds for amortisation of all loans
including loans from banks, liabilities on account of NSSF etc. The fund
should be maintained outside the consolidated fund of the States and the
Public Account and should not be used for any other purpose, except for
redemption of loans. Reserve Bank of India (RBI) maintains a Consolidated
Sinking Fund, on behalf of the State Governments, to provide a cushion for
amortisation of market borrowings/liabilities.
Government of Uttar Pradesh constituted35 (March 2020) a Consolidated
Sinking Fund (CSF) for redeeming its outstanding liabilities36. This was done
in line with the recommendations of 12th Finance Commission. The newly
created CSF is to come into force from the financial year 2020-21 and it shall
be administered by RBI. The corpus of fund comprising the periodic
contributions as well as income accruing to the Fund shall be kept outside
general revenue of the Government. No withdrawals will be allowed from the
Fund until the year 2024-25.
As per the Uttar Pradesh Government notification (17 March 2020), the
outstanding balance under the existing Sinking Fund at end-March 2020 was
to be transferred to the Consolidated Sinking Fund. However, the State
Government transferred (30 March 2020) the entire balance of the existing
Sinking Fund under Public Account amounting to ` 71,180.23 crore as non-
tax revenue of the State Government. This transfer of ` 71,180.23 crore was a
book adjustment and no cash was received by the State Government out of this
transaction.
Audit noted that the State Government had general cash balance of
` 21,386.75 crore as on 31 March 2020, which was less than the book balance
under Sinking Fund (before transfer to non-tax revenue). As such, the State
Government was not in a position to transfer the book balance of Sinking
Fund to Consolidated Sinking Fund with RBI which would involve actual cash
transfer. However, with the reduction of Sinking Fund balance to zero, the
State Government has no balance available under Sinking Fund/Consolidated
Sinking Fund as on 31.03.2020 for amortisation of its open market loans
amounting to ` 2,91,185.86 crore. Further, repayment of internal debt
amounting to ` 89,047 crore, including UP State Development Loan (market
loans) of ` 45,330 crore, was due during 2020-21 to 2023-24.
While closing the existing Sinking Fund, State Government also did not
adhere to the accounting principles laid down in the List of Major and Minor
Heads of Account of Union and States. Note (1) below Major Head 8222-
Sinking Fund of List of Major and Minor Heads of Accounts of Union and
States (LMMH) prescribes that on maturity of the loan, the balance
34 A Fund where the State Government is required to pay interest on deposits in the Fund on
such rate as may be fixed by the Government. 35 Vide notification no. 52/X-2020-10(4)-2006 dated 17.03.2020. 36 Defined as comprising Internal Debt and Public Account liabilities of the State
Government.
Chapter II – Finances of the State
49
outstanding under this head is credited to the head ‘8680-Miscellaneous
Government Accounts 101- Ledger Balance Adjustment accounts’. During the
year 2019-20, State Government repaid Market Loans of ` 13,877.20 crore.
As such, ` 13,877.20 crore was required to be transferred from Sinking Fund
to Miscellaneous Government Accounts (Major Head 8680) instead the State
Government transferred and credited entire balance of ` 71,180.23 crore from
Sinking Fund to Revenue Receipts (under the Major Head 0075-
Miscellaneous General Services- 800-Other Receipts). It overstated revenue
receipts during the year due to violation of accounting procedure mentioned
under Note (1) below Major Head 8222 of LMMH. Besides, transfer of the
remaining balance from Sinking Fund (` 57,303.03 crore) was an
extraordinary item of receipt during 2019-20 without actual cash receipt to the
State Government.
Thus, the revenue surplus of ` 67,560.14 crore and fiscal surplus of
` 11,082.69 crore during the year 2019-20 should be read in conjunction with
the transfer of ` 71,180.23 crore from Sinking Fund as revenue receipt of the
State without actual cash receipt. Further, the credited amount of the existing
Sinking Fund into non-tax revenue could not be utilised for amortisation of
borrowings for which it was created. This lack of financial prudence needs to
be addressed to ensure availability of adequate fund in Consolidated Sinking
Fund for repayment of borrowings.
2.5.2.2 State Disaster Response Fund
Government of India (GoI) replaced the erstwhile Calamity Relief Fund with
the State Disaster Response Fund (SDRF) with effect from 1 April 2010. The
SDRF is to be used largely for meeting the expenditure for providing
immediate relief to the victims of a disaster. In terms of the guidelines of the
Fund, the Centre and States are required to contribute to the Fund in the
certain proportion. The contributions are to be transferred to the Public
Account to Major Head – 8121. Expenditure during the year is to be incurred
by operating Major Head – 2245– Relief on account of Natural Calamities.
The guidelines of SDRF stipulate the following:
● The Fund should be operated under the category “Reserve Fund bearing
Interest” below Major Head-8121-General and Other Reserve Funds-122-
State Disaster Response Fund.
● The State Government shall pay interest to the SDRF at the interest
applicable to overdrafts under Overdraft Regulation Guidelines of the RBI.
The interest is to be credited on a half yearly basis. The accretions to the
SDRF together with the income earned on the investment of SDRF is to be
invested in Central Government dated Securities, auctioned Treasury Bills
and other interest earning deposits with scheduled commercial banks.
However, it was observed that the State Government operates its SDRF under
the category “Reserve Funds not bearing Interest” below Major Head 8235-
General and Other Reserve Funds-111- State Disaster Response Fund. The
balances in the Fund are also not invested in the manner specified by the GoI.
During the year 2019-20, an amount of ` 820 crore was contributed to the
Fund, which included ` 615 crore contributed by the GoI and ` 205 crore by
the State Government in the ratio of 75:25. Besides, an amount of
State Finances Audit Report for the year ended 31 March 2020
50
` 234.30 crore being arrears of Central share and ` 78.10 crore as State share
(in the ratio 90:10) was also contributed to the Fund.
At the beginning of the year 2019-20 and as on 01.10.2019, the SDRF had a
balance of ` 956.94 crore and ` 1,838.98 crore respectively. Therefore, total
interest of ` 116.55 crore on this balance (computed on six monthly basis at
the average rate of interest on overdraft as applicable in the year 2019-20) was
required to be paid by the State Government during 2019-20. However, the
State Government has not credited to SDRF any interest on un-invested
balances of the Fund as per the terms of the guidelines. Non-investment of
unspent amount due to the fact that the Fund continues to be maintained as
non-interest bearing, has impacted the corpus. Further, the revenue as well as
fiscal surplus of the State during the year 2019-20 was overstated by
` 116.55 crore.
2.5.2.3 Guarantee Redemption Fund
As per the recommendations of Twelfth Finance Commission, the State
Government should constitute ‘Guarantee Redemption Fund’ for meeting the
debt service obligations arising in the event of default by the borrowing
agency out of the guarantees issued by the Government in respect of bonds
issued and other borrowings by the State Public Sector Undertakings or other
Bodies and invoked by the beneficiaries. However, the State Government has
not created a Guarantee Redemption Fund.
The position of guarantees given by the State Government on the loans availed
by various institutions during the year is given in Statements 9 and 20 of
Finance Accounts, which is based on information received from the State
Government. The State Government had given guarantees for 23 entities viz.
statutory corporation, Government companies and other institutions for loan
raised by them in the year 2019-20. There was an outstanding guarantee of
` 1,18,696.49 crore at the end of the year 2019-20. The State Government
executed the net guarantees of ` 4,439.64 crore during the year 2019-20 (i.e.
about 0.25 per cent of GSDP). Further, the State Government had not fixed a
limit for giving guarantee in a financial year.
Out of 23 entities, guarantee fee of ` 4.93 crore during 2019-20 was receivable
from Uttar Pradesh Rajya Vidyut Utpadan Nigam Limited only, which was
received. The LMMH applicable to the Union and State Governments
provides for accountal of Guarantee fee as a specific minor head under Major
Head (0075-Miscellaneous General Services-108-Guarantee fees). In the case
of Uttar Pradesh, however, it was observed that guarantee fee is not being
collected/accounted for in the minor head as provided for in the LMMH.
2.5.2.4 State Compensatory Afforestation Fund
Under the Compensatory Afforestation Fund Act, 2016, State Government
shall establish a special Fund to be called the State Compensatory
Afforestation Fund (SCAF) under public accounts of the State. The monies
received by the State Governments from the User Agencies are to be credited
in ‘State Compensatory Afforestation Deposits’ under interest bearing section
in Public Account of the State at Minor head level below the Major Head
8336-Civil Deposits. Out of this, 90 per cent shall be transferred to Minor
Head 129- SCAF below Major Head 8121-General and Other Reserve Funds
in Public Account of State and balance 10 per cent shall be credited into the
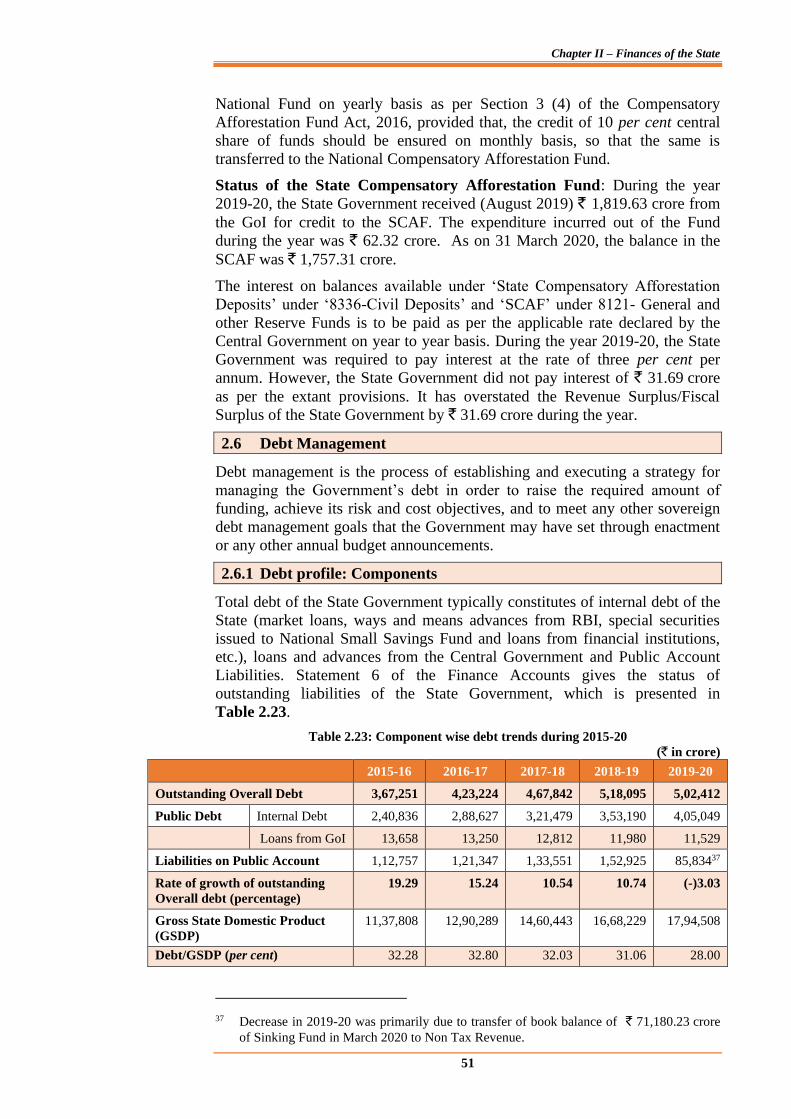
Chapter II – Finances of the State
51
National Fund on yearly basis as per Section 3 (4) of the Compensatory
Afforestation Fund Act, 2016, provided that, the credit of 10 per cent central
share of funds should be ensured on monthly basis, so that the same is
transferred to the National Compensatory Afforestation Fund.
Status of the State Compensatory Afforestation Fund: During the year
2019-20, the State Government received (August 2019) ` 1,819.63 crore from
the GoI for credit to the SCAF. The expenditure incurred out of the Fund
during the year was ` 62.32 crore. As on 31 March 2020, the balance in the
SCAF was ` 1,757.31 crore.
The interest on balances available under ‘State Compensatory Afforestation
Deposits’ under ‘8336-Civil Deposits’ and ‘SCAF’ under 8121- General and
other Reserve Funds is to be paid as per the applicable rate declared by the
Central Government on year to year basis. During the year 2019-20, the State
Government was required to pay interest at the rate of three per cent per
annum. However, the State Government did not pay interest of ` 31.69 crore
as per the extant provisions. It has overstated the Revenue Surplus/Fiscal
Surplus of the State Government by ` 31.69 crore during the year.
2.6 Debt Management
Debt management is the process of establishing and executing a strategy for
managing the Government’s debt in order to raise the required amount of
funding, achieve its risk and cost objectives, and to meet any other sovereign
debt management goals that the Government may have set through enactment
or any other annual budget announcements.
2.6.1 Debt profile: Components
Total debt of the State Government typically constitutes of internal debt of the
State (market loans, ways and means advances from RBI, special securities
issued to National Small Savings Fund and loans from financial institutions,
etc.), loans and advances from the Central Government and Public Account
Liabilities. Statement 6 of the Finance Accounts gives the status of
outstanding liabilities of the State Government, which is presented in
Table 2.23.
Table 2.23: Component wise debt trends during 2015-20
(` in crore)
2015-16 2016-17 2017-18 2018-19 2019-20
Outstanding Overall Debt 3,67,251 4,23,224 4,67,842 5,18,095 5,02,412
Public Debt Internal Debt 2,40,836 2,88,627 3,21,479 3,53,190 4,05,049
Loans from GoI 13,658 13,250 12,812 11,980 11,529
Liabilities on Public Account 1,12,757 1,21,347 1,33,551 1,52,925 85,83437
Rate of growth of outstanding
Overall debt (percentage)
19.29 15.24 10.54 10.74 (-)3.03
Gross State Domestic Product
(GSDP)
11,37,808 12,90,289 14,60,443 16,68,229 17,94,508
Debt/GSDP (per cent) 32.28 32.80 32.03 31.06 28.00
37 Decrease in 2019-20 was primarily due to transfer of book balance of ` 71,180.23 crore
of Sinking Fund in March 2020 to Non Tax Revenue.
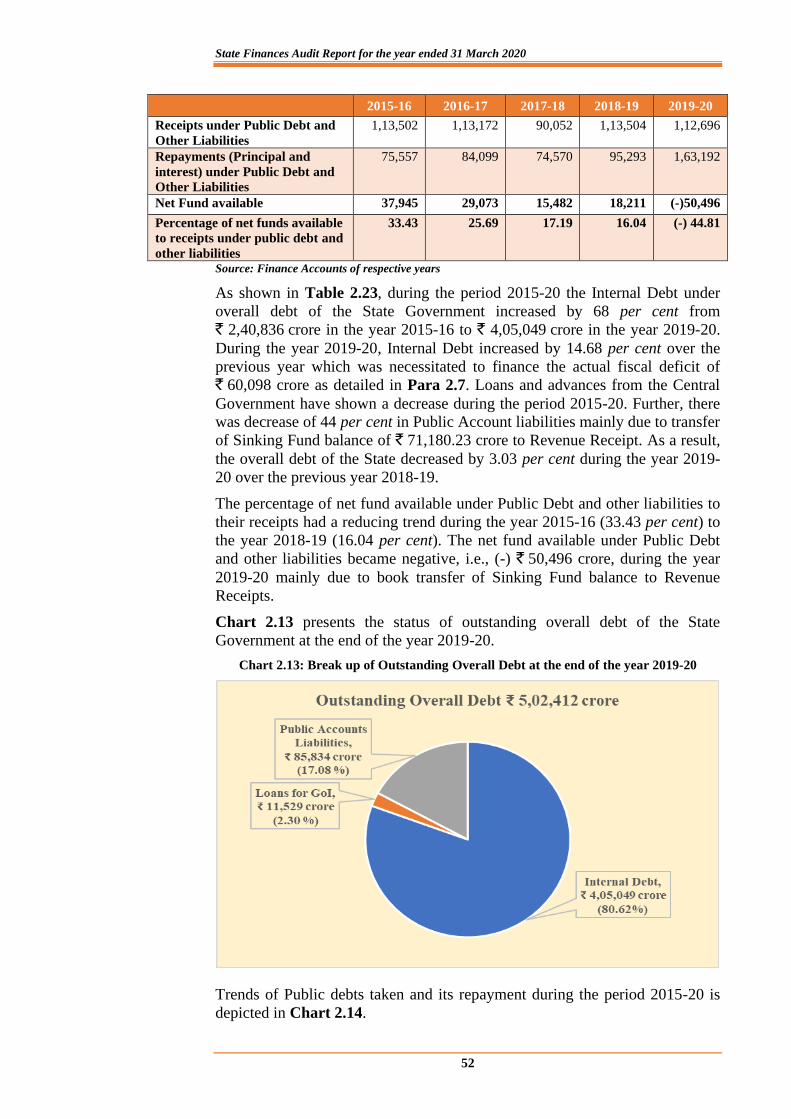
State Finances Audit Report for the year ended 31 March 2020
52
2015-16 2016-17 2017-18 2018-19 2019-20
Receipts under Public Debt and
Other Liabilities
1,13,502 1,13,172 90,052 1,13,504 1,12,696
Repayments (Principal and
interest) under Public Debt and
Other Liabilities
75,557 84,099 74,570 95,293 1,63,192
Net Fund available 37,945 29,073 15,482 18,211 (-)50,496
Percentage of net funds available
to receipts under public debt and
other liabilities
33.43 25.69 17.19 16.04 (-) 44.81
Source: Finance Accounts of respective years
As shown in Table 2.23, during the period 2015-20 the Internal Debt under
overall debt of the State Government increased by 68 per cent from
` 2,40,836 crore in the year 2015-16 to ` 4,05,049 crore in the year 2019-20.
During the year 2019-20, Internal Debt increased by 14.68 per cent over the
previous year which was necessitated to finance the actual fiscal deficit of
` 60,098 crore as detailed in Para 2.7. Loans and advances from the Central
Government have shown a decrease during the period 2015-20. Further, there
was decrease of 44 per cent in Public Account liabilities mainly due to transfer
of Sinking Fund balance of ` 71,180.23 crore to Revenue Receipt. As a result,
the overall debt of the State decreased by 3.03 per cent during the year 2019-
20 over the previous year 2018-19.
The percentage of net fund available under Public Debt and other liabilities to
their receipts had a reducing trend during the year 2015-16 (33.43 per cent) to
the year 2018-19 (16.04 per cent). The net fund available under Public Debt
and other liabilities became negative, i.e., (-) ` 50,496 crore, during the year
2019-20 mainly due to book transfer of Sinking Fund balance to Revenue
Receipts.
Chart 2.13 presents the status of outstanding overall debt of the State
Government at the end of the year 2019-20.
Chart 2.13: Break up of Outstanding Overall Debt at the end of the year 2019-20
Trends of Public debts taken and its repayment during the period 2015-20 is
depicted in Chart 2.14.
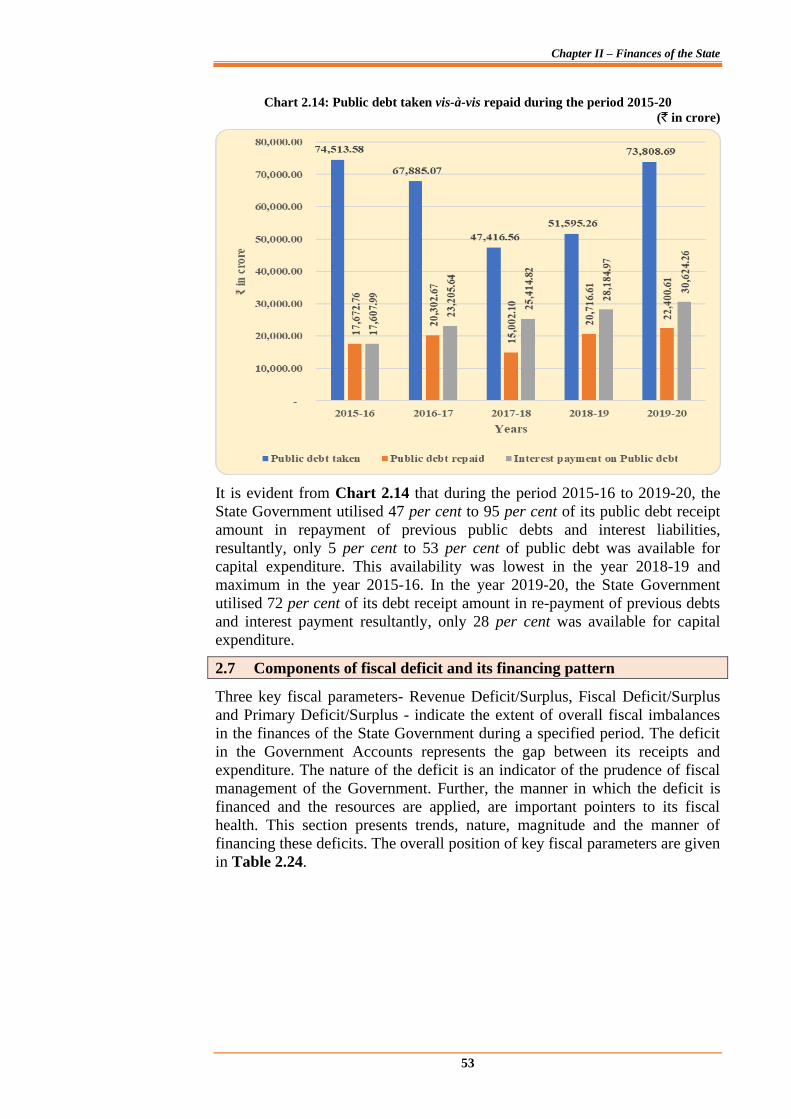
Chapter II – Finances of the State
53
Chart 2.14: Public debt taken vis-à-vis repaid during the period 2015-20 (` in crore)
It is evident from Chart 2.14 that during the period 2015-16 to 2019-20, the
State Government utilised 47 per cent to 95 per cent of its public debt receipt
amount in repayment of previous public debts and interest liabilities,
resultantly, only 5 per cent to 53 per cent of public debt was available for
capital expenditure. This availability was lowest in the year 2018-19 and
maximum in the year 2015-16. In the year 2019-20, the State Government
utilised 72 per cent of its debt receipt amount in re-payment of previous debts
and interest payment resultantly, only 28 per cent was available for capital
expenditure.
2.7 Components of fiscal deficit and its financing pattern
Three key fiscal parameters- Revenue Deficit/Surplus, Fiscal Deficit/Surplus
and Primary Deficit/Surplus - indicate the extent of overall fiscal imbalances
in the finances of the State Government during a specified period. The deficit
in the Government Accounts represents the gap between its receipts and
expenditure. The nature of the deficit is an indicator of the prudence of fiscal
management of the Government. Further, the manner in which the deficit is
financed and the resources are applied, are important pointers to its fiscal
health. This section presents trends, nature, magnitude and the manner of
financing these deficits. The overall position of key fiscal parameters are given
in Table 2.24.
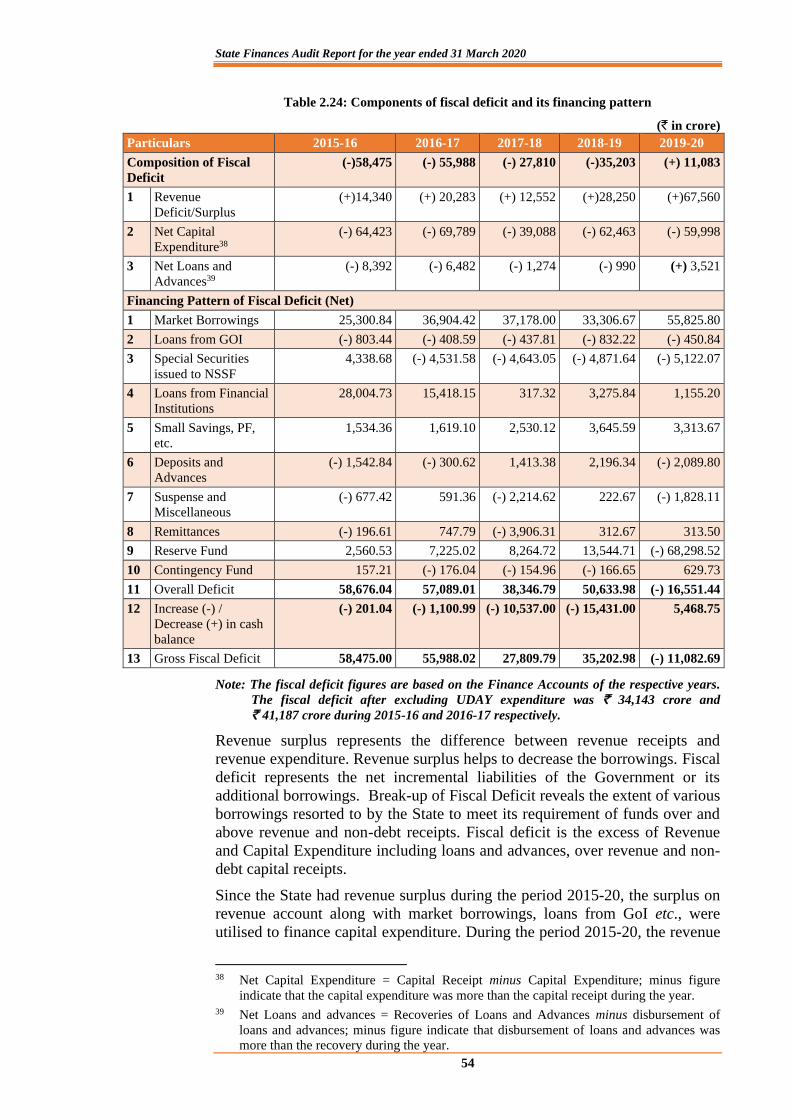
State Finances Audit Report for the year ended 31 March 2020
54
Table 2.24: Components of fiscal deficit and its financing pattern
(` in crore)
Particulars 2015-16 2016-17 2017-18 2018-19 2019-20
Composition of Fiscal
Deficit
(-)58,475 (-) 55,988 (-) 27,810 (-)35,203 (+) 11,083
1 Revenue
Deficit/Surplus
(+)14,340 (+) 20,283 (+) 12,552 (+)28,250 (+)67,560
2 Net Capital
Expenditure38
(-) 64,423 (-) 69,789 (-) 39,088 (-) 62,463 (-) 59,998
3 Net Loans and
Advances39
(-) 8,392 (-) 6,482 (-) 1,274 (-) 990 (+) 3,521
Financing Pattern of Fiscal Deficit (Net)
1 Market Borrowings 25,300.84 36,904.42 37,178.00 33,306.67 55,825.80
2 Loans from GOI (-) 803.44 (-) 408.59 (-) 437.81 (-) 832.22 (-) 450.84
3 Special Securities
issued to NSSF
4,338.68 (-) 4,531.58 (-) 4,643.05 (-) 4,871.64 (-) 5,122.07
4 Loans from Financial
Institutions
28,004.73 15,418.15 317.32 3,275.84 1,155.20
5 Small Savings, PF,
etc.
1,534.36 1,619.10 2,530.12 3,645.59 3,313.67
6 Deposits and
Advances
(-) 1,542.84 (-) 300.62 1,413.38 2,196.34 (-) 2,089.80
7 Suspense and
Miscellaneous
(-) 677.42 591.36 (-) 2,214.62 222.67 (-) 1,828.11
8 Remittances (-) 196.61 747.79 (-) 3,906.31 312.67 313.50
9 Reserve Fund 2,560.53 7,225.02 8,264.72 13,544.71 (-) 68,298.52
10 Contingency Fund 157.21 (-) 176.04 (-) 154.96 (-) 166.65 629.73
11 Overall Deficit 58,676.04 57,089.01 38,346.79 50,633.98 (-) 16,551.44
12 Increase (-) /
Decrease (+) in cash
balance
(-) 201.04 (-) 1,100.99 (-) 10,537.00 (-) 15,431.00 5,468.75
13 Gross Fiscal Deficit 58,475.00 55,988.02 27,809.79 35,202.98 (-) 11,082.69
Note: The fiscal deficit figures are based on the Finance Accounts of the respective years.
The fiscal deficit after excluding UDAY expenditure was ` 34,143 crore and
` 41,187 crore during 2015-16 and 2016-17 respectively.
Revenue surplus represents the difference between revenue receipts and
revenue expenditure. Revenue surplus helps to decrease the borrowings. Fiscal
deficit represents the net incremental liabilities of the Government or its
additional borrowings. Break-up of Fiscal Deficit reveals the extent of various
borrowings resorted to by the State to meet its requirement of funds over and
above revenue and non-debt receipts. Fiscal deficit is the excess of Revenue
and Capital Expenditure including loans and advances, over revenue and non-
debt capital receipts.
Since the State had revenue surplus during the period 2015-20, the surplus on
revenue account along with market borrowings, loans from GoI etc., were
utilised to finance capital expenditure. During the period 2015-20, the revenue
38 Net Capital Expenditure = Capital Receipt minus Capital Expenditure; minus figure
indicate that the capital expenditure was more than the capital receipt during the year. 39 Net Loans and advances = Recoveries of Loans and Advances minus disbursement of
loans and advances; minus figure indicate that disbursement of loans and advances was
more than the recovery during the year.
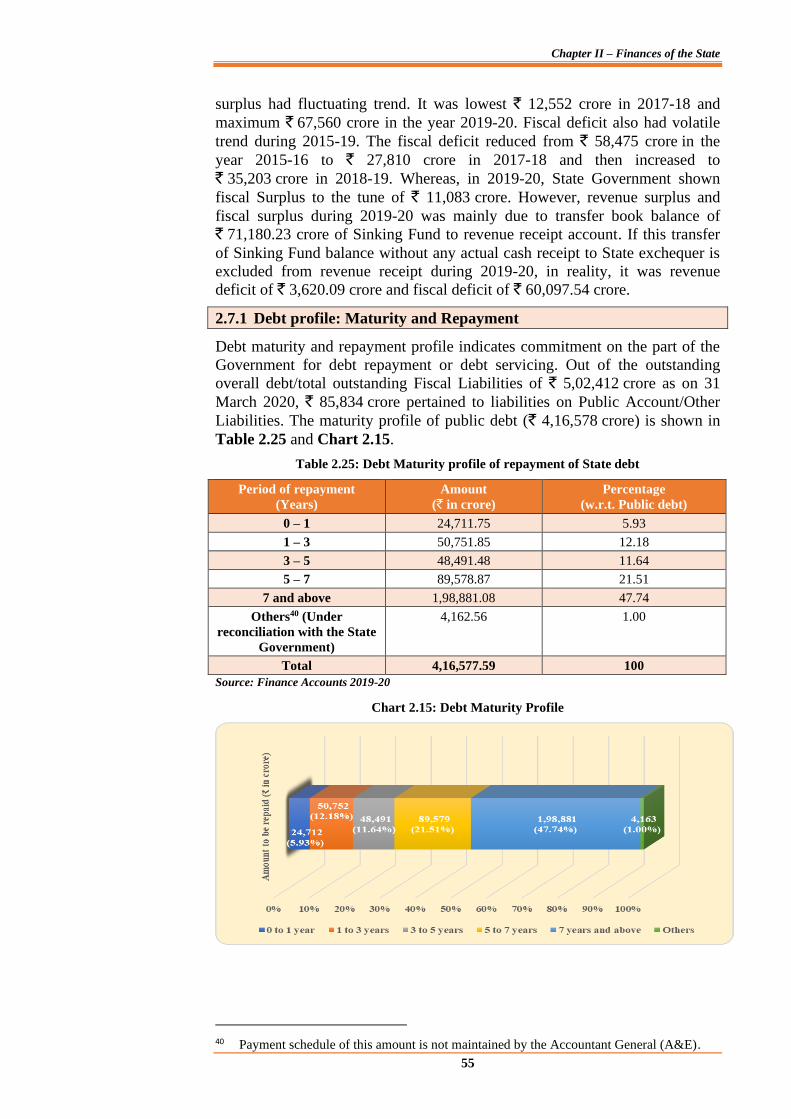
Chapter II – Finances of the State
55
surplus had fluctuating trend. It was lowest ` 12,552 crore in 2017-18 and
maximum ` 67,560 crore in the year 2019-20. Fiscal deficit also had volatile
trend during 2015-19. The fiscal deficit reduced from ` 58,475 crore in the
year 2015-16 to ` 27,810 crore in 2017-18 and then increased to
` 35,203 crore in 2018-19. Whereas, in 2019-20, State Government shown
fiscal Surplus to the tune of ` 11,083 crore. However, revenue surplus and
fiscal surplus during 2019-20 was mainly due to transfer book balance of
` 71,180.23 crore of Sinking Fund to revenue receipt account. If this transfer
of Sinking Fund balance without any actual cash receipt to State exchequer is
excluded from revenue receipt during 2019-20, in reality, it was revenue
deficit of ` 3,620.09 crore and fiscal deficit of ` 60,097.54 crore.
2.7.1 Debt profile: Maturity and Repayment
Debt maturity and repayment profile indicates commitment on the part of the
Government for debt repayment or debt servicing. Out of the outstanding
overall debt/total outstanding Fiscal Liabilities of ` 5,02,412 crore as on 31
March 2020, ` 85,834 crore pertained to liabilities on Public Account/Other
Liabilities. The maturity profile of public debt (` 4,16,578 crore) is shown in
Table 2.25 and Chart 2.15.
Table 2.25: Debt Maturity profile of repayment of State debt
Period of repayment
(Years)
Amount
(` in crore)
Percentage
(w.r.t. Public debt)
0 – 1 24,711.75 5.93
1 – 3 50,751.85 12.18
3 – 5 48,491.48 11.64
5 – 7 89,578.87 21.51
7 and above 1,98,881.08 47.74
Others40 (Under
reconciliation with the State
Government)
4,162.56 1.00
Total 4,16,577.59 100
Source: Finance Accounts 2019-20
Chart 2.15: Debt Maturity Profile
40 Payment schedule of this amount is not maintained by the Accountant General (A&E).
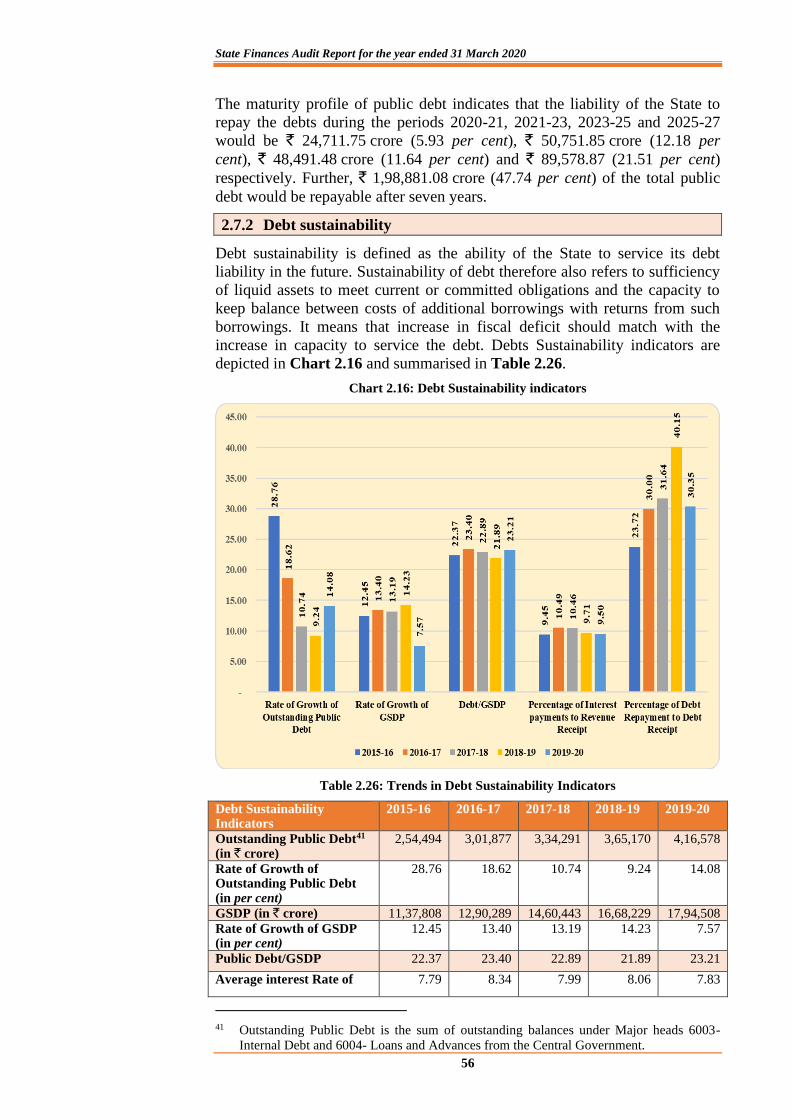
State Finances Audit Report for the year ended 31 March 2020
56
The maturity profile of public debt indicates that the liability of the State to
repay the debts during the periods 2020-21, 2021-23, 2023-25 and 2025-27
would be ` 24,711.75 crore (5.93 per cent), ` 50,751.85 crore (12.18 per
cent), ` 48,491.48 crore (11.64 per cent) and ` 89,578.87 (21.51 per cent)
respectively. Further, ` 1,98,881.08 crore (47.74 per cent) of the total public
debt would be repayable after seven years.
2.7.2 Debt sustainability
Debt sustainability is defined as the ability of the State to service its debt
liability in the future. Sustainability of debt therefore also refers to sufficiency
of liquid assets to meet current or committed obligations and the capacity to
keep balance between costs of additional borrowings with returns from such
borrowings. It means that increase in fiscal deficit should match with the
increase in capacity to service the debt. Debts Sustainability indicators are
depicted in Chart 2.16 and summarised in Table 2.26.
Chart 2.16: Debt Sustainability indicators
Table 2.26: Trends in Debt Sustainability Indicators
Debt Sustainability Indicators
2015-16 2016-17 2017-18 2018-19 2019-20
Outstanding Public Debt41 (in ` crore)
2,54,494 3,01,877 3,34,291 3,65,170 4,16,578
Rate of Growth of Outstanding Public Debt (in per cent)
28.76 18.62 10.74 9.24 14.08
GSDP (in ` crore) 11,37,808 12,90,289 14,60,443 16,68,229 17,94,508
Rate of Growth of GSDP (in per cent)
12.45 13.40 13.19 14.23 7.57
Public Debt/GSDP 22.37 23.40 22.89 21.89 23.21
Average interest Rate of 7.79 8.34 7.99 8.06 7.83
41 Outstanding Public Debt is the sum of outstanding balances under Major heads 6003-
Internal Debt and 6004- Loans and Advances from the Central Government.
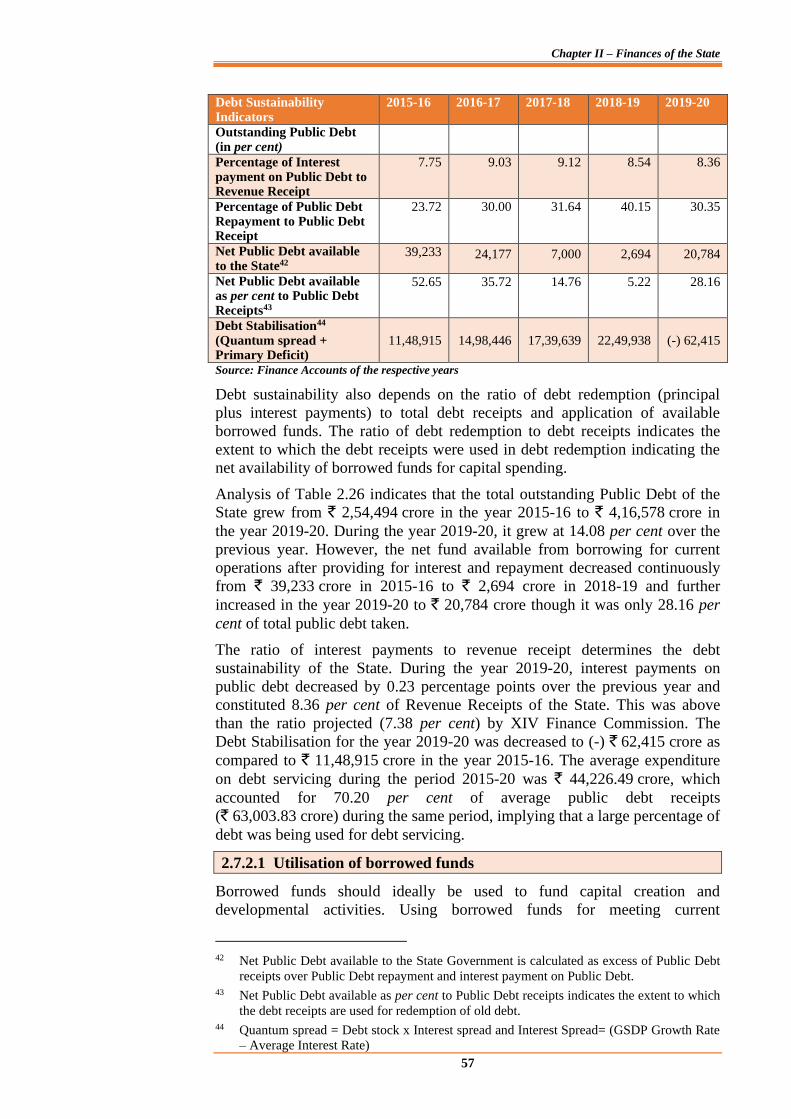
Chapter II – Finances of the State
57
Debt Sustainability Indicators
2015-16 2016-17 2017-18 2018-19 2019-20
Outstanding Public Debt (in per cent)
Percentage of Interest payment on Public Debt to Revenue Receipt
7.75 9.03 9.12 8.54 8.36
Percentage of Public Debt Repayment to Public Debt Receipt
23.72 30.00
31.64 40.15 30.35
Net Public Debt available to the State42
39,233 24,177 7,000 2,694 20,784
Net Public Debt available as per cent to Public Debt Receipts43
52.65 35.72 14.76 5.22 28.16
Debt Stabilisation44 (Quantum spread + Primary Deficit)
11,48,915
14,98,446
17,39,639
22,49,938
(-) 62,415
Source: Finance Accounts of the respective years
Debt sustainability also depends on the ratio of debt redemption (principal
plus interest payments) to total debt receipts and application of available
borrowed funds. The ratio of debt redemption to debt receipts indicates the
extent to which the debt receipts were used in debt redemption indicating the
net availability of borrowed funds for capital spending.
Analysis of Table 2.26 indicates that the total outstanding Public Debt of the
State grew from ` 2,54,494 crore in the year 2015-16 to ` 4,16,578 crore in
the year 2019-20. During the year 2019-20, it grew at 14.08 per cent over the
previous year. However, the net fund available from borrowing for current
operations after providing for interest and repayment decreased continuously
from ` 39,233 crore in 2015-16 to ` 2,694 crore in 2018-19 and further
increased in the year 2019-20 to ` 20,784 crore though it was only 28.16 per
cent of total public debt taken.
The ratio of interest payments to revenue receipt determines the debt
sustainability of the State. During the year 2019-20, interest payments on
public debt decreased by 0.23 percentage points over the previous year and
constituted 8.36 per cent of Revenue Receipts of the State. This was above
than the ratio projected (7.38 per cent) by XIV Finance Commission. The
Debt Stabilisation for the year 2019-20 was decreased to (-) ` 62,415 crore as
compared to ` 11,48,915 crore in the year 2015-16. The average expenditure
on debt servicing during the period 2015-20 was ` 44,226.49 crore, which
accounted for 70.20 per cent of average public debt receipts
(` 63,003.83 crore) during the same period, implying that a large percentage of
debt was being used for debt servicing.
2.7.2.1 Utilisation of borrowed funds
Borrowed funds should ideally be used to fund capital creation and
developmental activities. Using borrowed funds for meeting current
42 Net Public Debt available to the State Government is calculated as excess of Public Debt
receipts over Public Debt repayment and interest payment on Public Debt. 43 Net Public Debt available as per cent to Public Debt receipts indicates the extent to which
the debt receipts are used for redemption of old debt. 44 Quantum spread = Debt stock x Interest spread and Interest Spread= (GSDP Growth Rate
– Average Interest Rate)
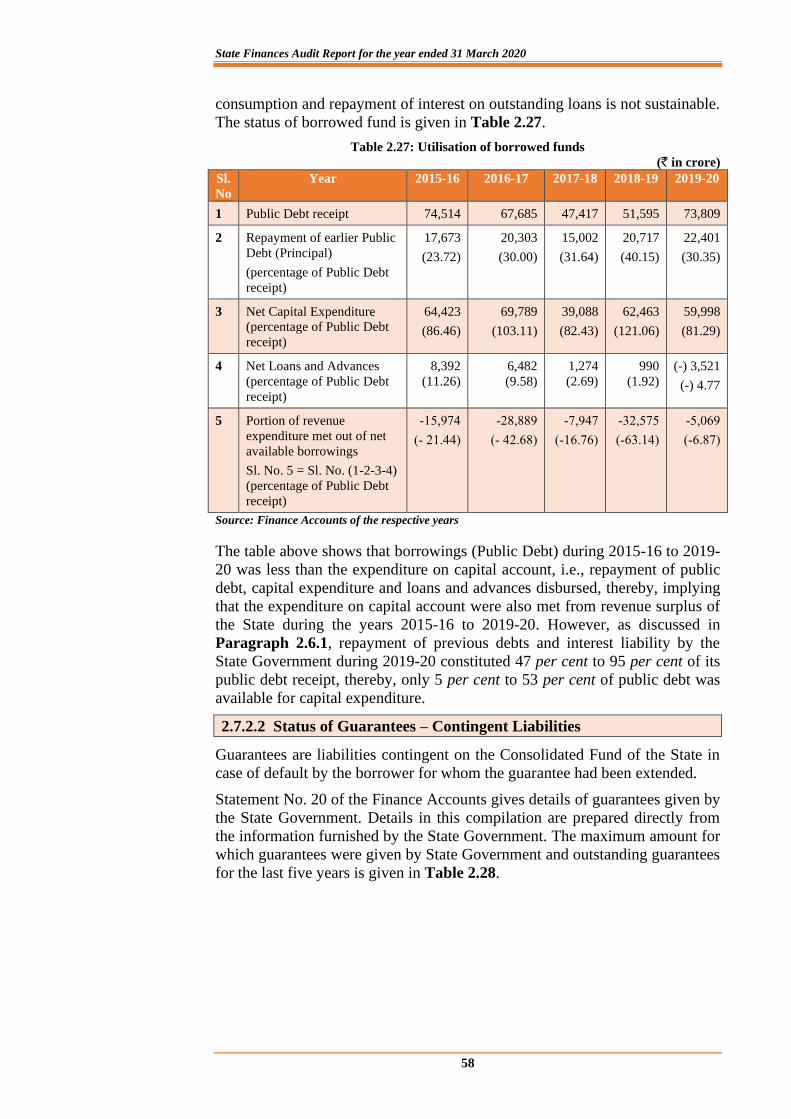
State Finances Audit Report for the year ended 31 March 2020
58
consumption and repayment of interest on outstanding loans is not sustainable.
The status of borrowed fund is given in Table 2.27.
Table 2.27: Utilisation of borrowed funds
(` in crore)
Sl.
No
Year 2015-16 2016-17 2017-18 2018-19 2019-20
1 Public Debt receipt 74,514 67,685 47,417 51,595 73,809
2 Repayment of earlier Public
Debt (Principal)
(percentage of Public Debt
receipt)
17,673
(23.72)
20,303
(30.00)
15,002
(31.64)
20,717
(40.15)
22,401
(30.35)
3 Net Capital Expenditure
(percentage of Public Debt
receipt)
64,423
(86.46)
69,789
(103.11)
39,088
(82.43)
62,463
(121.06)
59,998
(81.29)
4 Net Loans and Advances
(percentage of Public Debt
receipt)
8,392
(11.26)
6,482
(9.58)
1,274
(2.69)
990
(1.92)
(-) 3,521
(-) 4.77
5 Portion of revenue
expenditure met out of net
available borrowings
Sl. No. 5 = Sl. No. (1-2-3-4)
(percentage of Public Debt
receipt)
-15,974
(- 21.44)
-28,889
(- 42.68)
-7,947
(-16.76)
-32,575
(-63.14)
-5,069
(-6.87)
Source: Finance Accounts of the respective years
The table above shows that borrowings (Public Debt) during 2015-16 to 2019-
20 was less than the expenditure on capital account, i.e., repayment of public
debt, capital expenditure and loans and advances disbursed, thereby, implying
that the expenditure on capital account were also met from revenue surplus of
the State during the years 2015-16 to 2019-20. However, as discussed in
Paragraph 2.6.1, repayment of previous debts and interest liability by the
State Government during 2019-20 constituted 47 per cent to 95 per cent of its
public debt receipt, thereby, only 5 per cent to 53 per cent of public debt was
available for capital expenditure.
2.7.2.2 Status of Guarantees – Contingent Liabilities
Guarantees are liabilities contingent on the Consolidated Fund of the State in
case of default by the borrower for whom the guarantee had been extended.
Statement No. 20 of the Finance Accounts gives details of guarantees given by
the State Government. Details in this compilation are prepared directly from
the information furnished by the State Government. The maximum amount for
which guarantees were given by State Government and outstanding guarantees
for the last five years is given in Table 2.28.
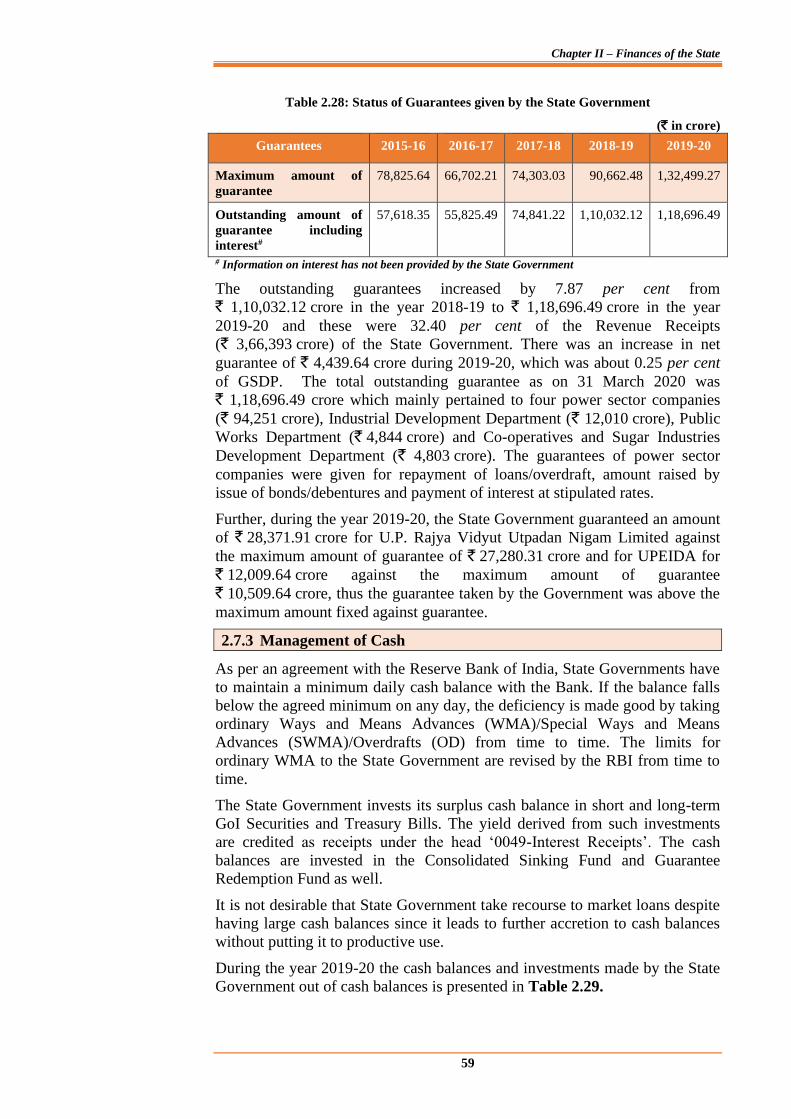
Chapter II – Finances of the State
59
Table 2.28: Status of Guarantees given by the State Government
(` in crore)
Guarantees 2015-16 2016-17 2017-18 2018-19 2019-20
Maximum amount of
guarantee
78,825.64 66,702.21 74,303.03 90,662.48 1,32,499.27
Outstanding amount of
guarantee including
interest#
57,618.35 55,825.49 74,841.22 1,10,032.12 1,18,696.49
# Information on interest has not been provided by the State Government
The outstanding guarantees increased by 7.87 per cent from
` 1,10,032.12 crore in the year 2018-19 to ` 1,18,696.49 crore in the year
2019-20 and these were 32.40 per cent of the Revenue Receipts
(` 3,66,393 crore) of the State Government. There was an increase in net
guarantee of ` 4,439.64 crore during 2019-20, which was about 0.25 per cent
of GSDP. The total outstanding guarantee as on 31 March 2020 was
` 1,18,696.49 crore which mainly pertained to four power sector companies
(` 94,251 crore), Industrial Development Department (` 12,010 crore), Public
Works Department (` 4,844 crore) and Co-operatives and Sugar Industries
Development Department (` 4,803 crore). The guarantees of power sector
companies were given for repayment of loans/overdraft, amount raised by
issue of bonds/debentures and payment of interest at stipulated rates.
Further, during the year 2019-20, the State Government guaranteed an amount
of ` 28,371.91 crore for U.P. Rajya Vidyut Utpadan Nigam Limited against
the maximum amount of guarantee of ` 27,280.31 crore and for UPEIDA for
` 12,009.64 crore against the maximum amount of guarantee
` 10,509.64 crore, thus the guarantee taken by the Government was above the
maximum amount fixed against guarantee.
2.7.3 Management of Cash
As per an agreement with the Reserve Bank of India, State Governments have
to maintain a minimum daily cash balance with the Bank. If the balance falls
below the agreed minimum on any day, the deficiency is made good by taking
ordinary Ways and Means Advances (WMA)/Special Ways and Means
Advances (SWMA)/Overdrafts (OD) from time to time. The limits for
ordinary WMA to the State Government are revised by the RBI from time to
time.
The State Government invests its surplus cash balance in short and long-term
GoI Securities and Treasury Bills. The yield derived from such investments
are credited as receipts under the head ‘0049-Interest Receipts’. The cash
balances are invested in the Consolidated Sinking Fund and Guarantee
Redemption Fund as well.
It is not desirable that State Government take recourse to market loans despite
having large cash balances since it leads to further accretion to cash balances
without putting it to productive use.
During the year 2019-20 the cash balances and investments made by the State
Government out of cash balances is presented in Table 2.29.

State Finances Audit Report for the year ended 31 March 2020
60
Table 2.29: Cash Balances and their investment during the year 2019-20
(` in crore)
Opening balance on
1 April 2019
Closing balance on
31 March 2020
A. General Cash Balance
Cash in Treasuries 0.00 0.00
Deposits with Reserve Bank of India 171.10 236.04
Deposits with other Banks 0.00 0.00
Remittances in transit – Local 0.00 0.00
Total 171.10 236.04
Investments held in Cash Balance
investment account
26,684.36 21,150.71
Total (A) 26,855.46 21,386.75
B. Other Cash Balances and Investments
Cash with departmental officers viz.,
Public Works, Forest Officers
10.96 10.91
Permanent advances for contingent
expenditure with department officers
0.49 0.50
Investment in earmarked funds 45.20 45.20
Total (B) 56.65 56.61
Total (A + B) 26,912.11 21,443.36
Source: Finance Accounts 2019-20
The State Government’s cash balances at the end of the current year amounted
to ` 21,443.36 crore. This has decreased by ` 5,468.75 crore (20.32 per cent)
when compared with balances at the end of the year 2018-19. During the year
2019-20, the opening balance of investment held in Cash Balance Investment
Account was ` 26,684.36 crore. Treasury Bills amounting to ` 4,93,843 crore
were purchased and these instruments amounting to ` 4,99,376.65 crore were
sold, leaving a balance of ` 21,150.71 crore in the account at the end of the
year. The amounts of ` 582.23 crore and ` 13.92 crore were received as
interest on investment under Treasury Bills and Long Term Government of
India’s Securities respectively.
Under the Cash Balance Investment Account, the transactions of the State
Government in investing in Treasury bills of Central Government had
consistently increased from ` 1,43,679 crore during the year 2015-16 to
` 5,44,061 crore during the year 2018-19 but decreased to ` 4,93,843 crore
during the year 2019-20. Corresponding to Cash Balance Investment Account,
the cash surplus increased during the period 2015-16 to 2018-19 from
(-) ` 213 crore to ` 26,855 crore which decreased to ` 21,387 crore during the
year 2019-20. The status of market loan taken by the State Government and
cash balance available with the State Government is presented in Chart 2.17.
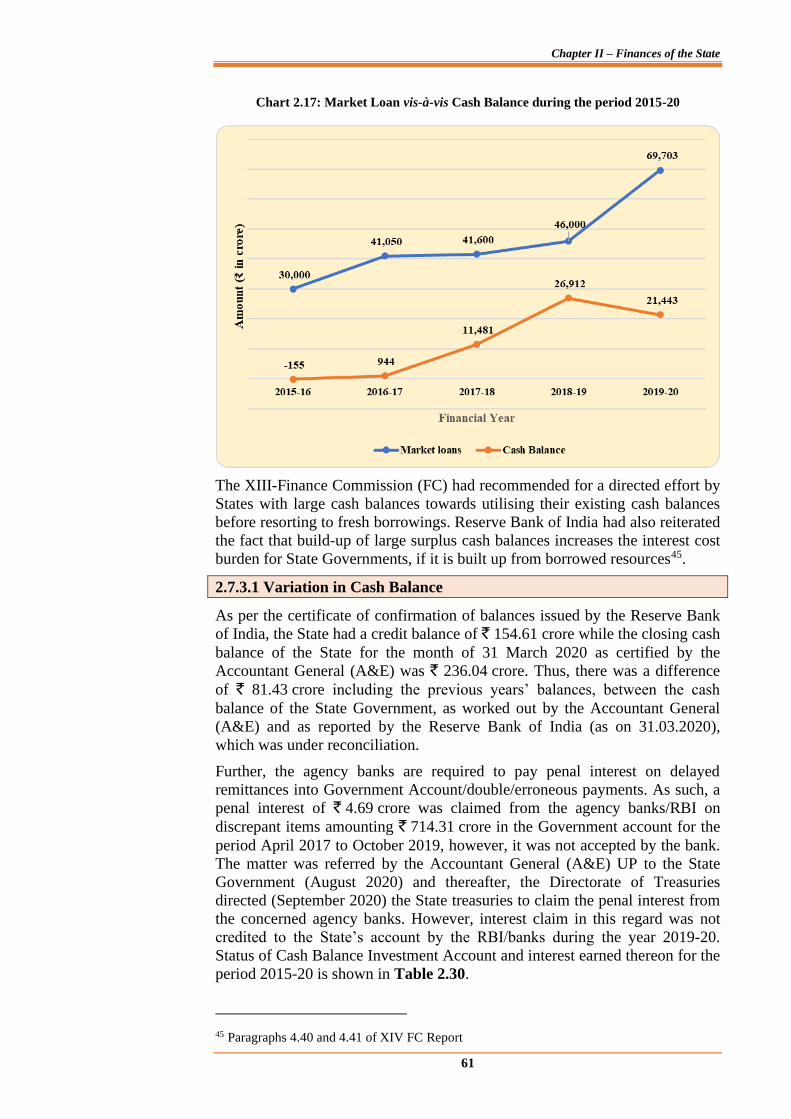
Chapter II – Finances of the State
61
Chart 2.17: Market Loan vis-à-vis Cash Balance during the period 2015-20
The XIII-Finance Commission (FC) had recommended for a directed effort by
States with large cash balances towards utilising their existing cash balances
before resorting to fresh borrowings. Reserve Bank of India had also reiterated
the fact that build-up of large surplus cash balances increases the interest cost
burden for State Governments, if it is built up from borrowed resources45.
2.7.3.1 Variation in Cash Balance
As per the certificate of confirmation of balances issued by the Reserve Bank
of India, the State had a credit balance of ` 154.61 crore while the closing cash
balance of the State for the month of 31 March 2020 as certified by the
Accountant General (A&E) was ` 236.04 crore. Thus, there was a difference
of ` 81.43 crore including the previous years’ balances, between the cash
balance of the State Government, as worked out by the Accountant General
(A&E) and as reported by the Reserve Bank of India (as on 31.03.2020),
which was under reconciliation.
Further, the agency banks are required to pay penal interest on delayed
remittances into Government Account/double/erroneous payments. As such, a
penal interest of ` 4.69 crore was claimed from the agency banks/RBI on
discrepant items amounting ` 714.31 crore in the Government account for the
period April 2017 to October 2019, however, it was not accepted by the bank.
The matter was referred by the Accountant General (A&E) UP to the State
Government (August 2020) and thereafter, the Directorate of Treasuries
directed (September 2020) the State treasuries to claim the penal interest from
the concerned agency banks. However, interest claim in this regard was not
credited to the State’s account by the RBI/banks during the year 2019-20.
Status of Cash Balance Investment Account and interest earned thereon for the
period 2015-20 is shown in Table 2.30.
45 Paragraphs 4.40 and 4.41 of XIV FC Report

State Finances Audit Report for the year ended 31 March 2020
62
Table 2.30: Cash Balance Investment Account (Major Head 8673)
(` in crore)
Year Opening
Balance
Closing
Balance
Increase (+) /
decrease (-)
(CB-OB)
Interest
earned
2015-16 595.35 1,196.44 601.09 113.76
2016-17 1,196.44 2,168.23 971.79 578.36
2017-18 2,168.23 11,159.38 8,991.15 486.61
2018-19 11,159.38 26,684.36 15,524.98 1088.56
2019-20 26,684.36 21,150.71 (-)5,533.65 596.15
Month wise movement of Cash Balances and Net Cash Balance Investments
during the year 2019-20 is presented in Chart 2.18.
Chart 2.18: Month wise movement of Cash Balances and net cash balance investments
during the year 2019-20
2.8 Recommendations
• The State Government should ensure that Consolidated Sinking Fund
balances are actually invested with Reserve Bank of India and are not
mere book entries. Availability of adequate fund in Consolidated Sinking
Fund may be ensured and as required under Consolidated Sinking Fund
Scheme, State Government should ensure that annual contribution to the
fund is at least 0.50 per cent of the outstanding liabilities. Further, the
transfers out of the fund are not to be treated as Revenue Receipts and the
amount equivalent to loan repaid should be transferred from Sinking Fund
to Major Head 8680 (Miscellaneous Government Account) on redemption
of debt.
• The State Government should transfer the SDRF balances to MH 8121-
General and Other Reserve Funds under the category “Reserve Funds
bearing Interest” and remit to the Fund accrued interest as per SDRF
guidelines. The State Government is also required to invest the fund
balances in the manner prescribed in the SDRF guidelines.
Chapter II – Finances of the State
63
• The State Government should create and operate the Guarantee
Redemption Fund as per the recommendations of XII FC. State
Government should also ensure that guarantee fees are realised promptly.
The Government should stop financial support to the institutions which
have not paid the guarantee fees and/or are also in arrears of accounts.
Further, collection/accounting of guarantee fee should be aligned to the
List of Major and Minor Head of Accounts.


65
CHAPTER-III
BUDGETARY MANAGEMENT
This Chapter deals with the integrity, transparency and effectiveness of the
budgetary process and allocative priorities, including supplementary grants,
and the concomitant financial management, assessing whether decisions taken
at the policy level are implemented at the administrative level without
diversion of funds.
3.1 Budget Process
The annual exercise of budgeting is a means for detailing the roadmap for
efficient use of public resources. Uttar Pradesh Budget Manual (UPBM)
specifies the Budget preparation process for the Government of Uttar Pradesh.
As per Para 8 of UPBM “the Finance Department is responsible for the
preparation of the annual budget. The budget is prepared on the basis of the
material furnished by the departmental officers and the administrative
departments of the Secretariat. The Heads of Departments and other estimating
officers prepare the estimates for each head of account with which they are
concerned and forward these to the Finance Department”. The budget
estimates must be submitted to the Finance Department by the prescribed date.
After the finalisation of the Budget with the inclusion of provision therein for
new expenditure, it is presented, under Article 202 of the Constitution, to both
the Houses of the State Legislature on the recommendation of the Governor.
After the Grants have been voted by the Legislative Assembly, a Bill to
provide for the appropriation out of the Consolidated Fund of the State of all
moneys required to meet the Voted as well as the Charged expenditure is
introduced in the Legislative Assembly. When the Appropriation Bill is passed
by both the Houses of the Legislature and it has also received the assent of the
Governor, the amounts shown therein can be expended during the financial
year concerned.
Article 205 of the Constitution of India prescribes that a Supplementary Grant
or Appropriation over the provisions passed in the Appropriation Act for the
year can be made during the current financial year to meet expenditure where
provisions of the Appropriation Act is found to be insufficient, or when a
need has arisen during the current financial year for supplementary or
additional expenditure upon some new service not contemplated in the original
budget, or if any money has been spent on any service during a financial year
in excess of the amount granted for that service and for that year.

State Finances Audit Report for the year ended 31 March 2020
66
Original
Budget
(` 5,09,003.49
crore)
Supplementary
Provision
(` 17,805.73
crore)
Total Budget
approved by
Legislature
(` 5,26,809.22
crore)
CSS: Centrally Sponsored Schemes; CS: Central Schemes.
Apart from supplementary grant, re-appropriation can also be used to re-
allocate funds within the same Grant or Charged Appropriation. Re-
appropriation is the transfer, by competent authority, of savings from one unit
of appropriation to meet additional expenditure on existing service under
another unit within the same section (viz. Revenue-Voted, Revenue-Charged,
Capital-Voted, Capital-Charged) of the Grant or Charged Appropriation. The
various components of budget for the year 2019-20 are depicted in the Chart
below.
Source: UP Annual Financial Statement, Supplementary Grants and Appropriation Accounts for the
year 2019-20.
Appropriation Accounts depict the original budget provision, supplementary
grants, surrenders and re-appropriations distinctly and indicate actual capital
Expenditure
(` 3,99,426.75
crore)
Savings
(` 1,27,382.47
crore)
Authorisation by Legislature Implementation by Government
Budget Components for the year 2019-20
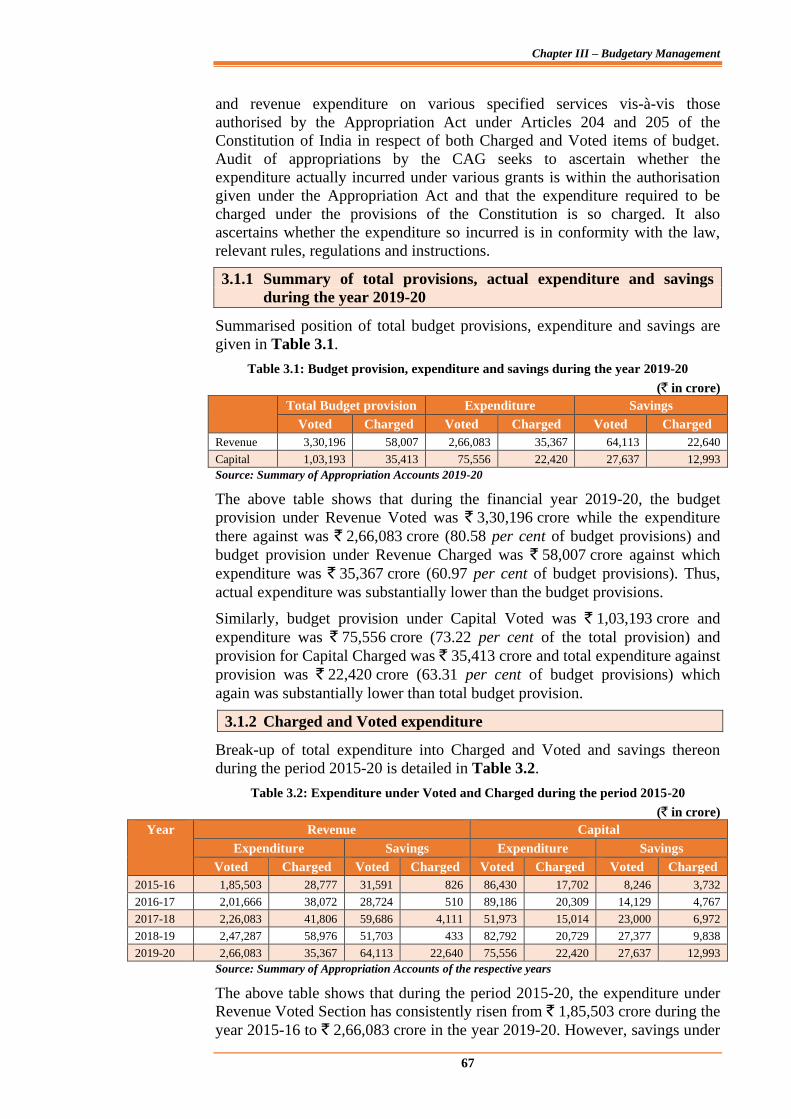
Chapter III – Budgetary Management
67
and revenue expenditure on various specified services vis-à-vis those
authorised by the Appropriation Act under Articles 204 and 205 of the
Constitution of India in respect of both Charged and Voted items of budget.
Audit of appropriations by the CAG seeks to ascertain whether the
expenditure actually incurred under various grants is within the authorisation
given under the Appropriation Act and that the expenditure required to be
charged under the provisions of the Constitution is so charged. It also
ascertains whether the expenditure so incurred is in conformity with the law,
relevant rules, regulations and instructions.
3.1.1 Summary of total provisions, actual expenditure and savings
during the year 2019-20
Summarised position of total budget provisions, expenditure and savings are
given in Table 3.1.
Table 3.1: Budget provision, expenditure and savings during the year 2019-20
(` in crore)
Total Budget provision Expenditure Savings
Voted Charged Voted Charged Voted Charged
Revenue 3,30,196 58,007 2,66,083 35,367 64,113 22,640
Capital 1,03,193 35,413 75,556 22,420 27,637 12,993
Source: Summary of Appropriation Accounts 2019-20
The above table shows that during the financial year 2019-20, the budget
provision under Revenue Voted was ` 3,30,196 crore while the expenditure
there against was ` 2,66,083 crore (80.58 per cent of budget provisions) and
budget provision under Revenue Charged was ` 58,007 crore against which
expenditure was ` 35,367 crore (60.97 per cent of budget provisions). Thus,
actual expenditure was substantially lower than the budget provisions.
Similarly, budget provision under Capital Voted was ` 1,03,193 crore and
expenditure was ` 75,556 crore (73.22 per cent of the total provision) and
provision for Capital Charged was ` 35,413 crore and total expenditure against
provision was ` 22,420 crore (63.31 per cent of budget provisions) which
again was substantially lower than total budget provision.
3.1.2 Charged and Voted expenditure
Break-up of total expenditure into Charged and Voted and savings thereon
during the period 2015-20 is detailed in Table 3.2.
Table 3.2: Expenditure under Voted and Charged during the period 2015-20
(` in crore)
Year Revenue Capital
Expenditure Savings Expenditure Savings
Voted Charged Voted Charged Voted Charged Voted Charged
2015-16 1,85,503 28,777 31,591 826 86,430 17,702 8,246 3,732
2016-17 2,01,666 38,072 28,724 510 89,186 20,309 14,129 4,767
2017-18 2,26,083 41,806 59,686 4,111 51,973 15,014 23,000 6,972
2018-19 2,47,287 58,976 51,703 433 82,792 20,729 27,377 9,838
2019-20 2,66,083 35,367 64,113 22,640 75,556 22,420 27,637 12,993
Source: Summary of Appropriation Accounts of the respective years
The above table shows that during the period 2015-20, the expenditure under
Revenue Voted Section has consistently risen from ` 1,85,503 crore during the
year 2015-16 to ` 2,66,083 crore in the year 2019-20. However, savings under
State Finances Audit Report for the year ended 31 March 2020
68
Revenue Voted section has also increased from 14.55 per cent in 2015-16 to
19.42 per cent during the year 2019-20 which is reflecting widened gap
between planning and execution.
Further, the expenditure under Revenue Charged Section has increased during
the period 2015-19 but decreased by 40.03 per cent during the year 2019-20 in
comparison to the year 2018-19. This was mainly due to saving of
` 22,455 crore in Revenue Charged section in Grant No-61 Finance
Department (Debt Services and Other Expenditure) in the year 2019-20.
Similarly, expenditure under Capital Voted section was volatile during the
period 2015-20 and it was highest during the year 2016-17 and lowest during
the year 2017-18. During the year 2019-20, the expenditure under Capital
Voted Section was ` 75,556 crore which was 8.74 per cent less than the
amount disbursed during the year 2018-19.
3.2 Comments on integrity of budgetary and accounting process
No money shall be withdrawn from the Consolidated Fund of the State except
under appropriation made by law passed in accordance with the provisions of
Article 204 of the Constitution. Deviations from prescribed procedures are
discussed in this section.
3.2.1 Expenditure without legislative authorisation
State Government failed to ensure legislative authorisation of expenditure
of ` 51.21 crore incurred by Uttar Pradesh Electricity Regulatory
Commission on purchase of land and construction of office building
complex.
In exercise of the powers conferred under section 17 and sub-section (2) of
section 22 of the Electricity Regulatory Commission Act 1998, the
Government of Uttar Pradesh (GoUP) vide notification dated 10 September
1998 established Uttar Pradesh Electricity Regulatory Commission (UPERC).
As per the procedure prescribed (November 2000) by the State Government,
UPERC would deposit fees collected by it into the treasury and the State
Government would allot grants-in-aid to UPERC. Subsequently, Electricity
Act, 2003 mandated that all fees received by UPERC shall be credited to
UPERC Fund and the State Government may, in consultation with the
Comptroller and Auditor General of India, prescribe the manner of applying
the Fund for meeting the expenses of UPERC. However, the State
Government has not yet established the UPERC Fund and the procedure
prescribed (November 2000) for release of grants-in-aid to UPERC was
continued to be followed. Accordingly, the State Government provided grants-
in-aid to UPERC in Grant Number 09 (Energy Department) under the object
heads 31-salary and 20-non-salary below the head – 2045 (Other taxes &
duties on Goods and Services)-103 (Collection Charges ED)- 04 (UPERC).
Audit noticed that the State Government accorded (September 2010) in-
principle approval on the proposal of UPERC for construction of office
building on a land allotted to it. For construction of the office building,
UPERC requested (November 2010) the State Government for administrative
approval and allotment of ` 24.47 crore (` 14.07 crore in the year 2010-11 and
` 10.40 crore in the year 2011-12). However, without receiving the
administrative approval/allotment of fund, UPERC made payments (December
Chapter III – Budgetary Management
69
2010) against cost of land and other charges amounting to ` 12.67 crore for
transfer of land in its favour. Later on, the State Government conveyed
(November 2013) to UPERC that for post facto approval of expenditure
incurred on purchase of land and in-principle approval for the estimated
expenditure to be incurred on the construction of building, no action was
required at the level of the Government and action should be ensured at the
level of UPERC according to its Act and Rules. However, the direction of the
State Government was in violation of Sections 102 and 106 of the Electricity
Act, 2003 which provides that UPERC shall forward its budget to the State
Government and the State Government may, after due appropriation made by
the State Legislature, make to the State Commission grants and loans of such
sums of money as the State Government may consider necessary. Further, the
direction of the State Government was also not in consonance with the
prescribed procedure (November 2000) requiring UPERC to make expenditure
from the grans-in-aid released by the State Government.
As on 31 March 2020, UPERC had incurred expenditure ` 51.21 crore46 for
the construction of office building. Incurrence of this expenditure was in
violation of Article 204 of the Constitution, as the required legislative
authorisation for grants-in-aid to UPERC for construction of the office
building was not obtained.
In reply, UPERC stated (January 2021) that the Commission had repeatedly
requested the State Government for budget allocation for land and building
project. UPREC further contended that the Commission had acted in
compliance of State Government orders (September 2010 and November
2013).
The reply was not acceptable, as UPERC was required to make expenditure
from grants-in-aid received from the State Government. As such, the
expenditure of any capital nature was to be incurred by UPERC out of grants-
in-aid received from the State Government under the object head 35-grants for
creation of capital assets after due authorisation by State Legislature through
budgetary process.
The matter was reported to Government (December 2020); their reply is
awaited (July 2021).
3.2.2 Misclassification of expenditure
As per the Uttar Pradesh Budget Manual (UPBM), the classification of
expenditure between Capital and Revenue is as follows:
(a) Capital Expenditure: Capital expenditure may be broadly defined as
expenditure incurred with the object of increasing concrete assets of material
and permanent character. Capital bears all charges for the first construction of
a project as well as charges for intermediate maintenance of the work while
not opened for service and also bears charges for such further additions and
improvements as may be sanctioned under the rules made by competent
authority.
46 Cost of land and other charges: ` 14.26 crore and construction of office complex:
` 36.95 crore.
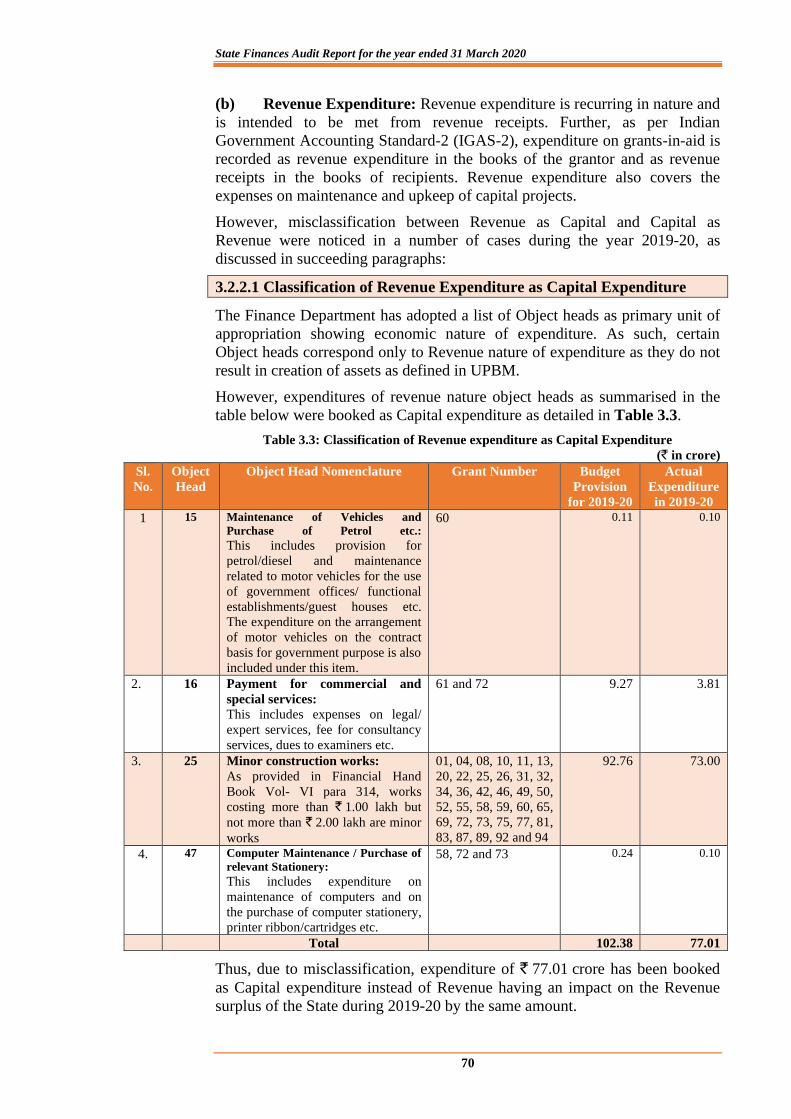
State Finances Audit Report for the year ended 31 March 2020
70
(b) Revenue Expenditure: Revenue expenditure is recurring in nature and
is intended to be met from revenue receipts. Further, as per Indian
Government Accounting Standard-2 (IGAS-2), expenditure on grants-in-aid is
recorded as revenue expenditure in the books of the grantor and as revenue
receipts in the books of recipients. Revenue expenditure also covers the
expenses on maintenance and upkeep of capital projects.
However, misclassification between Revenue as Capital and Capital as
Revenue were noticed in a number of cases during the year 2019-20, as
discussed in succeeding paragraphs:
3.2.2.1 Classification of Revenue Expenditure as Capital Expenditure
The Finance Department has adopted a list of Object heads as primary unit of
appropriation showing economic nature of expenditure. As such, certain
Object heads correspond only to Revenue nature of expenditure as they do not
result in creation of assets as defined in UPBM.
However, expenditures of revenue nature object heads as summarised in the
table below were booked as Capital expenditure as detailed in Table 3.3.
Table 3.3: Classification of Revenue expenditure as Capital Expenditure
(` in crore)
Sl.
No.
Object
Head
Object Head Nomenclature Grant Number Budget
Provision
for 2019-20
Actual
Expenditure
in 2019-20
1 15 Maintenance of Vehicles and
Purchase of Petrol etc.: This includes provision for
petrol/diesel and maintenance
related to motor vehicles for the use
of government offices/ functional
establishments/guest houses etc.
The expenditure on the arrangement
of motor vehicles on the contract
basis for government purpose is also
included under this item.
60 0.11 0.10
2. 16 Payment for commercial and
special services:
This includes expenses on legal/
expert services, fee for consultancy
services, dues to examiners etc.
61 and 72 9.27 3.81
3. 25 Minor construction works:
As provided in Financial Hand
Book Vol- VI para 314, works
costing more than ` 1.00 lakh but
not more than ` 2.00 lakh are minor
works
01, 04, 08, 10, 11, 13,
20, 22, 25, 26, 31, 32,
34, 36, 42, 46, 49, 50,
52, 55, 58, 59, 60, 65,
69, 72, 73, 75, 77, 81,
83, 87, 89, 92 and 94
92.76 73.00
4. 47 Computer Maintenance / Purchase of
relevant Stationery:
This includes expenditure on
maintenance of computers and on
the purchase of computer stationery,
printer ribbon/cartridges etc.
58, 72 and 73 0.24 0.10
Total 102.38 77.01
Thus, due to misclassification, expenditure of ` 77.01 crore has been booked
as Capital expenditure instead of Revenue having an impact on the Revenue
surplus of the State during 2019-20 by the same amount.
Chapter III – Budgetary Management
71
3.2.2.2 Misclassification of expenditure relating to Kumbh Mela
Misclassification of expenditure on Kumbh Mela led to booking of
` 15.21 crore as Capital expenditure instead of Revenue expenditure
Rule 30 of Government Accounting Rules, 1990 provides that expenditure of a
capital nature to be classified in the Capital Section shall be broadly defined as
expenditure incurred with the object of increasing concrete assets of a material
and permanent character. Further, expenditure on a temporary asset cannot
ordinarily be classifiable as capital expenditure, and shall not, except in cases
specifically authorised by the President on the advice of Comptroller and
Auditor General, be debited to a capital head of account.
During scrutiny of Appropriation Accounts it was noticed that a sum of
` 349 crore was allocated in Supplementary Budget (July 2019) under Capital
Account of Grant 37 (Urban Development Department) for Kumbh Mela-2019
held at Prayagraj during 15 January 2019 to 4 March 2019, as detailed below.
Head of Account Details
Grant No. 37
Head of Account - 4070-800-
06-24
Capital Outlay on other Administrative Service-Other
Expenditure - Kumbh Mela 2019, Prayagraj - Major
Construction Work
Subsequently, a sum of ` 161.98 crore out of this supplementary allocation
was surrendered on 31 March 2020 as an economy measure. However,
expenditure of ` 437.61 crore was incurred with a resultant excess expenditure
of ` 250.59 crore for which no reason has been intimated by the Government.
Test check of vouchers of expenditure from this supplementary provision for
Kumbh Mela revealed that against the provisions for executing capital works,
works of temporary nature (such as constructing temporary jetties, river
dredging, putting up signage work in mela area and approach road, etc.)
amounting to ` 15.21 crore were carried out. Expenditure of this nature should
have been budgeted and expended from revenue head of expenditure. This
misclassification has an impact of increasing revenue surplus during 2019-20
by ` 15.21 crore. The budgetary classification and nature of expenditure in the
instant case does not conform to the laid down guidelines of classification of
Capital/Revenue expenditure. The Government should, therefore, review the
remaining expenditure on Kumbh Mela 2019 to ascertain if the same has been
budgeted and classified as per the laid down provisions
The matter was reported to the Government (November 2020); their reply is
awaited (July 2021).
3.2.2.3 Classification of Capital Expenditure as Revenue Expenditure
Certain Object heads can only be associated with capital nature of expenditure
since assets are created from these provisions and need to be budgeted and
accounted for accordingly.
Audit scrutiny revealed that expenditure on such Object heads were classified
under Revenue head instead of Capital as summarised in Table 3.4.
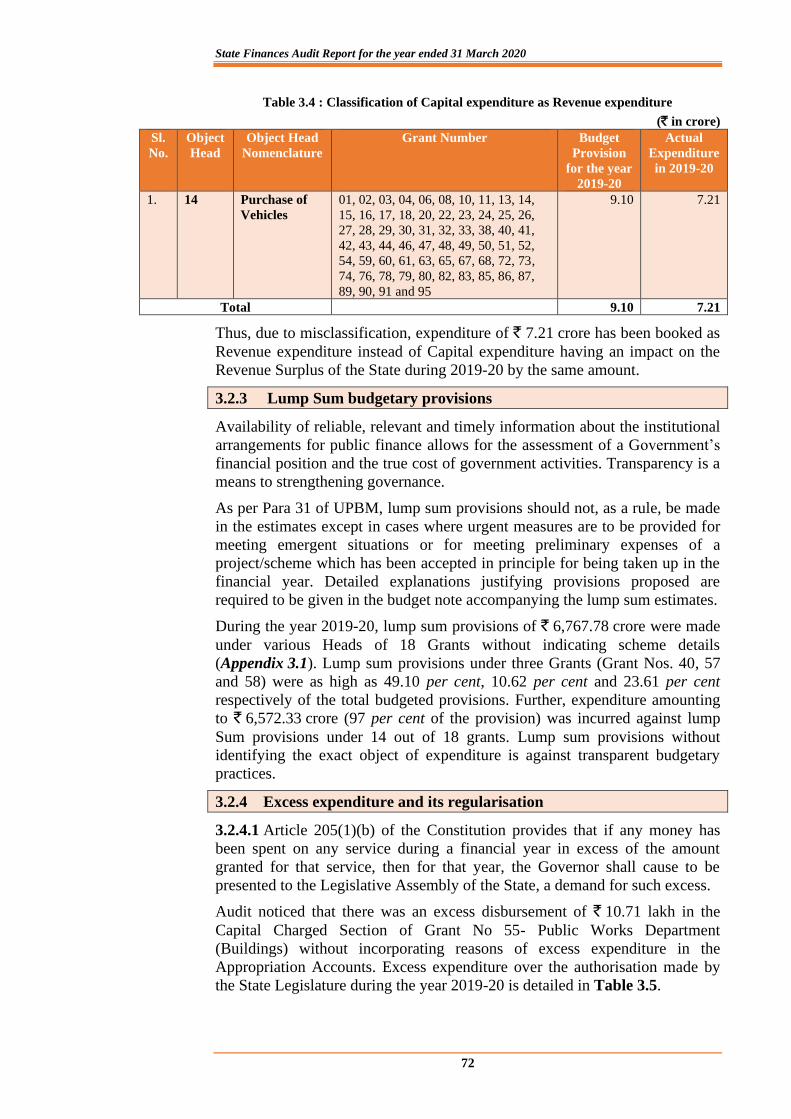
State Finances Audit Report for the year ended 31 March 2020
72
Table 3.4 : Classification of Capital expenditure as Revenue expenditure
(` in crore)
Sl.
No.
Object
Head
Object Head
Nomenclature
Grant Number Budget
Provision
for the year
2019-20
Actual
Expenditure
in 2019-20
1. 14 Purchase of
Vehicles
01, 02, 03, 04, 06, 08, 10, 11, 13, 14,
15, 16, 17, 18, 20, 22, 23, 24, 25, 26,
27, 28, 29, 30, 31, 32, 33, 38, 40, 41,
42, 43, 44, 46, 47, 48, 49, 50, 51, 52,
54, 59, 60, 61, 63, 65, 67, 68, 72, 73,
74, 76, 78, 79, 80, 82, 83, 85, 86, 87,
89, 90, 91 and 95
9.10 7.21
Total 9.10 7.21
Thus, due to misclassification, expenditure of ` 7.21 crore has been booked as
Revenue expenditure instead of Capital expenditure having an impact on the
Revenue Surplus of the State during 2019-20 by the same amount.
3.2.3 Lump Sum budgetary provisions
Availability of reliable, relevant and timely information about the institutional
arrangements for public finance allows for the assessment of a Government’s
financial position and the true cost of government activities. Transparency is a
means to strengthening governance.
As per Para 31 of UPBM, lump sum provisions should not, as a rule, be made
in the estimates except in cases where urgent measures are to be provided for
meeting emergent situations or for meeting preliminary expenses of a
project/scheme which has been accepted in principle for being taken up in the
financial year. Detailed explanations justifying provisions proposed are
required to be given in the budget note accompanying the lump sum estimates.
During the year 2019-20, lump sum provisions of ` 6,767.78 crore were made
under various Heads of 18 Grants without indicating scheme details
(Appendix 3.1). Lump sum provisions under three Grants (Grant Nos. 40, 57
and 58) were as high as 49.10 per cent, 10.62 per cent and 23.61 per cent
respectively of the total budgeted provisions. Further, expenditure amounting
to ` 6,572.33 crore (97 per cent of the provision) was incurred against lump
Sum provisions under 14 out of 18 grants. Lump sum provisions without
identifying the exact object of expenditure is against transparent budgetary
practices.
3.2.4 Excess expenditure and its regularisation
3.2.4.1 Article 205(1)(b) of the Constitution provides that if any money has
been spent on any service during a financial year in excess of the amount
granted for that service, then for that year, the Governor shall cause to be
presented to the Legislative Assembly of the State, a demand for such excess.
Audit noticed that there was an excess disbursement of ` 10.71 lakh in the
Capital Charged Section of Grant No 55- Public Works Department
(Buildings) without incorporating reasons of excess expenditure in the
Appropriation Accounts. Excess expenditure over the authorisation made by
the State Legislature during the year 2019-20 is detailed in Table 3.5.
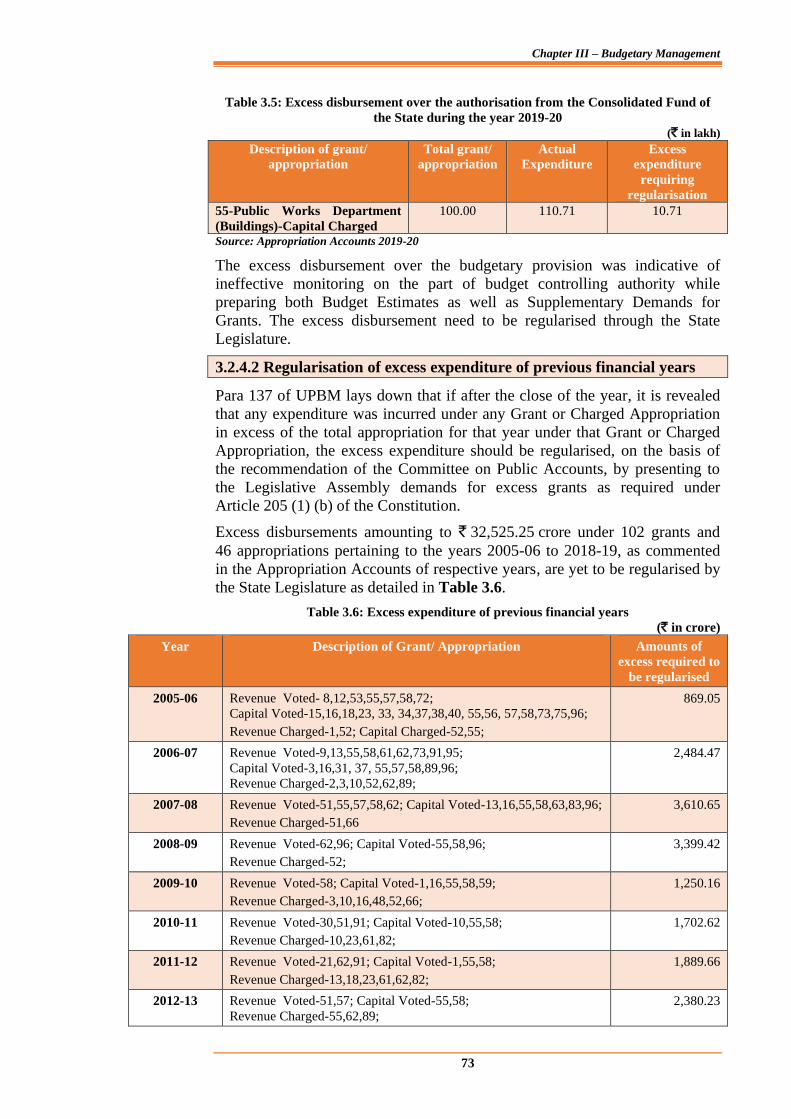
Chapter III – Budgetary Management
73
Table 3.5: Excess disbursement over the authorisation from the Consolidated Fund of
the State during the year 2019-20
(` in lakh)
Description of grant/
appropriation
Total grant/
appropriation
Actual
Expenditure
Excess
expenditure
requiring
regularisation
55-Public Works Department
(Buildings)-Capital Charged
100.00 110.71 10.71
Source: Appropriation Accounts 2019-20
The excess disbursement over the budgetary provision was indicative of
ineffective monitoring on the part of budget controlling authority while
preparing both Budget Estimates as well as Supplementary Demands for
Grants. The excess disbursement need to be regularised through the State
Legislature.
3.2.4.2 Regularisation of excess expenditure of previous financial years
Para 137 of UPBM lays down that if after the close of the year, it is revealed
that any expenditure was incurred under any Grant or Charged Appropriation
in excess of the total appropriation for that year under that Grant or Charged
Appropriation, the excess expenditure should be regularised, on the basis of
the recommendation of the Committee on Public Accounts, by presenting to
the Legislative Assembly demands for excess grants as required under
Article 205 (1) (b) of the Constitution.
Excess disbursements amounting to ` 32,525.25 crore under 102 grants and
46 appropriations pertaining to the years 2005-06 to 2018-19, as commented
in the Appropriation Accounts of respective years, are yet to be regularised by
the State Legislature as detailed in Table 3.6.
Table 3.6: Excess expenditure of previous financial years
(` in crore)
Year Description of Grant/ Appropriation Amounts of
excess required to
be regularised
2005-06 Revenue Voted- 8,12,53,55,57,58,72;
Capital Voted-15,16,18,23, 33, 34,37,38,40, 55,56, 57,58,73,75,96;
Revenue Charged-1,52; Capital Charged-52,55;
869.05
2006-07 Revenue Voted-9,13,55,58,61,62,73,91,95;
Capital Voted-3,16,31, 37, 55,57,58,89,96;
Revenue Charged-2,3,10,52,62,89;
2,484.47
2007-08 Revenue Voted-51,55,57,58,62; Capital Voted-13,16,55,58,63,83,96;
Revenue Charged-51,66
3,610.65
2008-09 Revenue Voted-62,96; Capital Voted-55,58,96;
Revenue Charged-52;
3,399.42
2009-10 Revenue Voted-58; Capital Voted-1,16,55,58,59;
Revenue Charged-3,10,16,48,52,66;
1,250.16
2010-11 Revenue Voted-30,51,91; Capital Voted-10,55,58;
Revenue Charged-10,23,61,82;
1,702.62
2011-12 Revenue Voted-21,62,91; Capital Voted-1,55,58;
Revenue Charged-13,18,23,61,62,82;
1,889.66
2012-13 Revenue Voted-51,57; Capital Voted-55,58;
Revenue Charged-55,62,89;
2,380.23
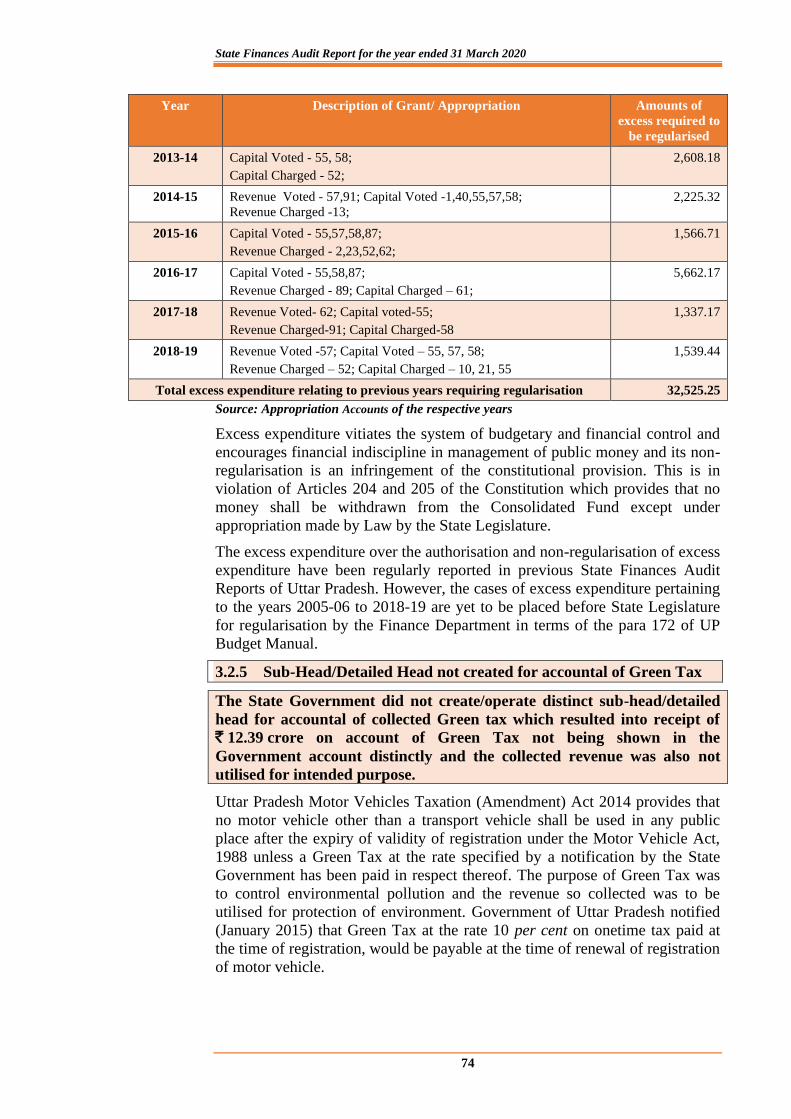
State Finances Audit Report for the year ended 31 March 2020
74
Year Description of Grant/ Appropriation Amounts of
excess required to
be regularised
2013-14 Capital Voted - 55, 58;
Capital Charged - 52;
2,608.18
2014-15 Revenue Voted - 57,91; Capital Voted -1,40,55,57,58;
Revenue Charged -13;
2,225.32
2015-16 Capital Voted - 55,57,58,87;
Revenue Charged - 2,23,52,62;
1,566.71
2016-17 Capital Voted - 55,58,87;
Revenue Charged - 89; Capital Charged – 61;
5,662.17
2017-18 Revenue Voted- 62; Capital voted-55;
Revenue Charged-91; Capital Charged-58
1,337.17
2018-19 Revenue Voted -57; Capital Voted – 55, 57, 58;
Revenue Charged – 52; Capital Charged – 10, 21, 55
1,539.44
Total excess expenditure relating to previous years requiring regularisation 32,525.25
Source: Appropriation Accounts of the respective years
Excess expenditure vitiates the system of budgetary and financial control and
encourages financial indiscipline in management of public money and its non-
regularisation is an infringement of the constitutional provision. This is in
violation of Articles 204 and 205 of the Constitution which provides that no
money shall be withdrawn from the Consolidated Fund except under
appropriation made by Law by the State Legislature.
The excess expenditure over the authorisation and non-regularisation of excess
expenditure have been regularly reported in previous State Finances Audit
Reports of Uttar Pradesh. However, the cases of excess expenditure pertaining
to the years 2005-06 to 2018-19 are yet to be placed before State Legislature
for regularisation by the Finance Department in terms of the para 172 of UP
Budget Manual.
3.2.5 Sub-Head/Detailed Head not created for accountal of Green Tax
The State Government did not create/operate distinct sub-head/detailed
head for accountal of collected Green tax which resulted into receipt of
` 12.39 crore on account of Green Tax not being shown in the
Government account distinctly and the collected revenue was also not
utilised for intended purpose.
Uttar Pradesh Motor Vehicles Taxation (Amendment) Act 2014 provides that
no motor vehicle other than a transport vehicle shall be used in any public
place after the expiry of validity of registration under the Motor Vehicle Act,
1988 unless a Green Tax at the rate specified by a notification by the State
Government has been paid in respect thereof. The purpose of Green Tax was
to control environmental pollution and the revenue so collected was to be
utilised for protection of environment. Government of Uttar Pradesh notified
(January 2015) that Green Tax at the rate 10 per cent on onetime tax paid at
the time of registration, would be payable at the time of renewal of registration
of motor vehicle.
Chapter III – Budgetary Management
75
Information provided by Transport Commissioner, Government of Uttar
Pradesh revealed that the Transport Department had realised Green Tax
amounting to ` 12.39 crore47 during the period 2015-16 to 2019-20. Audit
scrutiny revealed that no separate sub-head/detailed head has been created for
accountal of Green Tax and therefore, the same was deposited in the Major
Head-0041-Vehicle Tax along with other taxes levied by the State
Government. The aforesaid collected Green Tax was also not being utilised for
protection of the environment since no budgetary allocation had been made for
it. Thus, the stated objective of controlling environmental pollution by
utilising revenue so received from the Green tax was not being met.
The matter was reported to the Government (January 2021); their reply is
awaited (July 2021).
3.2.6 Non-operation of Major Head 2043-Collection Charges under
State Goods and Service Tax
Para 21 of UPBM states that the List of Major and Minor heads of account of
State receipts and disbursements, as prescribed by the Controller General of
Accounts (CGA), Department of Expenditure, Ministry of Finance,
Government of India on the advice of the Comptroller and Auditor General of
India in terms of Article 150 of the Constitution of India should be used for
the classification of heads of account. Further, Rule 26 of Government
Accounting Rules 1990 prescribes that the classification prescribed in the List
of Major and Minor Heads of Accounts of Union and States (including the
code number assigned up to the major heads and minor heads thereunder)
should be strictly followed. The CGA opened (June 2017) new Major Head
2043-Collection Charges under State Goods and Service Tax for booking of
expenditure related to State Goods and Service Tax (SGST) with effect from
financial year 2017-18. However, it was observed that the State Government
had not operated MH 2043 and instead, the expenditure related to SGST
collection were being incorrectly booked under MH 2040 (Taxes on Sales,
Trades, etc) in Grant No. 89 (Institutional Finance Department), which is in
violation of Rule 26 of Government Accounting Rules 1990.
The matter was reported to the Government (September 2020); their reply is
awaited (July 2021)
3.2.7 Discrepancy in depiction of Central Schemes/Centrally Sponsored
Schemes
The accounts of the Government follow a six-tier classification structure. The
manner of depicting the budgetary provisions in Budget documents is
mentioned in the Preface to the Budget Documents.
The Uttar Pradesh Budget Manual and the Guidelines issued for preparation of
Budget provide that the budget provisions should be made with specified
funding pattern (Central share/ State share/Financial Institution) with detailed
head under sub-head 01 or 02 in respect of Central schemes/ Central
Sponsored Schemes.
47 Year-wise Green Tax realised was: year 2015-16 - ` 1.49 crore, year 2016-17 -
` 1.72 crore, year 2017-18 - ` 2.12 crore, year 2018-19 - ` 2.66 crore and year 2019-20 -
` 4.40 crore.
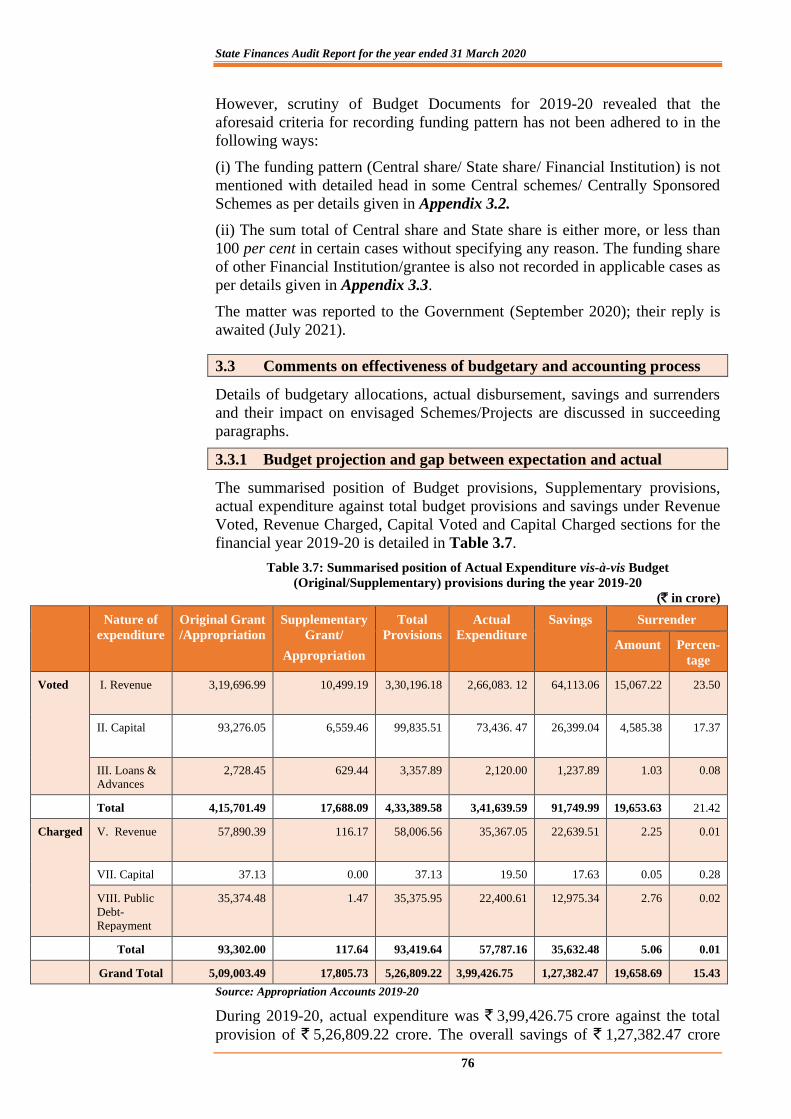
State Finances Audit Report for the year ended 31 March 2020
76
However, scrutiny of Budget Documents for 2019-20 revealed that the
aforesaid criteria for recording funding pattern has not been adhered to in the
following ways:
(i) The funding pattern (Central share/ State share/ Financial Institution) is not
mentioned with detailed head in some Central schemes/ Centrally Sponsored
Schemes as per details given in Appendix 3.2.
(ii) The sum total of Central share and State share is either more, or less than
100 per cent in certain cases without specifying any reason. The funding share
of other Financial Institution/grantee is also not recorded in applicable cases as
per details given in Appendix 3.3.
The matter was reported to the Government (September 2020); their reply is
awaited (July 2021).
3.3 Comments on effectiveness of budgetary and accounting process
Details of budgetary allocations, actual disbursement, savings and surrenders
and their impact on envisaged Schemes/Projects are discussed in succeeding
paragraphs.
3.3.1 Budget projection and gap between expectation and actual
The summarised position of Budget provisions, Supplementary provisions,
actual expenditure against total budget provisions and savings under Revenue
Voted, Revenue Charged, Capital Voted and Capital Charged sections for the
financial year 2019-20 is detailed in Table 3.7.
Table 3.7: Summarised position of Actual Expenditure vis-à-vis Budget
(Original/Supplementary) provisions during the year 2019-20
(` in crore)
Nature of
expenditure
Original Grant
/Appropriation
Supplementary
Grant/
Appropriation
Total
Provisions
Actual
Expenditure
Savings
Surrender
Amount Percen-
tage
Voted I. Revenue 3,19,696.99 10,499.19 3,30,196.18 2,66,083. 12
64,113.06
15,067.22 23.50
II. Capital 93,276.05 6,559.46 99,835.51 73,436. 47
26,399.04
4,585.38 17.37
III. Loans &
Advances
2,728.45 629.44 3,357.89 2,120.00 1,237.89 1.03 0.08
Total 4,15,701.49 17,688.09 4,33,389.58 3,41,639.59 91,749.99 19,653.63 21.42
Charged V. Revenue 57,890.39 116.17 58,006.56 35,367.05 22,639.51
2.25 0.01
VII. Capital 37.13 0.00 37.13 19.50 17.63 0.05 0.28
VIII. Public
Debt-
Repayment
35,374.48 1.47 35,375.95 22,400.61 12,975.34 2.76 0.02
Total 93,302.00 117.64 93,419.64 57,787.16 35,632.48 5.06 0.01
Grand Total 5,09,003.49 17,805.73 5,26,809.22 3,99,426.75 1,27,382.47 19,658.69 15.43
Source: Appropriation Accounts 2019-20
During 2019-20, actual expenditure was ` 3,99,426.75 crore against the total
provision of ` 5,26,809.22 crore. The overall savings of ` 1,27,382.47 crore

Chapter III – Budgetary Management
77
was 24.18 per cent of total provision, which included savings under Revenue
Voted (19.42 per cent), Capital Voted (26.44 per cent) and Revenue Charged
(39.03 per cent) sections. This indicated wide gap between planning and
execution by the State Government.
3.3.2 Budget Provision, Actual Expenditure and Savings during the last
five years (2015-20)
The budget provision, actual expenditure and savings during the last five years
(2015-20) is presented in Table 3.8.
Table 3.8: Details of Original budget, actual expenditure and savings
during the period 2015-20
(` in crore)
Particulars 2015-16 2016-17 2017-18 2018-19 2019-20
Original Budget 3,15,221.94 3,60,797.65 4,17,256.95 4,56,248.38 5,09,003.49
Supplementary
Budget
47,583.96 27,030.98 11,388.17 42,887.73 17,805.73
Total Budget 3,62,805.90 3,87,828.63 4,28,645.12 4,99,136.11 5,26,809.22
Actual Expenditure 3,18,412.23 3,49,232.60 3,34,876.62 4,09,784.50 3,99,426.75
Saving /excess 44,393.67 38,596.03 93,768.50 89,351.61 1,27,382.47
Percentage of
Saving
12.24 9.95 21.88 17.90 24.18
Source: Appropriation Accounts of the respective years
The above table indicates that during the period 2015-20, savings
(underutilisation of funds) varied between 9.95 per cent (2016-17) to 24.18
per cent (2019-20) of budget provisions. Pattern of lower budget utilisation
against provision during the last five years (2015-20) can also be visualised in
Chart 3.1.
Chart 3.1: Budget provisions and utilisation of budget during last five years (2015-20)
The above chart shows the budgetary provisions have increased consistently
during the last five years (2015-20) but utilisation of budget ranged between
76 per cent (2019-20) and 90 per cent (2016-17). There was a reduction of
` 10,358 crore (2.53 per cent) in expenditure during the year 2019-20 over the
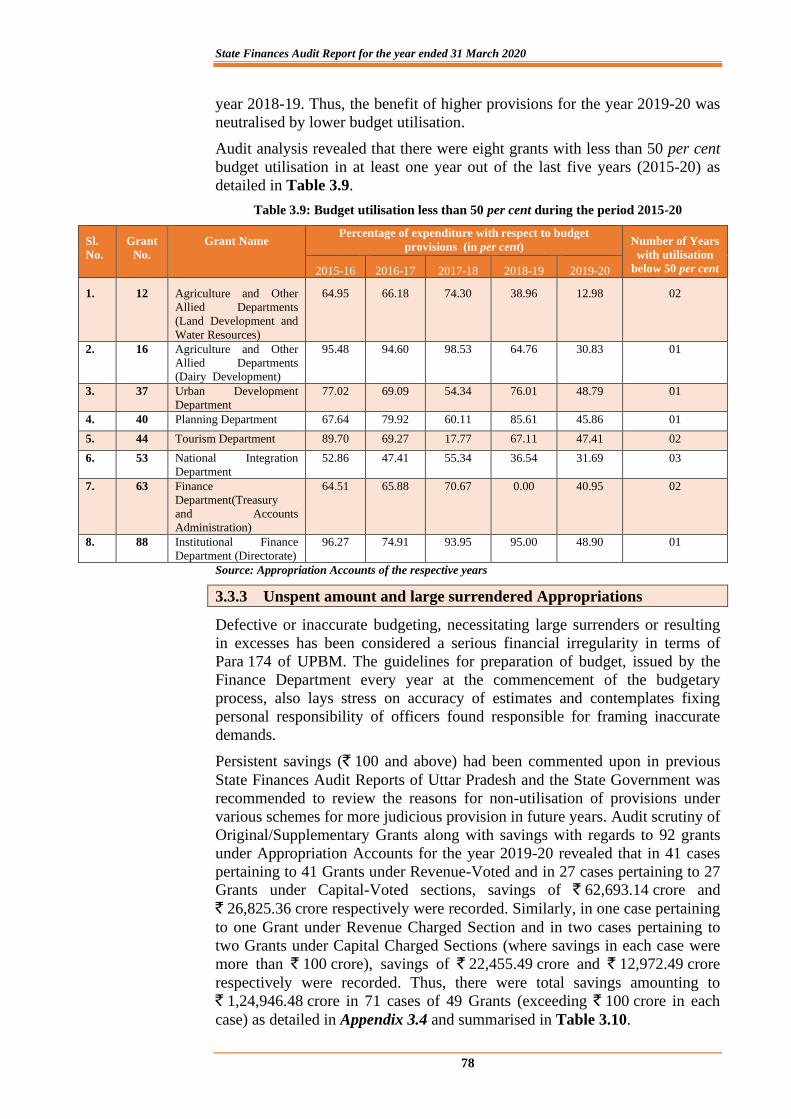
State Finances Audit Report for the year ended 31 March 2020
78
year 2018-19. Thus, the benefit of higher provisions for the year 2019-20 was
neutralised by lower budget utilisation.
Audit analysis revealed that there were eight grants with less than 50 per cent
budget utilisation in at least one year out of the last five years (2015-20) as
detailed in Table 3.9.
Table 3.9: Budget utilisation less than 50 per cent during the period 2015-20
Sl.
No.
Grant
No.
Grant Name Percentage of expenditure with respect to budget
provisions (in per cent) Number of Years
with utilisation
below 50 per cent 2015-16 2016-17 2017-18 2018-19 2019-20
1. 12 Agriculture and Other
Allied Departments
(Land Development and
Water Resources)
64.95 66.18 74.30 38.96 12.98 02
2. 16 Agriculture and Other
Allied Departments
(Dairy Development)
95.48 94.60 98.53 64.76 30.83 01
3. 37 Urban Development
Department
77.02 69.09 54.34 76.01 48.79 01
4. 40 Planning Department 67.64 79.92 60.11 85.61 45.86 01
5. 44 Tourism Department 89.70 69.27 17.77 67.11 47.41 02
6. 53 National Integration
Department
52.86 47.41 55.34 36.54 31.69 03
7. 63 Finance
Department(Treasury
and Accounts
Administration)
64.51 65.88 70.67 0.00 40.95 02
8. 88 Institutional Finance
Department (Directorate)
96.27 74.91 93.95 95.00 48.90 01
Source: Appropriation Accounts of the respective years
3.3.3 Unspent amount and large surrendered Appropriations
Defective or inaccurate budgeting, necessitating large surrenders or resulting
in excesses has been considered a serious financial irregularity in terms of
Para 174 of UPBM. The guidelines for preparation of budget, issued by the
Finance Department every year at the commencement of the budgetary
process, also lays stress on accuracy of estimates and contemplates fixing
personal responsibility of officers found responsible for framing inaccurate
demands.
Persistent savings (` 100 and above) had been commented upon in previous
State Finances Audit Reports of Uttar Pradesh and the State Government was
recommended to review the reasons for non-utilisation of provisions under
various schemes for more judicious provision in future years. Audit scrutiny of
Original/Supplementary Grants along with savings with regards to 92 grants
under Appropriation Accounts for the year 2019-20 revealed that in 41 cases
pertaining to 41 Grants under Revenue-Voted and in 27 cases pertaining to 27
Grants under Capital-Voted sections, savings of ` 62,693.14 crore and
` 26,825.36 crore respectively were recorded. Similarly, in one case pertaining
to one Grant under Revenue Charged Section and in two cases pertaining to
two Grants under Capital Charged Sections (where savings in each case were
more than ` 100 crore), savings of ` 22,455.49 crore and ` 12,972.49 crore
respectively were recorded. Thus, there were total savings amounting to
` 1,24,946.48 crore in 71 cases of 49 Grants (exceeding ` 100 crore in each
case) as detailed in Appendix 3.4 and summarised in Table 3.10.
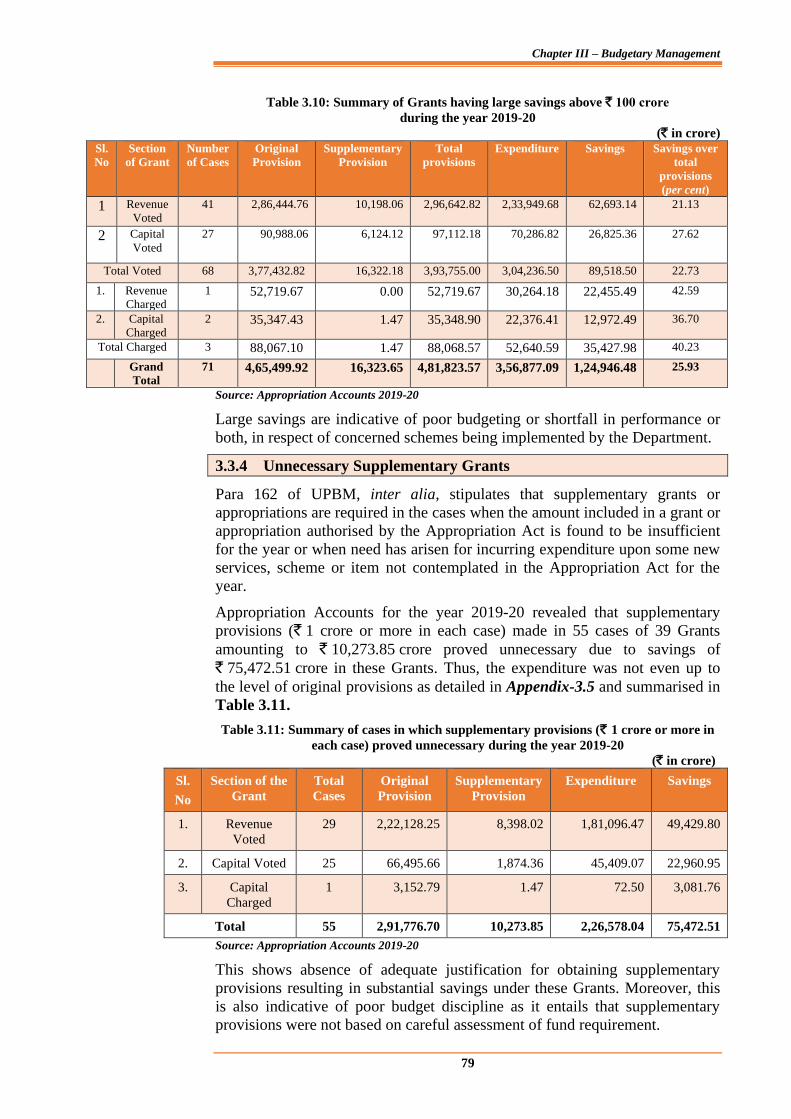
Chapter III – Budgetary Management
79
Table 3.10: Summary of Grants having large savings above ` 100 crore during the year 2019-20
(` in crore)
Sl.
No
Section
of Grant
Number
of Cases
Original
Provision
Supplementary
Provision
Total
provisions
Expenditure Savings Savings over
total
provisions
(per cent)
1 Revenue
Voted
41 2,86,444.76 10,198.06 2,96,642.82 2,33,949.68 62,693.14 21.13
2 Capital
Voted
27 90,988.06 6,124.12 97,112.18 70,286.82 26,825.36 27.62
Total Voted 68 3,77,432.82 16,322.18 3,93,755.00 3,04,236.50 89,518.50 22.73
1. Revenue
Charged
1 52,719.67 0.00 52,719.67 30,264.18 22,455.49 42.59
2. Capital
Charged
2 35,347.43 1.47 35,348.90 22,376.41 12,972.49 36.70
Total Charged 3 88,067.10 1.47 88,068.57 52,640.59 35,427.98 40.23
Grand
Total
71 4,65,499.92 16,323.65 4,81,823.57 3,56,877.09 1,24,946.48 25.93
Source: Appropriation Accounts 2019-20
Large savings are indicative of poor budgeting or shortfall in performance or
both, in respect of concerned schemes being implemented by the Department.
3.3.4 Unnecessary Supplementary Grants
Para 162 of UPBM, inter alia, stipulates that supplementary grants or
appropriations are required in the cases when the amount included in a grant or
appropriation authorised by the Appropriation Act is found to be insufficient
for the year or when need has arisen for incurring expenditure upon some new
services, scheme or item not contemplated in the Appropriation Act for the
year.
Appropriation Accounts for the year 2019-20 revealed that supplementary
provisions (` 1 crore or more in each case) made in 55 cases of 39 Grants
amounting to ` 10,273.85 crore proved unnecessary due to savings of
` 75,472.51 crore in these Grants. Thus, the expenditure was not even up to
the level of original provisions as detailed in Appendix-3.5 and summarised in
Table 3.11.
Table 3.11: Summary of cases in which supplementary provisions (` 1 crore or more in
each case) proved unnecessary during the year 2019-20
(` in crore)
Sl.
No
Section of the
Grant
Total
Cases
Original
Provision
Supplementary
Provision
Expenditure Savings
1. Revenue
Voted
29 2,22,128.25 8,398.02 1,81,096.47 49,429.80
2. Capital Voted 25 66,495.66 1,874.36 45,409.07 22,960.95
3. Capital
Charged
1 3,152.79 1.47 72.50 3,081.76
Total 55 2,91,776.70 10,273.85 2,26,578.04 75,472.51
Source: Appropriation Accounts 2019-20
This shows absence of adequate justification for obtaining supplementary
provisions resulting in substantial savings under these Grants. Moreover, this
is also indicative of poor budget discipline as it entails that supplementary
provisions were not based on careful assessment of fund requirement.
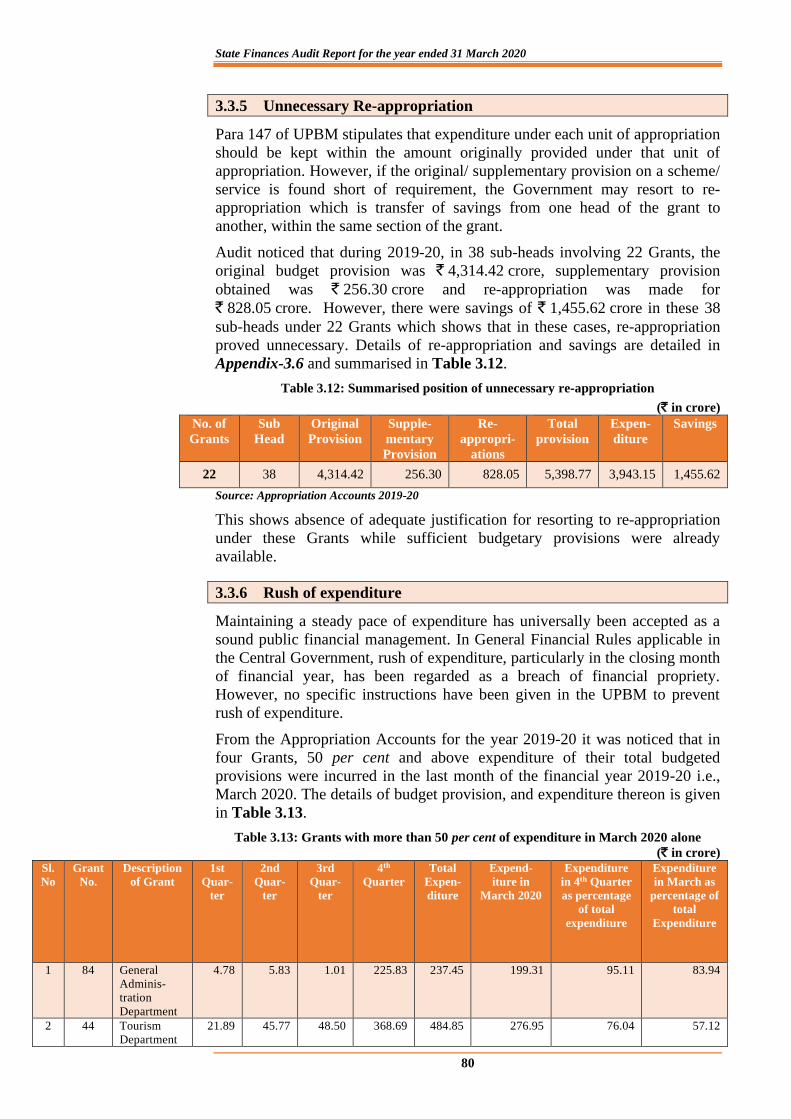
State Finances Audit Report for the year ended 31 March 2020
80
3.3.5 Unnecessary Re-appropriation
Para 147 of UPBM stipulates that expenditure under each unit of appropriation
should be kept within the amount originally provided under that unit of
appropriation. However, if the original/ supplementary provision on a scheme/
service is found short of requirement, the Government may resort to re-
appropriation which is transfer of savings from one head of the grant to
another, within the same section of the grant.
Audit noticed that during 2019-20, in 38 sub-heads involving 22 Grants, the
original budget provision was ` 4,314.42 crore, supplementary provision
obtained was ` 256.30 crore and re-appropriation was made for
` 828.05 crore. However, there were savings of ` 1,455.62 crore in these 38
sub-heads under 22 Grants which shows that in these cases, re-appropriation
proved unnecessary. Details of re-appropriation and savings are detailed in
Appendix-3.6 and summarised in Table 3.12.
Table 3.12: Summarised position of unnecessary re-appropriation
(` in crore)
No. of
Grants
Sub
Head
Original
Provision
Supple-
mentary
Provision
Re-
appropri-
ations
Total
provision
Expen-
diture
Savings
22 38 4,314.42 256.30 828.05 5,398.77 3,943.15 1,455.62
Source: Appropriation Accounts 2019-20
This shows absence of adequate justification for resorting to re-appropriation
under these Grants while sufficient budgetary provisions were already
available.
3.3.6 Rush of expenditure
Maintaining a steady pace of expenditure has universally been accepted as a
sound public financial management. In General Financial Rules applicable in
the Central Government, rush of expenditure, particularly in the closing month
of financial year, has been regarded as a breach of financial propriety.
However, no specific instructions have been given in the UPBM to prevent
rush of expenditure.
From the Appropriation Accounts for the year 2019-20 it was noticed that in
four Grants, 50 per cent and above expenditure of their total budgeted
provisions were incurred in the last month of the financial year 2019-20 i.e.,
March 2020. The details of budget provision, and expenditure thereon is given
in Table 3.13.
Table 3.13: Grants with more than 50 per cent of expenditure in March 2020 alone
(` in crore)
Sl.
No
Grant
No.
Description
of Grant
1st
Quar-
ter
2nd
Quar-
ter
3rd
Quar-
ter
4th
Quarter
Total
Expen-
diture
Expend-
iture in
March 2020
Expenditure
in 4th Quarter
as percentage
of total
expenditure
Expenditure
in March as
percentage of
total
Expenditure
1 84 General
Adminis-
tration
Department
4.78 5.83 1.01 225.83 237.45 199.31 95.11 83.94
2 44 Tourism
Department
21.89 45.77 48.50 368.69 484.85 276.95 76.04 57.12
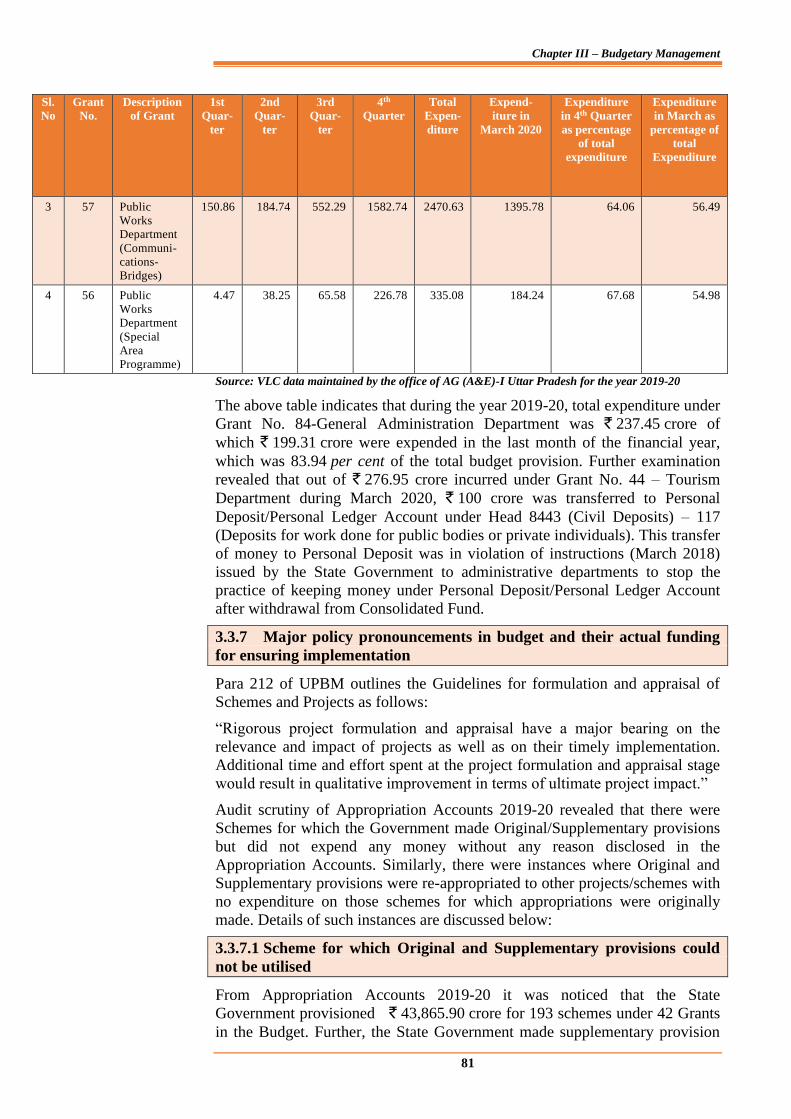
Chapter III – Budgetary Management
81
Sl.
No
Grant
No.
Description
of Grant
1st
Quar-
ter
2nd
Quar-
ter
3rd
Quar-
ter
4th
Quarter
Total
Expen-
diture
Expend-
iture in
March 2020
Expenditure
in 4th Quarter
as percentage
of total
expenditure
Expenditure
in March as
percentage of
total
Expenditure
3 57 Public
Works
Department
(Communi-
cations-
Bridges)
150.86 184.74 552.29 1582.74 2470.63 1395.78 64.06 56.49
4 56 Public
Works
Department
(Special
Area
Programme)
4.47 38.25 65.58 226.78 335.08 184.24 67.68 54.98
Source: VLC data maintained by the office of AG (A&E)-I Uttar Pradesh for the year 2019-20
The above table indicates that during the year 2019-20, total expenditure under
Grant No. 84-General Administration Department was ` 237.45 crore of
which ` 199.31 crore were expended in the last month of the financial year,
which was 83.94 per cent of the total budget provision. Further examination
revealed that out of ` 276.95 crore incurred under Grant No. 44 – Tourism
Department during March 2020, ` 100 crore was transferred to Personal
Deposit/Personal Ledger Account under Head 8443 (Civil Deposits) – 117
(Deposits for work done for public bodies or private individuals). This transfer
of money to Personal Deposit was in violation of instructions (March 2018)
issued by the State Government to administrative departments to stop the
practice of keeping money under Personal Deposit/Personal Ledger Account
after withdrawal from Consolidated Fund.
3.3.7 Major policy pronouncements in budget and their actual funding
for ensuring implementation
Para 212 of UPBM outlines the Guidelines for formulation and appraisal of
Schemes and Projects as follows:
“Rigorous project formulation and appraisal have a major bearing on the
relevance and impact of projects as well as on their timely implementation.
Additional time and effort spent at the project formulation and appraisal stage
would result in qualitative improvement in terms of ultimate project impact.”
Audit scrutiny of Appropriation Accounts 2019-20 revealed that there were
Schemes for which the Government made Original/Supplementary provisions
but did not expend any money without any reason disclosed in the
Appropriation Accounts. Similarly, there were instances where Original and
Supplementary provisions were re-appropriated to other projects/schemes with
no expenditure on those schemes for which appropriations were originally
made. Details of such instances are discussed below:
3.3.7.1 Scheme for which Original and Supplementary provisions could
not be utilised
From Appropriation Accounts 2019-20 it was noticed that the State
Government provisioned ` 43,865.90 crore for 193 schemes under 42 Grants
in the Budget. Further, the State Government made supplementary provision
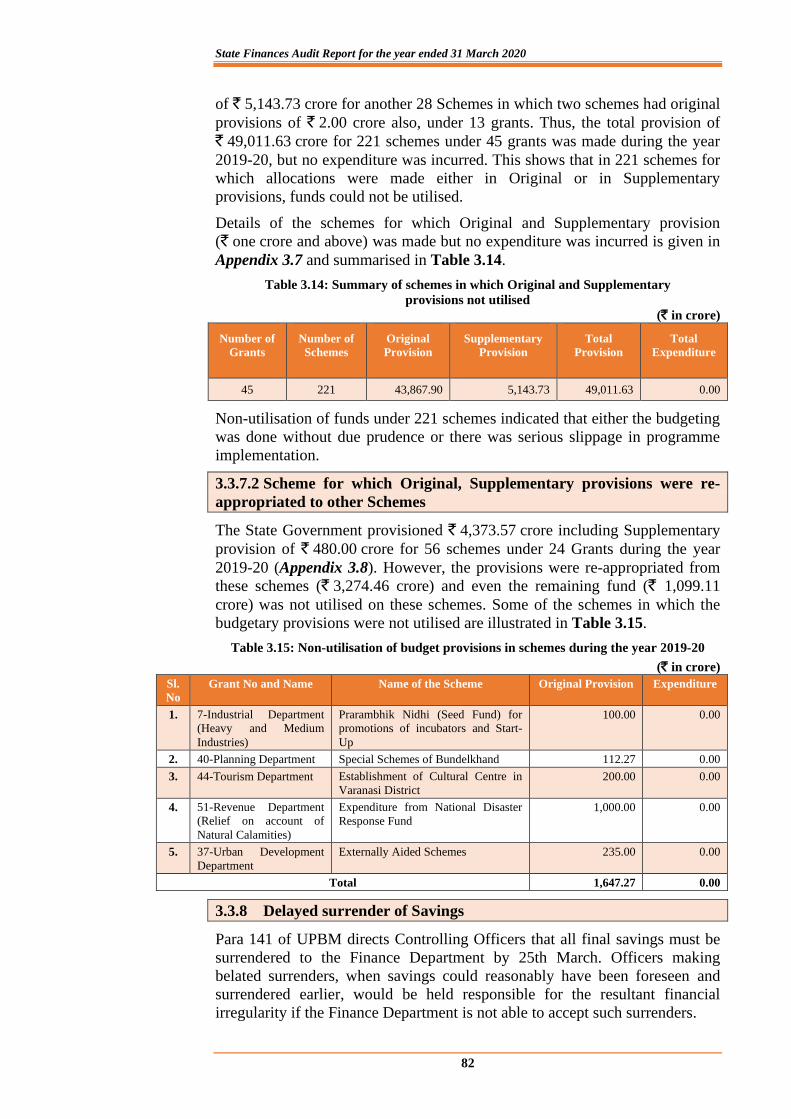
State Finances Audit Report for the year ended 31 March 2020
82
of ` 5,143.73 crore for another 28 Schemes in which two schemes had original
provisions of ` 2.00 crore also, under 13 grants. Thus, the total provision of
` 49,011.63 crore for 221 schemes under 45 grants was made during the year
2019-20, but no expenditure was incurred. This shows that in 221 schemes for
which allocations were made either in Original or in Supplementary
provisions, funds could not be utilised.
Details of the schemes for which Original and Supplementary provision
(` one crore and above) was made but no expenditure was incurred is given in
Appendix 3.7 and summarised in Table 3.14.
Table 3.14: Summary of schemes in which Original and Supplementary
provisions not utilised
(` in crore)
Number of
Grants
Number of
Schemes
Original
Provision
Supplementary
Provision
Total
Provision
Total
Expenditure
45 221 43,867.90 5,143.73 49,011.63 0.00
Non-utilisation of funds under 221 schemes indicated that either the budgeting
was done without due prudence or there was serious slippage in programme
implementation.
3.3.7.2 Scheme for which Original, Supplementary provisions were re-
appropriated to other Schemes
The State Government provisioned ` 4,373.57 crore including Supplementary
provision of ` 480.00 crore for 56 schemes under 24 Grants during the year
2019-20 (Appendix 3.8). However, the provisions were re-appropriated from
these schemes (` 3,274.46 crore) and even the remaining fund (` 1,099.11
crore) was not utilised on these schemes. Some of the schemes in which the
budgetary provisions were not utilised are illustrated in Table 3.15.
Table 3.15: Non-utilisation of budget provisions in schemes during the year 2019-20
(` in crore)
Sl.
No
Grant No and Name Name of the Scheme Original Provision Expenditure
1. 7-Industrial Department
(Heavy and Medium
Industries)
Prarambhik Nidhi (Seed Fund) for
promotions of incubators and Start-
Up
100.00 0.00
2. 40-Planning Department Special Schemes of Bundelkhand 112.27 0.00
3. 44-Tourism Department Establishment of Cultural Centre in
Varanasi District
200.00 0.00
4. 51-Revenue Department
(Relief on account of
Natural Calamities)
Expenditure from National Disaster
Response Fund
1,000.00 0.00
5. 37-Urban Development
Department
Externally Aided Schemes 235.00 0.00
Total 1,647.27 0.00
3.3.8 Delayed surrender of Savings
Para 141 of UPBM directs Controlling Officers that all final savings must be
surrendered to the Finance Department by 25th March. Officers making
belated surrenders, when savings could reasonably have been foreseen and
surrendered earlier, would be held responsible for the resultant financial
irregularity if the Finance Department is not able to accept such surrenders.
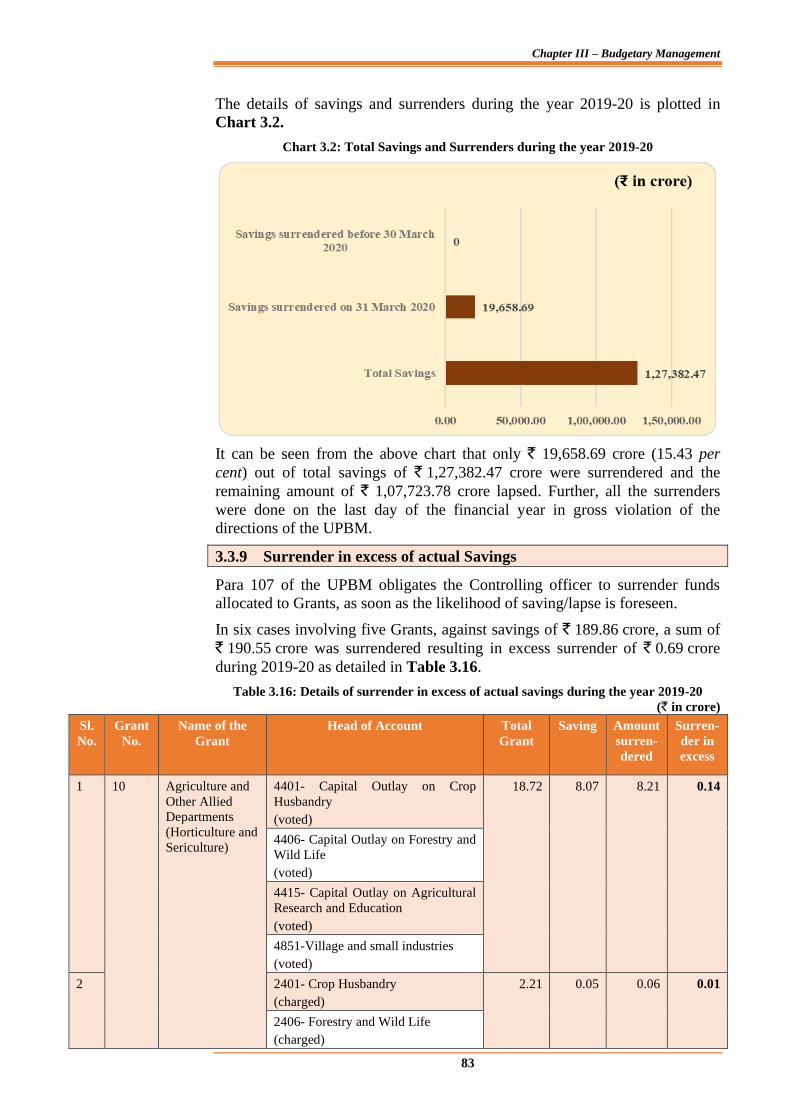
Chapter III – Budgetary Management
83
The details of savings and surrenders during the year 2019-20 is plotted in
Chart 3.2.
Chart 3.2: Total Savings and Surrenders during the year 2019-20
It can be seen from the above chart that only ` 19,658.69 crore (15.43 per
cent) out of total savings of ` 1,27,382.47 crore were surrendered and the
remaining amount of ` 1,07,723.78 crore lapsed. Further, all the surrenders
were done on the last day of the financial year in gross violation of the
directions of the UPBM.
3.3.9 Surrender in excess of actual Savings
Para 107 of the UPBM obligates the Controlling officer to surrender funds
allocated to Grants, as soon as the likelihood of saving/lapse is foreseen.
In six cases involving five Grants, against savings of ` 189.86 crore, a sum of
` 190.55 crore was surrendered resulting in excess surrender of ` 0.69 crore
during 2019-20 as detailed in Table 3.16.
Table 3.16: Details of surrender in excess of actual savings during the year 2019-20
(` in crore)
Sl.
No.
Grant
No.
Name of the
Grant
Head of Account Total
Grant
Saving Amount
surren-
dered
Surren-
der in
excess
1 10 Agriculture and
Other Allied
Departments
(Horticulture and
Sericulture)
4401- Capital Outlay on Crop
Husbandry
(voted)
18.72 8.07 8.21 0.14
4406- Capital Outlay on Forestry and
Wild Life
(voted)
4415- Capital Outlay on Agricultural
Research and Education
(voted)
4851-Village and small industries
(voted)
2 2401- Crop Husbandry
(charged)
2.21 0.05 0.06 0.01
2406- Forestry and Wild Life
(charged)
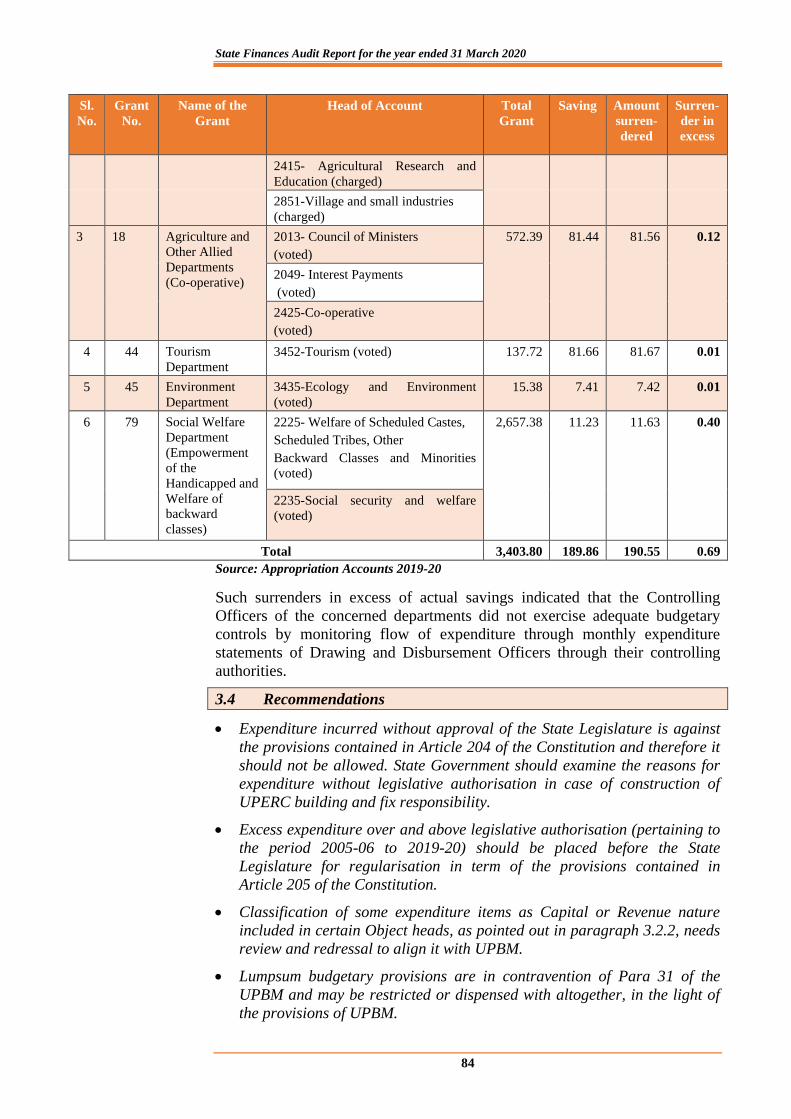
State Finances Audit Report for the year ended 31 March 2020
84
Sl.
No.
Grant
No.
Name of the
Grant
Head of Account Total
Grant
Saving Amount
surren-
dered
Surren-
der in
excess
2415- Agricultural Research and
Education (charged)
2851-Village and small industries
(charged)
3 18 Agriculture and
Other Allied
Departments
(Co-operative)
2013- Council of Ministers
(voted)
572.39 81.44 81.56 0.12
2049- Interest Payments
(voted)
2425-Co-operative
(voted)
4 44 Tourism
Department
3452-Tourism (voted) 137.72 81.66 81.67 0.01
5 45 Environment
Department
3435-Ecology and Environment
(voted)
15.38 7.41 7.42 0.01
6 79 Social Welfare
Department
(Empowerment
of the
Handicapped and
Welfare of
backward
classes)
2225- Welfare of Scheduled Castes,
Scheduled Tribes, Other
Backward Classes and Minorities
(voted)
2,657.38 11.23 11.63 0.40
2235-Social security and welfare
(voted)
Total 3,403.80 189.86 190.55 0.69
Source: Appropriation Accounts 2019-20
Such surrenders in excess of actual savings indicated that the Controlling
Officers of the concerned departments did not exercise adequate budgetary
controls by monitoring flow of expenditure through monthly expenditure
statements of Drawing and Disbursement Officers through their controlling
authorities.
3.4 Recommendations
• Expenditure incurred without approval of the State Legislature is against
the provisions contained in Article 204 of the Constitution and therefore it
should not be allowed. State Government should examine the reasons for
expenditure without legislative authorisation in case of construction of
UPERC building and fix responsibility.
• Excess expenditure over and above legislative authorisation (pertaining to
the period 2005-06 to 2019-20) should be placed before the State
Legislature for regularisation in term of the provisions contained in
Article 205 of the Constitution.
• Classification of some expenditure items as Capital or Revenue nature
included in certain Object heads, as pointed out in paragraph 3.2.2, needs
review and redressal to align it with UPBM.
• Lumpsum budgetary provisions are in contravention of Para 31 of the
UPBM and may be restricted or dispensed with altogether, in the light of
the provisions of UPBM.
Chapter III – Budgetary Management
85
• Supplementary provisions and re-appropriations should be based on
careful assessment of fund requirements. Finance Department may advice
line departments to improve accuracy in cost estimation of
schemes/projects at the time of submitting revised estimates in order to
optimise utilisation of funds.
• Compliance of instructions in Para 141 of UPBM regarding surrender of
funds by 25th March should be ensured for optimising funds utilisation
and ensuring budgetary discipline.
• The Government may consider issuing instructions/guidelines to control
rush of expenditure towards the closing months of the financial year
especially in the month of March in order to maintain a steady pace of
expenditure.


87
CHAPTER-IV
QUALITY OF ACCOUNTS AND FINANCIAL REPORTING
PRACTICES
A sound internal financial reporting system with relevant and reliable
information significantly contributes to efficient and effective governance by
the State Government. Compliance with financial rules, procedures and
directives as well as the timeliness and quality of reporting on the status of
such compliance is, thus, one of the attributes of good governance. Reports on
compliance and controls, if effective and operational, assist the Government in
meeting its basic stewardship responsibilities, including strategic planning and
decision-making. This Chapter provides an overview on the quality of
accounts and compliance of the State Government in its financial reporting
practices, with prescribed financial rules, procedures and directives with
regard to completeness, transparency, measurement and disclosure.
Issues related to completeness of accounts
4.1 Funds outside Consolidated Fund or Public Account of the State
Article 266 (1) subject to the provisions of Article 267, provides that all
revenues received by the Government of a State, all loans raised by the
Government by the issue of treasury bills, loans or ways and means advances
and all moneys received by that Government in repayment of loans shall form
one consolidated fund to be entitled “the Consolidated Fund of the State”.
Article 266 (2) provides that all other public moneys received by or on behalf
of the Government of a State shall be credited to the Public Account of the
State. However, in the following cases moneys received by the State
Government did not form part of the Consolidated Fund of the State /Public
Account of the State as discussed below:
4.1.1 Building and Other Construction Workers Welfare Cess
The Building and Other Construction Workers (BOCW) Welfare Cess Act,
1996 and the BOCW (Regulation of Employment and Conditions of Service)
Act, 1996 covers establishments employing ten or more building workers on
any day of the preceding twelve months in any building or other construction
work. The Acts, inter alia, provide for constitution of Welfare Boards with the
aim of improving the working conditions of workers and to provide financial
aid to them, and to augment the resources of the Welfare Boards through the
levy and collection of cess on the cost of construction works. Accordingly, the
State Government created (November 2009) the U.P. BOCW Welfare Board
and in terms of the Cess Act, levies cess at the rate of one per cent. The U.P.
BOCW Rules, 2009, as amended from time to time, provides for collection of
registration fee of ` 20 and annual membership fee of ` 20 from registered
workers which were subsequently reduced (December 2020) to zero till
31.03.2021 in view of the Covid pandemic. In this connection, the audit
findings are as follows:
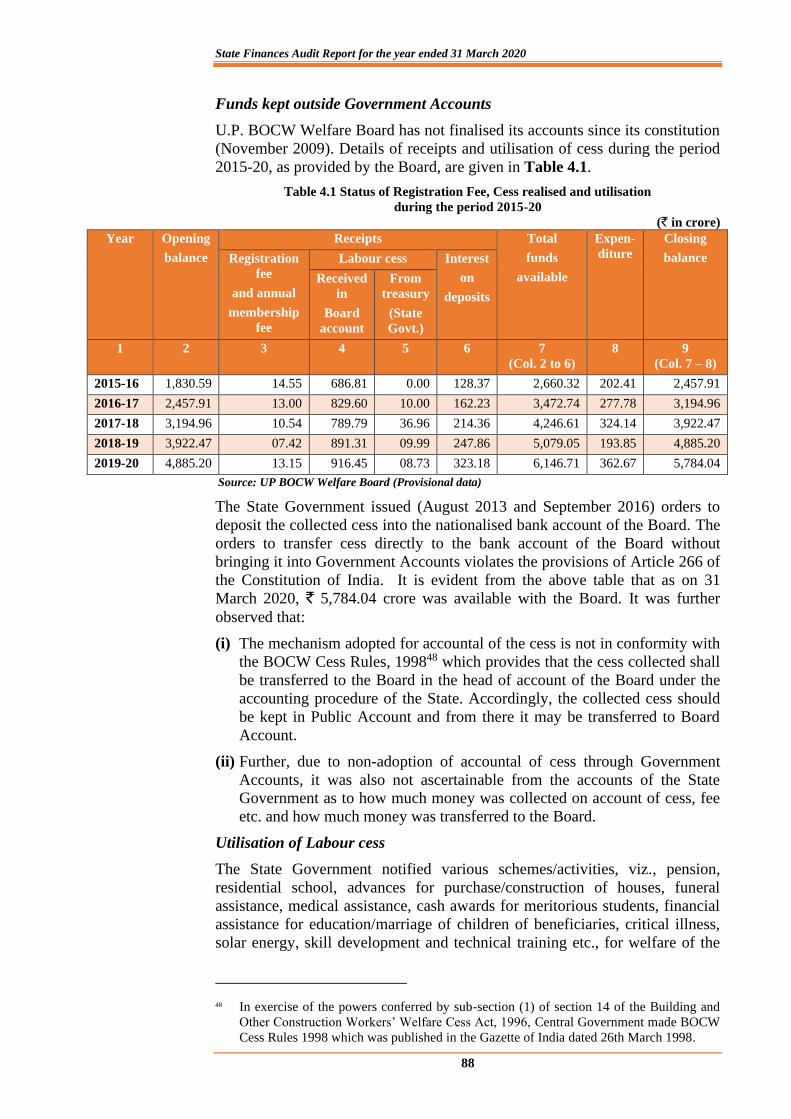
State Finances Audit Report for the year ended 31 March 2020
88
Funds kept outside Government Accounts
U.P. BOCW Welfare Board has not finalised its accounts since its constitution
(November 2009). Details of receipts and utilisation of cess during the period
2015-20, as provided by the Board, are given in Table 4.1.
Table 4.1 Status of Registration Fee, Cess realised and utilisation
during the period 2015-20
(` in crore)
Year Opening
balance
Receipts Total
funds
available
Expen-
diture
Closing
balance
Registration
fee
and annual
membership
fee
Labour cess Interest
on
deposits
Received
in
Board
account
From
treasury
(State
Govt.)
1 2 3 4 5 6 7
(Col. 2 to 6)
8 9
(Col. 7 – 8)
2015-16 1,830.59 14.55 686.81 0.00 128.37 2,660.32 202.41 2,457.91
2016-17 2,457.91 13.00 829.60 10.00 162.23 3,472.74 277.78 3,194.96
2017-18 3,194.96 10.54 789.79 36.96 214.36 4,246.61 324.14 3,922.47
2018-19 3,922.47 07.42 891.31 09.99 247.86 5,079.05 193.85 4,885.20
2019-20 4,885.20 13.15 916.45 08.73 323.18 6,146.71 362.67 5,784.04
Source: UP BOCW Welfare Board (Provisional data)
The State Government issued (August 2013 and September 2016) orders to
deposit the collected cess into the nationalised bank account of the Board. The
orders to transfer cess directly to the bank account of the Board without
bringing it into Government Accounts violates the provisions of Article 266 of
the Constitution of India. It is evident from the above table that as on 31
March 2020, ` 5,784.04 crore was available with the Board. It was further
observed that:
(i) The mechanism adopted for accountal of the cess is not in conformity with
the BOCW Cess Rules, 199848 which provides that the cess collected shall
be transferred to the Board in the head of account of the Board under the
accounting procedure of the State. Accordingly, the collected cess should
be kept in Public Account and from there it may be transferred to Board
Account.
(ii) Further, due to non-adoption of accountal of cess through Government
Accounts, it was also not ascertainable from the accounts of the State
Government as to how much money was collected on account of cess, fee
etc. and how much money was transferred to the Board.
Utilisation of Labour cess
The State Government notified various schemes/activities, viz., pension,
residential school, advances for purchase/construction of houses, funeral
assistance, medical assistance, cash awards for meritorious students, financial
assistance for education/marriage of children of beneficiaries, critical illness,
solar energy, skill development and technical training etc., for welfare of the
48 In exercise of the powers conferred by sub-section (1) of section 14 of the Building and
Other Construction Workers’ Welfare Cess Act, 1996, Central Government made BOCW
Cess Rules 1998 which was published in the Gazette of India dated 26th March 1998.
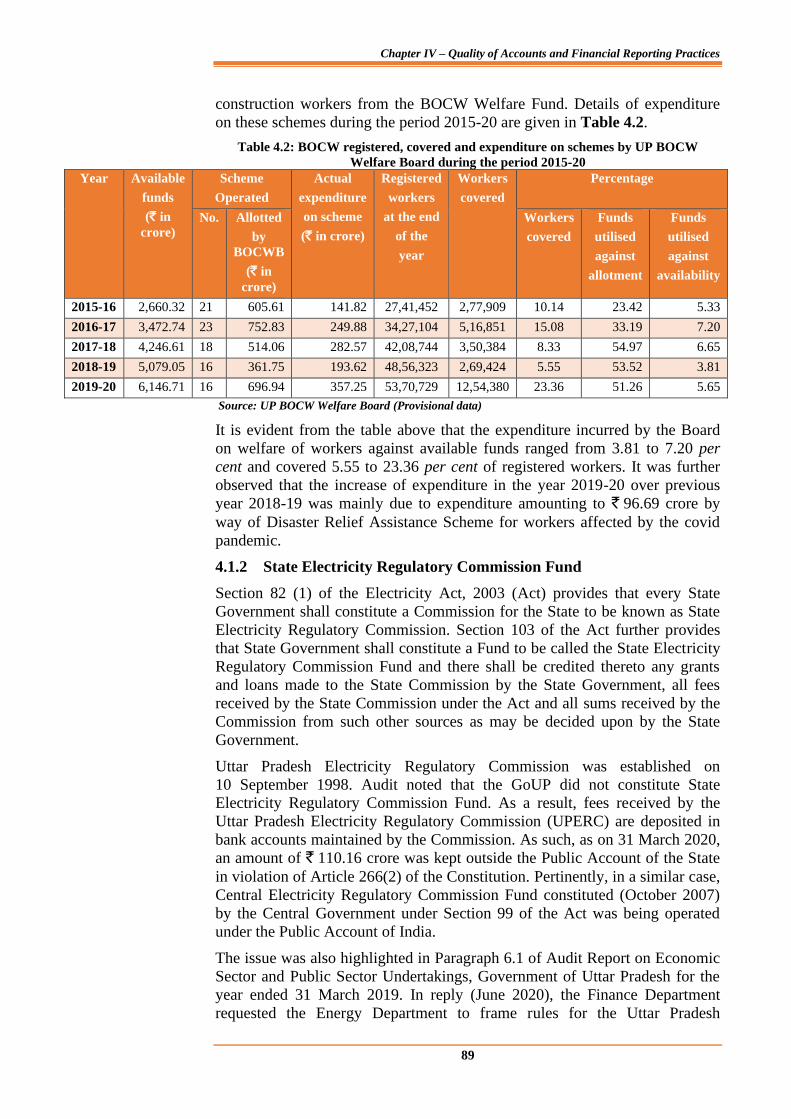
Chapter IV – Quality of Accounts and Financial Reporting Practices
89
construction workers from the BOCW Welfare Fund. Details of expenditure
on these schemes during the period 2015-20 are given in Table 4.2.
Table 4.2: BOCW registered, covered and expenditure on schemes by UP BOCW
Welfare Board during the period 2015-20
Year Available
funds
(` in
crore)
Scheme
Operated
Actual
expenditure
on scheme
(` in crore)
Registered
workers
at the end
of the
year
Workers
covered
Percentage
No. Allotted
by
BOCWB
(` in
crore)
Workers
covered
Funds
utilised
against
allotment
Funds
utilised
against
availability
2015-16 2,660.32 21 605.61 141.82 27,41,452 2,77,909 10.14 23.42 5.33
2016-17 3,472.74 23 752.83 249.88 34,27,104 5,16,851 15.08 33.19 7.20
2017-18 4,246.61 18 514.06 282.57 42,08,744 3,50,384 8.33 54.97 6.65
2018-19 5,079.05 16 361.75 193.62 48,56,323 2,69,424 5.55 53.52 3.81
2019-20 6,146.71 16 696.94 357.25 53,70,729 12,54,380 23.36 51.26 5.65
Source: UP BOCW Welfare Board (Provisional data)
It is evident from the table above that the expenditure incurred by the Board
on welfare of workers against available funds ranged from 3.81 to 7.20 per
cent and covered 5.55 to 23.36 per cent of registered workers. It was further
observed that the increase of expenditure in the year 2019-20 over previous
year 2018-19 was mainly due to expenditure amounting to ` 96.69 crore by
way of Disaster Relief Assistance Scheme for workers affected by the covid
pandemic.
4.1.2 State Electricity Regulatory Commission Fund
Section 82 (1) of the Electricity Act, 2003 (Act) provides that every State
Government shall constitute a Commission for the State to be known as State
Electricity Regulatory Commission. Section 103 of the Act further provides
that State Government shall constitute a Fund to be called the State Electricity
Regulatory Commission Fund and there shall be credited thereto any grants
and loans made to the State Commission by the State Government, all fees
received by the State Commission under the Act and all sums received by the
Commission from such other sources as may be decided upon by the State
Government.
Uttar Pradesh Electricity Regulatory Commission was established on
10 September 1998. Audit noted that the GoUP did not constitute State
Electricity Regulatory Commission Fund. As a result, fees received by the
Uttar Pradesh Electricity Regulatory Commission (UPERC) are deposited in
bank accounts maintained by the Commission. As such, as on 31 March 2020,
an amount of ` 110.16 crore was kept outside the Public Account of the State
in violation of Article 266(2) of the Constitution. Pertinently, in a similar case,
Central Electricity Regulatory Commission Fund constituted (October 2007)
by the Central Government under Section 99 of the Act was being operated
under the Public Account of India.
The issue was also highlighted in Paragraph 6.1 of Audit Report on Economic
Sector and Public Sector Undertakings, Government of Uttar Pradesh for the
year ended 31 March 2019. In reply (June 2020), the Finance Department
requested the Energy Department to frame rules for the Uttar Pradesh
State Finances Audit Report for the year ended 31 March 2020
90
Electricity Regulatory Fund and transfer the amount to the Public Account of
the State. Further necessary action in the matter was awaited (July 2021).
4.1.3 District Mineral Foundation Trusts
Section 9B of the Mines and Minerals (Development and Regulation) Act,
1957 (MMDR Act) as amended in January 2015 provides that in any district
affected by mining related operations, the State Governments shall establish a
trust, as a non-profit body, to be called the District Mineral Foundation.
Accordingly, Government of Uttar Pradesh established (April 2017) the
District Mineral Foundation Trusts (DMFTs).
In exercise of powers conferred by section 9B (3), 15 and 15A of MMDR Act
and adopting Model District Mineral Foundation (Trust) Rules, 2015 issued by
the Central Government, the State Government made (May 2017) the Uttar
Pradesh District Mineral Foundation Trust Rules, 2017 to regulate the
composition and functions of the DMFT. Audit observed that as per Rule-15
of the said Rules, the Trust Fund was to be kept in a scheduled commercial
nationalised bank in the name of the Trust in individual districts. A sum of
` 699.54 crore levied and collected between 2017-18 and 2019-20 was
deposited in various banks in the DMFT of different districts of Uttar Pradesh.
Out of this, expenditure of ` 202.91 crore was incurred for various purposes.
It is notable that in the case of National Mineral Exploration Trust (NMET),
the Government of India, Ministry of Mines which earlier permitted (August
2015) the Trust to open and operate bank accounts in scheduled banks, has
amended (March 2018) the National Mineral Exploration Trust Rules, 2015
and directed to close the bank account of the Trust as soon as possible. Under
the amended Rules, NMET Fund shall be opened under the Public Account of
India as a non-lapsable and non-interest-bearing account and shall be
administered by the Central Government. Annual Budget provision shall also
be made in the Demands for Grants of Central Government under the
appropriate Head for incurring expenditure from the Fund and an equivalent
amount thereof shall be met from the Fund.
As such, in the instant case, the State Government should revisit the existing
provision of maintaining the Trust Fund in a scheduled commercial bank and
bring it in line with the provisions of Article 266 of the Constitution. In this
context, a mention was made in the paragraph 5.3 of Audit Report (Revenue
Sector), Government of Uttar Pradesh for the year ended 31 March 2019 that
the State Government in violation of Articles 266 (1) of the Constitution
maintained DMFT fund in scheduled commercial banks. It was recommended
that the amount of royalty being contributed to the Trust should form part of
Government Accounts of the State and the Government may create DMFT
fund in the Public Account to enable incurrence of expenditure in accordance
with the codal provisions.
The Department stated (January 2021) that the accounts of DMFTs had been
opened according to the provisions contained in the Rule-15 of Uttar Pradesh
District Mineral Foundation Trust Rules, 2017 which was made by adopting
Model District Mineral Foundation (Trust) Rules, 2015 issued by the Central
Government.
The reply of the Department is not tenable as in the case of NMET, the
Government of India through notification dated 7 March 2018 had ensured the
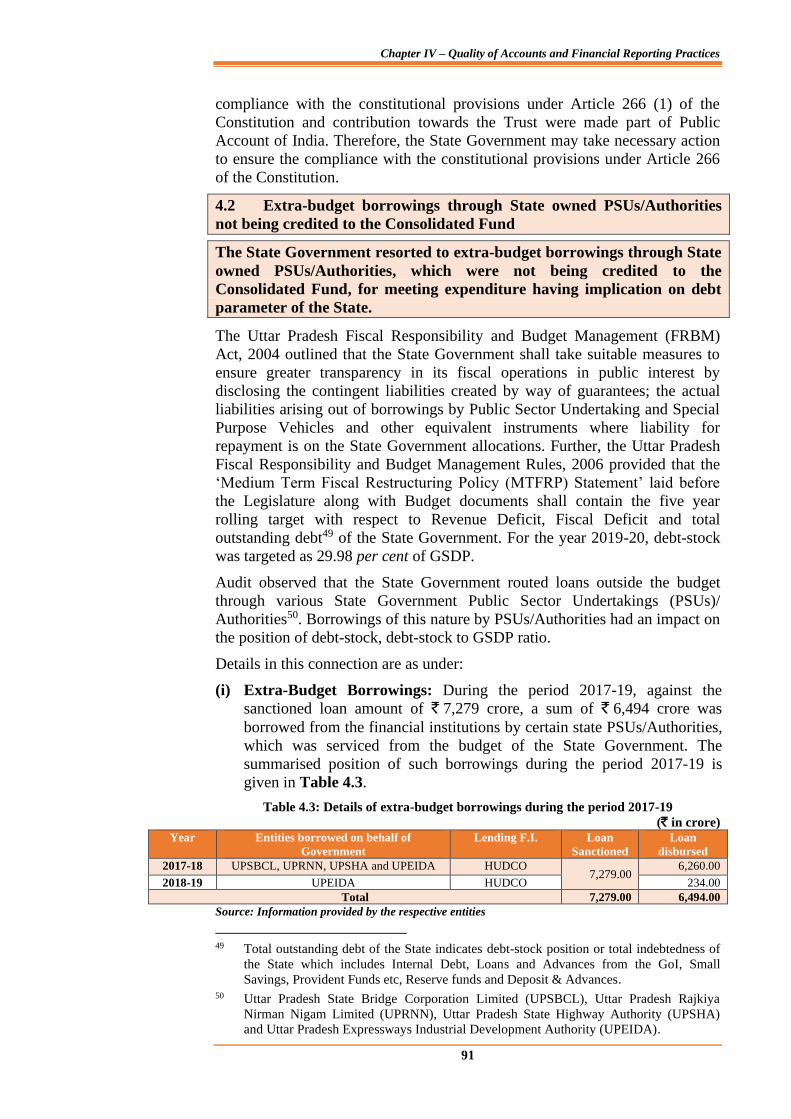
Chapter IV – Quality of Accounts and Financial Reporting Practices
91
compliance with the constitutional provisions under Article 266 (1) of the
Constitution and contribution towards the Trust were made part of Public
Account of India. Therefore, the State Government may take necessary action
to ensure the compliance with the constitutional provisions under Article 266
of the Constitution.
4.2 Extra-budget borrowings through State owned PSUs/Authorities
not being credited to the Consolidated Fund
The State Government resorted to extra-budget borrowings through State
owned PSUs/Authorities, which were not being credited to the
Consolidated Fund, for meeting expenditure having implication on debt
parameter of the State.
The Uttar Pradesh Fiscal Responsibility and Budget Management (FRBM)
Act, 2004 outlined that the State Government shall take suitable measures to
ensure greater transparency in its fiscal operations in public interest by
disclosing the contingent liabilities created by way of guarantees; the actual
liabilities arising out of borrowings by Public Sector Undertaking and Special
Purpose Vehicles and other equivalent instruments where liability for
repayment is on the State Government allocations. Further, the Uttar Pradesh
Fiscal Responsibility and Budget Management Rules, 2006 provided that the
‘Medium Term Fiscal Restructuring Policy (MTFRP) Statement’ laid before
the Legislature along with Budget documents shall contain the five year
rolling target with respect to Revenue Deficit, Fiscal Deficit and total
outstanding debt49 of the State Government. For the year 2019-20, debt-stock
was targeted as 29.98 per cent of GSDP.
Audit observed that the State Government routed loans outside the budget
through various State Government Public Sector Undertakings (PSUs)/
Authorities50. Borrowings of this nature by PSUs/Authorities had an impact on
the position of debt-stock, debt-stock to GSDP ratio.
Details in this connection are as under:
(i) Extra-Budget Borrowings: During the period 2017-19, against the
sanctioned loan amount of ` 7,279 crore, a sum of ` 6,494 crore was
borrowed from the financial institutions by certain state PSUs/Authorities,
which was serviced from the budget of the State Government. The
summarised position of such borrowings during the period 2017-19 is
given in Table 4.3.
Table 4.3: Details of extra-budget borrowings during the period 2017-19
(` in crore)
Year Entities borrowed on behalf of
Government
Lending F.I. Loan
Sanctioned
Loan
disbursed
2017-18 UPSBCL, UPRNN, UPSHA and UPEIDA HUDCO 7,279.00
6,260.00
2018-19 UPEIDA HUDCO 234.00
Total 7,279.00 6,494.00
Source: Information provided by the respective entities
49 Total outstanding debt of the State indicates debt-stock position or total indebtedness of
the State which includes Internal Debt, Loans and Advances from the GoI, Small
Savings, Provident Funds etc, Reserve funds and Deposit & Advances. 50 Uttar Pradesh State Bridge Corporation Limited (UPSBCL), Uttar Pradesh Rajkiya
Nirman Nigam Limited (UPRNN), Uttar Pradesh State Highway Authority (UPSHA)
and Uttar Pradesh Expressways Industrial Development Authority (UPEIDA).
State Finances Audit Report for the year ended 31 March 2020
92
(ii) Financial assistance by State Government: During the year 2019-20,
the State Government provided ` 1,953.08 crore (` 566.66 crore against
interest payment and ` 1,386.42 crore against repayment of principal) to
these PSUs/Authorities from the State Budget. The summarised position
of payment of interest and re-payment of principal is given in Table 4.4.
Table 4.4: Details of assistance for payment of Interest and repayment of principal
(` in crore) Sl.
No
Name of the
Entities
Assistance for payment
towards interest Amount
Assistance for re-payment towards
principal amount
1 UPSBCL 61.27 77.13
2 UPRNN 243.29 200.51
3 UPSHA 238.45 192.78
4 UPEIDA 23.65 916.00
Total 566.66 1,386.42
Source: Information provided by the respective entities
(iii) Debt-Stock: Since these extra-budget borrowings do not form part of the
Debt-Stock position of the State, the Debt-Stock position does not depict
the actual debt position as given in Table 4.5.
Table 4.5: Debt-Stock position after extra-budget borrowings
(` in crore) Particular Debt –
Stock
Extra-
budget
borrowings
Cumulative
extra-
budget
borrowings
Payment
against extra-
budget
borrowings
through
financial
assistance
Debts stock after
taking into account
extra-budget
borrowings and
financial assistance
for re-payment
1 2 3 4 5 6 = (2+4-5)
Debt stock as
on 31.03.2018
4,67,842.00 6,260.00 6,260.00 0.00 4,74,102.00
Debt stock as
on 31.03.2019
5,18,095.00 234.00 6,494.00 0.00 5,24,589.00
Debt stock as
on 31.03.2020
5,02,412.02 0.00 6,494.00 1,386.42 5,07,519.60
Source: Finance Accounts of the respective years and information provided by the respective entities
The table above indicates that Debt-Stock was higher by ` 5,107.58 crore51 in
2019-20 after taking into account extra-budget borrowing as on 31 March
2020. Accordingly, the debt-stock to GSDP52 ratio including extra-budget
borrowings was 28.28 per cent as on 31.03.2020 against the reported ratio of
28 per cent without taking into account the extra-budget borrowings.
The matter was reported to Government (January 2021), the reply of the
Government is awaited (July 2021).
51 ` 5,07,519.60 crore - ` 5,02,412.02 crore. 52 GSDP 2019-20: ` 17,94,508 crore
Chapter IV – Quality of Accounts and Financial Reporting Practices
93
4.3 Un-discharged liabilities in Defined Contribution Pension Scheme
The State Government did not remit ` 2,023.76 crore for the Defined
Contribution Pension Scheme to the designated fund managers for its
further investment during the year 2019-20.
State Government employees recruited on or after 1 April 2005 are covered
under the Defined Contribution Pension Scheme (DCPS). It is also applicable
to the new entrants of government aided educational institutions and
autonomous bodies financed by the State Government. In terms of the
Scheme, the government employees contribute 10 per cent of basic pay and
dearness allowance and an equal amount was contributed by the State
Government up to 2018-19. The State Government has increased its share
from 10 per cent to 14 per cent with effect from 1.4.2019. As per the
procedure prescribed by the Government of Uttar Pradesh, both the
contributions are to be initially credited to the Public Account under the
concerned Head of Accounts 8342-Other Deposit-117 DCPS for Government
employees and 8342-120-Miscellaneous Deposits for Government aided
Educational Institutions and Autonomous Bodies. Thereafter, the entire
amount (Government’s contribution and employees’ contribution) so
contributed to DCPS is required to be transferred to the designated fund
manager through the National Securities Depository Limited (NSDL)/Trustee
Bank. Further, the Major Head 8342 comes under the category of ‘deposits
bearing interest’ implying thereby, that the Government is required to pay
interest on un-transferred balance.
The State Government however, did not follow the above procedure in its
entirety. In respect of government employees, aided educational institutions
employees and employees of Autonomous Bodies, the State Government
booked expenditure of ` 3,478.57 crore as government contribution
(` 2,299.04 crore for government employees, ` 1,179.42 crore for aided
educational institutions employees and ` 0.11 crore for employees of
Autonomous Bodies) under the Head of Accounts 2071-01-117-Government
Contribution for DCPS during the year 2019-20. As against this, an amount of
` 1,232.29 crore (` 78.68 crore for government employees, ` 1,153.50 crore
for aided educational institution employees and ` 0.11 crore for employees of
Autonomous Bodies) was not transferred by the State Government during
2019-20 in the designated Head of Accounts 8342-117/120 Other Deposit.
Thus, government contribution amounting to ` 1,232.29 crore, though booked
as revenue expenditure in the Accounts, was not transferred by the State
Government to the designated major head 8342 for DCPS during the year
2019-20. Similar short transfer of contribution amounting to ` 530.59 crore
from major head 2071 to the designated major head 8342 was reported in the
State Finances Audit Report for the year ended 31 March 2019 (Paragraph
1.5.1.3 of Audit Report No. 2 of the year 2020-Government of Uttar Pradesh).
However, as stated in the Finance Accounts, the reason for this non-transfer
was not furnished by the State Government.
Further, during the year 2019-20, the Government was required to transfer
` 7,104.45 crore (Government’s contribution ` 3,478.57 crore, employees’
contribution ` 3,624.21 crore and ` 1.67 crore interest paid on DCPS) to the
designated fund manager. However, the Government transferred only
` 5,080.69 crore to the designated fund manager. Thus, there was a short
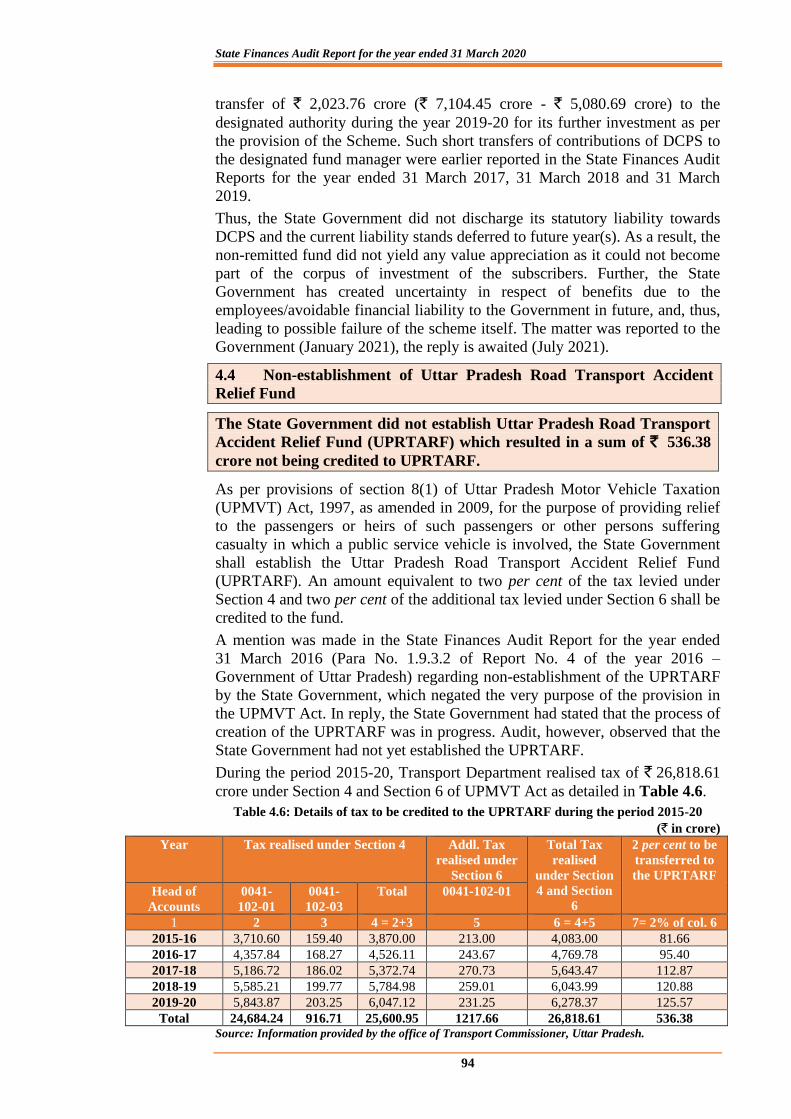
State Finances Audit Report for the year ended 31 March 2020
94
transfer of ` 2,023.76 crore (` 7,104.45 crore - ` 5,080.69 crore) to the
designated authority during the year 2019-20 for its further investment as per
the provision of the Scheme. Such short transfers of contributions of DCPS to
the designated fund manager were earlier reported in the State Finances Audit
Reports for the year ended 31 March 2017, 31 March 2018 and 31 March
2019.
Thus, the State Government did not discharge its statutory liability towards
DCPS and the current liability stands deferred to future year(s). As a result, the
non-remitted fund did not yield any value appreciation as it could not become
part of the corpus of investment of the subscribers. Further, the State
Government has created uncertainty in respect of benefits due to the
employees/avoidable financial liability to the Government in future, and, thus,
leading to possible failure of the scheme itself. The matter was reported to the
Government (January 2021), the reply is awaited (July 2021).
4.4 Non-establishment of Uttar Pradesh Road Transport Accident
Relief Fund
The State Government did not establish Uttar Pradesh Road Transport
Accident Relief Fund (UPRTARF) which resulted in a sum of ` 536.38
crore not being credited to UPRTARF.
As per provisions of section 8(1) of Uttar Pradesh Motor Vehicle Taxation
(UPMVT) Act, 1997, as amended in 2009, for the purpose of providing relief
to the passengers or heirs of such passengers or other persons suffering
casualty in which a public service vehicle is involved, the State Government
shall establish the Uttar Pradesh Road Transport Accident Relief Fund
(UPRTARF). An amount equivalent to two per cent of the tax levied under
Section 4 and two per cent of the additional tax levied under Section 6 shall be
credited to the fund.
A mention was made in the State Finances Audit Report for the year ended
31 March 2016 (Para No. 1.9.3.2 of Report No. 4 of the year 2016 –
Government of Uttar Pradesh) regarding non-establishment of the UPRTARF
by the State Government, which negated the very purpose of the provision in
the UPMVT Act. In reply, the State Government had stated that the process of
creation of the UPRTARF was in progress. Audit, however, observed that the
State Government had not yet established the UPRTARF.
During the period 2015-20, Transport Department realised tax of ` 26,818.61
crore under Section 4 and Section 6 of UPMVT Act as detailed in Table 4.6.
Table 4.6: Details of tax to be credited to the UPRTARF during the period 2015-20
(` in crore) Year Tax realised under Section 4 Addl. Tax
realised under
Section 6
Total Tax
realised
under Section
4 and Section
6
2 per cent to be
transferred to
the UPRTARF
Head of
Accounts
0041-
102-01
0041-
102-03
Total 0041-102-01
1 2 3 4 = 2+3 5 6 = 4+5 7= 2% of col. 6
2015-16 3,710.60 159.40 3,870.00 213.00 4,083.00 81.66
2016-17 4,357.84 168.27 4,526.11 243.67 4,769.78 95.40
2017-18 5,186.72 186.02 5,372.74 270.73 5,643.47 112.87
2018-19 5,585.21 199.77 5,784.98 259.01 6,043.99 120.88
2019-20 5,843.87 203.25 6,047.12 231.25 6,278.37 125.57
Total 24,684.24 916.71 25,600.95 1217.66 26,818.61 536.38 Source: Information provided by the office of Transport Commissioner, Uttar Pradesh.
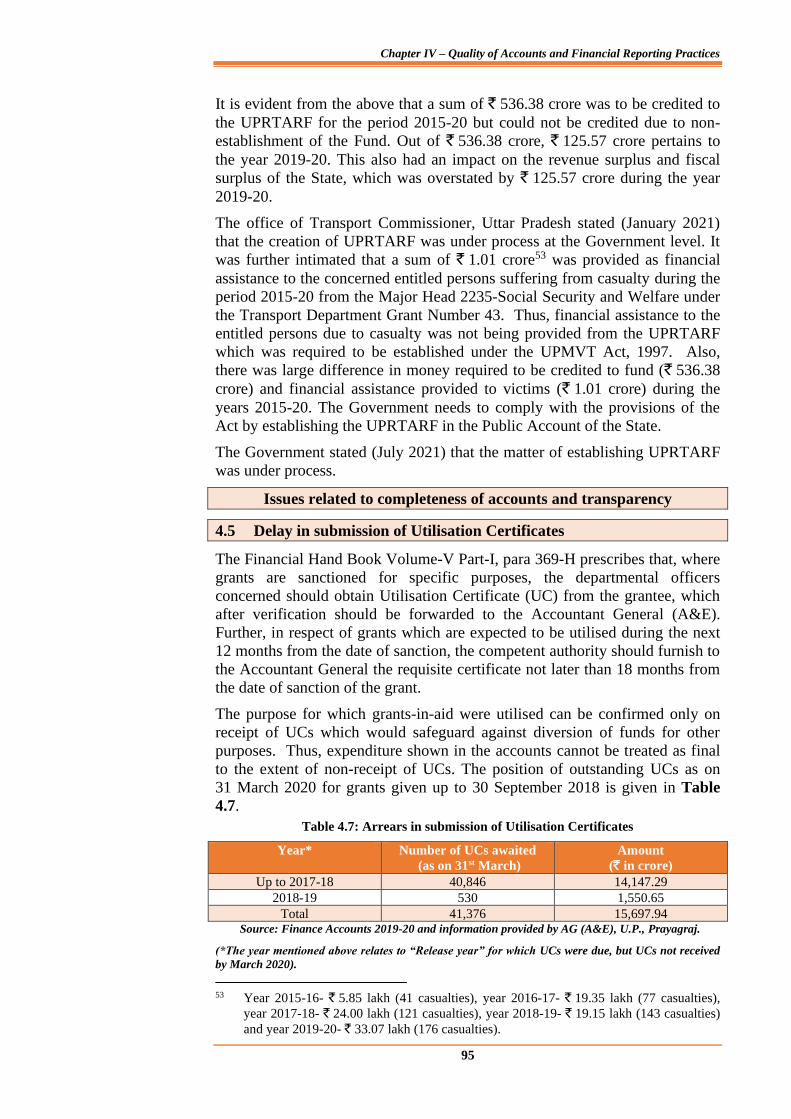
Chapter IV – Quality of Accounts and Financial Reporting Practices
95
It is evident from the above that a sum of ` 536.38 crore was to be credited to
the UPRTARF for the period 2015-20 but could not be credited due to non-
establishment of the Fund. Out of ` 536.38 crore, ` 125.57 crore pertains to
the year 2019-20. This also had an impact on the revenue surplus and fiscal
surplus of the State, which was overstated by ` 125.57 crore during the year
2019-20.
The office of Transport Commissioner, Uttar Pradesh stated (January 2021)
that the creation of UPRTARF was under process at the Government level. It
was further intimated that a sum of ` 1.01 crore53 was provided as financial
assistance to the concerned entitled persons suffering from casualty during the
period 2015-20 from the Major Head 2235-Social Security and Welfare under
the Transport Department Grant Number 43. Thus, financial assistance to the
entitled persons due to casualty was not being provided from the UPRTARF
which was required to be established under the UPMVT Act, 1997. Also,
there was large difference in money required to be credited to fund (` 536.38
crore) and financial assistance provided to victims (` 1.01 crore) during the
years 2015-20. The Government needs to comply with the provisions of the
Act by establishing the UPRTARF in the Public Account of the State.
The Government stated (July 2021) that the matter of establishing UPRTARF
was under process.
Issues related to completeness of accounts and transparency
4.5 Delay in submission of Utilisation Certificates
The Financial Hand Book Volume-V Part-I, para 369-H prescribes that, where
grants are sanctioned for specific purposes, the departmental officers
concerned should obtain Utilisation Certificate (UC) from the grantee, which
after verification should be forwarded to the Accountant General (A&E).
Further, in respect of grants which are expected to be utilised during the next
12 months from the date of sanction, the competent authority should furnish to
the Accountant General the requisite certificate not later than 18 months from
the date of sanction of the grant.
The purpose for which grants-in-aid were utilised can be confirmed only on
receipt of UCs which would safeguard against diversion of funds for other
purposes. Thus, expenditure shown in the accounts cannot be treated as final
to the extent of non-receipt of UCs. The position of outstanding UCs as on
31 March 2020 for grants given up to 30 September 2018 is given in Table
4.7.
Table 4.7: Arrears in submission of Utilisation Certificates
Year* Number of UCs awaited
(as on 31st March)
Amount
(` in crore)
Up to 2017-18 40,846 14,147.29
2018-19 530 1,550.65
Total 41,376 15,697.94 Source: Finance Accounts 2019-20 and information provided by AG (A&E), U.P., Prayagraj.
(*The year mentioned above relates to “Release year” for which UCs were due, but UCs not received
by March 2020).
53 Year 2015-16- ` 5.85 lakh (41 casualties), year 2016-17- ` 19.35 lakh (77 casualties),
year 2017-18- ` 24.00 lakh (121 casualties), year 2018-19- ` 19.15 lakh (143 casualties)
and year 2019-20- ` 33.07 lakh (176 casualties).
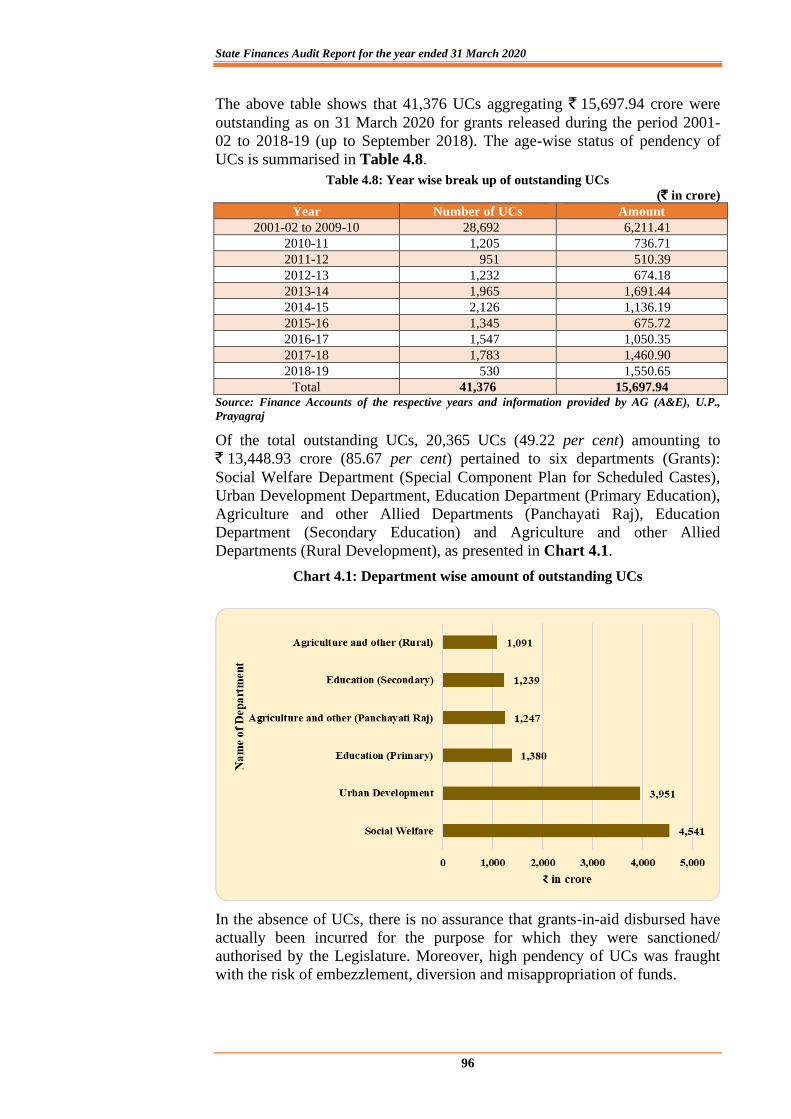
State Finances Audit Report for the year ended 31 March 2020
96
The above table shows that 41,376 UCs aggregating ` 15,697.94 crore were
outstanding as on 31 March 2020 for grants released during the period 2001-
02 to 2018-19 (up to September 2018). The age-wise status of pendency of
UCs is summarised in Table 4.8.
Table 4.8: Year wise break up of outstanding UCs
(` in crore) Year Number of UCs Amount
2001-02 to 2009-10 28,692 6,211.41
2010-11 1,205 736.71
2011-12 951 510.39
2012-13 1,232 674.18
2013-14 1,965 1,691.44
2014-15 2,126 1,136.19
2015-16 1,345 675.72
2016-17 1,547 1,050.35
2017-18 1,783 1,460.90
2018-19 530 1,550.65
Total 41,376 15,697.94 Source: Finance Accounts of the respective years and information provided by AG (A&E), U.P.,
Prayagraj
Of the total outstanding UCs, 20,365 UCs (49.22 per cent) amounting to
` 13,448.93 crore (85.67 per cent) pertained to six departments (Grants):
Social Welfare Department (Special Component Plan for Scheduled Castes),
Urban Development Department, Education Department (Primary Education),
Agriculture and other Allied Departments (Panchayati Raj), Education
Department (Secondary Education) and Agriculture and other Allied
Departments (Rural Development), as presented in Chart 4.1.
Chart 4.1: Department wise amount of outstanding UCs
In the absence of UCs, there is no assurance that grants-in-aid disbursed have
actually been incurred for the purpose for which they were sanctioned/
authorised by the Legislature. Moreover, high pendency of UCs was fraught
with the risk of embezzlement, diversion and misappropriation of funds.
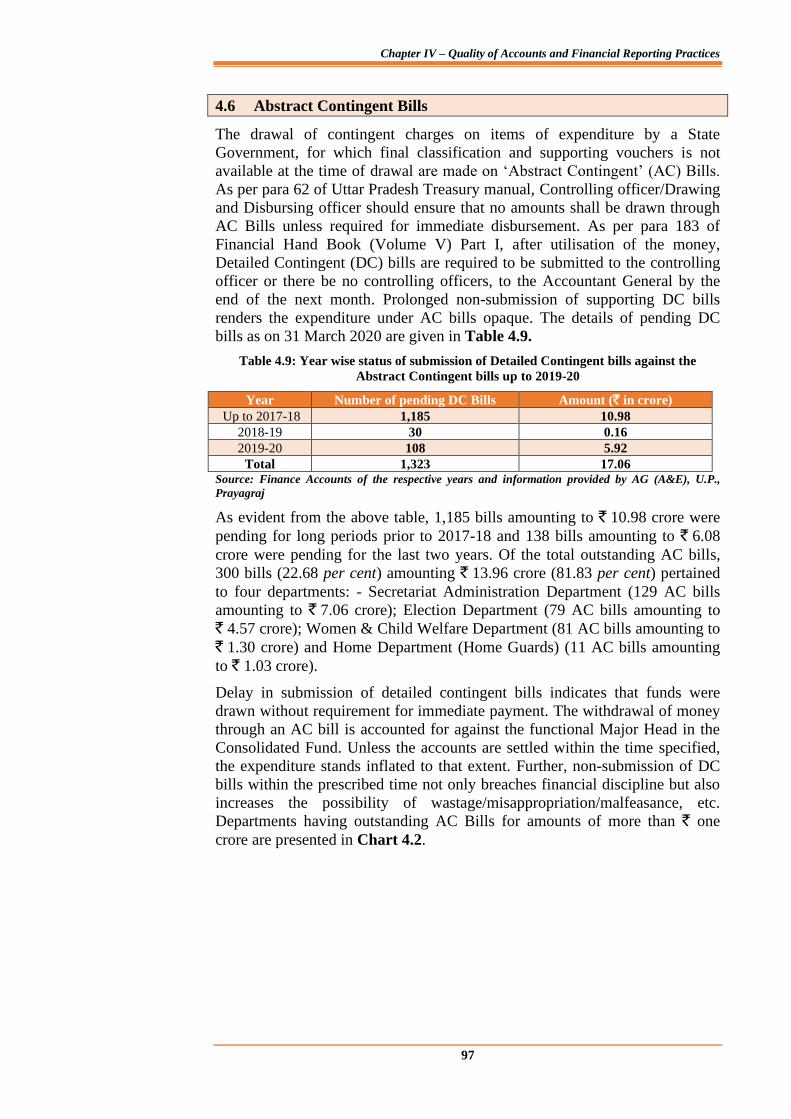
Chapter IV – Quality of Accounts and Financial Reporting Practices
97
4.6 Abstract Contingent Bills
The drawal of contingent charges on items of expenditure by a State
Government, for which final classification and supporting vouchers is not
available at the time of drawal are made on ‘Abstract Contingent’ (AC) Bills.
As per para 62 of Uttar Pradesh Treasury manual, Controlling officer/Drawing
and Disbursing officer should ensure that no amounts shall be drawn through
AC Bills unless required for immediate disbursement. As per para 183 of
Financial Hand Book (Volume V) Part I, after utilisation of the money,
Detailed Contingent (DC) bills are required to be submitted to the controlling
officer or there be no controlling officers, to the Accountant General by the
end of the next month. Prolonged non-submission of supporting DC bills
renders the expenditure under AC bills opaque. The details of pending DC
bills as on 31 March 2020 are given in Table 4.9.
Table 4.9: Year wise status of submission of Detailed Contingent bills against the
Abstract Contingent bills up to 2019-20
Year Number of pending DC Bills Amount (` in crore)
Up to 2017-18 1,185 10.98
2018-19 30 0.16
2019-20 108 5.92
Total 1,323 17.06 Source: Finance Accounts of the respective years and information provided by AG (A&E), U.P.,
Prayagraj
As evident from the above table, 1,185 bills amounting to ` 10.98 crore were
pending for long periods prior to 2017-18 and 138 bills amounting to ` 6.08
crore were pending for the last two years. Of the total outstanding AC bills,
300 bills (22.68 per cent) amounting ` 13.96 crore (81.83 per cent) pertained
to four departments: - Secretariat Administration Department (129 AC bills
amounting to ` 7.06 crore); Election Department (79 AC bills amounting to
` 4.57 crore); Women & Child Welfare Department (81 AC bills amounting to
` 1.30 crore) and Home Department (Home Guards) (11 AC bills amounting
to ` 1.03 crore).
Delay in submission of detailed contingent bills indicates that funds were
drawn without requirement for immediate payment. The withdrawal of money
through an AC bill is accounted for against the functional Major Head in the
Consolidated Fund. Unless the accounts are settled within the time specified,
the expenditure stands inflated to that extent. Further, non-submission of DC
bills within the prescribed time not only breaches financial discipline but also
increases the possibility of wastage/misappropriation/malfeasance, etc.
Departments having outstanding AC Bills for amounts of more than ` one
crore are presented in Chart 4.2.
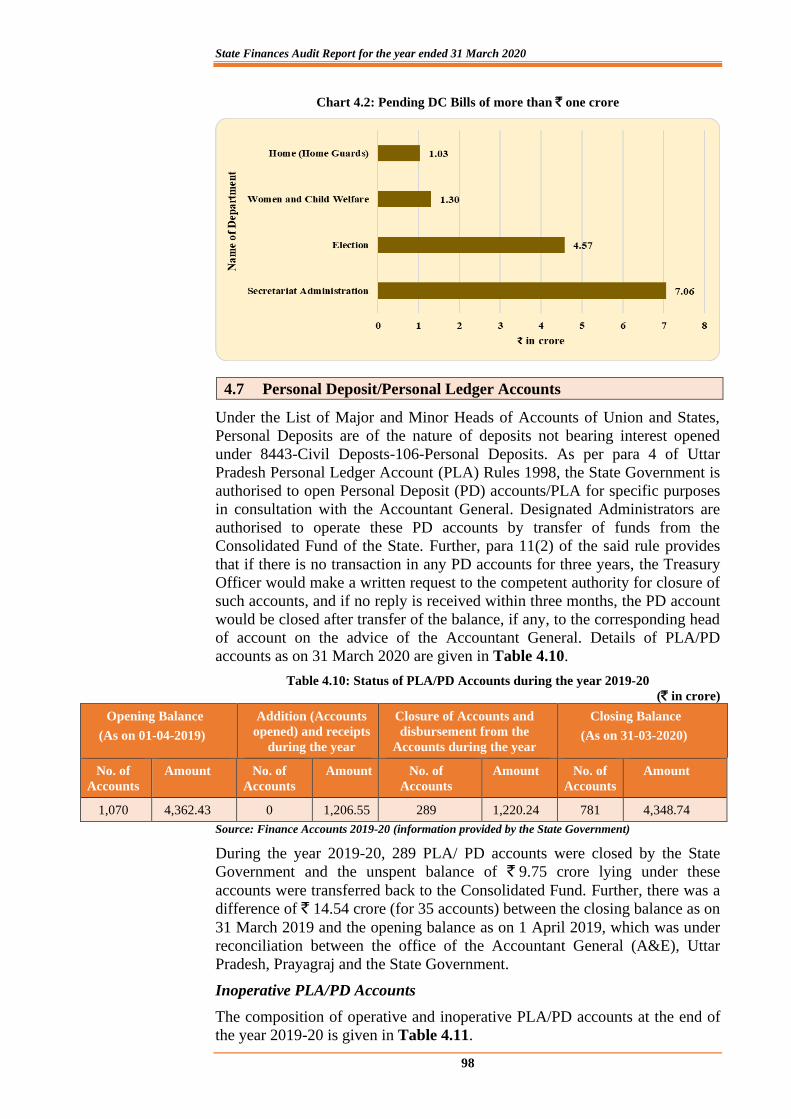
State Finances Audit Report for the year ended 31 March 2020
98
Chart 4.2: Pending DC Bills of more than ` one crore
4.7 Personal Deposit/Personal Ledger Accounts
Under the List of Major and Minor Heads of Accounts of Union and States,
Personal Deposits are of the nature of deposits not bearing interest opened
under 8443-Civil Deposts-106-Personal Deposits. As per para 4 of Uttar
Pradesh Personal Ledger Account (PLA) Rules 1998, the State Government is
authorised to open Personal Deposit (PD) accounts/PLA for specific purposes
in consultation with the Accountant General. Designated Administrators are
authorised to operate these PD accounts by transfer of funds from the
Consolidated Fund of the State. Further, para 11(2) of the said rule provides
that if there is no transaction in any PD accounts for three years, the Treasury
Officer would make a written request to the competent authority for closure of
such accounts, and if no reply is received within three months, the PD account
would be closed after transfer of the balance, if any, to the corresponding head
of account on the advice of the Accountant General. Details of PLA/PD
accounts as on 31 March 2020 are given in Table 4.10.
Table 4.10: Status of PLA/PD Accounts during the year 2019-20
(` in crore)
Opening Balance
(As on 01-04-2019)
Addition (Accounts
opened) and receipts
during the year
Closure of Accounts and
disbursement from the
Accounts during the year
Closing Balance
(As on 31-03-2020)
No. of
Accounts
Amount No. of
Accounts
Amount No. of
Accounts
Amount No. of
Accounts
Amount
1,070 4,362.43 0 1,206.55 289 1,220.24 781 4,348.74
Source: Finance Accounts 2019-20 (information provided by the State Government)
During the year 2019-20, 289 PLA/ PD accounts were closed by the State
Government and the unspent balance of ` 9.75 crore lying under these
accounts were transferred back to the Consolidated Fund. Further, there was a
difference of ` 14.54 crore (for 35 accounts) between the closing balance as on
31 March 2019 and the opening balance as on 1 April 2019, which was under
reconciliation between the office of the Accountant General (A&E), Uttar
Pradesh, Prayagraj and the State Government.
Inoperative PLA/PD Accounts
The composition of operative and inoperative PLA/PD accounts at the end of
the year 2019-20 is given in Table 4.11.
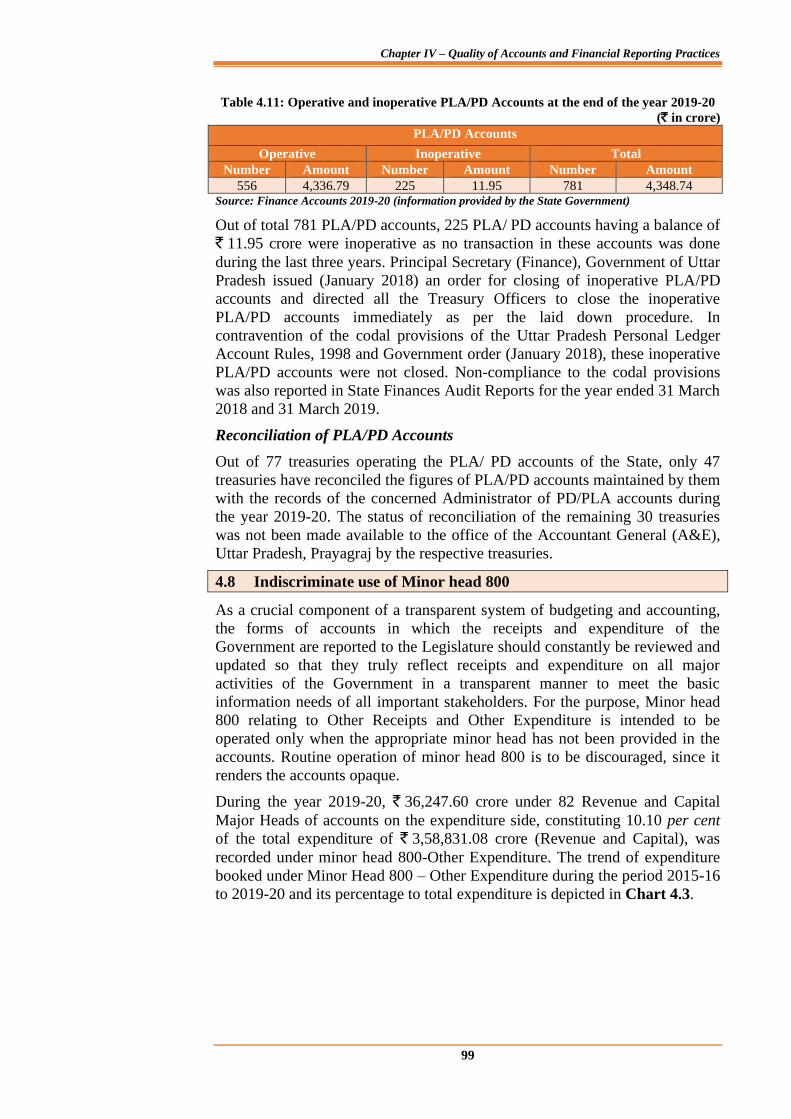
Chapter IV – Quality of Accounts and Financial Reporting Practices
99
Table 4.11: Operative and inoperative PLA/PD Accounts at the end of the year 2019-20
(` in crore)
PLA/PD Accounts
Operative Inoperative Total
Number Amount Number Amount Number Amount
556 4,336.79 225 11.95 781 4,348.74 Source: Finance Accounts 2019-20 (information provided by the State Government)
Out of total 781 PLA/PD accounts, 225 PLA/ PD accounts having a balance of
` 11.95 crore were inoperative as no transaction in these accounts was done
during the last three years. Principal Secretary (Finance), Government of Uttar
Pradesh issued (January 2018) an order for closing of inoperative PLA/PD
accounts and directed all the Treasury Officers to close the inoperative
PLA/PD accounts immediately as per the laid down procedure. In
contravention of the codal provisions of the Uttar Pradesh Personal Ledger
Account Rules, 1998 and Government order (January 2018), these inoperative
PLA/PD accounts were not closed. Non-compliance to the codal provisions
was also reported in State Finances Audit Reports for the year ended 31 March
2018 and 31 March 2019.
Reconciliation of PLA/PD Accounts
Out of 77 treasuries operating the PLA/ PD accounts of the State, only 47
treasuries have reconciled the figures of PLA/PD accounts maintained by them
with the records of the concerned Administrator of PD/PLA accounts during
the year 2019-20. The status of reconciliation of the remaining 30 treasuries
was not been made available to the office of the Accountant General (A&E),
Uttar Pradesh, Prayagraj by the respective treasuries.
4.8 Indiscriminate use of Minor head 800
As a crucial component of a transparent system of budgeting and accounting,
the forms of accounts in which the receipts and expenditure of the
Government are reported to the Legislature should constantly be reviewed and
updated so that they truly reflect receipts and expenditure on all major
activities of the Government in a transparent manner to meet the basic
information needs of all important stakeholders. For the purpose, Minor head
800 relating to Other Receipts and Other Expenditure is intended to be
operated only when the appropriate minor head has not been provided in the
accounts. Routine operation of minor head 800 is to be discouraged, since it
renders the accounts opaque.
During the year 2019-20, ` 36,247.60 crore under 82 Revenue and Capital
Major Heads of accounts on the expenditure side, constituting 10.10 per cent
of the total expenditure of ` 3,58,831.08 crore (Revenue and Capital), was
recorded under minor head 800-Other Expenditure. The trend of expenditure
booked under Minor Head 800 – Other Expenditure during the period 2015-16
to 2019-20 and its percentage to total expenditure is depicted in Chart 4.3.
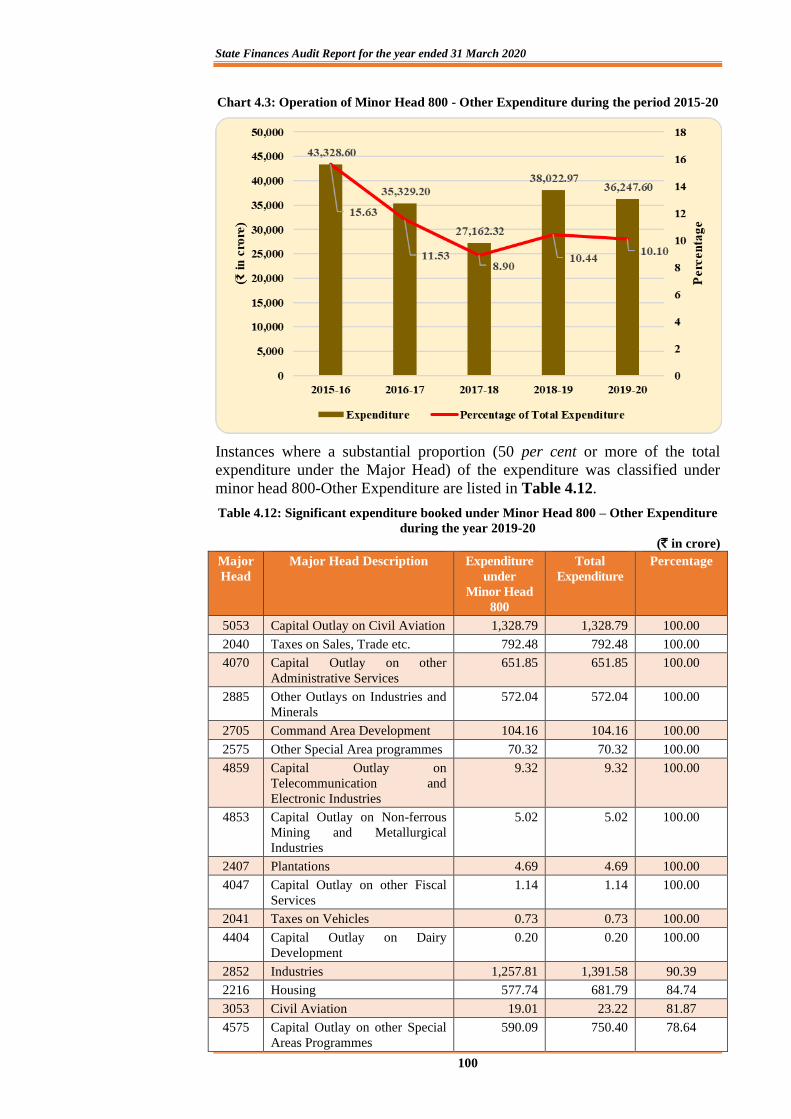
State Finances Audit Report for the year ended 31 March 2020
100
Chart 4.3: Operation of Minor Head 800 - Other Expenditure during the period 2015-20
Instances where a substantial proportion (50 per cent or more of the total
expenditure under the Major Head) of the expenditure was classified under
minor head 800-Other Expenditure are listed in Table 4.12.
Table 4.12: Significant expenditure booked under Minor Head 800 – Other Expenditure
during the year 2019-20
(` in crore)
Major
Head
Major Head Description Expenditure
under
Minor Head
800
Total
Expenditure
Percentage
5053 Capital Outlay on Civil Aviation 1,328.79 1,328.79 100.00
2040 Taxes on Sales, Trade etc. 792.48 792.48 100.00
4070 Capital Outlay on other
Administrative Services
651.85 651.85 100.00
2885 Other Outlays on Industries and
Minerals
572.04 572.04 100.00
2705 Command Area Development 104.16 104.16 100.00
2575 Other Special Area programmes 70.32 70.32 100.00
4859 Capital Outlay on
Telecommunication and
Electronic Industries
9.32 9.32 100.00
4853 Capital Outlay on Non-ferrous
Mining and Metallurgical
Industries
5.02 5.02 100.00
2407 Plantations 4.69 4.69 100.00
4047 Capital Outlay on other Fiscal
Services
1.14 1.14 100.00
2041 Taxes on Vehicles 0.73 0.73 100.00
4404 Capital Outlay on Dairy
Development
0.20 0.20 100.00
2852 Industries 1,257.81 1,391.58 90.39
2216 Housing 577.74 681.79 84.74
3053 Civil Aviation 19.01 23.22 81.87
4575 Capital Outlay on other Special
Areas Programmes
590.09 750.40 78.64
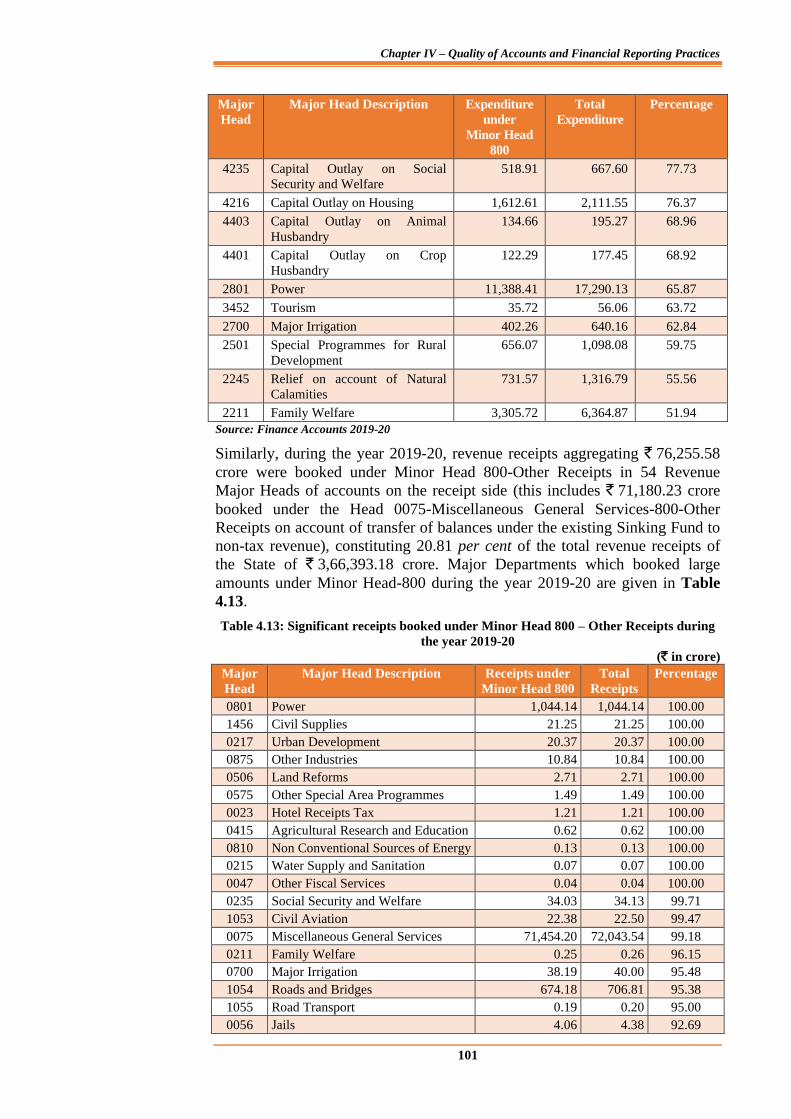
Chapter IV – Quality of Accounts and Financial Reporting Practices
101
Major
Head
Major Head Description Expenditure
under
Minor Head
800
Total
Expenditure
Percentage
4235 Capital Outlay on Social
Security and Welfare
518.91 667.60 77.73
4216 Capital Outlay on Housing 1,612.61 2,111.55 76.37
4403 Capital Outlay on Animal
Husbandry
134.66 195.27 68.96
4401 Capital Outlay on Crop
Husbandry
122.29 177.45 68.92
2801 Power 11,388.41 17,290.13 65.87
3452 Tourism 35.72 56.06 63.72
2700 Major Irrigation 402.26 640.16 62.84
2501 Special Programmes for Rural
Development
656.07 1,098.08 59.75
2245 Relief on account of Natural
Calamities
731.57 1,316.79 55.56
2211 Family Welfare 3,305.72 6,364.87 51.94
Source: Finance Accounts 2019-20
Similarly, during the year 2019-20, revenue receipts aggregating ` 76,255.58
crore were booked under Minor Head 800-Other Receipts in 54 Revenue
Major Heads of accounts on the receipt side (this includes ` 71,180.23 crore
booked under the Head 0075-Miscellaneous General Services-800-Other
Receipts on account of transfer of balances under the existing Sinking Fund to
non-tax revenue), constituting 20.81 per cent of the total revenue receipts of
the State of ` 3,66,393.18 crore. Major Departments which booked large
amounts under Minor Head-800 during the year 2019-20 are given in Table
4.13.
Table 4.13: Significant receipts booked under Minor Head 800 – Other Receipts during
the year 2019-20
(` in crore)
Major
Head
Major Head Description Receipts under
Minor Head 800
Total
Receipts
Percentage
0801 Power 1,044.14 1,044.14 100.00
1456 Civil Supplies 21.25 21.25 100.00
0217 Urban Development 20.37 20.37 100.00
0875 Other Industries 10.84 10.84 100.00
0506 Land Reforms 2.71 2.71 100.00
0575 Other Special Area Programmes 1.49 1.49 100.00
0023 Hotel Receipts Tax 1.21 1.21 100.00
0415 Agricultural Research and Education 0.62 0.62 100.00
0810 Non Conventional Sources of Energy 0.13 0.13 100.00
0215 Water Supply and Sanitation 0.07 0.07 100.00
0047 Other Fiscal Services 0.04 0.04 100.00
0235 Social Security and Welfare 34.03 34.13 99.71
1053 Civil Aviation 22.38 22.50 99.47
0075 Miscellaneous General Services 71,454.20 72,043.54 99.18
0211 Family Welfare 0.25 0.26 96.15
0700 Major Irrigation 38.19 40.00 95.48
1054 Roads and Bridges 674.18 706.81 95.38
1055 Road Transport 0.19 0.20 95.00
0056 Jails 4.06 4.38 92.69
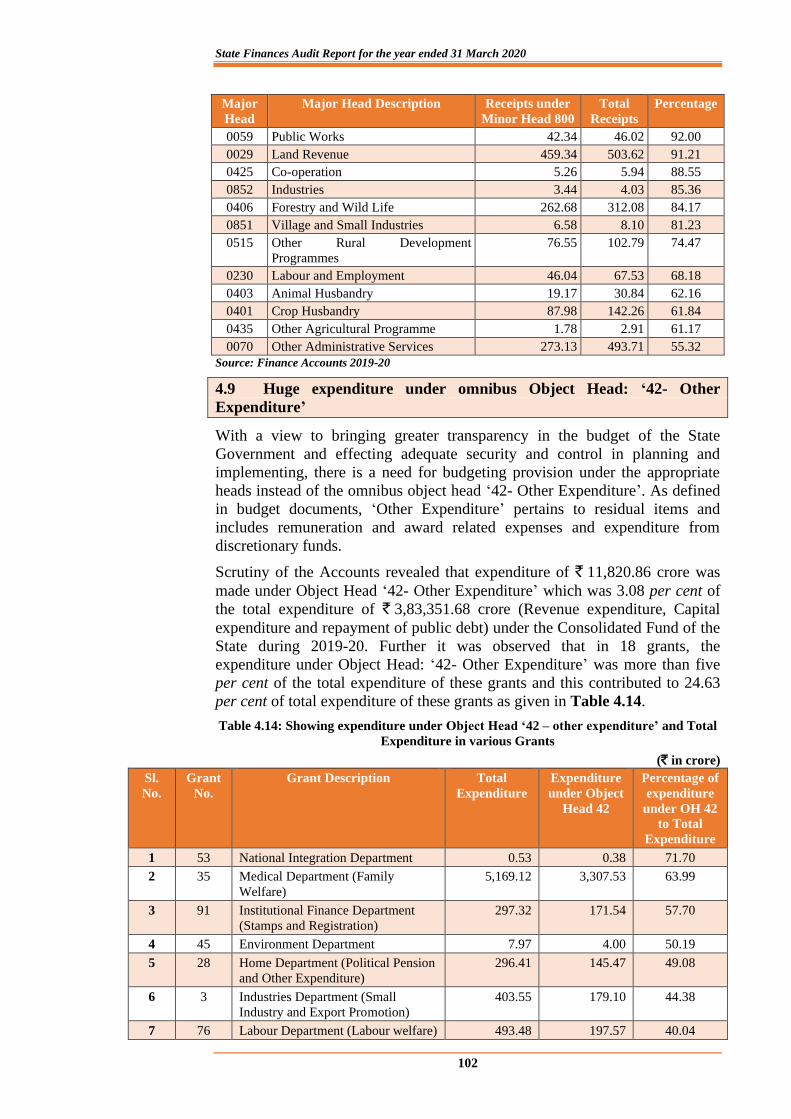
State Finances Audit Report for the year ended 31 March 2020
102
Major
Head
Major Head Description Receipts under
Minor Head 800
Total
Receipts
Percentage
0059 Public Works 42.34 46.02 92.00
0029 Land Revenue 459.34 503.62 91.21
0425 Co-operation 5.26 5.94 88.55
0852 Industries 3.44 4.03 85.36
0406 Forestry and Wild Life 262.68 312.08 84.17
0851 Village and Small Industries 6.58 8.10 81.23
0515 Other Rural Development
Programmes
76.55 102.79 74.47
0230 Labour and Employment 46.04 67.53 68.18
0403 Animal Husbandry 19.17 30.84 62.16
0401 Crop Husbandry 87.98 142.26 61.84
0435 Other Agricultural Programme 1.78 2.91 61.17
0070 Other Administrative Services 273.13 493.71 55.32
Source: Finance Accounts 2019-20
4.9 Huge expenditure under omnibus Object Head: ‘42- Other
Expenditure’
With a view to bringing greater transparency in the budget of the State
Government and effecting adequate security and control in planning and
implementing, there is a need for budgeting provision under the appropriate
heads instead of the omnibus object head ‘42- Other Expenditure’. As defined
in budget documents, ‘Other Expenditure’ pertains to residual items and
includes remuneration and award related expenses and expenditure from
discretionary funds.
Scrutiny of the Accounts revealed that expenditure of ` 11,820.86 crore was
made under Object Head ‘42- Other Expenditure’ which was 3.08 per cent of
the total expenditure of ` 3,83,351.68 crore (Revenue expenditure, Capital
expenditure and repayment of public debt) under the Consolidated Fund of the
State during 2019-20. Further it was observed that in 18 grants, the
expenditure under Object Head: ‘42- Other Expenditure’ was more than five
per cent of the total expenditure of these grants and this contributed to 24.63
per cent of total expenditure of these grants as given in Table 4.14.
Table 4.14: Showing expenditure under Object Head ‘42 – other expenditure’ and Total
Expenditure in various Grants
(` in crore)
Sl.
No.
Grant
No.
Grant Description Total
Expenditure
Expenditure
under Object
Head 42
Percentage of
expenditure
under OH 42
to Total
Expenditure
1 53 National Integration Department 0.53 0.38 71.70
2 35 Medical Department (Family
Welfare)
5,169.12 3,307.53 63.99
3 91 Institutional Finance Department
(Stamps and Registration)
297.32 171.54 57.70
4 45 Environment Department 7.97 4.00 50.19
5 28 Home Department (Political Pension
and Other Expenditure)
296.41 145.47 49.08
6 3 Industries Department (Small
Industry and Export Promotion)
403.55 179.10 44.38
7 76 Labour Department (Labour welfare) 493.48 197.57 40.04
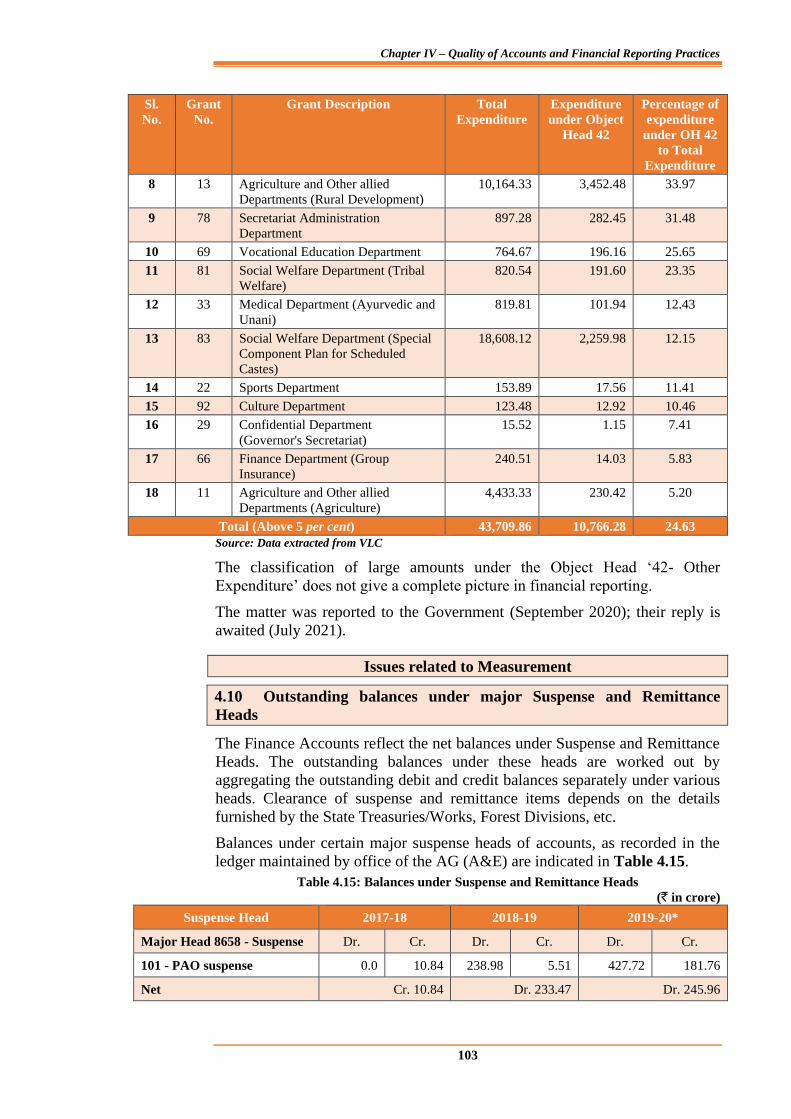
Chapter IV – Quality of Accounts and Financial Reporting Practices
103
Sl.
No.
Grant
No.
Grant Description Total
Expenditure
Expenditure
under Object
Head 42
Percentage of
expenditure
under OH 42
to Total
Expenditure
8 13 Agriculture and Other allied
Departments (Rural Development)
10,164.33 3,452.48 33.97
9 78 Secretariat Administration
Department
897.28 282.45 31.48
10 69 Vocational Education Department 764.67 196.16 25.65
11 81 Social Welfare Department (Tribal
Welfare)
820.54 191.60 23.35
12 33 Medical Department (Ayurvedic and
Unani)
819.81 101.94 12.43
13 83 Social Welfare Department (Special
Component Plan for Scheduled
Castes)
18,608.12 2,259.98 12.15
14 22 Sports Department 153.89 17.56 11.41
15 92 Culture Department 123.48 12.92 10.46
16 29 Confidential Department
(Governor's Secretariat)
15.52 1.15 7.41
17 66 Finance Department (Group
Insurance)
240.51 14.03 5.83
18 11 Agriculture and Other allied
Departments (Agriculture)
4,433.33 230.42 5.20
Total (Above 5 per cent) 43,709.86 10,766.28 24.63
Source: Data extracted from VLC
The classification of large amounts under the Object Head ‘42- Other
Expenditure’ does not give a complete picture in financial reporting.
The matter was reported to the Government (September 2020); their reply is
awaited (July 2021).
Issues related to Measurement
4.10 Outstanding balances under major Suspense and Remittance
Heads
The Finance Accounts reflect the net balances under Suspense and Remittance
Heads. The outstanding balances under these heads are worked out by
aggregating the outstanding debit and credit balances separately under various
heads. Clearance of suspense and remittance items depends on the details
furnished by the State Treasuries/Works, Forest Divisions, etc.
Balances under certain major suspense heads of accounts, as recorded in the
ledger maintained by office of the AG (A&E) are indicated in Table 4.15.
Table 4.15: Balances under Suspense and Remittance Heads
(` in crore)
Suspense Head 2017-18 2018-19 2019-20*
Major Head 8658 - Suspense Dr. Cr. Dr. Cr. Dr. Cr.
101 - PAO suspense 0.0 10.84 238.98 5.51 427.72 181.76
Net Cr. 10.84 Dr. 233.47 Dr. 245.96
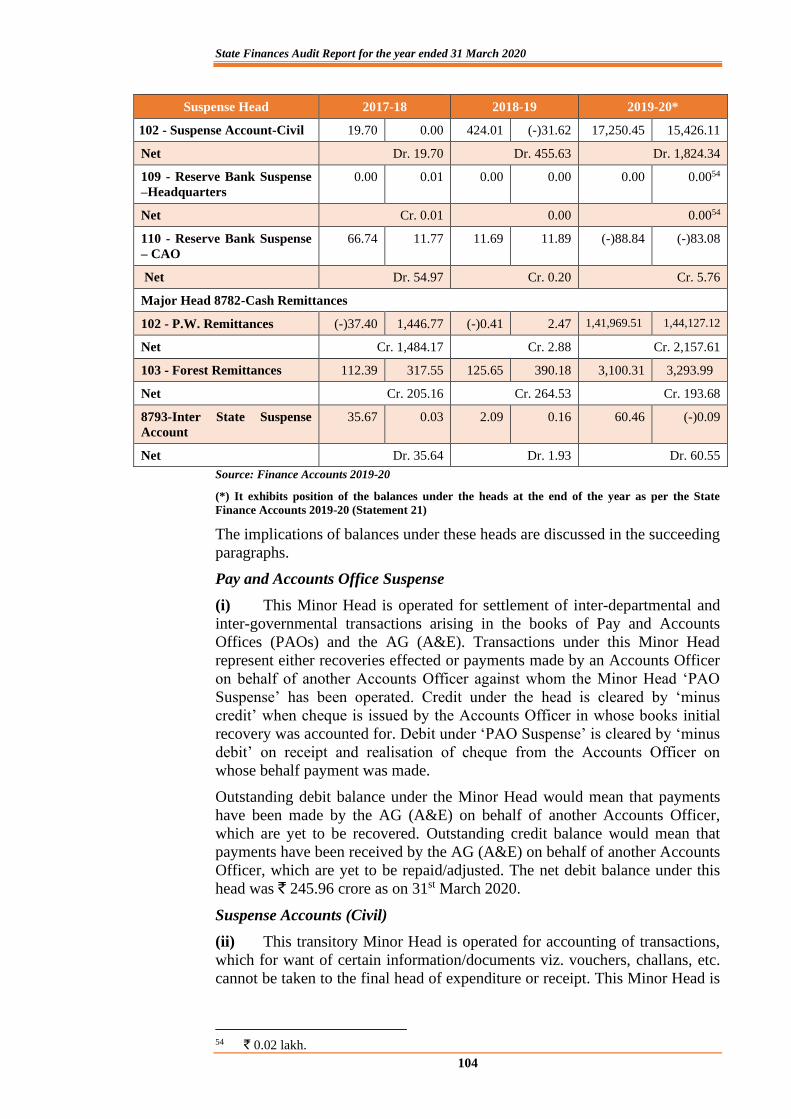
State Finances Audit Report for the year ended 31 March 2020
104
Suspense Head 2017-18 2018-19 2019-20*
102 - Suspense Account-Civil 19.70 0.00 424.01 (-)31.62 17,250.45 15,426.11
Net Dr. 19.70 Dr. 455.63 Dr. 1,824.34
109 - Reserve Bank Suspense
–Headquarters
0.00 0.01 0.00 0.00 0.00 0.0054
Net Cr. 0.01 0.00 0.0054
110 - Reserve Bank Suspense
– CAO
66.74 11.77 11.69 11.89 (-)88.84 (-)83.08
Net Dr. 54.97 Cr. 0.20 Cr. 5.76
Major Head 8782-Cash Remittances
102 - P.W. Remittances (-)37.40 1,446.77 (-)0.41 2.47 1,41,969.51 1,44,127.12
Net Cr. 1,484.17 Cr. 2.88 Cr. 2,157.61
103 - Forest Remittances 112.39 317.55 125.65 390.18 3,100.31 3,293.99
Net Cr. 205.16 Cr. 264.53 Cr. 193.68
8793-Inter State Suspense
Account
35.67 0.03 2.09 0.16 60.46 (-)0.09
Net Dr. 35.64 Dr. 1.93 Dr. 60.55
Source: Finance Accounts 2019-20
(*) It exhibits position of the balances under the heads at the end of the year as per the State
Finance Accounts 2019-20 (Statement 21)
The implications of balances under these heads are discussed in the succeeding
paragraphs.
Pay and Accounts Office Suspense
(i) This Minor Head is operated for settlement of inter-departmental and
inter-governmental transactions arising in the books of Pay and Accounts
Offices (PAOs) and the AG (A&E). Transactions under this Minor Head
represent either recoveries effected or payments made by an Accounts Officer
on behalf of another Accounts Officer against whom the Minor Head ‘PAO
Suspense’ has been operated. Credit under the head is cleared by ‘minus
credit’ when cheque is issued by the Accounts Officer in whose books initial
recovery was accounted for. Debit under ‘PAO Suspense’ is cleared by ‘minus
debit’ on receipt and realisation of cheque from the Accounts Officer on
whose behalf payment was made.
Outstanding debit balance under the Minor Head would mean that payments
have been made by the AG (A&E) on behalf of another Accounts Officer,
which are yet to be recovered. Outstanding credit balance would mean that
payments have been received by the AG (A&E) on behalf of another Accounts
Officer, which are yet to be repaid/adjusted. The net debit balance under this
head was ` 245.96 crore as on 31st March 2020.
Suspense Accounts (Civil)
(ii) This transitory Minor Head is operated for accounting of transactions,
which for want of certain information/documents viz. vouchers, challans, etc.
cannot be taken to the final head of expenditure or receipt. This Minor Head is
54 ` 0.02 lakh.
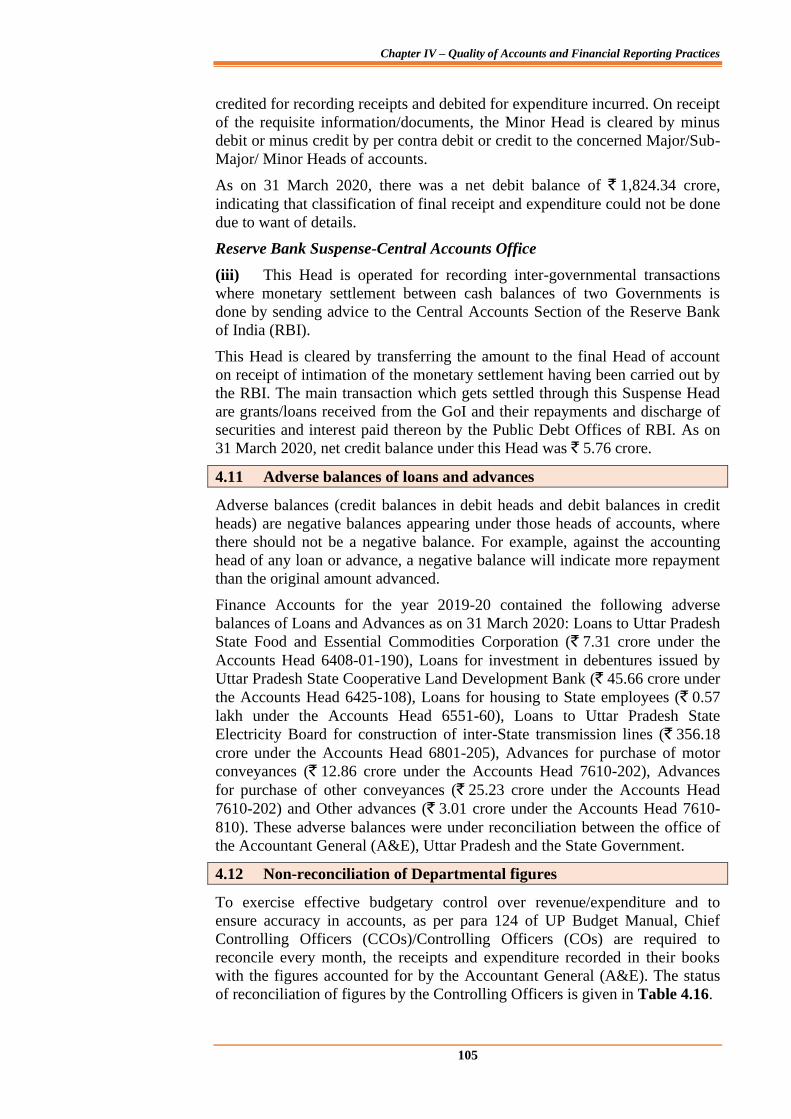
Chapter IV – Quality of Accounts and Financial Reporting Practices
105
credited for recording receipts and debited for expenditure incurred. On receipt
of the requisite information/documents, the Minor Head is cleared by minus
debit or minus credit by per contra debit or credit to the concerned Major/Sub-
Major/ Minor Heads of accounts.
As on 31 March 2020, there was a net debit balance of ` 1,824.34 crore,
indicating that classification of final receipt and expenditure could not be done
due to want of details.
Reserve Bank Suspense-Central Accounts Office
(iii) This Head is operated for recording inter-governmental transactions
where monetary settlement between cash balances of two Governments is
done by sending advice to the Central Accounts Section of the Reserve Bank
of India (RBI).
This Head is cleared by transferring the amount to the final Head of account
on receipt of intimation of the monetary settlement having been carried out by
the RBI. The main transaction which gets settled through this Suspense Head
are grants/loans received from the GoI and their repayments and discharge of
securities and interest paid thereon by the Public Debt Offices of RBI. As on
31 March 2020, net credit balance under this Head was ` 5.76 crore.
4.11 Adverse balances of loans and advances
Adverse balances (credit balances in debit heads and debit balances in credit
heads) are negative balances appearing under those heads of accounts, where
there should not be a negative balance. For example, against the accounting
head of any loan or advance, a negative balance will indicate more repayment
than the original amount advanced.
Finance Accounts for the year 2019-20 contained the following adverse
balances of Loans and Advances as on 31 March 2020: Loans to Uttar Pradesh
State Food and Essential Commodities Corporation (` 7.31 crore under the
Accounts Head 6408-01-190), Loans for investment in debentures issued by
Uttar Pradesh State Cooperative Land Development Bank (` 45.66 crore under
the Accounts Head 6425-108), Loans for housing to State employees (` 0.57
lakh under the Accounts Head 6551-60), Loans to Uttar Pradesh State
Electricity Board for construction of inter-State transmission lines (` 356.18
crore under the Accounts Head 6801-205), Advances for purchase of motor
conveyances (` 12.86 crore under the Accounts Head 7610-202), Advances
for purchase of other conveyances (` 25.23 crore under the Accounts Head
7610-202) and Other advances (` 3.01 crore under the Accounts Head 7610-
810). These adverse balances were under reconciliation between the office of
the Accountant General (A&E), Uttar Pradesh and the State Government.
4.12 Non-reconciliation of Departmental figures
To exercise effective budgetary control over revenue/expenditure and to
ensure accuracy in accounts, as per para 124 of UP Budget Manual, Chief
Controlling Officers (CCOs)/Controlling Officers (COs) are required to
reconcile every month, the receipts and expenditure recorded in their books
with the figures accounted for by the Accountant General (A&E). The status
of reconciliation of figures by the Controlling Officers is given in Table 4.16.
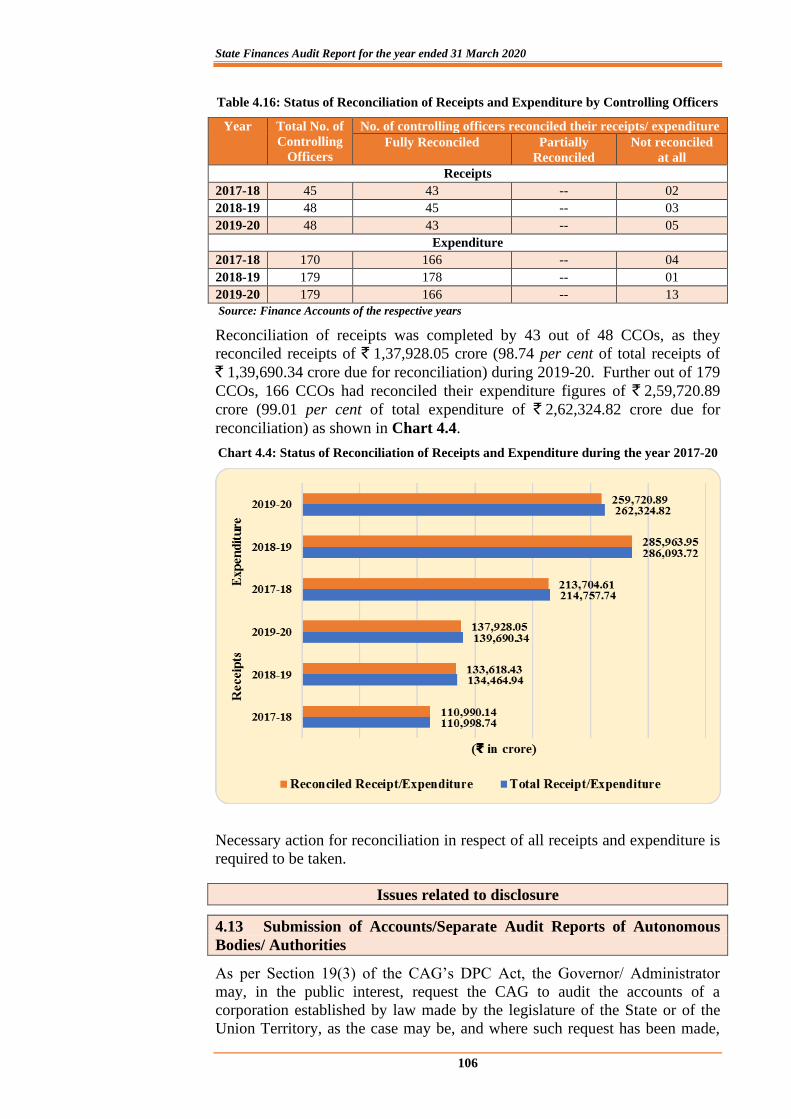
State Finances Audit Report for the year ended 31 March 2020
106
Table 4.16: Status of Reconciliation of Receipts and Expenditure by Controlling Officers
Year Total No. of
Controlling
Officers
No. of controlling officers reconciled their receipts/ expenditure
Fully Reconciled Partially
Reconciled
Not reconciled
at all
Receipts
2017-18 45 43 -- 02
2018-19 48 45 -- 03
2019-20 48 43 -- 05
Expenditure
2017-18 170 166 -- 04
2018-19 179 178 -- 01
2019-20 179 166 -- 13
Source: Finance Accounts of the respective years
Reconciliation of receipts was completed by 43 out of 48 CCOs, as they
reconciled receipts of ` 1,37,928.05 crore (98.74 per cent of total receipts of
` 1,39,690.34 crore due for reconciliation) during 2019-20. Further out of 179
CCOs, 166 CCOs had reconciled their expenditure figures of ` 2,59,720.89
crore (99.01 per cent of total expenditure of ` 2,62,324.82 crore due for
reconciliation) as shown in Chart 4.4.
Chart 4.4: Status of Reconciliation of Receipts and Expenditure during the year 2017-20
Necessary action for reconciliation in respect of all receipts and expenditure is
required to be taken.
Issues related to disclosure
4.13 Submission of Accounts/Separate Audit Reports of Autonomous
Bodies/ Authorities
As per Section 19(3) of the CAG’s DPC Act, the Governor/ Administrator
may, in the public interest, request the CAG to audit the accounts of a
corporation established by law made by the legislature of the State or of the
Union Territory, as the case may be, and where such request has been made,
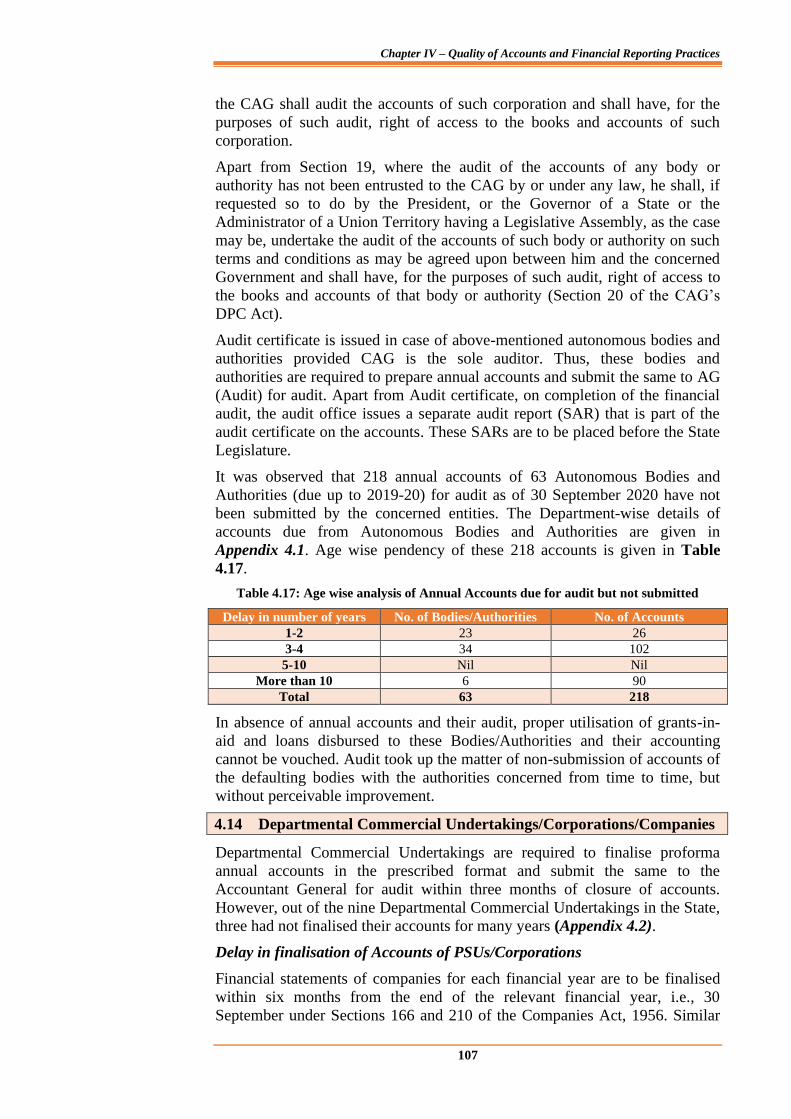
Chapter IV – Quality of Accounts and Financial Reporting Practices
107
the CAG shall audit the accounts of such corporation and shall have, for the
purposes of such audit, right of access to the books and accounts of such
corporation.
Apart from Section 19, where the audit of the accounts of any body or
authority has not been entrusted to the CAG by or under any law, he shall, if
requested so to do by the President, or the Governor of a State or the
Administrator of a Union Territory having a Legislative Assembly, as the case
may be, undertake the audit of the accounts of such body or authority on such
terms and conditions as may be agreed upon between him and the concerned
Government and shall have, for the purposes of such audit, right of access to
the books and accounts of that body or authority (Section 20 of the CAG’s
DPC Act).
Audit certificate is issued in case of above-mentioned autonomous bodies and
authorities provided CAG is the sole auditor. Thus, these bodies and
authorities are required to prepare annual accounts and submit the same to AG
(Audit) for audit. Apart from Audit certificate, on completion of the financial
audit, the audit office issues a separate audit report (SAR) that is part of the
audit certificate on the accounts. These SARs are to be placed before the State
Legislature.
It was observed that 218 annual accounts of 63 Autonomous Bodies and
Authorities (due up to 2019-20) for audit as of 30 September 2020 have not
been submitted by the concerned entities. The Department-wise details of
accounts due from Autonomous Bodies and Authorities are given in
Appendix 4.1. Age wise pendency of these 218 accounts is given in Table
4.17.
Table 4.17: Age wise analysis of Annual Accounts due for audit but not submitted
Delay in number of years No. of Bodies/Authorities No. of Accounts
1-2 23 26
3-4 34 102
5-10 Nil Nil
More than 10 6 90
Total 63 218
In absence of annual accounts and their audit, proper utilisation of grants-in-
aid and loans disbursed to these Bodies/Authorities and their accounting
cannot be vouched. Audit took up the matter of non-submission of accounts of
the defaulting bodies with the authorities concerned from time to time, but
without perceivable improvement.
4.14 Departmental Commercial Undertakings/Corporations/Companies
Departmental Commercial Undertakings are required to finalise proforma
annual accounts in the prescribed format and submit the same to the
Accountant General for audit within three months of closure of accounts.
However, out of the nine Departmental Commercial Undertakings in the State,
three had not finalised their accounts for many years (Appendix 4.2).
Delay in finalisation of Accounts of PSUs/Corporations
Financial statements of companies for each financial year are to be finalised
within six months from the end of the relevant financial year, i.e., 30
September under Sections 166 and 210 of the Companies Act, 1956. Similar
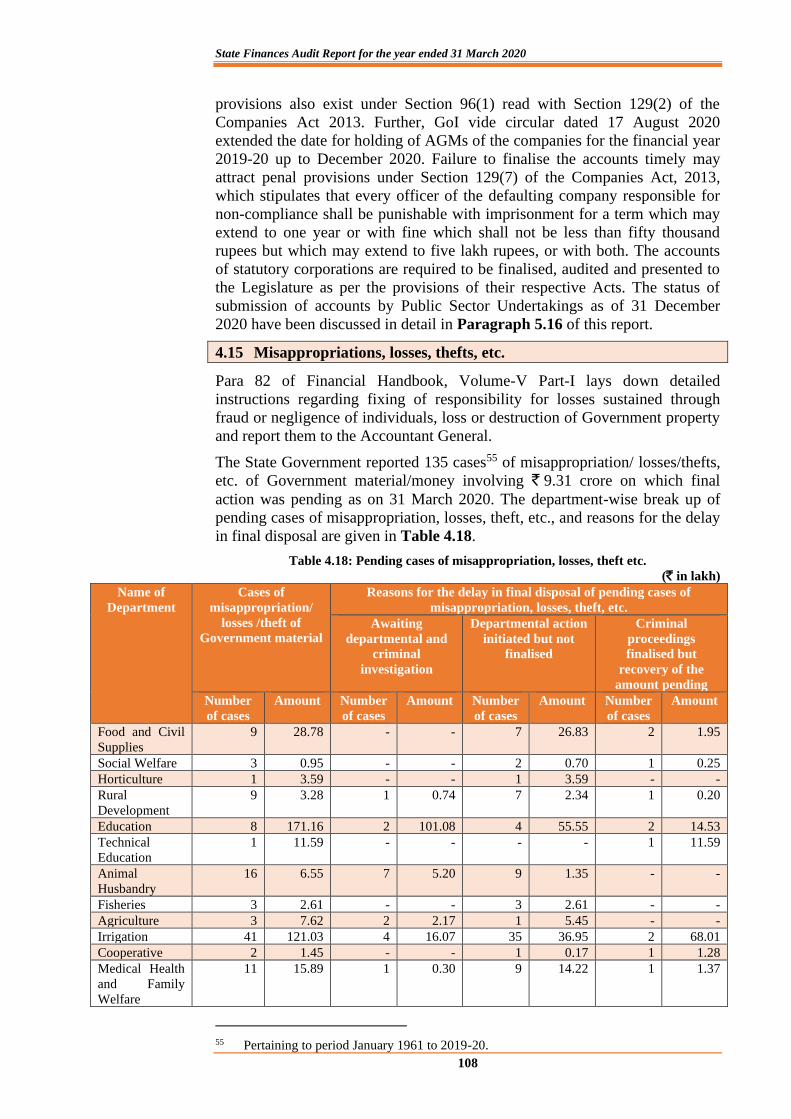
State Finances Audit Report for the year ended 31 March 2020
108
provisions also exist under Section 96(1) read with Section 129(2) of the
Companies Act 2013. Further, GoI vide circular dated 17 August 2020
extended the date for holding of AGMs of the companies for the financial year
2019-20 up to December 2020. Failure to finalise the accounts timely may
attract penal provisions under Section 129(7) of the Companies Act, 2013,
which stipulates that every officer of the defaulting company responsible for
non-compliance shall be punishable with imprisonment for a term which may
extend to one year or with fine which shall not be less than fifty thousand
rupees but which may extend to five lakh rupees, or with both. The accounts
of statutory corporations are required to be finalised, audited and presented to
the Legislature as per the provisions of their respective Acts. The status of
submission of accounts by Public Sector Undertakings as of 31 December
2020 have been discussed in detail in Paragraph 5.16 of this report.
4.15 Misappropriations, losses, thefts, etc.
Para 82 of Financial Handbook, Volume-V Part-I lays down detailed
instructions regarding fixing of responsibility for losses sustained through
fraud or negligence of individuals, loss or destruction of Government property
and report them to the Accountant General.
The State Government reported 135 cases55 of misappropriation/ losses/thefts,
etc. of Government material/money involving ` 9.31 crore on which final
action was pending as on 31 March 2020. The department-wise break up of
pending cases of misappropriation, losses, theft, etc., and reasons for the delay
in final disposal are given in Table 4.18.
Table 4.18: Pending cases of misappropriation, losses, theft etc.
(` in lakh)
Name of
Department
Cases of
misappropriation/
losses /theft of
Government material
Reasons for the delay in final disposal of pending cases of
misappropriation, losses, theft, etc.
Awaiting
departmental and
criminal
investigation
Departmental action
initiated but not
finalised
Criminal
proceedings
finalised but
recovery of the
amount pending
Number
of cases
Amount Number
of cases
Amount Number
of cases
Amount Number
of cases
Amount
Food and Civil
Supplies
9 28.78 - - 7 26.83 2 1.95
Social Welfare 3 0.95 - - 2 0.70 1 0.25
Horticulture 1 3.59 - - 1 3.59 - -
Rural
Development
9 3.28 1 0.74 7 2.34 1 0.20
Education 8 171.16 2 101.08 4 55.55 2 14.53
Technical
Education
1 11.59 - - - - 1 11.59
Animal
Husbandry
16 6.55 7 5.20 9 1.35 - -
Fisheries 3 2.61 - - 3 2.61 - -
Agriculture 3 7.62 2 2.17 1 5.45 - -
Irrigation 41 121.03 4 16.07 35 36.95 2 68.01
Cooperative 2 1.45 - - 1 0.17 1 1.28
Medical Health
and Family
Welfare
11 15.89 1 0.30 9 14.22 1 1.37
55 Pertaining to period January 1961 to 2019-20.
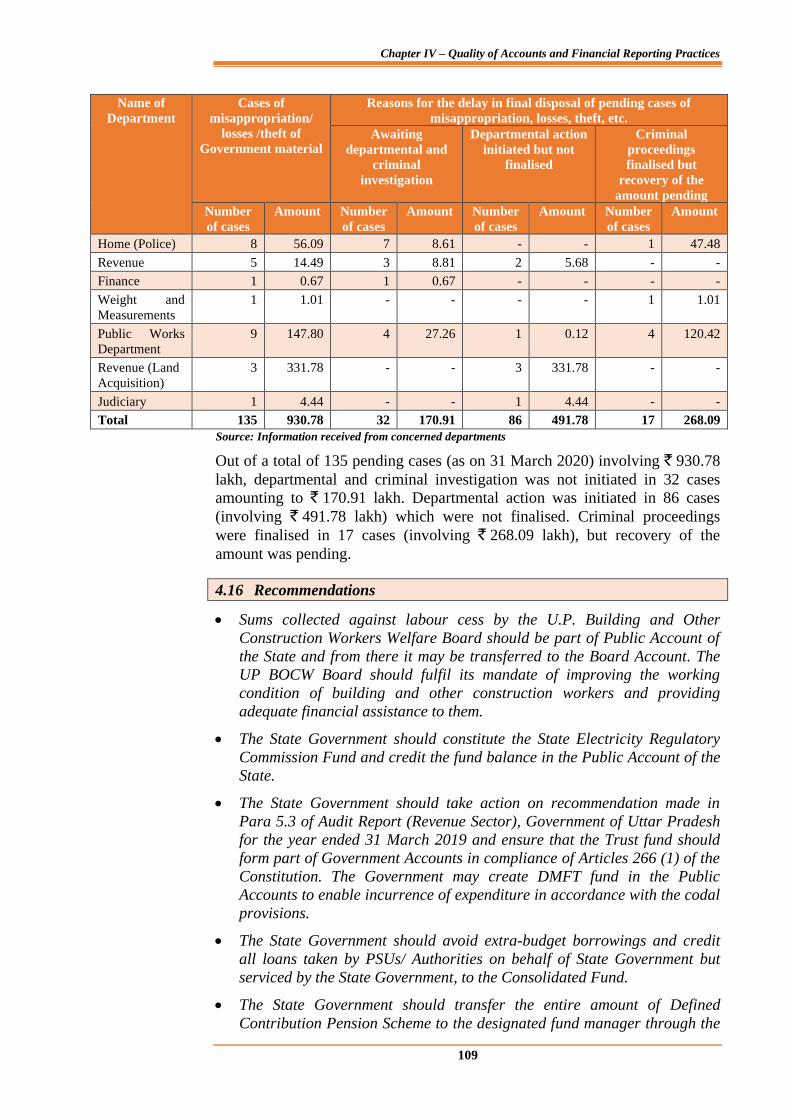
Chapter IV – Quality of Accounts and Financial Reporting Practices
109
Name of
Department
Cases of
misappropriation/
losses /theft of
Government material
Reasons for the delay in final disposal of pending cases of
misappropriation, losses, theft, etc.
Awaiting
departmental and
criminal
investigation
Departmental action
initiated but not
finalised
Criminal
proceedings
finalised but
recovery of the
amount pending
Number
of cases
Amount Number
of cases
Amount Number
of cases
Amount Number
of cases
Amount
Home (Police) 8 56.09 7 8.61 - - 1 47.48
Revenue 5 14.49 3 8.81 2 5.68 - -
Finance 1 0.67 1 0.67 - - - -
Weight and
Measurements
1 1.01 - - - - 1 1.01
Public Works
Department
9 147.80 4 27.26 1 0.12 4 120.42
Revenue (Land
Acquisition)
3 331.78 - - 3 331.78 - -
Judiciary 1 4.44 - - 1 4.44 - -
Total 135 930.78 32 170.91 86 491.78 17 268.09
Source: Information received from concerned departments
Out of a total of 135 pending cases (as on 31 March 2020) involving ` 930.78
lakh, departmental and criminal investigation was not initiated in 32 cases
amounting to ` 170.91 lakh. Departmental action was initiated in 86 cases
(involving ` 491.78 lakh) which were not finalised. Criminal proceedings
were finalised in 17 cases (involving ` 268.09 lakh), but recovery of the
amount was pending.
4.16 Recommendations
• Sums collected against labour cess by the U.P. Building and Other
Construction Workers Welfare Board should be part of Public Account of
the State and from there it may be transferred to the Board Account. The
UP BOCW Board should fulfil its mandate of improving the working
condition of building and other construction workers and providing
adequate financial assistance to them.
• The State Government should constitute the State Electricity Regulatory
Commission Fund and credit the fund balance in the Public Account of the
State.
• The State Government should take action on recommendation made in
Para 5.3 of Audit Report (Revenue Sector), Government of Uttar Pradesh
for the year ended 31 March 2019 and ensure that the Trust fund should
form part of Government Accounts in compliance of Articles 266 (1) of the
Constitution. The Government may create DMFT fund in the Public
Accounts to enable incurrence of expenditure in accordance with the codal
provisions.
• The State Government should avoid extra-budget borrowings and credit
all loans taken by PSUs/ Authorities on behalf of State Government but
serviced by the State Government, to the Consolidated Fund.
• The State Government should transfer the entire amount of Defined
Contribution Pension Scheme to the designated fund manager through the
State Finances Audit Report for the year ended 31 March 2020
110
National Securities Depository Limited (NSDL)/Trustee Bank so that the
un-transferred amount could become the part of corpus of investment of
the subscribers and yield value appreciation.
• Being the statutory requirement, the Government should create the ‘Uttar
Pradesh Road Transport Accident Relief Fund’ so that the fund could be
utilised for benefit of the affected persons.
• The Government may ensure timely submission of utilisation certificates by
the departments in respect of the grants released for specific purposes and
all pendencies may be reviewed before release of fresh grants to defaulting
grantees.
• The Finance Department should ensure that all controlling officer adjust
Abstract Contingent bills within stipulated period, as required under the
Rules.
• The Finance Department should review all PD accounts to ensure that all
amounts unnecessarily lying in these PD accounts are immediately
remitted to the Consolidated Fund. Further, the Finance Department
should reiterate the instructions contained in the financial rules/codal
provisions and ensure that appropriate action is taken against
departmental officers who fail to follow the rules.
• The Finance Department should, in consultation with the Accountant
General (A&E), conduct a comprehensive review of all items presently
appearing under minor head 800 and ensure that all such receipts and
expenditure are in future booked under the appropriate heads of account.
Further, at object head level, indiscriminate use of object head 42-Other
expenditure should be minimised.
• The Finance Department should consider evolving a system including
undertaking regular reviews to expedite the process of compilation and
submission of annual accounts by Bodies/Authorities in order to assess
their financial position.
• The Government may consider preparing a time bound framework for
taking prompt action in cases of misappropriation, loss, theft, etc. and
strengthening the internal control system to prevent recurrence of such
cases.

111
CHAPTER-V
FUNCTIONING OF STATE PUBLIC SECTOR UNDERTAKINGS
5.1 Introduction
State Public Sector Undertakings (PSUs) consist of State Government Companies and Statutory Corporations. State PSUs are established to carry out activities of commercial nature keeping in view the welfare of people and occupy an important place in the State economy. As on 31 March 2020, there were 113 PSUs in Uttar Pradesh, including six Statutory Corporations56 and 107 Government Companies (including 44 non-functional Government Companies57) under the audit jurisdiction of the Comptroller and Auditor General of India. During the year 2019-20, two companies viz. Moradabad Smart City Limited and Saharanpur Smart City Limited were added. None of these Government Companies was listed on the stock exchange.
The financial performance of 33 PSUs (consisting of 11 PSUs of power sector and 22 PSUs of other than power sector, as detailed in Appendix-5.1) on the basis of latest finalised accounts received upto 31 December 2020 is covered in this Chapter. This Chapter does not include analysis of financial performance of 80 PSUs (including 68 Government companies, nine other Government Controlled Companies58 and three Statutory Corporations) as these PSUs have accounts in arrears for three years or more or were defunct/under liquidation or first accounts were not received as detailed in Appendix-5.2. However, the Chapter covers investment in State PSUs (Paragraph 5.2), budgetary support to PSUs (paragraph 5.3), reconciliation with Finance Accounts of Government of Uttar Pradesh (paragraph 5.4), comments on accounts of PSUs (Paragraphs 5.14 and 5.15) and submission of accounts by PSUs (paragraph 5.16) in respect of all State PSUs.
The PSUs play an important role in the economy of the State. Apart from providing critical infrastructure required for development of the State’s economy, these PSUs also add significantly to the GDP of the State. The ratio of PSUs’ turnover to Gross State Domestic Product (GSDP) shows the extent of activities of PSUs in the State economy. Table 5.1 provides the details of turnover of PSUs and GSDP of Uttar Pradesh for a period of four years ending 31 March 202059.
56 Uttar Pradesh Avas Evam Vikas Parishad, Uttar Pradesh Jal Nigam, Uttar Pradesh
Financial Corporation, Uttar Pradesh State Road Transport Corporation, Uttar Pradesh State Warehousing Corporation and Uttar Pradesh Forest Corporation.
57 During the year 2019-20, two non-functional companies viz. Sonebhadra Power Generation Company Limited and Yamuna Power Generation Company Limited have been wound up.
58 Companies owned or controlled directly or indirectly, by the Central Government or by any State Government or Governments, or partly by the Central Government and partly by one or more State Governments
59 As per latest finalised accounts till 31 December 2020.
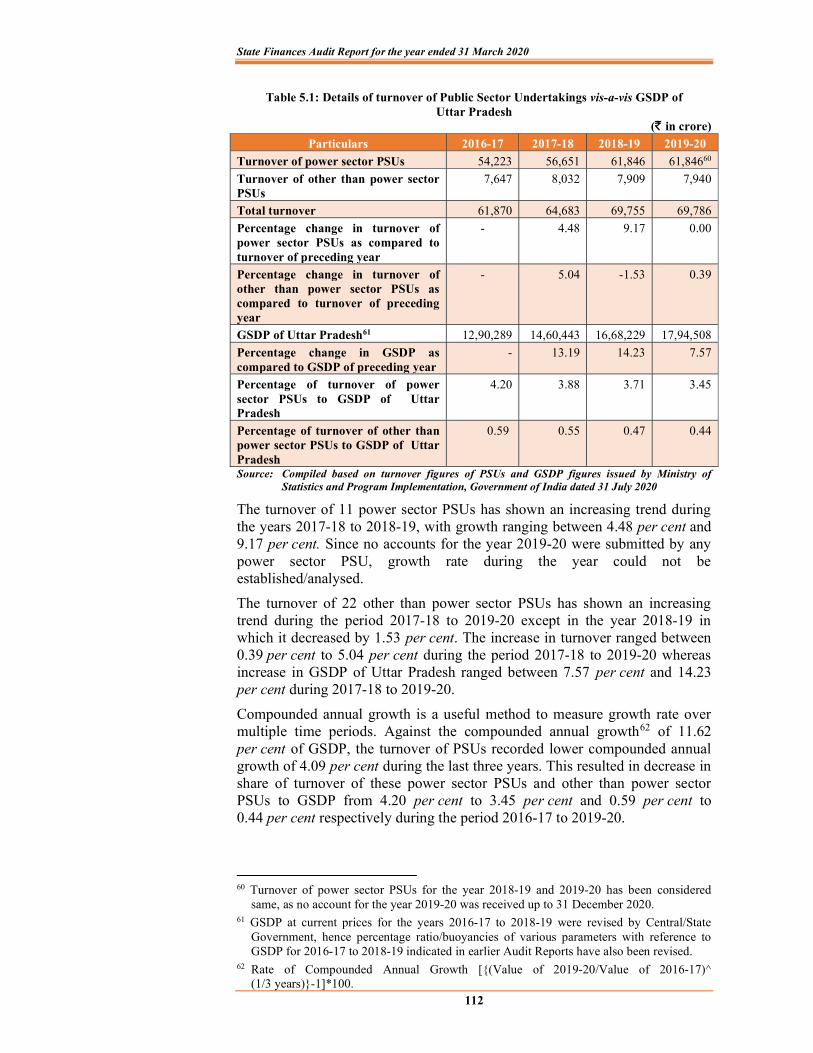
State Finances Audit Report for the year ended 31 March 2020
112
Table 5.1: Details of turnover of Public Sector Undertakings vis-a-vis GSDP of Uttar Pradesh
( in crore)
Particulars 2016-17 2017-18 2018-19 2019-20
Turnover of power sector PSUs 54,223 56,651 61,846 61,84660
Turnover of other than power sector PSUs
7,647 8,032 7,909 7,940
Total turnover 61,870 64,683 69,755 69,786
Percentage change in turnover of power sector PSUs as compared to turnover of preceding year
- 4.48 9.17 0.00
Percentage change in turnover of other than power sector PSUs as compared to turnover of preceding year
- 5.04 -1.53 0.39
GSDP of Uttar Pradesh61 12,90,289 14,60,443 16,68,229 17,94,508
Percentage change in GSDP as compared to GSDP of preceding year
- 13.19 14.23 7.57
Percentage of turnover of power sector PSUs to GSDP of Uttar Pradesh
4.20 3.88 3.71 3.45
Percentage of turnover of other than power sector PSUs to GSDP of Uttar Pradesh
0.59 0.55 0.47 0.44
Source: Compiled based on turnover figures of PSUs and GSDP figures issued by Ministry of Statistics and Program Implementation, Government of India dated 31 July 2020
The turnover of 11 power sector PSUs has shown an increasing trend during the years 2017-18 to 2018-19, with growth ranging between 4.48 per cent and 9.17 per cent. Since no accounts for the year 2019-20 were submitted by any power sector PSU, growth rate during the year could not be established/analysed.
The turnover of 22 other than power sector PSUs has shown an increasing trend during the period 2017-18 to 2019-20 except in the year 2018-19 in which it decreased by 1.53 per cent. The increase in turnover ranged between 0.39 per cent to 5.04 per cent during the period 2017-18 to 2019-20 whereas increase in GSDP of Uttar Pradesh ranged between 7.57 per cent and 14.23 per cent during 2017-18 to 2019-20.
Compounded annual growth is a useful method to measure growth rate over multiple time periods. Against the compounded annual growth62 of 11.62 per cent of GSDP, the turnover of PSUs recorded lower compounded annual growth of 4.09 per cent during the last three years. This resulted in decrease in share of turnover of these power sector PSUs and other than power sector PSUs to GSDP from 4.20 per cent to 3.45 per cent and 0.59 per cent to 0.44 per cent respectively during the period 2016-17 to 2019-20.
60 Turnover of power sector PSUs for the year 2018-19 and 2019-20 has been considered
same, as no account for the year 2019-20 was received up to 31 December 2020. 61 GSDP at current prices for the years 2016-17 to 2018-19 were revised by Central/State
Government, hence percentage ratio/buoyancies of various parameters with reference to GSDP for 2016-17 to 2018-19 indicated in earlier Audit Reports have also been revised.
62 Rate of Compounded Annual Growth [{(Value of 2019-20/Value of 2016-17)^ (1/3 years)}-1]*100.
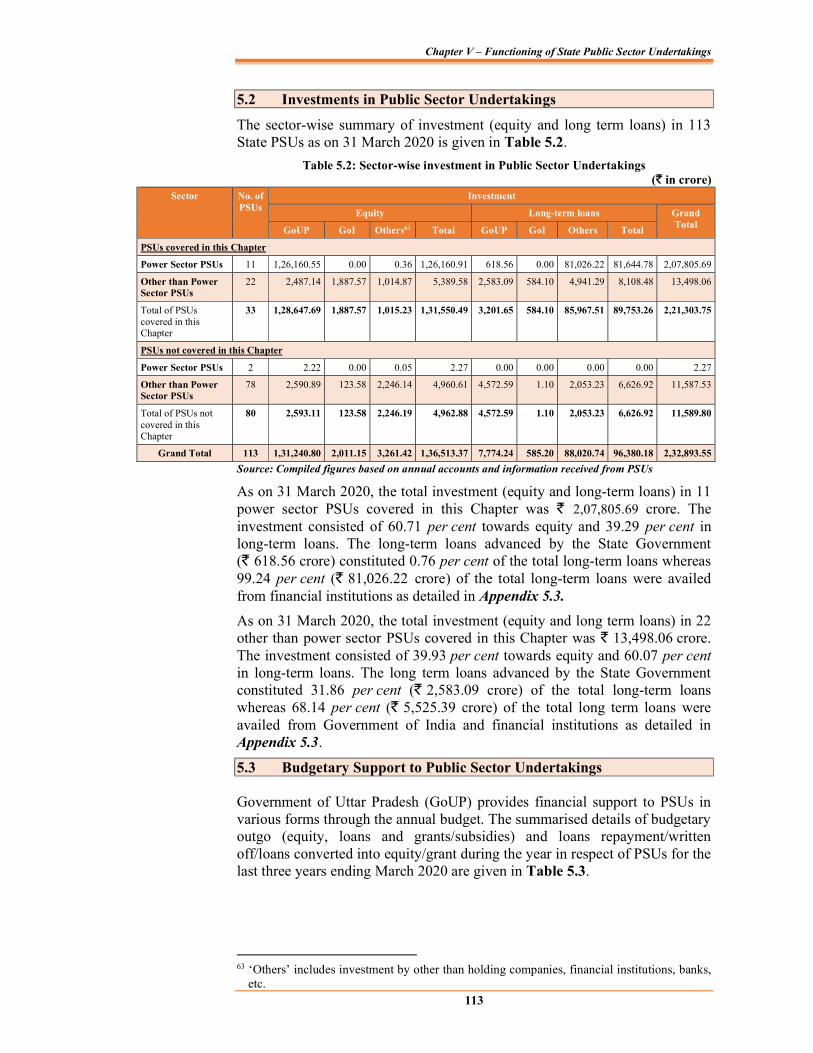
Chapter V – Functioning of State Public Sector Undertakings
113
5.2 Investments in Public Sector Undertakings
The sector-wise summary of investment (equity and long term loans) in 113 State PSUs as on 31 March 2020 is given in Table 5.2.
Table 5.2: Sector-wise investment in Public Sector Undertakings ( in crore)
Sector No. of PSUs
Investment
Equity Long-term loans Grand Total
GoUP GoI Others63 Total GoUP GoI Others Total
PSUs covered in this Chapter
Power Sector PSUs 11 1,26,160.55 0.00 0.36 1,26,160.91 618.56 0.00 81,026.22 81,644.78 2,07,805.69
Other than Power Sector PSUs
22 2,487.14 1,887.57 1,014.87 5,389.58 2,583.09 584.10 4,941.29 8,108.48 13,498.06
Total of PSUs covered in this Chapter
33 1,28,647.69 1,887.57 1,015.23 1,31,550.49 3,201.65 584.10 85,967.51 89,753.26 2,21,303.75
PSUs not covered in this Chapter
Power Sector PSUs 2 2.22 0.00 0.05 2.27 0.00 0.00 0.00 0.00 2.27
Other than Power Sector PSUs
78 2,590.89 123.58 2,246.14 4,960.61 4,572.59 1.10 2,053.23 6,626.92 11,587.53
Total of PSUs not covered in this Chapter
80 2,593.11 123.58 2,246.19 4,962.88 4,572.59 1.10 2,053.23 6,626.92 11,589.80
Grand Total 113 1,31,240.80 2,011.15 3,261.42 1,36,513.37 7,774.24 585.20 88,020.74 96,380.18 2,32,893.55
Source: Compiled figures based on annual accounts and information received from PSUs
As on 31 March 2020, the total investment (equity and long-term loans) in 11 power sector PSUs covered in this Chapter was 2,07,805.69 crore. The investment consisted of 60.71 per cent towards equity and 39.29 per cent in long-term loans. The long-term loans advanced by the State Government ( 618.56 crore) constituted 0.76 per cent of the total long-term loans whereas 99.24 per cent ( 81,026.22 crore) of the total long-term loans were availed from financial institutions as detailed in Appendix 5.3.
As on 31 March 2020, the total investment (equity and long term loans) in 22 other than power sector PSUs covered in this Chapter was 13,498.06 crore. The investment consisted of 39.93 per cent towards equity and 60.07 per cent in long-term loans. The long term loans advanced by the State Government constituted 31.86 per cent ( 2,583.09 crore) of the total long-term loans whereas 68.14 per cent ( 5,525.39 crore) of the total long term loans were availed from Government of India and financial institutions as detailed in Appendix 5.3.
5.3 Budgetary Support to Public Sector Undertakings
Government of Uttar Pradesh (GoUP) provides financial support to PSUs in various forms through the annual budget. The summarised details of budgetary outgo (equity, loans and grants/subsidies) and loans repayment/written off/loans converted into equity/grant during the year in respect of PSUs for the last three years ending March 2020 are given in Table 5.3.
63 ‘Others’ includes investment by other than holding companies, financial institutions, banks,
etc.
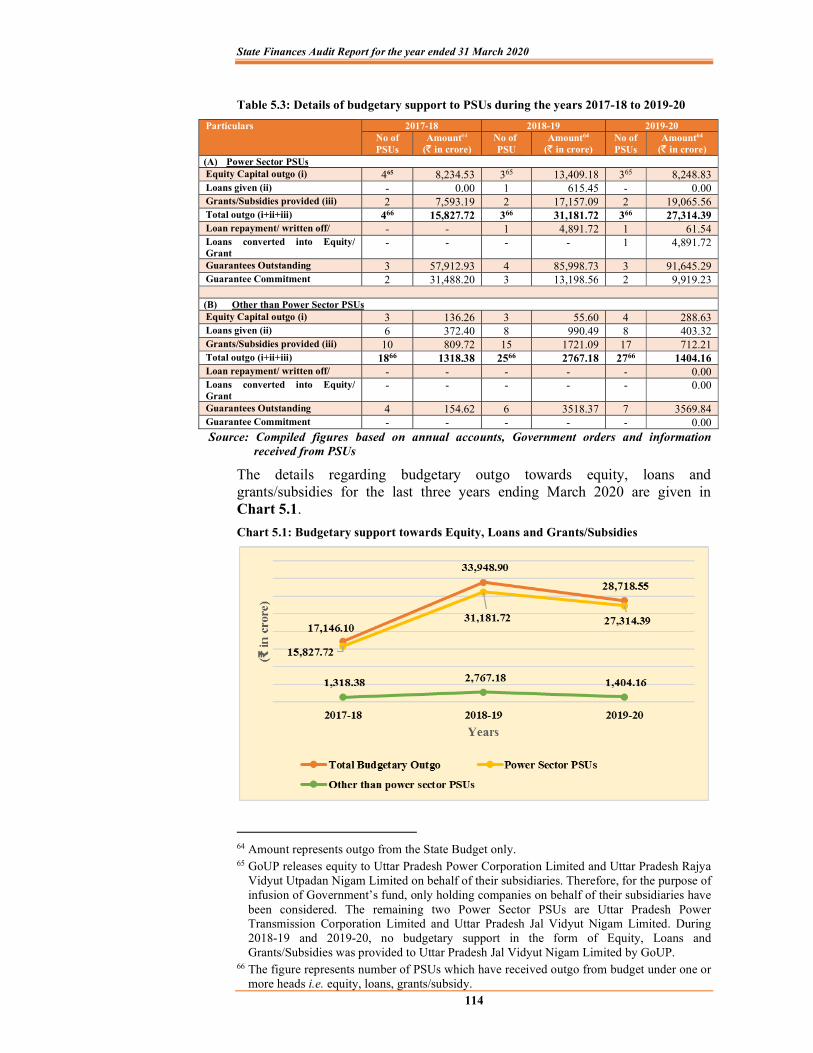
State Finances Audit Report for the year ended 31 March 2020
114
Table 5.3: Details of budgetary support to PSUs during the years 2017-18 to 2019-20
Particulars 2017-18 2018-19 2019-20 No of PSUs
Amount64
( in crore) No of PSU
Amount64 ( in crore)
No of PSUs
Amount64 ( in crore)
(A) Power Sector PSUs Equity Capital outgo (i) 465 8,234.53 365 13,409.18 365 8,248.83 Loans given (ii) - 0.00 1 615.45 - 0.00 Grants/Subsidies provided (iii) 2 7,593.19 2 17,157.09 2 19,065.56 Total outgo (i+ii+iii) 466 15,827.72 366 31,181.72 366 27,314.39 Loan repayment/ written off/ - - 1 4,891.72 1 61.54 Loans converted into Equity/ Grant
- - - - 1 4,891.72
Guarantees Outstanding 3 57,912.93 4 85,998.73 3 91,645.29 Guarantee Commitment 2 31,488.20 3 13,198.56 2 9,919.23
(B) Other than Power Sector PSUs Equity Capital outgo (i) 3 136.26 3 55.60 4 288.63 Loans given (ii) 6 372.40 8 990.49 8 403.32 Grants/Subsidies provided (iii) 10 809.72 15 1721.09 17 712.21 Total outgo (i+ii+iii) 1866 1318.38 2566 2767.18 2766 1404.16 Loan repayment/ written off/ - - - - - 0.00 Loans converted into Equity/ Grant
- - - - - 0.00
Guarantees Outstanding 4 154.62 6 3518.37 7 3569.84 Guarantee Commitment - - - - - 0.00 Source: Compiled figures based on annual accounts, Government orders and information
received from PSUs
The details regarding budgetary outgo towards equity, loans and grants/subsidies for the last three years ending March 2020 are given in Chart 5.1.
Chart 5.1: Budgetary support towards Equity, Loans and Grants/Subsidies
64 Amount represents outgo from the State Budget only. 65 GoUP releases equity to Uttar Pradesh Power Corporation Limited and Uttar Pradesh Rajya
Vidyut Utpadan Nigam Limited on behalf of their subsidiaries. Therefore, for the purpose of infusion of Government’s fund, only holding companies on behalf of their subsidiaries have been considered. The remaining two Power Sector PSUs are Uttar Pradesh Power Transmission Corporation Limited and Uttar Pradesh Jal Vidyut Nigam Limited. During 2018-19 and 2019-20, no budgetary support in the form of Equity, Loans and Grants/Subsidies was provided to Uttar Pradesh Jal Vidyut Nigam Limited by GoUP.
66 The figure represents number of PSUs which have received outgo from budget under one or more heads i.e. equity, loans, grants/subsidy.
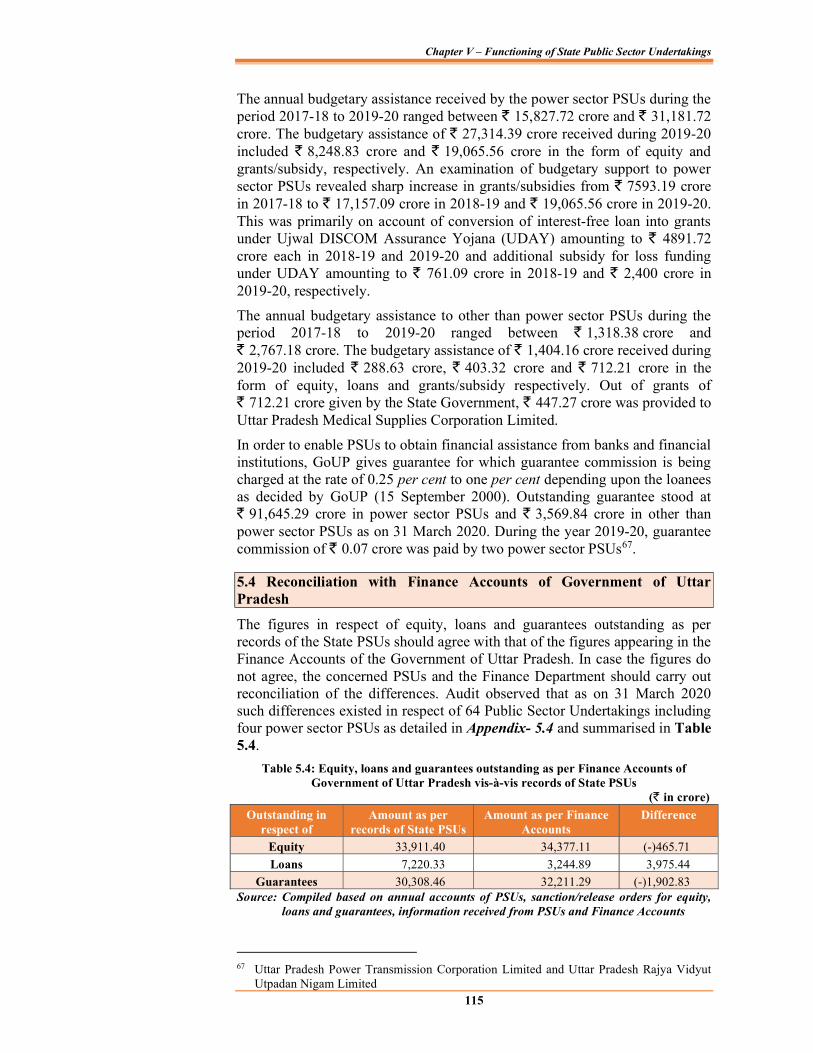
Chapter V – Functioning of State Public Sector Undertakings
115
The annual budgetary assistance received by the power sector PSUs during the period 2017-18 to 2019-20 ranged between 15,827.72 crore and 31,181.72 crore. The budgetary assistance of 27,314.39 crore received during 2019-20 included 8,248.83 crore and 19,065.56 crore in the form of equity and grants/subsidy, respectively. An examination of budgetary support to power sector PSUs revealed sharp increase in grants/subsidies from 7593.19 crore in 2017-18 to 17,157.09 crore in 2018-19 and 19,065.56 crore in 2019-20. This was primarily on account of conversion of interest-free loan into grants under Ujwal DISCOM Assurance Yojana (UDAY) amounting to 4891.72 crore each in 2018-19 and 2019-20 and additional subsidy for loss funding under UDAY amounting to 761.09 crore in 2018-19 and 2,400 crore in 2019-20, respectively.
The annual budgetary assistance to other than power sector PSUs during the period 2017-18 to 2019-20 ranged between 1,318.38 crore and
2,767.18 crore. The budgetary assistance of 1,404.16 crore received during 2019-20 included 288.63 crore, 403.32 crore and 712.21 crore in the form of equity, loans and grants/subsidy respectively. Out of grants of
712.21 crore given by the State Government, 447.27 crore was provided to Uttar Pradesh Medical Supplies Corporation Limited.
In order to enable PSUs to obtain financial assistance from banks and financial institutions, GoUP gives guarantee for which guarantee commission is being charged at the rate of 0.25 per cent to one per cent depending upon the loanees as decided by GoUP (15 September 2000). Outstanding guarantee stood at
91,645.29 crore in power sector PSUs and 3,569.84 crore in other than power sector PSUs as on 31 March 2020. During the year 2019-20, guarantee commission of 0.07 crore was paid by two power sector PSUs67.
5.4 Reconciliation with Finance Accounts of Government of Uttar Pradesh
The figures in respect of equity, loans and guarantees outstanding as per records of the State PSUs should agree with that of the figures appearing in the Finance Accounts of the Government of Uttar Pradesh. In case the figures do not agree, the concerned PSUs and the Finance Department should carry out reconciliation of the differences. Audit observed that as on 31 March 2020 such differences existed in respect of 64 Public Sector Undertakings including four power sector PSUs as detailed in Appendix- 5.4 and summarised in Table 5.4.
Table 5.4: Equity, loans and guarantees outstanding as per Finance Accounts of Government of Uttar Pradesh vis-à-vis records of State PSUs
( in crore)
Outstanding in respect of
Amount as per records of State PSUs
Amount as per Finance Accounts
Difference
Equity 33,911.40 34,377.11 (-)465.71
Loans 7,220.33 3,244.89 3,975.44
Guarantees 30,308.46 32,211.29 (-)1,902.83 Source: Compiled based on annual accounts of PSUs, sanction/release orders for equity,
loans and guarantees, information received from PSUs and Finance Accounts
67 Uttar Pradesh Power Transmission Corporation Limited and Uttar Pradesh Rajya Vidyut
Utpadan Nigam Limited
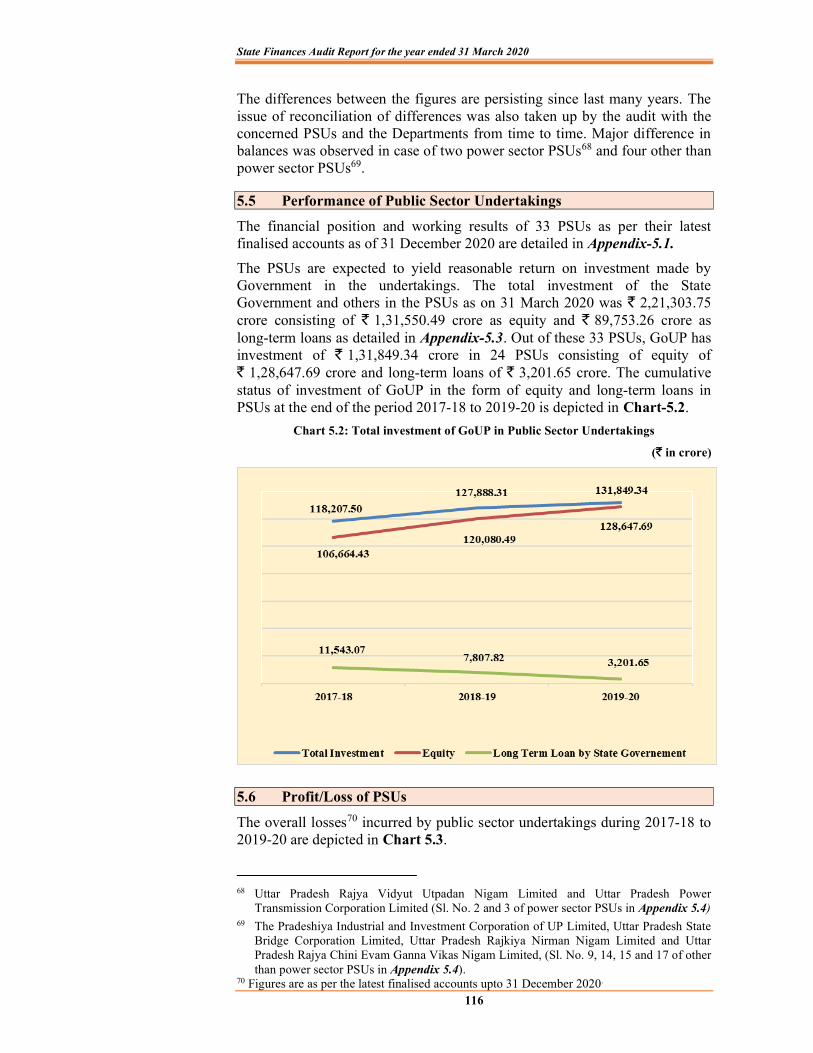
State Finances Audit Report for the year ended 31 March 2020
116
The differences between the figures are persisting since last many years. The issue of reconciliation of differences was also taken up by the audit with the concerned PSUs and the Departments from time to time. Major difference in balances was observed in case of two power sector PSUs68 and four other than power sector PSUs69.
5.5 Performance of Public Sector Undertakings
The financial position and working results of 33 PSUs as per their latest finalised accounts as of 31 December 2020 are detailed in Appendix-5.1.
The PSUs are expected to yield reasonable return on investment made by Government in the undertakings. The total investment of the State Government and others in the PSUs as on 31 March 2020 was 2,21,303.75 crore consisting of 1,31,550.49 crore as equity and 89,753.26 crore as long-term loans as detailed in Appendix-5.3. Out of these 33 PSUs, GoUP has investment of 1,31,849.34 crore in 24 PSUs consisting of equity of
1,28,647.69 crore and long-term loans of 3,201.65 crore. The cumulative status of investment of GoUP in the form of equity and long-term loans in PSUs at the end of the period 2017-18 to 2019-20 is depicted in Chart-5.2.
Chart 5.2: Total investment of GoUP in Public Sector Undertakings
( in crore)
5.6 Profit/Loss of PSUs
The overall losses70 incurred by public sector undertakings during 2017-18 to 2019-20 are depicted in Chart 5.3.
68 Uttar Pradesh Rajya Vidyut Utpadan Nigam Limited and Uttar Pradesh Power
Transmission Corporation Limited (Sl. No. 2 and 3 of power sector PSUs in Appendix 5.4) 69 The Pradeshiya Industrial and Investment Corporation of UP Limited, Uttar Pradesh State
Bridge Corporation Limited, Uttar Pradesh Rajkiya Nirman Nigam Limited and Uttar Pradesh Rajya Chini Evam Ganna Vikas Nigam Limited, (Sl. No. 9, 14, 15 and 17 of other than power sector PSUs in Appendix 5.4).
70 Figures are as per the latest finalised accounts upto 31 December 2020.
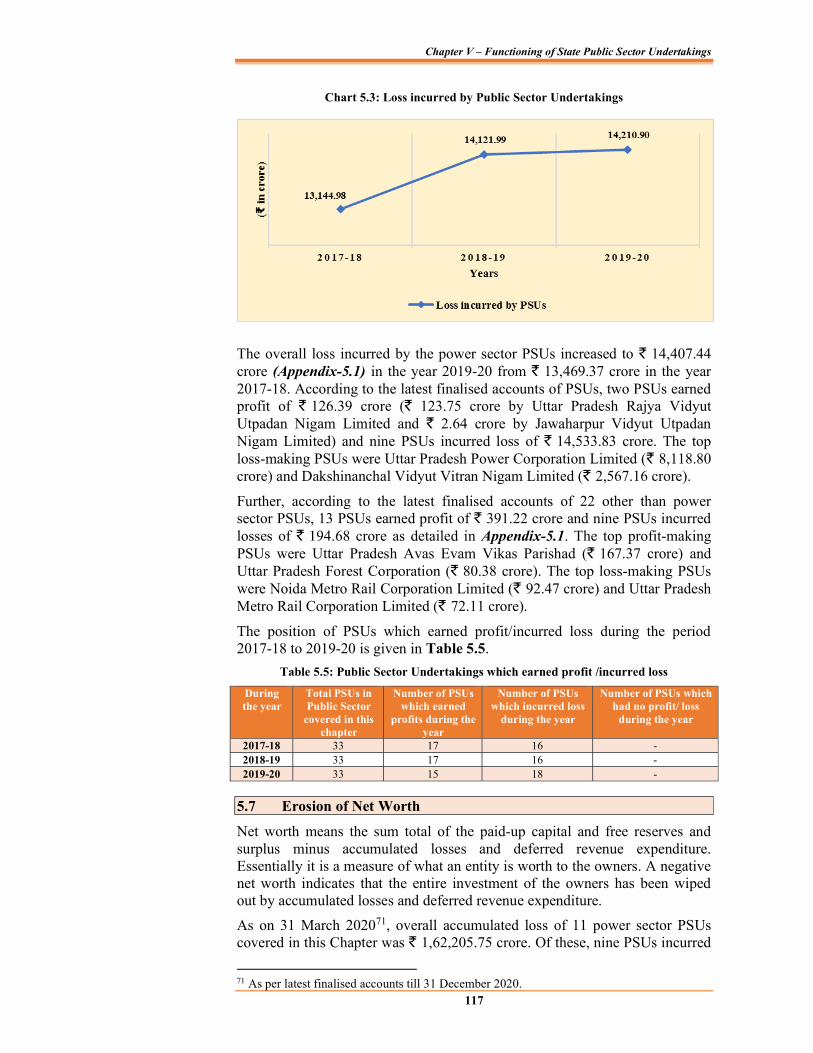
Chapter V – Functioning of State Public Sector Undertakings
117
Chart 5.3: Loss incurred by Public Sector Undertakings
The overall loss incurred by the power sector PSUs increased to 14,407.44 crore (Appendix-5.1) in the year 2019-20 from 13,469.37 crore in the year 2017-18. According to the latest finalised accounts of PSUs, two PSUs earned profit of 126.39 crore ( 123.75 crore by Uttar Pradesh Rajya Vidyut Utpadan Nigam Limited and 2.64 crore by Jawaharpur Vidyut Utpadan Nigam Limited) and nine PSUs incurred loss of 14,533.83 crore. The top loss-making PSUs were Uttar Pradesh Power Corporation Limited ( 8,118.80 crore) and Dakshinanchal Vidyut Vitran Nigam Limited ( 2,567.16 crore).
Further, according to the latest finalised accounts of 22 other than power sector PSUs, 13 PSUs earned profit of 391.22 crore and nine PSUs incurred losses of 194.68 crore as detailed in Appendix-5.1. The top profit-making PSUs were Uttar Pradesh Avas Evam Vikas Parishad ( 167.37 crore) and Uttar Pradesh Forest Corporation ( 80.38 crore). The top loss-making PSUs were Noida Metro Rail Corporation Limited ( 92.47 crore) and Uttar Pradesh Metro Rail Corporation Limited ( 72.11 crore).
The position of PSUs which earned profit/incurred loss during the period 2017-18 to 2019-20 is given in Table 5.5.
Table 5.5: Public Sector Undertakings which earned profit /incurred loss
During the year
Total PSUs in Public Sector
covered in this chapter
Number of PSUs which earned
profits during the year
Number of PSUs which incurred loss
during the year
Number of PSUs which had no profit/ loss
during the year
2017-18 33 17 16 - 2018-19 33 17 16 - 2019-20 33 15 18 -
5.7 Erosion of Net Worth
Net worth means the sum total of the paid-up capital and free reserves and surplus minus accumulated losses and deferred revenue expenditure. Essentially it is a measure of what an entity is worth to the owners. A negative net worth indicates that the entire investment of the owners has been wiped out by accumulated losses and deferred revenue expenditure.
As on 31 March 202071, overall accumulated loss of 11 power sector PSUs covered in this Chapter was 1,62,205.75 crore. Of these, nine PSUs incurred
71 As per latest finalised accounts till 31 December 2020.
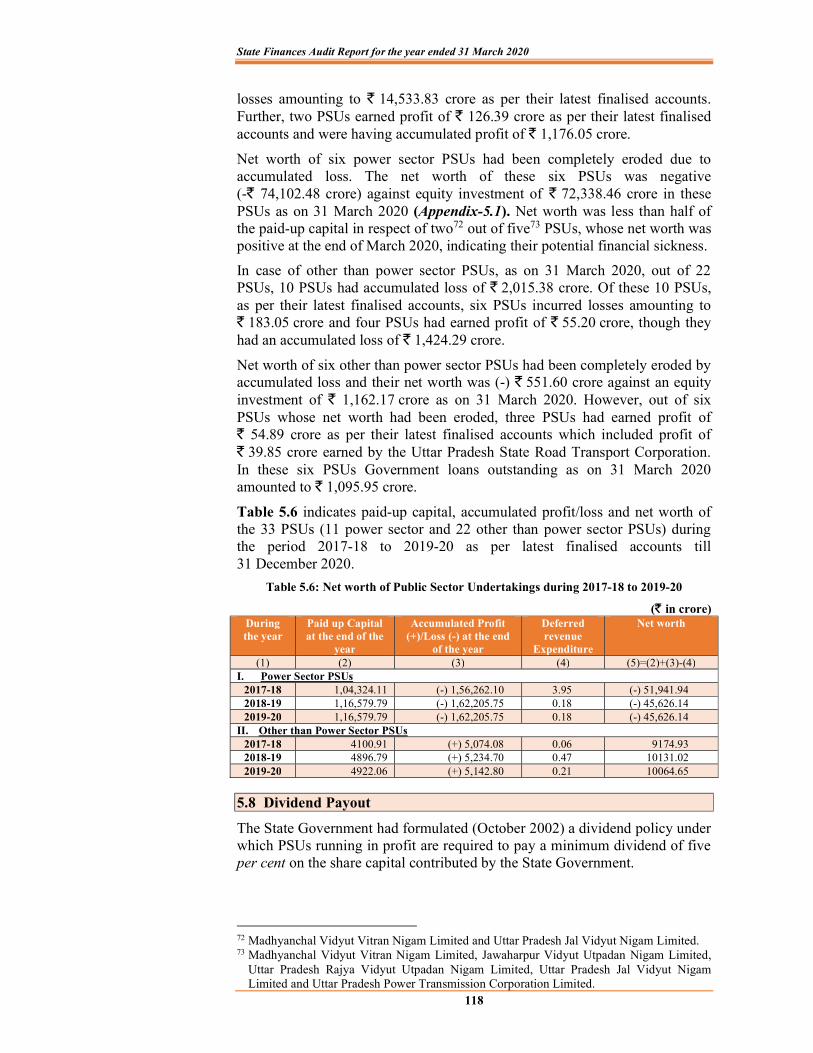
State Finances Audit Report for the year ended 31 March 2020
118
losses amounting to 14,533.83 crore as per their latest finalised accounts. Further, two PSUs earned profit of 126.39 crore as per their latest finalised accounts and were having accumulated profit of 1,176.05 crore.
Net worth of six power sector PSUs had been completely eroded due to accumulated loss. The net worth of these six PSUs was negative (- 74,102.48 crore) against equity investment of 72,338.46 crore in these PSUs as on 31 March 2020 (Appendix-5.1). Net worth was less than half of the paid-up capital in respect of two72 out of five73 PSUs, whose net worth was positive at the end of March 2020, indicating their potential financial sickness.
In case of other than power sector PSUs, as on 31 March 2020, out of 22 PSUs, 10 PSUs had accumulated loss of 2,015.38 crore. Of these 10 PSUs, as per their latest finalised accounts, six PSUs incurred losses amounting to
183.05 crore and four PSUs had earned profit of 55.20 crore, though they had an accumulated loss of 1,424.29 crore.
Net worth of six other than power sector PSUs had been completely eroded by accumulated loss and their net worth was (-) 551.60 crore against an equity investment of 1,162.17 crore as on 31 March 2020. However, out of six PSUs whose net worth had been eroded, three PSUs had earned profit of
54.89 crore as per their latest finalised accounts which included profit of 39.85 crore earned by the Uttar Pradesh State Road Transport Corporation.
In these six PSUs Government loans outstanding as on 31 March 2020 amounted to 1,095.95 crore.
Table 5.6 indicates paid-up capital, accumulated profit/loss and net worth of the 33 PSUs (11 power sector and 22 other than power sector PSUs) during the period 2017-18 to 2019-20 as per latest finalised accounts till 31 December 2020.
Table 5.6: Net worth of Public Sector Undertakings during 2017-18 to 2019-20
( in crore) During the year
Paid up Capital at the end of the
year
Accumulated Profit (+)/Loss (-) at the end
of the year
Deferred revenue
Expenditure
Net worth
(1) (2) (3) (4) (5)=(2)+(3)-(4) I. Power Sector PSUs
2017-18 1,04,324.11 (-) 1,56,262.10 3.95 (-) 51,941.94 2018-19 1,16,579.79 (-) 1,62,205.75 0.18 (-) 45,626.14 2019-20 1,16,579.79 (-) 1,62,205.75 0.18 (-) 45,626.14
II. Other than Power Sector PSUs 2017-18 4100.91 (+) 5,074.08 0.06 9174.93 2018-19 4896.79 (+) 5,234.70 0.47 10131.02 2019-20 4922.06 (+) 5,142.80 0.21 10064.65
5.8 Dividend Payout
The State Government had formulated (October 2002) a dividend policy under which PSUs running in profit are required to pay a minimum dividend of five per cent on the share capital contributed by the State Government.
72 Madhyanchal Vidyut Vitran Nigam Limited and Uttar Pradesh Jal Vidyut Nigam Limited. 73 Madhyanchal Vidyut Vitran Nigam Limited, Jawaharpur Vidyut Utpadan Nigam Limited,
Uttar Pradesh Rajya Vidyut Utpadan Nigam Limited, Uttar Pradesh Jal Vidyut Nigam Limited and Uttar Pradesh Power Transmission Corporation Limited.
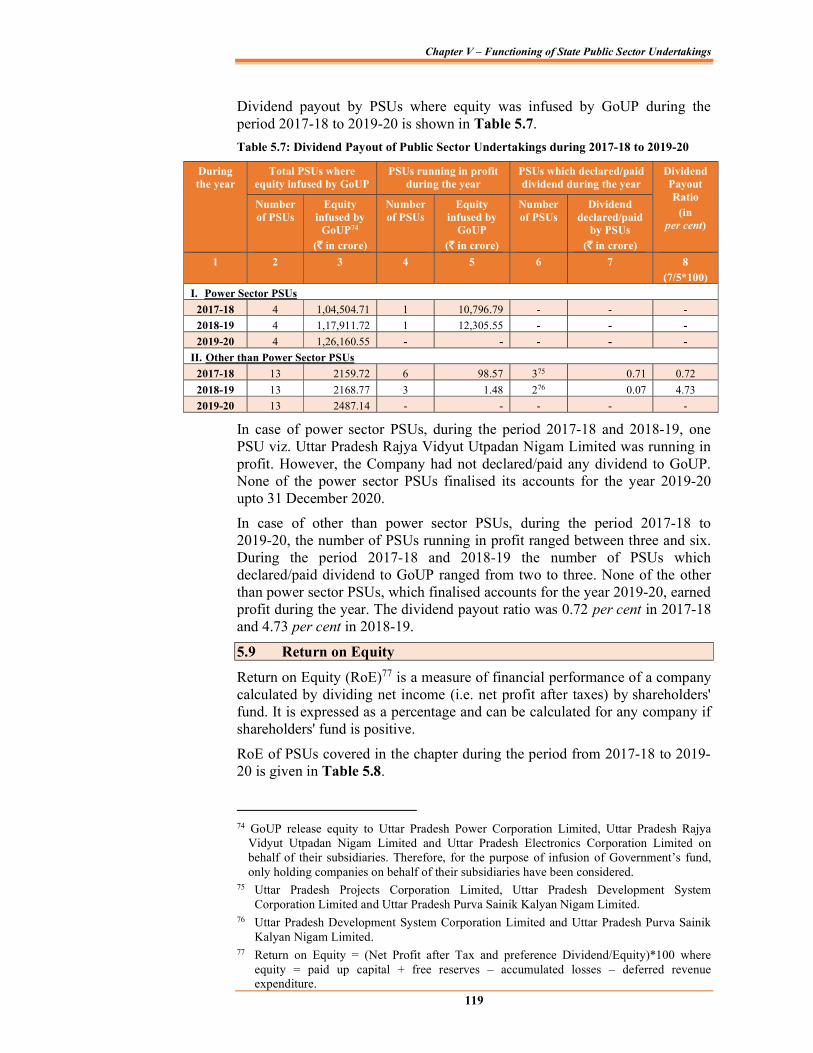
Chapter V – Functioning of State Public Sector Undertakings
119
Dividend payout by PSUs where equity was infused by GoUP during the period 2017-18 to 2019-20 is shown in Table 5.7.
Table 5.7: Dividend Payout of Public Sector Undertakings during 2017-18 to 2019-20
During the year
Total PSUs where equity infused by GoUP
PSUs running in profit during the year
PSUs which declared/paid dividend during the year
Dividend Payout Ratio
(in per cent)
Number of PSUs
Equity infused by
GoUP74 ( in crore)
Number of PSUs
Equity infused by
GoUP ( in crore)
Number of PSUs
Dividend declared/paid
by PSUs ( in crore)
1 2 3 4 5 6 7 8 (7/5*100)
I. Power Sector PSUs
2017-18 4 1,04,504.71 1 10,796.79 - - -
2018-19 4 1,17,911.72 1 12,305.55 - - -
2019-20 4 1,26,160.55 - - - - -
II. Other than Power Sector PSUs
2017-18 13 2159.72 6 98.57 375 0.71 0.72
2018-19 13 2168.77 3 1.48 276 0.07 4.73
2019-20 13 2487.14 - - - - -
In case of power sector PSUs, during the period 2017-18 and 2018-19, one PSU viz. Uttar Pradesh Rajya Vidyut Utpadan Nigam Limited was running in profit. However, the Company had not declared/paid any dividend to GoUP. None of the power sector PSUs finalised its accounts for the year 2019-20 upto 31 December 2020.
In case of other than power sector PSUs, during the period 2017-18 to 2019-20, the number of PSUs running in profit ranged between three and six. During the period 2017-18 and 2018-19 the number of PSUs which declared/paid dividend to GoUP ranged from two to three. None of the other than power sector PSUs, which finalised accounts for the year 2019-20, earned profit during the year. The dividend payout ratio was 0.72 per cent in 2017-18 and 4.73 per cent in 2018-19.
5.9 Return on Equity
Return on Equity (RoE)77 is a measure of financial performance of a company calculated by dividing net income (i.e. net profit after taxes) by shareholders' fund. It is expressed as a percentage and can be calculated for any company if shareholders' fund is positive.
RoE of PSUs covered in the chapter during the period from 2017-18 to 2019-20 is given in Table 5.8.
74 GoUP release equity to Uttar Pradesh Power Corporation Limited, Uttar Pradesh Rajya
Vidyut Utpadan Nigam Limited and Uttar Pradesh Electronics Corporation Limited on behalf of their subsidiaries. Therefore, for the purpose of infusion of Government’s fund, only holding companies on behalf of their subsidiaries have been considered.
75 Uttar Pradesh Projects Corporation Limited, Uttar Pradesh Development System Corporation Limited and Uttar Pradesh Purva Sainik Kalyan Nigam Limited.
76 Uttar Pradesh Development System Corporation Limited and Uttar Pradesh Purva Sainik Kalyan Nigam Limited.
77 Return on Equity = (Net Profit after Tax and preference Dividend/Equity)*100 where equity = paid up capital + free reserves – accumulated losses – deferred revenue expenditure.
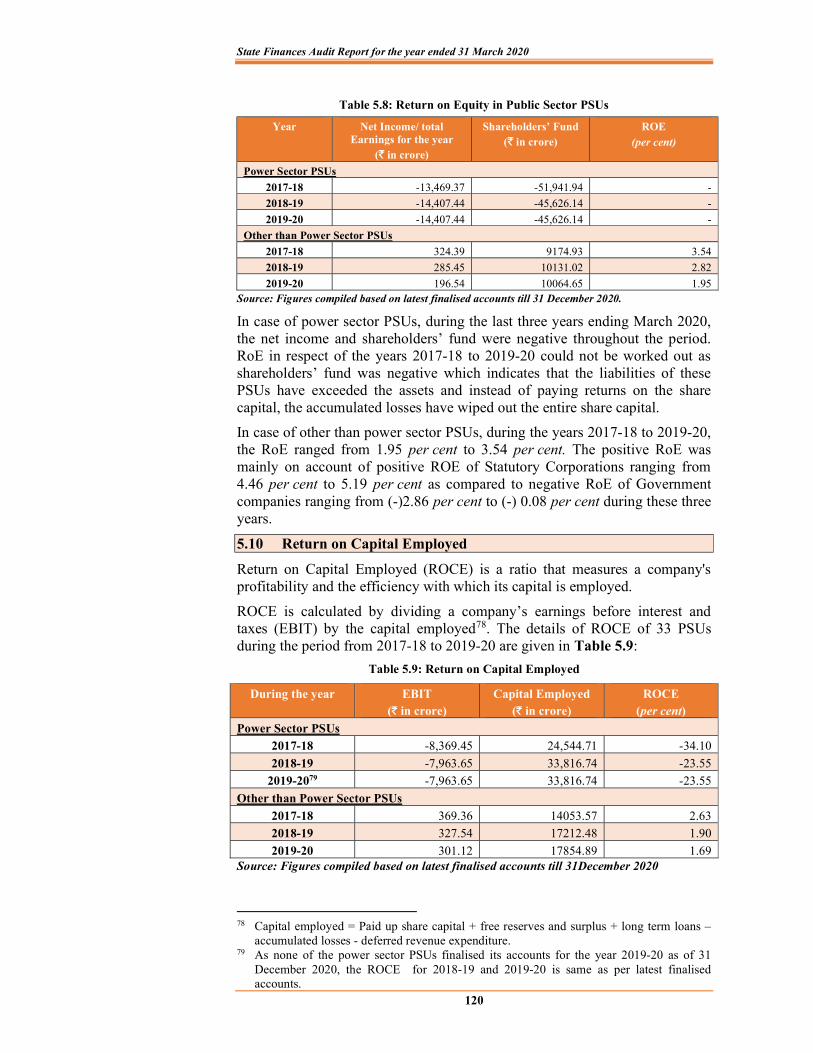
State Finances Audit Report for the year ended 31 March 2020
120
Table 5.8: Return on Equity in Public Sector PSUs
Year Net Income/ total Earnings for the year
( in crore)
Shareholders’ Fund ( in crore)
ROE (per cent)
Power Sector PSUs
2017-18 -13,469.37 -51,941.94 -
2018-19 -14,407.44 -45,626.14 -
2019-20 -14,407.44 -45,626.14 -
Other than Power Sector PSUs
2017-18 324.39 9174.93 3.54
2018-19 285.45 10131.02 2.82
2019-20 196.54 10064.65 1.95 Source: Figures compiled based on latest finalised accounts till 31 December 2020.
In case of power sector PSUs, during the last three years ending March 2020, the net income and shareholders’ fund were negative throughout the period. RoE in respect of the years 2017-18 to 2019-20 could not be worked out as shareholders’ fund was negative which indicates that the liabilities of these PSUs have exceeded the assets and instead of paying returns on the share capital, the accumulated losses have wiped out the entire share capital.
In case of other than power sector PSUs, during the years 2017-18 to 2019-20, the RoE ranged from 1.95 per cent to 3.54 per cent. The positive RoE was mainly on account of positive ROE of Statutory Corporations ranging from 4.46 per cent to 5.19 per cent as compared to negative RoE of Government companies ranging from (-)2.86 per cent to (-) 0.08 per cent during these three years.
5.10 Return on Capital Employed
Return on Capital Employed (ROCE) is a ratio that measures a company's profitability and the efficiency with which its capital is employed.
ROCE is calculated by dividing a company’s earnings before interest and taxes (EBIT) by the capital employed78. The details of ROCE of 33 PSUs during the period from 2017-18 to 2019-20 are given in Table 5.9:
Table 5.9: Return on Capital Employed
During the year EBIT ( in crore)
Capital Employed ( in crore)
ROCE (per cent)
Power Sector PSUs
2017-18 -8,369.45 24,544.71 -34.10
2018-19 -7,963.65 33,816.74 -23.55
2019-2079 -7,963.65 33,816.74 -23.55
Other than Power Sector PSUs
2017-18 369.36 14053.57 2.63
2018-19 327.54 17212.48 1.90
2019-20 301.12 17854.89 1.69 Source: Figures compiled based on latest finalised accounts till 31December 2020
78 Capital employed = Paid up share capital + free reserves and surplus + long term loans –
accumulated losses - deferred revenue expenditure. 79 As none of the power sector PSUs finalised its accounts for the year 2019-20 as of 31
December 2020, the ROCE for 2018-19 and 2019-20 is same as per latest finalised accounts.
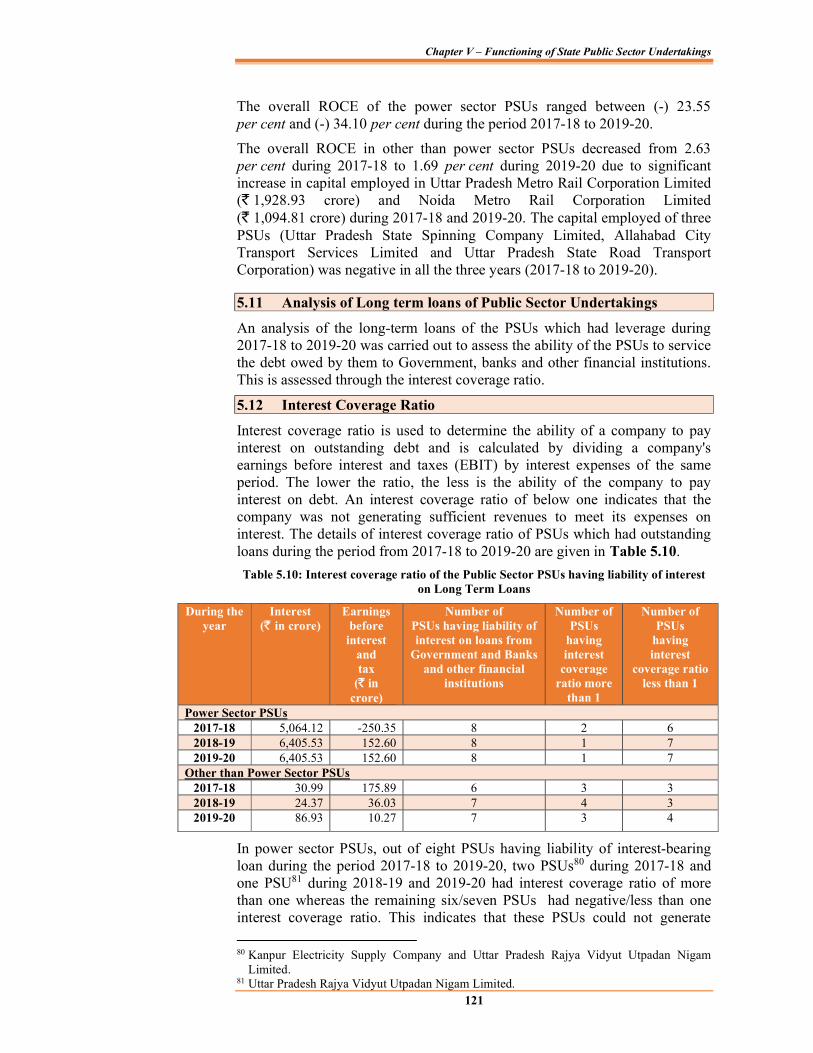
Chapter V – Functioning of State Public Sector Undertakings
121
The overall ROCE of the power sector PSUs ranged between (-) 23.55 per cent and (-) 34.10 per cent during the period 2017-18 to 2019-20.
The overall ROCE in other than power sector PSUs decreased from 2.63 per cent during 2017-18 to 1.69 per cent during 2019-20 due to significant increase in capital employed in Uttar Pradesh Metro Rail Corporation Limited ( 1,928.93 crore) and Noida Metro Rail Corporation Limited ( 1,094.81 crore) during 2017-18 and 2019-20. The capital employed of three PSUs (Uttar Pradesh State Spinning Company Limited, Allahabad City Transport Services Limited and Uttar Pradesh State Road Transport Corporation) was negative in all the three years (2017-18 to 2019-20).
5.11 Analysis of Long term loans of Public Sector Undertakings
An analysis of the long-term loans of the PSUs which had leverage during 2017-18 to 2019-20 was carried out to assess the ability of the PSUs to service the debt owed by them to Government, banks and other financial institutions. This is assessed through the interest coverage ratio.
5.12 Interest Coverage Ratio
Interest coverage ratio is used to determine the ability of a company to pay interest on outstanding debt and is calculated by dividing a company's earnings before interest and taxes (EBIT) by interest expenses of the same period. The lower the ratio, the less is the ability of the company to pay interest on debt. An interest coverage ratio of below one indicates that the company was not generating sufficient revenues to meet its expenses on interest. The details of interest coverage ratio of PSUs which had outstanding loans during the period from 2017-18 to 2019-20 are given in Table 5.10.
Table 5.10: Interest coverage ratio of the Public Sector PSUs having liability of interest on Long Term Loans
During the year
Interest ( in crore)
Earnings before
interest and tax
( in crore)
Number of PSUs having liability of interest on loans from
Government and Banks and other financial
institutions
Number of PSUs
having interest
coverage ratio more
than 1
Number of PSUs
having interest
coverage ratio less than 1
Power Sector PSUs 2017-18 5,064.12 -250.35 8 2 6 2018-19 6,405.53 152.60 8 1 7 2019-20 6,405.53 152.60 8 1 7
Other than Power Sector PSUs 2017-18 30.99 175.89 6 3 3 2018-19 24.37 36.03 7 4 3 2019-20 86.93 10.27 7 3 4
In power sector PSUs, out of eight PSUs having liability of interest-bearing loan during the period 2017-18 to 2019-20, two PSUs80 during 2017-18 and one PSU81 during 2018-19 and 2019-20 had interest coverage ratio of more than one whereas the remaining six/seven PSUs had negative/less than one interest coverage ratio. This indicates that these PSUs could not generate
80 Kanpur Electricity Supply Company and Uttar Pradesh Rajya Vidyut Utpadan Nigam
Limited. 81 Uttar Pradesh Rajya Vidyut Utpadan Nigam Limited.

State Finances Audit Report for the year ended 31 March 2020
122
sufficient revenues to meet their expenses on interest during the period.
Of the six/seven other than power sector PSUs having liability of loans during the period 2017-18 to 2019-20, three PSUs in 2017-18 and 2019-20 and four PSUs in 2018-19 had interest coverage ratio of more than one. Three/four PSUs had interest coverage ratio below one which indicates that these PSUs could not generate sufficient revenues to meet their expenses on interest during the period.
5.13 Age-wise analysis of interest outstanding on Public Sector Undertakings
As on 31 March 2020, interest amounting to 2,317.81 crore was outstanding on the long-term loans of six PSUs provided by GoUP. The age wise analysis of interest outstanding on GoUP loans in PSUs is depicted in Table 5.11.
Table 5.11: Age – wise analysis of interest outstanding on Public Sector Undertakings
( in crore)
Name of PSU Outstanding interest on
loans as on 31 March 2020
Outstanding for less
than 1 year
Outstanding for 1 to 3
years
Outstanding for more
than 3 years
I. Power Sector PSUs
Uttar Pradesh Jal Vidyut Nigam Limited
225.37 10.60 21.19 193.58
Uttar Pradesh Power Corporation Limited
29.90 29.90 0.00 0.00
Sub Total (I) 255.27 40.50 21.19 193.58
II. Other than Power Sector PSUs
Uttar Pradesh Electronics Corporation Limited
49.35 2.20 6.62 40.53
Noida Metro Rail Corporation Limited
1953.55 0.00 268.14 1685.41
Uttar Pradesh State Spinning Company Limited
28.51 4.46 10.79 13.26
The Pradeshiya Industrial and Investment Corporation of UP Limited
31.13 0.00 0.00 31.13
Sub Total (II) 2,062.54 6.66 285.55 1770.33
Grand Total 2,317.81 47.16 306.74 1963.91
The above table indicate that out of total interest amount of 2317.81 crore, 1963.91 crore was outstanding for more than three years which indicates that
these PSUs are not regular in paying interest.
5.14 Comments on Accounts of Government Companies
26 companies forwarded 32 audited accounts to the Principal Accountant General during the period from 1 January 2020 to 31 December 2020. Of these 25 accounts were selected for supplementary audit. The Audit Reports of Statutory Auditors and supplementary audit conducted by the CAG indicated that the quality of accounts needs to be improved substantially. The details of aggregate money value of the comments of Statutory Auditors and the CAG on accounts of 2017-20 are given in Table 5.12.
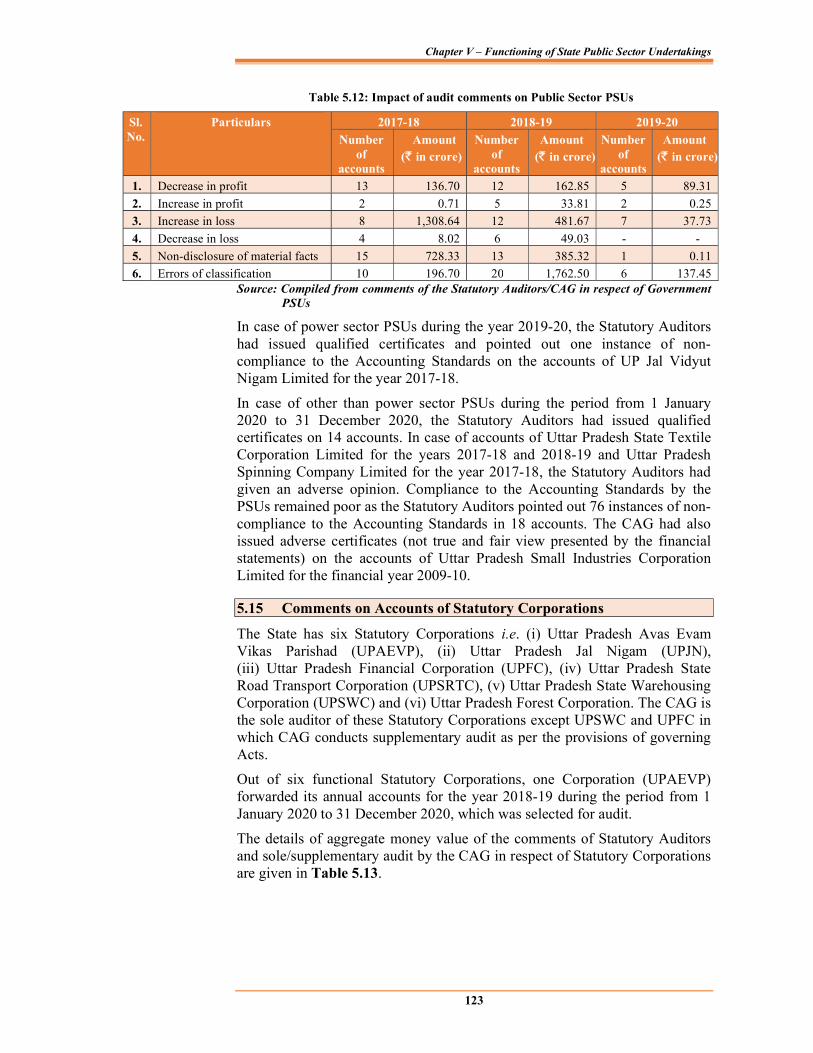
Chapter V – Functioning of State Public Sector Undertakings
123
Table 5.12: Impact of audit comments on Public Sector PSUs
Sl. No.
Particulars 2017-18 2018-19 2019-20
Number of
accounts
Amount ( in crore)
Number of
accounts
Amount ( in crore)
Number of
accounts
Amount ( in crore)
1. Decrease in profit 13 136.70 12 162.85 5 89.31
2. Increase in profit 2 0.71 5 33.81 2 0.25
3. Increase in loss 8 1,308.64 12 481.67 7 37.73
4. Decrease in loss 4 8.02 6 49.03 - -
5. Non-disclosure of material facts 15 728.33 13 385.32 1 0.11
6. Errors of classification 10 196.70 20 1,762.50 6 137.45 Source: Compiled from comments of the Statutory Auditors/CAG in respect of Government
PSUs
In case of power sector PSUs during the year 2019-20, the Statutory Auditors had issued qualified certificates and pointed out one instance of non- compliance to the Accounting Standards on the accounts of UP Jal Vidyut Nigam Limited for the year 2017-18.
In case of other than power sector PSUs during the period from 1 January 2020 to 31 December 2020, the Statutory Auditors had issued qualified certificates on 14 accounts. In case of accounts of Uttar Pradesh State Textile Corporation Limited for the years 2017-18 and 2018-19 and Uttar Pradesh Spinning Company Limited for the year 2017-18, the Statutory Auditors had given an adverse opinion. Compliance to the Accounting Standards by the PSUs remained poor as the Statutory Auditors pointed out 76 instances of non- compliance to the Accounting Standards in 18 accounts. The CAG had also issued adverse certificates (not true and fair view presented by the financial statements) on the accounts of Uttar Pradesh Small Industries Corporation Limited for the financial year 2009-10.
5.15 Comments on Accounts of Statutory Corporations
The State has six Statutory Corporations i.e. (i) Uttar Pradesh Avas Evam Vikas Parishad (UPAEVP), (ii) Uttar Pradesh Jal Nigam (UPJN), (iii) Uttar Pradesh Financial Corporation (UPFC), (iv) Uttar Pradesh State Road Transport Corporation (UPSRTC), (v) Uttar Pradesh State Warehousing Corporation (UPSWC) and (vi) Uttar Pradesh Forest Corporation. The CAG is the sole auditor of these Statutory Corporations except UPSWC and UPFC in which CAG conducts supplementary audit as per the provisions of governing Acts.
Out of six functional Statutory Corporations, one Corporation (UPAEVP) forwarded its annual accounts for the year 2018-19 during the period from 1 January 2020 to 31 December 2020, which was selected for audit.
The details of aggregate money value of the comments of Statutory Auditors and sole/supplementary audit by the CAG in respect of Statutory Corporations are given in Table 5.13.
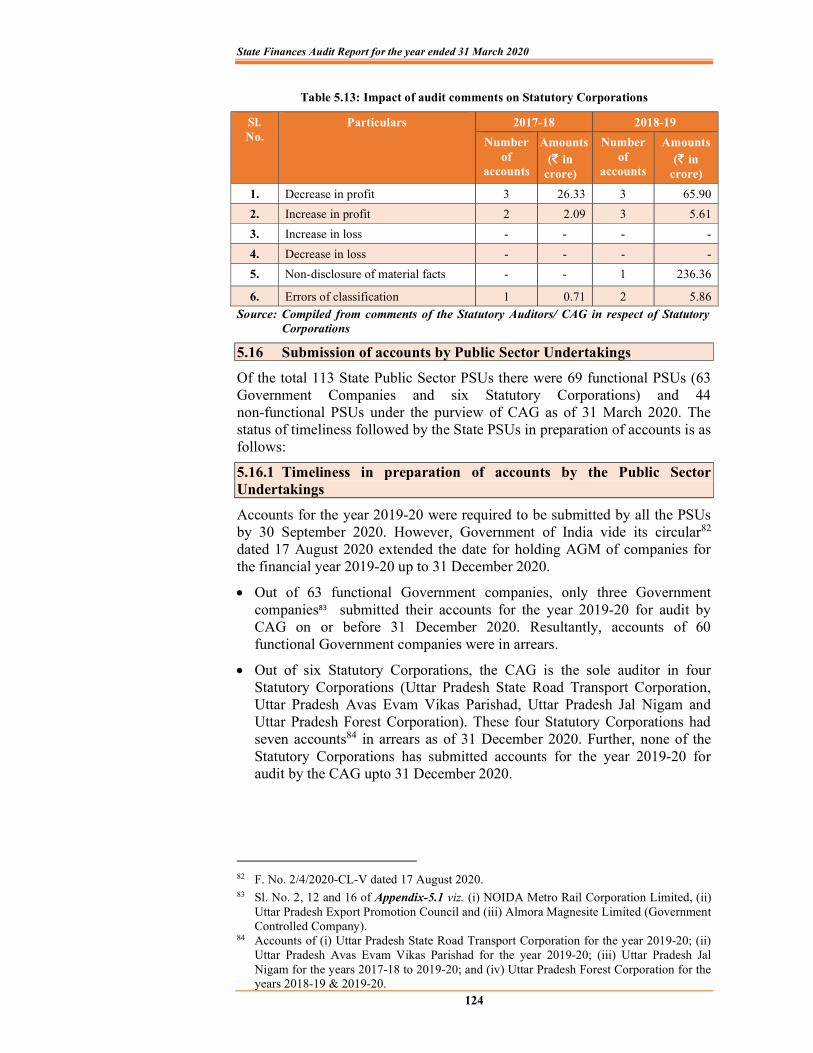
State Finances Audit Report for the year ended 31 March 2020
124
Table 5.13: Impact of audit comments on Statutory Corporations
Sl. No.
Particulars 2017-18 2018-19
Number of
accounts
Amounts ( in
crore)
Number of
accounts
Amounts ( in
crore)
1. Decrease in profit 3 26.33 3 65.90
2. Increase in profit 2 2.09 3 5.61
3. Increase in loss - - - -
4. Decrease in loss - - - -
5. Non-disclosure of material facts - - 1 236.36
6. Errors of classification 1 0.71 2 5.86
Source: Compiled from comments of the Statutory Auditors/ CAG in respect of Statutory Corporations
5.16 Submission of accounts by Public Sector Undertakings
Of the total 113 State Public Sector PSUs there were 69 functional PSUs (63 Government Companies and six Statutory Corporations) and 44 non-functional PSUs under the purview of CAG as of 31 March 2020. The status of timeliness followed by the State PSUs in preparation of accounts is as follows:
5.16.1 Timeliness in preparation of accounts by the Public Sector Undertakings
Accounts for the year 2019-20 were required to be submitted by all the PSUs by 30 September 2020. However, Government of India vide its circular82 dated 17 August 2020 extended the date for holding AGM of companies for the financial year 2019-20 up to 31 December 2020.
Out of 63 functional Government companies, only three Government companies83 submitted their accounts for the year 2019-20 for audit by CAG on or before 31 December 2020. Resultantly, accounts of 60 functional Government companies were in arrears.
Out of six Statutory Corporations, the CAG is the sole auditor in four Statutory Corporations (Uttar Pradesh State Road Transport Corporation, Uttar Pradesh Avas Evam Vikas Parishad, Uttar Pradesh Jal Nigam and Uttar Pradesh Forest Corporation). These four Statutory Corporations had seven accounts84 in arrears as of 31 December 2020. Further, none of the Statutory Corporations has submitted accounts for the year 2019-20 for audit by the CAG upto 31 December 2020.
82 F. No. 2/4/2020-CL-V dated 17 August 2020. 83 Sl. No. 2, 12 and 16 of Appendix-5.1 viz. (i) NOIDA Metro Rail Corporation Limited, (ii)
Uttar Pradesh Export Promotion Council and (iii) Almora Magnesite Limited (Government Controlled Company).
84 Accounts of (i) Uttar Pradesh State Road Transport Corporation for the year 2019-20; (ii) Uttar Pradesh Avas Evam Vikas Parishad for the year 2019-20; (iii) Uttar Pradesh Jal Nigam for the years 2017-18 to 2019-20; and (iv) Uttar Pradesh Forest Corporation for the years 2018-19 & 2019-20.
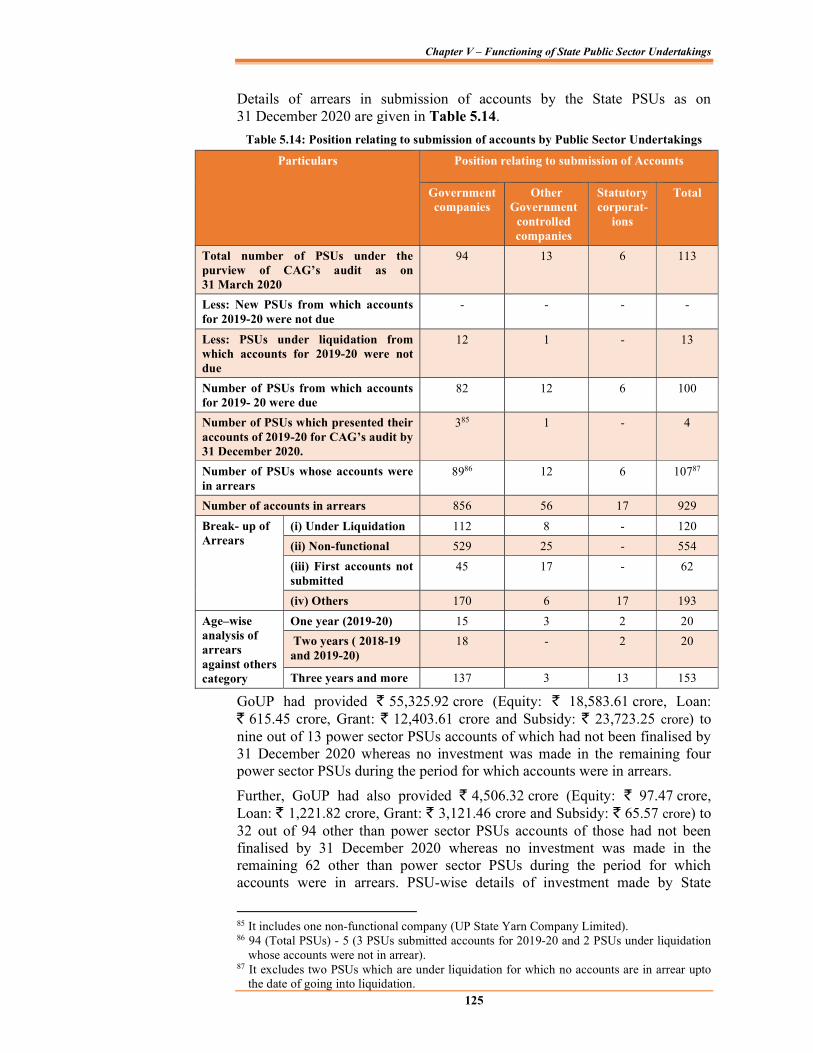
Chapter V – Functioning of State Public Sector Undertakings
125
Details of arrears in submission of accounts by the State PSUs as on 31 December 2020 are given in Table 5.14.
Table 5.14: Position relating to submission of accounts by Public Sector Undertakings
Particulars Position relating to submission of Accounts
Government companies
Other Government
controlled companies
Statutory corporat-
ions
Total
Total number of PSUs under the purview of CAG’s audit as on 31 March 2020
94 13 6 113
Less: New PSUs from which accounts for 2019-20 were not due
- - - -
Less: PSUs under liquidation from which accounts for 2019-20 were not due
12 1 - 13
Number of PSUs from which accounts for 2019- 20 were due
82 12 6 100
Number of PSUs which presented their accounts of 2019-20 for CAG’s audit by 31 December 2020.
385 1 - 4
Number of PSUs whose accounts were in arrears
8986 12 6 10787
Number of accounts in arrears 856 56 17 929
Break- up of Arrears
(i) Under Liquidation 112 8 - 120
(ii) Non-functional 529 25 - 554
(iii) First accounts not submitted
45 17 - 62
(iv) Others 170 6 17 193
Age–wise analysis of arrears against others category
One year (2019-20) 15 3 2 20
Two years ( 2018-19 and 2019-20)
18
- 2 20
Three years and more 137 3 13 153
GoUP had provided 55,325.92 crore (Equity: 18,583.61 crore, Loan: 615.45 crore, Grant: 12,403.61 crore and Subsidy: 23,723.25 crore) to
nine out of 13 power sector PSUs accounts of which had not been finalised by 31 December 2020 whereas no investment was made in the remaining four power sector PSUs during the period for which accounts were in arrears.
Further, GoUP had also provided 4,506.32 crore (Equity: 97.47 crore, Loan: 1,221.82 crore, Grant: 3,121.46 crore and Subsidy: 65.57 crore) to 32 out of 94 other than power sector PSUs accounts of those had not been finalised by 31 December 2020 whereas no investment was made in the remaining 62 other than power sector PSUs during the period for which accounts were in arrears. PSU-wise details of investment made by State
85 It includes one non-functional company (UP State Yarn Company Limited). 86 94 (Total PSUs) - 5 (3 PSUs submitted accounts for 2019-20 and 2 PSUs under liquidation
whose accounts were not in arrear). 87 It excludes two PSUs which are under liquidation for which no accounts are in arrear upto
the date of going into liquidation.

State Finances Audit Report for the year ended 31 March 2020
126
Government during the years for which accounts were in arrears are shown in Appendix-5.5.
The administrative departments have the responsibility to oversee the activities of these PSUs and to ensure that the accounts are finalised and adopted by these PSUs within the stipulated period. The concerned departments were informed regularly regarding arrears in accounts.
5.16.2 Impact of non-finalisation of accounts of State PSUs
Delay in finalisation of accounts may result in risk of fraud and leakage of public money apart from violation of the provisions of the Companies Act, 2013. In view of the above status of arrears of accounts, the actual performance including loss incurred/profit earned and contribution of these 107 PSUs88 to State GDP during the period of arrear accounts could not be ascertained/reported to the State Legislature. In the absence of finalisation of accounts by these PSUs and their subsequent audit, it could not be ensured whether the investments and expenditure incurred had been properly accounted for and the funds were utilised for the purpose for which these were provided by the State Government. This issue is of greater concern in case of those Statutory Corporations where the entire responsibility for certification lies on the CAG as the sole auditor.
5.17 Non-functional Public Sector Undertakings
As on 31 March 2020, 44 State PSUs were non-functional having a total investment of 1,713.07 crore in the form of capital ( 1,015.21 crore) and long-term loans ( 697.86 crore). Of these, significant investment were in Nandganj-Sihori Sugar Company Limited ( 256.80 crore), Uttar Pradesh State Handloom Corporation Limited ( 232.18 crore) and Uttar Pradesh State Textile Corporation Limited ( 224.67 crore). Further, 27 PSUs are non-functional since the year 2000-01. Non-functional PSUs include 13 PSUs which were under liquidation. The State Government may review the status of these non-functional PSUs.
5.17.1 Arrear accounts of non-functional PSUs
Out of 44 non-functional PSUs (including 13 PSUs under liquidation), 674 accounts of 41 non-functional PSUs were in arrears as on 31 December 2020. The age-wise analysis of arrear accounts of these PSUs is given in Table 5.15.
Table 5.15: Age-wise analysis of arrear in accounts of non-functional PSUs Age wise analysis of arrears Total
1-5 years
6-10 years
11-20 years
21 years and above
Non-functional PSUs with arrear in accounts
Under liquidation
4 1 5 1 11
Others 6 6 4 14 30
No. of Accounts in arrear
PSUs under liquidation
9 8 74 29 120
Other Non-functional PSUs
15 47 68 424 554
88 13 power sector PSUs and 94 other than power sector PSUs.


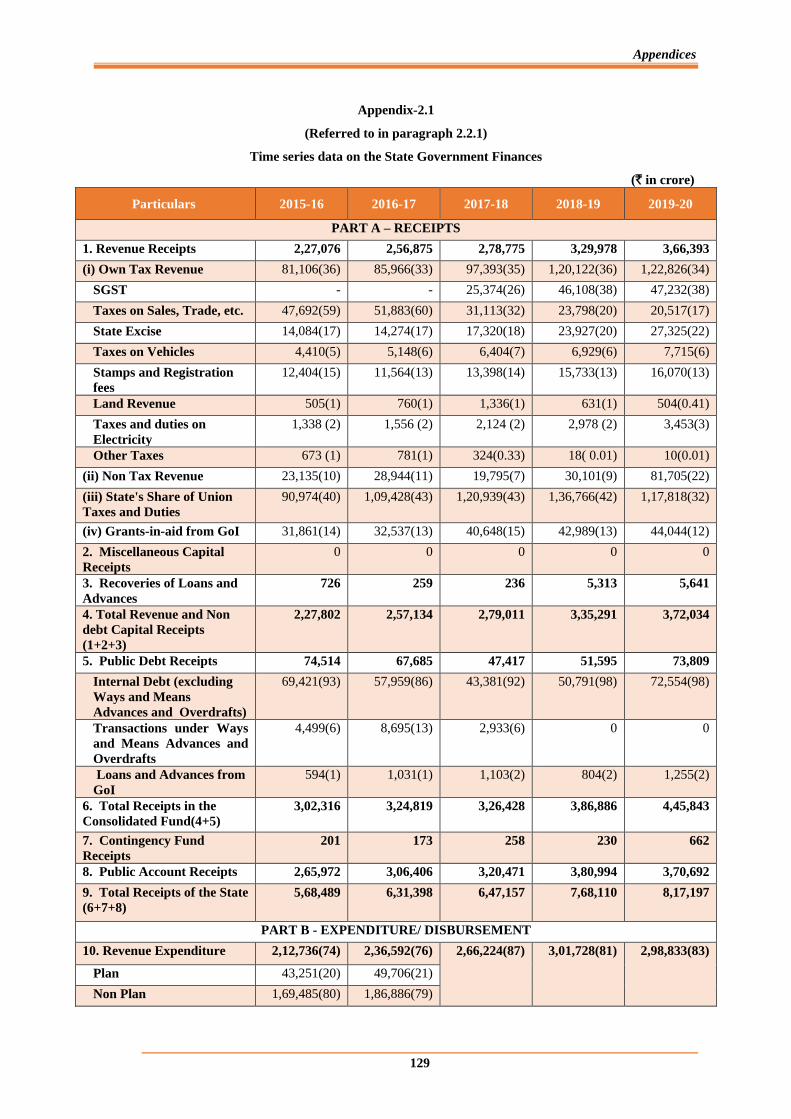
Appendices
129
Appendix-2.1
(Referred to in paragraph 2.2.1)
Time series data on the State Government Finances
(` in crore)
Particulars 2015-16 2016-17 2017-18 2018-19 2019-20
PART A – RECEIPTS
1. Revenue Receipts 2,27,076 2,56,875 2,78,775 3,29,978 3,66,393
(i) Own Tax Revenue 81,106(36) 85,966(33) 97,393(35) 1,20,122(36) 1,22,826(34)
SGST - - 25,374(26) 46,108(38) 47,232(38)
Taxes on Sales, Trade, etc. 47,692(59) 51,883(60) 31,113(32) 23,798(20) 20,517(17)
State Excise 14,084(17) 14,274(17) 17,320(18) 23,927(20) 27,325(22)
Taxes on Vehicles 4,410(5) 5,148(6) 6,404(7) 6,929(6) 7,715(6)
Stamps and Registration
fees
12,404(15) 11,564(13) 13,398(14) 15,733(13) 16,070(13)
Land Revenue 505(1) 760(1) 1,336(1) 631(1) 504(0.41)
Taxes and duties on
Electricity
1,338 (2) 1,556 (2) 2,124 (2) 2,978 (2) 3,453(3)
Other Taxes 673 (1) 781(1) 324(0.33) 18( 0.01) 10(0.01)
(ii) Non Tax Revenue 23,135(10) 28,944(11) 19,795(7) 30,101(9) 81,705(22)
(iii) State's Share of Union
Taxes and Duties
90,974(40) 1,09,428(43) 1,20,939(43) 1,36,766(42) 1,17,818(32)
(iv) Grants-in-aid from GoI 31,861(14) 32,537(13) 40,648(15) 42,989(13) 44,044(12)
2. Miscellaneous Capital
Receipts
0 0 0 0 0
3. Recoveries of Loans and
Advances
726 259 236 5,313 5,641
4. Total Revenue and Non
debt Capital Receipts
(1+2+3)
2,27,802 2,57,134 2,79,011 3,35,291 3,72,034
5. Public Debt Receipts 74,514 67,685 47,417 51,595 73,809
Internal Debt (excluding
Ways and Means
Advances and Overdrafts)
69,421(93) 57,959(86) 43,381(92) 50,791(98) 72,554(98)
Transactions under Ways
and Means Advances and
Overdrafts
4,499(6) 8,695(13) 2,933(6) 0 0
Loans and Advances from
GoI
594(1) 1,031(1) 1,103(2) 804(2) 1,255(2)
6. Total Receipts in the
Consolidated Fund(4+5)
3,02,316 3,24,819 3,26,428 3,86,886 4,45,843
7. Contingency Fund
Receipts
201 173 258 230 662
8. Public Account Receipts 2,65,972 3,06,406 3,20,471 3,80,994 3,70,692
9. Total Receipts of the State
(6+7+8)
5,68,489 6,31,398 6,47,157 7,68,110 8,17,197
PART B - EXPENDITURE/ DISBURSEMENT
10. Revenue Expenditure 2,12,736(74) 2,36,592(76) 2,66,224(87) 3,01,728(81) 2,98,833(83)
Plan 43,251(20) 49,706(21)
Non Plan 1,69,485(80) 1,86,886(79)
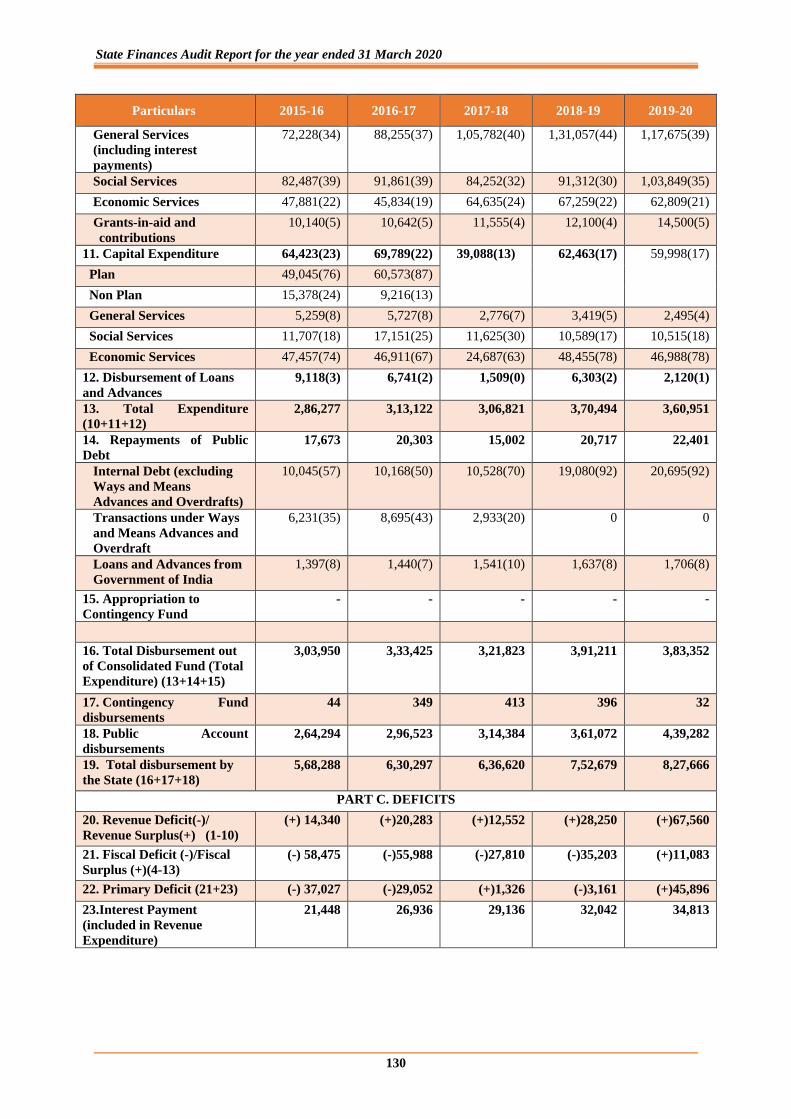
State Finances Audit Report for the year ended 31 March 2020
130
Particulars 2015-16 2016-17 2017-18 2018-19 2019-20
General Services
(including interest
payments)
72,228(34) 88,255(37) 1,05,782(40) 1,31,057(44) 1,17,675(39)
Social Services 82,487(39) 91,861(39) 84,252(32) 91,312(30) 1,03,849(35)
Economic Services 47,881(22) 45,834(19) 64,635(24) 67,259(22) 62,809(21)
Grants-in-aid and
contributions
10,140(5) 10,642(5) 11,555(4) 12,100(4) 14,500(5)
11. Capital Expenditure 64,423(23) 69,789(22) 39,088(13) 62,463(17) 59,998(17)
Plan 49,045(76) 60,573(87)
Non Plan 15,378(24) 9,216(13)
General Services 5,259(8) 5,727(8) 2,776(7) 3,419(5) 2,495(4)
Social Services 11,707(18) 17,151(25) 11,625(30) 10,589(17) 10,515(18)
Economic Services 47,457(74) 46,911(67) 24,687(63) 48,455(78) 46,988(78)
12. Disbursement of Loans
and Advances
9,118(3) 6,741(2) 1,509(0) 6,303(2) 2,120(1)
13. Total Expenditure
(10+11+12)
2,86,277 3,13,122 3,06,821 3,70,494 3,60,951
14. Repayments of Public
Debt
17,673 20,303 15,002 20,717 22,401
Internal Debt (excluding
Ways and Means
Advances and Overdrafts)
10,045(57) 10,168(50) 10,528(70) 19,080(92) 20,695(92)
Transactions under Ways
and Means Advances and
Overdraft
6,231(35) 8,695(43) 2,933(20) 0 0
Loans and Advances from
Government of India
1,397(8) 1,440(7) 1,541(10) 1,637(8) 1,706(8)
15. Appropriation to
Contingency Fund
- - - - -
16. Total Disbursement out
of Consolidated Fund (Total
Expenditure) (13+14+15)
3,03,950 3,33,425 3,21,823 3,91,211 3,83,352
17. Contingency Fund
disbursements
44 349 413 396 32
18. Public Account
disbursements
2,64,294 2,96,523 3,14,384 3,61,072 4,39,282
19. Total disbursement by
the State (16+17+18)
5,68,288 6,30,297 6,36,620 7,52,679 8,27,666
PART C. DEFICITS
20. Revenue Deficit(-)/
Revenue Surplus(+) (1-10)
(+) 14,340 (+)20,283 (+)12,552 (+)28,250 (+)67,560
21. Fiscal Deficit (-)/Fiscal
Surplus (+)(4-13)
(-) 58,475 (-)55,988 (-)27,810 (-)35,203 (+)11,083
22. Primary Deficit (21+23) (-) 37,027 (-)29,052 (+)1,326 (-)3,161 (+)45,896
23.Interest Payment
(included in Revenue
Expenditure)
21,448 26,936 29,136 32,042 34,813
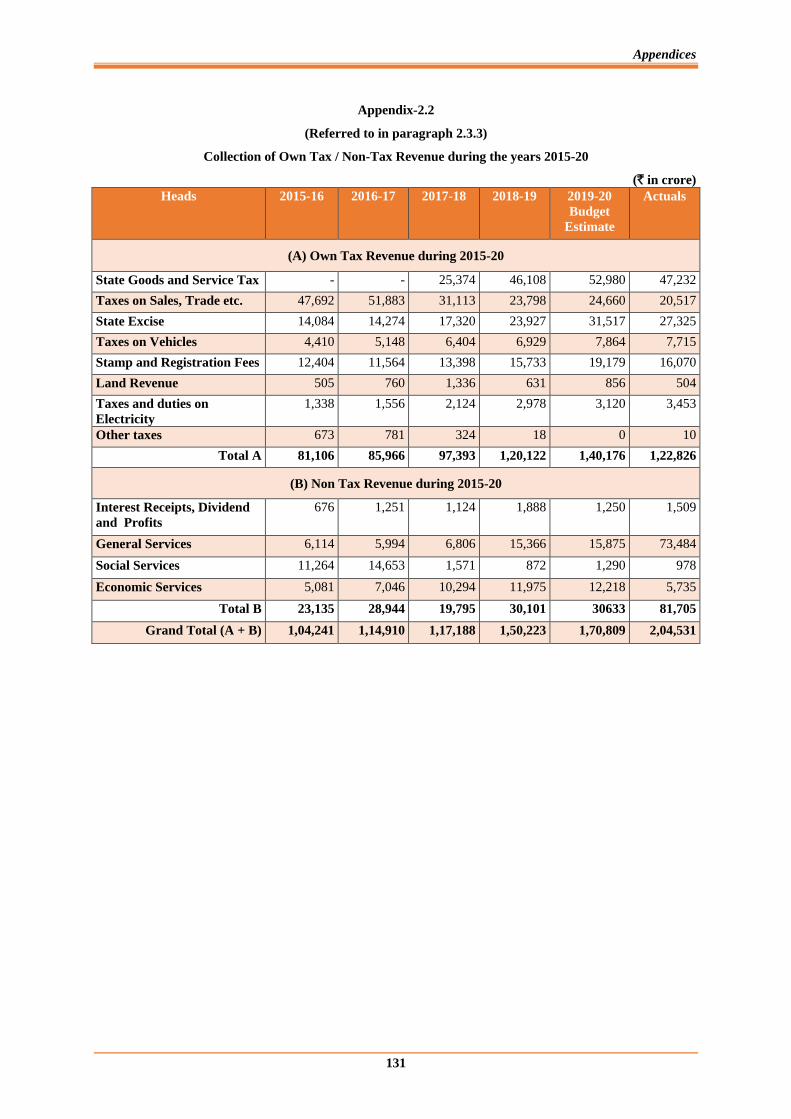
Appendices
131
Appendix-2.2
(Referred to in paragraph 2.3.3)
Collection of Own Tax / Non-Tax Revenue during the years 2015-20
(` in crore)
Heads 2015-16 2016-17 2017-18 2018-19 2019-20
Budget
Estimate
Actuals
(A) Own Tax Revenue during 2015-20
State Goods and Service Tax - - 25,374 46,108 52,980 47,232
Taxes on Sales, Trade etc. 47,692 51,883 31,113 23,798 24,660 20,517
State Excise 14,084 14,274 17,320 23,927 31,517 27,325
Taxes on Vehicles 4,410 5,148 6,404 6,929 7,864 7,715
Stamp and Registration Fees 12,404 11,564 13,398 15,733 19,179 16,070
Land Revenue 505 760 1,336 631 856 504
Taxes and duties on
Electricity
1,338 1,556 2,124 2,978 3,120 3,453
Other taxes 673 781 324 18 0 10
Total A 81,106 85,966 97,393 1,20,122 1,40,176 1,22,826
(B) Non Tax Revenue during 2015-20
Interest Receipts, Dividend
and Profits
676 1,251 1,124 1,888 1,250 1,509
General Services 6,114 5,994 6,806 15,366 15,875 73,484
Social Services 11,264 14,653 1,571 872 1,290 978
Economic Services 5,081 7,046 10,294 11,975 12,218 5,735
Total B 23,135 28,944 19,795 30,101 30633 81,705
Grand Total (A + B) 1,04,241 1,14,910 1,17,188 1,50,223 1,70,809 2,04,531
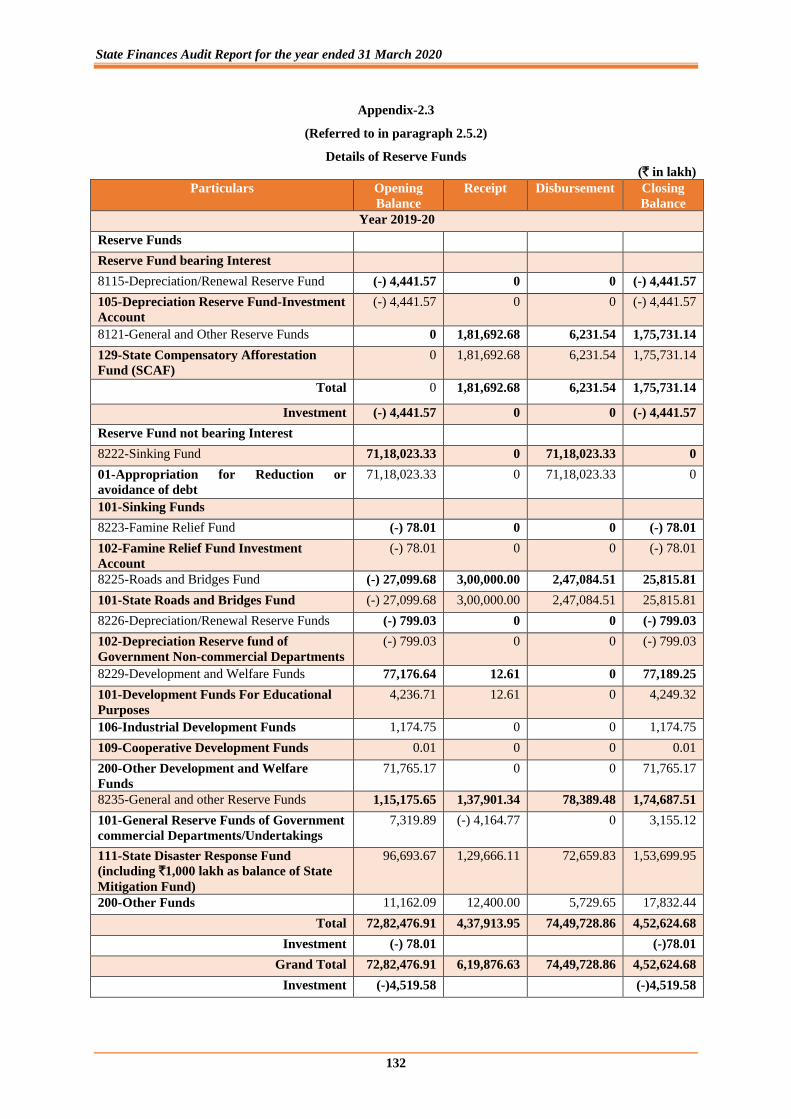
State Finances Audit Report for the year ended 31 March 2020
132
Appendix-2.3
(Referred to in paragraph 2.5.2)
Details of Reserve Funds
(` in lakh)
Particulars Opening
Balance
Receipt Disbursement Closing
Balance
Year 2019-20
Reserve Funds
Reserve Fund bearing Interest
8115-Depreciation/Renewal Reserve Fund (-) 4,441.57 0 0 (-) 4,441.57
105-Depreciation Reserve Fund-Investment
Account
(-) 4,441.57 0 0 (-) 4,441.57
8121-General and Other Reserve Funds 0 1,81,692.68 6,231.54 1,75,731.14
129-State Compensatory Afforestation
Fund (SCAF)
0 1,81,692.68 6,231.54 1,75,731.14
Total 0 1,81,692.68 6,231.54 1,75,731.14
Investment (-) 4,441.57 0 0 (-) 4,441.57
Reserve Fund not bearing Interest
8222-Sinking Fund 71,18,023.33 0 71,18,023.33 0
01-Appropriation for Reduction or
avoidance of debt
71,18,023.33 0 71,18,023.33 0
101-Sinking Funds
8223-Famine Relief Fund (-) 78.01 0 0 (-) 78.01
102-Famine Relief Fund Investment
Account
(-) 78.01 0 0 (-) 78.01
8225-Roads and Bridges Fund (-) 27,099.68 3,00,000.00 2,47,084.51 25,815.81
101-State Roads and Bridges Fund (-) 27,099.68 3,00,000.00 2,47,084.51 25,815.81
8226-Depreciation/Renewal Reserve Funds (-) 799.03 0 0 (-) 799.03
102-Depreciation Reserve fund of
Government Non-commercial Departments
(-) 799.03 0 0 (-) 799.03
8229-Development and Welfare Funds 77,176.64 12.61 0 77,189.25
101-Development Funds For Educational
Purposes
4,236.71 12.61 0 4,249.32
106-Industrial Development Funds 1,174.75 0 0 1,174.75
109-Cooperative Development Funds 0.01 0 0 0.01
200-Other Development and Welfare
Funds
71,765.17 0 0 71,765.17
8235-General and other Reserve Funds 1,15,175.65 1,37,901.34 78,389.48 1,74,687.51
101-General Reserve Funds of Government
commercial Departments/Undertakings
7,319.89 (-) 4,164.77 0 3,155.12
111-State Disaster Response Fund
(including `1,000 lakh as balance of State
Mitigation Fund)
96,693.67 1,29,666.11 72,659.83 1,53,699.95
200-Other Funds 11,162.09 12,400.00 5,729.65 17,832.44
Total 72,82,476.91 4,37,913.95 74,49,728.86 4,52,624.68
Investment (-) 78.01 (-)78.01
Grand Total 72,82,476.91 6,19,876.63 74,49,728.86 4,52,624.68
Investment (-)4,519.58 (-)4,519.58
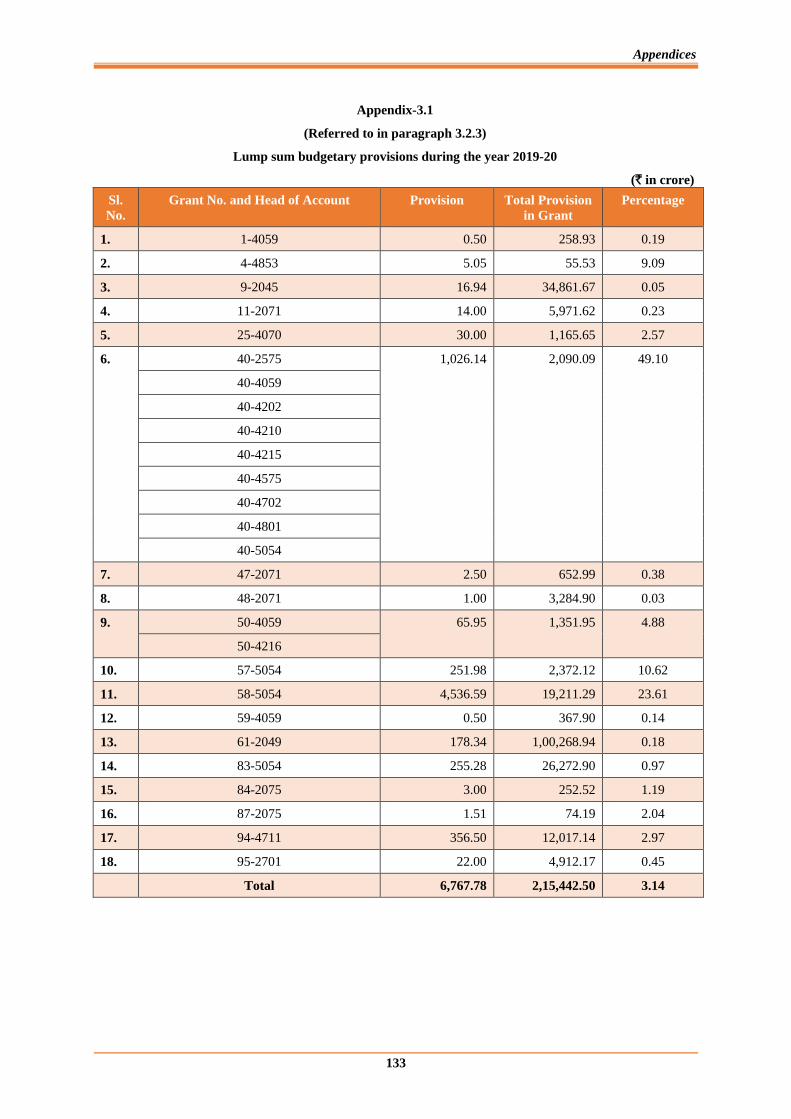
Appendices
133
Appendix-3.1
(Referred to in paragraph 3.2.3)
Lump sum budgetary provisions during the year 2019-20
(` in crore)
Sl.
No.
Grant No. and Head of Account Provision Total Provision
in Grant
Percentage
1. 1-4059 0.50 258.93 0.19
2. 4-4853 5.05 55.53 9.09
3. 9-2045 16.94 34,861.67 0.05
4. 11-2071 14.00 5,971.62 0.23
5. 25-4070 30.00 1,165.65 2.57
6. 40-2575 1,026.14
2,090.09
49.10
40-4059
40-4202
40-4210
40-4215
40-4575
40-4702
40-4801
40-5054
7. 47-2071 2.50 652.99 0.38
8. 48-2071 1.00 3,284.90 0.03
9. 50-4059 65.95
1,351.95
4.88
50-4216
10. 57-5054 251.98 2,372.12 10.62
11. 58-5054 4,536.59 19,211.29 23.61
12. 59-4059 0.50 367.90 0.14
13. 61-2049 178.34 1,00,268.94 0.18
14. 83-5054 255.28 26,272.90 0.97
15. 84-2075 3.00 252.52 1.19
16. 87-2075 1.51 74.19 2.04
17. 94-4711 356.50 12,017.14 2.97
18. 95-2701 22.00 4,912.17 0.45
Total 6,767.78 2,15,442.50 3.14
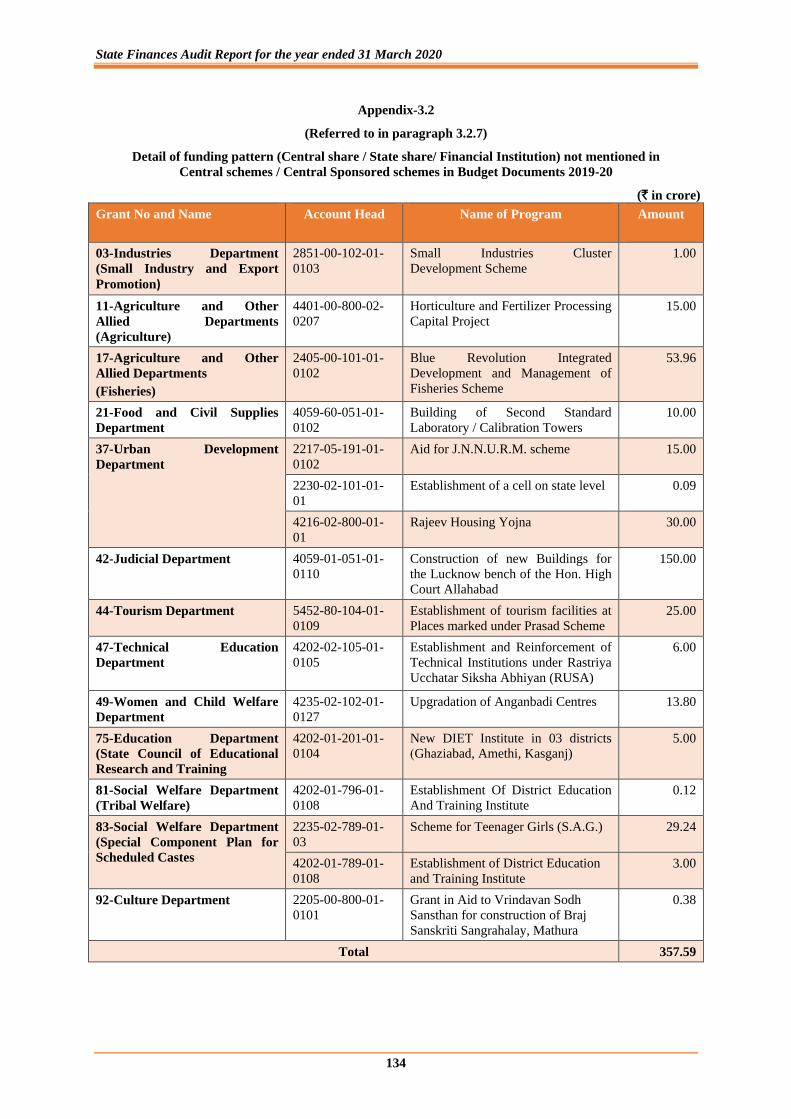
State Finances Audit Report for the year ended 31 March 2020
134
Appendix-3.2
(Referred to in paragraph 3.2.7)
Detail of funding pattern (Central share / State share/ Financial Institution) not mentioned in
Central schemes / Central Sponsored schemes in Budget Documents 2019-20
(` in crore)
Grant No and Name Account Head Name of Program Amount
03-Industries Department
(Small Industry and Export
Promotion)
2851-00-102-01-
0103
Small Industries Cluster
Development Scheme
1.00
11-Agriculture and Other
Allied Departments
(Agriculture)
4401-00-800-02-
0207
Horticulture and Fertilizer Processing
Capital Project
15.00
17-Agriculture and Other
Allied Departments
(Fisheries)
2405-00-101-01-
0102
Blue Revolution Integrated
Development and Management of
Fisheries Scheme
53.96
21-Food and Civil Supplies
Department
4059-60-051-01-
0102
Building of Second Standard
Laboratory / Calibration Towers
10.00
37-Urban Development
Department
2217-05-191-01-
0102
Aid for J.N.N.U.R.M. scheme 15.00
2230-02-101-01-
01
Establishment of a cell on state level 0.09
4216-02-800-01-
01
Rajeev Housing Yojna 30.00
42-Judicial Department 4059-01-051-01-
0110
Construction of new Buildings for
the Lucknow bench of the Hon. High
Court Allahabad
150.00
44-Tourism Department 5452-80-104-01-
0109
Establishment of tourism facilities at
Places marked under Prasad Scheme
25.00
47-Technical Education
Department
4202-02-105-01-
0105
Establishment and Reinforcement of
Technical Institutions under Rastriya
Ucchatar Siksha Abhiyan (RUSA)
6.00
49-Women and Child Welfare
Department
4235-02-102-01-
0127
Upgradation of Anganbadi Centres 13.80
75-Education Department
(State Council of Educational
Research and Training
4202-01-201-01-
0104
New DIET Institute in 03 districts
(Ghaziabad, Amethi, Kasganj)
5.00
81-Social Welfare Department
(Tribal Welfare)
4202-01-796-01-
0108
Establishment Of District Education
And Training Institute
0.12
83-Social Welfare Department
(Special Component Plan for
Scheduled Castes
2235-02-789-01-
03
Scheme for Teenager Girls (S.A.G.) 29.24
4202-01-789-01-
0108
Establishment of District Education
and Training Institute
3.00
92-Culture Department
2205-00-800-01-
0101
Grant in Aid to Vrindavan Sodh
Sansthan for construction of Braj
Sanskriti Sangrahalay, Mathura
0.38
Total 357.59
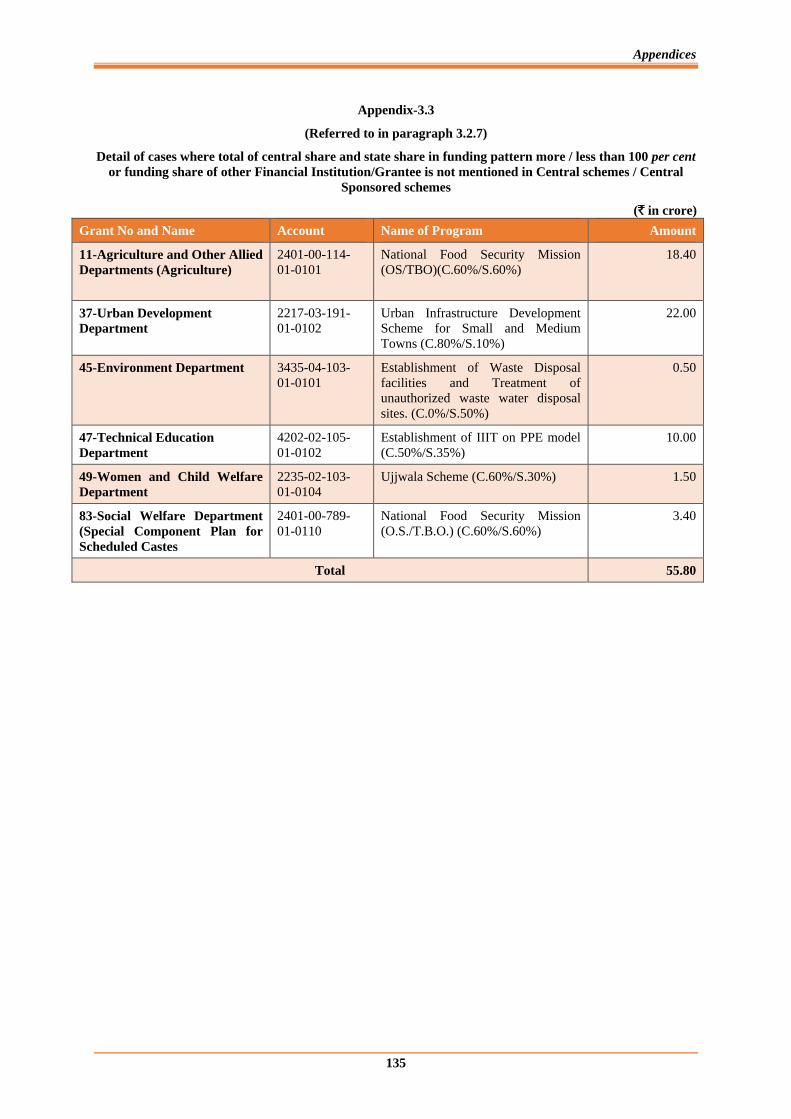
Appendices
135
Appendix-3.3
(Referred to in paragraph 3.2.7)
Detail of cases where total of central share and state share in funding pattern more / less than 100 per cent
or funding share of other Financial Institution/Grantee is not mentioned in Central schemes / Central
Sponsored schemes
(` in crore)
Grant No and Name Account Name of Program Amount
11-Agriculture and Other Allied
Departments (Agriculture)
2401-00-114-
01-0101
National Food Security Mission
(OS/TBO)(C.60%/S.60%)
18.40
37-Urban Development
Department
2217-03-191-
01-0102
Urban Infrastructure Development
Scheme for Small and Medium
Towns (C.80%/S.10%)
22.00
45-Environment Department 3435-04-103-
01-0101
Establishment of Waste Disposal
facilities and Treatment of
unauthorized waste water disposal
sites. (C.0%/S.50%)
0.50
47-Technical Education
Department
4202-02-105-
01-0102
Establishment of IIIT on PPE model
(C.50%/S.35%)
10.00
49-Women and Child Welfare
Department
2235-02-103-
01-0104
Ujjwala Scheme (C.60%/S.30%) 1.50
83-Social Welfare Department
(Special Component Plan for
Scheduled Castes
2401-00-789-
01-0110
National Food Security Mission
(O.S./T.B.O.) (C.60%/S.60%)
3.40
Total 55.80

State Finances Audit Report for the year ended 31 March 2020
136
Appendix-3.4
(Referred to in paragraph 3.3.3)
Grants in which savings were above ` 100 crore in each case during the year 2019-20
(` in crore)
Sl.
No.
Grant
No.
Grant Name Original
Provision
Supple-
mentary
Provision
Total
Grant
Expen-
diture
Saving Savings
excluding
surren-
dered
Revenue Voted
1. 3 Industries
Department (Small
Industry and Export
Promotion)
597.07 0.00 597.07 388.11 208.96 208.96
2. 7 Industries
Department (Heavy
and Medium
Industries)
1,766.36 1,039.92 2,806.28 1,896.24 910.04 907.99
3. 9 Power Department 17,233.75 1,600.00 18,833.75 16333.65 2,500.09 2492.50
4. 10 Agriculture and
other Allied
Departments
(Horticultural and
Sericulture
Development)
680.44 5.00 685.44 559.97 125.47 32.66
5. 11 Agriculture and
other Allied
Departments
(Agriculture)
5,352.03 54.00 5,406.03 4,327.79 1,078.24 938.16
6. 12 Agriculture and
other Allied
Departments (Land
Development and
Water Resources)
802.48 0.00 802.48 104.16 698.31 698.31
7. 13 Agriculture and
other Allied
Departments (Rural
Development)
3,719.53 0.00 3,719.53 3,070.98 648.55 489.39
8. 14 Agriculture and
Other Allied
Departments
(Panchayati Raj)
18,769.38 18.85 18,788.23 14,625.65 4,162.58 4,142.62
9. 15 Agriculture and
other Allied
Departments
(Animal Husbandry)
1,645.16 11.27 1,656.43 1,432.59 223.83 223.83
10. 26 Home Department
(Police)
21,705.24 0.00 21,705.24 19,895.38 1,809.86 1,809.86
11. 31 Medical Department
(Medical Education
and Training)
3,628.40 0.00 3,628.40 3,382.50 245.91 245.91
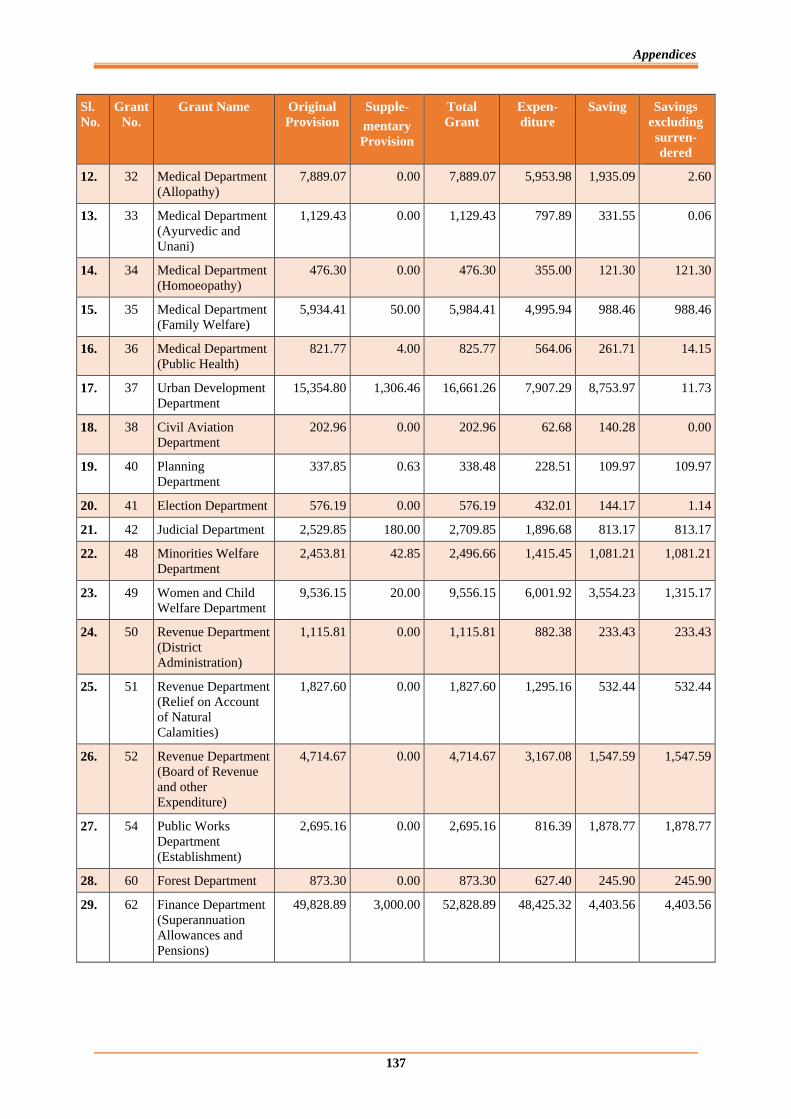
Appendices
137
Sl.
No.
Grant
No.
Grant Name Original
Provision
Supple-
mentary
Provision
Total
Grant
Expen-
diture
Saving Savings
excluding
surren-
dered
12. 32 Medical Department
(Allopathy)
7,889.07 0.00 7,889.07 5,953.98 1,935.09 2.60
13. 33 Medical Department
(Ayurvedic and
Unani)
1,129.43 0.00 1,129.43 797.89 331.55 0.06
14. 34 Medical Department
(Homoeopathy)
476.30 0.00 476.30 355.00 121.30 121.30
15. 35 Medical Department
(Family Welfare)
5,934.41 50.00 5,984.41 4,995.94 988.46 988.46
16. 36 Medical Department
(Public Health)
821.77 4.00 825.77 564.06 261.71 14.15
17. 37 Urban Development
Department
15,354.80 1,306.46 16,661.26 7,907.29 8,753.97 11.73
18. 38 Civil Aviation
Department
202.96 0.00 202.96 62.68 140.28 0.00
19. 40 Planning
Department
337.85 0.63 338.48 228.51 109.97 109.97
20. 41 Election Department 576.19 0.00 576.19 432.01 144.17 1.14
21. 42 Judicial Department 2,529.85 180.00 2,709.85 1,896.68 813.17 813.17
22. 48 Minorities Welfare
Department
2,453.81 42.85 2,496.66 1,415.45 1,081.21 1,081.21
23. 49 Women and Child
Welfare Department
9,536.15 20.00 9,556.15 6,001.92 3,554.23 1,315.17
24. 50 Revenue Department
(District
Administration)
1,115.81 0.00 1,115.81 882.38 233.43 233.43
25. 51 Revenue Department
(Relief on Account
of Natural
Calamities)
1,827.60 0.00 1,827.60 1,295.16 532.44 532.44
26. 52 Revenue Department
(Board of Revenue
and other
Expenditure)
4,714.67 0.00 4,714.67 3,167.08 1,547.59 1,547.59
27. 54 Public Works
Department
(Establishment)
2,695.16 0.00 2,695.16 816.39 1,878.77 1,878.77
28. 60 Forest Department 873.30 0.00 873.30 627.40 245.90 245.90
29. 62 Finance Department
(Superannuation
Allowances and
Pensions)
49,828.89 3,000.00 52,828.89 48,425.32 4,403.56 4,403.56
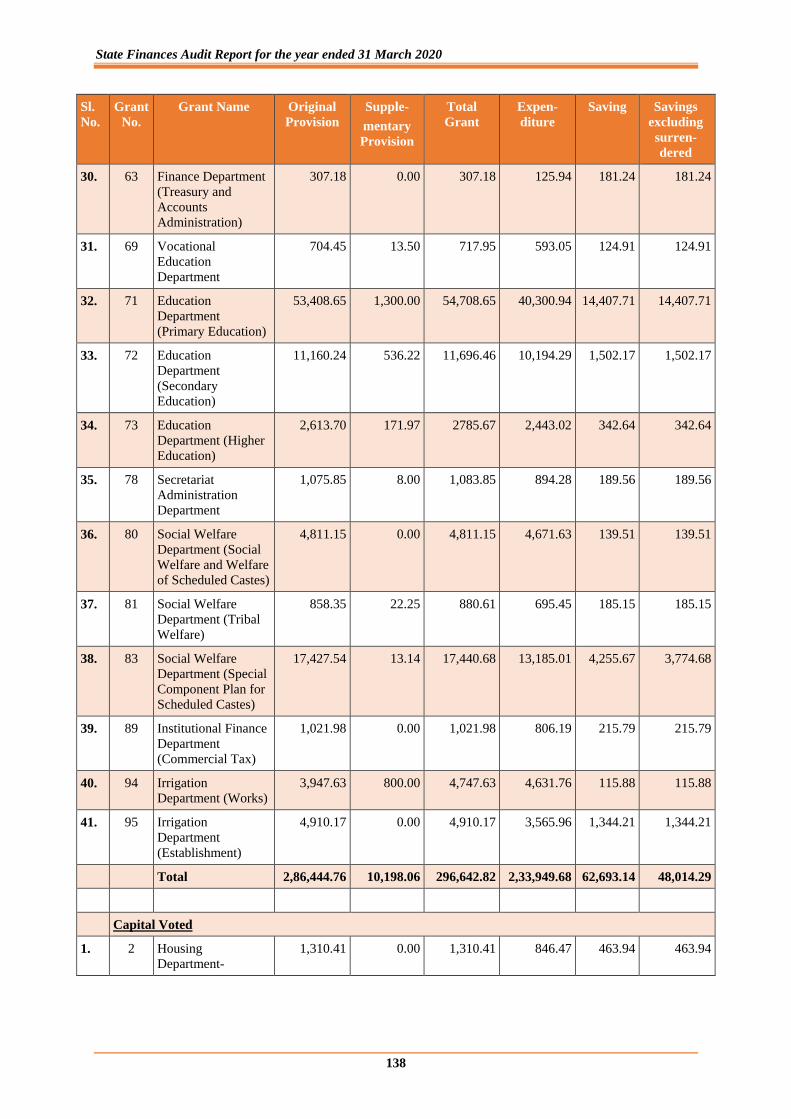
State Finances Audit Report for the year ended 31 March 2020
138
Sl.
No.
Grant
No.
Grant Name Original
Provision
Supple-
mentary
Provision
Total
Grant
Expen-
diture
Saving Savings
excluding
surren-
dered
30. 63 Finance Department
(Treasury and
Accounts
Administration)
307.18 0.00 307.18 125.94 181.24 181.24
31. 69 Vocational
Education
Department
704.45 13.50 717.95 593.05 124.91 124.91
32. 71 Education
Department
(Primary Education)
53,408.65 1,300.00 54,708.65 40,300.94 14,407.71 14,407.71
33. 72 Education
Department
(Secondary
Education)
11,160.24 536.22 11,696.46 10,194.29 1,502.17 1,502.17
34. 73 Education
Department (Higher
Education)
2,613.70 171.97 2785.67 2,443.02 342.64 342.64
35. 78 Secretariat
Administration
Department
1,075.85 8.00 1,083.85 894.28 189.56 189.56
36. 80 Social Welfare
Department (Social
Welfare and Welfare
of Scheduled Castes)
4,811.15 0.00 4,811.15 4,671.63 139.51 139.51
37. 81 Social Welfare
Department (Tribal
Welfare)
858.35 22.25 880.61 695.45 185.15 185.15
38. 83 Social Welfare
Department (Special
Component Plan for
Scheduled Castes)
17,427.54 13.14 17,440.68 13,185.01 4,255.67 3,774.68
39. 89 Institutional Finance
Department
(Commercial Tax)
1,021.98 0.00 1,021.98 806.19 215.79 215.79
40. 94 Irrigation
Department (Works)
3,947.63 800.00 4,747.63 4,631.76 115.88 115.88
41. 95 Irrigation
Department
(Establishment)
4,910.17 0.00 4,910.17 3,565.96 1,344.21 1,344.21
Total 2,86,444.76 10,198.06 296,642.82 2,33,949.68 62,693.14 48,014.29
Capital Voted
1. 2 Housing
Department-
1,310.41 0.00 1,310.41 846.47 463.94 463.94
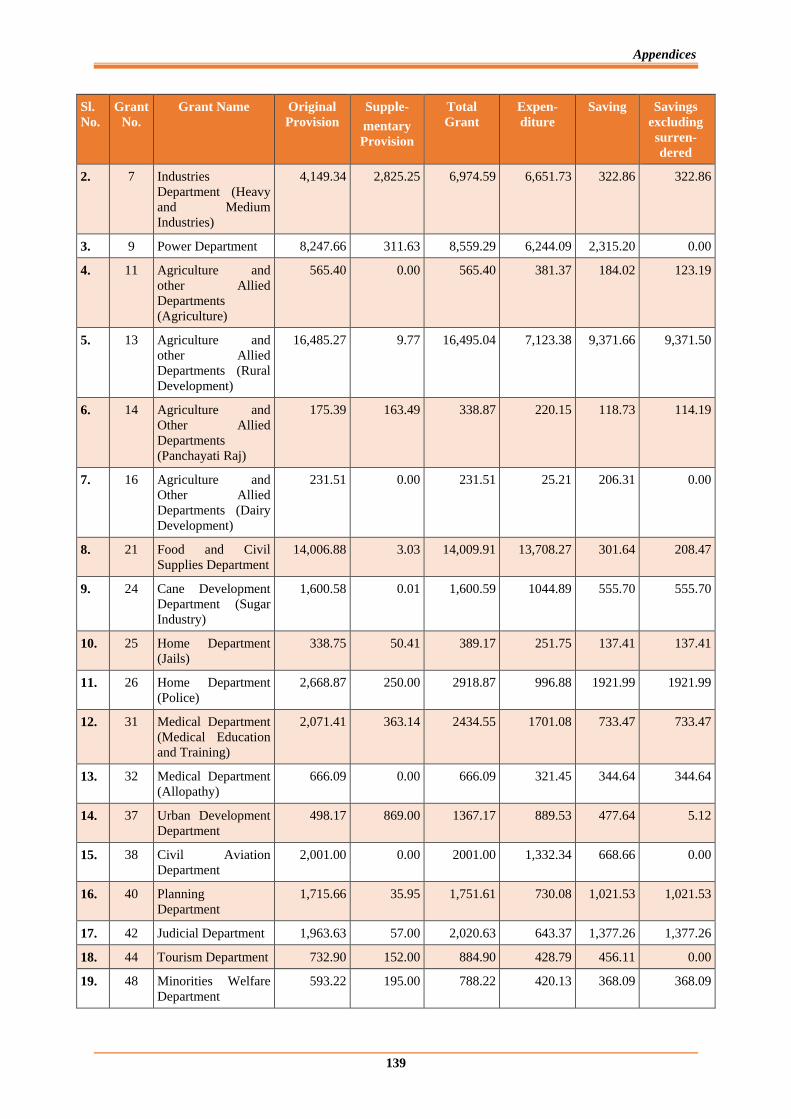
Appendices
139
Sl.
No.
Grant
No.
Grant Name Original
Provision
Supple-
mentary
Provision
Total
Grant
Expen-
diture
Saving Savings
excluding
surren-
dered
2. 7 Industries
Department (Heavy
and Medium
Industries)
4,149.34 2,825.25 6,974.59 6,651.73 322.86 322.86
3. 9 Power Department 8,247.66 311.63 8,559.29 6,244.09 2,315.20 0.00
4. 11 Agriculture and
other Allied
Departments
(Agriculture)
565.40 0.00 565.40 381.37 184.02 123.19
5. 13 Agriculture and
other Allied
Departments (Rural
Development)
16,485.27 9.77 16,495.04 7,123.38 9,371.66 9,371.50
6. 14 Agriculture and
Other Allied
Departments
(Panchayati Raj)
175.39 163.49 338.87 220.15 118.73 114.19
7. 16 Agriculture and
Other Allied
Departments (Dairy
Development)
231.51 0.00 231.51 25.21 206.31 0.00
8. 21 Food and Civil
Supplies Department
14,006.88 3.03 14,009.91 13,708.27 301.64 208.47
9. 24 Cane Development
Department (Sugar
Industry)
1,600.58 0.01 1,600.59 1044.89 555.70 555.70
10. 25 Home Department
(Jails)
338.75 50.41 389.17 251.75 137.41 137.41
11. 26 Home Department
(Police)
2,668.87 250.00 2918.87 996.88 1921.99 1921.99
12. 31 Medical Department
(Medical Education
and Training)
2,071.41 363.14 2434.55 1701.08 733.47 733.47
13. 32 Medical Department
(Allopathy)
666.09 0.00 666.09 321.45 344.64 344.64
14. 37 Urban Development
Department
498.17 869.00 1367.17 889.53 477.64 5.12
15. 38 Civil Aviation
Department
2,001.00 0.00 2001.00 1,332.34 668.66 0.00
16. 40 Planning
Department
1,715.66 35.95 1,751.61 730.08 1,021.53 1,021.53
17. 42 Judicial Department 1,963.63 57.00 2,020.63 643.37 1,377.26 1,377.26
18. 44 Tourism Department 732.90 152.00 884.90 428.79 456.11 0.00
19. 48 Minorities Welfare
Department
593.22 195.00 788.22 420.13 368.09 368.09
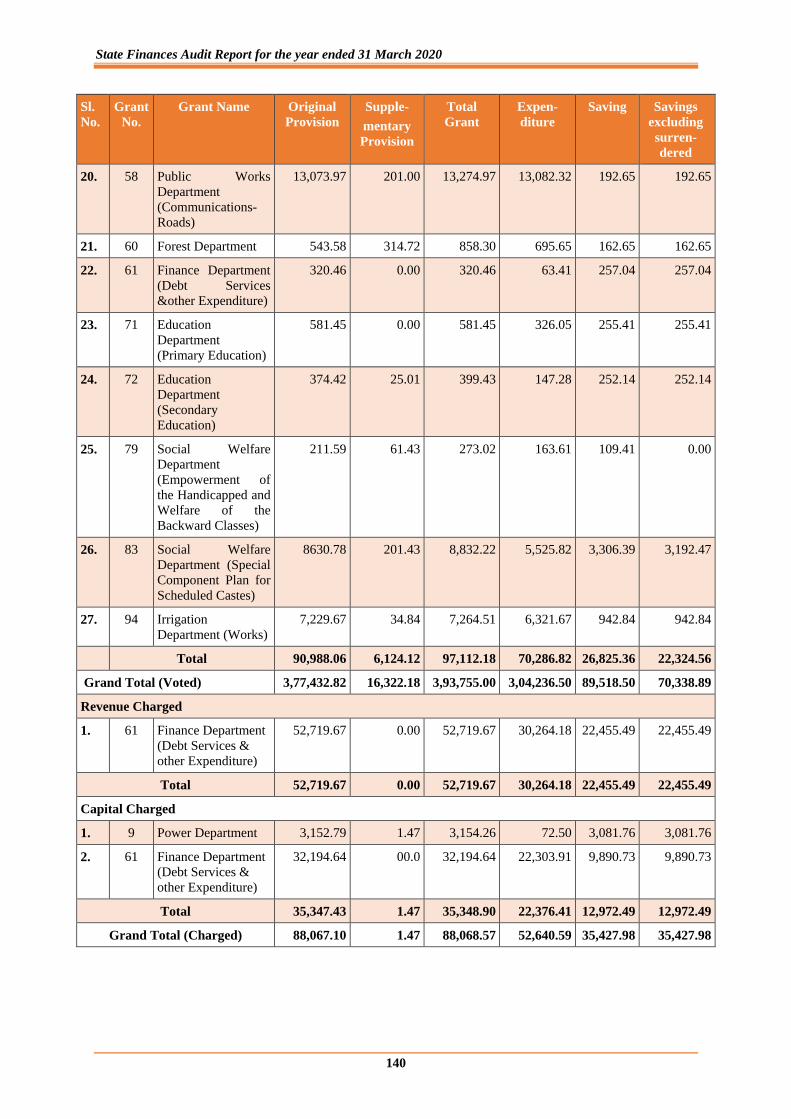
State Finances Audit Report for the year ended 31 March 2020
140
Sl.
No.
Grant
No.
Grant Name Original
Provision
Supple-
mentary
Provision
Total
Grant
Expen-
diture
Saving Savings
excluding
surren-
dered
20. 58 Public Works
Department
(Communications-
Roads)
13,073.97 201.00 13,274.97 13,082.32 192.65 192.65
21. 60 Forest Department 543.58 314.72 858.30 695.65 162.65 162.65
22. 61 Finance Department
(Debt Services
&other Expenditure)
320.46 0.00 320.46 63.41 257.04 257.04
23. 71 Education
Department
(Primary Education)
581.45 0.00 581.45 326.05 255.41 255.41
24. 72 Education
Department
(Secondary
Education)
374.42 25.01 399.43 147.28 252.14 252.14
25. 79 Social Welfare
Department
(Empowerment of
the Handicapped and
Welfare of the
Backward Classes)
211.59 61.43 273.02 163.61 109.41 0.00
26. 83 Social Welfare
Department (Special
Component Plan for
Scheduled Castes)
8630.78 201.43 8,832.22 5,525.82 3,306.39 3,192.47
27. 94 Irrigation
Department (Works)
7,229.67 34.84 7,264.51 6,321.67 942.84 942.84
Total 90,988.06 6,124.12 97,112.18 70,286.82 26,825.36 22,324.56
Grand Total (Voted) 3,77,432.82 16,322.18 3,93,755.00 3,04,236.50 89,518.50 70,338.89
Revenue Charged
1. 61 Finance Department
(Debt Services &
other Expenditure)
52,719.67 0.00 52,719.67 30,264.18 22,455.49 22,455.49
Total 52,719.67 0.00 52,719.67 30,264.18 22,455.49 22,455.49
Capital Charged
1. 9 Power Department 3,152.79 1.47 3,154.26 72.50 3,081.76 3,081.76
2. 61 Finance Department
(Debt Services &
other Expenditure)
32,194.64 00.0 32,194.64 22,303.91 9,890.73 9,890.73
Total 35,347.43 1.47 35,348.90 22,376.41 12,972.49 12,972.49
Grand Total (Charged) 88,067.10 1.47 88,068.57 52,640.59 35,427.98 35,427.98
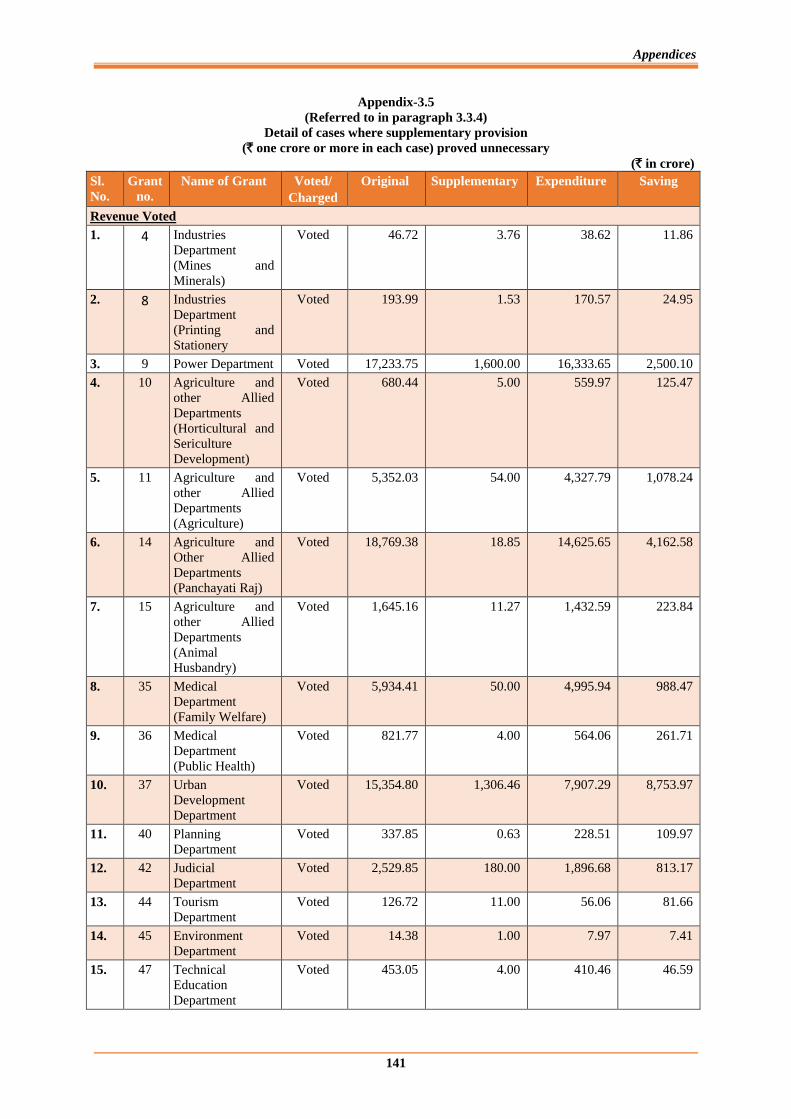
Appendices
141
Appendix-3.5
(Referred to in paragraph 3.3.4)
Detail of cases where supplementary provision
(` one crore or more in each case) proved unnecessary
(` in crore)
Sl.
No.
Grant
no.
Name of Grant Voted/
Charged
Original Supplementary Expenditure Saving
Revenue Voted
1. 4 Industries
Department
(Mines and
Minerals)
Voted 46.72 3.76 38.62 11.86
2. 8 Industries
Department
(Printing and
Stationery
Voted 193.99 1.53 170.57 24.95
3. 9 Power Department Voted 17,233.75 1,600.00 16,333.65 2,500.10
4. 10 Agriculture and
other Allied
Departments
(Horticultural and
Sericulture
Development)
Voted 680.44 5.00 559.97 125.47
5. 11 Agriculture and
other Allied
Departments
(Agriculture)
Voted 5,352.03 54.00 4,327.79 1,078.24
6. 14 Agriculture and
Other Allied
Departments
(Panchayati Raj)
Voted 18,769.38 18.85 14,625.65 4,162.58
7. 15 Agriculture and
other Allied
Departments
(Animal
Husbandry)
Voted 1,645.16 11.27 1,432.59 223.84
8. 35 Medical
Department
(Family Welfare)
Voted 5,934.41 50.00 4,995.94 988.47
9. 36 Medical
Department
(Public Health)
Voted 821.77 4.00 564.06 261.71
10. 37 Urban
Development
Department
Voted 15,354.80 1,306.46 7,907.29 8,753.97
11. 40 Planning
Department
Voted 337.85 0.63 228.51 109.97
12. 42 Judicial
Department
Voted 2,529.85 180.00 1,896.68 813.17
13. 44 Tourism
Department
Voted 126.72 11.00 56.06 81.66
14. 45 Environment
Department
Voted 14.38 1.00 7.97 7.41
15. 47 Technical
Education
Department
Voted 453.05 4.00 410.46 46.59
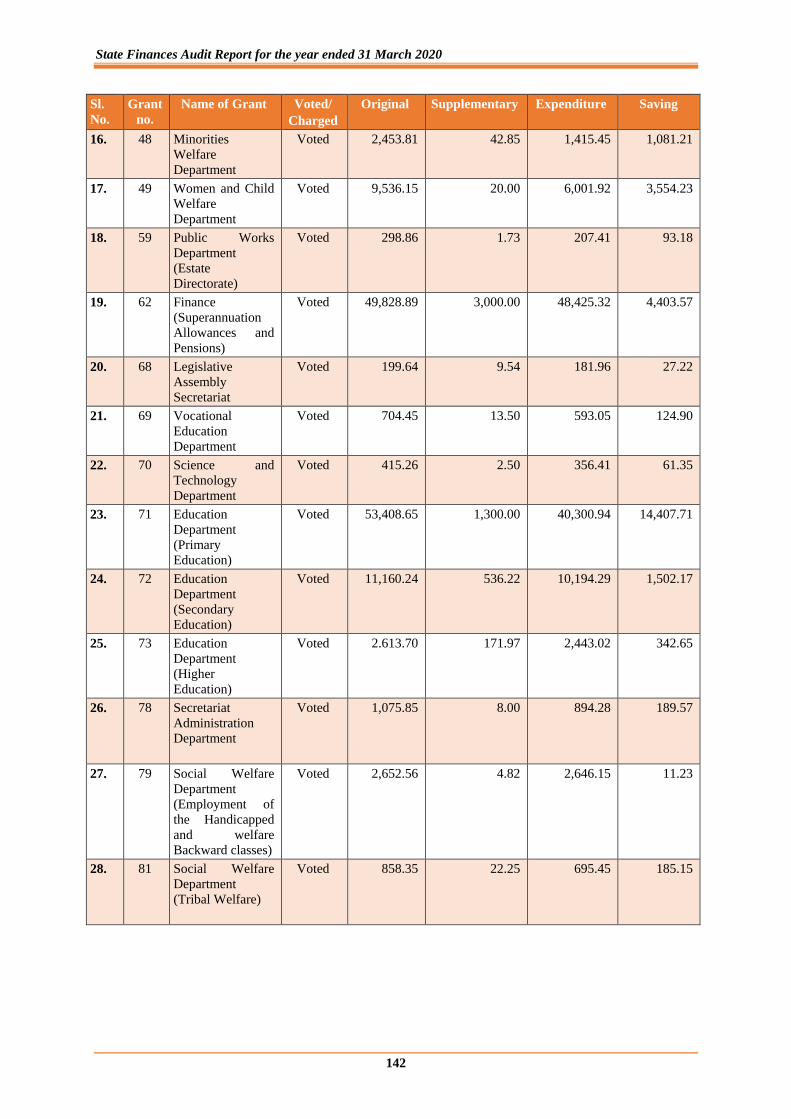
State Finances Audit Report for the year ended 31 March 2020
142
Sl.
No.
Grant
no.
Name of Grant Voted/
Charged
Original Supplementary Expenditure Saving
16. 48 Minorities
Welfare
Department
Voted 2,453.81 42.85 1,415.45 1,081.21
17. 49 Women and Child
Welfare
Department
Voted 9,536.15 20.00 6,001.92 3,554.23
18. 59 Public Works
Department
(Estate
Directorate)
Voted 298.86 1.73 207.41 93.18
19. 62 Finance
(Superannuation
Allowances and
Pensions)
Voted 49,828.89 3,000.00 48,425.32 4,403.57
20. 68 Legislative
Assembly
Secretariat
Voted 199.64 9.54 181.96 27.22
21. 69 Vocational
Education
Department
Voted 704.45 13.50 593.05 124.90
22. 70 Science and
Technology
Department
Voted 415.26 2.50 356.41 61.35
23. 71 Education
Department
(Primary
Education)
Voted 53,408.65 1,300.00 40,300.94 14,407.71
24. 72 Education
Department
(Secondary
Education)
Voted 11,160.24 536.22 10,194.29 1,502.17
25. 73 Education
Department
(Higher
Education)
Voted 2.613.70 171.97 2,443.02 342.65
26. 78 Secretariat
Administration
Department
Voted 1,075.85 8.00 894.28 189.57
27. 79 Social Welfare
Department
(Employment of
the Handicapped
and welfare
Backward classes)
Voted 2,652.56 4.82 2,646.15 11.23
28. 81 Social Welfare
Department
(Tribal Welfare)
Voted 858.35 22.25 695.45 185.15
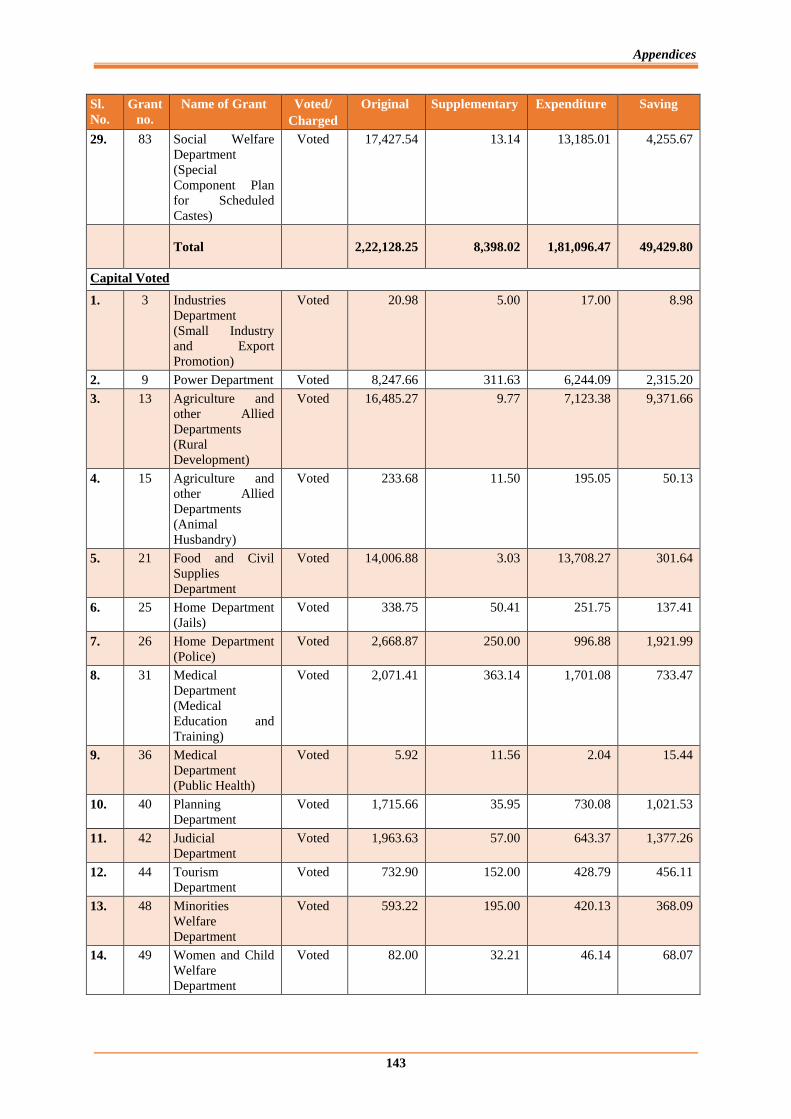
Appendices
143
Sl.
No.
Grant
no.
Name of Grant Voted/
Charged
Original Supplementary Expenditure Saving
29. 83 Social Welfare
Department
(Special
Component Plan
for Scheduled
Castes)
Voted 17,427.54 13.14 13,185.01 4,255.67
Total 2,22,128.25 8,398.02 1,81,096.47 49,429.80
Capital Voted
1. 3 Industries
Department
(Small Industry
and Export
Promotion)
Voted 20.98 5.00 17.00 8.98
2. 9 Power Department Voted 8,247.66 311.63 6,244.09 2,315.20
3. 13 Agriculture and
other Allied
Departments
(Rural
Development)
Voted 16,485.27 9.77 7,123.38 9,371.66
4. 15 Agriculture and
other Allied
Departments
(Animal
Husbandry)
Voted 233.68 11.50 195.05 50.13
5. 21 Food and Civil
Supplies
Department
Voted 14,006.88 3.03 13,708.27 301.64
6. 25 Home Department
(Jails)
Voted 338.75 50.41 251.75 137.41
7. 26 Home Department
(Police)
Voted 2,668.87 250.00 996.88 1,921.99
8. 31 Medical
Department
(Medical
Education and
Training)
Voted 2,071.41 363.14 1,701.08 733.47
9. 36 Medical
Department
(Public Health)
Voted 5.92 11.56 2.04 15.44
10. 40 Planning
Department
Voted 1,715.66 35.95 730.08 1,021.53
11. 42 Judicial
Department
Voted 1,963.63 57.00 643.37 1,377.26
12. 44 Tourism
Department
Voted 732.90 152.00 428.79 456.11
13. 48 Minorities
Welfare
Department
Voted 593.22 195.00 420.13 368.09
14. 49 Women and Child
Welfare
Department
Voted 82.00 32.21 46.14 68.07
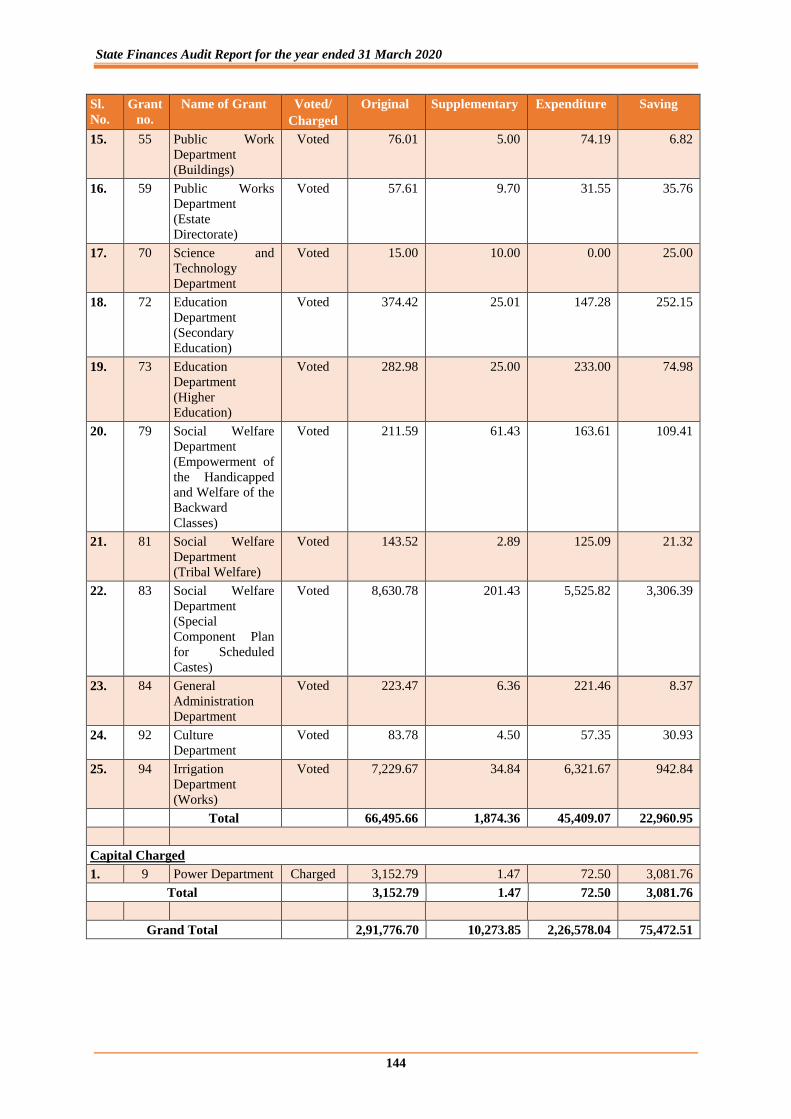
State Finances Audit Report for the year ended 31 March 2020
144
Sl.
No.
Grant
no.
Name of Grant Voted/
Charged
Original Supplementary Expenditure Saving
15. 55 Public Work
Department
(Buildings)
Voted 76.01 5.00 74.19 6.82
16. 59 Public Works
Department
(Estate
Directorate)
Voted 57.61 9.70 31.55 35.76
17. 70 Science and
Technology
Department
Voted 15.00 10.00 0.00 25.00
18. 72 Education
Department
(Secondary
Education)
Voted 374.42 25.01 147.28 252.15
19. 73 Education
Department
(Higher
Education)
Voted 282.98 25.00 233.00 74.98
20. 79 Social Welfare
Department
(Empowerment of
the Handicapped
and Welfare of the
Backward
Classes)
Voted 211.59 61.43 163.61 109.41
21. 81 Social Welfare
Department
(Tribal Welfare)
Voted 143.52 2.89 125.09 21.32
22. 83 Social Welfare
Department
(Special
Component Plan
for Scheduled
Castes)
Voted 8,630.78 201.43 5,525.82 3,306.39
23. 84 General
Administration
Department
Voted 223.47 6.36 221.46 8.37
24. 92 Culture
Department
Voted 83.78 4.50 57.35 30.93
25. 94 Irrigation
Department
(Works)
Voted 7,229.67 34.84 6,321.67 942.84
Total 66,495.66 1,874.36 45,409.07 22,960.95
Capital Charged
1. 9 Power Department Charged 3,152.79 1.47 72.50 3,081.76
Total 3,152.79 1.47 72.50 3,081.76
Grand Total 2,91,776.70 10,273.85 2,26,578.04 75,472.51
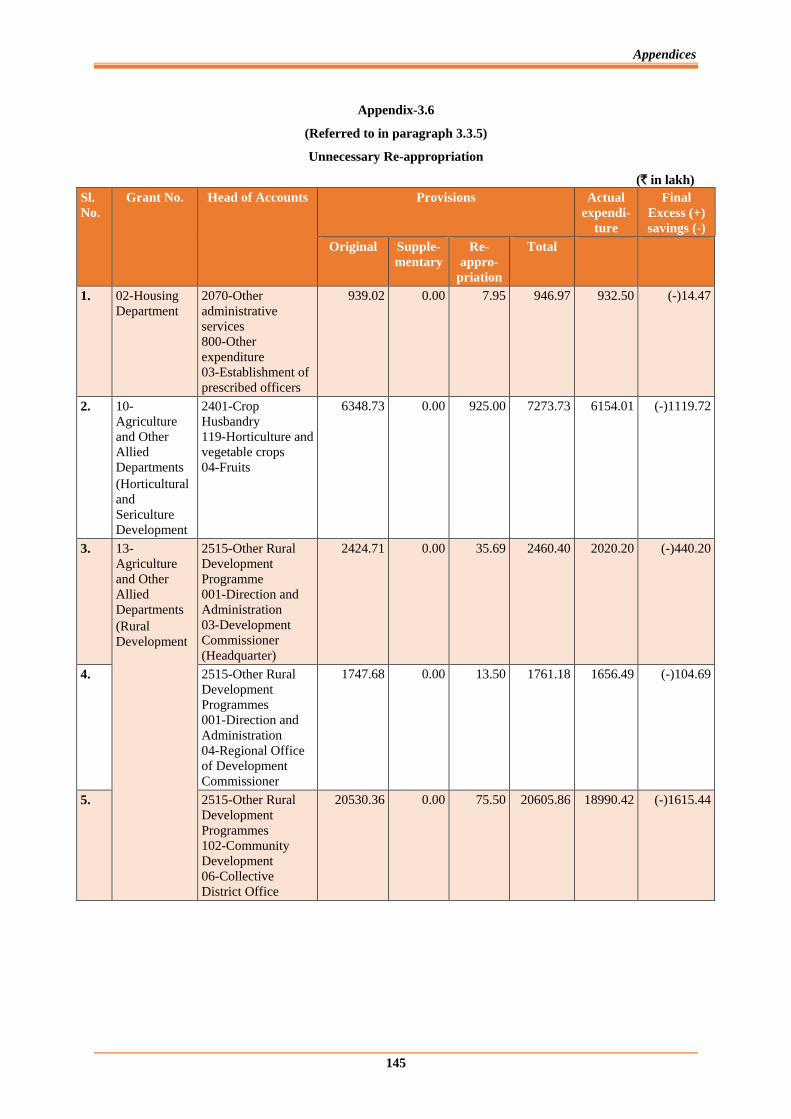
Appendices
145
Appendix-3.6
(Referred to in paragraph 3.3.5)
Unnecessary Re-appropriation
(` in lakh)
Sl.
No.
Grant No. Head of Accounts Provisions Actual
expendi-
ture
Final
Excess (+)
savings (-)
Original Supple-
mentary
Re-
appro-
priation
Total
1. 02-Housing
Department
2070-Other
administrative
services
800-Other
expenditure
03-Establishment of
prescribed officers
939.02 0.00 7.95 946.97 932.50 (-)14.47
2. 10-
Agriculture
and Other
Allied
Departments
(Horticultural
and
Sericulture
Development
2401-Crop
Husbandry
119-Horticulture and
vegetable crops
04-Fruits
6348.73 0.00 925.00 7273.73 6154.01 (-)1119.72
3. 13-
Agriculture
and Other
Allied
Departments
(Rural
Development
2515-Other Rural
Development
Programme
001-Direction and
Administration
03-Development
Commissioner
(Headquarter)
2424.71 0.00 35.69 2460.40 2020.20 (-)440.20
4. 2515-Other Rural
Development
Programmes
001-Direction and
Administration
04-Regional Office
of Development
Commissioner
1747.68 0.00 13.50 1761.18 1656.49 (-)104.69
5. 2515-Other Rural
Development
Programmes
102-Community
Development
06-Collective
District Office
20530.36 0.00 75.50 20605.86 18990.42 (-)1615.44
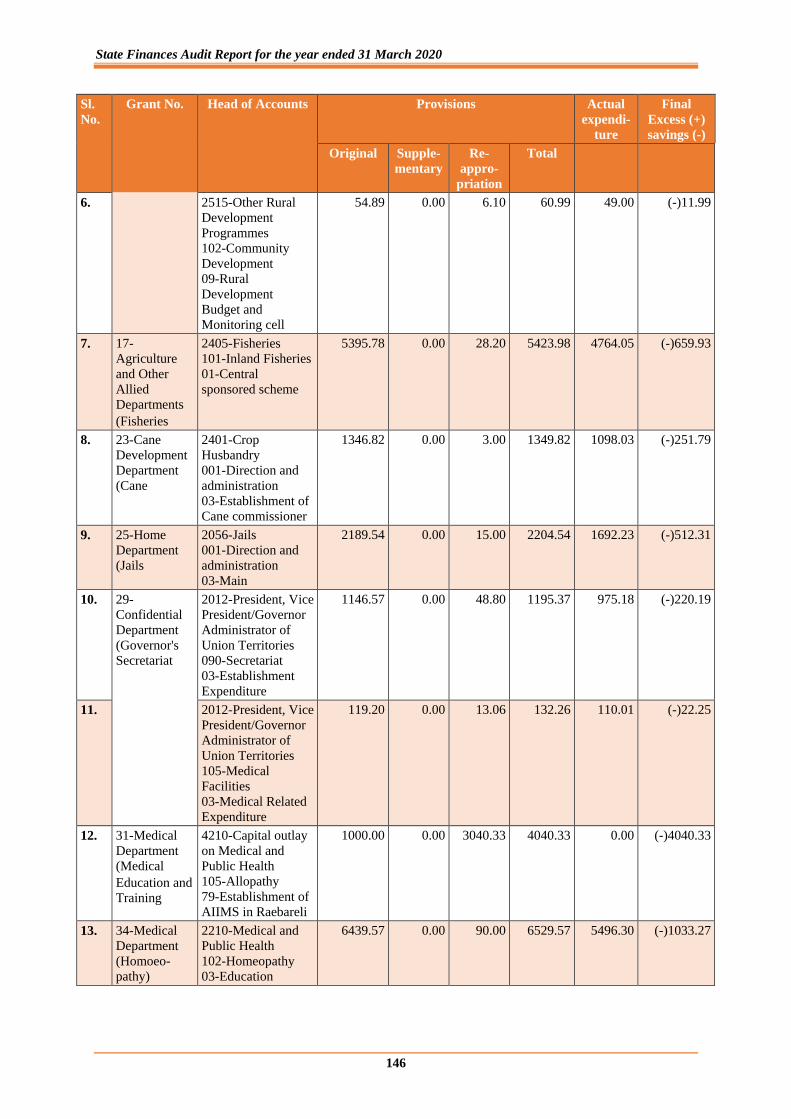
State Finances Audit Report for the year ended 31 March 2020
146
Sl.
No.
Grant No. Head of Accounts Provisions Actual
expendi-
ture
Final
Excess (+)
savings (-)
Original Supple-
mentary
Re-
appro-
priation
Total
6. 2515-Other Rural
Development
Programmes
102-Community
Development
09-Rural
Development
Budget and
Monitoring cell
54.89 0.00 6.10 60.99 49.00 (-)11.99
7. 17-
Agriculture
and Other
Allied
Departments
(Fisheries
2405-Fisheries
101-Inland Fisheries
01-Central
sponsored scheme
5395.78 0.00 28.20 5423.98 4764.05 (-)659.93
8. 23-Cane
Development
Department
(Cane
2401-Crop
Husbandry
001-Direction and
administration
03-Establishment of
Cane commissioner
1346.82 0.00 3.00 1349.82 1098.03 (-)251.79
9. 25-Home
Department
(Jails
2056-Jails
001-Direction and
administration
03-Main
2189.54 0.00 15.00 2204.54 1692.23 (-)512.31
10. 29-
Confidential
Department
(Governor's
Secretariat
2012-President, Vice
President/Governor
Administrator of
Union Territories
090-Secretariat
03-Establishment
Expenditure
1146.57 0.00 48.80 1195.37 975.18 (-)220.19
11. 2012-President, Vice
President/Governor
Administrator of
Union Territories
105-Medical
Facilities
03-Medical Related
Expenditure
119.20 0.00 13.06 132.26 110.01 (-)22.25
12. 31-Medical
Department
(Medical
Education and
Training
4210-Capital outlay
on Medical and
Public Health
105-Allopathy
79-Establishment of
AIIMS in Raebareli
1000.00 0.00 3040.33 4040.33 0.00 (-)4040.33
13. 34-Medical
Department
(Homoeo-
pathy)
2210-Medical and
Public Health
102-Homeopathy
03-Education
6439.57 0.00 90.00 6529.57 5496.30 (-)1033.27

Appendices
147
Sl.
No.
Grant No. Head of Accounts Provisions Actual
expendi-
ture
Final
Excess (+)
savings (-)
Original Supple-
mentary
Re-
appro-
priation
Total
14. 40-Planning
Department
2575-Other Special
Arrear Programme
800-Other
expenditure
04-Special Scheme
of Bundelkhand
11337.00 0.00 1145.00 12482.00 7032.07 (-)5449.93
15. 4575-Capital outlay
on other special
areas programme
800-Other
Expenditure
04-Special Schemes
of Bundelkhand.
48773.15 0.00 10307.00 59080.15 25450.17 (-)33629.98
16. 42-Judicial
Department
2014-Administration
of Justice
105-Civil and
Session Courts
01-Central
Sponsored Schemes
890.59 0.00 50.00 940.59 794.38 (-)146.21
17. 2014-Administration
of Justice
105-Civil and
Session Courts
16-Commericial
Courts
1085.55 0.00 2.00 1087.55 208.86 (-)878.69
18. 2052-Secretariat
General Services
091-Attached
Offices
03-Legal Cell Uttar
Pradesh Bhawan,
New Delhi
284.09 0.00 2.50 286.59 216.25 (-)70.34
19. 2235-Social Security
and Welfare
200-Other
Programmes
04-State Legal
Service Authority
and District Legal
Service
2221.50 0.00 97.00 2318.50 1751.55 (-)566.95
20. 47-Technical
Education
Department
2203-Technical
Education
001-Direction and
Administration
04-Regional Offices
303.85 0.00 10.56 314.41 289.04 (-)25.37
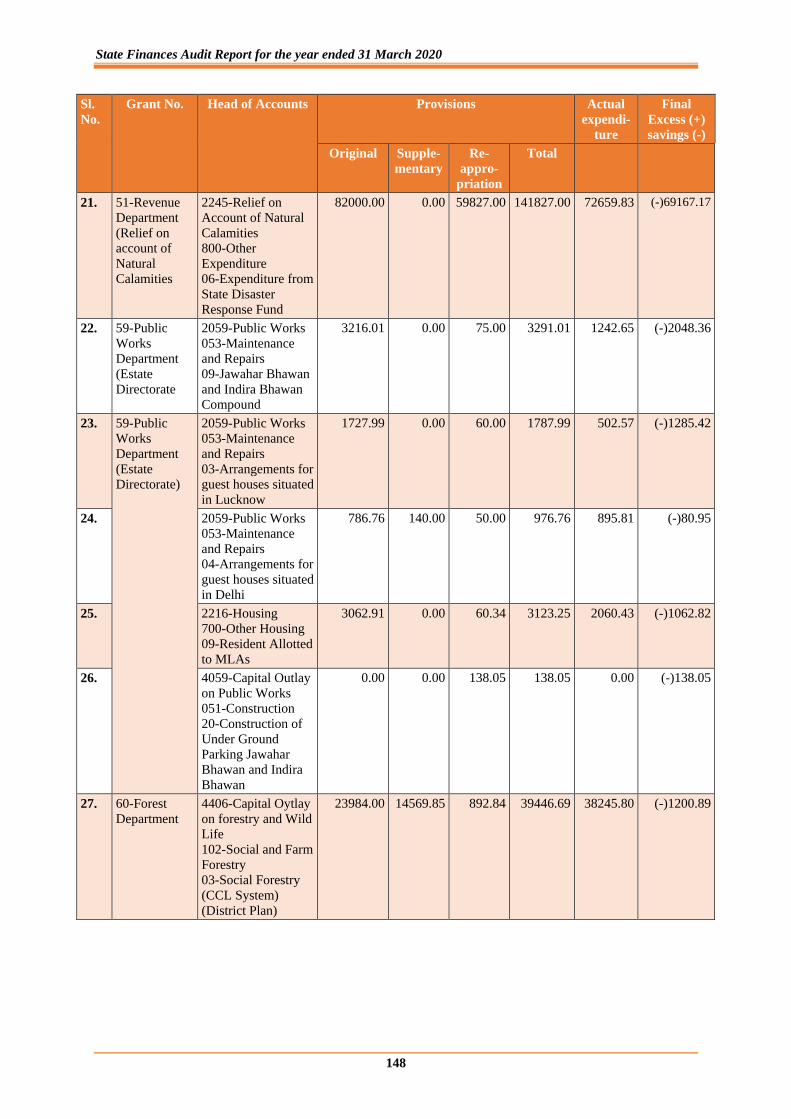
State Finances Audit Report for the year ended 31 March 2020
148
Sl.
No.
Grant No. Head of Accounts Provisions Actual
expendi-
ture
Final
Excess (+)
savings (-)
Original Supple-
mentary
Re-
appro-
priation
Total
21. 51-Revenue
Department
(Relief on
account of
Natural
Calamities
2245-Relief on
Account of Natural
Calamities
800-Other
Expenditure
06-Expenditure from
State Disaster
Response Fund
82000.00 0.00 59827.00 141827.00 72659.83 (-)69167.17
22. 59-Public
Works
Department
(Estate
Directorate
2059-Public Works
053-Maintenance
and Repairs
09-Jawahar Bhawan
and Indira Bhawan
Compound
3216.01 0.00 75.00 3291.01 1242.65 (-)2048.36
23. 59-Public
Works
Department
(Estate
Directorate)
2059-Public Works
053-Maintenance
and Repairs
03-Arrangements for
guest houses situated
in Lucknow
1727.99 0.00 60.00 1787.99 502.57 (-)1285.42
24. 2059-Public Works
053-Maintenance
and Repairs
04-Arrangements for
guest houses situated
in Delhi
786.76 140.00 50.00 976.76 895.81 (-)80.95
25. 2216-Housing
700-Other Housing
09-Resident Allotted
to MLAs
3062.91 0.00 60.34 3123.25 2060.43 (-)1062.82
26. 4059-Capital Outlay
on Public Works
051-Construction
20-Construction of
Under Ground
Parking Jawahar
Bhawan and Indira
Bhawan
0.00 0.00 138.05 138.05 0.00 (-)138.05
27. 60-Forest
Department
4406-Capital Oytlay
on forestry and Wild
Life
102-Social and Farm
Forestry
03-Social Forestry
(CCL System)
(District Plan)
23984.00 14569.85 892.84 39446.69 38245.80 (-)1200.89
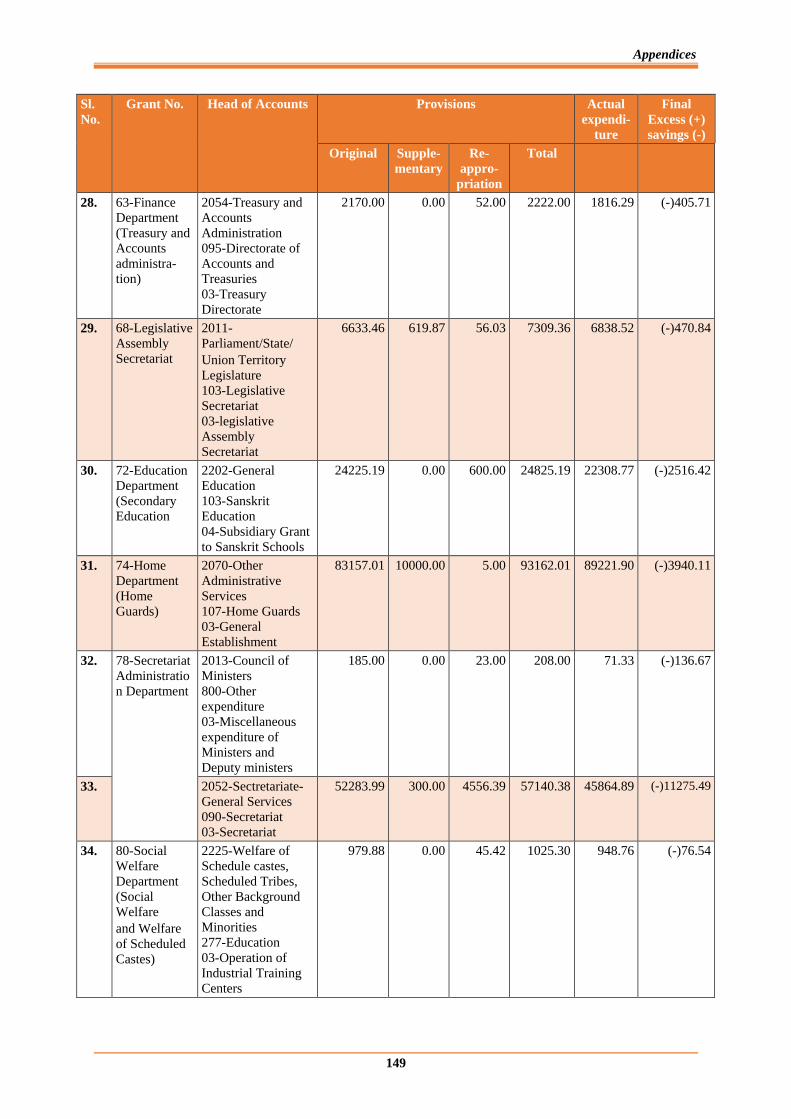
Appendices
149
Sl.
No.
Grant No. Head of Accounts Provisions Actual
expendi-
ture
Final
Excess (+)
savings (-)
Original Supple-
mentary
Re-
appro-
priation
Total
28. 63-Finance
Department
(Treasury and
Accounts
administra-
tion)
2054-Treasury and
Accounts
Administration
095-Directorate of
Accounts and
Treasuries
03-Treasury
Directorate
2170.00 0.00 52.00 2222.00 1816.29 (-)405.71
29. 68-Legislative
Assembly
Secretariat
2011-
Parliament/State/
Union Territory
Legislature
103-Legislative
Secretariat
03-legislative
Assembly
Secretariat
6633.46 619.87 56.03 7309.36 6838.52 (-)470.84
30. 72-Education
Department
(Secondary
Education
2202-General
Education
103-Sanskrit
Education
04-Subsidiary Grant
to Sanskrit Schools
24225.19 0.00 600.00 24825.19 22308.77 (-)2516.42
31. 74-Home
Department
(Home
Guards)
2070-Other
Administrative
Services
107-Home Guards
03-General
Establishment
83157.01 10000.00 5.00 93162.01 89221.90 (-)3940.11
32. 78-Secretariat
Administratio
n Department
2013-Council of
Ministers
800-Other
expenditure
03-Miscellaneous
expenditure of
Ministers and
Deputy ministers
185.00 0.00 23.00 208.00 71.33 (-)136.67
33. 2052-Sectretariate-
General Services
090-Secretariat
03-Secretariat
52283.99 300.00 4556.39 57140.38 45864.89 (-)11275.49
34. 80-Social
Welfare
Department
(Social
Welfare
and Welfare
of Scheduled
Castes)
2225-Welfare of
Schedule castes,
Scheduled Tribes,
Other Background
Classes and
Minorities
277-Education
03-Operation of
Industrial Training
Centers
979.88 0.00 45.42 1025.30 948.76 (-)76.54
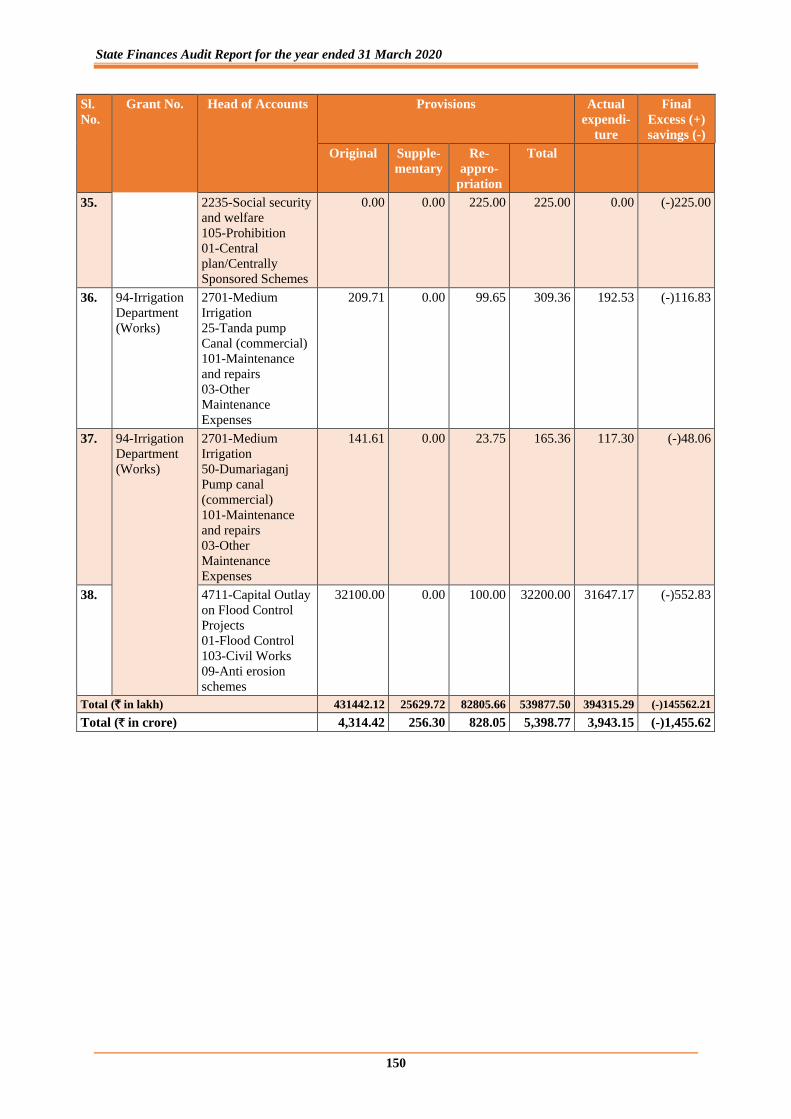
State Finances Audit Report for the year ended 31 March 2020
150
Sl.
No.
Grant No. Head of Accounts Provisions Actual
expendi-
ture
Final
Excess (+)
savings (-)
Original Supple-
mentary
Re-
appro-
priation
Total
35. 2235-Social security
and welfare
105-Prohibition
01-Central
plan/Centrally
Sponsored Schemes
0.00 0.00 225.00 225.00 0.00 (-)225.00
36. 94-Irrigation
Department
(Works)
2701-Medium
Irrigation
25-Tanda pump
Canal (commercial)
101-Maintenance
and repairs
03-Other
Maintenance
Expenses
209.71 0.00 99.65 309.36 192.53 (-)116.83
37. 94-Irrigation
Department
(Works)
2701-Medium
Irrigation
50-Dumariaganj
Pump canal
(commercial)
101-Maintenance
and repairs
03-Other
Maintenance
Expenses
141.61 0.00 23.75 165.36 117.30 (-)48.06
38. 4711-Capital Outlay
on Flood Control
Projects
01-Flood Control
103-Civil Works
09-Anti erosion
schemes
32100.00 0.00 100.00 32200.00 31647.17 (-)552.83
Total (` in lakh) 431442.12 25629.72 82805.66 539877.50 394315.29 (-)145562.21
Total (` in crore) 4,314.42 256.30 828.05 5,398.77 3,943.15 (-)1,455.62
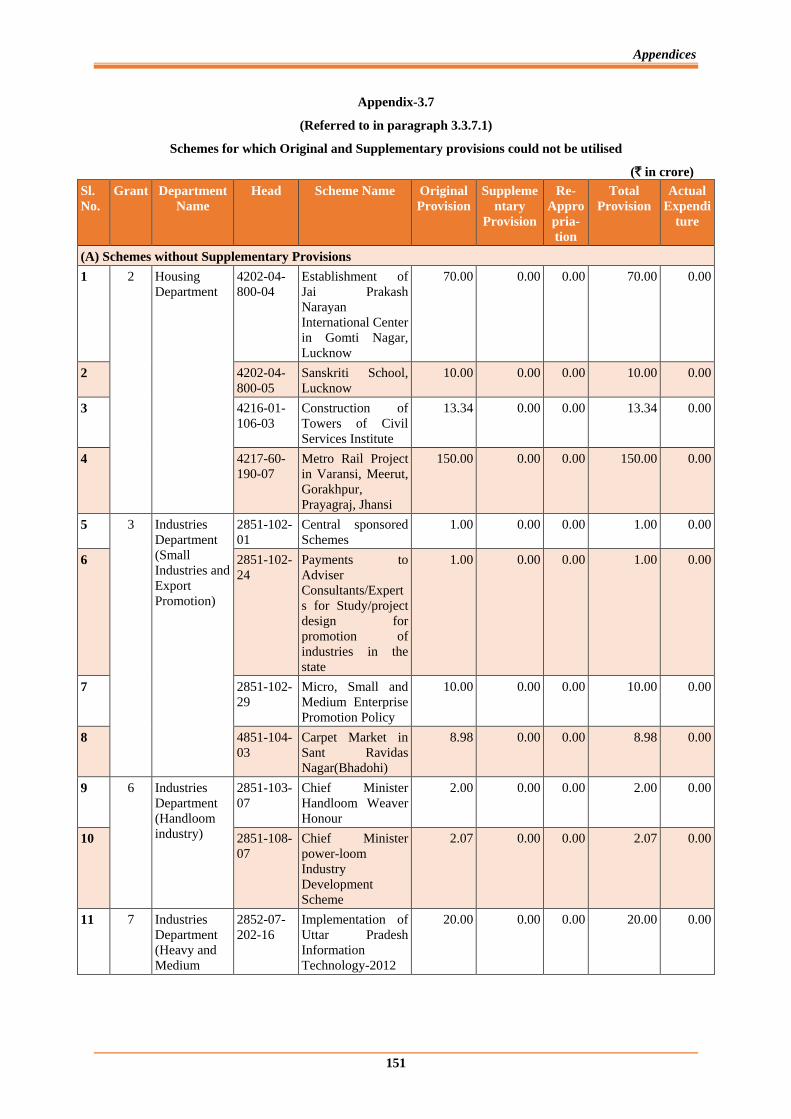
Appendices
151
Appendix-3.7
(Referred to in paragraph 3.3.7.1)
Schemes for which Original and Supplementary provisions could not be utilised
(` in crore)
Sl.
No.
Grant Department
Name
Head Scheme Name Original
Provision
Suppleme
ntary
Provision
Re-
Appro
pria-
tion
Total
Provision
Actual
Expendi
ture
(A) Schemes without Supplementary Provisions
1 2
Housing
Department
4202-04-
800-04
Establishment of
Jai Prakash
Narayan
International Center
in Gomti Nagar,
Lucknow
70.00 0.00 0.00 70.00 0.00
2 4202-04-
800-05
Sanskriti School,
Lucknow
10.00 0.00 0.00 10.00 0.00
3 4216-01-
106-03
Construction of
Towers of Civil
Services Institute
13.34 0.00 0.00 13.34 0.00
4 4217-60-
190-07
Metro Rail Project
in Varansi, Meerut,
Gorakhpur,
Prayagraj, Jhansi
150.00 0.00 0.00 150.00 0.00
5 3 Industries
Department
(Small
Industries and
Export
Promotion)
2851-102-
01
Central sponsored
Schemes
1.00 0.00 0.00 1.00 0.00
6 2851-102-
24
Payments to
Adviser
Consultants/Expert
s for Study/project
design for
promotion of
industries in the
state
1.00 0.00 0.00 1.00 0.00
7 2851-102-
29
Micro, Small and
Medium Enterprise
Promotion Policy
10.00 0.00 0.00 10.00 0.00
8 4851-104-
03
Carpet Market in
Sant Ravidas
Nagar(Bhadohi)
8.98 0.00 0.00 8.98 0.00
9 6 Industries
Department
(Handloom
industry)
2851-103-
07
Chief Minister
Handloom Weaver
Honour
2.00 0.00 0.00 2.00 0.00
10 2851-108-
07
Chief Minister
power-loom
Industry
Development
Scheme
2.07 0.00 0.00 2.07 0.00
11 7 Industries
Department
(Heavy and
Medium
Industries)
2852-07-
202-16
Implementation of
Uttar Pradesh
Information
Technology-2012
20.00 0.00 0.00 20.00 0.00
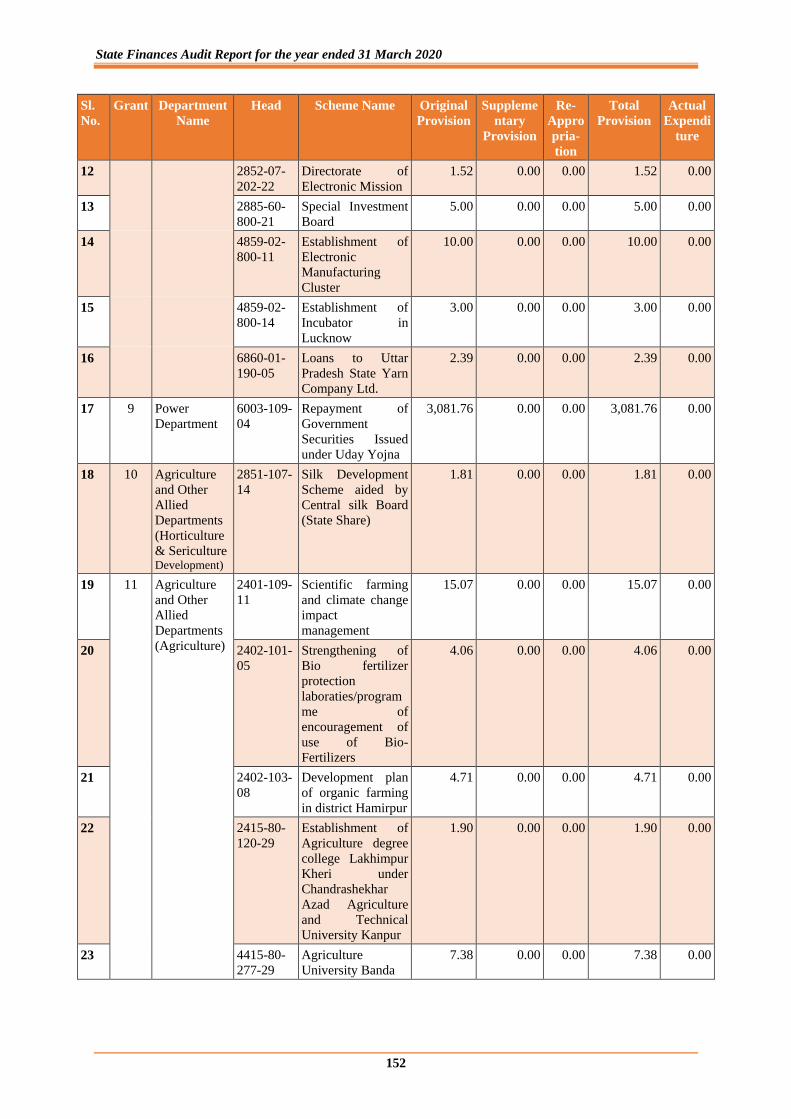
State Finances Audit Report for the year ended 31 March 2020
152
Sl.
No.
Grant Department
Name
Head Scheme Name Original
Provision
Suppleme
ntary
Provision
Re-
Appro
pria-
tion
Total
Provision
Actual
Expendi
ture
12 2852-07-
202-22
Directorate of
Electronic Mission
1.52 0.00 0.00 1.52 0.00
13 2885-60-
800-21
Special Investment
Board
5.00 0.00 0.00 5.00 0.00
14 4859-02-
800-11
Establishment of
Electronic
Manufacturing
Cluster
10.00 0.00 0.00 10.00 0.00
15 4859-02-
800-14
Establishment of
Incubator in
Lucknow
3.00 0.00 0.00 3.00 0.00
16 6860-01-
190-05
Loans to Uttar
Pradesh State Yarn
Company Ltd.
2.39 0.00 0.00 2.39 0.00
17 9 Power
Department
6003-109-
04
Repayment of
Government
Securities Issued
under Uday Yojna
3,081.76 0.00 0.00 3,081.76 0.00
18 10 Agriculture
and Other
Allied
Departments
(Horticulture
& Sericulture Development)
2851-107-
14
Silk Development
Scheme aided by
Central silk Board
(State Share)
1.81 0.00 0.00 1.81 0.00
19 11 Agriculture
and Other
Allied
Departments
(Agriculture)
2401-109-
11
Scientific farming
and climate change
impact
management
15.07 0.00 0.00 15.07 0.00
20 2402-101-
05
Strengthening of
Bio fertilizer
protection
laboraties/program
me of
encouragement of
use of Bio-
Fertilizers
4.06 0.00 0.00 4.06 0.00
21 2402-103-
08
Development plan
of organic farming
in district Hamirpur
4.71 0.00 0.00 4.71 0.00
22 2415-80-
120-29
Establishment of
Agriculture degree
college Lakhimpur
Kheri under
Chandrashekhar
Azad Agriculture
and Technical
University Kanpur
1.90 0.00 0.00 1.90 0.00
23 4415-80-
277-29
Agriculture
University Banda
7.38 0.00 0.00 7.38 0.00
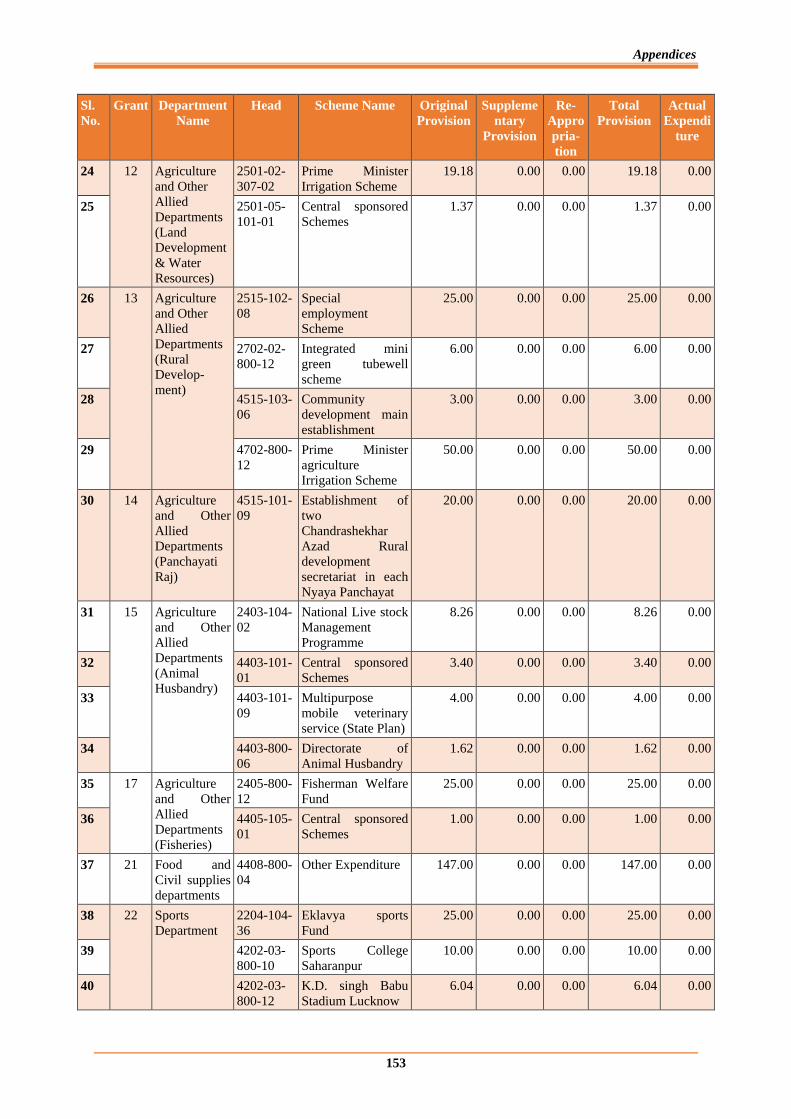
Appendices
153
Sl.
No.
Grant Department
Name
Head Scheme Name Original
Provision
Suppleme
ntary
Provision
Re-
Appro
pria-
tion
Total
Provision
Actual
Expendi
ture
24 12 Agriculture
and Other
Allied
Departments
(Land
Development
& Water
Resources)
2501-02-
307-02
Prime Minister
Irrigation Scheme
19.18 0.00 0.00 19.18 0.00
25 2501-05-
101-01
Central sponsored
Schemes
1.37 0.00 0.00 1.37 0.00
26 13 Agriculture
and Other
Allied
Departments
(Rural
Develop-
ment)
2515-102-
08
Special
employment
Scheme
25.00 0.00 0.00 25.00 0.00
27 2702-02-
800-12
Integrated mini
green tubewell
scheme
6.00 0.00 0.00 6.00 0.00
28 4515-103-
06
Community
development main
establishment
3.00 0.00 0.00 3.00 0.00
29 4702-800-
12
Prime Minister
agriculture
Irrigation Scheme
50.00 0.00 0.00 50.00 0.00
30 14 Agriculture
and Other
Allied
Departments
(Panchayati
Raj)
4515-101-
09
Establishment of
two
Chandrashekhar
Azad Rural
development
secretariat in each
Nyaya Panchayat
20.00 0.00 0.00 20.00 0.00
31 15 Agriculture
and Other
Allied
Departments
(Animal
Husbandry)
2403-104-
02
National Live stock
Management
Programme
8.26 0.00 0.00 8.26 0.00
32 4403-101-
01
Central sponsored
Schemes
3.40 0.00 0.00 3.40 0.00
33 4403-101-
09
Multipurpose
mobile veterinary
service (State Plan)
4.00 0.00 0.00 4.00 0.00
34 4403-800-
06
Directorate of
Animal Husbandry
1.62 0.00 0.00 1.62 0.00
35 17 Agriculture
and Other
Allied
Departments
(Fisheries)
2405-800-
12
Fisherman Welfare
Fund
25.00 0.00 0.00 25.00 0.00
36 4405-105-
01
Central sponsored
Schemes
1.00 0.00 0.00 1.00 0.00
37 21 Food and
Civil supplies
departments
4408-800-
04
Other Expenditure 147.00 0.00 0.00 147.00 0.00
38 22 Sports
Department
2204-104-
36
Eklavya sports
Fund
25.00 0.00 0.00 25.00 0.00
39 4202-03-
800-10
Sports College
Saharanpur
10.00 0.00 0.00 10.00 0.00
40 4202-03-
800-12
K.D. singh Babu
Stadium Lucknow
6.04 0.00 0.00 6.04 0.00
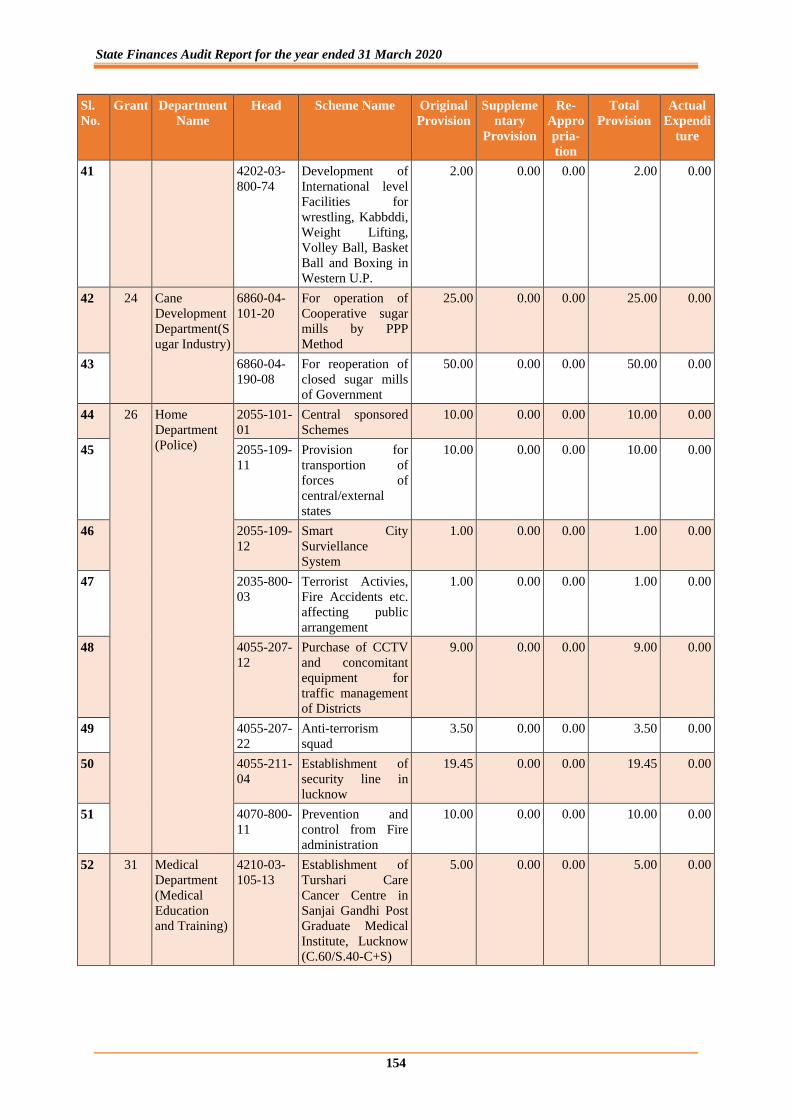
State Finances Audit Report for the year ended 31 March 2020
154
Sl.
No.
Grant Department
Name
Head Scheme Name Original
Provision
Suppleme
ntary
Provision
Re-
Appro
pria-
tion
Total
Provision
Actual
Expendi
ture
41 4202-03-
800-74
Development of
International level
Facilities for
wrestling, Kabbddi,
Weight Lifting,
Volley Ball, Basket
Ball and Boxing in
Western U.P.
2.00 0.00 0.00 2.00 0.00
42 24 Cane
Development
Department(S
ugar Industry)
6860-04-
101-20
For operation of
Cooperative sugar
mills by PPP
Method
25.00 0.00 0.00 25.00 0.00
43 6860-04-
190-08
For reoperation of
closed sugar mills
of Government
50.00 0.00 0.00 50.00 0.00
44 26 Home
Department
(Police)
2055-101-
01
Central sponsored
Schemes
10.00 0.00 0.00 10.00 0.00
45 2055-109-
11
Provision for
transportion of
forces of
central/external
states
10.00 0.00 0.00 10.00 0.00
46 2055-109-
12
Smart City
Surviellance
System
1.00 0.00 0.00 1.00 0.00
47 2035-800-
03
Terrorist Activies,
Fire Accidents etc.
affecting public
arrangement
1.00 0.00 0.00 1.00 0.00
48 4055-207-
12
Purchase of CCTV
and concomitant
equipment for
traffic management
of Districts
9.00 0.00 0.00 9.00 0.00
49 4055-207-
22
Anti-terrorism
squad
3.50 0.00 0.00 3.50 0.00
50 4055-211-
04
Establishment of
security line in
lucknow
19.45 0.00 0.00 19.45 0.00
51 4070-800-
11
Prevention and
control from Fire
administration
10.00 0.00 0.00 10.00 0.00
52 31 Medical
Department
(Medical
Education
and Training)
4210-03-
105-13
Establishment of
Turshari Care
Cancer Centre in
Sanjai Gandhi Post
Graduate Medical
Institute, Lucknow
(C.60/S.40-C+S)
5.00 0.00 0.00 5.00 0.00
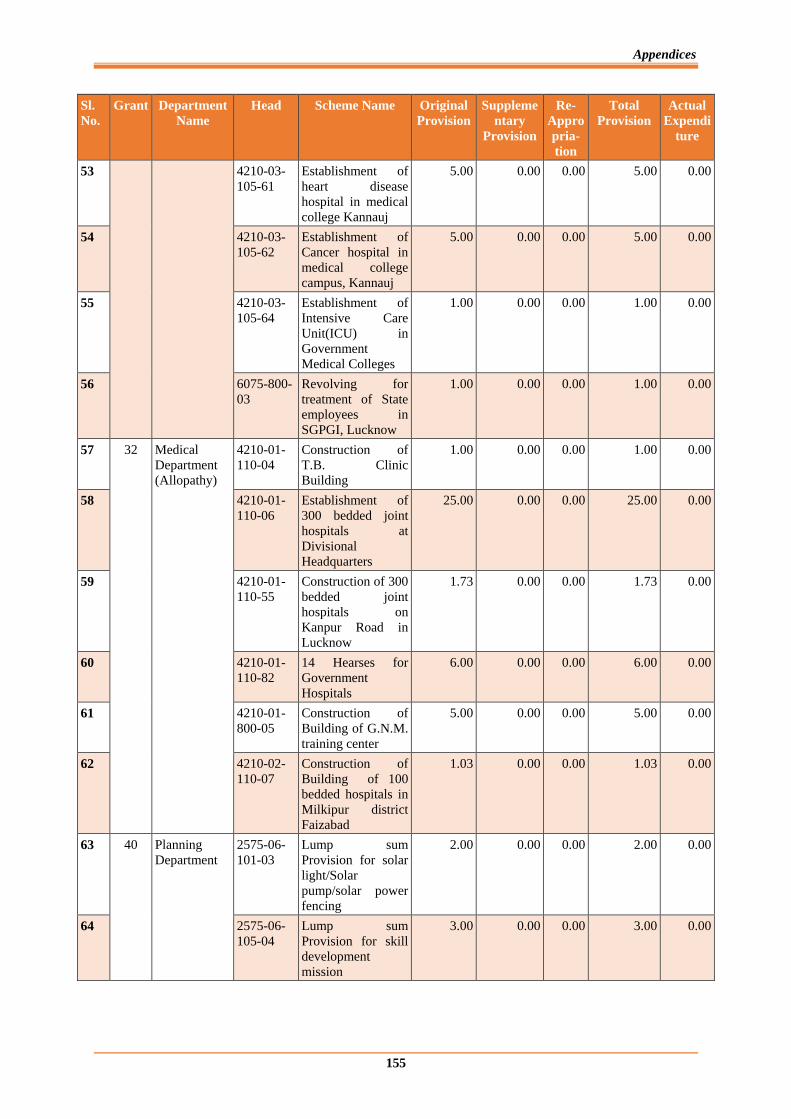
Appendices
155
Sl.
No.
Grant Department
Name
Head Scheme Name Original
Provision
Suppleme
ntary
Provision
Re-
Appro
pria-
tion
Total
Provision
Actual
Expendi
ture
53 4210-03-
105-61
Establishment of
heart disease
hospital in medical
college Kannauj
5.00 0.00 0.00 5.00 0.00
54 4210-03-
105-62
Establishment of
Cancer hospital in
medical college
campus, Kannauj
5.00 0.00 0.00 5.00 0.00
55 4210-03-
105-64
Establishment of
Intensive Care
Unit(ICU) in
Government
Medical Colleges
1.00 0.00 0.00 1.00 0.00
56 6075-800-
03
Revolving for
treatment of State
employees in
SGPGI, Lucknow
1.00 0.00 0.00 1.00 0.00
57 32 Medical
Department
(Allopathy)
4210-01-
110-04
Construction of
T.B. Clinic
Building
1.00 0.00 0.00 1.00 0.00
58 4210-01-
110-06
Establishment of
300 bedded joint
hospitals at
Divisional
Headquarters
25.00 0.00 0.00 25.00 0.00
59 4210-01-
110-55
Construction of 300
bedded joint
hospitals on
Kanpur Road in
Lucknow
1.73 0.00 0.00 1.73 0.00
60 4210-01-
110-82
14 Hearses for
Government
Hospitals
6.00 0.00 0.00 6.00 0.00
61 4210-01-
800-05
Construction of
Building of G.N.M.
training center
5.00 0.00 0.00 5.00 0.00
62 4210-02-
110-07
Construction of
Building of 100
bedded hospitals in
Milkipur district
Faizabad
1.03 0.00 0.00 1.03 0.00
63 40 Planning
Department
2575-06-
101-03
Lump sum
Provision for solar
light/Solar
pump/solar power
fencing
2.00 0.00 0.00 2.00 0.00
64 2575-06-
105-04
Lump sum
Provision for skill
development
mission
3.00 0.00 0.00 3.00 0.00

State Finances Audit Report for the year ended 31 March 2020
156
Sl.
No.
Grant Department
Name
Head Scheme Name Original
Provision
Suppleme
ntary
Provision
Re-
Appro
pria-
tion
Total
Provision
Actual
Expendi
ture
65 Planning
Department
4215-01-
101-03
Rapid Financial
development
Scheme
50.00 0.00 0.00 50.00 0.00
66 4215-01-
102-03
Rapid Financial
development
Scheme
80.00 0.00 0.00 80.00 0.00
67 4215-02-
101-03
Rapid Financial
development
Scheme
50.00 0.00 0.00 50.00 0.00
68 4215-02-
106-03
Rapid Financial
development
Scheme
50.00 0.00 0.00 50.00 0.00
69 4406-01-
102-03
Rapid Financial
development
Scheme
5.00 0.00 0.00 5.00 0.00
70 4575-06-
201-03
Lump sum
provision for
construction/extens
ion of boundary
wall of school
building
3.50 0.00 0.00 3.50 0.00
71 4575-06-
800-13
Lump sum
provision for
construction of
toilets
4.00 0.00 0.00 4.00 0.00
72 4702-800-
03
Rapid Financial
development
Scheme
5.00 0.00 0.00 5.00 0.00
73 4801-05-
800-03
Rapid Financial
development
Scheme
100.00 0.00 0.00 100.00 0.00
74 4801-06-
800-03
Rapid Financial
development
Scheme
20.00 0.00 0.00 20.00 0.00
75 4801-80-
800-03
Rapid Financial
development
Scheme
20.00 0.00 0.00 20.00 0.00
76 5054-04-
101-03
Rapid Financial
development
Scheme
100.00 0.00 0.00 100.00 0.00
77 42 Judicial
Department
2014-102-
15
Establishment of
courts for quick
disposal of cases
relating to women
victimization
22.28 0.00 0.00 22.28 0.00
78 2235-60-
200-12
Grant to Trustee
Committee of U.P.
Advocate welfare
fund
20.00 0.00 0.00 20.00 0.00
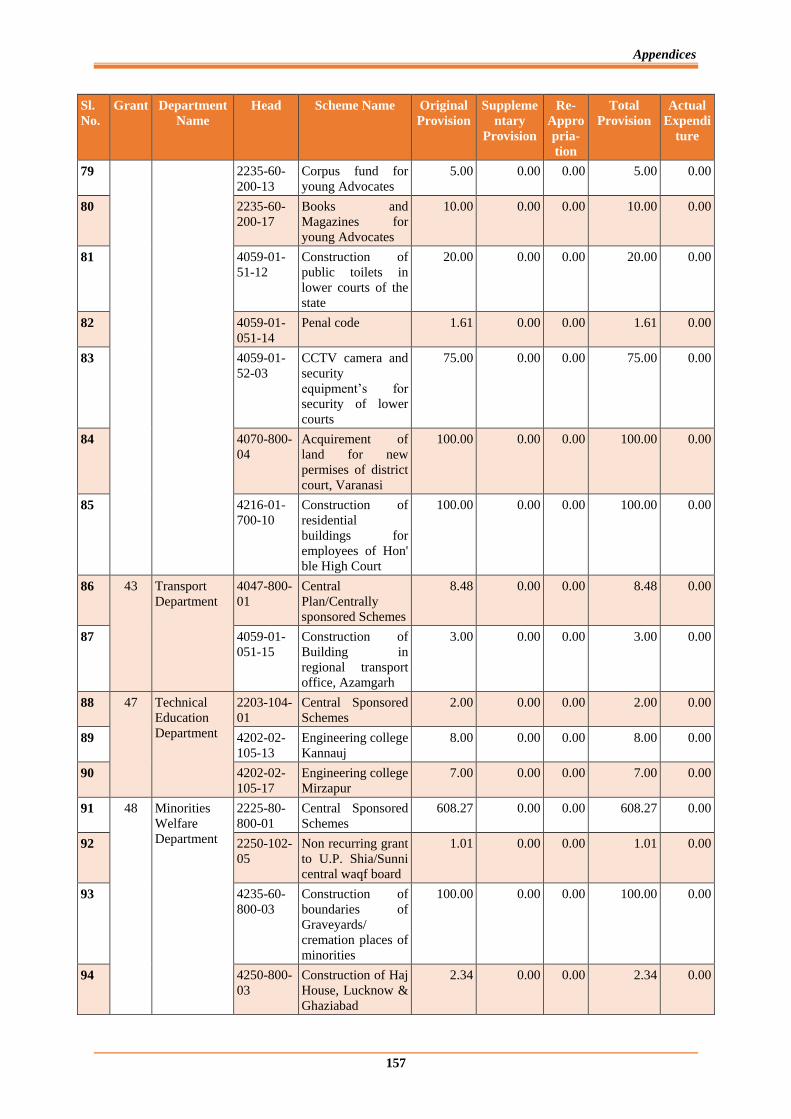
Appendices
157
Sl.
No.
Grant Department
Name
Head Scheme Name Original
Provision
Suppleme
ntary
Provision
Re-
Appro
pria-
tion
Total
Provision
Actual
Expendi
ture
79 2235-60-
200-13
Corpus fund for
young Advocates
5.00 0.00 0.00 5.00 0.00
80 2235-60-
200-17
Books and
Magazines for
young Advocates
10.00 0.00 0.00 10.00 0.00
81 4059-01-
51-12
Construction of
public toilets in
lower courts of the
state
20.00 0.00 0.00 20.00 0.00
82 4059-01-
051-14
Penal code 1.61 0.00 0.00 1.61 0.00
83 4059-01-
52-03
CCTV camera and
security
equipment’s for
security of lower
courts
75.00 0.00 0.00 75.00 0.00
84 4070-800-
04
Acquirement of
land for new
permises of district
court, Varanasi
100.00 0.00 0.00 100.00 0.00
85 4216-01-
700-10
Construction of
residential
buildings for
employees of Hon'
ble High Court
100.00 0.00 0.00 100.00 0.00
86 43 Transport
Department
4047-800-
01
Central
Plan/Centrally
sponsored Schemes
8.48 0.00 0.00 8.48 0.00
87 4059-01-
051-15
Construction of
Building in
regional transport
office, Azamgarh
3.00 0.00 0.00 3.00 0.00
88 47 Technical
Education
Department
2203-104-
01
Central Sponsored
Schemes
2.00 0.00 0.00 2.00 0.00
89 4202-02-
105-13
Engineering college
Kannauj
8.00 0.00 0.00 8.00 0.00
90 4202-02-
105-17
Engineering college
Mirzapur
7.00 0.00 0.00 7.00 0.00
91 48 Minorities
Welfare
Department
2225-80-
800-01
Central Sponsored
Schemes
608.27 0.00 0.00 608.27 0.00
92 2250-102-
05
Non recurring grant
to U.P. Shia/Sunni
central waqf board
1.01 0.00 0.00 1.01 0.00
93 4235-60-
800-03
Construction of
boundaries of
Graveyards/
cremation places of
minorities
100.00 0.00 0.00 100.00 0.00
94 4250-800-
03
Construction of Haj
House, Lucknow &
Ghaziabad
2.34 0.00 0.00 2.34 0.00
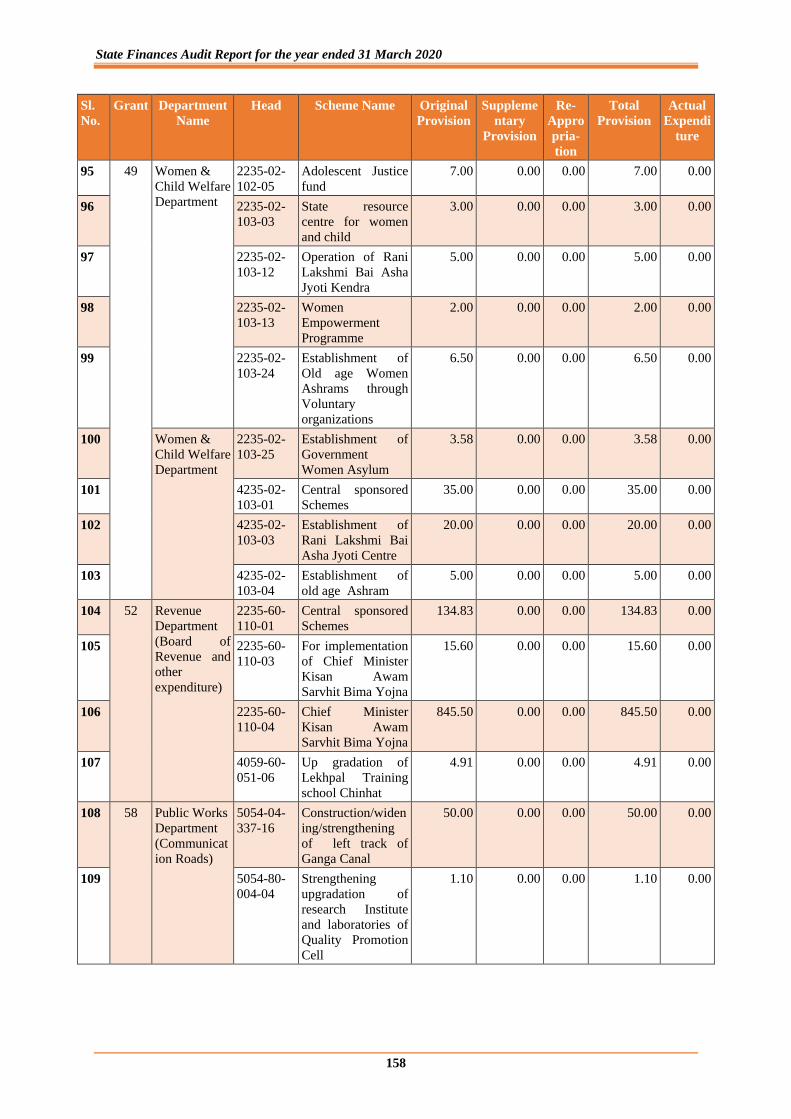
State Finances Audit Report for the year ended 31 March 2020
158
Sl.
No.
Grant Department
Name
Head Scheme Name Original
Provision
Suppleme
ntary
Provision
Re-
Appro
pria-
tion
Total
Provision
Actual
Expendi
ture
95 49 Women &
Child Welfare
Department
2235-02-
102-05
Adolescent Justice
fund
7.00 0.00 0.00 7.00 0.00
96 2235-02-
103-03
State resource
centre for women
and child
3.00 0.00 0.00 3.00 0.00
97 2235-02-
103-12
Operation of Rani
Lakshmi Bai Asha
Jyoti Kendra
5.00 0.00 0.00 5.00 0.00
98 2235-02-
103-13
Women
Empowerment
Programme
2.00 0.00 0.00 2.00 0.00
99 2235-02-
103-24
Establishment of
Old age Women
Ashrams through
Voluntary
organizations
6.50 0.00 0.00 6.50 0.00
100 Women &
Child Welfare
Department
2235-02-
103-25
Establishment of
Government
Women Asylum
3.58 0.00 0.00 3.58 0.00
101 4235-02-
103-01
Central sponsored
Schemes
35.00 0.00 0.00 35.00 0.00
102 4235-02-
103-03
Establishment of
Rani Lakshmi Bai
Asha Jyoti Centre
20.00 0.00 0.00 20.00 0.00
103 4235-02-
103-04
Establishment of
old age Ashram
5.00 0.00 0.00 5.00 0.00
104 52 Revenue
Department
(Board of
Revenue and
other
expenditure)
2235-60-
110-01
Central sponsored
Schemes
134.83 0.00 0.00 134.83 0.00
105 2235-60-
110-03
For implementation
of Chief Minister
Kisan Awam
Sarvhit Bima Yojna
15.60 0.00 0.00 15.60 0.00
106 2235-60-
110-04
Chief Minister
Kisan Awam
Sarvhit Bima Yojna
845.50 0.00 0.00 845.50 0.00
107 4059-60-
051-06
Up gradation of
Lekhpal Training
school Chinhat
4.91 0.00 0.00 4.91 0.00
108 58 Public Works
Department
(Communicat
ion Roads)
5054-04-
337-16
Construction/widen
ing/strengthening
of left track of
Ganga Canal
50.00 0.00 0.00 50.00 0.00
109 5054-80-
004-04
Strengthening
upgradation of
research Institute
and laboratories of
Quality Promotion
Cell
1.10 0.00 0.00 1.10 0.00
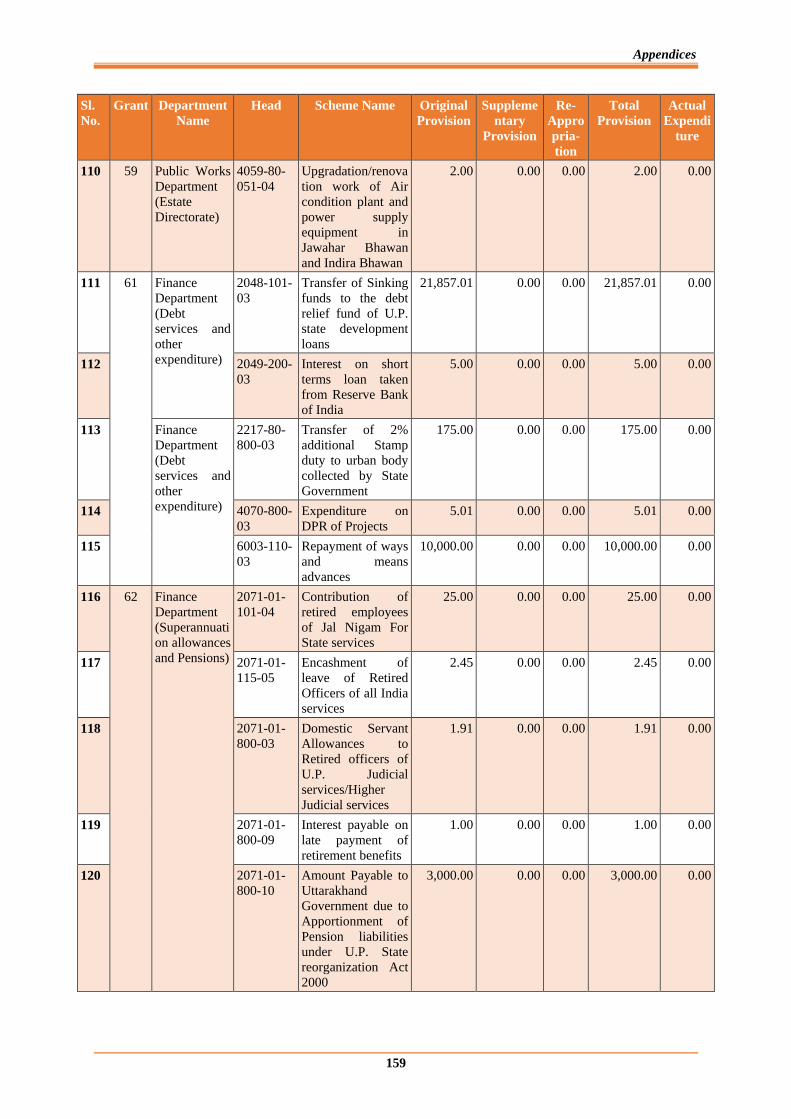
Appendices
159
Sl.
No.
Grant Department
Name
Head Scheme Name Original
Provision
Suppleme
ntary
Provision
Re-
Appro
pria-
tion
Total
Provision
Actual
Expendi
ture
110 59 Public Works
Department
(Estate
Directorate)
4059-80-
051-04
Upgradation/renova
tion work of Air
condition plant and
power supply
equipment in
Jawahar Bhawan
and Indira Bhawan
2.00 0.00 0.00 2.00 0.00
111 61 Finance
Department
(Debt
services and
other
expenditure)
2048-101-
03
Transfer of Sinking
funds to the debt
relief fund of U.P.
state development
loans
21,857.01 0.00 0.00 21,857.01 0.00
112 2049-200-
03
Interest on short
terms loan taken
from Reserve Bank
of India
5.00 0.00 0.00 5.00 0.00
113 Finance
Department
(Debt
services and
other
expenditure)
2217-80-
800-03
Transfer of 2%
additional Stamp
duty to urban body
collected by State
Government
175.00 0.00 0.00 175.00 0.00
114 4070-800-
03
Expenditure on
DPR of Projects
5.01 0.00 0.00 5.01 0.00
115 6003-110-
03
Repayment of ways
and means
advances
10,000.00 0.00 0.00 10,000.00 0.00
116 62 Finance
Department
(Superannuati
on allowances
and Pensions)
2071-01-
101-04
Contribution of
retired employees
of Jal Nigam For
State services
25.00 0.00 0.00 25.00 0.00
117 2071-01-
115-05
Encashment of
leave of Retired
Officers of all India
services
2.45 0.00 0.00 2.45 0.00
118 2071-01-
800-03
Domestic Servant
Allowances to
Retired officers of
U.P. Judicial
services/Higher
Judicial services
1.91 0.00 0.00 1.91 0.00
119 2071-01-
800-09
Interest payable on
late payment of
retirement benefits
1.00 0.00 0.00 1.00 0.00
120 2071-01-
800-10
Amount Payable to
Uttarakhand
Government due to
Apportionment of
Pension liabilities
under U.P. State
reorganization Act
2000
3,000.00 0.00 0.00 3,000.00 0.00
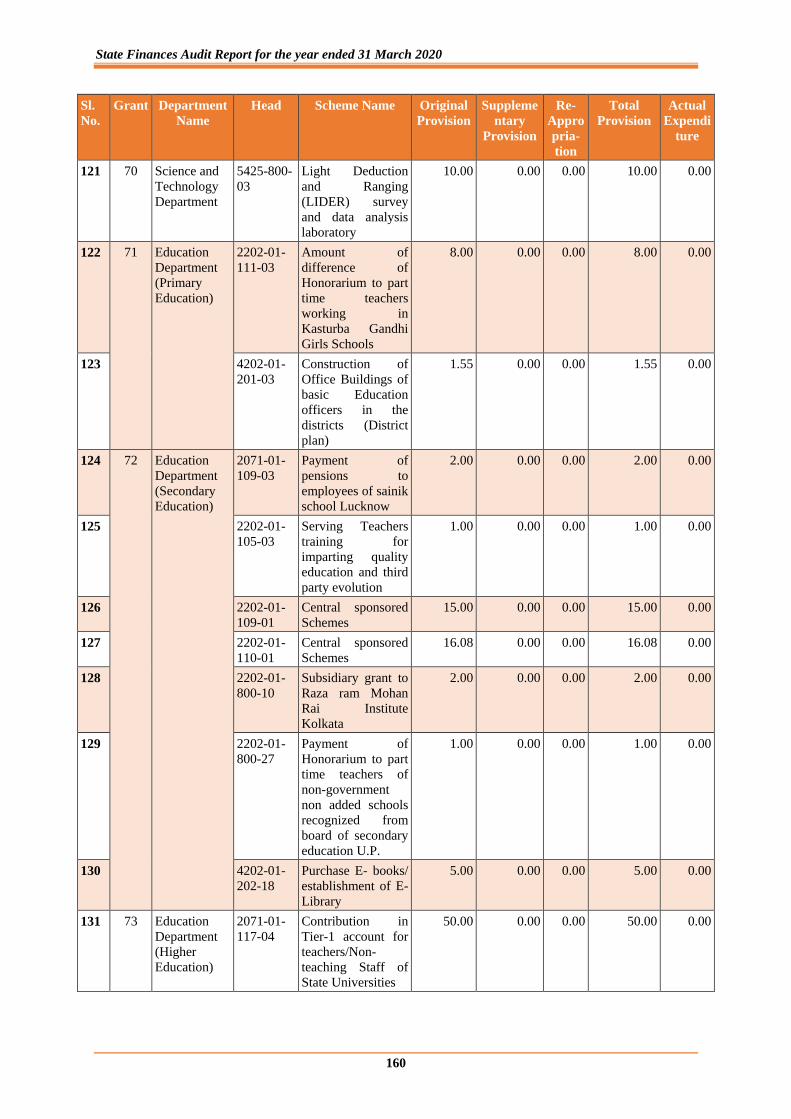
State Finances Audit Report for the year ended 31 March 2020
160
Sl.
No.
Grant Department
Name
Head Scheme Name Original
Provision
Suppleme
ntary
Provision
Re-
Appro
pria-
tion
Total
Provision
Actual
Expendi
ture
121 70 Science and
Technology
Department
5425-800-
03
Light Deduction
and Ranging
(LIDER) survey
and data analysis
laboratory
10.00 0.00 0.00 10.00 0.00
122 71 Education
Department
(Primary
Education)
2202-01-
111-03
Amount of
difference of
Honorarium to part
time teachers
working in
Kasturba Gandhi
Girls Schools
8.00 0.00 0.00 8.00 0.00
123 4202-01-
201-03
Construction of
Office Buildings of
basic Education
officers in the
districts (District
plan)
1.55 0.00 0.00 1.55 0.00
124 72 Education
Department
(Secondary
Education)
2071-01-
109-03
Payment of
pensions to
employees of sainik
school Lucknow
2.00 0.00 0.00 2.00 0.00
125 2202-01-
105-03
Serving Teachers
training for
imparting quality
education and third
party evolution
1.00 0.00 0.00 1.00 0.00
126 2202-01-
109-01
Central sponsored
Schemes
15.00 0.00 0.00 15.00 0.00
127 2202-01-
110-01
Central sponsored
Schemes
16.08 0.00 0.00 16.08 0.00
128 2202-01-
800-10
Subsidiary grant to
Raza ram Mohan
Rai Institute
Kolkata
2.00 0.00 0.00 2.00 0.00
129 2202-01-
800-27
Payment of
Honorarium to part
time teachers of
non-government
non added schools
recognized from
board of secondary
education U.P.
1.00 0.00 0.00 1.00 0.00
130 4202-01-
202-18
Purchase E- books/
establishment of E-
Library
5.00 0.00 0.00 5.00 0.00
131 73 Education
Department
(Higher
Education)
2071-01-
117-04
Contribution in
Tier-1 account for
teachers/Non-
teaching Staff of
State Universities
50.00 0.00 0.00 50.00 0.00

Appendices
161
Sl.
No.
Grant Department
Name
Head Scheme Name Original
Provision
Suppleme
ntary
Provision
Re-
Appro
pria-
tion
Total
Provision
Actual
Expendi
ture
132 2202-03-
800-13
Research and
Development in
degree
colleges/Universitie
s of the State
4.00 0.00 0.00 4.00 0.00
133 2202-03-
800-17
Ahilya Bai Kanya
free of cost
Education Scheme
21.12 0.00 0.00 21.12 0.00
134 2202-03-
800-18
Wi Fi Facility in all
colleges,
universities
50.00 0.00 0.00 50.00 0.00
135 4202-01-
203-11
Sampoorna Nand
Sanskrit University
Varanasi
3.67 0.00 0.00 3.67 0.00
136 4202-01-
203-12
Establishment of
State University in
Balia
5.00 0.00 0.00 5.00 0.00
137 4202-01-
203-35
State University in
District Saharanpur
10.00 0.00 0.00 10.00 0.00
138 4202-01-
203-36
Construction of
Savitri bai phule
girls Hostel in Baba
Saheb Dr. Bheem
Rao Ambedkar
University
Lucknow
5.00 0.00 0.00 5.00 0.00
139 76 Labour
Department
(Labour
Welfare)
2230-01-
111-03
Deen Dayal
security Insurance
scheme for
unorganized labour
1.25 0.00 0.00 1.25 0.00
140 2230-01-
111-06
Atal Pension
Scheme for
unorganized labour
12.52 0.00 0.00 12.52 0.00
141 80 Social
welfare
Department
(Social
Welfare &
Welfare of
Scheduled
Caste)
2235-01-
277-20
Scholarships to
Pre-High School
(Class 1st to 10th)
Students of persons
involved in work
like sweeper &
leather removal
services
1.00 0.00 0.00 1.00 0.00
142 2225-02-
200-11
Pre- Exam Training
for Preliminary
examination of
IAS/PCS in the
Institution situated
in Delhi
1.00 0.00 0.00 1.00 0.00
143 83 Social
welfare
Department
(Special
Component
2235-02-
789-09
Saree for Ladies of
BPL families
9.00 0.00 0.00 9.00 0.00
144 2501-02-
789-02
Prime Minister
agriculture
Irrigation Scheme
5.40 0.00 0.00 5.40 0.00

State Finances Audit Report for the year ended 31 March 2020
162
Sl.
No.
Grant Department
Name
Head Scheme Name Original
Provision
Suppleme
ntary
Provision
Re-
Appro
pria-
tion
Total
Provision
Actual
Expendi
ture
145 Plan for
Scheduled
Castes)
2501-05-
789-01
Central sponsored
Schemes
36.50 0.00 0.00 36.50 0.00
146 2515-789-
05
Ambedkar Rojgar
Yojna
25.00 0.00 0.00 25.00 0.00
147 2851-789-
14
Silk Development
Scheme developed
by central silk
board (State Share)
4.18 0.00 0.00 4.18 0.00
148 4202-02-
789-09
Engineering college
Kannauj
1.60 0.00 0.00 1.60 0.00
149 4202-01-
789-19
Engineering
college, Mirzapur
1.00 0.00 0.00 1.00 0.00
150 4210-02-
789-07
Construction of
Homeopathic
Hospital Building
1.13 0.00 0.00 1.13 0.00
151 83 Social
welfare
Department
(Special
Component
Plan for
Scheduled
Castes)
4210-03-
789-07
Government
allopathic medical
college, Saharanpur
3.03 0.00 0.00 3.03 0.00
152 4210-03-
789-08
Government
allopathic medical
college, Ambedkar
nagar
3.03 0.00 0.00 3.03 0.00
153 4210-03-
789-11
Government
medical college,
Allahabad
4.24 0.00 0.00 4.24 0.00
154 4210-03-
789-12
Government
medical college,
Meerut
4.75 0.00 0.00 4.75 0.00
155 4210-03-
789-13
Government
medical college
Jhansi
4.67 0.00 0.00 4.67 0.00
156 4210-03-
789-16
Government
medical college
Badaun
12.73 0.00 0.00 12.73 0.00
157 4210-03-
789-17
Government
medical college
Azamgarh
8.48 0.00 0.00 8.48 0.00
158 4210-03-
789-21
Cardiology
Hospital in medical
college Kannauj
3.18 0.00 0.00 3.18 0.00
159 4210-03-
789-22
Cancer Hospital in
medical college
Kannauj
3.18 0.00 0.00 3.18 0.00
160 4210-03-
789-30
Paramedical
Institute Saifai,
Etawah
1.00 0.00 0.00 1.00 0.00
161 4210-03-
789-33
Medical University
Greater NOIDA
10.00 0.00 0.00 10.00 0.00
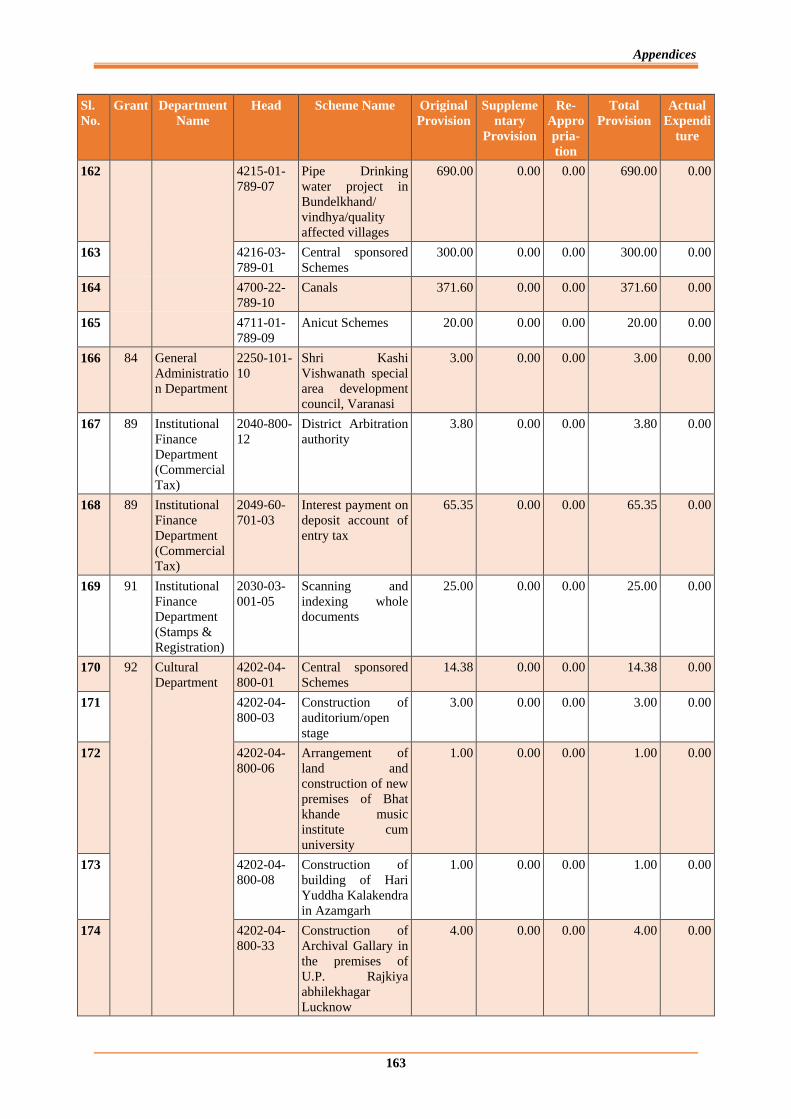
Appendices
163
Sl.
No.
Grant Department
Name
Head Scheme Name Original
Provision
Suppleme
ntary
Provision
Re-
Appro
pria-
tion
Total
Provision
Actual
Expendi
ture
162 4215-01-
789-07
Pipe Drinking
water project in
Bundelkhand/
vindhya/quality
affected villages
690.00 0.00 0.00 690.00 0.00
163 4216-03-
789-01
Central sponsored
Schemes
300.00 0.00 0.00 300.00 0.00
164 4700-22-
789-10
Canals 371.60 0.00 0.00 371.60 0.00
165 4711-01-
789-09
Anicut Schemes 20.00 0.00 0.00 20.00 0.00
166 84 General
Administratio
n Department
2250-101-
10
Shri Kashi
Vishwanath special
area development
council, Varanasi
3.00 0.00 0.00 3.00 0.00
167 89 Institutional
Finance
Department
(Commercial
Tax)
2040-800-
12
District Arbitration
authority
3.80 0.00 0.00 3.80 0.00
168 89 Institutional
Finance
Department
(Commercial
Tax)
2049-60-
701-03
Interest payment on
deposit account of
entry tax
65.35 0.00 0.00 65.35 0.00
169 91 Institutional
Finance
Department
(Stamps &
Registration)
2030-03-
001-05
Scanning and
indexing whole
documents
25.00 0.00 0.00 25.00 0.00
170 92 Cultural
Department
4202-04-
800-01
Central sponsored
Schemes
14.38 0.00 0.00 14.38 0.00
171 4202-04-
800-03
Construction of
auditorium/open
stage
3.00 0.00 0.00 3.00 0.00
172 4202-04-
800-06
Arrangement of
land and
construction of new
premises of Bhat
khande music
institute cum
university
1.00 0.00 0.00 1.00 0.00
173 4202-04-
800-08
Construction of
building of Hari
Yuddha Kalakendra
in Azamgarh
1.00 0.00 0.00 1.00 0.00
174 4202-04-
800-33
Construction of
Archival Gallary in
the premises of
U.P. Rajkiya
abhilekhagar
Lucknow
4.00 0.00 0.00 4.00 0.00
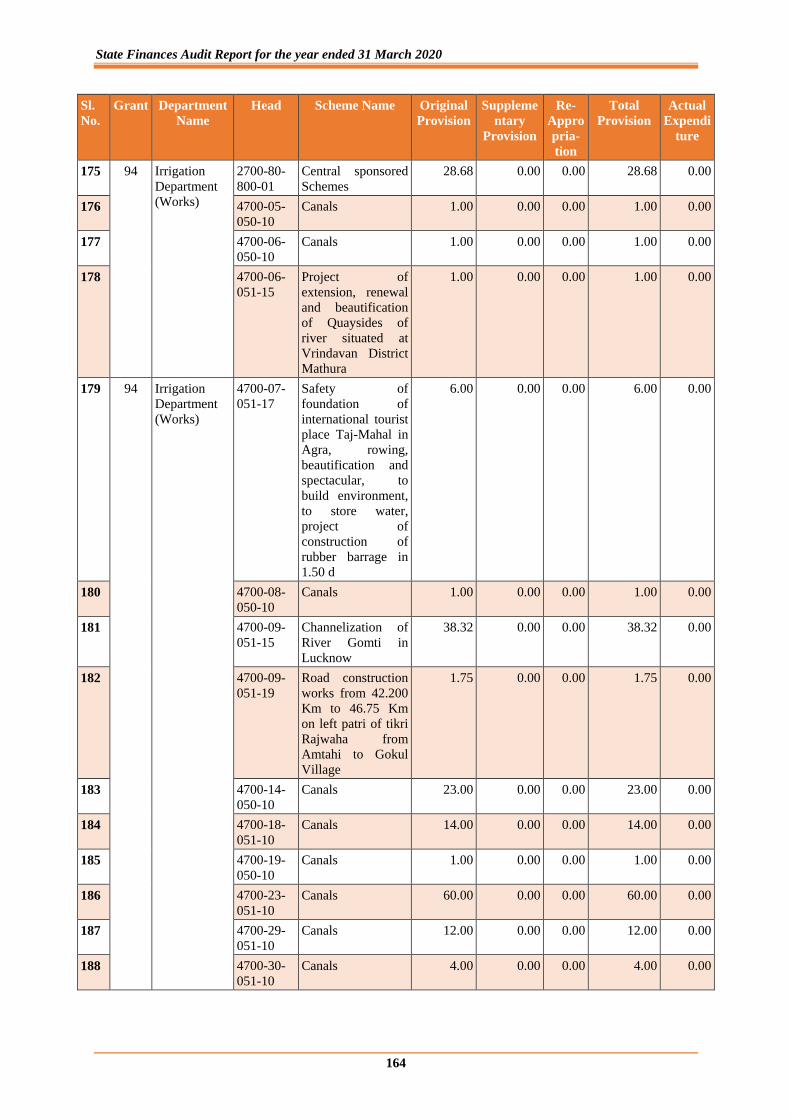
State Finances Audit Report for the year ended 31 March 2020
164
Sl.
No.
Grant Department
Name
Head Scheme Name Original
Provision
Suppleme
ntary
Provision
Re-
Appro
pria-
tion
Total
Provision
Actual
Expendi
ture
175 94 Irrigation
Department
(Works)
2700-80-
800-01
Central sponsored
Schemes
28.68 0.00 0.00 28.68 0.00
176 4700-05-
050-10
Canals 1.00 0.00 0.00 1.00 0.00
177 4700-06-
050-10
Canals 1.00 0.00 0.00 1.00 0.00
178 4700-06-
051-15
Project of
extension, renewal
and beautification
of Quaysides of
river situated at
Vrindavan District
Mathura
1.00 0.00 0.00 1.00 0.00
179 94 Irrigation
Department
(Works)
4700-07-
051-17
Safety of
foundation of
international tourist
place Taj-Mahal in
Agra, rowing,
beautification and
spectacular, to
build environment,
to store water,
project of
construction of
rubber barrage in
1.50 d
6.00 0.00 0.00 6.00 0.00
180 4700-08-
050-10
Canals 1.00 0.00 0.00 1.00 0.00
181 4700-09-
051-15
Channelization of
River Gomti in
Lucknow
38.32 0.00 0.00 38.32 0.00
182 4700-09-
051-19
Road construction
works from 42.200
Km to 46.75 Km
on left patri of tikri
Rajwaha from
Amtahi to Gokul
Village
1.75 0.00 0.00 1.75 0.00
183 4700-14-
050-10
Canals 23.00 0.00 0.00 23.00 0.00
184 4700-18-
051-10
Canals 14.00 0.00 0.00 14.00 0.00
185 4700-19-
050-10
Canals 1.00 0.00 0.00 1.00 0.00
186 4700-23-
051-10
Canals 60.00 0.00 0.00 60.00 0.00
187 4700-29-
051-10
Canals 12.00 0.00 0.00 12.00 0.00
188 4700-30-
051-10
Canals 4.00 0.00 0.00 4.00 0.00
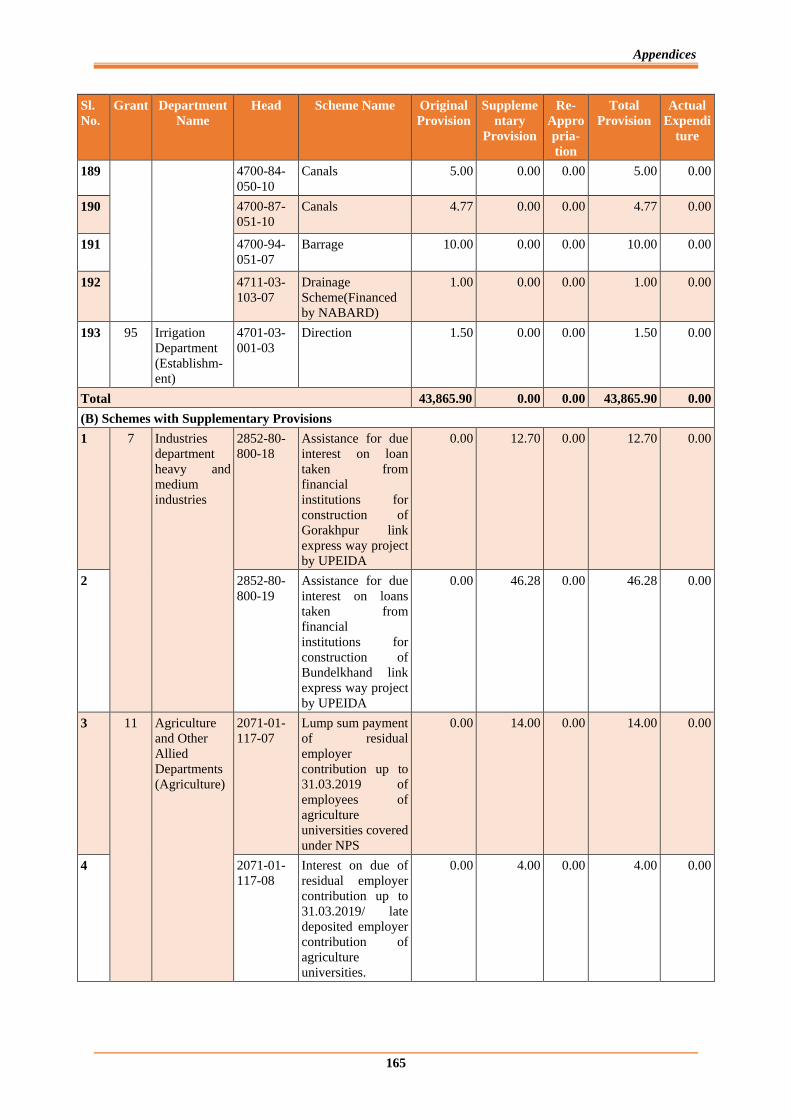
Appendices
165
Sl.
No.
Grant Department
Name
Head Scheme Name Original
Provision
Suppleme
ntary
Provision
Re-
Appro
pria-
tion
Total
Provision
Actual
Expendi
ture
189 4700-84-
050-10
Canals 5.00 0.00 0.00 5.00 0.00
190 4700-87-
051-10
Canals
4.77 0.00 0.00 4.77 0.00
191 4700-94-
051-07
Barrage
10.00 0.00 0.00 10.00 0.00
192 4711-03-
103-07
Drainage
Scheme(Financed
by NABARD)
1.00 0.00 0.00 1.00 0.00
193 95 Irrigation
Department
(Establishm-
ent)
4701-03-
001-03
Direction 1.50 0.00 0.00 1.50 0.00
Total 43,865.90 0.00 0.00 43,865.90 0.00
(B) Schemes with Supplementary Provisions
1 7 Industries
department
heavy and
medium
industries
2852-80-
800-18
Assistance for due
interest on loan
taken from
financial
institutions for
construction of
Gorakhpur link
express way project
by UPEIDA
0.00 12.70 0.00 12.70 0.00
2 2852-80-
800-19
Assistance for due
interest on loans
taken from
financial
institutions for
construction of
Bundelkhand link
express way project
by UPEIDA
0.00 46.28 0.00 46.28 0.00
3 11 Agriculture
and Other
Allied
Departments
(Agriculture)
2071-01-
117-07
Lump sum payment
of residual
employer
contribution up to
31.03.2019 of
employees of
agriculture
universities covered
under NPS
0.00 14.00 0.00 14.00 0.00
4 2071-01-
117-08
Interest on due of
residual employer
contribution up to
31.03.2019/ late
deposited employer
contribution of
agriculture
universities.
0.00 4.00 0.00 4.00 0.00
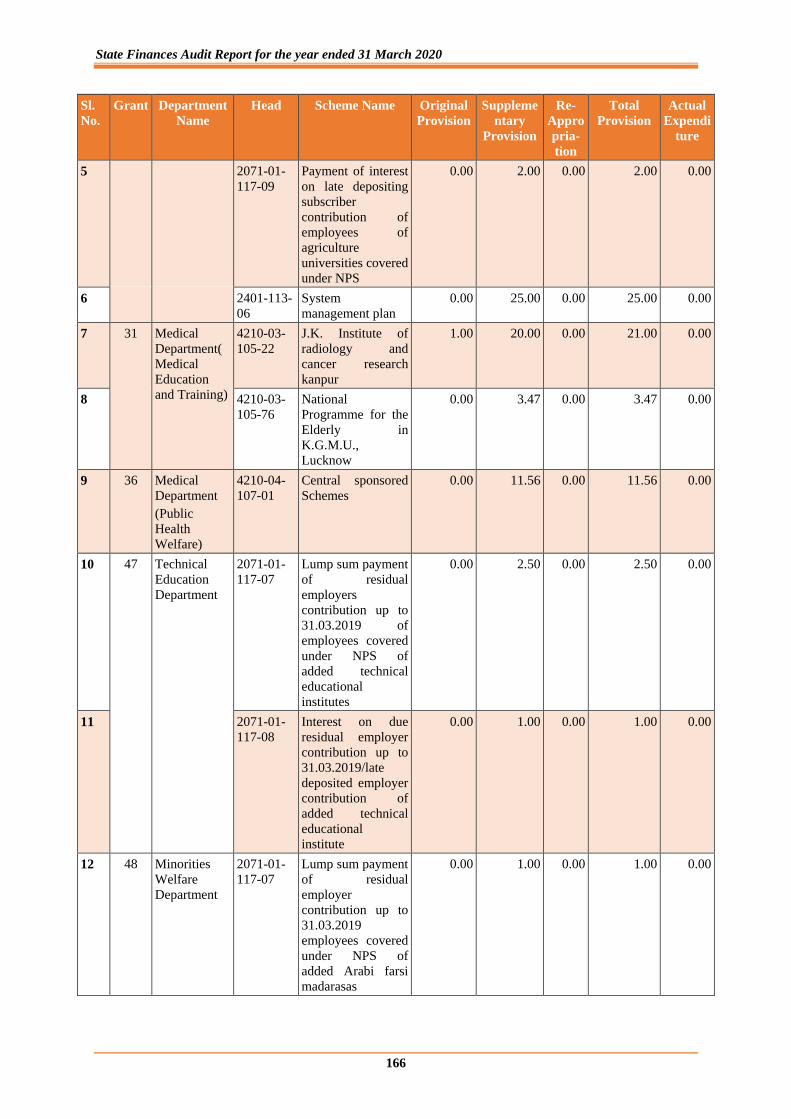
State Finances Audit Report for the year ended 31 March 2020
166
Sl.
No.
Grant Department
Name
Head Scheme Name Original
Provision
Suppleme
ntary
Provision
Re-
Appro
pria-
tion
Total
Provision
Actual
Expendi
ture
5 2071-01-
117-09
Payment of interest
on late depositing
subscriber
contribution of
employees of
agriculture
universities covered
under NPS
0.00 2.00 0.00 2.00 0.00
6 2401-113-
06
System
management plan
0.00 25.00 0.00 25.00 0.00
7 31 Medical
Department(
Medical
Education
and Training)
4210-03-
105-22
J.K. Institute of
radiology and
cancer research
kanpur
1.00 20.00 0.00 21.00 0.00
8 4210-03-
105-76
National
Programme for the
Elderly in
K.G.M.U.,
Lucknow
0.00 3.47 0.00 3.47 0.00
9 36 Medical
Department
(Public
Health
Welfare)
4210-04-
107-01
Central sponsored
Schemes
0.00 11.56 0.00 11.56 0.00
10 47 Technical
Education
Department
2071-01-
117-07
Lump sum payment
of residual
employers
contribution up to
31.03.2019 of
employees covered
under NPS of
added technical
educational
institutes
0.00 2.50 0.00 2.50 0.00
11 2071-01-
117-08
Interest on due
residual employer
contribution up to
31.03.2019/late
deposited employer
contribution of
added technical
educational
institute
0.00 1.00 0.00 1.00 0.00
12 48 Minorities
Welfare
Department
2071-01-
117-07
Lump sum payment
of residual
employer
contribution up to
31.03.2019
employees covered
under NPS of
added Arabi farsi
madarasas
0.00 1.00 0.00 1.00 0.00
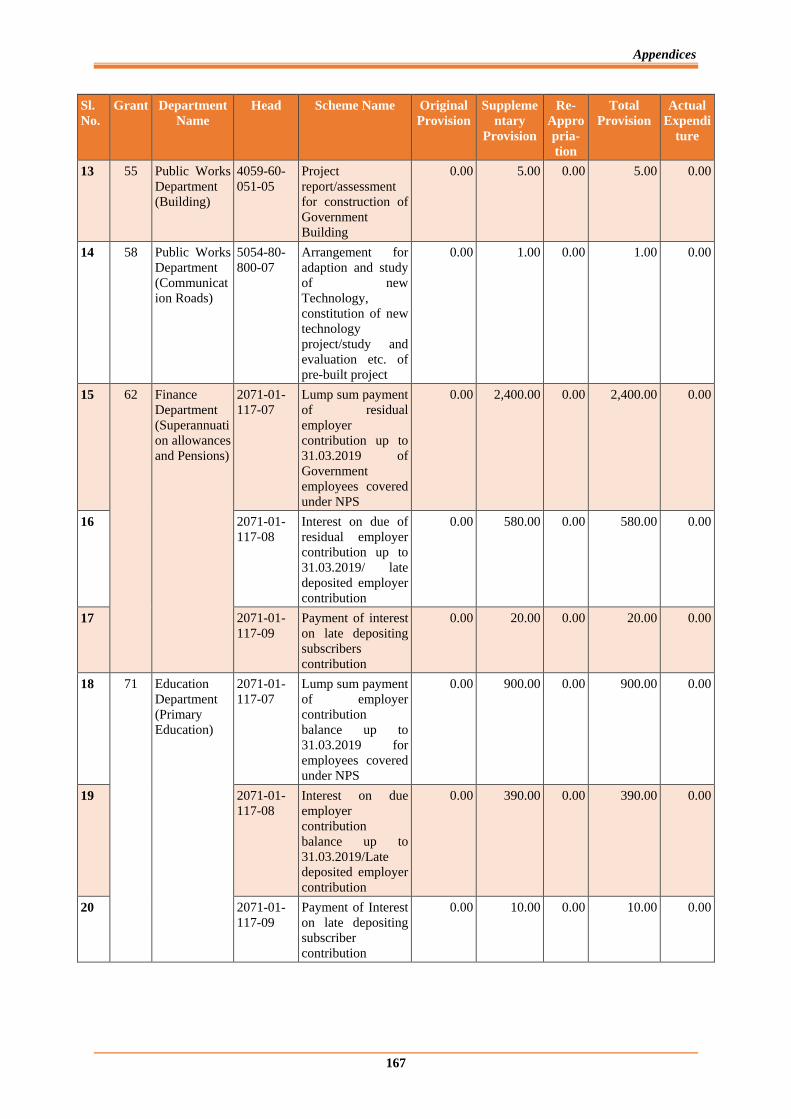
Appendices
167
Sl.
No.
Grant Department
Name
Head Scheme Name Original
Provision
Suppleme
ntary
Provision
Re-
Appro
pria-
tion
Total
Provision
Actual
Expendi
ture
13 55 Public Works
Department
(Building)
4059-60-
051-05
Project
report/assessment
for construction of
Government
Building
0.00 5.00 0.00 5.00 0.00
14 58 Public Works
Department
(Communicat
ion Roads)
5054-80-
800-07
Arrangement for
adaption and study
of new
Technology,
constitution of new
technology
project/study and
evaluation etc. of
pre-built project
0.00 1.00 0.00 1.00 0.00
15 62 Finance
Department
(Superannuati
on allowances
and Pensions)
2071-01-
117-07
Lump sum payment
of residual
employer
contribution up to
31.03.2019 of
Government
employees covered
under NPS
0.00 2,400.00 0.00 2,400.00 0.00
16 2071-01-
117-08
Interest on due of
residual employer
contribution up to
31.03.2019/ late
deposited employer
contribution
0.00 580.00 0.00 580.00 0.00
17 2071-01-
117-09
Payment of interest
on late depositing
subscribers
contribution
0.00 20.00 0.00 20.00 0.00
18 71 Education
Department
(Primary
Education)
2071-01-
117-07
Lump sum payment
of employer
contribution
balance up to
31.03.2019 for
employees covered
under NPS
0.00 900.00 0.00 900.00 0.00
19 2071-01-
117-08
Interest on due
employer
contribution
balance up to
31.03.2019/Late
deposited employer
contribution
0.00 390.00 0.00 390.00 0.00
20 2071-01-
117-09
Payment of Interest
on late depositing
subscriber
contribution
0.00 10.00 0.00 10.00 0.00
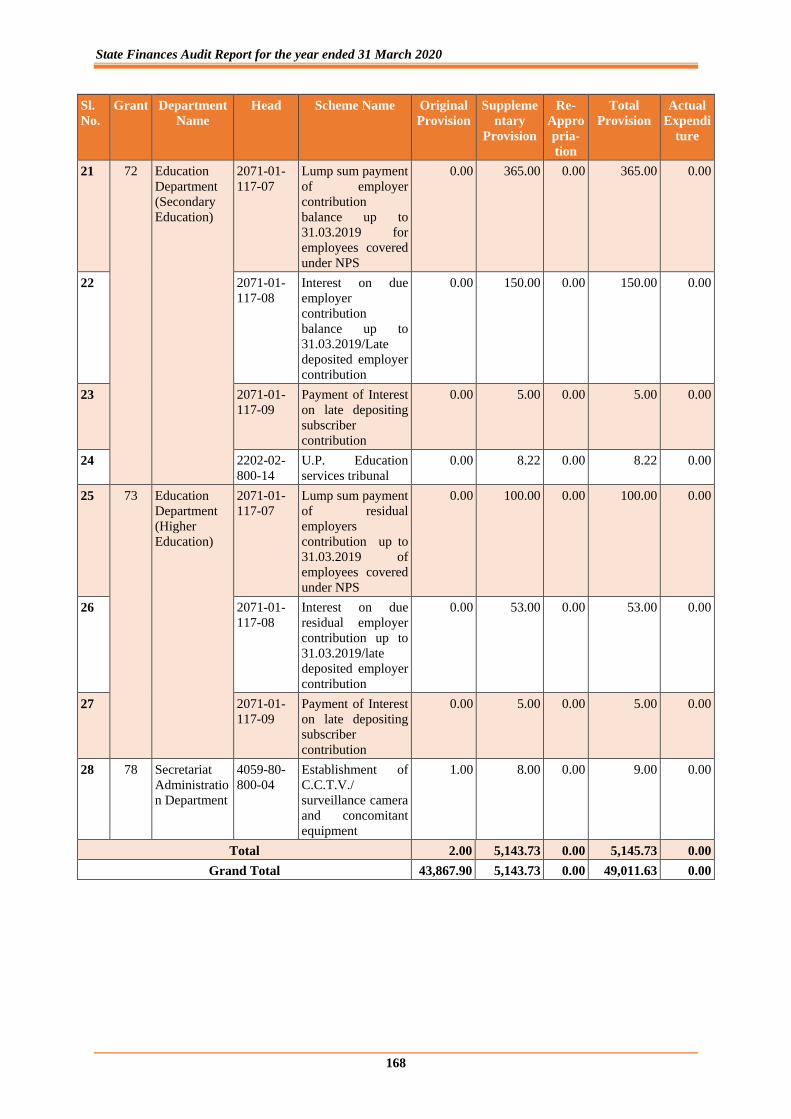
State Finances Audit Report for the year ended 31 March 2020
168
Sl.
No.
Grant Department
Name
Head Scheme Name Original
Provision
Suppleme
ntary
Provision
Re-
Appro
pria-
tion
Total
Provision
Actual
Expendi
ture
21 72 Education
Department
(Secondary
Education)
2071-01-
117-07
Lump sum payment
of employer
contribution
balance up to
31.03.2019 for
employees covered
under NPS
0.00 365.00 0.00 365.00 0.00
22 2071-01-
117-08
Interest on due
employer
contribution
balance up to
31.03.2019/Late
deposited employer
contribution
0.00 150.00 0.00 150.00 0.00
23 2071-01-
117-09
Payment of Interest
on late depositing
subscriber
contribution
0.00 5.00 0.00 5.00 0.00
24 2202-02-
800-14
U.P. Education
services tribunal
0.00 8.22 0.00 8.22 0.00
25 73 Education
Department
(Higher
Education)
2071-01-
117-07
Lump sum payment
of residual
employers
contribution up to
31.03.2019 of
employees covered
under NPS
0.00 100.00 0.00 100.00 0.00
26 2071-01-
117-08
Interest on due
residual employer
contribution up to
31.03.2019/late
deposited employer
contribution
0.00 53.00 0.00 53.00 0.00
27 2071-01-
117-09
Payment of Interest
on late depositing
subscriber
contribution
0.00 5.00 0.00 5.00 0.00
28 78 Secretariat
Administratio
n Department
4059-80-
800-04
Establishment of
C.C.T.V./
surveillance camera
and concomitant
equipment
1.00 8.00 0.00 9.00 0.00
Total 2.00 5,143.73 0.00 5,145.73 0.00
Grand Total 43,867.90 5,143.73 0.00 49,011.63 0.00

Appendices
169
Appendix 3.8
(Referred to in paragraph 3.3.7.2)
Details of Schemes for which Original, Supplementary provisions were re-appropriated to other schemes
(` in crore)
Sl.
No.
Grant
No
Name of
Grant
Head Scheme Name Original
Provi-
sion
Supple-
mentary
Provi-
sion
Re-Appro-
priation
Total
Provision
Actual
Expen-
diture
1. 7 Industries
department
(Heavy and
Medium
Industries)
2852-07-
202-05
Prarambhik Nidhi
(Seed Fund) for
promotions of
incubators and
start up
100.00 0.00 (-)30.15 69.85 0.00
2. 2852-80-
800-08
Dis-investment
and Privatization
of Public Private
Partnership
projects and
Public sector &
Co-operative
Units
2.05 0.00 (-)2.05 0.00 0.00
3. 9 Power
Department
2801-05-
800-21
For Prevention of
Electricity Theft
2.00 0.00 (-)2.00 0.00 0.00
4. 4801-06-
190-06
Share capital for
electricity
distribution work
under Deen Dayal
Upadhyaya Gram
Jyoti Scheme
(c.60/S.10/B.30-
C)
590.00 0.00 (-)590.00 0.00 0.00
5. 4801-80-
190-04
Share capital for
electrification
under Pradhan
Mantri Sahaj Bijli
Har Ghar Yojna
(saubhagya)(C.60/
S.10/B.30-C+S)
79.00 0.00 (-)79.00 0.00 0.00
6. 15 Agriculture
and Other
Allied
Departments
(Animal
Husbandry)
2403-
107-06
Additional Fodder
development
Programme
2.00 0.00 (-)2.00 0.00 0.00
7. 16 Agriculture
and Other
Allied
Departments
(Dairy
Development)
2404-
102-07
Revival of milk
federations under
N.P.D.D. Scheme
19.66 0.00 (-)19.66 0.00 0.00
8. 2404-
102-09
U.P. Milk Policy
2018
5.00 0.00 (-)5.00 0.00 0.00
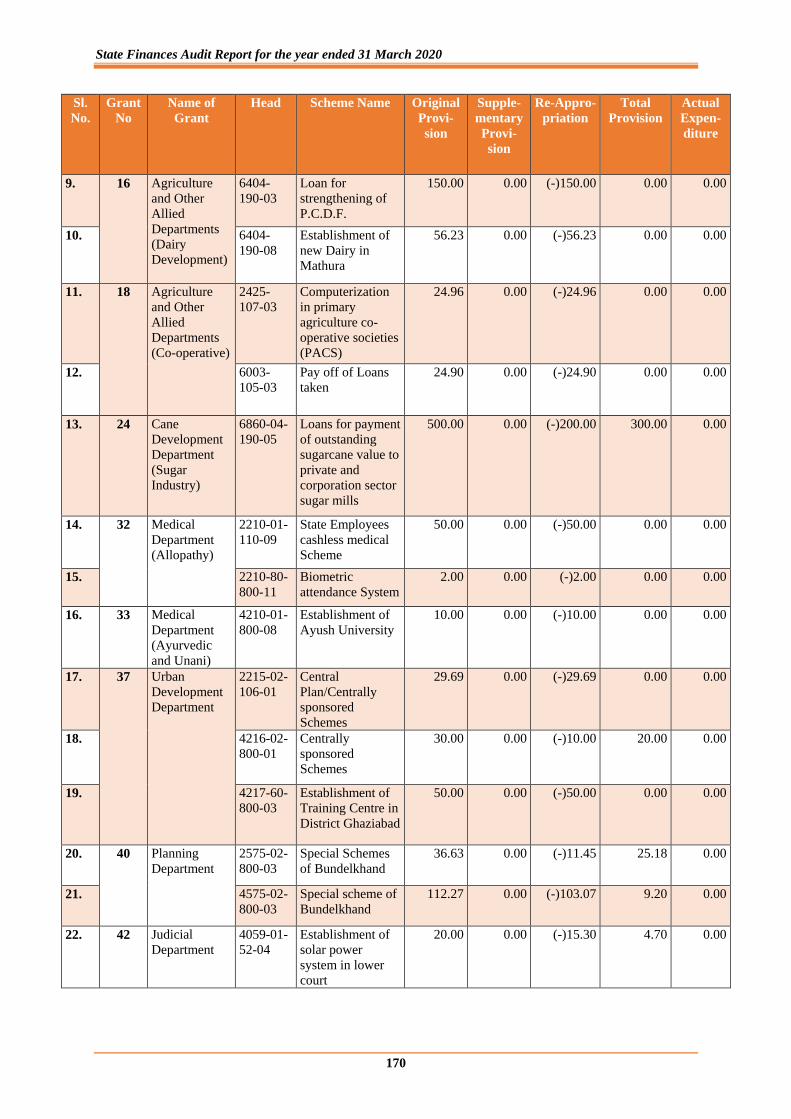
State Finances Audit Report for the year ended 31 March 2020
170
Sl.
No.
Grant
No
Name of
Grant
Head Scheme Name Original
Provi-
sion
Supple-
mentary
Provi-
sion
Re-Appro-
priation
Total
Provision
Actual
Expen-
diture
9. 16 Agriculture
and Other
Allied
Departments
(Dairy
Development)
6404-
190-03
Loan for
strengthening of
P.C.D.F.
150.00 0.00 (-)150.00 0.00 0.00
10. 6404-
190-08
Establishment of
new Dairy in
Mathura
56.23 0.00 (-)56.23 0.00 0.00
11. 18 Agriculture
and Other
Allied
Departments
(Co-operative)
2425-
107-03
Computerization
in primary
agriculture co-
operative societies
(PACS)
24.96 0.00 (-)24.96 0.00 0.00
12. 6003-
105-03
Pay off of Loans
taken
24.90 0.00 (-)24.90 0.00 0.00
13. 24 Cane
Development
Department
(Sugar
Industry)
6860-04-
190-05
Loans for payment
of outstanding
sugarcane value to
private and
corporation sector
sugar mills
500.00 0.00 (-)200.00 300.00 0.00
14. 32 Medical
Department
(Allopathy)
2210-01-
110-09
State Employees
cashless medical
Scheme
50.00 0.00 (-)50.00 0.00 0.00
15. 2210-80-
800-11
Biometric
attendance System
2.00 0.00 (-)2.00 0.00 0.00
16. 33 Medical
Department
(Ayurvedic
and Unani)
4210-01-
800-08
Establishment of
Ayush University
10.00 0.00 (-)10.00 0.00 0.00
17. 37 Urban
Development
Department
2215-02-
106-01
Central
Plan/Centrally
sponsored
Schemes
29.69 0.00 (-)29.69 0.00 0.00
18. 4216-02-
800-01
Centrally
sponsored
Schemes
30.00 0.00 (-)10.00 20.00 0.00
19. 4217-60-
800-03
Establishment of
Training Centre in
District Ghaziabad
50.00 0.00 (-)50.00 0.00 0.00
20. 40 Planning
Department
2575-02-
800-03
Special Schemes
of Bundelkhand
36.63 0.00 (-)11.45 25.18 0.00
21. 4575-02-
800-03
Special scheme of
Bundelkhand
112.27 0.00 (-)103.07 9.20 0.00
22. 42 Judicial
Department
4059-01-
52-04
Establishment of
solar power
system in lower
court
20.00 0.00 (-)15.30 4.70 0.00
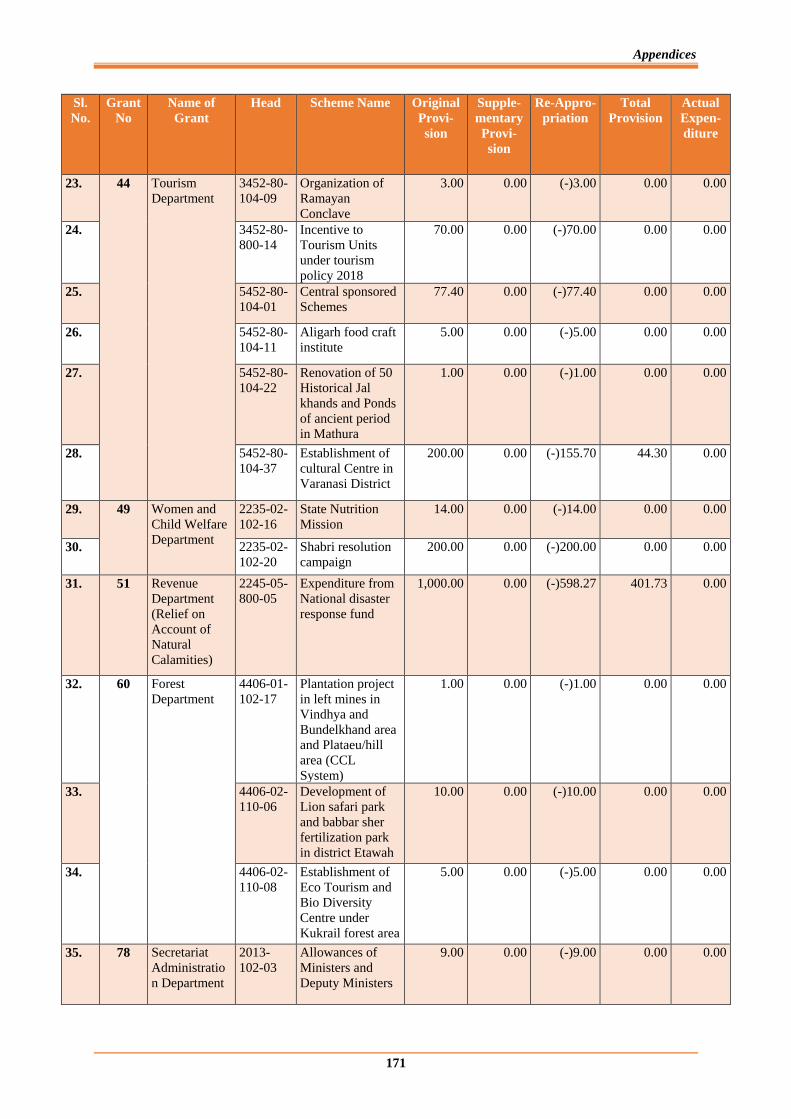
Appendices
171
Sl.
No.
Grant
No
Name of
Grant
Head Scheme Name Original
Provi-
sion
Supple-
mentary
Provi-
sion
Re-Appro-
priation
Total
Provision
Actual
Expen-
diture
23. 44 Tourism
Department
3452-80-
104-09
Organization of
Ramayan
Conclave
3.00 0.00 (-)3.00 0.00 0.00
24. 3452-80-
800-14
Incentive to
Tourism Units
under tourism
policy 2018
70.00 0.00 (-)70.00 0.00 0.00
25. 5452-80-
104-01
Central sponsored
Schemes
77.40 0.00 (-)77.40 0.00 0.00
26. 5452-80-
104-11
Aligarh food craft
institute
5.00 0.00 (-)5.00 0.00 0.00
27. 5452-80-
104-22
Renovation of 50
Historical Jal
khands and Ponds
of ancient period
in Mathura
1.00 0.00 (-)1.00 0.00 0.00
28. 5452-80-
104-37
Establishment of
cultural Centre in
Varanasi District
200.00 0.00 (-)155.70 44.30 0.00
29. 49 Women and
Child Welfare
Department
2235-02-
102-16
State Nutrition
Mission
14.00 0.00 (-)14.00 0.00 0.00
30. 2235-02-
102-20
Shabri resolution
campaign
200.00 0.00 (-)200.00 0.00 0.00
31. 51 Revenue
Department
(Relief on
Account of
Natural
Calamities)
2245-05-
800-05
Expenditure from
National disaster
response fund
1,000.00 0.00 (-)598.27 401.73 0.00
32. 60 Forest
Department
4406-01-
102-17
Plantation project
in left mines in
Vindhya and
Bundelkhand area
and Plataeu/hill
area (CCL
System)
1.00 0.00 (-)1.00 0.00 0.00
33. 4406-02-
110-06
Development of
Lion safari park
and babbar sher
fertilization park
in district Etawah
10.00 0.00 (-)10.00 0.00 0.00
34. 4406-02-
110-08
Establishment of
Eco Tourism and
Bio Diversity
Centre under
Kukrail forest area
5.00 0.00 (-)5.00 0.00 0.00
35. 78 Secretariat
Administratio
n Department
2013-
102-03
Allowances of
Ministers and
Deputy Ministers
9.00 0.00 (-)9.00 0.00 0.00
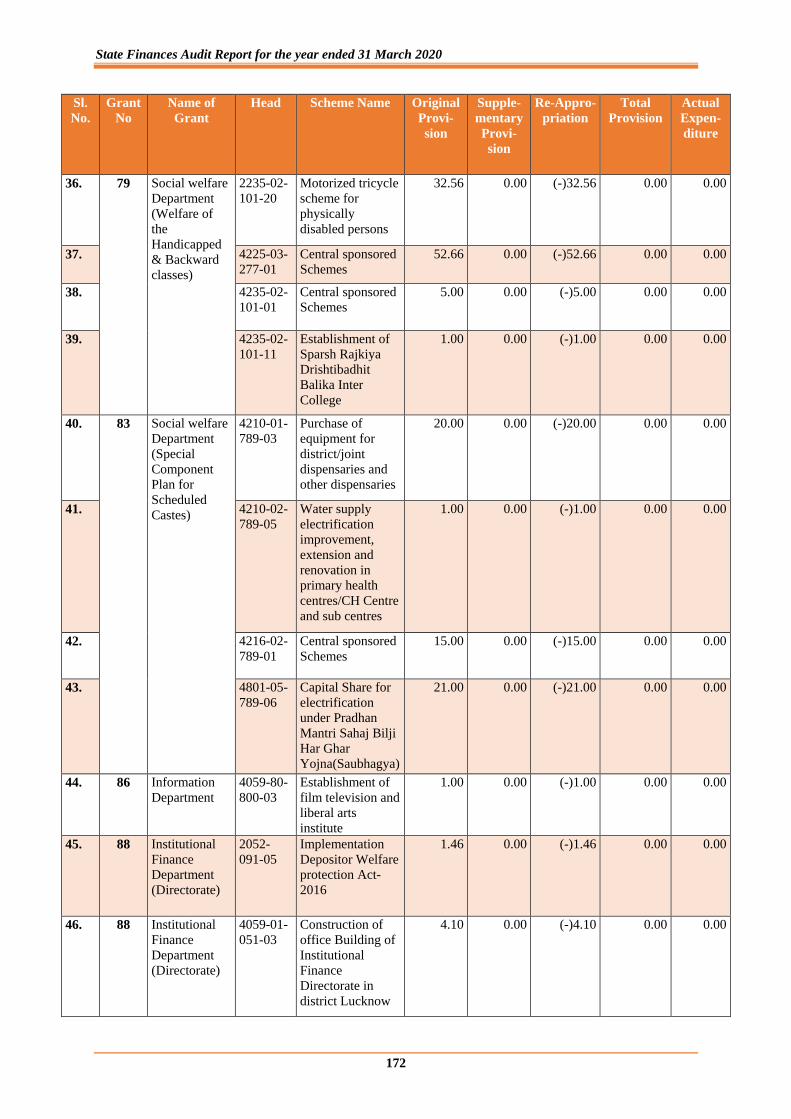
State Finances Audit Report for the year ended 31 March 2020
172
Sl.
No.
Grant
No
Name of
Grant
Head Scheme Name Original
Provi-
sion
Supple-
mentary
Provi-
sion
Re-Appro-
priation
Total
Provision
Actual
Expen-
diture
36. 79 Social welfare
Department
(Welfare of
the
Handicapped
& Backward
classes)
2235-02-
101-20
Motorized tricycle
scheme for
physically
disabled persons
32.56 0.00 (-)32.56 0.00 0.00
37. 4225-03-
277-01
Central sponsored
Schemes
52.66 0.00 (-)52.66 0.00 0.00
38. 4235-02-
101-01
Central sponsored
Schemes
5.00 0.00 (-)5.00 0.00 0.00
39. 4235-02-
101-11
Establishment of
Sparsh Rajkiya
Drishtibadhit
Balika Inter
College
1.00 0.00 (-)1.00 0.00 0.00
40. 83 Social welfare
Department
(Special
Component
Plan for
Scheduled
Castes)
4210-01-
789-03
Purchase of
equipment for
district/joint
dispensaries and
other dispensaries
20.00 0.00 (-)20.00 0.00 0.00
41. 4210-02-
789-05
Water supply
electrification
improvement,
extension and
renovation in
primary health
centres/CH Centre
and sub centres
1.00 0.00 (-)1.00 0.00 0.00
42. 4216-02-
789-01
Central sponsored
Schemes
15.00 0.00 (-)15.00 0.00 0.00
43. 4801-05-
789-06
Capital Share for
electrification
under Pradhan
Mantri Sahaj Bilji
Har Ghar
Yojna(Saubhagya)
21.00 0.00 (-)21.00 0.00 0.00
44. 86 Information
Department
4059-80-
800-03
Establishment of
film television and
liberal arts
institute
1.00 0.00 (-)1.00 0.00 0.00
45. 88 Institutional
Finance
Department
(Directorate)
2052-
091-05
Implementation
Depositor Welfare
protection Act-
2016
1.46 0.00 (-)1.46 0.00 0.00
46. 88 Institutional
Finance
Department
(Directorate)
4059-01-
051-03
Construction of
office Building of
Institutional
Finance
Directorate in
district Lucknow
4.10 0.00 (-)4.10 0.00 0.00
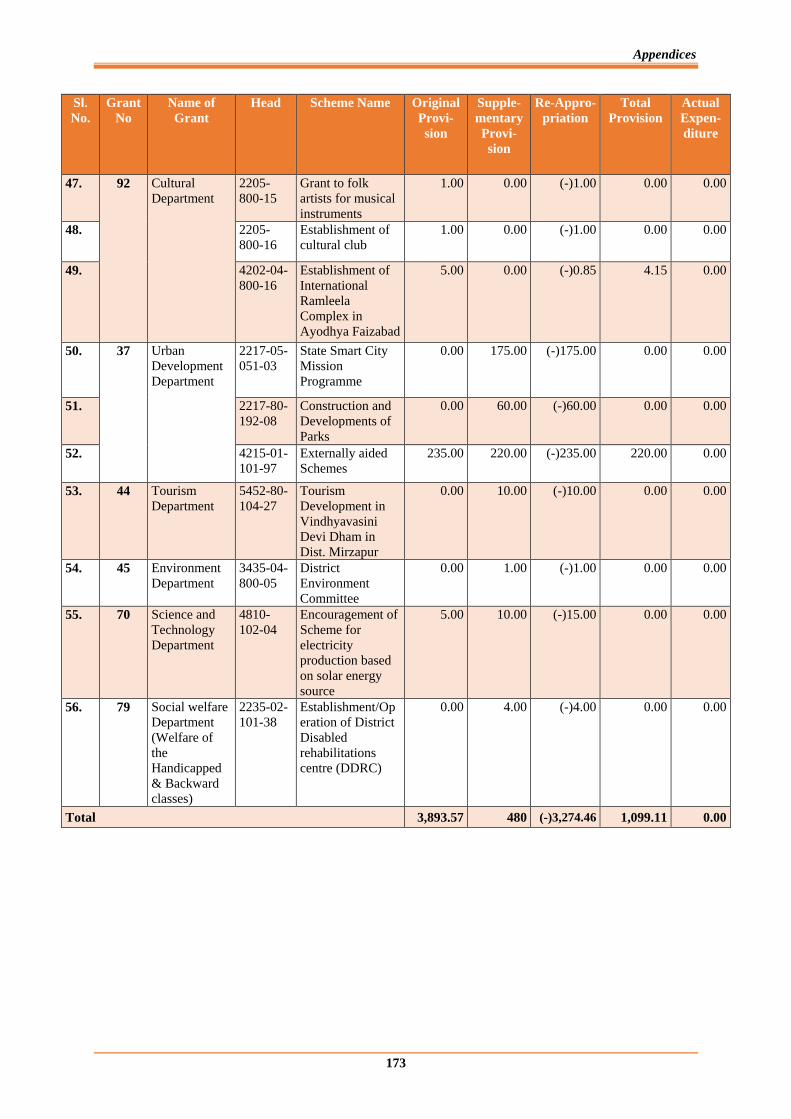
Appendices
173
Sl.
No.
Grant
No
Name of
Grant
Head Scheme Name Original
Provi-
sion
Supple-
mentary
Provi-
sion
Re-Appro-
priation
Total
Provision
Actual
Expen-
diture
47. 92 Cultural
Department
2205-
800-15
Grant to folk
artists for musical
instruments
1.00 0.00 (-)1.00 0.00 0.00
48. 2205-
800-16
Establishment of
cultural club
1.00 0.00 (-)1.00 0.00 0.00
49. 4202-04-
800-16
Establishment of
International
Ramleela
Complex in
Ayodhya Faizabad
5.00 0.00 (-)0.85 4.15 0.00
50. 37 Urban
Development
Department
2217-05-
051-03
State Smart City
Mission
Programme
0.00 175.00 (-)175.00 0.00 0.00
51. 2217-80-
192-08
Construction and
Developments of
Parks
0.00 60.00 (-)60.00 0.00 0.00
52. 4215-01-
101-97
Externally aided
Schemes
235.00 220.00 (-)235.00 220.00 0.00
53. 44 Tourism
Department
5452-80-
104-27
Tourism
Development in
Vindhyavasini
Devi Dham in
Dist. Mirzapur
0.00 10.00 (-)10.00 0.00 0.00
54. 45 Environment
Department
3435-04-
800-05
District
Environment
Committee
0.00 1.00 (-)1.00 0.00 0.00
55. 70 Science and
Technology
Department
4810-
102-04
Encouragement of
Scheme for
electricity
production based
on solar energy
source
5.00 10.00 (-)15.00 0.00 0.00
56. 79 Social welfare
Department
(Welfare of
the
Handicapped
& Backward
classes)
2235-02-
101-38
Establishment/Op
eration of District
Disabled
rehabilitations
centre (DDRC)
0.00 4.00 (-)4.00 0.00 0.00
Total 3,893.57 480 (-)3,274.46 1,099.11 0.00
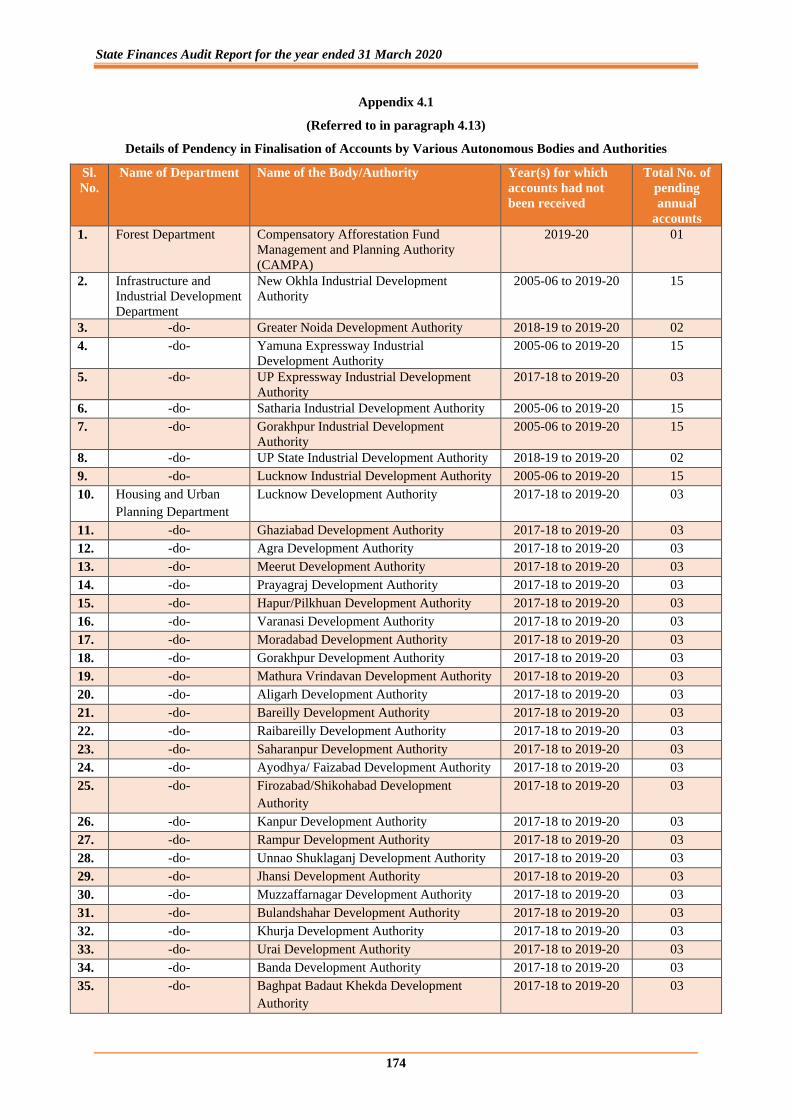
State Finances Audit Report for the year ended 31 March 2020
174
Appendix 4.1
(Referred to in paragraph 4.13)
Details of Pendency in Finalisation of Accounts by Various Autonomous Bodies and Authorities
Sl.
No.
Name of Department Name of the Body/Authority Year(s) for which
accounts had not
been received
Total No. of
pending
annual
accounts
1. Forest Department Compensatory Afforestation Fund
Management and Planning Authority
(CAMPA)
2019-20 01
2. Infrastructure and
Industrial Development
Department
New Okhla Industrial Development
Authority
2005-06 to 2019-20 15
3. -do- Greater Noida Development Authority 2018-19 to 2019-20 02
4. -do- Yamuna Expressway Industrial
Development Authority
2005-06 to 2019-20 15
5. -do- UP Expressway Industrial Development
Authority
2017-18 to 2019-20 03
6. -do- Satharia Industrial Development Authority 2005-06 to 2019-20 15
7. -do- Gorakhpur Industrial Development
Authority
2005-06 to 2019-20 15
8. -do- UP State Industrial Development Authority 2018-19 to 2019-20 02
9. -do- Lucknow Industrial Development Authority 2005-06 to 2019-20 15
10. Housing and Urban
Planning Department
Lucknow Development Authority 2017-18 to 2019-20 03
11. -do- Ghaziabad Development Authority 2017-18 to 2019-20 03
12. -do- Agra Development Authority 2017-18 to 2019-20 03
13. -do- Meerut Development Authority 2017-18 to 2019-20 03
14. -do- Prayagraj Development Authority 2017-18 to 2019-20 03
15. -do- Hapur/Pilkhuan Development Authority 2017-18 to 2019-20 03
16. -do- Varanasi Development Authority 2017-18 to 2019-20 03
17. -do- Moradabad Development Authority 2017-18 to 2019-20 03
18. -do- Gorakhpur Development Authority 2017-18 to 2019-20 03
19. -do- Mathura Vrindavan Development Authority 2017-18 to 2019-20 03
20. -do- Aligarh Development Authority 2017-18 to 2019-20 03
21. -do- Bareilly Development Authority 2017-18 to 2019-20 03
22. -do- Raibareilly Development Authority 2017-18 to 2019-20 03
23. -do- Saharanpur Development Authority 2017-18 to 2019-20 03
24. -do- Ayodhya/ Faizabad Development Authority 2017-18 to 2019-20 03
25. -do- Firozabad/Shikohabad Development
Authority
2017-18 to 2019-20 03
26. -do- Kanpur Development Authority 2017-18 to 2019-20 03
27. -do- Rampur Development Authority 2017-18 to 2019-20 03
28. -do- Unnao Shuklaganj Development Authority 2017-18 to 2019-20 03
29. -do- Jhansi Development Authority 2017-18 to 2019-20 03
30. -do- Muzzaffarnagar Development Authority 2017-18 to 2019-20 03
31. -do- Bulandshahar Development Authority 2017-18 to 2019-20 03
32. -do- Khurja Development Authority 2017-18 to 2019-20 03
33. -do- Urai Development Authority 2017-18 to 2019-20 03
34. -do- Banda Development Authority 2017-18 to 2019-20 03
35. -do- Baghpat Badaut Khekda Development
Authority
2017-18 to 2019-20 03
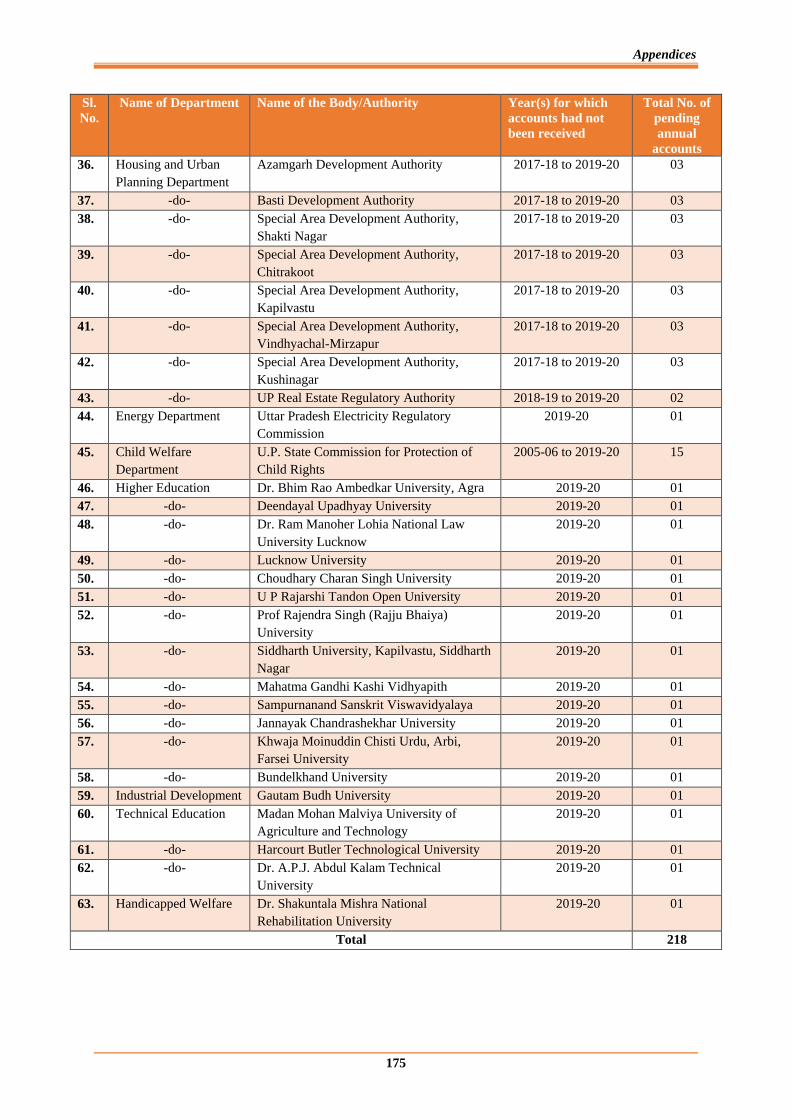
Appendices
175
Sl.
No.
Name of Department Name of the Body/Authority Year(s) for which
accounts had not
been received
Total No. of
pending
annual
accounts
36. Housing and Urban
Planning Department
Azamgarh Development Authority 2017-18 to 2019-20 03
37. -do- Basti Development Authority 2017-18 to 2019-20 03
38. -do- Special Area Development Authority,
Shakti Nagar
2017-18 to 2019-20 03
39. -do- Special Area Development Authority,
Chitrakoot
2017-18 to 2019-20 03
40. -do- Special Area Development Authority,
Kapilvastu
2017-18 to 2019-20 03
41. -do- Special Area Development Authority,
Vindhyachal-Mirzapur
2017-18 to 2019-20 03
42. -do- Special Area Development Authority,
Kushinagar
2017-18 to 2019-20 03
43. -do- UP Real Estate Regulatory Authority 2018-19 to 2019-20 02
44. Energy Department Uttar Pradesh Electricity Regulatory
Commission
2019-20 01
45. Child Welfare
Department
U.P. State Commission for Protection of
Child Rights
2005-06 to 2019-20 15
46. Higher Education Dr. Bhim Rao Ambedkar University, Agra 2019-20 01
47. -do- Deendayal Upadhyay University 2019-20 01
48. -do- Dr. Ram Manoher Lohia National Law
University Lucknow
2019-20 01
49. -do- Lucknow University 2019-20 01
50. -do- Choudhary Charan Singh University 2019-20 01
51. -do- U P Rajarshi Tandon Open University 2019-20 01
52. -do- Prof Rajendra Singh (Rajju Bhaiya)
University
2019-20 01
53. -do- Siddharth University, Kapilvastu, Siddharth
Nagar
2019-20 01
54. -do- Mahatma Gandhi Kashi Vidhyapith 2019-20 01
55. -do- Sampurnanand Sanskrit Viswavidyalaya 2019-20 01
56. -do- Jannayak Chandrashekhar University 2019-20 01
57. -do- Khwaja Moinuddin Chisti Urdu, Arbi,
Farsei University
2019-20 01
58. -do- Bundelkhand University 2019-20 01
59. Industrial Development Gautam Budh University 2019-20 01
60. Technical Education Madan Mohan Malviya University of
Agriculture and Technology
2019-20 01
61. -do- Harcourt Butler Technological University 2019-20 01
62. -do- Dr. A.P.J. Abdul Kalam Technical
University
2019-20 01
63. Handicapped Welfare Dr. Shakuntala Mishra National
Rehabilitation University
2019-20 01
Total 218

State Finances Audit Report for the year ended 31 March 2020
176
Appendix 4.2
(Referred to in paragraph 4.14)
Statement of finalisation of accounts and investments in Departmental Commercial Undertakings
(` in crore)
Sl.
No.
Name of the undertaking Accounts finalised up to
Investment as per the last
accounts finalised
Irrigation Department
1. Irrigation Workshop Division, Kanpur 2019-20 1.94
2. Irrigation Workshop Division, Jhansi 2019-20 11.95
3. Irrigation Workshop Division, Bareilly 2019-20 13.10
4. Irrigation Workshop Division, Meerut 2019-20 1.98
5. Irrigation Workshop Division, Gorakhpur 2019-20 0.54
6. Irrigation Workshop Division, Prayagraj 2019-20 3.97
Food and Civil Supplies Department
7. Food Commissioner and CAO 2014-15 4,002.95
Animal Husbandry Department
8. Dy. Director, Animal Husbandry Farms
Corporation
2015-16 32.61
Health Department
9. Dy. Director, State Ayurvedic & Unani
Medicine Department
1987-88 Not available
Total 4,069.04
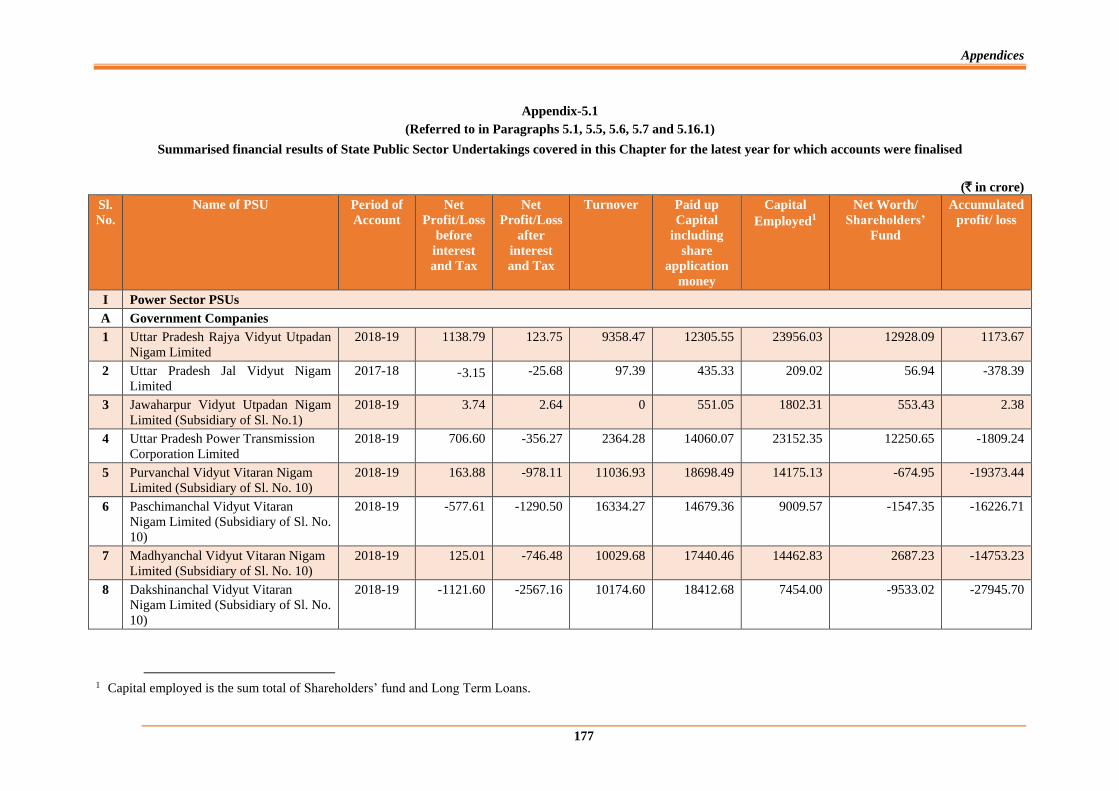
Appendices
177
Appendix-5.1
(Referred to in Paragraphs 5.1, 5.5, 5.6, 5.7 and 5.16.1)
Summarised financial results of State Public Sector Undertakings covered in this Chapter for the latest year for which accounts were finalised
(` in crore)
Sl.
No.
Name of PSU Period of
Account
Net
Profit/Loss
before
interest
and Tax
Net
Profit/Loss
after
interest
and Tax
Turnover Paid up
Capital
including
share
application
money
Capital
Employed1
Net Worth/
Shareholders’
Fund
Accumulated
profit/ loss
I Power Sector PSUs
A Government Companies
1 Uttar Pradesh Rajya Vidyut Utpadan
Nigam Limited
2018-19 1138.79 123.75 9358.47 12305.55 23956.03 12928.09 1173.67
2 Uttar Pradesh Jal Vidyut Nigam
Limited
2017-18 -3.15 -25.68 97.39 435.33 209.02 56.94 -378.39
3 Jawaharpur Vidyut Utpadan Nigam
Limited (Subsidiary of Sl. No.1)
2018-19 3.74 2.64 0 551.05 1802.31 553.43 2.38
4 Uttar Pradesh Power Transmission
Corporation Limited
2018-19 706.60 -356.27 2364.28 14060.07 23152.35 12250.65 -1809.24
5 Purvanchal Vidyut Vitaran Nigam
Limited (Subsidiary of Sl. No. 10)
2018-19 163.88 -978.11 11036.93 18698.49 14175.13 -674.95 -19373.44
6 Paschimanchal Vidyut Vitaran
Nigam Limited (Subsidiary of Sl. No.
10)
2018-19 -577.61 -1290.50 16334.27 14679.36 9009.57 -1547.35 -16226.71
7 Madhyanchal Vidyut Vitaran Nigam
Limited (Subsidiary of Sl. No. 10)
2018-19 125.01 -746.48 10029.68 17440.46 14462.83 2687.23 -14753.23
8 Dakshinanchal Vidyut Vitaran
Nigam Limited (Subsidiary of Sl. No.
10)
2018-19 -1121.60 -2567.16 10174.60 18412.68 7454.00 -9533.02 -27945.70
1 Capital employed is the sum total of Shareholders’ fund and Long Term Loans.
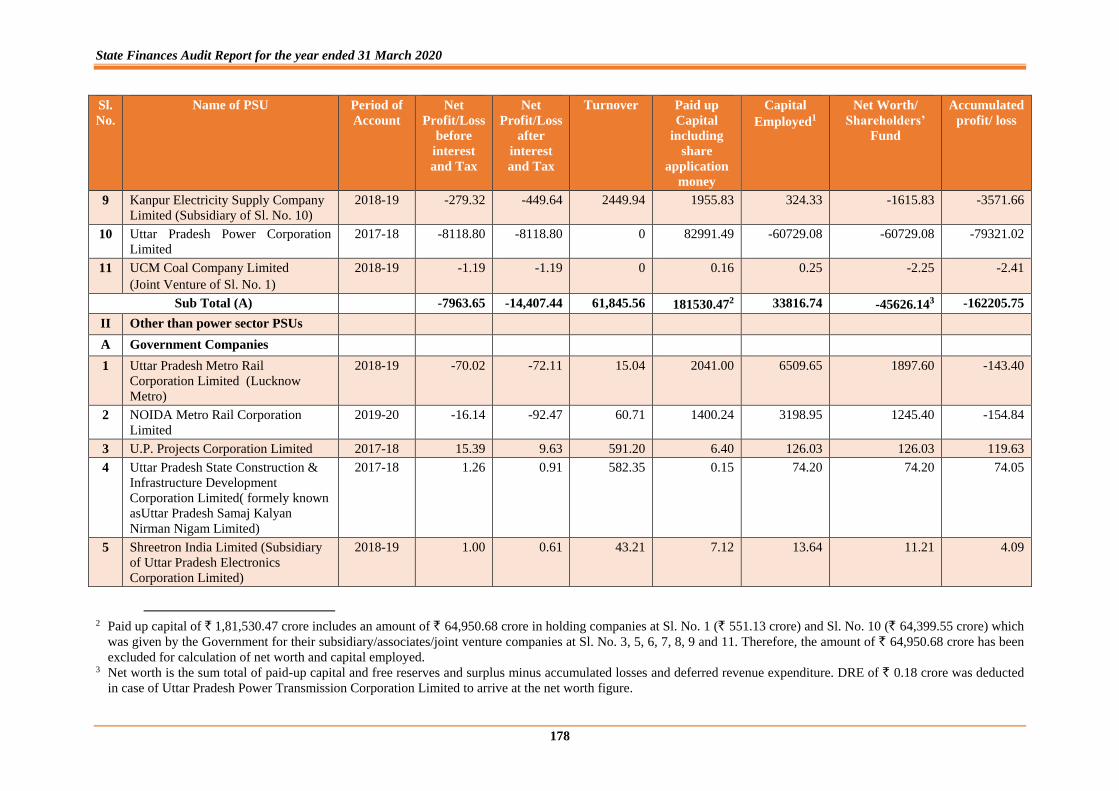
State Finances Audit Report for the year ended 31 March 2020
178
Sl.
No.
Name of PSU Period of
Account
Net
Profit/Loss
before
interest
and Tax
Net
Profit/Loss
after
interest
and Tax
Turnover Paid up
Capital
including
share
application
money
Capital
Employed1
Net Worth/
Shareholders’
Fund
Accumulated
profit/ loss
9 Kanpur Electricity Supply Company
Limited (Subsidiary of Sl. No. 10)
2018-19 -279.32 -449.64 2449.94 1955.83 324.33 -1615.83 -3571.66
10 Uttar Pradesh Power Corporation
Limited
2017-18 -8118.80 -8118.80 0 82991.49 -60729.08 -60729.08 -79321.02
11 UCM Coal Company Limited
(Joint Venture of Sl. No. 1)
2018-19 -1.19 -1.19 0 0.16 0.25 -2.25 -2.41
Sub Total (A) -7963.65 -14,407.44 61,845.56 181530.472 33816.74 -45626.143 -162205.75
II Other than power sector PSUs
A Government Companies
1 Uttar Pradesh Metro Rail
Corporation Limited (Lucknow
Metro)
2018-19 -70.02 -72.11 15.04 2041.00 6509.65 1897.60 -143.40
2 NOIDA Metro Rail Corporation
Limited
2019-20 -16.14 -92.47 60.71 1400.24 3198.95 1245.40 -154.84
3 U.P. Projects Corporation Limited 2017-18 15.39 9.63 591.20 6.40 126.03 126.03 119.63
4 Uttar Pradesh State Construction &
Infrastructure Development
Corporation Limited( formely known
asUttar Pradesh Samaj Kalyan
Nirman Nigam Limited)
2017-18 1.26 0.91 582.35 0.15 74.20 74.20 74.05
5 Shreetron India Limited (Subsidiary
of Uttar Pradesh Electronics
Corporation Limited)
2018-19 1.00 0.61 43.21 7.12 13.64 11.21 4.09
2 Paid up capital of ` 1,81,530.47 crore includes an amount of ` 64,950.68 crore in holding companies at Sl. No. 1 (` 551.13 crore) and Sl. No. 10 (` 64,399.55 crore) which
was given by the Government for their subsidiary/associates/joint venture companies at Sl. No. 3, 5, 6, 7, 8, 9 and 11. Therefore, the amount of ` 64,950.68 crore has been
excluded for calculation of net worth and capital employed. 3 Net worth is the sum total of paid-up capital and free reserves and surplus minus accumulated losses and deferred revenue expenditure. DRE of ` 0.18 crore was deducted
in case of Uttar Pradesh Power Transmission Corporation Limited to arrive at the net worth figure.
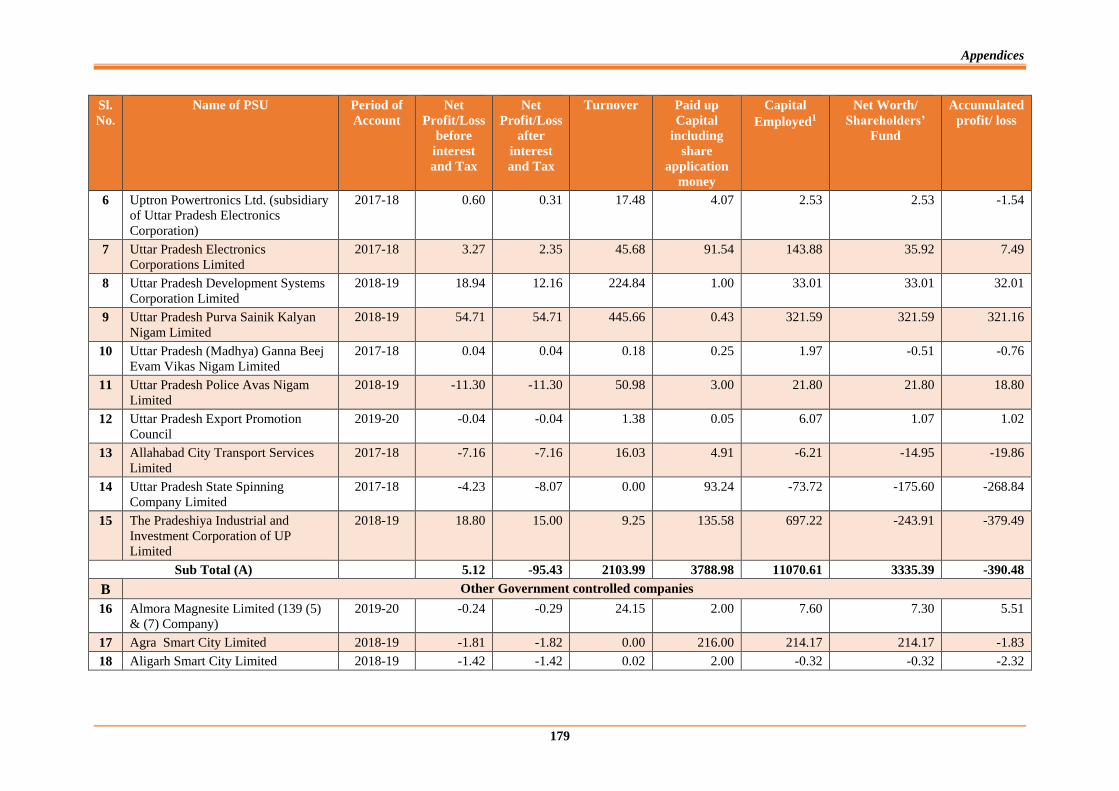
Appendices
179
Sl.
No.
Name of PSU Period of
Account
Net
Profit/Loss
before
interest
and Tax
Net
Profit/Loss
after
interest
and Tax
Turnover Paid up
Capital
including
share
application
money
Capital
Employed1
Net Worth/
Shareholders’
Fund
Accumulated
profit/ loss
6 Uptron Powertronics Ltd. (subsidiary
of Uttar Pradesh Electronics
Corporation)
2017-18 0.60 0.31 17.48 4.07 2.53 2.53 -1.54
7 Uttar Pradesh Electronics
Corporations Limited
2017-18 3.27 2.35 45.68 91.54 143.88 35.92 7.49
8 Uttar Pradesh Development Systems
Corporation Limited
2018-19 18.94 12.16 224.84 1.00 33.01 33.01 32.01
9 Uttar Pradesh Purva Sainik Kalyan
Nigam Limited
2018-19 54.71 54.71 445.66 0.43 321.59 321.59 321.16
10 Uttar Pradesh (Madhya) Ganna Beej
Evam Vikas Nigam Limited
2017-18 0.04 0.04 0.18 0.25 1.97 -0.51 -0.76
11 Uttar Pradesh Police Avas Nigam
Limited
2018-19 -11.30 -11.30 50.98 3.00 21.80 21.80 18.80
12 Uttar Pradesh Export Promotion
Council
2019-20 -0.04 -0.04 1.38 0.05 6.07 1.07 1.02
13 Allahabad City Transport Services
Limited
2017-18 -7.16 -7.16 16.03 4.91 -6.21 -14.95 -19.86
14 Uttar Pradesh State Spinning
Company Limited
2017-18 -4.23 -8.07 0.00 93.24 -73.72 -175.60 -268.84
15 The Pradeshiya Industrial and
Investment Corporation of UP
Limited
2018-19 18.80 15.00 9.25 135.58 697.22 -243.91 -379.49
Sub Total (A) 5.12 -95.43 2103.99 3788.98 11070.61 3335.39 -390.48
B Other Government controlled companies
16 Almora Magnesite Limited (139 (5)
& (7) Company)
2019-20 -0.24 -0.29 24.15 2.00 7.60 7.30 5.51
17 Agra Smart City Limited 2018-19 -1.81 -1.82 0.00 216.00 214.17 214.17 -1.83
18 Aligarh Smart City Limited 2018-19 -1.42 -1.42 0.02 2.00 -0.32 -0.32 -2.32
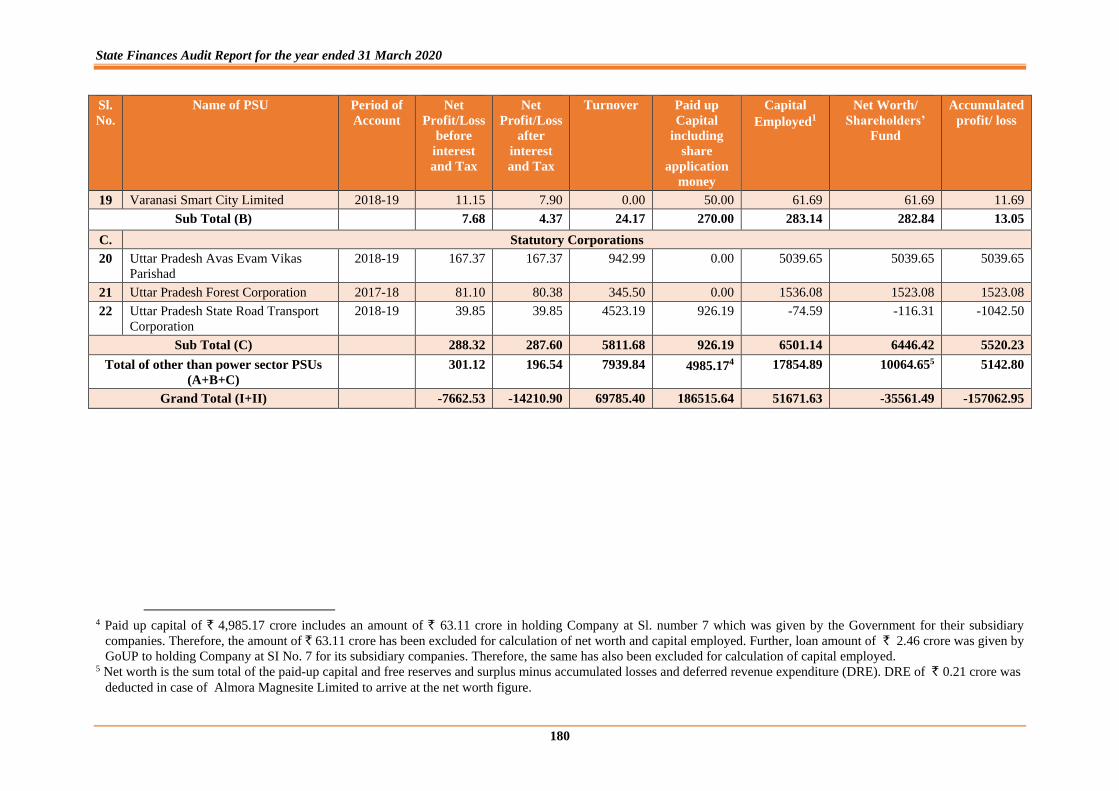
State Finances Audit Report for the year ended 31 March 2020
180
Sl.
No.
Name of PSU Period of
Account
Net
Profit/Loss
before
interest
and Tax
Net
Profit/Loss
after
interest
and Tax
Turnover Paid up
Capital
including
share
application
money
Capital
Employed1
Net Worth/
Shareholders’
Fund
Accumulated
profit/ loss
19 Varanasi Smart City Limited 2018-19 11.15 7.90 0.00 50.00 61.69 61.69 11.69
Sub Total (B) 7.68 4.37 24.17 270.00 283.14 282.84 13.05
C. Statutory Corporations
20 Uttar Pradesh Avas Evam Vikas
Parishad
2018-19 167.37 167.37 942.99 0.00 5039.65 5039.65 5039.65
21 Uttar Pradesh Forest Corporation 2017-18 81.10 80.38 345.50 0.00 1536.08 1523.08 1523.08
22 Uttar Pradesh State Road Transport
Corporation
2018-19 39.85 39.85 4523.19 926.19 -74.59 -116.31 -1042.50
Sub Total (C) 288.32 287.60 5811.68 926.19 6501.14 6446.42 5520.23
Total of other than power sector PSUs
(A+B+C)
301.12 196.54 7939.84 4985.174 17854.89 10064.655 5142.80
Grand Total (I+II) -7662.53 -14210.90 69785.40 186515.64 51671.63 -35561.49 -157062.95
4 Paid up capital of ` 4,985.17 crore includes an amount of ` 63.11 crore in holding Company at Sl. number 7 which was given by the Government for their subsidiary
companies. Therefore, the amount of ` 63.11 crore has been excluded for calculation of net worth and capital employed. Further, loan amount of ` 2.46 crore was given by
GoUP to holding Company at SI No. 7 for its subsidiary companies. Therefore, the same has also been excluded for calculation of capital employed. 5 Net worth is the sum total of the paid-up capital and free reserves and surplus minus accumulated losses and deferred revenue expenditure (DRE). DRE of ` 0.21 crore was
deducted in case of Almora Magnesite Limited to arrive at the net worth figure.
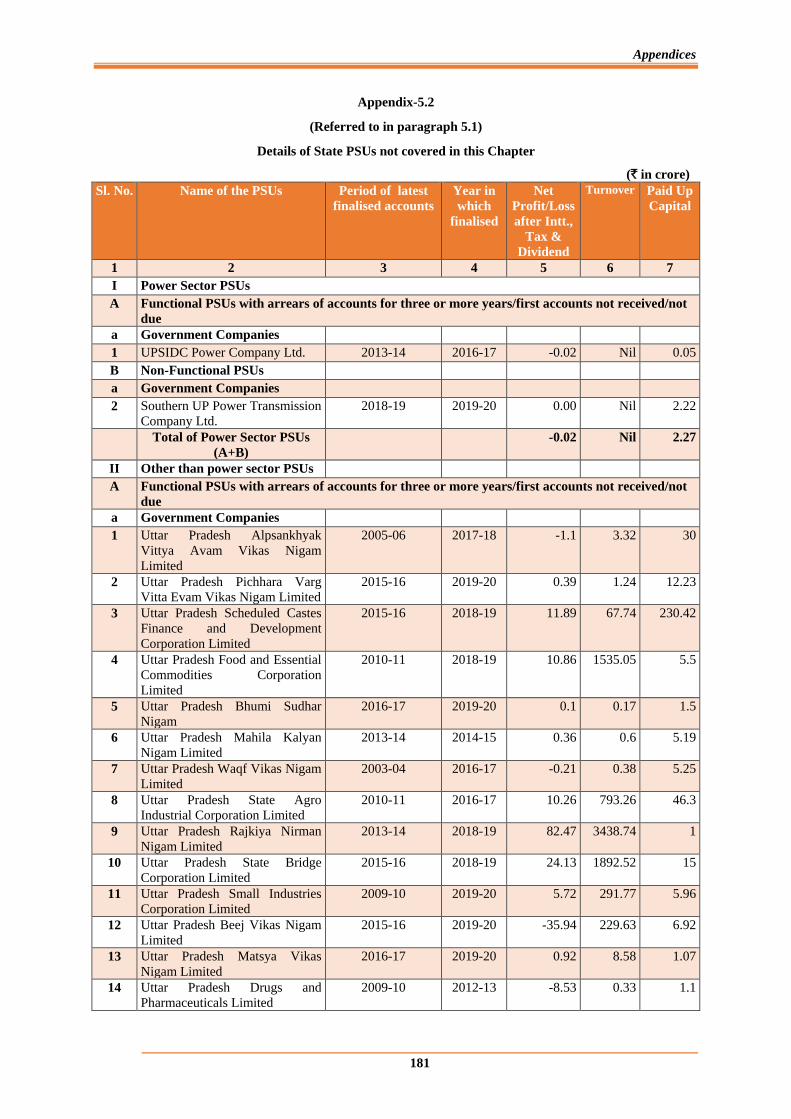
Appendices
181
Appendix-5.2
(Referred to in paragraph 5.1)
Details of State PSUs not covered in this Chapter
(` in crore)
Sl. No. Name of the PSUs Period of latest
finalised accounts
Year in
which
finalised
Net
Profit/Loss
after Intt.,
Tax &
Dividend
Turnover Paid Up
Capital
1 2 3 4 5 6 7
I Power Sector PSUs
A Functional PSUs with arrears of accounts for three or more years/first accounts not received/not
due
a Government Companies
1 UPSIDC Power Company Ltd. 2013-14 2016-17 -0.02 Nil 0.05
B Non-Functional PSUs
a Government Companies
2 Southern UP Power Transmission
Company Ltd.
2018-19 2019-20 0.00 Nil 2.22
Total of Power Sector PSUs
(A+B)
-0.02 Nil 2.27
II Other than power sector PSUs
A Functional PSUs with arrears of accounts for three or more years/first accounts not received/not
due
a Government Companies
1 Uttar Pradesh Alpsankhyak
Vittya Avam Vikas Nigam
Limited
2005-06 2017-18 -1.1 3.32 30
2 Uttar Pradesh Pichhara Varg
Vitta Evam Vikas Nigam Limited
2015-16 2019-20 0.39 1.24 12.23
3 Uttar Pradesh Scheduled Castes
Finance and Development
Corporation Limited
2015-16 2018-19 11.89 67.74 230.42
4 Uttar Pradesh Food and Essential
Commodities Corporation
Limited
2010-11 2018-19 10.86 1535.05 5.5
5 Uttar Pradesh Bhumi Sudhar
Nigam
2016-17 2019-20 0.1 0.17 1.5
6 Uttar Pradesh Mahila Kalyan
Nigam Limited
2013-14 2014-15 0.36 0.6 5.19
7 Uttar Pradesh Waqf Vikas Nigam
Limited
2003-04 2016-17 -0.21 0.38 5.25
8 Uttar Pradesh State Agro
Industrial Corporation Limited
2010-11 2016-17 10.26 793.26 46.3
9 Uttar Pradesh Rajkiya Nirman
Nigam Limited
2013-14 2018-19 82.47 3438.74 1
10 Uttar Pradesh State Bridge
Corporation Limited
2015-16 2018-19 24.13 1892.52 15
11 Uttar Pradesh Small Industries
Corporation Limited
2009-10 2019-20 5.72 291.77 5.96
12 Uttar Pradesh Beej Vikas Nigam
Limited
2015-16 2019-20 -35.94 229.63 6.92
13 Uttar Pradesh Matsya Vikas
Nigam Limited
2016-17 2019-20 0.92 8.58 1.07
14 Uttar Pradesh Drugs and
Pharmaceuticals Limited
2009-10 2012-13 -8.53 0.33 1.1

State Finances Audit Report for the year ended 31 March 2020
182
Sl. No. Name of the PSUs Period of latest
finalised accounts
Year in
which
finalised
Net
Profit/Loss
after Intt.,
Tax &
Dividend
Turnover Paid Up
Capital
15 Uttar Pradesh Rajya Chini Avam
Ganna Vikas Nigam Limited
(Subsidiary of Uttar Pradesh
State Sugar Corporation Limited)
2015-16 2018-19 -11.5 0 880.13
16 Uttar Pradesh State Sugar
Corporation Limited
2015-16
2018-19 0.87 100.39 1648.31
17 Uttar Pradesh Handicraft &
Marketing Development
Corporation Limited (Formerly
Uttar Pradesh Export Corporation
Limited)
2007-08 2017-18 -0.13 10.65 7.24
18 Uttar Pradesh State Tourism
Development Corporation
Limited
2016-17 2019-20 0.52 34.03 32.6
19 Lucknow City Transport Services
Limited
Accounts not
received
- - - -
20 Meerut City Transport Services
Limited
2013-14 2019-20 -0.17 17.19 0.05
21 Agra Mathura City Transport
Services Limited
Accounts not
received
- - - -
22 Kanpur City Transport Services
Limited
Accounts not
received
- - - -
23 Varanasi City Transport Services
Limited
Accounts not
received
- - - -
24 Uttar Pradesh Medical Supply
Corporation Limited
(Incorporated on 23.03.2018)
Accounts not
received
- - - -
25 Uttar Pradesh Rajya Krishi Evam
Gramin Vikas Nigam Limited
(Incorporated on 04.10.2018)
Accounts not
received
- - - -
Sub Total (a) 90.91 8425.59 2935.77
b Other Government Controlled
Companies
26 Jhansi Smart City Limited
(Incorporated on 22.11.2016)
Accounts not
received
- - - -
27 Kanpur Smart City Limited
(Incorporated on 08.12.2016)
Accounts not
received
- - - -
28 Bareilly Smart City Limited
(Incorporated on 03.04.2018)
Accounts not
received
- - - -
29 Prayagraj Smart City Limited
(Incorporated on 29.08.2017)
Accounts not
received
- - - -
30 Lucknow Smart City Limited 2016-17 2017-18 -0.22 0.00 0.50
31 Moradabad Smart City Limited
(DOI 16.06.2018)
Accounts not
received
- - -
32 Saharanpur Smart City Limited
(DOI 01.03.2018)
Accounts not
received
- - -
Sub Total (b) -0.22 0.00 0.50
c Statutory Corporation
33 Uttar Pradesh Financial
Corporation
2012-13 2015-16 17.38 22.22 179.28
34 Uttar Pradesh State Warehousing
Corporation
2016-17 2018-19 45.66 474.83 13.00
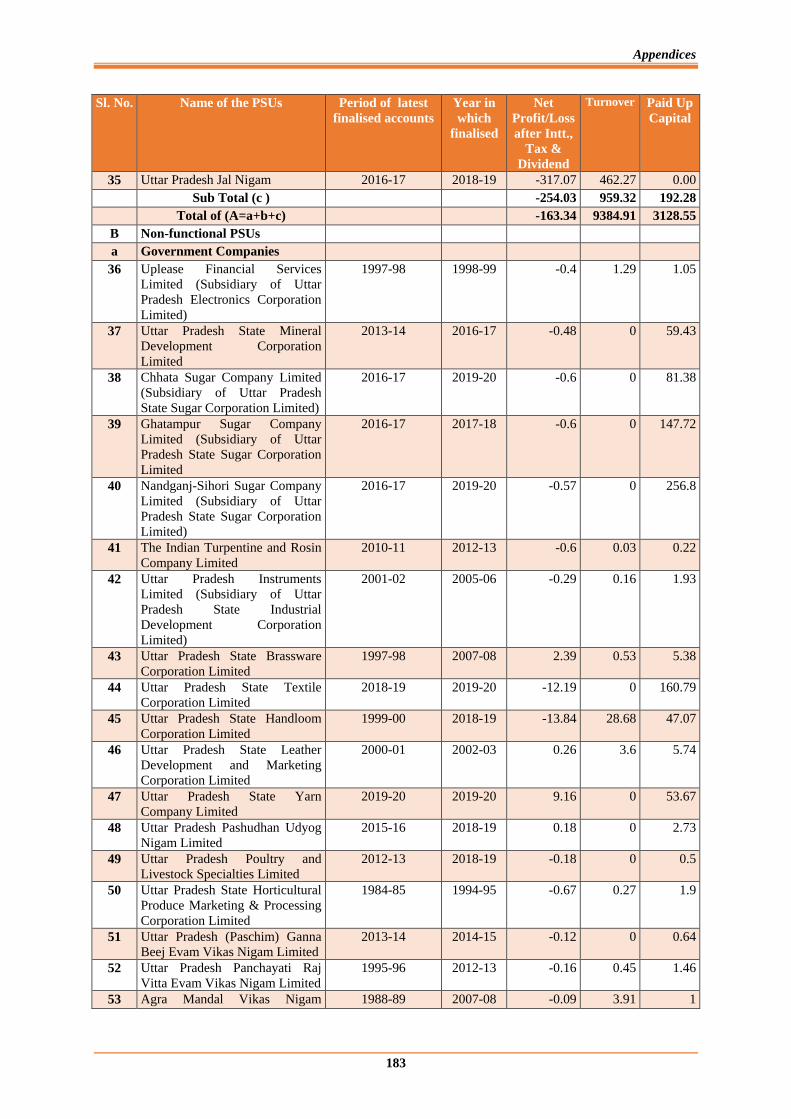
Appendices
183
Sl. No. Name of the PSUs Period of latest
finalised accounts
Year in
which
finalised
Net
Profit/Loss
after Intt.,
Tax &
Dividend
Turnover Paid Up
Capital
35 Uttar Pradesh Jal Nigam 2016-17 2018-19 -317.07 462.27 0.00
Sub Total (c ) -254.03 959.32 192.28
Total of (A=a+b+c) -163.34 9384.91 3128.55
B Non-functional PSUs
a Government Companies
36 Uplease Financial Services
Limited (Subsidiary of Uttar
Pradesh Electronics Corporation
Limited)
1997-98 1998-99 -0.4 1.29 1.05
37 Uttar Pradesh State Mineral
Development Corporation
Limited
2013-14 2016-17 -0.48 0 59.43
38 Chhata Sugar Company Limited
(Subsidiary of Uttar Pradesh
State Sugar Corporation Limited)
2016-17 2019-20 -0.6 0 81.38
39 Ghatampur Sugar Company
Limited (Subsidiary of Uttar
Pradesh State Sugar Corporation
Limited
2016-17 2017-18 -0.6 0 147.72
40 Nandganj-Sihori Sugar Company
Limited (Subsidiary of Uttar
Pradesh State Sugar Corporation
Limited)
2016-17 2019-20 -0.57 0 256.8
41 The Indian Turpentine and Rosin
Company Limited
2010-11 2012-13 -0.6 0.03 0.22
42 Uttar Pradesh Instruments
Limited (Subsidiary of Uttar
Pradesh State Industrial
Development Corporation
Limited)
2001-02 2005-06 -0.29 0.16 1.93
43 Uttar Pradesh State Brassware
Corporation Limited
1997-98 2007-08 2.39 0.53 5.38
44 Uttar Pradesh State Textile
Corporation Limited
2018-19 2019-20 -12.19 0 160.79
45 Uttar Pradesh State Handloom
Corporation Limited
1999-00 2018-19 -13.84 28.68 47.07
46 Uttar Pradesh State Leather
Development and Marketing
Corporation Limited
2000-01 2002-03 0.26 3.6 5.74
47 Uttar Pradesh State Yarn
Company Limited
2019-20 2019-20 9.16 0 53.67
48 Uttar Pradesh Pashudhan Udyog
Nigam Limited
2015-16 2018-19 0.18 0 2.73
49 Uttar Pradesh Poultry and
Livestock Specialties Limited
2012-13 2018-19 -0.18 0 0.5
50 Uttar Pradesh State Horticultural
Produce Marketing & Processing
Corporation Limited
1984-85 1994-95 -0.67 0.27 1.9
51 Uttar Pradesh (Paschim) Ganna
Beej Evam Vikas Nigam Limited
2013-14 2014-15 -0.12 0 0.64
52 Uttar Pradesh Panchayati Raj
Vitta Evam Vikas Nigam Limited
1995-96 2012-13 -0.16 0.45 1.46
53 Agra Mandal Vikas Nigam 1988-89 2007-08 -0.09 3.91 1
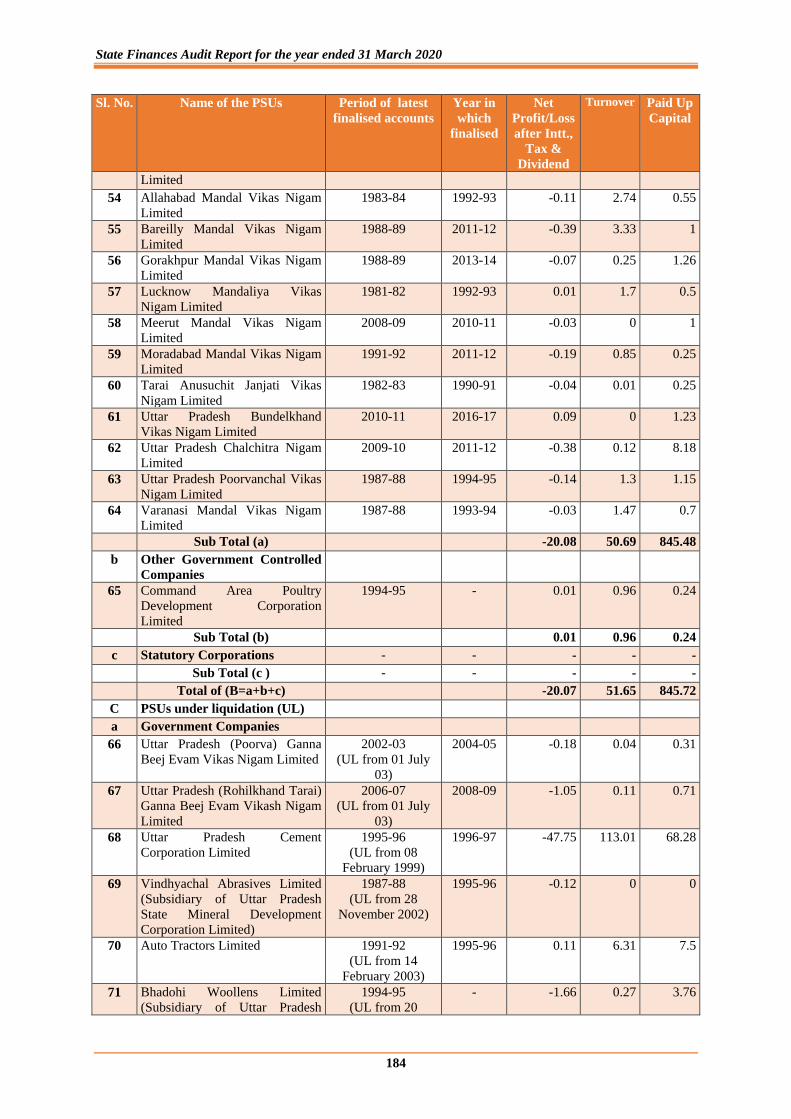
State Finances Audit Report for the year ended 31 March 2020
184
Sl. No. Name of the PSUs Period of latest
finalised accounts
Year in
which
finalised
Net
Profit/Loss
after Intt.,
Tax &
Dividend
Turnover Paid Up
Capital
Limited
54 Allahabad Mandal Vikas Nigam
Limited
1983-84 1992-93 -0.11 2.74 0.55
55 Bareilly Mandal Vikas Nigam
Limited
1988-89 2011-12 -0.39 3.33 1
56 Gorakhpur Mandal Vikas Nigam
Limited
1988-89 2013-14 -0.07 0.25 1.26
57 Lucknow Mandaliya Vikas
Nigam Limited
1981-82 1992-93 0.01 1.7 0.5
58 Meerut Mandal Vikas Nigam
Limited
2008-09 2010-11 -0.03 0 1
59 Moradabad Mandal Vikas Nigam
Limited
1991-92 2011-12 -0.19 0.85 0.25
60 Tarai Anusuchit Janjati Vikas
Nigam Limited
1982-83 1990-91 -0.04 0.01 0.25
61 Uttar Pradesh Bundelkhand
Vikas Nigam Limited
2010-11 2016-17 0.09 0 1.23
62 Uttar Pradesh Chalchitra Nigam
Limited
2009-10 2011-12 -0.38 0.12 8.18
63 Uttar Pradesh Poorvanchal Vikas
Nigam Limited
1987-88 1994-95 -0.14 1.3 1.15
64 Varanasi Mandal Vikas Nigam
Limited
1987-88 1993-94 -0.03 1.47 0.7
Sub Total (a) -20.08 50.69 845.48
b Other Government Controlled
Companies
65 Command Area Poultry
Development Corporation
Limited
1994-95 - 0.01 0.96 0.24
Sub Total (b) 0.01 0.96 0.24
c Statutory Corporations - - - - -
Sub Total (c ) - - - - -
Total of (B=a+b+c) -20.07 51.65 845.72
C PSUs under liquidation (UL)
a Government Companies
66 Uttar Pradesh (Poorva) Ganna
Beej Evam Vikas Nigam Limited
2002-03
(UL from 01 July
03)
2004-05 -0.18 0.04 0.31
67 Uttar Pradesh (Rohilkhand Tarai)
Ganna Beej Evam Vikash Nigam
Limited
2006-07
(UL from 01 July
03)
2008-09 -1.05 0.11 0.71
68 Uttar Pradesh Cement
Corporation Limited
1995-96
(UL from 08
February 1999)
1996-97 -47.75 113.01 68.28
69 Vindhyachal Abrasives Limited
(Subsidiary of Uttar Pradesh
State Mineral Development
Corporation Limited)
1987-88
(UL from 28
November 2002)
1995-96 -0.12 0 0
70 Auto Tractors Limited 1991-92
(UL from 14
February 2003)
1995-96 0.11 6.31 7.5
71 Bhadohi Woollens Limited
(Subsidiary of Uttar Pradesh
1994-95
(UL from 20
- -1.66 0.27 3.76
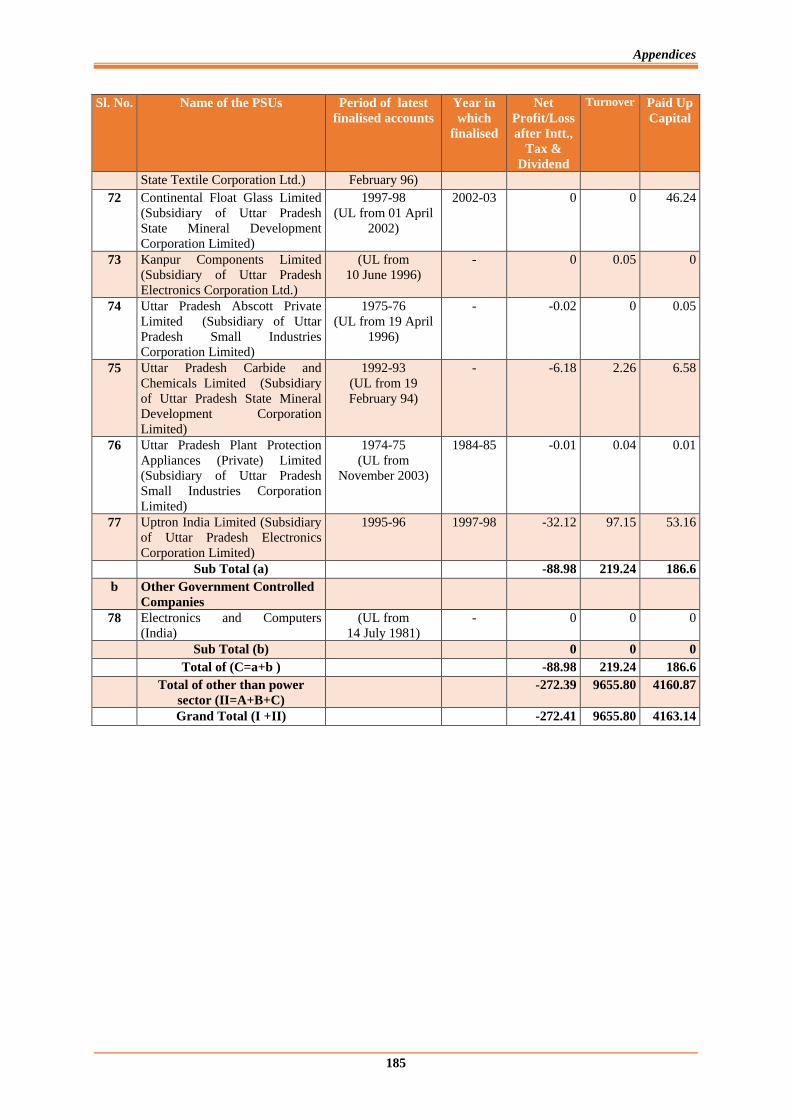
Appendices
185
Sl. No. Name of the PSUs Period of latest
finalised accounts
Year in
which
finalised
Net
Profit/Loss
after Intt.,
Tax &
Dividend
Turnover Paid Up
Capital
State Textile Corporation Ltd.) February 96)
72 Continental Float Glass Limited
(Subsidiary of Uttar Pradesh
State Mineral Development
Corporation Limited)
1997-98
(UL from 01 April
2002)
2002-03 0 0 46.24
73 Kanpur Components Limited
(Subsidiary of Uttar Pradesh
Electronics Corporation Ltd.)
(UL from
10 June 1996)
- 0 0.05 0
74 Uttar Pradesh Abscott Private
Limited (Subsidiary of Uttar
Pradesh Small Industries
Corporation Limited)
1975-76
(UL from 19 April
1996)
- -0.02 0 0.05
75 Uttar Pradesh Carbide and
Chemicals Limited (Subsidiary
of Uttar Pradesh State Mineral
Development Corporation
Limited)
1992-93
(UL from 19
February 94)
- -6.18 2.26 6.58
76 Uttar Pradesh Plant Protection
Appliances (Private) Limited
(Subsidiary of Uttar Pradesh
Small Industries Corporation
Limited)
1974-75
(UL from
November 2003)
1984-85 -0.01 0.04 0.01
77 Uptron India Limited (Subsidiary
of Uttar Pradesh Electronics
Corporation Limited)
1995-96 1997-98 -32.12 97.15 53.16
Sub Total (a) -88.98 219.24 186.6
b Other Government Controlled
Companies
78 Electronics and Computers
(India)
(UL from
14 July 1981)
- 0 0 0
Sub Total (b) 0 0 0
Total of (C=a+b ) -88.98 219.24 186.6
Total of other than power
sector (II=A+B+C)
-272.39 9655.80 4160.87
Grand Total (I +II) -272.41 9655.80 4163.14
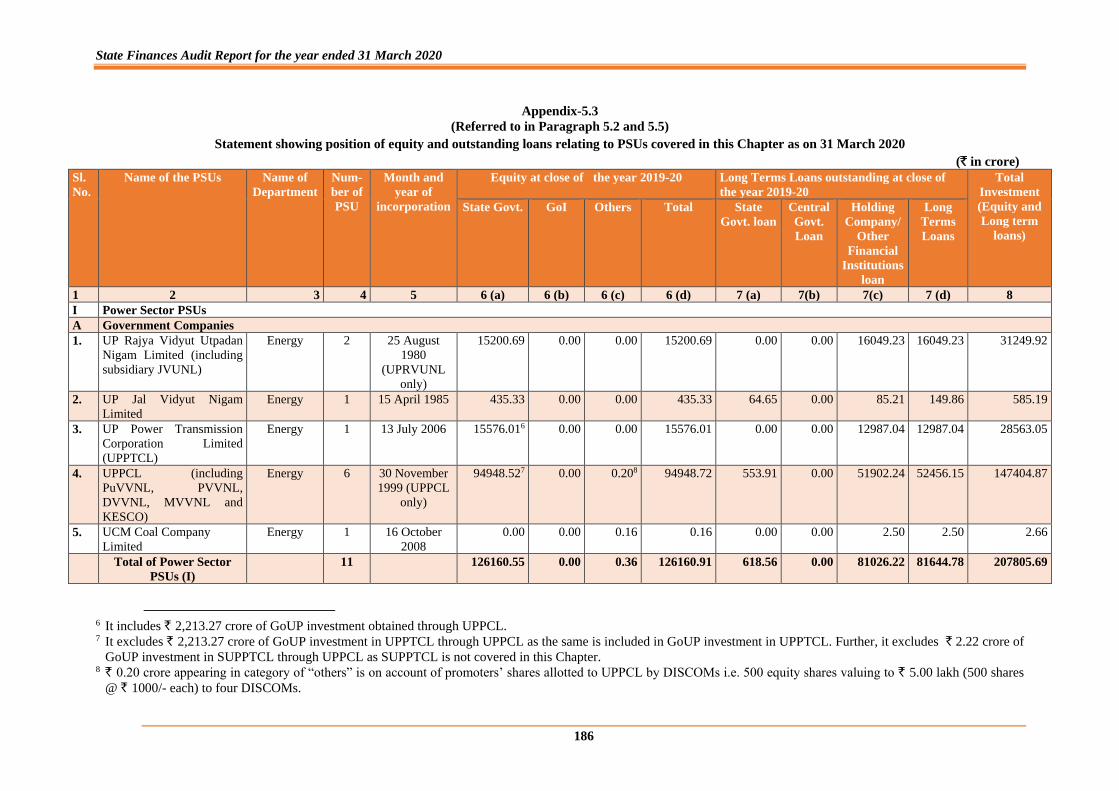
State Finances Audit Report for the year ended 31 March 2020
186
Appendix-5.3
(Referred to in Paragraph 5.2 and 5.5)
Statement showing position of equity and outstanding loans relating to PSUs covered in this Chapter as on 31 March 2020
(` in crore)
Sl.
No.
Name of the PSUs Name of
Department
Num-
ber of
PSU
Month and
year of
incorporation
Equity at close of the year 2019-20 Long Terms Loans outstanding at close of
the year 2019-20
Total
Investment
(Equity and
Long term
loans)
State Govt. GoI
Others Total State
Govt. loan
Central
Govt.
Loan
Holding
Company/
Other
Financial
Institutions
loan
Long
Terms
Loans
1 2 3 4 5 6 (a) 6 (b) 6 (c) 6 (d) 7 (a) 7(b) 7(c) 7 (d) 8
I Power Sector PSUs
A Government Companies
1. UP Rajya Vidyut Utpadan
Nigam Limited (including
subsidiary JVUNL)
Energy 2 25 August
1980
(UPRVUNL
only)
15200.69
0.00 0.00 15200.69
0.00 0.00 16049.23
16049.23 31249.92
2. UP Jal Vidyut Nigam
Limited
Energy 1 15 April 1985 435.33 0.00 0.00 435.33 64.65 0.00 85.21 149.86 585.19
3. UP Power Transmission
Corporation Limited
(UPPTCL)
Energy 1 13 July 2006 15576.016 0.00 0.00 15576.01 0.00 0.00 12987.04 12987.04 28563.05
4. UPPCL (including
PuVVNL, PVVNL,
DVVNL, MVVNL and
KESCO)
Energy 6 30 November
1999 (UPPCL
only)
94948.527 0.00 0.208 94948.72 553.91 0.00 51902.24 52456.15 147404.87
5. UCM Coal Company
Limited
Energy 1 16 October
2008
0.00 0.00 0.16 0.16 0.00 0.00 2.50 2.50 2.66
Total of Power Sector
PSUs (I)
11 126160.55 0.00 0.36 126160.91 618.56 0.00 81026.22 81644.78 207805.69
6 It includes ` 2,213.27 crore of GoUP investment obtained through UPPCL. 7 It excludes ` 2,213.27 crore of GoUP investment in UPPTCL through UPPCL as the same is included in GoUP investment in UPPTCL. Further, it excludes ` 2.22 crore of
GoUP investment in SUPPTCL through UPPCL as SUPPTCL is not covered in this Chapter. 8 ̀ 0.20 crore appearing in category of “others” is on account of promoters’ shares allotted to UPPCL by DISCOMs i.e. 500 equity shares valuing to ` 5.00 lakh (500 shares
@ ` 1000/- each) to four DISCOMs.

Appendices
187
Sl.
No.
Name of the PSUs Name of
Department
Num-
ber of
PSU
Month and
year of
incorporation
Equity at close of the year 2019-20 Long Terms Loans outstanding at close of
the year 2019-20
Total
Investment
(Equity and
Long term
loans)
State Govt. GoI
Others Total State
Govt. loan
Central
Govt.
Loan
Holding
Company/
Other
Financial
Institutions
loan
Long
Terms
Loans
II Other than Power Sector PSUs
B Government Companies
1 U P Metro Rail
Corporation Limited
(Erstwhile Lucknow Metro
Rail Corporation Limited)
Housing and
Urban
Planning
1 25 November
2013
1277.95 1138.94 0.05 2416.94 830.00 297.00 3502.00 4629.00 7045.94
2 NOIDA Metro Rail
Corporation Limited
Infrastructure
and
Industrial
Development
1 11 May 2014 0.00 687.62 712.62 1400.24 240.55 283.00 1430.00 1953.55 3353.79
3 U.P. Projects Corporation
Limited
Irrigation 1 26 May 1976 5.40 1.00 0.00 6.40 0.00 0.00 0.00 0.00 6.40
4 Uttar Pradesh State
Construction &
Infrastructure Development
Corporation Limited
(formely known as Uttar
Pradesh Samaj Kalyan
Nirman Nigam Limited)
Samaj
Kalyan
1 25 June 1976 0.15 0.00 0.00 0.15 0.00 0.00 0.00 0.00 0.15
5 Shreetron India Limited
(Subsidiary of Uttar
Pradesh Electronics
Corporation Limited)
Information
Technology
and
Electronics
1 02 October
1979
0.00 0.00 0.77 0.77 0.00 0.00 0.00 0.00 0.77
6 Uptron Powertronics Ltd.
(subsidiary of Uttar
Pradesh Electronics
Corporation)
Information
Technology
and
Electronics
1 04 October
1974
0.00 0.00 1.47 1.47 0.00 0.00 2.64 2.64 4.11
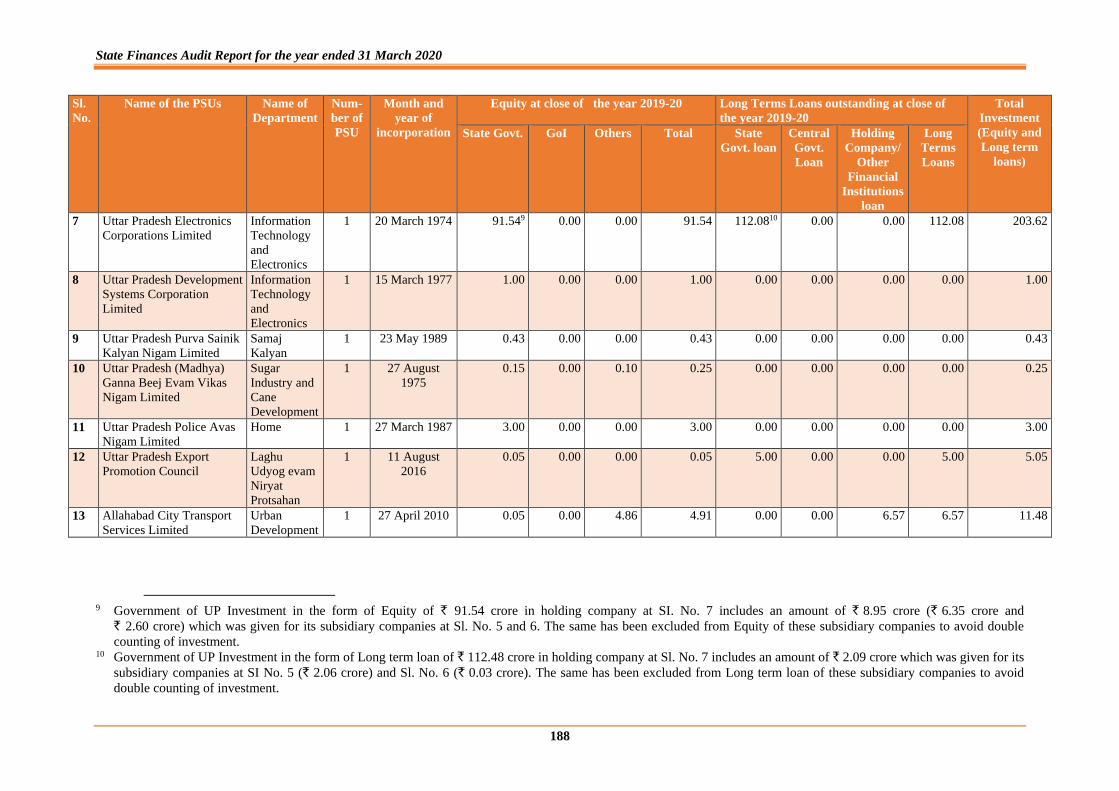
State Finances Audit Report for the year ended 31 March 2020
188
Sl.
No.
Name of the PSUs Name of
Department
Num-
ber of
PSU
Month and
year of
incorporation
Equity at close of the year 2019-20 Long Terms Loans outstanding at close of
the year 2019-20
Total
Investment
(Equity and
Long term
loans)
State Govt. GoI
Others Total State
Govt. loan
Central
Govt.
Loan
Holding
Company/
Other
Financial
Institutions
loan
Long
Terms
Loans
7 Uttar Pradesh Electronics
Corporations Limited
Information
Technology
and
Electronics
1 20 March 1974 91.549 0.00 0.00 91.54 112.0810 0.00 0.00 112.08 203.62
8 Uttar Pradesh Development
Systems Corporation
Limited
Information
Technology
and
Electronics
1 15 March 1977 1.00 0.00 0.00 1.00 0.00 0.00 0.00 0.00 1.00
9 Uttar Pradesh Purva Sainik
Kalyan Nigam Limited
Samaj
Kalyan
1 23 May 1989 0.43 0.00 0.00 0.43 0.00 0.00 0.00 0.00 0.43
10 Uttar Pradesh (Madhya)
Ganna Beej Evam Vikas
Nigam Limited
Sugar
Industry and
Cane
Development
1 27 August
1975
0.15 0.00 0.10 0.25 0.00 0.00 0.00 0.00 0.25
11 Uttar Pradesh Police Avas
Nigam Limited
Home 1 27 March 1987 3.00 0.00 0.00 3.00 0.00 0.00 0.00 0.00 3.00
12 Uttar Pradesh Export
Promotion Council
Laghu
Udyog evam
Niryat
Protsahan
1 11 August
2016
0.05 0.00 0.00 0.05 5.00 0.00 0.00 5.00 5.05
13 Allahabad City Transport
Services Limited
Urban
Development
1 27 April 2010 0.05 0.00 4.86 4.91 0.00 0.00 6.57 6.57 11.48
9 Government of UP Investment in the form of Equity of ` 91.54 crore in holding company at SI. No. 7 includes an amount of ` 8.95 crore (` 6.35 crore and
` 2.60 crore) which was given for its subsidiary companies at Sl. No. 5 and 6. The same has been excluded from Equity of these subsidiary companies to avoid double
counting of investment. 10 Government of UP Investment in the form of Long term loan of ` 112.48 crore in holding company at Sl. No. 7 includes an amount of ` 2.09 crore which was given for its
subsidiary companies at SI No. 5 (` 2.06 crore) and Sl. No. 6 (` 0.03 crore). The same has been excluded from Long term loan of these subsidiary companies to avoid
double counting of investment.
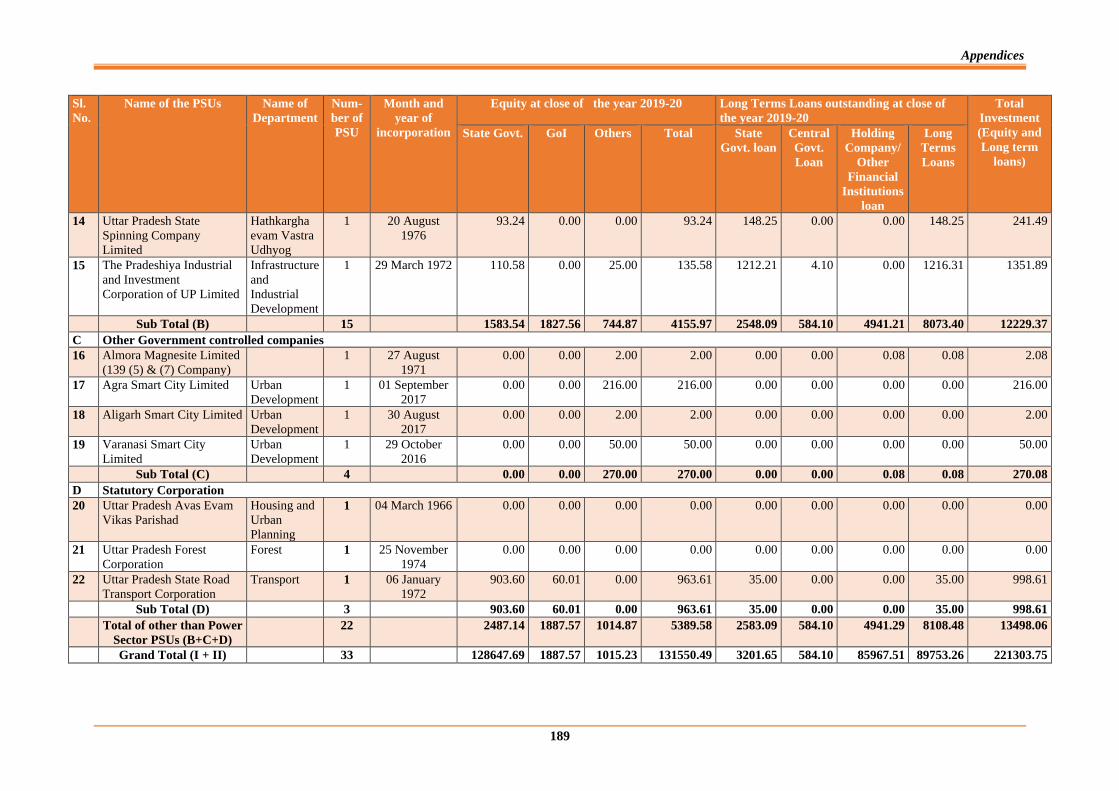
Appendices
189
Sl.
No.
Name of the PSUs Name of
Department
Num-
ber of
PSU
Month and
year of
incorporation
Equity at close of the year 2019-20 Long Terms Loans outstanding at close of
the year 2019-20
Total
Investment
(Equity and
Long term
loans)
State Govt. GoI
Others Total State
Govt. loan
Central
Govt.
Loan
Holding
Company/
Other
Financial
Institutions
loan
Long
Terms
Loans
14 Uttar Pradesh State
Spinning Company
Limited
Hathkargha
evam Vastra
Udhyog
1 20 August
1976
93.24 0.00 0.00 93.24 148.25 0.00 0.00 148.25 241.49
15 The Pradeshiya Industrial
and Investment
Corporation of UP Limited
Infrastructure
and
Industrial
Development
1 29 March 1972 110.58 0.00 25.00 135.58 1212.21 4.10 0.00 1216.31 1351.89
Sub Total (B) 15 1583.54 1827.56 744.87 4155.97 2548.09 584.10 4941.21 8073.40 12229.37
C Other Government controlled companies
16 Almora Magnesite Limited
(139 (5) & (7) Company)
1 27 August
1971
0.00 0.00 2.00 2.00 0.00 0.00 0.08 0.08 2.08
17 Agra Smart City Limited Urban
Development
1 01 September
2017
0.00 0.00 216.00 216.00 0.00 0.00 0.00 0.00 216.00
18 Aligarh Smart City Limited Urban
Development
1 30 August
2017
0.00 0.00 2.00 2.00 0.00 0.00 0.00 0.00 2.00
19 Varanasi Smart City
Limited
Urban
Development
1 29 October
2016
0.00 0.00 50.00 50.00 0.00 0.00 0.00 0.00 50.00
Sub Total (C) 4 0.00 0.00 270.00 270.00 0.00 0.00 0.08 0.08 270.08
D Statutory Corporation
20 Uttar Pradesh Avas Evam
Vikas Parishad
Housing and
Urban
Planning
1 04 March 1966 0.00 0.00 0.00 0.00 0.00 0.00 0.00 0.00 0.00
21 Uttar Pradesh Forest
Corporation
Forest 1 25 November
1974
0.00 0.00 0.00 0.00 0.00 0.00 0.00 0.00 0.00
22 Uttar Pradesh State Road
Transport Corporation
Transport 1 06 January
1972
903.60 60.01 0.00 963.61 35.00 0.00 0.00 35.00 998.61
Sub Total (D) 3 903.60 60.01 0.00 963.61 35.00 0.00 0.00 35.00 998.61
Total of other than Power
Sector PSUs (B+C+D) 22 2487.14 1887.57 1014.87 5389.58 2583.09 584.10 4941.29 8108.48 13498.06
Grand Total (I + II) 33 128647.69 1887.57 1015.23 131550.49 3201.65 584.10 85967.51 89753.26 221303.75
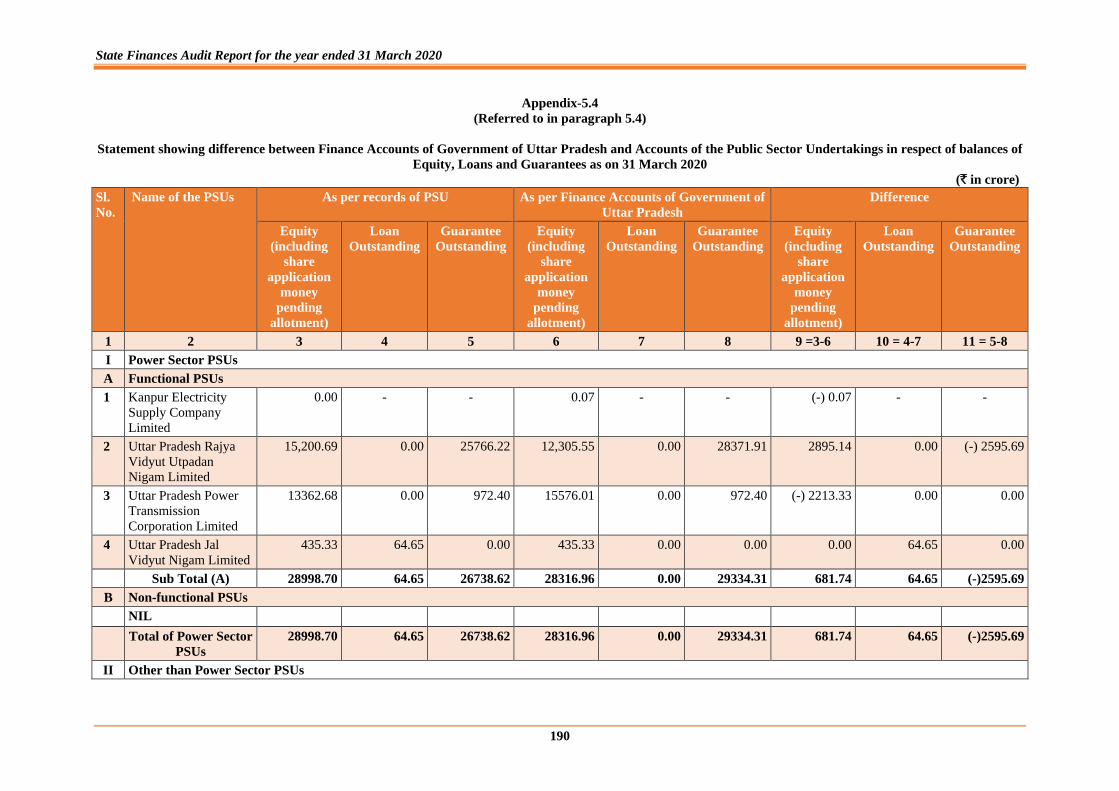
State Finances Audit Report for the year ended 31 March 2020
190
Appendix-5.4
(Referred to in paragraph 5.4)
Statement showing difference between Finance Accounts of Government of Uttar Pradesh and Accounts of the Public Sector Undertakings in respect of balances of
Equity, Loans and Guarantees as on 31 March 2020
(` in crore)
Sl.
No.
Name of the PSUs As per records of PSU As per Finance Accounts of Government of
Uttar Pradesh
Difference
Equity
(including
share
application
money
pending
allotment)
Loan
Outstanding
Guarantee
Outstanding
Equity
(including
share
application
money
pending
allotment)
Loan
Outstanding
Guarantee
Outstanding
Equity
(including
share
application
money
pending
allotment)
Loan
Outstanding
Guarantee
Outstanding
1 2 3 4 5 6 7 8 9 =3-6 10 = 4-7 11 = 5-8
I Power Sector PSUs
A Functional PSUs
1 Kanpur Electricity
Supply Company
Limited
0.00 - - 0.07 - - (-) 0.07 - -
2 Uttar Pradesh Rajya
Vidyut Utpadan
Nigam Limited
15,200.69 0.00 25766.22 12,305.55 0.00 28371.91 2895.14 0.00 (-) 2595.69
3 Uttar Pradesh Power
Transmission
Corporation Limited
13362.68 0.00 972.40 15576.01 0.00 972.40 (-) 2213.33 0.00 0.00
4 Uttar Pradesh Jal
Vidyut Nigam Limited
435.33 64.65 0.00 435.33 0.00 0.00 0.00 64.65 0.00
Sub Total (A) 28998.70 64.65 26738.62 28316.96 0.00 29334.31 681.74 64.65 (-)2595.69
B Non-functional PSUs
NIL
Total of Power Sector
PSUs
28998.70 64.65 26738.62 28316.96 0.00 29334.31 681.74 64.65 (-)2595.69
II Other than Power Sector PSUs
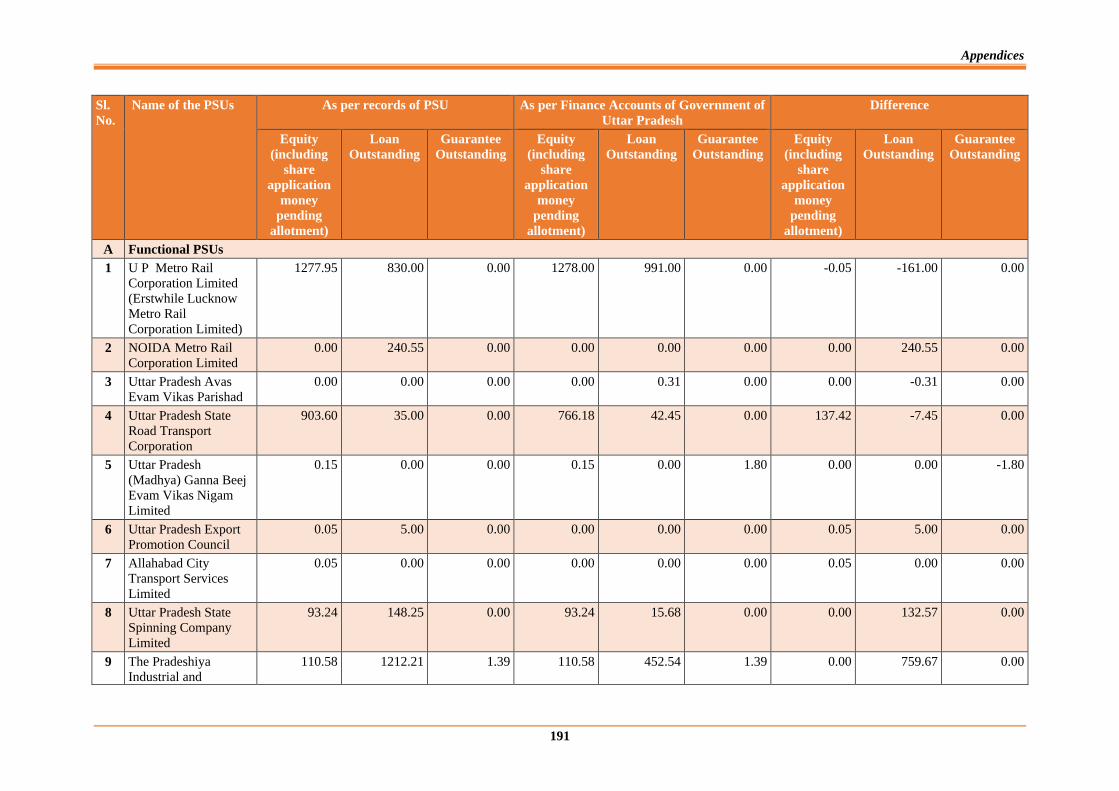
Appendices
191
Sl.
No.
Name of the PSUs As per records of PSU As per Finance Accounts of Government of
Uttar Pradesh
Difference
Equity
(including
share
application
money
pending
allotment)
Loan
Outstanding
Guarantee
Outstanding
Equity
(including
share
application
money
pending
allotment)
Loan
Outstanding
Guarantee
Outstanding
Equity
(including
share
application
money
pending
allotment)
Loan
Outstanding
Guarantee
Outstanding
A Functional PSUs
1 U P Metro Rail
Corporation Limited
(Erstwhile Lucknow
Metro Rail
Corporation Limited)
1277.95 830.00 0.00 1278.00 991.00 0.00 -0.05 -161.00 0.00
2 NOIDA Metro Rail
Corporation Limited
0.00 240.55 0.00 0.00 0.00 0.00 0.00 240.55 0.00
3 Uttar Pradesh Avas
Evam Vikas Parishad
0.00 0.00 0.00 0.00 0.31 0.00 0.00 -0.31 0.00
4 Uttar Pradesh State
Road Transport
Corporation
903.60 35.00 0.00 766.18 42.45 0.00 137.42 -7.45 0.00
5 Uttar Pradesh
(Madhya) Ganna Beej
Evam Vikas Nigam
Limited
0.15 0.00 0.00 0.15 0.00 1.80 0.00 0.00 -1.80
6 Uttar Pradesh Export
Promotion Council
0.05 5.00 0.00 0.00 0.00 0.00 0.05 5.00 0.00
7 Allahabad City
Transport Services
Limited
0.05 0.00 0.00 0.00 0.00 0.00 0.05 0.00 0.00
8 Uttar Pradesh State
Spinning Company
Limited
93.24 148.25 0.00 93.24 15.68 0.00 0.00 132.57 0.00
9 The Pradeshiya
Industrial and
110.58 1212.21 1.39 110.58 452.54 1.39 0.00 759.67 0.00
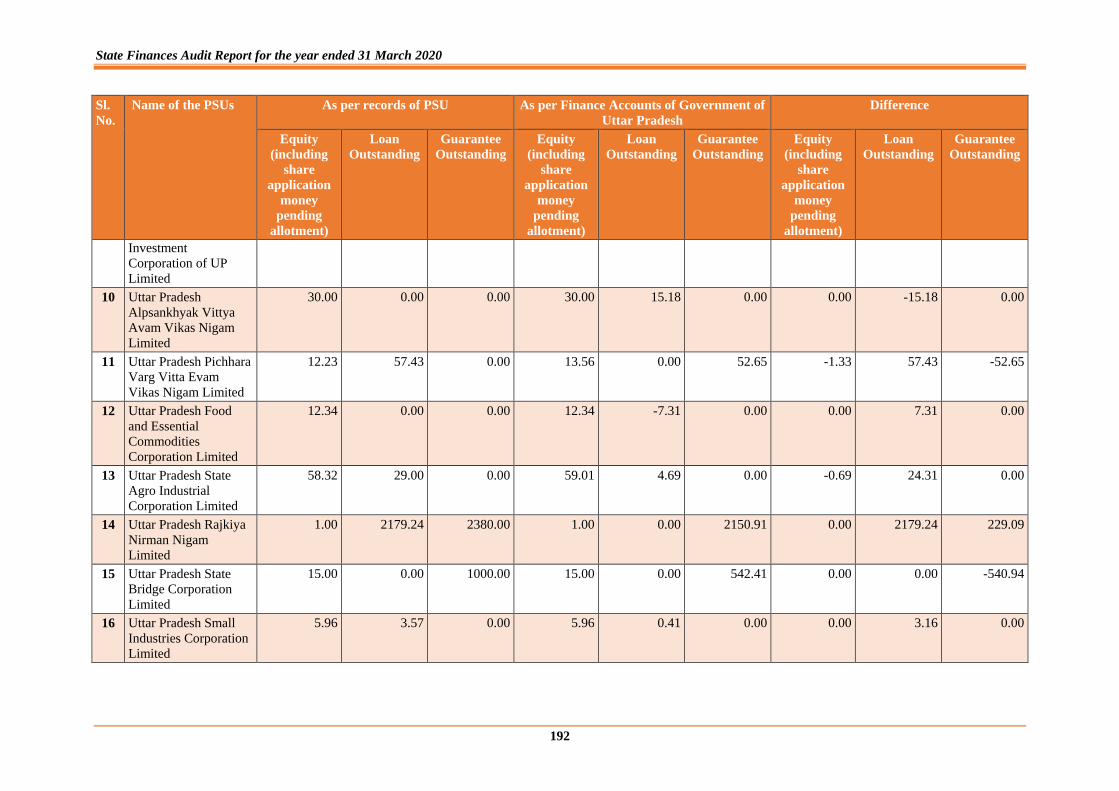
State Finances Audit Report for the year ended 31 March 2020
192
Sl.
No.
Name of the PSUs As per records of PSU As per Finance Accounts of Government of
Uttar Pradesh
Difference
Equity
(including
share
application
money
pending
allotment)
Loan
Outstanding
Guarantee
Outstanding
Equity
(including
share
application
money
pending
allotment)
Loan
Outstanding
Guarantee
Outstanding
Equity
(including
share
application
money
pending
allotment)
Loan
Outstanding
Guarantee
Outstanding
Investment
Corporation of UP
Limited
10 Uttar Pradesh
Alpsankhyak Vittya
Avam Vikas Nigam
Limited
30.00 0.00 0.00 30.00 15.18 0.00 0.00 -15.18 0.00
11 Uttar Pradesh Pichhara
Varg Vitta Evam
Vikas Nigam Limited
12.23 57.43 0.00 13.56 0.00 52.65 -1.33 57.43 -52.65
12 Uttar Pradesh Food
and Essential
Commodities
Corporation Limited
12.34 0.00 0.00 12.34 -7.31 0.00 0.00 7.31 0.00
13 Uttar Pradesh State
Agro Industrial
Corporation Limited
58.32 29.00 0.00 59.01 4.69 0.00 -0.69 24.31 0.00
14 Uttar Pradesh Rajkiya
Nirman Nigam
Limited
1.00 2179.24 2380.00 1.00 0.00 2150.91 0.00 2179.24 229.09
15 Uttar Pradesh State
Bridge Corporation
Limited
15.00 0.00 1000.00 15.00 0.00 542.41 0.00 0.00 -540.94
16 Uttar Pradesh Small
Industries Corporation
Limited
5.96 3.57 0.00 5.96 0.41 0.00 0.00 3.16 0.00
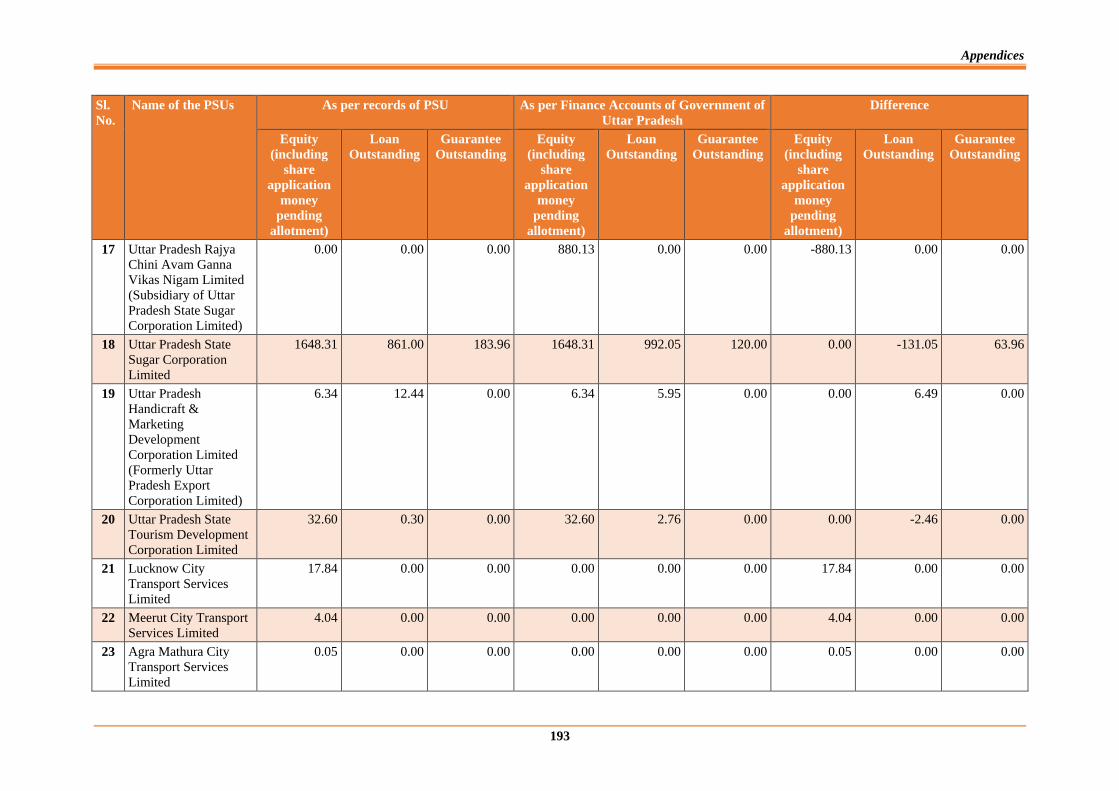
Appendices
193
Sl.
No.
Name of the PSUs As per records of PSU As per Finance Accounts of Government of
Uttar Pradesh
Difference
Equity
(including
share
application
money
pending
allotment)
Loan
Outstanding
Guarantee
Outstanding
Equity
(including
share
application
money
pending
allotment)
Loan
Outstanding
Guarantee
Outstanding
Equity
(including
share
application
money
pending
allotment)
Loan
Outstanding
Guarantee
Outstanding
17 Uttar Pradesh Rajya
Chini Avam Ganna
Vikas Nigam Limited
(Subsidiary of Uttar
Pradesh State Sugar
Corporation Limited)
0.00 0.00 0.00 880.13 0.00 0.00 -880.13 0.00 0.00
18 Uttar Pradesh State
Sugar Corporation
Limited
1648.31 861.00 183.96 1648.31 992.05 120.00 0.00 -131.05 63.96
19 Uttar Pradesh
Handicraft &
Marketing
Development
Corporation Limited
(Formerly Uttar
Pradesh Export
Corporation Limited)
6.34 12.44 0.00 6.34 5.95 0.00 0.00 6.49 0.00
20 Uttar Pradesh State
Tourism Development
Corporation Limited
32.60 0.30 0.00 32.60 2.76 0.00 0.00 -2.46 0.00
21 Lucknow City
Transport Services
Limited
17.84 0.00 0.00 0.00 0.00 0.00 17.84 0.00 0.00
22 Meerut City Transport
Services Limited
4.04 0.00 0.00 0.00 0.00 0.00 4.04 0.00 0.00
23 Agra Mathura City
Transport Services
Limited
0.05 0.00 0.00 0.00 0.00 0.00 0.05 0.00 0.00
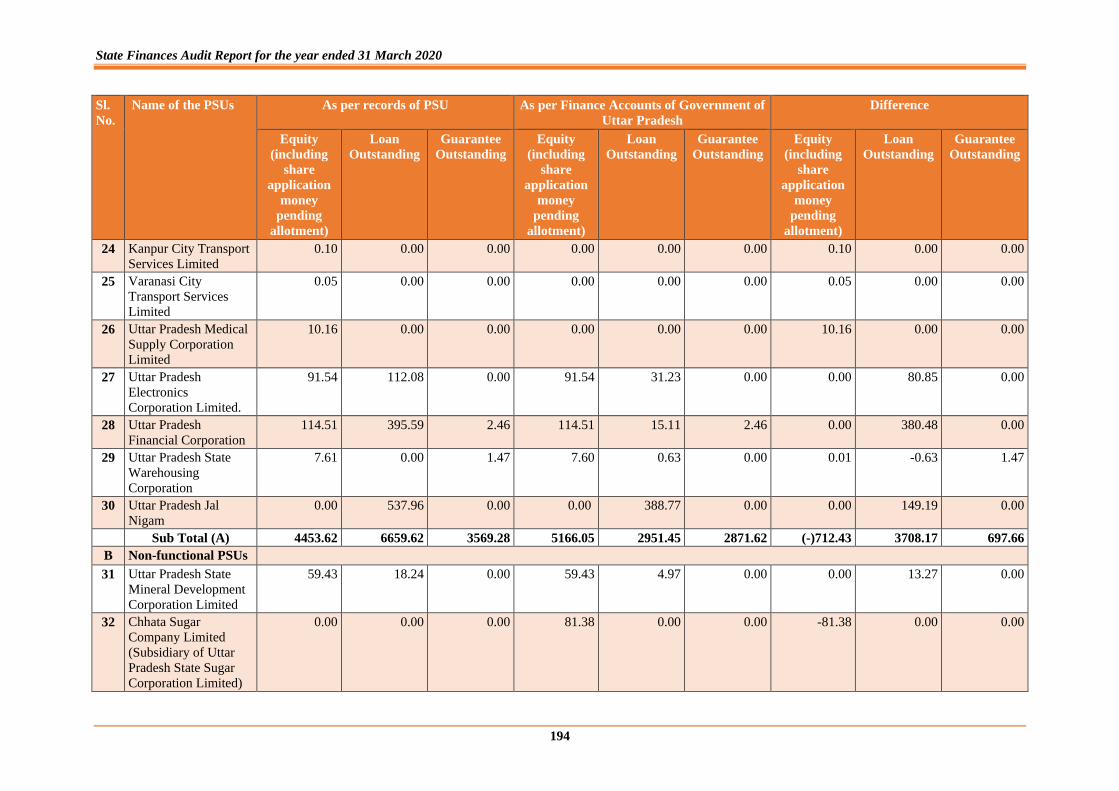
State Finances Audit Report for the year ended 31 March 2020
194
Sl.
No.
Name of the PSUs As per records of PSU As per Finance Accounts of Government of
Uttar Pradesh
Difference
Equity
(including
share
application
money
pending
allotment)
Loan
Outstanding
Guarantee
Outstanding
Equity
(including
share
application
money
pending
allotment)
Loan
Outstanding
Guarantee
Outstanding
Equity
(including
share
application
money
pending
allotment)
Loan
Outstanding
Guarantee
Outstanding
24 Kanpur City Transport
Services Limited
0.10 0.00 0.00 0.00 0.00 0.00 0.10 0.00 0.00
25 Varanasi City
Transport Services
Limited
0.05 0.00 0.00 0.00 0.00 0.00 0.05 0.00 0.00
26 Uttar Pradesh Medical
Supply Corporation
Limited
10.16 0.00 0.00 0.00 0.00 0.00 10.16 0.00 0.00
27 Uttar Pradesh
Electronics
Corporation Limited.
91.54 112.08 0.00 91.54 31.23 0.00 0.00 80.85 0.00
28 Uttar Pradesh
Financial Corporation
114.51 395.59 2.46 114.51 15.11 2.46 0.00 380.48 0.00
29 Uttar Pradesh State
Warehousing
Corporation
7.61 0.00 1.47 7.60 0.63 0.00 0.01 -0.63 1.47
30 Uttar Pradesh Jal
Nigam
0.00 537.96 0.00 0.00 388.77 0.00 0.00 149.19 0.00
Sub Total (A) 4453.62 6659.62 3569.28 5166.05 2951.45 2871.62 (-)712.43 3708.17 697.66
B Non-functional PSUs
31 Uttar Pradesh State
Mineral Development
Corporation Limited
59.43 18.24 0.00 59.43 4.97 0.00 0.00 13.27 0.00
32 Chhata Sugar
Company Limited
(Subsidiary of Uttar
Pradesh State Sugar
Corporation Limited)
0.00 0.00 0.00 81.38 0.00 0.00 -81.38 0.00 0.00
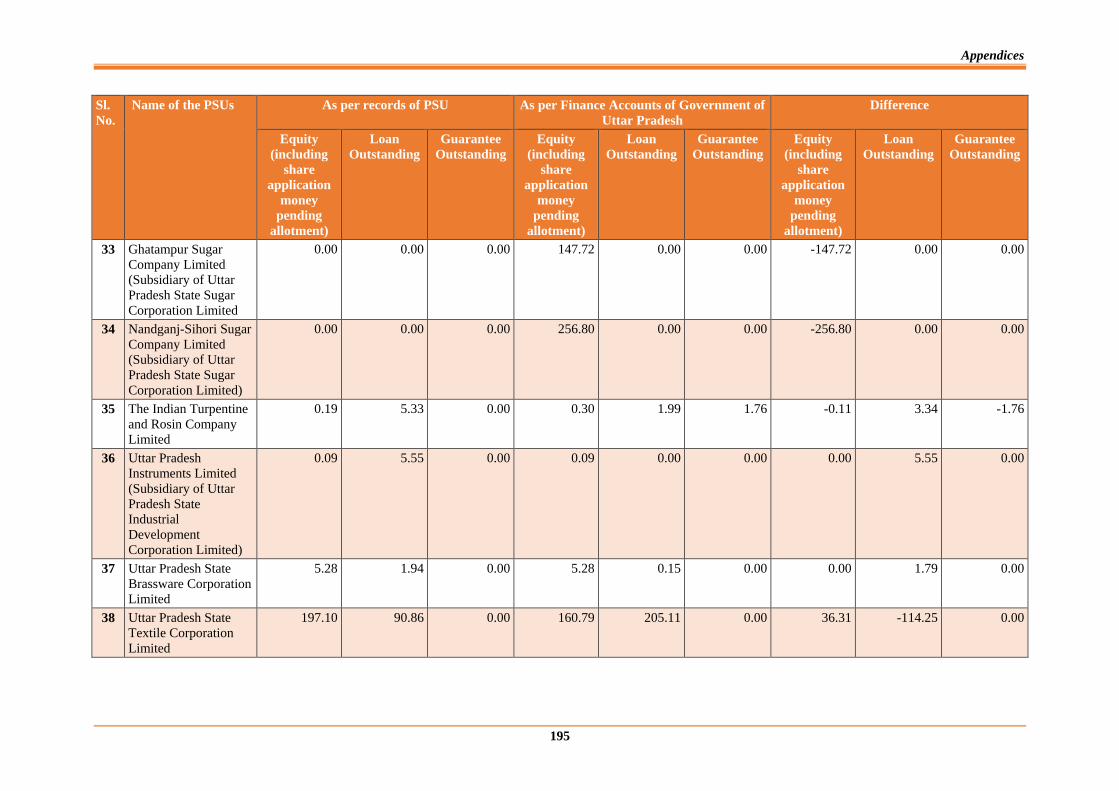
Appendices
195
Sl.
No.
Name of the PSUs As per records of PSU As per Finance Accounts of Government of
Uttar Pradesh
Difference
Equity
(including
share
application
money
pending
allotment)
Loan
Outstanding
Guarantee
Outstanding
Equity
(including
share
application
money
pending
allotment)
Loan
Outstanding
Guarantee
Outstanding
Equity
(including
share
application
money
pending
allotment)
Loan
Outstanding
Guarantee
Outstanding
33 Ghatampur Sugar
Company Limited
(Subsidiary of Uttar
Pradesh State Sugar
Corporation Limited
0.00 0.00 0.00 147.72 0.00 0.00 -147.72 0.00 0.00
34 Nandganj-Sihori Sugar
Company Limited
(Subsidiary of Uttar
Pradesh State Sugar
Corporation Limited)
0.00 0.00 0.00 256.80 0.00 0.00 -256.80 0.00 0.00
35 The Indian Turpentine
and Rosin Company
Limited
0.19 5.33 0.00 0.30 1.99 1.76 -0.11 3.34 -1.76
36 Uttar Pradesh
Instruments Limited
(Subsidiary of Uttar
Pradesh State
Industrial
Development
Corporation Limited)
0.09 5.55 0.00 0.09 0.00 0.00 0.00 5.55 0.00
37 Uttar Pradesh State
Brassware Corporation
Limited
5.28 1.94 0.00 5.28 0.15 0.00 0.00 1.79 0.00
38 Uttar Pradesh State
Textile Corporation
Limited
197.10 90.86 0.00 160.79 205.11 0.00 36.31 -114.25 0.00
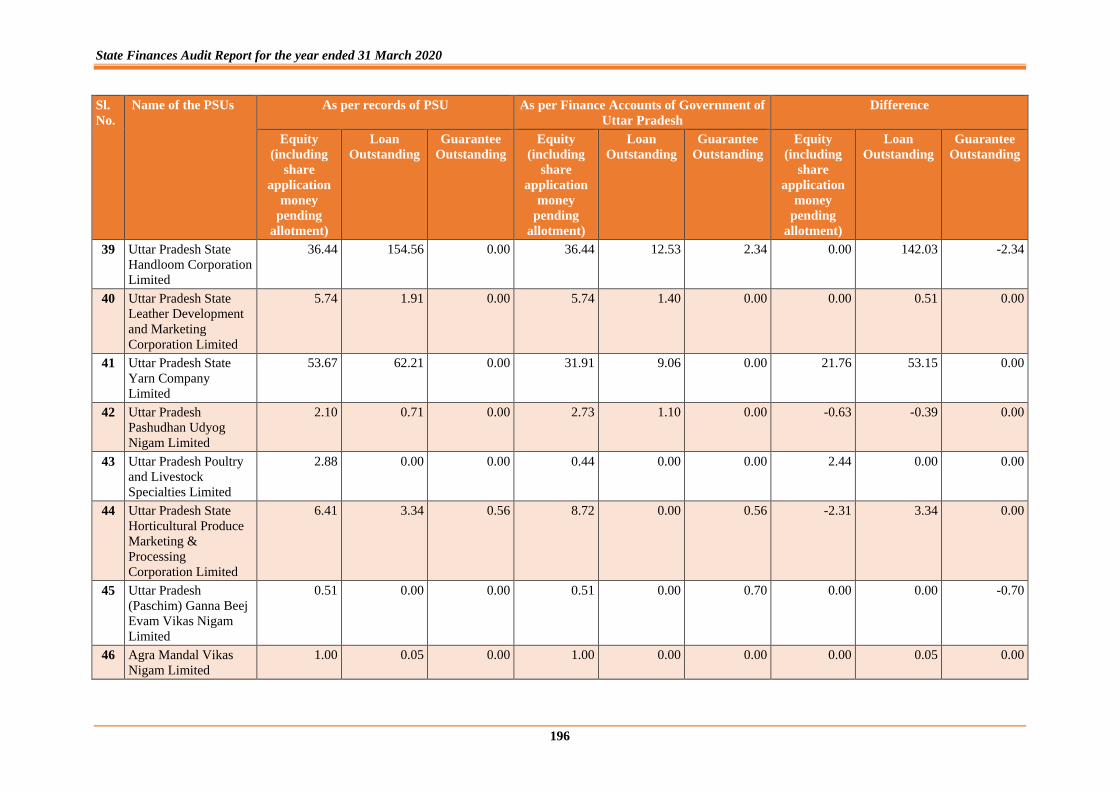
State Finances Audit Report for the year ended 31 March 2020
196
Sl.
No.
Name of the PSUs As per records of PSU As per Finance Accounts of Government of
Uttar Pradesh
Difference
Equity
(including
share
application
money
pending
allotment)
Loan
Outstanding
Guarantee
Outstanding
Equity
(including
share
application
money
pending
allotment)
Loan
Outstanding
Guarantee
Outstanding
Equity
(including
share
application
money
pending
allotment)
Loan
Outstanding
Guarantee
Outstanding
39 Uttar Pradesh State
Handloom Corporation
Limited
36.44 154.56 0.00 36.44 12.53 2.34 0.00 142.03 -2.34
40 Uttar Pradesh State
Leather Development
and Marketing
Corporation Limited
5.74 1.91 0.00 5.74 1.40 0.00 0.00 0.51 0.00
41 Uttar Pradesh State
Yarn Company
Limited
53.67 62.21 0.00 31.91 9.06 0.00 21.76 53.15 0.00
42 Uttar Pradesh
Pashudhan Udyog
Nigam Limited
2.10 0.71 0.00 2.73 1.10 0.00 -0.63 -0.39 0.00
43 Uttar Pradesh Poultry
and Livestock
Specialties Limited
2.88 0.00 0.00 0.44 0.00 0.00 2.44 0.00 0.00
44 Uttar Pradesh State
Horticultural Produce
Marketing &
Processing
Corporation Limited
6.41 3.34 0.56 8.72 0.00 0.56 -2.31 3.34 0.00
45 Uttar Pradesh
(Paschim) Ganna Beej
Evam Vikas Nigam
Limited
0.51 0.00 0.00 0.51 0.00 0.70 0.00 0.00 -0.70
46 Agra Mandal Vikas
Nigam Limited
1.00 0.05 0.00 1.00 0.00 0.00 0.00 0.05 0.00
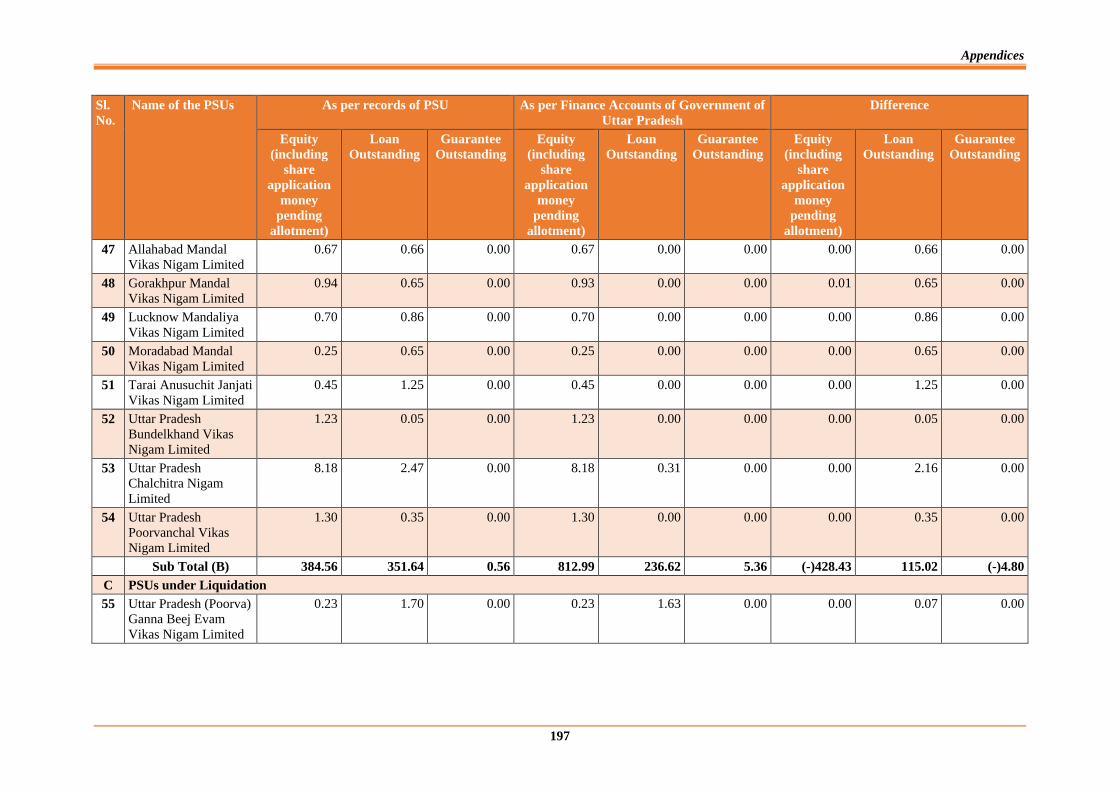
Appendices
197
Sl.
No.
Name of the PSUs As per records of PSU As per Finance Accounts of Government of
Uttar Pradesh
Difference
Equity
(including
share
application
money
pending
allotment)
Loan
Outstanding
Guarantee
Outstanding
Equity
(including
share
application
money
pending
allotment)
Loan
Outstanding
Guarantee
Outstanding
Equity
(including
share
application
money
pending
allotment)
Loan
Outstanding
Guarantee
Outstanding
47 Allahabad Mandal
Vikas Nigam Limited
0.67 0.66 0.00 0.67 0.00 0.00 0.00 0.66 0.00
48 Gorakhpur Mandal
Vikas Nigam Limited
0.94 0.65 0.00 0.93 0.00 0.00 0.01 0.65 0.00
49 Lucknow Mandaliya
Vikas Nigam Limited
0.70 0.86 0.00 0.70 0.00 0.00 0.00 0.86 0.00
50 Moradabad Mandal
Vikas Nigam Limited
0.25 0.65 0.00 0.25 0.00 0.00 0.00 0.65 0.00
51 Tarai Anusuchit Janjati
Vikas Nigam Limited
0.45 1.25 0.00 0.45 0.00 0.00 0.00 1.25 0.00
52 Uttar Pradesh
Bundelkhand Vikas
Nigam Limited
1.23 0.05 0.00 1.23 0.00 0.00 0.00 0.05 0.00
53 Uttar Pradesh
Chalchitra Nigam
Limited
8.18 2.47 0.00 8.18 0.31 0.00 0.00 2.16 0.00
54 Uttar Pradesh
Poorvanchal Vikas
Nigam Limited
1.30 0.35 0.00 1.30 0.00 0.00 0.00 0.35 0.00
Sub Total (B) 384.56 351.64 0.56 812.99 236.62 5.36 (-)428.43 115.02 (-)4.80
C PSUs under Liquidation
55 Uttar Pradesh (Poorva)
Ganna Beej Evam
Vikas Nigam Limited
0.23 1.70 0.00 0.23 1.63 0.00 0.00 0.07 0.00
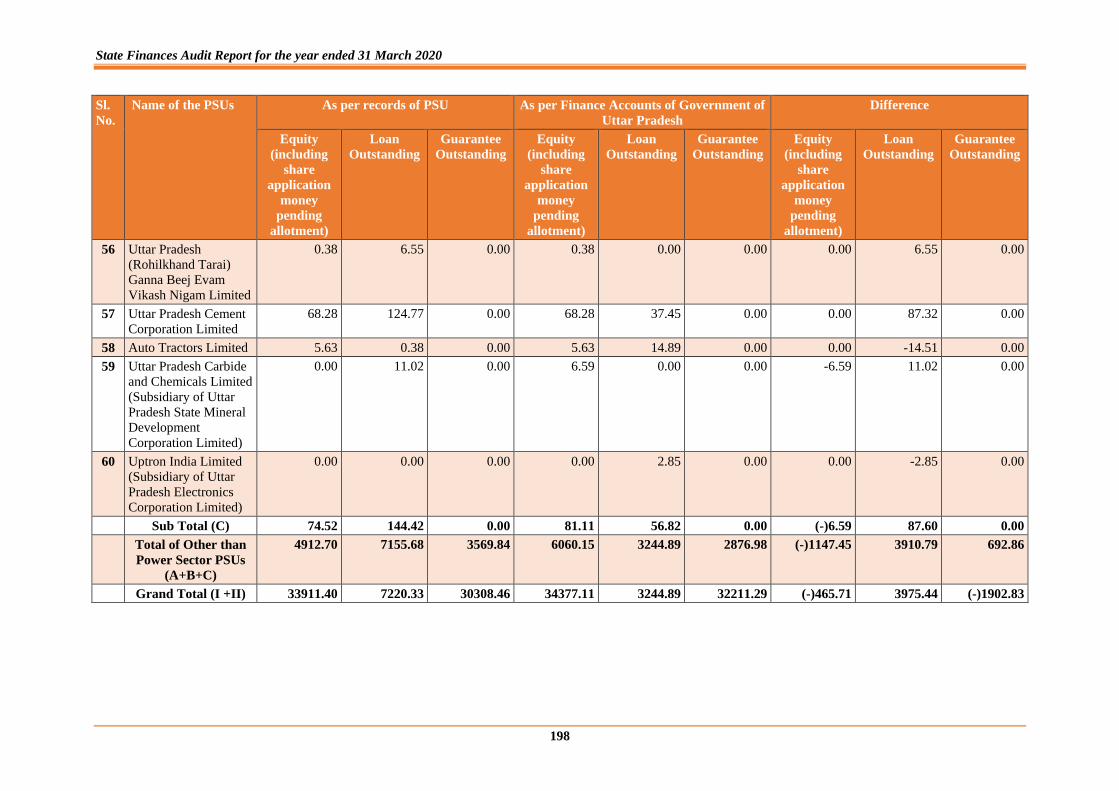
State Finances Audit Report for the year ended 31 March 2020
198
Sl.
No.
Name of the PSUs As per records of PSU As per Finance Accounts of Government of
Uttar Pradesh
Difference
Equity
(including
share
application
money
pending
allotment)
Loan
Outstanding
Guarantee
Outstanding
Equity
(including
share
application
money
pending
allotment)
Loan
Outstanding
Guarantee
Outstanding
Equity
(including
share
application
money
pending
allotment)
Loan
Outstanding
Guarantee
Outstanding
56 Uttar Pradesh
(Rohilkhand Tarai)
Ganna Beej Evam
Vikash Nigam Limited
0.38 6.55 0.00 0.38 0.00 0.00 0.00 6.55 0.00
57 Uttar Pradesh Cement
Corporation Limited
68.28 124.77 0.00 68.28 37.45 0.00 0.00 87.32 0.00
58 Auto Tractors Limited 5.63 0.38 0.00 5.63 14.89 0.00 0.00 -14.51 0.00
59 Uttar Pradesh Carbide
and Chemicals Limited
(Subsidiary of Uttar
Pradesh State Mineral
Development
Corporation Limited)
0.00 11.02 0.00 6.59 0.00 0.00 -6.59 11.02 0.00
60 Uptron India Limited
(Subsidiary of Uttar
Pradesh Electronics
Corporation Limited)
0.00 0.00 0.00 0.00 2.85 0.00 0.00 -2.85 0.00
Sub Total (C) 74.52 144.42 0.00 81.11 56.82 0.00 (-)6.59 87.60 0.00
Total of Other than
Power Sector PSUs
(A+B+C)
4912.70 7155.68 3569.84 6060.15 3244.89 2876.98 (-)1147.45 3910.79 692.86
Grand Total (I +II) 33911.40 7220.33 30308.46 34377.11 3244.89 32211.29 (-)465.71 3975.44 (-)1902.83
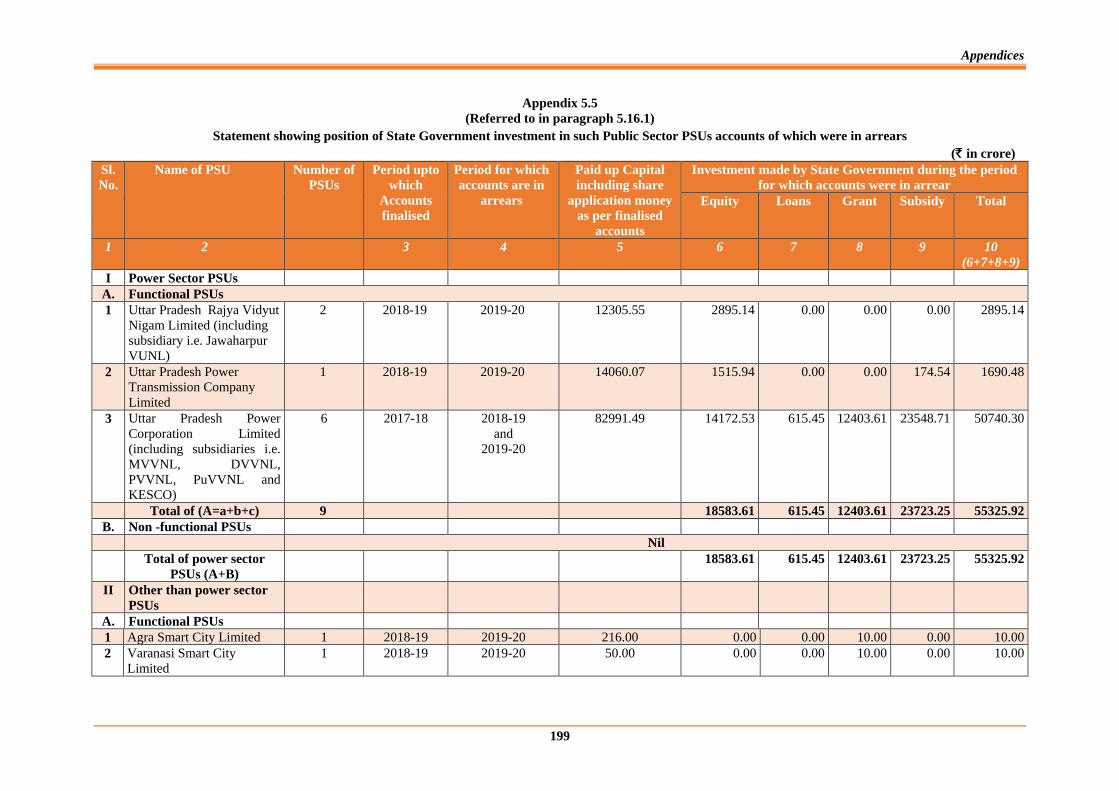
Appendices
199
Appendix 5.5
(Referred to in paragraph 5.16.1)
Statement showing position of State Government investment in such Public Sector PSUs accounts of which were in arrears
(` in crore) Sl.
No.
Name of PSU Number of
PSUs
Period upto
which
Accounts
finalised
Period for which
accounts are in
arrears
Paid up Capital
including share
application money
as per finalised
accounts
Investment made by State Government during the period
for which accounts were in arrear
Equity Loans Grant Subsidy Total
1 2 3 4 5 6 7 8 9 10
(6+7+8+9)
I Power Sector PSUs
A. Functional PSUs
1 Uttar Pradesh Rajya Vidyut
Nigam Limited (including
subsidiary i.e. Jawaharpur
VUNL)
2 2018-19 2019-20 12305.55 2895.14 0.00 0.00 0.00 2895.14
2 Uttar Pradesh Power
Transmission Company
Limited
1 2018-19 2019-20 14060.07 1515.94 0.00 0.00 174.54 1690.48
3 Uttar Pradesh Power
Corporation Limited
(including subsidiaries i.e.
MVVNL, DVVNL,
PVVNL, PuVVNL and
KESCO)
6 2017-18 2018-19
and
2019-20
82991.49 14172.53 615.45 12403.61 23548.71 50740.30
Total of (A=a+b+c) 9 18583.61 615.45 12403.61 23723.25 55325.92
B. Non -functional PSUs
Nil
Total of power sector
PSUs (A+B)
18583.61 615.45 12403.61 23723.25 55325.92
II Other than power sector
PSUs
A. Functional PSUs
1 Agra Smart City Limited 1 2018-19 2019-20 216.00 0.00 0.00 10.00 0.00 10.00
2 Varanasi Smart City
Limited
1 2018-19 2019-20 50.00 0.00 0.00 10.00 0.00 10.00
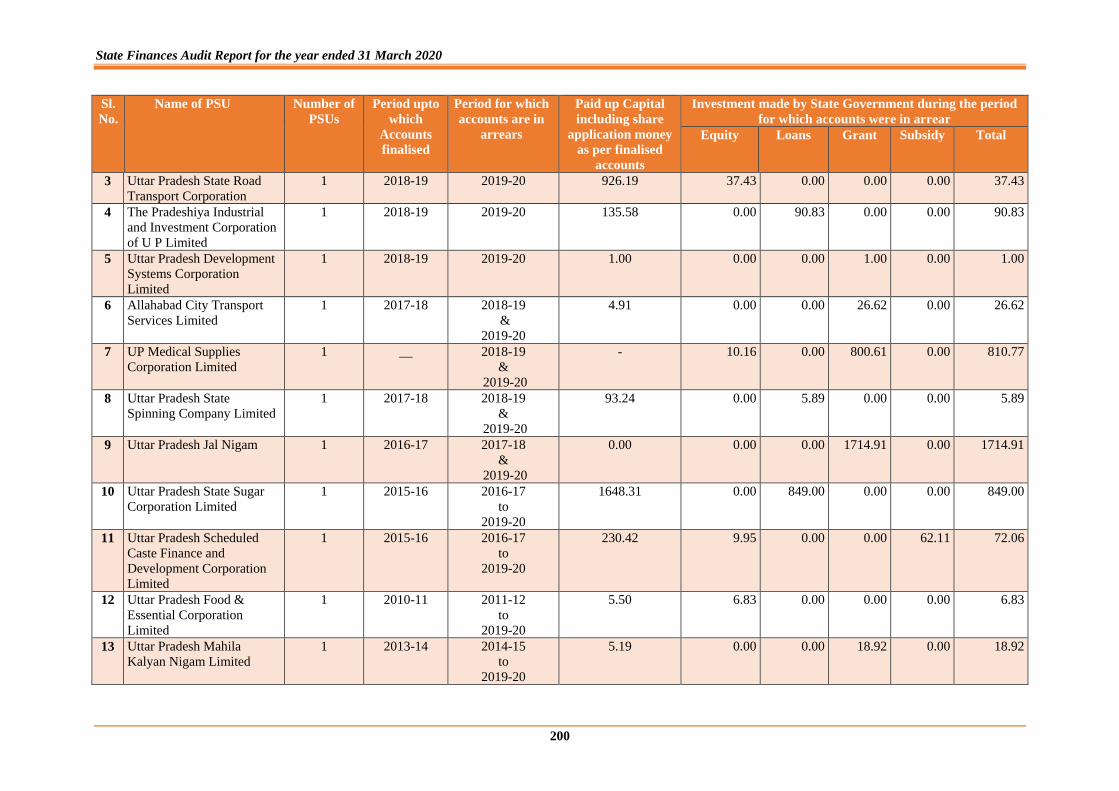
State Finances Audit Report for the year ended 31 March 2020
200
Sl.
No.
Name of PSU Number of
PSUs
Period upto
which
Accounts
finalised
Period for which
accounts are in
arrears
Paid up Capital
including share
application money
as per finalised
accounts
Investment made by State Government during the period
for which accounts were in arrear
Equity Loans Grant Subsidy Total
3 Uttar Pradesh State Road
Transport Corporation
1 2018-19 2019-20 926.19 37.43 0.00 0.00 0.00 37.43
4 The Pradeshiya Industrial
and Investment Corporation
of U P Limited
1 2018-19 2019-20 135.58 0.00 90.83 0.00 0.00 90.83
5 Uttar Pradesh Development
Systems Corporation
Limited
1 2018-19 2019-20 1.00 0.00 0.00 1.00 0.00 1.00
6 Allahabad City Transport
Services Limited
1 2017-18 2018-19
&
2019-20
4.91 0.00 0.00 26.62 0.00 26.62
7 UP Medical Supplies
Corporation Limited
1 __ 2018-19
&
2019-20
- 10.16 0.00 800.61 0.00 810.77
8 Uttar Pradesh State
Spinning Company Limited
1 2017-18 2018-19
&
2019-20
93.24 0.00 5.89 0.00 0.00 5.89
9 Uttar Pradesh Jal Nigam 1 2016-17 2017-18
&
2019-20
0.00 0.00 0.00 1714.91 0.00 1714.91
10 Uttar Pradesh State Sugar
Corporation Limited
1 2015-16 2016-17
to
2019-20
1648.31 0.00 849.00 0.00 0.00 849.00
11 Uttar Pradesh Scheduled
Caste Finance and
Development Corporation
Limited
1 2015-16 2016-17
to
2019-20
230.42 9.95 0.00 0.00 62.11 72.06
12 Uttar Pradesh Food &
Essential Corporation
Limited
1 2010-11 2011-12
to
2019-20
5.50 6.83 0.00 0.00 0.00 6.83
13 Uttar Pradesh Mahila
Kalyan Nigam Limited
1 2013-14 2014-15
to
2019-20
5.19 0.00 0.00 18.92 0.00 18.92
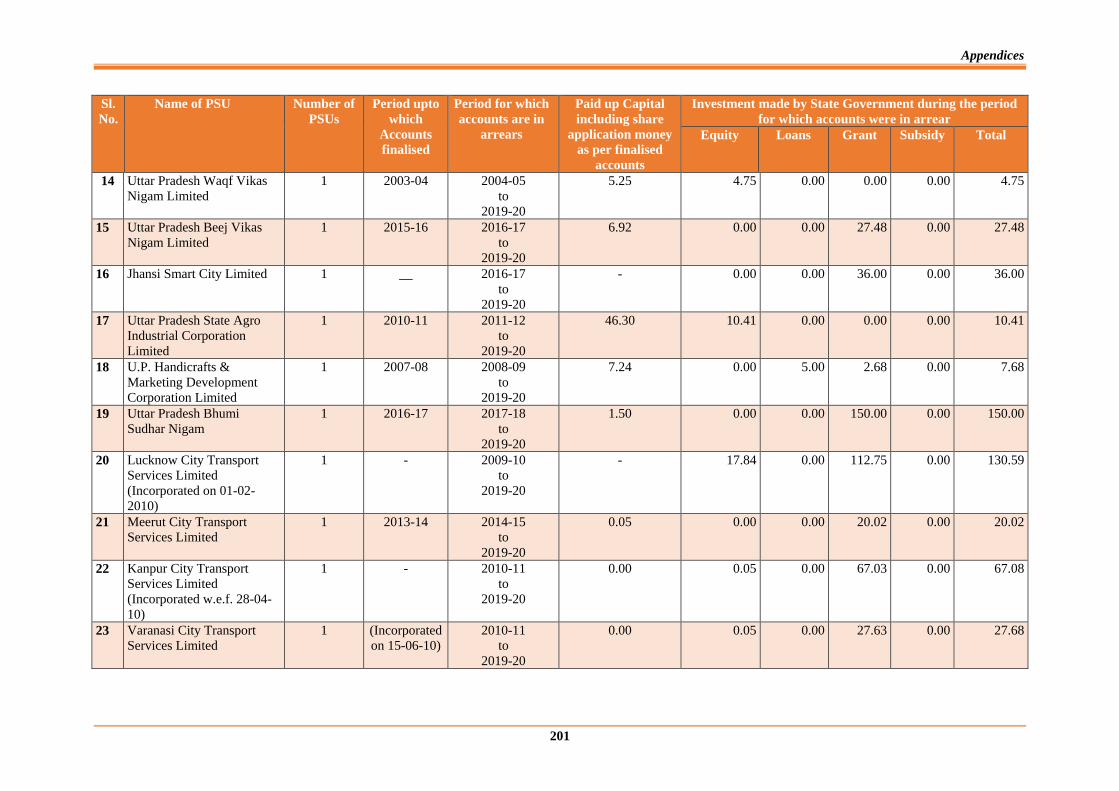
Appendices
201
Sl.
No.
Name of PSU Number of
PSUs
Period upto
which
Accounts
finalised
Period for which
accounts are in
arrears
Paid up Capital
including share
application money
as per finalised
accounts
Investment made by State Government during the period
for which accounts were in arrear
Equity Loans Grant Subsidy Total
14 Uttar Pradesh Waqf Vikas
Nigam Limited
1 2003-04 2004-05
to
2019-20
5.25 4.75 0.00 0.00 0.00 4.75
15 Uttar Pradesh Beej Vikas
Nigam Limited
1 2015-16 2016-17
to
2019-20
6.92 0.00 0.00 27.48 0.00 27.48
16 Jhansi Smart City Limited 1 __ 2016-17
to
2019-20
- 0.00 0.00 36.00 0.00 36.00
17 Uttar Pradesh State Agro
Industrial Corporation
Limited
1 2010-11 2011-12
to
2019-20
46.30 10.41 0.00 0.00 0.00 10.41
18 U.P. Handicrafts &
Marketing Development
Corporation Limited
1 2007-08 2008-09
to
2019-20
7.24 0.00 5.00 2.68 0.00 7.68
19 Uttar Pradesh Bhumi
Sudhar Nigam
1 2016-17 2017-18
to
2019-20
1.50 0.00 0.00 150.00 0.00 150.00
20 Lucknow City Transport
Services Limited
(Incorporated on 01-02-
2010)
1 - 2009-10
to
2019-20
- 17.84 0.00 112.75 0.00 130.59
21 Meerut City Transport
Services Limited
1 2013-14 2014-15
to
2019-20
0.05 0.00 0.00 20.02 0.00 20.02
22 Kanpur City Transport
Services Limited
(Incorporated w.e.f. 28-04-
10)
1 - 2010-11
to
2019-20
0.00 0.05 0.00 67.03 0.00 67.08
23 Varanasi City Transport
Services Limited
1 (Incorporated
on 15-06-10)
2010-11
to
2019-20
0.00 0.05 0.00 27.63 0.00 27.68
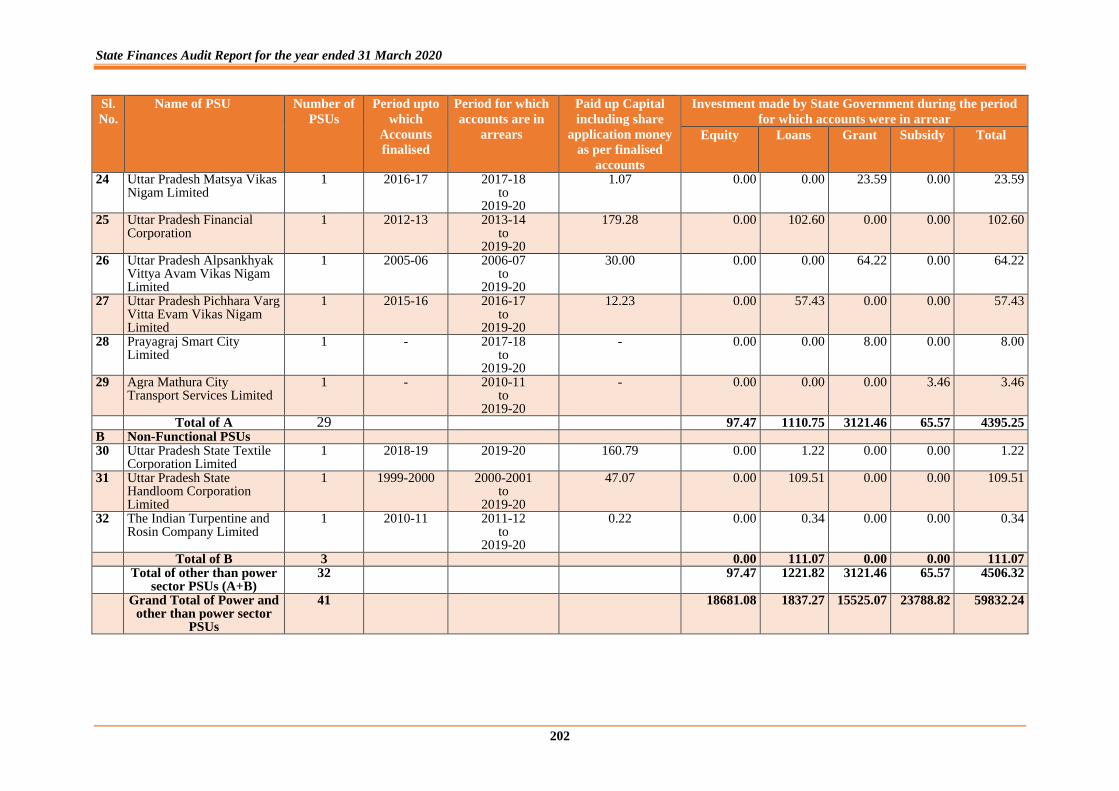
State Finances Audit Report for the year ended 31 March 2020
202
Sl.
No.
Name of PSU Number of
PSUs
Period upto
which
Accounts
finalised
Period for which
accounts are in
arrears
Paid up Capital
including share
application money
as per finalised
accounts
Investment made by State Government during the period
for which accounts were in arrear
Equity Loans Grant Subsidy Total
24 Uttar Pradesh Matsya Vikas Nigam Limited
1 2016-17 2017-18 to
2019-20
1.07 0.00 0.00 23.59 0.00 23.59
25 Uttar Pradesh Financial Corporation
1 2012-13 2013-14 to
2019-20
179.28 0.00 102.60 0.00 0.00 102.60
26 Uttar Pradesh Alpsankhyak Vittya Avam Vikas Nigam Limited
1 2005-06 2006-07 to
2019-20
30.00 0.00 0.00 64.22 0.00 64.22
27 Uttar Pradesh Pichhara Varg Vitta Evam Vikas Nigam Limited
1 2015-16 2016-17 to
2019-20
12.23 0.00 57.43 0.00 0.00 57.43
28 Prayagraj Smart City Limited
1 - 2017-18 to
2019-20
- 0.00 0.00 8.00 0.00 8.00
29 Agra Mathura City Transport Services Limited
1 - 2010-11 to
2019-20
- 0.00 0.00 0.00 3.46 3.46
Total of A 29 97.47 1110.75 3121.46 65.57 4395.25 B Non-Functional PSUs 30 Uttar Pradesh State Textile
Corporation Limited 1 2018-19 2019-20 160.79 0.00 1.22 0.00 0.00 1.22
31 Uttar Pradesh State Handloom Corporation Limited
1 1999-2000 2000-2001 to
2019-20
47.07 0.00 109.51 0.00 0.00 109.51
32 The Indian Turpentine and Rosin Company Limited
1 2010-11 2011-12 to
2019-20
0.22 0.00 0.34 0.00 0.00 0.34
Total of B 3 0.00 111.07 0.00 0.00 111.07 Total of other than power
sector PSUs (A+B) 32 97.47 1221.82 3121.46 65.57 4506.32
Grand Total of Power and other than power sector
PSUs
41 18681.08 1837.27 15525.07 23788.82 59832.24
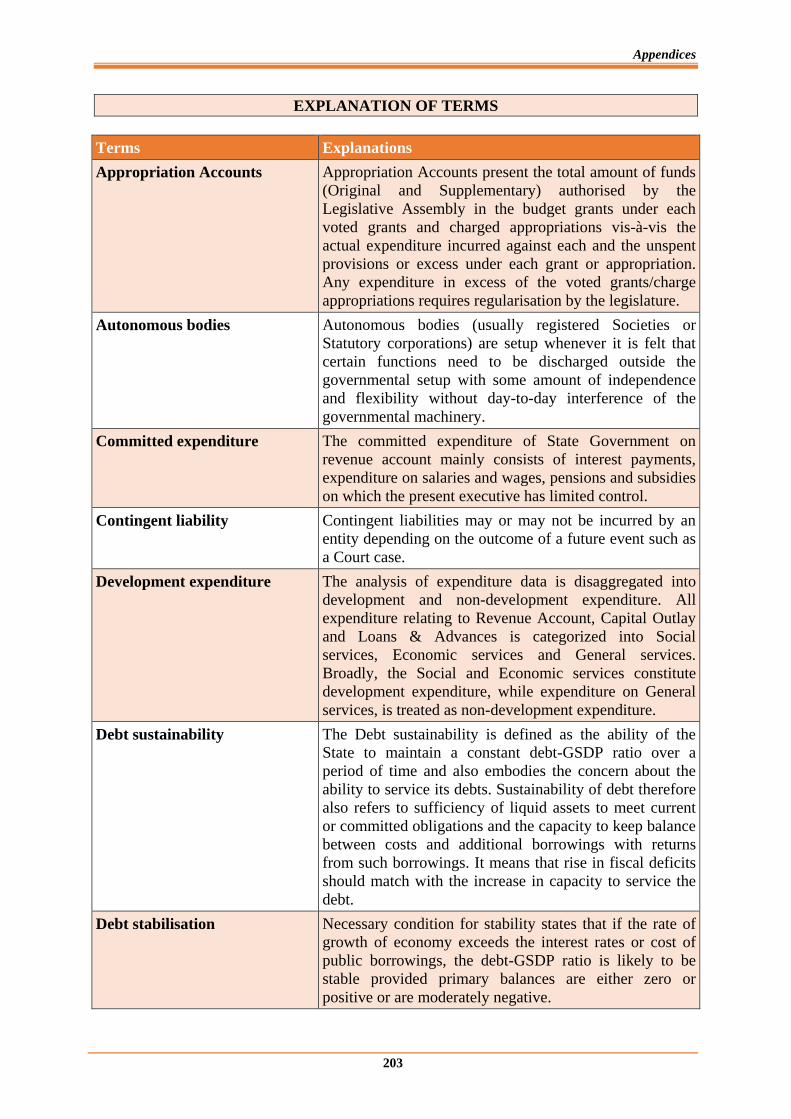
Appendices
203
EXPLANATION OF TERMS
Terms Explanations
Appropriation Accounts Appropriation Accounts present the total amount of funds
(Original and Supplementary) authorised by the
Legislative Assembly in the budget grants under each
voted grants and charged appropriations vis-à-vis the
actual expenditure incurred against each and the unspent
provisions or excess under each grant or appropriation.
Any expenditure in excess of the voted grants/charge
appropriations requires regularisation by the legislature.
Autonomous bodies Autonomous bodies (usually registered Societies or
Statutory corporations) are setup whenever it is felt that
certain functions need to be discharged outside the
governmental setup with some amount of independence
and flexibility without day-to-day interference of the
governmental machinery.
Committed expenditure The committed expenditure of State Government on
revenue account mainly consists of interest payments,
expenditure on salaries and wages, pensions and subsidies
on which the present executive has limited control.
Contingent liability Contingent liabilities may or may not be incurred by an
entity depending on the outcome of a future event such as
a Court case.
Development expenditure The analysis of expenditure data is disaggregated into
development and non-development expenditure. All
expenditure relating to Revenue Account, Capital Outlay
and Loans & Advances is categorized into Social
services, Economic services and General services.
Broadly, the Social and Economic services constitute
development expenditure, while expenditure on General
services, is treated as non-development expenditure.
Debt sustainability The Debt sustainability is defined as the ability of the
State to maintain a constant debt-GSDP ratio over a
period of time and also embodies the concern about the
ability to service its debts. Sustainability of debt therefore
also refers to sufficiency of liquid assets to meet current
or committed obligations and the capacity to keep balance
between costs and additional borrowings with returns
from such borrowings. It means that rise in fiscal deficits
should match with the increase in capacity to service the
debt.
Debt stabilisation Necessary condition for stability states that if the rate of
growth of economy exceeds the interest rates or cost of
public borrowings, the debt-GSDP ratio is likely to be
stable provided primary balances are either zero or
positive or are moderately negative.
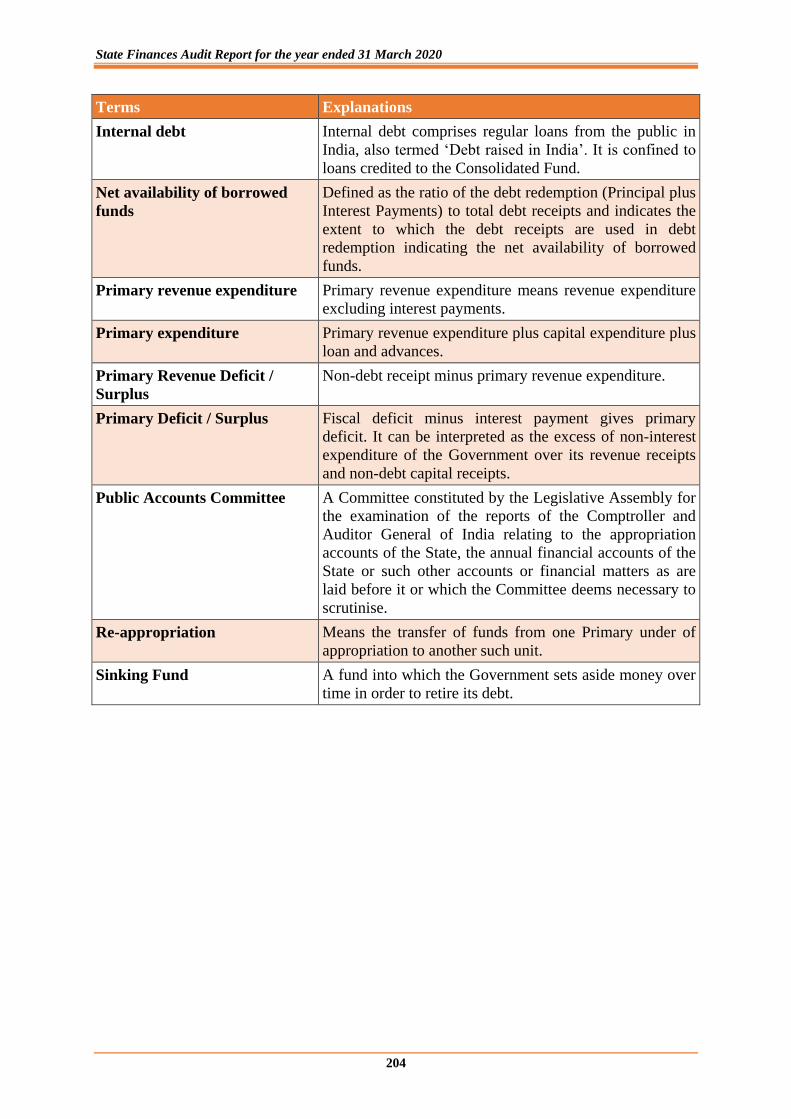
State Finances Audit Report for the year ended 31 March 2020
204
Terms Explanations
Internal debt Internal debt comprises regular loans from the public in
India, also termed ‘Debt raised in India’. It is confined to
loans credited to the Consolidated Fund.
Net availability of borrowed
funds
Defined as the ratio of the debt redemption (Principal plus
Interest Payments) to total debt receipts and indicates the
extent to which the debt receipts are used in debt
redemption indicating the net availability of borrowed
funds.
Primary revenue expenditure Primary revenue expenditure means revenue expenditure
excluding interest payments.
Primary expenditure Primary revenue expenditure plus capital expenditure plus
loan and advances.
Primary Revenue Deficit /
Surplus
Non-debt receipt minus primary revenue expenditure.
Primary Deficit / Surplus Fiscal deficit minus interest payment gives primary
deficit. It can be interpreted as the excess of non-interest
expenditure of the Government over its revenue receipts
and non-debt capital receipts.
Public Accounts Committee A Committee constituted by the Legislative Assembly for
the examination of the reports of the Comptroller and
Auditor General of India relating to the appropriation
accounts of the State, the annual financial accounts of the
State or such other accounts or financial matters as are
laid before it or which the Committee deems necessary to
scrutinise.
Re-appropriation Means the transfer of funds from one Primary under of
appropriation to another such unit.
Sinking Fund A fund into which the Government sets aside money over
time in order to retire its debt.
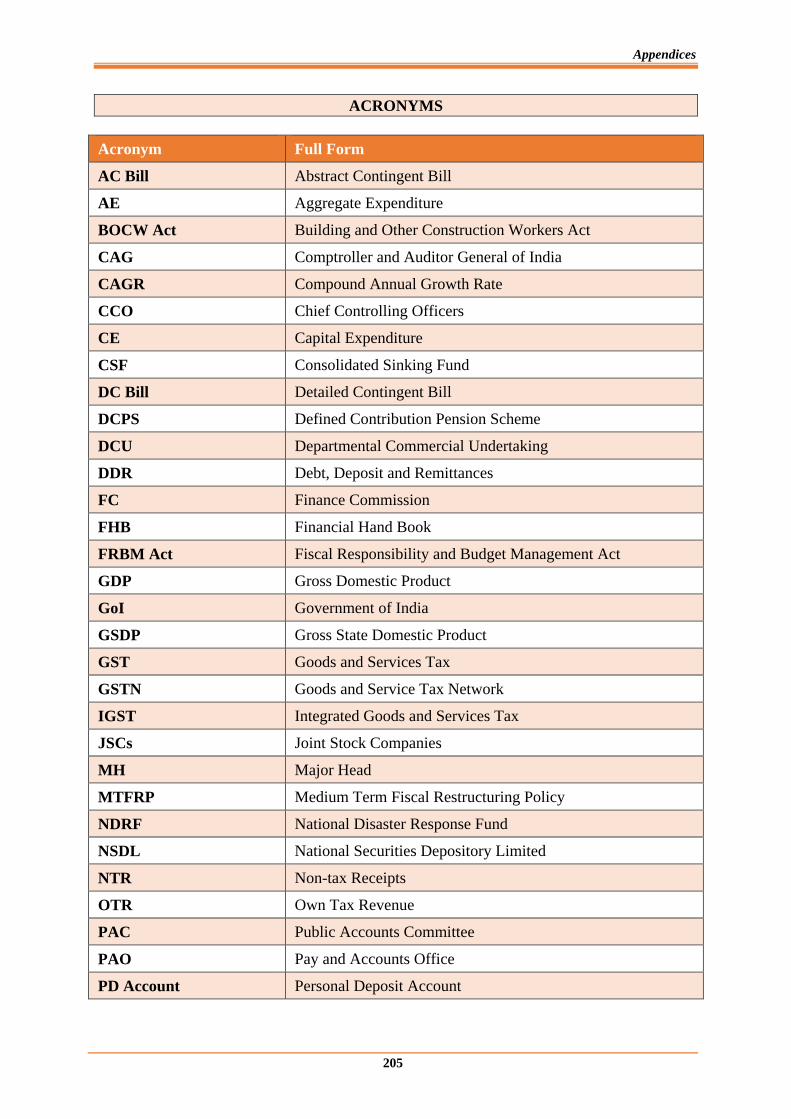
Appendices
205
ACRONYMS
Acronym Full Form
AC Bill Abstract Contingent Bill
AE Aggregate Expenditure
BOCW Act Building and Other Construction Workers Act
CAG Comptroller and Auditor General of India
CAGR Compound Annual Growth Rate
CCO Chief Controlling Officers
CE Capital Expenditure
CSF Consolidated Sinking Fund
DC Bill Detailed Contingent Bill
DCPS Defined Contribution Pension Scheme
DCU Departmental Commercial Undertaking
DDR Debt, Deposit and Remittances
FC Finance Commission
FHB Financial Hand Book
FRBM Act Fiscal Responsibility and Budget Management Act
GDP Gross Domestic Product
GoI Government of India
GSDP Gross State Domestic Product
GST Goods and Services Tax
GSTN Goods and Service Tax Network
IGST Integrated Goods and Services Tax
JSCs Joint Stock Companies
MH Major Head
MTFRP Medium Term Fiscal Restructuring Policy
NDRF National Disaster Response Fund
NSDL National Securities Depository Limited
NTR Non-tax Receipts
OTR Own Tax Revenue
PAC Public Accounts Committee
PAO Pay and Accounts Office
PD Account Personal Deposit Account

State Finances Audit Report for the year ended 31 March 2020
206
Acronym Full Form
PLA Personal Ledger Account
PPP Public Private Partnership
PRI Panchayati Raj Institution
PSUs Public Sector Undertakings
RE Revenue Expenditure
RR Revenue Receipts
SDRF State Disaster Response Fund
SGST State Goods and Services Tax
UC Utilisation Certificate
UDAY Ujwal DISCOM Assurance Yojana
UPBM Uttar Pradesh Budget Manual
UPEIDA Uttar Pradesh Expressways Industrial Development Authority
UPERC Uttar Pradesh Electricity Regulatory Commission
UPRNN Uttar Pradesh Rajkiya Nirman Nigam Limited
UPRTARF Uttar Pradesh Road Transport Accident Relief Fund
UPSBCL Uttar Pradesh State Bridge Corporation Limited
UPSHA Uttar Pradesh State Highway Authority
VAT Value Added Tax

Copyright © 2022 FDOKUMEN