Development of Nano-ZrO2 Reinforced Self-Flowing Low and ...
192
University of Wisconsin Milwaukee UWM Digital Commons eses and Dissertations 12-1-2012 Development of Nano-ZrO2 Reinforced Self- Flowing Low and Ultra Low Cement Refractory Castables Cem Gogtas University of Wisconsin-Milwaukee Follow this and additional works at: hps://dc.uwm.edu/etd Part of the Materials Science and Engineering Commons , and the Nanoscience and Nanotechnology Commons is Dissertation is brought to you for free and open access by UWM Digital Commons. It has been accepted for inclusion in eses and Dissertations by an authorized administrator of UWM Digital Commons. For more information, please contact [email protected]. Recommended Citation Gogtas, Cem, "Development of Nano-ZrO2 Reinforced Self-Flowing Low and Ultra Low Cement Refractory Castables" (2012). eses and Dissertations. 51. hps://dc.uwm.edu/etd/51
-
Upload
khangminh22 -
Category
Documents
-
view
0 -
download
0
Transcript of Development of Nano-ZrO2 Reinforced Self-Flowing Low and ...

University of Wisconsin MilwaukeeUWM Digital Commons
Theses and Dissertations
12-1-2012
Development of Nano-ZrO2 Reinforced Self-Flowing Low and Ultra Low Cement RefractoryCastablesCem GogtasUniversity of Wisconsin-Milwaukee
Follow this and additional works at: https://dc.uwm.edu/etdPart of the Materials Science and Engineering Commons, and the Nanoscience and
Nanotechnology Commons
This Dissertation is brought to you for free and open access by UWM Digital Commons. It has been accepted for inclusion in Theses and Dissertationsby an authorized administrator of UWM Digital Commons. For more information, please contact [email protected].
Recommended CitationGogtas, Cem, "Development of Nano-ZrO2 Reinforced Self-Flowing Low and Ultra Low Cement Refractory Castables" (2012).Theses and Dissertations. 51.https://dc.uwm.edu/etd/51

DEVELOPMENT OF NANO-ZrO2 REINFORCED SELF-FLOWING LOW AND
ULTRA LOW CEMENT REFRACTORY CASTABLES
by
Cem Gogtas
A Dissertation Submitted in
Partial Fulfillment of the
Requirements for the Degree of
Doctor of Philosophy
in Engineering
at
The University of Wisconsin-Milwaukee
December 2012

ii
ABSTRACT
DEVELOPMENT OF NANO-ZrO2 REINFORCED SELF-FLOWING LOW AND
ULTRA LOW CEMENT REFRACTORY CASTABLES
by
Cem Gogtas
The University of Wisconsin-Milwaukee,2012
Under the Supervision of Professor Hugo Lopez
The main goal of this research is to develop high strength high toughness nano-ZrO2
reinforced self flow low cement (5%) and ultra low cement (3 and 1%) castables based
on tabular alumina. In processing these castables, the Andreassen model was used to
obtain optimum self flow properties in both, low and ultra low castables. The castables
thus produced were fired at 110 and 1000, 1300 and 1500oC and the phases obtained
were investigated by X-ray diffraction (XRD) including energy dispersive X-ray (EDX),
scanning electron microscopy (SEM), thermogravimetric analysis (TGA) and differential
thermal analysis (DTA). In addition, the other castable properties were measured such as
cold crushing strength (CCS), apparent porosity (AP), bulk density (BD), water
absorption (WA), weight loss (WL), zeta potential (ZP), flexural strength (MOR),
fracture toughness (KIC), indentation toughness and self-leveling flowability. It was found
that 5% cement castables exhibit the highest densification and strength after firing at
1500oC for 3 hours. In addition, castables with various amounts of of nano-ZrO2 and
YSZ (yttria stabilized zirconia) (5%, 3%, 1%, 0.1% and 0.01%) were fired at 1300oC in
order to improve the flexural strength and fracture toughness. The results indicate that the
addition of nano-ZrO2 improves the flexural strength by 20% but it does not have an

iii
important effect on the KIC. Apparently, the presence of a relatively high density of pores
and cracks overrides the potential benefits associated with the nano-ZrO2 and YSZ
reinforcement additions.

iv
©Copyright by Cem Gogtas, 2012
All Rights Reserved

v
TABLE OF CONTENTS
ABSTRACT
TABLE OF CONTENTS
LIST OF FIGURES
LIST OF TABLES
LIST OF SYMBOLS and ABBREVIATIONS
ACKNOWLEDGEMENTS
CHAPTER 1. INTRODUCTION 1
CHAPTER 2. LITERATURE REVIEW 4
2.1 Refractory Castable Compositions 4
2.2 Phase Composition 9
2.2.1 Bonding Mechanism 13
2.2.2 Dehydration and Firing 16
2.3 Surface Chemistry 17
2.3.1 Dispersion Mechanism 18
2.3.2 Electric Double Layer 20
2.3.3 Zeta Potential 21
2.3.4 Dispersants 27
2.4 Types of Refractory Castables 29
2.4.1 Conventional Castables 30
2.4.1.1 Disadvantages 30
2.4.2 Low and Ultra Low Cement Castables 33
2.4.2.1 Particle Packing, Dispersion and Rheology 35

vi
2.4.2.2 Properties 41
2.4.3 Zero Cement or Cement Free Castables 45
2.4.4 Free or Self Flowable Castables 48
2.5 Fracture of Refractories 53
2.5.1 Strength of Refractories 57
2.5.1.1 Indentation Fracture Toughness 64
2.5.2 Crack Process Zone for Refractories 70
2.5.3. Toughening Mechanism 73
2.5.3.1 Transformation Toughening
2.5.3.1.1 Thermodynamics of Transformation
2.5.3.1.2 Stabilization of Tetragonal Zirconia
74
77
79
2.5.3.1.3 Yttria Content and Distribution 80
2.5.4 Fractography 84
Chapter 3. SCOPE and OBJECTIVES
3.1 Experimental Research
3.2 Experimental Refractory Compositions
3.2.1 Refractory Aggregate
3.2.2 Refractory Fillers and Modifiers
3.2.3 Bonding Agents
3.2.4 Additives
3.3 Preparation of Nanoparticles
3.4 Self-Flowing Test
3.5 Determination of Particle Size Distribution, Zeta Potential and pH of
Nanoparticles
89
89
89
90
90
90
90
91
92
93

vii
3.6 Bulk Density, Apparent Porosity, Water Absorption and Density
3.7 Microstructural Analysis
3.8 Cold Crushing Strength (CCS), Modulus of Rupture (MOR), Fracture
Toughness (KIC) and Indentation Toughness of Castables
3.9 Rheology and Flow Measurements of Castable Refractories
Chapter 4. EXPERIMENTAL RESULTS and DISCUSSION
4.1 Determination of Andreassen Distribution Coefficient of SFCs
4.2 X-Ray Diffraction (XRD) Analysis of SFCs
4.3 Self-Flow Measurement of Castables
4.4 Correlation of Zeta Potential, pH and Particle Size Distribution of Nano-ZrO2
Powder
4.5 Bulk Density, Apparent Porosity and Water Absorption of SFCs
4.6 Thermogravimetric Analysis (TGA) and Differential Thermal Analysis (DTA)
of Castables
4.7 Cold Crushing Strength (CCS) of Castables
4.8 Modulus of Rupture (MOR) of Castables
4.9 Fracture Toughness (KIC) of Castables
4.10 Indentation Toughness of Castables
4.11 Effect of nano-ZrO2 and YSZ Addition on the Modulus of Rupture (MOR) of
SFCs
4.12 Modulus of Rupture of Binding System
4.13 Fracture Toughness of Binding Systems of Castables
4.14 Effect of Nano-ZrO2 addition on the MOR of Binding System of Castables
4. 15 Effect of Yttria Distribution of Nano-ZrO2 Reinforced Refractory Castables
94
95
96
100
101
101
102
106
108
110
114
116
118
120
122
125
136
137
139
141

viii
4.16 Effect of Drying on Modulus of Rupture of Binding System
4.17 Microstructural Investigation of Fracture Surfaces
Chapter 5 CONCLUSION
Chapter 6. FUTURE WORK
REFERENCES
CURRICULUM VITAE
143
145
155
160
161
171
.

ix
LIST OF FIGURES
Figure 2.1 Typical powder processed refractory microstructure. 4
Figure 2.2 Wet-gunning of the ultra low cement bauxite based castable. 9
Figure 2.3 SEM micrographs of fracture surfaces of samples prepared using CaO–Al2O3:
(a) sintered at 1300oC and (b) sintered at 1550
oC for 2 h, showing the evolution and
morphology of CA2 and CA6, respectively.
12
Figure 2.4 (a) Uncharged Particles are free to collide and aggregate (b) charged particles
repel each other.
19
Figure 2.5 Schematic representation of the Double Layer 20
Figure 2.6 Schematic representation of zeta potential. 22
Figure 2.7 Zeta potential as a function of pH. 22
Figure 2.8 Zeta potential as a function of pH for some of the raw material commonly used
in refractory castables.
24
Figure 2.9 pH is as a function of the deflocculants content for the different types of
deflocculants.
24
Figure 2.10. Zeta potential of aqueous 3Y-TZP suspensions at diffeerent pH values 25
Figure 2.11 SEM micrographs of green compacts dried from the slurries with 47–50 wt.%
solid content and pH values at (a) pH 3; (b) pH 4.5; (c) pH 5.5; (d) pH 7.5.
26
Figure 2.12 Effect of time on the zeta potential of a suspension prepared from the Tosoh
zirconia powder.
27
Figure 2.13. Examples of the effect of (a) anionic (0.06 wt% citric acid) and (b) cationic
(0.33wt% polyethyleneimine, PEI) dispersants on the zeta potential curve of alumina and
silica particles, respectively
28
Figure 2.14 Relations between particle packing, dispersion and rheology 34
Figure 2.15. Free flow as a function of time and particle size distribution at 20oC 38
Figure 2.16. Comparison of self-flowability of castables 40
Figure 2.17. Free-flow value of castables as a function of the dispersant content for
compositions dispersed with citric acid, gallic acid and PBTCA (14 vol.% water)
41
Figure 2.18 Compressive strength in castables heat-treated at different temperature
42

x
Figure 2.19 CCS of different castable samples fired at different firing temperatures 43
Figure 2.20 Cold crushing strength of alumina castables
44
Figure 2.21 Cold crushing strength of ultra low cement castables vs. heating temperature.
44
Figure 2.22. Free flow and increase in water content vs. % dosage of Alphabond. 46
Figure 2.23 Drying behavior of green castables bonded with CAC and HAB subjected to
continuous heating: (a) Rate of 10oC/min from room temperature up to 800
oC. Curves (iii)
and (iv) refer to moisture free (MF) samples. (b) A more aggressive heating rate
(20oC/min) was applied to evaluate the explosive spalling occurrence.
47
Figure 2.24 The effect of various deflocculants on the self flow of castables.
49
Figure 2.25 Flow value and water addition for a 1.5 % cement, tabular alumina based
refractory castable as a function of microsilica content.
50
Figure 2.26 Impact of warehouse aging on flow at 30 minutes
51
Figure 2.27 Free flow at 35oC as a function of time and citric acid addition. Ultra low
cement castable composition with 13 vol% water (4.10 wt%).
52
Figure 2.28 Apparent viscosity as a function of time of matrix representative suspensions
containing 5wt.% of sodium citrate or sodium polymethacrylate
53
Figure 2.29 Fracture toughness as a function of spinel content before and after thermal
shock.
54
Figure 2.30 Fracture energy results for the samples of refractory castables heat treated at
the temperatures.
.
56
Figure 2.31. Photograph of the fractured sample showing: matrix (fine fraction), fractured
and debonded aggregates (coarse fraction), and hole produced by pull out of the aggregate.
56
Figure 2.32 Flexural strength values of 8D, 8DM and PKDOL refractory castables.
58
Figure 2.33 Plot of flexural strength (at 25oC) of fired (1500
oC) in situ spinel bonded
castable (G) with increasing concentration of spinel additive.
60
Figure 2.34. MOR–T curves for specimens A8 and S8
61
Figure 2.35 Schematic illustration of indenters tips.
65
Figure 2.36. Schematic illustration of radial cracking at a Vickers indentation. 65

xi
Figure 2.37 Typical load-displacement data. 66
Figure 2.38 Typical cracks produced using a cube-corner indenter under a load of 2.6 N.
A radial crack is highlighted. Crack tips are labelled c.
68
Figure 2.39 A small indentation in glass made with the cube-corner indenter showing well
defined radial cracks.
69
Figure 2.40 (a–d) Representative SEM micrographs of nanoindentations made with
various loading forces. Cracks at the corners of the indented impression can be observed.
69
Figure 2.41 Schematic of the crack process zone for refractory materials.
70
Figure 2.42 Toughening by crack deflection is estimated to increase as the obstacle shapes
change from spheres, discs and rods (GC is crack resistance force of composite, GM is
crack resitance force of matrix)
72
Figure 2.43 Crystal structures of most important zirconia polymorphs: cubic, tetragonal
and monoclinic
74
Figure 2.44 The transformation ZrO2 from tetragonal to monoclinic.
76
Figure 2.45 Stress induced phase transformation
76
Figure 2.46 Critical particle size for the retention of tetragonal zirconia
78
Figure 2.47 ZrO2 rich portion of ZrO2-Y2O3 phase diagram in the system
81
Figure 2.48 Influence of test temperature of fracture toughness. The transformation zone
size increases with decreasing temperature, as the tetragonal particles become less stable.
At some critical temperature, however, the transformation can become spontaneous.
81
Figure 2.49 Crack initially propagates on a plane but, if failure is unstable, the crack will
start branching
85
Figure 2.50 Fracture surfaces in brittle materials generally show a smooth region that
surrounds the failure origin (mirror region) but the surface increases in roughness as the
crack accelerates (mist region ) until crack branching occurs. The branched region contain
‘ridges’ known as a hackle Fracture surfaces are often described as to whether a crack
passes through grains (transgranular) or between grains (intergranular).
86
Figure 2.51 a) Lenticular void that acted as a fracture origin in an alumina-zirconia
composite b) Spherical void that acted as a fracture origin in a an open-cell vitreous
carbon; scanning electron micrograph
86

xii
Figure 2.52 Scanning electron microscopes showing processing defects that act as fracture
origins in alumina-zirconia composites: a) porous alumina agglomerate; b) large alumina
grain
87
Figure 2.53 Failure origin in a zirconia-toughened alumina, caused by the presence of a
zirconia aggregate in starting powder.
87
Figure 2.54 Scanning electron micrographs showing failure origins in single crystal
alumina (sapphire) fibers : a) internal pore: b) surface flaw
Figure 2.55 Silicon carbide inclusions that acted as fracture origin in silicon nitride
scanning electron micrograph.
Figure 3.56 The truncated flew cone described by ASTM C230
Figure 3.57 The measurement of self flow value of castable after pouring from truncated
cone
Figure 3.58 Three point bending test.
Figure 3.59 Schematic illustration of fracture toughness test.
Figure 3.60 (a-b) Cracks created by Berkovich indenter in nanoindentation test
Figure 4.61 Andreassen distribution coefficient (q value) of castables
Figure 4.62 XRD patterns for (a) SFC-5, (b) SFC-3 and (c) SFC-1 dried at 110oC for 24h.
Figure 4.63 XRD pattern for (a) SFC-5, (b) SFC-3, (c) SFC-1 fired at 1000oC for 3h
.
Figure 4.64 XRD pattern for (a) SFC-5, (b) SFC-3, (c) SFC-1 fired at 1300oC for 3h.
Figure 4.65 XRD pattern for (a) SFC-5, (b) SFC-3, (c) SFC-1 fired at 1500oC for 3h.
Figure 4.66 Self flow values of SFCs as a function of cement content
Figure 4.67 Self flow values of catables as a function of nano ZrO2/YSZ addition.
Figure 4.68 (a) PSD of nano-ZrO2 particles in the water solution. (b) PSD of
ultrasonicated nano-ZrO2 particles in the water solution. (c) PSD of nano-ZrO2 particles
dispersed with additive (D-811D) in water. (d). The effect of ultrasonication on the PSD
of nano-ZrO2 particles with D-811D in water. (e) PSD of nano-ZrO2 particles dispersed
with additive (M-ADS) in water. (f) The effect of ultrasonication on the PSD of nano-ZrO2
particles with M-ADS in water.
88
88
92
93
97
98
99
101
103
104
105
106
107
107
109

xiii
Figure 4.69 AP and BD of SFCs at different firing temperatures.
Figure 4.70 Water absorption of SFCs as a function of firing temperature.
Figure 4.71 Weight losses of SFCs as a function of firing temperatures.
Figure 4.72 TGA and DTA of SFCs at elevated temperatures
Figure 4.73 The CCS values of SFCs as a function of temperature.
Figure 4.74 The MOR of SFCs as a function of temperature.
Figure 4.75 Fracture toughness values of SFCs as a function of temperature.
Figure 4.76 Indentation toughness of SFCs as a function of firing temperatures
Figure 4.77 Optical microscope picture of SFC after nanoindentation test at 400X
Figure 4.78 (a) Linear crack (b) Non-linear crack created by Berkovich indenter at 400X
Figure 4.79 XRD patterns of (a) nano-ZrO2 and (b) 8% mol YSZ powders
Figure 4.80 XRD data of (a) 5%, (b) 3%, (c) 1%, (d) 0.1%, (e) 0.01% - 8 mol %YSZ
reinforced SFC-5 at 1300oC
Figure 4.81 XRD data of (a) 5%, (b) 3%, (c) 1%, (d) 0.1%, (e) 0.01% - nano ZrO2
reinforced SFC-5 at 1300oC.
Figure 4.82 MOR of nano-ZrO2 and YSZ reinforced SFC-5 at 1300oC.
Figure 4.83 KIC of nano-ZrO2 and YSZ reinforced SFC-5 at 1300oC.
Figure 4.84 XRD data of (a) 5%, (b) 3%, (c) 1%, (d) 0.1%, (e) 0.01% nano-ZrO2-
reinforced SFC-3 fired at 1300oC
Figure 4.85 XRD data of (a) 5%, (b) 3%, (c) 1%, (d) 0.1%, (e) 0.01% - 8 % mol YSZ
reinforced SFC-3 fired at 1300oC.
Figure 4.86 MOR of 8 mol%-YSZ and ZrO2 reinforced SFC-3 at 1300oC for 3h.
Figure 4.87 KIC of nano-ZrO2 and 8 mol %YSZ reinforced SFC-3 at 1300o
Figure 4.88 XRD data of (a) 5%, (b) 3%, (c) 1%, (d) 0.1%, (e) 0.01% nano-ZrO2-
reinforced SFC-1 fired at 1300oC for 3h.
111
113
114
115
117
119
121
122
123
124
125
126
127
128
128
129
130
131
132
132

xiv
Figure 4.89 XRD data of (a) 5%, (b) 3%, (c) 1%, (d) 0.1%, (e) 0.01% - 8 % mol YSZ
reinforced SFC-1 fired at 1300oC
Figure 4.90 The MOR of 8 mol %YSZ and ZrO2 reinforced SFC-1 at 1300oC.
Figure 4.91 KIC of nano- ZrO2 and 8 mol %YSZ reinforced SFC-1 at 1300oC.
Figure 4.92 The MOR of binding systems of SFCs as a function of temperature
Figure 4.93 KIC of binding systems of SFCs as a function of firing temperature
Figure 4.94 MOR of binding system of SFC-5 as a function of firing temperatures
Figure 4.95 MOR of binding system of SFC-3 as a function of firing temperatures.
Figure 4.96 MOR of binding system of SFC-1 as a function of elevated temperature.
Figure 4.97 MOR of binding system of SFC-3 at elevated temperatures as a function of
yttria distribution
Figure 4.98 Fracture toughness of binding systems of SFC-3 as a function of firing
temperature.
Figure 4.99 Drying effect of the MOR of binding system of (a) SFC-5, (b) SFC-3 and (c)
SFC-1 as a function of time
Figure 4.100 (a) and (b) Fracture surface of SFC-5 and SFC-3 at 110oC for 24 hours
respectively and (c) EDS pattern of fracture surface of SFC-5 sample at 100X.
Figure 4.101 (a) Fracture surface of SFC-5 dried at 110oC for 24h (b) and (c) SEM
pictures of SFC-5 at 100X
Figure 4.102 Fracture surfaces of (a) SFC-5 and (b)SFC-3 after drying at 110oC for 24 h
at 100X
Figure 4.103 Fracture surface of SFC-5 (a) at 100X and (b) at 500X after firing at 1000oC
for 3h.
Figure 4.104 (a) and (b) EDS patterns of SFC-5 sample after firing at 1000oC for 3h.
Figure 4.105 Fracture surfaces of (a) SFC-3 and (b) SFC-1 after firing at 1000oC for 3h at
100X
133
134
135
136
138
139
140
141
142
143
144
146
147
148
148
149
150

xv
Figure 4.106 Fracture surfaces of (a) SFC-5 and (b) SFC-1 after firing at 1300oC for 3h at
500X.
Figure 4.107 (a) Fracture surface of SFC-5 and (b) SEM picture of SFC-5 at 50X
(c)fracture surface and (d) SEM picture of SFC-1 at 50X after firing at 1500oC for 3h
Figure 4.108 Fracture surfaces of (a) SFC-1 and (b) SFC-5 after firing at 1300oC for 3h at
1000X.
Figure 4.109 Fracture surfaces of (a) SFC-1 and (b) SFC-3 after firing at 1500oC for 3h at
1000X
Figure 4.110 Fracture surfaces of (a) SFC-5 and (b) SFC-3 after firing at 1300oC for 3h at
1000X
Figure 4.111 Fracture surface of SFC-3 (a) at 2000X and (b) at 5000X after firing at
1300oC for 3h.
150
151
152
152
153
153
.

xvi
LIST OF TABLES
Table 2.1 Refractory Castable Composition. 5
Table 2.2 Primary Alumina and Alumina-Silicate Aggregates. 5
Table 2.3 Common Refractory Fillers and Modifiers. 6
Table 2.4 Calcium Aluminate Cement Types. 7
Table 2.5 General types of additives and their functions in the castable system. 8
Table 2.6 Typical mineral constituents of calcium aluminate cements. 10
Table 2.7 Properties of CAC mineral constituents. 11
Table 2.8 Properties of CA cement hydrates. 15
Table 2.9. Dehydration temperature of CA cement hydrates. 16
Table 2.10 Mineralogical changes of dehydrated high alumina cement on heating 17
Table 2.11. Details of Castable mixes. 39
Table 2.12 Some typical fracture toughness values for brittle materials. 73
Table 2.13 Measured properties of MgCr2O4-ZrO2 composite specimens with
different volume fractions of ZrO2 inclusions.
84
Table 3.14 Experimental castable compositions.
91
xvii
LIST OF SYMBOLS AND ABBREVIATIONS
LCC Low Cement Castable
ULCC Ultra Low Cement Castable
CAC Calcium Aluminate Cement
HAC High Alumina Cement
SFCs Self Flow Castables
PSD Particle Size Distribution
ASTM American Society for Testing and Materials
XRD X Ray Diffraction
EDX Energy Dispersive X-Ray
SEM Scanning Electron Microscope
TGA Thermo Gravimetric Analyzer
DTA Differential Thermal Analysis
CCS Cold Crushing Strength
AP Apparent Porosity
BD Bulk Density
WA Water Absorption
WL Weight Losses
ZP Zeta Potential
MOR Modulus of Rupture
KIC Fracture Toughness
HAB Hydratable Alumina Bonded
A-1000SG Calcined Alumina
ZPC The Zero Point of Charge

xviii
IEP Isoelectric Point
ZCC Zero Cement Castable
CPFT Cumulative Percent Finer Than
PEI Polyethyleneimine
CA Citric Acid
Na-PAA Sodium Polyacrylate Acid
TPP Sodium Tripolyphosphate
HMP Sodium Haxametaphosphate
PBTCA Phosphonobutane Tricarboxylic
MCC Medium Cement Castable
CS Conventional Castable
m-ZrO2 Monoclinic Zirconia
t-ZrO2 Tetragonal Zirconia
c-ZrO2 Cubic Zirconia
YSZ Ytrria Stabilized Zirconia
PSZ Partially Stabilized Zirconia
Y-TZP Ytrria-Stabilised Polycrystalline Tetragonal Zirconia
MS Start Temperature for Martensitic Transformation
Xcr Critical Yttria Content
EPMA Electron Probe Micro Analyzer
EF Edge Fracture
COD The Crack Opening Displacement
CMOD The Crack Mouth Opening Displacement
CTE Coefficient of Thermal Expansion

xix
ACKNOWLEDGEMENTS
I would first like to thank to my advisors, Professor Hugo Lopez and Associate Professor
Konstantin Sobolev for their guidance and support during this work. I would also like to
thank to Dr. Steve Hardcastle for his assistance in the characterization of samples and
Assistant Professor Ben Church for his support. In addition, I would like to thank to Dale
P. Zacherl and Steve Kowalski from Alcoa to supply the raw materials for the
experiments. Lastly, I would especially thank to my family members for their caring
support throughout my years of education.

1
CHAPTER 1 – INTRODUCTION
Refractory materials, by definition are supposed to be resistant to heat and are exposed to
different degrees of mechanical stress and strain, thermal stress and strain
corrosion/erosion from solids liquids and gases, gas diffusion, and mechanical abrasion at
various temperatures [1]. Development of the major consumer of the steel industry and
also other industries such as aluminum, copper, glass and cement force the refractory
industries to improve the quality of the refractories. The driving force for change is either
improved process technology or longer campaign lives. As a consequence, it creates the
most significant development in the refractory world that is the evolution of monolithic
refractories in the last 50 years. Since 1960s to the present time there has been a steady
increase in the use of monolithic refractories by refractory consuming industries. More
than 50% of the production is monolithic refractories in many countries due to ease of
installation and fixing and better corrosion resistivity of castables[1,2].
Use of submicron additions in refractory matrix is another development. It leads to
decrease cement content in refractory matrix. Low cement castables (LCCs), ultra-low
cement castables (ULLCs) have replaced a variety of other castables such as the
conventional ones. In addition to decreasing water, less water is used to achieve the
casting consistency in LCCs and ULCCs. That makes castables performance superior
such as: improved cold and hot strength, reduced porosity, higher density and better
corrosion resistance. Later on, a reduction in cement content was achieved with the

2
development of zero cement castables. Calcium aluminate cement (CAC) is replaced by a
hydraulic binder such as hydraulic alumina [1,2].
Due to decreasing water content with decreasing cement there is poor flow in castables
which makes it necessary the use of vibration for placing. This posses limitations in the
filling of spaces without the presence of defects of complex shapes. In the mid 1980s,
self-flowing castables (SFCs), which are LCCs or ULLCs with a consistency after mixing
that allows them to flow and degas without application of vibration, joined the family of
refractory concretes [3]. Particle size distribution (PSD) is one of the important factors
controlling the flowability and porosity. Since the last century, several packing models
have been presented. Furnas - Anderegg and Andreassen and Dinger - Funk (modified
Andreassen) are the best known models in the refractory world. The model of modified
Andreassen is the most commonly used among them. In this model, q is the distribution
coefficient. Basically the lower q values indicate the finer the particles in the refractory.
Results from Andreassen show that the q value should be lower than 0.25 for self flow
property and around 0.30 for vibrationable castables[4-7].
Alumina based castables widely investigated according to the published literature [7-22]
because alumina has high strength, hardness, thermal shock and good corrosion
resistance. On the other hand, alumina has low toughness so fracture has always been a
critical problem for refractories during their use. They can be strengthened by the
addition of secondary phase ceramic particles. Y2O3 (yttria), CeO2 (ceria), TiC, SiC,
Al2O3 and ZrO2 (zirconia) are successfully used as a secondary phase in the alumina
matrix [23]. Among them ZrO2 is getting more attention due to its high strength and good

3
toughness, even though it possesses relatively poor hardness. The strength and toughness
of alumina may be enhanced by a dispersion of ZrO2 solid solutions. Tetragonal-ZrO2
grains undergo a monolithic transformation (stress induced phase transformation) and
microcracks form around existing m-ZrO2 grains. Consequently, toughness of Al2O3-
ZrO2 is improved by both stress induced phase transformation and microcrack
toughening of dispersed alumina[24-26].
The goal of this research is to develop nano-ZrO2 reinforced self flow low cement (5%)
and ultra low cement (3 and 1%) castables based on tabular alumina. The Andreassen
model was used to obtain self flow property of both low and ultra low castables. After
samples were fired at 110 and 1000, 1300 and 1500oC, the corresponding phases obtained
were investigated in the castables by X-ray diffraction (XRD) with energy dispersive X-
ray (EDX), scanning electron microscopy (SEM), thermogravimetric analysis (TGA) and
differential thermal analysis (DTA). In addition, the cold crushing strength (CCS),
apparent porosity (AP), bulk density (BD), water absorption (WA), weight loss (WL),
zeta potential (ZP), flexural strength (MOR), fracture toughness (KIC), indentation
toughness and self-leveling flowability were all used in determining the various castable
properties, as well as the exhibited microstructures. Then, castables with different
amounts of (5%, 3%, 1%, 0.1% and 0.01%) of nano-ZrO2 and YSZ (yttria stabilized
zirconia) were fired at 1300oC in order to improve the flexural strength (MOR) and
fracture toughness (KIC) of castable samples. The results indicate that the addition of
nano-ZrO2 improves the performance of castables.

4
CHAPTER 2 - LITERATURE REVIEW
2.1 Refractory Castable Compositions
Refractories are a group of ceramic materials used in massive quantities to line vessels in
which other materials (such as metals, glass and cements) are produced at elevated
temperatures. They consist of large sized (up to centimeters) aggregates (filler) phases
held together with finer (sometimes submicrometers), often porous, binder phases
resulting in the microstructure shown schematically in figure 2.1.[2]
Figure 2.1 Typical powder processed refractory microstructure. [2]
The most significant trend in refractory technology since 1980 has been the ever
increasing use of monolithics, or unshaped refractories. The reasons for the rapid growth
of monolithic are their ready availability, faster, easier, and cheaper installation and fewer
corrosion-susceptible lining joints. A significant advance in monolithic technology was
the development of refractory concretes or castables based on calcium aluminate cements
(CACs)[1,2].
Refractory castables may be characterized as structures of premixed combinations of
refractory grain, matrix components, bonding agents, and admixtures. Table 2.1 lists the

5
general range of component quantities in a refractory castable. Refractory aggregate is
the main component or the basic skeleton of the castable. The sizing of the aggregates
can range between 20 mm to 300µm[1].
Table 2.1 Refractory Castable Composition[1]
Aggregate 40-80%
Modifiers 5-30%
Bond agents 2-50%
Admixtures ˂1%
The wide variety of refractory aggregates is available. Table 2.2 gives list the principal
aggregates used in refractory castables[1].
Table 2.2 Primary Alumina and Alumina-Silicate Aggregates[1]
Aggregate Al2O3 / SiO2 Max. service limit (oC)
Alumina-tabular or white
fused
99+ % / 0% 1870
Alumina-brown fused 94-98% / 1-2% 1760
Bauxite-S.A. and Chinese 84-90% / 5-7% 1760
Mullite-sintered and fused 74-76% / 19-24% 1760
Bauxitic kaolin-calcined 58-70% / 26-37% 1760
Andalusite 57-61% / 38-40% 1760
Calcined kaolin and flint clay 40-47% / 49-55% 1650
Pyrophllite 13-30% / 65-80% 1425
Fused silica 0% / 99.7+% 1370

6
In addition to aggregates and binders, refractory fillers and/or modifiers are added in
order to fill out the particle sizing and to impart other desired attributes such as expansion
control, chemistry/mineralogy modification, bond enhancement. Table 2.3 lists the most
common fillers and modifiers used in refractory castable compositions and their primary
function[1].
Table 2.3 Common Refractory Fillers and Modifiers [1]
Filler/Modifier Chemical formula Function
Fine milled aggregates Various Chemistry, mineralogy and
adjustment, bond
modification and
development
Alumina calcined α-Al2O3 Chemistry adjustment,
bond modification and
development
Alumina reactive α-Al2O3 Flow/rheology control,
bond modification and
development
Silica quartz SiO2 Shrinkage control (800oC)
Silica fume SiO2 Flow/rheology
characteristics, bond
modification and
development
Kyanite 3Al2O3.3SiO2 Shrinkage control (1325o-
1410oC), chemistry and
mineralogy adjustment
Clay (fire, ball, bentonite) Hydrated alumino-silicate Filler, flow/rheology
control
Zircon ZrSiO4 Reduce metal, slag, alkali
attack
Graphite/Carbon C Reduce metal, slag attack
Fly ash Varies Low-temperature filler

7
The types of bonding agents used in refractory castables have increased in the past 20
years. Non-cement bonds such as: hydratable alumina, clay, silica and alumina gels and
chemical bonds such as: momoaluminum phosphate, phosphoric acid, and alkali silicates
are getting increasing attention over the years but still calcium aluminate cements (CACs)
are used as the bonding agent in most refractory castables[1,2]. Table 2.4 lists the
available types of CACs. In order to complete the refractory castable formulation, various
types of additives or admixtures can be used. Table 2.5 lists the general types of additives
and their functions in castable system[1].
Table 2.4 Calcium Aluminate Cement Types (CAC) [1]
Chemistry (%) Max. use
tempt. (oC) Al2O3 SiO2 CaO Fe2O3
Low purity 36-48 3-9 35-40 7-16 1370
Medium purity-
50
51-53 4-5 37-39 1-2 1540
Medium purity-
60
57-59 4-5 33-35 1-2 1540
High purity-70 69-72 <0.5 27-29 <0.5 1870
High purity-80 79-82 <0.5 17-20 <0.5 1870
Usually, multiple additives are used in a single formulation. Additives are used in very
small amounts typically ˃0.2% and may possibly change in function by varying the
quantity used.

8
Table 2.5 General types of additives and their functions in the castable system.[1]
Function
Additive Accelerat
or
Retarder pH control Water
Reducer
Rheology
Modifier
Lithium
carbonate
x
Calcium
hydroxide
x x
Sodium
carbonate
x x
Sodium
bicarbonate
x
Sodium citrate x x x
Sodium
Phosphate
x x x
Sodium
polyacrylate
x x
Polycarboxylate x x
Citric acid
x
Boric acid
x
While conventional castables containing the largest amount of cement are the greatest
percentage of those produced but use of reduced cement varieties like low cement
castables (LCCs) and ultra low cement castables (ULCCs) have grown significantly over
the past 30 years. This is because the CaO (calcia) present in the cement leads to
deterioration in the high temperature properties of the castables. Refractory castables are
dry granular materials which require water addition. Installation is by casting or pouring
into place, vibration placement, trowelling or projection (spraying or shotcreting).
Mechanical vibration may be used to assist the flow of the concrete or to enable mold
filling with a low liquid content in the slurry. Some products can fill in molds without
vibration and such concretes are called as a free or self-flowing. The process like wet

9
gunning or shotcreting, refractory compositions are premixed with water and then
pumped under pressure to the site of placement where they are projected or sprayed on
the surface[2]. In this process, the concrete is termed a shotcreting or sprayable castable
(figure 2.2).
Figure 2.2 Wet-gunning of the ultra low cement bauxite based castable [27].
Modern castables are used increasingly in almost every refractory application, such as
blast furnaces, steel ladles, rotary cement kilns, direct reduction kilns, coke oven door
plugs, cyclones and transfer lines of fluidized catalytic cracking unit vessels of the
petrochemical industry, foundry ladles and heat treating furnaces, aluminum
reverberatory furnaces and ladles, boilers and waste incinerators seating (well) blocks and
powder injection lances, desulphurizing and argon stirring lances, refractory lining of
snorkels in RH degassing vessels and, more recently, fabrication of shrouds and
submerged entry nozzles used for the continuous casting of steel[1,2].
2.2. Phase Composition
Refractory castables must “set” or harden at room temperature. Either water or another
catalyzing agent must activate the bonds used in castables. After setting, a controlled

10
heat-up procedure is generally required to dewater or dehydrate the bond as the refractory
castable lined vessel or furnace is put into service. The majority of alumina and alumina-
silicate castables produced have historically been bonded with calcium aluminate cement
(CACs). Where C:CaO, A:Al2O3, F:Fe2O3,S:SiO2 and T:TiO2.
Table 2.6 Typical mineral constituents of calcium aluminate cements [2]
Relative hydration
rate
Cement purity
Low Intermediate High
Fast C12A7 C12A7 C12A7
Moderate CA CA CA
Slow CA2
C2S
C4AF
CA2
C2S
C4AF
CA2
…..
…..
Non-hydrating C2AS
CT
A
C2AS
CT
A
CA6
A
…..
Typical phases present in commercial CACs, based on their relative reaction rates with
H2O are listed in table 2.6. They form the hydrated cement phases responsible for
developing strength after curing the concrete in a humid environment. Useful properties
of these minerals are listed in table 2.7. Monocalcium aluminate (CaO.Al2O3 or CA) is
the most important component of CACs since it generally happens in large amounts (40-
70%), has a relatively high melting point (1600oC) and develops the highest strength
among the phases listed during the relatively short time available for hydrating refractory
concretes. It takes some time to start setting, but hardens rapidly after the initial set.

11
Table 2.7 Properties of CAC mineral constituents [2]
Chemical composition, wt-%
TmoC
Density
g.cm-3
Cold
crushing
MPa
Crystal
System
Mineral C A F S
C 99.8 2570 3.32 Cubic
C12A7 48.6 51.4 1415-
1495
2.69 15 Cubic
CA 35.7 64.6 1600 2.98 60 Monoclinic
CA2 21.7 78.3 1750-
1765
2.91 25 Monoclinic
C2S 65.1 34.9 2066 3.27 Monoclinic
C4AF 46.2 20.9 32.9 1415 3.77 Orthorhombic
C2AS 40.9 37.2 21.9 1590 3.04 Tetragonal
CA6 8.4 91.6 1830 3.38 Hexagonal
α-A 99.8 2051 3.98 Rhombohedral
Calsium dialuminate (CA2) is the secondary phase in CACs (˂25%) and is more
refractory than CA but takes an excessively long time to set though accelerated at high
temperature. While hydration of CA is known to be accelerated by the presence of CA2,
the opposite does not hold true, and the hydration of CA2 may actually be hindered by the
presence of CA. The strength of CA2 after three days hydration is comparable to that of
the pure CA and, unlike in CA, it always increases with time[2].
CA6 is the only non-hydrating phase in the pure calcium aluminate system and is often a
reaction product in alumina castables bonded with high purity aluminate cement. It is

12
believed that CA6 is mostly readily formed in alumina castables when using CA2 as a
precursor. More recently, studies on the properties and microstructure of the CA6 phase
have revealed its great potential as a strong thermal shock resistant, refractory material
and its important role in the bonding of corundum and spinel aggregates. Figure 2.3
shows the morphology of CA2 and CA6[2].
Figure 2.3 SEM micrographs of fracture surfaces of samples prepared using CaO–Al2O3:
(a) sintered at 1300oC and (b) sintered at 1550
oC for 2 hours, showing the evolution and
morphology of CA2 and CA6, respectively[2].
C12A7 hydrates rapidly and can be used to control the setting rate of CACs when used in
small quantities: it has a relatively low melting point. C2S and C4AF are common in
Portlant cement, but can also occur in the high silica and iron rich low purity CACs
respectively. C4AF forms hydrates of calcium aluminate and calcium ferrite or solid
solutions of the two hydrates and in its setting rate resembles C12A7. C2AS (gehlenite)
shows little tendency to hydrate and is an undesirable component of alumina cement
which limits refractoriness and hot strength properties[2].
Generally, the characteristics of CACs are associated with the amount of alumina, lime
and impurities present in the products. Increased alumina content will give higher

13
refractoriness, while high lime content in the cement increases cured strength. Iron
impurities lower the carbon monoxide resistance at high temperatures, and siliceous
compounds reduce resistance to hydrogen atmospheres under similar conditions[2].
2.2.1. Bonding Mechanism
Hydration begins when cement contacts water. As mentioned before, CA (calcium
monoaluminate) is the principal and most important hydrating phase [1,2,28,29] CA
hydrates according to the following reaction:
CA + H → C3AH6 + AH3 + heat [1]
Where C=CaO, A=Al2O3, and H=H2O. C3AH6 is the normal, stable hydrate phase when
cement curing temperatures of ˃35oC occur in the castable mass. While this curing
temperature may seem high, it is generally reachable because cement hydration is an
exothermic reaction. Rather often internal castable temperatures can reach temperatures
of up to 75oC or greater especially in high cement (20+%) formulations. If a curing
temperature of 35oC is attainable, the metastable hexagonal hydrates of CAH10 + AHx
(gel) (˂21oC) and C2AH8 + AHx + AH3(21
o-35
oC) will form. CAH10 can be detected after
6-24 hours. The presence of C2AH8 can be detected after 24 hours[1,2,28].These hydrates
will convert to C3AH6 per the following:
CAH10/AHx(gel)+time/temperature→C2AH8/AHx/AH3+time/temperature→C3AH6+2A3
As the temperature increases above 21oC, the metastable hydrates CAH10 and C2AH8
transform into the more stable compounds, C3AH6 and AH3. The transitional crystalline

14
change from one calcium aluminate hydrate to another is commonly referred to as
‘conversion’ However, with this conversion to the stable hydrate there is phase volume
shrinkage that can disrupt the bond structure and lead to weakening of the bond[1,2].
The morphologies of the main CAC hydrates (listed in table 2.8) change extensively
though, in general C3AH6 forms as cuboids, C2AH8 as platelets, CAH10 as needles or
hexagonal prisms, and gibbsite as tablets or needles. When the castable is heated for the
first time, the hydrated cement phase will undergo a dehydration process over a
temperature range. Dehydration of the hydrated cement occurs over a temperature range
from 210oC to 370
oC, with the peak dehydration temperature for AH3 at 230
oC and for
C3AH6 at 315oC[1,2].
Direct formation of denser stable hydrates (AH3 and C3AH6) at higher curing
temperatures produces greater porosity and larger pore sizes than when the metastable
and less dense hydrates (CAH10 and C2AH8) are formed at lower temperatures. While this
gives rise to lower green strengths it also gives coarse, permeable hydrate phases so that
the vapor species can escape on drying.

15
Table 2.8 Properties of CA cement hydrates[2]
Chemical composition, wt-% Crystal
System
Density
g.cm-3
Hydrate CAO Al2O3 H2O
CAH10 16.6 30.1 53.5 Hexagonal 1.72
C2AH8 31.3 28.4 40.3 Hexagonal 1.95
C3AH6 44.4 27.0 28.6 Cubic 2.52
AH3 -- 65.4 34.6 Hexagonal 2.42
If the castable is heated too quickly and if released steam from the dehydrating cement
cannot vent from the castable structure fast enough, internal pressure develops in the
castable and steam spalls or explosions can happen. Many advanced castables also
include fine powder additions and are packed to gain maximum density. That reduces the
castable permeability and further complicates heat-up procedures. It is quite common to
use organic, synthetic fiber additions in order to help reduce the possibilities of bake-out
spall. Those additions melt or burn out at low temperatures (typically ˂200oC) to assist
open the castable structure and ease the release of moisture. Polypropylene, acrylic, or
polyester are the most common fibers used in lengths ranging from 3 mm to 10 mm and
diameters of 15-40µm. The other method is to reduce the danger of explosive spalling.
For this purpose, refractory CAC castables are generally cured above 27oC. Best practice
for safe heating and maximum strength development is to cure for at least 24 h. at 30-
38oC covered in an impermeable membrane to maintain a humid environment for
hydration, followed by a 24 h. air cure with the surface exposed to 30-38oC. The increase
in porosity and its effect on strength are also heavily influenced by original total
water/cement ratio[2].

16
2.2.2. Dehydration and Firing
Strength loss is known to happen in hardened calcium aluminate pastes while the
metastable hexagonal CAH10 phase dehydrates through the hexagonal C2AH8 transition
phase into the stable cubic C3AH6. This loss of strength can best be understood by
considering the morphological and volume changes accompanying this conversion. When
CAH10 is allowed to form during low temperature curing, the metastable hexagonal
prisms (density 1.72gcm-3
) and gel (2.42gcm-3
) solidify. That eventually will convert to
the stable cubic (2.52gcm-3
) type with time and/or temperature. The gross restructuring
from H2O loss leading to pore formation and nominal 50% volume shrinkage on
conversion of CAH10 to denser C3AH6 and α - AH3 (table 2.9) are disruptive to a rigid
structure and account for the observed loss in mechanical strength[2].
Table 2.9 Dehydration temperature of CA cement hydrates[2]
Hydrate CAH10 C2AH8 C3AH6 AH3
Dehydrating
temperature, oC
100-130 170-195 300-360 210-300
As the temperature is increased, the dehydration process continues, until all phases lose
their water of crystallization[1,2,28]. The compounds formed during hydration of CACs
dehydrate up to around 550oC. The process of hydration followed by dehydration creates
the anhydrous material which is extremely fine and active. Lime and alumina reappear
and recombine in a way similar to that of the original raw materials in the kiln. Table
2.10 depicts the mineralogical changes in HACs as the temperature increases up to
1500oC[2].

17
Table 2.10 Mineralogical changes of dehydrated high alumina cement on heating[2]
Temperature(oC)
70% Al2O3 CAC 80% Al2O3 CAC
C12A7 CA CA2 CA6 A C12A7 CA CA2 CA6 A
500 X … … … X … … … … X
600 X … … … X … … … … X
700 X … … … X X … … … X
800 X … … … X X X … … X
900 X X X … X X X X … X
1000 X X X … X … X X … X
1100 … X X … X … X X … X
1200 … X X … … … X X … X
1300 … X X … … … X X … X
1400 … X X … … … … X X X
1500 … X X … … … … X X X
2.3. Surface Chemistry
Surface chemistry principles are rather important since they all involve the handling of
suspensions (solid–liquid mixtures) containing colloidal particles (<1 µm) of relatively
high specific surface area (>1 m2/g), which are more susceptible to the surface forces that
take place at the solid–liquid interface. The magnitude of these surface forces controls the
dispersion state of particles and the rheological behavior of colloidal suspensions.
Advanced refractory castables usually have a broad particle size distribution so they
contain a large fraction of micron- and submicron-sized particles (0.1–100 µm) in
combination with coarse aggregates (>100 µm). Thus, aspects of the surface chemistry

18
and the dispersion state of the smaller particles (matrix) in water also play a major role in
the processing and final properties of these refractory materials[1].
The term “agglomerate” is used to mean the relatively weak clusters of particles formed
in the absence of efficient dispersing mechanisms. From this standpoint, agglomerates
differ from the hard clusters of particles linked to each other by strong covalent bonds
which are normally referred to as aggregates. Particle agglomeration must result from a
strong driving force, which justifies the need for efficient dispersing mechanisms. This
driving force derives from the Van der Waals attractive forces originated by the
interactions between the permanent and/or induced inner electric dipoles of neighboring
particles. Especially, alumina particles show a strong driving force for agglomeration in
comparison to other materials. This is probably one of the reasons for the major role of
alumina particles in the dispersion of multicomponent castable systems[1].
2.3.1 Dispersion Mechanism
The agglomerates formed through the action of the Van Der Waals attractive forces
influence the rheological behavior and final properties of refractory castables (figure
2.4a). In terms of rheological properties, the agglomerates lead to an increase in the
apparent viscosity and yield stress of the matrix suspension and a reduction in the
castable’s flowability. Thus, higher water is needed to improve the fluidity of castables
and that causes a reduction ie the matrix suspension density and favors the segregation of
dense and coarse aggregates. Increase in water amount leads to a more porous final

19
microstructure, reducing the mechanical, wear, and corrosion strengths of the refractory
castables[1].
Figure 2.4 (a) Uncharged Particles are free to collide and aggregate (b) charged particles
repel each other[30]
In order to prevent particle agglomeration (figure 2.4b), dispersing mechanisms are
activated. The main methods used for this purpose are (1) electrostatic, (2) steric, and (3)
electrosteric dispersing mechanisms. The electrostatic mechanism involves the
development of electric charges on the surface of particles, inhibiting agglomeration
through the formation of an electric double layer around the particles. In the purely steric
mechanism, long-chain nonionic molecules are adsorbed at the particles surface to
prevent their close approach by a physical hindrance effect. The electrosteric mechanism
simultaneously combines the electrostatic and steric features of the previous mechanisms
by the adsorption of relatively long-chain charged molecules on the surface of particles.
All these mechanisms are expected to provide a repulsive force that counter balances the
attractive effect of the van der Waals forces[1].

20
2.3.2 Electric Double Layer
In the electrostatic and electrosteric mechanisms, the repulsive force required to
overcome the attractive van der Waals forces is developed through the formation of the
so-called electric double layer around particles. Figure 2.5 shows a schematic diagram of
the double layer. Initially, attraction from the negative colloid causes some of the positive
ions to form a firmly attached layer around the surface of the colloid; this layer of
counter-ions is known as the Stern layer. Additional positive ions are still attracted by the
negative colloid, but now they are repelled by the Stern layer as well as by other positive
ions that are also trying to approach the colloid. This dynamic equilibrium results in the
formation of a diffuse layer of counterions. They possess a high concentration near the
surface which gradually decreases with distance until it reaches equilibrium with the
counter-ion concentration in the solution[1].
Figure 2.5 Schematic representation of the Double Layer[1]
In a similar, but opposite, fashion there is a lack of negative ions in the neighborhood of
the surface, because they are repelled by the negative colloid. Negative ions are called co-

21
ions because they have the same charge as the colloid. Their concentration will gradually
increase with distance, as the repulsive forces of the colloid are screened out by the
positive ions, until equilibrium is again reached. The diffuse layer can be visualized as a
charged atmosphere surrounding the colloid. The charge density at any distance from the
surface is equal to the difference in concentration of positive and negative ions at that
point. Charge density is greatest near the colloid and gradually diminishes toward zero as
the concentration of positive and negative ions merge together. The attached counter-ions
in the Stern layer and the charged atmosphere in the diffuse layer are what it is refered to
as the double layer. The thickness of this layer depends upon the type and concentration
of ions in solution[1].
2.3.3 Zeta Potential
The double layer is formed in order to neutralize the charged colloid that causes an
electrokinetic potential between the surface of the colloid and any point in the mass of the
suspending liquid. This voltage difference is of the order of milivolts and is referred to as
the surface potential. The magnitude of the surface potential is related to the surface
charge and the thickness of the double layer. Away from the surface, the potential drops
off roughly linearly in the Stern layer and then exponentially through the diffuse layer,
approaching zero at the imaginary boundary of the double layer. The potential curve is a
useful one because it indicates the strength of the electrical force between particles and
the distance at which this force comes into play[1].

22
A charged particle will move with a fixed velocity in a voltage field. This phenomenon is
called electrophoresis. The particle mobility is related to the dielectric constant and
viscosity of the suspending liquid and to the electrical potential at the boundary between
the moving particle and the liquid. This boundary is called the slip plane and is usually
defined as the point where the Stern layer and the diffuse layer meet. The Stern layer is
considered to be rigidly attached to the colloid, while the diffuse layer is not. As a result,
the electrical potential at this junction is related to the mobility of the particle and is
called the zeta potential (see figure 2.6)[1].
Figure 2.6 Schematic representation of zeta potential[1].
The magnitude of the zeta potential gives an indication of the potential stability of the
colloidal system. If all the particles in suspension have a large negative or positive zeta
potential then they will tend to repel each other and there will be no tendency for the

23
particles to come together. However, if the particles have low zeta potential values then
there will be no force to prevent the particles coming together and flocculating. The most
important factor that affects zeta potential is the pH. A zeta potential value on its own
without a quoted pH is a virtually meaningless number. Figure 2.7 shows zeta potential as
a function of pH. The point where the plot passes through zero zeta potential is called the
Isoelectric point and is very important from a practical consideration. It is normally the
point where the colloidal system is least stable. Zeta potential is the minimum at the
isoelectric point so particles have a tendency to come together. A typical plot of zeta
potential versus pH is shown below in figure 2.7[1].
Figure 2.7 Zeta potential as a function of pH[1].
Figure 2.8 presents the variation of zeta potential as a function of pH for some finely
grinded raw materials used in refractory applications. It is worth noting the markedly
different zeta potential profiles of these raw materials.

24
Figure 2.8 Zeta potential as a function of pH for some of the raw materials commonly
used in refractory castables[1].
Otroj and colloquies investigated the effect of deflocculants on the self flow
characteristics of ultra-low cement castables. Figure 2.9 shows the variation of pH as a
function of deflocculant content for different types of deflocculants used[31].
Figure 2.9 pH is as a function of the deflocculants content for the different types of
deflocculants[31].
Their results showed that the addition of citric acid (CA) reduces the pH of the
suspension to values as low as 6.5 due to its acidic nature. On the other hand, other

25
deflocculants (sodium polyacrylate acid (Na-PAA), sodium tripolyphosphate (TPP) and
sodium hexametaphosphate (HMP)) have not produced such a dramatic change in pH
values which remain relatively stable. Hence, it is important to add anionic molecules
such as; citric acid to properly disperse high-alumina castables since alumina particles
have a ZPC (The zero point of charge) corresponding to the usual pH range (8–10) of the
castable.
Sun studied the influence of initial pH on nano zirconia powder. Figure 2.10 shows the
effect of pH on the zeta potential of 3Y-TZP powder in a variety of NaCl solutions. He
concluded that the isoelectric point of 3Y-TZP is near 6.8. The absolute value of zeta
potential measured in 100M NaCl solution is lower than those measured in 1 and 10mM
NaCl solution due to compression of the double layer in higher ionic strength[32].
Figure 2.10 Zeta potential of aqueous 3Y-TZP suspensions at diffeerent pH values[27].
Lan and collegues investigated the agglomeration on drying of 8wt.% yttria stabilized
zirconia slurry. Figure 2.11 shows the SEM micrographs of green compacts dried from
the slurries with different pH values[33].

26
Figure 2.11 SEM micrographs of green compacts dried from the slurries with 47–50
wt.% solid content and pH values at (a) pH 3; (b) pH 4.5; (c) pH 5.5; (d) pH 7.5[33].
His results showed that green compacts dried from a dispersed slurry with pH 3 possess a
dense microstructure, whereas green compacts dried from a strongly agglomerated slurry
with pH 7.5 displays the least dense microstructure, in which large pores are present.
Green compacts dried from weakly agglomerated slurries with pH 4.5, 5.5 show medium-
dense microstructures. He concluded that the isoelectric point (IEP) was determined as 8
for Y2O3 stabilized ZrO2. The zeta-potential decreases with increase of the pH value from
3 to 7.5. The slurry with pH 7.5 displays strong shear thinning behavior and high
viscosity, indicating a high agglomeration degree. This is attributed to the comparatively
lower zeta potential at a pH value close to the IEP.
Greenwood and Kendall studied the effect of time after mixing on the zeta potential of a
3 mol%Y203 stabilized ZrO2 (see Figure 2.12). Notice that the Zeta potential increases by
5mV over a period of 6h so particle size distribution decreases with time[34].

27
Figure 2.12 Effect of time on the zeta potential of a suspension prepared from the Tosoh
zirconia powder[34].
They concluded that the yttrium ions could precipitate on the powder surface so a
positive charge builds up with time. This increase in the zeta potential with time
corresponds to an increase in stability; as a result the particle size decreases as the
aggregates break down into smaller units.
2.3.4 Dispersants
The dispersion of refractory castables is usually accomplished by developing electric
charges with the same signal on the particle surfaces. However, a brief glance at the zeta
potential curves of powders indicates that it is impossible to promote particle dispersion
simply by controlling the suspension pH. This is due to the fact that the raw materials
display dissimilar surface charges over a very broad pH range. Even in the case of simple
refractory compositions, substantial pH shifts are not expected to favor particle
dispersion. This is due to the large contents of acid/alkaline compounds usually required
to change the pH of castables, which would substantially increase the ionic strength of

28
the liquid medium. Considering these factors, the most common method to disperse
refractory castables is the addition of specific charged molecules (dispersants), which can
absorb and provide charges with the same signal on particle surfaces[1].
Figure 2.13 Examples of the effect of (a) anionic (0.06 wt% citric acid) and (b) cationic
(0.33 wt% polyethyleneimine, PEI) dispersants on the zeta potential curve of alumina and
silica particles, respectively[1].
Figure 2.13 shows the ability of anionic and cationic dispersants to modify the surface
characteristics of ceramic powders in water. As it is seen from figure 2.13, the anionic
species causes a shift of the zeta potential curve towards acidic values, leading to
negatively charged particles over a broad pH range. The opposite behavior occurs in the
case of the cationic dispersants, whose adsorption produces a positive net charge on the
surface of silica particles within a wide pH interval[1].
It should be mentioned that the charged sites of such molecules should be able to
establish relatively strong interactions with the surface groups so as to actually modify
the surface chemistry of the particles. This can occur through the formation of either
primary bonds or coordinated interactions among the dispersant molecules and the
surface groups. This characteristic distinguishes the action of dispersants from that of the

29
counterions of the Stern and diffuse layers, which, rather than reacting with the particle
surface, simply exert a screening effect on the electric potential surface[1].
2.4. Types of Refractory Castables
Refractory castables are classified by The American Society for Testing and Materials
(ASTM) according to their lime content[1,2,10,13,35,36]:
Conventional Castables (CaO>%2.5)
Low Cement Castables (%2.5CaO>1.0%)
Ultra Low Cement Castables (%1>CaO>%0.2)
Cement free Castables (CaO<0.2%)
Castables can be also classified in various ways since they are a diverse group of
materials. The primary division of castables is based on chemistry. The division separates
the refractory castables based on alumina and alumina-silicate aggregates from the
castables based on basic refractory oxides such as magnesite and dolomite. A more
detailed classification[1]:
1. Chemistry and/or mineralogy
a. Alumina content/refractoriness (i.e., superduty, 60% alumina etc.)
b. Mineral base (i.e., mullite, fused silica, etc.)
2. Density/thermal insulating value
a. Dense (>1920kg/m3)
b. Medium weight (1600-1920kg/m3)
3. Cement Content (by CaO from cement)
a. Conventional Castables (CaO>%2.5)
b. Low Cement Castables (%2.5CaO>1.0%)
c. Ultra Low Cement Castables (%1>CaO>%0.2)
d. Cement free Castables (CaO<0.2%)

30
4. Flow/placement characteristics
a. Vibrating
b. Casting
c. Free-flow
d. Shotcrete
2.4.1. Conventional Castables
Conventional refractory castables contain 15-30% calcium aluminate cement (CAC) acts
as a lubricant in water suspension and as a binder after hardening to give mechanical
strength at room temperature. The properties of these concretes depend largely on the
choice of refractory aggregate and hydraulic cement. The cured strength of conventional
castables is due to the formation of various cement based hydrated phases. Because of the
high cement content in conventional castables, they have relatively high in water content
(8-15%)[2].
The functions of water in refractory castables are:
6 – 10 % water reacts with cement to form hydrated phases and to make the
concrete flow. The reminder of 2-6% water is for proper installation.
0-5 % water is often taken up by the porosity of the aggregates and does not
contribute to the hydraulic bond.
2.4.1.1. Disadvantages
These high cement castables have three major disadvantages. First, they are usually
porous and open textured because they need large water contents, which greatly reduces
their strength. The low porosity and permeability of castables at temperatures below 21oC

31
is caused by the alumina gel formed upon curing. The open porosity of conventional
castables dried at 110oC is usually about 9-17%, but can be as low as 8%. Although some
of this porosity is because of entrapped air bubbles, the most porosity is caused by the
excess water added on mixing. On heating, the hydraulic bond is first modified, as
conversion occurs and then destroyed by the dehydration process. During this textural
modification, the pore size distribution changes and porosity grows significantly. The
new porosity depends on the amount of chemically bonded water and is therefore
dependent on cement type and content. The final open porosity of conventional refractory
concretes fired at 1000oC generally varies from 22 to 26%, depending on the type of
aggregate used[1,2].
Second, conventional castables show a characteristic drop in strength at intermediate
temperatures (often quoted to be between 538 and 982oC), when the hydraulic bond has
already broken down, due to the dehydration process, but the still sluggish sintering has
not yet allowed the development of a ceramic bond. The exact temperature range when
strength deteriorates is not absolute, but may depend on various factors, such as the type
and proportion of hydrates, the curing temperature, and heating schedule. Early attempts
to accelerate the formation of a ceramic bond generally consisted in making additions of
various fluxes, most of which did little good and usually reduced the maximum
temperature of use. Values for the cold crushing strength of conventional refractory
castables fired at 1000oC usually vary from 10 to 30 MPa, averaging around 60% of the
strength after drying[2].

32
Finally, the high lime content of these castables favors the formation of a fluid vitreous
phase at high temperatures via the eutectic liquid in CaO-Al2O3-SiO2 (CAS) ternary
system which may encourage crystal formation but often remains as a glass or low
melting anorthite and gehlenite on cooling which degrades refractoriness and corrosion
resistance. The volume of viscous phase in refractory castable for a given temperature
and refractory aggregate is mainly determined by the impurity content of the binding
phase, i.e. by the composition and amount of cement used. Even with a high purity CAC
containing 70-80 % Al2O3, it is impossible to reduce the CaO content of conventional
castables to less than 3%, which is still a large amount, particularly if silica containing
aggregates are used. Further reduction is only possible by reducing the cement
content[1,2].
Unlike fired refractory bricks, whose final properties are largely fixed before reaching the
user, a refractory concrete has properties which evolve and alter for a considerable time
after it has been put into use. In the case of refractory concrete it is the behavior at the
service temperature which is more important than the unfired strength. By the end of the
1960s, there was little doubt about what should be done to improve the performance of
refractory castables. Reducing the amount of cement without impairing other properties
of the material proved difficult and challenging. However after several attempts it finally
led to the development of a new range of products: the low and ultra low cement
castables[1,2].

33
2.4.2. Low and Ultra Low Cement Castables
The first attempts to improve LCCs having excellent cold and hot strengths were
unsuccessful since mechanical resistance was insufficient with less than 10% cement. In
1969, Prost and Pauillac improved LCCs (5-8% cement) without any reduction in
strength. However they were very sensitive to rapid heating, mainly because the
chemically bonded water released in a much narrower temperature range. This led to
explosive spalling since the outer layers closed off and internal water pressure built up.
Further improvements led to the development of concretes characterized by a
pseudozeolithic bond, which releases the chemically bonded water slowly between 150
and 4500C, rather than within a narrow temperature range. This minimized the problems
associated with explosions during heating but, because LCCs and ULCC s are dense
materials with low permeability, baking out is always difficult, especially in thick
installations[1,2].
The idea was to reduce the water requirements by eliminating the intergranular voids,
which are often filled with excess water during the castable placement. This was achieved
by carefully grading the particle size distribution so that interstices were progressively
filled by smaller particles to gain the maximum packing density. Water requirements
were further reduced by proper selection of defloculants and water reducing agents,
which prevented coagulation of the fine powders and improved dispersion. The reduction
in the water content required for vibration casting and maximizing of the packing density
means these have higher density, low porosity and good mechanical and abrasion

34
Self flow castables
Packing
Rheology
dispersion
resistance. Low and ultra-low cement castables usually require 3-7% water for
placement, depending on the grade[1,2].
To appreciate fully modern refractory castables the interrelation between particle
packing, dispersion technology, and rheology is critical (Figure 2.14). Understanding the
relation between the first two of these gave rise to the new range of LCCs and ULCCs,
while incorporating the third further improved the overall understanding of the
technology and allowed the development of SFCs[2].
Figure 2.14 Relations between particle packing, dispersion and rheology[2]
Evangelista studied how to control the formulation and optimization of self-flow
castables based on pure calcium aluminates. His results show that free flow behavior is
obtained through the correct selection of the components of the refractory matrix and of
the volume ratio between matrix aggregates. In addition it is necessary to optimize
multiple additives for each specific system[3].

35
2.4.2.1 Particle Packing, Dispersion and Rheology
The main goal behind LCCs and ULCCs is to reduce the water requirement for placement
while maintaining strength. Minimizing the water addition has been one of the major
tasks in the development of castable technology[1,2]. Practical means of the reducing the
cement and the water level consist of:
Proprietary mixtures of chemicals, which improve the rheological behavior of the
system and the setting process
Ultrafine reactive powders which replace part of the cement of conventional
castables and when used appropriate dispersant, fill the voids between larger
which would otherwise filled with water.
Basically, the aim of the refractory industry is to get as dense refractory structures as
possible. A major breakthrough in the development of this technology was the realization
that this could be accomplished by improving the packing density of the material. The
use of particle size distribution (PSD) in the construction of refractory castables has the
recent few years become more common to achieve high dense castables. Although 100%
packing density is not achievable, control of the particle size distribution of a castable is
of vital importance[5,9,37]. Mainly for two reasons:
Whether the castable is of a vibratable or a self may be decided flowing type by
the particle size distribution. It is possible to design a castable to be either by
using PSD analyses.

36
Although 100% packing density is contradictory to flow, a solid structure with
optimum packing theoretically requires less water for placement than castables
with imperfect packing.
The particle size distribution (PSD) of the castables is a key factor to improve the
flowability and density of the mix. The fine and ultra fine particles can increase the
separation distance between aggregates and improve flowability. There are number of
models have been presented over the years. The most commonly known models are
Furnas - Anderegg and Andreassen and Dinger - Funk (modified Andreassen) [5,9,37].
The model of Furnas and Anderegg is however difficult and complicated to use. The
model of Andreassen is much simpler but it has been criticized because of its semi-
empirical nature. One interesting aspect of the Andreassen model is that it is does not
require any shape factor. It only requires the different particles to be of similar shape. The
main objection that has been raised against the Andreassen equation has been that the
model supposes infinitely small particles since real systems are finite. To overcome this
problem, Dinger and Funk, by combining the Andreassen and the Furnas distribution,
made a modified Andreassen distribution in which a minimum particle size was
incorporated. The resultant model is much easier to use than the one given by Furnas, and
is frequently called the "modified Andreassen" or the "Dinger and Funk" equation. Below
is given the models as proposed by Furnas, Andreassen and Dinger and Funk (modified
Andreassen)[5,9,37]:

37
Furnas :
100
CPFT=
SL
S
DD
Dd
rr
rrloglog
loglog
[2.1]
Andreassen :
CPFT= 100
q
LD
d [2.2]
Modified Andreassen (Dinger-Funk):
CPFT= 100
q
S
q
L
q
S
q
DD
Dd [2.3]
CPFT: Cumulative percent finer than
r: Average particle size ratio
d: Particle size
DS: Minimum particle size of the distribution
DL: Largest particle size
q: Distribution coefficient (q-value)
One important aspect when dealing with particle size distributions is that they are always
based on volumes. So for mixtures of powders with different densities, the amounts
always have to be transformed to volumes in order to give volume percents. The
parameters of the Andreassen and the modified Andreassen equation are the same i.e. the
q-value is identical for both. One important result presented by Dinger and Funk was the
influence of the q-value on packing. Using density values made it possible for infinite
distributions. There is always porosity q-values above 0.37 so the q-value should not
exceed 0.37 to get dense packing[5-9,37].

38
The Furnas distribution has been widely used in refractories. A common experience when
using this distribution on castables has been that flow is improved by adding more of the
finest fraction by adding more of the superfines change the distribution from a Furnas
type towards an Andreassen type. Thus, despite the imperfections of the Andreassen
distribution, it has been found that it works better for refractory castables than those of
the Furnas type on systems with microsilica. Results from systems based on the
Andreassen equation have indicated that in order to get good flow for castables, the q-
value should not exceed approximately 0.3. Model systems based on fused alumina have
shown that for 0.2 to 0.3, the flow pattern of the castables may be influence by
manipulating the q-value in the range. If relatively high q-values are used (i.e. close to
0.3), the castables are vibratables. On the other hand, self flow is dominant for lower q-
values (<0.25)[5-9,37]. Myrhe used different q values in Andreassan model to determine
self flow values based on ultra low cement castables[9]. Figure 2.15 shows free flow of
ultralow-cement castables (ULCCs) with different particle size distributions as a function
of time. His results show that the free flow is significantly influenced by the q- value,
lower q value gives higher free flow.[9]
Figure 2.15 Free flow as a function of time and particle size distribution at 20
oC[9]

39
Thus, it is possible to design either type of castable by manipulating the PSD. The effect
of reducing the q-value is an increase in fines content. Particle interactions are essential
for flow of castables, that is especially between coarser particles, so that an increase in
the content of fines effects a separation of the coarser particles. A separation of the
particles by viscous liquid containing water together with fines and superfines seems to
be essential for creating flow in such systems[5-9,37]. Zhou used different q values in
Andreasan’s model to determine self-flow property of castable mixes[14]. Table 2.11
shows these compositions based on different q values[14].
Table 2.11 Details of Castable mixes[14]
Composition CM-1 CM-2 CM-3 CM-4
Andreasen
modulus, q
0.23
0.26
0.29
0.26
Dmax, mm 5 5 5 8
Then, he measured self-flow properties of castables after mix for 30 minutes in Figure
2.16. His results show that self-flowability of all compositions looks similar at 0 min.
After 30 min, CM-1 has shown considerable increase in self-flowability while observing
little increase for composition CM-2. In the case of composition CM-3 and CM-4, there
is a decrease in self-flowability due to segregation. Also, he indicated that it would be
better to limit the maximum particle size since CM-2 and CM-4 have same q value but
CM-2 shows better self-flowability after 30 minutes[14].

40
Figure 2.16 Comparison of self-flowability of castables[14]
However, the idea of reducing the water requirement for placement by simply improving
the packing density of the castables would not have been successful without the proper
use of superplasticizing additives to allow adequate dispersion of the submicrometer
powders. Different types of additives or admixtures may be used to modify the
flow/rheology characteristics of the castables, control setting behavior (retarding or
accelerating), reduce casting water, stabilize/control the cement paste’s pH, or stabilize
storage behavior. In many cases, multiple additives are used in a single formulation.
Additives and admixtures are used in very small amounts, usually between 0.05 and
0.5%[1,2].
A.R. Studart researched at selection of dispersants for high alumina zero cement
refractory castables[15]. Gallic acid and 2-phosphonobutane-1,2,4-tricarboxylic
(PBTCA) were used to investigate the dispersing efficiency. The free flow value of zero-
cement high-alumina castables containing 14 vol.% water (4.12 wt.% based on dry
solids) is presented in Figure 2.17 as a function of the dispersant content. His results
indicate that such compounds are able to efficiently disperse zero-cement high-alumina

41
castables, enabling a reduction of their water consumption for a given fluidity level in
comparison to those dispersed with citric acid[15].
Figure 2.17 Free-flow value of castables as a function of the dispersant content for
compositions dispersed with citric acid, gallic acid and PBTCA (14 vol.% water)[15]
Refractory castables consist mainly of fine powders, aggregate, and water and it is
generally agreed that the workability of the material is governed by the flow properties of
the fine powders. Therefore, the study of abnormal flow properties in a fine powder-
water system, such as slurries and pastes, is important[1].
2.4.2.2 Properties
The main technical advantages of LCCs and ULCCs are their excellent physical
properties, such as high density, low porosity, high temperature and “cold” room
temperature strength, and high abrasion and corrosion resistance. The porosity and
mechanical strength of refractory castables vary with temperature. A conventional
castable has an open porosity of about 9-17% after drying and around 20-30% after heat

42
treatment at 1000oC. Most LCCs have an open porosity not higher than 10% and 16%
after drying and firing, respectively[2].
M.A. Serry, studied at bauxite based low and ultra low cement castables. His results
show that after firing at 1400oC, apparent porosity values between 10-15% and cold
crushing strength values between 40-65 MPa[16]. Low cement castables usually possess
a much finer pore size distribution than conventional high cement castables. In turn, this
further contributes to increase the corrosion resistance, by hindering the penetration of
metals and slags. The cold strength of LCCs rises steadily with temperature and is often
higher than that of a conventional castable of similar composition at all temperatures after
dehydration.
S. Goberis studied the properties of conventional castables (CS), medium cement
castables (MCC) and low cement castables (LCC)[38]. In Figure 2.18, results show that
at elevated temperatures, LCC samples have higher CCS values than both, CS and MCC
specimens. The reasons are the recrystallization of minerals at 800oC and formation of
bonding by the sintering process at 1100- 1300°C[38].
Figure 2.18 Compressive strength in castables heat-treated at different temperatures[38]

43
Zawrah investigated the effect of mullite formation on the properties of refractory
castables[39]. He prepared four different refractory compositions based on different
content of CAC’s. In figure 2.19, castable 1, 2, 3 and 4 refer to 15, 10, 5 and 2 % CAC’s
respectively.
Figure 2.19 CCS of different castable samples fired at different firing temperatures[39]
Figure 2.19 shows that at lower temperatures high cement content castables show better
strength values while low cement castables show lower Cold compressive strength (CCS)
since the amount of cement is very little to promote bonding. On the other hand,
Castables 3 and 4 containing the least amounts of cement (5 and 2wt.%, respectively)
show the highest values of CCS at increased temperatures, this is attributed to the
formation of mullite, a mineral that forms a network of mullite needles strengthening the
structure and providing better performance at high temperatures[39].
There is increasing interest in the use of new bonding agents with superfine materials.
Zawrah studied the effect of zircon additions on low and ultra low cement alumina
castables[40]. Figure 2.20, ZOA, Z2A, Z4A, Z6A and Z8A show the effect of 2, 4, 6,

44
and 8 wt.% zircon additions (cement replaced by zircon) respectively. These results show
that at elevated temperatures, castables with increased zircon dosage have improved cold
crushing strength values. This is because of decreasing cement and increasing of m-ZrO2
mullite-corundum or m-ZrO2- corundum within the composite matrix[40].
Figure 2.20. Cold crushing strength of alumina castables[40].
Mukhopadhyay used mullite and spinel sols as bonding agents in a high-alumina based
ultra low cement castables[41]. Figure 2.21 shows the performance of castables with (M)
and (S) mullite and spinel sols respectively. It was found that mullite is a promising
material as an additive in ultra low cement castables demonstrating better CCS values
than spinel sol containg castables[41].
Figure 2.21 Cold crushing strength of ultra low cement castables vs. heating
temperature[41].

45
Low cement castables (LCCs) usually have higher modulus of rupture and lower creep
values than conventional high cement castables. All these characteristics provide superior
performance over conventional (high cement) castables and other monolithic materials,
such as ramming mixes, plastics, and gunning refractories. However, high cement
castables are more robust with regards to installation and cast procedures, and ease of
placement. In contrast, LCCs and ULCCs are more sensitive to installation parameters
and possible variations in water content and casting conditions (such as the ambient
temperature that may affect pot life, hardening time, and strength)[2].
2.4.3. Zero-Cement or Cement Free Castables
Zero-cement castables are used in numerous molten iron steel contact applications, where
the elimination of lime in the refractory matrix increases the maximal use temperature.
These usually do not show the superior performance and mechanical properties of LCCs
and ULCCs, but they have a better corrosion resistance in respect to molten metals and
slags. Zero cement castables (ZCCs) utilize the diversity of bonding systems like clay
minerals, silica gels, hydratable aluminas, and phosphates[2].
Hydratable aluminas have attracted attention among the different binding systems for
zero-cement castables (ZCCs). The first reported applications came from Japan in the
early 1980s. Hydratable aluminas are amorphous mesophase transition aluminas which,
similar to cement, harden hydraulically. These are produced by the rapid dehydration of
gibbsite (Al(OH)3). In contact with water, γ-alumina rehydrates, forming pseudoboehmite
(AH1-2) and bayerite (AH3). During heating, the hydrated phases lose their chemically

46
bound water, giving rise to the stable form of alumina (α-Al2O3), which, at higher
temperatures, will help to develop a strong ceramic bond[2].
The hardening reaction of transition alumina can be accelerated by the inclusion of alkali
metal salts or delayed by the use of carboxylic acids. When used as a substitute for the
cement, transition aluminas are usually combined with microsilica to promote the
formation of mullite at high temperatures and to improve hot strength. In order to control
the setting time of the castable, it has been found that some small additions, usually
around 0.5% of CAC may be necessary. This is because a castable with a low hydraulic
alumina content will not set. Higher additions of hydraulic alumina would require the
increase of mixing water to maintain the flow however, this solution increases the
porosity of castables[2].
Myhre investigated the effect of hydraulic alumina (Alphabond) on free flow value as
demonstrated by Figure 2.22. It may be seen that with increased in the hydraulic alumina
content, more water has to be added to obtain given flow[7].
Figure 2.22 Free flow and increase in water content vs. % dosage of Alphabond[7].

47
Hydratable aluminas also have disadvantages. For examples, there is a high risk of
explosive spalling at low temperatures, usually around 200-300oC due to the impervious
structure[2]. Cardoso studied the drying behavior of hydratable alumina-bonded (HAB)
refractory castables and compared them with the ultra low cement compositions[42].
Figure 2.23 Drying behavior of CAC and HAB green castables subjected to continuous
heating: (a) Rate of 10oC/min from room temperature up to 800
oC. Curves (iii) and (iv)
refer to moisture free (MF) samples. (b) A more aggressive heating rate (20oC/min) was
applied to evaluate the explosive spalling occurrence[42].
Figure 2.23 shows that the intensity of the HAB evaporation peak is lower than that of
the CAC drying profile indicating that a larger amount of free water remains available for
vapor pressurization during the ebullition stage. The low permeability of the HAB
samples is related to the formation of gel-like phases. These phases did not only restrict
the evaporation process but also affected the second peak, causing it to shift to higher
temperatures as the release of steam was adversely affected. Hence, greater pressure

48
gradients (i.e., higher temperatures) were required to expel the water vapor from the bulk
of the solid at the same rate as from the CAC bodies[42].
In many cases, castables are selected as the preferred lining materials just because
installation of bricks may be difficult or even impossible. Low and ultra-low cement
castables are often the first technical choice, but whether these materials can be
satisfactorily installed is not always immediately apparent. Among many factors that
affect the quality of the installation, and of course the performance of the lining, are the
following: inefficient mixing, excess water additions poorly placement, and
inexperienced personnel. Flow of LCCs and ULCCs is usually promoted by internal or
external vibration, since these materials are thixotropic in nature, but this solution alone
is not always sufficient to assure the complete filling and good consolidation of all zones
of the filling[1,2].
2.4.4. Self Flowable Castables
In order to overcome the installation problems associated with the vibration placement, a
new class of high performance LCCs and ULCCs has been produced. These products
were developed in the mid 1980s, characterized by excellent consistency and flow after
mixing which allows the material to flow and degas without the application of external
vibration[2,3,10-13]. These materials were named ‘self-flowing castables’ (SFCs), and
were developed by modifying the rheology of the LCC and ULCC systems, by changing
the shape and size distribution of the aggregates and by the use of deflocculants.

49
Otraj studied the effect of four different dispersing agents: sodium polyacrylate acid (Na-
PAA), citric acid (CA), sodium tripolyphosphate (TPP) and sodium hexametaphosphate
(HMP) on the flow behavior of ultra low-cement Al2O3-SiC-C castables[31]. His results
show that sodium polyacrylate has proved to be the most effective additive (Figure 2.24).
The electrosteric mechanism of Na-PAA appears to promote the higher flowability in this
system.
Figure 2.24 The effect of various deflocculants on the self flow of castables[31].
The basic idea was to reduce the points of contact between the aggregates, which affect
the flow, by increasing the volume of the matrix, while keeping its density high. With
water addition in the range 4.5-8%, depending on the product type, these castables self-
flow under their own weight, easily filling intricate forms and shapes and, because of
their cohesive consistency, those can be installed without segregation of the fine material
or the fluid phase[2].
Early low cement, free flow castables had good flow characteristics but their strengths
were significantly below those of vibrated LCCs. Other free flow castables with higher
cement levels had an improved flow property. Modern self-levelling castables were

50
optimized to generate self-flow behavior at low water levels and utilize aggregates and
cement levels similar to those of LCCs and ULCCs. The self-flow technology can be
applied to a wide variety of compositions, ranging from fumed silica and bauxite based
products to high alumina and silicon carbide based castables[1,2].
Myrhe studied the use of microsilica in refractory castables. Figure 2.25 shows an
example of the effect of microsilica additions on flow of a tabular alumina based castable
with 1.5% cement[9]
Figure 2.25 Flow value and water addition of tabular alumina based refractory castable
as a function of microsilica content[9].
In this figure 2.25, when the microsilica content is increased from 2 to 4%, it allows to
lower the water content by 1% while maintaining the flow. One percent water equals
approximately the volume of 2% microsilica. However, at higher microsilca additions the
water replacing effect is not pronounced. In turn, this demonstrates the microsilica effect
as a microfiller[9].

51
However, despite of the significant improvements in the technology of castables, it
should be noted that the physical properties of vibrated LCCs are generally superior to
those of free flow castables. Self-flowing refractory castables also have their limitations
such as: control of the setting time to allow the natural degas of the castable and yet
prevent sedimentation or segregation[2]. Gierisch studied the aging behavior of
alphabond and calcium aluminate cement bonded castables[43]. For this purpose, he
prepared 4 different refractory compositons: Two low cement castables (LCCs) based on
different additives and ultra low cement castable (ULCC) and zero cement castable
(ZCC). His results show that ULCC with dispersing aluminas M-ADS/W shows the
higher aging resistance (Figure 2.26).
Figure 2.26. Impact of warehouse aging on flow at 30 minutes[43]
Other disadvantages are related to the strong influence of temperature on flow behavior
and the setting time, with temperatures above 30oC being particularly harmful and
detrimental to quality of installation differences in plant sites and applications. In turn,
this requires different but controlled placement and demolding times and dilatant flow
behavior, which complicates handling and dosing[2].
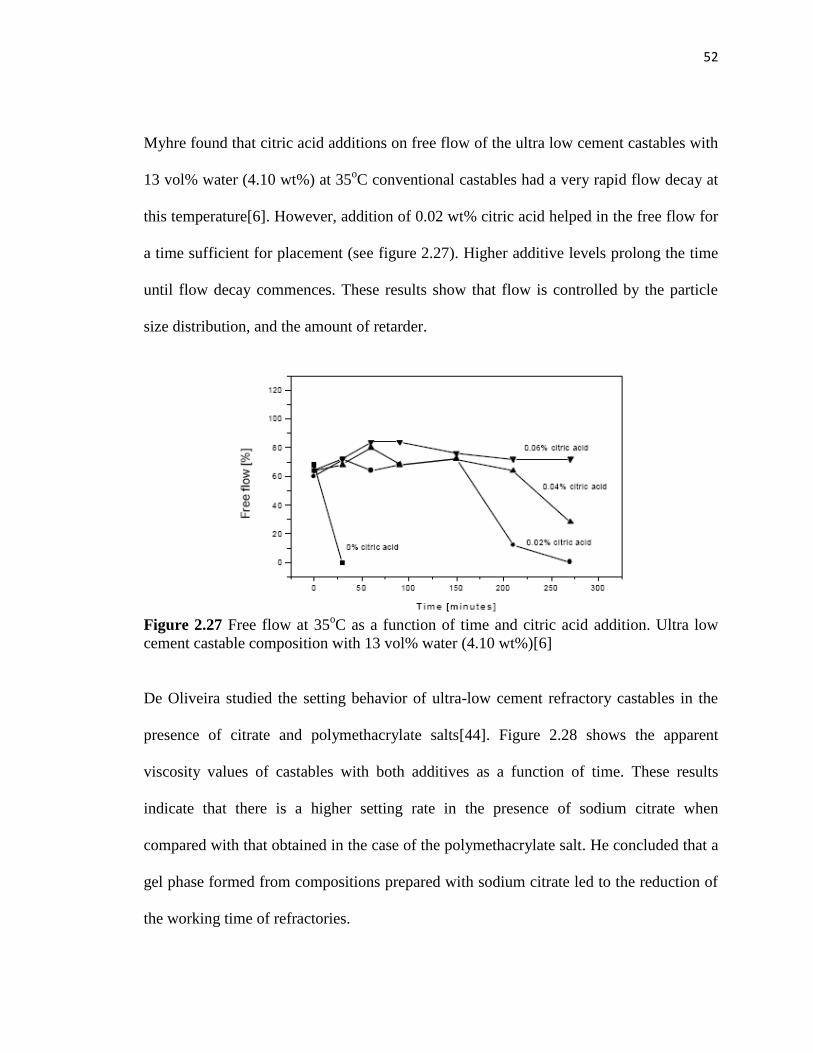
52
Myhre found that citric acid additions on free flow of the ultra low cement castables with
13 vol% water (4.10 wt%) at 35oC conventional castables had a very rapid flow decay at
this temperature[6]. However, addition of 0.02 wt% citric acid helped in the free flow for
a time sufficient for placement (see figure 2.27). Higher additive levels prolong the time
until flow decay commences. These results show that flow is controlled by the particle
size distribution, and the amount of retarder.
Figure 2.27 Free flow at 35
oC as a function of time and citric acid addition. Ultra low
cement castable composition with 13 vol% water (4.10 wt%)[6]
De Oliveira studied the setting behavior of ultra-low cement refractory castables in the
presence of citrate and polymethacrylate salts[44]. Figure 2.28 shows the apparent
viscosity values of castables with both additives as a function of time. These results
indicate that there is a higher setting rate in the presence of sodium citrate when
compared with that obtained in the case of the polymethacrylate salt. He concluded that a
gel phase formed from compositions prepared with sodium citrate led to the reduction of
the working time of refractories.

53
Figure 2.28 Apparent viscosity as a function of time of suspensions containing 5 wt% of
sodium citrate or sodium polymethacrylate[44].
Finally, the water demand of self-leveling systems is considerably higher than that of
vibration castables and similar to the thixotropic LCCs and ULCCs[2]. However,
overwatering significantly affects the mechanical strength and corrosion resistance of
these materials.
2.5 Fracture of Refractories
Fracture is always a critical problem for materials applications and one of the two most
common modes of failure for the refractory linings of modern industrial processing
vessels. The other is chemical attack, or corrosion by the material that the refractories are
containing within the process vessel, often molten metals or glasses at very high
temperatures[1].
Fracture failures are of several varieties, including simple mechanical overload that can
arise from impact during the loading of the process vessel with scrap metal. Thermal
stress fracture during cooling or heating, particularly the initial heat-up of a vessel or

54
during rapid thermal cycling between heats, is another type of failure. In the case of
refractory concretes or castables, the situation of explosive fracture from moisture
entrapment is also a major concern. These fractures may be catastrophic and result in the
complete loss of the refractory lining. Sometimes thermal shock simply causes surface
spalling and a significant reduction of the lifetime, or campaign, of the lining. However,
fracture need not always be disastrous; it may just result in the development of a crack
pattern in the process vessel lining. Those crack surfaces may be held together and closed
by the vessel lining compressive stresses that develop from thermal expansion when the
vessel is heated to operating temperatures[1].
Aksel studied the fracture behavior of magnesia and magnesia-spinel composites before
and after thermal shock[45]. Figure 2.29 shows the fracture toughness values for MgO.
Figure 2.29 Fracture toughness as a function of spinel content before and after thermal
shock[45]
The experimental composite toughness values are all below the one for pure MgO. The
reason is that at room temperature, the fracture of MgO was mostly transgranular

55
(through the grains), and a large proportion of intergranular (along the grain boundaries)
fracture was observed with increasing spinel content. The reason for the occurrence of
intergranular fracture is linked to the presence of spinel particles at the grain boundaries.
After thermal shock, fracture surfaces of MgO showed that the extension of a large
amount of combined intergranular fracture appeared with some transgranular fracture
above the critical quench temperature, >600oC. Spinel composites had mostly
intergranular fracture, after quenching from 800oC. Preexisting connected cracks
appeared not to be able to propagate easily in the 20 and 30% spinel materials. For this
reason, more energy was required to connect the cracks for propagation after thermal
quenching Therefore, the cracks propagate only a short distance and become arrested.
The composite containing 30% spinel in general shows the greatest resistance to crack
propagation, and to further thermal shock damage[45].
S. Ribeiro studied the influence of the microstructure on the maximum load and fracture
energy of refractory castables[46]. Figure 2.30 shows results of the count of fractured
aggregates at the surface. His results show that the number of fracturated aggregates
increases with the heat treatment temperature, indicating that the aggregates are strongly
bonded in the structure of the matrix, and that the energy required to debond from the
matrix would be higher than their resistance to fracture. This behavior is more
pronounced for the higher test temperature at 1550oC, when sintering occurred[46].

56
Figure 2.30 Fracture energy results for the samples of refractory castables heat treated at
the temperatures[46]
In figure 2.31, there is a good indication of the fractured surface of the castables B,
sintered at 1100oC for 12h, illustrating the fractured aggregates and debonded aggregates,
and the place where the aggregates were debonded from the refractory castable
matrix[46].
Figure 2.31 Photograph of the fractured sample showing: matrix (fine fraction), fractured
and debonded aggregates (coarse fraction), and hole produced by pull out of the
aggregate[46]
Basically, strength and fracture toughness are related through the aggregate sizing of
refractories, which illustrates the importance of the microstructural aspects of the
refractory aggregate to the strength. Their size and distribution in a refractory body of the

57
refractory aggregates play an important role in refractory fracture phenomena. This is due
to the crucial role that aggregates assume in following the wake region of a crack. Thus,
the aggregate distribution must be the focus of microstructural design for improved
fracture characteristics when all other factors are equal in a refractory body[1].
2.5.1 Strengths of Refractories
Refractory strengths are generally reported in terms of the three-point bend strength or
the flexural strength, frequently called the modulus of rupture (MOR)[47,48]. In the case
of refractories, there exists a standard test for this simple strength measurement. It is
based on the familiar formula[1]:
22
3)(
bd
PLMORf
[2.4]
Where σf is the strength in three-point bending, L is the length of the test span, b is the
specimen width, and d is the specimen height. The fracture load is P. It specifies the
tensile stress at the bottom of the flexing bend test beam. In principle, equation 2.4 is
strictly applicable only when the load-displacement curve is fully linear elastic to
failure[1]. This equation can be converted to fracture mechanics terminology:
2/1 YCK ICf [2.5]
Where KIC is the fracture toughness, Y is the geometric factor equal to π-1/2
in the
classical, and C is the critical flaw size. Flaw size are generally of the same size as the
largest aggregates in the refractory since refractory mixes with larger top sizes aggregates
have lower strengths than those containing just fine aggregates. It is an important point

58
for understanding the strength of refractories and the role of the aggregates in the
refractory mix[1].
When refractories fail in a brittle elastic manner, where the load-displacement curve is
clearly linear elastic to failure and both equations are satisfactory representations for the
strength[1]. L.A. Diaz studied the room temperature mechanical properties of high
alumina refractory castables with spinel, periclase and dolomite additions[49]. Figure
2.32 shows his bending strength results at room temperature with firing temperature. In
this figure, refractory castables with spinel content 5, 10, 15 and 20 wt.% (8D type), and
refractory castables with addition of magnesia (8DM type) and refractory castables with
dolomite additions of 5, 10, 15 and 20 wt. % (PKDOL type).
Figure 2.32 Flexural strength values of 8D, 8DM and PKDOL refractory castables[48].
Both the 8D and 8DM castables show similar flexural strength. Up to 400oC, the decrease
in mechanical strength is due to the non-cohesive aggregate-matrix union. The increase in

59
flexural strength between 800 and 1000oC is related to crystallization of CA. The reaction
of this phase with free alumina results in CA2 which increases the flexural strength. At
1200oC a transitory liquid phase can be observed due to the dissolution of the CA phase
after which another expansion occurs. Flexural strength is then observed to decrease.
Above 1200oC, flexural strength of both 8D and 8DM compositions increase due to the
sintering process. PKDOL compositions show lower values than both 8D-8DM sample
because of the different composition location in the Al2O3-MgO-CaO ternary diagram
system[49].
G. Prokopski studied the fracture toughness of concretes at high temperature. He used
three point bending tests to determine the fracture toughness[50]. His results show that
fracture toughness values of samples increase with an increase in testing temperature.
The reason is attributed to crack propagation along the contact surface between aggregate
grains and the cement paste. Above 400oC, the cohesion of the grains with the cement
paste caused grain cracks in numerous sites which resulted in the propagation of a
fracture through the cement paste[50].
However, when refractories do not fail in a brittle linear elastic manner, such as when an
extensive nonlinear region develops prior to fracture, then the use of these two equations
is not the best practice for strength determinations[1]. Gogotsi investigated alternative
methods of evaluating the fracture resistance of ceramics[51]. He indicated that the
experimental results favor the view of the edge fracture (EF) method, which is not based
on the linear elastic fracture mechanics principles. This method can be useful for
checking the fracture resistance of ceramics and their resistance to crack propagation.

60
For the most part refractory linings, or systems, are not subject to severe load-bearing
conditions: their function is primarily one of containment. Refractories do not have a
major structural role in their applications. For these reasons, refractories do not need to be
very strong or just strong enough to maintain their integrity. Typically, refractories have
room temperature bend, or flexural strengths in the range of approximately 10-40 MPa
(around 1500-6000 psi). It is important to realize that refractories are not very strong by
any standards or comparisons[1].
S. Mukhopadhya investigated the effect of increasing the spinel content on the flexure
strength of a low cement refractory castables[52]. Figure 2.33, shows the flexural
strength of G in-situ spinel bonded castable as a function of the spinel content. Notice
that spinel additions increases between 30-35 MPa the flexural strength which is better
than for spinel free castables[52].
Figure 2.33 Plot of flexural strength (at 25
oC) of fired (1500
oC) in situ spinel bonded
castable (G) with increasing concentration of spinel additive[52]
Fangboe Yea studied the high temperature mechanical properties of bauxite-based SiC-
containing ultra low cement castables[53]. In figure 2.34, both samples have similar
chemical composition except for the microsilica content (S8 and A8 samples contain 4.5

61
and 1.5% microsilica respectively). The results show that up to 600oC, there is only a
slight increase in the MOR with increasing temperature. At temperatures between 800–
1000oC, the MOR of specimens increases significantly, reaching a maximum at 800
◦C
(sample A8) and 1000 ◦C (sample S8), then there is a decrease in strength at higher
temperatures. It was concluded that both specimens contain more than two phases so the
strength of these kinds of materials increases with temperature up to the inflexion point
after which the strength decreases with temperature[53].
Figure 2.34 MOR–T curves for specimens A8 and S8[53]
Refractories are utilized at elevated temperatures, so there is an interest in improving
their strength with increasing temperatures[1]. When the strength of refractories is
measured by the three-point bend test and done so as a function of temperature, then the
bend or flexural strength invariably exhibits a maximum that is associated with the
softening of the silicate bonds. This strength maximum is usually not a very large one. It
is usually observed between 600oC and 1400
oC, depending on the particular refractory
type, its silicate content, and the specific chemistry of that silicate. At elevated
temperatures, above this strength maximum, the strength of the refractory rapidly
decreases to only a few MPa and exhibits distinctly nonlinear load-displacement curves.

62
Although refractories are never very strong, they become even weaker at elevated
temperatures, but they are noticeably less brittle as well. In addition, the loading rate
dependence of strength at elevated temperatures becomes quite complicated. The
coupling of the loading rate and temperature effects on strength have been previously
addressed. It is not a simple interdependency, but one that varies considerably from one
refractory system to another[1].
When attempting to understand the fundamentals that govern the strength of refractory
systems, it is important to realize that although many refractories can be considered
brittle materials at low temperatures (˂600oC), once the temperature of the strength
maximum is exceeded, refractories no longer remain very brittle. The silicates soften and
impart a significant degree of “plasticity.” Brittle fracture of refractories is not a major
problem at elevated temperatures where a distinctly viscous, or plastic deformation, type
of response occurs under most loading conditions. Furthermore, reported high
temperature strength values of refractories should only be accepted with reservations and
only applied to design situations with a considerable degree of caution. Most of those
strengths are probably not properly measured[1].
In the 1970s and 1980s, researchers realized that the approach to understanding the
fracture of refractories was to conduct measurements on individual or single cracks,
instead of, or in addition to, the common bend strength measurements[1]. The KIC-values
were determined by the single-edge crack, or notched-beam bend specimen, where the
normal three-point bend specimen was simply notched straight across at the half height

63
with a thin diamond blade. From this simple bend test of an artificially cracked (diamond
saw notched) specimen, the fracture toughness is then calculated from the equation[54]
d
af
da
da
bd
LPK IC 2/3
2/3
2/3
max
/1
/
2
3
[2.6]
Basically, equation 2.6 is combination of eqs. (2.4) and (2.5) where the parameters have
the same identities. The f {a/d} polynomial is related to the ratio of the crack length to
the specimen thickness and it is given by equation 2.7[53];
[2.7]
Although most researchers have used a straight through sawed artificial crack of a depth
of one half of the specimen thickness, it is recommended that the average precrack length
shall be within the range: 035W ≤ a ≤ 0.60W[54].
G.B. Palmer studied the specimen size effect on fracture toughness for a low cement
refractory pre-fired to 1200oC[55]. He concluded that fracture toughness was not constant
with specimen size but once the specimen displays brittle characteristics then the fracture
toughness becomes constant. Also once a critical size was reached, it was shown that the
stress to failure for notched specimens was inversely proportional to the specimen size on
a log-log scale[55].
The fracture toughness can be measured by this test at low temperatures where fractures
are predominantly brittle and the load-displacement curve is essentially linearly elastic to

64
failure. Experimental tests show that the toughness of refractories usually are in the range
of about 0.2 to 1.5 MPa.m1/2
, not very large toughness[1]. Refractory castables are at the
lower portion of this range and fired bricks at the higher end. Refractories are not very
strong since their intrinsic flaws are quite large, as evidenced by the readily visible large
aggregates (flaws) in refractory bodies. That means the crack initiation resistance of
refractories is not very large. Cracking and fracture may be expected to be of a concern
for industrial refractories in many of their applications[1].
2.5.1.1 Indentation Toughness
Indentation technique is another method to measure the fracture toughness of the brittle
materials. It is becoming increasingly attractive since it was first proposed by Palmqvist
(1962) and developed by Evans et al. (1980) for the measurement of the microstructural
toughness of ceramics. Indentation test is easy, quick to perform and requires only a
minimum area of mirror finish quality polishing. It can be performed on a standard
hardness tester, eliminating complex specimen geometries and experimental procedures.
It potentially allows the characterization of both local and fracture properties[56].
Development of the crack during the indentation test depends on indentation load,
material properties and type of indenter tip used in the test. In the literature, there are
different types of indenter tips used. Although it was originally intended for application
with sharp, geometrically self-similar indenters like the Vickers, Berkovich, it can be
applied to a variety of axisymmetric indenter geometries including the sphere[56]. Figure
2.35 shows the schematic illustration of some of the indenter tips.

65
Figure 2.35 Schematic illustration of indenters tips.
The main idea in the indentation fracture toughness is the radial cracking (c) which
occurs when brittle materials are indented by a sharp indenter. Then, the length of the
radial crack (figure 2.36) is correlated with the fracture toughness (KIC) and is used to
calculate fracture toughness values[55]. Figure 2.36 shows a schematic diagram with
indentation fracture.
Figure 2.36 Schematic illustration of radial cracking at a Vickers indentation[57].
Initially, a Vickers indenter (four sided pyramid) was used for microhardness indentation
test to correlate the length of the radial crack with the fracture toughness[57]. The well-
known equation developed by Evans was then used to determine the fracture
toughness[58].
Vickers
s
Berkovich
s
Knoop Conical Rockwell Spherical
al

66
[2.8]
KIC= Fracture toughness, lbf/in3/2
, (Mpa.m1/2
)
E= Elastic modulus.
H= Hardness.
δ= An empirical constant which depends on the geometry of the indenter (0.016 for
Vickers[59-61], 0.032 for berkovich[60-62] and 0.040 for cube-corner[56,57,60,61,69]
c=The length of the radial crack trace on the material surface after the indenter
withdrawing.
In this method, a small indentation is made with a Berkovich indenter as the indentation
load, P, and displacement, h, are continuously recorded during one complete cycle of
loading and unloading. Figure 2.37 shows a typical set of load-displacement data[59].
The important parameters are peak load Pmax, the displacement at peak load hmax, the final
displacement after complete unloading hf, and the initial unloading contact stiffness,
S=dP/dh, i.e. the slope of the initial portion of the unloading curve. Once the contact area
(A) is determined from the load displacement data, the hardness (H) is calculated by
H=Pmax/A.
Figure 2.37 Typical load-displacement data[61].

67
In micro hardness tests, indentations are typically made at loads of 1000g or greater, and
the crack lengths are of the order of 100μm or more. This method is generally effective
method when the radial crack predominates or pyramidal indenters such as Berkovich
(three-sided, having the same depth-projected area ratio as a Vickers indenter) and cube-
corner (three sided, in the shape of the corner of a cube) are used. In order to measure the
fracture toughness of thin films or small volumes using ultra low load indentation
(nanoindentation), much smaller indentations are needed[57]. This leads to a significant
problem called cracking threshold, below which indentation cracking does not occur.
Cracking thresholds in most ceramic materials are about 250 mN or more for Vickers and
Berkovich indenters, and the indentations produced at these loads are relatively large
(several microns). It should be noted that the cracking threshold depends on the condition
of the indenter tip, generally being higher for tips that have been blunted by wear[57].
The cube-corner can reduce the cracking thresholds 1-2 orders because of its much
sharper angle when compared with Berkovich and Vickers. The centerline-to-face angle
for cube corner is 34.3o
whereas for the Berkovich indenter is 65.3o Moreover, the cube-
corner indenter displaces more than three times of volume of material as the Berkovich
thus producing greater stresses and strains in the surrounding material. Significantly
lower thresholds (less than 10 mN) can be achieved using cube corner-indenter. Larger
stresses and strains promote propagation and indentation and reduce the cracking
thresholds. Therefore, it is better to use the cube-corner indenter for determining the
fracture toughness of brittle materials at a very small scale[57].

68
Mullins studied at measurement of the microstructural fracture toughness of cortical bone
using indentation fracture[56]. He investigated three indenters; Berkovich, Vickers and
cube corner as means of initiating cracks in applied loads between 0.05 and 3N. He found
that cracks were only initiated with cube corner indenter. Figure 2.38 shows crack
produced by using cube corner indenter.
Figure 2.38 Typical cracks produced using a cube-corner indenter under a load of 2.6 N.
A radial crack is highlighted. Crack tips are labelled c[56].
Pharr measured the mechanical properties by ultra-low load indentation. He reports that
the fracture toughnesses computed from the cube-corner data are subject to errors of
approximately ±40%[57,59]. Hardness and elastic modulus can be measured with
accuracies of about ±10% in materials which do not exhibit pile-up. If there is pile up, it
leads to overestimation of the hardness and modulus as much as 50%. Figure 2.39 shows
the well defined radial cracks made by cube corner indenter.

69
Figure 2.39 A small indentation in glass made with the cube-corner indenter showing
well defined radial cracks[57].
Guo studied the nanoindentation characterization of deformation and failure of aluminum
oxynitride[62]. He used a Berkovich indenter with different loads: 200mN, 300mN,
450mN and 700mN. Figures 2.40 (a-d) show the SEM micrographs of these indentations.
Figure 2.40(a–d) Representative SEM micrographs of nanoindentations made with
various loading forces. Cracks at the corners of the indented impression can be
observed[62].
In Figure 2.40, Guo showed that the micro-cracks become more distinct with increased
crack lengths at all three corners of the Berkovich indentations at higher maximum loads.
Harding researched at cracking nanoindentation and its use in the measurement of

70
fracture toughness. He concluded that the cube corner indenter performs extremely well
at low loads (<500mN) and indentation cracking thresholds can be reduced relative to the
Vickers and Berkovich thresholds by more than an order of magnitude[62].
2.5.2 The Crack Process Zone for Refractories
Energy absorbing phenomena happens in the surrounding of the cracks of refractories.
While the crack front moves ahead, a large amount of energy is consumed by the
propagation phenomena[1]. These events happen in two different regions: the process
zone in front of the advancing crack and the following wake region that trails the
advancing crack front. Once a crack starts to propagate, it develops a steady-state frontal
process zone, but the region behind the crack continues increasing. It is known that large
cracks are more difficult to propagate than short cracks. This suggests the following wake
region is more important to the crack growth resistance. Figure 2.41 schematically shows
the total process zone about the crack, both in front of and following behind the
advancing crack front[1].
Figure 2.41 Schematic of the crack process zone for refractory materials[1].

71
Microcracking is occurring in the front of the crack, and there is usually considerable
crack branching[1]. The other important region about an advancing crack front in
refractories is the region behind the crack front. In brittle materials the crack opening
displacement (COD) is not very large and neither is the crack mouth opening
displacement (CMOD). Refractory microstructural elements such as the large aggregates
are able to interact across the newly formed crack surfaces. It now appears that the
phenomena occurring in the following wake region of the crack are the most important of
all of the fracture, or cracking related phenomena in refractories. Refractory aggregate
bridging and silicate ligament bonding are believed to be the most important toughness
promoters in refractories[1].
Silicate ligament bridging of the crack surfaces is only of consequence to refractory
fracture at elevated temperatures where the glassy silicates become viscous and can flow
and form bonding ligaments between the newly created fracture surfaces. It is necessary
that these silicate ligaments have some strength so as to be able to hold the forming crack
faces together. They do, but only over a limited temperature range. Once the
temperatures get too high, the viscosity of the silicates decreases and they are no longer
strong enough to contribute to any significant toughness of the newly formed crack
surfaces. This is probably the reason why there is a strength maximum as a function of
temperature and a maximum in the work-of-fracture for silicate-containing refractory
bodies. The bridging role of the aggregates behind the advancing crack front is
monumental to the crack growth resistance of refractory materials but still their
contributions to cracking is not completely understood. It is desirable that aggregates are

72
as large and as strong as possible to encourage crack by pass and consume energy during
the bridging phenomena following the crack. An aggregate has to be at least as large as
the crack opening displacement (the COD) or perhaps to the crack mouth opening
displacement (the CMOD) to bridge the crack, if the aggregate is to bridge the crack at a
large distance behind the advancing crack front[1].
The other important parameter is the geometrical aspect of the aggregates. Basically,
angular aggregates have better mechanical interlocking effect than spherical ones. Also
the use of fiber addition to castables shows that length and aspect ratio are important.
Larger aspect ratios will give better crack growth resistance (see figure 2.42). However,
mixing of this type geometrical fiber addition into refractory castable is difficult.
Stronger and rough surfaces aggregates should be preferred than smooth ones. This
subject will be discussed in more detail in the toughening mechanism section[23].
Figure 2.42 Toughening by rods is estimated to increase as the aspect ratio of the rods
increases. The other important parameter is the chemistry of the bonding with silicates in
the refractory[23].

73
Also, the highly acceptable phenomena taking place behind the advancing crack front, in
the following wake region of a crack, are the most important effects to the crack growth
resistance of refractories.
2.5.3 Toughening Mechanism
The fracture toughness of ceramics was first evaluated in the late 1960s[23]. Values of
fracture toughness were typically below 5 MPa.m1/2
but some materials have now been
developed with significantly higher fracture toughness values. (see Table 2.12)
Table 2.12 Some typical fracture toughness values for brittle materials[23]
Material Mpa.m1/2
Silicate glasses 1
Barium titanate 1.5
Lead zirconium titanate 1.5
Alumina 2-6
Silicon carbide 2-4
Silicon nitride 3-7
Zirconia ceramics 5-35
Tungsten carbide/cobalt 10-20
Tremendous improvements have been made in the strength of ceramics in the past 40
years. These have lead to the detection of new toughening mechanisms and improved
processing methods. Toughening mechanisms in ceramics can be broadly classified into
two categories: one involves a process zone around the crack tip, the other is associated
with crack bridging by reinforcements such as fibers, whiskers and particulates (Figure
2.42).

74
2.5.3.1 Transformation Toughening
Transformation toughening is one of the process zone toughening mechanism, considered
to increase the intrinsic toughness. Among engineering ceramics, ZrO2 exhibits an
excellent combination of high flexural strength (1GPa) and good fracture toughness (~10
Mpa.m1/2
)but the mechanical properties of zirconia depend on phase structure and
composition[24,63,64]. Zirconia has three stable crystal structures (cubic, tetragonal and
monoclinic) as shown in Figure 2.43. The tetragonal (t) and monoclinic (m) polymorphs
have distorted fluorite structures. On the other hand, cubic (c) zirconia has the ideal
fluorite tetragonal. Undoped zirconia shows the following phase transformation:
monoclinic is stable from room temperature to 1170oC, tetragonal between 1170
oC and
2370oC and cubic above 2370
oC all the way to 2750
oC (melting point)[24,65-68]. Among
these phases tetragonal zirconia exhibits high strength and toughness since the tetragonal
to monoclinic transformation can be stress-induced or strain-induced under certain
conditions[24,67-69].
Figure 2.43 Crystal structures of most important zirconia polymorphs: cubic, tetragonal
and monoclinic[24]

75
It has been found that the transformation of tetragonal (t-) ZrO2 to monoclinic (m-) ZrO2
is a reversible athermal martensitic transformation. The transformation (t-ZrO2→m-ZrO2)
contains a large shear strain (14-15%) and a large volumetric strain (4-5%)[23,24]. The
tetragonal phase is usually found at high temperatures and transformation from tetragonal
to monoclinic starts at 950oC on cooling. However, the presence of a metastable
tetragonal phase is key for the transformation toughening mechanism. In some cases,
tetragonal zirconia can be retained at low temperatures by decreasing the grain size or
adding a dopant such as Y2O3, MgO, CaO or CeO2 to suppress the tetragonal to
monoclinic transformation upon cooling[64-67, 69-84].
The increase in the stability of t-ZrO2 with decreasing grain size is considered to be due
to increased effectiveness of the interface (relative to the volume fraction of the retained
tetragonal phase) in constraining the shape changes accompanying the martensitic
transformation. Another explanation is that the number of martensite units that can be
accommodated decreases as the parent grain size decreases. Thus, fewer accommodating
martensite colonies can form within finer t-ZrO2 grains. The retention is primarily a result
of the constraint on zirconia particles that is produced by the surrounding material, as
shown schematically in Figure 2.44. If the transformation proceeds (a to b), a large
amount of strain energy is produced in the surrounding material and this acts to’oppose’
the transformation. It has been shown that zirconia particles must be below a critical size
for retention to occur[23].

76
Figure 2.44 The transformation ZrO2 from tetragonal to monoclinic[23]
When metastable retained t-ZrO2 transforms to stable m-ZrO2 phase, transformation
toughening happens. The volume expansion (4-5%)[24,69,85] characteristic of the t→m
transformation introduces a net compressive stress in the process zone around the crack
tip. This reduces the local crack tip stress intensity and therefore the driving force for
crack propogation, thus increasing the effective toughness of the material (Figure 2.45).
Figure 2.45 Stress induced phase transformation[24]
The mechanism of transformation toughening can be characterized by a change in the
stress intensity factor.
ΔK=Ktip−K [2.9]
When the crack tip stress intensity factor Ktip is less than K (ΔK<0), crack tip shielding
can take place. The retention of the maximum amount of t-ZrO2 at the service
temperature with optimum transformability is necessary for effective transformation
toughening[24].

77
2.5.3.1.1 Thermodynamics of Transformation
Lang[69] proposed a thermodynamics approach based on the total energy involved in the
t→m transformation and later modified by Becher[71]. The total free energy change per
unit volume required for the constrained transformation can be expressed as
ΔGt→m=−ΔFCH+ΔUe+ΔUS–ΔUI [2.10]
= −ΔFCH + ΔS − ΔUI
ΔFCH= is the chemical free energy, change associated with the t→m transformation
ΔUe= is the strain free energy change
ΔUS= is the change surface free energy
ΔUI= is the interaction energy density (related to the application of external stress)
ΔS= is the sum of the changes in surface and strain free energy.
If the total free energy change can be increased, t-ZrO2 is retained. This can take place
by:
Decreasing the chemical free energy change by alloying with a stabilizing dopant
oxide (e.g. yttria, ceria, calcia, magnesia)
Increasing the strain free energy change by dispersing the tetragonal phase in a
constraining elastic matrix (e.g. alumina, cubic zirconia)
Increasing the surface free energy change, e.g. by reducing the tetragonal grain
size[24,69,71].
The effect of particle size on the transformation temperature (during cooling) is
illustrated schematically in Figure 2.46. The ease of retention of the tetragonal phase is
found to depend on the matrix surrounding the zirconia particles or precipatates[23].

78
Figure 2.46 Critical particle size for the retention of tetragonal zirconia[23]
Based on the grain size effect, it is widely accepted that tetragonal zirconia can be
stabilized at room temperature only if the size of the t-ZrO2 grains in the sintered
microstructure lies in the critical size range[24]. From equation 11, the condition for
transformation of retained t-ZrO2 with a grain size (d<dc) in the crack tip stress field is
given by
[2.11]
=the sum of the interfacial energy terms (ΔUe+ ΔUS)
It was further proposed that there is a critical size range (dcl-dcu), regardless of the Ms
temperature. Retained tetragonal particles can transform in the critical size range under
the applied stress field. This means that a particle cannot transform below a lower bound,
dcl even if the interaction energy density exceeds the dilatational strain energy density
characteristic of the transformation. On the other hand, particles above the upper bound,

79
dcu spontaneously transform to m-ZrO2 during cooling from the sintering temperature.
This could lead to degradation of mechanical properties, in particular toughness[23,24].
The critical size range for Ca-PSZ (partially stabilized zirconia) and Al203-ZrO2
composites were found as 62-95 nm and 0.38-0.45μm, respectively[74]. Lange showed
that the grain size must be <0.8 μm to retain a fully tetragonal microstructure for 3Y-
TZP[76].
2.5.3.1.2 Stabilization of Tetragonal Zirconia
The transformability/stability of the metastable tetragonal phase plays a critical role in
transformation toughening[24,87]. Previous researchers suggested that stabilization is
influenced by the size, charge and concentration of dopant cations[65,86]. The
tetragonality, expressed as the c/a ratio, is significantly modified by dopant additions and
hence influences the tetragonal phase stabilization. The displacement of the oxygen
anions from their ideal positions in the fluorite structure affects stability by inducing a
change in the electronic structure[24].
Yoshimura estimated the stability of the high temperature zirconia phases from both,
thermodynamic and kinetic viewpoints[67]. From thermodynamic aspect, addition of
sufficient stabilizing dopants can stabilize the tetragonal phase because its free energy
decreases with the increasing dopant content. Another way to stabilize
thermodynamically metastable phases (t-or c-ZrO2) at room temperature is not to
overcome the activation energy barrier for the transformation ΔG*. In a published work, it
was found that oxygen vacancies also play an important role in the stabilization of the

80
tetragonal phase[24]. Based on the Kroger-Vink notation, the defect reaction of zirconia
doped ytrria can be written as
is an Y atom occupying a Zr lattice, and is an oxygen atoms occupying a normal
lattice site, and shows a vacancy at an oxygen lattice site. Disorder in the ZrO2-Y2O3
system is increased with an increase in oxygen vacancy concentration. In turn, this leads
to increasing stability of the tetragonal phase.
Shukla and Seal[68] researched at the mechanisms of t-ZrO2 phase stabilization in
nanocrystalline (<100nm), submicrometer (0.1-1μm) and coarse (>1μm) grained bulk
ZrO2. Mainly, surface energy, strain energy, internal and external hydrostatic pressure,
lattice defects were investigated in analyzing the t-ZrO2 phase stability. Their results
showed that the generation of excess oxygen ion vacancies is primarily responsible for
room temperature stabilization of t-ZrO2 in nanocrystalline ZrO2 materials.
2.5.3.1.3 Yttria Content and Distribution
Previous works have shown that the nature and content of dopant cations largely
influence the effectiveness of transformation toughening[24]. It was proposed that the
chemical energy term in equation 2.10 is influenced by the yttria content in two different
ways[24]. First, increasing yttria or solute content leads to a decrease in the undercooling
effect (660oC for 2Y-TZP; 360
oC for 3Y-TZP). The benefit of adding yttria is to enable
the t-ZrO2 phase to be retained at low temperatures for a given particle size so the
fracture toughness of a transformation-toughened material is expected to increase with

81
decreasing test temperatures. Figure 2.47 shows the zirconia rich part of the ZrO2-Y2O3
phase diagram.
Figure 2.47 ZrO2 rich portion of ZrO2-Y2O3 phase diagram in the system[24]
At some critical temperature TC, however, it may not be possible to retain the tetragonal
phase and the fracture toughness will exhibit a maximum, as shown schematically in
figure 2.48[23]. Second, reduced yttria content increases the residual stresses due to
differences in the coefficients of thermal expansion (CTE).
Figure 2.48 Influence of test temperature of fracture toughness. The transformation zone
size increases with decreasing temperature, as the tetragonal particles become less stable.
At some critical temperature, however, the transformation can become spontaneous[23].

82
Sakuma[79] used different yttria contents between 1 and 3 mol-% in order to optimize the
fracture toughness of arc melted zirconia alloys. He achieved a maximum toughness of
15 MPa.m1/2
in a sample with 1.8 mol-%Y2O3. He also found that the toughness peak
occurred at about 2 mol-%Y2O3 in Y-TZP ceramics processed by conventional sintering
and arc melting. Masaki and Sinjo[80] produced zirconia ceramics with yttria levels of
1.5-5.0 mol-% by hot isostatic pressing. Their results showed that fracture toughness
increased non-linearly with decreasing yttria content from 2.5 to 2.0 mol-% with a
maximum of 20 MPa.m1/2
for the 2Y-TZP.
Matsui[85] investigated the effect of equivalent grain size to critical yttria content Xcr
over the mechanical behavior of Y-TZP ceramics. He showed that Xcr (critical yttria
content) is between 4 and 5 wt-% for a TZP ceramic with 0.3 μm average grain size. The
driving force for t→m transformation is relatively high during cooling from sintering for
the tetragonal phase with an yttria content below Xcr. As a result, microcracking will
happen due to the spontaneous thermally induced tetragonal transformation. Gao[88]
found that the fracture toughness in a 2.1 mol-% Y-TZP with a grain size of 2 μm and
70% t-ZrO2 was around 14 MPa.m1/2
. In another recent work, it was found by indentation
toughness that toughness values of up to 14 MPa.m1/2
can be achieved with 1.5Y-TZP
nanoceramics at 1150oC. In general, decreasing the yttria content increases the toughness
values.
The t-ZrO2 transformation and fracture toughness of Y-TZP are also influenced by the
yttria distribution. In order to achieve high toughness Y-TZPs, using powders with

83
widely different yttria contents are an important factor[24]. The presence of wide yttria
and grain size distributions leads to high transformability and tougher Y-TZP ceramics.
Basu[64] achieved toughness of 9-10 MPa.m1/2
by mixing 8Y-ZrO2 powders with
undoped ZrO2 to obtain an overall yttria content of 2 mol-%. The inhomogenous yttria
distribution was shown by electron probe micro analysis (EPMA) measurements.
Vleugels and co-workers[89] also found high toughness in TZP ceramics with tetragonal
microstructures and varying/heterogenous yttria distributions. The high driving force
acting on relatively large tetragonal grains with low yttria contents favors the t→m
transformation. Subsequently, increasing yttria containing grains transform in an
autocatalytic manner characteristic of the martensitic transformation. The Ms (the start
temperature for the martensitic transformation) is also another important parameter since
the t→m transformation in zirconia is martensitic, Generally, increasing grain size
increases to Ms which is independent of yttria content but also increases with decreasing
yttria content. The accepted theory for ZrO2-based ceramics predicts that the Ms for yttria
doped (2 mol %) should be high due to the relatively large grain size. In co-precipitated
Y-TZPs, the increased transformation toughening contribution from the increased mean
grain size is reflected in an increased Ms temperature: 390oC (0.5μm) and 312
oC
(<0.5μm) for co-precipated 2Y-TZP and a 2Y-TZP powder mixture-based, respectively.
The higher the temperature difference Ms-T, the lower the transformation toughness.
Apparently, Ms should be close to room temperature or to the service temperature in
order to optimize the transformation-toughening contribution[24].

84
J.P. Singh[90] studied the effects of unstabilized ZrO2 on the fracture surface energy and
thermal-shock resistance of MgCr2O4. Table 2.13 shows some of his experimental results
as a function of the ZrO2 content. Notice that both, flexural strength and fracture
toughness reach a maximum value at 16.5% ZrO2 content.
Table 2.13 Measured properties of MgCr2O4-ZrO2 composite specimens with different
volume fractions of ZrO2 inclusions[90]
ZrO2 (vol.%) Flexural Strength (MN/m2) Fracture Toughness
(MN/m3/2
)
0 66±7 1.36±0.05
3.8 120±15 1.49±0.06
7.3 105±15 1.54±0.02
10.6 132±11 1.79±0.06
13.6 137±31 2.26±0.17
16.5 154±25 2.84±0.18
21.6 132±31 2.42±0.13
He suggested that these improvements are due to the absorption of energy from
microcrack formation in the matrix, resulting from tensile stresses due to the mismatch in
thermal expansion coefficients and/or elastic modulus between matrix and inclusions. In
addition, a major cause of microcracking is the transformation of ZrO2 from tetragonal to
monoclinic phase, and the associated volume expansions Also, the degree of
improvement in the strength and fracture surface energy of MgCr2O4 with ZrO2
inclusions was found to depend on the agglomerate particle size, size distribution, and
volume fraction of ZrO2.
2.5.4 Fractography
Fractography is the study of fracture surfaces and it is an important tool in order to
identify both, fracture processes, as well as failure origins[23]. Critical information can
be obtained by observation of the fracture surfaces of brittle materials since they posses

85
very distinctive features. Cracks initially propagate on a plane perpendicular to the
maximum normal stress. When the failure is unstable, the crack can subsequently branch
as shown in figure 2.49. This leads to a large number of fragments from the failure
process but careful examination of the branching morphology often allows to identify the
region where failure started.
Figure 2.49 Crack initially propagates on a plane but, if failure is unstable, the crack will
start branching[23].
An example of a failure origin in a brittle material is shown in Figure 2.50[23]. At the
beginning, the region around the failure origin is rather smooth. In glasses, it is usually
very reflective and is known as the mirror region. The same region can be seen in
polycrystalline materials but the granular nature of the surface reduces the reflectivity. As
the crack progresses, the fracture surface increases in roughness and a less reflective
region (known as the mist region), is formed. This region is difficult to discern in
polycrystalline materials. Finally, the surface becomes extremely rough as the crack
branches and striations, known as hackle, are formed. The hackle marks usually ‘point
back’ to the failure origin so they are useful for identification of the failure sources[23].
Failure ranges from being exclusively one type to a mixture of features. Intergranular
failure is often associated with the presence of low-toughness grain boundaries or
residual tensile stresses across these boundaries

86
Figure 2.50 Fracture surfaces in brittle materials generally show a smooth region that
surrounds the failure origin (mirror region) but the surface increases in roughness as the
crack accelerates (mist region ) until crack branching occurs. The branched region
contain ‘ridges’ known as a hackle Fracture surfaces are often described as to whether a
crack passes through grains (transgranular) or between grains (intergranular)[23].
In many cases, sub-critical crack growth is found to be intergranular but changing to
transgranular once the crack becomes unstable[23]. It is important to determine the
source of failure in order to develop approaches which prevent or remove the source. The
failure origin is located at the center of the mirror region. Processing defects are common
failure origins and several examples are shown in Figures 2.51-55[23]. Figure 2.51 show
pores that acte as failure origins.
Figure 2.51 (a) Lenticular void that acted as a fracture origin in an alumina-zirconia
composite (b) Spherical void that acted as a fracture origin in a an open-cell vitreous
carbon; scanning electron micrograph[23]

87
These pores are sometimes associated with organic impurities that are thermally pyrolzed
in the fabrication process, i.e., during sintering. In two phase materials, poor mixing of
the two components can cause agglomerates to act as failure origins[23]. Two examples,
showing failure from alumina agglomerates in alumina-zirconia are given in Figure 2.52
Figure 2.52 Scanning electron microscopes showing processing defects that act as
fracture origins in alumina-zirconia composites: (a) porous alumina agglomerate; (b)
large alumina grain[23]
An example of failure from a zirconia agglomerate is given in figure 2.53. Clearly,
inclusions picked up as impurities during processing can also act as failure origins.
Figure 2.53 Failure origin in a zirconia-toughened alumina, caused by the presence of a
zirconia aggregate in starting powder[23].

88
Contact-induced flaws are also common in brittle materials and usually result from
machining damage, impact or simply surface contact figure 2.54(b) shows failure from a
surface flaw in a sapphire (single-crystal alumina) fiber.
Figure 2.54 Scanning electron micrographs showing failure origins in single crystal
alumina (sapphire) fibers : (a) internal pore: (b) surface flaw[23]
An example is given in figure 2.55, in which a silicon carbide inclusion in silicon nitride
acts as a failure origin. In this case, it was concluded that the inclusions would be in
residual tension at low temperatures and these stresses would aid in the crack initiation
process.
Figure 2.55 Silicon carbide inclusions that acted as fracture origin in silicon nitride;
scanning electron micrograph.

89
CHAPTER 3- SCOPE and OBJECTIVES
3.1 Experimental Research
Among the goals of this research is to investigate the effect of cement and nano zirconia
(ZrO2)/ yttria stabilized zirconia (YSZ) on the properties of self-flow refractory castables.
For this purpose, samples were heated up at different temperatures after designing
formulations for improving the self-flow property. In order to find useful correlations
between cement ratio, nano ZrO2/YSZ and the exhibited refractory physical properties,
various refractoy tests were carried out such as apparent porosity (AP), water absorption
(WA), bulk density (BD), weight loss (WL), zeta potential (ZP), particle size distribution
(PSD), cold crushing strength (CCS), modulus of rupture (MOR) and fracture toughness
(KIC). Moreover, the work included microstructural characterization by X-ray diffraction
(XRD), scanning electron microscope (SEM), energy dispersive X-ray spectroscopy
(EDX) and thermogravimetric analysis (TGA).
3.2 Experimental Refractory Compositions
In this research, the combination of different size Tabular Alumina, Microsilica, Calcined
Alumina, Hydrated Alumina, different types of Cement and Nano-Zirconia and different
additives such as; Darvan 811D, Citric Acid, M-ADS and M-ADW were used in the
refractory mix.

90
3.2.1 Refractory Aggregate
Tabular Alumina, Alcoa World Alumina, LLC, 99% Al2O3 fractions: (3-6mm) ,
(1-3mm), (0-1 mm) and (<45 micron)
3.2.2 Refractory Fillers and Modifiers
Microsilica, 971U, Elkem, Norway
Calcined Alumina, A-1000SG, Alcoa World Alumina, LLC,
3.2.3 Bonding Agents
Calcium Aluminate Cement, Secar 71, Lafarge
Calcium Aluminate Cement, CA-14M, Alcoa World Alumina, LLC
Hydrated Alumina, Alphabond-300, Alcoa World Alumina, LL
3.2.4 Additives
Polyacrylates, Darvan 811D, R.T. Vanderbilt Company, Inc
Citric Acid
Dispersing Aluminas M-ADS/M-ADW, Alcoa World Alumina, LLC,
ZrO2 and 8 mol Yttria stabilized ZrO2 (99.9% purity, 30-60 nm), Advanced
Materials US
The experimental compositions were designed in order to obtain outstanding self flow
properties at low water levels. All castables were made based on tabular alumina
refractory aggregates. Accordingly, the ceramic components of the binding system for
low cement castables containing 5wt% cement (SFC-5) are calcined alumina, microsilica
and calcium aluminate cement (CAC). The ceramic components of the binding system of

91
ultra low cement castables formulations containing 3wt% (SFC-3) and 1wt% (SFC-1)
cements are calcined alumina, microsilica, hydrated alumina and calcium aluminate
cement (CAC). Table 3.14 shows the compositions of the investigated refractory
castables.
Table 3.14 Experimental composition of SFCs.
%
SFC-5 SFC-3 SFC-1
Tabular Alumina
3-6 mm
1-3 mm
0-1 mm
<45 micron
17
26
27
13
17
26
27
14
17
26
27
14
Calcium Aluminate Cement 5 3 1
Hydratable Alumina (Alphabond 300) - 1 3
Calcined Alumina (A 1000SG) 7 7 7
Microsilica (971U) 5 5 5
Accelarater (M-ADS) - 0.9 0.9
Retarder M-ADW) - 0.1 0.1
Darvan-811D 0.05 - -
Citric Acid (Retarder) 0.05 - -
Water 5.5 5.5 5.5
3.3 Preparation of Nanoparticles
Different ratios of ZrO2/YSZ nanoparticles (0.01, 0.1, 1, 3 and 5% of binder system)
were mixed with 0.9% M-ADS and 0.05% Darvan 811D additives with total mixing
water in a Branson 3510 ultrasound mixer for 20 minutes.

92
3.4 Self-Flowing Test
All self flow measurements followed the ASTM-C71. Measurement of the flow value
was achieved by pouring the castable suspension into the truncated flew cone as
described in the ASTM standard C230 (Figure 3.56). After filling the castable into the
cone, the cone was removed and the castable allowed to spread under the effect of
gravity. When the spreading stops approximately after two minutes, the percentage
increase in the diameter of the spread cone is measured (Figure 3.57) and it is known as
the free flow value (equation 3.1).
Figure 3.56 The truncated flew cone described by ASTM C230.
The refractory compositions were prepared using the Andreassen Mathematical Model
where the q-value (Andreassen distribution coefficient) is determined using the EMMA
70mm
50mm
100mm

93
Elkem Material Mix Analyzer-Software. The experimental work shows that 5.5 % water
is sufficient to obtain a self-flow well dispersed castable system. In addition, the basic
flow properties of the refractory castables were investigated as a function of the amount
of cement and nano-ZrO2/YSZ.
Figure 3.57 The measurement of self flow value of castable after pouring from truncated
cone.
3.5 Determination of Particle Size Distribution, Zeta Potential and pH of
Nanoparticles
A dynamic light scattering equipment (DLS) (Brookhaven Instrument) was used in order
to measure the particle size distribution (PSD), zeta potential (ZP) and PH of nano
ZrO2/YSZ particles. The DLS was ready to measure PSD after the prepared solutions
containing nano-ZrO2/YSZ nanoparticles were diluted with de-ionized water. Each
measurement consisted of 5 runs, each of 60 seconds duration over the full range of
capacity of the instrument and the average results were used. In order to determine the
zeta potential (ZP), the prepared solutions, were diluted in 1μm KCL and phase analysis
145 mm

94
light scattering (PALS) was used for determinations of the velocity of the moving
particles through their effect on scattering laser light. Also, PH measurements were
necessary since the zeta potential (ZP) is a meaningless number without considering the
PH. Thus, the prepared solutions were connected to the DLS in order to measure the PH
of the solutions.
3.6 Bulk Density, Apparent Porosity, Water Absorption and Density
The bulk density (BD), apparent porosity (AP) and water absorption (WA) were
measured by using the Archimedian evacuation method according to the ASTM C 20-97
standard. For this purpose, the samples were dried at 110oC for 24 hours to a constant
mass and weighted in air. The samples were then placed in water and boiled for 2 hours.
After boiling, the specimens were kept immersed in water for 24 hours, and re-weighed
while suspended in the liquid. Finally, the soaked samples were re-weighted in air. Eqs.
3.2, 3.3, 3.4 and 3.5 were used for calculations of the bulk density, apparent density,
water density and density, respectively.

95
All of these properties are primary properties of the fired refractory castables and they
have an intimate influence over properties such as the refractory thermal conductivity and
thermal shock resistance. Low porosity materials have low water absorption properties,
higher density and better resistance to chemical attack when compared with high porosity
materials.
3.7 Microstructural Analysis
Experimental castable refractories including the binding systems were analyzed after
various thermal treatments in order to identify their exhibited microstructural features .
The binding systems were investigated using X-ray diffraction (XRD) in order to
determine any phase formation after exposure to 110oC for 24 hours and 1000
oC, 1300
oC
and 1500oC for 3 hours. Fracture surfaces and binding systems of samples were observed
in an SEM with an EDX detector. Both, refractory samples and binding systems were
coated with Au-Pd and for SEM determinations at 15kv accelerating voltage. In addition,
in order to determine thermal stability of the specimens, thermogravimetric analysis were
made in a SDT 2960, TGA equipment. Weight changes in the samples were measured as
a function time and temperature. The measurements were carried out on milligram size
samples with a heat rate of 20oC/min all the way to 1000
oC in a 100ml/min argon flow.

96
3.8 Cold Crushing Strength (CCS), Modulus of Rupture (MOR), Fracture
Toughness (KIC) and Indentation Toughness of Castables
After drying and firing of the castable compositions, mechanical properties were
determined by measuring cold compressive strength (CCS) using an universal testing
instrument INSTRON and the Modulus of Rupture and Fracture Toughness using
SATEC universal testing machine. The CCS measures the refractory strength of the
grains and of the bonding system. In order to measure the CCS, samples were cast on
cube-type molds (50x50x50mm). Equation 3.6 is used for calculations of the CCS.
S= cold crushing strength, lbf/in2, (MPa)
W= total maximum load indicated by the testing machine lbf, (N) and
A= average of the areas of the top and bottom of the specimen perpendicular to the line
of application of the load, in2, (mm
2).
The MOR is indicative of the strength of the bonding system for the refractory product.
Determinations by three point bending tests were made on 160x40x40 mm bars at a 100
mm span using a crosshead speed of 0.05 in/min. These samples were used to measure
the strength of the bond including the aggregates. The test configuration in Figure 3.58
shows the specimen loading location between two support bearings and the load
application at the center of the bar by a loading arm.

97
Figure 3.58 Three point bending test.
A second MOR experiment was implemented to measure the strength of the binder alone.
In this case, less than 150 micron powders were used to prepare the samples. The sample
dimensions were 25x10x10 mm at a crosshead speed of 0.2mm/min. Equation 2.4 gives
the standard formula for the calculation of MOR in three point flexure
MOR=modulus of rupture, lbf/in2 or (MPa)
P=maximum applied at rupture, lbf or (N)
L=span between supports, in. (mm),
b=breadth or width of specimens, in. (mm), and
d=depth of specimen, in. (mm)
Toughness values were determined using two different methods. In the first method,
fracture toughness values were determined using 160x40x40mm specimens with a sharp
L=100 mm
cmcmM
d=40 mm

98
notch at a crosshead speed of 0.5 mm/min. The sharp notch of approximately 14 mm and
0.35 mm of depth, was cut in the middle of the specimens using diamond saw (Figure
3.59). In addition, 25x10x10mm specimens were prepared in order to determine the
fracture toughness of the binding system. A crosshead speed of 0.1 mm/min was used for
fracture toughness testing and the KIc values determined using Eq. 2.6.
Figure 3.59 Schematic illustration of fracture toughness test.
d
af
da
da
bd
LPK IC 2/3
2/1
2/3
max
/1
/
2
3
KIC= Fracture toughness, lbf/in3/2
, (Mpa.m1/2
)
a= Crack length, in, (mm)
f{a/d}= function of the ratio of the crack length to the specimen thickness, is given by
Eq. 2.7
L=100 mm
cmcmM
d = 40 mm
Precrack = 14 mm

99
In addition to fracture toughness, an indentation toughness method was used. Prior to
indentation testing, the surfaces of the samples were mechanically polished with 400,
600, 800 and 1200 SiC grit paper and then polished with a water based diamond solution
of 3 and 1μm in size. Final polishing was completed with using 0.05 μm alumina
suspension. Elastic modulus and hardness values were determined with using a
Berkovich tip in an Agilent G200 nano-indenter machine. All nano-indentation tests were
performed at an allowable drift of 0.33 and an applied force of 50 gf. A standard vickers
HV hardness indenter (Buehler Micromet II micro hardness tester) was also used to
measure the hardness values and for crack initiation. The applied force was 500gf and
1kgf with a dwell time of 15 second. Crack lengths were measured in the microhardness
tester with an optical instrument as shown in Figure 3.60(a-b) .
Figure 3.60 (a-b) Cracks created by berkovich indenter in nanoindentation test
Equation 2.8 was used to calculate the indentation toughness of samples using the
indentation fracture method.
20 µm 20µm (a) (b)

100
KIC= Fracture toughness, lbf/in3/2
, (Mpa.m1/2
)
E= Elastic modulus
H= Hardness
δ= Empirical constant which depends on the geometry of the indenter (0.016 for Vickers,
0.032 for Berkovich)
c= Length of the radial crack trace on the material surface after the indenter withdraws
3.9 Rheology and Flow Measurements of Castable Refractories
The study of rheolology of self flowing low and ultra low castables was focused on
following subjects:
Effect of different amounts of cement and ZrO2/YSZ nanoparticles on self flow
behavior;
Determination of optimum particle size distribution (PSD) of refractory castables;
Influence of additives on Zeta Potential (ZP), pH and particle size distribution
(PSD) of ZrO2/YSZ nanoparticles;
Effect of ultrasonification and additives on distribution of ZrO2/YSZ
nanoparticles in the water based solution;
The goal of this research was to establish for a direct correlation between the flow
properties and cement amount and additives. In addition, maintain the homogenous
distribution of ZrO2/YSZ nanoparticles in the system and provide tool for optimization
and design of self flowing LCCs and ULLCs and improve the MOR and fracture
toughness of castables.

101
CHAPTER 4 - EXPERIMENTAL RESULTS and DISCUSSION
4.1 Determination of Andreassen Distribution Coefficient
The flow properties of the castables were studied using the Andreassen distribution
model . Figure 4.61 shows the Andreassen distribution coefficient (q value) of the
experimental castables as compared with the reference data (q=0.25).
Figure 4.61 Andreassen distribution coefficient (q value) for the experimental castables
As mentioned before in chapter I, in order to get dense castables the q value should be
≤0.37 whereas a q value above 0.37 results in castables with voids. For vibratable
castables, the q value should be ≤0.30. In order to get good self flow behavior, the q
value should be ≤0.25. As seen in the above figure 4.59, the q value of SFCs fits
approximately 0.25, indicating that it is in the proper range for q values of SFCs. Notice

102
that lower q values means smaller particle sizes and increasingly dense castables. In
contrast, high q values means large particle sizes and less dense castables. It is important
to know that small particles do the main contribution to flowability whereas large
particles do not play a good role in flowability. In addition, it is necessary to use proper
additives to get good self flow behavior at lower water contents since these additives
increase flowability with electrically charged particles and thus decrease the water
content. Notice that the water content can help the flowability but it evaporates at
elevated temperatures, resulting in porosity in the castable system. As a conclusion,
proper selection of the components in the castable system, using additives and by
determining the Andreassen distribution coefficient (q value) are crucial to get good self
flow properties.
4.2 X-Ray Diffraction (XRD) Analysis of SFCs
Figure 4.62 shows the X-ray diffraction patterns (XRD) of the refractory castables dried
at 110oC for 24h. As expected from the X-ray results, strong diffraction peaks
corresponding to the corundum phase (α-Al2O3), with a rhombohedral structure and
lattice parameters a=b=0.4758 and c=1.2991) was found in the experimental castables.

103
Figure 4.62 XRD patterns for (a) SFC-5, (b) SFC-3 and (c) SFC-1 dried at 110
oC for 24h.
After firing at 1000oC for 3h, XRD results revealed that there were no new phases
detected in both, SFC-3 and SFC-1 samples besides corundum as shown in figure 4.61. In
contrast, the formation of anorthite with a chemical formula CaAl2Si2O8, (a tricilinic
structure with lattice parameters a=0.8165nm, b= 1.2872, and c=1.41827nm) was
observed in SFC-5 samples, containing 5% cement as seen in Figure 4.63. In Turn, this
suggests that at increasing cement contents, there is an early development of ceramic
bonding when compared with hydratable alumina (e g no new phases detected in SFC-3
and SFC-1 samples).
10 30 50 70
A
A: α-Al2O3
(a)
(b)
(c)
A
A A
A
A
A A A
A

104
Figure 4.63 XRD pattern for (a) SFC-5, (b) SFC-3, (c) SFC-1 fired at 1000
oC for 3h.
Figure 4.64 shows XRD patterns for SFCs after firing at 1300oC for 3h. Notice that in
addition to the corundum phase, Cristobalite, SiO2 (tetragonal structure with lattice
parameters a=b=0.47932 nm and c=0.69236 nm) was detected in SFC-1 samples. This
crystalline form of SiO2 indicates a devitrification process of the microsilica particles
starting at 1075oC, as indicated by Chakravorty and Ghosh [91]. The formation of minor
contents of anorthite was detected in SFC-3 samples after firing at 1300oC for 3h (see
Fig. 4.64). There are no new phases detected in SFC-5 samples besides anorthite and
corundum. In particular, notice that the intensity peaks corresponding to anorthite are
increased in the SFC-5 castable when the firing temperature increases from 1000oC to
1300oC.
10 30 50 70
(a)
(b)
(c)
A A
A
A
A A
A
A A
An A
A: Alumina An: Anorthite

105
Figure 4.64 XRD pattern for (a) SFC-5, (b) SFC-3, (c) SFC-1 fired at 1300oC for 3h.
Figure 4.65 shows the XRD patterns of the SFCs fired at 1500oC for 3h. Notice the
formation of mullite, Al6Si2O13 (orthorhombic structure with lattice parameters
a=0.75456 nm, b=0.76898 nm and c= 0.28842 nm) at this temperature. Also, notice that
the mullite intensity peaks decrease with increasing cement content (1, 3 and 5%). This
is attributed to the relatively large amounts of cement which attack the mullite phase
inhibiting its formation [39]. Moreover, the cristobalite intensity peaks disappear in the
SFC-1 sample after firing at 1500oC for 3h. Apparently, this minor amount of cristobalite
reacts with the alumina from the matrix and forms mullite at high temperatures
(≥1400oC). The similar XRD pattern has been reported by Gerotto[92,93] While the
formation of anorthite was observed in the both, SFC-5 and SFC-3 samples, it was not
10 30 50 70
(a)
(b)
(c)
A
A A A
A A
A A
C
An An
A:Alumina An:Anorthite C:Cristobalite
A
A A

106
detected in the SFC-1 sample (see Fig. 4.65). Notice in particular that anorthite was first
detected at 1000oC in SFC-5 samples and at 1300
oC in SFC-3 samples.
Figure 4.65 XRD pattern for (a) SFC-5, (b) SFC-3, (c) SFC-1 fired at 1500
oC for 3h.
4.3 Castables Self-flow Measurements
Water addition (5.5%) was used to achieve full self-flowing properties. Under these
conditions, the castables self-flowed under their own weight and easily filled intricate
shape molds without any vibration. Figure 4.66 shows the self-flow values of the
castables as a function of the cement content. These results show that the self-flow
property values decrease from 150% to 140% when the cement content is reduced from
5% to 1%. This can be explained by the increasing hydraulic alumina content. Hydraulic
alumina needs more water than cement in order to set the castables. In order to control
10 30 50 70
(a)
(b)
(c)
A
A
A
A A
A
A A
A A
M
A: α-Al2O3
M: Mullite An: Anorthite
M M M M M
A M
An
M M

107
the setting time of the castables, it has been reported that small additions, usually around
0.5% of cement may be necessary [1]. Hence, increasing additions of hydraulic alumina
would require increasing water mixing to maintain the flow. However, this approach
would result in increasing castable porosity.
.
Figure 4.66 Self flow values of SFCs as a function of cement content
.
Figure 4.67 shows self-flow values of castables as a function of nano ZrO2/YSZ
additions. Notice that additions of nano-ZrO2/YSZ of up to 0.1% do not have any
influence on the self-flow behavior of the castables.
Figure 4.67 Self flow values of catables as a function of nano ZrO2/YSZ addition.
130
135
140
145
150
155
5 3 1
self
flo
w%
cement %
0
20
40
60
80
100
120
140
160
0 0.01 0.1 1 3 5
Self
-flo
w %
Nano ZrO2%
SFC-5
SFC-3
SFC-1

108
Additions of 1% nano-ZrO2/YSZ decrease by 10 % the self-flow values of castables as
seen in Figure 4.65. Afterwards, the self-flow values steadily decrease from 10% down to
30% when the additions of nano-ZrO2/YSZ increase from 1 to 5%.
4.4 Correlation of Zeta Potential, pH and Particle Size Distribution of Nano-ZrO2
Powder
As mentioned before, additives have a large effect on the self-flow behavior of castables
and on the uniform distribution of nano-ZrO2/YZS particles in water based solution. D-
811D and M-ADS/M-ADW are used as additives during the experiments to optimize the
self-flow behavior of the castables. In order to fully understand the effect of additives on
the solution, measurements were made of the zeta potential (ZP), pH and particle size
distribution (PSD) of the nano particles.
Figure 4.68(a) shows the PSD of nano-ZrO2 particles in the water based solution. The
average size of commercial nano-ZrO2 particles is 1782 nm due to agglomeration of
nano-ZrO2 particles because of the ineffective mixing method. The Zeta potential of the
particles is 24.24 and the corresponding pH is 7.52. After ultrasound mixing for 20
minutes the average particle size of the nano-ZrO2 decreases down to 185.8 nm as shown
in Figure 4.68(b). Ultrasonification results in negatively charged particles and ZP
changes from 24.24 to -41.39, while the pH stays constant at 7.52. Figure 4.68(c) shows
the bi-modal PSD of the nano-ZrO2 particles with the additive, D-881D (pH is 8.77). The
results show that the average particle size of nano ZrO2 is reduced from 185.8 nm down
to 23.4 nm. The corresponding ZP of the particles is -52.24, proving that D811 negatively
charges particles, increasing the pH from 7.52 to 9.

109
Figure 4.68 (a) PSD of nano-ZrO2 particles in the water solution. (b) PSD of
ultrasonicated nano-ZrO2 particles in the water solution. (c) PSD of nano-ZrO2 particles
dispersed with additive (D-811D) in water. (d). The effect of ultrasonication on the PSD
of nano-ZrO2 particles with D-811D in water. (e) PSD of nano-ZrO2 particles dispersed
with additive (M-ADS) in water. (f) The effect of ultrasonication on the PSD of nano-
ZrO2 particles with M-ADS in water
Figure 4.68(d) shows the average particle size of nano-ZrO2 with additive (D-811D) after
ultrasonification for 20 minutes. The effect of ultrasound with additive further improves
0
20
40
60
80
100
120
Inte
nsi
ty
Diameter (nm)
0
20
40
60
80
100
120
2.2
2.7
3.3
4
4.9
5.9
7.2
8.7
10
.6
12
.9
15
.7
Inte
nsi
ty
Diameter (nm)
0
20
40
60
80
100
120
10
0
11
0
15
0
21
0
29
0
40
0
55
0
74
2
10
00
Inte
nsi
ty
Diameter (nm)
0
20
40
60
80
100
120
5
6
8
10
12
15
19
24
29
36
45
Inte
nsi
ty
Diameter (nm)
0
20
40
60
80
100
120
5.5
6.7
8.2
10
12
.2
14
.9
18
.2
22
.2
27
33
40
.3
Inte
nsi
ty
Diameter (nm)
0
20
40
60
80
100
120
4 5 6 8 9 11 14 17 21 25 31
Inte
nsi
ty
Diameter (nm)
a
b
c
d
e
f
110
the PSD, decreasing the average particle size down to 8.9 nm. While the ZP increases to -
56.64, the pH remains constant at 9. Figure 4.68(e) shows the PSD of nano-ZrO2
particles with additive (M-ADS) in the water solution. The pH of M-ADS is measured as
5.42. These results show that the average particle size is reduced down to 26.8 nm. Also,
the ZP and pH are -43.95 and 5.4 respectively. In turn, this is an indication that the M-
ADS negatively charges particles, thus increasing the ZP while lowering the pH and
acting effectively in de-agglomeration solution. When nano-ZrO2 particles are mixed
with additive (M-ADS) in the water solution after 20 minutes of ultrasonification (see
Figure 4.68(f)), the ZP increases from -43.95 to -62.33. In turn, this leads to decrease in
the average particle size from 26.8 nm to 17.7 nm, resulting in a highly uniform
distribution (bimodal distribution with average particle size of 6.5 nm and 23.5 nm of
nano-ZrO2 particles). There is also a slight increase in the pH from 5.4 to 5.76. Overall,
the results show that the PSD of nano-ZrO2 can be enhanced by ultrasonification and by
proper use of additives like D811 and M-ADS. Alternatively, long ultrasounification
times can cause heat and lead to particle agglomeration. It is found that 20 minutes of
ultrasonification is the optimum time to distribute the particles efficiently.
4.5 Bulk Density, Apparent Porosity and Water Absorption of SFCs
Bulk density (BD), apparent porosity (AP) and water absorption (WA) are good
indicators of the refractories quality. Hence, the main goal in the refractory industry is to
produce low porosity, low water absorption and high density refractories in order to resist
chemical attack at elevated temperatures. ASTM C 20-97 was used to measure the BD,

111
AP and WA of refractory castables at 110oC, 1000
oC, 1300
oC and 1500
oC respectively.
Figure 4.67 shows the BD and AP of SFCs as a function of the firing temperatures.
Figure 4.69 AP and BD of SFCs at different firing temperatures.
The bulk density (BD) and apparent porosity (AP) of the experimental SFCs as a function
of the firing temperatures (110, 1000, 1300 and 1500oC) is given in figure 4.69. The BD
of SFC-5 samples dried at 110oC for 24h was 3.096±0.09 g.cm
-3, but decreases slightly to
3.046±0.0064 g.cm-3
after firing to 1300oC, and it increases to 3.205±0.02169 g.cm
-3
when fired at 1500
oC. Water evaporation in SFC-5 creates porosity, which results in
decreased BD and increased AP (10.995±0.843) at 1300oC. The higher AP observed at
1300oC in the SFC-5 indicates that the pores produced during water evaporation could
not be eliminated. As a result, an increased amount of anorthite (2.74-2.76 g.cm-3
) was
observed at 1300oC in the SFC-5 sample (see Figure 4.62). However, above 1300
oC due
to transformation of of metastable liquid in the SFC-5 into mullite (3.11-3.26g.cm-3
),
there is a significant reduction in AP to 7.0499±2.30. The BD of the SFC-3 sample dried
3
3.1
3.2
3.3
3.4
0
2
4
6
8
10
12
14
110 1000 1300 1500
Bu
lk D
en
sity
(g/
cm3 )
Ap
par
en
t P
oro
sity
%
Temperature (oC)
SFC-5 (AP)
SFC-3 (AP)
SFC-1 (AP)
SFC-5 (BD)
SFC-3 (BD)
SFC-1 (BD)

112
at 110oC for 24h, 3.092±0.075 g.cm
-3 increases to 3.157±0.0282 g.cm
-3 at 1500
oC due to
the formation of mullite and to the densification process. The AP of SFC-3 decreased
from 11.292±1.191 at 110oC to 8.776±0.645 at 1500
oC which confirms densification of
the SFC-3 at elevated temperatures. The BD of SFC-1 slightly decreased from
3.106±0.0006 at 110oC to 3.08±0.0254 at 1000
oC due to the dehydration process which
leads to an increased AP (14.00±1.09) at 1000oC. In addition, the BD gradually
increases to 3.112±0.008 with the formation of mullite at 1500oC, resulting in reduced
AP (11.137±1.38). Notice that hydrated alumina does not easily release the chemically
bonded water at elevated temperatures due to its gel structure. As a result, SFC-1
containing 3% hydrated alumina develops higher AP than both, the SFC-3 (1% hydrated
alumina) and the SFC-5 (zero hydrated alumina) after firing at 1500oC.
Finally, at 1500oC, the increase in BD of SFCs can be explained by the densification
behavior associated with the formation of the high density mullite phase (3.11-3.26g/cm3)
and the low melting phase anorthite (CAS2) which fills the interspaces of the castable
components. The final values in BD can be influenced to some extent by the cement
content since the formation of anorthite increases at high cement contents. It is worth
mentioning that the first anorthite formation was observed at 1000oC and 1300
oC in SFC-
5 and SFC-3 samples, respectively. No anorthite formation was observed in SFC-1
samples. Anorthite can act as a filler, helping the formation of mullite and thus
contributing to ceramic bonding. In addition, up to 1300oC, the increase in the AP of
castables can be attributed to the dehydration processes. Nevertheless, above 1300oC, the

113
AP starts to drop due to densification and to the development of new phases like
anorthite, cristobalite and mullite.
Figure 4.70 gives the water absorption (WA) data based on firing temperatures and result
AP values. It is evident from this figure the nature of the densification process thus
confirming the AP and BD results of Fig. 4.69. WA% increases at 1000oC due to an
increase in AP, but then decreases at 1500oC, as a result of the densification process in
the SFCs.
Figure 4.70 Water absorption of SFCs as a function of firing temperature.
Figure 4.71 shows the weight losses (WL) of SFCs as a function of the firing
temperatures. All the castables were dried at 110oC for 24 hours in order to remove the
free water which degrades the physical properties of the refractories at elevated
temperatures. As seen in Figure 4.71, the WL of the castables is highest at 110oC
indicating successfully removal of free water. The WL of SFC-5 decreased from 1.44 at
1000oC to 1.245 at 1500
oC due to densification. The WL of SFC-3 increases from 0.859
4.3 4.45 4.5
1.86
3.4375
4.03 3.7
2.87 3.46
4.34
3.9
3.27
0
0.5
1
1.5
2
2.5
3
3.5
4
4.5
5
110 1000 1300 1500
% W
A
Temperature (oC)
SFC-5
SFC-3
SFC-1

114
at 1000oC to 0.952 at 1300
oC but then decreases to 0.919 at 1500
oC after the formation of
anorthite and mullite phases at 1300oC and 1500
oC respectively. The WL of SFC-1
steadily increases from 0.97 at 1000oC to 1.215 at 1500
oC which indicates that
densification in SFC-1 is not as fast as in SFC-5 and SFC-3 samples due to the increasing
amount of hydratable alumina. Notice that hydratable alumina needs more water than
cement in order to develop a ceramic bond at elevated temperatures. Also, it takes time
to release the chemically bonded water due to its gel structure.
Figure 4.71 Weight losses of SFCs as a function of firing temperatures.
4.6 Thermogravimetric Analysis (TGA) and Differential Thermal Analysis (DTA)
of Castables
Figure 4.72 shows TGA and DTA results of SFCs in terms of weight loss (%) and
temperature difference (oC/mg) respectively as a function of firing temperatures. As
expected, all the SFCs showed weight loss at elevated temperatures. In particular, there is
2.65
1.44 1.39 1.245
3
0.86 0.95 0.92
2.93
0.97 1.06 1.22
0
0.5
1
1.5
2
2.5
3
3.5
110 1000 1300 1500
W.L
.%
Temperature (oC)
SFC-5
SFC-3
SFC-1

115
a characteristic drop in the weight of castables in the temperature range of 200-300oC.
This weight loss is associated with the dehydration of hydrated cement of AH3 and
C3AH6. Where C=CaO, A=Al2O3, and H=H2O
Figure 4.72 TGA and DTA of SFCs at elevated temperatures
According to the literature [1,2] dehydrating temperatures of AH3 and C3AH6 are
between 210-300oC and 300-360
oC respectively. Advantages of the high density stable
hydrates (AH3 and C3AH6) at higher curing temperatures produce significant porosity
with large pore sizes so that any vapor species can escape upon drying. In turn, this
promotes a sharp decrease in the weight of castables as seen in the above Figure 4.72.
Notice that weight loss (%) is higher in SFC-5 than in either SFC-3 or SFC-1. Since
both, SFC-3 and SFC-1 contain hydrated (transitional) alumina (γ or ρ - Al2O3), they do
not release chemically bonded water easily at elevated temperatures due to its gel
-0.08
-0.06
-0.04
-0.02
0.00
0.02
0.04
96
97
98
99
100
101
30 148 283 417 550 683 816 949
Tem
pe
ratu
re D
iffe
ren
ce (
oC
/mg)
We
igh
lt (
%)
Temperature (oC)
SFC-1 (Weight%)
SFC-3 (Weight%)
SFC-5 (Weight%)
SFC-1 (T.D.)
SFC-3 (T.D.)
SFC-5 (T.D.)

116
structure compared to cement. A reported [1] hydration reaction mechanism for hydrated
alumina is;
γ / ρ - Al2O3 + H2O → α-Al(OH)3(gel) + α – AlOOH (gel)
The DTA results of the castables show endothermic reactions coupled with the
dehydration of hydrated phases (AH3 and C3AH6) at around 200-300oC. Notice that
hydration starts when cement is in contact with water (exothermic reaction) and internal
castable temperatures can reach temperatures of up to 75oC. C3AH6 is the normal, stable
hydrate phase when cement curing temperatures of >35oC occur in the castable mass. The
hydraulic properties of CAC are attributed to CA (calcium monoaluminate), the main
phase of all kinds of CACs and hydrates per the following equation [28]:
CA + H → C3AH6 + AH3 + heat (~500 J/g)
As the temperature is increased, the process of hydration followed by dehydration
process continues until all phases lose their water of crystallization. TGA results show
gradually increased in weight loss (%) of castables in temperature range between 300-
1000oC. In contrast, DTA results of castables show almost linear line after 300
oC.
4.7 Cold Crushing Strength (CCS) of Castables
Figure 4.73 shows the exhibited cold crushing strength (CCS) as a function of the firing
temperatures. At 110oC, SFC-5 containing 5% cement shows the highest CCS values due
to the higher amount of cement hydrated products CAH10 and AH3 that play a role in

117
bonding. Decrease in the cement content to 1 % (SFC-1) results in deterioration of the
strength. The CCS of SFC-1 is reduced by approximately 50% and 60% when compared
with SFC-3 and SFC-5 samples, respectively. In this case, the amount of cement is too
small to obtain good bonding at low temperatures.
Figure 4.73 The CCS values of SFCs as a function of temperature.
The CCS of SFC-5 increases from 164±22.58 MPa at 110oC to 236.13±19.13 MPa at
1000oC due to the development of the ceramic bonding through the formation of
anorthite. After heating at 1500oC 3h, there is reduction in the strength in the SFC-5
samples, which coincides with the increase in the formation of low melting anorthite
phase. The CCS of SFC-3 increases from 119.93±15.8 MPa at 110oC to 192.15±9.2 at
1500oC. The increase in the CCS at increasing temperatures is attributed to the enhanced
densification in the SFC-3 and to the development of ceramic phases such as anorthite at
164
236
182
161
120
197 197 192
58 70
166 160
0
50
100
150
200
250
110 C 1000 C 1300 C 1500 C
CC
S(M
Pa)
Temperature (oC)
SFC-5
SFC-3
SFC-1

118
1300oC and mullite at 1500
oC. In SFC-1, there is a gradual increase strength from
57.8±4.9 MPa at 110oC to 69.9±14.2 MPa at 1000
oC due to the breakdown of hydraulic
bonds and to the lack of ceramic reactions. After heating at 1300oC for 3h, the CCS
values of SFC-1 exhibit a significant increase to 166.4±20.763 MPa due to the
crystallization of the cristobalite phase. Notice that there are no appreciable changes in
the CCSs of SFCs at 1500oC even though new phases are formed. It is also important to
mention that the formation of cracks was observed on the surfaces of SFCs after heating
at 1500oC for 3h. Those cracks vary depending on the cement content (SFC-5 containing
5 % cement has more cracks than the SFC-3 containing 3% cement). This is explained by
thermal expansion differences between the alumina aggregates and the new phases
formed (anorthite, cristobalite and mullite) at elevated temperatures. These cracks can
lead to a reduction in the strength and corrosion resistance of SFCs at elevated
temperatures.
4.8 Modulus of Rupture (MOR) of Castables
The measured modulus of rupture (MOR) of the SFCs as a function of the firing
temperature is given in Figure 4.74. At 110oC, the MOR values of SFC-5, SFC-3 and
SFC-1 are 18.56±0.47 MPa, 10.39±1.87 MPa and 8.54±1.13 MPa respectively, indicating
the MOR values decrease with decreased cement content. This is explained by the effect
of hydratable alumina which does not lead to high amounts of hydrated products such as
CAH10 and AH3 at room temperature like cement does it. Hence, up to 1000oC, the SFC-
5 samples show the highest MOR values due to the highest cement content (5%). In
addition, the MOR is also benefited by early development of ceramic bonding due to the

119
formation of anorthite. After firing at 1300oC for 3h, both SFC-3 and SFC-1 show
promising improvements in the MOR, as a result of the development of anorthite in SFC-
3 and cristobalite in SFC-1. In contrast, the MOR of SFC-5 is negatively affected by a
reduction in the formation of anorthite from 44.35±4.42 MPa at 1000oC to 36.34±1.3
MPa at 1300oC. At 1500
oC, all the SFCs show a gradual increase in MOR values and
they can be associated to the formation of the mullite phase.
Figure 4.74 The MOR of SFCs as a function of temperature
Increase in the MOR of SFCs at 1500oC is explained by the volume increase of the
alumina silica as it transforms to mullite. If the transformation takes place within the
liquid phase (SFC-5 and SFC-3), the expansion causes movement of the liquid.
Therefore, more pores in the castables become filled with liquid thus increasing the
volume fraction where mullite can develop and contribute to the bond.
18.56
44.35
36.34
52.86
10.39
28.2
51.85 53.68
8.54
20
45.93 46.15
0
10
20
30
40
50
60
110 1000 1300 1500
MO
R (
MP
a)
Temperature (oC)
SFC-5
SFC-3
SFC-1

120
4.9 Fracture Toughness (KIC) of Castables
Figure 4.75 shows the fracture toughness (KIC) values of self-flowing castables (SFCs) as
a function of temperature. At 110oC, KIC values of SFC-5, SFC-3 and SFC-1 are
1.594±0.029, 1.09±0.19 and 0.757±0.03 MPa.m1/2
respectively. Notice that SFC-5 has
the highest KIC values due to the high cement content (5%), indicating that cement is a
better binder than hydrated alumina at low temperatures. The KIC results follow similar
trends to those of MOR test results i.e., SFC-5 has the highest MOR at 110oC, and then
followed by SFC-3 and SFC-1 respectively.
At 1000oC, KIC of SFC-5 increases from 1.59±0.03 MPa.m
1/2 at 110
oC to 3.47±0.07
MPa.m1/2
at 1000oC, and the XRD results of SFC-5 (Figure 4.63) show that anorthite
crystallizes at 1000oC. The KIC of SFC-3 increases from 1.09±0.19 MPa.m
1/2 at 110
oC to
3.16±0.042 MPa.m1/2
at 1000oC as a result of densification behavior. Also, the KIC of
SFC-1 gradually increases from 0.757±0.035 MPa.m1/2
to 1.373±0.287 MPa.m1/2
which is
still far lower than SFC-5 and SFC-3 due to the reduced amount of cement. At 1300oC,
the KIC of SFC-5 decreases from 3.47±0.07 MPa.m1/2
at 1000oC to 2.98±0.317 MPa.m
1/2
at 1300oC due to an increase in the crystallization of anorthite as observed by XRD
(Figure 4.64). In turn, this leads to degradation of the fracture toughness properties of
SFC-5. The KIC of SFC-3 increases from 3.16±0.042 MPa.m1/2
at 1000oC to 3.53±0.00
MPa.m1/2
at 1300oC. XRD results of SFC-3 (figure 4.62) detected the formation of
anorthite in addition to corundum (α-Al2O3) at 1300oC. The KIC of SFC-1 increases from
1.373±0.287 MPa.m1/2
1000oC to 3.055±0.247 MPa.m
1/2 at 1300
oC. XRD pattern of SFC-
1 (figure 4.62) shows the crystallization of cristobalite.
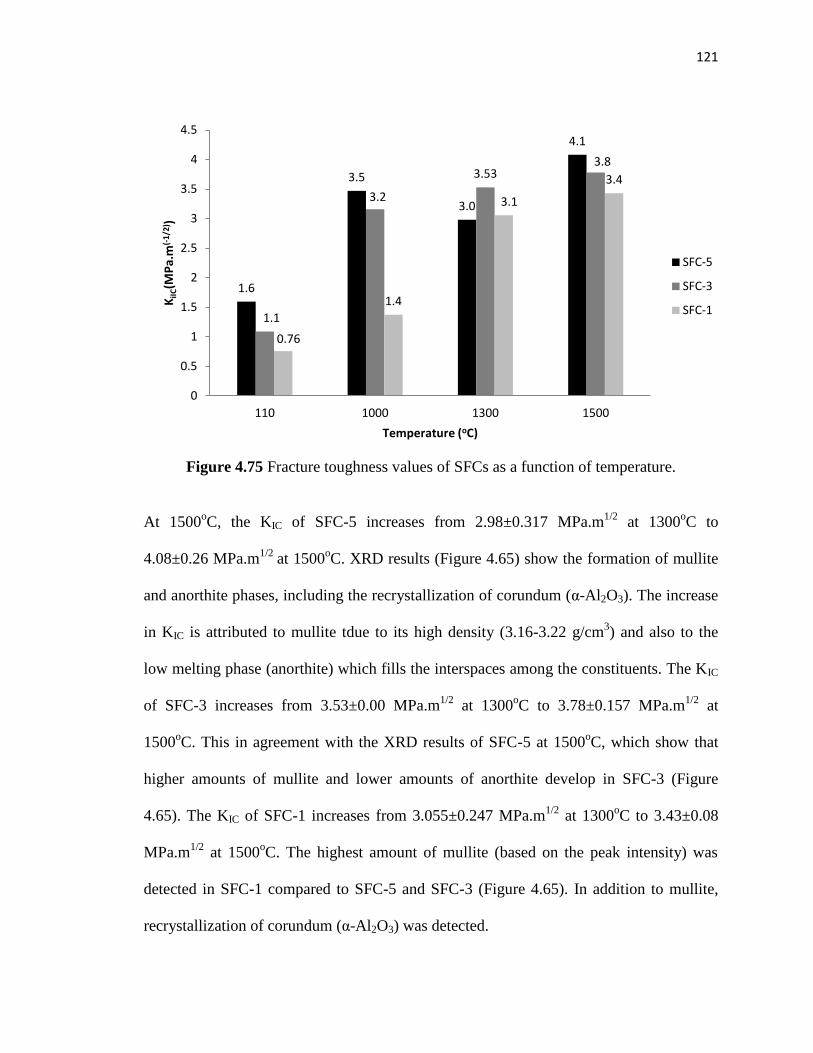
121
Figure 4.75 Fracture toughness values of SFCs as a function of temperature.
At 1500oC, the KIC of SFC-5 increases from 2.98±0.317 MPa.m
1/2 at 1300
oC to
4.08±0.26 MPa.m1/2
at 1500oC. XRD results (Figure 4.65) show the formation of mullite
and anorthite phases, including the recrystallization of corundum (α-Al2O3). The increase
in KIC is attributed to mullite tdue to its high density (3.16-3.22 g/cm3) and also to the
low melting phase (anorthite) which fills the interspaces among the constituents. The KIC
of SFC-3 increases from 3.53±0.00 MPa.m1/2
at 1300oC to 3.78±0.157 MPa.m
1/2 at
1500oC. This in agreement with the XRD results of SFC-5 at 1500
oC, which show that
higher amounts of mullite and lower amounts of anorthite develop in SFC-3 (Figure
4.65). The KIC of SFC-1 increases from 3.055±0.247 MPa.m1/2
at 1300oC to 3.43±0.08
MPa.m1/2
at 1500oC. The highest amount of mullite (based on the peak intensity) was
detected in SFC-1 compared to SFC-5 and SFC-3 (Figure 4.65). In addition to mullite,
recrystallization of corundum (α-Al2O3) was detected.
1.6
3.5
3.0
4.1
1.1
3.2
3.53 3.8
0.76
1.4
3.1
3.4
0
0.5
1
1.5
2
2.5
3
3.5
4
4.5
110 1000 1300 1500
KiI
C(M
Pa.
m(-
1/2)
)
Temperature (oC)
SFC-5
SFC-3
SFC-1

122
4.10 Indentation Toughness of Castables
Figure 4.76 shows indentation toughness results for SFCs as a function of the firing
temperatures. As seen from Figure 4.76, the indentation toughness of SFCs increases
with firing temperatures.
Figure 4.76 Indentation toughness of SFCs as a function of firing temperatures
In addition, indentation toughness results for SFCs based on nanoindentation are much
higher than the fracture toughness results (see Chapter IV). In nanoindentation toughness
measurements, it is necessary to prepare the surface of the samples prior to testing. The
polishing step is crucial as it reveals the microstructure of the samples for microhardness
and nanoindentation tests. Hardness and elastic modulus measurements depend on the
selected area in the sample and they can vary as the matrix consists of aggregates and a
binding system which have different mechanical properties. Moreover it is easier to
polish the aggregate than the binding system since the binding system is rather soft.
3.07
5.4
6.6
12.7
7.17
9.64
7.36
8.66
4.35 4.3
5.96
7.8
0
2
4
6
8
10
12
14
110 1000 1300 1500
Ind
en
tati
on
To
ugh
ne
ss (
MP
a.m
1/2 )
Temperature(oC)
SFC-5
SFC-3
SFC-1

123
Figure 4.77 is an optical micrograph of the binding system. Notice that in general it is
made of the dark regions that surround the aggregates. Making hardness measurements
on the binding system is rather difficult as it usually ends up giving rise to a blurry area.
Indentation toughness measurements lead to high KIC values when compared with those
obtained by conventional fracture toughness determinations due to a large extent on the
effect of both, aggregate and binder, as well as microstructural discontinuities (pores and
microcracks) that might be inherent to specimen size effects in brittle solids.
Figure 4.77 Optical microscope picture of SFC after nanoindentation test at 400X
The crack created during hardness testing might be another reason for deviation in
indentation toughness results. Figures 4.78 (a) and (b) show a crack generated using a
Berkovich indentor in the nanoindentation test.
Indentation (Berkovich indentor) Aggregate
Binding System

124
Figure 4.78 (a) Linear crack (b) Non-linear crack created by Berkovich indenter at 400X
In order to estimate the KIC from indentation toughness the length of the crack needs to
be measured (see Eq. 3.9). Notice that the crack should have a straight path for proper
determinations. Figure 4.78(a) shows the development of a linear crack created by the
indenter. On the other hand, Figure 4.78(b) shows a non-linear crack, leading to uneven
results in indentation toughness. In order to avoid non-linear cracks, cube-corner
indenters are desirable instead of Berkovich or vickers since cube corners are rather sharp
and it is easy to generate cracks. In the literature, Berkovich type indenters are typically
used to measure hardness and elastic modulus.
20µm
(a) (b)

125
4.11 Effect of nano-ZrO2 and YSZ Addition on the Modulus of Rupture (MOR) of
SFCs
Effect of different amounts of nano-ZrO2 and YSZ additions is investigated as to whether
it leads to improvements in either the MOR and/or the fracture toughness of SFCs. X-ray
results show that nano-ZrO2 and 8 mol% YSZ nanopowders have a monoclinic and a
cubic structure, respectively as seen Figure 4.79.
Figure 4.79 XRD patterns of (a) nano-ZrO2 and (b) 8% mol YSZ powders
The XRD results clearly show the presence of monoclinic ZrO2 and the formation of
cubic ZrO2 after addition of 1% YSZ at 1300oC (see Figure 4.80). In addition, anorthite
and α-Al2O3 phases were observed. The stabilization of tetragonal ZrO2 was not detected
at additions of 8 mol% YSZ in SFC-5.
10 30 50 70
M
M
M M
M
M M M M
M
M M M M
M M
M
C
C
C C
DEGREE
M: monoclinic C: cubic
(a)
(b)
c M

126
Figure 4.80 XRD data of (a) 5%, (b) 3%, (c) 1%, (d) 0.1%, (e) 0.01% - 8 mol %YSZ
reinforced SFC-5 at 1300oC.
Figure 4.81 shows XRD results of ZrO2-reinforced SFC-5 fired at 1300oC for 3 h.
Diffraction peaks corresponding to t-ZrO2 were observed after the addition of 1% ZrO2
(Figure 4.81). In addition to t-ZrO2, the α-Al2O3 (corundum), anorthite, and m-ZrO2 were
also detected.
20 40 60
A
A
A
A
An M
A
A
A A
A A C C M An A An
A: Alumina An: Anorthite M: Monoclinic Zirconia C: Cubic Zirconia
(c)
(a)
(b)
(d)
(e)

127
Figure 4.81 XRD data of (a) 5%, (b) 3%, (c) 1%, (d) 0.1%, (e) 0.01% - nano ZrO2
reinforced SFC-5 at 1300oC.
The MOR of SFC-5 with nano-ZrO2 and 8 mol% YSZ fired at 1300oC is shown in Figure
4.82. Notice that addition of 3% ZrO2 increased the MOR from 36.34±1.3 MPa to
44.32±9.19 MPa. This is explained by the stabilization of t-ZrO2, which was detected in
refractory castables (see Figure 4.81). Notice that retention of a maximum amount of t-
ZrO2 at the service temperature is important for effective transformation toughening.
Thus, the stabilization of tetragonal ZrO2 improves the MOR around 20 % with the
20 40 60
A
An
A
A
A
A
A
A
A
A
A
An M A T A
A: Alumina An: Anorthite M: Monoclinic Zirconia T: Tetragonal Zirconia
(a)
(b)
(c)
(d)
(e)

128
addition of 3% nano-ZrO2. On the other hand, the addition of nano-YSZ does not have
influence on the MOR of SFC-5 like nano-ZrO2 did. The addition of 3% YSZ increased
the MOR from 36.34±1.3 MPa to 40.42±4.98 MPa. Although there was a slight increase
in the MOR of SFC-5, tetragonal ZrO2 was not observed in the XRD results of Figure
4.78. This is attributed to the increased in packing density of the castables.
Figure 4.82 MOR of nano-ZrO2 and YSZ reinforced SFC-5 at 1300oC.
Figure 4.83 shows KIC of nano ZrO2 and 8 mol % YSZ reinforced SFC-5 at 1300oC. As
seen from Figure 4.83, the Kic of SFC-5 with nano-ZrO2 is between 2.77±0.19 -
2.94±0.26 MPa.m1/2
.
Figure 4.83 Fracture toughness of nano-ZrO2 and YSZ reinforced SFC-5 at 1300oC.
40.62 41.57 38.39
44.32
37.18 36.34 36.1 37.14 37.77 40.42
39.61
0
10
20
30
40
50
0 0.01 0.1 1 3 5
MO
R (
MP
a)
Dosage %
ZrO2
YSZ
3.0
2.8 2.9
2.8
2.9 2.8
2.8 2.8
3.2
2.85 2.7
2.4
2.6
2.8
3
3.2
3.4
0 0.01 0.1 1 3 5
KIC
(MP
a.m
-1/2
)
Dosage %
ZrO2
YSZ

129
Although retention of t-ZrO2 is achieved, the addition of nano-ZrO2 does not have a
major effect on the KIC of refractories. The addition of YSZ changes the KIC of castables
between 2.75±0.22 - 3.2±0.11 MPa.m1/2
, which is slightly higher when compared with
the reference. Thus, there is no significance effect of the additions of nano-ZrO2 and 8
mol% YSZ on KIC of SFC-5. Figure 4.84 shows XRD pattern of ZrO2 reinforced SFC-3
at 1300oC. Also, t-ZrO2 was observed after addition of 0.1% ZrO2. In addition to t-ZrO2,
α-Al2O3, anorthite and m-ZrO2 were detected in XRD.
Figure 4.84 XRD data of (a) 5%, (b) 3%, (c) 1%, (d) 0.1%, (e) 0.01% nano-ZrO2-
reinforced SFC-3 fired at 1300oC
20 40 60
A
A
A
A
A A
A
A
A A
M An T M M
A: Alumina An: Anorthite M: Monoclinic Zirconia T: Tetragonal Zirconia
A A An

130
Figure 4.85 shows XRD data of 8 mol% YSZ reinforced SFC-3 after firing at 1300oC for
3h. From the diffraction peaks, c-ZrO2 was detected after addition of 1% YSZ. In
addition, m-ZrO2, α-alumina and anorthite phases were detected. The formation of t-
ZrO2 was not detected with the addition of YSZ.
Figure 4.85 XRD data of (a) 5%, (b) 3%, (c) 1%, (d) 0.1%, (e) 0.01% - 8 % mol YSZ
reinforced SFC-3 fired at 1300oC.
20 40 60
A
A
A
A A
A
A A
A A C C
M An M
A: Alumina M: Monoclinic Zirconia An: Anorthite C: Cubic Zirconia
A An A

131
The MOR for SFC-3 with nano-ZrO2 and YSZ fired at 1300oC is shown in Figure 4.86.
The addition of 3% ZrO2 increased the MOR from 51.9±2.5 MPa to 59.5±2.5 MPa. This
is attributed to the stabilization of tetragonal ZrO2, which was detected in SFC-3 (Figure
4.84). The addition of YSZ does not have a major influence on the MOR of SFC-3 since
the stabilization of tetragonal ZrO2 was not achieved in YSZ-reinforced castables (Figure
4.85).
Figure 4.86 MOR of 8 mol%-YSZ and ZrO2 reinforced SFC-3 at 1300oC for 3h.
The KIC of SFC-3 with nano-ZrO2 is between 3.0±0.3 and 3.6±0.3 MPa.m1/2
. Although
retention of t-ZrO2 is achieved, the addition of nano-ZrO2 does not have a major
influence on the KIC of SFC-3. The addition of YSZ changes the KIC of SFC-3 between
3.0±0 and 3.4±0.3 MPa.m1/2
, which is slightly reduced when compared with the reference
as seen Figure 4.87.
53.6 54.2 52.2
59.5 55.1 51.9
46.22 51.4 48.1 47.9 51.3
0
10
20
30
40
50
60
70
0 0.01 0.1 1 3 5
MO
R (
MP
a)
Dosage %
ZrO2
YSZ

132
Figure 4.87 KIC of nano-ZrO2 and 8 mol %YSZ reinforced SFC-3 at 1300oC.
Figure 4.88 shows XRD data of nano-ZrO2 reinforced SFC-1 fired at 1300oC. Diffraction
peak of t-ZrO2 was observed after addition of 1% ZrO2. In addition, diffraction peaks
belonging to α-Al2O3, m-ZrO2 and cristobalite were observed as seen Figure 4.88.
Figure 4.88 XRD data of (a) 5%, (b) 3%, (c) 1%, (d) 0.1%, (e) 0.01% nano-ZrO2-
reinforced SFC-1 fired at 1300oC for 3h.
3.4 3.4
3.0
3.1
3.6 3.5
3.2 3.0
3.1 3.3
3.4
2.6 2.8
3 3.2 3.4 3.6 3.8
0 0.01 0.1 1 3 5
KIC
(MP
a.m
1/2 )
Dosage %
ZrO2
YSZ
20 40 60
A
A
A
A
A
A
A A
A A
CA M M T
A: Alumina Cr: Cristobalite M: Monoclinic Zirconia T: Tetragonal Zirconia
A

133
Figure 4.89 shows XRD patterns of an 8 mol %YSZ reinforced SFC-1 at 1300oC. c-ZrO2
was detected after addition of 1%YSZ. In addition, α-Al2O3, m-ZrO2 and the formation of
cristobalite phases were detected as those observed in nano-ZrO2 reinforced SFC-1. The
retention of t-ZrO2 was not detected at room temperature.
Figure 4.89 XRD data of (a) 5%,(b) 3%, (c) 1%, (d) 0.1%, (e) 0.01% - 8 % mol YSZ
reinforced SFC-1 fired at 1300oC
20 40 60
Cr
A
A
A
A
A A
A A
A
A
C C A M M
A: Alumina Cr: Cristobalite M: Monoclinic Zirconia C: Cubic Zirconia
A

134
Figure 4.90 shows the MOR of nano-ZrO2 reinforced SFC-1 fired at 1300oC. The
addition of 3% nano-ZrO2 increased the MOR from 45.9±1.71 MPa to 52±1.39 MPa.
That is attributed to stabilization of t- ZrO2 at room temperature which is similar to both,
the SFC-5 and SFC-3 samples. On the other hand, the addition of YSZ slightly changed
the MOR of SFC-1 due to the fact that retention of t-ZrO2 at room temperature was not
detected in YSZ reinforced SFC-1 samples as seen Figure 4.90.
Figure 4.90 The MOR of 8 mol %YSZ and ZrO2 reinforced SFC-1 at 1300oC.
The KIC results of nano-ZrO2 and 8 mol% YSZ reinforced SFC-1 fired at 1300oC for 3h
are given in Figure 4.91. Notice that the addition of nano-ZrO2 and 8 mol% YSZ
changed the KIC between 3±0.15 - 3.3±0.425 MPa.m1/2
and 2.7±0.08 - 3.2±0.789
MPa.m1/2
respectively. The addition of both, nano-ZrO2 and YSZ does not show any
effect on the KIC of SFC-1 samples regardless of the retention of t-ZrO2.
49.4 51.6
50.9
53.6
52
45.9 45.1 46.6
39.3
44.8 42.9
30
35
40
45
50
55
0 0.01 0.1 1 3 5
MO
R (
MP
a)
Dosage %
ZrO2
Y2O3

135
Figure 4.91 Fracture toughness of nano- ZrO2 and 8 mol %YSZ reinforced SFC-1 at
1300oC.
Consequently, it is found that the addition of nano-ZrO2 on the experimental tests show
that there are some benefits in some of the experimental castables. Figures 4.82, 4.86 and
4.90 show the MOR of nano-ZrO2 reinforced SFCs fired at 1300oC for 3h. Notice that the
MOR of all SFCs exhibited an increase of around 20% with the addition of 3% nano-
ZrO2. Apparently, this is attributed to the stabilization of tetragonal-ZrO2 at room
temperature (see XRD results Figures 4.81, 4.84 and 4.88). In contrast, additions of nano-
ZrO2 did not lead to appreciable improvements in the fracture toughness (KIC) of the
experimental castables, regardless of cement content and firing temperatures (see Figures
4.83, 4.87 and 4.91). The X-ray diffraction of the nanopowders added to SFCs shows a
monoclinic structure as seen Figure 4.79. In the nano-ZrO2 reinforced castables, no new
phases were identified that could be attributed to the presence of nano-ZrO2 as shown in
Figures 4.81, 4.84 and 4.88. In these Figures, XRD intensity peaks corresponding to t-
ZrO2, α-Al2O3 (corundum), m-ZrO2, anorthite(CaAl2Si2O8) and cristobalite phases were
detected depending on the cement content. It is important to optimize the tetragonal ZrO2
structure at service temperature since transformation toughening occurs by stabilization
3.0 3.3 3.1 3.2
3.0 3.1 2.9 2.7 3.0 3.1
3.2
0
1
2
3
4
0% 0.01% 0.10% 1% 3% 5%
Kic
(M
Pa.
m(-
1/2)
Dosage %
ZrO2
YSZ
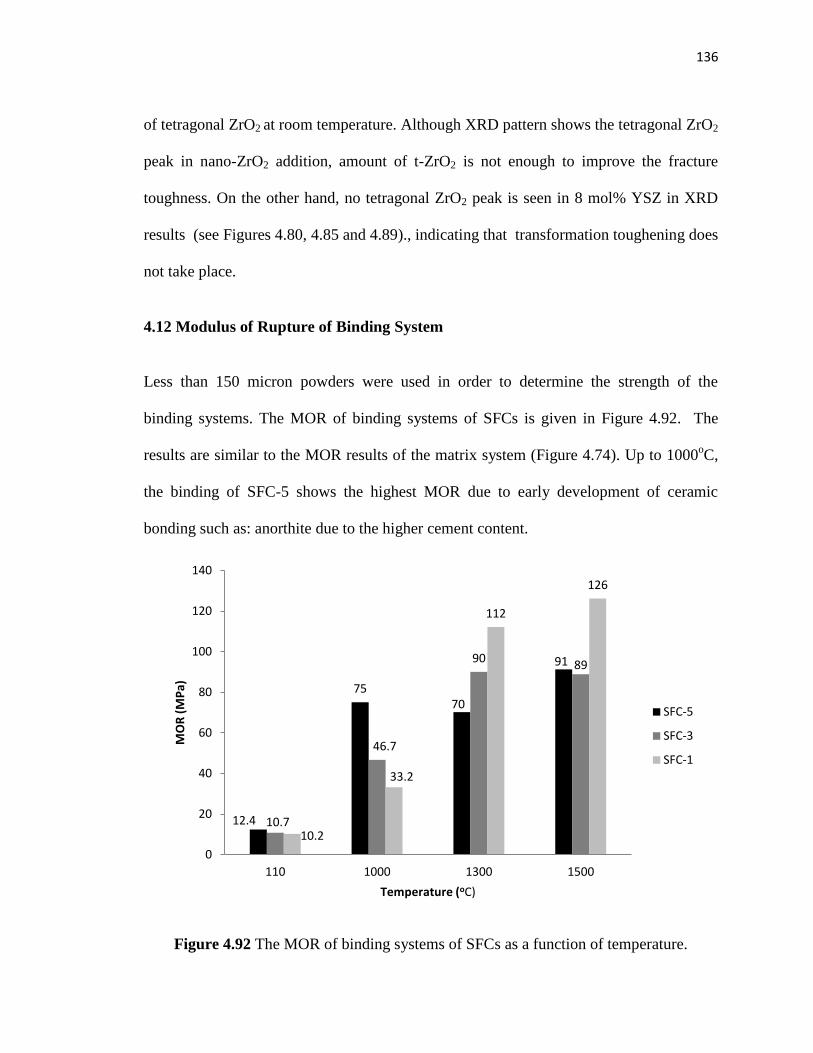
136
of tetragonal ZrO2 at room temperature. Although XRD pattern shows the tetragonal ZrO2
peak in nano-ZrO2 addition, amount of t-ZrO2 is not enough to improve the fracture
toughness. On the other hand, no tetragonal ZrO2 peak is seen in 8 mol% YSZ in XRD
results (see Figures 4.80, 4.85 and 4.89)., indicating that transformation toughening does
not take place.
4.12 Modulus of Rupture of Binding System
Less than 150 micron powders were used in order to determine the strength of the
binding systems. The MOR of binding systems of SFCs is given in Figure 4.92. The
results are similar to the MOR results of the matrix system (Figure 4.74). Up to 1000oC,
the binding of SFC-5 shows the highest MOR due to early development of ceramic
bonding such as: anorthite due to the higher cement content.
Figure 4.92 The MOR of binding systems of SFCs as a function of temperature.
12.4
75 70
91
10.7
46.7
90 89
10.2
33.2
112
126
0
20
40
60
80
100
120
140
110 1000 1300 1500
MO
R (
MP
a)
Temperature (oC)
SFC-5
SFC-3
SFC-1

137
After firing at 1300oC for 3h, the binding systems of SFC-3 and SFC-1 show a significant
increase in the MOR because of development of ceramic bonding through anorthite for
SFC-3 and cristobalite for SFC-1 which is similar to the matrix systems. On the other
hand, the MOR of SFC-5 is negatively affected by increasing amounts of anorthite
formation fired at 1300oC. At 1500
oC, the MOR of SFCs increased through the formation
of mullite. The MOR results of binding systems of SFCs are noticeably higher than in the
matrix systems of SFCs at elevated temperatures. This is attributed to the development of
ceramic bonding through the binding system, leading the stronger bonding since
aggregates do not have any effect on the development of ceramic bonding.
Notice that there is no crack formation observed in the binding systems as opposed to the
matrix systems of SFCs. This is attributed to thermal expansion differences between
alumina aggregates and the phases formed at elevated temperatures such as; anorthite,
cristobalite and mullite, leading to cracking. Notice that amount of cracks increases with
higher cement content due to increasing amount slow melting phase (anorthite) as seen
figure 4.105. It is important to keep in mind that these cracks would reduce the corrosion
resistance of castables at elevated temperatures, leading reduced service times of
castables.
4.13 Fracture Toughness of Binding Systems of Castables
Fracture toughness of binding systems of SFCs as a function of firing temperatures is
given Figure 4.93. Up to 1000oC, the KIC of binding system increases with increased

138
cement content since the higher cement leads to early development of ceramic matrix as
previously mentioned.
Figure 4.93 KIC of binding systems of SFCs as a function of firing temperature
At 1300oC, there was a slight decrease in the composition based on SFC-5 due to
increasing amounts of anorthite formation. On the other hand, a significant increase was
observed in the compositions based on SFC-3 and SFC-1, indicating the formation of
ceramic bonding. At 1500oC, the KIC of binding systems increases with the formation of
mullite phase at this temperature. In general, the KIC results of the binding systems were
gradually lower than those of the matrix systems of SFCs (see Figure 4.75). This can be
explained by the effect of aggregates since bonding with the binding system at elevated
temperatures, leading to an increase in fracture toughness of SFCs. In particular, the
formation of the anorthite phase leads to improved binding between aggregate and the
binding system since anorthite acts as a filler between aggregate and the binding system.
0.22
1.1 1.0
1.79
0.18
0.87
1.64 1.65
0.12
0.43
1.44
1.98
0
0.5
1
1.5
2
2.5
110 1000 1300 1500
Kic
(M
Pa.
m(1
/2) )
Temperature (C)
SFC-5
SFC-3
SFC-1

139
The results are also confirmed by experimental observations of fracture in the aggregates
as seen Figure 4.103(b).
4.14 Effect of Nano-ZrO2 addition on the MOR of Binding System of Castables
Figure 4.94 shows the MOR of nano-ZrO2 and YSZ reinforced binding systems of SFC-5
as a function of firing temperatures. Up to 1000oC, there was no big difference in the
MOR of nano-ZrO2 and YSZ reinforced samples. After firing at 1300oC, YSZ increased
the MOR of binding system from 79.9±10.2 MPa at 1000oC to 113±5.6 MPa at 1300
oC
which is higher compared to nano-ZrO2 reinforced samples. At 1500oC, nano-ZrO2
addition shows the highest MOR values from 93±2.2 MPa at 1300oC to 142±13.9 MPa at
1500oC. Notice that nano-ZrO2 and YSZ reinforced SFC-5 do not show any effect in the
MOR after firing at 1300oC compared with non-reinforced samples as seen Figure 4.94.
Figure 4.94 MOR of binding system of SFC-5 as a function of firing temperatures
12.4
75 71
90
12.6
85 93
142
13
80
113
96
0
20
40
60
80
100
120
140
160
110 1000 1300 1500
MO
R (
MP
a)
Temperature (C)
Binder
ZrO2%
YSZ

140
Figure 4.95 shows the MOR of nano-ZrO2 and YSZ reinforced binding systems of SFC-3
at elevated temperatures. Nano-ZrO2 addition shows the highest MOR after firing at
1300oC (117.82±9.34 MPa). At 1500
oC, the addition of both nano-ZrO2 and YSZ
increases the MOR compared with non-reinforced samples.
Figure 4.95 MOR of binding system of SFC-3 as a function of firing temperatures.
Figure 4.96 shows the MOR of nano-ZrO2 and YSZ reinforced binding systems of SFC-1
as a function of the firing temperatures.
10.7
47
90 89
11.4
65
118
107
13.2
49
85
102
0
20
40
60
80
100
120
140
110 1000 1300 1500
MO
R (
MP
a)
Temperature (C)
Binder
ZrO2
YSZ

141
Figure 4.96 MOR of binding system of SFC-1 as a function of elevated temperature.
The addition of nano-ZrO2 and YSZ gradually increases the MOR of binding systems
compared to non-reinforced samples but there was no significant improvement in the
MOR of samples. Notice that the MOR of nano-ZrO2 and YSZ reinforced and non-
reinforced SFC-1 steadily increases at elevated temperatures.
4. 15 Effect of Yttria Distribution of Nano-ZrO2 Reinforced Refractory Castables
Yttria distribution in nano zirconia has a strong effect on the stabilization of the
tetragonal phase at the service temperatures so it influences both, the KIC and the MOR of
the samples. In order to investigate the effect of yttria distribution, 8Y-ZrO2 was mixed
with undoped ZrO2 to obtain overall yttria content of 1, 2 and 3 mol-%. Figure 4.97
shows the MOR of binding system of SFC-3 as a function of firing temperatures. Notice
that 3%C-YSZ refers to 3%YSZ in the as received condition.
10.2
33
112
126
14.8
37
119 128
12.8
32
120
131
0
20
40
60
80
100
120
140
110 1000 1300 1500
MO
R (
MP
a)
Temperature (oC)
binder
ZrO2
YSZ

142
Figure 4.97 MOR of binding system of SFC-3 at elevated temperatures as a function of
yttria distribution
Results show that the addition of nano-ZrO2 increases the MOR steadily at elevated
temperatures. After drying at 110oC, there is no significant difference in the MOR of the
samples. At 1000oC, the addition of undoped nano-ZrO2 shows the highest MOR values
at 65.4±3.36 MPa. At 1300oC, the most significant increase was observed in the MOR
with addition of 1Y-ZrO2 from 36.7 MPa at 1000oC to 131.7 MPa at 1300
oC, this is
followed by undoped-ZrO2. After firing at 1500oC, the addition of 3Y-ZrO2 shows the
highest MOR at 129.1 MPa compared with the other SFCs.
0
20
40
60
80
100
120
140
110 1000 1300 1500
MO
R (
MP
a)
Temperature (C)
Binder
ZrO2
1%YSZ
2%YSZ
3%YSZ
3%C-YSZ
8%YSZ

143
Figure 4.98 Fracture toughness of binding systems of SFC-3 as a function of firing
temperature.
The KIC (fracture toughness) of binding system of SFC-3 as a function of firing
temperatures is illustrated in Figure 4.98. KIC values of all samples steadily increase at
elevated temperatures as seen figure. Although the addition of nano-ZrO2 gradually
increases the KIC of the binding systems, there was no promising improvement seen in
these samples. In general, the addition of 3Y-ZrO2 increases the KIC of the binding
systems slightly when compared with the other samples at elevated temperatures.
4.16 Effect of Drying on Modulus of Rupture of Binding System
In order to measure the effect of drying on the MOR of SFCs, two groups of samples
were prepared after de-molded. The first group of samples was dried at 110oC for 24 hour
while the others were not. Finally, the MOR of both dried and non-dried samples were
0
0.5
1
1.5
2
2.5
110 1000 1300 1500
Frac
ture
To
ugh
ne
ss
Temperature (C)
3%CA14M
3%ZrO2
1%YSZ
2%YSZ
3%YSZ
3%CYSZ
8%YSZ

144
measured as a function of time 1th
, 7th
and 28th
day, respectively using three point
bending testing. Figures 4.99(a-c) show the drying effect on the MOR of the binding
systems of SFCs as a function of time.
Figure 4.99 Drying effect of the MOR of binding system of (a) SFC-5, (b) SFC-3 and (c)
SFC-1 as a function of time
After the 1th
day, the MOR of non-dried samples is lower than the samples dried at
110oC. That is explained by the free water present in non-dried samples degrading the
physical properties of castables. After the 7th
day, the MOR values of non-dried sample
increased with decrease in their free water content with time i.e., getting lighter. On the
other hand, the MOR values of dried samples decreased because of humidity coming
from air i.e., the samples gained weight. After the 28th
day, the MOR values of both non-
dried and dried samples increased due to the drying effect (i.e., the both samples were
5.6
8.7 9.6
12.4
8.4
17
0
5
10
15
20
1th 7th 28th
MO
R (
MP
a)
Days
4.7
7.2 8.1
10.7
7.7
9.5
0
2
4
6
8
10
12
1th 7th 28th
MO
R (
MP
a)
Days
w/o drying
drying at 110C
5.8
9.6 10.4 10.2 9.5
12.5
0
2
4
6
8
10
12
14
1th 7th 28th
MO
R (
MP
a)
Days
(a) (b)
(c)

145
getting lighter). Consequently, the MOR of non-dried samples steadily increases with
drying time due to losing their free water. On the other hand, the MOR of dried samples
decreases after the 7th
day due to humidity from the air (i.e, gaining weight) and then
increases again due to drying becoming the dominant effect. Notice that the drying step
of castables is very crucial for both mechanical and physical properties. There is a
significant difference between dried and non-dried samples respect to the MOR values
after the 1st day since free water in non-dried samples degrades to mechanical properties
of samples. Drying at 110oC is needed to remove all superficial and free water. This also
fully converts any metastable phases (CAH10 and C2AH8) into cubic hydrates and
crystalline gibbsite, and provides higher strength development for the binder/aggregate
system cured 24 hours at higher temperatures. Although the MOR of non-dried samples
increases with time, it doesn’t reach the same value comparing to dried samples,
indicating that drying of castables is necessary to improve the strength of samples. In
addition, elimination of free water from samples with drying at 110oC permits to fire up
the samples at elevated temperatures because free water in the samples can lead to the
development of cracks or fracture at elevated temperatures.
4.17 Microstructural Investigation of Fracture Surfaces
It is critical to be able to correlate the evolution of thermo-mechanical properties of
castables with the microstructural evolution of the binding system. This, in order to
better understand the initial stages formation of the ceramic bond and how it affects the
fracture toughness of self-flow castables (SFCs). Scanning electron microscopy (SEM)
was used to evaluate the resultant microstructures of SFCs. Figures 4.100(a-c) show SEM

146
pictures and EDS pattern of fracture surface of SFCs at dried 110oC for 24 hours.
Fracture took place at the binding system as indicated by the EDS pattern in figure
4.100(c).
Figure 4.100 (a) and (b) Fracture surface of SFC-5 and SFC-3 at 110
oC for 24 hours
respectively and (c) EDS pattern of fracture surface of SFC-5 sample at 100X.
As seen from this figure, the EDS pattern shows Al, Si, Ca and O elemental peaks,
corresponding to the composition of matrix system. At 110oC, fracture occurred on the
binding system since the ceramic bond has not been developed yet and corundum
aggregate. The fracture surface is flat and smooth, indicating the brittle fracture behavior,
thus confirming the fracture toughness results. As seen in Figure 4.101(a), the aggregates
debonded from the matrix since the ceramic bonding hasn’t developed yet after drying at
110oC for 24h. Figure 4.101(b) is an SEM picture of a debonded aggregate, indicating
the weak bonding between aggregate and the binding system. Figure 4.101(c) shows the
porosity and the formation of cracks around the porosity.
(a) (b)

147
Figure 4.101 (a) Fracture surface of SFC-5 dried at 110
oC for 24h (b) and (c) SEM
pictures of SFC-5 at 100X
Ceramics are porous materials and this is one of the reasons why they are brittle. Porosity
is a common flaw in brittle materials. As seen from Figures 4.102, castables have
different size and shapes of pores, leading to brittle fracture.
Porosity
Debonded aggregate
Porosity Debonded aggregate
(a)
(b) (c)

148
Figure 4.102 Fracture surfaces of (a)SFC-5 and (b)SFC-3 after drying at 110oC for 24 h
at 100X
The properties of the castables changed at elevated temperatures due the development of
ceramic bonding. As seen Figure 4.103(a) and (b), the fracture surface of a SFC-5 sample
after firing at 1000oC shows that fracture evolves through both, the binding system and
the alumina aggregate through the development of a ceramic bonding as confirmed by the
EDS pattern in Figure 4.104(a-b).
Figure 4.103 Fracture surface of SFC-5 (a) at 100X and (b) at 500X after firing at
1000oC for 3h
As seen in Figure 4.104(a) and (b), the fracture surface is getting rough with the
development of ceramic bonding at elevated temperatures. Figure 4.104(a-b) shows the
elemental composition of binding system and aggregate respectively, indicating fracture
(a) (b)
(a) (b)

149
of the aggregate after firing at 1000oC in SFC-5 as bonding is developed. Notice that the
fracture toughness results of SFC-5 show an increase after firing at 1000oC in SFC-5 as
seen Figure 4.75.
Figure 4. 104 (a) and (b) EDS patterns of SFC-5 sample after firing at 1000oC for 3h.
Figure 4.105(a) and (b) show the fracture surface of SFC-3 and SFC-1 at 1000oC
respectively. The fracture surface is getting smoother with a decrease in the cement
content from 3% to 1% in castables. Since the ceramic bonding has not been developed
in SFC-1 at 1000oC (EDX results, Figure 4.63) as confirmed by the fracture toughness
results. Notice that the fracture surface of SFC-5 is rougher than in either the SFC-3 or
SFC-1 after firing at 1000oC as seen Figure 4.103(a-b). This is attributed to the early
development of ceramic bonding with a higher cement content.
(a)
(b)

150
Figure 4.105 Fracture surface of (a) SFC-3 and (b) SFC-1 after firing at 1000
oC for 3h at
100X
As seen figure 4.106(a) and (b), there is a crack observed at the interface between
alumina aggregate and binder with firing temperature. These cracks are attributed to
thermal expansion mismatch between the alumina aggregate and the new phases formed
such as anorthite, cristobalite and mullite at elevated temperatures.
Figure 4.106 Fracture surfaces of (a) SFC-5 and (b) SFC-1 after firing at 1300
oC for 3h
at 500X.
Notice also that cracks increase as s result of increasing thermal expansion mismatch
with increased cement content due to the formation of anorthite phase. Figure 4.107(a-d)
shows the fracture surfaces of SFC-5 and SFC-1 respectively after firing at 1500oC for
3h. As seen from these figures, the formation of cracks is noticeably higher in SFC-5
(a) (b)
(a) (b)

151
compared to SFC-1. This is explained by the formation of the low melting phase
(anorthite) in SFC-5 due to increasing cement content. These cracks are attributed to
thermal expansion mismatch between alumina aggregate and phases formed such as
anorthite, cristobalite and mullite at elevated temperatures.
Figure 4.107 (a) Fracture surface of SFC-5 and (b) SEM picture of SFC-5 at 50X (c)
fracture surface of SFC-1 and (d) SEM picture of SFC-1 at 50X after firing at 1500oC for
3h
Figures 4.108(a) and (b) show fracture surfaces of SFC-1 and SFC-5 after firing at
1300oC consisting of surface flaws, agglomerated particles and spherical porosities in the
microstructure, indicating processing defects causing the brittle fracture in the castables.
(a)
(c)
(b)
(d)

152
Figure 4.108 Fracture surfaces of (a) SFC-1 and (b) SFC-5 after firing at 1300oC for 3h
at 1000X.
Internal pores are the common failure origins in the brittle materials. As seen Figure
4.109(a) and (b), different sizes and shapes of internal pores are the leading failure
origins in castables.
Figure 4.109 Fracture surfaces of (a) SFC-1 and (b) SFC-3 after firing at 1500
oC for 3h
at 1000X
Surface flaws are another common failure origin in brittle materials in addition to
porosities. Figures 4.110(a) and (b) show both, surface flaws (columnar shape) and
circular internal pores, leading to brittle fracture in castables.
(a) (b)
(a) (b)

153
Figure 4.110 Fracture surfaces of (a) SFC-5 and (b) SFC-3 after firing at 1300
oC for 3h
at 1000X
Surface flaws can be seen in figures 4.11(a) and (b) more clearly. These flaws act like
failure origins in refractory castables.
Figure 4.111 Fracture surface of SFC-3 (a) at 2000X and (b) at 5000X after firing at
1300oC for 3h.
A fractographic investigation of the experimental refractories provide valuable
information on the fracture behavior of SFCs at elevated temperatures. The mechanical
property studies of refractories demonstrated that fracture toughness of the SFCs as well
as MOR and CCS increase at elevated temperatures due to ceramic bonding
development. SEM confirms the results obtained from mechanical studies. In general,
(a) (b)
(a) (b)

154
the fracture surfaces of the SFCs are smooth and flat at 110oC due to hydraulic bonding,
indication of brittle fracture behavior since ceramic bonding has not developed at this
temperature. There is still no strong bonding between the aggregate and the binding
system. Hence, aggregates debonded, causing to voids in the matrix as seen SEM
figures. At 1000oC, ceramic bonding is developed at SFC-5 and SFC-3 samples due to
high cement contents. As a result, the fracture in both, samples evolved through either the
alumina aggregate or the binding system since ceramic bonding becomes stronger in the
binding system than in the aggregate. On the other hand, the fracture surface of SFC-1 at
1000oC is still smooth and flat similar to 110
oC (figure), showing a low toughness
behavior since 1 wt.% cement content is not enough to develop a ceramic bonding at
1000oC as confirmed by XRD pattern in figure. At 1300
oC and 1500
oC, the fracture
surface of SFC-1 gets rough with the development of the ceramic bonding. This is
confirmed by XRD pattern showing crystallization of cristobalite at 1300oC and mullite
phase at 1500oC in figure 4.62 and 4.63 respectively. A formation of cracks was observed
in the SFCs at elevated tempertures due to thermal expansion mismatch between alumina
aggregate and the formation of new phases such as; anorthite, cristobalite and mullite.
These cracks increased with increased cement content due to the formation of the low
melting phase (anorthite). SEM micrographs also show common flaws like internal pores
and surface flaws in castables, acting failure origins and causing the brittle fracture.

155
CHAPTER 5- CONCLUSION
Based on both, the experimental and analytical work, the following conclusions can be
summarized as:
LCC and ULCCs compositions designed according to Andreassen model with a q
(Andreassen distribution coefficient) value of 0.25 provides good self-flow
properties in castables. A 5.5% water addition is satisfactory to achieve self
flowing performance. The results show that the self flow value decreased from
150% to 140% when the cement content was reduced from 5% to 1% with an
increment in the hydratable alumina content to 3%. This is attributed to the fact
that hydratable alumina needs additional water in order to set the castables.
Moreover, the self-flow values shift from 10% to 30% when nano-ZrO2/YSZ
additions increases from 1 to 5%.
XRD studies of the castable samples fired to 110oC for 24h revealed corundum
(Al2O3) phase. With increasing firing temperatures through 1000oC for 3h, the
anorthite phase was detected in SFC-5 sample. In contrast, there was no new
phases detected in the both SFC-3 and SFC-1 samples. This indicates that higher
cement can lead the early development of ceramic bonding at lower temperatures
when compared with hydratable alumina. At 1300oC for 3h, cristobalite and
anorthite phases were detected in SFC-1 and SFC-3 samples respectively. There
are no new phases detected in SFC-5, other than an increased peak intensity of the
anorthite phase. In the castable samples fired at 1500oC for 3h, the formation of
the mullite phase was detected, but the XRD peak intensity was decreased with

156
increased cement content. This is attributed to cement attack of the mullite phase
inhibiting its formation.
An increase in the firing temperature from 110oC to 1500
oC leads to an increase
in the BD of castables depending on the cement content. The SFC-5 sample
showed the highest densification behavior compared to SFC-3 and SFC-1 since
hydratable alumina does not relieve chemically bonded water easily due to its gel
structure. The WA of the castables exhibits a similar trend as the AP as a function
of the firing temperature. WA increases at 1000oC because of an increase in AP,
then decreases at 1500oC, indicating the densification process in the SFCs. The
WL of the castables confirms the BD results. At 110oC for 24 h, it shows the
highest WL due to the removal of free water from the castables. With increasing
firing temperatures through 1500oC for 3h, the WL of castables decreases except
for the SFC-1 sample since it has a higher hydratable alumina (3%). As
mentioned above, it takes time to relieve chemically bonded water for hydratable
alumina due to its gel structure so the SFC-1 sample still shows an increase in WL
at 1500oC.
The TGA results on the castables confirm the WL of the castables. The castables
showed WL at elevated temperatures. In particular, there is a characteristic drop
in the temperature range between 200-300oC due to dehydration of hydrated
cement of AH3 and C3AH6. In addition, WL of SFC-5 was higher than in both
SFC-3 and SFC-1 samples up to 1000oC since they do not contain any hydratable

157
alumina. The DTA results of the castables indicate an endothermic reaction at a
temperature between 200-300oC due to dehydration of the hydrated products.
The PSD of nano-ZrO2 particles was 1782 nm without any additives and
ultrasonification. ZP is 24.24 corresponding to a pH of 7.52. After 20 minutes of
ultrasound mixing with the additive of D811, the PSD of the nano-ZrO2 particles
was 8.9 nm. The corresponding ZP is -56.64 and the pH increases from 7.52 to 9.
When nano-ZrO2 particles were mixed with the additive of M-ADS/M-ADW after
20 minutes of ultrasound mixing, the PSD was 17.7 nm. The ZP is -62.33 and the
pH decreases to 5.76. These results show that ultrasonification and additives (D-
811 and M-ADS/MAD-W) enhance the PSD through its effect on negatively
charging the nano-ZrO2 particles.
Up to 1000oC, the highest values of CCS were obtained in the SFC-5 samples due
to the early development of ceramic bonding with a higher amount of cement
content. After firing at 1500oC, both SFC-3 and SFC-1 samples show a promising
increase in the CCS through the development of ceramic bonding. In contrast, the
CCS of SFC-5 decreases due to an increase in the amount of anorthite (low
melting phase).
The KIC and MOR results of the castables show similar trends. Up to 1000oC, the
SFC-5 samples show the highest MOR and KIC through the development of
ceramic bonding. After firing at 1300oC, SFC-3 and SFC-1 show significant
improvements in the KIC and MOR. In contrast, the KIC and MOR of SFC-5

158
decrease due to the increase in the amount of anorthite. With increasing firing
temperatures, up to 1500oC, there is a gradual increase in the MOR and KIC of
SFC-3 and SFC-1 samples. In contrast, the MOR and KIC of SFC-5 shows a
promising increase due to a reduction in the amount of anorthite through the
conversion of the mullite phase.
The indentation toughness results are much higher than the KIC results of castables
due to size difference effects. The discrepancy in the toughness results can be
explained by various reasons such as; (a) Using the Berkovich and vickers
indenters instead of a cube corner causes uneven results since the cube corner is
sharper than the Berkovich and creates more linear cracks, (b) During the
indentation test, the selected area is also an important factor in getting more
accurate results. Selecting an aggregate instead of the binder gives rise to much
higher results since the aggregates have a high hardness and a high elastic
modulus. Generally, aggregates are more visible than the binders the optical
microscope . In Contrast, the binder phase is usually blurry and it is difficult to
measure its inherent hardness.
The effect of nano-ZrO2/YSZ particles on the exhibited MOR and KIC values is
investigated in the experimental castables. XRD results show that nano ZrO2 and
YSZ particles are monoclinic and cubic respectively. The MOR of castables is
improved by approximately 20% with the addition of 3% ZrO2. This is attributed
to the stabilization of tetragonal ZrO2 at room temperature. In contrast, there are
no noticeably changes in the MOR of castables when nano-YSZ ws added.

159
Apparently, the stabilization of tetragonal-ZrO2 does not take place in this case.
There are no significant effects of the additions of nano-ZrO2/YSZ on the
exhibited KIC of the castables.
The binder systems of the castables show similar results to the matrix systems of
the castables. Up to 1000oC, the binder system of SFC-5 shows the highest MOR
and the KIC due to the development of a ceramic bonding. After firing at 1500oC,
SFC-3 and SFC-1 samples show a promising increase in the MOR and KIC with
the formation of the ceramic bond. It is also important to mention that there are no
cracks formation observed in the binding systems of samples after firing up to
1500oC. Crack formation is attributed to thermal expansion differences between
aggregate and the phases developed (anorthite, cristobalite and mullite) at
elevated temperatures. As a result, there is no characteristic drop observed in the
MOR results of castables after firing at 1500oC.
The effect of nano-ZrO2/YSZ particles on the exhibited MOR in the binder
systems of the castables. The results show that the MOR of binder systems is
improved with the addition of the both nano-ZrO2/YSZ at elevated temperatures.
In addition, the effect of the yttria distribution is investigated in terms of the MOR
and KIC of binder systems of SFC-3 samples. The ytria distribution has a strong
effect on the stabilization of tetragonal zirconia at the service temperatures. Also,
there is a significant improvement in the observed MOR of the binder system for
the SFC-3 samples with addition of different yttria content in the nano-ZrO2

160
particles. In contrast, there is a gradual increase observed in the KIC of the binder
system of SFC-3.
The drying step at 110oC for 24h is crucial for castables due to the removal of free
water and for the increasing strength development between the aggregate/binder
system. The results show that the dried samples possess a higher strength than the
non-dried samples. On the other hand, the strength of non-dried samples increases
with the drying time but they do not reach the strength of dried samples.
An investigation of the fracture surfaces of castables is necessary to understand
the evolution of thermal stresses. SEM pictures show that all the castables have
flat and smooth fracture surfaces after firing at 110oC, indicating brittle fracture
behavior. In addition, debonded aggregates are observed on the fracture surfaces
of castables since there is no strong bonding between aggregates and the binding
system. With increasing firing temperature through 1000oC, the fracture surfaces
of SFC-5 and SFC-3 samples evolve through the binding system and aggregate
due to the development of ceramic bonding. After firing at 1300oC, fracture
surfaces of all castables are getting rougher with the development of ceramic
bonding. The number of fractured aggregates increases at elevated temperatures,
indicating the development of a strong ceramic bonding between aggregate and
the binding system. In addition, fractography studies give valuable information
about the common failure origins in brittle materials. The studies show that
internal pores and surface flaws are common failure origins, causing brittle
fracture in the castables.

161
CHAPTER 6- FUTURE WORK
From the present work various research activities are recommended for further study on
self flowing castables
In order to identify the variables affecting the control setting time, zero cement
castables can be studied with using different additives and binders.
Indentation toughness of castables can be further studied using cube corner
indenter in addition to the Vickers and Berkovich indenters.
Additions of nano-ZrO2/YSZ can be increased beyond 5 % to investigate their
effect on the modulus of rupture (MOR) and fracture toughness (KIC) of castables.
In this study, physico-mechanical properties of castables were studied in terms of
cold crushing strength (CCS), modulus of rupture (MOR) and fracture toughness
(KIC). These properties can be measured at service temperatures since the
applications of castables are typically at elevated temperatures (>1000oC).
The effect of nano ZrO2/YSZ addition on physico-mechanical properties of
castables can be further investigated in the temperature range between 1200-
1500oC where ZrO2 has a tetragonal structure (1170-2370
oC).

162
REFERENCES
1. Charles A. Schacht, “ Refractories Handbook”, Marcel Dekker, Inc., New York-
Basel, 2004
2. W. E. Lee, W. Vieira, S. Zhang, K. Ghanbari Ahari, H. Sarpoolaky, and C. Parr, “
Castable refractory concretes”, International Materials Reviews, Vol. 46, No. 46,
(2001), pp. 145-16
3. Paulo Cesar Evangelista, Christopher Parr, Catherine Revais, “ Control of
formulation and optimization of self-slow castables based on pure calcium
aluminate”, Refractories Applications and New, Vol. 7, (2002), pp. 14-18
4. Walter C. Wedberg, Eldar Dingsoyr and Magne Dastol “ Particle size and particle
size distribution of elkem microsilica and its relevance to technical application”,
Presented at 5th
European Symposium Particle Characterization, Nurnberg,
Germany, 24-26 March 1992
5. Bjorn Myhre “ Particle size distribution and it relevance in refractory castables”
India International Refractory Congress 1996, New Dehli 8th
and 9th
February
1996
6. Bjorn Myhre, Bjorn Sandberg and Aase M. Hundere, “Flow and flow decay of
refractory castables”, Presented at the 3rd
India International Refractories
Congress, Elkem Refractories, 1998
7. Bjorn Myhre and Katinka Sunde, “ Alumina based castables with very low
contents of hydraulic compound part 1”, Presented at UNITECR 95, Elkem
Refractories, 1995
8. Bjorn Sandberg and Bjorn Myhre, “Microsilica: A versatile refractory raw
material”, Presented at the Indian Refractories Congress, 1994
9. Bjorn Myhre and Bjorn Sandbergh, “The use of microsilica in refractory
castables” Elkem ASA Materials.
10. C. Gogtas¸, N. Unlu, A. Odabas, L. Sezer, F. Cınar, S. Guner, G. Goller and N.
Eruslu, “Preperation and characterization self flowing refractory materilas
containing 971U type microsilica”, Advanced in Applied Ceramics, 2009
11. C. Gogtas, N. Unlu, A. Odabasi, L. Sezer, F. Cinar, S. Guner, and N. Eruslu,
“Characterization of the physical properties of a self-flowing low-cement castable

163
based on white-fused alumina” Journal of Ceramics Processing Research, Vol. 9,
No. 5, (2008), pp. 1-7
12. C. Gogtas, A. Odabasi L.Sezer, F. Cinar, S. Guner, N. Eruslu and N. Unlu,
“Improvement of properties of self-flowing low-cement castables based on brown
fused alumina”, Journal of Ceramics Processing Research, Vol. 8, No. 5, (2007),
pp. 324-33
13. C. Gogtas, N. Unlu A. Odabasi L.Sezer, S. Guner, G. Goller and N. Eruslu,
“Effects of firing temperature on the physical properties of a bauxite based
refractory castables” Refractories and Industrial Ceramics, Vol. 53, No. 1, 2012
14. Xianxin Zhou, K. Sankaranarayanane, Michel Rigaud, “ Design of bauxite-based
low cement pumpable castables : a rheological approach”, Ceramics International,
Vol. 30 (2004), pp.47-55
15. A.R. Studart, V.C. Pandolfelli, E. Tervoort, L.J. Gauckler, “Selection of
dispersants for high-alumina zero-cement refractory castables”, Journal of the
European Ceramic Society, Vol. 23 (2003), pp. 997-1004
16. M.A. Serry, M.F. Zawrah, and N.M. Khalil “ Bauxite based low and ultralow
cement castables”, British Ceramic Transactions, Vol. 101, pp. 165-168
17. Sasan Otroj, Mohammad Ali Bahrevar, Fatollah Mostarzadeh, Mohammad Reza
Nilforoshan, “The effect of deflocculants on the self-flow characteristics of ultra
low-cement castables in Al2O3-SiC-C system”, Ceramics international, Vol. 31,
(2005), pp. 647-653
18. Xianxin Zhou, K. Sankaranarayanane, Michel Rigaud, “Design of bauxite low-
cement pumpable castables: a rheological approach”, Ceramics International 30,
pp. 47-55,2004
19. Fangbao Ye, Mi Rigaud, Xinhong Liu, Xiangchong Zhong, “High temperature
mechanical properties of bauxite-based SiC-containing castables” Ceramics
International 30, pp. 801-805, 2004
20. P. Korgul, D.R. Wilson and W.E. Lee, “Microstructural analysis of corroded
alumina-spinel castable refractories”, Journal of the European Society 17, pp 77-
84, 1997

164
21. Swe-Kai Chen, Min-Yuan Cheng, Su-Jien Lin, Yung-Chao Ko “Thermal
characteristics of Al2O3-MgO and Al2O3-spinel castables for steel ladles”,
Ceramics International 28, pp. 811-817, 2002
22. Vicki Jones, Gerrards Cross, “Rheology control of low-cement self-flow
castables” Ceramics Industry, pp. 49, Feb 1998
23. David J. Green, “An introduction to mechanical properties of ceramics”, 1998
24. B. Basu, “Toughening yttria-stabilised tetragonal zirconia ceramics”, International
Materials Review”, Vol. 50, No. 4, (2005), pp. 239-256
25. M. Yoshimura, “ Phase Stability of Zirconia”, American Ceramic Society
Bulletin, Vol. 67, Issue:12 (1988), pp. 1950-1955 REF 47
26. L. Gao, T.S. Yen, J.K.Guo, “ Influence of ZrO2 particle size on toughening in hot-
pressed Y-TZP”, Advanced in Ceramics, Vol. 24: Science and Technology of
Zirconia III, (1988), pp. 405-414, REF. 102
27. Aase Hundere, Bjorn Myhre and Bjorn Sandberg, “ Free-flowing castables-a
prerequisite for wet-gunning of refractory castables”, Presented at VII-th
International Metallurgical Conference in Ustron, Poland.” May, 1997
28. Charles Alt, Lana Wong and Chirostopher Parr, “ Measuring castable rheology by
exothermic profile” Refractories Applications and News, Volume 8, No:2, 2003
29. F. Goetz Neunhoeffer, “ Hydration kinetics of calcium aluminate cement with
calcium sulfate hemihydrate in presence Ti+ and tartaric acid” Department of
Mineralogy, University of Erlangen-Nuremberg-Germany
30. Zeta Meter Inc, “ Zeta potential complete course in 5 minutes”
31. Sasan Otroj, Mohammad Ali Bahrevar, Fatollah Mostarzadeh, Mohammad Reza
Nilforoshan, “The effect of deflocculants on the self-flow characteristics of ultra
low-cement castables in Al2O3–SiC–C system”, Ceramics International 31 (2005)
647–653
32. Jing Sun, Lian Gao and Jingkun Guo, “ Influence of the Initial pH on the
Adsorption Behaviour of Dispersant on Nano Zirconia Powder” Journal of the
European Ceramic Society 19 (1999) 1725±1730

165
33. Weihua Lan, Xin Wang, Ping Xiao, “Agglomeration on drying of yttria-
stabilised-zirconia slurry on a metal substrate”, Journal of the European Ceramic
Society 26 (2006) 3599–3606
34. R. Greenwood and K. Kendal, “Selection of Suitable Dispersants for Aqueous
Suspensions of Zirconia and Titania Powders using Acoustophoresis”, Journal of
the European Ceramic Society 19 (1999) 479±488
35. Floris Esanu, “Self flowing refractory castables: Study of the hydraulic bond and
ceramic matrix formation” The University of British Colombia, January 2000
36. Yu E. Pivinskii, “New refractory concretes and binding systems: basic trends of
development, production, and use of refractories in the 21st century. Part IV low-
cement concretes and cement-free unshaped refractories”, Refractories and
Industrial Ceramics, Vol 39, No:5, pp. 2-10, May 1998
37. Bjorn Myhre and Aase M. Hundere, “ The use of particle size distribution in
development of refractory castables” Presented at XXV ALAFAR Congress San
Carlos de Bariloche, Argentina, Dec. 1-4, 1996
38. S. Goberis and V. Antonovich “Improving the structure and properties of a
refractory castable containing porous chamotte fillers”, Refractories and Industrial
Ceramics, Vol. 45, (2004), pp. 360-363
39. M.F.M. Zawrah, N.M. Khalil, “Effect of mullite formation on properties of
refractory castables”, Ceramics International, Vol. 27, (2001), pp. 689–694
40. M.F. Zawrah, “Effect of zircon additions on low and ultra-low cement alumina
and bauxite castables”, Ceramics International, Vol. 33 (2007), pp. 751–759
41. S. Mukhopadhyay, S. Ghosh, M.K. Mahapatra, R. Mazumder, P. Barick, S.
Gupta, S. Chakraborty “Easy-to-use mullite and spinel sols as bonding agents in a
high-alumina based ultra low cement castable”, Ceramics International, Vol. 28,
(2002), pp. 719–729
42. Fabio A. Cardoso, Murilo D.M. Innocentini, Marcela F.S. Miranda, Fernando
A.O. Valenzuela, Victor C. Pandolfelli, “Drying behavior of hydratable alumina-
bonded refractory castables”, Journal of the European Ceramic Society, (2003)

166
43. Dagmar Gierisch, Andreas Buhr, Jerry Dutton, Margarete Hösler, Brunhilde
Franz “Aging behaviour of Alphabond and Calcium Aluminate Cement bonded
castables”, Almatis GmbH, Ludwigshafen, Germany
44. Ivone R. de Oliveira, Andre R. Studart, Fernando A.O. Valenzuela, Victor C.
Pandolfelli “Setting behavior of ultra-low cement refractory castables in the
presence of citrate and polymethacrylate salts”, Journal of the European Ceramic
Society, Vol. 23 (2003), pp. 2225–2235
45. Aksel C., Warren P, Riley F. “Fracture behaviour of magnesia and magnesia-
spinel composites before and after thermal shock”. Journal of the European
Ceramic Society 24, pp. 2407-2416 (2004)
46. S. Ribeiro, J.A. Rodrigues, “The influence of microstructure on the maximum
load and fracture energy of refractory castables” Ceramics International 36
(2010), pp. 263–274
47. Fangbao Ye, M. Rigaud, Xinhong Liu, Xiangchong Zhong “High temperature
mechanical properties of bauxite-based SiC-containing castables” Ceramics
International 30 (2004) pp. 801–805
48. GV White, C.M. Sheppard, M Bowden, M Ryan, GC Barris, M Cooper and C Yu
Chen, “Precision Cast Sialon-bonded Silicon Carbide for Molten Metal
Refractory Applications” Journal of the Australian Ceramic Society Volume
45[1], 2009, pp. 50-57
49. L.A. Dıaz, R. Torrecillas, A.H. De Aza, P. Pena, S. De Az, “Alumina-rich
refractory concretes with added spinel, periclase and dolomite: A comparative
study of their microstructural evolution with temperature”, Journal of the
European Ceramic Society 25 (2005) pp. 1499–1506
50. G. Prokopski J. Halbiniak and B. Langier The examination of the fracture
toughness of concretes with diverse structure Journal of Materials Science 33
(1998) pp. 1819-1825
51. George Gogotsi, Sergey Mudrik, Vasily Galenko, “Evaluation of fracture
resistance of ceramics: Edge fracture tests” Ceramics International 30 (2004)
pp.801–805
52. S. Mukhopadhya, P.K. Das Poddar, “Effect of preformed and in situ spinels on
microstructure and properties of a low cement refractory castable” Ceramics
International, Vol:30 Issue:3, pp. 369-380

167
53. Fangbao Ye, M. Rigaud, Xinhong Liu, Xiangchong Zhong, “High temperature
mechanical properties of bauxite-based SiC-containing castables”, Ceramics
International 30 (2004) pp. 801–805
54. American Society for Testing and Materials, ASTM C 1421-99, “ Standard Test
Methods for Determination of Fracture Toughness of Advanced Ceramics at
Ambient Temperature”
55. Palmer G.B., Baker G, “Specimen size effect on fracture toughness for a low
cement refractory” International Journal of Rock Mechanics and Mining Sciences
and Geomechanics Abstracts Vol:22,Issue:1, (1995) pp.51-61
56. L.P. Mullins, M.S. Bruzzia, P.E. McHugh, “Measurement of the microstructural
fracture toughness of cortical bone using indentation fracture”, Journal of
Biomechanics 40 (2007), pp. 3285–3288
57. G.M. Pharr, ”Measurement of mechanical properties by ultra-low load
indentation”, Materials Science and Engineering A253 (1998) pp. 151–159
58. B.R. Lawn, A.G. Evans and D.B. Marshall, “Elastic/Plastic indentation damage in
ceramics: The median-radial crack system, journal of American Ceramic Society,
Vol:63, No:9-10, 1980
59. J. Kruzica, D.K. Kim, K.J. Koester, R.O. Ritchiec, “Indentation techniques for
evaluating the fracture toughness of biomaterials and hard tissues”, Journal of The
Mechanical Behavior of Biomedical Materials 2, 2009, pp. 384-395
60. Taihua Zhang, Yihui Feng, Rong Yang and Peng Jiang, “A method to determine
fracture toughness using cube-corner Indentation”, Scripta Materialia 62 (2010),
pp. 199–201
61. Ji-yu Sun, Jin Tong, “Fracture Toughness Properties of Three Different
Biomaterials Measured by Nanoindentation”, Journal of Bionic Engineering 4
(2007) pp. 11-17
62. J.J. Guo, K. Wang, T. Fujita, J.W. McCauley, J.P. Singh, M.W. Chen,
“Nanoindentation characterization of deformation and failure of aluminum
oxynitride”, Acta Materialia 59 (2011) pp. 1671–1679
63. L.Ruiz, M.J.Readey, “ Effect on heat treatment on grain size, phase assemblage
and mechanical properties of 3 mol% Y-TZP”, Journal of the American Ceramic
Society, Vol. 79, No. 9, (1996), pp. 2331-2340

168
64. N. Gupta, P.Mallik, B. Basu, “ Y-TZP ceramics with optimized toughness: new
results”, Journal of Alloys and Compounds, 379 (2004), pp. 228-232
65. E.C. Subbarao, “Zirconia-overview”, Department of Metallurgical Engineering,
Indian Institute of Technology, Kanpur,India
66. M. Morinaga, H. Adachi, M. Tsukada, “ Electronic Structure and Phase stability
of ZrO2”, Journal of Physics and Chemistry of Solids”, Vol. 44, Issue 4(1982), pp.
301-306
67. Masahiro Yoshimura, “Phase stability of Zirconia”, American Ceramic Society
Bulletin, Vol:67, Issue:12,1998, pp. 1950-1955
68. S. Shukla, S. Seal, “Mechanism of room temperature metastable tetragonal phase
stabilisation in zirconia”, International Materials Review, Vol. 50, No. 1, pp. 1-20
69. P.F.Lange, “, Transformation Toughening: Part 2”, Journal of Material Science”
Vol. 17, (1982) pp. 225-234
70. Dae Joon-Kim, “Effect of Ta2O5, Nb205 and Hf2O5 alloying on the
transformability of Y2O3 stabilized tetragonal ZrO2”, Journal of The American
Ceramic Society,73,(1), 1990, pp. 115-120
71. P.F.Becher, “ Toughening behavior in ceramics associated with the
transformation of tetragonal ZrO2”, Acta Metall., Vol. 34, No. 10, (1986) pp.
1885-1891
72. M. Hillert, “ Thermodynamic model of cubic tetragonal transition in
nonstoichiometric zirconia”, Journal of American Ceramic Society, Vol. 74,
Issue: 8 (1991), pp. 2005-2006
73. S.P.S. Badwal, N. Nardella, “ Formation of monoclinic zirconia at the anodic face
of tetragonal”, Applied Physics A Solids and Surfaces, Vol. 49, Issue: 1 (1989),
pp. 13-24
74. R.C. Garvie, “ Thermodyanamic analysis of the tetragonal to monoclinic
transformation in constrained zirconia microcrystal”, Vol. 20, Issue:10, (1985),
pp. 3478-3486
75. J. Vleugels,Z.X. Yuan, O. Van Der Biest, “Mechanical properties of Y2O3/Al2O3-
coated Y-TZP ceramics”, Journal of the European Ceramic Society 22 (2002)
pp.873–881

169
76. F.F.Lange, “ Transformation Toughening Part 3 Experimental Observations in
ZrO2 Y2O3 System”, Journal of Materials Science, Vol. 17, Issue 1, (1982), pp. -
240-246
77. H. Schubert, G. Petzow, “Microstructural investigations on the stability of yttria
stabilized tetragonal zirconia”, Advanced in Ceramics, Vol, 24, Science and
Technology of Zirconia III (1998), pp. 21-28
78. K. Tsukuma, Y. Kubota, T.Tsukidate, “ Thermal and mechanical properties of
Y2O3 stabilized tetragonal zirconia polycrystals”, Advanced in Ceramics, Vol. 12
: Science and technology of Zirconia II, (1984), pp. 382-390
79. T. Sakuma, H. Eda. H. Suto, “ Composition optimization of ZrO2-Y2O3 alloys to
improve the fracture toughness”, Advances in Ceramics, Vol. 24, Science and
Technology of Zirconia III, (1988), pp. 357-363
80. T. Masaki, K. Sinjo, “ Mechanical properties of highly toughened ZrO2-Y2O3”,
Vol. 13, Issue:2, (1987), pp. 109-112
81. F.F Lange, D.J.Green, “ Effect of inclusion size on the retention of tetragonal
ZrO2 : theory and experiments”, Advanced in Ceramics, Vol. 3 : Science and
technology of Zirconia III, (1981), pp. 217-225
82. O.Vasylkiv, Y. Sakka, V.V.Skorokhod, “Low temperature processing and
mechanical properties of zirconia and zirconi-alumina nanoceramics”, J. Am.
Ceram. Soc., 86 [2],299-304, (2003)
83. F.F. Lange, “Transformation-toughened ZrO2: Correlations between grain size
control and composition in the system ZrO2-Y2O3”, J. Am. Ceram. Soc., 69,[3],
(1986), pp. 240-242
84. B.F. Sorensen, A.N. Kumar, “Fracture resistance of 8 mol-% yttria stabilized
zirconia”, Bull. Mater. Sci., Vol. 24, No. 2, (2001), pp. 111-116
85. M. Matsui, T. Soma, I. Oda, “Stress-induced transformation and plastic
deformation for Y2O3-containing zirconia polycrystals”.,J. Am. Ceram. Soc.
69(3) (1986), 198–203
86. R.C.Garvie, M.F.Goss, “Intrinsic size dependence of the phase transformation
temperature in zirconia microcrystals”, Journal of Materials Science, Vol. 21,
Issue:4, (1986), pp. 1253-1257
87. R. H. J. Hannink and M. V. Swain, “Progress in transformation toughening of
ceramics” Mater. Sci. 24 (1994), pp. 359–408

170
88. L. Gao, T.S. Yen, and J.K. Guo, “Influence of ZrO2 particle size on toughening in
hot-pressed Y-TZP”, Advances in Ceramics, Vol:24, 1988, pp. 405-414
89. S. Stemmer, J. Vleugels, and O. Van Der Biest, “ Grain boundary segregation in
high purity yttria stabilized tetragonal zirconia polycrystals (Y-TZP)”, J. Eur.
Ceram. Soc. 18 (1998), pp. 1565-1570
90. J.P. Singh “The effects of unstabilized ZrO2 on the fracture surface energy and
thermal-shock resistance of MgCr2O4”, Journal of Materials Science, 1987,
pp.2685-2690
91. A. K. Chakravorty, D. K. Ghosh, "Kaolinite-mullite reaction series: The
development and significance of a binary aluminosilicate phase", J. Am. Ceram.
Soc. 74, 6 (1991) pp.1401-1406
92. Gerotto, M. V., Studart, A. R., Innocentini, M. D. M., Pandolfelli, V. C., Cabo, S.
S., “Kaolin, metakaolin and microsilica as fillers for high-alumina refractory
castables”, American Ceramic Society Bulletin, 81, 2002, pp. 40-47
93. M. V. Gerotto, A.R. Studart, R.G. Pileggi, V.C. Pandolfelli, “Zerocement, high-
alumina castables.” Am. Ceram. Soc.Bull. 79 (2000) pp. 75–83.

171
CURRICULUM VITAE
Cem Gogtas
Place of Birth: Istanbul, Turkey
Education:
University of Wisconsin-Milwaukee, Department of Materials Engineering Milwaukee, WI
Ph.D. in Materials Engineering August- 2012
Major Advisors: Prof. Hugo Lopez,and Ass. Prof. Konstantin Sobolev
Istanbul Technical University, Metallurgical and Material Engineering Istanbul-Turkey
Ms.C. Materials Engineering-Ceramic Program May-2004
Major Advisor: Prof. Niyazi Eruslu
Yildiz Technical University, Metallurgical and Material Engineering Istanbul-Turkey
B.Sc in Metallurgical Engineering July-2000
Dissertation Title: Development of Nano ZrO2 Reinforced Self-Flow Low and Ultra Low
Cement Refractory Castables
Publications:
1. Gogtas C.,Sobolev K., Lopez H. “Effect of cement content on the properties of self-
flowing refractories castables with nano-zirconia.” will be submitted to American
Ceramic Society Bulletin, 2012
2. Gogtas C., Lopez H., Sobolev K. “ Effect of nano-ZrO2 addition on the mechanical
behavior of ultra-low cement castables” submitted to Cement and Concrete Research,
2012
3. Gogtas C, N.Unlu, A.Odabasi, L.Sezer, S.Guner, G.Goller, N.Eruslu. “The investigation
of the effects of firing temperature on the physical properties of a bauxite-based
refractory castable” “Refractories and Industrial Ceramics”, 2012, 1, 24-30
4. Gogtas.C, N.Unlu, A.Odabasi, L.Sezer, F.Cinar, S.Guner, G.Goller, N.Eruslu.
“Preparation and characterization of self-flowing refractory material containing 971U
type microsilica.”Advances in Applied Ceramics,Vol. 109 ,pp. 6-11, 2010.
5. Gogtas, C., N. Unlu, A. Odabasi, L. Sezer, F. Cinar, S. Guner ve N. Eruslu.
“Characterization of the physical properties of a self-flowing low-cement castable based
on white-fused alumina.” Journal of Ceramic Processing Research, 10, 43-48, 2009.
6. Gogtas,C, N.Unlu, A.Odabasi, L.Sezer, F.Cinar, S.Guner, N.Eruslu. “Improvement of
properties of self-flowing low-cement castables based on brown fused alumina.” Journal
of Ceramic Processing Research Volume: 8 Issue: 5 Pages: 324-330, 2007
7. A.Odabasi, N. Unlu, C.Gogtas, L. Sezer, N. Eruslu. “The Effect of Georgia Bentonite on
The Properties of Molding Sands.” 13th International Metallurgy & Materials Congress
8. A.Odabasi, C.Gogtas, L.Sezer, N.Unlu, N.Eruslu. “Heat Treatment of High Chromium
Contented White Cast Irons.” Metal World Technical Magazine
Conferences
1. Gogtas C.,Sobolev K., Lopez H. “Effect of cement content on the properties of self-
flowing refractory castables with nano-zirconia.”American Ceramic Society, 48th Annual
Symposium on Refractories, March 28-29 2012, St. Louis
2. Gogtas C., Lopez H., Sobolev K. “ Effect of nano-ZrO2 addition on the mechanical
behavior of ultra-low cement castables” NICOM 4, 4th International Symposium on
Nanotechnology in Construction, May 20-22 2012, Crete-Greece

172
Significant Technical Projects:
Production and characterization of nano-ZrO2 reinforced ultra low and low cement self
flow refractory castables (Ph.D. thesis), supported by Engineering-Science of
Department-UWM 2008-2012
Role of CeO2 nanoparticles coatings on the corrosion resistance of auestenitic stainless
steels at high temperatures, Advanced Analysis Facility (AAF) under summer internship
program in University of Wisconsin, Milwaukee (UWM) summer-2008
Characterization of self flowing low cement refractory castables, supported by Institute of
Science and Technology, Istanbul Technical University, 2002-2004
Research Experience:
Characterization of nano ZrO2 reinforced ultra low and low cement self flow refractory
castables, (Ph.D. thesis)
Role of CeO2 nanoparticles coatings on the corrosion resistance of auestenitic stainless
steels at high temperatures, Advanced Analysis Facility (AAF) under summer internship
program in University of Wisconsin, Milwaukee (UWM) summer-2008
Production and characterization of self-flowing low cement refractory castables (Master
Thesis) with Refsan Refractory & Building Cons. Ltd. Co., 2002 –2003.
Research on glass properties and mold materials for glass production (Undergraduate
thesis) in Sisecam Glass Plant., Fall 1999-Spring 2000.
Honor/Awards:
Teaching Assistantship, UWM (2006-2012)
Chancellor's Graduate Student Award, UWM (2006-2012)
AAF Summer Research Intern Program, UWM, Summer-2008
Work Experience: Teaching Assistant, Department of Materials Engineering, UWM Fall 2006 - 2012
Taught 2 weekly sections of Engineering Materials Lab and Materials and Processes in
Manufacturing Lab
Graded undergraduate level courses (Engineering Materials and Materials and Processes
in Manufacturing)
Manager Laboratory, Department of Materials Engineering, UWM Fall 2008 - 2012
Set up the labs for Engineering Materials and Materials and Processes in Manufacturing
classes, including: lab procurements, and followed up sample preparation with the
machine shop.
Trained and assisted students to use Scanning Electron Microscope (SEM) and Energy
Dispersive Spectroscopy (EDS).
Advised and assisted the students to use different lab equipments in their class project
Engineering Internship, Advanced Analytical Facility (AAF), UWM Summer-2008
Produced nano-ceria by using sol-gel method.
Coated stainless steel with nano ceria and examined the crystallization and phase
formation behavior upon annealing at high temperature
Research Engineer, Team Leader, Refsan Refractory & Building Cons Ltd.,-Turkey 2004-2006
Led the team of four engineers and oversaw their work
Produced of self-flowing low cement refractory castables