Flowing Refractometer for Feed Water State Control in ... - MDPI
10
Citation: Davydov, V.; Gureeva, I.; Davydov, R.; Dudkin, V. Flowing Refractometer for Feed Water State Control in the Second Loop of Nuclear Reactor. Energies 2022, 15, 457. https://doi.org/10.3390/ en15020457 Academic Editors: Hiroshi Sekimoto and Sung Joong Kim Received: 29 November 2021 Accepted: 4 January 2022 Published: 10 January 2022 Publisher’s Note: MDPI stays neutral with regard to jurisdictional claims in published maps and institutional affil- iations. Copyright: © 2022 by the authors. Licensee MDPI, Basel, Switzerland. This article is an open access article distributed under the terms and conditions of the Creative Commons Attribution (CC BY) license (https:// creativecommons.org/licenses/by/ 4.0/). energies Article Flowing Refractometer for Feed Water State Control in the Second Loop of Nuclear Reactor Vadim Davydov 1,2, *, Irena Gureeva 1 , Roman Davydov 3 and Valentin Dudkin 4 1 Institute of Electronics and Telecommunications, Peter the Great St. Petersburg Polytechnic University, 195251 St. Petersburg, Russia; [email protected] 2 All Russian Research Institute of Phytopathology, 143050 Moscow, Russia 3 Institute of Physics and Mechanics, Peter the Great St. Petersburg Polytechnic University, 195251 St. Petersburg, Russia; [email protected] 4 Department of Photonics and Communication Lines, The Bonch-Bruevich Saint Petersburg State University of Telecommunication, 193232 St. Petersburg, Russia; [email protected] * Correspondence: [email protected] Abstract: The necessity to control the feed water state in the second loop of a nuclear power plant nuclear reactor is justified. The different methods of the state control of flowing water in the pipeline are reviewed. It has been established that controlling the feed water state should not result in irreversible changes in its chemical composition and physical structure. A change in the composition or structure of feed water leads to a change in its heat capacity. The heat transfer deteriorates, the production of electrical energy in the installation decreases, and the additional release of heat into the atmosphere increases. This process also occurs during the heat capacity changes for other reasons. The method for controlling the feed water heat capacity by measuring the value of the refractive index n is developed. The design of a flow-through refractometer based on the total internal reflection for control of the feed water state in the stream is made. The dependence of the heat capacity change of feed water from the refractive index is established. The results of research on different types of water are presented. Keywords: nuclear power plant; nuclear reactor; feed water; pipeline; refractometer; medium refractive index; heat capacity; heat exchange 1. Introduction At present, nuclear energy provides a significant proportion of humanity’s needs for electrical energy and, in some cases, thermal energy [1–7]. This direction of energy is constantly evolving since it has an undeniable advantage over other types of electrical and thermal power plants [2,3,5–9]. Regardless of weather conditions, a nuclear power plant (NPP) allows you to provide the required power level at any time of the day [4–7]. It is essential for large industrial areas. In addition, at a nuclear power plant, it is possible to regulate the generated power level within 20% of the nominal power level. More than 30% of regulation is included in new models of nuclear power plants. This will significantly reduce the cost of generating electricity. At NPPs, increased attention is paid to reducing electricity costs and increasing environmental safety [8–12]. One of the ways to reduce costs in the production of electrical energy is to increase the efficiency of heat exchange in the second loop of the reactor between the coolant and feed water. The efficiency of heat exchange (transfer of thermal energy from the coolant to the feed water) is determined by several parameters (interaction time, which depends on the flow rate of media in pipelines) and the specific heat capacities of these media [13,14]. In the case of a change, for example, a decrease in the specific heat capacity of the feed water will result in changes to the amount of heat transferred. This will decrease heat transfer efficiency and can be compensated by reducing the consumption of feed water Energies 2022, 15, 457. https://doi.org/10.3390/en15020457 https://www.mdpi.com/journal/energies
-
Upload
khangminh22 -
Category
Documents
-
view
2 -
download
0
Transcript of Flowing Refractometer for Feed Water State Control in ... - MDPI
�����������������
Citation: Davydov, V.; Gureeva, I.;
Davydov, R.; Dudkin, V. Flowing
Refractometer for Feed Water State
Control in the Second Loop of
Nuclear Reactor. Energies 2022, 15,
457. https://doi.org/10.3390/
en15020457
Academic Editors: Hiroshi Sekimoto
and Sung Joong Kim
Received: 29 November 2021
Accepted: 4 January 2022
Published: 10 January 2022
Publisher’s Note: MDPI stays neutral
with regard to jurisdictional claims in
published maps and institutional affil-
iations.
Copyright: © 2022 by the authors.
Licensee MDPI, Basel, Switzerland.
This article is an open access article
distributed under the terms and
conditions of the Creative Commons
Attribution (CC BY) license (https://
creativecommons.org/licenses/by/
4.0/).
energies
Article
Flowing Refractometer for Feed Water State Control in theSecond Loop of Nuclear ReactorVadim Davydov 1,2,*, Irena Gureeva 1, Roman Davydov 3 and Valentin Dudkin 4
1 Institute of Electronics and Telecommunications, Peter the Great St. Petersburg Polytechnic University,195251 St. Petersburg, Russia; [email protected]
2 All Russian Research Institute of Phytopathology, 143050 Moscow, Russia3 Institute of Physics and Mechanics, Peter the Great St. Petersburg Polytechnic University,
195251 St. Petersburg, Russia; [email protected] Department of Photonics and Communication Lines, The Bonch-Bruevich Saint Petersburg State University of
Telecommunication, 193232 St. Petersburg, Russia; [email protected]* Correspondence: [email protected]
Abstract: The necessity to control the feed water state in the second loop of a nuclear power plantnuclear reactor is justified. The different methods of the state control of flowing water in the pipelineare reviewed. It has been established that controlling the feed water state should not result inirreversible changes in its chemical composition and physical structure. A change in the compositionor structure of feed water leads to a change in its heat capacity. The heat transfer deteriorates, theproduction of electrical energy in the installation decreases, and the additional release of heat into theatmosphere increases. This process also occurs during the heat capacity changes for other reasons.The method for controlling the feed water heat capacity by measuring the value of the refractiveindex n is developed. The design of a flow-through refractometer based on the total internal reflectionfor control of the feed water state in the stream is made. The dependence of the heat capacity changeof feed water from the refractive index is established. The results of research on different types ofwater are presented.
Keywords: nuclear power plant; nuclear reactor; feed water; pipeline; refractometer; mediumrefractive index; heat capacity; heat exchange
1. Introduction
At present, nuclear energy provides a significant proportion of humanity’s needsfor electrical energy and, in some cases, thermal energy [1–7]. This direction of energy isconstantly evolving since it has an undeniable advantage over other types of electrical andthermal power plants [2,3,5–9]. Regardless of weather conditions, a nuclear power plant(NPP) allows you to provide the required power level at any time of the day [4–7]. It isessential for large industrial areas. In addition, at a nuclear power plant, it is possible toregulate the generated power level within 20% of the nominal power level. More than 30%of regulation is included in new models of nuclear power plants. This will significantlyreduce the cost of generating electricity. At NPPs, increased attention is paid to reducingelectricity costs and increasing environmental safety [8–12].
One of the ways to reduce costs in the production of electrical energy is to increasethe efficiency of heat exchange in the second loop of the reactor between the coolant andfeed water. The efficiency of heat exchange (transfer of thermal energy from the coolant tothe feed water) is determined by several parameters (interaction time, which depends onthe flow rate of media in pipelines) and the specific heat capacities of these media [13,14].In the case of a change, for example, a decrease in the specific heat capacity of the feedwater will result in changes to the amount of heat transferred. This will decrease heattransfer efficiency and can be compensated by reducing the consumption of feed water
Energies 2022, 15, 457. https://doi.org/10.3390/en15020457 https://www.mdpi.com/journal/energies
Energies 2022, 15, 457 2 of 10
q (the time of interaction with the coolant will increase). The feed water must be heatedin the pipeline to a temperature of 493 K (or more, depending on the model of the steamgenerator) [13–15].
During the operation of a nuclear power plant, various chemical processes occur inthe secondary circuit’s pipelines. These processes alter the composition and structure of thenutrient water. In addition, when the feed water in the steam generator is converted intosteam and then into the water, various impurities can enter it, changing the feed water com-position. Therefore, at the NPP, measures are taken to purify feed water. These measures areexpensive since they are associated with a decrease in the volume of electricity produced.
At present, at NPPs, the heat capacity of feed water C is monitored based on pressureand temperature measurements. For this, various devices are used, which are explicitlymade for nuclear power plants (for example, in the Russian Federation—AIR-30, in theUSA—the 3200 G series). These devices provide pressure measurements ranging from0.1 MPa to 100 MPa up to a temperature of 600 K with a measurement error of 0.3–0.5%(depending on the temperature regime). The interval between instrument verifications isthree years (this is not enough, since the instrument must be removed from the pipelineduring validation, the technological cycle in this pipeline is interrupted). In addition,under the new operating conditions of the nuclear power plant, this measurement error isinsufficient to ensure the optimal heat transfer regime.
It should be noted that the control of the feed water condition with this device cannotbe carried out. The control of the feed water condition is carried out using sampling atcertain intervals. Further, these samples are sent to a stationary laboratory for research. Thetime interval between sampling and obtaining data on the state of the feed water can beseveral hours. This results in wasted decision time and electrical power. It is necessary toautomatically monitor the state of the current feed water in real-time.
Therefore, it is advisable to carry them out only when necessary. As such, the purposeof our work is to develop a method for monitoring the state of feed water in real-time toensure an optimal heat transfer regime and its practical implementation.
2. Methodology for Monitoring the State of Feed Water and Its Practical Implementation
Currently, monitoring the state of the current environment in real-time in the pipelineis a complicated task [7,16–21]. This is especially the case at high pressures, temperatures,and flow rates in the pipeline. In this case, to ensure the long-term operation of themeasuring device required at a nuclear power plant, it is necessary to use non-contactmethods of monitoring the current environment. This is an optical method based onrefraction and a nuclear magnetic method based on the phenomenon of nuclear magneticresonance (NMR) [7,21–25]. The optical (refractometric) method has several advantagesover the nuclear magnetic method. Refractive index measurements are independent of thefluid flow rate, and there are no restrictions on the pipeline’s diameter [26–29]. Therefore,we have developed the following technique. The state of the feed water determines thevalue of the refractive index n (any change in feed water composition leads to a change inn). The value of the heat capacity C of the feed water is also determined by its composition.Any changes in the composition lead to a change in C. At a given temperature T in thefeed water, a specific value of n corresponds to a specific value of C. It is possible to plotthe C(n) dependence for the feed water at a given temperature. There will be a differenttemperature of the feed water’s different dependence C(n). Further, n and T are measuredin the current flow of feed water. Using the previously obtained calibration curves C(n) in astationary laboratory on devices with a measurement error of 10−4 or less, the value of Cis determined. This value is used to adjust the flow rate q of the feed water to ensure theoptimal heat exchange mode.
To implement this technique, we have developed a design of a flow-through re-fractometer using the phenomenon of total internal reflection [26–34]. The use of thisphenomenon in a refractometer allows the measurement error of n from 0.00005 to 0.0002 independence on temperature regime. The basis of any refractometer is its optical part, which

Energies 2022, 15, 457 3 of 10
we developed to measure the refractive index of feed water at high temperatures [29–38].Figure 1 shows a block diagram of the optical part of the refractometer and the propagationof laser beams in it.
Energies 2022, 15, x FOR PEER REVIEW 3 of 10
To implement this technique, we have developed a design of a flow-through refrac-
tometer using the phenomenon of total internal reflection [26–34]. The use of this phe-
nomenon in a refractometer allows the measurement error of n from 0.00005 to 0.0002 in
dependence on temperature regime. The basis of any refractometer is its optical part,
which we developed to measure the refractive index of feed water at high temperatures
[29–38]. Figure 1 shows a block diagram of the optical part of the refractometer and the
propagation of laser beams in it.
Figure 1. Structural diagram of the optical part of a refractometer.
The design of the optical part of the refractometer is a prism in the form of a trapezoid
with an angle at the bottom base β = 60 degrees and at the upper base α = 120 degrees. The
prism is made of leucosapphire. The leucosapphire has high chemical resistance (density
3950–4100 kg/m3) and a high melting point (2093–2123 K). The prism angles were calcu-
lated to provide the maximum contrast of the light/shadow boundary recorded in the
photodetector and the range change maximum in time registration of light/shadow border
displacement in case of a grand change of n. The refractive index n in the developed design
of the refractometer is measured as follows. A preliminary calculation of the propagation
of the maximum laser radiation in the prism is performed (the prism angles are given).
The relationship between the position of the light-shadow boundary on the photodetector
(photodiode ruler) and the angle of total internal reflection of the laser beam γ (Figure 1)
is determined. The value of the angle γ is determined by Equation (1).
𝛾 = 𝑎𝑟𝑐𝑠𝑖𝑛(𝑛𝑓
𝑛𝑝) (1)
where np is the refractive index of the material from which the prism is made (leu-
cosapphire), and nf is the refractive index of the feed water.
The angle γ corresponds to a certain maximum position on the photodetector. The
maximum of the laser radiation coincides with the position of the light-shadow boundary
recorded on the photodetector. The position of the light-shadow boundary determines γ.
Next, using Equation (1), nf is determined.
For this, in the developed design of the refractometer, the laser is installed perpen-
dicular to the prism’s base. The rays reach the interface between the prism and the liquid
Figure 1. Structural diagram of the optical part of a refractometer.
The design of the optical part of the refractometer is a prism in the form of a trapezoidwith an angle at the bottom base β = 60 degrees and at the upper base α = 120 degrees.The prism is made of leucosapphire. The leucosapphire has high chemical resistance(density 3950–4100 kg/m3) and a high melting point (2093–2123 K). The prism angles werecalculated to provide the maximum contrast of the light/shadow boundary recorded in thephotodetector and the range change maximum in time registration of light/shadow borderdisplacement in case of a grand change of n. The refractive index n in the developed designof the refractometer is measured as follows. A preliminary calculation of the propagationof the maximum laser radiation in the prism is performed (the prism angles are given).The relationship between the position of the light-shadow boundary on the photodetector(photodiode ruler) and the angle of total internal reflection of the laser beam γ (Figure 1) isdetermined. The value of the angle γ is determined by Equation (1).
γ = arcsin(n f
np) (1)
where np is the refractive index of the material from which the prism is made (leucosap-phire), and nf is the refractive index of the feed water.
The angle γ corresponds to a certain maximum position on the photodetector. Themaximum of the laser radiation coincides with the position of the light-shadow boundaryrecorded on the photodetector. The position of the light-shadow boundary determines γ.Next, using Equation (1), nf is determined.
For this, in the developed design of the refractometer, the laser is installed perpen-dicular to the prism’s base. The rays reach the interface between the prism and the liquidmedium at different angles. An additional optical system is used that extends the beam oflaser radiation.
Part of the rays, the angle of incidence of which is more γ, completely reflect off theinner surface of the prism and, emerging from it, form the light part of the image on thephotodetector. Other rays, the angle of incidence of which is less than γ, partially refract

Energies 2022, 15, 457 4 of 10
and pass into the feed water, where they partially reflect and form the dark part of theimage on the photodetector.
The position of the interface between light and shadow depends on the ratio betweenthe refractive indices of the prism material and medium and their temperatures. In the caseof composition changes in the feed water, its refractive index n changes, and the position ofthe light-shadow boundary recorded by the photodetector is shifted.
Figure 2 presents a structural diagram of a refractometer developed by us with thetrapezoidal prism for state control of flowing feed water in the pipeline.
Energies 2022, 15, x FOR PEER REVIEW 4 of 10
medium at different angles. An additional optical system is used that extends the beam of
laser radiation.
Part of the rays, the angle of incidence of which is more γ, completely reflect off the
inner surface of the prism and, emerging from it, form the light part of the image on the
photodetector. Other rays, the angle of incidence of which is less than γ, partially refract
and pass into the feed water, where they partially reflect and form the dark part of the
image on the photodetector.
The position of the interface between light and shadow depends on the ratio between
the refractive indices of the prism material and medium and their temperatures. In the
case of composition changes in the feed water, its refractive index n changes, and the po-
sition of the light-shadow boundary recorded by the photodetector is shifted.
Figure 2 presents a structural diagram of a refractometer developed by us with the
trapezoidal prism for state control of flowing feed water in the pipeline.
Figure 2. Structural diagram of an industrial refractometer: (1) radiation source, (2) fiber optic bun-
dle, (3) optical prism, (4) lens, (5) CCD array, (6) temperature sensor.
The optical system design developed for the refractometer allows it to be immersed
in the pipeline only until it comes into contact with the flowing liquid. It makes it possible
not to introduce additional hydraulic resistance into the pipeline during measurements,
which affects the heat transfer coefficient between the coolant and the feed water.
3. Results and Discussion
Figure 3 shows, as an example, the dependences of the change in the refractive index
n of various flowing media through the pipeline on the temperature T, measured using
our design of a refractometer on an experimental stand. The pressure of the flowing me-
dium in the pipeline is 2.4 MPa.
Figure 2. Structural diagram of an industrial refractometer: (1) radiation source, (2) fiber optic bundle,(3) optical prism, (4) lens, (5) CCD array, (6) temperature sensor.
The optical system design developed for the refractometer allows it to be immersed inthe pipeline only until it comes into contact with the flowing liquid. It makes it possiblenot to introduce additional hydraulic resistance into the pipeline during measurements,which affects the heat transfer coefficient between the coolant and the feed water.
3. Results and Discussion
Figure 3 shows, as an example, the dependences of the change in the refractive indexn of various flowing media through the pipeline on the temperature T, measured using ourdesign of a refractometer on an experimental stand. The pressure of the flowing mediumin the pipeline is 2.4 MPa.

Energies 2022, 15, 457 5 of 10Energies 2022, 15, x FOR PEER REVIEW 5 of 10
Figure 3. Dependence of the refractive index n on the temperature T. Graphs (1–3) correspond to
the following media: distilled water, feed water and tap water.
The obtained results of measuring the refractive indices coincided with the measure-
ment error with the data obtained by us on a stationary Abbe refractometer (NAR-2T UH)
with a temperature control unit. The measurement error of n is 0.0002 for the stationary
Abbe refractometer (NAR-2T UH). As an example, for temperature T = 343.1 K, Table 1
shows the measurements comparison results made with two refractometers.
Table 1. Refractive indices n of feed water are measured by different types of refractometers.
Nº
Refractometer Type
The Developed Flowing Refractometer Abbe Refractometer
(NAR-2T UH)
1 1.3317 ± 0.0003 1.3316 ± 0.0002
2 1.3318 ± 0.0003 1.3315 ± 0.0002
3 1.3317 ± 0.0003 1.3315 ± 0.0002
4 1.3316 ± 0.0003 1.3315 ± 0.0002
5 1.3318 ± 0.0003 1.3316 ± 0.0002
6 1.3317 ± 0.0003 1.3317 ± 0.0002
7 1.3317 ± 0.0003 1.3317 ± 0.0002
8 1.3316 ± 0.0003 1.3317 ± 0.0002
9 1.3316 ± 0.0003 1.3315 ± 0.0002
10 1.3318 ± 0.0003 1.3316 ± 0.0002
11 1.3318 ± 0.0003 1.3316 ± 0.0002
12 1.3316 ± 0.0003 1.3315 ± 0.0002
13 1.3317 ± 0.0003 1.3315 ± 0.0002
14 1.3317 ± 0.0003 1.3317 ± 0.0002
15 1.3317 ± 0.0003 1.3317 ± 0.0002
16 1.3316 ± 0.0003 1.3316 ± 0.0002
17 1.3316 ± 0.0003 1.3316 ± 0.0002
18 1.3318 ± 0.0003 1.3317 ± 0.0002
19 1.3317 ± 0.0003 1.3315 ± 0.0002
20 1.3318 ± 0.0003 1.3315 ± 0.0002
Figure 3. Dependence of the refractive index n on the temperature T. Graphs (1–3) correspond to thefollowing media: distilled water, feed water and tap water.
The obtained results of measuring the refractive indices coincided with the measure-ment error with the data obtained by us on a stationary Abbe refractometer (NAR-2T UH)with a temperature control unit. The measurement error of n is 0.0002 for the stationaryAbbe refractometer (NAR-2T UH). As an example, for temperature T = 343.1 K, Table 1shows the measurements comparison results made with two refractometers.
Table 1. Refractive indices n of feed water are measured by different types of refractometers.
NºRefractometer Type
The Developed Flowing Refractometer Abbe Refractometer (NAR-2T UH)
1 1.3317 ± 0.0003 1.3316 ± 0.00022 1.3318 ± 0.0003 1.3315 ± 0.00023 1.3317 ± 0.0003 1.3315 ± 0.00024 1.3316 ± 0.0003 1.3315 ± 0.00025 1.3318 ± 0.0003 1.3316 ± 0.00026 1.3317 ± 0.0003 1.3317 ± 0.00027 1.3317 ± 0.0003 1.3317 ± 0.00028 1.3316 ± 0.0003 1.3317 ± 0.00029 1.3316 ± 0.0003 1.3315 ± 0.0002
10 1.3318 ± 0.0003 1.3316 ± 0.000211 1.3318 ± 0.0003 1.3316 ± 0.000212 1.3316 ± 0.0003 1.3315 ± 0.000213 1.3317 ± 0.0003 1.3315 ± 0.000214 1.3317 ± 0.0003 1.3317 ± 0.000215 1.3317 ± 0.0003 1.3317 ± 0.000216 1.3316 ± 0.0003 1.3316 ± 0.000217 1.3316 ± 0.0003 1.3316 ± 0.000218 1.3318 ± 0.0003 1.3317 ± 0.000219 1.3317 ± 0.0003 1.3315 ± 0.000220 1.3318 ± 0.0003 1.3315 ± 0.0002
The data analysis presented in Table 1 showed that the results of measurements ofn for all numbers (No.) coincide within the measurement error. The developed device isdistinguished by the high accuracy and reliability of measurements.
Energies 2022, 15, 457 6 of 10
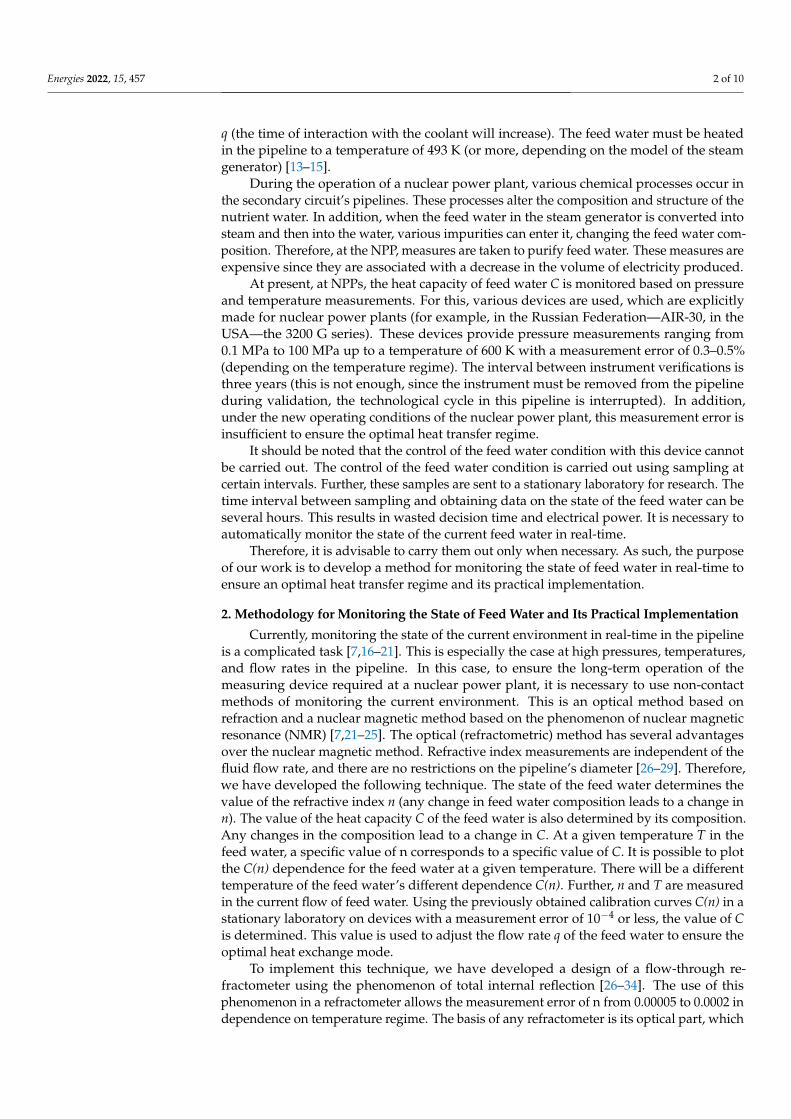
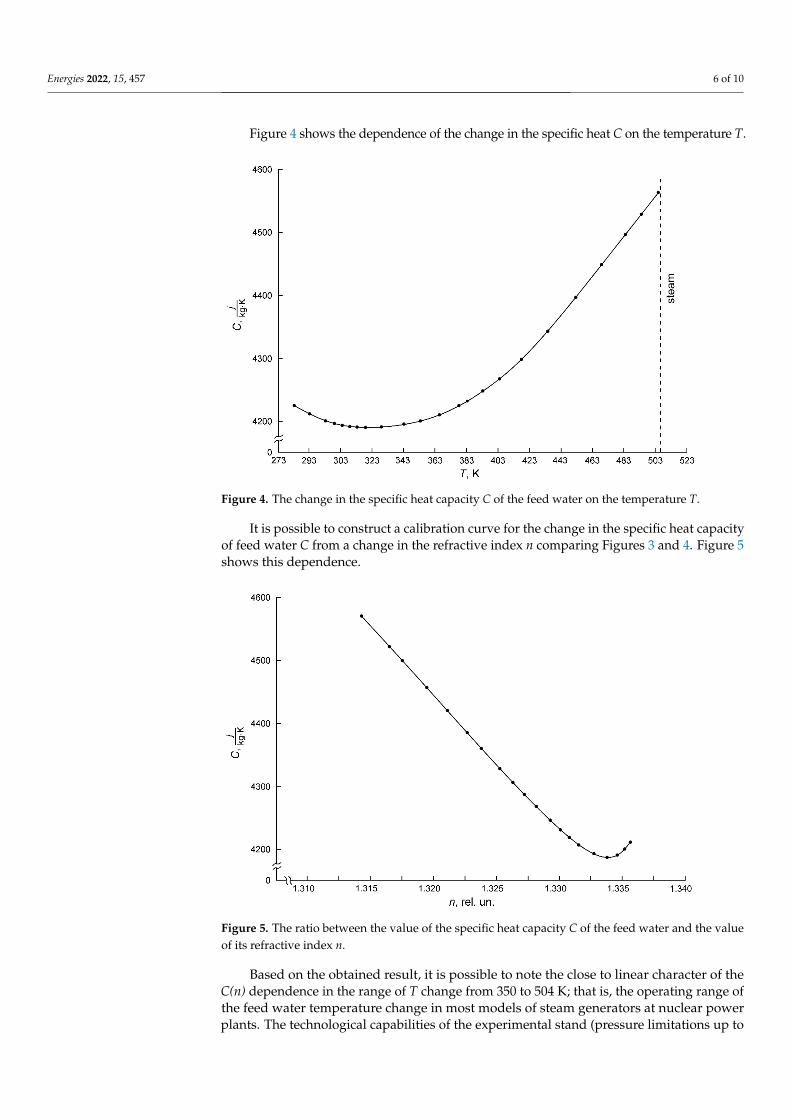
Figure 4 shows the dependence of the change in the specific heat C on the temperature T.
Energies 2022, 15, x FOR PEER REVIEW 6 of 10
The data analysis presented in Table 1 showed that the results of measurements of n
for all numbers (No.) coincide within the measurement error. The developed device is
distinguished by the high accuracy and reliability of measurements.
Figure 4 shows the dependence of the change in the specific heat C on the tempera-
ture T.
Figure 4. The change in the specific heat capacity C of the feed water on the temperature T.
It is possible to construct a calibration curve for the change in the specific heat capac-
ity of feed water C from a change in the refractive index n comparing Figures 3 and 4.
Figure 5 shows this dependence.
Figure 5. The ratio between the value of the specific heat capacity C of the feed water and the value
of its refractive index n.
Figure 4. The change in the specific heat capacity C of the feed water on the temperature T.
It is possible to construct a calibration curve for the change in the specific heat capacityof feed water C from a change in the refractive index n comparing Figures 3 and 4. Figure 5shows this dependence.
Energies 2022, 15, x FOR PEER REVIEW 6 of 10
The data analysis presented in Table 1 showed that the results of measurements of n
for all numbers (No.) coincide within the measurement error. The developed device is
distinguished by the high accuracy and reliability of measurements.
Figure 4 shows the dependence of the change in the specific heat C on the tempera-
ture T.
Figure 4. The change in the specific heat capacity C of the feed water on the temperature T.
It is possible to construct a calibration curve for the change in the specific heat capac-
ity of feed water C from a change in the refractive index n comparing Figures 3 and 4.
Figure 5 shows this dependence.
Figure 5. The ratio between the value of the specific heat capacity C of the feed water and the value
of its refractive index n.
Figure 5. The ratio between the value of the specific heat capacity C of the feed water and the valueof its refractive index n.
Based on the obtained result, it is possible to note the close to linear character of theC(n) dependence in the range of T change from 350 to 504 K; that is, the operating range ofthe feed water temperature change in most models of steam generators at nuclear powerplants. The technological capabilities of the experimental stand (pressure limitations up to
Energies 2022, 15, 457 7 of 10
2.4 MPa) did not allow us to heat the feed water above the temperature of 507 K (at a givenT, it turned into steam). At several nuclear power plants, feed water at a higher pressureis heated to a temperature of 600 K. The nature of the C(n) dependence in the region ofthese temperatures will need to be investigated additionally to use the method we havedeveloped to control C.
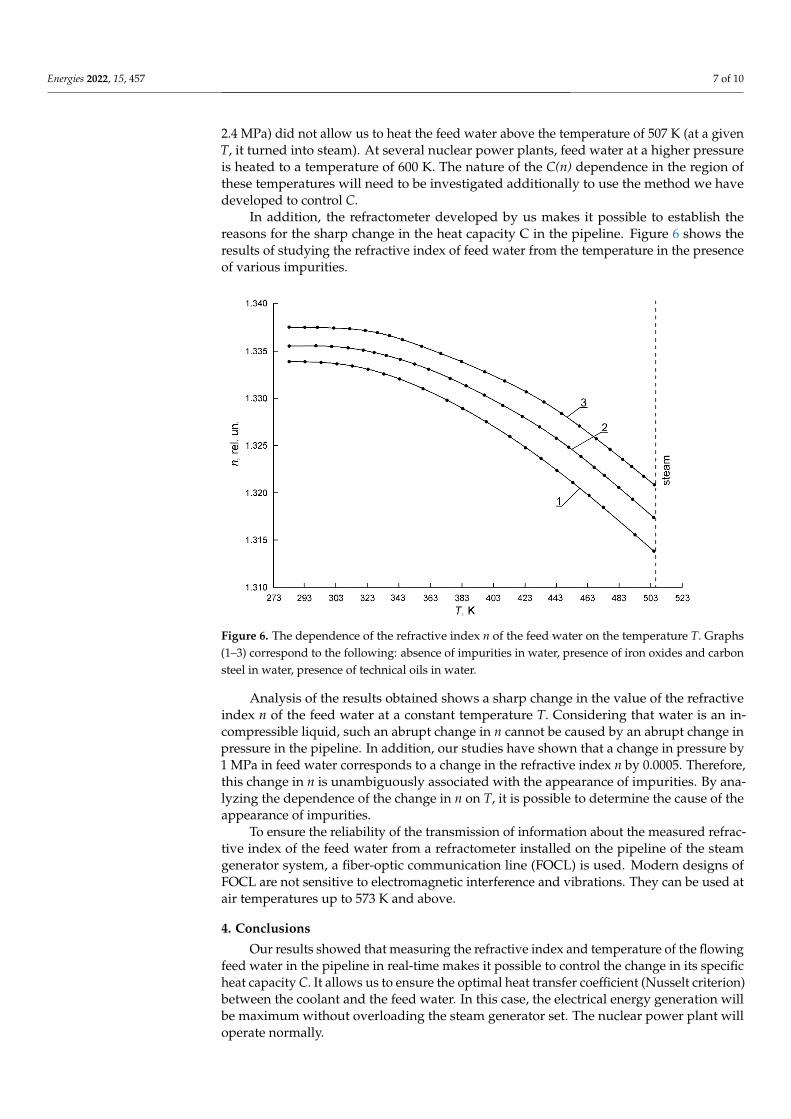
In addition, the refractometer developed by us makes it possible to establish thereasons for the sharp change in the heat capacity C in the pipeline. Figure 6 shows theresults of studying the refractive index of feed water from the temperature in the presenceof various impurities.
Energies 2022, 15, x FOR PEER REVIEW 7 of 10
Based on the obtained result, it is possible to note the close to linear character of the
C(n) dependence in the range of T change from 350 to 504 K; that is, the operating range
of the feed water temperature change in most models of steam generators at nuclear
power plants. The technological capabilities of the experimental stand (pressure limita-
tions up to 2.4 MPa) did not allow us to heat the feed water above the temperature of 507
K (at a given T, it turned into steam). At several nuclear power plants, feed water at a
higher pressure is heated to a temperature of 600 K. The nature of the C(n) dependence in
the region of these temperatures will need to be investigated additionally to use the
method we have developed to control C.
In addition, the refractometer developed by us makes it possible to establish the rea-
sons for the sharp change in the heat capacity C in the pipeline. Figure 6 shows the results
of studying the refractive index of feed water from the temperature in the presence of
various impurities.
Figure 6. The dependence of the refractive index n of the feed water on the temperature T. Graphs
(1–3) correspond to the following: absence of impurities in water, presence of iron oxides and carbon
steel in water, presence of technical oils in water.
Analysis of the results obtained shows a sharp change in the value of the refractive
index n of the feed water at a constant temperature T. Considering that water is an incom-
pressible liquid, such an abrupt change in n cannot be caused by an abrupt change in
pressure in the pipeline. In addition, our studies have shown that a change in pressure by
1 MPa in feed water corresponds to a change in the refractive index n by 0.0005. Therefore,
this change in n is unambiguously associated with the appearance of impurities. By ana-
lyzing the dependence of the change in n on T, it is possible to determine the cause of the
appearance of impurities.
To ensure the reliability of the transmission of information about the measured re-
fractive index of the feed water from a refractometer installed on the pipeline of the steam
generator system, a fiber-optic communication line (FOCL) is used. Modern designs of
FOCL are not sensitive to electromagnetic interference and vibrations. They can be used
at air temperatures up to 573 K and above.
Figure 6. The dependence of the refractive index n of the feed water on the temperature T. Graphs(1–3) correspond to the following: absence of impurities in water, presence of iron oxides and carbonsteel in water, presence of technical oils in water.
Analysis of the results obtained shows a sharp change in the value of the refractiveindex n of the feed water at a constant temperature T. Considering that water is an in-compressible liquid, such an abrupt change in n cannot be caused by an abrupt change inpressure in the pipeline. In addition, our studies have shown that a change in pressure by1 MPa in feed water corresponds to a change in the refractive index n by 0.0005. Therefore,this change in n is unambiguously associated with the appearance of impurities. By ana-lyzing the dependence of the change in n on T, it is possible to determine the cause of theappearance of impurities.
To ensure the reliability of the transmission of information about the measured refrac-tive index of the feed water from a refractometer installed on the pipeline of the steamgenerator system, a fiber-optic communication line (FOCL) is used. Modern designs ofFOCL are not sensitive to electromagnetic interference and vibrations. They can be used atair temperatures up to 573 K and above.
4. Conclusions
Our results showed that measuring the refractive index and temperature of the flowingfeed water in the pipeline in real-time makes it possible to control the change in its specificheat capacity C. It allows us to ensure the optimal heat transfer coefficient (Nusselt criterion)between the coolant and the feed water. In this case, the electrical energy generation willbe maximum without overloading the steam generator set. The nuclear power plant willoperate normally.

Energies 2022, 15, 457 8 of 10
Preliminary estimates have shown that the use of our methodology for monitoringthe state of feed water (with subsequent adjustment of its flow rate in the pipeline whenC changes) can increase the service life of the steam generator and reduce the number ofpreventive cleanings of feed water during the operation of a nuclear power plant by at leasttwo to three times. These conclusions were drawn based on the first data on the results ofprototypes of refractometers on an experimental bench with a steam generator.
It should also be noted that the refractometer developed by us allows us to controlthe quality of feed water (the presence of impurities in it) and establish the cause ofits appearance.
Another advantage of the developed device is its uninterrupted service life comparedto the pressure meter, which is now used at nuclear power plants. The pressure meterverification period is three years. It is due to the design of the instrument and the formationof calcium deposits in it. These deposits sharply increase the device error up to 5–7%. Theservice life of these meters is from 10 to 12 years (then replacement). All these proceduresare associated with the interruption of the technological cycle. The refractometer developedby us does not require verification (after preliminary calibration before installation) for15 years (further, it must be checked due to the degradation of electronics when working ina high-temperature area). Automatic cleaning of the optical element, which is in contactwith the feed water, allows the refractometer to operate continuously for 15 years. Thisis another indisputable advantage of the method developed by us compared to thosecurrently used at nuclear power plants.
It should also be noted that the refractometer developed by us makes it possible tomeasure the refractive index nf (heat capacity C) in the case of stationary feed water in thepipeline (the main central pump is turned off). The water temperature in the pipeline iscontinuously measured, but there is almost no pressure P in the pipeline. In this case, it isextremely difficult to determine C (using P) (there will be a huge measurement error). Thisis another additional function for monitoring the status of the feed water.
The authors plan to continue their refraction studies in the current environment toreduce the measurement error in the developed design of a flow-through refractometer. Thephenomenon of the Goos-Hanchen shift makes a significant contribution to its formation(about 0.0001). It must be studied in detail at various temperature conditions to developmethods for compensating this phenomenon.
Author Contributions: Conceptualization, R.D. and V.D. (Vadim Davydov); methodology, V.D.(Vadim Davydov); software, R.D.; validation, I.G., V.D. (Vadim Davydov) and R.D.; formal analysis,I.G and V.D. (Vadim Davydov); investigation, R.D.; resources, V.D. (Valentin Dudkin) and I.G.; datacuration, I.G.; writing—original draft preparation, V.D. (Vadim Davydov); writing—review andediting, R.D.; visualization, R.D.; supervision, V.D. (Valentin Dudkin); project administration, V.D.(Vadim Davydov); funding acquisition, V.D. (Vadim Davydov). All authors have read and agreed tothe published version of the manuscript.
Funding: The research is partially funded by the Ministry of Science and Higher Education of theRussian Federation under the strategic academic leadership program ‘Priority 2030’ (Agreement075-15-2021-1333 dated 30 September 2021).
Institutional Review Board Statement: Not applicable.
Informed Consent Statement: Not applicable.
Conflicts of Interest: The authors declare no conflict of interest.
References1. Agafonova, N.D.; Egorov, M.Y.; Sergeev, V.V.; Gotovskii, M.A.; Kruglikov, P.A.; Lebedev, M.E.; Sudakov, A.V.; Fedorovich, E.D.;
Fokin, B.S. Heat-and-Mass Transfer Intensification in Saturated-Steam Generators in NPP with VVER as a Means for IncreasingEfficiency and Reliability. At. Energy 2018, 123, 154–158. [CrossRef]
2. Gulevich, A.V.; Dekusar, V.M.; Chebeskov, A.N.; Kuchinov, V.P.; Voloshin, N.P. Possibility of Fast-Reactor Exportation Under anInternational Nuclear Non-Proliferation Regime. At. Energy 2020, 127, 192–195. [CrossRef]
Energies 2022, 15, 457 9 of 10
3. Ashurko, Y.M.; Gulevich, A.V.; Klinov, D.A.; Vasil’ev, B.A.; Vasyaev, A.V.; Marova, E.V.; Shepelev, S.F. Gen-IV Reactor SystemsCriteria Implementation in BN-1200. At. Energy 2019, 125, 351–358. [CrossRef]
4. Dong, Z.; Liu, M.; Jiang, D.; Huang, X.; Zhang, Y.; Zhang, Z. Automatic Generation Control of Nuclear Heating Reactor PowerPlants. Energies 2018, 11, 2782. [CrossRef]
5. Lee, K.-H.; Kim, M.-G.; Lee, J.I.; Lee, P.-S. Recent Advances in Ocean Nuclear Power Plants. Energies 2015, 8, 11470–11492.[CrossRef]
6. Wu, G.; Ju, P.; Song, X.; Xie, C.; Zhong, W. Interaction and Coordination among Nuclear Power Plants, Power Grids and TheirProtection Systems. Energies 2016, 9, 306. [CrossRef]
7. Davydov, V.V.; Myazin, N.S.; Kiryukhin, A.V. Nuclear-Magnetic Flowmeter-Relaxometers for Monitoring Coolant and Feed waterFlow and Status in Npp. At. Energy 2020, 127, 274–279. [CrossRef]
8. Davydov, R.; Antonov, V.; Makeev, S.; Batov, Y.; Dudkin, V.; Myazin, N. New high-speed system for controlling the parameters ofa nuclear reactor in a nuclear power plant. E3S Web Conf. 2019, 140, 02001. [CrossRef]
9. Krapivtsev, V.G.; Solonin, V.I. Model Studies of Interloop Coolant Mixing in VVER-1000 in-Reactor Pressure Channel. At. Energy2019, 125, 307–313. [CrossRef]
10. Elokhin, A.P. Unconventional Methods of Radiological Environmental Monitoring and Earthquake Prediction. At. Energy 2015,117, 206–215. [CrossRef]
11. Ksenofontov, A.I.; Elokhin, A.P.; Alalem, E.A. Application of simulation modelling approaches for analyzing γ-radiationcharacteristics of a plume induced by a Nuclear Accident at NPP. Loon 2019, 487, 012009. [CrossRef]
12. Fadeenko, V.; Fadeenko, I.; Nikolaev, D. Remote environmental monitoring in the area of a nuclear power plant. IOP Conf. Ser.Earth Environ. Sci. 2019, 390, 012022. [CrossRef]
13. Sorokin, A.P.; Kuzina, Y.A. Physical Modeling of Hydrodynamics and Heat Transfer in Liquid-Metal Cooled Fast Reactors. At.Energy 2020, 128, 277–286. [CrossRef]
14. Filimonov, P.E.; Semchenkov, Y.M.; Malyshev, V.V.; Dolgopolov, N.Y.; Povarov, V.P.; Gusev, I.N. VVER-1200 Tests in No. 6 Unit ofthe Novovoronezh NPP During Operation in a Daily Load Schedule. At. Energy 2020, 129, 143–148. [CrossRef]
15. Abramov, L.V.; Baklanov, A.V.; Bakmetiev, A.M.; Bylov, I.A.; Vasyuchenkov, A.A.; Gusev, D.O.; Kiselev, V.V. OKBM AfrikantovExperience in Developing Methods and Computer Codes for Reliability Analysis and Probabilistic Safety Analysis of NuclearInstallations. At. Energy 2020, 129, 103–108. [CrossRef]
16. Firth, J.; Ladouceur, F.; Brodzeli, Z.; Wyres, M.; Silvestri, L. A novel optical telemetry system applied to flowmeter networks. FlowMeas. Instrum. 2016, 48, 15–19. [CrossRef]
17. Looney, R.; Priede, J. Concept of a next-generation electromagnetic phase-shift flowmeter for liquid metals. Flow Meas. Instrum.2019, 65, 128–135. [CrossRef]
18. Novikova, O.V.; Erastov, A.E.; Livshits, S.A. Features of evaluating the efficiency indicators of the electric power enterprise. E3SWeb Conf. 2019, 124, 05057. [CrossRef]
19. Medeiros, K.A.R.; Barbosa, C.R.H.; d’Almeida, J.R.M.; Ribeiro, A.S.; de Paula, I.B. Flowmeter based on a piezoelectric PVDF tube.Meas. J. Int. Meas. Confed. 2019, 138, 368–378. [CrossRef]
20. Marusina, M.Y.; Bazarov, B.A.; Galaidin, P.A.; Marusin, M.P.; Silaev, A.A.; Zakemovskaya, E.Y.; Mustafaev, Y.N. Design of aGradient System for a Multiphase Flowmeter. Meas. Tech. 2014, 57, 580–586. [CrossRef]
21. Davydov, V.V.; Dudkin, V.I.; Karseev, A.Y.; Vologdin, V.A. Special Features in Application of Nuclear Magnetic Spectroscopy toStudy Flows of Liquid Media. J. Appl. Spectrosc. 2016, 82, 1013–1019. [CrossRef]
22. Karabegov, M.A. The dynamic characteristics of automatic analyzers. Meas. Tech. 2013, 55, 1301–1310. [CrossRef]23. Karabegov, M.A. Automatic differential prism refractometer for monitoring process liquids. Meas. Tech. 2007, 50, 619–628.
[CrossRef]24. Mishchenko, Y.V. Method of refractometric control of liquids in processing plants. Meas. Tech. 2007, 50, 1274–1281. [CrossRef]25. Mishchenko, Y.V. Fiber-optic interferometric refractometer for deep-water studies of sea water. Meas. Tech. 2006, 49, 1210–1217.
[CrossRef]26. Shur, V.L.; Naidenov, A.S.; Lukin, A.Y.; Leibengardt, G.I. A liquid autocollimation refractometer. Meas. Tech. 2006, 49, 815–819.
[CrossRef]27. Davydov, V.V.; Grebenikova, N.M.; Smirnov, K.Y. An Optical Method of Monitoring the State of Flowing Media with Low
Transparency That Contain Large Inclusions. Meas. Tech. 2019, 62, 519–526. [CrossRef]28. Meeten, G.H.; North, A.N. Refractive index measurement of absorbing and turbid fluids by reflection near the critical angle. Meas.
Sci. Technol. 1995, 6, 214–221. [CrossRef]29. Contrerastello, H.; Márquezislas, R.; Vázquezestrada, O.; Sánchezpérez, C.; Garcíavalenzuela, A. Understanding the performance
of Abbe-type refractometers with optically absorbing fluids. Meas. Sci. Technol. 2014, 25, 075201. [CrossRef]30. Leibengardt, G.I.; Naidenov, A.S.; Shur, V.L. A liquid laser interference refractometer for measuring the concentration of solutions.
Meas. Tech. 2004, 47, 1211–1216. [CrossRef]31. Chen, J.; Guo, W.; Xia, M.; Li, W.; Yang, K. In situ measurement of seawater salinity with an optical refractometer based on total
internal reflection method. Opt. Express 2018, 26, 25510–25523. [CrossRef] [PubMed]32. Morales-Luna, G.; Garcia-Valenzuela, A. Viability and fundamental limits of critical-angle refractometry of turbid colloids. Meas.
Sci. Technol. 2017, 28, 125203. [CrossRef]
Energies 2022, 15, 457 10 of 10
33. Niskanen, I.; Räty, J.; Peiponen, K.-E. On the Immersion Liquid Evaporation Method Based on the Dynamic Sweep of Magnitudeof the Refractive Index of a Binary Liquid Mixture: A Case Study on Determining Mineral Particle Light Dispersion. Appl.Spectrosc. 2017, 71, 1586–1592. [CrossRef]
34. Morales-Luna, G.; Herrera-Domínguez, M.; Pisano, E.; Balderas-Elizalde, A.; Hernandez-Aranda, R.I.; Ornelas-Soto, N. Plasmonicbiosensor based on an effective medium theory as a simple tool to predict and analyze refractive index changes. Opt. Laser Technol.2020, 131, 106332. [CrossRef]
35. Morales-Luna, G.; García-Valenzuela, A.; Barrera, R.G. Optical Coherent Reflection from a Confined Colloidal Film: Modelingand Experiment. J. Phys. Chem. B 2018, 122, 8570–8581. [CrossRef]
36. Bhardwaj, V.K.; Maini, S. Compact and self-aligned fluid refractometer based on the Doppler-induced self-mixing effect. Appl.Opt. 2020, 59, 3064–3072. [CrossRef]
37. Luo, Y.; Guo, W.; Yu, L.; Xia, M.; Li, W.; Yang, K. High-precision algorithms for critical angle refractive index measurement. Appl.Opt. 2019, 58, 6057–6062. [CrossRef]
38. Guo, W.; Li, R.; Yu, L.; Chen, J.; Xia, M.; Li, W.; Yang, K. Self-referenced technology for refractive index measurement undermechanical vibration and temperature fluctuation. Appl. Opt. 2019, 58, 1862–1867. [CrossRef] [PubMed]