Bibliography of Structuralism III (1995-2012, and Additions)
Upload
khangminh22Category
view
0download
0
1
1
Investigating the influence of long-
term culture and feed additions on
recombinant antibody production
in Chinese hamster ovary cells
A thesis submitted to the University of Manchester for the
degree of Doctor of Philosophy in
The Faculty of Life Sciences
2010
Laura Anne Bailey

2
CONTENTS
CONTENTS ..................................................................................................................... 2
LIST OF FIGURES ......................................................................................................... 8
LIST OF TABLES ......................................................................................................... 12
ABSTRACT ................................................................................................................... 13
DECLARATION ........................................................................................................... 14
COPYRIGHT ................................................................................................................. 14
ACKNOWLEDGEMENTS ........................................................................................... 15
DEDEDICATIONS ....................................................................................................... 15
ABBREVIATIONS ....................................................................................................... 16
CHAPTER 1. INTRODUCTION ............................................................................... 21
1.1 INTRODUCTORY REMARKS .............................................................................. 22
1.2 EXPRESSION SYSTEMS ...................................................................................... 24
1.2.1 Bacterial and yeast systems ............................................................................. 24
1.2.2 Mammalian systems ........................................................................................ 24
1.2.2.1 PER.C6® cells ........................................................................................ 25
1.2.2.2 NS0 myeloma cells ................................................................................ 25
1.2.2.3 CHO cells ............................................................................................... 25
1.2.2.4 The DHFR vector system for recombinant protein synthesis ................ 26
1.2.3.5 The GS vector system for recombinant protein synthesis ...................... 27
1.3 MONOCLONAL ANTIBODIES AS THERAPEUTICS ........................................ 28
1.4 CELL BIOMASS AS A POTENTIAL DETERMINANT
OF RECOMBINANT PROTEIN PRODUCTION .................................................. 32
1.4.1 Cell cycle progression ..................................................................................... 32
1.4.2 Cell cycle regulators ........................................................................................ 33
1.5 METABOLIC ACTIVITY AS A POTENTIAL DETERMINANT
OF RECOMBINANT PROTEIN PRODUCTION .................................................. 34
1.6 TRANSCRIPTION AS A POTENTIAL DETERMINANT
OF RECOMBINANT PROTEIN PRODUCTION .................................................. 37
1.7 TRANSLATION AS A POTENTIAL DETERMINANT
OF RECOMBINANT PROTEIN PRODUCTION .................................................. 39
1.7.1 Translational initiation .................................................................................... 39
1.7.2 RNA interference ........................................................................................... 40
1.8 PROTEIN FOLDING AS A POTENTIAL DETERMINANT
OF RECOMBINANT PROTEIN PRODUCTION .................................................. 41
1.8.1 N-linked glycosylation .................................................................................... 43
1.8.2 Calnexin/calreticulin (CNX/CRT) cycle ......................................................... 44
1.8.3 The Unfolded Protein Response (UPR) .......................................................... 45
1.8.3.1 IRE-1 ...................................................................................................... 46
1.8.3.2 ATF6 ...................................................................................................... 47
1.8.3.3 PERK .................................................................................................... 47
1.8.3.3.1 ATF4 ....................................................................................... 49

3
1.8.3.3.2 GADD153 ............................................................................... 49
1.8.3.3.3 GADD34 ................................................................................. 50
1.8.4 ER associated-degradation (ERAD) and ER stress-associated apoptosis . 50
1.8.4.1 ERAD ......................................................................................... 50
1.8.4.2 Macroautophagy ......................................................................... 51
1.8.4.3 ER stress-associated apoptosis ................................................... 51
1.9 PROTEIN SECRETION AS A POTENTIAL DETERMINANT
OF RECOMBINANT PROTEIN PRODUCTION ................................................. 53
1.10 IMPROVING PROTEIN PRODUCTION
BY FEED AND CHEMICAL ADDITIONS ......................................................... 54
1.11 INVESTIGATING INSTABILITY IN RECOMBINANT CHO CULTURES .... 55
1.12 SUMMARY AND PROJECT AIMS .................................................................... 56
CHAPTER 2. MATERIALS AND EQUIPMENT .................................................... 59
2.1 GENERAL MATERIALS ....................................................................................... 60
2.1.1 Sources of chemicals and reagents .................................................................. 60
2.1.2 Preparation and sterilisation of solutions ........................................................ 60
2.1.3 pH measurements ........................................................................................... 60
2.1.4 Mammalian cell lines and culture medium ..................................................... 60
2.2 GENERATION AND PURIFICATION OF PLASMIDS
IN BACTERIAL CELLS ......................................................................................... 61
2.2.1 Bacterial growth medium ................................................................................ 61
2.2.2 Generation of competent bacterial cells .......................................................... 61
2.2.3 Transformation of competent DH5α E.Coli cells .......................................... 61
2.2.4 Midi-preparation of plasmid DNA .................................................................. 61
2.2.5 Determination of nucleic acid concentration and purity ................................. 62
2.2.6 Restriction enzyme digestion .......................................................................... 62
2.3 CELL CULTURE .................................................................................................... 62
2.3.1 Maintenance of CHO cells .............................................................................. 62
2.3.2 Generation of batch cultures .......................................................................... 63
2.3.3 Determination of cell number, viability and diameter .................................... 63
2.3.4 Cryopreservation of cells ................................................................................ 64
2.3.5 Revival of cells from liquid nitrogen .............................................................. 64
2.3.6 Medium osmolality determination .................................................................. 64
2.3.7 Mycoplasma detection .................................................................................... 65
2.4 FLOW CYTOMETRY............................................................................................. 65
2.4.1 Cell cycle phase analysis ................................................................................. 65
2.4.2 Quantification of intracellular antibody .......................................................... 65
2.5 PROTEIN ANALYSIS ............................................................................................ 66
2.5.1 Detection of antibody by ELISA..................................................................... 66
2.5.2 Determination of total protein synthesis ......................................................... 67
2.5.3 Western blot analysis ...................................................................................... 68
2.5.3.1 Protein extraction ................................................................................... 68
2.5.3.2 SDS-PAGE ............................................................................................. 68

4
2.5.3.3 Protein transfer ....................................................................................... 69
2.5.3.4 Stripping nitrocellulose membranes ....................................................... 69
2.5.3.5 Densitometric analysis ........................................................................... 70
2.5.4 N- linked glycan analyses ............................................................................... 70
2.5.4.1 Antibody purification ............................................................................. 70
2.5.4.2 Deglycosylation of purified recombinant antibody................................ 70
2.5.4.3 Precipitation and lyophilisation of glycans ............................................ 71
2.5.4.4 Desalting using Graphite ........................................................................ 71
2.5.4.5 MALDI-ToF analysis ............................................................................. 71
2.6 DETERMINATION OF COPY NUMBER ............................................................ 72
2.6.1 Southern blot analysis ..................................................................................... 72
2.6.1.1 DNA extraction, phenol extraction and ethanol precipitation ............... 72
2.6.1.2 Determination of genomic DNA per cell ............................................... 72
2.6.1.3 Preparation of plasmid standards and genomic DNA
for Southern analysis .............................................................................. 73
2.6.1.4 Agarose gel electrophoresis of DNA samples ....................................... 73
2.6.1.5 Capillary blot transfer of DNA to nylon membrane .............................. 74
2.6.1.6 Isolation of DNA probes for Southern analysis ..................................... 74
2.6.1.7 Radioactive labelling of probes .............................................................. 75
2.6.1.8 Pre-hybridisation ................................................................................... 76
2.6.1.9 Hybridisation and washing ..................................................................... 76
2.6.1.10 Autoradiography .................................................................................. 76
2.6.1.11 Membrane stripping ............................................................................ 77
2.6.2 Quantitative PCR (q-PCR) .............................................................................. 77
2.6.2.1 Preparation of standard curve................................................................. 77
2.6.2.2 Preparation of samples ........................................................................... 77
2.6.2.3 Real-time q-PCR reaction ...................................................................... 77
2.6.2.4 Analysis of q-PCR results ...................................................................... 78
2.7 DETERMINATION OF mRNA ............................................................................. 79
2.7.1 Quantitative reverse transcriptase PCR (q-RTPCR) ....................................... 79
2.7.1.1 RNA isolation ........................................................................................ 79
2.7.1.2 DNase treatment of RNA ....................................................................... 79
2.7.1.3 cDNA synthesis from RNA ................................................................... 79
2.7.1.4 Preparation of samples and „check‟ sample ........................................... 80
2.7.1.5 Quantitation of mRNA .......................................................................... 80
2.7.2 Polymerase Chain Reaction (PCR) ................................................................ 81
2.8 POLYSOME PROFILING ...................................................................................... 82
2.8.1 Sucrose gradient preparation ........................................................................... 82
2.8.2 Extract preparation for polysome analysis ..................................................... 82
2.8.3 Sedimentation of extracts ................................................................................ 83
2.9 MICROSOPY ANALYSES .................................................................................... 83
2.9.1 Preparation of metaphase spreads ................................................................... 83
2.9.2 Metaphase staining .......................................................................................... 83
2.9.3 Image acquisition ............................................................................................ 84

5
2.9.4 Immunofluorescence ....................................................................................... 84
2.10 METABOLITE ANALYSES ................................................................................ 85
2.10.1 Glucose assay ................................................................................................ 85
2.10.2 Lactate assay ................................................................................................. 85
2.10.3 Gas chromatography-mass spectrometry (GC-MS) ...................................... 85
2.10.3.1 Sample derivatization .......................................................................... 85
2.10.3.2 GC-MS analysis ................................................................................... 86
2.10.4 Intracellular metabolite extraction ............................................................... 86
2.10.5 ATP assay ..................................................................................................... 87
2.10.6 NAD+/NADH assay ...................................................................................... 87
2.11 CALCULATIONS ................................................................................................. 87
2.11.1 Calculation of cell doubling time (dt) ........................................................... 87
2.11.2 Calculation of specific productivity (Qp)
and rates of metabolite production and utilisation ........................................ 88
2.11.3 Statistical methods ........................................................................................ 88
CHAPTER 3. CHARACTERISATION OF CELL LINE 3.90
IN DETERMINATION OF CELL LINE STABILITY .................. 90
3.1 INTRODUCTORY REMARKS .............................................................................. 91
3.2 ANALYSIS OF GROWTH CHARACTERISTICS
AND PRODUCTIVITY OF CELL LINE 3.90 ....................................................... 91
3.3 MOLECULAR INVESTIGATION OF ANTIBODY TITRE LOSS
DURING LTC OF CELL LINE 3.90 .................................................................... 101
3.3.1 Analysis of genomic stability during LTC .................................................... 101
3.3.2 Analysis of recombinant gene mRNA expression during LTC .................... 103
3.3.3 Investigating polysome profile characteristics during culture ...................... 103
3.3.4 Analysis of protein synthesis and secretion during LTC .............................. 104
3.4 THE REGULATION OF UPR MARKERS DURING CULTURE ...................... 116
3.5 METABOLIC ANALYSIS OF CELL LINE 3.90 ............................................... 127
3.6 DISCUSSION ........................................................................................................ 137
3.7 SUMMARY ........................................................................................................... 143
CHAPTER 4. CHARACTERISATION OF CELL LINE 3.90
IN REPSONSE TO FEED ADDITION .......................................... 150
4.1 INTRODUCTORY REMARKS ............................................................................ 151
4.2 ANALYSIS OF GROWTH CHARACTERISTICS AND PRODUCTIVITY
OF CELL LINE 3.90 IN RESPONSE TO FEED ADDITION ............................. 151
4.3 MOLECULAR INVESTIGATIONS OF RECOMBINANT CELL LINE 3.90
IN RESPONSE TO FEED ADDITION ................................................................. 163
4.3.1 Analysis of recombinant gene mRNA expression from cultures
with feed addition .......................................................................................... 163
4.3.2 Investigating characteristics of polysome profiles
in response to feed addition .......................................................................... 164

6
4.3.3 Analysis of intracellular recombinant protein
in response to feed addition .......................................................................... 165
4.4 DETERMINING THE REGULATION OF UPR MARKERS
IN RESPONSE TO FEED ADDITION ................................................................ 175
4.5 METABOLIC ANALYSIS OF CELL LINE 3.90
IN RESPONSE TO FEED ADDITION ................................................................. 183
4.6 DISCUSSION ........................................................................................................ 193
4.7 SUMMARY ........................................................................................................... 196
CHAPTER 5. CHARACTERISATION OF CELL LINE 3.90 IN RESPONSE TO
DIMETHYL SULFOXIDE (DMSO) ADDITION ......................... 202
5.1 INTRODUCTORY REMARKS ............................................................................ 203
5.2 ANALYSIS OF GROWTH CHARACTERISTICS AND PRODUCTIVITY
OF CELL LINE 3.90 IN RESPONSE TO DMSO ................................................ 204
5.3 MOLECULAR INVESTIGATIONS OF RECOMBINANT CELL LINE 3.90
IN RESPONSE TO DMSO ADDITION ............................................................... 214
5.3.1 Effect of DMSO addition on recombinant gene mRNA expression ............ 214
5.3.2 Effect of DMSO addition on polysome profiles .......................................... 214
5.3.3 Effect of DMSO addition on intracellular recombinant protein ................... 215
5.4 THE UPR STATUS OF CULTURES AFTER DMSO ADDITION .................... 219
5.5 FUNCTIONALITY OF THE SECRETED ANTIBODY ..................................... 226
5.6 METABOLISM OF 3.90 CULTURES
IN RESPONSE TO DMSO ADDITION ............................................................... 228
5.6.1 Effects of DMSO addition on the production of metabolites ....................... 228
5.6.2 Effects of DMSO addition on rates of glucose and lactate utilisation .......... 229
5.7 DISCUSSION ........................................................................................................ 237
5.8 SUMMARY ........................................................................................................... 240
CHAPTER 6. CELL LINE 51.69 HAS CHARACTERISTICS SIMILAR
TO THOSE OF CELL LINE 3.90 ................................................... 245
6.1 INTRODUCTORY REMARKS ............................................................................ 246
6.2 ANALYISIS OF CELL LINE 51.69 IN RESPONSE TO LTC ............................ 247
6.2.1 Final antibody titres and viable cell densities were lower as a result of LTC247
6.2.2 Antibody titre loss was not at the level of
recombinant mRNA expression .................................................................. 248
6.2.3 Late generation 51.69 cultures had greater rates of lactate utilisation .......... 249
6.3 ANALYSIS OF CELL LINE 51.69 IN RESPONSE TO FEED ADDITION ....... 257
6.3.1 Feed addition increased recombinant protein production ............................. 257
6.3.2 Feed addition significantly lowered GADD153
mRNA and protein expression ...................................................................... 258
6.3.3 Metabolic profiles were altered for 51.69 in response to feed addition ........ 258
6.4 ANALYSIS OF CELL LINE 51.69 IN RESPONSE TO DMSO ADDITION ..... 265
6.4.1 Cell line 51.69 encountered growth arrest in response to DMSO addition .. 265
6.4.2 GADD153 mRNA and protein expression was significantly lowered
7
in response to DMSO addition ..................................................................... 266
6.4.3 DMSO addition increased the rates of glucose utilisation
for 51.69 cultures .......................................................................................... 267
6.5 DISCUSSION ........................................................................................................ 281
6.5.1 How does 51.69 compare to 3.90 in response to LTC? ................................ 281
6.5.2 How does 51.69 compare to 3.90 in response to feed addition? ................... 282
6.5.3 How does 51.69 compare to 3.90 in response to DMSO addition? .............. 283
6.6 SUMMARY ........................................................................................................... 284
CHAPTER 7. OVERALL DISCUSSION ................................................................ 288
7.1 IS INSTABILITY CONNECTED TO A SPECIFIC CELLULAR EVENT? ....... 290
7.2 HOW IS RECOMBINANT PROTEIN PRODUCTION INCREASED
IN RESPONSE TO FEED ADDITION? ............................................................... 293
7.3 HOW IS RECOMBINANT PROTEIN PRODUCTION INCREASED
IN RESPONSE TO DMSO ADDITION? ............................................................. 295
7.4 ARE THERE MARKERS TO PREDICT THE LIKELIHOOD
OF INSTABILITY IN RECOMBINANT PROTEIN PRODUCTION? ............... 296
7.5 FUTURE WORK ................................................................................................... 297
REFERENCES ............................................................................................................. 299
APPENDICES ............................................................................................................. 329
APPENDIX1 – MATERIALS, CHEMICALS AND SPECIAL EQUIPMENT ......... 330
APPENDIX 2 – RELATIVE CONCENTRATION OF AMINO ACIDS ................... 338
APPENDIX 3 – OSMOLALITY MEASURMENTS .................................................. 341
APPENDIX 4 – INVESTIGATING CHEMICAL ADDITIONS ............................... 342
APPENDIX 5 – INVESTIGATING EXPRESSION OF UPR MARKERS
FOR THE PARENTAL CELL LINE ............................................... 345
APPENDIX 6 - MYCOPLASMA TESTING .............................................................. 349

8
LIST OF FIGURES
Figure 1.1 Cellular events which control secreted protein production .......................... 23
Figure 1.2 Reaction catalysed by DHFR........................................................................ 27
Figure 1.3 Reaction catalysed by GS ............................................................................. 28
Figure 1.4 Schematic of an antibody.............................................................................. 30
Figure 1.5 The cell cycle ................................................................................................ 33
Figure 1.6 Metabolic production of ATP, NAD+ and NADH ....................................... 35
Figure 1.7 ATP is critical at multiple sites of protein expression .................................. 37
Figure 1.8 Diagram of translation initiation ................................................................... 40
Figure 1.9 The role of PDI in disulphide bond formation ............................................. 42
Figure 1.10 Common N-linked glycan structures .......................................................... 44
Figure 1.11 The CNX/CRT cycle .................................................................................. 45
Figure 1.12 Activation of the UPR ................................................................................ 48
Figure 1.13 ER stress-mediated degradation and cell death pathways .......................... 52
Figure 2.1 Restriction sites for DNA probes for Southern blot analysis ....................... 75
Figure 3.1 Analysis of recombinant antibody titre, viable cell densities,
and cell viability for 3.90 cultures................................................................. 94
Figure 3.2 Effect of LTC on viable cell growth and CCT ............................................ 96
Figure 3.3 Analysis of cell cycle distribution in response to LTC................................. 97
Figure 3.4 Effect of culture generation time on specific productivity (Qp)................... 99
Figure 3.5 Effect of culture generation time on cell size ............................................. 100
Figure 3.6 Effect of culture generation time on chromosome number ........................ 102
Figure 3.7 Analysis of heavy chain gene and light chain gene copy number
for early and late generation cultures .......................................................... 106
Figure 3.8 Effect of culture generation time on recombinant mRNA expression ....... 108
Figure 3.9 Analysis of polysome profiles during culture ............................................. 110
Figure 3.10 Effects of culture on the relative area of monosome
and polysome peaks ................................................................................. 112
Figure 3.11 Measuring global protein synthesis and secretion
for early and late generation cultures ....................................................... 114
Figure 3.12 Analysis of intracellular heavy chain and light chain
protein during culture ............................................................................... 115
Figure 3.13 Effects of culture generation time on the mRNA expression
of UPR markers ........................................................................................ 119
Figure 3.14 Analysis of ATF4 and GADD153 protein expression
for early and late generation cultures ....................................................... 120
Figure 3.15 Analysis of BiP protein expression
for early and late generation cultures ....................................................... 123
Figure 3.16 Analysis of PDI protein expression
for early and late generation cultures ....................................................... 124

9
Figure 3.17 Analysis of XBP-1(s) mRNA during culture............................................ 125
Figure 3.18 Analysis of amino acid utilisation during culture ..................................... 129
Figure 3.19 Effects of culture generation time on metabolite accumulation ............... 131
Figure 3.20 Analysis of glucose and lactate concentrations during culture ................. 134
Figure 3.21 Investigating rates of glucose and lactate utilisation during culture......... 135
Figure 3.22 Correlation between antibody titre and proportion of cells in G0/G1 ...... 144
Figure 3.23 Potential metabolic changes in response to LTC ...................................... 146
Figure 3.24 Investigating ATP, NAD+ and NADH
concentrations for 3.90 cultures ............................................................... 147
Figure 3.25 Alterations to nutrient utilisation, UPR stress markers, cell biomass
and antibody titre in response to LTC ...................................................... 149
Figure 4.1 Effect of feed addition on recombinant antibody titre,
viable cell densities and cell viability during batch culture ....................... 154
Figure 4.2 Effect of feed addition on CCT ................................................................. 156
Figure 4.3 Effect of feed addition on cell cycle phase distribution
during batch culture.................................................................................... 157
Figure 4.4 The percentage of cells in G0/G1 cell cycle phase for culture
with and without feed addition .................................................................... 159
Figure 4.5 Effect of feed addition on specific productivity ......................................... 160
Figure 4.6 Effect of feed addition on cell diameter ..................................................... 162
Figure 4.7 Effect of feed addition on recombinant mRNA expression ....................... 166
Figure 4.8 Analysis of recombinant mRNA expression between cultures
with and without feed addition .................................................................. 168
Figure 4.9 Investigating characteristics of polysome profiles
in response to feed addition ....................................................................... 170
Figure 4.10 Quantification of monosome and polysome peak areas ........................... 172
Figure 4.11 Analysis of intracellular heavy chain and light chain protein
after feed addition ................................................................................... 174
Figure 4.12 Effect of feed addition on the mRNA expression
of ATF4, GADD34, and GADD153 ........................................................ 177
Figure 4.13 Effects of LTC on the mRNA expression of UPR markers
from cultures supplemented with feed addition ....................................... 179
Figure 4.14 Analysis of ATF4 and GADD153 protein in response to feed addition .. 181
Figure 4.15 Analysis of XBP-1 mRNA splicing in response to feed addition ............ 182
Figure 4.16 Effects of feed addition on amino acid concentrations ............................. 186
Figure 4.17 Increased metabolites in response to feed addition .................................. 188
Figure 4.18 Effects of feed addition on glucose and lactate concentrations ................ 191
Figure 4.19 Alterations to 3.90 cultures in response to feed addition.......................... 198
Figure 4.20 Concentrations of ATP, NAD and NADH
in response to feed addition ..................................................................... 199
Figure 4.21 Time-line of changes to late generation cultures with feed addition ........ 201

10
Figure 5.1 Effect of DMSO addition on antibody titre, viable cell growth and CCT
for early generation cultures ....................................................................... 206
Figure 5.2 Effect of DMSO addition on antibody titre, viable cell growth and CCT
for late generation cultures .......................................................................... 208
Figure 5.3 Effect of DMSO on specific productivity (Qp) .......................................... 211
Figure 5.4 Effect of DMSO addition on G0/G1 cell cycle phase transition ................ 212
Figure 5.5 Cell size comparisons for cultures with and without DMSO addition ....... 213
Figure 5.6 Effect of DMSO addition on recombinant mRNA expression ................. 216
Figure 5.7 Quantification of monosome and polysome peaks
in response to DMSO addition ................................................................... 217
Figure 5.8 Analysis of intracellular recombinant protein
in response to DMSO addition ................................................................... 218
Figure 5.9 Effect of DMSO addition on GADD153 mRNA expression ..................... 221
Figure 5.10 Effect of DMSO addition on expression
of PDI, ATF4 and GADD153 protein ..................................................... 222
Figure 5.11 Analysis of XBP-1(s) mRNA in response to DMSO addition ................. 224
Figure 5.12 Effects of culture conditions on secreted glycan profiles ....................... 227
Figure 5.13 Analysis of glycerol, glycine, alanine and lactate accumulation
from early generation cultures in the presence of DMSO........................ 231
Figure 5.14 Analysis of glycerol, glycine, alanine and lactate accumulation
from late generation cultures in the presence of DMSO .......................... 233
Figure 5.15 Investigating glucose utilisation rates in response to DMSO addition ..... 235
Figure 5.16 Investigating lactate production rates in response to DMSO addition ..... 236
Figure 5.17 Effect of DMSO addition on global protein synthesis ............................. 241
Figure 5.18 Correlation between antibody titre and rates of glucose utilisation ......... 242
Figure 5.19 Alterations to 3.90 cultures in response to DMSO addition ..................... 244
Figure 6.1 Analysis of recombinant antibody titre, viable cell densities,
CCT and Qp for cell line 51.69 ................................................................... 250
Figure 6.2 The percentage of cells in G0/G1 was lower for
late generation 51.69 cultures ..................................................................... 252
Figure 6.3 Expression of recombinant mRNA was not altered in response to LTC .... 254
Figure 6.4 ATF4 and GADD153 mRNA increased during batch culture.................... 255
Figure 6.5 Late generation cultures had greater rates of lactate utilisation ................. 256
Figure 6.6 Feed addition increased final antibody titres for cell line 51.69................. 259
Figure 6.7 Feed addition enhanced specific productivity (Qp) for cell line 51.69 ...... 260
Figure 6.8 The mRNA expression of ATF4, GADD34 and GADD153 were lower
for cultures with feed addition ................................................................... 261
Figure 6.9 GADD153 protein was significantly lowered in response to feed addition 262
Figure 6.10 XBP-1(s) mRNA was less after feed addition .......................................... 263
Figure 6.11 Rates of glucose utilisation and lactate production were increased
in response to feed addition ..................................................................... 264
Figure 6.12 DMSO addition to for early generation 51.69 cultures
did not enhance antibody titres ................................................................ 268

11
Figure 6.13 Antibody titres were enhanced for late generation 51.69 cultures
in the presence of feed and DMSO .......................................................... 270
Figure 6.14 Qp values were increased in response to DMSO addition ....................... 272
Figure 6.15 Recombinant mRNA expression was not altered in response to DMSO . 273
Figure 6.16 DMSO addition to 51.69 cultures lowered GADD153 expression ......... 275
Figure 6.17 XBP-1(s) mRNA was lowered in response to DMSO.............................. 277
Figure 6.18 Rates of glucose utilisation were increased for 51.69 cultures
in the presence of DMSO ......................................................................... 279
Figure 6.19 Alterations to nutrient utilisation, ER stress markers and antibody titre
for cell line 51.69 in response to LTC...................................................... 285
Figure 6.20 Alterations to 51.69 cultures in response to feed addition........................ 286
Figure 6.21 Alterations to 51.69 cultures in response to DMSO addition ................... 287
Figure 7.1 A pathway linking mitochondrial Ca2+
and ATP concentrations
to mis/unfolded proteins ............................................................................. 291
Figure A2.1 The relative concentrations of amino acids during batch culture ........... 338
Figure A4.2 Preliminary investigation of different chemical additions
to improve recombinant protein production ............................................ 342
Figure A5.1 Parental cells have lower GADD153 and XBP-1(s) mRNA
than recombinant CHO cultures ............................................................... 345
Figure A5.2 ATF4 is significantly lower for the parental cell line .............................. 346

12
LIST OF TABLES
Table 1.1 MAbs on the market ...................................................................................... 31
Table 2.1 Details of antibodies used for western blot analysis ...................................... 70
Table 2.2 Primers used in real-time q-PCR ................................................................... 78
Table 2.3 Primers used in real-time q-RTPCR .............................................................. 81
Table 2.4 Details of PCR primers .................................................................................. 81
Table A3.1 Osmolality measurements in response to feed and DMSO addition......... 341
Table A4.1 Analysis of different DMSO additions on cell growth and final antibody
titres ........................................................................................................... 344
Table A6.1 Mycoplasma is not detected during batch culture ..................................... 349
13
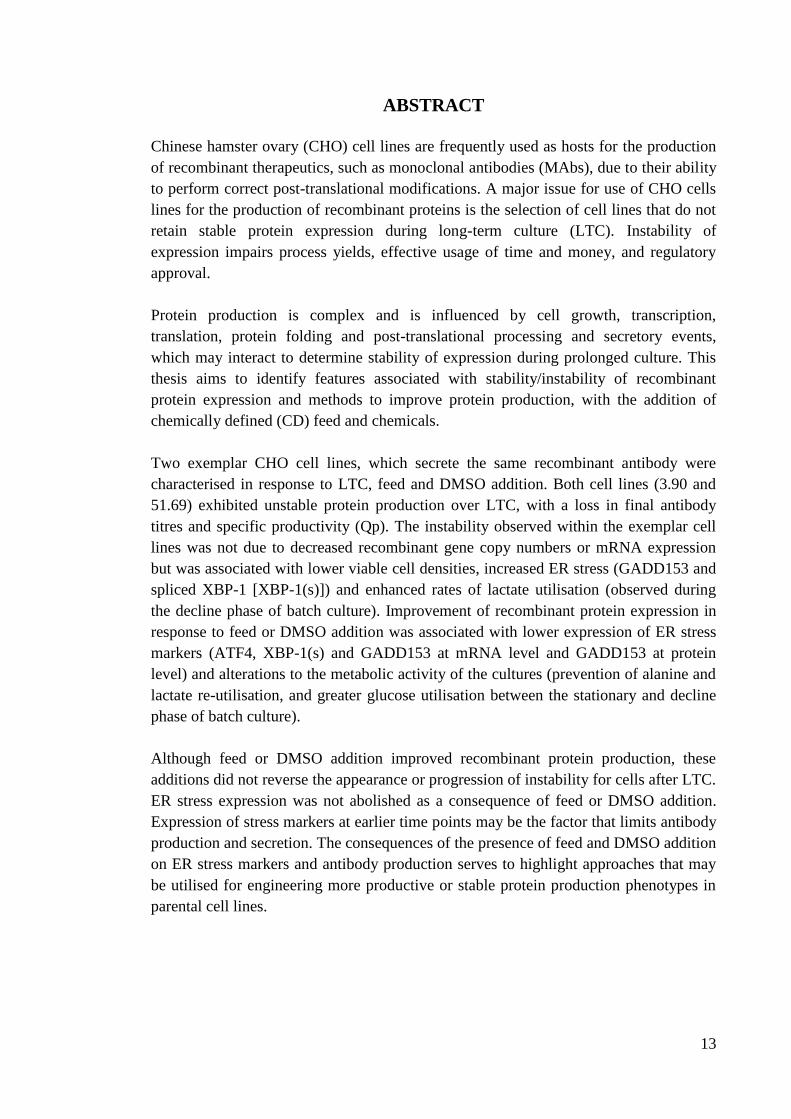
ABSTRACT
Chinese hamster ovary (CHO) cell lines are frequently used as hosts for the production
of recombinant therapeutics, such as monoclonal antibodies (MAbs), due to their ability
to perform correct post-translational modifications. A major issue for use of CHO cells
lines for the production of recombinant proteins is the selection of cell lines that do not
retain stable protein expression during long-term culture (LTC). Instability of
expression impairs process yields, effective usage of time and money, and regulatory
approval.
Protein production is complex and is influenced by cell growth, transcription,
translation, protein folding and post-translational processing and secretory events,
which may interact to determine stability of expression during prolonged culture. This
thesis aims to identify features associated with stability/instability of recombinant
protein expression and methods to improve protein production, with the addition of
chemically defined (CD) feed and chemicals.
Two exemplar CHO cell lines, which secrete the same recombinant antibody were
characterised in response to LTC, feed and DMSO addition. Both cell lines (3.90 and
51.69) exhibited unstable protein production over LTC, with a loss in final antibody
titres and specific productivity (Qp). The instability observed within the exemplar cell
lines was not due to decreased recombinant gene copy numbers or mRNA expression
but was associated with lower viable cell densities, increased ER stress (GADD153 and
spliced XBP-1 [XBP-1(s)]) and enhanced rates of lactate utilisation (observed during
the decline phase of batch culture). Improvement of recombinant protein expression in
response to feed or DMSO addition was associated with lower expression of ER stress
markers (ATF4, XBP-1(s) and GADD153 at mRNA level and GADD153 at protein
level) and alterations to the metabolic activity of the cultures (prevention of alanine and
lactate re-utilisation, and greater glucose utilisation between the stationary and decline
phase of batch culture).
Although feed or DMSO addition improved recombinant protein production, these
additions did not reverse the appearance or progression of instability for cells after LTC.
ER stress expression was not abolished as a consequence of feed or DMSO addition.
Expression of stress markers at earlier time points may be the factor that limits antibody
production and secretion. The consequences of the presence of feed and DMSO addition
on ER stress markers and antibody production serves to highlight approaches that may
be utilised for engineering more productive or stable protein production phenotypes in
parental cell lines.

14
DECLARATION
No portion of this work referred to in the thesis has been submitted in support of an
application for another degree or qualification of this or any other university or other
institute of learning.
COPYRIGHT STATEMENT
I. The author of this thesis (including any appendices and/or schedules to this thesis)
owns any copyright in it (the "Copyright") and she has given The University of
Manchester the right to use such Copyright, including for administrative purposes.
II. Copies of this thesis, either in full or in extracts, may be made only in accordance
with the Copyright, Designs and Patents Act 1988 (as amended) and regulations issued
under it or, where appropriate, in accordance with licensing agreements which the
University has from time to time. This page must form part of any such copies made.
III. The ownership of certain Copyright, patents, designs, trade marks and other
intellectual property (the “Intellectual Property”) and any reproductions of copyright
works in the thesis, for example graphs and tables (“Reproductions”), which may be
described in this thesis, may not be owned by the author and may be owned by third
parties. Such Intellectual Property and Reproductions cannot and must not be made
available for use without the prior written permission of the owner(s) of the relevant
Intellectual Property and/or Reproductions.
IV. Further information on the conditions under which disclosure, publication and
exploitation of this thesis, the Copyright and any Intellectual Property Rights and/or
Reproductions described in it may take place is available in the University IP policy
(see http://www.campus.manchester.ac.uk/medialibrary/policies/intellectual-
property.pdf), in any relevant Thesis restriction declarations deposited in the University
Library, The University Library‟s regulations (see
http://www.manchester.ac.uk/library/aboutus/regulations) and in The University‟s

15
policy on presentation of Theses from the Dean of the Faculty of Life Sciences, for
Faculty of Life Sciences' candidates.
ACKNOWLEDGEMENTS
First and foremost I would like to thank my supervisors, Alan Dickson and Diane
Hatton. I am sincerely grateful to them for their advice, enthusiasm and patience over
the course of my PhD.
I would like to thank my advisor, Neil Bullied, for his guidance and for the PDI
antibody, kindly donated. I would also like to thank my colleagues at MedImmune
Cambridge, in particular Tori Crook, Wyn Forrest-Owen, Alison Mason, and Ray Field,
for cell line creations and feed developments, and for general help and advice
throughout my studies. Many thanks also to Chris Sellick for assistance with GC-MS
analysis and Eleanor Taylor for her help in the development of the polysome protocol.
I wish to thank all the members of Lab B2075, and Suzanne Hunt, Hayley Campbell
and Verity Nancollis, for making my time as a postgraduate a wonderful experience.
Thanks also to Alexandra Croxford, whose advice and support throughout my entire
PhD will never be forgotten.
I would also like to acknowledge the BBSRC and MedImmune Cambridge for funding
my PhD. I am extremely grateful.
DEDICATIONS
This thesis is dedicated to my family, for their unconditional love and support.
Especially dedicated to my mum, Joy, for being my inspiration, and to my husband,
Andrew, for keeping things simple and making me smile.
16
ABBREVIATIONS
A - absorbance
AARE - amino acid response element
ACE - artificial chromosome expression
ACN - acetronitrile
ADCC - antibody-dependent cytotoxicity
ADP - adenosine diphosphate
AMDIS - automated mass spectral deconvolution and identification
software
APC - allophycocyanin
ASK1 - apoptosis signal-regulating kinase 1
ATF - activating transcription factor
ATP - adenosine triphosphate
BHK - Baby Hamster Kidney
BiP - heavy chain binding protein
BSA - Bovine serum albumin
CBF - CCAAT-binding factor
CCT - cumulative cell time
CD - chemically-defined
CDC - complement-dependent cytotoxicity
CDI - cyclin-dependent kinase inhibitors
CDK - cyclin-dependent kinases
cDNA - complementary DNA
C/EBP - CCAAT/enhancer binding protein (C/EBP)
CHO - Chinese Hamster Ovary
CIRP - cold-inducible RNA binding protein
CNX - calnexin
CRT - calreticulin
CV - coefficient of variation
DAbs - domain antibodies
DAPI - 4‟6-diamino-2-phenylindole
ddH2O - double distilled water
17
DEPC - diethylpyrocarbonate
DHB - 2,5-dihydroxybenzoic acid
DHFR - dyhydrofolate reductase
Dicer - ribonuclease III-like enzyme
DMSO - dimethyl sulfoxide
DNA - deoxyribonucleic acid
dt - doubling time
DTT - dithiothreitol
ECL - enhanced chemiluminescence
E. coli - Escherichia coli
EDTA - ethylenediaminotetra acetic acid
eIF - eukaryotic initiation factor
ELISA - enzyme-linked immunosorbent assay
ER - endoplasmic reticulum
ERAD - ER-associated degradation
ERdj - ER-resident J-domain co-chaperones
ERO - ER-resident oxidoreductases
ERSE - ER stress element
Fab - antibody binding region
FAD - flavin adenine dinucleotide
FDA - food and drug administration
FITC - fluorescein isothiocyanate
Fuc - fucose
GADD - growth arrest and DNA damage genes
Gal - galactose
GC - gas chromatography
GDP - guanosine diphosphate
Glc - glucose
GlcNAc - N-acetylglucosamine
GRP 78 - glucose-regulated protein 78
GS - glutamine synthetase
GTP - guanosine triphosphate
hr - hour
HAT - histone acetyltransferase
18
HEK-293 - Human embryonic kidney-293
hCMV - human cytomegalovirus promoter
HDAC - histone deacetylase
HRP - horseradish peroxidase
IFN - interferon
Ig - immunoglobin
IRE-1 - inositol requiring protein-1
IRS - Integrated Stress Response
JDP - jun dimerization protein 2
JIK - c-Jun NH2-terminal inhibitory kinase
JNK - c-Jun NH2-terminal kinase
kb - kilobase pair
L - litre
LB - Luria Bertani
LCR - locus control region
LDH - lactate dehydrogenase
LTC - long-term culture
M - Molar
MAbs - monoclonal antibodies
Man - mannose
MAPK - mitogen activated protein kinase
MDH - malate dehydrogenase
Met - Methionine
min - minute
miRNA - microRNA
mg - milligram
ml - millilitre
mM - milliMolar
mRNA - messenger RNA
MS - mass spectrometry
MSTFA - trimethylsilyltrifluoroacetamide
MSX - methionine sulphoximine
mTOR - mammalian target of rapamycin
MTX - Methotrexate

19
NAD+/ NADH - nicotinamide adenine dinucleotide/reduced NAD
+
ng - nanogram
NS0 - non-secreting, clone 0
OD - optical density
PAGE - polyacrylamide gel electrophoresis
PBA - 4-phenylbutyric acid
PBS - phosphate buffered saline
PCR - polymerase chain reaction
PDI - protein disulfide isomerise
PERK - protein kinase RNA (PKR)-like ER kinase
pg - pictogram
PI - propidium iodide
PI3K - phosphatidylinositol-3‟-kinase
pM - picoMolar
PMT - photomultiplier tube
QC - quality control
Qp - specific productivity
q-PCR - quantitative PCR
q-RTPCR - quantitative reverse transcription PCR
Rb - retinoblastoma
REDD1 - regulated in development and DNA damage responses
RIPA - Radio Immunoprecipitation buffer
RISC - RNA-interference silencing complex
RNA - ribonucleic acid
RNAi - RNA interferance
RNase - ribonuclease
rpm - revolutions per minute
rRNA - ribosomal RNA
RT - reverse transcription
SD - standard deviation
SDS - sodium dodecyl sulfate
sec - seconds
SEM - standard error of mean
siRNA - small interfering RNA

20
S/MAR - scaffold/matrix attachment regions
SP - site protease
SSC - standard saline citrate
SV40 - simian virus 40 promoter
TBE - tris, borate, EDTA
TCA - trichloroacetic acid
TCA cycle - tricarboxylic acid cycle
TE - tris, EDTA
TEMED - N, N, N‟, N‟-tetramethylethylenediamine
TEN - tris, EDTA, and NaCl
TMAO - tri-methylamine-N-oxide
TMB - 3, 3‟, 5, 5‟-tetramethylethylenediamine
TMCS - trimethylchorosilane
TRAF2 - TNF receptor-associated factor 2
Tris - tris (hydroxymethyl) aminomethane
tRNA - transfer RNA
Tween - polyethylene glycol sorbitan monolaurate
UCOE - ubiquitous chromatin opening element
UDP - uridine diphosphate
UGGT - α-glucosidase II and UDP-glucose:glycoprotein glucosyl
transferase
uORF - upstream open reading frame
UPR - unfolded protein response
UPRE - UPR response element
UTR - untranslated region
UV - ultraviolet
v/v - volume per volume
w/v - weight per volume
WCS - working cell stock
XBP-1 - X-box binding protein 1
XBP-1(s) - spliced XBP-1
µg - microgram
µl - microlitre
4E-BP1 - 4E binding protein1

21
1
CHAPTER 1
INTRODUCTION

22
1. INTRODUCTION
1.1 INTRODUCTORY REMARKS
In 1986 human tissue plasminogen activator (tPA, Activase; Genentech, S. San
Francisco, CA, USA) became the first therapeutic protein generated from recombinant
mammalian cells to obtain market approval. Since then the recombinant
biopharmaceutical market has increased dramatically with approximately 200 approved
peptide and protein pharmaceuticals on the food and drug administration (FDA) list
(Demain & Vaishnav, 2009). These protein pharmaceuticals include recombinant
hormones, cytokines, blood-related products (such as coagulation factors), vaccines,
therapeutic enzymes and monoclonal antibodies (MAbs, Section 1.3).
The production of recombinant proteins within an industrial environment must follow
strict procedures, including that mammalian-derived cell lines should be clonal and
remain stable over long-term culture (LTC) in accordance with the ICH guidelines
(ICH, 1996). Stable cell lines are regarded as cells that retain constant protein
production for extensive periods of culture, generally throughout a period of at least 60
generations beyond the production of a Manufacturers Working Cell Bank (Birch, 1993;
Brown, 1992). A failure of the recombinant cell line to maintain stability during LTC
can result in problems for process yields, protein quality, effective usage of time and
money, and regulatory approval (Barnes et al, 2003).
There are many cellular events that regulate overall recombinant protein expression and
long-term stability of recombinant cell lines (highlighted in Figure 1.1). As the ideal
characteristics of cell line development is to achieve high, stable recombinant protein
production within this Introduction I will discuss the intracellular events controlling
protein expression at the level of transcription (Section 1.6), translation (Section 1.7),
protein folding (Section 1.8) and protein secretion (Section 1.9). I will also discuss the
influence of cell biomass (Section 1.4) and metabolic control (Section 1.5) on protein
production.

23
Figure 1.1 Cellular events which control secreted protein production
The production of proteins from DNA involves several steps including transcription,
translation, protein folding and protein secretion. These events are also influenced by
the cell biomass, including the rates of cell division and cell death, and the metabolic
activity of the cell.
My research involves the Chinese hamster ovary (CHO) cell line and although this cell
line is mainly focused upon within this Introduction there are other expression systems
used in the production of recombinant proteins, including insect cell lines (Chai et al,
1996; Davis et al, 1993; Kost & Condreay, 1999; Wickham et al, 1992), fungal cell
lines (Gerngross, 2004; Keränen & Penttilä, 1995), transgenic animals (Houdebine,
2009; Lonberg, 2005) and transgenic plants (Daniell et al, 2001; Larrick & Thomas,
2001). The most commonly used expression systems for recombinant protein
production are bacterial, yeast and mammalian cells. These expression systems are
discussed in more detail in the next Section.
Transcription
Translation
Protein
Folding
Protein
Secretion
Nucleus
ER

24
1.2 EXPRESSION SYSTEMS
1.2.1 Bacterial and yeast systems
Bacterial and yeast species offer the advantages of rapid cell growth and high yields
with relatively low production costs (Baneyx, 1999; Demain & Vaishnav, 2009; Swartz,
2001). However, there are limitations with these expression systems. High cell densities
of cultures can result in toxicity due to acetate formation, and excessive recombinant
protein in the cytoplasm often becomes misfolded and segregates into soluble
aggregates, known as inclusion bodies (Baneyx, 1999; Demain & Vaishnav, 2009).
Enhanced secretion of recombinant proteins within bacteria can be achieved by
manipulating the cytoplasmic folding environment by increasing molecular folding
chaperones and foldases (Baneyx & Mujacic, 2004; Thomas et al, 1997), or by the
addition of specific signal sequences to the recombinant peptides (Choi & Lee, 2004). A
major disadvantage with using bacterial strains arises from the limited ability to perform
N- and O-linked glycosylation, essential for the function of many human therapeutic
proteins (Jenkins, 2007; Jenkins et al, 1996). Although yeast species have the advantage
of providing an environment capable of performing post-translational modifications
(Verma et al, 1998), the number and type of glycans observed for normal human
proteins differs from that provided by yeast (Cereghino et al, 2002). Approaches to
overcome this problem have included removal of yeast-specific glycosylation sites
(Asami et al, 2000), and genetic engineering yeast strains to perform human
glycosylation at high fidelity. The outcome from this engineering technology is a library
of engineered yeast strains with different glycosylation capabilities (Hamilton et al,
2006; Li et al, 2006a).
1.2.2 Mammalian systems
Although mammalian cells exhibit some disadvantages when compared to bacteria or
yeast systems, for example the expense of complex media and lower cell biomass, these
cells are still extensively used industrially due to their ability to perform correct post-
translational modifications (Andersen & Krummen, 2002; Werner et al, 1998). Post-
translational modifications dictate the pharmacokinetic and pharmocodynamic
properties of recombinant proteins and hence their biological activity (Chirino & Mire-
Sluis, 2004). Mammalian cell lines used for recombinant protein expression include

25
CHO (Section 1.2.2.3), NS0 myeloma (Section 1.2.2.2) and human PER.C6®
cells
(Section 1.2.2.1).
1.2.2.1 PER.C6® cells
PER.C6® cells are derived from primary culture of human fetal retinoblast immortalized
upon transfection with an E1 minigene of adenovirus type 5 (Fallaux et al, 1998). The
cells can be grown in suspension to high cell densities in serum-free medium (Pau et al,
2001). The PER.C6® cell line offers a reliable, safe and scalable solution for the
production of recombinant therapeutic proteins, with the advantage of human-type
glycosylation (Crucell, 2010).
1.2.2.2 NS0 myeloma cells
NS0 myeloma cells were derived in the 1960s from a plasmacytoma induced in a mouse
via peritoneal injection of mineral oils, myeloma cells from the tumour were then
cloned and selected until secretion of antibodies ceased, hence the name NS0 (non-
secreting, Galfre & Milstein, 1981; Potter & Boyce, 1962). Stable protein expression
has been shown for GS-NS0 cells over periods of extended batch culture (Barnes et al,
2001).
1.2.2.3 CHO cells
The CHO progenitor cell line was originally derived from partially inbred female adult
Chinese hamsters (Cricetulus griseus, Puck et al, 1958). CHO cells were considered
useful models in radiation cytogenetics, due to the low chromosome number of Chinese
hamsters (2n=22). It was soon found that these cells grew readily in vitro, with short
doubling times. These features of CHO cells and their ability to gain regulatory
approval has led to approximately 70% of all recombinant proteins being derived from
CHO cells (Jayapal et al, 2007).
The development of the CHO cell line has resulted in several CHO sub-clones, these
include sub-clones that require proline for growth (Kao & Puck, 1967), more commonly
known as CHO-K1. CHO-K1 cells have been used extensively for industrial purposes

26
and several further sub-clones have been generated from these cells including
dihydrofolate reductase (DHFR)-deficient mutant cell lines (DXB11 and DG44, Urlaub
& Chasin, 1980; Urlaub et al, 1983). These cells contain no DHFR enzyme so allow for
the transfected DHFR gene to be used as a selectable amplifiable marker for
heterologous gene expression (Section 1.2.2.4).
1.2.2.4 The DHFR vector system for recombinant protein synthesis
DHFR is an enzyme essential for the formation of folate for use in purine and
pyrimidine biosynthesis. Therefore introduction of a heterologous gene into a cell
deficient in DHFR can be selected for by co-transfection with a functional copy of the
heterologous DHFR gene. Clonal selection is achieved by growing cells in medium
without glycine, hypoxanthine and thymine, so only cells which have stably integrated
the DHFR transgene survive to form colonies (Kaufman, 1990). An advantage of using
DHFR as a selectable marker is that amplification of the heterologous DHFR gene,
along with associated transgenes, can be achieved by using methotrexate (MTX), a folic
acid analogue that competitively inhibits DHFR (Figure 1.2). By treating cells with
increasing concentrations of MTX (MTX amplification) the surviving cells can contain
several hundred to a few thousand copies of the integrated plasmid (Wurm et al, 1986).
Most 'amplified' cells produce more recombinant protein than the unamplified cells
(Jiang et al, 2006; Yoshikawa et al, 2000). Although MTX amplification results in the
isolation of very high producing cell lines, the process can be long and laborious, often
taking over 6 months to isolate and screen for high-producing cell lines (Page, 1988).

27
Figure 1.2 Reaction catalysed by DHFR
Dihydrofolate reductase (DHFR) catalyses the conversion of dihydrofolate to
tetrahydrolate, which is important in nucleoside and amino acid biosynthesis.
Methotrexate (MTX) inhibits the activity of DHFR.
1.2.3.5 The GS vector system for recombinant protein synthesis
The glutamine synthetase (GS) gene is another commonly used selection marker. The
incorporation of a GS gene in a plasmid vector provides a source of glutamine for the
cells and therefore allows for selection of cells in glutamine-free medium (Bebbington
et al, 1992). Glutamine is an essential amino acid, necessary for protein synthesis,
purine and pyrimidine biosynthesis, ammonia formation and the biosynthesis of amino
acids (Meister, 1976). NS0 cells, unlike CHO cells, are GS-deficient, and require
exogenous glutamine. This phenotype can allow for selection of successful transfectants
using the GS system. CHO cells, however, require methionine sulphoximine (MSX), an
inhibitor of GS activity to effectively identify transfected clones (Brown, 1992). The
reaction catalysed by GS is shown in Figure 1.3.
The GS vector system has been successfully used by over 85 biotechnology and
pharmaceutical companies worldwide (Lonza, 2010). Many of these companies have
utilised the GS selection technology in the production of the MAbs (Section 1.3).
Dihydrofolate + NADPH + H+ Tetrahydrofolate + NADP+
DHFR
MTX

28
Figure 1.3 Reaction catalysed by GS
Glutamine synthetase (GS) catalyses the conversion of glutamate and ammonia to
glutamine in the presence of magnesium. Glutamine is important in purine and
pyrimidine biosynthesis. Methionine sulphoximine (MSX) is used as an inhibitor of GS
activity.
1.3 MONOCLONAL ANTIBODIES AS THERAPEUTICS
Five major classes of human antibody (immunoglobulin, Ig) are defined as IgM, IgG,
IgA, IgD and IgE (Jefferis, 2009a). IgE is associated with allergy, IgM, is known to
protect against bacterial and fungal infection, whereas the function of IgD remains less
clear (Woof & Burton, 2004). IgA has been shown to provide a critical role in mucosal
protection (Underdown & Schiff, 1986; Woof & Kerr, 2004), whilst IgG provides the
majority of antibody-based immunity against invading pathogens (Karupiah &
Chaudhri, 2004). Four subclasses of human IgG are defined according to their relative
concentrations in normal serum: IgG1, IgG2, IgG3 and IgG4, which respectively
account for approximately 60%, 25%, 10% and 5% of serum IgG (Jefferis, 2009b). The
choice of IgG subclass is a crucial decision when developing recombinant MAb
therapeutics (Jefferis, 2007). For example, in oncology the IgG1 subclass is the isotype
of choice as it has maximal potential to eliminate targeted cancer cells by inducing
antibody-dependent cellular cytotoxicity (ADCC) and/or complement-dependent
cytotoxicity (CDC, Jefferis, 2009b). The IgG isotype will be dependent on its intended
therapeutic action.
Since the first generation of mouse, chimeric and humanised IgG1 antibodies reached
the market in the late 1990s, the variety of antibody structures has greatly increased
Glutamate + Ammonia Glutamine
GS
MSX
Mg2+

29
(Beck et al, 2010), including human antibodies of other IgG isotypes (IgG2 and IgG4)
(Lonberg, 2008), and IgG-related products such as domain antibodies (DAbs, Nelson &
Reichert, 2009).
In its simplest form an individual IgG molecule is composed of two identical light
chains and two identical heavy chains, linked by disulphide bonds (Steinmeyer &
McCormick, 2008). The light and heavy Ig chains are arranged to form two antigen-
binding (Fab) regions that are linked to an Fc region to form the tertiary structure of the
antibody, comprised of non-covalently paired heavy chain domains and covalently
linked inter-heavy chain disulphide-bonded hinge regions (Jefferis, 2009b; Woof &
Burton, 2004). Antibodies are thought to be connected by 16-28 disulphide bonds,
depending on their isotype (Borth et al, 2005). A generic antibody structure is shown in
Figure 1.4.
As discussed in Section 1.2.2 the major advantage of utilising mammalian cells for
therapeutic protein production is their capacity to perform the correct post-translational
modifications, including glycosylation. N-linked glycosylation (Section 1.8.1) is found
on the constant heavy chain regions of antibodies (Jefferis, 2009b; Rudd et al, 2001),
and on the antibody binding region of polyclonal human IgG antibodies (Holland et al,
2006). The oligosaccharides found on the antigen binding regions are attached to the
variable region of the kappa or lambda light chains or to the variable heavy chain
regions (Jefferis, 2009b). CHO cells hold a major advantage in recombinant protein
production as they can glycosylate variable heavy chain and light chain regions in a
manner similar to that observed for normal human IgG (Lim et al, 2008).

30
Figure 1.4 Schematic of an antibody
An antibody contains both heavy chain and light chain proteins linked by disulphide
bonds. Variable regions are found at the amino acid terminal ends of the heavy and
light chain proteins which confer antigen binding specificity. The Fc domain modulates
effector functions (adapted from Steinmeyer & McCormick, 2008).
Key for Figure 1.4
Therapeutic murine MAbs entered clinical studies in the early 1980s, but problems
arose due to lack of efficacy, and the rapid clearance of the murine MAbs due to the
patient‟s production of human anti-mouse antibodies (the HAMA response). These
issues became the driving forces for the evolution of MAb production technology
(Reichert et al, 2005) and ultimately the development of MAbs, and related proteins.
MAbs have been used successfully in a variety of disease therapies including several
forms of cancer, multiple sclerosis and immunological disorders (Table 1.1, Jefferis,
2009a; Shukla & Thömmes, 2010).
Heavy chainHeavy chain
Fc domain
Variable region
Constant region
Hinge region
Disulphide bonds

31
Table 1.1 MAbs on the market
Note: these products may not be approved for use in all countries. * MAbs derived from
recombinant CHO cells, a Synagis is also known as palivizumab (adapted from Shukla
& Thömmes, 2010).
Recently approved antibodies include Arzerra (ofatumumab) and Prolia (denosumab).
Arzerra, a MAb specific for CD20, was approved by the US FDA in October 2009 for
the treatment of chronic lymphocytic leukemia, and is under regulatory review in
Europe for the same indication (Keating et al, 2010). Prolia (denosumab), a
breakthrough fully-human MAb , approved by the FDA in 2010 for use in the treatment
and prevention of bone loss in hormone-treated prostate and breast cancer patients, has
also been fast-tracked by the FDA for treatment and prevention of postmenopausal
osteoporosis (Ellis et al, 2008; McClung et al, 2006).
Although MAbs have great therapeutic potential they can be constrained by their large
molecular size (Reichert et al, 2005). Domantis has pioneered DAbs, based on the
Name Target Indication Company Year
Orthoclone OKT3 CD3 Acute kidney transplant rejection Ortho Biotech 1986
ReoPro Platelet GP Blot clot prevention Centocor 1994
Panorex 17-1A Colorectal cancer Genentech/Biogen-Idec 1995
Rituxan * CD20 Non-Hodgkin's Lymphoma GlaxoSmithKline 1997
Zenapax * IL2R (CD25) Acute kidney transplant rejection Hoffman-LaRoche 1997
Simulect IL2R Prophylaxis of acute organ rejection Novartis 1998
Synagis *a
RSV Respiratory Synctial Virus MedImmune 1998
Remicade TNFα Rheumatoid arthritis Centocor 1998
Herceptin * Her2 Metastatic breast cancer Genentech 1998
Mylotarg * CD33 Acute mylogenous lymphoma Wyeth-Ayerst 2000
Campath * CD52 B cell chronic lymphocytic leukemia Takeda 2001
Zevalin * CD20 Non-Hodgkin's Lymphoma Biogen-Idec 2002
Humira * TNFα Rheumatoid arthritis Abbott 2002
Bexxar CD20 Non-Hodgkin's Lymphoma Corixa/GlaxoSmithKline 2003
Xolair * IgE Allergy Genentech/Novartis 2003
Eritux EGFR/Her1 Colorectal cancer Bristol-Myers 2004
Squibb/Imclone (Eli Lilly)
Avastin * VEGF Colorectal cancer Genentech 2004
Raptiva CD11 Psoriasis Genentech/Xoma 2004
Tysabri * A4 integrin Multiple sclerosis Biogen-Idec/Elan 2004
Vectibix * EGFR/Her1 Colorectal cancer Amgen 2006
Soliris * C5 complement Paroxysmal nocturnal hemoglobinuria Alexion 2007
Stelara IL12 and IL23 Psoriasis Centocor 2008
Simponi TNFα Rheumatoid arthritis Centocor 2008
Actemra IL6 Rheumatoid arthritis Roche 2009
Arzerra CD20 Non-Hodgkin's Lymphoma Genmab 2009
Prolia * RANK ligand Prevention of bone loss in cancer patients Amgen 2010

32
smallest functional binding units of human antibodies. DAbs contain either the variable
domain of an antibody light chain or heavy chain, ranging in size from 11 kDa to 15
kDa. DAbs are bioactive as monomers but they can also be formatted into larger
molecules to create drugs with prolonged serum half-lives or other pharmacological
activities (Holt et al, 2003).
1.4 CELL BIOMASS AS A POTENTIAL DETERMINANT OF RECOMBINANT
PROTEIN PRODUCTION
1.4.1 Cell cycle progression
Cell cycle progression and division in mammalian cells is controlled by a network of
checkpoints that are regulated by a complex network of kinases, inhibitors and signalling
molecules. The cycle itself is divided into two distinct phases interphase and M phase,
with each having further subphases (Figure 1.5). The genetic material of the cell is
replicated during S phase, a subphase of interphase. Two gap phases of interphase,
GAP1 (G1) and GAP2 (G2), occur before and after S phase and allow the cell to grow
and prepare for either the replication of nuclear material (S phase) or the separation into
two progenic cells (M phase). M phase, which consists of mitosis and cytokinesis,
follows immediately after G2 resulting in daughter cells, allowing the cell cycle to re-
initiate. Non-proliferating cells that are arrested during G1 phase may also enter the
quiescent G0 phase. These cells are maintained in G0 through the phosphorylation of
key cell cycle regulators (Section 1.4.2, Sunley & Butler, 2010). Previous investigations
have given differing reports with regards to how productive certain cell cycle phases are.
Maximum protein expression has been related to G1 phase (Al-Rubeai & Emery, 1990;
Dutton et al, 2006; Kromenaker & Srienc, 1991), S phase (Banik et al, 1996; Gu et al,
1996; Kubbies & Stockinger, 1990) and G2/M phase (Aggeler et al, 1982).
1.4.2 Cell cycle regulators
Progression through each phase of the cell cycle is tightly correlated with the expression
and rapid degradation of cyclin and cyclin-dependent kinase (CDK) complexes. From
early Gl the D-type cyclins form complexes with CDKs 4 or 6 (Bates et al, 1994;

33
Meyerson & Harlow, 1994), which initiates hyperphosphorylation of retinoblastoma
(Rb, Kitagawa et al, 1996). Hyperphosphorylation of Rb releases transcription factor
E2F1, and allows for the transcription of genes required for G1/S transition, such as
cyclin A, cyclin D and cyclin E (Dyson, 1998). Cyclin E-CDK2 is required to initiate S
phase, cyclin A-CDK2 is expressed during DNA synthesis in the cell, whilst cyclin B-
CDK1 is needed to drive entry into mitosis (Hochegger et al, 2008; Nurse, 2000)
Figure 1.5 The cell cycle
Cell cycle phases and the key cyclin-CDK complexes involved in the cell cycle.
Key for Figure 1.5
Various techniques have been used to regulate the proliferation of mammalian cells, for
example, via activation of cyclin-dependent kinase inhibitors (CKIs) and via
temperature control.
CKIs are divided into two major families, the INK4 (inhibitor of CDK4) family, which
specifically inhibit cyclin D-associated kinases (CDKs 4 and 6), and the Cip/Kip (kinase
inhibitor protein) family, consisting of p21cip1/waf1
, p27kip1
and p57kip2
, which inhibit
most CDKs (Dai & Grant, 2003). Enhancement of p21cip1
in a recombinant GS-CHO
cell line increased both productivity and final titre by arresting cells in the G1 phase of
MG0
G2
G1
S
Cyclin A-CDK2
Cyclin B-CDK1
Cyclin E-CDK2
Interphase
Mitosis

34
the cell cycle (Bi et al, 2004), whilst overexpression of p27kip1
also resulted in growth-
arrest and greater recombinant protein production from recombinant CHO cultures
(Mazur et al, 1998). Although growth arrest has been shown to improve protein
production from CHO cells it can occur with higher cellular energy expenditure. For
example, p27kip1
mediated CHO cell growth arrest resulted in increased rates of oxygen,
glutamine and glucose consumption, with greater production of lactate and ammonia
(Carvalhal et al, 2003).
Marchant et al, have also shown that CHO cell growth can also be regulated by
controlling culture temperature. A decrease in culture temperature from 37°C to 27°C
resulted in G1 cell cycle arrest and lower maximal cell densities. Although total
antibody titres were not enhanced, increased specific protein production rate per cell
(specific productivity [Qp]) was observed (Marchant et al, 2008). An associated
increase in Qp during mild-hypothermic conditions has also been observed for other
recombinant CHO cultures (Nam et al, 2008; Rodriguez et al, 2005; Yoon et al, 2006;
Yoon et al, 2003). Exposure of mammalian cells to low temperatures has resulted in the
determination of cold-stress genes (Al-Fageeh & Smales, 2006), such as the cold-
inducible RNA-binding protein (CIRP), which is highly expressed during mild-
hypothermic conditions but not physiological temperatures (Nishiyama et al, 1997).
Overexpression of CIRP has been shown to increase both recombinant CHO protein
titre and Qp values at 37°C, without affecting viable cell densities (Tan et al, 2008).
1.5 METABOLIC ACTIVITY AS A POTENTIAL DETERMINANT OF
RECOMBINANT PROTEIN PRODUCTION
Assessment of cell growth and metabolic activities are essential to the success in the
control and improvement of a cell culture processes (Tsao et al, 2005). A proliferating
cell must replicate all of its cellular contents. This imposes a large requirement for
nucleotides, lipid, amino acids and carbon sources for effective replication (Van der
Heiden et al, 2009).
Glucose serves as both a main carbon source and an important energy intermediate in
most medium formulations. Entry of glucose into the glycolytic pathway leads to the

35
formation of pyruvate. In mammalian cells, pyruvate can either be shuttled into the
tricarboxylic acid (TCA) cycle or be converted into lactate (Tsao et al, 2005). The
oxidation of glycolytic pyruvate in the TCA cycle produces NADH, needed to
maximize ATP production via oxidative phosphorylation (shown in Figure 1.6, Van der
Heiden et al, 2009). Metabolic production of ATP is necessary for many cellular
processes, including transcription, translation, protein folding, secretion and degradation
(highlighted in Figure 1.7).
Figure 1.6 Metabolic production of ATP, NAD+ and NADH
ATP, NAD+ and NADH production via metabolic pathways involved in glycolysis, the
TCA cycle, oxidative phosphorylation and the utilisation of lactate and alanine.
The consumption rate of glucose and the accumulation rate of lactate can reflect the
metabolic activities and cell growth of the cultures. For example, CHO cell lines with
low rates of glucose utilisation and lactate production had low rates of cell growth
(Marchant et al, 2008), whilst cultures exposed to limited glucose concentrations also
Glucose Glucose-6-phosphate
Acetyl CoA
Oxaloacetate TCA Cycle
Lactate
Glycolysis
Succinyl
CoA
Oxidative
Phosphorylation
NADH
NAD+
O2
ADP
ATP
NADH
NAD+
ATP
ADP
NADH
Mitochondria
Cytosol
α-Ketoglutarate
Malate
NAD+
NADH
NADH
NAD+
AlanineAlanine
NAD+
NADH
Lactate
Glyceraldehyde 3-phosphate
1,3-Diphosphoglycerate
3-Phosphoglycerate
ADP
ATP
NAD+
NADH
2-Phosphoglycerate
Phosphoenolpyruvate
ADP
ATP
Pyruvate
NAD+
Glucose Glucose-6-phosphate
Acetyl CoA
Oxaloacetate TCA Cycle
Lactate
Glycolysis
Succinyl
CoA
Oxidative
Phosphorylation
NADH
NAD+
O2
ADP
ATP
NADH
NAD+
O2
ADP
ATP
NADH
NAD+
ATP
ADP
NADH
Mitochondria
Cytosol
α-Ketoglutarate
Malate
NAD+
NADH
NADH
NAD+
AlanineAlanine
NAD+
NADH
Lactate
Glyceraldehyde 3-phosphate
1,3-Diphosphoglycerate
3-Phosphoglycerate
ADP
ATP
NAD+
NADH
2-Phosphoglycerate
Phosphoenolpyruvate
ADP
ATP
Pyruvate
NAD+

36
had decreased viable cell densities (Altamirano et al, 2006; Lu et al, 2005), less
intracellular ATP, and increased utilisation of amino acids (Lu et al, 2005)
Metabolic engineering has also been employed to increase recombinant protein
production. Many strategies have involved lowering the expression of lactate
dehydrogenase (LDH), the enzyme involved in the conversion of glucose-derived
pyruvate to lactate. Less LDH within CHO cultures resulted in lower lactate
concentrations with greater intracellular ATP and recombinant antibody production
(Chaya et al, 2008; Jeong et al, 2006; Jeong et al, 2004; Kim & Lee, 2007).
Components of the TCA cycle have also been targeted to improve productivity of
recombinant CHO cells. Overexpression of malate dehydrgoenase II (MDH II), which
converts malate to oxaloacetate in the mitochondria as part of the TCA cycle, resulted in
lower lactate secretion, a three- to four-fold increase in ATP and NADH, and enhanced
MAb titre (Chong et al, 2010). A recombinant yeast pyruvate carboxylase expressed in
baby hamster kidney (BHK-21) cells has also been shown to affect the metabolic
activity of mammalian cultures, increasing the flux of glucose into the TCA
consequently resulting in a higher intracellular ATP content and greater recombinant
protein production (Irani et al, 2002).

37
Figure 1.7 ATP is critical at multiple sites of protein expression
ATP is an important energy source used at various stages of recombinant protein
production. ATP is also needed for cell survival as cells deficient in ATP often undergo
apoptosis (Izyumov et al, 2004).
1.6 TRANSCRIPTION AS A POTENTIAL DETERMINANT OF
RECOMBINANT PROTEIN PRODUCTION
The variability of transgene expression is often attributed to the number of gene copies
integrated, and to the particular site of integration within the host chromatin structure
(Davies & James, 2009). Chromatin is a DNA-protein complex whose basic repeating
unit is the nucleosome (Kornberg & Lorch, 1999). The nucleosome contains a tripartite
core of eight histones (two molecules of each histone H2A, H2B, H3 and H4), around
which is wrapped 146 bp DNA (Luger et al, 1997). Each core histone has two domains,
a histone fold domain, which is involved in histone-histone interaction and in wrapping
DNA around the nucleosome, and an amino-terminal tail domain that lies on the outside
Ribosome
mRNA
Transcription
Polypeptide
Amino-acylated
tRNAs
Amino acids
free
tRNAs
ADPATP
ATPADP
GTP GDP
ChaperoneUnfolded
polypeptide
ATP
ADPFolded
polypeptide
ER associated-
degradation
ADPATP
Ubiquitination
& proteasomal degradation
UbUb
Ub
Protein
Folding
Translation
Degradation

38
of the nucleosome allowing interactions with other regulatory proteins and DNA, as
well as providing a site for post-translational modifications (Jones & Wolffe, 1999).
Chromatin can be subdivided in two forms, condensed heterochromatin, which is
generally accepted to exist in a transcriptionally silent state, and the transcriptionally
active decondensed euchromatin (Davies & James, 2009). It has been observed that
transcriptionally active genes are enriched in acetylated histones (Kouzarides, 2000).
Histone acetylation is a lysine amidation reaction catalyzed by acetyltransferases, which
acts to neutralize the positive charge of the histone tails thereby lowering their affinity
for DNA (Hong et al, 1993). Histone acetylases (HATs) and histone deacetylases
(HDACs) act as transcription coactivators and corepressors, respectively (Pazin &
Kadonaga, 1997; Struhl, 1998). Sodium butyrate, an inhibitor of HDAC, has been
shown to increase the specific productivity of recombinant proteins in CHO cells by
enhancing gene accessibility to transcription factors (Jiang & Sharfstein, 2008; Zhou &
Sharfstein, 2008).
Improvement of gene expression can also occur by site-specific integration or by
flanking the transgene with genomic DNA elements that promote high transcriptional
activity (Davies & James, 2009). There are many transgene flanking DNA elements
used to improve transgene expression and stability, these include locus control regions
(LCRs), boundary and insulator elements, scaffold/matrix attachment regions (S/MAR)
and ubiquitous chromatin opening elements (UCOEs). S/MAR elements have been used
to improve both stable gene expression (Kim et al, 2004) and antibody production from
recombinant CHO cells (Zahn-Zabal et al, 2001), whilst vectors containing an UCOE
element have been reported to provide a higher proportion of positive CHO clones with
greater recombinant protein expression (Benton et al, 2002). Gene-targeting vectors
have also been used to target desired genes within the CHO cell genome to obtain high
recombinant proteins producers (Huang et al, 2007; Kito et al, 2002).

39
1.7 TRANSLATION AS A POTENTIAL DETERMINANT OF RECOMBINANT
PROTEIN PRODUCTION
1.7.1 Translational initiation
The majority of translational control is exerted on the initiation stage of protein
synthesis, during which the ribosomes bind the mRNA and locate the start codon (AUG,
Gingras et al, 1999; Sonenberg & Hinnebusch, 2009). The eukaryotic translation
initiation factor (eIF) 4E plays a key role by binding to the cap structure at the 5'-end of
the mRNA and recruiting initiation factors to the mRNA (Proud, 2002a). To initiate
translation, the 40S ribosomal subunit, stabilised by association with the large
multisubunit initiation factor eIF3, binds to Met-tRNAi and the mRNA. The Met-tRNAi
is brought to the 40S ribosomal subunit as part of an eIF2–GTP complex (eIF2-GTP-
Met-tRNAi), and together with other initiation factors, eIF3, eIF1, eIF1A and eIF5,
forms the 43S preinitiation complex. On most mRNAs, 48S complexes form by a
„scanning‟ mechanism, whereby the 43S preinitiation complex attaches to the capped 5‟
proximal region of mRNA‟s 5‟ terminal secondary structure by eIF4A, eIF4B and
eIF4F. After initiation codon recognition the 48S complex formation, eIF5 and eIF5B
promote the hydrolysis of eIF2-bound GTP, the displacement of eIFs and the joining of
a 60S subunit. (Figure 1.8, Fraser & Doudna, 2007; Sonenberg & Hinnebusch, 2009).
Under stressed conditions eIF4F assembly is blocked by 4E-binding protein (4E-BP)
binding to eIF4E via the mammalian target of rapamycin (mTOR) pathway (Carrera,
2004; Fingar et al, 2004; Kimball & Jefferson, 2004).
Two main mechanisms control initiation through reversible phosphorylation. The first
phosphorylation of eIF4E binding proteins stimulates the binding of eIF4E to the
mRNA allowing translation initiation. The second phosphorylation of eIF2α halts
translation by interfering with binding of initiator methionyl-tRNA to the 40S ribosomal
subunit (Kaufman et al, 2002). Translation attenuation by eIF2α phosphorylation will be
discussed in more detail Section 1.8.3.2.
Engineering at the mRNA translation initiation step via transient expression of non-
phosphorylatable eIF2α has been shown to improve reporter activity within CHO cells
by improving rates of protein synthesis (Underhill et al, 2003).

40
Figure 1.8 Diagram of translation initiation
Translation of mRNA into protein begins after assembly of initiator tRNA, mRNA and
both ribosomal subunits. The pre-initiation complex eIF2-GTP-Met-tRNAi together with
eIF3, eIF1, eIF1A and eIF5 binds to the mRNA at the 5' terminal cap structure with
help of the eIF4F protein complex and proceeds to scan the mRNA until it encounters
the initiation codon. GTP hydrolysis allows the joining of the 60S subunit and recycling
of the initiation factors.
1.7.2 RNA interference (RNAi)
RNAi can also regulate gene expression at the level of translation. RNAi has been
shown to occur specifically in the presence of double-stranded (ds) RNA with a
sequence complementary to the mRNA being targeted (Tuschl et al, 1999; Wianny &
Zernicka-Goetz, 2000). Studies of transgene-induced and virus-induced gene silencing
in plants identified the presence of small interfering RNAs (siRNAs), approximately 22
nucleotides in length (Hamilton & Baulcombe, 1999). Ribonuclease III-like enzyme
(Dicer) is the enzyme responsible for processing dsRNA into siRNAs (Bernstein et al,
2001). The antisense strand of the siRNA is used by RNA-interference silencing
complex (RISC, Hammond et al, 2000) to guide mRNA cleavage and mRNA
degradation (McManus & Sharp, 2002). siRNAs can also function as microRNAs
eIF2-GTP
Met-tRNAi
eIF2-GTP-Met-tRNAi
43S preinitiation complex
eIF3
eIF1
eIF1A
eIF5
40S
eIF4F
60S
Ribosome Scanning
GTP hydrolysis
eIF5B-GTP
80S initiation complex
eIF2-GDP + Pi
eIF2B
AUG
GTP
GDP
mRNA
mRNA

41
(miRNA, Doench et al, 2003). miRNAs, are non-coding RNAs predicated to pair with
30% of mammalian protein coding genes, possibly to direct translational repression or
mRNA degradation (Baek et al, 2008; Bartel, 2004; Bartel, 2009; Filipowicz et al,
2008). The upregulation of growth inhibitory miRNAs, miR-21 and miR-24 has been
shown during CHO-K1 batch culture (Gammell et al, 2007).
In addition to the natural actions of siRNAs, RNAi technology has been exploited by
the industry to increase recombinant CHO cell productivity. For example, Lim et al,
used siRNA to knock down pro-apoptotic genes Bak and Bax, resulting in greater
viability of CHO batch cultures with improved interferon (IFN) product titre (Lim et al,
2006).
1.8 PROTEIN FOLDING AS A POTENTIAL DETERMINANT OF
RECOMBINANT PROTEIN PRODUCTION
Once effectively translated, proteins destined for secretion are directed to the ER
through a predominantly hydrophobic signal sequence and either co- or post-
translationally traverse the ER membrane through an aqueous channel, the Sec61
complex (Rutkowski et al, 2003). The ER plays a crucial role in the folding, assembly
and glycosylation of newly synthesised proteins. As many secretory proteins contain
disulphide bonds, a central role is played by ER-resident oxidoreductases (ERO),
including protein disulphide isomerase (PDI), and protein chaperones such as BiP
(Ellgaard & Helenius, 2003).
BiP (also known as glucose-regulated protein [GRP] 78) is an ER homologue of
HSP70, containing both an peptide-binding domain and ATPase domain (Bole et al,
1986; Haas & Wabl, 1983; Hendershot et al, 1987; Hendershot, 2004; Lee, 2001)). BiP
interacts with heavy chain proteins (in the absence of light chain proteins, Vanhove et
al, 2001), and hydrophobic residues exposed on unfolded proteins (Gregory et al, 1991).
When in its open conformation BiP is bound to ATP. ATP hydrolysis allows BiP to
bind to mis/unfolded proteins (Mayer et al, 2000), a process stimulated by ER-resident
J-domain (ERdj) co-chaperones, including ERdj3, ERdj4, ERdj5 and ERdj6 (p58IPK
,
Otero et al, 2009). BiP also assists PDI binding to mis/unfolded proteins, allowing it to
access the incorrectly folded protein (Mayer et al, 2000).

42
PDI aid protein re-folding by catalysing disulphide bond formation, with the assistance
of ERO1 (Bulleid & Freedman, 1988; Roth & Pierce, 1987). ERO1 is oxidized by
molecular oxygen and in turn acts as a specific oxidant of reduced PDI, whilst at the
same time reducing its cofactor flavin adenine dinucleotide (FAD) to FADH2 (Figure
1.11, Frand & Kaiser, 1999; Tu et al, 2000; Tu & Weissman, 2004). In mammalian cells
the capacity of oxidative protein folding machinery depends on two conserved resident
oxidases ERO1α and ERO1β. ERO1α is expressed in most cell types, whilst ERO1β is
induced by ER stress (Cabibbo et al, 2000; Mezghrani et al, 2001; Pagani et al, 2000).
Increased ERO1 expression in mammalian cells has been shown to increase the rate of
PDI-dependent immunoglobulin oxidation (Mezghrani et al, 2001).
Figure 1.9 The role of PDI in disulphide bond formation
Protein disulphide isomerase (PDI) operates in both an oxidised and reduced form to
assist in disulphide bond formation with the cooperation of ER-resident oxidoreductase
(ERO1).
Studies involving upregulation of ER chaperone proteins have given differing accounts
relating to the improvement of recombinant protein production from CHO cultures.
Borth et al, found that enhanced BiP expression in CHO cells resulted in lower antibody
productivity due to increased accumulation of intracellular heavy chain proteins (Borth
et al, 2005), whilst Hayes et al, found that overexpression of PDI had no effect on
recombinant CHO IgG4 MAb titres (Hayes et al, 2010). However, other investigations
have shown increased Qp values from recombinant CHO cell lines with the
upregulation of PDI expression alone (Borth et al, 2005; Chaya et al, 2007; Mohan et al,
H2O
O2
FAD
FADH2
ERO1 reduced
ERO1 oxidised
SH
PDI oxidised
PDI reduced
SHSH
SH
SS
SS
SS
SHSH

43
2007), or in combination with ERO1 (Mohan & Lee, 2010). These contradictory
findings highlight the cell line specific nature of the CHO cell line.
Protein folding in the case of MAbs also requires the coordinated expression of both
heavy chain and light chain proteins (Dinnis & James, 2005). It has been previously
suggested that excess copies of light chain proteins are necessary for optimal rates of
MAb assembly in mammalian cells (Smales et al, 2004), whilst heavy chain mRNA
translation was found to exert most control on a recombinant IgG4 antibody producing
CHO cell line (Schlatter et al, 2005). Again the dependency of heavy chain or light
chain expression on optimal MAb formation may be cell line specific.
1.8.1 N-linked glycosylation
As mentioned in Section 1.3 N-linked glycosylation is common to recombinant
antibodies, and is also important for protein folding (Hammond et al, 1994). When a
nascent protein enters the ER lumen through the Sec61 translocon complex, their
sequence is scanned by the luminal oligosaccharyltransferase (OST) for asparagine in
consensus Asn-X-Ser/Thr motifs. These are modified covalently by the addition of
preassembled, tri-antennary core glycan composed of two N-acetylglucosamine
(GlcNAc), nine mannose (Man) and three glucose (Glc) residues (Glc3Man9GlcNAc2,
Ruddock & Molinari, 2006). The glycoprotein is then monitored within the ER by the
calnexin (CNX)/calreticulin (CRT) cycle (Section 1.8.2) to ensure it has been correctly
folded. Once the glycoprotein has correctly folded it travels to the Golgi and becomes
characterised by the addition of new oligosaccharides including GlcNAc, galactose
(Gal), fucose (Fuc) and sialic acid (Helenius & Aebi, 2001; Jefferis, 2005; Jenkins et al,
1996). It has been reported that the sialylated profiles of antibodies produced from CHO
and human IgGs differ. However, the amount of sialylated oligosaccharides in both
human-and CHO-derived antibodies is so low that the difference in sialylation patterns
is not considered disadvantageous to recombinant CHO cell protein production (Raju et
al, 2000).
After terminal glycosylation only Man3GlcNAc2 from the original core is present. A
shorthand system of nomenclature for oligosaccharides uses G0, G1 and G2 for those
glycans bearing zero, one or two galactose residues, respectively. An F is added after

44
the oligosaccharide number to indicate the presence of fucose (Jefferis, 2009b). The
common N-linked glycan structures are shown in Figure 1.10
Figure 1.10 Common N-linked glycan structures
The shorthand system of nomenclature for the oligosaccharide structures commonly
found on antibodies.
The glycan profile of the therapeutic protein is extremely important as it can modulate
the immunogenic potential of the glycoprotein by defining all or part of an epitope
(Cumming, 1991). It is also important for maintaining quality control (QC) within the
ER, ensuring ER homeostasis.
1.8.2 Calnexin/calreticulin (CNX/CRT) cycle
The CNX/CRT cycle (Figure 1.11) acts as part of the QC mechanism in the ER to
monitor protein conformations and dictate whether a molecule is exported or targeted
for degradation. CNX and CRT are homologous lectins resident to the ER (Hammond et
al, 1994). As previously mentioned (in Section 1.8.1) N-linked glycosylation occurs
through the transfer of Glc3Man9GlcNAc2 to the nascent polypeptide chain as it enters
the ER lumen. Soon after transfer trimming of the core oligosaccharide occurs by the
successive action of ER glucosidases I and II to produce Glc1Man9GlcNAc2. The
monoglucosylated form interacts with CRT and CNX, shuttling through cycles of de-
G0
G1
G2
Non-Fucosylated Fucosylated (F)
GlcNAc
GlcNAc
Man
Man
Man GlcNAc GlcNAc
GlcNAc
GlcNAc
Man
Man
Man GlcNAc GlcNAc
Fuc
GlcNAc
GlcNAc
Man
Man
Man GlcNAc GlcNAc
GlcNAc
GlcNAc
Man
Man
Man GlcNAc GlcNAc
Fuc
Gal Gal
GlcNAc
GlcNAc
Man
Man
Man GlcNAc GlcNAc
GlcNAc
GlcNAc
Man
Man
Man GlcNAc GlcNAc
Fuc
Gal Gal
GalGal

45
and re-glucosylation by α-glucosidase II and uridine diphosphate (UDP)-
glucose:glycoprotein glucosyl transferase (UGGT, Ellgaard & Helenius, 2003). UGGT
preferentially recognizes and glucosylates partially mis/unfolded glycoproteins.
Mis/unfolded proteins are then retained within the CNX/CRT cycle, via interactions
with ERp57 (a thiol-disulphide oxidoreductase) until the protein is folded correctly or
targeted for degradation (Section 1.8.4, Ellgaard & Helenius, 2001; Frickel et al, 2002).
Figure 1.11 The CNX/CRT cycle
The calnexin (CNX) and calreticulin (CRT) cycle is a quality control mechanism within
the ER to ensure only correctly folded glycoproteins are secreted.
CNX and CRT can also act by binding to BiP if N-linked glycosylation is blocked, this
process results in the activation of an unfolded protein response (UPR, Section 1.8.3,
Balow et al, 1995; Zhang et al, 1997).
1.8.3 The Unfolded Protein Response (UPR)
As a major post-translational protein processing organelle, the ER monitors, and
controls via feedback mechanisms, the protein production load and ensures the QC of
proteins within the exocytic pathway (Ellgaard & Helenius, 2003; Rutkowski &
Kaufman, 2004). Ectopic expression of recombinant proteins can compromise the ER
protein folding capacity and result in accumulation of unfolded proteins within the ER
ER
Glucosidase I and II
CRT
Glc1Man9GlcNAc2
ERp57
Unfolded protein
Man9GlcNAc2
Glucosidase II
Man9GlcNAc2
Folded protein
Glc1Man9GlcNAc2
UGGT
Ribosome/sec61 complex
Glc1Man9GlcNAc2
ERp57
CNX

46
(Cudna & Dickson, 2003). Increased demands on the secretory pathway can activate the
UPR, which consists of four main processes (Brewer & Hendershot, 2005). These
processes include (i) transcriptional induction of molecular chaperones and folding
enzymes (Dorner et al, 1992), (ii) attenuation of global protein synthesis (Harding et al,
1999), (iii) ER-associated degradation (ERAD) of mis/unfolded proteins (Yoshida et al,
2003), and (iv) cellular apoptosis (Kim et al, 2006). Stress sensors, inositol requiring
protein-1 (IRE-1), activating transcription factor 6 (ATF6) and protein kinase RNA
(PKR)-like ER kinase (PERK) are activated upon the dissociation of BiP. These stress
sensors are discussed in more detail below.
1.8.3.1 IRE-1
Genetic screens in yeast identified IRE-1, a type I transmembrane protein with
serine/threonine protein kinase activity, as the ER stress receptor (Cox et al, 1993). The
accumulation of mis/unfolded proteins and dissociation of BiP activates IRE-1,
allowing it to homodimerize and transphosphorylate (Welihinda & Kaufman, 1996). In
yeast the endonuclease activity in the C-terminal domain of IRE-1 catalyses splicing
and activation of HAC1 mRNA (Cox & Walter, 1996; Sidrauski & Walter, 1997) to
allow induction of ER stress genes to aid in protein folding, as well as ER and Golgi
transport (Mori et al, 2000; Rüegsegger et al, 2001).
The mammalian IRE-1 pathway is similar to yeast, although there are two mammalian
IRE-1 genes that have been cloned, IRE1α (Tirasophon et al, 1998) and IRE1β (Wang
et al, 1998). Once activated the cytosolic endonuclease component of IRE-1 splices a
26-bp intron from X-box-binding protein (XBP)-1 mRNA (Bertolotti & Ron, 2001;
Yoshida et al, 2001), the mammalian homolog of HAC1 (Calfon et al, 2002; Tirasophon
et al, 1998). Activated and spliced XBP-1 (XBP-1[s]) migrates to the nucleus where it
binds with the general transcription factor, nuclear factor (NF)-γ, and the ER stress-
response element (ERSE), a promoter sequence encoding for XBP-1, BiP and P58IPK
(Calfon et al, 2002; Lee et al, 2003).
The cytosolic domain of IRE1α has also been shown to interact with the apoptosis-
associated proteins Bax and Bak, an interaction which increases during ER stress (Hetz
et al, 2006). The regulation of ER stress-induced apoptosis is discussed in Section
1.8.4.3.

47
1.8.3.2 ATF6
Two isoforms of ATF6 exist in mammalian cells, ATF6α and ATF6β (Haze et al, 1999;
Yoshida et al, 1998). The accumulation of mis/unfolded protein causes BiP dissociation
from ATF6 revealing two Golgi localisation signals. The localisation signals allow
ATF6 to enter COPII vesicles and translocate to the Golgi (Shen et al, 2002), where it is
proteolytically processed by two Golgi resident enzymes: site-1 protease (S1P) and site-
2 protease (S2P, Shen & Prywes, 2004). The cleavage yields a free cytoplasmic domain,
a 50-60kD cytosolic bZIP-containing fragment that migrates to the nucleus, and in the
presence of the CCAAT-binding factor (CBF), binds exclusively to the ERSE (Shen et
al, 2001). CHO cells defective in S2P are unable to proteolytically process ATF6 and
effectively respond to ER stress (Nadanaka et al, 2006).
ATF6 and IRE-1 differ in their timing but interact to induce XBP-1 transcription and
mRNA splicing (Yoshida et al, 2003). This splicing event creates a translational
frameshift in XBP1 mRNA allowing production of an active transcription factor, co-
inducing the UPR-response elements (UPRE, Calfon et al, 2002; Lee et al, 2002; Shen
et al, 2001; Yoshida et al, 2001). Since XBP-1(s) binds and activates both ERSE- and
UPRE-containing promoters, it has been considered a global regulator for sustained
stress recovery across the entire endomembrane/endocytic systems (Tigges &
Fussenegger, 2006).
1.8.3.3 PERK
PERK is type I ER-resident protein that senses ER stress through its luminal domain
(Harding et al, 2000a; Harding et al, 2000b; Harding et al, 1999). BiP dissociation
causes autophosphorylation and dimerisation of PERK (Bertolotti et al, 2000). Once
activated PERK phosphorylates serine-51 of eIF2α (Harding et al, 2000a; Harding et al,
2000b; Shi Y, 1998). Phosphorylated eIF2α prevents the exchange of eIF2-GDP to
eIF2-GTP, which is needed to bind to Met-tRNAi and assemble the 43S preinitiation
complex (Section 1.7.1). This process results in a transient decrease in protein synthesis
(Brostrom & Brostrom, 1998; Prostko et al, 1993). Although global protein synthesis is
inhibited, translation of ATF4 mRNA is preferentially initiated due to the position of
two upstream open reading frames (uORFs) allowing re-initiation at 5‟ sites (Harding et

48
al, 2000a; Lu et al, 2004). Activated PERK also blocks the translation of cyclin D1
mRNA, resulting in the loss of cyclin D-dependent kinase activity. This loss, in turn,
leads to inhibition of cyclin E- and A-dependent CDK2 leading to G1 cell cycle arrest
(Brewer & Diehl, 2000; Brewer et al, 1999). Cell cycle progression is discussed in
Section 1.4.
The stress sensor pathways involved in the UPR are shown in Figure 1.12. The proteins
affected by the PERK pathway are discussed in more detail below.
Figure 1.12 Activation of the UPR
The UPR pathway is mediated by three resident proteins, PERK, ATF6 and IRE-1
which act as mis/unfolded protein sensors. Upon activation the sensors initiate
responses that lower ER protein load by inhibiting translation and by enhancing
expression of UPR genes, such as ER chaperones.
Ribosome/Sec61 complex
BiP
PDI
P
IRE-1
Golgi
ATF6 (p50)
ATF6 (p90)P P
eIF2α
ATF4
GADD34
Cyclin D1translation
Cell cycle arrest
XBP-1splicing
PERK
P
P
ER
XBP-1(s)
GADD153
Global Translation
Attenuation
Induction of UPR genes

49
1.8.3.3.1 ATF4
ATF4 belongs to the ATF/CREB family of basic region-leucine zipper transcription
factors and is induced by many stress signals including ER stress, amino acid
deprivation, oxidative stress and anoxia/hypoxia. As mentioned earlier ATF4 mRNA is
translationally upregulated by ER stress via the PERK pathway (Harding et al, 2000a;
Lu et al, 2004) and is also transcriptionally upregulated by nutrient deprivation, through
the activation of GCN2 by the direct binding of uncharged tRNAs that accumulate
during amino acid limitation (Siu et al, 2002, Hinnebusch, 2005). The activation of
GCN2 also results in the eIF2α phosphorylation, which acts to limit protein synthesis,
ensuring amino acids are not completely depleted (Harding et al 2000a).
The downstream targets of ATF4 include genes involved in amino acid import, redox
regulation and cell growth (Harding et al, 2003), such as growth arrest and DNA–
damage–inducible genes (GADD34 & GADD153, Fawcett et al, 1999; Ma &
Hendershot, 2003).
1.8.3.3.2 GADD153
GADD153 is a bZIP-containing transcription factor that was identified as a member of
the CCAAT/enhancer binding protein (C/EBP) family (Ron & Habener, 1992), hence
also referred to as C/EBP homologous transcription factor (CHOP). Ma et al,
demonstrated that the C/EBP ATF composite site was essential for stimulation of
GADD153 promoter activity under ER stress (Ma et al, 2002).
The regulation of GADD153 is also dependent on the nutrient status of the cell, and is
induced during glucose (Carlson et al, 1993) and leucine (Bruhat et al, 2000; Bruhat et
al, 1997) deprivation. Induction of GADD153 expression by amino acid starvation
requires both ATF4 and phosphorylated ATF2 (Averous et al, 2004; Bruhat et al, 2007;
Bruhat et al, 2000). Bruhat et al, reported that in vivo binding of phosphorylated ATF2
and ATF4 to the GADD153 amino acid response element (AARE) is associated with
the acetylation of histones H4 and H2B in response to amino acid starvation, which
promotes the modification of the chromatin structure to enhance the transcription of
amino acid-regulated genes (Bruhat et al, 2007).

50
GADD153 activation affects a series of target genes including TRB3, Bcl-2, ERO1, and
GADD34 (Section 1.8.3.3.3). GADD153 acts to downregulate the expression of Bcl-2,
an anti-apoptotic protein (McCullough et al, 2001), whilst TRB3, a tribbles ortholog,
associates with GADD153 to block its proapoptotic activity whilst inhibiting its own
induction (Ohoka et al, 2005).
1.8.3.3.3 GADD34
GADD34 is a regulatory unit of phosphatase PP1 that binds to the catalytic subunit
(PP1c) resulting in dephosphorylation of eIF2α (Novoa et al, 2001). This negative
feedback loop acts to restore protein synthesis and allow translation of stress-induced
transcripts (Brush et al, 2003). GADD34 is not only transcriptionally induced but also
translationally regulated to ensure maximal expression during eIF2α phosphorylation.
Findings suggest that GADD34 translation is regulated by an unique 5′UTR uORF
mechanism, similar to that of ATF4, to ensure increased GADD34 expression during
eIF2α phosphorylation (Lee et al, 2009b). Overexpression of GADD34 resulted in
enhanced recombinant protein production from CHO cultures, possibly due to increased
rates of recombinant protein translation (Omasa et al, 2008).
Although UPR mechanisms act to ensure only correctly-folded proteins are secreted
from the ER persistent UPR would be undesirable in a stable production cell line as it
would decrease protein synthesis and ultimately lead to ERAD and cell death (Dinnis &
James, 2005).
1.8.4 ER associated-degradation (ERAD) and ER stress-associated apoptosis
1.8.4.1 ERAD
Mannose trimming by the ER α1,2-mannosidase I occurs when proteins are unable to
fold correctly and leads to their association with ER degradation-enhancing 1,2-
mannosidase-like protein (EDEM, Hosokawa et al, 2001; Olivari et al, 2006).
Transcriptional induction of EDEM is mediated by mis/unfolded proteins via the IRE1-
XBP1 pathway (Yoshida et al, 2003). It is thought that EDEMs deliver ERAD
substrates to the retro-translocation channel (Kanehara et al, 2007). Ubiquitylation of

51
the substrates on the cytoplasmic side of the membrane is essential for their retro-
translocation to the cytoplasm. There are various ubiquitin-protein ligases (E3s), such as
HRD1 and gp78 which have been shown to mediate the ubiquitylation of ER-derived
proteins (Fang et al, 2001; Schulze et al, 2005). Upon their ubiquitylation substrate
proteins are recognized by a protein complex consisting of p97, a cytosolic ATPase
responsible for removal of substrates for degradation by the cytosolic 26S proteasome
in an ATP-dependent process (Oberdorf et al, 2001).
1.8.4.2 Macroautophagy
Macroautophagy is another intracellular degradation system in which cells can remove
mis/unfolded proteins. Distinct classes of phosphatidylinositol-3‟-kinases (PI3Ks) are
involved in the control of macroautophagy in mammalian cells (Petiot et al, 2000). The
initial nucleation and assembly of the primary autophagosomal membrane requires a
kinase complex that consists of class III PI3K, p150 myristylated protein kinase and
beclin 1. The autophagosomes ultimately fuse with lysosomes leading to the degradation
of the sequestered material (Li et al, 2008). This degradation event is activated by the
IRE-1 pathway in order to prevent cell death in response to ER stress (Ding et al, 2007)
and nutrient deprivation (Hwang & Lee, 2008). The anti-apoptotic properties of
macroautophagy may be due to the clearance of mitochondria, thereby lowering the
amount of cytochrome c release and subsequent cell death (Ravikumar et al, 2006).
1.8.4.3 ER-stress induced apoptosis
Studies have linked ER stress with apoptosis mediated by mitochondrial pathways
involving Bcl-2, Bax and Bak. During ER stress Bax and Bak undergo conformational
changes allowing the release of Ca2+
from the ER to the cytoplasm (Scorrano et al,
2003; Zong et al, 2003). Increased Ca2+
in the cytosol activates m-calpain, which
subsequently cleaves and activates procaspase 12, initiating a caspase cascade
(Nakagawa & Yuan, 2000; Morishima et al, 2002). The caspase family is broadly
divided into two groups: initiator caspases (caspase-8, -9, and -12) and effector caspases
(caspase-3, -6, and -7). Initiator caspases undergo autoprocessing for activation in
response to apoptotic stimuli. Active initiator caspases in turn process precursors of the
effector caspases responsible for dismantling cellular structures (Morishima et al, 2002).

52
IRE-1α has also been found to induce apoptosis following ER stress, via recruitment of
the adaptor protein TNF receptor-associated factor 2 (TRAF2, Wang et al, 1998), c-Jun
NH2-terminal inhibitory kinase (JIK, Yoneda et al, 2001) and apoptosis signal-
regulating kinase 1 (ASK1, Nishitoh et al, 1998). The c-Jun NH2-terminal kinase
(JNK), which is activated by the IRE1α/JIK/TRAF2/ASK1 pathway, can phosphorylate
Bcl-2 (Yamamoto et al, 1999). Bcl-2 in a phosphorylated state is unable to bind and
prevent activation of proapoptotic members, resulting in changes to the concentration of
cytosolic Ca2+
, again causing cytochrome c release (Bassik et al, 2004). The ER stress-
mediated degradation and cell death pathways are summarised in Figure 1.13.
Figure 1.13 ER stress-mediated degradation and cell death pathways
ER associated-degradation (ERAD) aims to ensure ER homeostasis by degrading
mis/unfolded proteins or removing material which may cause cell death. If the protein
balance within the ER cannot be controlled and ER stress becomes severe ER-stress
associated apoptosis occurs.
Ribosome/Sec61 complex
BiP
PDI
P
IRE-1P P
PERK
P
ER
JIKTRAF2ASK
JNK
Bcl-2
MtCytochrom c
Bax/Bak
Ca2 +
m-calpain
Casp 12
Casp 9
Casp 3
Apoptosome
P
-
ERAD
ER-stress mediated
cell death pathways
lysosome
Proteasomaldegradation
EDEMUb
Ub
UbHRD1
gp78
p97
Autophagosome
MtCytochrome c
Apoptosome

53
Genetic engineering strategies to directly maintain or extend viable cell density to
improve protein production have concentrated on the inhibition of apoptotic cell death
(Singh & Anand, 1994). Overexpression of the anti-apoptotic proteins Bcl-2 and Bcl-xL
have been shown to increase maximal viable cell densities and suppress apoptosis in
CHO cultures (Mastrangelo et al, 2000; Tey et al, 2000; Kim et al, 2009, Kim & Lee,
2000), with the improvement of recombinant protein titres (Meents et al, 2002; Kim &
Lee, 2000). Recently upregulation of myeloid cell leukemia (Mcl)-1, a member of the
Bcl-2 family protein, has also been shown to increase viable cell densities and antibody
production in recombinant CHO cell cultures (Majors et al, 2009).
Recent strategies for improving viable cell densities, and recombinant protein
production, have also involved the mRNA knockdown of pro-apoptotic proteins. CHO
cells lacking Bax and Bak were able to grow but failed to activate caspases in response
to apoptotic stimuli. Antibody production was increased for these cultures (Cost et al,
2009). Direct inhibition of caspases by siRNA has also been shown to improve
recombinant protein titres and Qp values from CHO cultures (Wong et al, 2006).
1.9 PROTEIN SECRETION AS A POTENTIAL DETERMINANT OF
RECOMBINANT PROTEIN PRODUCTION
Protein secretion is the final part of the cellular recombinant protein production process.
Factors that regulate flow through the secretory pathway include regulation of ER and
Golgi transport, glycosylation and other post-translational modifications and the
segregation of proteins depending upon their intended destination (Barnes et al, 2003).
Any disruption to these factors could ultimately limit protein secretion and lower
protein expression for the recombinant cell line.
Transport through the secretory pathway involves vesicle intermediates, which bud
from the donor compartments and fuse with the acceptor compartments. Vesicle
budding is mediated by coat protein complexes (COPI, COPII and clathrin, Peng &
Fussenegger, 2009a), while vesicle fusion is catalyzed by SNARE and Sec1/Munc18
proteins (Wickner & Schekman, 2008).

54
Secretion engineering is a potential strategy to increase the production of
biopharmaceuticals. The ER and the Golgi of transgenic CHO-K1-derived cell lines
have been expanded through the ectopic expression of human-derived XBP-1,
increasing overall production capacity of these cells (Tigges & Fussenegger, 2006). Ku
et al, also suggested that transient expression of XBP-1(s) increased recombinant CHO
cell productivity by improving the secretory capacity of the cell (Ku et al, 2008).
However, other studies have shown no improvement in recombinant protein titres with
enhanced expression of XBP-1(s) in CHO cells (Ohya et al, 2008). It was suggested that
protein titres were not increased for this cell line as a secretory bottleneck was not a
limiting factor.
Recently overexpression of Munc18b has been shown to enhance the secretory capacity
of HeLa and HEK-293, observed with improved protein titres (Peng & Fussenegger,
2009b; Peng et al, 2010). It may be possible to utilise this technology to improve
secretion, and recombinant protein production, from CHO cultures.
1.10 IMPROVING PROTEIN PRODUCTION BY FEED AND CHEMICAL
ADDITIONS
Over the last twenty years improvements in cell line process control and media
formulation have increased product titres by 100-fold (Wurm, 2004). Although
chemically-defined (CD) media are commercially available, they may not adequately
meet the specific nutrient requirements of individual cell lines. Companies meet feeding
requirements by adding concentrated solutions of commercial media or standard amino
acids plus glucose and/or glutamine to cells usually during mid-culture stage (Huang et
al, 2004). Ultimately, optimisation of a fed-batch process involves interplay between
variables including feed solution constituents, concentration, timing and duration of
feed (Lavric et al, 2005; Wong et al, 2005). Many feed regimes act to increase
recombinant protein production in CHO cultures by enhancing viable cell numbers
(Choi et al, 2007; Kuwae et al, 2005; Wong et al, 2005), whilst decreasing rates of
ammonia and lactate production (Wong et al, 2005) and glucose utilisation (Kuwae et
al, 2005). There is limited information regarding the impact of feed additions on gene

55
transcription or protein translation. However, it is likely that feeding affects many
cellular events involved in recombinant protein production and secretion.
It has been suggested that a series of low-molecular-weight compounds like dimethyl
sulfoxide (DMSO), glycerol, trimethylamine-N-oxide (TMAO), 4-phenylbutyric acid
(PBA) can alleviate defective or impaired protein folding by stabilising proteins in their
native conformation (Perlmutter, 2002; Römisch, 2004). Both Glycerol (1% [v/v], Liu
& Chen, 2007a) and DMSO (1% [v/v], Liu & Chen, 2007b) addition to recombinant
CHO cultures has been shown to significantly enhance Qp values. Although chemical
additives, such as glycerol and DMSO, can improve recombinant Qp values overall titre
values were not necessarily increased due to induced growth arrest (Li et al, 2006c;
Rodriguez et al, 2005).
Understanding regulation of CD feeds and chemical additions in improving
recombinant protein titres and Qp values may provide valuable information for optimal
cell line development.
1.11 INVESTIGATING INSTABILITY IN RECOMBINANT CHO CULTURES
As mentioned in Section 1.1 cell line stability in terms of stable protein expression
during LTC is needed from a recombinant cell line in order to gain regulatory approval.
Transcription, translation, protein folding and secretion are events critical to
recombinant protein production. Any limitations to these cellular events could
potentially affect protein titres and cell line stability.
Loss of productivity from DHFR-CHO cell lines in response to LTC has been shown to
be dependent on transgene chromosomal location (Kim & Lee, 1999) and loss of
recombinant gene copies. Kim et al, showed that Qp was approximately 80% lower
after 8 weeks of culture due to a loss of amplified gene copies (Kim et al, 1998). As
discussed in Section 1.2.3.4 the amplification of the DHFR-CHO selection system in the
presence of MTX can increase recombinant cell line production. However, DHFR-CHO
instability has been shown to occur upon removal of the MTX selection (Fann et al,
2000; Kim et al, 1998; Yoshikawa et al, 2000).

56
Instability in terms of a loss in protein production has also been shown to act beyond
gene copy number or the site of gene integration (Jun et al, 2006). Decreased MAb
production in recombinant CHO cultures after 36 passages has been associated with a
decrease in heavy and light chain mRNA expression (Chusainow et al, 2009). Current
investigations have involved systems which allow for targeted transfection of single or
multiple genes. The artificial chromosome expression (ACE) system has been
developed based on pre-engineered artificial chromosomes with multiple recombination
acceptor sites and allowed for stable MAb expression during 70 days of culture, with
good Qp values (approximately 40 pg/cell/day, Kennard et al, 2009).
Stable protein expression is achievable, witnessed with the high number of therapeutic
proteins derived from recombinant CHO cultures. Recently large-scale antibody
productions using a DHFR-CHO cell line found this cell line to be stable in terms of
recombinant protein production during the scale-up period, which accounted to 53 days
in culture. However, Qp was found to decrease during the scale-down period (days 53
to 109 of culture). The 40% decrease in Qp was not due to genomic changes but was
associated with increased cell doubling time (dt, Kennard et al, 2009).
Although protein production instability is a published issue for recombinant CHO cells
the exact molecular mechanisms leading to instability are not yet fully understood
(Chusainow et al, 2009; Derouazi et al, 2006). Concerns regarding instability within
CHO, and other industrial mammalian cell lines, are often left unpublished due to
confidentiality. Many publications make speculations for the reason behind decreased
protein expression in response to LTC but fully understanding the precise mechanisms
for CHO cell instability is vital in producing consistently stable cell lines.
1.12 SUMMARY AND PROJECT AIMS
Recombinant protein expression is a complex task, there are many cellular events that
can effect production including transcriptional and translational regulation, protein
folding and protein secretion. All these events are also regulated by the metabolic state
of the cell and ATP availability. Although from an industrial perspective high
production titres are important it is crucial that the secreted protein is functional. Protein

57
events within the ER ensure only correctly-folded proteins are secreted. Mis/unfolded
proteins alter the ER homeostasis and result in an UPR, if mis/unfolded proteins cannot
be folded to the correct conformation by ER chaperones, such as BiP or PDI, or by the
CNX/CRT cycle, the protein is targeted for degradation or the cell undergoes apoptosis.
Alterations to these cellular events involved in protein production can increase
productivity. The insertion of S/MAR elements, overexpression of PDI, Bcl-2 and Bcl-
xL, and downregulation of Bax, Bak and certain caspases all enhanced recombinant
protein production from recombinant CHO cultures. Production of CHO cultures can
also be improved with feed and chemical additions, or under hypothermic conditions.
Feed addition mainly increased antibody titres by enhancing viable cell numbers, whilst
chemical and low temperatures arrested cell growth so although Qp was increased final
protein titres were often not.
Although improving productivity is advantageous when developing cell lines, ensuring
cell lines remain stable during LTC is vital in gaining regulatory approval. CHO cell
line instability during LTC has been shown to occur with a loss of gene copies,
chromosomal alterations and decreased recombinant mRNA expression. However, the
cause of instability is not always determined.
The overall aim of my project is to gain an improved understanding of regulatory events
that determine productivity and overall stability of an industrially-relevant CHO cell
line (engineered with the GS vector system to secrete a recombinant MAb). A greater
understanding may potentially offer approaches to optimise cell line selection and
culture, and the potential to engineer cells so product titre is optimum.
Therefore the main aims of my project are to:
Determine whether recombinant protein production is maintained at constant
levels over LTC (100 generations).
Characterise the exemplar cell line (3.90) to determine if antibody production is
linked to changes in cell growth, mRNA expression, translation or secretion.
Determine if protein titres can be enhanced by feed and chemical (DMSO)
additions.

58
Investigate the effects of feed and DMSO addition on intracellular factors that
control protein production.
To determine if the effects seen during LTC, and with feed and chemical
additions, exhibit cell line-specific profiles.
The results presented in this thesis fall into four discrete chapters. Chapter 3
characterises the main cell line (cell line 3.90) in determination of cell line stability
during a period of LTC (100 generations). Chapter 4 investigates the effects of feed
addition on protein production and stability, and Chapter 5 examines the effects of
DMSO addition to cell line 3.90. The fourth chapter (Chapter 6) aims to determine if the
effects of LTC, feed and DMSO addition are cell line specific.
All Chapters are collated to present an overall discussion. Chapter 7 aims to consider
the following questions:
Is instability connected to a specific cellular event?
How is recombinant protein production increased in response to feed addition?
How is recombinant protein production increased in response to DMSO
addition?
Are there any markers to predict the likelihood of recombinant protein
production?
What further work is required to answer these questions?

59
2
CHAPTER 2
3
MATERIALS AND METHODS

60
2. MATERIALS AND EQUIPMENT
2.1 GENERAL MATERIALS
2.1.1 Sources of chemicals and reagents
All chemical reagents were of the highest grade and obtained from standard sources.
The materials used, and their suppliers, are listed in Appendix 1.
2.1.2 Preparation and sterilisation of solutions
All solutions were prepared in milliQ water (ddH2O) unless otherwise stated. All
solutions used in the processing of RNA were made in ddH2O that had initially been
treated for 12-16 hr with 0.05% (v/v) diethylpyrocarbonate (DEPC), a ribonuclease
inhibitor. Phosphate buffered saline (PBS) solution was created with PBS tablets.
Solutions were sterilised by autoclaving in a LTE Scientific Series 250 autoclave or by
filtration through a 0.2µm filter where autoclaving was not viable. Solutions were stored
at room temperature, unless otherwise stated.
2.1.3 pH measurements
Measurements of pH were made using a digital Corning pH meter 120 with a glass
electrode. The pH was adjusted using hydrochloric acid or sodium hydroxide, as
appropriate, unless otherwise stated.
2.1.4 Mammalian cell lines and culture medium
The CHO cell lines 3.90 and 51.69 had been engineered to produce a recombinant IgG
antibody using the glutamine synthetase expression system, which is proprietary to
Lonza Biologics. The recombinant CHO cells, and untransfected parental cell line, were
cultured in CD-CHO medium. For the parental cells lacking the glutamine synthetase
gene the medium was supplemented with 6mM L-glutamine. Transfected recombinant
cells were grown in the medium supplemented with 25µM L-methionine sulphoximine
(MSX). All cell culture media were pre-warmed to 37oC, prior to use.
61
2.2 GENERATION AND PURIFICATION OF PLASMIDS IN BACTERIAL
CELLS
2.2.1 Bacterial growth medium
Luria Bertani (LB) broth was used as bacterial growth medium, unless otherwise stated,
and comprised of 1% (w/v) tryptone, 0.5% (w/v) yeast extract and 0.5% (w/v) sodium
chloride and supplemented with ampicillin (50µg/ml), where appropriate. Solid medium
contained the above constituents with the addition of 1.5% (w/v) agar. Ampicillin was
added to the LB agar once it was below a temperature of 55oC.
2.2.2 Generation of competent bacterial cells
DH5α E.Coli cells (100µl) were added to 10ml LB medium and grown overnight at
37oC at 250rpm. 2ml of the overnight culture were added to 40ml LB medium and
grown for about another 2 hr, or until the absorbance at 550nm was approximately 0.3.
Bacterial cells were harvested by centrifugation at 7,000g for 4 min and cells were
resuspended in 20ml ice-cold sterile 50mM calcium chloride, and incubated on ice for
20 min. Cells were stored with 20% (v/v) glycerol at -80oC.
2.2.3 Transformation of competent DH5α E.Coli cells
10µl of the recombinant IgG plasmid DNA (1ng/µl) was added to 100µl of competent
cells (Section 2.2.2), swirled to mix, and incubated on ice for 30 min. The cells were
then heat-shocked at 42oC for 2.5 min before addition of 1ml of room temperature LB
medium. The cells were incubated at 37oC with shaking at 250rpm for 1 hr. The cells
were diluted with LB medium, spread onto agar plates and incubated at 37oC overnight.
Colonies were then observed and counted.
2.2.4 Midi-preparation of plasmid DNA
Midi-preparation was used when relatively large quantities of pure plasmid were
required for transfection of cells or for further plasmid manipulation. Plasmid was
prepared from 200ml bacterial culture using the Qiagen® Plasmid Midi Kit. The

62
protocol for low-copy number plasmids was followed from the Qiagen plasmid
purification handbook.
2.2.5 Determination of nucleic acid concentration and purity
Concentrations were estimated using the NanoDrop® UV/Vis spectrophotometer,
according to manufacturer‟s instructions. The purity was assessed by using the
A260nm/A280nm ratio, where a ratio of 1.6-2.0 was considered pure.
2.2.6 Restriction enzyme digestion
Restriction enzyme digestion was performed to verify plasmid identity. Digestions were
performed in a final volume of 15µl using 1µg DNA, 5-10 units (U) of appropriate
restriction enzyme and the appropriate restriction enzyme buffer (final concentration
1x). After brief vortexing and pulse-centrifugation at 14,000g at room temperature, the
digests were incubated at 37oC for 1-3 hr, for plasmid samples, or overnight, for
genomic DNA samples. To evaluate if the restriction digest had reached completion,
and to investigate the pattern of cleaved DNA, the samples were analysed on agarose
gels (Section 2.6.4.1).
2.3 CELL CULTURE
2.3.1 Maintenance of CHO cells
Suspension cell lines were cultured routinely in 125ml and 250ml Erlenmeyer flasks
(referred to as shake flasks) at 36.5oC and 140 rpm with gassing 5% CO2 (v/v) in air.
Cells were sub-cultured every 4 days into a final volume of 30-50ml. At each sub-
culture cell density and viability were estimated by light microscopy and trypan blue
exclusion, respectively (Section 2.3.3), and an appropriate volume of each culture was
diluted in the relevant medium to give a cell density of 0.2x10⁶ viable cells/ml. All
solutions and equipment used for mammalian cell culture were either sterilised by the
manufacturer prior to receipt, or as stated in Section 2.1.2. All cell culture procedures

63
were performed within sterile laminar flow cabinets. Upon reaching the correct
generation time batch cultures were created (Section 2.3.2).
2.3.2 Generation of batch cultures
Batch cultures were created at time of subculture, once cells had reached the correct
generation time, generation 20, 40, 60, 80 and 100. Generation identification began
from the working cell stock (WCS, also known as generation 0), and calculated from
the dt of the cell (Section 2.11.1). Each culture doubling was equivalent to one
generation. Due to the dt of the cell, and day of subculture, the production of batch
cultures at each specific generation (generations 20, 40, 60, 80 and 100) may be created
at the specific generation, ±4 generations. For example, a generation 100 batch culture
could be created at generations 96, 97, 98 etc to 104.
CD-CHO media was used to dilute the cells to initial densities of 0.2x10⁶ viable cells/ml
using 250ml and 500ml shake flasks. The 250ml and 500ml shake flasks contained
culture volumes of 50ml and 100ml, respectively. Where appropriate a CD feed and/or
DMSO was added. A 2% (v/v) CD feed addition, together with 0.25% (v/v) sodium
bicarbonate, was added on days 3, 4, 5, 6 and 7 of batch culture, whilst a 2% (v/v)
DMSO addition was added on day 5 of batch culture, to the relevant cultures. Cell
number and viability counts were made every 48 hrs from day 0 of batch culture
(Section 2.3.3), with samples taken to allow determination of recombinant protein
production. Samples were centrifuged at 10,000g for 30 sec at room temperature. The
supernatant was then stored at -80°C until required for Enzyme-Linked Immunosorbent
Assay (ELISA, Section 2.5.1), N-linked glycan analysis (Section 2.5.4) or metabolite
analyses (Section 2.10). Exhaustion batch cultures were continued until cell viability
reached ≤ 30%.
2.3.3 Determination of cell number, viability and diameter
The cell densities and cell viability of cultures were determined by light microscopy and
trypan blue dye exclusion, respectively. Cell samples were diluted with 0.5% (w/v)
trypan blue dye in PBS (with a further dilution in PBS where appropriate) and counted
using an Improved Neubauer haemocytometer. Viable cells excluded the blue dye as
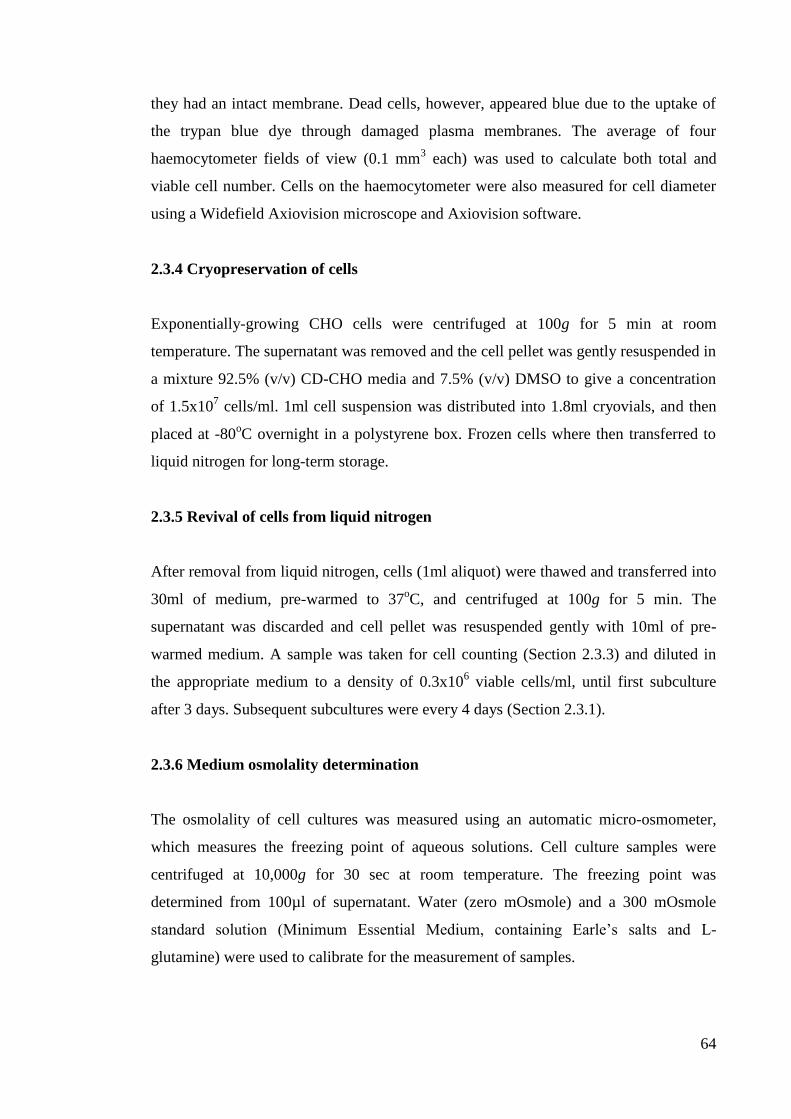
64
they had an intact membrane. Dead cells, however, appeared blue due to the uptake of
the trypan blue dye through damaged plasma membranes. The average of four
haemocytometer fields of view (0.1 mm3 each) was used to calculate both total and
viable cell number. Cells on the haemocytometer were also measured for cell diameter
using a Widefield Axiovision microscope and Axiovision software.
2.3.4 Cryopreservation of cells
Exponentially-growing CHO cells were centrifuged at 100g for 5 min at room
temperature. The supernatant was removed and the cell pellet was gently resuspended in
a mixture 92.5% (v/v) CD-CHO media and 7.5% (v/v) DMSO to give a concentration
of 1.5x10⁷ cells/ml. 1ml cell suspension was distributed into 1.8ml cryovials, and then
placed at -80oC overnight in a polystyrene box. Frozen cells where then transferred to
liquid nitrogen for long-term storage.
2.3.5 Revival of cells from liquid nitrogen
After removal from liquid nitrogen, cells (1ml aliquot) were thawed and transferred into
30ml of medium, pre-warmed to 37oC, and centrifuged at 100g for 5 min. The
supernatant was discarded and cell pellet was resuspended gently with 10ml of pre-
warmed medium. A sample was taken for cell counting (Section 2.3.3) and diluted in
the appropriate medium to a density of 0.3x10⁶ viable cells/ml, until first subculture
after 3 days. Subsequent subcultures were every 4 days (Section 2.3.1).
2.3.6 Medium osmolality determination
The osmolality of cell cultures was measured using an automatic micro-osmometer,
which measures the freezing point of aqueous solutions. Cell culture samples were
centrifuged at 10,000g for 30 sec at room temperature. The freezing point was
determined from 100µl of supernatant. Water (zero mOsmole) and a 300 mOsmole
standard solution (Minimum Essential Medium, containing Earle‟s salts and L-
glutamine) were used to calibrate for the measurement of samples.

65
2.3.7 Mycoplasma detection
Cell cultures were routinely tested for the presence of mycoplasma during LTC.
Following the instructions of the MycoAlert® Detection Kit, the presence of
mycoplasma could be determined by lysing the viable mycoplasma and allowing the
reaction of mycoplasmal enzymes with the MycoAlert® Substrate, which results in
elevated ATP levels. The emitted light intensity (linearly related to the ATP
concentration) was measured using a luminometer.
2.4 FLOW CYTOMETRY
2.4.1 Cell cycle phase analysis
1x10⁶ cells, taken during batch culture (Section 2.3.2) were resuspended in 200µl cold
PBS, 2ml ice-cold 70% (v/v) ethanol, the solution was vortexed and left on ice for 30
min. The cells were fixed in this state at 4oC for a maximum of one week. When needed
the cells were centrifuged at 100g for 5 min, the ethanol was removed and the cells were
resuspended in 400µl PBS. Together with 50µl RNase A (1mg/ml) and 50µl Propidium
Iodide (PI, 400µg/mL) the cells were incubated for 30 min at 37oC. The cells were
analysed by a CyAn ADP flow cytometer, using the 488nm excitation laser, according
to manufacturer‟s instructions. The emission was measured by a 613/20 nm bandpass
filter, the voltage applied to the photomultiplier (PMT) tube was adjusted to ensure the
histogram plots obtained were within range. The data was gated to select single cells
using a plot of the height of the PI signal against the area of the PI signal. The data was
analysed by Summit 4.3 and ModFit LT software.
2.4.2 Quantification of intracellular antibody
1x10⁷ cells, removed on days 4 and 9 of batch culture (Section 2.3.2), were centrifuged
at 100g for 5 min. The cell pellet was washed twice with PBS at room temperature prior
to cell fixation by resuspension in 5ml ice-cold 70% (v/v) methanol. The samples were
then stored at -20oC until required.

66
2 x 10⁶ cells (1ml of fixed cells) were removed from the previously fixed cells and
washed with pre-chilled 3ml PBS containing 1% (w/v) bovine serum albumin (BSA).
The cells were centrifuged at 100g for 5 min, the supernatant was removed, and the
cells were further washed with 5ml PBS, 1% (w/v) BSA, and again centrifuged at 100g
for 5 min. After removal of the supernatant the pellet was re-suspended 2ml PBS, 1%
(w/v) BSA supplemented with 10µg goat anti-human IgG, Fcγ-APC and 6µg goat anti-
human lambda light chain-FITC. The cells were incubated in the dark for 30 min at 4oC.
After incubation the stained cells were washed twice with pre-chilled 3ml PBS, 1%
(w/v) BSA. Unstained and stained parental cells were also required for use with the
CyAn-ADP flow cytometer.
The samples were then analysed by a CyAn ADP flow cytometer, using the 488nm and
infra-red excitation lasers to excite the FITC and APC conjugates. The unstained cells
and the stained parental cells were used to set the initial parameters. The voltage applied
to the PMT tube was adjusted to ensure the histogram plots obtained were within range.
The data was gated to select single cells and analysed by Summit 4.3 software.
2.5 PROTEIN ANALYSIS
2.5.1 Detection of antibody by ELISA
Nunc 96 well immunoassay plates were coated with monoclonal goat anti-human IgG
antibody at a final concentration of 3.25µg/ml, diluted in sterile PBS (100µl per well),
and incubated at 4oC overnight. The following day the coating solution was discarded
and plates were washed three times by filling each well with 250µl wash buffer (0.1%
[v/v] Tween-20 in sterile PBS). After the final wash the plates were blotted dry. Plates
were then blocked by addition of 150µl blocking solution per well (2% [w/v] milk in
sterile PBS) and incubated at room temperature for 1 hr. Supernatant samples (taken
routinely during batch culture, Section 2.3.2) were diluted in blocking solution at
1:1600 or 1:6400 (dependent on day of batch culture). 100µl diluted samples or
standards (highest concentration of standard 0.625µg/ml) were added (in duplicate) to
the well and combined with 100µl of blocking solution. The samples were serially
diluted directly on the plate using blocking solution. The plates, containing 100µl of

67
diluted sample per well, were incubated at room temperature for 1 hr.
Samples/standards were then discarded and the plate was washed three times with wash
buffer and blotted dry. 100µl of detection antibody (sheep anti-human lambda
peroxidise conjugate, 0.4µg/ml) was added to each well and incubated at room
temperature for a further 1 hr. Development solution was prepared by dissolving two
TMB (3,3‟,5,5‟ tetramethyl benzidine chromogen) tablets and 5µl 30% hydrogen
peroxide in 12ml TMB substrate solution (10mM sodium acetate and 10mM sodium
citrate, pH 5.5). After the plate was washed and dried, 100µl development solution was
added per well and incubated for 6 min at room temperature in darkness. The reaction
was stopped by addition of 100µl 0.2M sulphuric acid to each well. Absorbance in wells
was read at 450 nm.
2.5.2 Determination of total protein synthesis
The rate of protein synthesis was measured as the rate of L-[4,5-3H] leucine
incorporation into trichloroacetic acid (TCA) precipitable-material. Incubations were
carried out in 24 well plates containing 500µl cell suspensions (cell suspensions were
taken from cultures on day 7 of batch culture [Section 2.3.2]). 10µl of L-[4,5-3H]
leucine (final specific radioactivity of 14µCI/µmole [1:100 dilution]) was added to the
cell suspensions and incubated over a 48 hr time period. At 24 hr time intervals samples
were mixed with equal volumes of ice-cold 10% (w/v) TCA. After 30 min at 4oC the
sample was centrifuged for 2 min at 12,000g. The pelleted precipitate was washed three
times by resuspension in 500µl of 5% (w/v) TCA, followed by recentrifugation at
12,000g for 2 min. The pelleted precipitate was solubilised using 50µl of NCS tissue
solubiliser for 1 hr at room temperature, before addition to 1ml of Ecoscint scintillation
fluid. The remaining supernatant was washed with resuspension in 500µl of 5% (w/v)
TCA, with 10mg/ml BSA, followed by centrifugation at 12,000g for 2 min. The
supernatant precipitate was then solubilised using 50µl of NCS tissue solubiliser for 1 hr
at room temperature, before addition to 1ml of Ecoscint scintillation fluid. The
radioactivity was measured using a scintillation analyser.

68
2.5.3 Western blot analysis
2.5.3.1 Protein extraction
Cellular protein was extracted routinely during batch culture (Section 2.3.2). 1x10⁷ cells
were centrifuged at 100g for 5 min, the pellet was washed with 10ml PBS and
recentrifuged at 100g for 5 min. The pellet was resuspended in 500µl Radio
Immunoprecipitation (RIPA) buffer (1% [w/v] triton X-100, 0.2% [w/v] SDS, 125mM
sodium chloride, 10mM trisodium phosphate, 0.5% [w/v] sodium deoxycholate, 10mM
sodium orthovanadate, 25mM HEPES and 10mM sodium fluoride) supplemented on
day of use with the protease inhibitors (0.1% [w/v] leupeptin, 0.1% [w/v] aprotinin and
1% [w/v] phenyl-methyl sulfonyl fluoride). To ensure the pellet was fully resuspended
the extract was syringed through a needle several times, after which the extract was left
on ice for 30 min. Protein concentration was determined by the Bradford Protein Assay
(Bio-Rad) using BSA as a standard. 60g of the protein extract was resolved by sodium
dodecyl sulfate-polyacrylamide gel electrophoresis (SDS-PAGE, Section 2.5.3.2).
2.5.3.2 SDS-PAGE
The Bio-Rad mini gel II slab system was used for SDS-PAGE. The system consisted of
a 12% (w/v) separating gel overlaid by a 4% (w/v) stacking gel. The separating gel was
prepared by mixing 3.6ml Protogel solution (30% [w/v] acrylamide), 3.75ml separating
buffer (1.5M Tris, 14mM SDS, pH 8.8) and 5.05ml ddH2O. Stacking gel was prepared
by mixing 1.6ml Protogel solution, 2.5ml stacking buffer (0.5M Tris, 14mM SDS, pH
6.8) and 6ml ddH2O. Polymerisation was initiated by the addition of ammonium
persulphate and TEMED to a final concentration of 0.2µg/ml and 0.2% (v/v),
respectively.
Extracted protein samples (Section 2.5.3.1) were mixed 1:1 with sample buffer (20%
[v/v] glycerol, 7mM SDS, 6.2M Tris, 0.025% (w/v) bromophenol blue). Immediately
before use 2-mercaptoethanol was added to the sample buffer to a final concentration of
1.75% (v/v). The samples were heated at 100oC for 5-10 min and cooled before use.
Electrophoresis was performed in electrode buffer (10mM Tris, 80mM glycine, 1.4mM

69
SDS) and the samples, together with a protein marker, were electrophoresed at 75V
until the bromophenol blue front had moved into the separating gel and then at 200V
until the dye had reached the bottom of the gel.
2.5.3.3 Protein transfer
Separated proteins from SDS-PAGE were transferred onto a nitrocellulose membrane,
pre-soaked along with thick filter paper in the blotting buffer (25mM Tris, 190mM
glycine, 20% [v/v] methanol, pH 7.4) for 2-5 min prior to use. The transfer was set up
on a Bio-Rad Semi-Dry electroblotter at 15V for 60 min. To assess the efficiency of the
transfer, the membrane was stained with Ponceau-S (0.5% [w/v] in 1% [v/v] glacial
acetic acid). In order to minimise non-specific binding of antibodies the membrane was
incubated in blocking buffer (3% [w/v] milk in PBS) for 1 hr shaking at room
temperature, or overnight shaking at 4oC. The primary antibodies, detailed in Table 2.1,
were diluted in blocking buffer and incubated with the membrane for 1 hr shaking at
room temperature, or overnight shaking at 4oC. The secondary antibody-HRP conjugate
was also diluted in the blocking buffer (as stated in Table 2.1). The secondary antibody-
HRP conjugates were added to the membrane for 30-60 min, whilst shaking at room
temperature. In-between each incubation the membrane was washed with 1% (v/v)
Tween-20 in PBS, three times for 5-10 min. Protein bands were detected using an
enhanced chemiluminescence (ECL) system according to manufacturer‟s instructions.
The membrane was exposed to Kodak film. Band density was assessed by densitometric
analysis (Section 2.5.3.5)
2.5.3.4 Stripping nitrocellulose membranes
Membranes were stripped using stripping buffer (0.1M glycine, pH 2.5) for 1 hr whilst
shaking at room temperature. The membranes were then ready to be blocked, and
incubated with ERK antibody (dilutions stated in Table 2.1), before detection with ECL
and exposure.
ERK antibody was used as a standard for protein loading. All antibodies were then
compared to the densitometric analysis of ERK (Section 2.5.3.5).

70
2.5.3.5 Densitometric analysis
The densities of bands were analysed using Image J software, to determine the intensity
of the protein of interest relative to ERK.
Table 2.1: Details of antibodies used for western blot analysis
Primary
antibody Dilution
Secondary
antibody-HRP
conjugate
Dilution
pan ERK 1:5000 Mouse 1:2000
polyclonal ATF4
(CREB-2) 1:1000 Rabbit 1:1000
polyclonal
GADD153 1:1000 Rabbit 1:1000
polyclonal BiP
(GRP78) 1:1000 Goat 1:2000
polyclonal PDI 1:2000 Rabbit 1:1000
2.5.4 N-linked glycan analyses
2.5.4.1 Antibody purification
Antibody from the supernatant samples (taken from day 15 of batch culture, Section
2.3.2) was purified using Ab SpinTrap Protein A columns and concentrated using
MicroCon ultrafiltration units, both according to manufacturers‟ instructions.
2.5.4.2 Deglycosylation of purified recombinant antibody
Reaction mixes (50µl) containing 50-100µg antibody and a PNGase incubation buffer
(100mM sodium phosphate, pH 7.2, 25mM EDTA and 3U PNGase F) were incubated

71
overnight at 37oC. This enzyme is a native glycoaminidase cleaving the link between
asparagine and N-acetylglucosamines, allowing the study of N-linked carbohydrates.
2.5.4.3 Precipitation and lyophilisation of glycans
Proteins were removed by ethanol precipitation. 450µl 100 % ethanol was added to the
purified antibody prior to incubation at -20oC for 60 min. The samples were then
centrifuged at 15,000g for 10 min, the supernatant containing the glycans were
transferred to a fresh tube and lyophilised. .
2.5.4.4 Desalting using Graphite
Glycan samples were resuspended in 50µl of 0.05% (v/v) trifluoric acid (TFA). The
samples were desalted using the graphite tip „TopTip‟ columns according to the
manufacturer‟s instructions. Glycans were eluted with 20µl 60% (v/v) acetonitrile
(ACN), 0.05% (v/v) TFA.
2.5.4.5 MALDI-ToF analysis
The desalted glycan samples were mixed 1:1 with DHB (2,5-dihydroxybenzoic acid)
matrix, prepared in 60% (v/v) ACN, 0.05% (v/v) TFA. The sample was spotted onto the
MALDI target plate and analysed using a MALDI-ToF mass spectrometer (MS).
External calibration was used and the laser intensity was kept below 40% to prevent
fragmentation. The MALDI-ToF-MS spectrum was acquired in reflectron mode for
glycan profiling, and in MS/MS, CID LIFT™ mode, for glycan structural
determination.

72
2.6 DETERMINATION OF COPY NUMBER
2.6.1 Southern blot analysis
2.6.1.1 DNA extraction, phenol extraction and ethanol precipitation
An adapted version of the protocol detailed by Blin & Stafford (1976) was used to
extract genomic DNA from CHO cells. Approximately 2x10⁷ viable cells (from time of
subculture [Section 2.3.2]) were harvested by centrifugation at 100g for 5 min at room
temperature. The pellet obtained was washed three times in PBS, with centrifugation as
above between each wash step. The final pellet was then resuspended in 200µl of PBS
before addition of 3ml of EDTA-sarcosine solution (0.1M EDTA, pH 8.0, containing
0.5% (w/v) N-lauroyl-sarcosine) which was added drop wise to the pellet. 60µl
Proteinase K (10mg/ml) and 10µl RNase A (10mg/ml) were then added. The mixture
was incubated at 55oC for 2 hr with inversion every 20 min.
After the 2 hr inversion an equal volume of phenol:chloroform:isoamyl alcohol
(25:24:1) was added to the DNA and mixed by rocking for 10 min at room temperature.
The solution was then centrifuged at 13,000g for 10 min and the upper aqueous layer
was removed into a fresh tube. The DNA was extracted via this method three times. 3M
sodium acetate (pH 5.5) was added to the upper aqueous layer to a final concentration of
0.3M 2.5 volumes of 100% ice cold ethanol were then added before mixing. The
mixture was centrifuged at 13,000g for 5 min at room temperature and the supernatant
was discarded. The pellet was washed with 1ml 70% (v/v) ethanol, and the final pellet
was air dried for approximately 5 min. The pellet was resuspended in a suitable volume
of ddH2O water (50µl–250µl) and DNA concentration and purity was measured by
NanoDrop® UV-Vis Spectrophotometer (Section 2.2.5).
2.6.1.2 Determination of genomic DNA per cell
1x10⁷ viable cells (from time of subculture [Section 2.3.2]) were centrifuged at 100g for
10 min at room temperature. The pellet was resuspended in PBS and 0.5ml 0.5M
perchloric acid was added. The mixture was incubated on ice for 5 min and then
centrifuged at 200g for 10 min at room temperature. The pellet was then resuspended in

73
1ml 0.5M perchloric acid. A range of standards were created using calf thymus DNA
(diluted in 5mM sodium hydroxide). Standards contained between 0-100µg calf thymus
DNA diluted in 0.5M perchloric acid. Samples and standards were incubated at 80oC for
35 min and allowed to cool. 2ml of freshly made assay reagent (98% [v/v] glacial acetic
acid, 1.5% [v/v] concentrated sulphuric acid, 1.5% [w/v] diphenylamine, 0.5% [v/v]
acetaldehyde) was added to all samples and standards, which were then incubated for
12-16 hr at room temperature. Absorbance measurements were performed at 595nm
and, using the standard curve constructed from the calf thymus DNA samples and cell
numbers, DNA per cell was calculated.
2.6.1.3 Preparation of plasmid standards and genomic DNA for Southern
analysis
Genomic DNA was digested (Section 2.2.6) with HindIII and EcoRI, for copy number
analysis of light chain and heavy chain genes, respectively. Standards for copy number
analysis were generated by digestion of a known quantity of the recombinant plasmid,
and diluted using ddH2O to give a range of concentrations between 0-0.4ng of DNA.
Genomic DNA and plasmid standards were then separated on an agarose gel (Section
2.6.1.4).
2.6.1.4 Agarose gel electrophoresis of DNA samples
Agarose gel electrophoresis was used to separate DNA species on the basis of size.
Agarose gels were prepared by dissolving 1% (w/v) agarose in TBE buffer (0.09M Tris,
0.09M orthoboric acid and 0.2mM EDTA, pH8.0), by boiling in a microwave. Once the
gel had cooled to ≤ 55oC ethidium bromide was added to a final concentration of
0.1µg/ml. Gels were set and run in horizontal electrophoresis tanks with TBE as the
running buffer. DNA samples were mixed in a 5:1 ratio with the gel loading buffer
(1mM EDTA, pH 8.0, containing 50% [v/v] glycerol and 0.25% [w/v] bromophenol
blue) and loaded into wells. A voltage of 80V–100V was used to separate the DNA
based on size. Separated DNA species were then visualised by examination of the gel
on a UV transilluminator. Comparison of bands to a 10kb DNA ladder allowed
estimation of molecular size.

74
2.6.1.5 Capillary blot transfer of DNA to nylon membrane
After DNA separation, on the basis of size, by agarose gel electrophoresis (Section
2.6.1.4), capillary blot transfer was used to transfer DNA from agarose gels to nylon
membranes. The agarose gel was soaked three times in denaturing solution (1.5M
sodium chloride, 0.5M sodium hydroxide) for 15 min, ensuring the gel was covered
completely in all washes. The gel was then washed in ddH2O, and soaked a further three
times in neutralising solution (1M Tris, pH 7.4, containing 1.5M sodium chloride) for
10 min each time, again ensuring the gel was covered. The gel was again washed in
ddH2O, and then soaked in 10x SSC (1.5M sodium chloride, pH 7.0, containing 0.15M
sodium citrate) for 10 min. The nylon membrane was pre-soaked in ddH20 for 2 min
followed by soaking in 10x SSC for 2 min. The efficiency of the transfer to the nylon
membrane was checked by examination of both the membrane and the gel for DNA
species using a UV transilluminator. The membrane was air dried for 20 min, and the
DNA was linked using a UV cross-linker.
2.6.1.6 Isolation of DNA probes for Southern analysis
The probes for copy number for the light chain and heavy chain region were generated
by a restriction digest of the recombinant plasmid. Figure 2.1 shows a map of the
plasmid and indicates the position of all restriction digest sites that were used during
isolation of probes for Southern analysis. The probes for copy number analysis were
obtained by digesting with the recombinant plasmid with HindIII and EcoRI. The
fragment sizes were 900bp and 2150bp of light chain gene and heavy chain gene,
respectively. After digestion (Section 2.2.6) the products were separated on an agarose
gel (Section 2.6.1.4). Relevant bands were purified from the gel using a Qiagen®
Gel
Extraction Kit according to manufacturer‟s instruction.
The 18S probe was used a control, it was generated from plasmid p100-D9. This
plasmid contains a 220bp mouse 18S rRNA cDNA inserted into the PstI site of
pBR322. The entire plasmid was used for radioactive labelling (Section 2.6.1.7).

75
Figure 2.1 Restriction sites for DNA probes for Southern blot analysis
2.6.1.7 Radioactive labelling of probes
The probes were radioactively labelled using 32
P-αdATP, and a Random Primed Kit
according to the manufacturer‟s instructions (the reaction performed at 37oC was
stopped by the addition of 2µl of 0.2M EDTA [pH 8.0]). Unincorporated nucleotides
were then separated from DNA using a Sephadex G50 column. The mixture was added
to the column, with 100µl of TEN buffer (10mM Tris, pH 8.0, containing 0.1M sodium
chloride and 1mM EDTA) and the column was centrifuged at 800g for 30 sec at room
temperature until the column was packed to a volume of approximately 1ml. The
radioactive reaction mix was then added to the column and centrifuged as above.
The 18S probe was labelled using a Nick Translation Kit according to manufacturer‟s
instructions (the reaction performed at 15oC was stopped by the addition of 2µl of 0.2M
EDTA [pH 8.0]). The unincorporated nucleotides were separated from DNA as above.
HindIII
EcoRI
HindIII
EcoRI

76
2.6.1.8 Pre-hybridisation
The Southern analysis method used was adapted from that of Church and Gilbert
(1984). Nylon membranes, prepared as in Section 2.6.1.5, were incubated in a
hybridisation oven for 2-6 hr at 65oC in 15ml hybridisation solution (0.5M disodium
hydrogen phosphate, pH 7.2, containing 1mM EDTA, 7% [w/v] SDS and 1% [w/v]
BSA). The pH of all solutions used during pre-hybridisation, hybridisation and washing
were adjusted using 85% (v/v) orthophosphoric acid.
2.6.1.9 Hybridisation and washing
The solution used to pre-hybridise membranes was removed. The probes, generated as
detailed in Section 2.6.1.7, were added to 8ml fresh hybridisation solution and the
incubation with the pre-hybridised membrane was continued at 65oC for a further 12-16
hr.
After hybridisation, membranes were washed at 65oC for 15 min with 15ml initial wash
buffer (40mM disodium hydrogen phosphate, pH 7.2, containing 1mM EDTA, 5%
[w/v] SDS and 0.5% [w/v] BSA). A further two or three washes were performed at
65oC for 15 min each time using 15ml wash buffer (40mM disodium hydrogen
phosphate, pH 7.2, containing 1mM EDTA and 1% [w/v] SDS). The number of washes
was dependent on the level of background radioactivity present, detectable using a
hand-held giga monitor.
2.6.1.10 Autoradiography
The membrane was exposed to X-ray film in a cassette with intensifying screens.
Exposure was performed at -80oC for 3-7 days. The densities of bands on X-ray film
were determined by densitometric analysis on a Model GS-700 Imaging Densitometer
using Molecular Analyst® software.

77
2.6.1.11 Membrane stripping
Membranes were stripped by washing in boiling 0.05% (w/v) SDS with agitation.
Washing was continued until the solution had cooled to room temperature. The success
of the stripping was determined by exposing the membrane to a phosphoimager plate
for 12-16 hr.
2.6.2 Quantitative PCR (q-PCR)
The genomic DNA was extracted from cells as described in Section 2.6.1.1.
2.6.2.1 Preparation of standard curve
The recombinant plasmid vector was diluted to a final concentration of 1,000,000–1,347
copies per 5µl reaction, in a background of genomic DNA (10ng/µl) extracted from
parental cells. Background DNA was used to ensure the efficiency of the PCR reaction
was the same for all samples. Stock dilutions of the standards were made and stored in
aliquots at -80°C until required.
2.6.2.2 Preparation of samples
One sample was defined as a „check‟ sample that was run on all detection plates and
used to normalise the total DNA content in each well. The check sample was diluted to
final concentrations of 20, 10 and 5ng/µl, using ddH2O, and aliquots of these dilutions
were made and stored at -80°C, until required.
2.6.2.3 Real-time q-PCR reaction
The following reagents were added to each well of an MJ-white 96 well plate: 5µl of
genomic DNA (Section 2.6.1.1), 2.5µl of 10µM forward primer, 2.5µl of 10µM reverse
primer and 10µl of 2x SYBR®
Green I q-PCR MasterMix. Plates were sealed with clear
plastic caps and centrifuged at 900g. Primers used are detailed in Table 2.2. Samples
were analysed in triplicate. In addition, triplicate wells containing only 5µl ddH2O and
10ng/µl parental genomic DNA were prepared as negative controls for the reaction and

78
to check for any baseline expression from parental genomic DNA. Triplicate standards
were analysed concurrently. The PCR reaction was performed using an Chromo 4
thermal cycler with the following settings: 95°C for 10 min, followed by 35 cycles of
denaturation at 95°C for 10 sec, annealing at 57°C for 10 sec, elongation at 72°C for 20
sec and denaturation of any potential primer dimers at 76°C for 1 sec. A final elongation
step at 72°C for 10 min was performed, followed by a melting curve to check the
quality of the amplified product. Data was quantified using Opticon Monitor analysis
software.
Copy number data were normalised using a β-Actin real-time PCR reaction that was
performed as described. The β-Actin primers are detailed in Table 2.2. Due to
confidentiality concerns the recombinant PCR primers are not shown.
Table 2.2 Primers used in real-time q-PCR
Target gene Forward Reverse
β-Actin
(Genomic) 5‟-ACTGCTCTGGCTCCTAGCAC-3‟ 5‟-CATCGTACTCCTGCTTGCTG-3‟
All primers were designed using the primer 3 express software
(http://frodo.wi.mit.edu/).
2.6.2.4 Analysis of q-PCR results
Data was quantified using Opticon Monitor analysis software according to
manufacturer‟s protocol. Briefly, blanks and baseline fluorescence (as calculated as an
average over cycle range 1-10) were subtracted from fluorescent plots. The threshold
was raised manually to 0.05, and the cycle at which samples reached this fluorescence
were obtained (Ct value). A standard curve was obtained by plotting log [genomic
DNA] versus Ct values for the standards. Relative concentrations of genomic DNA,
compared to the standard sample, were extrapolated from the standard curve using the
Ct values. Total DNA content was normalised using a β-Actin q-PCR reaction using the
primers detailed in Table 2.2. The melting curve was checked to assess the quality of
the PCR product, where a pure product was indicated by a single peak at between 80°C
to 90°C.

79
2.7 DETERMINATION OF mRNA
2.7.1 Quantitative reverse transcriptase PCR (q-RTPCR)
2.7.1.1 RNA isolation
RNA was isolated from cells routinely taken during batch culture (Section 2.3.2). 5-10x
106 cells were pelleted by centrifugation at 400g for 4 min. Supernatant was removed
and RNA was isolated from the cell pellets using TRIzol® Reagent. Samples were
stored at -80oC until purification. Thawed samples were incubated at room temperature
for 5 min, 200µl of chloroform was added and the tubes were shaken vigorously for 15
sec. After incubation at room temperature for 5 min, samples were centrifuged at
13,000g for 15 min at 4oC. The upper aqueous phase was collected and the RNA was
precipitated by the addition of 500µl isopropanol at room temperature for 10 min.
Samples were centrifuged at 13,000g for 10 min at 4oC, supernatant was discarded and
the RNA pellets were washed with 1ml of 75 % (v/v) ethanol by vortexing. After
centrifugation at 5,000g for 5 min at 4oC, the pellets were air-dried for 5-10 min and
dissolved in 30-50µl of DEPC-treated ddH2O (Section 2.1.2). RNA was aliquoted and
stored at -80oC until needed.
2.7.1.2 DNase treatment of RNA
RNA samples (Section 2.7.1.1) were quantified using NanoDrop®
UV-Vis
Spectrophotometer (Section 2.2.5), and further diluted to 1μg/μl in DEPC-treated ddH2O
(Section 2.1.2). To remove any trace contamination of genomic DNA, RNA samples
were treated with DNase I, using a DNase I kit. DNase I treatment was performed by
mixing 1μl of RNA (1μg/μl), 7μl of 0.05% (v/v) DEPC-treated ddH2O, 1μl DNase 10x
reaction buffer and 1μl of DNase enzyme. The reaction was incubated at room
temperature for 20 min and then stopped by the addition of 1μl of 0.2mM EDTA.
2.7.1.3 cDNA synthesis from RNA
Reverse transcriptase (RT) production of cDNA was completed using a Bioline cDNA
Synthesis Kit. To the 11μl DNase I treated RNA (Section 2.7.1.2), the following

80
reagents were added: 4μl 5x cDNA synthesis buffer, 4μl dNTP mix, 1μl oligo dT and
1μl RT enzyme. The reaction was mixed and incubated at 42°C for 60 min. The reaction
was stopped by heating to 72°C for 10 min.
2.7.1.4 Preparation of samples and ‘check’ sample
One sample was again dedicated as a „check‟ sample that was run on all detection
plates. The cDNA reaction from the standard sample was diluted 1:5 in ddH2O, to give
the 100% standard. Serial dilutions of the 100% standard were then performed in
ddH2O to give 10%, and 1% final concentrations. All other samples were diluted once
at a ratio of 1:6 with ddH2O.
2.7.1.5 Quantitation of mRNA
The reaction, including concentrations and volumes of SYBR®
Green I MasterMix and
primers, is described in Section 2.6.2.3. The only alteration to the reaction mix is that
diluted cDNA (5µl per well, Section 2.7.1.3) was used instead of genomic DNA. The
primers were designed using the Primer 3 website (shown in Table 2.3). The PCR
reaction was performed using a Chromo 4 thermal cycler with the identical settings as
described in Section 2.8.3. Total mRNA content was normalised using a β-Actin real-
time q-RTPCR reaction using the primers detailed in Table 2.3. Again due to
confidentiality concerns the recombinant PCR primers are not shown.
Data was quantified using Opticon Monitor analysis software according to
manufacturer‟s protocol (Section 2.6.2.4).

81
Table 2.3 Primers used in real-time q-RTPCR
Target gene Forward Reverse
β-Actin
(mRNA) 5‟-TGTGACGTTGACATCCGTAAA-3‟ 5‟-CTCCCCTGTGTACAGCTTCAG-3‟
ATF4 5‟-CAGGTTGCCCCCTTTACATT-3‟ 5‟-CAGGCTTCCTGTCTCCTTCA-3‟
GADD34 5‟-CCTGGTCTGCAAAGTGCTGAT-3‟ 5‟CCAGCTCAGTCACTCCCTCTTC-3‟
GADD153 5‟-CACCACACCTGAAAGCAGAA-3‟ 5‟-ACCTCCTGCAGATCCTCATA-3
All primers were designed using the primer 3 express software
(http://frodo.wi.mit.edu/).
2.7.2 Polymerase Chain Reaction (PCR)
Reverse transcriptase (RT) production of cDNA was completed as described in Section
2.7.1.3. The PCR reaction was set up using the following reagents in a total volume of
49µl (made up with ddH20): 25ng of forward and reverse primers (Table 2.4), 0.2mM
each of dATP, dCTP, dTTP and dGTP, 2µl cDNA and 1x Taq polymerase buffer. The
PCR reaction was heated to 94ºC for 5 min prior to the addition of 5U of Taq DNA
polymerase, which was then followed by 35 reaction cycles consisting of denaturation
at 94ºC for 1 min, annealing at the appropriate temperature (Table 2.4) for 1 min and
elongation at 72ºC for 2 min. The overall reaction sequence was finished at 72ºC for 10
min. Products were checked by agarose gel electrophoresis (Section 2.6.1.4)
Table 2.4 Details of PCR primers
Primer
Name Forward Reverse
Annealing
Temp (oC)
XBP-1(s) 5‟CCTTGTGGTTGAG
AACCAGG-3‟
5‟AGAGGCTTGGTG
TATACATGGTC-3‟ 54
GAPDH 5‟GAGGACCAGGTT
GTCTCCTG-3‟
5‟CCCTGTTGCTGTA
GCCCGTAT-3‟ 57
All primers were designed using the primer 3 express software
(http://frodo.wi.mit.edu/).

82
2.8 POLYSOME PROFILING
Extracts were prepared (Section 2.8.2), layered onto 15-50% (w/v) sucrose gradient
(Section 2.8.1) and the gradients were analysed by spectophotometry (Section 2.8.3).
All solutions were prepared using DEPC-treated H2O (Section 2.1.2) to minimise
degradation of the polysomes. All disposables used were chilled to 4oC overnight prior
to preparation of polysome extracts to prevent polysome dissociation from mRNA.
2.8.1 Sucrose gradient preparation
Sucrose solutions of 50%, 42%, 33%, 24% and 15% (w/v) were prepared using DEPC-
treated water and polysome buffer (10mM Tris acetate [pH 7.4], 70mM ammonium
acetate, 4mM magnesium acetate). 2.25ml 50% (w/v) sucrose solutions was added to a
9/16 x 3½ inch polyallomer tube and frozen in liquid nitrogen. 2.25ml 42% (w/v)
sucrose solution was layer on top and then frozen, this process was repeated for the
remaining sucrose solutions. The gradients were stored at -80oC and thawed overnight
at -4oC before use.
2.8.2 Extract preparation for polysome analysis
Cells were grown until day 4 and 7 of batch culture (Section 2.3.2). 5x10⁷
cells were
transferred into chilled tubes containing 500µl cycloheximide (10mg/ml). The tubes
were centrifuged at 8,000g for 5 min at 4oC and the cell pellet was resuspended in 25 ml
of chilled lysis buffer (20mM HEPES, pH 7.4, 2mM magnesium acetate, 100mM
potassium acetate, 100µg/ml cycloheximide, 0.1mM DTT). Cells were pelleted for
5 min at 8,000g at 4oC, and the pellet was resuspended in 800µl of lysis buffer, and
transferred to a chilled 1.5ml eppendorf tubes. Cells were repelleted and resuspended in
an equal volume of lysis buffer and glass acid washed beads. Each tube was vortexed
six times for 20 sec, at 40 sec intervals on ice. Lysates were cleared briefly by
centrifugation at 13,000g for 1 min, and then removed and re-centrifuged at 10,000g for
10 min. Both centrifugations were at 4oC. After the final centrifugation the A260nm was
measured and lysates were frozen in liquid nitrogen and stored at -80oC until required.

83
2.8.3 Sedimentation of extracts
2.5 A260 units of extracts (Section 2.8.2) were layered onto the sucrose gradients
(Section 2.8.1). The gradients were centrifuged in a SW41 rotor for 2.5 hr at
40,000 rpm, after which the gradients
were collected. The A254 was measured
continuously using an ISCO UA-6 UV/Vis detector to generate the traces. Monosome
and polysome peaks were quantified using Image J software. Monosome and polysome
peaks were quantified using Image J software using a straight baseline drawn manually
below to connect the monosome and polysome peak areas.
2.9 MICROSOPY ANALYSES
2.9.1 Preparation of metaphase spreads
CHO cells were grown in batch culture (Section 2.3.2) until mid-exponential phase of
their growth cycle before treatment with 130ng/ml (w/v) of colcemid for 20 hr. Cells
were centrifuged at 100g, supernatant was removed and cells were resuspended in
approximately 100μl of medium. To the resuspended cells, 10ml of hypotonic solution
(0.04M potassium chloride, 0.025M trisodium citrate) was added drop wise with gentle
mixing. Cells were centrifuged at 220g for 5 min, supernatant was removed and cells
were resuspended in 100μl of hypotonic solution. Added to the resuspended cells was
5ml of ice-cold methanol:acetic acid (3:1). The solution was centrifuged at 220g for 5
min and supernatant was removed. The process of ice-cold methanol:acetic acid
addition and centrifugation was repeated three times in total. After the final
centrifugation cells were resuspended in a 100μl of ice-cold methanol:acetic acid (3:1).
Approximately 10μl of this solution was dropped, from a height of approximately 40-
50cm, onto glass slides that had previously been wiped with acetic acid. Slides were left
overnight at room temperature.
2.9.2 Metaphase staining
Slides were stained with 20ng/ml (w/v) DAPI in PBS for 5 min at room temperature.
Slides were air dried, one drop of SlowFade® antifade reagent was applied, after which

84
they were covered with a coverslip and sealed. Images were acquired as described in
Section 2.9.3.
2.9.3 Image acquisition
Images were collected using an Olympus BX51 upright microscope using a coolsnap
ES camera through Metavue software. Slides were viewed using a 100x/1.30UPlanFLn
oil immersion objective.
2.9.4 Immunofluorescence
CHO cells were grown until day 9 of batch culture (Section 2.3.2). 1ml of cell
suspension was centrifuged at 100g for 10 min, and resuspended to give 3x10⁶ cells in
200µl per coverslip. The cell suspension was air dried on the coverslip (pretreated with
20g/ml of poly-L-lysine) for 30 min at room temperature. After a 1 min wash in cold
PBS the cells were fixed on the coverslips using 4% (w/v) paraformaldehyde in PBS.
The cells were permeabilised by addition of using 0.5% (v/v) triton-X-100 in PBS for 5
min at room temperature, and then washed three times with PBS (each wash was for 5
min at room temperature). 200µl of the primary antibody (anti-ATF4, 1:100 dilution)
and 200µl of the fluorescent conjugated secondary antibody (Texas Red®
, anti-Rabbit,
1:100 dilution) were added to each coverslip and incubated separately for 30 min at
37C. Between each incubation the cells were washed, as described above. The
coverslips were then treated with DAPI (50ng/ml [w/v] diluted in PBS) for 1 min and
were mounted on slides using ProLong® antifade reagent. The coverslips were sealed
and stored at 4C until required.
Images were acquired at stated in Section 2.9.3, and analysed using Image J technology.

85
2.10 METABOLITE ANALYSES
2.10.1 Glucose assay
The glucose assay was based on the method developed by Trinder (1969). Glucose is
converted to glucoeimine in a two-step reaction catalysed by glucose oxidase and HRP.
Glucoeimine concentration is measured spectrophotometrically and correlates to initial
glucose concentration. To determine the glucose concentration 2µl from cell culture
supernatants (Section 2.3.2) were mixed with 200µl of assay buffer in 96 well plates.
The assay buffer (0.5M sodium phosphate, pH 7.5, 2U glucose oxidase/ml, 5U
peroxidise/ml, 10.6mM phenol, 1.5mM 4α-aminophenazone) was prepared on the day
of use (pH was adjusted using perchloric acid). The mixture of samples and assay buffer
was incubated at 37oC for 10 min before the absorbance at 505nm was measured.
Standards (0-20mM glucose) were analysed at the same time and used in determination
of glucose concentration.
2.10.2 Lactate assay
The concentration of lactate in samples was determined based on the catalysis to
pyruvate by LDH with the concomitant reduction of NAD+, which formed the L-isomer
of lactic acid (lactate at pH 7.0). To determine the amount of L-lactic acid 2.5µl from
cell culture supernatants (Section 2.3.2) was added to 1ml of assay buffer (2U lactate
dehydrogenase, 0.12mM hydrazine, 1mM NAD+, 0.1M glycine buffer, pH 9.0). The
mixture of samples and assay buffer was incubated at room temperature for 40 min
before the absorbance at 340nm was measured. Standards (0-25mM lactate) were
analysed at the same time and used in determination of lactate concentration.
2.10.3 Gas Chromatography (GC)-MS
2.10.3.1 Sample derivatization
20µl of cell culture supernatants (Section 2.3.2) for GC-MS analysis were spiked with
the internal standard (5µl of 3mg/ml myristic acid d 27) and lyophilised. To induce
volatility and thermal stability chemical derivatization was performed in two stages:

86
pellets were resuspended in methoxyamine hydrochloride in pyridine (40mg/ml; 10μl)
and incubated at 30°C for 90 min with gentle shaking. N-methyl-N-
trimethylsilyltrifluoroacetamide with 1% trimethylchorosilane (MSTFA + 1% TMCS)
(90μl) was then added and the samples were incubated at 37°C for 30 min. The samples
were then cooled to room temperature and transferred into silanized GC vials for GC-
MS analysis.
2.10.3.2 Gas chromatography-mass spectrometry (GC-MS) analysis
GC-MS analysis was performed as detailed by Sellick et al, using a 7890A GC System
coupled to a 5975C Inert XL MSD with Triple-Axis Detector (using the manufacturer‟s
software, ChemStation, Sellick et al, 2010). Samples were injected onto a DB-
5MS + DG column using helium as the carrier gas. Components were separated by
isothermal chromatography for 1 min at 60°C, followed by an increase to 325°C at a
rate of 10°C/min then 10 min at 325°C. Mass spectra were scanned from 50 to 600 mass
units. Metabolite peaks in the raw chromatograms were identified using ChemStation
and automated mass spectral deconvolution and identification system software
(AMDIS). Metabolite identifications were based on retention times and fragmentation
patterns. The data were combined using an in-house Microsoft Excel macro and
normalized to the standard (myristic acid d 27).
2.10.4 Intracellular metabolite extraction
The cells were grown until day 5 and 9 of batch culture (Section 2.3.2). At the
appropriate time-points the cells were rapidly quenched by addition of 1x10⁷ cells to 5
volumes of quenching solution (60% methanol with 0.85% [w/v] ammonium
bicarbonate [AMBIC, pH 7.4]) at -40°C. The cells in the quenching solution were
centrifuged at 1,000g for 1 min and the quenching solution was then removed. The
metabolites were extracted by resuspension of the cell pellet in 0.5ml of 100% methanol
followed by flash freezing in liquid nitrogen. After thawing on ice at 4°C samples were
vortexed for 30 sec, centrifuged at 800g and the supernatant removed. The pellet was
resuspended in 0.5ml of 100% methanol and the extraction procedure was again
repeated. The methanol extracts were pooled, centrifuged at 15,000g for 1 min, the
supernatant removed and the extracts were lyophilized. Dried metabolite extracts were
resuspended in 1ml of ddH20 prior to use.

87
2.10.5 ATP assay
ATP assays were performed using the Roche® ATP Bioluminescence Assay Kit CLS II
according to manufacturer‟s instructions. Intracellular metabolite extracts (50μl, Section
2.10.5) was mixed with an equal volume of luciferase reagent before measuring
luminescence in a luminometer according to manufacturer‟s instructions. ATP
concentration was confirmed using an ATP calibration curve. The ATP standard stock
was provided in the kit.
2.10.6 NAD+/NADH assay
NAD+/NADH assays were performed using the BioVision NAD
+/NADH Quantification
Kit in 96 well plates. NADH concentrations were determined by mixing intracellular
metabolite extracts (50μl, Section 2.10.5) with 50μl extraction buffer and decomposing
the NAD+ by incubation at 60°C for 1 hr after which 50μl was assayed. The assay was
performed by addition of 100μl of NAD cycling mix followed by incubation for 5 min
at room temperature, and then addition of 10μl of NADH developer. Plates were
incubated for 3 hr at room temperature before the absorbance at 450nm was measured
using a Multiskan Ascent plate reader.
2.11 CALCULATIONS
2.11.1 Calculation of cell doubling time (dt)
The cell dt was calculated as indicated below.
K = (1/ln) x ln (Nt/No)
Where K = the mean growth rate constant (generations/day)
No = the initial population number
Nt = the population at time (t)

88
2.11.2 Calculation of specific productivity (Qp) and rates of metabolite production
and utilisation
Qp or rates of production/utilisation = (P1-P0)/CCT
CCT = (VCC1 + VCC0/2)x(T1 –T0)
P0= antibody titre or metabolite concentration by first point of analysis
P1= antibody titre or metabolite concentration second point of analysis
VCC0= Viable cell density by first point of analysis
VCC1= Viable cell density by second point of analysis
T0= day of first point of analysis
T1= day of second point of analysis
2.11.3 Statistical methods
All data presented is represented as a mean ± standard deviation (SD), or mean ±
standard error of mean (SEM)
Standard Deviation (SD) = (√[∑{x-m}2]/{n-1})
x: observed value
m: mean of n observations
n-1: degrees of freedom
SEM = (SD/√n)
n: number of independent observations
The correlation coefficient (r value) was calculated for standard curves produced in
ELISAs (Section 2.5.1) and q-PCR assays (Section 2.8.4), using Microsoft Excel. Any
assays performed, where the standard curve had a correlation coefficient ≤ 0.98, were
disregarded.
Independent samples t-test was used to determine whether the difference between
samples was statistically significant. The independent samples t-test was performed

89
using SPSS (v14.0.2) software. Data was considered significant if p < 0.05 or p < 0.10.
The limits of p are stated where appropriate.

90
4
CHAPTER 3
5
CHARACTERISATION OF CELL
LINE 3.90 IN DETERMINATION
OF CELL LINE STABILITY

91
3. CHARACTERISATION OF CELL LINE 3.90 IN DETERMINATION OF
CELL LINE STABILITY
3.1 INTRODUCTORY REMARKS
This Chapter focuses on the stability of recombinant antibody titre and specific
productivity from the recombinant CHO cell line 3.90 (3.90). I examined the cell
growth, antibody titre, and molecular characteristics of 3.90 in response to LTC.
Potential regulatory factors that might affect antibody secretion were also investigated,
these included analysis of proteins and chaperones involved in protein folding and
maintenance of ER homeostasis. Finally this Chapter addresses the metabolic status of
3.90 cultures created at early and late generations, to examine potential relationships
between the metabolic activity of the cell and the stability of recombinant gene
expression.
3.2 ANALYSIS OF GROWTH CHARACTERISTICS AND PRODUCTIVITY OF
CELL LINE 3.90
The growth characteristics and antibody titre of 3.90 batch cultures were examined at
generations 20, 40, 60, 80 and 100. Generation 20 and 40 cultures expressed final
antibody titres of approximately 1000 mg/L, whilst generation 60, 80 and 100 cultures
had final antibody titres of approximately 600 mg/L (Figure 3.1A). Therefore, 3.90 was
shown to be unstable, with a 40% decrease in final antibody titre values in response to
LTC. Intriguingly, antibody titre was similar for all generation cultures throughout
exponential stage of culture. It was only as cells moved beyond the exponential phase
that generation dependent alterations in antibody titre were observed.
The growth of batch cultures were analysed in parallel to determine if changes in viable
cell densities would account for the decrease in antibody titre. The growth pattern for all
cultures was similar. The cultures were in exponential phase until day 7 of batch culture.
After day 7 the cultures entered, and stayed in, stationary phase until day 11 of batch
culture. For all cultures viable cell densities were maximal on day 9 of batch culture
(Figure 3.1B). Viability declined after day 11 of batch culture, and for all cultures the

92
viability was measured as 30%, or below, on the final day of batch culture (day 15,
Figure 3.1C).
Although patterns of growth were similar for all generations, changes in viable cell
densities were apparent. Batch cultures created at late generations (generations 80 and
100) had lower cell densities in the stationary and decline phase of batch culture than
early generation cultures (generations 20 and 40, Figure 3.1B). Figure 3.2A highlights a
difference in viable cell densities between an early generation (generation 20) and a late
generation (generation 100) culture. Alterations to viable cell densities can also be
observed with changes to cumulative cell time (CCT). CCT values were significantly
lower on days 13 and 15 of batch culture for cultures created at generations 80 and 100
compared to CCT values for generation 20 cultures (Figure 3.2B).
The alterations in cell densities between early and late generation cultures were also
seen with variations to the cell cycle phase transition of cultures. At generations 20, 40,
60, 80 and 100 the cell cycle profile on day 3 of batch culture showed 50% of cells in
G0/G1 phase (Figure 3.3A), approximately 40% in S phase (Figure 3.3B), and 10% in
G2/M phase (Figure 3.3C). The percentage of cells in G2/M phase remained the same
as batch cultures progressed, whilst the percentage of cells in G0/G1 phase increased
and the percentage of cells in S phase decreased. The proportion of cells in G0/G1 phase
and in S phase during batch culture was dependent on the culture generation. On day 11
of batch culture early generation cultures (generations 20 and 40 cultures) had
approximately 75% of cells in G0/G1 phase, with approximately 15% of cells in S
phase, whilst late generation cultures (generations 60, 80 and 100 cultures) had fewer
cells in G0/G1 phase (65%) and more cells in S phase (25%). The cultures with a
greater percentage of cells in G0/G1 also had higher antibody titres. This is supported
by other publications, which had previously stated that CHO cells, and hybridoma cells,
were more productive in the G0/G1 phase of cell cycle distribution (Al-Rubeai &
Emery, 1990; Dutton et al, 2006; Kromenaker & Srienc, 1991).
As generation number influenced CCT the Qp was determined to quantitate antibody
production rate per cell. Qp was calculated from antibody titre and viable cell densities
during different stages of batch culture. Qp was determined for the entire batch culture,
using antibody titre values and cell densities measured on days 0 to 15 of culture, Qp

93
(d0-d15). Similarly, Qp was also determined for the early (exponential) phase of batch
culture, Qp (d0-d7), and for the end (decline) phase of batch culture, Qp (d9-d15). Qp
(d0-d15) decreased by approximately 30% between early generation cultures
(generations 20 and 40) and late generation cultures (generations 60, 80 and 100, Figure
3.4), again confirming instability of 3.90 in response to LTC. Qp was found to be
maximal during the early phase of batch culture. Qp (d0-d7) values were two-fold
greater than Qp (d0-d15) values, and three- to five-fold greater than Qp (d9-d15) values,
dependent on the generation time of culture.
Interpretation of Qp data shows that 3.90 instability (seen with a decrease in final
antibody titre) was not solely due to changes in viable cell densities, as Qp also
decreased as a result of LTC. However, it could be possible that other cellular
alterations, such as a change in cell size, were affecting Qp (Lloyd et al, 2000). The
average diameter for both early generation (≤ 40 generation) and late (≥ 60 generation)
generation cells were approximately 13µm (Figure 3.5A). This value is in agreement
with previously stated CHO cell diameters (Kuystermans & Al-Rubeai, 2009). The cells
analysed gave a range of diameters from 8µm to 22µm, similar for both early generation
and the late generation cells (Figure 3.5B). The decrease in Qp in response to LTC was
not a consequence of changes in cell size but could be the result of changes to
intracellular events that control the efficiency of cellular expression of the recombinant
gene.

94
Figure 3.1 Analysis of recombinant antibody titre, viable cell densities, and cell
viability for 3.90 cultures
3.90 was subject to LTC in suspension using MSX supplemented CD-CHO media. Batch
growth analysis was performed in shake flasks at generation numbers 20, 40, 60, 80
and 100, ± 4 generations (Section 2.3.2). Batch cultures were created at 0.2x10⁶
cells/ml, and maintained at 37oC, 140 rpm and with a manual supply of 5% CO2 in air.
Cells were cultured under these conditions until viability was ≤ 30%. Antibody titres
(A), viable cell densities (B), and cell viabilities (C) are shown. Antibody titres were
measured by ELISA (Section 2.5.1) and viable cell densities and cell viabilities were
determined by light microscopy and trypan blue exclusion (Section 2.3.3) from samples
taken routinely during batch culture. Error bars represent SEM for three biological
replicates. Each biological replicate value is an average from duplicate technical
repeats. * indicates p<0.05, using independent samples t-test to compare cultures
created at generations 40, 60, 80 and 100 to generation 20 cultures (on the same day of
batch culture).
Annotation of the generation batch cultures in Figure 3.1
20
40
60
80
100

95
Figure 3.1 Analysis of recombinant antibody titre, viable cell densities, and cell
viability for 3.90 cultures
B.
C.
A.
0
200
400
600
800
1000
1200
0 3 5 7 9 11 13 15
An
tib
od
y t
itre
(mg
/L)
Day
0
2
4
6
8
0 5 10 15
Via
ble
cell
s
(x1
06
cell
s/m
l)
Day
0
20
40
60
80
100
0 5 10 15
Cell
via
bil
ity
(%)
Day
*** *** ***

96
Figure 3.2 Effect of LTC on viable cell growth and CCT
Viable cell densities were determined using light microscopy and trypan blue exclusion
(Section 2.3.3). A, highlights the change in viable cell densities between an early
generation batch culture (generation 20) and a late generation batch culture
(generation 100). The CCT was calculated from the growth of the batch cultures
(Figure 3.1B). B, shows the CCT during batch culture for cultures created at
generations 20, 40, 60, 80 and 100. For determination of CCT see Section 2.11.2. Error
bars represent SEM for three biological replicates. Each biological replicate value is
an average from duplicate technical repeats. * indicates p<0.05, using independent
samples t-test to compare cultures created at generations 40, 60, 80 and 100 to
generation 20 cultures (on the same day of batch culture).
Annotation of the generation batch cultures in Figure 3.2
B.
A.
0
2
4
6
8
0 5 10 15
Via
ble
cell
s
(x1
06
cell
s/m
l)
Day
0
10
20
30
40
50
60
70
0 3 5 7 9 11 13 15
Cu
mu
lati
ve c
ell
tim
e
(x1
06
cell
s x
da
y/m
l)
Day
20
40
60
80
100
** **
*
*

97
Figure 3.3 Analysis of cell cycle distribution in response to LTC
3.90 was cultured as previously described (Figure legend 3.1). 1x10⁶ cells, taken on
days 3, 5, 7, 9, and 11 of batch culture, were analysed by flow cytometry using PI
excitation by a 488nm laser, and emission measured by a 613/20nm bandpass filter
(Section 2.4.1). The data was analysed by Summit 4.3 and ModFit LT software. The
percentage of cells in A, G0/G1 phase, B, S phase, and C, G2 phase are shown. Error
bars represent SEM for three biological replicates.
Annotation of the generation batch cultures in Figure 3.3
20
40
60
80
100

98
Figure 3.3 Analysis of cell cycle phase distribution in response to LTC
B.
C.
A.
0
20
40
60
80
100
3 5 7 9 11
G0
/G1
cell
cy
cle
ph
ase
(%)
Day
0
20
40
60
80
100
3 5 7 9 11
S c
ell
cy
cle
ph
ase
(%)
Day
0
20
40
60
80
100
3 5 7 9 11
G2
/M c
ell
cy
cle
ph
ase
(%)
Day
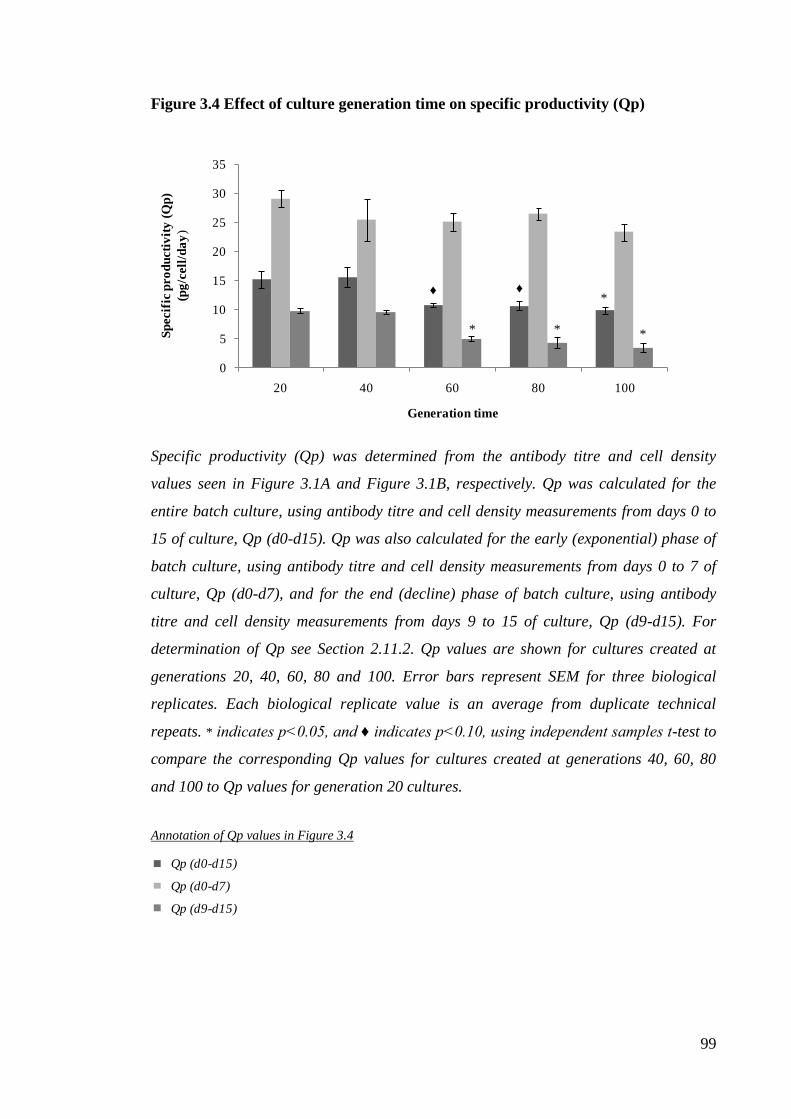
99
Figure 3.4 Effect of culture generation time on specific productivity (Qp)
Specific productivity (Qp) was determined from the antibody titre and cell density
values seen in Figure 3.1A and Figure 3.1B, respectively. Qp was calculated for the
entire batch culture, using antibody titre and cell density measurements from days 0 to
15 of culture, Qp (d0-d15). Qp was also calculated for the early (exponential) phase of
batch culture, using antibody titre and cell density measurements from days 0 to 7 of
culture, Qp (d0-d7), and for the end (decline) phase of batch culture, using antibody
titre and cell density measurements from days 9 to 15 of culture, Qp (d9-d15). For
determination of Qp see Section 2.11.2. Qp values are shown for cultures created at
generations 20, 40, 60, 80 and 100. Error bars represent SEM for three biological
replicates. Each biological replicate value is an average from duplicate technical
repeats. * indicates p<0.05, and ♦ indicates p<0.10, using independent samples t-test to
compare the corresponding Qp values for cultures created at generations 40, 60, 80
and 100 to Qp values for generation 20 cultures.
Annotation of Qp values in Figure 3.4
0
5
10
15
20
25
30
35
20 40 60 80 100
Sp
ecif
ic p
ro
du
cti
vit
y (
Qp
)
(pg
/cell
/da
y)
Generation time
Qp (d0-d15)
Qp (d0-d7)
Qp (d9-d15)
* * *
* ♦ ♦

100
Figure 3.5 Effect of culture generation time on cell size
3.90 was cultured as previously described (Figure legend 3.1). On day 9 of batch
culture, early generation (≤ 40 generations) and late generation (≥ 60 generations)
cells were prepared for cell counting using trypan blue dye (as described in Section
2.3.3). 100 cells were counted and measured for cell diameter using a Widefield
Axiovision microscope, and analysed using the Axiovision software. A, shows the
average cell diameter for early and late generation cells, and B, shows the range of cell
diameter measurements for early and late generation cells. Error bars represent the SD
for 100 cells counted.
Annotation of Figure 3.5
A.
B.
0
5
10
15
20
25
30
35
40
Nu
mb
er o
f cell
s
(Freq
uen
cy
)
Cell diameter
(µm)
0
4
8
12
16
Early Late
Cell
dia
mete
r
(µm
)
Generation
Early generation cells
Late generation cells

101
3.3 MOLECULAR INVESTIGATION OF ANTIBODY TITRE LOSS DURING
LTC OF CELL LINE 3.90
Characterisation analysis of 3.90 showed this cell line to be unstable, with a 40%
decrease in final antibody titre and a 30% decrease in Qp (d0-d15) between early
generation (generations 20 and 40) and late generation (generations 60, 80 and 100)
cultures. In order to determine the reason for instability molecular investigations of 3.90
were performed. In the work described in Section 3.3, 3.90 cultures were examined for
genomic stability in response to LTC, by analysis of chromosomal spreads and plasmid
gene copy numbers. Antibody mRNA and polysome profiles were also examined to
determine changes at transcript level. Molecular investigations extended to the analysis
of protein synthesis and secretion for 3.90 cultures.
For the remainder of this Chapter batch cultures created at generations 20 and 40 are
referred to as early generation cultures and batch cultures created at generations 60, 80
and 100 are referred to as late generation cultures.
3.3.1 Analysis of genomic stability during LTC
CHO cells have been reported to exhibit genetic instability, and have a karyotype that
has undergone extensive chromosomal rearrangement (Bacsi & Wejksnora, 1986). To
determine if 3.90 was experiencing karotypic changes chromosomal spreads were
analysed. Chromosomal numbers observed in early generation metaphase spreads
(Figure 3.6A(i)) and late generation metaphase spreads (Figure 3.6A(ii)) were similar.
For all the cultures analysed 18-20 chromosomes were observed in each spread (Figure
3.6B). The average chromosome number determined for 3.90 cultures was similar to
reported literature for CHO cultures. For example, Kao and Puck found the model
chromosome number of CHO-K1 to be 21 (Kao & Puck, 1969), whilst Derouazi et al,
found CHO-DG44 had an average of 20 chromosomes per cell (Derouazi et al, 2006).

102
Figure 3.6 Effect of culture generation time on chromosome number
3.90 cells in exponential phase were fixed in metaphase using 130ng/ml (w/v) colcemid
(Section 2.9.1). Metaphase spreads were created from an early generation (≤ 40
generations), and late generation (≥ 60 generations) culture. Images were collected on
an Olympus BX51 upright microscope with a 100x/1.30UPlanFLn oil immersion
objective using a coolsnap ES camera, through Metavue software (Section 2.9.3).
Typical examples of a early generation spread (A(i)), and a late generation metaphase
spread (A(ii)) are shown. The chromosome number (determined from 40 early and late
generation metaphase spreads) is shown in B. White scale bars = 10μm.
Annotation of the batch cultures in Figure 3.6
0
5
10
15
20
25
30
18 19 20
Freq
uen
cy
Number of chromosomes
A.
B.
(i) (ii)
Early generation
Late generation

103
Previous literature has shown DHFR-mediated CHO cells to be genetically unstable as a
result of recombinant gene loss during culture (Kim et al, 1998). Copy number analysis
determined 3.90 cultures had approximately 10 copies of both the heavy chain (Figure
3.7A) and light chain (Figure 3.7B) recombinant genes per cell. The number of heavy
chain and light chain gene copies per cell were similar for both early and late generation
cultures. Southern blot analysis also confirmed there was no alteration in plasmid gene
copy number in response to LTC.
3.3.2 Analysis of recombinant gene mRNA expression during LTC
A decrease in final antibody titre (Figure 3.1A) and Qp (Figure 3.4) was witnessed in
response to LTC, however, the instability cannot be attributed to molecular changes in
gross chromosome number (Figure 3.6) or gene copy number (Figure 3.7). As Qp has
been associated with recombinant transcript levels in CHO cell lines (Lee et al, 2009a)
recombinant mRNA expression was investigated for 3.90. GS mRNA expression was
constant during batch culture, and in response to LTC (Figure 3.8A). Although heavy
chain (Figure 3.8B) and light chain (Figure 3.8C) mRNA increased during batch culture
there was no significant difference in recombinant mRNA between cultures created at
early generations (generations 20 and 40) and those created at late generations
(generations 60, 80 and 100).
3.3.3 Investigating polysome profile characteristics during culture
Even though the expression antibody mRNA was not dependent on generation time of
culture mRNA association with translational machinery may have altered in response to
LTC. Lower rates of translation between early and late generation cultures may be
responsible for the decrease in antibody titre. It is possible that alterations to the
translation efficiency of the cell can be identified by modifications to polysome
conformations (reviewed in Ross, 1995). From polysome profiles analysed an increase
in the 80S peak was observed from day 4 to day 7 of batch culture, whilst a
corresponding decrease was observed for the 60S and polysome peaks (Figure 3.9).
Although the monosome peak areas were similar for both the early and late generation
polysome profiles, the polysome peak was lower for late generation day 7 polysome
profiles (Figure 3.9B(ii)) than for early generation day 7 polysome profiles (Figure

104
3.9A(ii)). To determine if the change in polysome peak area was altered during LTC the
relative change in peak area was quantified using Image J software. The resultant data
are shown in Figure 3.10.
Quantitative analysis of the monosome and polysome peak areas found that from days 4
to 7 of batch culture the relative 40S peak area was unaltered (Figure 3.10A), the
relative 60S peak area decreased (Figure 3.10B), and the relative 80S peak area
increased (Figure 3.10C). The changes to the monosome peaks during batch culture
were similar for both early and late generation cultures, but the percentage decrease
observed for the polysome peak area during batch culture was dependent on the
generation time of culture. The relative polysome area from days 4 to 7 of batch culture
decreased by 40% and 75% for early generation cultures and late generation cultures,
respectively (Figure 3.10D), suggesting that late generation cultures had greater
polysome dissociation than early generation cultures. The change to the polysome
profiles during culture indicate alterations to molecular events relating both to
instability in response to LTC, and the difference in Qp between the early (exponential)
phase and the end (decline) phase of batch culture. Harding et al, reported that during
ER stress, polysomes dissociate and monosomes accumulate, resulting in translational
inhibition (Harding et al, 2000b). My findings may reflect stress during batch culture
and potentially lower translational efficiency on day 7 of batch culture, particularly for
late generation cultures.
3.3.4 Analysis of protein synthesis and secretion during LTC
A change at the overall polysome locus has a potential consequence for the general
protein translational capacity of the cultures. In order to investigate the possibility that
changes in translation occurred with LTC, global protein synthesis was analysed using
incorporation of tritiated leucine (L-[4,5-3H] leucine). L-[4,5-3H] leucine was added to
early generation and late generation cultures which had undergone 7 days of prior batch
culture and was followed into intracellular proteins (cell pellets) and extracellular
proteins (supernatant samples). The relative L-[4,5-3H] leucine incorporation in the
intracellular proteins increased approximately thirty-fold after 48 hrs, for both early and
late generation cultures (Figure 3.11A). Although there was no change in the
intracellular L-[4,5-3H] leucine incorporation between early and late generation cultures

105
the extracellular protein from early generation cell suspensions had greater L-[4,5-3H]
leucine incorporation than the extracellular protein from late generation cell suspensions
(after 48 hrs incubation, Figure 3.11B). The change in L-[4,5-3H] leucine incorporation
in extracellular protein mirrored the decrease in antibody titre data measured by ELISA
(Figure 3.1A). The L-[4,5-3H] leucine incorporation method analysed protein synthesis
and secretion on a global scale. To investigate intracellular changes to the recombinant
protein antibody APC- and FITC-conjugated dyes (which detect the heavy chain and
light chain proteins, respectively) were used. The mean APC and FITC fluorescence
intensity increased from days 4 to 9 of batch culture, but no difference in APC or FITC
mean fluorescence was observed between early and late generation cultures (Figure
3.12). This confirmed, at an intracellular level, the results seen with the L-[4,5-3H]
leucine incorporation assay.
A molecular investigation of 3.90 suggests decreased final antibody titres and lower Qp
values in response to LTC could be due to changes at the level of protein secretion. A
working hypothesis can now be created that late generation cells have limitations with
the folding and secretion of the antibody chains or complexes. Mis-folded and unfolded
proteins can be recognized in the ER and cause activation of UPR (Figure 1.12) and
ERAD pathways (shown in Figure 1.13), with consequences for protein synthesis and
cell growth (Ellgaard & Helenius, 2003; Rutkowski & Kaufman, 2004). It is possible to
monitor the activation of these pathways to determine changes in response to LTC.

106
Figure 3.7 Analysis of heavy chain gene and light chain gene copy number for
early and late generation cultures
3.90 was cultured as previously described (Figure legend 3.1). Batch cultures were
created at early generations (≤ 40 generations) and late generations (≥ 60 generations,
Section 2.3.2). Gene copy numbers were analysed from genomic DNA extracted during
the exponential phase of batch culture (Section 2.6.1.1). Plasmid copies per cell were
assessed, using the light chain and heavy chain primer sets, by q-PCR (Section 2.6.2).
Genomic DNA content was normalised using the β-Actin primer set. Copy number was
also assessed by Southern blot analysis (Section 2.6.1). For Southern analysis of gene
copy number the genomic DNA, and plasmid DNA for probe design, was digested with
HindIII and EcoR1 (Section 2.6.1.3). The membrane was probed with the radiolabelled
heavy or light chain region, prepared as detailed in Section 2.6.1.7. Standardisation of
the loading of DNA species was performed using a radiolabelled 18S RNA gene. Tables
detailing heavy chain gene copy number per cell (A) and light chain gene copy number
per cell (B) are shown. An example of a Southern blot analysed for light chain gene
copy number is also shown (C). Copy number values determined by q-PCR are the
average values from triplicate experiments ± SEM. The plasmid copies determined by
Southern blot are the result of one experiment after normalisation.

107
Figure 3.7 Analysis of heavy chain gene and light chain gene copy number for
early and late generation cultures
A.
B.
Heavy chain g ene Plasmid copies per cell
( q-PCR)
Plasmid copies per cell
(Southern Blot)
Early g eneration 10.9 ± 2.3 8.7
Late generation 10.9 ± 1.9 10.3
Light chain g ene Plasmid copies per cell
( q-PCR)
Plasmid copies per cell
(Southern Blot)
Early generation 9.5 ± 1.1 10.2
Late generation 7.4 ± 1.2 10.8
C.
Southern blot standard
Early Late
Generation

108
Figure 3.8 Effects of culture generation time on recombinant mRNA expression
3.90 was cultured as previously described (Figure legend 3.1). mRNA levels were
compared using q-RTPCR from samples taken on days 3, 5, 7 and 9 of batch culture (as
detailed in Section 2.7.1), using the mRNA specific primer sets for A, GS, B, heavy
chain, and C, light chain. Samples were normalised using mRNA β-Actin primers. Error
bars represent SEM for three biological replicates.
Annotation of the generation batch cultures in Figure 3.8
20
40
60
80
100

109
Figure 3.8 Effect of culture generation time on recombinant mRNA expression
A.
B.
C.
0
50
100
150
200
250
300
3 5 7 9
Lig
ht ch
ain
mR
NA
ex
press
ion
(% r
ela
tiv
e to
sta
nd
ard
an
d
β-A
cti
nm
RN
A e
xp
ress
ion
)
Day
0
50
100
150
3 5 7 9
GS
mR
NA
ex
press
ion
(% r
ela
tiv
e to
sta
nd
ard
an
d
β-A
cti
nm
RN
A e
xp
ress
ion
)
Day
0
50
100
150
200
250
300
3 5 7 9
Hea
vy
ch
ain
mR
NA
ex
press
ion
(% r
ela
tiv
e to
sta
nd
ard
an
d
β-A
cti
nm
RN
A e
xp
ress
ion
)
Day

110
Figure 3.9 Analysis of polysome profiles during culture
3.90 was cultured as previously described (Figure legend 3.1). Batch cultures were
created at early generations (≤ 40 generations) and late generations (≥ 60 generations,
Section 2.3.2). Polysomes were extracted on day 4 and day 7 of batch culture (Section
2.8.2), and the extracts were analysed on a UV/Vis machine at 254nm after sucrose
gradient centrifugation, as described in Section 2.8.3. The peaks that contain the small
ribosomal subunit (40S), the large ribosomal subunit (60S), and both subunits (80S) are
indicated by arrows. The polysome peaks generated by 2, 3, 4 etc. 80S ribosomes on a
single mRNA are also indicated by an arrow. Figure 3.9A, represents a typical 3.90
early generation polysome profile, (i), shows a day 4 polysome profile, (ii), shows a day
7 polysome profile. Figure 3.9B, represents a typical 3.90 late generation polysome
profile, (i), shows a day 4 polysome profile, (ii) shows a day 7 polysome profile.

111
Figure 3.9 Analysis of polysome profiles during culture
60S
40S
80S
Polysomes40S
80S
60S
Polysomes
40S
80S
60S
Polysomes
60S
40S
80S
Polysomes
A.
B.
(i)(ii)
(i) (ii)
Early Generation Cultures
Late Generation Cultures
Day 4 Day 7
Day 4 Day 7

112
Figure 3.10 Effects of culture on the relative area of monosome and polysome
peaks
Polysomes were extracted and analysed (as described in Figure legend 3.9 and Section
2.8). The 40S, 60S, 80S and polysome peaks were analysed using Image J software to
provide a relative representation of peak area variation. The relative 40S peak area (A),
60S peak area (B), 80S peak area (C) and polysome peak area (D) are shown for early
and late generation day 4 and day 7 polysome profiles. Error bars represent SEM for
three biological replicates.
Annotation of the batch cultures in Figure 3.10
Early generation
Late generation

113
Figure 3.10 Effects of culture on the relative area of monosome and polysome
peaks
A.
B.
C.
0
10
20
30
40
50
4 7
Rela
tiv
e 4
0S
pea
k a
rea
Day
D.
0
20
40
60
80
100
120
4 7
Rela
tiv
e 6
0S
pea
k a
rea
Day
0
20
40
60
80
100
120
4 7
Rela
tiv
e p
oly
som
e
pea
k a
rea
Day
0
50
100
150
200
4 7
Rela
tiv
e 8
0S
pea
k a
rea
Day

114
Figure 3.11 Measuring global protein synthesis and secretion for early and late
generation cultures
3.90 was cultured as previously described (Figure legend 3.1). Cell suspensions (500µl)
from early generation (≤ 40 generations) and late generation (≥ 60 generations) day 7
cultures were transferred to 24 well plates and incubated with L-[4,5-3H] leucine.
Protein synthesis and secretion was measured as the rate of incorporation of L-[4,5-
3H] leucine into trichloroacetic acid (TCA) precipitable-material over a 48 hr time
period (Section 2.5.2). The fold increase for intracellular protein (A) and extracellular
protein (B) was determined relative to early generation cultures at 0 hrs. Error bars
represent SEM for three biological replicates.
Annotation of time-points in Figure 3.11
A.
B.
(i) (ii)
0
10
20
30
40
Early Late
Fo
ld in
crea
se i
n
intr
acell
ula
r p
ro
tein
(rela
tiv
e to
ea
rly
gen
era
tio
n
va
lues
at
0 h
rs)
Generation
0
10
20
30
Early Late
Fo
ld in
crea
se i
n
ex
tra
cell
ula
r p
ro
tein
(rela
tiv
e t
o e
arly
gen
era
tio
n
va
lues
at
0 h
rs)
Generation
0 hrs
24 hrs
48 hrs

115
Figure 3.12 Analysis of intracellular heavy chain and light chain protein during
culture
3.90 was cultured as previously described (Figure legend 3.1). Batch cultures were
created at early generations (≤ 40 generations) and late generations (≥ 60 generations,
Section 2.3.2). 2x10⁶ fixed cells, from days 4 and 9 of batch culture, were washed,
blocked and incubated with 10µg goat anti-human IgG, Fcγ-APC and 6µg goat anti-
human lambda light chain-FITC. The samples were then analysed by a CyAn ADP flow
cytometer, using the 488nm and infra-red excitation lasers to excite the FITC and APC
conjugates (Section 2.4.2). Unstained 3.90 cells and stained parental cells were
required for setting initial parameters with the CyAn-ADP flow cytometer. The data was
gated to select single cells, and was analysed by Summit 4.3 software. Error bars
represent SEM for three biological replicates.
Annotation of antibody conjugates in Figure 3.12
0
20
40
60
80
4 9 4 9
Early Late
Rela
tiv
e m
ea
n f
luo
resc
en
ce i
nte
nsi
ty
(fo
ld in
crea
se c
om
pa
red
to
th
e
pa
ren
tal
cell
lin
e)
Day/Generation
APC conjugate antibody (for use in heavy chain protein detection)
FITC conjugate antibody (for use in light chain protein detection)

116
3.4 THE REGULATION OF UPR MARKERS DURING CULTURE
Instability of 3.90 was characterised by a 40% decrease in antibody titre and a 30%
decrease in Qp between early generation and late generation cultures (Section 3.2).
Molecular characterisation studies confirmed that early and late generation cultures had
similar copies of antibody genes per cell and similar expression of recombinant mRNA,
but highlighted a decrease in protein secretion in response to LTC (Section 3.3). If late
generation cultures were encountering problems in antibody secretion, possibly due to
an accumulation of mis/unfolded proteins and the ability to handle such proteins
appropriately, the UPR would be initiated. A greater UPR for late generation cultures
would prevent incorrectly folded proteins from being secreted, ultimately resulting in
lower antibody titres.
In the temporal changes in response to mis/unfolded proteins, the PERK pathway is the
first pathway activated during the UPR. As discussed in Section 1 PERK becomes
activated as unfolded proteins accumulate in the ER (Bertolotti et al, 2000; Liu et al,
2000). Activated PERK phosphorylates eIF2α (Harding et al, 1999; Prostko et al, 1992;
Shi Y, 1998) resulting in global protein synthesis inhibition, with the exception of ATF4
(Harding et al, 2000a; Lu et al, 2004). Increased translation of ATF4 upregulates
expression of ER stress target genes including GADD34 (Ma & Hendershot, 2003) and
GADD153 (Harding et al, 2000a). Pathways involved in the UPR are shown in Figure
1.12. Expression of ATF4, GADD34 and GADD153 mRNA were examined in response
to LTC.
The expression of ATF4 and GADD34 mRNA increased from days 3 to 9 of batch
culture, five-fold and three-fold, respectively (Figure 3.13A and 3.13B). Although the
expression of ATF4 mRNA was the same between early and late generation cultures,
GADD34 mRNA expression was slightly altered in response to LTC. On day 7 of batch
culture GADD34 mRNA was approximately 30% lower for late generation cultures than
early generation cultures. The expression of GADD153 mRNA was also dependent on
the culture generation time (Figure 3.13C). On day 7 of batch culture expression of
GADD153 mRNA was approximately three-fold greater for late generation cultures than
for early generation cultures. Increased GADD153 mRNA expression for late generation

117
cultures was interpreted to be an indication of an adaptation to increased cell stress as a
result of LTC.
In order to confirm the observations made at mRNA level, cellular ATF4 and
GADD153 protein were examined by western blot analysis. A 50% increase in ATF4
protein expression was detected as cells moved from the exponential to the stationary
phase of batch culture, similar for both early and late generation cultures (Figure
3.14A). A similar percentage increase was seen for ATF4 mRNA expression during
batch culture (Figure 3.13A). Expression of GADD153 protein was also upregulated
during batch culture (Figure 3.14B). From days 3 to 9 of batch culture there was an
approximate eight-fold increase in GADD153 protein expression, with no significant
difference in GADD153 protein intensity between early and late generation cultures. A
western blot for GADD153 protein shows the expression of GADD153 protein during
batch culture (Figure 3.14C), which peaks on day 9 of batch culture.
The increased expression of ATF4 and GADD153 mRNA and protein was interpreted
to indicate that the cells experienced a stress response during batch culture. To confirm
increased ER stress during batch culture ER chaperones, BiP and PDI, were also
examined. Increased BiP expression has been associated with activation of the UPR
(Kaufman, 2002; Wang et al, 1996). Western blot analysis of BiP showed a band at
approximately 75 kDa, corresponding to the MW observed by Lee (Lee, 1987). The up-
regulation of BiP protein is shown in the representative western blot in Figure 3.15B.
From days 3 to 11 of batch culture the expression of BiP protein increased five-fold for
early generation cultures, and four-fold for late generation cultures (Figure 3.15A).
Although BiP protein expression increased during batch culture there was no change in
BiP protein intensity between early and late generation cultures. Similar findings were
also seen for PDI protein expression. Western blot analysis of the ER chaperone PDI
showed a band of approximately 57 kDa, a MW similar to other published data. An
approximate three-fold increase in relative PDI protein expression was observed from
days 3 to 11 of batch culture, for both early and late generation cultures (Figure 3.16A).
PDI protein expression is shown in the representative western blot in Figure 3.16B.
So far, experiments have focused upon mRNA and protein expression at the first
response to ER stress, such as the increase in ER chaperones, BiP and PDI, and on

118
downstream factors from the PERK pathway, including ATF4, GADD34 and
GADD153. There are two other pathways involved in the UPR, which involve the
activation of ER transmembrane proteins, ATF6 and IRE-1. ATF6 and IRE-1 differ in
the timing of their response, but merge to induce XBP-1 transcription, and mRNA
splicing (Yoshida et al, 2003), shown in Figure 1.12. This splicing event creates a
translational frameshift in XBP-1 mRNA allowing production of an active transcription
factor, co-inducing UPRE (Calfon et al, 2002; Lee et al, 2002; Shen et al, 2001;
Yoshida et al, 2001). Treatment with tunicamycin, a known activator of ER stress,
resulted in spliced XBP-1 mRNA after a 24 hr incubation (Figure 3.17A). XBP-1
mRNA splicing was also shown for 3.90 cultures during batch culture (Figure 3.17B).
The ratio of spliced XBP-1 mRNA to total XBP-1 mRNA increased from days 3 to 9 of
batch culture, and by day 9 of batch culture the ratio was greater for late generation
cultures (Figure 3.17C). The extent of XBP-1 mRNA splicing gave another indication
that late generation cultures might be experiencing greater ER stress than early
generation cultures.
A UPR was detected for 3.90 during batch culture, shown by increased expression of
ATF4 and GADD153 mRNA and protein, and BiP and PDI protein. There was also
enhanced GADD153 mRNA and XBP-1(s) mRNA for late generation cultures. These
findings suggest that late generation cultures encountered more ER stress, potentially
due to a greater concentration of mis/unfolded proteins in the ER, or a failure of late
generation cultures to restore proteins to the correctly-folded conformation. A failure in
protein folding would result in enhanced protein degradation, which would have
detrimental consequences for antibody secretion and antibody titres.

119
Figure 3.13 Effects of culture generation time on the mRNA expression of UPR
markers
3.90 was cultured as previously described (Figure legend 3.1). mRNA levels were
compared using q-RTPCR from samples taken on days 3, 5, 7 and 9 of batch culture (as
detailed in Section 2.7.1), using the mRNA specific primer sets for A, ATF4, B,
GADD34, and C, GADD153. Samples were normalised using mRNA β-Actin primers.
Error bars represent SEM for three biological replicates. ♦ indicates p<0.10, using
independent samples t-test to compare cultures created at generations 40, 60, 80 and
100 to generation 20 cultures (on the same day of batch culture).
Annotation of the generation batch cultures in Figure 3.13
20
40
60
80
100

120
Figure 3.13 Effect of culture generation time on the mRNA expression of UPR
markers
A.
B.
C.
0
50
100
150
200
250
300
350
400
3 5 7 9
GA
DD
34
mR
NA
ex
press
ion
(% r
ela
tiv
e to
sta
nd
ard
an
d
β-A
cti
nm
RN
A e
xp
ress
ion
)
Day
0
50
100
150
200
250
300
350
3 5 7 9
AT
F4
mR
NA
ex
press
ion
(% r
ela
tiv
e to
sta
nd
ard
an
d
β-A
cti
nm
RN
A e
xp
ress
ion
)
Day
0
50
100
150
200
250
300
3 5 7 9
GA
DD
15
3 m
RN
A e
xp
ress
ion
(% r
ela
tiv
e to
sta
nd
ard
an
d
β-A
cti
nm
RN
A e
xp
ress
ion
)
Day
♦ ♦
♦ ♦ ♦
♦ ♦
♦

121
Figure 3.14 Analysis of ATF4 and GADD153 protein expression for early and late
generation cultures
3.90 was cultured as previously described (Figure legend 3.1). Batch cultures were
created at early generations (≤ 40 generations) and late generations (≥ 60 generations,
Section 2.3.2). Protein was extracted during batch culture (as detailed in Section
2.5.3.1). 60µg of protein was separated by SDS-PAGE (Section 2.5.3.2), transferred
(Section 2.5.3.3) and detected using anti-rabbit polyclonal ATF4 and GADD153
antibodies. Membranes were stripped and re-probed using an anti-mouse pan ERK
antibody (Section 2.5.3.4). Bands were examined using Image J software, and the
amount of ATF and GADD153 protein expression was calculated relative to ERK
expression (Section 2.5.3.5). A, shows the relative intensity of ATF4 expression, B,
shows the relative intensity of GADD153 expression, and C, provides a representative
western blot using the GADD153 antibody. Error bars represent SEM for three
biological replicates.
Annotation of the batch cultures in Figure 3.14
Early generation
Late generation

122
Figure 3.14 Analysis of ATF4 and GADD153 protein expression for early and late
generation cultures
A.
B.
C.
3 7 9 11 3 7 9 11
Early Late
GADD153
ERK
0
20
40
60
80
100
120
140
exponential stationary
AT
F4
pro
tein
in
ten
sity
( rela
tiv
e to
sta
nd
ard
ER
K)
Stage of culture
0
50
100
150
200
250
3 7 9 11
GA
DD
15
3 p
ro
tein
in
ten
sity
( rela
tiv
e to
sta
nd
ard
ER
K)
Day
Day
Generation

123
Figure 3.15 Analysis of BiP protein expression for early and late generation
cultures
3.90 was cultured as previously described (Figure legend 3.1). Batch cultures were
created at early generations (≤ 40 generations) and late generations (≥ 60 generations,
Section 2.3.2). Protein was extracted on days 3, 7, 9 and 11 of batch culture (as detailed
in Section 2.5.3.1). 60µg of protein was separated by SDS-PAGE (Section 2.5.3.2),
transferred (Section 2.5.3.3) and then detected using an anti-goat polyclonal BiP
antibody. Membranes were stripped and re-probed using an anti-mouse pan ERK
antibody (Section 2.5.3.4). Bands were analysed using Image J software, and the
amount of BiP protein expression was calculated relative to ERK expression (Section
2.5.3.5). A, shows the relative intensity of BiP expression, and B, provides a
representative western blot. Error bars represent SEM for three biological replicates.
Annotation of the batch cultures in Figure 3.15
A.
B.
3 7 9 11 3 7 9 11
Early Late
BiP
ERK
0
100
200
300
400
500
3 7 9 11
BiP
pro
tein
in
ten
sity
(rela
tiv
e to
ER
K s
tan
da
rd
)
Day
Day
Generation
Early generation
Late generation

124
Figure 3.16 Analysis of PDI protein expression for early and late generation
cultures
3.90 was cultured as previously described (Figure legend 3.1). Batch cultures were
created at early generations (≤ 40 generations) and late generations (≥ 60 generations,
Section 2.3.2). Protein was extracted on days 3, 7, 9 and 11 of batch culture (as detailed
in Section 2.5.3.1). 60µg of protein was separated by SDS-PAGE (Section 2.5.3.2),
transferred (Section 2.5.3.3) and then detected using an anti-rabbit polyclonal PDI
antibody. Membranes were stripped and re-probed using an anti-mouse pan ERK
antibody (Section 2.5.3.4). Bands were analysed using Image J software, and the
amount of PDI protein expression was calculated relative to ERK expression (Section
2.5.3.5). A, shows the relative intensity of PDI expression, and B, provides a
representative western blot. Error bars represent SEM for three biological replicates.
Annotation of the batch cultures in Figure 3.16
A.
B.
0
50
100
150
200
250
300
3 7 9 11
PD
I p
ro
tein
in
ten
sity
(rela
tiv
e to
ER
K s
tan
da
rd
)
Day
3 7 9 11 3 7 9 11
Early Late
PDI
ERK
Day
Generation
Early generation
Late generation

125
Figure 3.17 Analysis of XBP-1(s) mRNA during culture
3.90 was cultured as previously described (Figure legend 3.1). Batch cultures were
created at early generations (≤ 40 generations) and late generations (≥ 60 generations,
Section 2.3.2). cDNA was synthesised from RNA extracted on days 3 and 9, for early
and late generation cultures, and on day 3 for the positive control culture (Section
2.7.1.3). The positive control culture had been treated with tunicamycin (6µg/ml) 24 hrs
prior to RNA extraction. The PCR was performed using the newly synthesised cDNA
and the relevant primers (Section 2.7.2). The PCR products were electrophoresed on a
2% (w/v) agarose gel and visualised by UV transillumination (Section 2.6.1.4). The
positive control PCR (A) and the PCR for early and late generation cultures (B) are
shown. The product bands were analysed using Image J software, and the ratio of
spliced XBP-1 mRNA to total XBP-1 mRNA (C) is also shown. Error bars represent
SEM for three biological replicates. ♦ indicates p<0.10, using independent samples t-
test to compare late generation cultures to early generation cultures (on the same day
of batch culture).
Annotation of the batch cultures in Figure 3.17
Early generation
Late generation

126
Figure 3.17 Analysis of XBP-1 mRNA during culture
A.
B.
C.
3 9 3 9
Early Late
GAPDH XBP-1
XBP-1(u)
XBP-1(s)
0
10
20
30
40
50
60
3 9 Positive
Am
ou
nt
of
spli
ced
XB
P-1
mR
NA
to to
tal
XB
P-1
mR
NA
(%
)
Day
Day
Generation
♦

127
3.5 METABOLIC ANALYSIS OF CELL LINE 3.90
3.90 was shown to be unstable with a 40% decrease in antibody titre between early and
late generation cultures (Section 3.2). The instability of 3.90 was thought not to be due
to a loss in recombinant antibody gene copy number, antibody mRNA expression or
protein synthesis (Section 3.3), but was attributed to less protein secretion (Figure
3.11B). As the protein expression of the UPR markers (ATF4, GADD153, BiP and PDI)
all increased during batch culture, I suggested that some recombinant antibody was
failing to fold correctly, initiating an UPR (Section 3.4). It has also been previously
reported that increased expression of ATF4 and GADD153 mRNA can result from
nutrient deprivation (Bruhat et al, 1997), and that unfolded proteins can accumulate
with glucose starvation (Pouysségur et al, 1977). Therefore, changes in the availability
of nutrients (including glucose) may influence the UPR status of the cell, and may
potentially affect the mechanisms involved in protein folding. Metabolite profiles of
early generation and late generation cultures were investigated to determine possible
nutrient limitations between early and late generation cultures.
Most amino acids analysed only decreased during the first five days of batch culture,
with no further decline in their relative concentrations after day 5 of batch culture
(Appendix 2). However, asparagine, serine, leucine and lysine were found to be utilised
during the entire batch culture (Figure 3.18). Asparagine decreased rapidly during batch
culture and was depleted from both early generation and late generation cultures by day
9 of batch culture (Figure 3.18A). Serine consumption by 3.90 cultures was also rapid.
There was a five-fold decrease in serine by day 5, and complete serine depletion by day
13 of batch culture, for both early and late generation cultures (Figure 3.18B). Leucine
(Figure 3.18C), and lysine (Figure 3.18D) concentrations were also decreased during
batch culture, but neither of these amino acids were completely depleted.
As well as investigating metabolites that were utilised during culture, metabolites
released from the cell were also considered. By day 13 of batch culture both early and
late generation cultures showed a relative thirty-fold increase in glycerol (Figure
3.19A), and a relative one hundred and twenty-fold increase in glycine (Figure 3.19B).
The accumulation of glycine and glycerol during batch culture was not altered in
response to LTC. The profile of alanine accumulation, however, was dependent on the

128
generation time of culture. Alanine concentration was greatest for early generation
cultures on day 9 of batch culture, after which alanine decreased slightly between days 9
and 13 of batch culture (Figure 3.19C). For late generation cultures alanine
concentration was maximal by day 7 of batch culture, followed by a steady decrease in
relative alanine concentration. The observed decrease in relative alanine concentration
during the end phase of batch culture suggests that following production of alanine, as a
by-product, cells were possible re-utilising alanine at a crucial point during culture
when nutrients were limiting. On days 5 and 7 of batch culture relative alanine
concentration was greater for late generation cultures than early generation cultures.
Late generation cultures were potentially producing more alanine, resulting in the
increased accumulation of extracellular alanine. Increased alanine production has been
previously stated to be an indication of poor energy usage by CHO cells (Bonarius et al,
2001; Goudar et al, 2009; Lu et al, 2005), and may suggest altered metabolic flux for
3.90 cultures in response to LTC, resulting in poor energy usage for late generation
cultures. Poor energy usage for late generation cultures may account for lower antibody
titres for these cultures.

129
Figure 3.18 Analysis of amino acid utilisation during culture
3.90 was cultured as previously described (Figure legend 3.1). Batch cultures were
created at early generations (≤ 40 generations) and late generations (≥ 60 generations,
Section 2.3.2). Supernatant samples, taken on days 5, 7, 9 and 13 of batch culture
(Section 2.3.2), and a medium control sample, were spiked with the internal standard
myristic acid d27 and lyophilised. Chemical derivatization was performed in two stages,
with methyloxyamine hydrochloride in pyridine, before the addition of MSTFA and
TMCS (Section 2.10.3.1). All samples were analysed using GC-MS analysis, within 24
hrs of derivatization. Raw data processing was performed using ChemStation and
AMDIS (Section 2.10.3.2). The relative percentage of asparagine (A), serine (B),
leucine (C) and lysine (D) are shown. All values were normalised to the internal
standard, myristic acid d27. Error bars represent SD for two biological replicates.
Annotation of the batch cultures in Figure 3.18
Early generation
Late generation

130
Figure 3.18 Analysis of amino acid utilisation during culture
A.
B.
D.
C.
0
1
2
3
4
5
6
Medium 5 7 9 13
Rela
tiv
e a
spa
ra
gin
e
(%)
Day
0
5
10
15
20
25
30
35
Medium 5 7 9 13
Rela
tiv
e s
erin
e
(%)
Day
0
5
10
15
20
Medium 5 7 9 13
Rela
tiv
e ly
sin
e
(%)
Day
0
20
40
60
80
Medium 5 7 9 13
Rela
tiv
e leu
cin
e
(%)
Day

131
Figure 3.19 Effect of culture generation time on metabolite accumulation
3.90 was cultured as previously described (Figure legend 3.1). Batch cultures were
created at early generations (≤ 40 generations) and late generations (≥ 60 generations,
Section 2.3.2). Supernatant samples, taken on days 5, 7, 9 and 13 of batch culture
(Section 2.3.2), and a medium control sample, were lyophilised, and derivatized as
stated in Figure legend 3.18 and Section 2.10.3. All samples were analysed using GC-
MS analysis, within 24 hrs of derivatization. Raw data processing was performed using
ChemStation and AMDIS (Section 2.10.3.2). The relative percentage of glycerol (A),
glycine (B), and alanine (C) are shown. All values were normalised to the internal
standard, myristic acid d27. Error bars represent SD for two biological replicates.
Annotation of the batch cultures in Figure 3.19
Early generation
Late generation

132
Figure 3.19 Effect of culture generation time on metabolite accumulation
A.
B.
C.
0
20
40
60
80
100
Medium 5 7 9 13
Rela
tiv
e g
lycero
l
(%)
Day
0
50
100
150
Medium 5 7 9 13
Rela
tiv
e g
lycin
e
(%)
Day
0
5
10
15
20
Medium 5 7 9 13
Rela
tiv
e a
lan
ine
(%)
Day
133
The TCA cycle has been described as the central regulator in cell energy homeostasis
and cell metabolism (Krebs 1970). The TCA cycle uses acetyl CoA, created from
pyruvate, as a result of glycolysis. Pyruvate can also act as a precursor for the
production of alanine and lactate. Concentrations of glucose were completely depleted
by day 13 of batch culture, with no change in glucose consumption between early and
late generation cultures (Figure 3.20A). As the cell utilised glucose, lactate was created
and released from the cell. For early generation cultures lactate reached a maximum
concentration on day 9 of batch culture, after which lactate was re-utilised by the cell, as
glucose concentrations were depleted (Figure 3.20B). For late generation cultures
lactate was greatest on day 7 of batch culture, after which lactate was re-utilised. On
days 9 and 13 of batch culture lactate concentrations were lower for late generation
cultures than early generation cultures, possibly due to increased rates of lactate re-
utilisation.
To confirm and fully quantitate rates of glucose and lactate utilisation, glucose and
lactate concentrations were determined enzymatically. Glucose consumption determined
enzymatically mirrored the glucose consumption seen during batch culture using GC-
MS analysis (Figure 3.21A). Although glucose concentration was similar for both early
and late generation batch cultures late generation cultures had a higher rate of glucose
utilisation than early generation cultures (Figure 3.21B) due to lower CCT values as a
result of LTC. The rate of glucose metabolism possibly influenced lactate production
(Figure 3.21C). Late generation cultures re-utilised lactate at a faster rate than early
generation cultures during the end (decline) phase of batch culture (Figure 3.21D).
Potentially due to inefficient glucose metabolism during LTC, late generation cultures
utilised glucose at a faster rate then switched to using lactate as an energy source. The
metabolic changes between early and late generation cultures may have influenced
antibody titre loss as a result of LTC.
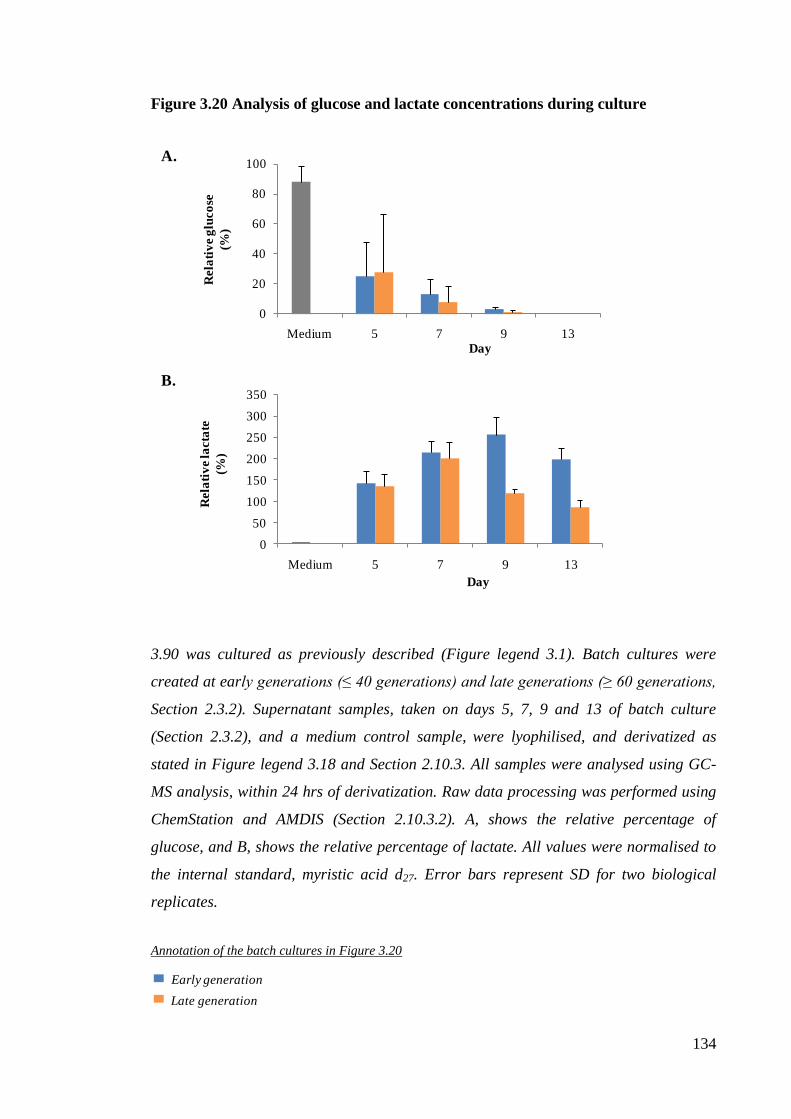
134
Figure 3.20 Analysis of glucose and lactate concentrations during culture
3.90 was cultured as previously described (Figure legend 3.1). Batch cultures were
created at early generations (≤ 40 generations) and late generations (≥ 60 generations,
Section 2.3.2). Supernatant samples, taken on days 5, 7, 9 and 13 of batch culture
(Section 2.3.2), and a medium control sample, were lyophilised, and derivatized as
stated in Figure legend 3.18 and Section 2.10.3. All samples were analysed using GC-
MS analysis, within 24 hrs of derivatization. Raw data processing was performed using
ChemStation and AMDIS (Section 2.10.3.2). A, shows the relative percentage of
glucose, and B, shows the relative percentage of lactate. All values were normalised to
the internal standard, myristic acid d27. Error bars represent SD for two biological
replicates.
Annotation of the batch cultures in Figure 3.20
A.
B.
0
20
40
60
80
100
Medium 5 7 9 13
Rela
tiv
e g
luco
se
(%)
Day
0
50
100
150
200
250
300
350
Medium 5 7 9 13
Rela
tiv
e la
cta
te
(%)
Day
Early generation
Late generation
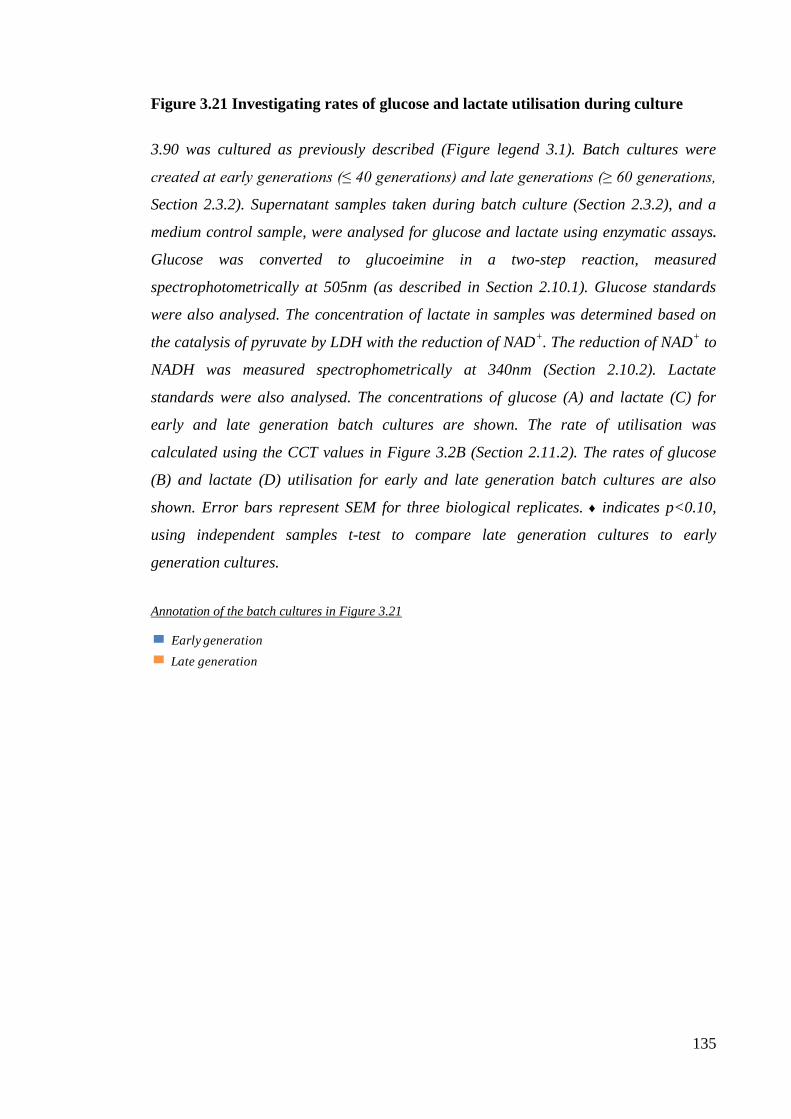
135
Figure 3.21 Investigating rates of glucose and lactate utilisation during culture
3.90 was cultured as previously described (Figure legend 3.1). Batch cultures were
created at early generations (≤ 40 generations) and late generations (≥ 60 generations,
Section 2.3.2). Supernatant samples taken during batch culture (Section 2.3.2), and a
medium control sample, were analysed for glucose and lactate using enzymatic assays.
Glucose was converted to glucoeimine in a two-step reaction, measured
spectrophotometrically at 505nm (as described in Section 2.10.1). Glucose standards
were also analysed. The concentration of lactate in samples was determined based on
the catalysis of pyruvate by LDH with the reduction of NAD+. The reduction of NAD
+ to
NADH was measured spectrophometrically at 340nm (Section 2.10.2). Lactate
standards were also analysed. The concentrations of glucose (A) and lactate (C) for
early and late generation batch cultures are shown. The rate of utilisation was
calculated using the CCT values in Figure 3.2B (Section 2.11.2). The rates of glucose
(B) and lactate (D) utilisation for early and late generation batch cultures are also
shown. Error bars represent SEM for three biological replicates. ♦ indicates p<0.10,
using independent samples t-test to compare late generation cultures to early
generation cultures.
Annotation of the batch cultures in Figure 3.21
Early generation
Late generation

136
Figure 3.21 Investigating rates of glucose and lactate utilisation during culture
A.
B.
D.
C.
0
10
20
30
40
50
Medium 5 7 9 13
Glu
co
se c
on
cen
tra
tio
n
(mM
)
Day
0
10
20
30
40
50
60
Medium 5 7 9 13
La
cta
te c
on
cen
tra
tio
n
(mM
)
Day
0
0.5
1
1.5
2
Ra
te o
f la
cta
te u
tili
sati
on
(dd
9-d
13
)
(pM
/cell
/da
y)
0
0.2
0.4
0.6
0.8
1
Ra
te o
f g
luco
se u
tili
sati
on
(d0
-d1
3)
(pM
/cell
/da
y)
♦

137
3.6 DISCUSSION
Results show that recombinant CHO cell line 3.90 was unstable in response to LTC.
Instability was characterised with a 40% decrease in final antibody titre and a 30%
decrease in Qp (d0-d15) between early generation (generations 20 and 40) and late
generation cultures (generations 60, 80 and 100, Section 3.2). Any insight into the
reason for instability provides valuable information, potentially presenting
characteristics of an optimal cell line (which could be chosen at the screening stage),
and/or highlighting markers of instability that could be used to exclude cell lines before
proceeding with extensive characterisation studies.
During the initial stages of batch culture there was no evidence of instability in response
to LTC. Antibody titre values, for all generations, were similar until day 7 of batch
culture (Figure 3.1A), with no change in viable cell densities (Figure 3.1B), CCT
(Figure 3.2B), cell cycle distribution (Figure 3.3), Qp (Figure 3.4) or recombinant
mRNA expression (Figure 3.8) between early and late generation cultures during the
exponential phase of batch culture. Differences in antibody titre between early and late
generation cultures only became significant from day 11 of batch culture (Figure 3.1A).
The main questions from the characterisation investigations were why did late
generation cultures express less antibody than early generation cultures, and why did the
decline in antibody titre only occur during the end phase of batch culture.
The loss in antibody titre in response to LTC was accompanied with lower viable cell
densities. Late generation cultures had lower viable cell densities (Figure 3.1A) and
CCT values (Figure 3.2B) than early generation cultures during the end (decline) phase
of batch culture. As CCT is determined by the rates of cell growth and cell death, with
the balance between these two fates dependent on the rate of cell division (Lloyd & Al-
Rubeai, 1999), it was not surprising that cell cycle distribution was also altered in
response to LTC (Figure 3.3). By day 11 of batch culture early generation cultures had
significantly higher antibody titres and a greater proportion of cells in G0/G1. A trend
which has been previously reported for other CHO and hybridoma cells (Al-Rubeai &
Emery, 1990; Dutton et al, 2006; Kromenaker & Srienc, 1991). However, this trend was
only observed during the end (decline) phase of batch culture. Figure 3.22 shows that
there was no correlation between antibody titre and proportion of cells in G0/G1 on

138
days 3 and 7 of batch culture. The figure also highlights the increase in the percentage
of cells in G0/G1 as batch culture progresses. The accumulation of late generation cells
in G0/G1 halts on day 7 of batch culture (Figure 3.22B), whilst the accumulation of
early generation cells in G0/G1 continues, until at least day 11 of batch culture (Figure
3.22C). It is highly possible that the changes in cell cycle distributions were due to the
factors altering the cell biomass between early and late generation cultures (Lodish et al,
2004; Morgan, 2007).
The decrease in antibody titres values in response to LTC was not solely due to
alterations in cell biomass as Qp values were also affected (Figure 3.4). However, the
changes in cell biomass and antibody titre in response to LTC were potentially linked to
similar mechanisms. A decrease in viable cells suggests late generation cultures were
experiencing enhanced cell death compared to early generation cultures. Increased cell
death could be due to stimuli involved in receptor-mediated, mitochondrial, or ER-stress
mediated apoptosis (reviewed in Arden & Betenbaugh, 2006), or due to a loss of
protective factors, such as nutrients. Apoptosis as a result of ER stress occurs due to the
accumulation of mis/unfolded proteins in the ER. Late generation cultures may have
experienced changes to its cell biomass due to the accumulation of more mis/unfolded
proteins in the ER, resulting in an enhanced UPR. The UPR pathway is initially
activated to lower ER stress by preventing global protein translation (Harding et al,
2002; Harding et al, 1999), with the exception of ATF4 (Harding et al, 2000a; Lu et al,
2004). Although the expression of ATF4 (mRNA and protein expression) was not
dependent on generation time (Figure 3.13A and Figure 3.14A), the expression of
ATF4‟s downstream targets, GADD34 (Ma & Hendershot, 2003) and GADD153
(Harding et al, 2000a) were altered in response to LTC, resulting in greater GADD153
mRNA and less GADD34 mRNA for late generation cultures (Figure 3.13B). As
GADD34 is required for feedback inhibition of the UPR, mediating dephosphorylation
of eIF2α (Novoa et al, 2001), decreased GADD34 mRNA for late generation cultures
(Figure 3.13B) potentially suggests less feedback inhibition on the UPR pathway, which
could result in enhanced ER stress for late generation cultures. Protein expression of
GADD34 needs to be examined but initial protein investigations found eIF2α
phosphorylation was not altered in response to LTC (data not shown). Studies
examining eIF2α phosphorylation found that addition of tunicamycin, a known ER
stress inducer, did not further enhance eIF2α phosphorylation within this cell line (data

139
not shown). These findings suggest that phosphorylation of eIF2α was possibly elevated
by the process of recombinant protein production, and it may have taken sufficient
GADD34 protein to alter the feedback pathway. Analysis of GADD34 protein would be
needed to determine if expression was altered in response to LTC.
Less feedback inhibition of the UPR would allow the up-regulation of proteins to either
assist in protein folding or, during excessive stress, commit the cell to cell death
(McCullough et al, 2001; Yoshida et al, 2003). The mRNA expression of such proteins,
XBP-1(s) (Figure 3.17C) and GADD153 (Figure 3.13C), were increased for late
generation cultures, during the late exponential and stationary phase of batch culture. As
no change in ATF4 protein was observed between early and late generation cultures
(Figure 3.14) regulation of GADD153 mRNA was possibly under the control of other
ER stress proteins, such as ATF6 and XBP-1 (Oyadomari & Mori, 2003). Protein
analysis of ATF6 and XBP-1 may have shown altered regulation between early and late
generation culture, which could have further supported the suggestion that late
generation cultures were potentially experiencing prolonged, and enhanced ER stress.
Unfortunately there is a lack of commercially available good quality antibodies to detect
ATF6 and spliced XBP-1 proteins.
As previously mentioned in Section 1.5 protein production, folding and secretion are
energy dependent processes (highlighted in Figure 1.7). Any impact on the cells ability
to provide ATP will adversely impact these processes (Scriven et al, 2007; Simone &
Roberto, 2007). Previously findings have linked glucose concentrations to ATP
production in CHO cultures (Lu et al, 2005). Glucose was used rapidly by 3.90, for both
early and late generation cultures (Figure 3.20A and 3.21A). I suggest lactate, produced
as a by-product of glycolysis, was re-utilised by 3.90 cultures upon glucose depletion
(Figure 3.20B and Figure 3.21C). Lactate can be exploited by cells as it can be
converted back to pyruvate and used within the TCA cycle. The re-utilisation of lactate
has also been highlighted for other CHO cultures (Altamirano et al, 2009; Altamirano et
al, 2006; Ma et al, 2009; Tsao et al, 2005). Another glycolysis by-product which also
appeared to be re-utilised during the decline phase of batch culture was alanine. Alanine
is produced from the reversible transamination of glutamate and pyruvate. Low
extracellular glutamate concentrations were determined using GC-MS but

140
concentrations were similar for both early and late generation cultures (data not shown).
Although re-utilisation of alanine was apparent for both early and late generation
cultures during the decline phase of culture, differences in extracellular alanine
concentration was observed on day 5 and 7 of culture between early and late generation
cultures (Figure 3.19C). The increased alanine production could be an indication of
poor energy usage of late 3.90 cultures (particularly on day 5 and 7 of batch culture,
Bonarius et al, 2001; Goudar et al, 2009; Lu et al, 2005). Enhanced alanine production
may be a potential marker of lower protein production within this cell line.
Intracellular metabolite analysis would have been useful to identify intracellular
changes in metabolism. However, investigating intracellular metabolites has limitations,
including medium contamination, and the requirement for intact viable cells, ideally
from the exponential or stationary phase of culture. Unfortunately during these phases
no significant difference in antibody titre was observed between early and late
generation cultures (Figure 3.1A).
I propose that in response to LTC the metabolic profiles of 3.90 were altered, resulting
in lower antibody titres for late generation cultures. I suggest the equilibrium of
pyruvate conversion favours by-product formation, with less pyruvate available for
acetyl CoA conversion. The proposed alterations in metabolic pathways in response to
LTC are shown in Figure 3.23. These changes would limit flux through the glycolytic
pathway, and TCA cycle, ultimately producing less intermediates for ATP production.
Intracellular concentrations of ATP and metabolic co-enzymes, NAD+ and NADH, are
discussed in the next paragraph.
Initial investigations highlighted alterations for intracellular ATP, NAD+ and NADH
between early and late generation cultures (Figure 3.24). During exponential phase of
batch culture ATP, NAD+ and NADH were greater for late generation cultures than
early generation cultures, however, all concentrations were similar to CHO ATP, NAD+
and NADH concentrations reported by Sellick, et al. (Sellick et al, 2008). Enhanced
NADH for late generation cultures during the exponential phase of batch culture may
have favoured increased lactate and NAD+ production by LDH. By the stationary phase
of batch culture late generation cultures had less NAD+ and NADH, potentially
indicating the requirement for enhanced recycling of NAD/NADH (using re-utilised

141
lactate as a substrate) to maintain ATP production. Less NAD+
may also be related to
the stress status of the cell and nutrient availability (Bordone et al, 2006; Imai, 2009;
Yang & Sauve, 2006). The ratio of NAD+ and NADH provides information on the state
of a cell in the form of the catabolic reduction charge (crc), which is defined as
[NADH]/([NAD+]+[NADH]). In growing cells the crc is always low, as NAD
+, in the
oxidized form provides an oxidizing power for catabolism. On day 5 of batch culture
the crc charge for early and late generation cultures was between 0.03-0.04, consistent
with growing cells (Sellick et al, 2008). However by day 9 of batch culture early
generation cultures had a crc of 0.017 whilst late generation cultures had a crc of 0.001.
The difference of crc provides another indication of metabolic changes to 3.90 cultures
in response to LTC.
Maintaining redox homeostasis is necessary for a high producing cell line. The
production of secretory proteins, rich in disulphide bonds, can result in oxidative stress
(Cenci & Sitia, 2007; Harding et al, 2003). Disulphide bonds are required for correct
protein folding, and require the oxidation and reduction of ERO1α and PDI. If redox
intermediates become limiting (potentially due to altered glycolytic and TCA flux)
reduced proteins would accumulate in the ER (Masciarelli & Sitia, 2008). These
reduced, unfolded proteins would result in an UPR and eventual degradation.
Fluorescent protein reporters have been used to measure ER redox status and UPR
activity in single yeast cells (Kang & Hegde, 2008; Merksamer et al, 2008). The
methods could potentially be used within mammalian cells to determine the real-time
ER redox status during culture.
Increased protein degradation may also reflect the metabolic state of the cell (Vabulas &
Hartl, 2005). Increased ERAD for late generation cultures could be a possible
explanation for the loss in antibody titre observed in response to LTC. However, ERAD
is also an ATP-dependent mechanism (Goldberg, 2003; Meusser et al, 2005). Enhanced
degradation may maintain the amino acid pool (which undergoes a net-loss during
protein secretion), but it would deplete the cellular stocks of ATP, and consequently
limit protein translation. The association of monosomes and dissociation of polysomes
were observed during batch culture (Figure 3.9), consistent with attenuation of an early
step in translation (Prostko et al, 1993). Late generation cultures also exhibited greater
polysome dissociation than early generation cultures (Figure 3.10), suggesting late

142
generation cultures had lower rates of translation than early generation cultures
(Harding et al, 2000b), and although the relative concentrations of intracellular
recombinant protein were similar between early and late generation cultures (Figure
3.11A and 3.12) these assays were unable to detect the recombinant protein in a fully-
folded conformation.
From the investigations it was clear that ER stress markers and nutrient utilisation were
altered in response to LTC, ultimately resulting in lower antibody titres and CCT values
for late generation cultures. The alterations in response to LTC are summarised in
Figure 3.25. It may be possible that two different situations are influencing antibody
titre stability in response to LTC (Figure 3.1A). One explanation could be the possibility
that older cells (late generation cells) have a lower resistance to ER stress (Li &
Holbrook, 2004), resulting in an enhanced UPR, observed with increased expression of
GADD153 mRNA (Figure 3.13C) and XBP-1(s) mRNA (Figure 3.17C), and decreased
antibody titre values. However, if the age of cells were the key determinant of instability
why was antibody titre loss between early and late generation cultures only limited to
the end (decline) phase of batch culture. During the decline phase of batch culture
asparagine (Figure 3.18A), serine (Figure 3.18B), and glucose (Figure 3.20A and Figure
3.21A) were depleted from cultures. Nutrient availability and usage during batch culture
may be the key determining factor in antibody stability. I have previously suggested that
in response to LTC the metabolic profile of 3.90 becomes altered, observed with
increased rates of glucose and lactate utilisation for late generation cultures (Figure
3.21). Greater rates of glucose and lactate utilisation may be needed to continue flux
through the glycolytic pathway and TCA cycle in order to maintain production of ATP.
Any limitations in the production of ATP, and redox intermediates, could potentially
inhibit protein production and protein folding, resulting in lower antibody titres and
increased ER stress, both observed for late generation cultures. Any protein unable to
fold correctly would eventually experience ERAD, and cultures unable to rectify the ER
stress would instead commit to apoptosis (Merksamer & Papa, 2010), resulting in lower
antibody titres and viable cell densities, also observed for late generation cultures.
To determine if metabolic profiles of cultures were altered in response to LTC the flux
of CHO culture could be examined using 13
C labelled glucose addition and MS/NMR
spectroscopy. Labelled glucose has been used to assess fluxes, but there are

143
disadvantages in determining flux through the TCA cycle especially as most 13
C atoms
tend to be released in the form of lactate and alanine (Goudar et al, 2009; Omasa et al,
2010; Quek et al, 2010). Although this approach could be undertaken to determine the
metabolic flux of 3.90 cultures the limitations have to be addressed.
3.7 SUMMARY
Characterisation studies showed 3.90 to be unstable in response to LTC, observed with
a 40% decrease in final antibody titre and a 30% decrease in Qp values. I propose the
instability observed for 3.90 was due to metabolic changes as a result of LTC.
Metabolic flux alterations, seen with enhanced alanine accumulation, and increased
rates of lactate utilisation for late generation cultures, potentially resulted in less energy
and intermediates needed to maintain high levels of recombinant protein production,
folding and secretion for late generation cultures. Less metabolic intermediates as a
consequence of changes to metabolic profiles possibly limited protein folding, resulting
in stressed cultures. An increase in the mRNA expression of UPR markers, GADD153
and XBP-1(s), was also observed as a consequence of LTC. These characteristics of ER
stress were not absent from early generation cultures, but they were often delayed, or
expressed at lower levels, compared to that seen for late generation cultures. These
stress markers may also limit antibody production and secretion for early generation
cultures.

144
Figure 3.22 Correlation between antibody titre and proportion of cells in G0/G1
3.90 was cultured as previously described (Figure legend 3.1). On days 3, 7 and 11 of
batch culture supernatant samples were analysed by ELISA (Section 2.5.1) for
determination of antibody titre. Fixed cells on the same days of batch culture were
analysed by flow cytometry using PI excitation for determination of G0/G1 cell cycle
phase transition (as described in Section 2.4.1). Antibody titre values are shown
together with the percentage cells in G0/G1 for days 3 (A), 7 (B) and 11 (C) of batch
culture. Error bars represent SEM for three biological replicates.
Annotation of the generation batch cultures in Figure 3.22
20
40
60
80
100

145
Figure 3.22 Correlation between antibody titre and proportion of cells in G0/G1
A.
B.
C.
0
200
400
600
800
1000
40 50 60 70 80 90
An
tib
od
y t
itre
(mg
/L)
G0/G1 cell cycle phase
(%)
0
200
400
600
800
1000
40 50 60 70 80 90
An
tib
od
y t
itre
(mg
/L)
G0/G1 cell cycle phase
(%)
0
200
400
600
800
1000
40 50 60 70 80 90
An
tib
od
y t
itre
(mg
/L)
G0/G1 cell cycle phase
(%)

146
Figure 3.23 Potential metabolic changes in response to LTC
A basic metabolic profile showing flux through the glycolytic pathway and the TCA
cycle. Red arrows indicate the potential metabolic changes in response to LTC. I
suggest that as a result of LTC the metabolic equilibrium is altered in favour of alanine
and lactate production, limiting metabolic flux through the TCA cycle. This process
would ultimately result in less intracellular ATP intermediates needed for protein
production and protein folding.
Glucose Glucose-6-phosphate
Glyceraldehyde-3-phosphate
Acetyl CoA
Pyruvate
Oxaloacetate
TCA Cycle
Lactate Lactate
Alanine
Serine
Glycine
Asparagine
Glycolysis
Glycine
Succinyl
CoA
Alanine
Asparagine
Oxidative
Phosphorylation
NADH
NAD+
O2
ADP
ATP
NADH
NAD+
ADP
ATP
ATP
ADP
Mitochondria
Cytosol

147
Figure 3.24 Investigating ATP, NAD+ and NADH concentrations for 3.90 cultures
3.90 was cultured as previously described (Figure legend 3.1). Batch cultures were
created at early generations (≤ 40 generations) and late generations (≥ 60 generations,
Section 2.3.2). 1x10⁷ cells, taken from days 5 and 9 of batch culture (Section 2.3.2),
were quenched in 60% methanol with 0.85% (w/v) AMBIC (at -40 °C). The metabolites
were extracted by resuspension of the cell pellet in 100% methanol followed by flash
freezing in liquid nitrogen (Section 2.10.4). Once the samples were thawed and re-
extracted the methanol extracts were pooled and lyophilised. Dried metabolite extracts
were resuspended in ddH20 for use in each of the metabolite assays. ATP assays were
performed using an ATP Bioluminescence Assay Kit CLS II (Section 2.10.5) and
NAD+/NADH assays were performed using an NAD
+/NADH Quantification Kit (Section
2.10.6). Both kits were utilised according to manufacturer’s instructions.
Annotation of the generation batch cultures in Figure 3.24
Early generation
Late generation

148
Figure 3.24 Investigating ATP, NAD+ and NADH concentrations for 3.90 cultures
A.
B.
C.
0
2
4
6
8
10
5 9
AT
P c
on
cen
tra
tio
n (
mM
)
Day
0.00
0.05
0.10
0.15
0.20
0.25
5 9
NA
D+
co
ncen
tra
tio
n (
mM
)
Day
0.000
0.002
0.004
0.006
0.008
0.010
5 9
NA
DH
co
ncen
tra
tio
n (
mM
)
Day

149
Figure 3.25 Alterations to nutrient utilisation, UPR stress markers, cell biomass
and antibody titre in response to LTC
Characteristics of antibody titre loss were examined in response to LTC. The changes in
these markers were possibly related to the decrease in CCT and antibody titre values
seen for late generation cultures during the end (decline) phase of batch culture.
indicates a significant change for late generation cultures compared to generation 20
cultures (p<0.10 using independent samples t-test).
Annotation of Figure 3.25
Day 0 3 5 7 9 11 13 15
Antibody titre
CCT
Percentage of cells in
G0/G1
GADD153 mRNA
GADD34 mRNA
XBP-1 (s) mRNA
Rates of glucose and lactate utilisation
Polysome peak area
*
*
*
**
*
Alanine accumulation
Late generation cultures
Generation 60
Generation 80
Generation 100
Increased values
Decreased values

150
6
CHAPTER 4
7
CHARACTERISATION OF CELL
LINE 3.90 IN RESPONSE TO
FEED ADDITION

151
4. CHARACTERISATION OF CELL LINE 3.90 IN REPSONSE TO FEED
ADDITION
4.1 INTRODUCTORY REMARKS
Cell line 3.90 was initially characterised in Chapter 3. Instability was observed between
early generation and late generation cultures, characterised with a 40% loss in final
antibody titre and a 30% decrease in Qp (d0-d15, Section 3.2.1). Characterisation
studies suggested that decreased antibody titre was due to changes in the metabolic flux
profiles of cultures in response to LTC, which potentially impacted protein production
and secretion from the cell.
In this Chapter a CD feed was added to cultures with the aim to further enhance
antibody titre and to identify factors involved in improving antibody titre, whilst
maintaining stable protein production during LTC. Throughout the investigations the
term early generation cultures refers to batch cultures created at ≤ 40 generations and
the term late generation cultures refers to batch cultures created at ≥ 60 generations. In
this Chapter the batch cultures defined as the control cultures with no addition, are the
cultures previously characterised in Chapter 3, and are used as a control within this
Chapter to determine the effects of feed addition on cell line 3.90.
4.2 ANALYSIS OF GROWTH CHARACTERISTICS AND PRODUCTIVITY OF
CELL LINE 3.90 IN RESPONSE TO FEED ADDITION
Batch cultures were created at generations 20, 40, 60, 80 and 100. A CD feed (2% [v/v])
was added to cultures during the exponential phase of growth (days 3-7 of batch
culture). Supernatant samples were taken routinely throughout batch culture and
analysed for antibody titre. During the exponential stage of batch culture, antibody titres
for cultures with feed addition (Figure 4.1A) were similar to antibody titres for cultures
without feed addition (Figure 3.1A). The increase in antibody titres in response to feed
addition was only observed from the stationary phase of culture. Feeding enhanced final
antibody titres for all generation cultures by approximately 300 mg/ml. Although final
antibody titres were increased in response to feed addition, cultures supplemented with

152
feed still experienced instability in response to LTC, observed with a significant 30%
decrease in final antibody titre between early and late generation cultures (Figure 4.1A).
Growth analysis was performed in parallel to ensure that changes in cell densities were
not responsible for the changes in antibody titre. The patterns of growth for cultures in
the presence of feed were similar at all stages of LTC (Figure 4.1B). At all generations,
cultures were in exponential phase until day 7 of batch culture. After day 7 cultures
entered, and remained in stationary phase until day 11, following which cultures entered
a decline phase. Viable cell densities were maximal on day 9 for all generation cultures.
Culture viability declined from day 11, and was ≤ 30% or below by day 15 of batch
culture. Viability measurements for batch cultures with feed addition (Figure 4.1C)
were similar to viability measurements for the control batch cultures without feed
addition (Figure 3.1C). Final CCT values for all batch cultures with feed addition were
between 50-60x106 cells x day/ml (Figure 4.2). These CCT findings were similar to the
CCT values determined for control cultures in the absence of feed addition (Figure
3.2B).
Although feeding increased final antibody titre without significantly altering viable cell
densities cell cycle phase distribution was analysed as previous findings have shown
CHO cells to accumulate in G0/G1 after nutrient addition (Sitton & Srienc, 2008).
Throughout fed batch culture the percentage of cells in G0/G1 phase increased (Figure
4.3A), the percentage of cells in S phase decreased (Figure 4.3B), and the percentage of
cells in G2/M phase remained relatively unchanged (Figure 4.3C). The percentage of
cells in G0/G1 was similar for both early generation cultures with or without feed
addition (Figure 4.4A). However, late generation day 11 cultures without feed addition
had a significantly lower percentage of cells in G0/G1 than day 11 cultures with feed
addition. An example is shown for generation 60 cultures showing the influence of feed
addition on the proportion of late generation cells in G0/G1 phase cells (Figure 4.4B).
As feed addition increased antibody titres (Figure 4.1A), without enhancing viable cell
densities (Figure 4.1B), Qp was calculated to determine the effect of feed addition on
antibody production rate, per cell, per day. Qp was calculated using viable cell densities
and antibody titre measurements at different stages of batch culture, as explained in
Section 3.2. In response to feed addition Qp (d0-d15) values for early and late

153
generation cultures were increased by approximately 5 pg/cell/day (Figure 4.5A).
Maximal Qp values were observed during the early (exponential) phase of batch culture.
Qp (d0-d7) values were similar for cultures regardless of feed addition (Figure 4.5B).
Although feed was added to cultures during the exponential phase of batch culture
feeding had the greatest impact on Qp during the end (decline) phase of batch culture.
At generations 20, 40 and 60 feed addition increased Qp (d9-d15) values by
approximately 20-40%, with a significant 65% increase in Qp (d9-d15) for cultures
created at generations 80 and 100 (Figure 4.5C). Qp (d9-d15) values for cultures
supplemented with feed addition decreased by approximately 30% in response to LTC
(Figure 4.5C). However despite the decline in Qp between early and late generation
cultures, Qp was still enhanced in response to feed addition.
It has been reported that some cell phenotypes, such as cell size and viable cell
densities, are altered by changes to medium osmolality (Kutz & Burg, 1998). Initial
analysis showed osmolality to increase from approximately 0.310 Osm/kg to 0.450
Osm/kg after feed addition (Appendix 3). Although viable cell densities of 3.90 cultures
were not affected by the addition of feed (Figure 4.1B), the average cell diameter for
both early and late generation cells was increased by 2 µm in response to feed addition
(Figure 4.5A). However, this increase was not statistically different.

154
Figure 4.1 Effect of feed addition on recombinant antibody titre, viable cell
densities and cell viability during batch culture
3.90 was subject to long-term culture in suspension using MSX supplemented CD-CHO
media. Batch growth analysis was performed in shake flasks at generation numbers 20,
40, 60, 80 and 100, ± 4 generations. Batch cultures were created at 0.2x10⁶ cells/ml,
and maintained at 37oC, 140 rpm and with a manual supply of 5% CO2 in air. A CD
feed was added during the exponential stage of batch culture (as described in Section
2.3.2). Cells were cultured under these conditions until viability was ≤ 30%. Antibody
titres (A), viable cell densities (B), and cell viabilities (C) are shown. Antibody titre was
measured by ELISA (Section 2.5.1) and viable cell densities and cell viabilities were
determined by light microscopy and trypan blue exclusion (Section 2.3.3) from samples
taken routinely during batch culture. Error bars represent SEM for three biological
replicates. Each biological replicate value is an average from duplicate technical
repeats. * indicates p<0.05, using independent samples t-test to compare cultures
created at generations 40, 60, 80 and 100 to generation 20 cultures (on the same day of
batch culture).
Annotation of the generation batch cultures in Figure 4.1
20
40
60
80
100

155
Figure 4.1 Effect of feed addition on recombinant antibody titre, viable cell
densities and cell viability during batch culture
B.
C.
A.
0
2
4
6
8
10
0 5 10 15
Via
ble
cell
s
(x1
06
cell
s/m
l)
Day
0
200
400
600
800
1000
1200
1400
1600
0 3 5 7 9 11 13 15
An
tib
od
y t
itre
(mg
/L)
Day
0
20
40
60
80
100
0 5 10 15
Percen
tag
e v
iab
ilit
y
(%)
Day
*** ***

156
Figure 4.2 Effect of feed addition on CCT
Viable cell densitites was determined using the trypan blue exclusion (as described in
Section 2.3.3). The CCT was determined from the growth of the batch cultures with feed
addition (Figure 4.1B). This figure shows the CCT for batch cultures created at
generations 20, 40, 60, 80 and 100. For calculation of CCT see Section 2.11.2. Error
bars represent SEM for three biological replicates. Each biological replicate value is
an average from duplicate technical repeats. ♦ indicates p<0.10, using independent
samples t-test to compare cultures created at generations 40, 60, 80 and 100 to
generation 20 cultures (on the same day of batch culture).
Annotation of the generation batch cultures in Figure 4.2
0
10
20
30
40
50
60
70
80
0 3 5 7 9 11 13 15
Cu
mu
lati
ve c
ell
tim
e
(x1
06
cell
s x
da
y/m
l)
Day
20
40
60
80
100
♦♦ ♦♦

157
Figure 4.3 Effect of feed addition on cell cycle phase distribution during batch
culture
3.90 was cultured as previously described (Figure legend 4.1). A CD feed was added
during the exponential stage of batch culture (as described in Section 2.3.2). 1x10⁶
cells, taken on days 3, 5, 7, 9 and 11 of batch culture, were analysed by flow cytometry
using PI excitation by a 488 nm laser, and emission measured by a 613/20 nm bandpass
filter (Section 2.4.1). The data was analysed by Summit 4.3 and ModFit LT software.
The percentage of cells in A, G0/G1 phase, B, S phase, and C, G2/M phase are shown.
Error bars represent SEM for three biological replicates.
Annotation of the generation batch cultures in Figure 4.3
20
40
60
80
100

158
Figure 4.3 Effect of feed addition on cell cycle phase distribution during batch
culture
0
20
40
60
80
100
3 5 7 9 11
S c
ell
cy
cle
ph
ase
(%)
Day
0
20
40
60
80
100
3 5 7 9 11
G2
/M c
ell
cy
cle
ph
ase
(%)
Day
B.
C.
A.
0
20
40
60
80
100
3 5 7 9 11
G0
/G1
cell
cy
cle
ph
ase
(%)
Day

159
Figure 4.4 The percentage of cells in G0/G1 cell cycle phase for cultures with and
without feed addition
3.90 was cultured as previously described (Figure legend 3.1 and Figure legend 4.1). A
CD feed was added to the relevant cultures during the exponential stage of batch
culture (as described in Section 2.3.2). 1x10⁶ cells, taken from days 3, 5, 7, 9 and 11 of
batch culture, were analysed by flow cytometry using PI excitation by a 488 nm laser,
and emission measured by a 613/20 nm bandpass filter (Section 2.4.1). The data was
analysed by Summit 4.3 and ModFit LT software. A, shows the percentage of generation
20 cells in G0/G1 phase, and B, shows the percentage of generation 60 cells in G0/G1
phase. Error bars represent SEM for three biological replicates. * indicates p<0.05,
and ♦ indicates p<0.10, using independent samples t-test to compare cultures with feed
addition to the corresponding control culture with no addition (on the same day of
batch culture).
Annotation of the batch cultures in Figure 4.4
B.
A.
0
20
40
60
80
100
3 5 7 9 11
Gen
era
tio
n 2
0
G0
/G1
cell
cy
cle
ph
ase
(%)
Day
0
20
40
60
80
100
3 5 7 9 11
Gen
era
tio
n 6
0
G0
/G1
cell
cy
cle
ph
ase
(%)
Day
Control (no addition)
+ feed addition
* ♦

160
Figure 4.5 Effect of feed addition on specific productivity
Specific productivity (Qp) was determined from the antibody titre and the growth of
control batch cultures (with no addition) shown in Figure 3.1A and Figure 3.1B,
respectively, and from the antibody titre and the growth of batch cultures with feed
addition, shown in Figure. 4.1A and Figure 4.1B, respectively. Qp was calculated for
the entire batch culture, using antibody titre and cell density measurements from days 0
to 15 of culture, Qp (d0-d15). Qp was also calculated for the early (exponential) phase
of batch culture, using antibody titre and cell density measurements from days 0 to 7 of
culture, Qp (d0-d7), and for the end (decline) phase of batch culture, using antibody
titre and cell density measurements from days 9 to 15 of culture, Qp (d9-d15). For
determination of Qp see Section 2.11.2. Qp (d0-d15) (A), Qp (d0-d7) (B), and Qp (d9-
d15) (C) are shown. Error bars represent SEM for three biological replicates. Each
biological replicate value is an average from duplicate technical repeats. * indicates
p<0.05, and ♦ indicates p<0.10, using independent samples t-test to compare cultures
with feed addition to the corresponding control culture with no addition.
Annotation of the batch cultures in Figure 4.5
Control (no addition)
+ feed addition

161
Figure 4.5 Effect of feed addition on specific productivity
0
10
20
30
40
50
20 40 60 80 100
Qp
(d0
-d7
)
(pg
/cell
/da
y)
Generation
0
5
10
15
20
25
20 40 60 80 100
Qp
(d9
-d1
5)
(pg
/cell
/da
y)
Generation
B.
C.
A.
0
5
10
15
20
25
20 40 60 80 100
Qp
(d0
-d1
5)
(pg
/cell
/da
y)
Generation
* *
* *
*
♦
♦

162
Figure 4.6 Effect of feed addition on cell diameter
3.90 was cultured as previously described (Figure legend 3.1 and Figure legend 4.1).
On day 9 of batch culture, early generation (≤ 40 generations) and late generation (≥
60 generations) cells, with and without feed addition, were prepared for cell counting
using trypan blue dye (as described in Section 2.3.3). 100 cells were counted and
measured for cell diameter using a Widefield Axiovision microscope, and using the
Axiovision software. The average cell diameter, for early and late generation cultures
in the presence and absence of feed, is shown. Error bars represent the SD for 100 cells
counted.
0
5
10
15
20
no addition + feed addition no addition + feed addition
Early Late
Cell
dia
mete
r
(µm
)
Culture condition/Generation

163
4.3 MOLECULAR INVESTIGATIONS OF RECOMBINANT CELL LINE 3.90
IN RESPONSE TO FEED ADDITION
Feed addition during batch culture increased antibody titres by approximately 25%,
producing on average 5 pg/cell/day more antibody than batch cultures in the absence of
feed (Section 3.2.1 and Section 4.2.1). However, cultures with feed addition still
experienced instability in response to LTC, presenting a 30% loss in final antibody titre
and a 25% decrease in Qp (d0-d15) for late generation cultures (Section 4.2.1). In the
work described in Section 4.3, antibody mRNA expression was investigated to
determine how feed affects productivity and instability relating to mRNA expression.
The work also examined polysome profiles and the prevalence of intracellular
recombinant protein in response to feed addition.
4.3.1 Analysis of recombinant gene mRNA expression from cultures with feed
addition
For cultures in the presence of feed, GS mRNA was increased by approximately 50%
from day 3 to day 9 of batch culture for all generations, with no difference in GS
mRNA expression between early and late generation cultures (Figure 4.7A). Heavy
chain mRNA increased two-fold from day 3 to day 9 of batch culture, for all generations
(Figure 4.7B). Light chain mRNA also increased during batch culture, but the fold
change was dependent on the culture generation (Figure 4.7C). Light chain mRNA
expression for generations 20, 40, and 60 fed cultures increased approximately four-
fold, whilst expression for generations 80 and 100 fed cultures increased two-fold from
day 3 to day 9 of culture, however, the changes in light chain mRNA expression
between early and late generation cultures were not significant. As antibody titre and Qp
values were enhanced in response to feed it was also important to compare the relative
recombinant mRNA expression for cultures with and without feed addition (shown in
Figure 4.8).
Although the relative GS mRNA expression was greater for cultures with feed addition
than for the control cultures, the increase in GS mRNA was not statistically significant
(Figure 4.8A). Expression of heavy chain mRNA (Figure 4.8B) and the light chain
mRNA (Figure 4.8C) was similar for all cultures, regardless of feed addition. As

164
cultures in the presence of feed had greater antibody titres and similar expression of
recombinant mRNA than cultures in the absence of feed addition, the cultures
supplemented with feed may have utilised the available recombinant transcripts in a
more productive manner.
4.3.2 Investigating characteristics of polysome profiles in response to feed addition
To investigate the possibility that the mRNA could be utilised more efficiently
polysome profiles were investigated. For both early (Figure 4.9A) and late (Figure
4.9B) generation cultures, feed addition enhanced the polysome peak area, compared to
polysome peak area from profiles for cultures without feed addition (previously shown
in Figure 3.9). To quantify monosome and polysome peak areas, polysome profiles in
response to feed addition were analysed using Image J software and the resultant data
are shown in Figure 4.10.
The quantified 40S peak area (Figure 4.10A), 60S peak area (Figure 4.10B), 80S peak
area (Figure 4.10C) all increased slightly in response to feed addition for both early and
late generation cultures. The polysome peak area also increased in response to feed
addition. (Figure 4.10D). In the presence of feed the polysome peak area increased
approximately two-fold for early generation cultures and a significant three-fold for late
generation cultures compared to the polysome peak area for the respective generation
cultures in the absence of feed. Harding et al, have shown polysome dissociation to
occur in murine embryonic stem cells as a result of ER stress, these cultures also had
decreased translational ability (Harding et al, 2000b). The increase in polysome peak
area for cultures with feed addition indicated potentially greater rates of translation for
these cultures, a feature that may be consistent with cells experiencing less cell stress.
4.3.3 Analysis of intracellular recombinant protein in response to feed addition
Analysis of the intracellular protein within cells may give an indication of increased
protein translation. L-[4,5-3H] leucine incorporation, previously used to measure global
protein synthesis in Section 3.2.2, was not a chosen method for analysis due to unknown
concentrations of leucine within the CD feed. To investigate intracellular protein levels
in response to feeding, antibody-conjugated dyes, which specifically detect both the

165
recombinant heavy and light chain proteins were used in the immunofluorescent assays.
Both early and late generation cultures had less intracellular heavy chain and light chain
protein after feeding (Figure 4.11). Although intracellular recombinant protein levels
were lower in response to feed addition this was not necessarily indicative of protein
synthesis rates. Lower levels of intracellular recombinant protein could be the result of
enhanced rates of protein secretion in response to feed addition. Protein secretion would
be enhanced if feeding allowed a greater concentration of correctly-folded proteins that
match the fidelity required for protein secretion. More fully-folded proteins and
potentially less mis/unfolded proteins would also result in less ER stress. To determine
if feed addition was affecting the cellular stress status UPR markers were examined.
These data are described in the next Section.

166
Figure 4.7 Effect of feed addition on recombinant mRNA expression
3.90 was cultured as previously described (Figure legend 4.1). A CD feed was added
during the exponential stage of batch culture (as described in Section 2.3.2). mRNA
levels were compared using q-RTPCR from samples taken on days 3, 5, 7 and 9 of batch
culture (as detailed in Section 2.7.1), using the mRNA specific primer sets for A, GS, B,
heavy chain, and C, light chain. Samples were normalised using mRNA β-Actin primers.
Error bars represent SEM for three biological replicates.
Annotation of the generation batch cultures in Figure 4.7
20
40
60
80
100

167
Figure 4.7 Effect of feed addition on recombinant mRNA expression
A.
B.
C.
0
50
100
150
200
3 5 7 9
Hea
vy
ch
ain
mR
NA
ex
press
ion
(% r
ela
tiv
e to
sta
nd
ard
an
d
β-A
cti
nm
RN
A ex
press
ion
)
Day
0
50
100
150
200
250
3 5 7 9
Lig
ht ch
ain
mR
NA
ex
press
ion
(% r
ela
tiv
e to
sta
nd
ard
an
d
β-A
cti
nm
RN
A ex
press
ion
)
Day
0
50
100
150
200
3 5 7 9
GS
mR
NA
ex
press
ion
(% r
ela
tiv
e to
sta
nd
ard
an
d
β-A
cti
nm
RN
A ex
press
ion
)
Day

168
Figure 4.8 Analysis of recombinant mRNA expression between cultures with and
without feed addition
3.90 was cultured as previously described (Figure legend 3.1 and Figure legend 4.1). A
CD feed was added to the relevant cultures during the exponential stage of batch
culture (as described in Section 2.3.2). mRNA levels were compared using q-RTPCR
from samples taken on day 9 of batch culture (as detailed in Section 2.7.1), using the
mRNA specific primer sets for A, GS, B, heavy chain, and C, light chain. Samples were
normalised using mRNA β-Actin primers. Error bars represent SEM for three biological
replicates.
Annotation of the generation batch cultures in Figure 4.8
20
40
60
80
100

169
Figure 4.8 Analysis of recombinant mRNA expression between cultures with and
without feed addition
A.
B.
C.
0
50
100
150
200
250
300
no addition + feed addition
Lig
ht ch
ain
mR
NA
ex
press
ion
(% r
ela
tiv
e to
sta
nd
ard
an
d
β-A
cti
nm
RN
A e
xp
ress
ion
)
Culture condition
0
50
100
150
200
250
300
no addition + feed additionHea
vy
ch
ain
mR
NA
ex
press
ion
(% r
ela
tiv
e to
sta
nd
ard
an
d
β-A
cti
nm
RN
A e
xp
ress
ion
)
Culture condition
0
50
100
150
200
no addition + feed addition
GS
mR
NA
ex
press
ion
(% r
ela
tiv
e to
sta
nd
ard
an
d
β-A
cti
nm
RN
A e
xp
ress
ion
)
Culture condition
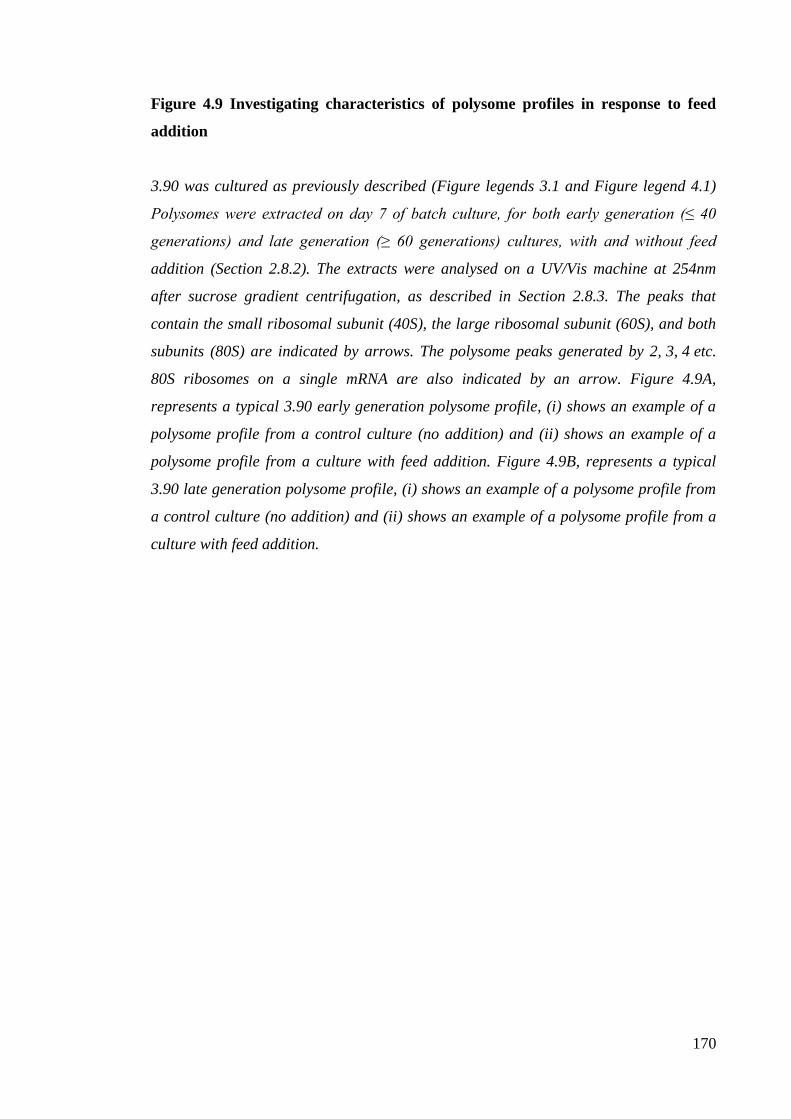
170
Figure 4.9 Investigating characteristics of polysome profiles in response to feed
addition
3.90 was cultured as previously described (Figure legends 3.1 and Figure legend 4.1)
Polysomes were extracted on day 7 of batch culture, for both early generation (≤ 40
generations) and late generation (≥ 60 generations) cultures, with and without feed
addition (Section 2.8.2). The extracts were analysed on a UV/Vis machine at 254nm
after sucrose gradient centrifugation, as described in Section 2.8.3. The peaks that
contain the small ribosomal subunit (40S), the large ribosomal subunit (60S), and both
subunits (80S) are indicated by arrows. The polysome peaks generated by 2, 3, 4 etc.
80S ribosomes on a single mRNA are also indicated by an arrow. Figure 4.9A,
represents a typical 3.90 early generation polysome profile, (i) shows an example of a
polysome profile from a control culture (no addition) and (ii) shows an example of a
polysome profile from a culture with feed addition. Figure 4.9B, represents a typical
3.90 late generation polysome profile, (i) shows an example of a polysome profile from
a control culture (no addition) and (ii) shows an example of a polysome profile from a
culture with feed addition.

171
Figure 4.9 Investigating characteristics of polysome profiles in response to feed
addition
Polysomes
60S
40S
80S
40S
80S
60S
Polysomes
40S
80S
60S
Polysomes
60S
40S
80S
Polysomes
A.
B.
(i)(ii)
(i)(ii)
Early Generation Culture
Late Generation Culture
no addition + feed addition
Polysomes

172
Figure 4.10 Quantification of monosome and polysome peak areas
Polysomes were extracted and analysed as described in Figure 4.9 and Section 2.8, for
both early generation (≤ 40 generations), and late generation (≥ 60 generations)
cultures, with and without feed addition. The peaks that contain the small ribosomal
subunit (40S), the large ribosomal subunit (60S), and both subunits (80S), and the
polysome peaks were analysed using Image J software to provide a relative
representation of peak variation. The change in the 40S (A), 60S (B), 80S (C) and
polysome (D) peak areas between early and late generation day 7 polysome profiles are
shown. Error bars represent SEM for three biological replicates. * indicates p<0.05,
using independent samples t-test to compare cultures with feed addition to the
corresponding control culture with no addition.
Annotation of the batch cultures in Figure 4.10
Control (no addition)
+ feed addition

173
Figure 4.10 Quantification of monosome and polysome peak areas
A.
B.
C.
D.
0
20
40
60
80
Early Late
Rela
tiv
e 6
0S
pea
k a
rea
Generation
0
50
100
150
200
250
Early Late
Rela
tiv
e 8
0S
pea
k a
rea
Generation
0
20
40
60
80
100
120
Early Late
Rela
tiv
e p
oly
som
e
pea
k a
rea
Generation
0
10
20
30
40
Early Late
Rela
tiv
e 4
0S
pea
k a
rea
Generation
*

174
Figure 4.11 Analysis of intracellular heavy chain and light chain protein after feed
addition
3.90 was cultured as previously described (Figure legend 3.1 and Figure legend 4.1).
Batch cultures created at early generations (≤ 40 generations) and late generations (≥
60 generations). A CD feed was added to the relevant cultures during the exponential
stage of batch culture (as described in Section 2.3.2). 2x10⁶ fixed cells on day 9 of batch
culture were washed, blocked and incubated with 10µg goat anti-human IgG, Fcγ-APC
and 6µg goat anti-human lambda light chain-FITC (Section 2.4.2). The samples were
then analysed by a CyAn ADP flow cytometer, using the 488nm and infra-red excitation
lasers to excite the FITC and APC conjugates. Unstained 3.90 cells and stained
parental cells were also required for setting initial parameters with the CyAn-ADP flow
cytometer. The data was gated to select single cells, and was analysed by Summit 4.3
software. Error bars represent SEM for three biological replicates.
Annotation of antibody conjugates in Figure 4.11
0
20
40
60
80
no addition + feed addition no addition + feed addition
Early Late
Rela
tiv
e m
ea
n f
luo
resc
en
ce i
nte
nsi
ty
(co
mp
ared
to
th
e p
aren
tal
cell
lin
e)
Culture condition/Generation
APC conjugate antibody (for use in heavy chain protein detection)
FITC conjugate antibody (for use in light chain protein detection)
175
4.4 DETERMINING THE REGULATION OF UPR MARKERS IN RESPONSE
TO FEED ADDITION
Feed addition to batch cultures increased antibody titres by approximately 25%, but did
not prevent antibody titre loss in response to LTC (Section 3.2 and Section 4.2).
Molecular characterisation studies showed that increased antibody titre and Qp in
response to feed addition were not due to changes in expression of recombinant
antibody transcript (Section 4.3.1). Increased polysome association (Section 4.3.2) gave
an indication of greater translational capacity for cultures in the presence of feed.
Analysis of intracellular recombinant protein showed that cultures had less intracellular
protein in response to feed addition, however, this is not an indicator of decreased
protein translation (Section 4.3.3). I suggested that cultures supplemented with feed had
less intracellular protein due to enhanced rates of protein secretion. Protein secretion
would be increased for cultures that had a greater concentration of proteins in their
correctly-folded conformation. More correctly-folded proteins, and potentially less
mis/unfolded proteins, would also result in less ER stress. The expression of UPR
markers were investigated to determine potential changes in response to feed addition.
As previously mentioned in Section 3.4 once mis/unfolded proteins are detected in the
ER, expression of ATF4, GADD34 and GADD153 are upregulated via the activation of
the PERK pathway. The mRNA expression of UPR markers were compared between
cultures with and without feed addition on day 9 of batch culture. The mRNA
expression of ATF4 (Figure 4.12A), GADD34 (Figure 4.12B) and GADD153 (Figure
4.12C) was approximately two to three-fold lower for cultures with feed addition
compared to expression measured for the control cultures. As the expression of
GADD34 and GADD153 mRNA were altered in response to LTC (Figure 3.13), the
expression of UPR markers were investigated between early and late generation cultures
in the presence of feed. These studies are discussed below.
Investigations found that the expression of ATF4 (Figure 4.13A) and GADD34 (Figure
4.13B) mRNA for fed cultures was not altered in response to LTC, but the expression of
GADD153 mRNA was dependent on the generation time of culture. GADD153 mRNA
expression was two-fold greater for late generation cultures than early generation
cultures (Figure 4.13C). This increase, however, was not statistically different.

176
In order to extend the observations made at the mRNA level, cellular ATF4 and
GADD153 protein were examined by western blot analysis. The relative ATF4 protein
expression on day 9 of batch culture was similar for cultures with or without feed
addition, with no difference in expression of ATF4 protein (Figure 4.14A) or
GADD153 protein (Figure 4.14B) between early and late generation cultures. However,
a significant six-fold decrease in GADD153 protein was observed in response to feed
addition, regardless of generation time of culture (Figure 4.14B). As GADD153 protein
was lowered in response to feed addition other UPR markers were also investigated.
Although the expression of PDI protein and BiP protein (ER chaperones) was not
affected by feeding (data not shown), spliced XBP-1 mRNA was significantly lowered
as a result of feed addition (Figure 4.15).
Feed addition, by an unknown mechanism, increased antibody titre whilst lowering cell
stress, shown with a lower expression of ATF4, GADD34, GADD153 and XBP-1(s)
mRNA and less GADD153 protein. The decreased expression of such UPR markers
was possibly the result of the passage of less mis/unfolded proteins in the ER. I propose
that after feed addition cultures were not subjected to nutrient depletion, so nutrients
were available for the maintenance of relevant polypeptides needed for correct antibody
formation, allowing for greater rates of protein secretion and higher antibody titres.
Metabolic investigations were undertaken to provide an insight into the differences in
productivity in response to feed addition (Section 4.5).

177
Figure 4.12 Effect of feed addition on the mRNA expression of ATF4, GADD34,
and GADD153
3.90 was cultured as previously described (Figure legends 3.1 and Figure legend 4.1).
A CD feed was added to the relevant cultures during the exponential stage of batch
culture (as described in Section 2.3.2). mRNA levels were compared using q-RTPCR
from samples taken on day 9 of batch culture (as detailed in Section 2.7.1), using the
mRNA specific primer sets for A, ATF4, B, GADD34, and C, GADD153. Samples were
normalised using mRNA β-Actin primers. Error bars represent SEM for three biological
replicates. * indicates p<0.05, and ♦ indicates p<0.10, using independent samples t-test
to compare cultures with feed addition to the corresponding generation with no
addition.
Annotation of the generation batch cultures in Figure 4.12
20
40
60
80
100

178
Figure 4.12 Effect of feed addition on the mRNA expression of ATF4, GADD34,
and GADD153
A.
B.
C.
0
50
100
150
200
250
300
no addition + feed addition
GA
DD
15
3 m
RN
A e
xp
ress
ion
(% r
ela
tiv
e to
sta
nd
ard
an
d
β-A
cti
nm
RN
A e
xp
ress
ion
)
Culture condition
0
50
100
150
200
250
300
350
400
no addition + feed addition
GA
DD
34
mR
NA
ex
press
ion
(% r
ela
tiv
e to
sta
nd
ard
an
d
β-A
cti
nm
RN
A e
xp
ress
ion
)
Culture condition
0
50
100
150
200
250
300
350
no addition + feed addition
AT
F4
mR
NA
ex
press
ion
(% r
ela
tiv
e to
sta
nd
ard
an
d
β-A
cti
nm
RN
A e
xp
ress
ion
)
Culture condition
*
* * * * *
♦ ♦
♦ ♦
* ♦ ♦ ♦ ♦ ♦

179
Figure 4.13 Effects of LTC on the mRNA expression of UPR markers from
cultures supplemented with feed addition
3.90 was cultured as previously described (Figure legend 4.1). A CD feed was added
during the exponential stage of batch culture (as described in Section 2.3.2). mRNA
levels were compared using q-RTPCR from samples taken on days 3, 5, 7, and 9 of
batch culture (as detailed in Section 2.7.1), using the mRNA specific primer sets for A,
ATF4, B, GADD34, and C, GADD153. Samples were normalised using mRNA β-Actin
primers. Error bars represent SEM for three biological replicates.
Annotation of the generation batch cultures in Figure 4.13
20
40
60
80
100

180
Figure 4.13 Effects of LTC on the mRNA expression of UPR markers from
cultures supplemented with feed addition
A.
B.
C.
0
50
100
3 5 7 9
GA
DD
15
3 m
RN
A e
xp
ress
ion
(% r
ela
tiv
e to
sta
nd
ard
an
d
β-A
cti
nm
RN
A ex
press
ion
)
Day
0
50
100
150
200
3 5 7 9
GA
DD
34
mR
NA
ex
press
ion
(% r
ela
tiv
e to
sta
nd
ard
an
d
β-A
cti
nm
RN
A ex
press
ion
)
Day
0
50
100
150
200
3 5 7 9
AT
F4
mR
NA
ex
press
ion
(% r
ela
tiv
e to
sta
nd
ard
an
d
β-A
cti
nm
RN
A ex
press
ion
)
Day

181
Figure 4.14 Analysis of ATF4 and GADD153 protein in response to feed addition
3.90 was cultured as previously described (Figure legend 3.1 and Figure legend 4.1).
Batch cultures created at early generations (≤ 40 generations) and late generations (≥
60 generations). A CD feed was added to the relevant cultures during the exponential
stage of batch culture (as described in Section 2.3.2). Protein was extracted on day 9 of
batch culture (detailed in Section 2.5.3.1). 60µg of protein was separated by SDS-
PAGE (Section 2.5.3.2), transferred (Section 2.5.3.3) and then detected using anti-
rabbit polyclonal ATF4 and GADD153 antibodies. Membranes were stripped and re-
probed using an anti-mouse pan ERK antibody (Section 2.5.3.4). Bands were analysed
using Image J software and calculated relative to ERK (Section 2.5.3.5). The relative
intensities of ATF4 (A) and GADD153 (B) are shown. Error bars represent SEM for
three biological replicates. * indicates p<0.05, using independent samples t-test to
compare cultures with feed addition to the corresponding control culture with no
addition.
Annotation of the batch cultures in Figure 4.14
A.
B.
0
50
100
150
Early Late
AT
F4
pro
tein
in
ten
sity
(rela
tiv
e t
o E
RK
sta
nd
ard
)
Generation
0
50
100
150
200
250
Early Late
GA
DD
15
3 p
ro
tein
in
ten
sity
(rela
tiv
e to
ER
K s
tan
da
rd
)
Generation
Control (no addition)
+ feed addition
* *

182
Figure 4.15 Analysis of XBP-1 mRNA splicing in response to feed addition
3.90 was cultured as previously described (Figure legend 3.1 and Figure legend 4.1).
Batch cultures created at early generations (≤ 40 generations) and late generations (≥
60 generations). A CD feed was added to the relevant cultures during the exponential
stage of batch culture (as described in Section 2.3.2). cDNA was synthesised from RNA
extracted on day 9 of batch culture (Section 2.7.1.3) and the PCR was performed using
the newly synthesised cDNA and the XBP-1(s) primers (Section 2.7.2). The PCR
products were electrophoresed on a 2% (w/v) agarose gel and visualised by UV
transillumination (Section 2.6.1.4). The product bands were analysed using Image J
software and the ratio of spliced XBP-1 mRNA to total XBP-1 mRNA is shown. Error
bars represent SEM for three biological replicates. * indicates p<0.05, using
independent samples t-test to compare cultures with feed addition to the corresponding
control culture with no addition.
Annotation of the batch cultures in Figure 4.15
0
10
20
30
40
50
Early Late
Ra
tio
of
spli
ced
XB
P-1
mR
NA
to t
ota
l X
BP
-1 m
RN
A
(%)
Generation
Control (no addition)
+ feed addition
*
*

183
4.5 METABOLIC ANALYSIS OF CELL LINE 3.90 IN RESPONSE TO FEED
ADDITION
Cultures with feed addition had enhanced final antibody titre and Qp values than
cultures without feed addition (Section 3.2 and Section 4.2). In order to obtain greater
antibody titres protein secretion must also have been increased. I suggest that antibody
titre and secretion were the result of greater protein folding as a result of feed addition.
Feeding possibly provided the cultures with the concentrations of nutrients needed for
the production of relevant antibody protein/chains required for complete folding and
effective post-translational modifications.
Fed cultures also experienced instability during LTC (Section 4.2.1), characterised by a
30% loss in final antibody titre and a 25% decrease in Qp (d0-d15). Metabolic
alterations were also considered as contributing factors to the apparent instability,
especially as alanine accumulation, and lactate utilisation rates were altered in response
to LTC (observed for control cultures in Section 3.5). Metabolite profiles of early
generation and late generation batch cultures have been generated to characterise
potential differences in nutrient usage in response to feed addition. These profiles are
compared to metabolic profiles from cultures without feed addition (previously
discussed in Section 3.5).
Asparagine, serine, and lysine were all previously shown to decrease during batch
culture in the absence of feed addition, with the complete depletion of asparagine by
day 9 of batch culture, and depletion of serine by day 13 of batch culture (Figure 3.18).
Extracellular asparagine concentrations were increased for cultures with feed addition
(due to the presence of asparagine within the feed). However, despite feed addition,
asparagine concentration declined during batch culture, and became limiting by day 13
of batch culture (Figure 4.16A). Serine (Figure 4.16B) and lysine (Figure 4.16C)
concentrations were also enhanced after feed addition, and were maintained at
concentrations similar to that of the medium sample during the entire batch culture.
Leucine concentrations were greatly increased in the presence of feed, with
concentrations two- to three-fold greater than the medium sample (Figure 4.17A). It was
also apparent that even in the presence of feed late generation cultures had lower leucine
concentrations by day 13 of batch culture, compared to the corresponding early

184
generation culture. This may suggest altered metabolic flux in response to LTC, with
late generation cultures experiencing greater rates of leucine utilisation despite feed
additions. Isoleucine and valine concentrations were also enhanced by feed addition,
and by day 13 of batch culture the concentrations of isoleucine (Figure 4.17B) and
valine (Figure 4.17C) were three- to four-fold greater than concentrations observed for
the medium sample, regardless of generation time of culture. The increased
concentrations of leucine, isoleucine and valine were the result of feed accumulation
during the exponential phase of culture and a lack of utilisation of these amino acids,
possibly as feeding supplies the cell with other more favourable amino acids to
metabolise. Glycerol, glycine and alanine also accumulated during batch culture.
However, the increase in glycerol, glycine and alanine concentrations were not a result
of feed addition as these metabolites were not present in the CD feed. Glycerol
accumulation for batch cultures with feed addition was similar to the glycerol
accumulation observed for batch cultures without feed addition (Figure 4.17D).
However, glycine and alanine concentrations were altered in cultures which had
undergone a feeding regime. Although glycine still increased fifty-fold during fed batch
culture the relative concentration of glycine on day 13 of culture was approximately half
the concentration analysed from the control cultures without feed addition (Figure
4.17E), and whilst relative alanine concentrations by day 13 of batch culture were
similar for all cultures (regardless of feed addition) addition of feed to cultures resulted
in a steady increase of alanine during batch culture, with no apparent re-utilisation of
alanine (which was observed for the control cultures in the absence of feed addition,
Figure 4.17F).
Glucose and lactate utilisation rates were also investigated in response to feed addition.
In the presence of feed glucose concentration was greatest on day 7 of batch culture (the
last day of feed addition) and was slightly utilised over the remainder of the batch
culture (Figure 4.18A). For cultures supplemented with feed glucose concentrations
(Figure 4.18A) and rates of glucose utilisation (Figure 4.18B) were similar between
early and late generation batch cultures. There was, however, a decrease in the rate of
glucose utilisation for cultures in the presence of feed compared to the relative control
culture. As glucose was not depleted from batch cultures in the presence of feed
addition, lactate re-utilisation was not required. Lactate accumulated during the entire
batch culture, and by day 13 of culture lactate concentrations were three-fold greater for
185
cultures with feed addition than for cultures without feed addition (Figure 4.18C). As
lactate was not re-utilised after feeding the rate of lactate utilisation/production was
significantly altered, observed with a „shift‟ towards lactate production in response to
feed addition (Figure 4.18D).
For cultures in the presence of feed addition the majority of nutrients were not limited,
glucose utilisation rates were decreased, lactate was not re-utilised, and less glycine and
alanine were released from the cell. These adaptations may have generated a more
energy-efficient cell, allowing for greater antibody titres in a fed environment.

186
Figure 4.16 Effects of feed addition on amino acid concentrations
3.90 was cultured as previously described (Figure legend 3.1 and Figure legend 4.1).
Batch cultures were created at early generations (≤ 40 generations) and late
generations (≥ 60 generations). A CD feed was added to the relevant cultures during
the exponential stage of batch culture (as described in Section 2.3.2). Supernatant
samples, taken on days 5, 7, 9 and 13 of batch culture (Section 2.3.2), and a medium
control sample, were spiked with the internal standard myristic acid d27 and lyophilised.
Chemical derivatization was performed in two stages, with methyloxyamine
hydrochloride in pyridine, before the addition of MSTFA and TMCS (Section 2.10.3.1).
All samples were analysed using GC-MS analysis, within 24 hrs of derivatization. Raw
data processing was performed using ChemStation and AMDIS (Section 2.10.3.2). The
relative percentage of asparagine (A), serine (B), and lysine (C) are shown. All values
were normalised to the internal standard myristic acid d27. Error bars represent SD for
two biological replicates.
Annotation of the batch cultures in Figure 4.16
Early generation control (no addition)
Early generation + feed addition
Late generation control (no addition)
Late generation + feed addition

187
Figure 4.16 Effects of feed addition on amino acid concentrations
A.
B.
C.
0
1
2
3
4
5
6
Medium 5 7 9 13
Rela
tiv
e a
spa
ra
gin
e
(%)
Day
0
10
20
30
40
Medium 5 7 9 13
Rela
tiv
e s
erin
e
(%)
Day
0
5
10
15
20
Medium 5 7 9 13
Rela
tiv
e ly
sin
e
(%)
Day

188
Figure 4.17 Increased metabolites in response to feed addition
3.90 was cultured as previously described (Figure legend 3.1 and Figure legend 4.1).
Batch cultures were created at early generations (≤ 40 generations) and late
generations (≥ 60 generations). A CD feed was added to the relevant cultures during
the exponential stage of batch culture (as described in Section 2.3.2). Supernatant
samples, taken on days 5, 7, 9 and 13 of batch culture (Section 2.3.2), and a medium
control sample, were lyophilised and derivatized as stated in Figure legend 4.16 and
Section 2.10.3.1. All samples were analysed using GC-MS analysis, within 24 hrs of
derivatization. Raw data processing was performed using Chemstation and AMDIS
(Section 2.10.3.2). The relative percentage of leucine (A), isoleucine (B), valine (C),
glycerol (D), glycine (E) and alanine (E) are shown. All values were normalised to the
internal standard myristic acid d27. Error bars represent SD for two biological
replicates.
Annotation of the batch cultures in Figure 4.17
Early generation control (no addition)
Early generation + feed addition
Late generation control (no addition)
Late generation + feed addition
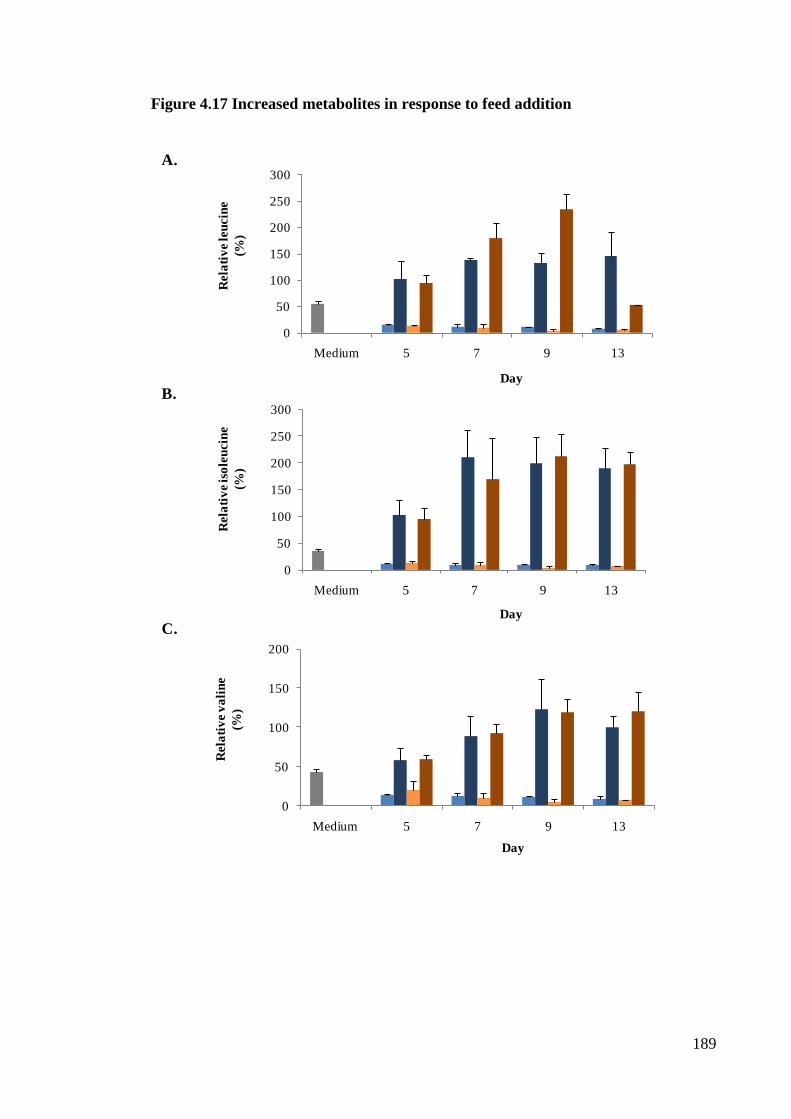
189
Figure 4.17 Increased metabolites in response to feed addition
A.
B.
C.
0
50
100
150
200
250
300
Medium 5 7 9 13
Rela
tiv
e iso
leu
cin
e
(%)
Day
0
50
100
150
200
250
300
Medium 5 7 9 13
Rela
tiv
e leu
cin
e
(%)
Day
0
50
100
150
200
Medium 5 7 9 13
Rela
tiv
e v
ali
ne
(%)
Day

190
D.
E.
F.
0
20
40
60
80
Medium 5 7 9 13
Rela
tiv
e g
lycero
l
(%)
Day
0
50
100
150
Medium 5 7 9 13
Rela
tiv
e g
lycin
e
(%)
Day
0
5
10
15
Medium 5 7 9 13
Rela
tiv
e a
lan
ine
(%)
Day

191
Figure 4.18 Effect of feed addition on glucose and lactate concentrations
3.90 was cultured as previously described (Figure legend 3.1 and Figure legend 4.1).
Batch cultures were created at early generations (≤ 40 generations) and late
generations (≥ 60 generations). A CD feed was added to the relevant cultures during
the exponential stage of batch culture (as described in Section 2.3.2). Supernatant
samples taken on days 5, 7, 9 and 13 (Section 2.3.2), and a medium control sample,
were analysed for glucose and lactate using enzymatic assays. Glucose was measured
spectrophotometrically at 505nm (as described in Section 2.10.1). Glucose standards
were also analysed. The concentration of lactate in samples was determined based on
the catalysis of pyruvate by LDH with the reduction of NAD+. The reduction of NAD
+ to
NADH was measured spectrophometrically at 340nm (as described in Section 2.10.2).
Lactate standards were also analysed. The concentrations of glucose (A) and lactate
(C) for early and late generation batch cultures are shown. The rates of production and
utilisation were calculated from days 5-13 of batch culture using the CCT values in
Figure 4.2 (Section 2.11.2). The rates of glucose utilisation (B) and lactate production
(D) for early and late generation batch cultures are also shown. Error bars represent
SEM for three biological replicates. * indicates p<0.05, and ♦ indicates p<0.10, using
independent samples t-test to compare cultures with feed addition to the corresponding
generation control culture.
Annotation of the batch cultures in Figure 4.18
Early generation control (no addition)
Early generation + feed addition
Late generation control (no addition)
Late generation + feed addition

192
Figure 4.18 Effect of feed addition on glucose and lactate concentrations
A.
B.
C.
D.
0
10
20
30
40
50
Medium 5 7 9 13
Glu
co
se c
on
cen
tra
tio
n
(mM
)
Day
0
10
20
30
40
50
60
70
80
Medium 5 7 9 13
La
cta
te c
on
cen
tra
tio
n
(mM
)
Day
-1
-0.5
0
0.5
1
1.5
Ra
te o
f la
cta
te p
ro
du
cti
on
( p
M/c
ell
/da
y)
0
0.2
0.4
0.6
0.8
1
Ra
te o
f g
luco
se u
tili
sati
on
(pM
/cell
/da
y)
* *
* *
* *
* *
* *
♦
193
4.6 DISCUSSION
Analysis showed final antibody titres were increased in response to a CD feed addition
(Figures 3.1 and 4.1), consistent with previous findings for recombinant protein
production in mammalian fed cultures (Bibila et al, 1994; deZengotita et al, 2000;
Kuwae et al, 2005; Ma et al, 2009). Antibody titre was greater for cultures in the
presence of feed, without alteration to cell biomass (Figure 4.1B and Figure 4.2) or
recombinant mRNA expression (Figure 4.8). Figure 4.19 summarises the changes to
cultures in response to feed addition. Increased antibody titre and Qp values (Figure
4.5A) for cultures in the presence of feed occurred alongside changes to polysome
profiles. Greater polysome association as a result of feed addition (Figure 4.10D) is
possibly be due to less cellular stress (Harding et al, 2000b; Talvas et al, 2006), also
observed with decreased mRNA expression of UPR markers, ATF4, GADD34,
GADD153 (Figure 4.13), and XBP-1(s) (Figure 4.15). Although expression of ATF4
mRNA was lower for cultures supplemented with feed (Figure 4.13A), interestingly
ATF4 protein was not altered in response to feed addition (Figure 4.14A). As ATF4
protein intensity was similar for all cultures, regardless of feed addition, I propose that
all cultures encountered some degree of ER stress during recombinant protein
production. ATF4 protein may be essential for efficient recombinant protein production
and secretion. This suggestion will also be addressed again in Chapter 7.
Although the relative intensity of ATF4 protein was not altered in response to feed
addition, cultures supplemented with feed expressed significantly less GADD153
protein than cultures without feed addition (Figure 5.14B). As discussed in Section
1.8.3.3.2 GADD153 is regulated by both ER stress and amino acid deprivation. ATF4
translation, subsequent to ER stress, is not sufficient to fully activate AARE-dependent
transcription of GADD153 (Averous et al, 2004; Oyadomari & Mori, 2003) and that
ATF2 phosphorylation is necessary for AARE-dependent GADD153 transcription
(Averous et al, 2004). ATF2 phosphorylation is increased during cellular stress by
mitogen-activated protein kinase (MAPK) cascades (Ouwens et al, 2002). Initial
investigations showed no definite association between ATF2 phosphorylation and the
fed status of the cell (data not shown). The phosphorylation status of ATF2 alone may
not be enough to regulate GADD153 transcription and may require binding partners
such as Jun dimerisation protein 2 (JDP2), a bZIP protein known to interact with ATF2

194
(Jin et al, 2001). It has been suggested that the JDP2 may recruit HDAC to silencing
GADD153 transcription during periods when amino acids are not limited (Cherasse et
al, 2008; Chaveroux et al, 2010). However, further analysis would be needed to confirm
the regulation of ATF2, and JDP2, in response to feed addition. Other activating
transcription factors are also regulated by amino acid availability within the cell,
including ATF3. ATF3 expression increases during ER stress and amino acid
deprivation (Chen et al, 1996; Chen et al, 2004; Hashimoto et al, 2002), and has been
shown to modulate the transcription of asparagine synthetase (ASNS, Chen et al, 2004;
Pan et al, 2003). ASNS is discussed in more detail below.
Feed addition had the greatest impact on Qp during the end (decline) phase of batch
culture. It was during this phase of culture when nutrients, such as asparagine, serine,
and glucose became depleted in cultures without feed addition (Section 3.5). Previous
data has shown that glucose limitation alters recombinant glycosylation patterns (Hayter
et al, 1992). Potentially excess glucose, in response to feed addition, enhanced
glycosylation, allowing for greater antibody secretion (glycosylation profiles of the
secreted protein in response to the different culture conditions will be discussed in
Chapter 5). Feed addition maintained the majority of amino acids, and glucose, to a
similar concentration as observed for the medium control sample (Figure 4.16). One
exception was for the concentration of asparagine. Despite the addition of feed to
cultures the concentration of asparagine was not maintained at high concentrations
during batch culture due to the rapid utilisation of asparagine by 3.90 cultures (Figure
4.16A). Previous findings have also highlighted rapid utilisation of asparagine by CHO
cells (Hayter et al, 1991). In the presence of feed asparagine concentrations became
limiting by day 13 batch culture, four days after depletion in cultures without feed
addition. It was during this end (decline) phase of culture when Qp and antibody titres
were significantly increased in response to feed addition. It may be possible that the
increased productivity in response to feed addition was primarily due to enhanced
availability of asparagine.
Asparagine is needed for polypeptide synthesis and N-linked glycan formation. It can be
generated by cells from aspartate using ASNS, an enzyme up-regulated during amino
acid starvation (Gong et al, 1991; Guerrini et al, 1993; Hutson et al, 1997). Andrulis et
al, have shown that asparagine-starved CHO cells had decreased asparaginyl-tRNAAsn

195
and increased ASNS activity (Andrulis et al, 1979). It is possible that intracellular
asparagine concentrations were increased in response to feed addition, potentially
enhancing the rates of protein production for fed cultures. Intracellular metabolite
analysis would be needed to confirm intracellular concentrations of asparagine. As
asparagine was available for cultures during a crucial time of productivity it would be
tempting to state the importance of this single amino acid in relation to increased
antibody titre and Qp. However, the effects of a commercially available feed, CHO CD
Efficient Feed™ A (Invitrogen), were investigated to determine if another feed, which
contained asparagine, could also enhance productivity. The commercial feed did not
enhance antibody titre or Qp values above those attained for cultures in the absence of
feed (data not shown). Enhancing the productivity of 3.90 cultures was dependent on
creating an optimum specific feed based on the nutritional requirement of the specific
cultures.
Although cultures in the presence of feed utilised a small number of amino acids after
day 5 of batch culture the release of metabolites during the entire batch culture was
affected by feed addition. Glycine (Figure 4.17E), alanine (Figure 4.17F) and lactate
(Figure 4.18C) accumulation all altered in response to feed addition. Glycine
concentration was lower for cultures in the presence of feed, and alanine and lactate
were not re-utilised as a result of feed addition. In response to feed addition 3.90
cultures could be experiencing improved metabolism. Improved metabolic flux has been
shown for other CHO cultures in response to feed addition (Ma et al, 2009; Omasa et al,
2009; Chong et al, 2010). For example, the addition of pyruvate to CHO cultures was
shown to increase productivity whilst also enhancing ATP and NADH production
(Omasa et al, 2009). Initial investigations showed ATP, NAD+ and NADH
concentrations for 3.90 cultures were increased in response to feed addition (Figure
4.20). As discussed in Section 3.6 greater concentrations of ATP, NAD+ and NADH
may allow for greater protein production and protein folding. The determination of
correct/greater protein folding prior to protein secretion will be discussed further in
Chapter 7. Although concentrations of ATP, NAD+ and NADH were increased with
feed addition, lower ATP and NADH concentrations were seen for the late generation
fed cultures compared to the early generation culture. Low levels of energy
intermediates may be related to the instability observed for this cell line.

196
Instability was still apparent for cultures in the presence of feed. Changes in antibody
titre between early and late generation cultures were observed from day 13 of batch
culture (Figure 4.1A). Feed addition did not prevent antibody titre loss between early
and late generation cultures but it did appear to delay the effects of instability, and the
associated characteristics (shown in Figure 4.21). For example, significant antibody titre
loss between early and late generation cultures in the presence of feed occurred on day
13 of batch culture (Figure 4.1A), whilst significant antibody titre loss between early
and late generation cultures in the absence of feed was observed on day 11 of batch
culture (Figure 3.1A). Late generation cultures with feed addition also had increased
GADD153 mRNA on day 9 of batch culture compared to early generation cultures
(Figure 4.12C), whilst alterations in GADD153 mRNA between early and late
generation batch cultures, in the absence of feed addition, was observed on day 7 of
batch culture (Section 3.4). Unlike batch cultures without feed addition, the cell cycle
phase distribution of cultures supplemented with feed addition was not altered between
early and late generation cultures (Figure 4.3). As feed addition delayed characteristics
of instability, the changes in cell cycle distribution, particularly a decrease in the
percentage of cells in G0/G1, may have occurred after day 11 of batch culture (as
indicated in Figure 4.21). The delay in antibody titre loss between early and late
generation cultures in the presence of feed was during a period of culture when
extracellular asparagine (Figure 4.16A) and glucose (4.18A) were still available for
cultures in the presence of feed. As mentioned further investigations showed that Qp
was not entirely dependent on asparagine availability.
4.7 SUMMARY
Antibody titre and Qp was enhanced in response to feed addition, potentially due to
altered cellular metabolism, which resulted in less lactate and alanine re-utilisation and
less glycine accumulation. These potential metabolic flux alterations in response to feed
addition allowed for greater concentrations of ATP, NAD+ and NADH, potentially
increasing protein production and protein folding. Either due to enhanced protein
folding, or as a direct result of nutrient availability, cultures with feed addition had
lower mRNA expression of UPR markers, ATF4, GADD34, GADD153 and XBP-1(s),
and less GADD153 protein than cultures without feed addition. However, despite

197
increased antibody titre and Qp values as a result of feed addition these cultures still
experienced instability in response to LTC. Late generation fed cultures had
significantly less antibody titre and Qp values that early generation fed cultures,
possibly as a result of metabolic flux changes, observed with lower ATP and NADH
concentrations. Intracellular metabolite analysis may provide conclusive data regarding
the changes to metabolites and the metabolic flux of 3.90 cultures in response to feed
addition and LTC.

198
Figure 4.19 Alterations to 3.90 cultures in response to feed addition
The changes to productivity, expression of UPR stress markers and nutrient utilisation
in the presence of feed. In response to feed addition the expression of UPR markers and
lactate re-utilisation were decreased, viable cell densities, CCT and recombinant mRNA
expression remained unaltered, and antibody titre and Qp values were increased.
Polysome peak area
Antibody titre
Qp
Viable cell densities
CCT
Recombinant mRNA
ATF4, GADD34 mRNA
GADD153 mRNA and protein
XBP-1(s) mRNA
Glycine accumulation
Alanine re-utilisation
Lactate re-utilisation
Enhanced in response to feed addition
Lowered in response to feed addition

199
Figure 4.20 Concentrations of ATP, NAD and NADH in response to feed addition
3.90 was cultured as previously described (Figure legend 3.1 and Figure legend 4.1).
Batch cultures were created at early generations (≤ 40 generations) and late
generations (≥ 60 generations). A CD feed was added to the relevant cultures during
the exponential stage of batch culture (as described in Section 2.3.2). 1x10⁷ cells, taken
on day 9 of batch culture (Section 2.3.2), were quenched in 60% methanol with 0.85%
(w/v) AMBIC (at -40 °C). The metabolites were extracted by resuspension of the cell
pellet in 100% methanol followed by flash freezing in liquid nitrogen (Section 2.10.4).
Once the samples were thawed and re-extracted the methanol extracts were pooled and
lyophilised. Dried metabolite extracts were resuspended in ddH20 for use in each of the
metabolite assays. ATP assays were performed using an ATP Bioluminescence Assay
Kit CLS II (Section 2.10.5) and NAD+/NADH assays were performed using an
NAD+/NADH Quantification Kit (Section 2.10.6). Both kits were utilised according to
manufacturer’s instructions.
Annotation of the generation batch cultures in Figure 4.20
Control (no addition)
+ feed adidition
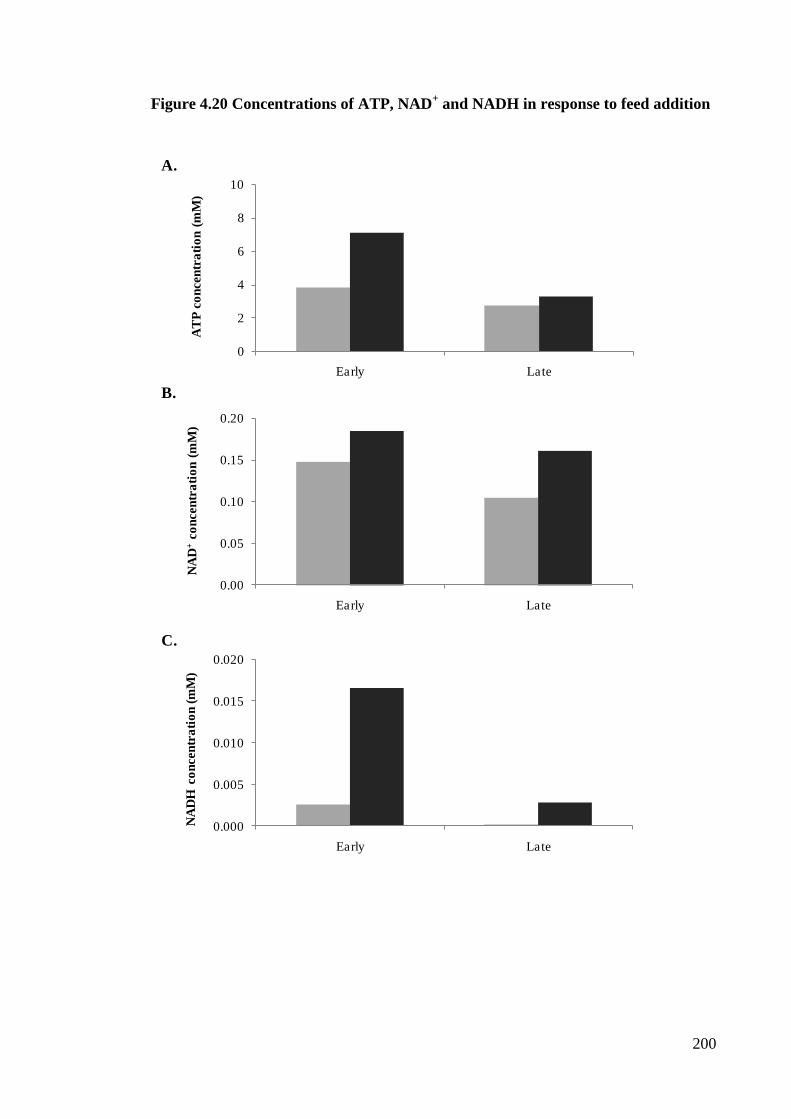
200
Figure 4.20 Concentrations of ATP, NAD+ and NADH in response to feed addition
A.
B.
C.
0
2
4
6
8
10
Early Late
AT
P c
on
cen
tra
tio
n (
mM
)
0.00
0.05
0.10
0.15
0.20
Early Late
NA
D+
co
ncen
tra
tio
n (
mM
)
0.000
0.005
0.010
0.015
0.020
Early Late
NA
DH
co
ncen
tra
tio
n (
mM
)

201
Figure 4.21 Time-line of changes to late generation cultures with feed addition
Although feed addition increased productivity for all generation cultures, a significant
decrease in antibody titre between early and late generation cultures in the presence of
feed was apparent. During batch culture alterations in the mRNA expression of ER
stress markers, and a decrease in CCT, were observed between early and late
generation cultures. These markers of instability were delayed in response to feed
addition but were still evident during the end (decline) phase of batch culture. ?
suggests the possibility that changes to cell cycle distribution may have occurred
between early and late generation culture during the decline phase of batch culture.
indicates a significant change for late generation cultures compared to generation 20
cultures (p<0.10, using independent samples t-test).
Annotation of Figure 4.21
Day 0 3 5 7 9 11 13 15
Antibody titre
CCT
Percentage of cells in
G0/G1
GADD153 mRNA
XBP-1 (s) mRNA
*
?
Late generation cultures
Generation 60
Generation 80
Generation 100
Increased values
Decreased values

202
8
CHAPTER 4
9
CHARACTERISATION OF CELL
LINE 3.90 IN RESPONSE TO
DIMETHYL SULFOXIDE
ADDITION

203
5. CHARACTERISATION OF CELL LINE 3.90 IN RESPONSE TO DIMETHYL
SULFOXIDE (DMSO) ADDITION
5.1 INTRODUCTORY REMARKS
Cell line 3.90 was previously characterised in Chapter 3 and found to be unstable in
terms of a loss in final antibody titre and Qp between early and late generation cultures.
The protein expression of UPR markers ATF4 and GADD153, and ER chaperones BiP
and PDI were all upregulated during batch culture, with enhanced expression of
GADD153 and XBP-1(s) mRNA for late generation cultures (Section 3.4). Metabolite
analysis also showed differences in alanine accumulation, and altered rates of lactate
utilisation between early and late generation cultures, potentially indicating altered
metabolic flux in response to LTC (Section 3.5). Investigations were continued to
determine if antibody titres and Qp values could be improved further by addition of a
CD feed (Chapter 4). Feeding did enhance final antibody titres and Qp values (Section
4.2.), whilst lowering the mRNA expression of UPR markers ATF4, GADD34 and
GADD153, and XBP-1(s) (Section 4.4). As the effects of feeding maintained a high
concentration of most nutrients and ensured, for example, that during batch culture
glucose was never depleted and lactate was not re-utilised (Section 4.5), I suggested that
feeding altered the metabolic flux of the cell allowing for increased ATP and greater
protein secretion. Although feed addition increased final antibody titres, feed addition to
cultures did not prevent instability as a result of LTC (Figure 4.1A). My next aim was to
increase antibody titre and Qp, whilst maintaining stable antibody production during
LTC, using addition of simple supplements.
Previous literature has shown that addition of simple low molecular weight chemicals,
including sodium butyrate, hexanohydroxamic acid, glycerol, DMSO and sorbitol,
increased productivity for CHO and hybridoma cells (Allen et al, 2008; Kim & Lee,
2000; Li et al, 2006b; Li et al, 2006c; Petch & Butler, 1996; Rodriguez et al, 2005;
Zhou & Sharfstein, 2008). I initially investigated the consequences of glycerol, sorbitol,
and DMSO addition at various concentrations to cultures and identified that 2% (v/v)
DMSO addition had the greatest impact on antibody titre (Appendix 4), and have
therefore focused upon the consequence and mechanisms in response to the addition of
2% (v/v) DMSO on day 5 of batch culture.

204
In this Chapter, consistent with the format in Chapters 3 and 4, the term early generation
cultures will refer to batch cultures created at ≤ 40 generations and the term late
generation cultures will refer to batch cultures created at ≥ 60 generations. Where
appropriate, 2% (v/v) DMSO was added on day 5 of batch culture. As described in
Chapter 4 appropriate cultures were also supplemented with a 2% (v/v) CD feed
addition on days 3 to 7 of batch culture. The data obtained for cultures in the absence
and presence of feed addition within this Chapter represent control cultures performed
in parallel to the cultures with DMSO addition. The majority of the control cultures
discussed in this Chapter have not been described in the previous Chapters. However, I
will state when I am comparing the cultures supplemented with DMSO to cultures that
have been previously mentioned in Chapters 3 and 4. The main aim of Chapter 5 is to
determine the influence of DMSO on antibody titre, Qp values, the expression of UPR
markers and metabolic utilisation/production rates.
5.2 ANALYSIS OF GROWTH CHARACTERISTICS AND PRODUCTIVITY OF
CELL LINE 3.90 IN RESPONSE TO DMSO
The growth characteristics and antibody titre of cultures with and without DMSO
addition were assessed for early generation (Figure 5.1) and late generation (Figure 5.2)
cultures. Early generation control cultures had similar antibody titres to values observed
in Chapters 3 and 4. DMSO addition significantly enhanced antibody titres from day 13
of batch culture, increasing final antibody titre by approximately 200-300 mg/L
(regardless of feed addition, Figure 5.1A). The addition of DMSO to early generation
cultures increased antibody titres whilst inhibiting cell growth. Early generation cultures
without DMSO addition had maximal cell densities of approximately 6x10⁶ cells/ml,
whilst cultures supplemented with DMSO only achieved maximal cell densities of
approximately 4x10⁶ cell/ml (Figure 5.1B). As a result of DMSO addition viable cell
densities were statistically lower on day 9 of batch culture. The alteration in viable cell
densities was also reflected in the CCT values for cultures. From day 9 of batch culture
the CCT for cultures with DMSO was less than the CCT for cultures without DMSO,
and significantly lower for fed cultures in the presence of DMSO from day 11 of batch
culture (Figure 5.3C).

205
Late generation cultures were also analysed to determine the influence of DMSO on
productivity and stability on cultures after LTC. Late generation cultures also had
increased final antibody titres (by approximately 200-300 mg/L) in response to DMSO
addition (Figure 5.2A), with lower viable cell densities (Figure 5.2B), and CCT values
(Figure 5.2C). No changes in cell biomass were observed for late generation cultures as
a result of DMSO addition.
The addition of DMSO to cultures increased antibody titre values, but only during the
end (decline) phase of batch culture (also seen for antibody titres in response to feed
addition, Section 4.2). Early generation cultures with DMSO had significantly increased
antibody titres from day 11 of batch culture, compared to the relative control culture
(Figure 5.1A), whereas enhanced antibody titres for late generation cultures in response
to DMSO addition were dependent on the fed status of the culture. Without feed
addition antibody titres for late generation cultures supplemented with DMSO were
significantly increased from day 13 of batch culture in response to DMSO, whilst in the
presence of feed the antibody titre for late generation cultures was significantly
enhanced from day 9 of batch culture (Figure 5.2A). Although final antibody titres were
greater for cultures in response to DMSO addition, DMSO addition did not prevent
antibody titre loss in response to LTC. Final antibody titres between early and late
generation cultures with DMSO decreased by 372 mg/L, and final antibody titres
between early and late generation cultures with feed and DMSO addition decreased by
246 mg/L, however, this change was not statistically significant. Therefore, in order to
increase productivity and maintain stable antibody titres during LTC it may be
advantageous to utilise cultures in a fed environment in the presence of DMSO.

206
Figure 5.1 Effect of DMSO addition on antibody titre, viable cell growth and CCT
for early generation cultures
3.90 was subject to LTC in suspension using MSX supplemented CD-CHO media. Batch
culture analysis was performed in shake flasks for early generation (≤ 40 generations)
cultures. Batch cultures were created at 0.2x10⁶ cells/ml, and maintained at 37
oC, 140
rpm and with a manual supply of 5% CO2 in air. A CD feed was added to cultures
during the exponential stage of batch culture, whilst 2% (v/v) DMSO was added on day
5 of batch culture (as described in Section 2.3.2). Antibody titres were measured by
ELISA (Section 2.5.1) and viable cell densities were determined by light microscopy
and trypan blue exclusion (Section 2.3.3) from samples taken routinely during batch
culture. Antibody titres (A), viable cell densities (B), and CCT (C) are shown. For
determination of CCT see Section 2.11.2. Error bars represent SEM for three biological
replicates. Each biological replicate value is an average from duplicate technical
repeats. * indicates p<0.05, using independent samples t-test to compare the cultures
with DMSO to the corresponding control culture without DMSO addition (on the same
day of batch culture).
Annotation of early generation batch cultures in Figure 5.1
Control (no addition)
+ DMSO addition
Control (+ feed addition)
+ feed + DMSO addition

207
Figure 5.1 Effect of DMSO addition on antibody titre, viable cell growth and CCT
for early generation cultures
B.
C.
A.
0
2
4
6
8
0 5 10 15
Via
ble
cell
s
(x1
06
cell
s/m
l)
Day
0
10
20
30
40
50
60
0 3 5 7 9 11 13 15
Cu
mu
lati
ve c
ell
tim
e
(x1
06
cell
s x
da
y/m
L)
Day
0
400
800
1200
1600
2000
0 3 5 7 9 11 13 15
An
tib
od
y t
itre
(mg
/L)
Day
*
**
* *
*
*
*
*

208
Figure 5.2 Effect of DMSO addition on antibody titre, viable cell growth and CCT
for late generation cultures
3.90 was cultured as described previously (Figure legend 5.1), for batch cultures
created at late generations (≥ 60 generations). A CD feed and 2% (v/v) DMSO was
added to the relevant cultures (as described in Section 2.3.2). Antibody titres were
measured by ELISA (Section 2.5.1) and viable cell densities were determined by light
microscopy and trypan blue exclusion (Section 2.3.3) from samples taken routinely
during batch culture. Antibody titres (A), viable cell densities (B), and CCT (C) are
shown. For determination of CCT see Section 2.11.2. Error bars represent SEM for
three biological replicates. Each biological replicate value is an average from duplicate
technical repeats. * indicates p<0.05, using independent samples t-test to compare the
cultures with DMSO to the corresponding control culture without DMSO addition (on
the same day of batch culture).
Annotation of late generation batch cultures in Figure 5.2
Control (no addition)
+ DMSO addition
Control (+ feed addition)
+ feed + DMSO addition
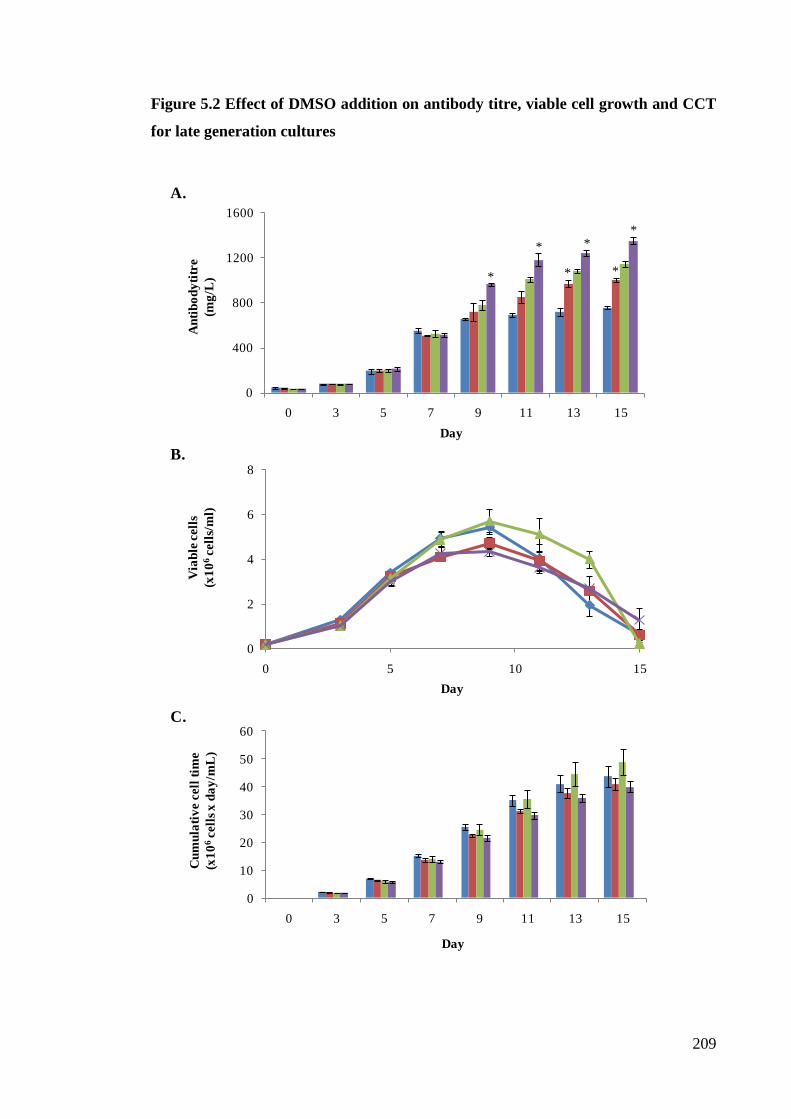
209
Figure 5.2 Effect of DMSO addition on antibody titre, viable cell growth and CCT
for late generation cultures
B.
C.
A.
0
400
800
1200
1600
0 3 5 7 9 11 13 15
An
tib
od
yti
tre
(mg
/L)
Day
0
2
4
6
8
0 5 10 15
Via
ble
cell
s
(x1
06
cell
s/m
l)
Day
0
10
20
30
40
50
60
0 3 5 7 9 11 13 15
Cu
mu
lati
ve c
ell
tim
e
(x1
06
cell
s x
da
y/m
L)
Day
*
*
*
*
*
*

210
From analysis it was apparent that antibody titres were increased and viable cell
densities were lowered as a result of DMSO addition, as a consequence to these changes
Qp (d0-d15) was significantly enhanced (Figure 5.3). In response to DMSO addition the
fold change in Qp (d0-d15) was increased by 30-40% for both early and late generation
cultures. Although cell growth was altered by DMSO addition cell cycle distribution
was not. The percentage of cells G0/G1 cell cycle phase was not altered by the addition
of DMSO to either early generation (Figure 5.4A) or late generation (Figure 5.4B)
cultures. The proportion of cells in S cell cycle phase and G2/M cell cycle phase were
also unaffected by DMSO addition (data not shown). My findings were contradictory to
the findings reported by Li et al, and Liu et al, who found CHO cell cycle distribution to
change in presence of DMSO (Li et al, 2006c; Liu & Chen, 2007b). Although Li et al,
and Liu et al, added lower DMSO concentrations per culture (1-1.5% [v/v] DMSO
addition), the viable cell densities upon DMSO addition were less than the viable cell
densities for my 3.90 cultures at the time of DMSO addition. The changes to DMSO
concentration on a per cell basis may have resulted in greater alterations to cell cycle
distribution.
During investigations I also found that DMSO addition to cultures (in the absence of
feed) increased medium osmolality by approximately 0.25 Osm/kg (Appendix 4). As
previously mentioned in Section 4.2.1 changes to medium osmolality can affect cell
growth and cell size. Larger cells may be more productive merely due to increased
cellular volume (Lloyd et al, 2000). I found cell diameters for early and late generation
cultures with DMSO were approximately 13-14µm (Figure 5.5), similar to diameter
measurements of cells from cultures previously described in Section 3.2.1. Therefore
the enhancement in productivity in response to DMSO addition was not due to changes
within cellular volume. The alterations in productivity were possibly due to other
mechanisms potentially at the site of mRNA transcription, protein translation, post-
translation modification and/or protein secretion.

211
Figure 5.3 Effect of DMSO on specific productivity (Qp)
Specific productivity (Qp) was determined from the antibody tire and the CCT values
for early generation (≤ 40 generations) and late generation (≥ 60 generations) batch
cultures seen in Figure 5.1 and Figure 5.2, respectively. Qp was calculated for the
entire batch culture, using antibody titre and cell density measurements on days 0 to 15
of culture, Qp (d0-d15). For determination of Qp see Section 2.11.2. The fold change in
Qp (d0-d15) relative to early generation control cultures (without feed or DMSO
additions) is shown. Error bars represent SEM for three biological replicates. Each
biological replicate value is an average from duplicate technical repeats. * indicates
p<0.05, using independent samples t-test to cultures with DMSO to the corresponding
control culture without DMSO addition.
Annotation of the batch cultures in Figure 5.3
0
0.5
1
1.5
2
2.5
- DMSO + DMSO - DMSO + DMSO
- feed addition + feed addition
Fo
ld c
ha
ng
e i
n Q
p(d
0-d
15
)
(rela
tiv
e to
ea
rly
gen
era
tio
n c
ult
ures
wit
ho
ut
feed
or D
MS
O a
dd
itio
ns)
Culture condition
Early generation
Late generation
*
*
*
*

212
Figure 5.4 Effect of DMSO addition on G0/G1 cell cycle phase transition
3.90 was cultured as described previously (Figure legend 5.1). A CD feed and 2% (v/v)
DMSO was added to the relevant cultures (as described in Section 2.3.2). 1x10⁶ cells,
taken on days 7, 9, and 11 of batch culture, were analysed by flow cytometry using PI
excitation by a 488nm laser, and emission measured by a 613/20nm bandpass filter
(Section 2.4.1). The data was analysed by Summit 4.3 and ModFit LT software. The
percentage of early generation (≤ 40 generations) cells in G0/G1 cell cycle phase (A)
and the percentage of late generation (≥ 60 generations) cells in G0/G1 cell cycle phase
(B) are shown. Error bars represent SEM for three biological replicates.
Annotation of the generation batch cultures in Figure 5.4
B.
A.
0
20
40
60
80
100
7 9 11
G0
/G1
cell
cy
cle
ph
ase
(%)
Day
0
20
40
60
80
100
7 9 11
G0
/G1
cell
cy
cle
ph
ase
(%)
Day
Control (no addition)
+ DMSO addition
Control (+ feed addition)
+ feed + DMSO addition

213
Figure 5.5 Cell size comparisons for cultures with and without DMSO addition
3.90 was cultured as previously described (Figure legend 5.1). On day 9 of batch
culture, early generation (≤ 40 generations) and late generation (≥ 60 generations)
cells, with and without DMSO addition (2% [v/v] added on day 5 of culture), were
prepared for cell counting using trypan blue dye (as described in Section 2.3.3). 100
cells were counted and measured for cell diameter using a Widefield Axiovision
microscope, and analysed using the Axiovision software. The average cell diameter for
early and late generation cells is shown. Error bars represent the SD for 100 cells
counted.
0
5
10
15
20
- DMSO + DMSO - DMSO + DMSO
Early Late
Cell
Dia
mete
r
(µm
)
Culture condition/
Generation

214
5.3 MOLECULAR INVESTIGATIONS OF RECOMBINANT CELL LINE 3.90
IN RESPONSE TO DMSO ADDITION
DMSO addition on day 5 of batch culture increased final antibody titre regardless of fed
status or generation time of the culture (Section 5.2.1). The increased antibody titres in
response to DMSO addition were not due to changes in cell size or cell cycle
distribution. As previous studies highlighted changes to mRNA transcription as a result
of DMSO addition (Liu et al, 2001), investigations were continued to determine
molecular changes of 3.90 cultures as a result of DMSO addition. These investigations
included analysis of antibody mRNA expression (Section 5.3.1) and polysome profiles
(Section 5.3.2).
5.3.1 Effect of DMSO addition on recombinant gene mRNA expression
As no change in GS mRNA expression was observed in response to LTC (Section
3.3.2) or feed addition (Section 4.3.1) I did not examine GS mRNA in response to
DMSO addition. The expression of both heavy chain mRNA (Figure 5.6A) or light
chain mRNA (Figure 5.6B) was not altered in response to DMSO addition, regardless of
generation time of culture. Analysis of mRNA supported findings shown in Chapters 3
and 4 that recombinant mRNA expression was not affected by LTC or feed addition.
5.3.2 Effect of DMSO addition on polysome profiles
Polysome profiles were also investigated for cultures supplemented with DMSO and
compared to the polysome profiles previously described in Chapters 3 and 4. Analysis
showed that DMSO addition did not influence the relative 40S and 60S monosome peak
areas (data not shown) but did result in a lower 80S peak area and a lower polysome
peak area (for early and late cultures in the presence of feed, Figure 5.7). Increased 80S
peaks have been previously associated with culture conditions which promote cell stress
and halt protein synthesis (Ashe et al, 2000; Demeshkina et al, 2007; Shenton et al,
2006; Talvas et al, 2006; Volarevic et al, 2000). DMSO addition to 3.90 cultures may
create a culture environment which encourages protein synthesis (and potentially lowers
cellular stress).

215
5.3.3 Effect of DMSO addition on intracellular recombinant protein
To determine if protein synthesis was enhanced in response to DMSO addition
intracellular heavy chain and light chain proteins were analysed using specific antibody-
conjugated dyes. The mean fluorescence intensity of both the heavy chain protein and
the light chain protein were not altered in response to DMSO addition (when compared
to the respective control cultures previously described in Chapters 3 and 4, Figure 5.8).
DMSO addition could have stimulated both the rate of protein synthesis and protein
secretion to a similar degree so that no overall change in levels of intracellular protein
was observed. DMSO addition may have potentially encouraged correct protein folding
within the ER, lowering the concentration of mis/unfolded proteins and ER stress,
allowing for increased rates of protein secretion. The UPR markers were measured to
determine any changes in response to DMSO addition. These data are shown in the next
Section.

216
Figure 5.6 Effect of DMSO addition on recombinant mRNA expression
3.90 was cultured as previously described (Figure legend 5.1). Batch cultures were
created at early generations (≤ 40 generations) and late generations (≥ 60 generations).
A CD feed and 2% (v/v) DMSO was added to the relevant cultures (as described in
Section 2.3.2). mRNA levels were compared using q-RTPCR from samples taken on
days 7 and 9 of batch culture (as detailed in Section 2.7.1), using the mRNA specific
primer sets for A, heavy chain, and B, light chain. Samples were normalised using
mRNA β-Actin primers. Error bars represent SEM for three biological replicates.
Annotation of the generation batch cultures in Figure 5.6
A.
B.
0
50
100
150
200
250
300
7 9 7 9
Early Late
Hea
vy
ch
ain
mR
NA
ex
pre
ssio
n
(% r
ela
tiv
e to
sta
nd
ard
an
d
β-A
ctin
mR
NA
ex
pre
ssio
n)
Day/Generation
0
50
100
150
200
250
300
350
400
7 9 7 9
Early Late
Lig
ht c
ha
in m
RN
A e
xp
ress
ion
(% r
ela
tiv
e to
sta
nd
ard
an
d
β-A
ctin
mR
NA
ex
pre
ssio
n)
Day/Generation
Control (no addition)
+ DMSO addition
Control (+ feed addition)
+ feed + DMSO addition

217
Figure 5.7 Quantification of monosome and polysome peaks in response to DMSO
addition
3.90 was cultured as previously described (Figure legend 5.1). Batch cultures were
created at early generations (≤ 40 generations) and late generations (≥ 60 generations).
A CD feed and 2% (v/v) DMSO was added to the relevant cultures (as described in
Section 2.3.2). Polysomes were extracted on day 7 of batch culture (Section 2.8.2). The
extracts were analysed on a UV/Vis machine at 254nm after sucrose gradient
centrifugation, as described in Section 2.8.3. The peaks were analysed using Image J
software to provide a relative representation of peak variation. The fold change in the
80S peak area and the polysome peak area between early and late generation day 7
polysome profiles is shown. Error bars represent SEM for three biological replicates. *
indicates p<0.05, using independent samples t-test to compare cultures with DMSO to
the corresponding control culture without DMSO addition.
Annotation of the batch cultures in Figure 5.7
0.00
0.50
1.00
1.50
2.00
2.50
80S Polysome 80S Polysome
Early Late
Fo
ld c
ha
ng
e i
n p
ea
k a
rea
(rela
tiv
e to
ea
rly
gen
era
tio
n c
on
tro
l
cu
ltu
res
wit
ho
ut
DM
SO
ad
dit
ion
)
Peak /Generation
Control (no addition)
+ DMSO addition
Control (+ feed addition)
+ feed + DMSO addition
*
* *
*

218
Figure 5.8 Analysis of intracellular recombinant protein in response to DMSO
addition
3.90 was cultured as previously described (Figure legend 5.1). 2x10⁶ of fixed cells from
early generation (≤ 40 generations) and late generation (≥ 60 generations) day 9
cultures (with and without feed and DMSO additions, Section 2.3.2) were washed,
blocked and incubated with 10 µg goat anti-human IgG, Fcγ-APC and 6 µg goat anti-
human lambda light chain-FITC. The samples were then analysed by a CyAn ADP flow
cytometer, using the 488nm and infra-red excitation lasers to excite the FITC and APC
conjugates (Section 2.4.2). Unstained 3.90 cells and stained parental cells were also
required for setting initial parameters with the CyAn-ADP flow cytometer. The data was
gated to select single cells, and was analysed by Summit 4.3 software. Error bars
represent SEM for three biological replicates.
Annotation of antibody conjugates in Figure 5.8
0.0
0.5
1.0
1.5
2.0
- DMSO + DMSO - DMSO + DMSO - DMSO + DMSO - DMSO + DMSO
- feed addition + feed addition - feed addition + feed addition
Early Late
Fo
ld c
ha
ng
e i
n m
ea
n f
luo
resc
en
ce i
nte
nsi
ty
(rela
tiv
e to
ea
rly
gen
era
tio
n c
on
tro
l cu
ltu
res)
Culture condition/Generation
APC conjugate antibody (for use in heavy chain protein detection)
FITC conjugate antibody (for use in light chain protein detection)
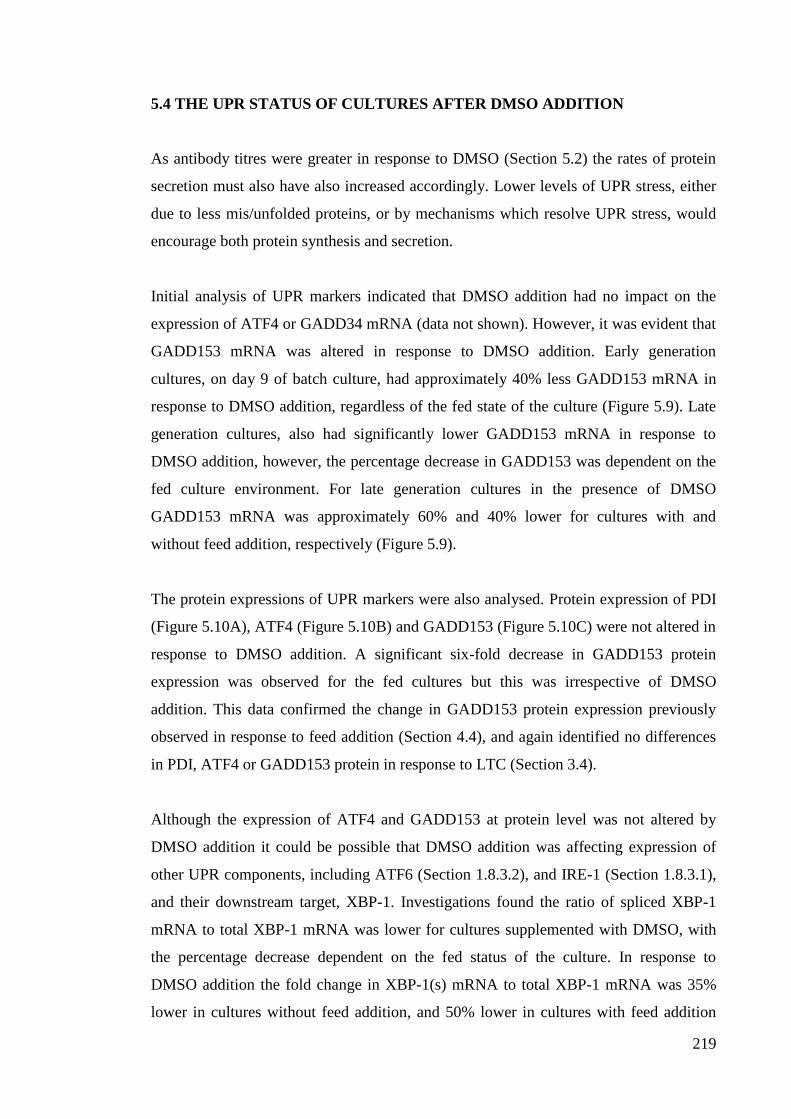
219
5.4 THE UPR STATUS OF CULTURES AFTER DMSO ADDITION
As antibody titres were greater in response to DMSO (Section 5.2) the rates of protein
secretion must also have also increased accordingly. Lower levels of UPR stress, either
due to less mis/unfolded proteins, or by mechanisms which resolve UPR stress, would
encourage both protein synthesis and secretion.
Initial analysis of UPR markers indicated that DMSO addition had no impact on the
expression of ATF4 or GADD34 mRNA (data not shown). However, it was evident that
GADD153 mRNA was altered in response to DMSO addition. Early generation
cultures, on day 9 of batch culture, had approximately 40% less GADD153 mRNA in
response to DMSO addition, regardless of the fed state of the culture (Figure 5.9). Late
generation cultures, also had significantly lower GADD153 mRNA in response to
DMSO addition, however, the percentage decrease in GADD153 was dependent on the
fed culture environment. For late generation cultures in the presence of DMSO
GADD153 mRNA was approximately 60% and 40% lower for cultures with and
without feed addition, respectively (Figure 5.9).
The protein expressions of UPR markers were also analysed. Protein expression of PDI
(Figure 5.10A), ATF4 (Figure 5.10B) and GADD153 (Figure 5.10C) were not altered in
response to DMSO addition. A significant six-fold decrease in GADD153 protein
expression was observed for the fed cultures but this was irrespective of DMSO
addition. This data confirmed the change in GADD153 protein expression previously
observed in response to feed addition (Section 4.4), and again identified no differences
in PDI, ATF4 or GADD153 protein in response to LTC (Section 3.4).
Although the expression of ATF4 and GADD153 at protein level was not altered by
DMSO addition it could be possible that DMSO addition was affecting expression of
other UPR components, including ATF6 (Section 1.8.3.2), and IRE-1 (Section 1.8.3.1),
and their downstream target, XBP-1. Investigations found the ratio of spliced XBP-1
mRNA to total XBP-1 mRNA was lower for cultures supplemented with DMSO, with
the percentage decrease dependent on the fed status of the culture. In response to
DMSO addition the fold change in XBP-1(s) mRNA to total XBP-1 mRNA was 35%
lower in cultures without feed addition, and 50% lower in cultures with feed addition

220
(Figure 5.11). The degree of spliced XBP-1 mRNA also highlighted differences
between early and late generation cultures. For each culture condition the ratio of XBP-
1(s) mRNA was greater for the late generation cultures than early generation cultures.
The changes in antibody titre, Qp, GADD153 mRNA and XBP-1(s) mRNA in response
to DMSO addition were similar to the changes observed in response to feed addition (as
described in Chapter 4). DMSO addition to fed cultures further increased productivity,
whilst lowering GADD153 mRNA expression and XBP-1 splicing to levels below those
observed for cultures with separate feed or DMSO additions. As components of the
UPR are affected by both feed and DMSO addition I suggest that these culture
conditions result in less ER stress due to a greater degree of correctly-folded proteins
within the ER, suitable for secretion. However, it may also be possible that by adding
feed and DMSO to cultures any mis/unfolded proteins within the ER by-pass the
regulation of the UPR, and become unintentionally secreted. Protein conformations,
including correct post-translational modifications are extremely important for protein
functionality. Mis/unfolded proteins which are secreted may not contain these essential
modifications and therefore may impact protein quality. The functionality of the
secreted protein is discussed in Section 5.5.

221
Figure 5.9 Effect of DMSO addition on GADD153 mRNA expression
3.90 was cultured as previously described (Figure legend 5.1). Batch cultures were
created at early generations (≤ 40 generations) and late generations (≥ 60 generations).
A CD feed and 2% (v/v) DMSO was added to the relevant cultures (as described in
Section 2.3.2). mRNA levels were compared using q-RTPCR from samples taken on day
7 and 9 of batch culture (as detailed in Section 2.7.1), using the GADD153 mRNA
specific primer set. Samples were normalised using mRNA β-Actin primers. Error bars
represent SEM for three biological replicates. ♦ indicates p<0.10, using independent
samples t-test to compare cultures with DMSO to the corresponding control culture
without DMSO addition.
Annotation of the generation batch cultures in Figure 5.9
0
100
200
300
400
7 9 7 9
Early Late
GA
DD
15
3 m
RN
A e
xp
ress
ion
(% r
ela
tiv
e to
sta
nd
ard
an
d
β-A
cti
nm
RN
A e
xp
ress
ion
)
Day/Generation
Control (no addition)
+ DMSO addition
Control (+ feed addition)
+ feed + DMSO addition
♦
♦
♦
♦
♦

222
Figure 5.10 Effect of DMSO addition on expression of PDI, ATF4 and GADD153
protein
3.90 was cultured as previously described (Figure legend 5.1). Batch cultures were
created at early generations (≤ 40 generations) and late generations (≥ 60 generations).
A CD feed and 2% (v/v) DMSO was added to the relevant cultures (as described in
Section 2.3.2). Protein was extracted on day 9 of batch culture (as detailed in Section
2.5.3.1). 60µg of protein was separated by SDS-PAGE (Section 2.5.3.2), transferred
(Section 2.5.3.3) and then detected using anti-rabbit polyclonal PDI, ATF4, GADD153
antibodies. All membranes were stripped and re-probed using an anti-mouse pan ERK
antibody (Section 2.5.3.4). Bands were analysed using Image J software, and the
amount of PDI, ATF and GADD153 protein expression was calculated relative to ERK
expression (Section 2.5.3.5). The relative protein intensities of PDI (A), ATF4 (B), and
GADD153 (C) are shown. Error bars represent SEM for three biological replicates.
Annotation of the batch cultures in Figure 5.10
Control (no addition)
+ DMSO addition
Control (+ feed addition)
+ feed + DMSO addition

223
Figure 5.10 Effect of DMSO addition on expression of PDI, ATF4 and GADD153
protein
A.
B.
C.
0
50
100
150
200
250
Early Late
PD
I p
ro
tein
in
ten
sity
(rela
tiv
e t
o E
RK
sta
nd
ard
)
Generation
0
50
100
150
200
250
Early Late
GA
DD
15
3 p
ro
tein
in
ten
sity
(rela
tiv
e t
o E
RK
sta
nd
ard
)
Generation
0
50
100
150
Early Late
AT
F4
pro
tein
in
ten
sity
(rela
tiv
e t
o E
RK
sta
nd
ard
)
Generation

224
Figure 5.11 Analysis of XBP-1(s) mRNA in response to DMSO addition
3.90 was cultured as previously described (Figure legend 5.1). Batch cultures were
created at early generations (≤ 40 generations) and late generations (≥ 60 generations).
A CD feed and 2% (v/v) DMSO was added to the relevant cultures (as described in
Section 2.3.2). cDNA was synthesised from RNA extracted on day 9 of batch culture
(Section 2.7.1.3) and the PCR was performed using the newly synthesised cDNA and the
XBP-1(s) primers (Section 2.7.2). The PCR products were electrophoresed on a 2%
(w/v) agarose gel and visualised by UV transillumination (Section 2.6.1.4). The product
bands were analysed using Image J software, and the quantified ratio of spliced XBP-1
mRNA to total XBP-1mRNA is shown (A). The visualised ratio of spliced XBP-1 mRNA
to total XBP-1 mRNA for an early generation culture (B) is also shown. Error bars
represent SEM for three biological replicates. * indicates p<0.05, using independent
samples t-test to compare cultures with DMSO to the corresponding control culture
without DMSO addition.
Annotation of the batch cultures in Figure 5.11
Early generation
Late generation

225
Figure 5.11 Analysis of XBP-1(s) mRNA in response to DMSO addition
A.
B.
- + - +
Feed addition
DMSO
- - + +
0
0.5
1
1.5
- DMSO + DMSO - DMSO + DMSO
- feed addition + feed addition
Fo
ld c
ha
ng
e o
f sp
liced
XB
P-1
mR
NA
to t
ota
l X
BP
-1 m
RN
A
(Rela
tiv
e to
ea
rly
gen
era
tio
n co
ntr
ol
cu
ltu
res
wit
ho
ut
ad
dit
ion
s)
Culture condition
* *
* *

226
5.5 FUNCTIONALITY OF THE SECRETED ANTIBODY
The glycan characteristics for the secreted antibody protein were investigated to
determine if LTC, feed or DMSO addition altered the oligosaccharide profiles of the
secreted protein. The main glycan detected, with approximately 80% of the relative
oligosaccharide area, was the fucosylated G0F. The other glycans identified
(representing approximately 20% of the relative oligosaccharide area) were G1 and
G1F. There was no statistical difference in the relative percentage areas of the three
main oligosaccharides in response to feed or DMSO addition, or generation time of
culture (Figure 5.12). Product characterisation data, which included whole molecule
analysis, oligosaccharide analysis, peptide map analysis and potency analysis, was also
provided by colleagues at MedImmune. The product characterisation data showed the
secreted antibody was not functionally compromised as a result of DMSO addition (or
feed addition, or generation time, data not shown). The addition of DMSO to cultures
improves antibody titres for a valuable protein with therapeutic potential.

227
Figure 5.12 Effects of culture conditions on secreted glycan profiles
3.90 was cultured as previously described (Figure legend 5.1). Batch cultures were
created at early generations (≤ 40 generations) and late generations (≥ 60 generations).
A CD feed and 2% (v/v) DMSO was added to the relevant cultures (as described in
Section 2.3.2). The antibody was purified (Section 2.5.4.1) and deglycosylated using
PNGase F (Section 2.5.4.2). Proteins were removed using ethanol precipitation and the
remaining glycans were lyophilised (Section 2.5.4.3). The resuspended glycans were
desalted (Section 2.2.4.4) and analysed by MALDI-ToF-MS for relative glycan form
quantification and glycan structural determination (Section 2.2.4.5). Error bars
represent SEM for three biological replicates.
Annotation of the batch cultures in Figure 5.12
0
20
40
60
80
100
120
- DMSO + DMSO - DMSO + DMSO - DMSO + DMSO - DMSO + DMSO
- feed additon + feed addition - feed addition + feed addition
Early Late
Rela
tiv
e a
rea
of
oli
go
sacch
arid
es
(%)
Culture condition/Generation
G0F
G1
G1F

228
5.6 METABOLISM OF 3.90 CULTURES IN RESPONSE TO DMSO ADDITION
DMSO addition to culture increased final antibody titre and Qp values (Section 5.2). As
I have previously suggested in Chapter 4, with regards to feed addition, protein
synthesis and secretion would be enhanced if the cells contained a greater concentration
of correctly-folded proteins and less mis/unfolded proteins. The ability of cultures to
produce antibody protein/chains, and to ensure the correct post-translation
modifications required for complete folding, may be greatly linked to the metabolic
profile of the cell. Previous literature has shown that DMSO addition to CHO cultures
decreased glucose and amino acid utilisation, and lactate production (Li et al, 2006b; Li
et al, 2006c). It may be possible that metabolic flux pathways were altered in response
to DMSO addition, allowing for the overall consequence of increased antibody titres.
The metabolite profiles of early and late generation cultures in the presence of DMSO
were compared to the metabolic profiles of control cultures in the absence of DMSO.
The metabolic profiles for the control cultures were previously described in Sections 3.5
and 4.5.
5.6.1 Effects of DMSO addition on the production of metabolites
For both early and late generation cultures the relative concentrations of isoleucine,
leucine, valine, methionine, threonine, lysine, serine, and asparagine were not altered in
response to DMSO (data not shown). However, DMSO addition did affect the
accumulation of glycerol, glycine, lactate and alanine for early generation (Figure 5.13)
and late generation (Figure 5.14) cultures. On days 7 and 9 of batch culture the
accumulation of glycerol and glycine for early generation cultures in the presence of
DMSO was similar to glycine and glycerol accumulation from cultures in the absence of
DMSO. However, by day 13 of batch culture extracellular glycerol (Figure 5.13A) and
glycine (Figure 5.13B) concentrations were 50% lower for cultures supplemented with
DMSO compared to the corresponding control culture. Alterations to alanine and lactate
in response to DMSO were also apparent. In fed conditions alanine accumulation was
increased by day 13 of batch culture in response to DMSO addition (Figure 5.13C),
whilst lactate accumulation was less as a result of DMSO addition (regardless of fed
status, Figure 5.13D).

229
The changes in glycerol and glycine accumulation for late generation cultures were
similar to the differences observed for the early generation cultures, with glycerol
(Figure 5.14A) and glycine (Figure 5.14B) concentrations approximately 50% lower for
cultures supplemented with DMSO by day 13 of batch culture. Although changes were
apparent for extracellular accumulation of glycerol and glycine, the accumulations of
alanine (Figure 5.14C) and lactate (Figure 5.14D) in late generation cultures were not
affected by the addition of DMSO.
For early and/or late generation cultures glycerol, glycine, lactate and alanine
accumulation were altered in response to DMSO, independent of feed addition or
generation time of culture. Metabolic variations in response to DMSO potentially
altered the conversion balance of pyruvate, with less pyruvate used in the by-product
production of glycerol, glycine and lactate, allowing for more pyruvate to be converted
to acetyl CoA for use within the TCA cycle. If DMSO addition was adjusting the
glycolytic and TCA flux pathways changes in glucose uptake may be apparent.
5.6.2 Effects of DMSO addition on rates of glucose and lactate utilisation
The rate of glucose utilisation from days 0 to 13 of batch culture were not affected by
DMSO addition (Figure 5.15A). As the feeding regime created difficulties in
determining glucose usage for fed cultures during the exponential phase of batch
culture, rates of glucose utilisation were also calculated for the end (decline) phase of
batch culture. Both early and late generation cultures had greater rates of glucose
utilisation from days 9 to 13 of batch culture in response to DMSO addition (Figure
5.15B). This may be an indication that cultures with DMSO had a greater requirement
for glucose metabolism during the decline phase of batch culture than cultures without
DMSO. The rate of lactate production was also altered in response to DMSO addition
(Figure 5.16). The changes in the rate of lactate utilisation was an indication that either
lactate production was low, or that any lactate produced and released from the cell was
quickly re-utilised. Lactate concentration was 50% lower for cultures supplemented
with both feed and DMSO addition compared to the concentration from the control
cultures. As fed cultures did not re-utilise lactate changes in the rates of lactate
production/utilisation in response to DMSO was probably due to less lactate production.

230
In response to DMSO addition differences in glycine and glycerol accumulation, and
changes in the rates of glucose utilisation and lactate production/utilisation, were
observed. Increased rates of glucose utilisation during the decline phase of batch
cultures in response to DMSO may suggest that cultures in the presence of DMSO were
still metabolically active during the end phase of batch culture, whilst lower glycine,
glycerol and lactate accumulation in response to DMSO could be an indication of
enhanced metabolic flux through the TCA cycle. Greater flux through the TCA cycle
could increase ATP availability for the DMSO cultures. Altered metabolism in response
to DMSO may allow for increased protein synthesis and secretion. Both events would
ultimately result in higher antibody titres and Qp values, as observed for cultures in the
presence of DMSO.
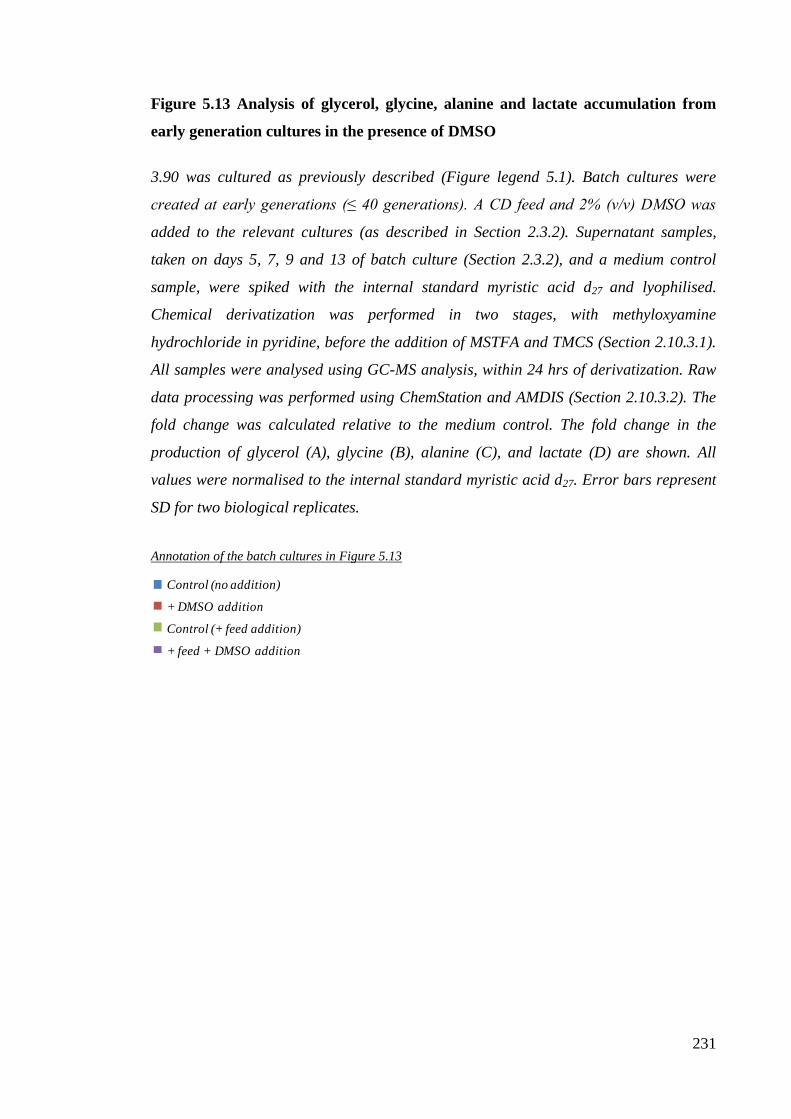
231
Figure 5.13 Analysis of glycerol, glycine, alanine and lactate accumulation from
early generation cultures in the presence of DMSO
3.90 was cultured as previously described (Figure legend 5.1). Batch cultures were
created at early generations (≤ 40 generations). A CD feed and 2% (v/v) DMSO was
added to the relevant cultures (as described in Section 2.3.2). Supernatant samples,
taken on days 5, 7, 9 and 13 of batch culture (Section 2.3.2), and a medium control
sample, were spiked with the internal standard myristic acid d27 and lyophilised.
Chemical derivatization was performed in two stages, with methyloxyamine
hydrochloride in pyridine, before the addition of MSTFA and TMCS (Section 2.10.3.1).
All samples were analysed using GC-MS analysis, within 24 hrs of derivatization. Raw
data processing was performed using ChemStation and AMDIS (Section 2.10.3.2). The
fold change was calculated relative to the medium control. The fold change in the
production of glycerol (A), glycine (B), alanine (C), and lactate (D) are shown. All
values were normalised to the internal standard myristic acid d27. Error bars represent
SD for two biological replicates.
Annotation of the batch cultures in Figure 5.13
Control (no addition)
+ DMSO addition
Control (+ feed addition)
+ feed + DMSO addition

232
Figure 5.13 Analysis of glycerol, glycine, alanine and lactate accumulation from
early generation cultures in the presence of DMSO
A.
B.
C.
0
5
10
15
20
25
30
7 9 13
Fo
ld c
ha
ng
e i
n a
lan
ine
(rela
tiv
e to
med
ium
)
Day
0
50
100
150
7 9 13
Fo
ld c
ha
ng
e i
n g
lycin
e
(rela
tiv
e to
med
ium
)
Day
0
50
100
150
200
250
300
7 9 13
Fo
ld c
ha
ng
e i
n l
acta
te
(rela
tiv
e to
med
ium
)
Day
D.
0
10
20
30
40
7 9 13
Fo
ld c
ha
ng
e i
n g
lycero
l
(rela
tiv
e to
med
ium
)
Day

233
Figure 5.14 Analysis of glycerol, glycine, alanine and lactate accumulation from
late generation cultures in the presence of DMSO
3.90 was cultured as previously described (Figure legend 5.1). Batch cultures were
created at late generations (≥ 60 generations). A CD feed and 2% (v/v) DMSO was
added to the relevant cultures (as described in Section 2.3.2). Supernatant samples,
taken on days 5, 7, 9 and 13 of batch culture (Section 2.3.2), and a medium control
sample, were spiked with the internal standard myristic acid d27 and lyophilised as
stated in Figure legend 5.13. All samples were analysed using GC-MS analysis, within
24 hrs of derivatization. Raw data processing was performed using ChemStation and
AMDIS (Section 2.10.3.2). The fold change was calculated relative to the medium
control. The fold change in the production of glycerol (A), glycine (B), alanine (C), and
lactate (D) are shown. All values were normalised to the internal standard myristic acid
d27. Error bars represent SD for two biological replicates.
Annotation of the batch cultures in Figure 5.14
Control (no addition)
+ DMSO addition
Control (+ feed addition)
+ feed + DMSO addition

234
Figure 5.14 Analysis of glycerol, glycine, alanine and lactate accumulation from
late generation cultures in the presence of DMSO
A.
B.
C.
D.
0
10
20
30
40
7 9 13
Fo
ld c
ha
ng
e i
n g
lycero
l
(rela
tiv
e to
med
ium
)
Day
0
5
10
15
7 9 13
Fo
ld c
ha
ng
e i
n a
lan
ine
(rela
tiv
e to
med
ium
)
Day
0
50
100
150
7 9 13
Fo
ld c
ha
ng
e i
n g
lycin
e
(rela
tiv
e to
med
ium
)
Day
0
50
100
150
200
250
300
7 9 13
Fo
ld c
ha
ng
e i
n l
acta
te
(rela
tiv
e to
med
ium
)
Day

235
Figure 5.15 Investigating glucose utilisation rates in response to DMSO addition
3.90 was cultured as previously described (Figure legend 5.1). Batch cultures were
created at early generations (≤ 40 generations) and late generations (≥ 60 generations).
A CD feed and 2% (v/v) DMSO was added to the relevant cultures (as described in
Section 2.3.2). Supernatant samples taken on days 5, 7, 9 and 13, were analysed for
glucose using an enzymatic assay (described in Section 2.10.1). Rates of utilisation
were determined using the relevant CCT values (for calculations see Section 2.11.2). A,
shows the rate of glucose utilisation during batch culture (d5-d13), and B, shows the
rate of glucose utilisation during the decline phase of batch culture (d9-d13). Error
bars represent SEM for three biological replicates.
Annotation of the batch cultures in Figure 5.15
A.
B.
-0.5
0.0
0.5
1.0
1.5
Early LateRa
te o
f g
luco
se u
tili
sati
on
(d5
-d1
3)
(pM
/cell
/da
y)
Generation
-0.5
0.0
0.5
1.0
1.5
Early LateRa
te o
f g
luco
se u
tili
sati
on
(d
9-d
13
)
(pM
/cell
/da
y)
Generation
Control (no addition)
+ DMSO addition
Control (+ feed addition)
+ feed + DMSO addition

236
Figure 5.16 Investigating lactate production rates in response to DMSO addition
3.90 was cultured as previously described (Figure legend 5.1). Batch cultures were
created at early generations (≤ 40 generations) and late generations (≥ 60 generations).
A CD feed and 2% (v/v) DMSO was added to the relevant cultures (as described in
Section 2.3.2). Supernatant samples taken on days 5, 7, 9 and 13, were analysed for
lactate using an enzymatic assay (described in Section 2.10.2). Rates of production
were determined using the relevant CCT values (for calculations see Section 2.112).
The rate of lactate utilisation is shown. Error bars represent SEM for three biological
replicates. * indicates p<0.05, and ♦ indicates p<0.10, using independent samples t-test
to compare cultures with DMSO to the corresponding control culture without DMSO
addition.
Annotation of the batch cultures in Figure 5.16
-1.0
-0.5
0.0
0.5
1.0
1.5
Early Late
Ra
te o
f la
cta
te p
ro
du
cti
on
(pM
/cell
/da
y)
Generation
Control (no addition)
+ DMSO addition
Control (+ feed addition)
+ feed + DMSO addition
*
♦
♦ *

237
5.7 DISCUSSION
Final antibody titres and Qp (d0-d15) values were increased in response to DMSO, by
approximately 30-50%, regardless of the generation time or fed status of the culture
(Figure 5.1A, Figure 5.2A and Figure 5.3). A similar enhancement of productivity in
response to DMSO addition has been reported for other CHO cultures, with changes in
cell growth as a result of DMSO addition (Li et al, 2006b; Li et al, 2006c; Liu & Chen,
2007b; Ma et al, 2008). Growth arrest was observed for 3.90 cultures supplemented
with DMSO (Figure 5.1B and Figure 5.2B). DMSO-induced growth arrest of CHO and
hybridoma cells has been previously associated with increased expression of CKI p27
and inactivation of Rb kinases, cyclin D2/CDK4 and cyclin E/CDK2, resulting in
induction of p21cip1
(Fiore & Degrassi, 1999; Ponzio et al, 1998). Although G1/G0 cell
cycle inhibition was not apparent for 3.90 cultures in response to DMSO addition
(Figure 5.4), cell cycle arrest has been shown for other CHO cultures as a result of
DMSO addition (Fiore & Degrassi, 1999; Fiore et al, 2002; Li et al, 2006c; Liu & Chen,
2007b; Ponzio et al, 1998). G1 cycle arrest may have been observed for other CHO cell
cultures and not for 3.90 cultures due to differences in culture conditions, including time
of DMSO addition. DMSO (1% [v/v]) addition on day 0 of batch culture was also
investigated (a similar supplement procedure used in previous literature) and although it
suppressed cell growth, it did not altered cell cycle distribution (data not shown).
Changes in G1 phase may not be apparent for 3.90 cultures as the PI staining, used in
determination of cell cycle distribution, does not distinguish G0 and G1 as individually
phases. Although the proportion of cells in G0/G1 were not altered in response to
DMSO addition it may be possible that the ratio of cells in G0 and G1 were affected,
but these changes were not be detected (Sitton & Srienc, 2008). Protocols which
separate cells in G0 and G1, for example, using stains such as acridine orange,
flurorescent antibodies, or staining for specific cyclins, may provided a more useful
method for the elucidation of changes to cell cycle progression in response to DMSO
addition (Darzynkiewicz et al, 1996; Darzynkiewicz et al, 1980a; Darzynkiewicz et al,
1980b; Gerdes et al, 1983).
Previous investigations have suggested that increased Qp as a result of DMSO addition
was due to increased mRNA transcription (Liu et al, 2001). Stratling, found that DMSO
addition increased RNA synthesis and put forward that the effects of DMSO on RNA

238
synthesis were mediated by weakening the interactions between histones and chromatin
subunits (Stratling, 1976). My findings indicate that recombinant mRNA, for both early
and late generation cultures, was not affected by DMSO addition (Figure 5.6), but
changes to polysome profiles suggest protein synthesis may have been increased for
cultures supplemented with DMSO. The increased dissociation, or less association, of
the 80S ribosomal subunit for cultures supplemented with DMSO (Figure 5.7) may have
allowed for increased rates of protein translation (Ashe et al, 2000; Demeshkina et al,
2007; Shenton et al, 2006; Talvas et al, 2006; Volarevic et al, 2000). Although there are
limitations with the quantative measurement of the polysome peaks, such as the
potential variation in the manual baseline of the peaks, initial tritiated leucine
incorporation assays confirmed that global protein synthesis was increased in response
to DMSO addition (Figure 5.17). However, further investigations would be needed to
confirm specific recombinant protein synthesis rates for 3.90 cultures in the presence
and absence of DMSO.
As cultures supplemented with DMSO had greater antibody titres, rates of antibody
secretion must also have been increased. I previously suggested that 3.90 cultures were
experiencing an UPR during batch culture observed with the increased expression of ER
stress markers ATF4, GADD34, GADD153 and XBP-1(s) mRNA and BiP, PDI, ATF4
and GADD153 protein (Section 3.5). In response to DMSO addition GADD153 (Figure
5.9) and XBP-1(s) mRNA (Figure 5.11) was less, possibly as cultures supplemented
with DMSO had a higher degree of protein folding, avoiding an elevated UPR
compared to cultures without DMSO. DMSO has been previously shown to stabilise
proteins in their native conformation and influence protein folding (Yoshida et al,
2002). Investigating protein expression of XBP-1, and the proteins which trigger XBP-1
splicing, such as ATF6, may provide greater insight into regulation of ER stress in
response to DMSO addition. However, as mentioned in Section 4.6 the commercially
available antibodies against these proteins are poor quality.
Although DMSO addition lowered expression of GADD153 mRNA (Figure 5.9) it did
not affect GADD153 protein or the protein expression of PDI or ATF4 (Figure 5.10).
The translation control of GADD153 was only dependent on the „fed status‟ of the
culture. Although the expression of GADD153 mRNA was lower in the presence of
DMSO sufficient transcript was available to allow for GADD153 translation. As

239
discussed in Section 1.8.3.3.2 the regulation of GADD153 is not only dependent on ER
stress but also amino acid limitations within cultures (Bruhat et al, 1997).
Previous literature has shown that DMSO addition to CHO cultures significantly
decreased rates of glucose and amino acid utilisation, and lactate production (Li et al,
2006b; Li et al, 2006c). Although amino acid utilisation for 3.90 cultures was not
affected by DMSO addition the accumulation of glycerol and glycine were lowered in
response to DMSO addition, for both early generation (Figure 5.13) and late generation
(Figure 5.14) cultures. As viable cell densities were also altered as a result of DMSO
addition, relative rates of glycerol and glycine productions (per cell, per day) were
calculated. The average relative rates of both glycerol and glycine productions were
lower for cultures in the presence of DMSO, but the changes were not significant (data
not shown). Decreased extracellular glycerol and glycine accumulation suggests
metabolic changes in response to DMSO addition, with less by-product formation and
altered rates of lactate production/utilisation (Figure 5.16). Lactate concentration in
cultures has been shown to alter with LDH activity (Kim & Lee, 2007). Investigating
LDH may provide a clearer understanding of lactate usage in response to DMSO
addition.
The rates of glucose utilisation were also increased for cultures supplemented with
DMSO, but only during the end (decline) phase of batch culture (Figure 5.15B).
Correlation between glucose utilisation and antibody titres were investigated and it was
found that cultures with the greatest rates of glucose utilisation during the decline phase
of batch culture also had the highest final antibody titres (Figure 5.18). The rates of
glucose utilisation were also dependent on the generation time of culture. Late
generation cultures (Figure 5.18B) had lower rates of glucose utilisation, and lower final
antibody titres, than early generation cultures (Figure 5.18A), with the exception of
cultures supplemented with both feed and DMSO addition. These cultures had similar
rates of glucose utilisation regardless of culture generation time and also had similar
final antibody titres. Enhanced rates of glucose utilisation during the end phase of batch
culture may have allowed for increased glycolytic flux to maintain production of ATP
and relevant intermediates needed for protein synthesis and secretion.
DMSO addition to hybridoma and CHO cultures has also been shown to affect
glycosylation patterns (Hayter et al, 1992; Rodriguez et al, 2005; Tachibana et al, 1994).

240
The glycan profiles for the secreted antibody from 3.90 cultures was not affected by
DMSO, feed addition or LTC, and was similar to other monoclonal antibodies
expressed from CHO cells (Hansen et al, 2010; Wai Lam et al, 2003).
The effects of DMSO addition on productivity, expression of UPR markers and
metabolism are highlighted in Figure 5.19. These alterations in response to DMSO
addition may have been dependent on the culture conditions used for this suspension
cell line, or the time of DMSO addition, or cell line specificity. As there is little
literature discussing the response of DMSO to suspension CHO cells, and to ensure that
the effects seen for 3.90 were not cell line specific, studies were continued with another
suspension antibody-secreting CHO cell line. These findings are discussion in the next
Chapter.
5.8 SUMMARY
DMSO addition increased final antibody titres and Qp values for both early and late
generation cultures. Initial investigations indicated that protein synthesis was increased
in response to DMSO addition, also reflected with changes to the
association/dissociation of the 80S ribosomal subunit. Enhanced protein synthesis may
have been possible due to changes in the metabolic flux of the cultures, observed with
increased rates of glucose utilisation, during the decline phase of batch cultures, and less
by-product accumulation. Active glucose metabolism during the end phase of batch
culture may have allowed cultures supplemented with DMSO to generate more ATP,
potentially enhancing the rates of protein synthesis, protein folding and protein
secretion within this cell line

241
Figure 5.17 Effect of DMSO addition on global protein synthesis
3.90 was cultured as previously described (Figure legend 5.1) Cell suspensions (500µl)
from early generation (≤ 40 generations) and late generation (≥ 60 generations) day 7
cultures (with and without 2% (v/v) DMSO addition) were transferred to 24 well plates
and incubated with L-[4,5-3H] leucine. Protein synthesis and secretion was measured
as the rate of incorporation of L-[4,5-3H] leucine into TCA precipitable-material over a
48 hr time period (Section 2.5.2) The fold increase for intracellular protein was
determined relative to early generation cultures at 0 hrs. Error bars represent SD for
two biological replicates.
Annotation of time-points in Figure 5.17
0
10
20
30
40
50
60
70
no addition + DMSO no addition + DMSO
Early Late
Fo
ld in
crea
se i
n i
ntr
acell
ula
r p
ro
tein
( rela
tiv
e to
ea
rly
gen
era
tio
n v
alu
es
at
0h
rs)
Culture condition/Generation
0 hrs
24 hrs
48 hrs

242
Figure 5.18 Correlation between antibody titre and rates of glucose utilisation
3.90 was cultured as previously described (Figure legend 5.1). Batch cultures were
created at early generations (≤ 40 generations) and late generations (≥ 60 generations).
A CD feed and 2% (v/v) DMSO was added to the relevant cultures (as described in
Section 2.3.2). Batch culture supernatant samples were analysed by ELISA (Section
2.5.1) for determination of antibody titre and for glucose concentrations using the
enzymatic assay described in Section 2.10.1. The rate of glucose utilisation was
determined from the relevant CCT values (for calculations see Section 2.11.2). Final
antibody titre values are shown together with rates of glucose utilisation (d9-d13) for
early generation cultures (A), and late generation cultures (B). Error bars represent
SEM for three biological replicates.
Annotation of the generation batch cultures in Figure 5.18
Control (no addition)
+ DMSO addition
Control (+ feed addition)
+ feed + DMSO addition
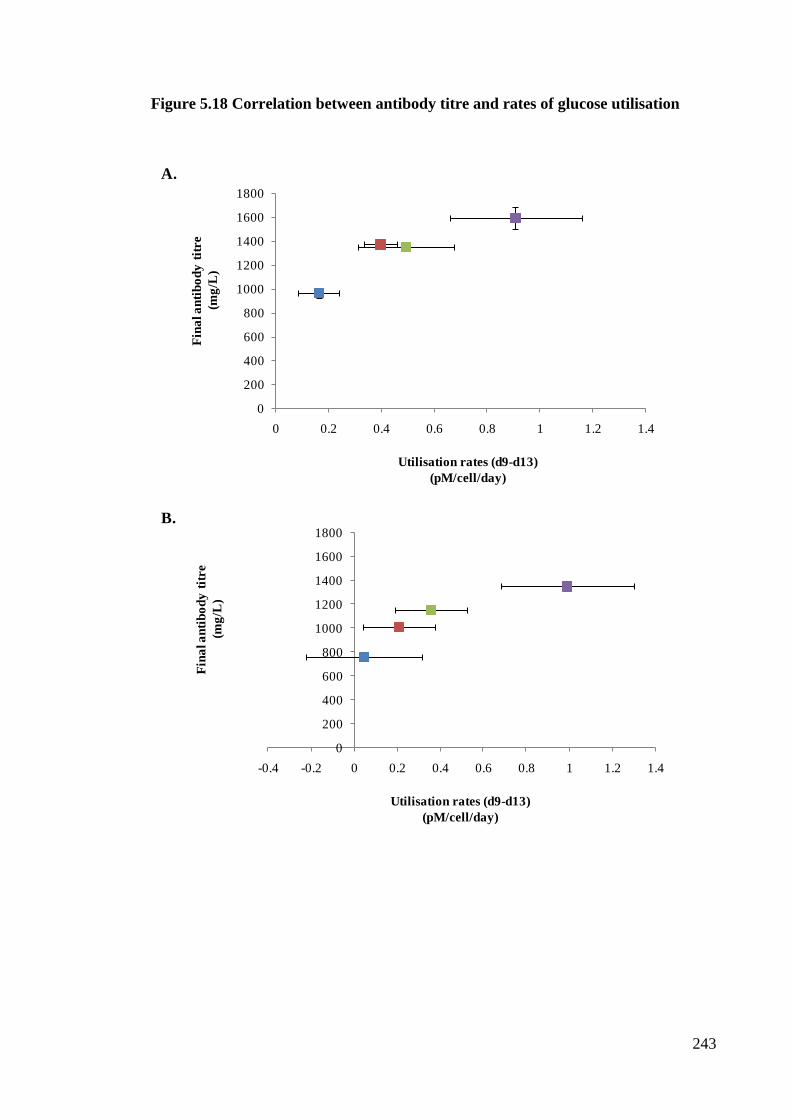
243
Figure 5.18 Correlation between antibody titre and rates of glucose utilisation
B.
A.
0
200
400
600
800
1000
1200
1400
1600
1800
0 0.2 0.4 0.6 0.8 1 1.2 1.4
Fin
al a
nti
bo
dy
tit
re
(mg
/L)
Utilisation rates (d9-d13)
(pM/cell/day)
0
200
400
600
800
1000
1200
1400
1600
1800
-0.4 -0.2 0 0.2 0.4 0.6 0.8 1 1.2 1.4
Fin
al a
nti
bo
dy
tit
re
(mg
/L)
Utilisation rates (d9-d13)
(pM/cell/day)

244
Figure 5.19 Alterations to 3.90 cultures in response to DMSO addition
The changes to productivity, expression of UPR stress markers and nutrient utilisation
in the presence of DMSO. In response to DMSO viable cell densities, CCT, the 80S
peak area, the expression of GADD153 and XBP-1(s) mRNA, and glycerol and glycine
accumulation were lowered, recombinant mRNA expression remained unaltered, and
final antibody titres, Qp values and rates of glucose utilisation during the decline (end)
phase of batch cultures were increased. ? indicates that potentially lactate
accumulation was either lowered or lactate re-utilisation was increased in response to
DMSO addition.
Antibody titre
Qp
Glucose utilisation (decline phase)
Lactate re-utilisation ?
Recombinant mRNA
Viable cell densities
CCT
80S peak area
GADD153 mRNA
XBP-1(s) mRNA
Glycerol accumulation
Glycine accumulation
Lactate accumulation ?
Enhanced in response to DMSO addition
Lowered in response to DMSO addition

245
10
CHAPTER 6
11
CELL LINE 51.69 HAS
CHARACTERISTICS SIMILAR
TO THOSE OF CELL LINE 3.90

246
6. CELL LINE 51.69 HAS CHARACTERISTICS SIMILAR TO THOSE OF
CELL LINE 3.90
6.1 INTRODUCTORY REMARKS
The recombinant CHO cell line, 3.90, has been previously characterised in response to
LTC (Chapter 3), feed addition (Chapter 4) and DMSO addition (Chapter 5). 3.90 was
found to be unstable, with a loss in final antibody titre and Qp values between early
generation (generations 20 and 40) and late generation (generations 60, 80 and 100)
cultures (Section 3.2). CD feed (Section 4.2) and DMSO (Section 5.2) additions
increased final antibody titre but did not prevent antibody titre loss in response to LTC.
Data shown in Section 3.4 highlighted an UPR during 3.90 batch culture, indicating
problems in protein folding, or problems in the mechanisms resolving mis/unfolded
proteins. From investigations detailed in Chapters 3, 4 and 5 I found that expression of
GADD153 and XBP-1(s) mRNA were enhanced in response to LTC, and lowered in
response to feed and DMSO addition. The metabolic profiles of cultures were also
altered in response to different culture conditions. Late generation cultures had greater
rates of glucose and lactate utilisation than early generation cultures (Section 3.5).
These data gave indications of altered cellular metabolism between early and late
generation cultures, potentially resulting in less glycolytic and TCA flux, and lower
ATP production. Changes in rates of glucose and lactate production/utilisation were
also observed in response to feed (Section 4.5) and DMSO (Section 5.5) addition.
It is possible that the expression of UPR markers and changes in lactate and glucose
utilisation for 3.90 cultures, in response to LTC, feed and/or DMSO addition were
specific to 3.90. My findings would have greater generic relevance if such events were
characterised for another recombinant CHO cell line. Cell line 51.69 (51.69) was chosen
for the investigations. Although 51.69 was derived from transfections of the same
parental cell host as 3.90, with the same plasmid DNA, 51.69 was generated from a
separate transfection. In this Chapter I have characterised 51.69 in response to LTC,
feed addition and DMSO addition.

247
Characterisation of 51.69 involved investigating growth and antibody titre properties for
both early generation and late generation cultures. As described in the earlier Chapters
the term early generation cultures will refer to batch cultures created at ≤ 40
generations, and the term late generation cultures will refer to batch cultures created at ≥
60 generations.
6.2 ANALYISIS OF CELL LINE 51.69 IN RESPONSE TO LTC
6.2.1 Final antibody titres and viable cell densities were lower as a result of LTC
Cell line 51.69 was shown to be unstable in terms of antibody titre between early and
late generation cultures. Early generation cultures had final antibody titres of
approximately 1000 mg/L (similar to early generation 3.90 cultures, Section 3.2). A
significant 25% decrease in final antibody titre values were observed for late generation
cultures Figure 6.1A). Changes in antibody titres between early and late generation
cultures were apparent from day 11 of batch culture. Growth analysis for cultures
showed that the maximal viable cell densities for early and late generation 51.69
cultures were approximately 4x10⁶ cells/ml (Figure 6.1B). Although the growth patterns
during the exponential and stationary phase of cultures were similar for both early and
late generation cultures it was noticed that during the end (decline) phase of batch
culture late generation cultures had lower viable cell densities than early generation
cultures (observed on day 13 of batch culture). Despite the change in viable cell
densities there was no significant alteration in CCT between early and late generation
cultures (Figure 6.1C). Alterations to viable cell densities and antibody titres were also
observed with decreased Qp (d0-d15) values in response to LTC (Figure 6.1D).
Changes to cell growth in response to LTC were also seen with variations to cell cycle
distribution. Late generation 51.69 cultures, on days 9 and 11 of batch culture, had
fewer cells in G0/G1 cell cycle phase than early generation cultures (Figure 6.2A).
Alterations in the percentage of cells in G0/G1 reflected changes in the proportion of
cells in S and G2/M phase. Late generation cultures had a greater percentage of cells in
S phase on day 11 of batch culture (Figure 6.2B), and a greater percentage of cells in
G2/M phase on day 9 of batch culture (Figure 6.2C). Alterations to cell cycle phase

248
distribution in response to LTC were similar for both 51.69 cultures and 3.90 cultures
(Figure 3.3).
6.2.2 Antibody titre loss was not at the level of recombinant mRNA expression for
51.69
The instability observed for 51.69 cultures in response to LTC was not due to changes
in the expression of heavy chain or light chain mRNA (Figure 6.3). Expression of heavy
chain (Figure 6.3A) and light chain (Figure 6.3B) mRNA increased approximately two-
fold from days 3 to 9 of batch culture, but was similar for both early and late generation
cultures. As the decrease in antibody titre observed between early and late generation
cultures was not due to changes at mRNA level again it was proposed the resultant
decrease in antibody titre in response to LTC was due to changes in cellular events
acting between mRNA expression and protein secretion. These include actions
regulating protein translation and protein folding.
Intracellular protein was measured on day 9 of batch culture using specific antibody-
conjugated dyes which detect the recombinant heavy chain and light chain protein. The
relative intensities of both intracellular heavy chain and light chain protein were not
altered in response to LTC (data not shown). The expression of UPR markers were also
investigated to determine if antibody titre loss between early and late generation
cultures was seen with enhanced cellular stress. From days 3 to 9 of batch culture,
ATF4 (Figure 6.4A) and GADD153 (Figure 6.4B) mRNA increased four-fold and
seven-fold, respectively, but the expression of ATF4 and GADD153 mRNA and protein
(data not shown) was similar for both early and late generation cultures. The up-
regulation of UPR markers suggested that both early and late generation 51.69 cultures
experienced ER stress during batch culture.

249
6.2.3 Late generation 51.69 cultures had greater rates of lactate utilisation
ER stress has been previously linked changes in the metabolic state of the cell during
nutrient deprivation (Lee, 2001; Okada et al, 2002: Harding et al, 2003). Nutrient
starvation occurs during rapid utilisation of amino acids and glucose. Although the rates
of glucose utilisation were similar for early and late generation batch cultures (data not
shown), the rates of lactate utilisation were greater for late generation cultures than for
early generation cultures (Figure 6.5). A greater rate of lactate utilisation for late
generation cultures may be an indication of a metabolic „shift‟ as a result of LTC. A
metabolic „shift‟ could be linked to altered energy production between early and late
generation culture, and the resultant loss in productivity.

250
Figure 6.1 Analysis of recombinant antibody titre, viable cell densities, CCT and
Qp for cell line 51.69
51.69 was subject to long-term culture in suspension using MSX supplemented CD-
CHO media. Batch growth analysis was performed in shake flasks at early generations
(≤ 40 generations) and late generations (≥ 60 generations). Batch cultures were created
at 0.2x10⁶ cells/ml, and maintained at 37
oC, 140 rpm and with a manual supply of 5%
CO2 in air. Antibody titres were measured by ELISA (Section 2.5.1), and viable cell
densities were determined by light microscopy and trypan blue exclusion (Section 2.3.3)
from samples taken routinely during batch culture. Antibody titres (A), viable cell
densities (B), CCT (C) and Qp (d0-d15) (D) are shown. For determination of CCT and
Qp see Section 2.11.2. Error bars represent SEM for three biological replicates. Each
biological replicate value is an average from duplicate technical repeats. * indicates
p<0.05, and ♦ indicates p<0.10, using independent samples t-test to compare late
generation cultures to early generation cultures (on the same day of batch culture).
Annotation of the generation batch cultures in Figure 6.1
Early generation
Late generation

251
Figure 6.1 Analysis of recombinant antibody titre, viable cell densities, CCT and
Qp for cell line 51.69
B.
C.
A.
0
1
2
3
4
5
0 5 10 15
Via
ble
cell
s
(x1
06
cell
s/m
l)
Day
0
5
10
15
20
25
30
35
40
0 3 5 7 9 11 13 15
Cu
mu
lati
ve c
ell
tim
e
(x1
06
cell
s x
da
y/m
l)
Day
0
400
800
1200
0 3 5 7 9 11 13 15
An
tib
od
y t
itre
(mg
/L)
Day
D.
0
5
10
15
20
25
30
Qp (d0-d15)
Sp
ecif
ic p
ro
du
cti
vit
y (
Qp
)
(pg
/cell
/da
y)
* * *
*
♦

252
Figure 6.2 The percentage of cells in G0/G1 was lower for late generation 51.69
cultures
51.69 was cultured as previously stated (Figure legend 6.1). Batch cultures were created
at early generations (≤ 40 generations) and late generations (≥ 60 generations). 1x10⁶
cells, taken on days 3, 5, 7, 9, and 11 of batch culture, were analysed by flow cytometry
using PI excitation by a 488nm laser, and emission measured by a 613/20nm bandpass
filter (Section 2.4.1). The data was analysed by Summit 4.3 and ModFit LT software. The
percentage of cells in A, G0/G1 phase, B, S phase, and C, G2/M phase are shown. Error
bars represent SEM for three biological replicates. * indicates p<0.05, using independent
samples t-test to compare late generation cultures to early generation cultures (on the
same day of batch culture).
Annotation of the generation batch cultures in Figure 6.2
Early generation
Late generation

253
Figure 6.2 The percentage of cells in G0/G1 was lower for late generation 51.69
cultures
B.
C.
A.
0
25
50
75
100
3 5 7 9 11
G0
/G1
cell
cy
cle
ph
ase
(%)
Day
0
25
50
75
100
3 5 7 9 11
S cell
cy
cle
ph
ase
(%)
Day
0
25
50
75
100
3 5 7 9 11
G2
cell
cy
cle
ph
ase
(%)
Day
* *
*
*

254
Figure 6.3 Expression of recombinant mRNA was not altered in response to LTC
51.69 was cultured as previously described (Figure legend 6.1). Batch cultures were
created at early generations (≤ 40 generations) and late generations (≥ 60 generations).
mRNA levels were compared using q-RTPCR from samples taken on days 3, 5, 7 and 9
of batch culture (as detailed in Section 2.7.1), using the mRNA specific primer sets for
A, heavy chain, and B, light chain. Samples were normalised using mRNA β-Actin
primers. Error bars represent SEM for three biological replicates.
Annotation of the generation batch cultures in Figure 6.3
B.
A.
0
50
100
150
200
3 5 7 9
Hea
vy
ch
ain
mR
NA
ex
press
ion
(% r
ela
tiv
e to
sta
nd
ard
an
d
β-A
cti
n m
RN
A e
xp
ress
ion
)
Day
0
50
100
150
200
3 5 7 9
Lig
ht ch
ain
mR
NA
ex
press
ion
(% r
ela
tiv
e to
sta
nd
ard
an
d
β-A
cti
nm
RN
A e
xp
ress
ion
)
Day
Early generation
Late generation

255
Figure 6.4 ATF4 and GADD153 mRNA increased during batch culture
51.69 was cultured as previously described (Figure legend 6.1). Batch cultures were
created at early generations (≤ 40 generations) and late generations (≥ 60 generations).
mRNA levels were compared using q-RTPCR from samples taken on days 3, 5, 7 and 9
of batch culture (Section 2.7.1), using the mRNA specific primer sets for A, ATF4, and
B, GADD153. Samples were normalised using mRNA β-Actin primers. Error bars
represent SEM for three biological replicates.
Annotation of the generation batch cultures in Figure 6.4
B.
A.
0
50
100
150
200
250
3 5 7 9
AT
F4
mR
NA
ex
press
ion
(% r
ela
tiv
e to
sta
nd
ard
an
d
β-A
cti
n m
RN
A e
xp
ress
ion
)
Day
0
50
100
150
200
3 5 7 9
GA
DD
15
3 m
RN
A e
xp
ress
ion
(% r
ela
tiv
e to
sta
nd
ard
an
d
β-A
cti
n m
RN
A e
xp
ress
ion
)
Day
Early generation
Late generation

256
Figure 6.5 Late generation cultures had greater rates of lactate utilisation
51.69 was cultured as previously described (Figure legend 6.1). Batch cultures were
created at early generations (≤ 40 generations) and late generations (≥ 60 generations).
Supernatant samples taken on days 5, 7, 9 and 13 of batch culture (Section 2.3.2) were
analysed for lactate using an enzymatic assay (described in Section 2.10.2). Rates of
lactate utilisation were determined using the relevant CCT values (for calculations see
Section 2.11.2). The rate of lactate utilisation is shown for days 5 to 13 of batch culture.
Error bars represent SEM for three biological replicates.
Annotation of the batch cultures in Figure 6.5
-0.1
0
0.1
0.2
0.3
0.4
0.5
Ra
te o
f la
cta
teu
tili
sati
on
(pM
/cell
/da
y)
Generation
Early generation
Late generation

257
6.3 ANALYSIS OF CELL LINE 51.69 IN RESPONSE TO FEED ADDITION
Initial productivity analysis showed that 51.69 was unstable in response to LTC. The
change in productivity between early and late generation 51.69 cultures was similar to
the decrease in productivity observed between early and late generation 3.90 cultures.
The upregulation of UPR markers during batch culture and the differences in viable cell
densities, cell cycle distribution and lactate utilisation rates between early and late
generation cultures were also similar for exemplar cell lines 51.69 and 3.90. Analysis
was continued to determine if the characteristics described in Section 6.2 were altered in
response to different culture conditions. In this Section growth, productivity, markers of
ER stress and rates of glucose and lactate utilisation were investigated in response to a
CD feed addition (the same feed and feeding regime previously described in Section
2.3.2 and Chapter 4).
6.3.1 Feed addition increased recombinant protein production
Feed addition significantly increased antibody titres from day 11 and day 9 of batch
culture for early generation cultures and late generation cultures, respectively (Figure
6.6A). In response to feed addition final antibody titres were increased by
approximately 30% for both early and late generation cultures. However, cultures
supplemented with feed still experienced an approximate 25% decrease in antibody titre
in response to LTC. For both early and late generations cultures feed addition increased
antibody titres without affecting viable cell densities (Figure 6.6B). Qp was also
significantly increased, as a consequent of feed addition enhancing antibody titres
without altering viable cell growth. Qp (d0-d15) was approximately two-fold greater in
response to feed addition, for both early and late generation cultures (Figure 6.7).
Although the CD feed was added during the exponential phase of culture Qp (d0-d7)
was not affected by feeding, instead the feed addition had the greatest influence on Qp
during the decline phase of batch culture. In the presence of feed Qp (d9-d15) was
increased three-fold and two-fold for early and late generation cultures, respectively
(Figure 6.7).

258
6.3.2 Feed addition significantly lowered GADD153 mRNA and protein expression
Investigations were continued to determine the regulation of events at molecular level in
response to feed addition. Recombinant mRNA was similar for all cultures, regardless
of feed addition (data not shown). However, ATF4, GADD34 and GADD153 mRNA
expression was found to be significantly three-fold to four-fold lower in response to
feed addition (Figure 6.8). Although the expression of PDI and ATF4 protein was not
affected by feeding, GADD153 protein was significantly less in response to feed
addition (Figure 6.9). GADD153 protein was approximately four-fold lower for cultures
in the presence of feed compared to cultures without feed addition. Lower XBP-1(s)
mRNA (Figure 6.10) and GADD153 protein expression indicates 51.69 cultures in the
presence of feed had less ER stress than cultures without feed addition.
6.3.3 Metabolic profiles were altered for 51.69 in response to feed addition
As productivity and ER stress was altered in response to feed addition, metabolic
changes were also investigated at the level of glucose and lactate utilisation. As the
feeding regime involved addition of feed to cultures during the exponential stage of
batch culture I only investigated the rates glucose utilisation from the stationary phase
of batch culture. The rates of glucose utilisation were slightly greater during this period
of batch culture in response to feed addition (Figure 6.11A). Lactate re-utilisation was
also not apparent for cultures supplemented with feed, but rates of lactate production
were ultimately dependent on generation time of culture. In the presence of feed late
generation cultures either had lower rates of lactate production than early generation
cultures, or late generation cultures produced lactate then utilised lactate at a greater rate
than early generation cultures. However, due to changes in the net rate of lactate
production, alterations to lactate utilisation were not seen (Figure 6.11B). Either
suggestion indicates the possibility of a metabolic „shift‟ as a result of LTC.
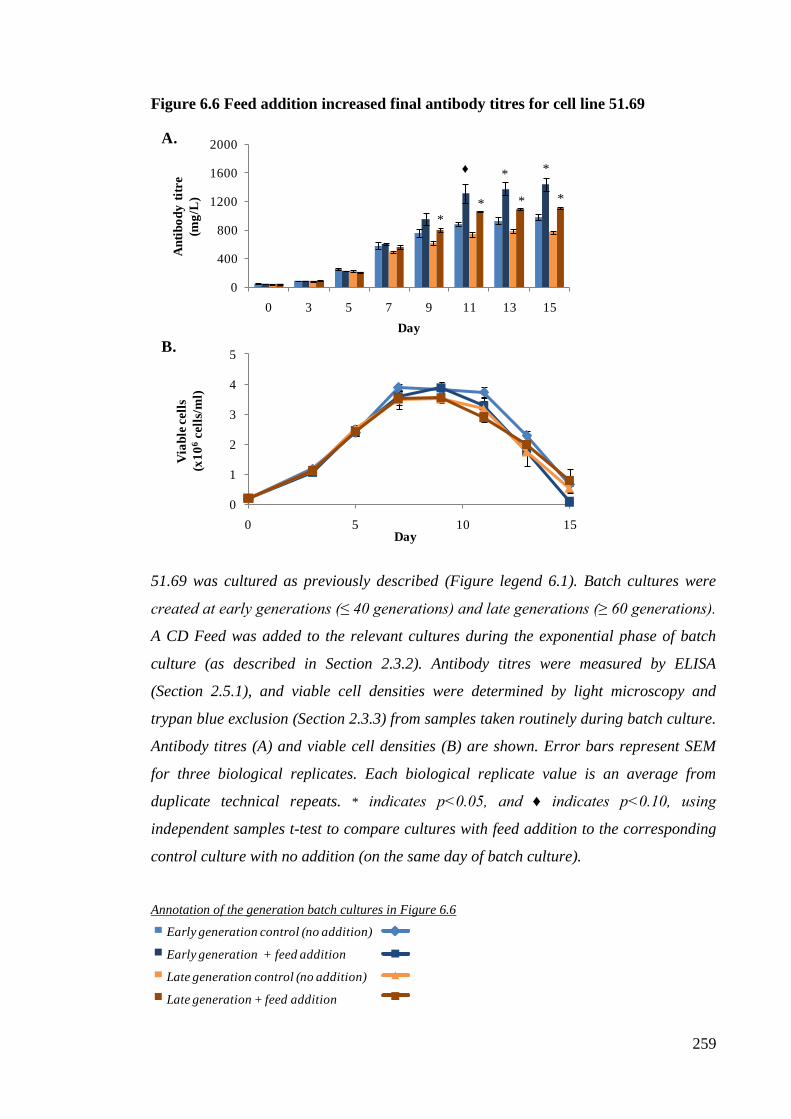
259
Figure 6.6 Feed addition increased final antibody titres for cell line 51.69
51.69 was cultured as previously described (Figure legend 6.1). Batch cultures were
created at early generations (≤ 40 generations) and late generations (≥ 60 generations).
A CD Feed was added to the relevant cultures during the exponential phase of batch
culture (as described in Section 2.3.2). Antibody titres were measured by ELISA
(Section 2.5.1), and viable cell densities were determined by light microscopy and
trypan blue exclusion (Section 2.3.3) from samples taken routinely during batch culture.
Antibody titres (A) and viable cell densities (B) are shown. Error bars represent SEM
for three biological replicates. Each biological replicate value is an average from
duplicate technical repeats. * indicates p<0.05, and ♦ indicates p<0.10, using
independent samples t-test to compare cultures with feed addition to the corresponding
control culture with no addition (on the same day of batch culture).
Annotation of the generation batch cultures in Figure 6.6
B.
A.
0
400
800
1200
1600
2000
0 3 5 7 9 11 13 15
An
tib
od
y t
itre
(mg
/L)
Day
0
1
2
3
4
5
0 5 10 15
Via
ble
cell
s
(x1
06
cell
s/m
l)
Day
Early generation control (no addition)
Early generation + feed addition
Late generation control (no addition)
Late generation + feed addition
* *
*
♦
* *
*

260
Figure 6.7 Feed addition enhanced specific productivity (Qp) for cell line 51.69
This figure compares Qp values for early generation (≤ 40 generations) and late
generation (≥ 60 generations) cultures, with and without feed addition. Qp was
calculated for the entire batch culture, using antibody titre and cell density
measurements from days 0 to 15 of culture, Qp (d0-d15). Qp was also calculated for the
early (exponential) phase of batch culture, using antibody titre and cell density
measurements from days 0 to 7 of culture, Qp (d0-d7), and for the end (decline) phase
of batch culture, using antibody titre and cell density measurements from days 9 to 15
of culture, Qp (d9-d15). For determination of Qp see Section 2.11.2. Error bars
represent SEM for three biological replicates. Each biological replicate value is an
average from duplicate technical repeats. * indicates p<0.05, using independent
samples t-test to compare cultures with feed addition to the corresponding control
culture with no addition (during the same period of batch culture).
Annotation for Figure 6.7
0
10
20
30
40
50
60
70
no addition + feed addition no addition + feed addition
Early Late
Sp
ecif
ic p
ro
du
cti
vit
y (
Qp
)
(pg
/cell
/da
y)
Culture condition/Generation
Qp (d0-d15)
Qp (d0-d7)
Qp (d9-d15)
*
*
*
*
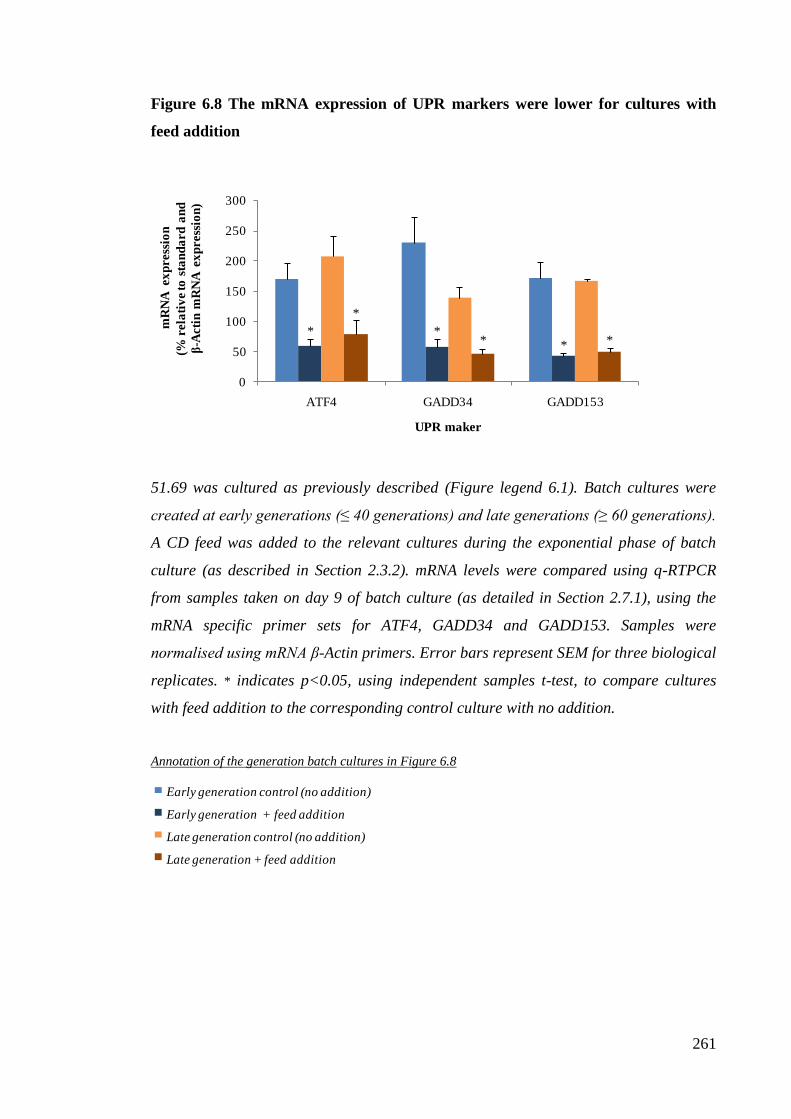
261
Figure 6.8 The mRNA expression of UPR markers were lower for cultures with
feed addition
51.69 was cultured as previously described (Figure legend 6.1). Batch cultures were
created at early generations (≤ 40 generations) and late generations (≥ 60 generations).
A CD feed was added to the relevant cultures during the exponential phase of batch
culture (as described in Section 2.3.2). mRNA levels were compared using q-RTPCR
from samples taken on day 9 of batch culture (as detailed in Section 2.7.1), using the
mRNA specific primer sets for ATF4, GADD34 and GADD153. Samples were
normalised using mRNA β-Actin primers. Error bars represent SEM for three biological
replicates. * indicates p<0.05, using independent samples t-test, to compare cultures
with feed addition to the corresponding control culture with no addition.
Annotation of the generation batch cultures in Figure 6.8
0
50
100
150
200
250
300
ATF4 GADD34 GADD153
mR
NA
ex
press
ion
(% r
ela
tiv
e to
sta
nd
ard
an
d
β-A
cti
n m
RN
A e
xp
ress
ion
)
UPR maker
Early generation control (no addition)
Early generation + feed addition
Late generation control (no addition)
Late generation + feed addition
* * *
* *
*

262
Figure 6.9 GADD153 protein was significantly lowered in response to feed addition
51.69 was cultured as previously described (Figure legend 6.1). Batch cultures were
created at early generations (≤ 40 generations) and late generations (≥ 60 generations).
A CD feed was added to the relevant cultures during the exponential stage of batch
culture (Section 2.3.2). Protein was extracted on day 9 of batch culture (as detailed in
Section 2.5.3.1). 60µg protein was separated by SDS-PAGE (Section 2.5.3.2),
transferred (Section 2.5.3.3) and then detected using anti-rabbit polyclonal PDI, ATF4
and GADD153 antibodies. All membranes were stripped and re-probed using an anti-
mouse pan ERK antibody (Section 2.5.3.4). Bands were examined using Image J
software, and the amount of PDI, ATF and GADD153 protein expression was
calculated relative to ERK expression (Section 2.5.3.5). Error bars represent SEM for
three biological replicates. * indicates p<0.05, using independent samples t-test, to
compare cultures with feed addition to the corresponding control culture with no
addition.
Annotation of the batch cultures in Figure 6.9
0
50
100
150
200
250
300
PDI ATF4 GADD153
Pro
tein
in
ten
sity
(rela
tiv
be to
ER
K s
tan
da
rd
)
UPR maker
Early generation control (no addition)
Early generation + feed addition
Late generation control (no addition)
Late generation + feed addition
* *

263
Figure 6.10 XBP-1(s) mRNA was less after feed addition
51.69 was cultured as previously described (Figure legend 6.1). Batch cultures were
created at early generations (≤ 40 generations) and late generations (≥ 60 generations).
A CD feed was added to the relevant cultures during the exponential phase of batch
culture (as described in Section 2.3.2). cDNA was synthesised from RNA extracted on
day 9 of batch culture (Section 2.7.1.3) and the PCR was performed using the newly
synthesised cDNA and the XBP-1(s) primers (Section 2.7.2). The PCR products were
electrophoresed on a 2% (w/v) agarose gel and visualised by UV transillumination
(Section 2.6.1.4). The product bands were analysed using Image J software, and the
quantified ratio of spliced XBP-1mRNA to total XBP-1mRNA is shown Error bars
represent SEM for three biological replicates. ♦ indicates p<0.10, using independent
samples t-test to compare cultures with feed addition to the corresponding control
culture with no addition.
Annotation of the batch cultures in Figure 6.10
0
10
20
30
40
50
Early Late
Am
ou
nt
of
spli
ced
XB
P-1
mR
NA
to t
ota
l X
BP
-1 m
RN
A
(%)
Generation
Control (no addition)
+ feed adidition
♦

264
Figure 6.11 Analysis of glucose and lactate utilisation rates in response to feed
addition
51.69 was cultured as previously described (Figure legend 6.1). Batch cultures were
created at early generations (≤ 40 generations) and late generations (≥ 60 generations).
A CD feed was added to the relevant cultures during the exponential phase of batch
culture (as described in Section 2.3.2). Supernatant samples taken on days 5, 7, 9 and
13 of batch culture were analysed enzymatically to determine the concentration of
glucose (Section 2.10.1) and lactate (Section 2.10.2). The rates of utilisation and
production were determined using the relevant CCT values (using the calculation
described in Section 2.11.2). Error bars represent SEM for three biological replicates.
Annotation of the batch cultures in Figure 6.11
B.
A.
-0.6
-0.4
-0.2
0
0.2
0.4
0.6
0.8
1
Early Late
Ra
te o
f la
cta
te p
ro
du
cti
on
(d5
-d1
3)
(pM
/cell
/da
y)
Generation
0
0.2
0.4
0.6
0.8
1
1.2
1.4
Early Late
Ra
te o
f lg
luco
seu
tili
sati
on
(d9
-d1
3)
(pM
/cell
/da
y)
Generation
Control (no addition)
+ feed adidition

265
6.4 ANALYSIS OF CELL LINE 51.69 IN RESPONSE TO DMSO ADDITION
Characterisation analysis showed that 51.69 was unstable in response to LTC. Late
generation cultures had 25% lower final antibody titres than early generation cultures
(Section 6.2.1). Late generation cultures also had less cells in G0/G1 cell cycle phase
(Figure 6.2), and greater rates of lactate utilisation (Figure 6.5) than early generation
cultures. Although the expression of UPR markers (including expression of ATF4,
GADD34, and GADD153 mRNA and PDI, ATF4 and GADD153 protein) were
increased during batch culture, the expression remained similar for both early and late
generation cultures (Section 6.2.2). In response to feed addition the expression levels of
ATF4, GADD34, GADD153, and XBP-1(s) mRNA and GADD153 protein were lower
(Section 6.3.2), and changes in lactate production and re-utilisation were observed
(Section 6.3.3). In this Section growth, productivity, markers of ER stress and rates of
glucose and lactate metabolism were investigated in response to a DMSO addition, to
determine if antibody titres for 51.69 cultures could be further enhanced, and
maintained at a stable concentration during LTC
6.4.1 Cell line 51.69 encountered growth arrest in response to DMSO addition
The final antibody titres for early generation cultures were not affected by DMSO
addition (Figure 6.12A), but changes in cell growth were observed in response to
DMSO (Figure 6.12B). Cultures supplemented with DMSO had altered patterns of
growth, observed with an extended stationary phase of batch culture and lower maximal
viable cell densities. The effect of DMSO on cell growth consequently altered cell
biomass, resulting in lower CCT values (Figure 6.12C).
Antibody titres for late generation cultures were not enhanced with DMSO addition
alone and were only increased for cultures supplemented with both feed and DMSO
additions (Figure 6.13A, observed from day 11 of batch culture). Late generation
cultures also had decreased viable cell densities (observed on day 9 of batch culture,
Figure 6.13B), and CCT values (Figure 6.13C), in response to DMSO addition. The
effect of DMSO on cell growth and antibody titres subsequently altered antibody
production rates per cell. Qp (d0-d15) was increased by approximately 30% for both
early and late generation cultures in response to DMSO addition (Figure 6.14).

266
6.4.2 GADD153 mRNA and protein expression was significantly lowered in
response to DMSO addition
Cultures with DMSO had relatively similar expression of heavy chain mRNA (Figure
6.15A) and light chain mRNA (Figure 6.15B) compared to the mRNA expression from
the respective control cultures. Therefore changes in productivity were not due to
differences in the expression of the antibody transcript. As mentioned in previous
Chapters an increase in antibody titre, in response to feed and DMSO addition, was
dependent on cultures undergoing increased rates of antibody secretion. Secretion may
be enhanced for cultures experiencing low levels of ER stress. The expressions of ER
stress markers were investigated and although the expression of ATF4 (Figure 6.15C)
and GADD34 (Figure 6.15D) mRNA was not altered in response to DMSO, the
expression of GADD153 mRNA and protein was less (Figure 6.16). In response to
DMSO addition GADD153 mRNA was 39% and 34% lower for early generation and
late generation cultures (with no additions), respectively (Figure 6.16A). GADD153
mRNA, however, was not altered when DMSO was added to cultures already
supplemented with feed, possibly as feeding alone was sufficient in maintaining low
expression of GADD153 mRNA.
The effect of DMSO addition on GADD153 mRNA was also reflected at protein level.
GADD153 protein for both early and late generation cultures was approximately 50%
less in response to DMSO addition. Cultures supplemented with feed had similar levels
of GADD153 protein, independent of DMSO addition (Figure 6.16B). An example of
the regulation of GADD153 protein in response to the different culture conditions is
shown in Figure 6.16C. The alteration in GADD153 suggested that cultures with
DMSO had less cellular stress than cultures without DMSO.
Other cell stress pathways were also altered in response to DMSO. Ratios of XBP-1(s)
mRNA to total XBP-1 mRNA were also lower for cultures supplemented with DMSO
(Figure 6.17A). The regulation of XBP-1(s) mRNA in response to DMSO addition is
shown in Figure 6.17B. Investigations showed that DMSO addition to cultures resulted
in lower expression of ER stress markers, potentially due to greater protein folding in

267
response to DMSO. Increased protein folding would result in less ER stress and
enhanced protein secretion.
6.4.3 DMSO addition increased the rates of glucose utilisation for 51.69 cultures
As cellular stress was lowered in response to DMSO addition metabolic changes were
also investigated to determine if possible metabolic changes could be responsible for a
higher degree of protein folding. The rate of glucose utilisation (d9-d13) was increased
in response to DMSO (Figure 6.18A), possibly as glucose metabolism was still active
during the end (decline) phase of batch culture for cultures with DMSO. In response to
DMSO addition glucose utilisation rates were increased two-fold for early generations
cultures (without feed supplements), and three-fold for late generation cultures
(regardless of feed addition).
Early generation cultures in the presence of DMSO had slightly increased lactate
utilisation rates, whilst late generation cultures had similar rates of lactate
production/utilisation, independent of DMSO addition (Figure 6.18B). The increased
rate of glucose utilisation and the changes to lactate production in response to DMSO
are either directly or indirectly related to a more productive cell.

268
Figure 6.12 DMSO addition to for early generation 51.69 cultures did not enhance
antibody titres
51.69 was cultured as previously described (Figure legend 6.1). Batch cultures were
created at early generations (≤ 40 generations). A CD feed and 2% (v/v) DMSO was
added to the relevant cultures, as described in Section 2.3.2. Antibody titres were
measured by ELISA (Section 2.5.1), and viable cell densities were determined by light
microscopy and trypan blue exclusion (Section 2.3.3) from samples taken routinely
during batch culture. Antibody titres (A), viable cell densities (B), and CCT (C) are
shown. For determination of CCT see Section 2.11.2. Error bars represent SEM for
three biological replicates. Each biological replicate value is an average from duplicate
technical repeats. * indicates p<0.05, using independent samples t-test to compare
cultures with DMSO to the corresponding control culture without DMSO addition (on
the same day of batch culture).
Annotation of the generation batch cultures in Figure 6.12
Control (no addition)
+ DMSO addition
Control (+ feed addition)
+ feed + DMSO addition

Figure 6.12 DMSO addition to for early generation 51.69 cultures did not enhance
antibody titres
B.
C.
A.
0
1
2
3
4
5
0 5 10 15
Via
ble
cell
s
(x1
06
cell
s/m
l)
Day
0
5
10
15
20
25
30
35
40
0 3 5 7 9 11 13 15
Cu
mu
lati
ve c
ell
tim
e
(x1
06
cell
s x
da
y/m
l)
Day
0
400
800
1200
1600
0 3 5 7 9 11 13 15
An
tib
od
y t
itre
(mg
/L)
Day
* *

270
Figure 6.13 Antibody titres were enhanced for late generation 51.69 cultures in the
presence of feed and DMSO
51.69 was cultured as previously described (Figure legend 6.1). Batch cultures were
created at late generations (≥ 60 generations). A CD feed and 2% (v/v) DMSO was
added to the relevant cultures, as described in Section 2.3.2. Antibody titres were
measured by ELISA (Section 2.5.1), and viable cell densities were determined by light
microscopy and trypan blue exclusion (Section 2.3.3) from samples taken routinely
during batch culture. Antibody titres (A), viable cell densities (B), and CCT (C) are
shown. For determination of CCT see Section 2.11.2. Error bars represent SEM for
three biological replicates. Each biological replicate value is an average from duplicate
technical repeats. * indicates p<0.05, using independent samples t-test to compare
cultures with DMSO to the corresponding control culture without DMSO addition (on
the same day of batch culture).
Annotation of the generation batch cultures in Figure 6.13
Control (no addition)
+ DMSO addition
Control (+ feed addition)
+ feed + DMSO addition

271
Figure 6.13 Antibody titres were enhanced for late generation 51.69 cultures in the
presence of feed and DMSO
B.
C.
A.
0
400
800
1200
1600
0 3 5 7 9 11 13 15
An
tib
od
y t
itre
(mg
/L)
Day
0
5
10
15
20
25
30
35
40
0 3 5 7 9 11 13 15
Cu
mu
lati
ve c
ell
tim
e
(x1
06
cell
s x
da
y/m
l)
Day
0
1
2
3
4
5
0 5 10 15
Via
ble
cell
s
(x1
06
cell
s/m
l)
Day
* *
* *
*

272
Figure 6.14 Qp values were increased in response to DMSO addition
Specific productivity (Qp) was determined from the antibody tire and the growth of
early generation (≤ 40 generations) and late generation (≥ 60 generations) batch
cultures seen in Figure 6.13 and Figure 6.14, respectively. Qp was calculated for the
entire batch culture, using antibody titre and cell density measurements from days 0 to
15 of culture, Qp (d0-d15). For determination of Qp see Section 2.11.2. Error bars
represent SEM for three biological replicates. Each biological replicate value is an
average from duplicate technical repeats. * indicates p<0.05 and ♦ indicates p<0.10,
using independent samples t-test to compare cultures with DMSO to the corresponding
control culture without DMSO addition.
Annotation of the batch cultures in Figure 6.14
0
10
20
30
40
50
60
70
Early Late
Sp
ecif
ic p
ro
du
cti
vit
y (
Qp
)
(pg
/cell
/da
y)
Generation
Control (no addition)
+ DMSO addition
Control (+ feed addition)
+ feed + DMSO addition
*
♦ ♦

273
Figure 6.15 Recombinant mRNA expression was not altered in response to DMSO
51.69 was cultured as previously described (Figure legend 6.1). Batch cultures were
created at early generations (≤ 40 generations) and late generations (≥ 60 generations).
A CD feed and 2% (v/v) DMSO was added to the relevant cultures, as described in
Section 2.3.2. mRNA levels were compared using q-RTPCR from samples taken on day
9 of batch culture (as detailed in Section 2.7.1), using the mRNA specific primer sets for
A, heavy chain, B, light chain, C, ATF4 and D, GADD34. Samples were normalised
using mRNA β-Actin primers. Error bars represent SEM for three biological replicates.
Annotation of the generation batch cultures in Figure 6.15
Control (no addition)
+ DMSO addition
Control (+ feed addition)
+ feed + DMSO addition

274
Figure 6.15 Recombinant mRNA expression was not altered in response to DMSO
A.
B.
C.
0
50
100
150
200
250
300
350
Early Late
GA
DD
34
mR
NA
ex
press
ion
(% r
ela
tiv
e to
sta
nd
ard
an
d
β-A
cti
n m
RN
A e
xp
ress
ion
)
Generation
D.
0
50
100
150
200
250
Early LateLig
ht ch
ain
mR
NA
ex
press
ion
(% r
ela
tiv
e to
sta
nd
ard
an
d
β-A
cti
n m
RN
A e
xp
ress
ion
)
Generation
0
50
100
150
200
250
300
Early Late
AT
F4
mR
NA
ex
press
ion
(% r
ela
tiv
e to
sta
nd
ard
an
d
β-A
cti
n m
RN
A e
xp
ress
ion
)
Generation
0
50
100
150
200
250
Early Late
Hea
vy
ch
ain
mR
NA
ex
press
ion
(% r
ela
tiv
e to
sta
nd
ard
an
d
β-A
cti
n m
RN
A e
xp
ress
ion
)
Generation

275
Figure 6.16 DMSO addition to 51.69 cultures lowered GADD153 expression
51.69 was cultured as previously described (Figure legend 6.1). A CD feed and 2%
(v/v) DMSO was added to the relevant culture, as described in Section 2.3.2. mRNA and
protein was isolated on day 9 of batch culture. mRNA levels were compared using q-
RTPCR (as detailed in Section 2.7.1), using the mRNA specific primer sets for
GADD153. Samples were normalised using mRNA β-Actin primers. Protein was
extracted on days 9 of batch culture (as detailed in Section 2.5.3.1). 60µg protein was
separated by SDS-PAGE (Section 2.5.3.2), transferred (Section 2.5.3.3) and then
detected using an anti-rabbit polyclonal GADD153 antibody. Membranes were stripped
and re-probed using an anti-mouse pan ERK antibody (Section 2.5.3.4). Bands were
analysed using Image J software, and the amount of GADD153 protein expression was
calculated relative to ERK expression (Section 2.5.3.5). A, shows the relative intensity
of GADD153 mRNA expression, and B, shows the relative intensity of GADD153
protein expression. The regulation of GADD153 protein for the different culture
conditions is also shown (C) Error bars represent SEM for three biological replicates. *
indicates p<0.05 and ♦ indicates p<0.10, using independent samples t-test to compare
cultures with DMSO to the corresponding control culture without DMSO addition.
Annotation of the batch cultures in Figure 6.16
Control (no addition)
+ DMSO addition
Control (+ feed addition)
+ feed + DMSO addition

276
Figure 6.16 DMSO addition to 51.69 cultures lowered GADD153 expression
A.
0
50
100
150
200
250
Early Late
GA
DD
15
3 m
RN
A e
xp
ress
ion
(% r
ela
tiv
e to
sta
nd
ard
an
d
β-A
cti
n m
RN
A e
xp
ress
ion
)
Generation
B.
0
50
100
150
200
250
Early Late
GA
DD
15
3 p
ro
tein
in
ten
sity
(rela
tiv
e t
o E
RK
sta
nd
ard
)
Generation
C.
Early Late
GADD153
ERK
Feed addition
Generation
DMSO addition- + - + - + - +
- - + + - - + +
*
♦
*

277
Figure 6.17 XBP-1(s) mRNA was lowered in response to DMSO
51.69 was cultured as previously described (Figure legend 6.1). Batch cultures were
created at early generations (≤ 40 generations) and late generations (≥ 60 generations).
A CD feed and 2% (v/v) DMSO was added to the relevant culture, as described in
Section 2.3.2. cDNA was synthesised from RNA extracted on day 9 of batch culture
(Section 2.7.1.3) and the PCR was performed using the newly synthesised cDNA and
XBP-1(s) primers (Section 2.7.2). The PCR products were electrophoresed on a 2%
(w/v) agarose gel and visualised by UV transillumination (Section 2.6.1.4). Bands were
analysed using Image J software and the ratio of spliced XBP-1 mRNA to total XBP-1
mRNA is shown. Error bars represent SEM for three biological replicates. * indicates
p<0.05 and ♦ indicates p<0.10, using independent samples t-test to compare cultures
with DMSO to the corresponding control culture without DMSO addition.
Annotation of the batch cultures in Figure 6.17
Control (no addition)
+ DMSO addition
Control (+ feed addition)
+ feed + DMSO addition

278
Figure 6.17 XBP-1(s) mRNA was lowered in response to DMSO
0
10
20
30
40
50
60
Early Late
Ra
tio
of
spli
ced
XB
P-1
mR
NA
to to
tal
XB
P-1
mR
NA
(%)
A.
B.
Early Late
Feed addition
Generation
DMSO addition- + - + - + - +
- - + + - - + +
♦
♦ *
♦

279
Figure 6.18 Rates of glucose utilisation were increased for 51.69 cultures in the
presence of DMSO
51.69 was cultured as previously described (Figure legend 6.1). Batch cultures were
created at early generations (≤ 40 generations) and late generations (≥ 60 generations).
A CD feed and 2% (v/v) DMSO was added to the relevant culture, as described in
Section 2.3.2. Supernatant samples taken on days 5, 7, 9 and 13 of batch culture were
analysed enzymatically to determine the concentration of glucose (Section 2.10.1) and
lactate (Section 2.10.2). The rates of utilisation and production were determined using
the relevant CCT values (for calculation see Section 2.11.2). Error bars represent SEM
for three biological replicates. * indicates p<0.05, and ♦ indicates p<0.10, using
independent samples t-test to compare cultures with DMSO to the corresponding
control culture without DMSO addition.
Annotation of the batch cultures in Figure 6.18
Control (no addition)
+ DMSO addition
Control (+ feed addition)
+ feed + DMSO addition

280
Figure 6.18 Rates of glucose utilisation were increased for 51.69 cultures in the
presence of DMSO
B.
A.
0
0.5
1
1.5
2
2.5
Early Late
Ra
te o
f lg
luco
seu
tili
sati
on
(d9
-d1
3)
(pM
/cell
/da
y)
Generation
-1
-0.5
0
0.5
1
Early Late
Ra
te o
f la
cta
te p
ro
du
cti
on
(d5
-d1
3)
(pM
/cell
/da
y)
Generation
♦
* ♦

281
6.5 DISCUSSION
Analysis of 3.90 showed this cell line to be unstable in response to LTC (Chapter 3).
Feed (Chapter 4) and DMSO addition (Chapter 5) increased productivity for this cell
line. To ensure the changes to 3.90 were not cell line-specific another cell line 51.69
was characterised in response to LTC (Section 6.2), feed addition (Section 6.3) and
DMSO addition (Section 6.4).
6.5.1 How does 51.69 compare to 3.90 in response to LTC?
Antibody titre values for early and late generation 51.69 cultures (Figure 6.1A) were
similar to the respective 3.90 culture (Figure 3.1A). However, Qp values were greater
for 51.69 cultures by approximately 10 pg/cell/day (regardless of generation time of
culture), as 51.69 cultures were capable of achieving the same antibody titres with fewer
viable cells (Figure 6.1B) than 3.90 cultures (Figure 3.1B). Although maximal viable
cell densities were different between the two cell lines, cell cycle distribution between
51.69 (Figure 6.2) and 3.90 (Figure 3.3) was similar. As discussed in Chapter 3
alterations to cell cycle transition between early and late generation cultures could be
due to changes in cell growth, however, there is also the possibility that the differences
in cell cycle distribution between early and late generation cultures was due to
alterations in ER stress regulation. An UPR can inhibit translation of cyclin D, causing
cells to halt in G1 cell cycle phase (Brewer et al, 1999). Halting cells in G0/G1 may
provide the cell with a time window to decide whether conditions favour cell survival or
cell death (Niwa & Walter, 2000). The increase in G0/G1 for early generation cultures
may be a route to prevent these cultures from entering cell death pathways.
51.69 cultures experienced ER stress during batch culture, with expression of UPR
markers dependent on the generation time of cultures (these findings are summarised in
Figure 6.19). Late generation 51.69 cultures, on day 7 of batch culture, had increased
GADD153 mRNA compared to early generation 51.69 cultures (Figure 6.4B). Similar
findings were shown for 3.90 cultures in Section 3.4. Lower levels of ER stress for early
generation cultures would allow for increased rates of protein secretion (Malhotra et al,
2008), observed with greater antibody titres. Increased ER stress in response to LTC
could remain a possible explanation for the changes to antibody titres between early and

282
late generation cultures. Enhanced ER stress may also be the result of nutrient
limitations and changes to the metabolic activity of the cell.
Late generation 51.69 cultures had greater rates of lactate utilisation than early
generation 51.69 cultures (Figure 6.5). Similar to the rates of lactate utilisation observed
for 3.90 early and late generation cultures (Figure 3.21C). The potential linkage
between metabolic changes and LTC has been discussed previously in Section 3.6.
Further investigations of alanine production and re-utilisation for cell line 51.69 would
be needed to confirm the increased production of extracellular alanine as a marker of
poor protein expression within these cell lines.
6.5.2 How does 51.69 compare to 3.90 in response to feed addition?
Antibody titre values from cultures in the presence of feed were similar for both cell
lines, however, due to differences in cell biomass Qp (d0-d15) values in the presence of
feed were two-fold greater for 51.69 cultures (Figure 6.7) than 3.90 cultures (Figure
4.5A). As observed for 3.90 cultures feed addition had the greatest impact on Qp for
51.69 cultures during the end (decline) phase of batch culture. The addition of feed to
cultures increased productivity whilst lowering the relative expression of ATF4,
GADD34, and GADD153 mRNA (Figure 6.8), XBP-1(s) mRNA (Figure 6.10) and
GADD153 protein (Figure 6.9). The relative expression of the ER stress markers for
51.69 cultures in response to feed addition was similar to the expression observed for
3.90 cultures (Section 4.4). Explanations for the lower expression of these markers in
response to feed addition have been described previously in Section 4.6.
Addition of feed to 51.69 cultures did not prevent loss of productivity in response to
LTC, also shown for 3.90 cultures (Chapter 4). In the presence of feed late generation
51.69 cultures had lower antibody titres (Figure 6.6A) and Qp values (Figure 6.7) than
early generation 51.69 cultures. It is possible that flux through metabolic pathways was
altered in response to LTC, consequently affecting antibody synthesis and secretion.
However, further investigations, such as intracellular metabolite analysis, would be
needed to confirm metabolic changes. Ultimately investigations with cell line 51.69
show that findings observed for 3.90 in response to feed addition (Figure 4.19) were not

283
specific for this cell line as they were also apparent for 51.69. These findings are
summarised in Figure 6.20.
6.5.3 How does 51.69 compare to 3.90 in response to DMSO addition?
Initial investigation found that 2% (v/v) DMSO addition had the greatest influence on
productivity for 51.69 cultures compared to the other DMSO concentrations
investigated (data not shown). Although the addition of DMSO to 3.90 cultures
increased antibodies titres, regardless of generation time of culture or fed culture
condition (Section 5.2), addition of DMSO to 51.69 cultures did not enhance antibody
titre values for early generation 51.69 cultures (Figure 6.12), and only increased
antibody titres for late generation 51.69 cultures when added to cultures that were also
undergoing feed additions (Figure 6.13). However, due to changes in cell biomass the
fold change in Qp for 51.69 cultures in the presence of DMSO (Figure 6.14) was similar
to the fold change in Qp for 3.90 cultures with DMSO (Figure 5.3).
Other alterations characterised for 3.90 cultures in response DMSO addition were also
observed for 51.69 cultures (detailed in Figure 6.21). Expression of GADD153 (Figure
6.16) and XBP-1(s) (Figure 6.17) mRNA was less in response to DMSO. As ATF4
protein expression was not affected by DMSO addition (data not shown) lower
expression of GADD153 mRNA could be the result of less XBP-1 splicing, or
decreased activation of other UPR markers such as ATF6 (Yoshida et al, 2001;Yoshida
et al, 2003). A lower expression of stress markers in response to DMSO addition could
also be the result of metabolic changes. 51.69 cultures in the presence of DMSO
showed altered rates of glucose and lactate utilisation (Figure 6.18), similar to findings
for 3.90 cultures in response to DMSO addition (Figure 5.15 and 5.16). As previously
suggested in Section 5.6.3, less lactate production and increased glucose utilisation
during the end (decline) phase of batch culture may have provided the cultures with a
beneficial metabolic shift allowing for increased Qp values. Detailed metabolic flux
analysis would be needed to confirm metabolic changes in response to DMSO addition
(Goudar et al, 2009; Omasa et al, 2010; Quek et al, 2010).

284
6.6 SUMMARY
The response of cell line 51.69 to LTC, feed addition and DMSO addition gave similar
characteristics to those previously identified for cell line 3.90. Late generation 51.69
cultures had fewer cells in G0/G1, less GADD34 mRNA, increased GADD153 and
XBP-1(s) mRNA, and greater lactate utilisation than early generation 51.69 cultures.
Cultures in the presence of feed had lower expression of ATF4, GADD34, GADD153
and XBP-1(s) mRNA and less GADD153 protein, whilst cultures in the presence of
DMSO addition had lower expression of GADD153 and XBP-1(s) mRNA and less
GADD153 protein. Both feed and DMSO additions resulted in alterations to glucose
utilisation and lactate accumulation, but further investigations would be needed to
determine the metabolic changes as a result of LTC, feed and DMSO addition.

285
Figure 6.19 Alterations to nutrient utilisation, ER stress markers and antibody
titre for cell line 51.69 in response to LTC
Cell line 51.69 had altered characteristics in response to LTC. Characteristics of
antibody titre loss were examined for alterations to cell growth, cellular stress and
metabolism during batch culture for early and late generation cultures. The changes in
these markers were possibly related to the decrease in antibody titre values seen for late
generation cultures during the end (decline) phase of batch culture. indicates a
significant change for late generation cultures compared early generation cultures
(p<0.10 using independent samples t-test).
Annotation of Figure 6.19
Day 0 3 5 7 9 11 13 15
Antibody titre
Percentage of cells in G0/G1
GADD153 mRNA*
*
Rates of lactate utilisation
Increased values
Decreased values

286
Figure 6.20 Alterations to 51.69 cultures in response to feed addition
The changes to productivity, expression of ER stress markers and nutrient utilisation in
the presence of feed. In response to feed addition the expression of ER stress markers
and lactate re-utilisation were lowered, viable cell densities, CCT and recombinant
mRNA expression remained unaltered, and antibody titre and Qp values were
increased.
Antibody titre
Qp
Viable cell densities
CCT
Recombinant mRNA
ATF4, GADD34 mRNA
GADD153 mRNA and protein
XBP-1(s) mRNA
Lactate re-utilisation
Enhanced in response to feed addition
Lowered in response to feed addition

287
Figure 6.21 Alterations to 51.69 cultures in response to DMSO addition
The changes to productivity, expression of ER stress markers and nutrient utilisation in
the presence of DMSO. In response to DMSO addition viable cell densities, CCT, and
the expression of GADD153 and XBP-1(s) mRNA were less, recombinant mRNA and
ATF and GADD34 mRNA remained unaltered, and antibody titre and Qp values were
increased. Lactate accumulation was either lowered in response to DMSO addition or
rates of lactate re-utilisation were increased. ? indicates that potentially lactate
accumulation was either lowered or lactate re-utilisation was increased in response to
DMSO addition.
Qp
Glucose utilisation (decline phase)
Lactate re-utilisation ?
Recombinant mRNA
ATF4, GADD34 mRNA
Viable cell densities
CCT
GADD153 mRNA and protein
XBP-1(s) mRNA
Lactate accumulation ?
Enhanced in response to DMSO addition
Lowered in response to DMSO addition

288
12
CHAPTER 6
13
OVERALL DISCUSSION

289
7. OVERALL DISCUSSION
The results in this thesis have been presented in four discrete chapters, and as such
detailed discussions have been made at the end of each Chapter. In summary, the key
findings described in this study are:
Characterisation studies on an exemplar cell line (3.90) highlighted instability,
observed with decreased final antibody titres and Qp values. The key findings of
this cell line were replicated with a second exemplar cell line (51.69).
The instability was not due to loss of recombinant gene copies or lower
expression of recombinant mRNA.
Instability was associated with decreased CCT values, increased rates of lactate
utilisation, a lower proportion of cells in G0/G1 and greater expression of
GADD153 and XBP-1 mRNA.
The exemplar cell line experienced ER stress during batch culture, defined in
terms of increased ATF4, GADD34, GADD153 and XBP-1(s) mRNA, and
increased ATF4, GADD153, BiP and PDI protein during the course of the batch
culture.
Feed additions improved antibody titres and Qp values but did not reverse the
instability observed in response to LTC.
Feed addition did not increase expression of recombinant mRNA, but did
increase antibody titre.
The improvement in recombinant protein production in response to feed addition
was associated with decreased ER stress. This was exemplified by less ATF4,
GADD34, XBP-1(s) and GADD153 mRNA, and lower GADD153 protein
expression.
The addition of feed to cultures also altered the metabolic profile of the cultures,
resulting in less glycine accumulation, and prevention of alanine or lactate re-
utilisation.
The addition of DMSO to cultures increased antibody titres and Qp values,
whilst suppressing cell growth, without an increased expression of recombinant
mRNA
Cultures with DMSO had lower 80S polysome peak areas.

290
In response to DMSO addition, expression of GADD153 and XBP-1(s) mRNA
was decreased.
DMSO addition also altered the metabolic profiles of the cultures. DMSO
addition altered rates of lactate production and increased glucose utilisation
during the end (decline) phase of batch culture.
The overall findings observed with the exemplar cell line 3.90, including
changes to antibody titre, cell cycle distribution, ER stress markers, and rates of
glucose and lactate utilisation in response to LTC, feed and DMSO addition
were similar for a second exemplar cell line, 51.69. The effects were not cell line
specific.
From the findings listed above it is apparent that the main aims stated at the start of this
project have been achieved (Section 1.11). In addition to the main aims of this project,
several questions were established, which will also be considered during this overall
discussion.
7.1 IS INSTABILITY CONNECTED TO A SPECIFIC CELLULAR EVENT?
As summarised for 3.90 and 51.69 cultures in Figures 3.25 and 6.19, respectively,
instability, in terms of a loss in recombinant protein proteins in response to LTC, was
also observed with lower CCT values, greater GADD153 and XBP-1(s) mRNA and
enhanced rates of lactate utilisation for late generation cultures. Increased rates of
lactate utilisation may provide cultures with a carbon source once glucose has become
depleted, possibly to maintain ATP production (as shown in Figure 1.6).
Studies have suggested that mitochondrial integrity declines with age (Shigenaga et al,
1994). It may be possible that mitochondrial function in my cell lines diminished in
response to LTC, resulting in lower ATP concentrations for late generation cultures (as
shown in Figure 3.24). Low mitochondrial membrane potentials have also been
associated with decreased concentrations of ATP in CHO cultures (Jeong et al, 2004).
Measuring mitochondrial membrane potentials may provide a simple method of
distinguishing between cells with different intracellular ATP concentrations.

291
The intracellular mitochondrial Ca2+
concentration has been shown to be a key regulator
of ATP production (Griffiths & Rutter, 2009). Decreased mitochondrial Ca2+
concentrations, and mitochondrial membrane potential, occurs during periods of ER
stress (Arnaudeau et al, 2002). CRT expression also increases in response to ER stress
(to aid in protein refolding, shown in Figure 1.13, Scorrano et al, 2003; Zong et al,
2003), and upon ER Ca2+
depletion (Llewellyn et al, 1996). It may be possible that in
response to LTC ER stress is greater, observed with significantly increased GADD153
(Figure 3.13C, for 3.90, and Figure 6.4B, for 51.69) and XBP-1(s) mRNA (Figure
3.17C, for 3.90). Enhanced ER stress due to mis/unfolded proteins would increase CRT
expression and lower ATP production (Oyadomari & Mori, 2003). As ATP is needed
for protein folding, less ATP could allow for greater concentrations of mis/unfolded
proteins in the ER, causing further ER stress. The cycle involving Ca2+
, ATP and
mis/unfolded proteins is shown in Figure 7.1.
Figure 7.1 A pathway linking mitochondrial Ca2+
and ATP concentrations to
mis/unfolded proteins
The downregulation of the TCA cycle, observed with the accumulation of alanine,
glycerol and glycine, (shown for 3.90 in Figure 3.19) could also decrease mitochondrial
ATP generation (Duchen, 2000). ATP concentration not only regulates protein folding,
but also transcription, translation, protein secretion and protein degradation (Figure 1.7).
ATP is also needed for cell growth (Kondo et al, 2000), with depletion of ATP
(Izyumov et al, 2004), and NAD+ (Ha & Snyder, 1999; Virag, 2005) resulting in cell
ATP
CRT
Mt Ca2+Mis/unfolded
proteins
292
death. Lower ATP (and NADH and NAD+) concentrations for late generation cultures
by the stationary phase of batch culture (Figure 3.24) could be linked to the decrease in
CCT values, seen for both late generation 3.90 (Figure 3.2B) and 51.69 (Figure 6.1C)
cultures. Late generation cells may be more predisposed to cell death. The trypan-blue
exclusion method, used to determine viable and non-viable cells, cannot elucidate
between cells in different stages of apoptosis. Differential staining with FITC-
conjugated Annexin V or acridine orange/ethidium bromide may provide a useful
method for identifying early apoptotic cells (Bradbury et al, 2000). It is possible than in
response to LTC the apoptotic nature of the cultures increased (potentially due to
limitations in ATP and NAD+ concentrations). The possible up-regulation of early
apoptotic cells for late generation cultures may also account for enhanced GADD153
mRNA for late generation 3.90 (Figure 3.13C) and 51.69 (Figure 6.4B) cultures.
Although productivity for 3.90 and 51.69 cultures was enhanced with feed (Section 4.2
and Section 6.3) and DMSO (Section 5.2 and Section 6.2) additions, final antibody
titres and Qp values were still lower for late generation cultures than early generation
cultures. Again these late generation cultures (with feed and DMSO additions)
illustrated greater ER stress than the corresponding early generation cultures. The ER
stress phenotype for late generation cultures in the presence of feed was delayed
compared to cultures in the absence of feed. Feed addition did not prevent instability,
instead it delayed the ER stress characteristics.
The productivity of cultures, and the ability to maintain high, stable, expression during
LTC, may also be regulated by other pathways such as mammalian target of rapamycin
(mTOR). mTOR has been described as the cellular central coordinator, linking growth
factors, amino acids, energy and nutrient availability signals to cell growth, protein
synthesis, cell size, cell cycle and autophagy (Fingar & Blenis, 2004; Hay & Sonenberg,
2004). REDD1 (regulated in development and DNA damage responses 1) has been
indicated to mediate cellular responses to energy stress through the mTOR pathway in
glucose-withdrawn or ATP depleted cells, promoting dephosphorylation of S6K and
4E-BP1 (Sofer et al, 2005). It is also possible that the regulation of the mTOR pathway
becomes altered in response to LTC, resulting in late generation cultures having
decreased protein synthesis and cellular growth.

293
The loss of antibody titre in response to LTC, observed for 3.90 and 51.69, may also be
the result of other alterations, including mycoplasma contamination and alterations to
the heterogeneity of the cultures. The loss in protein production from cultures in
response to LTC could have been due the cultures developing a diverse population of
cells with differing Qp values. Methods used to detect intracellular heavy chain and
light chain proteins (Section 2.4.2) did not highlight any differences in the heterogeneity
of early or late generation cultures for both cell lines (data not shown). Both cell lines
were also routinely analysed for mycoplasma. Mycoplasma can alter cell function,
possibly resulting in lower recombinant gene expression (Eldering et al, 2004).
Mycoplasma was not detected during culture (see Appendix 6). Therefore mycoplasma
contamination did not contribute to lower protein expression in response to LTC.
7.2 HOW IS RECOMBINANT PROTEIN PRODUCTION INCREASED IN
RESPONSE TO FEED ADDITION?
The alterations to cultures in response to feed addition are summarised for 3.90 in
Figure 4.19 and for 51.69 in Figure 6.20. The addition of feeds to cultures increased
antibody titres and Qp values with alterations to the metabolic profiles of cultures,
observed with no lactate re-utilisation for 3.90 (Figure 3.21D) or 51.69 (Figure 6.5)
cultures. The activity of LDH activity has been shown to alter in CHO cells during fed-
batch culture (Ma et al, 2009). As previously mentioned in Section 1.5, decreased LDH
expression within recombinant CHO cultures has been shown to increase ATP and
antibody protein production (Jeong et al, 2006; Jeong et al, 2004). Feed addition may
have lowered LDH activity, allowing for altered glycolytic and TCA cycle fluxes,
observed with increased concentrations of ATP, NADH and NAD+, for 3.90 cultures
(Figure 4.20).
The improvement in antibody titres in response to feed addition may be due to increased
rates of protein translation. In response to amino acid feeding of CHO cells, the mTOR
target, eukaryotic initiation factor 4E-binding protein1 (4E-BP1), becomes highly
phosphorylated and dissociates from eIF4E (Proud, 2002b). Free eIF4E can then bind
other factors to assemble productive initiation complexes promoting successful
translation (Section 1.7.1). Intracellular recombinant heavy chains or light chains were

294
detected by specific conjugated antibodies and were found to decrease after feed
addition (Figure 4.11). However, as previously suggested in Chapter 4 less intracellular
protein does not necessarily signify lower rates of protein translation. Rates of specific
recombinant protein synthesis, via techniques such as pulse-chase analysis, would be
needed to confirm the translational activity of the cultures in response to feed addition.
Lower amounts of intracellular recombinant proteins in response to feed addition could
imply greater protein secretion, possibly as a result of greater protein folding. The
expression of ATF4, GADD153 and XBP-1(s) mRNA and GADD153 protein was
decreased in response to feed addition (shown in Section 4.4 for 3.90 cultures and
Section 6.3.2 for 51.69 cultures). As previously mentioned ER stress markers, ATF4
(Siu et al, 2002) and GADD153 (Bruhat et al, 2000; Bruhat et al, 1997; Carlson et al,
1993) have been shown to increase as a result of nutrient deprivation. Nutrient
deprivation, mis/unfolded proteins, as well as hypoxia and oxidative stress, all result in
a common ER stress mechanism including the phosphorylation of eIF2α and the
upregulation of ATF4. These stress responses have been collectively termed the
Integrated Stress Response (ISR, Fels et al, 2005; Harding et al, 2003; Rzymski &
Harris, 2007; Wek & Staschke, 2010).
I investigated the stress response in the parental cell line (cells which do not express the
recombinant antibody). The parental cells utilised glucose and amino acids at rates that
were similar to these observed with the exemplar cell lines (data not shown), but had
significantly lower expression of ATF4, GADD153 and XBP-1(s) mRNA during batch
culture relative to the exemplar cell lines, and interestingly had relatively low
expression of ATF4 protein (Appendix 5.2). ATF4 protein was observed for all
recombinant cultures regardless of culture condition, or generation time of culture. It is
not known if ATF4 protein production during recombinant culture was a method for
overcoming or adapting to ER stress within these cell lines, or just a consequence of
excessive protein load on the ER. ATF4 is central to the ISR, and possibly the most
sensitive indicator of ER stress and mis/unfolded proteins. As ATF4, GADD153 and
XBP-1(s) mRNA expression for the parental line was similar for cultures in the
presence and absence of feed (Appendix 5) I predict the decrease observed for these
markers in response to feed and DMSO in the exemplar cell lines were due to lower

295
protein load within the ER, by enhanced protein folding and less mis/unfolded,
potentially due to altered metabolic flux pathways.
It has been previously suggested the ER chaperone BiP is also affected by nutrient
starvation (Ledford & Leno, 1994), which may alter its ability to bind mis/unfolded
proteins. Relative expression of BiP protein was similar for all culture regardless of feed
addition (Figure 5.10A). However, the functionality of BiP may have been improved in
response to feed addition. Enhanced BiP binding for cultures supplemented with feed
may have improved protein folding, lowering ER stress in these cultures. Altered post-
translational modifications may have also aided protein folding in response to feed
addition. Although N-linked glycosylation profiles of the secreted proteins from the
exemplar cell line (3.90) were not changed in response to feed (or DMSO addition,
Figure 5.12) intracellular glycosylation patterns may have been modified under the
influence of different culture conditions. Experiments have shown that there is a link
between the adenylate energy change of cultures and their glycosylation profiles
(Kochanowski et al, 2008). Enhanced protein folding by improved BiP binding and N-
linked glycosylation patterns in response to feed addition may have led to greater
recombinant protein titres and decreased UPR. Investigating recombinant protein
folding during culture (Section 7.5) may provide evidence to support this proposal.
7.3 HOW IS RECOMBINANT PROTEIN PRODUCTION INCREASED IN
RESPONSE TO DMSO ADDITION?
The alterations to cultures in response to DMSO addition are summarised for 3.90 in
Figure 5.19 and for 51.69 in Figure 6.21. Previously Li et al, found that enzymes, such
as triosephosphate isomerase, glyceraldehyde 3-phosphate dehydrogenase (GAPDH),
and aldolase, were downregulated in response to DMSO addition, with suggestion that
DMSO altered the metabolic state of the CHO cultures (Li et al, 2006b). DMSO
additions altered the metabolic status of the exemplar cell lines, observed with greater
rates of glucose utilisation during the end (decline) phase of batch cultures, for both
3.90 (Section 5.15B) and 51.69 (Section 6.16A). Potentially the addition of DMSO
controlled the use of nutrients during culture, extending the cell culture function.
Greater metabolic activity during the decline phase of culture may have allowed for

296
enhanced ATP concentrations in response to DMSO addition. Investigations confirming
ATP concentrations for cultures with DMSO would be needed.
Initial analyses suggested that rates of protein translation were increased for cultures in
response to DMSO addition (Figure 5.17). Protein translation was measured as the rate
of incorporation of L-[4,5-3H] leucine into TCA precipitable-material. After 48 hrs
incubation protein translation was two-fold greater for cultures in the presence of
DMSO. The fold increase in protein translation for these cultures was not seen with
same fold increase in antibody titres. As L-[4,5-3H] leucine incorporation measures
global protein synthesis it is possible that the translational rates of the recombinant
protein were unaffected by DMSO addition, however, it is also likely that other
mechanisms influencing protein folding and protein secretion, affect the potentially
translational affects of DMSO addition, possibly suggesting a secretory bottleneck for
cultures with high productivity.
In response to DMSO addition ER stress markers were decreased for both 3.90 (Section
5.4) and 51.69 (Section 6.4.2), regardless of fed status of the cultures. This suggests that
cultures with DMSO were not limited by protein folding mechanisms. Mead et al, have
shown that protein turnover in high producing cell lines can limit protein production
(Mead et al, 2009). High protein turnover may have been occurred for cultures in the
presence of DMSO to replenish the amino acids utilised during protein translation. It is
also possible that high antibody titres and Qp values observed as a result of adding both
feed and DMSO to cultures was due to a lower rates of protein turnover consequent to
increased amino acid availability as a result of feed addition. Investigating rates of
protein turnover would be needed to confirm any changes as a result of different culture
conditions.
7.4 ARE THERE MARKERS TO PREDICT THE LIKELIHOOD OF
INSTABILITY IN RECOMBINANT PROTEIN PRODUCTION?
As decreased recombinant protein was observed for late generation cultures, from
generation 60, during the end (decline) phase of batch culture it is difficult to identify
markers that predict culture stability at the onset of characterisation assays.

297
Markers of ER stress, ATF4, GADD153 and XBP-1(s) mRNA were lower for
conditions which promoted enhanced protein production. As ER stress makers were
altered in response to LTC and feed additions investigating GCN2 may provide a link
with the alterations observed with ER stress markers and changes with the metabolic
activity of the cells. It may be possible to screen for recombinant cell lines based on the
IRS phenotype, and select cells exhibiting lower levels of cellular stress.
Individual experiments have shown overexpression of ATF4, GADD34 and XBP-1(s)
increased productivity of CHO cells, with the suggestion that enhanced productivity
was due to expansion of the ER and less translation attenuation due to feedback
inhibition (Ku et al, 2008; Ohya et al, 2008; Omasa et al, 2008; Tigges & Fussenegger,
2006). Isolating cells for a low ER stress-response phenotype, for example cells with
little expression of GADD153 and spliced XBP-1, may ensure the cells are not limited
at the level of translation and secretion.
7.5 FUTURE WORK
Whilst addressing the questions in this Chapter some future investigations have been
suggested. However, the main future investigations would involve further analysis of
intracellular ATP, NADH and NAD+, needed to confirm the concentrations of energy
intermediates in response to LTC, feed and DMSO addition.
Measuring rates of protein secretion and protein folding would also be advantageous to
determine if the changes in antibody titres were at the level of secretion, or if problems
in protein folding resulted in a greater degree of protein degradation. Exocytotic
secretion of proteins in CHO cells has been visualised using secreted Gaussia luciferase
as a reporter protein method of real-time bioluminescence imaging to investigate protein
trafficking in mammalian cells (Suzuki et al, 2007). As the folding within the cell is also
controlled by the oxidation state of the ER (Helenius et al, 1992) studies have also
involved imaging dynamic redox changes in mammalian cells with fluorescent protein
indicators (Dooley et al, 2004). GFP-based probes can be introduced into the cell,
together with the recombinant gene, and targeted to specific subcellular locations to

298
determine the redox state. These strategies may determine if protein folding, or the
environment needed to maintain protein folding, is altered in response to LTC, feed and
DMSO addition.
Finally as the investigation only focuses upon two cell lines, both of which produce the
same particular recombinant protein, the observations seen during LTC, and under the
influence of different feeding regimes, may not be indicative of protein expression on a
global scale. To gain a further understanding of the findings within this thesis future
work researching a „stable‟ cell line would be required. The comparison of a „stable‟
cell line, which does not have experience a loss in protein production with LTC, with an
„unstable‟ cell line, may offer more supportive data with the changes observed during
LTC, feed and DMSO addition.
As ER stress has been implicated in diabetes (Harding & Ron, 2002), cardiovascular
diseases (Vasa-Nicotera, 2004), cancer (Ma & Hendershot, 2004), immune responses
(Brewer & Hendershot, 2005) and neurodegenerative diseases (Rao & Bredesen, 2004),
hopefully a greater knowledge of the mechanisms involved within the UPR and protein
folding, and strategies to regulate protein secretion, may provide a greater deal of
understanding to ER stress in disease.
1
2

299
1
2
3
4 REFERENCES
5
6
7
8

300
Aggeler J, Kapp LN, Tseng SC, Werb Z (1982) Regulation of protein secretion in
Chinese hamster ovary cells by cell cycle position and cell density. Plasminogen
activator, procollagen fibronectin. Exp Cell Res 139(2): 275-283
Al-Fageeh MB, Smales CM (2006) Control and regulation of the cellular responses to
cold shock: the responses in yeast and mammalian systems. Biochem J 15(397): 247-
259
Al-Rubeai M, Emery AN (1990) Mechanisms and kinetics of monoclonal antibody
synthesis and secretion in synchronous and asynchronous hybridoma cell cultures. J
Biotechnol 16(1-2): 67-85
Allen MJ, Boyce JP, Trentalange MT, Treiber DL, Rasmussen B, Tillotson B, Davis R,
Reddy P (2008) Identification of novel small molecule enhancers of protein production
by cultured mammalian cells. Biotechnol Bioeng 100(6): 1193-1204
Altamirano C, Berrios J, Vergara M (2009) Galactose and lactate as nutrients in
continuous cultures of CHO cells producing rh-tPA. New Biotechnology 25(Supplement
1): S239-S239
Altamirano C, Illanes A, Becerra S, Cairó JJ, Gòdia F (2006) Considerations on the
lactate consumption by CHO cells in the presence of galactose. J Biotechnol 125(4):
547-556
Andersen DC, Krummen L (2002) Recombinant protein expression for therapeutic
applications. Curr Opin Biotechnol 13(2): 117-123
Andrulis IL, Hatfield GW, Arfin SM (1979) Asparaginyl-tRNA aminoacylation levels
and asparagine synthetase expression in cultured Chinese hamster ovary cells. J Biol
Chem 254(21): 10629-10633
Arden N, Betenbaugh MJ (2006) Regulating apoptosis in mammalian cell cultures.
Cytotechnology 50(1): 77-92
Arnaudeau S, Frieden M, Nakamura K, Castelbou C, Michalak M, Demaurex N (2002)
Calreticulin Differentially Modulates Calcium Uptake and Release in the Endoplasmic
Reticulum and Mitochondria. J Biol Chem 277(48): 46696-46705
Asami Y, Nagano H, Ikematsu S, Murasugi A (2000) An Approach to the Removal of
Yeast Specific O-Linked Oligo-Mannoses from Human Midkine Expressed in Pichia
pastoris Using Site-Specific Mutagenesis. J Biol Chem 128(5): 823-826
Ashe MP, De Long SK, Sachs AB (2000) Glucose Depletion Rapidly Inhibits
Translation Initiation in Yeast. Mol Biol Cell 11(3): 833-848
Averous J, Bruhat A, Jousse Cl, Carraro Vr, Thiel G, Fafournoux P (2004) Induction of
CHOP Expression by Amino Acid Limitation Requires Both ATF4 Expression and
ATF2 Phosphorylation. J Biol Chem 279(7): 5288-5297
Bacsi SG, Wejksnora PJ (1986) Effect of increase in ploidy on the activation of
nucleolar organizer regions in Chinese hamster ovary (CHO) cells. Exp Cell Res 165(1):
283-289
301
Baek D, Villen J, Shin C, Camargo FD, Gygi SP, Bartel DP (2008) The impact of
microRNAs on protein output. Nature 455(7209): 64-71
Balow JP, Weissman JD, Kearse KP (1995) Unique Expression of Major
Histocompatibility Complex Class I Proteins in the Absence of Glucose Trimming and
Calnexin Association. J Biol Chem 270(48): 29025-29029
Baneyx F (1999) Recombinant protein expression in Escherichia coli. Curr Opin
Biotechnol 10(5): 411-421
Baneyx F, Mujacic M (2004) Recombinant protein folding and misfolding in
Escherichia coli. Nat Biotech 22(11): 1399-1408
Banik GG, Tood P, Kompala DS (1996) Foreign protein expression from S phase
specific promoters in continuous cultures of recombinant CHO cells. Cytotechnology
22: 179-184
Barnes LM, Bentley CM, Dickson AJ (2001) Characterization of the stability of
recombinant protein production in the GS-NS0 expression system. Biotechnol Bioeng
73(4): 261-270
Barnes LM, Bentley CM, Dickson AJ (2003) Stability of protein production from
recombinant mammalian cells. Biotechnol Bioeng 81(6): 631-639
Bartel DP (2004) MicroRNAs - Genomics, Biogenesis, Mechanism, and Function. Cell
116: 281-297
Bartel DP (2009) MicroRNAs: target recognition and regulatory functions. Cell 136(2):
215-233
Bassik MC, Scorrano L, Oakes SA, Pozzan T, Korsmeyer SJ (2004) Phosphorylation of
BCL-2 regulates ER Ca2+ homeostasis and apoptosis. EMBO J 23(5): 1207-1216
Bates S, Parry D, Bonetta L, Vousden K, Dickson C, Peters G (1994) Absence of cyclin
D/cdk complexes in cells lacking functional retinoblastoma protein. Oncogene 9(6):
1633-1640
Bebbington CR, Renner G, Thomson S, King D, Abrams D, Yarranton GT (1992)
High-level expression of a recombinant antibody from myeloma cells using a glutamine
synthetase gene as an amplifiable selectable marker. Biotechnology 10(2): 169-175
Beck A, Wurch T, Bailly C, Corvaia N (2010) Strategies and challenges for the next
generation of therapeutic antibodies. Nat Rev Immunol 10(5): 345-352
Benton T, Chen T, McEntee M, Fox B, King D, Crombie R, Thomas TC, Bebbington C
(2002) The use of UCOE vectors in combination with a preadapted serum free,
suspension cell line allows for rapid production of large quantities of protein.
Cytotechnology 38(1): 43-46
Bernstein E, Caudy AA, Hammond SM, Hannon GJ (2001) Role for a bidentate
ribonuclease in the initiation step of RNA interference. Nature 409(6818): 363-366

302
Bertolotti A, Ron D (2001) Alterations in an IRE1-RNA complex in the mammalian
unfolded protein response. J Cell Sci 114(17): 3207-3212
Bertolotti A, Zhang Y, Hendershot LM, Harding HP, Ron D (2000) Dynamic
interaction of BiP and ER stress transducers in the unfolded-protein response. Nat Cell
Biol 2(6): 326-332
Bi JX, Shuttleworth J, Al-Rubeai M (2004) Uncoupling of cell growth and proliferation
results in enhancement of productivity in p21CIP1-arrested CHO cells. Biotechnol
Bioeng 85(7): 741-749
Bibila TA, Ranucci CS, Glazomitsky K, Buckland BC, Aunins JG (1994) Monoclonal
antibody process development using medium concentrates. Biotechnol Prog 10(1): 87-
96
Birch J, Bebbington, CR., Field, R., Renner, G., Brand, H. & Finney, H. (1993) The
production of recombinant antibodies using the glutamine synthetase (GS) system., Vol.
5, Dordrecht: Kluwer Academic Publishers.
Bole DG, Hendershot LM, Kearney JF (1986) Posttranslational association of
immunoglobulin heavy chain binding protein with nascent heavy chains in nonsecreting
and secreting hybridomas. J Cell Biol 102(5): 1558-1566
Bonarius HPJ, Özemre A, Timmerarends B, Skrabal P, Tramper J, Schmid G, Heinzle E
(2001) Metabolic-flux analysis of continuously cultured hybridoma cells using mass
spectrometry in combination with 13C-lactate nuclear magnetic resonance spectroscopy
and metabolite balancing. Biotechnol Bioeng 74(6): 528-538
Bordone L, Motta MC, Picard F, Robinson A, Jhala US, Apfeld J, McDonagh T,
Lemieux M, McBurney M, Szilvasi A, Easlon EJ, Lin S-J, Guarente L. (2006) Sirt1
Regulates Insulin Secretion by Repressing UCP2 in Pancreatic β Cells. PLoS Biol 4(2):
e31
Borth N, Mattanovich D, Kunert R, Katinger H (2005) Effect of Increased Expression
of Protein Disulfide Isomerase and Heavy Chain Binding Protein on Antibody Secretion
in a Recombinant CHO Cell Line. Biotechnology Progress 21(1): 106-111
Bradbury DA, Simmons TD, Slater KJ, Crouch SPM (2000) Measurement of the
ADP:ATP ratio in human leukaemic cell lines can be used as an indicator of cell
viability, necrosis and apoptosis. Journal of Immunological Methods 240(1-2): 79-92
Brewer JW, Diehl JA (2000) PERK mediates cell-cycle exit during the mammalian
unfolded protein response. PNAS 97(23): 12625-12630
Brewer JW, Hendershot LM (2005) Building an antibody factory: a job for the unfolded
protein response. Nat Immunol 6(1): 23-29
Brewer JW, Hendershot LM, Sherr CJ, Diehl JA (1999) Mammalian unfolded protein
response inhibits cyclin D1 translation and cell-cycle progression. PNAS USA 96(15):
8505-8510

303
Brostrom CO, Brostrom MA (1998) Regulation of translational initiation during cellular
responses. PNAS 58: 79-125
Brown M, Renner G, Field, RP, Hassell T. (1992) Process development for the
production of recombinant antibodies using the glutamine synthetase (GS) system.
Cytotechnology 9: 231-236
Bruhat A, Cherasse Y, Maurin A-C, Breitwieser W, Parry L, Deval C, Jones N, Jousse
C, Fafournoux P (2007) ATF2 is required for amino acid-regulated transcription by
orchestrating specific histone acetylation. Nucl Acids Res 35(4): 1312-1321
Bruhat A, Jousse C, Carraro V, Reimold AM, Ferrara M, Fafournoux P (2000) Amino
Acids Control Mammalian Gene Transcription: Activating Transcription Factor 2 Is
Essential for the Amino Acid Responsiveness of the CHOP Promoter. Mol Cell Biol
20(19): 7192-7204
Bruhat A, Jousse C, Wang XZ, Ron D, Ferrara M, Fafournoux P (1997) Amino acid
limitation induces expression of CHOP, a CCAAT/enhancer binding protein-related
gene, at both transcriptional and post-transcriptional levels. J Biol Chem 272(28):
17588-17593
Brush MH, Weiser DC, Shenolikar S (2003) Growth Arrest and DNA Damage-
Inducible Protein GADD34 Targets Protein Phosphatase 1α to the Endoplasmic
Reticulum and Promotes Dephosphorylation of the α Subunit of Eukaryotic Translation
Initiation Factor 2. Mol Cell Biol 23(4): 1292-1303
Bulleid NJ, Freedman R, B. (1988) Defective co-translational formation of disulphide
bonds in protein disulphide-isomerase-deficient microsomes. Nature 335: 649-651
Cabibbo A, Pagani M, Fabbri M, Rocchi M, Farmery MR, Bulleid NJ, Sitia R (2000)
ERO1-L, a Human Protein That Favors Disulfide Bond Formation in the Endoplasmic
Reticulum. J Biol Chem 275(7): 4827-4833
Calfon M, Zeng H, Urano F, Till JH, Hubbard SR, Harding HP, Clark SG, Ron D
(2002) IRE1 couples endoplasmic reticulum load to secretory capacity by processing
the XBP-1 mRNA. Nature 415(6867): 92-96
Carlson SG, Fawcett TW, Bartlett JD, Bernier M, Holbrook NJ (1993) Regulation of the
C/EBP-related gene gadd153 by glucose deprivation. Mol Cell Biol 13(8): 4736-4744
Carrera AC (2004) TOR signaling in mammals. J Cell Sci 117(20): 4615-4616
Carvalhal AV, Marcelino I, Carrondo MJT (2003) Metabolic changes during cell
growth inhibition by p27 overexpression. Applied Microbiology and Biotechnology
63(2): 164-173
Cenci S, Sitia R (2007) Managing and exploiting stress in the antibody factory. FEBS
letters 581(19): 3652-3657
Cereghino GPL, Cereghino JL, Ilgen C, Cregg JM (2002) Production of recombinant
proteins in fermenter cultures of the yeast Pichia pastoris. Curr Opin Biotechnol 13(4):
329-332

304
Chai H, Al-Rubeai M, Chua K, L., Oh S, W.,L., Yap M, G.,S. (1996) Insect cell line
dependent gene expression of recombinant human tumor necrosis factor-β. Enzyme
Microb Technol 18: 126-132
Chaveroux C, Lambert-Langlais S, Cherasse Y, Averous J, Parry L, Carraro V, Jousse
C, Maurin A-C, Bruhat A, Fafournoux P (2010) Molecular mechanisms involved in the
adaptation to amino acid limitation in mammals. Biochimie 92(7): 736-745
Chaya M, Soon Hye P, Joo Young C, Gyun Min L (2007) Effect of doxycycline-
regulated protein disulfide isomerase expression on the specific productivity of
recombinant CHO cells: Thrombopoietin and antibody. Biotechnol Bioeng 98(3): 611-
615
Chaya M, Yeon-Gu K, Jane K, Gyun Min L (2008) Assessment of cell engineering
strategies for improved therapeutic protein production in CHO cells. Biotechnology
Journal 3(5): 624-630
Chen BP, Wolfgang CD, Hai T (1996) Analysis of ATF3, a transcription factor induced
by physiological stresses and modulated by gadd153/Chop10. Mol Cell Biol 16(3):
1157-1168
Cherasse C, Chaveroux C, Jousse AC, Maurin V, Carraro L, Parry P, Bruhat A (2008)
Role of repressor JDP2 in the amino acid-regulated transcription of CHOP. Febs Lett
582 1537-154
Chen H, Pan Y-X, Dudenhausen EE, Kilberg MS (2004) Amino Acid Deprivation
Induces the Transcription Rate of the Human Asparagine Synthetase Gene through a
Timed Program of Expression and Promoter Binding of Nutrient-responsive Basic
Region/Leucine Zipper Transcription Factors as Well as Localized Histone Acetylation.
J Biol Chem 279(49): 50829-50839
Chirino AJ, Mire-Sluis A (2004) Characterizing biological products and assessing
comparability following manufacturing changes. Nat Biotech 22(11): 1383-1391
Choi JH, Lee SY (2004) Secretory and extracellular production of recombinant proteins
using Escherichia coli. Applied Microbiology and Biotechnology 64(5): 625-635
Choi Y, Lee D, Kim I, Kim H, Park H, Choe T, Kim I-H (2007) Enhancement of
erythropoietin production in recombinant Chinese hamster ovary cells by sodium lactate
addition. Biotechnology and Bioprocess Engineering 12(1): 60-72
Chong WPK, Reddy SG, Yusufi FNK, Lee D-Y, Wong NSC, Heng CK, Yap MGS, Ho
YS (2010) Metabolomics-driven approach for the improvement of Chinese hamster
ovary cell growth: Overexpression of malate dehydrogenase II. J Biotechnol 147(2):
116-121
Chusainow J, Yang YS, Yeo J, H. M. , Toh PC, Asvadi P, Wong N, S. C. , Yap M, G.
S. (2009) A study of monoclonal antibody-producing CHO cell lines: What makes a
stable high producer? Biotechnology and Bioengineering 102(4): 1182-1196

305
Cost GJ, Freyvert Y, Vafiadis A, Santiago Y, Miller JC, Rebar E, Collingwood T, N,
Snowden A, Gregory PD (2009) BAK and BAX deletion using zinc-finger nucleases
yields apoptosis-resistant CHO cells. Biotechnol Bioeng 105(2): 330-340
Cox JS, Shamu CE, Walter P (1993) Transcriptional induction of genes encoding
endoplasmic reticulum resident proteins requires a transmembrane protein kinase. Cell
73(6): 1197-1206
Cox JS, Walter P (1996) A Novel Mechanism for Regulating Activity of a Transcription
Factor That Controls the Unfolded Protein Response Cell 87(3): 391-404
Crucell (2010) http://crucell.com/
Cudna RE, Dickson AJ (2003) Endoplasmic reticulum signaling as a determinant of
recombinant protein expression. Biotechnol Bioeng 81(1): 56-65
Cumming DA (1991) Glycosylation of recombinant protein therapeutics: control and
functional implications. Glycobiology 1(2): 115-130
Dai Y, Grant S (2003) Cyclin-dependent kinase inhibitors. Current Opinion in
Pharmacology 3(4): 362-370
Daniell H, Streatfield SJ, Wycoff K (2001) Medical molecular farming: production of
antibodies, biopharmaceuticals and edible vaccines in plants. Trends in Plant Science
6(5): 219-226
Darzynkiewicz Z, Gong J, Juan G, Ardelt B, Traganos F (1996) Cytometry of cyclin
proteins. Cytometry 25(1): 1-13
Darzynkiewicz Z, Sharpless T, Staiano-Coico L, Melamed MR. (1980a)
Subcompartments of the G1 phase of cell cycle detected by flow cytometry.
Darzynkiewicz Z, Traganos F, Melamed M, R. (1980b) New cell cycle compartments
identified by multiparameter flow cytometry. Cytometry 1(2): 98-108
Davies SL, James DC (2009) Engineering Mammalian Cells for Recombinant
Monoclonal Antibody Production. In Cell Line Development, pp 153-173.
Davis T, Wickham T, McKenna K, Granados R, Shuler M, Wood H (1993)
Comparative recombinant protein production of eight insect cell lines. In Vitro Cellular
& Developmental Biology - Animal 29(5): 388-390
Demain AL, Vaishnav P (2009) Production of recombinant proteins by microbes and
higher organisms. Biotechnology Advances 27(3): 297-306
Demeshkina N, Hirokawa G, Kaji A, Kaji H. (2007) Novel activity of eukaryotic
translocase, eEF2: dissociation of the 80S ribosome into subunits with ATP but not with
GTP. Oxford University Press.
Derouazi M, Martinet D, Besuchet Schmutz N, Flaction R, Wicht M, Bertschinger M,
Hacker DL, Beckmann JS, Wurm FM (2006) Genetic characterization of CHO

306
production host DG44 and derivative recombinant cell lines. Biochemical and
Biophysical Research Communications 340(4): 1069-1077
deZengotita VM, Miller WM, Aunins JG, Zhou W (2000) Phosphate feeding improves
high-cell-concentration NS0 myeloma culture performance for monoclonal antibody
production. Biotechnol Bioeng 69(5): 566-576
Ding W-X, Ni H-M, Gao W, Yoshimori T, Stolz DB, Ron D, Yin X-M (2007) Linking
of Autophagy to Ubiquitin-Proteasome System Is Important for the Regulation of
Endoplasmic Reticulum Stress and Cell Viability. Am J Pathol 171(2): 513-524
Dinnis DM, James DC (2005) Engineering mammalian cell factories for improved
recombinant monoclonal antibody production: lessons from nature? Biotechnol Bioeng
91(2): 180-189
Doench JG, Petersen CP, Sharp PA (2003) siRNAs can function as miRNAs. Genes
Dev 17(4): 438-442
Dooley CT, Dore TM, Hanson GT, Jackson WC, Remington SJ, Tsien RY (2004)
Imaging Dynamic Redox Changes in Mammalian Cells with Green Fluorescent Protein
Indicators. J Biol Chem 279(21): 22284-22293
Dorner AJ, Wasley LC, Kaufman RJ. (1992) Overexpression of GRP78 mitigates stress
induction of glucose regulated proteins and blocks secretion of selective proteins in
Chinese hamster ovary cells. EMBO J 11(4) 1563-1571
Duchen MR (2000) Mitochondria and calcium: from cell signalling to cell death. The
Journal of Physiology 529(1): 57-68
Dutton RL, Scharer J, Moo Young M (2006) Cell cycle phase dependent productivity of
a recombinant chinese hamster ovary cell line. Cytotechnology 52: 55-69
Dyson N (1998) The regulation of E2F by pRB-family proteins. Genes Dev 12(15):
2245-2262
Eldering JA, Felten C, Veilleux CA, Potts BJ (2004) Development of a PCR method for
mycoplasma testing of Chinese hamster ovary cell cultures used in the manufacture of
recombinant therapeutic proteins. Biologicals 32(4): 183-193
Ellgaard L, Helenius A (2001) ER quality control: towards an understanding at the
molecular level. Current Opinion in Cell Biology 13(4): 431-437
Ellgaard L, Helenius A (2003) Quality control in the endoplasmic reticulum. Nat Rev
Mol Cell Biol 4(3): 181-191
Ellis GK, Bone HG, Chlebowski R, Paul D, Spadafora S, Smith J, Fan M, Jun S (2008)
Randomized Trial of Denosumab in Patients Receiving Adjuvant Aromatase Inhibitors
for Nonmetastatic Breast Cancer. J Clin Oncol 26(30): 4875-4882
Fallaux FJ, Bout A, van der Velde I, van den Wollenberg DJM, Hehir KM, Keegan J,
Auger C, Cramer SJ, van Ormondt H, van der Eb AJ, Valerio D, Hoeben RC (1998)
New Helper Cells and Matched Early Region 1-Deleted Adenovirus Vectors Prevent

307
Generation of Replication-Competent Adenoviruses. Human Gene Therapy 9(13):
1909-1917
Fang S, Ferrone M, Yang C, Jensen JP, Tiwari S, Weissman AM (2001) The tumor
autocrine motility factor receptor, gp78, is a ubiquitin protein ligase implicated in
degradation from the endoplasmic reticulum. PNAS USA 98(25): 14422-14427
Fann CH, Guirgis F, Chen G, Lao MS, Piret JM (2000) Limitations to the amplification
and stability of human tissue-type plasminogen activator expression by Chinese hamster
ovary cells. Biotechnol Bioeng 69(2): 204-212
Fawcett TW, Martindale JL, Guyton KZ, Hai T, Holbrook NJ (1999) Complexes
containing activating transcription factor (ATF)/cAMP-responsive-element-binding
protein (CREB) interact with the CCAAT/enhancer-binding protein (C/EBP)-ATF
composite site to regulate Gadd153 expression during the stress response. Biochem J
339 ( Pt 1): 135-141
Fels D, Bi M, Naczki C, Koritzinsky M, Wouters BG, Koumenis C (2005) Activation of
the Integrated Stress Response (ISR) is required for adaptation of tumor cells to hypoxic
stress and contributes to tumor growth. AACR Meeting Abstracts 2005(1): 884-a-
Filipowicz W, Bhattacharyya SN, Sonenberg N (2008) Mechanisms of post-
transcriptional regulation by microRNAs: are the answers in sight? Nat Rev Genet 9(2):
102-114
Fingar DC, Blenis J (2004) Target of rapamycin (TOR): an integrator of nutrient and
growth factor signals and coordinator of cell growth and cell cycle progression.
Oncogene 23(18): 3151-3171
Fingar DC, Richardson CJ, Tee AR, Cheatham L, Tsou C, Blenis J (2004) mTOR
Controls Cell Cycle Progression through Its Cell Growth Effectors S6K1 and 4E-
BP1/Eukaryotic Translation Initiation Factor 4E. Mol Cell Biol 24(1): 200-216
Fiore M, Degrassi F (1999) Dimethyl Sulfoxide Restores Contact Inhibition-Induced
Growth Arrest and Inhibits Cell Density-Dependent Apoptosis in Hamster Cells. Exp
Cell Res 251(1): 102-110
Fiore M, Zanier R, Degrassi F (2002) Reversible G(1) arrest by dimethyl sulfoxide as a
new method to synchronize Chinese hamster cells. Mutagenesis 17(5): 419-424
Frand AR, Kaiser CA (1999) Ero1p oxidizes protein disulfide isomerase in a pathway
for disulfide bond formation in the endoplasmic reticulum. Mol Cell 4(4): 469-477
Fraser CS, Doudna JA (2007) Structural and mechanistic insights into hepatitis C viral
translation initiation. Nat Rev Micro 5(1): 29-38
Frickel EM, Riek R, Jelesarov I, Helenius A, Wuthrich K, Ellgaard L (2002) TROSY-
NMR reveals interaction between ERp57 and the tip of the calreticulin P-domain. PNAS
USA 99(4): 1954-1959
Galfre G, Milstein C (1981) Preparation of monoclonal antibodies: strategies and
procedures. Methods Enzymol 73(Pt B): 3-46

308
Gammell P, Barron N, Kumar N, Clynes M (2007) Initial identification of low
temperature and culture stage induction of miRNA expression in suspension CHO-K1
cells. J Biotechnol 130(3): 213-218
Gerdes J, Schwab U, Lemke H, Stein H (1983) Production of a mouse monoclonal
antibody reactive with a human nuclear antigen associated with cell proliferation.
International Journal of Cancer 31(1): 13-20
Gerngross TU (2004) Advances in the production of human therapeutic proteins in
yeasts and filamentous fungi. Nat Biotech 22(11): 1409-1414
Gingras A-C, Raught B, Sonenberg N (1999) eIF4 INITIATION FACTORS: Effectors
of mRNA Recruitment to Ribosomes and Regulators of Translation. Annual Review of
Biochemistry 68(1): 913-963
Goldberg AL (2003) Protein degradation and protection against misfolded or damaged
proteins. Nature 426(6968): 895-899
Gong SS, Guerrini L, Basilico C (1991) Regulation of asparagine synthetase gene
expression by amino acid starvation. Mol Cell Biol 11(12): 6059-6066
Goudar C, Biener R, Boisart C, Heidemann R, Piret J, de Graaf A, Konstantinov K
(2009) Metabolic flux analysis of CHO cells in perfusion culture by metabolite
balancing and 2D [13C, 1H] COSY NMR spectroscopy. Metabolic Engineering 12(2):
138-149
Gregory CF, Jan P, Mark TF, James ER. (1991) Peptide-binding specificity of the
molecular chaperone BiP. Nature Publishing Group.
Griffiths EJ, Rutter GA (2009) Mitochondrial calcium as a key regulator of
mitochondrial ATP production in mammalian cells. Biochimica et Biophysica Acta
(BBA) - Bioenergetics 1787(11): 1324-1333
Gu MB, Tood P, Kompala DS (1996) Cell cycle analysis of foreign gene (b-
galactosidase) expression in recombinant mouse cells under the control of mouse
mammary tumor virus promoter. Biotechnol Bioeng 50: 229-237
Guerrini L, Gong SS, Mangasarian K, Basilico C (1993) Cis- and trans-acting elements
involved in amino acid regulation of asparagine synthetase gene expression. Mol Cell
Biol 13(6): 3202-3212
ICH Guidelines (1996) Quality of Biotechnological Products: Analysis of the
expression construct in cells used for the production of r-DNA derived from protein
products.
Imani S-I (2009) The NAD World: A new systemic regulatory network for metabolism
and aging - Sirt1, systemic NAD biosynthesis, and their importance. Cell Biochemistry
and Biophysics 53(2): 65-74
Ha HC, Snyder SH (1999) Poly(ADP-ribose) polymerase is a mediator of necrotic cell
death by ATP depletion. PNSA USA 96(24): 13978-13982

309
Haas IG, Wabl M (1983) Immunoglobulin heavy chain binding protein. Nature
306(5941): 387-389
Hamilton AJ, Baulcombe DC (1999) A Species of Small Antisense RNA in
Posttranscriptional Gene Silencing in Plants. Science 286(5441): 950-952
Hamilton SR, Davidson RC, Sethuraman N, Nett JH, Jiang Y, Rios S, Bobrowicz P,
Stadheim TA, Li H, Choi B-K, Hopkins D, Wischnewski H, Roser J, Mitchell T,
Strawbridge RR, Hoopes J, Wildt S, Gerngross TU (2006) Humanization of Yeast to
Produce Complex Terminally Sialylated Glycoproteins. Science 313(5792): 1441-1443
Hammond C, Braakman I, Helenius A (1994) Role of N-linked oligosaccharide
recognition, glucose trimming, and calnexin in glycoprotein folding and quality control.
Proceedings of the National Academy of Sciences of the United States of America 91(3):
913-917
Hammond SM, Bernstein E, Beach D, Hannon GJ (2000) An RNA-directed nuclease
mediates post-transcriptional gene silencing in Drosophila cells. Nature 404(6775):
293-296
Hansen R, Dickson AJ, Goodacre R, Stephens GM, Sellick CA (2010) Rapid
characterisation of N-linked glycans from secreted and gel-purified monoclonal
antibodies using MALDI-ToF mass spectroscopy. Biotechol and Bioengin: DOI:
10.1002/bit22879
Harding HP, Calfon M, Urano F, Novoa I, Ron D (2002) Transcriptional and
translational control in the Mammalian unfolded protein response. Annu Rev Cell Dev
Biol 18: 575-599
Harding HP, Novoa I, Zhang Y, Zeng H, Wek R, Schapira M, Ron D (2000a) Regulated
translation initiation controls stress-induced gene expression in mammalian cells. Mol
Cell 6(5): 1099-1108
Harding HP, Ron D (2002) Endoplasmic Reticulum Stress and the Development of
Diabetes. Diabetes 51(suppl 3): S455-S461
Harding HP, Zhang Y, Bertolotti A, Zeng H, Ron D (2000b) Perk is essential for
translational regulation and cell survival during the unfolded protein response. Mol Cell
5(5): 897-904
Harding HP, Zhang Y, Ron D (1999) Protein translation and folding are coupled by an
endoplasmic-reticulum-resident kinase. Nature 397(6716): 271-274
Harding HP, Zhang Y, Zeng H, Novoa I, Lu PD, Calfon M, Sadri N, Yun C, Popko B,
Paules R, Stojdl DF, Bell JC, Hettmann T, Leiden JM, Ron D (2003) An Integrated
Stress Response Regulates Amino Acid Metabolism and Resistance to Oxidative Stress.
Molecular Cell 11(3): 619-633
Hashimoto Y, Zhang C, Kawauchi J, Imoto I, Adachi MT, Inazawa J, Amagasa T, Hai
T, Kitajima S (2002) An alternatively spliced isoform of transcriptional repressor ATF3
and its induction by stress stimuli. Nucl Acids Res 30(11): 2398-2406

310
Hay N, Sonenberg N. (2004) Upstream and downstream of mTOR. Genes & Dev 18:
1926-1945
Hayes NVL, Smales CM, Klappa P (2010) Protein disulfide isomerase does not control
recombinant IgG4 productivity in mammalian cell lines. Biotechnol Bioeng 105(4):
770-779
Hayter PM, Curling EMA, Baines AJ, Jenkins N, Salmon I, Strange P, Tong JM, Bull
AT. (1992) Glucose-limited chemostat culture of chinese hamster ovary cells producing
recombinant human interferon-gamma. Biotechnol Bioengin 39(3): 327-335
Hayter PM, Curling EMA, Baines AJ, Jenkins N, Salmon I, Strange PG, Bull AT
(1991) Chinese hamster ovary cell growth and interferon production kinetics in stirred
batch culture. Applied Microbiology and Biotechnology 34(5): 559-564
Haze K, Yoshida H, Yanagi H, Yura T, Mori K (1999) Mammalian Transcription
Factor ATF6 Is Synthesized as a Transmembrane Protein and Activated by Proteolysis
in Response to Endoplasmic Reticulum Stress. Mol Biol Cell 10(11): 3787-3799
Helenius A, Aebi M (2001) Intracellular Functions of N-Linked Glycans. Science
291(5512): 2364-2369
Helenius A, Marquardt T, Braakman I (1992) The endoplasmic reticulum as a protein-
folding compartment. Trends in Cell Biology 2(8): 227-231
Hendershot L, Bole D, Kohler G, Kearney JF (1987) Assembly and secretion of heavy
chains that do not associate posttranslationally with immunoglobulin heavy chain-
binding protein. J Cell Biol 104(3): 761-767
Hendershot LM (2004) The ER function BiP is a master regulator of ER function. Mt
Sinai J Med 71(5): 289-297
Hetz C, Bernasconi P, Fisher J, Lee A-H, Bassik MC, Antonsson B, Brandt GS,
Iwakoshi NN, Schinzel A, Glimcher LH, Korsmeyer SJ (2006) Proapoptotic BAX and
BAK Modulate the Unfolded Protein Response by a Direct Interaction with IRE1α.
Science 312(5773): 572-576
Hinnebusch AG (2005) Translation regulation of GCN4 and the generation amino acid
control of yeast. Annual Review of Microbiology 59: 407-450
Hochegger H, Takeda S, Hunt T (2008) Cyclin-dependent kinases and cell-cycle
transitions: does one fit all? Nat Rev Mol Cell Biol 9(11): 910-916
Holland M, Yagi H, Takahashi N, Kato K, Savage COS, Goodall DM, Jefferis R (2006)
Differential glycosylation of polyclonal IgG, IgG-Fc and IgG-Fab isolated from the sera
of patients with ANCA-associated systemic vasculitis. Biochimica et Biophysica Acta
(BBA) 1760(4): 669-677
Holt LJ, Herring C, Jespers LS, Woolven BP, Tomlinson IM (2003) Domain antibodies:
proteins for therapy. Trends in Biotechnology 21(11): 484-490

311
Hong L, Schroth GP, Matthews HR, Yau P, Bradbury EM (1993) Studies of the DNA
binding properties of histone H4 amino terminus. Thermal denaturation studies reveal
that acetylation markedly reduces the binding constant of the H4 "tail" to DNA. J Biol
Chem 268(1): 305-314
Hosokawa N, Wada I, Hasegawa K, Yorihuzi T, Tremblay LO, Herscovics A, Nagata K
(2001) A novel ER alpha-mannosidase-like protein accelerates ER-associated
degradation. EMBO Rep 2(5): 415-422
Houdebine L-M (2009) Production of pharmaceutical proteins by transgenic animals.
Comparative Immunology, Microbiology and Infectious Diseases 32(2): 107-121
Huang EP, Marquis CP, Gray PP (2004) Process development for a recombinant
Chinese hamster ovary (CHO) cell line utilizing a metal induced and amplified
metallothionein expression system. Biotechnol Bioeng 88(4): 437-450
Huang Y, Li Y, Wang YG, Gu X, Wang Y, Shen BF (2007) An efficient and targeted
gene integration system for high-level antibody expression. Journal of Immunological
Methods 322(1-2): 28-39
Hutson RG, Kitoh T, Moraga Amador DA, Cosic S, Schuster SM, Kilberg MS (1997)
Amino acid control of asparagine synthetase: relation to asparaginase resistance in
human leukemia cells. Am J Physiol 272: C1691-C1699
Hwang SO, Lee GM (2008) Nutrient deprivation induces autophagy as well as
apoptosis in Chinese hamster ovary cell culture. Biotechnology and Bioengineering
99(3): 678-685
Irani N, Beccaria AJ, Wagner R (2002) Expression of recombinant cytoplasmic yeast
pyruvate carboxylase for the improvement of the production of human erythropoietin by
recombinant BHK-21 cells. J Biotechnol 93(3): 269-282
Izyumov DS, Avetisyan AV, Pletjushkina OY, Sakharov DV, Wirtz KW, Chernyak BV,
Skulachev VP (2004) "Wages of Fear": transient threefold decrease in intracellular ATP
level imposes apoptosis. Biochimica et Biophysica Acta (BBA) - Bioenergetics 1658(1-
2): 141-147
Jayapal KR, Wlaschin KF, Hu WS, Yap MGS (2007) Recombinant protein therapeutics
from CHO cells - 20 years and counting. Chem Eng Prog 103(10): 40-47
Jefferis R (2005) Glycosylation of Recombinant Antibody Therapeutics. Biotechnology
Progress 21(1): 11-16
Jefferis R (2007) Antibody therapeutics. Expert Opinion on Biological Therapy 7(9):
1401-1413
Jefferis R (2009a) Glycosylation as a strategy to improve antibody-based therapeutics.
Nat Rev Drug Discov 8(3): 226-234
Jefferis R (2009b) Recombinant antibody therapeutics: the impact of glycosylation on
mechanisms of action. Trends in Pharmacological Sciences 30(7): 356-362

312
Jenkins N (2007) Modifications of therapeutic proteins: challenges and prospects.
Cytotechnology 53(1): 121-125
Jenkins N, Parekh RB, James DC (1996) Getting the glycosylation right: Implications
for the biotechnology industry. Nat Biotech 14(8): 975-981
Jeong D-W, Cho I, Kim T, Bae G, Kim I-H, Kim I (2006) Effects of lactate
dehydrogenase suppression and glycerol-3-phosphate dehydrogenase overexpression on
cellular metabolism. Molecular and Cellular Biochemistry 284(1): 1-8
Jeong D-W, Kim T-S, Cho IT, Kim IY (2004) Modification of glycolysis affects cell
sensitivity to apoptosis induced by oxidative stress and mediated by mitochondria.
Biochemical and Biophysical Research Communications 313(4): 984-991
Jiang Z, Huang Y, Sharfstein ST (2006) Regulation of recombinant monoclonal
antibody production in chinese hamster ovary cells: a comparative study of gene copy
number, mRNA level, and protein expression. Biotechnology progress 22(1): 313-318
Jiang Z, Sharfstein S, T. (2008) Sodium butyrate stimulates monoclonal antibody over-
expression in CHO cells by improving gene accessibility. Biotechnology and
Bioengineering 100(1): 189-194
Jin C, Ugai H, Song J, Murata T, Sun K, Horikoshi M, Yokoyama KK (2001)
Identification of mouse Jun dimerization protein 2 as a novel repressor of ATF-2. Febs
Lett 489(1): 34-41
Jones PL, Wolffe AP (1999) Relationships between chromatin organization and DNA
methylation in determining gene expression. Semin Cancer Biol 9(5): 339-347
Jun SC, Kim MS, Hong HJ, Lee GM (2006) Limitations to the Development of
Humanized Antibody Producing Chinese Hamster Ovary Cells Using Glutamine
Synthetase-Mediated Gene Amplification. Biotechnology Progress 22(3): 770-780
Kanehara K, Kawaguchi S, Ng DTW (2007) The EDEM and Yos9p families of lectin-
like ERAD factors. Seminars in Cell & Developmental Biology 18(6): 743-750
Kang S-W, Hegde RS (2008) Lighting Up the Stressed ER. Cell 135(5): 787-789
Kao F-T, Puck TT (1967) Genetics of somatic mamalian cells IV. Genetics 55(3): 513-
524
Kao FT, Puck TT (1969) Genetics of somatic mammalian cells. IX. Quantitation of
mutagenesis by physical and chemical agents. Journal of Cellular Physiology 74(3):
245-257
Karupiah G, Chaudhri G (2004) IMMUNOLOGY, INFECTION, AND IMMUNITY.
Immunol Cell Biol 82(6): 651-651
Kaufman RJ (1990) Vectors used for expression in mammalian cells. Methods Enzymol
185: 487-511

313
Kaufman RJ (2002) Orchestrating the unfolded protein response in health and disease. J
Clin Invest 110(10): 1389-1398
Kaufman RJ, Scheuner D, Schroder M, Shen X, Lee K, Liu CY, Arnold SM (2002) The
unfolded protein response in nutrient sensing and differentiation. Nat Rev Mol Cell Biol
3(6): 411-421
Keating MJ, Dritselis A, Yasothan U, Kirkpatrick P (2010) Ofatumumab. Nat Rev Drug
Discov 9(2): 101-102
Kennard ML, Goosney DL, Monteith D, Zhang L, Moffat M, Fischer D, Mott J (2009)
The generation of stable, high MAb expressing CHO cell lines based on the artificial
chromosome expression (ACE) technology. Biotechnol Bioeng 104(3): 540-553
Keränen S, Penttilä M (1995) Production of recombinant proteins in the filamentous
fungus Trichoderma reesei. Curr Opin Biotechnol 6(5): 534-537
Kim JM, Kim JS, Park DH, Kang HS, Yoon J, Baek K, Yoon Y (2004) Improved
recombinant gene expression in CHO cells using matrix attachment regions. J
Biotechnol 107(2): 95-105
Kim NS, Kim SJ, Lee GM (1998) Clonal variability within dihydrofolate reductase-
mediated gene amplified Chinese hamster ovary cells: stability in the absence of
selective pressure. Biotechnol Bioeng 60(6): 679-688
Kim NS, Lee GM (2000) Overexpression of bcl-2 inhibits sodium butyrate-induced
apoptosis in Chinese hamster ovary cells resulting in enhanced humanized antibody
production. Biotechnol Bioengin 71(3): 184-193
Kim R, Emi M, Tanabe K, Murakami S (2006) Role of the unfolded protein response in
cell death. Apoptosis 11(1): 5-13
Kim S, Lee G (2007) Down-regulation of lactate dehydrogenase-A by siRNAs for
reduced lactic acid formation of Chinese hamster ovary cells producing thrombopoietin.
Applied Microbiology and Biotechnology 74(1): 152-159
Kim SJ, Lee GM (1999) Cytogenetic analysis of chimeric antibody-producing CHO
cells in the course of dihydrofolate reductase-mediated gene amplification and their
stability in the absence of selective pressure. Biotechnol Bioengin 64(6): 741-749
Kim Y-G, Kim JY, Mohan C, Lee GM (2009) Effect of Bcl-x overexpression on
apoptosis and autophagy in recombinant Chinese hamster ovary cells under nutrient-
deprived condition. Biotechnol Bioengin 103(4): 757-766
Kimball SR, Jefferson LS (2004) Molecular mechanisms through which amino acids
mediate signaling through the mammalian target of rapamycin. Current Opinion in
Clinical Nutrition & Metabolic Care 7(1): 39-44
Kitagawa M, Higashi H, Jung HK, Suzuki-Takahashi I, Ikeda M, Tamai K, Kato J,
Segawa K, Yoshida E, Nishimura S, Taya Y. (1996) The consensus motif for

314
phosphorylation by cyclin D1-Cdk4 is different from that for phosphorylation by cyclin
A/E-Cdk2.
Kito M, Itami S, Fukano Y, Yamana K, Shibui, Shibui T (2002) Construction of
engineered CHO strains for high-level production of recombinant proteins. Applied
Microbiology and Biotechnology 60(4): 442-448
Kochanowski N, Blanchard F, Cacan R, Chirat F, Guedon E, Marc A, Goergen JL
(2008) Influence of intracellular nucleotide and nucleotide sugar contents on
recombinant interferon-γ glycosylation during batch and fed-batch cultures of CHO
cells. Biotechnol Bioeng 100(4): 721-733
Kondo M, Yamaoka T, Honda S, Miwa Y, Katashima R, Moritani M, Yoshimoto K,
Hayashi Y, Itakura M (2000) The Rate of Cell Growth Is Regulated by Purine
Biosynthesis via ATP Production and G1 to S Phase Transition. J Biochem 128(1): 57-
64
Kornberg RD, Lorch Y (1999) Twenty-Five Years of the Nucleosome, Fundamental
Particle of the Eukaryote Chromosome. Cell 98(3): 285-294
Kost TA, Condreay JP (1999) Recombinant baculoviruses as expression vectors for
insect and mammalian cells. Curr Opin Biotechnol 10(5): 428-433
Kouzarides T (2000) Acetylation: a regulatory modification to rival phosphorylation?
Embo J 19(6): 1176-1179
Kromenaker SJ, Srienc F (1991) Cell-cycle-dependent protein accumulation by
producer and nonproducer murine hybridome cell lines: A population analysis
Biotechnol Bioeng 28: 665-677
Ku SC, Ng DT, Yap MG, Chao SH (2008) Effects of overexpression of X-box binding
protein 1 on recombinant protein production in Chinese hamster ovary and NS0
myeloma cells. Biotechnol Bioeng 99(1): 155-164
Kubbies M, Stockinger H (1990) Cell cycle-dependent DHFR and t-PA production in
cotransfected, MTX-amplified CHO cells revealed by dual-laser flow cytometry. Exp
Cell Res 188(2): 267-271
Kutz D, Burg M (1998) Evolution of osmotic stress signaling via MAP kinase cascades.
J Exp Biol 201(22): 3015-3021
Kuwae S, Ohda T, Tamashima H, Miki H, Kobayashi K (2005) Development of a fed-
batch culture process for enhanced production of recombinant human antithrombin by
Chinese hamster ovary cells. J Biosci Bioeng 100(5): 502-510
Kuystermans D, Al-Rubeai M (2009) cMyc increases cell number through uncoupling
of cell division from cell size in CHO cells. BMC Biotechnology 9(1): 76
Larrick JW, Thomas DW (2001) Producing proteins in transgenic plants and animals.
Curr Opin Biotechnol 12(4): 411-418

315
Lavric V, Ofieru ID, Woinaroschy A (2005) A sensitivity analysis of the fed-batch
animal-cell bioreactor with respect to some control parameters. Biotechnol Appl
Biochem 41(Pt 1): 29-35
Ledford BE, Leno GH (1994) ADP-ribosylation of the molecular chaperone
GRP78/BiP. Molecular and Cellular Biochemistry 138(1): 141-148
Lee A-H, Iwakoshi NN, Glimcher LH (2003) XBP-1 Regulates a Subset of
Endoplasmic Reticulum Resident Chaperone Genes in the Unfolded Protein Response.
Mol Cell Biol 23(21): 7448-7459
Lee AS (1987) Coordinated regulation of a set of genes by glucose and calcium
ionophores in mammalian cells. Trends in Biochemical Sciences 12: 20-23
Lee AS (2001) The glucose-regulated proteins: stress induction and clinical
applications. Trends in Biochemical Sciences 26(8): 504-510
Lee C, J, Gargi S, Joni T, Robert WH (2009a) A clone screening method using mRNA
levels to determine specific productivity and product quality for monoclonal antibodies.
Biotechnology and Bioengineering 102(4): 1107-1118
Lee K, Tirasophon W, Shen X, Michalak M, Prywes R, Okada T, Yoshida H, Mori K,
Kaufman RJ (2002) IRE1-mediated unconventional mRNA splicing and S2P-mediated
ATF6 cleavage merge to regulate XBP1 in signaling the unfolded protein response.
Genes Dev 16(4): 452-466
Lee Y-Y, Cevallos RC, Jan E (2009b) An Upstream Open Reading Frame Regulates
Translation of GADD34 during Cellular Stresses That Induce eIF2α Phosphorylation.
Journal of Biological Chemistry 284(11): 6661-6673
Li H, Sethuraman N, Stadheim TA, Zha D, Prinz B, Ballew N, Bobrowicz P, Choi B-K,
Cook WJ, Cukan M, Houston-Cummings NR, Davidson R, Gong B, Hamilton SR,
Hoopes JP, Jiang Y, Kim N, Mansfield R, Nett JH, Rios S, Strawbridge R, Wildt S,
Gerngross TU (2006a) Optimization of humanized IgGs in glycoengineered Pichia
pastoris. Nat Biotech 24(2): 210-215
Li J, Holbrook NJ (2004) Elevated gadd153/chop expression and enhanced c-Jun N-
terminal protein kinase activation sensitizes aged cells to ER stress. Experimental
Gerontology 39(5): 735-744
Li J, Huang Z, Sun X, Yang P, Zhang Y (2006b) Understanding the enhanced effect of
dimethyl sulfoxide on hepatitis B surface antigen expression in the culture of Chinese
hamster ovary cells on the basis of proteome analysis. Enzyme and Microbial
Technology 38(3-4): 372-380
Li J, Ni M, Lee B, Barron E, Hinton DR, Lee AS (2008) The unfolded protein response
regulator GRP78/BiP is required for endoplasmic reticulum integrity and stress-induced
autophagy in mammalian cells. Cell Death Differ 15(9): 1460-1471
Li J, Sun X, Zhang Y (2006c) Improvement of hepatitis B surface antigen expression by
dimethyl sulfoxide in the culture of recombinant Chinese hamster ovary cells. Process
Biochemistry 41(2): 317-322

316
Lim A, Reed-Bogan A, Harmon BJ (2008) Glycosylation profiling of a therapeutic
recombinant monoclonal antibody with two N-linked glycosylation sites using liquid
chromatography coupled to a hybrid quadrupole time-of-flight mass spectrometer.
Analytical Biochemistry 375(2): 163-172
Lim SF, Chuan KH, Liu S, Loh SOH, Chung BYF, Ong CC, Song Z (2006) RNAi
suppression of Bax and Bak enhances viability in fed-batch cultures of CHO cells.
Metabolic Engineering 8(6): 509-522
Liu C-H, Chen L-H (2007a) Enhanced recombinant M-CSF production in CHO cells by
glycerol addition: model and validation. Cytotechnology 54(2): 89-96
Liu C-H, Chen L-H (2007b) Promotion of recombinant macrophage colony stimulating
factor production by dimethyl sulfoxide addition in Chinese hamster ovary cells.
Journal of Bioscience and Bioengineering 103(1): 45-49
Liu C-H, Chu IM, Hwang S-M (2001) Enhanced expression of various exogenous genes
in recombinant Chinese hamster ovary cells in presence of dimethyl sulfoxide.
Biotechnology Letters 23(20): 1641-1645
Liu CY, Schroder M, Kaufman RJ (2000) Ligand-independent dimerization activates
the stress response kinases IRE1 and PERK in the lumen of the endoplasmic reticulum.
J Biol Chem 275(32): 24881-24885
Llewellyn DH, Kendall JM, Sheikh FN, Campbell AK (1996) Induction of calreticulin
expression in HeLa cells by depletion of the endoplasmic reticulum Ca2+ store and
inhibition of N-linked glycosylation. Biochem J 318(2): 555-560
Lloyd DR, Al-Rubeai M (1999) Cell cycle, New York: John Wiley and Sons.
Lloyd DR, Holmes P, Jackson L, P., Emery AN, Mohamed AR (2000) Relationship
between cell size, cell cycle and specific recombinant protein productivity.
Cytotechnology 34: 59-70
Lodish H, Berk A, Matsudaira P, Kaiser CA, Krieger M, Scott MP, Zipursky SL,
Darnell J (2004) Molecular Cell Biology, 5 edn. New York: WH Freeman.
Lonberg N (2005) Human antibodies from transgenic animals. Nat Biotech 23(9): 1117-
1125
Lonberg N (2008) Fully human antibodies from transgenic mouse and phage display
platforms. Current Opinion in Immunology 20(4): 450-459
Lonza (2010) http://www.lonza.com/
Lu PD, Harding HP, Ron D (2004) Translation reinitiation at alternative open reading
frames regulates gene expression in an integrated stress response. The Journal of Cell
Biology 167(1): 27-33
Lu S, Sun X, Zhang Y (2005) Insight into metabolism of CHO cells at low glucose
concentration on the basis of the determination of intracellular metabolites. Process
Biochemistry 40(5): 1917-1921

317
Luger K, Mader AW, Richmond RK, Sargent DF, Richmond TJ (1997) Crystal
structure of the nucleosome core particle at 2.8A resolution. Nature 389(6648): 251-260
Ma, Ningning., Ellet J, Okediadi C, Hermes P, McCormick E, Casnocha S (2009) A
single nutrient feed supports both chemically defined NS0 and CHO fed-batch
processes: Improved productivity and lactate metabolism. Biotechnology Progress
25(5): 1353-1363
Ma Y, Brewer JW, Alan Diehl J, Hendershot LM (2002) Two Distinct Stress Signaling
Pathways Converge Upon the CHOP Promoter During the Mammalian Unfolded
Protein Response. Journal of Molecular Biology 318(5): 1351-1365
Ma Y, Hendershot LM (2003) Delineation of a Negative Feedback Regulatory Loop
That Controls Protein Translation during Endoplasmic Reticulum Stress. Journal of
Biological Chemistry 278(37): 34864-34873
Ma Y, Hendershot LM (2004) The role of the unfolded protein response in tumour
development: friend or foe? Nat Rev Cancer 4(12): 966-977
Ma Z, Yi X, Zhang Y (2008) Enhanced intracellular accumulation of recombinant
HBsAg in CHO cells by dimethyl sulfoxide. Process Biochemistry 43(6): 690-695
Majors B, S., Betenbaugh M, J. , Pederson N, E. , Chiang G, G. (2009) Mcl-1
overexpression leads to higher viabilities and increased production of humanized
monoclonal antibody in Chinese hamster ovary cells. Biotechnology Progress 25(4):
1161-1168
Malhotra J, Miao H, Zhang K, Wolfson A, Pennathur S, Pipe S, Kaufman R (2008)
Antioxidants reduce endoplasmic reticulum stress and improve protein secretion. PNAS
105(47): 18525-18530
Marchant R, Al-Fageeh M, Underhill M, Racher A, Smales C (2008) Metabolic Rates,
Growth Phase, and mRNA Levels Influence Cell-Specific Antibody Production Levels
from In Vitro-Cultured Mammalian Cells at Sub-Physiological Temperatures.
Molecular Biotechnology 39(1): 69-77
Masciarelli S, Sitia R (2008) Building and operating an antibody factory: Redox control
during B to plasma cell terminal differentiation. Biochimica et Biophysica Acta (BBA) -
Molecular Cell Research 1783(4): 578-588
Mastrangelo AJ, Hardwick JM, Zou S, Betenbaugh MJ (2000) Part II. Overexpression
of bcl-2 family members enhances survival of mammalian cells in response to various
culture insults. Biotechnol Bioeng 67(5): 555-564
Mayer M, Kies U, Kammermeier R, Buchner J (2000) BiP and PDI Cooperate in the
Oxidative Folding of Antibodiesin Vitro. Journal of Biological Chemistry 275(38):
29421-29425
Mazur X, Fussenegger M, Renner WA, Bailey JE (1998) Higher productivity of
growth-arrested Chinese hamster ovary cells expressing the cyclin-dependent kinase
inhibitor p27. Biotechnol Progress 14(5);705-13

318
McClung MR, Lewiecki EM, Cohen SB, Bolognese MA, Woodson GC, Moffett AH,
Peacock M, Miller PD, Lederman SN, Chesnut CH, Lain D, Kivitz AJ, Holloway DL,
Zhang C, Peterson MC, Bekker PJ, the AMGBLSG (2006) Denosumab in
Postmenopausal Women with Low Bone Mineral Density. N Engl J Med 354(8): 821-
831
McCullough KD, Martindale JL, Klotz L-O, Aw T-Y, Holbrook NJ (2001) Gadd153
Sensitizes Cells to Endoplasmic Reticulum Stress by Down-Regulating Bcl2 and
Perturbing the Cellular Redox State. Mol Cell Biol 21(4): 1249-1259
McManus MT, Sharp PA (2002) Gene silencing in mammals by small interfering
RNAs. Nat Rev Genet 3(10): 737-747
Mead EJ, Chiverton LM, Smales CM, von der Haar T (2009) Identification of the
limitations on recombinant gene expression in CHO cell lines with varying luciferase
production rates. Biotechnology and Bioengineering 102(6): 1593-1602
Meents H, Enenkel B, Eppenberger HM, Werner RG, Fussenegger M (2002) Impact of
coexpression and coamplification of sICAM and antiapoptosis determinants bcl-2/bcl-
x(L) on productivity, cell survival, and mitochondria number in CHO-DG44 grown in
suspension and serum-free media. Biotechnol Bioeng 80(6): 706-716
Meister A (1976) [Enzymology and function of the gamma-glutamyl moiety (author's
transl)]. Seikagaku 48(3): 155-166
Merksamer PI, Papa FR (2010) The UPR and cell fate at a glance. J Cell Sci 123(7):
1003-1006
Merksamer PI, Trusina A, Papa FR (2008) Real-Time Redox Measurements during
Endoplasmic Reticulum Stress Reveal Interlinked Protein Folding Functions. Cell
135(5): 933-947
Meusser B, Hirsch C, Jarosch E, Sommer T (2005) ERAD: the long road to destruction.
Nat Cell Biol 7(8): 766-772
Meyerson M, Harlow E (1994) Identification of G1 kinase activity for cdk6, a novel
cyclin D partner. Mol Cell Biol 14(3): 2077-2086
Mezghrani A, Fassio A, Benham A, Simmen T, Braakman I, Sitia R (2001)
Manipulation of oxidative protein folding and PDI redox state in mammalian cells.
EMBO J 20(22): 6288-6296
Mohan C, Lee GM (2010) Effect of inducible co-overexpression of protein disulfide
isomerase and endoplasmic reticulum oxidoreductase on the specific antibody
productivity of recombinant Chinese hamster ovary cells. Biotechnology and
Bioengineering 107(2): 337-346
Mohan C, Park SH, Chung JY, Lee GM (2007) Effect of doxycycline-regulated protein
disulfide isomerase expression on the specific productivity of recombinant CHO cells:
Thrombopoietin and antibody. Biotechnology and Bioengineering 98(3): 611-615
Morgan D, O. (2007) The Cell Cycle: Principles of Control: New Science Press.

319
Mori K, Ogawa N, Kawahara T, Yanagi H, Yura T (2000) mRNA splicing-mediated C-
terminal replacement of transcription factor Hac1p is required for efficient activation of
the unfolded protein response. PNAS USA 97(9): 4660-4665
Morishima N, Nakanishi K, Takenouchi H, Shibata T, Yasuhiko Y (2002a) An
Endoplasmic Reticulum Stress-specific Caspase Cascade in Apoptosis. Journal of
Biological Chemistry 277(37): 34287-34294
Nadanaka S, Yoshida H, Sato R, Mori K (2006) Analysis of ATF6 Activation in Site-2
Protease-deficient Chinese Hamster Ovary Cells. Cell Structure and Function 31(2):
109-116
Nakagawa T, Yuan J (2000) Cross-Talk between Two Cysteine Protease Families:
Activation of Caspase-12 by Calpain in Apoptosis. J Cell Biol 150(4): 887-894
Nam JH, Zhang F, Ermonval M, Linhardt RJ, Sharfstein ST (2008) The effects of
culture conditions on the glycosylation of secreted human placental alkaline
phosphatase produced in Chinese hamster ovary cells. Biotechnol Bioeng 100(6): 1178-
1192
Nelson AL, Reichert JM (2009) Development trends for therapeutic antibody
fragments. Nat Biotech 27(4): 331-337
Nishitoh H, Saitoh M, Mochida Y, Takeda K, Nakano H, Rothe M, Miyazono K, Ichijo
H (1998) ASK1 Is Essential for JNK/SAPK Activation by TRAF2. Molecular Cell 2(3):
389-395
Nishiyama H, Itoh K, Kaneko Y, Kishishita M, Yoshida O, Fujita J (1997) A Glycine-
rich RNA-binding Protein Mediating Cold-inducible Suppression of Mammalian Cell
Growth. The Journal of Cell Biology 137(4): 899-908
Niwa M, Walter P (2000) Pausing to decide. PNAS USA 97(23): 12396-12397
Novoa I, Zeng H, Harding HP, Ron D (2001) Feedback Inhibition of the Unfolded
Protein Response by GADD34-Mediated Dephosphorylation of eIF2α. J Cell Biol
153(5): 1011-1022
Nurse P (2000) A Long Twentieth Century of the Cell Cycle and Beyond. Cell 100(1):
71-78
Oberdorf J, Carlson EJ, Skach WR (2001) Redundancy of Mammalian Proteasome β
Subunit Function during Endoplasmic Reticulum Associated Degradation Biochemistry
40(44): 13397-13405
Ohoka N, Yoshii S, Hattori T, Onozaki K, Hayashi H (2005) TRB3, a novel ER stress-
inducible gene, is induced via ATF4-CHOP pathway and is involved in cell death.
EMBO J 24(6): 1243-1255
Ohya T, Hayashi T, Kiyama E, Nishii H, Miki H, Kobayashi K, Honda K, Omasa T,
Ohtake H (2008) Improved production of recombinant human antithrombin III in
Chinese hamster ovary cells by ATF4 overexpression. Biotechnol Bioeng 100(2): 317-
324

320
Okada T, Yoshida H, Akazawa R, Negishi M, Mori K (2002) Distinct roles of
activating transcription factor 6 (ATF6) and double-stranded RNA-activated protein
kinase-like endoplasmic reticulum kinase (PERK) in transcription during the
mammalian unfolded protein response. Biochem J 366(2): 585-594
Olivari S, Cali T, Salo KEH, Paganetti P, Ruddock LW, Molinari M (2006) EDEM1
regulates ER-associated degradation by accelerating de-mannosylation of folding-
defective polypeptides and by inhibiting their covalent aggregation. Biochemical and
Biophysical Research Communications 349(4): 1278-1284
Omasa T, Furuichi K, Iemura T, Katakura Y, Kishimoto M, Suga K-i (2009) Enhanced
antibody production following intermediate addition based on flux analysis in
mammalian cell continuous culture. Bioprocess and Biosystems Engineering 33(1):
117-125
Omasa T, Onitsuka M, Kim W-D (2010) Cell Engineering and Cultivation of Chinese
Hamster Ovary (CHO) Cells. Current Pharmaceutical Biotechnology 11: 233-240
Omasa T, Takami T, Ohya T, Kiyama E, Hayashi T, Nishii H, Miki H, Kobayashi K,
Honda K, Ohtake H (2008) Overexpression of GADD34 Enhances Production of
Recombinant Human Antithrombin III in Chinese Hamster Ovary Cells. Journal of
Bioscience and Bioengineering 106(6): 568-573
Otero JH, Lizák B, Hendershot LM (2009) Life and death of a BiP substrate. Seminars
in Cell & Developmental Biology 21(5): 472-478
Ouwens DM, de Ruiter ND, van der Zon GCM, Carter AP, Schouten J, van der Burgt
C, Kooistra K, Bos JL, Maassen JA, van Dam H (2002) Growth factors can activate
ATF2 via a two-step mechanism: phosphorylation of Thr71 through the Ras-MEK-ERK
pathway and of Thr69 through RalGDS-Src-p38. EMBO J 21(14): 3782-3793
Oyadomari S, Mori M (2003) Roles of CHOP//GADD153 in endoplasmic reticulum
stress. Cell Death Differ 11(4): 381-389
Pagani M, Fabbri M, Benedetti C, Fassio A, Pilati S, Bulleid NJ, Cabibbo A, Sitia R
(2000) Endoplasmic Reticulum Oxidoreductin 1-Lβ (ERO1-Lβ), a Human Gene
Induced in the Course of the Unfolded Protein Response. Journal of Biological
Chemistry 275(31): 23685-23692
Page MJ (1988) Expression of Foreign Genes in Mammalian Cells. In New Nucleic
Acid Techniques, pp 371-384.
Pan Y, Chen H, Siu F, Kilberg MS (2003) Amino Acid Deprivation and Endoplasmic
Reticulum Stress Induce Expression of Multiple Activating Transcription Factor-3
mRNA Species That, When Overexpressed in HepG2 Cells, Modulate Transcription by
the Human Asparagine Synthetase Promoter. Journal of Biological Chemistry 278(40):
38402-38412
Pau MG, Ophorst C, Koldijk MH, Schouten G, Mehtali M, Uytdehaag F (2001) The
human cell line PER.C6 provides a new manufacturing system for the production of
influenza vaccines. Vaccine 19(17-19): 2716-2721

321
Pazin MJ, Kadonaga JT (1997) What's up and down with histone deacetylation and
transcription? Cell 89(3): 325-328
Peng R-W, Fussenegger M (2009a) Engineering the Secretory Pathway in Mammalian
Cells. In Cell Line Development, Al-Rubeai M, Hauser H, Betenbaugh M, Fussenegger
M, Jenkins N, Merten O-W (eds), Vol. 6, pp 233-248. Springer Netherlands
Peng R-W, Fussenegger M (2009b) Molecular engineering of exocytic vesicle traffic
enhances the productivity of Chinese hamster ovary cells. Biotechnology and
Bioengineering 102(4): 1170-1181
Peng R-W, Guetg C, Tigges M, Fussenegger M (2010) The vesicle-trafficking protein
munc18b increases the secretory capacity of mammalian cells. Metabolic Engineering
12(1): 18-25
Perlmutter DH (2002) Chemical Chaperones: A Pharmacological Strategy for Disorders
of Protein Folding and Trafficking. Pediatric Research 52(6): 832-836
Petch D, Butler M (1996) The effect of alternative carbohydrates on the growth and
antibody production of a murine hybridoma. Applied Biochemistry and Biotechnology
59(1): 93-104
Petiot A, Ogier-Denis E, Blommaart EFC, Meijer AJ, Codogno P (2000) Distinct
Classes of Phosphatidylinositol 3-Kinases Are Involved in Signaling Pathways That
Control Macroautophagy in HT-29 Cells. Journal of Biological Chemistry 275(2): 992-
998
Ponzio G, Loubat A, Rochet N, Turchi L, Rezzonico R, Farahi Far D, Vjekoslav D,
Rossi B (1998) Early G1 growth arrest of hybridoma B cells by DMSO involves cyclin
D2 inhibition and p21[CIP1] induction. Oncogene 17(3): 1159-1166
Potter M, Boyce CR (1962) Induction of plasma-cell neoplasms in strain BALB/c mice
with mineral oil and mineral oil adjuvants. Nature 193: 1086-1087
Pouysségur J, Shiu RPC, Pastan I (1977) Induction of two transformation-sensitive
membrane polypeptides in normal fibroblasts by a block in glycoprotein synthesis or
glucose deprivation. Cell 11(4): 941-947
Prostko CR, Brostrom MA, Brostrom CO (1993) Reversible phosphorylation of
eukaryotic initiation factor 2α in response to endoplasmic reticular signaling. Molecular
and Cellular Biochemistry 127(1): 255-265
Prostko CR, Brostrom MA, Malara EM, Brostrom CO (1992) Phosphorylation of
eukaryotic initiation factor (eIF) 2 alpha and inhibition of eIF-2B in GH3 pituitary cells
by perturbants of early protein processing that induce GRP78. Journal of Biological
Chemistry 267(24): 16751-16754
Proud CG (2002a) Control of the translational machinery in mammalian cells. Eur J
Biochem 269(22): 5337
Proud CG (2002b) Regulation of mammalian translation factors by nutrients. Eur J
Biochem 269(22): 5338-5349

322
Puck TT, Cieciura SJ, Robinson A (1958) Genetics of somatic mammalian cells. III.
Long-term cultivation of euploid cells from human and animal subjects. J Exp Med
108(6): 945-956
Quek L-E, Dietmair S, Krömer JO, Nielsen LK (2010) Metabolic flux analysis in
mammalian cell culture. Metabolic Engineering 12(2): 161-171
Raju TS, Briggs JB, Borge SM, Jones AJS (2000) Species-specific variation in
glycosylation of IgG: evidence for the species-specific sialylation and branch-specific
galactosylation and importance for engineering recombinant glycoprotein therapeutics.
Glycobiology 10(5): 477-486
Rao RV, Bredesen DE (2004) Misfolded proteins, endoplasmic reticulum stress and
neurodegeneration. Current Opinion in Cell Biology 16(6): 653-662
Ravikumar B, Berger Z, Vacher C, O'Kane CJ, Rubinsztein DC (2006) Rapamycin pre-
treatment protects against apoptosis. Hum Mol Genet 15(7): 1209-1216
Reichert JM, Rosensweig CJ, Faden LB, Dewitz MC (2005) Monoclonal antibody
successes in the clinic. Nat Biotechnol 23(9): 1073-1078
Rodriguez J, Spearman M, Huzel N, Butler M (2005) Enhanced Production of
Monomeric Interferon-beta by CHO Cells through the Control of Culture Conditions.
Biotechnology Progress 21(1): 22-30
Römisch K (2004) A Cure for Traffic Jams: Small Molecule Chaperones in the
Endoplasmic Reticulum. Traffic 5(11): 815-820
Ron D, Habener JF (1992) CHOP, a novel developmentally regulated nuclear protein
that dimerizes with transcription factors C/EBP and LAP and functions as a dominant-
negative inhibitor of gene transcription. Genes & Dev 6(3): 439-453
Ross J (1995) mRNA stability in mammalian cells. Microbiol Rev 59(3): 423-450
Roth RA, Pierce SB (1987) In vivo cross-linking of protein disulfide isomerase to
immunoglobulins. Biochemistry 26(14): 4179-4182
Rudd PM, Elliott T, Cresswell P, Wilson IA, Dwek RA (2001) Glycosylation and the
Immune System. Science 291(5512): 2370-2376
Ruddock LW, Molinari M (2006) N-glycan processing in ER quality control. J Cell Sci
119(21): 4373-4380
Rüegsegger U, Leber JH, Walter P (2001) Block of HAC1 mRNA Translation by Long-
Range Base Pairing Is Released by Cytoplasmic Splicing upon Induction of the
Unfolded Protein Response. Cell 107(1): 103-114
Rutkowski DT, Kaufman RJ (2004) A trip to the ER: coping with stress. Trends Cell
Biol 14(1): 20-28

323
Rutkowski DT, Ott CM, Polansky JR, Lingappa VR (2003) Signal Sequences Initiate
the Pathway of Maturation in the Endoplasmic Reticulum Lumen. Journal of Biological
Chemistry 278(32): 30365-30372
Rzymski T, Harris AL (2007) The Unfolded Protein Response and Integrated Stress
Response to Anoxia. Clinical Cancer Research 13(9): 2537-2540
Schlatter S, Stansfield S, H, Dinnis DM, Racher AJ, Birch JR, James DC (2005) On the
Optimal Ratio of Heavy to Light Chain Genes for Efficient Recombinant Antibody
Production by CHO Cells. Biotechnology Progress 21(1): 122-133
Schulze A, Standera S, Buerger E, Kikkert M, van Voorden S, Wiertz E, Koning F,
Kloetzel P-M, Seeger M (2005) The Ubiquitin-domain Protein HERP forms a Complex
with Components of the Endoplasmic Reticulum Associated Degradation Pathway.
Journal of Molecular Biology 354(5): 1021-1027
Scorrano L, Oakes SA, Opferman JT, Cheng EH, Sorcinelli MD, Pozzan T, Korsmeyer
SJ (2003) BAX and BAK Regulation of Endoplasmic Reticulum Ca2+: A Control Point
for Apoptosis. Science 300(5616): 135-139
Scriven P, Brown N, Pockley A, Wyld L (2007) The unfolded protein response and
cancer: a brighter future unfolding? Journal of Molecular Medicine 85(4): 331-341
Sellick C, Knight D, Croxford A, Maqsood A, Stephens G, Goodacre R, Dickson A
(2010) Evaluation of extraction processes for intracellular metabolite profiling of
mammalian cells: matching extraction approaches to cell type and metabolite targets.
Metabolomics 6(3): 427-438
Sellick CA, Hansen R, Maqsood AR, Dunn WB, Stephens GM, Goodacre R, Dickson
AJ (2008) Effective Quenching Processes for Physiologically Valid Metabolite
Profiling of Suspension Cultured Mammalian Cells. Analytical Chemistry 81(1): 174-
183
Shen J, Chen X, Hendershot L, Prywes R (2002) ER Stress Regulation of ATF6
Localization by Dissociation of BiP/GRP78 Binding and Unmasking of Golgi
Localization Signals. Developmental Cell 3(1): 99-111
Shen J, Prywes R (2004) Dependence of Site-2 Protease Cleavage of ATF6 on Prior
Site-1 Protease Digestion Is Determined by the Size of the Luminal Domain of ATF6.
Journal of Biological Chemistry 279(41): 43046-43051
Shen X, Ellis RE, Lee K, Liu CY, Yang K, Solomon A, Yoshida H, Morimoto R,
Kurnit DM, Mori K, Kaufman RJ (2001) Complementary signaling pathways regulate
the unfolded protein response and are required for C. elegans development. Cell 107(7):
893-903
Shenton D, Smirnova JB, Selley JN, Carroll K, Hubbard SJ, Pavitt GD, Ashe MP, Grant
CM (2006) Global Translational Responses to Oxidative Stress Impact upon Multiple
Levels of Protein Synthesis. Journal of Biological Chemistry 281(39): 29011-29021

324
Shi Y VK, Sood R, An J, Liang J, Stramm L, Wek RC. (1998) Identification and
characterization of pancreatic eukaryotic initiation factor 2 alpha-subunit kinase, PEK,
involved in translational control. Mol Cell Biol 18(12): 7499-7509
Shigenaga MK, Hagen TM, Ames BN (1994) Oxidative damage and mitochondrial
decay in aging. PNAS USA 91(23): 10771-10778
Shukla AA, Thömmes J (2010) Recent advances in large-scale production of
monoclonal antibodies and related proteins. Trends in Biotechnology 28(5): 253-261
Sidrauski C, Walter P (1997) The Transmembrane Kinase Ire1p Is a Site-Specific
Endonuclease That Initiates mRNA Splicing in the Unfolded Protein Response. Cell
90(6): 1031-1039
Simone C, Roberto S (2007) Managing and exploiting stress in the antibody factory.
FEBS letters 581(19): 3652-3657
Singh N, Anand S (1994) Cell death by apoptosis. Indian J Exp Biol 32(12): 843-847
Sitton G, Srienc F (2008) Growth dynamics of mammalian cells monitored with
automated cell cycle staining and flow cytometry. Cytometry Part A 73A(6): 538-545
Siu F, Bain PJ, LeBlanc-Chaffin R, Chen H, Kilberg MS (2002) ATF4 Is a Mediator of
the Nutrient-sensing Response Pathway That Activates the Human Asparagine
Synthetase Gene. Journal of Biological Chemistry 277(27): 24120-24127
Smales CM, Dinnis DM, Stansfield SH, Alete D, Sage EA, Birch JR, Racher AJ,
Marshall CT, James DC (2004) Comparative proteomic analysis of GS-NS0 murine
myeloma cell lines with varying recombinant monoclonal antibody production rate.
Biotechnol Bioeng 88(4): 474-488
Sofer A, Lei K, Johannessen CM, Ellisen LW (2005) Regulation of mTOR and Cell
Growth in Response to Energy Stress by REDD1. Mol Cell Biol 25(14): 5834-5845
Sonenberg N, Hinnebusch AG (2009) Regulation of translation initiation in eukaryotes:
mechanisms and biological targets. Cell 136(4): 731-745
Steinmeyer DE, McCormick EL (2008) The art of antibody process development. Drug
Discovery Today 13(13-14): 613-618
Stratling WH (1976) Stimulation of transcription on chromatin by polar organic
compounds. Nucl Acids Res 3(5): 1203-1214
Struhl K (1998) Histone acetylation and transcriptional regulatory mechanisms. Genes
Dev 12(5): 599-606
Sunley K, Butler M (2010) Strategies for the enhancement of recombinant protein
production from mammalian cells by growth arrest. Biotechnology Advances 28(3):
385-394

325
Suzuki T, Usuda S, Ichinose H, Inouye S (2007) Real-time bioluminescence imaging of
a protein secretory pathway in living mammalian cells using Gaussia luciferase. FEBS
letters 581(24): 4551-4556
Swartz JR (2001) Advances in Escherichia coli production of therapeutic proteins. Curr
Opin Biotechnol 12(2): 195-201
Tachibana H, Taniguchi K, Ushio Y, Teruya K, Osada K, Murakami H (1994) Changes
of monosaccharide availability of human hybridoma lead to alteration of biological
properties of human monoclonal antibody. Cytotechnology 16(3): 151-157
Talvas J, Obled A, Fafournoux P, Mordier S (2006) Regulation of Protein Synthesis by
Leucine Starvation Involves Distinct Mechanisms in Mouse C2C12 Myoblasts and
Myotubes. J Nutr 136(6): 1466-1471
Tan HK, Lee MM, Yap MG, Wang DI (2008) Overexpression of cold-inducible RNA-
binding protein increases interferon-gamma production in Chinese-hamster ovary cells.
Biotechnol Appl Biochem 49(4): 247-257
Tey BT, Singh RP, Piredda L, Piacentini M, Al-Rubeai M (2000) Influence of bcl-2 on
cell death during the cultivation of a Chinese hamster ovary cell line expressing a
chimeric antibody. Biotechnol Bioeng 68(1): 31-43
Thomas J, Ayling A, Baneyx F (1997) Molecular chaperones, folding catalysts, and the
recovery of active recombinant proteins fromE. coli. Applied Biochemistry and
Biotechnology 66(3): 197-238
Tigges M, Fussenegger M (2006) Xbp1-based engineering of secretory capacity
enhances the productivity of Chinese hamster ovary cells. Metab Eng
Tirasophon W, Welihinda AA, Kaufman RJ (1998) A stress response pathway from the
endoplasmic reticulum to the nucleus requires a novel bifunctional protein
kinase/endoribonuclease (Ire1p) in mammalian cells. Genes Dev 12(12): 1812-1824
Tsao YS, Cardoso AG, Condon RGG, Voloch M, Lio P, Lagos JC, Kearns BG, Liu Z
(2005) Monitoring Chinese hamster ovary cell culture by the analysis of glucose and
lactate metabolism. J Biotechnol 118(3): 316-327
Tu BP, Ho-Schleyer SC, Travers KJ, Weissman JS (2000) Biochemical Basis of
Oxidative Protein Folding in the Endoplasmic Reticulum. Science 290(5496): 1571-
1574
Tu BP, Weissman JS (2004) Oxidative protein folding in eukaryotes. The Journal of
Cell Biology 164(3): 341-346
Tuschl T, Zamore PD, Lehmann R, Bartel DP, Sharp PA (1999) Targeted mRNA
degradation by double-stranded RNA in vitro. Genes Dev 13(24): 3191-3197
Underdown BJ, Schiff JM (1986) Immunoglobulin A: Strategic Defense Initiative at the
Mucosal Surface. Annual Review of Immunology 4(1): 389-417

326
Underhill MF, Coley C, Birch JR, Findlay A, Kallmeier R, Proud CG, James DC (2003)
Engineering mRNA Translation Initiation to Enhance Transient Gene Expression in
Chinese Hamster Ovary Cells. Biotechnology Progress 19(1): 121-129
Urlaub G, Chasin LA. (1980) Isolation of Chinese hamster cell mutants deficient in
dihydrofolate reductase activity. PNAS USA 77(7) 4216-4220
Urlaub G, Kas E, Carothers AM, Chasin LA (1983) Deletion of the diploid
dihydrofolate reductase locus from cultured mammalian cells. Cell 33(2): 405-412
Vabulas RM, Hartl FU (2005) Protein Synthesis upon Acute Nutrient Restriction Relies
on Proteasome Function. Science 310(5756): 1960-1963
Van der Heiden MG, Cantley LC, Thompson CB (2009) Understanding the Warburg
Effect: The Metabolic Requirements of Cell Proliferation. Science 324(5930): 1029-
1033
Vanhove M, Usherwood YK, Hendershot LM (2001) Unassembled Ig Heavy Chains Do
Not Cycle from BiP In Vivo but Require Light Chains to Trigger Their Release.
Immunity 15: 105-114
Vasa-Nicotera M (2004) The new kid on the block: the unfolded protein response in the
pathogenesis of atherosclerosis. Cell Death Differ 11(S1): S10-S11
Verma R, Boleti E, George AJT (1998) Antibody engineering: Comparison of bacterial,
yeast, insect and mammalian expression systems. Journal of Immunological Methods
216(1-2): 165-181
Virag L (2005) Structure and Function of Poly(ADP-ribose) Polymerase-1: Role in
Oxidative Stress-Related Pathologies. Current Vascular Pharmacology 3: 209-214
Volarevic S, Stewart MJ, Ledermann B, Zilberman F, Terracciano L, Montini E,
Grompe M, Kozma SC, Thomas G (2000) Proliferation, But Not Growth, Blocked by
Conditional Deletion of 40S Ribosomal Protein S6. Science 288(5473): 2045-2047
Wai Lam WL, Liang D, Joseph L, Collette C, Susan C-C, Yan W, Marcio V (2003)
Improvement of Monoclonal Antibody Production in Hybridoma Cells by Dimethyl
Sulfoxide. Biotechnology Progress 19(1): 158-162
Wang XZ, Harding HP, Zhang Y, Jolicoeur EM, Kuroda M, Ron D (1998) Cloning of
mammalian Ire1 reveals diversity in the ER stress responses. EMBO J 17(19): 5708-
5717
Wang XZ, Lawson B, Brewer JW, Zinszner H, Sanjay A, Mi LJ, Boorstein R, Kreibich
G, Hendershot LM, Ron D (1996) Signals from the stressed endoplasmic reticulum
induce C/EBP-homologous protein (CHOP/GADD153). Mol Cell Biol 16(8): 4273-
4280
Wek RC, Staschke KA (2010) How do tumours adapt to nutrient stress. EMBO J
29(12): 1946-1947

327
Welihinda AA, Kaufman RJ (1996) The unfolded protein response pathway in
Saccharomyces cerevisiae. Oligomerization and trans-phosphorylation of Ire1p (Ern1p)
are required for kinase activation. J Biol Chem 271(30): 18181-18187
Werner RG, Noe W, Kopp K, Schluter M (1998) Appropriate mammalian expression
systems for biopharmaceuticals. Arzneimittelforschung 48(8): 870-880
Wianny F, Zernicka-Goetz M (2000) Specific interference with gene function by
double-stranded RNA in early mouse development. Nat Cell Biol 2(2): 70-75
Wickham TJ, Davis T, Granados RR, Shuler ML, Wood HA (1992) Screening of Insect
Cell Lines for the Production of Recombinant Proteins and Infectious Virus in the
Baculovirus Expression System. Biotechnology Progress 8(5): 391-396
Wickner W, Schekman R (2008) Membrane fusion. Nat Struct Mol Biol 15(n7): 658-
664
Wong DC, Wong KT, Nissom PM, Heng CK, Yap MG (2006) Targeting early
apoptotic genes in batch and fed-batch CHO cell cultures. Biotechnol Bioeng 95(3):
350-361
Wong DCF, Wong KTK, Goh LT, Heng CK, Yap MGS (2005) Impact of dynamic
online fed-batch strategies on metabolism, productivity and N-glycosylation quality in
CHO cell cultures. Biotechnoland Bioeng 89(2): 164-177
Woof JM, Kerr MA (2004) IgA function; variations on a theme. Immunology 113(2):
175-177
Woof JM, Burton DR (2004) Human antibody-Fc receptor interactions illuminated by
crystal structures. Nat Rev Immunol 4(2): 89-99
Wurm FM (2004) Production of recombinant protein therapeutics in cultivated
mammalian cells. Nat Biotechnol 22(11): 1393-1398
Wurm FM, Gwinn KA, Kingston RE (1986) Inducible overproduction of the mouse c-
myc protein in mammalian cells. PNAS USA 83(15): 5414-5418
Yamamoto K, Ichijo H, Korsmeyer SJ (1999) BCL-2 Is Phosphorylated and Inactivated
by an ASK1/Jun N-Terminal Protein Kinase Pathway Normally Activated at G2/M. Mol
Cell Biol 19(12): 8469-8478
Yang T, Sauve A (2006) NAD metabolism and sirtuins: Metabolic regulation of protein
deacetylation in stress and toxicity. The AAPS Journal 8(4): E632-E643
Yoneda T, Imaizumi K, Oono K, Yui D, Gomi F, Katayama T, Tohyama M (2001)
Activation of Caspase-12, an Endoplastic Reticulum (ER) Resident Caspase, through
Tumor Necrosis Factor Receptor-associated Factor 2-dependent Mechanism in
Response to the ER Stress. J Biol Chem 276(17): 13935-13940
Yoon SK, Hong JK, Choo SH, Song JY, Park HW, Lee GM (2006) Adaptation of
Chinese hamster ovary cells to low culture temperature: Cell growth and recombinant
protein production. J Biotechnol 122(4): 463-472

328
Yoon SK, Song JY, Lee GM (2003) Effect of low culture temperature on specific
productivity, transcription level, and heterogeneity of erythropoietin in Chinese hamster
ovary cells. Biotechnology and Bioengineering 82(3): 289-298
Yoshida H, Haze K, Yanagi H, Yura T, Mori K (1998) Identification of the cis-Acting
Endoplasmic Reticulum Stress Response Element Responsible for Transcriptional
Induction of Mammalian Glucose-regulated Proteins. INVOLVEMENT OF BASIC
LEUCINE ZIPPER TRANSCRIPTION FACTORS. J Biol Chem 273(50): 33741-
33749
Yoshida H, Matsui T, Hosokawa N, Kaufman RJ, Nagata K, Mori K (2003) A time-
dependent phase shift in the mammalian unfolded protein response. Dev Cell 4(2): 265-
271
Yoshida H, Matsui T, Yamamoto A, Okada T, Mori K (2001) XBP1 mRNA is induced
by ATF6 and spliced by IRE1 in response to ER stress to produce a highly active
transcription factor. Cell 107(7): 881-891
Yoshida H, Yoshizawa T, Shibasaki F, Shoji S, Kanazawa I (2002) Chemical
Chaperones Reduce Aggregate Formation and Cell Death Caused by the Truncated
Machado-Joseph Disease Gene Product with an Expanded Polyglutamine Stretch.
Neurobiology of Disease 10(2): 88-99
Yoshikawa T, Nakanishi F, Ogura Y, Oi D, Omasa T, Katakura Y, Kishimoto M, Suga
K (2000) Amplified gene location in chromosomal DNA affected recombinant protein
production and stability of amplified genes. Biotechnol Prog 16(5): 710-715
Zahn-Zabal M, Kobr M, Girod PA, Imhof M, Chatellard P, de Jesus M, Wurm F,
Mermod N (2001) Development of stable cell lines for production or regulated
expression using matrix attachment regions. J Biotechnol 87(1): 29-42
Zhang J-X, Braakman I, Matlack KES, Helenius A (1997) Quality Control in the
Secretory Pathway: The Role of Calreticulin, Calnexin and BiP in the Retention of
Glycoproteins with C-Terminal Truncations. Mol Biol Cell 8(10): 1943-1954
Zhou J, Sharfstein ST (2008) Sodium butyrate stimulates monoclonal antibody over-
expression in CHO cells by improving gene accessibility. Biotechnol Bioengin 100(1):
189-194
Zong W-X, Li C, Hatzivassiliou G, Lindsten T, Yu Q-C, Yuan J, Thompson CB (2003)
Bax and Bak can localize to the endoplasmic reticulum to initiate apoptosis. J Cell Biol
162(1): 59-69

329
9
10
APPENDICES

330
APPENDIX 1 – MATERIALS, CHEMICALS AND EQUIPMENT
BACTERIAL CELLS
Professor. A. J. Dickson, University of Manchester, UK
E. coli DH5α strain (genotype F-, φ80dlacZΔM15, Δ(lacZYA-argF)U169, deoR,
recA1, endA1, hsdR17(rk-, mk+), phoA, supE44, λ-, thi-1, gyrA96, relA1)
PLASMIDS
Professor. A. J. Dickson, University of Manchester, UK
p100-D9
MedImmune, Cambridge, UK
Recombinant IgG
MEDIA AND SUPPLEMENTS
Invitrogen, UK
Chemically-defined (CD) CHO media -glutamine, -hypoxanthine, -thymidine
Lonza
L-Glutamine
MedImmune, Cambridge, UK
CD feed
Sigma-Aldrich, UK
Dimethyl sulfoxide (DMSO)
CHEMICALS AND SOLVENTS
Acros Organics, NV
Methoxyamine hydrochloride
Amersham Bioscience, UK
L-[4,5-3H] leucine
NCS tissue solubiliser
BD Transduction Laboratories, UK
Mouse anti-pan ERK antibody (610123)
BDH Chemicals Ltd., U.K.
Acetaldehyde
Ammonium acetate
Calcium chloride
Citric acid
Disodium hydrogen phosphate
Ethylenediaminetetra-acetic acid (EDTA)

331
Glucose
Glycine
HEPES
Hydrochloric acid
Orthoboric acid
Orthophosphoric acid
Paraformaldehyde
Perchloric acid
Peroxidase
Potassium chloride
Sodium acetate
Sodium carbonate
Sodium chloride
Sodium deoxycholate
Sodium dodecyl sulphate (SDS)
Sodium hydrogen orthophosphate
Sodium hydroxide
Sodium phosphate
Sulphuric acid
Trichloroacetic acid (TCA)
Tris(hydroxymethyl) methylamine (Tris)
Bioline, UK
1kb DNA ladder (DNA marker)
Bio-Rad Laboraties, Ltd., UK
Bromophenol blue
Precision Plus Protein All Blue Standards 250 kD
Bio-Rad Laboraties Ltd., UK
Bio-Rad protein reagent
Burdick & Jackson, USA
Methanol (for metabolite extraction)
Dako
Anti-mouse Ig-HRP
Eurofins MWG Operon, Germany
Custom made oligonucleotides
Eurogentec Ltd., UK
qPCR Mastermix SYBR® Green 1
Fisher Scientific, UK
Acetic acid
Acetronitrile (ACN)
Chloroform
Ethanol
Glacial acetic acid
Glycerol

332
Isopropanol
Methanol
Perchloric acid
Potassium acetate
Trifluroacetic acid (TFA)
Fluka
NAD+
GE Healthcare, UK
[α32
P] dATP (specific activity 3000Ci/mmol, concentration 10mCi/ml)
Gibco BRL, UK
Colcemid
Invitrogen, UK
ProLong® antifade reagent
TRIzol® reagent
SlowFade® antifade reagent
Jackson Immuno Research Laboratories, USA.
AffiniPure goat anti-human IgG (109-005-098)
Allophycocyan-conjugate AffiniPure (Fab‟)2 Fragment anti-human Fcγ
(109-136-170)
Texas Red® dye-conjugated AffiniPure anti-rabbit IgG (711-075-152)
Melford Laboratories, Ltd., UK
Agar
Agarose
Phenyl-methyl sulfonyl fluoride
Tryptone
Yeast extract
National Diagnostics, UK.
Ecoscint scintillation liquid
Protogel solution
Roche Applied Science, UK
dATP (Li Salt)
dCTP (Li Salt)
dGTP (Li Salt)
dTTP (Li Salt)
PNGase F
Proteinase K
Restriction endonucleases
Taq DNA polymerase
Santa Cruz Biotechnology, CA
Polyclonal rabbit anti-GADD153 antibody (sc-793)
Polyclonal goat anti-GRP78 antibody (sc-1050)

333
Polyclonal rabbit anti-CREB2 antibody (sc-200)
Sigma-Aldrich, UK
2-mercaptoethanol
3,3‟,5,5‟-tetramethylbensidine tablets
4‟,6-diamino-2-phenylindole (DAPI)
4α-aminophenazone
Albumin bovine (BSA)
Ammonium bicarbonate (AMBIC)
Ammonium persulphate
Ampicillin
Anti-rabbit Ig-HRP
Aprotinin
Bromophenol blue
Calf thymus DNA
Cycloheximide
Diethyl polycarbonate (DEPC)
Dimethyl sulfoxide (DMSO)
Diphenylamine
Dithiothreitol (DTT)
Ethidium Bromide
Glass-acid washed beads
Glucose oxidase
Hydrogen peroxide
Hydrazine
Isoamyl alcohol
Lactate
Lactate dehydrogenase (LDH)
Leupeptin
L-methionine sulphoximine (MSX)
Magnesium acetate
Myristic acid d 27
N-lauroyl sarcosine
N,N,N‟,N‟-tetramethylethylenediamine (TEMED)
Paraformaldehyde
Phenol
Phosphate buffered saline tablets
Poly-L-lysine
Ponceau stain
Potassium
Propidium Iodide (PI)
Pyridine
RNase A
Sephadex G-50
Sodium bicarbonate
Sodium citrate
Sodium fluoride
Sodium orthovanadate
Sucrose (high grade 99.5% GC)
Trisodium phosphate

334
Triton x100
Trypan blue
Tween-20
Southern Biotechnology
Goat anti-human lamda FITC conjugate (2070-02)
The Binding Site, U.K
Sheep anti-human lambda (peroxidise conjugate)
ThermoScientific, USA
N-methyl-N-trimethylsilyltrifluoroacetamide (MSTFA) with 1%
trimethylchorosilane (TMCS)
Defatted milk [MarvelTM
] can be bought from most supermarkets and PDI was kindly
donated from Professor Neil Bulleid.
KITS
Bioline, UK
cDNA Synthesis Kit (Bio-65025)
BioVision
NAD/NADH Quantification Kit (K337-100)
GE Healthcare, UK
ECL western detection kit (RPN2106)
Ab SpinTrap columns (28-4083-47)
Lonza Biologics
MycoAlert® Detection Kit (LT07-118)
Millipore Corporation, USA
MicroCon ultrafiltration unit (478)
Roche Ltd., UK
Nick Translation Kit (10976776001)
Random Primed DNA Labelling Kit (11004760001)
ATP Bioluminescence Assay Kit CLS II (1169969500)
Sigma-Aldrich, UK
DNase I kit (AMPD1-1KT)
Qiagen Ltd., UK
Plasmid Midi Kit (12143)
Qiaex II Gel Extraction Kit (20021)

335
APPARATUS
All general and disposable glassware and plasticware were obtained from standard
suppliers. Specialised equipment was purchased from the following companies
Amersham International Plc., UK
Nylon membrane (Hybond-N)
Agilent Technologies
7890A GC System
5975C Inert XL MSD with Triple-Axis Detector
ChemStation
BDH Chemicals Ltd., UK
Haemacytometer (Improved Neubauer)
Beckman Coulter Inc., USA
CyAn ADP flow cytometer, with Summit 4.3 software
J2-21 centrifuge with JA-20 rotor
L8-70 centrifuge with SW41 rotor
Bio-Rad Laboraties Ltd., UK
Chromo4 thermal cycler
Model GS-700 imaging densitometer
Mini-gel II Slab System
Thick Filter paper
Trans-blot semi- dry transfer cell
MJ white 96 well plate for real-time PCR
Clear plastic caps for MJ white plates
Bruker, Ltd.
UltraFLEX MALDI-ToF mass spectrometer and software
Dynex Technologies Inc., UK
Dias System Plate reader
Gibco BRL, UK
Horizontal electrophoresis gel tank
Glycan Corp, USA
HyperCarb solid phase TopTips column
Gonotec GmbH, Germany
Osmomat030 cryoscopic osmometer
Kodak, USA
M35-M X-OMAT film processor
X-ray film (Biomax MR-1)
X-ray film cassettes & intensifying paper

336
Labcaire systems Ltd., UK
Recirculating class II microbiological safety cabinet
Labsystems Oy
Multiskan RC plate reader and Ascent software
LaserBio Labs, France
2,5 dihydroxybenzoic acid (DHB) matrix
LTE Scientific Ltd., UK
Series 250 Autoclave
Molecular Devices
MetaVue Software
Millipore, UK
ElixTM
water purification system
Mini-instruments Ltd., UK
Series 900 mini radioactive monitor
MJ Research, UK
Opticon Monitor real-time PCR software version 2.03.6
New Brunswick Scientific Ltd., UK
Innova 4000 shaking incubator
NIH
Image J software
NIST
AMDIS
Olympus Ltd., UK
Olympus BX51 upright microscope
Packard, UK
Tri Carb 2100TR liquid scintillation analyser
Photometrics
Coolsnap HQ camera
Scientific Laboratory Supplies, UK
13mm round glass coverslips
Scintillation vials
Scleicher & Schuell, Germany
Nitrocellulose membrane

337
Sefton Scientific, USA
9/16 x 3½ inch polyallomer tube
Spectronics Corporation
SpectroLinker XL-1000 UV crosslinker
SPSS, Inc
Analytical software
Techne, UK
Thermal cycler
Hybridiser HB-1D hybridisation oven
Teledyne Isco, Inc., USA
Isco-UA-6 UV/Vis detector
Thermo Fisher Scientific
Cryovials
GC vials
NanoDrop® 1000, UV/Vis spectrophotometer
Nunc-immuno plates (maxisorp F96)
HETO VR MAXI vacuum centrifguge attached to a HETO CT/DW 60E cooling
trap
Turner Designs, USA
TD20/20 luminometer
Ultraviolet Products, USA
UV transilluminator
Verity Software House
ModFit LTTM
Vickers Instruments, UK
Light microscope
VWR International
Erlenmeyer flasks
Whatman Biosystems Ltd., UK
3mm filter paper
Zeiss, Germany
Widefield Axiovision microscope and Axiovision software

338
APPENDIX 2 – RELATIVE CONCENTRATION OF AMINO ACIDS
Figure A2.1 The relative concentrations of amino acids during batch culture
3.90 was cultured as previously described (Figure legend 3.1). Batch cultures were
created at early generations (≤ 40 generations) and late generations (≥ 60 generations,
Section 2.3.2). Supernatant samples, taken on days 5, 7, 9 and 13 of batch culture
(Section 2.3.2), and a medium control sample, were spiked with the internal standard
myristic acid d27 and lyophilised. Chemical derivatization was performed in two stages,
with methyloxyamine hydrochloride in pyridine, before the addition of MSTFA and
TMCS (Section 2.10.3.1). All samples were analysed using GC-MS analysis, within 24
hr of derivatization. Raw data processing was performed using ChemStation and
AMDIS (Section 2.10.3.2). A, shows the relative percentage of isoleucine B, shows the
relative percentage leucine, C, shows the relative percentage of valine, D, shows the
relative percentage methionine, E, shows the relative percentage of proline, F, shows
the relative percentage tyrosine, and G, shows the relative percentage threonine. All
values were normalised to the internal standard, myristic acid d27. Error bars represent
SD for two biological replicates.
Annotation of the batch cultures in Figure A2.1
Early generation cultures
Late generation cultures

339
Figure A2.1 The relative concentrations of amino acids during batch culture
A.
B.
D.
C.
0
10
20
30
40
50
Medium 5 7 9 13
Rela
tiv
e iso
leu
cin
e
(%)
Day
0
20
40
60
80
Medium 5 7 9 13
Rela
tiv
e leu
cin
e
(%)
Day
0
10
20
30
40
50
Medium 5 7 9 13
Rela
tiv
e v
ali
ne
(%)
Day
0.0
0.5
1.0
1.5
2.0
2.5
3.0
Medium 5 7 9 13
Rela
tiv
e m
eth
ion
ine
(%)
Day

340
E.
F.
G.
0
2
4
6
8
10
12
Medium 5 7 9 13
Rela
tiv
e th
reo
nin
e
(%)
Day
0
20
40
60
80
100
Medium 5 7 9 13
Rela
tiv
e p
ro
lin
e
(%)
Day
0
5
10
15
20
Medium 5 7 9 13
Rela
tiv
e ty
ro
sin
e
(%)
Day

341
APPENDIX 3 – OSMOLALITY MEASURMENTS
Table A3.1 Osmolality measurements in response to feed and DMSO addition
Cell culture supernatants, taken from day 7 of batch culture, were measured for
osmolality. The osmolality of cultures was measured using an automatic micro-
osmometer (Section 2.3.6). Water (zero mOsmole) and a 300 mOsmole standard
solution (Minimum Essential Medium, containing Earle’s salts and L-glutamine) were
used to calibrate for the measurement of samples.
Generation Day Culture condition Osm/kg
Early 3 no addition 0.318
Early 3 + feed addition 0.343
Early 7 no addition 0.308
Early 7 + feed addition 0.449
Early 7 + DMSO addition 0.573
Late 3 no addition 0.319
Late 3 + feed addition 0.352
Late 7 no addition 0.311
Late 7 + feed addition 0.452
Late 7 + DMSO addition 0.58

342
APPENDIX 4 – INVESTIGATING CHEMICAL ADDITIONS
Figure A4.1 Preliminary investigation of different chemical additions to improve
recombinant protein production
Cell Line 3.90 was subject to long-term culture in suspension using MSX supplemented
CD-CHO media. Batch growth analysis was created from 0.2x10⁶ cells/ml, and
maintained at 37oC, 140rpm with a manual supply of 5% CO2 in air. Cultures were
supplemented with different chemical addition on day 5 of batch culture. These
additions included 0.4M glycerol, 1M glycerol, 2% (v/v) DMSO, 5% (v/v) DMSO,
0.05M sorbitol or 0.5M sorbitol. Cells were cultured under these conditions until
viability was ≤ 50%. Antibody titres were measured by ELISA (Section 2.5.1), and
viable cell densities were determined by light microscopy and trypan blue exclusion
(Section 2.3.3). This figure shows A. antibody titres, and B. viable cell densities, for the
different chemical additions.
Annotation of the generation batch cultures in Figure A4.1
Unfed
0.4M Glycerol
1M Glycerol
2% (v/v) DMSO
5% (v/v) DMSO
0.05M Sorbitol
0.5M Sorbitol

343
Figure A4.1 Preliminary investigation of different chemical additions to improve
recombinant protein production
B.
A.
0
400
800
1200
1600
0 3 5 7 9 11 13 15
An
tib
od
y t
itre
(mg
/L)
Day
0
2
4
6
0 5 10 15
Via
ble
cell
s
(x1
06
cell
s/m
l)
Day

344
Table A4.1 Analysis of different DMSO additions on cell growth and final antibody
titres
3.90 was subject to LTC in suspension using MSX supplemented CD-CHO media. Batch
culture analysis was performed in shake flasks for early generation (≤ 40 generations)
and late (≥ 60 generation) cultures. Batch cultures were created at 0.2x10⁶ cells/ml, and
maintained at 37oC, 140 rpm and with a manual supply of 5% CO2 in air. DMSO
addition was added to early and late generation cultures at concentrations of 2% (v/v)
on day 5 of batch culture or 1% (v/v) on day 0 of batch culture. Antibody titres were
measured by ELISA (Section 2.5.1), and viable cell densities were determined by light
microscopy and trypan blue exclusion (Section 2.3.3) from samples taken during batch
culture (Section 2.3.2). The table shows final antibody titres, maximal viable cell
densities and overall CCT values. For determination of CCT see Section 2.11.2. The
average value is shown ± SEM for three biological replicates. Each biological replicate
value is an average from duplicate technical repeats.
2% (v/v) DMSO addition d5
control 2% (v/v) DMSO control 2% (v/v) DMSO
Maximal viable cell densities (x106 cells/ml) 5.8 ± 0.2 4.5 ± 0.3 5.4 ± 0.2 4.7 ± 0.2
Overall cumulative cell time (x106 x day/L) 46 ± 1.8 42 ± 2.7 43 ± 0.8 41 ± 2.3
Final antibody titre (mg/L) 941 ± 20 1377 ± 38 695 ± 10 1005 ± 17
1% (v/v) DMSO addition d0
control 1% (v/v) DMSO control 1% (v/v) DMSO
Maximal viable cell densities (x106 cells/ml) 5.8 ± 0.2 3 ± 0.5 5.4 ± 0.2 2.9 ± 0.3
Overall cumulative cell time (x106 x day/L) 46 ± 1.8 29 ± 2.4 43 ± 0.8 29 ± 1.7
Final antibody titre (mg/L) 941 ± 20 1073 ± 88 695 ± 10 848 ± 11
Early Late
Early Late

345
APPENDIX 5 – INVESTIGATING EXPRESSION OF UPR MARKERS FOR
THE PARENTAL CELL LINE
Figure A5.1 Parental cells have lower GADD153 and XBP-1(s) mRNA than
recombinant CHO cultures
Cell Line 3.90 and parental cells were subject to subject to culture using MSX and L-
glutamine supplemented CD-CHO media, respectively. Batch growth analysis was
created from 0.2x10⁶ cells/ml, and maintained at 37
oC, 140rpm with a manual supply of
5% CO2 in air. mRNA levels were compared using q-RTPCR from samples taken on day
9 of batch culture (as detailed in Section 2.7.1), using the mRNA specific primer sets for
GADD153. Samples were normalised using mRNA β-Actin primers. (A) The relative
expression of GADD153mRNA is shown for the recombinant and parental cell line.
A PCR was also performed using parental cDNA (Section 2.7.1.3) and XBP-1(s)
primers (Section 2.7.2), from samples taken on days 3, 7, and 9 during batch culture.
The PCR products were electrophoresed on a 2% (w/v) agarose gel and visualised by
UV transillumination (Section 2.6.1.4). The product bands were analysed using Image J
software. The quantified ratio of spliced XBP-1mRNA to total XBP-1mRNA (B) and the
product bands (C) is shown. Error bars represent SEM for three biological replicates. *
indicates p<0.05, using independent samples t-test to compare parental cultures to the
recombinant 3.90 culture.
Annotation of the generation batch cultures in Figure A5.1
3.90 early generation, no addition
Parental no addition
Parental with feed addition

346
Figure A5.1 Parental cells have lower GADD153 and XBP-1(s) mRNA than
recombinant CHO cultures
A.
B.
C.
0
50
100
150
200
GA
DD
15
3 m
RN
A e
xp
ress
ion
(% r
ela
tiv
e t
o s
tan
da
rd
an
d
β-A
cti
nm
RN
A e
xp
ress
ion
)
3 7 9 Positive
XBP-1(U)
XBP-1(S)
0
5
10
15
20
25
30
35
40
3 7 9
Am
ou
nt
of
spli
ced
XB
P-1
mR
NA
to to
tal
XB
P-1
(%)
Day
*
*

347
Figure A5.2 ATF4 is significantly lower for the parental cell line
Cell Line 3.90 and parental cells were subject to subject to culture using MSX and L-
glutamine supplemented CD-CHO media, respectively. Batch growth analysis was
created from 0.2x10⁶ cells/ml, and maintained at 37
oC, 140rpm with a manual supply of
5% CO2 in air. mRNA levels were compared using q-RTPCR from samples taken on day
9 of batch culture (as detailed in Section 2.7.1), using the mRNA specific primer sets for
ATF4. Samples were normalised using mRNA β-Actin primers. (A) The relative
expression of ATF4 mRNA is shown for the recombinant and parental cell line. ATF4
protein was also investigated via immunofluoresence (Section 2.94) and western
blotting (Section 2.5.3). Protein was extracted on day 9 of batch culture (detailed in
Section 2.5.3.1). 60µg of protein was separated by SDS-PAGE (Section 2.5.3.2),
transferred then detected using anti-rabbit polyclonal ATF4 antibody (Section 2.5.3.3).
Membranes were stripped and re-probed using an anti-mouse pan-ERK antibody
(Section 2.5.3.4). Bands were analysed using Image J software and calculated relative
to ERK (Section 2.5.3.5). Cells on day 9 of cultures were permeabilised, fixed and
incubated with ATF4, Texas Red®, and DAPI separately as described in Section 2.9.4.
Images were collected using an Olympus BX51 upright microscope using a coolsnap ES
camera through Metavue software, and analysed using Image J Software. The relative
protein intensities for western blot and immunofluorescence analyses are shown in B
and C, respectively. Typical examples of a recombinant cell line (D(i)), and a parental
cell line (D(ii)) expressing ATF4 are shown. Error bars represent SEM for three
biological replicates. * indicates p<0.05, using independent samples t-test to compare
parental cultures to the recombinant 3.90 culture. White scale bars = 10μm.
Annotation of the generation batch cultures in Figure A5.2
3.90 early generation, no addition
Parental no addition
Parental with feed addition

348
Figure A5.2 ATF4 is significantly lower for the parental cell line
A.
B.
0
50
100
150
200
250
300
AT
F4
mR
NA
ex
press
ion
(% r
ela
tiv
e t
o s
tan
da
rd
an
d
β-A
cti
nm
RN
A e
xp
ress
ion
)
0
20
40
60
80
100
120
140
3.90 Early 3.90 Late Parental
AT
F4
pro
tein
in
ten
sity
(rela
tiv
e to
sta
nd
ard
ER
K)
Cell line/GenerationC.
0
20
40
60
80
100
120
3.90 Early 3.90 Late Parental
AT
F4
mic
ro
sco
py
qu
an
tifi
ca
tio
n
Cell line/Generation
D.
(i) (ii)
* *
*
*

349
APPENDIX 6 - MYCOPLASMA TESTING
Table A6.1 Mycoplasma is not detected during batch culture
Early (≤ 40 generations) and late (≥ 60 generation) 3.90 and 51.69 cell cultures were
routinely tested for the presence of mycoplasma during LTC, using a MycoAlert®
Detection Kit (Section 2.3.7), according to manufacturer’s instructions.
Early Late Negative Positive
Cell line
3.90 0.32 ± 0.02 0.36 ± 0.04 0.61 ± 0.10 76.25 ± 7.43
Cell line
51 0.28 ± 0.05 0.31 ± 0.08 0.61 ± 0.11 76.25 ± 7.44
Copyright © 2022 FDOKUMEN