
qra for oslo carbon capture - feed
60
Issued for information 01 20.11.2020 JW/MF OMM OMM Reason for Issue Client Rev. Rev. Date Prep. By Checked Approved Company: Fortum Oslo Varme AS Project: Project CCS Carbon Capture Oslo Document title: Quantitative Risk Assessment (QRA) for CCS plant NC03i-FOV-S-RA-0004 Number of pages: 163 N/A Rev: N/A KI: Attachments:
-
Upload
khangminh22 -
Category
Documents
-
view
1 -
download
0
Transcript of qra for oslo carbon capture - feed

Issued for information 01 20.11.2020 JW/MF OMM OMM
Reason for Issue Client Rev. Rev. Date Prep. By Checked Approved
Company: Fortum Oslo Varme AS Project: Project CCS Carbon Capture Oslo Document title:
Quantitative Risk Assessment (QRA) for CCS plant
NC03i-FOV-S-RA-0004 Number of pages:
163 N/A Rev: N/A KI:
Attachments:

QRA FOR OSLO CARBON CAPTURE - FEED
Document no. LaC-P0624-R-0026 Revision 02 Date 30.11.2019


QRA for Oslo carbon capture - FEED lilleaker.com
LaC-P0624-R-0026 / Rev. 02 / 30.11.2019 Page: 3 of 59
Table of contents: 1 Introduction ................................................................................................................................... 5
1.1 Scope of work ................................................................................................................................... 5 1.2 Limitations ........................................................................................................................................ 5 1.3 Governing regulations ...................................................................................................................... 5
2 System description ......................................................................................................................... 6
2.1 Carbon capture plant ....................................................................................................................... 8 2.2 Intermediate storage solutions ........................................................................................................ 8 2.3 Truck loading and offloading .......................................................................................................... 11 2.4 Truck transport ............................................................................................................................... 11 2.5 Harbour facilities ............................................................................................................................ 12 2.6 Weather conditions ........................................................................................................................ 14 2.7 DSB requirements/guidance for risk acceptance criteria .............................................................. 15
2.7.1 Minimal endogenous mortality ................................................................................................. 15 2.7.2 DSB guidance on restricted area zones ..................................................................................... 15
3 Methods and data ........................................................................................................................ 16
3.1 General ........................................................................................................................................... 16 3.2 Generic accident data .................................................................................................................... 16 3.3 Catastrophic failure of CO2 storage tanks ...................................................................................... 18 3.4 Leak and dispersion modelling ....................................................................................................... 19
3.4.1 General ...................................................................................................................................... 19 3.4.2 Modelling leak rates and durations ........................................................................................... 20
3.5 Vulnerability of humans ................................................................................................................. 20 3.5.1 CO2 toxicity ................................................................................................................................ 20 3.5.2 Exposure time ............................................................................................................................ 21
3.6 Calculation of risk contours ............................................................................................................ 21
4 Hazard identification (HAZID) ....................................................................................................... 22
5 CFD simulation scenarios .............................................................................................................. 25
6 Risk assessment carbon capture plant and storage at Klemetsrud ............................................... 26
6.1 CO2 leaks at the carbon capture and conditioning plant ............................................................... 26 6.2 Hydrogen leak scenario at the carbon capture and conditioning plant ........................................ 28 6.3 CO2 leak scenario from liquefaction at Klemetsrud ....................................................................... 28 6.4 CO2 leak scenario from storage tanks at Klemetsrud .................................................................... 28
6.4.1 120 kg/s release scenarios ......................................................................................................... 29 6.4.2 600 kg/s release scenarios .................................................................................. 31
6.5 CO2 leak scenario from truck/hose at Klemetsrud ......................................................................... 33 6.5.1 Leak from loading hose .............................................................................................................. 33 6.5.2 Tank rupture/BLEVE - truck ....................................................................................................... 34
7 Risk assessment - storage tank rupture and BLEVE scenarios ......................................................... 35
7.1 General ........................................................................................................................................... 35 7.2 Storage tank rupture frequency at Klemetsrud ............................................................................. 35 7.3 Storage tank rupture frequency at Oslo Harbour .......................................................................... 36 7.4 Accident consequences of storage tank rupture scenarios ........................................................... 37

QRA for Oslo carbon capture - FEED lilleaker.com
LaC-P0624-R-0026 / Rev. 02 / 30.11.2019 Page: 4 of 59
8 Risk assessment for truck transport .............................................................................................. 41
9 Risk assessment for Oslo Harbour ................................................................................................. 42
9.1 Accident statistics for Oslo Harbour .............................................................................................. 42 9.2 Risk assessment, prior to introducing the CO2 facilities ................................................................ 43
9.2.1 Existing activities and risks......................................................................................................... 43 9.2.2 Ship incidents and accident scenarios in Oslo Harbour ............................................................. 43 9.2.3 Risk picture Oslo Harbour prior to CO2 facilities ..................................................................... 44
9.3 Risk assessment, CO2 facilities ....................................................................................................... 45 9.3.1 CO2 leak scenario from truck/hose at Oslo Harbour................................................................. 45 9.3.2 CO2 leak scenario from storage tanks at Oslo Harbour ............................................................. 45
9.3.2.1 Simulation results .............................................................................................................................................46 9.3.3 CO2 leak scenario from offloading to ship ................................................................................. 48
9.4 Risk contribution from CO2 transport ship while in Oslo Harbour ................................................. 48 9.4.1 General ...................................................................................................................................... 48 9.4.2 Risk contribution from the CO2 transport ship .......................................................................... 49
10 Risk contours ............................................................................................................................... 52
11 Risk summary .............................................................................................................................. 54
12 Recommendations ....................................................................................................................... 58
13 References ................................................................................................................................... 59
Appendix: Appendix A: Generic accident frequency Appendix B: Regulatory requirements Appendix C: Calculation of restricted areas Appendix D: Klemetsrud CO2 dispersion analysis Appendix E: Sensitivities

QRA for Oslo carbon capture - FEED lilleaker.com
LaC-P0624-R-0026 / Rev. 02 / 30.11.2019 Page: 5 of 59
1 1.1 Scope of work This document contains the FEED risk analysis for the Oslo Carbon Capture (CC) project. This includes risk assessments of both the CC plant facilities at Klemetsrud and at Oslo Harbour as proposed by Contractor.
1.2 Limitations The risk analysis is limited to the operational phase, which means that risk related to construction work is not included. Accidents at the Klemetsrud energy from waste facilities and at neighbouring facilities at Oslo Harbour are not addressed in detail in this analysis. The risk analysis focuses on risks related to accident scenarios and releases with major accident potential. Occupational accidents are not focused. Possible effects of continuous or planned release of substances is not focused. Release of nitrosamines could be a concern for carbon capture facilities, depending on the chemicals to be applied in the process.
1.3 Governing regulations A set of relevant regulations is listed in Appendix B (in Norwegian).

QRA for Oslo carbon capture - FEED lilleaker.com
LaC-P0624-R-0026 / Rev. 02 / 30.11.2019 Page: 6 of 59
2 Klemetsrud Energy from Waste (WtE) plant produces approximately 460,000 tons CO2 a year from the three incineration lines K1, K2 and K3. The capture plant will be designed to capture approximately 90% (average) of produced CO2. Any CO2 produced will be compressed and conditioned for water and oxygen content. Following compression and conditioning CO2 will be liquified and sent to intermediate storage at WtE site. Liquid CO2 will be transported to Oslo Harbour using truck transport where it will be stored in a tankage facility before being exported and shipped via a CO2 Terminal located at the Jetty. The CO2 capture plant (CC plant) will be located east of the original WtE plant (see Figure 2-1).
Figure 2-1: Original WtE plant marked with grey, CO2 capture plant to the east.
Klemetsrud Energy from Waste (WtE) plant is located at Klemetsrud in Oslo, near E6 (south direction). As can be seen in Figure 2-2 there are residential areas and schools nearby the facility. Hilly terrain and partly wooded area surrounding the facility will be beneficial considering direct exposure from plant to nearby areas.
Carbon capture and liquefaction
Culvert with pipeline for liquefied CO2
CO2 intermediate storage and truck loading
Existing WtE plant

QRA for Oslo carbon capture - FEED lilleaker.com
LaC-P0624-R-0026 / Rev. 02 / 30.11.2019 Page: 7 of 59
Figure 2-2: Klemetsrud WtE and nearby areas
WtE Klemetsrud
School School and sports facilities
School
School
School
Residential area
Residential area

QRA for Oslo carbon capture - FEED lilleaker.com
LaC-P0624-R-0026 / Rev. 02 / 30.11.2019 Page: 8 of 59
2.1 Carbon capture plant An overview of the carbon capture process is shown in Figure 2-3.
Figure 2-3: Overview - Carbon capture process
In the pre-treatment unit the booster fan provides the flue gas with sufficient pressure to flow through the carbon capture plant. The pre-scrubber cools the flue gas to the required temperature for the capture process. The pre-treated flue gas from the pre-scrubber is routed through the carbon capture plant and then returned to the existing flue gas stacks for proper dispersion. The CO2 produced from the capture unit is sent to the compression and conditioning unit. The compressed CO2 passes further through an oxygen removal reactor and driers before sent to liquefaction. In the liquefaction unit the CO2 is compressed, dried and liquefied. Liquid CO2 from Intermediate Storage at WtE plant is transported using trucks to Intermediate Storage in Oslo Harbour.
2.2 Intermediate storage solutions 2
production, while at Oslo Harbour, the storage capacity is four times larger. Four 30m long bullet tanks are currently being planned for at Klemetsrud, and 16 at Oslo Harbour. Each tank has a working capacity of 342m3 (364 t). The storage tank configuration is a two- level structure shown in Figure 2-4. In the concept phase, large spherical tanks were assumed at Oslo Harbour. An assessment of the risk aspects of tank configuration is included in Appendix E.

QRA for Oslo carbon capture - FEED lilleaker.com
LaC-P0624-R-0026 / Rev. 02 / 30.11.2019 Page: 9 of 59
Figure 2-4: Storage tanks at Klemetsrud
From the liquefaction facility the liquefied CO2 enters the four intermediate storage tanks. A schematic sketch of the storage tanks with piping and valves can be seen in Figure 2-5. The tanks are filled sequentially through the manifold. Valves to the tanks not being loaded will then be closed. The heat which is transferred into the tank is absorbed by the liquid CO2 in the tank and will cause some of the CO2 to be vaporized. The flashed and displaced vapour from the storage tanks is sent to a displaced vapour header for reliquefication.
Figure 2-5: Schematic overview of lines in and out of storage tanks at Klemetsrud
At Oslo Harbour there are 16 storage tanks; each with a working capacity the same as at Klemetsrud (342m3). The tanks are arranged in two levels as shown in Figure 2-6.

QRA for Oslo carbon capture - FEED lilleaker.com
LaC-P0624-R-0026 / Rev. 02 / 30.11.2019 Page: 10 of 59
Figure 2-6: Storage tanks at Oslo Harbour
The storage tanks to be applied are designed as double walled ansfer into the tank. There will be vacuum in the annular space between the inner and outer vessel. The heat which is transferred into the tank is absorbed by the liquid CO2 in the tank and will cause some of the CO2 to be vaporized. The vaporized gas will be recovered in the relief system and re-liquefied to prevent pressure build-up (or it could be vented to the atmosphere). Design basis for the proposed storage tank configuration is shown in Table 2.1.
Table 2.1: Design basis for storage tanks
Products Inside diameter [mm]
Length [mm] Working capacity [m3]
Design pressure [barg]
Design temperature [ C]
Liquefied CO2 4000 27500 342 17 -52 to 85 There will be a pressure relief system for the intermediate storage tanks with two PSVs and a blowdown valve as shown in Figure 2-7. Leaks in the inner or outer tank will be detected by pressure sensors in the annulus and in response to pressure build-up in the annulus, the tank will be depressurized. During blowdown the pressure will be reduced to 50% of design pressure in 11.5 minutes and 35% of design pressure in 15 minutes. There will be back-pressure in the relief system to prevent tank pressure from falling below the triple point and freeze. Liquid CO2 will solidify when the pressure drops below 4.18 bar. Blowdown lines as well as all PSV discharges from liquid CO2 sources are routed to relief system with 4 bar(g) backpressure. This will prevent formation of dry ice and blockage of the relief lines. At Klemetsrud venting through the flue stack is proposed, while at Oslo Harbour a dedicated vent stack will be required.

QRA for Oslo carbon capture - FEED lilleaker.com
LaC-P0624-R-0026 / Rev. 02 / 30.11.2019 Page: 11 of 59
Figure 2-7: Storage tanks with pressure relief system
2.3 Truck loading and offloading At Klemetsrud the liquefied CO2 will be pumped to the trucks at a filling rate of approximately 75m3/hour. The trucks will be unloaded in the harbour, and liquefied CO2 transferred to the harbour storage tanks. The truck and storage tank will be connected by a displaced vapor line. Truck loading and offloading operations will be performed day and night, using 7 trucks in all. The total operation time for the trucks at the facility will be about 45 minutes. The duration of the filling operation will be about 25-30 minutes.
2.4 Truck transport The preferred route to transport CO2 from Klemetsrud to Oslo Harbour will be along E6 heading north to Ryen, continuing down the Ekeberg tunnel and Vålerenga tunnel and the southwest along E18 to Oslo Harbour (Figure 2-8). Note that the last part at Oslo Harbour may deviate from the indicated route.

QRA for Oslo carbon capture - FEED lilleaker.com
LaC-P0624-R-0026 / Rev. 02 / 30.11.2019 Page: 12 of 59
Figure 2-8: Truck transport route (blue)
Tank trucks will be purpose-built for this mission. Size of the trucks are assumed to be 50 ton. A truck of this size can transport a volume of 25m³ CO2 at temperature -25°C and 15 barg pressure.
2.5 Harbour facilities The current location being considered for storage and loading at Oslo Harbour is Sydhavna (Figure 2-9).
Figure 2-9: Oslo Harbour - Sydhavna

QRA for Oslo carbon capture - FEED lilleaker.com
LaC-P0624-R-0026 / Rev. 02 / 30.11.2019 Page: 13 of 59
The south part of Oslo Harbour (Sydhavna) is considered a national centre for logistics and includes container handling, storage and distribution of petroleum products and more. Sydhavna is a harbour area with several different activities and facilities including container handling, storage and distribution of petroleum products. The oil terminal supplies Oslo Harbour has several major accident scenarios prior to introducing the CO2 storage and offloading facilities. The facilities include the following
Offloading facilities for CO2 trucks 16 storage tanks Loading system for CO2 transport ship CO2 transport ship
Location of the CO2 storage tanks and nearby petroleum storage facilities can be seen in Figure 2-10.

QRA for Oslo carbon capture - FEED lilleaker.com
LaC-P0624-R-0026 / Rev. 02 / 30.11.2019 Page: 14 of 59
Figure 2-10: Intermediate storage at Oslo Harbour and nearby petroleum storage facilities
Port security International ship and port facility security code (ISPS) is implemented at Oslo Harbour. This means that access control is implemented for the area. The intention is to reduce the risk for terror and sabotage. The Norwegian Coastal Administration is the national authority responsible for implementing international regulations on port security. This includes supervision of port facilities concerning compliance with security and safety regulations
2.6 Weather conditions Wind measurements from [1] are available from Bleikøya (near Sjursøya) and from Solveien between Sjursøya and Klemetsrud. It is 5 km between the two locations. According to these measurements the average wind speed at Bleikøya is 1 m/s, while the average wind speed at Solveien is 2 m/s. The dominant wind direction is from south. It seems the resolution in the wind direction measurements from Bleikøya has some limitations and does not match the resolution in the radar plot.
Petroleum ship loading

QRA for Oslo carbon capture - FEED lilleaker.com
LaC-P0624-R-0026 / Rev. 02 / 30.11.2019 Page: 15 of 59
Figure 2-11: Wind direction distribution in %. Left: Bleikøya 2014-2019, right Solveien 2012-2019
2.7 DSB requirements/guidance for risk acceptance criteria 2.7.1 Minimal endogenous mortality In a DSB guideline [2], Minimal Endogenous Mortality (MEM) is used to define risk acceptance criteria. The MEM method is based on experienced mortality rates in society, depending on age and sex. MEM compares the risks due to a prdemands that the new system/facility does not significantly contribute to the existing mortality. Statistics shows that for 10 to 14-year-old girls in Norway, the mo -5 per year. For a planned
-5 deaths per 3rd party person and year are considered a noteworthy contribution to this -5 per year for an individual is not considered
acceptable. This is used as basis for defining requirements to restricted area zones and criteria for individual risks in [2].
2.7.2 DSB guidance on restricted area zones Based on the assessments in the previo -5 per year fatality rate is proposed as a criterion for
at all times. Proposed risk acceptance criteria (DSB) for hazardous substances [2]
Individual risk shall be less than 10-5 per year for personnel outside the facility For 3rd party persons in residential areas, individual risk shall be less than 10-6 per year For particularly vulnerable persons in residential areas, individual risk shall be less than 10-7 per
year Identified accident scenarios with a frequency 10-8 per year or less are considered broadly
acceptable
In addition, the rules for restricted areas are included as part of the risk acceptance criteria. These zones are defined in accordance with Norwegian Regulations on handling of hazardous substances, (FOR-2009-06-08-602, §16), see Appendix B for more details.

QRA for Oslo carbon capture - FEED lilleaker.com
LaC-P0624-R-0026 / Rev. 02 / 30.11.2019 Page: 16 of 59
Figure 2-12 shows the different zones and the objects that are allowed in each zone. Defined this way, the restricted area zones outside the facility are stricter than the individual risk criterion, since a person will not always be exposed to high risks.
Figure 2-12: Restricted area zones
3 3.1 General A general reference quantitative risk assessment that has been applied quantitative risk assessments [3].
3.2 Generic accident data Relevant data sources and generic accident frequencies, focusing on leak frequencies, are presented in Appendix A. The data applied are historical data, frequencies based on fault tree analysis and expert judgement. Leak frequencies are mainly based on HSE data, but other data sources have been used as well when considered relevant. The main leak sources to be considered at Klemetsrud and Oslo Harbour is piping and storage tanks. Piping When considering leaks from piping at Klemetsrud and Oslo Harbour, HSE data as shown in Table 3.1 has been applied.

QRA for Oslo carbon capture - FEED lilleaker.com
LaC-P0624-R-0026 / Rev. 02 / 30.11.2019 Page: 17 of 59
Table 3.1: HSE data piping leaks
Hole size (diameter), ref. HSE data
Hole size categories
Failure rates (per m per y) for pipework diameter 50mm to 149mm
150mm 299mm
300mm 499mm
500mm-1000mm
4 mm 1 mm-10 mm -6 -6 -7 -7 25 mm 11 mm-49 mm -6 7 -7 5 -7 4 -7 1/3 pipework - - -7 -7 -7 Rupture - -7 2 -7 7 -8 4 -8
Considering leaks from flanges some of the considered data sets have included this in the leak frequency for piping. HSE and PLOFAM have specific data for these leaks. Details with regards to flanges has not been looked into in this project but depending of type of flange/gasket the leak frequency per year would be in the order of 1.0 -5 to 1. 0 -6 per flange joint. Storage tanks Liquefied CO2 is stored in pressurised tanks both at Klemetsrud and at the harbour. Release of liquid CO2 could be either from connected piping and flanges or from a crack or rupture of the tank itself. When establishing frequencies for the CO2 storage tanks it has been necessary to consider data for several types of vessels in order to reflect the design and content for the vessels to be used for CO2 storage. As basis data from HSE has been used. The HSE has established frequencies for single- and double walled refrigerated vessels, and specific data have been derived for LNG storage vessels. The HSE data divides the catastrophic tank scenarios into 3 main causes:
- Defaults developing in service - Pressure/temp. outside design limits - External damage
This is further discussed in chapter 3.3 and appendix A.
Table 3.2: HSE data, basis for establishing frequencies for catastrophic tank rupture scenarios
Vessel Catastrophic failure frequency (per vessel year) Comments
Pressure vessels -6 External impact excluded Refrigerated ambient pressure vessels
-7
LNG vessels -8 Double walled Leaks in the connection between pipe and tank are considered as leaks from vessel (with various hole sizes) or as leaks in piping (with frequencies from HSE as described above). Loading/unloading hose Both hose and loading arms are being considered for loading/unloading operations. Basis for this analysis is use of hose between truck and storage tanks and use of loading arms between ship and storage tanks. Leak frequencies from [4] have been use for establishing hose rupture frequencies. The frequency for full bore
-8 per operation. Leak frequencies for loading arms (for ships) have -5 per transhipment.

QRA for Oslo carbon capture - FEED lilleaker.com
LaC-P0624-R-0026 / Rev. 02 / 30.11.2019 Page: 18 of 59
Other leak sources In Appendix A frequencies for other leak sources such as process vessels, heat exchanger and pumps have been addressed as well. This is equipment that can be found on Klemetsrud and Oslo Harbour, but they have been judged to have minor effect on the total risk picture and are hence not looked further into.
3.3 Catastrophic failure of CO2 storage tanks Tank rupture or BLEVE are scenarios with major CO2 release potential. For a BLEVE, there will be blast effects, with a potential for escalation to neighbouring tanks. Generic frequency for rupture of refrigerated- and pressurized storage tanks is addressed in Appendix A. The HSE has established frequencies for single- and double walled refrigerated vessels. Specific data have been derived for LNG storage vessels. The double walled storage vessels at Klemetsrud and harbour might be compared to double walled LNG storage vessels but note that the recommended frequencies are applicable only if the outer wall is designed to retain fluids in the tank. There are no recorded incidents as background for storage LNG vessel frequency and the HSE data does not give detailed background information regarding the frequencies. Potential causes can be divided into three categories as shown in Figure 3-1; failures developing in service, pressure or temperature outside design limits or external damages.
Figure 3-1: Causes for storage tank failure
Defects developing in service includes corrosion and fatigue that may undetected develop to a catastrophic failure. The CO2 storage will consist of double walled tanks with pressure detection in the annulus, and this will possibly reduce the risk for undetected faults. Even minor leaks in the inner (or outer) shell will be detected since the vacuum in the annulus will be lost.

QRA for Oslo carbon capture - FEED lilleaker.com
LaC-P0624-R-0026 / Rev. 02 / 30.11.2019 Page: 19 of 59
As observed from previous accidents, failures caused by pressure outside design limits can be catastrophic. For a fully isolated tank (relief valves closed or otherwise blocked), pressure would increase to about 60 bara as the temperature approach the ambient temperature. This overpressure scenario is prevented by the pressure control system including the PSVs. The considered tanks are relatively large and heating that cause pressure build-up will take long. Sensors will monitor temperature and pressure increase inside the tank and detect abnormal pressure and temperature. The accidents described in Appendix A involved quite violent explosions (BLEVE) and caused fatal consequences and material damages. Relief system failure (blocked outlet/valve could be due to for example manually closed valves or ice) and gradual heating of tank inventory has caused some of these accidents. Note that with a BLEVE, there is risk for escalation to neighbouring tanks. Among the incidents reviewed in Appendix A, there is one example of an escalated scenario (Hungary 1969). External damage includes threats as shown to the right in the fault tree in Figure 3-1. Safeguards are implemented to ensure that this risk contribution is as low as possible. Potential external threats will not necessary be the same for Oslo Harbour and Klemetsrud. Relating these scenarios to the fault three shown in Figure 3-1
are considered causes for leaks in connection point between vessel and piping.
3.4 Leak and dispersion modelling 3.4.1 General Dispersion modelling has been performed by DNVGL as a separate study. The study has been performed using a version of KFX that can handle solid CO2 particles. A description of the simulation tool, the simulated scenarios and the geometry model applied is included in Appendix D. The primary parameters that determine the hazardous distance for a liquid CO2 release are:
Table 3.3: Parameters and the effect on gas dispersion
Parameter Comment Leak rate The leak rate is the most important parameter determining hazardous distances,
provided the inventory is sufficiently large such that a steady state gas cloud can be formed.
Leak duration The leak duration is estimated assuming the tank is full, and the leak rate is constant. The time to establish a steady state gas cloud depends on the cloud size.
Leak direction The simulations have assumed a jet release vertically downwards hitting a relatively flat surface. This is a wall-jet scenario with relatively little air entrainment and a good starting point for a heavy gas dispersion scenario with long hazardous distances.
Geometry/terrain The scenarios simulated are heavy gas scenarios that to a large degree are affected by the terrain.
Wind With moderate wind speeds it is seen that the terrain dominates the dispersion direction rather than the wind. Wind is the governing factor in flat surfaces such as the sea.

QRA for Oslo carbon capture - FEED lilleaker.com
LaC-P0624-R-0026 / Rev. 02 / 30.11.2019 Page: 20 of 59
3.4.2 Modelling leak rates and durations Leak rate is a function of fluid properties (pressure, density, etc.) and hole size. Initial leak rate modelling is described in Appendix A. In this risk analysis and for the CFD simulations performed, CO2 leaks are modelled with constant leak rate. The leak rate is determined by the initial conditions. During the leak scenario, pressure will drop, and the actual leak rate will fall. Intermediate storage at Klemetsrud and Oslo Harbour is planned with a blowdown system as described in chapter 2.2. Pressure drop may be a result of the leak itself, blowdown or a combination of the two. For leaks from liquid CO2, pressure drop could lead to phase change of the inventory. The result could be vessel failure, or the leak could stop due to solid CO2 clogging the leak. Considering the transient nature of actual leak scenarios, the hazardous distances found using CFD (Appendix D) should be conservative.
3.5 Vulnerability of humans 3.5.1 CO2 toxicity According to the HSE, data available for carbon dioxide indicate that it does not meet the criteria for classification as a dangerous substance [5]. Nevertheless, releases of CO2 have the potential to cause fatalities either due to short time exposure at high concentrations or due to long time exposure to more moderate concentrations. Mortality for CO2 exposure is given as probit functions is described in detail in Appendix A. The resulting mortality is shown in Figure 3-2. For exposure time one hour or less, 6% CO2 concentration is used as the lower concentration that could pose risk for fatal accidents. This is also used as the lower concentration in the plots from CFD simulations.
Figure 3-2: Mortality curves for CO2 exposure for different exposure times

QRA for Oslo carbon capture - FEED lilleaker.com
LaC-P0624-R-0026 / Rev. 02 / 30.11.2019 Page: 21 of 59
3.5.2 Exposure time The accident scenarios identified give different dispersion distances and exposure periods. As to the
high concentrations. The duration of a leak is therefore of significance for determination of fatal concentration levels. Provided a fast-responding detection and alarm (PA) system, site personnel and third-party personnel will start evacuating. At the CC plant, personnel will be trained to evacuate to safe haven (mustering areas) which should be at high elevations (CO2 is a heavy gas). Evacuation speed (walking speed) is normally set to 1 m/s which means it takes approx. 5 minutes to evacuate 300 meters. Although evacuation routes and muster areas are still not determined it is reason to believe that a safe haven can be established within this distance. Evacuation of 3rd party personnel is more unpredictable since alarms and contingency plans are not established and because drills are not easily undertaken for persons in residential areas or for the public in general. For the input to the restricted area zones evaluation, one-hour exposure time has been applied in this study, unless the exposure time is judged to be shorter because the leak and exposure has short duration. This is judged to be a conservative approach, as it is believed that exposure times exceeding 30 minutes will be rare in most occasions. One-hour exposure means there is a risk for fatalities if concentration exceeds 6% (Figure 3-2).
3.6 Calculation of risk contours Risk contours are obtained by combining the frequencies for the different leak scenarios by the gas dispersion results, using applicable models for quantifying fatality risk. The probit functions described in chapter 3.5.1 are applied for this purpose. The principle applied for setting the risk contours in this report is best explained with an example. In Figure 3-3 there are four example scenarios, each with a frequency and a probability for fatal outcome as a function of distance in a chosen direction. The sum of the four scenarios is shown, and three bullets show the distance to the 10-5, 10-6 and 10-7 iso-risk contours. In this simple case, we see that scenario B determines the 10-6 and 10-7 contours, while scenario B and C in combination determine the 10-5 zone.
Figure 3-3: Calculation example for risk contours

QRA for Oslo carbon capture - FEED lilleaker.com
LaC-P0624-R-0026 / Rev. 02 / 30.11.2019 Page: 22 of 59
4 A combined HAZID and ENVID workshop was performed 31st of January 2019. The HAZID and ENVID is documented in separate reports; [6] and [7], respectively. The HAZID forms the basis for the scenarios to be evaluated as part of the risk analysis. The HAZID did primarily focus on major accident hazards. These are hazards that could cause multiple casualties at the facility or expose 3rd party outside the plant area to accident effects such as toxic gases. With respect to major accident risks, massive releases of CO2 are the primary concern. The worst-case accident scenario is a catastrophic failure of the intermediate storage tank. This could either be a large leak or a BLEVE scenario. There will be use of hydrogen in the oxygen removal process. Use of hydrogen also means the need for hydrogen storage. Hydrogen will most likely be stored in bottles at the facility, since quantity will be modest. A hydrogen leak could be a potential hazard as hydrogen is both flammable and potentially explosive. Collision is a risk contributor for truck transport from Klemetsrud to the harbour. Most collision accidents will not involve any release of the cargo. The high number of daily round-trips means that the collision frequency is significant. The chosen transport route has dense traffic. Part of the route is downhill through tunnels, which means increased accident risk. In a worst-case collision scenario, 25 tons of liquid CO2 could be released, which represents a severe accident scenario. Storage and offloading to ship at Oslo Harbour include risk for leak of large quantities of liquid CO2. Collision impacts to storage tanks and piping; overpressure and mechanical failure are among causes for acute large leaks. Explosion and fire loads from nearby sources may represent a threat to the storage. This was not addressed in the HAZID, as exact location of the facility at Oslo Harbour was subject to change at the time. The intermediate storage at Oslo Harbour is very similar to the intermediate storage at Klemetsrud, but there will be a larger tank farm (16 bullet tanks in two levels). The identified hazards to be further evaluated when establishing risk contours are summarized in Table 4.1.

QRA for Oslo carbon capture - FEED lilleaker.com
LaC-P0624-R-0026 / Rev. 02 / 30.11.2019 Page: 23 of 59
Table 4.1: Identified hazards to be further evaluated and reference to chapter in report
No. Hazard Description Chapter 1 Gaseous CO2 leak from the
carbon capture plant. a. Low pressure CO2 leak upstream the
compression package. b. High pressure CO2 leak downstream the
compression package.
6.1
2 CO2 leak from liquefaction at Klemetsrud.
a. Liquefied CO2 leak downstream liquefaction
6.3
3 CO2 leak scenarios from storage tanks at Klemetsrud.
a. CO2 leak from storage tank 6.4
4 Storage tank rupture at Klemetsrud.
a. An instantaneous release of tank inventory, incl. BLEVE
7
5 CO2 leak in truck loading area at Klemetsrud.
a. CO2 leak from loading hose b. Tank rupture/BLEVE truck
6.5
6 CO2 leak in truck offloading area at Oslo Harbour.
a. CO2 leak from loading hose b. Tank rupture/BLEVE truck
9.3.1
7 CO2 leak scenarios from storage tanks at Oslo Harbour.
a. CO2 leak from storage tank 9.3.2
8 Storage tank rupture at Oslo Harbour.
a. An instantaneous release of tank inventory, incl. BLEVE
7
9 CO2 leak scenarios during offloading to ship
a. CO2 leak during offloading 9.3.3
10 Truck transport accidents a. CO2 leak from truck 8 11 Potential threats from
neighbouring facilities. A report has been issued by the DSB [8] specifically addressing the safety aspects at and near Sjursøya. Results will be considered when establishing risk contours at Oslo Harbour.
9.2.3
12 Hydrogen fire and explosion risks
Release from high pressure hydrogen equipment/piping of explosion of hydrogen bottles
6.2
13 CO2 carrier ship collision with CO2 and/or LNG release
Risks quantification for the CO2 carrier was originally not part of the scope for this analysis. Relevant information and a coarse risk analysis is documented in chapter 9.4.2. CO2 carrier collision frequency is quantified in consistence with assessments performed for the Northern Lights project [9].
9.4.2
In addition to the hazards identified and listed above, there is a general concern and risk for liquid CO2 being blocked between closed valves in a shut-down situation. As the liquid CO2 is heated, pressure will increase up to about 60 bar. Pipe rupture will occur when the structural capacity is reached. This could result in risk to personnel and possible damages to adjacent equipment. Release of other substances and other hazards were discussed in the HAZID session as well. However, these hazards will not be evaluated further as they have been judged to have minor relevance for risk of 3rdparty. Hazards not further evaluated is listed in Table 4.2.

QRA for Oslo carbon capture - FEED lilleaker.com
LaC-P0624-R-0026 / Rev. 02 / 30.11.2019 Page: 24 of 59
Table 4.2: Identified hazards that are not quantified further
Hazard Description Other releases in CC plant:
Flue gas Solvent (amines dissolved in water) Degraded solvent (sludge) Refrigerant (R-1234ZE and ammonia
seem to be viable options) Caustic soda / NAOH (diluted to about
20% during pumping to consumers) Hot water Lube oil Glycol
It has however been concluded that the amounts are too small being a concern for personnel outside the vicinity of the leak or for people outside the plant area (3rd. party). Such releases are therefore subject to WHERA sessions. Further description can also be seen in the HAZID/ENVID log sheets [6], [7].
Occupational risk Occupational risks will be subject to the WHERA; a separate study in the project.
Sabotage The probability for sabotage is not quantified. It is assumed that necessary mitigating measures to prevent this is implemented.

QRA for Oslo carbon capture - FEED lilleaker.com
LaC-P0624-R-0026 / Rev. 02 / 30.11.2019 Page: 25 of 59
5 A set of gas dispersion simulations was performed as part of the concept risk analysis [10]. This set of simulations have been documented in [11]. The simulations from the concept phase included the following:
Large leaks from large spherical tanks at alternative locations in Oslo Harbour (a with release rate 1270 kg/s)*
Gaseous leaks from pipeline Large leaks from intermediate storage at Klemetsrud (254 kg/s)
* Hence, the frequency for a 1270 kg/s are remote ( ). A set of new gas dispersion simulations have been performed for the FEED phase. These simulations are documented in Appendix D to this report. The new simulations
Intermediate storage in Oslo Harbour is at Sjursøya-Kneppeskjær Intermediate storage in Oslo Harbour is in bullet tanks significantly smaller than the previous
spherical tanks, and the piping dimension is reduced to 150mm Layout and arrangement at Klemetsrud have been revised
Chapter 3.4 lists the input data for the gas dispersion simulations and discusses the use of constant leak rates until the inventory is emptied (blowdown and pressure drop are not reflected).
Table 5.1: Loss of containment scenarios simulated using KFX for the FEED phase
Case Location Rate kg/s
Jet direction (towards)
Comment
1 (2-Phase) Interm. Storage, Klemetsrud
617 Down Leak from tank at upper level Constant leak for 8 minutes
2 (2-Phase) 617 East Leak from tank at lower level Constant leak for 8 minutes
3 (2-Phase) 119 Down 20% of full rupture, lower level 4 (2-Phase) 119 East 20% of full rupture, upper level 6 (gas) Gas com-
pression, Klemetsrud
17 East Gas leak, long duration 7 (gas) 30 South Gas leak, 2 minutes 8 (gas) 50 Down Gas leak, 1 minute 9 (2-phase) Truck
loading, Klemetsrud
50 Down Hose rupture scenario, 1 minute 10 (2-phase) 250 Down Diameter is maximum 100mm. Maximum (initial) rate is
about 250 kg/s. 20 sec. duration. 11 (2-Phase) Sjursøya 617 Down , leak from tank at upper level
Constant leak for 8 minutes 12 (2-Phase) 617 Down , leak from tank at lower level
Constant leak for 8 minutes 13 (2-Phase) 617 East
Constant leak for 8 minutes 14 (2-Phase) 617 West
Constant leak for 8 minutes

QRA for Oslo carbon capture - FEED lilleaker.com
LaC-P0624-R-0026 / Rev. 02 / 30.11.2019 Page: 26 of 59
6
6.1 CO2 leaks at the carbon capture and conditioning plant The carbon capture plant will handle large quantities of gaseous CO2. The plant is naturally ventilated. Depending on exposure time, CO2 leaks are considered potentially lethal at about 6 % concentration. CO2 rich absorbent is routed to the CO2 stripper. The pressure in the feed line upstream and downstream the stripper is modest, about 1 barg. Downstream the stripper gaseous CO2 is routed further to compression. The low-pressure gaseous CO2 is transported through piping with diameter of 800mm (30 inch). After four stages of compression the gaseous CO2 has a pressure of about 43 barg. The CO2 is transported and conditioned through several vessels for i.e. oxygen removal and dehydration before liquefaction. The piping for compressed gas has a diameter of 200mm (8 inch). There is a shut-off valve between the liquid CO2 volume in the liquefaction process and the gaseous CO2 volume. For the piping with low pressure gaseous CO2 between stripper and compressor package, the length of piping is approximately 150 meters. The leak rate depends on the pressure (and partly on the temperature) inside the segment. Down-stream the stripper where the pressure is low (1 barg) the leak rates will be relatively low given a small hole. Large holes or rupture may provide large leak rates initially, but upon detection and shutdown the leak rate will drop rapidly, and the duration will be short due to limited CO2 mass in the segment. It is expected that this scenario will not affect personnel outside the facility and hence the scenario is not quantified further. For the piping with high pressure gaseous CO2, between compressor- and liquefaction package, the length of piping is considered to be approximately 100 meters. The duration of a rupture scenario will due to the quantities be short. Smaller leak hole sizes could last for some minutes. It is assumed a Gaseous CO2 inventory in the CC plant of approximately 3000 kg. This assumption is based on the volume of the Oxygen Removal Reactor (C2HKAZ002) with an approximately volume of about 20m3, and some piping. Release of gaseous CO2 in the capture and conditioning plant Scenarios with leak rates of 17 kg/s, 30 kg/s and 50 kg/s have been simulated by use of KFX. The results show that the lower rates will to a small degree expose the area outside the process area to lethal CO2 concentrations. A leak with rate 50 kg/s can be seen in Figure 6-1.
Figure 6-1: Gas cloud when release stops and 3000kg CO2 has been released. Case 06, 07 and 08

QRA for Oslo carbon capture - FEED lilleaker.com
LaC-P0624-R-0026 / Rev. 02 / 30.11.2019 Page: 27 of 59
The plots in Figure 6-1 show the following (3000 kg CO2 released):
Case 06 - 17 kg/s leak towards east, 3 minutes after the leak started
Case 07 - 30 kg/s leak towards east, 1.5 minutes after the leak started
Case 08 - 50 kg/s leak towards east, 1 minute after the leak started
It will take some time before gas is removed from all the area. The rightmost picture in Figure 6-1 shows the 50 kg/s scenario when the leak is assumed to stop after 1 minute. Figure 6-2 shows the gas remaining in the area after the leak is stopped. After about 30 minutes there is still some gas in the area. The wind speed in this case is 3 m/s with direction from south.
Figure 6-2: Case 08 at 4, 9, 14 and 28 minutes after the leak is stopped
From these simulations it is seen that there is not very much difference between a 17 kg/s leak and a 50 kg/s leak when it is reflected that the larger leak will have longer duration. What is more important is whether the leak is obstructed or not. An unobstructed jet will not form a large gas cloud, and the gas will disappear very fast when the leak is stopped. Case 04 (Figure 6-4) shows an example of an unobstructed jet for comparison. The frequency for leaks from piping have been based on HSE data and is shown in Table 6.1. The rupture scenario is assessed to potentially affect a larger area, but the average mortality within this area is expected to be relatively low, since duration of CO2 exposure is likely to be short.
Table 6.1: Leak rates- and frequencies for CO2 gaseous leaks at carbon capture plant
Hole size 4 mm 50 mm 70 mm Rupture Leak rate [kg/s] 1 17 30 >50 Leak frequency per year 1.0E-04 7.0E-05 4.0E-05 2.0E-05
Considering leaks from flanges some of the considered data sets have included this in the leak frequency for piping, but HSE and PLOFAM have specific data for these leaks. Details with regards to flanges has not been looked into in this project but depending of type of flange/gasket the leak frequency per year would be in the order of 1.0 -5 to 1.0 -6 per flange joint. A coarse quantification of individual risk level in the area can be performed by distributing the risk contribution over the area with high pressure CO2 equipment and piping. For these cases, the impacted area
individual risk level for a person in the process area is -4 per year.

QRA for Oslo carbon capture - FEED lilleaker.com
LaC-P0624-R-0026 / Rev. 02 / 30.11.2019 Page: 28 of 59
6.2 Hydrogen leak scenario at the carbon capture and conditioning plant Hydrogen is used for oxygen removal; hence there is a risk for jet fire and gas explosion. At the suction of the fourth stage of compression, hydrogen is injected. From this stage the CO2 is routed to the Oxygen Removal Reactor (C2HKAZ002). This vessel has a volume about 20m3 and will contain high pressure CO2 (with some hydrogen). The hydrogen injected reacts with oxygen to form water, reducing the concentration of oxygen to the specified level. The average dosing rate of hydrogen is 4.8 kg/d og 1600 kg/year [12]. This reference has a note that says hydrogen will be delivered from a tube trailer, but with the modest quantities applied delivery from bottles will be chosen [13]. In any case, there will be hydrogen at high pressure handled and stored and used at the facility. There is a fire and explosion risk related to the hydrogen use. Hydrogen storage must be well protected from possible impact and fire exposure. Where hydrogen is used indoors, the gas explosion risk must be considered. A hydrogen gas detection system must be considered. A vent system for pressure relief and other safety measures may also be required. With moderate quantities of hydrogen stored and handled at the facility, risk contribution outside the fence should be very low. This risk is not further quantified in this FEED QRA.
6.3 CO2 leak scenario from liquefaction at Klemetsrud The liquefaction process comprises several steps of compression and cooling, H2O O2 removal to reach the CO2 export specification. Few details about the liquefaction package are available at current stage, and both the frequency estimates and the leak durations are thus uncertain. The focus in the risk assessment is on 3rd party risk, and the focus is therefore on large release scenarios. There will be shutdown valves downstream the liquefaction package. This will prevent the storage tank(s) to be emptied in case of a leak in the liquefaction package. Gaseous CO2 leaks upstream the liquefaction package was evaluated in chapter 6.1. Approximately 250m of 6`` piping will be installed for transporting the liquefied CO2 from liquefaction package to the storage tanks. Most of the piping will however be underground. The potential release points will then be close to the package or close to the storage tanks. The frequency for leaks from piping have been based on HSE data and is shown in Table 6.2.
Table 6.2: Leak rates- and frequencies for CO2 leaks from liquefaction at Klemetsrud
Hole size 4 mm 25 mm 50 mm Rupture (150 mm) Leak rate [kg/s] 1 17 70 650 Leak frequency per year 2.5E-04 1.8E-04 1.0E-04 5.0E-05
If the compression and liquefaction equipment is located within a building, a leak may quickly fill the building with lethal concentrations of CO2. Procedures for building entrance and gas detection must be in place to ensure that personnel do not enter the building without proper protection if a CO2 leak has occurred. Leaks outside could be comparable to CO2 leaks from the filling station and CFD simulation results for these scenarios are described in chapter 6.5. Personnel outside the facility is not likely to be exposed in these scenarios.
6.4 CO2 leak scenario from storage tanks at Klemetsrud Figure 6-3 shows the piping and valve arrangement for the CO2 storage tank outlet. There is about 2 meters of piping to the first shutdown valve. This means that in case of a pipe rupture on the tank outlet or inlet

QRA for Oslo carbon capture - FEED lilleaker.com
LaC-P0624-R-0026 / Rev. 02 / 30.11.2019 Page: 29 of 59
there is a potential for emptying the whole tank inventory through the hole (given there is no system or arrangement inside the tank to prevent tank content to be emptied).
Figure 6-3: Piping and valves downstream the CO2 storage tank (arrangement is equal upstream the storage tank)
The leak frequencies are based on HSE data; both for piping and pressure vessels. Basis for the frequencies in Table 6.4 can be found in Appendix A. Lengths and number of storage tanks that has been used as basis when calculating the frequencies are summarised in Table 6.3.
Table 6.3: Lengths and number of storage tanks used as basis for frequency calculations at Klemetsrud
Leak source No./ m Storage tanks 4 Piping length 16
A scenario of 650 kg/s as the worst credible scenario when establishing the restricted area zones. A hole size of 50mm will (approximately) correspond to 20% of the cross s
Table 6.4: Leak rate- and frequencies for CO2 leak scenarios from storage tanks at Klemetsrud
Hole size 10 mm 25 mm 50 mm Rupture Leak rate [kg/s] 3 17 120 650 Leak frequency per year 1.6E-05 1.1E-05 1.0E-05 3.6E-06
6.4.1 120 kg/s release scenarios The simulation cases 3 and 4 illustrate the dispersion pattern for 120 kg/s constant leak rates from a storage tank with liquid CO2. The duration of such a leak can be 50 minutes, but this is a rather theoretical case since pressure drop would make the scenario transient. Figure 6-4 shows the unobstructed jet dispersion for a 120 kg/s jet. The jet length is about 100 meters, and the cloud will disappear almost instantly when the leak stops. This scenario is not considered very likely, since for most leak points there will be at least some obstructions that will disturb the free jet.

QRA for Oslo carbon capture - FEED lilleaker.com
LaC-P0624-R-0026 / Rev. 02 / 30.11.2019 Page: 30 of 59
Figure 6-4: Gas dispersion for a 120 kg/s unobstructed jet (Case 04)
For an obstructed jet, there a gas plume driven by gravity and wind forces will result. A downward directed jet can be considered a worst-case scenario and representative for an obstructed jet dispersion. The transient development of the gas cloud from a 50 minutes constant rate leak scenario is shown in Figure 6-5 and Figure 6-6. Figure 6-5 shows the developing cloud after 1 minute and 10 minutes into the leak scenario. After about 30 minutes, the gas cloud is fully developed and remains about steady until the leak stops at 50 minutes. The maximum gas extent is shown to the left in Figure 6-6.
Figure 6-5: 120 kg/s downward jet, after 1 min and 10 min constant release (Case 03)
After the leak stops, it takes some time for the gas to be diluted. The two pictures to the right in Figure 6-6 show the situation 15 and 30 minutes after the leak stops. Gas remains in low spots and there is also gas trapped in the carbon capture plant. In this case there is 3 m/s wind from south, and this probably contributes to trapping gas at and near the carbon capture and waste to energy facilities. Form an escape and emergency response perspective it is observed that the north side of the plant is virtually free from gas.

QRA for Oslo carbon capture - FEED lilleaker.com
LaC-P0624-R-0026 / Rev. 02 / 30.11.2019 Page: 31 of 59
Figure 6-6: 120 kg/s downward jet, when leak stops, 15 minutes and 30 minutes later (Case 03)
6.4.2 600 kg/s release scenarios The 600 kg/s case corresponds to As for the 120 kg/s scenario, a large gas cloud is formed if the jet is obstructed. A free horizontal jet for this case would appear as shown in Figure 6-7.
Figure 6-7: 617 kg/s horizontal jet. Left: unobstructed (case 02) and right, obstructed (case 02a)
A downward directed jet will result in an even larger gas cloud than the obstructed horizontal jet shown in Figure 6-7. The transient development of this scenario (Case 01) is shown in Figure 6-6. It is seen that there is dense gas at the highway after about 2-3 minutes and that a large area will be exposed to a high

QRA for Oslo carbon capture - FEED lilleaker.com
LaC-P0624-R-0026 / Rev. 02 / 30.11.2019 Page: 32 of 59
concentration CO2 gas plume within 8 minutes. Then, the gas cloud continues to grow while other parts are diluted, reaching the max extension about 8 minutes after the leak is stops (16 minutes after start of the leak).
Figure 6-8: 617 kg/s down after 1, 3 and 8 minutes
After the cloud reaches its maximum extension, the gas is diluted gradually. Figure 6-9 shows that there are still areas with high (and lethal) gas concentration half an hour after the leak stops. The simulation was stopped at this point, but still illustrates that it may take hours before the area is gas-free.
Figure 6-9: 617 kg/s down after 16, 26 and 36 minutes (leak stopped after 8 minutes)

QRA for Oslo carbon capture - FEED lilleaker.com
LaC-P0624-R-0026 / Rev. 02 / 30.11.2019 Page: 33 of 59
6.5 CO2 leak scenario from truck/hose at Klemetsrud 6.5.1 Leak from loading hose With 90% of CO2 captured, the initial transport demand is approximately 400 000 t/yr, with a future capacity demand at 587 400 t/yr (future line 4). It is assumed 25m3 CO2 capacity per truck. The resulting number of loading and offloading operations per year is approximately 16 000. This means in average 45 round trips per day for the initial case. Flexible loading hoses are applied. With a filling rate of approximately 75 m3/hour the total loading time is:
Loading time = 25 m3/ 75 m3
In total it is assumed that the truck will be at the facility 30 40 minutes. It is assumed that the offloading system is provided with an automatic shutdown valve to stop outflow from the tank in the event of a hose leak. It is also assumed there is an automatic shutdown valve on the upstream side of the tank close to the first tank flange. The quantity of liquid CO2 released is set to 3000 kg for the consequence evaluation. Table 6.5 shows the leak frequencies based on the chosen generic data. Reference is made to Appendix A for more details on generic leak frequencies. Due to the high number of load transfer operations, the leak frequencies are relatively high.
Table 6.5: Leak frequencies for hose load transfer operations - KLEMETSRUD
Leak hole diameter (mm)
Frequency (per operation) Leak rate (kg/s)
Number of operations at KLEMETSRUD
Leak frequency (per year)
15 2.8·10-6 7 16 000
0.044 25 2.0·10-7 17 0.0031
Full rupture 4.9·10-8 250 0.00076
Leak consequences
Leak consequences for truck loading has been assessed based on gas dispersion case 09 and 10. For both cases the wind speed is 3 m/s and the wind direction from west.
Case09: 50 kg/s for 1 minute directed down (3000 kg released) Case 10: 250 kg/s for 20 seconds directed down (5000 kg released)
Figure 6-10 shows the resulting gas cloud. The last picture shows some solid CO2 (dry-ice) at the ground. Case 11, which is a 250 kg/s leak for 20 seconds is has a marginally larger footprint.

QRA for Oslo carbon capture - FEED lilleaker.com
LaC-P0624-R-0026 / Rev. 02 / 30.11.2019 Page: 34 of 59
Figure 6-10: Case 09 (50 kg/s for 1 minute) when leak stops, 1 minute later and 2 minutes later
Note that if a tanker is emptied, the inventory is about 25 tons, and this is significantly more than assumed in these simulations. The leftmost picture in Figure 6-10 gives an illustration of the worst-case scenario. It is assumed that the offloading system is provided with an automatic shutdown valve to stop outflow from the tank in the event of a hose leak. It is also assumed there is an automatic shutdown valve on the upstream side of the tank close to the first tank flange. Releases during loading and offloading operations are therefore found to lead to limited quantities of CO2 release, and will primarily pose a risk to nearby personnel. The restricted area zones are judged not to be affected by incidents during loading and offloading.
6.5.2 Tank rupture/BLEVE - truck Scenarios like heat exposure of truck tank or overfilling could cause pressure build-up in the tank and could potentially result in a BLEVE scenario. HSE proposes failure rates for road tankers; 2.2 -7 (per km). With a relatively short driving distance at the Klemetsrud area, the frequency is estimated to approximately 1 -7 per year. 2 and t is therefore assumed that these tankers will be robust. Also, if measures are implemented to reduce probability for overfilling, an even lower frequency could be argued. Explosion/BLEVE consequences The results in Table 6.6 have been derived using relations between explosion energy, blast pressure and lethality as described in chapter 7.4. Explosion energy corresponds to change in internal energy from the storage condition to the triple point:
E = 25 -130.4) kJ/kg 0.22 GJ
Table 6.6: Distance and consequences for BLEVE from a truck
Distance(m) Dimensionless distance Pressure (bar) Fatal probability for blast 10 0.77 0.42 100 % 20 1.55 0.18 100 % 50 3.87 0.06 25 % 70 5.42 0.04 5 %

QRA for Oslo carbon capture - FEED lilleaker.com
LaC-P0624-R-0026 / Rev. 02 / 30.11.2019 Page: 35 of 59
7 7.1 General The storage tanks will be designed equal at Klemetsrud and Oslo Harbour. The tanks will be designed with double walls with monitored annulus. The storage tanks will have a design pressure of 17 barg and temperature range from -52 C to 85 C. With operational pressure at 15 barg, there is not much margin from the operational pressure to the tank design pressure. At -22.9°C, which is about 3°C above normal storage temperature, the saturation pressure will equal the design pressure. The normal operating temperature is -26°C, which is well above the lower temperature limit at -52°C. However, a fast pressure drop in the tank could occur, i.e. due to fast depressurization or opened bypass for the PSV/relief system. If pressure drop is too fast, temperature could fall below -52°C, and there is a potential for brittle fracture that could threaten tank integrity. Process safety systems will be designed to prevent this scenario. Pressure and temperature must be carefully controlled, and any increase or decrease in temperature or pressure therefore need to be detected. The PSVs and blowdown system will control pressure build-up, but due to the characteristics of CO2, icing and blockage of relief valves is a concern. Historically it has been seen that these failures have caused accidents with quite violent explosions (BLEVE) with fatal consequences and significant material damages. To the extent safety critical task is involved in safe operation of the tank farm, tank failure will be affected by the reliability of operators carrying out such tasks. External impact from operation of cranes and vehicles are possible failures related to manually operated equipment. In relation to overpressure incidents, manual closure of a valve in the safety relief system contributed to one of the CO2 BLEVE accidents, and in different ways human error can contribute to either overpressure or too low temperature and brittle fracture. Inspection and maintenance are other manual operations that are critical to the safe operation of the facility. A systematic analysis to identify safety critical tasks (manual operations) that could cause overpressure or otherwise lead to tank failure has not been performed as part of this analysis. Note that some of the more relevant human errors that potentially could contribute to tank failure relates to incorrect operation of valves related to pressure relief.
7.2 Storage tank rupture frequency at Klemetsrud The frequency for storage tank rupture/BLEVE scenario is calculated as: ftank rupture = fpressure outside design limits + fexternal damage
in Appendix A estimated to be around 1.0E-07 per year. Potential external impacts that may pose a risk to the storage tanks at Klemetsrud are discussed in Table 7.1.

QRA for Oslo carbon capture - FEED lilleaker.com
LaC-P0624-R-0026 / Rev. 02 / 30.11.2019 Page: 36 of 59
Table 7.1: External impacts at Klemetsrud
Type of threat external impact Safeguards
Vehicle/crane impact to storage facilities
Mechanical impact to the storage tank shall be prevented primarily by use of physical barriers. The tanks at Klemetsrud are protected by the structure and are not likely to be exposed to collision impacts. It should however be ensured that the structure is protected or robust enough to sustain potential impacts.
Aircraft HSE recommends a generic aircraft crash frequency of -5 per km2 that the frequency for the plant at Klemetsrud will be very low and considered negligible).
Fuel (gasoline, diesel, paraffine) fire/explosion scenarios
Fuel storage, transformer buildings or other buildings close to the CO2 tank storage could cause heat exposure to the tanks. Currently no such potential scenarios are identified near the tanks but should be considered when location of storage have been concluded. There are no other potential fire-/explosion scenarios identified that will threaten the storage tanks.
CO2 BLEVE from truck There is a possibility for tank explosion for the truck during loading operation. The effect could be a blast load and shrapnel impacting the tank farm. The probability for such a scenario to affect the storage tanks is considered very low, but design blast load should be considered.
Sabotage Physical protection and access control are implemented.
Based on the above discussion the contribution from external damages at Klemetsrud are considered negligible. The annual frequency for tank rupture is hence estimated to: ftank rupture Klemetsrud
-7 + negl. = 1.0 -7
7.3 Storage tank rupture frequency at Oslo Harbour The frequency for storage tank rupture/BLEVE scenario is calculated as: ftank rupture = fpressure outside design limits + fexternal damage Reference is made to Appendix A for further din Appendix A estimated to be about 1.0E-07 per year. Potential external impacts that may pose a risk to the storage tanks at Klemetsrud are discussed in Table 7.2.
QRA for Oslo carbon capture - FEED lilleaker.com
LaC-P0624-R-0026 / Rev. 02 / 30.11.2019 Page: 37 of 59
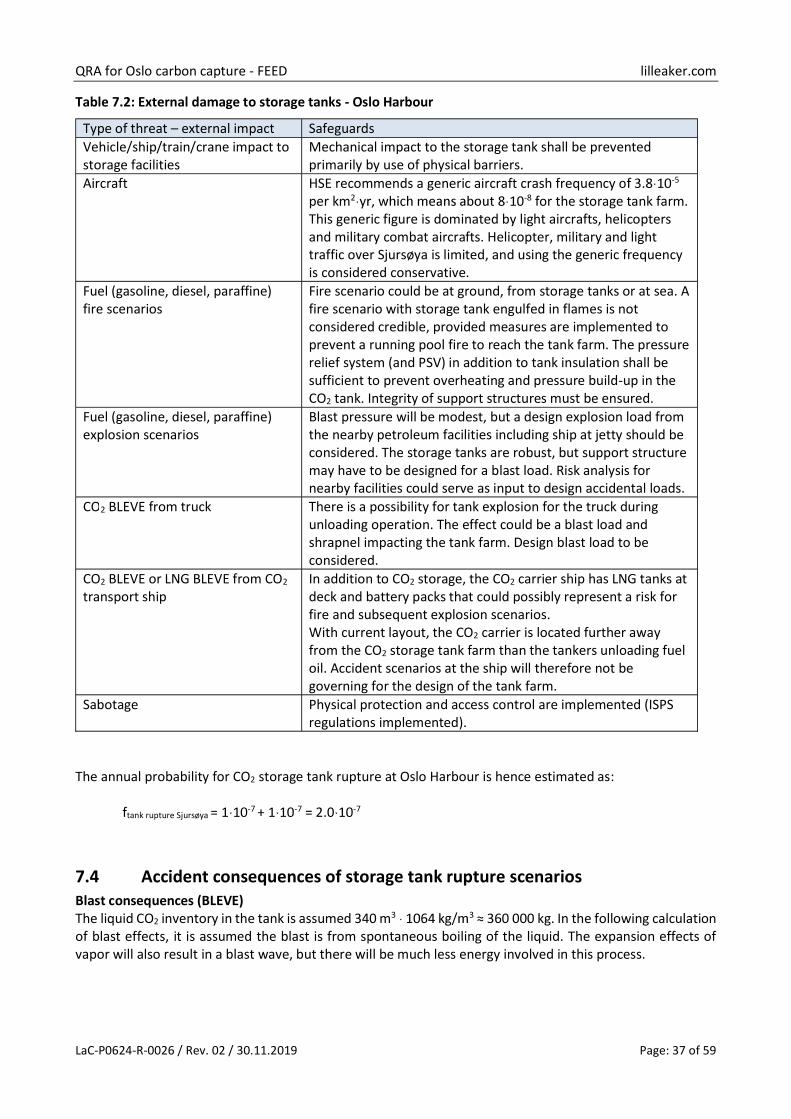
Table 7.2: External damage to storage tanks - Oslo Harbour
Type of threat external impact Safeguards Vehicle/ship/train/crane impact to storage facilities
Mechanical impact to the storage tank shall be prevented primarily by use of physical barriers.
Aircraft HSE recommends a generic aircraft crash frequency -5 per km2 0-8 for the storage tank farm. This generic figure is dominated by light aircrafts, helicopters and military combat aircrafts. Helicopter, military and light traffic over Sjursøya is limited, and using the generic frequency is considered conservative.
Fuel (gasoline, diesel, paraffine) fire scenarios
Fire scenario could be at ground, from storage tanks or at sea. A fire scenario with storage tank engulfed in flames is not considered credible, provided measures are implemented to prevent a running pool fire to reach the tank farm. The pressure relief system (and PSV) in addition to tank insulation shall be sufficient to prevent overheating and pressure build-up in the CO2 tank. Integrity of support structures must be ensured.
Fuel (gasoline, diesel, paraffine) explosion scenarios
Blast pressure will be modest, but a design explosion load from the nearby petroleum facilities including ship at jetty should be considered. The storage tanks are robust, but support structure may have to be designed for a blast load. Risk analysis for nearby facilities could serve as input to design accidental loads.
CO2 BLEVE from truck There is a possibility for tank explosion for the truck during unloading operation. The effect could be a blast load and shrapnel impacting the tank farm. Design blast load to be considered.
CO2 BLEVE or LNG BLEVE from CO2 transport ship
In addition to CO2 storage, the CO2 carrier ship has LNG tanks at deck and battery packs that could possibly represent a risk for fire and subsequent explosion scenarios. With current layout, the CO2 carrier is located further away from the CO2 storage tank farm than the tankers unloading fuel oil. Accident scenarios at the ship will therefore not be governing for the design of the tank farm.
Sabotage Physical protection and access control are implemented (ISPS regulations implemented).
The annual probability for CO2 storage tank rupture at Oslo Harbour is hence estimated as: ftank rupture Sjursøya
-7 -7 = 2.0 -7
7.4 Accident consequences of storage tank rupture scenarios Blast consequences (BLEVE) The liquid CO2 inventory in the tank is assumed 340 m3 3 360 000 kg. In the following calculation of blast effects, it is assumed the blast is from spontaneous boiling of the liquid. The expansion effects of vapor will also result in a blast wave, but there will be much less energy involved in this process.

QRA for Oslo carbon capture - FEED lilleaker.com
LaC-P0624-R-0026 / Rev. 02 / 30.11.2019 Page: 38 of 59
The explosion energy for a CO2 BLEVE has been coarsely estimated based on the internal energy at storage conditions compared to the internal energy of vapor at the triple point (which is the lowest pressure CO2 can exist as vapor).
Table 7.3: Fluid properties table
State
Pressure (bara)
Internal energy (kJ/kg) Specific volume (m3/kg) Entropy (kJ/kgK) uliq ugas vliq vgas sliq sgas
1 16 139 399 0.00094 0.024 0.778 1.98 2 6 86 394 0.00086 0.063 0.552 2.12
Internal energy at state 1 (storage condition) is Table 7.3 is 139 kJ/kg Vapor mass fraction (or quality) in liquid phase after expansion: = 0.144
Internal energy for the liquid at state 2 (triple point) is calculated using the appropriate fractions of liquid and vapor.
U= (1 - kJ/kg kJ/kg = 130.4 kJ/kg
Explosion energy corresponds to change in internal energy from state 1 to state 2: E = 360 -130.4) kJ/kg 3.1 GJ
The chart (Figure 7-1) applies the non-dimensional range:
A ground reflection factor of 2 is applied in the calculations; Eex
This means the dimensionless distance is receptor. Since P0 1 bar, explosion overpressure in bar is practically the same as dimensionless pressure in the chart. The red line in Figure 7-1 shows the part of the graph that is used to establish the blast loads in Table 7.4. The distances considered are in the range 50 meters to 400 meters. This corresponds to a dimensionless distance is in the range 1.25 to 10. It is seen from the Baker-Tang chart that the dimensionless pressure is in the range 0.23 to 0.02 (which means the pressure is 0.23 bar to 0.02 bar.

QRA for Oslo carbon capture - FEED lilleaker.com
LaC-P0624-R-0026 / Rev. 02 / 30.11.2019 Page: 39 of 59
Figure 7-1: Baker-Tang blast curves [14]
Based on the pressures, the probability for fatal outcome is found from Figure 7-2. The results are shown in Table 7.4. According to this relation, the fatal probability for 0.23 bar (23 kPa) is close to 100%, while the fatal probability for 0.02 bar (2 kPa) is close to zero. This relation is recommended by DSB and is found conservative compared to other relations in use1.
Figure 7-2: Relation between explosion pressure and fatality risk [DSB]
1 Alternative figures are available from for example by NIOSH

QRA for Oslo carbon capture - FEED lilleaker.com
LaC-P0624-R-0026 / Rev. 02 / 30.11.2019 Page: 40 of 59
Table 7.4: Hazardous distances from storage tank BLEVE (360 000 kg CO2)
Distance Dimensionless distance (m) Pressure (bar) Fatal probability for blast 50 1.25 0.23 100 %
100 2.5 0.1 75 % 150 3.75 0.06 30 % 200 5 0.04 5 % 300 7.5 0.03 0.10 % 400 10 0.02 0.00 %
For a truck tank, the inventory is about 25 000kg, and 61. The hazardous distance from an explosion is less than half, see Table 7.5.
Table 7.5: Hazardous distances from truck BLEVE (25 000 kg liquid CO2)
Distance Dimensionless distance (m) Pressure (bar) Fatal probability for blast 21 1.25 0.23 100 % 41 2.5 0.1 75 % 62 3.75 0.06 30 % 82 5 0.04 5 %
123 7.5 0.03 0.10 % 164 10 0.02 0.00 %
Dispersion from a tank rupture or explosion scenario In a tank rupture scenario, about 360 000 kg CO2 can be released instantaneously. At atmospheric pressure and -52°C, the CO2 density in vapor phase is about 2.5 kg/m3. Neglecting the solids, the CO2 volume could therefore reach about 140 000 m3. Upon a tank rupture or explosion, the gas will be diluted. A rule of thumb is that the gas concentration could be about 10% in the diluted gas cloud [15], but this should be considered a very rough estimate. The initial gas cloud can be imagined as a cylinder with radius = height 75 meters. This gas cloud will be diluted as it disperses with wind and gravitational effects. A very coarse dispersion assessment has been performed in Table 7.6. The duration of exposure will depend on the wind speed and the terrain, but exposure will normally not be very long in a tank rupture scenario. Based on wind statistics is assessed that duration of exposure for this scenario could typically be in the range 5 minutes to 15 minutes.
Table 7.6: Hazardous distances from storage tank rupture CO2 exposure
Distance (m) Typical gas concentration range
Fatal probability due to exposure of CO2 360t tank 25t tank
50 21 15% - 30% 100 % 100 41 10% - 20% 50 % 150 62 5%-15% 10 % 200 82 0%-10% 3 % 300 123 0% - 7% 1 % 400 164 0% - 5% 0.1 %

QRA for Oslo carbon capture - FEED lilleaker.com
LaC-P0624-R-0026 / Rev. 02 / 30.11.2019 Page: 41 of 59
Combined fatality risk BLEVE and gas exposure for tank rupture accidents The combined fatality risk for blast and gas exposure has been calculated considering the two effects as independent and assuming the conditional probability for significant blast loads given a tank rupture scenario, Pblast, is 50%.
Table 7.7: Hazardous distances from storage rupture (BLEVE risk and CO2 risk combined)
Distance (m) Fatal probability, blast
Fatal probability, gas
Fatal prob, total (assuming Pblast = 0.5) Pfatal = 1 (1 - Pfatal,dispersion Pblast fatal,blast) 360t tank 25t tank
50 21 100 % 100 % 100.0 % 100 41 75 % 50 % 68.8 % 150 62 30 % 10 % 23.5 % 200 82 5 % 3 % 5.4 % 300 123 0.1 % 1 % 1.0 % 400 164 - 0.1 % 0.1 %
8 Collision accidents will in most cases not result in release of CO2 but can still result in casualties for persons involved. Collision accident statistics is available. Driving downhill through the tunnels involves additional risks. The driving distance is about 13 kilometres each direction and takes about 15 minutes each direction (Figure 2-8).
-9 fatalities per vehicle kilometre for 2014. This is for all vehicles, and the statistics is dominated by cars. For the period 2011-2015 there were in average 19.4 fatalities per year related to heavy transport [16]. The number of accidents with injuries for the same period was 191. According to Statistic Norway [17] 6 kilometres in 2015. With 19.4
9 kilometres -8 per kilometre. This means the fatal accident rate i -8 fatalities per kilometre, a coarse estimate of traffic accident risk for truck transport is obtained. For each trip, fatalities from traffic accidents is quantified as PLL = 13 -8 = 2.6 -7. In one trip, about 25 tons of CO2 -8 fatalities per ton CO2 transported to Oslo Harbour. With the lines K1, K2 and K3 in operation, 460 000 t CO2 is produced per year. Capturing 90% of this means that the transport requirement is 414 000 t CO2 per year. The resulting potential loss of lives (PLL) from traffic accidents is calculated as follows:
PLL = 400 000 -8 fatalities/t = 0.004 fatalities/yr. This figure does not include the risk contribution from CO2 releases following a traffic accident or other scenarios that could lead to a large leak from the truck. The exposure time at road is:
400 000 / 25 = 4000

QRA for Oslo carbon capture - FEED lilleaker.com
LaC-P0624-R-0026 / Rev. 02 / 30.11.2019 Page: 42 of 59
Assuming a pressure vessel failure rate at 10-6 per year also for the truck (Purple book table 3.19), the -7 per year. It is not clear from this
reference if releases related to traffic accidents should be added it probably should.
-9 per km. The distance travelled with full tank is 13 00 200 000 200 -9 = 8.6 -4. The outflow
frequency is defined as the frequency of an accident with a hazardous substance transport unit where at least 100 kg of the transported substance is released. It is not specified what fraction of these loss of containment incidents that are large and could pose a risk to persons along the route. Truck transport includes frequent manual loading and offloading operations with potential for operational and equipment failure. In addition, there is risk for traffic accidents. The potential loss of lives from these operations is however found low.
9 9.1 Accident statistics for Oslo Harbour Risk picture for Sydhavna is summarised in [8]. There have been several accidents over the last years, and recorded accidents at Oslo Harbour before 2014 include the following:
August 14th, 1990: Fire and explosion in a cavern at Ekeberg Oil storage. Damages were limited to mechanical equipment.
February 17th, 2003: Collision between train and tanker (truck) loaded with 38 m3 fuels in a roundabout. The railway is crossing the roundabout which has dense traffic of dangerous goods. The collision resulted in a leak which was ignited.
June 13th, 2009: Overfilling of cavern and diesel/aircraft fuel mixed, Oil spill to gangways etc. March 24th, 2010: Railway accident. Empty train set of 7 container wagons totalling 194 tons was
rolling uncontrolled downhill to Oslo Harbour. The speed was up to 125 km/h on the way from Alnabru to the container terminal. The consequence was three fatalities, four injuries damages to buildings, cars and infrastructure, two wagons ended up in the sea. (Train with aircraft fuel was not hit.)
December 26th and 27th, 2012: Spill of 340 m3 (and some paraffin) diesel from storage tank farm.

QRA for Oslo carbon capture - FEED lilleaker.com
LaC-P0624-R-0026 / Rev. 02 / 30.11.2019 Page: 43 of 59
Figure 9-1: Roundabout with crossing railway side-track
Accident statistics for Oslo Harbour includes 35 incidents for the period 2007-2013. There are accidents related to crane operations, material handling and vehicle impacts.
9.2 Risk assessment, prior to introducing the CO2 facilities 9.2.1 Existing activities and risks The south part of Oslo Harbour (Sydhavna) is considered a national centre for logistics and includes container handling, storage and distribution of petroleum products and more. Sydhavna has been categorized as an area with elevated risk (forhøyet risiko) by DSB [8]. A dedicated report has been prepared to describe these risks. Risk contribution from CO2 handling facilities in Sydhavna will be additional to existing risk exposure
9.2.2 Ship incidents and accident scenarios in Oslo Harbour The Norwegian Maritime Directorate has a database with ship incidents2 as described in [18]. The following data includes all types of vessels except vessels used for leisure. The number of reported accidents per year for the period 2003 2014 shows that incidents are relatively frequent in Norway:
Impacts to quay, bridge etc. (Dominant scenario is ferry impact to quay): 37 incidents per year Collisions: 20 incidents per year Fire/explosions: 19 incidents per year
2 Sjøfartsdirektoratets ulykkesdatabase

QRA for Oslo carbon capture - FEED lilleaker.com
LaC-P0624-R-0026 / Rev. 02 / 30.11.2019 Page: 44 of 59
Table 9.1: Scenario analysis with plots from [8]
Sjursøya escalated oil fire scenario. Wind conditions will affect the extent of this scenario.
Bjørvika oil fire at sea scenario. This is a scenario with fuel leak from a tanker (ship) to the sea which is ignited. The wind and current conditions are important for the accident consequences. Note: A similar scenario could occur south of Sjursøya, near the planned CO2 facilities.
Cavern storage accident scenario. This scenario is assessed to have primarily consequences local to the facilities.
9.2.3 Risk picture Oslo Harbour prior to CO2 facilities Several risk analyses have been performed for the activities and installations in the Oslo Harbour area. Scenarios identified include leak of flammable liquids with possible fire, tank explosion, train vehicle
Scandpower in 2007 as presented in Figure 9-2.

QRA for Oslo carbon capture - FEED lilleaker.com
LaC-P0624-R-0026 / Rev. 02 / 30.11.2019 Page: 45 of 59
Figure 9-2: Risk Contours
9.3 Risk assessment, CO2 facilities 9.3.1 CO2 leak scenario from truck/hose at Oslo Harbour. These hose leak scenarios are essentially the same as for truck loading at Klemetsrud. The frequencies are summarised in Table 9.2.
Table 9.2: Leak frequencies for hose load transfer operations Oslo Harbour
Leak hole diameter (mm)
Frequency (per operation)
Leak rate (kg/s)
Number of operations at Klemetsrud and
Oslo Harbour
Leak frequency at Oslo Harbour
(per year) 15 2.8·10-6 7
16 000 0.044
25 2.0·10-7 17 0.0031 Full rupture 4.9·10-8 250 0.00076
A potential BLEVE scenario in the truck were discussed in chapter 6.5. The frequency for this scenario is proposed the same as at Klemetsrud; -7 per year. There will however not be scenarios related to overfilling of the truck.
9.3.2 CO2 leak scenario from storage tanks at Oslo Harbour The piping and valve arrangement out of the storage tanks are assumed equal as the intermediate storage tanks at Klemetsrud (see chapter 6.4). An alternative with larger storage tanks was found to result in longer hazardous distances. Also, the effect of introducing local physical barriers has been studied. No such barrier has been assumed in this risk analysis. These sensitivities are documented in Appendix E.

QRA for Oslo carbon capture - FEED lilleaker.com
LaC-P0624-R-0026 / Rev. 02 / 30.11.2019 Page: 46 of 59
The leak frequencies are based on HSE data; both for piping and pressure vessels. Basis for the frequencies in Table 6.4 can be found in Appendix A. Lengths and number of storage tanks that has been used as basis when calculating the frequencies are summarised in Table 9.3.
Table 9.3: Lengths and number of storage tanks used as basis for frequency calculations at Oslo Harbour
Leak source No./ m Storage tanks 16 Piping length 64
scenario when establishing the restricted area zones. A hole size of 50mm will (approximately) correspond .
The applied frequencies are based on the same basis as on Klemetsrud and is shown in Table 9.4.
Table 9.4: Leak rates and durations for the intermediate storage
Hole size 10 mm 25 mm 50 mm Rupture Leak rate [kg/s] 3 17 120 650 Leak frequency per year 6.4E-05 4.5E-05 4.2E-05 1.4E-05
9.3.2.1 Simulation results Dispersion simulations for 600 kg/s releases at Sjursøya, have been simulated for the FEED phase. In the
rupture) and 254 kg/s were simulated. The storage tanks were substantially larger than the current configuration, and the worst-case gas dispersion scenario had a large footprint compared to the current solution.
a leak rate more than 600 kg/s initially. Figure 9-3 and Figure 9-5 shows the dispersion for the four cases. The plots show the gas cloud 8 minutes after the leak starts, when the leak ends. The scenario is that one tank emptied at constant rate.
Figure 9-3: 620 kg/s, case 11 and 12, 2-phase jet down, wind from North and South Z = 12m and 3m

QRA for Oslo carbon capture - FEED lilleaker.com
LaC-P0624-R-0026 / Rev. 02 / 30.11.2019 Page: 47 of 59
Figure 9-4 shows case 11 and case 12 at 2 and 4 minutes after the end of the leak, respectively. Within 10 minutes, these gas clouds are diluted to non-hazardous concentrations.
Figure 9-4: Case 11 2 minutes after end of leak and case 12 4 minutes after end of the leak As for Klemetsrud it is seen that the horizontal releases can lead to smaller gas clouds, in particular if the release is unobstructed. Still, the horizontal jet directed west (over the sea surface) has a quite long hazardous distance. For these cases, the gas will be diluted to non-hazardous concentrations even faster than for case 11 and 12. For all the tank rupture scenarios, exposure to toxic levels of gas will rarely exceed 15 minutes.
Figure 9-5: 600 kg/s, case 13 and 14, 2-phase jet east and west, wind from South, Z = 12m and 3m Note that all the plots above show projected maximum in z-direction; that is, for each (x, y)-coordinate in the domain the maximum gas concentration in z-direction is plotted. In this way, the maximum extent of gas exposure is found. The CFD simulations show that the gas cloud is limited to a few meters above ground or sea level. This means that physical barriers could affect the spreading of CO2 and that elevated areas and buildings may effectively prevent exposure of individuals

QRA for Oslo carbon capture - FEED lilleaker.com
LaC-P0624-R-0026 / Rev. 02 / 30.11.2019 Page: 48 of 59
9.3.3 CO2 leak scenario from offloading to ship During loading operations to ship the CO2 from the storage tanks is routed through a a . CO2 leak scenarios from offloading operations hence includes leaks from pumps, piping, connections and loading arm. Assuming about 75 offloading operations to ship per year and 300m piping, the frequencies for this operation can be estimated as shown in Table 9.5.
Table 9.5: Leak frequency per year for loading operations to ship
Hole size 15 mm 50 mm Rupture
Leak rate (kg/s) 6.5 72 650 Leak duration after isolation (minutes) 14.5 1.3 0.1 Leak frequency from 300m piping 2.1E-04 1.2E-04 1.5E-04 Leak frequency from loading arm (75 operations) 4.5E-02 4.0E-03 Leak frequency per year (sum) 4.5E-02 1.2E-04 4.7E-03
It is expected that safety barriers such as break-away coupling are in place such that the possible leak inventory will be limited. The leak durations in Table 9.5 is based on 5600 kg pipe inventory. In addition, there will be a delay before the pipe inventory is isolated. Hazardous distances For the smallest hole size category, consequences are local and hazardous distances have not been assessed for the iso-risk contour calculations. For the 50mm hole scenario and the rupture scenario, hazardous distances can be significant. Because the inventory is modest, this rupture scenario will result in a smaller gas cloud as compared to the storage tank scenarios with similar leak rate. The dominating leak scenario is related to the loading arm and not the pipeline from the storage to the ship. The maximum hazardous distance is set to 150 meters. The scenario is governing for the 10-5 iso-risk contour in the south-east sector, see Figure 10-2.
9.4 Risk contribution from CO2 transport ship while in Oslo Harbour 9.4.1 General Storage at Oslo Harbour is required for efficient offloading to ship, and the storage capacity is four days production. The ship introduces some additional accident scenarios including tank rupture and BLEVE for the CO2 storage tanks onboard. The ship will primarily use LNG for propulsion but will also have a battery pack for electric propulsion and operation. There will be no LNG bunkering in Oslo Harbour, but there will be battery charging. Fire and explosion risks for the ship includes scenarios from LNG tanks and the battery pack. This analysis has not quantified risk from the CO2 transport ship. These risks will be additional to the risk picture presented in this report.

QRA for Oslo carbon capture - FEED lilleaker.com
LaC-P0624-R-0026 / Rev. 02 / 30.11.2019 Page: 49 of 59
9.4.2 Risk contribution from the CO2 transport ship General An interface request was raised by FOV to Equinor and the Northern Lights project (at Øygarden, west in Norway) [19] regarding the risk contribution (dimensioning accidents) from the CO2 transport ship. The response to the request (from Equinor) is that: The ship will be designed according to the IGC code and relevant class rules. CO2 is classified as a non-flammable gas under pressure, and the CO2 carrier will be designed based on the relevant rules for this classification. For standard ship design, a quantitative risk analysis is not considered necessary, and therefore not carried out. Safety is assumed to be implemented in design and safety barriers will be implemented according to the standards and normal approval processes for ship design. Detailed design of the CO2 carrier will take place after 2021. The ship equipment approximate sizes are as follows:
Liquid CO2 cargo tanks: 7 500m3 (est. 2 x 3 563m3 @max 95% capacity) Marine diesel oil (MDO) tanks incl. settling and day tanks, ca. 770m3 LNG fuel tank 580 m3 (est. 2 x 290m3)
Figure 9-6: LCO2 carrier with CO2 tanks in hull and LNG tank on deck [9]
The jetty and the harbour area are shown in Figure 2-10. The CO2 carrier will be present at Oslo harbour about 8 hours 75 times a year, which is about 7% of time. Risk contribution from collision incidents The ship collision analysis [9] which is a part of the Northern Lights project has been made available -7 per arrival. It is further assumed that 10% of collisions will damage a loading arm and 1% of collisions lead to damage to the double hull and a CO2 release. The frequency for LNG release is set equal to the frequency for CO2 release. For LNG releases, ignition

QRA for Oslo carbon capture - FEED lilleaker.com
LaC-P0624-R-0026 / Rev. 02 / 30.11.2019 Page: 50 of 59
probability is set to 50%. The consequence assessments for these scenarios have not been available for review. With 75 offloading operations per year and using the same assessments as in [9], the following accident frequencies result:
a) -7 -5 b) Annual frequency for collision upon arrival with CO2 -5 -7 c) Annual frequency for collision upon arrival with LNG fire -5 = 9.0 -8
[9] does not explicitly say whether scenario b) and c) occur simultaneously. The frequency for an LNG BLEVE scenario is considered low with reference to standard design and requirements and assessed not to contribute to the risk contours for Øygarden. The main risk for ship collision at the jetty is at arrival. In consistence with the assessments for Øygarden, the ship collision scenario with release from CO2 tank is set to 1.8 -7 per year for Oslo Harbour (see above). In contrast to the CO2 carrier arriving at Øygarden, the ship is expected to, in most cases, only to carry small CO2 quantities upon arrival. This will significantly reduce the risk for major accidents from collisions upon arrival at Oslo Harbour. There is a collision risk related to other large vessels manoeuvring in Oslo Harbour in near vicinity of the CO2 facilities and the CO2 carrier during loading operation. This could potentially threaten the CO2 and LNG tanks at the CO2 carrier while in harbour. There is also collision risk while manoeuvring the CO2 carrier from the harbour. LNG tank rupture and BLEVE while at the jetty There is a potential risk for LNG and BLEVE scenarios from the CO2 carrier while in harbour. The generic frequency for a catastrophic failure of an LNG tank rupture is very low -8 per year in (see Appendix A for details). With the ship present 7% of time, the frequency for a catastrophic failure of the LNG tank while in harbour is negligible in the sense that the restricted area zones will be unaffected -9 per year for the two fuel tanks combined). CO2 tank rupture and BLEVE while at the jetty In addition to collision scenarios, there is a potential for CO2 tank rupture while the ship is in harbour. The scenarios are generally the same as for the storage tanks evaluated in chapter 7. The main difference is that the tank volume is 10 times larger for the ship as compared to the intermediate storage tanks. The dispersion distance for a gas release could be longer and the worst case BLEVE scenario will have about twice the hazardous distances compared to the storage tanks, and the scaled hazardous distances are shown in Table 9.6. This is based on the methodology used in chapter 7.4.
Table 9.6: Hazardous distances from CO2 carrier tank BLEVE (3500 t CO2)
Distance Fatal probability for blast Fatal probability, gas Fatal prob, total (assuming Pblast = 0.5)
107 100 % 100 % 100.0 % 213 75 % 50 % 68.8 % 320 30 % 10 % 23.5 % 427 5 % 3 % 5.4 % 640 0.1 % 1 % 1.0 % 854 - 0.1 % 0.1 %

QRA for Oslo carbon capture - FEED lilleaker.com
LaC-P0624-R-0026 / Rev. 02 / 30.11.2019 Page: 51 of 59
The frequency for catastrophic accident scenario at the CO2 carrier is found to be low. Most collision scenarios will be with empty or near empty ship. The ship will be present about 7% of time, but failure frequency during loading operations are judged to be higher than during sailing. For the purpose of this QRA, the frequency of catastrophic failure of a full CO2 tank at the ship is set to 10-7 per year with corresponding hazardous distances as shown in Table 9.6. The effect on the risk contours is small, and this is basically the case when the frequency for this -7 per year. With higher frequencies than this, the 10-7 risk contour is moved significantly further south. Plots in Appendix C shows the contribution from the different scenarios and can be used to assess the robustness of the restricted area zones considering uncertainties in frequency and consequence modelling. Fire and explosion scenarios from the battery pack The CO2 carrier is equipped with a battery pack to operate as a hybrid with LNG/electric propulsion. While at the jetty, there will be battery charging. Experience has shown that introducing batteries involves risk of overheating. Perhaps the most serious case to date is the resent fire and subsequent explosion at MF Ytterøyningen October 10th and 11th 2019. For the CO2 carrier ship, the main concern related to the battery pack is the risk for escalation to either CO2 or LNG tanks, or causing damages to the hull.

QRA for Oslo carbon capture - FEED lilleaker.com
LaC-P0624-R-0026 / Rev. 02 / 30.11.2019 Page: 52 of 59
10 The calculation of iso-risk contours for individual risk is documented in Appendix C and the methodology is explained in chapter 3.6. The relation between the iso-risk contours and the restricted area zones are shown in Figure 2-12. The calculated risk contours for Klemetsrud are shown in Figure 10-1. It is seen that the 10-5 contour is at the site, while the 10-6 and 10-7 contours extend outside the fence. The contours (10-6 and 10-7) will follow the terrain and dense gas will reach the highway. The residential areas are up in the hill and will therefore be outside the contours. Based on a review of a risk analysis for the WtE plant [20], it is assessed that the WtE plant will not affect the risk contours except at the site.
Figure 10-1: Risk contours for Klemetsrud
Risk contours for Sjursøya are shown in Figure 10-2. These risk contours include and is to some extent dominated by the existing risk picture as presented in [8]. The 10-5 per year iso-risk contour would be smaller to the north if existing risk picture from the petroleum handling and storage was not included (see Figure

QRA for Oslo carbon capture - FEED lilleaker.com
LaC-P0624-R-0026 / Rev. 02 / 30.11.2019 Page: 53 of 59
10-3). The 10-6 and 10-7 risk contours are dominated by the CCS facilities, but do not extend much beyond the risk contours from existing facilities and related activities as shown in Figure 9-2. Offloading to CO2 carrier ship is included in the SoW for this risk analysis and in the iso-risk contours. Major accidents at the ship is considered outside SoW and only coarsely assessed as described in chapter 9.4.2. To reduce the uncertainty in restricted area zones and better understand the risk from major accident scenarios at the CO2 carrier, a more detailed risk analysis for the CO2 carrier is recommended.
Figure 10-2: Risk contours for Oslo Harbour/Sjursøya (including existing risk picture)

QRA for Oslo carbon capture - FEED lilleaker.com
LaC-P0624-R-0026 / Rev. 02 / 30.11.2019 Page: 54 of 59
Figure 10-3: Risk contours for Oslo Harbour/Sjursøya (not including existing risk picture)
11 Several accident scenarios have been evaluated in order to investigate the risk for personnel at the carbon capture facilities and 3rd party. The scenarios that have been identified and investigated further are summarised in Table 11.1 and Table 11.2 for Klemetsrud and Sjursøya respectively.

QRA for Oslo carbon capture - FEED lilleaker.com
LaC-P0624-R-0026 / Rev. 02 / 30.11.2019 Page: 55 of 59
Table 11.1: Overview of the Klemetsrud risk assessment
Case Leak rate (kg/s)
Frequency (per year)
Comment Primary data source Consequence assessment
Storage tank BLEVE
NA 1.0E-07 Includes catastrophic failure of tanks, excl. fault developing in service.
HSE data, failure rate for vessels (catastrophic scenarios)
Blast loads from BLEVE and coarse assessment of gas cloud size included in chapter 7.
CO2 leak scenario from tank/piping
600 3.6E-06 Catastrophic scenarios developing in service + rupture (hole size = 150mm) of piping connected to tank (between ESV and tank), 2m, upstream and downstream tank
HSE data, failure rate for piping
Gas dispersion simulation cases 01, 02, 02a, 03 and 04. The results are presented and discussed in 6.4. Note: Pressure drop from blowdown and leak will contribute to make the leak transient and with reduced leak duration (See chapter 3.4.2 discussion)
CO2 leak scenario from tank/piping
120 1.0E-05 Leak in piping connected to tank + connection point (hole size = 50 mm)
HSE data, failure rate for piping + vessel (hole size = 50 mm)
CO2 leak from Klemetsrud CC plant
17 7.0E-05 Leak in piping HSE data, failure rate for piping.
Gas dispersion simulation cases 06, 07, and 08. The results are presented and discussed in 6.1. 50 2.0E-05 Leak in piping HSE data, failure rate for
piping. Tank rupture/ BLEVE truck
NA 1.0E-07 This could for example be an overpressure scenario while loading.
HSE data for road tankers. Blast loads from BLEVE and coarse assessment of gas cloud size included in 6.5.2.
Hose rupture (truck loading)
250 7.6E-04 Hose and Coupling Failure Rates and the Role of Human Error [4]
Gas dispersion simulation cases 09 and 10. The results are presented and discussed in 6.5. Note: The resulting gas cloud size will depend on the quantity released, which is a function of the time to isolate the leak.

QRA for Oslo carbon capture - FEED lilleaker.com
LaC-P0624-R-0026 / Rev. 02 / 30.11.2019 Page: 56 of 59
Table 11.2: Overview of the Oslo Harbour risk assessment
Case Leak rate (kg/s)
Frequency (per year)
Comment Primary data source Consequence assessment
Background - Existing
NA NA Include existing risk picture for 10-5, 10-6 and 10-7 risk level in the iso-risk presentation.
DSB report [2] These are primarily risks related to handling petroleum products. Risk at storage facilities and jetty dominate the risk picture. In some cases, the CO2 interim storage can be affected. Existing risk picture on Oslo Harbour is presented in chapter 9.2.
Storage tank BLEVE
NA 2.0E-07 Includes catastrophic failure of tanks, excl. fault developing in service.
HSE data, failure rate for vessels (catastrophic scenarios)
Blast loads from BLEVE and coarse assessment of gas cloud size included in chapter 7.
CO2 leak scenario from tank/piping
600 1.4E-05 Catastrophic scenarios developing in service + rupture (hole size = 150mm) of piping connected to tank (between ESV and tank), 2m, upstream and downstream tank
HSE data, failure rate for piping
Gas dispersion simulation cases 11, 12, 13 and 14, and simulations performed in the concept phase. The results are presented and discussed in chapter 9.3.2. Note: Pressure drop from blowdown and leak will contribute to make the leak transient and with reduced leak duration (See chapter 3.4.2 discussion) CO2 leak
scenario from tank/piping
120 4.2E-05 Leak in piping connected to tank + connection point (hole size = 50 mm)
HSE data, failure rate for piping + vessel (hole size = 50 mm)
Tank rupture/ BLEVE truck
NA 1.0E-07 This could for example be an overpressure scenario while loading
HSE data for road tankers. Blast loads from BLEVE and coarse assessment of gas cloud size included in chapter 9.3.1.
Hose rupture (truck loading)
250 7.6E-04 Hose and Coupling Failure Rates and the Role of Human Error [4]
Gas dispersion simulation cases 09 and 10 (at Klemetsrud) are relevant. The results are presented and discussed in 6.5. Note: The resulting gas cloud size will depend on the quantity released, which is a function of the time to isolate the leak.
Offloading to ship
600 4.7E-03 Rupture scenario. This includes 300m
station and loading arm.
TNO, Purple book (loading arm) + HSE data (piping)
Scenario is discussed in 9.3.3.
CO2 tank rupture/BLEVE at ship
NA 1.0E-07 Includes ship collision with full tank, catastrophic tank rupture and BLEVE
Collision risk analysis for Nothern Lights and generic data, see Appendix A
As for storage tank rupture, but scaled for distances, see chapter 9.4.2.

QRA for Oslo carbon capture - FEED lilleaker.com
LaC-P0624-R-0026 / Rev. 02 / 30.11.2019 Page: 57 of 59
The assessment of risks at the carbon capture plant concludes that the individual risk for personnel at the plant will be low. There are several gas release scenarios that are toxic or could cause asphyxiation, but as long as the leak sources are outdoors, the risk is found low. For indoor areas (compressor house s may be an example) the risk related to these scenarios must be focused. The major accident risks that have been identified are liquid CO2 releases from storage tanks. The liquid leaks are likely to result in dense gas dispersion that can expose large areas to hazardous gas concentrations. Risk contours have been established and is presented in chapter 10. Comparing the results against the DSB acceptance criteria the risk picture is acceptable both for Klemetsrud and for Oslo Harbour. From CFD simulation plots in chapter 6.4 it is seen that for large releases dense gas reaches out of the facility area on Klemetsrud and down to the highway. These releases are governing for the 10-6 and 10-7 risk contours, but according to DSB criteria it is acceptable with roads inside the 10-6 contour. At Oslo Harbour large liquid leaks from the storage tanks is also dominating the 10-6 and 10-7 contours, but existing risk from petroleum handling and storage at the harbour has also a significant contribution. As for other process plants, occupational risk is an issue. This includes risks such as falling objects, fall from height, confined space entry and high voltage equipment. This risk contribution has not been quantified in this analysis and no specific scenario has been identified as a particularly high-risk scenario. The CO2 will be transported from Klemetsrud to Oslo Harbour by truck. The truck transport includes some risks worth being mentioned. The high number of manual loading and offloading operations means that there is risk for operation or equipment failure during such operations. In addition, there is risk for traffic accidents. The potential loss of lives from these operations is however found low. From storage tanks at Oslo Harbour the CO2 is loaded to ship. Risk assessment of scenarios on the ship has not been part of scope for this analysis. Nevertheless, a very coarse analysis of the scenarios has been included in 9.4.2. The ship will introduce some additional accident scenarios such as tank rupture and BLEVE for the CO2 storage tanks and LNG onboard. The risk associated with the loading operation (via 300 m piping and loading arms) has been considered but due to modest inventory the leak duration and hence the extent of the gas cloud will be limited.

QRA for Oslo carbon capture - FEED lilleaker.com
LaC-P0624-R-0026 / Rev. 02 / 30.11.2019 Page: 58 of 59
12 To the extent safety critical task is involved in safe operation of the tank farm, tank failure will be affected by the reliability of operators carrying out such tasks. External impact from operation of cranes and vehicles are possible failures related to manually operated equipment. In relation to overpressure incidents, manual closure of a valve in the safety relief system contributed to one of the CO2 BLEVE accidents, and in different ways human error can contribute to either overpressure or too low temperature and brittle fracture. Inspection and maintenance are other manual operations that are critical to the safe operation of the facility. A systematic analysis to identify safety critical tasks (manual operations) that could cause overpressure or otherwise lead to tank failure is recommended. This QRA and the related gas dispersion analysis assumes constant release rate based on initial storage tank conditions. The actual development of the scenario will be more complex. Pressure drop will lead to temperature drop and could result in phase transition and possibly very low temperatures. It is recommended that the possible consequences for the tank (and the leak scenario) from large leaks, possibly in combination with pressure relief is assessed in more detail. A detailed ESD hierarchy with automatic and manual responses to process disturbances and the fire and gas systems should be developed.

QRA for Oslo carbon capture - FEED lilleaker.com
LaC-P0624-R-0026 / Rev. 02 / 30.11.2019 Page: 59 of 59
13
[1] https://www.windfinder.com/windstatistics/bleikoya and https://www.windfinder.com/windstatistics/oslo solveien.
[2] Sikkerheten rundt anlegg som handterer brannfarlige reaksjonsfarlige trykksatte eksplosjonsfarlige stoffer. Kriterier for akseptable risiko, Direktoratet for samfunnssikkerhet og beredskap (DSB), 2012.
[3] Retningslinjer for kvantitative risikovurderinger for anlegg som håndterer farlig stoff. DSB/LR Consulting Oct. 2017.
[4] Hose and Coupling Failure Rates and the Role of Human Error, M. Trainor, J. Gould and M. Anderson, Health and Safety Laboratory Report HSL/2000/09.
[5] Toxicity levels of chemicals, footnote, HSE, http://www.hse.gov.uk/chemicals/haztox.htm#footnote1. [6] HAZID for Oslo CCS, doc.no: LaC-P0624-R-0018, rev.01, february 2019. [7] ENVID for Oslo CCS, doc.no: LaC-P0624-R-0019, rev.01, february 2019. [8] Sydhavna (Sjursøya) - et område med forhøyet risiko, DSB, Februar 2014. [9] S. (. KBR), Northern Lights Project FEED Phase - Total Risk Analysis Appendix E - Ship Collision. Rev 03,
11.09.2019. [10] NC02-KEA-Q-RA-0004: CRA for Oslo carbon capture_Technip. [11] CO2 dispersion analysis, Klemetsrud - Draft Report, Computit, R1715, 25.08.2017. [12] Catalyst and chemicals summary (preliminary). NC03-TEC-P-RA-0004. [13] Email from Vivekananthan Suthan (Citec) 26.04.2019, "Hydrogen forbruk for CC plant". [14] Guidelines for Vapor cloud explosion, pressure vessel burst, BLEVE and flash fire hazards. 2n edition.
Center for chemical process safety, Wiley, 2010. [15] F. P. Lees, Loss prevention in the process industries, Second edition 1996. [16] Norges Lastebileier-Forbund, https://lastebil.no/Aktuelt/Nyhetsarkiv/2016/Antall-ulykker-halvert-
paa-to-aar. [17] Road traffic volumes 2015, Statistic Norway (SSB), https://www.ssb.no/transport-og-
reiseliv/statistikker/klreg/aar/2016-04-22. [18] Analyse av ulykkesstatistikken for norske farvann de siste 30 årene DNV GL Report No. 2014-1060,
Rev. C. [19] Interface request, Scenarios for dimensioning of accidents on CO2 Transport ship, NCD-FOV-EQUINOR-
CORR-IR-000001. [20] Risikoanalyse Klemetsrud forbrenningsanlegg, Rambøll as, Rev. 0, 2008-04-22.