Studies on Nano-CaO·SnO 2 and Nano-CaSnO 3 as Anodes for Li-Ion Batteries
11
Studies on Nano-CaO · SnO 2 and Nano-CaSnO 3 as Anodes for Li-Ion Batteries Yogesh Sharma, N. Sharma, G. V. Subba Rao, and B. V. R. Chowdari* Department of Physics, National UniVersity of Singapore, Singapore 117542 ReceiVed March 11, 2008. ReVised Manuscript ReceiVed August 30, 2008 The nanocomposite “CaO · SnO 2 ” and nano-CaSnO 3 are prepared by the thermal decomposition of CaSn(OH) 6 precursor and characterized by X-ray diffraction (XRD), scanning electron microscopy (SEM), and high resolution transmission electron microscopy (HR-TEM) along with selected area electron diffraction (SAED) and density measurements. Nanosize (3-6 nm) grains of CaO and SnO 2 in the X-ray amorphous CaO · SnO 2 and particles of ∼ 60 nm size in nano-CaSnO 3 are obtained. Galvanostatic cycling of both the phases vs Li metal is performed in the voltage ranges 0.005-1.0 V and 0.005-1.3 V at the current rate, 60 mA g -1 (0.12 C). Stable and reversible capacities of 490 ((5) and 550 ((5) mA h g -1 are observed for nano-CaO · SnO 2 respectively up to 50 cycles in the above voltage windows. These values correspond to 3.8 and 4.2 mol of cyclable Li per mole of CaO · SnO 2 in comparison to the theoretical value of 4.4 mol of Li. A capacity of 420 ((5) mA h g -1 is observed at a rate of 0.4 C. Nano-CaSnO 3 showed a stable capacity of 445 ((5) mA h g -1 (3.4 moles of Li) up to 50 cycles when cycled in the voltage window, 0.005-1.0 V. The average discharge and charge potentials are 0.2 V and 0.5 V, respectively, for both the phases. The reasons for the superior Li-cycling performance of nano-CaO · SnO 2 in comparison to nano-CaSnO 3 are discussed. Ex situ XRD, TEM, and SAED studies are carried out to support the reaction mechanism. Cyclic voltammetry and electrochemical impedance spectroscopy (EIS) data as a function of voltage are presented and discussed to complement the galvanostatic results. The “apparent” Li-ion diffusion coefficient (D Li + ) estimated from EIS is ∼1.0 × 10 -14 cm 2 s -1 at V e 1.0 V during the first cycle and 11th discharge cycle. 1. Introduction Since 1990 when Sony Company introduced the recharge- able Li-ion batteries (LIBs) as a dc-power source for portable appliances, worldwide, extensive research has been in progress on LIB cathodes 1-4 and anodes. 5-12 Major research accomplishments are the proposal of Sn-based 1,5,12-23 and Co- based oxides 1,6,7,10,11 as the possible alternatives to the graphite anode presently used in LIBs. Their potential lies in the high reversible capacities achievable with the above oxides in contrast to the graphite. Transition metal oxides react with Li through the “conver- sion reaction” in which the metal oxides are reduced to the metal nanoparticles embedded in the amorphous Li 2 O matrix. 1,6-11 The reverse reaction occurs on charging and contributes to the capacity of the electrode. The conversion reactions (oxidation/reduction), however, occur at relatively higher potential versus Li metal, which reduces the overall output voltage of LIBs incorporating such anodes. 6-11 The Sn-based binary and ternary oxides with various morphol- ogies have shown the ability to deliver high reversible capacity at lower potential versus Li. 12-16 But, still, nonre- tention of high capacity on long-term cycling has been one of the major drawbacks of Sn-based oxides. 12-16,20-23 Composites of Sn-metal particles dispersed in electrochemi- cally active/inactive matrices like carbon (C) and cobalt (Co) have received considerable attention recently as a possible * Corresponding author. Tel.: (65) 6516 2531. Fax: (65) 6777 6126. E-mail: [email protected]. (1) Nazri, G. A., Pistoia G. Eds. Lithium Batteries: Science and Technol- ogy; Kluwer Academic: New York, 2003. (2) Thackeray, M. Nat. Mater. 2002, 1, 81. (3) Chung, S.-Y.; Bloking, J. T.; Chiang, Y.-M. Nat. Mater. 2002, 1, 123. (4) Morcrette, M.; Rozier, P.; Dupont, L.; Mugnier, E.; Sannier, L.; Galy, J.; Tarascon, J.-M. Nat. Mater. 2003, 2, 755. (5) Idota, Y.; Kubota, T.; Matsufuji, A.; Maekawa, Y.; Miyasaka, T. Science 1997, 276, 1395. (6) Poizot, P.; Laruelle, S.; Grugeon, S.; Dupont, L.; Tarascon, J.-M. Nature 2000, 407, 496. (7) Sharma, Y.; Sharma, N.; Subba Rao, G. V.; Chowdari, B. V. R. AdV. Funct. Mater. 2007, 17, 2855. (8) Arico, A. S.; Bruce, P.; Scrosati, B.; Tarascon, J.-M.; Schalkwijk, W. V. Nat. Mater. 2005, 4, 366. (9) Tirado, J. L. Mater. Sci. Eng. R 2003, 40, 103. (10) Yu, Y.; Chen, C.-H.; Shui, J.-L.; Xie, S. Angew. Chem., Int. Ed. 2005, 44, 7085. (11) Sharma, Y.; Sharma, N.; Subba Rao, G. V.; Chowdari, B. V. R. J. Power Sources 2007, 173, 495. (12) Ying, Z.; Wan, Q.; Cao, H.; Song, Z. T.; Feng, S. L. Appl. Phys. Lett. 2005, 87, 113108. (13) Zhu, J.; Lu, Z.; Aruna, S. T.; Aurbach, D.; Gedanken, A. Chem. Mater. 2000, 12, 2557. (14) Courtney, I. A.; Dahn, J. R. J. Electrochem. Soc. 1997, 144, 2943. (15) Sharma, N.; Shaju, K. M.; Subba Rao, G. V.; Chowdari, B. V. R. Electrochem. Commun. 2002, 4, 947. (16) Sharma, N.; Shaju, K. M.; Subba Rao, G. V.; Chowdari, B. V. R. J. Power Sources 2005, 139, 250. (17) Courtney, I. A.; Dahn, J. R. J. Electrochem. Soc. 1997, 144, 2045. (18) Li, N.; Martin, C. R. J. Electrochem. Soc. 2001, 148, A164. (19) Behm, M.; Irvine, J. T. S. Electrochim. Acta 2002, 47, 1727. (20) Sandu, I.; Brousse, T.; Schleich, D. M.; Danot, M. J. Solid State Chem. 2004, 177, 4332. (21) Yuan, Z.; Huang, F.; Sun, J.; Zhou, Y. J. Mater. Sci. Lett. 2003, 22, 143. (22) Huang, F.; Yuan, Z.; Zhan, H.; Zhou, Y.; Sun, J. Mater. Chem. Phys. 2004, 83, 16. (23) Huang, F.; Yuan, Z.; Zhan, H.; Zhou, Y.; Sun, J. Mater. Lett. 2003, 57, 3341. 6829 Chem. Mater. 2008, 20, 6829–6839 10.1021/cm8020098 CCC: $40.75 2008 American Chemical Society Published on Web 10/10/2008
-
Upload
independent -
Category
Documents
-
view
1 -
download
0
Transcript of Studies on Nano-CaO·SnO 2 and Nano-CaSnO 3 as Anodes for Li-Ion Batteries

Studies on Nano-CaO ·SnO2 and Nano-CaSnO3 as Anodes for Li-IonBatteries
Yogesh Sharma, N. Sharma, G. V. Subba Rao, and B. V. R. Chowdari*
Department of Physics, National UniVersity of Singapore, Singapore 117542
ReceiVed March 11, 2008. ReVised Manuscript ReceiVed August 30, 2008
The nanocomposite “CaO ·SnO2” and nano-CaSnO3 are prepared by the thermal decomposition ofCaSn(OH)6 precursor and characterized by X-ray diffraction (XRD), scanning electron microscopy (SEM),and high resolution transmission electron microscopy (HR-TEM) along with selected area electrondiffraction (SAED) and density measurements. Nanosize (3-6 nm) grains of CaO and SnO2 in the X-rayamorphous CaO ·SnO2 and particles of ∼ 60 nm size in nano-CaSnO3 are obtained. Galvanostatic cyclingof both the phases vs Li metal is performed in the voltage ranges 0.005-1.0 V and 0.005-1.3 V at thecurrent rate, 60 mA g-1 (0.12 C). Stable and reversible capacities of 490 ((5) and 550 ((5) mA h g-1
are observed for nano-CaO ·SnO2 respectively up to 50 cycles in the above voltage windows. Thesevalues correspond to 3.8 and 4.2 mol of cyclable Li per mole of CaO ·SnO2 in comparison to the theoreticalvalue of 4.4 mol of Li. A capacity of 420 ((5) mA h g-1 is observed at a rate of 0.4 C. Nano-CaSnO3
showed a stable capacity of 445 ((5) mA h g-1 (3.4 moles of Li) up to 50 cycles when cycled in thevoltage window, 0.005-1.0 V. The average discharge and charge potentials are 0.2 V and 0.5 V,respectively, for both the phases. The reasons for the superior Li-cycling performance of nano-CaO ·SnO2
in comparison to nano-CaSnO3 are discussed. Ex situ XRD, TEM, and SAED studies are carried out tosupport the reaction mechanism. Cyclic voltammetry and electrochemical impedance spectroscopy (EIS)data as a function of voltage are presented and discussed to complement the galvanostatic results. The“apparent” Li-ion diffusion coefficient (DLi+) estimated from EIS is ∼1.0 × 10⁻¹⁴ cm2 s-1 at V e 1.0V during the first cycle and 11th discharge cycle.
1. Introduction
Since 1990 when Sony Company introduced the recharge-able Li-ion batteries (LIBs) as a dc-power source for portableappliances, worldwide, extensive research has been inprogress on LIB cathodes1-4 and anodes.5-12 Major researchaccomplishments are the proposal of Sn-based 1,5,12-23 and
Co- based oxides 1,6,7,10,11 as the possible alternatives to thegraphite anode presently used in LIBs. Their potential liesin the high reversible capacities achievable with the aboveoxides in contrast to the graphite.
Transition metal oxides react with Li through the “conver-sion reaction” in which the metal oxides are reduced to themetal nanoparticles embedded in the amorphous Li2Omatrix.1,6-11 The reverse reaction occurs on charging andcontributes to the capacity of the electrode. The conversionreactions (oxidation/reduction), however, occur at relativelyhigher potential versus Li metal, which reduces the overalloutput voltage of LIBs incorporating such anodes.6-11 TheSn-based binary and ternary oxides with various morphol-ogies have shown the ability to deliver high reversiblecapacity at lower potential versus Li.12-16 But, still, nonre-tention of high capacity on long-term cycling has been oneof the major drawbacks of Sn-based oxides.12-16,20-23
Composites of Sn-metal particles dispersed in electrochemi-cally active/inactive matrices like carbon (C) and cobalt (Co)have received considerable attention recently as a possible
* Corresponding author. Tel.: (65) 6516 2531. Fax: (65) 6777 6126. E-mail:[email protected].(1) Nazri, G. A., Pistoia G. Eds. Lithium Batteries: Science and Technol-
ogy; Kluwer Academic: New York, 2003.(2) Thackeray, M. Nat. Mater. 2002, 1, 81.(3) Chung, S.-Y.; Bloking, J. T.; Chiang, Y.-M. Nat. Mater. 2002, 1, 123.(4) Morcrette, M.; Rozier, P.; Dupont, L.; Mugnier, E.; Sannier, L.; Galy,
J.; Tarascon, J.-M. Nat. Mater. 2003, 2, 755.(5) Idota, Y.; Kubota, T.; Matsufuji, A.; Maekawa, Y.; Miyasaka, T.
Science 1997, 276, 1395.(6) Poizot, P.; Laruelle, S.; Grugeon, S.; Dupont, L.; Tarascon, J.-M.
Nature 2000, 407, 496.(7) Sharma, Y.; Sharma, N.; Subba Rao, G. V.; Chowdari, B. V. R. AdV.
Funct. Mater. 2007, 17, 2855.(8) Arico, A. S.; Bruce, P.; Scrosati, B.; Tarascon, J.-M.; Schalkwijk, W. V.
Nat. Mater. 2005, 4, 366.(9) Tirado, J. L. Mater. Sci. Eng. R 2003, 40, 103.
(10) Yu, Y.; Chen, C.-H.; Shui, J.-L.; Xie, S. Angew. Chem., Int. Ed. 2005,44, 7085.
(11) Sharma, Y.; Sharma, N.; Subba Rao, G. V.; Chowdari, B. V. R. J.Power Sources 2007, 173, 495.
(12) Ying, Z.; Wan, Q.; Cao, H.; Song, Z. T.; Feng, S. L. Appl. Phys. Lett.2005, 87, 113108.
(13) Zhu, J.; Lu, Z.; Aruna, S. T.; Aurbach, D.; Gedanken, A. Chem. Mater.2000, 12, 2557.
(14) Courtney, I. A.; Dahn, J. R. J. Electrochem. Soc. 1997, 144, 2943.(15) Sharma, N.; Shaju, K. M.; Subba Rao, G. V.; Chowdari, B. V. R.
Electrochem. Commun. 2002, 4, 947.(16) Sharma, N.; Shaju, K. M.; Subba Rao, G. V.; Chowdari, B. V. R. J.
Power Sources 2005, 139, 250.
(17) Courtney, I. A.; Dahn, J. R. J. Electrochem. Soc. 1997, 144, 2045.(18) Li, N.; Martin, C. R. J. Electrochem. Soc. 2001, 148, A164.(19) Behm, M.; Irvine, J. T. S. Electrochim. Acta 2002, 47, 1727.(20) Sandu, I.; Brousse, T.; Schleich, D. M.; Danot, M. J. Solid State Chem.
2004, 177, 4332.(21) Yuan, Z.; Huang, F.; Sun, J.; Zhou, Y. J. Mater. Sci. Lett. 2003, 22,
143.(22) Huang, F.; Yuan, Z.; Zhan, H.; Zhou, Y.; Sun, J. Mater. Chem. Phys.
2004, 83, 16.(23) Huang, F.; Yuan, Z.; Zhan, H.; Zhou, Y.; Sun, J. Mater. Lett. 2003,
57, 3341.
6829Chem. Mater. 2008, 20, 6829–6839
10.1021/cm8020098 CCC: $40.75 2008 American Chemical SocietyPublished on Web 10/10/2008

anode for LIBs. Derrien et al.24 found a stable capacity of∼500 mA h g-1 for at least 200 cycles in the voltagewindow, 0.005-1.5 V, at a rate of 0.8 C for nano-Sn-Ccomposite. For mechanically alloyed (CoSn2 + C + Co) and(CoSn + C) nanocomposites, Ferguson et al.25 observedcapacities of ∼450 and ∼280 mA h g-1 stable in the rangeof 10-100 cycles when cycled in the voltage window0.005-1.2 V at a rate of 0.2 C.
The reversible capacity of tin oxide-based electrodes arisesdue to the alloying-dealloying reaction of Sn metal withLi, after the formation of Sn metal by the reduction of Snoxide.1,5,9,14-16 The volume variation in unit cell duringcharge and discharge reaction leads to cracking and crum-bling of electrode causing extensive capacity- fading up onelectrochemical cycling.1,5,9,14-20 Thus, realization of a stablecycling response of Sn-oxides over a large number of cyclesis one of the major goals, and this issue is addressed to someextent by using nanoparticles of starting materials and/or byusing some matrix elements which could buffer the volumevariation during the alloying-dealloying reaction1,14-18 andby choosing appropriate voltage range of cycling.14-17,19
Among various matrix elements studied in conjunction withtin oxides, we have shown that the sol-gel derived nano-CaSnO3 which contains SnO6 octahedra and adopts aperovskite structure has shown good cycling performancewith a reversible capacity of 380 mA h g-1 stable up to 100cycles in the voltage range 0.005-1.0 V.15,16 This capacityvalue corresponds to only 2.9 mol of Li per mole of CaSnO3
as compared to the theoretically obtainable value, 4.4 molof Li. Therefore, scope exists to enhance the capacity ofCaSnO3 by tailoring its particle size as well as morphologyby employing different synthesis routes.
In the past few years, various tin-composite oxidesobtained by the decomposition of ASn(OH)6, A ) Mn, Mg,and Co,21-23 have been investigated for their Li-cyclability.It has been found that the amorphous composite (e.g.,MgO ·SnO2
22) shows a higher reversible capacity incomparison to the crystalline compounds but exhibits poorcapacity retention on long-term cycling. By keeping in mindthe beneficial effect of Ca counterion in the cyclingperformance of crystalline-CaSnO3, presently we preparedX-ray amorphous CaO ·SnO2 nanocomposite and X-raycrystalline nanophase CaSnO3 by the thermal decompositionof CaSn(OH)6 and tested them for Li-cyclability at roomtemperature in two different voltage windows, that is,0.005-1.0 V and 0.005-1.3 V versus Li. Results show theimproved and stable reversible capacity values of 490 ((5)mA h g-1 and 550 ((5) mA h g-1, respectively, for nano-CaO ·SnO2 in the afore-stated voltage ranges at least up to50 cycles.
2. Experimental Section
The metal salts, CaCl2 (0. 1M, Fluka; >97%) and SnCl4 (0.1M, Merck; >99%) were dissolved separately in deionized water(20 mL) and then mixed together. Drop by drop, 0.65 M NaOH
aqueous solution was added to the mixed chloride solution. Thishas resulted in a white precipitate of CaSn(OH)6. Warming at 50°C and stirring of the solution along with the precipitate was carriedout for 2 h using stirrer-cum-hot plate, after which it was filtered,washed several times with deionized water, and then dried at 80°C for 12 h in an air oven. The white powder was calcined in airat 400, 500, 600, and 900 °C for 6 h each separately and anotherbatch at 600 °C for 24 h and cooled to room temperature. Structuralcharacterization and thermogravimetric analysis were carried outby an X-ray diffractometer (XRD) (Philips X’PERT MPD instru-ment, equipped with Cu KR radiation) and a TA Instrument (SDT-2960 Simultaneous DTA-TGA) at a heating rate of 5 °C min-1, inair, respectively. Density measurements were carried out on thecompounds prepared at 600 °C for 24 h and at 900 °C for 6 h,using AccuPyc 1330 pycnometer (Micromeritics, U.S.A.). Thecompounds were pressed into pellets and vaccuum-dried for densitydetermination. Microstructural characterizations were carried outby a scanning electron microscope (SEM) (JEOL JSM-6700F, FieldEmission Electron Microscope) and high resolution transmissionelectron microscope (HR-TEM) (JEOL JEM 3010 operating at 300kV). For TEM and selected area electron diffraction (SAED)measurements, the powder was dispersed in ethanol using theultrasonic miller (Transsoinc 660/H Elma), and after obtaining ahomogeneous dispersion, a drop of it was deposited on a holeycarbon-coated Cu-grid, dried, and then transferred to the TEMchamber.
The doctor blade technique was used to prepare the electrodefor electrochemical studies. The active material, Super P carbonpowder (MMM Ensaco), and binder (Kynar 2801) in the weightratio 70:15:15 were mixed thoroughly using N-methyl-pyrrolidinone(NMP) as the solvent for the binder. Etched copper foil (∼10 µmthick) was the current collector. The thick film (20-30 µm)electrode was dried at 80 °C in an air oven for 12 h to evaporatethe NMP and then pressed between twin rollers to ensure intimatecontact with the current collector and cut into circular disks (16mm diameter and containing 3-4 mg active material’s mass)followed by vacuum drying at 70 °C for 12 h. These electrodeswere transferred to an Ar-filled glovebox (MBraun, Germany) whichmaintains the H2O and O2 content less than 1 ppm. Coin cells (size2016) were assembled in the glovebox with Li metal (KyukotoMetal Co., Japan) as the counter electrode, glass microfiber filter(Whatmann) as the separator, and 1 M LiPF6 in ethylene carbonate(EC) + diethyl carbonate (DEC) (1:1, v/v, Merck; Selectipur LP40) as the electrolyte. The cyclic voltammetry and galvanostaticcharge-discharge cycling of the cells were carried out at roomtemperature after aging the cells for 24 h (to ensure the percolationof the electrolyte in to the electrode) by Macpile II (Biologic,France) and computer controlled Bitrode multiple battery tester(model SCN, Bitrode, U.S.A.), respectively. Electrochemicalimpedance spectroscopy was performed using the Solartron imped-ance/phase-gain analyzer (SI 1255) coupled with a battery testingunit (1470). The measurements were carried out at room temperaturein the frequency range 5 mHz to 0.10 MHz, with an ac signal ofamplitude 5 mV. Data acquisition and analysis were done,respectively, using the electrochemical impedance software, Zplotand Zview (version 2.2, Scribner Associates Inc., U.S.A.).
3. Results and Discussion
3.1. Structural and Morphological Characterization.The XRD pattern along with the Miller indices of synthesized-CaSn(OH)6 is shown in Figure 1. It crystallizes in a cubicstructure. The calculated lattice parameter a ) 8.14(2) Åmatches well with the 8.15 Å reported in JCPDS card no.
(24) Derrein, G.; Hassoun, J.; Panero, S.; Scrosati, B. AdV. Mater. 2007,19, 2336.
(25) Ferguson, P. P.; Todd, A. D. W.; Dahn, J. R. Electrochem. Commun.2008, 10, 25.
6830 Chem. Mater., Vol. 20, No. 21, 2008 Sharma et al.
74-1823. It is known that CaSn(OH)6 decomposes on heatingat temperature T > 250 °C, to form the compositeCaO ·SnO2, and at T > 500 °C forms the compoundCaSnO3.26,27 The TGA and derivative of weight loss (DWL)curves of CaSn(OH)6 are shown in Figure 2. An intense peakin the DWL curve is observed at ∼290 °C which can beattributed to the decomposition of CaSn(OH)6 to form thecomposite CaO ·SnO2. The decomposition equation can bewritten as
CaSn(OH)6fCaO·SnO2 + 3H2O (1)
The observed weight loss, ∼18% up to 600 °C, is almostconsistent with the theoretically estimated loss, ∼20%according to eq 1. The small peaks observed in the DWLcurves at 50-70 °C is due to desorption of the adsorbedwater. To ascertain the temperature at which the compositeCaO ·SnO2 transforms to the well defined CaSnO3, theCaSn(OH)6 was calcined in air at various temperatures asmentioned in Experimental Section.
The XRD patterns indicate that the CaSn(OH)6 heated at400, 500, and 600 °C for 6 h are X-ray amorphous in nature,and only broad peaks with 2θ at ∼32° and ∼52° are observed(Figure 1). The well-defined peaks corresponding to orthor-hombic CaSnO3 are observed only when CaSn(OH)6 isheated at 600 °C for 24 h, and as expected, at 900 °C for6 h (pattern not shown). The derived lattice parameters, a )
5.52(2) Å, b ) 5.67(2) Å, and c ) 7.89(2) Å match wellwith the reported values, in the JCPDS card no. 77-1797(a ) 5.532(2) Å, b ) 5.681(2) Å, and c ) 7.906(2) Å). Thecrystallite size of crystalline-CaSnO3 was calculated usingthe Scherrer’s formula, P ) Kλ/(1/2 cos θ).28 Here, K is aconstant, λ is the wavelength of Cu KR radiation in Å, 1/2
is the full width at half-maximum (fwhm) in radians, and θis the scattering angle. The instrumental resolution of 0.15°is determined using the standard compounds, LiNbO3 andLiCoO2. This value is subtracted from the measured fwhm’s,and then P was calculated using the fwhm of the maximumintensity peak (112), λ ) 1.54059 Å, and K ) 0.9. Theestimated crystallite size for the CaSnO3 prepared by heatingCaSn(OH)6 at 600 °C for 24 h is 60 ((5) nm, therebyestablishing it as a nanophase. The crystallite size of theCaSnO3 prepared at 900 °C for 6 h is 120 ((5) nm, meaningit is submicrocrystalline. The XRD data are in tune with theTGA curve (Figure 2) where 600 °C was found to be theappropriate temperature to obtain crystalline CaSnO3 fromCaSn(OH)6 and agree with the findings in the literaturereports.26,27 The experimentally observed density of X-raycrystalline-CaSnO3 (prepared at 600 °C, 24 h) is 5.25 ((0.05)g/cm3 and is slightly smaller than theoretical X-ray densityof 5.52 g/cm3, which could be attributed to the porositypresent in the compound. The value determined for CaSnO3
prepared by heating CaSn(OH)6 at 900 °C for 6 h is5.58((0.05) g/cm3 and matches well with the X-ray density.
Morphological characterization was carried out on X-rayamorphous (CaSn(OH)6, heated at 600 °C; 6 h) and X-raycrystalline (CaSn(OH)6, heated at 600 °C; 24 h) CaSnO3 bySEM. Agglomeration of fine particles and their inhomoge-neous distribution is observed in both the cases. However,the X-ray crystalline CaSnO3 showed a denser packing ofthe agglomerates of fine particles (Figure S1, SupportingInformation). The high resolution (HR)-TEM lattice imageof the X-ray amorphous CaSnO3 shown in Figure 3a clearlyindicates nano-crystalline regions (size, 3-5 nm) dispersedin an amorphous phase. Some of the regions are marked as1, 2, and 3. Careful measurements of the interplanard-spacings of the nanosize regions, that is, 1 and 2, give thevalues of 3.35 ((0.02) Å and 2.78 ((0.02) Å, respectively.These values can be assigned to the Miller indices, (110) oftetragonal SnO2 (JCPDS no. 72-1147) and (111) of cubicCaO (JCPDS no. 82-1691), respectively. However, the d )2.78 ((0.02) Å can also be indexed as the (112) plane oforthorhombic-CaSnO3 (JCPDS no. 77-1797). The regionsmarked as 3 are comprised of various sets of lattice planesattributable to CaO, SnO2, and CaSnO3 which, however,cannot be indexed unambiguously to any one of them. Theselected area electron diffraction (SAED) pattern of the X-rayamorphous CaSnO3, shown in Figure 3 b, exhibits concentricdiffuse rings without specific spots indicative of an amor-phous nature of the compound as a whole. The d valuescorresponding to these concentric rings were evaluated bymeasuring the radius of the ring from the center, and theymatch well with the values derived from the nanophaseregions in the HR-TEM lattice image (Figure 3a).
(26) Inagaki, M.; Kuroishi, T.; Yamashita, Y.; Urata, M. Z. Anorg. Allg.Chem. 1985, 527, 193.
(27) Jena, H.; Kutty, K. V. G.; Kutty, T. R. N. Mater. Chem. Phys. 2004,88, 167.
(28) Jha, P.; Arya, P. R.; Ganguli, A. K. Mater. Chem. Phys. 2003, 82,355.
Figure 1. X-ray diffraction patterns of as prepared cubic-CaSn(OH)6 andof the products calcined in air at 400, 500, and 600 °C for 6 h at eachtemperature and at 600 °C for 24 h. Formation of X-ray crystalline CaSnO3
is seen in the latter case. Miller indices (hkl) are shown.
Figure 2. TGA and derivative weight loss curves of CaSn(OH)6 at a heatingrate of 5 °C per min, in air.
6831Chem. Mater., Vol. 20, No. 21, 2008Nano-CaO ·SnO2 and Nano-CaSnO3 as Anodes

The HR-TEM lattice image along with SAED pattern ofX-ray crystalline CaSnO3 are shown in Figure 3c,d, respec-tively. The lattice fringes of the nanosize grains are clearlyseen in Figure 3c. The d-values corresponding to some ofthe planes are 2.78 ((0.02) Å and 2.30 ((0.02) Å, whichcorrespond to the Miller indices (112) and (022), respectively,of the orthorhombic-CaSnO3. The SAED pattern comprisesof well-defined but diffuse spots, and some of the spots areindexed by comparing the d-values of crystalline CaSnO3
(Figure 3d). Therefore, on the basis of XRD, HR-TEM, andSAED measurements, we can conclude that the X-rayamorphous phase is comprised of nanocomposite CaO ·SnO2
(and possibly a small amount of nano-CaSnO3), whereas theCaSn(OH)6 calcined at 600 °C for 24 h in air is comprisedof nanophase crystalline CaSnO3. Henceforth, the nanocom-posite is designated as nano-CaO ·SnO2 and X-ray crystallinenanophase as nano-CaSnO3.
3.2. Electrochemical Studies. 3.2.1. GalVanostatic Cy-cling. Figure 4a shows the capacity-voltage profiles of thefirst discharge and charge cycle of nano-CaO ·SnO2 andnano-CaSnO3 at a current density of 60 mA g-1 in thevoltage window 0.005-1.0 V. The profiles of the former inthe range 0.005-1.3 V are also shown. The discharge profilecommenced from the OCV (∼2.3-2.5 V) to the lower cutoffvoltage, 0.005 V. The first discharge profile of nano-CaSnO3
shows a small plateau at ∼ 0.8 V with an onset at ∼1.0 Vfollowed by a sloping profile until a capacity of ∼500 mAh g-1 is reached. Thereafter, a large plateau region sets in
at ∼0.20 V, whereas the nano-CaO ·SnO2 exhibits a smallshoulder plateau at ∼0.8 V and then continuous a slopingprofile from ∼0.6 V to the lower cutoff voltage, 0.005 V.This difference in the first-discharge profiles can be attributedto the presence of electrochemically inactive-CaO in nano-CaO ·SnO2 as compared to the nano-CaSnO3. The electro-chemical process occurring during the first discharge is thestructure destruction (amorphization of crystal lattice), thatis, the formation of electrochemically inactive CaO matrixand active Sn-metal (eq 2) in the case of nano-CaSnO3. Fornano-CaO ·SnO2, the reaction of eq 3 occurs. The freshlyformed Sn-metal reacts with Li to form the intermetallicalloy, Li4.4Sn at ∼0.2 V according to the forward reactionof eq 4. It has been observed that CaO will not be reducedto the Ca-metal by Li because of strong bonding betweenCa and O.15,16
CaSnO3 + 4Li++4e-fCaO+ 2Li2O+ Sn (2)
CaO·SnO2 + 4Li++ 4e-fCaO+ 2Li2O+ Sn (3)
4.4Li++ 4.4e-+ SnTLi4.4Sn (4)
The above eqs show the overall consumption of 8.4 molof Li per mole of nano-CaSnO3 or CaO ·SnO2 and constitute1089 mA h g-1 as the overall first-discharge capacity.However, the experimentally observed capacity in both nano-CaO ·SnO2 and nano-CaSnO3 is higher than the theoreticallyenvisaged values, namely, 1310 ((30) mA h g-1 (∼10.1
Figure 3. (a) HR-TEM lattice image of X-ray amorphous nano-CaO ·SnO2 (The precursor CaSn(OH)6 heated at 600 °C for 6 h.) showing the presence ofnanocrystalline regions (size, 3-6 nm) dispersed in the amorphous region, marked as 1, 2, and 3. The regions marked 1 and 2 correspond to SnO2 and CaO,respectively. (b) The SAED pattern. The assignment of the diffuse rings to the phases CaO, SnO2, and CaSnO3 are shown along with the Miller indices. (c)The HR-TEM lattice image of X-ray crystalline nano-CaSnO3 (the precursor CaSn(OH)6 heated at 600 °C for 24 h). The d-values estimated from the latticefringes are assigned to CaSnO3. (d) The corresponding SAED pattern of nano-CaSnO3. The assigned Miller indices of CaSnO3 to the spots are shown.
6832 Chem. Mater., Vol. 20, No. 21, 2008 Sharma et al.

mol of Li per mole of nano-CaO ·SnO2) and 1165 ((20)mA h g-1 (∼9.0 moles of Li per mole of nano-CaSnO3),respectively. These extra capacity values, over and abovethe theoretical ones, can be ascribed to the solid-electrolyteinterphase (SEI) formation due to the reaction of Li withthe solvents of the electrolyte.13-23 The difference betweenthe observed first-discharge capacities in nano-CaSnO3 versusnano-CaO ·SnO2 is possibly due to the difference in the wellcrystalline nanophase versus nanophase X-ray amorphousnature and a thicker SEI formation in the case of nano-CaO ·SnO2. Analogous results were noted with the com-pounds MnO ·SnO2, MgO ·SnO2, and CoO ·SnO2 reportedin the literature.21-23 The voltage-capacity profiles of nano-CaSnO3 show clear and relatively flat voltage plateau regionsin comparison to nano-CaO ·SnO2 indicative of well definedreaction potentials in the case of the former as compared tolatter and can be attributed to the coexistence of two-phaseregions. The energy required for Li to react with the nano-CaO ·SnO2 is lesser, and therefore, a sloping profile ratherthan clearly defined flat plateau potential is seen.
The first charge profiles of nano-CaO ·SnO2 in twodifferent voltage windows (0.005-1.0 V and 0.005-1.3 V)and of nano-CaSnO3 in the range 0.005-1.0 V show similarbehavior, and the first charge capacity is 420 ((5) mA h
g-1 for nano-CaSnO3 (Figure 4a). In the case of nano-CaO ·SnO2, the first charge capacities of 480 ((5) mA hg-1 and 570 ((5) mA h g-1 were observed in the voltagewindows of 0.005-1.0 V and 0.005-1.3 V, respectively.These capacity values correspond to 3.7 and 4.4 mol of Liper mole of nano-CaO ·SnO2, respectively (Figure 4a). Thesefindings are encouraging since the theoretical capacity isachieved with nano-CaO ·SnO2 in the voltage window0.005-1.3 V. The theoretical irreversible capacity loss (ICL)during the first cycle is ∼48% (from eqs 2-4), whereas theobserved ICL is ∼56% for the nano-CaO ·SnO2. Theobserved second discharge and charge capacities of 580 ((5)mA h g-1 and 550 ((5) mA h g-1, respectively, are veryclose to the first charge capacity which confirms the validityof eq 4 and good reversibility. In the range of 2-50 cycles,the charge-discharge profiles for nano-CaO ·SnO2 are welloverlapped and show good reversibility in both the voltagewindows (Figure 4b,c).
The capacity versus cycle number plots are shown inFigure 5a,b. Both nano-CaO ·SnO2 and nano-CaSnO3 showa stable and high capacity in the range of 0.005-1.0 V upto 50 cycles. As is evident from Figures 4 and 5a,b, thedischarge and charge capacities in both the cases show anoticeable increasing tendency on cycling when cycled inthe voltage range, 0.005-1.0 V. The 30th cycle reversiblecapacities of nano-CaO ·SnO2 and nano-CaSnO3 are 490((5) and 445 ((5) mA h g-1, respectively. The Coulombicefficiency, η, is in the range 96-98%. When cycled in therange of 0.005-1.3 V, nano-CaSnO3 showed an initialreversible capacity of 570 ((5) mA h g-1 (theoretical value)but capacity-fading occurred relatively slowly up to 40 cyclesand fairly rapidly in the range 40-70 cycles, and only acapacity of 380((5) mA h g-1 is retained at the 70th cycle(Figure 5b). On the other hand, the capacity of nano-CaO ·SnO2 remains stable at 550 ((5) mA h g-1 (4.2 molof Li) up to 50 cycles when cycled in the range 0.005-1.3V at 0.12 C (assuming 1 C ) 500 mA g-1). The η is∼96-98% in the range of 5-50 cycles. We note, however,
Figure 4. Voltage vs capacity profiles at the current rate of 60 mA g-1
(0.12 C) at room temperature. (a) The first cycle for nano-CaO ·SnO2 andnano-CaSnO3 in the two voltage windows, namely, 0.005-1.0 V and0.005-1.3 V vs Li. (b) The profiles for nano-CaO ·SnO2 during the 2-65cycles in the voltage window, 0.005-1.3 V, and (c) during the 2-50 cyclesin the voltage window 0.005-1.0 V. Only selected cycles are shown forclarity. The numbers refer to the cycle number.
Figure 5. Capacity vs cycle number plots at the current of 60 mA g-1
(0.12C), (a) for nano-CaO ·SnO2, and (b) for nano-CaSnO3. Voltagewindows are indicated. (c) The capacity vs cycle number plot at variouscurrent rates of nano-CaO ·SnO2 in the voltage window, 0.005-1.0 V. Thefilled and open symbols represent discharge and charge capacities,respectively. The C values corresponding to different current rates are shown,assuming 1 C ) 500 mA g-1.
6833Chem. Mater., Vol. 20, No. 21, 2008Nano-CaO ·SnO2 and Nano-CaSnO3 as Anodes

capacity fading sets in beyond 50 cycles, and in the rangeof 50-80 cycles, the rate of fading is ∼2 mA h g-1 percycle. It has been noted in the literature that the operatingvoltage window is crucial for better reversibility of Sn-basedoxide compounds.14-17,20 It is noted that beyond 1.0 V theconsumption of Li2O and reformation of tin oxide (e.g., SnO)is responsible for capacity fading due to the loss of holdingability of keeping Sn-metal particles apart from each otherand destroying the stable nanocomposite structure ofSn-Li2O matrix.14,17,20,29,30 Therefore, the observed capacityfading in nano-CaO ·SnO2 in the voltage range 0.005-1.3V on cycling beyond 50 cycles can be attributed to the partialoxidation of Sn metal (Li2O consumption) to form Sn oxides.
Both nano-CaSnO3 and nano-CaO ·SnO2 show higher andstable capacities of 445 ((5) mA h g-1 and 490 ((5) mAh g-1, respectively, than the 380 ((5) mA h g-1, reportedby us earlier 15,16 for the nano-CaSnO3 prepared by sol-gelmethod when cycled in the range of 0.005-1.0 V at 60 mAg-1. The good cycling response of nano-CaO ·SnO2 andnano-CaSnO3 is attributed to the excellent buffering abilityof CaO against the unit cell volume variations occurringduring alloying-dealloying of Sn metal (eq 4). The bettercycling performance of the nano-CaO ·SnO2 in comparisonto nano-CaSnO3 up to 50 cycles in both the voltage ranges(upper cutoff, 1.0V and 1.3 V) is attributed to the nanophasenature of X-ray amorphous CaO ·SnO2 which containssmaller nanosize regions (3-6 nm) against the relativelylarger crystallite size (∼ 60 nm) in nano-CaSnO3 (Figures 1and 3). The electro-inactive CaO matrix also serves as thebarrier against the agglomeration of Sn nanoparticles duringcycling.
3.2.2. Rate Capability. The encouraging galvanostaticcycling performance in the form of high and stable capacity,supported by the cyclic voltammetry studies to be discussedlater, motivated us to check the rate capability of nano-CaO ·SnO2 at various current densities in the voltage window0.005-1.0 V at ambient temperature. The specific currentwas increased after 8-10 cycles in steps from 0.06 to 0.4 Cup to 40 cycles assuming 1 C ) 500 mA g-1. The capacityvs cycle number plot is shown in the Figure 5c. The capacity,520 ((5) mA h g-1, observed at 0.06 C decreases to 420((5) mA h g-1 upon increasing the current almost sevenfold,to 0.4 C. However, at each C-rate, the capacity remains fairlystable on cycling. We note that the capacity observed at 0.4C is higher than the theoretical capacity of graphite (372mA h g-1).
3.2.3. Cyclic Voltammetry. The galvanostatic cyclingperformance of nano-CaO ·SnO2 has been complemented bycyclic voltammetry carried out in the potential range of0.005-1.0 V and 0.005-1.3 V at the slow scan rate of 58µV s-1. The cyclic voltammograms (CV) are shown inFigure 6. As can be seen in Figure 6a, the first dischargecommenced from the open circuit voltage and no cathodicpeaks are seen until 1.0 V. A broad shoulder peak at ∼0.75V is observed which can be ascribed to the onset of reduction
of SnO2 to form the Sn metal (eq 3). This is followed by asmooth sloping curve and a broad peak at ∼0.1 V. This peakcan be attributed to the formation of Li4.4Sn alloy (forwardreaction of eq 4).
The first charge (anodic) sweep up to the cutoff potential,1.0 V, showed only one well- defined peak at ∼0.55 V. Fromthe second cycle onward, the discharge and charge CV showpeaks at 0.2V and 0.55 V, respectively (Figure 6a). Thesplitting of the cathodic peak into a doublet, discernible at0.1-0.15 V during 2-25 cycles, indicates that the Li-Snalloying reaction occurs in two stages instead of a singlestep, as shown in eq 4. Nevertheless, the overlapping ofanodic and cathodic peaks during the 2 to 25 cycles indicatesgood Li cyclability and reveals the average discharge andcharge potentials, 0.2 and 0.5 V, respectively, for alloyingand dealloying reaction as per the reversible reactions of eq4 (Figure 6a).
Figure 6b shows the CV of nano-CaO ·SnO2 in the voltagerange 0.005-1.3 V. The first-cycle CV is identical to thatof Figure 6a, as expected, indicating excellent reproducibilityof a duplicate cell. During the 2-20 cycles, the CVs overlapwell and qualitatively resemble those of Figure 6a. However,a cathodic peak at 0.55 V and a broad anodic peak at ∼1.2V are clearly seen during the 2-20 cycles in Figure 6b. Thelatter peak may be associated with oxidation of Sn nano-particles to form tin oxide, which means that the correspond-ing reduction of the tin oxide to Sn metal is occurring at∼0.55 V. We note, however, that the formed tin oxide maynot be the well-defined SnO, since studies by Courtney andDahn17 have shown that SnO reduction by Li metal underelectrochemical conditions occurs only at ∼1.1 V. Thus, theabove cathodic and anodic peaks may represent reductionand oxidation of a suboxide, SnOx (x < 1), which may existas a nanophase under room temperature electrochemicalcycling. Indeed, 119Sn Mossbauer studies by Sandu et al.20
indicated the presence of unusual tin species (“exotic” formsof Sn(II) or Sn(0)) during the electrochemical reduction ofSnO2 by Li metal. Therefore, we conclude that the CV resultsare in good agreement with the galvanostatic cycling data.
(29) Chang, S. T.; Leu, I. C.; Liao, C. L.; Yen, J. H.; Hon, M. H. J. Mater.Chem. 2004, 14, 1821.
(30) Mohamedi, M.; Lee, S.-J.; Takahashi, D.; Nishizawa, M.; Itoh, T.;Uchida, I. Electrochim. Acta 2001, 46, 1161.
Figure 6. Cyclic voltammograms of nano-CaO ·SnO2 in the voltage window(a) 0.005-1.0 V and (b) 0.005-1.3 V vs Li at the slow scan rate of 58 µVs-1. Numbers indicate the cycle number.
6834 Chem. Mater., Vol. 20, No. 21, 2008 Sharma et al.
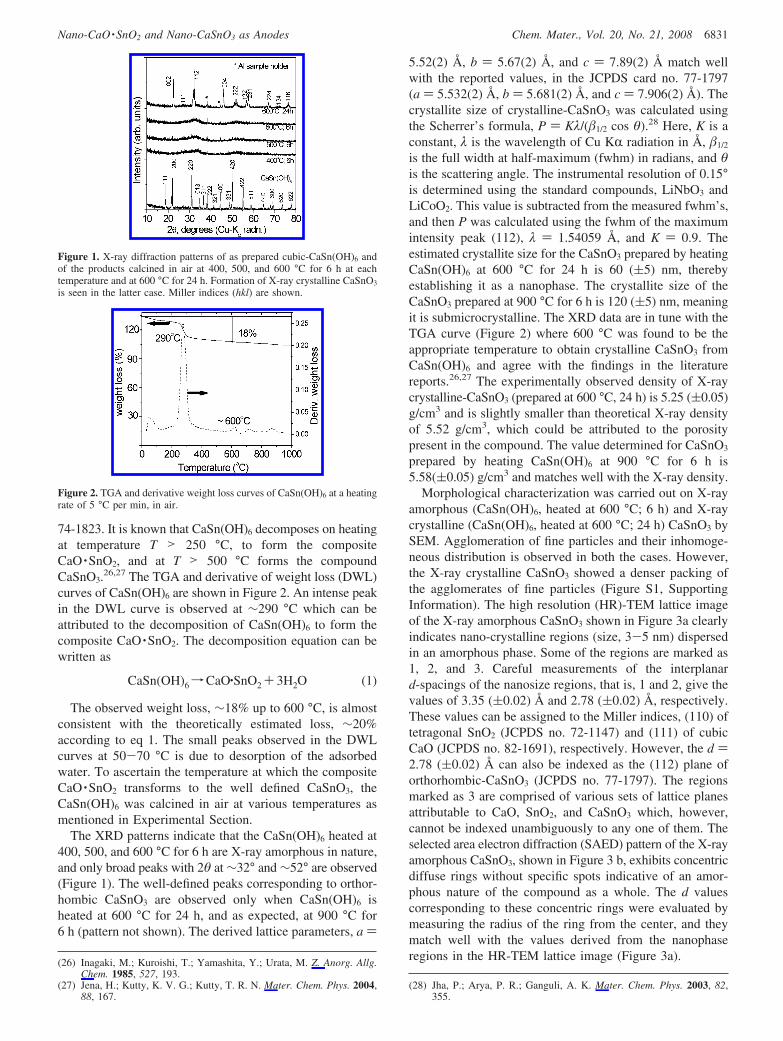
3.3. Ex Situ XRD and TEM. To supplement the gal-vanostatic cycling and cyclic voltammetry data, ex situ XRDon nano-CaSnO3 and TEM studies on nano-CaO ·SnO2 wereperformed, and the results are shown in Figures 7 and 8,respectively. For ex situ XRD, duplicate cells were discharged/charged to different voltages and then equilibrated for 2-3h. The cells were then dismantled inside the glovebox, andthe composite electrodes were recovered, washed withsolvent DEC to remove the electrolyte, and then covered byparafilm “M” (American National Can, U.S.A.) to ensureminimal contact with air. Figure 7 shows the XRD patternsof the electrodes recorded at various voltages, OCV, 0.5 Vand 0.005 V, during first discharge, and at 1.0 V after 30discharge-charge cycles. As can be seen, the characteristiclines of CaSnO3 were observed at OCV and at 0.5 V duringfirst discharge, which reveals that the crystal structure is notdestroyed at 0.5 V. In the XRD pattern taken at 0.005 V,the lines due to CaSnO3 completely disappeared (amorphiza-tion of lattice) and peaks corresponding to Li-Sn alloy andsmall intensity peaks due to Sn metal are seen. As per theforward reaction of eq 4, only alloy (Li-Sn) formation canbe expected at 0.005 V. The observed lines due to Sn metalmay be ascribed to the slight decomposition of alloy underex situ conditions and exposure to X-rays. The XRD pattern,devoid of lines due to Sn metal, is seen at 1.0 V after 30cycles (Figure 7).
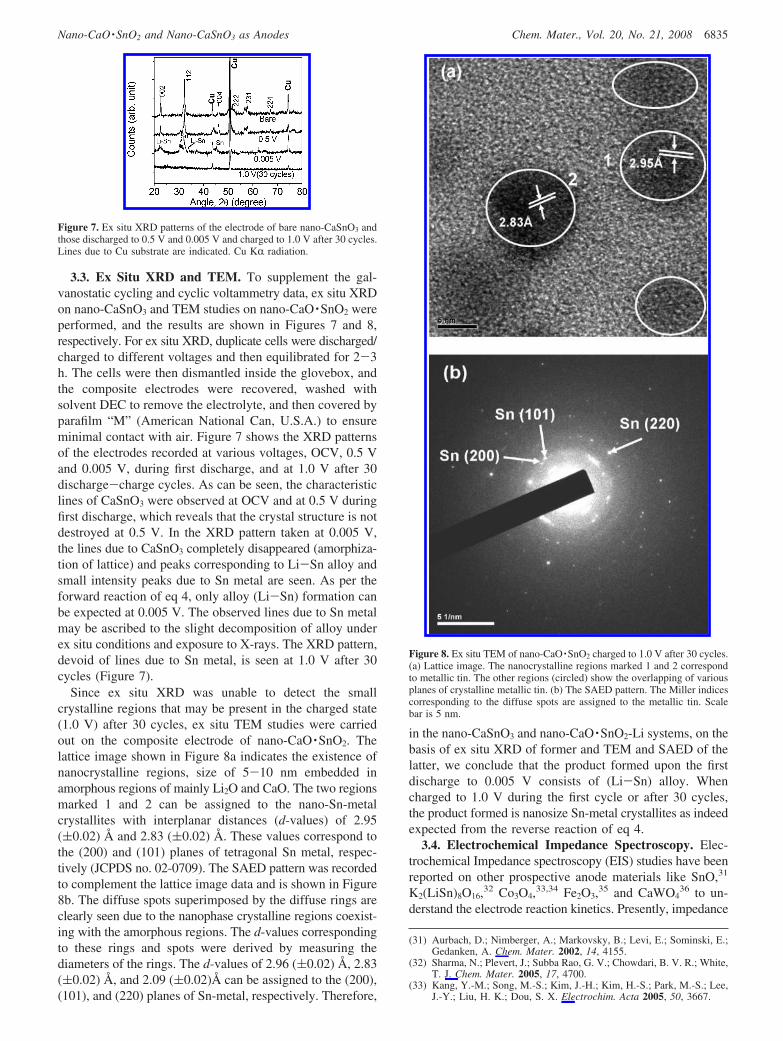
Since ex situ XRD was unable to detect the smallcrystalline regions that may be present in the charged state(1.0 V) after 30 cycles, ex situ TEM studies were carriedout on the composite electrode of nano-CaO ·SnO2. Thelattice image shown in Figure 8a indicates the existence ofnanocrystalline regions, size of 5-10 nm embedded inamorphous regions of mainly Li2O and CaO. The two regionsmarked 1 and 2 can be assigned to the nano-Sn-metalcrystallites with interplanar distances (d-values) of 2.95((0.02) Å and 2.83 ((0.02) Å. These values correspond tothe (200) and (101) planes of tetragonal Sn metal, respec-tively (JCPDS no. 02-0709). The SAED pattern was recordedto complement the lattice image data and is shown in Figure8b. The diffuse spots superimposed by the diffuse rings areclearly seen due to the nanophase crystalline regions coexist-ing with the amorphous regions. The d-values correspondingto these rings and spots were derived by measuring thediameters of the rings. The d-values of 2.96 ((0.02) Å, 2.83((0.02) Å, and 2.09 ((0.02)Å can be assigned to the (200),(101), and (220) planes of Sn-metal, respectively. Therefore,
in the nano-CaSnO3 and nano-CaO ·SnO2-Li systems, on thebasis of ex situ XRD of former and TEM and SAED of thelatter, we conclude that the product formed upon the firstdischarge to 0.005 V consists of (Li-Sn) alloy. Whencharged to 1.0 V during the first cycle or after 30 cycles,the product formed is nanosize Sn-metal crystallites as indeedexpected from the reverse reaction of eq 4.
3.4. Electrochemical Impedance Spectroscopy. Elec-trochemical Impedance spectroscopy (EIS) studies have beenreported on other prospective anode materials like SnO,31
K2(LiSn)8O16,32 Co3O4,33,34 Fe2O3,35 and CaWO436 to un-
derstand the electrode reaction kinetics. Presently, impedance
(31) Aurbach, D.; Nimberger, A.; Markovsky, B.; Levi, E.; Sominski, E.;Gedanken, A. Chem. Mater. 2002, 14, 4155.
(32) Sharma, N.; Plevert, J.; Subba Rao, G. V.; Chowdari, B. V. R.; White,T. J. Chem. Mater. 2005, 17, 4700.
(33) Kang, Y.-M.; Song, M.-S.; Kim, J.-H.; Kim, H.-S.; Park, M.-S.; Lee,J.-Y.; Liu, H. K.; Dou, S. X. Electrochim. Acta 2005, 50, 3667.
Figure 7. Ex situ XRD patterns of the electrode of bare nano-CaSnO3 andthose discharged to 0.5 V and 0.005 V and charged to 1.0 V after 30 cycles.Lines due to Cu substrate are indicated. Cu KR radiation.
Figure 8. Ex situ TEM of nano-CaO ·SnO2 charged to 1.0 V after 30 cycles.(a) Lattice image. The nanocrystalline regions marked 1 and 2 correspondto metallic tin. The other regions (circled) show the overlapping of variousplanes of crystalline metallic tin. (b) The SAED pattern. The Miller indicescorresponding to the diffuse spots are assigned to the metallic tin. Scalebar is 5 nm.
6835Chem. Mater., Vol. 20, No. 21, 2008Nano-CaO ·SnO2 and Nano-CaSnO3 as Anodes

studies were carried out on the cell comprising nano-CaO ·SnO2 as the working electrode versus Li during thefirst discharge and charge cycle and during the 11thdischarge. The cell was discharged or charged to a specificvoltage and relaxed at that voltage for 3 h, and the impedancedata were collected. The results are presented as Nyquistplots (Z′ vs -Z′′ ), where Z′ and Z′′ refer to the real andimaginary parts of cell impedance, respectively (Figure 9a-c). The impedance spectra have a qualitative resemblanceto those observed with SnO31 and another Sn-containingoxide, K2(LiSn)8O16.32 The spectra were fitted with anequivalent electrical circuit using series and parallel com-binations of resistances (R), CPEs, where CPE is the constantphase element and W the Warburg impedance. The experi-mental data points are represented as symbols, and fitting isrepresented as continuous lines in Figure 9a-c. The equiva-lent circuit is shown in Figure 10.32,35 The overall cellimpedance is a summation of the resistances offered by theelectrolyte (Re), surface film (sf) impedance components (Rsf
and CPEsf), charge transfer (ct) resistance and the corre-
sponding double layer (dl) CPE (Rct+ CPEdl), the bulk (b)impedance components (Rb and CPEb), and the Warburgimpedance (W). Since the Nyquist plots show depressedsemicircles, indicative of deviation from the ideal behavior,CPEs have been used instead of the pure capacitors. Theimpedance of constant phase element can be derived fromthe equation, ZCPE ) 1/[Ci(jω)n] where j ) -1, ω is theangular frequency, Ci is the capacitance, and n is a constant.The value of n (<1) gives the degree of distortion from thepure capacitor behavior, and for the latter, n ) 1.
The electrolyte resistance (Re) was found to be 4.5 ((0.5)Ω irrespective of the state of discharge/charge of the cell.The Nyquist plot of the fresh cell under the open circuitvoltage (OCV) conditions showed only one semicircle in therange of 100 kHz-10 Hz. The data were fitted by one R|CPEcombination and indicates the contribution from the surfacefilm impedance (R(sf)). The straight line inclined at ∼45° inthe low frequency side shows the contribution of Warburgimpedance. Under the OCV conditions, R(sf) ) 390 ((5) Ωand CPE(sf) ) 380 ((5) µF were obtained after fitting (Table1). It is evident from Figure 9a and Table 1 that, as thedischarge reaction proceeds, that is, as more and more Lireacts with the electrode material, both the surface film andthe charge transfer resistances contribute to the overallimpedance. As can be seen, the diameter of the semicircledecreases, indicating a reduction in the respective values.However, since only one semicircle is seen, the data werefitted using only one R|CPE combination (R(sf+ct)). Thus, at1.5 V and 1.0V, the R(sf+ct) decreased to 230 ((5) and 198((5) Ω (CPE(sf+dl) to 42((5) and 39((5) µF), respectively.In addition, at 1.0 V, an undeveloped semicircle (almost astraight line parallel to the x-axis) is seen which is anindication of contribution from the bulk resistance (Rb) tothe overall impedance. Accordingly, the correspondingequivalent circuit of Figure 10 is used for fitting the spectrum.The derived value of Rb is fairly large (398((5) Ω) as givenin Table 1. Below 1.0 V, the impedance spectrum exhibitedsignificant changes as can be expected since the reductionof nano-CaO ·SnO2 to the Sn-metal and Li-Sn alloy forma-tion occurs in the range 1.0-0.005 V. This is in agreementwith the galvanostatic first discharge profile and CV whichshowed the onset of the plateau region marking the two-phase region. In the voltage range 0.75-0.2 V, all theimpedance parameters show a decreasing trend and becomealmost constant for V ) 0.05 and 0.005 V (Table 1 andFigure 9 a). The degree of distortion of the first semicircledecreases and n increases from ∼0.74 to ∼0.84 in the voltagerange 1.5-0.005 V indicating thereby that the CPE tends to
(34) Liu, Y.; Mi, C.; Su, L.; Zhang, X. Electrochim. Acta 2008, 53, 2507.(35) Reddy, M. V.; Yu, T.; Sow, C. H.; Shen, Z. X.; Lim, C. T.; Subba
Rao, G. V.; Chowdari, B. V. R. AdV. Funct. Mater. 2007, 17, 2792.(36) Sharma, N.; Subba Rao, G. V.; Chowdari, B. V. R. Electrochim. Acta
2005, 50, 5305.
Figure 9. Family of Nyquist plots (Z′ vs -Z′′ ) for the cell with nano-CaO ·SnO2 as cathode at different voltages vs Li. (a) During the firstdischarge reaction from open circuit voltage (OCV ∼ 2.6 V) to 0.005 V.(b) During the first-charge reaction from 0.005 to 1.0 V and (c) the 11thdischarge cycle, after 10 charge-discharge cycles, from 1.0 to 0.005 V.Selected frequencies in the impedance spectra are shown. Symbols representthe experimental data points. Continuous lines show fitting with theequivalent circuit of Figure 10. Geometric area of the electrode is 2 cm2.
Figure 10. (a) Equivalent circuit used for fitting the impedance spectra ofFigure 9. Different resistances, Ri and/or Ri|CPEi components, and theWarburg element, W, are shown.
6836 Chem. Mater., Vol. 20, No. 21, 2008 Sharma et al.

become the true capacitor (Table 1). The observed lowimpedance values of R(sf+ct) and Rb for Ve 0.1 V are ascribedto the formation of Li-Sn alloy from Sn nanoparticles freshlygenerated from nano-CaO ·SnO2.
The capacity-voltage profile of the first charge cycle isdifferent from the first-discharge cycle in nano-CaO ·SnO2
(Figure 4a), and so are the impedance spectra as a functionof the voltage shown in Figure 9b. As anticipated from thegalvanostatic voltage profiles, no noticeable changes in thespectra are seen until 0.5 V, which is the average chargepotential for the dealloying reaction, eq 4. At 0.1 and 0.2 V,a semicircle (10 kHz to 100 Hz) is observed along with analmost straight line parallel to the x-axis (in the range 25Hz to 50 mHz) followed by the finite length diffusion region,namely, a line inclined at ∼80° (Figure 9b). The fittedimpedance parameters are tabulated in Table 1. At voltagesabove 0.2 V, a drastic decrease in the spread of the semicircleis observed in the range of 0.5-1.0 V. At 0.5 V, both R(sf+ct)
and Rb decrease to 18 and 19 ((5) Ω, respectively (Table 1and Figure 9b). At 0.75 V and 1.0 V, the contribution fromthe bulk impedance disappears and the overall impedance isonly governed by the R(sf+ct) and the Warburg impedance.This significant decrease in the R(sf+ct) when voltage isincreased from 0.2 V to 0.5 V can be attributed to dealloyingof Li4.4Sn and nanometal Sn particle formation in thecomposite matrix.
It is well-known that the first few discharge-charge cyclesare the “formation” cycles, after which the Li cycling occursin the homogeneous composite electrode and the contribu-tions from the constituent frequency-dependent circuit ele-ments can be seen clearly in the impedance spectra. Hence,the impedance data were collected at various voltages duringthe 11th discharge cycle, and the experimental and fittedspectra are shown in Figure 9c. The spectra at 1.0, 0.75,and 0.5 V are qualitatively the same as those during the first-charge cycle at 0.75 and 1.0 V (Figure 9b,c). This cor-roborates the reversibility of the electrochemical processes
in nano-CaO ·SnO2. In the voltage range 1.0 to 0.5 V, theR(sf+ct) ) 12 ((5) Ω and negligible contribution from thebulk impedance is noted. The CPE(sf+dl) decreases from 460to 310 ((5) µF. The spectra at 0.1, 0.05, and 0.005 V showedan increase in the spread of the semicircles and thedevelopment of a second semicircle. The latter semicirclecan be attributed to the high bulk impedance (Rb) that hasmasked the straight line feature which may be present inthe very low frequency region (<5 mHz). The values ofR(sf+ct) and CPE(sf+dl) stabilize to 24 ((4) Ω and 185 ((5)µF, respectively, for voltages 0.1 to 0.005 V. The n valueincreases gradually with a decrease in the voltage and reaches0.95 at V ) 0.05 and 0.005 V (Table 1). The observed largevalue of Rb (135 ((20) Ω) is attributed to the formation ofLi-Sn alloy at voltages below 0.5 V from the freshly formedSn metal, since the Li-Sn alloy has higher absolute valueof resistivity in comparison to Sn metal. 32,37 A similarbehavior has been noted by Aurbach et al.31 in theirimpedance spectral studies on nano-SnO.
3.5. Li-Ion Diffusion Coefficient. A detailed analysis ofthe impedance spectra can yield information about thechemical diffusion coefficient (DLi+) of the Li ions involvedin the electrode system. Both thin films as well as polycrys-talline electrode materials have been used to estimate theDLi+ and its variation with the applied voltage from theimpedance spectral analysis. Thus, Cabanel et al.38,39 andXie et al.40 studied thin films of Nb2O5-H and LiCoO2-Lisystems, respectively. On the other hand, Garcia et al.41 and
(37) Lupu, C.; Mao, J.-G.; Rabalais, J. W.; Guloy, A. M.; Richardson, J. W.Inorg. Chem. 2003, 42, 3765.
(38) Cabanel, R.; Chaussy, J.; Mazuer, J.; Delabouglise, G.; Joubert, J. C.;Barral, G.; Montella, C. J. Electrochem. Soc. 1990, 137, 1444.
(39) Cabanel, R.; Barral, G.; Diard, J.-P.; Gorrec, B. L.; Montella, C.J. Appl. Electrochem. 1993, 23, 93.
(40) Xie, J.; Imanishi, N.; Matsumura, T.; Hirano, A.; Takeda, Y.;Yamamoto, O. Solid State Ionics 2008, 179, 362.
(41) Garcia, B.; Farcy, J.; Pereira-Ramos, J. P.; Baffier, N. J. Electrochem.Soc. 1997, 144, 1179.
Table 1. Impedance Parameters Obtained by Fitting the Impedance Spectra of the Nano-CaO ·SnO2 (vs Li) to the Equivalent Circuit Elementsduring the First Cycle and the 11th Discharge Cycle and the Diffusion Coefficients Calculated Using Equation 5
voltage, V (vs Li) R(sf+ct), ((5) Ω CPE(sf+dl), ((5) µF Rb, ((5) Ω CPEb, ((1) mF n ((0.01)frequency,
fL, mHzdiffusion coeff. (DLi+),
((0.1 × 10⁻¹⁴) cm2 s-1
first discharge cycleOCV 390 380 0.51.50 230 42 0.75 160 12.61.00 198 39 398 2 0.74 10 0.80.75 160 32 145 7 0.74 10 0.80.50 124 29 55 7 0.76 15 1.20.20 100 20 83 6 0.82 16 1.30.10 102 22 65 5 0.85 20 1.60.05 91 24 60 9 0.830.005 91 23 60 7 0.84
first charge cycle0.10 95 21 66 5 0.85 8 0.60.20 93 18 70 6 0.85 13 1.00.50 18 41 19 1 0.86 15 1.20.75 24 135 0.851.00 22 240 0.89
11th discharge cycle1.00 12 460 0.75 16 1.30.75 12 360 0.83 16 1.30.50 13 310 0.90 19 1.50.10 20 190 140 47 0.920.05 25 185 135 45 0.950.005 28 183 115 43 0.95
6837Chem. Mater., Vol. 20, No. 21, 2008Nano-CaO ·SnO2 and Nano-CaSnO3 as Anodes

Cho et al.42 studied the polycrystalline LiCoO2-Li system.Recently, Wang et al.43 and Liu et al.34 estimated the DLi+
from the impedance spectra on multiwalled carbon nanotubesand nano-Co3O4 vs Li, respectively. The DLi+ can becalculated from the impedance spectrum at a given voltageusing the equation41
DLi+ )πfLL2 (5)
where fL is the limiting frequency extracted from thespectrum where the Warburg region (a straight line with aslope close to 45° from the real axis in the Nyquist plot)gives way to a vertical line, ∼80° on the real axis, the lattercorresponding to the finite length diffusion process. UsuallyfL is realized at low frequencies (e0.5 Hz). The L in eq 5 isthe maximum length in the diffusion pathway in the electrodesystem, and in the case of thin-film electrodes, is usuallytaken as the thickness of the film. In the case of electrodescomprised of polycrystalline materials, the diameter of thefine (nanosize) particles can be taken as the approximatevalue of L.
Presently, we extracted the fL values from the spectra atvarious voltages for the nano-CaO ·SnO2-Li system in thosecases where the transition from the straight line Warburgregion (semi-infinite diffusion) to the vertical line with anangle of ∼80° on the real axis could be clearly delineated.Representative spectra, redrawn from the impedance spectraof Figure 9 at selected voltages, are shown in Figure 11.The fL values are listed in Table 1. The L value is taken as5 nm, as has been shown in Figure 3a for nano-CaO ·SnO2.The calculated DLi+ values are given in Table 1.
It must be mentioned that the absolute values of DLi+
estimated from the EIS may differ from those evaluated by
CV or by more accurate direct methods, like potentiometricintermittent titration (PITT) or galvanostatic intermittenttitration (GITT) techniques. Also, in the presently studiednano-CaO ·SnO2-Li system, after the first discharge reaction,Li extraction and subsequent insertion occurs in the form oftwo-phase reaction (eq 4), whereas eq 5 applies strictly tothe single-phase process. Further, after the first cycle,“electrochemical grinding” may occur in the electrode activematerial during subsequent cycling, causing a change in theL value, even though in the present study it is unlikely thatthe crystallite size will be further reduced from the startingvalue of ∼5 nm (Figures 3a and 8a). Thus, the DLi+ valuesin Table 1 must be considered as “apparent” chemicaldiffusion coefficients. However, the relative variation in DLi+
with the applied voltage does have significance and repre-sents the changes taking place in the system during Li-cycling. To our knowledge, this is the first study reportingthe DLi+ values in a tin oxide system, involving alloying-dealloying reactions with Li.
As can be seen from Table 1, during the first discharge at1.5 V, the DLi+ is 12.6 × 10⁻¹⁴ cm2 s-1. Upon furtherdischarge at 1.0 V and 0.5 V, the value decreases by morethan 1 order of magnitude, to 0.8 × 10⁻¹⁴ cm2 s-1. This isdue to onset of the two phase region, that is, the formationof Sn-metal and subsequent alloy formation as observed inthe galvanostatic and CV data, and the onset of bulkimpedance (Rb) below 1.0 V. However, there is a gradualincrease in DLi+ from 0.8 to 1.6 × 10⁻¹⁴ cm2 s-1 when thevoltage decreases from 0.75 V f 0.5 V f 0.1 V (Table 1).This twofold increase is due to the facile alloy-formingreaction, occurring through several stages, when x finallyreaches 4.4 in LixSn. During the first charge, the DLi+ is 0.6× 10⁻¹⁴ cm2 s-1 at 0.1 V. The value increases to 1.0 and1.2 × 10-14 cm2 s-1 when the charging voltage is increasedto 0.2 and 0.5 V, respectively, corresponding to the deal-loying reaction.
During 11th discharge cycle, the DLi+ remains almostconstant at 1.4 ((0.1) × 10-14 cm2 s-1 at voltages 1.0, 0.75,and 0.5 V (Table 1). This value is approximately the sameas that observed during the first-charge cycle, indicatingexcellent Li-cyclability in nano-CaO ·SnO2.
In the graphite-Li system, Levi and Aurbach44 reportedthat the DLi+ values estimated from the EIS and PITT are inthe range 1 × 10⁻¹⁰ -10-12 cm2 s-1 depending on thepotential versus Li. Careful measurements on thin films ofLiCoO2 by Rho and Kanamura45 using EIS, PITT, and CVmethods gave consistent values of DLi+ in the range 1 ×10-12-10-13 cm2 s-1 for variation of x in Li1-xCoO2.Recently, Xie. et al.40 found DLi+ in the range of 1 × 10⁻⁹
-10-14 cm2 s-1 in thin-film LiCoO2 depending on thepotential versus Li. They also made a comparison of the DLi+
values determined by GITT, PITT, CV, and EIS techniques.Hence, from EIS we conclude that the bulk impedance of
the electrode (Rb) dominates at low voltages, whereas R(sf+ct)
and Warburg impedance dominate at higher voltages (V >0.5 V), during the Li cycling of nano-CaO ·SnO2. Theapparent DLi+ obtained from EIS is in the range of 0.8-1.5
(42) Cho, P.-J.; Jeong, E.-D.; Shim, Y.-B. Bull. Korean Chem. Soc. 1998,19, 39.
(43) Wang, G.-X.; Ahn, J.-H.; Yao, J.; Lindsay, M.; Liu, H. K.; Dou, S.-X. J. Power Sources 2003, 119-121, 16.
(44) Levi, M. D.; Aurbach, D. J. Phys. Chem. B 1997, 101, 4641.(45) Rho, Y. H.; Kanamura, K. J. Electrochem. Soc. 2004, 151, A1406.
Figure 11. Selected Nyquist plots redrawn from Figure 9 in an expandedscale, for the determination of the limiting frequency (fL). The spectra at1.5 and 0.75 V during first discharge and at 0.1 and 0.2 V during the firstcharge are shown. The fL values, selected frequencies, and the angles thatthe vertical lines make on the real (Z′) axis are shown.
6838 Chem. Mater., Vol. 20, No. 21, 2008 Sharma et al.

× 10-14 cm2 s-1 at V e 1.0 V during the first cycle and11th discharge cycle.
4. Summary and Conclusions
X-ray amorphous nanocomposite CaO ·SnO2 and X-raycrystalline nanophase-CaSnO3 were synthesized by thethermal decomposition of CaSn(OH)6 in air at 600 °C for 6and 24 h, respectively. The hydroxide precursor was preparedusing coprecipitation from the salt solutions at ambienttemperature. X-ray diffraction, HR-TEM, and SAED analysisrevealed that the X-ray amorphous nano-CaO ·SnO2 consistsof nanosize (3-6 nm) grains of CaO and SnO2 whereas nano-CaSnO3 consists of ∼60 nm size crystallites. Galvanostaticcycling studies at room temperature at the current rate, 60mA g-1(0.12 C), were performed on both nano-CaO ·SnO2
and nano-CaSnO3 in two voltage windows, 0.005-1.0 V and0.005-1.3 V vs Li. The cycling performance of nano-CaO ·SnO2 is better than the nano-CaSnO3 and showedalmost theoretical capacity, 550 ((5) mA h g-1 (4.2 mol ofcyclable Li vs the theoretical 4.4 mol of Li) stable up to 50cycles when cycled between 0.005 and 1.3 V. In the rangeof 0.005-1.0 V, nano-CaO ·SnO2 and nano-CaSnO3 showedreversible capacities of 490 ((5) mA h g-1 (∼3.8 mol ofLi) and 445 ((5) mA h g-1(∼3.4 mol of Li) stable up to 50cycles, respectively, with a Coulombic efficiency, 96-98%.At 0.4 C, nano-CaO ·SnO2 showed a capacity of 420 ((5)mA h g-1(∼3.2 mol of Li).
Nano-CaSnO3 gave an initial reversible capacity of 570((5) mA h g-1 (4.4 mol of Li, theoretical value) when cycledin the voltage window, 0.005-1.3 V at 60 mA g-1. But,the capacity degraded on cycling, relatively slowly up to 40cycles and fairly rapidly in the range 40-70 cycles, andretained only 380 ((5) mA h g-1 at the end of 70th cycle.The better cycling performance of nano-CaO ·SnO2 can beattributed to the presence of smaller nanosize regions (3-6nm) of CaO and SnO2 in it and thus a better buffering effectof CaO, as an electrochemically inactive matrix, along withLi2O. It is pertinent to point out here that CaO has also beenfound to be a beneficial matrix in “conversion reaction”involving transition metal oxides and Li metal as shown byus for Ca2Fe2O5 and Ca2Co2O5
46 and recently for Ca3Co4O9
by Kim et al. 47 The observed capacity-fading beyond 50cycles in nano-CaO ·SnO2 with the upper cutoff voltage of
1.3 V may be attributed to the SnOx (x e 1) formation.Similar explanation holds for nano-CaSnO3 when cycled withthe upper cutoff voltage, 1.3 V. Average discharge andcharge potentials for both nano-CaO ·SnO2 and nano-CaSnO3, observed by CV in the voltage window 0.005-1.0V and complemented by galvanostatic cycling, are ∼0.2 and∼0.5 V, respectively. Ex situ XRD on nano-CaSnO3 duringthe first cycle and ex situ TEM and SAED on nano-CaO ·SnO2 after 30 cycles were carried out, and the resultswere interpreted to support the proposed reaction mechanism(eqs 2-4). Impedance spectra were measured on nano-CaO ·SnO2 during the first discharge-charge cycle and alsoduring the 11th discharge cycle, and the relevant impedanceparameters along with the “apparent” chemical diffusioncoefficients (DLi+) have been evaluated and interpreted tocomplement the CV and galvanostatic results. Bulk imped-ance of the electrode (Rb) dominates at low voltages (<0.5V), whereas surface-film and charge transfer impedances(R(sf+ct)) and Warburg impedance dominate at higher voltages(>0.5 V) during Li cycling of nano-CaO ·SnO2. The ob-served value of DLi+ is ∼1.0 × 10⁻¹⁴ cm2 s-1 at voltages e1 V vs Li during the first cycle and the 11th discharge cycle.
We conclude that nano-CaO ·SnO2 can be considered asan alternative anode material for LIBs due to the easysynthesis method, very favorable discharge-charge poten-tials, and exhibition of a stable capacity of 4.2 mol ofcyclable Li at least up to 50 cycles at 0.12 C rate, and acapacity of ∼3.2 mol of Li at 0.4 C rate. It must, however,be pointed out that the large ICL during the first discharge-charge cycle, theoretically about 48%, and observed valueof about 56% in the nano-CaO ·SnO2-Li system, is a seriousdrawback for implementation of this material as anode inthe present-day LIB technology. On the other hand, this isinherent to all the Sn-based oxides due to the necessity ofobtaining Sn metal, in situ, by reducing the oxide by Li asper eqs 2 or 3.1,5,8,9,14-23,29-32 One plausible way to reducethe ICL significantly will be to use SnO31 or SnOx (x e 1)-based nanocomposites containing suitably chosen matrixelements, the latter acting as good buffering agents tosuppress capacity-fading on long-term Li-cycling. Suchstudies are presently underway in our laboratory.
Supporting Information Available: SEM micrographs (PDF).This material is available free of charge via the Internet athttp://pubs.acs.org.
CM8020098
(46) Sharma, N.; Shaju, K. M.; Subba Rao, G. V.; Chowdari, B. V. R.Electrochim. Acta 2004, 49, 1035.
(47) Kim, D.-W.; Ko, Y.-D.; Park, J.-G.; Kim, B.-K. Angew. Chem., Int.Ed. 2007, 46, 6654.
6839Chem. Mater., Vol. 20, No. 21, 2008Nano-CaO ·SnO2 and Nano-CaSnO3 as Anodes