Nano-Cu modified Cu and nano-Cu modified ... - J-Stage
27
1 Original Papers Nano-Cu modified Cu and nano-Cu modified graphite electrodes for chemical oxygen demand sensors Yuris DIKSY,* , ** Isnaini RAHMAWATI,* Prastika K. JIWANTI,*** and Tribidasari A. IVANDINI † * *Department of Chemistry, Faculty of Mathematics and Natural Sciences, Universitas Indonesia, Kampus UI Depok, Jakarta 16424, Indonesia **AKA Bogor Polytechnic, Jl. Pangeran Sogiri No.283, Tanah Baru, Bogor 16154, Indonesia *** Nanotechnology Engineering, School of Advanced Technology and Multidisciplinary, Airlangga University, Surabaya 60115, Indonesia † To whom correspondence should be addressed. E-mail: [email protected] Analytical Sciences Advance Publication by J-STAGE Received March 2, 2020; Accepted June 9, 2020; Published online on June 12, 2020 DOI: 10.2116/analsci.20P069
-
Upload
khangminh22 -
Category
Documents
-
view
1 -
download
0
Transcript of Nano-Cu modified Cu and nano-Cu modified ... - J-Stage
1
Original Papers
Nano-Cu modified Cu and nano-Cu modified graphite electrodes for chemical oxygen demand sensors
Yuris DIKSY,*,** Isnaini RAHMAWATI,* Prastika K. JIWANTI,*** and
Tribidasari A. IVANDINI†*
*Department of Chemistry, Faculty of Mathematics and Natural Sciences, Universitas
Indonesia, Kampus UI Depok, Jakarta 16424, Indonesia
**AKA Bogor Polytechnic, Jl. Pangeran Sogiri No.283, Tanah Baru, Bogor 16154,
Indonesia
*** Nanotechnology Engineering, School of Advanced Technology and Multidisciplinary,
Airlangga University, Surabaya 60115, Indonesia
† To whom correspondence should be addressed.
E-mail: [email protected]
Analytical SciencesAdvance Publication by J-STAGEReceived March 2, 2020; Accepted June 9, 2020; Published online on June 12, 2020DOI: 10.2116/analsci.20P069

2
Abstract
Nano-Cu modified Cu (nano-Cu/Cu) and nano-Cu modified graphite (nano-Cu/C) electrodes
were prepared by depositing a thin layer of copper nanoparticles on a Cu wire or graphite electrode.
Chronoamperometric and cyclic voltammetry techniques were applied to deposit the
nanoparticles. The effects of Cu2+ concentration, deposition time, number of scan cycles, and scan
rate were studied to determine the optimum conditions of the experiment. The applications of
both electrodes in the COD analysis were performed using glucose and glycine as the models.
The voltammetry of a mixture solution of glucose (mg/L) and glycine (mg/L) in 0.075 M NaOH
solution showed an oxidation peak at +0.68 V vs Ag/AgCl. Good stability of this peak currents
was shown with relative standard deviations lower than 3% for 10 measurements. Amperometric
determination of COD at this potential showed excellent linearities at both nano-Cu/Cu and nano-
Cu/C electrodes (R2 = 0.997) as well as good precision and accuracy with estimated detection
limits of around ~9 mgO/L for both the developed electrodes. Validation using the conventional
COD measurements showed that the measurements achieved the average values of 92.58% and
87.86%, respectively, for nano-Cu/Cu and nano-Cu/C electrodes. Furthermore, comparison with
the theoretical COD value achieved 94.90% and 89.87% respectively, for nano-Cu/Cu and nano-
Cu/C electrodes. The results indicated that both electrodes are suitable for the real application in
COD determination.
Keywords: sensor, chemical oxygen demand, copper wire, graphite, nano-Cu, glycine and
glucose
Analytical SciencesAdvance Publication by J-STAGEReceived March 2, 2020; Accepted June 9, 2020; Published online on June 12, 2020DOI: 10.2116/analsci.20P069

3
Introduction
Industrial revolution affects the quality of the available fresh water. The increasing
industrial activity making it one of the main sources of severe pollution problem globally.
Measurement of organic compounds amount in water is undoubtedly important for pollution
levels management and this generally is monitored by the measurement of oxygen content or
oxygen dissolved in water. Chemical oxygen demand (COD) and biochemical oxygen demand
(BOD) are widely used as a parameter to evaluate the amount of organic pollutants in wastewater
and the most important index in monitoring the water quality1,2. COD is defined as the demand
of oxygen required for the oxidative degradation of organic compounds by strong oxidizing agents,
such as dichromate and permanganate. Potassium dichromate (K2Cr2O7) and potassium
permanganate (KMnO4) are employed as an oxidizer for the conventional measurement of COD.
These oxidizers have disadvantages, namely dichromate contains poisonous hexavalent
chromium and permanganate, which could only oxidize organic compounds partially 1,2. The
conventional method of COD requires a longer time analysis (approximately 3-4h), the use of
expensive reagent (Ag2SO4), toxic (K2Cr2O7, HgSO4), corrosive (H2SO4) chemicals, and the
results’ dependency on the measurement accuracy of operating proficiency 3,4. To overcome the
disadvantages of conventional method of COD, numerous efforts have been conducted in
developing a rapid and environmentally friendly new method for the COD measurement.
Recently, photocatalytic and photoelectrocatalytic methods have been reported to
determine COD using TiO2 materials 5,6. Nevertheless, the photogenerated electron-hole pairs
easily recombined and the use of UV light source increase the running cost for COD measurement.
The other method such as spectroscopy, fluorescence spectroscopy, and chemiluminescence
method are possible to use flow injection techniques to determine COD which greatly improve
the analysis efficiency 7-10. However, digestion procedure using corrosive solvent is unavoidable.
Analytical SciencesAdvance Publication by J-STAGEReceived March 2, 2020; Accepted June 9, 2020; Published online on June 12, 2020DOI: 10.2116/analsci.20P069

4
Electrochemical method for COD measurement has been considered as a promising method due
to its advantages such as rapidness, sensitivity, low cost, with good precision and accuracy 11-14.
Over last decades, electrochemical techniques have been developed for COD measurement, in
which the organic substances were oxidized on the surface of a working electrode. Various
electrode materials have been investigated for COD measurement. Copper metal in basic media
could act as an electrocatalyst for the oxidation of organic species such as carbohydrates and
amino acids, which are mainly responsible for COD. However, the direct oxidation of organic
species in aqueous solution using a simple metal electrode is not simple as high potentials are
required for the oxidation of organic compounds and usually resulting in the oxidation of water.
Therefore, a proper choice of a suitable electrode material for this purpose is very important. A
number of novel electrode materials have been reported for the electrochemical detection of COD,
such as copper electrode modified with copper nanoparticles, Cu-cable and Cu-disk electrode
modified with Cu nanoparticle, an activated copper electrode, CuO/Cu nanowire and NiCu alloy
electrode 15-18.
The deposition process of metallic nanoparticles on foreign substrates has attracted great
attention due to the different properties of nanoparticles compared to those materials 19-21.
Nanoparticles were reported to improve the surface roughness, provided an increase of conductive
area which corresponds to the improvement of sensitivity, and also enhanced the electrocatalytic
activity. In particular, this condition may lead to an improvement of the ability to amplify the
current signal. This research studies the preparation of electrochemical sensors for the
determination of COD using Cu-wire and graphite electrode modified with nano-copper films.
Chronoamperometry and cyclic voltammetry techniques were applied to deposit the nanoparticles.
Cu was selected as the based electrode as it powerfully oxidizes carbohydrates and amino acids,
known as a culprit for COD 22. On the other hand, graphite is cheap, simple, and a well-known
carbon electrode 23. The characteristic of the electrochemical sensors was assessed using standard
Analytical SciencesAdvance Publication by J-STAGEReceived March 2, 2020; Accepted June 9, 2020; Published online on June 12, 2020DOI: 10.2116/analsci.20P069

5
reagents of glycine and glucose to evaluate COD value15. Validation performed by conventional
measurements of COD showed comparable results with the prepared electrodes, indicating that
the prepared electrodes are promising for COD sensors.
Experimental
Reagents and chemicals
All chemicals were of analytical grade. CuSO4.5H2O (≥ 99.0 %), H2SO4 (98%), NaOH (≥ 97%),
K2Cr2O7 (≥ 99.9 %), Ag2SO4 (99%), HgSO4 (98%), Fe(NH4)2(SO4)2 (99.9%), acetone (99.8%),
glycine (99.7%), and D-Glucose (97.5-102.0%) purchased from Merck were used for
modification of the electrode. A commercially Cu wire (0.5 mm diameter), carbon powder and
liquid paraffin were used for fabrication of the electrode.
Apparatus
Electrochemical measurements were performed in a three-electrode cell system
(EDAQ E-Corder 410). A platinum wire (Nilaco, Japan) was used as a counter electrode and
Ag/AgCl electrode (BAS System) as a reference electrode. Analytical instruments used in this
research were Ultrasonic (NOVA) and scanning electron microscope-energy dispersive X-Ray
(SEM-EDX JEOL/EO JCM-6000 Plus Japan).
Preparation of nano-Cu/Cu and nano-Cu/C electrodes
Nano Cu on Cu wire (nano-Cu/Cu) and nano Cu on graphite (nano-Cu/C) electrodes were
prepared by electrochemical deposition. Firstly, Cu wire was polished with metal polish solution
and rinsed thoroughly with pure water. Cu wire and graphite was sonicated using ultrasonic in the
Analytical SciencesAdvance Publication by J-STAGEReceived March 2, 2020; Accepted June 9, 2020; Published online on June 12, 2020DOI: 10.2116/analsci.20P069

6
mix of water and acetone solution with ration of 1:1 for 5 min afterward. The carbon paste was
made from carbon powder and liquid paraffin (1:3). The electrode was fabricated by following
the previous publication about microelectrode 24. Briefly, the carbon paste was inserted into
micropipette tip. The Cu wire and graphite was then inserted through a micropipette tip with a
carbon paste inside (Figure 1). The copper sensing film was prepared by using a solution of 4 mM
CuSO4.5H2O/1mM H2SO4. Two types of method were applied, i.e. electrodeposited with
chronoamperometry at constant potential (-1.0 V) for 120 s and cyclic voltammetric in the
potential range from -0.1 V to -1.30 V for 30 cycles at 100 mV/s. CuSO4.5H2O with various
concentrations of 4, 8, 12, 16, and 20 mM were used to evaluate the optimum Cu2+ concentration.
Deposition time was also optimized. The resulting electrodes were rinsed with pure water to
remove any adsorbed species.
Electrochemical measurement and determination of COD
The electrochemical measurements were performed in one compartment cell
containing three electrodes, nano-Cu/Cu or nano-Cu/C, Pt, and Ag/AgCl, respectively, as the
working, counter, and reference electrodes. As standard solutions, 0.075 M NaOH containing
glycine and glucose (ratio of 1:1) with different concentrations in the range 32-256 mg/L were
used. The detection was performed with amperometric detection technique at a potential of +680
mV for 450 s. A steady state background current was attained at 120 s in tap water containing
0.075 M NaOH electrolyte. Then, the testing solution was added into an electrochemical cell for
the determination of COD. All experiments were carried out at ambient temperature. Samples for
COD measurements were prepared by employing Bogor tap-water samples (PDAM Tirta Pakuan,
Bogor, West Java, Indonesia). Analysis of this water, reported on February 24th, 2020, showed the
presence of inorganic compounds (in mg/L), including iron (<0.20); fluoride (0.41); cadmium
(0.03); potassium (140.22); chromium (<0.025); manganese (<0.04); nitrate (0.01); nitrite
Analytical SciencesAdvance Publication by J-STAGEReceived March 2, 2020; Accepted June 9, 2020; Published online on June 12, 2020DOI: 10.2116/analsci.20P069

7
(<0.004); selenium (<0.002); zinc (<0.05); cyanide (0.005); sulphate (9.04); lead (<0.04) as well
as organic compounds (4.55) and detergent (<0.01). All the COD measurement results of the
developed sensors were compared to the conventional COD method.
Results and Discussion
Characterization of fabricated electrodes
SEM was employed to investigate the morphology of bare Cu wire, bare graphite, nano-Cu/Cu
and nano-Cu/C electrodes (Figure 2). SEM images indicate that Cu was covered with Cu
nanoparticles with a diameter range of 50-500 nm, whereas graphite was covered with Cu
nanoparticles with a diameter range of 133-355 nm. Overall, the electrodeposited nano-Cu film
prepared by cyclic voltammetry appeared in smaller and more uniform particles over the surface
prepared by chronoamperometric deposition. This is probably due to the repeated scans that were
applied in cyclic voltammetry method. The atomic characterization was also carried out using
EDX (Figure S1a-S1b). Chronoamperometric deposition could cover Cu electrode by nano-Cu at
around 7.35%, while the cyclic voltammetry one at around 14.35%. Meanwhile, nano-Cu was
less deposited on graphite electrode than on Cu electrode as 0.81% and 7.81% Cu nanoparticles
could be deposited by chonoamperometric deposition and cyclic voltammetry method,
respectively.
Electrochemical behavior of copper electrode
Copper electrode in alkaline media electrocatalytically oxidizes organic compounds
mediated by surface of metal oxides 22. Figure 3 shows a cyclic voltammetry of 0.075 M NaOH
in a potential range of -1.0 V to +0.8 V for nano-Cu/Cu prepared by cyclic voltammetry. A typical
Analytical SciencesAdvance Publication by J-STAGEReceived March 2, 2020; Accepted June 9, 2020; Published online on June 12, 2020DOI: 10.2116/analsci.20P069

8
peak response was also observed at nano-Cu/C electrode (data not shown). The anodic peak 1 (-
0.30 V vs Ag/AgCl) corresponds to the formation of first layer of copper(I)oxide (Cu2O), while
the peak 2 (-0.12 V vs Ag/AgCl) corresponds to the formation of a second layer of
copper(II)hydroxide (Cu(OH)2). In addition, an increasing current observed at around 0.70 V vs
Ag/AgCl indicates the Cu(II)/Cu(III) oxidation and the cathodic peaks 3 and 4 correspond to the
Cu(II)/Cu(I) and Cu(I)/Cu(0) reduction reactions were observed at-0.54 V and -0.89 V (vs
Ag/AgCl), respectively. The electrochemical process of metallic Cu in alkaline media is highly
dependent on both hydroxide concentration and formation of a specific layer of Cu(II)oxide. The
participation of Cu(III) species as an electron transfer mediator has been suggested to explain the
performance of Cu particles in anodic process related to several organic compounds 16. Cu(III) is
central in the electrocatalytic oxidation of organic compounds in alkaline media.
The expected electrocatalytic oxidation of organic compounds at the copper electrode
in alkaline medium is proposed as follows (Eq (1-3) 16:
Cu + 2OH ‾ Cu(OH)2 + 2 e‾ (1)
Cu(OH)2 + OH ‾ Cu(III)OOH• + H2O + e‾ (2)
Cu(III)OOH • + organics (red) + H2O Cu(OH)2 + organics (ox) + OH ‾ (3)
Optimization of the electrodeposition parameters of nano-Cu film
The effect of different deposition variables was investigated. The applied potential, the
concentration of CuSO4 solution, and the reduction time of the chronoamperometric technique
were studied to prepare the electrode. The effect of such variables on the responses of nano-Cu/Cu
electrodes toward the oxidation of mixture solutions of 150 mg/L glycine-glucose (1:1) in 0.075
M NaOH was then investigated by measuring the oxidation peak observed in linear sweep
Analytical SciencesAdvance Publication by J-STAGEReceived March 2, 2020; Accepted June 9, 2020; Published online on June 12, 2020DOI: 10.2116/analsci.20P069

9
voltammetry (LSV). The effect of each variable was represented graphically by plotting the
change in this variable versus oxidation peak current to determine the optimal condition for
deposition of nano-Cu on Cu wire electrode. Figure 4a shows the effect of Cu2+ concentration on
the catalytic activity of the prepared nano-Cu sensors. The optimal Cu2+ concentration was
achieved by chronoamperometric from 4 mM CuSO4 bath composition. The influence of
deposition time on the electrocatalytic activity of nano-Cu film-based sensors was also studied.
As shown in Figure 4b, the oxidation current of glycine-glucose was optimum at deposition time
120 s. The study of the electrodeposition parameters of nano-Cu film was also performed on
graphite electrode (Figure S2). The deposition time of 240 s to achieve the current of 0.14 mA
and the Cu2+ concentration of 16 mM was then applied for the next experiments by using
chronoamperometry method (Figure S2a, S2b).
Deposition of nano-Cu on Cu wire and graphite electrode using cyclic voltammetry
techniques was performed at the potential range of -0.1 V to -1.3 V. The LSV responses in 0.075
M NaOH solution containing 150 mg/L glycine and 150 mg/L glucose were studied to obtain the
optimal concentration of Cu2+ and number of scan cycles. Figure 5a shows the effect of Cu2+
concentration for nano-Cu deposited on Cu wire electrode prepared by cyclic voltammetry. Figure
5b shows the optimum number of scan cycles for the prepared electrode. The optimum
concentration of Cu2+ was achieved at 4 mM with number of cycles of 30 cycles. Meanwhile,
nano-Cu/graphite electrode required 30 cycles with an optimum Cu2+ concentration of 12 mM
(Figure S2c, S2d). It is suggested that sensors prepared using cyclic voltammetry technique
exhibits a higher oxidation current than chronoamperometric technique due to the smaller and the
uniform copper nanoparticles on the electrode surface that responsible for the enhancement of the
electrocatalytic oxidation of glycine-glucose in term of current value. Therefore, the deposition
of nano-Cu prepared by using cyclic voltammetry was selected for further characterization and
the detection of COD in artificial water samples. Summary of the current and potential responses
Analytical SciencesAdvance Publication by J-STAGEReceived March 2, 2020; Accepted June 9, 2020; Published online on June 12, 2020DOI: 10.2116/analsci.20P069

10
of concentration and deposition optimization are presented in Table S1 and S2.
Effect of scan rate
The effect of various scan rate was investigated using LSV experiments at a constant
concentration of 0.075 M NaOH containing 150 mg/L glycine and 150 mg/L glucose at nano-
Cu/Cu and nano-Cu/C electrode. A shift in peak potential with an increasing scan rate was
observed (Figure 6). Randles-Sevčik equation (Eq. (4)) could describe the anodic oxidation
process:
Ip = (2.99x10⁵ )n[(1-α)nα]1⁄2 [(ACb (Dv)]1⁄2 (4)
Where, n is the number of electron transfer, α is the electron transfer coefficient, nα is the number
of electrons involved in the rate-determining step, A is the electrode area, Cb glycine/glucose.
According to the Eq. (4), a plot of the peak current Ip against the square root of scan rate v1/2
should give a linear relationship for diffusion-controlled process. A linear relation was observed
for glycine-glucose oxidation in 0.075 M NaOH on nano-Cu/Cu electrode shows a linear
regression equation of Ipa (mA) = 0.0119 v1/2 (mV/s)1/2 – 0.0125 (R2=0.9926), whereas on nano-
Cu/C electrode shows Ipa (mA) =0.0093 v1/2 (mV/s)1/2 – 0.0104 (R2=0.9925). The results
confirmed the diffusion-controlled nature of the oxidation process.
Amperometric detection of COD
A mixture solution of glycine and glucose were employed as the model compounds for
the amperometric detections of COD. A steady state background current was attained at 120 s
from 10 mL NaOH 0.075 M solution at an applied potential of +0.68 V vs. Ag/AgCl. Figure 7a
and 7b show that increasing the glycine-glucose concentrations could linearly increase the
oxidation signals at both of the prepared nano-Cu/Cu and nano-Cu/C electrodes, respectively.
Both prepared electrodes showed good linearities (R2=0.997) in the concentration ranges of
Analytical SciencesAdvance Publication by J-STAGEReceived March 2, 2020; Accepted June 9, 2020; Published online on June 12, 2020DOI: 10.2116/analsci.20P069

11
17.45-176 mgO/L COD and 32-256 mgO/L COD, respectively, at nano-Cu/Cu and nano-Cu/C
electrodes. A mixture solution of 1000 mg/L glycine and 1000 mg/L glucose, theoretically, has a
COD values of 1280 mgO/L. Accordingly, the concentration range was made by diluting this
solution. The LOD evaluated according to IUPAC regulations (S/N= 3) was estimated to be
9.02 mgO/L COD at nano-Cu/Cu, while it was 8.90 mgO/L at nano-Cu/C electrode.
Electroanalytical performances of the developed COD sensors are displayed in Table 1. Excellent
linearities were also successfully demonstrated by using different concentration ratios of glycine-
glucose, i.e. 1:9 and 9:1 with a concentration range of 17.45-176 mgO/L COD (S3), indicated that
the method can be used in any composition of glycine glucose.
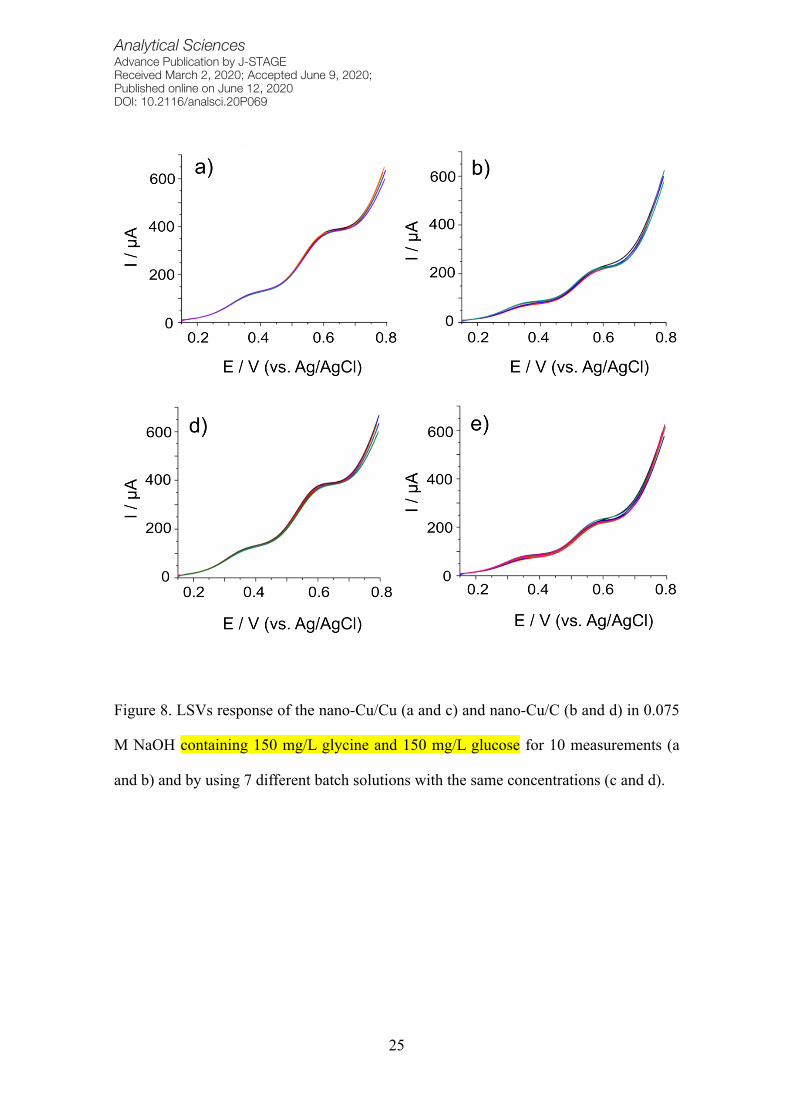
Stability, reproducibility, and selectivity of the proposed electrochemical sensors
The stability of the current responses was investigated by using LSV. The LSV
responses of both electrodes were observed for 10 measurements of 0.075 M NaOH solution
containing 150 mg/L glycine and 150 mg/L glucose. Good stability of the current responses was
shown by the voltammograms for nano Cu/Cu (Figure 8a) and nano Cu/C (Figure 8b) with relative
standard deviations (RSDs) of 3.84% and 2.90%, respectively. Meanwhile, the reproducibility of
the proposed electrochemical sensors was evaluated by measuring the LSV oxidation responses
of 0.075 M NaOH solutions containing of 150 mg/L standard glycine and 150 mg/L standard
glucose at nano-Cu/Cu and nano-Cu/C (Figure 8c and d, respectively) in 7 different batch
solutions with the same concentrations. RSD values (n=7) of 1.63 % and 1.87 %, respectively,
using nano-Cu/Cu and nano-Cu/C indicated excellent reproducibility of both electrodes.
Furthermore, the interference of chloride and nitrite ion was considered in the
measuring of COD. Significant change of the COD sensor’s responses was observed in the
presence of chloride and nitrite at nano-Cu/Cu as shown in Figure 9(a). On the contrary, the
current was less interfered at nano-Cu/C (Figure 9b). Reactivity of Cu was the possible reason of
Analytical SciencesAdvance Publication by J-STAGEReceived March 2, 2020; Accepted June 9, 2020; Published online on June 12, 2020DOI: 10.2116/analsci.20P069
12
the interferences at nano-Cu/Cu. It seems reducing the size of copper particles in nano-Cu/C can
maintain the current from nitrite and chloride.
Analysis of tap water samples and the recovery study
COD analysis using tap-water samples to produce 0.075 M NaOH with 250 mg/L
glycine and 250 mg/L glucose was employed for the real sample approach. Analysis of the tap
water indicated the presence of organic compounds (4.55 mg/L) and detergent (<0.01) mg/L
besides metal ions and inorganic anions. The validation was performed with conventional
dichromate method.
Table 2 shows COD of the tap water containing 0.075 M NaOH with a mixture of 250
mg/L glycine and 250 mg/L glucose measured at the developed sensors in comparison with the
conventional dichromate method. Theoretically, this solution has 320 mgO/L COD value. The
average of obtained COD at nano-Cu/Cu and nano-Cu/C were 303.69 mgO/L and 287.59 mgO/L,
respectively, which were 92.58% and 87.86% comparable against the measurements by the
conventional technique. Comparison with theoretical COD value showed the recovery percentage
at nano-Cu/Cu and nano-Cu/C were 94.90 % and 89.87%, respectively, while it was 102.51% for
the conventional method. Moreover, an excellent stability of the results could be achieved at both
electrodes with RSDs (n=3) of 0.77% and 1.66 %, respectively, at nano-Cu/Cu and nano-Cu/C,
while it was 1.20% at the conventional methods. The results indicated that the developed sensors
were promising for the determination of COD in water quality monitoring.
Conclusions
Modification of Cu wire and graphite electrode with nanoparticles copper film was successfully
performed using cyclic voltammetry deposition method. Characterization of the modified
Analytical SciencesAdvance Publication by J-STAGEReceived March 2, 2020; Accepted June 9, 2020; Published online on June 12, 2020DOI: 10.2116/analsci.20P069

13
electrode by SEM shows the formation of nanoparticles Cu on the surface of Cu wire and graphite.
Both nano-Cu/Cu and nano-Cu/C electrodes were applied to determine COD of glycine-glucose
mixture in basic medium solution with 0.075 M NaOH as the supporting electrolyte. A positive
potential of +0.68 V vs. Ag/AgCl was applied. The results showed that both nano-Cu/Cu and
nano-Cu/C electrodes are promising to be applied as COD sensors with comparable results toward
the conventional dichromate method. Therefore, less poisonous of the nano-Cu/C electrode was
considered as the better option for COD sensors.
Acknowledgements
This research was funded by the Indonesian Ministry of Research, Technology and Higher
Education under Hibah PUPT Kemenristek Dikti 2019, Contract No. NHB-
3034/UN2.R3.1/HKP.05.00/2019
References
1. T. A. Ivandini, E. Saepudin, Y. Einaga. Anal. Sci. 2015, 31, 643.
2. T. Kondo, Y. Tamura, M. Hoshino, T. Watanabe, T. Aikawa, M. Yuasa, and Y. Einaga, Anal.
Chem., 2014, 86, 8066.
3. A. Cuesta, J. L. Todoli, and A. Canals, Spectrochim. Acta - Part B At. Spectrosc., 1996, 51,
1791.
4. Y. Hu and Z. Yang, Talanta, 2004, 63, 521.
5. L. Zhu, Y. Chen, Y. Wu, X. Li, and H. Tang, Anal. Chim. Acta, 2006, 571, 242.
6. S. Zhang, L. Li, H. Zhao, and G. Li, Sensors Actuators, B Chem., 2009, 141, 634.
7. H. Yu, C. Ma, X. Quan, S. Chen, and H. Zhao, Environ. Sci. Technol., 2009, 43, 1935.
8. H. Kong and H. Wu, Water Environ. Res., 2009, 81, 2381.
Analytical SciencesAdvance Publication by J-STAGEReceived March 2, 2020; Accepted June 9, 2020; Published online on June 12, 2020DOI: 10.2116/analsci.20P069

14
9. J. Hur, B. M. Lee, T. H. Lee, and D. H. Park, Sensors, 2010, 10, 2460.
10. X. Z. Wu and L. Huang, Anal. Sci. 2018, 34, 1335
11. C. R. Silva, C. D. C. Conceição, V. G. Bonifácio, O. F. Filho, and M. F. S. Teixeira, J.
Solid State Electrochem., 2009, 13, 665.
12. Y. Ge, Y. Zhai, D. Niu, Y. Wang, C. Fernandez, T. Ramakrishnappa, X. Hu, and L. Wang,
Int. J. Electrochem. Sci., 2016, 11, 9812.
13. S. Lin and J. Liao, in 17th International Meeting on Chemical Sensors - IMCS 2018, 2018,
751–752.
14. K. H. Lee, T. Ishikawa, S. McNiven, Y. Nomura, S. Sasaki, Y. Arikawa, and I. Karube,
Anal. Chim. Acta, 1999, 386, 211.
15. H. H. Hassan, I. H. A. Badr, H. T. M. Abdel-Fatah, E. M. S. Elfeky, and A. M. Abdel-Aziz,
Arab. J. Chem., 2018, 11, 171.
16. Y. Zhou, T. Jing, Q. Hao, Y. Zhou, and S. Mei, Electrochim. Acta, 2012, 74, 165.
17. X. Huang, Y. Zhu, W. Yang, A. Jiang, X. Jin, Y. Zhang, L. Yan, G. Zhang, and Z. Liu,
Molecules, 2019, 24, 3132.
18. J. Yang, J. Chen, Y. Zhou, and K. Wu, Sensors Actuators, B Chem., 2011, 153, 78.
19. P. K. Jiwanti and Y. Einaga, Phys. Chem. Chem. Phys., 2019, 21, 15297.
20. T. A. Ivandini, Y. Naono, A. Nakajima, Y. Einaga, Chem. Lett., 2004, 34, 1086.
21. K. L. Ng, S. M. Lee, S. M. Khor, G. H. Tan, Anal. Sci. 2015, 31, 1075
22. T. Carchi, B. Lapo, J. Alvarado, P. J. E. Montero, J. Llorca, and L. Fernández, Sensors
(Switzerland), 2019, 19(3), 669.
23. V. X. Oliveira, A.A. Dias, L. L. Carvalho, T. M. Cardoso, F. Colmati, W. K. T. Coltro, Anal.
Sci. 2018, 34, 91.
24. A. Suzuki, T. A. Ivandini, K. Yoshimi, A. Fujishima, G. Oyama, T. Nakazato, N. Hattori,
S. Kitazawa, Y. Einaga, Anal. Chem. 2007, 79(22), 8608.
Analytical SciencesAdvance Publication by J-STAGEReceived March 2, 2020; Accepted June 9, 2020; Published online on June 12, 2020DOI: 10.2116/analsci.20P069

15
Table 1. Electroanalytical performances of the developed COD sensor
Electroanalytical feature
Details
Nano-Cu/Cu Nano-Cu/C
Limit of detection (LOD) (mgO/L) 9.02 8.90
Linear range (mgO/L) 17.45-176 32-256
Reproducibility (n=7 ) (%RSD) 2.84 2.90
Table 2. Comparison between COD determination of tap water injected by a mixture solution of
250 mg/L glycine and 250 mg/L glucose using the proposed method vs. a conventional dichromate
method. Recovery was calculated in comparison with the theoretical COD value of the
solution (320 mgO/L).
Sample No. COD (mgO/L)
measured at nano-
Cu/Cu
COD (mgO/L)
measured at nano-
Cu/C
COD (mgO/L)
measured by the
conventional
method
1 306.08 292.97 331.97
2 301.40 283.80 324.06
3 303.60 286.00 328.02
Average 303.69 287.59 328.02
%RSD (n=3) 0.77 1.66 1.20
Recovery (%) 94.90 89.87 102.51
Analytical SciencesAdvance Publication by J-STAGEReceived March 2, 2020; Accepted June 9, 2020; Published online on June 12, 2020DOI: 10.2116/analsci.20P069

16
Figure Captions
Fig. 1 Schematic drawing and real pictures of the fabricated electrodes
Fig. 2 SEM images of bare Cu wire electrode (A), nano-Cu/Cu prepared by
chronoamperometric deposition (B) and by cyclic voltammetry (C); bare graphite (D), nano-
Cu/C prepared by chronoamperometric deposition (E) and cyclic voltammetry (F).
Fig. 3 Voltammogram of nano-Cu/Cu electrode prepared by cyclic voltammetry in 0.075 M
NaOH solution, performed from potential of -1.0 to +0.8 V vs Ag/AgCl with a scan rate of 100
mV/s.
Fig. 4 Effect of various Cu2+ concentrations (a) and effect of deposition time of Cu
nanoparticles (b) on the oxidation current responses of 0.075 M NaOH containing 150
mg/L glycine and 150 mg/L glucose at nano-Cu/Cu prepared by chronoamperometric
deposition.
Fig. 5 Effect of various Cu2+ concentrations (a) and effect of repeated number of scan
cycles (b) on the oxidation current response of 0.075 M NaOH containing 150 mg/L
glycine and 150 mg/L glucose on nano-Cu/Cu prepared by cyclic voltammetry.
Fig. 6 LSVs response of the nano-Cu/Cu (a) and nano-Cu/C (b) electrodes in 0.075
M NaOH containing 150 mg/L glycine and 150 mg/L glucose on the various scan rates.
Fig. 7 Current vs. time response curves of nano-Cu/Cu (a) and nano-Cu/C (b) electrodes
prepared by cyclic voltammetry technique in solutions with various COD values at
Analytical SciencesAdvance Publication by J-STAGEReceived March 2, 2020; Accepted June 9, 2020; Published online on June 12, 2020DOI: 10.2116/analsci.20P069

17
applied potential of +0.68 V vs. Ag/AgCl. Inset curves show the related calibration plots
of COD (mgO/L) vs. current responses.
Fig. 8. LSVs response of the nano-Cu/Cu (a and c) and nano-Cu/C (b and d) in 0.075 M
NaOH containing 150 mg/L glycine and 150 mg/L glucose for 10 measurements (a and
b) and by using 7 different batch solutions with the same concentrations (c and d).
Fig.9. Amperometric response of the nano-Cu/Cu (a) and nano-Cu/C (b) in 0.075 M
NaOH containing 150 mg/L glycine and 150 mg/L glucose in the presence of chloride
and nitrite.
Analytical SciencesAdvance Publication by J-STAGEReceived March 2, 2020; Accepted June 9, 2020; Published online on June 12, 2020DOI: 10.2116/analsci.20P069

18
Figure 1 Photograph of the fabricated electrodes
Analytical SciencesAdvance Publication by J-STAGEReceived March 2, 2020; Accepted June 9, 2020; Published online on June 12, 2020DOI: 10.2116/analsci.20P069

19
Figure 2. SEM images of bare Cu wire electrode (A), nano-Cu/Cu prepared by
chronoamperometric deposition (B) and by cyclic voltammetry (C); bare graphite (D), nano-Cu/C
prepared by chronoamperometric deposition (E) and cyclic voltammetry (F)
Analytical SciencesAdvance Publication by J-STAGEReceived March 2, 2020; Accepted June 9, 2020; Published online on June 12, 2020DOI: 10.2116/analsci.20P069

20
Figure 3. Voltammogram of nano-Cu/Cu electrode prepared by cyclic voltammetry in 0.075 M
NaOH solution, performed from potential of -1.0 to +0.8 V vs Ag/AgCl with a scan rate of 100
mV/s.
Analytical SciencesAdvance Publication by J-STAGEReceived March 2, 2020; Accepted June 9, 2020; Published online on June 12, 2020DOI: 10.2116/analsci.20P069

21
Figure 4. Effect of various Cu2+ concentrations (a) and effect of deposition time of Cu
nanoparticles (b) on the oxidation current responses of 0.075 M NaOH containing 150
mg/L glycine and 150 mg/L glucose at nano-Cu/Cu prepared by chronoamperometric
deposition.
Analytical SciencesAdvance Publication by J-STAGEReceived March 2, 2020; Accepted June 9, 2020; Published online on June 12, 2020DOI: 10.2116/analsci.20P069

22
Figure 5. Effect of various Cu2+ concentrations (a) and effect of repeated number of scan
cycles (b) on the oxidation current response of 0.075 M NaOH containing 150 mg/L
glycine and 150 mg/L glucose on nano-Cu/Cu prepared by cyclic voltammetry.
Analytical SciencesAdvance Publication by J-STAGEReceived March 2, 2020; Accepted June 9, 2020; Published online on June 12, 2020DOI: 10.2116/analsci.20P069

23
Figure 6. LSVs response of the nano-Cu/Cu (a) and nano-Cu/C (b) electrodes in 0.075 M
NaOH containing 150 mg/L glycine and 150 mg/L glucose on the various scan rates.
Analytical SciencesAdvance Publication by J-STAGEReceived March 2, 2020; Accepted June 9, 2020; Published online on June 12, 2020DOI: 10.2116/analsci.20P069

24
Figure 7. Current vs. time response curves of nano-Cu/Cu (a) and nano-Cu/C (b)
electrodes prepared by cyclic voltammetry technique in solutions with various COD
values at an applied potential of +0.68 V vs. Ag/AgCl. Inset curves show the related
calibration plots of COD (mgO/L) vs. current responses.
Analytical SciencesAdvance Publication by J-STAGEReceived March 2, 2020; Accepted June 9, 2020; Published online on June 12, 2020DOI: 10.2116/analsci.20P069
25
Figure 8. LSVs response of the nano-Cu/Cu (a and c) and nano-Cu/C (b and d) in 0.075
M NaOH containing 150 mg/L glycine and 150 mg/L glucose for 10 measurements (a
and b) and by using 7 different batch solutions with the same concentrations (c and d).
Analytical SciencesAdvance Publication by J-STAGEReceived March 2, 2020; Accepted June 9, 2020; Published online on June 12, 2020DOI: 10.2116/analsci.20P069

26
Figure 9. Amperometric response of the nano-Cu/Cu (a) and nano-Cu/C (b) in 0.075 M
NaOH containing 150 mg/L glycine and 150 mg/L glucose in the presence of chloride
and nitrite.
Analytical SciencesAdvance Publication by J-STAGEReceived March 2, 2020; Accepted June 9, 2020; Published online on June 12, 2020DOI: 10.2116/analsci.20P069

27
Graphical Index
Analytical SciencesAdvance Publication by J-STAGEReceived March 2, 2020; Accepted June 9, 2020; Published online on June 12, 2020DOI: 10.2116/analsci.20P069