Urinary Plasmin Inhibits TRPV5 in Nephrotic-Range Proteinuria


305
Alamgir Khan1a, Son T. Truong1, Ed J. Breen1, Kylie Nelson2, Chris Howe2 and Nicolle H.
Packer1
New urinary EPO drug testing method using two-dimensional gel
electrophoresis* 1Proteome Systems Ltd., 1/35-41 Waterloo Road, North Ryde NSW 2113 Australia; web
address: www.proteomesystems.com 2National Measurement Institute, 1 Suakin Street, Pymble NSW 2073 Australia.
Current addresses: a Australian Proteome Analysis Facility, Level 4, Building F7B, Macquarie University
Sydney NSW 2109 Australia. E-mail: [email protected]; Web address:
www.proteome.org.au
* Part of the data presented in the seminar has been published in Clinica Chimica Acta (2005)
[1]. Additional data only are presented in this article.
Abstract
We present a two-dimensional electrophoresis (2DE) method for the detection of the
drug, recombinant erythropoietin (rHuEPO) in urine and its separation from endogenous
erythropoietin (HuEPO). This method involves a one-step acetonitrile precipitation of the
proteins in urine, addition of an internal standard, two dimensional gel electrophoresis (2D
PAGE), a single Western blot and chemiluminescent immunodetection.
Results. The 2DE method separates HuEPO and rHuEPO isoforms by both iso-electric point
and molecular mass. We have identified several urinary proteins with which the monoclonal
EPO antibody used in the current test has non-specific binding. The iso-electric points of
these cross-reactive proteins are in the same pI range as the isoforms of HuEPO and rHuEPO
however, they separate distinctly by the 2DE method. Alpha- 2-HS-glycoprotein (HSGP) was
identified by peptide mass fingerprinting as one of the urinary cross-reacting proteins, and
commercially available purified HSGP was chosen to be added into urine samples as an
internal standard prior to separation. Software (EpIQ) was specifically developed that applies

306
four separate criteria to the detection of the migration of rHuEPO and HuEPO relative to the
internal standard.
Conclusion. The combination of sample preparation, two-dimensional separation, internal
standard, standardized blotting procedures and image analysis software enables the 2DE test
for rHuEPO in urine to be performed reproducibly and accurately.
Introduction
We have reported detail results on the urine preparation, immobilised pH gradient
(IPG), 2DE, EPO detection method and level of detection, antibody specificity (both primary
and secondary antibodies), internal standard, and development of image analysis software
(EpIQ) in a publication since this workshop [1]. In this article we describe the comparative
analysis of urine samples spiked with rHuEPO by the 2DE method and the current 1D IEF
method.
Results Using the 2DE method, we have analyzed (blind analysis) 11 spiked (+) and 8
unspiked (-) urine samples supplied by the NMI in Sydney. Native HuEPO was detected by
the 2DE method in most of the corresponding unspiked samples (Fig.1, b (E-, H-, B -, F-) and
d (D-, A-). Although containing bands in the rHuEPO pI range, the unspiked sample A- was
determined to be negative by the 1D method, using the current WADA criteria
(http://www.wada-ama.org/rtecontent/document/td2004epo_en.pdf). The 2D method also
showed the presence of unusually basic EPO isoforms, which, if only the relative pI position
was taken into account would be identified as recombinant rHuEPO by the image analysis
software EpIQ. However when the other three criteria were applied by the software, the
isoforms were identified as native HuEPO. The same native EPO isoforms can be seen in the
A+ sample underlying the added rHuEPO isoforms. The added rHuEPO was detected in all
but one of the spiked samples (Fig.2d, J+) albeit with only low levels visible in G+ and K+.
No samples resulted in a positive detection of rHuEPO when it was not there.
The same 19 urine samples were also analyzed by NMI using the French 1D IEF
method [2] (Figs. 1 a and c; Figs. 2 a and c; and Table 1). A summary of the comparative
results of the methods is shown in Table 2. The 1D IEF method failed to detect rHuEPO in
three samples (Tables 1 and 2) using the criteria currently defined by the WADA.
307
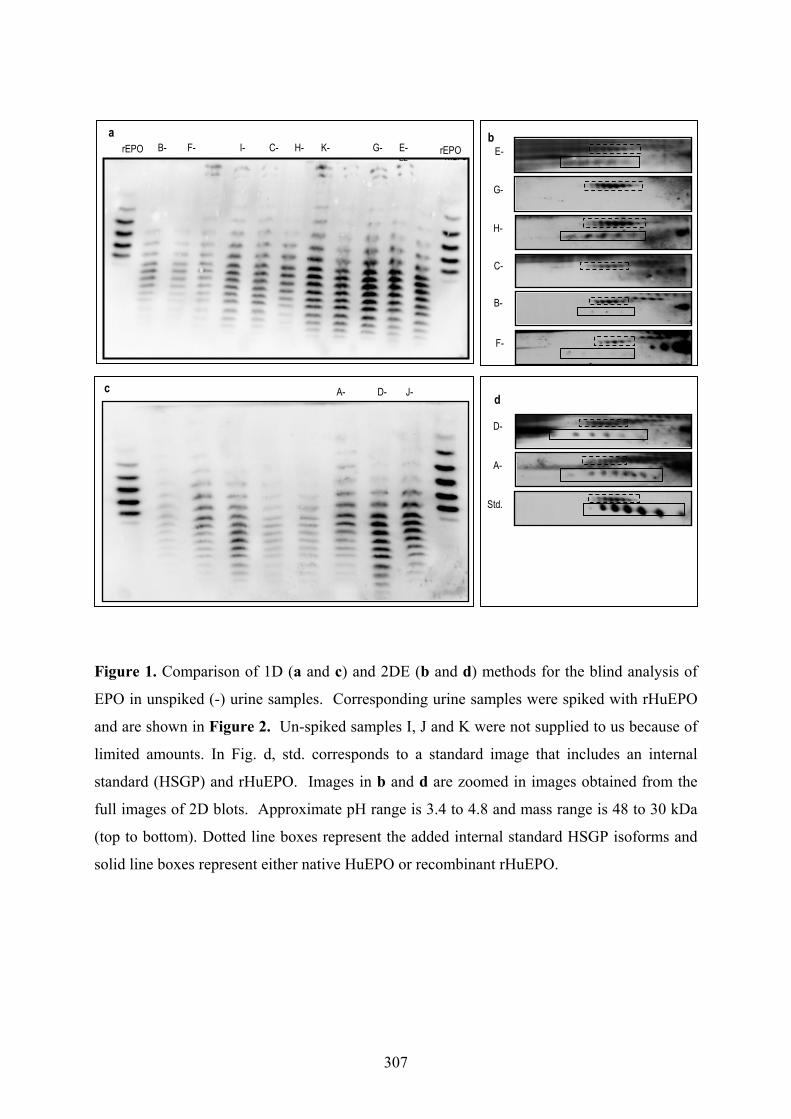
Figure 1. Comparison of 1D (a and c) and 2DE (b and d) methods for the blind analysis of
EPO in unspiked (-) urine samples. Corresponding urine samples were spiked with rHuEPO
and are shown in Figure 2. Un-spiked samples I, J and K were not supplied to us because of
limited amounts. In Fig. d, std. corresponds to a standard image that includes an internal
standard (HSGP) and rHuEPO. Images in b and d are zoomed in images obtained from the
full images of 2D blots. Approximate pH range is 3.4 to 4.8 and mass range is 48 to 30 kDa
(top to bottom). Dotted line boxes represent the added internal standard HSGP isoforms and
solid line boxes represent either native HuEPO or recombinant rHuEPO.
A- D- J- c
A-
D-
Std.
d
F-
B-
C-
E-
G-
H-
bE- K- C- G- H- I- F- B-
arEPO rEPO

308
Figure 2. Comparison of 1D (a and c) and 2DE (b and d) methods for the blind analysis of
EPO in urine samples spiked (+) with rHuEPO. Images of the corresponding unspiked urine
samples are shown in Figure 1. Boxed lanes in Figs. a and c (samples E+, G+ and K+) were
spiked with rHuEPO but the 1D IEF method failed to produce conclusive results. The 2DE
method separated all the EPO isoforms distinctly and EpIQ software diagnosed them correctly
except in the case of J+. Images in b and d are zoomed in images obtained from the full
images of 2D blots. Approximate pH range is 3.4 to 4.8 and mass range is 48 to 30 kDa (top
to bottom). Dotted line boxes represent the added internal standard HSGP isoforms and solid
line boxes represent either native HuEPO or recombinant rHuEPO.
C+ A+ B+ D+ E+ F+ a
rEPO rEPO
B+
C+
D+
E+
F+
A+ b
H+ G+ I+ J+ K+ c rEPO rEPO G+
H+
I+
J+
K+
d

309
Table 1. Results of unknown urine samples analyzed by NMI using the 1D IEF method.
Sample No.
Percent Basic
Isoforms
Largest Basic
Peak Area B1
Second Largest Basic Peak
Area B2
Largest Endo.
Peak Area A1
Ratio 1
B1/A1
Ratio 2
B2/A1
Sample comment
s
All four blots were clear and well distributed with minimal blemishes - Diagnosis
A+ 86.7 120550 72603 13969 8.63 5.20 3IU/L spike
Weak signal except for some very basic material - negative on quality grounds despite the numeric data.
A- 53.6 644361 502798 684847 0.94 0.73 Clear negative
B+ 86.0 260700 181818 28833 9.04 6.31 3IU/L spike Clear positive
B- 35.6 362921 247895 550571 0.66 0.45 Clear negative
C+ 78.8 272390 132476 35453 7.68 3.74 6IU/L spike Clear positive
C- 36.8 568766 383728 710071 0.80 0.54 Clear negative
D+ 84.8 168144 159299 28521 5.90 5.59 3IU/L spike Clear positive
D- 22.0 787303 341127 1512164 0.52 0.23 Clear negative
E+ 45.6 69019 55757 62170 1.11 0.90 3IU/L spike
Negative according to numeric data, and isoform intensity is distributed biphasically across endogenous and basic areas
E- 34.0 1097798 805658 1555884 0.71 0.52 Clear negative
F+ 88.3 145062 82025 12756 11.37 6.43 3IU/L spike Clear positive
F- 35.1 177391 102723 358318 0.50 0.29 Clear negative
G+ 45.1 117316 83363 105577 1.11 0.79 3IU/L spike
Negative- numerically and the isoform distribution across basic and endogenous areas does not support a positive
G- 27.5 1378104 884141 2013235 0.68 0.44 Clear negative
H+ 88.4 175204 143687 23481 7.46 6.12 3IU/L spike Clear positive
H- 42.1 889614 433077 1010678 0.88 0.43 Clear negative
I+ 80.6 122063 120550 19233 6.35 6.27 3IU/L spike Clear positive
I- 45.4 971105 650518 677543 1.43 0.96 Clear negative
J+ 83.7 55401 40832 8395 6.60 4.86 3IU/L spike Clear positive
J- 34.3 1113384 691321 1337208 0.83 0.52 Clear negative
K+ 57.9 90214 47753 25000 3.61 1.91 3IU/L spike
Negative- numerically and the isoform distribution across basic and endogenous areas does not support a positive
K- 42.5 1645109 1117876 1705133 0.96 0.66 Clear negative

310
Table 2. Summary of the comparison of 1D and 2DE methods on the analysis of unknown
urine samples1.
1 1D IEF method was carried out by NMI; 2DE method was carried out by Proteome Systems, sample
information was not known to us until the results were compared.
Discussion
The 2DE method for the analysis of EPO in urine has addressed most of the WADA
recommendations [3] for the improvement of the test. In this discussion we will focus on the
comparison of 1D IEF and 2DE method for the analysis of unknown urine samples supplied
by the NMI.
We have used the 2DE method to identify urines which had been spiked with 3IU/L
(except sample C+, which was spiked at 6IU/L) rHuEPO and detected native HuEPO in most
of the corresponding unspiked urine. The 2DE system separates EPO and urinary proteins in
two-dimensions, with separation of proteins according to their iso-electric points in the first
dimension and further separation according to their molecular masses in the second
dimension. This approach separates each protein isoform as an individual component on the
gels. Additionally we have included an internal standard in each sample that allowed correct
localization of the EPO isoforms for scoring the results by the image analysis software. This
Sample 1D IEF 2DE A+ Correct Correct A- Correct Correct B+ Correct Correct B- Correct Correct C+ Correct Correct C- Correct Correct D+ Correct Correct D- Correct Correct E+ False negative Correct E- Correct Correct F+ Correct Correct F- Correct Correct G+ False negative Correct G- Correct Correct H+ Correct Correct H- Correct Correct I+ Correct Correct J+ Correct False negativeK+ False negative Correct

311
combination of 2D separation and image analysis software allowed the correct identification
of all but one of the urines spiked with rHuEPO.
It has been reported that the pI of urinary HuEPO isoforms sometimes shifts to
become more basic if rHuEPO is administered in an individual [4]. However, we have seen in
the 2DE method that some basic isoforms with apparent slightly higher molecular masses
than the EPO (either HuEPO or rHuEPO) on the gels are reactive to the EPO antibody which
is present even when the native and recombinant EPO isoforms are also present in their usual
pI ranges (Fig. 3b). These basic isofroms are also observed in the same pI ranges when
separated by the 1D IEF method (Fig. 3a) using the same urine as used for 2DE analysis.
Attempts were made to identify this basic protein from the 2D gels by peptide mass
fingerprinting but were unsuccessful because of the very low amounts of proteins present in
the gel. This suggests that the level of this protein in urine is very low but has very high
affinity to the EPO antibody. It is not known whether these basic isoforms are the break down
products of HuEPO or another cross reactive protein (other than those already reported, ref: 1)
however, further study is needed to confirm the identity of this protein.
Conclusion
The 2DE method presented has dealt with most of the WADA recommendations for a new
EPO test [3] and provides a sensitive and accurate detection of the EPO drug in urine. In the
blind urine analysis, out of 19 samples, the 2DE method correctly detected rHuEPO with one
false negative, in contrast to the current 1D IEF method which diagnosed three false
negatives. Neither method identified a false positive.

312
Figure 3. Basic proteins are detected by the antibody while EPO isoforms are at their usual
pI. Sample A+ analyzed by 1D IEF (a) and 2DE (b) methods show basic proteins (circled)
while EPO isoforms are present in their usual position (boxed). This data shows that EPO
isoforms and unknown protein(s) separated in the “basic” area of pH 3-5 are detected by the
EPO antibody.
Acknowledgements
We thank Ray Kazlauskas and Graham Trout from the National Measurement Institute
(NMI), Australia for the supply and analysis by ID IEF of the urine samples, and Ben Herbert
from Proteome Systems for critical comments during method development. Hayati, MM and
Borhanuddin, F. from the Doping Control Center, Penang, Malaysia assisted in the
optimization of Western detection. This research was funded by a grant from the World Anti-
Doping Agency (WADA) to Proteome Systems Limited for the development of protocols for
the detection of protein-based drugs in sports.
a
b
3 pH 5

313
References
[1] Khan A, Grinyer J, Truong ST, Breen EJ, Packer NH. New urinary EPO drug testing
method using two-dimensional gel electrophoresis. Clin Chim Acta, 2005; 358: 119-130.
[2] Lasne F, Martin L, Crepin N, de Ceaurriz J. Detection of isoelectric profiles of
erythropoietin in urine: differentiation of natural and administered recombinant hormones.
Anal Biochem 2002;311:119-126.
[3] Peltre G, Thormann W. Evaluation report of the urine EPO test. Paris and Bern: Council
of the World Anti-Doping Agency (WADA), 2003;March 11.
[4] Nissen-Lie G, Birkeland K, Hemmersbach P, Skibeli V. Serum sTfR levels may indicate
charge profiling of urinary r-hEPO in doping control. Med Sci Sports Exerc 2004;36:588-
93.
Copyright © 2022 FDOKUMEN