Contactless Vital Signs Measurement System Using RGB ...
16
sensors Article Contactless Vital Signs Measurement System Using RGB-Thermal Image Sensors and Its Clinical Screening Test on Patients with Seasonal Influenza Toshiaki Negishi 1 , Shigeto Abe 2 , Takemi Matsui 3 , He Liu 4 , Masaki Kurosawa 1 , Tetsuo Kirimoto 1 and Guanghao Sun 1, * 1 Graduate School of Informatics and Engineering, The University of Electro-Communications, 1-5-1 Chofugaoka, Chofu, Tokyo 182-8585, Japan; [email protected] (T.N.); [email protected] (M.K.); [email protected] (T.K.) 2 Takasaka Clinic, Fukushima 973-8407, Japan; [email protected] 3 Graduate School of System Design, Tokyo Metropolitan University, Tokyo 191-0065, Japan; [email protected] 4 School of Materials Science and Engineering, Harbin University of Science and Technology, Harbin 150000, China; [email protected] * Correspondence: [email protected]; Tel.: +81-42-443-5412 Received: 18 March 2020; Accepted: 10 April 2020; Published: 13 April 2020 Abstract: Background: In the last two decades, infrared thermography (IRT) has been applied in quarantine stations for the screening of patients with suspected infectious disease. However, the fever-based screening procedure employing IRT suffers from low sensitivity, because monitoring body temperature alone is insufficient for detecting infected patients. To overcome the drawbacks of fever-based screening, this study aims to develop and evaluate a multiple vital sign (i.e., body temperature, heart rate and respiration rate) measurement system using RGB-thermal image sensors. Methods: The RGB camera measures blood volume pulse (BVP) through variations in the light absorption from human facial areas. IRT is used to estimate the respiration rate by measuring the change in temperature near the nostrils or mouth accompanying respiration. To enable a stable and reliable system, the following image and signal processing methods were proposed and implemented: (1) an RGB-thermal image fusion approach to achieve highly reliable facial region-of-interest tracking, (2) a heart rate estimation method including a tapered window for reducing noise caused by the face tracker, reconstruction of a BVP signal with three RGB channels to optimize a linear function, thereby improving the signal-to-noise ratio and multiple signal classification (MUSIC) algorithm for estimating the pseudo-spectrum from limited time-domain BVP signals within 15 s and (3) a respiration rate estimation method implementing nasal or oral breathing signal selection based on signal quality index for stable measurement and MUSIC algorithm for rapid measurement. We tested the system on 22 healthy subjects and 28 patients with seasonal influenza, using the support vector machine (SVM) classification method. Results: The body temperature, heart rate and respiration rate measured in a non-contact manner were highly similarity to those measured via contact-type reference devices (i.e., thermometer, ECG and respiration belt), with Pearson correlation coefficients of 0.71, 0.87 and 0.87, respectively. Moreover, the optimized SVM model with three vital signs yielded sensitivity and specificity values of 85.7% and 90.1%, respectively. Conclusion: For contactless vital sign measurement, the system achieved a performance similar to that of the reference devices. The multiple vital sign-based screening achieved higher sensitivity than fever-based screening. Thus, this system represents a promising alternative for further quarantine procedures to prevent the spread of infectious diseases. Keywords: contactless measurement; vital signs; RGB-thermal image processing; infection diseases Sensors 2020, 20, 2171; doi:10.3390/s20082171 www.mdpi.com/journal/sensors
-
Upload
khangminh22 -
Category
Documents
-
view
0 -
download
0
Transcript of Contactless Vital Signs Measurement System Using RGB ...
sensors
Article
Contactless Vital Signs Measurement System UsingRGB-Thermal Image Sensors and Its ClinicalScreening Test on Patients with Seasonal Influenza
Toshiaki Negishi 1, Shigeto Abe 2, Takemi Matsui 3, He Liu 4, Masaki Kurosawa 1,Tetsuo Kirimoto 1 and Guanghao Sun 1,*
1 Graduate School of Informatics and Engineering, The University of Electro-Communications, 1-5-1Chofugaoka, Chofu, Tokyo 182-8585, Japan; [email protected] (T.N.); [email protected] (M.K.);[email protected] (T.K.)
2 Takasaka Clinic, Fukushima 973-8407, Japan; [email protected] Graduate School of System Design, Tokyo Metropolitan University, Tokyo 191-0065, Japan;
[email protected] School of Materials Science and Engineering, Harbin University of Science and Technology, Harbin 150000,
China; [email protected]* Correspondence: [email protected]; Tel.: +81-42-443-5412
Received: 18 March 2020; Accepted: 10 April 2020; Published: 13 April 2020�����������������
Abstract: Background: In the last two decades, infrared thermography (IRT) has been applied inquarantine stations for the screening of patients with suspected infectious disease. However, thefever-based screening procedure employing IRT suffers from low sensitivity, because monitoringbody temperature alone is insufficient for detecting infected patients. To overcome the drawbacksof fever-based screening, this study aims to develop and evaluate a multiple vital sign (i.e., bodytemperature, heart rate and respiration rate) measurement system using RGB-thermal image sensors.Methods: The RGB camera measures blood volume pulse (BVP) through variations in the lightabsorption from human facial areas. IRT is used to estimate the respiration rate by measuring thechange in temperature near the nostrils or mouth accompanying respiration. To enable a stable andreliable system, the following image and signal processing methods were proposed and implemented:(1) an RGB-thermal image fusion approach to achieve highly reliable facial region-of-interest tracking,(2) a heart rate estimation method including a tapered window for reducing noise caused by theface tracker, reconstruction of a BVP signal with three RGB channels to optimize a linear function,thereby improving the signal-to-noise ratio and multiple signal classification (MUSIC) algorithmfor estimating the pseudo-spectrum from limited time-domain BVP signals within 15 s and (3) arespiration rate estimation method implementing nasal or oral breathing signal selection based onsignal quality index for stable measurement and MUSIC algorithm for rapid measurement. We testedthe system on 22 healthy subjects and 28 patients with seasonal influenza, using the support vectormachine (SVM) classification method. Results: The body temperature, heart rate and respirationrate measured in a non-contact manner were highly similarity to those measured via contact-typereference devices (i.e., thermometer, ECG and respiration belt), with Pearson correlation coefficientsof 0.71, 0.87 and 0.87, respectively. Moreover, the optimized SVM model with three vital signsyielded sensitivity and specificity values of 85.7% and 90.1%, respectively. Conclusion: For contactlessvital sign measurement, the system achieved a performance similar to that of the reference devices.The multiple vital sign-based screening achieved higher sensitivity than fever-based screening. Thus,this system represents a promising alternative for further quarantine procedures to prevent the spreadof infectious diseases.
Keywords: contactless measurement; vital signs; RGB-thermal image processing; infection diseases
Sensors 2020, 20, 2171; doi:10.3390/s20082171 www.mdpi.com/journal/sensors
Sensors 2020, 20, 2171 2 of 16
1. Introduction
Emerging infectious diseases are serious threats to global health. During the last two decades, therehave been travel-related outbreaks of infectious diseases, such as severe acute respiratory syndromeand novel Coronavirus (2019-nCoV), around the world in 2003 and 2019 [1,2]. To contain the outbreakof emerging viral diseases, infrared thermography (IRT) has been applied for fever screening ofpassengers with suspected infection in many international quarantine stations [3–5]. IRT is an effectivemethod for measuring elevated body temperature. However, monitoring body temperature alone isinsufficient for accurate detection of infected patients, as IRT monitoring facial surface temperaturecan be affected by many factors such as antipyretic consumption [6]. The positive predictive values offever-based screening using IRT vary from 3.5% to 65.4%, indicating the limited efficacy for detectingsymptomatic passengers [7].
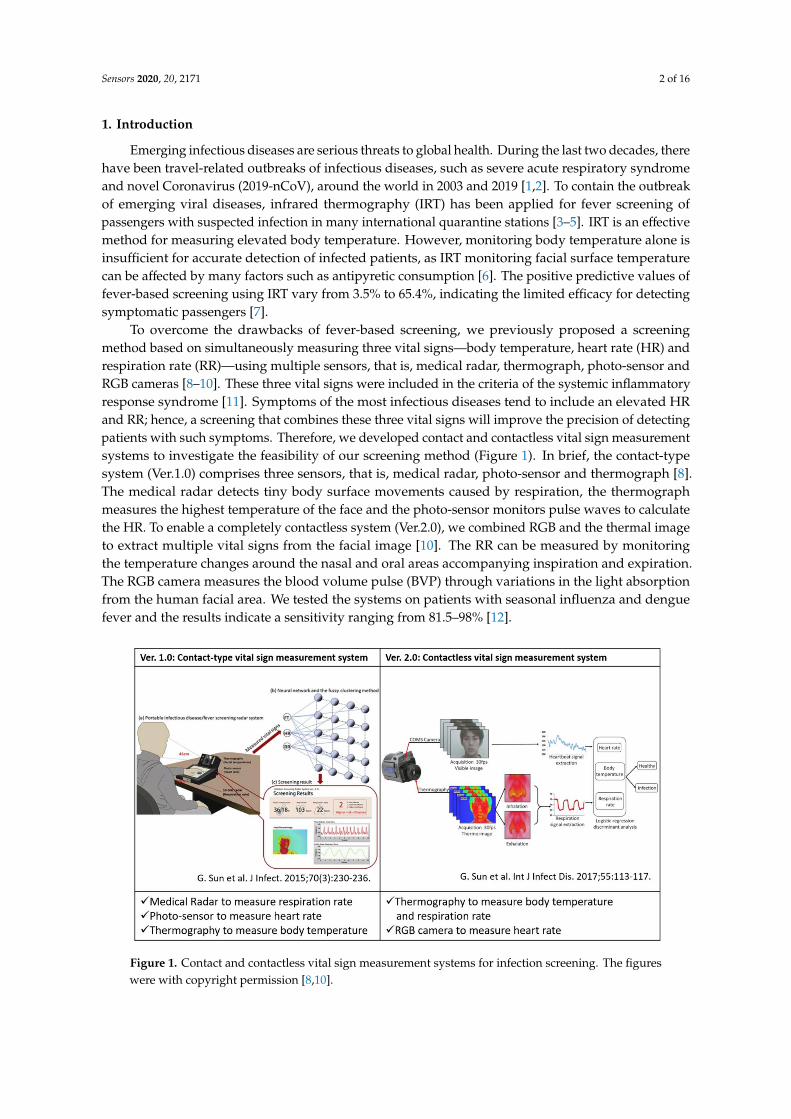
To overcome the drawbacks of fever-based screening, we previously proposed a screeningmethod based on simultaneously measuring three vital signs—body temperature, heart rate (HR) andrespiration rate (RR)—using multiple sensors, that is, medical radar, thermograph, photo-sensor andRGB cameras [8–10]. These three vital signs were included in the criteria of the systemic inflammatoryresponse syndrome [11]. Symptoms of the most infectious diseases tend to include an elevated HRand RR; hence, a screening that combines these three vital signs will improve the precision of detectingpatients with such symptoms. Therefore, we developed contact and contactless vital sign measurementsystems to investigate the feasibility of our screening method (Figure 1). In brief, the contact-typesystem (Ver.1.0) comprises three sensors, that is, medical radar, photo-sensor and thermograph [8].The medical radar detects tiny body surface movements caused by respiration, the thermographmeasures the highest temperature of the face and the photo-sensor monitors pulse waves to calculatethe HR. To enable a completely contactless system (Ver.2.0), we combined RGB and the thermal imageto extract multiple vital signs from the facial image [10]. The RR can be measured by monitoringthe temperature changes around the nasal and oral areas accompanying inspiration and expiration.The RGB camera measures the blood volume pulse (BVP) through variations in the light absorptionfrom the human facial area. We tested the systems on patients with seasonal influenza and denguefever and the results indicate a sensitivity ranging from 81.5–98% [12].
Sensors 2020, 20, x FOR PEER REVIEW 2 of 16
1. Introduction
Emerging infectious diseases are serious threats to global health. During the last two decades,
there have been travel-related outbreaks of infectious diseases, such as severe acute respiratory
syndrome and novel Coronavirus (2019-nCoV), around the world in 2003 and 2019 [1,2]. To contain
the outbreak of emerging viral diseases, infrared thermography (IRT) has been applied for fever
screening of passengers with suspected infection in many international quarantine stations [3–5]. IRT
is an effective method for measuring elevated body temperature. However, monitoring body
temperature alone is insufficient for accurate detection of infected patients, as IRT monitoring facial
surface temperature can be affected by many factors such as antipyretic consumption [6]. The positive
predictive values of fever-based screening using IRT vary from 3.5% to 65.4%, indicating the limited
efficacy for detecting symptomatic passengers [7].
To overcome the drawbacks of fever-based screening, we previously proposed a screening
method based on simultaneously measuring three vital signs—body temperature, heart rate (HR)
and respiration rate (RR)—using multiple sensors, that is, medical radar, thermograph, photo-sensor
and RGB cameras [8–10]. These three vital signs were included in the criteria of the systemic
inflammatory response syndrome [11]. Symptoms of the most infectious diseases tend to include an
elevated HR and RR; hence, a screening that combines these three vital signs will improve the
precision of detecting patients with such symptoms. Therefore, we developed contact and contactless
vital sign measurement systems to investigate the feasibility of our screening method (Figure 1). In
brief, the contact-type system (Ver.1.0) comprises three sensors, that is, medical radar, photo-sensor
and thermograph [8]. The medical radar detects tiny body surface movements caused by respiration,
the thermograph measures the highest temperature of the face and the photo-sensor monitors pulse
waves to calculate the HR. To enable a completely contactless system (Ver.2.0), we combined RGB
and the thermal image to extract multiple vital signs from the facial image [10]. The RR can be
measured by monitoring the temperature changes around the nasal and oral areas accompanying
inspiration and expiration. The RGB camera measures the blood volume pulse (BVP) through
variations in the light absorption from the human facial area. We tested the systems on patients with
seasonal influenza and dengue fever and the results indicate a sensitivity ranging from 81.5–98% [12].
Figure 1. Contact and contactless vital sign measurement systems for infection screening. The figures
were with copyright permission [8,10]. Figure 1. Contact and contactless vital sign measurement systems for infection screening. The figureswere with copyright permission [8,10].
Sensors 2020, 20, 2171 3 of 16
In this study, to promote the widespread use of our vital sign-based infection screening method,we enhanced the function of the Ver.2.0 contactless system to enable a stable, reliable and real-timesystem. We improved the stability of HR and RR measurement with the RGB-thermal image fusionapproach for a highly reliable facial region-of-interest (ROI) tracking [13]. Moreover, we focused onimproving the robustness of extracting BVP and respiration signal from the RGB camera and IRT. Weproposed a signal processing method for reconstructing the BVP waveform using all RGB channels andselecting nasal or oral breathing based on signal quality index (SQI), for improving the signal-to-noiseratio. To enable a real-time system, we implemented a multiple signal classification (MUSIC) algorithmto estimate the pseudo-spectrum from limited time-domain BVP and respiration signals within 15 s [14].Finally, we tested the system on 22 healthy subjects and 41 patients with influenza-like symptoms (28diagnosed influenza patients and 13 undiagnosed patients).
The remainder of this paper is organized as follows. In the Section “Materials and Methods,” wedescribe an overview of our system and proposed signal and image processing methods. The Section“Results” contains the results of comparison between our contactless system with contact-type referencedevices and screening performance on detecting influenza patients using a support vector machine(SVM). In the Section “Discussion and Conclusion,” we discuss our findings and draw conclusions.
2. Materials and Methods
2.1. Related Work on Vision based Clinical Screening
Vision-based clinical screening using RGB and thermal image sensors have recently attractedincreasing attention in academia and industry. Ming-Zher Poh et al. developed a robust methodfor measuring HR and HRV from digital RGB video recording of skin color changes [15]. He Liu etal. proposed a novel method using dual cameras to estimate arterial oxygen saturation [16]. PhilipsResearch has been launching an app called “Vital Signs Camera” in 2012. Moreover, the thermalcamera-based approaches have been widely applied in clinical screening and research, such as feverscreening and human pose estimation [5]. To enable such specific applications, image processingmethod for keypoint detection has been proposed using a stacked hourglass network and featureboosting networks [17–19].
2.2. Overview of Infectious Screening System using RGB-thermal Image Sensors
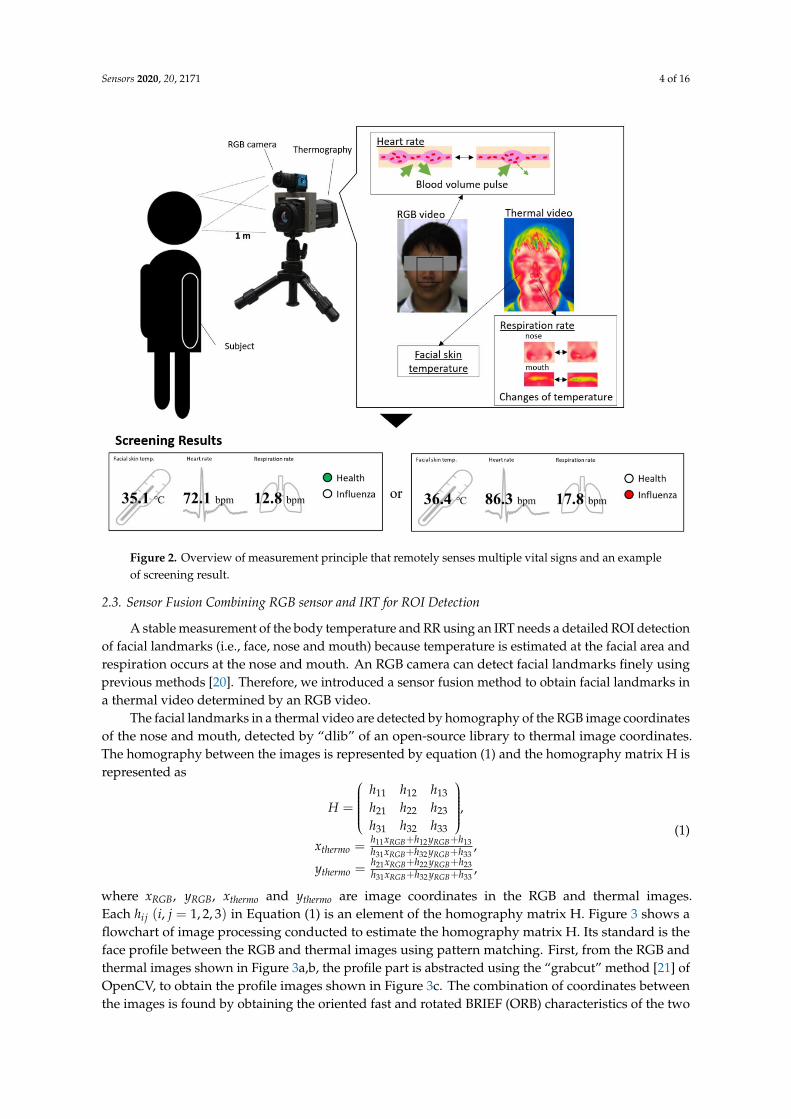
In our previous work, a dual image sensor-based infectious screening system was developed forpredicting the possibility of infection [10]. It comprises an RGB camera and an IRT for measuringHR, RR and body temperature. We used DFK23U618 (The Imaging Source Co. Ltd., Germany) as theRGB camera and FLIR A315 (FLIR Systems, Inc., USA) as the IRT. The visible video was recorded at aspeed of 15 frames per second (fps) with a pixel resolution of 640 × 480 and the thermal video wasrecorded at a speed of 15 fps with a pixel resolution of 320 × 240. An RGB camera senses fluctuationsin hemoglobin absorption derived from the volumetric change in facial blood vessels and obtainsheartbeat signals. An IRT detects temperature changes between inhalation and exhalation in the nasalor oral area. In addition, the facial skin temperature is measured by the IRT. Multiple vital signsdistinguish between patients with influenza and healthy subjects. Figure 2 shows an overview of aninfectious screening system.
Sensors 2020, 20, 2171 4 of 16Sensors 2020, 20, x FOR PEER REVIEW 4 of 16
Figure 2. Overview of measurement principle that remotely senses multiple vital signs and an
example of screening result.
2.3. Sensor Fusion Combining RGB sensor and IRT for ROI Detection
A stable measurement of the body temperature and RR using an IRT needs a detailed ROI
detection of facial landmarks (i.e., face, nose and mouth) because temperature is estimated at the facial
area and respiration occurs at the nose and mouth. An RGB camera can detect facial landmarks finely
using previous methods [20]. Therefore, we introduced a sensor fusion method to obtain facial
landmarks in a thermal video determined by an RGB video.
The facial landmarks in a thermal video are detected by homography of the RGB image
coordinates of the nose and mouth, detected by “dlib” of an open-source library to thermal image
coordinates. The homography between the images is represented by equation (1) and the homography
matrix H is represented as
𝐻 = (
ℎ11 ℎ12 ℎ13ℎ21 ℎ22 ℎ23ℎ31 ℎ32 ℎ33
),
𝑥𝑡ℎ𝑒𝑟𝑚𝑜 =ℎ11𝑥𝑅𝐺𝐵 + ℎ12𝑦𝑅𝐺𝐵 + ℎ13ℎ31𝑥𝑅𝐺𝐵 + ℎ32𝑦𝑅𝐺𝐵 + ℎ33
,
𝑦𝑡ℎ𝑒𝑟𝑚𝑜 =ℎ21𝑥𝑅𝐺𝐵+ℎ22𝑦𝑅𝐺𝐵+ℎ23
ℎ31𝑥𝑅𝐺𝐵+ℎ32𝑦𝑅𝐺𝐵+ℎ33,
(1)
where 𝑥𝑅𝐺𝐵, 𝑦𝑅𝐺𝐵, 𝑥𝑡ℎ𝑒𝑟𝑚𝑜 and 𝑦𝑡ℎ𝑒𝑟𝑚𝑜 are image coordinates in the RGB and thermal images. Each
ℎ𝑖𝑗 (𝑖, 𝑗 = 1,2,3) in Equation (1) is an element of the homography matrix H. Figure 3 shows a
flowchart of image processing conducted to estimate the homography matrix H. Its standard is the
face profile between the RGB and thermal images using pattern matching. First, from the RGB and
thermal images shown in Figures 3(a) and (b), the profile part is abstracted using the “grabcut”
Figure 2. Overview of measurement principle that remotely senses multiple vital signs and an exampleof screening result.
2.3. Sensor Fusion Combining RGB sensor and IRT for ROI Detection
A stable measurement of the body temperature and RR using an IRT needs a detailed ROI detectionof facial landmarks (i.e., face, nose and mouth) because temperature is estimated at the facial area andrespiration occurs at the nose and mouth. An RGB camera can detect facial landmarks finely usingprevious methods [20]. Therefore, we introduced a sensor fusion method to obtain facial landmarks ina thermal video determined by an RGB video.
The facial landmarks in a thermal video are detected by homography of the RGB image coordinatesof the nose and mouth, detected by “dlib” of an open-source library to thermal image coordinates.The homography between the images is represented by equation (1) and the homography matrix H isrepresented as
H =
h11 h12 h13
h21 h22 h23
h31 h32 h33
,
xthermo =h11xRGB+h12 yRGB+h13h31xRGB+h32 yRGB+h33
,
ythermo =h21xRGB+h22 yRGB+h23h31xRGB+h32 yRGB+h33
,
(1)
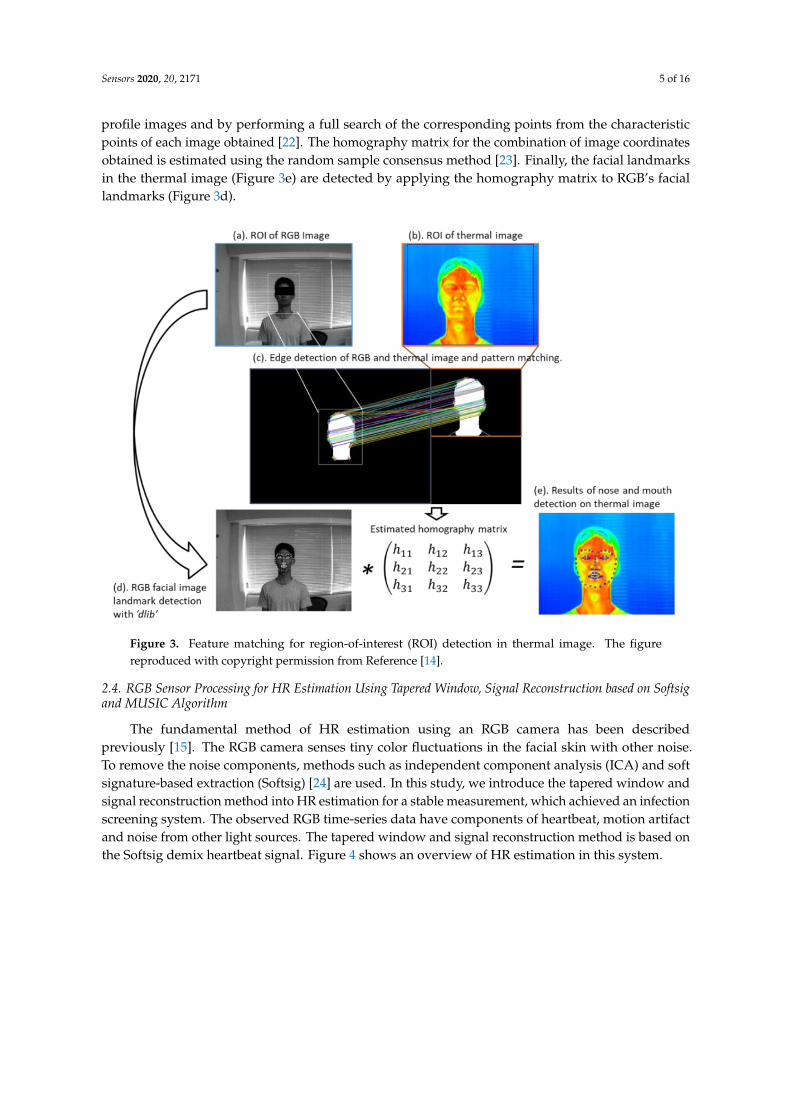
where xRGB, yRGB, xthermo and ythermo are image coordinates in the RGB and thermal images.Each hi j (i, j = 1, 2, 3) in Equation (1) is an element of the homography matrix H. Figure 3 shows aflowchart of image processing conducted to estimate the homography matrix H. Its standard is theface profile between the RGB and thermal images using pattern matching. First, from the RGB andthermal images shown in Figure 3a,b, the profile part is abstracted using the “grabcut” method [21] ofOpenCV, to obtain the profile images shown in Figure 3c. The combination of coordinates betweenthe images is found by obtaining the oriented fast and rotated BRIEF (ORB) characteristics of the two
Sensors 2020, 20, 2171 5 of 16
profile images and by performing a full search of the corresponding points from the characteristicpoints of each image obtained [22]. The homography matrix for the combination of image coordinatesobtained is estimated using the random sample consensus method [23]. Finally, the facial landmarksin the thermal image (Figure 3e) are detected by applying the homography matrix to RGB’s faciallandmarks (Figure 3d).
Sensors 2020, 20, x FOR PEER REVIEW 5 of 16
method [21] of OpenCV, to obtain the profile images shown in Figures 3(c). The combination of
coordinates between the images is found by obtaining the oriented fast and rotated BRIEF (ORB)
characteristics of the two profile images and by performing a full search of the corresponding points
from the characteristic points of each image obtained [22]. The homography matrix for the
combination of image coordinates obtained is estimated using the random sample consensus method
[23]. Finally, the facial landmarks in the thermal image (Figure 3(e)) are detected by applying the
homography matrix to RGB’s facial landmarks (Figure 3(d)).
Figure 3. Feature matching for region-of-interest (ROI) detection in thermal image. The figure
reproduced with copyright permission from Reference [14].
2.4. RGB Sensor Processing for HR Estimation Using Tapered Window, Signal Reconstruction based on
Softsig and MUSIC Algorithm
The fundamental method of HR estimation using an RGB camera has been described previously
[15]. The RGB camera senses tiny color fluctuations in the facial skin with other noise. To remove the
noise components, methods such as independent component analysis (ICA) and soft signature-based
extraction (Softsig) [24] are used. In this study, we introduce the tapered window and signal
reconstruction method into HR estimation for a stable measurement, which achieved an infection
screening system. The observed RGB time-series data have components of heartbeat, motion artifact
and noise from other light sources. The tapered window and signal reconstruction method is based
on the Softsig demix heartbeat signal. Figure 4 shows an overview of HR estimation in this system.
Figure 3. Feature matching for region-of-interest (ROI) detection in thermal image. The figurereproduced with copyright permission from Reference [14].
2.4. RGB Sensor Processing for HR Estimation Using Tapered Window, Signal Reconstruction based on Softsigand MUSIC Algorithm
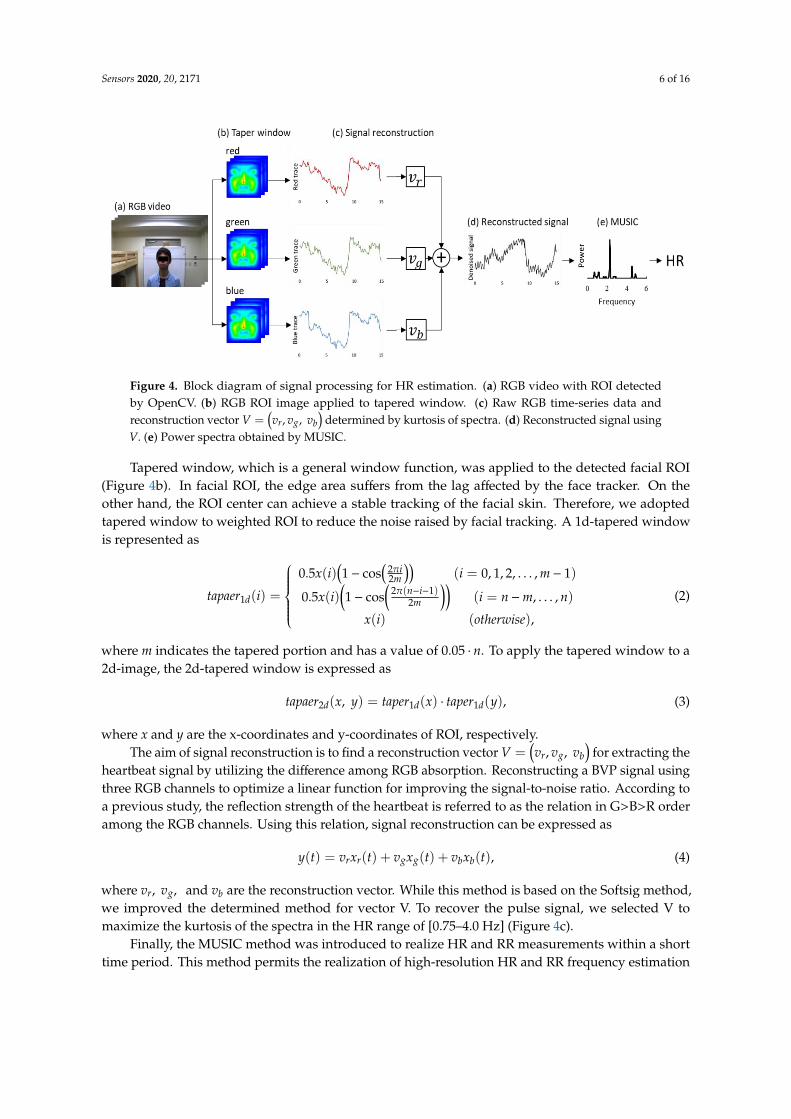
The fundamental method of HR estimation using an RGB camera has been describedpreviously [15]. The RGB camera senses tiny color fluctuations in the facial skin with other noise.To remove the noise components, methods such as independent component analysis (ICA) and softsignature-based extraction (Softsig) [24] are used. In this study, we introduce the tapered window andsignal reconstruction method into HR estimation for a stable measurement, which achieved an infectionscreening system. The observed RGB time-series data have components of heartbeat, motion artifactand noise from other light sources. The tapered window and signal reconstruction method is based onthe Softsig demix heartbeat signal. Figure 4 shows an overview of HR estimation in this system.
Sensors 2020, 20, 2171 6 of 16Sensors 2020, 20, x FOR PEER REVIEW 6 of 16
Figure 4. Block diagram of signal processing for HR estimation. (a) RGB video with ROI detected by
OpenCV. (b) RGB ROI image applied to tapered window. (c) Raw RGB time-series data and
reconstruction vector 𝑉 = (𝑣𝑟 , 𝑣𝑔, 𝑣𝑏) determined by kurtosis of spectra. (d) Reconstructed signal
using V. (e) Power spectra obtained by MUSIC.
Tapered window, which is a general window function, was applied to the detected facial ROI
(Figure 4(b)). In facial ROI, the edge area suffers from the lag affected by the face tracker. On the other
hand, the ROI center can achieve a stable tracking of the facial skin. Therefore, we adopted tapered
window to weighted ROI to reduce the noise raised by facial tracking. A 1d-tapered window is
represented as
where m indicates the tapered portion and has a value of 0.05 ⋅ 𝑛. To apply the tapered window to a
2d-image, the 2d-tapered window is expressed as
where x and y are the x-coordinates and y-coordinates of ROI, respectively.
The aim of signal reconstruction is to find a reconstruction vector 𝑉 = (𝑣𝑟 , 𝑣𝑔, 𝑣𝑏) for extracting
the heartbeat signal by utilizing the difference among RGB absorption. Reconstructing a BVP signal
using three RGB channels to optimize a linear function for improving the signal-to-noise ratio.
According to a previous study, the reflection strength of the heartbeat is referred to as the relation in
G>B>R order among the RGB channels. Using this relation, signal reconstruction can be expressed as
𝑦(𝑡) = 𝑣𝑟𝑥𝑟(𝑡) + 𝑣𝑔𝑥𝑔(𝑡) + 𝑣𝑏𝑥𝑏(𝑡), (4)
where 𝑣𝑟 , 𝑣𝑔, and 𝑣𝑏 are the reconstruction vector. While this method is based on the Softsig method,
we improved the determined method for vector V. To recover the pulse signal, we selected V to
maximize the kurtosis of the spectra in the HR range of [0.75–4.0 Hz] (Figure 4(c)).
Finally, the MUSIC method was introduced to realize HR and RR measurements within a short
time period. This method permits the realization of high-resolution HR and RR frequency
estimation based on short-period measurement data Equation (5) expresses the spectrum estimation
formula of the MUSIC method [14]:
𝑡𝑎𝑝𝑎𝑒𝑟1𝑑(𝑖) =
{
0.5𝑥(𝑖) (1 − cos (
2𝜋𝑖
2𝑚)) (𝑖 = 0,1,2, … ,𝑚 − 1)
0.5𝑥(𝑖) (1 − cos (2𝜋(𝑛 − 𝑖 − 1)
2𝑚)) (𝑖 = 𝑛 −𝑚,… , 𝑛)
𝑥(𝑖) (𝑜𝑡ℎ𝑒𝑟𝑤𝑖𝑠𝑒),
(2)
𝑡𝑎𝑝𝑎𝑒𝑟2𝑑(𝑥, 𝑦) = 𝑡𝑎𝑝𝑒𝑟1𝑑(𝑥) ⋅ 𝑡𝑎𝑝𝑒𝑟1𝑑(𝑦), (3)
Figure 4. Block diagram of signal processing for HR estimation. (a) RGB video with ROI detectedby OpenCV. (b) RGB ROI image applied to tapered window. (c) Raw RGB time-series data andreconstruction vector V =
(vr, vg, vb
)determined by kurtosis of spectra. (d) Reconstructed signal using
V. (e) Power spectra obtained by MUSIC.
Tapered window, which is a general window function, was applied to the detected facial ROI(Figure 4b). In facial ROI, the edge area suffers from the lag affected by the face tracker. On theother hand, the ROI center can achieve a stable tracking of the facial skin. Therefore, we adoptedtapered window to weighted ROI to reduce the noise raised by facial tracking. A 1d-tapered windowis represented as
tapaer1d(i) =
0.5x(i)
(1− cos
(2πi2m
))(i = 0, 1, 2, . . . , m− 1)
0.5x(i)(1− cos
(2π(n−i−1)
2m
))(i = n−m, . . . , n)
x(i) (otherwise),
(2)
where m indicates the tapered portion and has a value of 0.05 · n. To apply the tapered window to a2d-image, the 2d-tapered window is expressed as
tapaer2d(x, y) = taper1d(x) · taper1d(y), (3)
where x and y are the x-coordinates and y-coordinates of ROI, respectively.The aim of signal reconstruction is to find a reconstruction vector V =
(vr, vg, vb
)for extracting the
heartbeat signal by utilizing the difference among RGB absorption. Reconstructing a BVP signal usingthree RGB channels to optimize a linear function for improving the signal-to-noise ratio. According toa previous study, the reflection strength of the heartbeat is referred to as the relation in G>B>R orderamong the RGB channels. Using this relation, signal reconstruction can be expressed as
y(t) = vrxr(t) + vgxg(t) + vbxb(t), (4)
where vr, vg, and vb are the reconstruction vector. While this method is based on the Softsig method,we improved the determined method for vector V. To recover the pulse signal, we selected V tomaximize the kurtosis of the spectra in the HR range of [0.75–4.0 Hz] (Figure 4c).
Finally, the MUSIC method was introduced to realize HR and RR measurements within a shorttime period. This method permits the realization of high-resolution HR and RR frequency estimation
Sensors 2020, 20, 2171 7 of 16
based on short-period measurement data Equation (5) expresses the spectrum estimation formula ofthe MUSIC method [14]:
SMUSIC( f ) =1∑p
k=M+1
∣∣∣eT( f )Wk∣∣∣2 × 1
δ f, (5)
where e( fi) represents a complex sinusoidal wave vector and Wk represents the eigenvector of thecorrelation matrix. This system applies the MUSIC method separately to the HR and RR time-seriesdata obtained from the video. In the case of heartbeat, the peak of 0.75–3.0 Hz (45–180 beats per minute(bpm)) of the obtained spectrum was assumed to be the HR.
2.5. IRT Sensor Processing for RR Estimation Using Nasal and Oral Breathing Decision based on SQI andMUSIC Algorithm and Body Temperature Estimation
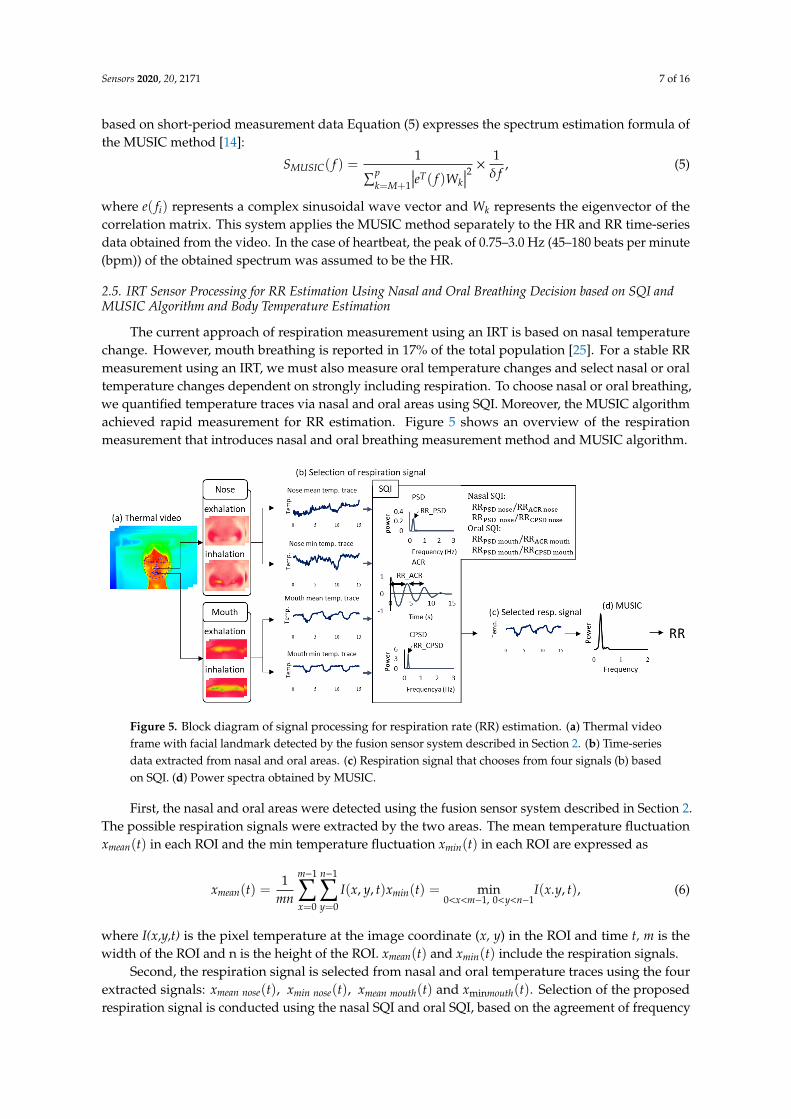
The current approach of respiration measurement using an IRT is based on nasal temperaturechange. However, mouth breathing is reported in 17% of the total population [25]. For a stable RRmeasurement using an IRT, we must also measure oral temperature changes and select nasal or oraltemperature changes dependent on strongly including respiration. To choose nasal or oral breathing,we quantified temperature traces via nasal and oral areas using SQI. Moreover, the MUSIC algorithmachieved rapid measurement for RR estimation. Figure 5 shows an overview of the respirationmeasurement that introduces nasal and oral breathing measurement method and MUSIC algorithm.
Sensors 2020, 20, x FOR PEER REVIEW 7 of 16
𝑆𝑀𝑈𝑆𝐼𝐶(𝑓) =1
∑ |𝑒𝑇(𝑓)𝑊𝑘|𝑝𝑘=𝑀+1
2 ×1
𝛿𝑓, (5)
where 𝑒(𝑓𝑖) represents a complex sinusoidal wave vector and 𝑊𝑘 represents the eigenvector of the
correlation matrix. This system applies the MUSIC method separately to the HR and RR time-series
data obtained from the video. In the case of heartbeat, the peak of 0.75–3.0 Hz (45–180 beats per
minute (bpm)) of the obtained spectrum was assumed to be the HR.
2.5. IRT Sensor Processing for RR Estimation Using Nasal and Oral Breathing Decision based on SQI and
MUSIC Algorithm and Body Temperature Estimation
The current approach of respiration measurement using an IRT is based on nasal temperature
change. However, mouth breathing is reported in 17% of the total population [25]. For a stable RR
measurement using an IRT, we must also measure oral temperature changes and select nasal or oral
temperature changes dependent on strongly including respiration. To choose nasal or oral breathing,
we quantified temperature traces via nasal and oral areas using SQI. Moreover, the MUSIC algorithm
achieved rapid measurement for RR estimation. Figure 5 shows an overview of the respiration
measurement that introduces nasal and oral breathing measurement method and MUSIC algorithm.
Figure 5. Block diagram of signal processing for respiration rate (RR) estimation. (a) Thermal video
frame with facial landmark detected by the fusion sensor system described in section 2. (b) Time-
series data extracted from nasal and oral areas. (c) Respiration signal that chooses from four signals
(b) based on SQI. (d) Power spectra obtained by MUSIC.
First, the nasal and oral areas were detected using the fusion sensor system described in Section
2. The possible respiration signals were extracted by the two areas. The mean temperature fluctuation
𝑥𝑚𝑒𝑎𝑛(𝑡) in each ROI and the min temperature fluctuation 𝑥𝑚𝑖𝑛(𝑡) in each ROI are expressed as
𝑥𝑚𝑒𝑎𝑛(𝑡) =1
𝑚𝑛∑∑𝐼(𝑥, 𝑦, 𝑡)
𝑛−1
𝑦=0
𝑚−1
𝑥=0
𝑥𝑚𝑖𝑛(𝑡) = min0<𝑥<𝑚−1,0<𝑦<𝑛−1
𝐼(𝑥. 𝑦, 𝑡),
(6)
where I(x,y,t) is the pixel temperature at the image coordinate (x, y) in the ROI and time t, m is the
width of the ROI and n is the height of the ROI. 𝑥𝑚𝑒𝑎𝑛(𝑡) and 𝑥𝑚𝑖𝑛(𝑡) include the respiration
signals.
Second, the respiration signal is selected from nasal and oral temperature traces using the four
extracted signals: 𝑥𝑚𝑒𝑎𝑛 𝑛𝑜𝑠𝑒(𝑡) , 𝑥𝑚𝑖𝑛 𝑛𝑜𝑠𝑒(𝑡) , 𝑥𝑚𝑒𝑎𝑛 𝑚𝑜𝑢𝑡ℎ(𝑡) and 𝑥min𝑚𝑜𝑢𝑡ℎ(𝑡) . Selection of the
Figure 5. Block diagram of signal processing for respiration rate (RR) estimation. (a) Thermal videoframe with facial landmark detected by the fusion sensor system described in Section 2. (b) Time-seriesdata extracted from nasal and oral areas. (c) Respiration signal that chooses from four signals (b) basedon SQI. (d) Power spectra obtained by MUSIC.
First, the nasal and oral areas were detected using the fusion sensor system described in Section 2.The possible respiration signals were extracted by the two areas. The mean temperature fluctuationxmean(t) in each ROI and the min temperature fluctuation xmin(t) in each ROI are expressed as
xmean(t) =1
mn
m−1∑x=0
n−1∑y=0
I(x, y, t)xmin(t) = min0<x<m−1, 0<y<n−1
I(x.y, t), (6)
where I(x,y,t) is the pixel temperature at the image coordinate (x, y) in the ROI and time t, m is thewidth of the ROI and n is the height of the ROI. xmean(t) and xmin(t) include the respiration signals.
Second, the respiration signal is selected from nasal and oral temperature traces using the fourextracted signals: xmean nose(t), xmin nose(t), xmean mouth(t) and xminmouth(t). Selection of the proposedrespiration signal is conducted using the nasal SQI and oral SQI, based on the agreement of frequency
Sensors 2020, 20, 2171 8 of 16
estimated by power spectral density (PSD), autocorrelation (ACR) and cross-power spectral density(CPSD). The frequency of PSD using xmean(t) was estimated from the peak of power spectra from0.1–0.75 Hz, to provide the range of RR measurement. The frequency of ACR using xmean(t) wasestimated from the average peak interval. The frequency of CPSD using xmean(t) and xmin(t) wasestimated from the peak of cross-power spectra ranging from 0.1–0.75 Hz. If the temperature changein the nasal or oral area includes dominant respiration frequency, CPSD indicates the frequency bystrengthening the respiration frequency between xmean(t) and xmin(t) in the ROI. The following tworules are adopted sequentially:
1. Rule 1 (nasal SQI): If the ratio of RRPSD nose to RRACR nose and that of RRPSD nose to RRCSPD noseobtained by the nasal area lie between 0.85 and 1.15, we select the nasal temperature changeas the respiration signal. (This index shows that the nasal area includes the respiration signalbecause a ratio close to 1 indicates that the respiration frequency is dominant)
2. Rule 2 (oral SQI): If the ratio of RRPSD mouth to RRACR mouth and that of RRPSD mouth to RRCSPD mouthobtained by the oral area lie between 0.85 and 1.15, we select the oral temperature change as therespiration signal. (This index shows that the oral area includes the respiration signal because aratio close to 1 indicates that the respiration frequency is dominant)
If the two rules are not satisfied, we select nasal area as the respiration signal.This system applies the MUSIC method separately to the HR and RR time-series data obtained
from the video. In the case of respiration, the peak of 0.1– 0.75 Hz (6–45 bpm) of the spectrum obtainedwas assumed to be the RR. Temperature was also determined as the max facial temperature in thedetected facial ROI using the sensor fusion technique.
2.6. SVM Discriminant Analysis to Predict Patients with Seasonal Influenza based on the Three Vital SignsMeasured
Aiming at screening using features of HR, RR and body temperature of patients with infection,we proposed a classification model based on SVM. SVM is a method that predicts the separatinghyperplane to maximize the margin between the two classes and achieves a high generalizationcapability. The SVM discriminant function is defined as
minw, w0, ξ
(12‖w‖
2 + CN∑
i=0ξi
)subject to
{yi f (xi) ≥ 1− ξi
ξi ≥ 0,
(7)
where w is a constant that indicates the SVM coefficients corresponding to HR, RR and temperature;yi is a category of health or infection; C is the penalty parameter and ξi is the slack parameter; f (xi)
is linear discriminant function formula w · xi + w0. The calculation of SVM is performed using theMATLAB software.
2.7. Evaluation of the System in Laboratory and Clinical Settings
Laboratory and clinical testing of the system was conducted in 2019. Twenty-two healthy controlsubjects with no symptoms of fever (23.4 years of average age) participated in the laboratory test atthe University of Electro-Communications. A total of 41 patients (45.0 years of average age) withsymptoms such as influenza were included, who visited Takasaka Clinic, Fukushima, Japan. TheirRR, HR and body temperature were measured using the contactless system; reference measurementswere simultaneously obtained using a contact-type electrocardiogram (ECG) (LRR-03, GMS Co. Ltd.,Tokyo, Japan) or pulse oximeter (SAT-2200 Oxypal mini, NIHONKOHDEN Co., Tokyo, Japan), clinicalthermometer (TERUMO electric thermometer C230, TERUMO Co., Tokyo, Japan) and a respirationeffort belt (DL-231, S&ME Inc.,Tokyo, Japan). It should be noted that, some patients may showincreased heart rate due to white-coat hypertension. This study was approved by the Committee on
Sensors 2020, 20, 2171 9 of 16
Human Research of the Faculty of System Design, Tokyo Metropolitan University and the Universityof Electro-Communications. All subjects gave their informed written consent.
2.8. Statistical Analysis
The Bland–Altman plot and scatter plot were utilized for statistical and graphical proof ofthe agreement between the proposed method and reference method [26]. The reference vital signswere measured by ECG or a pulse oximeter for HR, respiration effort belt for RR and electronicthermometer for axillary temperature. The results from the SVM classification model were used tocalculate the sensitivity, specificity negative predictive value (NPV) and positive predictive value(PPV). A leave-one-out cross-validation was performed to avoid overfitting.
3. Results
3.1. HR Measurements Using RGB Sensor in a Laboratory and Clinical Setting
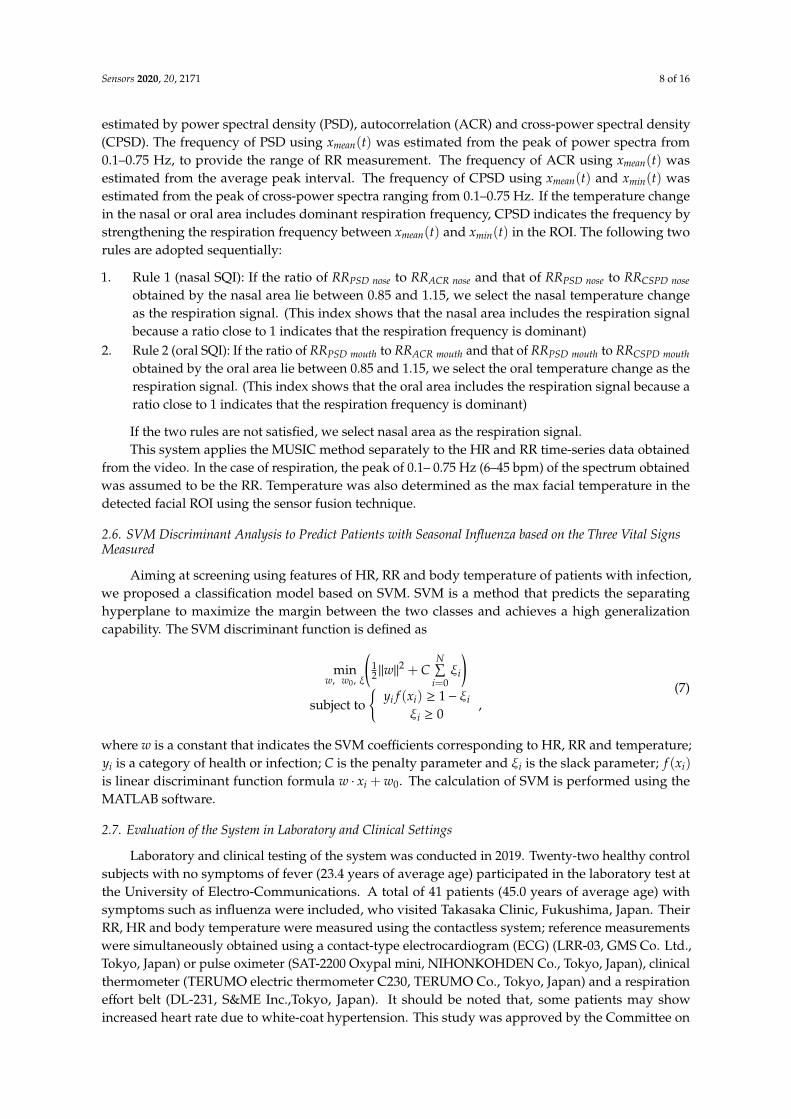
Figure 6 presents an example of signal recovery applied using the proposed method, by employingthe tapered window and signal reconstruction based on Softsig. Raw traces of RGB color (Figure 6a)contained a dominant frequency of noise components, which can be observed by their spectra(Figure 6b), because the ground truth of HR measured by the pulse oximeter is 1.83 Hz. However,applying the proposed method, we can observe a clear peak of the HR frequency component inFigure 6e. This example shows the advantage of the proposed HR estimation.
Sensors 2020, 20, x FOR PEER REVIEW 9 of 16
Human Research of the Faculty of System Design, Tokyo Metropolitan University and the University
of Electro-Communications. All subjects gave their informed written consent.
2.8. Statistical Analysis
The Bland–Altman plot and scatter plot were utilized for statistical and graphical proof of the
agreement between the proposed method and reference method [26]. The reference vital signs were
measured by ECG or a pulse oximeter for HR, respiration effort belt for RR and electronic
thermometer for axillary temperature. The results from the SVM classification model were used to
calculate the sensitivity, specificity negative predictive value (NPV) and positive predictive value
(PPV). A leave-one-out cross-validation was performed to avoid overfitting.
3. Results
3.1. HR Measurements Using RGB Sensor in a Laboratory and Clinical Setting
Figure 6 presents an example of signal recovery applied using the proposed method, by
employing the tapered window and signal reconstruction based on Softsig. Raw traces of RGB color
(Figure 6(a)) contained a dominant frequency of noise components, which can be observed by their
spectra (Figure 6(b)), because the ground truth of HR measured by the pulse oximeter is 1.83 Hz.
However, applying the proposed method, we can observe a clear peak of the HR frequency
component in Figure 6(e). This example shows the advantage of the proposed HR estimation.
Figure 6. Recovery of heartbeat signal by applying tapered window and signal reconstruction. (a)
RGB color traces obtained by RGB video. (b) Spectra estimated by Fast Fourier Transform (FFT). (c)
Signal reconstruction determined through kurtosis of the spectra. (d), (e) Reconstructed signal and its
spectra.
To evaluate the tapered window, signal reconstruction and MUSIC, we compared the proposed
method to raw green trace, which uses only green channel and Fast Fourier Transform (FFT). The
green trace method is a general method for estimating HR using an RGB camera. The ground truth
of HR was measured by ECG and the pulse oximeter. We performed 15 s measurement four times
against healthy control subjects and obtained 128 pairs of HRs from all subjects, which included 22
healthy control subjects and 41 patients with influenza-like symptoms. A comparison of HR
estimation is shown in Figure 7. Figure 7(a) shows the Bland–Altman plot of green trace applying
Figure 6. Recovery of heartbeat signal by applying tapered window and signal reconstruction. (a) RGBcolor traces obtained by RGB video. (b) Spectra estimated by Fast Fourier Transform (FFT). (c) Signalreconstruction determined through kurtosis of the spectra. (d), (e) Reconstructed signal and its spectra.
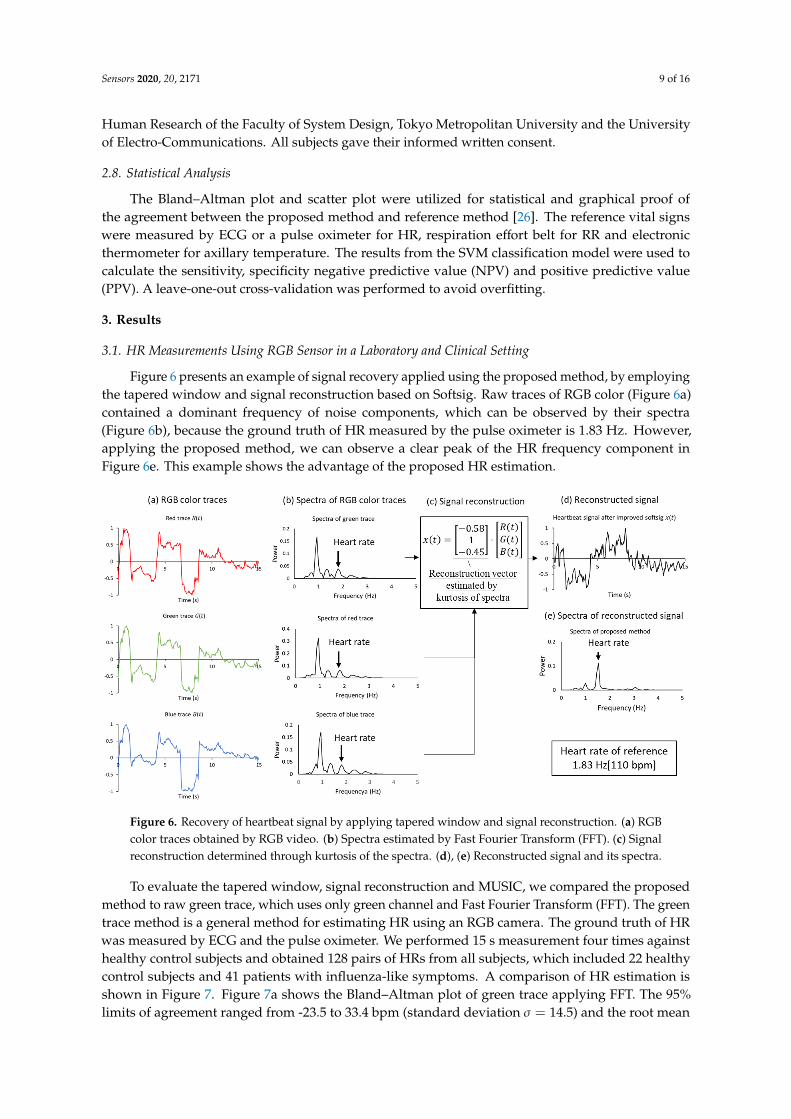
To evaluate the tapered window, signal reconstruction and MUSIC, we compared the proposedmethod to raw green trace, which uses only green channel and Fast Fourier Transform (FFT). The greentrace method is a general method for estimating HR using an RGB camera. The ground truth of HRwas measured by ECG and the pulse oximeter. We performed 15 s measurement four times againsthealthy control subjects and obtained 128 pairs of HRs from all subjects, which included 22 healthycontrol subjects and 41 patients with influenza-like symptoms. A comparison of HR estimation isshown in Figure 7. Figure 7a shows the Bland–Altman plot of green trace applying FFT. The 95%limits of agreement ranged from -23.5 to 33.4 bpm (standard deviation σ = 14.5) and the root mean
Sensors 2020, 20, 2171 10 of 16
square error (RMSE) was 15.3. Figure 7c shows the scatter plot of the green trace method; the Pearsoncorrelation coefficient was 0.48. Figure 7b shows the Bland–Altman plot of the proposed method,which applies the tapered window, signal reconstruction and MUSIC. The 95% limits of agreementranged from -10.4 to 12.6 bpm (standard deviation σ = 5.85) and RMSE was 5.93. Figure 7d shows thescatter plot of the proposed method; the Pearson correlation coefficient was 0.87. The results showedthat the proposed method can reduce the 95% limits of agreement from [−23.5, 33.4] to [−10.4, 12.6]bpm. Especially, the result of patients with influenza-like illness (red circle) was improved because theexperiment at a clinic is close to a real-world setting.
Sensors 2020, 20, x FOR PEER REVIEW 10 of 16
FFT. The 95% limits of agreement ranged from -23.5 to 33.4 bpm (standard deviation 𝜎 = 14.5) and
the root mean square error (RMSE) was 15.3. Figure 7(c) shows the scatter plot of the green trace
method; the Pearson correlation coefficient was 0.48. Figure 7(b) shows the Bland–Altman plot of the
proposed method, which applies the tapered window, signal reconstruction and MUSIC. The 95%
limits of agreement ranged from -10.4 to 12.6 bpm (standard deviation 𝜎 = 5.85) and RMSE was 5.93.
Figure 7(d) shows the scatter plot of the proposed method; the Pearson correlation coefficient was
0.87. The results showed that the proposed method can reduce the 95% limits of agreement from
[−23.5, 33.4] to [−10.4, 12.6] bpm. Especially, the result of patients with influenza-like illness (red
circle) was improved because the experiment at a clinic is close to a real-world setting.
Figure 7. Bland–Altman plots and scatter plots of heart rate (HR) obtained by RGB sensor and
electrocardiogram (ECG) or pulse oximeter. (a) Bland–Altman plot of raw green trace method
applying FFT. (b) Bland–Altman plot of the proposed method applying tapered window, signal
reconstruction and MUSIC. (c) Scatter plot of raw green trace. (d) Scatter plot of proposed method.
3.2. RR and Body Temperature Measurements Using IRT at a Laboratory and Clinical Settings
Figure 8 shows an example of the signal selection applied by the proposed method, which is
detailed in Section 2. The mean and minimum temperature changes in each ROI are shown in Figure
8(b) and (d). To determine the respiration signal from four signals, we calculated the SQI parameters,
which included the PSD, ACR and CPSD of each signal (Figure 8(c) and (e)). Using the SQI
parameters, we chose the respiration signal.
Figure 7. Bland–Altman plots and scatter plots of heart rate (HR) obtained by RGB sensor andelectrocardiogram (ECG) or pulse oximeter. (a) Bland–Altman plot of raw green trace method applyingFFT. (b) Bland–Altman plot of the proposed method applying tapered window, signal reconstructionand MUSIC. (c) Scatter plot of raw green trace. (d) Scatter plot of proposed method.
3.2. RR and Body Temperature Measurements Using IRT at a Laboratory and Clinical Settings
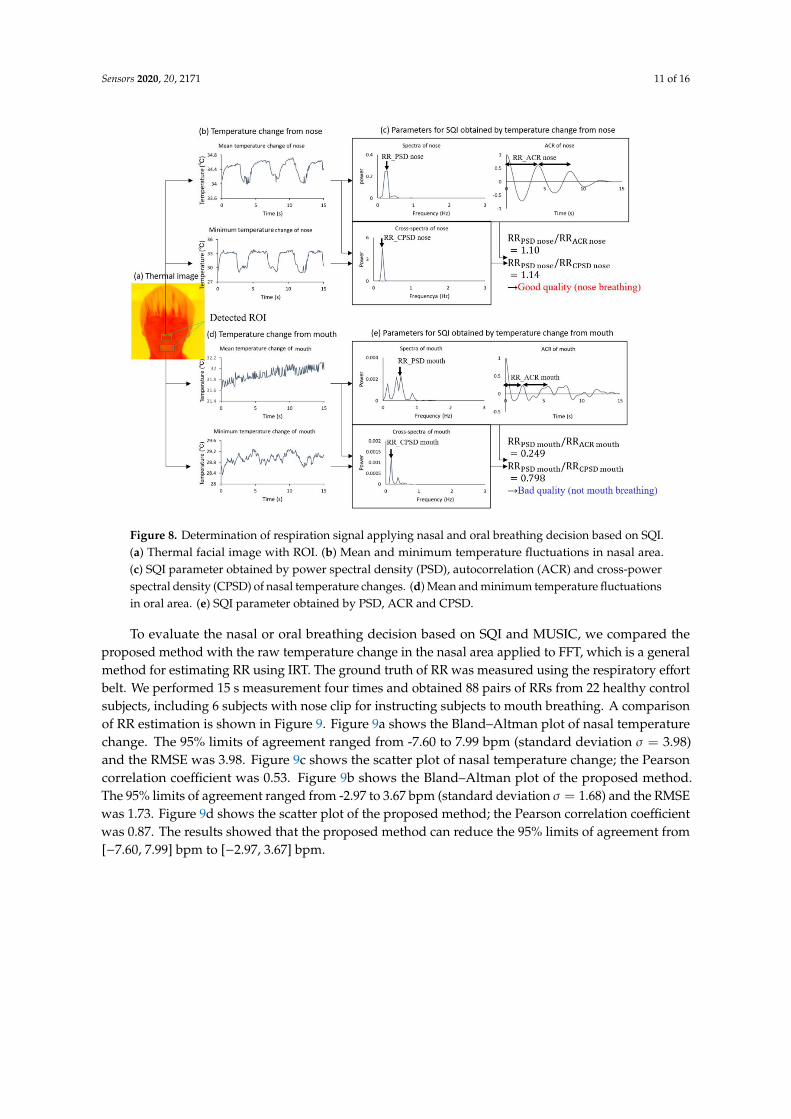
Figure 8 shows an example of the signal selection applied by the proposed method, whichis detailed in Section 2. The mean and minimum temperature changes in each ROI are shown inFigure 8b,d. To determine the respiration signal from four signals, we calculated the SQI parameters,which included the PSD, ACR and CPSD of each signal (Figure 8c,e). Using the SQI parameters, wechose the respiration signal.
Sensors 2020, 20, 2171 11 of 16Sensors 2020, 20, x FOR PEER REVIEW 11 of 16
Figure 8. Determination of respiration signal applying nasal and oral breathing decision based on
SQI. (a) Thermal facial image with ROI. (b) Mean and minimum temperature fluctuations in nasal
area. (c) SQI parameter obtained by power spectral density (PSD), autocorrelation (ACR) and cross-
power spectral density (CPSD) of nasal temperature changes. (d) Mean and minimum temperature
fluctuations in oral area. (e) SQI parameter obtained by PSD, ACR and CPSD.
To evaluate the nasal or oral breathing decision based on SQI and MUSIC, we compared the
proposed method with the raw temperature change in the nasal area applied to FFT, which is a
general method for estimating RR using IRT. The ground truth of RR was measured using the
respiratory effort belt. We performed 15 s measurement four times and obtained 88 pairs of RRs from
22 healthy control subjects, including 6 subjects with nose clip for instructing subjects to mouth
breathing. A comparison of RR estimation is shown in Figure 9. Figure 9(a) shows the Bland–Altman
plot of nasal temperature change. The 95% limits of agreement ranged from -7.60 to 7.99 bpm
(standard deviation 𝜎 = 3.98) and the RMSE was 3.98. Figure 9(c) shows the scatter plot of nasal
temperature change; the Pearson correlation coefficient was 0.53. Figure 9(b) shows the Bland–
Altman plot of the proposed method. The 95% limits of agreement ranged from -2.97 to 3.67 bpm
(standard deviation 𝜎 = 1.68) and the RMSE was 1.73. Figure 9(d) shows the scatter plot of the
proposed method; the Pearson correlation coefficient was 0.87. The results showed that the proposed
method can reduce the 95% limits of agreement from [−7.60, 7.99] bpm to [−2.97, 3.67] bpm.
Figure 8. Determination of respiration signal applying nasal and oral breathing decision based on SQI.(a) Thermal facial image with ROI. (b) Mean and minimum temperature fluctuations in nasal area.(c) SQI parameter obtained by power spectral density (PSD), autocorrelation (ACR) and cross-powerspectral density (CPSD) of nasal temperature changes. (d) Mean and minimum temperature fluctuationsin oral area. (e) SQI parameter obtained by PSD, ACR and CPSD.
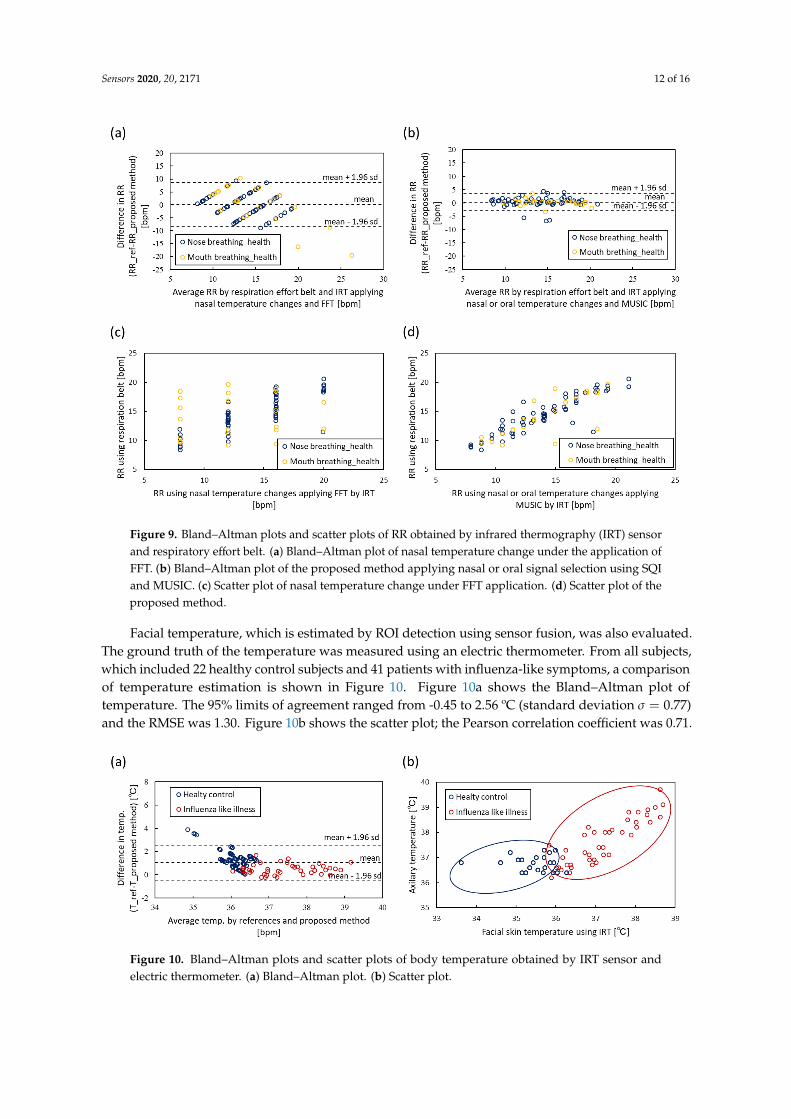
To evaluate the nasal or oral breathing decision based on SQI and MUSIC, we compared theproposed method with the raw temperature change in the nasal area applied to FFT, which is a generalmethod for estimating RR using IRT. The ground truth of RR was measured using the respiratory effortbelt. We performed 15 s measurement four times and obtained 88 pairs of RRs from 22 healthy controlsubjects, including 6 subjects with nose clip for instructing subjects to mouth breathing. A comparisonof RR estimation is shown in Figure 9. Figure 9a shows the Bland–Altman plot of nasal temperaturechange. The 95% limits of agreement ranged from -7.60 to 7.99 bpm (standard deviation σ = 3.98)and the RMSE was 3.98. Figure 9c shows the scatter plot of nasal temperature change; the Pearsoncorrelation coefficient was 0.53. Figure 9b shows the Bland–Altman plot of the proposed method.The 95% limits of agreement ranged from -2.97 to 3.67 bpm (standard deviation σ = 1.68) and the RMSEwas 1.73. Figure 9d shows the scatter plot of the proposed method; the Pearson correlation coefficientwas 0.87. The results showed that the proposed method can reduce the 95% limits of agreement from[−7.60, 7.99] bpm to [−2.97, 3.67] bpm.
Sensors 2020, 20, 2171 12 of 16Sensors 2020, 20, x FOR PEER REVIEW 12 of 16
Figure 9. Bland–Altman plots and scatter plots of RR obtained by infrared thermography (IRT) sensor
and respiratory effort belt. (a) Bland–Altman plot of nasal temperature change under the application
of FFT. (b) Bland–Altman plot of the proposed method applying nasal or oral signal selection using
SQI and MUSIC. (c) Scatter plot of nasal temperature change under FFT application. (d) Scatter plot
of the proposed method.
Facial temperature, which is estimated by ROI detection using sensor fusion, was also evaluated.
The ground truth of the temperature was measured using an electric thermometer. From all subjects,
which included 22 healthy control subjects and 41 patients with influenza-like symptoms, a
comparison of temperature estimation is shown in Figure 10. Figure 10(a) shows the Bland–Altman
plot of temperature. The 95% limits of agreement ranged from -0.45 to 2.56 ºC (standard deviation
𝜎 = 0.77) and the RMSE was 1.30. Figure 10(b) shows the scatter plot; the Pearson correlation
coefficient was 0.71.
Figure 10. Bland–Altman plots and scatter plots of body temperature obtained by IRT sensor and
electric thermometer. (a) Bland–Altman plot. (b) Scatter plot.
Figure 9. Bland–Altman plots and scatter plots of RR obtained by infrared thermography (IRT) sensorand respiratory effort belt. (a) Bland–Altman plot of nasal temperature change under the application ofFFT. (b) Bland–Altman plot of the proposed method applying nasal or oral signal selection using SQIand MUSIC. (c) Scatter plot of nasal temperature change under FFT application. (d) Scatter plot of theproposed method.
Facial temperature, which is estimated by ROI detection using sensor fusion, was also evaluated.The ground truth of the temperature was measured using an electric thermometer. From all subjects,which included 22 healthy control subjects and 41 patients with influenza-like symptoms, a comparisonof temperature estimation is shown in Figure 10. Figure 10a shows the Bland–Altman plot oftemperature. The 95% limits of agreement ranged from -0.45 to 2.56 ºC (standard deviation σ = 0.77)and the RMSE was 1.30. Figure 10b shows the scatter plot; the Pearson correlation coefficient was 0.71.
Sensors 2020, 20, x FOR PEER REVIEW 12 of 16
Figure 9. Bland–Altman plots and scatter plots of RR obtained by infrared thermography (IRT) sensor
and respiratory effort belt. (a) Bland–Altman plot of nasal temperature change under the application
of FFT. (b) Bland–Altman plot of the proposed method applying nasal or oral signal selection using
SQI and MUSIC. (c) Scatter plot of nasal temperature change under FFT application. (d) Scatter plot
of the proposed method.
Facial temperature, which is estimated by ROI detection using sensor fusion, was also evaluated.
The ground truth of the temperature was measured using an electric thermometer. From all subjects,
which included 22 healthy control subjects and 41 patients with influenza-like symptoms, a
comparison of temperature estimation is shown in Figure 10. Figure 10(a) shows the Bland–Altman
plot of temperature. The 95% limits of agreement ranged from -0.45 to 2.56 ºC (standard deviation
𝜎 = 0.77) and the RMSE was 1.30. Figure 10(b) shows the scatter plot; the Pearson correlation
coefficient was 0.71.
Figure 10. Bland–Altman plots and scatter plots of body temperature obtained by IRT sensor and
electric thermometer. (a) Bland–Altman plot. (b) Scatter plot.
Figure 10. Bland–Altman plots and scatter plots of body temperature obtained by IRT sensor andelectric thermometer. (a) Bland–Altman plot. (b) Scatter plot.
Sensors 2020, 20, 2171 13 of 16
3.3. Classification of Healthy Control Subjects and Influenza Patients
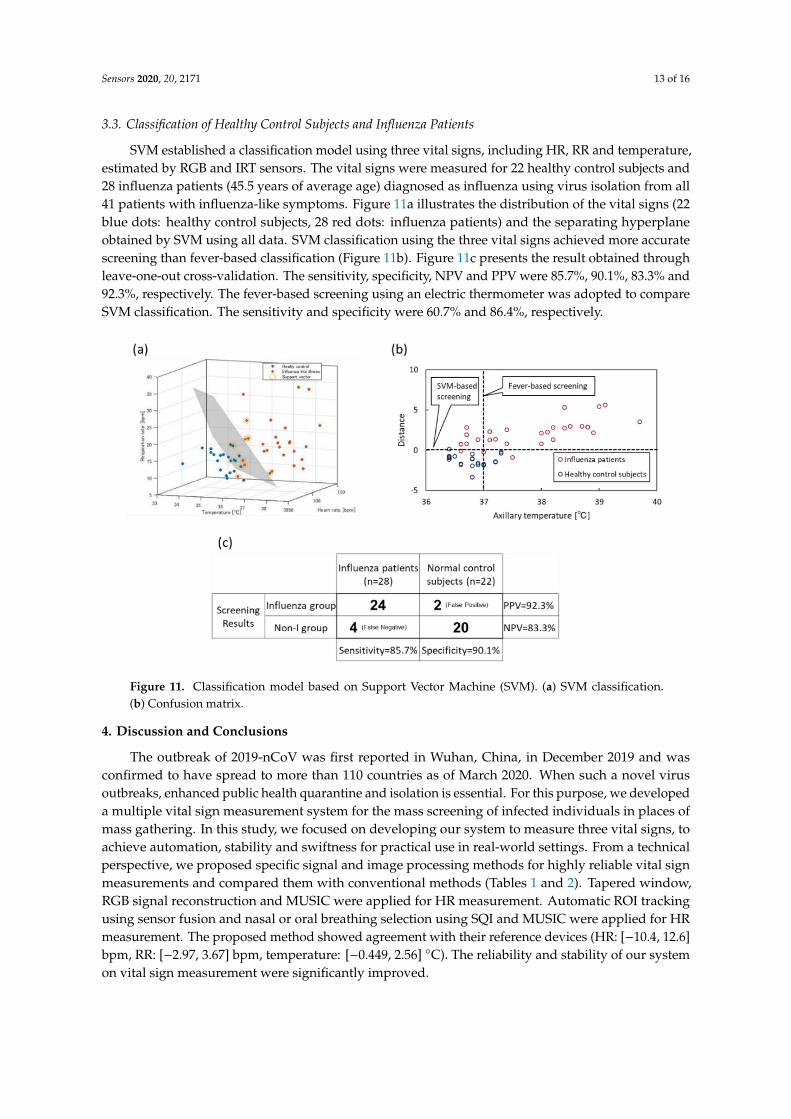
SVM established a classification model using three vital signs, including HR, RR and temperature,estimated by RGB and IRT sensors. The vital signs were measured for 22 healthy control subjects and28 influenza patients (45.5 years of average age) diagnosed as influenza using virus isolation from all41 patients with influenza-like symptoms. Figure 11a illustrates the distribution of the vital signs (22blue dots: healthy control subjects, 28 red dots: influenza patients) and the separating hyperplaneobtained by SVM using all data. SVM classification using the three vital signs achieved more accuratescreening than fever-based classification (Figure 11b). Figure 11c presents the result obtained throughleave-one-out cross-validation. The sensitivity, specificity, NPV and PPV were 85.7%, 90.1%, 83.3% and92.3%, respectively. The fever-based screening using an electric thermometer was adopted to compareSVM classification. The sensitivity and specificity were 60.7% and 86.4%, respectively.
Sensors 2020, 20, x FOR PEER REVIEW 13 of 16
3.3. Classification of Healthy Control Subjects and Influenza Patients
SVM established a classification model using three vital signs, including HR, RR and
temperature, estimated by RGB and IRT sensors. The vital signs were measured for 22 healthy control
subjects and 28 influenza patients (45.5 years of average age) diagnosed as influenza using virus
isolation from all 41 patients with influenza-like symptoms. Figure 11(a) illustrates the distribution
of the vital signs (22 blue dots: healthy control subjects, 28 red dots: influenza patients) and the
separating hyperplane obtained by SVM using all data. SVM classification using the three vital signs
achieved more accurate screening than fever-based classification (Figure 11(b)). Figure 11(c) presents
the result obtained through leave-one-out cross-validation. The sensitivity, specificity, NPV and PPV
were 85.7%, 90.1%, 83.3% and 92.3%, respectively. The fever-based screening using an electric
thermometer was adopted to compare SVM classification. The sensitivity and specificity were 60.7%
and 86.4%, respectively.
Figure 11. Classification model based on Support Vector Machine (SVM). (a) SVM classification. (b)
Confusion matrix.
4. Discussion and Conclusion
The outbreak of 2019-nCoV was first reported in Wuhan, China, in December 2019 and was
confirmed to have spread to more than 110 countries as of March 2020. When such a novel virus
outbreaks, enhanced public health quarantine and isolation is essential. For this purpose, we
developed a multiple vital sign measurement system for the mass screening of infected individuals
in places of mass gathering. In this study, we focused on developing our system to measure three
vital signs, to achieve automation, stability and swiftness for practical use in real-world settings. From
a technical perspective, we proposed specific signal and image processing methods for highly reliable
vital sign measurements and compared them with conventional methods (Tables 1 and 2). Tapered
window, RGB signal reconstruction and MUSIC were applied for HR measurement. Automatic ROI
tracking using sensor fusion and nasal or oral breathing selection using SQI and MUSIC were applied
for HR measurement. The proposed method showed agreement with their reference devices (HR:
[−10.4, 12.6] bpm, RR: [−2.97, 3.67] bpm, temperature: [−0.449, 2.56] °C). The reliability and stability
of our system on vital sign measurement were significantly improved.
Figure 11. Classification model based on Support Vector Machine (SVM). (a) SVM classification.(b) Confusion matrix.
4. Discussion and Conclusions
The outbreak of 2019-nCoV was first reported in Wuhan, China, in December 2019 and wasconfirmed to have spread to more than 110 countries as of March 2020. When such a novel virusoutbreaks, enhanced public health quarantine and isolation is essential. For this purpose, we developeda multiple vital sign measurement system for the mass screening of infected individuals in places ofmass gathering. In this study, we focused on developing our system to measure three vital signs, toachieve automation, stability and swiftness for practical use in real-world settings. From a technicalperspective, we proposed specific signal and image processing methods for highly reliable vital signmeasurements and compared them with conventional methods (Tables 1 and 2). Tapered window,RGB signal reconstruction and MUSIC were applied for HR measurement. Automatic ROI trackingusing sensor fusion and nasal or oral breathing selection using SQI and MUSIC were applied for HRmeasurement. The proposed method showed agreement with their reference devices (HR: [−10.4, 12.6]bpm, RR: [−2.97, 3.67] bpm, temperature: [−0.449, 2.56] ◦C). The reliability and stability of our systemon vital sign measurement were significantly improved.
Sensors 2020, 20, 2171 14 of 16
Table 1. Comparison of proposed RGB signal reconstruction method with conventional green tracemethod on HR measurement.
HR RMSE Bland–Altman Pearson Correlation
RGB signalreconstruction and
MUSIC5.93
The 95% limits ofagreement -10.4 to 12.6
bpm (σ = 5.85)0.87
Green trace alone andFFT 15.30
The 95% limits ofagreement -23.5 to 33.4
bpm (σ = 14.5)0.48
Table 2. Comparison of proposed Nasal/oral SQI method with conventional nasal alone method onRR measurement.
RR RMSE Bland–Altman Pearson Correlation
Nasal or oral SQI andMUSIC 1.73
The 95% limits ofagreement -2.97 to 3.67
bpm (σ = 1.68)0.89
Nasal and FFT 3.98The 95% limits of
agreement -7.60 to 7.99bpm (σ = 3.98)
0.53
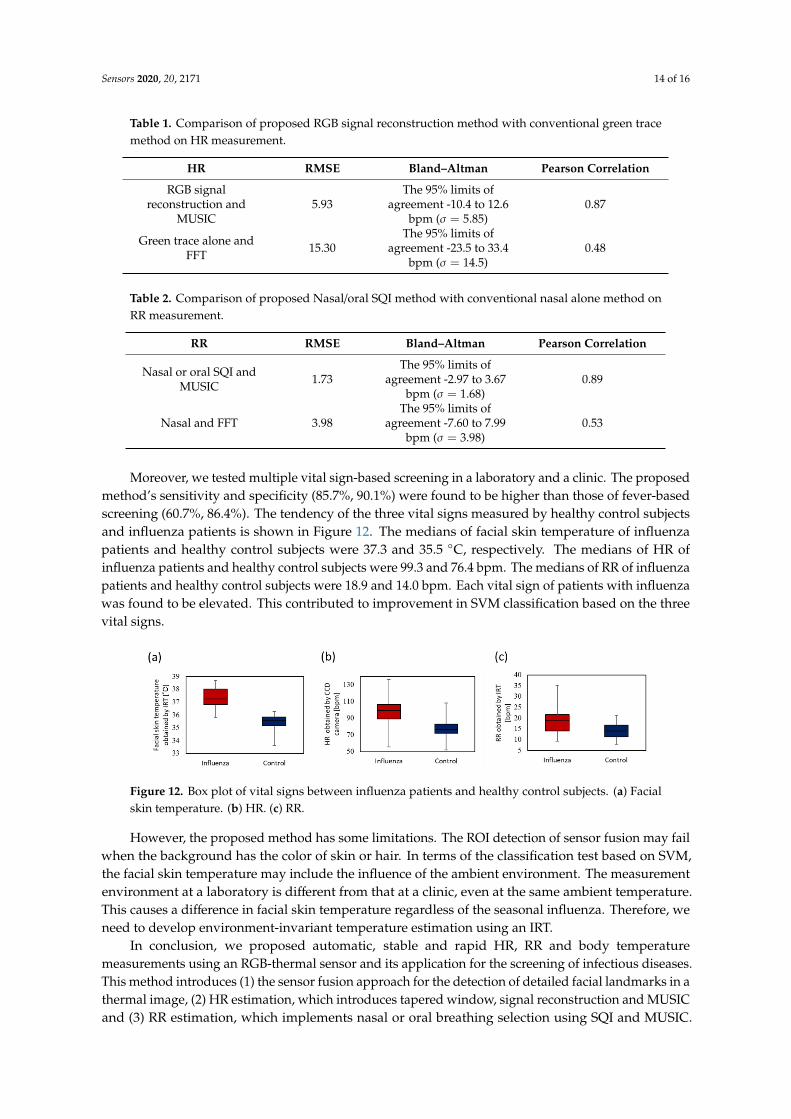
Moreover, we tested multiple vital sign-based screening in a laboratory and a clinic. The proposedmethod’s sensitivity and specificity (85.7%, 90.1%) were found to be higher than those of fever-basedscreening (60.7%, 86.4%). The tendency of the three vital signs measured by healthy control subjectsand influenza patients is shown in Figure 12. The medians of facial skin temperature of influenzapatients and healthy control subjects were 37.3 and 35.5 ◦C, respectively. The medians of HR ofinfluenza patients and healthy control subjects were 99.3 and 76.4 bpm. The medians of RR of influenzapatients and healthy control subjects were 18.9 and 14.0 bpm. Each vital sign of patients with influenzawas found to be elevated. This contributed to improvement in SVM classification based on the threevital signs.
Sensors 2020, 20, x FOR PEER REVIEW 14 of 16
Table 1. Comparison of proposed RGB signal reconstruction method with conventional green trace method
on HR measurement.
Table 2. Comparison of proposed Nasal/oral SQI method with conventional nasal alone method on
RR measurement.
Moreover, we tested multiple vital sign-based screening in a laboratory and a clinic. The
proposed method’s sensitivity and specificity (85.7%, 90.1%) were found to be higher than those of
fever-based screening (60.7%, 86.4%). The tendency of the three vital signs measured by healthy
control subjects and influenza patients is shown in Figure 12. The medians of facial skin temperature
of influenza patients and healthy control subjects were 37.3 and 35.5 °C, respectively. The medians of
HR of influenza patients and healthy control subjects were 99.3 and 76.4 bpm. The medians of RR of
influenza patients and healthy control subjects were 18.9 and 14.0 bpm. Each vital sign of patients
with influenza was found to be elevated. This contributed to improvement in SVM classification
based on the three vital signs.
Figure 12. Box plot of vital signs between influenza patients and healthy control subjects. (a) Facial
skin temperature. (b) HR. (c) RR.
However, the proposed method has some limitations. The ROI detection of sensor fusion may
fail when the background has the color of skin or hair. In terms of the classification test based on SVM,
the facial skin temperature may include the influence of the ambient environment. The measurement
environment at a laboratory is different from that at a clinic, even at the same ambient temperature.
This causes a difference in facial skin temperature regardless of the seasonal influenza. Therefore, we
need to develop environment-invariant temperature estimation using an IRT.
In conclusion, we proposed automatic, stable and rapid HR, RR and body temperature
measurements using an RGB-thermal sensor and its application for the screening of infectious
diseases. This method introduces (1) the sensor fusion approach for the detection of detailed facial
landmarks in a thermal image, (2) HR estimation, which introduces tapered window, signal
HR RMSE Bland–Altman Pearson Correlation
RGB signal reconstruction
and MUSIC 5.93
The 95% limits of
agreement -10.4 to
12.6 bpm (𝜎 = 5.85)
0.87
Green trace alone and FFT
15.30
The 95% limits of
agreement -23.5 to
33.4 bpm (𝜎 = 14.5)
0.48
RR RMSE Bland–Altman Pearson Correlation
Nasal or oral SQI and
MUSIC 1.73
The 95% limits of
agreement -2.97 to
3.67 bpm (𝜎 = 1.68)
0.89
Nasal and FFT
3.98
The 95% limits of
agreement -7.60 to
7.99 bpm (𝜎 = 3.98)
0.53
Figure 12. Box plot of vital signs between influenza patients and healthy control subjects. (a) Facialskin temperature. (b) HR. (c) RR.
However, the proposed method has some limitations. The ROI detection of sensor fusion may failwhen the background has the color of skin or hair. In terms of the classification test based on SVM,the facial skin temperature may include the influence of the ambient environment. The measurementenvironment at a laboratory is different from that at a clinic, even at the same ambient temperature.This causes a difference in facial skin temperature regardless of the seasonal influenza. Therefore, weneed to develop environment-invariant temperature estimation using an IRT.
In conclusion, we proposed automatic, stable and rapid HR, RR and body temperaturemeasurements using an RGB-thermal sensor and its application for the screening of infectious diseases.This method introduces (1) the sensor fusion approach for the detection of detailed facial landmarks in athermal image, (2) HR estimation, which introduces tapered window, signal reconstruction and MUSICand (3) RR estimation, which implements nasal or oral breathing selection using SQI and MUSIC.
Sensors 2020, 20, 2171 15 of 16
Moreover, we demonstrated a classification model based on SVM using healthy control subjects andpatients with seasonal influenza. The results indicate that the proposed method is indispensable forthe high performance of contactless multiple vital sign measurements for infection screening.
Author Contributions: Conceptualization, G.S., S.A. and T.M.; methodology, T.N., T.M., H.L., M.K., T.K. andG.S.; software, T.N., G.S.; validation, T.N., G.S., S.A. and T.M.; formal analysis, T.N., G.S.; investigation, G.S.;resources, G.S.; data curation, T.N., G.S., S.A.; writing—original draft preparation, T.N., G.S.; visualization, T.N.,G.S.; supervision, G.S.; project administration, G.S.; funding acquisition, G.S. All authors have read and agreed tothe published version of the manuscript.
Funding: This research was funded by in part by the JSPS KAKENHI Grant-in-Aid for Scientific Research (B)under Grant 19H02385, The Okawa Foundation for Information and Telecommunications and in part by theNational Science Foundation Program of China under Grant 61801149.
Conflicts of Interest: The authors declare no conflict of interest.
References
1. Parashar, U.D.; Anderson, L.J. Severe acute respiratory syndrome: Review and lessons of the 2003 outbreak.Int. J. Epidemiol. 2004, 33, 628–634. [CrossRef] [PubMed]
2. Hui, D.S.; IAzhar, E.; Madani, T.A.; Ntoumi, F.; Kock, R.; Dar, O.; Ippolito, G.; Mchugh, T.D.; Memish, Z.A.;Drosten, C.; et al. The continuing 2019-nCoV epidemic threat of novel coronaviruses to global health—Thelatest 2019 novel coronavirus outbreak in Wuhan, China. Int. J. Infect. Dis. 2020, 91, 264–266. [CrossRef][PubMed]
3. Ng, E.Y.; Kaw, G.J.; Chang, W.M. Analysis of IR thermal imager for mass blind fever screening. Microvasc.Res. 2004, 68, 104–109. [CrossRef] [PubMed]
4. Chiang, M.F.; Lin, P.W.; Lin, L.F.; Chiou, H.Y.; Chien, C.W.; Chu, S.F. Mass screening of suspected febrilepatients with remote-sensing infrared thermography: Alarm temperature and optimal distance. J. Formos.Med. Assoc. 2008, 107, 937–944. [CrossRef]
5. Sun, G.; Matsui, T.; Kirimoto, T.; Yao, Y.; Abe, S. Applications of infrared thermography for noncontact andnoninvasive mass screening of febrile international travelers at airport quarantine stations. In Application ofInfrared to Biomedical Sciences; Ng, E.Y.K., Etehadtavakol, M., Eds.; Springer: Singapore, 2017; pp. 347–358.
6. Nishiura, H.; Kamiya, K. Fever screening during the influenza (H1N1-2009) pandemic at Narita InternationalAirport, Japan. BMC Infect Dis. 2011, 11, 111. [CrossRef] [PubMed]
7. Bitar, D.; Goubar, A.; Desenclos, J.C. International travels and fever screening during epidemics: A literaturereview on the effectiveness and potential use of non-contact infrared thermometers. Eurosurveillance 2009, 12,19115.
8. Sun, G.; Matsui, T.; Hakozaki, Y.; Abe, S. An infectious disease/fever screening radar system which stratifieshigher-risk patients within ten seconds using a neural network and the fuzzy grouping method. J. Infect.2015, 70, 230–236. [CrossRef] [PubMed]
9. Yao, Y.; Sun, G.; Matsui, T.; Hakozaki, Y.; van Waasen, S.; Schiek, M. Multiple vital-sign-based infectionscreening outperforms thermography independent of the classification algorithm. IEEE Trans. Biomed. Eng.2016, 63, 1025–1033. [CrossRef] [PubMed]
10. Sun, G.; Nakayama, Y.; Dagdanpurev, S.; Abe, S.; Nishimura, H.; Kirimoto, T.; Matsui, T. Remote sensingof multiple vital signs using a CMOS camera-equipped infrared thermography system and its clinicalapplication in rapidly screening patients with suspected infectious diseases. Int. J. Infect. Dis. 2017, 55,113–117. [CrossRef] [PubMed]
11. Kaukonen, K.M.; Bailey, M.; Pilcher, D.; Cooper, D.J.; Bellomo, R. Systemic inflammatory response syndromecriteria in defining severe sepsis. N. Engl. J. Med. 2015, 372, 1629–1638. [CrossRef] [PubMed]
12. Sun, G.; Trung, N.V.; Matsui, T.; Ishibashi, K.; Kirimoto, T.; Furukawa, H.; Hoi, L.T.; Huyen, N.N.; Nguyen, Q.;Abe, S.; et al. Field evaluation of an infectious disease/fever screening radar system during the 2017 denguefever outbreak in Hanoi, Vietnam: A preliminary report. J. Infect. 2017, 75, 593–595. [CrossRef] [PubMed]
13. Negishi, T.; Sun, G.; Liu, H.; Sato, S.; Matsui, T.; Kirimoto, T. Stable contactless sensing of vital signs usingRGB-thermal image fusion system with facial tracking for infection screening. Conf. Proc. IEEE Eng. Med.Biol. Soc. 2018, 4371–4374. [CrossRef]
Sensors 2020, 20, 2171 16 of 16
14. Negishi, T.; Sun, G.; Sato, S.; Liu, H.; Matsui, T.; Abe, S.; Nishimura, H.; Kirimoto, T. Infection screeningsystem using thermography and CCD camera with good stability and swiftness for non-contact vital-signsmeasurement by feature matching and MUSIC algorithm. Conf. Proc. IEEE Eng. Med. Biol. Soc. 2019,3183–3186. [CrossRef]
15. Poh, M.Z.; McDuff, D.J.; Picard, R.W. Advancements in noncontact, multiparameter physiologicalmeasurements using a webcam. IEEE Trans. Biomed. Eng. 2011, 58, 7–11. [CrossRef] [PubMed]
16. Liu, H.; Ivanov, K.; Wang, Y.; Wang, L. A novel method based on two cameras for accurate estimation ofarterial oxygen saturation. BioMed. Eng. Online 2015, 14, 52. [CrossRef] [PubMed]
17. Newell, A.; Yang, K.; Deng, J. Stacked hourglass networks for human pose estimation. In Proceedings of theEuropean Conference on Computer Vision, Amsterdam, The Netherlands, 8–16 October 2016.
18. Liu, J.; Ding, H.; Shahroudy, A.; Duan, L.; Jiang, X.; Wang, G.; Kot, A. Feature boosting network for 3D poseestimation. IEEE Trans. Pattern Anal. Mach. Intell. 2016, 42, 494–501. [CrossRef] [PubMed]
19. Nibali, A.; He, Z.; Morgan, S.; Prendergast, L. 3D human pose estimation with 2D marginal heatmaps. InProceedings of the IEEE Winter Conference on Applications of Computer Vision (WACV), Waikoloa Village,HI, USA, 8–10 January 2019.
20. Kazemi, V.; Sulivan, J. One millisecond face alignment with an ensemble of regression trees. In Proceedingsof the IEEE Conference on Computer Vision and Pattern Recognition, Columbus, OH, USA, 23–28 June 2014.
21. Rother, C.; Kolmogorov, V.; Blake, A. “GrabCut”—Interactive foreground extraction using iterated graphcuts. In ACM Transactions on Graphics Siggraph; Association for Computing Machinery: New York, NY, USA,2004; pp. 309–314.
22. Rublee, E.; Rabaud, V.; Konolige, K.; Bradski, G. ORB: An efficient alternative to SIFT or SURF. InProceedings of the 2011 International Conference on Computer Vision, Barcelona, Spain, 6–13 November2011; pp. 2564–2571.
23. Raguram, R.; Chum, O.; Pollefeys, M.; Matas, J.; Frahm, J.M. USAC: A universal framework for randomsample consensus. IEEE Trans. Pattern Anal. Mach. Intel. 2012, 35, 2022–2038. [CrossRef] [PubMed]
24. Wang, W.; den Brinker, A.C.; de Haan, G. Single element remote-PPG. IEEE Trans. Biomed. Eng. 2018.[CrossRef] [PubMed]
25. Izuhara, Y.; Matsumoto, H.; Nagasaki, T.; Kanemitsu, Y.; Murase, K.; Ito, I.; Oguma, T.; Muro, S.; Asai, K.;Tabara, Y.; et al. Mouth breathing another risk factor for asthma: The Nagahama study. Eur. J. Allergy Clin.Immunol. 2016, 71, 1031–1036. [CrossRef] [PubMed]
26. Bland, J.M.; Altman, D.G. Statistical methods for assessing agreement between two methods of clinicalmeasurement. Lancet 1986, 1, 307–310. [CrossRef]
© 2020 by the authors. Licensee MDPI, Basel, Switzerland. This article is an open accessarticle distributed under the terms and conditions of the Creative Commons Attribution(CC BY) license (http://creativecommons.org/licenses/by/4.0/).