the effect of using estimate, read, respond, and
73
THE EFFECT OF USING ESTIMATE, READ, RESPOND, AND QUESTION (ERRQ) STRATEGY ON STUDENTS’ READING COMPREHENSION OF NARRATIVE TEXT OF THE SECOND YEAR AT SENIOR HIGH SCHOOL 1 KOTO KAMPAR HULU DISTRICT OF KAMPAR REGENCY By NURLELA ABBAS SIN. 10914005046 FACULTY OF EDUCATION AND TEACHER TRAINING STATE ISLAMIC UNIVERSITY OF SULTAN SYARIF KASIM RIAU PEKANBARU 1435 H/2013 M
-
Upload
khangminh22 -
Category
Documents
-
view
0 -
download
0
Transcript of the effect of using estimate, read, respond, and

THE EFFECT OF USING ESTIMATE, READ, RESPOND, AND
QUESTION (ERRQ) STRATEGY ON STUDENTS’ READING
COMPREHENSION OF NARRATIVE TEXT OF THE
SECOND YEAR AT SENIOR HIGH SCHOOL 1
KOTO KAMPAR HULU DISTRICT OF
KAMPAR REGENCY
By
NURLELA ABBAS
SIN. 10914005046
FACULTY OF EDUCATION AND TEACHER TRAINING
STATE ISLAMIC UNIVERSITY OF SULTAN SYARIF KASIM RIAU
PEKANBARU
1435 H/2013 M

1
CHAPTER I
INTRODUCTION
A. The Background of the Problem
Reading is one of four English skills that should be mastered
by all of the English learners. Reading is a language skill that needs
reader to comprehend a text . In reading process, the reader brings his
own meaning and experiences to obtain meaning from the printed text.
This idea is related to Brown’s ideas that says, “Reading is the most
important language skill that should be developed inside and outside
the classroom. It is also one of the most common ways to get
information. The ability to read ordinary texts is an additional crucial
skill that the students should master it”. 1 In addition, reading is the
ability to receive information, to get pleasure, to get main idea, and
sometimes we are expected to synthesize information from multiple
texts, or from a longer chapter or book, etc. So, everybody can
improve his or her knowledge and get pleasure.2
Senior High School 1 Koto Kampar Hulu is one of the
schools that is located in Tanjung Village of Koto Kampar Hulu
district in Kampar Regency. As a formal school, this school also
provides English subject that is taught twice a week with 40 minutes
1H. Douglas Brown, Teaching by Principles an Interactive Approach to Pedagog,(Englewood Cliffs, New Jersey: Prentice Hall, inc,1994) 217.
2Marianne Celce Murcia, Teaching English as a Second or Foreign Language, (Boston:Heinle & Heinle, 2001) 187.
1
2
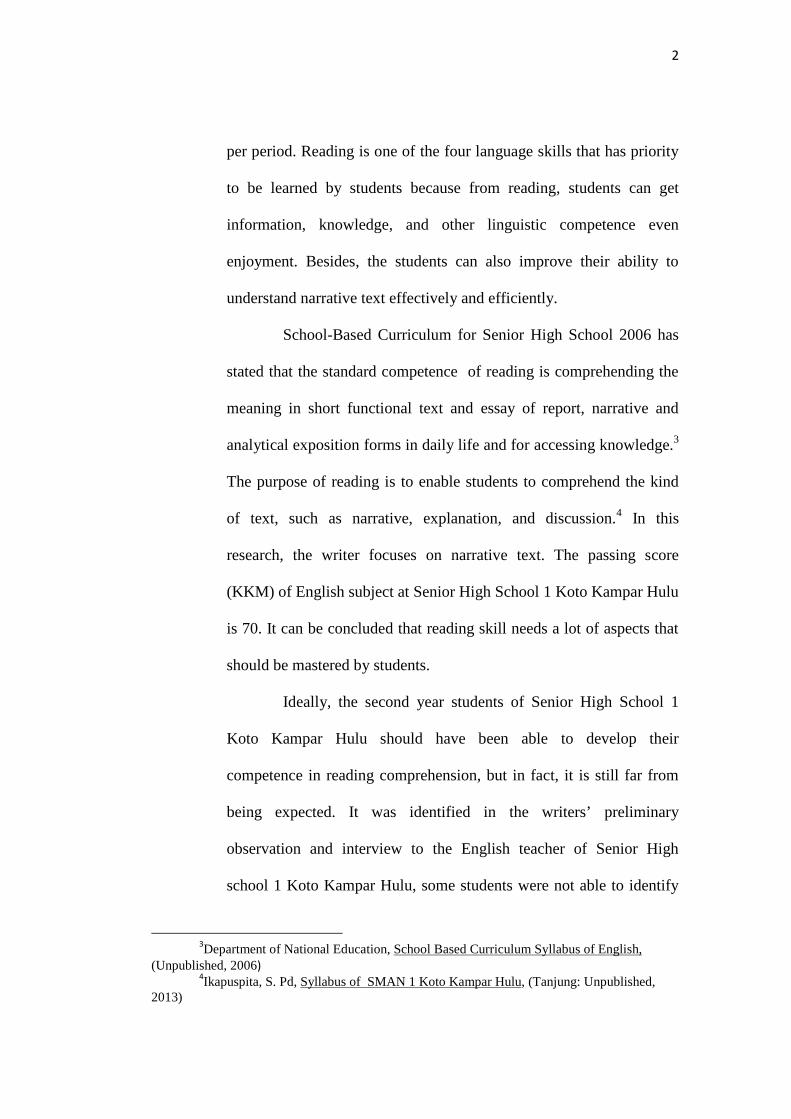
per period. Reading is one of the four language skills that has priority
to be learned by students because from reading, students can get
information, knowledge, and other linguistic competence even
enjoyment. Besides, the students can also improve their ability to
understand narrative text effectively and efficiently.
School-Based Curriculum for Senior High School 2006 has
stated that the standard competence of reading is comprehending the
meaning in short functional text and essay of report, narrative and
analytical exposition forms in daily life and for accessing knowledge.3
The purpose of reading is to enable students to comprehend the kind
of text, such as narrative, explanation, and discussion.4 In this
research, the writer focuses on narrative text. The passing score
(KKM) of English subject at Senior High School 1 Koto Kampar Hulu
is 70. It can be concluded that reading skill needs a lot of aspects that
should be mastered by students.
Ideally, the second year students of Senior High School 1
Koto Kampar Hulu should have been able to develop their
competence in reading comprehension, but in fact, it is still far from
being expected. It was identified in the writers’ preliminary
observation and interview to the English teacher of Senior High
school 1 Koto Kampar Hulu, some students were not able to identify
3Department of National Education, School Based Curriculum Syllabus of English,(Unpublished, 2006)
4Ikapuspita, S. Pd, Syllabus of SMAN 1 Koto Kampar Hulu, (Tanjung: Unpublished,2013)

3
the generic structure and language feature of narrative text. And some
of them were not interested in reading narrative text. The strategy
used by the English teacher in this school was Comprehension-Based
Approach. The strategy used by the teacher made the students bored
and some of them were not interested in reading. Senior High School
1 Koto Kampar Hulu uses School-Based Curriculum in the Teaching
and learning of English. A lot of efforts to increase students’
competences in English, but they seem not to perform their English
proficiency as directed in the curriculum. As a result they still get low
score in reading.
Based on the explanation above, some of the students still
face various problems and difficulties in English, especially reading
comprehension. Difficulties are itemized in the following symptoms:
1. Some of the students are not able to identify the generic
structure of narrative text.
2. Some of the students are not able to identify language features
of narrative text.
3. Some of the students are not able to identify the topic of the
text.
4. Some of the students are not able to identify inference of
narrative text.
5. Some of the students are not able to identify characters and
place of narrative text.

4
Therefore, to solve this problem, it needs a suitable strategy
to enhance students’ reading comprehension on narrative text. One of
the strategy that can help students to comprehend a reading text is
called Estimate, Read, Respond, and Question (ERRQ) Strategy. The
ERRQ Strategy helps the students to organize information and give
the teacher a way to understand the students’ comprehension.
According to David, Estimate, Read, Respond, and Question (ERRQ)
is a reading strategy that involves students’ questioning of text to gain
meaning.5 In this case, the writer is interested in applying estimate,
read, respond, and question (ERRQ) strategy to help students in
comprehending narrative text in reading. Finally, the writer would like
to conduct a research entitled: The Effect of Using Estimate, Read,
Respond, and Question (ERRQ) Strategy on Students’ Reading
Comprehension of Narrative Text of the Second Year at Senior
High School 1 Koto Kampar Hulu District of Kampar Regency.
B. The Problems
Based on the background illustrated above, it is very clear that the
students still have a lot of problems, especially in term of
comprehending narrative text of reading.
1. The Identification of the Problems
5David C. Anchin Center, Learning strategies Resources Guide, (Florida: Litton/PRC,inc,
1995) 24.

5
Based on the background and the problems explained above, it
is clear that most of the second year students of Senior High School 1
Koto Kampar Hulu still get difficulties in comprehending narrative
text.
To make it clear, the problems in this research can be
identified as follows:
1. What factors make the students unable to identify the
generic structure of narrative text?
2. What factors make the students unable to identify
language features of narrative text?
3. What factors make the students unable to identify the
topic of the text?
4. What factors cause the students unable to identify
inference of narrative text?
5. What factors cause the students unable to identify
characters and place of narrative text?
2. The Limitation of the Problems
Considering limited time, finance, and the writer’s capabilities
in conducting a scientific research, it is necessary to limit the students’
problems in identifying the generic structure, language features, topic,
inference, characters, plot, code, and settings in the narrative text and
teachers’ problem in previous strategy to use estimate, read, respond,

6
and question (ERRQ) strategy to toward students’ reading
comprehension on narrative text of the second year at Senior High
School 1 Koto Kampar Hulu
3. The Formulation of the Problems
Based on the limitation of the problems stated above, the
problems of this research are formulated as in the following research
questions:
a. How is the students’ reading comprehension on narrative text
taught by using estimate, read, respond, and question (ERRQ)
strategy of the second year at Senior High School 1 Koto Kampar
Hulu District of Kampar Regency?
b. How is the students’ reading comprehension on narrative text
taught without using estimate, read, respond, and question (ERRQ)
Strategy of the second year at Senior High School 1 Koto Kampar
Hulu District of Kampar Regency?
c. Is there any significant difference of the students’ reading
comprehension on narrative text taught by using estimate, read,
respond, and question (ERRQ) Strategy and those taught by using
conventional strategy at Senior High School 1 Koto Kampar Hulu
Dictrict of Kampar Regency?
C. The Objectives and Significance of the Research

7
1. The Objectives of the Research
The objectives of the study on the student’s reading
comprehension by using estimate, read, respond, and question
(ERRQ) strategy are;
a) To find out the information about students’ reading
comprehension on narrative text of the second year at Senior
High School 1 Koto Kampar Hulu before treatment was given
to both experimental and control classes.
b) To find out the information about students’ reading
comprehension on narrative text of the second year at Senior
High School 1 Koto Kampar Hulu after treatment was given to
both experimental and control classes.
c) To find out whether there is any significant difference of using
estimate, read, respond, and question (ERRQ) strategy toward
students’ reading comprehension on narrative text of the
second year at Senior High School 1 Koto Kampar Hulu or
not.
2. The Significance of the Research
Related to the objectives of the research above, the significance
of the research is as follows:
a) To give some information to the teachers about the effect of
using estimate, read, respond, and question (ERRQ) strategy
toward students’ reading comprehension on narrative text.

8
b) To give contribute some information about strategy to
comprehend reading text in the form narrative.
c) To fulfill one of the requirements to finish the writers’ study in
English Education Department of Sultan Syarif Kasim Riau
D. The Definition of the Terms
a. Estimate, Read, Respond, and Question (ERRQ) is a reading
strategy that involves students’ questioning of text to gain
meaning. Students estimate how far they can read with
understanding in reading and then read that portion. They
respond the information by reacting it and forming a question
about it.
b. Reading comprehension
Reading comprehension is the ability to take information from
narrative written text and do something with it in a way that
demonstrates knowledge or understanding of that information. It
means that, reading comprehension is the ability of the reader to
take the information and knowledge from narrative written text.
In this case, the writer used literal comprehension. Literal
comprehension is reading in order to understand, remember, or
recall the information explicitly in a narrative passage. In this
study, reading comprehension is the way for the students to
understand and remember the information presented in the
narrative text.
9
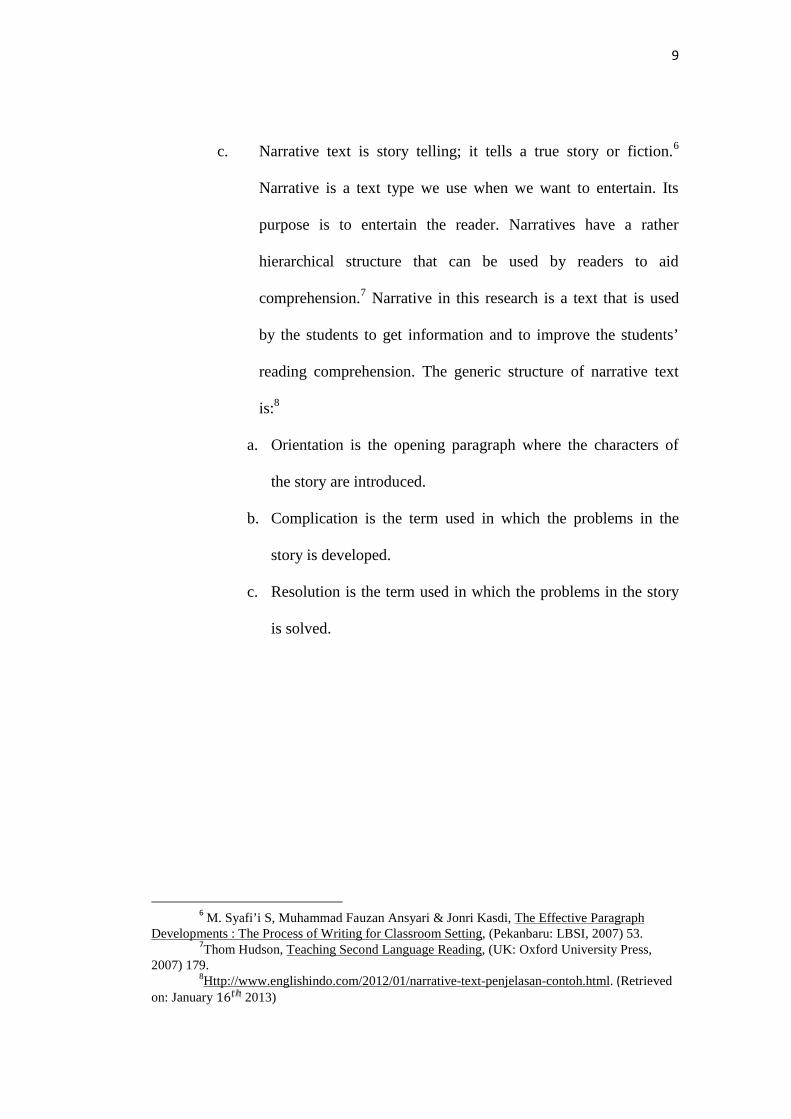
c. Narrative text is story telling; it tells a true story or fiction.6
Narrative is a text type we use when we want to entertain. Its
purpose is to entertain the reader. Narratives have a rather
hierarchical structure that can be used by readers to aid
comprehension.7 Narrative in this research is a text that is used
by the students to get information and to improve the students’
reading comprehension. The generic structure of narrative text
is:8
a. Orientation is the opening paragraph where the characters of
the story are introduced.
b. Complication is the term used in which the problems in the
story is developed.
c. Resolution is the term used in which the problems in the story
is solved.
6 M. Syafi’i S, Muhammad Fauzan Ansyari & Jonri Kasdi, The Effective ParagraphDevelopments : The Process of Writing for Classroom Setting, (Pekanbaru: LBSI, 2007) 53.
7Thom Hudson, Teaching Second Language Reading, (UK: Oxford University Press,2007) 179.
8Http://www.englishindo.com/2012/01/narrative-text-penjelasan-contoh.html. (Retrievedon: January 16 2013)

10
CHAPTER II
REVIEW OF LITERATURE
A. The Review of Related Theory
1. The Nature of Reading Comprehension
Reading is one of the important language skills. Reading is
a way to get information and knowledge. Almost every aspect in
our life is covered by reading. Every day, we read books,
magazines, advertisements, etc. to get information from a book, we
need to comprehend it well. Andrew states “reading is practice of
using text to create meaning.”9 It means that when we cannot
create the meaning, the reading will not happen. Brown also states
“Learning a foreign language is long and complex undertaking.”10
It means that we must have high motivation and work hard to
achieve it.
Reading is important activity. Students get many benefits
from reading. Reading is not only a source of information and
pleasure activity but also as a means of consolidating and
extending one’s knowledge of language. I.S.P. nation says that
reading is a source of learning and a source of enjoyment.11
Reading can help learners learn new vocabulary and grammar.
9P. Johnson Andrew, Teaching Reading and Writing, (New York: Rowman andLittlefield Education, 2008) 3.
10H. Douglas Brown, Principle of Language Learning and Teaching, Fourth Edition,(New York: Addison Wesley Longman, Inc, 2000) 1.
11I.S.P. Nation, Teaching ESL/EFL Reading and Writing, (New York: Routledge, 2009)49.

11
Reading can also be a source for enjoyment and a way of gaining
information in the world. According to Nunan reading is an
interactive process in which the reader engages idea with an author
via text.12 It means that the reader can use reading to learn and to
gain information from the world around them.
As the explained above, reading can be easier to do if we
do it as a pleasure activity. Reading is a process. Hasibuan and
Ansyari says that reading is interactive process that goes on
between the reader and the text, resulting comprehension.13
According to Nunan, reading is a fluent process of readers in
combining information from a text and their own background
knowledge to build meaning. 14 It means that we can build meaning
of the text if we are combining our background knowledge and
information from the text.
According to Patel and Jain, there are four types of reading,
they are:15
1. Intensive reading
2. Extensive reading
3. Aloud reading
4. Silent reading
12David Nunan, Designing Task for the Communicative Classroom, (Cambridge :Cambridge University press, 1989) 12.
13Kalayo Hasibuan and Muhammad Fauzan Ansyari, Teaching English as a ForeignLanguage (TEFL), (Pekanbaru: Alaf Riau Graha UNRI Press, 2007) 114.
14DavidNunan, Practical English Language Teaching, (Sydney: McGraw Hill, 2003) 68.15 M.F. Patel and Prevenm Jain, English Language Teaching : method, tool, and
teachnique, (Sunriceplubisher: Jaipur, 2008) 117.

12
Based on the four types of reading above, the writer
concerns is to discuss the intensive reading because this is relevant
in this study. Intensive reading is related to further progress in
language learning under the teacher’s guidance. Intensive reading
is reading a text or a passage in which learner reads the text to get
information.
The aim of reading is comprehension. Comprehension is
the center of reading.16 Comprehension is important part of
reading. To get information in reading, students need
comprehension. Students cannot get the meaning of the text if the
text is not comprehended by them. Comprehension is a process,
not a product. Readers filter understanding through the lens of
their motivation, knowledge, cognitive abilities, and experiences.17
Effective readers have a purpose for reading, and use their
background knowledge and experiences to relate to the text:
We do not comprehend unless we draw connections between
what we read and our background knowledge. Words have to be
proceeded at the “thinking” level before comprehension can take
place.The following four important factors that influence
reading comprehension are: Command of the linguistic structure
of the text, Adequate vocabulary in the content area, Degree of
16Karen Tankersley, The Thread of Reading Strategies for Literacy Development, (Unitedstated of America: ASCD, 2003) 90.
17Karen Tankersley, Literacy Strategies for Grades 4-12: Reinforcing the Threads ofReading, (Alexandria, Virginia USA: ASCD, 2005) 108.

13
metacognitive control of the text, and Adequate domain
knowledge.
Next, Reading comprehension is a multicomponent,
highly complex process that involves many interactions
between readers and what they bring to the text (previous
knowledge, strategy used) as well as variables related to the text
itself (interest in text, understanding of text types).18 It means that
Reading comprehension involves much more than readers’
responses to text. Furthermore, Reading comprehension refers to
reading for meaning, understanding, and entertainment.19 It means
that reading not only reads, but also gets meaning, understanding,
and entertainment. Different types of reading comprehension are
often distinguished, according to the readers’ purposes in reading
and the type of reading used. The following are commonly referred
to: 20
1. Literal comprehension: reading in order to understand,
remember, or recall the information explicitly contained in
a passage.
2. Inferential comprehension: reading in order to find
information which is not explicitly stated in a passage,
18Janette K. Klingner, et al, What Works for Special-Needs Learners: Teaching ReadingComprehension to Students with Learning Difficulties, (New York: the Guildford Press, 2007) 8.
19Caroline T. Linse, Practical English Language Teaching: Young Learners, (New York:The McGraw Hill Companies, Inc, 2005) 71.
20Jack C Richards, et al, Longman Dictionary of Language Teaching and AppliedLinguistics, (Edinburgh Gate: person Education Limite, 1992) 306-307.
14
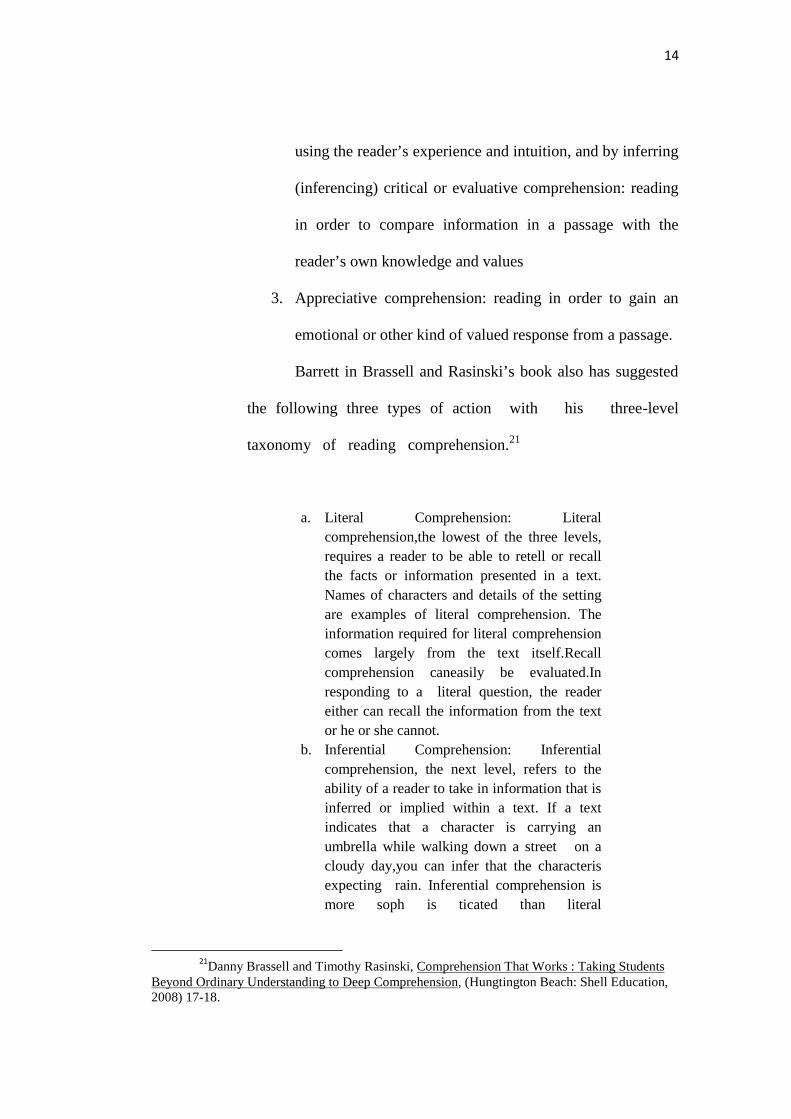
using the reader’s experience and intuition, and by inferring
(inferencing) critical or evaluative comprehension: reading
in order to compare information in a passage with the
reader’s own knowledge and values
3. Appreciative comprehension: reading in order to gain an
emotional or other kind of valued response from a passage.
Barrett in Brassell and Rasinski’s book also has suggested
the following three types of action with his three-level
taxonomy of reading comprehension.21
a. Literal Comprehension: Literalcomprehension,the lowest of the three levels,requires a reader to be able to retell or recallthe facts or information presented in a text.Names of characters and details of the settingare examples of literal comprehension. Theinformation required for literal comprehensioncomes largely from the text itself.Recallcomprehension caneasily be evaluated.Inresponding to a literal question, the readereither can recall the information from the textor he or she cannot.
b. Inferential Comprehension: Inferentialcomprehension, the next level, refers to theability of a reader to take in information that isinferred or implied within a text. If a textindicates that a character is carrying anumbrella while walking down a street on acloudy day,you can infer that the characterisexpecting rain. Inferential comprehension ismore soph is ticated than literal
21Danny Brassell and Timothy Rasinski, Comprehension That Works : Taking StudentsBeyond Ordinary Understanding to Deep Comprehension, (Hungtington Beach: Shell Education,2008) 17-18.

15
comprehension because it requires theorchestration and manipulation of information
from the text as well as information thatresides within the readers—their backgroundknowledge.
c. Critical Comprehension: Critical or evaluativecomprehension, the third and highest level inthe taxonomy, involves making criticaljudgments about the information presented inthe text. Were the characters reputable andhonest in their actions? Did the selection offerthe reader new information,new insights,oradded enjoyment? Were the charactersauthentic? Was the literary qualityof the texthigh? Answers to such questions require ahigh level of interaction between informationfrom the text, the reader, perhaps otherpeople with whom the reader has interacted,or even other texts the reader has read.Moreover,in-depth analysis and criticalthinking are necessary to make informedjudgments and evaluations. Because responsesto inferential and critical-level questions arehighly dependent on the reader’s ownbackground, interest, and disposition,determining a reader’s level and the quality ofa reader’s inferential and criticalcomprehension is not easy.
In conclusion, three type levels of comprehension are
important to the students in comprehending the text. In literal
comprehension, a reader is able to retell or recall the facts or
information presented in a text. Meanwhile, inferential and critical
are highly dependent in the reader’s own background, interest, and
disposition, so a focus on inferential and critical comprehension is
appropriate. And based on the writer’s opinion, the three type
levels of comprehension above are important to develop students’
reading comprehension on narrative text.

16
Dorn and Soffos also says “comprehension is a
complex regulated by cognitive, emotional, perceptual and social
experiments.” It means that comprehension is not easy to get, but
we need some factors to comprehend a text such as cognitive,
emotion, perceptual, and social experience.
Moreover, Reading comprehension is the ability to take
information from written text and do something with it in a way
that demonstrates knowledge or understanding of that
information.22Comprehension occurs when a reader is able to act
on, respond to, or transform the information that is presented in
written text in ways that demonstrate understanding. The following
examples illustrate how readers can show they understand
what they read. When a reader is able to engage in an intelligent
discussion about a text with others, the reader is demonstrating
comprehension of the passage. When a reader is able to relate text
to real events, the reader is demonstrating comprehension. When a
reader is able to apply information from a text to a new situation,
such as fixing an automobile, the reader is demonstrating
comprehension. When a reader is able to transform a narrative
story into a poem, play, newspaper article, critical review,
insightful essay,entertaining advertisement,visual image, musical
score,or dance movement, the reader is demonstrating a
sophisticated level of understanding of text.
22Danny Brassell and Timothy Rasinski, Op. Cit., P.18

17
In English learning, there are some kinds of texts that are
taught to the students of Senior High School level. They are
narrative, recount, procedure, and analytical expository. Narrative
text is story telling; it tells a true story or fiction.23 Narrative text
tells an imaginative story. Narrative text is not fact but only fiction
story. This text is one of the text types learned by students in every
education level, starting from high schools until university levels.
The main purpose of narrative is to entertain and engage the reader
in an imaginative experience.
2. Estimate, Read, Respond, and Question (ERRQ) Strategy in
Teaching Reading Comprehension
a. The Definition of Estimate, Read, Respond, and Question
(ERRQ) Strategy
Estimate, read, respond, and question (ERRQ) strategy is
a comprehension strategy that we learn in reading. This
strategy helps students organize what they know and what they
have learned from the text. Students have to estimate how far
they can read and still remember, they read the selected number
of paragraphs, and review by writing a note or retelling to a
friend, and then write a question based on what they read or
23M. Syafi’i S, Muhammad Fauzan Ansyari & Jonri Kasdi, The Effective ParagraphDevelopments : The Process of Writing for Classroom Setting, (Pekanbaru: LBSI, 2007) 53.

18
want to know. Moreover, Estimate, read, Respond, and
question (ERRQ) strategy can be used with any classroom at
any grade level. This strategy helps students support reading
comprehension, strengthen student engagement, and also help
learners as they construct meaning.24
According to David, Estimate, Read, Respond, and
Question (ERRQ) is a strategy that involves students’
questioning of text to gain meaning and allows for students to
decide how far they can read with understandingand then read
that portion. They respond the information by reacting it and
forming a question about it.25 this strategy will involve a
variety of text choices. Joyner says that Estimate, Read,
Respond, and Question (ERRQ) is a comprehension strategy
that we learned in Reading. Students have to Estimate how far
they can read and still remember, Read the selected number of
paragraphs, Review by writing a note or retelling to a friend,
and then write a Question based on what they read or want to
know.26 Nurhayati also says that estimate, read, respond, and
24Harry K and Rosemary, Teaching Strategies, Tips and Ideas, (Retrieved on: April 242013)
25David C. Anchin Center, Loc. Cit. 2426Debbie Joyner, Provide Students with Strategies for Independent Learning, (Retrieved
on: January 16 2013)

19
question (ERRQ) Strategy is the best strategy to guide the
students in comprehending the texts.27
In teaching reading , the teacher should use many
strategies to make teaching reading interesting. Because the
aim of reading is comprehension, in teaching reading
comprehension needs the strategies to gain the level of reading
comprehension itself. Reader needs to use a strategy in order to
make them easy to get the meaning of the text. In this case, the
writer suggests a good strategy to make the students understand
about the text, especially on narrative text. The name of this
strategy is estimate, read, respond, and question (ERRQ)
strategy.
Strategies are especially important for language
learning because they are tools for active, self-directed
involvement, which is essential for developing communicative
competence.28Furthermore, learning strategies are specific
actions taken by the learner to make learning easier, faster,
more enjoyable, more self-directed, more effective, and more
transferrable to new situations.29According to Rebecca,
strategies are divided into two major classes: direct and
27Nurhayati, Teaching Reading Comprehension to the Tenth Grade Students of the
Islamic Senior High School 3 Palembang by Using ERRQ, (Retrieved on: January 16 2013)28Rebecca. L. Oxford, Language Learning Strategies, (New York: NewBury House
Publisher, 1991) 1.29Ibid, 8.

20
indirect. These two classes are subdivided into a total of six
groups (memory, cognitive and compensation under the direct
class; metacognitive, affective and social under the indirect
class).30
Direct strategies are language learning strategies that
directly involve the target language.31 Direct strategies for
dealing with the new language, are like the performer in a stage
play, working with the language itself in a variety of specific
tasks and situation. The direct class is composed of memory
strategies for remembering and retrieving new information,
cognitive strategies for understanding and producing the
language, and compensation strategies for using the language
despite knowledge gaps.32Indirect strategies for general
management of learning. This class is made up of
metacognitive strategies for coordinating the learning process,
affective strategies for regulating emotions, and social
strategies for learning with others.33
Related to estimate, read, respond, and question
(ERRQ) strategy, it includes to compensation strategies of
direct class. Because, compensation strategies enable learners
to use the new language for either comprehension or
30Ibid, 1431Ibid, 3732Ibid, 1433Ibid, 15

21
production despite limitations in knowledge. In addition,
compensation strategies, like getting help and coining words,
may lead learners to gain new information about what is
appropriate or permissible in the target language.34
Next, The basic purpose of estimate. Read, respond, and
question (ERRQ) strategy is to get the reader to link what
he/she has with new information. Estimate, read, respond, and
question (ERRQ) might be useful for reading any kind of
text.35It means that estimate, read, respond, and question
(ERRQ) strategy is suitable for comprehending the narrative
text. Estimate, read, respond, and question (ERRQ) strategy is
designed to help students link new information to their own
experiences.36When students formulate questions, they have to
think about what they know in a different context.
Furthermore, the benefits of estimate, read, respond,
and question (ERRQ) strategy are the question help the
students to organize information and give the teacher a way to
understand the reader’s comprehension.37The teacher may
need to demonstrate different types of questions and
discuss the appropriateness of each in accessing
information.The estimate, read, respond, and question (ERRQ)
34Ibid, 4335M Ashraf Rizvi, Effective Technical Communication, (India: Tata McGraw-Hill
Education, 2005) 253.36David C. Anchin Center, Loc. Cit.37Ibid.

22
strategy helps to make questions and to combine one's own
knowledge to the knowledge in the text.38
b. The Procedures of Estimate, Read, Respond, and Question
(ERRQ) Strategy
Estimate, Read, Respond, and Question (ERRQ) is a
reading strategy that involves students’ questioning of text to
gain meaning. The procedures of estimate, read, respond, and
question (ERRQ) strategy are:39
1. The teacher explains that estimate, read, respond, and
question (ERRQ) stands for estimate, read, respond, and
question. After a text has been chosen and distributed, the
teacher demonstrates the process.
2. Estimate. Students look over the text and estimate how far
they can read and maintain understanding. They identify
the text portions with a light pencil mark.
3. Read. Students read the text silently, orally, or with a
partner in paired reading. They are urged to consider how
the text affects them. What images come to mind as they
read? Does the text remind them of anything from their
experience?
38Verkostovatti, Reading Techniques, 2006. (Retrieved on: January 16 2013)39David C. Anchin Center, Loc. Cit.

23
4. Respond. After reading, students react. What comes to
mind as they read? What images or feelings are evoked? If
students are working with partners, they share oral and
retell with their partners. If students are working
individually, they retell everything they can remember to
themselves or write their responses down for future
reference.
5. Question.Students generate questions about the reading. If
students have marked the text by paragraphs or smaller
portions of text, they may create questions about each of
the marked portions, or they may ask general questions
about the whole pieces. The teacher may collect the
questions for evaluation purposes.
As stated by Rizvi, ERRQ strategy has four stages, those
are estimate, read, respond, and question.40
1. Estimate : estimate what the text will be like. Rapid reading
techniques may be used for this purpose
2. Read : read the text carefully and thoroughly
3. Respond : respond to the text
4. Question: question things about the text and analyze
responses to it
40M. Ashraf Rizvi., Loc. Cit.

24
Based on the various procedures that were written by many
resources above, the writer adapts these procedures into her own
teaching procedures to meet the characteristic of students in
Indonesia. The steps of ERRQ strategy are as follows:
1. The teacher explains that ERRQ stands for estimate,
read, respond, and question.
2. The teacher chooses and distributes the narrative text,
and demonstrates the process.
3. The teacher asks students to look over thetext and
estimate how far they can read the text and maintain
understanding
4. The teacher asks students to identify the text portions
with a light pencil mark
5. The teacher asks students to read the text silently,
orally, or with a partner in paired reading
6. Respond.After reading, the teacher asks students to
work with partners, they share oral and retell with their
partner
7. The teacher asks Students to generate questions about
the reading
8. The teacher collects the questions from the students for
evaluation purposes

25
Based on eight steps of estimate, read, respond, and
question (ERRQ) strategy above, the writer concludes that
estimate. Read, respond, and question (ERRQ) strategy is
the best strategy in teaching reading, especially in teaching
reading comprehension. Because, the students will be able
to develop their comprehension in reading by using this
strategy.
c. The Nature of Narrative Text
Narrative text is story telling; it tells a true story or
fiction.41 Narrative text tells an imaginative story. Narrative
text is not fact but only fiction story. The purpose of narrative
text is to entertain the reader. According Thomas S. Kane, A
narrative is a meaningful sequence of events told in words.42
Type of narrative text is folktales, fairytales, fable, myth,
legend, science fiction, short story, ballads.
The generic structures of narrative text:
a. Orientation: it is about the opening paragraph where the
characters of the story are introduced.
b. Complication: where the problems in the story
developed.
c. Resolution: where the problems in the story is solved
41M. syafi’i S M. Fauzan Ansyari & Jonry Kasdi, Loc. Cit.42Thomas S. Kane, The Oxford Essential Guide to Writing, (Berkley Books: New York,
2000) 366.

26
Language feature of narrative text are:
a. Specific participants
b. Past tense form; describe thing that happen in the past
c. Word giving details of people; such as adjective and
adverb
d. Connectors of form, such as last week, then.
Meanwhile, the content of a narrative is usually more
familiar. Most researchers on narrative text have focused on
teaching students to utilize story structure as an organizing
framework for understanding critical aspects of the stories they
read. Narrative is stories about past event. In general meaning,
narrative text is to amuse the readers/listeners with actual or
imaginary experince in different ways. All narrative story do in
the past and has happy ending. As mentioned by Kane, A
narrative is a meaningful sequence of events told in words. It is
sequential in that the events are ordered, not merely random.
Sequence always involves an arrangement in time (and usually
other arrangements as well). A straightforward movement is
from the first event to the last constitutes the simplest
chronology. However, chronology is sometimes complicated
by presenting the events in another order : for example, a story

27
may open with the final episode and then flash back
to all that precedes it.43
Therefore, Stories can be very long and complicated,
with many characters, elaborate plots, and subtle
interpenetration of character, action, and setting.44 Many things
of narrative that should be known by the English teacher.
Because, it is crucial for the teacher in order to make the
students easily to understand the content of narrative text for
example to know the generic structure, language feature, main
idea, characters of the story in narrative text, plot, setting, code,
and so on. In teaching narrative text, the teacher should know
what indicators that could make the students easily in
comprehending narrative text in reading. Moreover, at the
second year of Senior High School 1 Koto Kampar Hulu ,
narrative text taught is to get the competence. Here, there are
some indicators to get the competence in this school, they are:
identify the topic of the narrative text, identify the meaning of
narrative text, determine the complication of narrative text,
identify the event of narrative text, and the last is to determine
the plot of narrative text.
43Thomas S. Kane, Loc. Cit., P. 36644Ibid., P. 367
28
B. The Relevant Research
According to Syafi’i, a relevant research is required to
observe some previous researches conducted by other researchers
in which they are relevant to the research you are conducting.45 In
this case, there is one writer concerning ERRQ Strategy. A
research from Septiani (2013), entitled “A pre experimental study
in teaching inference from spoof text by using errq reading
strategy”. She conducted this study in SMA SANTUN UNTAN .
The study was a pre experimental design. The sample of her
research was grade- XI IPA in SMA SANTUN UNTAN that
consisted of thirty students. She collected the data by using a
multiple choice test and analyzed by t-test and size effect formula.
And for the result, She found that the use of ERRQ reading
strategy increase students’ ability in inference-making significantly
and the level of the effectiveness is classified as high.46
C. The Operational Concept
In carrying out this research, it will be necessary to clarify the
variable used in analyzing the data. There are two variables in this
research, they are independent variable (X) and dependent variable
45M. Syafi’i. S, From Paragraph to a Research Report : A Writing of English forAcademic Purposes, (Pekanbaru: LBSI, 2007) 122.
46Septiani, A Pre Experimental Study in Teaching Inference froms spoof Text by UsingERRQ Reading Strategy, 2013.(Retrieved on: June 29 2013)

29
(Y). variable X is the effect of using ERRQ strategy. Variable Y is
students’ reading comprehension.
1. The indicator of variable X ( the effect of using ERRQ
strategy) :
a. The teacher explains that ERRQ stands for estimate, read,
respond, andquestion.
b. The teacher chooses and distributes the narrative text, and
demonstrates the process.
c. The teacher asks students to look over thetext and
estimate how far they can read the text and maintain
understanding.
d. The teacher asks students to identify the text portions
with a light pencil mark.
e. The teacher asks students to read the text silently, orally,
or with a partner in paired reading.
f. After reading, the teacher asks students to work with
partners, they share oral retellings with their partner.
g. The teacher asks Students to generate questions about the
reading.
h. The teacher collects the questions from the students for
evaluation purposes.

30
2. The indicator of variable Y ( students’ reading comprehension
):
a. The students are able to state the topic on narrative text
b. The students are able to identify generic structure on
narrative text
c. The students are able to make inference on narrative text
d. The students are able to locate or identify facts such as
the names of characters, the time of the story or the place
of the story on narrative
e. The students are able to analyze the meaning of certain
words on narrative text.47
D. Assumption and Hypothesis
1. Assumption
Based on the theories and relevant research in this research,
the writer assumes that using estimate, read, respond, and question
(ERRQ) strategy in teaching and learning process will give new
contribution to support students’ reading comprehension, and
teaching strategy can increase the ability in understanding the
reading text.
47Barrett, Taxonomy of Reading Comprehension: Remedial Instruction, (Retrieved on:January 3 2013)

31
2. Hypothesis
Ho: There is no significant difference of the students’ reading
comprehension on narrative text taught by using estimate,
read, respond, and question (ERRQ) Strategy and those
taught by using conventional strategy at Senior High
School 1 Koto Kampar Hulu Dictrict of Kampar Regency
Ha : There is a significant difference of the students’ reading
comprehension on narrative text taught by using estimate,
read, respond, and question (ERRQ) Strategy and those
taught by using conventional strategy at Senior High
School 1 Koto Kampar Hulu Dictrict of Kampar Regency

32
CHAPTER III
METHOD OF THE RESEARCH
A. The Research Design
This research is a kind of experimental research. According to
Gay and Airasian, experimental research is “the only type of the
research that can test hypotheses to establish cause-and-effect
relationship”.48 The research design used in this research is quasi-
experimental research. This research used non equivalent control
group design which consisted of two classes (control and treatment
class), pre-test, post-test.49
Table III.1The Research Design
Experimental Class O1 XO2
Control Class O3 - O4
Where:
O1 : pre-test to experimental class
O2 : post-test to experimental class
O3 : pre-test to control class
48L.R. Gay and Peter Airasian, Educational Research Competencies for Analysis andApplication, Six Ed. (New Jersey: Prentice-Hall, Inc, 2000.) 367.
49Donald T. Campbell and Julian C. Stanley, Experimental and Quesi- ExperimentalDesign for Research, (London: Houghton Mifflin Company, 1966) 47.

33
O4 : post-test to control class
X : Treatment
- : no treatment
B. The Location and Time of the Research
The research was carried out at Senior High School 1 Koto
Kampar Hulu district of Kampar Regency in 2012-2013 of academic
year. There were two English teachers in this school, and English was
taught twice a week with duration 40 minutes per period.Furthermore,
it was conducted from May to June 2013.
C. The Subject and the Object of the Research
The subject of the research was the second year students of
Senior High School 1 Koto Kampar Hulu at Kampar Regency. The
object of the research was the effect of using ERRQ strategy toward
students’ reading comprehension on narrative text.
D. The Population and Sample of the Research
The population of the research was the second year students of
Senior High School 1 Koto Kampar Hulu district of Kampar Regency.
They consisted of 90 students from three classes, and the writer took

34
two classes as sample. The specification of population can be seen on
the table below:
Table III.2The Total Population of the Second Year Students of Senior
High School 1 Koto Kampar Hulu 2012-2013
NO CLASS MALE FEMALE TOTAL1 XI SCIENCE 6 18 242 XI SOCIAL 1 19 14 333 XI SOCIAL 2 20 13 33
Total 90
The population above was large enough to be taken as sample
of the research. Based on the design of the research, the writer took only
two classes as the sample of this research. The writer took a sample by
using cluster sampling. Gay says that cluster sampling randomly select
group not individuals. All the members of selected group have similar
characteristics.50 In this research, the writer used lottery as one of the
techniques of using cluster sampling. So, there were 3 lotteries because
there were 3 classes of second year of Senior High School 1 Koto
Kampar Hulu. Then, the writer decided to take the first lottery as an
experimental class and the second lottery as the control class. In this
case, class XI Social 1 was for experimental class and the class XI Social
2 was for control class. The sample of this research was two classes of
XI Social students. The sample consisted of 66 students. So in this
research, the writer took 66 students as a sample in order to accurate the
data because the number of subject was large.
50L.R. Gay and Peter Airasian, Op. Cit., p. 129

35
Table III.3The Sample of the Second Year Students of Senior High School
1 Koto Kampar Hulu
NO CLASS MALE FEMALE TOTAL1 XI SOCIAL 1 19 14 332 XI SOCIAL 2 20 13 33
Total 66
E. The Technique of Data Collection
Technique of data collection is an important rule in conducting
a research for the results’ validity. The writer collected the data by
using the reading test. The type of the test was multiple choices.
Questions of the test consisted of 25 items. The test was used to find
out the students’ reading comprehension on narrative text. The test was
done twice, the first was a pre- test which was given before treatment
and the second one was a post-test which was given after treatment.
Pre-test and post-test to experimental and control classes were used to
find out the different of students’ reading comprehension on narrative
text taught by using estimate, read, respond, and question (ERRQ)
strategy.

36
Table III.4The Classification of Students’ Score51
SCORE CATEGORIES80-100 Very good66-79 Good56-65 Enough40-55 Less30-39 Fail
Moreover, Multiple-choices could assess the student’s ability in
comprehension. In order to get the data related to the problem of the
research, the writer collected the data by giving pre-test and it was
given before the treatment. Pre-test was given in order to determine
two classes as the samples. And the second was a post- test which was
given after treatment. The writer used pre-test and post-test to
experimental and control classes in order to know the difference
between control class and experimental class. And also to find out the
effect of using estimate, read, respond, and question (ERRQ) strategy
toward students’ reading comprehension on narrative text.
Before the test was conducted, the writer gave the students
reliability and validity test.
51Suharsimi Arikunto, Dasar-Dasar Evaluasi Pendidikan, (Jakarta: BumiAksara, 2009)245.

37
1. Validity
A test is valid if it measures what it purposes to measure. In
order to find out the validity of the test in this research, the writer
concern to content validity. According to Gay Content validity is the
degree to which a test measures an intended content area.52 In content
validity the writer consulted with her supervisor to discuss the
instrument used in measuring reading comprehension of the students.
In analyzed the validity in this research, the writer used instrument.
The instrument was a test. Before the test given for students, the writer
had consulted first with the writers’ supervisor. Questions of the test
consisted of 25 items. There were 33 students in this test and there
were 5 passages in this test. Question of each item in this test included
each indicator of reading comprehension. There were 5 indicators of
reading comprehension in this research. And for the score the writer
gave 4 points for the students’ correct answer in each item. After the
test, the writer collected the students score and analyzed the data
manually.
According to Arikunto, the level of difficulty was used to
show how easy and difficult an item is. It was calculated by using
the formula: =52 L.R. Gay and Peter Airasian, Op. Cit. 163

38
Where:
P = Difficulty level
B = The number of correct answer
JS = The number of students
For example, if item number 1 was correct by 8 students of
20 students, the difficulty could be calculated as follows:
P =
P =
P = 0.4
If the value was changed into percentage, it could be
calculated 0.4 x 100% = 40. The value was considered standard,
and could be used to get the data. In other words, the item did not
need to be changed. After doing try out, the researcher found that
there were no any items modified because the level of difficulty
reached the standard item of difficulty. Then, the proportion
correct was represented by “p” , whereas the proportion incorrect
was represented by “q”.
Table III.5The Students are Able to State Topic on Narrative text
Variable State topic NItem no 2 10 14 16 22
33
Total ofcorrect
item19 20 21 18 20
P 0.58 0.61 0.64 0.55 0.61
Q 0.42 0.39 0.36 0.45 0.39

39
Based on table III.5, the item number for state the topic is
2, 10, 14, 16, and 22. It shows that the proportion of correct answer
of number 2 is 0.58, the proportion of correct answer of number 10
is 0.61, and the proportion of the correct answer of number 14 is
0.64, and the proportion of correct answer of number 16 is 0.55,
and the proportion of correct answer of number 22 is 0.61. the total
correct answer of state the topic is 0.60. Then, based on the
standard difficulty “P” is > 0.30 and < 0.70. So, the items of
difficulties for state the topic are accepted.
Table III.6The Students are Able to Identify Generic Structure
(Orientation, Complication and Resolution) on Narrative Text
Variable Identify generic structure NItem no 5 6 13 19 23
33
Total ofcorrect
item18 17 18 18 20
P 0.55 0.52 0.55 0.55 0.61
Q 0.45 0.48 0.45 0.45 0.39
Based on table III.6, the item number for identifying
generic structure is 5, 6, 13, 19, and 23. It shows that the
proportion of correct answer of number 5 is 0.55, the proportion of
correct answer of number 6 is 0.52, and the proportion of the
correct answer of number 13 is 0.55, and the proportion of correct
answer of number 19 is 0.55, and the proportion of correct answer

40
of number 23 is 0.61. the total correct answer of identify generic
structure is 0.56. Then, based on the standard difficulty “P” is >
0.30 and < 0.70. So, the items of difficulties for identify generic
structure are accepted.
Table III.7The Students are Able to Make Inference on Narrative
Text
Variable Make inference NItem no 1 4 7 20 24
33
Total ofcorrect
item21 17 18 11 20
P 0.64 0.52 0.55 0.33 0.61
Q 0.36 0.48 0.45 0.67 0.39
Based on table III.7, the item number for make inference is
1, 4, 7, 20, and 24. It shows that the proportion of correct answer of
number 1 is 0.64, the proportion of correct answer of number 4 is
0.52, and the proportion of the correct answer of number 7 is 0.55,
and the proportion of correct answer of number 20 is 0.33, and the
proportion of correct answer of number 24 is 0.61. the total correct
answer of make inference is 0.53. Then, based on the standard
difficulty “P” is > 0.30 and < 0.70. So, the items of difficulties for
make inference are accepted.

41
Table III.8The Students are Able to Locate or Identify Facts on
Narrative Text
Variable Identify facts NItem no 3 11 15 17 21
33
Total ofcorrect
item11 18 20 17 19
P 0.33 0.55 0.61 0.52 0.58
Q 0.67 0.45 0.39 0.48 0.42
Based on table III.8, the item number for identifying the
facts is 3, 11, 15, 17, and 21. It shows that the proportion of correct
answer of number 3 is 0.33, the proportion of correct answer of
number 11 is 0.55, and the proportion of the correct answer of
number 15 is 0.61, and the proportion of correct answer of number
17 is 0.52, and the proportion of correct answer of number 21 is
0.58. the total correct answer of identify facts is 0.52. Then, based
on the standard difficulty “P” is > 0.30 and < 0.70. So, the items of
difficulties for identify facts are accepted.
Table III.9The Students are Able to Analyze the Meaning of
Certain Words on Narrative Text
Variable Analyze the meaning of certain words NItem no 8 9 12 18 25
33
Total ofcorrect
item11 18 11 20 17
P 0.33 0.55 0.33 0.61 0.52
Q 0.67 0.45 0.67 0.39 0.48

42
Based on table III.9, the item number for analyzed the
meaning of certain word is 8, 9, 12, 18, and 25. It shows that the
proportion of correct answer of number 8 is 0.33, the proportion of
correct answer of number 9 is 0.55, and the proportion of the
correct answer of number 12 is 0.33, and the proportion of correct
answer of number 18 is 0.61, and the proportion of correct answer
of number 25 is 0.52. the total correct answer of analyze the
meaning of certain words is 0.47. Then, based on the standard
difficulty “P” is > 0.30 and < 0.70. So, the items of difficulties for
analyze the meaning of certain words are accepted.
2. Reliability
Before getting the data, the researcher conducted a try out
to examine all items. Try out was used to find out the value of the
test. The value itself was used to find out the level of difficulties of
each item. The standard of value used was ≥ 0.30 and ≤ 0.7053.
A test must first be reliable before measuring the
instrument. Reliability is a necessary characteristic of a good test.
A reliability measure provides consistent and stable indication of
the characteristic being investigated.54 To find out the reliability of
the test in this research, the writer used the scores of the students’
test and after that the writer took the total items (n) of the test, the
proportion of the correct answer (P), the proportion of incorrect
53 Ibid, 208.54Suharsimi Arikunto, Dasar-Dasar Evaluasi Pendidikan, (Jakarta: Bumi Aksara, 2009)87.

43
answer (q), and the total variances (S2). And then the writer
analyzed it by using the Kuder Richardson 20 (K-R 20) formula to
calculate the reliability of the test. The formula is as follows:
2
2
S
S
1
pq
n
nrii
Where:
n : total items
P : proportion the correct scores
q: 1-P
2S : total Variances
Based on Suharsimi Arikunto, there is the interpretation of
reliability as follows:55
Table III.10Reliability Classification
Where:
= Σ
= 689.7333= .55Suharsimi Arikunto, Dasar-Dasar Evaluasi Pendidikan (Edisi Revisi), (Jakarta: Bumi
Aksara, 2008) 75.
SCORE CATEGORIES0.800 – 1.00 Very High
0.600 – 0.800 High0.400 – 0.600 Enough0.200 – 0.400 Low0.00 – 0.200 Very Low

44
= 25 = 4.57Σ = 6.01
Σ = 689.73 = 33So,
738.0
71.004.1
88.20
01.688.20
24
25
57.4
01.657.4
125
25
S
1
2
2
2
2
S
pq
n
nrii
> .
Based on the statistical analysis above, it can be seen that the
reliability score of the test was 0.738. To know the reliability of the
test must be compared with r product moment. rii must be higher than
rt. Then at 5% level of significant is 0.349. While in the significant 1
% is 0.449. So, it can be analyzed that is higher than . 5%<rii >
1%. (0.349 <0.738> 0.449). On the other hand, the instrument was
reliable. It means that the coefficient of reliability was high.
F. The Technique of Data Analysis
The data of students’ pre-test scores and post-test scores were
obtained from the result of their reading comprehension on narrative

45
text. In order to find out whether or not there was any significant
effect of using estimate, read, respond, and questions (ERRQ) strategy
toward students’ reading comprehension on narrative text, the data
were analyzed statistically. In analyzing the data, the writer checked
all of the students answer sheet and corrected it. After that the writer
analyzed the students’ scores of post-test of the experimental class and
control class. Those scores were analyzed by using statistical analysis.
In this research, the writer used t-test formula. In this term, it was an
independent samples t-test.
Hinton says that the independent sample t-test is undertaken
when the samples are unrelated with different participant in each
sample. This test is also called the unrelated t-test or the independent
measure t-test.56Jeremy also says that the independent groups t-test is
the most powerful and is the test most likely to spot significant
difference in the data. The independent groups t-test can be used for a
non-experimental or quasi-experimental design.57
In this research, the writer used Independent sample t-test
formula.The t-test for independent sample was used to determine the
formulation of the problem, whether or not there is a significant
56Perry R. Hinton, SPSS Explained, (New York: Routledge, 2004) 107.57Jeremy Miles and Philip Banyard, Understanding and Using Statistic in Psychology,
(SAGE Publication: Los Angeles, 2007) 136-137

46
difference between the means of two independent sample.58The
different mean was analysis by using t-test formula59 :
22
11
N
SDy
N
SDx
MyMxto
Where : to : The value of t- obtained
Mx : Mean score of experiment class
My : Mean score of control class
SDx : Standard deviation of experiment
SDy : Standard deviation of control class
N : Number of students
The t-test was obtained by considering the degree of
freedom (df) = (N1+N2) – 2. Statistically, the Hypothesis are:
Ho is accepted if to< t-table or there is no significant effect of
using estimate, read, respond, and question (ERRQ) strategy
toward students reading comprehension narrative text.
Ha is accepted if to > t-table or there is any significant effect of
using estimate, read, respond, and question (ERRQ) strategy
toward students’ reading comprehension on narrative text.
Furthermore, in computing the data, the writer used Statistical
Product and Service Solutions (SPSS) 16.
58L.R. Gay and Peter Airasian.Op cit.48459Hartono, Statistik Pendidikan, (Pekanbaru: CV Jaya pratama, 2004) 193.

47
CHAPTER IV
THE DATA PRESENTATION AND THE DATA ANALYSIS
A. The Description of the Data
The purpose of this research was to obtain the difference
between students’ reading comprehension on narrative text taught by
using Estimate, Read, Respond, and Question (ERRQ) Strategy and
students’ reading comprehension on narrative text taught without using
Estimate, Read, Respond, and Question (ERRQ) Strategy and then to
find the significant difference of students’ reading comprehension
taught by using Estimate, Read, Respond, and Question (ERRQ)
Strategy and those who were taught by conventional strategy at Senior
High School 1 Koto Kampar Hulu.
Besides, the writer got the data from the students’ post-test of
both experimental and control classes. The total score of the test for
both classes were significant difference. The total score of the
experimental class was 2284 while the highest score was 88 and the
lowest was 44. The total score of control class was 2000 while the
highest score was 76 and the lowest score was 48.
B. The Data Presentation
There data presentation that served by the writer consisted of
pre-test and post-test data. They are:

48
1. The Implementation of Estimate, Read, Respond, and
Question (ERRQ) Strategy
a. The teacher explains that ERRQ to the Students.
b. The teacher chooses and distributes the narrative text, and
demonstrates the process.
c. The students look over the text and estimate how far they
can read the text and maintain understanding.
d. The students identify the text portions with a light pencil
mark.
e. The students read text with a partner in paired reading.
f. After reading, the students work with partner, they share oral
retellings with their partner.
g. The students generate question about the reading.
h. The teacher collects the questions for evaluation purposes.
2. The Data Presentation of Reading Comprehension
a. Students’ Reading Comprehension Taught by Using
Estimate, Read, Respond, and Question (ERRQ) Strategy
Indent the data of students’ reading comprehension taught
by using Estimate, Read, Respond, and Question (ERRQ)
Strategy were gotten from pre-test of 33 students of class XI
Social 1 as an experimental group. It can be seen in the table
below:
49
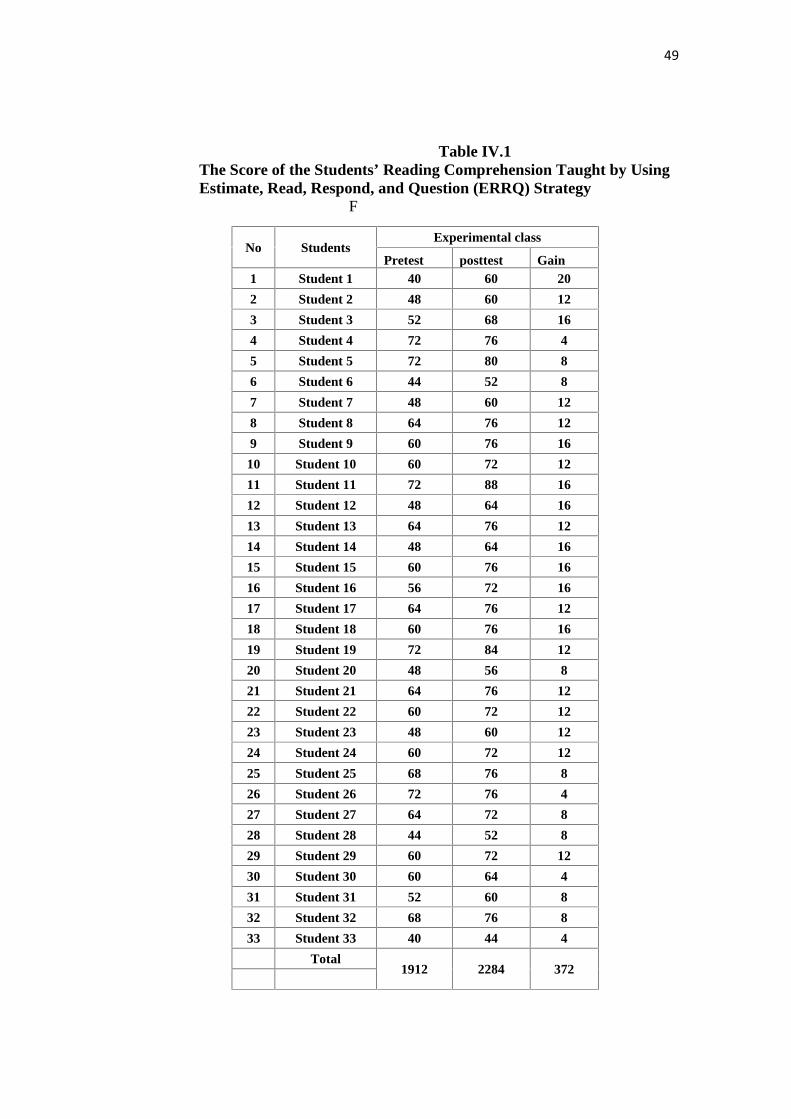
Table IV.1The Score of the Students’ Reading Comprehension Taught by UsingEstimate, Read, Respond, and Question (ERRQ) Strategy
F
No StudentsExperimental class
Pretest posttest Gain1 Student 1 40 60 20
2 Student 2 48 60 12
3 Student 3 52 68 16
4 Student 4 72 76 4
5 Student 5 72 80 8
6 Student 6 44 52 8
7 Student 7 48 60 12
8 Student 8 64 76 12
9 Student 9 60 76 16
10 Student 10 60 72 12
11 Student 11 72 88 16
12 Student 12 48 64 16
13 Student 13 64 76 12
14 Student 14 48 64 16
15 Student 15 60 76 16
16 Student 16 56 72 16
17 Student 17 64 76 12
18 Student 18 60 76 16
19 Student 19 72 84 12
20 Student 20 48 56 8
21 Student 21 64 76 12
22 Student 22 60 72 12
23 Student 23 48 60 12
24 Student 24 60 72 12
25 Student 25 68 76 8
26 Student 26 72 76 4
27 Student 27 64 72 8
28 Student 28 44 52 8
29 Student 29 60 72 12
30 Student 30 60 64 4
31 Student 31 52 60 8
32 Student 32 68 76 8
33 Student 33 40 44 4
Total1912 2284 372

50
From table IV.1, the writer found that the total of
pre-test in the experimental class was 1912 while the
highest was 72 and the lowest was 40 and the total score of
post-test in experimental class was 2284 while the highest
score was 88 and the lowest score was 44. The frequency
score of pre-test and post-test which was significantly
different and it can be seen below:
Table IV.2The Frequency Score of Pre-test of Experimental
From the table above, it shows that there were 2 students
who got score 40 (6.1%); there were 2 students who got 44 (6.1%);
there were 6 students who got 48 (18.2%); there were 2 students
who got 52 (6.1%); there was 1 student who got score 56 (3%);
Preexp
Frequency Percent Valid Percent
Cumulative
Percent
Valid 40 2 6.1 6.1 6.1
44 2 6.1 6.1 12.1
48 6 18.2 18.2 30.3
52 2 6.1 6.1 36.4
56 1 3.0 3.0 39.4
60 8 24.2 24.2 63.6
64 5 15.2 15.2 78.8
68 2 6.1 6.1 84.8
72 5 15.2 15.2 100.0
Total 33 100.0 100.0

51
there were8 students who got score 60 (24.2%); there were5
students who got score 64 (15.2%); there were2 students who got
score 68 (6.1%); and there were 5 students who got score 72
(15.2%). The highest frequency was 8 at the score 60. The total
frequency was 33.
Histogram IV.1The Histogram of the Frequency Distribution of Pre-test Result
of Experimental Class
From the histogram above, it can be analyzed that the
histogram is almost normal because the difference of Mean and
Standard Deviation was far.

52
Table IV.3The Frequency Score of Post-Test of Experimental Class
Postexp
Frequency Percent Valid Percent
Cumulati
ve Percent
Valid 44 1 3.0 3.0 3.0
52 2 6.1 6.1 9.1
56 1 3.0 3.0 12.1
60 5 15.2 15.2 27.3
64 3 9.1 9.1 36.4
68 1 3.0 3.0 39.4
72 6 18.2 18.2 57.6
76 11 33.3 33.3 90.9
80 1 3.0 3.0 93.9
84 1 3.0 3.0 97.0
88 1 3.0 3.0 100.0
Total 33 100.0 100.0
Based on the table above, it can be seen that in post-test
there was 1 student who got score 44 (3%), 2 students who got
score 52 (16.1%), 1 student who got score 56 (3.0%), 5 students
who got score 60 (15.2%), 3 students who got score 64 (9.1%), 1
student who got score 68(3.0%), 6 students who got score 72
(18.2%), 11 students who got score 76 (33.3%), 1 student who got
score 80 (3.0%), 1 student who got score 84 (3.0%), and 1 student
who got score 88 (3.0%).The highest frequency was 11 at the score
76. The total frequency was 33.

53
Histogram IV.2Frequency Post-test of Experimental Class
From the histogram above, it can be analyzed that the
histogram is almost normal because the difference of Mean and
Standard Deviation was far.
Besides, the mean (Mx) and Standard Deviation (SD) were
also needed in analyzing data gotten from the scores of pre-test and
post-test. In determining the mean and standard deviation, the
writer used the software SPSS version 16 to the mean and the
standard deviation of pre-test and post-test can be seen in table
IV.4 below:

54
Table IV.4The mean and standard deviation of pre-test and
post-test of experimental class
Mean Std. deviationPretest 57.94 9.855Posttest 69.21 9.924
From the table IV.4, the mean of pre-test in experimental
class is 57.94 and the standard deviation of pre-test in experimental
class is 9.855. the mean of post-test in experimental class is 69.21
and the standard deviation of post-test in experimental class is
9.924. The classification can be seen from the following table:
Table IV.5The Classification of Experimental Class Score (Post-Test)
Based on the table above, it can be seen that there are 5
categories for students’ reading comprehension of experimental
class. The frequency of Very Good category is 3 students (9.1%),
the frequency of Good category is 18 students (54.5%), the
frequency of Enough category is 9 students (27.3%), the frequency
of Less category is 3 students (9.1%). there is no students who is
categorized into Fail category. The table shows that the highest
No Categories Score Frequency Percentage1 Very Good 80-100 3 9.1%2 Good 66-79 18 54.5%3 Enough 56-65 9 27.3%4 Less 40-55 3 9.1%5 Fail 30-39 - 0%
Total 33 100%

55
percentage of experimental class is 54.5%. Thus, the majority of
the students in experimental class are classified as Good.
b. Students’ Reading Comprehension Taught without UsingEstimate, Read, Respond, and Question (ERRQ) Strategy
The data of students’ reading comprehension taught
without using Estimate, Read, Respond, and Question (ERRQ)
Strategy were also taken from pre-test and post-test of XI Social 2
as control class taken from the sample of this class (33) students:

56
Table IV.6Table Score of Students’ Reading Comprehension Taught
without UsingEstimate, Read, Respond, and Question (ERRQ) Strategy
No Students Control Class
Pretest Posttest Gain
1 Student 1 60 64 4
2 Student 2 60 64 4
3 Student 3 64 68 4
4 Student 4 60 68 8
5 Student 5 40 48 8
6 Student 6 52 56 4
7 Student 7 72 76 4
8 Student 8 40 48 8
9 Student 9 60 64 4
10 Student 10 44 48 4
11 Student 11 60 64 4
12 Student 12 60 68 8
13 Student 13 72 76 4
14 Student 14 60 64 4
15 Student 15 68 72 4
16 Student 16 60 64 4
17 Student 17 40 48 8
18 Student 18 52 60 8
19 Student 19 52 60 8
20 Student 20 60 64 4
21 Student 21 48 52 4
22 Student 22 40 48 8
23 Student 23 68 72 4
24 Student 24 52 60 8
25 Student 25 60 64 4
26 Student 26 52 60 8
27 Student 27 52 56 4
28 Student 28 60 64 4
29 Student 29 36 52 16
30 Student 30 52 60 8
31 Student 31 44 52 8
32 Student 32 60 64 4
33 Student 33 44 52 8
Total 1804 2000 196

57
From table IV.6, the writer found that the total of pre-test in
control class was 1804 while the highest was 72 and the lowest was
36 and the total score of post-test in control class was 2000 while
the highest score was 76 and the lowest score was 48. The
frequency score of pre-test and post-test differed significantly, It
can be seen on table IV.7 below:
Table IV.7The Frequency Score of Pre-Test of Control Class
Based on the table above, it can be seen that in pre-test there was
1 student who got score 36 (3.0%), 4 students who got score 40 (12.1%),
3 students who got score 44 (9.1%), 1 student who got score 48 (3.0%),
7 students who got score 52 (21.2%), 12 students who got score
Precont
Frequency Percent Valid Percent
Cumulative
Percent
Valid 36 1 3.0 3.0 3.0
40 4 12.1 12.1 15.2
44 3 9.1 9.1 24.2
48 1 3.0 3.0 27.3
52 7 21.2 21.2 48.5
60 12 36.4 36.4 84.8
64 1 3.0 3.0 87.9
68 2 6.1 6.1 93.9
72 2 6.1 6.1 100.0
Total 33 100.0 100.0

58
60(36.4%), 1 student who got 64 (3.0%), 2 students who got score 68
(6.1%), 1 student who got score 72 (3%). The highest frequency was 12
at the score 60. The total frequency was 33.
Histogram IV.3Frequency Pre-test of Control Class
From the histogram above, it can be analyzed that the
histogram is almost normal because the difference of Mean and
Standard Deviation was far.

59
Table IV.8The Frequency Score of Post-test of Control Class
Postcont
Frequency Percent Valid Percent
Cumulative
Percent
Valid 48 5 15.2 15.2 15.2
52 4 12.1 12.1 27.3
56 2 6.1 6.1 33.3
60 5 15.2 15.2 48.5
64 10 30.3 30.3 78.8
68 3 9.1 9.1 87.9
72 2 6.1 6.1 93.9
76 2 6.1 6.1 100.0
Total 33 100.0 100.0
Based on the table above, it can be seen that in post-test
there were 5 students who got score 48 (15.2%), 4 students who
got score 52 (12.1%), 2 students who got score 56 (6.1%), 5
students who got score 60 (15.2%), 10 students who got score 64
(30.3%), 3 students who got score 68(9.1%), 2 students who got
score 72 (6.1%). 2 students who got score 76 (6.1%). The highest
frequency was 10 at the score 64. The total frequency was 33.

60
Histogram IV.4Frequency Post-test of Control Class
From the histogram above, it can be analyzed that the
histogram is almost normal because the difference of Mean and
Standard Deviation was far.
Besides, the mean (Mx) and Standard Deviation (d) were
also needed in analyzing data gotten from the scores of pre-test and
post-test. In determining the mean and standard deviation, the
writer used the software SPSS Version 16. The mean and the
standard deviation of pre-test and post-test can be seen on table
IV.9:
61
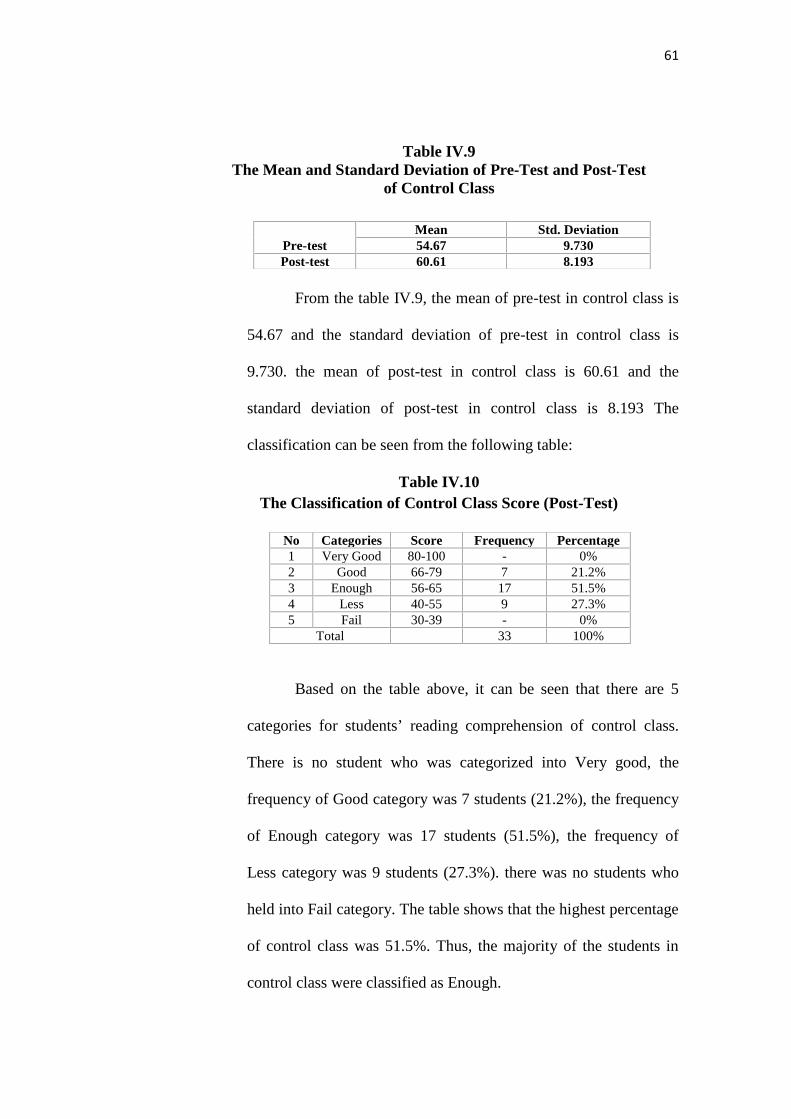
Table IV.9The Mean and Standard Deviation of Pre-Test and Post-Test
of Control Class
From the table IV.9, the mean of pre-test in control class is
54.67 and the standard deviation of pre-test in control class is
9.730. the mean of post-test in control class is 60.61 and the
standard deviation of post-test in control class is 8.193 The
classification can be seen from the following table:
Table IV.10The Classification of Control Class Score (Post-Test)
Based on the table above, it can be seen that there are 5
categories for students’ reading comprehension of control class.
There is no student who was categorized into Very good, the
frequency of Good category was 7 students (21.2%), the frequency
of Enough category was 17 students (51.5%), the frequency of
Less category was 9 students (27.3%). there was no students who
held into Fail category. The table shows that the highest percentage
of control class was 51.5%. Thus, the majority of the students in
control class were classified as Enough.
Pre-testMean Std. Deviation54.67 9.730
Post-test 60.61 8.193
No Categories Score Frequency Percentage1 Very Good 80-100 - 0%2 Good 66-79 7 21.2%3 Enough 56-65 17 51.5%4 Less 40-55 9 27.3%5 Fail 30-39 - 0%
Total 33 100%

62
To find the data analysis of the significant effect of using
estimate, read, respond, and question (ERRQ) strategy toward
students’ reading comprehension on narrative text of the second
year at senior high school 1 Koto Kampar Hulu, the writer used t-
test by using SPSS 16.The output of data analysis is as follows:
C. Data Analysis
The following table is the description of pre-test and post-test
of both experimental and control classes.

63
Table IV.11Students’ Pre-test and Post-test of Experimental and Control Class
No Studentsexperimental class control class
Pretest Posttest Gain Pretest Posttest Gain1 Student 1 40 60 20 60 64 4
2 Student 2 48 60 12 60 64 4
3 Student 3 52 68 16 64 68 4
4 Student 4 72 76 4 60 68 8
5 Student 5 72 80 8 40 48 8
6 Student 6 44 52 8 52 56 4
7 Student 7 48 60 12 72 76 4
8 Student 8 64 76 12 40 48 8
9 Student 9 60 76 16 60 64 4
10 Student 10 60 72 12 44 48 4
11 Student 11 72 88 16 60 64 4
12 Student 12 48 64 16 60 68 8
13 Student 13 64 76 12 72 76 4
14 Student 14 48 64 16 60 64 4
15 Student 15 60 76 16 68 72 4
16 Student 16 56 72 16 60 64 4
17 Student 17 64 76 12 40 48 8
18 Student 18 60 76 16 52 60 8
19 Student 19 72 84 12 52 60 8
20 Student 20 48 56 8 60 64 4
21 Student 21 64 76 12 48 52 4
22 Student 22 60 72 12 40 48 8
23 Student 23 48 60 12 68 72 4
24 Student 24 60 72 12 52 60 8
25 Student 25 68 76 8 60 64 4
26 Student 26 72 76 4 52 60 8
27 Student 27 64 72 8 52 56 4
28 Student 28 44 52 8 60 64 4
29 Student 29 60 72 12 36 52 16
30 Student 30 60 64 4 52 60 8
31 Student 31 52 60 8 44 52 8
32 Student 32 68 76 8 60 64 4
33 Student 33 40 44 4 44 52 8
Total 1912 2284 372 1804 2000 196
Mean 57.94 69.21 11.27 54.67 60.61 5.94

64
From the table above, it can be seen that the total score of
pre-test in experimental class was 1912 and post-test was 2284.
While the total score of pre-test in control class was 1804 and post-
test was 2000. It can also be seen from the difference gain in the
experimental and control classes. To make it clear, it is analyzed as
follows
Table IV. 12
Group Statistics
Exp N Mean Std. Deviation Std. Error Mean
Cont 1 33 11.27 4.178 .727
2 33 5.94 2.669 .465
Based on the table above, it can be seen that the total of
students from each class was 33, the mean of the experimental
class was 11.27, and mean of control class was 5.94. Standard
deviation from the experimental class was 4.178, while the
standard deviation from control class was 2.669. Standard error
mean of experimental class was 727 and control class was 465.

65
Table IV.13
To give the implication for hyphotesis on the result of t-test above,
firstly the writer looked for the degree of freedom (df). Before the t-value
is compared to t-table the degree of freedom (df) should be determined
firstly. T-table in the degree of freedom of 64 at significant level of 5%
and 1% was obtained 2.00 and 2.65. The t-test result was higher than t-
table, that was 2.00<6.180>2.65. In conclusion, It can be concluded that
Ho is rejected and Ha is accepted. In other word, there is a significant
difference of the students’ reading comprehension on narrative text taught
by using estimate, read, respond, and question (ERRQ) Strategy and those
taught by using conventional strategy at Senior High School 1 Koto
Kampar Hulu Dictrict of Kampar Regency.
Independent Samples Test
Levene's Test
for Equality
of Variances t-test for Equality of Means
F Sig. T Df
Sig. (2-
tailed)
Mean
Difference
Std. Error
Difference
95%
Confidence
Interval of the
Difference
Lower Upper
gaincont Equal
variances
assumed
5.235 .025 6.180 64 .000 5.333 .863 3.609 7.057
Equal
variances not
assumed
6.180 54.385 .000 5.333 .863 3.603 7.063

66
When this research was conducted, the writer followed all of the
procedures of Estimate, Read, Respond, and Question (ERRQ) Strategy in
teaching reading of a narrative passage at the second year students of
Senior High School 1 Koto Kampar Hulu District of Kampar Regency.
The result of the strategy showed that the students’ reading comprehension
on narrative text increased after using Estimate, Read, Respond, and
Question (ERRQ) Strategy. Joyner says that Estimate, Read, Respond, and
Question (ERRQ) Strategy is a comprehension strategy that we learned in
reading.60 By using this strategy students can read and remember the
information in narrative text. Nurhayati also says that Estimate, Read,
Respond, and Question (ERRQ) Strategy is the best strategy to guide the
students in comprehending narrative passages.61 Moreover, Estimate,
Read, Respond, and Question (ERRQ) Strategy can be used by the teacher
in teaching reading, especially in narrative text at the second year students
of Senior High School 1 Koto Kampar Hulu of Kampar Regency. In other
words, the result of the research cannot be generalized, because Estimate,
Read, Respond, and Question (ERRQ) Strategy has not used in other
Schools yet.
60Debbie Joyner, Loc.Cit61Nurhayati, Loc.Cit
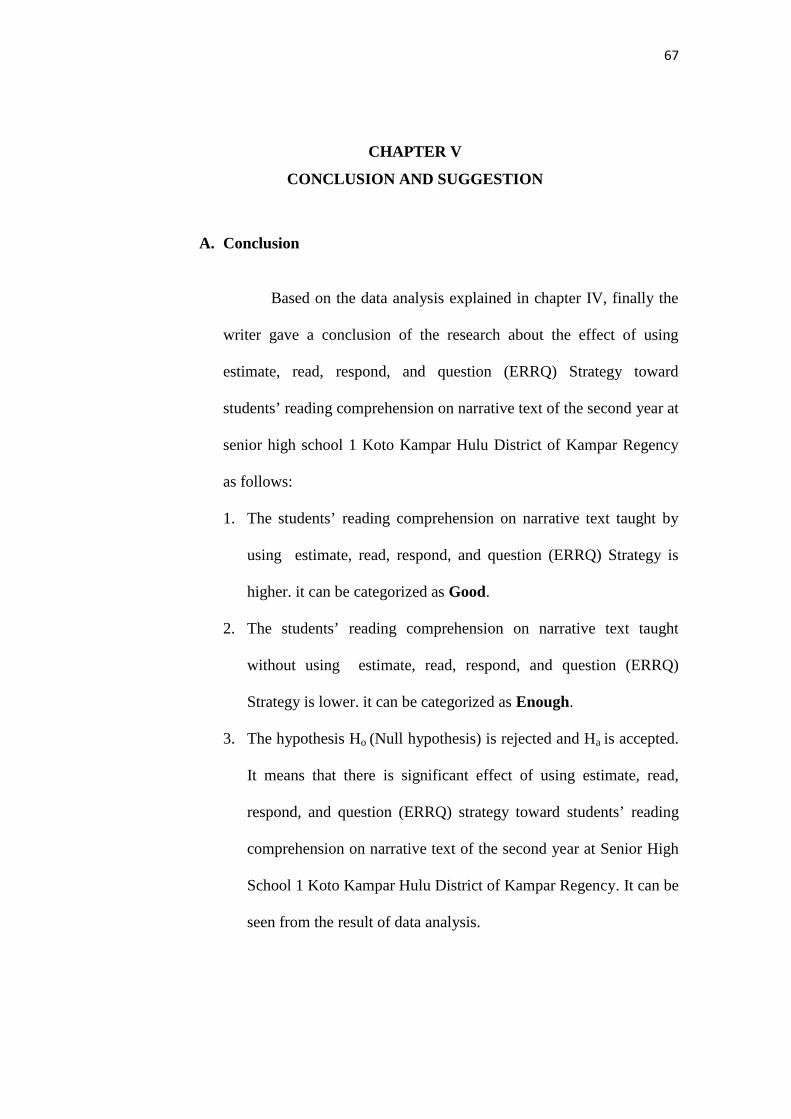
67
CHAPTER V
CONCLUSION AND SUGGESTION
A. Conclusion
Based on the data analysis explained in chapter IV, finally the
writer gave a conclusion of the research about the effect of using
estimate, read, respond, and question (ERRQ) Strategy toward
students’ reading comprehension on narrative text of the second year at
senior high school 1 Koto Kampar Hulu District of Kampar Regency
as follows:
1. The students’ reading comprehension on narrative text taught by
using estimate, read, respond, and question (ERRQ) Strategy is
higher. it can be categorized as Good.
2. The students’ reading comprehension on narrative text taught
without using estimate, read, respond, and question (ERRQ)
Strategy is lower. it can be categorized as Enough.
3. The hypothesis Ho (Null hypothesis) is rejected and Ha is accepted.
It means that there is significant effect of using estimate, read,
respond, and question (ERRQ) strategy toward students’ reading
comprehension on narrative text of the second year at Senior High
School 1 Koto Kampar Hulu District of Kampar Regency. It can be
seen from the result of data analysis.

68
So, it can be concluded that ERRQ strategy has a positive
effect on the students’ reading comprehension on narrative text of
the second year at Senior high School 1 Koto Kampar Hulu
District of Kampar Regency.
B. Suggestion
In this part, the writer would like to give some suggestion as
follows:
1. Suggestion for the Teacher
a. The teacher should be creative in selecting the strategy.
ERRQ Strategy can be used in English teaching by the
teacher in order to make the students interested and not
bored.
b. The teacher can use ERRQ strategy as interesting
strategy in teaching reading comprehension, especially
in narrative text.
c. By using ERRQ Strategy, the teacher can help the
students to find the topic and other pertinent
information from the text.
2. Suggestion for the Students
a. The students should pay more attention to the lesson
that has been explained by the teacher.

69
b. The students should have discussion and share
information with their friends about English to
improve their reading comprehension.
3. Suggestion for the Future Student Researcher
a. Next student researcher should give contribution in
conducting the research especially about reading
comprehension.
b. This research is one of the ways toward students’
reading comprehension. It is expected that the findings
will be used as starting points to conduct another
research. There are many other techniques to make
teaching and learning process more effectively.

BIBLIOGRAPHY
Anchin, David C. Center. Learning strategies Resources Guide. Florida:Litton/PRC,inc, 1995.
Andrew, P. Johnson. Teaching Reading and Writing. New York: Rowmanand Littlefield Education, 2008.
Arikunto, Suharsimi. Dasar-DasarEvaluasiPendidikan. Jakarta: BumiAksara,
2009
Barret. Taxonomy of Reading Comprehension: Remedial Instruction.Retrieved on:January 3 2013.
Brassell, Danny and Timothy Rasinski. Comprehension That Works: TakingStudents Beyond Ordinary Understanding to DeepComprehension. Hungtington Beach: Shell Education, 2008.
Brown, H. Douglas. Teaching by Principles an Interactive Approach toPedagogy. Englewood Cliffs, New Jersey: Prentice Hall, inc,1994.
-------------------------. Principle of Language Learning and Teaching, FourthEdition. New York: Addison Wesley Longman. Inc, 2000.
Brown, James Dean. The elements of language Curriculum. Boston: Heinleand Heinle Publisher, 1995.
Campbell, Donald T and Julian C Stanley. Experimental and Quesi-Experimental Design for Research.London: Houghton MifflinCompany, 1996.
Department of National Education. School Based Curriculum Syllabus of
English,2006.
Gay, L.R. and Peter Airasian. Educational Research Competencies forAnalysis and Application.Six Ed. New Jersey: Prentice-Hall,Inc, 2000.
Hartono. Statistik Pendidikan. Pekanbaru: CV Jaya pratama, 2004.

-----------. Statistik untuk Penelitian. Yogyakarta: Pustaka Pelajar, 2004.
-----------. Spss 16.0: Analisis Data Statistika dan Penelitian. Yogyakarta:Pustaka Pelajar, 2008.
Harry, K and Rosemary. Teaching Strategies, Tips and Ideas. Retrieved on:April 24 2013.
Hasibuan, Kalayo. et.al. Teaching English as a Foreign language(TEFL).Pekanbaru: Alaf Riau Graha UNRI Press, 2007.
Hinton, Perry R. SPSS Explained. New York: Routledge, 2004.
Hudson, Thom. Teaching Second Language Reading. UK: Oxford UniversityPress, 2007.
Ikapuspita, S. Pd. Syllabus of SMAN 1 Koto Kampar Hulu. Tanjung:Unpublished, 2013.
I.S.P. Nation. Teaching ESL/EFL Reading and Writing. New York:
Routledge, 2009.
Joyner, Debbie. Provide Students with Strategies for Independent Learning.
Retrieved on: January 16 2013.
Klingner, Janette K. et.al. What Works for special-needs Learners: TeachingReading Comprehension to students with LearningDifficulties. New York: the Guildford Press, 2007.
Linse, Caroline T. Practical English Language Teaching: Young Learners.New York: The McGraw Hill Companies, Inc, 2005.
Miles, Jeremy and Philip Banyard. Understanding and Using Statistic inPsychology. SAGE Publication: Los Angeles, 2007.
Murcia, Marianne Celce. Teaching English as a Second or ForeignLanguage. Boston: Heinle & Heinle, 2001.
Nunan, David. Practical English language teaching. Sydney: McGraw Hill,2003.

------------------.Designing Task for the communicative Classroom.Cambridge : Cambridge University press, 1989.
Nurhayati. Teaching Reading Comprehension to the Tenth Grade Students of
the Islamic Senior High School 3 Palembang by using
ERRQ.Retrieved on: January 16 2013, 2008.
Richards, Jack C et al. Longman Dictionary of Language Teaching andApplied Linguistics. Edinburgh Gate: person EducationLimite, 1992.
Syafi’I, M.S. From Paragraph to a Research Report : A Writing of Englishfor Academic Purposes. Pekanbaru: LBSI, 2007.
--------------. et.al. The effective Paragraph Developments : the Process ofWriting For Classroom Setting. Pekanbaru: LBSI, 2007.
Oxford, Rebecca. L. Language Learning Strategies. New York: NewBuryHouse Publisher, 1991.
Patel, M.F and Prevenm Jain. English language teaching: method, tool, andteachnique.Sunriceplubisher: Jaipur, 2008.
Rizvi, M. Ashraf. Effective Technical Communication. India: Tata McGraw-
Hill Education, 2005.
Stovatti, Verko. Reading Techniques. Retrieved on: January 16 2013,
2006.
Tankersley, Karen. The thread of reading strategies for literacy
Development. Alexandria: ASCD, 2003.
-------------------------. Literacy Strategies for Grades 4-12: Reinforcing theThreads of Reading. Alexandria: ASCD, 2005.
Willis, Judy M.D. Teaching the Brain to Read: strategy for improvingfluency, vocabulary and Comprehension. Alexandria: ASCD,2008.
Http://www./2012/01/narrative-text-penjelasan-contoh.html. Retrieved on:January 16 2013.


![Tiernan Humphrys.ppt [Read-Only]](https://static.fdokumen.com/doc/165x107/631e0aba5ff22fc7450683ec/tiernan-humphrysppt-read-only.jpg)