
Shashlik calorimetry
72
A mq · ( (0 — ll on leave from INR, Moscow on leave from LAPP, Annecy Contact person Spokesperson Brunel University,Uxbrzdge , UK OCR Output PR. Hobson, D.C. Iznrie Rutherford Appleton Laboratory, Didcot,UK R.M. Brown, D..l.A. Cockerill, J. Connolly, L. Demon, R. Stephenson Imperial College, London, UK E. Clayzon, D. Miller, C. Seez, T.S. Virdee LIP, Lisboa, PORTUGAL P. Bordalo, C. Lourenco, Ri. Nobrega, V. Pop0v", S. Ramos,]. Varela INR, Moscow RUSSIA A. Proskurja/cov, B. Semenov, I. Sernenyuk, V. Sukhov G. Atoyan, S. Gninenko, E. Guschin, V. Issa/cov, V. Klirnenko, V. Marin, Y. Musienko, A. Poblaguev, V. Postoev , IHEP, Protvino, RUSSIA S. Bityukov, A. Gorin , V. Obraztsov, A. Ostankov, B. Polyakov, V. Rykalin, V. Soushkov, V. Vasil’chenk0, A.Zaitchenko ITEP, RUSSIA S. Abdullin, V. Kaftanov, V. Lukashin, A. Nikitenko, Y. Semenov, A. Szarodurnov, N. Stepanov, Y. Trebukhovsky JINR, Dubna, RUSSIA S. Sergueev. A. Sidorov, E. Zubarev, N. Zamiazin, A. Zarubin, A. Cheremukhin, A. Egorov, I. Golutvin, I. Ivanchenko, Y. Kretov, Y. Kozlov, V. Minashkin, P. Moissenz, A. Rashevsky, CERN, Geneva, SWITZERLAND E. Rosso Ph. Blochz, J. Christiansen, H. Heijne, M. Glaser. P. Jarron, F. Lerneilleur, I. Karyotakis’ , R. Loos, A. Marchioro, Ecole Polytechnique, Palaiseau, FRANCE I. Badier, G. Bonneaud, A. Busata, Ph. Busson, C. Charlot, L. Dobrzynski’, Ch. Gregory, A. Karar, R. Tanaka A combined Shashlik + Preshower detector for LHC. O O Shashlnk Calonmetry R&D Proposal we . ;·,g» #4 M »· Dawg sc:00000220 ?" August 13m, 1993 \ _ DRDC/P50 CERN [ DRDC g3_28 CERN LIBRARIES, GENEVA
-
Upload
khangminh22 -
Category
Documents
-
view
3 -
download
0
Transcript of Shashlik calorimetry
A mq · ( (0 — ll
on leave from INR, Moscowon leave from LAPP, AnnecyContact personSpokesperson
Brunel University,Uxbrzdge , UK OCR OutputPR. Hobson, D.C. Iznrie
Rutherford Appleton Laboratory, Didcot,UKR.M. Brown, D..l.A. Cockerill, J. Connolly, L. Demon, R. Stephenson
Imperial College, London, UKE. Clayzon, D. Miller, C. Seez, T.S. Virdee
LIP, Lisboa, PORTUGALP. Bordalo, C. Lourenco, Ri. Nobrega, V. Pop0v", S. Ramos,]. Varela
INR, Moscow RUSSIAA. Proskurja/cov, B. Semenov, I. Sernenyuk, V. Sukhov
G. Atoyan, S. Gninenko, E. Guschin, V. Issa/cov, V. Klirnenko, V. Marin, Y. Musienko, A. Poblaguev, V. Postoev ,
IHEP, Protvino, RUSSIAS. Bityukov, A. Gorin , V. Obraztsov, A. Ostankov, B. Polyakov, V. Rykalin, V. Soushkov, V. Vasil’chenk0, A.Zaitchenko
ITEP, RUSSIAS. Abdullin, V. Kaftanov, V. Lukashin, A. Nikitenko, Y. Semenov, A. Szarodurnov, N. Stepanov, Y. Trebukhovsky
JINR, Dubna, RUSSIAS. Sergueev. A. Sidorov, E. Zubarev, N. Zamiazin, A. Zarubin,
A. Cheremukhin, A. Egorov, I. Golutvin, I. Ivanchenko, Y. Kretov, Y. Kozlov, V. Minashkin, P. Moissenz, A. Rashevsky,
CERN, Geneva, SWITZERLANDE. Rosso
Ph. Blochz, J. Christiansen, H. Heijne, M. Glaser. P. Jarron, F. Lerneilleur, I. Karyotakis’ , R. Loos, A. Marchioro,
Ecole Polytechnique, Palaiseau, FRANCEI. Badier, G. Bonneaud, A. Busata, Ph. Busson, C. Charlot, L. Dobrzynski’, Ch. Gregory, A. Karar, R. Tanaka
A combined Shashlik + Preshower detector for LHC.
O O Shashlnk Calonmetry
R&D Proposal
we
. ;·,g» #4 M »· Dawgsc:00000220?"
August 13m, 1993\ _
DRDC/P50CERN [ DRDC g3_28CERN LIBRARIES, GENEVA

development that we wish to undertake. OCR Output
this paper we present the current status of the Shashlik calorimeter and the program of research and
Further research and development are essential before building a full scale projective detector. In
(’j6(mrad) =7 0
The angular resolution deduced from measurements is:
6 (8.4i.1) (.37i.03) %energy resolution is:
projective calorimeter prototype exposed to high energy electrons, are encouraging. The measured
expected that such calorimeters can be built at a relatively low cost. The first results, from a non
enables fine lateral segmentation to be achieved with a minimum of dead space. In addition, it is
yields from such calorimeters are in excess of 10000 photons per GeV. The use of optical fibres
calorimeters. These techniques involve the use of wavelength shifting optical fibres. The light
New techniques have been developed to read out the light from lead/scintillator sampling


5 G. S. Atoyan et al. Nucl. Instr. and Meth. (to be published),,Prcprint INR-736/91, INR, Moscow (1991) OCR OutputH. Fessler et al., Nucl. Instr. and Mem. 228(1985)303.25 nsec bunch crossing
>1 Mrad/year
up to 4 Tesla
Altogether, there are 75 layers giving a total radiation length of about 27.5 X0 .
sandwich, made out of perforated lead (2.0i0.005 mm) and plastic scintillator(41·0.05 mm) plates.
INR—II~IEP collaboration is shown in Figure 1. Each module is a 47 x 47 x 440 mm} lead/scintillator
The design of an individual CMS prototype module developed by the Ecole Polytechnique
2.1. Description.
2. The Shashlik calorimeter.
build a compact calorimeter with a high degree of hermeticity;
minimize dead space and thus obtain good lateral uniformity of response,
(silicon photodiodes, tetrodes...),
obtain promising results with photo detectors which can work in high magnetic field
obtain good light collection and light transmission efficiency;
obtain good energy resolution and it/e separation,
CERN4, BNL and IHEP5 showed that it was possible to:
The first beam—test measurement results for a prototype of the calorimeter performed at
the holes necessary for the insertion of the WLS fibres.
IHEP(Protvino)$ developed a process for mass production of scintillator tiles and lead plates with
scintillation light from sandwich electromagnetic calorimeters. Four years later INR(Moscow) and
In the mid—1980’s Fessler et al" suggested the use of WLS optical fibres for the readout of
and low cost.
sandwich calorimeter having the crucial properties of compactness, timing, good spatial resolution
The Shashlik detector has been designed to meet these requirements. It is a lead/scintillator
as good a hermeticity as possible.
high speedj;
high radiation resistance
operation in the presence of high magnetic fieldlg
energy resolution at least as good as O`/E=O. 10/VE and a constant term of 1%,electromagnetic calorimeter:
essential. In the CMS detector we wish to achieve the following performance for the
In order to search for new phenomena at the LHC good electromagnetic calorimetry will be
OCR OutputOCR Output1. Introduction
R&D Proposal: Shashlik calorimetry.

The Y7 WLS Gbres are produced by Kuraray. We have also used K27 WLS libres produced at INR(l·/loscow). OCR OutputUThis seintiunter was produced in Russia10
J. Bsdier et e1. , Preprint CMS TN/93-66, INR - 821/93, X-LPNHE / 93-4.V.K.Semenov et ei., Preprint JINR 13-90-16, Dubna (1990) (in Russian).
The niuniinirauen was done by Preeirrenie s. A. Cl·l272O TRAM ELAN.In this version we used K27 WLS fibres produced at INR.
The optimal number of WLS fibres in the module was chosen, on the one hand, by
Table 1: Main parameters of CMS prototype S has/zli/c tower.
Hole diameter in lead 1.5 mm
Hole diameter in scintillator 1.3 mm
Fibre diameter 1.2 i.03 mm
Number of fibres 25
Y7Tvpe er WLS tibres ]1
Scintillator thickness 4 1.05 mm
+ 2% Para-TerphenvlSCin{il]a[()I· typg lo POlyS[yI`€I'l€ +
Lead thickness 2 i .005 mm
Moliere radius 34 mm
Mean radiation length (XO) 16.9 mm
Total depth (465 mm 27.5 X0
Number of planes 75
Tower lateral size 47 x 47 mm
of the sampling layers are summarized in table 1 for the CMS9 prototype.
fixed to aluminum plates at the front and at the rear of each tower. The composition and properties
The module as a whole was wrapped with aluminized mylar and held together by 4 bicycle rods
plates to act as a reflecting surface. The paper was perforated by the same punch as the lead plates.
punching. White paper (20 mg/cm, 0.1 mm thick) was placed between the lead and scintillator
lead plates, containing 5% antimony additive to increase their rigidity, were manufactured by cold
plates with a surface of high optical quality including the surface of the holes for fibres. Perforated
The scintillator plates were manufactured at IHEP with casting technologyx. This produces
Y7 WLS fibres were used. These were aluminized7 at the front face of the towers.
and 25 in the version readout by Si photodiode (for details see table 1). In this last version Kuraray
total number of fibres was 13 (12 with loops + 1 single) in the version readout by photomultiplier6
bunch, polished, and were viewed directly by a photomultiplier tube and/or a Si photodiode. The
were inserted into these holes perpendicularly to the plates. The fibre ends were collected in one
Each plate of the module has 25 holes in it, arranged as a 5 x 5 square matrix. WLS fibres
Labarga and E.Ros, Preprint Univer. Sicgcn, FTUAM-EP-86-3,(l986). OCR Output12
stability. Non uniformity in the optical properties of the fibres can lead to a decrease in the light
The WLS fibres are required to have good optical uniformity and long-term mechanical
1%.
energy resolution function, due to longitudinal fluctuations of the electromagnetic shower, to about
in Shashlik towers with a length of 40 cm. This limits contributions to the "constant temi" of the
The WLS fibres are required to have a light attenuation length of at least 1.5 m, when used
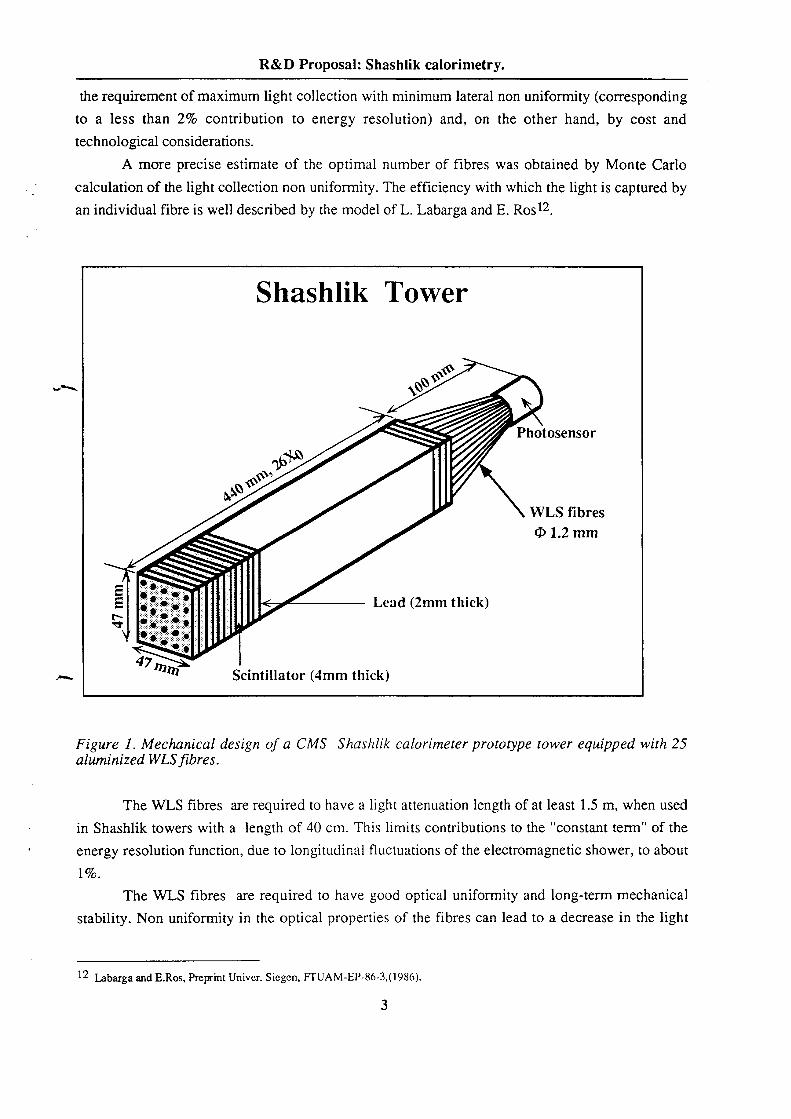
aluminized WLS fibres.Figure 1. Mechanical design of a CMS Shashlik calorimeter prototype tower equipped with 25
Scintillator (4mm thick)47 mm
.;.;"' ·=·t·2 :2:
E Lead (2mm thick)I
<I> 1.2 mm
WLS fibres
Photosensor
B"
Shashlik Tower
an individual fibre is well described by the model of L. Labarga and E. Rosl
calculation of the light collection non uniformity. The efficiency with which the light is captured by
A more precise estimate of the optimal number of fibres was obtained by Monte Carlo
technological considerations.
to a less than 2% contribution to energy resolution) and, on the other hand, by cost and
the requirement of maximum light collection with minimum lateral non uniformity (corresponding
R&D Proposal: Shashlik calorimetry.
for a loop with the radius 3 cm the light losses are < 5% OCR Output15
E i:;t1ro sarno simulation, one nos N ~ 150 in our ooso for i Gov?r;i.For example this is due to the large nunrbor of ronootions for individual photon (o simple optical simulation gives about 250 for
13
same light yield.
Kuraray Y7 fibres cut at the front of the tower and aluminized. The two methods gave us about the
In the CMS modules we tested in the beam, we used K27 WLS fibres with the loops and
tower. This could lead to a greater uniformity of light collection.
1.2 m. Looping the fibres avoids the necessity of aluminizing the fibres ends at the front of the
reflection coefficient > 95%15. The effective light absorption length in the fibres of the module was
then sees both ends of the same fibre at once. Such a loop acts as an almost ideal mirror with the
of the tower and fed back through the tower to complete the insertion process. The photomultiplier
The WLS fibres were fed through the entire length of the tower, looped around at the front
7tmax=530nm.
spectrum of the Pterphenyl+POPOP scintillator. The luminophor emission spectrum has
luminophor with the absorption spectrum Xmax =45O nm, which matches quite well the emission
index of n =l.59. The cladding is made of fluorinated PMMA with n :1.40. The core contains
produced at INR (Moscow). The core of this optical fibre is made of polystyrene with a refractive
The first WLS fibres used for the prototypes were "Polychrome—26" fibres developed and
fibres are inserted into the holes.
exceed i0.03 mm. This is important when the calorimeter modules are assembled mechanically and
total light yield from an electromagnetic shower]? The diameter dispersion of the fibres should not
o is the dispersion of fibre to fibre response and N is the number of fibres which contribute to the
yield13. There is also an additional contribution to the energy resolution of the order o NN, where
R&D Proposal: Shashlik calorimetry.
We used 10 x IO mm‘ HAMAMATSU photodiodes. OCR Output18
The towers were also readout by Russian photo multipliers during the September 92 test( see CMS TNI 92-45).17the front of the module and one single fibre was running through the hole situated at the center of the tower.
In a previous test reported in CMS TN/ 92-45, we used K27 WLS fibres produced at INR (Moscow). Twelve fibres were bent atThe aluminization was done by Precitramc S. A. CH2720 TRAMELAN.16
(usually a few degrees in the horizontal plane) with respect to the fibres axis.
be rotated around its vertical axis, so that the particles could be sent into the detector at an angle 9Z
vertically with respect to the beam line with a precision better than 0.1 mm. The detector could also
The calorimeter was mounted on a platform which could be moved horizontally and
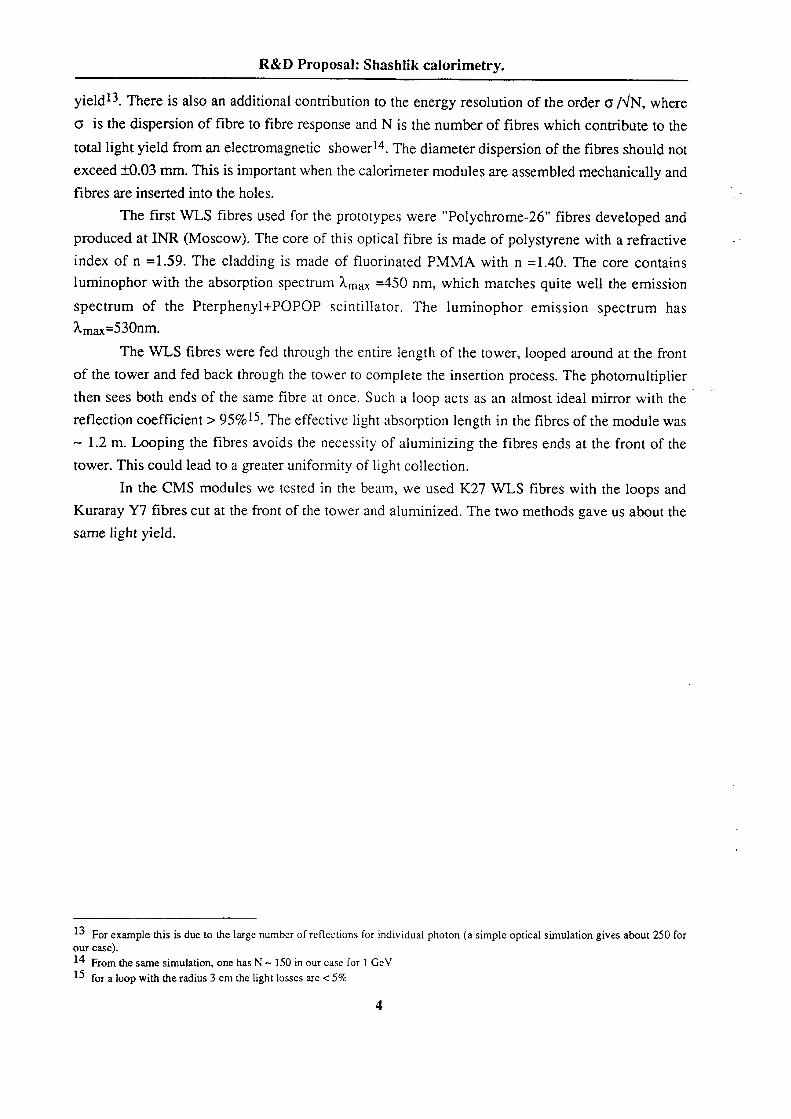
Figure 2: Preamplyier signal output.
10 ns / div.
gain : 200 mV/109 e'
TRC_CR :10 HS
CD = 30 pF
Preamp.
Si Photodiode readout
O O Shashlik calorimeter
the preamplifier output and its main parameters.
a preamplifier whose characteristics are given in reference 9. Figure 2 gives the observed signal at
mixer was used to couplethe fibres to a Silicon photodiodelg. Each photodiode was followed byn
bunched together at the rear of the tower and cut with a diamond mill. A hexagonal Plexiglas light
The WLS fibres (Y7) were cut at the front of the tower and aluminizedm. The fibres were
the equivalent of a standard lead plate.
in October 1992 at the CERN SPS. The amount of material in front of the first scintillator tile was
The nine parallelipedical Shashlik towers assembled in a 3 x 3 matrix (figure 3) were tested
f the.CMS Shashlik pr
R&D Proposal: Shashlik calorimetry.
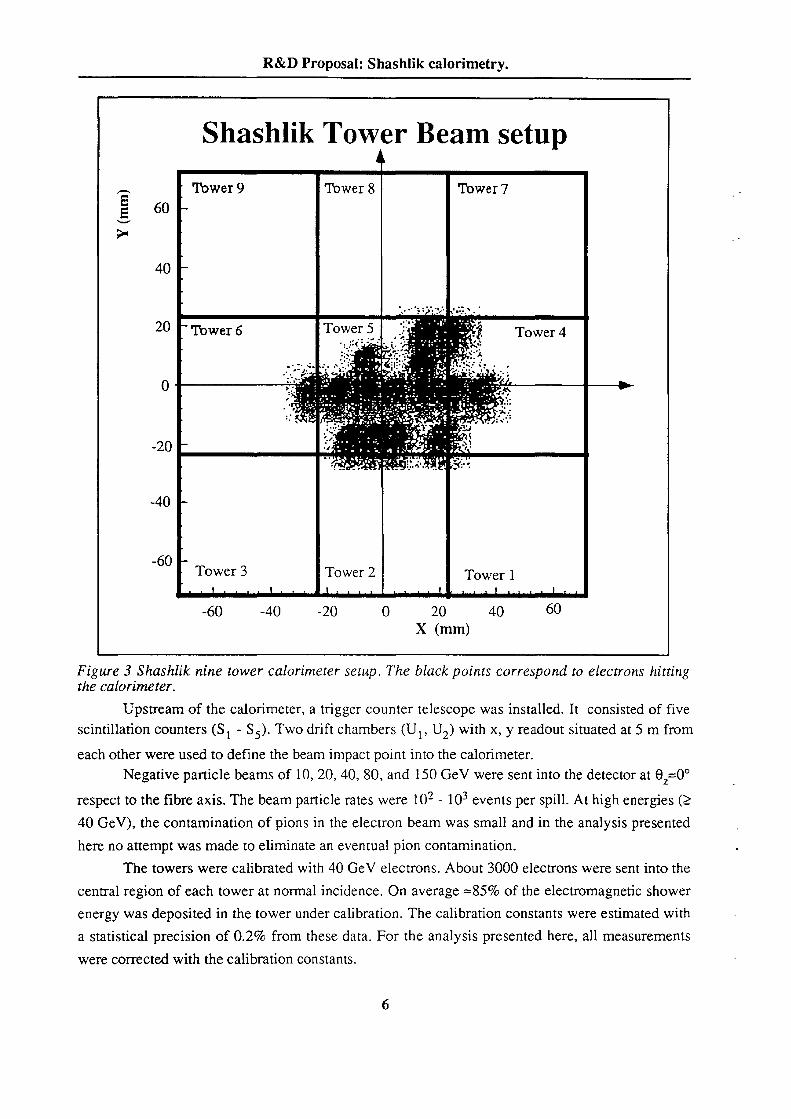
were corrected with the calibration constants. OCR Output
a statistical precision of 0.2% from these data. For the analysis presented here, all measurements
energy was deposited in the tower under calibration. The calibration constants were estimated with
central region of each tower at normal incidence. On average =85% of the electromagnetic shower
The towers were calibrated with 40 GeV electrons. About 3000 electrons were sent into the
here no attempt was made to eliminate an eventual pion contamination.
40 GeV), the contamination of pions in the electron beam was small and in the analysis presented
respect to the fibre axis. The beam particle rates were 10— 10events per spill. At high energies (22 3
Negative particle beams of 10, 20, 40, 80, and 150 GeV were sent into the detector at 97=O°
each other were used to define the beam impact point into the calorimeter.
scintillation counters (Sl · S5). Two drift chambers (U1, U2) with x, y readout situated at 5 m from
Upstream of the calorimeter, a trigger counter telescope was installed. It consisted of five
the calorimeter.Figure 3 Shashlik nine tower calorimeter setup. The black points correspond to electrons hitting
X (mm)
-60 -40 -20 0 20 40 60
Tower 1Tower 2TOWH 3-60
-40
S-*'-*¥!!!I·$‘=‘
-20
1}}-w
¢:€ial7`$'?`·`
tt row 4T¤W¢{ § 120 Ir 'lbwer 6
40
E 60
'llower 7Tower 8'Ibwcr 9
Shashlik Tower Beam setup
R&D Proposal: Shashlik calorimetry.
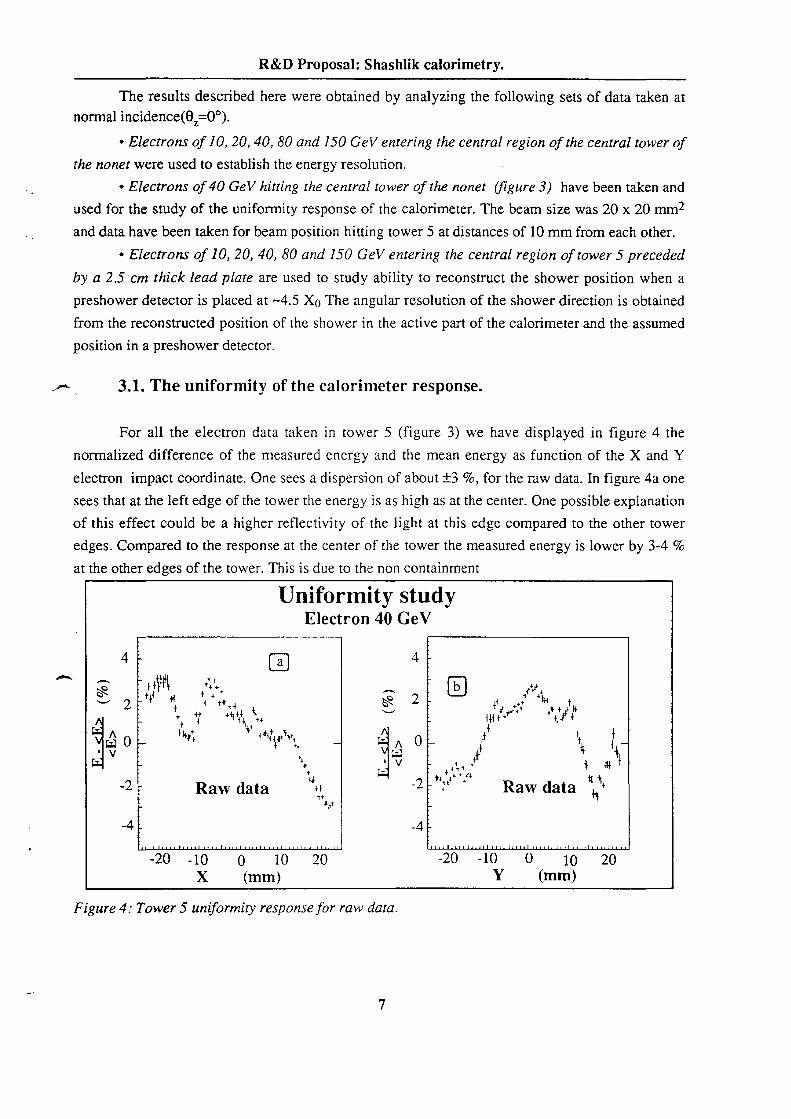
Figure 4: Tower 5 unjormity response for raw data.
X (mm) Y (mm) OCR Output-20 -10 0 10 20 -20 -10 0 10 20
. Raw data zi?
*"·*115 0 I \[ *gl` (Y **+ nl n I L?/I 1 3* V in *1 1** '2 it Raw data 1. ++w HM m{+*ww
111+ 1at +,_ 1+y ititii,, +, ..,.*1t * *V 2 1 1 rmA { E] gg. § 2 ****g {*1,+*1***1 * **
Electron 40 GeV
Uniformity study
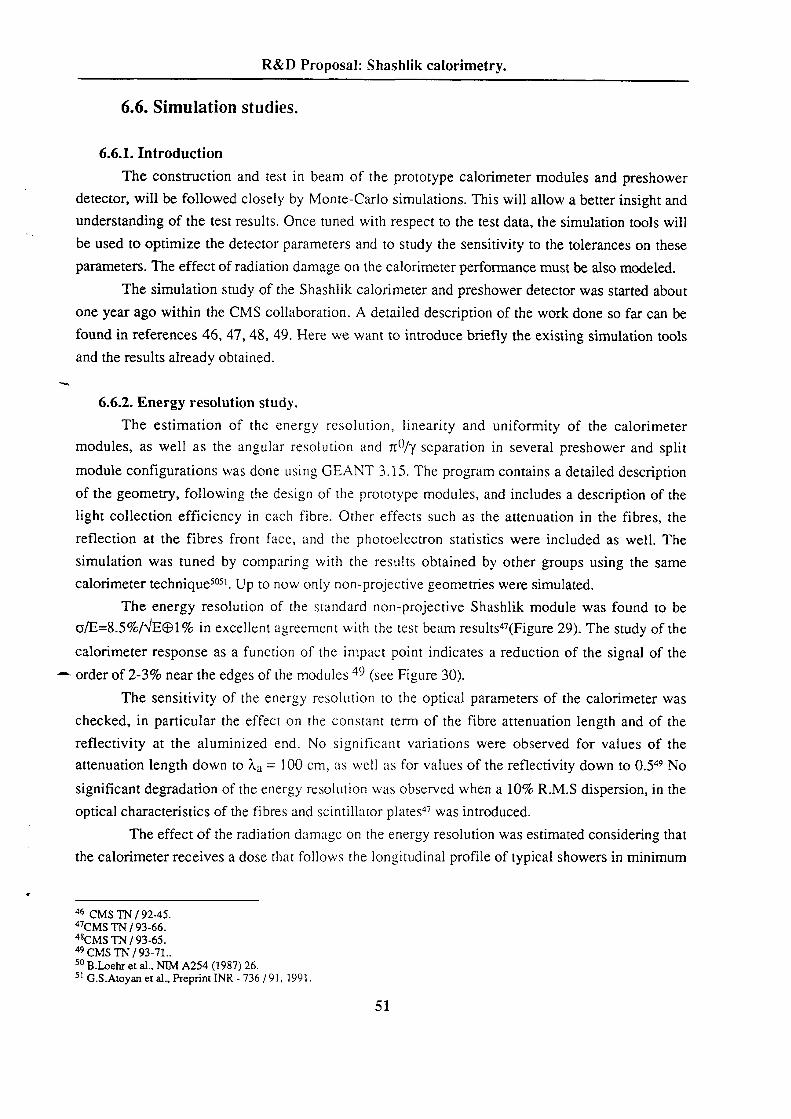
at the other edges of the tower. This is due to the non containment
edges. Compared to the response at the center of the tower the measured energy is lower by 3-4 %
of this effect could be a higher reflectivity of the light at this edge compared to the other tower
sees that at the left edge of the tower the energy is as high as at the center. One possible explanation
electron impact coordinate. One sees a dispersion of about i3 %, for the raw data. In figure 4a one
normalized difference of the measured energy and the mean energy as function of the X and Y
For all the electron data taken in tower 5 (figure 3) we have displayed in figure 4 the
3.1. The uniformity of the calorimeter response.
position in a preshower detector.
from the reconstructed position of the shower in the active p81‘t of the calorimeter and the assumed
preshower detector is placed at ~4.5 XO The angular resolution of the shower direction is obtained
by a 2.5 cm thick lead plate are used to study ability to reconstruct the shower position when a
Electrons of 10, 20, 40, 80 and 150 GeV entering the central region of tower 5 preceded
and data have been taken for beam position hitting tower 5 at distances of 10 mm from each other.
used for the study of the uniformity response of the calorimeter. The beam size was 20 x 20 mm2
Electrons of 40 GeV hitting the central tower of the nonet (figure 3) have been taken and
the nonet were used to establish the energy resolution.
Electrons of 10, 20, 40, 80 and 150 GeV entering the central region of the central tower of
normal incidence(6,=0°).
The results described here were obtained by analyzing the following sets of data taken at
R&D Proposal: Shashlik calorimetry.
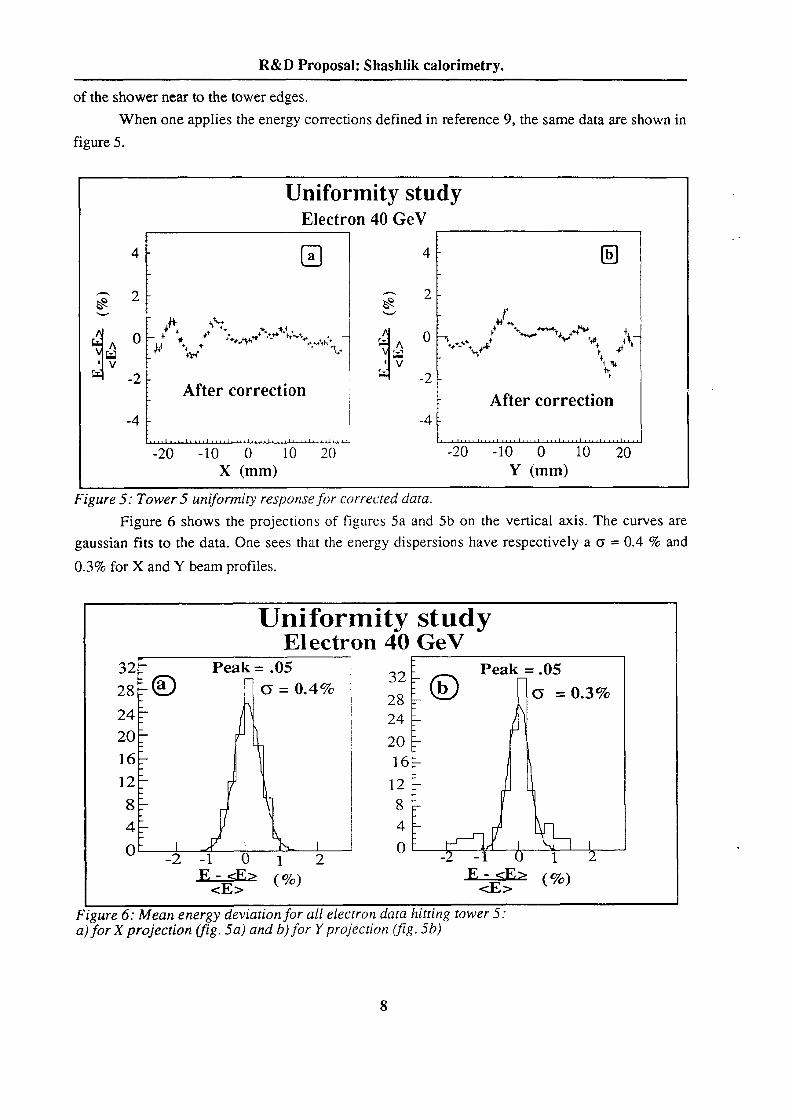
a)forXprojection (fig. 5a) and b)for Yprojection (fig. 5b) OCR OutputFigure 6: Mean energy deviation for all electron data hitting tower 5:
;.Slh2 <E> (%’ .:$L2 <E> (%)-2 -1 0 1 2
1212
1616
2-424
G :0.3%E ® 28 = 0-4% 1 28g CD32
Peak = _()532 Peak = .05
Electron 40 GeVUniformity study
0.3% for X and Y beam profiles.
gaussian fits to the data. One sees that the energy dispersions have respectively a 0 = 0.4 % and
Figure 6 shows the projections of figures 5a and 5b on the vertical axis. The curves are
Figure 5: Tower 5 unQ‘0rmizy response for corrected data.
X (mm) Y (mm)
-20 -10 0 10 20 -20 -10 0 10 20
After correction_ After correctnon
{lt-N' V -22% i 4+
é ' V -2,_,._·.-—+w_*{A , "*t‘ *;,*% O *;* ’•*“+$+‘ *1* + 1*,4;*‘ **,++1 ,,1, ·" 0 *, {N · W }"" V+*,
*9 + +` am+4} ‘ Q1»14*{ {·.. tf}.,
§ 2
Electron 40 GeV
Uniformity study
figure 5.
When one applies the energy corrections defined in reference 9, the same data are shown in
of thc shower ucar to thc tower cdgcs.
R&D Proposal: Shashlik calorimetry.
(.8 a .2 >% OCR Output21The Si photodiode was mounted on the central tower of the nonet.The regions around the fibres( r = l mm) and the region near the edges of the tower (0.5 mm) are excluded.I9
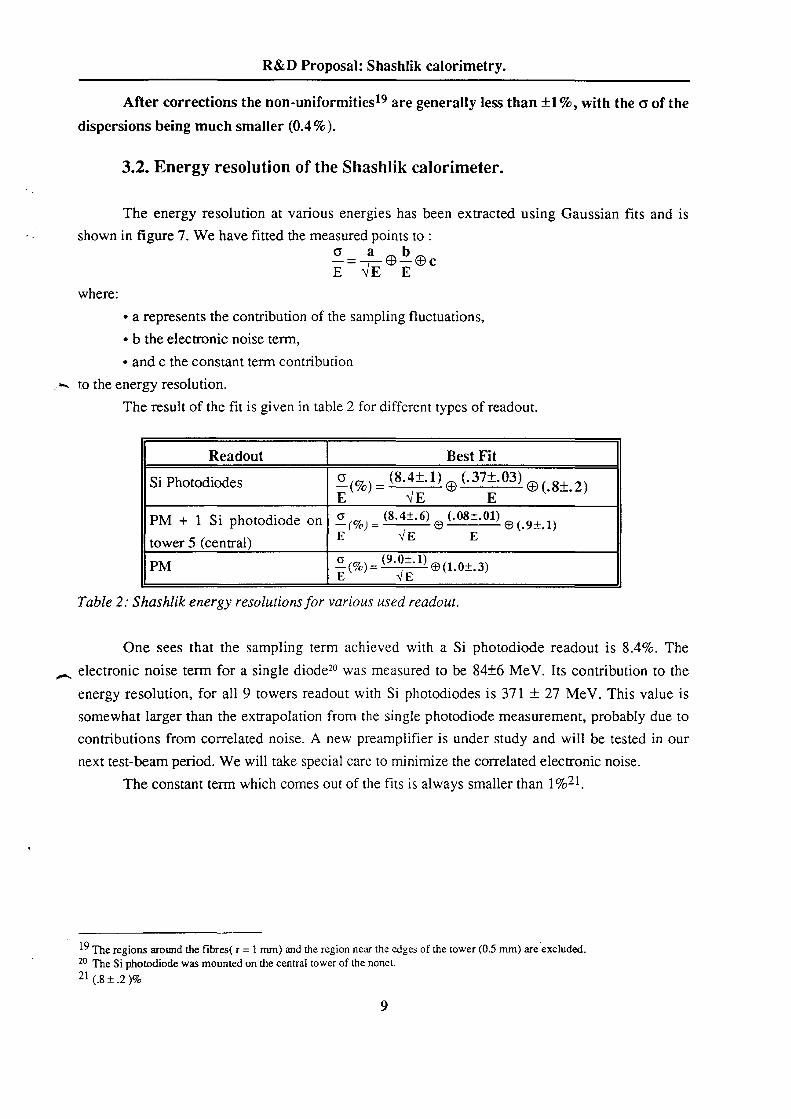
The constant temi which comes out of the fits is always smaller than l%21next test-beam period. We will take special care to minimize the correlated electronic noise.
contributions from correlated noise. A new preamplifier is under study and will be tested in our
somewhat larger than the extrapolation from the single photodiode measurement, probably due to
energy resolution, for all 9 towers readout with Si photodiodes is 371 1 27 MeV. This value is
A electronic noise term for a single diode2° was measured to be 84i6 MeV. Its contribution to the
One sees that the sampling term achieved with a Si photodiode readout is 8.4%. The
Table 2: S hashlik energy resolutions for various used readout.
L V E(%)=®(l.0i.3)PM (iiw
tower 5 (central)@ (_gi_1) E VE EPM + l pl'1OIOdlOdC Ofll :E tl E
C9 (_8i_2)(%) ZSi Photodiodes g(8‘4i·l) rn (37`L03)
Readout Best Fit
The result of the fit is given in table 2 for different types of readout.
,····~ to the energy resolution.
and c the constant term contribution
b the electronic noise term,
a represents the contribution of the sampling fluctuations,
where:
E E E= ®® C; 6 ashown in figure 7. We have fitted the measured pointto
The energy resolution at various energies has been extracted using Gaussian fits and is
3.2. Energy resolution of the Shashlik calorimeter.
dispersions being much smaller (0.4%).
After corrections the non-uniformitiesw are generally less than i1%, with the 0 of the
R&D Proposal: Shashlik calorimetry.

10 OCR Output
2 J. Badier etal., Preprint CMS TN /93-65, INR - 823/93, X-LPNHE / 93-3.
5x Z ..i.. ldA| 64
from the asymmetry measurement by:
study are described in reference 23. The precision of the reconstructed shower center is deduced
where imax denotes the interval in which the deposited energy is maximum. The details of this
Elo!A(x) = i<1max 1>1max
asymmetry variablezz
The shower center is estimated from the lateral energy distribution by the following
3.3. Shower position measurement.
Figure 7: S hashlik energy resolution measurement.
beam
0 20 40 60 80 100 120 140 160
~/E__
F3t;x’{(.(§;11LQl)2+(.;l1;c;(Q])2+(.008¤;.002)2}
EI`l€l°gy I`€SOlUtiOI`l
R&D Proposal: Shashlik calorimetry.

11 OCR Output
our setup.
Figure 8: Precision of the reconstructed shower position for 40 GeV electrons hitting tower 5 of
X (tower size unit)
0 0.05 0.1 0.15 0.2 0.25 0.3 0.35 0.4 0.45 0.5.
0.5
1 .5
25 €', 40 GEV
POSITION RESOLUTION
SHASHLIK
edges it is better by a factor of 3.
The precision on the shower position is worst at the tower center. Towards the tower
E——·······Gm = 9.1 i 0.3Sm i 0.75ysl 27 1 1.4sm i 2.1sysl_ @of the energy. The best tit to the data is obtained with a quadratic form of type:
The precision in the shower position has been measured at the tower center as a function
function of the electron impact point.
For 40 GeV electron data we show in figure 8 the variation of error on the shower position as a
R&D Proposal: Shashlik calorimetry.
12 OCR Output
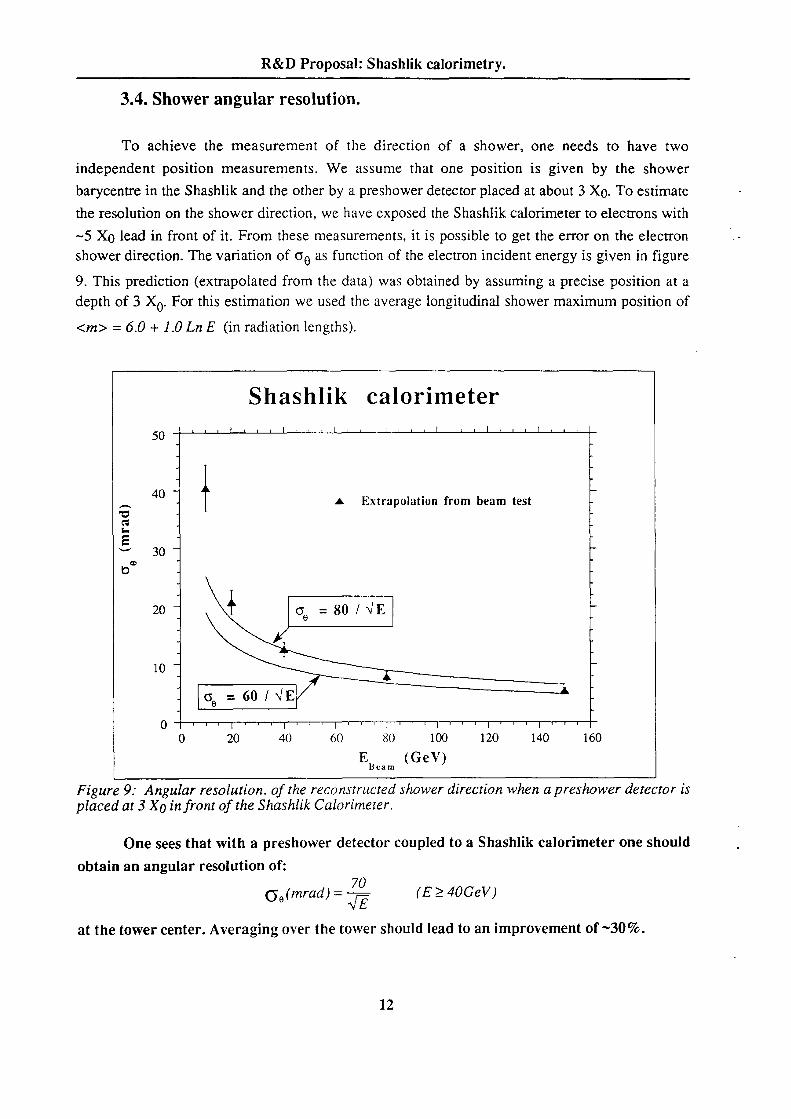
at the tower center. Averaging over the tower should lead to an improvement of ~30%.
(‘j9(mrad) = (E 2 40GeV)70
obtain an angular resolution of :
One sees that with a preshower detector coupled to a Shashlik calorimeter one should
placed at 3 Xg infront of the Shashlik Calorirneter.Figure 9: Angular resolution. of the reconstructed shower direction when a preshower detector is
licam
0 20 40 60 80 100 120 140 160
as = 60 x ve
10
20 é og = 80 / JE
30
A Extrapolation from beam test
so
Shashlik calorimeter
<m> = 6.0 + 1.0 Ln E (in radiation lengths).
depth of 3 X0. For this estimation we used the average longitudinal shower maximum position of
9. This prediction (extrapolated from the data) was obtained by assuming a precise position at a
shower direction. The variation of 09 as function of the electron incident energy is given in figure
5 X0 lead in front of it. From these measurements, it is possible to get the error on the electron
the resolution on the shower direction, we have exposed the Shashlik calorimeter to electrons with
barycentre in the Shashlik and the other by a preshower detector placed at about 3 X0. To estimate
independent position measurements. We assume that one position is given by the shower
To achieve the measurement of the direction of a shower, one needs to have two
3.4. Shower angular resolution.
R&D Proposal: Shashlik calorimetry.
13 OCR Output
electrons/GeV was measured for the seven towers corresponding to 12,300 Y/GeV.
the central tower of the nonet we obtained 64()0 electrons/GeV. A mean value of 6600
seven towers. The photodiode efficiency for Y—7 emission spectrum Ot = 500 nm) is 62.5% . For
aluminized at the front end of the tower. The light yield measurements were performed this time on
In the second test period, the towers were equipped with 25 Y—7 KURARAY WLS fibres
13,060 Y/GeV.
region of K—27 emission spectrum (X = 525 nm), one estimates that the total observed light yield is
the central tower. Using a quantum efficiency of 65% for the HAMAMATSU photodiode in the
gives a signal equal to 292000 electrons (7300 electrons/GeV ). 86% of the energy is deposited in
had loops. The light yield provided by a 40 GeV electron shower hitting the center of the tower
(September 1992) the central tower of our setup was equipped with 13 K—27 fibres out of which 12
The light yield was measured in different experimental conditions. In the first measurement
measurements is $10%.
charge through a calibration capacitance. Our estimation of the systematic error in these
to a low-noise charge-sensitive amplifier. The gain of the amplifier was measured by injecting a test
The light yield provided by a Shashlik tower was measured with a Si photodiode connected
3.5. Light yield of a Shashlik tower.
R&D Proposal: Shashlik calorimetry.

14 OCR Output
24 see RD3.to be published in " Nuovo Cimento"conference on Large Scale Applications and Radiation Hardness of Semiconductor Detectors. Floreze, Italy July 1993. Proceedings
Beam-test results of a preshower with Si strip detectors as active media. M. Glaser, et al., Submitted to the l" Intcmational
Figure 10: Preshower test beam setup.
The schematic of the beam test set—up is shown in figure 10.
4.2. Test beam setup.
of the shower and to correct for the energy lost in the preshower absorber material.
The analog signals from the strip detectors of the preshower are used to find the barycentre
detectors placed after 2XO and 3XO of absorber?optimized solution in terms of cost, accuracy and number of layers is to have two layers of silicon
resolution. After the preshower the shower is sampled by 2 mm pitch silicon strip detectors. The
shower coordinate information at the expense of a relatively small worsening of the energy
rejection a preshower detector will be required at CMS. The preshower detector will provide
In order to measure the direction of the electromagnetic shower and provide good 1:0
4.1. Introduction.
4, Test hggm rgsggltsu gf a preshowe; detector with silicon stri
R&D Proposal: Shashlik calorimetry.
IS OCR Output
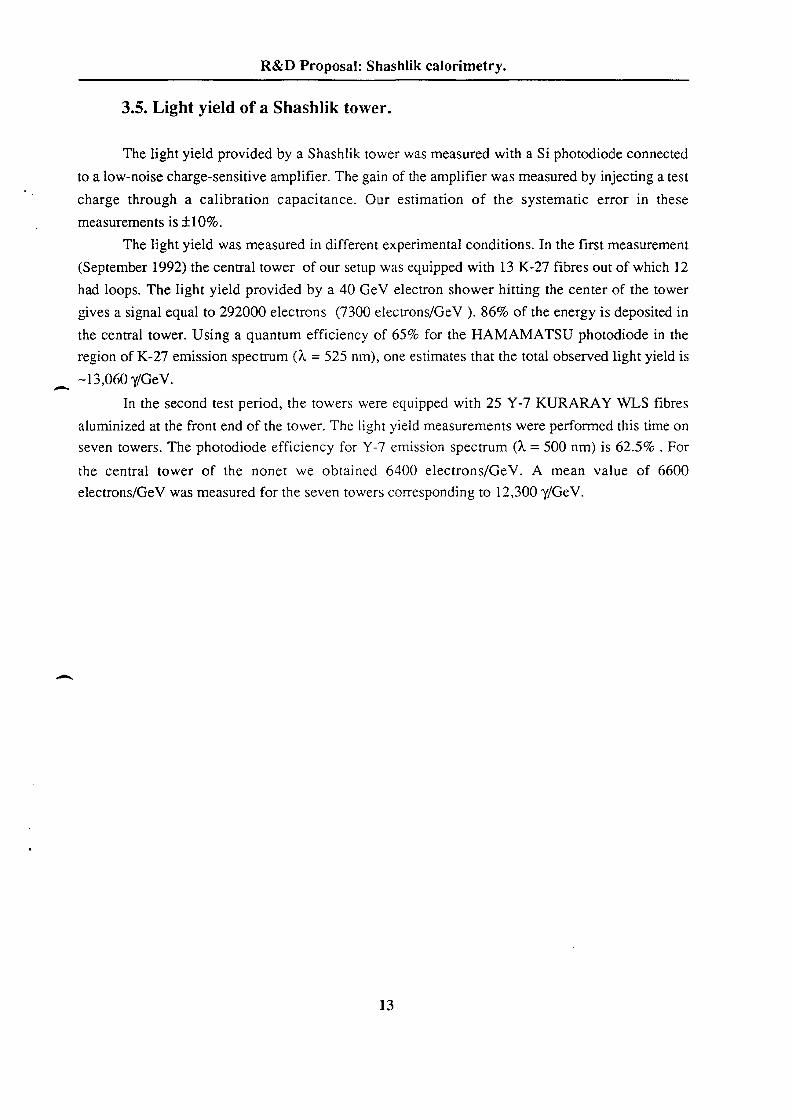
Each strip has an area of 1.2 cme and a reverse current of about 50 nA (at 170V).
Full depletion occurs at 170 V and each detector strip has a capacitance about 27 pF/cm
Figure 11: Preshower silicon strip detector.
—l-HV
Q1 , QJ, 7 it m
V-) z L Um
pig];mm FT stm; im@1
Si Q2 /
Output
silicon material.
detectors (figure 11) were manufactured by ELMA (Moscow) from 3.6 kQcm n-type FZ-Wacker
a pitch of 2 mm were used (each one with 29 strips and guard ring along its perimeter). These
Copper was used as the absorber material. Two silicon detectors (60 x 60 x 0.4 mm’) with strips at
R&D Proposal: Shashlik calorimetry.
16 OCR Output
E. Beuville at A11., Nuclear Physics B. (Proc. Suppl.) 23A (1991) 198
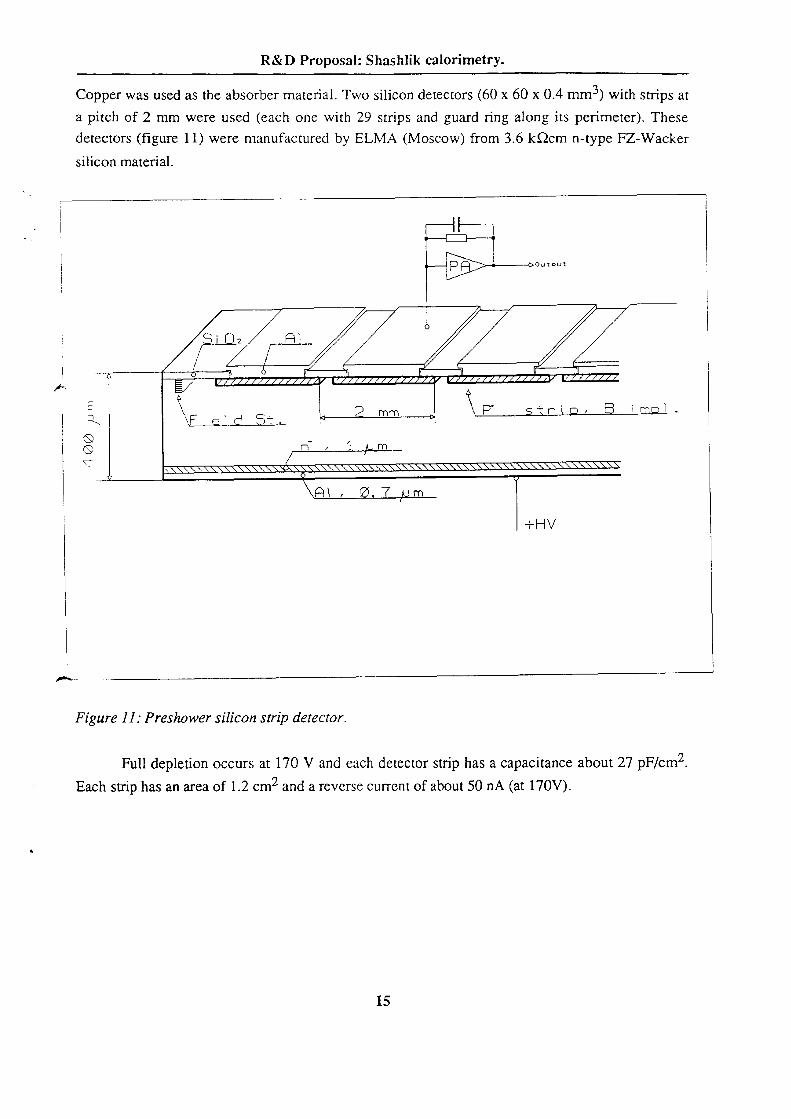
from a single AMPLEX channel.
distribution from the alpha particles was obtained in a self triggering mode by "FAST-OR" signal
The Si detectors were tested using a Am(5.5 MeV) alpha-source. The pulse height241
Figure 12 Preshower readout system.
B E QM
(2 mm l
29 Str i eg illlllll llli
st}-§ps ·l>l<¥st%·ins
L6 ® 29
level treamslétorb"`
ControlSICQL AHPLEX Control $ig¤&lQMPLEX
strobeSEQUENCER
GDC strobe
RDS CLR Jl Resetpc :ll—~J oooIBM " llé @05
startRDS r·ead·;>ut ,._]i Readout
CLR
5:.tr—;qge·r— ,_]| T/•-1CLR
per board) as shown on figure 12.
Each detectors was connected to a printed board circuit containing two AMPLEX's (32 channels
A 16-charmcl AMPLEX-SICAL signal proccssoru was used to readout the silicon detector.
4.3. The readout.
R&D Proposal: Shushlik calorimetry.
17 OCR Output
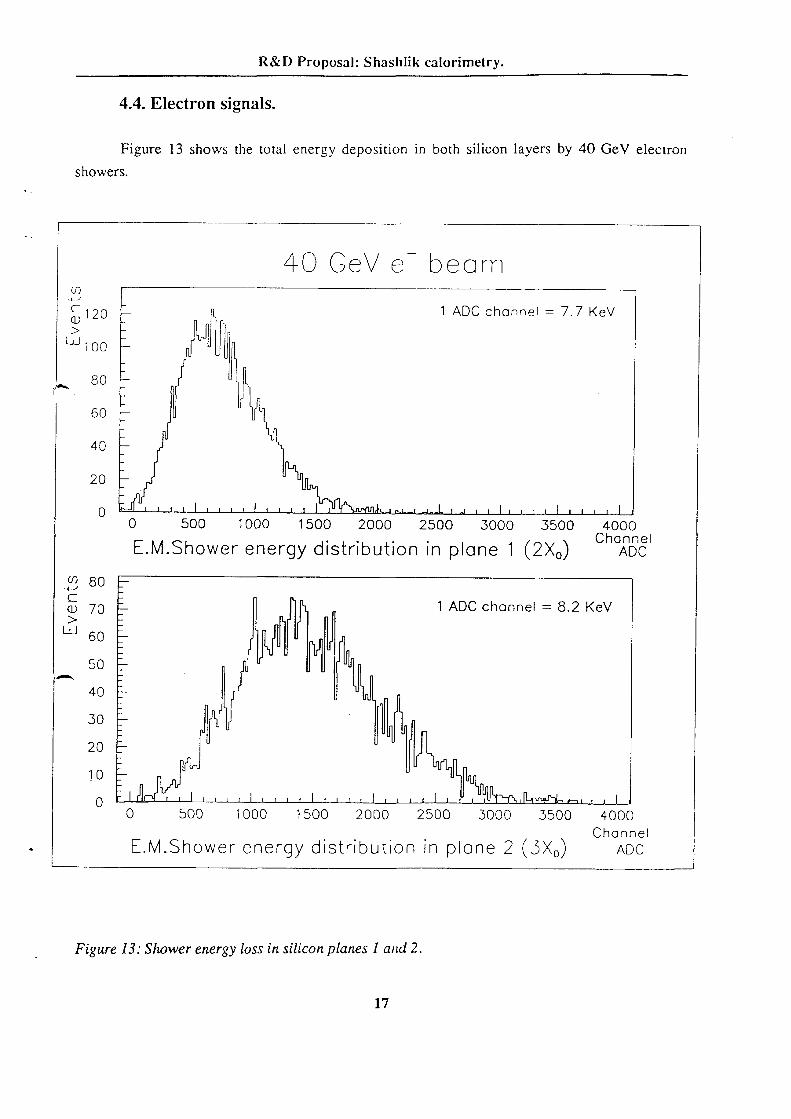
Figure 13: Shower energy loss in silicon planes 1 and 2.
____ E.M.$h0wer energy distribution in plone 2 (3><O) AocChonnel
0 500 1000 1500 2000 2500 3000 3500 4000
20
30
40
50
60
70 1 ADC chonnel = 8.2 KeV
80
,._, E.lvl.Shower energy distribution in plone 1 (2XO) AocC41I onne0 500 1000 1500 2000 2500 3000 3500 000
20
40
60
80
LU100
5120 1 ADC channel = 7.7 Ke\/
4 O G e\/ e D e o m
showers.
Figure 13 shows thc total cncrgy deposition in both silicon layers by 40 GeV electron
4.4. Electron signals.
R&D Proposal: Shashlik calorimetry.

18 OCR Output
our simulation.
placed after 3 Xg. Preliminary measurements (not shown) give results that are in agreement with
indicates that a position resolution of .35 mm at 40 GeV should be achieved with 2 mm pitch strips
The analysis of coordinate reconstruction is under way. The Monte Carlo simulation
4.6. Shower position resolution.
calorimeter.
energy resolution is degraded by les$ than 10% in comparison to that obtained for the stand alone
preliminary analysis (not shown) in\dicates that, using the energy deposited in the Si strips, the
Data have been taken with|and without the preshower in front of the calorimeter. A
4.5. Effect on the calorimeter resolution.
R&D ll>roposal: Shashlik calorimetry.
20 OCR Output
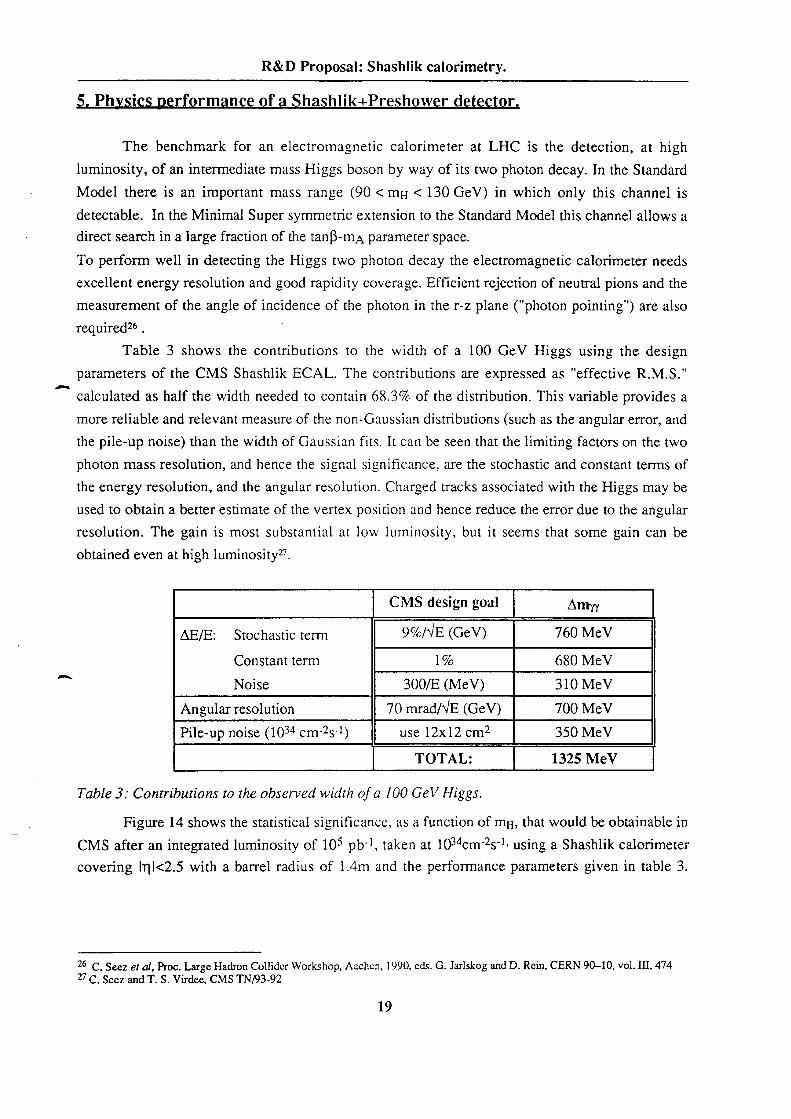
ECAL.Figure 14: Signal signyicance in the H -+9/)/channel after 105 pir] delivered to CMS Shashllk
GSS (UG
90 100 110 120 130 140 150
-·-------- Stondord model H
50
g
100
Q/_S=16TeV, fLdt=10° pb'1, In |< 2.5OCR Output\/200 AE/E=9%/x/E€91.0% EP 0.500/E
R&D Proposal: Shashlik calorimetry.
21 OCR Output
8 CMS Letter of Intern, CERN/LHCC 92-3, LHCC/Il, October 1992
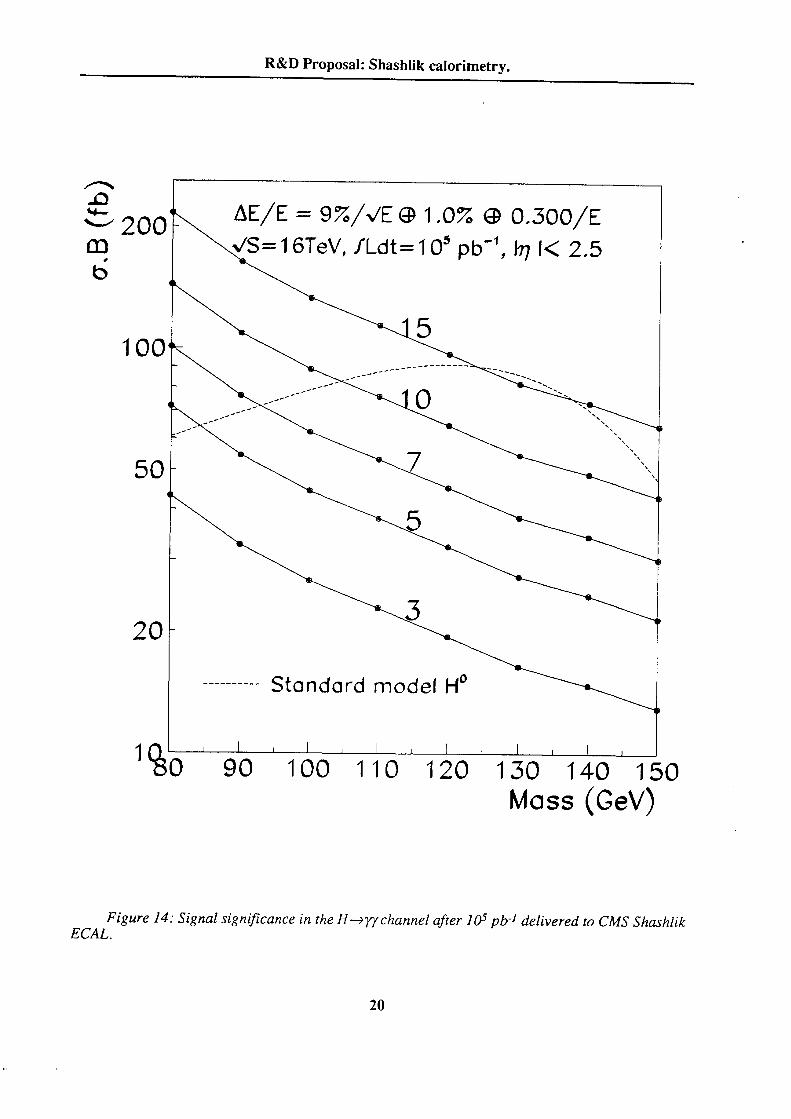
and 150 GeV.Figure 15: Result ofa single Monte-Carlo experiment for 105 ph] with Higgs peaks at 90, 110, 130
my, (GeV)80 1 00 1 20 1 40
lm
`§ 500
1 000
therein.
look after background subtraction. For more details of this analysis see referencezg and references
experiment for 105 pb·l and illustrates how SM Higgs of masses 90, 110, 130 and 150 GeV would
Standard Model Higgs for my > 85 GeV. Figure 15 shows the result of a single Monte-Carlo
A signal with a statistical significance of more than 5 sigma would be expected from a
22 OCR Output
the choice of parameters listed in table 4.
compactness, high light yield, good energy resolution and acceptable number of elements leads to
the scintillator plates are determined. A compromise satisfying the contradictory needs of
desired energy resolution fixes the sampling frequency. Hence the thickness of the lead plates and
requires the ratio K (scintillator volume versus the lead volume) to be as high as possible. The
Spatial constraints lead to a depth of S 40 cm for the calorimeter itself. Good light yield
the scintillator must be maximized.
photodiodes which lead to an appreciable electronics noise. Therefore, the light yield provided by
one imposes a photo-sensor that can work in a magnetic field. The baseline solution uses Si
the Barrel region to ~ 600 mm between the inner tracking and the hadron calorimeter. The second
magnetic field of 4 Tesla. The first one limits allowed space for the electromagnetic calorimeter in
CMS constraints stem essentially from overall compactness and the presence of a high
whose effect on overall energy resolution has to be well understood.
detector to give the shower direction. The preshower should be considered as a separate detector
have projective towers. At high luminosity, a second point has to be measured using a preshower
radiation levels allow the use of the Shashlik technique without many problems. The barrel will
We have concentrated on the Barrel which covers 90% of the solid angle and where the
or non—project1ve.
cables have to be taken out, leading to a crack that can be either projective (and covered by HCAL)
The transition between the Barrel and the End caps is not yet well defined. A large number of
the two end caps (I nl: l.65————>2.5)
the Barrel (I nl: 0;+ l.65)
The two main parts are:
6.1.1. Shashlik electromagnetic calorimeter for CMS.
6.1. Optimization of the tower parameters.
methods for monitoring the response of the ensemble over a long period.
quality control of various components,
mechanical design of an ensemble of Shashlik+Preshower detectors ,
radiation tolerant combinations of scintillator and WLS fibres,
lateral uniformity of response in projective towers,
Further R&D should involve the investigation of the following:
s.0Lthe.present R&D.
R&D Proposal: Shashlik calorimetry.
23 OCR Output
the lead manufacture.
the attenuation length of the WLS fibres. The choice of parallel fibres simplifies the scintillator and
efficiency decreases as an inverse function of the tower depth but is more or less compensated by
fibres parallel to the axis of the tower. The light collection is not much affected. The collection
The towers have a projective (truncated pyramid) shape. We propose to keep the WLS
a) Geometry of the fibres.
6.1.5. Light collection.
technical and obvious financial reasons ( increase in readout channels).
performance (position reconstruction, it/e separation,.) we do not foresee any segmentation for both
Although the fact that longitudinal segmentation of towers would improve the calorimeter
6.1.4. Tower segmentation.
up to In! = 1.65, all towers will have a constant depth of 30 X0.
propose to increase smoothly the depth of the towers up to 30 Xg at Inl = 0.75. Above this value and
to have 30 Xg. However, it is possible to increase the depth of the towers as function of T]. We
We have limited the depth of the calorimeter at Tl = 0 to 25 X0, although one would prefer
6.1.3. Depth of the calorimeter.
23760.
and 110 in 1] (/1]/S 1.65). The total number of towers for the barrel part of the calorimeter is
measured to better than 1.5 mm at the tower center for 40 GeV electrons. There are 216 towers in CD
Both simulations and tests indicate that the lateral position of the shower barycentre can be
An = ACD = 0.03
mm! corresponding to:
·- cost related to the number of channels. We propose a front cross section of towers to be~40 x 40
The parameters involved here are: the occupancy, the Moliere radius of the medium and the
6.1.2. Tower granularity.
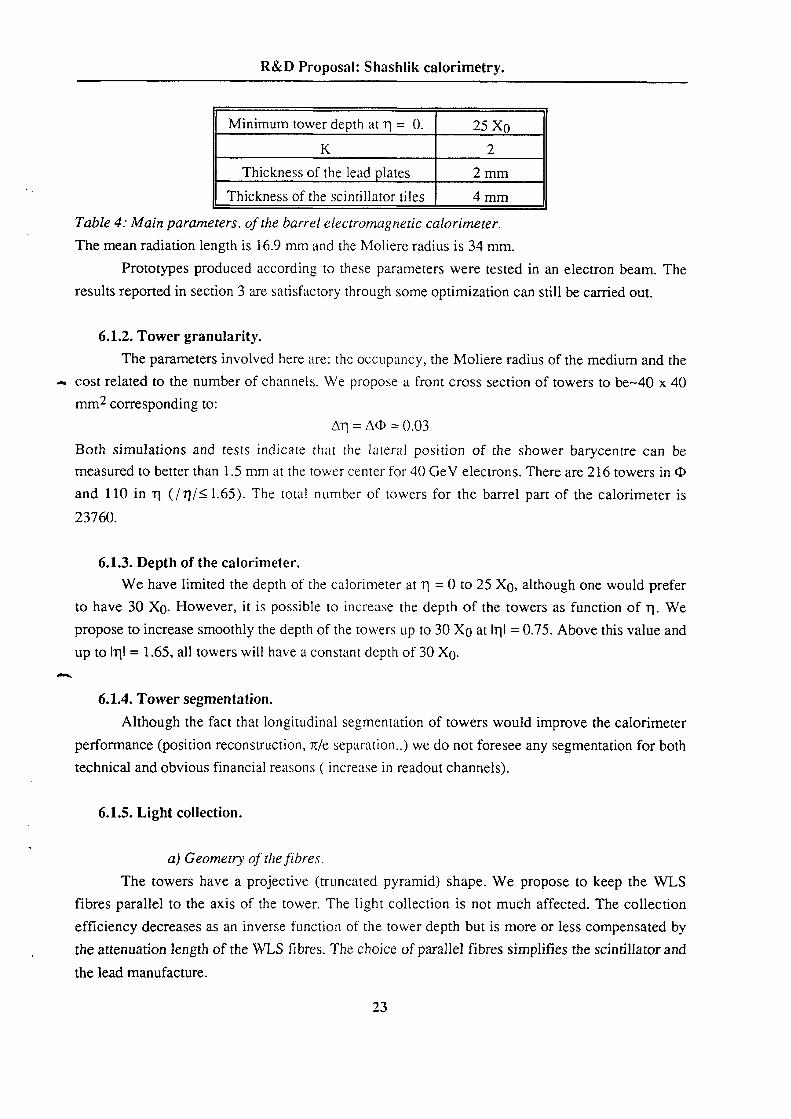
results reported in section 3 are satisfactory through some optimization can still be carried out.
Prototypes produced according to these parameters were tested in an electron beam. The
The mean radiation length is 16.9 mm and the Moliere radius is 34 mm.
Table 4: Main parameters. of the barrel electromagnetic calorimeter.
Thickness of the scintillator tiles I 4 mm
2 mmThickness of the lead plates
l\/linimum tower depth at T] = 0. | 25 Xt)
R&D Proposal: Shashlik calorimetry.
24 OCR Output
of the tower, larger diameter of fibres than the one foreseen in the final towers).
However, our test conditions were not fully representative (no magnetic field, no preshower in front
was necessary to tilt the towers by a small angle (2-3 degrees has been measured to be sufficient).
This is an important point. From test beam results, it was shown that to avoid channeling, it
6.1.6. Tilt of the towers in <D.
For the moment, we are working on both configurations and will test them thoroughly.
achieve and needs machining of the bunch after assembly of the tower.
view, the second solution offers some advantages. Bundling 36 fibres together could be difficult to
Electronic noise considerations favor the first solution. However, from a technical point of
several diodes each one optically coupled to several fibres.
one diode optically coupled to the 36 fibres,
Two configuration can be envisaged:
d) Number of diodes per tower.
of channeling and uniformity.
36 fibres with a diameter of 0.83 mm, rather than 16 fibres with a diameter of 1.8 mm, for reasons
scales as n*d (where n is the number of fibres and d their diameter). Therefore, we propose to use
efficiency of light collection does not change. For a tower of a given lateral size, the light yield
Twenty five fibres of 1 mm in diameter for a tower of 40 x 40 mm2 is an homotetic and hence the
diameter for a tower of 47 x 47 mm?. We have shown (section 3) that the light yield was adequate.
an even number, i.e. either 16 or 36. In prototypes tested in beam, we had 25 fibres of 1.2 mm in
For a solution using loops, the number of fibres going through a tower must be the square of
c) Number and diameter of the jibres.
less difficult and more reproducible though both techniques need to be studied.
end of the fibres or by making U-loops and hence effectively reading both ends. The use of loops is
temi in the energy resolution function. The situation can be improved, either by aluminizing one
fluctuations. Indeed, due to the finite fibre attenuation length such fluctuations induce a constant
Ideally, the fibres should be readout at both ends because of the longitudinal shower
b) Reflective ends.
the lead manufacture.
the attenuation length of the WLS fibres. The choice of parallel fibres simplifies the scintillator and
R&D Proposal: Shashlik calorimetry.
25 OCR Output
final mounting and wrapping and remain in place until WLS fibres are inserted.
obtained by machining. The holes are used as a reference for this procedure. Steel rods are used for
the drilling must be done first. The correct lateral dimensions of the lead and scintillator plates are
Only the edges of lead and scintillator are machined. Due to the required alignment of holes,
d) Machining ofthe components.
For monitoring, we intend to insert between 2-4 clear quartz fibres in each tower.
are well aligned. The drilling must be done precisely, to within $5 ttm.
introduced into the towers after the tower assembly described above. This requires that all the holes
mm in diameter, all parallel to the tower axis. The pitch between fibres is around 7 mm. They are
The light produced by a shower in the scintillator plates is readout by 36 WLS fibres of 0.83
c) Holes for WLS jibres and monitoring jibres.
paper.
different parts, measuring their thickness and finally by correct shimming with extra sheets of
be at its nominal design position to within 100 ttm. This is only possible by selecting the
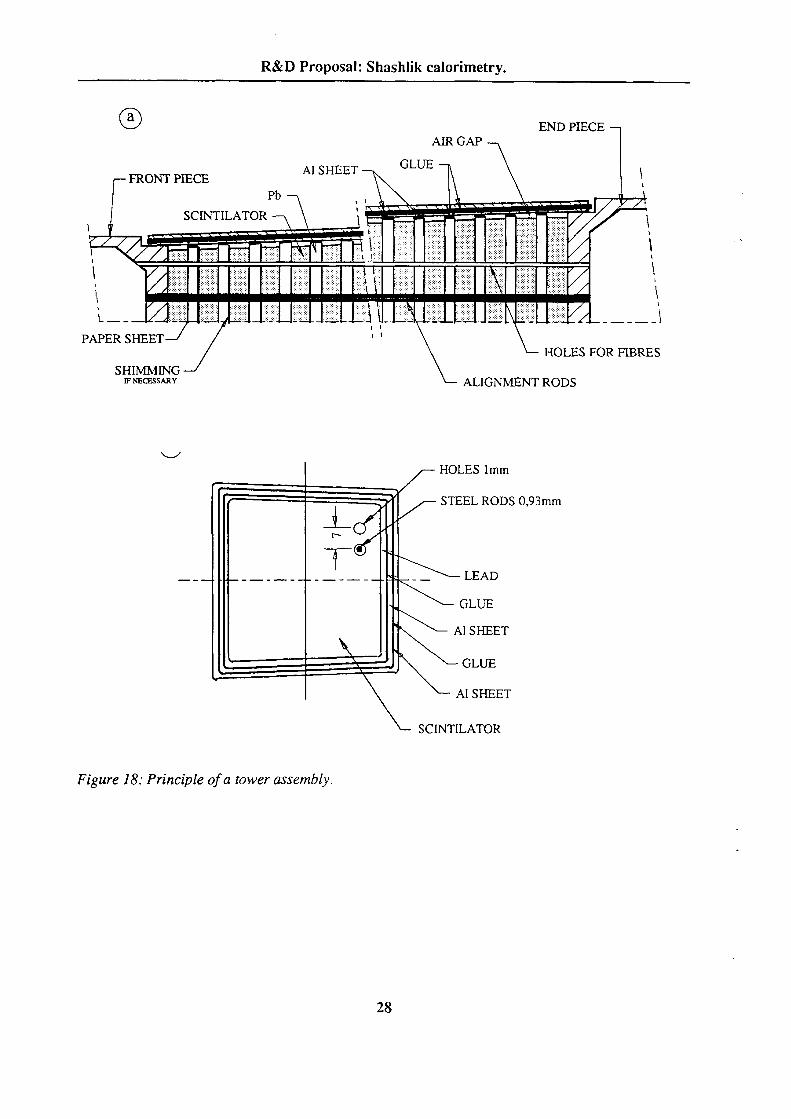
Figure 18 explains the assembly principle of a tower. In this assembly option each lead plate must
towers are stiff and can be manipulated. The tower lateral dimensions have to be within $15 um.
wrapped with the aluminum sheets. The compression is released once the glue has hardened. The
are set back a bit from lead plate edges. After putting the glue on the lead, the whole assembly is
The respective dimensions of lead and scintillator plates are such that scintillator plate edges
nominal value to within $0.2 mm.
compression (~0.6 bar). Elasticity of the components allows the total length to be brought to its
Using appropriate tooling, the components in a tower are aligned and put under
b) Tower assembly.
construction.
Two thin aluminum foils (25-30um thick) will be glued to the lead plates for mechanical
140 to 168 white paper sheets .1 mm thick.
70 to 84 scintillator plates.
70 to 84 lead plates according to its position at given T].
1 front and rear part in aluminum produced by injection molding.
Each tower is made out of:
a) Mechanical components.
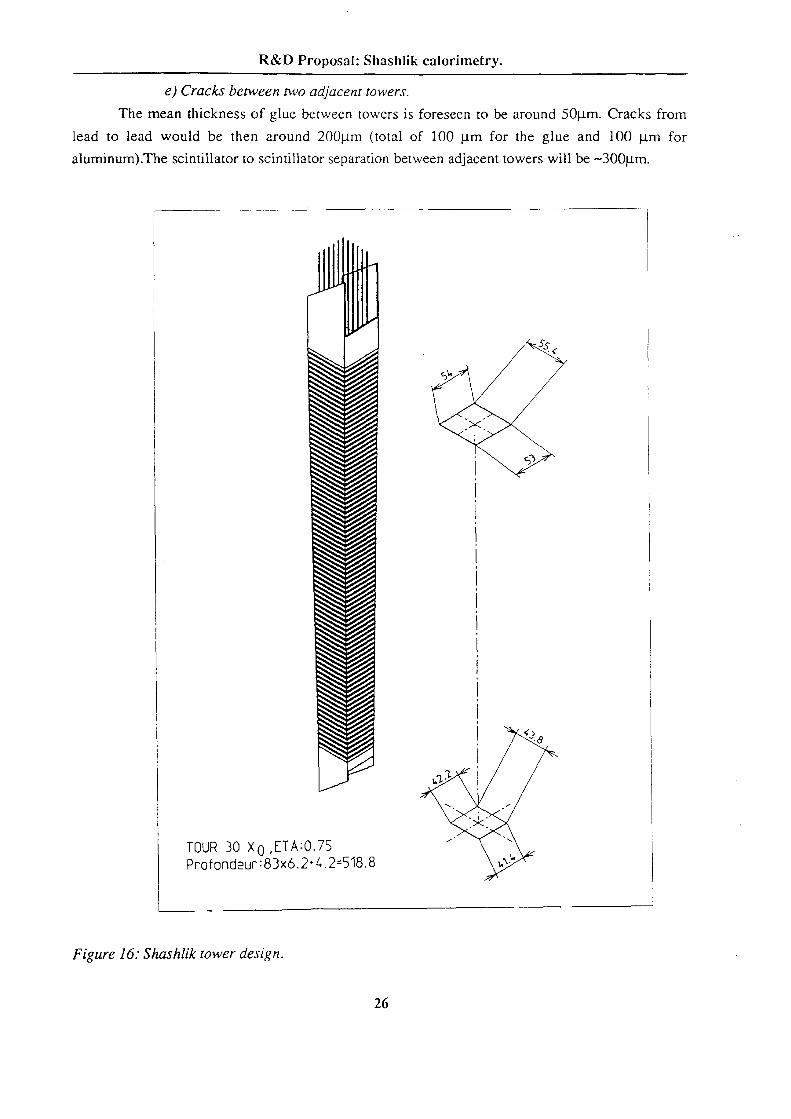
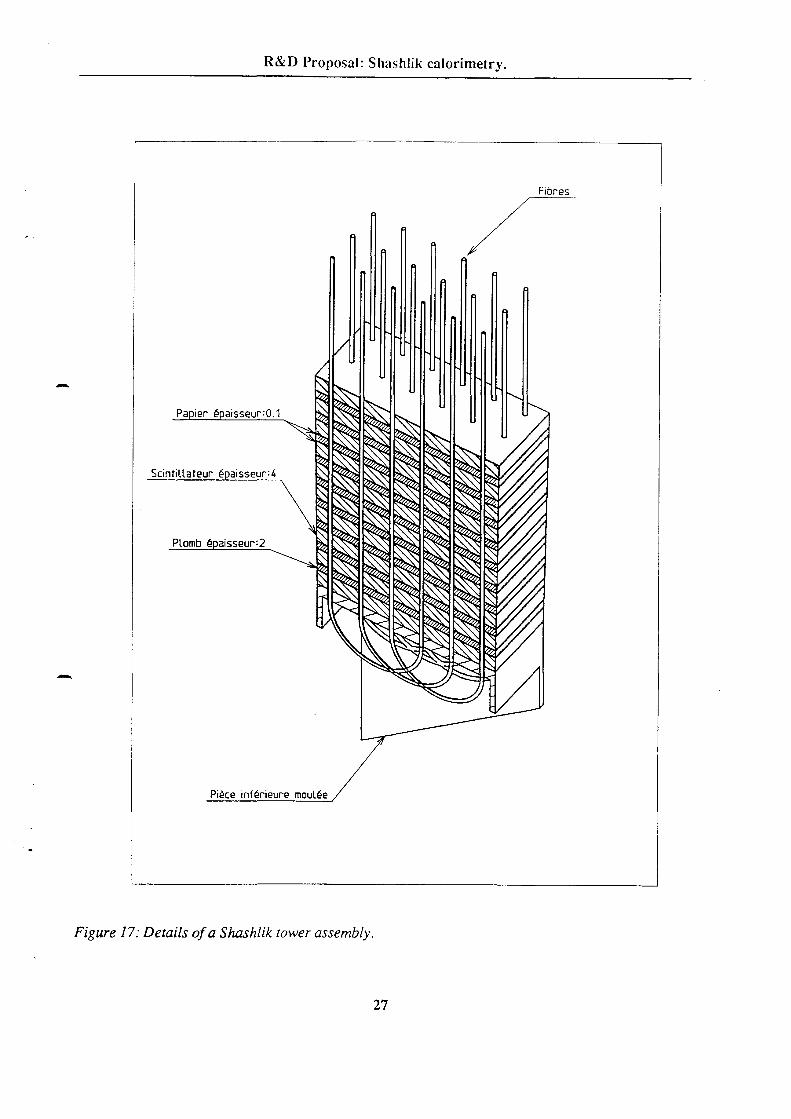
Figure 16 gives a full design of a Shashlik tower and figure 17 illustrates tower details.
6.1.7. Tower production.
R&D Proposal: Shashlik calorimetry.
26
Figure 16: Shashlik tower design.
Profoodeur¤83x6.2*4.2618.8TOUR BO XO ,ETA¤O.7S in Cv
/ X
\ X 1
ifi}
@<OCR Output
aluminum).The scintillator to seintillator separation between adjacent towers will be ~300pm.
lead to lead would be then around 200um (total of 100 ttm for the glue and 100 um for
The mean thickness of glue between towers is foreseen to be around 50pm. Cracks from
e) Cracks between two adjacent towers.
R&D Proposal: Shashlik calorimetry.
27
Figure 17: Details of a S hashlik tower assembly.
Piéce imférieure mouléa
Plumb é¤aisseur=2
Scintillateur épaisseurm
Papier é¤aisseur=O.1
Fibres OCR Output
28
Figure 18: Principle ofa tower assembly.
SCINTILATOR OCR Output
Al SHEET
GLUE
Al SHEET
GLUE
..-..1lU.---...-.1.---.--.LI>i=L.--\— LEAD
STEEL RODS 0,93mm
HOLES lmm
WNECBSARY ALIGNMENT RODSSHIMMING
HOLES FOR FIBRES
PAPER SHEET
- ilk •··¢·I··••··••-·|—·|··••~·-|-[|-•~•·-|~-—I···-·•·-~4—I··---··J- -I-·•-•·|— |--6-~ -N-|·•’··‘•J—I-··•-··L-.|........·L.§....~.».,.|_|,·.`;,;·,;|_, .1...]; - t _ .1 ,.§
SCINTILATOR
Pb
FRONT PIECEGLUE Al SHEET —»\
AIR GAP
END PIECE
R&D Proposal: Shashlik calorimetry.

29 OCR Output
the principle of the gluing assembly procedure.
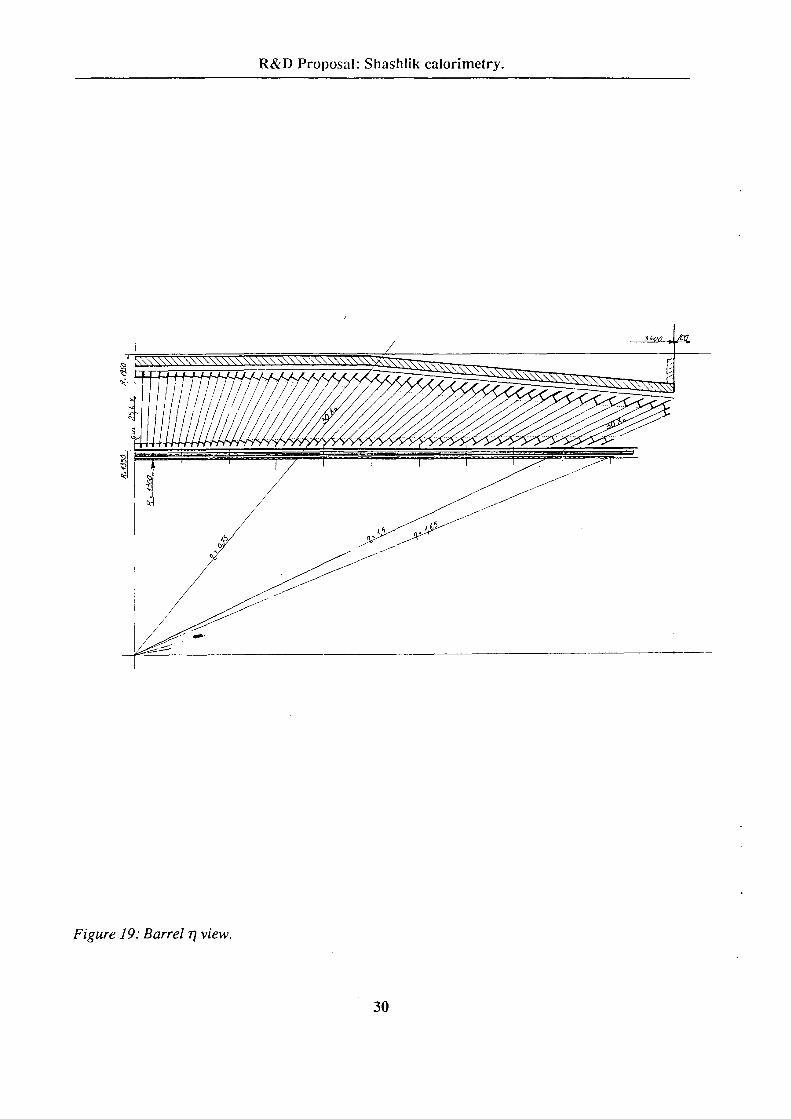
Figures 19 and 20 show the proposed geometry in 1] and (D for the barrel. Figure 21 sketches
a self supporting barrel.
The calorimeter itself is surrounded by an internal and an external cylindrical shell creating
towers are against each other.
dimensions must be kept within tight tolerances, in order to ensure that lead plates of adjacent
mechanical continuity of the lead. Special care has to be taken when producing towers. Their
aluminum sheets of 50 to 70um thick. All the towers are then glued together. This achieves the
in order to satisfy the second point, the mechanical boundary of towers is made of a thin polished
boundaries of a tower have to be glued to each lead plate on the four sides. For optical reasons, and
different towers in both T] and CD directions. As a consequence, the optical and mechanical
Considering the first point, one can achieve mechanical continuity of the lead plates of the
the cracks between towers must be minimized for hermeticity and uniformity.
stability of the detector.
the absorber material, i.e., the lead, must as far as possible, participate in the mechanical
We consider here two main guide lines:
6.1.8. Barrel Mechanical design: Option 1.
R&D Proposal: Shashlik calorimetry.
30 OCR Output
Figure 19: Barrel 17 view.
AFX HJ?
ef ‘*
/ / // fn
R&D Proposal: Shashlik calorimetry.


32 OCR Output
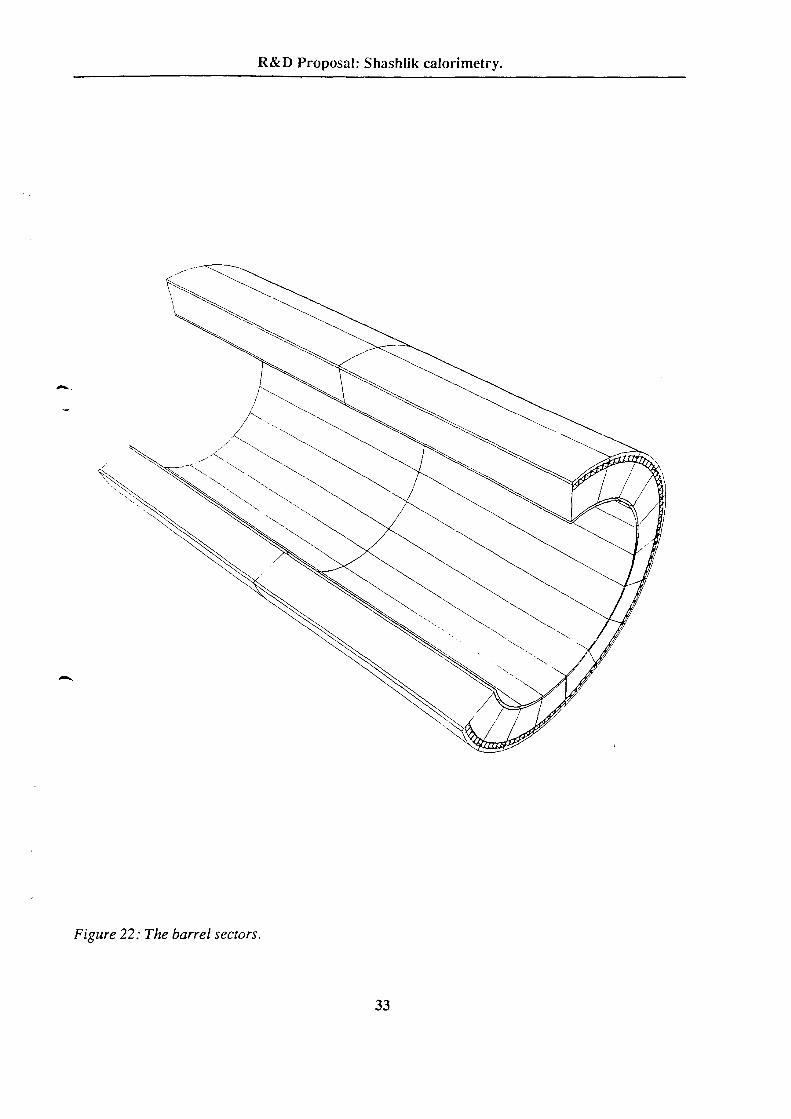
Figure 22 shows the barrel subdivision into sectors.
One sector should be representative of the whole detector.
the towers are equipped with their readout and should have been thoroughly tested before gluing.
in n, all glued together while mechanical adjustment ensures the correct geometry. At this stage, all
The weight of each sector is roughly 3 tons. It is made out of 12 towers in <l> and 55 towers
test and calibration of each sector. Production of 40 sectors has to be foreseen including spares.
Each half barrel is made out of 18 sectors (209 in <D) assembled by gluing, after full beam
Subdivide the barrel into two parts,
propose the following:
Due to its dimension and weight, the detector has to be divided into independent parts. We
6.1.9. Barrel subdivision.
Figure 21: Principle 0f the gluing procedure.
AIR GAP 50u
Al 50/70u
OF TOWERS' EPOXY/GLASSFIBRE 50].1ASSEMBLY
\/\$(SCINTILATOR , :/2
CB"},
. x» ~*!
iii
OCR Outputcintilator
R&D Proposal: Shashlik calorimetry.
33
Figure 22: The barrel sectors.
`\ / / OCR Output\\ `\ / \
\
\\ \\\j§\\ \
.//&\
R&D Proposal: Shashlik calorimetry.

34 OCR Output
0 Progress of the L3/BGO Calorimeter. M Schnecgans NIM A257 (1987) 528-537.RIS Greenhalgh, IG Denton, DJA Cockerill. Rutherford Appleton Laboratory. CMS TN/93-61.9 Initial Finite Element Analysis of a Support for the CMS Electromagnetic Calorimetcr.
preshower detector being achieved by removal only of the inner tracker from the inner bore of the
at later date after start up without the need to move the ECAL. The installation of the staged
proposals for the preshower detector. This planning requires that the preshower detector be installed
secondaiy support- structure is made more complicated by the need to accommodate the staging
detectors which have to be mounted within the inner bore of the ECAL. The design of this
turn must be designed to provide support for the installation of the preshower and inner tracker
by a primary rail system mounted on the inner bore of the HC. The ECAL mounting stmcture in
basically as outlined in the LOl. In this planning, the cylindrical section of the ECAL is supported
The overall support and installation planning for the barrel section of the ECAL are still
calorimeter.
b) Overall structural support for the barrel section of the electromagnetic
are both indicative of the possibilities of such an approach.
calorimeter3° which although smaller in scale than the support system required for the CMS ECAL
as the individual elements and the carbon fibre lattice support produced for the L3/BGO
The previous work carried out by RAL2° on a similar system for a calorimeter using crystal towers
will be based on the use of either individual pockets or some form of super pocket lattice structure.
investigate a suitable support system for the cylindrical barrel section of the ECAL. This approach
impractical to adopt the glued approach, a second design study will be undertaken at RAL to
To ensure that an alternative construction and support system is available, should it prove
extremely difficult and expensive to implement in practice.
require very high tolerances both in manufacture and in assembly techniques and could prove to be
attractive given the minimum amount of mass introduced by support system but it does however
overall glued up cylindrical barrel detector. This approach, as described in the previous sections, is
need to define an acceptable modularity for handling purposes and for subsequent assembly into an
surface hall. The number of towers chosen to form a sub module in this approach is dictated by the
sub modules suitable for calibration and assembly into the final detector in the intersection region
gluing operation where several adjacent tower elements are glued together initially to form larger
as individual detector elements. The first design approach described earlier is based on a sequential
effective method of constructing the cylindrical barrel section of the ECAL using Shashlik towers
Two alternative design approaches have been initiated to identify the most suitable and cost
a) Support system for tower construction.
for a crystal tower calorimeter.
An alternative solution is an extension of the work carried out at RAL on support systems
6.1.10. Barrel Mechanical design: Option 2.
R&D Proposal: Shashlik calorimetry.

35 OCR Output
analysis to be carried out on any proposal.
RAL will have access to modern CAD tools including 3D layout and FEA to allow quantitative
of design and manufacture of large scale detectors for the LEP programme. The design teams at
In both design studies RAL will provide experienced design staff with previous experience
c) Conclusion.
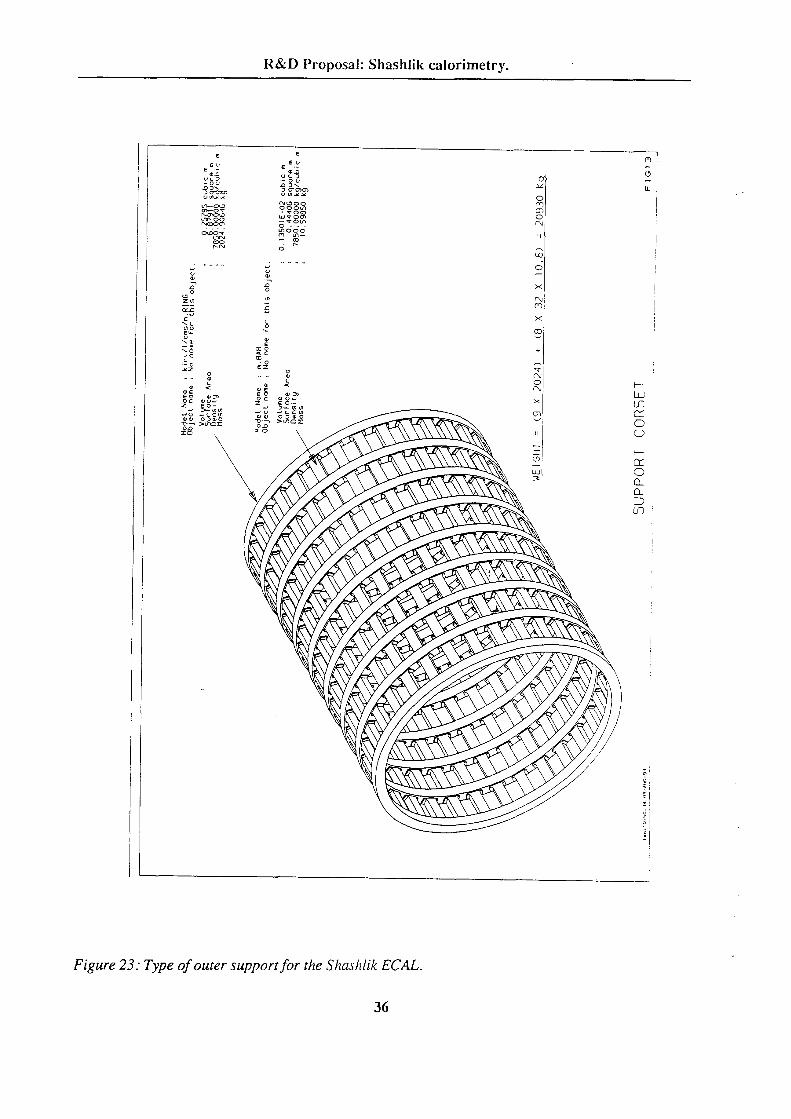
of outer support structure envisaged at present .
onto the primaiy rail system. The preliminary design studies shown on figure 23 indicate the type
the total weight being transferred through the detector array to the outer support and ultimately
The combined weight of the three detectors is estimated to be approximately 130 tons with
and inner tracker detector array with facility for withdrawal from inside the ECAL.
ECAL. Such a scenario defines the need for a special support system for the combined preshower
R&D Proposal: Shashlik calorimetry.
36 OCR Output
Figure 23: Type of outer support for the S hashlik ECAL.
IO0.0 IO`O—>U'CI O9
·*U -4&CU$ GNU ODQIO §»3 uw 0 ‘¤·—»>¤.¤QZ.» D¤-wm ‘”° "$‘Z EO- ·-’ J~V|U>Z E0-
EO 09 OC wu.: EO 0) OC 0Uudl WE AJ QE
-0 A12 ·O EZ
P-O —*C KO <C\® -··E
\L UlO
GL
O Zlh
®O l\(\IGOO? LNN LDOOO M LOU'¥\OO @@007 Luv -~vOlD
"’8%U$—·OV NUCDLD-OLD <'\1\DOO OOOL/'\U Vtxx
U manuD D\ D O'UU$ B?éDC'®U>OL D · O U QLD ’
GLD¢.D
E U _EU
R&D Proposal: Shashlik calorimetry.
37 OCR Output
Florida,1992Prototype design, construction and tcst of a Pb/scintillator sampling calorimeter with WLS readout" conn-. to IEEE conf,
between two Polaroid filters with the polarization axes rotated by 90 degrees. The parameter that
which indicates the level of stresses by measuring the birefringence of the tiles by placing the tile
plastic when cooling it after the injection into the mould. It is possible to develop a simple device
and could be responsible for aging effects is the mechanical stress which has been built into the
An important factor which could cause systematic variation in the response from tile to tile
desired mechanical accuracy of the towers.
parameters may be stored in a data base and tiles may be subdivided into groups to provide the
chamber measurement table can be used, as demonstrated by the "STIC" project of Delphim . The
Mechanical accuracy, including tile dimensions, the hole position and radii etc. A bubble
The parameters to be measured and controlled for the tiles production are :
project.
We will rely and benefit from the control procedures laid down in the Delphi "STIC"
6.1.13. Quality control.
constructed and tested in an electron beam.
Other types of prototypes for evaluating the calorimeter performances have also to be
for the calorimeter.
Answers to the above questions will allow us to choose the optimal mechanical structure
techniques.
Construct a finite number of mechanical prototypes to define the tower construction
the LHC environment.
Demonstrate that the glued solution at the level of a tower is realistic and would work in
holding structure using the Shashlik towers. They are:
The main goals of the present R&D arise from the question as to how best realize the
6.1.12. R&D objectives.
aluminum parts, the shape of which will be a simple plate of equivalent thickness.
and gluing. All components of the towers must be identical to the real one except front and rear
Their cross section is chosen to be square in order to minimize the tooling needed for the assembly
towers 30 X0 in depth of pyramidal shape. Their dimensions will reflect towers sitting at Inl = 0.75.
In order to carry out this program, we intend to fabricate a certain number of identical
DAPNIA (Saclay). The latter are involved in the design study only.
need to be carried out. They will be carried out by RAL and the Detector Support group from
obtained with the construction methods described above. A finite element calculations of the ECAL
Mechanical prototypes are needed for the study of the mechanical stability of the barrel
6.1.11. Mechanical prototypes.
R&D Proposal: Shashlik calorimetry.
38 OCR Output
(Delphi 92-31 Phys 166)32
The development of the quality control stations is an important part of the proposed project.
longitudinal uniformity of response.
can be used to monitor the current. This measurement should allow quantification of the
tower a collimated radioactive source can be moved longitudinally along one of the edges. A PM
compatible with the goal of building a calorimeter with a 1% constant term. After assembly of the
checking the tiles and the fibres is not sufficient to guarantee a uniformity of response
local problems at the core·claddin g junction, non uniformity of the refractive index etc.
which is very sensitive to all possible quality fluctuations like non parallelism of the fibre walls,
the source), or by measuring an optical properties of the fibre like, for example, numerical aperture,
scanning the fibre with a light source(the light may be produced by a small scintillator irradiated by
WLS fibres quality control may be organized either by measuring the attenuation curve by
the variation.
effectiveness of this method. Not only can the average light output be measured in this way but also
source and the PM current is measured. The Delphi STIC group have demonstrated the
inserted into the holes and the bundle is connected to a PM. The tile is irradiated with a collimated
The light output from the tiles may be controlled by using a bundle of fibres, which are
amount of light transmission. Such a ICSI was proposed by Delphi NEC groupa
could be measured is the total light that gets through the filters. Smaller stresses lead to smaller
R&D Proposal: Shashlik calorimetry.
39 OCR Output
3 Readout electronics for the Shasmik calorimeter. CMS TN / 93-76.
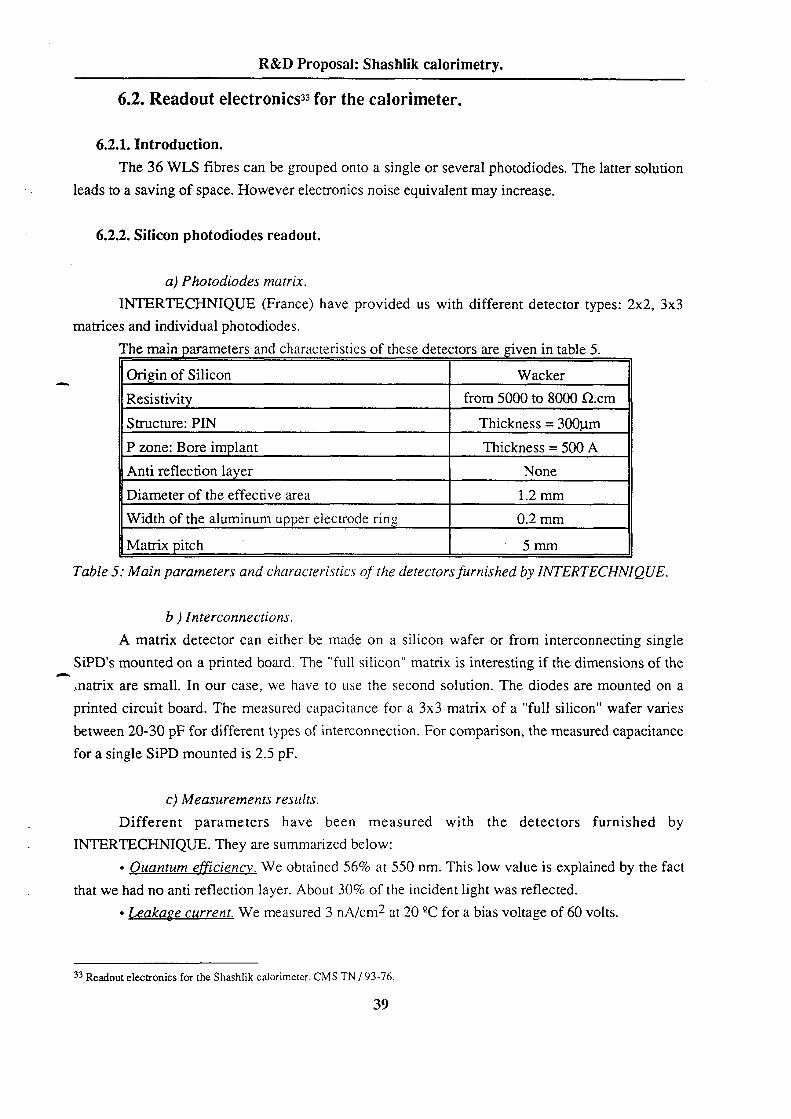
Leakage current. We measured 3 nA/cm2 at 20 QC for a bias voltage of 60 volts.
that we had no anti reflection layer. About 30% of the incident light was reflected.
uantum etiiciencv. We obtained 56% at 550 nm. This low value is explained by the fact
INTERTECHNIQUE. They are summarized below:
Different parameters have been measured with the detectors furnished by
c) Measurements results.
for a single SiPD mounted is 2.5 pF.
between 20-30 pF for different types of interconnection. For comparison, the measured capacitance
printed circuit board. The measured capacitance for a 3x3 matrix of a "full silicon" wafer varies
matrix are small. In our case, we have to use the second solution. The diodes are mounted on a
SiPD's mounted on a printed board. The "full silicon" matrix is interesting if the dimensions of the
A matrix detector can either be made on a silicon wafer or from interconnecting single
b ) Interconnectians.
Table 5: Main parameters and characteristics ofthe detectors furnished by INTERTECHNI QUE .
5 mmMatrix Ditch
0.2 mmWidth ofthe aluminum upper electrode ring
1.2 mmDiameter of the effective area
NoneAnti reflection laver
Thickness = 500 AP zone: Bore implant
Thickness = 300umStructure: PIN
Resistivit from 5000 to 8000 (lem
Wacker___ Origin of Silicon
The main parameters and characteristics of these detectors are given in table 5.
matrices and individual photodiodes.
INTERTECHNIQUE (France) have provided us with different detector types: 2x2, 3x3
a) Phatadiodes matrix.
6.2.2. Silicon photodiodes readout.
leads to a saving of space. However electronics noise equivalent may increase.
The 36 WLS fibres can be grouped onto a single or several photodiodes. The latter solution
6.2.1. Introduction.
6.2. Readout electronicsw for the calorimeter.
R&D Proposal: Shashlik calorimetry.

40 OCR Output
prototype S hashlik towers (b) .Figure 24: Photodiode power supply (a) and preampldier design used to readout the CMS
PD
x {MQ §R* ~(300 Q)CM e L? b 1-i2.7vI é22 nr II {N
I MQKT 3109 __ ,—.JYI}KT382
1K
Rd MK I 30'°MK l>i KT363 le{ 33 MQ "’°“F0.1 mn E*•f§7é·_?·<
6.sK Ji s.1i<
100 V +24v
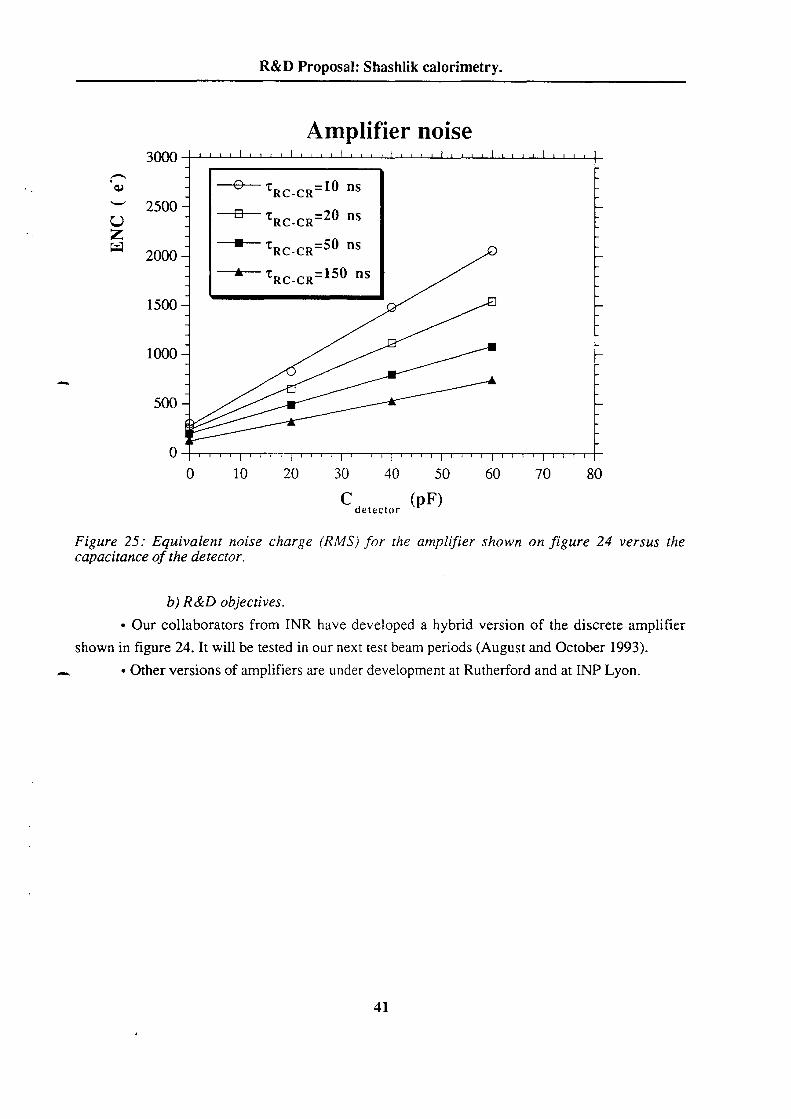
1100 e- is measured.
capacitance is given in figure 25. One sees that for CD = 30 pF and a TR(;-R(; = 10 ns, an ENC of
(Moscow) shown in figure 24. The equivalent noise charge (RMS) for this amplifier versus detector
For the test beam results presented in section 3, we used a IFET amplifier designed at INR
a) Discrete component amplwer.
6.2.3. Low noise preamplifiers.
performance using matrix and single diode solutions.
detectors has to be improved and the series resistance decreased. We plan to compare the
series resistance as it will be shown here after. The quantum efficiency of the INTERTECHNIQUE
resistance of our detector. Our JFET amplifier with its high gm (> 10 mmho) is very sensitive to the
for the preamplifier with the same input capacitance. This is mainly due to the relatively high series
capacitance of the setup was 29 pF. The results gave a 17% additional noise to the one measured
"full silicon" wafer. The interconnection between diodes were of thick oxide type. The measured
which will be described in the next section. We made the measurement with a 3 x 3 matrix of a
The noise due to the SiPD matrix was measured with a discrete components JFET amplifier
d) Noise measurements.
itange, The measured capacitance is 1 pF for 1,6 mm diameter diodes.
relatively high. A series resistance smaller than l0 Q is needed for the detector.
• bertes r· For the 3 x 3 matrix we measured a resistance of 10 to 20 Q. This is
R&D Proposal: Shashlik calorimetry.
41 OCR Output
.... • Other versions of amplifiers are under development at Rutherford and at INP Lyon.
shown in figure 24. It will be tested in our next test beam periods (August and October 1993).
Our collaborators from INR have developed a hybrid version of the discrete amplifier
b) R&D objectives.
capacitance of the detector.Figure 25: Equivalent noise charge (RMS) for the amplyier shown on figure 24 versus the
detector
0 10 20 30 40 50 60 70 80
500
1000
1500
-4- zRC_CR:150 ns2000
—I— tRC_CR=S0 ns
**5- ·cRC_CR:20 ns2500
—©—— zRC_CR:10 ns
3000
Amplifier noise
R&D Proposal: Shashlik calorimetry.
42 OCR Output
the Shashlik towers.
For all these studies different prototypes must be built and tested on a beam together with
Define and study the appropriate rad—hard electronics for the read-out.
Study the mechanical realization, with special care given to the cooling system.
Measure the angular and energy resolution of the Preshower + Shashlik system.
6.3.3. Milestones for the R&D.
either included in the radiator or be independent .
In both cases the cooling system (most probably the same as for the inner tracker) can be
the first one is sandwiched between 2 aluminum plates of a thickness of 1.5 mm.
cylinder. The 2 cylinders are joined together with small mechanical pieces. To ensure the rigidity,
the radiation length seen by the showers (figure 26). The silicon detectors are fixed on each
absorber material. The physical thickness of the cylinders decreases as T] increases, to keep constant
Two independent cylinders made of lead, are built respectively with 2XO and 1XO of
presented below as an example.
Many different options for the mechanical lay-out have been considered. One of them is
6.3.2. Choice of the preshower mechanical structure.
the tracking detector. The total weight is 12 tons.
detailed study of the cooling system is needed. The detector is supported by the ECAL and supports
channels is around 500K. The power dissipation is estimated to be between 5-10 kW. Therefore a
respectively. Overlapping in both CD and T] directions should avoid cracks. The total number of
measured by Si strip detectors, 2 mm pitch, placed after 2Xg, and 3XO for the CD and 1] position
in plates. It is 7m long, 8·l() cm thick and will have 3 radiation lengths in total. Shower position is
The detector is cylindrical in shape for the barrel. It could be either continuous or segmented
6.3.1. Main parameters.
carefully studied, in the beam with and without magnetic field and compared with Monte Carlo.
Precise simulation has to be developed and compared to the data. 1tO rejection has also to be
much. These results have to be confirmed by placing the device in the magnetic field.
Shashlik+Preshower combination, while the energy resolution of the whole system is not degraded
Preliminary results from the test beam data indicate promising angular resolution for the
6.3. R&D on preshower detector.
R&D Proposal: Shashlik calorimetry.

43
Figure 26: Possible designs of the pres/tower detector mechanical structure.
LEAD ——/ 1,%.2 Al REINFORCEMENT OCR Output
WAFER (cp)
@
LEAD(jO()LINGEXTERNAL SHELL
Al REINFORCEMENTWAFER (U)
R&D Proposal: Shashlik calorimetry.

44 OCR Output
100-111.
F. Anghinolli et al., A 66 MHz, 32 channel analog memory circuit with data selection for fast silicon detectors. NIM A326(l993)4°High rate particle detector. IEEE Trans on Nuclear Science, VOL 40, No3, June 1993, 27]-274.
ICON, M. Campbell, F. Anghinolli, E. Heijne and P. Jarron., A Current Mode Preamplilier in CMOS technology for use withRD2 status report CERN/DRDC/93-18 9 March 1993RD2 status report CERN/DRDC/92-4 9 January 1992RD2 proposal CERN! DRDC/90-27. DRDC/P3. 2 August 1990.
October 1990.E. Heijne et al., Monolithics CMOS front end Electronics with analog pipelines. IEEE Nuclear Science Symposium, Arlington,
Lecroy Conference in 91.P. Jarron et.,al Analog Sampling techniques in CMOS technology, in proceedings of the first Electronics for Particles Physics
detector signal.
the sum of adjacent memory cells belonging to the triggered event is sufficient to retrieve the full
preamplifier with a gain of 1() mV/MlP—30()ttm-Si. If the detector charge is spread over few BCO,
The silicon detector charge is sampled by the analog memory at 40 (66) MHz via the ICON
performed simultaneously to enable readout with no dead time.
charges of the 32 channels synchronized with the level—l decision. Write and read operations are
output of the chip provides an analog multiplexed signal of the amplified and sampled input
analog electronics, all the digital circuits necessary to control the analog memory addressing. The
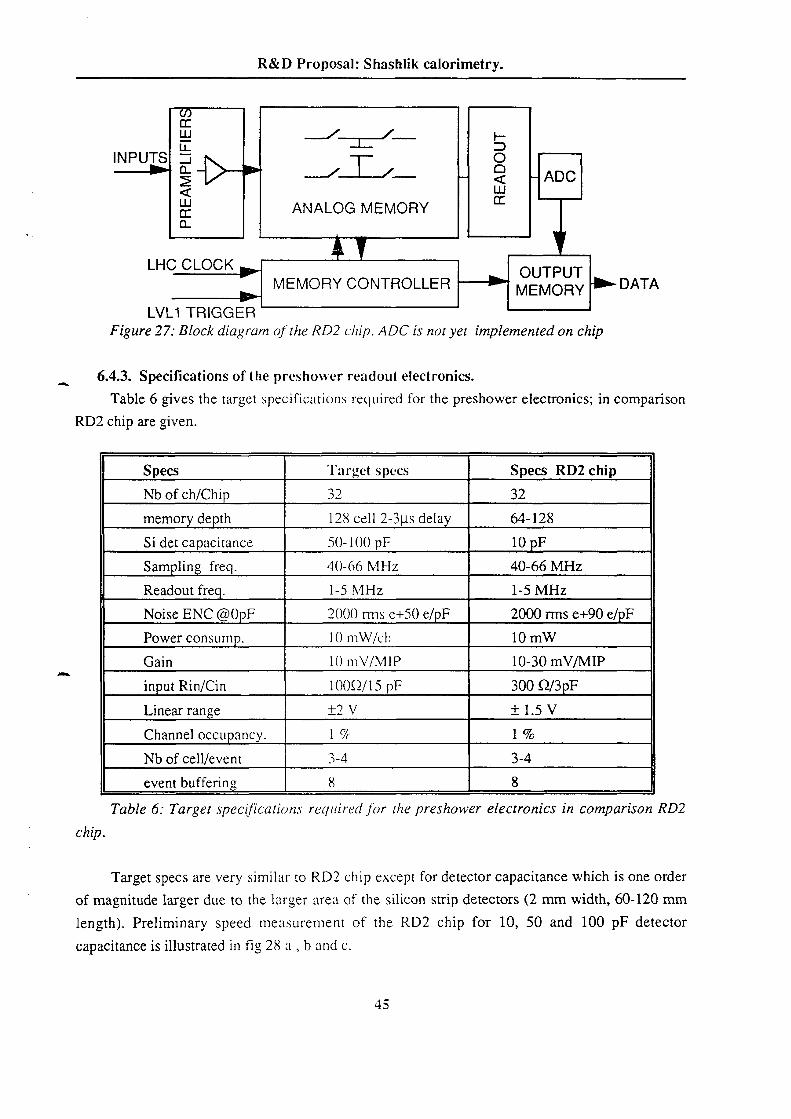
detector is now availablem. The chip architecture , shown in Fig. 27 , includes in addition to the
BCO) with fast current amplifiers lCON3” compatible with a direct coupling to the silicon strip
A 32-channel analog memory chip , 128 memory cell (3tts of local storage time at 25 ns
6.4.2. Analog memory readout chip.
has speed, noise and dynamic range perfomiance close to our requirement.
1 trigger. First developed by RD2 for silicon preshower application’°,’7 3* this readout electronics
VLSI CMOS technology on silicon to store analog signals during the processing time of the level~
framework of RD2 . This readout system utilizes an analog memory technique implemented in
C electronics system, based on the HARP architecture3“,” has been already developed in the
low power consumption (<l0 mW) in order limit the data flow to the DAQ system. Such a custom I
The preshower readout electronics must provide signal processing and sparse data readout at
dimensions.
on FLASH digitizers (one per channel) is not acceptable in terms of power consumption and
be placed directly on the silicon strip detector modules. For this reason, readout electronics based
electronics is excluded. Therefore, the front end electronics, in the fomi of monolithic chips, must
The preshower detector mLlSI have a compact construction and with 500 k channels remote
6.4.1. Introduction.
6.4. Readout electronics for the preshower.
R&D Proposal: Shashlik calorimetry.
45 OCR Output
capacitance is illustrated in tig 28 a , b and c.
length). Preliminary speed measurement of the RD2 chip for 10, 50 and 100 pF detector
of magnitude larger due to the larger area of the silicon strip detectors (2 mm width, 60-120 mm
Target specs are very similar to RD2 chip except for detector capacitance which is one order
chip.
Table 6: Target specQ‘icati0ns required for the preshawer electronics in comparison RD2
event buffering
Nb of cell/event 3-4 3-4
Channel occupancy. 1 % 1 %
Linear range 12 V t 1.5 V
input Rin/Cin 1009/15 pF 300 Q/3pF
Gain 10 mV/MIP 10-30 mV/MIP
Power consump. 10 mW/ch 10 mW
Noise ENC @0pF 2000 mis e+50 e/pF 2000 rms e+90 e/pF
1-5 MHzReadout fre 1-5 MHz
Sampling freq. 40-66 MHz 40-66 MHz
Si det capacitance 50-1()() pF 10 pF
memorv depth 128 cell 2-3tLs dela 64-128
Nb of ch/Chip 32 32
Target specsSpecs Specs RD2 chip
RD2 chip are given.
Table 6 gives the target specifications required for the preshower electronics; in comparison
6.4.3. Specifications ofthe preshower readout electronics.
Figure 27: Block diagram (it/ze RD2 c/zip. ADC is not yet implemented an chip
LVL1 TRIGGER
MEMORY CONTROLLER MEMORY I-} DATAOUTPUT
LHC CLOCK
ANALOG MEMORY
E H ADCINPUTSI :
R&D Proposal: Shashlik calorimetry.

46 OCR Output
Miniato conference.
1 R. Bonino et al., Electronics and readout of a large area silicon detector for LHC. to be published in the proceedings of 93' San
precision and dynamic range of monolithic circuit.
required (11 bits). We plan to carry out a specific study the impact of radiation damage on the
radiation in the barrel region. Nevertheless, in our case a relative high precision of the front end is
CMOS monolithic chip amplifier and analog memory (RD9) can easily operate up to levels of
radiation hard electronics (RD9, MPI Munich, CEA—Sac1ay,RAL...) indicate that radiation hard
to be envisaged for the region 2.()<InI <2.5. Preliminary results of various groups working on
go up to 5 Mrad and 3 10M n at rt = 2.5 for 106 pb‘*. Special treatment (cooling, replacements.) has
Radiation level in the barrel preshower is ~().5 Mrad and 2 1013 n/cm2 for 106 pb‘l. These
6.4.5. Radiation hardness.
above this threshold. ECP—MlC group has the responsibility of this chip development.
compared to a presetable minimum energy threshold. Readout is only perfomied when sum is
possibility by implementing on chip a fast sum of the selected memory cells which the value is
A sparse chip readout is very useful to reduce the front end raw data. We expect to study this
Leakage current monitoring.
Electronic calibration circuit.
data formatting and bus interfacing.
triggered memory cells, gain correction
local digital signal processing to accomplish pedestal subtraction signal summing of
implementation of a l l bit dynamic range, 8 bit precision A to D converter.
improvement of the precision ofthe analog memory
ICON redesign
Further improvements of the chip architecture foreseen are:
50ttA.
The present chip can handle detector leakage current of 10 uA which must be improved to
bits and a linearity of few %.
and common mode pedestal fluctuations must be carefully studied to ensure a dynamic of 10-11
taking into account a possible trade off between speed and power consumption. Pedestal uniformity
The first step is the existing chip by redesigning the ICON amplifier for larger capacitance
6.4.4. R&D objectives.
based on the existing version.
modifications for our preshower beam tests in 94. ECP-MIC group will provide us front end chip
chip described in reference°l. We plan to use components of this readout system with the necessary
2 has developed a complete test beam acquisition system based on the analog memory

47
Cac: 100 pF, Charge spread: 6.5 bins. OCR OutputCdet = 50 pF, Charge spread = 3.5 bins.
= 12 pF, Charge spread = 1.5 bin.a)f_m,,,pH,,g: 40 MHz (BCO = 25 ns), Cde,Figure 28: Preliminary speed meezsuremenz of z/ze RD2 chip (horizontal scale = 25 ns/bin):
R&D Proposal: Shashlik calorimetry.
48 OCR Output
double) isolated electromagnetic energy deposits and fed into a dedicated on—line analysis chain to
The calorimeter and tracking information will be taken from events triggered by single (or
be received in a similar time at high luminosity.
2.5. A similar number of di—electrons with transverse momenta above 30 GeV, from Z decays, will
transverse momentum of 35 GeV, in ~5 days from single electron production, for rapidities out to
startup luminosity of 10cmsec, each tower will receive about 100 electrons, above a33 ‘2 ‘]
The initial calibration will be refined once the experiment begins data taking. At the LHC
10 GeV and S 1% at 50 GeV for the whole of the central region out to a rapidity of 2.0.
The tracker system will be able to measure the transverse momentum of electrons to within 0.5% at
will be done by requiring a momentum and energy match between the tracker and the calorimeter.
intermediate vector boson decays to accomplish, in situ, precision calibration and monitoring. This
At LHC we will rely on isolated high transverse momentum electrons from heavy quark or
monitoring systems for each of the Shashlik subsystems.
monitoring system. We intend to keep these changes to a minimum by providing dedicated
disconnection’s and reconnections which may alter the signal size for both the calorimeter and the
calibration and final installation in the experiment. These changes arise, in part, through
This initial calibration is limited by changes which occur to the system between test beam
within 2% at the start of operation at LHC. This corresponds to a constant term of around 1.3%.
beam measurements, we hope to achieve absolute calibration and inter—calibration of all towers to
CMS. The subsystems will be fitted with their final readout and monitoring systems. With the test
We intend to calibrate the complete Shashlik detector at test beams prior to installation at
b) Calibration procedure .
the R.M.S. error on the calibration constant for a single tower must be less than 0.4%.
energy. In order, for the inter-calibration error not to significantly contribute to the constant term
energy resolution, 0 /E, due to inter—calibration errors, will be approximately independent of
constant on a shower to shower basis and as a function of energy. Hence the deterioration of the —.
contain >80% of the shower energy. To first order, the lateral shape of electromagnetic showers is
Electromagnetic showers are narrow; between one and (at most) four Shashlik towers will
a) Required calibration precision.
6.5.1. Calibration.
essential for fault detection and for the commissioning and running phases of the experiment.
to the so called constant term in the energy resolution formula. Reliable monitoring will be
resolution in the Shashlik calorimeter. Calibration errors affect the energy resolution and connibute
A precise calibration system will be required to achieve and maintain good energy
6.5. Calibration and monitoring of the Calorimeter.
R&D Proposal: Shashlik calorimetry.

49 OCR Output
Y. Kubota et al., NIM A320 (1992) 66.E. Aker etal., CERN-PPE/92—l26(l992)
3 The xenon monitor of the I3 electromagnetic calorimeter, NIM A32l(l992) ll9.The OPAL detector at LEP, NIM A305(l99l) 275.42
trigger systems.
from 0.23 GeV to 30 GeV [48]. This may be useful for monitoring the response of the ADC and
L3 xenon calibration system in order to obtain a range of light intensities corresponding to energies
to be around 0.45% R.M.S. from the barrel lead glass system on OPAL [47]. Filters are used on the
The pulse to pulse fluctuations of the intensity from xenon flash lamps have been measured
system will provide relative inter tower calibration.
system will pulse many towers at the same time and will be monitored by a photodiode. Such a
lasers), to some of the optical fibers in each tower in order to excite the scintillator plates. The
We intend to flash light from xenon flash lamps or excited liquid scintillator (using UV
a) Monitoring by scintillator excitation .
fibers.
yield from the scintillator plates or a loss of efficiency or an increase in attenuation in the WLS
order to evaluate the effects of radiation damage. The radiation damage may cause a loss in light
two fibers will be used to pass light to a few planes of scintillator near the shower maximum, in
the full length of each tower and will be used to pass light to all scintillator layers. A further one or
performance of the scintillator plates and the wavelength shifting fibers. One or two fibers will run
Up to four optical fibers will be inserted into each Shashlik tower in order to monitor the
day gain changes have been monitored to a precision of 0.2%.
achieve the necessary precision that would be required for monitoring the Shashlik towers. Day to
L3‘*3, Crystal Barrel‘“ and CLEO‘5. The fully commissioned systems on these experiments appear to
light flasher systems to monitor each Shashlik tower. Light flasher systems are used on OPAL4
this work will form part of the Shashlik R&D program. We plan to install at least two independent
Research is needed to find the optimum techniques for monitoring the Shashlik towers and
6.5.2. Monitoring.
correct the calibration constants.
monitoring, below, will be used. Variations detected by these systems will be recorded and used to
calorimeter response over the short term (day by day) the systems described in the section on
single or double electrons as described above due to a lack of statistics. In order to follow the
Changes in calorimeter response, inside periods of 3 to 4 days, cannot be measured with the
refreshed every few days to accomplish the task of absolute calibration and long term monitoring.
Z mass constraint) and tower to tower inter—calibration. The set of calibration constants will be
verify the proper functioning of the system and to cross-check both absolute calibration (using the
continually update the set of calibration constants. A fraction of such events will be recorded to
R&D Proposal: Shashlik calorimetry.

50 OCR Output
timing of the Fermi chips if these are used for readout.
items as detector temperature, low voltage supplies, photodiode bias voltage, and the relative clock
A number of slow control monitors will be required. These will be needed to monitor such
e) Slow control monitoring .
chain downstream of the photodiodes.
A precision electronic pulser system will be used to monitor and calibrate the electronics
d) Electronics monitoring .
The use of such sources will be evaluated during the R&D program.
necessary to attenuate the xenon light by a factor of one thousand using a package of Kodak filters.
In order to match the pulse height from their xenon lamp to the one of the photo peak it was found
with gamma sources. L3 use the photo peak produced by the 59.5 keV gamma ray line of Am241Photodiodes, both for Shashlik readout and for the monitoring system, could be monitored
c) Photodiode monitoring .
right.
however, is not sufficiently good for this system to be used as a stand alone calibrator in its own
monitoring. It is reliable over short term periods (day to day). The overall stability of LED's,
be useful for checking the trigger system. It also acts as a backup to the xenon or liquid scintillator
monitoring and fault finding. It enables various configurations of towers to be pulsed, which may
The LED system is essential for single-tower testing, commissioning and subsequent
capable of exciting the scintillator plates of the Shashlik.
emitting at different wavelengths, will be tested. Of particular interest will be any LED's which are
light into one of the optical fibers of the tower. As part of the R&D program a range of LED's,
We intend to install a single LED for each Shashlik tower. The LED will be used to flash
b) LED monitoring .
R&D Proposal: Shashlik calorimetry.
51 OCR Output
G.S.Atoyan etal., Preprint INR - 736 /91, l99l.B.L6em etal., NIM A254 (1987) 26.
49 cms TN/93-71..4*cMs TN / 93-65."civis TN / 93-66.46 cms TN/92-46.
the calorimeter receives a dose that follows the longitudinal profile of typical showers in minimum
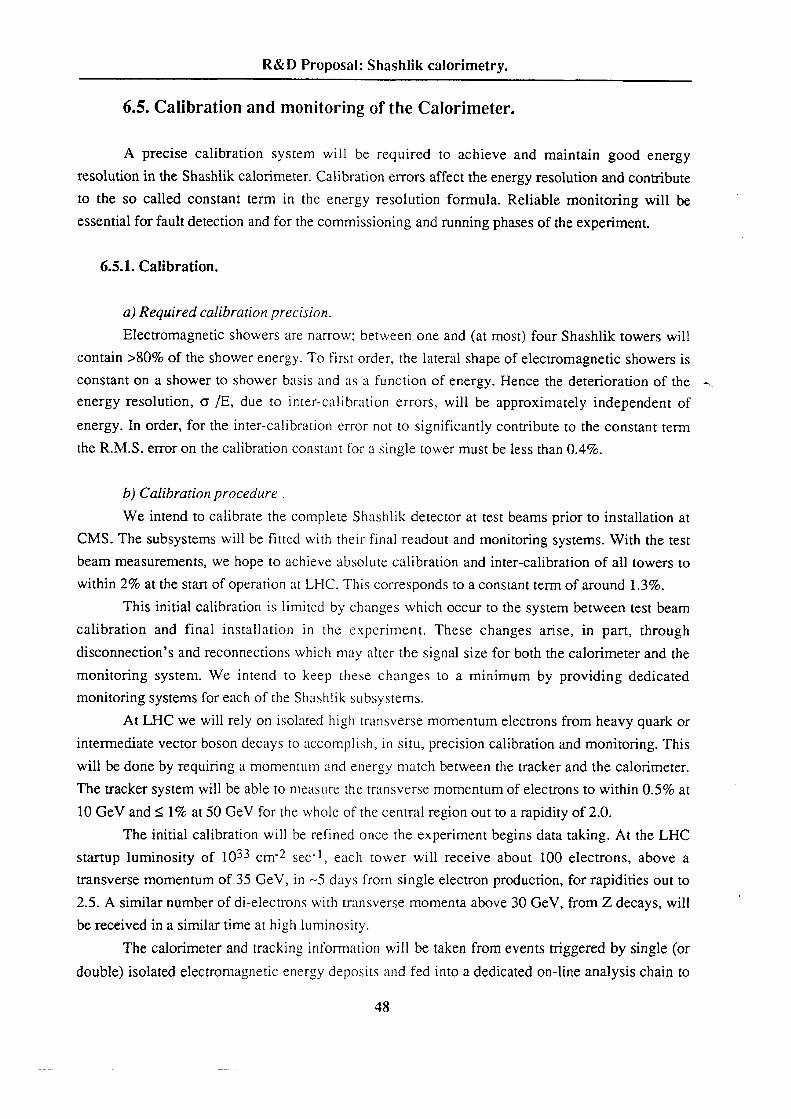
The effect of the radiation damage on the energy resolution was estimated considering that
optical characteristics of the fibres and scintillator platesil was introduced.
significant degradation of the energy resolution was observed when a 10% R.M.S dispersion, in the
attenuation length down to Xu = 100 cm, as well as for values of the reflectivity down to 0.549 No
reflectivity at the aluminized end. No significant variations were observed for values of the
checked, in particular the effect on the constant term of the fibre attenuation length and of the
The sensitivity of the energy resolution to the optical parameters of the calorimeter was
order of 2-3% near the edges of the modules (see Figure 30).49
calorimeter response as a function of the impact point indicates a reduction of the signal of the
o/E=8.5%/N/E®l% in excellent agreement with the test beam results"7(Figure 29). The study of theThe energy resolution of the standard non—projective Shashlik module was found to be
calorimeter technique5°5‘. Up to now only non—projective geometries were simulated.
simulation was tuned by comparing with the results obtained by other groups using the same
reflection at the fibres front face, and the photoelectron statistics were included as well. The
light collection efficiency in each fibre. Other effects such as the attenuation in the fibres, the
of the geometry, following the design of the prototype modules, and includes a description of the
module configurations was done using GEANT 3.15. The program contains a detailed description
modules, as well as the angular resolution and rtl)/Y separation in several preshower and splitThe estimation of the energy resolution, linearity and uniformity of the calorimeter
6.6.2. Energy resolution study.
and the results already obtained.
found in references 46, 47, 48, 49. I-lere we want to introduce briefly the existing simulation tools
one year ago within the CMS collaboration. A detailed description of the work done so far can be
The simulation study of the Shashlik calorimeter and preshower detector was started about
parameters. The effect of radiation damage on the calorimeter performance must be also modeled.
be used to optimize the detector parameters and to study the sensitivity to the tolerances on these
understanding of the test results. Once tuned with respect to the test data, the simulation tools will
detector, will be followed closely by Monte—Car1o simulations. This will allow a better insight and
The construction and test in beam of the prototype calorimeter modules and preshower
6.6.1. Introduction
6.6. Simulation studies.
R&D Proposal: Shashlik calorimetry.
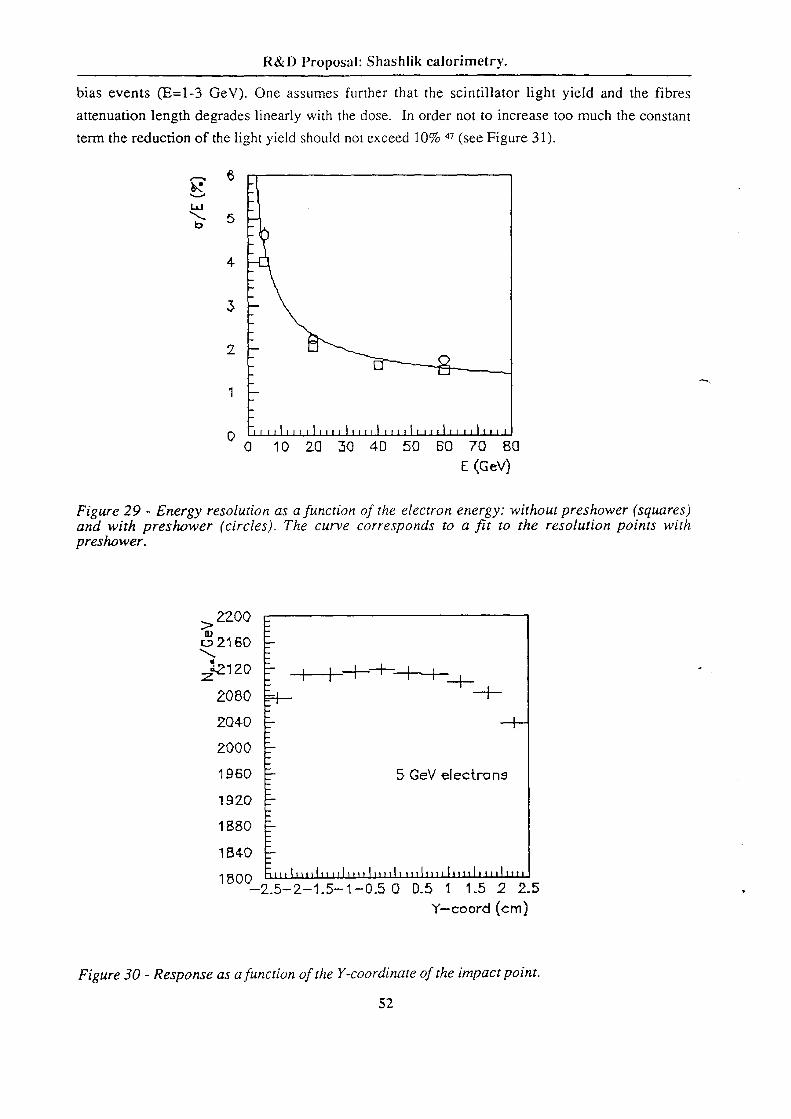
52 OCR Output
Figure 30 - Response as cz function of the Y-coordinate of the impact point.
Y—coord (cm)
2.5-2-1.5-1-05 0 0.5 1 1.5 2 2.51500
1 840
1880
19 20
5 GeV electrons1960
2000
2040
2080
212120 _i__|__-l——l—..l..`.i.. —l—
cp 2160
> 22.00
preshower.and with preshower (circles). The curve corresponds to a fit to the resolution points withFigure 29 — Energy resolution as cz function of the electron energy: without preshower (squares)
&(¤¢v)
010 20 zo 40 50 B0 70 B0
term the reduction ofthe light yield should not exceed 10% 47 (see Figure 31).
attenuation length degrades linearly with the dose. In order not to increase too much the constant
bias events (E=1—3 GeV). One assumes further that the scintillator light yield and the fibres
R&D Proposal: Shashlik calorimetry.
53 OCR Output
CMS Technical Note in preparation$2
m0dules49.
measurements performed in beam with a 4.5XO Pb absorber placed in front of the calorimeter
resolution and rtg/Y separation. We get og = 9.5 mrad at EY = 60 GeV compatible with the
The configuration with the preshower detector gives the best results on the angular
following structure: 2 Xg Pb absorber- Si tb-strips (4 mm) - IXO Pb absorber · Si 1]-strips (2 mm) ;
Shashlik modules, front face 4x4 cme, combined with a preshower detector with the
layers of orthogonal Si strips in between.
Shashlik modules divided in two longitudinal segments (first segment 4X0), with two
__three different detector configurations were studied5
In order to assess the Shashlik angular resolution and two shower separation capabilities,
6.6.3. Angular resolution studies.
reduction of the fiber attenuation length at the position of maximum radiation damage (squares).scintillator plate at the position of maximum damage (circles); and as a function of the fractionalFigure 31 — Constant term of the energy resolution function versus the fractional light loss in the
0 0-1 0.2 0.3 0.4 0.5 D-6 0-7 0.8 D.9 1
1 E Q E1 U Q
A 10
R&D Proposal: Shashlik calorimetry.

54 OCR Output
53 cms TN /93-63.
surface and being absorbed in the fiber, and the total number of generated rays.
inside it; the efficiency is given by the ratio between the number of rays going through a hole
smaller than the total reflection angle or until they are lost at the surface of the plate or are absorbed
number of rays generated in random direction are followed until they hit a hole surface at an angle
collection as a function of the point in the scintillator plate where the light is produced. A large
of the light yield. A dedicated Monte Carlo simulation was done to compute the efficiency of light
system is needed to determine the geometrical and optical parameters that maximize the uniformity
resolution (especially the constant term). A good understanding of the optical behavior of the
potentially a source of non-uniformity which can degrade the calorimeter uniformity and energy
The light collection system of the Shashlik calorimeter, based on a matrix of WLS fibers, is
c) Unyformity of light collection.
resolution on transverse size and longitudinal segmentation of the calorimeter modules .
allowed a detailed investigation, with high statistics, of the dependence of the position and angular
using the fast simulation was made 37. ln particular, the greater flexibility of the fast simulation
An exploratory study of the position and angular resolution with the Shashlik calorimeter
figure 32.
The transverse shower shape is found to be in excellent agreement with the DATA as illustrated on
parametrization of the longitudinal and transverse profile of the showers as a function of the energy.
CPU time, To overcome this limitation, a fast Monte-Carlo simulation was developed53, based on a
Detailed shower simulations based on the GEANT package are very expensive in terms of
b)Resulzs from fast simulation.
preshower is expected to be small (Figure 31).
result is 6/E=9.4%/~lECBl.%, showing that the degradation in the energy resolution induced by thecorrection of the calorimeter energy using the infomation provided by the preshower Si·strips. The
The energy resolution of the Shashlik—preshower configuration was estimated, after
a) Effect of Preshower on energy resolution.
R&D Proposal: Shashlik calorimetry.
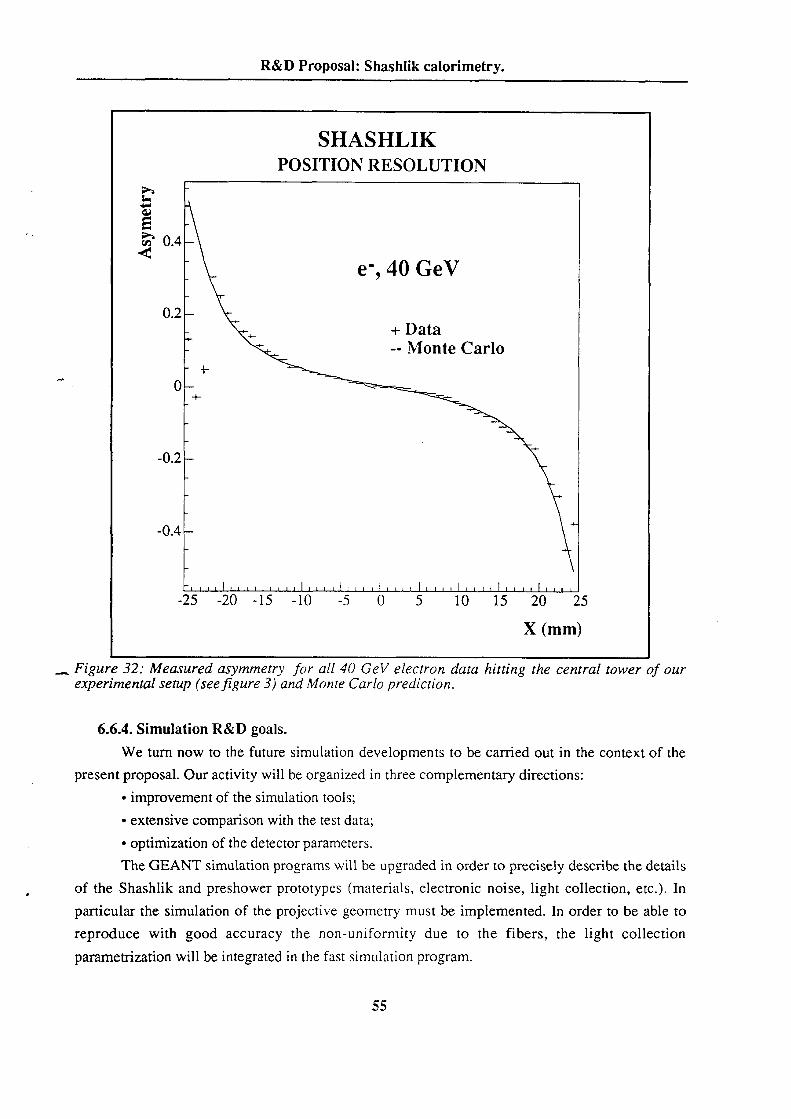
55 OCR Output
parametrization will be integrated in the fast simulation program.
reproduce with good accuracy the non-uniformity due to the fibers, the light collection
particular the simulation of the projective geometry must be implemented. In order to be able to
of the Shashlik and preshower prototypes (materials, electronic noise, light collection, etc.), In
The GEANT simulation programs will be upgraded in order to precisely describe the details
optimization of the detector parameters.
extensive comparison with the test data;
improvement of the simulation tools;
present proposal. Our activity will be organized in three complementary directions:
We turn now to the future simulation developments to be carried out in the context of the
6.6.4. Simulation R&D goals.
experimental setup (see figure 3) and Monte Carlo prediction.___ Figure 32: Measured asymmetry for all 40 GeV electron data hitting the central tower of our
X (mm)
-25 -20 -15 -10 -5 0 5 10 15 20 25
-0.4
-0.2
i>>·ce_
-- Monte Carlo
+ Data0.2
e', 40 GeV
Q 0.4
POSITION RESOLUTION
SHASHLIK
R&D Proposal: Shashlik calorimetry.

56 OCR Output
effect of radiation damage.
dependence on the tolerances of the geometrical and optical parameters
the fibers, attenuation lengths, reflectivity’s, etc.)
optical and geometrical parameters of the light collection system (number and diameter of
effect of magnetic field
effect of dead materials
geometrical integration of the preshower and calorimeter
productivity, etc.)
geometrical parameters of the Shashlik modules (module dimensions, sampling,
silicon strips width and thickness, etc.)
geometrical parameters of the preshower detector ( absorber structure and thickness,
real measurements. The following aspects will be studied:
reflectivity at the scintillator plate surfaces, etc.) will be simulated and compared to the results of
the light collection system as a function of its parameters (number and diameter of the fibers,
in terms of the energy resolution, uniformity and position and angular resolution. The efficiency of
These simulation tools will allow extensive comparisons with the ICSI beam data collected,
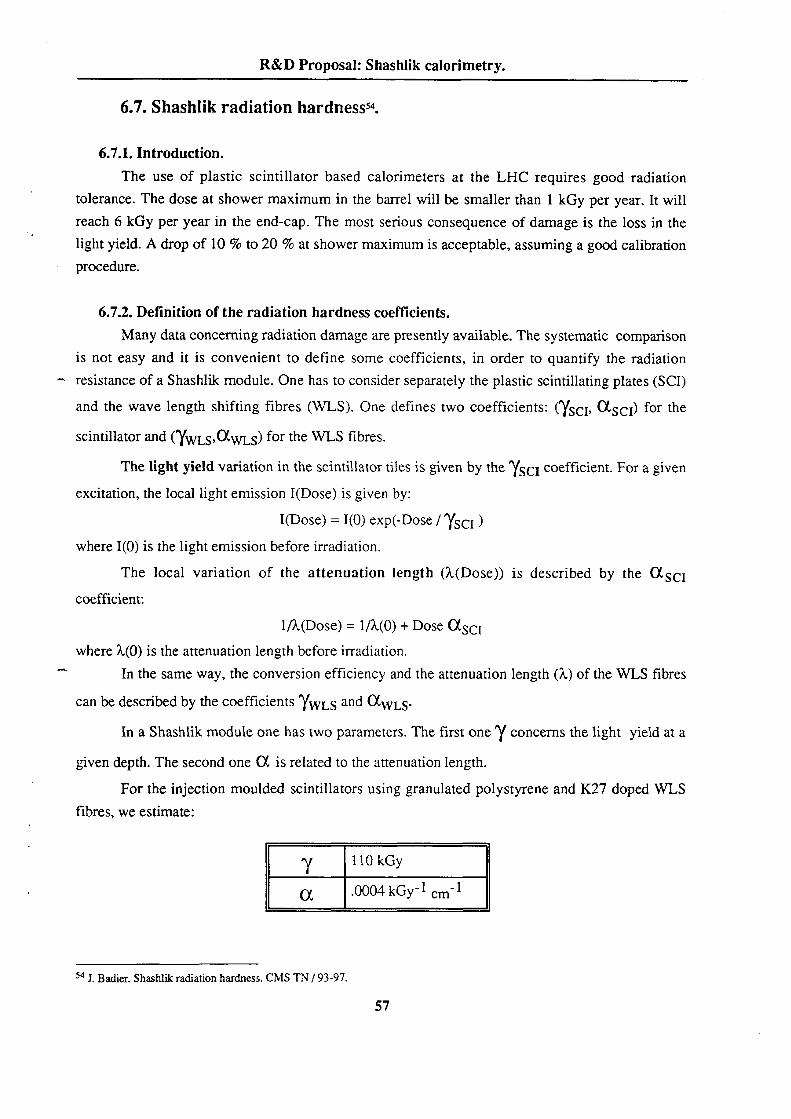
57 OCR Output
4 J, Badier. Shashlik radiation hardness. CMS TN / 93-97.
OL | .0004 toy-1 cm-1
110 kGy
fibres, we estimate:
For the injection moulded scintillators using granulated polystyrene and K27 doped WLS
given depth. The second one OL is related to the attenuation length.
In a Shashlik module one has two parameters. The first one 'Y concerns the light yield at a
can be described by the coefficients 'YWLS and GWLS.
In the same way, the conversion efficiency and the attenuation length Ot) of the WLS fibres
where M0) is the attenuation length before irradiation.
1/}t(Dose) = l/M0) + Dose (XSCI
coefficient:
The local variation of the attenuation length (?t(Dose)) is described by the OCSCI
where I(O) is the light emission before irradiation.
I(Dose) = I(O) exp(-Dose / 'YSCI )
excitation, the local light emission I(Dose) is given by:
The light yield variation in the scintillator tiles is given by the 'YSCI coefficient. For a given
scintillator and ('YWLS,OCWLS) for the WLS fibres.
and the wave length shifting fibres (WLS). One defines two coefficients: ('YSCI, (XSCI) for the
resistance of a Shashlik module. One has to consider separately the plastic scintillating plates (SCI)
is not easy and it is convenient to define some coefficients, in order to quantify the radiation
Many data conceming radiation damage are presently available. The systematic comparison
6.7.2. Definition of the radiation hardness coefficients.
procedure.
light yield. A drop of 10 % to 20 % at shower maximum is acceptable, assuming a good calibration
reach 6 kGy per year in the end-cap. The most serious consequence of damage is the loss in the
tolerance. The dose at shower maximum in the barrel will be smaller than 1 kGy per year. It will
The use of plastic scintillator based calorimeters at the LHC requires good radiation
6.7.1. Introduction.
6.7. Shashlik radiation hardness54.
R&D Proposal: Shashlik calorimetry.

58 OCR Output
and (X Shashlik coefficients. Full size detector modules have to be therefore irradiated.
Optimized SCI-WLS combination have to be used, in order to measure experimentally the Y
The respective qualities of K27 and Y7 WLS fibres have to be compared.
fibres. For each type, a sufficient number of samples have to be measured.
Systematic irradiation has to be carried out on various types scintillating tiles and WLS
irradiation will be necessary
methods. Investigation of the radiation hardness with low dose rates, neutron irradiation and hadron
The first aim is a search for an optimal SCI—WLS combination and for the best fabrication
6.7.4. Radiation hardness R&D goals.
have several modules which will be periodically tested in beam to monitor the light yield.
Another point of concern is the natural aging of the scintillator based systems. We plan to
6.7.3. Natural aging.
tolerate an integrated dose over l0 years at the nominal LHC luminosity (106 pb‘l) up to lnl = 2.shown in figure 33. Using presently available materials, it appears that the Shashlik calorimeter can
light due to decreased attenuation length and light yield. These and the induced constant term are
Using these coefficients and folding in the longitudinal damage profile we can estimate the loss in
R&D Proposal: Shashlik calorimetry.
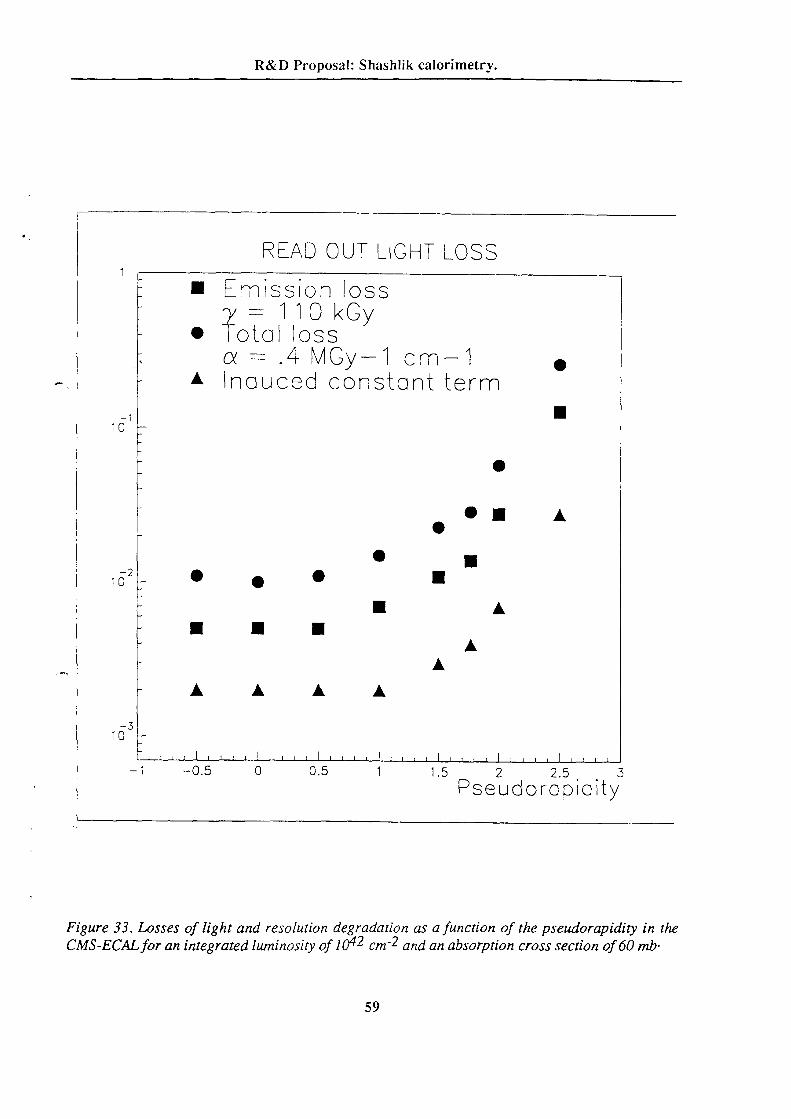
59 OCR Output
CMS —ECAL for an integrated luminosity of 1042 crn‘2 and an absorption cross section of 60 mbFigure 33. Losses of light and resolution degradation as a function of the pseudorapidity in the
_ _ Pssodoropidity1 —0.5 0 0.5 1 1.5 2 2.5 5
TO
A A A
I I
10
O I A
ridiicsd comstorit termoa Z .4 MO;/—i cm—i% 1 otollossiiO i<GyEmission loss
READ OUT UGHT LOSS
R&D Proposal: Shashlik calorimetry.
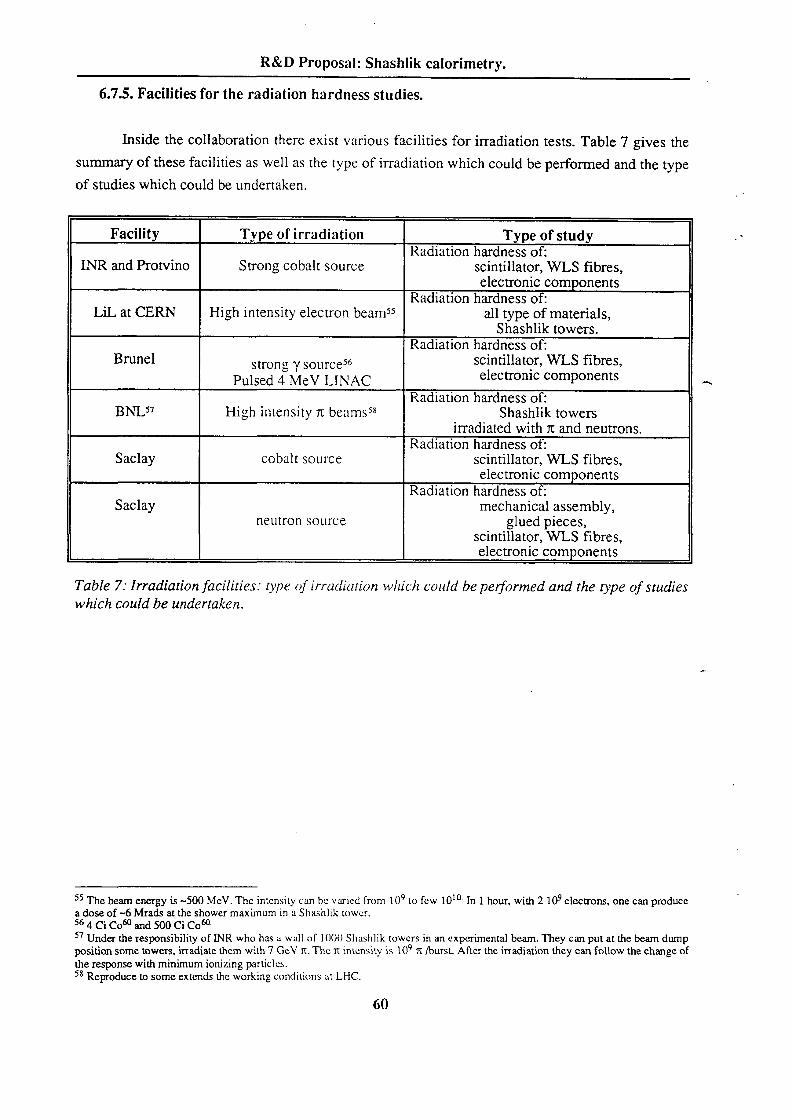
60 OCR Output
Reproduce to some extends the working conditions at LHC.the response with minimum ionizing particles.position some towers, irradiate them with 7 GeV it. The it intensity is 109 it [burst. After the irradiation they can follow the change of
Under the responsibility of INR who has a wall ol` 1000 Shashlik Lowers in an experimental beam. They can put at the beam dump
56 4 ci Cow mo 500 cs cowa dose of ~6 Mrads at the shower maximum in a Shashlik tower.
The beam energy is ~500 MeV. The intensity can be varied from 10to few 10In 1 hour, with 2 109 electrons, one can produce9 10
which could be undertaken.
Table 7: Irradiation facilities: type (J irradiation which could be performed and the type of studies
electronic componentsscintillator, WLS fibres,
neutron source glued pieces,mechanical assembly,Saclay
Radiation hardness of:
electronic componentsscintillator, WLS fibres,cobalt sourceSaclay
Radiation hardness of:
irradiated with it and neutrons.Shashlik towersBNL57 High intensity it beamss
Radiation hardness of:
Pulsed 4 MCV C CCUOHIC COH'lpOI'l€H[SStrong Y SOWCGS6 scintillator, WLS tibres,Brunel
Radiation hardness of:
Shashlik towers.all type of materials,LiL at CERN | High intensity electron beam5
Radiation hardness of:
electronic componentsscintillator, WLS libres,INR and Protvino | Strong cobalt source
Radiation hardness of:Type of studyType of irradiationFacilit
of studies which could be undertaken.
summary of these facilities as well as the type of irradiation which could be performed and the type
Inside the collaboration there exist various facilities for irradiation tests. Table 7 gives the
6.7.5. Facilities for the radiation hardness studies.
R&D Proposal: Shashlik calorimetry.

61 OCR Output
I Size: 12 x 12 cm2, strip width: 2 mm.These towers were irradiated at LIL up to about 3 Mrads.
9 Size: 6 x 6 cm2, strip width: 2 mm.
wish to have the allocated beam time spread over the whole year.
and muons up to 150 GeV. The H2 beam or another beam in North area would be suitable. We
In 1994, we would need about 2 months of test beam time. We will need electrons, pions
relevance as far as Si is concerned.
in beam at the same time as the calorimeter prototypes. Work carried out in RD35 may be of direct
In parallel, developments on the preshower will continue and new prototypes will be tested
12 x 6 towers.
to have a few such towers (9 to 16) before May 1994 and to enlarge the sample to get a matrix of
__ chosen to constnict them in the pseudorapidity region of 11 = 0.75. As already mentioned, we expect
dimensions. These towers will be constructed with the techniques described in section 6.1. We have
position and angular resolution.
uniformity of the response,
energy resolution,
field on:
largeril in size) covering 4 Shashlik towers. This test will mainly study the effect of the magnetic
hybrid amplifiers designed at INR. The towers will have a new preshower prototype (four times
placed in the EHS magnet. All the towers will be equipped with SiPD readout followed by the
The last test beam period for 1993 will partly be devoted to the study of our prototypes
to test the first version of a new hybrid preamplifier designed at INR.
to made extensive studies of uniformity of response with tilted towers,
to get more data with the 16 projective towers including the silicon preshower in front,
to study the effect of irradiation°° on the five towers mentioned above,
August (3 days) and another one in October (5 days). The first one will be mainly devoted:
Two other test beam periods have been allocated for Shashlik calorimetry in 1993: one in
of silicon detectors5° in front of the calorimeter.
been taken at energies between 10 and 150 GeV. Part of the data have been taken with two planes
All have been studied in the CERN SPS H2 beam in May 1993. About 106 electron triggers have
Sixteen projective towers in T] and (D,
radiation hardness tests,
Five parallelipedical towers (using the gluing technique described in section 6.1) for
In 1993, new sets of Shashlik towers were constructed:
Z. Beam testrequiremen
R&D Proposal: Shashlik calorimetry.

62 OCR Output
Table 9: Required test beam time at P.S`..
Number of days 50 I 50 I $0 I 50 I 100 I 100 I 100
Year 95I96I97I98I99IOOI0l
Tests Production I Calibration
requested beam time at PS is summarized in table 9.
usually include low energy particles. Therefore we will need a low momentum it/K/p PS beam. The
In parallel, we also need to perform studies related to the calorimeter response to jets which
advisable.
at 50 GeV for which a Ap/p of 0.1% will be required. l-lence equipping a new beam line may be
to be the same as the one for the studies of the CMS I-ICAL. The final calibration will be performed
performed in magnetic field. The use of the 3 Tesla EHS magnet is essential. The test beam has also
The beam should provide particles with momenta from l0 to 250 GeV. Some tests will be
Table 8: Required test beam time in a high energy electron and pion beam.
Number of davs I 50 I 100 I 100 I 50 I 50 I 200 I 200 I 200
Year 94I95I96I97I98I99IOOI01
Tests Production I Calibration
calibrated in the test beam. A model of our needs is given in table 8.
Over a longer term, final detector elements will be constructed. They will need to be
R&D Proposal: Shashlik calorimetry.
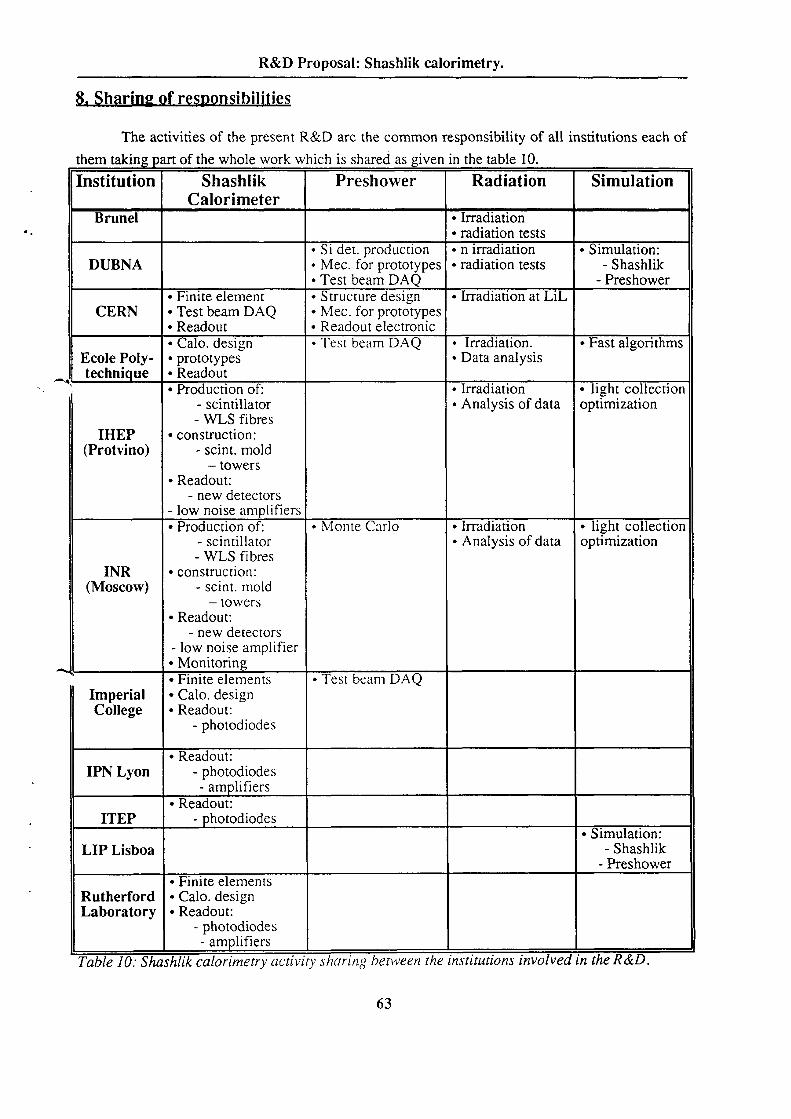
63 OCR Output
Table 10: Shashlik calorimetry at-tttitiy sltaring between the institutions involved in the R&D.
- amplifiersphotodiodes
Laboratory · Readout:
Rutherford Calo. designFinite elements
PreshowerLIP Lisboa Shashlik
· Simulation:ITEP hotodiodes
• Readout:
- amplifiersIPN Lyon photodiodes
• Readout:
photodiodesCollege • Readout:Imperial Calo. design
Finite elements I • Test beam DAQ• Monitotinlow noise amplifier
new detectors
• Readout:
towers
(Moscow) scint. moldconstruction:INR
— WLS fibres
scintillatorProduction of: I • Monte Carlo I • Irradiation • light collectionI Analysis of data optimizationlow noise amplifiers
new detectors
• Readout:
—— towers
(Protvino) scint. mold
construction:IHEP
- WLS fibres
scintillator
Production of: • Irradiation • light collectionAnalysis of data I optimizationtechnique • Readout
prototypesEcole Poly Data analysis• Calo. design I • Test beam DAQ | • Irradiation. | • Fast algorithms• Readout Readout electronic
CERN Test beam DAQ • Mee. for prototypesFinite element • Structure design | • Irradiation at LiL
PreshowerTest beam DAQDUBNA Mec. for prototypes • radiation tests - Shashlik
Si det. production • n irradiation • Simulation:radiation tests
Brunel • Irradiation
Calorimeter
Institution Shashlik Preshower I Radiation I Simulation
them takinz part of the whole work which is shared as given in the table 10.
The activities of the present R&D are the common responsibility of all institutions each of
harinz of responsibilities
R&D Proposal: Shashlik calorimetry.
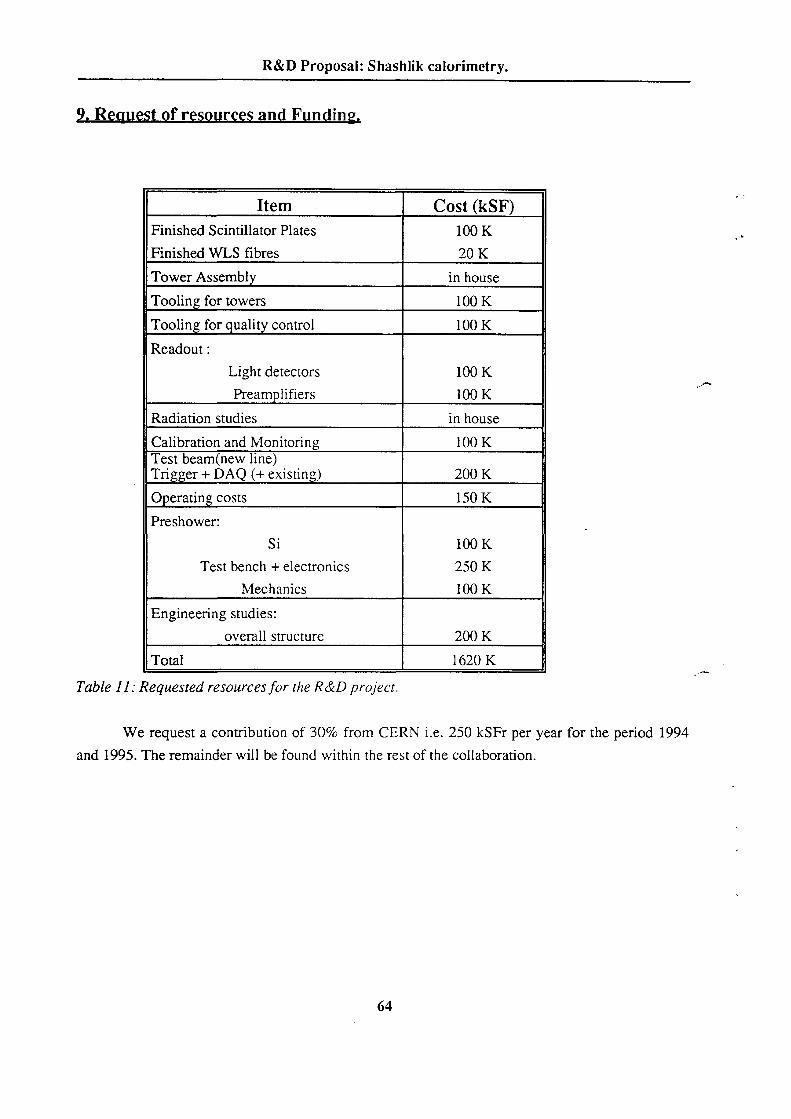
64 OCR Output
and 1995. The remainder will be found within the rest of the collaboration.
We request a contribution of 30% from CERN i.e. 250 kSFr per year for the period 1994
Table 11 s Requested resources for the R&D project.
Total 1620 K
overall structure 200 K
Engineering studies:
Mechanics 100 K
Test bench + electronics 250 K
100 KSi
Preshower:
150 KOperating costs
200 KTrigger + DAQ (+ existing)Test beam(new line)
100 KCalibration and Monitoring
in houseRadiation studies
100 KPreamplifiers
100 KLight detectors
Readout :
100 KTooling for qualitv control
100 KTooling for towers
in houseTower Assembl
20 KFinished WLS fibres
100 KFinished Scintillator Plates
Cost (kSF)Item
f resources and Fundin
R&D Proposal: Shashlik calorimetry.
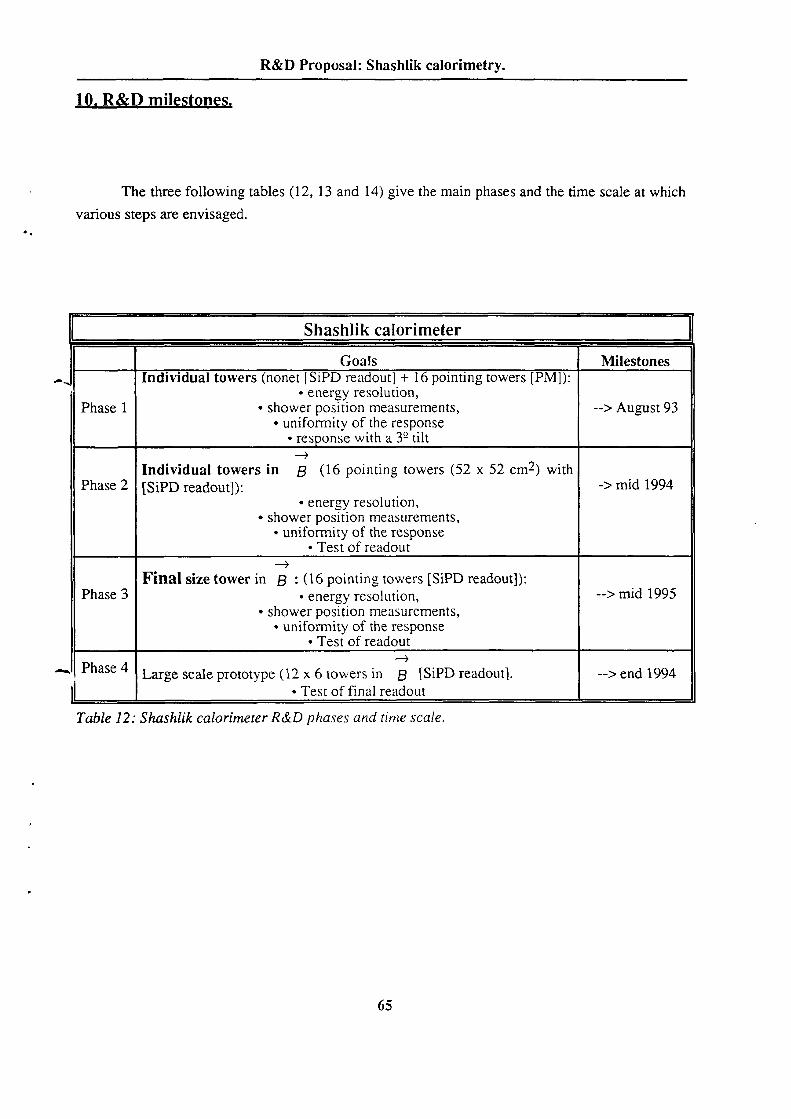
65 OCR Output
Table 12 :‘ Shashlik calorimeter R&D phases and time scale.
Test of final readout
-·> end 1994Large scale prototype (12 x 6 towers in 5 [SiPD readout]...|l Phase 4
Test of readoutuniformity of the response
shower position measurements,energy resolution,Phase 3 ··> mid 1995
Final size tower in B : (16 pointing towers [SiPD readout]):
Test of readoutuniformity of the response
shower position measurements,energy resolution,
[SiPD readout]):Phase 2 ·> mid 1994Individual towers in B (16 pointing towers (52 x 52 cm!) with
response with a 39 tiltuniformity ofthe response
Phase 1 shower position measurements, -—> August 93energy resolution,
Individual towers (nonet [SiPD readout] + 16 pointing towers [PM]):MilestonesGoals
Shashlik calorimeter
various steps are envisaged.
The thrcc following tables (12, 13 and 14) givc thc main phases and the time scale at which
10. R&D mileston
R&D Proposal: Shashlik calorimetry.

66 OCR Output
Table 14: Mechanical design 0fS/tas/1/lk calorimeter and preshower R&D phases and time scale.
definition of theconstruction tooling.h 3 P asc
Full design of the barrel calorimeter including the preshower and [ --> mid 1995Finite element calculation for the preshower.
··> mid 1994the glued and pocket solution.Phase 2 I Finite element calculation for a barrel electromagnetic calorimeter for
detector.construction procedures and prepare the final mechanical design of the | --> End 93
Ph Sc 1¤ . | Mechanical Prototypes of the preshower detector to define thecalculations.
measure the mechanical parameters needed for finite element | --> End 93Phase 1 Mechanical Prototypes to define the construction procedures and
MilestonesGoals
Mechanical design of the calorimeter and preshower.
Table 13 Shashlik preshower R&D phases and time scale.
Test of final readoutlarge scale final geometry preshower).Large scale prototype (12 x 6 towers in B [SiPD readout] +| --> mid 1995
Phase 4
Test of readoutunifomiity of the response
shower position measurements,energy resolution,
planes [12 X 12 ¤m2]> ' ··> mu 1994Phase 3Final tower in 5 : (I6 pointing towers [SiPD readout]+ 2 Si
Test of readouteffect on unifomnity of the response
shower position measurements,effect on energy resolution,
Si planes [l2 x 12 cm2]) : _ '> mid 1994Phase 2Individual towers in B (16 pointing towers [SiPD readout] + 2
effect on unifomiity ofthe responseshower position measurements, "> August 93Phasc 1effect on energy resolution,
First prototype (2 Si planes [6 x 6 cm2])MilestonesGoals
Shashlik preshower
R&D Proposal: Shashlik calorimetry.

68
intermediate milestones as defined in section l0.
To achieve the program we have defined in this paper, we will need two years with
quality control and the acceptable limits for the large scale production of the components.
investigate altemative photo-detectors,
radiation resistance of all components of the detectors,
calibration and monitoring,
An extensive Monte Carlo simulation programme.
Work in high magnetic field to study its effect on the calorimeter response.
developed.
and the full detector. In parallel, an alternative solution for the mechanical structure will also be
Make the mechanical tests of the gluing technique proposed for the tower construction,
calorimeter and for the preshower.
Design and build a cheap, low noise, radiation resistant readout electronics for the
uniformity of the electromagnetic calorimeter.
the required angular precision and 7tU rejection whilst maintaining good energy resolution and
Demonstrate that one can find a Preshower + Shashlik calorimeter geometry which gives
resolution function.
tolerate the LHC high radiation level without worsening too much the constant term in the energy
Find the best scintillator/WLS fibre combination that provides high light output and can
Special care has to be given to tower edges as well as to the tower to tower boundaries.
Demonstrate that for a pointing geometry one can achieve a good uniformity response.
large number items requiring R&D, we list below the items of highest priority:
Further R&D work is essential before building a full scale projective detector. Amongst the
(90 < my < 130 GeV) after one year of LHC running at high luminosity.
The performance is good enough to observe (So) the Standard Model H—>'YY in the mass range
G9(mrad) =70
The angular resolution deduced from measurements is:
gf: (8.3;.1)® (.37;.03)®(.8_L2) % (E in GeV)energy resolution is:
projective calorimeter prototype exposed to high energy electrons, are encouraging. The measured
expected that such calorimeters can be built at a relatively low cost. The first results, from a non
enables fine lateral segmentation to be achieved with a minimum of dead space. In addition, it is
yields from such calorimeters are in excess of l0()00 photons per GeV. The use of optical fibres
calorimeters. These techniques involve the use of wavelength shifting optical fibres. The light
New techniques have been developed to read out the light from lead/scintillator sampling
OCR Output12. Conclusion
R&D Proposal: Shashlik calorimetry.