2 3 Journal of Thermal Analysis and Calorimetry An International Forum for Thermal Studies...
14
1 23 Journal of Thermal Analysis and Calorimetry An International Forum for Thermal Studies ISSN 1388-6150 Volume 107 Number 1 J Therm Anal Calorim (2012) 107:171-182 DOI 10.1007/s10973-011-1816-y Applications of some thermo-analytical techniques to glasses and polymers Arun Pratap & Kananbala Sharma
Transcript of 2 3 Journal of Thermal Analysis and Calorimetry An International Forum for Thermal Studies...
1 23
Journal of Thermal Analysis andCalorimetryAn International Forum for ThermalStudies ISSN 1388-6150Volume 107Number 1 J Therm Anal Calorim (2012)107:171-182DOI 10.1007/s10973-011-1816-y
Applications of some thermo-analyticaltechniques to glasses and polymers
Arun Pratap & Kananbala Sharma

1 23
Your article is protected by copyright and
all rights are held exclusively by Akadémiai
Kiadó, Budapest, Hungary. This e-offprint is
for personal use only and shall not be self-
archived in electronic repositories. If you
wish to self-archive your work, please use the
accepted author’s version for posting to your
own website or your institution’s repository.
You may further deposit the accepted author’s
version on a funder’s repository at a funder’s
request, provided it is not made publicly
available until 12 months after publication.
Applications of some thermo-analytical techniques to glassesand polymers
Arun Pratap • Kananbala Sharma
29th STAC-ICC Conference Special Chapter
� Akademiai Kiado, Budapest, Hungary 2011
Abstract Thermal characterization of materials provides
conclusions regarding the identification of materials as
well as their purity and composition, polymorphism, and
structural changes. Analytical experimental techniques for
thermal characterization comprise of a group of techniques,
in which physical properties of materials are ascertained
through controlled temperature program. Among these
techniques, traditional differential scanning calorimetry
(DSC) is a well-accepted technique for analyzing thermal
transitions in condensed systems. Modulated DSC (MDSC)
is used to study the same material properties as conven-
tional DSC including: transition temperatures, melting and
crystallization, and heat capacity. Further, MDSC also
provides unique feature of increased resolution and
increased sensitivity in the same measurement. ‘‘Hot disk
thermal constant analyzer’’, based on Transient Plane
Source (TPS) technique, offers simultaneous measurement
of thermal transport properties of specimen, which are
directly related to heat conduction such as thermal con-
ductivity (k) and thermal diffusivity (v). This method
enables the thermal analysis on large number of materials
from building materials to materials with high thermal
conductivity like iron. The temperature range covered so
far extends from the liquid nitrogen point to 1000 K and
should be possible to extend further. This review also
presents some interesting results of phase transition tem-
perature of miscible (CPI/TPI) and immiscible (PS/
PMMA) polymeric systems carried out through dynamic
mechanical analyzer along with the thermal transport
properties obtained for cis-polyisoprene (CPI), trans-
polyisoprene (TPI), and their blends determined by TPS
technique.
Keywords Thermal properties � Modulated DSC �Transient plane source � Thermal conductivity �Thermal diffusivity � Dynamic mechanical analyzer �Phase transition temperature
Introduction
Glasses and polymers are condensed materials that support
a number of technology and commercial thrust areas;
photonics, clean energy and alternative energy sources,
nanotechnology, thermal appliances, electrical insulation,
and high performance composites used in aircrafts are a
few to name. With the advent of bulk metallic glasses, it
has become possible to use them in golf clubs and exploit
other applications due to their extremely enhanced
mechanical properties. These materials seamlessly inte-
grate multidisciplinary research including chemist and
chemical engineering, physicist, device engineers, bio-
technologist, and bio-medical researchers. The tempestu-
ous growth in the uses of polymers, glasses, and ceramics
has provided a leading role in the development of thermo-
analytical measuring techniques with a high degree of
automation to assist the determination of important
parameters necessary for the processing. An increasing
knowledge of the structure and properties are facilitated by
A. Pratap (&)
Condensed Matter Physics Laboratory, Applied Physics
Department, Faculty of Technology & Engineering,
The M. S. University of Baroda, Vadodara 390001, India
e-mail: [email protected]; [email protected]
K. Sharma
Semiconductor and Polymer Science Laboratory 5-6, Vigyan
Bhawan, Department of Physics, University of Rajasthan,
Jaipur 302004, India
e-mail: [email protected]; [email protected]
123
J Therm Anal Calorim (2012) 107:171–182
DOI 10.1007/s10973-011-1816-y
Author's personal copy
these techniques including some important aspects about
thermal stability, and temperature limits of applicability,
aging and thermo-mechanical behavior, viscoelastic prop-
erties and processing conditions for shaping, casting,
molding, and extrusion. Analytical experimental tech-
niques for thermal characterization comprise a group of
techniques, in which physical properties of materials are
ascertained through controlled temperature program.
Among these, some of the commonly used thermal char-
acterization techniques are thermogravimetric analyzer
(TG), differential thermal analyzer (DTA), differential
scanning calorimeter (DSC), dynamical mechanical ana-
lyzer (DMA), and thermal constant analyzer (TCA) etc.
Table 1 depicts the list of the physical properties measured
from the above mentioned respective characterization
techniques.
When a material system is subjected to heat energy, its
interaction with matter can be measured in terms of the
following thermal characteristic parameters like:
• Thermal conductivity.
• Thermal diffusivity.
• Specific heat.
• Thermal expansion.
• Thermo elasticity.
• Phase transformations.
These parameters are fundamental physical properties of
both the scientific and technological interest, which are
particularly important for construction materials used in a
thermal environment, where heat transfer and insulation are
of primary concern. Based on these, we will focus our
attention toward these thermal characteristic parameters of
the materials through DMA and hot disk thermal constant
analyzer. DMA is frequently used to ascertain phase tran-
sition temperature of the material where as, Hot Disk
Thermal Constant analyzer (based on transient plane
source (TPS) technique) offers simultaneous measurement
of thermal transport properties of specimen which are
directly related to heat conduction such as thermal con-
ductivity (k), and thermal diffusivity (v). DSC is a versatile
thermal analysis technique used for about three decades to
measure heat flows associated with transitions in materials
as a function of temperature or time. DSC is widely used to
provide quantitative and qualitative information about
physical and chemical changes involving endothermic or
exothermic processes or heat capacity changes.
Apart from the numerous advantages leading to its use
in variety of areas like materials analysis, applicability to
polymers and organic materials as well as various inor-
ganic materials, pharmaceutical drugs; DSC does have
some limitations. These limitations include the difficulty of
optimum choice of heating range to get good resolution and
good sensitivity simultaneously, difficulty in interpreting
complex transitions (e.g. glass transition and enthalpic
relaxation, melting and crystallization perfection), and
measurement of heat capacity during a reaction.
Modulated DSC is a new improved technique and is an
attempt toward overcoming most of the limitations of
conventional DSC. Modulated DSC and MDSC is a pat-
ented [1] and commercialized [2] method invented by Dr.
Mike Reading of ICI Paints (Slough, UK) and patented by
TA instruments.
Numerical modeling and analysis of temperature mod-
ulated DSC has been recently carried out [3] on the sepa-
rability of reversing heat flow from non-reversing heat flow
to study heat capacity. In fact, one of the major advantages
of the MDSC method is its ability to separate these
reversing and non-reversible processes by the measurement
of the contribution of reverse and non-reserve heat flows in
total heat flow during a phase transition. Several studies
have been reported for glass transitions and crystallization
in polymers [4], chalcogenide glasses [5], and metallic
glasses [6] by MDSC. But the study of the detailed crys-
tallization process of an amorphous alloy using various
kinetics equations is yet to be reported. Our recently
reported study [7] on a three component transition metal
based amorphous alloys viz. Ti50Cu20Ni30 are among the
first such publication. Recently, MDSC has been used quite
effectively and extensively for investigating [8] thermo-
dynamics of crystalline and amorphous phases of a new
drug and vitrification and curing study [9]. Jinan Cao [10,
11] has carried out detailed mathematical studies of mod-
ulated DSC and has concluded that a quantitative separa-
tion of the kinetic and non-kinetic components is
Table 1 List of various thermal characterization techniques with the physical property ascertained through controlled temperature program.
Physical properties ascertained Technique
Thermal stability/degradation, curing kinetics, phase transition measurement and pyrolysis kinetics Thermogravimetric analyzer (TG)
Phase transition, thermal stability and kinetics of phase transition Differential thermal analyzer (DTA)
Phase transition, thermal stability and kinetics of phase transition Differential scanning calorimeter (DSC)
Phase transition, mechanical properties, viscosity, and activation energy Dynamical mechanical analyser (DMA)
Thermal conductivity and thermal diffusivity Thermal constant analyser (TCA)
Thermal expansion coefficient, phase transition, and density change Thermal dilatometer
172 A. Pratap, K. Sharma
123
Author's personal copy
problematic. Besides, the quantitative determination of
the heat capacity of a sample is rather difficult, if not
impossible.
Theory
In modulated DSC, the same heat flux DSC cell arrange-
ment is employed, but the heating profile applied to the
sample and reference by furnace are different. The non-
linear heating profile results from the sinusoidal modula-
tion (oscillation) overlaid on the traditional linear ramp.
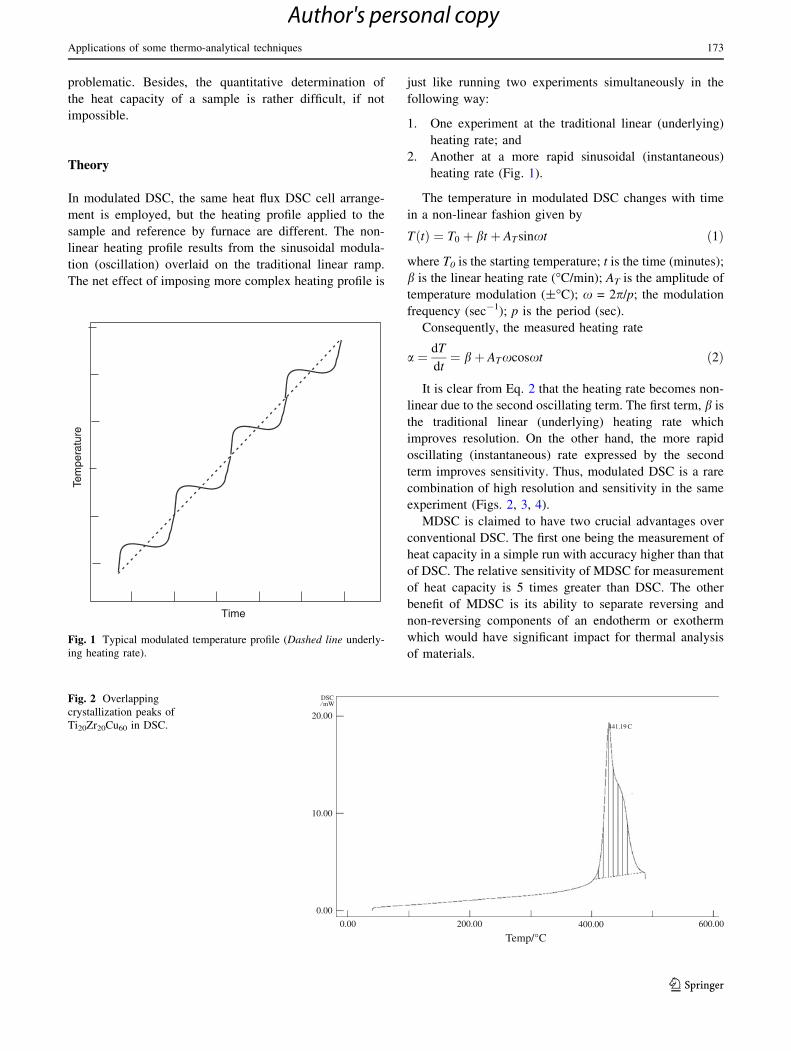
The net effect of imposing more complex heating profile is
just like running two experiments simultaneously in the
following way:
1. One experiment at the traditional linear (underlying)
heating rate; and
2. Another at a more rapid sinusoidal (instantaneous)
heating rate (Fig. 1).
The temperature in modulated DSC changes with time
in a non-linear fashion given by
TðtÞ ¼ T0 þ bt þ AT sinxt ð1Þ
where T0 is the starting temperature; t is the time (minutes);
b is the linear heating rate (�C/min); AT is the amplitude of
temperature modulation (±�C); x = 2p/p; the modulation
frequency (sec-1); p is the period (sec).
Consequently, the measured heating rate
a ¼ dT
dt¼ bþ ATxcosxt ð2Þ
It is clear from Eq. 2 that the heating rate becomes non-
linear due to the second oscillating term. The first term, b is
the traditional linear (underlying) heating rate which
improves resolution. On the other hand, the more rapid
oscillating (instantaneous) rate expressed by the second
term improves sensitivity. Thus, modulated DSC is a rare
combination of high resolution and sensitivity in the same
experiment (Figs. 2, 3, 4).
MDSC is claimed to have two crucial advantages over
conventional DSC. The first one being the measurement of
heat capacity in a simple run with accuracy higher than that
of DSC. The relative sensitivity of MDSC for measurement
of heat capacity is 5 times greater than DSC. The other
benefit of MDSC is its ability to separate reversing and
non-reversing components of an endotherm or exotherm
which would have significant impact for thermal analysis
of materials.
Time
Tem
pera
ture
Fig. 1 Typical modulated temperature profile (Dashed line underly-
ing heating rate).
20.00
10.00
0.00
0.00 200.00 400.00 600.00
Temp/°C
DSC⁄ mW
441.19 C
Fig. 2 Overlapping
crystallization peaks of
Ti20Zr20Cu60 in DSC.
Applications of some thermo-analytical techniques 173
123
Author's personal copy
The instantaneous heat flow in a modulated DSC
dQ
dT¼ Cpðbþ ATx Cos xtÞ þ f 0ðt; TÞ þ AkSin xt ð3Þ
where bþ ATxcosxtð Þ ¼ dTdt
is measured heating rate;
f0(t,T) is the kinetic response without temperature modu-
lation; Ak is the amplitude of kinetic response to temper-
ature modulation.
The total heat flow consists of heat capacity-related
(reversing) and kinetic (non-reversing) components. Aver-
age heat flow value is continuously calculated by Fourier
transformation analysis of modulated heat flow signal. Heat
capacity is calculated from the ratio of modulated heat flow
amplitude to the product of amplitude of modulation tem-
perature and frequency. The reversing heat flow is deter-
mined by multiplying this heat capacity with average
heating rate. Events observed in the reversing heat flow are
usually transitions, which are thermodynamically reversible
at the time and temperature at which they are detected.
Typical reversing events are glass transitions and crystalline
melting. Thermal dehydration and decomposition have also
been studied extensively [12, 13] using thermo-analytical
techniques. On the contrary, non-reversible events are usu-
ally thermodynamically non-reversible at the time and
temperature at which they are detected. Such non-reversible
transitions are evaporation, decomposition, enthalpic
relaxation, cold crystallization, thermo-set cure etc.
Applications
Glass transition
The conventional DSC has been extensively employed for
studying the glass transition and crystallization. However,
many metallic glasses have very small undercooling
(T = Tx-Tg); where Tx is crystallization temperature and
Tg is glass transition temperature. In such glasses, glass
transitions are closely followed by crystallization and often
the transitions are not observed by conventional DSC. The
glass transition is a reversible process in which heat is
absorbed to accommodate the heat capacity increase during
the transition.
Many transitions are complex because they involve
multiple processes. Enthalpic relaxation that occurs at the
glass transition is an endothermic process that can vary in
magnitude depending on the thermal history of the mate-
rial. Under some circumstances, it can make the glass
transition appear to be a melting transition. These problems
get enhanced in analyzing blends of materials. Conven-
tional DSC does not allow these complex transitions to be
analyzed properly because it measures only the sum of all
thermal events of the samples.
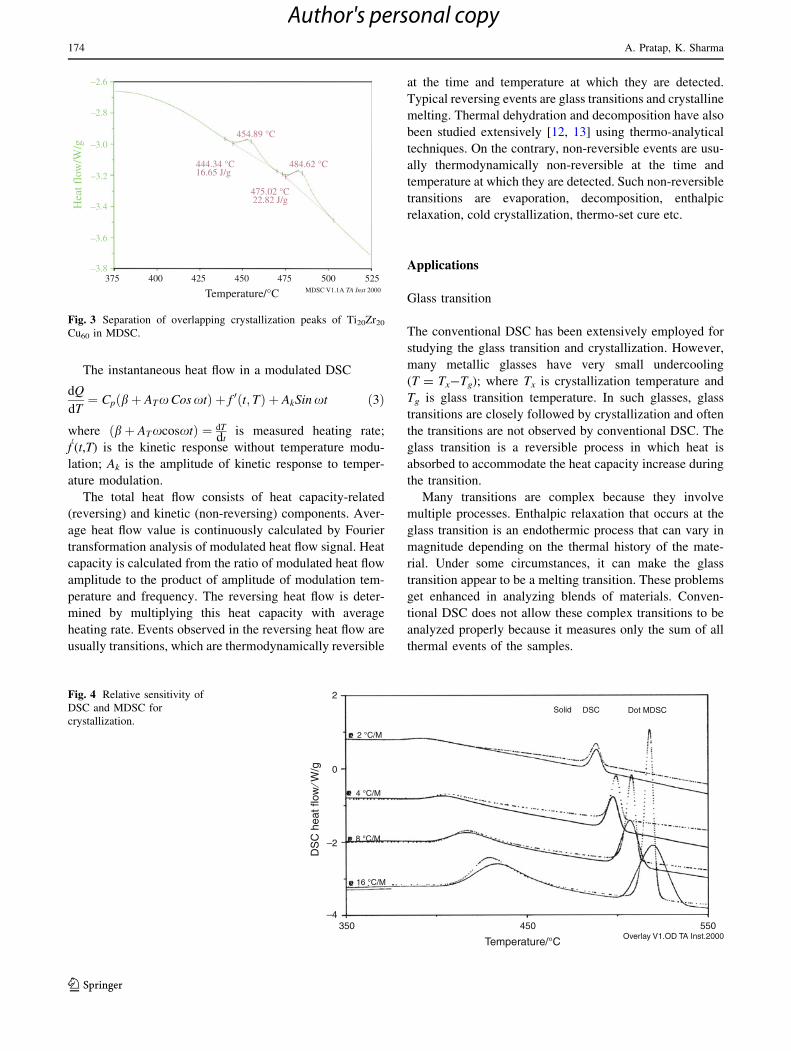
375
–3.6
–3.8
–3.4
–3.2
Hea
t flo
w/W
/g –3.0
–2.8
–2.6
400 425 450
475.02 °C22.82 J/g
444.34 °C
454.89 °C
484.62 °C16.65 J/g
Temperature/°C475 500
MDSC V1.1A TA Inst 2000
525
Fig. 3 Separation of overlapping crystallization peaks of Ti20Zr20
Cu60 in MDSC.
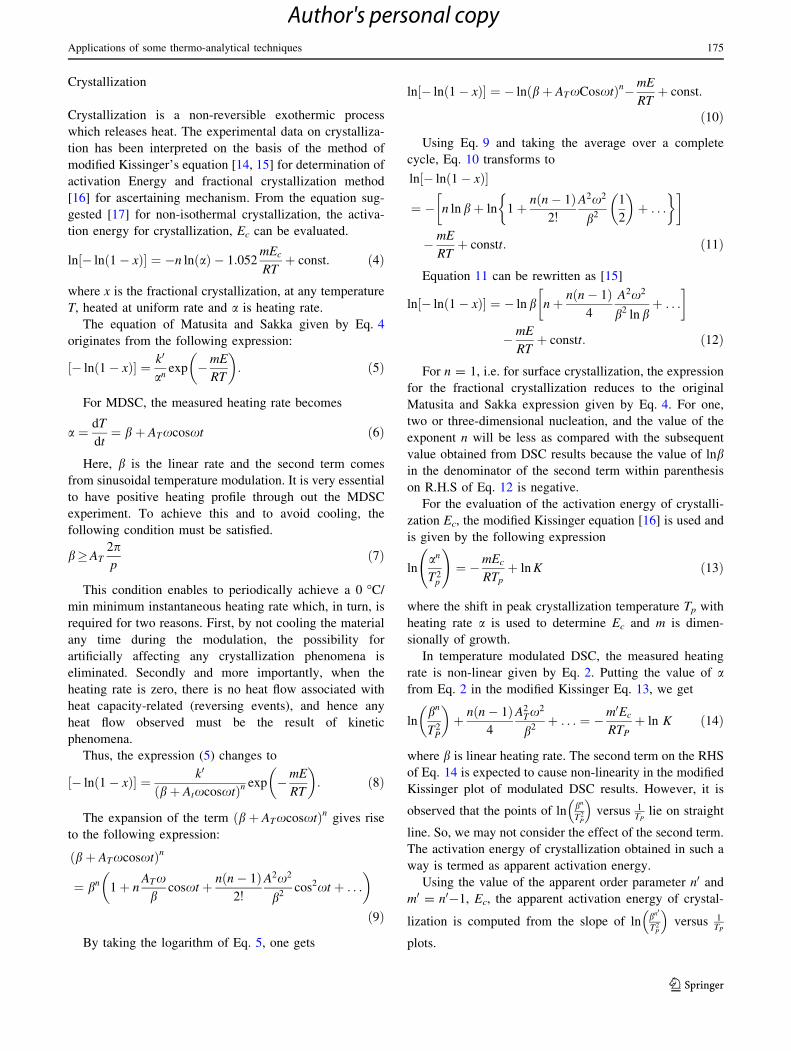
2
0
–2
–4350 450 550
2 °C/M
4 °C/M
8 °C/M
16 °C/M
Solid DSC Dot MDSC
Overlay V1.OD TA Inst.2000Temperature/°C
DS
C h
eat f
low
⁄ W/g
Fig. 4 Relative sensitivity of
DSC and MDSC for
crystallization.
174 A. Pratap, K. Sharma
123
Author's personal copy
Crystallization
Crystallization is a non-reversible exothermic process
which releases heat. The experimental data on crystalliza-
tion has been interpreted on the basis of the method of
modified Kissinger’s equation [14, 15] for determination of
activation Energy and fractional crystallization method
[16] for ascertaining mechanism. From the equation sug-
gested [17] for non-isothermal crystallization, the activa-
tion energy for crystallization, Ec can be evaluated.
ln½� lnð1� xÞ� ¼ �n lnðaÞ � 1:052mEc
RTþ const. ð4Þ
where x is the fractional crystallization, at any temperature
T, heated at uniform rate and a is heating rate.
The equation of Matusita and Sakka given by Eq. 4
originates from the following expression:
½� lnð1� xÞ� ¼ k0
anexp �mE
RT
� �: ð5Þ
For MDSC, the measured heating rate becomes
a ¼ dT
dt¼ bþ ATxcosxt ð6Þ
Here, b is the linear rate and the second term comes
from sinusoidal temperature modulation. It is very essential
to have positive heating profile through out the MDSC
experiment. To achieve this and to avoid cooling, the
following condition must be satisfied.
b�AT2pp
ð7Þ
This condition enables to periodically achieve a 0 �C/
min minimum instantaneous heating rate which, in turn, is
required for two reasons. First, by not cooling the material
any time during the modulation, the possibility for
artificially affecting any crystallization phenomena is
eliminated. Secondly and more importantly, when the
heating rate is zero, there is no heat flow associated with
heat capacity-related (reversing events), and hence any
heat flow observed must be the result of kinetic
phenomena.
Thus, the expression (5) changes to
½� lnð1� xÞ� ¼ k0
bþ Atxcosxtð Þn exp �mE
RT
� �: ð8Þ
The expansion of the term bþ ATxcosxtð Þn gives rise
to the following expression:
bþ ATxcosxtð Þn
¼ bn 1þ nATxb
cosxt þ nðn� 1Þ2!
A2x2
b2cos2xt þ . . .
� �
ð9Þ
By taking the logarithm of Eq. 5, one gets
ln½� lnð1� xÞ� ¼ � ln bþ ATxCosxtð Þn�mE
RTþ const.
ð10Þ
Using Eq. 9 and taking the average over a complete
cycle, Eq. 10 transforms to
ln½� lnð1� xÞ�
¼ � n ln bþ ln 1þ nðn� 1Þ2!
A2x2
b2
1
2
� �þ . . .
� �� �
� mE
RTþ constt: ð11Þ
Equation 11 can be rewritten as [15]
ln½� lnð1� xÞ� ¼ � ln b nþ nðn� 1Þ4
A2x2
b2 ln bþ . . .
� �
� mE
RTþ constt: ð12Þ
For n = 1, i.e. for surface crystallization, the expression
for the fractional crystallization reduces to the original
Matusita and Sakka expression given by Eq. 4. For one,
two or three-dimensional nucleation, and the value of the
exponent n will be less as compared with the subsequent
value obtained from DSC results because the value of lnbin the denominator of the second term within parenthesis
on R.H.S of Eq. 12 is negative.
For the evaluation of the activation energy of crystalli-
zation Ec, the modified Kissinger equation [16] is used and
is given by the following expression
lnan
T2p
!¼ �mEc
RTpþ ln K ð13Þ
where the shift in peak crystallization temperature Tp with
heating rate a is used to determine Ec and m is dimen-
sionally of growth.
In temperature modulated DSC, the measured heating
rate is non-linear given by Eq. 2. Putting the value of afrom Eq. 2 in the modified Kissinger Eq. 13, we get
lnbn
T2P
� �þ nðn� 1Þ
4
A2Tx2
b2þ . . . ¼ �m0Ec
RTPþ ln K ð14Þ
where b is linear heating rate. The second term on the RHS
of Eq. 14 is expected to cause non-linearity in the modified
Kissinger plot of modulated DSC results. However, it is
observed that the points of ln bn
T2P
� versus 1
TPlie on straight
line. So, we may not consider the effect of the second term.
The activation energy of crystallization obtained in such a
way is termed as apparent activation energy.
Using the value of the apparent order parameter n0 and
m0 = n0-1, Ec, the apparent activation energy of crystal-
lization is computed from the slope of ln bn0
T2P
� versus 1
TP
plots.
Applications of some thermo-analytical techniques 175
123
Author's personal copy
Dynamic mechanical analyzer (DMA)
Dynamic mechanical analyzer is a sensitive technique that
characterizes the mechanical response of materials by
monitoring property change with respect to the temperature
and frequency of applied sinusoidal stress. It is used to
(i) Detect transitions arising from molecular motions or
relaxations.
(ii) Determine mechanical properties, i.e. modulus,
damping of viscoelastic materials over spectrum of
time and temperature.
(iii) Develop structure property or morphology rela-
tionships.
Theory and instrumentation of DMA
The instrument operation is relatively simple to understand.
In this instrument, a sinusoidal force (stress) with a defined
frequency is applied to the sample through the motor. The
stress is transmitted though the device shaft onto the
sample, which is mounted in a clamping mechanism. As
the sample deforms, the amount of displacement is mea-
sured by linear variable differential transformer (LVDT)
positional sensor. The strain can be calculated from the
displacement. The magnitude of the applied stress and the
resultant strain are used to calculate the stiffness of the
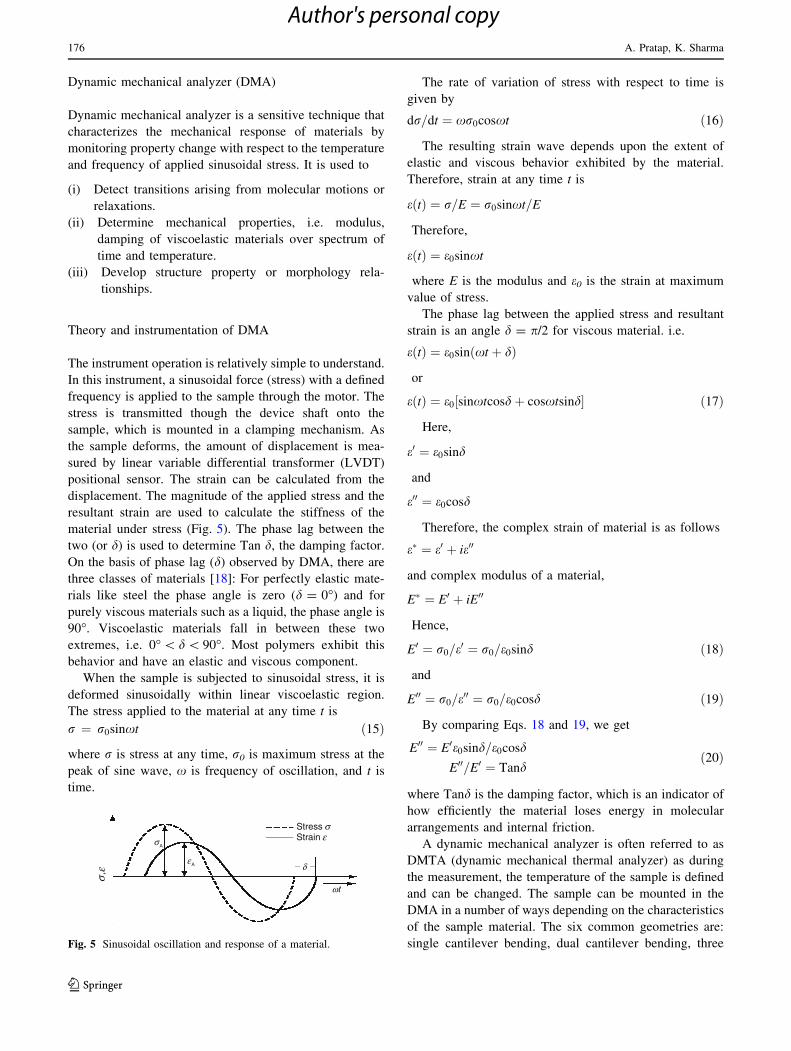
material under stress (Fig. 5). The phase lag between the
two (or d) is used to determine Tan d, the damping factor.
On the basis of phase lag (d) observed by DMA, there are
three classes of materials [18]: For perfectly elastic mate-
rials like steel the phase angle is zero (d = 0�) and for
purely viscous materials such as a liquid, the phase angle is
90�. Viscoelastic materials fall in between these two
extremes, i.e. 0� \ d\ 90�. Most polymers exhibit this
behavior and have an elastic and viscous component.
When the sample is subjected to sinusoidal stress, it is
deformed sinusoidally within linear viscoelastic region.
The stress applied to the material at any time t is
r ¼ r0sinxt ð15Þ
where r is stress at any time, r0 is maximum stress at the
peak of sine wave, x is frequency of oscillation, and t is
time.
The rate of variation of stress with respect to time is
given by
dr=dt ¼ xr0cosxt ð16Þ
The resulting strain wave depends upon the extent of
elastic and viscous behavior exhibited by the material.
Therefore, strain at any time t is
e tð Þ ¼ r=E ¼ r0sinxt=E
Therefore,
e tð Þ ¼ e0sinxt
where E is the modulus and e0 is the strain at maximum
value of stress.
The phase lag between the applied stress and resultant
strain is an angle d = p/2 for viscous material. i.e.
e tð Þ ¼ e0sinðxt þ dÞ
or
e tð Þ ¼ e0 sinxtcosdþ cosxtsind½ � ð17Þ
Here,
e0 ¼ e0sind
and
e00 ¼ e0cosd
Therefore, the complex strain of material is as follows
e� ¼ e0 þ ie00
and complex modulus of a material,
E� ¼ E0 þ iE00
Hence,
E0 ¼ r0=e0 ¼ r0=e0sind ð18Þ
and
E00 ¼ r0=e00 ¼ r0=e0cosd ð19Þ
By comparing Eqs. 18 and 19, we get
E00 ¼ E0e0sind=e0cosd
E00=E0 ¼ Tandð20Þ
where Tand is the damping factor, which is an indicator of
how efficiently the material loses energy in molecular
arrangements and internal friction.
A dynamic mechanical analyzer is often referred to as
DMTA (dynamic mechanical thermal analyzer) as during
the measurement, the temperature of the sample is defined
and can be changed. The sample can be mounted in the
DMA in a number of ways depending on the characteristics
of the sample material. The six common geometries are:
single cantilever bending, dual cantilever bending, three
Stress σStrain ε
εA
σA
δ
ωt
σ,ε
Fig. 5 Sinusoidal oscillation and response of a material.
176 A. Pratap, K. Sharma
123
Author's personal copy
point bending, tension, compression, and shear. Sample
stiffness depends upon the modulus of elasticity and
geometry. In this technique, the measured modulus
depends upon the choice of geometry i.e. tension, com-
pression and bending mode yields the Young’s (E*), and
shear (torsion) mode gives the shear modulus.
The temperature that corresponds to a maximum in Tan
d versus temperature curve has been considered as ‘‘phase
transition temperature (Tg)’’ for the polymeric blend sam-
ples. The phase transition temperature (Tg) is a temperature
boundary almost for all amorphous polymers (and many
crystalline polymers) above which the substance remains
soft, flexible, and rubbery and below which it becomes
hard, brittle, and glassy. The phase transition temperature
(Tg) of a polymer material is correlated with the segmental
motion of the polymer chains. It is an important parameter
for a polymeric material. It is used as a measure for eval-
uating the flexibility of a polymer and the type of response
the polymeric material would exhibit to mechanical stress.
The Tg of a polymer, therefore, decides whether a polymer
at the ‘use temperature’ will behave like rubber or plastic.
In this way, it helps in choosing the right processing tem-
perature, i.e. the temperature region in which the material
can be converted into finished product through different
processing techniques such as molding, calendaring, and
extrusion. In the study of polymer blends these factors are
considered for industrial interest, due to the synergic
effects of mixing a commercially available component to
enhance properties such as processability and end-use
characteristic, the knowledge of Tg value is very essential.
DMA is estimated to be 100 times more sensitive to the
glass transition than DSC [19]. It can resolve other more
localized transitions not detected in DSC [20]. In addition,
this technique allows the rapid scanning of a material’s
modulus and viscosity as a function of temperature or
frequency.
Hot disk thermal constants analyzer
The thermal transport properties such as thermal conduc-
tivity (k) and thermal diffusivity (v) are important in
ascertaining the processing conditions as well as the
applications of polymeric materials. This method enables
the thermal analysis on large number of materials from
building materials to materials with high thermal conduc-
tivity like iron. The temperature range covered so far
extends from cryogenic to high temperatures (1000 K) and
should be possible to extend further. It can measure ther-
mal conductivities between 0.01 and 500 W/mK.
The hot disk thermal constant analyzer is based on
Transient Plane Source (TPS) method. TPS method is a
transient method, which is an extension of the transient
hot strip method (THS) and initially introduced by
Gustafsson [21]. In transient method, the sample has to be
taken to be at thermal equilibrium with the surroundings
and then one end of the sample is subjected to a transient
heat pulse. The change in temperature is monitored at
different points of time of measurement. By using the
measured values of temperature variation and with the
help of the solution of the differential heat equation the
thermal diffusivity (v) and thermal conductivity (k) can be
evaluated [22].
The advantage of using TPS method over the other
transient method is that the hot wire (THW) and hot strip
(THS) methods require long samples since the resistivity of
a resistance thermometer is directly proportional to the
initial resistance of the wire or the strip. In order to obtain a
reasonably high initial resistance of the sensor element and
at the same time to be able to work with a convenient and
compact configuration of the sample, the hot disk sensor
has been designed to minimize the total size of the sample.
Other advantage of using TPS method over THS method is
better protection, better electrical contacts, and repeated
use of sensor.
The temperature dependence of the thermal conductivity
and thermal diffusivity of polymers is also of scientific
interest both from the practical standpoint as it entails
establishing the mechanism of heat conduction in polymers
in different states. Thermal conductivity describes the
ability of materials to transport heat while thermal diffu-
sivity is the thermophysical parameter, which characterizes
the rate of temperature diffusion in the material due to heat
flux in the non-steady state. It is familiarly known that the
thermal conductivity and diffusivity of polymers vary
extensively depending on the structure, density, porosity,
molecular weight, orientations, and other structural fea-
tures of the material [23]. These properties also exhibit a
strong dependence toward temperature, pressure, and
environmental condition. The heat conduction in polymeric
materials is mainly caused through phonons. On the
microscopic level, thermal conductivity and thermal dif-
fusivity are colligated to the distribution function of these
phonons of a given material as well as to the average
phonon velocity and their mean-free path between suc-
cessive collisions.
Theory of transient plane source method
In this method, the transient plane source element behaves
both as a source of heat given to the sample and as a sensor
of temperature increase in the sample. The TPS element
consists of an electrical conducting pattern of thin nickel
foil (10 lm) in the form of double spiral, which resembles
a hot disk, embedded in an insulating layer made of kapton
(70 lm) or mica depending upon their use in low, room,
and high temperature respectively.
Applications of some thermo-analytical techniques 177
123
Author's personal copy
For the measurement of thermal constants-k, v, and qcp of
the sample material the sensor is sandwiched between
identical plane surfaces of the test samples. Size of the
sample should be such that the distance from the hot disk
(conducting pattern) to the nearest sample boundary is larger
than the probing depth Dp [24], which can be defined as
Dp ¼ b vtmaxð Þ1=2 ð21Þ
where tmax is the total time of the transient recording; v is the
thermal diffusivity of sample under test; b is the constant of
the order of unity and related to the experimental accuracy.
If R0 is the initial resistance of hot disk, and a is the
temperature coefficient of resistance of the nickel foil then
after applying a constant electrical power to the sensor, the
increase in temperature DS(s) can be calculated using the
equation
R tð Þ ¼ R0 1þ a DT sð Þh i
ð22Þ
where R(t) is the variation in the sensor resistance with
time and DT sð Þ is a properly calculated mean value of the
time dependent temperature increase of the TPS element.
Let us consider an infinite solid with a thermal con-
ductivity k, a thermal diffusivity v, and specific heat per
unit volume qcp. If conducting pattern (sensor) is located in
the yz plane inside this solid, the temperature increase, at a
point y, z and the time t, due to an output of power Q per
unit area is given by
DT y; z; tð Þ ¼ 1
8p3=2qc
Z t
0
dt0 j t � t0ð Þ½ ��3=2
�ZA
dy0dz0Q½y0; z0; t0�
exp � ðy� y0Þ2 þ ðz� z0Þ2h i
� ½4j t � t0ð Þ��1n o
ð23Þ
where A is the total area of the conducting pattern.
For convenience, the temperature increase can be
expressed as a function of s, which is defined as
s ¼ t=h½ �1=2; h ¼ a2=v ð24Þ
where t is the time measured from the start of the transient
heating, a is the radius of hot disk, and h is the charac-
teristic time.
Using Eq. 24 and taking v t � t0ð Þ ¼ r2a2, Eq. 23 can be
written as
DT y; z; sð Þ ¼ 1
4p3=2ak
Zsa
0
r�2drZA
dy0dz0Q y0; z0; t � r2a2
v
� �
� exp �ðy� y0Þ2 þ ðz� z0Þ2
4r2a2
" #ð25Þ
where v = k/qcp, q is the density of material of the sample,
r is a constant variable
If it is assumed that the disk contains a number ‘m’ of
concentric ring sources, an exact solution of Eq. 24 from
ring source solution immediately becomes
DTðsÞ ¼ P0
p32ak
DSðsÞ ð26Þ
where P0 is the total output power and Ds(s) is the
geometric function given by the relation
Ds sð Þ ¼ m mþ 1ð Þ½ ��2
�Zs
0
drr2
Xm
l¼1
lXm
k¼1
k:Exp� l2� k2ð Þ2 r2 m2
� �( )L0
lk
2 r2 m2
� �" #
ð27Þ
in which L0 is the modified Bessel function and l, k are the
dimension of the resistive pattern.
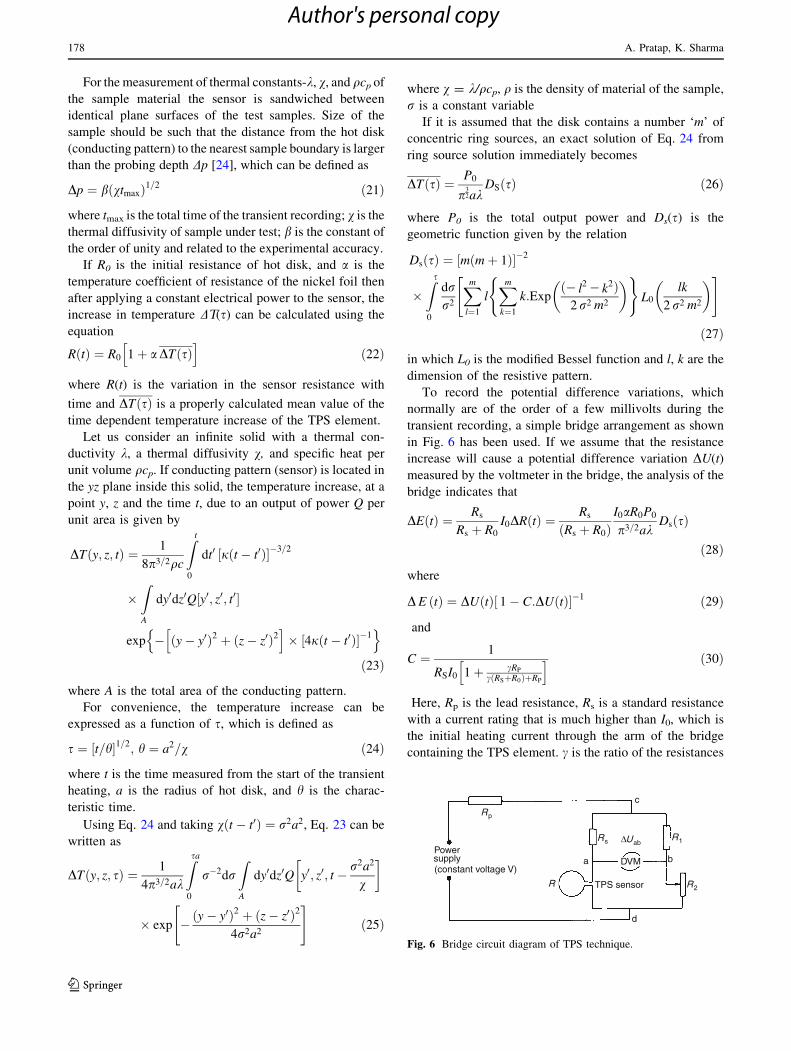
To record the potential difference variations, which
normally are of the order of a few millivolts during the
transient recording, a simple bridge arrangement as shown
in Fig. 6 has been used. If we assume that the resistance
increase will cause a potential difference variation DU(t)
measured by the voltmeter in the bridge, the analysis of the
bridge indicates that
DEðtÞ ¼ Rs
Rs þ R0
I0DRðtÞ ¼ Rs
ðRs þ R0ÞI0aR0P0
p3=2akDsðsÞ
ð28Þ
where
D E tð Þ ¼ DU tð Þ 1� C:DU tð Þ½ ��1 ð29Þ
and
C ¼ 1
RSI0 1þ cRP
cðRSþR0ÞþRP
h i ð30Þ
Here, Rp is the lead resistance, Rs is a standard resistance
with a current rating that is much higher than I0, which is
the initial heating current through the arm of the bridge
containing the TPS element. c is the ratio of the resistances
Powersupply(constant voltage V)
R TPS sensor
DVMa
c
b
Rs ΔUab
Rp
R1
R2
d
Fig. 6 Bridge circuit diagram of TPS technique.
178 A. Pratap, K. Sharma
123
Author's personal copy
in two ratio arms of the bridge circuit, which is taken to be
100 in the present experiment.
Calculating Ds sð Þ using a computer program and
recording the change in potential difference DU(t), one can
determine k. Similarly, diffusivity v can be determined by
finding the values of h from the transient event.
Many polymers and polymeric blends have been char-
acterized in this aspect by the author and her group in the
last decade. This study also presents some interesting
results of phase transition temperature of miscible (CPI/
TPI) and immiscible (PS/PMMA) polymeric systems car-
ried out through dynamic mechanical analyzer along with
the thermal transport properties obtained for cis-polyiso-
prene (CPI), trans-polyisoprene (TPI) and their blends
determined by TPS technique.
Results
Phase transition temperature study of miscible blends
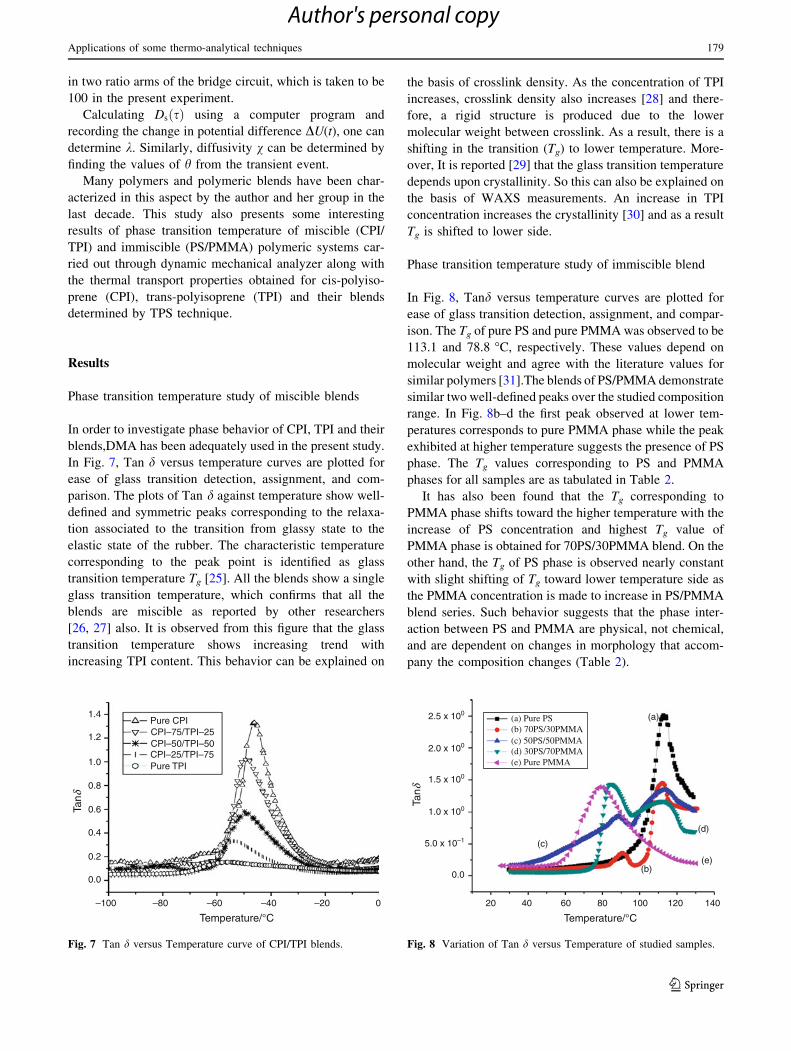
In order to investigate phase behavior of CPI, TPI and their
blends,DMA has been adequately used in the present study.
In Fig. 7, Tan d versus temperature curves are plotted for
ease of glass transition detection, assignment, and com-
parison. The plots of Tan d against temperature show well-
defined and symmetric peaks corresponding to the relaxa-
tion associated to the transition from glassy state to the
elastic state of the rubber. The characteristic temperature
corresponding to the peak point is identified as glass
transition temperature Tg [25]. All the blends show a single
glass transition temperature, which confirms that all the
blends are miscible as reported by other researchers
[26, 27] also. It is observed from this figure that the glass
transition temperature shows increasing trend with
increasing TPI content. This behavior can be explained on
the basis of crosslink density. As the concentration of TPI
increases, crosslink density also increases [28] and there-
fore, a rigid structure is produced due to the lower
molecular weight between crosslink. As a result, there is a
shifting in the transition (Tg) to lower temperature. More-
over, It is reported [29] that the glass transition temperature
depends upon crystallinity. So this can also be explained on
the basis of WAXS measurements. An increase in TPI
concentration increases the crystallinity [30] and as a result
Tg is shifted to lower side.
Phase transition temperature study of immiscible blend
In Fig. 8, Tand versus temperature curves are plotted for
ease of glass transition detection, assignment, and compar-
ison. The Tg of pure PS and pure PMMA was observed to be
113.1 and 78.8 �C, respectively. These values depend on
molecular weight and agree with the literature values for
similar polymers [31].The blends of PS/PMMA demonstrate
similar two well-defined peaks over the studied composition
range. In Fig. 8b–d the first peak observed at lower tem-
peratures corresponds to pure PMMA phase while the peak
exhibited at higher temperature suggests the presence of PS
phase. The Tg values corresponding to PS and PMMA
phases for all samples are as tabulated in Table 2.
It has also been found that the Tg corresponding to
PMMA phase shifts toward the higher temperature with the
increase of PS concentration and highest Tg value of
PMMA phase is obtained for 70PS/30PMMA blend. On the
other hand, the Tg of PS phase is observed nearly constant
with slight shifting of Tg toward lower temperature side as
the PMMA concentration is made to increase in PS/PMMA
blend series. Such behavior suggests that the phase inter-
action between PS and PMMA are physical, not chemical,
and are dependent on changes in morphology that accom-
pany the composition changes (Table 2).
1.4
1.2
1.0
0.8
0.6
0.4
0.2
0.0
–100 –80 –60 –40 –20 0
Pure CPICPI–75/TPI–25CPI–50/TPI–50CPI–25/TPI–75Pure TPI
Temperature/°C
Tan δ
Fig. 7 Tan d versus Temperature curve of CPI/TPI blends.
2.5 x 100
2.0 x 100
1.5 x 100
1.0 x 100
5.0 x 10⁻¹
0.0
20 40 60 80 100 120 140
Temperature/°C
(a) Pure PS(b) 70PS/30PMMA(c) 50PS/50PMMA(d) 30PS/70PMMA(e) Pure PMMA
(c)
(b)(e)
(d)
(a)
Tan δ
Fig. 8 Variation of Tan d versus Temperature of studied samples.
Applications of some thermo-analytical techniques 179
123
Author's personal copy
The existence of two well-defined Tg peaks corre-
sponding to PMMA and PS phases respectively, in PS/
PMMA blends with statistically constant Tg value of PS
phase clearly reveals the fact that PS/PMMA polymeric
blends are highly immiscible over the studied composition
range.
The data shows that PMMA phase undergoes glass
transition stage first, and so the crystallization process of
this phase tends to occur primarily and initiates significant
volume reduction and shrinkage, much more in the pres-
ence of number of PS domains. This differential shrinkage
causes the PS phase to exert isotropic hydrostatic pressure
on the PMMA phase, the available free volume is reduced,
the ability of the polymer chains to attain the critical free
volume is constrained, and the resultant glass structure of
PMMA phase tends to attain at a comparatively higher
temperature than pure state.
PMMA appears in viscous phase at about 110 �C,
whereas PS phase is about to undergo transitions to glassy
phase, and the Tg of the PS phase is observed to remain
unaffected by the presence of the PMMA phase in all
samples. This can be understood from the perspective of
image analysis and morphologies of PS/PMMA blends.
Interestingly, the dispersed PMMA phase has pulled away
from the PS matrix during crystallization, presumably due
to the differential shrinkage and incompatibility between
PS and PMMA phases. This eliminates the possibility of
compression effects of PMMA phase on the Tg of PS phase.
Thermal conductivity and thermal diffusivity of CPI,
TPI and their blends
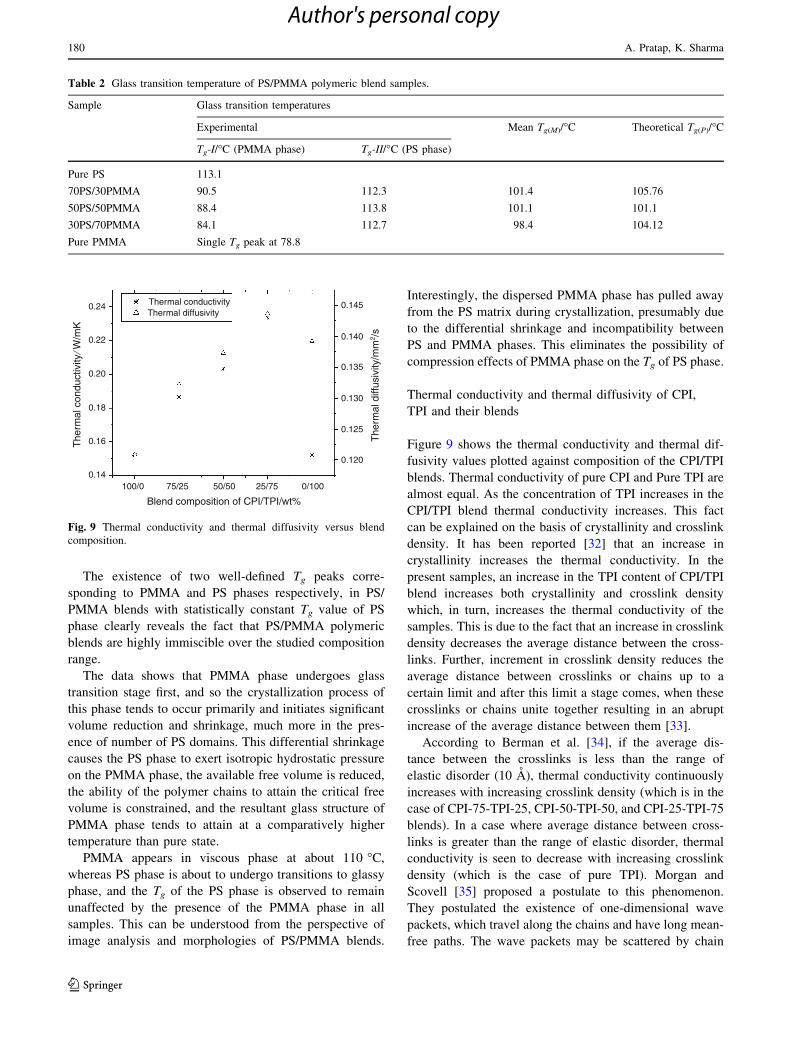
Figure 9 shows the thermal conductivity and thermal dif-
fusivity values plotted against composition of the CPI/TPI
blends. Thermal conductivity of pure CPI and Pure TPI are
almost equal. As the concentration of TPI increases in the
CPI/TPI blend thermal conductivity increases. This fact
can be explained on the basis of crystallinity and crosslink
density. It has been reported [32] that an increase in
crystallinity increases the thermal conductivity. In the
present samples, an increase in the TPI content of CPI/TPI
blend increases both crystallinity and crosslink density
which, in turn, increases the thermal conductivity of the
samples. This is due to the fact that an increase in crosslink
density decreases the average distance between the cross-
links. Further, increment in crosslink density reduces the
average distance between crosslinks or chains up to a
certain limit and after this limit a stage comes, when these
crosslinks or chains unite together resulting in an abrupt
increase of the average distance between them [33].
According to Berman et al. [34], if the average dis-
tance between the crosslinks is less than the range of
elastic disorder (10 A), thermal conductivity continuously
increases with increasing crosslink density (which is in the
case of CPI-75-TPI-25, CPI-50-TPI-50, and CPI-25-TPI-75
blends). In a case where average distance between cross-
links is greater than the range of elastic disorder, thermal
conductivity is seen to decrease with increasing crosslink
density (which is the case of pure TPI). Morgan and
Scovell [35] proposed a postulate to this phenomenon.
They postulated the existence of one-dimensional wave
packets, which travel along the chains and have long mean-
free paths. The wave packets may be scattered by chain
Table 2 Glass transition temperature of PS/PMMA polymeric blend samples.
Sample Glass transition temperatures
Experimental Mean Tg(M)/�C Theoretical Tg(P)/�C
Tg-I/�C (PMMA phase) Tg-II/�C (PS phase)
Pure PS 113.1
70PS/30PMMA 90.5 112.3 101.4 105.76
50PS/50PMMA 88.4 113.8 101.1 101.1
30PS/70PMMA 84.1 112.7 98.4 104.12
Pure PMMA Single Tg peak at 78.8
0.24
0.22
0.20
0.18
0.16
0.14100/0 75/25 50/50 25/75 0/100
0.145
0.140
0.135
0.130
0.125
0.120
Blend composition of CPI/TPI/wt%
The
rmal
con
duct
ivity
⁄ W/m
K
The
rmal
diff
usiv
ity/m
m2 /
s
Thermal conductivityThermal diffusivity
Fig. 9 Thermal conductivity and thermal diffusivity versus blend
composition.
180 A. Pratap, K. Sharma
123
Author's personal copy
ends, crosslinks or interactions with other molecules, which
reduces the thermal conductivity. Thermal diffusivity (v) of
the blends exhibit the same trend as obtained in the case of
the thermal conductivity values, showing the proportion-
ality between k and v.
Conclusions
Modulated DSC provides a powerful enhancement to the
standard DSC experiment. MDSC has the unique combi-
nation of increased sensitivity and increased resolution. It
provides simultaneously the heat flow as well as heat
capacity in a single experiment. However, one feels that the
choice of optimum MDSC conditions are not unique for all
the thermodynamic processes (i.e. reversible and non-
reversible) like glass transition, crystallization, melting etc.
Hence, one has to be very careful in choosing the param-
eters of modulation corresponding to a particular process.
Besides, the present study suggests that thermal analysis
techniques particularly, DMA and TPS are extremely
useful in materials processing and characterizations. DMA
is very sensitive to the motions of the polymer chains and it
is a powerful tool for measuring transitions in polymers. It
provides valuable information regarding phase transition
temperature and conclusions toward miscibility of the
polymeric blend system. For example, the phase transition
study of CPI/TPI blends reveals that all the studied poly-
meric blend compositions exhibit single well-defined
peaks. This shows that the blends of CPI with TPI are
highly miscible system at all composition while, the phase
transition study of PS/PMMA blends reveals that all the
studied polymeric blend compositions exhibit two well-
defined peaks and the Tg of PMMA phase gets changed as a
function of the composition, whereas Tg of PS phase
remains about constant statistically. This resolved that the
blends of PS with PMMA are highly immiscible system.
On the other hand, TPS technique is also one of the
versatile techniques for the precision of thermal transport
properties of the material. The advantage of using TPS
method over other transient method is that the conductivity
pattern can be laid down such that the total electric resis-
tance of the TPS element is much higher than that of the
hot strip of THS method, while the sample size may be
kept as small as 10 cc. Other advantages of using TPS
sensor over THS methods are the better protection, better
electrical contacts, and repeated use of the sensor. In case
of CPI, TPI, and CPI/TPI blends, the thermal transport
properties-thermal conductivity and thermal diffusivity are
increased with increasing TPI content. However, pure TPI
shows lower thermal properties than that of the blends but
higher than that of pure CPI. This variation in thermal
transport properties confirms that not only crystallinity, but
also crosslink density and effective average chain length
are responsible for these properties.
Acknowledgements The authors are grateful to I.U.C. for DAE
facilities, Indore for providing the modulated DSC (TA Instruments,
2920) for experimentation on various amorphous alloys.
References
1. Reading Mike. US Patent Nos. B1 5,224,775; 5,248,199;
5,335,993;5,346,306.
2. Gill PS, Sauerbrunn SR, Reading M. Modulated differential
scanning calorimetry. J Therm Anal. 1993;40:931–9.
3. Xu SX, Li Y, Feng YP. Numerical modeling and analysis of
temperature modulated differential scanning calorimetry: on the
separability of reversing heat flow from non- reversing heat flow.
Thermochim Acta. 2000;343:81–8.
4. Boller A, Schick C, Wunderlich B. Modulated differential scan-
ning calorimetry in the glass transition region. Thermochim Acta.
1995;266:97–111.
5. Wagner T, Kasap SO. Glass transformation, heat capacity and
structure of Asx Se1-x glasses studied by modulated temperature
differential scanning calorimetry experimets. Phil Mag B. 1996;
74:667–80.
6. Li Y, Ng SC, Lu ZP, Feng YP, Lu K. Separation of glass transition
and crystallization in metallic glasses by temperature-modulated
differential scanning calorimetry. Phil Mag Lett. 1998;78:213–20.
7. Arun Pratap, Raval KG, Awasthi AM. Kinetics of crystallization
of a ternary titanium based amorphous alloy. Mater Sci Engg A.
2001;304–306:357–61.
8. Bruni G, Milanese C, Berbenni V, Sartor F, Villa M, Marini A.
Crystalline and amorphous phases of a new drug. J Therm Anal
Calorim. 2010;102:297–303.
9. Gracia-Fernandez CA, Davies P, Gomez-Barreiro S, Lopez
Beceiro J, Tarrio-Saavedra J, Artaga R. A vitrification and curing
study by simultaneous TMDSC-photocalorimetry. J Therm Anal
Calorim. 2010;102:1057–62.
10. Cao J. Mathematical studies of modulated differential scanning
calorimetry II. Kinetic and non-kinetic components. Thermochim
Acta. 1999;325:89–95.
11. Cao J. Mathematical studies of modulated differential scanning
calorimetry I. Heat capacity measurements. Thermochim Acta.
1999;325:101–9.
12. Verma RK, Verma L, Chandra M, Verma BP. Kinetic parameters
of thermal dehydration and decomposition from thermoanalytical
curves of zinc dl-lactate. J Indian Chem Soc. 1998;75:162–4.
13. Verma RK, Verma L, Chandra M. Thermoanalytical studies on
the non-isothermal dehydration and decomposition of dl-lactates
of a series of transition metals. Indian J Chem. 2003;42A:2982–7.
14. Kissinger HE. Reaction kinetics in differential thermal analysis.
Anal Chem. 1957;29:1702–6.
15. Matusita K, Sakka S. Kinetic study of crystallization of glass by
differential scanning calorimetry. Phys Chem Glasses. 1979;20:
81–4.
16. Matusita K, Sakka S. Kinetic study on crystallization of glass by
differential thermal analysis-criterion on application of Kissinger
plot. J Non-Cryst Solids. 1980;38–39:741–6.
17. Raval KG, Lad Kirit N, Pratap A, Awasthi AM, Bhardwaj S.
Crystallization kinetics of a multicomponent Fe-based amorphous
alloy using modulated differential scanning calorimetry. Ther-
mochimica Acta. 2005;425:47–57.
18. Nahm S. Use of dynamic mechanical analysis in thermoset resin
development for composite applications. Composites convention
and trade show 2001, Florida, USA.
Applications of some thermo-analytical techniques 181
123
Author's personal copy
19. Menard K. Dynamic mechanical analysis: a practical introduc-
tion. 2nd ed. U. S. A.: CRC Press; 1999.
20. Dixit M, Gupta S, Mathur V, Sharma K, Saxena NS. Activation
energy of a- and b- relaxation process of PMMA and CdS-
PMMA nanocomposite. J Nanostructured Polym Nanocomposite.
2009;6:28–35.
21. Gustafsson SE, International Patent Appl No PCT/SE 89/100137.
22. Gustafsson SE. Transient plane source techniques for thermal
conductivity and thermal diffusivity measurements of solid
materials. Rev Sci Instrum. 1991;62:797–804.
23. Lopes AMA, Felisberti IM. Thermal conductivity of PET/(LDPE/
AI) composites determined by MDSC. Polym Testing. 2004;23:
637–43.
24. Gustafsson SE, Karawacki E, Chohan Mohammad A. Thermal
transport studies of electrically conducting materials using the
transient hot-strip technique. J Phys D Appl Phys. 1986;19:
727–35.
25. Baboo M, Dixit M, Sharma KB, Saxena NS. The structure and
thermomechanical properties of blends of trans-polyisoprene with
cis-polyisoprene. Int J Polym Mater. 2009;58:636–46.
26. Manzur A. Strain-induced crystallization in cis- and trans-poly-
isoprene blends: apparent crystallinity. J Macromol Sci Phys B.
1989;28:329–37.
27. Bochathum P, Chuwnawin S. Vulcanization of cis- and trans-
polyisoprene and their blends: crystallization characteristics and
properties. Euro Polym J. 2001;37:429–34.
28. Boochathum P, Prajudtake W. Vulcanization of cis- and trans-
polyisoprene and their blends: cure characteristics and crosslink
distribution. Euro Polym J. 2001;37:417–27.
29. Arvanitoyannis I, Kolokuris I, Nakayama A, Aiba S-I. Prepara-
tion and study of novel biodegradable blends based on gelatinized
starch and 1, 4-trans-polyisoprene (gutta percha) for food pack-
aging or biomedical applications. Carbohyd Polym. 1997;34:
291–302.
30. Baboo M, Dixit M, Sharma K, Saxena NS. Effect of blending on
mechanical and thermal transport properties of cis-polyisoprene
with trans-polyisoprene. Polymer bulletin 2010; doi:10.1007/
s00289-010-0378-7.
31. Mark JE. Polymer data handbook. New York: Oxford University
Press; 1999.
32. Jayasree TK, Predeep P, Agarwal R, Saxena NS. Thermal con-
ductivity and thermal diffusivity of thermoplastic elastomeric
blends of styrene butadiene rubber/high density polyethylene:
effect of blend ratio and dynamic crosslinking. Trends in Applied
science Research. 2006;1:278–91.
33. Evseeva LE, Tanaeva SA. Thermophysical properties of epoxy
composite materials at low temperatures. Cryogenics. 1995;35:
277–9.
34. Berman BL, Madding RP, Dellinger JR. Effect of crosslinking on
the thermal conductivity of polystyrene between 0.3 K and 10 K.
Phys Lett A. 1969;30:315–6.
35. Morgan GJ, Scovell PD. Effective conductivity of short carbon
fiber-reinforced polychloroprene rubber and mechanism of con-
duction. Polym Lett. 1977;15:193.
182 A. Pratap, K. Sharma
123
Author's personal copy