Differential thermogravimetry and differential scanning calorimetry of organic matter in mineral...
12
This article appeared in a journal published by Elsevier. The attached copy is furnished to the author for internal non-commercial research and education use, including for instruction at the authors institution and sharing with colleagues. Other uses, including reproduction and distribution, or selling or licensing copies, or posting to personal, institutional or third party websites are prohibited. In most cases authors are permitted to post their version of the article (e.g. in Word or Tex form) to their personal website or institutional repository. Authors requiring further information regarding Elsevier’s archiving and manuscript policies are encouraged to visit: http://www.elsevier.com/copyright
-
Upload
independent -
Category
Documents
-
view
5 -
download
0
Transcript of Differential thermogravimetry and differential scanning calorimetry of organic matter in mineral...
This article appeared in a journal published by Elsevier. The attachedcopy is furnished to the author for internal non-commercial researchand education use, including for instruction at the authors institution
and sharing with colleagues.
Other uses, including reproduction and distribution, or selling orlicensing copies, or posting to personal, institutional or third party
websites are prohibited.
In most cases authors are permitted to post their version of thearticle (e.g. in Word or Tex form) to their personal website orinstitutional repository. Authors requiring further information
regarding Elsevier’s archiving and manuscript policies areencouraged to visit:
http://www.elsevier.com/copyright
Author's personal copy
Differential thermogravimetry and differential scanning calorimetry of soilorganic matter in mineral horizons: Effect of wildfires and land use
Beatriz Duguy a, Pere Rovira b,*
a University of Barcelona, Dept. of Plant Biology, Diagonal 645, 08028 Barcelona, Catalonia, Spainb Forest Technology Centre of Catalonia (CTFC) Carretera St Llorenç de Morunys, km 2, 25280 Solsona, Catalonia, Spain
a r t i c l e i n f o
Article history:Received 15 September 2009Received in revised form 22 March 2010Accepted 18 May 2010Available online 9 June 2010
a b s t r a c t
Wildfires strongly affect the biochemical quality (q) of soil organic matter (SOM), but whether theseeffects are relevant in the long term is less clear. In Mediterranean ecosystems, the post-fire recoveryof vegetation may occur quickly and the new and fresh organic inputs to the soil could mask the effectsof wildfires. To verify this hypothesis, we studied a series of plots in Vall de Gallinera (Alacant, E Spain),affected by 0, 1 or 2 wildfires in the last decades and including never cropped plots (NC), old crops earlyabandoned, or old crops recently abandoned. The study focused on the uppermost 5 cm of mineral soil,where an effect of wildfires is likely to be detected. SOM was studied by differential thermogravimetry(DTG) and differential scanning calorimetry (DSC). The study focused on several indicators of SOM q:(i) T50, i.e. the temperature at which 50% of SOM is lost (in DTG), or at which 50% of the energy contentof SOM has been released (in DSC); (ii) the energetic yield, in J/mg OC; (iii) the area of the recalcitrant(thermoresistant) peak, in % of total SOM; and (iv) the exact position of peaks. T50 for DTG was about348 �C and for DSC about 378 �C. The recalcitrant pool was about 45% of SOM (in DTG), and about 53%of total energy yield (in DSC). The energetic yield was �2 J/mg OC. All these parameters were little ornot affected by wildfires. Some results suggested a small increase in q with wildfires: the position ofthe recalcitrant peak shifted to lower temperatures and the energetic yield slightly increased. We didnot detect a charcoal signature (either a shift of the recalcitrant peak towards higher temperatures orthe presence of an extra-recalcitrant peak). In summary, we did not detect a shift towards a higher dom-inance of recalcitrant forms in SOM due to wildfires. The post-fire recovery of the vegetation and theinputs of fresh debris to the soil seem to be enough to mask the immediate effects of wildfires onSOM biochemical quality, up to the point that it may even be difficult to detect them in the mediumor long term.
� 2010 Elsevier Ltd. All rights reserved.
1. Introduction
In Mediterranean and semiarid lands, wildfires are main distur-bance events for soils as ecosystems. While low severity fires, suchas those prescribed for forest management, have been reported tohave transient but positive effects on soil fertility, severe wildfiresresult in significant losses of soil organic matter (SOM) and nutri-ents, and deterioration of the overall physical–chemical propertiesof soil that determine its fertility, such as porosity, structure andrichness of both invertebrate and microbial communities (Certini,2005).
In addition to their effects on the total amount of SOM, wildfireshave been widely reported to strongly affect SOM biochemistry(González-Pérez et al., 2004, and references therein). The extentof fire effects on SOM biochemical quality (henceforth, q) dependson fire intensity and periodicity. Thus, a well designed prescribed
burning plan may hamper not only the loss of SOM but also a dropin q (Hatten et al., 2008). In contrast, intense wildfires stronglyaffect both. The two main features of burnt soils in comparisonwith those that are unburnt are a loss of labile fractions such ascarbohydrates and proteins, which usually volatilize at relativelylow temperatures, and an increased relative abundance of refrac-tory materials, in particular aromatic compounds. The latterphenomenon is perhaps the most relevant of all of them; it hasbeen verified repeatedly, both in laboratory and field studies bythe increased signal of aromatic C in 13C CPMAS-NMR analysis(Almendros et al., 1988; Knicker et al., 1996, 2005; Baldock andSmernik, 2002). The increased relative abundance of aromatic or-ganic structures (not necessarily its total amount) is due not onlyto the resistance of aromatic C forms, much higher than other Cforms (Flaig et al., 1975), but also to the fact that new aromaticstructures (black carbon, in a broad sense) are generated de novoas a consequence of chemical reactions driven by the high temper-atures (Schmidt and Noack, 2000). Heterocyclic N forms in soils, forinstance, seem due mostly to wildfires (Knicker et al., 2005).
0146-6380/$ - see front matter � 2010 Elsevier Ltd. All rights reserved.doi:10.1016/j.orggeochem.2010.05.015
* Corresponding author. Tel.: +34 973 48 17 52; fax: +34 973 48 04 31.E-mail address: [email protected] (P. Rovira).
Organic Geochemistry 41 (2010) 742–752
Contents lists available at ScienceDirect
Organic Geochemistry
journal homepage: www.elsevier .com/locate /orggeochem
Author's personal copy
Benzene-carboxylic acids, generated specifically by necromassburning, seem the most distinctive fire derived aromatic com-pounds and are used as black carbon indicators (Glaser et al.,1998; Brodowski et al., 2005); they increase in wildfire affectedsoils, while other phenolic acids decrease (Tinoco et al., 2006).Aside from aromatic compounds, changes in the lipidic fractionhave also been recorded, such as a shift of FAs towards a higherdominance of short chain ones (González-Pérez et al., 2008).
A different issue is whether the effect of wildfires on SOM q isrelevant in the long term. This is not obvious a priori because thecapacity of the ecosystem to recover after the wildfire must betaken into account. Some Mediterranean terrigenous ecosystems,such as shrublands and holm oak forests, are highly resilient: asubstantial part of the ecosystem functions can be restored a fewyears after a wildfire, particularly the input of new and fresh or-ganic debris to the soil. If the total input is lower than in a fire unaf-fected ecosystem, then it will not be enough to hamper a decline inSOM content; but at any rate it can be enough to mask or even turnback the short term deleterious effect of fires on SOM q.
We must stress that in our context q is meant as a global prop-erty of the whole SOM. If the refractory forms, including black car-bon, are a small fraction of total SOM, then their effect on theoverall q may be small. Such a viewpoint forces the choice of themost appropriate analytical approach for studies on SOM q in wild-fire affected soils. Rather than use specific biochemical methods toidentify and quantify specific compounds (e.g., aromatic com-pounds, including polyaromatic hydrocarbons, PAH; black carbon;lipid biomarkers), it will be better to apply simpler methods capa-ble of providing an overall view of the SOM q, i.e. a balance be-tween the relative abundance of labile and recalcitrant C forms:for instance, acid hydrolysis (Rovira and Vallejo, 2002; Paul et al.,2006) or thermal analysis (Angehrn-Bettinazzi et al., 1988; Rehet al., 1990).
Thermal analysis methods have been applied to the study of soilorganic matter (Flaig et al., 1975; Provenzano and Senesi, 1998;Rovira and Vallejo, 2000; Dell’Abate et al., 2002). These methodssubmit the samples to increasing temperature in order to detectseveral peaks in loss of matter (differential thermogravimetry:DTG), or the release of energy in the form of heat (differential scan-ning calorimetry: DSC). Both the DTG and the DSC curves show twomain peaks: a labile one at low or medium temperatures and a re-calcitrant one at high temperatures. The labile peak is due to theoxidation of carbohydrates and proteins and to the loss of carboxylgroups, whereas the recalcitrant peak is attributed to polyphenolicand other condensed structures, including lignin (Flaig et al., 1975;Barros et al., 2007). The proportion between these peaks is widelyused as an indicator of q, (Angehrn-Bettinazzi et al., 1988; Kristen-sen, 1990; Beyer et al., 1998), even though recent work suggeststhat in mineral soil the turnover of both pools is much more similarthan expected (Dorodnikov et al., 2007).
However, thermal methods may give a great deal of informationabout SOM properties, much beyond the simple quantification of alabile and a recalcitrant pool (Barros et al., 2007). We showed(Rovira et al., 2008) how thermal methods can be applied to ap-proach q by quantifying how easily a given substrate can be usedas a source of energy: (i) how much energy an organism could ob-tain from it and (ii) how much energy is needed to obtain suchbenefit. The balance between both determines whether or notthe substrate is worth being biodegraded. Ultimately, this is theconcept underlying the term ‘biochemical quality’. Thermal meth-ods are particularly appropriate for this kind of study. As pointedout by Leinweber et al. (2008), ‘the thermal stability of compoundsseems to be a universal predictor for the decomposition, perhapsbecause energy required for bond cleavage reflects the activationenergy in the enzymatic driven biochemical decomposition reac-tions’. The relationship between thermal properties and biochem-
ical stability has been shown in compost studies (Mondini et al.,2003; Baffi et al., 2007).
When studying changes in SOM q due to wildfires, an additionalreason for applying thermal analysis is that these changes are pri-marily due precisely to a thermal shock and that the losses of SOMduring wildfires affect precisely the most thermolabile SOM pools(carbohydrates, proteins), while the most thermoresistant may re-main. Thus, monitoring in wildfire affected soils the recovery ofSOM q through the recovery of SOM thermal properties seems anapproach of quite impregnable logic. In a recent paper, De la Rosaet al., 2008 deomonstrate the usefulness of thermal analysis meth-ods to detect wildfire driven, short term changes in SOM q: theseauthors applied thermal analysis (in combination with GC–MS)to compare the SOM of a burnt and an unburnt forest soil, threeyears after the wildfire event; they detected a decrease in the labilepeak and the appearance of a highly thermoresistant peak, inter-preted as black carbon.
The aim of our paper is to apply thermal analysis methods (DTGand DSC) to elucidate how repeated wildfires affect SOM q in Med-iterranean shrublands. Our working hypothesis is that, while theshort term effects of wildfires on SOM q are well established, theresilience of the Mediterranean shrublands and the restoration offresh organic inputs can mask these effects, to the extent of even-tually making them almost irrelevant.
2. Materials and methods
2.1. Site
The study was carried out in La Vall de Gallinera, in Alacantprovince (E Spain), a site with a mean temperature of 17.4 �C anda mean annual precipitation of 825 mm. The region has been af-fected by fires since the 1970s (Duguy, 2003). Soils are mostlyLeptosols over limestone and calcaric Cambisols over marls. Owingto their cultivation for centuries, many of the natural slopes havebeen modified by terracing. Most agricultural fields were culti-vated until the 1960s. After abandonment, the vegetation revertedto secondary shrublands of the Rosmarino-Ericion alliance Br.-Bl.1931, dominated by Ulex parviflorus Pourr., Cistus spp., and Brac-hypodium retusum (Pers.) Beauv. (Duguy and Vallejo, 2008).
2.2. Plot selection and sampling
The experimental area was studied through aerial photographsfrom 1956, 1978, 1989 and 1994. A set of plots was selected,according to two factors:
(i) land use: never cropped (NC), early abandoned (EA: set asidebefore 1978), recently abandoned (RA: set aside after 1978)and
(ii) number of wildfires between 1976 and 1999: either 0, 1 or 2.
The number of plots found was not the same for all combina-tions. No RA plots were found having suffered two wildfires(Table 1).
Table 1Number of plots for each experimental condition.
Land use No fires One fire Two fires
NC Number of plots 4 4 4EA Years since abandon 23–43 23–43 23–43
Number of plots 4 3 4RA Years since abandon 7–10 7–10 7–10
Number of plots 4 3 0
B. Duguy, P. Rovira / Organic Geochemistry 41 (2010) 742–752 743
Author's personal copy
On each plot, four randomly chosen points were sampled, usinga cylindrical core sampler. Since the main short term changes aftera wildfire are expected at the surface (Debano and Conrad, 1978),our study focused on the first 5 cm of mineral soil. Litter was notincluded in this study. Soil samples were air dried and sieved to2 mm. For chemical analysis, a subsample was ground in an agatemortar.
2.3. Standard analyses
Organic carbon was analyzed by dichromate oxidation (Mebiusmethod, in aluminum heating block, following Nelson and Som-mers, 1996). Total nitrogen was determined using a ThermoQuestCHONS analyzer. Soil pH in water (1:2.5) was determined with aglass electrode and carbonates with a Bernard’s calcimeter, textureby the pipette method. Analyses were performed in all individualsamples, except texture, which was done in a single compositesample per plot.
2.4. Hydrofluoric acid pre-treatment
The mineral component of soils is not thermally inert. The wellknown phenomenon of clay dehydration results in both weightlosses and energy exchanges that could mask those due to SOM,thus making the results of both DTG and DSC difficult to interpret(Gibbs et al., 2000). We verified in a previous paper (Rovira andVallejo, 2000) that the mixture of an organic substrate with min-eral matter strongly changes both its DTG and DSC curves. To avoidsuch a problem, a previous demineralization with HF is needed.Sieved (not ground) soil samples (2 g) were placed in Teflon tubes,and 15 ml of 10% HF was added. After gentle stirring, tubes wereleft to stand overnight. The next day, the tubes were centrifugedand the liquid discarded. The process (acid addition, agitation, leftto stand, centrifugation) was repeated twice. The final residue waswashed with deionized water, dried at 60 �C, weighed and ana-lyzed for C in a ThermoQuest CE CHONS analyzer.
This pre-treatment follows the method applied by Rumpel et al.(2006a) for black carbon analysis, but the original five HF washingswere reduced to just three. In spite of this conservative change, OMlosses due to HF treatment were noteworthy (mean: 29% of totalOC). Rumpel et al. (2006b) showed that HF treatment induceschanges in some fine biochemical parameters but not in the grosschemical characteristics, as shown by the lack of relevant changesin the 13C CPMAS-NMR or FTIR spectra. Thermal properties of SOMdepend on its gross chemical structure: the temperature of volatil-ization and the amount of energy released in it are different in thecases of a C atom placed in a sugar, an amino acid, an alkyl chain oran aromatic ring. Thus the preservation in SOM of the proportionsbetween the several C types, after HF washings, should imply littlechanges in its thermal properties.
2.5. Thermal analysis
For thermal analyses, two samples per plot were selected: therichest in SOM and the poorest. This was done in order to coverthe widest possible range of SOM contents. Following the hydroflu-oric acid pre-treatment the selected soil samples were analyzed viadifferential thermogravimetry (DTG) and differential scanning cal-orimetry (DSC). The DTG analyses were performed in a Mettler-To-ledo TGA-851e thermobalance, calibrated with standard indium(purity: 99.99%). Curves were obtained under air flux (50 cm3/min). Temperature increase followed a three step program: (i)samples (�15 mg) were heated at a rate of 10 �C/min, up to105 �C; (ii) the sample was maintained at 105 �C for 15 min, toeliminate water; then (iii) the temperature was raised up to600 �C, at a rate of 3 �C/min. The weight loss between 105 �C (after
the 15 min period and just before starting the temperature in-crease) and 550 �C was taken as the organic matter (OM) contentof the sample. The final remaining weight was taken as ash. Thetemperature at which 50% OM is lost (T50) is obtained directly.The first derivative is obtained thereafter, i.e., the mass loss perunit time; in our case mg/min. The graph of the first derivativeshows the peaks of mass loss; the exact position of each peak (tem-perature at which it occurs) was recorded. In the first derivativegraph, the lowermost point between the two main peaks was takenas the pivot to split the mass loss between the labile and the recal-citrant pool.
The DSC analyses were performed in a Mettler-Toledo DSC-22ecalorimeter. The temperature program was the same as applied inDTG. The output of DSC analysis is a plot of energy flux (in Watts)versus time or temperature. The exact position of peaks is re-corded. The device automatically integrates these data into Joules(1 J = 1 W � 1 s). The result is the total energy released by the sam-ple (J/g) and its distribution in time. From this distribution we cal-culate the temperature at which half of the total stored energy inthe sample has been released (T50). As in DTG analysis, the lowestpoint between the two main peaks was taken as the pivot to splitthe released energy between a labile and a recalcitrant pool.
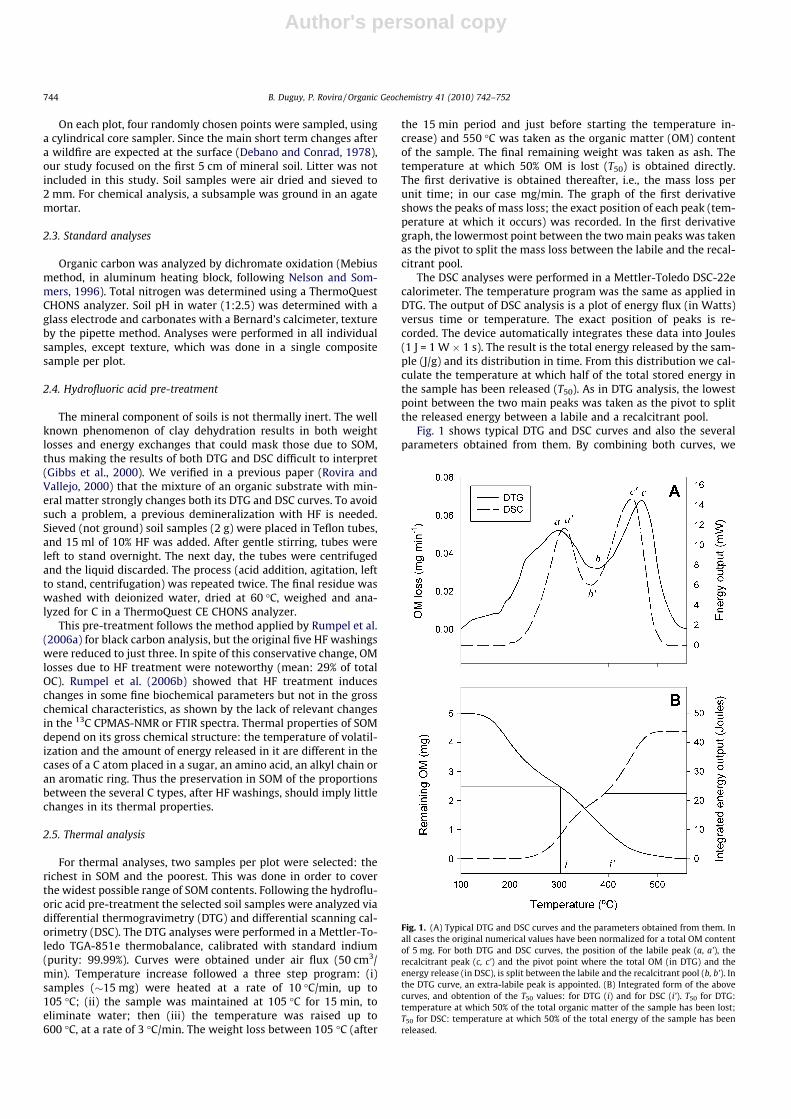
Fig. 1 shows typical DTG and DSC curves and also the severalparameters obtained from them. By combining both curves, we
Fig. 1. (A) Typical DTG and DSC curves and the parameters obtained from them. Inall cases the original numerical values have been normalized for a total OM contentof 5 mg. For both DTG and DSC curves, the position of the labile peak (a, a’), therecalcitrant peak (c, c’) and the pivot point where the total OM (in DTG) and theenergy release (in DSC), is split between the labile and the recalcitrant pool (b, b’). Inthe DTG curve, an extra-labile peak is appointed. (B) Integrated form of the abovecurves, and obtention of the T50 values: for DTG (i) and for DSC (i’). T50 for DTG:temperature at which 50% of the total organic matter of the sample has been lost;T50 for DSC: temperature at which 50% of the total energy of the sample has beenreleased.
744 B. Duguy, P. Rovira / Organic Geochemistry 41 (2010) 742–752
Author's personal copy
calculated the energetic net output, as J/mg OM. It is possible tocalculate this parameter for the whole sample, or for the OM lostwithin a range of temperatures, as shown below.
2.6. Statistics
The main parameters obtained in DTG and DSC were studiedby standard two-way ANOVA, taking land use as the first factor(three levels: NC, EA and RA) and number of wildfires as the sec-ond (three levels: 0, 1 and 2 wildfires). The design was unbal-anced, since no plots were found for one combination (RA, twowildfires). When data were percentages, they were transformedby arc sine of square root. In the remaining cases no transforma-tion was applied. Since both the number of wildfires and the pre-vious land use affect the SOM stock, the effect of these factorscould merely reflect the effect of a higher or lower SOM content.To account for this effect, we additionally repeated all the ANO-VAs by adding the % OC of the soil samples as covariate (i.e.,turning ANOVAs to ANCOVAs).
All statistical analyses were performed with SPSS v. 12.0. A gen-eric table with the results of all ANOVAs and ANCOVAs is given inAppendix A (Table A1).
3. Results
3.1. Main data about total SOM in the plots
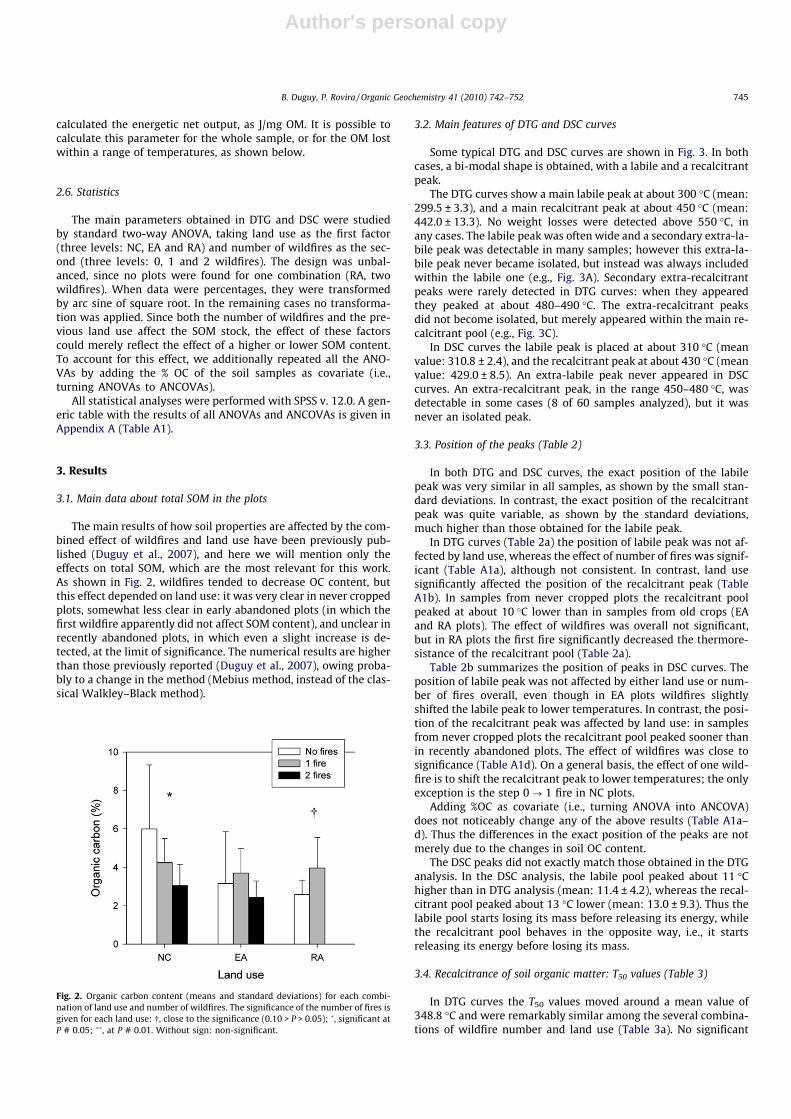
The main results of how soil properties are affected by the com-bined effect of wildfires and land use have been previously pub-lished (Duguy et al., 2007), and here we will mention only theeffects on total SOM, which are the most relevant for this work.As shown in Fig. 2, wildfires tended to decrease OC content, butthis effect depended on land use: it was very clear in never croppedplots, somewhat less clear in early abandoned plots (in which thefirst wildfire apparently did not affect SOM content), and unclear inrecently abandoned plots, in which even a slight increase is de-tected, at the limit of significance. The numerical results are higherthan those previously reported (Duguy et al., 2007), owing proba-bly to a change in the method (Mebius method, instead of the clas-sical Walkley–Black method).
3.2. Main features of DTG and DSC curves
Some typical DTG and DSC curves are shown in Fig. 3. In bothcases, a bi-modal shape is obtained, with a labile and a recalcitrantpeak.
The DTG curves show a main labile peak at about 300 �C (mean:299.5 ± 3.3), and a main recalcitrant peak at about 450 �C (mean:442.0 ± 13.3). No weight losses were detected above 550 �C, inany cases. The labile peak was often wide and a secondary extra-la-bile peak was detectable in many samples; however this extra-la-bile peak never became isolated, but instead was always includedwithin the labile one (e.g., Fig. 3A). Secondary extra-recalcitrantpeaks were rarely detected in DTG curves: when they appearedthey peaked at about 480–490 �C. The extra-recalcitrant peaksdid not become isolated, but merely appeared within the main re-calcitrant pool (e.g., Fig. 3C).
In DSC curves the labile peak is placed at about 310 �C (meanvalue: 310.8 ± 2.4), and the recalcitrant peak at about 430 �C (meanvalue: 429.0 ± 8.5). An extra-labile peak never appeared in DSCcurves. An extra-recalcitrant peak, in the range 450–480 �C, wasdetectable in some cases (8 of 60 samples analyzed), but it wasnever an isolated peak.
3.3. Position of the peaks (Table 2)
In both DTG and DSC curves, the exact position of the labilepeak was very similar in all samples, as shown by the small stan-dard deviations. In contrast, the exact position of the recalcitrantpeak was quite variable, as shown by the standard deviations,much higher than those obtained for the labile peak.
In DTG curves (Table 2a) the position of labile peak was not af-fected by land use, whereas the effect of number of fires was signif-icant (Table A1a), although not consistent. In contrast, land usesignificantly affected the position of the recalcitrant peak (TableA1b). In samples from never cropped plots the recalcitrant poolpeaked at about 10 �C lower than in samples from old crops (EAand RA plots). The effect of wildfires was overall not significant,but in RA plots the first fire significantly decreased the thermore-sistance of the recalcitrant pool (Table 2a).
Table 2b summarizes the position of peaks in DSC curves. Theposition of labile peak was not affected by either land use or num-ber of fires overall, even though in EA plots wildfires slightlyshifted the labile peak to lower temperatures. In contrast, the posi-tion of the recalcitrant peak was affected by land use: in samplesfrom never cropped plots the recalcitrant pool peaked sooner thanin recently abandoned plots. The effect of wildfires was close tosignificance (Table A1d). On a general basis, the effect of one wild-fire is to shift the recalcitrant peak to lower temperatures; the onlyexception is the step 0 ? 1 fire in NC plots.
Adding %OC as covariate (i.e., turning ANOVA into ANCOVA)does not noticeably change any of the above results (Table A1a–d). Thus the differences in the exact position of the peaks are notmerely due to the changes in soil OC content.
The DSC peaks did not exactly match those obtained in the DTGanalysis. In the DSC analysis, the labile pool peaked about 11 �Chigher than in DTG analysis (mean: 11.4 ± 4.2), whereas the recal-citrant pool peaked about 13 �C lower (mean: 13.0 ± 9.3). Thus thelabile pool starts losing its mass before releasing its energy, whilethe recalcitrant pool behaves in the opposite way, i.e., it startsreleasing its energy before losing its mass.
3.4. Recalcitrance of soil organic matter: T50 values (Table 3)
In DTG curves the T50 values moved around a mean value of348.8 �C and were remarkably similar among the several combina-tions of wildfire number and land use (Table 3a). No significant
Fig. 2. Organic carbon content (means and standard deviations) for each combi-nation of land use and number of wildfires. The significance of the number of fires isgiven for each land use: �, close to the significance (0.10 > P > 0.05); �, significant atP # 0.05; ��, at P # 0.01. Without sign: non-significant.
B. Duguy, P. Rovira / Organic Geochemistry 41 (2010) 742–752 745

Author's personal copy
effect of either wildfires or land use was detected, but when %OCwas applied as covariate (in ANCOVA) the effect of land use be-came highly significant (Table A1e). There is an overall positive
and significant correlation (r = 0.3355��) between OC content andT50 for DTG: the more abundant SOM is in a given soil sample,the more recalcitrant it is (Table 4a). When studying this relation-ship under each experimental condition (land use x number offires), we observed that the correlation does not always appear:it seems particularly clear for never cropped plots unaffected bywildfires and also in a more general way for early abandoned plots.
The T50 values for DSC stay around a mean value of 373.7 �C, i.e.about 25 �C higher than those obtained in the DTG analyses (Table3b). Differences due to both the land use and the number of wild-fires were significant (Table A1f), and the trends were much clearerthan in the DTG study. Overall, T50 values were in the order
Fig. 3. Examples of DTG and DSC curves obtained from the studied soil samples. (A) Sample obtained from a never cropped plot, affected by two wildfires. The energy releasedis quite small, lower than usual. (B) Sample from an early abandoned plot, affected by two wildfires. (C) Sample from a recently abandoned plot, affected by one wildfire. (D)Sample from an early abandoned plot, never burnt.
Table 2Position of the peaks in �C. Data are means ± standard deviations. For a given analysis(either DTG or DSC, not both), and for a given peak (labile or recalcitrant, not both) (i)data in the same row followed by contrasting lowercase letters differ, at P = 0.05 level,and (ii) data in the same column followed by contrasting uppercase letters differ, atP = 0.05 level. If no letters are given, differences are not significant. N.D.: no data.
Peak Landuse
No wildfires 1 wildfire 2 wildfires All
(a) Differential thermogravimetryLpa NC 299.5 ± 2.3 298.4 ± 3.5 301.9 ± 4.2 299.9 ± 3.6
EA 300.5 ± 1.2 296.7 ± 3.3 300.0 ± 4.4 299.2 ± 3.4RA 299.5 ± 2.9 298.5 ± 2.2 N.D. 299.1 ± 2.6All 299.8 ± 2.2ab 297.9 ± 3.1a 301.0 ± 4.3 b 299.5 ± 3.3
Rpb NC 437.8 ± 12.4A 435.0 ± 16.3 433.6 ± 9.3 435.5 ± 12.5AEA 444.8 ± 8.7AB 446.8 ± 11.6 446.4 ± 16.4 445.9 ± 11.9BRA 453.0 ± 13.7B,a 439.5 ± 6.1b N.D. 447.2 ± 12.8BAll 445.2 ± 13.0 439.9 ± 13.0 439.6 ± 14.2 442.0 ± 13.3
(b) Differential scanning calorimetryLp NC 310.6 ± 1.7 310.4 ± 1.7 310.5 ± 2.3 310.5 ± 1.8
EA 312.5 ± 3.0a 311.0 ± 1.4ab 309.4 ± 2.0b 311.0 ± 2.6RA 309.9 ± 1.5 312.7 ± 3.7 N.D. 311.1 ± 2.9All 311.0 ± 2.3 311.3 ± 2.5 309.9 ± 2.1 310.8 ± 2.4
Rp NC 427.6 ± 4.9A 420.5 ± 7.6A 425.0 ± 5.9 424.4 ± 6.7AEA 431.4 ± 5.5AB 429.8 ± 7.4AB 428.9 ± 8.4 430.1 ± 6.9ABRA 437.8 ± 11.9B 431.8 ± 4.1B N.D. 435.2 ± 9.3BAll 432.3 ± 8.4 426.7 ± 8.2 426.9 ± 7.3 429.0 ± 8.5
a Labile peak.b Recalcitrant peak.
Table 3T50 for differential thermogravimetry (DTG) and differential scanning calorimetry(DSC), in �C. Data are means ± standard deviations. For a given analysis (either DTG orDSC, not both), (i) data in the same row followed by contrasting lowercase lettersdiffer, at P = 0.05 level, and (ii) data in the same column followed by contrastinguppercase letters differ, at P = 0.05 level. If no letters are given, differences are notsignificant. N.D.: no data.
Land use No wildfires One wildfire Two wildfires All
(a) Differential thermogravimetryNC 344.8 ± 11.4 348.5 ± 10.8 346.2 ± 10.9 346.3 ± 10.9EA 349.9 ± 9.6 350.1 ± 10.6 351.6 ± 10.3 351.6 ± 10.3RA 349.1 ± 7.5 348.8 ± 3.7 N.D. 349.0 ± 6.0All 348.0 ± 9.5 349.1 ± 8.8 349.9 ± 12.3 348.8 ± 9.9
(b) Differential scanning calorimetryNC 369.7 ± 13.2A 369.6 ± 6.5 364.9 ± 8.3A 368.1 ± 9.6AEA 376.8 ± 6.7AB 375.6 ± 5.5 374.1 ± 5.2B 375.5 ± 5.7BRA 387.7 ± 5.4Ba 371.1 ± 9.3 b N.D. 380.6 ± 11.0BAll 378.1 ± 11.5a 371.8 ± 7.3 b 369.5 ± 8.2b 373.7 ± 10.0
746 B. Duguy, P. Rovira / Organic Geochemistry 41 (2010) 742–752
Author's personal copy
NC < EA < RA, and 0 wildfires > 1 wildfire > 2 wildfires. In the AN-COVA analysis the effect of OC as covariate was significant (TableA1f), but surprisingly the relationship between T50 and OC contentwas not significant overall (r = 0.0752, ns). The significance of OCcontent as covariate was clearly due to the strong relationshipfound for never burnt, never cropped plots; in the rest of the exper-imental conditions the relationship was never significant, and evennegative in some cases (Table 4b).
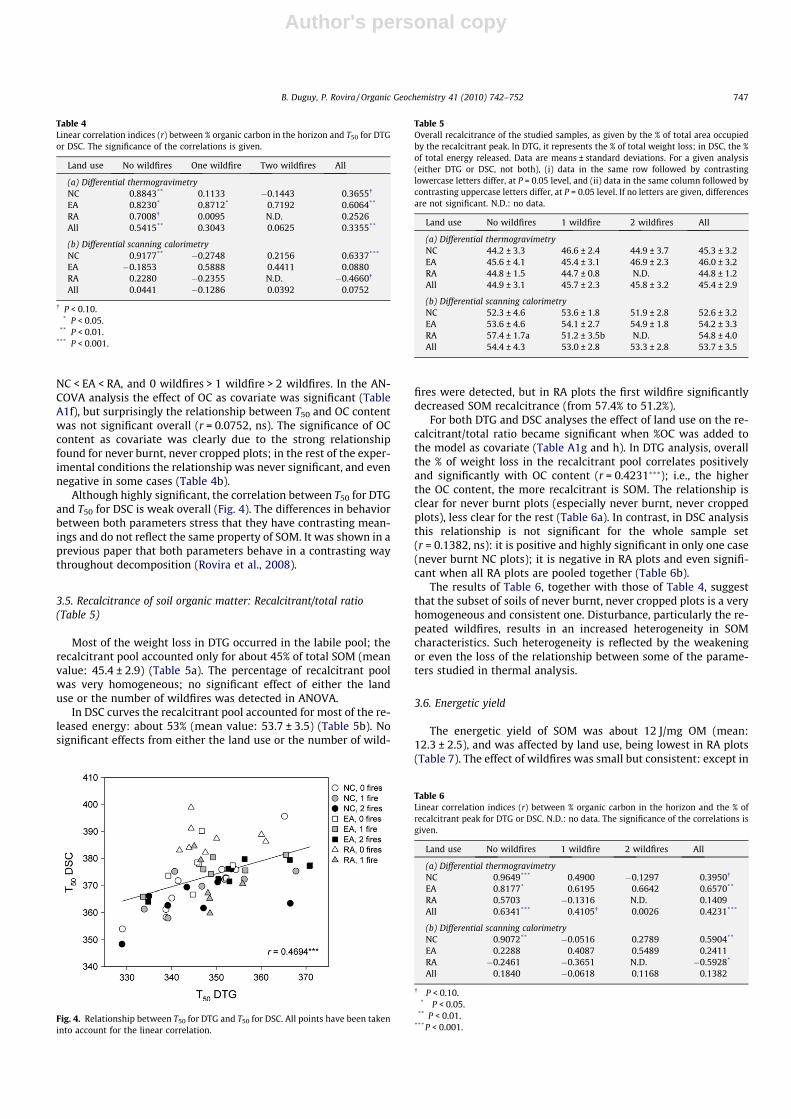
Although highly significant, the correlation between T50 for DTGand T50 for DSC is weak overall (Fig. 4). The differences in behaviorbetween both parameters stress that they have contrasting mean-ings and do not reflect the same property of SOM. It was shown in aprevious paper that both parameters behave in a contrasting waythroughout decomposition (Rovira et al., 2008).
3.5. Recalcitrance of soil organic matter: Recalcitrant/total ratio(Table 5)
Most of the weight loss in DTG occurred in the labile pool; therecalcitrant pool accounted only for about 45% of total SOM (meanvalue: 45.4 ± 2.9) (Table 5a). The percentage of recalcitrant poolwas very homogeneous; no significant effect of either the landuse or the number of wildfires was detected in ANOVA.
In DSC curves the recalcitrant pool accounted for most of the re-leased energy: about 53% (mean value: 53.7 ± 3.5) (Table 5b). Nosignificant effects from either the land use or the number of wild-
fires were detected, but in RA plots the first wildfire significantlydecreased SOM recalcitrance (from 57.4% to 51.2%).
For both DTG and DSC analyses the effect of land use on the re-calcitrant/total ratio became significant when %OC was added tothe model as covariate (Table A1g and h). In DTG analysis, overallthe % of weight loss in the recalcitrant pool correlates positivelyand significantly with OC content (r = 0.4231���); i.e., the higherthe OC content, the more recalcitrant is SOM. The relationship isclear for never burnt plots (especially never burnt, never croppedplots), less clear for the rest (Table 6a). In contrast, in DSC analysisthis relationship is not significant for the whole sample set(r = 0.1382, ns): it is positive and highly significant in only one case(never burnt NC plots); it is negative in RA plots and even signifi-cant when all RA plots are pooled together (Table 6b).
The results of Table 6, together with those of Table 4, suggestthat the subset of soils of never burnt, never cropped plots is a veryhomogeneous and consistent one. Disturbance, particularly the re-peated wildfires, results in an increased heterogeneity in SOMcharacteristics. Such heterogeneity is reflected by the weakeningor even the loss of the relationship between some of the parame-ters studied in thermal analysis.
3.6. Energetic yield
The energetic yield of SOM was about 12 J/mg OM (mean:12.3 ± 2.5), and was affected by land use, being lowest in RA plots(Table 7). The effect of wildfires was small but consistent: except in
Table 4Linear correlation indices (r) between % organic carbon in the horizon and T50 for DTGor DSC. The significance of the correlations is given.
Land use No wildfires One wildfire Two wildfires All
(a) Differential thermogravimetryNC 0.8843** 0.1133 �0.1443 0.3655�
EA 0.8230* 0.8712* 0.7192 0.6064**
RA 0.7008� 0.0095 N.D. 0.2526All 0.5415** 0.3043 0.0625 0.3355**
(b) Differential scanning calorimetryNC 0.9177** �0.2748 0.2156 0.6337***
EA �0.1853 0.5888 0.4411 0.0880RA 0.2280 �0.2355 N.D. �0.4660�
All 0.0441 �0.1286 0.0392 0.0752
� P < 0.10.* P < 0.05.
** P < 0.01.*** P < 0.001.
Fig. 4. Relationship between T50 for DTG and T50 for DSC. All points have been takeninto account for the linear correlation.
Table 5Overall recalcitrance of the studied samples, as given by the % of total area occupiedby the recalcitrant peak. In DTG, it represents the % of total weight loss; in DSC, the %of total energy released. Data are means ± standard deviations. For a given analysis(either DTG or DSC, not both), (i) data in the same row followed by contrastinglowercase letters differ, at P = 0.05 level, and (ii) data in the same column followed bycontrasting uppercase letters differ, at P = 0.05 level. If no letters are given, differencesare not significant. N.D.: no data.
Land use No wildfires 1 wildfire 2 wildfires All
(a) Differential thermogravimetryNC 44.2 ± 3.3 46.6 ± 2.4 44.9 ± 3.7 45.3 ± 3.2EA 45.6 ± 4.1 45.4 ± 3.1 46.9 ± 2.3 46.0 ± 3.2RA 44.8 ± 1.5 44.7 ± 0.8 N.D. 44.8 ± 1.2All 44.9 ± 3.1 45.7 ± 2.3 45.8 ± 3.2 45.4 ± 2.9
(b) Differential scanning calorimetryNC 52.3 ± 4.6 53.6 ± 1.8 51.9 ± 2.8 52.6 ± 3.2EA 53.6 ± 4.6 54.1 ± 2.7 54.9 ± 1.8 54.2 ± 3.3RA 57.4 ± 1.7a 51.2 ± 3.5b N.D. 54.8 ± 4.0All 54.4 ± 4.3 53.0 ± 2.8 53.3 ± 2.8 53.7 ± 3.5
Table 6Linear correlation indices (r) between % organic carbon in the horizon and the % ofrecalcitrant peak for DTG or DSC. N.D.: no data. The significance of the correlations isgiven.
Land use No wildfires 1 wildfire 2 wildfires All
(a) Differential thermogravimetryNC 0.9649*** 0.4900 �0.1297 0.3950�
EA 0.8177* 0.6195 0.6642 0.6570**
RA 0.5703 �0.1316 N.D. 0.1409All 0.6341*** 0.4105� 0.0026 0.4231***
(b) Differential scanning calorimetryNC 0.9072** �0.0516 0.2789 0.5904**
EA 0.2288 0.4087 0.5489 0.2411RA �0.2461 �0.3651 N.D. �0.5928*
All 0.1840 �0.0618 0.1168 0.1382
� P < 0.10.* P < 0.05.
** P < 0.01.***P < 0.001.
B. Duguy, P. Rovira / Organic Geochemistry 41 (2010) 742–752 747

Author's personal copy
the step 0 ? 1 wildfires for RA plots, the energy yield increasedwith each fire, even though the increases did not reachsignificance.
3.7. Combined DTG and DSC study
The analysis of DTG curves by temperature intervals allows adetailed comparison of the former, in order to verify whether theexperimental conditions enhance or decrease the relevance ofsome pools relative to others. An increase in SOM recalcitrancedue to repeated wildfires should be reflected by (i) a relative de-crease of weight loss at low temperature intervals and (ii) an in-crease at high temperature intervals. As shown in Fig. 5, this wasnot observed in NC and EA plots; on the contrary this analysisstresses the homogeneity of DTG curves in these plots. In NC plots,for instance, at the interval 350–400 �C weight loss increases in thestep 0 ? 1 wildfires, but in the step 1 ? 2 wildfires they decreaseagain. The same behavior is observed at the interval 150–200 �C,very labile. No consistent trends appeared for the rest of the inter-vals. In EA plots, repeated wildfires consistently increased massloss in the most labile intervals (<200 �C, even though it was signif-icant only at 150–200 �C). The effect of repeated wildfires in therest of the temperature intervals was not consistent.
Recently abandoned plots showed a distinct behavior. The step0 ? 1 wildfire resulted in a decrease in the labile SOM (lost atintervals <250 �C), and an increase in the recalcitrant SOM (inter-vals between 250 and 450 �C), even though the changes did not al-ways reach significance. In the most recalcitrant intervals (>450 �C)the effect was not consistent. Leaving aside the >450 �C intervals,RA plots are the only ones in which wildfires increase the relativeweight of at least part of the recalcitrant pool. However, the behav-ior of the most thermoresistant pools (>450 �C) seems to compen-sate for the behavior of the rest of them; the final result is thatneither T50 for DTG nor the % of recalcitrant pool ultimately in-creased with fires (Tables 3a and 5a).
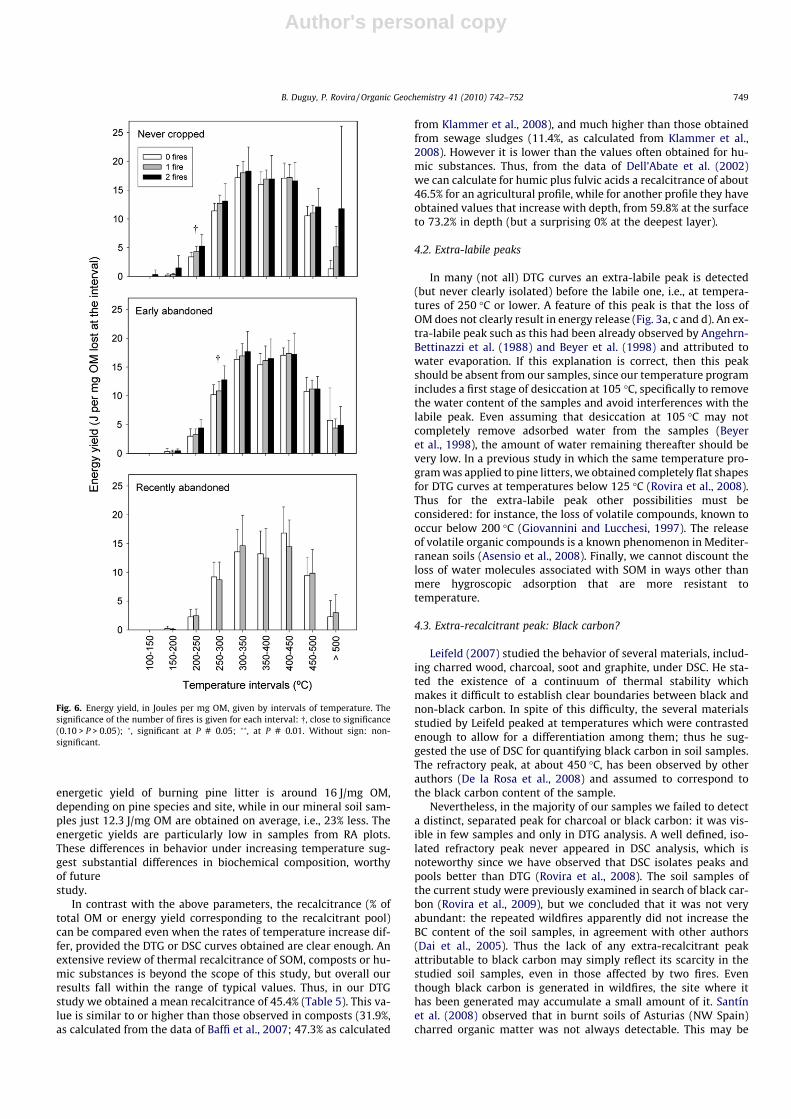
The study of the energetic yield at each temperature intervalgives more interesting results (Fig. 6). In NC and EA plots, the re-peated wildfires result in an increase in the energetic yield (J/mgOM lost) at most temperature intervals: only the 400–450 �C inter-val for NC and EA plots, and >500 �C for EA plots, evaded this rule.The effect was consistent, even though differences did not reachsignificance owing to their great variability.
Recently abandoned plots show a distinct behavior. The abovementioned increase in energetic yield, apparently due to wildfires,is not consistently detected in RA plots.
4. Discussion
4.1. SOM thermal properties: comparison with other studies
We applied a temperature increase rate of 3 �C/min since,according to our trials, it gave the best peak resolution. This rate,however, is among the lowest used. Rates of 5 �C/min are common
(Schnitzer and Hoffmann, 1966; Peuravuori et al., 1999) and evenhigher (Angehrn-Bettinazzi et al., 1988; Kristensen, 1990; Rehet al., 1990; Beyer et al., 1998; Kolokassidou et al., 2007). Heatingrates even slower, e.g., 2 �C/min, have also been applied (Dorodni-kov et al., 2007). At higher heating rates, peaks shift towards highertemperatures and peak resolution decreases. Some parametersthat describe the thermal properties of our soil samples (T50 forDTG and DSC, position of the peaks) are thus only comparable withthose of other samples submitted to the same rate of temperatureincrease.
We applied the same experimental conditions to the study ofdecomposing pine litters (Rovira et al., 2008). Pine litters at ad-vanced stages of decomposition showed a T50 for DTG of 340–345 �C, a bit lower than that observed in our samples. T50 for DSCwas also lower than that observed in our samples (�352–365 �C).More important than this is the fact that the energetic yields ofSOM in mineral horizons seem lower than those obtained fordecomposing litters: at advanced decomposition stages, the
Table 7Energetic yield of soil organic matter, in Joules per mg OM. Data are means ± standarddeviations. Rows: data followed by contrasting lowercase letters differ, at P = 0.05level. Columns: data followed by contrasting uppercase letters differ, at P = 0.05 level.If no letters are given, differences are not significant. N.D.: no data.
Land use No wildfires One wildfire Two wildfires All
NC 12.5 ± 1.6 13.1 ± 1.1 13.5 ± 2.9 13.0 ± 2.0AEA 12.2 ± 1.2 12.6 ± 1.8 13.0 ± 2.7 12.6 ± 1.9ARA 10.6 ± 3.0 10.6 ± 4.2 N.D. 10.6 ± 3.4BAll 11.7 ± 2.2 12.2 ± 2.7 13.3 ± 2.7 12.3 ± 2.5
Fig. 5. Organic matter lost (as % of total OM), by intervals of temperature. Thesignificance of the number of fires is given for each interval: �, close to thesignificance (0.10 > P > 0.05); �, significant at P # 0.05; ��, at P # 0.01. Without sign:non-significant.
748 B. Duguy, P. Rovira / Organic Geochemistry 41 (2010) 742–752
Author's personal copy
energetic yield of burning pine litter is around 16 J/mg OM,depending on pine species and site, while in our mineral soil sam-ples just 12.3 J/mg OM are obtained on average, i.e., 23% less. Theenergetic yields are particularly low in samples from RA plots.These differences in behavior under increasing temperature sug-gest substantial differences in biochemical composition, worthyof futurestudy.
In contrast with the above parameters, the recalcitrance (% oftotal OM or energy yield corresponding to the recalcitrant pool)can be compared even when the rates of temperature increase dif-fer, provided the DTG or DSC curves obtained are clear enough. Anextensive review of thermal recalcitrance of SOM, composts or hu-mic substances is beyond the scope of this study, but overall ourresults fall within the range of typical values. Thus, in our DTGstudy we obtained a mean recalcitrance of 45.4% (Table 5). This va-lue is similar to or higher than those observed in composts (31.9%,as calculated from the data of Baffi et al., 2007; 47.3% as calculated
from Klammer et al., 2008), and much higher than those obtainedfrom sewage sludges (11.4%, as calculated from Klammer et al.,2008). However it is lower than the values often obtained for hu-mic substances. Thus, from the data of Dell’Abate et al. (2002)we can calculate for humic plus fulvic acids a recalcitrance of about46.5% for an agricultural profile, while for another profile they haveobtained values that increase with depth, from 59.8% at the surfaceto 73.2% in depth (but a surprising 0% at the deepest layer).
4.2. Extra-labile peaks
In many (not all) DTG curves an extra-labile peak is detected(but never clearly isolated) before the labile one, i.e., at tempera-tures of 250 �C or lower. A feature of this peak is that the loss ofOM does not clearly result in energy release (Fig. 3a, c and d). An ex-tra-labile peak such as this had been already observed by Angehrn-Bettinazzi et al. (1988) and Beyer et al. (1998) and attributed towater evaporation. If this explanation is correct, then this peakshould be absent from our samples, since our temperature programincludes a first stage of desiccation at 105 �C, specifically to removethe water content of the samples and avoid interferences with thelabile peak. Even assuming that desiccation at 105 �C may notcompletely remove adsorbed water from the samples (Beyeret al., 1998), the amount of water remaining thereafter should bevery low. In a previous study in which the same temperature pro-gram was applied to pine litters, we obtained completely flat shapesfor DTG curves at temperatures below 125 �C (Rovira et al., 2008).Thus for the extra-labile peak other possibilities must beconsidered: for instance, the loss of volatile compounds, known tooccur below 200 �C (Giovannini and Lucchesi, 1997). The releaseof volatile organic compounds is a known phenomenon in Mediter-ranean soils (Asensio et al., 2008). Finally, we cannot discount theloss of water molecules associated with SOM in ways other thanmere hygroscopic adsorption that are more resistant totemperature.
4.3. Extra-recalcitrant peak: Black carbon?
Leifeld (2007) studied the behavior of several materials, includ-ing charred wood, charcoal, soot and graphite, under DSC. He sta-ted the existence of a continuum of thermal stability whichmakes it difficult to establish clear boundaries between black andnon-black carbon. In spite of this difficulty, the several materialsstudied by Leifeld peaked at temperatures which were contrastedenough to allow for a differentiation among them; thus he sug-gested the use of DSC for quantifying black carbon in soil samples.The refractory peak, at about 450 �C, has been observed by otherauthors (De la Rosa et al., 2008) and assumed to correspond tothe black carbon content of the sample.
Nevertheless, in the majority of our samples we failed to detecta distinct, separated peak for charcoal or black carbon: it was vis-ible in few samples and only in DTG analysis. A well defined, iso-lated refractory peak never appeared in DSC analysis, which isnoteworthy since we have observed that DSC isolates peaks andpools better than DTG (Rovira et al., 2008). The soil samples ofthe current study were previously examined in search of black car-bon (Rovira et al., 2009), but we concluded that it was not veryabundant: the repeated wildfires apparently did not increase theBC content of the soil samples, in agreement with other authors(Dai et al., 2005). Thus the lack of any extra-recalcitrant peakattributable to black carbon may simply reflect its scarcity in thestudied soil samples, even in those affected by two fires. Eventhough black carbon is generated in wildfires, the site where ithas been generated may accumulate a small amount of it. Santínet al. (2008) observed that in burnt soils of Asturias (NW Spain)charred organic matter was not always detectable. This may be
Fig. 6. Energy yield, in Joules per mg OM, given by intervals of temperature. Thesignificance of the number of fires is given for each interval: �, close to significance(0.10 > P > 0.05); �, significant at P # 0.05; ��, at P # 0.01. Without sign: non-significant.
B. Duguy, P. Rovira / Organic Geochemistry 41 (2010) 742–752 749
Author's personal copy
due to losses caused by wind transport, thermal convection airstreams generated by the fire itself, or by post-fire erosion, whichmay remove substantial amounts of char deposited on the soil sur-face (e.g., Rumpel et al., 2006a). However the latter explanationcannot be applied to our plots, since they were plains, mostly interraced slopes.
Besides black carbon, there are alternative explanations for theextra-recalcitrant peak. For instance, an interaction with the min-eral matrix and more specifically the presence of complexes of or-ganic polymers with metal ions, which have been observed toresult in an increase in the thermoresistance of the polymer, rela-tive to their non-salt forms (Bartoli et al., 1988; Provenzano andSenesi, 1998). In our samples these bonds must have been mostlydestroyed by the HF, while in samples not treated in this way (as isthe case in most of the research done by other authors), organiccompounds in salt forms may peak at very high temperaturesand could be confounded with black carbon forms. Verifying thishypothesis deserves future research.
4.4. Overall view: long term effect of wildfires on SOM biochemicalquality
The effect of fires on SOM characteristics has been widely stud-ied. The described changes consist of the generation of refractoryforms by the thermal shock itself, partly as black carbon and alsothe loss of compounds such as polysaccharides, which are morethermolabile and are selectively lost during the fire driven thermalshock (e.g., Almendros et al., 1984a; Almendros et al., 1984b; Cer-tini, 2005; Tinoco et al., 2006). However, the post-fire recovery ofthe vegetation, especially in highly resilient vegetation types,may drive soil to a partial recovery of its previous SOM character-istics. Thus Santín et al. (2008), in Asturias (NW Spain), a non-Med-iterranean region, observed that in shrubland soils repeatedwildfires increase the aromatic/total C ratio, but the O-alkyl Cforms, attributed mainly to polysaccharides, are ultimately thedominant ones in all soil samples, both burnt and unburnt.
The thermal methods applied in our work do not allow for a de-tailed analysis of SOM composition (e.g. carbohydrates, proteins,
humic substances), which is beyond the scope of this paper. BothDTG and DSC answer a more general question, i.e., whether ornot repeated wildfires drive SOM evolution towards an overallhigher dominance of refractory forms. Should this occur, then itwould result in one or more of these indicators: (i) an increaseddominance of the recalcitrant (thermoresistant) pool, relative tothe labile one, either in DTG, DSC, or both; (ii) an increase in T50
for either DTG, DSC, or both; (iii) a shift of the peaks towards highertemperatures: especially the recalcitrant peak, owing to the accu-mulation of black carbon or other refractory C forms generatedby fire.
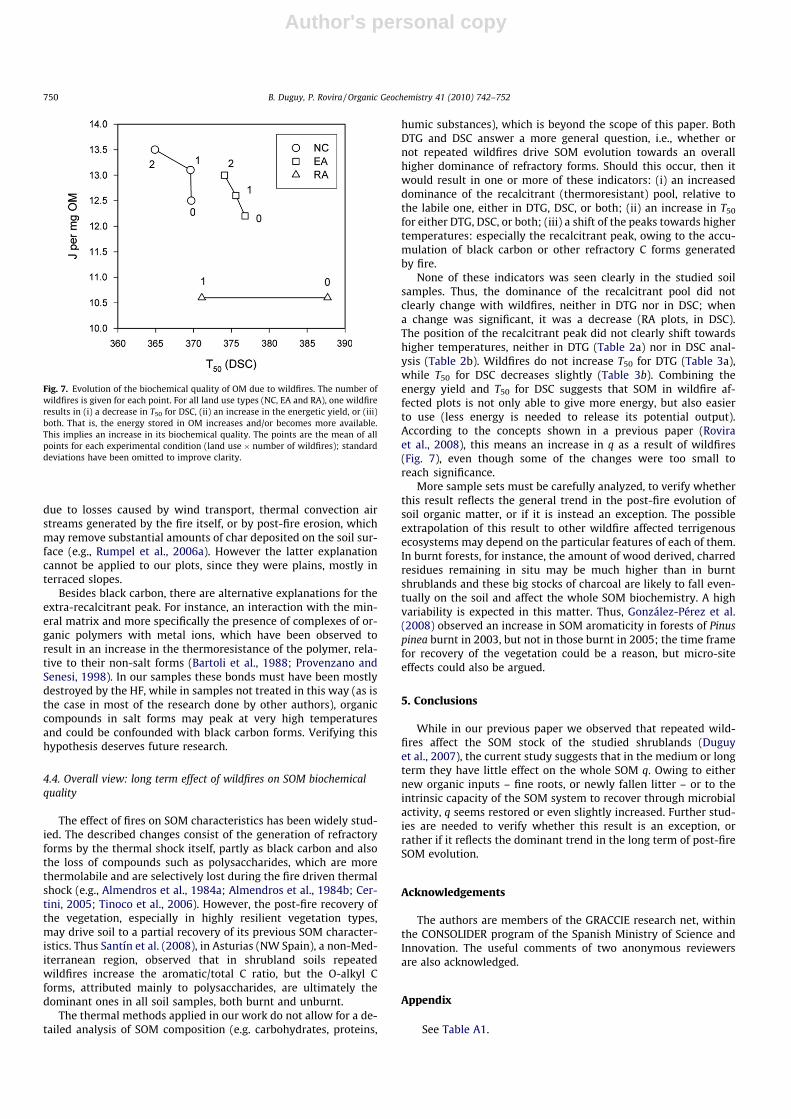
None of these indicators was seen clearly in the studied soilsamples. Thus, the dominance of the recalcitrant pool did notclearly change with wildfires, neither in DTG nor in DSC; whena change was significant, it was a decrease (RA plots, in DSC).The position of the recalcitrant peak did not clearly shift towardshigher temperatures, neither in DTG (Table 2a) nor in DSC anal-ysis (Table 2b). Wildfires do not increase T50 for DTG (Table 3a),while T50 for DSC decreases slightly (Table 3b). Combining theenergy yield and T50 for DSC suggests that SOM in wildfire af-fected plots is not only able to give more energy, but also easierto use (less energy is needed to release its potential output).According to the concepts shown in a previous paper (Roviraet al., 2008), this means an increase in q as a result of wildfires(Fig. 7), even though some of the changes were too small toreach significance.
More sample sets must be carefully analyzed, to verify whetherthis result reflects the general trend in the post-fire evolution ofsoil organic matter, or if it is instead an exception. The possibleextrapolation of this result to other wildfire affected terrigenousecosystems may depend on the particular features of each of them.In burnt forests, for instance, the amount of wood derived, charredresidues remaining in situ may be much higher than in burntshrublands and these big stocks of charcoal are likely to fall even-tually on the soil and affect the whole SOM biochemistry. A highvariability is expected in this matter. Thus, González-Pérez et al.(2008) observed an increase in SOM aromaticity in forests of Pinuspinea burnt in 2003, but not in those burnt in 2005; the time framefor recovery of the vegetation could be a reason, but micro-siteeffects could also be argued.
5. Conclusions
While in our previous paper we observed that repeated wild-fires affect the SOM stock of the studied shrublands (Duguyet al., 2007), the current study suggests that in the medium or longterm they have little effect on the whole SOM q. Owing to eithernew organic inputs – fine roots, or newly fallen litter – or to theintrinsic capacity of the SOM system to recover through microbialactivity, q seems restored or even slightly increased. Further stud-ies are needed to verify whether this result is an exception, orrather if it reflects the dominant trend in the long term of post-fireSOM evolution.
Acknowledgements
The authors are members of the GRACCIE research net, withinthe CONSOLIDER program of the Spanish Ministry of Science andInnovation. The useful comments of two anonymous reviewersare also acknowledged.
Appendix
See Table A1.
Fig. 7. Evolution of the biochemical quality of OM due to wildfires. The number ofwildfires is given for each point. For all land use types (NC, EA and RA), one wildfireresults in (i) a decrease in T50 for DSC, (ii) an increase in the energetic yield, or (iii)both. That is, the energy stored in OM increases and/or becomes more available.This implies an increase in its biochemical quality. The points are the mean of allpoints for each experimental condition (land use � number of wildfires); standarddeviations have been omitted to improve clarity.
750 B. Duguy, P. Rovira / Organic Geochemistry 41 (2010) 742–752
Author's personal copy
Associate Editor—James Rice
References
Almendros, G., Polo, A., Ibáñez, J.J., Lobo, M.C., 1984a. Contribución al estudio de lainfluencia de los incendios forestales en las características de la materiaorgánica del suelo. I: Transformaciones del humus en un bosque de Pinus pineadel centro de España. Revue d’Écologie et de Biologie du Sol 21, 7–20.
Almendros, G., Polo, A., Lobo, M.C., Ibáñez, J.J., 1984b. Contribución al estudio de lainfluencia de los incendios forestales en las características de la materiaorgánica del suelo. II: Transformaciones del humus por ignición en condicionescontroladas de laboratorio. Revue d’Écologie et de Biologie du Sol 21, 154–160.
Almendros, G., Martín, F., González-Vila, F.J., 1988. Effects of fire on humic and lipidfractions in a Dystric Xerochrept in Spain. Geoderma 42, 115–127.
Angehrn-Bettinazzi, C., Lüscher, P., Hertz, J., 1988. Thermogravimetry as a methodfor distinguishing various degrees of mineralisation in macromorphologically-defined humus horizons. Zeitschrift für Pflanzenernährung und Bodenkunde151, 177–183.
Asensio, D., Peñuelas, J., Prieto, P., Estiarte, M., Filella, I., Llusià, J., 2008. Interannualand seasonal changes in the soil exchange rates of monoterpenes and other VOCsin a Mediterranean shrubland. European Journal of Soil Science 59, 878–891.
Baffi, C., Dell’Abate, M.T., Nassisi, A., Silva, S., Benedetti, A., Genevini, P.L., Adani, F.,2007. Determination of biological stability in compost: a comparison ofmethodologies. Soil Biology & Biochemistry 39, 1284–1293.
Baldock, J.A., Smernik, R.J., 2002. Chemical composition and bioavailability ofthermally altered Pinus resinosa (red pine) wood. Organic Geochemistry 33,1093–1109.
Barros, N., Salgado, J., Feijóo, S., 2007. Calorimetry and soil. Thermochimica Acta458, 11–17.
Bartoli, F., Doirisse, M., Hatira, A., 1988. Degradation thermique de complexessolutions de podzol-cuivre. Soil Biology & Biochemistry 20, 587–589.
Beyer, L., Deslis, K., Vogt, B., 1998. Estimation of soil organic matter compositionaccording to a simple thermoanalytical approach. Communications in SoilScience and Plant Analysis 29, 1277–1297.
Brodowski, S., Rodionov, A., Haumaier, L., Glaser, B., Amelung, W., 2005. Revisedblack carbon assessment using benzene polycarboxylic acids. OrganicGeochemistry 36, 1299–1310.
Certini, G., 2005. Effects of fire on properties of forest soils: a review. Oecologia 143,1–10.
Dai, X., Boutton, T.W., Glaser, B., Ansley, R.J., Zech, W., 2005. Black carbonin temperate mixed-grass savanna. Soil Biology & Biochemistry 37, 1879–1881.
De la Rosa, J.M., González-Pérez, J.A., González-Vázquez, R., Knicker, H., López-Capel,E., Manning, D.A.C., González-Vila, F.J., 2008. Use of pyrolysis/GC-MS combinedwith thermal analysis to monitor C and N changes in soil organic matter from aMediterranean fire affected forest. Catena 74, 296–303.
Debano, L.F., Conrad, C.E., 1978. The effect of fire on nutrients in a chaparralecosystem. Ecology 59, 489–497.
Dell’Abate, M.T., Benedetti, A., Trinchera, A., Dazzi, C., 2002. Humic substances alongthe profile of two Typic Haplexerert. Geoderma 107, 281–296.
Dorodnikov, M., Fangmeier, A., Kuzyakov, Y., 2007. Thermal stability of soil organicmatter pools and their d13C values after C3–C4 vegetation change. Soil Biology &Biochemistry 39, 1173–1180.
Duguy, B., 2003. Interacción de la historia de usos del suelo y el fuego encondiciones Mediterráneas. Respuesta de los ecosistemas y estructura delpaisaje [Interaction of land use history and wildfires: Ecosystembehaviour and landscape structure]. Ph.D. Thesis, Universitat d’Alacant,Spain.
Duguy, B., Vallejo, V.R., 2008. Land-use and fire history effects on post-firevegetation dynamics in eastern Spain. Journal of Vegetation Science 19, 108–997.
Duguy, B., Rovira, P., Vallejo, R., 2007. Land use history and fire effects onsoil fertility in eastern Spain. European Journal of Soil Science 58,83–91.
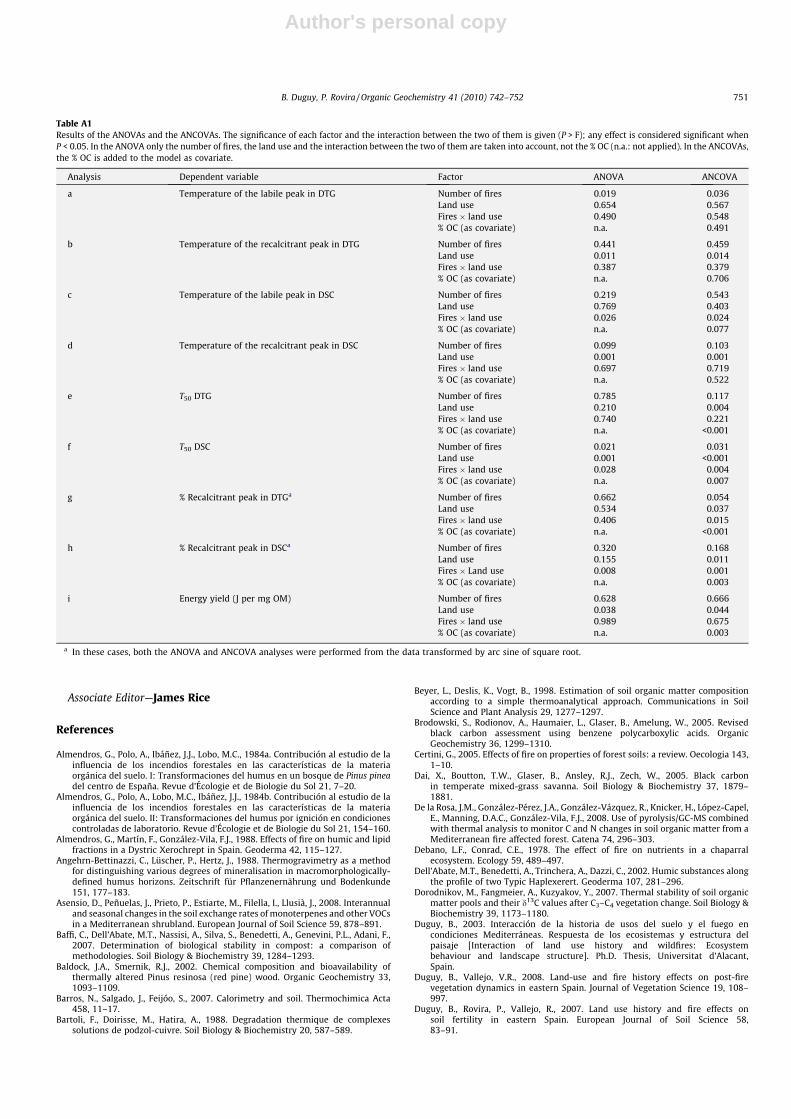
Table A1Results of the ANOVAs and the ANCOVAs. The significance of each factor and the interaction between the two of them is given (P > F); any effect is considered significant whenP < 0.05. In the ANOVA only the number of fires, the land use and the interaction between the two of them are taken into account, not the % OC (n.a.: not applied). In the ANCOVAs,the % OC is added to the model as covariate.
Analysis Dependent variable Factor ANOVA ANCOVA
a Temperature of the labile peak in DTG Number of fires 0.019 0.036Land use 0.654 0.567Fires � land use 0.490 0.548% OC (as covariate) n.a. 0.491
b Temperature of the recalcitrant peak in DTG Number of fires 0.441 0.459Land use 0.011 0.014Fires � land use 0.387 0.379% OC (as covariate) n.a. 0.706
c Temperature of the labile peak in DSC Number of fires 0.219 0.543Land use 0.769 0.403Fires � land use 0.026 0.024% OC (as covariate) n.a. 0.077
d Temperature of the recalcitrant peak in DSC Number of fires 0.099 0.103Land use 0.001 0.001Fires � land use 0.697 0.719% OC (as covariate) n.a. 0.522
e T50 DTG Number of fires 0.785 0.117Land use 0.210 0.004Fires � land use 0.740 0.221% OC (as covariate) n.a. <0.001
f T50 DSC Number of fires 0.021 0.031Land use 0.001 <0.001Fires � land use 0.028 0.004% OC (as covariate) n.a. 0.007
g % Recalcitrant peak in DTGa Number of fires 0.662 0.054Land use 0.534 0.037Fires � land use 0.406 0.015% OC (as covariate) n.a. <0.001
h % Recalcitrant peak in DSCa Number of fires 0.320 0.168Land use 0.155 0.011Fires � Land use 0.008 0.001% OC (as covariate) n.a. 0.003
i Energy yield (J per mg OM) Number of fires 0.628 0.666Land use 0.038 0.044Fires � land use 0.989 0.675% OC (as covariate) n.a. 0.003
a In these cases, both the ANOVA and ANCOVA analyses were performed from the data transformed by arc sine of square root.
B. Duguy, P. Rovira / Organic Geochemistry 41 (2010) 742–752 751
Author's personal copy
Flaig, W., Beutelspacher, H., Rietz, E., 1975. Chemical composition and physicalproperties of humic substances. In: Gieseking, J.E. (Ed.), Soil Components,Organic Components, vol. 1. Springer, Berlin, pp. 1–211.
Gibbs, H.A.A., O’Garro, L.W., Newton, A.M., 2000. Differential thermal analysis: ameans of identifying soil samples from Barbados, Trinidad, Tobago, St. Vincent,Jamaica and Guyana. Thermochimica Acta 363, 71–79.
Giovannini, G., Lucchesi, S., 1997. Modifications induced in soil physico-chemicalparameters by experimental fires at different intensities. Soil Science 162, 479–486.
Glaser, B., Haumaier, L., Guggenberger, G., Zech, W., 1998. Black carbon in soils: theuse of benzenecarboxylic acids as specific markers. Organic Geochemistry 29,811–819.
González-Pérez, J.A., González-Vila, F.J., Almendros, G., Knicker, H., 2004. The effectof fire on soil organic matter - A review. Environment International 30, 855–870.
González-Pérez, J.A., González-Vila, F.J., González-Vázquez, R., Arias, M.E.,Rodríguez, J., Knicker, H., 2008. Use of multiple biogeochemical parameters tomonitor the recovery of soils after forest fires. Organic Geochemistry 39, 940–944.
Hatten, J.A., Zabowski, D., Ogden, A., Thies, W., 2008. Soil organic matter in aponderosa pine forest with varying seasons and intervals of prescribed burn.Forest Ecology and Management 255, 2555–2565.
Klammer, S., Knapp, B., Insam, H., Dell’Abate, M.T., Ros, M., 2008. Bacterialcommunity patterns and thermal analyses of various composts. WasteManagement & Research 26, 173–187.
Knicker, H., Almendros, G., González-Vila, F.J., Martín, F., Lüdemann, H.D., 1996. 13Cand15N NMR spectroscopic examination of the transformation of organicnitrogen in plant biomass during thermal treatment. Soil Biology &Biochemistry 28, 1053–1060.
Knicker, H., González-Vila, F.J., Polvillo, O., González, J.A., Almendros, G., 2005. Fire-induced transformation of C- and N-forms in different organic soil fractionsfrom a Dystric Cambisol under a Mediterranean pine forest (Pinus pinaster). SoilBiology & Biochemistry 37, 701–718.
Kolokassidou, C., Pashalidis, I., Costa, C.N., Efstatthiou, A.M., Buckau, G., 2007.Thermal stability of solid and aqueous solutions of humic acid. ThermochimicaActa 454, 78–83.
Kristensen, E., 1990. Characterization of biogenic organic matter by stepwisethermo-gravimetry (STG). Biogeochemistry 9, 135–159.
Leifeld, J., 2007. Thermal stability of black carbon characterised by oxidativedifferential scanning calorimetry. Organic Geochemistry 38, 112–127.
Leinweber, P., Jandl, G., Baum, C., Eckhardt, K.U., Kandeler, E., 2008. Stability andcomposition of soil organic matter control respiration and soil enzymeactivities. Soil Biology & Biochemistry 40, 1496–1505.
Mondini, C., Dell’Abate, M.T., Leita, L., Benedetti, A., 2003. An integrated chemical,thermal, and microbiological approach to compost stability evaluation. Journalof Environmental Quality 32, 2379–2386.
Nelson, D.W., Sommers, L.E., 1996. Total carbon, organic carbon, and organic matter.In: Sparks, D.L. (Ed.), Methods of Soil Analysis. Part 3. Chemical Methods. ASA-SSSA, Madison, USA, pp. 961–1010.
Paul, E.A., Morris, S.J., Conant, R.T., Plante, A.F., 2006. Does the acid hydrolysis –incubation method measure meaningful soil organic carbon pools. Soil ScienceSociety of America Journal 70, 1023–1035.
Peuravuori, J., Paaso, N., Pihlaja, K., 1999. Kinetic study of the thermal degradationof lake aquatic humic matter by thermogravimetric analysis. ThermochimicaActa 325, 181–193.
Provenzano, M.R., Senesi, N., 1998. Differential scanning calorimetry of river aquaticfulvic acids and their metal complexes. Fresenius Environmental Bulletin 7,423–428.
Reh, U., Kratz, W., Kraepelin, G., Angehrn-Bettinazzi, C., 1990. Analysis of leaf andneedle litter decomposition by differential scanning calorimetry anddifferential thermogravimetry. Biology and Fertility of Soils 9, 188–191.
Rovira, P., Vallejo, V.R., 2000. Evaluating thermal and acid hydrolysis methods asindicators of soil organic matter quality. Communications in Soil Science andPlant Analysis 31, 81–100.
Rovira, P., Vallejo, V.R., 2002. Labile and recalcitrant pools of carbon and nitrogen inorganic matter decomposing at different depths in soil: an acid hydrolysisapproach. Geoderma 107, 109–141.
Rovira, P., Kurz-Besson, C., Coûteaux, M.M., Vallejo, V.R., 2008. Changes in litterproperties during decomposition: a study by differential thermogravimetry andscanning calorimetry. Soil Biology & Biochemistry 40, 172–185.
Rovira, P., Duguy, B., Vallejo, V.R., 2009. Black carbon in wildfire-affected shrublandMediterranean soils. Journal of Plant Nutrition and Soil Science 172, 43–52.
Rumpel, C., Alexis, M., Chabbi, A., Chaplot, V., Rasse, D.P., Valentin, C., Mariotti, A.,2006a. Black carbon contribution to soil organic matter composition in tropicalsloping land under slash and burn agriculture. Geoderma 130, 35–46.
Rumpel, C., Rabia, N., Derenne, S., Quénea, K., Eusterhues, K., Kögel-Knabner, I.,Mariotti, A., 2006b. Alteration of soil organic matter following treatment withhydrofluoric acid (HF). Organic Geochemistry 37, 1437–1451.
Santín, C., Knicker, H., Fernández, S., Menéndez-Duarte, R., Álvarez, M.A., 2008.Wildfires influence on soil organic matter in an Atlantic mountainous region(NW of Spain). Catena 74, 286–295.
Schnitzer, M., Hoffman, I., 1966. A thermogravimetric approach to theclassification of organic soils. Soil Science Society of America Proceedings 30,63–66.
Schmidt, M.W.I., Noack, A.G., 2000. Black carbon in soils and sediments: analysis,distribution, implications, and current challenges. Global BiogeochemicalCycles 14, 777–793.
Tinoco, P., Almendros, G., Sanz, J., González-Vázquez, R., González-Vila, F.J.,2006. Molecular descriptors of the effect of fire on soils under pine forestin two continental Mediterranean soils. Organic Geochemistry 37, 1995–2018.
752 B. Duguy, P. Rovira / Organic Geochemistry 41 (2010) 742–752