Impact of wildfires on Canada's oil sands facilities - NHESS
14
Nat. Hazards Earth Syst. Sci., 18, 3153–3166, 2018 https://doi.org/10.5194/nhess-18-3153-2018 © Author(s) 2018. This work is distributed under the Creative Commons Attribution 4.0 License. Impact of wildfires on Canada’s oil sands facilities Nima Khakzad Faculty of Technology, Policy, and Management, Delft University of Technology, Delft 2628BX, the Netherlands Correspondence: Nima Khakzad ([email protected]) Received: 17 May 2018 – Discussion started: 6 July 2018 Accepted: 10 November 2018 – Published: 23 November 2018 Abstract. Exponential growth of oil and gas facilities in wildlands from one side and an anticipated increase of global warming from the other have exposed such facilities to an ever-increasing risk of wildfires. Extensive oil sands op- erations in Canadian wildlands, especially in the province of Alberta, along with the recent massive wildfires in the province, require the development of quantitative risk as- sessment (QRA) methodologies which are presently lack- ing in the context of wildfire-related technological accidents. The present study is an attempt to integrate Canadian online wildfire information systems with current QRA techniques in a dynamic risk assessment framework for wildfire-prone process plants. The developed framework can easily be cus- tomized to other process plants potentially exposed to wild- fires worldwide, provided that the required wildfire informa- tion is available. 1 Introduction Rising temperatures and climate change have increased the risk of weather-related hazards in Europe (European Joint Research Centre, 2017). Canada and the US are no excep- tion as evident by the recent hurricanes, floods, and wild- fires which devastated the states of Texas and California in the US and the provinces of British Columbia and Alberta in Canada. Aside from the impact of such natural disasters on the environment and urban areas, their effect on indus- trial plants and hazardous facilities (process plants, nuclear plants, etc.) has started to raise concerns in academia, the in- dustry, and regulatory bodies. Massive fires in a refinery in Turkey in 1999 during the Kocaeli earthquake, substantial release of petroleum prod- ucts and chemicals in the US during Hurricane Katrina in 2005 and Hurricane Harvey in 2017, extensive damage to coastal industrial complexes in Japan in 2011 during the Great Sendai Earthquake and the following tsunami, and shutdown of oil sands plants which incurred enormous oil production losses during massive wildfires in Canada in 2016 are just some examples among others. Although the hazard of wildfires in ecological and urban risk assessment studies has long been recognized (Preisler et al., 2004; Scott et al., 2012, 2013;), the relevant work in the context of wildland-prone industrial complexes has been very limited (FireSmart, 2012; Khakzad et al., 2018). In Eu- rope, for example, Seveso Directive III (2012) has only re- cently mandated the member states to consider the probabil- ity of natural disasters in the risk assessment of major ac- cident scenarios when preparing safety reports (Article 10), with an explicit mention of floods and earthquakes (the An- nex II) but not of wildfires. Most European countries that consider natechs (natural hazards triggering technological disasters) have likewise limited their focus to only a few nat- ural hazards (Krausmann and Baranzini, 2012). Table 1 ex- emplifies some of such efforts. Exponential growth of industrial facilities and the subse- quent prolongation of wildland–industry interfaces from one side and an anticipated increase of global warming from the other are expected to increase the frequency and severity of technological accidents caused by natural disasters, includ- ing wildfires. In May 2015, a massive wildfire in northern Alberta, Canada, spread into the oil sands areas, threatening several operations and keeping about 10 % of the production offline. Two major petroleum companies, Canadian Natural and Cen- ovus Energy, shut down their 80 000 and 135 000-barrel-a- day operations, respectively, for safety precautions as the fires approached Foster Creek oil sands facility and Caribou South natural gas plant (Mining.Com, 2015). Published by Copernicus Publications on behalf of the European Geosciences Union.
-
Upload
khangminh22 -
Category
Documents
-
view
1 -
download
0
Transcript of Impact of wildfires on Canada's oil sands facilities - NHESS
Nat. Hazards Earth Syst. Sci., 18, 3153–3166, 2018https://doi.org/10.5194/nhess-18-3153-2018© Author(s) 2018. This work is distributed underthe Creative Commons Attribution 4.0 License.
Impact of wildfires on Canada’s oil sands facilitiesNima KhakzadFaculty of Technology, Policy, and Management, Delft University of Technology, Delft 2628BX, the Netherlands
Correspondence: Nima Khakzad ([email protected])
Received: 17 May 2018 – Discussion started: 6 July 2018Accepted: 10 November 2018 – Published: 23 November 2018
Abstract. Exponential growth of oil and gas facilities inwildlands from one side and an anticipated increase of globalwarming from the other have exposed such facilities to anever-increasing risk of wildfires. Extensive oil sands op-erations in Canadian wildlands, especially in the provinceof Alberta, along with the recent massive wildfires in theprovince, require the development of quantitative risk as-sessment (QRA) methodologies which are presently lack-ing in the context of wildfire-related technological accidents.The present study is an attempt to integrate Canadian onlinewildfire information systems with current QRA techniquesin a dynamic risk assessment framework for wildfire-proneprocess plants. The developed framework can easily be cus-tomized to other process plants potentially exposed to wild-fires worldwide, provided that the required wildfire informa-tion is available.
1 Introduction
Rising temperatures and climate change have increased therisk of weather-related hazards in Europe (European JointResearch Centre, 2017). Canada and the US are no excep-tion as evident by the recent hurricanes, floods, and wild-fires which devastated the states of Texas and California inthe US and the provinces of British Columbia and Albertain Canada. Aside from the impact of such natural disasterson the environment and urban areas, their effect on indus-trial plants and hazardous facilities (process plants, nuclearplants, etc.) has started to raise concerns in academia, the in-dustry, and regulatory bodies.
Massive fires in a refinery in Turkey in 1999 during theKocaeli earthquake, substantial release of petroleum prod-ucts and chemicals in the US during Hurricane Katrina in2005 and Hurricane Harvey in 2017, extensive damage to
coastal industrial complexes in Japan in 2011 during theGreat Sendai Earthquake and the following tsunami, andshutdown of oil sands plants which incurred enormous oilproduction losses during massive wildfires in Canada in 2016are just some examples among others.
Although the hazard of wildfires in ecological and urbanrisk assessment studies has long been recognized (Preisleret al., 2004; Scott et al., 2012, 2013;), the relevant work inthe context of wildland-prone industrial complexes has beenvery limited (FireSmart, 2012; Khakzad et al., 2018). In Eu-rope, for example, Seveso Directive III (2012) has only re-cently mandated the member states to consider the probabil-ity of natural disasters in the risk assessment of major ac-cident scenarios when preparing safety reports (Article 10),with an explicit mention of floods and earthquakes (the An-nex II) but not of wildfires. Most European countries thatconsider natechs (natural hazards triggering technologicaldisasters) have likewise limited their focus to only a few nat-ural hazards (Krausmann and Baranzini, 2012). Table 1 ex-emplifies some of such efforts.
Exponential growth of industrial facilities and the subse-quent prolongation of wildland–industry interfaces from oneside and an anticipated increase of global warming from theother are expected to increase the frequency and severity oftechnological accidents caused by natural disasters, includ-ing wildfires.
In May 2015, a massive wildfire in northern Alberta,Canada, spread into the oil sands areas, threatening severaloperations and keeping about 10 % of the production offline.Two major petroleum companies, Canadian Natural and Cen-ovus Energy, shut down their 80 000 and 135 000-barrel-a-day operations, respectively, for safety precautions as thefires approached Foster Creek oil sands facility and CaribouSouth natural gas plant (Mining.Com, 2015).
Published by Copernicus Publications on behalf of the European Geosciences Union.

3154 N. Khakzad: Impact of wildfires on Canada’s oil sands facilities
Table 1. Natural hazards considered in safety assessment and man-agement of process plants in the European Union (Krausmann andBaranzini, 2012).
Country Natural hazard
Lithuania FloodsSlovakia FloodsCzech Republic Mainly floodsUK Mainly floodsRomania Floods, landslides, earthquakesGermany Floods, storms, earthquakesFrance Floods, landslides, earthquakes, lightningItaly Floods, storms, earthquakes, lightning, wildfireNetherlands All-hazards approach∗
∗ It is not identified whether it accounts for wildfires.
In May 2016, a wildfire burned part of Fort McMurray,Alberta, Canada, and spread towards oil sands plants northof the city where major oil sands production plants Syncrudeand Suncor Energy along with some smaller petroleum oper-ations were located, resulting in a 40 % drop in production atnearby oil sands facilities (Fig. 1).
The operations shutdowns or reductions were also influ-enced by precautionary shutdowns of pipeline carrying dilu-ent, a flammable substance needed to thin the oil sands’bitumen, resulting in a reduction of the oil sands’ outputof roughly as much as 1 million barrels a day (Maclean’s,2016a). The wildfire did not cause damage to oil sands plantsand process equipment, but it burned down a 665-unit workeraccommodation camp in northern Fort McMurray (GlobalNews, 2016a). But what would have happened if the fire hadreached the oil sands mines and the production facilities?
As far as the oil sands mines are concerned, bitumen,the main component of oil sands, does not easily catch fire(Global News, 2016b). Considering the fact that 80 % of bi-tumen is buried deep underground, the bitumen in oil sandsmines is mixed with sand (similar to asphalt), and wouldprobably smolder if ignited (Maclean’s, 2016b). However, oilsands projects rely on two highly flammable substances forthe extraction, processing and transport of bitumen: naturalgas and diluent, which is a very light petroleum substance.
Natural gas is used to generate power for the plants andheat up the steam used to liquefy the bitumen. Diluent, on theother hand, is used to dilute the crude bitumen thin enough toflow through pipelines. Both the natural gas and diluent canpose high risks if exposed to fire, though the pipes carryingthem are usually buried underground.
Oil sands process plants are usually accompanied by largetank terminals in the vicinity to store oil products. Exposed toexternal fires (such as wildfire), buckling of atmospheric stor-age tanks and spill of hydrocarbons, tank fires, vapor cloudexplosions, and explosion of pressurized tanks can be recog-nized as potential risks (Heymes et al., 2013, Godoy 2016).In case one or more storage tanks are ignited by the wildfire,
Figure 1. Wildfire in Fort McMurray and the location of affectedoil sands plants: 1 Canadian Natural Resources, 2 Syncrude jointventure, 3 Imperial Oil, 4 Shell Canada, 5 Husky Energy/BP, 6 Sun-cor, 7 Athabasca, 8 Nexen (CNOOC), 9 Japan Canada Oil Sands, 10Connacher Oil and Gas, 11 ConocoPhillips, 12 Statoil (Maclean’s,2016a).
the tank fire(s) can impact adjacent storage tanks, leading toa fire domino effect.
In order to protect oil sands facilities from wildfires (andalso protect the forest from potential ignition sources at thefacilities), there is a buffer zone (safety distance in the formof vegetation-free ground) between facilities and forest veg-etation. In the absence of methodologies for quantitativerisk assessment and management in wildland–industrial in-terfaces, such buffer zones are usually determined based onrule-of-thumb guidelines (e.g., see FireSmart, 2012). Numer-ical simulations of storage tanks exposed to wildfire have,however, demonstrated that in most cases such safety dis-tances would not suffice (Heymes et al., 2013).
Due to extensive oil sands operations in Canadian wild-lands, in the present study, we have developed a dynamicframework, mainly based on available techniques and dailyupdated wildfire maps made available online by the govern-ment of Canada, to assess the impact of wildfires on oil sandsfacilities. Since the framework is modular, it can be tailoredto assess the risk of wildfires at process plants in wildfire-prone areas worldwide. Section 2 revisits the Canadian wild-land fire information system; in Sect. 3, the components ofwildfire risk assessment are described and quantified; Sect. 4is devoted to the impact assessment of wildfires on processfacilities; Sect. 5 concludes the study.
Nat. Hazards Earth Syst. Sci., 18, 3153–3166, 2018 www.nat-hazards-earth-syst-sci.net/18/3153/2018/
N. Khakzad: Impact of wildfires on Canada’s oil sands facilities 3155
2 Canadian Wildfire Information System
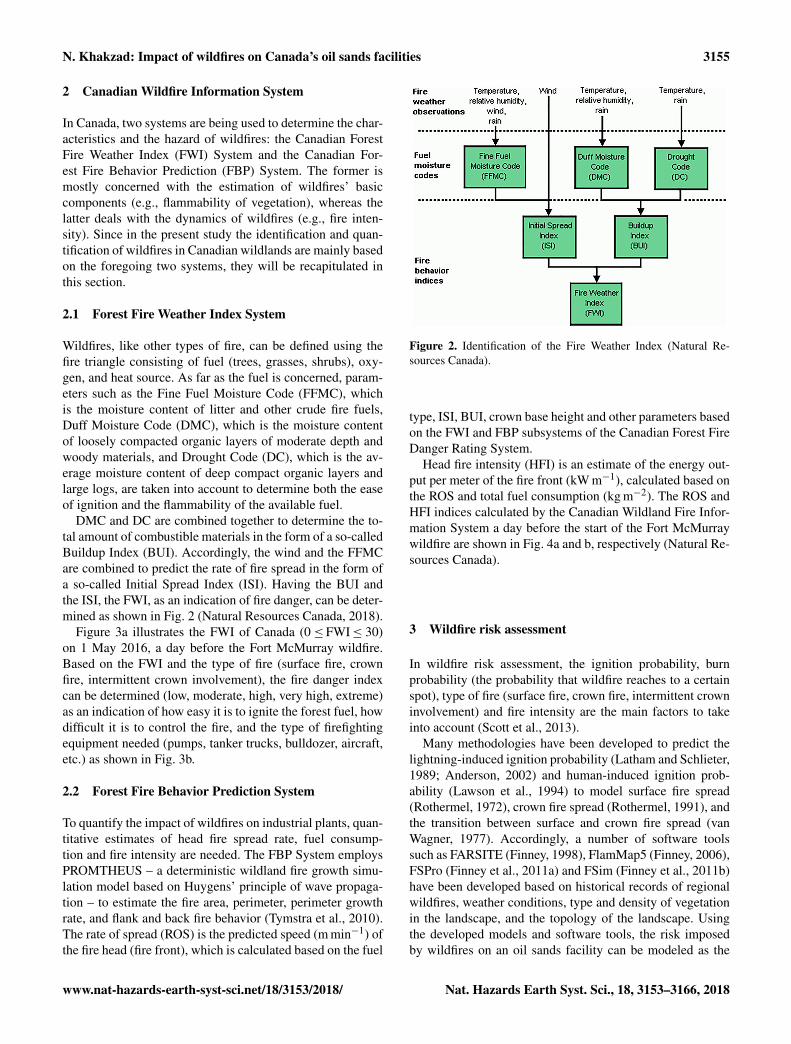
In Canada, two systems are being used to determine the char-acteristics and the hazard of wildfires: the Canadian ForestFire Weather Index (FWI) System and the Canadian For-est Fire Behavior Prediction (FBP) System. The former ismostly concerned with the estimation of wildfires’ basiccomponents (e.g., flammability of vegetation), whereas thelatter deals with the dynamics of wildfires (e.g., fire inten-sity). Since in the present study the identification and quan-tification of wildfires in Canadian wildlands are mainly basedon the foregoing two systems, they will be recapitulated inthis section.
2.1 Forest Fire Weather Index System
Wildfires, like other types of fire, can be defined using thefire triangle consisting of fuel (trees, grasses, shrubs), oxy-gen, and heat source. As far as the fuel is concerned, param-eters such as the Fine Fuel Moisture Code (FFMC), whichis the moisture content of litter and other crude fire fuels,Duff Moisture Code (DMC), which is the moisture contentof loosely compacted organic layers of moderate depth andwoody materials, and Drought Code (DC), which is the av-erage moisture content of deep compact organic layers andlarge logs, are taken into account to determine both the easeof ignition and the flammability of the available fuel.
DMC and DC are combined together to determine the to-tal amount of combustible materials in the form of a so-calledBuildup Index (BUI). Accordingly, the wind and the FFMCare combined to predict the rate of fire spread in the form ofa so-called Initial Spread Index (ISI). Having the BUI andthe ISI, the FWI, as an indication of fire danger, can be deter-mined as shown in Fig. 2 (Natural Resources Canada, 2018).
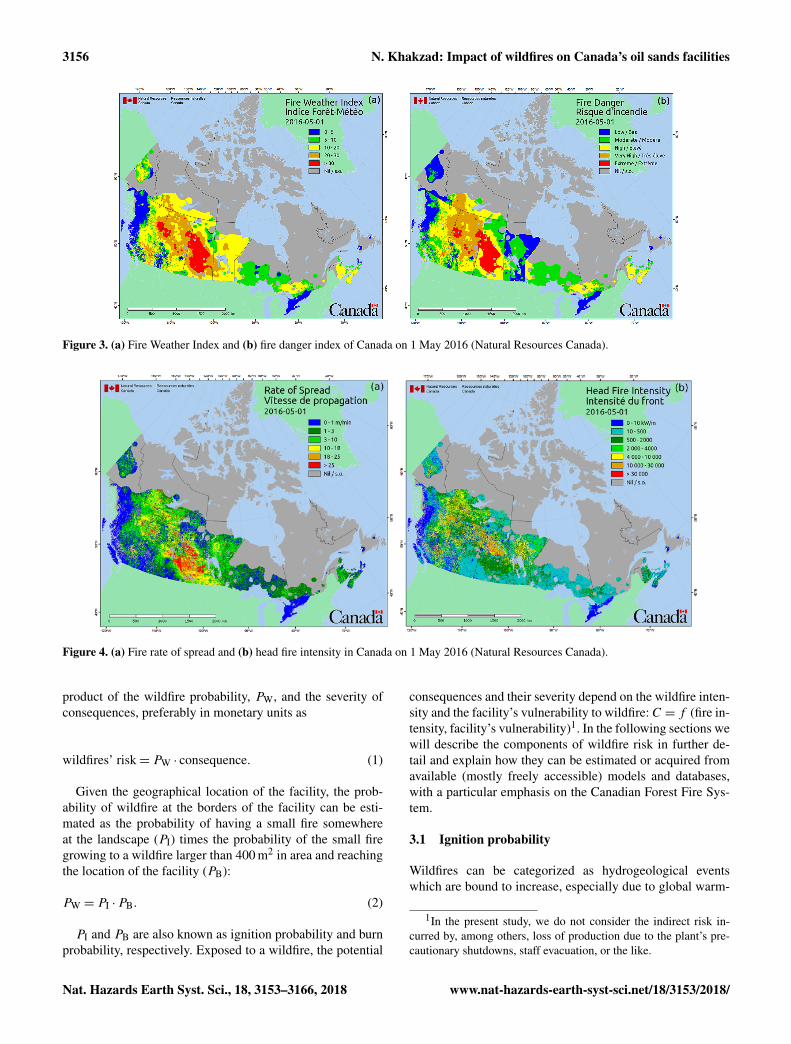
Figure 3a illustrates the FWI of Canada (0≤FWI≤ 30)on 1 May 2016, a day before the Fort McMurray wildfire.Based on the FWI and the type of fire (surface fire, crownfire, intermittent crown involvement), the fire danger indexcan be determined (low, moderate, high, very high, extreme)as an indication of how easy it is to ignite the forest fuel, howdifficult it is to control the fire, and the type of firefightingequipment needed (pumps, tanker trucks, bulldozer, aircraft,etc.) as shown in Fig. 3b.
2.2 Forest Fire Behavior Prediction System
To quantify the impact of wildfires on industrial plants, quan-titative estimates of head fire spread rate, fuel consump-tion and fire intensity are needed. The FBP System employsPROMTHEUS – a deterministic wildland fire growth simu-lation model based on Huygens’ principle of wave propaga-tion – to estimate the fire area, perimeter, perimeter growthrate, and flank and back fire behavior (Tymstra et al., 2010).The rate of spread (ROS) is the predicted speed (m min−1) ofthe fire head (fire front), which is calculated based on the fuel
Figure 2. Identification of the Fire Weather Index (Natural Re-sources Canada).
type, ISI, BUI, crown base height and other parameters basedon the FWI and FBP subsystems of the Canadian Forest FireDanger Rating System.
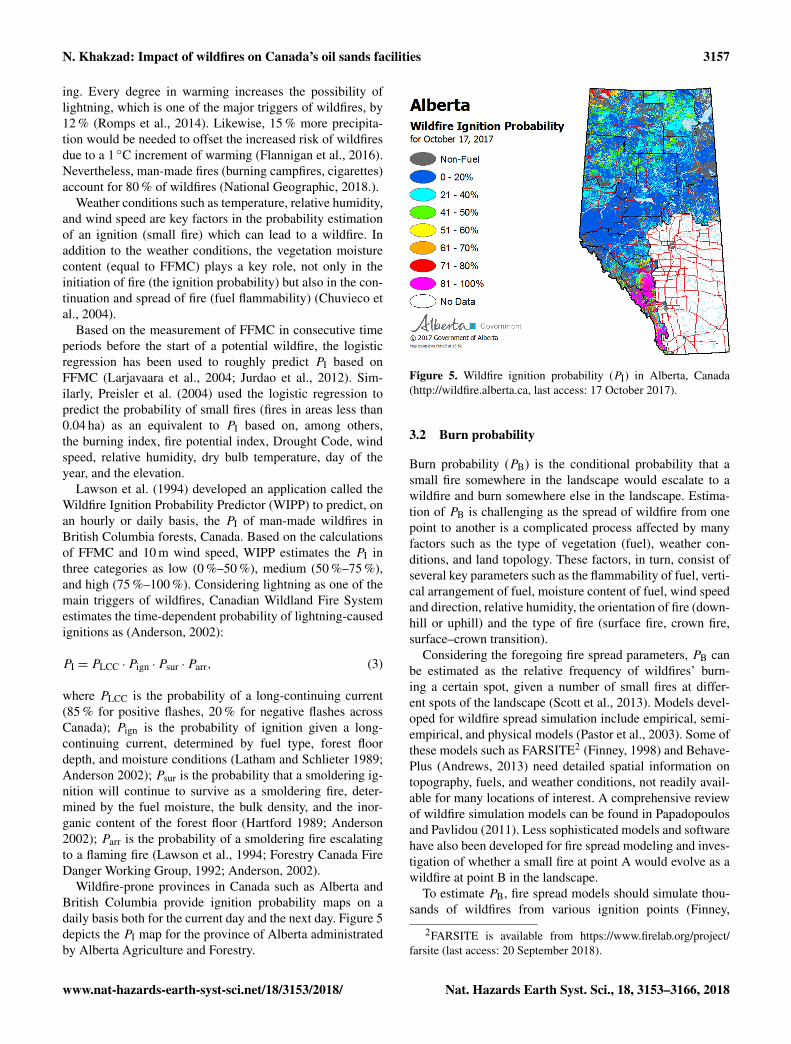
Head fire intensity (HFI) is an estimate of the energy out-put per meter of the fire front (kW m−1), calculated based onthe ROS and total fuel consumption (kg m−2). The ROS andHFI indices calculated by the Canadian Wildland Fire Infor-mation System a day before the start of the Fort McMurraywildfire are shown in Fig. 4a and b, respectively (Natural Re-sources Canada).
3 Wildfire risk assessment
In wildfire risk assessment, the ignition probability, burnprobability (the probability that wildfire reaches to a certainspot), type of fire (surface fire, crown fire, intermittent crowninvolvement) and fire intensity are the main factors to takeinto account (Scott et al., 2013).
Many methodologies have been developed to predict thelightning-induced ignition probability (Latham and Schlieter,1989; Anderson, 2002) and human-induced ignition prob-ability (Lawson et al., 1994) to model surface fire spread(Rothermel, 1972), crown fire spread (Rothermel, 1991), andthe transition between surface and crown fire spread (vanWagner, 1977). Accordingly, a number of software toolssuch as FARSITE (Finney, 1998), FlamMap5 (Finney, 2006),FSPro (Finney et al., 2011a) and FSim (Finney et al., 2011b)have been developed based on historical records of regionalwildfires, weather conditions, type and density of vegetationin the landscape, and the topology of the landscape. Usingthe developed models and software tools, the risk imposedby wildfires on an oil sands facility can be modeled as the
www.nat-hazards-earth-syst-sci.net/18/3153/2018/ Nat. Hazards Earth Syst. Sci., 18, 3153–3166, 2018
3156 N. Khakzad: Impact of wildfires on Canada’s oil sands facilities
Figure 3. (a) Fire Weather Index and (b) fire danger index of Canada on 1 May 2016 (Natural Resources Canada).
Figure 4. (a) Fire rate of spread and (b) head fire intensity in Canada on 1 May 2016 (Natural Resources Canada).
product of the wildfire probability, PW, and the severity ofconsequences, preferably in monetary units as
wildfires’ risk= PW · consequence. (1)
Given the geographical location of the facility, the prob-ability of wildfire at the borders of the facility can be esti-mated as the probability of having a small fire somewhereat the landscape (PI) times the probability of the small firegrowing to a wildfire larger than 400 m2 in area and reachingthe location of the facility (PB):
PW = PI ·PB. (2)
PI and PB are also known as ignition probability and burnprobability, respectively. Exposed to a wildfire, the potential
consequences and their severity depend on the wildfire inten-sity and the facility’s vulnerability to wildfire:C = f (fire in-tensity, facility’s vulnerability)1. In the following sections wewill describe the components of wildfire risk in further de-tail and explain how they can be estimated or acquired fromavailable (mostly freely accessible) models and databases,with a particular emphasis on the Canadian Forest Fire Sys-tem.
3.1 Ignition probability
Wildfires can be categorized as hydrogeological eventswhich are bound to increase, especially due to global warm-
1In the present study, we do not consider the indirect risk in-curred by, among others, loss of production due to the plant’s pre-cautionary shutdowns, staff evacuation, or the like.
Nat. Hazards Earth Syst. Sci., 18, 3153–3166, 2018 www.nat-hazards-earth-syst-sci.net/18/3153/2018/
N. Khakzad: Impact of wildfires on Canada’s oil sands facilities 3157
ing. Every degree in warming increases the possibility oflightning, which is one of the major triggers of wildfires, by12 % (Romps et al., 2014). Likewise, 15 % more precipita-tion would be needed to offset the increased risk of wildfiresdue to a 1 ◦C increment of warming (Flannigan et al., 2016).Nevertheless, man-made fires (burning campfires, cigarettes)account for 80 % of wildfires (National Geographic, 2018.).
Weather conditions such as temperature, relative humidity,and wind speed are key factors in the probability estimationof an ignition (small fire) which can lead to a wildfire. Inaddition to the weather conditions, the vegetation moisturecontent (equal to FFMC) plays a key role, not only in theinitiation of fire (the ignition probability) but also in the con-tinuation and spread of fire (fuel flammability) (Chuvieco etal., 2004).
Based on the measurement of FFMC in consecutive timeperiods before the start of a potential wildfire, the logisticregression has been used to roughly predict PI based onFFMC (Larjavaara et al., 2004; Jurdao et al., 2012). Sim-ilarly, Preisler et al. (2004) used the logistic regression topredict the probability of small fires (fires in areas less than0.04 ha) as an equivalent to PI based on, among others,the burning index, fire potential index, Drought Code, windspeed, relative humidity, dry bulb temperature, day of theyear, and the elevation.
Lawson et al. (1994) developed an application called theWildfire Ignition Probability Predictor (WIPP) to predict, onan hourly or daily basis, the PI of man-made wildfires inBritish Columbia forests, Canada. Based on the calculationsof FFMC and 10 m wind speed, WIPP estimates the PI inthree categories as low (0 %–50 %), medium (50 %–75 %),and high (75 %–100 %). Considering lightning as one of themain triggers of wildfires, Canadian Wildland Fire Systemestimates the time-dependent probability of lightning-causedignitions as (Anderson, 2002):
PI = PLCC ·Pign ·Psur ·Parr, (3)
where PLCC is the probability of a long-continuing current(85 % for positive flashes, 20 % for negative flashes acrossCanada); Pign is the probability of ignition given a long-continuing current, determined by fuel type, forest floordepth, and moisture conditions (Latham and Schlieter 1989;Anderson 2002); Psur is the probability that a smoldering ig-nition will continue to survive as a smoldering fire, deter-mined by the fuel moisture, the bulk density, and the inor-ganic content of the forest floor (Hartford 1989; Anderson2002); Parr is the probability of a smoldering fire escalatingto a flaming fire (Lawson et al., 1994; Forestry Canada FireDanger Working Group, 1992; Anderson, 2002).
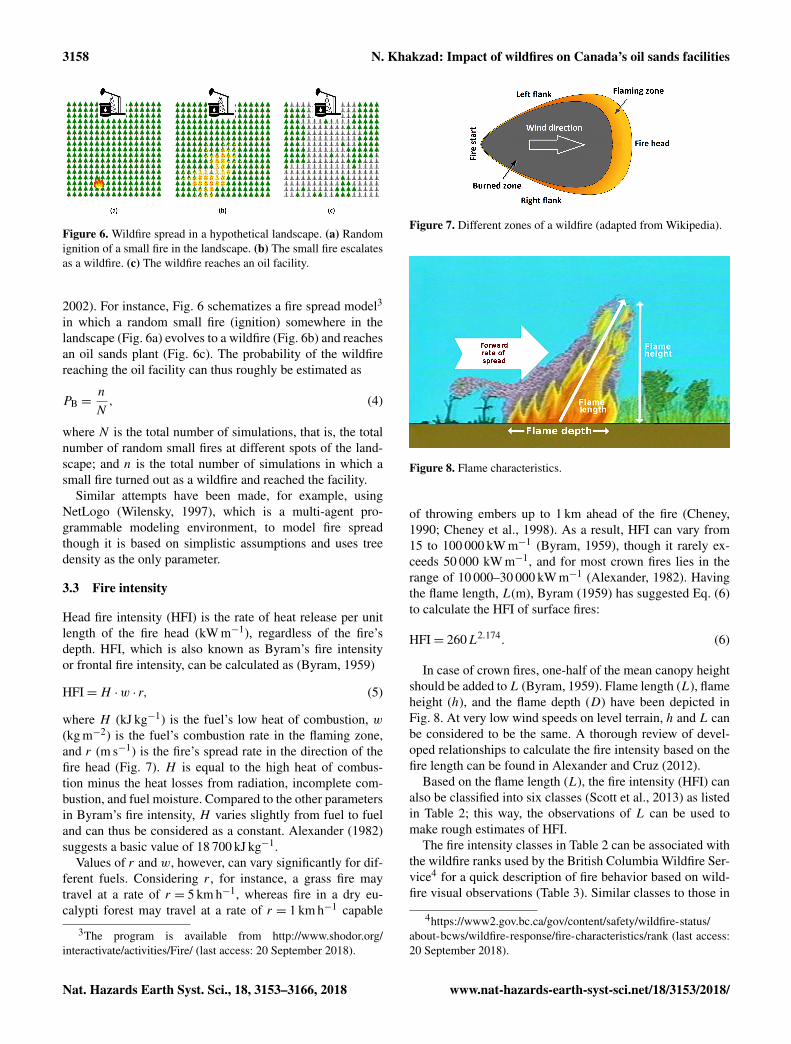
Wildfire-prone provinces in Canada such as Alberta andBritish Columbia provide ignition probability maps on adaily basis both for the current day and the next day. Figure 5depicts the PI map for the province of Alberta administratedby Alberta Agriculture and Forestry.
Figure 5. Wildfire ignition probability (PI) in Alberta, Canada(http://wildfire.alberta.ca, last access: 17 October 2017).
3.2 Burn probability
Burn probability (PB) is the conditional probability that asmall fire somewhere in the landscape would escalate to awildfire and burn somewhere else in the landscape. Estima-tion of PB is challenging as the spread of wildfire from onepoint to another is a complicated process affected by manyfactors such as the type of vegetation (fuel), weather con-ditions, and land topology. These factors, in turn, consist ofseveral key parameters such as the flammability of fuel, verti-cal arrangement of fuel, moisture content of fuel, wind speedand direction, relative humidity, the orientation of fire (down-hill or uphill) and the type of fire (surface fire, crown fire,surface–crown transition).
Considering the foregoing fire spread parameters, PB canbe estimated as the relative frequency of wildfires’ burn-ing a certain spot, given a number of small fires at differ-ent spots of the landscape (Scott et al., 2013). Models devel-oped for wildfire spread simulation include empirical, semi-empirical, and physical models (Pastor et al., 2003). Some ofthese models such as FARSITE2 (Finney, 1998) and Behave-Plus (Andrews, 2013) need detailed spatial information ontopography, fuels, and weather conditions, not readily avail-able for many locations of interest. A comprehensive reviewof wildfire simulation models can be found in Papadopoulosand Pavlidou (2011). Less sophisticated models and softwarehave also been developed for fire spread modeling and inves-tigation of whether a small fire at point A would evolve as awildfire at point B in the landscape.
To estimate PB, fire spread models should simulate thou-sands of wildfires from various ignition points (Finney,
2FARSITE is available from https://www.firelab.org/project/farsite (last access: 20 September 2018).
www.nat-hazards-earth-syst-sci.net/18/3153/2018/ Nat. Hazards Earth Syst. Sci., 18, 3153–3166, 2018
3158 N. Khakzad: Impact of wildfires on Canada’s oil sands facilities
Figure 6. Wildfire spread in a hypothetical landscape. (a) Randomignition of a small fire in the landscape. (b) The small fire escalatesas a wildfire. (c) The wildfire reaches an oil facility.
2002). For instance, Fig. 6 schematizes a fire spread model3
in which a random small fire (ignition) somewhere in thelandscape (Fig. 6a) evolves to a wildfire (Fig. 6b) and reachesan oil sands plant (Fig. 6c). The probability of the wildfirereaching the oil facility can thus roughly be estimated as
PB =n
N, (4)
where N is the total number of simulations, that is, the totalnumber of random small fires at different spots of the land-scape; and n is the total number of simulations in which asmall fire turned out as a wildfire and reached the facility.
Similar attempts have been made, for example, usingNetLogo (Wilensky, 1997), which is a multi-agent pro-grammable modeling environment, to model fire spreadthough it is based on simplistic assumptions and uses treedensity as the only parameter.
3.3 Fire intensity
Head fire intensity (HFI) is the rate of heat release per unitlength of the fire head (kW m−1), regardless of the fire’sdepth. HFI, which is also known as Byram’s fire intensityor frontal fire intensity, can be calculated as (Byram, 1959)
HFI=H ·w · r, (5)
where H (kJ kg−1) is the fuel’s low heat of combustion, w(kg m−2) is the fuel’s combustion rate in the flaming zone,and r (m s−1) is the fire’s spread rate in the direction of thefire head (Fig. 7). H is equal to the high heat of combus-tion minus the heat losses from radiation, incomplete com-bustion, and fuel moisture. Compared to the other parametersin Byram’s fire intensity, H varies slightly from fuel to fueland can thus be considered as a constant. Alexander (1982)suggests a basic value of 18 700 kJ kg−1.
Values of r and w, however, can vary significantly for dif-ferent fuels. Considering r , for instance, a grass fire maytravel at a rate of r = 5 km h−1, whereas fire in a dry eu-calypti forest may travel at a rate of r = 1 km h−1 capable
3The program is available from http://www.shodor.org/interactivate/activities/Fire/ (last access: 20 September 2018).
Figure 7. Different zones of a wildfire (adapted from Wikipedia).
Figure 8. Flame characteristics.
of throwing embers up to 1 km ahead of the fire (Cheney,1990; Cheney et al., 1998). As a result, HFI can vary from15 to 100 000 kW m−1 (Byram, 1959), though it rarely ex-ceeds 50 000 kW m−1, and for most crown fires lies in therange of 10 000–30 000 kW m−1 (Alexander, 1982). Havingthe flame length, L(m), Byram (1959) has suggested Eq. (6)to calculate the HFI of surface fires:
HFI= 260L2.174. (6)
In case of crown fires, one-half of the mean canopy heightshould be added toL (Byram, 1959). Flame length (L), flameheight (h), and the flame depth (D) have been depicted inFig. 8. At very low wind speeds on level terrain, h and L canbe considered to be the same. A thorough review of devel-oped relationships to calculate the fire intensity based on thefire length can be found in Alexander and Cruz (2012).
Based on the flame length (L), the fire intensity (HFI) canalso be classified into six classes (Scott et al., 2013) as listedin Table 2; this way, the observations of L can be used tomake rough estimates of HFI.
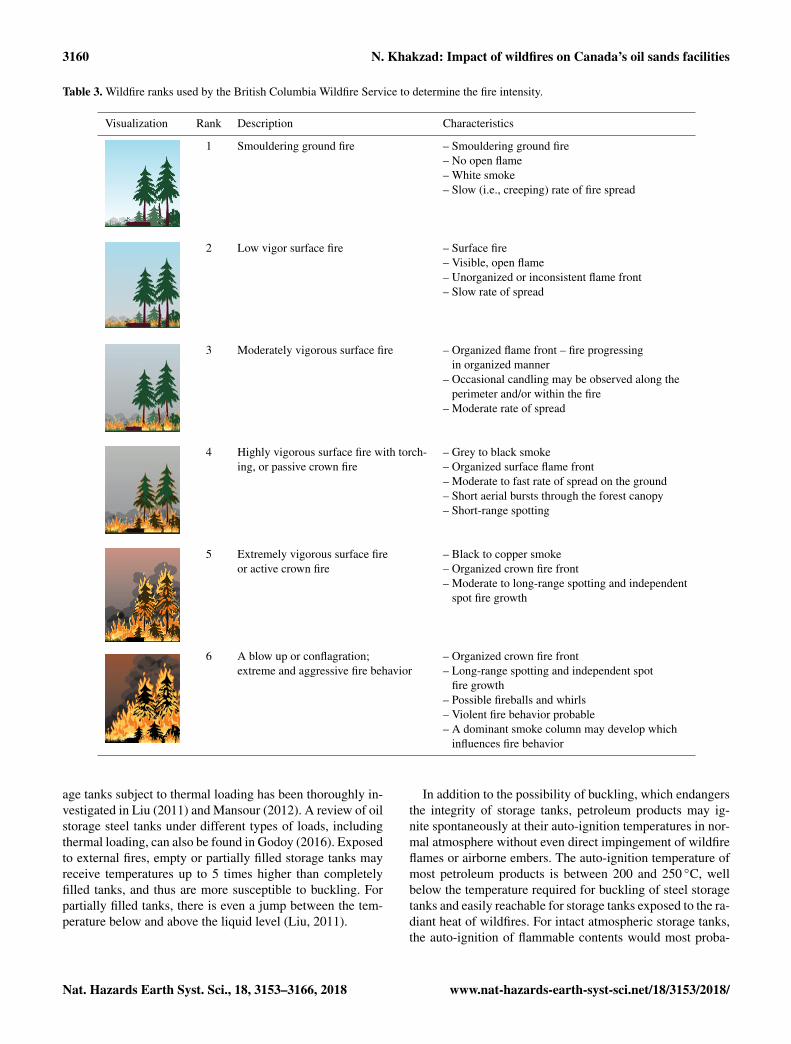
The fire intensity classes in Table 2 can be associated withthe wildfire ranks used by the British Columbia Wildfire Ser-vice4 for a quick description of fire behavior based on wild-fire visual observations (Table 3). Similar classes to those in
4https://www2.gov.bc.ca/gov/content/safety/wildfire-status/about-bcws/wildfire-response/fire-characteristics/rank (last access:20 September 2018).
Nat. Hazards Earth Syst. Sci., 18, 3153–3166, 2018 www.nat-hazards-earth-syst-sci.net/18/3153/2018/
N. Khakzad: Impact of wildfires on Canada’s oil sands facilities 3159
Table 2. Flame length range associated with six standard fire inten-sity classes.
Fire intensity class Flame length (m)
Class 1 0.0–0.6Class 2 0.6–1.2Class 3 1.2–1.8Class 4 1.8–2.4Class 5 2.4–3.7Class 6a 3.7–15Class 6b >15
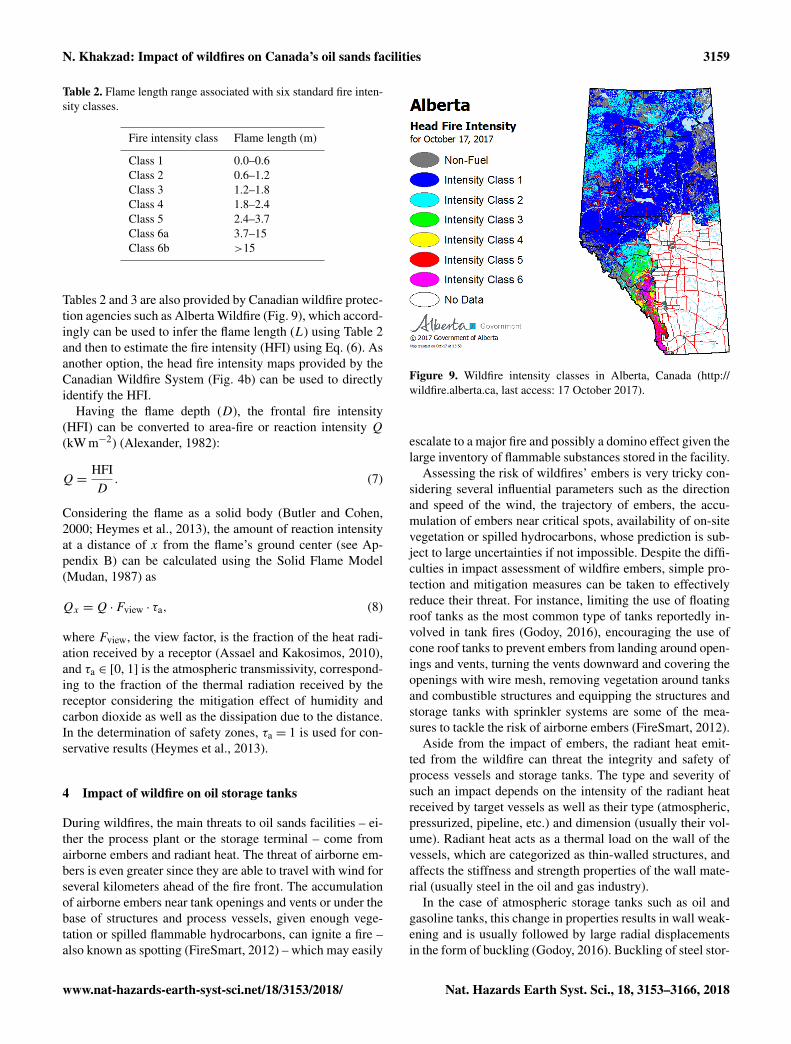
Tables 2 and 3 are also provided by Canadian wildfire protec-tion agencies such as Alberta Wildfire (Fig. 9), which accord-ingly can be used to infer the flame length (L) using Table 2and then to estimate the fire intensity (HFI) using Eq. (6). Asanother option, the head fire intensity maps provided by theCanadian Wildfire System (Fig. 4b) can be used to directlyidentify the HFI.
Having the flame depth (D), the frontal fire intensity(HFI) can be converted to area-fire or reaction intensity Q(kW m−2) (Alexander, 1982):
Q=HFID. (7)
Considering the flame as a solid body (Butler and Cohen,2000; Heymes et al., 2013), the amount of reaction intensityat a distance of x from the flame’s ground center (see Ap-pendix B) can be calculated using the Solid Flame Model(Mudan, 1987) as
Qx =Q ·Fview · τa, (8)
where Fview, the view factor, is the fraction of the heat radi-ation received by a receptor (Assael and Kakosimos, 2010),and τa ∈ [0, 1] is the atmospheric transmissivity, correspond-ing to the fraction of the thermal radiation received by thereceptor considering the mitigation effect of humidity andcarbon dioxide as well as the dissipation due to the distance.In the determination of safety zones, τa = 1 is used for con-servative results (Heymes et al., 2013).
4 Impact of wildfire on oil storage tanks
During wildfires, the main threats to oil sands facilities – ei-ther the process plant or the storage terminal – come fromairborne embers and radiant heat. The threat of airborne em-bers is even greater since they are able to travel with wind forseveral kilometers ahead of the fire front. The accumulationof airborne embers near tank openings and vents or under thebase of structures and process vessels, given enough vege-tation or spilled flammable hydrocarbons, can ignite a fire –also known as spotting (FireSmart, 2012) – which may easily
Figure 9. Wildfire intensity classes in Alberta, Canada (http://wildfire.alberta.ca, last access: 17 October 2017).
escalate to a major fire and possibly a domino effect given thelarge inventory of flammable substances stored in the facility.
Assessing the risk of wildfires’ embers is very tricky con-sidering several influential parameters such as the directionand speed of the wind, the trajectory of embers, the accu-mulation of embers near critical spots, availability of on-sitevegetation or spilled hydrocarbons, whose prediction is sub-ject to large uncertainties if not impossible. Despite the diffi-culties in impact assessment of wildfire embers, simple pro-tection and mitigation measures can be taken to effectivelyreduce their threat. For instance, limiting the use of floatingroof tanks as the most common type of tanks reportedly in-volved in tank fires (Godoy, 2016), encouraging the use ofcone roof tanks to prevent embers from landing around open-ings and vents, turning the vents downward and covering theopenings with wire mesh, removing vegetation around tanksand combustible structures and equipping the structures andstorage tanks with sprinkler systems are some of the mea-sures to tackle the risk of airborne embers (FireSmart, 2012).
Aside from the impact of embers, the radiant heat emit-ted from the wildfire can threat the integrity and safety ofprocess vessels and storage tanks. The type and severity ofsuch an impact depends on the intensity of the radiant heatreceived by target vessels as well as their type (atmospheric,pressurized, pipeline, etc.) and dimension (usually their vol-ume). Radiant heat acts as a thermal load on the wall of thevessels, which are categorized as thin-walled structures, andaffects the stiffness and strength properties of the wall mate-rial (usually steel in the oil and gas industry).
In the case of atmospheric storage tanks such as oil andgasoline tanks, this change in properties results in wall weak-ening and is usually followed by large radial displacementsin the form of buckling (Godoy, 2016). Buckling of steel stor-
www.nat-hazards-earth-syst-sci.net/18/3153/2018/ Nat. Hazards Earth Syst. Sci., 18, 3153–3166, 2018
3160 N. Khakzad: Impact of wildfires on Canada’s oil sands facilities
Table 3. Wildfire ranks used by the British Columbia Wildfire Service to determine the fire intensity.
Visualization Rank Description Characteristics
1 Smouldering ground fire – Smouldering ground fire– No open flame– White smoke– Slow (i.e., creeping) rate of fire spread
2 Low vigor surface fire – Surface fire– Visible, open flame– Unorganized or inconsistent flame front– Slow rate of spread
3 Moderately vigorous surface fire – Organized flame front – fire progressingin organized manner
– Occasional candling may be observed along theperimeter and/or within the fire
– Moderate rate of spread
4 Highly vigorous surface fire with torch- – Grey to black smokeing, or passive crown fire – Organized surface flame front
– Moderate to fast rate of spread on the ground– Short aerial bursts through the forest canopy– Short-range spotting
5 Extremely vigorous surface fire – Black to copper smokeor active crown fire – Organized crown fire front
– Moderate to long-range spotting and independentspot fire growth
6 A blow up or conflagration; – Organized crown fire frontextreme and aggressive fire behavior – Long-range spotting and independent spot
fire growth– Possible fireballs and whirls– Violent fire behavior probable– A dominant smoke column may develop which
influences fire behavior
age tanks subject to thermal loading has been thoroughly in-vestigated in Liu (2011) and Mansour (2012). A review of oilstorage steel tanks under different types of loads, includingthermal loading, can also be found in Godoy (2016). Exposedto external fires, empty or partially filled storage tanks mayreceive temperatures up to 5 times higher than completelyfilled tanks, and thus are more susceptible to buckling. Forpartially filled tanks, there is even a jump between the tem-perature below and above the liquid level (Liu, 2011).
In addition to the possibility of buckling, which endangersthe integrity of storage tanks, petroleum products may ig-nite spontaneously at their auto-ignition temperatures in nor-mal atmosphere without even direct impingement of wildfireflames or airborne embers. The auto-ignition temperature ofmost petroleum products is between 200 and 250 ◦C, wellbelow the temperature required for buckling of steel storagetanks and easily reachable for storage tanks exposed to the ra-diant heat of wildfires. For intact atmospheric storage tanks,the auto-ignition of flammable contents would most proba-
Nat. Hazards Earth Syst. Sci., 18, 3153–3166, 2018 www.nat-hazards-earth-syst-sci.net/18/3153/2018/
N. Khakzad: Impact of wildfires on Canada’s oil sands facilities 3161
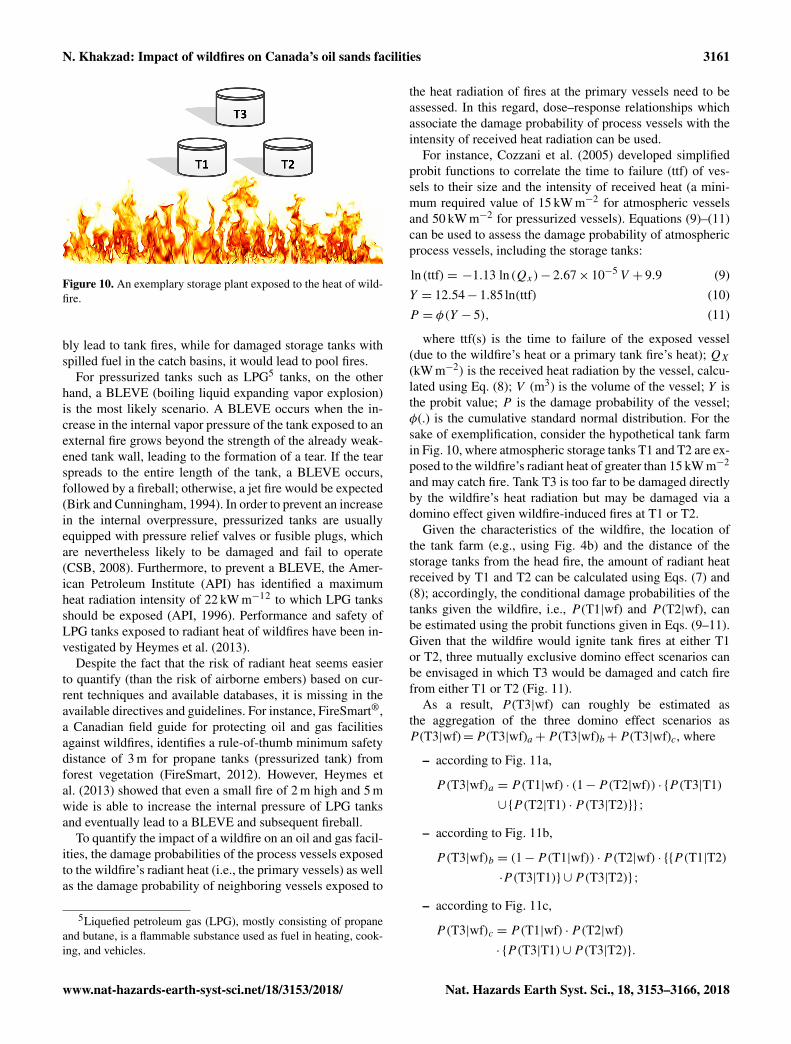
Figure 10. An exemplary storage plant exposed to the heat of wild-fire.
bly lead to tank fires, while for damaged storage tanks withspilled fuel in the catch basins, it would lead to pool fires.
For pressurized tanks such as LPG5 tanks, on the otherhand, a BLEVE (boiling liquid expanding vapor explosion)is the most likely scenario. A BLEVE occurs when the in-crease in the internal vapor pressure of the tank exposed to anexternal fire grows beyond the strength of the already weak-ened tank wall, leading to the formation of a tear. If the tearspreads to the entire length of the tank, a BLEVE occurs,followed by a fireball; otherwise, a jet fire would be expected(Birk and Cunningham, 1994). In order to prevent an increasein the internal overpressure, pressurized tanks are usuallyequipped with pressure relief valves or fusible plugs, whichare nevertheless likely to be damaged and fail to operate(CSB, 2008). Furthermore, to prevent a BLEVE, the Amer-ican Petroleum Institute (API) has identified a maximumheat radiation intensity of 22 kW m−12 to which LPG tanksshould be exposed (API, 1996). Performance and safety ofLPG tanks exposed to radiant heat of wildfires have been in-vestigated by Heymes et al. (2013).
Despite the fact that the risk of radiant heat seems easierto quantify (than the risk of airborne embers) based on cur-rent techniques and available databases, it is missing in theavailable directives and guidelines. For instance, FireSmart®,a Canadian field guide for protecting oil and gas facilitiesagainst wildfires, identifies a rule-of-thumb minimum safetydistance of 3 m for propane tanks (pressurized tank) fromforest vegetation (FireSmart, 2012). However, Heymes etal. (2013) showed that even a small fire of 2 m high and 5 mwide is able to increase the internal pressure of LPG tanksand eventually lead to a BLEVE and subsequent fireball.
To quantify the impact of a wildfire on an oil and gas facil-ities, the damage probabilities of the process vessels exposedto the wildfire’s radiant heat (i.e., the primary vessels) as wellas the damage probability of neighboring vessels exposed to
5Liquefied petroleum gas (LPG), mostly consisting of propaneand butane, is a flammable substance used as fuel in heating, cook-ing, and vehicles.
the heat radiation of fires at the primary vessels need to beassessed. In this regard, dose–response relationships whichassociate the damage probability of process vessels with theintensity of received heat radiation can be used.
For instance, Cozzani et al. (2005) developed simplifiedprobit functions to correlate the time to failure (ttf) of ves-sels to their size and the intensity of received heat (a mini-mum required value of 15 kW m−2 for atmospheric vesselsand 50 kW m−2 for pressurized vessels). Equations (9)–(11)can be used to assess the damage probability of atmosphericprocess vessels, including the storage tanks:
ln(ttf)= −1.13 ln(Qx)− 2.67× 10⁻⁵V + 9.9 (9)Y = 12.54− 1.85 ln(ttf) (10)P = φ(Y − 5), (11)
where ttf(s) is the time to failure of the exposed vessel(due to the wildfire’s heat or a primary tank fire’s heat); QX
(kW m−2) is the received heat radiation by the vessel, calcu-lated using Eq. (8); V (m3) is the volume of the vessel; Y isthe probit value; P is the damage probability of the vessel;φ(.) is the cumulative standard normal distribution. For thesake of exemplification, consider the hypothetical tank farmin Fig. 10, where atmospheric storage tanks T1 and T2 are ex-posed to the wildfire’s radiant heat of greater than 15 kW m−2
and may catch fire. Tank T3 is too far to be damaged directlyby the wildfire’s heat radiation but may be damaged via adomino effect given wildfire-induced fires at T1 or T2.
Given the characteristics of the wildfire, the location ofthe tank farm (e.g., using Fig. 4b) and the distance of thestorage tanks from the head fire, the amount of radiant heatreceived by T1 and T2 can be calculated using Eqs. (7) and(8); accordingly, the conditional damage probabilities of thetanks given the wildfire, i.e., P (T1|wf) and P (T2|wf), canbe estimated using the probit functions given in Eqs. (9–11).Given that the wildfire would ignite tank fires at either T1or T2, three mutually exclusive domino effect scenarios canbe envisaged in which T3 would be damaged and catch firefrom either T1 or T2 (Fig. 11).
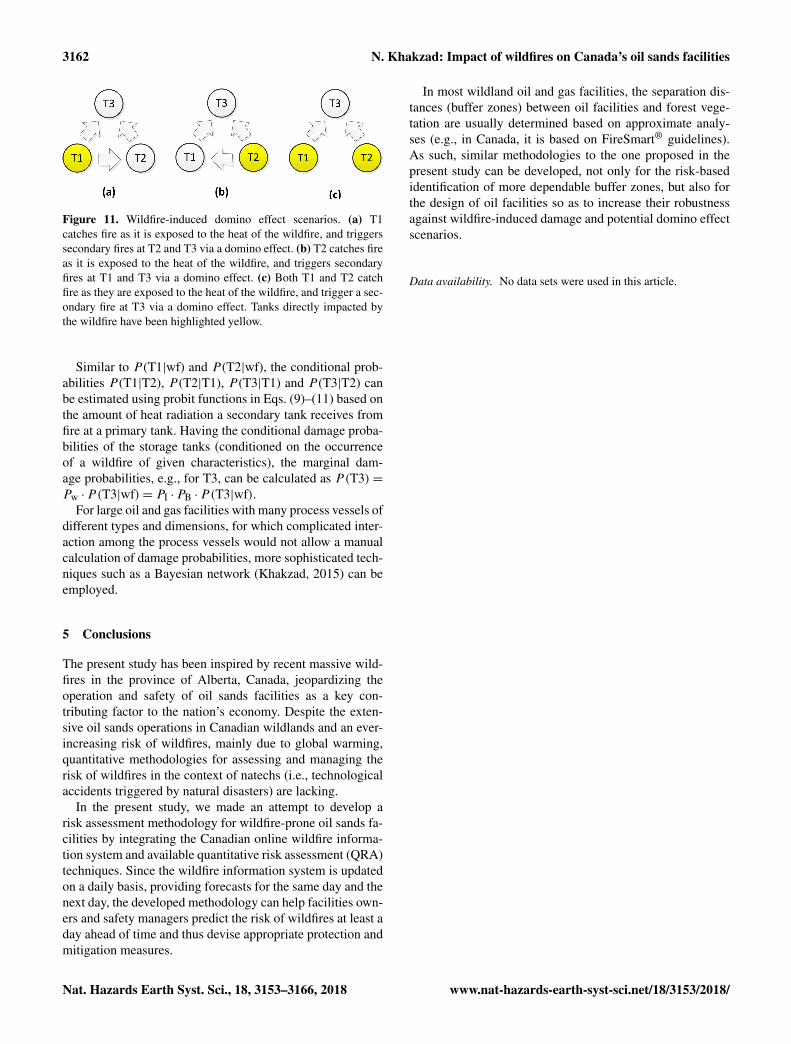
As a result, P (T3|wf) can roughly be estimated asthe aggregation of the three domino effect scenarios asP (T3|wf)=P (T3|wf)a+P (T3|wf)b+P (T3|wf)c, where
– according to Fig. 11a,
P(T3|wf)a = P(T1|wf) · (1−P(T2|wf)) · {P(T3|T1)∪{P(T2|T1) ·P(T3|T2)}} ;
– according to Fig. 11b,
P(T3|wf)b = (1−P(T1|wf)) ·P(T2|wf) · {{P(T1|T2)·P(T3|T1)} ∪P(T3|T2)} ;
– according to Fig. 11c,
P(T3|wf)c = P(T1|wf) ·P(T2|wf)· {P(T3|T1)∪P(T3|T2)}.
www.nat-hazards-earth-syst-sci.net/18/3153/2018/ Nat. Hazards Earth Syst. Sci., 18, 3153–3166, 2018
3162 N. Khakzad: Impact of wildfires on Canada’s oil sands facilities
Figure 11. Wildfire-induced domino effect scenarios. (a) T1catches fire as it is exposed to the heat of the wildfire, and triggerssecondary fires at T2 and T3 via a domino effect. (b) T2 catches fireas it is exposed to the heat of the wildfire, and triggers secondaryfires at T1 and T3 via a domino effect. (c) Both T1 and T2 catchfire as they are exposed to the heat of the wildfire, and trigger a sec-ondary fire at T3 via a domino effect. Tanks directly impacted bythe wildfire have been highlighted yellow.
Similar to P (T1|wf) and P (T2|wf), the conditional prob-abilities P (T1|T2), P (T2|T1), P (T3|T1) and P (T3|T2) canbe estimated using probit functions in Eqs. (9)–(11) based onthe amount of heat radiation a secondary tank receives fromfire at a primary tank. Having the conditional damage proba-bilities of the storage tanks (conditioned on the occurrenceof a wildfire of given characteristics), the marginal dam-age probabilities, e.g., for T3, can be calculated as P(T3)=Pw ·P(T3|wf)= PI ·PB ·P(T3|wf).
For large oil and gas facilities with many process vessels ofdifferent types and dimensions, for which complicated inter-action among the process vessels would not allow a manualcalculation of damage probabilities, more sophisticated tech-niques such as a Bayesian network (Khakzad, 2015) can beemployed.
5 Conclusions
The present study has been inspired by recent massive wild-fires in the province of Alberta, Canada, jeopardizing theoperation and safety of oil sands facilities as a key con-tributing factor to the nation’s economy. Despite the exten-sive oil sands operations in Canadian wildlands and an ever-increasing risk of wildfires, mainly due to global warming,quantitative methodologies for assessing and managing therisk of wildfires in the context of natechs (i.e., technologicalaccidents triggered by natural disasters) are lacking.
In the present study, we made an attempt to develop arisk assessment methodology for wildfire-prone oil sands fa-cilities by integrating the Canadian online wildfire informa-tion system and available quantitative risk assessment (QRA)techniques. Since the wildfire information system is updatedon a daily basis, providing forecasts for the same day and thenext day, the developed methodology can help facilities own-ers and safety managers predict the risk of wildfires at least aday ahead of time and thus devise appropriate protection andmitigation measures.
In most wildland oil and gas facilities, the separation dis-tances (buffer zones) between oil facilities and forest vege-tation are usually determined based on approximate analy-ses (e.g., in Canada, it is based on FireSmart® guidelines).As such, similar methodologies to the one proposed in thepresent study can be developed, not only for the risk-basedidentification of more dependable buffer zones, but also forthe design of oil facilities so as to increase their robustnessagainst wildfire-induced damage and potential domino effectscenarios.
Data availability. No data sets were used in this article.
Nat. Hazards Earth Syst. Sci., 18, 3153–3166, 2018 www.nat-hazards-earth-syst-sci.net/18/3153/2018/
N. Khakzad: Impact of wildfires on Canada’s oil sands facilities 3163
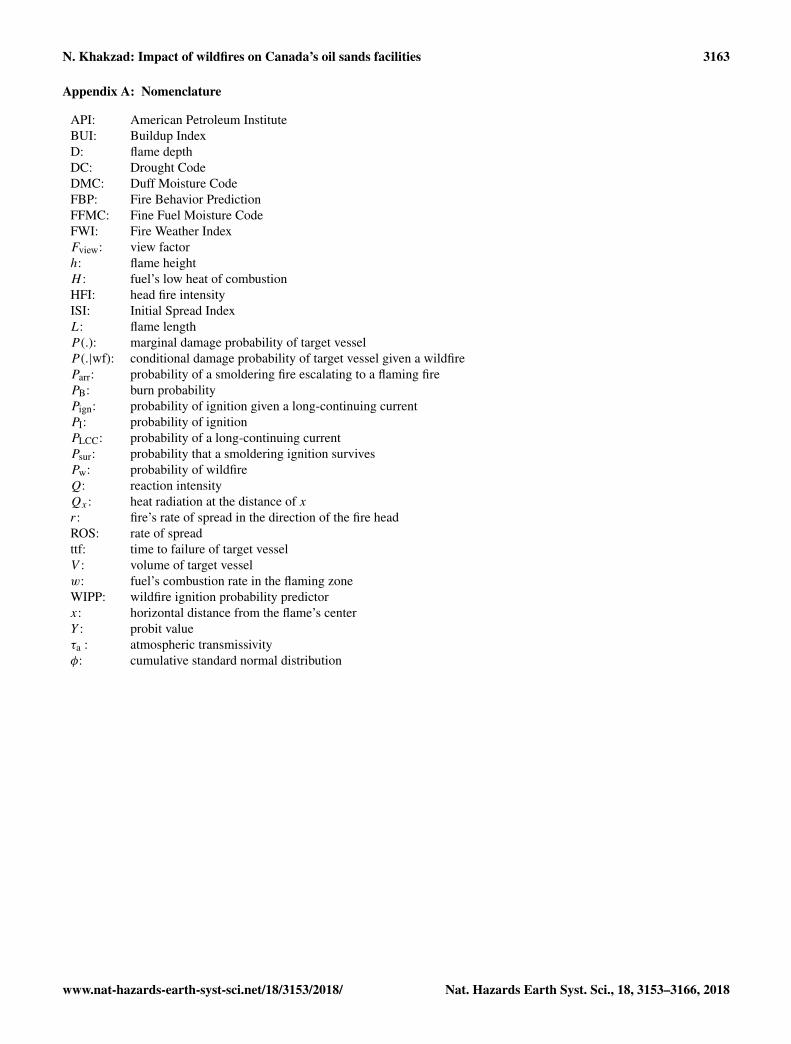
Appendix A: Nomenclature
API: American Petroleum InstituteBUI: Buildup IndexD: flame depthDC: Drought CodeDMC: Duff Moisture CodeFBP: Fire Behavior PredictionFFMC: Fine Fuel Moisture CodeFWI: Fire Weather IndexFview: view factorh: flame heightH : fuel’s low heat of combustionHFI: head fire intensityISI: Initial Spread IndexL: flame lengthP (.): marginal damage probability of target vesselP (.|wf): conditional damage probability of target vessel given a wildfireParr: probability of a smoldering fire escalating to a flaming firePB: burn probabilityPign: probability of ignition given a long-continuing currentPI: probability of ignitionPLCC: probability of a long-continuing currentPsur: probability that a smoldering ignition survivesPw: probability of wildfireQ: reaction intensityQx : heat radiation at the distance of xr: fire’s rate of spread in the direction of the fire headROS: rate of spreadttf: time to failure of target vesselV : volume of target vesselw: fuel’s combustion rate in the flaming zoneWIPP: wildfire ignition probability predictorx: horizontal distance from the flame’s centerY : probit valueτa : atmospheric transmissivityφ: cumulative standard normal distribution
www.nat-hazards-earth-syst-sci.net/18/3153/2018/ Nat. Hazards Earth Syst. Sci., 18, 3153–3166, 2018

3164 N. Khakzad: Impact of wildfires on Canada’s oil sands facilities
Appendix B: Identification of view factors in the SolidFlame Model
Fview can be calculated as a function of vertical Fv and hori-zontal Fh view factors as (Assael and Kakosimos, 2010)
Fview =
√F 2
v +F2h ,
where
πFv =−E tan−1∅
+E
[α2+ (β + 1)2− 2β (1+α sinθ)
AB
]tan−1
(A∅B
)
+cosθC
[tan−1
(αβ −F 2 sinθ
FC
)+ tan−1
(F sinθC
)]πFh = tan−1
(1∅
)+
sinθC
[tan−1
(αβ −F 2 sinθ
FC
)+ tan−1
(F sinθC
)]−
[α2+ (β + 1)2− 2(β + 1+αβ sinθ)
AB
]tan−1
(A∅B
)α =
L
R
β =X
R
A=
√α2+ (β + 1)2− 2α (β + 1)sinθ
B =
√α2+ (β − 1)2− 2α (β − 1)sinθ
C =
√1+ (β2− 1)cos2θ
∅=√(β − 1)/(β + 1)
E =α cosθ
β −α sinθ
F =
√β2− 1.
The angle of tilt, θ , can be calculated as a function of windspeed uw as (Pritchard and Binding, 1992)
tanθcosθ
= 0.666Fr 0.333Re0.117,
where Fr is the Froud number Fr= u2wg∅ , and Re is the
Reynolds number Re= uwρa∅ηa
, both non-dimensional num-bers. ρa and ηa are, respectively, the density (∼ 1.21 kg m−3)
and viscosity (∼ 16.7 µPa s) of air; g is gravitational acceler-ation (∼ 9.81 m s−2).
Figure B1. Flame as a tilted cylinder.
Nat. Hazards Earth Syst. Sci., 18, 3153–3166, 2018 www.nat-hazards-earth-syst-sci.net/18/3153/2018/
N. Khakzad: Impact of wildfires on Canada’s oil sands facilities 3165
Competing interests. The author declares that there is no conflictof interest.
Edited by: Rosa LasaponaraReviewed by: two anonymous referees
References
Alexander, M. E.: Calculating and interpreting forest fire intensities,Can. J. Botany, 60, 349–357, 1982.
Alexander, M. E. and Cruz, M. G.: Interdependencies betweenflame length and fireline intensity in predicting crown fire initia-tion and crown scorch height, Int. J. Wildland Fire, 21, 95–113,2012.
American Petroleum Institute (API): Fire-protection considerationsfor the design and operation of liquefied petroleum gas (LPG)storage facilities, Publication 2510A, 2nd edition, AmericanPetroleum Institute, Washington DC, US, 1996.
Andrews, P. L.: Current status and future needs of the BehavePlusFire Modeling System, Int. J. Wildland Fire, 23, 21–33, 2013.
Anderson, K. R.: A model to predict lightning-caused fire occur-rences, Int. J. Wildland Fire, 11, 174–182, 2002.
Assael, M. J. and Kakosimos, K. E. (Eds.): Fires, explosions, andtoxic gas dispersions: Effects calculation and risk analysis, 1stEdition, CRC Press, Taylor & Francis Group, Boca Raton, FL,2010.
Birk, A. M. and Cunnigham, M. H.: The boiling liquid expandingvapor cloud explosion, J. Loss Prevent. Proc., 7, 474–480, 1994.
Butler, B. W. and Cohen, J. D.: Field verification of a firefightersafety zone model, the 2000 International Wildfire Safety Sum-mit, Edmonton, Alberta, 10–12 October 2000, 54–61, 2000.
Byram, G. M.: Combustion of forest fuels, in: Forest Fire: Controland Use, edited by: Davis, K. P., McGraw Hill, New York, 61–89,1959.
Chemical Safety Board (CSB): LPG fire at Valerio-McKee Re-finery, Report No. 2007-05-I-TX, available at: https://www.csb.gov/valero-refinery-propane-fire/ (last access: 11 October 2018),2008.
Cheney, N. P.: Quantifying bushfires, Math. Comput. Model., 13,9–15, 1990.
Cheney, N. P., Gould, J. S., and Catchpole, W. R.: Prediction of firespread in grasslands, Int. J. Wildland Fire, 8, 1–13, 1998.
Chuvieco, E., Aguado, I., and Dimitrakopoulos, A. P.: Conversionof fuel moisture content values to ignition potential for integratedfire danger assessment, Can. J. Forest Res., 34, 2284–2293, 2004.
Cozzani, V., Gubinelli, G., Antonioni, G., Spadoni, G., and Zanelli,S.: The assessment of risk caused by domino effect in quantita-tive area risk analysis, J. Hazard. Mater., A127, 14–30, 2005.
European Joint Research Centre, available at: https://ec.europa.eu/jrc/en/news/europe-be-hit-hard-climate-related-disasters-future(last access: 11 October 2018), 2017.
Finney, M. A.: FARSITE: Fire Area Simulator – model devel-opment and evaluation, Res. Pap. RMRS-RP-4, Department ofAgriculture, Forest Service, Rocky Mountain Research Station,Fort Collins, CO, U.S., 47 pp., 1998.
Finney, M. A.: Fire growth using minimum travel time methods,Can. J. Forest Res., 32, 1420–1424, 2002.
Finney, M. A.: An overview of FlamMap fire modeling capabilities,in: Fuels management-how to measure success, edited by: An-drews, P. L. and Butler, B. W., Proc. RMRS-P-41, Department ofAgriculture, Forest Service, Rocky Mountain Research Station,Fort Collins, CO, U.S., 213–220, 2006.
Finney, M. A., Grenfell, I. C., McHugh, C. W., Seli, R. C., Trethe-way, D., Stratton, R. D., and Britton, S.: A method for ensemblewildland fire simulation, Environ. Model. Assess., 16, 153–167,2011a.
Finney, M. A., McHugh, C. W., Grenfell, I. C., Riley, K. L., andShort, K. C.: A simulation of probabilistic wildfire risk compo-nents for the continental United States, Stoch. Env. Res. Risk A.,25, 973–1000, 2011b.
FireSmart®: Canadian Guidebook for the Oil and Gas Industry,Alberta, Canada, available at: http://wildfire.alberta.ca/firesmart/documents/FireSmart-Guidebook-OilAndGasIndustry-2008.pdf(last access: 11 October 2018), 2012.
Flannigan, M. D., Wotton, B. M., Marshall, G. A., de Groot, W. J.,Johnston, J., Jurko, N., and Cantin, A. S.: Fuel moisture sensitiv-ity to temperature and precipitation: climate change implications,Climatic Change, 134, 59–71, 2016.
Forestry Canada Fire Danger Group: Development and structure ofthe Canadian Forest Fire Behavior Prediction System, For. Can.Ottawa, ON. Inf. Rep. ST-X-3, Forestry Canada, Ottawa, ON,1992.
Global News: Fort McMurray wildfire: Oilsands work campdestroyed as flames threaten other sites, 17 May 2016, availableat: https://globalnews.ca/news/2706177/fort-mcmurray-wildfire-several-homes-damaged-in-explosion-in-dickinsfield-fire-in-thickwood/ (last access: 11 October 2018), 2016a.
Global News: Why experts say Alberta oilsands sites areconsidered resilient to wildfires, 17 May 2016, availableat: https://globalnews.ca/news/2707147/why-experts-say-alberta-oilsands-sites-are-considered-resilient-to-wildfires/ (lastaccessed 11 October 2018), 2016b.
Godoy, L.: Buckling of vertical oil storage steel tanks: Review ofstatic buckling studies, Thin Wall. Struct., 103, 1–21, 2016.
Hartford, R. A.: Smoldering combustion limits in peat as influ-enced by moisture, mineral content, and organic bulk density,the 10th Conference on Fire and Forest Meteorology, Ottawa,ON, Canada, 17–21 April, 282–286, 1989.
Heymes, F., Aprin, L., Forestier, S., Slangen, P., Jarry, J. B.,François, H., and Dusserre, G.: Impact of a distant wildland fireon an LPG tank, Fire Safety J., 61, 100–107, 2013.
Jurdao, S., Chuvieco, E., Jorge, M., and Arevalillo, J. M.: Mod-elling fire ignition probability from satellite estimates of live fuelmoisture content, Fire Ecol., 8, 77–97, 2012.
Khakzad, N.: Application of dynamic Bayesian network to riskanalysis of domino effects in chemical infrastructures, Reliab.Eng. Syst. Safe., 138, 263–272, 2015.
Khakzad, N., Dadashzadeh, M., and Reniers, G.: Quantitative as-sessment of wildfire risk in oil facilities, J. Environ. Manage.,223, 433–443, 2018.
Krausmann, E. and Baranzini, D.: Natech risk reduction in the Eu-ropean Union, J. Risk Res., 15, 1027–1047, 2012.
Larjavaara, M., Kuuluvainen, T., Tanskanen, H., and Venäläinen,A.: Variation in forest fire ignition probability in Finland, SilvaFenn., 38, 253–266, 2004.
www.nat-hazards-earth-syst-sci.net/18/3153/2018/ Nat. Hazards Earth Syst. Sci., 18, 3153–3166, 2018
3166 N. Khakzad: Impact of wildfires on Canada’s oil sands facilities
Latham, D. J. and Schlieter, J. A.: Ignition probabilities of wild-land fuels based on simulated lightning discharges, USDA For.Serv. Ogden, UT. Res. Pap. INT-411, United states Departmentof Agriculture (USDA), Ogden, Utah, 1989.
Lawson, B. D., Armitage, O. B., and Dalrymple, G. N.: Ignitionprobabilities for simulated people-caused fires in B.C.’s lodgepole pine and white spruce-subalpine fire forests, 12th Confer-ence on Fire and Forest Meteorology, Beltsville, MD, U.S., 26–28 October 1993, 493–505, 1994.
Liu, Y.: Thermal buckling of metal oil tanks subject to an adjacentfire, PhD Thesis, University of Edinburgh, Scotland, 2011.
Maclean’s: The Fort McMurray wildfire has hit the oil sands hard,6 May 2016, available at: http://www.macleans.ca/economy/the-fort-mcmurray-wildfire-has-hit-the-oil-sands-hard/ (last access:11 October 2018), 2016a.
Maclean’s: Could the oil sands catch fire?, 4 May 2016,available at: http://www.macleans.ca/news/canada/could-the-oil-sands-catch-fire/ (last access: 11 October 2018), 2016b.
Mansour, K.: Fires in large atmospheric storage tanks and their ef-fect on adjacent tanks, PhD Thesis, Loughborough University,UK, 2012.
Mining.Com: Wildfire spreads closer to Canada’s oilsands: hundreds evacuated, 28 May 2015, available at:http://www.mining.com/wildfire-spreads-closer-to-canadas-oil-sands-hundreds-evacuated/ (last access: 11 October 2018),2015.
Mudan, K. S.: Geometric view factors for thermal radiation hazardassessment, Fire Safety J., 12, 89–96, 1987.
National Geographic, Learn more about wildfires, avail-able at: https://www.nationalgeographic.com/environment/natural-disasters/wildfires/, last access: 27 July 2018.
Natural Resources Canada: Canadian Wildland Fire InformationSystem, available at: http://cwfis.cfs.nrcan.gc.ca/background/summary/fwi, last access: 11 October 2018.
Papadopoulos, G. D. and Pavlidou, F. N.: A Comparative Reviewon Wildfire Simulators, IEEE Syst. J., 5, 233–243, 2011.
Pastor, E., Zarate, L., Planas, E., and Arnaldos, J.: Mathematicalmodels and calculation systems for the study of wildland fire be-havior, Prog. Energ. Combust., 29, 139–153, 2003.
Preisler, H. K., Brillinger, D. R., Burgan, R. E., and Benoit, J. W.:Probability based models for estimation of wildfire risk, Int. J.Wildland Fire, 13, 133–142, 2004.
Romps, D. M., Seeley, J. T., Vollaro, D., and Molinari, J.: Projectedincrease in lightning strikes in the United States due to globalwarming, Science, 346, 851–854, 2014.
Rothermel, R. C.: A mathematical model for predicting fire spreadin wildland fuels, Res. Pap. INT-115, U.S. Department of Agri-culture, Forest Service, Intermountain Forest and Range Experi-ment Station, Ogden, UT, 40 pp., 1972.
Rothermel, R. C.: Predicting behavior and size of crown fires in theNorthern Rocky Mountains. Res. Pap. INT-438, U.S. Departmentof Agriculture, Forest Service, Intermountain Forest and RangeExperiment Station, Ogden, UT, 46 pp., 1991.
Scott, J., Helmbrecht, D., Thompson, M. P., Calkin, D. E., and Mar-cille, K.: Probabilistic assessment of wildfire hazard and munic-ipal watershed exposure, Nat. Hazards, 64, 707–728, 2012.
Scott, J., Thompson, M. P., and Calkin, D. E.: A wildfire risk as-sessment framework for land and resource management, GeneralTechnical Report RMRS-GTR-315, U.S. Department of Agri-culture, Forest Service, Rocky Mountain Research Station, 83pp., available at: https://www.nrs.fs.fed.us/pubs/44723 (last ac-cess: 11 October 2018), 2013.
Seveso Directive III, Directive 2012/18/EU of the European Par-liament and of the Council of 4 July 2012 on the control ofmajor-accident hazards involving dangerous substances, amend-ing and subsequently repealing Council Directive 96/82/EC, Of-ficial Journal of the European Communities, No L 197, 1–37,2012.
Tymstra, C., Bryce, R. W., Wotton, B. M., Taylor, S. W., and Ar-mitage, O. B.: Development and Structure of Prometheus: theCanadian Wildland Fire Growth Simulation Model, INFORMA-TION REPORT NOR-X-417, Natural Resources Canada, Cana-dian Forest Service, Northern Forestry Centre, Victoria, BC,Canada, 2010.
Van Wagner, C. E.: Conditions for the start and spread of crown fire,Can. J. Forest Res., 7, 23–34, 1977.
Wilensky, U.: NetLogo Fire model, Center for Connected Learn-ing and Computer-Based Modeling, Northwestern University,Evanston, IL, available at: http://ccl.northwestern.edu/netlogo/models/Fire (last access: 11 October 2018), 1997.
Nat. Hazards Earth Syst. Sci., 18, 3153–3166, 2018 www.nat-hazards-earth-syst-sci.net/18/3153/2018/