Tutunup South Mineral Sands Project - Public Environmental ...
Upload
uni-hohenheimCategory
view
2download
0
KSCE Journal of Civil Engineering (2009) 13(4):257-272DOI 10.1007/s12205-009-0257-7
− 257 −
www.springer.com/12205
Geotechnical Engineering
A General Dry Density Law for Sands
Emöke Imre*, János Lörincz**, Q. Phong Trang***, Stephen Fityus****, József Pusztai*****,Gábor Telekes******, and Tom Schanz*******
Received January 30, 2009/Accepted April 23, 2009
···································································································································································································································
Abstract
The direct interpolation of a transfer function needs exponentially many data in terms of the number of the fractions in the gradingcurve. The suggested transfer function construction method - based on a double approximation technique, the grading entropyconcept and at most quadratic many data in terms of the fraction number – is tested on the example of the dry density of sands hereusing some previously measured data. In the first approximation step a “preliminary transfer function” is interpolated in the non-normalized grading entropy diagram on the basis of some “optimal” soil data. In the second approximation step the preliminarytransfer function is extended to the space of the possible grading curves with the constant function. The so determined transferfunction is tested against an independent “non-optimal” data set, measured on some soil series with basically continuous (i.e., notgap-graded) grading curves. The aim of this paper is to present the main results of the study supporting the goodness of the methodand the predictability of the dry density transfer function.Keywords: grading curve, grading entropy, void ratio, density, sand, transfer function
···································································································································································································································
1. Introduction
A transfer function - describing the relation between the grad-ing curves and a physical property or a physical property function- can extremely be useful in those cases when the measurementof the soil property is troublesome (e.g., unsaturated soil func-tions). The theoretical determination of a transfer function ishindered by the fact that the soil structure is intractable withgeometrical models (see e.g., Dexter and Tanner, 1971). Thedirect interpolation of the transfer function on the basis of somemeasured data is obstructed by the fact that the number of thedata increases exponentially with the number of the fractions inthe grading curve. Because of this reason, the dry density transferfunction is generally interpolated for two- and three-fraction soilsonly (see e.g., Kabai, 1972, Lörincz 1986; Yu and Standish 1988).
To overcome this difficulty a double approximation techniquehas been elaborated based on the grading entropy concept and afew measured data (Imre et al., 2008). The number of the dataneeded for this method increases linearly with the number of
fractions in the best possible case.The grading entropy S - as it is described in the next section –
is a kind of statistical entropy of the grading curves. It is the sumof the two “entropy coordinates” – the base entropy S0 and theentropy increment ∆S - which can be normalized in some extentresulting in the relative base entropy A and the normalizedentropy increment B. The grading curves can be represented inthe two dimensional space of two entropy coordinates, a possiblerepresentation – the simplified form of the so called normalizedentropy diagram - is shown in Fig. 1.
The problems of filtering (Lörincz, 1993a), particle migration(Lörincz, 1993b) and, the change of the grading curves due toparticle crushing (Lörincz et al., 2005) have been described interms of the grading entropy coordinates, in agreement withsome theoretical studies (Einav, 2007). The “best soils” for con-crete production have the entropy coordinates A=2/3 and maxi-mum B (Lörincz, 1990, see Fig. 1). There is an experimentalevidence (Lörincz, 1986) that, if A<2/3 then the soil structure isunstable since the large particles are “swimming” in the matrix
*Senior Research Fellow, Ybl Miklós Fac. Arch. and Civil Eng., Szent István University, Budapest 1111, Hungary and Geotechnical Dept., BudapestUniversity of Technology and Economics, Budapest 1111, Hungary (Corresponding Author, E-mail: [email protected])
**Honorary Associate Professor, Geotechnical Dept., Budapest University of Technology and Economics, Budapest 1111, Hungary (E-mail:[email protected])
***Ph.D. Student, Geotechnical Dept., Budapest University of Technology and Economics, Budapest 1111, Hungary (E-mail: [email protected])****Professor, The School of Engineering, The University of Newcastle:Callaghan, Newcastle 2308, Australia (E-mail: stephen.fityus@newcastle.
edu.au)*****Associate Professor, Geotechnical Dept., Budapest University of Technology and Economics, Budapest 1111, Hungary (E-mail: [email protected])
******Professor, Ybl Miklós Fac. Arch. and Civil Eng., Szent István University, Budapest 1111, Hungary (E-mail: telekes.gabor @ymmfk.szie.hu)*******Professor, Bauhaus University of Weimar, 99425 Weimar, Germany (E-mail: [email protected])

Emöke Imre, János Lörincz, Q. Phong Trang, Stephen Fityus, József Pusztai, Gábor Telekes, and Tom Schanz
− 258 − KSCE Journal of Civil Engineering
of the small particles; otherwise the soil structure is stable (Fig.1).
For the elaboration of the transfer function constructionmethod a few mathematical features of the grading entropyconcept were necessary to be analysed (e.g., the inverse image ofan entropy diagram point, the meaning of entropy coordinates,the properties of the optimal grading curves, the shape of theentropy diagram, see in Imre et al., 2008). These are described insections 3 and 4. The suggested transfer function constructionmethod consists of two steps. The first approximation is made inthe entropy diagram allowing a visualization of the main ten-dencies of the transfer function. The so determined “preliminarytransfer function” is extended onto the inverse image of theentropy diagram points in the second step. The method is brieflydescribed in section 5.
The method was first tested on an example of a simple soilproperty, the dry density of sands The results of this aresummarized in this paper verifying the assumption of the generaltransfer function construction method and giving an approximatedry density transfer function for a class of sands with “conti-nuous” (not gap-graded) grading curves.
The minimum dry density was treated only using the fact thatfrom this the maximum dry density can be estimated (Kabai,1972). The previously measured data of Lörincz (1986), con-cerning some “optimal” soil series with five-fraction and a mini-mum grain diameter of dmin = 0.063 mm was used to constructthe preliminary dry density transfer function. A second indepen-dent data set previously measured on some non-optimal butcontinuous (i.e., not gap-graded) soil series with nine fractionsand minimum grain diameter of dmin = 0.063 mm (Kabai, 1972)was used to test the validity of the preliminary dry densitytransfer function.
2. Grading Entropy
In this section the grading entropy concept of Lörincz (1986) isbriefly presented together with some notions used in the transferfunction construction method (Imre et al., 2008).
2.1 Statistical EntropyLet us consider M elements in m cells and, Mi elements in the i-
th cell. The statistical entropy Ss is (Korn and Korn, 1975):
(1)
where s is the specific entropy or the entropy of an element givenby
, , (2)
In Eq. (2), b is the base of the logarithm, and α i is the relativefrequency of the i-th cell, given by
(3)
Let us consider two statistical cells, with relative frequenciesof α1 and α2 =1-α1. If the base of the logarithm is set to 2 in Eq.(2) then the maximal specific entropy of this system is equal to 1at the point where the relative frequencies are equal to α1 = α2 =0.5. In the following, the base of the logarithm will be consideredto be equal to 2.The specific entropy is written as follows:
(4)
As it will be shown later on, this function – being similar to ahalf-ellipse (Fig. 2) – determines the shape of the boundary linesof the entropy diagram for small N.
2.2 Statistical Cells for the Grading Entropy (Fractions andElementary Cells)
Two statistical cell systems are used as follows. The primarystatistical cells or fractions are defined by successive multi-plication with a factor of 2 (i.e., the same constant as the base ofthe logarithm in Eq. (4)), starting from an (arbitrary) elementarycell width d0, on the pattern of the classical sieve hole diametersfollows. If the fractions are numbered by a serial number j (j =1,2...) then the diameter range for fraction j:
Ss Ms=
s αii 1=
m
∑ logbαi–= αi 0≠ m 1≥
αiMi
M------=
s 1ln2------- αi
i 1=
m
∑ lnαi=
Fig. 1. The Normalized Entropy Diagram with the Particle Migra-tion Zones (I-piping. II-stable. III-stable with suffosion) andthe Maximum Entropy Points for Various N Values
Fig. 2. The Statistical Entropy for Two Statistical Cells and Its Nu-merical Approximation with a Half-ellipse

A General Dry Density Law for Sands
Vol. 13, No. 4 / July 2009 − 259 −
(5)
where d0 is the elementary cell width (Table 1). The number ofthe fractions N is the difference of the serial numbers of finestand coarsest fractions as follows:
(6)
A secondary cell system is defined with an equal width of d0,assuming that the distribution is uniform within a fraction. Thenumber of the elementary cells Ci in fraction i is equal to:
(7)
The relative frequency of any elementary cell in fraction i isequal to:
(8)
where xi is the relative frequency of fraction i. A note can be addedconcerning the statistical cell definition. As it will be shown lateron, the concept is basically not influenced by the selection of theelementary cell width d0. For convenience, the height of the SiO4
tetrahedron (2-22 mm, Imre, 1995) is adopted here.
2.3 Space of the Possible Grading Curves, Simplex Rep-resentation
The space of the possible grading curves consists of suchgrading curves that are composed from the same N consecutivefractions with the same minimum grain diameter dmin (beinglarger than or equal to d0) and with the distribution being uniformwithin each fraction. Only N -1 relative frequencies xi (i = 1, 2, 3,..., N) are independent:
, , (9)
Eq. (9) is the defining equation of N-1 dimensional closedsimplex. Both the closed and open simplex are denoted by ∆, inthe inner simplex points (i.e., in the open simplex) every relativefrequency is greater than zero, at the boundary of the simplex atleast one relative frequency is zero. The N-1 dimensional simplexis the N-1 dimensional analogy of the triangle or tetrahedron (i.e.,the 2 and 3 dimensional instances). Due to the one-to-onerelationship between the possible grading curves and the pointsof N-1 dimensional closed simplex, the latter is frequently usedin the description of the grading entropy map.
2.4 The Definition of the Grading EntropyThe grading entropy S is the statistical entropy of the grading
curve in terms of the elementary statistical cells. It can be derivedby inserting the relative frequency of the secondary cell α i (i.e.,Eq. (8)) into Eq. (4):
, xi ≥ 0 (10)
The grading entropy S can be split
(11)
into the base entropy S0 and the entropy increment ∆S. Thedifference of the grading entropy S and the entropy increment ∆Sis a linear function, the base entropy S0:
(12)
where S0k is the grading entropy of the k-th fraction (Table 1),which is a positive integer, which can be derived from Eqs. (7)and (10) as follows:
(13)
(14)
The entropy increment ∆S can be expressed as follows:
(15)
which is extended to the vertices by zero value. The entropyincrement ∆S is the statistical specific entropy of the gradingcurve in terms of the fractions. It is independent of the selectionof d0. The width of the secondary cell system d0 is generally setto be equal to the minimum grain diameter dmin for the sake of thesimplest computation. It follows from the defining equations thatthe range of the non-normalized entropy coordinates is depen-dent on N, ∆S varies between 0 and lnN/ln2 and S0 variesbetween S0min and S0max.
2.5 Normalized Grading Entropy Co-ordinatesThe normalized base entropy, the so-called relative base
entropy A is defined as follows:
(16)
where S0max and S0min are the eigen-entropies of the largest and thesmallest fractions in the mixture, respectively. The relative baseentropy can be rewritten as follows:
(17)
The normalized entropy increment is defined as follows:
(18)
2jd0 d≥ 2j 1– d0>
N jmax jmin– 1+=
Ci2id0 2i 1– d0–
d0---------------------------- 2i 1–= =
αixi
Ci-----=
xii 1=
N
∑ 1= xi 0≥ N 1≥
S 1ln2-------– Ci
xi 0≠∑
xi
Ci-----ln
xi
Ci-----=
S So S∆+=
Sok xkk∑ Sok=
SoklnCk
ln2----------=
Sokln2k 1–
ln2-------------- k 1–= =
S∆ 1ln2------- xi
xi 0≠∑ lnxi–=
A So Somin–Somax Somin–--------------------------=
Axi
i 1=
N
∑ Soi Somin–( )
N 1–------------------------------------
xii 1=
N
∑ i 1–( )
N 1–------------------------= =
B S∆lnN--------=
Table 1. Fraction (Eigen-) Entropies
Fraction serial number i 1 ... 23 24 25
d limits in [mm] 2-22-2-21 1-2 2-4 4-8
S0i [-] 0 22 23 24

Emöke Imre, János Lörincz, Q. Phong Trang, Stephen Fityus, József Pusztai, Gábor Telekes, and Tom Schanz
− 260 − KSCE Journal of Civil Engineering
The normalized coordinates are independent of the selection ofd0. The normalized coordinate B varies between 0 and 1/ln2 andA varies between 0 and 1.
2.6 The Analysis of the Grading Entropy Coordinate Func-tions
The base entropy S0 (relative base entropy A) is the mean of theentropy (reduced entropy) of the fractions, weighted by the rela-tive frequencies. The grading entropy co-ordinate A is linearlyrelated to the area of the sub-graph of the grading curve (Imre etal., 2008). The grading curves with the same A have the samesub-graph area, any two of them may deviate from each-other insuch a way that “equal areas are found below and above”.
The entropy increment ∆S (and the normalized entropy incre-ment B) is the mean of the logarithm of the relative frequencies,weighted by the relative frequencies. It is the continuous, sym-metric and strictly concave function of the relative frequencies,being its second derivative negative definite. It has a singlemaximum at the gravity centre of the simplex. The correspond-ing distribution is the “most uniform”, each xi is equal to 1/N.
It can be noted that a similar statement holds for the gradingentropy S if the relative frequency of the elementary cells isconsidered instead of the relative frequency of the fractions asthe independent variables. The entropy S has a single maximumif the relative frequencies of the elementary cells are equal (and,therefore, relative frequencies of successive fractions xi aredoubled).
3. The Grading Entropy Diagram
The normalized entropy map fn: ∆→[A,B] is defined betweenthe N-1 dimensional open simplex and the two dimensionalspace of the normalized grading entropy coordinates, for a givenvalue of N. It can readily be seen that this map is continuous onthe open simplex and can continuously be extended to the closedsimplex. The image of the compact simplex – the (normalized)entropy diagram – is compact (bounded and closed).
Due to this compactness, there exists a minimum and amaximum value for B at every specified A. The conditional mini-mum and maximum points and the corresponding simplex pointsare treated in this section. The non-normalized and thenormalised entropy coordinates differ in scaling. Therefore, it isenough to analyse the normalized grading entropy diagram, thesame results apply to the non-normalized grading entropydiagram.
3.1 Analysis of the Conditional MinimumThe points of the minimum B line of the entropy diagram are
mapped from the vertices and the edges of the simplex (i.e., fromthe fractions and the two-fraction mixtures, see App. 1). To selectthe vertex or edge points with a specified A and minimum B, theentropy coordinates has to be computed which can be done asfollows. The relative base entropy A of the points of edge i – j -according to Eq. (17) - is equal to:
(19)
The A coordinate of vertex k is equal to (k-1)/(N-1) and the Bcoordinate is equal to zero. The points of edge i– j map inbetween the image of vertices I and j in terms of A, especiallyedge 1 – N maps into the interval [0,1] in terms of A. The Bcoordinate of points of the edge i – j can be computed accordingto Eq. (18) as follows:
(20)
It follows from Eqs. (19) and (20) that the image of any twoedges differ in A-scaling only. In practice the image of edge 1 – Nis used as an approximate minimum B bounding line (see Fig. 1).
3.2 Analysis of the Conditional MaximumAccording to the result of the various analyses (Lörincz, 1986;
Imre et al., 2008, App. 1), the points of the maximum B line ofthe entropy diagram are uniquely related to some inner points ofthe simplex which can be characterized by the following coor-dinates:
(21)
(22)
where parameter a is the root of the following equation :
(23)
Following from the Descartes rule of signs, polynomial y hasone and only one positive root for a. This root defines one pointin the simplex (“optimal point”) and one grading curve in thespace of the possible grading curves (“optimal grading curve”).The optimal points (and optimal grading curves) map into thepoints of the maximum B line in a one-to-one way.
As A varies between 0 and 1 then the positive root a of Eq. (23)varies continuously between 0 and ∞, the extreme valuesrepresent the extreme fractions 1 and N. Both polynomial y and,the maximum line of B line are symmetric. If a* is the positiveroot at A* then a = 1/a* is a root at A = 1-A*. The symmetry“axis” can be found at a = 1 and A = 0.5 where xi = 1/N.
3.3 The Distribution of the Optimal Grading CurvesThe equation of a finite final fractal distribution is as follows
(Einav, 2007):
(24)
Taking into account that the fraction limits can be expressed bythe powers of 2 (i.e., di = dmin 2i, i=1, 2, ..., N, see Inequality (5)),it can be derived that the relative frequencies of this distribution
A xi i 1–( ) xj j 1–( )–N 1–
----------------------------------------=
B 1lnNln2----------------– xilnxi 1 xi–( )ln 1 xi–( )+[ ]=
x11
aj 1–
j 1=
N
∑--------------- 1 a–
1 aN–-------------= =
xi x1ai 1–=
y aj 1–
j 1=
N
∑ j 1– A N 1–( )–[ ] 0= =
d 3 n–( ) dmin
3 n–( )–dmax
3 n–( ) dmin3 n–( )–
-----------------------------

A General Dry Density Law for Sands
Vol. 13, No. 4 / July 2009 − 261 −
has the same factorized form as indicated by Eq. (22) for theoptimal grading curves if the following expression is used for a:
(25)
It can therefore be noticed that the distribution of the optimalgrading curve agrees with the fractal distribution at the fractionlimits. The fractal-dimension n = 2 is related to the maximumentropy point and, n = 3 (where Eq. (24) is not valid) is related tothe maximum entropy increment point.
The optimal grading curve has therefore finite fractal distri-bution at the fraction boundaries. The grading curves with thesame A have the same sub-graph area, any two of them maydeviate from each-other in such a way that “equal areas arefound below and above”. Considering the grading curves wherethe A = constant condition is met, it can be said that the optimalgrading curve has the most uniform distribution, with theminimum curve length. The optimal grading curve is therefore akind of mean for the grading curves with the same A.
4. The Inverse Image of the Entropy DiagramPoints
The structure of the inverse image of a specified normalizeddiagram point [A,B] is different for the regular and the criticalvalues of the normalized entropy map fn: ∆→[A,B]. A specifieddiagram point [A,B] is regular or critical value if the rank of thefirst derivative of the map is maximal or not maximal, respec-tively, at the inverse image points. (The maximum rank is equalto 2 which is the dimension of the entropy diagram.)
The critical values of the entropy map are the points of themaximum B line. The inverse image of a critical value is anoptimal (or critical) point which was treated in the previoussection. In this section the analysis is completed by the dis-cussion of the inverse image of the regular values. Since the non-normalized and the normalised entropy coordinates differ only inscaling, it is again enough to analyse only the inverse image ofthe normalized entropy diagram points, as the same results applyto the non-normalized entropy diagram points.
4.1 Analytical FormulaeIt follows from the regular value theorem (see e.g., Hirsch,
1976; Milnor, 1981) that the inverse image of the entropy diagrampoint [A,B] – if it is a regular value – is an N –3 dimensionalmanifold which can be computed as the solution of the followingsystem of equations:
(26)
(27)
(28)
Geometrically, the inverse image of the normalized entropydiagram point [A,B] is situated on the A = constant, N-2 dimen-sional hyper-plane section of the simplex (see Figs. 3(a), 4(a)).The inverse image of a point of the maximum B line (which is acritical value) is an optimal point, a kind of centre of the A =constant simplex section. The inverse image of an inner diagrampoint (which is a regular value) is similar to a N-3 dimensionalsphere, “centred” to optimal point (see App.1). These are visual-ised in some examples as follows.
4.2 ExamplesThe inverse image of some regular values (see Figs. 3(b), 4(b))
was computed with Eqs. (26) to (28) for the two (N = 3) and athree dimensional (N = 4) simplex. The corresponding optimalpoints were determined using Eqs. (21) to (23). The result isshown in Figs. 5 (a) and 6 (a). It consists of some parts of a N-3dimensional “circle”, being “centred” to the optimal point on theA = constant hyper-plane section of the simplex.
The inverse image is shown in terms of grading curves in Figs.5(b) and 6(b). The grading curves form some N-3 dimensionalcircles in the following sense. The A = constant condition meansgrading curves that have the same sub-graph area. They deviatefrom each-other in such a way that “equal areas are found belowand above.” The amount of the deviation depends on the distance
a 2 3 n–( )=
f1 xii 1=
N
∑ 1– 0= =
f2 Axi
i 1=
N
∑ i 1–( )
N 1–------------------------– 0= =
f3 B 1ln2lnN---------------- xi
xi 0≠∑ lnxi– 0= =
Fig. 3. N=3, the Image of the 2D Simplex in the Entropy Space (a) The Simplex and Its A=0.5 Hyper-plane Section (b) The Entropy Dia-gram with 3 Points on Coordinate Line A=0.5 (B=1; 1.4 and Bmax.=1.44)

Emöke Imre, János Lörincz, Q. Phong Trang, Stephen Fityus, József Pusztai, Gábor Telekes, and Tom Schanz
− 262 − KSCE Journal of Civil Engineering
of the grading curve from the optimal grading curve, which canbe expressed in terms of the difference Bmax - B.
The optimal point is some kind of logarithmical mean of the A= constant section of the simplex. The optimal grading curveshave the “most uniform”, fractal-like distribution, being concaveif A<0.5, linear if A=0.5, convex if A>0.5 (Fig. 7). The optimalpoints constitute a continuous, 1 dimensional line – called optimalline –between vertices 1 and N (line a in Fig. 5(a)), uniquelydepending on parameter A.
5. The Transfer Function Generation Method
A transfer function relates the possible grain size distributioncurves and a physical property or a uniquely determinableparameter of a physical property function. In this section thegeneral transfer function construction method is described. Theconcept of the multiple grading entropy diagrams is brieflytreated beforehand.
Fig. 4. N=4, the Image of the 3D Simplex in the Entropy Space (a) The Simplex and Its Two Parallel Hyper-plane Sections with A=0.2 and0.5, (b) The Entropy Diagram with a Point Series on the Coordinate line A=0.2
Fig. 5. N=3, the Inverse Image of Some Entropy Diagram Points Indicated in Fig. 3(b) (a) in the Simplex, (b) in the Space of the PossibleGrading Curves
Fig. 6. N=4, the Inverse Image of Some Entropy Diagram Points Indicated in Fig. 4(b) (a) in the Simplex, (b) in the Space of the PossibleGrading Curves

A General Dry Density Law for Sands
Vol. 13, No. 4 / July 2009 − 263 −
5.1 Multiple Grading Entropy DiagramsMore than one simplex can be represented in a unified grading
entropy diagram (Figs. 8, 9). According to the results of ananalysis (Imre et al., 2008), the maximum entropy incrementlines of the different N valued simplexes nearly coincide for thenormalized case if the fraction number N is small but do notcoincide for the non-normalised case. This can also be seen fromthe range of the entropy coordinates (B varies between 0 and 1/ln2 and A varies between 0 and 1, ∆S varies between 0 and lnN/ln2 and S0 varies between S0min and S0max = S0min + N - 1). Themaximum of the approximate minimum entropy increment lines
is equal to 1 and 1/lnN for the non-normalised the normalisedcase, respectively.
If a different fraction number N value is selected for the samegrading curve - by adding some zero fractions - then the nor-malized entropy coordinates will be different, the non-nor-malized entropy coordinates will be unchanged. It follows thatthe different N valued simplexes can be considered as the sub-simplexes of a “large simplex” in the non-normalised gradingentropy diagram; in other words, the notion of the single and themultiple diagrams coincide in the non-normalized case. The non-normalized diagram is used in the transfer function construction.It can be noted that - being pair-wise in a linear relationship - thenormalized coordinates of a specified simplex can be computedby a linear transformation from the non- normalized coordinates.
5.2 The Algorithm of the Method Initially a “large” simplex is defined by specifying the N and
Somin values to describe the space of the possible grading curves.Then some continuous boundary sub-simplexes are selected andan optimal grading curve series is specified for each. The soilproperty R is experimentally determined for these grading curveseries.
The soil property value is related to the corresponding pointsof the maximum ∆S lines in the non-normalised entropy diagram(Figs. 9, 10), implying an assumption described later on in thissection. The preliminary transfer function F1: [S0,∆S]→R isinterpolated using the scalars given in the discrete points of themaximum ∆S lines.
Finally, the so determined preliminary transfer function is ex-tended onto the inverse image of the entropy diagram pointsresulting in F2: ∆→R. In the simplest case – which is appliedhere - the constant function is used for the extension.
5.3 Number of Data Needed for the Construction of aTransfer Function
Using the fact that the composition of an N - fraction soil canbe represented in the N-1 dimensional simplex of the gradingcurves (i.e., the higher dimensional analogy of the trianglediagram, see section 2), the iso-lines of the physical property canbe interpolated on the basis of some data over the simplex.However, in larger dimensions, the number of the data neededfor the interpolation could be too large. This is considered as
Fig. 7. Optimal Grading Curves (a) N = 7, A Varies, (b) A = 2/3, N Varies
Fig. 8. Normalized Entropy Diagram for Various (“small”) N Values(N =1 to 7)
Fig. 9. Non-normalized Entropy Diagram with the Maximum andApproximate Minimum Entropy Increment Lines for a“Large” Simplex (N =5, S0min=1) and Some of its ContinuousSub-simplexes (N =2 and 3, S0min=1 to 4)

Emöke Imre, János Lörincz, Q. Phong Trang, Stephen Fityus, József Pusztai, Gábor Telekes, and Tom Schanz
− 264 − KSCE Journal of Civil Engineering
follows.If the transfer function is approximated directly over the
simplex then data are sampled from a grid generated on theboundary and in the inner parts of the simplex. For example, inthe case of the triangle diagram some data are needed from thevertices, edges and from the inner part of the diagram. There are2N-1 sub-simplexes, where N is the number of the soil fractionsin the grading curve (see section 2). For example this number isequal to 7 for a triangle, 15 for a tetrahedron and 127 for a 7-fraction soil. Considering 5 data for each sub-simplex, thenumber of the necessary data is around 5×(2N-1).
In the case of the suggested method, data are sampled from theoptimal lines of some continuous sub-simplexes only. Forexample, in the case of the triangle diagram some data may beused from the vertices, from the continuous edges 1-2 and 2-3and from the optimal line of the triangle diagram. The number ofthe continuous sub-simplexes is 1/2×(N+1)×N, being equal to 6for the triangle, 10 for a tetrahedron and 28 for a 7-fraction soil.Considering 4 data for each continuous sub-simplex, the numberof the necessary data is around 2(N+1)N.
If the preliminary transfer function is characterized by lineariso-lines then these can be interpolated from less data, beingrelated to the lower and the upper boundaries of the gradingentropy diagram only. These points map from the optimal line ofthe N dimensional simplex and from the N fractions. ConsideringN data for the optimal line of the N dimensional simplex, thenumber of the necessary data can be as small as about 2N.
5.4 The Evaluation of the Suggested Transfer FunctionConstruction Method
The suggested method – a double approximation technique –may give a transfer function from “very few” data. This can beattributed to application of the grading entropy concept. In thefirst step the preliminary transfer function is constructed in termsof the grading entropy coordinates. For this, optimal gradingcurve data are used. In the second step the preliminary transferfunction is extended to the inverse image of the entropy diagrampoint.
The entropy coordinates are pseudo-metrics in the space of thegrading curves giving a strict classification of the grading curves(Imre et al., 2008). The entropy parameter A measures the sub-graph area, the A = constant condition means the grading curvesare such that they have the same sub-graph area, and they candeviate from each-other in such a way that “equal areas arefound below and above”.
Within the A = constant section of the simplex, the maximumB is encountered at the optimal point which is a kind of meanpoint of the section, which is not necessary the gravity centre.The corresponding grading curve is a mean grading curve havingthe most uniform (fractal) distribution, minimum curve length.The normalized entropy increment difference Bmax - B measuresdistance from this mean. The entropy increment difference∆Smax-∆S has the same meaning except that the fraction numberis also taken into account.
According to some earlier results, the relative base entropy Adetermines the type of the soil structure (see section 1 andLörincz, 1986), it can be considered as a continuous “measure”of the soil structure (e.g., for a 2-fraction soil, A expresses theratio of the small and large grains, increasing with large grainproportion, mathematically it is related to the area of the gradingcurve). The base entropy S0 has the same meaning except that theminimum grain diameter and the fraction number are also takeninto account.
It can be said that the entropy coordinates give a strict classi-fication of the grading curves by characterizing the soil behaviour.The relative base entropy A can be considered as a continuousmeasure concerning the soil structure. The normalized entropydifference Bmax – B for a given soil structure is the distance of thegrading curve from a mean (or optimal) grading curve. Inaddition, the fraction number and the minimum grain diameterare included in the entropy increment ∆S and in the base entropyS0.
Fig. 10. The Normalised Entropy Diagram of a Large Simplex (N =7, S0min =1) and the Continuous Sub-simplexes: The Max-imum ∆S Lines and the “Zones” of the 2, 3, …, 7 FractionSoil Behaviour
Fig. 11. The Definition of the emax Test
A General Dry Density Law for Sands
Vol. 13, No. 4 / July 2009 − 265 −
5.5 Assumptions and ApproximationsThe data are measured on some optimal grading curve series
with various fraction numbers. These map into the maximum ∆Sline with fraction number k in the non-normalized gradingentropy diagram, such that ∆S varies between 0 and lnk/ln2 (Fig.10). These lines may intersect each-other if the fraction numberis less than N. It is assumed that the scalar values related to thenearly coinciding points of the maximum ∆S lines are about thesame. The acceptability of this assumption may follow from thecontinuity of the non-normalised entropy map.
The preliminary transfer function can be considered as aspecial transfer function such that the function value is the samefor those grading curves that map into the same non-normalizedgrading entropy diagram point (i.e., the constant function is usedfor the extension onto the inverse image of the entropy diagrampoints which is an N-3 dimensional manifold). The approxi-mations of this transfer function can be characterized as follows.
The optimal grading curve data represent some kind of meanbehavior at a specified value of the base entropy A and fractionnumber k. It follows that some extreme behavior is missing fromthe preliminary transfer function. The interpolation is made in“downwards direction” in terms of N. An N-fraction soil maymap below the maximum ∆S line with fraction numbers N. If it
maps in between the maximum ∆S lines with k and k + 1 (k < N)then its behaviour is interpolated from the optimal soils withfraction numbers k and k + 1 (Fig. 10).
6. Laboratory Tests
For the elaboration of a dry density transfer function, theresults some previously obtained laboratory emax test data wereused. This section summarizes the emax test procedure andpresents the two independent data sets which were previouslymeasured and were used for the application.
6.1 The emax Test In the emax test, the sand is poured through a funnel into a
cylinder (10 cm high and 10 cm diameter, Fig. 3). During thisprocess the bottom of the funnel is positioned just above thesoil surface, so that the possibility for grains to rearrange andpack is minimized. The results can be expressed in terms ofmaximum void ratio emax, minimum dry density ρdmin, minimumsolid volume ratio smin (hoping that the use of s for both thespecific entropy and the solid volume ratio is not confusing) ormaximum specific volume vmax which are in the followingrelationships:
Fig. 12. The Entropy Representation of the Optimal Soil Series of Lörincz (1986) (a) in the Normalized Diagram, (b) in the Non-normal-ized Diagram
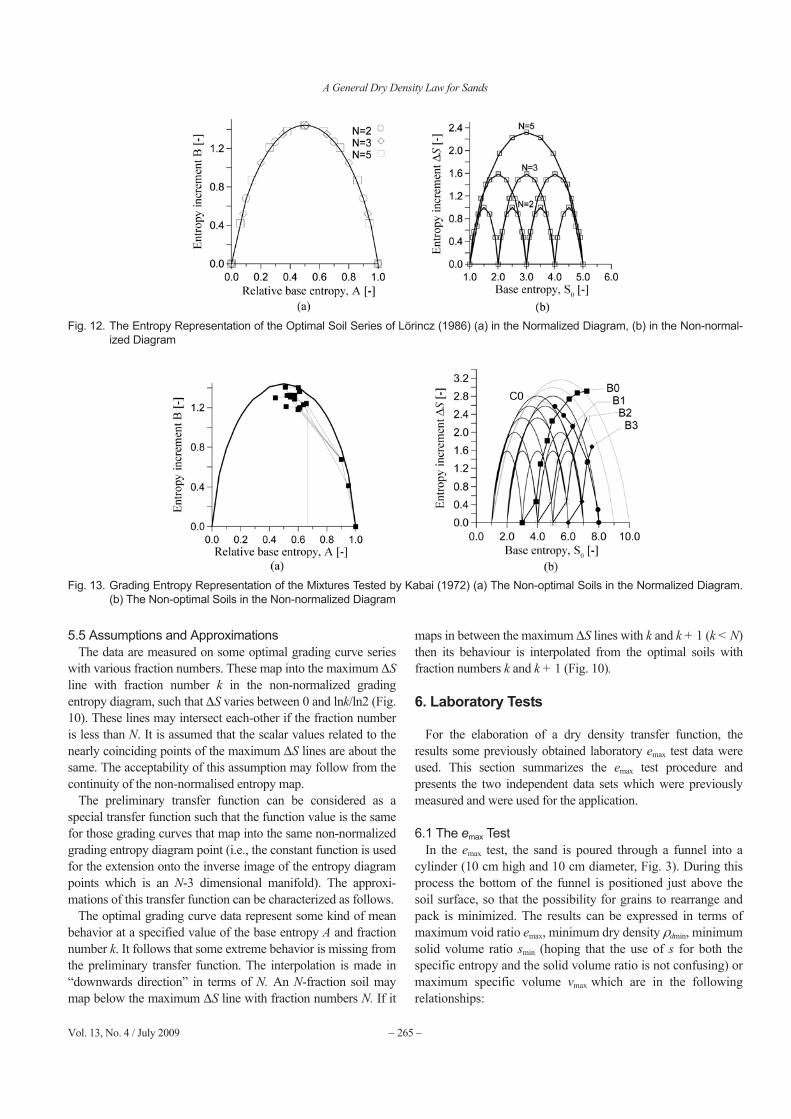
Fig. 13. Grading Entropy Representation of the Mixtures Tested by Kabai (1972) (a) The Non-optimal Soils in the Normalized Diagram.(b) The Non-optimal Soils in the Non-normalized Diagram

Emöke Imre, János Lörincz, Q. Phong Trang, Stephen Fityus, József Pusztai, Gábor Telekes, and Tom Schanz
− 266 − KSCE Journal of Civil Engineering
(29)
(30)
(31)
6.2 The Testing ProgramsIn the work of Lörincz (1986) the emax tests were made on
some optimal mixture series with N=1 to 3, 5 (Fig. 12) and onsome gap-graded mixture series with N= 3, with diameterbetween dmin = 0.063 mm and dmax = 2 mm, the grading curvesare shown in Figs. 14 and 15.
In the work of Kabai (1972) on sand compaction six non-optimal grading curve series were tested with the emax test andProctor tests, which were defined in terms of U (uniformitycoefficient), dmax, d10, as it can be seen in Table 2, Figs. 13 and 16.The diameter varied between dmin = 0.063 mm and dmax = 20 mm.These were denoted by A0, B0, B1, B2, B3, B0 . The members ofseries A0 were one-diameter soils.
7. Results
In this section the transfer function is constructed with thedirect interpolation method for 3-fraction soils using the previ-ously measured data set of Lörincz (1986). The suggestedgeneral transfer function construction method is applied to thesame data set and the results are compared.
7.1 Direct Transfer Function ConstructionThe dry density level lines were interpolated over the triangle
diagram (Fig. 17) using the data of Lörincz (1986) concerningtwo- and three-fraction soils (optimal and gap-graded, Figs. 14,15). The so determined dry density transfer functions show thefollowing consistent results.
In accordance with the earlier results, the dry density is in-creasing with decreasing relative frequency of the medium frac-tion. The maximum density is related to the gap-graded mixturewith 1/3 finest, 2/3 coarsest ratio. This point maps to the mini-mum B line at about A=2/3 in the normalized grading entropydiagram.
emax1 smim–
smin----------------=
ρdmin sminρs=
vmax1
smin--------=
Fig. 14. (a) to (f) the Optimal Soil Tested by Lörincz (1986)
Fig. 15. (a) to (c) the Gap-graded Soil Tested by Lörincz (1986)

A General Dry Density Law for Sands
Vol. 13, No. 4 / July 2009 − 267 −
Following from the fact that the level lines have a nearlyvertical tangent on the bottom (“gap-graded”) triangle edge, itcan be assumed that the maximum density point of the verticalline sections of the triangle diagram (i.e., which are the constantA sections) might be found on the bottom triangle edge. In termsof any fraction number, it can be assumed that the maximumdensity point of the constant A sections of the simplex might be
found on the simplex edge 1-N, at the grading curve with finestand coarsest fractions in ratio of (1-A) : A.
7.2 Transfer Function Construction with the SuggestedMethod
The optimal points constitute a continuous one dimensionalline – optimal line – within the simplex, between vertices 1 and
Fig. 16. (a) to (f) the Soil Mixture Series Tested by Kabai (1972)
Table 2. The Grading Curve Series of Kabai (1972)
Sign of series B0 B1 B2 B3 C0
dmax [mm] 0.145-20.0 0.29-4.74 0.58-1.54 1.24-9.42 4.74
d10 [mm] 0.145 0.29 0.58 1.24
U [-] 1-30 1-5 1-5 1-3 1-8
Fig. 17. The Triangle Diagram (2D Simplex) to Represent the Results of the emax Test, smin Iso-lines for Three 3 - Component ContinuousMixtures Consisting of Different Fractions (a) Fractions C, D, E, (b) Fractions A, B, C

Emöke Imre, János Lörincz, Q. Phong Trang, Stephen Fityus, József Pusztai, Gábor Telekes, and Tom Schanz
− 268 − KSCE Journal of Civil Engineering
N, being uniquely dependent on the entropy parameter A.Representing the measured smin values of the optimal points inthe function of the relative base entropy A, the results show thatthe measured A - smin functions are similar for N=2, 3 and 5. Themaximum smin value is found at about A=2/3 in every case (Fig.18).
Representing the smin data of the optimal soils with fractionnumber of N = 1, 2, 3 and 5 in the non-normalized grading entropydiagram it can be found that the assumption of the method isacceptable since the smin values of the (nearly) coinciding points
of the maximum ∆S lines are about the same (Fig. 19). The preliminary dry density transfer function – the mean soil
behavior – is characterized by parallel, nearly linear level lineswith negative slope. The mean dry density is increasing withboth entropy coordinates. It can broadly be said that the meandensity is increasing with N and with the grain diameter (seeTable 3).
Using the fact that the A - smin functions of the optimal gradingcurve series have a maximum at A=2/3 (see Fig. 18), the slope ofthe iso-lines can be estimated as the slope of the tangent of themaximum ∆S line at A=2/3. It can be shown that the tangent ofthis slope is equal to -1 for N=2.
7.3 Comparing the Result of the Direct and the SuggestedTransfer Function Construction Method
The image of the smin level lines through the entropy map is a“two sheeted cover” for a three-fraction soil (Fig. 20). Eachentropy diagram point will belong to two iso-density lines fromthe simplex since each point on the entropy diagram may have 2discrete inverse points in the simplex (i.e., 0 dimensional circles).The smin value is not the same on these. For example, a diagrampoint may belong to both the smin=0.55 and smin=0.57 level lines.The slopes of the two sheets at each point differ (see Fig. 20(b)).
Noting that, x1, x2, x3 denotes the proportion of fine fraction,middle fraction and coarse fraction; respectively, the followingwas observed. The level lines mapped from the upper part of thetriangle diagram (bounded by the optimal line – line “a” – of thetriangle diagram and the continuous edges 1-2 and 2-3) arepresent, however, the iso-density lines mapped from the lowerpart of the triangle diagram (bounded by the optimal line – line“a” – of the triangle diagram and the triangle edge 1-3) are notpresent in the preliminary transfer function. It follows that thedensest point information is missing from the preliminary
Fig. 18. The Variation of the smin Data with A (a) Value of smin along the Optimal Line N=3, (b) Value of smin along the Optimal Line for N=2and 5
Fig. 19. The Dry Density Transfer Function Defined by the smin
Level Lines of Optimal Soils
Table 3. Loosest State for the Fractions of Lörincz (1986)
Fraction sign A B C D E
d limits in [mm] 0.071-0.125 0.125-0.25 0.25-0.5 0.5-1.0 1.0-2.0
smin [-] 0.4983 0.5132 0.5285 0.5484 0.5674

A General Dry Density Law for Sands
Vol. 13, No. 4 / July 2009 − 269 −
transfer function.For larger dimensions it can be said that the density infor-
mation of some two dimensional subspaces of the simplex arecarried into the preliminary dry density transfer function only.These surfaces are situated between the optimal lines of thecontinuous sub-simplexes with neighboring dimensions.
8. Discussion
In this section the first dry density transfer function is validatedand discussed. The practical use of the first dry density transferfunction is presented through an example.
8.1 Validation of the Dry Density Transfer FunctionThe preliminary transfer function is a special transfer function
where the constant function is used for the extension onto theinverse image of the entropy diagram points (i.e., the functionvalue is the same for those grading curves that map into the samenon-normalized grading entropy diagram point). Being con-structed from optimal grading curve data which represent a kindof mean behavior at a specified value of the base entropy, someextreme behavior is missing from the preliminary transfer func-tion.
To test the goodness of this simplest possible dry density transferfunction, the data of the independent, non-optimal grading curveseries of Kabai (1972) were represented in the non-normalizedgrading entropy diagram. According to the results, the scalarvalues related to such grading curves that map close to each-other are slightly different only (Fig. 21). Therefore, the iso-density lines could have been constructed in the non-normalizedgrading entropy diagram. The iso-density lines of the two exper-imental works (using optimal, non-optimal soils) show surpri-singly good agreement (Fig. 22).
These results can possibly be attributed to the fact that the non-optimal, continuous grading curve series map mostly to thevicinity of the maximum B line (see Fig. 13), the entropy map“contracts” the inner part of the simplex. This can also be seenfrom Figs. 3(b) and 5(a).
Fig. 20. The Entropy Map of the smin Transfer Function (a) The Triangle Diagram with Some smin Iso-lines, (b) The Entropy Diagram withthe Image of the smin Iso-lines
Fig. 21. The Approximate Dry Density Transfer Function Definedby ρdmin Level Lines from the Non-optimal Soil Data ofKabai (1972)
Fig. 22. The smin Level Lines Constructed from the Optimal SoilData of Lörincz (1986) and from the Non-optimal SoilData of Kabai (1972)

Emöke Imre, János Lörincz, Q. Phong Trang, Stephen Fityus, József Pusztai, Gábor Telekes, and Tom Schanz
− 270 − KSCE Journal of Civil Engineering
8.2 The Practical Use of the ResultsThe preliminary dry density transfer function (see Fig. 19) - as
the simplest possible transfer function - was successfully testedagainst some “basically” continuous soils. It can therefore beused to determine the density of some continuous soil mixtureswhich can be done as follows (see also the Appendix 2).
At first the entropy coordinates of the specified grading curveare computed. Then the minimum density is interpolated on Fig.19. Finally – based the experimental fact that the ratio of theminimum and the maximum dry density is about equal to 0.92for sands (Kabai, 1972) – the maximum dry density can beestimated.
9. Conclusions
The direct interpolation of a transfer function can be made onthe basis of about c exp(N) measured data where N is the numberof the fractions in the grading curve. The suggested method – adouble approximation technique – gives a good approximationfor the transfer function on the basis of about c N2 data which canbe decreased to c N in the best possible case.
This can be attributed to grading entropy concept which isapplied in both the interpolation and the data selection phases.The grading entropy coordinates give a strict classification of thegrading curves incorporating the following basic variables: acontinuous measure of the soil structure (mathematically in theform of the area of subgraph of the grading curve), a distancefrom the optimal grading curve (with fractal distribution) for agiven soil structure; the fraction number and the minimum graindiameter.
Needing very few data, it is important to test the suggestedtransfer function construction method in the practice. Taking thesimplest case first, a dry density transfer function was construct-ed on the basis of some previously measured data. The results ofthis study can be summarized as follows.
The assumption of the general transfer function constructionmethod was acceptable in the first application to the dry density.The preliminary transfer function could have been interpolatedin the non-normalized grading entropy diagram from optimalsoil data showing an increase with increasing entropy coordinates(i.e., the mean dry density basically increases with the fractionnumber N, and with minimum grain diameter dmin). This resultsupports the applicability of the general transfer functionconstruction method. In addition, the preliminary dry densitytransfer function is characterized by approximately linear iso-lines. It follows that the extension for a “larger” space (in termsof parameters N, dmin) can be realized with a few (around N)additional measurements.
The preliminary dry density transfer function is the simplestpossible dry density transfer function such that the same functionvalue is considered for those grading curves that map into thesame non-normalized grading entropy diagram point. (Theconstant function is used for the extension to the inverse imageof the entropy diagram point, which is an N-3 dimensional
manifold of the grading curves). The validity was tested usingsecond, non-optimal data set. The results suggest that this simpledry density transfer function can be used to determine the drydensity - the basic input parameter of most of the geotechnicalmodels (see e.g., Scheuermann and Bieberstein, 2007) – for aclass sands with basically continuous grading curve.
The results of the direct interpolation of the dry density transferfunction over the triangle diagram (N = 3) indicate that themaximum dry density of the vertical sections of the trianglediagram can possibly be found at the gap-graded grading curveswith finest and coarsest fraction ratio of (1-A) : A. Generallyspeaking, the maximum dry density point of the constant Asections of the simplex might be the point of simplex edge 1 - N.Especially, the maximum dry density might be encountered at A= 2/3 for the whole simplex. These hypotheses can be furtherinvestigated and, the results can be used for the extension of thepreliminary dry density transfer function.
It can be concluded that the assumption of the suggestedmethod was verified by the dry density application. It wasproved that the so determined simplest possible (preliminary)dry density transfer function can be used for the determination ofthe dry density of a class of sands with basically continuousgrading curve. It follows that the suggested transfer functionconstruction method was verified. In other words, the transferfunction construction method can be applied to any other soilproperty (function) if “a few”, specially selected data are available.
Further studies can be suggested on the extension of the drydensity transfer function for a “larger” space (in terms of para-meters N, dmin) using a few (around fraction number N) addi-tional measurements; moreover, on the extension to the inverseimage of the entropy diagram points using a more sophisticatedfunction than the constant function. The application of themethod to the unsaturated soil functions has been started by theestimation of the soil water characteristic curve of sands (Imre etal., 2008).
Acknowledgements
The support of the COLAS and of the National Research FundJedlik Ányos NKFP B1 2006 08 is greatly acknowledged.
References
Dexter, A. R. and Tanner, D. W. (1971). “Packing density of ternarymixtures of spheres.” Nature, Vol. 230, p. 177.
Einav, I (2007). “Breakage mechanics – Part I: Theory.” J. of the Mech.and Physics of Solids, Vol. 55, No. 6, pp. 1274-1297.
Hirsch, M. W. (1976). Differential topology, Springer-Verlag. p. 221.Imre, E. (1995). “Characterization of dispersive and piping soils.” Proc.
XI. ECSMFE, Copenhagen, Vol. 2, pp. 49-55.Imre, E., Lörincz, J., and Rózsa, P. (2008). “Characterization of some
sand mixtures.” The Proc. of the 12th Int. Conference of Inter-national Association for Computer Methods and Advances inGeomechanics, IACMAG, Goa, India, pp. 2064-2075.
Kabai, I. (1972). Relationship between the grading curve and the

A General Dry Density Law for Sands
Vol. 13, No. 4 / July 2009 − 271 −
compactibility, PhD thesis, TU of Budapest, Hungary (in Hungarian).Korn G. A. and Korn T. M. (1975). Mathematical handbook for
scientists and engineers, 2nd Edition, McGraw-Hill Book Com-pany.
Lörincz, J. (1986). Grading entropy of soils, PhD thesis, TechnicalSciences, TU of Budapest. (in Hungarian).
Lörincz, J. (1990). “Relationship between grading entropy and dry bulkdensity of granular soils.” Periodica Polytechnica, Vol. 34, No. 3,pp. 255-265.
Lörincz, J. (1993a). “On granular filters with the help of gradingentropy.” Proc. of Conf. on Filters in Geotechnical and Hydr. Eng.Brauns, Heibaum, Schuler, BALKEMA, pp. 67-69.
Lörincz, J. (1993b). “On particle migration with the help of gradingentropy.” Proc. of Conf. on Filters in Geotechnical and Hydr. Eng.Brauns, Heibaum, Schuler, BALKEMA, pp. 63-65.
Lörincz, J., Imre, E., Gálos, M., Trang, Q. P., Telekes, G., Rajkai, K., andFityus, I. (2005). “Grading entropy variation due to soil crushing.”Int. Journ. of Geomechanics, Vol 5, No. 4, pp. 311-320.
Milnor, J. W. (1981). Topology from the differentiable viewpoint, SixthPrinting, The University Press of Virginia, Charlottesville.
Scheuermann, A. and Bieberstein, A. (2007). “Determination of thesoils water retention curve and the unsaturated hydraulic conduc-tivity from the particle size distribution.” Experimental UnsaturatedSoil Mechanics, Springer, pp. 421-433.
Yu, A. B. and Standish, N. (1988). “An analytical-parametric theory ofthe random packing particles.” Powder Technology, Vol. 55, No. 3,pp. 171-186.
Appendix 1. Geometrical Interpretation of theGrading Entropy Diagram and the Inverse Imageof the Entropy Diagram Points
Let us consider the N dimensional Euclidean space as thedirect sum of the B axis and the hyper-plane of the simplex. Letus consider the A = constant and B = constant hyper-planes. Letus consider the graph of B, denoted by X: ∆→[∆,B].
The map X is a homeomorphism, it is continuous, one-to-onetogether with its inverse. The graph of B can be visualized insuch a way that above each simplex point, in the verticaldirection (i.e., B axis direction) we indicate a point in distance ofB. The inverse X-1:[∆,B]→∆ can be imagined such that the pointabove the simplex in distance B is pushed back into the simplex.
The entropy diagram can be interpreted as a projection p: [∆,B]→[A,B] such that the image of the graph of B (denoted by [∆,B])is projected onto the two dimensional space defined by thesimplex edge 1-N and axis B in the N dimensional Euclideanspace. The direction of the projection is defined by the hyper-planes A = constant and B = constant. The projection means thatthe intersection of [∆,B] with the A = constant and B = constanthyper-planes in the N dimensional Euclidean space is mappedinto a single point with coordinates [A,B]. This interpretationfollows from the fact that the A coordinate a point of the simplexedge 1-N is equal to the relative frequency of the fraction Ndenoted by xN which is equal to the distance of the intersection ofthe A = constant hyper-plane from vertex 1.
Let us denote the intersection of [∆,B] with the A = constanthyper-planes in the N dimensional Euclidean space with [A,B]A
and the intersection of [∆,B] with the A = constant and B =constant hyper-planes in the N dimensional Euclidean with[A,B]AB.
The graph of B is concave and symmetric (e.g., in the case ofN=3 it is a two dimensional symmetric “cupola” over the twodimensional triangle diagram). Due to the concaveness and thesymmetry, the image of the graph of B denoted by [∆,B] issimilar to a part of a N–1 dimensional sphere for any N. The non-empty intersection of a sphere and a plane is a single point or it isa lower dimensional sphere. It follows that [∆,B]A and [∆,B]AB areconcave and symmetric, being similar to some parts of a N–2 andan N–3 dimensional spheres, respectively.
Minimum and Maximum Lines of the Entropy DiagramLet us introduce the restriction of function X onto the A =
constant points of the simplex which is a homeomorphismdenoted by XA: ∆A→[∆A,B]. It follows from the definitions that[∆A,B] = [∆,B]A , the image of the restriction [∆A,B] is equal to theintersection of the image of the graph of B [∆,B] with the A =constant, N-1 dimensional, affine hyper-plane denoted by [∆,B]A.
Being [∆,B]A concave and symmetric, (i) its minimum Bvalues – which are projected into the minimum B line of theentropy diagram - are related to its boundary, (ii) its maximum Bvalue – which is projected into the maximum B line of theentropy diagram - is related to such a single inner point where thedirection of the projection is in tangent position to [∆,B]A.
Being XA-1: [∆A,B]→ ∆A a homeomorphism, the inverse of the
minimum points of [∆A,B] – being situated at the boundary of[∆A,B] – are related to the boundary of ∆A (i.e., the vertices of theA = constant polyhedron sections of the simple, being situated onthe edges of the simplex). Moreover, the inverse of the maxi-mum point of [∆A,B] – being a single inner point of [∆A,B] – willbe a single inner point of ∆A.
Inverse Image of the Entropy Diagram PointsLet us denote the inverse image of the entropy diagram point
[A,B] in the simplex by ∆AB. Let us consider the restriction of thefunction X -1:[∆,B]→∆ onto the A = constant and B = constantpoints of the image of the graph of B denoted by [∆,B]AB which isa homeomorphism XA
-1B:[∆,B]AB→∆. By definition the image of
the restriction [∆,B]AB is ∆AB Being B = constant, the orthogonalprojection between [∆,B]AB and ∆AB is a simple shift and, therefore,the inverse image of the entropy diagram point [A,B] in thesimplex ∆AB is congruent with [∆,B]AB, it is enough to determinethe structure of [∆,B]AB.
Geometrically, [∆,B]AB can be constructed as the intersection of[∆,B] with the A = constant and B = constant hyper-planes in theN dimensional Euclidean space. If the entropy diagram point[A,B] is a critical value of the entropy map (i.e., it is a point of themaximum B line, B = Bmax), then [∆,B]AB is a single point, themaximum point of [∆,B]A such that the direction of the projectionis in tangent position to [∆,B]A. Its inverse image in the simplexis the optimal (or critical) point.
If the entropy diagram point [A,B] is a regular value (i.e., it is

Emöke Imre, János Lörincz, Q. Phong Trang, Stephen Fityus, József Pusztai, Gábor Telekes, and Tom Schanz
− 272 − KSCE Journal of Civil Engineering
an inner point of the diagram), then [∆,B]AB is non-trivial, beingsimilar to some parts of a N-3 dimensional sphere with increas-ing radius as B decreases from the value B = Bmax. Its inverse imagein the simplex is similar to some parts of a N-3 dimensionalsphere with increasing radius as B decreases from the value B =Bmax, being “centred” to optimal point.
Appendix 2. A Numerical Example
Let us determine the density bounds of a soil with a gradingcurve consisting of N=4 fractions, the smallest fraction isbetween grain diameters of d = 0.063 mm and d = 0.125 mm, therelative frequencies of the fractions are equal:
(32)
Let us compute the entropy coordinates first. The base entropySo is given by the following formula:
(33)
The entropy increment ∆S is given by the following formula:
(34)
The normalised base entropy, the relative base entropy A isgiven as:
(35)
The normalised entropy increment B is given as:
(36)
Being this mixture not only continuous but also optimal, thepreliminary dry density transfer function given in Fig. 19 can beused. Let us determine the approximate minimum dry densityvalue in terms of dry solid volume ratio smin from Fig. 19. It isfound that at So = 2.5 and ∆S = 2 its value is equal to smin = 0.57.It is known that the ratio of the minimum and the maximum drydensity is about equal to 0. 92 for sands (Kabai, 1972). It followsthat the maximum dry density in terms of smin is about equal tosmax = 0.57/0. 92=0.62.
xi14---=
S0 xii 1=
N
∑ i 1–( ) S01+ 14---
i 1=
7
∑ i 1–( ) 1+ 2.5= = =
S∆ 1ln2-------– xi
i 1=
N
∑ lnxi1
ln2-------– *4*1
4---*ln 1
4---⎝ ⎠⎛ ⎞ 2.0= = =
A
xii 1=
N
∑ i 1–( )
N 1–------------------------
14---
1
4
∑ i 1–( )
3---------------------- 0.5= = =
B S∆ln N( )------------- 1
ln2------- 1.44= = =
Copyright © 2022 FDOKUMEN