Bulk density of wet and dry wheat straw and switchgrass particles
8
Applied Engineering in Agriculture Vol. 24(3): 351‐358 E 2008 American Society of Agricultural and Biological Engineers ISSN 0883-8542 351 BULK DENSITY OF WET AND DRY WHEAT STRAW AND SWITCHGRASS P ARTICLES P. S. Lam, S. Sokhansanj, X. Bi, C. J. Lim, L. J. Naimi, M. Hoque, S. Mani, A. R. Womac, X. P. Ye, S. Narayan ABSTRACT. Bulk density is a major physical property in designing the logistic system for biomass handling. The size, shape, moisture content, individual particle density, and surface characteristics are few factors affecting the bulk density. This research investigates the effects of true particle lengths ranging from 6 to 50 mm and moisture contents ranging from 8% to 60% wet basis (wb) on the bulk density of wheat straw and switchgrass. Three types of particle densities of straw and switchgrass measured were: a hollow particle density assuming a hollow cylindrical geometry, a solid particle density assuming a solid cylindrical geometry, and a particle density measured using a gas pycnometer at a gas pressure of 40 kPa. The bulk density of both loose‐fill and packed‐fill biomass samples was examined. The calculated wet and dry bulk density ranged from 24 to 111 kg m ‐3 for straw and from 49 to 266 kg m ‐3 for switchgrass. The corresponding tapped bulk density ranged from 34 to 130 kg m ‐3 for straw and 68 to 323 kg m ‐3 for switchgrass. The increase in bulk density due to tapping the container was from 10% for short 6‐mm particles to more than 50% for long 50‐mm particles. An equation relating the bulk density of stems as a function of moisture content, dry bulk density, and particle size was developed. After the validation of this bulk density equation, the relationship would be highly useful in designing the logistics system for large‐scale transport of biomass to a biorefinery. The bulk density and particle density data of uniform particles would be important, if straw and switchgrass is used for pulping and paper making. Keywords. Bulk density, Particle density, Straw, Switchgrass, Packing, Porosity, Fibrous biomass. ulk density is an important characteristic of biomass that influences directly the cost of feedstock delivered to a biorefinery and storage cost (Sokhansanj and Fenton, 2006). It also impacts storage requirements, the sizing of the material handling system and how the material behaves during subsequent thermo‐chemical and biological processes. (McKendry, 2002). The engineering design and operation of transport equipment, storages, and conversion processes Submitted for review in November 2007 as manuscript number FPE 7262; approved for publication by Food & Process Engineering Institute Division of ASABE in April 2008. Presented at the 2007 ASABE Annual Meeting as Paper No. 076058. The authors are Pak Sui Lam, ASABE Member, Graduate Research Associate, Department of Chemical and Biological Engineering, University of British Columbia, Vancouver, British Columbia, Canada; Shahab Sokhansanj, ASABE Member, Adjunct professor, Department of Chemical and Biological Engineering, University of British Columbia, Vancouver, British Columbia, Canada and Distinguished Research Scientist Oak Ridge National Laboratory, Environmental Sciences Division, Oak Ridge, Tennessee; Xiaotao Bi, Professor, C. Jim Lim, Professor, Ladan J. Naimi, ASABE Member, Graduate Research Associate, Mozammel Hoque, ASABE Member, Posdoctoral Associate Department of Chemical and Biological Engineering, University of British Columbia, Vancouver, British Columbia, Canada,; Sudhagar Mani, Assistant Professor, Faculty of Engineering, Driftmier Engineering Center, University of Georgia, Athens Georgia; Alvin Ray Womac, ASABE Member, Professor, X. Philip Ye, Assistant Professor, Department of Biosystems Engineering and Soil Science, The University of Tennessee, Knoxville, Tennessee; Sundar Narayan, Professor, Lambton College, Sarnia, Ontario, Canada. Corresponding author: Pak Sui Lam, Department of Chemical and Biological Engineering, University of British Columbia, Vancouver, British Columbia, Canada, V6T1Z3; phone: 604‐827‐3413; fax: 604‐802‐6003; e‐mail: [email protected]. depends on bulk density and flow characteristics of feedstock (Woodcock and Mason, 1987). A recent study by Ryu et al. (2006) investigated the effect of bulk density on the combustion characteristics of biomass. They found that the ignition front speed was inversely proportional to bulk density, while the burning rate tends to decrease linearly. As a physical property, bulk density (r b ) depends on material composition (c), particle shape (f) and size (l, d), orientation of particles (s), specific density of individual particles (r p ), particle size distribution (PSD), moisture content (mc), and applied axial pressure (p) (Peleg, 1983; Lang et al., 1993; Sokhansanj and Lang, 1996). ) p , mc , PSD , s , , d , l , , c ( f p b = ò f ò (1) where l and d are length and diameter of particles. The variables in the right side of equation 1 are not all independent of each other. For example, moisture content has an effect on particle density and surface characteristics. Similarly, particle size and distribution depends on upstream processes such as chopping, drying, grinding, sieving, etc. Length (l) and diameter (d) define a shape factor (f) for the particle. Other factors such as surface characteristics also affect the bulk density and flow characteristics of biomass. The agricultural biomass particles are usually cylindrical or disk shape depending upon the part of the plant they originate. The long particles with aspect ratio (l/d) of greater than one are classified as cylindrical while the short particles (l/d<1) are classified as disk. The packing behavior of these non‐spherical shapes usually starts from studying the mono‐sized particles (Zou and Yu, 1996a; Zhang et al., 2006) and then gradually moves to the particle mixtures with B
-
Upload
independent -
Category
Documents
-
view
1 -
download
0
Transcript of Bulk density of wet and dry wheat straw and switchgrass particles
Applied Engineering in Agriculture
Vol. 24(3): 351‐358 � 2008 American Society of Agricultural and Biological Engineers ISSN 0883-8542 351
BULK DENSITY OF WET AND DRY WHEAT STRAW AND SWITCHGRASS PARTICLES
P. S. Lam, S. Sokhansanj, X. Bi, C. J. Lim, L. J. Naimi, M. Hoque, S. Mani, A. R. Womac, X. P. Ye, S. Narayan
ABSTRACT. Bulk density is a major physical property in designing the logistic system for biomass handling. The size, shape,moisture content, individual particle density, and surface characteristics are few factors affecting the bulk density. Thisresearch investigates the effects of true particle lengths ranging from 6 to 50 mm and moisture contents ranging from 8% to60% wet basis (wb) on the bulk density of wheat straw and switchgrass. Three types of particle densities of straw andswitchgrass measured were: a hollow particle density assuming a hollow cylindrical geometry, a solid particle densityassuming a solid cylindrical geometry, and a particle density measured using a gas pycnometer at a gas pressure of 40 kPa.The bulk density of both loose‐fill and packed‐fill biomass samples was examined. The calculated wet and dry bulk densityranged from 24 to 111 kg m‐3 for straw and from 49 to 266 kg m‐3 for switchgrass. The corresponding tapped bulk densityranged from 34 to 130 kg m‐3 for straw and 68 to 323 kg m‐3 for switchgrass. The increase in bulk density due to tapping thecontainer was from 10% for short 6‐mm particles to more than 50% for long 50‐mm particles. An equation relating the bulkdensity of stems as a function of moisture content, dry bulk density, and particle size was developed. After the validation ofthis bulk density equation, the relationship would be highly useful in designing the logistics system for large‐scale transportof biomass to a biorefinery. The bulk density and particle density data of uniform particles would be important, if straw andswitchgrass is used for pulping and paper making.
Keywords. Bulk density, Particle density, Straw, Switchgrass, Packing, Porosity, Fibrous biomass.
ulk density is an important characteristic ofbiomass that influences directly the cost offeedstock delivered to a biorefinery and storagecost (Sokhansanj and Fenton, 2006). It also
impacts storage requirements, the sizing of the materialhandling system and how the material behaves duringsubsequent thermo‐chemical and biological processes.(McKendry, 2002). The engineering design and operation oftransport equipment, storages, and conversion processes
Submitted for review in November 2007 as manuscript number FPE7262; approved for publication by Food & Process Engineering InstituteDivision of ASABE in April 2008. Presented at the 2007 ASABE AnnualMeeting as Paper No. 076058.
The authors are Pak Sui Lam, ASABE Member, Graduate ResearchAssociate, Department of Chemical and Biological Engineering,University of British Columbia, Vancouver, British Columbia, Canada;Shahab Sokhansanj, ASABE Member, Adjunct professor, Department ofChemical and Biological Engineering, University of British Columbia,Vancouver, British Columbia, Canada and Distinguished ResearchScientist Oak Ridge National Laboratory, Environmental SciencesDivision, Oak Ridge, Tennessee; Xiaotao Bi, Professor, C. Jim Lim,Professor, Ladan J. Naimi, ASABE Member, Graduate ResearchAssociate, Mozammel Hoque, ASABE Member, Posdoctoral AssociateDepartment of Chemical and Biological Engineering, University of BritishColumbia, Vancouver, British Columbia, Canada,; Sudhagar Mani,Assistant Professor, Faculty of Engineering, Driftmier Engineering Center,University of Georgia, Athens Georgia; Alvin Ray Womac, ASABEMember, Professor, X. Philip Ye, Assistant Professor, Department ofBiosystems Engineering and Soil Science, The University of Tennessee,Knoxville, Tennessee; Sundar Narayan, Professor, Lambton College,Sarnia, Ontario, Canada. Corresponding author: Pak Sui Lam,Department of Chemical and Biological Engineering, University of BritishColumbia, Vancouver, British Columbia, Canada, V6T1Z3; phone:604‐827‐3413; fax: 604‐802‐6003; e‐mail: [email protected].
depends on bulk density and flow characteristics of feedstock(Woodcock and Mason, 1987). A recent study by Ryu et al.(2006) investigated the effect of bulk density on thecombustion characteristics of biomass. They found that theignition front speed was inversely proportional to bulkdensity, while the burning rate tends to decrease linearly. Asa physical property, bulk density (�b) depends on materialcomposition (c), particle shape (�) and size (l, d), orientationof particles (s), specific density of individual particles (�p),particle size distribution (PSD), moisture content (mc), andapplied axial pressure (p) (Peleg, 1983; Lang et al., 1993;Sokhansanj and Lang, 1996).
)p,mc,PSD,s,,d,l,,c(f pb =� �� (1)
where l and d are length and diameter of particles. Thevariables in the right side of equation 1 are not allindependent of each other. For example, moisture content hasan effect on particle density and surface characteristics.Similarly, particle size and distribution depends on upstreamprocesses such as chopping, drying, grinding, sieving, etc.Length (l) and diameter (d) define a shape factor (�) for theparticle. Other factors such as surface characteristics alsoaffect the bulk density and flow characteristics of biomass.
The agricultural biomass particles are usually cylindricalor disk shape depending upon the part of the plant theyoriginate. The long particles with aspect ratio (l/d) of greaterthan one are classified as cylindrical while the short particles(l/d<1) are classified as disk. The packing behavior of thesenon‐spherical shapes usually starts from studying themono‐sized particles (Zou and Yu, 1996a; Zhang et al., 2006)and then gradually moves to the particle mixtures with
B

352 APPLIED ENGINEERING IN AGRICULTURE
different shapes and volume fractions (Yu and Zou, 1996;Zou et al., 1997).
Zou and Yu (1996a) and Yu and Zou (1996) developedequations to estimate the porosity of mono‐sizednon‐spherical particles by defining a sphericity factor. In asubsequent publication, Zou et al. (1997) reported that thepacking of long cylindrical particles was dependent on thelength distribution of particles and the porosity of bulkcylindrical particles could not be estimated from packingrelations for spherical particles. The shape and size effectcontribute to the packing structure of the non‐sphericalparticles and the shape effect dominates the packing structurewith the particle length distribution. They assumed awell‐defined solid cylindrical geometry in their analysis. Theapplicability of this phenomenon to biomass particles may bequestionable as straws and switchgrass are hollow‐tubestructures with non‐uniform diameter along the particlelength.
OBJECTIVES
The objective of this research is to measure the bulkdensity of straw and switchgrass with respect to some of themeasurable physical attributes (particle length and moisturecontent) and to develop predictive equations for bulk densityof biomass.
MATERIALS AND METHODSSAMPLE PREPARATION
The wheat straw was collected from Richmond CountryFarms, Richmond, BC. The bales were of rectangular shapewith a moisture content of 8.45% wet basis (wb) as received.The switchgrass was a round bale acquired from a farm inManitoba. The moisture content of switchgrass was 7.96%wet basis (wb) as received. The moisture contents weremeasured using ASAE Standard S358.2 FEB 03 (ASABEStandards, 2006) for forages. The procedure specifies drying5‐ to 20‐g samples of chopped or ground material in aconvection oven at 105°C for 24 h. The moisture content isdetermined by subtracting the dried mass from original wetmass divided by the wet mass.
The stems of straw and switchgrass were sorted outmanually. The leafy material and small pieces were removed.The stems were cut into sizes of 50.80, 25.40, 12.70, and6.35 mm (2, 1, 1/2, and 1/4 in.) using a scissor. The actualparticles size of switchgrass and straw are listed in table 1.
The moisture content of switchgrass and straw wasadjusted by spraying a predetermined amount of distilledwater uniformly over the samples in a container. Themoistened samples were thoroughly mixed and sealed insidea plastic bag. The bags were placed inside a sealed plasticcontainer for 48 h at 4°C to allow the samples to equilibrateto three levels of target moisture content (i.e., 20%, 40%, and60% wb). The final moisture contents were measured usingair oven method (ASAE Standard S358.2 FEB 03, ASABEStandards, 2006).
BULK DENSITY
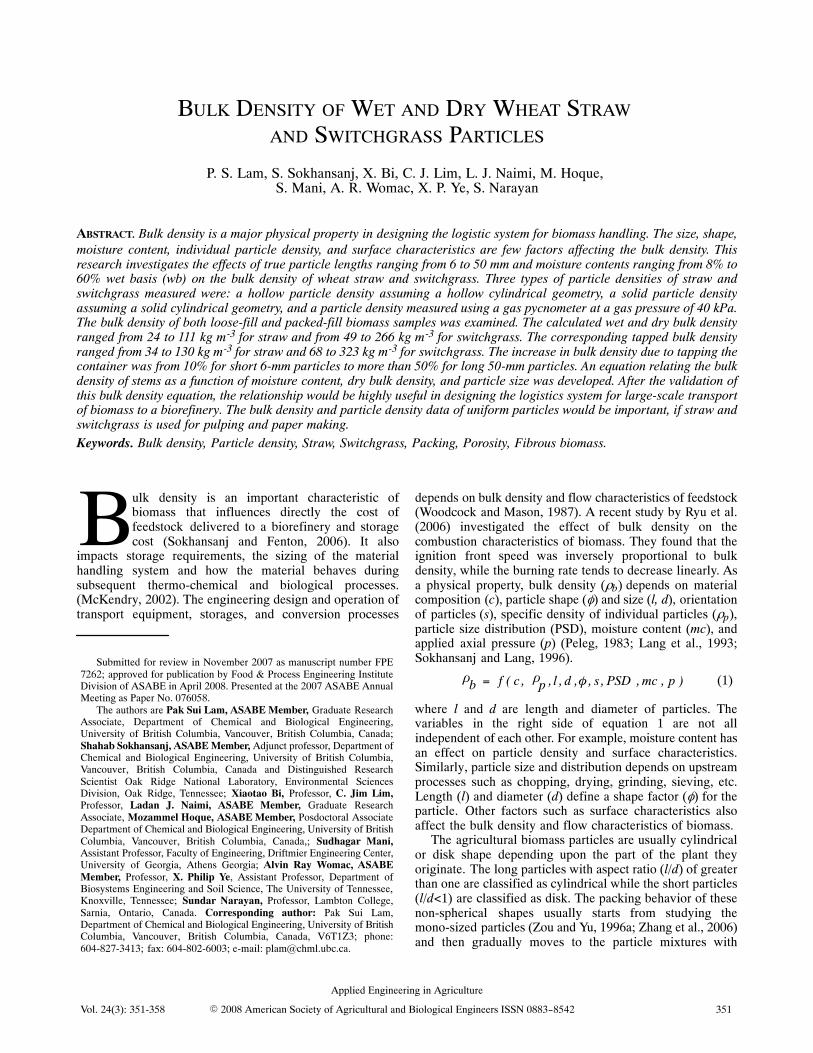
Bulk density of wheat straw and switchgrass wasdetermined according to the ASAE Standard S269.4 DEC 91(ASABE Standards, 2007) for cubes, pellets, and crumbles.Three cylindrical containers each with a specific insidediameter (DT) were used for determination of bulk density ofdifferent particle sizes (table 1). Figure 1 shows a plexiglasscontainer loosely filled with the same size switchgrassparticles to measure bulk density. Each measurement wasrepeated for five refills using the same straw or switchgrasssample. Biomass was poured into the container from a certainheight to facilitate the free flowing of the samples until thecontainer was overflowed. The height of pour for 50‐ and25‐mm long particles was 500 mm and for 12.5‐ and 6‐mmlong particles was 200 mm. The height of pour was measuredfrom the bottom of the container. The excess material wasremoved by striking a straight edge across the top. The weightof the material with the container was recorded. The netweight of the sample was obtained by subtracting the weightof the empty container. For tapped density, the loosely filledcontainer was tapped on the laboratory bench five times bydropping the container from a height of 50 and 10 cm for thelong and short particles, respectively. Tapping was done bythe same individual. Filling and tapping was repeated untilthe container was overflowed. The filled container wasweighed to 0.01‐g precision. Bulk density was calculated bydividing the mass over the container volume.
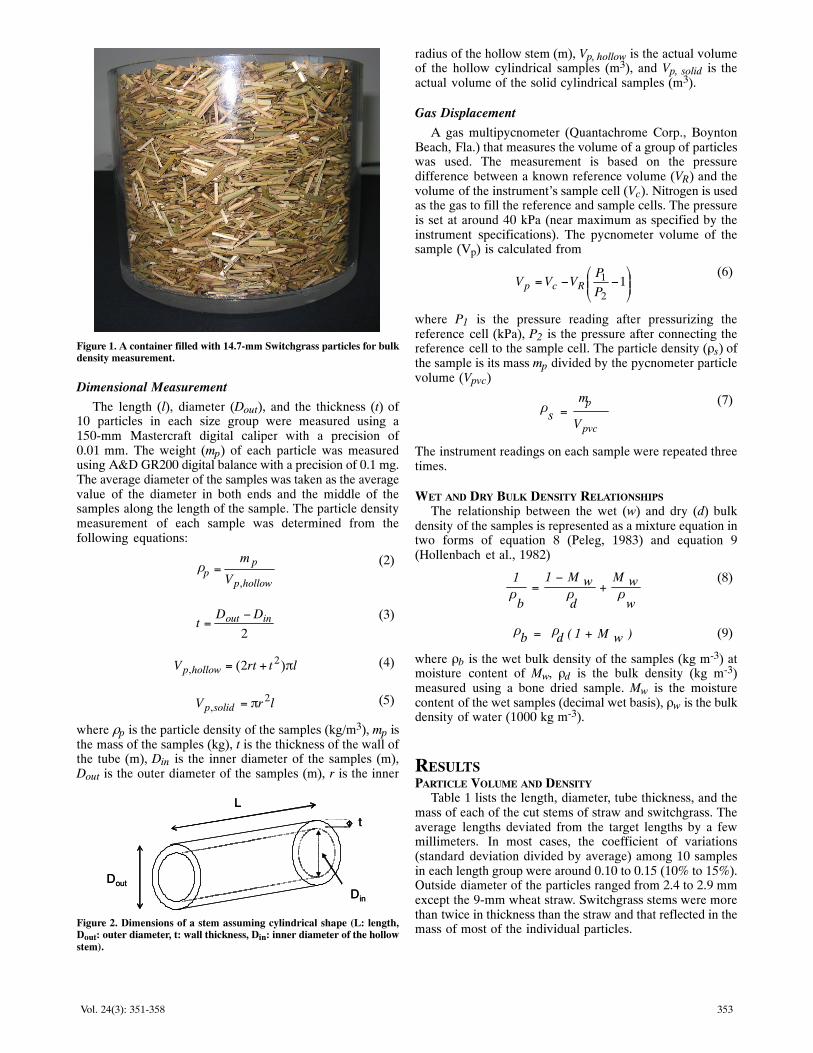
PARTICLE DENSITYThe straw and switchgrass are hollow cylindrical particles
as shown schematically in figure 2. Cleaned stems of strawand switchgrass were oven dried at 105°C for 24 h. Thevolume of a single particle was measured in three ways: bygeometrical dimensions (assumed as hollow and solid) andby gas displacement. These volume measurements aredescribed below.
Table 1. Measured dimensions and mass of single particles (n=10).
Type ofBiomass
Length, L (mm) Diameter, Din (mm) Thickness, t (mm) Mass, mp (g)
Average SD Average SD Average SD Average SD
Wheat straw
56.598 2.708 2.648 0.419 0.146 0.053 0.029 0.010
34.503 2.045 2.914 0.542 0.145 0.035 0.024 0.008
17.172 1.432 2.952 0.346 0.125 0.025 0.010 0.003
9.078 0.530 3.380 0.485 0.216 0.073 0.008 0.003
Switchgrass
51.774 1.990 2.600 0.581 0.340 0.108 0.064 0.019
28.974 3.013 2.855 0.565 0.581 0.239 0.043 0.019
14.721 1.079 2.916 0.562 0.486 0.152 0.025 0.015
8.042 1.064 2.420 0.468 0.486 0.152 0.008 0.002
353Vol. 24(3): 351‐358
Figure 1. A container filled with 14.7‐mm Switchgrass particles for bulkdensity measurement.
Dimensional Measurement
The length (l), diameter (Dout), and the thickness (t) of10 particles in each size group were measured using a150‐mm Mastercraft digital caliper with a precision of0.01 mm. The weight (mp) of each particle was measuredusing A&D GR200 digital balance with a precision of 0.1 mg.The average diameter of the samples was taken as the averagevalue of the diameter in both ends and the middle of thesamples along the length of the sample. The particle densitymeasurement of each sample was determined from thefollowing equations:
hollowp
pp
V
m
,=�
(2)
2inout DD
t−
=(3)
ltrtV hollowp �+= )2( 2,
(4)
lrV solidp2
, �= (5)
where �p is the particle density of the samples (kg/m3), mp isthe mass of the samples (kg), t is the thickness of the wall ofthe tube (m), Din is the inner diameter of the samples (m),Dout is the outer diameter of the samples (m), r is the inner
L
Dout
t
Din
L
Dout
t
Din
Figure 2. Dimensions of a stem assuming cylindrical shape (L: length,Dout: outer diameter, t: wall thickness, Din: inner diameter of the hollowstem).
radius of the hollow stem (m), Vp, hollow is the actual volumeof the hollow cylindrical samples (m3), and Vp, solid is theactual volume of the solid cylindrical samples (m3).
Gas Displacement
A gas multipycnometer (Quantachrome Corp., BoyntonBeach, Fla.) that measures the volume of a group of particleswas used. The measurement is based on the pressuredifference between a known reference volume (VR) and thevolume of the instrument's sample cell (Vc). Nitrogen is usedas the gas to fill the reference and sample cells. The pressureis set at around 40 kPa (near maximum as specified by theinstrument specifications). The pycnometer volume of thesample (Vp) is calculated from
⎟⎟⎠
⎞⎢⎢⎝
⎛−−= 1
2
1
P
PVVV Rcp
(6)
where P1 is the pressure reading after pressurizing thereference cell (kPa), P2 is the pressure after connecting thereference cell to the sample cell. The particle density (ρs) ofthe sample is its mass mp divided by the pycnometer particlevolume (Vpvc)
pvc
ps
V
m=�
(7)
The instrument readings on each sample were repeated threetimes.
WET AND DRY BULK DENSITY RELATIONSHIPS
The relationship between the wet (w) and dry (d) bulkdensity of the samples is represented as a mixture equation intwo forms of equation 8 (Peleg, 1983) and equation 9(Hollenbach et al., 1982)
w
w
d
w
b
MM11+
−=
� � �
(8)
)M1( wdb += �� (9)
where ρb is the wet bulk density of the samples (kg m‐3) atmoisture content of Mw, ρd is the bulk density (kg m‐3)measured using a bone dried sample. Mw is the moisturecontent of the wet samples (decimal wet basis), ρw is the bulkdensity of water (1000 kg m‐3).
RESULTSPARTICLE VOLUME AND DENSITY
Table 1 lists the length, diameter, tube thickness, and themass of each of the cut stems of straw and switchgrass. Theaverage lengths deviated from the target lengths by a fewmillimeters. In most cases, the coefficient of variations(standard deviation divided by average) among 10 samplesin each length group were around 0.10 to 0.15 (10% to 15%).Outside diameter of the particles ranged from 2.4 to 2.9 mmexcept the 9‐mm wheat straw. Switchgrass stems were morethan twice in thickness than the straw and that reflected in themass of most of the individual particles.
354 APPLIED ENGINEERING IN AGRICULTURE
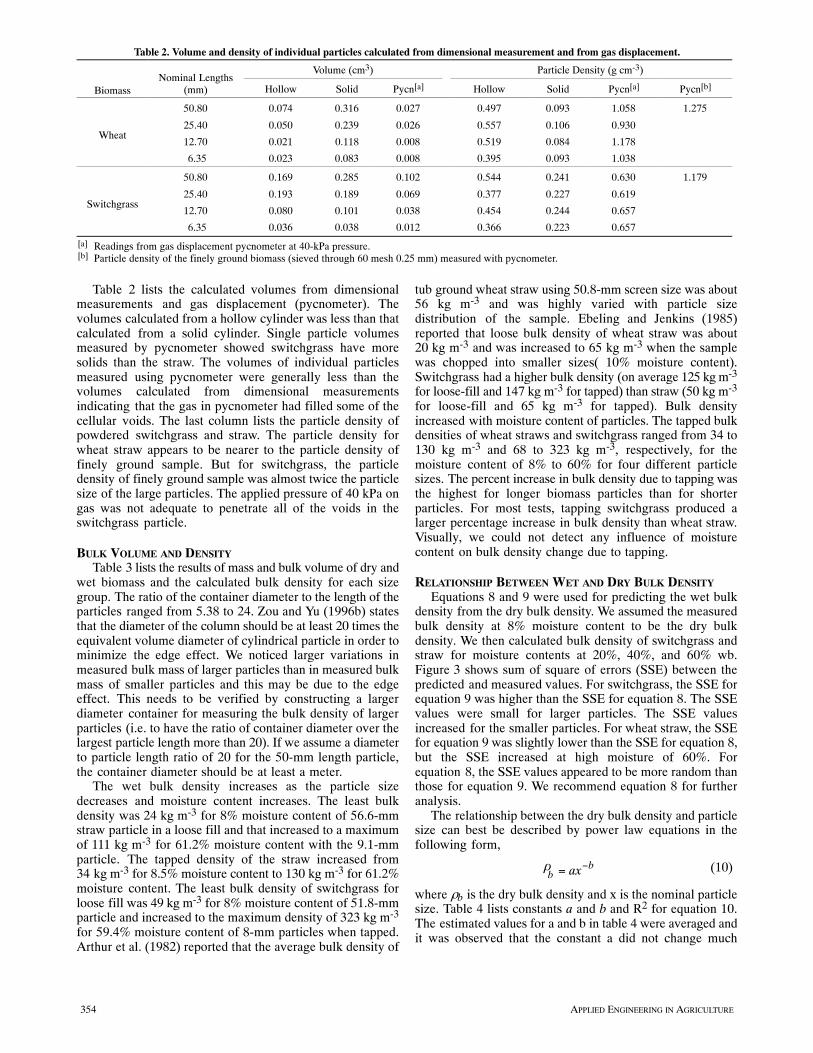
Table 2. Volume and density of individual particles calculated from dimensional measurement and from gas displacement.
BiomassNominal Lengths
(mm)
Volume (cm3) Particle Density (g cm‐3)
Hollow Solid Pycn[a] Hollow Solid Pycn[a] Pycn[b]
Wheat
50.80 0.074 0.316 0.027 0.497 0.093 1.058 1.275
25.40 0.050 0.239 0.026 0.557 0.106 0.930
12.70 0.021 0.118 0.008 0.519 0.084 1.178
6.35 0.023 0.083 0.008 0.395 0.093 1.038
Switchgrass
50.80 0.169 0.285 0.102 0.544 0.241 0.630 1.179
25.40 0.193 0.189 0.069 0.377 0.227 0.619
12.70 0.080 0.101 0.038 0.454 0.244 0.657
6.35 0.036 0.038 0.012 0.366 0.223 0.657
[a] Readings from gas displacement pycnometer at 40‐kPa pressure.[b] Particle density of the finely ground biomass (sieved through 60 mesh 0.25 mm) measured with pycnometer.
Table 2 lists the calculated volumes from dimensionalmeasurements and gas displacement (pycnometer). Thevolumes calculated from a hollow cylinder was less than thatcalculated from a solid cylinder. Single particle volumesmeasured by pycnometer showed switchgrass have moresolids than the straw. The volumes of individual particlesmeasured using pycnometer were generally less than thevolumes calculated from dimensional measurementsindicating that the gas in pycnometer had filled some of thecellular voids. The last column lists the particle density ofpowdered switchgrass and straw. The particle density forwheat straw appears to be nearer to the particle density offinely ground sample. But for switchgrass, the particledensity of finely ground sample was almost twice the particlesize of the large particles. The applied pressure of 40 kPa ongas was not adequate to penetrate all of the voids in theswitchgrass particle.
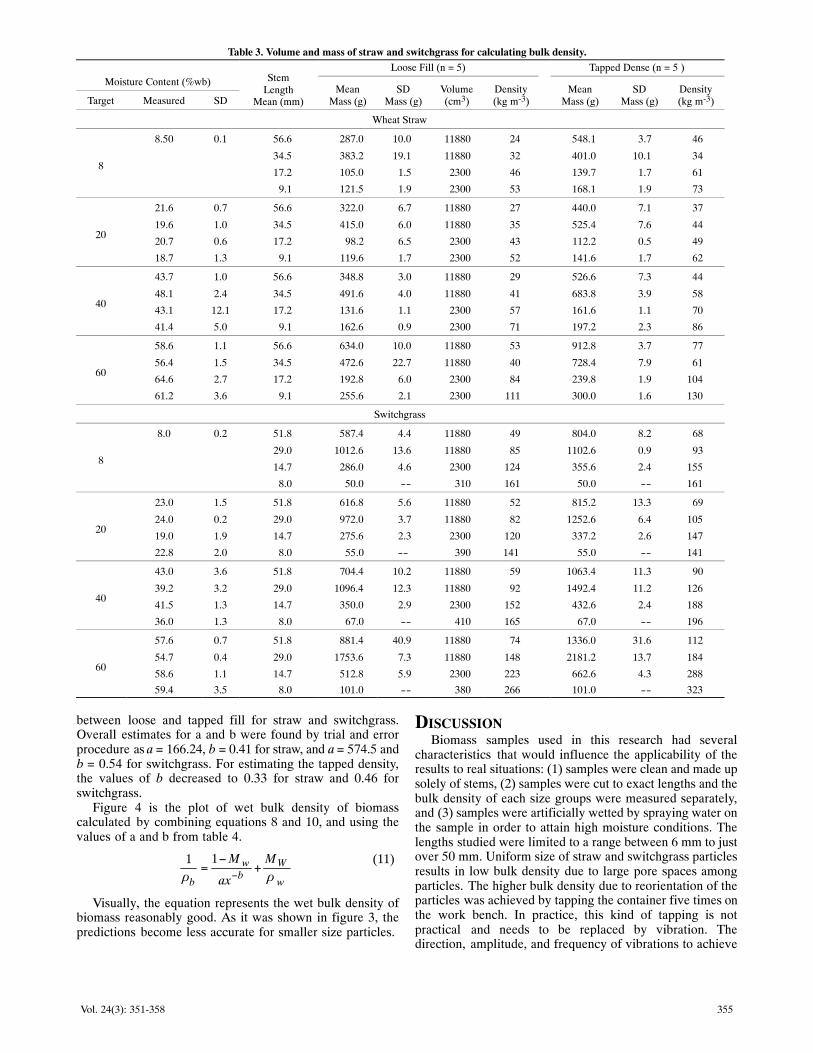
BULK VOLUME AND DENSITYTable 3 lists the results of mass and bulk volume of dry and
wet biomass and the calculated bulk density for each sizegroup. The ratio of the container diameter to the length of theparticles ranged from 5.38 to 24. Zou and Yu (1996b) statesthat the diameter of the column should be at least 20 times theequivalent volume diameter of cylindrical particle in order tominimize the edge effect. We noticed larger variations inmeasured bulk mass of larger particles than in measured bulkmass of smaller particles and this may be due to the edgeeffect. This needs to be verified by constructing a largerdiameter container for measuring the bulk density of largerparticles (i.e. to have the ratio of container diameter over thelargest particle length more than 20). If we assume a diameterto particle length ratio of 20 for the 50‐mm length particle,the container diameter should be at least a meter.
The wet bulk density increases as the particle sizedecreases and moisture content increases. The least bulkdensity was 24 kg m‐3 for 8% moisture content of 56.6‐mmstraw particle in a loose fill and that increased to a maximumof 111 kg m‐3 for 61.2% moisture content with the 9.1‐mmparticle. The tapped density of the straw increased from34 kg m‐3 for 8.5% moisture content to 130 kg m‐3 for 61.2%moisture content. The least bulk density of switchgrass forloose fill was 49 kg m‐3 for 8% moisture content of 51.8‐mmparticle and increased to the maximum density of 323 kg m‐3
for 59.4% moisture content of 8‐mm particles when tapped.Arthur et al. (1982) reported that the average bulk density of
tub ground wheat straw using 50.8‐mm screen size was about56 kg m‐3 and was highly varied with particle sizedistribution of the sample. Ebeling and Jenkins (1985)reported that loose bulk density of wheat straw was about20 kg m‐3 and was increased to 65 kg m‐3 when the samplewas chopped into smaller sizes( 10% moisture content).Switchgrass had a higher bulk density (on average 125 kg m‐3
for loose‐fill and 147 kg m‐3 for tapped) than straw (50 kg m‐3
for loose‐fill and 65 kg m‐3 for tapped). Bulk densityincreased with moisture content of particles. The tapped bulkdensities of wheat straws and switchgrass ranged from 34 to130 kg m‐3 and 68 to 323 kg m‐3, respectively, for themoisture content of 8% to 60% for four different particlesizes. The percent increase in bulk density due to tapping wasthe highest for longer biomass particles than for shorterparticles. For most tests, tapping switchgrass produced alarger percentage increase in bulk density than wheat straw.Visually, we could not detect any influence of moisturecontent on bulk density change due to tapping.
RELATIONSHIP BETWEEN WET AND DRY BULK DENSITY
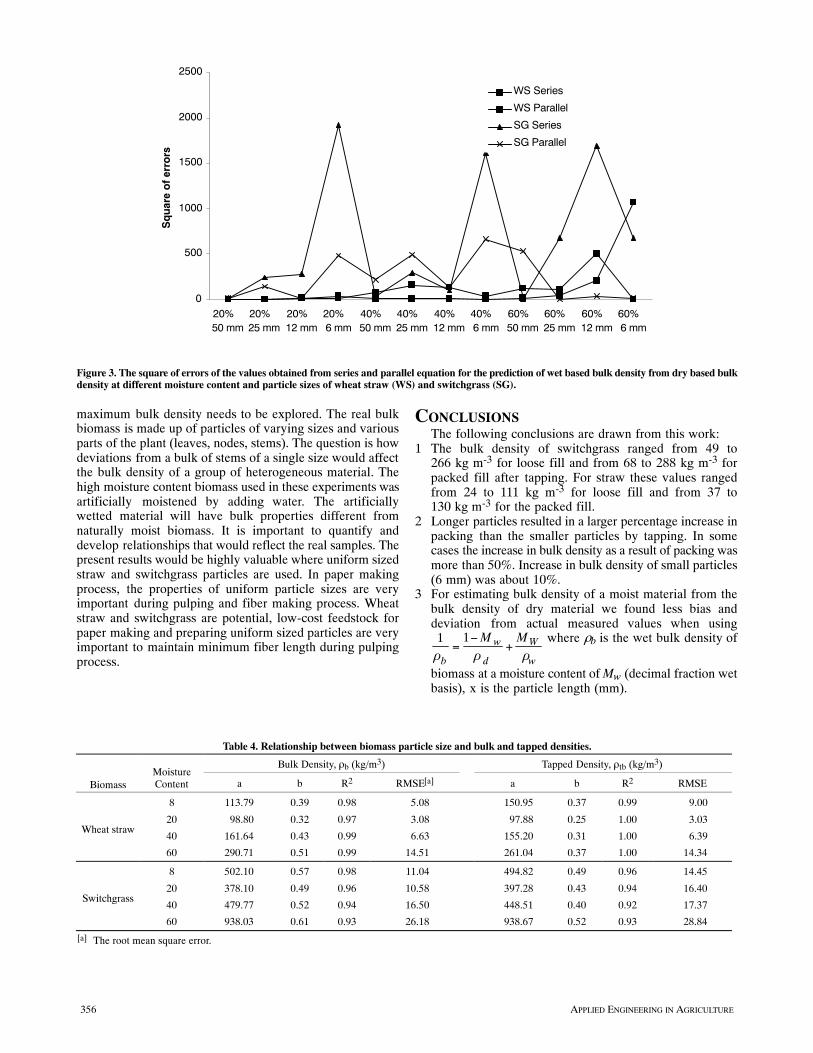
Equations 8 and 9 were used for predicting the wet bulkdensity from the dry bulk density. We assumed the measuredbulk density at 8% moisture content to be the dry bulkdensity. We then calculated bulk density of switchgrass andstraw for moisture contents at 20%, 40%, and 60% wb.Figure 3 shows sum of square of errors (SSE) between thepredicted and measured values. For switchgrass, the SSE forequation 9 was higher than the SSE for equation 8. The SSEvalues were small for larger particles. The SSE valuesincreased for the smaller particles. For wheat straw, the SSEfor equation 9 was slightly lower than the SSE for equation 8,but the SSE increased at high moisture of 60%. Forequation 8, the SSE values appeared to be more random thanthose for equation 9. We recommend equation 8 for furtheranalysis.
The relationship between the dry bulk density and particlesize can best be described by power law equations in thefollowing form,
bb ax−=� (10)
where �b is the dry bulk density and x is the nominal particlesize. Table 4 lists constants a and b and R2 for equation 10.The estimated values for a and b in table 4 were averaged andit was observed that the constant a did not change much
355Vol. 24(3): 351‐358
Table 3. Volume and mass of straw and switchgrass for calculating bulk density.
StemLength
Mean (mm)
Loose Fill (n = 5) Tapped Dense (n = 5 )Moisture Content (%wb)
MeanMass (g)
SDMass (g)
Volume(cm3)
Density(kg m‐3)
MeanMass (g)
SDMass (g)
Density(kg m‐3)Target Measured SD
Wheat Straw
8
8.50 0.1 56.6 287.0 10.0 11880 24 548.1 3.7 46
34.5 383.2 19.1 11880 32 401.0 10.1 34
17.2 105.0 1.5 2300 46 139.7 1.7 61
9.1 121.5 1.9 2300 53 168.1 1.9 73
20
21.6 0.7 56.6 322.0 6.7 11880 27 440.0 7.1 37
19.6 1.0 34.5 415.0 6.0 11880 35 525.4 7.6 44
20.7 0.6 17.2 98.2 6.5 2300 43 112.2 0.5 49
18.7 1.3 9.1 119.6 1.7 2300 52 141.6 1.7 62
40
43.7 1.0 56.6 348.8 3.0 11880 29 526.6 7.3 44
48.1 2.4 34.5 491.6 4.0 11880 41 683.8 3.9 58
43.1 12.1 17.2 131.6 1.1 2300 57 161.6 1.1 70
41.4 5.0 9.1 162.6 0.9 2300 71 197.2 2.3 86
60
58.6 1.1 56.6 634.0 10.0 11880 53 912.8 3.7 77
56.4 1.5 34.5 472.6 22.7 11880 40 728.4 7.9 61
64.6 2.7 17.2 192.8 6.0 2300 84 239.8 1.9 104
61.2 3.6 9.1 255.6 2.1 2300 111 300.0 1.6 130
Switchgrass
8
8.0 0.2 51.8 587.4 4.4 11880 49 804.0 8.2 68
29.0 1012.6 13.6 11880 85 1102.6 0.9 93
14.7 286.0 4.6 2300 124 355.6 2.4 155
8.0 50.0 -- 310 161 50.0 -- 161
20
23.0 1.5 51.8 616.8 5.6 11880 52 815.2 13.3 69
24.0 0.2 29.0 972.0 3.7 11880 82 1252.6 6.4 105
19.0 1.9 14.7 275.6 2.3 2300 120 337.2 2.6 147
22.8 2.0 8.0 55.0 -- 390 141 55.0 -- 141
40
43.0 3.6 51.8 704.4 10.2 11880 59 1063.4 11.3 90
39.2 3.2 29.0 1096.4 12.3 11880 92 1492.4 11.2 126
41.5 1.3 14.7 350.0 2.9 2300 152 432.6 2.4 188
36.0 1.3 8.0 67.0 -- 410 165 67.0 -- 196
60
57.6 0.7 51.8 881.4 40.9 11880 74 1336.0 31.6 112
54.7 0.4 29.0 1753.6 7.3 11880 148 2181.2 13.7 184
58.6 1.1 14.7 512.8 5.9 2300 223 662.6 4.3 288
59.4 3.5 8.0 101.0 -- 380 266 101.0 -- 323
between loose and tapped fill for straw and switchgrass.Overall estimates for a and b were found by trial and errorprocedure as a = 166.24, b = 0.41 for straw, and a = 574.5 andb = 0.54 for switchgrass. For estimating the tapped density,the values of b decreased to 0.33 for straw and 0.46 forswitchgrass.
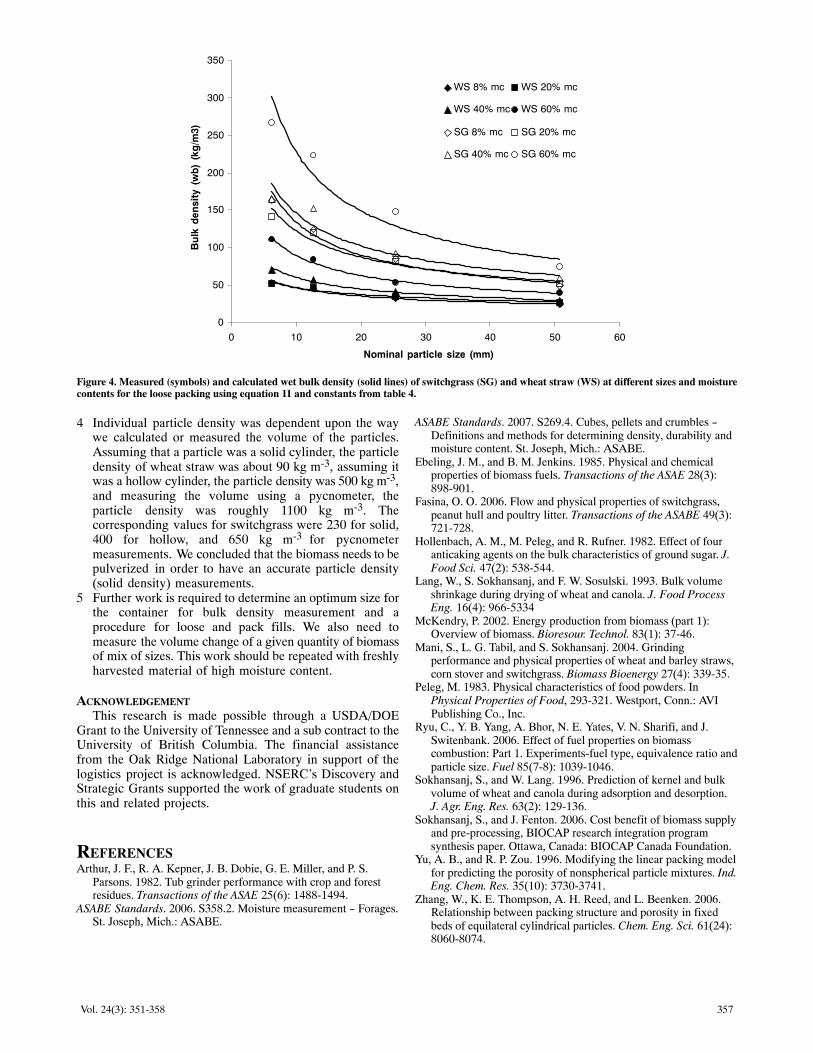
Figure 4 is the plot of wet bulk density of biomasscalculated by combining equations 8 and 10, and using thevalues of a and b from table 4.
w
Wbw
b
M
ax
M+
−=
−
11��
(11)
Visually, the equation represents the wet bulk density ofbiomass reasonably good. As it was shown in figure 3, thepredictions become less accurate for smaller size particles.
DISCUSSIONBiomass samples used in this research had several
characteristics that would influence the applicability of theresults to real situations: (1) samples were clean and made upsolely of stems, (2) samples were cut to exact lengths and thebulk density of each size groups were measured separately,and (3) samples were artificially wetted by spraying water onthe sample in order to attain high moisture conditions. Thelengths studied were limited to a range between 6 mm to justover 50 mm. Uniform size of straw and switchgrass particlesresults in low bulk density due to large pore spaces amongparticles. The higher bulk density due to reorientation of theparticles was achieved by tapping the container five times onthe work bench. In practice, this kind of tapping is notpractical and needs to be replaced by vibration. Thedirection, amplitude, and frequency of vibrations to achieve
356 APPLIED ENGINEERING IN AGRICULTURE
Figure 3. The square of errors of the values obtained from series and parallel equation for the prediction of wet based bulk density from dry based bulkdensity at different moisture content and particle sizes of wheat straw (WS) and switchgrass (SG).
maximum bulk density needs to be explored. The real bulkbiomass is made up of particles of varying sizes and variousparts of the plant (leaves, nodes, stems). The question is howdeviations from a bulk of stems of a single size would affectthe bulk density of a group of heterogeneous material. Thehigh moisture content biomass used in these experiments wasartificially moistened by adding water. The artificiallywetted material will have bulk properties different fromnaturally moist biomass. It is important to quantify anddevelop relationships that would reflect the real samples. Thepresent results would be highly valuable where uniform sizedstraw and switchgrass particles are used. In paper makingprocess, the properties of uniform particle sizes are veryimportant during pulping and fiber making process. Wheatstraw and switchgrass are potential, low‐cost feedstock forpaper making and preparing uniform sized particles are veryimportant to maintain minimum fiber length during pulpingprocess.
CONCLUSIONSThe following conclusions are drawn from this work:
1 The bulk density of switchgrass ranged from 49 to266 kg m‐3 for loose fill and from 68 to 288 kg m‐3 forpacked fill after tapping. For straw these values rangedfrom 24 to 111 kg m‐3 for loose fill and from 37 to130 kg m‐3 for the packed fill.
2 Longer particles resulted in a larger percentage increase inpacking than the smaller particles by tapping. In somecases the increase in bulk density as a result of packing wasmore than 50%. Increase in bulk density of small particles(6 mm) was about 10%.
3 For estimating bulk density of a moist material from thebulk density of dry material we found less bias anddeviation from actual measured values when using
w
W
d
w
b
MM+
−=
11� � �
where �b is the wet bulk density of
biomass at a moisture content of Mw (decimal fraction wetbasis), x is the particle length (mm).
Table 4. Relationship between biomass particle size and bulk and tapped densities.
BiomassMoistureContent
Bulk Density, ρb (kg/m3) Tapped Density, ρtb (kg/m3)
a b R2 RMSE[a] a b R2 RMSE
Wheat straw
8 113.79 0.39 0.98 5.08 150.95 0.37 0.99 9.00
20 98.80 0.32 0.97 3.08 97.88 0.25 1.00 3.03
40 161.64 0.43 0.99 6.63 155.20 0.31 1.00 6.39
60 290.71 0.51 0.99 14.51 261.04 0.37 1.00 14.34
Switchgrass
8 502.10 0.57 0.98 11.04 494.82 0.49 0.96 14.45
20 378.10 0.49 0.96 10.58 397.28 0.43 0.94 16.40
40 479.77 0.52 0.94 16.50 448.51 0.40 0.92 17.37
60 938.03 0.61 0.93 26.18 938.67 0.52 0.93 28.84
[a] The root mean square error.
0
500
1000
1500
2000
2500
20%50 mm
20%25 mm
20%12 mm
20%6 mm
40%50 mm
40%25 mm
40%12 mm
40%6 mm
60%50 mm
60%25 mm
60%12 mm
60%6 mm
Sq
uar
e o
f er
rors
WS Series
WS Parallel
SG Series
SG Parallel
357Vol. 24(3): 351‐358
0
50
100
150
200
250
300
350
0 10 20 30 40 50 60
Nominal particle size (mm)
Bu
lk d
ensi
ty (
wb
) (k
g/m
3)
WS 8% mc WS 20% mc
WS 40% mc WS 60% mc
SG 8% mc SG 20% mc
SG 40% mc SG 60% mc
Figure 4. Measured (symbols) and calculated wet bulk density (solid lines) of switchgrass (SG) and wheat straw (WS) at different sizes and moisturecontents for the loose packing using equation 11 and constants from table 4.
4 Individual particle density was dependent upon the waywe calculated or measured the volume of the particles.Assuming that a particle was a solid cylinder, the particledensity of wheat straw was about 90 kg m‐3, assuming itwas a hollow cylinder, the particle density was 500 kg m‐3,and measuring the volume using a pycnometer, theparticle density was roughly 1100 kg m‐3. Thecorresponding values for switchgrass were 230 for solid,400 for hollow, and 650 kg m‐3 for pycnometermeasurements. We concluded that the biomass needs to bepulverized in order to have an accurate particle density(solid density) measurements.
5 Further work is required to determine an optimum size forthe container for bulk density measurement and aprocedure for loose and pack fills. We also need tomeasure the volume change of a given quantity of biomassof mix of sizes. This work should be repeated with freshlyharvested material of high moisture content.
ACKNOWLEDGEMENT
This research is made possible through a USDA/DOEGrant to the University of Tennessee and a sub contract to theUniversity of British Columbia. The financial assistancefrom the Oak Ridge National Laboratory in support of thelogistics project is acknowledged. NSERC's Discovery andStrategic Grants supported the work of graduate students onthis and related projects.
REFERENCESArthur, J. F., R. A. Kepner, J. B. Dobie, G. E. Miller, and P. S.
Parsons. 1982. Tub grinder performance with crop and forestresidues. Transactions of the ASAE 25(6): 1488‐1494.
ASABE Standards. 2006. S358.2. Moisture measurement - Forages.St. Joseph, Mich.: ASABE.
ASABE Standards. 2007. S269.4. Cubes, pellets and crumbles -Definitions and methods for determining density, durability andmoisture content. St. Joseph, Mich.: ASABE.
Ebeling, J. M., and B. M. Jenkins. 1985. Physical and chemicalproperties of biomass fuels. Transactions of the ASAE 28(3):898‐901.
Fasina, O. O. 2006. Flow and physical properties of switchgrass,peanut hull and poultry litter. Transactions of the ASABE 49(3):721‐728.
Hollenbach, A. M., M. Peleg, and R. Rufner. 1982. Effect of fouranticaking agents on the bulk characteristics of ground sugar. J.Food Sci. 47(2): 538‐544.
Lang, W., S. Sokhansanj, and F. W. Sosulski. 1993. Bulk volumeshrinkage during drying of wheat and canola. J. Food ProcessEng. 16(4): 966‐5334
McKendry, P. 2002. Energy production from biomass (part 1):Overview of biomass. Bioresour. Technol. 83(1): 37‐46.
Mani, S., L. G. Tabil, and S. Sokhansanj. 2004. Grindingperformance and physical properties of wheat and barley straws,corn stover and switchgrass. Biomass Bioenergy 27(4): 339‐35.
Peleg, M. 1983. Physical characteristics of food powders. InPhysical Properties of Food, 293‐321. Westport, Conn.: AVIPublishing Co., Inc.
Ryu, C., Y. B. Yang, A. Bhor, N. E. Yates, V. N. Sharifi, and J.Switenbank. 2006. Effect of fuel properties on biomasscombustion: Part 1. Experiments‐fuel type, equivalence ratio andparticle size. Fuel 85(7‐8): 1039‐1046.
Sokhansanj, S., and W. Lang. 1996. Prediction of kernel and bulkvolume of wheat and canola during adsorption and desorption.J. Agr. Eng. Res. 63(2): 129‐136.
Sokhansanj, S., and J. Fenton. 2006. Cost benefit of biomass supplyand pre‐processing, BIOCAP research integration programsynthesis paper. Ottawa, Canada: BIOCAP Canada Foundation.
Yu, A. B., and R. P. Zou. 1996. Modifying the linear packing modelfor predicting the porosity of nonspherical particle mixtures. Ind.Eng. Chem. Res. 35(10): 3730‐3741.
Zhang, W., K. E. Thompson, A. H. Reed, and L. Beenken. 2006.Relationship between packing structure and porosity in fixedbeds of equilateral cylindrical particles. Chem. Eng. Sci. 61(24):8060‐8074.
358 APPLIED ENGINEERING IN AGRICULTURE
Zou, R. P., and A. B. Yu. 1996a. Evaluation of the packingcharacteristics of mono‐sized non‐spherical particles. PowderTechnol. 88(1): 71‐79.
Zou, R. P., and A. B. Yu. 1996b. Wall effect on the packing ofcylindrical particles. Chem. Eng. Sci. 51(7): 1177‐1180.
Zou, R. P., X. Lin, A. B. Yu, and P. Wong. 1997. Packing ofcylindrical particles with a length distribution. J. Am. Ceram.Soc. 89(3): 646‐652.
Zou, R. P., C. L. Feng, J. Q. Xu, and A. B. Yu. 2005. Predictions ofthe porosity of multicomponent mixtures of wet coarse spheres.Ind. Eng. Chem. Res. 44(22): 8401‐8408.
Woodcock, C. R., and J. S. Mason. 1987. Bulk Solids Handling: AnIntroduction to the Practice and Technology. Glasgow, Scotland:Blackie and Son Ltd.
NOMENCLATUREAp Actual surface area of the particle (m2)a, b Biomass species constantsDin Inner diameter of the samples (mm)Dout Outer diameter of the samples (mm)DT Diameter of the container for bulk density
measurement (mm)l Particle length (mm)Mw Moisture content of the wet samples (decimal wet
basis)
mp Mass of the samples (g)P1 Pressure reading after pressurizing the reference
volume (kPa)P2 Pressure after including the volume of the cell (kPa)r Inner radius of the hollow stem (m)t Thickness of the inner wall of the samples (mm)Vp, hollow Actual volume of the hollow cylindrical samples
(m3)Vp, solid Actual volume of the solid cylindrical samples (m3)Vpvc Pycnometer particle volume (m3)ρb Wet based bulk density of the samples (kg/m3) at
moisture content of Mwρb,wet_tapped Tapped bulk density (wb) of the samples
(kg/m3)ρb,wet_loose Loose bulk density (wb) of the samples (kg/m3)ρd Dry based bulk density (kg/m3) at bone dry sampleρp Particle density of the samples after drying (kg/m3)ρs Particle density measured by pycnometer (kg/m3)ρw Bulk density of water (1000 kg/m3)