LOOSE-FILLED AND TAPPED DENSITIES OF CHOPPED SWITCHGRASS, CORN STOVER AND WHEAT STRAW
15
The authors are solely responsible for the content of this technical presentation. The technical presentation does not necessarily reflect the official position of the American Society of Agricultural and Biological Engineers (ASABE), and its printing and distribution does not constitute an endorsement of views which may be expressed. Technical presentations are not subject to the formal peer review process by ASABE editorial committees; therefore, they are not to be presented as refereed publications. Citation of this work should state that it is from an ASABE meeting paper. EXAMPLE: Author's Last Name, Initials. 2008. Title of Presentation. ASABE Paper No. 08----. St. Joseph, Mich.: ASABE. For information about securing permission to reprint or reproduce a technical presentation, please contact ASABE at [email protected] or 269-429-0300 (2950 Niles Road, St. Joseph, MI 49085-9659 USA). An ASABE Meeting Presentation Paper Number: 084085 LOOSE-FILLED AND T APPED DENSITIES OF CHOPPED SWITCHGRASS, CORN STOVER AND WHEAT STRAW Nehru Chevanan, Alvin R Womac, Venkata S Bitra, University of Tennessee, Biosystems Engineering and Soil Science, Knoxville, TN. Written for presentation at the 2008 ASABE Annual International Meeting Sponsored by ASABE Rhode Island Convention Center Providence, Rhode Island June 29 – July 2, 2008 Abstract. Bulk density is one of the important engineering property of biomass having significant impact on the supply logistics and processing in ethanol production facilities using lignocellulosic materials. Bulk density of most of the comminuted biomass significantly increased by tapping. Switchgrass, wheat straw and corn stover were chopped in a knife mill at different operating conditions including four different screens having 50, 25, 19, 12 mm diameter. Mean loose-filled bulk densities were 67.5 ± 18.4 kg/m 3 for switchgrass, 36.1 ± 8.6 kg/m 3 for wheat straw, and 52.1± 10.8 kg/m 3 for corn stover. Mean tapped bulk densities were 81.8 ± 26.2 kg/m 3 for switchgrass, 42.8 ± 11.7 kg/m 3 for wheat straw, and 58.9 ± 13.4 kg/m 3 for corn stover. The maximum volume reduction ratio observed for switchgrass, wheat straw and corn stover was 0.159, 0.165, and 0.154, respectively for fine-chopped samples and 0.107, 0.117, and 0.098, respectively for coarse-chopped samples. By tapping, the infinite compressibility was highest for chopped switchgrass followed by chopped wheat straw and corn stover as indicated by the ‘a’ values in Sone’s model. Degree of difficulty in packing was minimum for chopped wheat straw followed by chopped switchgrass and corn stover. This indicated that the chopped wheat straw particle compacts very rapidly by tapping compared to chopped switchgrass and corn stover. Hausner ratio, a measure of internal friction, determined after 50 taps ranged from 1.114 to 1.321 for chopped switchgrass, 1.105 to 1.309 for chopped wheat straw and 1.060 to 1.239 for chopped corn stover. Keywords. Switchgrass, wheat straw, corn stover, bulk density, tapped bulk density.
-
Upload
independent -
Category
Documents
-
view
1 -
download
0
Transcript of LOOSE-FILLED AND TAPPED DENSITIES OF CHOPPED SWITCHGRASS, CORN STOVER AND WHEAT STRAW

The authors are solely responsible for the content of this technical presentation. The technical presentation does not necessarily reflect the official position of the American Society of Agricultural and Biological Engineers (ASABE), and its printing and distribution does not constitute an endorsement of views which may be expressed. Technical presentations are not subject to the formal peer review process by ASABE editorial committees; therefore, they are not to be presented as refereed publications. Citation of this work should state that it is from an ASABE meeting paper. EXAMPLE: Author's Last Name, Initials. 2008. Title of Presentation. ASABE Paper No. 08----. St. Joseph, Mich.: ASABE. For information about securing permission to reprint or reproduce a technical presentation, please contact ASABE at [email protected] or 269-429-0300 (2950 Niles Road, St. Joseph, MI 49085-9659 USA).
An ASABE Meeting Presentation Paper Number: 084085
LOOSE-FILLED AND TAPPED DENSITIES OF CHOPPED SWITCHGRASS, CORN STOVER AND WHEAT STRAW
Nehru Chevanan, Alvin R Womac, Venkata S Bitra, University of Tennessee, Biosystems Engineering and Soil Science, Knoxville, TN.
Written for presentation at the 2008 ASABE Annual International Meeting
Sponsored by ASABE Rhode Island Convention Center
Providence, Rhode Island June 29 – July 2, 2008
Abstract. Bulk density is one of the important engineering property of biomass having significant impact on the supply logistics and processing in ethanol production facilities using lignocellulosic materials. Bulk density of most of the comminuted biomass significantly increased by tapping. Switchgrass, wheat straw and corn stover were chopped in a knife mill at different operating conditions including four different screens having 50, 25, 19, 12 mm diameter. Mean loose-filled bulk densities were 67.5 ± 18.4 kg/m3 for switchgrass, 36.1 ± 8.6 kg/m3 for wheat straw, and 52.1± 10.8 kg/m3 for corn stover. Mean tapped bulk densities were 81.8 ± 26.2 kg/m3 for switchgrass, 42.8 ± 11.7 kg/m3 for wheat straw, and 58.9 ± 13.4 kg/m3 for corn stover. The maximum volume reduction ratio observed for switchgrass, wheat straw and corn stover was 0.159, 0.165, and 0.154, respectively for fine-chopped samples and 0.107, 0.117, and 0.098, respectively for coarse-chopped samples. By tapping, the infinite compressibility was highest for chopped switchgrass followed by chopped wheat straw and corn stover as indicated by the ‘a’ values in Sone’s model. Degree of difficulty in packing was minimum for chopped wheat straw followed by chopped switchgrass and corn stover. This indicated that the chopped wheat straw particle compacts very rapidly by tapping compared to chopped switchgrass and corn stover. Hausner ratio, a measure of internal friction, determined after 50 taps ranged from 1.114 to 1.321 for chopped switchgrass, 1.105 to 1.309 for chopped wheat straw and 1.060 to 1.239 for chopped corn stover.
Keywords. Switchgrass, wheat straw, corn stover, bulk density, tapped bulk density.

2
Introduction In the present world economy, much importance is placed on the production of energy
from biomass. Energy production from biomass has increased sustainability and environmental benefits (Knauf and Moniruzzaman, 2004; Sokhansanj et al. 2006). Biomass sources include forestry residues, purpose grown agricultural crops, organic, agricultural, agro-industrial and domestic wastes (Demirdbas, 2001). Among the agricultural sources, switchgrass, corn stover, and wheat straw have potential to be used as raw material for biorefineries.
Raw material supply logistic problems for biorefineries include material handling, size reduction, drying, and storage systems (Wright et al. 2006). Biomass size reduction is an important unit operation in which biomass with varying physical characteristics are comminutioned to a product with reduced particle size for thermochemical or biochemical methods. A knife mill is traditionally used for chopping forages and agricultural crop residues. Biomass with long, rigid stems such as corn stover, as well as thin, flexible stems like switchgrass and wheat straw can be chopped in a knife mill. Subsequent size reduction operations in a hammer mill and/or disc mill can further reduce particles as well as powders.
Some of the important characteristics of biomass that have significance in relation to efficient handling operations in a biorefinery are variability in physical and chemical characteristics, and spoilage due to moisture content (Sokhansanj et al. 2003). Bulk density is a physical characteristic that depends on particle size distribution, moisture content, and product processing history (Barletta et al. 1993). Bulk density affects functional properties such as compressibility and flowability.
Bulk density of comminuted biomass was less than 300 kg/m3 (Lam et al. 2007). Low density combined with high compressibility of the biomass led to poor flowability (Fasina, 2006). Hence the compaction behavior of biomass is very important for flowability and transport related issues. The compaction behavior of non-food powders under compression and vibratory conditions were studied using various models (Kawakita and Ludde, 1971; Tabil and Sokhansanj, 1997; Adapa et al., 2005). Mani et al. (2004a) studied the compaction behavior of biomass under compression using the models developed by Cooper and Eaton (1962) and Kawakita and Ludde (1971). Even though the compaction behavior under vibration and tapping of metallic and pharmaceutical powders were studied using various models, the model developed by Sone (1969) performed well for biomaterials (Peleg and Bagley, 1983). Sone’s model was tested in biomaterials for understanding the behavior for proper filling of containers for packaging purposes (Kaletunc and Breslauer, 2003). However, in biorefineries, large quantities of biomass may need to be processed in different process lines subjected to vibrations and various flow conditions (Fayed and Otten, 1984).
The objectives of this study were: 1. To determine the effect of particle size on the densities of biomass chopped in a knife mill, and 2. To evaluate the compaction behavior of chopped biomass subjected to tapping.
Methods and Materials
Raw material
Switchgrass, wheat straw and corn stover were chopped in a knife mill at different rotational speed, feed rate, and screen sizes. Screen opening diameters of 50, 25, 19 and 12 mm were used. The chopped biomass had varying particle size and distribution and were used as raw material for experiments.

3
Particle size
Particle size was classified using ASAE S424.1-specified screens (ASAE, 2004). The mass fractions retained on the screens having diagonal opening dimensions of 1.65 mm, 5.61 mm, 8.98 mm, 18.0 mm, 26.9 mm, and pan were used to determine the geometric mean length (Xgm) and standard deviation (Sgm).
Loose-filled bulk density
The loose filled bulk density was measured using a cylindrical aluminum container with 149 mm diameter and 143 mm height. Biomass was filled in layers with approximately 1 cm thickness, and care was taken to avoid any unfilled spaces due to entangling of biomass particles. The mass of biomass in the container was determined using an electronic balance (± 0.01 g). The loose filled bulk density in kg/m3 was determined as:
biomasstheofVolume
biomasstheofMassdensitybulkfilledLoose L =)(ρ (1)
All the loose filled bulk density measurements were made in triplicate.
Tapped bulk density
The container with biomass was tapped on a wooden platform 50 times with an approximate amplitude of 20 mm. The reduction in height of the top biomass surface was measured using a vernier caliper (± 0.01 mm). The settled distance was measured at a total of nine locations. Four locations were near the inside wall of container. Another four were at 50% of radius. One measure was taken at the center of the container. The reduction in volume of biomass was calculated as an imaginary cylindrical volume having diameter of the container and height of average settled distance. The tapped bulk density was calculated as
reductionvolumesettledvolumeCylinder
biomasstheofMassdensitybulkTapped T −=)(ρ (2)
All the tapped bulk density measurements were made in triplicate.
Compaction behavior
The compaction behavior of switchgrass, wheat straw and corn stover under tapping was studied using the model developed by Sone (1972) for biomaterials. Two samples of chopped switchgrass having Xgm of 3.30 mm and 14.06 mm, two samples of chopped wheat straw having Xgm of 3.69 and 10.68 mm and two samples of chopped corn stover having Xgm of 3.22 and 12.79 mm were selected as contrasting values for modeling. For comparison purpose, similar particle size distributions in switchgrass, wheat straw and corn stover were deliberately selected. The three coarse samples were chopped using similar operating conditions with 50 mm classifying screen in the knife mill whereas the three finer samples were chopped using 12 mm classifying screen in the knife mill with similar operating conditions. The chopped biomass samples were filled in to the aluminum cylinder used for the determination of the density. Reduction in volume was recorded for every 5 taps. Measurements were made in triplicate for all the samples. Volume reduction ratio (γ n) and number of tapping (n) data were used for modeling. The relationship between the volume reduction ratio and the number of tappings is given by

4
bn
abnV
VV nn +
=−
=1
)(
0
0γ (3)
Where ‘V0’ is the initial volume, ‘Vn’ is the volume after n taps, and ‘a’ and ‘b’ are constants. The value of constants ‘a’ and ‘b’ were determined as explained by Peleg and Bagley (1983). The equation can be rewritten in the linear form
an
abn
n
+=1
γ (4)
The slope and intercept values of the linear relationship between ‘(n/γn)’ Vs ‘n’ values were used to determine the values of ‘a’ and ‘b’.
Hausner ratio
During modeling studies, no reduction was observed in volume after 50 taps for all three chopped biomass materials studied in our experiments. Hausner ratio (Grey and Beddow, 1969; Kaletunc and Breslauer, 2003) was determined as:
)()(
T
L
densitybulkfilledLoosedensitybulkTapped
ratioHausnerρ
ρ= (5)
Results and Discussion
Compaction characteristics
The relationship between the volume reduction ratio and the number of taps is given in Figure 1. All three biomass materials had reached the maximum volume reduction ratio by 50 taps. Highest volume reduction ratio was observed for chopped wheat straw followed by chopped switchgrass and chopped corn stover. The maximum volume reduction ratios observed for finely chopped switchgrass, wheat straw and corn stover were 0.159, 0.165, and 0.154, respectively. The maximum volume reduction ratios observed for coarsely chopped switchgrass, wheat straw and corn stover were 0.107, 0.117, and 0.098, respectively. The difference in volume reduction ratio between three chopped biomass particles may be due to difference in shape, strength, particle density and surface roughness properties. The ground corn stover contained lot of fiber-like particles (from rind) in addition to other irregular shaped particles (from pith) and affected the compaction characteristics.
The linear relationship between ‘n’ and ‘n/ γn’ for chopped switchgrass, wheat straw and corn stover is shown in Figure 2. In the Sone’s model, ‘a’ value represents infinite compressibility by tapping, and ‘b’ value represents the degree of difficulty of tapping (Sone, 1969). In our experiments, we observed, ‘a’ values of the fine chopped particles was significantly higher than the coarse chopped biomass particles, indicating that the infinite compressibility was higher for fine chopped biomass particles. Infinite compressibility was highest for chopped switchgrass indicated by the ‘a’ values followed by wheat straw and corn stover (Table 1). We observed that ‘b’ values of all the fine chopped biomass were less than the coarse chopped biomass (Table 1). This indicated that as the particle size decreased, the samples compacted easily leading to rapid increase in bulk density by tapping. In the same way, the difficulty in packing/compacting by tapping of corn stover was highest followed by switchgrass and wheat straw indicated by the ‘b’ values (Table 1).

5
Loose filled bulk density
Loose filled bulk density of chopped switchgrass was found to be highest followed by chopped corn stover and wheat straw in a knife mill. Loose filled bulk density of chopped switchgrass ranged from 41.49 to 105.18 kg/m3 for samples having Xgm of 12.12 to 2.65 mm (Table 2). Loose filled bulk density of chopped wheat straw ranged from 22.67 to 52.21 kg/m3 for samples having Xgm of 12.27 to 3.19 mm (Table 3). Loose filled bulk density of chopped corn stover ranged from 33.23 to 69.05 kg/m3 for samples having Xgm of 14.89 mm to 3.22 mm (Table 4). Loose filled bulk density of chopped switchgrass and chopped corn stover having Xgm of 3.2 ± 0.2 mm was 108.0 % and 38.6 % higher than chopped wheat straw. In the same way loose filled bulk density of chopped wheat straw and chopped corn stover having Xgm of 12.3 ± 0.5 mm was 80.6 % and 35.1 % higher than loose filled bulk density of chopped wheat straw. As the particle size increased, loose filled bulk density of the biomass decreased. Mani et al. (2004c) also observed the same trend during grinding studies on wheat straw, switchgrass and barley straw in a hammer mill. This was expected because, as the particle sizes increased, pore spaces formed between the irregularly arranged particles increased. The loose-filled bulk densities (kg/m3) of the chopped switchgrass (BDSG), corn stover (BDCS), wheat straw (BDWS) as a function of the geometric mean length (Xgm, mm) were as follows:
gmSG XBD *670.437.103 −= (R2=0.80) (6)
gmWS XBD *79.2244.55 −= (R2=0.87) (7)
gmCS XBD *643.2305.74 −= (R2=0.74) (8)
R2 values indicated that the loose-filled bulk density measurement is a very good indicator of particle size and vice versa. Both intercept and slope values were found to be maximum for switchgrass. Increased slope value for switchgrass indicated that loose-filled bulk density decreased as the particle size increased, to a greater degree than other tested biomass.
Tapped bulk density
Tapped bulk density was highest for chopped switchgrass followed by chopped corn stover and wheat straw. Tapped bulk density of the chopped switchgrass ranged from 47.10 to 136.86 kg/m3 for samples having Xgm of 14.06 to 2.65 mm (Table 2). Tapped bulk density of chopped wheat straw ranged from 25.01 to 65.49 kg/m3 for samples having Xgm of 12.27 to 3.19 mm (Table 3). Tapped bulk density of chopped corn stover ranged from 37.17 to 85.55 kg/m3 for samples having 14.89 to 3.22 mm (Table 4). Tapped bulk density of chopped switchgrass and chopped corn stover having Xgm of 3.2 ± 0.2 mm was 120.6 % and 38.6 % higher than tapped bulk density of chopped wheat straw. In the same way the tapped bulk density of chopped switchgrass and chopped corn stover having Xgm of 12.3 ± 0.5 mm was 80.6 % and 28.6 % higher than chopped wheat straw having similar geometric mean particle length. The geometric mean length (Xgm, mm) predicted the tapped bulk density (kg/m3) of the ground switchgrass (TBDSG) with the following linear regression equation:
gmSG XTBD *60.658.132 −= (R2=0.79) (9)
The linear regression models for the prediction of tapped bulk density of chopped switchgrass (TBDCS) and tapped bulk density of chopped wheat straw (TBDWS) using geometric mean length for corn stover and wheat straw were as follows:
gmWS XTBD *81.3100.69 −= (R2=0.87) (10)
6
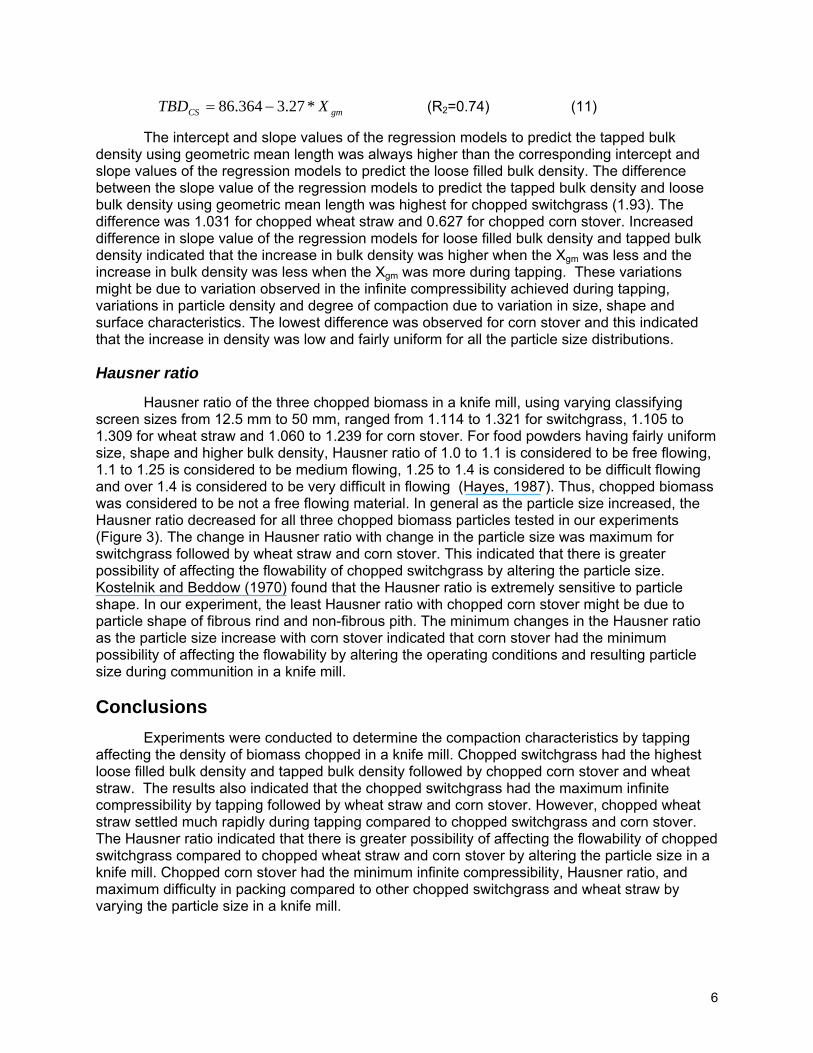
gmCS XTBD *27.3364.86 −= (R2=0.74) (11)
The intercept and slope values of the regression models to predict the tapped bulk density using geometric mean length was always higher than the corresponding intercept and slope values of the regression models to predict the loose filled bulk density. The difference between the slope value of the regression models to predict the tapped bulk density and loose bulk density using geometric mean length was highest for chopped switchgrass (1.93). The difference was 1.031 for chopped wheat straw and 0.627 for chopped corn stover. Increased difference in slope value of the regression models for loose filled bulk density and tapped bulk density indicated that the increase in bulk density was higher when the Xgm was less and the increase in bulk density was less when the Xgm was more during tapping. These variations might be due to variation observed in the infinite compressibility achieved during tapping, variations in particle density and degree of compaction due to variation in size, shape and surface characteristics. The lowest difference was observed for corn stover and this indicated that the increase in density was low and fairly uniform for all the particle size distributions.
Hausner ratio
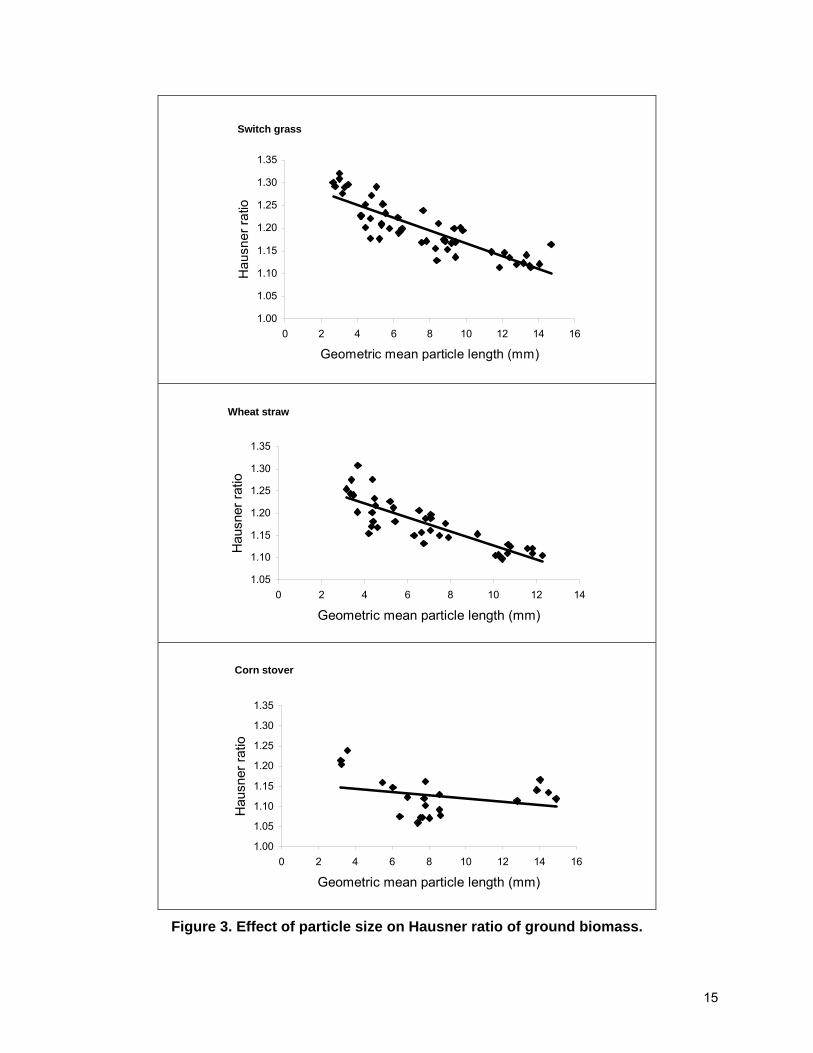
Hausner ratio of the three chopped biomass in a knife mill, using varying classifying screen sizes from 12.5 mm to 50 mm, ranged from 1.114 to 1.321 for switchgrass, 1.105 to 1.309 for wheat straw and 1.060 to 1.239 for corn stover. For food powders having fairly uniform size, shape and higher bulk density, Hausner ratio of 1.0 to 1.1 is considered to be free flowing, 1.1 to 1.25 is considered to be medium flowing, 1.25 to 1.4 is considered to be difficult flowing and over 1.4 is considered to be very difficult in flowing (Hayes, 1987). Thus, chopped biomass was considered to be not a free flowing material. In general as the particle size increased, the Hausner ratio decreased for all three chopped biomass particles tested in our experiments (Figure 3). The change in Hausner ratio with change in the particle size was maximum for switchgrass followed by wheat straw and corn stover. This indicated that there is greater possibility of affecting the flowability of chopped switchgrass by altering the particle size. Kostelnik and Beddow (1970) found that the Hausner ratio is extremely sensitive to particle shape. In our experiment, the least Hausner ratio with chopped corn stover might be due to particle shape of fibrous rind and non-fibrous pith. The minimum changes in the Hausner ratio as the particle size increase with corn stover indicated that corn stover had the minimum possibility of affecting the flowability by altering the operating conditions and resulting particle size during communition in a knife mill.
Conclusions Experiments were conducted to determine the compaction characteristics by tapping affecting the density of biomass chopped in a knife mill. Chopped switchgrass had the highest loose filled bulk density and tapped bulk density followed by chopped corn stover and wheat straw. The results also indicated that the chopped switchgrass had the maximum infinite compressibility by tapping followed by wheat straw and corn stover. However, chopped wheat straw settled much rapidly during tapping compared to chopped switchgrass and corn stover. The Hausner ratio indicated that there is greater possibility of affecting the flowability of chopped switchgrass compared to chopped wheat straw and corn stover by altering the particle size in a knife mill. Chopped corn stover had the minimum infinite compressibility, Hausner ratio, and maximum difficulty in packing compared to other chopped switchgrass and wheat straw by varying the particle size in a knife mill.
7
References Adapa, P., G. Schoenau, L. Tabil, S. Sokhansanj, and A. Singh. 2005. Compression of
fractionated sun-cured and dehydrated alfalfa chops into cubes: Pressure and density models. Canadian biosystems engineering. 47(3): 33-39.
ASAE Standards. 2004. S424.1: Method of determining and expressing particle size of chopped forage materials by screening. St. Joseph, MI: ASAE.
Barletta, B. J., K. M. Knight, and G. V. Barbosa-Canovas. 1993. Compaction characteristics of agglomerated coffee during tapping. Journal of texture studies. 24: 253-268.
Cooper, A. R., and L. E. Eaton. 1962. Compaction behavior of several ceramic powders. Journal of American Ceramic Society. 45(3): 97-101.
Demirbas, A. 2001. Biomass resource facilities and biomass conversion processing for fuels and chemicals. Energy conversion and management. 42: 1357-1378.
Fasina, O. O. 2006. Flow and physical properties of switchgrass, peanut hull, and poultry litter. Transactions of ASABE. 49(3): 721-728.
Fayed, M.E., and L. Otten. 1984. Handbook of powder science and technology. New York, N. Y.: Van Nostrand Reinhold Company.
Grey, R. O., and J. K. Beddow. 1969. On the Hausner ratio and its relationship to some properties of metal powders. Powder Technol. 2: 323-326.
Hayes, G. D. 1987. Food engineering data handbook. New York, N.Y.: Longman Scientific and Technical.
Knauf, M., and M. Moniruzzaman. 2004. Lignicellulosic biomass processing: A perspective. International sugar journal. 106(1263): 147-150.
Kaletunc, G., and K. Breslauer. 2003. Characterization of cereal and flours. New York, N.Y.: Marcel Dekker, Inc.
Kawakita, K. and K. H. Ludde. 1971. Some considerations on powder compression equations. Powder Technol. 4: 61-68.
Kostelnik, M. C., and J. K. Beddow. 1970. New techniques for tap density. In Modern developments in powder metallurgy, H. H. Hausner, ed. New York: Plenum press.
Lam, P. S., S. Sokhansanj, X. Bi, S. Mani, A. R. Womac, M. Hoque, J. Peng, T. JayaShankar, L. J. Naimi, and S. Narayan. 2007. Physical characterization of wet and dry wheat straw and switchgrass – bulk and specific density, Paper No. 076058. St. Joseph, Mich.: ASAE.
Mani, S., L. G. Tabil, and S. Sokhansanj. 2004a. Evaluation of compaction equations applied to four biomass species. Canadian Biosystems Engineering. 46(3): 55-61.
Mani, S., L. G. Tabil, and S. Sokhansanj. 2004b. Mechanical properties of corn Stover grind. Trans. ASAE. 47(6): 1983-1990.
Mani, S., L. G. Tabil, and S. Sokhansanj. 2004c. Grinding performance and physical properties of wheat and barley straws, corn stover and switchgrass. Biomass and Bioenergy 27: 339-352.
Peleg, M and E. B. Bagley. 1983. Physical properties of foods. Connecticut: AVI publishing company, Inc.

8
Sokhansanj, S., J. Cushman, and L. Wright. 2003. Collection and delivery of biomass for fuel and power production. The CIGR Journal of Scientific Research and Development V: 1-22.
Sokhansanj, S., A. Kumar, and F. A. Turhollow. 2006. Development and implementation of integrated biomass supply analysis and logistics model (IBSAL). Biomass and Bioenergy. 30: 838-847.
Sone, T. 1969. Consistency of foodstuffs. Dordecht, Holland: Reidell publishing company.
Tabil, L. G., and S. Sokhansanj. 1997. Bulk properties of alfalfa grind in relation to its compaction characteristics. Applied Engineering in Agriculture 13(4): 499-505.
Wright, C. T., P. A. Pryfogle, N. A. Stevens, J. R. Hess, C. W. Radtke. 2006. Value of distributed preprocessing of biomass feedstocks to a biorefinery industry. Paper No.066151. St. Joseph, Mich.: ASAE.

9
Table 1. Coefficients of Sone’s model for switchgrass, wheat straw and corn stover* Sample a B Wheat straw (fine) Wheat straw (Coarse) Switchgrass (fine) Switchgrass (Coarse) Corn Stover (fine) Corn Stover (Coarse)
0.191b 0.121e 0.195a 0.140d 0.186c 0.108f
0.090f 0.128c 0.097e 0.161b 0.100d 0.173a
*Values suffixed with different letters in a column were significantly different.

10
Table 2. Particle size and densities of ground switchgrass in a knife mill* Treatment No.
Xgm (mm)
Sgm (mm)
Loose filled bulk density (Kg/m3)
Tapped bulk density (Kg/m3)
Hausner ratio
KMSG4 KMSG5 KMSG6 KMSG7 KMSG8 KMSG9 KMSG10 KMSG12 KMSG13 KMSG14 KMSG15 KMSG16 KMSG17 KMSG18 KMSG20 KMSG21 KMSG23 KMSG24 KMSG25 KMSG26 KMSG27 KMSG28 KMSG29 KMSG30 KMSG32 KMSG33 KMSG34 KMSG35 KMSG36 KMSG37 KMSG38 KMSG39 KMSG40 KMSG41 KMSG42 KMSG43 KMSG44 KMSG45 KMSG46 KMSG47 KMSG48 KMSG49 KMSG50 KMSG51 KMSG52 KMSG53 KMSG54 KMSG55 KMSG56 KMSG57
13.50 13.18 13.59 12.79 12.38 14.06 12.12 12.32 2.65 2.99 3.49 3.00 3.17 3.30 2.77 7.55 9.35 9.43 7.63 8.50 8.97 6.46 7.81 9.20 8.77 9.83 8.32
11.40 9.43 8.39 9.70 8.85
14.69 11.86 5.77 5.21 4.21 4.20 5.55 5.33 6.29 4.70 5.34 4.70 4.45 4.45 5.04 5.41 4.77 6.24
2.55 2.79 2.54 2.55 2.50 2.64 2.49 2.54 2.51 2.47 2.69 2.40 2.65 2.52 2.37 2.80 2.58 2.64 2.68 2.92 2.65 2.81 2.77 2.65 2.63 2.78 2.52 2.91 2.71 2.84 2.76 2.57 2.62 2.62 2.65 2.57 2.77 2.78 2.66 2.69 2.78 2.45 2.63 2.54 2.58 2.50 2.70 2.66 2.76 2.72
42.16zab 47.28xy 44.09za 43.67za 41.49zab 43.97za 47.84x 45.26yz 105.03a 104.60a 104.18a 95.99d
103.50ab 105.18a 101.58bc 66.11n 59.84op 58.10p-s 55.79s-r 61.36o 59.79op 59.36op 58.91pq 53.49v 58.01p-t 60.04op 55.70t-v 56.56r-u 51.12w 50.33w 56.62r-u 58.35p-r 55.36uv 54.96uv 76.41ij 74.83jk 82.86e 80.05fg 76.72h-j 70.69m 68.12n
78.94gh 74.77jk 77.38hi 74.87jk 81.26e-g 73.26kl 75.49i-k 71.44lm 72.20lm
47.12yz 53.09vw 49.12xy 48.93x-z 47.10yz 49.30xy 54.78uv 51.63wx 136.56a 136.86a 134.10ab 126.81d 132.07bc 135.68a 131.29c 77.25m 71.79no 67.95q
69.10o-q 74.30nm 68.91o-q 71.11op 69.01o-q 62.44rs 68.20pq 71.72no 64.33r 64.92r 58.08t 56.84tu 68.02q 68.29pq 64.44r 61.21s 91.69g-i 88.05jk 101.69e 98.25f 94.59g 85.51k 81.06l
92.96gh 90.29h-j 94.47g 89.91ij
101.78e 94.59g 94.58g 90.86h-j 88.33jk
1.118 1.123 1.114 1.121 1.135 1.121 1.145 1.141 1.300 1.308 1.296 1.321 1.276 1.290 1.292 1.168 1.200 1.169 1.239 1.211 1.153 1.198 1.171 1.167 1.176 1.195 1.155 1.148 1.136 1.129 1.201 1.170 1.164 1.114 1.200 1.177 1.227 1.227 1.233 1.210 1.910 1.178 1.208 1.221 1.201 1.253 1.291 1.253 1.272 1.223
*Mean values suffixed with different letters in a column were significantly different (LSD) at P<0.05.
Xgm – Geometric mean length. Sgm – Standard deviation

11
Table 3. Particle size and densities of ground wheat straw in a knife mill*
Treatment No.
Xgm (mm)
Sgm (mm)
Loose filled bulk density (Kg/m3)
Tapped bulk
density (Kg/m3)
Hausner ratio
KMWS1 KMWS2 KMWS3 KMWS4 KMWS5 KMWS6 KMWS7 KMWS8 KMWS9 KMWS10 KMWS11 KMWS12 KMWS13 KMWS14 KMWS15 KMWS16 KMWS17 KMWS18 KMWS19 KMWS20 KMWS21 KMWS22 KMWS23 KMWS24 KMWS25 KMWS26 KMWS27 KMWS28 KMWS29 KMWS30 KMWS31 KMWS32 KMWS33 KMWS34 KMWS35 KMWS36 KMWS37 KMWS38 KMWS39
10.78 9.25
10.68 10.25 10.10 10.82 11.57 10.65 12.27 11.82 10.39 3.38 3.67 3.17 3.69 3.35 3.50 5.42 6.30 7.09 6.86 6.53 7.91 6.67 7.77 7.06 7.09 7.48 6.76 4.61 4.33 4.21 5.33 4.40 4.52 4.37 4.47 4.36 5.19
2.72 2.70 2.48 2.63 2.50 2.49 2.42 2.57 2.52 2.55 2.38 2.07 2.18 2.06 2.05 2.12 2.08 2.27 2.41 2.30 2.40 2.29 2.39 2.44 2.50 2.15 2.37 2.49 2.25 2.19 2.16 2.15 2.23 2.09 2.11 2.13 2.18 2.19 2.23
27.59o 31.05h 24.33p 25.11p 24.84p 22.67q 22.31q 25.26p 25.06p 24.23p 24.57p 48.22c 50.79ab 52.21a 46.57d 50.46b 48.12c 32.96lm 36.17ij 37.53hi 35.50jk 34.95kl 37.41hi 34.28kl 37.72jk 38.49h 38.21h
33.97klm 32.62m 44.41e 41.30gf 43.91e 37.23ih 42.33f 40.77g 38.55h 40.46g 36.23ij 41.80gj
31.05q 35.81p 27.49r 27.78r 27.43r 25.41st 25.01r 28.02t 27.68r 26.90rs 26.96rs 61.51bc 60.09bcd 65.49a 60.94cd 62.75b 59.70d 38.95o 41.58lm 44.91ij
42.18klm 41.56lm 42.88kl 39.67no 42.86nm 44.74ij 45.44i 39.05o 39.94p 51.89e 48.35h 50.67efg 45.17ij
50.04fgh 49.63fgh 49.22gh 49.87fgh 43.54jk 51.67efg
1.126 1.153 1.130 1.106 1.104 1.121 1.121 1.109 1.105 1.110 1.097 1.276 1.203 1.254 1.309 1.244 1.241 1.182 1.150 1.197 1.188 1.206 1.146 1.157 1.177 1.162 1.189 1.149 1.132 1.168 1.171 1.154 1.212 1.182 1.217 1.277 1.233 1.202 1.226
*Mean values suffixed with different letters in a column were significantly different (LSD) at P<0.05.
Xgm – Geometric mean length. Sgm – Standard deviation

12
Table 4. Particle size and densities of ground corn stover in a knife mill* Treatment No.
Xgm (mm)
Sgm (mm)
Loose filled bulk density (Kg/m3)
Tapped bulk
density (Kg/m3)
Hausner ratio
KMCS3 KMCS4 KMCS5 KMCS6 KMCS7 KMCS9 KMCS10 KMCS11 KMCS12 KMCS13 KMCS14 KMCS15 KMCS17 KMCS19 KMCS20 KMCS21 KMCS22 KMCS23 KMCS24 KMCS25 KMCS26 KMCS27
14.89 13.86 14.03 14.48 12.79 3.56 3.26 3.22 8.56 7.80 7.73 6.85 7.80 6.42 7.40 7.52 8.02 7.65 8.55 8.62 6.40 5.49
2.22 2.27 2.28 2.18 2.09 2.27 2.37 2.42 2.41 2.33 2.22 2.50 2.27 2.59 2.46 2.31 2.10 2.31 2.20 2.39 2.49 2.50
33.23r 39.16op 42.39n 36.78pq 34.44qr 69.05a 66.56b 65.16bc 50.60k-m 40.95no 50.80kl 50.10lm 53.79ij 56.22hi 51.35kl 59.07e-g 65.88b 54.38ij 61.89d 48.21m 54.83ij 62.18d
37.17w 44.66u 49.45t 41.73v 38.35w 85.55a 80.24b 79.12bc 57.17pq 45.13u 56.90pq 56.30qr 62.49mn 60.43no 54.41rs 63.33lm 70.59gh 58.34o-q 67.61ij 51.98s 62.91lm 72.06fg
1.119 1.141 1.167 1.135 1.114 1.239 1.205 1.214 1.165 1.102 1.120 1.124 1.162 1.075 1.060 1.072 1.071 1.073 1.092 1.078 1.147 1.159
*Mean values suffixed with different letters in a column were significantly different (LSD) at P<0.05.
Xgm – Geometric mean length. Sgm – Standard deviation

13
Switch grass
0.04
0.06
0.08
0.1
0.12
0.14
0.16
0.18
0 10 20 30 40 50 60
Number of taps
Vol
ume
redu
ctio
n ra
tio `
Fine chopCoarse chop
Wheat straw
0.04
0.06
0.08
0.1
0.12
0.14
0.16
0.18
0 10 20 30 40 50 60
Number of taps
Vol
ume
redu
ctio
n ra
tio `
Fine chopCoarse chop
Corn Stover
0.04
0.06
0.08
0.1
0.12
0.14
0.16
0.18
0 10 20 30 40 50 60
Number of taps
Vol
ume
redu
ctio
n ra
tio
Fine chopCoarse chop
Figure 1. Effect of number of taps on volume reduction ratio of biomass.

14
Figure 2. Linear relationship between number of taps (n) and ratio of n/volume ratio
(n/ nγ ).
Fine grind
y = 4.8455x + 55.684 (Switchgrass)
y = 5.4462x + 63.763 (Wheat straw)
y = 6.3088x + 60.456 (Corn stover)
0
50
100
150
200
250
300
350
400
0 10 20 30 40 50
n
n/γn
Switchgrass Wheat straw Corn stover
Coarse grind
y = 6.8916x + 84.936 (Sw itchgrass)
y = 7.9765x + 65.862 (w heat straw )
y = 8.994x + 62.866 (Corn stover)
0
100
200
300
400
500
600
0 10 20 30 40 50
n
n/γn
Sw itch grass Wheat straw Corn stover
15
Switch grass
1.00
1.05
1.10
1.15
1.20
1.25
1.30
1.35
0 2 4 6 8 10 12 14 16
Geometric mean particle length (mm)
Hau
sner
ratio
Wheat straw
1.05
1.10
1.15
1.20
1.25
1.30
1.35
0 2 4 6 8 10 12 14
Geometric mean particle length (mm)
Hau
sner
ratio
Corn stover
1.00
1.05
1.10
1.15
1.20
1.25
1.30
1.35
0 2 4 6 8 10 12 14 16
Geometric mean particle length (mm)
Hau
sner
ratio
Figure 3. Effect of particle size on Hausner ratio of ground biomass.