Contact network topology in tapped granular media
9
PHYSICAL REVIEW E 87, 022203 (2013) Contact network topology in tapped granular media Roberto Ar´ evalo CNR-SPIN, Dipartimento di Scienze Fisiche, Universit´ a di Napoli “Federico II,” Naples, Italy Luis A. Pugnaloni Departamento de Ingenier´ ıa Mec ´ anica, Facultad Regional La Plata, Universidad Tecnol´ ogica Nacional, Avenida 60 esquina 124 s/n, 1900 La Plata, Argentina Iker Zuriguel and Diego Maza Departamento de F´ ısica, Facultad de Ciencias, Universidad de Navarra, E-31080 Pamplona, Spain (Received 16 October 2012; published 8 February 2013) We analyze the contact network of simulated two-dimensional granular packings in different states of mechanical equilibrium obtained by tapping. We show that topological descriptors of the contact network allow one to distinguish steady states of the same mean density obtained with different tap intensities. These equal-density states were recently proven to be distinguishable through the mean force moment tensor. In contrast, geometrical descriptors, such as radial distribution functions, bond order parameters, and Voronoi cell distributions, can hardly discriminate among these states. We find that small-order loops of contacts—the polygons of the network—are especially sensitive probes for the contact structure. DOI: 10.1103/PhysRevE.87.022203 PACS number(s): 81.05.Rm, 61.43.−j I. INTRODUCTION Dense granular media in mechanical equilibrium constitute a class of systems of deceptive simplicity. A paradigmatic example of such systems is a bed of grains inside a container which is subjected to vertical pulsed agitation, allowing the grains to relax between successive excitations. By setting the dimensionless vertical acceleration of the shaking, the system can explore a variety of configurations of mechanical equilibrium and reach a final steady state. This situation has been widely studied; experimentally [1–4], by means of simulations [5–7], and theoretically [8]. Ideally, we would like to understand the macroscopic or collective properties of the steady state of the material in terms of an ensemble of microscopic states (configurations), in analogy with the way in which we understand thermodynamics in terms of statistical mechanics. A statistical description of this type was put forward by Edwards and Oakeshott [8] using solely the number of grains N and the volume V of the pack (or, equivalently, the packing fraction φ) to characterize the microscopic states. This framework has been developed by several authors [9–12] over the years and has been shown to be useful to explain distinctive features of granular media. Despite the functionality of this idea, it has been recently suggested that the so-called NV ensemble should be extended to take into account the stress propagation in the system to achieve a complete description of a granular packing [13–18]. On the other hand, recent experiments and simulations [6,19] have shown that the packing fraction φ is not a monotonic function of the excitation intensity. Instead, a minimum packing fraction φ min is achieved at a certain value min . Beyond this value the packing fraction increases again. It has been shown [20] that this behavior is observed in both in two and three dimensions using hard sphere models with various simulation techniques and soft frictional spheres simulated by discrete-element methods. This nonmonotonic behavior implies that steady states with equal average packing fractions can be reached with very different tap intensities. Then the question of whether or not these states are statistically equivalent naturally arises. This question has been thoroughly studied by means of simulations in Refs. [6,7] where it is found that a measure of the stress inside the system—the force moment tensor —increases monotonically for the whole range of intensities considered. Hence, it is concluded that states at the two sides of the minimum are not equivalent, and that is a suitable candidate to complete the description of the equilibrium magnitudes that represent a granular system at the macroscopic level. Provided that is shown to distinguish steady states of equal φ, one would like to explore what other descriptors of the granular packing would display such sensitivity to changes in the configurations which are not discernible by φ. Since the external stress applied to the system is equilibrated exclusively by contacts, it seems reasonable that the properties of the contact network may carry some of the key information contained in . We can then use the concepts and tools of complex networks [21] to analyze the properties of the contact structure. This will be used to evaluate whether there is any network property that allows a clear distinction between states with the same φ. At this point, let us note that any static granular system can be considered in terms of nodes (the grains) and edges (the contacts between grains). This approach has been recently applied to address a wide variety of granular phenomena such as tapping [22], porosity [23], force distribution [24], rheology [25], signal propagation [26], and the jamming transition [27]. The aim of the present work is to characterize the contact networks of the different steady states of packings generated by tapping. On the one hand, we will show that it is not possible to clearly uncover the differences between steady 022203-1 1539-3755/2013/87(2)/022203(9) ©2013 American Physical Society
-
Upload
independent -
Category
Documents
-
view
5 -
download
0
Transcript of Contact network topology in tapped granular media

PHYSICAL REVIEW E 87, 022203 (2013)
Contact network topology in tapped granular media
Roberto ArevaloCNR-SPIN, Dipartimento di Scienze Fisiche, Universita di Napoli “Federico II,” Naples, Italy
Luis A. PugnaloniDepartamento de Ingenierıa Mecanica, Facultad Regional La Plata, Universidad Tecnologica Nacional,
Avenida 60 esquina 124 s/n, 1900 La Plata, Argentina
Iker Zuriguel and Diego MazaDepartamento de Fısica, Facultad de Ciencias, Universidad de Navarra, E-31080 Pamplona, Spain
(Received 16 October 2012; published 8 February 2013)
We analyze the contact network of simulated two-dimensional granular packings in different states ofmechanical equilibrium obtained by tapping. We show that topological descriptors of the contact networkallow one to distinguish steady states of the same mean density obtained with different tap intensities. Theseequal-density states were recently proven to be distinguishable through the mean force moment tensor. Incontrast, geometrical descriptors, such as radial distribution functions, bond order parameters, and Voronoicell distributions, can hardly discriminate among these states. We find that small-order loops of contacts—thepolygons of the network—are especially sensitive probes for the contact structure.
DOI: 10.1103/PhysRevE.87.022203 PACS number(s): 81.05.Rm, 61.43.−j
I. INTRODUCTION
Dense granular media in mechanical equilibrium constitutea class of systems of deceptive simplicity. A paradigmaticexample of such systems is a bed of grains inside a containerwhich is subjected to vertical pulsed agitation, allowing thegrains to relax between successive excitations. By settingthe dimensionless vertical acceleration � of the shaking, thesystem can explore a variety of configurations of mechanicalequilibrium and reach a final steady state. This situationhas been widely studied; experimentally [1–4], by means ofsimulations [5–7], and theoretically [8]. Ideally, we wouldlike to understand the macroscopic or collective properties ofthe steady state of the material in terms of an ensemble ofmicroscopic states (configurations), in analogy with the wayin which we understand thermodynamics in terms of statisticalmechanics.
A statistical description of this type was put forwardby Edwards and Oakeshott [8] using solely the number ofgrains N and the volume V of the pack (or, equivalently, thepacking fraction φ) to characterize the microscopic states. Thisframework has been developed by several authors [9–12] overthe years and has been shown to be useful to explain distinctivefeatures of granular media. Despite the functionality of thisidea, it has been recently suggested that the so-called NV
ensemble should be extended to take into account the stresspropagation in the system to achieve a complete description ofa granular packing [13–18].
On the other hand, recent experiments and simulations[6,19] have shown that the packing fraction φ is not amonotonic function of the excitation intensity. Instead, aminimum packing fraction φmin is achieved at a certain value�min. Beyond this value the packing fraction increases again.It has been shown [20] that this behavior is observed inboth in two and three dimensions using hard sphere modelswith various simulation techniques and soft frictional spheres
simulated by discrete-element methods. This nonmonotonicbehavior implies that steady states with equal average packingfractions can be reached with very different tap intensities.Then the question of whether or not these states are statisticallyequivalent naturally arises. This question has been thoroughlystudied by means of simulations in Refs. [6,7] where it isfound that a measure of the stress inside the system—the forcemoment tensor �—increases monotonically for the wholerange of intensities considered. Hence, it is concluded thatstates at the two sides of the minimum are not equivalent, andthat � is a suitable candidate to complete the description ofthe equilibrium magnitudes that represent a granular system atthe macroscopic level.
Provided that � is shown to distinguish steady states ofequal φ, one would like to explore what other descriptorsof the granular packing would display such sensitivity tochanges in the configurations which are not discernible by φ.Since the external stress applied to the system is equilibratedexclusively by contacts, it seems reasonable that the propertiesof the contact network may carry some of the key informationcontained in �. We can then use the concepts and toolsof complex networks [21] to analyze the properties of thecontact structure. This will be used to evaluate whether thereis any network property that allows a clear distinction betweenstates with the same φ. At this point, let us note that anystatic granular system can be considered in terms of nodes(the grains) and edges (the contacts between grains). Thisapproach has been recently applied to address a wide varietyof granular phenomena such as tapping [22], porosity [23],force distribution [24], rheology [25], signal propagation [26],and the jamming transition [27].
The aim of the present work is to characterize the contactnetworks of the different steady states of packings generatedby tapping. On the one hand, we will show that it is notpossible to clearly uncover the differences between steady
022203-11539-3755/2013/87(2)/022203(9) ©2013 American Physical Society
AREVALO, PUGNALONI, ZURIGUEL, AND MAZA PHYSICAL REVIEW E 87, 022203 (2013)
states of equal packing fraction using standard geometricalcharacterizations such as the pair correlation function andVoronoi cell distribution. Nevertheless, we will demonstratethat states with the same volume obtained with different tapintensities exhibit discernible contact structures, renderingthem nonequivalent.
II. SIMULATION AND TAPPING PROTOCOL
We use soft-particle molecular dynamics simulations intwo dimensions (2D), in which static friction is implementedthrough the usual Cundall-Strack model [28]. The detailsof the implementation have been described elsewhere [29],and in the following we give the values of the interactionparameters used in the present work. The friction coefficientis μ = 0.5, stiffness in the normal direction of the contactkn = 105(mg/d), damping parameter in the normal direc-tion γn = 300(m
√g/d), stiffness in the tangential direction
ks = 27kn, and damping parameter in the tangential direction
γs = 200(m√
g/d). The integration time step is set to δ =10−4√d/g. The confining box (13.39d wide and infinitelyhigh) contains N = 512 monosized disks. Units are reducedwith the diameter of the disks d, the disk mass m, andthe acceleration of gravity g. Additional simulations for twodifferent stiffnesses were run, with values 2kn and kn/2.
Tapping is simulated by moving the confining box inthe vertical direction following a half sine wave trajectory{A sin(2πνt)[1 − (2πνt − π )]}. The excitation is appliedwith a constant frequency ν = π/2(g/d)1/2, and hence itis solely controlled through the amplitude A. The tap ischaracterized by the dimensionless parameter � = A(2πν)2/g
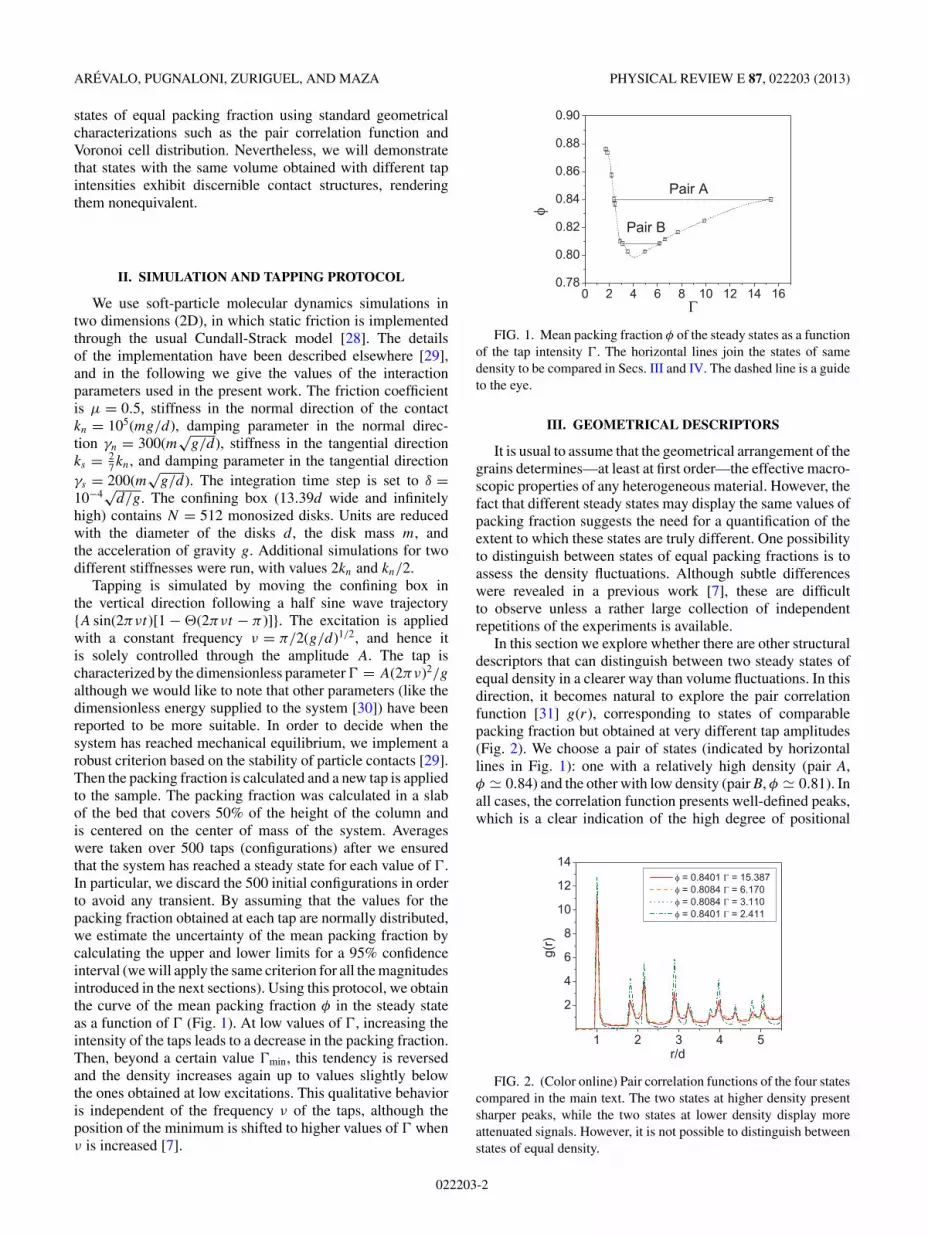
although we would like to note that other parameters (like thedimensionless energy supplied to the system [30]) have beenreported to be more suitable. In order to decide when thesystem has reached mechanical equilibrium, we implement arobust criterion based on the stability of particle contacts [29].Then the packing fraction is calculated and a new tap is appliedto the sample. The packing fraction was calculated in a slabof the bed that covers 50% of the height of the column andis centered on the center of mass of the system. Averageswere taken over 500 taps (configurations) after we ensuredthat the system has reached a steady state for each value of �.In particular, we discard the 500 initial configurations in orderto avoid any transient. By assuming that the values for thepacking fraction obtained at each tap are normally distributed,we estimate the uncertainty of the mean packing fraction bycalculating the upper and lower limits for a 95% confidenceinterval (we will apply the same criterion for all the magnitudesintroduced in the next sections). Using this protocol, we obtainthe curve of the mean packing fraction φ in the steady stateas a function of � (Fig. 1). At low values of �, increasing theintensity of the taps leads to a decrease in the packing fraction.Then, beyond a certain value �min, this tendency is reversedand the density increases again up to values slightly belowthe ones obtained at low excitations. This qualitative behavioris independent of the frequency ν of the taps, although theposition of the minimum is shifted to higher values of � whenν is increased [7].
FIG. 1. Mean packing fraction φ of the steady states as a functionof the tap intensity �. The horizontal lines join the states of samedensity to be compared in Secs. III and IV. The dashed line is a guideto the eye.
III. GEOMETRICAL DESCRIPTORS
It is usual to assume that the geometrical arrangement of thegrains determines—at least at first order—the effective macro-scopic properties of any heterogeneous material. However, thefact that different steady states may display the same values ofpacking fraction suggests the need for a quantification of theextent to which these states are truly different. One possibilityto distinguish between states of equal packing fractions is toassess the density fluctuations. Although subtle differenceswere revealed in a previous work [7], these are difficultto observe unless a rather large collection of independentrepetitions of the experiments is available.
In this section we explore whether there are other structuraldescriptors that can distinguish between two steady states ofequal density in a clearer way than volume fluctuations. In thisdirection, it becomes natural to explore the pair correlationfunction [31] g(r), corresponding to states of comparablepacking fraction but obtained at very different tap amplitudes(Fig. 2). We choose a pair of states (indicated by horizontallines in Fig. 1): one with a relatively high density (pair A,φ � 0.84) and the other with low density (pair B, φ � 0.81). Inall cases, the correlation function presents well-defined peaks,which is a clear indication of the high degree of positional
FIG. 2. (Color online) Pair correlation functions of the four statescompared in the main text. The two states at higher density presentsharper peaks, while the two states at lower density display moreattenuated signals. However, it is not possible to distinguish betweenstates of equal density.
022203-2

CONTACT NETWORK TOPOLOGY IN TAPPED GRANULAR MEDIA PHYSICAL REVIEW E 87, 022203 (2013)
FIG. 3. (Color online) Size distribution of the area (normalizedby the disk area) of the Voronoi cells for the four states comparedin the text. All the distributions are very similar. It is possible todiscriminate only states at high density from those at low density bylooking at the height of the main peak, which is larger for the former.
ordering present in the system [32]. Indeed, the higher thepacking fraction, the sharper the peaks in the distribution,which indicates an increase of the order in the sample as φ
increases. In addition, when comparing the states with thesame density, it is realized that the peaks are notably enhancedfor the states obtained with lower �. This suggests a differencein the packing structure of states that display the same valueof φ. The combination of both effects (packing fraction andtap intensity) leads to a curious result: the g(r) obtainedfor � = 15.34 and � = 3.10 are virtually indistinguishablealthough their packing fractions are different (φ � 0.84 andφ � 0.81 respectively).
As we use monosize particles, the Voronoi tessellationof the system obtained from the grain centers could be analternative indicator of the degree of ordering displayed bythe system at different tap amplitudes. This method has beenused as a tool to assess the structure of granular materials, inboth 2D and 3D [3,33]. In Fig. 3, we show the distributionof areas (normalized by the disk area) of the tessellationscomputed for the four states that we are comparing. In allcases, the decay is exponential for large areas and the curvesshow a high population of the minimum Voronoi cell atv ∼ 1.09. This corresponds to the area of the Voronoi cell thatis assigned to a disk in a perfect hexagonal packing of identicalgrains vhex =
√3
2 d2 ≈ 1.0911. The height of this peak allowsfor distinguishing between states of different density sincehigh-density, ordered structures present a bigger number ofhexagonal arrangements. However, the distributions for steadystates of equal density are nearly indistinguishable.
Provided that the main differences in these indicatorsare usually related to the degree of hexagonal order and theexistence of defects (localized or distributed) we consideredthe Ql order parameter proposed by Steinhardt et al. [34].In particular, the value of Q6 has been demonstrated to bea useful tool to describe order in hard-sphere systems [35].Importantly, we will compute Q6 in two different ways. First,as defined in Ref. [34] we consider as nearest neighbors anypair of particles that are closer than a distance 1.2d. Then weconsider as nearest neighbors only those particles in contact.We denote by Q6 the former quantity and Q∗
6 the latter. Noticethat Q6 reflects the geometrical order whereas Q∗
6 is related to
FIG. 4. Average value of the bond order parameter for nearestneighbors Q6, upper panels, and contacts Q∗
6, lower panels. (a) and(b) show the mean value of the bond order parameter as a function ofthe tap amplitude �, and (c) and (d) as a function of the density φ. In(c) and (d), the arrows indicate the direction of increasing �.
properties of the contact network. In Figs. 4(a) and 4(b), theaverage values of both Q6 and Q∗
6 are shown as functions ofthe tap intensity �. Both Q6 and Q∗
6 behave nonmonotonicallyin resemblance to the behavior of the packing fraction (Fig. 1).Nevertheless, some differences appear when the resultsare plotted as functions of the packing fraction [Figs. 4(c)and 4(d)]. When computed taking into account the actualcontacts (i.e., Q∗
6), the bond order parameter suggests theexistence of two branches: the highest (lowest) correspondsto the lowest (highest) values of �. This means that the bondorder parameter might be the right descriptor to distinguishbetween states at each side of the minimum density. However,we cannot make a strong statement since the relative distancebetween the branches in Q∗
6 is only 1%, at most, and thestandard error is larger than this [see the error bars in Figs. 4(c)and 4(d)]. In experiments, this minute variation could renderthis measure useless as a method to distinguish steady statesof equal density. Interestingly, the two branches collapse intoa single curve if we compute the bond order parameter fornearest neighbors Q6. This is an indication that descriptorsbased on contacts rather than purely geometrical arrangementsare more suitable to distinguish between steady states withthe same φ but obtained with different �.
We have run additional simulations for two different stiff-nesses of the disks. The results for the bond order parameter arepresented in Fig. 5 for disks with stiffness 2kn (stiff) and kn/2(soft). The bond order parameters for nearest neighbors (Q6)and for contacts (Q∗
6) as functions of tap intensity [Figs. 5(a)and 5(b)] follow the same general trends, the only differencebeing a displacement in the position of the minimum. This shiftof the position of the minimum Q6 is coincident with a shift inthe position �min of the minimum packing fraction. The shiftis due to a change in the effective expansion of the granularcolumn during a tap (this is the ultimate effect of the excitationthrough taps). Softer disks are more dissipative (have a lower
022203-3

AREVALO, PUGNALONI, ZURIGUEL, AND MAZA PHYSICAL REVIEW E 87, 022203 (2013)
FIG. 5. (Color online) Average value of the bond order parameterfor stiff (2kn) and soft (kn/2) disks; nearest-neighbors Q6 (upperpanel) and contact Q∗
6 (lower panel). (a) and (b) show the mean valueof the bond order parameter as a function of the tap amplitude �
(squares for stiff and triangles for soft disks), and (c) and (d) as afunction of the density φ (squares and closed arrows for stiff disks,and triangles and open arrows for soft disks). In (c) and (d), the arrowsindicate the direction of increasing �.
restitution coefficient for given γn). Hence, softer disks requirestronger taps for the granular bed to expand enough to reachthe high-intensity regime where the packing fraction starts togrow with tap intensity. For both stiff and soft disks, when thebond order parameter is considered as a function of density[Figs. 5(c) and 5(d)], there is a narrow gap between the twobranches for Q∗
6 which is not present if one considers Q6,as we observed before. The qualitative behavior of the bondorder parameters is therefore unaffected by the stiffness of thedisks.
Since the bond order parameter generally presents adistribution with characteristic peaks for partially orderedsystems, we now focus on this distribution and compare twoequal-density pairs of states at each side of the minimumdensity to see if any clear difference can be observed. In Fig. 6,we show the distribution of Q6 and Q∗
6 for these four states.Clearly, this parameter is a poor indicator for distinguishingbetween equal-density steady states. The two states at highdensity and the two at low density are fairly paired for bothbond order parameters, especially in the region of intermediatevalues, and at the peaks. At high values (Q6 � 0.75), the datafrom the high and low tap intensities seem to slightly separate(except at the peaks), yet it becomes difficult to infer a clearsystematic trend.
In summary, the bond order parameters Q6 and Q∗6, the pair
correlation function g(r), and the size distribution of Voronoicells are parameters that subtly suggest that steady states withthe same φ but obtained with different tap intensities are,indeed, different. Nevertheless, the differences displayed arevery small, which implies that none of these measurementscan be univocally used to differentiate the states.
(a)
(b)
FIG. 6. (Color online) Distribution of Q6 and Q∗6 for the four
states compared in the text. The signals appear paired for states ofequal density, without any salient feature allowing one to distinguishbetween them.
IV. STRUCTURE OF THE CONTACT NETWORK
As we mentioned in the Introduction, steady states of equaldensity at the two sides of the minimum density can bedistinguished by the force moment tensor. Hence, it seemsplausible that the properties of the contact network also allowsuch a distinction. Indeed, the contact network carries a portionof the information contained in the contact forces which is atthe heart of the stress tensor definition. A result that supportsthis idea is that the bond order parameter based on actualcontacts (i.e., Q∗
6) is more suitable to distinguish betweenstates of the same φ than the Q6 based on just first neighbors.
A natural approach to further explore the properties of thecontact network is to define a graph considering every contactbetween particles as an edge and each grain as a node (Fig. 7).Every grain representing a node in the network is equilibratedby at least two contacts (edges), and the graph as a whole isresponsible for the transmission of stresses through the packing[36]. Note that, due to gravity, in our samples there are norattlers, i.e., particles without any contact. The graphs are thencharacterized by means of the following descriptors [37]: (a)the mean shortest distance (or mean topological distance) 〈l〉between two given nodes measured by number of edges; (b)the diameter D of the network, which is the largest topologicaldistance in the graph; and (c) the degree of the network 〈k〉which is equivalent to the average contact number per grain,Z. Furthermore, we analyze the networks by measuring thenumber of polygons: closed loops whose size is measured inthe number of contacts (or edges) (Fig. 7). In the following,
022203-4

CONTACT NETWORK TOPOLOGY IN TAPPED GRANULAR MEDIA PHYSICAL REVIEW E 87, 022203 (2013)
FIG. 7. Part of one of the deposits analyzed. In dark gray, edgesjoining the centers of grains in contact. The width of the edgesis proportional to the corresponding normal force. Different loops(triangles, squares, pentagons, and hexagons) can be observed.
we term these empty closed loops simply as triangles, squares,pentagons, and so on.
The role of polygons was originally introduced in [38]where it was shown that odd loops are rigid due to thefrustration of rotations, playing an important role in therigidity of a granular sample. Following this argument,triangles—the minimal polygonal structure—were proposedas an order parameter to characterize the jamming transitionin an isotropically compressed granular packing [36]. Indeed,while the number of triangles grows in the proximity of thejamming point, the population of the other loops remainsconstant or decreases [27]. This idea was also applied tocharacterize the rheological properties of sheared granularmaterials (see Ref. [25] and references therein), showing theusefulness of this parameter to characterize the evolution ofthe equilibrium states developed by a granular material underexternal loads.
In Figs. 8(a)–8(c), we show the results of 〈l〉, D, and 〈k〉for different values of the tap intensity �. As with the packingfraction in Fig. 1, all these descriptors have a nonmonotonicdependence on �. For tap intensities below �min, 〈l〉 andD grow as � is increased, indicating that the network isbecoming more disconnected. Correspondingly, 〈k〉 decreasesuntil the system reaches its minimum packing fraction around� � 4.0. Beyond this point, the contact network recoversconnections (〈k〉 increases), thus reducing 〈l〉 and D. Theimportance of these topological parameters in characterizingthe spatial structure of the sample becomes more evidentfrom Figs. 8(d)–8(f) where the values of 〈l〉, D, and 〈k〉 arepresented as functions of φ. In all these plots two branchesare distinguishable, each corresponding to a different side of�min. This implies that the topological descriptors are able todistinguish between states with equal φ obtained at differenttap intensities. However, care should be taken as the relativedifferences between different states with the same φ are verysmall. Indeed, the greatest relative difference is about 5% (forthe case of 〈k〉 in the states with φ � 0.84). The fact that theresolution is very high in our numerical simulations becomeskey to differentiating the states with the same φ.
FIG. 8. Average shortest distance 〈l〉, average diameter D, andaverage connectivity 〈k〉 as functions of the tap intensity � (a)–(c),and as functions of the mean packing fraction φ (d)–(f). The arrowsindicate the direction of increasing �.
The number of loops (or polygons) in the network isshown in Fig. 9. As in Fig. 8, the left (right) column showsthe average population of each type of motif as a functionof the tap intensity (packing fraction). Figures 9(a)–9(e)reveal that, for low values of �, small polygons—trianglesand squares—decrease in number as � increases and thenetwork becomes disordered and disconnected. Instead, bigpolygons—pentagons and heptagons—become more numer-ous. For � > �min this tendency is reversed and the number ofsmall (big) polygons increases (decreases) as the tap intensityis augmented. Notably, hexagons behave in a peculiar way;their population decreases monotonically with �. Althoughthe decrease becomes attenuated for � > �min, the monotonicbehavior of hexagons is a unique feature which has notbeen observed in any other descriptor—either geometricalor topological—considered so far. We speculate that thisparticular behavior of the number of hexagons is stronglyrelated to the boundary effects. Most hexagons observed arelocated near the vertical walls of the container (as exemplifiedby Fig. 7). This phenomenon could be associated with thespecial columnar arrangements of particles induced by thewalls [39–41]. However, we will not further pursue this issuein this paper.
The behavior of the number of polygons within the networkcan be easily linked to the results obtained for the othertopological properties. Indeed, increasing the number of smallpolygons adds connectivity to the network. For example, ifwe consider a group of three nodes connected through two
022203-5

AREVALO, PUGNALONI, ZURIGUEL, AND MAZA PHYSICAL REVIEW E 87, 022203 (2013)
FIG. 9. The populations of polygons defined in the text as afunction of the tap intensity (a)–(e), and as a function of themean packing fraction (f)–(j). The arrows indicate the direction ofincreasing �. NT, NS, NP, NHx, and NHp indicate the numbers oftriangles, squares, pentagons, hexagons, and heptagons, respectively.
edges, the distance is 〈l〉 = 2 and the average connectivityis 〈k〉 = 4/3. If a triangle is formed by adding one edge,the distance reduces to 〈l〉 = 1 and the connectivity risesto 〈k〉 = 2. For � < �min, increasing � leads to a reductionin the number of small polygons and, hence, the networkconnectivity is reduced. For � > �min, the behavior reverses,with large polygons being divided into smaller ones by newedges.
FIG. 10. (Color online) Average shortest distance 〈l〉, averagediameter D, and average connectivity 〈k〉 for stiff (squares) andsoft (triangles) disks, as functions of the tap intensity � (a)–(c),and as functions of the mean packing fraction φ (d)–(f). The arrows(closed for stiff disks, open for soft disks) indicate the direction ofincreasing �.
The population of polygons as a function of the density[see Figs. 9(f)–9(j)] reveals —like the other topologicaldescriptors—the existence of two branches, one at each side ofthe minimum. This behavior is especially clear for the casesof triangles and hexagons. In brief, we can state that the branchof higher � is characterized by a higher number of triangles anda lower number of hexagons, in comparison with the branchof lower �.
We present the results of the topological measurements forstiff and soft disks in Figs. 10 and 11. In Figs. 10(a)–10(c) theshortest distance 〈l〉, the diameter D, and the connectivity 〈k〉of the networks are plotted as functions of the tap intensity.Figures 10(d)–10(f) display the same results as functions ofthe density. As we can observe, despite the shift in �, all theconclusions drawn for the original stiffness are valid also forsofter and stiffer disks.
In Fig. 11 we show the results obtained for the populationsof polygons, as functions of the tap intensity [Figs. 11(a)–11(e)] and as functions of the density [Figs. 11(f)–11(j)].The observations highlighted previously remain unchanged forthe different stiffnesses. Hexagons remain the only polygonswhose population is monotonic in �. The two branches inFigs. 11(f)–11(j) appear well separated only for triangles andhexagons. The loop in the population of pentagons remainspresent. Interestingly, although the branches in the population
022203-6

CONTACT NETWORK TOPOLOGY IN TAPPED GRANULAR MEDIA PHYSICAL REVIEW E 87, 022203 (2013)
FIG. 11. (Color online) The populations of polygons for stiff(squares) and soft (triangles) disks as a function of the tap intensity(a)–(e), and as a function of the mean packing fraction (f)–(j). Thearrows (closed for stiff disks, open for soft disks) indicate the directionof increasing �.
of heptagons are rather collapsed for stiffnesses kn/2 and kn,a slight separation appears for the stiffest disks considered.
At this point, we may wonder which is the best topologicalindicator to distinguish between two different states withthe same packing fraction. In order to answer this question,we compare the two pairs of steady states of equal φ at eachside of the minimum density that were analyzed in Sec. III.The topological indicators on these states are summarized inTable I for the pair A of steady states obtained with high density,
TABLE I. Topological descriptors for two states of equal, highpacking fraction.
� 2.411 15.387 Relativeφ 0.840101 0.840053 change
〈l〉 16.923 16.697 −2%D 47.034 46.104 −2%〈k〉 3.319 3.496 +5%NT 85.122 131.510 +54%NS 114.758 128.046 +12%NP 51.128 50.686NH 49.218 40.430 −18%NHp 24.762 22.766 −8%
and Table II for the pair B of steady states obtained with lowdensity. Focusing first on the pair with high density, we seethat the relative variation in 〈l〉 and D is about −2% (the stateobtained at higher � takes smaller values than the one obtainedat lower �). In accordance, the average connectivity for thestate at higher � increases by around 5%. The population ofpolygons exhibits more significant variations: the number oftriangles rises by 54%, and that of squares by 12%. At thesame time, the number of hexagons decreases by 18% and thatof heptagons decreases by 8%. The population of pentagonsseems to remain fairly constant with a decrease of less than 1%.These important changes in the population of polygons that justimply minute changes in the connectivity can be understood asfollows. Converting a hexagon into four triangles requires theintroduction of three new links in the network (Fig. 7). Then, 9hexagons may give rise to 36 triangles by just adding 27 linkswhich indeed implies an increase of 〈k〉 of around 0.1 (recallthat the network is composed of 512 particles). Naturally,this is the simplest combination we can think of. Hexagonscan also give rise to squares, and we see that the number ofheptagons slightly decreases, thus contributing also to the risethe populations of small polygons. In summary, the importantobservation is that a slight change in the connectivity of thenetwork leads to dramatic changes in the number of polygons,without having an impact on the density of the packing.
The differences in the pair B of steady states with lowdensity (Table II) show the same qualitative behavior, althoughthe relative changes are smaller due to the proximity of thevalues of � used to obtain them. Again, the largest variations
TABLE II. Topological descriptors for two states of equal, lowpacking fraction.
� 3.110 6.170 Relativeφ 0.808458 0.808433 change
〈l〉 17.273 17.288D 47.898 47.854〈k〉 3.221 3.255 +1%NT 68.546 77.826 +13%NS 96.282 96.012NP 58.024 60.468 +4%NH 44.850 43.188 −4%NHp 30.122 29.89
022203-7

AREVALO, PUGNALONI, ZURIGUEL, AND MAZA PHYSICAL REVIEW E 87, 022203 (2013)
are observed in the populations of triangles and hexagons,with an increase of 13% for the former and a decrease of 4%for the latter. Thus, the population of polygons seems to bea suitable topological property, as it is more sensitive thanother measurements to changes in the structure of the packingor—as in this case—to distinguish between different states ofmechanical equilibrium.
V. CONCLUSIONS
We have studied the contact network structure of the steadystates reached by a granular layer when submitted to verticaltapping. It has been recently shown [6] that the volume fractionof the system is not a monotonic function of the tap amplitudeand that an extra variable is necessary to univocally identifyeach steady state of the system [7].
In this work, we have shown that standard geometricalmeasurements such as the pair correlation function or thesize distribution of Voronoi cells are unable to give a cleardistinction between states of equal packing fraction that areknown to differ in the average moment tensor. Thus, we haveimplemented a series of topological measurements based onthe contact network of the resulting packings. This approachallows us to distinguish between such different states.
We can understand the suitability of a topological approachover any geometrical measurement based on the fact thatminute changes in the actual position of a single particle caninduce dramatic variations in the contact network as a whole.The topology of the interparticle contacts univocally deter-
mines the stress transmission of each mechanical equilibriumstate, but may not affect, in a distinguishable way, the density orthe number of nearest neighbors (defined by proximity ratherthan contact). The contact network, instead, will reflect suchsmall changes, thus becoming a more sensitive probe of thestate of the system.
The family of polygonal structures displayed by the contactnetwork may be thought of as a mesoscopic extension ofthe geometrical measurements. Effectively, the bond orderparameters and Voronoi tessellations are highly local metricsbased on information about the nearest neighbors, regardlessof whether there is actually a contact or not. The polygons arebased on contacts but also extend and consider the neighborsof neighbors. This mesoscopic nature allows polygons tocapture information lost in a purely local context and couldbe considered as a suitable scale to define a representativevolume element in order to perform a homogenization processof the system as a whole.
ACKNOWLEDGMENTS
R.A. thanks MIUR-FIRB RBFR081IUK for financial sup-port. L.A.P. acknowledges The Aspen Center for Physicsand Instituto de Fısica de Lıquidos y Sistemas Biologicos(CONICET La Plata, UNLP) where parts of this work weredone. I.Z. and D.M. acknowledge Grant No. FIS2011-26675(Spanish Government) and PIUNA (Universidad de Navarra)for their support.
[1] E. R. Nowak, J. B. Knight, E. Ben-Naim, H. M. Jaeger, andS. R. Nagel, Phys. Rev. E 57, 1971 (1998).
[2] E. R. Nowak, J. B. Knight, M. L. Povinelli, H. M. Jaeger, andS. R. Nagel, Powder Technol. 94, 79 (1997).
[3] Ph. Ribiere, P. Richard, P. Philippe, D. Bideau, and R. Delannay,Eur. Phys. J. E 22, 249 (2007).
[4] M. Schroter, D. I. Goldman, and H. L. Swinney, Phys. Rev. E71, 030301(R) (2005).
[5] M. Pica Ciamarra, A. Coniglio, and M. Nicodemi, Phys. Rev.Lett. 97, 158001 (2006).
[6] L. A. Pugnaloni, I. Sanchez, P. A. Gago, J. Damas, I. Zuriguel,and D. Maza, Phys. Rev. E 82, 050301(R) (2010).
[7] L. A. Pugnaloni, J. Damas, I. Zuriguel, and D. Maza, Pap. Phys.3, 030004 (2011).
[8] S. F. Edwards and R. B. S. Oakeshott, Physica A 157, 1080(1989).
[9] S. F. Edwards and C. C. Mounfield, Physica A 226, 1 (1996).[10] A. Mehta and S. F. Edwards, Physica A 157, 1091 (1989).[11] S. F. Edwards and D. V. Grinev, Phys. Rev. E 58, 4758 (1998).[12] S. F. Edwards and D. V. Grinev, Granular Matter 4, 147
(2003).[13] J. H. Snoeijer, T. J. H. Vlugt, W. G. Ellenbroek, M. van Hecke,
and J. M. J. van Leeuwen, Phys. Rev. E 70, 061306 (2004).[14] S. F. Edwards, Physica A 353, 114 (2005).[15] S. Henkes, C. S. OHern, and B. Chakraborty, Phys. Rev. Lett.
99, 038002 (2007).[16] S. Henkes and B. Chakraborty, Phys. Rev. E 79, 061301
(2009).
[17] R. Blumenfeld and S. F. Edwards, J. Phys. Chem. B 113, 3981(2009).
[18] B. P. Tighe, A. R. T. van Eerd, and T. J. H. Vlugt, Phys. Rev.Lett. 100, 238001 (2008).
[19] P. A. Gago, N. E. Bueno, and L. A. Pugnaloni, Granular Matter11, 365 (2009).
[20] L. A. Pugnaloni, M. Mizrahi, C. M. Carlevaro, and F. Vericat,Phys. Rev. E 78, 051305 (2008).
[21] M. E. J. Newman, SIAM Rev. 45, 167 (2003).[22] J. Berg and A. Mehta, Europhys. Lett. 56, 784 (2001).[23] J. A. Dodds, J. Colloid Interface Sci. 77, 317 (1980).[24] S. Ostojic, E. Somfai, and B. Nienhuis, Nature (London) 439,
828 (2006).[25] D. M. Walker and A. Tordesillas, Phys. Rev. E 85, 011304
(2012).[26] D. S. Bassett, E. T. Owens, K. E. Daniels, and M. A. Porter,
Phys. Rev. E 86, 041306 (2012).[27] R. Arevalo, I. Zuriguel, and D. Maza, Phys. Rev. E 81, 041302
(2010).[28] P. A. Cundall and O. D. L. Strack, Geotechnique 29, 47
(1979).[29] R. Arevalo, D. Maza, and L. A. Pugnaloni, Phys. Rev. E 74,
021303 (2006).[30] F. Ludewig, S. Dorbolo, T. Gilet, and N. Vandewalle, Europhys.
Lett. 84, 44001 (2008).[31] S. Torquato, Random Heterogeneous Material (Springer,
New York, 2002).[32] J. S. Olafsen and J. S. Urbach, Phys. Lett. 95, 098002 (2005).
022203-8

CONTACT NETWORK TOPOLOGY IN TAPPED GRANULAR MEDIA PHYSICAL REVIEW E 87, 022203 (2013)
[33] T. Aste, T. D. Matteo, M. Saadatfar, T. J. Senden, M. Schroter,and H. L. Swinney, Europhys. Lett. 79, 24003 (2007).
[34] P. J. Steinhardt, D. R. Nelson, and M. Ronchetti, Phys. Rev. B28, 784 (1983).
[35] P. Richard, L. Oger, J. P. Troadec, and A. Gervois, Phys. Rev. E60, 4551 (1999).
[36] R. Arevalo, I. Zuriguel, S. Ardanza-Trevijano, and D. Maza, Int.J. Bifurcation Chaos Appl. Sci. Eng. 20, 897 (2010).
[37] R. Arevalo, I. Zuriguel, and D. Maza, Int. J. Bifurcation ChaosAppl. Sci. Eng. 19, 695 (2009).
[38] N. Rivier, J. Non-Cryst. Solids 352, 42 (2006).[39] I. Bartos and I. M. Janosi, Granular Matter 9, 81
(2007).[40] I. Zuriguel, T. Mullin, and R. Arevalo, Phys. Rev. E 77, 061307
(2008).[41] H. K. Chan, Phys. Rev. E 84, 050302(R) (2011).
022203-9