
Internet Core Topology Mapping and Analysis
14
HAL Id: hal-00344481 https://hal.archives-ouvertes.fr/hal-00344481 Submitted on 27 Apr 2014 HAL is a multi-disciplinary open access archive for the deposit and dissemination of sci- entific research documents, whether they are pub- lished or not. The documents may come from teaching and research institutions in France or abroad, or from public or private research centers. L’archive ouverte pluridisciplinaire HAL, est destinée au dépôt et à la diffusion de documents scientifiques de niveau recherche, publiés ou non, émanant des établissements d’enseignement et de recherche français ou étrangers, des laboratoires publics ou privés. Internet Core Topology Mapping and Analysis Damien Magoni, Mickaël Hoerdt To cite this version: Damien Magoni, Mickaël Hoerdt. Internet Core Topology Mapping and Analysis. Computer Com- munications, Elsevier, 2005, 28 (5), pp.494-506. 10.1016/j.comcom.2004.09.002. hal-00344481
-
Upload
khangminh22 -
Category
Documents
-
view
0 -
download
0
Transcript of Internet Core Topology Mapping and Analysis

HAL Id: hal-00344481https://hal.archives-ouvertes.fr/hal-00344481
Submitted on 27 Apr 2014
HAL is a multi-disciplinary open accessarchive for the deposit and dissemination of sci-entific research documents, whether they are pub-lished or not. The documents may come fromteaching and research institutions in France orabroad, or from public or private research centers.
L’archive ouverte pluridisciplinaire HAL, estdestinée au dépôt et à la diffusion de documentsscientifiques de niveau recherche, publiés ou non,émanant des établissements d’enseignement et derecherche français ou étrangers, des laboratoirespublics ou privés.
Internet Core Topology Mapping and AnalysisDamien Magoni, Mickaël Hoerdt
To cite this version:Damien Magoni, Mickaël Hoerdt. Internet Core Topology Mapping and Analysis. Computer Com-munications, Elsevier, 2005, 28 (5), pp.494-506. �10.1016/j.comcom.2004.09.002�. �hal-00344481�

Internet Core Topology Mapping and Analysis
Damien MagoniUniversite Louis Pasteur – LSIIT
67400 Illkirch, [email protected]
Mickael HoerdtUniversite Louis Pasteur – LSIIT
67400 Illkirch, [email protected]
Abstract—The study of the Internet topology allowsus to discover properties that can be exploited in orderto improve the performance of network protocols andapplications. Thus, Internet mapping is very useful tosimulation software focusing on network protocols. Un-fortunately Internet mapping has two major drawbacks.First it takes a lot of time to be carried out and secondlyit is often incomplete. To solve these two problems, wehave developed a fast mapping software whose aim is tomap the heart of the Internet as fast as possible withthe highest possible accuracy. In this paper, we describeour software and evaluate its performance compared to anexisting and freely available mapping software. We assessthe completeness of the router level maps by creatingoverlays with an autonomous system topology. We alsostudy the absolute efficiency of our software by makingan extensive campaign. We show that limitations on theamount of information do appear when trying to carry outan exhaustive mapping. Finally we study the path inflationphenomenon caused by the routing protocols.
I. I NTRODUCTION
In this paper, we describe our Internet mappingsoftware and we analyze the maps that it produces.The section II describes earlier work concerning routerlevel Internet mapping as well as the software usedfor comparison with our software. Section III describesin detail how our mapping software works. Section IVpresents the collected maps from each software and theautonomous system map used to create the overlays. Italso contains the results of the analysis of these maps aswell as an evaluation of their accuracy which can assessthe efficiency of each mapping software. In section V wedescribe our efforts to create an exhaustive Internet mapas well as the resulting data and the problems that weencountered. Finally in the section VI we study the pathinflation phenomenon at the router level and we showthat it is a common and non-negligible aspect of Internetrouting.
II. PREVIOUS WORK
The Internet mapping research effort began a fewyears ago. In 1995, Pansiotet al. created a router levelmap from a single host toward about 5000 destina-tions [1]. They used source routing to discover traversallinks. In 1999, Burchet al. used BGP tables to findthe destination prefixes [2]. They also used traceroutesfrom a single host but they used tunnels toward otherhosts to obtain a similar effect to source routing. Alsoin 1999, Govindanet al. wrote a mapping softwarecalled Mercator. It uses a random address selection forthe traceroute destinations [3]. We use this software forcomparison withnecbecause it is the only free availablemapping software for the research community. It runsfrom a single host, sending UDP packet with a increasingTTL (similar to traceroute). It also uses source routingto discover traversal links. In 2002, Springet al. wrotethe Rocketfuel software [4]. This software has a similarapproach thannec but it only enables to map a singleISP at a time. In addition, this software is not freelydistributed in contrary to the alias resolution softwareused in it. This alias resolution software is named Allyand it can be freely downloaded. We used Ally withnec. Router level Internet mapping has received muchattention very recently. Aside of our project, we can alsocite Scriptroute [5] which is the successor of Rocketfuel(and the code is now available) and the Opte project [6]for which no code is currently available. However wecould not comparenec to these last two because theywere done nearly at the same time.
Concerning our overlay creation method, it is differentand new compared to the methods used in [7] and in [8]because we compute a correspondence between discov-ered routers from Mercator ornec and the ASes foundin the route-viewsBGP tables using the IP interfaceand BGP prefixes. As a consequence, we do not needto generate the AS graph with a grouping algorithmas the one presented in [7] and we avoid the possible

introduction of errors in the cases where many disjointsrouter groups belong to the same AS and thus have to bereassigned. Moreover, our creation method, unless otherapproaches, has the advantage to give an completenessrate evaluation (For the AS and BGP connections) of theAS level map over the router level map. This allows usto estimate the completeness quality of our router levelmaps. Our overlay creation method has been describedin [9].
III. NETWORK CARTOGRAPHER
Our cartographer software is namednetwork cartog-rapher or nec in short.nec is launched from one givenpoint in the Internet (typically on a host computer) andqueries in parallel a set of traceroute web servers tosend requests towards a set of targets (i.e. destinationaddresses) locally stored. This technique is illustratedin figure 1. As the figure shows, the computer runningnec sends requests to various traceroute web servers inparallel (setsa andb of messages). However the processof querying a traceroute web server, the latter doing thetrace and sending the result back tonec is sequential(ordered from 1 to 3 in the figure). The number ofitems in the sets of sources and destinations can bepotentially high, that’s why we implement a local anddistant resource saving mechanism. At the startup ofnec,we can fix a limit to the local number of simultaneousrequests (typically between 10 and 100). The number ofdistant simultaneous requests coming from the same hostwherenec is running is limited to one in order to avoidoverloading a server more than a normal manual webrequest and being kicked out for overuse.
Fig. 1. nec functioning principle.
In the following text, we will callx the local limit.
On initialization, we openx HTTP connections towardx distinct traceroute web servers for which we submit arequest towards the same destinationD. We wait for theresults, knowing that we can’t predict the arrival orderof the answers and that some answers can be incompletegiven the inherent properties of the Internet (i.e. ICMPpackets filtered on some routers).
Upon the reception of the answers, we store themfor later offline computation. If a request is complete,we close the connection to open another one and sendanother request towardD, using the next unsolicitedtraceroute web server. If the latter has already sent arequest forD, it will send a request to the next destina-tion address afterD. If the answer is not complete, westore the already sent data and wait again, trusting TCPto achieve the completion of the information recovery. Ifa traceroute request is filtered, we close the connection(i.e. if we receive a succession of * symbols). Beforeeach new connection initialization, we make sure thatour resource saving criteria are still true: that there isnot another request running on the traceroute server thatwe would like to query and that the number of locallyrunning request is less or equal tox. neckeeps some stateinformation in order to be able to restart an interruptedmapping without having to carry out all the alreadycompleted requests.
The IP destination addresses (i.e. traceroute targets)selection is a crucial aspect or our mapping system. Inour first campaign, we have selected targets based ontheir owning autonomous system and known from previ-ous mapping campaigns (see section IV). The destinationaddresses all belong to distinct autonomous systems inorder to obtain an optimal topological distribution of thetargets and as a consequence the more accurate mappossible using the least possible amount of requests. Inour second campaign, we have built the target addressesfrom a list of the network prefixes contained in a BGPdump fromroute-views(see section V in order to achievea more complete list of targets.
nec is written in C and C++. Its source code is freelyavailable for non-commercial use. It can be downloadedat the address [10]. But it is still not finished andwe would like to implement additional functionalities.Thus it is currently available to the network researchcommunity only for functional evaluation and testingpurposes.
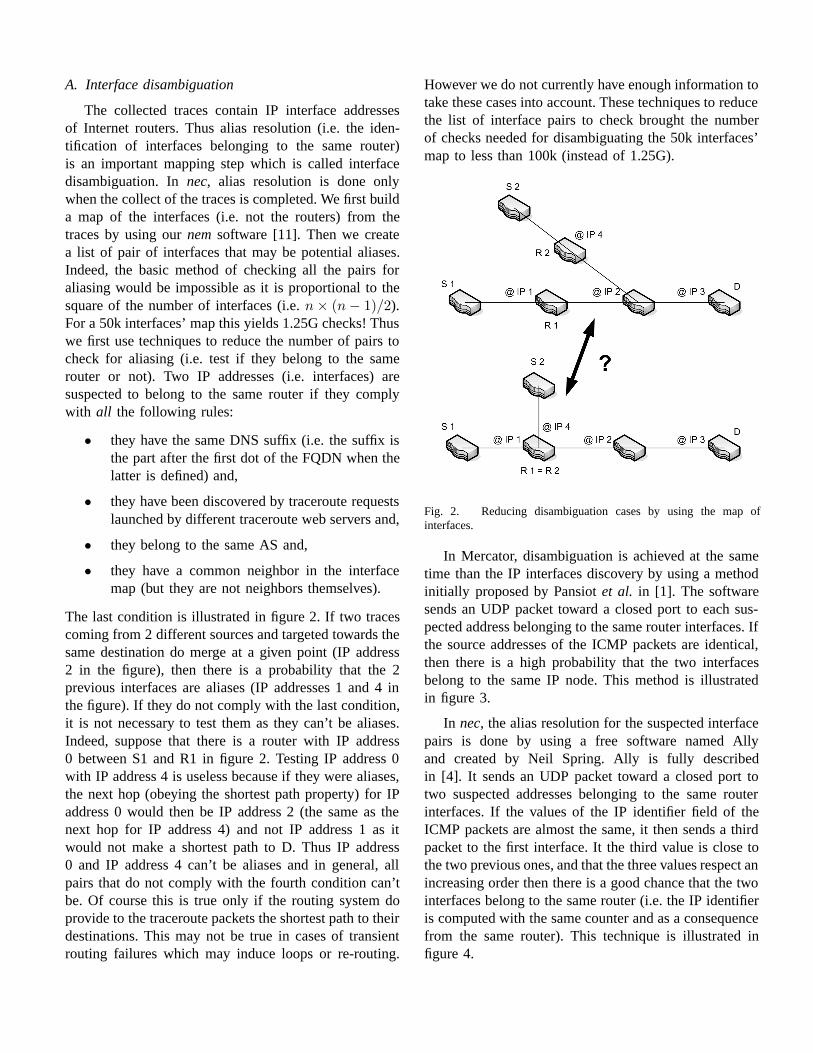
A. Interface disambiguation
The collected traces contain IP interface addressesof Internet routers. Thus alias resolution (i.e. the iden-tification of interfaces belonging to the same router)is an important mapping step which is called interfacedisambiguation. Innec, alias resolution is done onlywhen the collect of the traces is completed. We first builda map of the interfaces (i.e. not the routers) from thetraces by using ournemsoftware [11]. Then we createa list of pair of interfaces that may be potential aliases.Indeed, the basic method of checking all the pairs foraliasing would be impossible as it is proportional to thesquare of the number of interfaces (i.e.n× (n− 1)/2).For a 50k interfaces’ map this yields 1.25G checks! Thuswe first use techniques to reduce the number of pairs tocheck for aliasing (i.e. test if they belong to the samerouter or not). Two IP addresses (i.e. interfaces) aresuspected to belong to the same router if they complywith all the following rules:
• they have the same DNS suffix (i.e. the suffix isthe part after the first dot of the FQDN when thelatter is defined) and,
• they have been discovered by traceroute requestslaunched by different traceroute web servers and,
• they belong to the same AS and,
• they have a common neighbor in the interfacemap (but they are not neighbors themselves).
The last condition is illustrated in figure 2. If two tracescoming from 2 different sources and targeted towards thesame destination do merge at a given point (IP address2 in the figure), then there is a probability that the 2previous interfaces are aliases (IP addresses 1 and 4 inthe figure). If they do not comply with the last condition,it is not necessary to test them as they can’t be aliases.Indeed, suppose that there is a router with IP address0 between S1 and R1 in figure 2. Testing IP address 0with IP address 4 is useless because if they were aliases,the next hop (obeying the shortest path property) for IPaddress 0 would then be IP address 2 (the same as thenext hop for IP address 4) and not IP address 1 as itwould not make a shortest path to D. Thus IP address0 and IP address 4 can’t be aliases and in general, allpairs that do not comply with the fourth condition can’tbe. Of course this is true only if the routing system doprovide to the traceroute packets the shortest path to theirdestinations. This may not be true in cases of transientrouting failures which may induce loops or re-routing.
However we do not currently have enough information totake these cases into account. These techniques to reducethe list of interface pairs to check brought the numberof checks needed for disambiguating the 50k interfaces’map to less than 100k (instead of 1.25G).
Fig. 2. Reducing disambiguation cases by using the map ofinterfaces.
In Mercator, disambiguation is achieved at the sametime than the IP interfaces discovery by using a methodinitially proposed by Pansiotet al. in [1]. The softwaresends an UDP packet toward a closed port to each sus-pected address belonging to the same router interfaces. Ifthe source addresses of the ICMP packets are identical,then there is a high probability that the two interfacesbelong to the same IP node. This method is illustratedin figure 3.
In nec, the alias resolution for the suspected interfacepairs is done by using a free software named Allyand created by Neil Spring. Ally is fully describedin [4]. It sends an UDP packet toward a closed port totwo suspected addresses belonging to the same routerinterfaces. If the values of the IP identifier field of theICMP packets are almost the same, it then sends a thirdpacket to the first interface. It the third value is close tothe two previous ones, and that the three values respect anincreasing order then there is a good chance that the twointerfaces belong to the same router (i.e. the IP identifieris computed with the same counter and as a consequencefrom the same router). This technique is illustrated infigure 4.

Fig. 3. Disambiguation with the source address of the reply.
Fig. 4. Disambiguation with the IP identifier value of the reply.
When the list of suspected interface pairs has beenproduced bynemand resolved by Ally, we finally buildthe router map by merging the interfaces that belong tothe same router. We keep the lowest IP address of all theIP aliases of a router as the canonical IP address for thisrouter. We have implemented this procedure in ournemsoftware.
B. Internet mapping
We want to fast map the Internet core. Previous workon Internet mapping [1], [2], [3] campaign have typicalduration of several weeks or even many months. Herewe make a campaign where the measurement duration is10 days. This may be seen as a long time too, but oneshould not forget that a fastest campaign could damagethe service provided by the traceroute servers (whenusingnec) and/or could be seen as a distributed denial ofservice attack toward the destinations addresses (Merca-tor andnec) or as a network spying tentative (Mercator).In addition, we have only requested IP addresses in thepublic range, not considering private addressing behindNAT boxes. We are limited by the ICMP processing ofthe different routers. Some of them do not respond withan ICMP message and others filter all ICMP packets.This last behavior is very common within large Internetproviders but not within the large network operators. Thisexplains why we are mostly mapping the Internet corerather than the Internet leaves (i.e. traceroute requests donot always reach their destinations). We ran Mercator andnecduring 10 days and we compared the collected routermaps. To create the overlays required for completenessanalysis, we need router maps and an autonomous systemmap. We collected the two router level maps from thesame host, located in our laboratory (LSIIT, at Illkirch,France). We used the Mercator software written byGovindanet al. and documented in [3] for the first mapand our software for the other. The next section presentsthe collected maps as well as their analysis.
IV. A CCURACY COMPARISON OFnec vsMERCATOR
In this section, we study the map properties collectedwith Mercator andnec in order to evaluate their quality.We also gathered an AS level map, computed from therouting table of the BGP router observerroute-viewsdated from April 2003. The table I contains generalinformation about these maps. We notice that Mercatordetected 4.6% of aliases and Ally 6.1%. Without anyhypothesis about the efficiency of these alias resolutionmethods, we note that the alias detection rate is about5%, which is one third of the value observed in [12].
A. General properties
The table II shows the main properties of the maps.We recall that these properties have been collected in10 days. First,nec discovered 15% router less thanMercator. An increase in the request frequency and/or

TABLE I. I NTERNET MAPS USED FOR ANALYSIS
Source Interface or router or link count Dateprefix number AS number
Mercator 58119 55425 65237 7-17/4/2003nec 50123 47055 119909 19-29/4/2003route-views 130815 15129 31378 1/4/2003
the number of traceroute servers would permit us tomake up with this difference. After the overlay con-struction, we found that 12% of the routers presentin the Mercator IP topology can be defined as BGProuters according to our resolution method explainedin [9]. With nec this rate is almost 60%. We do notpossess enough information which could permit us toassess this number with its real value in the Internet butthis shows that our target distribution method (i.e. thetraceroute destination address selection) based on takingone address in each AS discovers a lot of inter-domainIP links. Second, and this is the most important point,nec discovered almost 84% more links than Mercator!This result is very encouraging. It clearly shows theadvantage of using multiple distributed vantage pointsover the source-routing techniques which are not fastenough to discover a similar number of traversal links.As a result, the mean degree of thenec map is twicemore as in Mercator (And this means having a higherdensity of redundant links). The meshed part (i.e. thegraph without its trees) of the maps is important. TheInternet is far more meshed than other previous workshowed (85% of thenec map routers are in the mesh).This shows that the meshed value of Internet graphs mustnot be considered as a good indicator (i.e. as a stablegraph property). Always with the AS overlay map, wecan compute the completeness of the router maps. TheAS completeness give the percentage of AS containingat least 1 router (ideally this should be 100%). Theseindicators are relatively inaccurate but sufficient enoughto show the limits of our router maps. We can see in thesevalues the high bias of Mercator which only fill 12%of AS and 6% of connections.nec reach very superiorvalues with a respective filling rate of 35% and 28%.Although these values are still not sufficient, the progressoffered byneccompared to the other mapping methodsis real.
B. Power laws and distances
Topological indicators are interesting tools to quantifythe similitude of a graph with the Internet topology.
TABLE II. C OLLECTED MAP PROPERTIES
Property Mercator map necmap DeviationRouters 55425 47055 -15.1%BGP routers 12.0% 59.8% +398.3%IP links 65237 119909 +83.8%Mean degree 2.35 5.09 +116.6%Mesh part 24.8% 85.7% +245.5%AS completeness 11.7% 35.0 % +199.1%BGP connection completeness 6.1% 27.8% +355.7%
TABLE III. M AIN INDICATOR VALUES
Indicator Mercator map necmapDegree CC 0.98 0.96Degree exponent -2.80 -2.36Rank CC 0.96 0.95Rank exponent -0.65 -0.73Tree size CC 0.98 0.97Tree size exponent -2.12 -3.92Tree rank CC 0.98 0.96Tree rank exponent -0.83 -0.35Number of shortest paths CC 0.67 0.95Number of shortest paths exponent -1.38 -1.51Pair rank CC 0.99 0.99Pair rank exponent -0.58 -0.58Mean distance 16.3 9.0Eccentricity 30.9 18.9Radius 23 15Diameter 44 28
These indicators are defined in our previous work [13].The table III contains the main indicator values for ourtwo router maps. In general, they are very similar (moreimportant variations for exponents are usual), except forthose concerning the number of shortest paths and thoseconcerning the distances.
The correlation coefficient (CC) of the number ofshortest paths (which illustrates the presence of the powerlaw number 5 described in [14]) is not verified with theMercator map (i.e. it is less than the threshold valueof 0.95). This property is linked to the redundant linkquantity and we can illustrate by this default the inac-curacy of Mercator. In opposition, thenec map verifiesthis crucial property thanks to the important numberof discovered links. The figure 5 shows the percentagedistribution of the pair of routers having between 1 to100 shortest paths. The dots must be aligned. We noticethe strong dissemination of Mercator. This is not the casefor nec. Concerning the distances (measured in numberof hops, the Mercator map has very different propertyvalues compared to the ones present in big router maps.In the opposite,necpossesses almost the same propertyvalues than those measured in the maps bigger than200k routers [15]. Missing links in the Mercator mapstretch the distances between the routers. This increases

the distance values by up to 50% as compared to theusual distance indicators. The figure 6 shows the routerpercentage distribution having a given mean distancewith the others (rounded to the tenth). Thenec dotsmake a clear and well centered around 9 hops normaldistribution while the Mercator dots are disseminatedaround the value of 17 hops.
Fig. 5. Number of shortest paths distribution.
Fig. 6. Mean distance distribution.
C. Overlay quality analysis
To verify the accuracy of our overlays, we study thedistribution of the AS sizes. The size of an AS is equal tothe number of routers inside this AS. We showed beforethat the completeness rate is equal to 12% for Mercatorand 35% fornec. This clearly shows that our router levelmap is far from having a total completeness. We lookin our collected maps for the presence of heavy tailed
distributions found in the Internet overlays created byTangmunarunkitet al. in [16]. An efficient method usedin [16] in order to achieve this consists in plotting thecumulative complementary distribution functionCCDFof the AS size on a log–log scale. Figures 7 and 8 showthe CCDF of the AS size distribution from Mercatorand nec and they clearly show the characteristics of aheavy tailed distribution. We can notice that the MercatorCCDF is slightly curved contrary to thenecCCDF whichis perfectly straight and shows a perfect correlation.However the heavy tailed distribution fromnecis brokenafter a size of 1000. This is probably a consequence ofthe missing data due to the short measurement period.This phenomena appears for Mercator too but it’s notclearly visible because of the curved line.
Fig. 7. Cum. comp. distr. of the AS size seen by Mercator.
Fig. 8. Cum. comp. distr. of the AS size seen by nec.
We trace on figures 9 and 10 the correlation betweenthe size and the degree of the 100 most important AS.

The correlation for these AS is strong and very similarto the one found in [16] especially in thenecmap wherethe linearity is better than in the Mercator map.
Fig. 9. Correlation between the AS sizes and their degrees seen byMercator.
Fig. 10. Correlation between the AS sizes and their degrees seenby nec.
Figures 11 and 12 show on a log–log scale the CCDFdistribution of the number of BGP routers per AS. Theseare very similar to the AS size and can be commentedin the same way. The higher number of BGP routers inthe necmap issue an almost perfect linearity, except forhigh abscissas. It’s clear with these measures that thesedistributions are strongly correlated with the AS size.
Thanks to our overlay creation method, we can studythe BGP connection sizes. The BGP connection size isequal to the number of IP links coming from any routerin an AS toward any router in a given AS different from
Fig. 11. Cum. comp. distr. of the BGP routers per AS seen byMercator.
Fig. 12. Cum. comp. distr. of the BGP routers per AS seen by nec.
the first one. In a similar way to the AS, only a partof all connections contains one or more IP links. Thisgives us a ratio of the number of filled connections (i.e.having a size≥ 1) vs the total number of connectionswhich equals 6% for Mercator and 28% fornecwhich islesser than the filling AS ratio. Once again this tends toshow that the Mercator map misses a significant amountof IP links. Figures 13 and 14 show on a log–log scalethe CCDF distribution of the BGP connection sizes andit is heavy tailed. To our knowledge, we are the first toshow these kind of results (although they were intuitivelypredictable).
We can conclude that despite our router–AS overlaysare incomplete, they contain a lot of heavy tailed distri-butions typically found at the macroscopic level of theInternet topology [16]. On this point, the Mercator and

Fig. 13. Cum. comp. distr. of the connection sizes seen by Mercator.
Fig. 14. Cum. comp. distr. of the connection sizes seen by nec.
necmaps show similar distributions, although those fromnecare more accurate with regard to the linear regressioncorrelation coefficients.
V. EXHAUSTIVE MAPPING
Our first mapping campaign was mainly aimed atinvestigating how fast and accurate we could map the In-ternet compared to other mapping efforts and especiallyMercator. However with respect to the number of routers(i.e. 47k) the collected map was rather small. For oursecond mapping campaign we wanted to achieve a muchmore complete map. We wanted to keep the benefits ofour previous mapping (i.e. discovery of traversal links)while collecting a much bigger map. We usednec thesame way as for the first campaign but we changedparameters and data sets. For the target addresses we tookrandom addresses created from every prefixes of aroute-
TABLE IV. C AMPAIGNS COMPARISON
Parameter First campaign Second campaign RatioEnd date 4/29/2003 9/15/2003 -Duration (days) 10 40 4.00Tracers 76 228 3.00Targets 6013 13828 2.30Routers 47055 75885 1.61Links 119909 357317 2.98Traces 456988 3152784 6.90Traffic (traces/day) 45698.8 78819.6 1.72Efficiency (routers/trace) 0.103 0.024 0.23Efficiency (links/trace) 0.262 0.113 0.43
viewsBGP dump with prefixes above /16 being reducedto /16. This yielded nearly 14k destination addresses. Weincorporated many new tracers innec(i.e. traceroute webservers). The campaign required 40 days to be carried outwhich is 4 times longer than the first campaign. The datacomparison of the two campaigns are shown in table IV.
If the mapping produced bynecwas linear and giventhe figures in table IV, we should have collected anearly 7 times bigger map than the first one. That isa 325k router map with nearly 827k links! However,the values in table IV clearly show that this was notthe case. The mapping efficiency was clearly lower inthe second campaign and this illustrates the limits ofthe ”more is better” approach. A partial explanation ofthis limitation is that big parts of the public Internet arenot mappable because of ICMP filtering (for securityconsiderations) and we won’t be able to map these areasno matter how many tracers and targets we use. Anotherexplanation is that our target address set may not beoptimum (i.e. we may not be looking ”everywhere” in theaddressing space). Thus we need to define our intendedtraces with great care in order to avoid redundant tracesthat reduce the overall efficiency ofnecand to increasethe amount of interesting traces. We should do our bestto follow these guidelines in order to keep collectingthe highest amount of information (i.e. new routers andlinks). We are currently studying this issue. Between thetwo campaigns, the amount of routers found per trace fellby 77% while the amount of links found per trace fellby 57%. Incremental traceroute (i.e. not starting at thesource but at the middle of the path) would greatly helpreducing useless traces but this would require a specialtraceroute version. That is we would have to deploy ourown tracers and we would loose the benefit of using allthe public traceroute servers as well as looking glasses.Of course we could associate both methods.
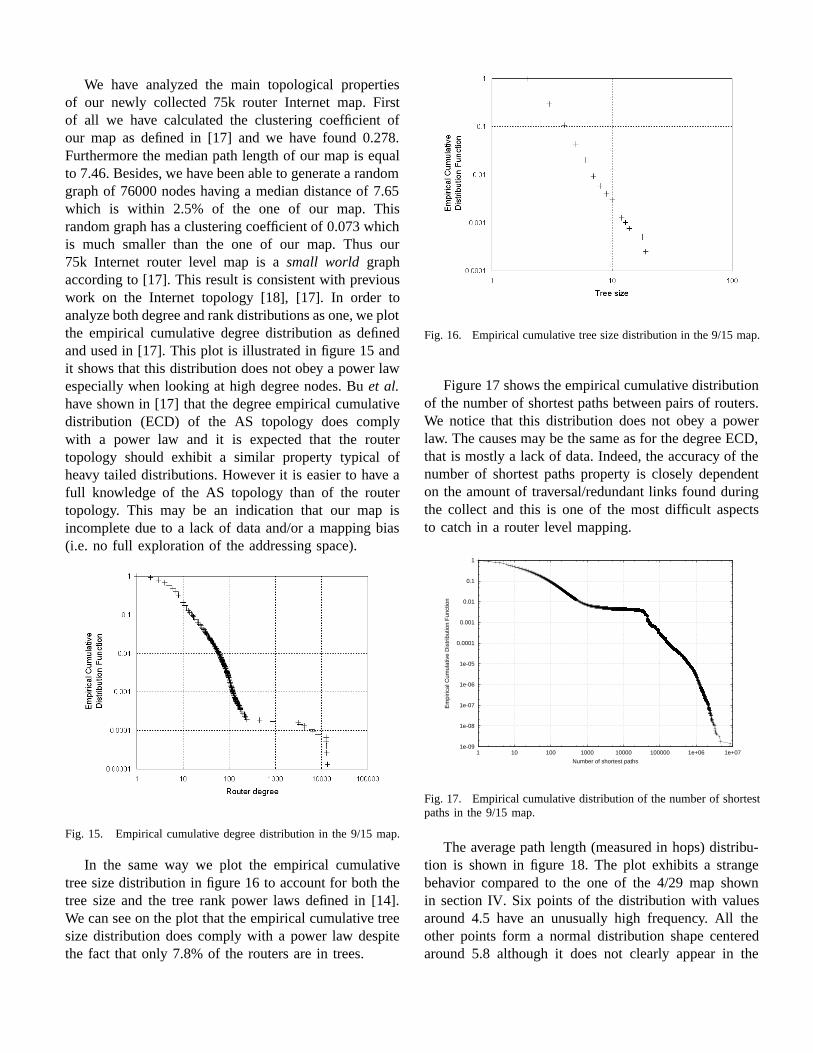
We have analyzed the main topological propertiesof our newly collected 75k router Internet map. Firstof all we have calculated the clustering coefficient ofour map as defined in [17] and we have found 0.278.Furthermore the median path length of our map is equalto 7.46. Besides, we have been able to generate a randomgraph of 76000 nodes having a median distance of 7.65which is within 2.5% of the one of our map. Thisrandom graph has a clustering coefficient of 0.073 whichis much smaller than the one of our map. Thus our75k Internet router level map is asmall world graphaccording to [17]. This result is consistent with previouswork on the Internet topology [18], [17]. In order toanalyze both degree and rank distributions as one, we plotthe empirical cumulative degree distribution as definedand used in [17]. This plot is illustrated in figure 15 andit shows that this distribution does not obey a power lawespecially when looking at high degree nodes. Buet al.have shown in [17] that the degree empirical cumulativedistribution (ECD) of the AS topology does complywith a power law and it is expected that the routertopology should exhibit a similar property typical ofheavy tailed distributions. However it is easier to have afull knowledge of the AS topology than of the routertopology. This may be an indication that our map isincomplete due to a lack of data and/or a mapping bias(i.e. no full exploration of the addressing space).
Fig. 15. Empirical cumulative degree distribution in the 9/15 map.
In the same way we plot the empirical cumulativetree size distribution in figure 16 to account for both thetree size and the tree rank power laws defined in [14].We can see on the plot that the empirical cumulative treesize distribution does comply with a power law despitethe fact that only 7.8% of the routers are in trees.
Fig. 16. Empirical cumulative tree size distribution in the 9/15 map.
Figure 17 shows the empirical cumulative distributionof the number of shortest paths between pairs of routers.We notice that this distribution does not obey a powerlaw. The causes may be the same as for the degree ECD,that is mostly a lack of data. Indeed, the accuracy of thenumber of shortest paths property is closely dependenton the amount of traversal/redundant links found duringthe collect and this is one of the most difficult aspectsto catch in a router level mapping.
1e-09
1e-08
1e-07
1e-06
1e-05
0.0001
0.001
0.01
0.1
1
1 10 100 1000 10000 100000 1e+06 1e+07
Em
piric
al C
umul
ativ
e D
istr
ibut
ion
Fun
ctio
n
Number of shortest paths
Fig. 17. Empirical cumulative distribution of the number of shortestpaths in the 9/15 map.
The average path length (measured in hops) distribu-tion is shown in figure 18. The plot exhibits a strangebehavior compared to the one of the 4/29 map shownin section IV. Six points of the distribution with valuesaround 4.5 have an unusually high frequency. All theother points form a normal distribution shape centeredaround 5.8 although it does not clearly appear in the
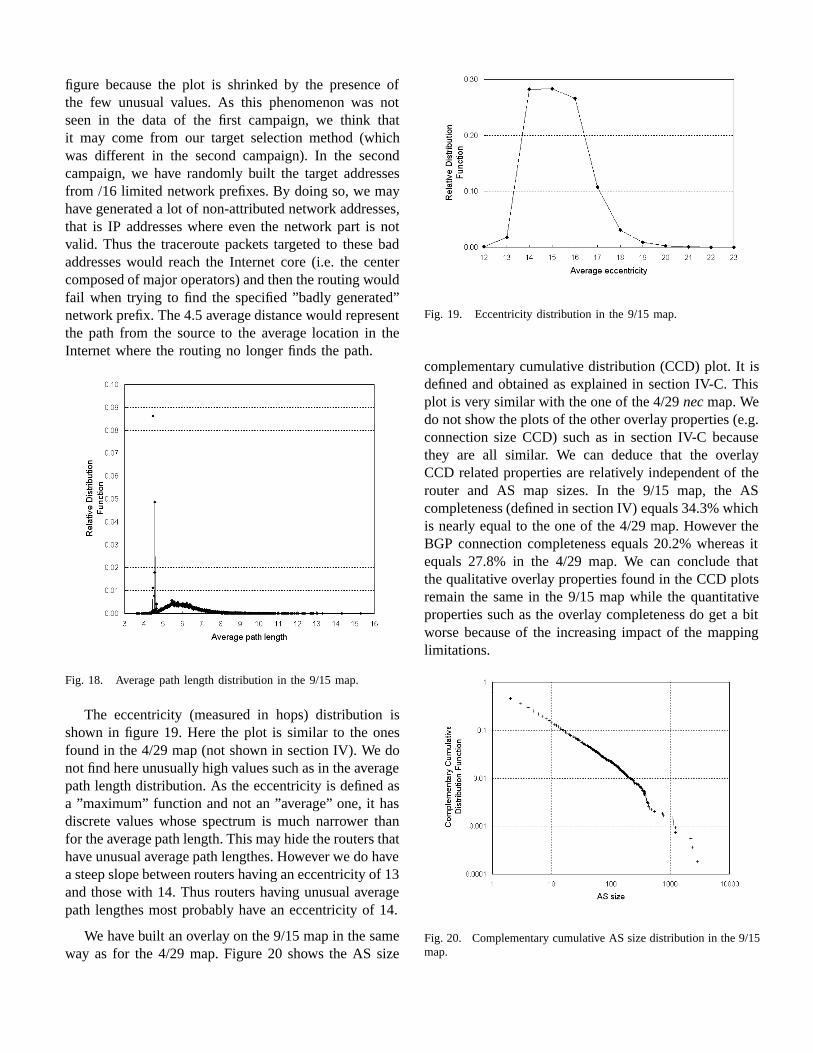
figure because the plot is shrinked by the presence ofthe few unusual values. As this phenomenon was notseen in the data of the first campaign, we think thatit may come from our target selection method (whichwas different in the second campaign). In the secondcampaign, we have randomly built the target addressesfrom /16 limited network prefixes. By doing so, we mayhave generated a lot of non-attributed network addresses,that is IP addresses where even the network part is notvalid. Thus the traceroute packets targeted to these badaddresses would reach the Internet core (i.e. the centercomposed of major operators) and then the routing wouldfail when trying to find the specified ”badly generated”network prefix. The 4.5 average distance would representthe path from the source to the average location in theInternet where the routing no longer finds the path.
Fig. 18. Average path length distribution in the 9/15 map.
The eccentricity (measured in hops) distribution isshown in figure 19. Here the plot is similar to the onesfound in the 4/29 map (not shown in section IV). We donot find here unusually high values such as in the averagepath length distribution. As the eccentricity is defined asa ”maximum” function and not an ”average” one, it hasdiscrete values whose spectrum is much narrower thanfor the average path length. This may hide the routers thathave unusual average path lengthes. However we do havea steep slope between routers having an eccentricity of 13and those with 14. Thus routers having unusual averagepath lengthes most probably have an eccentricity of 14.
We have built an overlay on the 9/15 map in the sameway as for the 4/29 map. Figure 20 shows the AS size
Fig. 19. Eccentricity distribution in the 9/15 map.
complementary cumulative distribution (CCD) plot. It isdefined and obtained as explained in section IV-C. Thisplot is very similar with the one of the 4/29necmap. Wedo not show the plots of the other overlay properties (e.g.connection size CCD) such as in section IV-C becausethey are all similar. We can deduce that the overlayCCD related properties are relatively independent of therouter and AS map sizes. In the 9/15 map, the AScompleteness (defined in section IV) equals 34.3% whichis nearly equal to the one of the 4/29 map. However theBGP connection completeness equals 20.2% whereas itequals 27.8% in the 4/29 map. We can conclude thatthe qualitative overlay properties found in the CCD plotsremain the same in the 9/15 map while the quantitativeproperties such as the overlay completeness do get a bitworse because of the increasing impact of the mappinglimitations.
Fig. 20. Complementary cumulative AS size distribution in the 9/15map.

We have seen in this section that extending theamount of mapping as much as possible is quite difficultto carry out efficiently with just the use of the tracerouteservers. It is hard to substantially increase the number ofrouters and links found, and some of the distribution plots(e.g. degree and average path length) do not match theexpected behavior. This leads us to think that the map-ping remains incomplete. We need to add other mappingtechniques tonec in order to overcome the limitationsthat appear when we try to make an exhaustive mappingof the public Internet.
VI. PATH LENGTH INFLATION
With our second bigger map collected in September,we have studied the inflation of the Internet paths. Anytraceroute is defining a path really taken by a packetfrom the traceroute server (source) to the target address(destination). After having created the map, we cancalculate the all-pairs shortest paths by using the Dijkstraalgorithm for every router of the map. We obtain amongall the shortest paths those between the sources anddestinations of our traceroute paths. We measure thelength of the traceroutes and the shortest paths by usingthe hop count metric. The path inflation is the traceroutelength of a source-destination pair divided by the shortestpath length of the same pair. The division result is areal number equal or greater than 1. We call it thepath length ratioor the path inflation. With the tracescollected for the built of the September map, we havebeen able to calculate the ratio of 2196960 paths (i.e.source-destination pairs). The distribution of the pathinflation of the 2M pairs are plotted in figure 21.
Fig. 21. Path inflation with different granularities.
The ratio ranges from 1 to 10. We chose 10 as an
arbitrary upper limit. We had a few results above 10that we consider abnormal. This can be readily explainedby the fact that the traceroute paths come from the rawdata while the shortest paths come from the router mapobtained after desaliasing the interfaces and making themap connected. Thus some IP interfaces and links havedisappeared from the map and they can be the cause ofstrange paths leading to high path inflation. To bettervisualize the distribution of the path length ratios, wehave rounded the values to 1/10th and to unity. Figure 21show all distributions on a y-log plot. Because pathlengthes are natural numbers, the path length ratios havenot a smooth distribution when they are not rounded tounity (i.e. sawtooth plot). This is an expectable behavior.We can see that the distributions are spread out mainlybetween 1 and 5 but we are far from the ideal casewhere most of the paths would have a ratio of 1. Theseresults confirm that path length inflation is definitely nota marginal phenomenon but is globally impacting most ofthe paths with a high effect. The causes can be multifold:
• Mostly this is due to the routing policy in theInternet especially in inter-domain. Links androutes can have administratively attributed costs(especially in inter-domain) and thus they maynot be optimum. Furthermore in inter-domainrouting, it is by design impossible to determinethe shortestrouter-levelpath from any node toany other one located in a different AS becauseonly a subset of the topology information isadvertised by intra-domain protocols to the inter-domain one (i.e. BGP).
• Many paths are aborted in the traces (i.e. theystop before reaching the desired destination) be-cause of ICMP filtering. We do use the realdestination (i.e. last responding router) and notthe desired one to determine ratios but still ifwe had the full paths maybe the ratios would belower especially if there is no path overhead atthe last hops (the ones we do not have).
• It can also be caused by our selection of des-tinations as traceroute targets. We may choosepaths that do not reflect typical source-destinationpairs (i.e. that have uncommon sources and/ordestinations).
Figure 22 shows the cumulative distribution of thepath length ratios for an easier classification of the pathshaving a ratio above a given threshold. The most inter-esting facts of these data is that only 2.72% of the paths
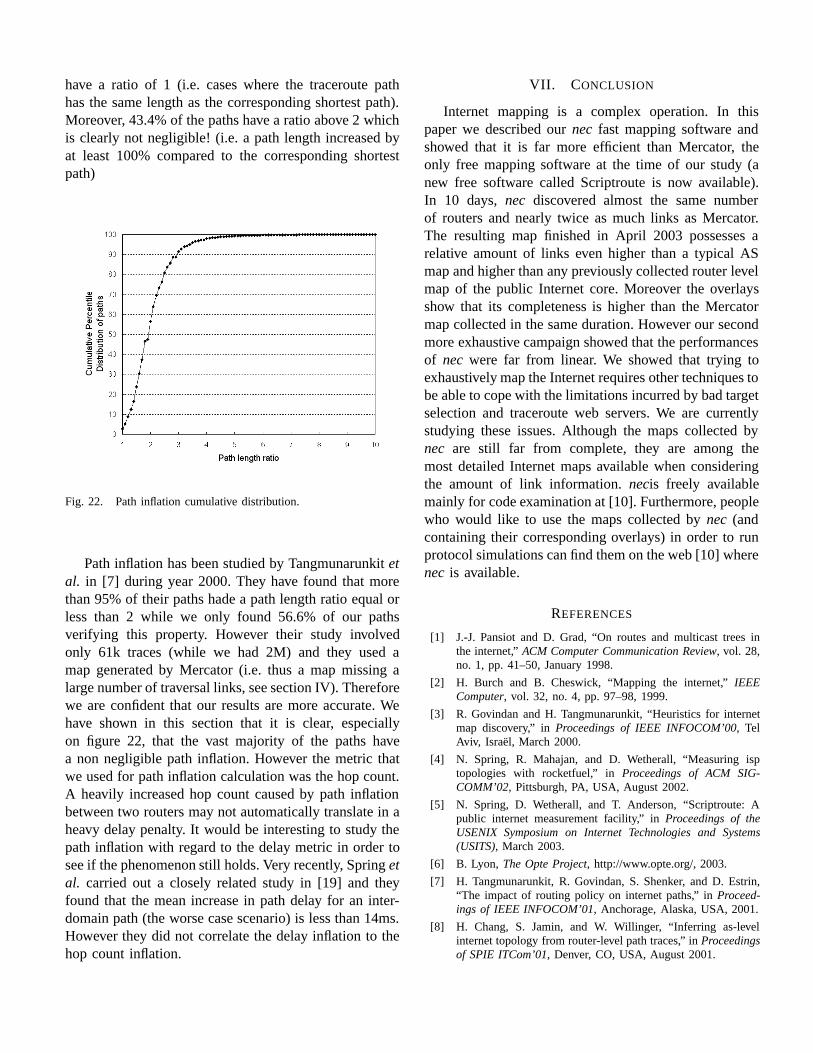
have a ratio of 1 (i.e. cases where the traceroute pathhas the same length as the corresponding shortest path).Moreover, 43.4% of the paths have a ratio above 2 whichis clearly not negligible! (i.e. a path length increased byat least 100% compared to the corresponding shortestpath)
Fig. 22. Path inflation cumulative distribution.
Path inflation has been studied by Tangmunarunkitetal. in [7] during year 2000. They have found that morethan 95% of their paths hade a path length ratio equal orless than 2 while we only found 56.6% of our pathsverifying this property. However their study involvedonly 61k traces (while we had 2M) and they used amap generated by Mercator (i.e. thus a map missing alarge number of traversal links, see section IV). Thereforewe are confident that our results are more accurate. Wehave shown in this section that it is clear, especiallyon figure 22, that the vast majority of the paths havea non negligible path inflation. However the metric thatwe used for path inflation calculation was the hop count.A heavily increased hop count caused by path inflationbetween two routers may not automatically translate in aheavy delay penalty. It would be interesting to study thepath inflation with regard to the delay metric in order tosee if the phenomenon still holds. Very recently, Springetal. carried out a closely related study in [19] and theyfound that the mean increase in path delay for an inter-domain path (the worse case scenario) is less than 14ms.However they did not correlate the delay inflation to thehop count inflation.
VII. C ONCLUSION
Internet mapping is a complex operation. In thispaper we described ournec fast mapping software andshowed that it is far more efficient than Mercator, theonly free mapping software at the time of our study (anew free software called Scriptroute is now available).In 10 days,nec discovered almost the same numberof routers and nearly twice as much links as Mercator.The resulting map finished in April 2003 possesses arelative amount of links even higher than a typical ASmap and higher than any previously collected router levelmap of the public Internet core. Moreover the overlaysshow that its completeness is higher than the Mercatormap collected in the same duration. However our secondmore exhaustive campaign showed that the performancesof nec were far from linear. We showed that trying toexhaustively map the Internet requires other techniques tobe able to cope with the limitations incurred by bad targetselection and traceroute web servers. We are currentlystudying these issues. Although the maps collected bynec are still far from complete, they are among themost detailed Internet maps available when consideringthe amount of link information.necis freely availablemainly for code examination at [10]. Furthermore, peoplewho would like to use the maps collected bynec (andcontaining their corresponding overlays) in order to runprotocol simulations can find them on the web [10] wherenec is available.
REFERENCES
[1] J.-J. Pansiot and D. Grad, “On routes and multicast trees inthe internet,”ACM Computer Communication Review, vol. 28,no. 1, pp. 41–50, January 1998.
[2] H. Burch and B. Cheswick, “Mapping the internet,”IEEEComputer, vol. 32, no. 4, pp. 97–98, 1999.
[3] R. Govindan and H. Tangmunarunkit, “Heuristics for internetmap discovery,” inProceedings of IEEE INFOCOM’00, TelAviv, Israel, March 2000.
[4] N. Spring, R. Mahajan, and D. Wetherall, “Measuring isptopologies with rocketfuel,” inProceedings of ACM SIG-COMM’02, Pittsburgh, PA, USA, August 2002.
[5] N. Spring, D. Wetherall, and T. Anderson, “Scriptroute: Apublic internet measurement facility,” inProceedings of theUSENIX Symposium on Internet Technologies and Systems(USITS), March 2003.
[6] B. Lyon, The Opte Project, http://www.opte.org/, 2003.
[7] H. Tangmunarunkit, R. Govindan, S. Shenker, and D. Estrin,“The impact of routing policy on internet paths,” inProceed-ings of IEEE INFOCOM’01, Anchorage, Alaska, USA, 2001.
[8] H. Chang, S. Jamin, and W. Willinger, “Inferring as-levelinternet topology from router-level path traces,” inProceedingsof SPIE ITCom’01, Denver, CO, USA, August 2001.

[9] D. Magoni, “Tearing down the internet,”IEEE Journal onSelected Areas in Communications, vol. 21, no. 6, pp. 949–960, August 2003.
[10] ——, network cartographer (nec), Universite Louis Pasteur,http://www-r2.u-strasbg.fr/˜magoni/nec/.
[11] ——, network manipulator (nem), Universite Louis Pasteur,http://www-r2.u-strasbg.fr/nem/.
[12] P. Barford, A. Bestavros, J. Byers, and M. Crovella, “Onthe marginal utility of network topology measurements,” inProceedings of ACM SIGCOMM Internet Measurement Work-shop’01, November 2001, pp. 5–17.
[13] D. Magoni and J.-J. Pansiot, “Evaluation of internet topologygenerators by power law and distance indicators,” inProceed-ings of the 10th IEEE International Conference On Networks,Singapore, August 2002, pp. 401–406.
[14] ——, “Analysis of the autonomous system network topology,”ACM Computer Communication Review, vol. 31, no. 3, pp.26–37, July 2001.
[15] ——, “Internet topology modeler based on map sampling,” inProceedings of the 7th IEEE Symposium on Computers andCommunications, Giardini Naxos, Sicily, Italy, July 2002, pp.1021–1027.
[16] H. Tangmunarunkit, J. Doyle, R. Govindan, S. Jamin,S. Shenker, and W. Willinger, “Does as size determine degree inas topology?”ACM Computer Communication Review, vol. 31,2001.
[17] T. Bu and D. Towsley, “On distinguishing between internetpower law topology generators,” inProceedings of IEEE IN-FOCOM’02, New York City, NY, USA, June 2002.
[18] R. Albert and A.-L. Barabasi, “Topology of evolving networks:local events and universality,”Physical Review Letters, no. 85,p. 5234, 2000.
[19] N. Spring, R. Mahajan, and T. Anderson, “Quantifying thecauses of path inflation,” inProceedings of the ACM SIG-COMM’03, August 2003.