Bulk density of wet and dry wheat straw and switchgrass particles
Standards in Genomic Sciences (2013) 7:382-398 DOI:10.4056/sigs.3377516
The Genomic Standards Consortium
Metagenomes of tropical soil-derived anaerobic switchgrass-adapted consortia with and without iron
Kristen M. DeAngelis1,2*, Patrik D’Haeseleer2,3, Dylan Chivian4,5, Blake Simmons2,6, Adam P. Arkin4,5, Konstantinos Mavromatis7, Stephanie Malfatti7, Susannah Tringe7, Terry C. Hazen2,8,9,10
1Microbiology Department, University of Massachusetts, Amherst MA USA 2Microbial Communities Group, Deconstruction Division, Joint BioEnergy Institute, Em-
eryville CA USA 3Lawrence Livermore National Laboratory, Livermore CA USA 4Physical Biosciences Division, Lawrence Berkeley National Laboratory, Berkeley CA USA 5Technologies Division, Joint BioEnergy Institute, Emeryville CA USA 6Sandia National Lab, Livermore CA USA 7Department of Energy Joint Genome Institute, Walnut Creek CA USA 8Ecology Department, Earth Sciences Division, Lawrence Berkeley National Laboratory,
Berkeley, California, USA 9Department of Civil and Environmental Engineering, University of Tennessee, Knoxville,
Tennessee, USA 10Biosciences Division, Oak Ridge National Laboratory, Oak Ridge, Tennessee, USA
*Corresponding author: Kristen M. DeAngelis, [email protected]
Keywords: Anaerobic decomposition, switchgrass, Panicum virgatum, tropical forest soil, feedstock-adapted consortia, bacteria, archaea, metagenomics
Tropical forest soils decompose litter rapidly with frequent episodes of anoxia, making it likely that bacteria using alternate terminal electron acceptors (TEAs) such as iron play a large role in supporting decomposition under these conditions. The prevalence of many types of metabolism in litter deconstruction makes these soils useful templates for improv-ing biofuel production. To investigate how iron availability affects decomposition, we cul-tivated feedstock-adapted consortia (FACs) derived from iron-rich tropical forest soils ac-customed to experiencing frequent episodes of anaerobic conditions and frequently fluctu-ating redox. One consortium was propagated under fermenting conditions, with switchgrass as the sole carbon source in minimal media (SG only FACs), and the other con-sortium was treated the same way but received poorly crystalline iron as an additional ter-minal electron acceptor (SG + Fe FACs). We sequenced the metagenomes of both consortia to a depth of about 150 Mb each, resulting in a coverage of 26× for the more diverse SG + Fe FACs, and 81× for the relatively less diverse SG only FACs. Both consortia were able to quickly grow on switchgrass, and the iron-amended consortium exhibited significantly higher microbial diversity than the unamended consortium. We found evidence of higher stress in the unamended FACs and increased sugar transport and utilization in the iron-amended FACs. This work provides metagenomic evidence that supplementation of alter-native TEAs may improve feedstock deconstruction in biofuel production.
Abbreviations: EMBL: European Molecular Biology Laboratory NCBI: National Center for Biotechnology Information (Bethesda, MD, USA) RDP: Ribosomal Database Project (East Lan-sing, MI, USA)

DeAngelis et al.
http://standardsingenomics.org 383
Introduction Development of renewable, sustainable biofuels from plant feedstock material has emerged as a key goal of the US Department of Energy. The use of lignocellulose as a renewable energy source has many advantages, above all that lignocellulose is the most abundant biopolymer on earth, with its production independent of food agriculture [1]. The deconstruction of plant biomass is a key first step in the conversion of plant sugars to biofuels, though this step has posed a great challenge to making biofuels economically viable. The major hurdles involve both lignin occlusion of cellulose and lignin derivatives that inhibit lignocellulose deconstruction and fuel synthesis [1]. Lignin is also a potentially valuable waste stream that is current-ly burned to produce energy as heat [2]. Part of the impact of this work is the discovery of enzymes and pathways in natural ecosystems that function to liberate lignin from cellulose. These discoveries promise to both provide insight into the natural processes of plant lignin decomposition, as well as improve efficiency of biofuels production.
The microbial communities present in the wet tropical soils of Puerto Rican rain forests are prom-ising in providing pathways to overcome the chal-lenges of lignocellulose deconstruction. These trop-ical soil communities are responsible for near com-plete decomposition of leaf plant litter in as little as eighteen months [3], which is interesting consider-ing that the soils experience strong fluctuations in redox potential, switching from a completely oxic state to an anoxic state on a daily or weekly basis [4,5]. We have also observed considerable microbi-al activity and plant litter decomposition under an-aerobic conditions in the lab and field [6-9]. This is at odds with the current paradigm of the “enzyme latch hypothesis,” which posits that oxidative en-zyme activities are the rate-limiting steps of plant litter decomposition [10-12]. Understanding the enzymes employed by native tropical soil microbes to deconstruct lignocellulose has the potential to illuminate the mechanisms of fast anaerobic ligno-cellulose decomposition.
Classification and features Two metagenomes were generated from feedstock-adapted consortia, originally derived from tropical forest soil communities [Table 1]. Soil samples were collected from a wet subtropical lower montane forest in the Luquillo Experimental For-est, which is part of the NSF-sponsored Long-Term
Ecological Research program in Puerto Rico (18°18′N, 65°50′W). The fieldwork was conducted and samples collected and transported under USDA permit number P526P-08-00634. Soils are acidic (pH 5.5), clayey ultisols with high iron and alumi-num content and characterized by a fluctuating re-dox that ranges from oxic to anoxic on a timescale of weeks [4,5,15]. Soils were collected from the Bisley watershed, 250 meters above sea level (masl) from the 0–10 cm depth, using a 2.5-cm di-ameter soil corer. Cores were stored intact in Ziploc bags at ambient temperature and immediately transported to the lab, where they were used for growth inoculum.
For adaptation to growth on feed-stocks as sole carbon source, tropical forest soils were homoge-nized then used to inoculate basal salts minimal medium (BMM) [16] containing trace minerals [17,18], vitamins [19], and buffered to pH 5.5 to match the measured soil pH using MES. Soils were added at a rate of 0.5 g (wet weight) per 200 mL BMM, and the resulting mixture was incubated an-aerobically at ambient temperatures for 8 weeks with 10 g L-1 dried, ground switchgrass as the sole carbon source. Samples of switchgrass (MPV 2 cul-tivar) were kindly provided by the laboratory of Dr. Ken Vogel (USDA, ARS, Lincoln, NE). Soluble iron was added to a final concentration of 5 mM. A stock solution of soluble iron was obtained by adding ferric chloride hexahydrate [Fe(III)] to a solution of nitrilotriacetic acid disodium salt and sodium bi-carbonate. Dinitrogen gas was bubbled through media to remove any dissolved O2, and containers were quickly sealed with airtight stoppers to main-tain anaerobic conditions. Containers were auto-claved for 20 min at 121°C. Anaerobic switchgrass-adapted consortia were enriched from tropical for-est soils by passaging the communities two times for ten weeks each, with switchgrass as the sole carbon source, under anaerobic conditions with and without supplemental iron.
Metagenome sequencing information Metagenome project history These metagenomes were selected based on the ability of the consortia to mineralize switchgrass as the sole C source anaerobically, and represented two distinct metabolisms for deconstructing switchgrass that are both likely to be prevalent un-der natural field conditions. Sequence analysis of the small subunit ribosomal RNA genes revealed

Switchgrass-adapted consortia
384 Standards in Genomic Sciences
that growth on switchgrass as the sole carbon source resulted in a richness of 84 taxa, while in-clusion of iron in the consortia growth media re-
sulted in a richness of 336 taxa; this was in compar-ison to the richness of the original soil sample which was 1,339 taxa [20] based on 97% identity.
Table 1. Classification and general features of the four metagenome data sets according to the Minimum Information about Genomes and Metagenomes (MIMS) standards [13]. MIMS ID Property Term Evidence codea
Current classification
Metagenome ecological metagenome terrestrial metagenome
TAS [5]
Carbon source Switchgrass IDA
Energy source Switchgrass IDA
Terminal electron receptor Iron reduction or fermentation TAS [8]
MIGS-6 Habitat Consortia (mixed community) derived from wet tropical forest soils
TAS [8]
MIGS-14 Pathogenicity none NAS MIGS-4 Geographic location Wet tropical forest, Puerto Rico, USA MIGS-5 Sample collection time April, 2009 MIGS-4.1 Latitude 18°18N MIGS-4.2 Longitude 65°50W MIGS-4.3 Depth 0-10 cm TAS [8] MIGS-4.4 Altitude 250 masl TAS [8]
aEvidence codes - IDA: Inferred from Direct Assay; TAS: Traceable Author Statement (i.e., a direct report ex-ists in the literature); NAS: Non-traceable Author Statement (i.e., not directly observed for the living, isolat-ed sample, but based on a generally accepted property for the species, or anecdotal evidence). These evi-dence codes are from the Gene Ontology project [14].
Growth conditions and DNA isolation Consortia were grown for metagenomic DNA se-quencing in the same manner as described for the cultivation of communities, as above. DNA was extracted using a CTAB extraction method, which is the standard operating procedure recommend-ed by the Joint Genome Institute. Cells from the consortia were pelleted by centrifugation and re-constituted in TE to an equivalent OD (600 nm) of about 1.0 using direct counts. Lysozyme was add-ed (final concentration 1.3 mg per ml) and incu-bated for 5 minutes at room temperature, then 10% SDS (33 µl per ml) and proteinase K (final concentration 5.5µl per ml) was added and incu-bated at 37oC for 1 hour. Sodium chloride (5M stock added to final concentration 0.22 M) was added, then the CTAB/NaCl buffer was added both at 0.075 ml per ml starting volume. This mix was incubated at 65oC for 10 minutes. Chloro-form:isoamyl alcohol (24:1) was added at 0.2 vol, then centrifuged at 14,000 x g for 10 minutes at room temperature. DNA in the aqueous phase was
extracted again with phenol:chloroform:isoamyl alcohol (25:24:1), subjected to an ethanol precipi-tation, and the DNA pellet finally reconstituted at 37oC for 20 minutes in TE plus RNAse. The quanti-ty and quality of the extraction were checked by gel electrophoresis using JGI standards.
Metagenome sequencing and assembly The metagenomes were sequenced using the Illumina GaII sequencing platform. Two types of short-insert (300 bp) paired-end libraries were generated, with and without PCR amplification after adapter ligation. All general aspects of the library construction process can be accessed via the DOE Joint Genome Institute website [21]. 16.2 Gb of Illumina GaII sequence data were generated for the PR soil-derived Feedstock-adapted consor-tia SG + Fe sample and 33.9 Gb Illumina GaII se-quence data were generated for the PR soil-derived Feedstock-adapted consortia SG only sample. Raw Illumina metagenomic reads were

DeAngelis et al.
http://standardsingenomics.org 385
trimmed using a minimum quality score cutoff of 10. Trimmed, paired-end Illumina reads were as-sembled using SOAPdenovo v1.05 [22] with a range of Kmers (85, 89, 93, 97, 101, 105). Default settings for all SOAPdenovo assemblies were used (flags: –d 1 and –R). Contigs generated by each assembly (6 total contig sets) were sorted into two pools based on length. Contigs smaller than 1,800 bp were assembled using Newbler (Life Technologies, Carlsbad, CA) in an attempt to gen-erate larger contigs (flags: -tr, -rip, -mi 98, -ml 80).
All assembled contigs larger than 1,800 bp, as well as the contigs generated from the final Newbler run, were combined using minimus 2 (flags: -D MINID=98 -D OVERLAP=80)(AMOS [23]). The as-sembly was a result of two rounds of sequencing in this manner, with and without amplification. Table 2 presents the project information and its association with MIGS version 2.0 compliance [13]. These sequences are currently available to the public at IMG/M.
Table 2. Project information MIGS ID Property Term
MIGS-31 Finishing quality Standard Draft
MIGS-28 Libraries used Illumina standard paired-end library (0.3 kb insert size) MIGS-29 Sequencing platforms Illumina GaIIX
MIGS-31.2 Fold coverage 26.1466 × (PR soil-derived FAC SG + Fe) 81.1761 × (PR soil-derived FAC SG only)
MIGS-30 Assemblers SOAPdenovo v1.05, Newbler v2.5, minimus2 MIGS-32 Gene calling method Glimmer GOLD ID Gm00278 IMG Project ID 18182 Project relevance biotechnological
Metagenome annotation Prior to annotation, all sequences were trimmed to remove low quality regions falling below a mini-mum quality of Q13, and stretches of undetermined sequences at the ends of contigs are removed. Low complexity regions are masked using the dust algo-rithm from the NCBI toolkit and very similar se-quences (similarity > 95%) with identical 5’ pentanucleotides are replaced by one representa-tive, typically the longest, using uclust [24]. The gene prediction pipeline included the detection of non-coding RNA genes (tRNA, and rRNA) and CRISPRs, followed by prediction of protein coding genes. Identification of tRNAs was performed using tRNAScan-SE-1.23 [25]. In case of conflicting pre-dictions, the best scoring predictions were selected. Since the program cannot detect fragmented tRNAs at the end of the sequences, we also checked the last 70 nt of the sequences by comparing these to a database of nt sequences of tRNAs identified in the isolate genomes using blastn [26]. Hits with high similarity were kept; all other parameters are set to default values. Ribosomal RNA genes (tsu, ssu, lsu) were predicted using the hmmsearch [27] with in-ternally developed models for the three types of RNAs for the domains of life. Identification of
CRISPR elements was performed using the pro-grams CRT [28] and PILERCR [29]. The predictions from both programs were concatenated and, in case of overlapping predictions, the shorter predic-tion was removed. Identification of protein-coding genes was per-formed using four different gene calling tools, GeneMark (v.2.6r) [29] or Metagene (v. Aug08) [30], prodigal [31] and FragGenescan [32] all of which are ab initio gene prediction programs. We typically followed a majority rule based decision scheme to select the gene calls. When there was a tie, we selected genes based on an order of gene callers determined by runs on simulated metagenomic datasets (Genemark > Prodigal > Metagene > FragGeneScan). At the last step, CDS and other feature predictions were consolidated. The regions identified previously as RNA genes and CRISPRs were preferred over protein-coding genes. Functional prediction followed and involved com-parison of predicted protein sequences to the pub-lic IMG database using the usearch algorithm [24], the COG db using the NCBI developed PSSMs [33], the pfam db [34] using hmmsearch. Assignment to KEGG Ortholog protein families was performed us-ing the algorithm described in [35].

Switchgrass-adapted consortia
386 Standards in Genomic Sciences
Metagenome properties The metagenomes were sequenced at a total size of 152,660,070 bp for the SG only FACS and 154,120,208 bp for the SG + Fe FACS. The GC con-tent of these metagenomes was 41.18% for SG only and 46.02% for SG + Fe FACs. This sequencing in-cluded 197,271 and 193,491 predicted genes with 98.85% and 99.62% predicted protein-coding genes for SG only and SG + Fe FACs, respectively. A total of 127,406 and 129,389 of the protein coding genes, or 64.58% and 66.87% of the total predicted protein-coding genes, were assigned to a putative function with the remaining annotated as hypothet-ical proteins for SG only and SG + Fe FACs, respec-tively. The iron-amended consortia (SG + Fe) was signifi-cantly enriched in protein-coding genes with puta-tive function for 11 of the 25 general COG catego-ries that genes were assigned. The largest differ-ences were observed for genes associated with amino acid transport and metabolism (E), carbo-hydrate transport and metabolism (G), and second-ary metabolites biosynthesis, transport, and catab-olism (Q), which were all enriched in the iron-amended compared to the unamended FACs. Genes assigned to translation, ribosomal structure and biogenesis (J) and transcription (K) were signifi-cantly depleted in the iron-amended compared to the unamended consortia. The properties and the statistics of the genome are summarized in Table 3, Table 4 and Table 5.
Taxonomic diversity The taxonomic diversity and phylogenetic struc-ture of the two metagenomes was determined based on all genes, classifying at a minimum 60% identity to members of the listed phyla. The phy-logeny reported is the one in use in IMG/M [36], which uses the phylogeny described as part of the genomic encyclopedia of Bacteria and Archaea (GEBA) project [37]. Both consortia were dominated by representative genes belonging to the Firmicutes, which accounted for 20 and 23% of the counts in the SG only and SG + Fe FACs, respectively. In terms of relative abun-dance, the next most dominant genes belonged to the phylum Bacteroidetes, accounting for 7% of the counts, and Proteobacteria, accounting for 6% of the counts. Members of the archaeal phylum Euryarchaeota accounted for 2.6% and 1.34% of the SG only and SG + Fe FACs gene counts, respec-tively. There were very few documented members
of the Eukaryota, accounting for less than one-tenth of one percent. Plasmid population-associated genes were dominated by those associated with Firmicutes and Proteobacteria, and these were out-numbered by double-stranded DNA viruses by about two to one. Differences were observed in abundance of genes in many phyla, which was expected given the much higher richness observed by pyrosequencing the small subunit ribosomal RNA genes in consortia amended with iron as terminal electron acceptor. To visualize which phyla were over- or under-represented in gene counts for each metagenome, we chose to present the phyla that were at least two-fold (double) differentially represented in the iron-amended consortia compared to the una-mended consortia. Fold-differences were calculated by dividing the counts detected in SG+Fe FACs di-vided by counts detected in SG only FACs, and the log2 of fold differences are presented in Figure 1. Phyla that were over-represented in the iron-amended FACs included Acidobacteria (5.17-fold enriched), Actinobacteria (2.5-fold), Elusimicrobia (2-fold), and Chlamydiae (2-fold), which are all Bac-teria; also over-represented in the SG + Fe were Firmicutes plasmids (2-fold). Of these, only the Acidobacteria and Actinobacteria were abundant (>2% relative abundance), with the rest detected in the tens of counts per metagenome. Phyla that were under-represented in the iron-amended FACs compared to the SG only FACs included Basidiomycota (domain Eukaryota, 0.625-fold), Euryarchaeota (domain Archaea, 0.52-fold), Chordata (domain Eukaryota, 0.5-fold), Proteobacteria Plasmids (0.5-fold), and Crenarchaeota (domain Archaea, 0.17-fold) [Table 6]. While gene counts of representative phyla suggest phylogenetic differences, these data are certainly biased towards phyla that have more sequenced representatives. Additionally, phyla that are includ-ed in coverage of popular universal small subunit rRNA primers are also may be over-represented in these analyses because of their over-representation in the databases. While the relative abundances of between-phyla comparisons may be questionable based on differential representation in the data-base, the relative abundances of taxa within a phyla is reflective of the distinct metabolic conditions af-forded by growth of consortia with lignocellulose as sole C source either with or without iron as an additional terminal electron acceptor.

DeAngelis et al.
http://standardsingenomics.org 387
Table 3. Summary of metagenomes
Metagenome Size (Mb) # scaffolds GOLD ID GOLD sample idID
SG only 152.66 57,147 Gm00278 Gs0000888
SG + Fe 154.12 65,160 Gm00278 Gs0000889
Table 4. Nucleotide content and gene count levels of the metagenomes SG only Metagenome SG + Fe Metagenome Number % of Total Number % of Total DNA, total number of bases 152,660,070 100.00% 154,120,208 100.00% DNA coding number of bases 130,438,005 85.44% 136,080,382 88.29% DNA G+C number of bases 62,858,797 41.18%* 70,930,796 46.02%* DNA scaffolds 57,147 100.00% 65,160 100.00% CRISPR Count 51 4 Genes total number 197,271 100.00% 193,491 100.00% Protein coding genes 195,006 98.85% 192,751 99.62% RNA genes 2,265 1.15% 740 0.38% rRNA genes 294 0.15% 16 0.01% 5S rRNA 106 0.05% 9 0.00% 16S rRNA 75 0.04% 3 0.00% 18S rRNA 1 0.00% 4 0.00% tRNA genes 1,971 1.00% 724 0.37% Protein coding genes with function prediction 127,406 64.58% 129,389 66.87% without function prediction 67,600 34.27% 63,362 32.75% not connected to SwissProt Protein Product 195,006 98.85% 192,751 99.62% Protein coding genes with enzymes 33,383 16.92% 30,632 15.83% w/o enzymes but with candidate KO based enzymes 26,793 13.58% 32,919 17.01% Protein coding genes connected to KEGG pathways3 37,533 19.03% 34,348 17.75% not connected to KEGG pathways 157,473 79.83% 15,8403 81.87% Protein coding genes connected to KEGG Orthology (KO) 63,949 32.42% 57,111 29.52% not connected to KEGG Orthology (KO) 131,057 66.44% 135,640 70.10% Protein coding genes connected to MetaCyc pathways 32,243 16.34% 29,552 15.27% not connected to MetaCyc pathways 162,763 82.51% 163,199 84.34% Protein coding genes with COGs3 121,020 61.35% 123,077 63.61% with Pfam3 115,645 58.62% 118,589 61.29% with TIGRfam3 33,743 17.10% 33,969 17.56% in internal clusters 77,655 39.36% 73,856 38.17% Protein coding genes coding signal peptides 48,556 24.61% 49,644 25.66% Protein coding genes coding transmembrane proteins 43,693 22.15% 43,726 22.60% COG clusters 4,125 84.65% 3,974 81.55% KOG clusters 0 0.00% 0 0.00% Pfam clusters 4,447 37.33% 4,293 36.04%
TIGRfam clusters 2,580 64.13% 2,489 61.87%
*GC percentage shown as count of G's and C's divided by a total number of G's, C's, A's, and T's. This is not necessarily synonymous with the total number of bases.

Switchgrass-adapted consortia
388 Standards in Genomic Sciences
Table 5. Number of genes associated with the 25 general COG functional categories. ID Name SG only SG + Fe R P-value
J Translation, ribosomal structure and biogenesis 6,659 6,055 4.57 *** 0.000
A RNA processing and modification 21 22 0 n.s.
K RNA processing and modification 21 22 0 n.s.
L Replication, recombination and repair 6,248 6,103 1.36 0.086
B Chromatin structure and dynamics 49 35 0.21 n.s.
D Cell cycle control, cell division, chromosome partitioning 1,457 1,68 1.35 0.089
Y Nuclear structure - - - -
V Defense mechanisms 2,884 3,232 -2.11 * 0.018
T Signal transduction mechanisms 10,430 10,271 2.01 * 0.022
M Cell wall/membrane/envelope biogenesis 8,396 8,753 -1.67 * 0.047
N Cell motility 3,150 3,146 -1.2 n.s.
Z Cytoskeleton 39 43 -0.29 n.s.
W Extracellular structures 2 1 0 n.s.
U Intracellular trafficking, secretion, and vesicular transport 2,438 2,525 -0.56 n.s.
O Posttranslational modification, protein turnover, chaperones 3,893 3,914 0.14 n.s.
C Energy production and conversion 8,221 8,426 0.08 n.s.
G Carbohydrate transport and metabolism 13,038 14,361 -3.69 *** 0.000
E Amino acid transport and metabolism 9,571 10,682 -5.33 *** 0.000
F Nucleotide transport and metabolism 2,808 3,022 -2.21 * 0.014
H Coenzyme transport and metabolism 5,193 5,080 2.17 * 0.015
I Lipid transport and metabolism 3,034 3,375 -1.9 * 0.029
P Inorganic ion transport and metabolism 5,914 6,171 0.12 n.s.
Q Secondary metabolites biosynthesis, transport and catabolism 1,608 1,916 -2.51 ** 0.006
R General function prediction only 15,442 15,796 -0.87 n.s.
S Function unknown 10,667 10,106 0.6 n.s. aP-value symbols denote * P<0.05, ** P<0.01, *** P<0.001, and n.s. indicates not significant. In an additional, separate experiment, we tested the effects of additional terminal electron accep-tors on the ability of feedstock-adapted consortia to degrade switchgrass, which included iron as well as sulfate and nitrate, with switchgrass-only as a control. In this additional experiment, we ana-lyzed the resulting microbial communities by the taxonomic marker 16S ribosomal RNA gene se-quence libraries [8]. These communities were grown from the SG only FACs whose metagenomic sequences are presented here. Further passages were made before community analysis, making these consortia from this additional experiment less rich and characterized by fewer dominant species. Because these communities are simpler, we are able to more closely examine the relation-ships among taxa and co-occurrences under vary-ing availability of terminal electron acceptors.
We observed some differences in taxon occur-rence and functional gene abundance between the iron-amended and iron-unamended metagenomes, and used network analysis to illus-trate the phylogenetic basis of taxon co-occurrence among differences in availability of terminal electron acceptors. Network analyses were constructed by calculating all possible corre-lations between taxa using Pearson's correlation coefficient, then discarding any pairwise correla-tions that did not meet the criteria for a “connec-tion”, which was a minimum r value of 0.9 and minimum P-value of 0.01. Network analysis was conducted based on the methods presented in Barberán et al. [38] in R using the packages igraph [39], Hmisc [40], multtest [41], doMC [42], and foreach [43].

DeAngelis et al.
http://standardsingenomics.org 389
These networks were strongly dominated by a few taxa, as evidenced by the large number of singletons (661 taxa, 62%) and doubletons (167 taxa, 16%) detected among the total taxa detected (1,060). The-se singleton and doubleton taxa were not included in the network analysis, leaving 232 taxa for analyzing co-occurrences. Of the 1,060 taxa included in this analysis, 170 taxa met the minimum criteria for a significant connection, with 579 connections be-tween them. Taxa are mapped in Figure 2 with col-ors corresponding to phylum (left) as well as by generalist or specialist (right), where generalists were defined as taxa detected in all TEA treatments, while specialists were defined as taxa detected in only one treatment. As expected due to the static anaerobic conditions, networked communities are dominated by Firmicutes, which are prevalent in all clusters. Firmicutes also dominated the SG only and SG + Fe FACs, accounting for 20 and 23% of total richness, respectively. The Firmicutes contain the Clostridiales, which are fast-growing obligate anaerobes, ferment-ers, and well-known lignocellulolytic microbes [44-46]. In our consortia networks, the Firmicutes tend-ed to either be generalists or switchgrass-only spe-cialists, which may also explain their prevalence in our metagenomes. The specialists were dominated by Firmicutes, with the notable observation that there were no nitrate specialists detected by this method. Of the remaining specialists, there were more sulfate-specialists than any other kind, fol-lowed by switchgrass-only specialists, then iron spe-cialists. All iron specialists were Firmicutes; this was somewhat surprising considering that the best-known iron reducers are in the phylum Proteobacteria, including Geobacter and Shewanella [47,48]. However, these taxa were notably absent in previous phylogenetic and metagenomic analyses of wet tropical forest soils of Puerto Rico [9,20], and there are actually a wide diversity of iron-reducing bacteria within the Firmicutes. In the network, Firmicutes also tended to co-occur either with each other, forming large cliques, or with taxa from di-verse phyla. Generalists were mostly Firmicutes, but also included representatives from the phyla Proteobacteria and Methanomicrobia (of the Euryarchaeota). These phyla are known to accom-modate some well-known K-selected species; taxa that are not fast growers but have persistent growth and are able to survive under a range of conditions [12,49].
Functional genetic diversity Analysis of pfams that were significantly different between iron-amended FACs (SG+Fe) and una-mended FACs (SG only) suggested that there were strong differences between the function and meta-bolic status of the two consortia (Table 7, Figure 3). There were 15 pfams that were significantly en-riched in the SG + Fe FACs, compared to 23 pfams enriched in SG only compared to SG + Fe. The pfams enriched in the SG + Fe suggested that the addition of iron caused the consortia to be overall more effi-cient at transporting xylose and other nutrients, as evidenced by the large number of ABC transporters and other bacterial transporter systems. Transport-ers made up the bulk of the identified pfams, repre-senting the most abundant pfam domains differen-tially detected in the SG + Fe compared to the SG on-ly FACs. There was also evidence that the increased transport of carbon and other nutrients resulted in increased biosynthesis of biomass and secondary metabolites, with pfams such as S-layer homology domain, oxidoreductase family domains, [Fe-S] bind-ing domains, and polyketide synthesis domains. The SG + Fe FACs were also significantly enriched in glycosyl-hydrolase family 65 domains compared to the switchgrass only FACs, suggesting that this community had more members that were able to utilize the switchgrass for energy and microbial bi-omass. In contrast, the pfams detected in the SG only FACs that were significantly enriched compared to the SG + Fe FACs hinted at stressful conditions in survival of the community without the addition of the exoge-nous terminal electron acceptor iron. There were a number of intracellular signaling domains that were enriched, suggesting that there were more interac-tions among remaining community members that grow under these conditions. There was also evi-dence of enrichment for mobile genetic elements and viral DNA transfer, evidenced by increased de-tection of transposase domains, retroviral integrases, and phage replication domains. It has been demonstrated that communities under stress have higher transfer rate of mobile genetic elements, potentially as a mechanism to induce better survival strategies [50]. These differences in detected pfams at the DNA level suggest that the metagenomic se-quencing of the SG only FACs occurred prior to the community adapting to the lack of exogenous termi-nal electron acceptors. That is, our sequencing was performed before the community had arrived at a new equilibrium, and over the course of selection for

Switchgrass-adapted consortia
390 Standards in Genomic Sciences
anaerobic growth of tropical soil communities on switchgrass as sole C source, the communities were
unable to adapt to the lack of iron as terminal elec-tron acceptor.
Table 6. Overview of taxonomic diversity in metagenomes. Domain Phylum SG only Count % SG + Fe Count % Archaea Crenarchaeota 575 0.29 88 0.05 Euryarchaeota 5,089 2.58 2,590 1.34 Nanoarchaeota 1 0 0 0 Bacteria Acidobacteria 478 0.24 2,392 1.24 Actinobacteria 1,113 0.56 2,756 1.42 Aquificae 100 0.05 99 0.05 Bacteroidetes 14,680 7.44 14,937 7.72 Chlamydiae 16 0.01 35 0.02 Chlorobi 460 0.23 530 0.27 Chloroflexi 1,073 0.54 2042 1.06 Chrysiogenetes 13 0.01 18 0.01 Cyanobacteria 742 0.38 823 0.43 Deferribacteres 117 0.06 121 0.06 Deinococcus-Thermus 158 0.08 275 0.14 Dictyoglomi 132 0.07 144 0.07 Elusimicrobia 17 0.01 35 0.02 Fibrobacteres 30 0.02 36 0.02 Firmicutes 38,958 19.75 44,858 23.18 Fusobacteria 533 0.27 534 0.28 Gemmatimonadetes 11 0.01 29 0.01 Lentisphaerae 113 0.06 165 0.09 Nitrospirae 70 0.04 80 0.04 Planctomycetes 375 0.19 448 0.23 Proteobacteria 11,289 5.72 11,803 6.1 Spirochaetes 2,460 1.25 3,795 1.96 Synergistetes 314 0.16 460 0.24 Tenericutes 30 0.02 34 0.02 Thermodesulfobacteria 36 0.02 43 0.02 Thermotogae 330 0.17 414 0.21 Verrucomicrobia 450 0.23 611 0.32 Eukaryota Apicomplexa 25 0.01 19 0.01 Arthropoda 32 0.02 30 0.02 Ascomycota 64 0.03 59 0.03 Bacillariophyta 7 0 8 0 Basidiomycota 8 0 5 0 Chlorophyta 5 0 5 0 Chordata 32 0.02 29 0.01 Microsporidia 1 0 0 0 Nematoda 7 0 3 0 Streptophyta 73 0.04 66 0.03 Plasmid:Archaea Crenarchaeota 5 0 2 0 Euryarchaeota 4 0 4 0 Plasmid:Bacteria Actinobacteria 3 0 3 0 Bacteroidetes 2 0 1 0 Firmicutes 23 0.01 32 0.02 Proteobacteria 32 0.02 29 0.01 Viruses ds DNA viruses, no RNA stage 113 0.06 97 0.05 ss DNA viruses 1 0 0 0

DeAngelis et al.
http://standardsingenomics.org 391
Figure 1. Phyla that are at least 2-fold differentially represented in one metagenome compared to the other, and had greater than one representative detected. Phyla with gene counts over-represented in the iron-amended consortium (SG + Fe) are colored brown, while phyla with gene counts over-represented in the unamended consortium (SG only) are colored light green.
Figure 2. Network analysis of feedstock adapted consortia grown on switchgrass only (SG on-ly), SG plus iron oxides (FeOx), SG plus nitrate (NO3
-), or SG plus sulfate (SO3-). Each point rep-
resents one taxon, and the size of the point corresponds to the number of connections (edges) associated with the taxon. Edges (grey lines) indicate a minimum correlation of Pearson r = 0.9 as well as statistical significance (P<0.01). On the left, taxa are colored by taxonomy according to their assigned phylum; on the right, taxa are colored based on whether they are generalists (present in all four treatments) or specialists (present in one treatment only and absent in the rest).

Switchgrass-adapted consortia
392 Standards in Genomic Sciences
Table 7. Report of pfams that were significantly enriched† ID SG only R SG + Fe Description Enriched in SG+Fe FACs
pfam00005 2,409 -7.38 8.10e-14 3,025 ABC transpoerter
pfam00528 1,817 -7.36 9.02e-14 2,348 Bacterial binding protein-dependent transport systems
pfam02653 394 -6.24 2.23e-10 605 Bacterial binding protein-dependent transport systems
pfam00106 420 -4.88 5.38e-07 589 short-chain dehydrogenases/reductases family
pfam01979 163 -5.55 1.44e-08 287 large metal dependent hydrolase superfamily
pfam08352 99 -6.43 6.20e-11 218 C-terminus of oligopeptide ABC transporter ATP binding proteins
pfam02894 146 -4.1 2.03e-05 231 Oxidoreductase family, C-terminal alpha/beta domain
pfam02782 113 -4.33 7.56e-06 193 FGGY carbohydrate kinase family
pfam00395 130 -3.98 3.39e-05 208 S-layer homology domain
pfam01266 93 -3.77 8.17e-05 156 FAD dependent oxidoreductase family
pfam02801 47 -4.13 1.79e-05 99 Beta-ketoacyl-ACP synthase (fatty acid synthesis)
pfam00404 2 -6.02 8.86e-10 43 Dockerin: protein domain in cellulosome cellular structure
pfam01799 24 -3.71 1.02e-04 59 [2Fe-2S] binding domain
pfam03632 19 -3.8 7.32e-05 52 glycoside hydrolase family 65
pfam08659 1 -5.41 3.23e-08 33 polyketide synthase domain, catalyses the first step in the reductive modification of the beta-carbonyl centers in the growing polyketide chain
Enriched in SG only FACs
pfam00990 697 5.95 1.33e-09 508 GGDEF domain, cyclic di-GMP synthesis involved in in-tracellular signaling
pfam03466 499 6.29 1.60e-10 330 LysR substrate binding domain, similar to periplasmic binding protein
pfam00126 476 5.71 5.71e-09 326 Helix-turn-helix DNA binding domain
pfam00583 1,048 3.88 5.26e-05 905 Acetyltransferase (or transacetylase)
pfam00989 569 3.89 4.92e-05 459 PAS domain, signal sensor
pfam00563 262 5.43 2.89e-08 157 EAL domain, possible diguanylate phosphodiesterase with metal-binding site
pfam01473 135 8.26 1.11e-16 31 Putative cell wall binding repeat
pfam02311 405 3.78 7.82e-05 314 rabinose-binding and dimerization domain of the AraC regulatory protein
pfam00665 201 4.53 2.94e-06 124 Retroviral integrase
pfam02378 145 4.25 1.08e-05 84 Phosphotransferase system, EIIC, part of a sugar-specific permease system
pfam00801 163 3.71 1.03e-04 106 Polycystic-kidney disease domain, usually involved in me-diating protein-protein interactions
†in either the iron-amended consortia (SG + Fe FAC, upper half of table) or the unamended feedstock-adapted consortia (SG only FAC, lower half of table).

DeAngelis et al.
http://standardsingenomics.org 393
Table 7 (cont.). Report of pfams that were significantly enriched† ID SG only R SG + Fe Description pfam01797 119 3.84 6.07e-05 69 Transposase IS200, for transposition of insertion elements
pfam01609 119 3.76 8.44e-05 70 Transposase DDE domain, for transposition of insertion el-ements
pfam01011 75 4.54 2.83e-06 30 beta propeller, found in several enzymes which utilize pyrrolo-quinoline quinone as a prosthetic group
pfam00367 80 4.35 6.80e-06 35 phosphotransferase system, EIIB
pfam02302 105 3.69 1.13e-04 60 phosphoenolpyruvate: sugar phosphotransferase system (PTS) system, Lactose/Cellobiose specific IIB subunit
pfam09681 47 5.93 1.53e-09 5 N-terminal phage replisome organizer, origin of phage replication
pfam01978 83 3.83 6.47e-05 42 sugar-specific transcriptional regulator of the treha-lose/maltose ABC transporter
pfam03143 52 3.75 8.81e-05 21 GTP-binding elongation factor family
pfam09820 35 4.41 5.09e-06 7 predicted AAA-ATPase domain
pfam08350 33 4 3.22e-05 8 domain of unknown function, so far found only at the C-terminus of archaean proteins
pfam08495 36 3.74 9.02e-05 11 FIST N domain: novel sensory domain present in signal transduction proteins
pfam09373 22 4.45 4.34e-06 1 Pseudomurein-binding repeat, pseudomurein being a cell-wall structure
pfam08004 18 3.96 3.71e-05 1 domain of unknown function, so far found only among archaeal proteins
†in either the iron-amended consortia (SG + Fe FAC, upper half of table) or the unamended feedstock-adapted consortia (SG only FAC, lower half of table).
Figure 3. Illustration of pfams that were differentially represented in SG only compared to SG + Fe. On the left, pfams are listed for the consortium grown in switchgrass only with no iron (SG only), and on the right, pfams are listed for the consortium grown in switchgrass with iron (SG + Fe). This illustration is based on data from Table 7.

Switchgrass-adapted consortia
394 Standards in Genomic Sciences
Table 8. Count of genes in COGs that bear protein sequence homology to target lignocellulolytic genes of interest. COG ID SG only SG + Fe COG Description
COG1472 11 23 Beta-glucosidase-related glycosidases
COG3250 11 7 Beta-galactosidase/beta-glucuronidase
COG5001 9 9 Predicted signal transduction protein containing a membrane domain, an EAL and a GGDEF domain
COG1028 4 33 Dehydrogenases with different specificities (related to short-chain alcohol dehydrogen-ases)
COG0300 3 2 Short-chain dehydrogenases of various substrate specificities
COG4221 3 2 Short-chain alcohol dehydrogenase of unknown specificity
COG1012 2 11 NAD-dependent aldehyde dehydrogenases
COG0677 2 3 UDP-N-acetyl-D-mannosaminuronate dehydrogenase
COG3384 2 3 Uncharacterized conserved protein
COG0280 1 3 Phosphotransacetylase
COG1344 1 3 Flagellin and related hook-associated proteins
COG3325 1 2 Chitinase
COG0277 1 1 FAD/FMN-containing dehydrogenases
COG0179 1 2-keto-4-pentenoate hydratase/2-oxohepta-3-ene-1,7-dioic acid hydratase (catechol pathway)
COG1874 1 Beta-galactosidase
COG2132 1 Putative multicopper oxidases
COG1129 20 ABC-type sugar transport system, ATPase component
COG2723 11 Beta-glucosidase/6-phospho-beta-glucosidase/beta-galactosidase
COG0411 9 ABC-type branched-chain amino acid transport systems, ATPase component
COG0673 8 Predicted dehydrogenases and related proteins
COG0036 4 Pentose-5-phosphate-3-epimerase
COG1455 4 Phosphotransferase system cellobiose-specific component IIC
COG1486 4 Alpha-galactosidases/6-phospho-beta-glucosidases, family 4 of glycosyl hydrolases
COG2200 4 FOG: EAL domain
COG0366 3 Glycosidases
COG1004 3 Predicted UDP-glucose 6-dehydrogenase
COG3842 3 ABC-type spermidine/putrescine transport systems, ATPase components
COG3845 3 ABC-type uncharacterized transport systems, ATPase components
COG0435 2 Predicted glutathione S-transferase
COG0583 2 Transcriptional regulator
COG0812 2 UDP-N-acetylmuramate dehydrogenase
COG3836 2 2,4-dihydroxyhept-2-ene-1,7-dioic acid aldolase
COG4213 2 ABC-type xylose transport system, periplasmic component
DeAngelis et al.
http://standardsingenomics.org 395
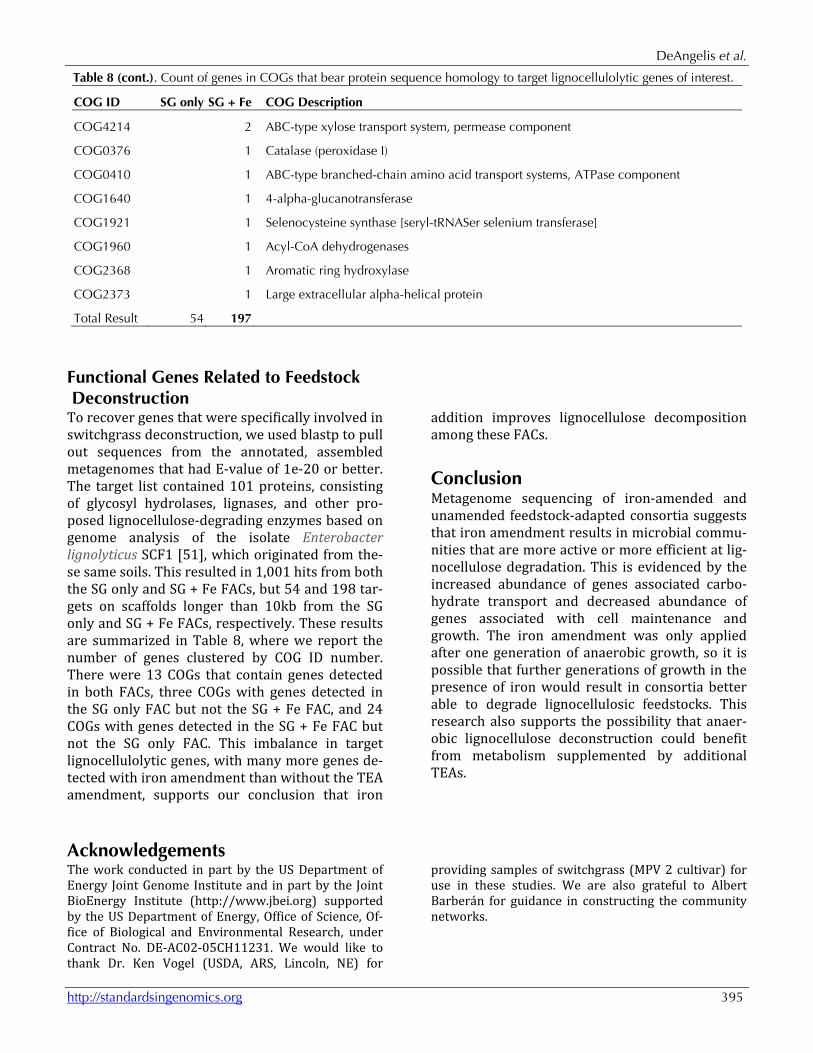
Table 8 (cont.). Count of genes in COGs that bear protein sequence homology to target lignocellulolytic genes of interest.
COG ID SG only SG + Fe COG Description
COG4214 2 ABC-type xylose transport system, permease component
COG0376 1 Catalase (peroxidase I)
COG0410 1 ABC-type branched-chain amino acid transport systems, ATPase component
COG1640 1 4-alpha-glucanotransferase
COG1921 1 Selenocysteine synthase [seryl-tRNASer selenium transferase]
COG1960 1 Acyl-CoA dehydrogenases
COG2368 1 Aromatic ring hydroxylase
COG2373 1 Large extracellular alpha-helical protein
Total Result 54 197
Functional Genes Related to Feedstock Deconstruction To recover genes that were specifically involved in switchgrass deconstruction, we used blastp to pull out sequences from the annotated, assembled metagenomes that had E-value of 1e-20 or better. The target list contained 101 proteins, consisting of glycosyl hydrolases, lignases, and other pro-posed lignocellulose-degrading enzymes based on genome analysis of the isolate Enterobacter lignolyticus SCF1 [51], which originated from the-se same soils. This resulted in 1,001 hits from both the SG only and SG + Fe FACs, but 54 and 198 tar-gets on scaffolds longer than 10kb from the SG only and SG + Fe FACs, respectively. These results are summarized in Table 8, where we report the number of genes clustered by COG ID number. There were 13 COGs that contain genes detected in both FACs, three COGs with genes detected in the SG only FAC but not the SG + Fe FAC, and 24 COGs with genes detected in the SG + Fe FAC but not the SG only FAC. This imbalance in target lignocellulolytic genes, with many more genes de-tected with iron amendment than without the TEA amendment, supports our conclusion that iron
addition improves lignocellulose decomposition among these FACs.
Conclusion Metagenome sequencing of iron-amended and unamended feedstock-adapted consortia suggests that iron amendment results in microbial commu-nities that are more active or more efficient at lig-nocellulose degradation. This is evidenced by the increased abundance of genes associated carbo-hydrate transport and decreased abundance of genes associated with cell maintenance and growth. The iron amendment was only applied after one generation of anaerobic growth, so it is possible that further generations of growth in the presence of iron would result in consortia better able to degrade lignocellulosic feedstocks. This research also supports the possibility that anaer-obic lignocellulose deconstruction could benefit from metabolism supplemented by additional TEAs.
Acknowledgements The work conducted in part by the US Department of Energy Joint Genome Institute and in part by the Joint BioEnergy Institute (http://www.jbei.org) supported by the US Department of Energy, Office of Science, Of-fice of Biological and Environmental Research, under Contract No. DE-AC02-05CH11231. We would like to thank Dr. Ken Vogel (USDA, ARS, Lincoln, NE) for
providing samples of switchgrass (MPV 2 cultivar) for use in these studies. We are also grateful to Albert Barberán for guidance in constructing the community networks.

Switchgrass-adapted consortia
396 Standards in Genomic Sciences
References 1. Lee SK, Chou H, Ham TS, Lee TS, Keasling JD.
Metabolic engineering of microorganisms for bio-fuels production: from bugs to synthetic biology to fuels. Curr Opin Biotechnol 2008; 19:556-563. PubMed http://dx.doi.org/10.1016/j.copbio.2008.10.014
2. Jaeger KE, Eggert T. Lipases for biotechnology. Curr Opin Biotechnol 2002; 13:390-397. PubMed http://dx.doi.org/10.1016/S0958-1669(02)00341-5
3. Parton W, Silver WL, Burke IC, Grassens L, Har-mon ME, Currie WS, King JY, Adair EC, Brandt LA, Hart SC, et al. Global-scale similarities in ni-trogen release patterns during long-term decom-position. Science 2007; 315:361-364. PubMed http://dx.doi.org/10.1126/science.1134853
4. Silver WL, Lugo A, Keller M. Soil oxygen availa-bility and biogeochemistry along rainfall and topographic gradients in upland wet tropical for-est soils. Biogeochemistry 1999; 44:301-328. http://dx.doi.org/10.1007/BF00996995
5. Silver WL, Liptzin D, Almaraz M. Soil redox dy-namics and biogeochemistry alonga tropical elevational gradient. Ecol Bull 2013; (In press).
6. Pett-Ridge J, Firestone MK. Redox fluctuation structures microbial communities in a wet tropi-cal soil. Appl Environ Microbiol 2005; 71:6998-7007. PubMed http://dx.doi.org/10.1128/AEM.71.11.6998-7007.2005
7. DeAngelis KM, Allgaier M, Chavarria Y, Fortney JL, Hugenholtz P, Simmons B, Sublette K, Silver WL, Hazen TC. Characterization of Trapped Lig-nin-Degrading Microbes in Tropical Forest Soil. PLoS ONE 2011; 6:e19306. PubMed http://dx.doi.org/10.1371/journal.pone.0019306
8. DeAngelis, K. M. et al. Anaerobic decomposition of switchgrass by tropical soil-derived feedstock-adapted consortia. MBio 3, (2012).
9. DeAngelis KM, Silver WL, Thompson AW, Fire-stone MK. Microbial communities acclimate to recurring changes in soil redox potential status. Environ Microbiol 2010; 12:3137-3149. PubMed http://dx.doi.org/10.1111/j.1462-2920.2010.02286.x
10. Paul EA, Clark FE. Soil microbiology, ecology, and biochemistry. (Academic Pr, 1996).
11. Freeman C, Ostle N, Kang H. An enzymic ‘latch’ on a global carbon store. Nature 2001; 409:149. PubMed http://dx.doi.org/10.1038/35051650
12. Fierer N, Grandy AS, Six J, Paul EA. Searching for unifying principles in soil ecology. Soil Biol Biochem 2009; 41:2249-2256. http://dx.doi.org/10.1016/j.soilbio.2009.06.009
13. Field D, Garrity G, Gray T, Morrison N, Selengut J, Sterk P, Tatusova T, Thomson N, Allen MJ, Angiuoli SV, et al. The minimum information about a genome sequence (MIGS) specification. Nat Biotechnol 2008; 26:541-547. PubMed http://dx.doi.org/10.1038/nbt1360
14. Ashburner M, Ball CA, Blake JA, Botstein D, But-ler H, Cherry JM, Davis AP, Dolinski K, Dwight SS, Eppig JT. Gene Ontology: tool for the unifica-tion of biology. Nat Genet 2000; 25:25-29. Pub-Med http://dx.doi.org/10.1038/75556
15. McGroddy M, Silver WL. Variations in Below-ground Carbon Storage and Soil CO2 Flux Rates along a Wet Tropical Climate Gradient1. Biotropica 2000; 32:614-624. http://dx.doi.org/10.1646/0006-3606(2000)032[0614:VIBCSA]2.0.CO;2
16. Tanner, R. S. et al. Cultivation of bacteria and fun-gi. 69–78 (2007).
17. Widdel F, Kohring GW, Mayer F. Studies on dissimilatory sulfate-reducing bacteria that de-compose fatty acids. Arch Microbiol 1981; 129:395-400. PubMed http://dx.doi.org/10.1007/BF00406470
18. Tschech A, Pfennig N. Growth yield increase linked to caffeate reduction in Acetobacterium woodii. Arch Microbiol 1984; 137:163-167. http://dx.doi.org/10.1007/BF00414460
19. Janssen PH, Schuhmann A, Morschel E, Rainey FA. Novel anaerobic ultramicrobacteria belong-ing to the Verrucomicrobiales lineage of bacterial descent isolated by dilution culture from anoxic rice paddy soil. Appl Environ Microbiol 1997; 63:1382-1388. PubMed
20. DeAngelis KM, Gladden JM, Allgaier M, D'haeseleer P. Strategies for enhancing the effec-tiveness of metagenomic-based enzyme discovery in lignocellulolytic microbial communities. Bio-Energy Research 2010; 3:146-158. http://dx.doi.org/10.1007/s12155-010-9089-z
21. DOE Joint Genome Institute. http://www.jgi.doe.gov
22. SOAPdenovo v1.05. http://soap.genomics.org.cn/soapdenovo.html
23. AMOS. http://sourceforge.net/projects/amos

DeAngelis et al.
http://standardsingenomics.org 397
24. Edgar RC. Search and clustering orders of magni-tude faster than BLAST. Bioinformatics 2010; 26:2460-2461. PubMed http://dx.doi.org/10.1093/bioinformatics/btq461
25. Lowe, T. M. & Eddy, S. R. tRNAscan-SE: A Program for Improved Detection of Transfer RNA Genes in Genomic Sequence. Nucl. Acids Res. 25, 0955–964 (1997).
26. Altschul SF, Madden TL, Schäffer AA, Zhang J, Zhang Z, Miller W, Lipman DJ. Gapped BLAST and PSI-BLAST: a new generation of protein data-base search programs. Nucleic Acids Res 1997; 25:3389-3402. PubMed http://dx.doi.org/10.1093/nar/25.17.3389
27. Eddy SR. Accelerated Profile HMM Searches. PLOS Comput Biol 2011; 7:e1002195. PubMed http://dx.doi.org/10.1371/journal.pcbi.1002195
28. Bland C, Ramsey TL, Sabree F, Lowe M, Brown K, Kyrpides NC, Hugenholtz P. CRISPR Recognition Tool (CRT): a tool for automatic detection of clus-tered regularly interspaced palindromic repeats. BMC Bioinformatics 2007; 8:209. PubMed http://dx.doi.org/10.1186/1471-2105-8-209
29. Edgar RC. PILER-CR: Fast and accurate identifica-tion of CRISPR repeats. BMC Bioinformatics 2007; 8:18. PubMed http://dx.doi.org/10.1186/1471-2105-8-18
30. Noguchi H, Park J, Takagi T. MetaGene: prokary-otic gene finding from environmental genome shotgun sequences. Nucleic Acids Res 2006; 34:5623-5630. PubMed http://dx.doi.org/10.1093/nar/gkl723
31. Hyatt D, Chen GL, Locascio PF, Land ML, Lar-imer FW, Hauser LJ. Prodigal: prokaryotic gene recognition and translation initiation site identifi-cation. BMC Bioinformatics 2010; 11:119. Pub-Med http://dx.doi.org/10.1186/1471-2105-11-119
32. Rho M, Tang H, Ye Y. FragGeneScan: predicting genes in short and error-prone reads. Nucleic Ac-ids Res 2010; 38:e191. PubMed http://dx.doi.org/10.1093/nar/gkq747
33. Tatusov RL, Fedorova ND, Jackson JD, Jacobs AR, Kiryutin B, Koonin EV, Krylov DM, Mazumder R, Mekhedov SL, Nikolskaya AN, et al. The COG database: an updated version includes eukary-otes. BMC Bioinformatics 2003; 4:41. PubMed http://dx.doi.org/10.1186/1471-2105-4-41
34. Finn RD, Mistry J, Tate J, Coggill P, Heger A, Pollington JE, Gavin OL, Gunasekaran P, Ceric G, Forslund K. The Pfam protein families database.
Nucleic Acids Res 2010; 38:D211-D222. PubMed http://dx.doi.org/10.1093/nar/gkp985
35. Mao X, Cai T, Olyarchuk JG, Wei L. Automated genome annotation and pathway identification using the KEGG Orthology (KO) as a controlled vocabulary. Bioinformatics 2005; 21:3787-3793. PubMed http://dx.doi.org/10.1093/bioinformatics/bti430
36. Markowitz VM, Chen IM, Chu K, Szeto E, Palaniappan K, Grechkin Y, Ratner A, Jacob B, Pati A, Huntemann M. IMG/M: the integrated metagenome data management and comparative analysis system. Nucleic Acids Res 2012; 40:D123-D129. PubMed http://dx.doi.org/10.1093/nar/gkr975
37. Wu D, Hugenholtz P, Mavromatis K, Pukall R, Dalin E, Ivanova NN, Kunin V, Goodwin L, Wu M, Tindall BJ. A phylogeny-driven genomic ency-clopaedia of Bacteria and Archaea. Nature 2009; 462:1056-1060. PubMed http://dx.doi.org/10.1038/nature08656
38. Barberán A, Bates ST, Casamayor EO, Fierer N. Using network analysis to explore co-occurrence patterns in soil microbial communities. ISME J 2012; 6:343-351. PubMed http://dx.doi.org/10.1038/ismej.2011.119
39. Csardi, G. & Nepusz, T. The igraph software pack-age for complex network research. InterJournal, Complex Systems 1695 (2006).
40. Harrell, F. E. & And with contributions from many other users Hmisc (Harrell Miscellaneous). R package version 3.9-3 (2012).at http://biostat.mc.vanderbilt.edu/trac/Hmisc
41. Pollard KS, Gilbert HN, Ge Y, Taylor S, Dudoit S. multtest: Resampling-based multiple hypothesis testing. R package version 2.12.0 (2012).at http://www.bioconductor.org/packages/2.10/bioc/html/multtest.html
42. Revol doMC: Foreach parallel adaptor for the multicore package. R package version 1.2.5 (2012).at http://CRAN.R-project.org/package=doMC
43. Revolution Analytics foreach: Foreach looping construct for R. R package version 1.4.0 (2012).at http://CRAN.R-project.org/package=foreach
44. Leschine SB, Canale-Parola E. Mesophilic cellulo-lytic clostridia from freshwater environments. Appl Environ Microbiol 1983; 46:728-737. Pub-Med
45. Calusinska, M., Happe, T., Joris, B. & Wilmotte, A. The surprising diversity of clostridial

Switchgrass-adapted consortia
398 Standards in Genomic Sciences
hydrogenases: a comparative genomic perspec-tive. Microbiology (Reading, Engl.) 156, 1575–1588 (2010).
46. Schimel JP, Schaeffer SM. Microbial control over carbon cycling in soil. Front Microbiol 2012; 3:348. PubMed
47. Lovley DR, Holmes DE, Nevin KP. Dissimilatory fe (iii) and mn (iv) reduction. Adv Microb Physiol 2004; 49:219-286. PubMed http://dx.doi.org/10.1016/S0065-2911(04)49005-5
48. Weber KA, Achenbach LA, Coates JD. Microor-ganisms pumping iron: anaerobic microbial iron oxidation and reduction. Nat Rev Microbiol 2006; 4:752-764. PubMed http://dx.doi.org/10.1038/nrmicro1490
49. Stevenson BS, Eichorst SA, Wertz JT, Schmidt TM, Breznak JA. New Strategies for Cultivation and Detection of Previously Uncultured Microbes. Appl Environ Microbiol 2004; 70:4748-4755. PubMed http://dx.doi.org/10.1128/AEM.70.8.4748-4755.2004
50. Heuer, H. & Smalla, K. Plasmids foster diversifica-tion and adaptation of bacterial populations in soil. FEMS Microbiology Reviews n/a–n/a (2012).
51. DeAngelis KM, D'Haeseleer P, Chivian D, Fort-ney JL, Khudyakov J, Simmons B, Woo H, Arkin AP, Davenport KW, Goodwin L. Complete ge-nome sequence of ‘Enterobacter lignolyticus’ SCF1. Stand Genomic Sci 2011; 5:69-85. PubMed http://dx.doi.org/10.4056/sigs.2104875
Copyright © 2022 FDOKUMEN