Metagenomic characterization of bacterial consortia for the ...
259
Metagenomic characterization of bacterial consortia for the bioremediation of organic pollutants Daniel Garrido Sanz A dissertation submitted for the degree of Doctor of Philosophy (Microbiology Program RD99/2011) of the Universidad Autónoma de Madrid. November 2019
-
Upload
khangminh22 -
Category
Documents
-
view
8 -
download
0
Transcript of Metagenomic characterization of bacterial consortia for the ...

Metagenomic characterization of bacterial consortia for the
bioremediation of organic pollutantsDaniel Garrido Sanz
A dissertation submitted for the degree of Doctor of Philosophy (Microbiology Program RD99/2011)
of the Universidad Autónoma de Madrid.
November 2019

Metagenomic characterization of bacterial consortia for the bioremediation of organic pollutants PhD thesis dissertation Author
Daniel Garrido Sanz – Universidad Autónoma de Madrid Email: [email protected] Supervisors
Dr. Rafael Rivilla Palma – Full Professor. Universidad Autónoma de Madrid Dr. Miguel Redondo Nieto – Assistant Professor. Universidad Autónoma de Madrid Funding
This thesis and the research derived from it has been possible due to the funding of several institutions and programs:
Fellowship program Formación del Profesorado Universitario – MECD – Grant no. FPU14/03965 MINECO/EU – Grant no. BIO2012-31634 MINECO/EU – Grant no. BIO2015-64480-R MICINN/EU – Grant no. RTI2018-0933991-B-I00 The Cooperación Interuniversitaria con América Latina program – UAM-Banco Santander GREENER-H2020 – EU – Grant no. 826312
MECD: Spanish Ministry of Education, Culture and Sport | MINECO: Spanish Ministry of Economy and Finance | MICINN: Spanish Ministry of Science, Innovation and Universities | EU: European Union
PhD Thesis dissertation © 2019 by the authors.
This copy of the thesis has been supplied on condition that anyone who consults it is understood to recognize that its copyright rest with its author, unless otherwise stated, and that no quotation from the thesis and no information derived from it may be published without the appropriate citation. Note that Chapter II and Chapter III of this thesis have been published and are recognized under the terms and conditions of the Creative Commons Attribution License, which permits unrestricted use, distribution, and reproduction in any medium, provided the original work is properly cited (CC BY 4.0).
Cover image │ Bacterial consortia growing with diesel oil under UV light – Daniel Garrido-Sanz

“It is a profound and necessary truth that the deep things in science are not found because they are useful; they are found because it was possible to find them”
- Robert Oppenheimer

Metagenomic characterization of bacterial consortia
for the bioremediation of organic pollutants
A dissertation submitted for the degree of
Doctor of Philosophy (Microbiology Program RD99/2011) of the Universidad Autónoma de Madrid.
Doctoral Thesis presented by
Daniel Garrido Sanz ____________________
Dpto. de Biología, Facultad de Ciencias Universidad Autónoma de Madrid
2019
Supervisors ____________________
Dr. Rafael Rivilla Palma Full Professor Dpto. de Biología, Facultad de Ciencias Universidad Autónoma de Madrid.
____________________
Dr. Miguel Redondo Nieto Assistant Professor Dpto. de Biología, Facultad de Ciencias Universidad Autónoma de Madrid.

Acknowledgements
It is not an easy task to thank everyone who has contributed one way or another to this thesis. Important as it is not to forget anyone, I won’t feel comfortable by listing the names that are more recent in my memory and leaving those who I cannot remember behind. If you came across this thesis you surely have played a role on it: either as a someone who has contributed to the scientific development during my formative period, as a coworker, friend, family… Every path I came across has led me to this point, either had I taken different choices, or had I met different people, most certainly I would not be writing these lines now. Thank you.
However, a special mention goes to my supervisors, Rafael Rivilla and Miguel Redondo. It has been an amazing experience during all these years for which I had your complete support, both in the academic and the personal extents. This is also true for Marta Martín, without your support this thesis would have lack the passion for science that brought me here and for which I am truly grateful. Also, a special mention to Esther Blanco and David Durán, full-time lab and life partners. We had such a great time working side by side in the lab and hanging out together… I am truly going to miss these years. Similarly, a big thanks to the Plant Physiology Teaching Commission of the Autonomous University of Madrid. I’ve known you since my first years in the university as a student and latter during my thesis period. You are an amazing example of good will and endless support. I hope wherever I go, I could find people like you. And finally, but not less important, to my family for giving me everything.
Daniel October 2019

Table of contents
i
Table of contents
03 Summary (English version)
07 Resumen (versión en español)
11 Chapter I General introduction
13 Environmental pollution 13 Chemical nature of pollutants 16 Distribution and persistence in the environment 18 Toxicity of pollutants 20 Environmental effects of pollution 21 Bacterial biodegradation pathways of organic pollutants 22 Biodegradation of alkanes 26 Biodegradation of aromatic compounds 30 Bioremediation of organic pollutants 31 Classification of bioremediation techniques 35 Environmental factors affecting bioremediation 37 Challenges of bacterial community enhancement 39 NGS and metagenomics 40 References
61 Objectives
63 Chapter II Metagenomic analysis of a biphenyl-degrading soil bacterial consortium reveals the metabolic roles of specific populations
65 Abstract 66 Introduction 68 Materials and Methods 68 Isolation of the biphenyl-degrading consortium and growth
conditions 69 DNA extraction, sequencing, processing of reads, and assembly 69 Reconstruction of nearly complete genomes from metagenome
shotgun sequencing 70 Diversity analysis of the 16S rRNA gene and coding DNA
sequences (CDSs)

Table of contents
ii
70 Identification of CDSs involved in biphenyl metabolism and phylogenetic analysis
71 Rhodococcus isolation and genetic analysis 72 Sequence deposition 73 Results and discussion 73 Metagenomic sequencing and bacterial diversity 75 Identification of biphenyl upper degradative pathway gene clusters 79 Identification of biphenyl lower degradative pathway genes 81 Population roles in the biphenyl-degrading consortium 86 Conclusions 86 Supplementary material 87 References
93
Chapter III Metagenomic insights into the bacterial functions of a diesel-degrading consortium for the rhizoremediation of diesel-polluted soil
95 Abstract 96 Introduction 98 Materials and Methods 98 Isolation of the bacterial consortium and growth conditions 99 DNA extraction, sequencing and assembly
100 Diversity analysis of the 16S rRNA gene and coding DNA sequences (CDSs)
100 Identification of CDSs involved in alkanes and aromatic hydrocarbon metabolism
101 Bioremediation treatments in microcosms 102 Total petroleum hydrocarbon and PAHs characterization 102 Sequence deposition 102 Results and discussion 102 Diesel characterization 104 Bacterial diversity in the diesel-degrading consortium 106 Substrate-specific diversity 107 Identification of alkane-degrading CDSs 109 Identification of PAH-degrading CDSs and central aromatic
metabolism CDSs 112 Metabolic roles of specific populations in the diesel-degrading
consortium 114 Rhizoremediation assays in diesel-polluted soil microcosms

Table of contents
iii
116 Conclusions 117 Supplementary material 117 References
123 Chapter IV Analysis of the biodegradative and adaptive potential of Rhodococcus sp. WAY2 revealed by its complete genome sequence
125 Abstract 125 Introduction 127 Materials and Methods 127 Growth conditions and functional characterization 128 Genome sequencing and assembly 128 Genome annotation 129 Phylogenetic analysis 130 Phylogenomic analysis 130 Ring-hydroxylating dioxygenases phylogeny 131 PCBs resting cell assay 131 Results and discussion 131 Genome anatomy 134 Phylogenetic and phylogenomic analyses 136 General functional content 138 Degradation capabilities of Rhodococcus sp. WAY2 139 Central metabolic pathways 141 Peripheral metabolism 141 Degradation of aromatic compounds 145 Degradation of n-alkanes 146 Co-metabolism of PCBs 149 Environmental adaption 150 Genetic islands and heavy metal resistance 151 Conclusions 152 Supplementary material 153 References

Table of contents
iv
161 Chapter V Comparative genomics of the Rhodococcus genus
163 Abstract 164 Introduction
166 Materials and Methods
166 Dataset
166 Phylogenomic analysis
166 Clustering of Rhodococcus genomes
167 Orthologous groups identification and genome fractions
168 Results and discussion
168 Phylogenomic analysis and clustering of the Rhodococcus genus
171 Phylogeny based on single-copy proteins
173 Genome fractions of the Rhodococcus genus 174 Group-specific genome fractions of Rhodococcus phylogenomic
groups 176 Distribution of PAHs and alkane degradation
178 Conclusions
179 Supplementary material
179 References
187 Chapter VI General discussion
191 References
195 Conclusions (English version)
196 Conclusiones (versión en español)
199 Appendix I List of publications
201 Appendix II Supplementary material

Table of contents
v
List of figures and tables Chapter I
14 Figure 1.1 Schematic representation of the main pollutants described
in this chapter based on their chemical characteristics
17 Figure 1.2 Infographic timeline of the compounds included in the Stockholm Convention on Persistent Organic Pollutants
23 Figure 1.3 Schematic representation of n-alkanes aerobic biodegradation pathways in bacteria
28 Figure 1.4 Simplified schematic representation of PAHs aerobic biodegradation upper and lower pathways in bacteria
30 Figure 1.5 Simplified schematic representation of angular dioxygenation of dibenzo-p-dioxin and dibenzofuran degradation pathway
32 Figure 1.6 Classification of the main bioremediation techniques based on in situ and ex situ site of application
36 Figure 1.7 Schematic representation of the environmental factors affecting the bioremediation process in a hypothetical soil environment
Chapter II
74 Figure 2.1 Diversity and composition of the biphenyl-degrading consortium
75 Table 2.1 Genomic statistics of the five nearly complete genomes reconstructed from the whole-metagenome sequence of the biphenyl-degrading consortium
76 Table 2.2 Summary of the number and genus affiliation of the main CDSs for enzymes involved in the biphenyl and metabolic derivatives degradation identified in the biphenyl-degrading consortium
78
Figure 2.2
Synteny and sequence identity of gene clusters involved in biphenyl degradation compared with reference sequences
80 Figure 2.3 Box gene clusters identified in the metagenome of the biphenyl-degrading consortium

Table of contents
vi
81 Table 2.3 Summary of the pathways assigned to the main genus present in the biphenyl-degrading consortium
82 Table 2.4 Consortium growth on different organic compounds as the sole carbon and energy source
84 Figure 2.4 Pathways from biphenyl degradation identified in the metagenome of the biphenyl-degrading consortium
Chapter III
103 Table 3.1 Aliphatic and aromatic hydrocarbon fraction composition of the diesel oil and aged diesel-polluted soil used in this study
105 Figure 3.1 Diversity and taxonomic composition of the diesel-degrading consortium growing on diesel and different alkanes and polycyclic aromatic hydrocarbons (PAHs) as sole carbon and energy source
108 Figure 3.2 Number and taxonomic assignation at the genus level of the enzymes belonging to alkyl group hydroxylases
111 Figure 3.3 Number and taxonomic assignation at the class level of the enzymes belonging to alkanes, PAHs and aromatic metabolism pathways
113 Figure 3.4 Summary of alkanes, PAHs, and central aromatic biodegradation pathways found in the most abundant genera/families within the metagenome of the diesel-degrading consortium
115 Figure 3.5 Results of total hydrocarbons remaining after treatments with the diesel-degrading consortium, in four-month microcosms assays
Chapter IV
132 Figure 4.1 Genomic map of Rhodococcus sp. WAY2 replicons
133 Table 4.1 Summary of Rhodococcus sp. WAY2 genome characteristics across replicons
135 Figure 4.2 16S rRNA-based maximum-likelihood phylogeny of Rhodococcus type strains
136 Figure 4.3 Neighbor-joining phylogeny based in GBDP intergenomic distances of 38 sequenced Rhodococcus type strains genomes and WAY2

Table of contents
vii
137 Figure 4.4 Functional distribution of COGs among the five Rhodococcus sp. WAY2 replicons
138 Table 4.2 Functional characterization of the aromatic degradation capabilities of Rhodococcus sp. WAY2
140 Table 4.3 Central metabolic pathways identified in Rhodococcus sp. WAY2 genome and genes involved
142 Table 4.4 Gene clusters of Rhodococcus sp. WAY2 involved in degradation compounds
144 Figure 4.5 Gene organization of Rhodococcus sp. WAY2 etb, bph and nah gene clusters and syntenic comparisons with homologous clusters in other rhodococci
147 Figure 4.6 PCB congeners remaining in resting cell assays after 48 h of incubation with Delor 103 PCB mixture
148 Figure 4.7 PCB congeners degraded by Rhodococcus sp. WAY2
151 Table 4.5 Genetic islands (GIs) present in the genome of Rhodococcus sp. WAY2
Chapter V
169 Figure 5.1 GBDP-based phylogeny of 327 Rhodococcus genomes and data matrixes
171 Figure 5.2 Interpolation/extrapolation rarefaction analysis of the clusters at species and phylogenomic groups levels
172 Figure 5.3 ML phylogenetic tree of the Rhodococcus genus based in 212 single-copy amino acid sequences
173 Figure 5.4 Genome fractions of the Rhodococcus genus.
175 Figure 5.5 Specific genome and core genome of each of the PGs identified in this study
177 Figure 5.6 Distribution of OGs involved in aromatic and aliphatic compounds degradation in Rhodococcus PGs

1
Summary Resumen

Summary | English version
3
Summary Metagenomic characterization of bacterial consortia for the bioremediation of organic pollutants _________________
Pollution caused by organic compounds is regarded as one of the major environmental concerns of modern societies. Their global distribution combined with high persistence and deleterious effects require improved and environmentally sustainable technologies to remove these compounds. Bacteria can degrade many organic pollutants, which has led to the development of multiple bioremediation techniques that harness their potential to restore polluted sites. However, multiple factors affect the bioremediation process. Among them, the presence of microorganisms harboring the appropriate degradative pathways and their ability to remain in the targeted site once inoculated are the main problems of bioremediation technologies. The use of selected indigenous populations already adapted to the physicochemical and biological conditions of a particular site can overcome these problems. Nevertheless, it is necessary to evaluate the metabolic capacities of the community members to infer their functional roles in the biodegradation process.
Chapter I constitutes a general introduction on environmental pollution including basic concepts. The known catabolic pathways for the aerobic biodegradation of aromatic and aliphatic compounds are also introduced in this chapter together with a brief description of the main bioremediation technologies, the multiple factors affecting the bioremediation process, their challenges and how new sequencing developments can help overcome some of the problems of bioremediation.
The isolation by successive enrichment culture of two bacterial consortia able to grow with biphenyl (chemical analog of PCBs) and diesel fuel mixture as sole carbon sources are described in Chapters II and III. The characterization of both consortia based on microbiome analysis of the 16S rRNA gene shows that while the biphenyl-degrading consortium is constituted by 24 members, the diesel-degrading consortium is composed of 76, and different relative abundance of taxa is observed. The biphenyl-degrading consortium is dominated by Pseudomonas (28.97%), followed by Bordetella (21.28%), Achromobacter (12.67%), Stenotrophomonas (8.57%) and Rhodococcus (2.18%). On the other hand, the

Summary | English version
4
diesel-degrading consortium is dominated by Pseudomonas (27.01%), Aquabacterium (22.36%), Chryseobacterium (15.34%), and genera from the Sphingomonadaceae family (9.26%). Metagenome shotgun sequencing and analysis of the biphenyl-degrading consortium identified genes involved in three pathways for the conversion of biphenyl to benzoate, and five pathways from benzoate to TCA cycle intermediates. While the three biphenyl degradation pathways were assigned to Rhodococcus, strains from Pseudomonas and Bordetella are responsible of three of the benzoate to TCA cycle pathways. On the other hand, in the diesel-degrading consortium, the oxidation of alkanes could be initiated by multiple genera harboring AlkB, LadA and CYP450 enzymes, while enzymes for the initial oxidation of polycyclic aromatic hydrocarbons (PAHs) are mainly assigned to genera from the Sphingomonadaceae family. The taxonomic assignment of these enzymes and pathways to specific members of both consortia allowed us to model the functional roles they perform in populations actively involved in biodegradation processes.
In Chapter IV the complete genome sequence of a member of the biphenyl-degrading consortium isolated in Chapter II, Rhodococcus sp. WAY2, is presented. It consists of a circular chromosome, three linear replicons with typical Actinobacteria invertron telomeres, and a small circular plasmid. Comparative analysis of the 16S rRNA with other Rhodococcus type strain species resulted in a clear differentiation of WAY2, which is likely a new species. Aside of the three biphenyl to benzoate gene clusters described in Chapter II, its complete genome sequence revealed two additional gene clusters that are likely to be involved in the degradation of multiple aromatic compounds. These five clusters are found within WAY2 linear replicons and probably allows its growth with biphenyl, naphthalene and xylene as sole carbon and energy source and the cometabolism of 23 PCB congeners. In addition, WAY2 can also use several chain-length n-alkanes as sole carbon source, probably because of the presence of alkB and ladA gene copies and mmo and pmo gene clusters for soluble and particulate methane monooxygenases, respectively. Aside of biodegradation capabilities, the genome of WAY2 also revealed the presence of several environmental adaption strategies that could allow its survival under a wide range of conditions.
The diversity of the Rhodococcus genus is further analyzed in Chapter V, where comparative genomics of more than 300 genomes is used to address their phylogenomic relationship. Forty-two distinct phylogenomic groups (PGs) and 83

Summary | English version
5
species clusters are found within the genus genomes. Rarefaction and extrapolation analyses show that the number of species is likely to continue growing as more strains are sequenced. The identification of genomic fractions revealed a small “hard” core genome, composed of 381 orthologous groups (OGs) present in all the genomes, while a “soft” core of 1,253 OGs is achieved within the 99% of genomes. The “open” pangenome of the Rhodococcus genus, consisting on 26,080 OGs is expected to continue growing and evidence the high diversity exhibited by this genus, which is further reflected in the specific and core genome of the different PGs. Finally, the distribution of traits involved in the degradation of aromatic and aliphatic compounds among the PGs evidence that while most of the PGs could potentially degrade aromatic compounds, the degradation of alkanes, specifically short-chain n-alkanes might be a more limited feature of the Rhodococcus genus.
Conclusively, this Thesis shows that metagenomic characterization of bacterial consortia intended for bioremediation purposes can explain the functional roles of the different members of the community actively involved in the biodegradation process. This information can be used to further isolate, sequence and characterize the best performing strains to obtain additional knowledge about other traits that can also be of use in biotechnological applications.

Resumen | versión en español
7
Resumen Caracterización metagenómica de consorcios bacterianos para la biorremediación de contaminantes orgánicos _________________
La contaminación causada por compuestos orgánicos es considerada como uno de los principales problemas de las sociedades modernas. Su distribución global combinada con una alta persistencia y efectos nocivos requieren tecnologías mejoradas y ambientalmente sostenibles para eliminar estos compuestos. Las bacterias pueden degradar múltiples contaminantes orgánicos, lo que ha llevado al desarrollo de varias técnicas de biorremediación que aprovechan su potencial para restaurar sitios contaminados. Sin embargo, múltiples factores afectan el proceso de biorremediación. Entre ellos, la presencia de microorganismos con las rutas de degradación apropiadas y su capacidad para permanecer en el sitio objetivo una vez inoculados son los principales problemas de las técnicas de biorremediación. El uso de poblaciones indígenas seleccionadas y adaptadas a las condiciones fisicoquímicas y biológicas de un sitio concreto pueden hacer frente a estos problemas. Sin embargo, es necesario evaluar las capacidades metabólicas de los miembros de la comunidad para inferir su papel funcional en el proceso de biodegradación
El Capítulo I constituye una introducción general sobre contaminación ambiental, incluyendo conceptos básicos. Las rutas catabólicas conocidas para la biodegradación aerobia de compuestos aromáticos y alifáticos son también introducidas en este capítulo junto con una breve descripción de las principales tecnologías de biorremediación, los múltiples factores que afectan al proceso de biorremediación, sus desafíos y cómo nuevos desarrollos en técnicas de secuenciación pueden ayudar a superar algunos de los problemas de la biorremediación.
El aislamiento mediante cultivo por enriquecimiento sucesivo de dos consorcios bacterianos capaces de crecer con bifenilo (análogo químico de los PCBs) y combustible diésel como fuente de carbono y energía es descrito en los Capítulos II y III. La caracterización de ambos consorcios basada en análisis del microbioma mediante el gen 16S rRNA muestra que mientras que el consorcio degradador de bifenilo está formado por 24 miembros, el consorcio degradador de diésel está formado por 76, y muestran una abundancia relativa de taxones

Resumen | versión en español
8
diferente. El consorcio degradador de bifenilo está dominado por Pseudomonas (28,97%), seguido de Bordetella (21,28%), Achromobacter (12,67%), Stenotrophomonas (8.57%) y Rhodococcus (2.18%). Por otro lado, el consorcio degradador de diésel está dominado por Pseudomonas (27,01%), Aquabacterium (22,36%), Chryseobacterium (15,34%) y géneros de la familia Sphingomonadaceae (9,26%). La secuenciación del metagenoma del consorcio degradador de bifenilo y su posterior análisis ha permitido identificar genes involucrados en tres rutas de conversión de bifenilo a benzoato y cinco rutas de benzoato al ciclo de los ácidos tricarboxílicos (TCA). Mientras que las tres rutas de degradación del bifenilo son asignadas a Rhodococcus, cepas de Pseudomonas y Bordetella son responsables de la conversión del benzoato al ciclo de TCA mediante tres rutas distintas. Por otro lado, en el consorcio degradador de diésel la oxidación de alcanos puede ser iniciada por múltiples géneros que presentan las enzimas AlkB, LadA y CYP450, mientras que la oxidación inicial de hidrocarburos policíclicos aromáticos (PAHs) es principalmente asignada a géneros de la familia Sphingomonadaceae. La asignación taxonómica de estas enzimas y rutas a miembros específicos de ambos consorcios nos ha permitido modelar los roles funcionales que desempeñan en poblaciones activamente involucradas en procesos de biodegradación.
En el Capítulo IV se presenta la secuencia del genoma completo de un miembro del consorcio degradador de bifenilo aislado en el Capítulo II, Rhodococcus sp. WAY2. El genoma de WAY2 consiste en un cromosoma circular, tres replicones lineares con telómeros típicos de Actinobacteria y un plásmido circular pequeño. Análisis comparativos del gen 16S rRNA con otras cepas tipo del género Rhodococcus resulta en una clara distinción de WAY2, que posiblemente corresponde a una nueva especie. A parte de los tres clústeres de genes implicados en la conversión de bifenilo a benzoato descritos en el Capítulo II, la secuencia completa de su genoma contiene dos clústeres de genes adicionales que están probablemente implicados en la degradación de múltiples compuestos aromáticos. Estos clústeres se encuentran en los replicones lineares de WAY2 y probablemente son los que permiten su crecimiento en bifenilo, naftaleno y xileno como única fuente de carbono y energía y el cometabolismo de 23 congéneres de PCBs. Además, WAY2 puede también usar n-alcanos de diferente longitud de cadena como fuente de carbono y energía, probablemente debido a la presencia de copias de los genes alkB y ladA junto con los clústeres de genes mmo y pmo que codifican para metano monooxigenasas solubles y particuladas,

Resumen | versión en español
9
respectivamente. Además de sus capacidades de biodegradación, el genoma de WAY2 también ha revelado la presencia de varias estrategias de adaptación al ambiente que pueden permitir su supervivencia bajo un amplio rango de condiciones.
La diversidad del género Rhodococcus se analiza con más detalle en el Capítulo V, dónde análisis genómicos comparativos de más de 300 genomas se usan para estudiar su relación filogenómica. Cuarenta y dos grupos filogenómicos (PGs) distintos y 83 clústeres de especies se identifican entre los genomas del género. Análisis de rarefacción y extrapolación muestran que el número de especies probablemente continuará incrementando a medida que más cepas sean secuenciadas. La identificación de las fracciones genómicas muestra un pequeño genoma central “estricto” compuestos por 381 grupos de ortólogos (OGs) presentes en todos los genomas, mientras que un “relajado” genoma central de 1.253 OGs se alcanza en el 99% de los genomas. El pangenoma “abierto” del género Rhodococcus formado por 26.080 OGs se espera que continúe creciendo y evidencia la alta diversidad mostrada por este género, lo que se refleja en el genoma específico y central de los diferentes PGs. Finalmente, la distribución de rasgos implicados en la degradación de compuestos aromáticos y alifáticos entre los distintos PGs muestran que mientras que la mayor parte de los PGs pueden potencialmente degradar compuestos aromáticos, la degradación de alcanos, específicamente los de cadena corta, es un rasgo más limitado dentro del género Rhodococcus.
En conclusión, esta Tesis muestra que la caracterización metagenómica de consorcios bacterianos destinados a fines de biorremediación puede explicar los roles funcionales de los diferentes miembros de la comunidad que participan activamente en el proceso de biodegradación. Esta información puede ser usada para aislar, secuenciar y caracterizar más en profundidad las cepas de mejor rendimiento para obtener conocimiento adicional sobre otros rasgos que también pueden ser útiles en aplicaciones biotecnológicas.

11
Chapter I
General Introduction

General introduction | Chapter I
13
Chapter I General Introduction _________________
Environmental pollution
Human activities often result in the pollution of the environment. Pollution is defined as “the presence of a chemical or substance out of place and/or present at a higher than normal concentration that has adverse effects on any non-targeted organism” (FAO and ITPS, 2015). It is important not to confuse it with the term “contaminant”, which also refers to substances present at a higher than normal concentration but do not necessarily cause harm (Chapman, 2007). Pollution can have naturally occurring origins, such as forest fires that release toxic elements including certain polycyclic aromatic hydrocarbons (PAHs) and dioxin-like compounds (Yunker et al., 2002; Deardorff et al., 2008), or heavy metals freed during volcanic eruptions (Doelsch et al., 2006). However, the anthropogenic origin is considered the main source of modern environmental pollution (Cachada et al., 2018). Man-made pollutants are usually referred as xenobiotics: “compounds released in any compartment of the environment by the action of man and thereby occur in a concentration that is higher than natural” (Leisinger, 1983).
Chemical nature of pollutants
The chemical nature of pollutants is diverse, but two major groups can be defined: inorganic and organic pollutants. A schematic classification of the main pollutants described in this chapter is depicted in Figure 1.1. Inorganic pollutants comprise mainly metals/metalloids and radionuclides. The first ones include lead, cadmium, mercury and copper, among others, and are extensively used in several industrial processes. Although they naturally occur in the environment at low concentration (less than 100 mg · kg-1) and some of them are essential for life, at higher concentrations they are toxic (Kabata-Pendias and Mukherjee, 2007; Hooda, 2010). They can enter the environment through emissions produced by the metallurgical industries, the disposal of products or during their transport, storage and applications (Kabata-Pendias and Mukherjee, 2007). On the other hand, radionuclides are unstable isotopes that undergo radioactive decay. Although there are natural sources of radionuclides, including cosmic radiation or terrestrial

Chapter I | General introduction
14
radiation derived from radioactive decay of certain elements (Mehra et al., 2010), human activities such as coal-fired power plants and cement production intensify the release of radionuclides into the atmosphere and upper soil (El-Taher et al., 2010; Ćujić et al., 2015). Nevertheless, nuclear weapon testing and nuclear accidents are responsible for most of the radio activity passing into the environment (Szefer, 2002).
Figure 1.1 | Schematic classification of the main pollutants described in this chapter based on their chemical characteristics.
Organic pollutants are compounds derived from carbon species. They include
several diverse groups that can be divided into aromatic and aliphatic. Aromatic compounds are constituted by one or more aromatic rings. Monoaromatic chemicals comprise benzene and radical substitutions of hydrogen atoms in the benzene ring, and include toluene, ethylbenzene and xylene, known collectively as BTEX. Conversely, polycyclic aromatic hydrocarbons (PAHs) are constituted by multiple fused aromatic rings, being the simplest one naphthalene with two fused benzene rings. These compounds might present substitutions in one or more hydrogens by atoms of chlorine or bromine, known as halogenated PAHs (HPAHs), which usually make them more toxic than their parent PAHs (Sun et al., 2013). On the other hand, dioxin and dioxin-like compounds are highly toxic heterocyclic organic compounds (Van den Berg et al., 2006) that might also contain different
General introduction | Chapter I
15
chlorine or bromine substitutions, forming multiple related chemicals known as congeners (McNaught and Wilkinson, 1997). For instance, the eight hydrogen atoms of the dibenzo-p-dioxin skeleton can be substituted by chlorine or bromine atoms, forming 75 (poly)chlorinated dibenzo-p-dioxin (PCDDs) or (poly)brominated dibenzo-p-dioxins (PBDDs) congeners, respectively. Similarly, these halogenated substitutions can also occur in the dibenzofuran and biphenyl skeletons, forming the (poly)chlorinated and (poly)brominated dibenzofurans (PCDFs and PBDFs respectively) and (poly)chlorinated and (poly)brominated biphenyls (PCBs and PBBs respectively). The presence of chlorine and bromine substitutions generally increase their toxic effects and enhance their persistence in the environment (Brink et al., 1983; Sun et al., 2013).
Aliphatic compounds include alkanes, alkenes and alkynes. Alkanes are the major components of fuel oils (National Research Council, 1985) and can vary in chain length and ramifications depending on the geographical source of the crude oil used for distillation. Although alkanes are naturally produced by bacteria, green algae, plants and animals (Cheesbrough and Kolattukudy, 1988), release of hydrocarbons into the environment by man has resulted in the pollution of soils and water bodies. They enter the ecosystems by accidental spills or by leaks from subterranean storage tanks and pipelines (Chaerun et al., 2004; Wang et al., 2018), and have a profound impact on living organisms and the ecosystems (Sikkema et al., 1995; Labud et al., 2007). On the other hand, alkenes and alkynes, present in oil fuels and also released by the exhaust of engines, pollute the ambient air (Schmitz et al., 2000; Tang et al., 2015; Zhang et al., 2017) as volatile organic compounds (VOCs). In fact, the emission of VOCs is regulated by different national and international organisms, including the European Union (Council Directive 2004/42/CE, 2004).
Pesticides are complex pollutants that include herbicides, fungicides and insecticides, among others. They are extensively used in the agriculture industry to reduce crop losses caused by insects and pathogens and to avoid the growth of weeds. The use of pesticides worldwide has been steadily increasing since 1992 to guarantee global food supplies for an increasing population (Tarradellas and Bitton, 1997; FAO and ITPS, 2017). Pesticides can be of inorganic or organic nature. Among the inorganic pesticides, copper sulfate has been historically used as fungicide (Martin, 1933), releasing copper into the environment with its associated toxicity (Bünemann et al., 2006). On the other hand, organic pesticides are complex

Chapter I | General introduction
16
compounds of diverse chemical nature (Jayaraj et al., 2016). Among them, organochlorines such as dichlorodiphenyltrichloroethane (DDT), Dicofol, Endrin, Dieldrin, Endosulfan and Isodrin are classified by the World Health Organization (WHO) as moderate to highly hazardous because of their persistence, bioaccumulation potential and toxic effects (WHO, 2010).
Distribution and persistence in the environment
Release of pollutants into the environment by human activities can be either deliberate or accidental. Deliberate pollution includes mining, disposal of waste, fossil fuel combustion and application of agrochemicals or sewage (Strzebońska et al., 2017; Mbangi et al., 2018). Accidental release of chemicals can occur during their transport and storage, for example oil spills or landfill leaks (Fritt-Rasmussen et al., 2012; Bayat et al., 2016). When the source of the pollution is known and occurs in a localized environment, usually by a specific event or a series of events, it is known as point-source pollution. In contrast, when the pollutant is transported via air-soil-water systems and emission, transformation and dilution of the pollutant have occurred, it is known as diffuse pollution or nonpoint source pollution (FAO and ITPS, 2015). Atmospheric transport and deposition of pollutants play a major role in diffuse pollution and the global distribution of pollutants, which can reach remote areas (Tanabe et al., 1983; Travnikov, 2005).
In addition, many organic pollutants are reluctant to degradation, either by biological or physicochemical processes, and are known as persistent organic pollutants (POPs). The list of POPs is constantly being evaluated by, among others, the Stockholm Convention on Persistent Organic Pollutants international treaty (Fiedler et al., 2019), currently covering 28 POPs (Figure 1.2). POPs comprise many dioxin-like compounds, including PCDDs, PCBs, PCDFs and pesticides such as DDT, hexachlorobenzene (HCB), hexachlorocyclohexanes (HCH), pentachlorobenzene (PeCB), perfluorooctane sulfonic acid and sulfonyl fluoride (PFOS and PFOSF), hexabromocyclododecane (HBCD), pentachlorophenol (PCP), hexachlorobutadiene (HCBD), polychlorinated naphthalenes (PCNs), commercial decabromodiphenyl ether mixture (c-decaDBE) and short-chain chlorinated paraffins (SCCPs).

General introduction | Chapter I
17
Figure 1.2 | Infographic timeline of the compounds included in the Stockholm Convention on Persistent Organic Pollutants. Black, dark-yellow and green tipping include chemicals in the Annex A (Elimination), Annex B (Restriction) and Annex C (Unintentional Production) classification, respectively. Asterisks denote chemicals also included in Annex C category. Pentadecafluorooctanoic acid (PFOA) and its derivates included in 2019 are recommendations to consider listing. Information obtained from Fiedler at al., 2019.

Chapter I | General introduction
18
The physicochemical characteristics of POPs, including chemical stability, hydrophobicity and lipophilic nature, make them remarkably resistant to natural degradation and tend to bioaccumulate and biomagnify through the food chain (Vasseur and Cossu-Leguille, 2006), producing adverse effects to human health and the environment (Norstrom, 2002). In addition, POPs are highly susceptible to be dispersed through water in its gaseous phase and volatilize from soils into the atmosphere, from which they can spread throughout the globe (Muir and de Wit, 2010).
All these processes have resulted in the pollution of many ecosystems, including soils, groundwaters, rivers, lakes, oceans and air, either by deliberate or accidental release of contaminants (Nriagu and Pacyna, 1988; Novotny, 1999; Schwarzenbach et al., 2010; Su, 2014). The extent of human-derived pollution is wide, affecting even pristine environments such as glaciers (Sharma et al., 2015) and polar regions (Muir and de Wit, 2010; Lu et al., 2012).
Toxicity of pollutants
The deleterious effects caused by pollutants on living organisms vary widely depending on the specific compound. Toxicity by metals, heavy metals and metalloids usually occurs by replacing essential metals in enzymes, reacting with the phosphate group in ADP and ATP, inducing oxidative stress responses or by destroying cellular structures, thus, disrupting the metabolism of cells (Stohs and Bagchi, 1995; Patrick, 2002; Flora et al., 2008; Jaishankar et al., 2014). These processes also apply to metallic radionuclides, including uranium and plutonium. Aside from the toxicity derived from their metallic nature, radionuclides also present radioactive decay. The effects of radioactive decay by ionizing radiation occurs at high doses over a short period of time and causes severe damage to DNA (Goodhead, 1994; Lavelle and Foray, 2014). In humans, it produces the acute radiation syndrome (Centers for Disease Control and Prevention, 2015). However, this type of toxicity is rare and only occurs due to nuclear accidents or warfare.
Toxicity caused by n-alkanes (straight-chain alkanes) depend on their chain length, which is related to their hydrophobicity, water solubility and volatility. Low molecular gaseous alkanes, such as methane, ethane and propane are simple asphyxiants: air with high levels of these gases does not contain enough oxygen to support respiration (Gordon and Amdur, 1991). Alkanes with 5 to 8 carbon atoms

General introduction | Chapter I
19
are volatile liquids that can enter the body via inhalation. Toxicity by n-hexane has been shown to produce the degradation of myelin and axons by forming covalent adducts with neurofilament proteins (Blake, 2004). Skin contact to C5-C8 hydrocarbons causes dermatitis as a consequence of the dissolution of the fat portions of the skin (Manahan, 1992). Although alkanes higher than C8 are not regarded as very toxic, interactions with biological membranes have been reported, producing an increase in membrane thickness (McIntosh et al., 1980) along with inhibition of membrane-dependent cellular transport systems (Gill and Ratledge, 1972).
Alkanes usually pollute the environment in combination with aromatic compounds, present in complex mixtures that are used to fuel engines. Aromatic compounds have multiple toxicological effects. There is not one type of toxic action but different toxicity mechanisms that depend on a number of factors, including the specific chemical, the exposure (acute or chronic), the organism and the environmental conditions (Neilson and Hutzinger, 1997). The simplest aromatic compound, benzene, is a confirmed carcinogen in humans and animals (Huff, 2007). The genotoxic effect of benzene in humans is due to multiple processes that involve the production of metabolites that lead to the inhibition of the topoisomerase II, disruption of cellular structures, generation of oxygen free radicals and oxidative stress, inducing DNA strand breaks and altering DNA methylation (Baker et al., 2001; Lindsey et al., 2005; Bollati et al., 2007; Badham and Winn, 2009; Smith, 2010). Similarly, other monoaromatic BTEX compounds are known to induce DNA damage by oxidative stress (Chen et al., 2008; Liu et al., 2010). PAHs toxicity in humans is also based upon their enzymatic activation, for which three major pathways have been uncovered. These pathways result in the formation of diol-epoxides, cation radicals or reactive and redox-active o-quinones, which in turn damage the DNA by the formation of DNA adducts (Burczynski and Penning, 2000; Shimada and Fujii‐Kuriyama, 2004; Xue and Warshawsky, 2005; Moorthy et al., 2015). Additionally, the reactive metabolites of PAHs can also form protein adducts and reactive oxygen species, which can directly damage DNA, lipids and proteins (Kwack and Mu Lee, 2000; Berge et al., 2004; Käfferlein et al., 2010).

Chapter I | General introduction
20
Environmental effects of pollution
Environmental pollution results in an impact in the food chain and ecosystem services. It is estimated that 95% of food production depends on soils (Oliver and Gregory, 2015). Pollution of soils by heavy metals, fuel oil hydrocarbon mixtures and PAHs have a profound effect on crop productivity. They reduce the germination rates, decrease elongation of shoots and roots, induce alterations in sugars and proteins and produce reactive oxygen species that cause chlorophyll damage, all of which ultimately leads to alterations of the overall growth of the plant (Chaineau et al., 1997; Ahmad and Ashraf, 2012; Dubrovskaya et al., 2016; Najeeb et al., 2017). Aside of the reduction in productivity, heavy metals and PAHs can bioaccumulate in plants, resulting in substantial losses due to, for example, grain contamination that needs to be disposed (Kobayashi et al., 2008; Zhang et al., 2015). If they enter the food chain, there is a food security and human health risk. Similarly, heavy metals have also been found in cultured marine fishes in different sites, along with their surrounding sea waters and sediments (Wong et al., 2001), where they bioaccumulate through the food chain and ultimately could result in food security issues (Afshan et al., 2014).
Pollution also affect the structure and ecological function of ecosystems. For example, acidification of soils or eutrophication of aquatic environments have been linked to excessive use of nitrogen and phosphate fertilizers (Lucas et al., 2011; Stork and Lyons, 2012; Zhao et al., 2014). Also, organochlorine pesticides have been shown to suppress symbiotic nitrogen fixation, resulting in reduced crop production (Fox et al., 2007). Furthermore, polluted sites often result in changes at population and community levels in bacteria, fungi, plants and animals (Bobbink et al., 2010; Chelinho et al., 2011; Sawulski et al., 2014; Ling et al., 2015). For example, pollution of soils by crude oil severely affects the biodiversity and abundance of microbial populations, creating a more homogenous environment without those communities susceptible to the toxic effects of the pollutant (Abbasian et al., 2016). Ultimately, these changes might affect the structure and ecological function of the ecosystems, since key organisms might be displaced.
Physicochemical methods used for remediation of polluted soils are based on the application of potent solvents and/or oxidants, combined with high pressure and temperature to extract and oxidize the pollutants, respectively (for a review, see Rivas, 2006). However, these methods often result in a profound destruction of the soil ecosystem and, in addition, are usually expensive. Therefore, other viable and

General introduction | Chapter I
21
environmentally sustainable methods should be considered for the restoration of polluted sites.
Bacterial biodegradation pathways of organic pollutants
Bacteria are able to degrade many organic pollutants, process known as biodegradation and defined as the “degradation caused by enzymatic process resulting from the action of cells” (Vert et al., 2012). This mechanism usually involves several enzymatic steps in a pathway that ultimately end with the complete oxidation of the compound, known as mineralization, which also provides the carbon and energy necessary for the growth of cells (Maier and Pepper, 2015). Some organic pollutants, however, are partially degraded due to the absence of a specific enzyme within its pathway. This might result in dead-end bioproducts that can be either less or more toxic than the parent compound, depending on the specific substrate, or be more persistent in the environment by a more limited bioavailability than the parent compound (Cámara et al., 2004; Pepper et al., 2011). On the other hand, cometabolism is defined as “the process by which a contaminant is fortuitously degraded by an enzyme or cofactor produced during the microbial metabolism of another compound”, but the obtained energy from the oxidation is not used for cell growth (McCarty, 1988; Hazen, 2018). Cometabolism can occur during active growth or in resting, non-growing cells interacting with an organic compound (Hazen, 2018).
Biodegradation can take place under both, aerobic and anaerobic conditions. Aerobic biodegradation of organic compounds implies that oxygen is the terminal electron acceptor and the use of aerobic respiration to generate cellular energy. The substrate is mineralized into water and carbon dioxide, although part of it is not fully oxidized and instead is used to build new cell mass. Conversely, anaerobic biodegradation requires alternative electron acceptors that can be either organic compounds in fermentation or inorganic electron acceptors in anaerobic respiration. Ultimately, the final step of anaerobic degradation is methanogenesis, which occurs when other inorganic electron acceptors are exhausted (Maier and Gentry, 2015; Maier and Pepper, 2015). For most contaminants, however, biodegradation rates are higher under aerobic conditions (Suarez and Rifai, 1999).

Chapter I | General introduction
22
Although the pathways for the biodegradation of organic pollutants differ whether they are aerobic or anaerobic, the following sections will only discuss aerobic biodegradation, as this thesis is focused in aerobic processes.
Biodegradation of alkanes
Many bacteria can aerobically degrade n-alkanes, using them as sole source of carbon and energy (Van Beilen et al., 2003; Ji et al., 2013). However, bacteria first must cope with the insolubility and hydrophobicity of alkanes in order to absorb them into the cells. This is usually achieved by producing surfactant compounds that emulsify hydrocarbon molecules to form droplets, which finally are taken up by microorganisms (Bustamante et al., 2012). Aerobic biodegradation of alkanes can be achieved by any of the four different pathways that have been uncovered to date (Van Beilen et al., 2003; Ji et al., 2013; Abbasian et al., 2015) and are summarized in Figure 1.3.
a) Terminal oxidation: One of the terminal methyl group of the alkane is oxidized by a monooxygenase enzyme (Li et al., 2008), resulting in a primary alcohol that is reduced into a fatty acid by the successive action of alcohol and aldehyde dehydrogenases. This fatty acid enters then the β-oxidation (Watkinson and Morgan, 1991).
b) Biterminal oxidation: The fatty acid generated during the terminal oxidation, is converted into an ω-hydroxy fatty acid by a ω-hydroxylation at the terminal methyl group and further transformed into a dicarboxylic acid, which also enters β-oxidation (Watkinson and Morgan, 1991; Coon, 2005).
c) Subterminal oxidation: A methylene group close to one of the alkane termini is oxidized by a monooxygenase, resulting in a secondary alcohol that is transformed by an alcohol dehydrogenase into a ketone and then oxidized by a Baeyer-Villiger monooxygenase into an ester. The ester is further hydrolyzed by an esterase to an alcohol and a carboxylic acid (Watkinson and Morgan, 1991; Kotani et al., 2007).
d) Finnerty pathway: Is a less characterized alkane oxidation pathway that has only been reported in Acinetobacter spp. and consists on a first alkane dioxygenation step that results in the formation of n-alkyl peroxides that are converted into fatty acids by a series of reactions before entering β-oxidation (Maeng et al., 1996; Sakai et al., 1996).

General introduction | Chapter I
23
Figure 1.3 | Schematic representation of n-alkanes aerobic biodegradation pathways in bacteria. Modified from van Beilen et al., 2003 and Ji et al., 2013.
Several different enzymes have been found to initiate the oxidation of n-alkanes. These can be categorized into four main groups, according to their substrate range, degradation characteristics and type of enzyme:

Chapter I | General introduction
24
(a) Alkane monooxygenase (AlkB): The most characterized n-alkane degradation system includes the AlkB enzyme: a 2FeO-containing rubredoxin-dependent integral membrane alkane monooxygenase (Kok et al., 1989; van Beilen et al., 1992). It was first described in Pseudomonas putida GPo1 (formerly P. oleovorans) and is able to terminal oxidize C3 to C12 n-alkanes (van Beilen et al., 1994; Johnson and Hyman, 2006). The system also includes the electron transfer proteins rubredoxin AlkG and rubredoxin reductase AlkT. AlkT transfers electrons from NADH to AlkG, which in turns transfers the electrons to AlkB. AlkB uses one oxygen atom from O2 to oxidize the terminal methyl group of the alkane, while the other oxygen is reduced to H2O by electrons transferred by AlkG (van Beilen et al., 2002; Rojo, 2009). However, different AlkB proteins have been reported. For example, in Dietzia spp., AlkB contains a fused rubredoxin domain, which allows the oxidation of long-chain alkanes (Bihari et al., 2011). AlkB enzymes of Rhodococcus spp. have also been found to oxidize long-chain cyclic alkanes (Kawagoe et al., 2019)
(b) Long-chain alkane monooxygenase (LadA/AlmA): Long-chain alkanes (>C20) are most commonly degraded by two different type of long-chain alkane monooxygenase enzymes, LadA and AlmA. LadA was first isolated in Geobacillus thermodenitrificans NG80-2 and can convert C15-C36 n-alkanes to 1-alkanols by the terminal oxidation pathway (Feng et al., 2007; Li et al., 2008). LadA is a two-component flavin-dependent thermostable alkane monooxygenase that also inserts one oxygen atom into the terminal methyl group of the alkane. On the other hand, AlmA was first identified in Acinetobacter sp. DSM 17874 (Throne-Holst et al., 2007) and belongs to monooxygenases of the flavin-binding family. This enzyme is able to degrade n-alkanes with carbon chains longer than C30. AlmA homologues have been identified in several Acinetobacter spp. and other marine genera (Wang and Shao, 2012). For instance, AlmA of the marine Alcanivorax dieselolei B-5 oxidizes C22 to C36 n-alkanes (Liu et al., 2011).
(c) Cytochrome P450, CYP153 family: Terminal oxidation of n-alkanes can also be achieved by cytochrome P450 monooxygenases, a group of heme-containing enzymes that function together with electron transfer systems to oxidize multiple compounds (Urlacher and Eiben, 2006). Bacterial cytochrome P450s involved in alkane hydroxylation are assigned to the CYP153 family of P450s class I. In class I P450s, electron transfer is mediated by ferredoxin reductase, which accepts electrons from NAD(P)H, and ferredoxin, which transfer the electrons to

General introduction | Chapter I
25
the P450 monooxygenase (Munro and Lindsay, 1996; Ortiz de Montellano, 2009). Many bacteria have been found to use P450s for the initial terminal oxidation of C4 to C16 n-alkanes (Müller et al., 1989; Hamamura et al., 1999; Maier et al., 2001; Zhou et al., 2011), and it has also been shown to produce biterminal oxidation on specific substrates in Mycobacterium (Scheps et al., 2011).
(d) Short-chain monooxygenases: Bacteria can also oxidize gaseous and other short-chain n-alkanes by different monooxygenase systems that includes methane monooxygenase (MMO) and propane or butane monooxygenase (BMO) enzymes. MMOs are three-component systems that can be either membrane-associated particulate copper-dependent (pMMO) or soluble non-heme diiron (sMMO) monooxygenases (Merkx et al., 2001; Chan et al., 2004; Balasubramanian et al., 2010). While pMMO has a relatively narrow substrate specificity (<C5 n-alkanes) and a preferent subterminal oxidation of propane, butane and pentane (Elliott et al., 1997), sMMO can oxidize a broad range of substrates and produce both, terminal and subterminal oxidations of n-alkanes (Smith and Dalton, 2004). The propane monooxygenase reported in Gordonia sp. TY-5 is a putative dinuclear-iron-containing multicomponent monooxygenase that oxidizes propane via subterminal oxidation (Kotani et al., 2003). Other propane monooxygenases can, however, oxidize propane in both, terminal and subterminal positions (Kotani et al., 2006). On the other hand, the soluble butane monooxygenase (sBMO) from Thauera butanivorans is a three-component diiron monooxygenase with a strong hydroxylation regiospecificity at the terminal position of C2-C9 alkanes (Sluis et al., 2002; Halsey et al., 2006; Dubbels et al., 2007). Also, a novel membrane-associated butane monooxygenase (pBMO) has been reported in Nocardioides sp. CF8, which allows its growth in C2-C10 n-alkanes (Hamamura et al., 2001; Sayavedra‐Soto et al., 2011) and represent a new lineage within MMOs protein family.
Aside of straight-chain alkanes, branched aliphatic hydrocarbons are also susceptible of aerobic degradation by bacteria. For instance, Alcanivorax spp. is able to degrade branched alkanes (Hara et al., 2003) and it is thought that P450, AlkB and AlmA enzymes might be involved in their degradation, as the expression of these genes is strongly induced when exposed to two branched alkanes, pristane and phytane (Schneiker et al., 2006; Liu et al., 2011; Wang and Shao, 2012). The metabolic pathways that mediate the degradation of branched alkanes is still poorly understood, although they may involve terminal, subterminal and biterminal oxidation pathways (Mikolasch et al., 2009; Nhi‐Cong et al., 2010).

Chapter I | General introduction
26
Biodegradation of aromatic compounds
The aerobic bacterial biodegradation of PAHs has been extensively studied (for reviews see Cerniglia, 1993; Peng et al., 2008; Haritash and Kaushik, 2009; Mallick et al., 2011; Ghosal et al., 2016). Among PAHs, naphthalene, anthracene and phenanthrene are considered prototypic PAHs given that their core structural skeleton is found in many other PAHs. In addition, phenanthrene is the smallest PAH that contains a bay-region and a K-region, reason for which is often used as a model for studies on the metabolism of carcinogenic PAHs (Bücker et al., 1979; Mohammad, 1985; Mallick et al., 2011). Complete degradation of PAHs is divided into upper and lower pathways (Figure 1.4). Upper pathways involve the degradation of PAHs into intermediate aromatic metabolites of the central metabolism: compounds in which the degradation of multiple compounds converge, such as catechol, gentisate and protocatechuate (Mallick et al., 2011). Lower pathways involve the degradation of the former central aromatic compounds into intermediates of the TCA cycle.
Bacterial aerobic degradation of PAHs is usually initiated by either ring-hydroxylating dioxygenases or cytochrome P450 monooxygenases (Figure 1.4). Typical PAH ring-hydroxylating dioxygenases, such as naphthalene 1,2-dioxygenase, are multimeric enzymes consisting on a ferredoxin and NADH oxidoreductase that form the electron transfer system (Haigler and Gibson, 1990b; 1990a), and an oxygenase component, composed of a large and a small subunit (α and β respectively) rearranged in a α3β3 hexamer (Kauppi et al., 1998). The α subunit contains a Rieske [2Fe-2S] center and a mononuclear non-heme iron active site, which determines the substrate specificity of the enzyme (Butler and Mason, 1996; Ferraro et al., 2006). Two electrons from NADH are transported through the electron transfer system and the Rieske center into the Fe (II) active site, which allows the activation of O2 and the lateral dihydroxylation of the substrate into cis-dihydrodiols (Cerniglia, 1993; Ferraro et al., 2005). A NAD+-dependent dehydrogenase acts then to rearomatize the cis-dihydrodiol and form a dihydroxy intermediate, which can undergo either ortho- or, more frequently, meta-cleavage reactions catalyzed by intra or extradiol dioxygenases respectively (Mallick et al., 2011). The products from the ring fission are further metabolized by a set of other enzymes that ultimately result in salicylate-type or phthalate-type structural intermediates. These intermediates are transformed into central aromatic

General introduction | Chapter I
27
metabolites such as catechol, gentisate and protocatechuate, whose catabolic products are funneled into the TCA cycle (Figure 1.4). Although these are general considerations for the degradation of PAHs, unique metabolic pathways have been reported in many different bacteria (Casellas et al., 1997; Annweiler et al., 2000; Moody et al., 2001; Seo et al., 2006; Mallick et al., 2011). Additionally, ring-hydroxylating dioxygenases are known to have a broad substrate range and can catalyze multiple reactions (Resnick et al., 1996; Parales and Resnick, 2004). For example, the naphthalene 1,2-dioxygenase of Pseudomonas sp. NCIB 9816 can catalyze more than 75 different reactions, including dioxygenation, monooxygenation, sulfoxidation and desaturation of different aromatic compounds (for a review see Resnick et al., 1996).
On the other hand, cytochrome P450 monooxygenases have also been found to initiate the oxidation of PAHs in several bacterial genera, including Mycobacterium, Rhodococcus and Streptomyces (Sutherland et al., 1990; Moody et al., 2004; Brezna et al., 2006; Luo et al., 2016), producing an arene oxide (epoxide) that can be further enzymatic-independent rearranged into phenols or transformed into trans-dihydrodiols by epoxide hydrolases (Kelley et al., 1990; Moody et al., 2004). Scarce evidence of the fate of these products is found in the literature. However, it has been postulated that trans-dihydodiols could be converted into their corresponding dihydroxy compounds by a dehydrogenase (Kweon et al., 2011), and phenols could also be transformed into dihydroxy compounds by monooxygenase/hydroxylase enzymes (Zhu et al., 2008).

Chapter I | General introduction
28
Figure 1.4 | Simplified schematic representation of PAHs aerobic biodegradation upper and lower pathways in bacteria. Adapted from Cerniglia, 1993 and Bamforth and Singleton, 2005.
General introduction | Chapter I
29
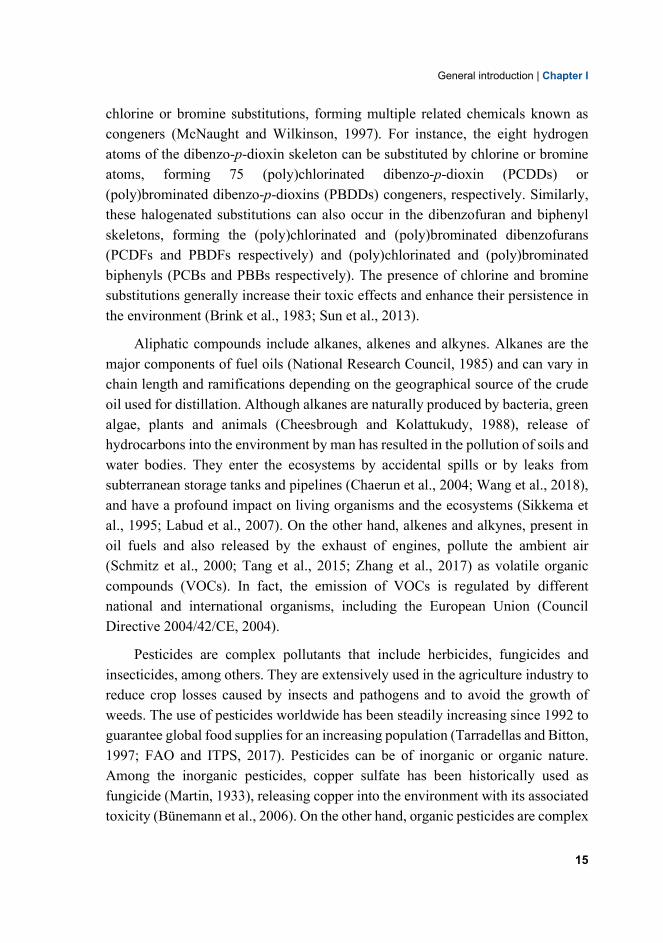
Dioxin and dioxin-like parent compounds, such as dibenzo-p-dioxin (DD) and dibenzofuran (DF) are also susceptible of biodegradation (Halden and Dwyer, 1997). These compounds contain aromatic rings, and therefore can be degraded following similar pathways to those of PAHs. However, as opposed to naphthalene 1,2-dioxygenase that only catalyze lateral insertion of oxygen (Resnick et al., 1996), initial dioxygenation of DD and DF can be achieved by either lateral or more commonly, angular dioxygenation (Habe et al., 2001; Nam et al., 2006). In the angular oxidative attack, one carbon bonded to the oxygen atom in DD and DF and its adjacent carbon in the aromatic ring, are both oxidized (Figure 1.5), destroying the planar structure of dioxins from which their toxicity derives (Nojiri and Omori, 2002). This attack produces highly unstable hemiacetal products that spontaneously decay into intermediates that follow meta-cleavage ring fission and subsequent reactions until they are funneled into the central metabolism (Fortnagel et al., 1990; Wittich et al., 1992; Nojiri and Omori, 2002). In addition to the angular attack, dioxin dioxygenases contain an atypical electron transfer system consisting on a ferredoxin and a reductase that are more related to cytochrome P450 monooxygenases than to the Rieske nonheme iron dioxygenase systems (Armengaud and Timmis, 1997; Armengaud et al., 1998; Armengaud and Timmis, 1998).
Although DD, DF and biphenyl can be used by certain bacteria as carbon source, only their chlorinated derivatives PCDD, PCDF and PCBs are metabolized when chlorine atoms are only present in a single ring, using the carbon in the unsubstituted ring to grow (Ahmed and Focht, 1973). The metabolism of these congeners results in the production of aliphatic acids generated from the ring cleavage that are used for bacterial growth, and accumulation of dead-end chlorinated salicylic acids and catechols (Wilkes et al., 1996; Wittich et al., 1999; Nam et al., 2006). For example, Pseudomonas veronii PH-03 can grow with 1-chlorodibenzo-p-dioxin and 2-chlorodibenzo-p-dioxin as carbon source, growing on the aliphatic acids generated from the ring cleavage, but the dead products 2-chlorocatechol and 4-chlorocatechol, respectively, are accumulated (Hong et al., 2004). Highly chlorinated PCDD, PCDF and PCB congeners cannot support bacterial growth. However, they are still subjected to degradation by cometabolism (Keim et al., 1999; Nam et al., 2006; Seeger and Pieper, 2010).

Chapter I | General introduction
30
Figure 1.5 | Simplified schematic representation of angular dioxygenation of dibenzo-p-dioxin and dibenzofuran degradation pathway. Unstable compounds spontaneously degraded into other products are indicated in brackets.
Bioremediation of organic pollutants
The biodegradative potential exhibited by bacteria can be exploited to restore polluted sites, known as bioremediation and defined as “the process whereby organic wastes are biologically degraded under controlled conditions to an innocuous state, or to levels below concentration limits stablished by regulatory authorities” (Mueller et al., 1996). Although bioremediation is not limited to the use of bacteria (Pointing, 2001; Sinha et al., 2009), their ubiquitous presence in multiple and diverse environments and their huge metabolic abilities (Curtis et al., 2002; Paul et al., 2005), make them the preferred agents for bioremediation.

General introduction | Chapter I
31
Compared to chemical and physical remediation techniques, bioremediation is often less expensive, can result in complete elimination of the hazardous pollutant and is considered a sustainable environmental practice, since it stimulates natural processes (Russell, 1992; US EPA, 2008). However, bioremediation is limited to those chemicals that can be biodegraded and the presence of the microorganisms harboring the appropriate metabolic capabilities (Venosa, 1998). In fact, communities adapted to polluted environments can respond faster and with enhanced biodegradation rates than those communities that have not been exposed to pollution (Leahy and Colwell, 1990; Atlas and Bartha, 1998). The search for pollutant-degrading microorganisms, understanding their genetics, biochemistry and how the communities behave under polluted sites along with the development of new methods for their application in bioremediation processes, have become an important issue (Megharaj et al., 2011; Adams et al., 2015; Azubuike et al., 2016; Alegbeleye et al., 2017). Recent advances in metagenomics and whole-genome sequencing have resulted in a profound understanding of the microbial community dynamics in response to pollution and bioremediation treatments (Fuentes et al., 2016; Ribicic et al., 2018), and help to monitor and identify key genes involved in the bioremediation process, which increase our knowledge of the functional degradative potential of microbial communities (Techtmann and Hazen, 2016; Duarte et al., 2017; Bharagava et al., 2019).
Classification of bioremediation techniques
There are multiple bioremediation techniques that, depending on the nature of the pollutant and the environmental conditions, are better suited for the restoration of certain polluted sites. In general, these techniques can be divided according to the site of application into in situ and ex situ, depending whether the bioremediation techniques are applied in the site of pollution or the polluted site is removed and transported elsewhere in a contained environment (Azubuike et al., 2016). However, for most of the techniques, the decision of in situ or ex situ application depends on different factors rather than the technique itself, such as depth and degree of pollution, type of environment and location, cost and environmental policies (Philp and Atlas, 2005; Frutos et al., 2012). A list of bioremediation techniques is schematized in Figure 1.6 and briefly described below.

Chapter I | General introduction
32
Figure 1.6 | Classification of the main bioremediation techniques based on in situ and ex situ site of application. The divergence is hypothetical and do not represent technique development. Adapted from Azubuike et al., 2016.
a) Natural attenuation: Is an in situ technique that involves passive
remediation of polluted sites without human intervention. During natural attenuation, the pollutants are transformed into less harmful compounds or immobilized by autochthonous microbial aerobic and anaerobic processes (Smets and Pritchard, 2003). The absence of external intervention implies that the technique is less expensive (Mulligan and Yong, 2004), but it might require longer time to achieve the target level of pollutant concentration and must be monitored to demonstrate that bioremediation is ongoing (Clement et al., 2002).
b) Bioaugmentation: Consists in the addition of cultured microorganisms with the capacity to degrade target pollutants to supplement the indigenous populations and improve the degradation (Vogel, 1996). This technique can be applied when the autochthonous populations are not capable of degrading potential substrates present in complex mixtures (Leahy and Colwell, 1990), they are in low abundance, the speed of the decontamination is a major factor and when inoculation may reduce the lag period to start the bioremediation process (Adams et al., 2015). For this technique to be successful, the introduced microorganisms must be able to compete with indigenous populations and survive the foreign environmental
General introduction | Chapter I
33
conditions (Goldstein et al., 1985; Singer et al., 2005). The inoculum survival can be improved by encapsulating cells in a carrier (Gentry et al., 2004).
c) Biostimulation: Consists in the stimulation of indigenous microbial degradation by addition of nutrients (Atagana et al., 2003; Wolicka et al., 2009) or oxygen (Gallizia et al., 2004), or by manipulating environmental conditions such as pH, moisture, temperature and redox potential to enhance the effectiveness of these populations (Megharaj et al., 2011; Tyagi et al., 2011). Additionally, substrates to promote cometabolism can also be added in order to accelerate the biodegradation of pollutants (Kuo et al., 2004). There are multiple biostimulation techniques. Among them, biosparging, bioventing and bioslurping consist in the injection of air into the soil. In biosparging, air is injected into the saturated subsurface, below the lowest point of contamination, which causes an upward movement of volatile and semivolatile contaminant partitions to the unsaturated zone. As the oxygen concentration is increased, microbial degradation is stimulated (Philp and Atlas, 2005; Azubuike et al., 2016). Biosparging has been applied in aquifers for the removal of petroleum products (Kao et al., 2008). On the other hand, bioventing consists in the stimulation of indigenous microbial degradation by delivering oxygen into vadose (unsaturated) zones through airflow stimulation (Dupont, 1993). In bioventing, nutrients and moisture are often added to the subsurface to enhance biodegradation (Lee and Swindoll, 1993). Bioventing has been successfully used in the bioremediation of diesel and PAHs (Alleman et al., 1995; Downey et al., 1995). Bioventing can be combined with vacuum-enhanced pumping and soil vapor extraction in another technique named bioslurping. Bioslurping is designed to achieve soil and groundwater remediation by indirect provision of oxygen and stimulation of contaminant biodegradation (Place et al., 2003; Gidarakos and Aivalioti, 2007). Bioslurping systems recover free product such as light nonaqueous-phase liquids (LNAPLs) and bioremediate the unsaturated and saturated zones (Philp and Atlas, 2005). Aside from increasing the biodegradation by providing oxygen, another innovative in situ technique, electrobioremediation, uses a combination of bioremediation with electrokinetics to mobilize pollutants and soil-bound microorganisms by the application of a weak electric field to the soil (Wick et al., 2004; Wick et al., 2007). The mobilization of pollutants and indigenous microorganisms enhance their interaction and therefore the biodegradation (Acuña et al., 2012).

Chapter I | General introduction
34
d) Biopile: Consists in above-ground piling of excavated polluted soil, which can be amended with nutrients and/or moisture and arranged around aeration and irrigation systems to enhance aerobic microbial degradation activities (Philp and Atlas, 2005; Azubuike et al., 2016). Biopiles can incorporate heating systems to increase microbial activities and contaminant availability (Filler et al., 2001) and be combined with other techniques (Gomez and Sartaj, 2014). For instance, in ecopiling, biopile technique is further enhanced with phytoremediation, a bioremediation technique involving the use of plants (Germaine et al., 2015).
e) Composting: Is a technique that relay on periodic turning of piled polluted soil together with some organic, heat-generating material (Antizar-Ladislao et al., 2004; Philp and Atlas, 2005). The turning of the soil increase aeration and uniform distribution of pollutants and nutrients, which enhance the rate of bioremediation.
f) Bioreactor: Consists of a vessel where the biodegradation of the pollutant takes place under controlled settings that provide optimal conditions. Bioprocess parameters such as temperature, pH, agitation, aeration and substrate and inoculum concentrations are controlled and can be modified to enhance the bioremediation process (Azubuike et al., 2016). Bioreactors have been used to effectively remove petroleum hydrocarbon, PAHs and pesticides from soils and sediments (Plangklang and Reungsang, 2010; Mustafa et al., 2015; Chikere et al., 2016).
g) Landfarming: The basis of landfarming is the excavation or tilling of polluted soils that are deposited on a fixed layer support above the ground surface to allow aerobic biodegradation by autochthonous microorganisms (Philp and Atlas, 2005; Paudyn et al., 2008; Silva-Castro et al., 2015). Aeration, addition of nutrients and irrigation are the major operations that stimulate the bioremediation process. Landfarming is usually used for the bioremediation of hydrocarbon and PAH-polluted sites (Straube et al., 2003; Silva-Castro et al., 2015).
All the bioremediation techniques are therefore based upon (i) providing the optimal conditions to the microorganisms that will ultimately degrade the pollutants, including ensuring nutrients and making available the pollutants, or (ii) enhancing the bacterial communities that will degrade the pollutants.

General introduction | Chapter I
35
Environmental factors affecting bioremediation Aside of the characteristics of the microbial population (i.e. the presence of the appropriate catabolic machinery), several environmental factors can strongly influence the bioremediation process by inhibiting the growth of pollutant-degrading microorganisms. These include temperature, oxygen, pH, soil moisture, salinity and nutrients (Figure 1.7A). Temperature plays a significant role in defining the extent and rate of microbial metabolism of the organic pollutants. Temperature affects both, the solubility of pollutants and activity of the microorganisms (Venosa and Zhu, 2003). Solubility of petroleum hydrocarbons increases with increasing temperature, which also enhances bioavailability (Mohan et al., 2006). Conversely, increasing temperature reduces oxygen solubility and, in turn, inhibits the aerobic metabolism of microorganisms. Although bioremediation of hydrocarbons can occur at low temperatures (Margesin and Schinner, 1997), it is reported that in soils, 30-40 ºC is the optimal temperature for degradation, while in some freshwaters 20-30 ºC, and in marine environments 15-20 ºC (Bartha and Bossert, 1984; Cooney, 1984). Acidic and alkaline polluted environment also have a negative impact in bioremediation. It has been shown that adjusting pH values around neutral (pH of 7) increases the bioremediation rates (Dibble and Bartha, 1979). High salinity causes an increased sorption of aromatic hydrocarbons (Means, 1995), therefore reducing the bioavailability of aromatic organic pollutants and limiting the bioremediation (Rhykerd et al., 1995). Water is essential for diffusion of nutrients. In soils, it has been reported that the optimum aerobic degradation occurs with 25-85% of water holding capacity (Sims et al., 1990). Below 10%, a limitation of substrate supply causes a decrease in biodegradation rates (Ronen et al., 2000). On the other hand, excess of moisture significantly reduces soil gas permeability, which makes oxygen diffusion limited for aerobic metabolism (Børresen and Rike, 2007), thus reducing the rates of biodegradation. Nutrients present in polluted environments also are of extreme importance for an effective bioremediation. Pollution with organic compounds increases the supply of organic carbon but other nutrients, including nitrogen and phosphorus, become rapidly depleted during bacteria metabolism (Breedveld and Sparrevik, 2000). Addition of inorganic nutrients generally stimulate the microbial community and enhance bioremediation (Choi et al., 2002; Atagana et al., 2003). Although many polluted environments are characterized by adverse conditions regarding temperature, pH and high salt concentrations, extremophilic indigenous microorganisms with the ability to degrade organic pollutants have been found in

Chapter I | General introduction
36
such environments (Margesin and Schinner, 2001), which are of great interest for the bioremediation of polluted extreme habitats.
Figure 1.7 | Schematic representation of the environmental factors (A), bioavailability (B) and biotic factors (C) affecting the bioremediation process in a hypothetical soil environment. OM, organic matter. Adapted from Luthy et al, 1997.
Bioavailability is regarded as one of the most important factors involved in efficient bioremediation. In terms of bioremediation, bioavailability can be defined as “the extent to which a contaminant is available for biological conversion which is a function of the biological system, physicochemical properties of the contaminant and environmental factors” (Naidu et al., 2008). The bioavailability of organic pollutants is negatively affected by several factors including water solubility, sorption, matrix composition and partitioning into LNAPLs (Juhasz et al., 2000; Maier, 2000). Organic pollutants, such as aliphatic hydrocarbons and

General introduction | Chapter I
37
PAHs are hydrophobic chemicals with low water solubility and strong sorption capacity to the surface of minerals and organic matter (Figure 1.7B), thus reducing their accessibility for microbial degradation (Volkering et al., 1993; Ghosh et al., 2000; Xia and Pignatello, 2001). Physical exclusion of bacteria from the microporous domain of structured porous media also limits the bioavailability of pollutants (Killham et al., 1993; Maier, 2000). The longer the pollutant is in contact with the soil matrix, the more irreversible the sorption, process, known as “aging”, which significatively reduces its bioavailability (Hatzinger and Alexander, 1995; Alexander, 2000). However, microorganisms are known to produce several types of surfactant compounds, such as rhamnolipids, which enhances hydrocarbon pollutants desorption and therefore, increases bioavailability and biodegradation (Rahman et al., 2003; Congiu and Ortega-Calvo, 2014).
Challenges of bacterial community enhancement The bioremediation process relies on the biodegradation capabilities of the microorganisms present in the polluted environment. However, natural populations are not always capable of efficiently degrade a wide range of pollutants present in complex mixtures, such as petroleum hydrocarbons (Leahy et al., 1990). Bioaugmentation could be a solution by supplementing the existing microbial communities in order to improve its functionality and hence, the bioremediation process. However, the introduction of microorganisms into the environment for bioremediation purposes has proven challenging, with many failed attempts reported (Bouchez et al., 2000; Wagner-Dobler, 2003; Thompson et al., 2005). Survival of the inoculant into the environment depends on the ability of the isolated strains to face abiotic and biotic factors (Figure 1.7AC). Among the biotic factors, predation by protozoa, bacteriophage infection and inability to efficiently form biofilms (Figure 1.7C) have been reported to be the cause of bioaugmentation failures (Songzhe et al., 2009; Ellegaard-Jensen et al., 2016). Furthermore, chemotaxis towards pollutants also affects the bioremediation process (Singh and Olson, 2008). Nevertheless, these traits are usually ignored when isolating strains for bioaugmentation purposes, focusing only in their pollutant’s degradation potential. These other traits are required to survive the environmental conditions and to compete with indigenous populations (Thompson et al., 2005). Therefore, the selection of the appropriate microorganism(s) should consider several features, including ease of culture, fast growth, the ability to withstand high concentration

Chapter I | General introduction
38
of pollutants, high potential for the pollutant degradation and high resistance to environmental stresses (Thompson et al., 2005; Mrozik and Piotrowska-Seget, 2010). On the other hand, depending on the isolation origin of the inoculants, three different approaches can be distinguished (Semrany et al., 2012):
a) Autochthonous (indigenous) bioaugmentation: Consists in the isolation of microorganisms from a polluted site (mainly by enrichment culture techniques) and reintroducing them into the same site, i.e. reinoculation (Vecchioli et al., 1990). This is used if lack of biodegradation is attributed to low biomass or high toxicity of the pollutant.
b) Allochthonous bioaugmentation: Microorganisms are isolated elsewhere, after which they are introduced into the targeted site. This approach is less likely to succeed due to inadequate adaption to the abiotic and biotic conditions of the new environment (Mrozik and Piotrowska-Seget, 2010). However, cell immobilization techniques can maintain a bioaugmented seed in a hostile environment (Nwankwegu and Onwosi, 2017).
c) Gene bioaugmentation: Involves the use of genetically engineered microorganisms (GEMs) harboring genes responsible for desired functions (Monti et al., 2005; Mrozik et al., 2011), the introduction of versatile plasmid carrier bacteria (Inoue et al., 2012), or the direct introduction of catabolic vectors into the environment (Zhang et al., 2012; Gao et al., 2015).
Although bioaugmentation with single cultured strains has proven to enhance the bioremediation of several pollutants compared to non-inoculated controls (Dams et al., 2007; Niu et al., 2009), different studies indicate that application of heterogenous consortia is more powerful than single strains by the presence of complementary degradative pathways (Heinaru et al., 2005; Jacques et al., 2008) and redundant functions, which increases the resilience and stability of the community (Loreau et al., 2001). Furthermore, the reintroduction of strains or consortia derived from a population that is already present in a certain environment is more likely to survive than allochthonous strains that might be completely foreign to such environment (Belotte et al., 2003; Thompson et al., 2005). For this purpose, next-generation sequencing (NGS) and specifically metagenomics can help to characterize the populations, monitor, and identify critical factors to facilitate an efficient bioremediation process.

General introduction | Chapter I
39
NGS and metagenomics Next-generation sequencing technologies allow the analysis of biomolecules such as DNA and RNA extracted directly from the environment, thus reducing the loss of information resulting from culture-dependent methods. This is of extreme importance because it is estimated that only a small fraction of microorganisms can be cultivated under laboratory conditions (Hugenholtz, 2002; Singh, 2010). Sequencing of environmental DNA (metagenomics) can serve to analyze the prokaryotic and eukaryotic community structure and diversity of a variety of environments and how they change in response to different conditions. Also, metagenomics can provide information about the involvement of certain organisms in different processes (Mukherjee and Chattopadhyay, 2017).
Usually, metagenomic approaches are either targeted to a specific gene or shotgun (for a review, see Oulas et al., 2015). Targeted metagenomics (microbiomics) are commonly based in sequencing PCR amplicons of a single gene from environmental DNA. The 16S rRNA gene for prokaryotes and the 18S rRNA gene or the internal transcribed spacer (ITS) sequence for eukaryotes and fungi, respectively, are the most widely used markers in targeted metagenomics. Further analysis allows to investigate both the phylogenetic diversity and their relative abundance (Techtmann and Hazen, 2016). This approach has been recently used to characterize the bacterial taxa that dominate soils worldwide (Delgado-Baquerizo et al., 2018) and the bacterial populations present in oil-contaminated soils (Sun et al., 2015). Metagenomic shotgun sequencing, on the other hand, is aimed to sequence the total genomic content of a sample and is powerful to identify the functional potential of a community by gaining information of the genes present in the sample. However, this approach is limited by the depth of sequencing and a good coverage of the entire genomic content, which is usually achieved in the dominant populations but those with low abundance are lightly covered (Quince et al., 2017). Another important factor is that many genes derived from metagenomic shotgun sequencing do not have homologous sequences or are of unknown function in the current sequence databases, thus limiting the functional knowledge that can be obtained (Delmont et al., 2012). Frequently, targeted and shotgun metagenomic approaches are used in combination to associate the abundance of different taxa with a specific function. For example, the most abundant taxa in biopile treatments of artic diesel-polluted soils showed a higher presence of genes involved in the aerobic metabolism of hydrocarbons (Jung et al., 2016). The combined

Chapter I | General introduction
40
metagenomic techniques have also allowed the elucidation of the functional role performed by the non-cultivable and predominant cyanobacteria Oceanospirillales sp. in the Deepwater Horizon oil spill accident that occurred in the Gulf of Mexico in 2010 (Mason et al., 2012).
These examples, among others, evidence the high potential of metagenomic techniques in bioremediation processes, from characterizing the bacterial populations and monitoring the changes they undergo under polluted conditions and bioremediation treatments, to functional elucidation of the roles these communities play in such and other environments.
References Abbasian, F., Lockington, R., Mallavarapu, M., and Naidu, R. (2015). A comprehensive
review of aliphatic hydrocarbon biodegradation by bacteria. Applied biochemistry and biotechnology 176, 670-699.
Abbasian, F., Lockington, R., Megharaj, M., and Naidu, R. (2016). The biodiversity changes in the microbial population of soils contaminated with crude oil. Current microbiology 72, 663-670.
Acuña, A.J., Pucci, O.H., and Pucci, G.N. (2012). Electrobioremediation of hydrocarbon contaminated soil from Patagonia Argentina. InTech New Tech Oil Gas Ind, 29-48.
Adams, G.O., Fufeyin, P.T., Okoro, S.E., and Ehinomen, I. (2015). Bioremediation, biostimulation and bioaugmention: a review. International Journal of Environmental Bioremediation & Biodegradation 3, 28-39.
Afshan, S., Ali, S., Ameen, U.S., Farid, M., Bharwana, S.A., Hannan, F., and Ahmad, R. (2014). Effect of different heavy metal pollution on fish. Research Journal of Chemical and Environmental Sciences 2, 74-79.
Ahmad, M.S.A., and Ashraf, M. (2012). "Essential roles and hazardous effects of nickel in plants" in Reviews of environmental contamination and toxicology. Springer, 125-167.
Ahmed, M., and Focht, D. (1973). Degradation of polychlorinated biphenyls by two species of Achromobacter. Canadian Journal of Microbiology 19, 47-52.
Alegbeleye, O.O., Opeolu, B.O., and Jackson, V.A. (2017). Polycyclic aromatic hydrocarbons: a critical review of environmental occurrence and bioremediation. Environmental management 60, 758-783.
Alexander, M. (2000). Aging, bioavailability, and overestimation of risk from environmental pollutants. Environmental science & technology 34, 4259-4265.
Alleman, B.C., Hinchee, R., Brenner, R., and Mccauley, P. (1995). "Bioventing PAH contamination at the Reilly tar site" in In situ aeration: Air sparging, bioventing, and related remediation process. Battelle Press, Columbus, OH (United States).
Annweiler, E., Richnow, H., Antranikian, G., Hebenbrock, S., Garms, C., Franke, S., Francke, W., and Michaelis, W. (2000). Naphthalene degradation and incorporation of naphthalene-derived carbon into biomass by the thermophile Bacillus thermoleovorans. Appl. Environ. Microbiol. 66, 518-523.

General introduction | Chapter I
41
Antizar-Ladislao, B., Lopez-Real, J., and Beck, A. (2004). Bioremediation of polycyclic aromatic hydrocarbon (PAH)-contaminated waste using composting approaches. Critical Reviews in Environmental Science and Technology 34, 249-289.
Armengaud, J., Happe, B., and Timmis, K.N. (1998). Genetic analysis of dioxin dioxygenase of Sphingomonas sp. strain RW1: catabolic genes dispersed on the genome. Journal of Bacteriology 180, 3954-3966.
Armengaud, J., and Timmis, K.N. (1997). Molecular Characterization of Fdx1, a Putidaredoxin‐Type [2Fe‐2S] Ferredoxin Able to Transfer Electrons to the Dioxin Dioxygenase of Sphingomonas sp. RW1. European journal of biochemistry 247, 833-842.
Armengaud, J., and Timmis, K.N. (1998). The reductase RedA2 of the multi‐component dioxin dioxygenase system of Sphingomonas sp. RW1 is related to class‐I cytochrome P450‐type reductases. European journal of biochemistry 253, 437-444.
Atagana, H., Haynes, R., and Wallis, F. (2003). Optimization of soil physical and chemical conditions for the bioremediation of creosote-contaminated soil. Biodegradation 14, 297-307.
Atlas, R., and Bartha, R. (1998). Microbiology Ecology, Fundamentals and Applications. Addison-Wesley Publishing Company, Massachusetts.
Azubuike, C.C., Chikere, C.B., and Okpokwasili, G.C. (2016). Bioremediation techniques–classification based on site of application: principles, advantages, limitations and prospects. World Journal of Microbiology and Biotechnology 32, 180.
Badham, H.J., and Winn, L.M. (2009). In utero exposure to benzene disrupts fetal hematopoietic progenitor cell growth via reactive oxygen species. Toxicological sciences 113, 207-215.
Baker, R.K., Kurz, E.U., Pyatt, D.W., Irons, R.D., and Kroll, D.J. (2001). Benzene metabolites antagonize etoposide-stabilized cleavable complexes of DNA topoisomerase IIα. Blood 98, 830-833.
Balasubramanian, R., Smith, S.M., Rawat, S., Yatsunyk, L.A., Stemmler, T.L., and Rosenzweig, A.C. (2010). Oxidation of methane by a biological dicopper centre. Nature 465, 115.
Bamforth, S.M., and Singleton, I. (2005). Bioremediation of polycyclic aromatic hydrocarbons: current knowledge and future directions. Journal of Chemical Technology & Biotechnology: International Research in Process, Environmental & Clean Technology 80, 723-736.
Bartha, R., and Bossert, I. (1984). The Treatment and Disposal of Petroleum Wastes. Petroleum Microbiology, RM, Atlas, Ed. Macmillan, New York, NY, USA.
Bayat, J., Hashemi, S.H., Khoshbakht, K., and Deihimfard, R. (2016). Fingerprinting aliphatic hydrocarbon pollutants over agricultural lands surrounding Tehran oil refinery. Environmental monitoring and assessment 188, 612.
Belotte, D., Curien, J.B., Maclean, R.C., and Bell, G. (2003). An experimental test of local adaptation in soil bacteria. Evolution 57, 27-36.
Berge, G., Mollerup, S., Øvrebø, S., Hewer, A., Phillips, D.H., Eilertsen, E., and Haugen, A. (2004). Role of estrogen receptor in regulation of polycyclic aromatic hydrocarbon metabolic activation in lung. Lung Cancer 45, 289-297.
Bharagava, R.N., Purchase, D., Saxena, G., and Mulla, S.I. (2019). "Applications of metagenomics in microbial bioremediation of pollutants: From genomics to

Chapter I | General introduction
42
environmental cleanup" in Microbial diversity in the genomic era. Elsevier, 459-477.
Bihari, Z., Szvetnik, A., Szabó, Z., Blastyák, A., Zombori, Z., Balázs, M., and Kiss, I. (2011). Functional analysis of long-chain n-alkane degradation by Dietzia spp. FEMS microbiology letters 316, 100-107.
Blake, B.L. (2004). Toxicology of the nervous system. A textbook of modern toxicology, 279-297.
Bobbink, R., Hicks, K., Galloway, J., Spranger, T., Alkemade, R., Ashmore, M., Bustamante, M., Cinderby, S., Davidson, E., and Dentener, F. (2010). Global assessment of nitrogen deposition effects on terrestrial plant diversity: a synthesis. Ecological applications 20, 30-59.
Bollati, V., Baccarelli, A., Hou, L., Bonzini, M., Fustinoni, S., Cavallo, D., Byun, H.M., Jiang, J., Marinelli, B., and Pesatori, A.C. (2007). Changes in DNA methylation patterns in subjects exposed to low-dose benzene. Cancer research 67, 876-880.
Børresen, M., and Rike, A. (2007). Effects of nutrient content, moisture content and salinity on mineralization of hexadecane in an Arctic soil. Cold regions science and technology 48, 129-138.
Bouchez, T., Patureau, D., Dabert, P., Juretschko, S., Dore, J., Delgenes, P., Moletta, R., and Wagner, M. (2000). Ecological study of a bioaugmentation failure. Environmental Microbiology 2, 179-190.
Breedveld, G.D., and Sparrevik, M. (2000). Nutrient-limited biodegradation of PAH in various soil strata at a creosote contaminated site. Biodegradation 11, 391-399.
Brezna, B., Kweon, O., Stingley, R.L., Freeman, J.P., Khan, A.A., Polek, B., Jones, R.C., and Cerniglia, C.E. (2006). Molecular characterization of cytochrome P450 genes in the polycyclic aromatic hydrocarbon degrading Mycobacterium vanbaalenii PYR-1. Applied microbiology and biotechnology 71, 522.
Brink, R.H., Thom, G.T., and Partymiller, K.G. (1983). Environmental Transport and Transformation of Polchlorinated Biphenyls. US Environmental Protection Agency.
Bücker, M., Glatt, H., Platt, K., Avnir, D., Ittah, Y., Blum, J., and Oesch, F. (1979). Mutagenicity of phenanthrene and phenanthrene K-region derivatives. Mutation Research/Genetic Toxicology 66, 337-348.
Bünemann, E.K., Schwenke, G., and Van Zwieten, L. (2006). Impact of agricultural inputs on soil organisms—a review. Soil Research 44, 379-406.
Burczynski, M.E., and Penning, T.M. (2000). Genotoxic polycyclic aromatic hydrocarbon ortho-quinones generated by aldo-keto reductases induce CYP1A1 via nuclear translocation of the aryl hydrocarbon receptor. Cancer research 60, 908-915.
Bustamante, M., Duran, N., and Diez, M. (2012). Biosurfactants are useful tools for the bioremediation of contaminated soil: a review. Journal of soil science and plant nutrition 12, 667-687.
Butler, C.S., and Mason, J.R. (1996). "Structure-function analysis of the bacterial aromatic ring-hydroxylating dioxygenases" in Advances in microbial physiology. Elsevier, 47-84.
Cachada, A., Rocha-Santos, T., and Duarte, A.C. (2018). "Soil and pollution: an introduction to the main issues" in Soil pollution. Elsevier, 1-28.

General introduction | Chapter I
43
Cámara, B., Herrera, C., González, M., Couve, E., Hofer, B., and Seeger, M. (2004). From PCBs to highly toxic metabolites by the biphenyl pathway. Environmental Microbiology 6, 842-850.
Casellas, M., Grifoll, M., Bayona, J.M., and Solanas, A.M. (1997). New metabolites in the degradation of fluorene by Arthrobacter sp. strain F101. Appl. Environ. Microbiol. 63, 819-826.
Centers for Disease Control and Prevention (2015). Acute radiation syndrome: a fact sheet for clinicians. Center for Preparedness and Response (CPR): Georiga, 2017a [cited 16 November 2017]. Available from: https://emergency.cdc.gov/ radiation/arsphysicianfactsheet.asp.
Cerniglia, C.E. (1993). Biodegradation of polycyclic aromatic hydrocarbons. Current opinion in biotechnology 4, 331-338.
Clement, T.P., Truex, M.J., and Lee, P. (2002). A case study for demonstrating the application of US EPA's monitored natural attenuation screening protocol at a hazardous waste site. Journal of Contaminant Hydrology 59, 133-162.
Congiu, E., and Ortega-Calvo, J.J. (2014). Role of desorption kinetics in the rhamnolipid-enhanced biodegradation of polycyclic aromatic hydrocarbons. Environmental science & technology 48, 10869-10877.
Coon, M.J. (2005). Omega oxygenases: nonheme-iron enzymes and P450 cytochromes. Biochemical and biophysical research communications 338, 378-385.
Cooney, J. (1984). The fate of petroleum pollutants in freshwater ecosystems. Council Directive 2004/42/Ce (2004). "Directive 2004/42/CE of the European Parliament
and of the Council of 21 April 2004 on the limitation of emissions of volatile organic compounds due to the use of organic solvents in certain paints and varnishes and vehicle refinishing products amending Directive 1999/13/EC" in Official Journal of the European Union L.
Ćujić, M., Dragović, S., Đorđević, M., Dragović, R., Gajić, B., and Miljanić, Š. (2015). Radionuclides in the soil around the largest coal-fired power plant in Serbia: radiological hazard, relationship with soil characteristics and spatial distribution. Environmental Science and Pollution Research 22, 10317-10330.
Curtis, T.P., Sloan, W.T., and Scannell, J.W. (2002). Estimating prokaryotic diversity and its limits. Proceedings of the National Academy of Sciences 99, 10494-10499.
Chaerun, S.K., Tazaki, K., Asada, R., and Kogure, K. (2004). Bioremediation of coastal areas 5 years after the Nakhodka oil spill in the Sea of Japan: isolation and characterization of hydrocarbon-degrading bacteria. Environment International 30, 911-922.
Chaineau, C., Morel, J.-L., and Oudot, J. (1997). Phytotoxicity and plant uptake of fuel oil hydrocarbons. Journal of Environmental Quality 26, 1478-1483.
Chan, S.I., Chen, K.H.C., Yu, S.S.F., Chen, C.L., and Kuo, S.S.J. (2004). Toward delineating the structure and function of the particulate methane monooxygenase from methanotrophic bacteria. Biochemistry 43, 4421-4430.
Chapman, P.M. (2007). Determining when contamination is pollution—weight of evidence determinations for sediments and effluents. Environment International 33, 492-501.
Cheesbrough, T.M., and Kolattukudy, P. (1988). Microsomal preparation from an animal tissue catalyzes release of carbon monoxide from a fatty aldehyde to generate an alkane. Journal of Biological Chemistry 263, 2738-2743.

Chapter I | General introduction
44
Chelinho, S., Sautter, K.D., Cachada, A., Abrantes, I., Brown, G., Duarte, A.C., and Sousa, J.P. (2011). Carbofuran effects in soil nematode communities: Using trait and taxonomic based approaches. Ecotoxicology and environmental safety 74, 2002-2012.
Chen, C.S., Hseu, Y.C., Liang, S.H., Kuo, J.Y., and Chen, S.C. (2008). Assessment of genotoxicity of methyl-tert-butyl ether, benzene, toluene, ethylbenzene, and xylene to human lymphocytes using comet assay. Journal of hazardous materials 153, 351-356.
Chikere, C.B., Okoye, A.U., and Okpokwasili, G.C. (2016). Microbial community profiling of active oleophilic bacteria involved in bioreactor-based crude-oil polluted sediment treatment. Journal of Applied and Environmental Microbiology 4, 1-20.
Choi, S.C., Kwon, K.K., Sohn, J.H., and Kim, S.J. (2002). Evaluation of fertilizer additions to stimulate oil biodegradation in sand seashore mesocosms. Journal of microbiology and biotechnology 12, 431-436.
Dams, R., Paton, G., and Killham, K. (2007). Bioaugmentation of pentachlorophenol in soil and hydroponic systems. International Biodeterioration & Biodegradation 60, 171-177.
Deardorff, T., Karch, N., and Holm, S. (2008). Dioxin levels in ash and soil generated in Southern California fires. Organohalogen Compd 70, 2284-2288.
Delgado-Baquerizo, M., Oliverio, A.M., Brewer, T.E., Benavent-González, A., Eldridge, D.J., Bardgett, R.D., Maestre, F.T., Singh, B.K., and Fierer, N. (2018). A global atlas of the dominant bacteria found in soil. Science 359, 320-325.
Delmont, T.O., Simonet, P., and Vogel, T.M. (2012). Describing microbial communities and performing global comparisons in the ‘omic era. The ISME journal 6, 1625.
Dibble, J., and Bartha, R. (1979). Effect of environmental parameters on the biodegradation of oil sludge. Appl. Environ. Microbiol. 37, 729-739.
Doelsch, E., Saint Macary, H., and Van De Kerchove, V. (2006). Sources of very high heavy metal content in soils of volcanic island (La Réunion). Journal of Geochemical Exploration 88, 194-197.
Downey, D.C., Guest, P.R., and Ratz, J.W. (1995). Results of a two‐year in situ bioventing demonstration. Environmental progress 14, 121-125.
Duarte, M., Nielsen, A., Camarinha‐Silva, A., Vilchez‐Vargas, R., Bruls, T., Wos‐Oxley, M.L., Jauregui, R., and Pieper, D.H. (2017). Functional soil metagenomics: elucidation of polycyclic aromatic hydrocarbon degradation potential following 12 years of in situ bioremediation. Environmental microbiology 19, 2992-3011.
Dubbels, B.L., Sayavedra-Soto, L.A., and Arp, D.J. (2007). Butane monooxygenase of ‘Pseudomonas butanovora’: purification and biochemical characterization of a terminal-alkane hydroxylating diiron monooxygenase. Microbiology 153, 1808-1816.
Dubrovskaya, E., Pozdnyakova, N., Muratova, A.Y., and Turkovskaya, O. (2016). Changes in phytotoxicity of polycyclic aromatic hydrocarbons in the course of microbial degradation. Russian journal of plant physiology 63, 172-179.
Dupont, R.R. (1993). Fundamentals of bioventing applied to fuel contaminated sites. Environmental progress 12, 45-53.
El-Taher, A., Makhluf, S., Nossair, A., and Halim, A.A. (2010). Assessment of natural radioactivity levels and radiation hazards due to cement industry. Applied Radiation and Isotopes 68, 169-174.

General introduction | Chapter I
45
Ellegaard-Jensen, L., Albers, C.N., and Aamand, J. (2016). Protozoa graze on the 2,6-dichlorobenzamide (BAM)-degrading bacterium Aminobacter sp. MSH1 introduced into waterworks sand filters. Applied microbiology and biotechnology 100, 8965-8973.
Elliott, S.J., Zhu, M., Tso, L., Nguyen, H.H.T., Yip, J.H.K., and Chan, S.I. (1997). Regio-and stereoselectivity of particulate methane monooxygenase from Methylococcus capsulatus (Bath). Journal of the American Chemical Society 119, 9949-9955.
FAO and ITPS (2015). Status of the world’s soil resources (SWSR) – main report. Rome, Italy: Food and agriculture organization of the United Nations and Intergovernmental Technical Panel on Soils.
FAO and ITPS (2017). Global assessment of the impact of plant protection products on soil functions and soil ecosystems. Rome, Italy: Food and agriculture organization of the United Nations/Global Soil Partnership and Intergovernmental Technical Panel on Soils.
Feng, L., Wang, W., Cheng, J., Ren, Y., Zhao, G., Gao, C., Tang, Y., Liu, X., Han, W., and Peng, X. (2007). Genome and proteome of long-chain alkane degrading Geobacillus thermodenitrificans NG80-2 isolated from a deep-subsurface oil reservoir. Proceedings of the National Academy of Sciences 104, 5602-5607.
Ferraro, D.J., Gakhar, L., and Ramaswamy, S. (2005). Rieske business: structure–function of Rieske non-heme oxygenases. Biochemical and biophysical research communications 338, 175-190.
Ferraro, D.J., Okerlund, A.L., Mowers, J.C., and Ramaswamy, S. (2006). Structural basis for regioselectivity and stereoselectivity of product formation by naphthalene 1,2-dioxygenase. Journal of bacteriology 188, 6986-6994.
Fiedler, H., Kallenborn, R., De Boer, J., and Sydnes, L.K. (2019). The Stockholm Convention: A Tool for the Global Regulation of Persistent Organic Pollutants. Chemistry International 41, 4-11.
Filler, D.M., Lindstrom, J.E., Braddock, J.F., Johnson, R.A., and Nickalaski, R. (2001). Integral biopile components for successful bioremediation in the Arctic. Cold Regions Science and Technology 32, 143-156.
Flora, S., Mittal, M., and Mehta, A. (2008). Heavy metal induced oxidative stress & its possible reversal by chelation therapy. Indian Journal of Medical Research 128, 501.
Fortnagel, P., Harms, H., Wittich, R.-M., Krohn, S., Meyer, H., Sinnwell, V., Wilkes, H., and Francke, W. (1990). Metabolism of dibenzofuran by Pseudomonas sp. strain HH69 and the mixed culture HH27. Appl. Environ. Microbiol. 56, 1148-1156.
Fox, J.E., Gulledge, J., Engelhaupt, E., Burow, M.E., and Mclachlan, J.A. (2007). Pesticides reduce symbiotic efficiency of nitrogen-fixing rhizobia and host plants. Proceedings of the National Academy of Sciences 104, 10282-10287.
Fritt-Rasmussen, J., Jensen, P.E., Christensen, R.H.B., and Dahllöf, I. (2012). Hydrocarbon and toxic metal contamination from tank installations in a northwest Greenlandic village. Water, Air, & Soil Pollution 223, 4407-4416.
Frutos, F.G., Pérez, R., Escolano, O., Rubio, A., Gimeno, A., Fernandez, M., Carbonell, G., Perucha, C., and Laguna, J. (2012). Remediation trials for hydrocarbon-contaminated sludge from a soil washing process: Evaluation of bioremediation technologies. Journal of hazardous materials 199, 262-271.

Chapter I | General introduction
46
Fuentes, S., Barra, B., Caporaso, J.G., and Seeger, M. (2016). From rare to dominant: a fine-tuned soil bacterial bloom during petroleum hydrocarbon bioremediation. Appl. Environ. Microbiol. 82, 888-896.
Gallizia, I., Vezzulli, L., and Fabiano, M. (2004). Oxygen supply for biostimulation of enzymatic activity in organic-rich marine ecosystems. Soil Biology and Biochemistry 36, 1645-1652.
Gao, C., Jin, X., Ren, J., Fang, H., and Yu, Y. (2015). Bioaugmentation of DDT-contaminated soil by dissemination of the catabolic plasmid pDOD. Journal of Environmental Sciences 27, 42-50.
Gentry, T., Rensing, C., and Pepper, I. (2004). New approaches for bioaugmentation as a remediation technology. Critical reviews in environmental science and technology 34, 447-494.
Germaine, K.J., Byrne, J., Liu, X., Keohane, J., Culhane, J., Lally, R.D., Kiwanuka, S., Ryan, D., and Dowling, D.N. (2015). Ecopiling: a combined phytoremediation and passive biopiling system for remediating hydrocarbon impacted soils at field scale. Frontiers in plant science 5, 756.
Ghosal, D., Ghosh, S., Dutta, T.K., and Ahn, Y. (2016). Current state of knowledge in microbial degradation of polycyclic aromatic hydrocarbons (PAHs): a review. Frontiers in microbiology 7, 1369.
Ghosh, U., Gillette, J.S., Luthy, R.G., and Zare, R.N. (2000). Microscale location, characterization, and association of polycyclic aromatic hydrocarbons on harbor sediment particles. Environmental Science & Technology 34, 1729-1736.
Gidarakos, E., and Aivalioti, M. (2007). Large scale and long term application of bioslurping: the case of a Greek petroleum refinery site. Journal of hazardous materials 149, 574-581.
Gill, C., and Ratledge, C. (1972). Effect of n-alkanes on the transport of glucose in Candida sp. strain 107. Biochemical Journal 127, 59P.
Goldstein, R., Mallory, L., and Alexander, M. (1985). Reasons for possible failure of inoculation to enhance biodegradation. Appl. Environ. Microbiol. 50, 977-983.
Gomez, F., and Sartaj, M. (2014). Optimization of field scale biopiles for bioremediation of petroleum hydrocarbon contaminated soil at low temperature conditions by response surface methodology (RSM). International Biodeterioration & Biodegradation 89, 103-109.
Goodhead, D.T. (1994). Initial events in the cellular effects of ionizing radiations: clustered damage in DNA. International journal of radiation biology 65, 7-17.
Gordon, T., and Amdur, M.O. (1991). Responses of the respiratory system to toxic agents. Casarett and Doull’s Toxicology 4, 391-392.
Habe, H., Chung, J.-S., Lee, J.-H., Kasuga, K., Yoshida, T., Nojiri, H., and Omori, T. (2001). Degradation of chlorinated dibenzofurans and dibenzo-p-dioxins by two types of bacteria having angular dioxygenases with different features. Appl. Environ. Microbiol. 67, 3610-3617.
Haigler, B.E., and Gibson, D.T. (1990a). Purification and properties of ferredoxinNAP, a component of naphthalene dioxygenase from Pseudomonas sp. strain NCIB 9816. Journal of bacteriology 172, 465-468.
Haigler, B.E., and Gibson, D.T. (1990b). Purification and properties of NADH-ferredoxinNAP reductase, a component of naphthalene dioxygenase from Pseudomonas sp. strain NCIB 9816. Journal of bacteriology 172, 457-464.

General introduction | Chapter I
47
Halden, R.U., and Dwyer, D.F. (1997). Biodegradation of dioxin-related compounds: a review. Bioremediation Journal 1, 11-25.
Halsey, K.H., Sayavedra-Soto, L.A., Bottomley, P.J., and Arp, D.J. (2006). Site-directed amino acid substitutions in the hydroxylase α subunit of butane monooxygenase from Pseudomonas butanovora: implications for substrates knocking at the gate. Journal of bacteriology 188, 4962-4969.
Hamamura, N., Storfa, R.T., Semprini, L., and Arp, D.J. (1999). Diversity in butane monooxygenases among butane-grown bacteria. Appl. Environ. Microbiol. 65, 4586-4593.
Hamamura, N., Yeager, C.M., and Arp, D.J. (2001). Two Distinct Monooxygenases for Alkane Oxidation in Nocardioides sp. Strain CF8. Appl. Environ. Microbiol. 67, 4992-4998.
Hara, A., Syutsubo, K., and Harayama, S. (2003). Alcanivorax which prevails in oil‐contaminated seawater exhibits broad substrate specificity for alkane degradation. Environmental Microbiology 5, 746-753.
Haritash, A., and Kaushik, C. (2009). Biodegradation aspects of polycyclic aromatic hydrocarbons (PAHs): a review. Journal of hazardous materials 169, 1-15.
Hatzinger, P.B., and Alexander, M. (1995). Effect of aging of chemicals in soil on their biodegradability and extractability. Environmental science & technology 29, 537-545.
Hazen, T.C. (2018). Cometabolic bioremediation. Consequences of Microbial Interactions with Hydrocarbons, Oils, and Lipids: Biodegradation and Bioremediation, 1-15.
Heinaru, E., Merimaa, M., Viggor, S., Lehiste, M., Leito, I., Truu, J., and Heinaru, A. (2005). Biodegradation efficiency of functionally important populations selected for bioaugmentation in phenol- and oil-polluted area. FEMS microbiology ecology 51, 363-373.
Hong, H.B., Nam, I.H., Murugesan, K., Kim, Y.M., and Chang, Y.S. (2004). Biodegradation of dibenzo-p-dioxin, dibenzofuran, and chlorodibenzo-p-dioxins by Pseudomonas veronii PH-03. Biodegradation 15, 303-313.
Hooda, P. (2010). Trace elements in soils. John Wiley & Sons. Huff, J. (2007). Benzene-induced cancers: abridged history and occupational health impact.
International journal of occupational and environmental health 13, 213-221. Hugenholtz, P. (2002). Exploring prokaryotic diversity in the genomic era. Genome biology
3, reviews0003. 0001. Inoue, D., Yamazaki, Y., Tsutsui, H., Sei, K., Soda, S., Fujita, M., and Ike, M. (2012).
Impacts of gene bioaugmentation with pJP4-harboring bacteria of 2,4-D-contaminated soil slurry on the indigenous microbial community. Biodegradation 23, 263-276.
Jacques, R.J., Okeke, B.C., Bento, F.M., Teixeira, A.S., Peralba, M.C., and Camargo, F.A. (2008). Microbial consortium bioaugmentation of a polycyclic aromatic hydrocarbons contaminated soil. Bioresource Technology 99, 2637-2643.
Jaishankar, M., Tseten, T., Anbalagan, N., Mathew, B.B., and Beeregowda, K.N. (2014). Toxicity, mechanism and health effects of some heavy metals. Interdisciplinary toxicology 7, 60-72.
Jayaraj, R., Megha, P., and Sreedev, P. (2016). Organochlorine pesticides, their toxic effects on living organisms and their fate in the environment. Interdisciplinary toxicology 9, 90-100.

Chapter I | General introduction
48
Ji, Y., Mao, G., Wang, Y., and Bartlam, M. (2013). Structural insights into diversity and n-alkane biodegradation mechanisms of alkane hydroxylases. Front Microbiol 4, 58.
Johnson, E.L., and Hyman, M.R. (2006). Propane and n-butane oxidation by Pseudomonas putida GPo1. Appl. Environ. Microbiol. 72, 950-952.
Juhasz, A., Megharaj, M., and Naidu, R. (2000). Bioavailability: the major challenge (constraint) to bioremediation of organically contaminated soils. Environmental Science And Pollution Control Series, 217-242.
Jung, J., Philippot, L., and Park, W. (2016). Metagenomic and functional analyses of the consequences of reduction of bacterial diversity on soil functions and bioremediation in diesel-contaminated microcosms. Scientific reports 6, 23012.
Kabata-Pendias, A., and Mukherjee, A.B. (2007). Trace elements from soil to human. Springer Science & Business Media.
Käfferlein, H.U., Marczynski, B., Mensing, T., and Brüning, T. (2010). Albumin and hemoglobin adducts of benzo [a] pyrene in humans—analytical methods, exposure assessment, and recommendations for future directions. Critical reviews in toxicology 40, 126-150.
Kao, C., Chen, C., Chen, S., Chien, H., and Chen, Y. (2008). Application of in situ biosparging to remediate a petroleum-hydrocarbon spill site: Field and microbial evaluation. Chemosphere 70, 1492-1499.
Kauppi, B., Lee, K., Carredano, E., Parales, R.E., Gibson, D.T., Eklund, H., and Ramaswamy, S. (1998). Structure of an aromatic-ring-hydroxylating dioxygenase–naphthalene 1,2-dioxygenase. Structure 6, 571-586.
Kawagoe, T., Kubota, K., Araki, K.S., and Kubo, M. (2019). Analysis of the Alkane Hydroxylase Gene and Long-Chain Cyclic Alkane Degradation in Rhodococcus. Advances in Microbiology 9, 151-163.
Keim, T., Francke, W., Schmidt, S., and Fortnagel, P. (1999). Catabolism of 2,7-dichloro-and 2,4,8-trichlorodibenzofuran by Sphingomonas sp strain RW1. Journal of Industrial Microbiology and Biotechnology 23, 359-363.
Kelley, I., Freeman, J.P., and Cerniglia, C.E. (1990). Identification of metabolites from degradation of naphthalene by a Mycobacterium sp. Biodegradation 1, 283-290.
Killham, K., Amato, M., and Ladd, J. (1993). Effect of substrate location in soil and soil pore-water regime on carbon turnover. Soil Biology and Biochemistry 25, 57-62.
Kobayashi, R., Okamoto, R.A., Maddalena, R.L., and Kado, N.Y. (2008). Polycyclic aromatic hydrocarbons in edible grain: a pilot study of agricultural crops as a human exposure pathway for environmental contaminants using wheat as a model crop. Environmental research 107, 145-151.
Kok, M., Oldenhuis, R., Van Der Linden, M., Raatjes, P., Kingma, J., Van Lelyveld, P.H., and Witholt, B. (1989). The Pseudomonas oleovorans alkane hydroxylase gene. Sequence and expression. Journal of Biological Chemistry 264, 5435-5441.
Kotani, T., Kawashima, Y., Yurimoto, H., Kato, N., and Sakai, Y. (2006). Gene structure and regulation of alkane monooxygenases in propane-utilizing Mycobacterium sp. TY-6 and Pseudonocardia sp. TY-7. Journal of bioscience and bioengineering 102, 184-192.
Kotani, T., Yamamoto, T., Yurimoto, H., Sakai, Y., and Kato, N. (2003). Propane monooxygenase and NAD+-dependent secondary alcohol dehydrogenase in propane metabolism by Gordonia sp. strain TY-5. Journal of bacteriology 185, 7120-7128.

General introduction | Chapter I
49
Kotani, T., Yurimoto, H., Kato, N., and Sakai, Y. (2007). Novel acetone metabolism in a propane-utilizing bacterium, Gordonia sp. strain TY-5. Journal of bacteriology 189, 886-893.
Kuo, M.T., Liang, K., Han, Y., and Fan, K. (2004). Pilot studies for in-situ aerobic cometabolism of trichloroethylene using toluene-vapor as the primary substrate. Water research 38, 4125-4134.
Kwack, S.J., and Mu Lee, B. (2000). Correlation between DNA or protein adducts and benzo[a]pyrene diol epoxide I–triglyceride adduct detected in vitro and in vivo. Carcinogenesis 21, 629-632.
Kweon, O., Kim, S.J., Holland, R.D., Chen, H., Kim, D.W., Gao, Y., Yu, L.R., Baek, S., Baek, D.H., and Ahn, H. (2011). Polycyclic aromatic hydrocarbon metabolic network in Mycobacterium vanbaalenii PYR-1. Journal of bacteriology 193, 4326-4337.
Labud, V., Garcia, C., and Hernandez, T. (2007). Effect of hydrocarbon pollution on the microbial properties of a sandy and a clay soil. Chemosphere 66, 1863-1871.
Lavelle, C., and Foray, N. (2014). Chromatin structure and radiation-induced DNA damage: from structural biology to radiobiology. The international journal of biochemistry & cell biology 49, 84-97.
Leahy, J.G., and Colwell, R.R. (1990). Microbial degradation of hydrocarbons in the environment. Microbiology and Molecular Biology Reviews 54, 305-315.
Leahy, J.G., Somerville, C.C., Cunningham, K.A., Adamantiades, G.A., Byrd, J.J., and Colwell, R.R. (1990). Hydrocarbon mineralization in sediments and plasmid incidence in sediment bacteria from the Campeche Bank. Appl. Environ. Microbiol. 56, 1565-1570.
Lee, M.D., and Swindoll, C.M. (1993). Bioventing for in situ remediation. Hydrological sciences journal 38, 273-282.
Leisinger, T. (1983). Microorganisms and xenobiotic compounds. Experientia 39, 1183-1191.
Li, L., Liu, X., Yang, W., Xu, F., Wang, W., Feng, L., Bartlam, M., Wang, L., and Rao, Z. (2008). Crystal structure of long-chain alkane monooxygenase (LadA) in complex with coenzyme FMN: unveiling the long-chain alkane hydroxylase. Journal of molecular biology 376, 453-465.
Lindsey, R.H., Bender, R.P., and Osheroff, N. (2005). Effects of benzene metabolites on DNA cleavage mediated by human topoisomerase IIα: 1, 4-hydroquinone is a topoisomerase II poison. Chemical research in toxicology 18, 761-770.
Ling, J., Zhang, Y., Wu, M., Wang, Y., Dong, J., Jiang, Y., Yang, Q., and Zeng, S. (2015). Fungal community successions in rhizosphere sediment of seagrasses Enhalus acoroides under PAHs stress. International journal of molecular sciences 16, 14039-14055.
Liu, C., Wang, W., Wu, Y., Zhou, Z., Lai, Q., and Shao, Z. (2011). Multiple alkane hydroxylase systems in a marine alkane degrader, Alcanivorax dieselolei B‐5. Environmental microbiology 13, 1168-1178.
Liu, Y., Zhou, Q., Xie, X., Lin, D., and Dong, L. (2010). Oxidative stress and DNA damage in the earthworm Eisenia fetida induced by toluene, ethylbenzene and xylene. Ecotoxicology 19, 1551-1559.

Chapter I | General introduction
50
Loreau, M., Naeem, S., Inchausti, P., Bengtsson, J., Grime, J., Hector, A., Hooper, D., Huston, M., Raffaelli, D., and Schmid, B. (2001). Biodiversity and ecosystem functioning: current knowledge and future challenges. science 294, 804-808.
Lu, Z., Cai, M., Wang, J., Yang, H., and He, J. (2012). Baseline values for metals in soils on Fildes Peninsula, King George Island, Antarctica: the extent of anthropogenic pollution. Environmental monitoring and assessment 184, 7013-7021.
Lucas, R., Klaminder, J., Futter, M., Bishop, K.H., Egnell, G., Laudon, H., and Högberg, P. (2011). A meta-analysis of the effects of nitrogen additions on base cations: implications for plants, soils, and streams. Forest Ecology and Management 262, 95-104.
Luo, A., Wu, Y.R., Xu, Y., Kan, J., Qiao, J., Liang, L., Huang, T., and Hu, Z. (2016). Characterization of a cytochrome P450 monooxygenase capable of high molecular weight PAHs oxidization from Rhodococcus sp. P14. Process Biochemistry 51, 2127-2133.
Luthy, R.G., Aiken, G.R., Brusseau, M.L., Cunningham, S.D., Gschwend, P.M., Pignatello, J.J., Reinhard, M., Traina, S.J., Weber, W.J., and Westall, J.C. (1997). Sequestration of hydrophobic organic contaminants by geosorbents. Environmental Science & Technology 31, 3341-3347.
Maeng, J.H., Sakai, Y., Tani, Y., and Kato, N. (1996). Isolation and characterization of a novel oxygenase that catalyzes the first step of n-alkane oxidation in Acinetobacter sp. strain M-1. Journal of bacteriology 178, 3695-3700.
Maier, R.M. (2000). "Bioavailability and its importance to bioremediation" in Bioremediation. Springer, 59-78.
Maier, R.M., and Gentry, T.J. (2015). "Microorganisms and organic pollutants" in Environmental microbiology. Elsevier, 377-413.
Maier, R.M., and Pepper, I.L. (2015). "Bacterial growth" in Environmental microbiology. Elsevier, 37-56.
Maier, T., Förster, H.H., Asperger, O., and Hahn, U. (2001). Molecular characterization of the 56-kDa CYP153 from Acinetobacter sp. EB104. Biochemical and biophysical research communications 286, 652-658.
Mallick, S., Chakraborty, J., and Dutta, T.K. (2011). Role of oxygenases in guiding diverse metabolic pathways in the bacterial degradation of low-molecular-weight polycyclic aromatic hydrocarbons: a review. Critical reviews in microbiology 37, 64-90.
Manahan, S.E. (1992). Toxicological chemistry. CRC Press. Margesin, R., and Schinner, F. (1997). Bioremediation of diesel-oil-contaminated alpine
soils at low temperatures. Applied Microbiology and Biotechnology 47, 462-468. Margesin, R., and Schinner, F. (2001). Biodegradation and bioremediation of hydrocarbons
in extreme environments. Applied microbiology and biotechnology 56, 650-663. Martin, H. (1933). Studies upon the copper fungicides: II. Some modifications of bordeaux
mixture designed to overcome practical difficulties in its application. Annals of Applied Biology 20, 342-363.
Mason, O.U., Hazen, T.C., Borglin, S., Chain, P.S., Dubinsky, E.A., Fortney, J.L., Han, J., Holman, H.Y.N., Hultman, J., and Lamendella, R. (2012). Metagenome, metatranscriptome and single-cell sequencing reveal microbial response to Deepwater Horizon oil spill. The ISME journal 6, 1715.

General introduction | Chapter I
51
Mbangi, A., Muchaonyerwa, P., and Zengeni, R. (2018). Accumulation of multiple heavy metals in plants grown on soil treated with sewage sludge for more than 50 years presents health risks and an opportunity for phyto-remediation. Water SA 44, 569-576.
McCarty, P.L. (1988). "Bioengineering issues related to in situ remediation of contaminated soils and groundwater" in Environmental Biotechnology. Springer, 143-162.
McIntosh, T., Simon, S., and Macdonald, R. (1980). The organization of n-alkanes in lipid bilayers. Biochimica et Biophysica Acta (BBA)-Biomembranes 597, 445-463.
McNaught, A.D., and Wilkinson, A. (1997). Compendium of chemical terminology. Blackwell Science Oxford.
Means, J. (1995). Influence of salinity upon sediment-water partitioning of aromatic hydrocarbons. Marine Chemistry 51, 3-16.
Megharaj, M., Ramakrishnan, B., Venkateswarlu, K., Sethunathan, N., and Naidu, R. (2011). Bioremediation approaches for organic pollutants: a critical perspective. Environment international 37, 1362-1375.
Mehra, R., Kumar, S., Sonkawade, R., Singh, N., and Badhan, K. (2010). Analysis of terrestrial naturally occurring radionuclides in soil samples from some areas of Sirsa district of Haryana, India using gamma ray spectrometry. Environmental Earth Sciences 59, 1159-1164.
Merkx, M., Kopp, D.A., Sazinsky, M.H., Blazyk, J.L., Müller, J., and Lippard, S.J. (2001). Dioxygen activation and methane hydroxylation by soluble methane monooxygenase: a tale of two irons and three proteins. Angewandte Chemie International Edition 40, 2782-2807.
Mikolasch, A., Klenk, H.P., and Schauer, F. (2009). Degradation of the multiple branched alkane 2,6,10,14-tetramethyl-pentadecane (pristane) in Rhodococcus ruber and Mycobacterium neoaurum. International Biodeterioration & Biodegradation 63, 201-207.
Mohammad, S. (1985). Relative roles of K region and bay region towards determining the carcinogenic potencies of polycyclic aromatic hydrocarbons. Cancer biochemistry biophysics 8, 41-46.
Mohan, S.V., Kisa, T., Ohkuma, T., Kanaly, R.A., and Shimizu, Y. (2006). Bioremediation technologies for treatment of PAH-contaminated soil and strategies to enhance process efficiency. Reviews in Environmental Science and Bio/Technology 5, 347-374.
Monti, M.R., Smania, A.M., Fabro, G., Alvarez, M.E., and Argarana, C.E. (2005). Engineering Pseudomonas fluorescens for biodegradation of 2,4-dinitrotoluene. Appl. Environ. Microbiol. 71, 8864-8872.
Moody, J.D., Freeman, J.P., Doerge, D.R., and Cerniglia, C.E. (2001). Degradation of phenanthrene and anthracene by cell suspensions of Mycobacterium sp. strain PYR-1. Appl. Environ. Microbiol. 67, 1476-1483.
Moody, J.D., Freeman, J.P., Fu, P.P., and Cerniglia, C.E. (2004). Degradation of benzo[a]pyrene by Mycobacterium vanbaalenii PYR-1. Appl. Environ. Microbiol. 70, 340-345.
Moorthy, B., Chu, C., and Carlin, D.J. (2015). Polycyclic aromatic hydrocarbons: from metabolism to lung cancer. Toxicological Sciences 145, 5-15.

Chapter I | General introduction
52
Mrozik, A., Miga, S., and Piotrowska‐Seget, Z. (2011). Enhancement of phenol degradation by soil bioaugmentation with Pseudomonas sp. JS150. Journal of applied microbiology 111, 1357-1370.
Mrozik, A., and Piotrowska-Seget, Z. (2010). Bioaugmentation as a strategy for cleaning up of soils contaminated with aromatic compounds. Microbiological research 165, 363-375.
Mueller, J.G., Cerniglia, C.E., and Pritchard, P.H. (1996). Bioremediation of environments contaminated by polycyclic aromatic hydrocarbons. Biotechnology Research Series 6, 125-194.
Muir, D.C., and De Wit, C.A. (2010). Trends of legacy and new persistent organic pollutants in the circumpolar arctic: overview, conclusions, and recommendations. Science of the total environment 408, 3044-3051.
Mukherjee, A., and Chattopadhyay, D. (2017). Exploring environmental systems and processes through next-generation sequencing technologies: insights into microbial response to petroleum contamination in key environments. The Nucleus 60, 175-186.
Müller, R., Asperger, O., and Kleber, H. (1989). Purification of cytochrome P-450 from n-hexadecane-grown Acinetobacter calcoaceticus. Biomedica biochimica acta 48, 243-254.
Mulligan, C.N., and Yong, R.N. (2004). Natural attenuation of contaminated soils. Environment international 30, 587-601.
Munro, A.W., and Lindsay, J.G. (1996). Bacterial cytochromes P‐450. Molecular microbiology 20, 1115-1125.
Mustafa, Y.A., Abdul‐Hameed, H.M., and Razak, Z.A. (2015). Biodegradation of 2,4‐Dichlorophenoxyacetic Acid Contaminated Soil in a Roller Slurry Bioreactor. CLEAN–Soil, Air, Water 43, 1241-1247.
Naidu, R., Semple, K.T., Megharaj, M., Juhasz, A., Bolan, N., Gupta, S., Clothier, B., and Schulin, R. (2008). Bioavailability: definition, assessment and implications for risk assessment. Developments in soil science 32, 39-51.
Najeeb, U., Ahmad, W., Zia, M.H., Zaffar, M., and Zhou, W. (2017). Enhancing the lead phytostabilization in wetland plant Juncus effusus L. through somaclonal manipulation and EDTA enrichment. Arabian journal of chemistry 10, S3310-S3317.
Nam, I.H., Kim, Y.M., Schmidt, S., and Chang, Y.S. (2006). Biotransformation of 1,2,3-tri- and 1,2,3,4,7,8-hexachlorodibenzo-p-dioxin by Sphingomonas wittichii strain RW1. Appl. Environ. Microbiol. 72, 112-116.
National Research Council (1985). "Oil in the sea: inputs, fates, and effects" Ed. National Research Council. (Washington, D.C.: National Academy Press).
Neilson, A.H., and Hutzinger, O. (1997). PAHs and related compounds: Biology. Springer Science & Business Media.
Nhi‐Cong, L.T., Mikolasch, A., Awe, S., Sheikhany, H., Klenk, H.P., and Schauer, F. (2010). Oxidation of aliphatic, branched chain, and aromatic hydrocarbons by Nocardia cyriacigeorgica isolated from oil‐polluted sand samples collected in the Saudi Arabian Desert. Journal of basic microbiology 50, 241-253.
Niu, G.L., Zhang, J.J., Zhao, S., Liu, H., Boon, N., and Zhou, N.Y. (2009). Bioaugmentation of a 4-chloronitrobenzene contaminated soil with Pseudomonas putida ZWL73. Environmental Pollution 157, 763-771.

General introduction | Chapter I
53
Nojiri, H., and Omori, T. (2002). Molecular bases of aerobic bacterial degradation of dioxins: involvement of angular dioxygenation. Bioscience, biotechnology, and biochemistry 66, 2001-2016.
Norstrom, R.J. (2002). Understanding bioaccumulation of POPs in food webs. Environmental Science and Pollution Research 9, 300-303.
Novotny, V. (1999). Diffuse pollution from agriculture—a worldwide outlook. Water Science and Technology 39, 1-13.
Nriagu, J.O., and Pacyna, J.M. (1988). Quantitative assessment of worldwide contamination of air, water and soils by trace metals. nature 333, 134.
Nwankwegu, A.S., and Onwosi, C.O. (2017). Microbial cell immobilization: a renaissance to bioaugmentation inadequacies. A review. Environmental Technology Reviews 6, 186-198.
Oliver, M.A., and Gregory, P. (2015). Soil, food security and human health: a review. European Journal of Soil Science 66, 257-276.
Ortiz De Montellano, P.R. (2009). Hydrocarbon hydroxylation by cytochrome P450 enzymes. Chemical reviews 110, 932-948.
Oulas, A., Pavloudi, C., Polymenakou, P., Pavlopoulos, G.A., Papanikolaou, N., Kotoulas, G., Arvanitidis, C., and Iliopoulos, L. (2015). Metagenomics: tools and insights for analyzing next-generation sequencing data derived from biodiversity studies. Bioinformatics and biology insights 9, BBI. S12462.
Parales, R.E., and Resnick, S.M. (2004). "Aromatic hydrocarbon dioxygenases" in Biodegradation and bioremediation. Springer, 175-195.
Patrick, L. (2002). Mercury toxicity and antioxidants: part I: role of glutathione and alpha-lipoic acid in the treatment of mercury toxicity. Alternative Medicine Review 7, 456-472.
Paudyn, K., Rutter, A., Rowe, R.K., and Poland, J.S. (2008). Remediation of hydrocarbon contaminated soils in the Canadian Arctic by landfarming. Cold Regions Science and Technology 53, 102-114.
Paul, D., Pandey, G., Pandey, J., and Jain, R.K. (2005). Accessing microbial diversity for bioremediation and environmental restoration. TRENDS in Biotechnology 23, 135-142.
Pepper, I.L., Gerba, C.P., and Brusseau, M.L. (2011). Environmental and pollution science. Elsevier.
Philp, J.C., and Atlas, R.M. (2005). "Bioremediation of contaminated soils and aquifers" in Bioremediation. American Society of Microbiology, 139-236.
Place, M., Hoeppel, R., Chaudhry, T., Mccall, S., and Williamson, T. (2003). "Application Guide for Bioslurping Principles and Practices of Bioslurping Addendum: Use of Pre-Pump Separation for Improved Bioslurper System Operation". Naval facilities engineering command port hueneme CA engineering service center.
Plangklang, P., and Reungsang, A. (2010). Bioaugmentation of carbofuran by Burkholderia cepacia PCL3 in a bioslurry phase sequencing batch reactor. Process Biochemistry 45, 230-238.
Pointing, S. (2001). Feasibility of bioremediation by white-rot fungi. Applied microbiology and biotechnology 57, 20-33.
Quince, C., Walker, A.W., Simpson, J.T., Loman, N.J., and Segata, N. (2017). Shotgun metagenomics, from sampling to analysis. Nature biotechnology 35, 833.

Chapter I | General introduction
54
Rahman, K.S., Rahman, T.J., Kourkoutas, Y., Petsas, I., Marchant, R., and Banat, I. (2003). Enhanced bioremediation of n-alkane in petroleum sludge using bacterial consortium amended with rhamnolipid and micronutrients. Bioresource Technology 90, 159-168.
Resnick, S., Lee, K., and Gibson, D. (1996). Diverse reactions catalyzed by naphthalene dioxygenase from Pseudomonas sp strain NCIB 9816. Journal of industrial microbiology 17, 438-457.
Rhykerd, R.L., Weaver, R.W., and Mcinnes, K.J. (1995). Influence of salinity on bioremediation of oil in soil. Environmental Pollution 90, 127-130.
Ribicic, D., Netzer, R., Hazen, T.C., Techtmann, S.M., Drabløs, F., and Brakstad, O.G. (2018). Microbial community and metagenome dynamics during biodegradation of dispersed oil reveals potential key-players in cold Norwegian seawater. Marine pollution bulletin 129, 370-378.
Rivas, F.J. (2006). Polycyclic aromatic hydrocarbons sorbed on soils: a short review of chemical oxidation based treatments. Journal of Hazardous Materials 138, 234-251.
Rojo, F. (2009). Degradation of alkanes by bacteria. Environmental microbiology 11, 2477-2490.
Ronen, Z., Vasiluk, L., Abeliovich, A., and Nejidat, A. (2000). Activity and survival of tribromophenol-degrading bacteria in a contaminated desert soil. Soil Biology and Biochemistry 32, 1643-1650.
Russell, D.L. (1992). Remediation manual for petroleum contaminated sites. CRC Press. Sakai, Y., Maeng, J.H., Kubota, S., Tani, A., Tani, Y., and Kato, N. (1996). A non-
conventional dissimilation pathway for long chain n-alkanes in Acinetobacter sp. M-1 that starts with a dioxygenase reaction. Journal of fermentation and bioengineering 81, 286-291.
Sawulski, P., Clipson, N., and Doyle, E. (2014). Effects of polycyclic aromatic hydrocarbons on microbial community structure and PAH ring hydroxylating dioxygenase gene abundance in soil. Biodegradation 25, 835-847.
Sayavedra‐Soto, L.A., Hamamura, N., Liu, C.W., Kimbrel, J.A., Chang, J.H., and Arp, D.J. (2011). The membrane‐associated monooxygenase in the butane‐oxidizing Gram‐positive bacterium Nocardioides sp. strain CF8 is a novel member of the AMO/PMO family. Environmental microbiology reports 3, 390-396.
Scheps, D., Malca, S.H., Hoffmann, H., Nestl, B.M., and Hauer, B. (2011). Regioselective ω-hydroxylation of medium-chain n-alkanes and primary alcohols by CYP153 enzymes from Mycobacterium marinum and Polaromonas sp. strain JS666. Organic & biomolecular chemistry 9, 6727-6733.
Schmitz, T., Hassel, D., and Weber, F.-J. (2000). Determination of VOC-components in the exhaust of gasoline and diesel passenger cars. Atmospheric environment 34, 4639-4647.
Schneiker, S., Dos Santos, V.A.P.M., Bartels, D., Bekel, T., Brecht, M., Buhrmester, J., Chernikova, T.N., Denaro, R., Ferrer, M., and Gertler, C. (2006). Genome sequence of the ubiquitous hydrocarbon-degrading marine bacterium Alcanivorax borkumensis. Nature biotechnology 24, 997.
Schwarzenbach, R.P., Egli, T., Hofstetter, T.B., Von Gunten, U., and Wehrli, B. (2010). Global water pollution and human health. Annual Review of Environment and Resources 35, 109-136.

General introduction | Chapter I
55
Seeger, M., and Pieper, D. (2010). Genetics of biphenyl biodegradation and co-metabolism of PCBs. Handbook of hydrocarbon and Lipid Microbiology, 1179-1199.
Semrany, S., Favier, L., Djelal, H., Taha, S., and Amrane, A. (2012). Bioaugmentation: possible solution in the treatment of bio-refractory organic compounds (Bio-ROCs). Biochemical Engineering Journal 69, 75-86.
Seo, J.S., Keum, Y.S., Hu, Y., Lee, S.E., and Li, Q.X. (2006). Phenanthrene degradation in Arthrobacter sp. P1-1: initial 1,2-, 3,4- and 9,10-dioxygenation, and meta-and ortho-cleavages of naphthalene-1,2-diol after its formation from naphthalene-1,2-dicarboxylic acid and hydroxyl naphthoic acids. Chemosphere 65, 2388-2394.
Sharma, B.M., Nizzetto, L., Bharat, G.K., Tayal, S., Melymuk, L., Sáňka, O., Přibylová, P., Audy, O., and Larssen, T. (2015). Melting Himalayan glaciers contaminated by legacy atmospheric depositions are important sources of PCBs and high-molecular-weight PAHs for the Ganges floodplain during dry periods. Environmental pollution 206, 588-596.
Shimada, T., and Fujii‐Kuriyama, Y. (2004). Metabolic activation of polycyclic aromatic hydrocarbons to carcinogens by cytochromes P450 1A1 and1B1. Cancer science 95, 1-6.
Sikkema, J., De Bont, J.A., and Poolman, B. (1995). Mechanisms of membrane toxicity of hydrocarbons. Microbiol. Mol. Biol. Rev. 59, 201-222.
Silva-Castro, G.A., Uad, I., Rodríguez-Calvo, A., González-López, J., and Calvo, C. (2015). Response of autochthonous microbiota of diesel polluted soils to land-farming treatments. Environmental research 137, 49-58.
Sims, J.L., Sims, R.C., and Matthews, J.E. (1990). Approach to bioremediation of contaminated soil. Hazardous waste and hazardous materials 7, 117-149.
Singer, A.C., Van Der Gast, C.J., and Thompson, I.P. (2005). Perspectives and vision for strain selection in bioaugmentation. TRENDS in Biotechnology 23, 74-77.
Singh, B.K. (2010). Exploring microbial diversity for biotechnology: the way forward. Trends in biotechnology 28, 111-116.
Singh, R., and Olson, M.S. (2008). "Application of bacterial swimming and chemotaxis for enhanced bioremediation" in Emerging environmental technologies. Springer, 149-172.
Sinha, R.K., Valani, D., Sinha, S., Singh, S., and Herat, S. (2009). Bioremediation of contaminated sites: a low-cost nature’s biotechnology for environmental clean up by versatile microbes, plants & earthworms. Solid waste management and environmental remediation, 978-971.
Sluis, M.K., Sayavedra-Soto, L.A., and Arp, D.J. (2002). Molecular analysis of the soluble butane monooxygenase from ‘Pseudomonas butanovora’. Microbiology 148, 3617-3629.
Smets, B.F., and Pritchard, P. (2003). Elucidating the microbial component of natural attenuation. Current opinion in biotechnology 14, 283-288.
Smith, M.T. (2010). Advances in understanding benzene health effects and susceptibility. Annual review of public health 31, 133-148.
Smith, T., and Dalton, H. (2004). "Biocatalysis by methane monooxygenase and its implications for the petroleum industry" in Studies in surface science and catalysis. Elsevier, 177-192.

Chapter I | General introduction
56
Songzhe, F., Hongxia, F., Shuangjiang, L., Ying, L., and Zhipei, L. (2009). A bioaugmentation failure caused by phage infection and weak biofilm formation ability. Journal of Environmental Sciences 21, 1153-1161.
Stohs, S.J., and Bagchi, D. (1995). Oxidative mechanisms in the toxicity of metal ions. Free radical biology and medicine 18, 321-336.
Stork, P.R., and Lyons, D.J. (2012). Phosphorus loss and speciation in overland flow from a plantation horticulture catchment and in an adjoining waterway in coastal Queensland, Australia. Soil research 50, 515-525.
Straube, W., Nestler, C., Hansen, L., Ringleberg, D., Pritchard, P., and Jones‐Meehan, J. (2003). Remediation of polyaromatic hydrocarbons (PAHs) through landfarming with biostimulation and bioaugmentation. Acta Biotechnologica 23, 179-196.
Strzebońska, M., Jarosz-Krzemińska, E., and Adamiec, E. (2017). Assessing historical mining and smelting effects on heavy metal pollution of river systems over span of two decades. Water, Air, & Soil Pollution 228, 141.
Su, C. (2014). A review on heavy metal contamination in the soil worldwide: Situation, impact and remediation techniques. Environmental Skeptics and Critics 3, 24.
Suarez, M.P., and Rifai, H.S. (1999). Biodegradation rates for fuel hydrocarbons and chlorinated solvents in groundwater. Bioremediation Journal 3, 337-362.
Sun, J.L., Zeng, H., and Ni, H.G. (2013). Halogenated polycyclic aromatic hydrocarbons in the environment. Chemosphere 90, 1751-1759.
Sun, W., Dong, Y., Gao, P., Fu, M., Ta, K., and Li, J. (2015). Microbial communities inhabiting oil-contaminated soils from two major oilfields in Northern China: Implications for active petroleum-degrading capacity. Journal of microbiology 53, 371-378.
Sutherland, J.B., Freeman, J.P., Selby, A.L., Fu, P.P., Miller, D.W., and Cerniglia, C.E. (1990). Stereoselective formation of a K-region dihydrodiol from phenanthrene by Streptomyces flavovirens. Archives of microbiology 154, 260-266.
Szefer, P. (2002). Metals, metalloids and radionuclides in the Baltic Sea ecosystem. Elsevier.
Tanabe, S., Hidaka, H., and Tatsukawa, R. (1983). PCBs and chlorinated hydrocarbon pesticides in Antarctic atmosphere and hydrosphere. Chemosphere 12, 277-288.
Tang, G., Sun, J., Wu, F., Sun, Y., Zhu, X., Geng, Y., and Wang, Y. (2015). Organic composition of gasoline and its potential effects on air pollution in North China. Science China Chemistry 58, 1416-1425.
Tarradellas, J., and Bitton, G. (1997). Chemical pollutants in soil. Soil Ecotoxicology, 3-32. Techtmann, S.M., and Hazen, T.C. (2016). Metagenomic applications in environmental
monitoring and bioremediation. Journal of industrial microbiology & biotechnology 43, 1345-1354.
Thompson, I.P., Van Der Gast, C.J., Ciric, L., and Singer, A.C. (2005). Bioaugmentation for bioremediation: the challenge of strain selection. Environmental Microbiology 7, 909-915.
Throne-Holst, M., Wentzel, A., Ellingsen, T.E., Kotlar, H.-K., and Zotchev, S.B. (2007). Identification of novel genes involved in long-chain n-alkane degradation by Acinetobacter sp. strain DSM 17874. Appl. Environ. Microbiol. 73, 3327-3332.
Travnikov, O. (2005). Contribution of the intercontinental atmospheric transport to mercury pollution in the Northern Hemisphere. Atmospheric Environment 39, 7541-7548.

General introduction | Chapter I
57
Tyagi, M., Da Fonseca, M.M.R., and De Carvalho, C.C. (2011). Bioaugmentation and biostimulation strategies to improve the effectiveness of bioremediation processes. Biodegradation 22, 231-241.
Urlacher, V.B., and Eiben, S. (2006). Cytochrome P450 monooxygenases: perspectives for synthetic application. Trends in biotechnology 24, 324-330.
US EPA (2008). "Green remediation: Incorporating sustainable environmental practices into remediation of contaminated sites" Ed. U.S. Environmental Protection Agency Office of Solid Waste and Emergency Response. Technology Primer.
Van Beilen, J., Li, Z., Duetz, W., Smits, T., and Witholt, B. (2003). Diversity of alkane hydroxylase systems in the environment. Oil & gas science and technology 58, 427-440.
Van Beilen, J.B., Neuenschwander, M., Smits, T.H., Roth, C., Balada, S.B., and Witholt, B. (2002). Rubredoxins involved in alkane oxidation. Journal of bacteriology 184, 1722-1732.
Van Beilen, J.B., Penninga, D., and Witholt, B. (1992). Topology of the membrane-bound alkane hydroxylase of Pseudomonas oleovorans. Journal of Biological Chemistry 267, 9194-9201.
Van Beilen, J.B., Wubbolts, M.G., and Witholt, B. (1994). Genetics of alkane oxidation by Pseudomonas oleovorans. Biodegradation 5, 161-174.
Van Den Berg, M., Birnbaum, L.S., Denison, M., De Vito, M., Farland, W., Feeley, M., Fiedler, H., Hakansson, H., Hanberg, A., and Haws, L. (2006). The 2005 World Health Organization reevaluation of human and mammalian toxic equivalency factors for dioxins and dioxin-like compounds. Toxicological sciences 93, 223-241.
Vasseur, P., and Cossu-Leguille, C. (2006). Linking molecular interactions to consequent effects of persistent organic pollutants (POPs) upon populations. Chemosphere 62, 1033-1042.
Vecchioli, G., Del Panno, M., and Painceira, M. (1990). Use of selected autochthonous soil bacteria to enhanced degradation of hydrocarbons in soil. Environmental Pollution 67, 249-258.
Venosa, A.D. (1998). Oil spill bioremediation on coastal shorelines: a critique. Bioremediation: principles and practice 3, 259-301.
Venosa, A.D., and Zhu, X. (2003). Biodegradation of crude oil contaminating marine shorelines and freshwater wetlands. Spill Science & Technology Bulletin 8, 163-178.
Vert, M., Doi, Y., Hellwich, K.H., Hess, M., Hodge, P., Kubisa, P., Rinaudo, M., and Schué, F. (2012). Terminology for biorelated polymers and applications (IUPAC Recommendations 2012). Pure and Applied Chemistry 84, 377-410.
Vogel, T.M. (1996). Bioaugmentation as a soil bioremediation approach. Current opinion in biotechnology 7, 311-316.
Volkering, F., Breure, A., and Van Andel, J. (1993). Effect of micro-organisms on the bioavailability and biodegradation of crystalline naphthalene. Applied microbiology and biotechnology 40, 535-540.
Wagner-Dobler, I. (2003). Microbial inoculants: snake oil or panacea. Bioremediation: a critical review. Horizon Scientific Press, Norfolk, 259-289.

Chapter I | General introduction
58
Wang, W., and Shao, Z. (2012). Diversity of flavin-binding monooxygenase genes (almA) in marine bacteria capable of degradation long-chain alkanes. FEMS microbiology ecology 80, 523-533.
Wang, Y., Liang, J., Wang, J., and Gao, S. (2018). Combining stable carbon isotope analysis and petroleum-fingerprinting to evaluate petroleum contamination in the Yanchang oilfield located on loess plateau in China. Environmental Science and Pollution Research 25, 2830-2841.
Watkinson, R.J., and Morgan, P. (1991). "Physiology of aliphatic hydrocarbon-degrading microorganisms" in Physiology of Biodegradative Microorganisms. Springer, 79-92.
WHO (2010). The WHO recommended classification of pesticides by hazard and guidelines to classification 2009. Geneva: World Health Organization.
Wick, L.Y., Mattle, P.A., Wattiau, P., and Harms, H. (2004). Electrokinetic transport of PAH-degrading bacteria in model aquifers and soil. Environmental science & technology 38, 4596-4602.
Wick, L.Y., Shi, L., and Harms, H. (2007). Electro-bioremediation of hydrophobic organic soil-contaminants: A review of fundamental interactions. Electrochimica Acta 52, 3441-3448.
Wilkes, H., Wittich, R., Timmis, K.N., Fortnagel, P., and Francke, W. (1996). Degradation of Chlorinated Dibenzofurans and Dibenzo-p-Dioxins by Sphingomonas sp. Strain RW1. Appl. Environ. Microbiol. 62, 367-371.
Wittich, R.M., Wilkes, H., Sinnwell, V., Francke, W., and Fortnagel, P. (1992). Metabolism of dibenzo-p-dioxin by Sphingomonas sp. strain RW1. Appl. Environ. Microbiol. 58, 1005-1010.
Wittich, R., Strömpl, C., Moore, E., Blasco, R., and Timmis, K. (1999). Interaction of Sphingomonas and Pseudomonas strains in the degradation of chlorinated dibenzofurans. Journal of Industrial Microbiology and Biotechnology 23, 353-358.
Wolicka, D., Suszek, A., Borkowski, A., and Bielecka, A. (2009). Application of aerobic microorganisms in bioremediation in situ of soil contaminated by petroleum products. Bioresource Technology 100, 3221-3227.
Wong, C., Wong, P., and Chu, L. (2001). Heavy metal concentrations in marine fishes collected from fish culture sites in Hong Kong. Archives of Environmental Contamination and Toxicology 40, 60-69.
Xia, G., and Pignatello, J.J. (2001). Detailed sorption isotherms of polar and apolar compounds in a high-organic soil. Environmental science & technology 35, 84-94.
Xue, W., and Warshawsky, D. (2005). Metabolic activation of polycyclic and heterocyclic aromatic hydrocarbons and DNA damage: a review. Toxicology and applied pharmacology 206, 73-93.
Yunker, M.B., Macdonald, R.W., Vingarzan, R., Mitchell, R.H., Goyette, D., and Sylvestre, S. (2002). PAHs in the Fraser River basin: a critical appraisal of PAH ratios as indicators of PAH source and composition. Organic geochemistry 33, 489-515.
Zhang, Q., Wang, B., Cao, Z., and Yu, Y. (2012). Plasmid-mediated bioaugmentation for the degradation of chlorpyrifos in soil. Journal of hazardous materials 221, 178-184.

General introduction | Chapter I
59
Zhang, X., Xue, Z., Li, H., Yan, L., Yang, Y., Wang, Y., Duan, J., Li, L., Chai, F., and Cheng, M. (2017). Ambient volatile organic compounds pollution in China. Journal of Environmental Sciences 55, 69-75.
Zhang, X., Zhong, T., Liu, L., and Ouyang, X. (2015). Impact of soil heavy metal pollution on food safety in China. PLoS One 10, e0135182.
Zhao, S., Qiu, S., Cao, C., Zheng, C., Zhou, W., and He, P. (2014). Responses of soil properties, microbial community and crop yields to various rates of nitrogen fertilization in a wheat–maize cropping system in north-central China. Agriculture, ecosystems & environment 194, 29-37.
Zhou, R., Huang, C., Zhang, A., Bell, S.G., Zhou, W., and Wong, L.L. (2011). Crystallization and preliminary X-ray analysis of CYP153C1 from Novosphingobium aromaticivorans DSM12444. Acta Crystallographica Section F: Structural Biology and Crystallization Communications 67, 964-967.
Zhu, C., Zhang, L., and Zhao, L. (2008). Molecular cloning, genetic organization of gene cluster encoding phenol hydroxylase and catechol 2,3-dioxygenase in Alcaligenes faecalis IS-46. World Journal of Microbiology and Biotechnology 24, 1687-1695.

Objectives
61
Objectives _________________
Pollution of soils by organic compounds poses a major risk and new and improved sustainable technologies need to be developed in order to restore such environments. Bioremediation of organic pollutants by microorganisms have been used in multiple soil restoration projects, mainly using either single strains or simple combinations of different bacteria. However, the indigenous bacterial diversity found in polluted soils could offer a far more diverse repertory of catabolic and environmental adaption abilities that could improve the problems associated with using limited and/or allochthonous microorganisms and result in a successful enhanced bioremediation process.
The overall aim of this thesis is to isolate and characterize bacterial consortia for the bioremediation of PCBs and oil-fuel hydrocarbon mixtures. First, by enrichment culture techniques and using the chemicals of study as sole carbon source, indigenous bacterial consortia will be isolated from polluted environments with a trophic dependency for the pollutant. Secondly, microbiome analysis will serve to analyze the composition and relative abundance of taxa of the isolated consortia and whole-metagenome analysis will be used to address the catabolic potential of the community members. Additional characterization of the biodegradation/bioremediation abilities of the consortia and the most promising strains will be tested in microcosms. Finally, the strains showing a high potential for bioremediation purposes based on the microbiome-metagenome analysis of the consortia, will be isolated, sequenced and characterized in depth at the genomic level to fully explore their catabolic repertoire and potential environmental adaption traits that could ensure their survival under different conditions.
Specific objectives
1. Isolate bacterial consortia growing aerobically with two compounds: biphenyl (chemical mineralizable analog of PCBs) and diesel-fuel hydrocarbon mixture, as sole carbon and energy source.

Objectives
62
2. Characterize the taxonomical composition and relative abundance of the isolated bacterial consortia based in microbiome analyses of the 16S rRNA gene.
3. Sequence and analyze the whole metagenome of each consortium to identify key genes involved in the degradation pathways of these pollutants and to assign them to specific populations present in them.
4. Analyze the effective biodegradation of the targeted pollutant by the consortia or strains derived from them in microcosms assays to assess their potential feasibility in bioremediation applications.
5. Sequence and analyze the genome of the best-performing strain in order to characterize in depth its biodegradative potential and environmental adaption traits.

63
Chapter II
Metagenomic analysis of a biphenyl-degrading soil bacterial consortium reveals the metabolic roles of
specific populations

Metagenomics of biphenyl-degrading bacterial consortium | Chapter II
65
Chapter II Metagenomic analysis of a biphenyl-degrading soil bacterial consortium reveals the metabolic roles of specific populations __________________
This chapter has been entirely published in Frontiers in Microbiology. Only modifications of format have been made to ensure consistency throughout the thesis.
Garrido-Sanz D, Manzano J, Martín M, Redondo-Nieto M and Rivilla R (2018). Metagenomic Analysis of a Biphenyl-Degrading Soil Bacterial Consortium Reveals the Metabolic Roles of Specific Populations. Front. Microbiol. 9:232. doi: 10.3389/fmicb.2018.00232.
Received: 28 September 2017; Accepted: 30 January 2018; Published: 15 February 2018.
Abstract Polychlorinated biphenyls (PCBs) are widespread persistent pollutants that cause several adverse health effects. Aerobic bioremediation of PCBs involves the activity of either one bacterial species or a microbial consortium. Using multiple species will enhance the range of PCB congeners co-metabolized since different PCB-degrading microorganisms exhibit different substrate specificity. We have isolated a bacterial consortium by successive enrichment culture using biphenyl (analog of PCBs) as the sole carbon and energy source. This consortium is able to grow on biphenyl, benzoate, and protocatechuate. Whole-community DNA extracted from the consortium was used to analyze biodiversity by Illumina sequencing of a 16S rRNA gene amplicon library and to determine the metagenome by whole-genome shotgun Illumina sequencing. Biodiversity analysis shows that the consortium consists of 24 operational taxonomic units (≥97% identity). The consortium is dominated by strains belonging to the genus Pseudomonas, but also contains betaproteobacteria and Rhodococcus strains. whole-genome shotgun (WGS) analysis resulted in contigs containing 78.3 Mbp of sequenced DNA, representing around 65% of the expected DNA in the consortium. Bioinformatic analysis of this metagenome has identified the genes encoding the enzymes implicated in three pathways for the conversion of biphenyl to benzoate and five pathways from benzoate to tricarboxylic acid (TCA) cycle intermediates, allowing us to model the whole biodegradation network. By genus assignment of coding sequences, we have also been able to determine that the

Chapter II | Metagenomics of biphenyl-degrading bacterial consortium
66
three biphenyl to benzoate pathways are carried out by Rhodococcus strains. In turn, strains belonging to Pseudomonas and Bordetella are the main responsible of three of the benzoate to TCA pathways while the benzoate conversion into TCA cycle intermediates via benzoyl-CoA and the catechol meta-cleavage pathways are carried out by beta proteobacteria belonging to genera such as Achromobacter and Variovorax. We have isolated a Rhodococcus strain WAY2 from the consortium which contains the genes encoding the three biphenyl to benzoate pathways indicating that this strain is responsible for all the biphenyl to benzoate transformations. The presented results show that metagenomic analysis of consortia allows the identification of bacteria active in biodegradation processes and the assignment of specific reactions and pathways to specific bacterial groups.
Introduction Biphenyl has been widely used as a mineralizable polychlorinated biphenyls (PCBs) analog in biodegradation studies (Leigh et al., 2006; Uhlik et al., 2009; Leewis et al., 2016; Vergani et al., 2017a). PCBs are a family of man-made persistent organic chemicals that consist of a biphenyl skeleton where 1–10 hydrogen atoms are substituted by chlorine giving rise to up to 209 congeners. PCBs have been widely manufactured because of their chemical and physical properties (National Research Council, 1979) and a significant amount of PCBs has been released into the environment (Pieper, 2005; Sharma et al., 2014). The relative volatility of PCBs contributes to their spread throughout the globe (Gomes et al., 2013) where they bioaccumulate and biomagnify in the food web (Turrio-Baldassarri et al., 2007). PCBs have been shown to pose a broad range of exposure-related health effects in humans (Ross, 2004; Quinete et al., 2014) and are categorized as carcinogens (Mayes et al., 1998; Lauby-Secretan et al., 2013). Because of their chemical stability, poor water solubility, and toxicity, PCBs are considered recalcitrant toxics.
Bacteria can co-metabolize PCBs anaerobically and aerobically. Anaerobic cometabolism consists of reductive dehalogenation, a process in which highly chlorinated PCBs act as electron acceptors and reduce their chlorination (Quensen et al., 1988; Fennell et al., 2004). Thus, the biphenyl skeleton is not degraded through this pathway. Aerobic biodegradation on the contrary is better suited for low chlorinated congeners (Pieper, 2005; Furukawa and Fujihara, 2008; Pieper and Seeger, 2008) and biphenyl can be aerobically mineralized either by a

Metagenomics of biphenyl-degrading bacterial consortium | Chapter II
67
single microorganism or by a consortium (Hernandez-Sanchez et al., 2013). Aerobic bioremediation of PCBs has been one of the main approaches to alleviate their persistence (Harkness et al., 1993; Pieper, 2005; Sharma et al., 2017) and usually occurs through its cometabolism by enzymes of the biphenyl upper degradation pathway, encoded by the bphABCDEFG gene cluster (Furukawa and Fujihara, 2008), although gene clusters for ethylbenzene (etb) and naphthalene (nar) degradation have also been shown to contribute to biphenyl and aerobic degradation of PCBs (Kimura and Urushigawa, 2001; Iwasaki et al., 2007), resulting in the formation of (chloro)benzoic acid using biphenyl as carbon and energy source (Pieper, 2005; Pieper and Seeger, 2008). The specificity toward different PCB congeners depends mainly of the particular BphA enzyme (Gibson and Parales, 2000), some of which have been shown to produce the dechlorination of certain chlorinated biphenyls (Haddock et al., 1995; Seeger et al., 2001). The genes from the biphenyl upper degradative pathway have been extensively studied in Paraburkholderia xenovorans LB400, Pseudomonas pseudoalcaligenes KF707, and Rhodococcus jostii RHA1 due to the wide range of PCB congeners that they are able to metabolize (Seeger et al., 1995; Seto et al., 1995; Mondello et al., 1997; Furukawa and Fujihara, 2008). Aerobic degradation of PCBs usually occurs via cometabolism as their chlorinated derivatives might be channeled into dead-end pathways (Brenner et al., 1994) and it has been shown that some chlorinated intermediates are toxic to bacteria (Dai et al., 2002; Camara et al., 2004). After formation of (chloro)benzoic acid, it can be further funneled through catechol, protocatechuate, or the box pathways, ending up into tricarboxylic acid (TCA) cycle intermediates (Harwood and Parales, 1996; Gescher et al., 2002), known as the lower biphenyl degradation pathways.
Strategies for bioremediation of PCBs have been mainly focused on single microorganisms, either natural or modified (Haluska et al., 1995; Abbey et al., 2003; Sierra et al., 2003; Villacieros et al., 2005; Saavedra et al., 2010), which combined with biostimulation and bioaugmentation have resulted in enhanced degradation capabilities of a wide range of congeners (Singer et al., 2000; Fava et al., 2003; Ohtsubo et al., 2004; Field and Sierra-Alvarez, 2008). On the other hand, plant–microorganism interaction also plays a major role in degradation of PCBs (Leigh et al., 2006; Gerhardt et al., 2009; Vergani et al., 2017b). The use of PCB-degrading strains together with others that are capable of degrading their metabolic products (i.e., chlorinated benzoic acids) has also shown to extend the

Chapter II | Metagenomics of biphenyl-degrading bacterial consortium
68
degradation rate of PCBs and results in complete mineralization of certain chlorobiphenyls (Fava et al., 1994; Hernandez-Sanchez et al., 2013).
In this study, we report the isolation and characterization of a soil bacterial consortium that is able to grow aerobically with the PCBs analog biphenyl as the sole carbon and energy source. In order to characterize this consortium, we have followed a metagenomic approach. Previous work using stable isotope probing (SIP) has shown to be useful in order to identify the bacterial populations implicated in biphenyl and benzoate degradation in soil microcosms (Leewis et al., 2016). However, the complexity of the bacterial community and the abundance of cross-feeders limit the study. Here, we show that reducing the community complexity to a lower number of bacterial populations by means of enrichment cultures, the metagenomic analysis allows not only to identify the populations playing a role in biphenyl and benzoate degradation but also to assign specific reactions and pathways to specific populations and therefore elucidating the trophic relationships occurring within the consortium to a higher detail.
Materials and Methods Isolation of the biphenyl-degrading consortium and growth conditions For the isolation of the biphenyl-degrading consortium, 2 g of rhizospheric soil collected near a petrol station (Tres Cantos, Madrid, Spain) was added to 500 mL of sterile liquid minimal salt medium (MM) (Brazil et al., 1995), supplemented with 1 mL/L of phosphate-buffered mineral medium salts (PAS) (Bedard et al., 1986) and 0.005% of yeast extract. One gram per liter of biphenyl crystals was added as the sole carbon and energy source. The culture was grown at 28 °C with shaking (135 rpm) and maintained within a 9-day subculture. After five subcultures, when the culture was unable to grow without biphenyl as the sole carbon and energy source, 20 mL of the culture was centrifuged at 4,248 × g. The pellet was then resuspended in 0.75 mL of MM+PAS and mixed with 0.25 mL of glycerol (80%) and deep-frozen at -80 °C. The isolated consortium was routinely grown on MM+PAS with 1 g/L of biphenyl as the sole carbon and energy source at 28 °C with shaking. For solid media, 1.5% agar (w/v) was added to the media and the biphenyl crystals were placed on the Petri dish lid. The culture growth assessment on different organic compounds was performed as above but benzoic acid, protocatechuate, benzoate, 2-chlorobenzoic acid, 3-chlorobenzoic acid, or 4-chlorobenzoic acid (1 g/L) were added as the sole carbon and energy source.

Metagenomics of biphenyl-degrading bacterial consortium | Chapter II
69
DNA extraction, sequencing, processing of reads, and assembly DNA extraction from the biphenyl-degrading consortium at exponential growth (OD600 = 0.6) was carried out using the Realpure Genomic DNA Extraction Kit (Durviz, Spain). The 16S rRNA gene and the complete metagenome were sequenced by means of amplification of the V3–V4 16S rRNA region (primers 16SV3-V4-CS1; 5′-ACA CTG ACG ACA TGG TTC TAC ACC TAC GGG NGG CWG CAG-3′ and 16SV3-V4-CS2; 5′-TAC GGT AGC AGA GAC TTG GTC TGA CTA CHV GGG TAT CTA ATC C-3′) prior to libraries preparation and by whole-genome shotgun sequencing, respectively. The sequencing was carried out by Parque Científico de Madrid (Spain) using Illumina MiSeq paired 300-bp reads. Reads from the 16S rRNA gene and the whole metagenome were filtered and trimmed using Trimmomatic v0.36 (Bolger et al., 2014) software. Those with less than 50 nts in the case of the 16S rRNA gene or 100 nts in the case of the whole metagenome were removed. Reads from whole-metagenome sequencing were assembled using SPAdes v.10.1 software (Bankevich et al., 2012), metaSPAdes option, and default settings. Assembly quality was assessed using QUAST v4.4 (Gurevich et al., 2013). The resulting contigs were annotated using RAST (Aziz et al., 2008).
Reconstruction of nearly complete genomes from metagenome shotgun sequencing Trimmed pair-reads from the whole-metagenome shotgun sequencing (as described above) were mapped against all available and closed NCBI genomes of Achromobacter, Bordetella, Cupriavidus, Microbacterium, Pseudomonas, Rhodococcus, and Stenotrophomonas using bowtie2 v2.3.3.1 software (Langmead and Salzberg, 2012) with an expected range of inter-mate distances between 373 and 506 nts, consecutive seed extension attempts of 20, number of mismatches allowed in a seed alignment of 0, and length of the seed substrings to align of 20. For each genus, mapping reads and those without matching alignments across all genera examined were merged, processed, and retrieved with SAMtools v1.6 software (Li et al., 2009) for further assembly with SPAdes. Chimeric and misassigned contigs were checked by comparing assemblies of each genus against the same databases used for reads mapping using BLAST v.2.2.28+ software (Camacho et al., 2009). Contigs without positive hits within the expected genus were removed along with those with matching hits belonging to different genera.

Chapter II | Metagenomics of biphenyl-degrading bacterial consortium
70
Contigs of Cupriavidus, Microbacterium, and Rhodococcus assemblies were also removed as genomic sizes were too small for a complete or nearly complete genome. In the case of Pseudomonas, contigs were also classified as belonging to P. pseudoalcaligenes or P. putida based on best blast hits.
Diversity analysis of the 16S rRNA gene and coding DNA sequences (CDSs)
Data analysis of the 16S rRNA gene diversity was assessed with QIIME v1.9.0 (Caporaso et al., 2010) and UPARSE v9 (Edgar, 2013) following the 16S profiling data analysis pipeline specified in the Brazilian Microbiome Project1. Briefly, filtered and trimmed forward and reverse reads were assembled using the fastq-join algorithm2 and further length-filtered by a minimum of 430 nts, representing more than 99% of total reads. Singletons were also removed. These sequences were imported into UPARSE to identify operational taxonomic units (OTUs) at a 97% sequence identity. Chimeras were removed using SILVA v123 database (Quast et al., 2013) as reference, which was also used for genus assignation. QIIME was also used to perform alpha rarefaction analysis. Convergence of observed OTUs rarefaction curve was determined using R (R Core Team, 2013) and the R package iNEXT (Hsieh et al., 2016) with a bootstrapping of 1,000 and a confidence interval of 5%.
To assess the diversity of coding DNA sequences (CDSs), after whole-metagenome assembly and annotation (see above), CDSs were blasted against the NCBI nt database (on April 2017) using blastn from BLAST v2.2.28+ software (Camacho et al., 2009). For each query, the first hit was kept and further filtered by a minimum of 75% sequence identity and 50% coverage. Genus assignation of the CDSs was based on the subject entry.
Identification of CDSs involved in biphenyl metabolism and phylogenetic analysis Amino-acid sequences for biphenyl 2,3-dioxygenase (BphA1), BenA, benzoate-CoA ligase (BclA), CatA, CatE, PobA, protocatechuate 4,5-dioxygenase alpha subunit (LigA), and protocatechuate 3,4-dioxygenase alpha subunit (PcaG)
1 http://www.brmicrobiome.org/ 2 https://github.com/ExpressionAnalysis/ea-utils/blob/wiki/FastqJoin.md

Metagenomics of biphenyl-degrading bacterial consortium | Chapter II
71
enzymes (Supplementary File 2.S1) were downloaded from the NCBI and used to build blast databases using makeblastdb from BLAST. These databases were used as queries for orthologs identification within the whole-metagenome proteome. Results were filtered by 75% sequence identity, 50% coverage, and 1e-10 expected value and further blasted against the nr NCBI database (on April 2017) to validate their annotation. After orthologs identification, clusters of CDSs were searched within the whole-metagenome contigs and represented using own Perl scripts. Contigs carrying bph CDSs were also compared with those reported on reference sequences of Rhodococcus strains HA99 (AB272986.1), RHA1 (AB120955.1), and SAO101 (AB110633.1) to reconstruct the gene clusters using Clustal Omega (Sievers et al., 2011). Synteny representation was based on GenBank annotations and represented as described above.
BphA1, NarA1, and EtbA1 protein sequences from the metagenome annotation of the biphenyl-degrading consortium were aligned using Clustal Omega (Sievers et al., 2011) against 15 well-known BphA1 and closely related NarA1 and EtbA1 protein sequences. Results were imported into MEGA v7 (Kumar et al., 2016) to build the phylogenetic tree using maximum-likelihood with Tamura–Nei model, 1,000 bootstrap replicates, and represented with MEGA. BenA protein sequence of Pseudomonas putida PRS200 was used as an outgroup.
Rhodococcus isolation and genetic analysis Rhodococcus sp. WAY2 was isolated by plating washed (NaCl2 0.85%) and diluted biphenyl-degrading consortium culture on MM+PAS solid medium with biphenyl (1 g/L) as the sole carbon and energy source. After 12 days of incubation at 28 °C, colonies were replated under the same conditions as above. This process was repeated twice. Finally, a single colony was grown on liquid MM+PAS media supplemented with 1 g/L of biphenyl. The culture was centrifuged at 4,248 × g prior to DNA extraction using the Realpure Genomic DNA Extraction Kit (Durviz, Spain). 16S rRNA gene was amplified using the universal primer pairs 27F (5′-AGA GTT TGA TCM TGG CTC AG-3′) and 1492R (5′-CTA CGR RTA CCT TGT TAC GAC-3′) (Weisburg et al., 1991). Amplicons were cloned into pGEM®-T Easy Vector System I (Promega) and transformed into E. coli DH5α. Plasmid DNA was extracted using the kit Wizard® Plus SV Minipreps DNA Purification System (Promega). Inserts were sequenced by means of Sanger sequencing using the universal primers T7 and SP6.

Chapter II | Metagenomics of biphenyl-degrading bacterial consortium
72
The three bph gene clusters identified in the whole metagenome of the biphenyl-degrading consortium were screened by PCR on the genome of the isolated Rhodococcus sp. WAY2 using the own-designed primers BphClus1F (5′-CGC CTC ATC ACG AAT GTG ACC G-3′), BphClus1R (5′-GCG TCC TCA TGC GTA CAG GTG TCC-3′), BphClus2F (5′-CGA CTG CTC GGA CTG GAG GG-3′), BphClus2R (5′-CCC ATC GAG TTA CCG ACT ATG TGC G-3′), BphClus3F (5′-GCC CGA CCA AGC AGT ACA AAG TG-3′), and BphClus3R (5′-GTC CAG TCG GAC TTC ACG TCG-3′). Primers were designed on the genomic sequence of these clusters. Melting temperature, absence of dimerization and hairpin formation, and lack of secondary priming sites were assessed with OligoAnalyzer 3.13. PCR was carried out in a total volume of 25 μL containing 2.5 μL of 10 × PCR buffer MgCl2 free, 1 μL MgCl2 50 mM, 0.5 μL dNTP mix 10 mM (2.5 μM each), 1 μL of each primer at 10 μM, 1 μL of Taq DNA polymerase 1 U/μL (Biotools), and 1 μL of DNA template 30–50 ng/μL. The cycling conditions consisted in a first denaturation step at 95 °C for 5 min followed by 32 cycles of amplification (45 s denaturation at 95 °C, 45 s of primer annealing at 58 °C, and an elongation step at 72 °C for 1.5 min) followed by a final elongation step at 72 °C for 7 min. PCR products were electrophoretically separated in 0.8% (w/v) agarose gels and post-dyed with GelRed.
Sequence deposition Raw reads of the 16S rRNA gene amplicons and whole-metagenome shotgun sequencing of the biphenyl-degrading consortium were deposited to the NCBI Sequence Read Archive under the accession numbers SRR6076973 and SRR6076972, respectively. Assemblies of Achromobacter sp., Bordetella sp., P. pseudoalcaligenes, Pseudomonas sp., and Stenotrophomonas sp. reconstructed from the metagenome were deposited to GenBank under the accession numbers PKCB00000000, PKCD00000000, PKCC00000000, PKCE00000000, and PKCF00000000, respectively. The 16S rRNA gene sequence of the isolated Rhodococcus sp. WAY2 was submitted to GenBank and it is available under the accession number MF996860. The 16S rRNA gene sequence of the 24 identified OTUs is shown in Supplementary File 2.S2.
3 https://eu.idtdna.com/calc/analyzer

Metagenomics of biphenyl-degrading bacterial consortium | Chapter II
73
Results and discussion Metagenomic sequencing and bacterial diversity After sequencing the 16S rRNA genes of bacteria in the biphenyl-degrading consortium, a total of 44,644 sequences were obtained and assigned to 24 OTUs (≥97% sequence identity). The rarefaction curve shows a clear and early saturation of observed OTUs, as shown in Figure 2.1A, which indicates that a full community coverage was achieved before 40,000 sequences and the presence of other taxa is unlikely. Furthermore, statistical analysis of the rarefaction curve (Supplementary File 2.S3) showed that doubling the sampling would not increase the number of detected OTUs. On the other hand, the whole-genome shotgun sequencing of the metagenome resulted in 78.4 Mbp distributed in 45,046 contigs (Supplementary File 2.S4). After annotation, 66,967 coding DNA sequences (CDSs) were obtained, from which 47,689 (71.2%) were assigned to the genus level, showing a high concordance with the identified OTUs. The relative abundance of the 16S rRNA and the CDSs (Figure 2.1B) shows that the biphenyl-degrading consortium is clearly dominated by Pseudomonas (28.97% 16S rRNA and 41.57% CDSs). Other genera that are present in the consortium are Bordetella (21.28% 16S rRNA and 11.75% CDSs), Achromobacter (12.67% 16S rRNA and 9.88% CDSs), Stenotrophomonas (8.57% 16S rRNA and 12.99% CDSs), Rhodococcus (2.18% 16S rRNA and 8.17% CDSs), and Cupriavidus (1.51% 16S rRNA and 7.62% CDSs). This distribution is detailed in Supplementary File 2.S5. The main difference between the 16S rRNA and CDSs relative genus abundance lies in Pigmentiphaga, which is relatively abundant in the 16S rRNA analysis (20.54%) but is almost absent on CDSs representation (0.04%). This is probably due to lack of sequenced Pigmentiphaga genomes in the NCBI database, which makes CDSs assignation to this genus impossible and explains the higher relative abundance of the remaining genera in the CDSs diversity analysis. However, some genera, such as Bordetella and Achromobacter, have a lower relative CDSs representation than in the 16S rRNA. This could be explained by an incomplete metagenome, given that around 120 Mbp metagenome size was expected (considering an average bacterial genome size of 5 Mbp) to achieve a full genomic representation of the 24 OTUs identified in the biphenyl-degrading consortium. Furthermore, the presence of only 16 16S rRNA genes annotated in the metagenome is congruent with an incomplete one. However, it is important to indicate that the seven most represented genera represent more than 95% of the bacterial community and 96% of the identified CDS (Figure 2.1B), indicating a

Chapter II | Metagenomics of biphenyl-degrading bacterial consortium
74
high coverage of the metagenome. This level of coverage would be impossible to achieve analyzing directly a soil sample or microcosm.
Figure 2.1 | Diversity and composition of the biphenyl-degrading consortium. (A) Rarefaction curve of observed OTUs (≥97% sequence identity) over the number of 16S rRNA sequences and (B) relative abundance of genus based on 16S rRNA and CDSs taxonomic assignment. Only taxa with a minimum relative abundance of 0.15% for 16S rRNA and 0.9% for CDSs is represented.
On the other hand, we have been able to reconstruct five nearly complete genomes from the whole-metagenome sequence, which correspond with the most abundant OTUs identified in the consortium (Table 2.1). These include two genomes classified as P. pseudoalcaligenes and Pseudomonas sp.,

Metagenomics of biphenyl-degrading bacterial consortium | Chapter II
75
Achromobacter sp., Bordetella sp., and Stenotrophomonas sp. Their genomic sizes and %GC content are congruent with their closest relative genome.
Table 2.1 | Genomic statistics of the five nearly complete genomes reconstructed from the whole-metagenome sequence of the biphenyl-degrading consortium.
Assembly (Accs. No.)
OTU no.a
Closest relative genomeb
(Accs. No.) Contigs
Largest contig (bp)
Total length (bp)
GC% N50
Achromobacter sp. (PKCB00000000)
4 A. xylosoxidans
DPB_1 (MTLI00000000.1)
2,603 31,468 7,352,073 65.7 3,641
Bordetella sp. (PKCD00000000)
2 B. petrii DSM
12804 (NC_010170.1)
2,637 33,811 5,644,602 65.3 3,914
Pseudomonas pseudoalcaligenes (PKCC00000000)
3
P. pseudoalcaligenes
KF707 (NZ_AP014862.1)
1,404 73,619 5,455,424 66.2 8,550
Pseudomonas sp. (PKCE00000000)
12 P. putida KF715
(NZ_AP015029.1) 7,053 12,148 6,703,495 63.4 1,079
Stenotrophomonas sp.
(PKCF00000000) 5
S. maltophilia ISMMS3
(NZ_CP011010.1) 411 38,468 4,489,164 66.8 12,006
a See Supplementary File 2.S2. b According to contigs size and best blast hits.
Identification of biphenyl upper degradative pathway gene clusters In order to identify the metabolic pathways involved in the biphenyl biodegradation that are present in the whole metagenome of the biphenyl-degrading consortium, alpha subunits of the BphA1 were used as query to search for orthologous sequences. Three different BphA1 were identified (Table 2.2), which are present in three different contigs and are classified as belonging to the Rhodococcus genus by sequence identity (Supplementary File 2.S6). BphA1 encodes the α subunit of biphenyl dioxygenases, and are responsible for the enzyme specificity (Gibson and Parales, 2000). As shown in Figure 2.2D, BphA1 proteins can be classified into three families. Typical BphA1 have been identified and characterized in many bacterial strains, including P. xenovorans LB400 (Seeger et al., 1995), P. pseudoalcaligenes KF707 (Taira et al., 1992), and R. jostii RHA1 (Seto et al., 1995). None of the BphA1 CDS identified here belongs to this family. A second family of atypical BphA1 was identified in several strains of the genus Rhodococcus, including strains HA99 and R04 (Taguchi et al., 2007; Yang et al., 2007). One of the CDS identified here is identical to these atypical BphA1.

Chapter II | Metagenomics of biphenyl-degrading bacterial consortium
76
The other family is formed by proteins with proved BphA1 activity, but formerly identified as NarA1 or EtbA1. These proteins have also been identified within the genus Rhodococcus (Kimura et al., 2006; Iwasaki et al., 2007) and two of the BphA1 CDSs identified here are identical to CDSs in Rhodococcus opacus SAO101 and R. jostii RHA1, respectively.
Table 2.2 | Summary of the number and genus affiliation of the main CDSs for enzymes involved in the biphenyl and metabolic derivatives degradation identified in the biphenyl-degrading consortium.
Gene Protein / genus assignation Number of CDSs bphA a Biphenyl 2,3-dioxigenase (EC 1.14.12.18) 3 Rhodococcus 3 benA a Benzoate 1,2-dioxigenase (EC 1.14.12.10) 10 Pseudomonas 5 Bordetella 4 Rhodococcus 1 catA Catechol 1,2-dioxygenase (EC 1.13.11.1) 13 Pseudomonas 5 Rhodococcus 4 Bordetella 2 Achromobacter 1 Variovorax 1 catE Catechol 2,3-dioxygenase (EC 1.13.11.2) 5 Variovorax 2 Cupriavirus 2 Uncultured/unclassified 1 pobA 4-Hydroxybenzoate 3-monooxygenase (EC 1.14.13.2) 10 Pseudomonas 4 Bordetella 2 Achromobacter 1 Ralstonia 1 Rhodococcus 1 Uncultured/unclassified 1 pcaG a Protocatechuate 3,4-dioxygenase (EC 1.13.11.13) 9 Pseudomonas 4 Achromobacter 2 Bordetella 1 Cupriavidus 1 Ralstonia 1 ligA a Protocatechuate 4,5-dioxygenase (EC 1.13.11.8) 4 Uncultured/unclassified 2 Pseudomonas 1 Bordetella 1 boxA a Benzoyl-CoA oxygenase (EC 1.14.13.208) 4 Achromobacter 3 Variovorax 1 a Only alpha subunits of multimeric enzymes are considered.
Metagenomics of biphenyl-degrading bacterial consortium | Chapter II
77
On the other hand, the comparison between these CDSs and the ones previously reported in other Rhodococcus strains sequences allowed us to reconstruct the bph gene clusters from the whole-metagenome contigs, as shown in Figure 2.2. The first cluster (Figure 2.2A) was reconstructed from four different metagenome contigs and shows high sequence identity with the bph gene clusters reported in Rhodococcus sp. HA99 (Taguchi et al., 2007). This cluster is composed by bphBCA1A2A3A4 and bphD, which are responsible for biphenyl and PCBs degradation into (chloro)benzoate and 2-hydroxypenta-2,4-dienoate (Taguchi et al., 2007). The second gene cluster (Figure 2.2B) was reconstructed from three different metagenome contigs and presents high sequence identity with bph and etb gene clusters which have been reported to be involved in both, biphenyl and PCBs degradation in R. jostii RHA1 (Iwasaki et al., 2006; Iwasaki et al., 2007). This cluster is composed by etbA1A2C and bphDE2F2. The third gene cluster is present in a single metagenome contig (Figure 2.2C) and shows high sequence identity with nar gene clusters previously described in the plasmid pWK301 of R. opacus SAO101 (Kimura et al., 2006).
This gene cluster is composed by narA1A2BC and two transcriptional regulators narR1R2 and it has been reported to be involved in the degradation of a wide range of substrates, including biphenyl and PCBs (Kimura and Urushigawa, 2001; Kitagawa et al., 2004; Kimura et al., 2006). These results strongly suggest that Rhodococcus is the only genus responsible for initiating the biphenyl degradation in the consortium and that initial degradation can proceed through three distinct pathways. To our knowledge, multiple pathways have only been found in R. jostii RHA1, where a bph and an etb pathways have been described (Iwasaki et al., 2006; Iwasaki et al., 2007).
To further study if the bph, etb, and nar gene clusters identified in the metagenome belong to one or multiple Rhodococcus strains that might be present in the biphenyl-degrading consortium, we isolated a Rhodococcus strain (Rhodococcus sp. WAY2) from the consortium and tested for the presence of these three gene clusters by means of PCR. The results revealed that the three clusters are present in a single Rhodococcus strain WAY2, which 16S rRNA showed a high sequence identity (>99%) with R. jostii RHA1. This might suggest that the etb gene cluster is present in the chromosome of the isolated WAY2 strain as it is in the case of RHA1, while bph and nar gene clusters could be present in

Chapter II | Metagenomics of biphenyl-degrading bacterial consortium
78
plasmids, as reported in strains HA99 and SAO101, respectively (Kimura et al., 2006; Taguchi et al., 2007).
Figure 2.2 | Synteny and sequence identity of gene clusters involved in biphenyl degradation compared with reference sequences. (A) Biphenyl degradative gene cluster, (B) ethylbenzene degradative gene cluster, and (C) naphthalene degradative gene cluster. Rhodococcus sp. HA99, R. jostii RHA1, and R. opacus SAO101 sequences are shown as reference. Contigs from the metagenome are represented as black lines and their ID number is shown below. Black arrows represent hypothetical genes. Percentage according to nucleotide sequence identity of the CDSs. (D) Phylogenetic tree showing the relation of the isolated BphA1 protein sequences with previously characterized proteins. A BenA protein sequence from Pseudomonas putida was used as an outgroup.

Metagenomics of biphenyl-degrading bacterial consortium | Chapter II
79
Identification of biphenyl lower degradative pathway genes Biphenyl is metabolized to benzoate and 2-hydroxypenta-2,4-dienoate by either the bph, etb, or nar gene clusters. Benzoate can be then further mineralized by three different aerobic pathways: catechol, protocatechuate, or benzoyl-coA ligation (Harwood and Parales, 1996; Rather et al., 2010; Fuchs et al., 2011). All the CDSs for enzymes of these aerobic benzoate degradation pathways were screened and found in the metagenome of the biphenyl-degrading consortium and are summarized in Table 2.2 (for details see Supplementary File 2.S6). The benzoate degradative pathway via catechol formation is first initiated by BenABCD to form catechol. The coding sequence for benzoate 1,2-dioxygenase alpha subunit (BenA) was found 10 times in different contigs and was mainly assigned to Pseudomonas (five) and Bordetella (four). The remaining one was assigned to Rhodococcus (Table 2.2). After catechol formation, it can be further mineralized by ortho or meta cleavage, in which catechol 1,2-dioxygenase (CatA) or catechol 2,3-dioxygenase (CatE) is, respectively, involved. The coding sequence of CatA was found 13 times in the metagenome and was mainly assigned to Pseudomonas (five) and Rhodococcus (four). The remaining ones were assigned to Bordetella (two), Achromobacter (one), and Variovorax (one) (Table 2.2). On the other hand, the coding sequence for CatE was found five times in the metagenome and was assigned to Variovorax (two), Cupriavidus (two), and the remaining two could not be assigned (Table 2.2). These results suggest that the degradation of benzoate via catechol is mainly supported by Pseudomonas, Bordetella, and Rhodococcus, while other genera such as Achromobacter, Variovorax, and Cupriavidus have a smaller involvement in this pathway. Regarding the presence of this pathway in Rhodococcus, the isolated strain R. sp. WAY2 was unable to grow on benzoate as the sole carbon and energy source, suggesting that another Rhodococcus strain, different than the one harboring the bph, etb, and nar gene clusters, is present in the biphenyl-degrading consortium.
Benzoate can also be metabolized via protocatechuate formation, in which a benzoate 4-monooxygenase (CYP450) and a 4-hydroxybenzoate 3-monooxygenase (PobA) are involved (Fuchs et al., 2011). The coding sequence of PobA was found 10 times in different contigs in the metagenome and was assigned to Pseudomonas (four), Bordetella (two), Achromobacter (one), Ralstonia (one), Rhodococcus (one), and the remaining one could not be assigned to any genus (Table 2.2). After protocatechuate formation, it can also be mineralized via ortho and meta cleavage, in which protocatechuate 3,4-

Chapter II | Metagenomics of biphenyl-degrading bacterial consortium
80
dioxygenase (PcaGH) and protocatechuate 4,5-dioxygenase (LigAB) are, respectively, involved. The coding sequence for PcaG was found nine times in the metagenome and was assigned to Pseudomonas (four), Achromobacter (two), Bordetella (one), Cupriavidus (one), and Ralstonia (one) (Table 2.2). On the other hand, the coding sequence of LigA was found four times in the metagenome and was assigned to Pseudomonas (one) and Bordetella (one). The remaining ones could not be assigned to any genus (Table 2.2). These results suggest that the degradation of benzoate via protocatechuate formation is also dominated by Pseudomonas and Bordetella, harboring both, the ortho and meta protocatechuate cleavage pathways, while Achromobacter, Ralstonia, and Cupriavidus only have the coding sequences for protocatechuate formation and/or its ortho-cleavage pathway.
Finally, benzoate can also be mineralized by a novel pathway in which acetyl-CoA is first ligated to benzoate by a BclA and further epoxidated by benzoyl-CoA 2,3-epoxidase (BoxAB) (Rather et al., 2010). The coding sequence for BoxA was found four times in different contigs in the metagenome and was assigned to Achromobacter (three) and Variovorax (one) (Table 2.2). Contigs carrying the BoxA-coding sequence were also found to contain the remaining genes for the box cluster (boxABCD and bclA), along with the transcriptional regulator boxR and several coding sequences involved in benzoate transport, as shown in Figure 2.3. However, two of these contigs assigned to Achromobacter lack the boxD gene, which might result in dead-end production of 3,4-didehydroadipyl-CoA semialdehyde and formate, although they could be source of carbon and energy through alternative pathways.
Figure 2.3 | Box gene clusters identified in the metagenome of the biphenyl-degrading consortium. Black arrows represent genes with no involvement in benzoate degradation. Genus assignation of the clusters based on sequence identity of CDSs.

Metagenomics of biphenyl-degrading bacterial consortium | Chapter II
81
Population roles in the biphenyl-degrading consortium The catabolic pathways for biphenyl and its metabolic derivatives found in the metagenome of the biphenyl-degrading consortium and the genus affiliation of the coding sequences for these pathways (Table 2.2 and Supplementary File 2.S6) provide a complete understanding of the different roles of the main bacterial populations that are present in the consortium with regard of their relative abundance. It is interesting to note that the seven most represented genera in the consortium have been identified as the source of 90% of the CDSs identified in the biphenyl/benzoate degradation pathways and that these genera harbor all the enzymatic activities in the degradation pathways. These results reflect a high degree of functional redundancy, as the same reactions seem to be carried out by different taxa. These results are summarized in Table 2.3 and the metabolic pathways reconstructed for the biphenyl-degrading consortium is represented in Figure 2.4.
Table 2.3 | Summary of the pathways assigned to the main genus present in the biphenyl-degrading consortium. Metabolic pathway identified
Relative abundance (%)
Bip
heny
l to
benz
oate
Ben
zoat
e to
cat
echo
l
Cat
echo
l ort
ho c
leav
age
Cat
echo
l met
a cl
eava
ge
Ben
zoat
e to
pro
toca
tech
uate
Prot
ocat
echu
ate
orth
o cl
eava
ge
Prot
ocat
echu
ate
met
a cl
eava
ge
Ben
zoat
e to
ben
zoyl
-CoA
Genus 16S rRNA CDSs Pseudomonas 28.97 41.57 + + + + + Bordetella 21.28 11.75 + + + + + Pigmentiphaga 20.54 0.04 Achromobacter 12.67 9.88 + + + + Stenotrophomonas 8.57 12.99 Rhodococcus 1.16 8.18 + + + + Cupriavidus 1.51 7.62 + + +
Rhodococcus is the genus responsible for initiating the biphenyl
degradation into benzoate as the three BphA1 that have been found in the metagenome have been only assigned to this genus. Furthermore, the presence of complete gene clusters for bph, etb, and nar in a single Rhodococcus strain, and the previous reports of the involvement of these clusters in both biphenyl and

Chapter II | Metagenomics of biphenyl-degrading bacterial consortium
82
PCBs degradation (Kimura et al., 2006; Iwasaki et al., 2007; Taguchi et al., 2007), makes this strain suited for bioremediation of PCBs. However, although the consortium was not able to grow in any of the chlorobenzoates tested (2-, 3-, or 4-chlorobenzoic acid) as the sole carbon and energy source (Table 2.4), cometabolism of chlorobenzoates as well as PCB congeners should be further analyzed. After formation of benzoate as the product of biphenyl degradation, the remaining bacterial populations can thrive, either by using benzoate, catechol, or protocatechuate. Our results show that protocatechuate and catechol degradative pathways in the consortium are rather abundant (Table 2.2), and are dominated by Pseudomonas and Bordetella, harboring genes for both, ortho and meta cleavage of protocatechuate and ortho cleavage of catechol. The relative high abundance of this genus in the consortium can be explained by the different alternative pathways for benzoate and its metabolic derivates degradation. Other genera such as Achromobacter and Cupriavidus are likely using catechol and/or protocatechuate to grow (Table 2.3). In addition, the consortium was able to grow on benzoate and protocatechuate as the sole carbon and energy source (Table 2.4), which is in agreement with the results presented here. On the other hand, the benzoate degradative pathway via acetyl-CoA ligation was mainly assigned to Achromobacter, which explains its presence in the consortium although it could also use protocatechuate and catechol via ortho cleavage (Table 2.3).
Table 2.4 | Consortium growth on different organic compounds as the sole carbon and energy source. Substrate Growth Biphenyl + Benzoic acid + Protocatechuic acid + 2-Chlorobenzoic acid - 3-Chlorobenzoic acid - 4-Chlorobenzoic acid -
Interestingly, two of the most abundant genera within the consortium,
Pigmentiphaga and Stenotrophomonas (20.54 and 8.57% 16S rRNA relative abundance, respectively) do not have any of the coding sequences for enzymes screened in the metagenome (Table 2.2 and Supplementary File 2.S6). In the case of Pigmentiphaga, it is clear that the lack of sequenced genomes available on the NCBI database (on April 2017) prevented the affiliation of CDSs to this genus. However, it is unclear if any of the coding sequences for enzymes of these
Metagenomics of biphenyl-degrading bacterial consortium | Chapter II
83
pathways that could not been assigned to any genus (Table 2.2) might belong to Pigmentiphaga or if other metabolic abilities are involved. Regarding Stenotrophomonas, it is a common member of biphenyl, PCBs, and other aromatics-degrading communities (Leigh et al., 2007; Uhlik et al., 2013; Wald et al., 2015) and exhibits high metabolic versatility (Hauben et al., 1999). Its presence in the biphenyl-degrading consortium might be explained by cross-feeding on secondary metabolites produced by the rest of the consortium members, as it has been previously suggested (Wald et al., 2015). These results show that the metagenomic analysis of this consortium allows the determination of the biodegradation network involved in biphenyl degradation, being able to determine the specific role of different bacterial populations in the biodegradation process.

Chapter II | Metagenomics of biphenyl-degrading bacterial consortium
84
Figure 2.4 | (Figure caption in next page)
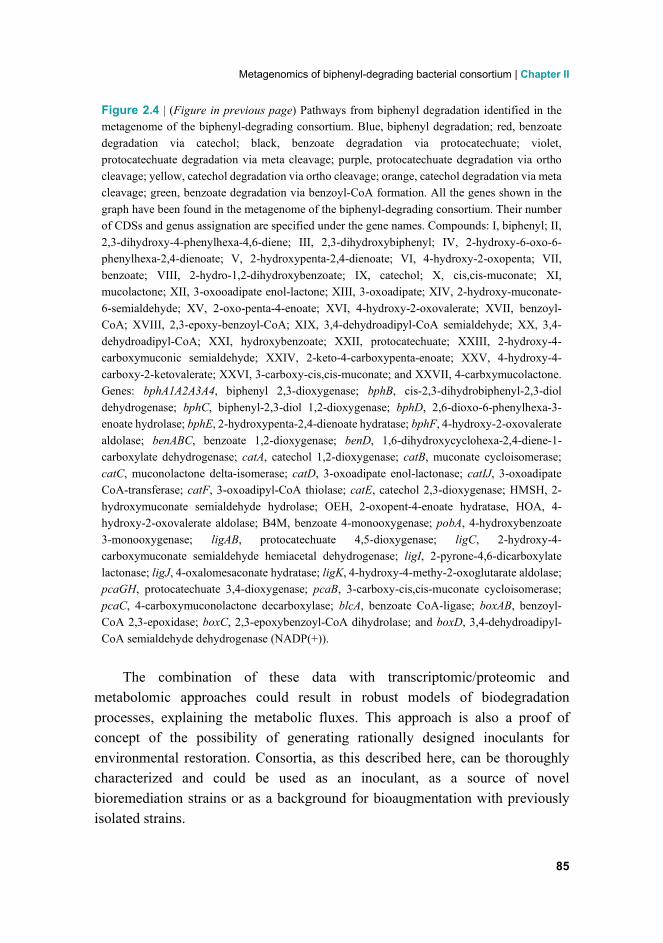
Metagenomics of biphenyl-degrading bacterial consortium | Chapter II
85
Figure 2.4 | (Figure in previous page) Pathways from biphenyl degradation identified in the metagenome of the biphenyl-degrading consortium. Blue, biphenyl degradation; red, benzoate degradation via catechol; black, benzoate degradation via protocatechuate; violet, protocatechuate degradation via meta cleavage; purple, protocatechuate degradation via ortho cleavage; yellow, catechol degradation via ortho cleavage; orange, catechol degradation via meta cleavage; green, benzoate degradation via benzoyl-CoA formation. All the genes shown in the graph have been found in the metagenome of the biphenyl-degrading consortium. Their number of CDSs and genus assignation are specified under the gene names. Compounds: I, biphenyl; II, 2,3-dihydroxy-4-phenylhexa-4,6-diene; III, 2,3-dihydroxybiphenyl; IV, 2-hydroxy-6-oxo-6-phenylhexa-2,4-dienoate; V, 2-hydroxypenta-2,4-dienoate; VI, 4-hydroxy-2-oxopenta; VII, benzoate; VIII, 2-hydro-1,2-dihydroxybenzoate; IX, catechol; X, cis,cis-muconate; XI, mucolactone; XII, 3-oxooadipate enol-lactone; XIII, 3-oxoadipate; XIV, 2-hydroxy-muconate-6-semialdehyde; XV, 2-oxo-penta-4-enoate; XVI, 4-hydroxy-2-oxovalerate; XVII, benzoyl-CoA; XVIII, 2,3-epoxy-benzoyl-CoA; XIX, 3,4-dehydroadipyl-CoA semialdehyde; XX, 3,4-dehydroadipyl-CoA; XXI, hydroxybenzoate; XXII, protocatechuate; XXIII, 2-hydroxy-4-carboxymuconic semialdehyde; XXIV, 2-keto-4-carboxypenta-enoate; XXV, 4-hydroxy-4-carboxy-2-ketovalerate; XXVI, 3-carboxy-cis,cis-muconate; and XXVII, 4-carbxymucolactone. Genes: bphA1A2A3A4, biphenyl 2,3-dioxygenase; bphB, cis-2,3-dihydrobiphenyl-2,3-diol dehydrogenase; bphC, biphenyl-2,3-diol 1,2-dioxygenase; bphD, 2,6-dioxo-6-phenylhexa-3-enoate hydrolase; bphE, 2-hydroxypenta-2,4-dienoate hydratase; bphF, 4-hydroxy-2-oxovalerate aldolase; benABC, benzoate 1,2-dioxygenase; benD, 1,6-dihydroxycyclohexa-2,4-diene-1-carboxylate dehydrogenase; catA, catechol 1,2-dioxygenase; catB, muconate cycloisomerase; catC, muconolactone delta-isomerase; catD, 3-oxoadipate enol-lactonase; catIJ, 3-oxoadipate CoA-transferase; catF, 3-oxoadipyl-CoA thiolase; catE, catechol 2,3-dioxygenase; HMSH, 2-hydroxymuconate semialdehyde hydrolase; OEH, 2-oxopent-4-enoate hydratase, HOA, 4-hydroxy-2-oxovalerate aldolase; B4M, benzoate 4-monooxygenase; pobA, 4-hydroxybenzoate 3-monooxygenase; ligAB, protocatechuate 4,5-dioxygenase; ligC, 2-hydroxy-4-carboxymuconate semialdehyde hemiacetal dehydrogenase; ligI, 2-pyrone-4,6-dicarboxylate lactonase; ligJ, 4-oxalomesaconate hydratase; ligK, 4-hydroxy-4-methy-2-oxoglutarate aldolase; pcaGH, protocatechuate 3,4-dioxygenase; pcaB, 3-carboxy-cis,cis-muconate cycloisomerase; pcaC, 4-carboxymuconolactone decarboxylase; blcA, benzoate CoA-ligase; boxAB, benzoyl-CoA 2,3-epoxidase; boxC, 2,3-epoxybenzoyl-CoA dihydrolase; and boxD, 3,4-dehydroadipyl-CoA semialdehyde dehydrogenase (NADP(+)).
The combination of these data with transcriptomic/proteomic and
metabolomic approaches could result in robust models of biodegradation processes, explaining the metabolic fluxes. This approach is also a proof of concept of the possibility of generating rationally designed inoculants for environmental restoration. Consortia, as this described here, can be thoroughly characterized and could be used as an inoculant, as a source of novel bioremediation strains or as a background for bioaugmentation with previously isolated strains.
Chapter II | Metagenomics of biphenyl-degrading bacterial consortium
86
Conclusions The results presented here show that metagenomic analysis is a powerful tool for the functional characterization of consortia designed for bioremediation of complex contaminants. The analysis of consortia rather than soil microcosms has obvious advantages. First of all, while a typical soil microcosm usually contains thousands of genotypes, a consortium such as the one shown here contains less than a hundred genotypes, and therefore the depth of sequencing is much higher. Furthermore, while most of the genotypes detected in the consortium play a role in the biodegradation process, as shown here, most of the populations in a microcosm are irrelevant for the process. Furthermore, metagenomic analysis has proven to be advantageous over SIP in analyzing the biodegrading populations. While SIP was able to identify the bacterial populations involved in biphenyl and benzoate degradation in a soil microcosm and to determine that biphenyl and benzoate were mostly degraded by different populations (Leewis et al., 2016), here we have been able to determine not only the biodegrading populations, but also to assign specific functions and reactions to specific populations, identifying all the biodegradation pathways and therefore providing a deeper insight in the biodegradation process.
Supplementary material The supplementary material of this chapter is available in the electronic version of the thesis and, alternatively, can be downloaded from:
https://www.frontiersin.org/articles/10.3389/fmicb.2018.00232/full#supplementary-material
Supplementary File 2.S1 | Accession numbers of enzymes used to construct databases. Retrieved from the NCB on April 2017.
Supplementary File 2.S2 | 16S rRNA sequences and genus assignation of the 24 OTUs (97% seq. ident.) obtained in the diversity analysis of the biphenyl-degrading bacterial consortium.
Supplementary File 2.S3 | Interpolation-extrapolation convergence analysis for the rarefaction curve of the observed OTUs.
Supplementary File 2.S4 | Statistics of the 16S rRNA and whole-metagenome shotgun sequencing and processing of reads.

Metagenomics of biphenyl-degrading bacterial consortium | Chapter II
87
Supplementary File 2.S5 | Relative abundance of both, the 16S rRNA sequences and CDSs from the metagenome annotation assigned to the genus level.
Supplementary File 2.S6 | CDSs for biphenyl, benzoate, catechol and protocatechuate degradative pathways found in the metagenome annotation and their genus affiliation based on blastn.
References Abbey, A.M., Beaudette, L.A., Lee, H., and Trevors, J.T. (2003). Polychlorinated biphenyl
(PCB) degradation and persistence of a gfp-marked Ralstonia eutropha H850 in PCB-contaminated soil. Appl Microbiol Biotechnol 63, 222-230.
Aziz, R.K., Bartels, D., Best, A.A., Dejongh, M., Disz, T., Edwards, R.A., Formsma, K., Gerdes, S., Glass, E.M., Kubal, M., Meyer, F., Olsen, G.J., Olson, R., Osterman, A.L., Overbeek, R.A., Mcneil, L.K., Paarmann, D., Paczian, T., Parrello, B., Pusch, G.D., Reich, C., Stevens, R., Vassieva, O., Vonstein, V., Wilke, A., and Zagnitko, O. (2008). The RAST Server: rapid annotations using subsystems technology. BMC Genomics 9, 75.
Bankevich, A., Nurk, S., Antipov, D., Gurevich, A.A., Dvorkin, M., Kulikov, A.S., Lesin, V.M., Nikolenko, S.I., Pham, S., Prjibelski, A.D., Pyshkin, A.V., Sirotkin, A.V., Vyahhi, N., Tesler, G., Alekseyev, M.A., and Pevzner, P.A. (2012). SPAdes: a new genome assembly algorithm and its applications to single-cell sequencing. J Comput Biol 19, 455-477.
Bedard, D.L., Unterman, R., Bopp, L.H., Brennan, M.J., Haberl, M.L., and Johnson, C. (1986). Rapid assay for screening and characterizing microorganisms for the ability to degrade polychlorinated biphenyls. Appl Environ Microbiol 51, 761-768.
Bolger, A.M., Lohse, M., and Usadel, B. (2014). Trimmomatic: a flexible trimmer for Illumina sequence data. Bioinformatics 30, 2114-2120.
Brazil, G.M., Kenefick, L., Callanan, M., Haro, A., De Lorenzo, V., Dowling, D.N., and O'gara, F. (1995). Construction of a rhizosphere pseudomonad with potential to degrade polychlorinated biphenyls and detection of bph gene expression in the rhizosphere. Appl Environ Microbiol 61, 1946-1952.
Brenner, V., Arensdorf, J.J., and Focht, D.D. (1994). Genetic construction of PCB degraders. Biodegradation 5, 359-377.
Camacho, C., Coulouris, G., Avagyan, V., Ma, N., Papadopoulos, J., Bealer, K., and Madden, T.L. (2009). BLAST+: architecture and applications. BMC Bioinformatics 10, 421.
Camara, B., Herrera, C., Gonzalez, M., Couve, E., Hofer, B., and Seeger, M. (2004). From PCBs to highly toxic metabolites by the biphenyl pathway. Environ Microbiol 6, 842-850.
Caporaso, J.G., Kuczynski, J., Stombaugh, J., Bittinger, K., Bushman, F.D., Costello, E.K., Fierer, N., Pena, A.G., Goodrich, J.K., Gordon, J.I., Huttley, G.A., Kelley, S.T., Knights, D., Koenig, J.E., Ley, R.E., Lozupone, C.A., Mcdonald, D., Muegge, B.D., Pirrung, M., Reeder, J., Sevinsky, J.R., Turnbaugh, P.J., Walters, W.A., Widmann, J., Yatsunenko, T., Zaneveld, J., and Knight, R. (2010). QIIME

Chapter II | Metagenomics of biphenyl-degrading bacterial consortium
88
allows analysis of high-throughput community sequencing data. Nat Methods 7, 335-336.
Dai, S., Vaillancourt, F.H., Maaroufi, H., Drouin, N.M., Neau, D.B., Snieckus, V., Bolin, J.T., and Eltis, L.D. (2002). Identification and analysis of a bottleneck in PCB biodegradation. Nat Struct Biol 9, 934-939.
Edgar, R.C. (2013). UPARSE: highly accurate OTU sequences from microbial amplicon reads. Nat Methods 10, 996-998.
Fava, F., Bertin, L., Fedi, S., and Zannoni, D. (2003). Methyl-beta-cyclodextrin-enhanced solubilization and aerobic biodegradation of polychlorinated biphenyls in two aged-contaminated soils. Biotechnol Bioeng 81, 381-390.
Fava, F., Di Gioia, D., Cinti, S., Marchetti, L., and Quattroni, G. (1994). Degradation and dechlorination of low-chlorinated biphenyls by a three-membered bacterial co-culture. Applied Microbiology and Biotechnology 41, 117-123.
Fennell, D.E., Nijenhuis, I., Wilson, S.F., Zinder, S.H., and Haggblom, M.M. (2004). Dehalococcoides ethenogenes strain 195 reductively dechlorinates diverse chlorinated aromatic pollutants. Environ Sci Technol 38, 2075-2081.
Field, J.A., and Sierra-Alvarez, R. (2008). Microbial transformation and degradation of polychlorinated biphenyls. Environ Pollut 155, 1-12.
Fuchs, G., Boll, M., and Heider, J. (2011). Microbial degradation of aromatic compounds - from one strategy to four. Nat Rev Microbiol 9, 803-816.
Furukawa, K., and Fujihara, H. (2008). Microbial degradation of polychlorinated biphenyls: biochemical and molecular features. J Biosci Bioeng 105, 433-449.
Gerhardt, K.E., Huang, X.D., Glick, B.R., and Greenberg, B.M. (2009). Phytoremediation and rhizoremediation of organic soil contaminants: Potential and challenges. Plant Science 176, 20-30.
Gescher, J., Zaar, A., Mohamed, M., Schagger, H., and Fuchs, G. (2002). Genes coding for a new pathway of aerobic benzoate metabolism in Azoarcus evansii. J Bacteriol 184, 6301-6315.
Gibson, D.T., and Parales, R.E. (2000). Aromatic hydrocarbon dioxygenases in environmental biotechnology. Curr Opin Biotechnol 11, 236-243.
Gomes, H.I., Dias-Ferreira, C., and Ribeiro, A.B. (2013). Overview of in situ and ex situ remediation technologies for PCB-contaminated soils and sediments and obstacles for full-scale application. Sci Total Environ 445-446, 237-260.
Gurevich, A., Saveliev, V., Vyahhi, N., and Tesler, G. (2013). QUAST: quality assessment tool for genome assemblies. Bioinformatics 29, 1072-1075.
Haddock, J.D., Horton, J.R., and Gibson, D.T. (1995). Dihydroxylation and dechlorination of chlorinated biphenyls by purified biphenyl 2,3-dioxygenase from Pseudomonas sp. strain LB400. J Bacteriol 177, 20-26.
Haluska, L., Barancikova, G., Balaz, S., Dercova, K., Vrana, B., Paz-Weisshaar, M., Furciova, E., and Bielek, P. (1995). Degradation of PCB in different soils by inoculated Alcaligenes xylosoxidans. Sci Total Environ 175, 275-285.
Harkness, M.R., Mcdermott, J.B., Abramowicz, D.A., Salvo, J.J., Flanagan, W.P., Stephens, M.L., Mondello, F.J., May, R.J., Lobos, J.H., Carroll, K.M., and Et Al. (1993). In situ stimulation of aerobic PCB biodegradation in Hudson River sediments. Science 259, 503-507.
Harwood, C.S., and Parales, R.E. (1996). The beta-ketoadipate pathway and the biology of self-identity. Annu Rev Microbiol 50, 553-590.

Metagenomics of biphenyl-degrading bacterial consortium | Chapter II
89
Hauben, L., Vauterin, L., Moore, E.R., Hoste, B., and Swings, J. (1999). Genomic diversity of the genus Stenotrophomonas. Int J Syst Bacteriol 49 Pt 4, 1749-1760.
Hernandez-Sanchez, V., Lang, E., and Wittich, R.M. (2013). The Three-Species Consortium of Genetically Improved Strains Cupriavidus necator RW112, Burkholderia xenovorans RW118, and Pseudomonas pseudoalcaligenes RW120 Grows with Technical Polychlorobiphenyl, Aroclor 1242. Front Microbiol 4, 90.
Hsieh, T.C., Ma, K.H., and Chao, A. (2016). iNEXT: an R package for rarefaction and extrapolation of species diversity (Hill numbers). Methods in Ecology and Evolution 7, 1451–1456.
Iwasaki, T., Miyauchi, K., Masai, E., and Fukuda, M. (2006). Multiple-subunit genes of the aromatic-ring-hydroxylating dioxygenase play an active role in biphenyl and polychlorinated biphenyl degradation in Rhodococcus sp. strain RHA1. Appl Environ Microbiol 72, 5396-5402.
Iwasaki, T., Takeda, H., Miyauchi, K., Yamada, T., Masai, E., and Fukuda, M. (2007). Characterization of two biphenyl dioxygenases for biphenyl/PCB degradation in A PCB degrader, Rhodococcus sp. strain RHA1. Biosci Biotechnol Biochem 71, 993-1002.
Kimura, N., Kitagawa, W., Mori, T., Nakashima, N., Tamura, T., and Kamagata, Y. (2006). Genetic and biochemical characterization of the dioxygenase involved in lateral dioxygenation of dibenzofuran from Rhodococcus opacus strain SAO101. Appl Microbiol Biotechnol 73, 474-484.
Kimura, N., and Urushigawa, Y. (2001). Metabolism of dibenzo-p-dioxin and chlorinated dibenzo-p-dioxin by a gram-positive bacterium, Rhodococcus opacus SAO101. J Biosci Bioeng 92, 138-143.
Kitagawa, W., Kimura, N., and Kamagata, Y. (2004). A novel p-nitrophenol degradation gene cluster from a gram-positive bacterium, Rhodococcus opacus SAO101. J Bacteriol 186, 4894-4902.
Kumar, S., Stecher, G., and Tamura, K. (2016). MEGA7: Molecular Evolutionary Genetics Analysis Version 7.0 for Bigger Datasets. Mol Biol Evol 33, 1870-1874.
Langmead, B., and Salzberg, S.L. (2012). Fast gapped-read alignment with Bowtie 2. Nat Methods 9, 357-359.
Lauby-Secretan, B., Loomis, D., Grosse, Y., El Ghissassi, F., Bouvard, V., Benbrahim-Tallaa, L., Guha, N., Baan, R., Mattock, H., and Straif, K. (2013). Carcinogenicity of polychlorinated biphenyls and polybrominated biphenyls. Lancet Oncol 14, 287-288.
Leewis, M.C., Uhlik, O., and Leigh, M.B. (2016). Synergistic Processing of Biphenyl and Benzoate: Carbon Flow Through the Bacterial Community in Polychlorinated-Biphenyl-Contaminated Soil. Sci Rep 6, 22145.
Leigh, M.B., Prouzova, P., Mackova, M., Macek, T., Nagle, D.P., and Fletcher, J.S. (2006). Polychlorinated biphenyl (PCB)-degrading bacteria associated with trees in a PCB-contaminated site. Appl Environ Microbiol 72, 2331-2342.
Li, H., Handsaker, B., Wysoker, A., Fennell, T., Ruan, J., Homer, N., Marth, G., Abecasis, G., Durbin, R., and 1000 Genome Project Data Processing Subgroup. (2009). The Sequence Alignment/Map format and SAMtools. Bioinformatics 25, 2078-2079.
Mayes, B.A., Mcconnell, E.E., Neal, B.H., Brunner, M.J., Hamilton, S.B., Sullivan, T.M., Peters, A.C., Ryan, M.J., Toft, J.D., Singer, A.W., Brown, J.F., Jr., Menton, R.G., and Moore, J.A. (1998). Comparative carcinogenicity in Sprague-Dawley rats of

Chapter II | Metagenomics of biphenyl-degrading bacterial consortium
90
the polychlorinated biphenyl mixtures Aroclors 1016, 1242, 1254, and 1260. Toxicol Sci 41, 62-76.
Mondello, F.J., Turcich, M.P., Lobos, J.H., and Erickson, B.D. (1997). Identification and modification of biphenyl dioxygenase sequences that determine the specificity of polychlorinated biphenyl degradation. Appl Environ Microbiol 63, 3096-3103.
National Research Council (1979). "Polychlorinated Biphenyls." Washington, DC: The National Academies Press.
Ohtsubo, Y., Kudo, T., Tsuda, M., and Nagata, Y. (2004). Strategies for bioremediation of polychlorinated biphenyls. Appl Microbiol Biotechnol 65, 250-258.
Pieper, D.H. (2005). Aerobic degradation of polychlorinated biphenyls. Appl Microbiol Biotechnol 67, 170-191.
Pieper, D.H., and Seeger, M. (2008). Bacterial metabolism of polychlorinated biphenyls. J Mol Microbiol Biotechnol 15, 121-138.
Quast, C., Pruesse, E., Yilmaz, P., Gerken, J., Schweer, T., Yarza, P., Peplies, J., and Glockner, F.O. (2013). The SILVA ribosomal RNA gene database project: improved data processing and web-based tools. Nucleic Acids Res 41, D590-596.
Quensen, J.F., 3rd, Tiedje, J.M., and Boyd, S.A. (1988). Reductive dechlorination of polychlorinated biphenyls by anaerobic microorganisms from sediments. Science 242, 752-754.
Quinete, N., Schettgen, T., Bertram, J., and Kraus, T. (2014). Occurrence and distribution of PCB metabolites in blood and their potential health effects in humans: a review. Environ Sci Pollut Res Int 21, 11951-11972.
R Core Team (2013). R: A language and environment for statistical computing. Vienna, Austria. Available: http://www.R-project.org.
Rather, L.J., Knapp, B., Haehnel, W., and Fuchs, G. (2010). Coenzyme A-dependent aerobic metabolism of benzoate via epoxide formation. J Biol Chem 285, 20615-20624.
Ross, G. (2004). The public health implications of polychlorinated biphenyls (PCBs) in the environment. Ecotoxicol Environ Saf 59, 275-291.
Saavedra, J.M., Acevedo, F., Gonzalez, M., and Seeger, M. (2010). Mineralization of PCBs by the genetically modified strain Cupriavidus necator JMS34 and its application for bioremediation of PCBs in soil. Appl Microbiol Biotechnol 87, 1543-1554.
Seeger, M., Camara, B., and Hofer, B. (2001). Dehalogenation, denitration, dehydroxylation, and angular attack on substituted biphenyls and related compounds by a biphenyl dioxygenase. J Bacteriol 183, 3548-3555.
Seeger, M., Timmis, K.N., and Hofer, B. (1995). Conversion of chlorobiphenyls into phenylhexadienoates and benzoates by the enzymes of the upper pathway for polychlorobiphenyl degradation encoded by the bph locus of Pseudomonas sp. strain LB400. Appl Environ Microbiol 61, 2654-2658.
Seto, M., Kimbara, K., Shimura, M., Hatta, T., Fukuda, M., and Yano, K. (1995). A Novel Transformation of Polychlorinated Biphenyls by Rhodococcus sp. Strain RHA1. Appl Environ Microbiol 61, 3353-3358.
Sharma, J.K., Gautam, R.K., Misra, R.R., Kashyap, S.M., Singh, S.K., and Juwarkar, A.A. (2014). Degradation of Di- Through Hepta-Chlorobiphenyls in Clophen Oil Using Microorganisms Isolated from Long Term PCBs Contaminated Soil. Indian J Microbiol 54, 337-342.

Metagenomics of biphenyl-degrading bacterial consortium | Chapter II
91
Sharma, J.K., Gautam, R.K., Nanekar, S.V., Weber, R., Singh, B.K., Singh, S.K., and Juwarkar, A.A. (2017). Advances and perspective in bioremediation of polychlorinated biphenyl-contaminated soils. Environ Sci Pollut Res Int.
Sierra, I., Valera, J.L., Marina, M.L., and Laborda, F. (2003). Study of the biodegradation process of polychlorinated biphenyls in liquid medium and soil by a new isolated aerobic bacterium (Janibacter sp.). Chemosphere 53, 609-618.
Sievers, F., Wilm, A., Dineen, D., Gibson, T.J., Karplus, K., Li, W., Lopez, R., Mcwilliam, H., Remmert, M., Soding, J., Thompson, J.D., and Higgins, D.G. (2011). Fast, scalable generation of high-quality protein multiple sequence alignments using Clustal Omega. Mol Syst Biol 7, 539.
Singer, A.C., Gilbert, E.S., Luepromchai, E., and Crowley, D.E. (2000). Bioremediation of polychlorinated biphenyl-contaminated soil using carvone and surfactant-grown bacteria. Appl Microbiol Biotechnol 54, 838-843.
Taguchi, K., Motoyama, M., Iida, T., and Kudo, T. (2007). Polychlorinated biphenyl/biphenyl degrading gene clusters in Rhodococcus sp. K37, HA99, and TA431 are different from well-known bph gene clusters of Rhodococci. Biosci Biotechnol Biochem 71, 1136-1144.
Taira, K., Hirose, J., Hayashida, S., and Furukawa, K. (1992). Analysis of bph operon from the polychlorinated biphenyl-degrading strain of Pseudomonas pseudoalcaligenes KF707. J Biol Chem 267, 4844-4853.
Turrio-Baldassarri, L., Abate, V., Alivernini, S., Battistelli, C.L., Carasi, S., Casella, M., Iacovella, N., Iamiceli, A.L., Indelicato, A., Scarcella, C., and La Rocca, C. (2007). A study on PCB, PCDD/PCDF industrial contamination in a mixed urban-agricultural area significantly affecting the food chain and the human exposure. Part I: soil and feed. Chemosphere 67, 1822-1830.
Uhlik, O., Jecna, K., Mackova, M., Vlcek, C., Hroudova, M., Demnerova, K., Paces, V., and Macek, T. (2009). Biphenyl-metabolizing bacteria in the rhizosphere of horseradish and bulk soil contaminated by polychlorinated biphenyls as revealed by stable isotope probing. Appl Environ Microbiol 75, 6471-6477.
Vergani, L., Mapelli, F., Marasco, R., Crotti, E., Fusi, M., Di Guardo, A., Armiraglio, S., Daffonchio, D., and Borin, S. (2017a). Bacteria Associated to Plants Naturally Selected in a Historical PCB Polluted Soil Show Potential to Sustain Natural Attenuation. Front Microbiol 8, 1385.
Vergani, L., Mapelli, F., Zanardini, E., Terzaghi, E., Di Guardo, A., Morosini, C., Raspa, G., and Borin, S. (2017b). Phyto-rhizoremediation of polychlorinated biphenyl contaminated soils: An outlook on plant-microbe beneficial interactions. Sci Total Environ 575, 1395-1406.
Villacieros, M., Whelan, C., Mackova, M., Molgaard, J., Sanchez-Contreras, M., Lloret, J., Aguirre De Carcer, D., Oruezabal, R.I., Bolanos, L., Macek, T., Karlson, U., Dowling, D.N., Martin, M., and Rivilla, R. (2005). Polychlorinated biphenyl rhizoremediation by Pseudomonas fluorescens F113 derivatives, using a Sinorhizobium meliloti nod system to drive bph gene expression. Appl Environ Microbiol 71, 2687-2694.
Wald, J., Hroudova, M., Jansa, J., Vrchotova, B., Macek, T., and Uhlik, O. (2015). Pseudomonads Rule Degradation of Polyaromatic Hydrocarbons in Aerated Sediment. Front Microbiol 6, 1268.
Weisburg, W.G., Barns, S.M., Pelletier, D.A., and Lane, D.J. (1991). 16S ribosomal DNA amplification for phylogenetic study. J Bacteriol 173, 697-703.

Chapter II | Metagenomics of biphenyl-degrading bacterial consortium
92
Yang, X., Liu, X., Song, L., Xie, F., Zhang, G., and Qian, S. (2007). Characterization and functional analysis of a novel gene cluster involved in biphenyl degradation in Rhodococcus sp. strain R04. J Appl Microbiol 103, 2214-2224.

93
Chapter III
Metagenomic insights into the bacterial functions of a diesel-degrading consortium for the
rhizoremediation of diesel-polluted soil

Metagenomics of diesel-degrading bacterial consortium | Chapter III
95
Chapter III Metagenomic insights into the bacterial functions of a diesel-degrading consortium for the rhizoremediation of diesel-polluted soil __________________
This chapter has been entirely published in Genes. Only modifications of format have been made to ensure consistency throughout the thesis.
Garrido-Sanz D, Redondo-Nieto M, Guirado M, Pindado Jiménez O, Millán R, Martín M and Rivilla R (2019). Metagenomic insights into the bacterial functions of a diesel-degrading consortium for the rhizoremediation of diesel-polluted soil. Genes. 10:6. doi: 10.3390/genes10060456.
Received: 25 March 2019; Accepted: 7 June 2019; Published: 15 June 2019.
Abstract Diesel is a complex pollutant composed of a mixture of aliphatic and aromatic hydrocarbons. Because of this complexity, diesel bioremediation requires multiple microorganisms, which harbor the catabolic pathways to degrade the mixture. By enrichment cultivation of rhizospheric soil from a diesel-polluted site, we have isolated a bacterial consortium that can grow aerobically with diesel and different alkanes and polycyclic aromatic hydrocarbons (PAHs) as the sole carbon and energy source. Microbiome diversity analyses based on 16S rRNA gene showed that the diesel-degrading consortium consists of 76 amplicon sequence variants (ASVs) and it is dominated by Pseudomonas, Aquabacterium, Chryseobacterium, and Sphingomonadaceae. Changes in microbiome composition were observed when growing on specific hydrocarbons, reflecting that different populations degrade different hydrocarbons. Shotgun metagenome sequence analysis of the consortium growing on diesel has identified redundant genes encoding enzymes implicated in the initial oxidation of alkanes (AlkB, LadA, CYP450) and a variety of hydroxylating and ring-cleavage dioxygenases involved in aromatic and polyaromatic hydrocarbon degradation. The phylogenetic assignment of these enzymes to specific genera allowed us to model the role of specific populations in the diesel-degrading consortium. Rhizoremediation of diesel-polluted soil microcosms using the consortium,
Chapter III | Metagenomics of diesel-degrading bacterial consortium
96
resulted in an important enhancement in the reduction of total petroleum hydrocarbons (TPHs), making it suited for rhizoremediation applications.
Introduction
Soil pollution by petroleum hydrocarbons, including diesel fuel, is produced by spills and leakages and is a major environmental concern due to the large number of hazardous and toxic constituents (Risher and Rhodes, 1995; Nessel, 1999) that lead to reduced germination rates of plant seeds and a decrease in the diversity of the associated soil biota (Hentati et al., 2013; Ramadass et al., 2015). Diesel is a complex mixture of alkanes and polycyclic aromatic hydrocarbons (PAHs) which varies widely depending on the geographical source of the crude oil fraction used during petroleum separation. Furthermore, diesel pollution is usually associated with the presence of heavy metals (Pulles et al., 2012), which also poses an environmental concern due to its toxic effects and produces an acute inhibition of the diesel biodegradation process by microorganisms (Riis et al., 2002).
Many microorganisms can aerobically degrade alkanes, using them as carbon and energy source (Van Beilen et al., 2003; Ji et al., 2013). Four different pathways for aerobic biodegradation of alkanes have been uncovered to date (Ji et al., 2013). Two of these well-studied pathways are initiated by a terminal or subterminal oxidation of a methyl or methylene group, mediated by alkane monooxygenase enzymes, and resulting in the production of primary or secondary alcohols respectively (Kotani et al., 2003; Van Beilen et al., 2003; Feng et al., 2007), which are further oxidized by alcohol and aldehyde dehydrogenases into fatty acids before they can enter the beta-oxidation (Throne-Holst et al., 2007). Alternatively, fatty acids resulting in the alkane terminal oxidation can be further oxidized at the terminal omega methyl group via biterminal oxidation. This process results in the formation of omega-hydroxy fatty acids that are then converted by alcohol and aldehyde dehydrogenases into dicarboxylic acids, which are also funneled into the beta-oxidation (Coon, 2005). Initial terminal or subterminal oxidation of alkanes is carried out by alkane 1-monooxygenases (AlkB) or long-chain alkane monooxygenases (LadA), which have been extensively characterized (van Beilen et al., 1994; Hamamura et al., 2001; Li et al., 2008; Bihari et al., 2011). On the other hand, the omega-hydroxy fatty acid formation via the biterminal oxidation pathway is primarily attributed to

Metagenomics of diesel-degrading bacterial consortium | Chapter III
97
cytochrome P450 of the PYC153 family (Coon, 2005; Scheps et al., 2011), which can also hydroxylate alkanes on terminal positions to primary alcohols.
Bacteria can aerobically metabolize PAHs via different well-established pathways (Cerniglia, 1993; Samanta et al., 2002; Mallick et al., 2011). Metabolism of low molecular weight PAHs, such as naphthalene, anthracene, phenanthrene, and fluorene is usually initiated by the addition of molecular oxygen into the aromatic nucleus mediated by ring-hydroxylating dioxygenases (Jerina et al., 1976; Ensley and Gibson, 1983). The dihydrodiols formed in this initial step follow a dehydrogenation and then a meta-cleavage mediated by extradiol dioxygenases to give the ring cleavage products, which are further converted into central aromatic intermediates via subsequent series of enzymatic reactions. Many of these PAHs can also be degraded by co-metabolism in the environment (Bouchez et al., 1995).
Aged hydrocarbon-polluted soils are characterized by the presence of recalcitrant TPHs, such as branched aliphatic, PAHs and substituted aromatic hydrocarbons, which are usually associated to the organic and clay soil fractions, limiting the access to microorganisms and therefore reducing their biodegradation ability (Cunliffe and Kertesz, 2006; Dandie et al., 2010; Ranc et al., 2016). In fact, an important factor affecting the bioremediation of hydrocarbon-polluted soils is the presence of appropriate microorganisms (Solano-Serena et al., 2001), along with the soil physicochemical characteristics and other environmental conditions required to support this biota (Gallego et al., 2011). For bioremediation purposes, the use of indigenous bacterial consortia isolated from the polluted sites, rather than using allochthonous strains, might be advantageous. The effective cooperation of several specialized local microorganisms already adapted to the polluted site in terms of complementary substrate specificity can result in the mineralization of complex hydrocarbon mixtures (Richard and Vogel, 1999). Furthermore, as several studies indicate, microbial structure and function are influenced by total petroleum hydrocarbons (TPHs) (Margesin et al., 2007; dos Santos et al., 2011). Therefore, choosing an indigenous population might overcome the problems of bacterial composition shift when introduced into a new environment, which could be replaced by indigenous non-degrading populations that are, however, more competitive. To this purpose, metagenomic approaches have been used to analyze the bacterial composition and its changes (Sutton et al., 2012), and to identify key genes encoding enzymes involved in the pollutant

Chapter III | Metagenomics of diesel-degrading bacterial consortium
98
degradation process (Yergeau et al., 2012). Rhizoremediation, a type of bioremediation that involves the use of plants to stimulate the activity of petroleum-degrading microorganisms, has been reported to be a cost-effective method for the removal of petroleum hydrocarbons from soil (Chaineau et al., 2000; Miya and Firestone, 2001; Kuiper et al., 2004; Liste and Felgentreu, 2006). The combined use of indigenous microorganisms and plants to stimulate their degradation abilities could enhance the removal of hydrocarbons in soil-polluted environments.
Although most of the studies to date have focused on evaluating the degradation abilities of specific bacterial strains or synthetic bacterial consortia (Wu et al., 2017), in this work, we report the isolation and characterization of an indigenous soil bacterial consortium that can grow aerobically with diesel oil and other aliphatic and aromatic constituents of diesel as sole carbon and energy source. Metagenomic analysis of the diesel-degrading microbiota allowed us to identify active populations in the degradation of both, aliphatic and aromatic polycyclic hydrocarbons by the assignation of specific key coding DNA sequences (CDSs) to certain genera. Finally, we have tested this consortium in real diesel-polluted soil microcosms to address its potential for rhizoremediation.
Materials and Methods Isolation of the bacterial consortium and growth conditions Standard successive enrichment culture procedures were used to isolate the diesel-degrading bacterial consortium. Briefly, samples were collected from the rhizosphere of two plant species: Tamarix gallica and Pistacia lentiscus, planted in an aged diesel-polluted soil. Pollution came from ship fuel tanks spills in San Fernando (Cádiz, Spain. 36.497624 N, 6.191080 W). 2 g of diesel-polluted rhizospheric soil was added to 500 mL of sterile liquid minimum salt medium (MM) (Brazil et al., 1995), supplemented with 1 mL/L of phosphate-buffered mineral medium salts (PAS) (Bedard et al., 1986) and 0.005% yeast extract, and grown at 28 °C with shaking (140 rpm). One mL/L of diesel oil (from the ship fuel tank) was added as the sole carbon and energy source. After five subcultures, 20 mL aliquots after 48 h of growth were centrifuged for 10 min at 4,000 × g. The pellet was then resuspended in 0.75 mL of MM+PAS and mixed with 0.25 mL of glycerol 80% and deep-frozen at −80 °C. The isolated consortium was routinely grown in a liquid culture of MM+PAS supplemented with 1 mL/L of diesel oil as

Metagenomics of diesel-degrading bacterial consortium | Chapter III
99
the sole carbon and energy source and 0.005% yeast extract, at 28 °C with shaking (140 rpm).
The culture growth on different aliphatic and aromatic compounds as sole carbon and energy sources was evaluated as above, but n-hexane, n-heptadecane, n-tetracosane, naphthalene, and phenanthrene (1 mL or 1 g/L) were added as the sole carbon and energy source. In the case of hexane, sterile filter paper was soaked in hexane, added to the flask caps and sealed to prevent its evaporation.
DNA extraction, sequencing and assembly DNA extraction from the bacterial consortium after 48 h of growth (Supplementary Figure S1), on diesel oil, hexane, pentadecane, heptadecane, tetracosane, naphthalene, or phenanthrene as sole carbon and energy source was performed using the Realpure Genomic DNA Extraction Kit (Durviz, Spain). Illumina sequencing of 16S rRNA amplicons in all samples and whole-metagenome shotgun of the consortium growing with diesel as sole carbon source was carried out by Parque Científico de Madrid (Spain). Briefly, the 16S rRNA genes in each sample were sequenced by means of amplification of the V3-V4 16S rRNA region with the primers 16SV3-V4-CS1 (5′-CCT ACG GGN GGC WGC AG-3’) and 16SV3-V4-CS2 (5′-GAC TAC HVG GGT ATC TAA TCC-3′), position 341 to 785 in Escherichia coli, prior to libraries preparation with Illumina MiSeq v3 reagent kit according to supplier specifications, and sequenced by Illumina MiSeq paired 300-bp platform. Whole-metagenome of the diesel-growing bacterial consortium was sequenced using Illumina TruSeq preparation kit, a mean library size of 483 bp and Illumina MiSeq paired 300-pb.
Raw reads were trimmed and quality-filtered using Trimmomatic v0.36 software (Bolger et al., 2014) to remove those with less than 50 nts in the case of microbiomes or 100 nts in the metagenome, resulting in a read recovery rate ranging from 95.9% to 97.5% in the microbiomes and 97.2% in the metagenome reads. Trimmed reads from the metagenome sequencing were assembled using SPAdes v3.12 software (Bankevich et al., 2012), metaSPAdes option, and default settings. Assembly quality was evaluated using QUAST v4.4 (Gurevich et al., 2013). The resulting contigs were annotated using the RAST pipeline (Aziz et al., 2008).

Chapter III | Metagenomics of diesel-degrading bacterial consortium
100
Diversity analysis of the 16S rRNA gene and coding DNA sequences (CDSs) Microbiome 16S rRNA gene diversity was assessed with QIIME v2-2019.4 (Bolyen et al., 2018). Briefly, cleaned and trimmed paired reads (described above) were filtered and denoised using DADA2 (Callahan et al., 2016). For chimera identification, 200,000 training sequences were used. Identified amplicon sequence variants (ASVs) were aligned using MAFFT (Katoh et al., 2002) and further processed to construct a phylogeny with fasttree2 (Price et al., 2010). Rarefaction curves and Shannon Index were estimated using the plugin q2-diversity running 10 iterations, and 1,000 sequence steps up to the maximum number of sequences per sample. Taxonomy was assigned to ASVs using the q2-feature-classifier (Bokulich et al., 2018), classify-sklearn naïve Bayes taxonomy classifier against the SILVA v132 99% 16S sequence database (Quast et al., 2013). A specific classifier for the amplified 16S region was trained using the primers specified above and a maximum fragment size of 300 nts.
To assess the diversity of coding DNA sequences (CDSs), after whole-metagenome assembly and annotation (as specified above), CDSs were searched against the NCBI nucleotide (nt) database (October 2018) using blastn from BLAST v2.2.31+ software (Camacho et al., 2009). For each query, the first hit with a minimum of 75% sequence identity and 50% coverage was used for genus assignation.
Identification of CDSs involved in alkanes and aromatic hydrocarbon metabolism Coding DNA sequences of alkane 1-monooxygenase (AlkB), long-chain alkane monooxygenase (LadA), cytochrome P450 alkane hydrolase (CYP153 family) and extra and intradiol ring-cleavage and ring-hydroxylating dioxygenases (catechol 2,3-dioxygenase, biphenyl-2,3-dioxygenase, 3-carboxyethylcatechol 2,3-dioxygenase, 3-hydroxyantranilate 3,4-dioxygenase, 3-O-methylgallate 3,4-dioxygenase, 2,3-dihydryphenylpropionate 1,2-dioxygenase, 4,5-DOPA dioxygenase, 2-aminophenyl-1,6-dioxygenase, protocatechuate 4,5-dioxygenase, 3,4-dihydroxyphenylacetate 2,3-dioxtygenase, catechol 1,2-dioxygenase, protocatechuate 3,4-dioxygenase, gentisate 1,2-dioxygenase, homogentisase 1,2-dioxygenase, anthranilate 1,2-dioxygenase, benzoate 1,2-dioxygenase, naphthalene 1,2-dioxygenase, 2-halobenzoate 1,2-dioxygenase, biphenyl 2,3-
Metagenomics of diesel-degrading bacterial consortium | Chapter III
101
dioxygenase, 3-phenylpropanoate dioxygenase and p-cumate 2,3-dioxygenase) were identified in the diesel oil-degrading bacterial metagenome by means of annotations and validated by blast searches against the nucleotide (nt) NCBI database (October 2018). Results were further filtered by 75% sequence identity, 50% coverage and a minimum of 1 × 10⁻¹⁰ expected value. For queries without significant hits against nt NCBI database, protein searches against non-redundant (nr) NCBI database (October 2018) were used instead.
Bioremediation treatments in microcosms To evaluate the bioremediation feasibility of the diesel-degrading bacterial consortium, four-month microcosms systems with two different treatments were evaluated. The microcosms and the treatments are detailed below:
(a) Soil homogenization processing. Diesel-polluted bulk soil from ship fuel tank spills was collected in San Fernando (Cádiz, Spain). The soil was homogenized by a first sieving process with a < 4 mm net, followed by manual homogenization. The soil was then automatically quartered with 2, 4 and 8 divisions. Finally, 200 g of this sieved, homogenized and quartered soil was included in an automatic tumbler for 12 h to ensure homogeneity before placing it into pots. The initial diesel concentration of the pot’s soil was 2974 ± 143 mg·kg−1. The soil had a water holding capacity of 32.25 mL·100 g−1, a pH of 8.165, an electrical conductivity of 203 µL·cm−1, 512.1 mg·L−1 of nitrogen, 4.32 mg·kg−1 of phosphate and 23.16 mg·kg−1 of easily oxidizable carbon (EOC).
(b) Treatment 1. Pots with 200 g of the homogenized soil previously described were surface-inoculated once, at the beginning of the experiment, with 1 mL of washed diesel-degrading bacterial consortium after 48 h of growth and concentrated to a final DO600 = 0.6. Four replicates of the treatment 1 together with other four control replicates without the bacterial inoculum were placed.
(c) Treatment 2. Five one-week old alfalfa (Medicago sativa) were transplanted into each pot, consisting in 200 g of the homogenized soil previously described. Alfalfa seeds were surface sterilized with 70% ethanol for 3 min and 5% NaClO for 10 min, washed 10 times with sterile distilled water and pre-germinated in 1% (w/v) sterilized agar-water plates at 28 °C before transplant. 1 mL of the bacterial consortium specified above was inoculated per pot to the stem

Chapter III | Metagenomics of diesel-degrading bacterial consortium
102
base of the plants (0.2 mL per plant). Four replicates of the treatment 2 together with other four control replicates without the bacterial inoculum were placed.
(d) Microcosms conditions. The two treatments together with the controls were kept for four months in culture chambers with a photoperiod of 16/8 h light/dark and 25/18 °C and maintaining an 80% soil humidity with Fahraeus Plant (FP) medium (Fåhraeus, 1957) when needed. The experiment started when the bacterial inoculum was added.
Total petroleum hydrocarbon and PAHs characterization Total petroleum hydrocarbons (TPHs) and other hydrocarbon fractions in soils, were analyzed by gas chromatography (GC) according to the procedure previously described (Jiménez et al., 2014). Briefly, 1 g of duplicates dry soil samples were microwave-extracted by a mixture of hexane/acetone (1:1) and extracts with petroleum hydrocarbons were subsequently fractioned by a solid phase extraction (SPE) procedure. Aliphatic and aromatic fractions were finally analyzed by GC with a flame ionization detector (GC-FID). Sample analyses for PAH determination in the diesel fuel used for enrichment cultures were performed on an Agilent series 1200 high-performance liquid chromatograph (HPLC) coupled to an Agilent 1100 fluorescent detector (FD, Waldbronn, Germany). Diesel was weighted to obtain more precise PAHs measurements. Particular conditions were previously optimized (García-Alonso et al., 2011).
Sequence deposition Raw reads of the microbiomes 16S rRNA gene amplicons and the whole-metagenome shotgun sequence of the diesel-degrading consortium have been deposited in the NCBI Sequence Read Archive (SRA) and are available under the BioProject accession number PRJNA525339 and SRAs SRR8663212-SRR8663218.
Results and discussion Diesel characterization The initial characterization of the aliphatic and aromatic hydrocarbon fractions in the diesel oil from ship fuel tanks and the aged diesel-polluted soil used in this

Metagenomics of diesel-degrading bacterial consortium | Chapter III
103
study by means of gas chromatography (Jiménez et al., 2014), shows a prevalence of middle-chain to long-chain aliphatic hydrocarbons (C12 to C35) and EC16–EC35 aromatic hydrocarbons (Table 3.1). The aged soil, compared with the diesel oil from the tanks, is enriched in aliphatic >C21–C35 and >C35 and aromatic >EC21–EC35 and >EC35 fractions while a reduction in aliphatic >C10–C12 in the diesel-polluted soil is observed. This was expected as short-chain alkanes are more volatile and prone to bioremediation than long-chain alkanes and PAHs (Leahy and Colwell, 1990).
Table 3.1 | Aliphatic and aromatic hydrocarbon fraction composition of the diesel oil and aged diesel-polluted soil used in this study.
TPH fraction Diesel oil (mg·mL–1) Soil (µg·g–1) Aliphatic hydrocarbons
>C10–C12 82 ± 1 3.5 ± 0.5
>C12–C16 257 ± 7 151 ± 4
>C16–C21 283 ± 8 563 ± 28
>C21–C35 55 ± 4 1086 ± 73
>C35 0.05 ± 0.001 116 ± 16
>C10–C12 82 ± 1 3.5 ± 0.5 Aromatic hydrocarbons
>EC10–C12 17 ± 1 11 ± 5
>EC12–C16 13 ± 1 8 ± 1
>EC16–C21 57 ± 3 484 ± 48
>EC21–C35 2 ± 0.1 530 ± 70
>EC35 0.1 ± 0.004 22 ± 4 TPHs 764 ± 7 2,974 ± 143
Among the aromatic hydrocarbon fraction of the diesel oil analyzed by HPLC/FD, the composition of the diesel oil is mainly supported by 2-methylnaphthalene (4,000 µg·g−1), 1-methylnaphthalene (1,300 µg·g−1), and naphthalene (870 µg·g−1). Other constituents are phenanthrene (720 µg·g−1), fluorene (230 µg·g−1), acenaphthene (90 µg·g−1), pyrene (40 µg·g−1), anthracene (30 µg·g−1), chrysene (27 µg·g−1), benzo(b)fluoranthene (2.6 µg·g−1), benzo(k)fluoranthene (2 µg·g−1), and benzo(a)pyrene (2 µg·g−1). Trace aromatic hydrocarbons are fluoranthene (<1 µg·g−1), benzo(a)anthracene (<1 µg·g−1), dibenzo(ah)anthracene (<1 µg·g−1), and benzo(ghi)perylene (<1 µg·g−1).

Chapter III | Metagenomics of diesel-degrading bacterial consortium
104
Bacterial diversity in the diesel-degrading consortium Sequencing of the 16S rRNA gene in the diesel-degrading consortium resulted in a total of 47,306 sequences assigned to 76 different amplicon sequence variants (ASV). The rarefaction curve obtained (Figure 3.1A) shows a clear community coverage, as saturation of observed ASVs is achieved before 40,000 sequences and the presence of other taxa in the consortium is unlikely. The relative abundance of genera assigned to these sequences shows dominance of Pseudomonas, Aquabacterium, and Chryseobacterium, with relative abundances of 27.01%, 22.36%, and 15.34%, respectively (Figure 3.1B). Other genera with a representative abundance in the diesel-degrading consortium are Sphingobium, Novosphingobium, Dokdonella, Parvibaculum, and Achromobacter (5.2%, 3.65%, 3.29%, 3.24%, and 2.45%% of relative abundance, respectively). This abundance is detailed in Supplementary Table 3.S1. On the other hand, the metagenome shotgun sequencing of the diesel-degrading consortium resulted in 140 Mbps, distributed in 114,357 contigs (Supplementary Table 3.S2), 18,473 of them > 1 Kbp. After annotation, 120,867 CDSs were identified and roughly 65% of them could be assigned to the genus level (78,110). The relative abundance of these CDSs in the diesel-degrading consortium shows a major difference of populations, as shown in Supplementary Table 3.S1. Although CDSs of Pseudomonas remain as the most abundant (15.53%), CDSs of Aquabacterium and Chryseobacterium are scarce with relative abundances of 0.04% and 2.82%, respectively, while CDSs from Achromobacter and Commamonadaceae bacteria are increased (11.07% and 15.08% in CDSs abundance, while 2.45% and 2.64% in 16S rRNA abundance, Supplementary Table 3.S1). Interestingly, other genera that have little representation in 16S rRNA sequences appear in the CDSs genus assignation, such as Cupriavidus (6.99% in CDSs while 1.15% in 16S rRNA). However, these differences between 16S rRNA and CDSs are diminished at the class level (Figure 3.1C), which might suggest an unreliable genus assignation of CDSs, lack of representative sequences for all genera in the NCBI nt database, a primer bias of 16S rRNA sequence or failed prediction of ORFs in small contigs. This result was not unexpected, as it has been previously reported (Chapter II).

Metagenomics of diesel-degrading bacterial consortium | Chapter III
105
Figure 3.1 | Diversity and taxonomic composition of the diesel-degrading consortium growing on diesel and different alkanes and polycyclic aromatic hydrocarbons (PAHs) as sole carbon and energy source. (A) Rarefaction curves of observed amplicon sequence variants (ASVs) over the number of sequences sampled. Lines represent mean values while colored shadows represent standard deviation over 10 iterations. All curves show complete community coverages. Number of ASVs in each microbiome and Shannon diversity index (H) are indicated above/below each curve. (B) Relative genus abundance or (C) class abundance based on 16S rRNA. Only taxa with a minimum relative abundance of 1% across samples are represented. For detailed abundance distribution, see Supplementary Table 3.S1.

Chapter III | Metagenomics of diesel-degrading bacterial consortium
106
The taxa identified in the microbiome of the diesel-degrading consortium are in agreement with previous works, where it has been shown what Pseudomonas is one of the most abundant genera on hydrocarbon-polluted soils (Whyte et al., 2002; Yergeau et al., 2012; Gontikaki et al., 2018) and Aquabacterium and Chryseobacterium are also common members in hydrocarbon-degrading bacterial communities (Viggor et al., 2015; Gontikaki et al., 2018). Although Pseudomonas also rules the degradation of PAHs in sediments (Wald et al., 2015), other genera present in the diesel-degrading consortium belonging to the Sphingomonadaceae family have also been previously reported to be responsible for the degradation of different PAHs (van Herwijnen et al., 2003; Rentz et al., 2008).
Substrate-specific diversity To address the changes in populations of the diesel-degrading consortium that might be occurring due to specific constituents of diesel, microbiome analyses were performed with the consortium growing on three different n-alkanes (hexane, heptadecane, and tetracosane) and two PAHs (phenanthrene and naphthalene) as sole carbon and energy source. It is important to note that growth patterns and yield were different on different hydrocarbons (Supplementary Figure 3.S1). The yield was very low in the case of phenanthrene. When growing on this hydrocarbon, OD600 at sampling time (48 h) was only 0.06, compared to 0.25–0.5 for the other hydrocarbons. Therefore, phenanthrene is a poor carbon and energy source for bacteria present in the consortium. Regarding the growth pattern, polyphasic curves were obtained for growth on hexane, heptadecane, tetracosane, and phenanthrene, indicating probably a succession in the bacterial populations present in the consortium. Taken together, it is likely that depending on the carbon and energy source, different populations are thriving at different times, and therefore, the detected microbiota reflects a snapshot at the sampling time. As expected, the number of ASVs varies greatly depending on the specific substrate, as shown in Figure 3.1A. While the consortium growing in tetracosane and heptadecane presents the highest number of ASVs (45), followed by phenanthrene (34), hexane (29), and naphthalene (20), the Shannon diversity index is considerably higher in the consortium growing with hexane (H = 3.3) and lower in the consortium growing with naphthalene (H = 0.05) (Figure 3.1A). Rarefaction curves, in all cases show nearly complete community coverage. Regarding bacterial abundance, all alkanes are dominated by Pseudomonas. In the

Metagenomics of diesel-degrading bacterial consortium | Chapter III
107
case of heptadecane and tetracosane, Pseudomonas represent the ~89% of the bacterial community and little changes are observed in the remaining genera, none of them representing more than 5% of relative abundance (Figure 3.1B, Supplementary Table 3.S1). The similarity of the bacterial populations in both, middle and long-chain alkanes, suggest that the same populations are involved in the degradation of both hydrocarbons. On the other hand, diversity of the consortium growing with hexane, shows a dominancy of Pseudomonas (64.92%), Stenotrophomonas (25.23%), and Gordonia (8.7%). Gordonia is known to degrade short-chain gaseous alkanes, such as propane (Kotani et al., 2003; Kotani et al., 2007), which could explain the abundance of this genus in the consortium growing with hexane, although there are also reports of Pseudomonas strains that are also able to degrade short-chain alkanes (Takahashi et al., 1980). In the case of Stenotrophomonas, it has been suggested that the high metabolic versatility of this genus (Hauben et al., 1999) might contribute to its ubiquity in different bacterial populations, including hydrocarbon and PAH-degrading communities (Zanaroli et al., 2010; Wald et al., 2015) by cross-feeding on secondary metabolites.
Regarding the relative abundance of the consortium growing with two different PAHs as sole carbon and energy source, naphthalene-degrading diversity is almost exclusive to Pseudomonas, representing the 99.72% of the bacterial community (Figure 3.1B). On the other hand, the bacterial populations that thrive in the phenanthrene culture are mainly distributed between Pseudomonas (53.6%) and Novosphingobium (33.69%), which is in agreement with previous reports (van Herwijnen et al., 2003; Rentz et al., 2008; Wald et al., 2015).
Identification of alkane-degrading CDSs In order to identify putative active populations in the degradation of alkanes, the metagenome CDSs of the diesel-degrading consortium were screened to find alkane 1-monooxygenases (AlkB), cytochrome P450 alkane hydroxylases from the CYP153 family and long-chain alkane monooxygenases (LadA), whose role in n-alkane degradation have been extensively studied (Kok et al., 1989; Maier et al., 2001; Li et al., 2008; Scheps et al., 2011; Ji et al., 2013). The results are summarized in Figure 3.2 (for details see Supplementary Table 3.S3).

Chapter III | Metagenomics of diesel-degrading bacterial consortium
108
Figure 3.2 | Number and taxonomic assignation at the genus level of the enzymes belonging to alkyl group hydroxylases; AlkB (alkane 1-monooxygenase), LadA (long-chain alkane monooxygenase), and CYP153 (cytochrome P450 family CYP153). Class adscription of the genera depicted is indicated under parenthesis. For additional information, see Supplementary Table 3.S3.
AlkB is a non-heme iron integral membrane protein that is responsible for the initial hydroxylation of a diverse range of n-alkanes (Kok et al., 1989; van Beilen et al., 1994; Van Beilen et al., 2003). Ten putative AlkB have been identified in the metagenome of the diesel-growing bacterial consortium. Half of these AlkB have been classified as belonging to the Pseudomonas genus (5), three were assigned to Aquabacterium, and the remaining ones were classified as belonging to Sphingomonas and Sphingobium (Figure 3.2). On the other hand, LadA, a flavoprotein monooxygenase that inserts an oxygen atom into long-chain alkanes (Li et al., 2008), was putatively found 29 times in the metagenome and was mainly assigned to Pseudomonas (8), Cupriavidus (4) and Sphingomonas (3) among others (Figure 3.2). Finally, CYP153 family of cytochrome P450 have been reported to display hydroxylating activity toward alkanes (Maier et al., 2001; Scheps et al., 2011). The metagenome of the diesel-growing consortium contains eight of these enzymes, which have been classified as belonging to Parvibaculum (5), Sphingobium (1), and Cupriavidus (1), while the remaining one could not be assigned to any genera.

Metagenomics of diesel-degrading bacterial consortium | Chapter III
109
These results are in agreement with the relative abundance of Pseudomonas, Aquabacterium, and Sphingobium, and other Sphingomonadaceae genera in the diesel-growing consortium and suggest that different genera are active in the degradation of the alkane constituents of diesel. The fact that the consortium growing on heptadecane and tetracosane is dominated by Pseudomonas could indicate that the rest of AlkB, LadA, and CYP153-containing bacteria plays a predominant role in the degradation of other alkanes or are specific for a certain alkane length or pathway. For instance, CYP153 coding sequences, which have been primarily assigned to Parvivaculum suggest that biterminal oxidation of alkanes is specific to this genus, although it could also hydroxylate alkanes on terminal positions. On the other hand, the diversity of ASVs found in the consortium growing with the long-chain alkane tetracosane (Figure 3.1) is congruent with the number of LadA enzymes found in the metagenome (29), although AlkB could also be involved on long-chain alkane degradation (Bihari et al., 2011). It is important to note that also genes participating in the early oxidation of alkanes or those belonging to low abundant bacteria could be missing from the analysis given that metagenome analysis was performed after 48 h of the diesel-degrading consortium growth.
Identification of PAH-degrading CDSs and central aromatic metabolism CDSs Among PAHs present in diesel oil, naphthalene and its methyl derivatives are the most abundant (see above). Naphthalene biodegradation is initiated by the ring-hydroxylating naphthalene 1,2-dioxygenase (NahA) enzyme, whose implication in a wide range of different PAHs degradative reactions have been uncovered (Resnick et al., 1996; Ferraro et al., 2017), including hydroxylation of anthracene, phenanthrene, and fluorene, and monooxygenation of acenaphthene among others (Jerina et al., 1976; Resnick et al., 1996; Selifonov et al., 1996). Initial oxidation of naphthalene and other PAHs is followed by subsequent reactions until funneled into central aromatic degradation pathways, usually with catechol, gentisate, or protocatechuate as intermediaries depending on the specific PAH (for a review see (Mallick et al., 2011)). The screening of the diesel-degrading consortium metagenome revealed the presence of 83 putative ring-hydroxylating dioxygenases, nine of which were annotated as naphthalene 1,2-dioxygenases (Figure 3.3A). Most of these NahA were assigned to Sphingomonas (5), Sphingobium (2), and Bordetella (2) (Figure 3.3B, Supplementary Table 3.S3),

Chapter III | Metagenomics of diesel-degrading bacterial consortium
110
which is in agreement with the fraction of Alphaproteobacteria present in the microbiome of the consortium growing with phenanthrene as the sole carbon and energy source (Figure 3.1). Unexpectedly, none of these NahA were assigned to Pseudomonas or even to Gammaproteobacteria, class that dominates both PAH-degrading microbiomes (59.59% and 99.75% in phenanthrene or naphthalene, respectively). The number of other ring-hydroxylating and ring-cleavage intra and estradiol dioxygenases is also scarce among Gammaproteobacteria, which suggest that the involvement of Pseudomonas in the degradation of PAHs in the diesel-degrading consortium might be attributed to the use of products of PAHs degradation rather than being involved on its initial oxidation. However, other causes cannot be ruled out, including low representation of enzymes not appearing at the metagenome depth this study was carried out.
Regarding central metabolism of aromatic compounds, catechol 1,2-dioxygenase, catechol 2,3-dioxygenase, gentisate 1,2-dioxygenase, and homogentisate 1,2-dioxygenase were among the most abundant CDSs found in the diesel-degrading metagenome (16, 17, 19 and 19 CDSs respectively, Figure 3.3A). Protocatechuate 3,4-dioxygenase, protocatechuate 4,5-dioxygenases, and benzoate 1,2-dioxygenase were also found in the metagenome (7, 8, and 10 CDSs, respectively). These results agree with the degradation pathways of the catabolic products of naphthalene, anthracene, phenanthrene, and fluorene, among others, via ortho or meta cleavage (Mallick et al., 2011). According to the taxonomic assignation of these central aromatic degradation enzymes, most of them belong to genera such as Pseudomonas, Bordetella, Achromobacter, Sphingomonas, Sphingobium, and Cupriavidus, among others (Figure 3.3B), which could explain their presence in the diesel-degrading consortium.

Metagenomics of diesel-degrading bacterial consortium | Chapter III
111
Figure 3.3 | (A) Number and taxonomic assignation at the class level of the enzymes belonging to alkanes, PAHs and aromatic metabolism pathways. Total sequences of each main protein groups are indicated in parenthesis. (B) Classification at the genus level of naphthalene 1,2-dioxygenase and other central aromatic biodegradation pathways involving catechol, protocatechuate, gentisate, and benzoate. For additional information, see Supplementary Table 3.S3.

Chapter III | Metagenomics of diesel-degrading bacterial consortium
112
Metabolic roles of specific populations in the diesel-degrading consortium The identification and taxonomic assignment of enzymes involved in the initial hydroxylation of alkanes and PAHs within the diesel-degrading consortium metagenome, along with the characterization of the enzymes responsible of central aromatic degradation pathways, provides a profound understanding of the different roles of the main bacterial populations that thrive in the consortium with regard of their relative abundance. These results are summarized in Figure 3.4. The initial hydroxylation of alkanes is carried out by different bacteria, including Pseudomonas, Aquabacterium, Sphingomonadaceae family bacteria, and Achromobacter. Among these, alkane group hydroxylases (AlkB, LadA, and CYP153 cytochrome P450 family) are more abundant in Pseudomonas and Sphingomonadaceae family, containing 13 and 8 of these enzymes, respectively (Figure 3.4), which is consistent with their relative abundance in the consortium and with previous reports (Whyte et al., 2002; Yergeau et al., 2012; Viggor et al., 2015; Gontikaki et al., 2018). These genera could be responsible for the initial terminal or subterminal oxidation or biterminal oxidation of different chain-length alkanes. Conversely, the initial hydroxylation of PAHs based on the presence of naphthalene 1,2-dioxygenases found in the metagenome of the diesel-degrading consortium is primarily attributed to bacteria of the Sphingomonadaceae family. High redundancy of central aromatic degradation pathways is observed among the different genera present in the consortium, which could explain the diversity found in the diesel-degrading consortium and the population shift towards Pseudomonas when growing in alkanes as sole carbon and energy source (Figure 3.1). Although none of the naphthalene 1,2-dioxygenases found in the metagenome have been classified as belonging to Pseudomonas, the fact that this genus dominates the naphthalene-growing population (Figure 3.3B), might be also related with the functional redundancy of central aromatic pathways this genus exhibits (Figure 3.4). Nonetheless, genes from key species playing an important role in the early oxidation of alkanes and PAHs might be missing, since 48 h growth culture of the consortium was used to perform the analyses. The different growth pattern of the consortium on different carbon substrates (Supplementary Figure 3.S1) shows that different populations could evolve on time. Further analyses to see the evolution of the community over time and the genes present in different growth stages could provide deeper insights into the biodegradation process.

Metagenomics of diesel-degrading bacterial consortium | Chapter III
113
Interestingly, two of the most abundant genera within the diesel-
degrading consortium do not harbor many of the CDSs for these pathways. This is the case of Aquabacterium and Chryseobacterium (22.36% and 15.34% 16S rRNA relative abundance, respectively). The differences in relative abundance observed between 16S rRNA and CDSs in these genera might suggest a misclassification of CDSs. In the specific case of Burkholderiales order, the CDSs
Figure 3.4 | (A) Summary of alkanes, PAHs, and central aromatic biodegradation pathways found in the most abundant genera/families within the metagenome of the diesel-degrading consortium. Red scale bar represents the number of enzymes for each pathway identified. (B) Schematic view of the initial terminal, subterminal, and biterminal alkane aerobic oxidation mediated by AlkB, LadA, and CYP153 enzymes. Adapted from (Van Beilen et al., 2003; Ji et al., 2013). (C) Schematic view of initial naphthalene 1,2-dioxygenase hydroxylating reactions in PAHs components of diesel and aromatic central metabolites generated by further oxidation reactions of these cis-diol intermediates. Dotted lines indicate metabolic products depending on specific degradation pathways. Enzymes and chemical reactions catalyzed by these enzymes are indicated in red typing.

Chapter III | Metagenomics of diesel-degrading bacterial consortium
114
abundance of Commamonadaceae family and Cupriavidus genus (15.08% and 6.99%, respectively) is similar to Aquabacterium 16S rRNA (22.36%), another Burkholderiales order genus. This finding could explain the relatively low representation of Aquabacterium CDSs and its presence in the consortium. Nevertheless, this is not the case of Chryseobacterium, a Flavovacteriia class whose representation in CDSs is less than 3%. It is unclear if unclassified coding sequences could belong to this genus or the role it might have in the diesel-degrading consortium, even though Chryseobacterium have been previously identified in diesel fuel degrading consortia (Zanaroli et al., 2010). Other possibilities, such as the bacterial shift towards more metabolically versatile members in late states of the biodegradation process, which do not participate in the initial oxidation of diesel constituents, could also explain the presence of these genera.
Rhizoremediation assays in diesel-polluted soil microcosms Rhizoremediation with indigenous hydrocarbon-degrading microorganisms have been proposed as one of the most effective techniques in restoring diesel-polluted soils (Chaineau et al., 2000; Miya and Firestone, 2001; Liste and Felgentreu, 2006), which could be enhanced by stimulation of the catalytic activities of microorganisms by plant roots (Kuiper et al., 2004; Pilon-Smits, 2005) and can also be combined with other techniques such as chemical oxidation (del Reino et al., 2014). In order to test whether the bacterial consortium isolated in this study could be suited for rhizoremediation of the original diesel-polluted soil from where it was isolated, soil microcosms assays inoculated with the consortium were evaluated. Additionally, alfalfa (Medicago sativa) plants were used to address a possible stimulating effect. The results show a clear soil TPHs reduction after 4 months (Figure 3.5). In the control, untreated pot, TPHs reduced from the original 2,974 mg·kg−1 to 2,588 mg·kg−1. The soil treatment with the consortium resulted in a further reduction of 8.35%. This reduction was 12.36% with alfalfa plants without inoculum, probably due to the stimulation of indigenous populations already present in the soil. However, the combined effect of the consortium with alfalfa plants resulted in a 27.91% decrement in TPHs, when compared with the original soil, which tripled that of the consortium alone. The aromatic fraction in all cases was the most degraded, showing a 44.14% reduction in the consortium

Metagenomics of diesel-degrading bacterial consortium | Chapter III
115
with plants treatment while the aliphatic fraction accounted for a 21.42% reduction (Figure 3.5).
Figure 3.5 | (A) Gas chromatography with a flame ionized detector (GC-FID) results of total hydrocarbons remaining after four-month treatments with the diesel-degrading consortium, alfalfa (M. sativa) plants without inoculum, and combined consortium and alfalfa plants in four-month microcosms assays. Each box indicates Q1 and Q3, while the red line indicates the median values out of four replicates. Error bars indicate maximum and minimum values. Different letters indicate statistically significant differences (p < 0.05) using two-way ANOVA with Tukey’s multiple comparison test corrections. (B) Mean values in each treatment in mg·kg−1 out of four replicates and percentages compared to the control.

Chapter III | Metagenomics of diesel-degrading bacterial consortium
116
Regarding the specific aliphatic and aromatic chain content, the consortium combined with alfalfa plants showed a major reduction of short and long-chain alkanes (>C10–C12, >C21–C35 and >C35), showing a 65.96%, 27.31%, and 31.36% hydrocarbon reduction respectively (Supplementary Figure 3.S2). These results are consistent with the number of long-chain alkane monooxygenases found in the metagenome and the fact that the consortium is able to grow in the presence of the short-chain alkane hexane. In the case of aromatic hydrocarbons, the diesel-degrading consortium combined with alfalfa plants resulted in a major decrease in most cases (Supplementary Figure 3.S2). This reduction is more substantial in the case of the >EC10–EC16 fraction (41.67% and 57.69% for >EC10–C12 and >EC12–C16, respectively) which is compatible with naphthalene (C10), fluorene (C13), anthracene (C14), and phenanthrene (C14), among others. The observed effect caused by alfalfa plants in both, aliphatic and aromatic hydrocarbons was not unexpected, as it has been previously reported (Chaineau et al., 2000; Huang et al., 2005; Liste and Felgentreu, 2006) and might be attributed to induction of microbial biodegradation pathways by plant metabolites (Singer et al., 2003) and other stimulating effects (Nichols et al., 1997; Kuiper et al., 2004).
The microcosms results show that the bacterial consortium isolated in this study could serve as an inoculum for effective rhizoremediation of diesel-polluted soils. However, further analyses are required to evaluate its potential in other polluted sites, whose hydrocarbon composition might vary, and to evaluate the plant factors affecting the rhizoremediation process. Additional analyses at different times of the bioremediation process could also provide powerful insights into the community evolution and to identify key bacterial roles of the consortium.
Conclusions Complex pollutants such as diesel require multiple microorganisms for their degradation. We have shown here that an effective autochthonous bacterial consortium can be constructed by successive enrichment cultivation of soils from contaminated sites. By metagenomic analysis of the consortium, growing on diesel and on specific aliphatic and polyaromatic hydrocarbons, we have been able to determine the bacterial genera composition of the consortium, the genes and enzymes implicated in diesel degradation and the specific degradative roles of the major populations within the consortium. The functional redundancy observed in

Metagenomics of diesel-degrading bacterial consortium | Chapter III
117
the metagenome might be related to the plasticity that allows the populations to adapt to changes in the environment, and therefore conferring robustness to the degrading hydrocarbon system.
Supplementary material The supplementary material of this chapter is available in the electronic version of the thesis and, alternatively, can be downloaded from:
https://www.mdpi.com/2073-4425/10/6/456#supplementary
Supplementary Figure 3.S1 | Growth curves of the diesel-degrading consortium in each of the substrates used in this study.
Supplementary Figure 3.S2 | GC-FID results of total hydrocarbons fractions remaining after treatments.
Supplementary Table 3.S1 | Relative abundances of the 16S rRNA and CDSs at different taxonomic levels.
Supplementary Table 3.S2 | Statistics of the 16S rRNA and whole-metagenome shotgun sequencing and processing of reads.
Supplementary Table 3.S3 | Enzymes identified, and genus assignation retrieved from the metagenome of the diesel-degrading bacterial consortium.
References Aziz, R.K., Bartels, D., Best, A.A., Dejongh, M., Disz, T., Edwards, R.A., Formsma, K.,
Gerdes, S., Glass, E.M., Kubal, M., Meyer, F., Olsen, G.J., Olson, R., Osterman, A.L., Overbeek, R.A., Mcneil, L.K., Paarmann, D., Paczian, T., Parrello, B., Pusch, G.D., Reich, C., Stevens, R., Vassieva, O., Vonstein, V., Wilke, A., and Zagnitko, O. (2008). The RAST Server: rapid annotations using subsystems technology. BMC Genomics 9, 75.
Bankevich, A., Nurk, S., Antipov, D., Gurevich, A.A., Dvorkin, M., Kulikov, A.S., Lesin, V.M., Nikolenko, S.I., Pham, S., Prjibelski, A.D., Pyshkin, A.V., Sirotkin, A.V., Vyahhi, N., Tesler, G., Alekseyev, M.A., and Pevzner, P.A. (2012). SPAdes: a new genome assembly algorithm and its applications to single-cell sequencing. J Comput Biol 19, 455-477.
Bedard, D.L., Unterman, R., Bopp, L.H., Brennan, M.J., Haberl, M.L., and Johnson, C. (1986). Rapid assay for screening and characterizing microorganisms for the ability to degrade polychlorinated biphenyls. Appl Environ Microbiol 51, 761-768.

Chapter III | Metagenomics of diesel-degrading bacterial consortium
118
Bihari, Z., Szvetnik, A., Szabó, Z., Blastyák, A., Zombori, Z., Balázs, M., and Kiss, I. (2011). Functional analysis of long-chain n-alkane degradation by Dietzia spp. FEMS microbiology letters 316, 100-107.
Bokulich, N.A., Kaehler, B.D., Rideout, J.R., Dillon, M., Bolyen, E., Knight, R., Huttley, G.A., and Caporaso, J.G. (2018). Optimizing taxonomic classification of marker-gene amplicon sequences with QIIME 2’s q2-feature-classifier plugin. Microbiome 6, 90.
Bolger, A.M., Lohse, M., and Usadel, B. (2014). Trimmomatic: a flexible trimmer for Illumina sequence data. Bioinformatics 30, 2114-2120.
Bolyen, E., Rideout, J.R., Dillon, M.R., Bokulich, N.A., Abnet, C., Al-Ghalith, G.A., Alexander, H., Alm, E.J., Arumugam, M., and Asnicar, F. (2018). QIIME 2: Reproducible, interactive, scalable, and extensible microbiome data science. PeerJ Preprints.
Bouchez, M., Blanchet, D., and Vandecasteele, J. (1995). Degradation of polycyclic aromatic hydrocarbons by pure strains and by defined strain associations: inhibition phenomena and cometabolism. Applied Microbiology and Biotechnology 43, 156-164.
Brazil, G.M., Kenefick, L., Callanan, M., Haro, A., De Lorenzo, V., Dowling, D.N., and O'gara, F. (1995). Construction of a rhizosphere pseudomonad with potential to degrade polychlorinated biphenyls and detection of bph gene expression in the rhizosphere. Appl Environ Microbiol 61, 1946-1952.
Callahan, B.J., McMurdie, P.J., Rosen, M.J., Han, A.W., Johnson, A.J., and Holmes, S.P. (2016). DADA2: High-resolution sample inference from Illumina amplicon data. Nat Methods 13, 581-583.
Camacho, C., Coulouris, G., Avagyan, V., Ma, N., Papadopoulos, J., Bealer, K., and Madden, T.L. (2009). BLAST+: architecture and applications. BMC Bioinformatics 10, 421.
Cerniglia, C.E. (1993). Biodegradation of polycyclic aromatic hydrocarbons. Current opinion in biotechnology 4, 331-338.
Coon, M.J. (2005). Omega oxygenases: nonheme-iron enzymes and P450 cytochromes. Biochemical and biophysical research communications 338, 378-385.
Cunliffe, M., and Kertesz, M.A. (2006). Effect of Sphingobium yanoikuyae B1 inoculation on bacterial community dynamics and polycyclic aromatic hydrocarbon degradation in aged and freshly PAH-contaminated soils. Environ Pollut 144, 228-237.
Chaineau, C., Morel, J., and Oudot, J. (2000). Biodegradation of fuel oil hydrocarbons in the rhizosphere of maize. Journal of environmental quality 29, 569-578.
Dandie, C.E., Weber, J., Aleer, S., Adetutu, E.M., Ball, A.S., and Juhasz, A.L. (2010). Assessment of five bioaccessibility assays for predicting the efficacy of petroleum hydrocarbon biodegradation in aged contaminated soils. Chemosphere 81, 1061-1068.
Del Reino, S., Rodríguez-Rastrero, M., Escolano, O., Welte, L., Bueno, J., Fernández, J., Schmid, T., and Millán, R. (2014). "In Situ Chemical Oxidation Based on Hydrogen Peroxide: Optimization of Its Application to an Hydrocarbon Polluted Site" in Environment, Energy and Climate Change I. Springer, 207-228.
Dos Santos, H.F., Cury, J.C., Do Carmo, F.L., Dos Santos, A.L., Tiedje, J., Van Elsas, J.D., Rosado, A.S., and Peixoto, R.S. (2011). Mangrove bacterial diversity and

Metagenomics of diesel-degrading bacterial consortium | Chapter III
119
the impact of oil contamination revealed by pyrosequencing: bacterial proxies for oil pollution. PLoS One 6, e16943.
Ensley, B., and Gibson, D. (1983). Naphthalene dioxygenase: purification and properties of a terminal oxygenase component. Journal of bacteriology 155, 505-511.
Fåhraeus, G. (1957). The infection of clover root hairs by nodule bacteria studied by a simple glass slide technique. Microbiology 16, 374-381.
Feng, L., Wang, W., Cheng, J., Ren, Y., Zhao, G., Gao, C., Tang, Y., Liu, X., Han, W., Peng, X., Liu, R., and Wang, L. (2007). Genome and proteome of long-chain alkane degrading Geobacillus thermodenitrificans NG80-2 isolated from a deep-subsurface oil reservoir. Proc Natl Acad Sci U S A 104, 5602-5607.
Ferraro, D.J., Okerlund, A., Brown, E., and Ramaswamy, S. (2017). One enzyme, many reactions: structural basis for the various reactions catalyzed by naphthalene 1,2-dioxygenase. IUCrJ 4, 648-656.
Gallego, J.L.R., Sierra, C., Permanyer, A., Peláez, A.I., Menéndez-Vega, D., and Sánchez, J. (2011). Full-scale remediation of a jet fuel-contaminated soil: assessment of biodegradation, volatilization, and bioavailability. Water, Air, & Soil Pollution 217, 197-211.
García-Alonso, S., Pérez-Pastor, R., and García-Frutos, F. (2011). An evaluation of analytical quality for selected PAH measurements in a fuel-contaminated soil. Accreditation and quality assurance 16, 369-377.
Gontikaki, E., Potts, L.D., Anderson, J.A., and Witte, U. (2018). Hydrocarbon-degrading bacteria in deep-water subarctic sediments (Faroe-Shetland Channel). J Appl Microbiol 125, 1040-1053.
Gurevich, A., Saveliev, V., Vyahhi, N., and Tesler, G. (2013). QUAST: quality assessment tool for genome assemblies. Bioinformatics 29, 1072-1075.
Hamamura, N., Yeager, C.M., and Arp, D.J. (2001). Two Distinct Monooxygenases for Alkane Oxidation in Nocardioides sp. Strain CF8. Applied and environmental microbiology 67, 4992-4998.
Hauben, L., Vauterin, L., Moore, E.R., Hoste, B., and Swings, J. (1999). Genomic diversity of the genus Stenotrophomonas. Int J Syst Bacteriol 49 Pt 4, 1749-1760.
Hentati, O., Lachhab, R., Ayadi, M., and Ksibi, M. (2013). Toxicity assessment for petroleum-contaminated soil using terrestrial invertebrates and plant bioassays. Environmental monitoring and assessment 185, 2989-2998.
Huang, X.D., El-Alawi, Y., Gurska, J., Glick, B.R., and Greenberg, B.M. (2005). A multi-process phytoremediation system for decontamination of persistent total petroleum hydrocarbons (TPHs) from soils. Microchemical Journal 81, 139-147.
Jerina, D.M., Selander, H., Yagi, H., Wells, M.C., Davey, J.F., Mahadevan, V., and Gibson, D.T. (1976). Dihydrodiols from anthracene and phenanthrene. J Am Chem Soc 98, 5988-5996.
Ji, Y., Mao, G., Wang, Y., and Bartlam, M. (2013). Structural insights into diversity and n-alkane biodegradation mechanisms of alkane hydroxylases. Front Microbiol 4, 58.
Jiménez, O.P., Pastor, R.M.P., and Segovia, O.E. (2014). An analytical method for quantifying petroleum hydrocarbon fractions in soils, and its associated uncertainties. Analytical Methods 6, 5527-5536.
Katoh, K., Misawa, K., Kuma, K., and Miyata, T. (2002). MAFFT: a novel method for rapid multiple sequence alignment based on fast Fourier transform. Nucleic Acids Res 30, 3059-3066.

Chapter III | Metagenomics of diesel-degrading bacterial consortium
120
Kok, M., Oldenhuis, R., Van Der Linden, M.P., Raatjes, P., Kingma, J., Van Lelyveld, P.H., and Witholt, B. (1989). The Pseudomonas oleovorans alkane hydroxylase gene. Sequence and expression. J Biol Chem 264, 5435-5441.
Kotani, T., Yamamoto, T., Yurimoto, H., Sakai, Y., and Kato, N. (2003). Propane monooxygenase and NAD+-dependent secondary alcohol dehydrogenase in propane metabolism by Gordonia sp. strain TY-5. J Bacteriol 185, 7120-7128.
Kotani, T., Yurimoto, H., Kato, N., and Sakai, Y. (2007). Novel acetone metabolism in a propane-utilizing bacterium, Gordonia sp. strain TY-5. J Bacteriol 189, 886-893.
Kuiper, I., Lagendijk, E.L., Bloemberg, G.V., and Lugtenberg, B.J. (2004). Rhizoremediation: a beneficial plant-microbe interaction. Molecular plant-microbe interactions 17, 6-15.
Leahy, J.G., and Colwell, R.R. (1990). Microbial degradation of hydrocarbons in the environment. Microbiological reviews 54, 305-315.
Li, L., Liu, X., Yang, W., Xu, F., Wang, W., Feng, L., Bartlam, M., Wang, L., and Rao, Z. (2008). Crystal structure of long-chain alkane monooxygenase (LadA) in complex with coenzyme FMN: unveiling the long-chain alkane hydroxylase. J Mol Biol 376, 453-465.
Liste, H.-H., and Felgentreu, D. (2006). Crop growth, culturable bacteria, and degradation of petrol hydrocarbons (PHCs) in a long-term contaminated field soil. Applied Soil Ecology 31, 43-52.
Maier, T., Forster, H.H., Asperger, O., and Hahn, U. (2001). Molecular characterization of the 56-kDa CYP153 from Acinetobacter sp. EB104. Biochem Biophys Res Commun 286, 652-658.
Mallick, S., Chakraborty, J., and Dutta, T.K. (2011). Role of oxygenases in guiding diverse metabolic pathways in the bacterial degradation of low-molecular-weight polycyclic aromatic hydrocarbons: a review. Crit Rev Microbiol 37, 64-90.
Margesin, R., Hammerle, M., and Tscherko, D. (2007). Microbial activity and community composition during bioremediation of diesel-oil-contaminated soil: effects of hydrocarbon concentration, fertilizers, and incubation time. Microb Ecol 53, 259-269.
Miya, R.K., and Firestone, M.K. (2001). Enhanced phenanthrene biodegradation in soil by slender oat root exudates and root debris. Journal of Environmental Quality 30, 1911-1918.
Nessel, C.S. (1999). A comprehensive evaluation of the carcinogenic potential of middle distillate fuels. Drug Chem Toxicol 22, 165-180.
Nichols, T., Wolf, D., Rogers, H., Beyrouty, C., and Reynolds, C. (1997). Rhizosphere microbial populations in contaminated soils. Water, Air, and Soil Pollution 95, 165-178.
Pilon-Smits, E. (2005). Phytoremediation. Annu. Rev. Plant Biol. 56, 15-39. Price, M.N., Dehal, P.S., and Arkin, A.P. (2010). FastTree 2--approximately maximum-
likelihood trees for large alignments. PLoS One 5, e9490. Pulles, T., Van Der Gon, H.D., Appelman, W., and Verheul, M. (2012). Emission factors
for heavy metals from diesel and petrol used in European vehicles. Atmospheric Environment 61, 641-651.
Quast, C., Pruesse, E., Yilmaz, P., Gerken, J., Schweer, T., Yarza, P., Peplies, J., and Glockner, F.O. (2013). The SILVA ribosomal RNA gene database project: improved data processing and web-based tools. Nucleic Acids Res 41, D590-596.

Metagenomics of diesel-degrading bacterial consortium | Chapter III
121
Ramadass, K., Megharaj, M., Venkateswarlu, K., and Naidu, R. (2015). Ecological implications of motor oil pollution: earthworm survival and soil health. Soil Biology and Biochemistry 85, 72-81.
Ranc, B., Faure, P., Croze, V., and Simonnot, M.O. (2016). Selection of oxidant doses for in situ chemical oxidation of soils contaminated by polycyclic aromatic hydrocarbons (PAHs): A review. J Hazard Mater 312, 280-297.
Rentz, J.A., Alvarez, P.J., and Schnoor, J.L. (2008). Benzo[a]pyrene degradation by Sphingomonas yanoikuyae JAR02. Environ Pollut 151, 669-677.
Resnick, S., Lee, K., and Gibson, D. (1996). Diverse reactions catalyzed by naphthalene dioxygenase from Pseudomonas sp strain NCIB 9816. Journal of industrial microbiology 17, 438-457.
Richard, J., and Vogel, T. (1999). Characterization of a soil bacterial consortium capable of degrading diesel fuel. International Biodeterioration & Biodegradation 44, 93-100.
Riis, V., Babel, W., and Pucci, O.H. (2002). Influence of heavy metals on the microbial degradation of diesel fuel. Chemosphere 49, 559-568.
Risher, J., and Rhodes, S. (1995). Toxicological profile for fuel oils. US Department of Health and Human Services. Public Health Service, Agency for Toxic Substances and Disease Registry, Atlanta, GA.
Samanta, S.K., Singh, O.V., and Jain, R.K. (2002). Polycyclic aromatic hydrocarbons: environmental pollution and bioremediation. TRENDS in Biotechnology 20, 243-248.
Scheps, D., Malca, S.H., Hoffmann, H., Nestl, B.M., and Hauer, B. (2011). Regioselective omega-hydroxylation of medium-chain n-alkanes and primary alcohols by CYP153 enzymes from Mycobacterium marinum and Polaromonas sp. strain JS666. Org Biomol Chem 9, 6727-6733.
Selifonov, S.A., Grifoll, M., Eaton, R.W., and Chapman, P.J. (1996). Oxidation of naphthenoaromatic and methyl-substituted aromatic compounds by naphthalene 1,2-dioxygenase. Appl Environ Microbiol 62, 507-514.
Singer, A.C., Crowley, D.E., and Thompson, I.P. (2003). Secondary plant metabolites in phytoremediation and biotransformation. TRENDS in Biotechnology 21, 123-130.
Solano-Serena, F., Marchal, R., and Vandecasteele, J. (2001). Biodegradation of gasoline in the environment: from overall assessment to the case of recalcitrant hydrocarbons. Oil Gas Sci. Technol 56, 479-498.
Sutton, N.B., Maphosa, F., Morillo, J.A., Al-Soud, W.A., Langenhoff, A.A., Grotenhuis, T., Rijnaarts, H.H., and Smidt, H. (2012). Impact of long term diesel contamination on soil microbial community structure. Applied and environmental microbiology, AEM. 02747-02712.
Takahashi, J., Ichikawa, Y., Sagae, H., Komura, I., Kanou, H., and Yamada, K. (1980). Isolation and identification of n-butane-assimilating bacterium. Agricultural and Biological Chemistry 44, 1835-1840.
Throne-Holst, M., Wentzel, A., Ellingsen, T.E., Kotlar, H.K., and Zotchev, S.B. (2007). Identification of novel genes involved in long-chain n-alkane degradation by Acinetobacter sp. strain DSM 17874. Appl Environ Microbiol 73, 3327-3332.
Van Beilen, J., Li, Z., Duetz, W., Smits, T., and Witholt, B. (2003). Diversity of alkane hydroxylase systems in the environment. Oil & gas science and technology 58, 427-440.

Chapter III | Metagenomics of diesel-degrading bacterial consortium
122
Van Beilen, J.B., Wubbolts, M.G., and Witholt, B. (1994). Genetics of alkane oxidation by Pseudomonas oleovorans. Biodegradation 5, 161-174.
Van Herwijnen, R., Wattiau, P., Bastiaens, L., Daal, L., Jonker, L., Springael, D., Govers, H.A., and Parsons, J.R. (2003). Elucidation of the metabolic pathway of fluorene and cometabolic pathways of phenanthrene, fluoranthene, anthracene and dibenzothiophene by Sphingomonas sp. LB126. Res Microbiol 154, 199-206.
Viggor, S., Joesaar, M., Vedler, E., Kiiker, R., Parnpuu, L., and Heinaru, A. (2015). Occurrence of diverse alkane hydroxylase alkB genes in indigenous oil-degrading bacteria of Baltic Sea surface water. Mar Pollut Bull 101, 507-516.
Wald, J., Hroudova, M., Jansa, J., Vrchotova, B., Macek, T., and Uhlik, O. (2015). Pseudomonads Rule Degradation of Polyaromatic Hydrocarbons in Aerated Sediment. Front Microbiol 6, 1268.
Whyte, L.G., Schultz, A., Beilen, J.B., Luz, A.P., Pellizari, V., Labbe, D., and Greer, C.W. (2002). Prevalence of alkane monooxygenase genes in Arctic and Antarctic hydrocarbon-contaminated and pristine soils. FEMS Microbiol Ecol 41, 141-150.
Wu, M., Li, W., Dick, W.A., Ye, X., Chen, K., Kost, D., and Chen, L. (2017). Bioremediation of hydrocarbon degradation in a petroleum-contaminated soil and microbial population and activity determination. Chemosphere 169, 124-130.
Yergeau, E., Sanschagrin, S., Beaumier, D., and Greer, C.W. (2012). Metagenomic analysis of the bioremediation of diesel-contaminated Canadian high arctic soils. PLoS One 7, e30058.
Zanaroli, G., Di Toro, S., Todaro, D., Varese, G.C., Bertolotto, A., and Fava, F. (2010). Characterization of two diesel fuel degrading microbial consortia enriched from a non acclimated, complex source of microorganisms. Microb Cell Fact 9, 10.

123
Chapter IV
Analysis of the biodegradative and adaptive potential of Rhodococcus sp. WAY2 revealed
by its complete genome sequence

Genome sequence of Rhodococcus sp. WAY2 | Chapter IV
125
Chapter IV Analysis of the biodegradative and adaptive potential of Rhodococcus sp. WAY2 revealed by its complete genome sequence __________________
Abstract The complete genome sequence of Rhodococcus sp. WAY2 (WAY2) consist of a circular chromosome, three linear replicons and a small, circular plasmid. The linear replicons contain typical Actinobacteria invertron telomeres with the central CGTXCGC motif. Comparative phylogenetic analysis of the 16S rRNA gene along with phylogenomic analysis based in the GBDP algorithm and digital DNA-DNA hybridization (dDDH) with other Rhodococcus type strains resulted in a clear differentiation of WAY2, which is likely a new species. The genome of WAY2 contains five distinct clusters of bph, etb and nah genes, putatively involved in the degradation of several aromatic compounds, and that are distributed throughout the linear plasmids. The high sequence homology of the ring-hydroxylating subunits of these systems with other known enzymes has allowed us to model the range of aromatic substrates they could modify and degrade. Further functional characterization revealed that WAY2 is able to grow with biphenyl, naphthalene and xylene as sole carbon and energy sources and can oxidize multiple aromatic compounds, including ethylbenzene, phenanthrene, dibenzofuran and toluene. In addition, WAY2 was able to co-metabolize 23 PCB congeners, which could be explained by the five different ring-hydroxylating systems encoded on its genome. WAY2 can also use several chain-length n-alkanes as sole carbon source, probably because of the presence of alkB and ladA gene copies only found on its chromosome. These results show that WAY2 has potential to be used in the bioremediation of multiple organic compounds.
Introduction Rhodococcus is a gram-positive Actinobacteria genus widely distributed in the environment, including soil and water from tropics, deserts and artic habitats (Sharma and Pant, 2001; Ruberto et al., 2005; Röttig et al., 2016). Although some

Chapter IV | Genome sequence of Rhodococcus sp. WAY2
126
members of this genus are known pathogens of plants and animals (Prescott, 1991; Cornelis et al., 2001) or symbionts in the gut of insects (Yassin, 2005), most of the species have been isolated from different polluted sites where they thrive along with other bacterial communities (Kästner et al., 1994; Ghosh et al., 2006; Jiménez et al., 2007). In fact, the ability to grow in polluted environments, including hydrocarbon-polluted soils (Song et al., 2011) results of the presence of multiple catabolic pathways predominantly encoded in extrachromosomal replicons (Shimizu et al., 2001; McLeod et al., 2006), which allows rhodococci to degrade a wide range of structural groups, including aliphatic hydrocarbons, polycyclic aromatic hydrocarbons (PAHs), halogenated compounds such as polychlorinated biphenyls (PCBs), nitroaromatics, heterocyclic compounds and herbicides (De Carvalho et al., 2005; Ghosh et al., 2006; Iwasaki et al., 2007; Song et al., 2011). The adaptation of rhodococci to various environments also relies in the use of storage compounds, such as glycogen, polyhydroxyalkanoates (PHAs) and triacylglycerols (TAGs), the presence of cold shock proteins, osmotic and oxidative stress proteins and other factors involved in membrane/cell wall alteration that allows them to adapt to different nutritional states and environmental changes (Behki et al., 1993; Alvarez et al., 2008; Hernandez et al., 2008; Goordial et al., 2016; Röttig et al., 2016).
Genome analysis of Rhodococcus strains has shown their huge metabolic potential (McLeod et al., 2006; Larkin et al., 2010). It has been proposed that the catabolic abilities of rhodococci rely on a hyper-recombinant strategy that consists of the acquisition and storage of genes to be deployed for recombination, contributing to the dispersal of acquired DNA without the involvement of mobile genetic elements (Larkin et al., 2005). This results in large and complex multipartite genomes (diCenzo and Finan, 2017) consisting on a main chromosome, which can be circular or linear, and multiple linear replicons up to 1.1 Mbp in size (McLeod et al., 2006) together with small circular plasmids. Actinobacteria linear replicons usually show invertron-type telomeres, and are proposed to have evolved from bacteriophages (Chen et al., 2002). The presence of these multiple extrachromosomal elements contributes in overall to the rich repertoire of catabolic genes that appear in Rhodococcus genomes (Larkin et al., 2010). Among them, dioxygenase systems have been extensively studied in this genus because of their involvement in the degradation of several toxic aromatic compounds. These include the bph, etb and nah gene cluster encoding the ring-hydroxylating dioxygenases that initiate the degradation of biphenyl and PCB

Genome sequence of Rhodococcus sp. WAY2 | Chapter IV
127
congeners, ethylbenzene and naphthalene respectively, in many strains (Shimizu et al., 2001; Iwasaki et al., 2006; Kimura et al., 2006; Iwasaki et al., 2007; Taguchi et al., 2007). Multiple studies show that these enzymes are versatile and the range of aromatic substrates they can utilize is wide, including biphenyl/PCBs, naphthalene, ethylbenzene, dibenzofuran, dibenzo-p-dioxins, phenanthrene, toluene and xylene, among others (Resnick et al., 1996; Furukawa et al., 2004; Kimura et al., 2006; Patrauchan et al., 2008).
The catabolic potential that Rhodococcus strains exhibit along with extensive ecological adaptions to harsh and changing conditions, makes this genus specifically suited for multiple environmental and industrial applications. Rhodococci have been successfully applied in the bioremediation of fuel-oil (Ruberto et al., 2005; Jiménez et al., 2007), PAHs (Cavalca et al., 2002; Kim and Lee, 2007) and herbicides (Kitova et al., 2004), among other pollutants. Members of this genus have also been used as biocatalysts (Krivoruchko et al., 2019), including the production of biofuel, degradation of pharma pollutants and production of acrylic acid (Ivshina et al., 2012; Hernández et al., 2015; Thakur et al., 2016). Furthermore, Rhodococcus strains are recently gaining attention in the discovery and production of drugs (Adnani et al., 2016; Alizadeh-Sani et al., 2018) and in the production of electricity from organic waste in microbial fuel cells (Cheng et al., 2018). All these examples of biotechnological uses make the discovery and characterization of novel Rhodococcus strains essential for new or enhanced applications.
Rhodococcus sp. WAY2 was isolated from a bacterial rhizosphere consortium growing with biphenyl as sole carbon and energy source in a previous metagenomic study (Chapter II). In this work, we report the complete genome sequence of Rhodococcus sp. WAY2. Phylogenetic and phylogenomic comparisons with other Rhodococcus type strains are conducted to address its taxonomic status. Further genome and functional analyses are performed to characterize its degradative potential.
Materials and Methods Growth conditions and functional characterization Rhodococcus sp. WAY2 was routinely grown in LB or PCA liquid or solid (agar 1.5% w/v) media. The range of temperature on which WAY2 was able to grow was tested in PCA plates at 5, 12, 20, 28, 37 and 40 ºC. Salinity and toluene

Chapter IV | Genome sequence of Rhodococcus sp. WAY2
128
tolerance were tested in LB liquid media supplemented with 1, 2, 3, 4 and 5% of NaCl and toluene respectively. Minimal salt medium (MM) (Brazil et al., 1995), supplemented with 0.1% (v/v) of phosphate-buffered mineral medium salts (PAS) (Bedard et al., 1986) was used for growing WAY2 in different organic compounds as sole carbon and energy source at 1 mL/L or 1 g/L for biphenyl, naphthalene, xylene (p-, m- and o-xylene mixture), toluene, n-pentadecane, n-heptadecane and tetracosane. Phenanthrene, dibenzofuran, ethylbenzene, n-hexane, 1-butanol, 2-butanol and methanol were added to the lid of solid MM+PAS media (1.5% agar (w/v)) either as crystals or in sterile 200 µL microtubes for constant vapor release.
Genome sequencing and assembly Total DNA extraction for genome sequencing was performed in LB-grown WAY2 culture with the NucleoSpin® Microbial DNA kit (Macherey-Nagel) according to the supplier specifications. The genome of Rhodococcus sp. WAY2 was sequenced by paired-end Illumina MiSeq 2x150 and PacBio RS II (Pacific Biosciences) technologies by the Parque Científico de Madrid (Spain) and Novogene Co., Ltd. (China) respectively. Illumina reads were quality-filtered with Trimmomatic software v0.38 (Bolger et al., 2014). Both Illumina and PacBio RS II reads were used for hybrid assembly with SPAdes software v1.12.0 (Bankevich et al., 2012) using careful mode to reduce the number of mismatches and short indels. PacBio RS II raw reads were additionally quality-filtered and assembled into contigs using CANU software v1.7.1 (Koren et al., 2017). Overlapping contigs found with blastn v2.2.31+ (Camacho et al., 2009) searches and CANU assembly allowed genome closure and plasmid determination. Additionally, the topology of the pRWAY01, pRWAY02, pRWAY03 and pRWAY04 replicons was confirmed by PCR and it is described in full in the Supplementary File 4.S1.
Genome annotation The complete genome of Rhodococcus sp. WAY2 was annotated using the RAST pipeline (Overbeek et al., 2014) and eggNOG-mapper v1.0.3 (Huerta-Cepas et al., 2017) against the bacNOG version 38 database. Annotations of regions of interest were additionally curated by blastn or blastp against the nucleotide (nt) or nonredundant (nr) NCBI databases, respectively. Noncoding RNA (ncRNA) genes were predicted using RNAspace online environment v1.2.1 (Cros et al.,

Genome sequence of Rhodococcus sp. WAY2 | Chapter IV
129
2011), using blast searches of Rfam 10.0 database and default parameters. Genome maps were built using the DNAPlotter software (Carver et al., 2009).
The telomeric sequences of WAY2 linear replicons and those found in closely related genomes were identified by blastn against the NCBI nt database and aligned using multiple sequence comparison by log-expectation (MUSCLE) (Edgar, 2004). The alignments were manually examined to identify the previously described CGTXCGC motif (Kalkus et al., 1998; Warren et al., 2004) and inverted terminal repeats.
Genomic islands (GIs) were predicted with the IslandViewer 4 online service (Bertelli et al., 2017) using the IslandPath-DIMOB (Bertelli and Brinkman, 2018) and SIGI-HMM (Waack et al., 2006) prediction methods. Small GIs contained into a bigger GI were removed. Partially overlapping GIs were combined.
Phylogenetic analysis The 16S rRNA sequences of all Rhodococcus type strains (according to List of Prokaryotic Names with Standing in Nomenclature, last accessed in April 2019), listed in Supplementary Table 4.S1, were downloaded and aligned with Clustal Omega (Sievers et al., 2011). R. obulensis ATCC 44610T was excluded of further analyses because its 16S rRNA sequence was truncated (505 nts). The resulting alignment was trimmed from position 108 to 1,331, using a 16S rRNA sequence of WAY2 (732,059 .. 733,282) to adjust the alignments to 1,249 nts. The resulting alignment was filtered with Gblocks v0.91b (Castresana, 2000) to remove poorly aligned positions and hypervariable regions, using a minimum block length of two nucleotides and allowing gap positions in all sequences. Maximum-likelihood (ML) phylogenetic tree was built using the Pthreads-parallelized RAxML package v8.2.10 (Stamatakis, 2014), using the GTR model of nucleotide substitution (Tavaré, 1986) combined with the gamma model of rate heterogeneity and optimization of substitution rates using the BFGS algorithm. Rapid bootstrapping and subsequent ML search combined with autoMRE (Pattengale et al., 2010) criterium were applied. The phylogenetic tree was plotted and exported using MEGA v7 software (Kumar et al., 2016).

Chapter IV | Genome sequence of Rhodococcus sp. WAY2
130
Phylogenomic analysis All sequenced Rhodococcus type strains genomes were downloaded from the NCBI ftp RefSeq database in March 2019, resulting in 38 genomes listed in Supplementary Table 4.S2. Nocardia brasiliensis NCTC 11294T was used as outgroup. Genome-to-genome blast distance phylogeny (GBDP) (Meier-Kolthoff et al., 2013) was used via the genome-to-genome distance calculator (GGDC) v2.1 web service4. Resulting sets of intergenomic distances were used to build the Neighbor-Joining phylogenomic tree with MEGA v7 software. Digital DDH values were calculated using the recommended settings of the GGDC 2.1 (Meier-Kolthoff et al., 2013).
Additionally, the genome sequence of WAY2 was submitted to the Type (Strain) Genome Server (TYGS) platform5 for a whole genome-based taxonomic analysis (Meier-Kolthoff and Goker, 2019). In brief, the 16S rRNA gene sequences of WAY2 were extracted using RNAmmer (Lagesen et al., 2007) and blasted against the 16S rRNA gene sequences of 9,094 type strains available in the TYGS database to find the best 50 matching type strains according to bitscore. Using GBDP, the distances were used to determine the 10 closest type strain genomes and further compared using GBDP and intergenomic distances inferred under the ‘trimming’ algorithm and the d5 formula (Meier-Kolthoff et al., 2013), using 100 replicates. Digital DDH values were calculated as described above. Minimum evolution tree was constructed with the resulting intergenomic distances, with 100 pseudo-bootstrap replicates branch support via FASTME v2.1.4 including SPR postprocessing (Lefort et al., 2015). Trees were visualized with PhyD3 (Kreft et al., 2017). Digital DDH clustering using a 70% radius around the 10 type strains was done as previously reported (Liu et al., 2015).
Ring-hydroxylating dioxygenases phylogeny Amino acid sequences of the five alpha-subunits of ring-hydroxylating dioxygenases identified in the WAY2 genome were aligned using Clustal Omega to form the matrix for phylogenetic analyses. A ML phylogenetic tree was built using the Pthreads-parallelized RAxML package as specified above but the LG model of amino acid evolution (Le and Gascuel, 2008) combined with gamma-
4 https://ggdc.dsmz.de 5 https://tygs.dsmz.de

Genome sequence of Rhodococcus sp. WAY2 | Chapter IV
131
distributed substitution rates and empirical amino acid frequencies were used instead.
PCBs resting cell assay Resting cell assays to test the ability of Rhodococcus sp. WAY2 to degrade PCB congeners were assessed in 20 mL microcosms after 48 h. R. jostii RHA1, Paraburkholderia xenovorans LB400 and Pseudomonas alcaliphila JAB1 were also included for comparison purposes. Bacterial cultures at an OD600 between 0.5 – 1 in MM+PAS medium growing with biphenyl as sole carbon source were filtered with a funnel filled with woolen glass to remove biphenyl crystals, centrifuged at 4,000 x g for 10 min and washed twice with MM+PAS. Cells were resuspended in 200 mL of MM+PAS to achieve a final OD600 = 1. Autoclaved cell suspensions (120ºC for 20 min) were used as controls. Three replicas of 20 mL of active and autoclaved cells were incubated with 0.001% (w/v) Delor 103 PCB mixture in glass vials sealed with screw caps during 48 h at 28ºC on a rotary shaker at 250 rpm. The samples were stored at -20 ºC until analyzed. Individual PCB congener depletion in the microcosms were determined using GC-MS (450-GC, 240-MS ion trap detector, Varian).
Results and discussion Genome anatomy The multipartite genome architecture of Rhodococcus sp. WAY2 is composed of 8.44 Mbp distributed in five replicons: a circular chromosome of 6.62 Mbp, three linear mega-plasmids designated pRWAY01 (0.99 Mbp), pRWAY02 (0.46 Mbp) and pRWAY03 (0.35 Mbp), and a small circular plasmid designated pRWAY04 (14.85 Kbp), represented in Figure 4.1. The final assembly yielded an overall average coverage of 232x. The chromosome GC% is 65.87%, similar to that of the linear plasmids (65.04%, 64.92% and 65.10% respectively), while the small circular plasmid has a GC% of 61.45% (Table 4.1). The linearity of the pRWAY01, pRWAY02 and pRWAY03 mega-plasmids and the presence of the small circular pRWAY04 plasmid were also confirmed by PCR analyses (Supplementary File 4.S1).

Chapter IV | Genome sequence of Rhodococcus sp. WAY2
132
The telomeres of the linear replicons of WAY2 are typical Actinobacteria invertrons,
with Terminal Inverted Repeats (TIRs) and the central GCTXCGC motif, as previously described (Kalkus et al., 1998; Warren et al., 2004). These telomeres are similar to those found in other rhodococci linear replicons, such as R. jostii RHA1 and R. opacus strains B4 and 1CP (Supplementary File 4.S2). WAY2 telomeric sequences share between 88-93% sequence identity along their first 500 bp, except pRWAY03 left end, which shares
Figure 4.1 | Genomic map of Rhodococcus sp. WAY2 replicons. Chromosome (A), linear mega-plasmids pRWAY01, pRWAY02 and pRWAY03 (BCD) and circular plasmid pRWAY04 (E). The outer/top two rings/rows represent CDSs in the forward reverse strand, respectively, colored according to COG main groups. The third circle/row represent RNA genes (dark blue: rRNA; purple: tRNA; black: ncRNA). The fourth circle/row represent deviation in GC content, using a 10,000 bp window size and a 200 bp step size for the chromosome, 3,000 bp window size and 300 bp step size for the linear replicons and 200 bp window size and 5 bp step size for the pRWAY04 circular plasmid (grey/black represent above/below the mean GC content, respectively). The fifth circle/row represent the GC skew using a 10,000 bp window size and 500 bp step size for the chromosome, a 3,000 bp window size and 200 bp step size for the three linear replicons and a 200 bp window size and 5 bp step size for the pRWAY04 circular plasmid (grey/black represent above/below 1, respectively).

Genome sequence of Rhodococcus sp. WAY2 | Chapter IV
133
no homology with any other WAY2 telomeric sequence but has a 95% sequence identity with the sequences of pRHL2 and pROB01 right ends from R. jostii RHA1 and R. opacus B4, respectively. Interestingly, the TIRs of pRWAY03 left end contains two central GCTXCGC motifs with different short inverted repeats than those found in the remaining WAY2 telomeres (Supplementary File 4.S2), which might suggest a different plasmid origin. The three WAY2 linear mega-plasmids harbor distant homologous sequences of tap and tpg genes found on Streptomyces and other Actinobacteria (Bao and Cohen, 2003; Zhang et al., 2006; Kolkenbrock et al., 2010), encoding putative telomerase-binding proteins (Tap) and terminal proteins (TPs), respectively (Supplementary Table 4.S3). Among these, those encoded by the pRWAY03 right end share a 99% amino acid sequence identity with other Rhodococcus Tap/TP proteins and between 33% to 37% sequence identity with Arthrobacter Tap/TP proteins characterized in its pAL1 linear plasmid (Kolkenbrock et al., 2010). This poor Tap/TP sequence conservation has been previously reported within Streptomyces linear plasmids (Zhang et al., 2006).
Table 4.1 | Summary of Rhodococcus sp. WAY2 genome characteristics across replicons. Replicon
Characteristic
Chr
omos
ome
pRW
AY
01
pRW
AY
02
pRW
AY
03
pRW
AY
04
Total length (bp) 6,622,033 991,117 461,410 353,952 14,853 Topology Circular Linear Linear Linear Circular GC% 65.86 65.04 64.92 65.10 61.45 Genes 6,204 1,082 526 404 20 Protein coding genes 6,127 1,081 523 403 20 rRNA genes 12 0 0 0 0 tRNA genes 51 1 0 0 0 ncRNA genes 14 0 3 1 0
The WAY2 chromosome contains the chromosomal replication initiator gene
dnaA whereas several putative copies of the chromosome/plasmid partitioning and segregation parAB system are present in all WAY2 replicons (Supplementary Table 4.S3). Four parA homologues are present in the WAY2 chromosome and single parA copies are found in each of the WAY2 plasmids. In contrast, parB copies are only found in the chromosome and in the pRWAY01 mega-plasmid, suggesting a dependency of the remaining replicons for stable maintenance during cell division. A similar parAB gene distribution is found in R. jostii RHA1 (McLeod et al., 2006). Amino acid sequence identity among ParAs of WAY2 is less than 50%, but highly similar to those found in other rhodococci genomes

Chapter IV | Genome sequence of Rhodococcus sp. WAY2
134
(>90%). This finding suggests that the WAY2 chromosome and plasmids have different origins. The sequence dissimilarity between chromosomal ParAs is probably due to genetic exchange among extrachromosomal elements rather than duplication and speciation of parA genes, as previously suggested (Yamaichi and Niki, 2000). Nonetheless, these are probably recurring processes in rhodococci.
Phylogenetic and phylogenomic analyses To date, there are 66 validly named Rhodococcus species of which 38 type strain genomes have been sequenced. Phylogenetic analyses based in the 16S rRNA gene of all type strains and phylogenomic analyses based on intergenomic distances calculated with sequenced type strains and using the GBDP algorithm were carried out in order to evaluate the phyletic relationship of WAY2 within the Rhodococcus genus. The results show a clear distinction of WAY2 from the rest of type strains (Figure 4.2 and 4.3). The four 16S rRNAs of WAY2 conform a single cluster separated from other type strains, being the closest one R. maanshanensis M712T. Other closely related 16S rRNA genes belong to known aromatic-degrading species, such as R. jostii and R. opacus (Figure 4.2).
Regarding phylogenomic analyses, GBDP-based genome comparisons also shows that WAY2 does not belong to any previously sequenced Rhodococcus species, since digital DNA-DNA hybridization (dDDH) value threshold for species delineation (≥70%) is not achieved in any of the intergenomic comparisons (Figure 4.3). The highest dDDH values were obtained in the comparison of WAY2 with R. opacus DSM 43205T and R. imtechensis JCM 13270T (27.7% and 27.6% dDDH respectively, Supplementary Table 4.S4) which are known to degrade different aromatic compounds (Klatte et al., 1994; Ghosh et al., 2006). Surprisingly, four genome comparisons of validly named type strains resulted in dDDH values above the species threshold (Figure 4.3), denoting that they are the same species. These are R. biphenylivorans TG9T and R. pyridinivorans DSM 44555T (88.3% dDDH), R. equi DSM 20307T and R. hoagii DSM 20295T (91% dDDH), R. qingshengii KCM 15477T and R. enclensis NIO 1009T (88% dDDH), and R. opacus DSM 43205T and R. imtechensis JCM 13270T (81.2% dDDH, Figure 4.3B). These results regarding R. equi and R. hoagii are in agreement with a reclassification proposal previously reported (Kampfer et al., 2014).
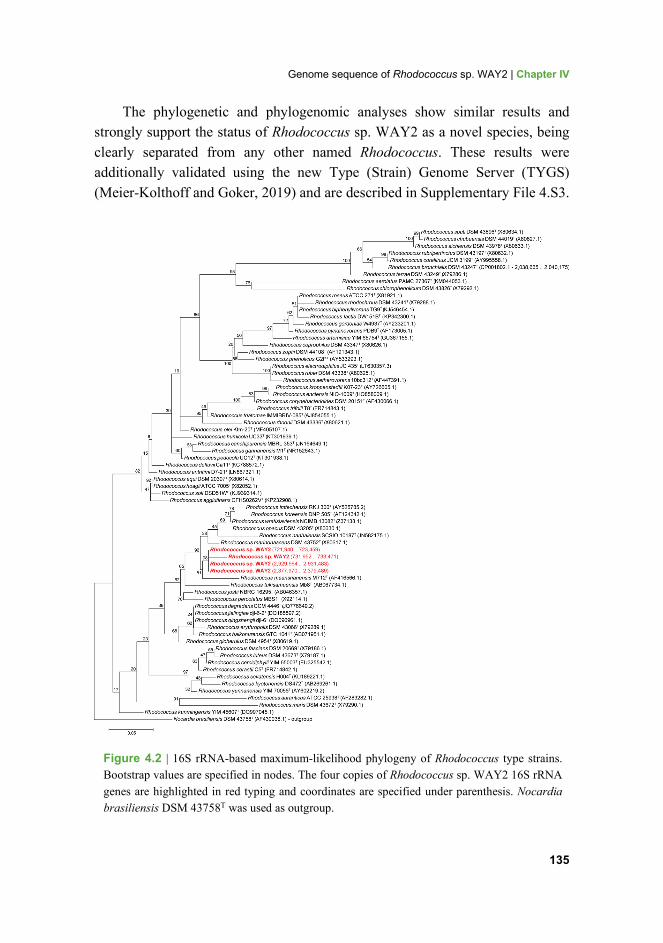
Genome sequence of Rhodococcus sp. WAY2 | Chapter IV
135
The phylogenetic and phylogenomic analyses show similar results and strongly support the status of Rhodococcus sp. WAY2 as a novel species, being clearly separated from any other named Rhodococcus. These results were additionally validated using the new Type (Strain) Genome Server (TYGS) (Meier-Kolthoff and Goker, 2019) and are described in Supplementary File 4.S3.
Figure 4.2 | 16S rRNA-based maximum-likelihood phylogeny of Rhodococcus type strains. Bootstrap values are specified in nodes. The four copies of Rhodococcus sp. WAY2 16S rRNA genes are highlighted in red typing and coordinates are specified under parenthesis. Nocardia brasiliensis DSM 43758T was used as outgroup.

Chapter IV | Genome sequence of Rhodococcus sp. WAY2
136
Figure 4.3 | (A) Neighbor-joining phylogeny based in GBDP intergenomic distances of 38 sequenced Rhodococcus type strains genomes and WAY2 (red typing). Grey boxes denote those comparisons resulting in >70% dDDH. (B) dDDH matrix of the genome comparisons.
General functional content The annotation of Rhodococcus sp. WAY2 genome resulted in 8,236 genes distributed across the replicons, with 8,154 (99%) being protein-coding genes of which 2,873 (35.23%) putatively encode proteins of unknown function (Table 4.1). A total of 82 RNA genes are found in the WAY2 genome. The chromosome contains four rRNA operons, all ribosomal proteins (except for S21p) and 51 tRNA genes, with only a copy of the tRNAGlyCCC also located in the pRWAY01 mega-plasmid (Figure 4.1). This distribution is similar to that reported in other rhodococci (McLeod et al., 2006). In addition, 18 noncoding RNA genes (ncRNAs) have been identified mainly in the chromosome (14), but also in the mega-plasmids pRWAY02 (3) and pRWAY03 (1), as shown in Table 4.1.
The functional distribution of clusters of orthologous groups (COG) across the WAY2 replicons was examined with eggNOG-mapper (Huerta-Cepas et al., 2017) and it is summarized in the Figure 4.4. The chromosome of WAY2 is enriched in core cellular functions, such as translation, energy production and conversion, amino-acid, nucleotide and lipid transport and metabolism (COGs JKCEFG). Conversely, all plasmids are enriched in replication, recombination and repair (COG L) compared to the WAY2 chromosome. This category

Genome sequence of Rhodococcus sp. WAY2 | Chapter IV
137
represents the 30.8% of all COGs in pRWAY02 mega-plasmid and around 10% in the remaining ones. Yet, none of these genes participate in these core cellular functions. These genes are annotated as mobile elements, transposases, integrases, retron-type RNA-directed DNA polymerases and other integrative elements that evidence acquisition of novel elements by the extrachromosomal replicons. Moreover, genes encoding the machinery for cell division, replication, transduction and translation core functions are exclusively found in the WAY2 chromosome (Supplementary Table 4.S3). WAY2 mega-plasmids are rich in genes associated with metabolism, such as those included in the COGs categories CIP (energy production and conversion, lipid transport and metabolism and inorganic ion transport and metabolism, respectively), representing between 4.1% and 6.7%. On the other hand, categories related to cellular processes are scarce among the mega-plasmids, except for those of posttranscriptional modifications and signal transduction mechanisms (COGs O and T).
Figure 4.4 | Functional distribution of COGs among the five Rhodococcus sp. WAY2 replicons. Proteins were classified into COGs using eggNOG-mapper. Proteins with no COG hit were included in the S category.

Chapter IV | Genome sequence of Rhodococcus sp. WAY2
138
The distribution of COGs observed in the WAY2 replicons is consistent with a specialization of the mega-plasmids towards peripheral metabolism (see below). This functionality division between core functions encoded by the chromosome and secondary or novel adaptive functions harbored in the mega-plasmids is typical of multipartite genomes found in many different phyla (diCenzo and Finan, 2017; diCenzo et al., 2019).
Degradation capabilities of Rhodococcus sp. WAY2 The ability of WAY2 to use different carbon sources was addressed by growing WAY2 on several aromatic compounds, alkanes and alcohols as sole carbon and energy source. The results are summarized in Table 4.2.
Table 4.2 | Functional characterization of the aromatic degradation capabilities of Rhodococcus sp. WAY2.
Characteristic Rhodococcus sp.
WAY2 Characteristic Rhodococcus sp.
WAY2 Ranges of growth Utilization/oxidation of: Temperature (ºC) 5-37 Aromatics Lowest pH 6 Toluene a o Highest NaCl (%) 4 n-Alkanes Utilization/oxidation of: Hexane - Aromatics Pentadecane + Biphenyl + Heptadecane + Naphthalene + Tetracosane + Xylene + Alcohols Ethylbenzene o 1-butanol + Phenanthrene o 2-butanol - Dibenzofuran o Methanol - Growth (+). Lack of growth (-). No growth observed but change in color of the media was observed (o). a Growth using toluene as sole carbon source was not detected, but tolerance up to 1% was observed.
Among the aromatic compounds tested, WAY2 can use biphenyl, naphthalene and xylene (p-, m- and o-xylene mixture) as sole carbon source while changes in media color (yellow-brown) were observed with ethylbenzene, phenanthrene, dibenzofuran and toluene, but not in the controls with only these compounds, which could be attributed to the byproducts of extradiol dioxygenases (Foght and Westlake, 1988; Selifonov et al., 1991; Furukawa et al., 2004). WAY2 was also able to grow with various chain-length n-alkanes (pentadecane, heptadecane and tetracosane) as sole carbon source, but not with hexane, and to use 1-butanol but not 2-butanol or methanol. In addition, WAY2 was able to grow between 5 to 37

Genome sequence of Rhodococcus sp. WAY2 | Chapter IV
139
ºC, being the optimal growth temperature between 20 to 37 ºC, and to tolerate up to 4% of NaCl. This was not unexpected as rhodococci are found in cold, tropical and even arid and desertic environments (Luz et al., 2004; Koberl et al., 2011; Goordial et al., 2015), and thrive in marine environments (Adnani et al., 2016; Undabarrena et al., 2018).
Central metabolic pathways The chromosome of Rhodococcus sp. WAY2 encodes genes involved in typical central carbohydrate metabolic pathways in bacteria, including the two glycolytic pathways: Embden-Meyerhof-Parnas (EMP) and Entner-Duodoroff (ED) previously reported in other Rhodococcus (Alvarez, 2010), gluconeogenesis, the pentose phosphate pathway and the tricarboxylic acid (TCA) cycle (Table 4.3, Supplementary Table 4.S5). The chromosome also encodes general pathways for purine and pyrimidine metabolism, the beta-oxidation pathway and the metabolic pathways for amino-acids biosynthesis, degradation and their interconversion (Table 4.3).
Regarding central aromatic metabolism, genes for the beta-ketoadipate (pcaGHBCDIJ and catABC), the 2-hydroxypentadienoate (2HDP, bphEFG), benzoate (benABCD), gentisate (gdoA) and homogentisate (hmgA) metabolism are found predominantly in the WAY2 chromosome, although copies of genes involved in the 2HDP and gentisate metabolism are also found in the mega-plasmids pRWAY01 and pRWAY02. Two copies of catechol 2,3-dioxygenases (catE) involved in catechol meta-cleavage are also found in these plasmids (Table 4.3, Supplementary Table 4.S5), probably related to specific catabolic pathways of aromatic compounds. Interestingly, genes involved in phenylacetate and homoprotocatechuate degradation previously identified in R. opacus PD300 and R. jostii RHA1 (Alvarez et al., 2002; Navarro-Llorens et al., 2005) are missing in the genome of WAY2, which could suggest specialized metabolism of aromatic compounds.

Chapter IV | Genome sequence of Rhodococcus sp. WAY2
140
Table 4.3 | Central metabolic pathways identified in Rhodococcus sp. WAY2 genome and genes involved.
Pathway Replicon Genes
GLY Chromosome glkA, glk, gntk, ppgK, pgi1-2, pfkA, fruK, fba, tpiA, gap, pgk, gpmA1-2, eno, pyk, edd, edaK, zwf1-4, pgl,
pRWAY01 pgl
GLN Chromosome pgi1-2, fba, gap, pgk, gpmA1-2, eno, glpX, pckG pRWAY01 glpX pRWAY02 pckG
PP Chromosome pgi1-2, zwf-4, pgl, gnd1-4, rpe, rpiB, tal, tkt1-2 pRWAY01 pgl, gnd, tal
ACoA Chromosome pdh, pdhA1-3, pdhB1-3, pdhC1-4, aceE1-2,
TCA Chromosome citA, gltA, acnA, icd1-2, sucA, sucC, sucD, sdhA1-2, sdhB1-2, fumB, mqo, mdh1-4
pRWAY01 citA, mdh1-2
PU Chromosome purF, purD, purN, purM, purL, purS, purQ, purK, purE, purC, purB, purH, purA, purB, adk1-2, ndk, gmk, guaA, guaB1-4, xdhA1-2, xdhB1-2, pucL, puuE, pucM, uraD, alc
PY Chromosome dnk, carA, carB, pyrC, pyrR, pyrD, pyrE, pyrF, pyrH, pyrG, nrdE, nrdF, nrdH, nrdI, dcd, dut, thyA, tmk1-2
BO Chromosome fadD1-17, acx, fadE1-26, acd, paaF1-3, echA1-15, hadH1-7, fadA1-15,
atoB1-4 pRWAY01 fadD, fadE, paaF, hadH, fadA1-2 pRWAY02 fadA, atoB1-2
AAM Chromosome
serA, serB1-2, serC, lysC, asd, hom, thrB, thrC, cysK1-2, cbs, cth, metK, pfs, metE, metH, achy, cdm, ilvB, ilvC, ilvD, ilvE1-3, leuB, leuC1-3, leuD1-3, leuA, lpd1-4, lpdA, dapA1-4, dapB, dapD, argD, dapC, dapE, dapF, lysA, argJ, argB, argC, argF, argG, argH, proB, proA, proC, hisG, hisE, hisI, hisA, hisF, hisB, hisC, hisD, hutH, hutU, hutI, hutG, trpC, trpD, trpE, trpF, trpG, trpB, trpA, csm, pheA, aspC, tyrA, tat1-2, hppD1-2, kynA, kynU
BKA Chromosome pcaG, pcaH, pcaB, pcaC, pcaD1-5, pcaI, pcaJ, catA, catB, catC
CATM pRWAY01 catE pRWAY02 catE
2HDP Chromosome bphE1-3, bphF1-3, bphG1-3 pRWAY01 bphE, bphF1-3, bphG1-2 pRWAY02 bphE, bphF, bphG1-3
BEN Chromosome benA, benB, benC, benD
GEN Chromosome gdoA1-2 pRWAY01 gdoA pRWAY02 gdoA
HGEN Chromosome hmgA GLY; glycolysis, GLN; gluconeogenesis, PP, pentose phosphate, ACoA; acetyl-CoA synthesis, TCA; tricarboxylic acid cycle, PU; purine metabolism, PY; pyrimidine metabolism, BO; beta-oxidation, AAM; amino acids metabolism; BKA; beta-ketoadipate, CATM; catechol meta-cleavage, 2HPD; 2-hydroxypentadienoate metabolism, BEN; benzoate metabolism, GEN; gentisate metabolism, HGEN; homogentisate metabolism. For additional information see Supplementary Table 4.S5.

Genome sequence of Rhodococcus sp. WAY2 | Chapter IV
141
Peripheral metabolism Degradation of aromatic compounds
Rhodococci are known for their ability to degrade many organic aromatic compounds, usually by using ring-hydroxylating dioxygenases for the first step of their catabolism. The genome of Rhodococcus sp. WAY putatively encodes 160 oxygenases; 67 dioxygenases and 93 monooxygenases. Among the oxygenases, there are 11 ring-hydroxylating dioxygenases distributed in the chromosome (6) and the pRWAY01 and pRWAY02 replicons (2 and 3 respectively). Of these, those present in the lineal replicons are clustered with other genes involved in the catabolism of biphenyl (bph), ethylbenzene (etb) and naphthalene (nah). These genetic clusters putatively involved in the degradation of aromatic compounds are summarized in Table 4.4 and Figure 4.5 and are detailed in Supplementary Table 4.S6.
The bph gene cluster (bphEDA4A3A2aA1aCB) is located in the pRWAY01 mega-plasmid. Additionally, this plasmid also harbors an incomplete bph cluster (bphBA2bA1b+bphD) and the 2HDP pathway (see above, Table 4.3). Similarly, the pRWAY02 replicon contains the complete etb/bph gene cluster (etbA4B+etbA1aA2aC+bphDEF), an incomplete etb/bph cluster (etbA1bA2bA3D) and a copy of the 2HDP pathway (see above, Table 4.3), which could also be involved in complete mineralization of ethylbenzene, biphenyl and other aromatic substrates, including PCBs and xylene, as reported in RHA1 (Iwasaki et al., 2007; Patrauchan et al., 2008). Finally, the pRWAY02 mega-plasmid also encodes the nah gene cluster (nahR1R2A1A2CB), putatively involved in naphthalene, biphenyl and different aromatic compounds degradation (Kimura et al., 2006). Unlike RHA1, WAY2 is able to grow using naphthalene as sole carbon and energy source, probably due to this nah gene cluster that is missing in the RHA1 genome (Patrauchan et al., 2008). These results evidence that pRWAY01 and pRWAY02 replicons have a predominant role in the degradation of aromatic compounds. Furthermore, compatible exchange of some bph/etb subunits in R. jostii RHA1 have also been reported (Iwasaki et al., 2006; Iwasaki et al., 2007), suggesting that the combination of these genetic clusters within the same organism could enhance the range of aromatic compounds to be degraded. The fact that WAY2 can grow using biphenyl and naphthalene as sole carbon and energy source, suggest that at least one of these genetic clusters is functional.

Chapter IV | Genome sequence of Rhodococcus sp. WAY2
142
Table 4.4 | Gene clusters of Rhodococcus sp. WAY2 involved in degradation compounds.
Gene cluster Replicon
(Cluster coordinates) Closest homologue a
% ident. / % cover. Evidence of substrate
specificity b
bphA1aA2aA3A4BCDE pRWAY01 (503,862 .. 510,599)
Rhodococcus sp. R04 ABD65916.1 100% / 100%
Biphenyl/PCBs Dibenzofuran
bphA1bA2bBD pRWAY01 (58,025 .. 71,297)
Rhodococcus opacus SAO101
BAD02377.1 98.9% / 100%
Biphenyl/PCBs Dibenzo-p-dioxin
Naphthalene Dibenzofuran Phenanthrene
etbA1aA2aA4BCDEFST pRWAY02 (139,073 .. 161,605)
Rhodococcus jostii RHA1
BAC92712.1 99.6% / 99%
Biphenyl/PCBs Naphthalene Ethylbenzene
o-xylene
etbA1bA2bA3D pRWAY02 (167,939 .. 170,250)
Rhodococcus jostii RHA1
BAC92718.1 99.8% / 99%
Biphenyl/PCBs Naphthalene Ethylbenzene
o-xylene
nahA1A2BCR1R2 pRWAY02 (213,725 .. 219,208)
Rhodococcus opacus SAO101
BAD02377.1 98.3% / 100%
Biphenyl/PCBs Dibenzo-p-dioxin
Naphthalene Dibenzofuran Phenanthrene
a Only large subunits (bphA1, etbA1 and narA1) are considered. Percentages based in blastp. b See main text for references.
WAY2 can also use xylene as carbon source for cell growth (Table 4.2).
Previous studies have shown that the bph and etb gene clusters of RHA1 can metabolize o-xylene (Patrauchan et al., 2008). Furthermore, the o-xylene degradation akb gene cluster reported in Rhodococcus sp. DK17 (Kim et al., 2004) shares a 98% overall amino acid sequence identity with the etb gene cluster of WAY2 and is identical to that of RHA1 (Figure 4.5A), which strongly suggests the involvement of the WAY2 etb gene cluster in xylene utilization.
Altogether, WAY2 contains five hydroxylating dioxygenases large subunits with the rieske 2Fe-2S domain: bphA1a, bphA1b, etbA1a, etbA1b and nahA1, which are either clustered in the genome with complete or incomplete gene sets for the degradation of aromatic compounds in the WAY2 genome (Table 4.4). Phylogenetic analyses show that these dioxygenases belong to three distinct groups, with a 99% overall sequence identity and strong syntenic conservation with previously well-characterized dioxygenase clusters (Figure 4.5). While the two etbA1 conform the first cluster, together with their respective homologous in RHA1 and DK17, bphA1a and bphA1b belong to two distinct groups. The former is clustered with atypical bphA1 enzymes found in Rhodococcus sp. strains HA99

Genome sequence of Rhodococcus sp. WAY2 | Chapter IV
143
and R04, and R. erythropolis TA431 (Figure 4.5 C), previously described for being involved in biphenyl/PCBs and dibenzofuran degradation (Yang et al., 2004; Taguchi et al., 2007). The second, bphA1b is clustered together with WAY2 nahA1 and with known naphthalene dioxygenases including nahA1 of R. opacus SA0101 (Kimura et al., 2006) which has been shown to act in the dioxygenation of dibenzofuran, naphthalene, biphenyl/PCBs, dibenzo-p-dioxin and phenanthrene (Figure 4.5B). None of these WAY2 enzymes clustered together with the typical, well-characterized biphenyl dioxygenases of RHA1, LB400 or KF707 strains (Figure 4.5D). The repertory of ring-hydroxylating dioxygenases that are found in the WAY2 genome explain the wide range of aromatic degradation abilities it displays. Furthermore, substrate redundancy by these distinct enzymes could also enhance its degradation performance.
The pRWAY01 mega-plasmid also contains the cluster tmoABCDEF (Supplementary Table 4.S6) previously described for being responsible for the conversion of toluene to p-cresol (Yen et al., 1991). Although WAY2 was unable to grow either with 0.5% (v/v) of toluene or in gaseous form as sole carbon source, it can tolerate up to 1% (v/v) of toluene in LB growth medium. This was not unexpected as it has been previously reported in other rhodococci (de Carvalho et al., 2004). The fact that WAY2 genome do not contain any of the pch genes for p-cresol degradation (Peters et al., 2007), suggests that the tmo gene cluster is active in toluene detoxification. Furthermore, WAY2 incubated in MM+PAS medium with toluene (0.5% v/v) turned into light brown color, suggesting conversion.

Chapter IV | Genome sequence of Rhodococcus sp. WAY2
144
Figure 4.5 | (ABC) Gene organization of Rhodococcus sp. WAY2 etb, bph and nah gene clusters and syntenic comparisons with homologous clusters in other rhodococci. Percentages indicate amino acid sequence identity. Replicon and position of the regions shown are specified under strain names. etbS/akbS not at scale. (D) Maximum-likelihood phylogenetic tree based on amino acid sequences of the ring-hydroxylating dioxygenases large subunits of Rhodococcus sp. WAY2 (red typing) with putative involvement in degradation of aromatic compounds. Other well-characterized dioxygenases were included for comparison purposes. Bootstrap values are shown above branches. Validated substrates of these enzymes (marked with asterisks) are shown in the right panel connected with lines. Dashed line to PCBs indicates assumed function for co-metabolism based on biphenyl degradation, but not direct evidence.
All the genetic systems for aromatic degradation compounds that are present
in the genome of Rhodococcus sp. WAY2 could allow its survival under aromatic hydrocarbon-polluted environments, either by metabolizing these substrates obtaining carbon and energy as it is the case of biphenyl, naphthalene and xylene,

Genome sequence of Rhodococcus sp. WAY2 | Chapter IV
145
by transforming them into nontoxic bioproducts as it is probably the case of toluene, or by co-metabolism as it is the case of PCB congeners (see below).
Degradation of n-alkanes
Aside PAHs, alkanes constitute the major fraction in the hydrocarbon mixtures used in fuels. Many microorganisms are able to degrade alkanes using alkane monooxygenase enzymes for their initial aerobic hydroxylation (Ji et al., 2013). The WAY2 chromosome putatively encodes an alkane 1-monooxygenase (alkB) and three long-chain alkane monooxygenases (ladA) involved in alkane degradation (van Beilen et al., 1994; Bihari et al., 2011). The fact that WAY2 is able to grow with n-pentadecane, n-heptadecane and n-tetracosane as sole carbon and energy source suggests that these enzymes are functional. This result is in agreement with previous reports, were it has been shown that rhodococci can degrade short-to-middle chain n-alkanes ranging from C5 to C16 (de Carvalho and da Fonseca, 2005) and also long-chain n-alkanes such as tetracosane, for which the role of alkB has been reported (Zampolli et al., 2014). Additionally, the genome of WAY2 also harbors several clusters of genes for methane utilization (Supplementary Table 4.S6). Three of these systems are assigned to putative soluble methane monooxygenase systems (sMMO) encoded by mmoXCYB genes located in the chromosome and mmoXYBC and mmoX2Y2B2C2Z genes located in the pRWAY02 replicon. The remaining cluster putatively encodes a particulate methane monooxygenase system (pMMO) encoded by pmoBAC genes, also located in the pRWAY02 mega-plasmid. Aside of methane oxidation, these monooxygenases have been also reported to be involved in the degradation of other short-chain alkanes (up to five carbon atoms) such as propane, n-butane and n-pentane (Chan et al., 2004). These substrates can be converted by sMMOs or pMMOs to their corresponding alcohols, which are finally transformed into formate and carbon dioxide by subsequent alcohol, formaldehyde and formate dehydrogenase reactions (Ji et al., 2013). Previous reports show that rhodococci strains can grow using different alcohols, such as methanol, ethanol and butanol as carbon source (De Carvalho et al., 2005). Surprisingly, our assays to test the ability of WAY2 to grow with methanol, either supplemented as a gas or in liquid (0.5% v/v), were unsuccessful, but WAY2 was able to use 1-butanol supplemented in vapor form as sole carbon and energy source. However, further studies are required in order to test if indeed these MMOs systems are active.

Chapter IV | Genome sequence of Rhodococcus sp. WAY2
146
Co-metabolism of PCBs
The ability of Rhodococcus sp. WAY2 to co-metabolize different PCB congeners was assessed in resting cell assays, using Delor 103 as PCB mixture. Two of the most powerful PCB degraders known to date, R. jostii RHA1 and P. xenovorans LB400, and P. alcaliphila JAB1 whose bph gene cluster has been shown to be identical to that of Pseudomonas pseudoalcaligenes KF707 (Ridl et al., 2018) were also included in the assay for comparison purposes. WAY2 is able to effectively degrade 23 PCB congeners, with less than 80% of mean PCB congener remaining after 48 h of incubation with Delor 103 (Figure 4.6). Among these, WAY2 was highly effective against 14 congeners, resulting in less than 50% of mean PCB congeners remaining after treatment. These include the chlorobiphenyls (CB) PCB congeners 2-, 3- and 4-CB, the di-chlorobiphenyls (DCB) congeners 2,2’- / 2,6-, 2,5- / 2,4-, 2,3- / 2,4'-, 2,3'- and 4,4'-DCB and the tri-chlorobiphenyls (TCB) 2,2',5-, 2,4',6-, 2,2',4-, 2,3',4'-, 2,3',5- / 2,3',4- and 2,4,4'- / 2,4',5-TCB PCB congeners (Figure 4.6).
The strikingly similar congener specificity of WAY2 and RHA1 could be due to the high sequence homology of the etb gene cluster, which has been shown in RHA1 that has a predominant role in the degradation of highly chlorinated PCBs, preferably ortho-substituted, than the bph gene cluster (Iwasaki et al., 2006). Compared to JAB1, WAY2 perform better in all the PCB congeners tested (Figure 4.6). This could be due to the three independent genetic systems (bph, etb and nah) that are putatively involved in the degradation of PCBs, although further analysis to test the implications of each system in the degradation of specific congeners should be properly addressed. Although there are 23 PCB congeners for which WAY2 has shown to be active and with similar spectrum than RHA1, is important to notice that RHA1 can effectively degrade 54 PCB congeners (Seto et al., 1995), suggesting that the etb gene cluster is only partially responsible or specific to certain congeners degradation. Furthermore, WAY2 performed better than RHA1 and LB400 in the 4,4’-DCB and LB400 in the case of 3,4,4’-TCB and 2,4,4’,5-TeCB PCB congeners (Figure 4.6).

Genome sequence of Rhodococcus sp. WAY2 | Chapter IV
147
Figure 4.6 | PCB congeners remaining in resting cell assays after 48 h of incubation with Delor 103 PCB mixture. Degradation abilities of Rhodococcus sp. WAY2, R. jostii RHA1, P. xenovorans LB400 and P. alcaligenes JAB1 are shown compared with autoclaved controls. Mean values are represented in columns. Error bars indicate standard deviation out of three replicates.
Our results also show that WAY2 has a preference for ortho- and para-
substituted PCB congeners (Figure 4.7). All the congeners degraded by WAY2 (except 3-CB) contain chlorine atoms in ortho- and/or para- positions. This result is congruent with the etb gene cluster being responsible for the degradation of most PCB congeners as previously suggested (Iwasaki et al., 2006).

Chapter IV | Genome sequence of Rhodococcus sp. WAY2
148
Figure 4.7 | PCB congeners degraded by Rhodococcus sp. WAY2. Only congeners with more than 20% of degradation in resting cell assays are considered. Different colored boxes indicate monochlorinated biphenyls (grey), dichlorinated biphenyls (yellow), trichlorinated biphenyls (orange) and tetrachlorinated biphenyls (violet). PCB congener name and percentage of degradation is indicated under each congener. Different colors of chlorine substitutions are indicated for those PCB congeners within the same retention times in GC-MS.
Genome sequence of Rhodococcus sp. WAY2 | Chapter IV
149
Additionally, the bphA1a gene of WAY2, identical to the R04 strain (Table 4.4), could be responsible for the degradation of specific congeners, such as 3-CB, 4,4’-DCB and 2,4’,5-TCB as previously reported (Yang et al., 2004), although these are probably redundant substrates for the different bph/etb/nah clusters in WAY2.
Environmental adaption Members of the Rhodococcus genus are known to accumulate diverse storage compounds, including glycogen, polyphosphate, triacylglycerols (TAG), and polyhydroxyalkanoates (PHA) which could be related to environmental adaptions to fluctuating nutritional states and metabolic balance (Alvarez et al., 1996; Alvarez et al., 2000; Alvarez et al., 2008; Hernandez et al., 2008). Genes for the biosynthesis and degradation of glycogen (glgXBEPUCA and pgm), polyphosphate metabolism (ppk and ppx) and wax ester synthase/acyl-CoA:diacylglucerol acyltransferase (WS/DGAT, aft gene) involved in TAG metabolism are also present in the WAY2 chromosome (Supplementary Table 4.S7). Unlike in RHA1, none of these genes are found within the WAY2 mega-plasmids. Furthermore, WAY2 possesses half of aft genes (seven) compared to RHA1 (Hernandez et al., 2008). Interestingly, although the chromosome of WAY2 contains five putative PHA synthases (phaC), no PHA depolymerase is found, raising questions whether WAY2 is able to use PHA as a storage compound.
On the other hand, lithoautotrophy has been previously described in several Rhodococcus, and the genes involving the production of energy and carbon intermediates from inorganic H2, CO and CO2 have been uncovered (Aragno, 1992; Grzeszik et al., 1997a; Grzeszik et al., 1997b; Alvarez, 2010). The chromosome of WAY2 contains two clusters of genes encoding putative NiFe hydrogenase systems (hypABDC+hyaAB and hypDCEF) suggesting that WAY2 could be able to oxidize H2 to obtain energy. Additionally, two major gene clusters for carbon monoxide utilization (coxMLSED and coxEGDFLSMI) are encoded in the WAY2 chromosome, while four carbonic anhydrases are present in the chromosome and one in the pRWAY03 mega-plasmid (Supplementary Table 4.S7). All these data suggest that Rhodococcus sp. WAY2 is adapted to nutritional starvation during environmental changes by using auxiliary mechanisms for energy production and carbon utilization and storage.

Chapter IV | Genome sequence of Rhodococcus sp. WAY2
150
In addition to nutritional stress adaption, the genome of Rhodococcus sp. WAY2 contains multiple cold shock proteins, including six CspA and a CspC (Supplementary Table 4.S7) involved in the correct folding of proteins that have been linked to the ability of other rhodococci to grow at subzero temperatures (Goordial et al., 2016). Furthermore, compatible osmolytes, such as glycine betaine, choline, ectoine and trehalose play an important role at low temperatures by avoiding ice formation and by helping to resist the osmotic pressures of subzero temperatures (Mader et al., 2006; Chin et al., 2010). The chromosome of WAY2 contains multiple glycine betaine and choline transporters (proP and betT) and the betaine, ectoine and trehalose biosynthetic genes (betAB, ectABC and tresSZY respectively, Supplementary Table 4.S7). These genes are found predominantly in the WAY2 chromosome and could explain its ability to grow at 5ºC.
Genetic islands and heavy metal resistance Genetic islands (GIs) are a common feature in bacterial genomes and are involved in genome evolution by providing novel genes that are often related to antimicrobial and heavy metal resistance (Hsiao et al., 2005; Navarro et al., 2013; Pagano et al., 2016) or acquisition of entire metabolic pathways (Miyazaki et al., 2015). The genome of WAY2 was screened using the IslandPath-DIMOB and SIGI-HMM sequence composition-based prediction methods to identify GIs. WAY2 contains a total of 30 GIs, most of which are found within its chromosome (16), ranging from 4 to 43 Kbp in length, while the linear replicon pRWAY01 contains 8 GIs ranging from 5 to 21 Kbp, pRWAY02 contains 2 GIs around 7 Kbp each, and pRWAY03 contains 4 GIs, ranging from 5 to 8 Kbp (Table 4.5, Supplementary Table 4.S8). No GI was found in the small circular plasmid pRWAY04. The length of these GIs per replicon represents the 4.4% of the chromosome length and the 11.6%, 3% and 6.9% of the linear replicon’s lengths, respectively. Most of the genes included within these GIs do not have a predicted function or are poorly characterized. However, certain GIs present in all replicons contains clusters of genes involved in resistance to heavy metals and metalloids. For instance, the cluster of genes arsCBR involved in arsenate reduction is found in a chromosome GI, while a multicopper oxidase (mco), the copper resistance protein CopC, and a mercuric ion reductase (merA) are present in pRWAY01 GIs (Supplementary Table 4.S8). One of the GIs of the pRWAY02 replicon also contains the tellurium resistance protein TerD, and a GI of the pRWAY03 contains a copper chaperone (copZ), the copper-translocating P-type ATPase

Genome sequence of Rhodococcus sp. WAY2 | Chapter IV
151
(copA) and the repressor CsoR of the copZA operon. Furthermore, the linear replicons of WAY2 contain multiple of these and other heavy metal resistance systems that are not associated with the predicted GIs. The presence of heavy metal resistance mechanisms, along with the WAY2 ability to degrade several chain-length alkanes and PAHs, could be of use in bioremediation of hydrocarbon-polluted environments in which heavy metals are also frequently present (Pulles et al., 2012).
Table 4.5 | Genetic islands (GIs) present in the genome of Rhodococcus sp. WAY2.
Replicon GIs no. Total size (bp) Size range (Kbp) % replicon size Genes Chromosome 16 289,487 4.1 – 43.2 4.4 267 pRWAY01 8 115,699 5.1 – 35.8 11.6 133 pRWAY02 2 13,883 6.9 – 7 3 17 pRWAY03 4 24,573 5 - 8 6.9 33 See Supplementary Table 4.S8 for extended information.
The results show that a small fraction of novel genes for resistance of metal and metalloid toxicity could have been acquired by horizontal gene transfer, being found within GIs. However, the fact that none of the catabolic pathways for the degradation of aromatic and alkanes described above are found in GIs and that multiple metal and metalloid resistance proteins are also outside GIs, is congruent with the hyper-recombinant mechanism described in Rhodococcus genomes to acquire novel catabolic pathways (Larkin et al., 2005; 2010) that do not fall into GIs prediction.
Conclusions Rhodococcus sp. WAY2 possess a multipartite genome in which there is a division of functions encoded in its chromosome and those present in the extrachromosomal replicons. While the chromosome harbors core cellular functions and central metabolic pathways, the linear replicons provide the machinery for the biodegradation of multiple aromatic compounds. The wide range of aromatic organic compounds WAY2 is able to degrade is explained by the presence of five distinct genetic clusters. These clusters also explain the powerful degradation of PCBs congeners observed in the resting cell assay. In addition, WAY2 is able to grow with different chain-length alkanes as sole carbon source and harbors different heavy metals resistance mechanisms, some of which are found within GIs. This make this strain particularly suited for bioremediation
Chapter IV | Genome sequence of Rhodococcus sp. WAY2
152
of fuel-polluted soils where PAHs and alkanes are the main constituents, combined with heavy metals and metalloids pollution. Furthermore, adaption strategies to nutritional starvation by using storage compounds and putative lithoautotrophic mechanisms, along with cold shock proteins and compatible osmolytes found predominantly in the chromosome of Rhodococcus sp. WAY2, show that this strain is adapted to a wide range of environmental conditions. The phylogenetic and phylogenomic analyses of Rhodococcus sp. WAY2 also provided insights into what is likely a new species of this genus. An in-depth characterization of the features that makes this strain different to any other named Rhodococcus species is still required and will provide further information about its suitability to be applied in environmental technologies.
Supplementary material The supplementary material of this chapter is included in the Appendix II section. It is also available in the electronic version of the thesis. Files too large to be displayed or in a non-text supported format, are only included in the electronic version. Supplementary File 4.S1 | Analysis of the Rhodococcus sp. WAY2 plasmids.
Supplementary File 4.S2 | Analysis of the invertron-type telomeric nucleotide sequences of Rhodococcus sp. WAY2 linear mega-plasmids and identification of Terminal Inverted Repeats (RITs).
Supplementary File 4.S3 | Whole genome-based taxonomic analysis of Rhodococcus sp. WAY2 using the Type (Strain) Genome Server (TYGS).
Supplementary Table 4.S1 | Rhodococcus type strains 16S rRNA genes used in this study
Supplementary Table 4.S2 | Genomes of Rhodococcus type strains used in this study.
Supplementary Table 4.S3 | Genes involved in core cellular functions of Rhodococcus sp. WAY2.
Supplementary Table 4.S4 | GGDC comparisons of Rhodococcus type strains sequenced genomes.
Supplementary Table 4.S5 | Genes involved in the central metabolism of Rhodococcus sp. WAY2.

Genome sequence of Rhodococcus sp. WAY2 | Chapter IV
153
Supplementary Table 4.S6 | Genes involved in peripheral metabolism of Rhodococcus sp. WAY2.
Supplementary Table 4.S7 | Genes involved in stress response found in Rhodococcus sp. WAY2.
Supplementary Table 4.S8 | Genetic islands (GIs) identified in Rhodococcus sp. WAY2.
References Adnani, N., Braun, D.R., Mcdonald, B.R., Chevrette, M.G., Currie, C.R., and Bugni, T.S.
(2016). Complete genome sequence of Rhodococcus sp. strain WMMA185, a marine sponge-associated bacterium. Genome Announc 4.
Alizadeh-Sani, M., Hamishehkar, H., Khezerlou, A., Azizi-Lalabadi, M., Azadi, Y., Nattagh-Eshtivani, E., Fasihi, M., Ghavami, A., Aynehchi, A., and Ehsani, A. (2018). Bioemulsifiers Derived from Microorganisms: Applications in the Drug and Food Industry. Advanced pharmaceutical bulletin 8, 191.
Alvarez, A.F., Alvarez, H.M., Kalscheuer, R., Waltermann, M., and Steinbuchel, A. (2008). Cloning and characterization of a gene involved in triacylglycerol biosynthesis and identification of additional homologous genes in the oleaginous bacterium Rhodococcus opacus PD630. Microbiology 154, 2327-2335.
Alvarez, H.M. (2010). "Central metabolism of species of the genus Rhodococcus" in Biology of Rhodococcus. Springer, 91-108.
Alvarez, H.M., Kalscheuer, R., and Steinbuchel, A. (2000). Accumulation and mobilization of storage lipids by Rhodococcus opacus PD630 and Rhodococcus ruber NCIMB 40126. Appl Microbiol Biotechnol 54, 218-223.
Alvarez, H.M., Luftmann, H., Silva, R.A., Cesari, A.C., Viale, A., Waltermann, M., and Steinbuchel, A. (2002). Identification of phenyldecanoic acid as a constituent of triacylglycerols and wax ester produced by Rhodococcus opacus PD630. Microbiology 148, 1407-1412.
Alvarez, H.M., Mayer, F., Fabritius, D., and Steinbüchel, A. (1996). Formation of intracytoplasmic lipid inclusions by Rhodococcus opacus strain PD630. Archives of microbiology 165, 377-386.
Aragno, M. (1992). "Thermophilic, aerobic, hydrogen-oxidizing (Knallgas) bacteria" in The prokaryotes. Springer, 3917-3933.
Bankevich, A., Nurk, S., Antipov, D., Gurevich, A.A., Dvorkin, M., Kulikov, A.S., Lesin, V.M., Nikolenko, S.I., Pham, S., Prjibelski, A.D., Pyshkin, A.V., Sirotkin, A.V., Vyahhi, N., Tesler, G., Alekseyev, M.A., and Pevzner, P.A. (2012). SPAdes: a new genome assembly algorithm and its applications to single-cell sequencing. J Comput Biol 19, 455-477.
Bao, K., and Cohen, S.N. (2003). Recruitment of terminal protein to the ends of Streptomyces linear plasmids and chromosomes by a novel telomere-binding protein essential for linear DNA replication. Genes Dev 17, 774-785.
Bedard, D.L., Unterman, R., Bopp, L.H., Brennan, M.J., Haberl, M.L., and Johnson, C. (1986). Rapid assay for screening and characterizing microorganisms for the

Chapter IV | Genome sequence of Rhodococcus sp. WAY2
154
ability to degrade polychlorinated biphenyls. Appl Environ Microbiol 51, 761-768.
Behki, R., Topp, E., Dick, W., and Germon, P. (1993). Metabolism of the herbicide atrazine by Rhodococcus strains. Appl. Environ. Microbiol. 59, 1955-1959.
Bertelli, C., and Brinkman, F.S.L. (2018). Improved genomic island predictions with IslandPath-DIMOB. Bioinformatics 34, 2161-2167.
Bertelli, C., Laird, M.R., Williams, K.P., Simon Fraser University Research Computing, Group, Lau, B.Y., Hoad, G., Winsor, G.L., and Brinkman, F.S.L. (2017). IslandViewer 4: expanded prediction of genomic islands for larger-scale datasets. Nucleic Acids Res 45, W30-W35.
Bihari, Z., Szvetnik, A., Szabó, Z., Blastyák, A., Zombori, Z., Balázs, M., and Kiss, I. (2011). Functional analysis of long-chain n-alkane degradation by Dietzia spp. FEMS microbiology letters 316, 100-107.
Bolger, A.M., Lohse, M., and Usadel, B. (2014). Trimmomatic: a flexible trimmer for Illumina sequence data. Bioinformatics 30, 2114-2120.
Brazil, G.M., Kenefick, L., Callanan, M., Haro, A., De Lorenzo, V., Dowling, D.N., and O'gara, F. (1995). Construction of a rhizosphere pseudomonad with potential to degrade polychlorinated biphenyls and detection of bph gene expression in the rhizosphere. Appl Environ Microbiol 61, 1946-1952.
Camacho, C., Coulouris, G., Avagyan, V., Ma, N., Papadopoulos, J., Bealer, K., and Madden, T.L. (2009). BLAST+: architecture and applications. BMC Bioinformatics 10, 421.
Carver, T., Thomson, N., Bleasby, A., Berriman, M., and Parkhill, J. (2009). DNAPlotter: circular and linear interactive genome visualization. Bioinformatics 25, 119-120.
Castresana, J. (2000). Selection of conserved blocks from multiple alignments for their use in phylogenetic analysis. Mol Biol Evol 17, 540-552.
Cavalca, L., Colombo, M., Larcher, S., Gigliotti, C., Collina, E., and Andreoni, V. (2002). Survival and naphthalene‐degrading activity of Rhodococcus sp. strain 1BN in soil microcosms. Journal of applied microbiology 92, 1058-1065.
Cornelis, K., Ritsema, T., Nijsse, J., Holsters, M., Goethals, K., and Jaziri, M. (2001). The plant pathogen Rhodococcus fascians colonizes the exterior and interior of the aerial parts of plants. Molecular plant-microbe interactions 14, 599-608.
Cros, M.J., De Monte, A., Mariette, J., Bardou, P., Grenier-Boley, B., Gautheret, D., Touzet, H., and Gaspin, C. (2011). RNAspace.org: An integrated environment for the prediction, annotation, and analysis of ncRNA. RNA 17, 1947-1956.
Chan, S.I., Chen, K.H.C., Yu, S.S.F., Chen, C.L., and Kuo, S.S.J. (2004). Toward delineating the structure and function of the particulate methane monooxygenase from methanotrophic bacteria. Biochemistry 43, 4421-4430.
Chen, C.W., Huang, C.H., Lee, H.H., Tsai, H.H., and Kirby, R. (2002). Once the circle has been broken: dynamics and evolution of Streptomyces chromosomes. TRENDS in Genetics 18, 522-529.
Cheng, P., Shan, R., Yuan, H.-R., Deng, L.F., and Chen, Y. (2018). Enhanced Rhodococcus pyridinivorans HR-1 anode performance by adding trehalose lipid in microbial fuel cell. Bioresource technology 267, 774-777.
Chin, J.P., Megaw, J., Magill, C.L., Nowotarski, K., Williams, J.P., Bhaganna, P., Linton, M., Patterson, M.F., Underwood, G.J., and Mswaka, A.Y. (2010). Solutes determine the temperature windows for microbial survival and growth. Proceedings of the National Academy of Sciences 107, 7835-7840.

Genome sequence of Rhodococcus sp. WAY2 | Chapter IV
155
De Carvalho, C.C., Da Cruz, A.A., Pons, M.N., Pinheiro, H.M., Cabral, J.M., Da Fonseca, M.M., Ferreira, B.S., and Fernandes, P. (2004). Mycobacterium sp., Rhodococcus erythropolis, and Pseudomonas putida behavior in the presence of organic solvents. Microsc Res Tech 64, 215-222.
De Carvalho, C.C., and Da Fonseca, M.M.R. (2005). Degradation of hydrocarbons and alcohols at different temperatures and salinities by Rhodococcus erythropolis DCL14. FEMS microbiology ecology 51, 389-399.
De Carvalho, C.C., Parreño-Marchante, B., Neumann, G., Da Fonseca, M.M.R., and Heipieper, H.J. (2005). Adaptation of Rhodococcus erythropolis DCL14 to growth on n-alkanes, alcohols and terpenes. Applied microbiology and biotechnology 67, 383-388.
Dicenzo, G.C., and Finan, T.M. (2017). The Divided Bacterial Genome: Structure, Function, and Evolution. Microbiol Mol Biol Rev 81.
Dicenzo, G.C., Mengoni, A., and Perrin, E. (2019). Chromids Aid Genome Expansion and Functional Diversification in the Family Burkholderiaceae. Mol Biol Evol 36, 562-574.
Edgar, R.C. (2004). MUSCLE: multiple sequence alignment with high accuracy and high throughput. Nucleic Acids Res 32, 1792-1797.
Foght, J., and Westlake, D. (1988). Degradation of polycyclic aromatic hydrocarbons and aromatic heterocycles by a Pseudomonas species. Canadian journal of microbiology 34, 1135-1141.
Furukawa, K., Suenaga, H., and Goto, M. (2004). Biphenyl dioxygenases: functional versatilities and directed evolution. J Bacteriol 186, 5189-5196.
Ghosh, A., Paul, D., Prakash, D., Mayilraj, S., and Jain, R.K. (2006). Rhodococcus imtechensis sp. nov., a nitrophenol-degrading actinomycete. Int J Syst Evol Microbiol 56, 1965-1969.
Goordial, J., Raymond-Bouchard, I., Ronholm, J., Shapiro, N., Woyke, T., Whyte, L., and Bakermans, C. (2015). Improved-high-quality draft genome sequence of Rhodococcus sp. JG-3, a eurypsychrophilic Actinobacteria from Antarctic Dry Valley permafrost. Stand Genomic Sci 10, 61.
Goordial, J., Raymond-Bouchard, I., Zolotarov, Y., De Bethencourt, L., Ronholm, J., Shapiro, N., Woyke, T., Stromvik, M., Greer, C.W., and Bakermans, C. (2016). Cold adaptive traits revealed by comparative genomic analysis of the eurypsychrophile Rhodococcus sp. JG3 isolated from high elevation McMurdo Dry Valley permafrost, Antarctica. FEMS microbiology ecology 92.
Grzeszik, C., Lubbers, M., Reh, M., and Schlegel, H.G. (1997a). Genes encoding the NAD-reducing hydrogenase of Rhodococcus opacus MR11. Microbiology 143 ( Pt 4), 1271-1286.
Grzeszik, C., Ross, K., Schneider, K., Reh, M., and Schlegel, H.G. (1997b). Location, catalytic activity, and subunit composition of NAD-reducing hydrogenases of some Alcaligenes strains and Rhodococcus opacus MR22. Arch Microbiol 167, 172-176.
Hernández, M.A., Comba, S., Arabolaza, A., Gramajo, H., and Alvarez, H.M. (2015). Overexpression of a phosphatidic acid phosphatase type 2 leads to an increase in triacylglycerol production in oleaginous Rhodococcus strains. Applied microbiology and biotechnology 99, 2191-2207.
Hernandez, M.A., Mohn, W.W., Martinez, E., Rost, E., Alvarez, A.F., and Alvarez, H.M. (2008). Biosynthesis of storage compounds by Rhodococcus jostii RHA1 and

Chapter IV | Genome sequence of Rhodococcus sp. WAY2
156
global identification of genes involved in their metabolism. BMC Genomics 9, 600.
Hsiao, W.W., Ung, K., Aeschliman, D., Bryan, J., Finlay, B.B., and Brinkman, F.S. (2005). Evidence of a large novel gene pool associated with prokaryotic genomic islands. PLoS Genet 1, e62.
Huerta-Cepas, J., Forslund, K., Coelho, L.P., Szklarczyk, D., Jensen, L.J., Von Mering, C., and Bork, P. (2017). Fast Genome-Wide Functional Annotation through Orthology Assignment by eggNOG-Mapper. Mol Biol Evol 34, 2115-2122.
Ivshina, I., Vikhareva, E., Richkova, M., Mukhutdinova, A., and Karpenko, J.N. (2012). Biodegradation of drotaverine hydrochloride by free and immobilized cells of Rhodococcus rhodochrous IEGM 608. World Journal of Microbiology and Biotechnology 28, 2997-3006.
Iwasaki, T., Miyauchi, K., Masai, E., and Fukuda, M. (2006). Multiple-subunit genes of the aromatic-ring-hydroxylating dioxygenase play an active role in biphenyl and polychlorinated biphenyl degradation in Rhodococcus sp. strain RHA1. Appl Environ Microbiol 72, 5396-5402.
Iwasaki, T., Takeda, H., Miyauchi, K., Yamada, T., Masai, E., and Fukuda, M. (2007). Characterization of two biphenyl dioxygenases for biphenyl/PCB degradation in a PCB degrader, Rhodococcus sp. strain RHA1. Biosci Biotechnol Biochem 71, 993-1002.
Ji, Y., Mao, G., Wang, Y., and Bartlam, M. (2013). Structural insights into diversity and n-alkane biodegradation mechanisms of alkane hydroxylases. Frontiers in microbiology 4, 58.
Jiménez, N., Viñas, M., Bayona, J.M., Albaiges, J., and Solanas, A.M. (2007). The Prestige oil spill: bacterial community dynamics during a field biostimulation assay. Applied Microbiology and Biotechnology 77, 935-945.
Kalkus, J., Menne, R., Reh, M., and Schlegel, H.G. (1998). The terminal structures of linear plasmids from Rhodococcus opacus. Microbiology 144 ( Pt 5), 1271-1279.
Kampfer, P., Dott, W., Martin, K., and Glaeser, S.P. (2014). Rhodococcus defluvii sp. nov., isolated from wastewater of a bioreactor and formal proposal to reclassify [Corynebacterium hoagii] and Rhodococcus equi as Rhodococcus hoagii comb. nov. Int J Syst Evol Microbiol 64, 755-761.
Kästner, M., Breuer-Jammali, M., and Mahro, B. (1994). Enumeration and characterization of the soil microflora from hydrocarbon-contaminated soil sites able to mineralize polycyclic aromatic hydrocarbons (PAH). Applied Microbiology and Biotechnology 41, 267-273.
Kim, D., Chae, J.C., Zylstra, G.J., Kim, Y.S., Kim, S.K., Nam, M.H., Kim, Y.M., and Kim, E. (2004). Identification of a novel dioxygenase involved in metabolism of o-xylene, toluene, and ethylbenzene by Rhodococcus sp. strain DK17. Appl Environ Microbiol 70, 7086-7092.
Kim, J.D., and Lee, C.G. (2007). Microbial degradation of polycyclic aromatic hydrocarbons in soil by bacterium-fungus co-cultures. Biotechnology and Bioprocess Engineering 12, 410-416.
Kimura, N., Kitagawa, W., Mori, T., Nakashima, N., Tamura, T., and Kamagata, Y. (2006). Genetic and biochemical characterization of the dioxygenase involved in lateral dioxygenation of dibenzofuran from Rhodococcus opacus strain SAO101. Appl Microbiol Biotechnol 73, 474-484.
Genome sequence of Rhodococcus sp. WAY2 | Chapter IV
157
Kitova, A., Kuvichkina, T., Arinbasarova, A.Y., and Reshetilov, A. (2004). Degradation of 2, 4-dinitrophenol by free and immobilized cells of Rhodococcus erythropolis HL PM-1. Applied Biochemistry and Microbiology 40, 258-261.
Klatte, S., Kroppenstedt, R.M., and Rainey, F.A. (1994). Rhodococcus opacus sp. nov., an unusual nutritionally versatile Rhodococcus-species. Systematic and Applied Microbiology 17, 355-360.
Koberl, M., Muller, H., Ramadan, E.M., and Berg, G. (2011). Desert farming benefits from microbial potential in arid soils and promotes diversity and plant health. PLoS One 6, e24452.
Kolkenbrock, S., Naumann, B., Hippler, M., and Fetzner, S. (2010). A novel replicative enzyme encoded by the linear Arthrobacter plasmid pAL1. J Bacteriol 192, 4935-4943.
Koren, S., Walenz, B.P., Berlin, K., Miller, J.R., Bergman, N.H., and Phillippy, A.M. (2017). Canu: scalable and accurate long-read assembly via adaptive k-mer weighting and repeat separation. Genome Res 27, 722-736.
Kreft, L., Botzki, A., Coppens, F., Vandepoele, K., and Van Bel, M. (2017). PhyD3: a phylogenetic tree viewer with extended phyloXML support for functional genomics data visualization. Bioinformatics 33, 2946-2947.
Krivoruchko, A., Kuyukina, M., and Ivshina, I. (2019). Advanced Rhodococcus biocatalysts for environmental biotechnologies. Catalysts 9, 236.
Kumar, S., Stecher, G., and Tamura, K. (2016). MEGA7: Molecular Evolutionary Genetics Analysis Version 7.0 for Bigger Datasets. Mol Biol Evol 33, 1870-1874.
Lagesen, K., Hallin, P., Rodland, E.A., Staerfeldt, H.H., Rognes, T., and Ussery, D.W. (2007). RNAmmer: consistent and rapid annotation of ribosomal RNA genes. Nucleic Acids Res 35, 3100-3108.
Larkin, M.J., Kulakov, L.A., and Allen, C.C. (2005). Biodegradation and Rhodococcus–masters of catabolic versatility. Current opinion in Biotechnology 16, 282-290.
Larkin, M.J., Kulakov, L.A., and Allen, C.C. (2010). "Genomes and plasmids in Rhodococcus" in Biology of Rhodococcus. Springer, 73-90.
Le, S.Q., and Gascuel, O. (2008). An improved general amino acid replacement matrix. Mol Biol Evol 25, 1307-1320.
Lefort, V., Desper, R., and Gascuel, O. (2015). FastME 2.0: A Comprehensive, Accurate, and Fast Distance-Based Phylogeny Inference Program. Mol Biol Evol 32, 2798-2800.
Liu, Y., Lai, Q., Göker, M., Meier-Kolthoff, J.P., Wang, M., Sun, Y., Wang, L., and Shao, Z. (2015). Genomic insights into the taxonomic status of the Bacillus cereus group. Sci Rep 5, 14082.
Luz, A.P., Pellizari, V.H., Whyte, L.G., and Greer, C.W. (2004). A survey of indigenous microbial hydrocarbon degradation genes in soils from Antarctica and Brazil. Can J Microbiol 50, 323-333.
Mader, H.M., Pettitt, M.E., Wadham, J.L., Wolff, E.W., and Parkes, R.J. (2006). Subsurface ice as a microbial habitat. Geology 34, 169-172.
Mcleod, M.P., Warren, R.L., Hsiao, W.W., Araki, N., Myhre, M., Fernandes, C., Miyazawa, D., Wong, W., Lillquist, A.L., Wang, D., Dosanjh, M., Hara, H., Petrescu, A., Morin, R.D., Yang, G., Stott, J.M., Schein, J.E., Shin, H., Smailus, D., Siddiqui, A.S., Marra, M.A., Jones, S.J., Holt, R., Brinkman, F.S., Miyauchi, K., Fukuda, M., Davies, J.E., Mohn, W.W., and Eltis, L.D. (2006). The complete

Chapter IV | Genome sequence of Rhodococcus sp. WAY2
158
genome of Rhodococcus sp. RHA1 provides insights into a catabolic powerhouse. Proc Natl Acad Sci U S A 103, 15582-15587.
Meier-Kolthoff, J.P., Auch, A.F., Klenk, H.P., and Göker, M. (2013). Genome sequence-based species delimitation with confidence intervals and improved distance functions. BMC Bioinformatics 14, 60.
Meier-Kolthoff, J.P., and Göker, M. (2019). TYGS is an automated high-throughput platform for state-of-the-art genome-based taxonomy. Nat Commun 10, 2182.
Miyazaki, R., Bertelli, C., Benaglio, P., Canton, J., De Coi, N., Gharib, W.H., Gjoksi, B., Goesmann, A., Greub, G., Harshman, K., Linke, B., Mikulic, J., Mueller, L., Nicolas, D., Robinson-Rechavi, M., Rivolta, C., Roggo, C., Roy, S., Sentchilo, V., Siebenthal, A.V., Falquet, L., and Van Der Meer, J.R. (2015). Comparative genome analysis of Pseudomonas knackmussii B13, the first bacterium known to degrade chloroaromatic compounds. Environ Microbiol 17, 91-104.
Navarro-Llorens, J.M., Patrauchan, M.A., Stewart, G.R., Davies, J.E., Eltis, L.D., and Mohn, W.W. (2005). Phenylacetate catabolism in Rhodococcus sp. strain RHA1: a central pathway for degradation of aromatic compounds. J Bacteriol 187, 4497-4504.
Navarro, C.A., Von Bernath, D., and Jerez, C.A. (2013). Heavy metal resistance strategies of acidophilic bacteria and their acquisition: importance for biomining and bioremediation. Biol Res 46, 363-371.
Overbeek, R., Olson, R., Pusch, G.D., Olsen, G.J., Davis, J.J., Disz, T., Edwards, R.A., Gerdes, S., Parrello, B., Shukla, M., Vonstein, V., Wattam, A.R., Xia, F., and Stevens, R. (2014). The SEED and the Rapid Annotation of microbial genomes using Subsystems Technology (RAST). Nucleic Acids Res 42, D206-214.
Pagano, M., Martins, A.F., and Barth, A.L. (2016). Mobile genetic elements related to carbapenem resistance in Acinetobacter baumannii. Braz J Microbiol 47, 785-792.
Patrauchan, M.A., Florizone, C., Eapen, S., Gomez-Gil, L., Sethuraman, B., Fukuda, M., Davies, J., Mohn, W.W., and Eltis, L.D. (2008). Roles of ring-hydroxylating dioxygenases in styrene and benzene catabolism in Rhodococcus jostii RHA1. J Bacteriol 190, 37-47.
Pattengale, N.D., Alipour, M., Bininda-Emonds, O.R., Moret, B.M., and Stamatakis, A. (2010). How many bootstrap replicates are necessary? Journal of computational biology 17, 337-354.
Peters, F., Heintz, D., Johannes, J., Van Dorsselaer, A., and Boll, M. (2007). Genes, enzymes, and regulation of para-cresol metabolism in Geobacter metallireducens. J Bacteriol 189, 4729-4738.
Prescott, J.F. (1991). Rhodococcus equi: an animal and human pathogen. Clinical microbiology reviews 4, 20-34.
Pulles, T., Van Der Gon, H.D., Appelman, W., and Verheul, M. (2012). Emission factors for heavy metals from diesel and petrol used in European vehicles. Atmospheric Environment 61, 641-651.
Resnick, S., Lee, K., and Gibson, D. (1996). Diverse reactions catalyzed by naphthalene dioxygenase from Pseudomonas sp strain NCIB 9816. Journal of industrial microbiology 17, 438-457.
Ridl, J., Suman, J., Fraraccio, S., Hradilova, M., Strejcek, M., Cajthaml, T., Zubrova, A., Macek, T., Strnad, H., and Uhlik, O. (2018). Complete genome sequence of
Genome sequence of Rhodococcus sp. WAY2 | Chapter IV
159
Pseudomonas alcaliphila JAB1 (=DSM 26533), a versatile degrader of organic pollutants. Stand Genomic Sci 13, 3.
Röttig, A., Hauschild, P., Madkour, M.H., Al-Ansari, A.M., Almakishah, N.H., and Steinbüchel, A. (2016). Analysis and optimization of triacylglycerol synthesis in novel oleaginous Rhodococcus and Streptomyces strains isolated from desert soil. Journal of biotechnology 225, 48-56.
Ruberto, L.A., Vazquez, S., Lobalbo, A., and Mac Cormack, W. (2005). Psychrotolerant hydrocarbon-degrading Rhodococcus strains isolated from polluted Antarctic soils. Antarctic Science 17, 47-56.
Selifonov, S., Slepen'kin, A., Adanin, V., Nefedova, M., and Starovoĭtov, I. (1991). Oxidation of dibenzofuran by Pseudomonas strains harboring plasmids of naphthalene degradation. Mikrobiologiia 60, 67-71.
Seto, M., Kimbara, K., Shimura, M., Hatta, T., Fukuda, M., and Yano, K. (1995). A Novel Transformation of Polychlorinated Biphenyls by Rhodococcus sp. Strain RHA1. Appl Environ Microbiol 61, 3353-3358.
Sharma, S., and Pant, A. (2001). Crude oil degradation by a marine actinomycete Rhodococcus sp. Indian J Mar Sci 30, 146-150.
Shimizu, S., Kobayashi, H., Masai, E., and Fukuda, M. (2001). Characterization of the 450-kb linear plasmid in a polychlorinated biphenyl degrader, Rhodococcus sp. strain RHA1. Appl Environ Microbiol 67, 2021-2028.
Sievers, F., Wilm, A., Dineen, D., Gibson, T.J., Karplus, K., Li, W., Lopez, R., Mcwilliam, H., Remmert, M., Soding, J., Thompson, J.D., and Higgins, D.G. (2011). Fast, scalable generation of high-quality protein multiple sequence alignments using Clustal Omega. Mol Syst Biol 7, 539.
Song, X., Xu, Y., Li, G., Zhang, Y., Huang, T., and Hu, Z. (2011). Isolation, characterization of Rhodococcus sp. P14 capable of degrading high-molecular-weight polycyclic aromatic hydrocarbons and aliphatic hydrocarbons. Marine pollution bulletin 62, 2122-2128.
Stamatakis, A. (2014). RAxML version 8: a tool for phylogenetic analysis and post-analysis of large phylogenies. Bioinformatics 30, 1312-1313.
Taguchi, K., Motoyama, M., Iida, T., and Kudo, T. (2007). Polychlorinated biphenyl/biphenyl degrading gene clusters in Rhodococcus sp. K37, HA99, and TA431 are different from well-known bph gene clusters of Rhodococci. Biosci Biotechnol Biochem 71, 1136-1144.
Tavaré, S. (1986). Some probabilistic and statistical problems in the analysis of DNA sequences. Lectures on mathematics in the life sciences 17, 57-86.
Thakur, N., Kumar, V., Sharma, N.K., Thakur, S., and Bhalla, T.C. (2016). Aliphatic amidase of Rhodococcus rhodochrous PA-34: purification, characterization and application in synthesis of acrylic acid. Protein and peptide letters 23, 152-158.
Undabarrena, A., Salvà-Serra, F., Jaén-Luchoro, D., Castro-Nallar, E., Mendez, K., Valencia, R., Ugalde, J., Moore, E., Seeger, M., and Cámara, B. (2018). Complete genome sequence of the marine Rhodococcus sp. H-CA8f isolated from Comau fjord in Northern Patagonia, Chile. Marine Genomics 40, 13-17.
Van Beilen, J.B., Wubbolts, M.G., and Witholt, B. (1994). Genetics of alkane oxidation by Pseudomonas oleovorans. Biodegradation 5, 161-174.
Waack, S., Keller, O., Asper, R., Brodag, T., Damm, C., Fricke, W.F., Surovcik, K., Meinicke, P., and Merkl, R. (2006). Score-based prediction of genomic islands

Chapter IV | Genome sequence of Rhodococcus sp. WAY2
160
in prokaryotic genomes using hidden Markov models. BMC Bioinformatics 7, 142.
Warren, R., Hsiao, W.W., Kudo, H., Myhre, M., Dosanjh, M., Petrescu, A., Kobayashi, H., Shimizu, S., Miyauchi, K., Masai, E., Yang, G., Stott, J.M., Schein, J.E., Shin, H., Khattra, J., Smailus, D., Butterfield, Y.S., Siddiqui, A., Holt, R., Marra, M.A., Jones, S.J., Mohn, W.W., Brinkman, F.S., Fukuda, M., Davies, J., and Eltis, L.D. (2004). Functional characterization of a catabolic plasmid from polychlorinated- biphenyl-degrading Rhodococcus sp. strain RHA1. J Bacteriol 186, 7783-7795.
Yamaichi, Y., and Niki, H. (2000). Active segregation by the Bacillus subtilis partitioning system in Escherichia coli. Proc Natl Acad Sci U S A 97, 14656-14661.
Yang, X., Sun, Y., and Qian, S. (2004). Biodegradation of seven polychlorinated biphenyls by a newly isolated aerobic bacterium (Rhodococcus sp. R04). Journal of Industrial Microbiology and Biotechnology 31, 415-420.
Yassin, A. (2005). Rhodococcus triatomae sp. nov., isolated from a blood-sucking bug. International journal of systematic and evolutionary microbiology 55, 1575-1579.
Yen, K.M., Karl, M.R., Blatt, L.M., Simon, M.J., Winter, R.B., Fausset, P.R., Lu, H.S., Harcourt, A.A., and Chen, K.K. (1991). Cloning and characterization of a Pseudomonas mendocina KR1 gene cluster encoding toluene-4-monooxygenase. J Bacteriol 173, 5315-5327.
Zampolli, J., Collina, E., Lasagni, M., and Di Gennaro, P. (2014). Biodegradation of variable-chain-length n-alkanes in Rhodococcus opacus R7 and the involvement of an alkane hydroxylase system in the metabolism. AMB Express 4, 73.
Zhang, R., Yang, Y., Fang, P., Jiang, C., Xu, L., Zhu, Y., Shen, M., Xia, H., Zhao, J., Chen, T., and Qin, Z. (2006). Diversity of telomere palindromic sequences and replication genes among Streptomyces linear plasmids. Appl Environ Microbiol 72, 5728-5733.

161
Chapter V
Comparative genomics of the Rhodococcus genus and distribution of biodegradation traits
Comparative genomics of Rhodococcus | Chapter V
163
Chapter V Comparative genomics of the Rhodococcus genus and distribution of biodegradation traits __________________
Abstract The genus Rhodococcus exhibits great potential for bioremediation applications due to its huge metabolic diversity, including biotransformation of aromatic and aliphatic compounds. Comparative genomic studies of this genus are limited to a small number of genomes, while the high number of sequenced strains could provide more information about the Rhodococcus diversity. Using the genome-to-genome blast distance phylogeny (GBDP) algorithm we compared 327 Rhodococcus genomes. Further clustering of intergenomic distances and digital DNA-DNA hybridization (dDDH) values identified 42 phylogenomic groups (PGs) and 83 species clusters. Rarefaction models show that these numbers are likely to increase as new Rhodococcus strains are sequenced. A small “hard” core genome of the Rhodococcus genus consisting of 381 orthologous groups (OGs) has been identified, while a “soft” core genome representing 99.16% of the sequenced Rhodococcus strains consists of 1,253 OGs. Models of sequentially randomly added genomes show that a small number of genomes are enough to explain most of the shared diversity of the Rhodococcus strains, while the “open” pangenome and specific genome evidence that the diversity of the genus will increase as new genomes still add more OGs to the whole genomic set. Finally, the distribution of traits involved in aromatic and aliphatic compounds degradation shows that although most of the Rhodococcus genomes could putatively degrade both, short-chain alkane degradation seems to be restricted to a certain number of groups, among which, a specific particulate methane monooxygenase (pMMO) is specific of Rhodococcus sp. strain WAY2.

Chapter V | Comparative genomics of Rhodococcus
164
Introduction Rhodococcus is a gram-positive genus within the Actinobacteria class that is ubiquitously distributed in the environment. Strains from this genus have been isolated from a variety of habitats, including soils, oceans and fresh waters (Helmke and Weyland, 1984; Margesin et al., 2003; Ryu et al., 2006), and from the guts of insects or living in association with sea sponges (Yassin, 2005; Adnani et al., 2016). Some species are known pathogens, including R. hoagii (formerly R. equi), which causes zoonotic infections in grazing animals (Prescott, 1991; Giguère et al., 2011), and R. fascians, the causing agent of leafy gall disease in plants (Cornelis et al., 2001; Goethals et al., 2001). In addition, multiple Rhodococcus species are known to degrade diverse organic compounds, including polychlorinated biphenyls (PCBs), polycyclic aromatic hydrocarbons (PAHs) and aliphatic hydrocarbons (De Carvalho et al., 2005; Iwasaki et al., 2007; Song et al., 2011), making this genus a very promising tool for bioremediation purposes. The diverse number of niches that rhodococci are able to inhabit and their extensive catabolic potential is thought to be a consequence of their large genomes and the presence of multiple extrachromosomal elements that add genes to the general content (McLeod et al., 2006).
The taxonomy of the Rhodococcus genus is constantly growing due to the frequent description of novel species (Silva et al., 2018; Lee et al., 2019; Wang et al., 2019), which adds more complexity to the frequent reassignments and merge of species (Kämpfer et al., 2014). Examples of the inconsistency in the classification can be found in the report of an illegitimate genus name of Rhodococcus Zopf 1981 which postdates the homonym algal genus Rhodococcus Hansgirg 1884 (Tindall, 2014a), and the proposed reclassification of Rhodococcus equi to the genus Prescottia (Jones et al., 2013). However, the formal reclassification of R. equi into the species Rhodococcus hoagii (Kämpfer et al., 2014) has further complicated this question, which awaits formal consideration (Sangal et al., 2019). Until these issues are resolved, Rhodococcus hoagii is still valid (Tindall, 2014b) and also the genus Rhodococcus Zopf 1981, which currently includes 66 validly named species according to the List of Prokaryotic names with Standing in Nomenclature6 (accessed in July 2019).
6 http://www.bacterio.net/

Comparative genomics of Rhodococcus | Chapter V
165
Phylogenies of the Rhodococcus genus based on multilocus sequence analysis (MLSA) using the housekeeping genes 16S rRNA, secY, rpoC and rpsA (Orro et al., 2015) or several universal protein sequences (Sangal et al., 2019) have been used to address the phyletic relationship within strains from this genus and to identify a varying number of groups of species (Anastasi et al., 2016; Sangal et al., 2019), providing more reliability than phylogenies based on the 16S rRNA gene (Gürtler et al., 2004; Creason et al., 2014). However, the number of sequenced rhodococci allows the use of whole-genome comparisons for a better understanding of their relatedness and divergence. In this sense, average nucleotide identity (ANI) has been used to identify seven clades within 59 Rhodococcus isolates (Creason et al., 2014), although in other proteobacterial genera, including Pseudomonas and Bradyrhizobium, the GBDP (genome-to-genome blast distance phylogeny) algorithm (Meier-Kolthoff et al., 2013) has proven to be more reliable than ANI for stablishing species and phylogenomic groups boundaries (Garrido-Sanz et al., 2016; Garrido-Sanz et al., 2019). Comparative genomics have also been performed to assess the functional diversity of several rhodococcal groups (Orro et al., 2015; Anastasi et al., 2016). However, these analyses are scarce and limited to a few genome comparisons, which do not represent the entire diversity of the genus. Therefore, a global comparison of Rhodococcus strains is needed to better understand the differences in their lifestyles and catabolic potential and to further acknowledge their diversity.
Among the different members of the Rhodococcus genus, Rhodococcus sp. WAY2 was isolated from a biphenyl-degrading bacterial consortium (Chapter II) and its complete genome sequence and further characterization revealed that it is able to use various aromatic compounds and different chain-length alkanes as sole carbon and energy source and also to cometabolize 23 PCB congeners and oxidize several other aromatic compounds (Chapter IV). Initial comparative genomics with type strains of the Rhodococcus genus, showed that it might constitute a novel species (Chapter IV). Although multiple Rhodococcus strains have showed remarkable biodegradation capabilities (McLeod et al., 2006; Song et al., 2011), the distribution of these traits among the Rhodococcus genus remains unexplored.
In this work, we report a global comparative genomic study of the Rhodococcus genus using more than 300 sequenced strains. By means of phylogenomics, digital DNA-DNA hybridization (dDDH) and the determination of clusters of orthologous groups (OGs), we explore its diversity and the specific

Chapter V | Comparative genomics of Rhodococcus
166
genome fractions of the phylogenomic groups (PGs) identified within. Finally, we analyze the distribution of certain traits found in Rhodococcus sp. WAY2 relevant for the biodegradation of aromatic and aliphatic compounds in the PGs of Rhodococcus to characterize the extent of these capabilities.
Materials and Methods Dataset All sequenced Rhodococcus genomes, proteomes and annotations were downloaded from the RefSeq (GeneBank when RefSeq not available) NCBI ftp server 7 in June 2019. Duplicated type strain genomes from different culture collections were removed based on the number of contigs, removing those with a higher number, likely underrepresenting the strain genome, resulting in a total of 327 genomes listed in Supplementary Table 5.S1.
Phylogenomic analysis The 327 Rhodococcus genomes were compared using the Genome-to-genome Blast Distance Phylogeny (GBDP) algorithm (Meier-Kolthoff et al., 2013) via the Genome-to-genome Distance Calculator (GGDC) web service8. The resulting sets of intergenomic distances (Supplementary Table 5.S2) were converted into a matrix and imported into MEGA X software (Kumar et al., 2018) to build a Neighbor-Joining (NJ) phylogenomic tree. Nocardia brasiliensis ATCC 700358 was used as outgroup. In addition, GBDP was also used to calculate the digital DNA-DNA hybridization (dDDH) values among all genome pair-wise comparisons.
Clustering of Rhodococcus genomes Clustering of GBDP intergenomic distances from the Rhodococcus genus at species level (70% dDDH) and into phylogenomic groups was examined using the OPTSIL clustering software, version 1.5 (Göker et al., 2009). An average-linkage clustering (i.e. F = 0.5) was chosen, as previously proposed (Meier-Kolthoff et al., 2014; Garrido-Sanz et al., 2016) and clustering threshold (T) values from 0 to 0.2, using a step size of 0.0005 were evaluated. The best T for both
7 ftp://ftp.ncbi.nlm.nih.gov/ 8 http://ggdc.dsmz.de/ggdc.php
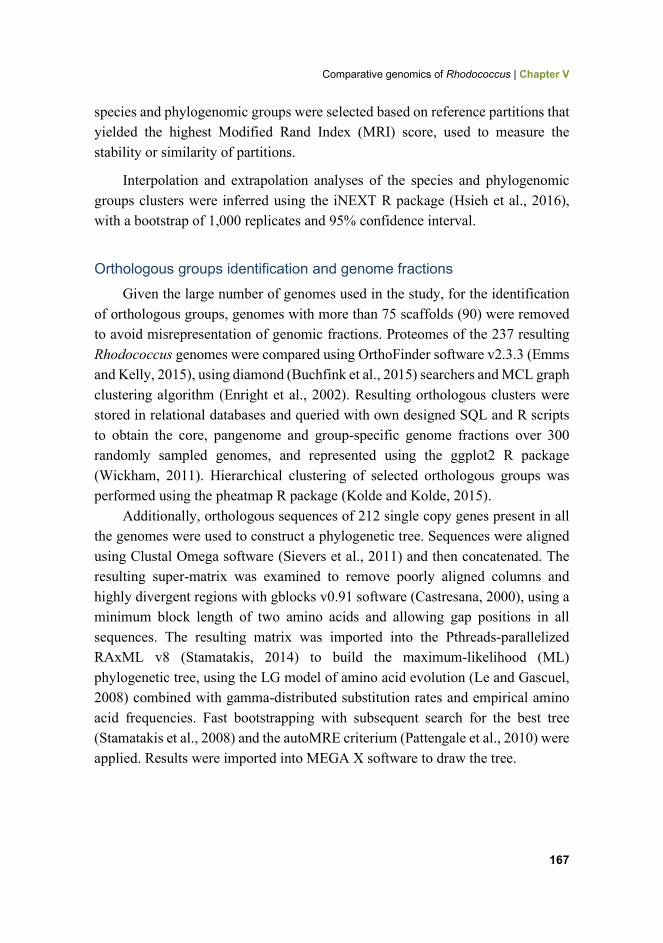
Comparative genomics of Rhodococcus | Chapter V
167
species and phylogenomic groups were selected based on reference partitions that yielded the highest Modified Rand Index (MRI) score, used to measure the stability or similarity of partitions.
Interpolation and extrapolation analyses of the species and phylogenomic groups clusters were inferred using the iNEXT R package (Hsieh et al., 2016), with a bootstrap of 1,000 replicates and 95% confidence interval.
Orthologous groups identification and genome fractions
Given the large number of genomes used in the study, for the identification of orthologous groups, genomes with more than 75 scaffolds (90) were removed to avoid misrepresentation of genomic fractions. Proteomes of the 237 resulting Rhodococcus genomes were compared using OrthoFinder software v2.3.3 (Emms and Kelly, 2015), using diamond (Buchfink et al., 2015) searchers and MCL graph clustering algorithm (Enright et al., 2002). Resulting orthologous clusters were stored in relational databases and queried with own designed SQL and R scripts to obtain the core, pangenome and group-specific genome fractions over 300 randomly sampled genomes, and represented using the ggplot2 R package (Wickham, 2011). Hierarchical clustering of selected orthologous groups was performed using the pheatmap R package (Kolde and Kolde, 2015).
Additionally, orthologous sequences of 212 single copy genes present in all the genomes were used to construct a phylogenetic tree. Sequences were aligned using Clustal Omega software (Sievers et al., 2011) and then concatenated. The resulting super-matrix was examined to remove poorly aligned columns and highly divergent regions with gblocks v0.91 software (Castresana, 2000), using a minimum block length of two amino acids and allowing gap positions in all sequences. The resulting matrix was imported into the Pthreads-parallelized RAxML v8 (Stamatakis, 2014) to build the maximum-likelihood (ML) phylogenetic tree, using the LG model of amino acid evolution (Le and Gascuel, 2008) combined with gamma-distributed substitution rates and empirical amino acid frequencies. Fast bootstrapping with subsequent search for the best tree (Stamatakis et al., 2008) and the autoMRE criterium (Pattengale et al., 2010) were applied. Results were imported into MEGA X software to draw the tree.

Chapter V | Comparative genomics of Rhodococcus
168
Results and discussion Phylogenomic analysis and clustering of the Rhodococcus genus The phylogenomic GBDP-based analysis of 327 Rhodococcus genomes and further clustering of the intergenomic distances (Supplementary Table 5.S1) revealed the presence of 42 phylogenomic groups (PGs) and 83 species-level clusters (Figure 5.1). The 42 PGs are in total agreement with the reference partition according to the Modified Rand Index (MRI = 1) using a distance threshold T between 0.1395 and 0.143, which correspond to a 29.8% and 30.5% dDDH, respectively. This result is similar to the threshold identified for phylogroups clustering in other proteobacterial genera (Garrido-Sanz et al., 2016; Garrido-Sanz et al., 2019). These 42 PGs contains 22 single-genome clusters, some of which are composed by a type strain alone, and 20 others with more than one genome. Only 18 PGs contain type sequenced strain genomes and, according to the oldest species description, these are named R. fascians, (PG 2), R. kyotonensis (PG 7), R. yunnamensis (PG 8), R. corynebacterioides (PG 13), R. globerulus (PG 16), R. erythropolis (PG 18), R. marinonascens (PG 19), R. opacus (PG 22), R. rhodochrous (PG 23), R. coprophilus (PG 25), R. ruber (PG 26), R. triatomae (PG 28), R. maashanensis (PG 29), R. tukisamuensis (PG 30), R. defluvii (PG 36), R. agglutinans (PG 37), R. hoagii (PG 39), R. kunmingensis (PG 40) and R. rhodnii (PG 41, Figure 5.1). The genome of Rhodococcus sp. WAY2 is clustered with Rhodococcus sp. S2-17 and corresponds to the PG 21. Some of the PGs identified in this work are in agreement with a previous study conducted by Creason et al., 2014, which identified seven main clades within the Rhodococcus genus using 59 genomes based on whole-genome comparisons (Creason et al., 2014). Clade I corresponds with PG 1 (sub-clades ii, iii and iv) and PG 2-R. fascians (sub-clade i), and clade II corresponds with PG 12. These two clades were phylogenetically close, as is the case of the PG 1 to PG 12 in our analyses, which share an ancestral node. Clades III, IV, V, VI and VII identified by Creason et al., 2014 correspond with PG 18-R. erythropolis (clade III), PG 22-R. opacus (clade IV), PGs 39, 40 and 41 (R. hoagii, R. kunmingensis and R. rhodnii, all included in clade V), PG 26-R. ruber (clade VI) and PG 23-R. rhodochrous (clade VII), respectively. The remaining PGs identified in our analysis are probably missing from the previous study due to their smaller dataset. However, the fact that both analyses found the same phylogenomic groups supports their status.

Comparative genomics of Rhodococcus | Chapter V
169
Figure 5.1 | GBDP-based phylogeny of 327 Rhodococcus genomes (A) and data matrixes (B) from PG 42 (upper) to PG 1 (lower). Neighbor-joining tree was built using the GBDP intergenomic distances. Nocardia brasiliensis ATCC 700358 was used as outgroup. Clusters at the species level (inner circle) or phylogenomic groups (PGs, outer circle) are defined by OPTSIL clustering of intergenomic distances. Colors according to phylogenomic groups. Blue, bold and T indicate type strain. Rhodococcus sp. WAY2 is highlighted in yellow and red typing.

Chapter V | Comparative genomics of Rhodococcus
170
On the other hand, we identified 83 species-level clusters within the 327 Rhodococcus genomes (Figure 5.1). These clusters were stablished with the conventional threshold of 70% dDDH, which corresponds to a distance of 0.0361 between genomes. The clustering result is in total agreement with the reference partition (MRI = 1). Thirty of these clusters contain sequenced type strains genomes, while the remaining 53, either correspond with previously not sequenced type strains or are novel species, which should be properly validated according with standards in nomenclature. Surprisingly, several genomes of type strain species clustered together, achieving dDDH% values higher than the 70%. These include R. imtechensis RKJ300T and R. opacus ATCCC 51882T (80.2% dDDH, 77.3-82.9% confidence interval and 90.77% probability of same species) and R. biphenylivorans TG9T and R. pyridinivorans DSM 44555T (88.3% dDDH, 85.9-90.4% confidence interval and 95.2% probability of same species), whose species status should be properly revised. In addition, Rhodococcus sp. WAY2 achieved a 70.2% dDDH with Rhodococcus sp. S2-17, with a 67.2-73% confidence interval and a 78.63% probability of same species.
In order to investigate whether the diversity of PGs and species found within the Rhodococcus sequenced genomes had achieved its maximum representation, we conducted rarefaction analyses. The results are shown in Figure 5.2. In both cases, curves are far from reaching an asymptote with 327 genomes sampled, and extrapolation analysis up to 1,000 genomes still shows an increment in the number of clusters, which will probably grow to the hundreds in the case of species and above 50 in the case of PGs (Figure 5.2). This evidence that the diversity exhibited by the Rhodococcus genus will increase as long as new genomes are sequenced and is in agreement with the fact that most of the PGs are composed of only one genome.

Comparative genomics of Rhodococcus | Chapter V
171
Figure 5.2 | Interpolation/extrapolation rarefaction analysis of the clusters at species and phylogenomic groups levels.
Phylogeny based on single-copy proteins The comparison of 237 strains proteomes resulted in a total of 16,799 OGs. Among these orthologous groups, 212 appeared in all the genomes as single-copy amino acid sequences. These OGs were used to construct a ML phylogenetic tree shown in Figure 5.3, whose clustering pattern is consistent with a previous phylogenetic analysis also based in amino acid sequences (Sangal et al., 2019). The same PGs found in the GBDP-based phylogenomic analysis (Figure 5.1) are also identified with total bootstrap support using amino acid sequences, which validates the genome clustering reported here. Nonetheless, PGs 4, 28, 41 and 42, all composed of single strains, are distant and separated from their closest PGs compared to the GBDP-based tree, probably due to different evolutive pressure on the core fraction versus the whole genome content. In the case of PGs 41 and 42, composed of R. rhodnii NBRC 100604T and R. rhodochrous NCTC 630, respectively, the high distance in the single-copy amino acid tree is also observed at the genomic level, being the most early-diverging groups within the Rhodococcus genus (Figure 5.1). In addition, PG 41 and PG 28 (R. rhodnii NBRC 100604T and R. triatomae DSM 44892T, respectively) are clustered together in the amino acid-based phylogeny, which agrees with a previous report (Sangal et al., 2019).
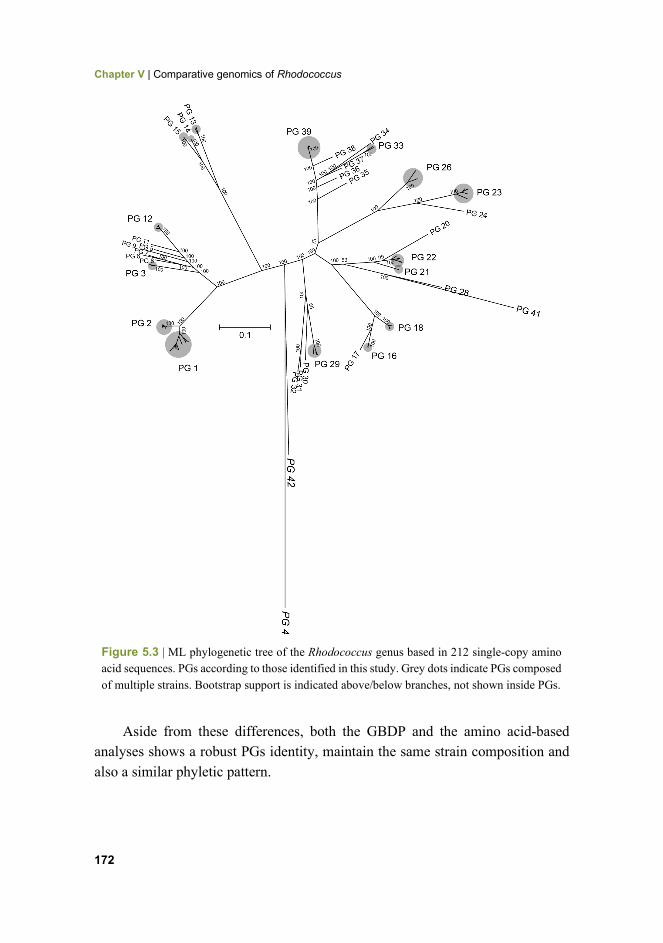
Chapter V | Comparative genomics of Rhodococcus
172
Figure 5.3 | ML phylogenetic tree of the Rhodococcus genus based in 212 single-copy amino acid sequences. PGs according to those identified in this study. Grey dots indicate PGs composed of multiple strains. Bootstrap support is indicated above/below branches, not shown inside PGs.
Aside from these differences, both the GBDP and the amino acid-based analyses shows a robust PGs identity, maintain the same strain composition and also a similar phyletic pattern.

Comparative genomics of Rhodococcus | Chapter V
173
Genome fractions of the Rhodococcus genus The orthologous groups (OGs) identified by the comparative analysis were used to identify the core genome, the pangenome and the strain-specific genome fractions. The core genome of the Rhodococcus genus, which consists in those OGs where all genomes are represented (“hard” core), is composed of 381 OGs (Figure 5.4A). However, given the number of genomes included in the study, a “soft core” were a high percentage of genomes are represented, rather than the 100%, is probably more accurate. Considering a presence in at least 99.16% of the genomes, we obtain a soft core of 1,253 OGs that shift to 1,493 OGs when fixing the threshold to 98.73% of genomes (Figure 5.4A).
Figure 5.4 | Genome fractions of the Rhodococcus genus. (A) Core genome, (B) strain-specific and (C) pangenome analysis representing mean values (line) and standard deviation (shadow) over 300 replicates of randomly sampled 237 genomes.
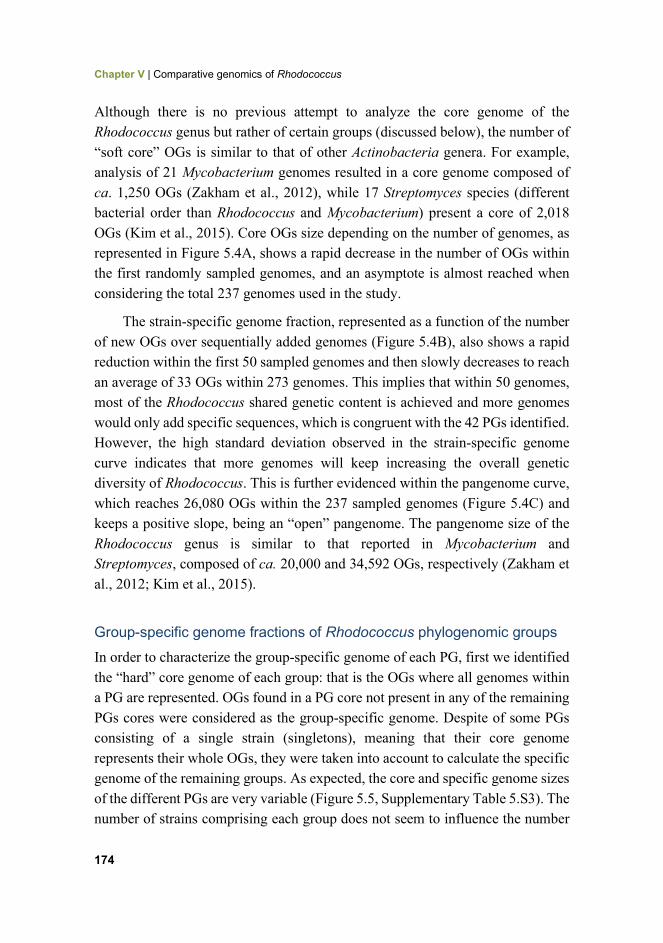
Chapter V | Comparative genomics of Rhodococcus
174
Although there is no previous attempt to analyze the core genome of the Rhodococcus genus but rather of certain groups (discussed below), the number of “soft core” OGs is similar to that of other Actinobacteria genera. For example, analysis of 21 Mycobacterium genomes resulted in a core genome composed of ca. 1,250 OGs (Zakham et al., 2012), while 17 Streptomyces species (different bacterial order than Rhodococcus and Mycobacterium) present a core of 2,018 OGs (Kim et al., 2015). Core OGs size depending on the number of genomes, as represented in Figure 5.4A, shows a rapid decrease in the number of OGs within the first randomly sampled genomes, and an asymptote is almost reached when considering the total 237 genomes used in the study.
The strain-specific genome fraction, represented as a function of the number of new OGs over sequentially added genomes (Figure 5.4B), also shows a rapid reduction within the first 50 sampled genomes and then slowly decreases to reach an average of 33 OGs within 273 genomes. This implies that within 50 genomes, most of the Rhodococcus shared genetic content is achieved and more genomes would only add specific sequences, which is congruent with the 42 PGs identified. However, the high standard deviation observed in the strain-specific genome curve indicates that more genomes will keep increasing the overall genetic diversity of Rhodococcus. This is further evidenced within the pangenome curve, which reaches 26,080 OGs within the 237 sampled genomes (Figure 5.4C) and keeps a positive slope, being an “open” pangenome. The pangenome size of the Rhodococcus genus is similar to that reported in Mycobacterium and Streptomyces, composed of ca. 20,000 and 34,592 OGs, respectively (Zakham et al., 2012; Kim et al., 2015).
Group-specific genome fractions of Rhodococcus phylogenomic groups In order to characterize the group-specific genome of each PG, first we identified the “hard” core genome of each group: that is the OGs where all genomes within a PG are represented. OGs found in a PG core not present in any of the remaining PGs cores were considered as the group-specific genome. Despite of some PGs consisting of a single strain (singletons), meaning that their core genome represents their whole OGs, they were taken into account to calculate the specific genome of the remaining groups. As expected, the core and specific genome sizes of the different PGs are very variable (Figure 5.5, Supplementary Table 5.S3). The number of strains comprising each group does not seem to influence the number

Comparative genomics of Rhodococcus | Chapter V
175
of specific OGs. For instance, PG 18 and PG 33, composed of 26 and 2 genomes respectively, have similar core genomes of 2,614 and 2,779 OGs, respectively, which are the smallest core genomes found within the Rhodococcus PGs. A similar behavior is observed with the specific genome. Although the larger groups (i.e. PGs 1, 2, 12 and 39) present the smallest specific genomes (Figure 5.5), similar specific genome size is also found in PG comprising a small number of genomes (i.e. PGs 13 and 14). This finding might be related with the in-group diversity and size of genomes.
Figure 5.5 | Specific genome and core genome of each of the PGs identified in this study. Genomic fractions not determined (n.d.) for PGs composed by genomes with more than 75 contigs.
Among the phylogenomic groups, PG 39-R. hoagii, composed of 33
genomes, contains a core of 3,354 OGs, which is similar to that reported in a previous study of 29 R. hoagii (formerly R. equi) strains, composed of 3,858 OGs (Anastasi et al., 2016). On the other hand, PG 22-R. opacus is composed of 13 genomes with a core of 3,699 OGs. A previous study identified a core of 4,222 OGs with only three genomes belonging to this group, although three additional genomes of PGs 23 and 26 lowered the core genome to 644 OGs (Orro et al., 2015), which resembles that of the Rhodococcus genus reported here.

Chapter V | Comparative genomics of Rhodococcus
176
Distribution of PAHs and alkane degradation OGs Rhodococcus strains have the ability of degrading multiple organic compounds, including PAHs, dioxin and dioxin-like compounds and different chain-length n-alkanes (De Carvalho et al., 2005; Iwasaki et al., 2007; Song et al., 2011). Degradation of aromatic compounds is commonly carried out by dioxygenase systems, including those involved in biphenyl/PCBs, ethylbenzene and naphthalene degradation (bph, etb and nah gene clusters) which present a wide range of substrate specificity and have been reported in multiple Rhodococcus strains (Resnick et al., 1996; Kimura et al., 2006; Iwasaki et al., 2007; Patrauchan et al., 2008). Rhodococcus genomes can simultaneously possess several of these systems (McLeod et al., 2006). Among them, Rhodococcus sp. WAY2 contains 5 different clusters putatively involved in the degradation of many aromatic compounds and a tmo gene cluster putatively involved in toluene detoxification (Chapter IV). The OGs which include the genes of these clusters where searched to address their distribution within the Rhodococcus genus and are shown in Figure 5.6A. Alpha subunits of these dioxygenases (BphA1a, EtbA1a, EtbA1b and NahA1) are widely distributed within the genus PGs. However, they are missing from PGs 3, 20, 28, 33 and 34 and partially present in PGs 12, 13 and 18. Additionally, another copy of the BphA1 of WAY2 (BphA1b) present a different distribution, being present in all groups except PGs 29, 30, 31, 34,35, 36, 38 and 39. Interestingly, the beta subunits of these dioxygenases are scarce among Rhodococcus PGs and only BphA2b is found within most of the groups not containing the remaining beta subunits OGs (Figure 5.6A), which could be related with an exchange of subunits reported among these clusters (Iwasaki et al., 2006). These results indicate that all PGs within the Rhodococcus genus, except PG 34, could putatively degrade aromatic compounds. The cooccurrence of two systems also seems a common trait within the Rhodococcus PGs. In addition, the tmo gene cluster involved in the conversion of toluene to p-cresol (Yen et al., 1991) has a more limited distribution, being only present in PGs 42 and 21 and partially present in PGs 16 and 22 (Figure 5.6A).
Aliphatic compounds, on the other hand, can be degraded by several different pathways (Ji et al., 2013). The first step is a monooxygenation catalyzed by soluble or particulate methane monooxygenases (sMMO or pMMO, respectively) for short chain n-alkanes (Elliott et al., 1997; Smith and Dalton, 2004), or alkane monooxygenases (AlkB) and long-chain alkane monooxygenases (LadA) for
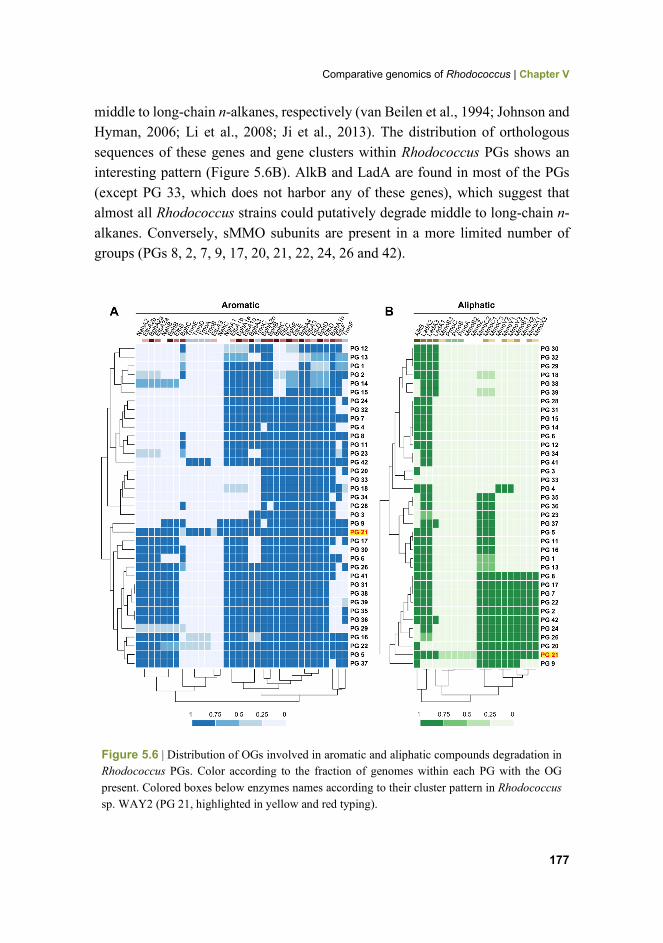
Comparative genomics of Rhodococcus | Chapter V
177
middle to long-chain n-alkanes, respectively (van Beilen et al., 1994; Johnson and Hyman, 2006; Li et al., 2008; Ji et al., 2013). The distribution of orthologous sequences of these genes and gene clusters within Rhodococcus PGs shows an interesting pattern (Figure 5.6B). AlkB and LadA are found in most of the PGs (except PG 33, which does not harbor any of these genes), which suggest that almost all Rhodococcus strains could putatively degrade middle to long-chain n-alkanes. Conversely, sMMO subunits are present in a more limited number of groups (PGs 8, 2, 7, 9, 17, 20, 21, 22, 24, 26 and 42).
Figure 5.6 | Distribution of OGs involved in aromatic and aliphatic compounds degradation in Rhodococcus PGs. Color according to the fraction of genomes within each PG with the OG present. Colored boxes below enzymes names according to their cluster pattern in Rhodococcus sp. WAY2 (PG 21, highlighted in yellow and red typing).
Chapter V | Comparative genomics of Rhodococcus
178
Interestingly mmoC, which encodes the iron-sulfur component of sMMO (Stainthorpe et al., 1990), is found in other groups that do not contain the remaining sMMO subunits (Figure 5.6B), which could be due to similar homology to other iron-sulfur electron transfer systems. Surprisingly, the pMMO system reported in Rhodococcus sp. WAY2 (Chapter IV) is not found in any other PG or genome within the Rhodococcus genus, being a unique and distinctive feature of WAY2 (Figure 5.6B). It has been reported that pMMO has a narrow substrate specificity, oxidizing n-alkanes up to C5, preferentially at the C2 position (Chan et al., 2004) and it has been found in several putative aerobic methanotrophic bacteria (Tavormina et al., 2010). The absence of this cluster in other rhodococci could imply a horizontal transfer event and a novel catabolic acquisition that distinguish this strain from any other Rhodococcus, although further analyses are required to prove this hypothesis and tests its functionality in Rhodococcus sp. WAY2.
Nonetheless, although in this study only the distribution of the main traits reported in Rhodococcus sp. WAY2 have been explored, other traits not found in WAY2 could also show a distinctive pattern among the rest of PGs in the genus, which require further analysis.
Conclusions The diversity of the Rhodococcus genus is reflected in the 42 phylogenomic groups (PGs) and 83 species clusters that are identified within more than 300 sequenced genomes. The number of PGs and species are likely to increase with the sequencing of more strains. In fact, the here presented Rhodococcus sp. strain WAY2, represents a novel PG. Comparative genomic analysis shows a high degree of genetic diversity reflected in a small core genome of 831 orthologous groups (OGs) and a large open pangenome of 26,080 PGs. Further identification of a variable group’s core and specific genome sizes are congruent with this diversity. Finally, the distribution of biodegradative traits among Rhodococcus PGs shows that although many of the Rhodococcus strains could potentially catabolize aromatic and aliphatic compounds, short-chain n-alkanes biodegradation is limited to a certain number of groups, and specialized metabolism of these alkanes is present in Rhodococcus sp. WAY2.

Comparative genomics of Rhodococcus | Chapter V
179
Supplementary material The supplementary material of this chapter is included in the Appendix II section. It is also available in the electronic version of the thesis. Files too large to be displayed or in a non-text supported format, are only included in the electronic version. Supplementary Table 5.S1 | List of Rhodococcus genomes used in this study.
Supplementary Table 5.S2 | GGDC intergenomic distances of the reciprocal Rhodococcus genomes comparisons.
Supplementary Table 5.S3 | Specific genomic fractions of the Rhodococcus PGs identified in this study.
References Adnani, N., Braun, D.R., Mcdonald, B.R., Chevrette, M.G., Currie, C.R., and Bugni, T.S.
(2016). Complete genome sequence of Rhodococcus sp. strain WMMA185, a marine sponge-associated bacterium. Genome Announc. 4, e01406-01416.
Anastasi, E., Macarthur, I., Scortti, M., Alvarez, S., Giguère, S., and Vázquez-Boland, J.A. (2016). Pangenome and phylogenomic analysis of the pathogenic actinobacterium Rhodococcus equi. Genome biology and evolution 8, 3140-3148.
Buchfink, B., Xie, C., and Huson, D.H. (2015). Fast and sensitive protein alignment using DIAMOND. Nature methods 12, 59.
Castresana, J. (2000). Selection of conserved blocks from multiple alignments for their use in phylogenetic analysis. Molecular biology and evolution 17, 540-552.
Cornelis, K., Ritsema, T., Nijsse, J., Holsters, M., Goethals, K., and Jaziri, M. (2001). The plant pathogen Rhodococcus fascians colonizes the exterior and interior of the aerial parts of plants. Molecular plant-microbe interactions 14, 599-608.
Creason, A.L., Davis, E.W., Putnam, M.L., Vandeputte, O.M., and Chang, J.H. (2014). Use of whole genome sequences to develop a molecular phylogenetic framework for Rhodococcus fascians and the Rhodococcus genus. Frontiers in plant science 5, 406.
Chan, S.I., Chen, K.H.-C., Yu, S.S.-F., Chen, C.-L., and Kuo, S.S.-J. (2004). Toward delineating the structure and function of the particulate methane monooxygenase from methanotrophic bacteria. Biochemistry 43, 4421-4430.
De Carvalho, C.C., Parreño-Marchante, B., Neumann, G., Da Fonseca, M.M.R., and Heipieper, H.J. (2005). Adaptation of Rhodococcus erythropolis DCL14 to growth on n-alkanes, alcohols and terpenes. Applied microbiology and biotechnology 67, 383-388.
Elliott, S.J., Zhu, M., Tso, L., Nguyen, H.H.T., Yip, J.H.K., and Chan, S.I. (1997). Regio-and stereoselectivity of particulate methane monooxygenase from Methylococcus capsulatus (Bath). Journal of the American Chemical Society 119, 9949-9955.

Chapter V | Comparative genomics of Rhodococcus
180
Emms, D.M., and Kelly, S. (2015). OrthoFinder: solving fundamental biases in whole genome comparisons dramatically improves orthogroup inference accuracy. Genome biology 16, 157.
Enright, A.J., Van Dongen, S., and Ouzounis, C.A. (2002). An efficient algorithm for large-scale detection of protein families. Nucleic acids research 30, 1575-1584.
Garrido-Sanz, D., Meier-Kolthoff, J.P., Göker, M., Martin, M., Rivilla, R., and Redondo-Nieto, M. (2016). Genomic and genetic diversity within the Pseudomonas fluorescens complex. PLoS One 11, e0150183.
Garrido-Sanz, D., Redondo-Nieto, M., Mongiardini, E., Blanco-Romero, E., Durán, D., Quelas, J.I., Martin, M., Rivilla, R., Lodeiro, A.R., and Althabegoiti, M.J. (2019). Phylogenomic analyses of Bradyrhizobium reveal uneven distribution of the lateral and subpolar flagellar systems, which extends to Rhizobiales. Microorganisms 7, 50.
Giguère, S., Cohen, N., Keith Chaffin, M., Hines, S., Hondalus, M., Prescott, J., and Slovis, N. (2011). Rhodococcus equi: Clinical Manifestations, Virulence, and Immunity. Journal of veterinary internal medicine 25, 1221-1230.
Goethals, K., Vereecke, D., Jaziri, M., Van Montagu, M., and Holsters, M. (2001). Leafy gall formation by Rhodococcus fascians. Annual review of phytopathology 39, 27-52.
Göker, M., García-Blázquez, G., Voglmayr, H., Tellería, M.T., and Martín, M.P. (2009). Molecular taxonomy of phytopathogenic fungi: a case study in Peronospora. PloS one 4, e6319.
Gürtler, V., Mayall, B.C., and Seviour, R. (2004). Can whole genome analysis refine the taxonomy of the genus Rhodococcus? FEMS microbiology reviews 28, 377-403.
Helmke, E., and Weyland, H. (1984). Rhodococcus marinonascens sp. nov., an actinomycete from the sea. International Journal of Systematic and Evolutionary Microbiology 34, 127-138.
Hsieh, T.C., Ma, K.H., and Chao, A. (2016). iNEXT: an R package for rarefaction and extrapolation of species diversity (Hill numbers). Methods in Ecology and Evolution 7, 1451–1456.
Iwasaki, T., Miyauchi, K., Masai, E., and Fukuda, M. (2006). Multiple-subunit genes of the aromatic-ring-hydroxylating dioxygenase play an active role in biphenyl and polychlorinated biphenyl degradation in Rhodococcus sp. strain RHA1. Appl Environ Microbiol 72, 5396-5402.
Iwasaki, T., Takeda, H., Miyauchi, K., Yamada, T., Masai, E., and Fukuda, M. (2007). Characterization of two biphenyl dioxygenases for biphenyl/PCB degradation in a PCB degrader, Rhodococcus sp. strain RHA1. Bioscience, biotechnology, and biochemistry 71, 993-1002.
Ji, Y., Mao, G., Wang, Y., and Bartlam, M. (2013). Structural insights into diversity and n-alkane biodegradation mechanisms of alkane hydroxylases. Frontiers in microbiology 4, 58.
Johnson, E.L., and Hyman, M.R. (2006). Propane and n-butane oxidation by Pseudomonas putida GPo1. Appl. Environ. Microbiol. 72, 950-952.
Jones, A., Sutcliffe, I., and Goodfellow, M. (2013). Proposal to replace the illegitimate genus name Prescottia Jones et al. 2013 with the genus name Prescottella gen. nov. and to replace the illegitimate combination Prescottia equi Jones et al. 2013 with Prescottella equi comb. nov. Antonie van Leeuwenhoek 103, 1405-1407.

Comparative genomics of Rhodococcus | Chapter V
181
Kämpfer, P., Dott, W., Martin, K., and Glaeser, S.P. (2014). Rhodococcus defluvii sp. nov., isolated from wastewater of a bioreactor and formal proposal to reclassify [Corynebacterium hoagii] and Rhodococcus equi as Rhodococcus hoagii comb. nov. International journal of systematic and evolutionary microbiology 64, 755-761.
Kim, J.N., Kim, Y., Jeong, Y., Roe, J.H., Kim, B.G., and Cho, B.K. (2015). Comparative genomics reveals the core and accessory genomes of Streptomyces species. J Microbiol Biotechnol 25, 1599-1605.
Kimura, N., Kitagawa, W., Mori, T., Nakashima, N., Tamura, T., and Kamagata, Y. (2006). Genetic and biochemical characterization of the dioxygenase involved in lateral dioxygenation of dibenzofuran from Rhodococcus opacus strain SAO101. Appl Microbiol Biotechnol 73, 474-484.
Kolde, R., and Kolde, M.R. (2015). Package ‘pheatmap’. R Package 1. Kumar, S., Stecher, G., Li, M., Knyaz, C., and Tamura, K. (2018). MEGA X: molecular
evolutionary genetics analysis across computing platforms. Molecular biology and evolution 35, 1547-1549.
Le, S.Q., and Gascuel, O. (2008). An improved general amino acid replacement matrix. Molecular biology and evolution 25, 1307-1320.
Lee, S.D., Kim, Y.J., and Kim, I.S. (2019). Rhodococcus subtropicus sp. nov., a new actinobacterium isolated from a cave. International journal of systematic and evolutionary microbiology.
Li, L., Liu, X., Yang, W., Xu, F., Wang, W., Feng, L., Bartlam, M., Wang, L., and Rao, Z. (2008). Crystal structure of long-chain alkane monooxygenase (LadA) in complex with coenzyme FMN: unveiling the long-chain alkane hydroxylase. Journal of molecular biology 376, 453-465.
Margesin, R., Labbe, D., Schinner, F., Greer, C., and Whyte, L. (2003). Characterization of hydrocarbon-degrading microbial populations in contaminated and pristine alpine soils. Appl. Environ. Microbiol. 69, 3085-3092.
Mcleod, M.P., Warren, R.L., Hsiao, W.W., Araki, N., Myhre, M., Fernandes, C., Miyazawa, D., Wong, W., Lillquist, A.L., and Wang, D. (2006). The complete genome of Rhodococcus sp. RHA1 provides insights into a catabolic powerhouse. Proceedings of the National Academy of Sciences 103, 15582-15587.
Meier-Kolthoff, J.P., Auch, A.F., Klenk, H.-P., and Göker, M. (2013). Genome sequence-based species delimitation with confidence intervals and improved distance functions. BMC bioinformatics 14, 60.
Meier-Kolthoff, J.P., Hahnke, R.L., Petersen, J., Scheuner, C., Michael, V., Fiebig, A., Rohde, C., Rohde, M., Fartmann, B., and Goodwin, L.A. (2014). Complete genome sequence of DSM 30083 T, the type strain (U5/41 T) of Escherichia coli, and a proposal for delineating subspecies in microbial taxonomy. Standards in genomic sciences 9, 2.
Orro, A., Cappelletti, M., D’ursi, P., Milanesi, L., Di Canito, A., Zampolli, J., Collina, E., Decorosi, F., Viti, C., and Fedi, S. (2015). Genome and phenotype microarray analyses of Rhodococcus sp. BCP1 and Rhodococcus opacus R7: genetic determinants and metabolic abilities with environmental relevance. PLoS One 10, e0139467.
Patrauchan, M.A., Florizone, C., Eapen, S., Gomez-Gil, L., Sethuraman, B., Fukuda, M., Davies, J., Mohn, W.W., and Eltis, L.D. (2008). Roles of ring-hydroxylating

Chapter V | Comparative genomics of Rhodococcus
182
dioxygenases in styrene and benzene catabolism in Rhodococcus jostii RHA1. J Bacteriol 190, 37-47.
Pattengale, N.D., Alipour, M., Bininda-Emonds, O.R., Moret, B.M., and Stamatakis, A. (2010). How many bootstrap replicates are necessary? Journal of computational biology 17, 337-354.
Prescott, J.F. (1991). Rhodococcus equi: an animal and human pathogen. Clinical microbiology reviews 4, 20-34.
Resnick, S., Lee, K., and Gibson, D. (1996). Diverse reactions catalyzed by naphthalene dioxygenase from Pseudomonas sp strain NCIB 9816. Journal of industrial microbiology 17, 438-457.
Ryu, H.W., Joo, Y.H., An, Y.J., and Cho, K.S. (2006). Isolation and characterization of psychrotrophic and halotolerant Rhodococcus sp. YHLT-2. Journal of microbiology and biotechnology 16, 605-612.
Sangal, V., Goodfellow, M., Jones, A.L., Seviour, R.J., and Sutcliffe, I.C. (2019). "Refined Systematics of the Genus Rhodococcus Based on Whole Genome Analyses" in Biology of Rhodococcus. Springer, 1-21.
Sievers, F., Wilm, A., Dineen, D., Gibson, T.J., Karplus, K., Li, W., Lopez, R., Mcwilliam, H., Remmert, M., and Söding, J. (2011). Fast, scalable generation of high‐quality protein multiple sequence alignments using Clustal Omega. Molecular systems biology 7.
Silva, L.J., Souza, D.T., Genuario, D.B., Hoyos, H.a.V., Santos, S.N., Rosa, L.H., Zucchi, T.D., and Melo, I.S. (2018). Rhodococcus psychrotolerans sp. nov., isolated from rhizosphere of Deschampsia antarctica. Antonie Van Leeuwenhoek 111, 629-636.
Smith, T., and Dalton, H. (2004). "Biocatalysis by methane monooxygenase and its implications for the petroleum industry" in Studies in surface science and catalysis. Elsevier, 177-192.
Song, X., Xu, Y., Li, G., Zhang, Y., Huang, T., and Hu, Z. (2011). Isolation, characterization of Rhodococcus sp. P14 capable of degrading high-molecular-weight polycyclic aromatic hydrocarbons and aliphatic hydrocarbons. Marine pollution bulletin 62, 2122-2128.
Stainthorpe, A., Lees, V., Salmond, G.P., Dalton, H., and Murrell, J.C. (1990). The methane monooxygenase gene cluster of Methylococcus capsulatus (Bath). Gene 91, 27-34.
Stamatakis, A. (2014). RAxML version 8: a tool for phylogenetic analysis and post-analysis of large phylogenies. Bioinformatics 30, 1312-1313.
Stamatakis, A., Hoover, P., and Rougemont, J. (2008). A rapid bootstrap algorithm for the RAxML web servers. Systematic biology 57, 758-771.
Tavormina, P.L., Ussler Iii, W., Joye, S.B., Harrison, B.K., and Orphan, V.J. (2010). Distributions of putative aerobic methanotrophs in diverse pelagic marine environments. The ISME journal 4, 700.
Tindall, B. (2014a). A note on the genus name Rhodococcus Zopf 1891 and its homonyms. International journal of systematic and evolutionary microbiology 64, 1062-1064.
Tindall, B. (2014b). The correct name of the taxon that contains the type strain of Rhodococcus equi. International journal of systematic and evolutionary microbiology 64, 302-308.
Van Beilen, J.B., Wubbolts, M.G., and Witholt, B. (1994). Genetics of alkane oxidation by Pseudomonas oleovorans. Biodegradation 5, 161-174.

Comparative genomics of Rhodococcus | Chapter V
183
Wang, L., Zhang, L., Zhang, X., Zhang, S., Yang, L., Yuan, H., Chen, J., Liang, C., Huang, W., and Liu, J. (2019). Rhodococcus daqingensis sp. nov., isolated from petroleum-contaminated soil. Antonie van Leeuwenhoek 112, 695-702.
Wickham, H. (2011). ggplot2. Wiley Interdisciplinary Reviews: Computational Statistics 3, 180-185.
Yassin, A. (2005). Rhodococcus triatomae sp. nov., isolated from a blood-sucking bug. International journal of systematic and evolutionary microbiology 55, 1575-1579.
Yen, K.M., Karl, M.R., Blatt, L.M., Simon, M.J., Winter, R.B., Fausset, P.R., Lu, H.S., Harcourt, A.A., and Chen, K.K. (1991). Cloning and characterization of a Pseudomonas mendocina KR1 gene cluster encoding toluene-4-monooxygenase. J Bacteriol 173, 5315-5327.
Zakham, F., Aouane, O., Ussery, D., Benjouad, A., and Ennaji, M.M. (2012). Computational genomics-proteomics and Phylogeny analysis of twenty one mycobacterial genomes (Tuberculosis & non Tuberculosis strains). Microbial informatics and experimentation 2, 7.

185
Chapter VI
General discussion

General discussion | Chapter VI
187
Chapter VI General discussion __________________
Pollution caused by organic compounds is a major concern due to the deleterious effects they pose to the environment. Solutions for this problem include various remediation strategies, but among them, bioremediation is considered environmentally sustainable and cost effective. However, the use of bacteria for the restoration of polluted sites appears to be challenging due to the multiple factors on which its success depends. Among these, the ability of the inoculant to effectively degrade the pollutant and the survival of the inoculum to abiotic and biotic factors are key aspects. The selection of an autochthonous community can overcome these problems by being already adapted to the conditions of the targeted site (Thompson et al., 2005; Mrozik and Piotrowska-Seget, 2010). Understanding the catabolic pathways involved in the biodegradation of pollutants and how these pathways are compartmentalized across the members of the bacterial community actively involved in the biodegradation is key to efficiently design improved strategies for the bioremediation of polluted sites.
Chapters II and III cover the isolation and characterization of two bacterial consortia that can effectively degrade biphenyl (chemical analog of PCBs) and diesel fuel, respectively. During the isolation process, the enrichment culture using these substrates as carbon source allows the selection of that fraction of the population that is actively involved in their metabolism. Both consortia are apparently distinct, which is in part a result of the different composition of the fed substrate. While biphenyl is a simple polyaromatic compound with a limited number of possible degradation pathways (Figure 2.4), diesel-oil is a complex mixture of multiple aliphatic and aromatic hydrocarbon constituents and therefore many pathways are involved in its biodegradation (Figure 3.4), which allows the growth of a more diverse population. Nonetheless, both consortia have members in common, including Pseudomonas (29% and 27% relative abundance in the biphenyl- and diesel-degrading consortia, respectively), Achromobacter (12.7% and 2.5%, respectively) and Stenotrophomonas (8.6% and 2.1%, respectively). Our results show that Pseudomonas most likely participates in the degradation of

Chapter IV | General discussion
188
the aliphatic fraction of diesel fuel due to the presence of multiple enzymes responsible for alkane catabolism (Figure 3.4). In the case of aromatic compounds, the presence of Pseudomonas in both consortia can be explained by the rich and diverse collection of central aromatic pathways on which the degradation of peripheral compounds such as biphenyl, naphthalene and phenanthrene are funneled (Table 2.3, Figure 3.4). The high metabolic versatility exhibited by Pseudomonas species (Silby et al., 2011; Garrido-Sanz et al., 2016) might explain its occurrence in multiple polluted environments (Yergeau et al., 2012; Sun et al., 2015; Jung et al., 2016) by the presence of both, peripheral and central catabolic pathways. Similarly, this might be the case of other genera present in both consortia without a direct involvement in the degradation of the fed substrates, including Stenotrophomonas, who is likely a generalist species cross-feeding on secondary metabolites (Wald et al., 2015). On the other hand, there are specific genera to each consortium that are involved in key steps of the degradation process. For example, Rhodococcus is only found in the biphenyl-degrading consortium and it is the only member of that population that harbors bph genes for the catabolism of biphenyl (Table 2.3). Conversely, the initial degradation of aromatic hydrocarbons in the diesel-degrading consortium can be attributed to genera from the Sphingomonadaceae family (Figure 3.4) harboring most of the dioxygenases needed for the initial degradation of PAHs. The presence of generalist and specialist members on both consortia along with redundant and alternative pathways might contribute to an overall functional resilience, which remains an advantage over biodegradation approaches using single species (Sydow et al., 2016).
The importance of metagenomic analysis is demonstrated in both Chapters II and III by the identification of enzymes and pathways responsible for the biodegradation of the fed substrates and their assignation to specific populations within the consortia. However, these findings are limited to the most abundant members, while pathways present in lightly covered genera are probably missing (Quince et al., 2017). In addition, the data shown in both chapters represent a single moment of the community development, and changes in abundance are likely to occur as time progresses. Monitoring the community structure over time could provide more information about the population behavior and could help identify key aspects important for the inoculant design, including displacement of

General discussion | Chapter VI
189
some of the consortium members in late growth states, which should be taken into account for the bioremediation strategy to be used. This is of great importance in bioremediation processes where compounds more resistant to degradation tend to accumulate (Alexander, 2000). If members of the community that can degrade these persistent compounds are displaced in early stages of the bioremediation process, the complete degradation of these chemicals might be compromised, and several applications of the inoculant could be needed. In addition, in Chapter III the ability of the diesel-degrading consortium to be used in bioremediation applications was also examined in four-month soil microcosms polluted with aged diesel fuel (Figure 3.5). While the inoculation of the consortium alone resulted in a small reduction of TPHs (8.35%), its combination with alfalfa (Medicago sativa) plants resulted in an increased depletion of TPHs of up to ~28%. This result evidence that other parameters such as the presence of plants can have a profound impact in the bioremediation process, in this case by a probable stimulation of bacterial metabolism (Kuiper et al., 2004), which should be accounted for in bioremediation strategies.
The isolation of the Rhodococcus sp. WAY2 strain from the biphenyl-degrading consortium and further genome sequencing and characterization of its ability to grow on multiple aromatic and aliphatic compounds, as detailed in Chapter IV, has provided far more knowledge about the potential of this strain to be used for bioremediation purposes than that based on the consortium metagenome. On the one hand, although initial evidence based on the metagenome of the biphenyl-degrading consortium revealed that it possessed three catabolic gene clusters putatively involved in the degradation of aromatic compounds (Figure 2.2), analysis of its whole genome sequence identified two additional clusters: bphA1bA2bBC and etbA1bA2bA3D+etbA4B (Table 4.2 and Figure 4.5). These clusters were likely missing from the metagenome of the consortium given the low abundance of this strain (2.16% 16S rRNA), but nonetheless they probably participate in the degradation of multiple aromatic compounds, including biphenyl and PCBs (Kimura et al., 2006; Iwasaki et al., 2007). In addition, WAY2 is able to grow on multiple aromatic and aliphatic compounds (Table 4.2) and cometabolize 23 PCB congeners (Figure 4.6), which make this strain not only suited for PCBs bioremediation but also could be applied in the remediation of mixed pollutants. On the other hand, WAY2 genome

Chapter IV | General discussion
190
sequence also revealed the presence of multiple adaption traits that could ensure its survival under multiple environmental stresses, including nutritional starvation, low temperatures and metal contamination (Supplementary Table 4.S7). The information derived from the WAY2 genome sequence enabled the exploration of its complete catabolic repertoire, which could not have been possible with a partial sequence derived from the biphenyl-degrading consortium metagenome. Although it is possible to obtain nearly complete genome sequences from metagenomes (Tully et al., 2018), as demonstrated in Chapter II (Table 2.1), the low abundance of certain taxa prevents a complete genomic representation of all individuals.
In Chapter V, comparative genomic analyses are applied to the Rhodococcus genus to further explore the distribution of traits found in Rhodococcus sp. WAY2 related to the biodegradation of organic compounds. The availability of many genome sequences deposited in public databases can be used to stablish phylogenetic groups and species clusters (Meier-Kolthoff et al., 2013), as demonstrated in the phylogenomic analysis including more than 300 genomes of the Rhodococcus genus, and the clustering of intergenomic distances and dDDH% values (Figure 5.1). Additionally, bioinformatic analysis also allow the identification of clusters of orthologous proteins (Emms and Kelly, 2015), which is of great importance in order to evaluate how certain traits are distributed among the compared genomes. Frequently, the distribution of certain traits follows a phylogenetic pattern among eco-physiological groups (Berlemont and Martiny, 2013; Garrido-Sanz et al., 2016). Nonetheless, in Rhodococcus, the traits involved in the degradation of aromatic and aliphatic compounds are rather common to most lineages (Figure 5.6), with the exception of traits putatively involved in the degradation of short-chain n-alkanes (sMMO and pMMO). While the presence of sMMO subunits is restricted to a few phylogenomic groups (Figure 5.6) that contain strains known to grow on gaseous short-chain n-alkanes (Cappelletti et al., 2015), the presence of pMMO subunits is only found in the WAY2 genome, corresponding to a novel feature of this strain not found in any other Rhodococcus strain sequenced to date.
Altogether, this thesis corroborates that metagenomic analyses are a potent tool to characterize bacterial consortia intended for bioremediation purposes. The information regarding the composition of the consortia obtained from enrichment

General discussion | Chapter VI
191
cultures can serve to identify key populations actively involved in the biodegradation process, while the presence of genes and pathways participating in the degradation of pollutants and their assignation to specific members of the consortia can explain the functions that those populations perform within the consortium. In addition, this could serve as a starting point to isolate and further characterize strains with the best biodegradation potential, and to search for other important traits, such as complementary metabolic pathways or environmental adaption characteristics, which are necessary for a viable and efficient bioremediation process.
References Alexander, M. (2000). Aging, bioavailability, and overestimation of risk from
environmental pollutants. Environmental science & technology 34, 4259-4265. Berlemont, R., and Martiny, A.C. (2013). Phylogenetic distribution of potential cellulases
in bacteria. Appl. Environ. Microbiol. 79, 1545-1554. Cappelletti, M., Presentato, A., Milazzo, G., Turner, R.J., Fedi, S., Frascari, D., and
Zannoni, D. (2015). Growth of Rhodococcus sp. strain BCP1 on gaseous n-alkanes: new metabolic insights and transcriptional analysis of two soluble di-iron monooxygenase genes. Frontiers in microbiology 6, 393.
Emms, D.M., and Kelly, S. (2015). OrthoFinder: solving fundamental biases in whole genome comparisons dramatically improves orthogroup inference accuracy. Genome biology 16, 157.
Garrido-Sanz, D., Meier-Kolthoff, J.P., Göker, M., Martin, M., Rivilla, R., and Redondo-Nieto, M. (2016). Genomic and genetic diversity within the Pseudomonas fluorescens complex. PLoS One 11, e0150183.
Iwasaki, T., Takeda, H., Miyauchi, K., Yamada, T., Masai, E., and Fukuda, M. (2007). Characterization of two biphenyl dioxygenases for biphenyl/PCB degradation in a PCB degrader, Rhodococcus sp. strain RHA1. Biosci Biotechnol Biochem 71, 993-1002.
Jung, J., Philippot, L., and Park, W. (2016). Metagenomic and functional analyses of the consequences of reduction of bacterial diversity on soil functions and bioremediation in diesel-contaminated microcosms. Scientific reports 6, 23012.
Kimura, N., Kitagawa, W., Mori, T., Nakashima, N., Tamura, T., and Kamagata, Y. (2006). Genetic and biochemical characterization of the dioxygenase involved in lateral dioxygenation of dibenzofuran from Rhodococcus opacus strain SAO101. Appl Microbiol Biotechnol 73, 474-484.
Kuiper, I., Lagendijk, E.L., Bloemberg, G.V., and Lugtenberg, B.J. (2004). Rhizoremediation: a beneficial plant-microbe interaction. Molecular plant-microbe interactions 17, 6-15.

Chapter IV | General discussion
192
Meier-Kolthoff, J.P., Auch, A.F., Klenk, H.-P., and Göker, M. (2013). Genome sequence-based species delimitation with confidence intervals and improved distance functions. BMC bioinformatics 14, 60.
Mrozik, A., and Piotrowska-Seget, Z. (2010). Bioaugmentation as a strategy for cleaning up of soils contaminated with aromatic compounds. Microbiological research 165, 363-375.
Quince, C., Walker, A.W., Simpson, J.T., Loman, N.J., and Segata, N. (2017). Shotgun metagenomics, from sampling to analysis. Nature biotechnology 35, 833.
Silby, M.W., Winstanley, C., Godfrey, S.A., Levy, S.B., and Jackson, R.W. (2011). Pseudomonas genomes: diverse and adaptable. FEMS microbiology reviews 35, 652-680.
Sun, W., Dong, Y., Gao, P., Fu, M., Ta, K., and Li, J. (2015). Microbial communities inhabiting oil-contaminated soils from two major oilfields in Northern China: Implications for active petroleum-degrading capacity. Journal of microbiology 53, 371-378.
Sydow, M., Owsianiak, M., Szczepaniak, Z., Framski, G., Smets, B.F., Ławniczak, Ł., Lisiecki, P., Szulc, A., Cyplik, P., and Chrzanowski, Ł. (2016). Evaluating robustness of a diesel-degrading bacterial consortium isolated from contaminated soil. New biotechnology 33, 852-859.
Thompson, I.P., Van Der Gast, C.J., Ciric, L., and Singer, A.C. (2005). Bioaugmentation for bioremediation: the challenge of strain selection. Environmental Microbiology 7, 909-915.
Tully, B.J., Graham, E.D., and Heidelberg, J.F. (2018). The reconstruction of 2,631 draft metagenome-assembled genomes from the global oceans. Scientific data 5, 170203.
Wald, J., Hroudova, M., Jansa, J., Vrchotova, B., Macek, T., and Uhlik, O. (2015). Pseudomonads Rule Degradation of Polyaromatic Hydrocarbons in Aerated Sediment. Front Microbiol 6, 1268.
Yergeau, E., Sanschagrin, S., Beaumier, D., and Greer, C.W. (2012). Metagenomic analysis of the bioremediation of diesel-contaminated Canadian high arctic soils. PloS one 7, e30058.

193
Conclusions Conclusiones

Conclusions
195
Conclusions __________________
1. Enrichment culture techniques allow the isolation of bacterial consortia derived from environmental samples that are actively involved in the biodegradation process.
2. The combination of microbiome and metagenome analysis result in the characterization of the functional roles that the consortia members perform during the biodegradation process by identifying genes and pathways involved their metabolism and their assignation to the taxa present in the consortia.
3. The reintroduction of the isolated diesel-degrading consortium into diesel-polluted soil increased TPHs reduction in an 8.35%. However, the combination of the inoculant and alfalfa (M. sativa) plants further enhanced this degradation to 27.91%.
4. The sequencing and analysis of the Rhodococcus sp. WAY2 genome revealed the presence of five replicons and multiple genes and pathways involved in the degradation of organic compounds and environmental adaption strategies.
5. Rhodococcus sp. WAY2 is able to effectively cometabolize 23 PCB congeners in resting cell assays, probably due to the presence of five genetic systems that could be involved in PCB degradation according to homologous sequences in other Rhodococcus.
6. Comparative genomic analyses of the Rhodococcus genus demonstrate that it contains 42 phylogenomic groups and 83 species clusters. The small core genome composed of 381 orthologous groups and the large “open” pangenome of 26,080 orthologous groups, show a high genetic diversity.
7. Clusters of genes involved in the degradation of aromatic and aliphatic compounds are found in most of the Rhodococcus phylogenomic groups However, short-chain n-alkanes degradation mediated by soluble methane monooxygenase (sMMO) is confined to certain groups and particulate methane monooxygenase (pMMO) is exclusively present in Rhodococcus sp. WAY2

Conclusiones
196
Conclusiones __________________
1. Las técnicas de cultivo por enriquecimiento permiten el aislamiento de consorcios bacterianos derivados de muestras ambientales que participan activamente en el proceso de biodegradación.
2. La combinación del análisis del microbioma y del metagenoma da como resultado la caracterización de los papeles funcionales que desempeñan los miembros de consorcios durante el proceso de biodegradación, identificando los genes y las rutas involucradas en su metabolismo y asignándolos a los taxones presentes en los consorcios.
3. La reintroducción del consorcio degradador de diésel obtenido en suelos contaminados con diésel aumenta la reducción de TPHs en un 8,35%. Sin embargo, la combinación del inóculo y plantas de alfalfa (M. sativa) aumenta aún más esta degradación hasta el 27,91%.
4. La secuenciación y el análisis del genoma de Rhodococcus sp. WAY2 reveló la presencia de cinco replicones y múltiples genes y rutas metabólicas implicadas en la degradación de compuestos orgánicos y estrategias de adaptación ambiental.
5. Rhodococcus sp. WAY2 es capaz de cometabolizar eficazmente 23 congéneres de PCBs en ensayos de “resting cells”, probablemente debido a la presencia de cinco sistemas genéticos que podrán estar involucrados en la degradación de PCBs debido a su homología con otras secuencias de Rhodococcus.
6. Análisis de genómica comparativa del género Rhodococcus demuestran que está formado por 42 groups filogenómicos y 83 grupos de especies. El pequeño genoma central, compuesto por 381 grupos de ortólogos, y el gran pangenoma “abierto” de 26.080 grupos de ortólogos muestran una alta diversidad genética.
7. En la mayoría de los grupos filogenómicos de Rhodococcus se encuentran grupos de genes implicados en la degradación de compuestos aromáticos y alifáticos. Sin embargo, la degradación de n-alcanos de cadena corta mediada por metano monooxigenasa soluble (sMMO) se limita a ciertos grupos, mientras que la metano monooxigenasa particulada (pMMO) está presente exclusivamente en Rhodococcus sp. WAY2.

197
Appendixes

Appendix I
199
Appendix I List of publications
__________________
Garrido-Sanz, D., Meier-Kolthoff, J.P., Göker, M., Martín, M., Rivilla, R. and Redondo-Nieto, M. (2016) Genomic and genetic diversity within the Pseudomonas fluorescens complex. PLoS One. 11(4):e0153733.
doi: 10.1371/journal.pone.0150183 | Published: 25 February 2016.
Barahona, E., Navazo, A., Garrido-Sanz, D., Muriel, C., Martínez-Granero, F., Redondo-Nieto, M., Martín, M. and Rivilla, R. (2016) Pseudomonas fluorescens F113 can produce a second flagellar apparatus, which is important for plant root colonization. Front. Microbiol. 7:1471.
doi: 10.3389/fmicb.2016.01471 | Published: 22 September 2016.
Garrido-Sanz, D., Arrebola, E., Martínez-Granero, F., García-Méndez, S., Muriel, C., Blanco-Romero, E., Martín, M., Rivilla, R. and Redondo-Nieto, M. (2017) Classification of isolates from the Pseudomonas fluorescens complex into phylogenomic groups based in group-specific markers. Front. Microbiol. 8:413.
doi: 10.3389/fmicb.2017.00413 | Published: 15 March 2017.
Garrido-Sanz, D., Manzano, J., Martín, M., Redondo-Nieto, M. and Rivilla, R. (2018) Metagenomic Analysis of a Biphenyl-Degrading Soil Bacterial Consortium Reveals the Metabolic Roles of Specific Populations. Front. Microbiol. 9:232.
doi: 10.3389/fmicb.2018.00232 | Published: 15 February 2018.
Blanco-Romero, E., Redondo-Nieto, M., Martinez-Granero, F., Garrido-Sanz, D., Ramos-González, M.I., Martín, M. and Rivilla, R. (2018) Genome-wide analysis of the FleQ direct regulon in Pseudomonas fluorescens F113 and Pseudomonas putida KT2440. Sci. Reps. 8:13145.
doi: 10.1038/s41598-018-31371-z | Published: 3 September 2018.

Appendix I
200
Garrido-Sanz, D., Redondo-Nieto, M., Mongiardini, E., Blanco-Romero, E., Durán, D., Quelas, J.I., Martín, M., Rivilla, R., Lodeiro, A.R. and Althabegoiti, M.J. (2019) Phylogenomic analyses of Bradyrhizobium reveal uneven distribution of the lateral and subpolar flagellar systems, which extends to Rhizobiales. Microorganisms. 7:50.
doi: 10.3390/microorganisms7020050 | Published: 13 February 2019.
Garrido-Sanz, D., Redondo-Nieto, M., Guirado, M., Jiménez, O.P., Millán, R., Martín, M. and Rivilla, R. (2019) Metagenomic insights into the bacterial functions of a diesel-degrading consortium for the rhizoremediation of diesel-polluted soil. Genes. 10:6.
doi: 10.3390/genes10060456 | Published: 15 June 2019.

Supplementary material | Appendix II
201
Appendix II Supplementary material __________________
This section collects the supplementary material of chapters IV and V of this thesis. Files too large to be displayed or in a non-text supported format, are only included in the electronic version.
__________________
Supplementary material Chapter IV Supplementary File 4.S1 Analysis of the Rhodococcus sp. WAY2 plasmids.
To test the topology of the pRWAY01, pRWAY02 and pRWAY03 replicons, different sets of primers were designed at least at 800 bp from each replicon end to avoid telomeric sequences. A reverse primer in each of the left ends of the three replicons (1L3, 2L3 and 3L3, Table 1), was designed in order to amplify with its respective forward primer in the replicons right ends (1R1, 2R1, 3R1, Table 1) only in case of circular topology. Additionally, forward primers in the left ends (1L2, 2L1 and 3L2) and reverse primers in the right ends (1R3, 2R2 and 3R3), were designed to be combined with the ones previously described as positive controls. The sequences of the primers, Tm, positions in each replicon and combinations used can be seen in Table 1 and 2 and a scheme of the priming sites is depicted in Figure 1. For the small circular plasmid pRWAY04, two sets of primers (4F1-4R3 and 4F2-4R4) were designed to amplify ~10 Kbps of overlapping fragments that covers the total plasmid length (14.8 Kbps). Melting temperature of the primers, absence of dimerization and harping formation and lack of secondary priming sites were assessed using the OligoAnalyzer tool available at https://eu.idtdna.com/calc/analyzer.
For pRWAY01, pRWAY02 and pRWAY03, PCR reactions were carried out in a total volume of 25 µL containing 2.5 µL of 10x PCB buffer MgCl2 free, 1 µL MgCl2 50 mM, 0.5 µL of DMSO (dimethyl sulfoxide) at 10% (v/v), 0.5 µL dNTP mix 10 mM (2.5 mM each), 1 µL of each primer at 10 µM, 1 µL of Taq DNA polymerase 1 U/µL (Biotools) and 1 µL of Rhodococcus sp. WAY2 genomic DNA at a 30-50 ng/µL. The cycling conditions consisted in a first denaturation step at 95 ºC for 5 min followed by 27 cycles of amplification (1 min denaturation at 95 ºC, 45 s of primer annealing at 60 ºC and an elongation step at 72 ºC for 1.5 min) followed by a final elongation step at 72 ºC for 7 min.

Appendix II | Supplementary material
202
For pRWAY04, PCR reactions were carried out in a total volume of 25 µL containing 12.5 µL of Master Mix Q5’ High Fidelity 2x (New England BioLabs), 1.25 µL of each primer at 10 µM, 0.5 µL of DMSO at 10% (v/v) and 9.5 µL of WAY2 genomic DNA at a 30-50 ng/µL. The cycling conditions consisted inn a first denaturation step at 98 ºC for 3 min followed by 35 cycles of amplification (10 s denaturation at 98 ºC, 30 s of primer annealing at 71 ºC and an elongation step at 72 ºC for 7 min) followed by a final elongation step at 72 ºC for 3 min. PCR products were electrophoretically separated in 0.8% (w/v) agarose gels and dyed with Gel Red.
The results can be seen in Figure 1. All the primer combinations to test the linear topology of the pRWAY01, pRWAY02 and pRWAY03 plasmids resulted in positive amplification of the controls, with amplicon sizes congruent with the theoretically expected, and negative amplification with the primer combinations designed to amplify only in case of circular topology (1L3-1R1, 2L3-2R1 and 3L3-3R1, lanes 3, 6 and 9 in Figure 1C, respectively). These results validate the linear topology of the pRWAY01, pRWAY02 and pRWAY03 replicons of Rhodococcus sp. WAY2, as predicted by its genome sequence. The two PCRs of the pRWAY04 circular small plasmid resulted in amplicon sizes of ~10 Kbps, congruent with the theoretically expected and validate the circular topology of this plasmid.

Supplementary material | Appendix II
203
Figure 1. (A) Schematic representation of the primers designed to test the topology of the pRWAY01, pRWAY02 and pRWAY03 replicons of Rhodococcus sp. WAY2. Red arrows indicate the combination of primers which will result in positive amplification in case of circular topology. (B) Schematic representation of the primers designed to test the topology of the small pRWAY04 replicon. (C) PCR results in agarose gels at 0.8% (w/v). Black typing lanes show positive control amplicons (arrows), while red typing lanes (3, 6 and 9) show no amplification, which correspond with a linear topology of the pRWAY01, pRWAY02 and pRWAY03 replicons. Lanes 10 and 11 show the PCR products of the pRWAY04 small replicon, congruent with a circular topology.

Appendix II | Supplementary material
204
Table 1. Primers designed to test the topology of the Rhodococcus sp. WAY2 extrachromosomal replicons.
Rep
licon
Nam
e
Forward (F) / Reverse (R) Sequence (5’ – 3’)
Tm (°C) Position
pRW
AY
01 1L2 F CAAACTCAGATCCCGCCTCACC 60,0 1116 .. 1137
1L3 R CAGCCGCGAGTACGACCTC 60,4 2357 .. 2375
1R1 F GAACCGGAACCGCTGACCC 61,2 989404 .. 989422
1R3 R CGTTGGCTGCCTTCAAGTGGAAC 61,0 989932 .. 989954
pRW
AY
02 2L1 F GCATGACGGTGTCGACGTGTC 60,7 998 .. 1018
2L3 R CCCGAACTCTCGCCACAGC 61,1 2122 .. 2140
2R1 F GGAGGGTTCAGTGTTCGGCTG 60,4 459155 .. 459175
2R2 R CCGGTTCCTGAGAGGATGCGTTC 61,7 460267 .. 460289
pRW
AY
03 3L2 F CGTCCTCCACCATGAGCCCC 60,6 1354 .. 1372
3L3 R CATTCCCGCAACCAGTGGACC 61,0 2233 .. 2253
3R1 F GTGTCGGTGACATCGAGTCGC 60,3 351739 .. 351759
3R3 R CGAAGGGGTGATCCGGGAAC 60,3 352400 .. 352419
pRW
AY
04 4F1 F CTGTCTCCGGCTCGAGTGC 60,5 51 .. 69
4F2 F GGAGATGCTGCAGGAAACAGGC 60,8 7185 .. 7206
4R3 R GGGCGGTGCGTATTTACTTCGC 61,0 9951 .. 9972
4R4 R CTCCCAATCCCCGTACAGTCG 59,5 2617 .. 2637
Table 2. Primer combinations used.
Replicon Forward Reverse Expected amplicon length (bp)
pRWAY01 1L2 1L3 1.260 1R1 1R3 551 1L3 1R1 -
pRWAY02 2L1 2L3 1.143 2R1 2R2 1.135 2L3 2R1 -
pRWAY03 3L2 3L3 900 3R1 3R3 681 3L3 3R1 -
pRWAY04 4F1 4R3 9.922 4F2 4R4 10.306

Supplementary material | Appendix II
205
Supplementary File 4.S2 Analysis of the invertron-type telomeric nucleotide sequences of Rhodococcus sp. WAY2 linear mega-plasmids and identification of Terminal Inverted Repeats (RITs).
Comparison of Rhodococcus sp. WAY2 linear mega-plasmids telomeres (except for pRWAY03 left end) with linear replicons of other rhodococci: R. jostii RHA1 chromosome and plasmids pRHL1, pRHL2 and pRHL3, R. opacus B4 chromosome and plasmids pROB01, pROB02 and R. opacus 1CP plasmid pR1CP1. Conserved nucleotides are indicated with asterisks. The two sets of inverted repeats are highlighted with blue boxes and the GCTXCGC central motif with red boxes and bold. Non-conserved nucleotides in these inverted repeats and central motif are red typed.
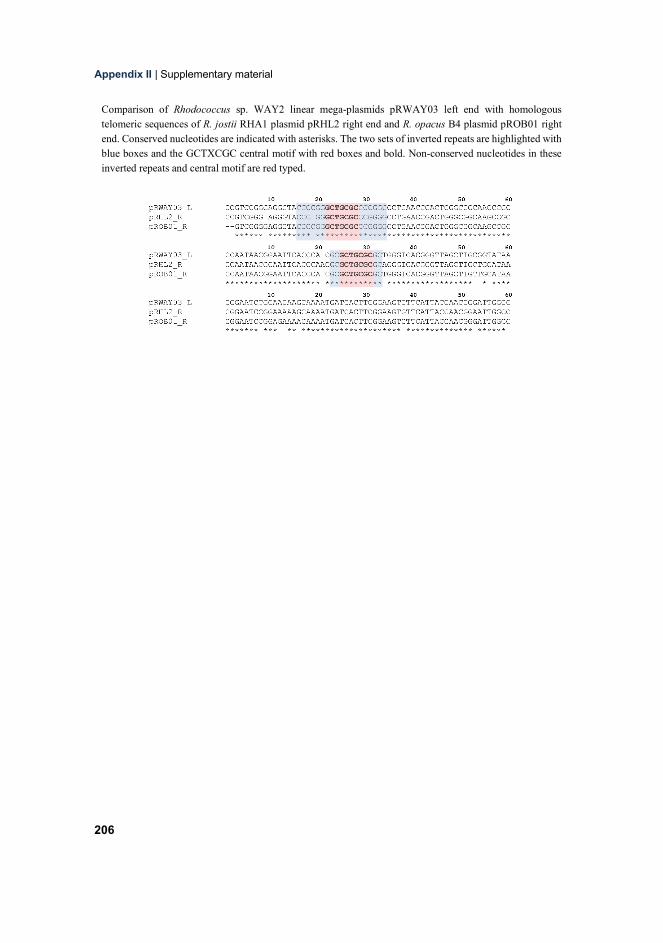
Appendix II | Supplementary material
206
Comparison of Rhodococcus sp. WAY2 linear mega-plasmids pRWAY03 left end with homologous telomeric sequences of R. jostii RHA1 plasmid pRHL2 right end and R. opacus B4 plasmid pROB01 right end. Conserved nucleotides are indicated with asterisks. The two sets of inverted repeats are highlighted with blue boxes and the GCTXCGC central motif with red boxes and bold. Non-conserved nucleotides in these inverted repeats and central motif are red typed.

Supplementary material | Appendix II
207
Supplementary File 4.S3 Whole genome-based taxonomic analysis of Rhodococcus sp. WAY2 using the Type (Strain) Genome Server (TYGS).
Figure 1. GBDP tree based in whole-genome sequences of the 10 closest type strain genomes to R. sp. WAY2 (red typing) inferred with FastME from GBDP distances. Tree was rooted at midpoint. Pseudo-bootstrap support values are shown below branches and were calculated over 100 replicates, with an average branch support of 91.5%.
Table 1. Pairwise comparisons of Rhodococcus sp. WAY2 against the 10 closest type strain genomes.
Query strain Subject strain dDDH
(d4, in %) C.I.
(d4, in %)
%GC content
difference Rhodococcus sp. WAY2 Rhodococcus opacus DSM 43205 27.7 [25.4 - 30.2] 2.8 Rhodococcus sp. WAY2 Rhodococcus imtechensis RKJ300 27.6 [25.2 - 30.1] 2.75 Rhodococcus sp. WAY2 Rhodococcus wratislaviensis NBRC 100605 26.8 [24.4 - 29.2] 2.3 Rhodococcus sp. WAY2 Rhodococcus jostii DSM 44719 26.7 [24.4 - 29.2] 2.41 Rhodococcus sp. WAY2 Rhodococcus koreensis DSM 44498 26.5 [24.1 - 28.9] 2.9 Rhodococcus sp. WAY2 Rhodococcus marinonascens NBRC 14363 22.9 [20.6 - 25.3] 0.07 Rhodococcus sp. WAY2 Rhodococcus maanshanensis DSM 44675 20.2 [18.0 - 22.7] 4.69 Rhodococcus sp. WAY2 Rhodococcus erythropolis NBRC 15567 20.1 [17.9 - 22.5] 2.08 Rhodococcus sp. WAY2 Rhodococcus globerulus NBRC 14531 19.4 [17.2 - 21.8] 2.8 Rhodococcus sp. WAY2 Nocardia globerula DSM 44596 19.4 [17.2 - 21.8] 2.75

Appendix II | Supplementary material
208
Figure 2. GBDP tree based in 16S rRNA gene sequences of the 10 closest type strain to R. sp. WAY2 (red typing) inferred with FastME from GBDP distances. Tree was rooted at midpoint. Pseudo-bootstrap support values are shown below branches and were calculated over 100 replicates, with an average branch support of 62.5%.

Supplementary material | Appendix II
209
Table 2. Type-based species clustering using a 70% dDDH threshold around each of the 10 type strains. Species cluster Name Authority
Size (Mbp) %GC
No. proteins
Assembly accession
1 Rhodococcus
marinonascens NBRC 14363
Helmke and Weyland 1984
4.92 64.41 4777 GCA_001894885
2 Rhodococcus
globerulus NBRC 14531
Goodfellow et al. 1985 emend. Nouioui et al.
2018 6.74 61.67 6262 GCA_001894805
2 Nocardia globerula
DSM 44596 (Gray 1928) Waksman
and Henrici 1948 6.48 61.72 6050 -
3 Rhodococcus
koreensis DSM 44498
Yoon et al. 2000 emend. Nouioui et al. 2018
10.31 67.38 9444 GCA_900105905
4 Rhodococcus jostii
DSM 44719 Takeuchi et al. 2002 9.91 66.88 9110 GCA_900105375
5 Rhodococcus
wratislaviensis NBRC 100605
(Goodfellow et al. 1995) Goodfellow et al. 2002 emend. Nouioui et al.
2018
10.40 66.78 9472 GCA_000583735
6 Rhodococcus
erythropolis NBRC 15567
(Gray and Thornton 1928) Goodfellow and Alderson 1979 emend.
Nouioui et al. 2018
6.59 62.4 6211 GCA_001552595
7 Rhodococcus
imtechensis RKJ300 Ghosh et al. 2006 emend.
Nouioui et al. 2018 8.23 67.22 7681 GCA_000260815
7 Rhodococcus
opacus DSM 43205 Klatte et al. 1995 8,53 67.28 7425 GCF_001646735
8 Rhodococcus
maanshanensis DSM 44675
Zhang et al. 2002 emend. Nouioui et al. 2018
5,67 69.17 5173 GCA_900109405
9 Rhodococcus sp.
WAY2 This work 8,44 64.47 7841 -

Supplementary material | Appendix II
210
Supplementary Table 4.S1 Rhodococcus type strains 16S rRNA genes used in this study
Type strain name Accs. no.
16S rRNA Type strain name Accs. no.
16S rRNA R. aerolatus PAMC 27367 T KM044053.1 R. koreensis DNP505 T AF124342.1 R. aetherovorans 10bc312 T AF447391.1 R. kroppenstedtii K07-23 T AY726605.1 R. agglutinans CFH S0262 T KP232908.1 R. kunmingensis YIM 45607 T DQ997045.1 R. aichiensis DSM 43978 T X80633.1 R. kyotonensis DS472 T AB269261.1 R. antrifimi D7-21 T LN867321.1 R. lactis DW151B T KP342300.1 R. artemisiae YIM 65754 T GU367155.1 R. luteus DSM 43673 T X79187.1 R. auranticus ATCC 25938 T AF283282.1 R. maanshanensis M712 T AF416566.1 R. baikonurensis GTC 1041 T AB071951.1 R. marinonascens DSM 43752 T X80617.1 R. biphenylivorans TG9 T KJ546454.1 R. maris DSM 43672 T X79290.1 R. bronchialis DSM 43247 T CP001802.1 R. nanhaiensis SCSIO 10187 T JN582175.1 R. canchipurensis MBRL 353 T JN164649.1 R. obuensis ATCC 33610 T a AY262329.1 R. cerastii C5 T FR714842.1 R. olei Ktm-20 T MF405107.1 R. cercidiphylli YIM 65003 T EU325542.1 R. opacus DSM 43205 T X80630.1 R. chlorophenolicum DSM 43826 T X79292.1 R. pedocola UC12 T KT301938.1 R. chubuensis DSM 44019 T X80627.1 R. percolatus MBS1 T X92114.1 R. coprophilus DSM 43347 T X80626.1 R. phenolicus G2P T AY533293.1 R. corallinus JCM 3199 T AY995558.1 R. pyridinovorans PDB9 T AF173005.1 R. corynebacterioides DSM 20151T AF430066.1 R. qingshengii djl-6 T DQ090961.1 R. defluvii Ca11 T KC788572.1 R. rhodnii DSM 43336 T X80621.1 R. degradans CCM 4446 T JQ776649.2 R. rhodochrous DSM 43241 T X79288.1 R. electrodiphilus JC435 T LT630357.3 R. roseus ATCC 271 T X81921.1 R. enclensis NIO-1009 T HQ858009.1 R. ruber DSM 43338 T X80625.1 R. equi DSM 20307 T X80614.1 R. rubripertinctus DSM 43197 T X80632.1 R. erythropolis DSM 43066 T X79289.1 R. soli DSD51W T KJ939314.1 R. fascians DSM 20669 T X79186.1 R. sovatensis H004 T KU189221.1 R. gannanensis M1 T NR152643.1 R. sputi DSM 43896 T X80634.1 R. globerulus DSM 4954 T X80619.1 R. terrae DSM 43249 T X79286.1 R. gordoniae W 4937 T AY233201.1 R. triatomae IMMIB RIV-085 T AJ854055.1 R. hoagii ATCC 7005 T X82052.1 R. trifolii T8 T FR714843.1 R. humicola UC33 T KT301939.1 R. tukisamuensis Mb8 T AB067734.1 R. imtechensis RKJ300 T AY525785.2 R. wratislaviensis NCIMB 13082 T Z37138.1 R. jialingiae djl-6-2 T DQ185597.2 R. yunnanensis YIM 70056 T AY602219.2 R. jostii NBRC 16295 T AB046357.1 R. zopfii DSM 44108 T AF191343.1 a R. obuensis ATCC 33610 T was excluded of further analysis because its 16S rRNA gene sequence was too small (505 nts)

Supplementary material | Appendix II
211
Supplementary Table 4.S2 Genomes of Rhodococcus type strains used in this study.
Type strain gene name Assembly Accs. no. Sc
affo
lds
Size
(Mbp
)
GC
%
Genes Proteins R. agglutinans CCTCC AB2014297 T GCA_004011865.1 22 5.43 69.3 4.994 4.862 R. biphenylivorans TG9 T GCA_003288095.1 1 5.03 68 4.700 4.373 R. bronchialis DSM 43247 T GCA_000024785.1 - 5.29 67.1 4.934 4.601 R. chlorophenolicum DSM 43826 T GCA_001044235.1 72 7.38 68.4 7.164 6.729 R. coprophilus NBRC 100603 T GCA_001895045.1 30 4.55 66.9 4.206 4.079 R. corynebacterioides DSM 20151 T GCA_001646675.1 180 3.9 70.2 3.651 3.445 R. defluvii Ca11 T GCA_000738775.1 267 5.13 68.7 4.85 4.535 R. enclensis NIO-1009 T GCA_900094765.1 76 7.48 62.3 7.098 6.826 R. equi DSM 20307 T GCA_002094305.1 37 5.2 68.8 4.85 4.735 R. erythropolis NBRC 15567 T GCA_001552595.1 67 6.59 62.4 6.147 5.981 R. fascians NBRC 12155 T GCA_001894785.1 36 5.77 64.4 5.422 5.284 R. globerulus NBRC 14531 T GCA_001894805.1 30 6.74 61.7 6.231 6.054 R. gordoniae DSM 44689 T GCA_001646655.1 114 4.82 67.9 4.46 4.238 R. hoagii DSM 20295 T GCA_001646645.1 279 4.97 68.8 4.757 4.427 R. imtechensis RKJ300 T GCA_000260815.1 178 8.23 67.2 7.962 7.245 R. jostii NBRC 16295 T GCA_001894825.1 286 9.73 66.9 8.983 8.358 R. koreensis DSM 44498 T GCA_900105905.1 9 10.31 67.4 9.491 8.902 R. kroppenstedtii DSM 44908 T GCA_900111805.1 30 4.08 70.1 3.789 3.652 R. kunmingensis DSM 45001 T GCA_001646865.1 330 5.62 66.2 3.76 4.885 R. kyotonensis JCM 23211 T GCA_900188125.1 50 6.31 64.2 5.86 5.698 R. maanshanensis DSM 44675 T GCA_900109405.1 61 5.67 69.2 5.143 4.972 R. marinonascens NBRC 14363 T GCA_001894885.1 156 4.92 64.4 3.28 4.269 R. maris DSM 43672 T GCA_001630765.1 57 3.51 70.9 3.302 3.098 R. opacus DSM 43205 T GCA_001646735.1 382 8.53 67.3 8.198 7.418 R. phenolicus DSM 44812 T GCA_001646785.1 232 6.28 68.4 5.916 5.6 R. pyridinivorans DSM 44555 T GCA_900105195.1 3 5.26 67.8 4.864 4.604 R. qingshengii JCM 15477 T GCA_001646745.1 131 7.26 62.4 6.82 6.574 R. rhodnii NBRC 100604 T GCA_001894925.1 70 4.46 69.7 4.265 4.08 R. rhodochrous DSM 43241 T GCA_001646825.1 105 5.18 68.2 4.79 4.585 R. ruber DSM 43338 T GCA_001646835.1 164 5.3 70.7 4.93 4.677 R. rubripertincta NBRC 101908 T GCA_000327325.1 134 5.2 67.4 4.792 4.571 R. sputi NBRC 100414 T GCA_000248055.2 158 4.95 65.4 4.642 4.592 R. terrae NRRL B-16283 T GCA_003183825.1 - 5.71 67.8 5.109 4.951 R. triatomae DSM 44892 T GCA_900099725.1 38 4.73 68.7 4.430 4.297 R. tukisamuensis NBRC 100609 T GCA_001894985.1 66 5.49 69.9 4.970 4.779 R. wratislaviensis NBRC 100605T GCA_000583735.1 151 10.4 66.8 9.514 8.883 R. yunnanensis NBRC 103083 T GCA_001895005.1 68 6.37 63.9 5.847 5.65 R. zopfii NBRC 100606 T GCA_001895025.1 146 6.3 68.2 5.848 5.575
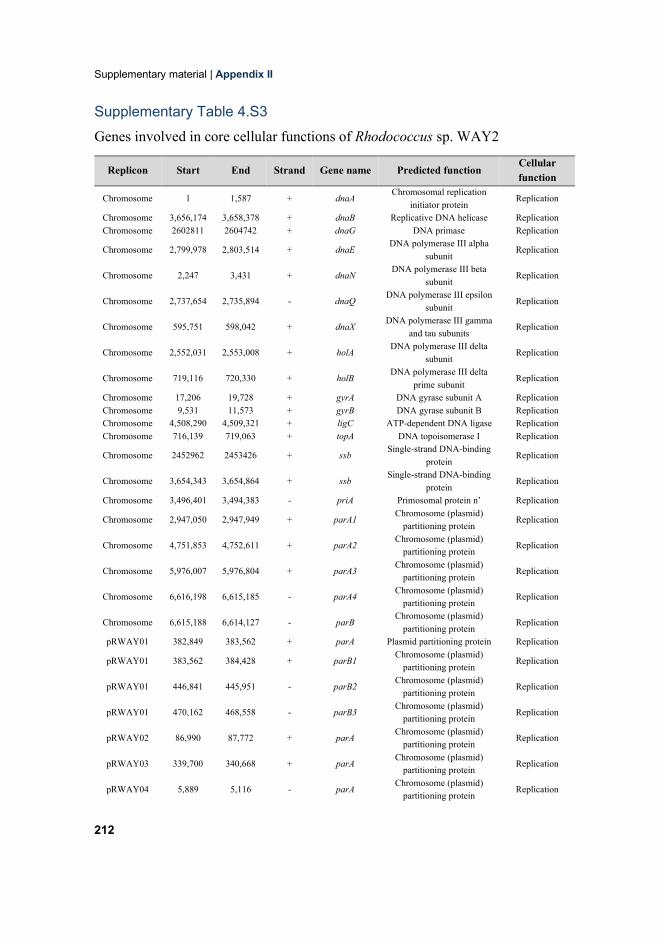
Supplementary material | Appendix II
212
Supplementary Table 4.S3 Genes involved in core cellular functions of Rhodococcus sp. WAY2
Replicon Start End Strand Gene name Predicted function Cellular function
Chromosome 1 1,587 + dnaA Chromosomal replication initiator protein Replication
Chromosome 3,656,174 3,658,378 + dnaB Replicative DNA helicase Replication Chromosome 2602811 2604742 + dnaG DNA primase Replication Chromosome 2,799,978 2,803,514 + dnaE DNA polymerase III alpha
subunit Replication
Chromosome 2,247 3,431 + dnaN DNA polymerase III beta subunit Replication
Chromosome 2,737,654 2,735,894 - dnaQ DNA polymerase III epsilon subunit Replication
Chromosome 595,751 598,042 + dnaX DNA polymerase III gamma and tau subunits Replication
Chromosome 2,552,031 2,553,008 + holA DNA polymerase III delta subunit Replication
Chromosome 719,116 720,330 + holB DNA polymerase III delta prime subunit Replication
Chromosome 17,206 19,728 + gyrA DNA gyrase subunit A Replication Chromosome 9,531 11,573 + gyrB DNA gyrase subunit B Replication Chromosome 4,508,290 4,509,321 + ligC ATP-dependent DNA ligase Replication Chromosome 716,139 719,063 + topA DNA topoisomerase I Replication Chromosome 2452962 2453426 + ssb Single-strand DNA-binding
protein Replication
Chromosome 3,654,343 3,654,864 + ssb Single-strand DNA-binding protein Replication
Chromosome 3,496,401 3,494,383 - priA Primosomal protein n’ Replication Chromosome 2,947,050 2,947,949 + parA1 Chromosome (plasmid)
partitioning protein Replication
Chromosome 4,751,853 4,752,611 + parA2 Chromosome (plasmid) partitioning protein Replication
Chromosome 5,976,007 5,976,804 + parA3 Chromosome (plasmid) partitioning protein Replication
Chromosome 6,616,198 6,615,185 - parA4 Chromosome (plasmid) partitioning protein Replication
Chromosome 6,615,188 6,614,127 - parB Chromosome (plasmid) partitioning protein Replication
pRWAY01 382,849 383,562 + parA Plasmid partitioning protein Replication pRWAY01 383,562 384,428 + parB1 Chromosome (plasmid)
partitioning protein Replication
pRWAY01 446,841 445,951 - parB2 Chromosome (plasmid) partitioning protein Replication
pRWAY01 470,162 468,558 - parB3 Chromosome (plasmid) partitioning protein Replication
pRWAY02 86,990 87,772 + parA Chromosome (plasmid) partitioning protein Replication
pRWAY03 339,700 340,668 + parA Chromosome (plasmid) partitioning protein Replication
pRWAY04 5,889 5,116 - parA Chromosome (plasmid) partitioning protein Replication

Supplementary material | Appendix II
213
pRWAY01 106,121 104,127 - tap1 Telomere-binding protein Telomere stabilization
pRWAY01 572,964 571,006 - tap2 Telomere-binding protein Telomere stabilization
pRWAY01 734,553 733,756 - tpg Telomere terminal protein Telomere stabilization
pRWAY01 736,526 734,553 - tap3 Telomere-binding protein Telomere stabilization
pRWAY02 105,788 107,872 + tap1 Telomere-binding protein Telomere stabilization
pRWAY02 107,872 108,669 + tpg Telomere terminal protein Telomere stabilization
pRWAY02 164,253 162,955 - tap2 Telomere-binding protein Telomere stabilization
pRWAY02 454,926 458,255 + tap3 Telomere-binding protein Telomere stabilization
pRWAY02 460,071 458,329 - tap4 Telomere-binding protein Telomere stabilization
pRWAY03 241,118 239,262 - tap1 Telomere-binding protein Telomere stabilization
pRWAY03 342,324 347,702 + tap2 Telomere-binding protein Telomere stabilization
pRWAY03 347,699 348,433 + tpg Telomere terminal protein Telomere stabilization
Chromosome 5,771,254 5,772,315 + rpoA DNA-directed RNA polymerase alpha subunit Transcription
Chromosome 1,814,549 1,818,037 + rpoB DNA-directed RNA polymerase beta subtunit Transcription
Chromosome 1,818,157 1,822,113 + rpoC DNA-directed RNA polymerase beta’ subunit Transcription
Chromosome 6,343,022 6,341,646 - rpoD RNA polymerase sigma factor RpoD Trnascription
Chromosome 4,194,213 4,194,719 + rpoN RNA polymerase sigma-54 factor RpoN Transcription
Chromosome 3,499,415 3,499,110 - rpoZ DNA-directed RNA polymerase omega subunit Transcription
Chromosome 1,089,695 1,088,799 - sigF1 RNA polymerase sigma-70 factor Transcription
Chromosome 1,411,251 1,410,331 - sigJ1 RNA polymerase sigma-70 factor Transcription
Chromosome 1,685,881 1,685,144 - sigF2 RNA polymerase sigma-70 factor Transcription
Chromosome 3,209,743 3,210,678 + sigX RNA polymerase sigma-70 factor Transcription
Chromosome 3,304,884 3,305,681 + sigF3 RNA polymerase sigma-70 factor Transcription
Chromosome 3,811,818 3,812,057 + sig RNA polymerase sigma-70 factor Transcription
Chromosome 3,927,675 3,926,941 - sigK1 RNA polymerase sigma-70 factor Transcription
Chromosome 4,125,707 4,125,036 - sigD1 RNA polymerase sigma-70 factor Transcription
Chromosome 4,600,503 4,600,982 + sigD2 RNA polymerase sigma-70 factor Transcription

Appendix II | Supplementary material
214
Chromosome 4,890,674 4,891,333 + sigZ RNA polymerase sigma-70 factor Transcription
Chromosome 4,913,325 4,912,345 - sig RNA polymerase sigma-70 factor Transcription
Chromosome 5,229,528 5,228,305 - sig RNA polymerase sigma-70 factor Transcription
Chromosome 5,554,709 5,555,359 + sigE RNA polymerase sigma-70 factor Transcription
Chromosome 5,814,072 5,813,404 - sigK2 RNA polymerase sigma-70 factor Transcription
Chromosome 5,817,100 5,817,447 + sigD3 RNA polymerase sigma-70 factor Transcription
Chromosome 5,969,836 5,970,573 + sigH RNA polymerase sigma-70 factor Transcription
Chromosome 6,332,642 6,331,671 - sigB RNA polymerase sigma-70 factor Transcription
Chromosome 6,606,184 6,606,765 + sigM RNA polymerase sigma-70 factor Transcription
Chromosome 3,211,552 3,211,214 - rbpA1 RNA polymerase-binding protein Transcription
Chromosome 721,940 723,459 + 16S rRNA Small Subunit Ribosomal RNA Translation
Chromosome 731,952 733,471 + 16S rRNA Small Subunit Ribosomal RNA Translation
Chromosome 2,377,970 2,379,489 + 16S rRNA Small Subunit Ribosomal RNA Translation
Chromosome 2,929,964 2,931,483 + 16S rRNA Small Subunit Ribosomal RNA Translation
Chromosome 723,795 726,930 + 23S rRNA Large Subunit Ribosomal RNA Translation
Chromosome 733,805 736,936 + 23S rRNA Large Subunit Ribosomal RNA Translation
Chromosome 2,379,825 2,382,960 + 23S rRNA Large Subunit Ribosomal RNA Translation
Chromosome 2,931,819 2,934,954 + 23S rRNA Large Subunit Ribosomal RNA Translation
Chromosome 727,095 727,215 + 5S rRNA 5S RNA Translation Chromosome 737,090 737,210 + 5S rRNA 5S RNA Translation Chromosome 2,383,114 2,383,234 + 5S rRNA 5S RNA Translation Chromosome 2,935,107 2,935,227 + 5S rRNA 5S RNA Translation Chromosome 2,890,126 2,891,613 + rpsA 30S ribosomal protein S1 Translation Chromosome 6,183,560 6,184,408 + rpsB 30S ribosomal protein S2 Translation Chromosome 5,759,342 5,760,148 + rpsC 30S ribosomal protein S3 Translation Chromosome 5,770,532 5,771,137 + rpsD 30S ribosomal protein S4 Translation Chromosome 5,764,275 5,764,931 + rpsE 30S ribosomal protein S5 Translation Chromosome 3,653,990 3,654,277 + rpsF 30S ribosomal protein S6 Translation Chromosome 1,856,786 1,857,256 + rpsG 30S ribosomal protein S7 Translation Chromosome 5,762,858 5,763,280 + rpsH 30S ribosomal protein S8 Translation Chromosome 5,792,720 5,793,256 + rpsI 30S ribosomal protein S9 Translation Chromosome 5,755,800 5,756,105 + rpsJ 30S ribosomal protein S10 Translation Chromosome 5,770,096 5,770,509 + rpsK 30S ribosomal protein S11 Translation Chromosome 1,856,412 1,856,786 + rpsL 30S ribosomal protein S12 Translation Chromosome 5,769,764 5,770,096 + rpsM 30S ribosomal protein S13 Translation Chromosome 5,201,297 5,200,992 - rpsN 30S ribosomal protein S14 Translation

Supplementary material | Appendix II
215
Chromosome 6,248,056 6,248,325 + rpsO 30S ribosomal protein S15 Translation Chromosome 6,165,774 6,166,235 + rpsP 30S ribosomal protein S16 Translation Chromosome 5,760,801 5,761,082 + rpSQ 30S ribosomal protein S17 Translation Chromosome 3,654,918 3,655,145 + rpsR1 30S ribosomal protein S18 Translation Chromosome 5,200,982 5,200,728 - rpsR2 30S ribosomal protein S18 Translation Chromosome 5,758,660 5,758,941 + rpsS 30S ribosomal protein S19 Translation Chromosome 2,553,338 2,553,078 - rpsT 30S ribosomal protein S20 Translation Chromosome 5,762,543 5,762,728 + rpsZ 30S ribosomal protein S14
type Z Translation Chromosome 1,797,555 1,798,271 + rplA 50S ribosomal protein L1 Translation Chromosome 5,757,810 5,758,646 + rplB 50S ribosomal protein L2 Translation Chromosome 5,756,126 5,756,782 + rplC 50S ribosomal protein L3 Translation Chromosome 5,756,779 5,757,468 + rplD 50S ribosomal protein L4 Translation Chromosome 5,761,972 5,762,538 + rplE 50S ribosomal protein L5 Translation Chromosome 5,763,295 5,763,834 + rplF 50S ribosomal protein L6 Translation Chromosome 1,799,337 1,799,726 + rplL 50S ribosomal protein
L7/L12 Translation Chromosome 3,655,163 3,655,618 + rplI 50S ribosomal protein L9 Translation Chromosome 1,798,701 1,799,258 + rplJ 50S ribosomal protein L10 Translation Chromosome 1,796,992 1,797,426 + rplK 50S ribosomal protein L11 Translation Chromosome 5,792,280 5,792,723 + rplM 50S ribosomal protein L13 Translation Chromosome 5,761,285 5,761,653 + rplN 50S ribosomal protein L14 Translation Chromosome 5,765,113 5,765,556 + rplO 50S ribosomal protein L15 Translation Chromosome 5,760,152 5,760,568 + rplP 50S ribosomal protein L16 Translation Chromosome 5,772,346 5,772,921 + rplQ 50S ribosomal protein L17 Translation Chromosome 5,763,836 5,764,243 + rplR 50S ribosomal protein L18 Translation Chromosome 6,171,274 6,171,615 + rplS 50S ribosomal protein L19 Translation Chromosome 2,907,916 2,908,305 + rplT 50S ribosomal protein L20 Translation Chromosome 2,523,861 2,524,172 + rplU 50S ribosomal protein L21 Translation Chromosome 5,758,938 5,759,342 + rplV 50S ribosomal protein L22 Translation Chromosome 5,757,465 5,757,770 + rplW 50S ribosomal protein L23 Translation Chromosome 5,761,653 5,761,970 + rplX 50S ribosomal protein L24 Translation Chromosome 5,275,581 5,274,967 - rplY 50S ribosomal protein L25 Translation Chromosome 2,524,282 2,524,479 + rpmA 50S ribosomal protein L27 Translation Chromosome 5,201,715 5,201,473 - rpmB 50S ribosomal protein L28 Translation Chromosome 5,760,568 5,760,804 + rpmC 50S ribosomal protein L29 Translation Chromosome 5,764,931 5,765,110 + rpmD 50S ribosomal protein L30 Translation Chromosome 2,362,720 2,362,962 + rpmE1 50S ribosomal protein L31 Translation Chromosome 5,203,078 5,203,332 + rpmE2 50S ribosomal protein L31 Translation Chromosome 5,203,394 5,203,567 + rpmF1 50S ribosomal protein L32 Translation Chromosome 6,149,124 6,149,237 + rpmF2 50S ribosomal protein L32 Translation Chromosome 1,794,071 1,794,238 + rpmG1 50S ribosomal protein L33 Translation Chromosome 5,201,473 5,201,309 - rpmG2 50S ribosomal protein L33 Translation Chromosome 6,621,327 6,621,184 - rpmH 50S ribosomal protein L34 Translation Chromosome 2,907,657 2,907,851 + rpmI 50S ribosomal protein L35 Translation Chromosome 5,769,373 5,769,486 + rpmJ 50S ribosomal protein L36 Translation Chromosome 5,218,862 5,218,937 + tRNAAlaCGC tRNA-Ala-CGC Translation Chromosome 6,044,028 6,044,103 + tRNAAlaGGC tRNA-Ala-GGC Translation Chromosome 21,380 21,452 + tRNAAlaTGC tRNA-Ala-TGC Translation Chromosome 542,988 543,063 + tRNAArgACG tRNA-Arg-ACG Translation Chromosome 2,349,107 2,349,032 - tRNAArgCCG tRNA-Arg-CCG Translation Chromosome 1,525,339 1,525,267 - tRNAArgCCT tRNA-Arg-CCT Translation Chromosome 2,450,226 2,450,154 - tRNAArgTCT tRNA-Arg-TCT Translation Chromosome 2,605,142 2,605,217 + tRNAAsnGTT tRNA-Asn-GTT Translation
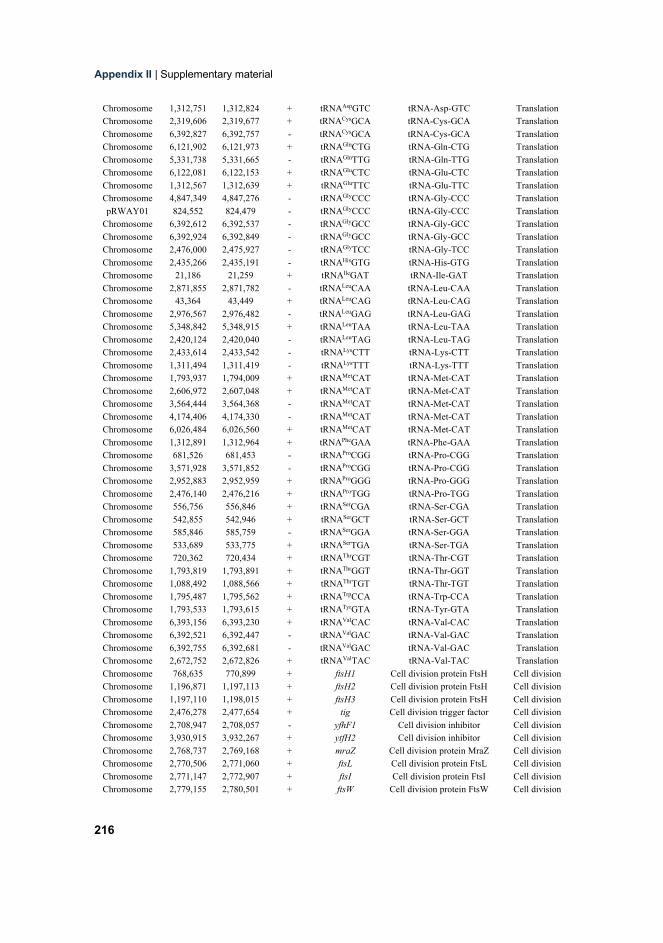
Appendix II | Supplementary material
216
Chromosome 1,312,751 1,312,824 + tRNAAspGTC tRNA-Asp-GTC Translation Chromosome 2,319,606 2,319,677 + tRNACysGCA tRNA-Cys-GCA Translation Chromosome 6,392,827 6,392,757 - tRNACysGCA tRNA-Cys-GCA Translation Chromosome 6,121,902 6,121,973 + tRNAGlnCTG tRNA-Gln-CTG Translation Chromosome 5,331,738 5,331,665 - tRNAGlnTTG tRNA-Gln-TTG Translation Chromosome 6,122,081 6,122,153 + tRNAGluCTC tRNA-Glu-CTC Translation Chromosome 1,312,567 1,312,639 + tRNAGluTTC tRNA-Glu-TTC Translation Chromosome 4,847,349 4,847,276 - tRNAGlyCCC tRNA-Gly-CCC Translation pRWAY01 824,552 824,479 - tRNAGlyCCC tRNA-Gly-CCC Translation
Chromosome 6,392,612 6,392,537 - tRNAGlyGCC tRNA-Gly-GCC Translation Chromosome 6,392,924 6,392,849 - tRNAGlyGCC tRNA-Gly-GCC Translation Chromosome 2,476,000 2,475,927 - tRNAGlyTCC tRNA-Gly-TCC Translation Chromosome 2,435,266 2,435,191 - tRNAHisGTG tRNA-His-GTG Translation Chromosome 21,186 21,259 + tRNAIleGAT tRNA-Ile-GAT Translation Chromosome 2,871,855 2,871,782 - tRNALeuCAA tRNA-Leu-CAA Translation Chromosome 43,364 43,449 + tRNALeuCAG tRNA-Leu-CAG Translation Chromosome 2,976,567 2,976,482 - tRNALeuGAG tRNA-Leu-GAG Translation Chromosome 5,348,842 5,348,915 + tRNALeuTAA tRNA-Leu-TAA Translation Chromosome 2,420,124 2,420,040 - tRNALeuTAG tRNA-Leu-TAG Translation Chromosome 2,433,614 2,433,542 - tRNALysCTT tRNA-Lys-CTT Translation Chromosome 1,311,494 1,311,419 - tRNALysTTT tRNA-Lys-TTT Translation Chromosome 1,793,937 1,794,009 + tRNAMetCAT tRNA-Met-CAT Translation Chromosome 2,606,972 2,607,048 + tRNAMetCAT tRNA-Met-CAT Translation Chromosome 3,564,444 3,564,368 - tRNAMetCAT tRNA-Met-CAT Translation Chromosome 4,174,406 4,174,330 - tRNAMetCAT tRNA-Met-CAT Translation Chromosome 6,026,484 6,026,560 + tRNAMetCAT tRNA-Met-CAT Translation Chromosome 1,312,891 1,312,964 + tRNAPheGAA tRNA-Phe-GAA Translation Chromosome 681,526 681,453 - tRNAProCGG tRNA-Pro-CGG Translation Chromosome 3,571,928 3,571,852 - tRNAProCGG tRNA-Pro-CGG Translation Chromosome 2,952,883 2,952,959 + tRNAProGGG tRNA-Pro-GGG Translation Chromosome 2,476,140 2,476,216 + tRNAProTGG tRNA-Pro-TGG Translation Chromosome 556,756 556,846 + tRNASerCGA tRNA-Ser-CGA Translation Chromosome 542,855 542,946 + tRNASerGCT tRNA-Ser-GCT Translation Chromosome 585,846 585,759 - tRNASerGGA tRNA-Ser-GGA Translation Chromosome 533,689 533,775 + tRNASerTGA tRNA-Ser-TGA Translation Chromosome 720,362 720,434 + tRNAThrCGT tRNA-Thr-CGT Translation Chromosome 1,793,819 1,793,891 + tRNAThrGGT tRNA-Thr-GGT Translation Chromosome 1,088,492 1,088,566 + tRNAThrTGT tRNA-Thr-TGT Translation Chromosome 1,795,487 1,795,562 + tRNATrpCCA tRNA-Trp-CCA Translation Chromosome 1,793,533 1,793,615 + tRNATyrGTA tRNA-Tyr-GTA Translation Chromosome 6,393,156 6,393,230 + tRNAValCAC tRNA-Val-CAC Translation Chromosome 6,392,521 6,392,447 - tRNAValGAC tRNA-Val-GAC Translation Chromosome 6,392,755 6,392,681 - tRNAValGAC tRNA-Val-GAC Translation Chromosome 2,672,752 2,672,826 + tRNAValTAC tRNA-Val-TAC Translation Chromosome 768,635 770,899 + ftsH1 Cell division protein FtsH Cell division Chromosome 1,196,871 1,197,113 + ftsH2 Cell division protein FtsH Cell division Chromosome 1,197,110 1,198,015 + ftsH3 Cell division protein FtsH Cell division Chromosome 2,476,278 2,477,654 + tig Cell division trigger factor Cell division Chromosome 2,708,947 2,708,057 - yfhF1 Cell division inhibitor Cell division Chromosome 3,930,915 3,932,267 + ytfH2 Cell division inhibitor Cell division Chromosome 2,768,737 2,769,168 + mraZ Cell division protein MraZ Cell division Chromosome 2,770,506 2,771,060 + ftsL Cell division protein FtsL Cell division Chromosome 2,771,147 2,772,907 + ftsI Cell division protein FtsI Cell division Chromosome 2,779,155 2,780,501 + ftsW Cell division protein FtsW Cell division

Supplementary material | Appendix II
217
Chromosome 2,783,343 2,784,026 + ftsQ Cell division protein FtsQ Cell division Chromosome 2,784,237 2,785,433 + ftsZ Cell division protein FtsZ Cell division Chromosome 6,035,272 6,035,961 + ftsE Cell division transporter,
ATP-binding protein FtsE Cell division Chromosome 6,036,025 6,036,930 + ftsX Cell division protein FtsX Cell division Chromosome 6,157,007 6,158,422 + ftsY Signal recognition particle
receptor protein FtsY Cell division Chromosome 6,263,572 6,266,208 + ftsK Cell division protein FtsK Cell division
Supplementary Table 4.S4 GGDC comparisons of Rhodococcus type strains sequenced genomes.
XLSX file. Only included in the electronic version.

Supplementary material | Appendix II
218
Supplementary Table 4.S5 Genes involved in the central metabolism of Rhodococcus sp. WAY2.
Replicon Start End Strand Gene name Predicted function Function,
pathway Chromosome 654,458 655,462 + glkA Glucokinase Glycolysis Chromosome 2,747,596 2,748,597 + glk Glucokinase Glycolysis Chromosome 4,167,043 4,167,567 + gntk Glucokinase
thermoresistant Glycolysis
Chromosome 6,343,896 6,343,144 - ppgK Polyphosphate glucokinase Glycolysis
Chromosome 227,909 229,564 + pgi1 Glucose-6-phosphate isomerase
Glycolysis, gluconeogenesis, pentose phosphate
pathway
Chromosome 5,115,499 5,114,198 - pgi2 Glucose-6-phosphate isomerase
Glycolysis, gluconeogenesis, pentose phosphate
pathway Chromosome 6,102,346 6,103,377 + pfkA 6-phosphofructokinase Glycolysis Chromosome 6,297,174 6,296,194 - fruK 1-phosphofructokinase Glycolysis Chromosome 5,083,954 5,084,988 + fba Fructose-bisphosphate
aldolase Glycolysis,
gluconeogenesis Chromosome 3,474,588 3,473,803 - tpiA Triose-phosphate
isomerase Glycolysis
Chromosome 3,476,836 3,475,817 - gap Glyceraldehyde 3-phosphate dehydrogenase
Glycolysis, gluconeogenesis
Chromosome 3,475,745 3,474,588 - pgk Phosphoglycerate kinase Glycolysis, gluconeogenesis
Chromosome 1,728,074 1,728,829 + gpmA1 Phosphoglycerate mutase Glycolysis, gluconeogenesis
Chromosome 5,975,937 5,975,323 - gpmA2 Phosphoglycerate mutase Glycolysis, gluconeogenesis
Chromosome 5,345,257 5,346,543 + eno Phosphopyruvate hydratase / enolase
Glycolysis, gluconeogenesis
Chromosome 2,865,568 2,866,986 + pyk Pyruvate kinase Glycolysis, purine metabolism
Chromosome 4,159,399 4,161,252 + edd Phosphogluconate dehydratase Glycolysis (ED)
Chromosome 4,161,265 4,161,891 + eda 4-hydroxy-2-oxoglutarate aldolase Glycolysis (ED)
Chromosome 5,389,671 5,388,631 - glpX Fructose-1,6-biphosphatase class II Gluconeogenesis
pRWAY01 292,410 293,354 + glpX Fructose-1,6-bisphosphatase Gluconeogenesis
Chromosome 4,553,850 4,555,679 + pckG Phosphoenolpyruvate carboxykinase Gluconeogenesis
prWAY02 385,109 383,205 - pckG Phosphoenolpyruvate carboxykinase Gluconeogenesis
Chromosome 241,101 238,750 - pdh Pyruvate dehydrogenase E1 component
Acetyl-CoA synthesis
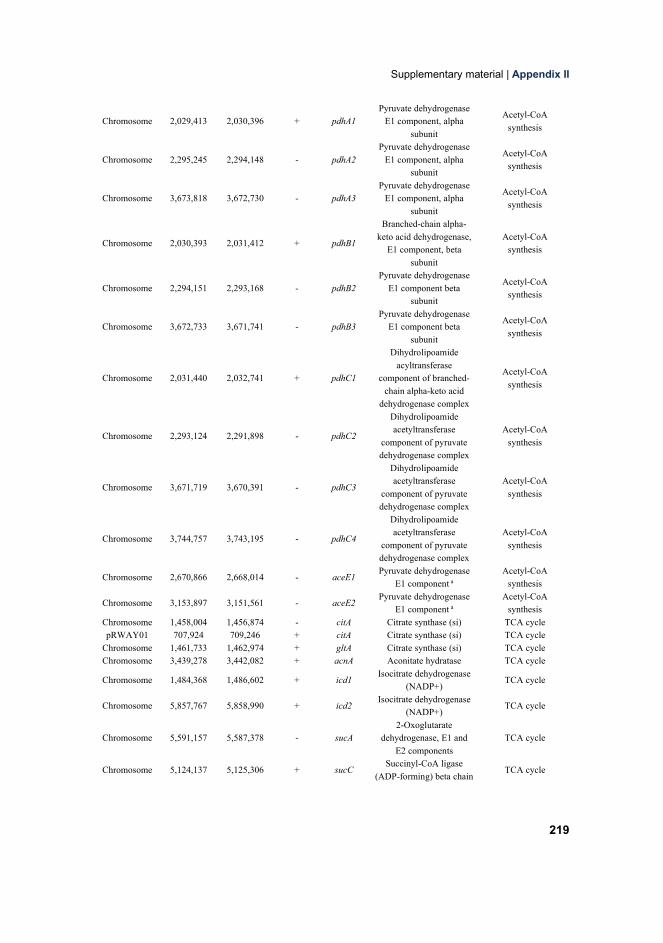
Supplementary material | Appendix II
219
Chromosome 2,029,413 2,030,396 + pdhA1 Pyruvate dehydrogenase
E1 component, alpha subunit
Acetyl-CoA synthesis
Chromosome 2,295,245 2,294,148 - pdhA2 Pyruvate dehydrogenase
E1 component, alpha subunit
Acetyl-CoA synthesis
Chromosome 3,673,818 3,672,730 - pdhA3 Pyruvate dehydrogenase
E1 component, alpha subunit
Acetyl-CoA synthesis
Chromosome 2,030,393 2,031,412 + pdhB1 Branched-chain alpha-
keto acid dehydrogenase, E1 component, beta
subunit
Acetyl-CoA synthesis
Chromosome 2,294,151 2,293,168 - pdhB2 Pyruvate dehydrogenase
E1 component beta subunit
Acetyl-CoA synthesis
Chromosome 3,672,733 3,671,741 - pdhB3 Pyruvate dehydrogenase
E1 component beta subunit
Acetyl-CoA synthesis
Chromosome 2,031,440 2,032,741 + pdhC1
Dihydrolipoamide acyltransferase
component of branched-chain alpha-keto acid
dehydrogenase complex
Acetyl-CoA synthesis
Chromosome 2,293,124 2,291,898 - pdhC2 Dihydrolipoamide acetyltransferase
component of pyruvate dehydrogenase complex
Acetyl-CoA synthesis
Chromosome 3,671,719 3,670,391 - pdhC3 Dihydrolipoamide acetyltransferase
component of pyruvate dehydrogenase complex
Acetyl-CoA synthesis
Chromosome 3,744,757 3,743,195 - pdhC4 Dihydrolipoamide acetyltransferase
component of pyruvate dehydrogenase complex
Acetyl-CoA synthesis
Chromosome 2,670,866 2,668,014 - aceE1 Pyruvate dehydrogenase E1 component a
Acetyl-CoA synthesis
Chromosome 3,153,897 3,151,561 - aceE2 Pyruvate dehydrogenase E1 component a
Acetyl-CoA synthesis
Chromosome 1,458,004 1,456,874 - citA Citrate synthase (si) TCA cycle pRWAY01 707,924 709,246 + citA Citrate synthase (si) TCA cycle
Chromosome 1,461,733 1,462,974 + gltA Citrate synthase (si) TCA cycle Chromosome 3,439,278 3,442,082 + acnA Aconitate hydratase TCA cycle Chromosome 1,484,368 1,486,602 + icd1 Isocitrate dehydrogenase
(NADP+) TCA cycle
Chromosome 5,857,767 5,858,990 + icd2 Isocitrate dehydrogenase (NADP+) TCA cycle
Chromosome 5,591,157 5,587,378 - sucA 2-Oxoglutarate
dehydrogenase, E1 and E2 components
TCA cycle
Chromosome 5,124,137 5,125,306 + sucC Succinyl-CoA ligase (ADP-forming) beta chain TCA cycle

Appendix II | Supplementary material
220
Chromosome 5,125,323 5,126,225 + sucD Succinyl-CoA ligase (ADP-forming) alpha
chain TCA cycle
Chromosome 2,824,678 2,826,609 + sdhA1 Succinate dehydrogenase flavoprotein subunit TCA cycle
Chromosome 5,870,475 5,868,724 - sdhA2 Succinate dehydrogenase flavoprotein subunit TCA cycle
Chromosome 2,826,611 2,827,360 + sdhB1 Succinate dehydrogenase iron-sulfur protein TCA cycle
Chromosome 5,868,724 5,867,945 - sdhB2 Succinate dehydrogenase iron-sulfur protein TCA cycle
Chromosome 5,495,768 5,494,071 - fumB Fumarate hydratase class I TCA cycle
Chromosome 6,208,259 6,209,806 + mqo Malate dehydrogenase (quinone oxidoreductase) TCA cycle
Chromosome 1,941,117 1,942,310 + mdh1 Malate dehydrogenase TCA cycle Chromosome 2,149,115 2,150,170 + mdh2 Malate dehydrogenase TCA cycle Chromosome 4,840,775 4,841,710 + mdh3 Malate dehydrogenase TCA cycle Chromosome 5,577,218 5,578,411 + mdh4 Malate dehydrogenase TCA cycle pRWAY01 27,337 28,536 + mdh1 Malate dehydrogenase TCA cycle pRWAY01 632,113 630,920 - mdh2 Malate dehydrogenase TCA cycle
Chromosome 3,467,019 3,468,557 + zwf1 Glucose-6-phosphate 1-dehydrogenase
Pentose phosphate pathway, glycolysis
(ED)
Chromosome 4,157,906 4,159,402 + zwf2 Glucose-6-phosphate 1-dehydrogenase
Pentose phosphate pathway, glycolysis
(ED)
Chromosome 5,223,741 5,222,395 - zwf3 Glucose-6-phosphate 1-dehydrogenase
Pentose phosphate pathway, glycolysis
(ED)
Chromosome 6,488,580 6,490,118 + zwf4 Glucose-6-phosphate 1-dehydrogenase
Pentose phosphate pathway, glycolysis
(ED)
Chromosome 3,469,462 3,470,205 + pgl 6-phosphogluconolactonase
Pentose phosphate pathway, glycolysis
(ED)
pRWAY01 276,334 275,534 - pgl 6-phosphogluconolactonase
Pentose phosphate pathway, glycolysis
(ED)
Chromosome 3,495 4,406 + gnd1 6-Phosphogluconate
dehydrogenase, decarboxylating
Pentose phosphate pathway
Chromosome 226,045 226,911 + gnd2 6-Phosphogluconate
dehydrogenase, decarboxylating
Pentose phosphate pathway
Chromosome 3,355,733 3,357,181 + gnd3 6-Phosphogluconate
dehydrogenase, decarboxylating
Pentose phosphate pathway
Chromosome 6,488,387 6,487,479 - gnd4 6-Phosphogluconate
dehydrogenase, decarboxylating
Pentose phosphate pathway
pRWAY01 291,430 292,347 + gnd 6-Phosphogluconate
dehydrogenase, decarboxylating
Pentose phosphate pathway

Supplementary material | Appendix II
221
Chromosome 3,486,888 3,486,205 - rpe Ribulose-phosphate 3-epimerase
Pentose phosphate pathway
Chromosome 2,473,583 2,474,056 + rpiB Ribose 5-phosphate isomerase B
Pentose phosphate pathway
Chromosome 3,465,885 3,467,009 + tal Transaldolase Pentose phosphate pathway
pRWAY01 296,705 297,859 + tal Transaldolase Pentose phosphate pathway
Chromosome 294,587 296,695 + tkt1 Transketolase Pentose phosphate pathway
Chromosome 3,463,767 3,465,875 + tkt2 Transketolase Pentose phosphate pathway
Chromosome 1,276,787 1,278,370 + purF Amidophosphoribosyltransferase Purine metabolism
Chromosome 1,231,769 1,233,022 + purD Phosphoribosylamine-glycome ligase Purine metabolism
Chromosome 5,130,043 5,130,483 + purN Phosphoribosylglycinamide formyltransferase Purine metabolism
Chromosome 1,278,489 1,279,568 + purM Phosphoribosylformylglycinamidine cyclo-ligase Purine metabolism
Chromosome 1,271,293 1,273,578 + purL Phosphoribosylformylgly
cinamidine synthase, synthetase subunit
Purine metabolism
Chromosome 1,262,421 1,262,660 + purS Phosphoribosylformylglycinamidine synthase, PurS
subunit Purine metabolism
Chromosome 1,262,657 1,263,334 + purQ Phosphoribosylformylgly
cinamidine synthase, glutamine
amidotransferase subunit Purine metabolism
Chromosome 5,926,967 5,928,157 + purK Phosphoribosylaminoimidazole carboxylase ATPase
subunit Purine metabolism
Chromosome 5,928,150 5,928,668 + purE Phosphoribosylamidazole
carboxylase catalytic subunit
Purine metabolism
Chromosome 1,246,819 1,247,703 + purC Phosphoribosylaminoimid
azole-succinocarboxamide
synthase Purine metabolism
Chromosome 1,238,668 1,240,089 + purB Adenylosuccinate lyase Purine metabolism
Chromosome 5,130,476 5,132,032 + purH Phosphoribosylaminoimid
azolecarboxamide formyltransferase
Purine metabolism
Chromosome 5,097,130 5,098,419 + purA Adenylosuccinate synthetase Purine metabolism
Chromosome 1,238,668 1,240,089 + purB Adenylosuccinate lyase Purine metabolism Chromosome 5,767,055 5,767,600 + adk1 Adenylate kinase Purine metabolism Chromosome 3,300,576 3,301,157 + adk2 Adenylate kinase Purine metabolism
Chromosome 2,519,189 2,519,608 + ndk Nucleoside diphosphate kinase
Purine and pyrimidine metabolism
Chromosome 3,499,983 3,499,465 - gmk Guanylate kinase Purine metabolism Chromosome 5,823,892 5,825,463 + guaA GMP synthase Purine metabolism

Appendix II | Supplementary material
222
Chromosome 3,359,549 3,360,985 + guaB1 Inosine-5’-
monophosphate dehydrogenase
Purine metabolism
Chromosome 4,127,515 4,127,069 - guaB2 Inosine-5’-
monophosphate dehydrogenase
Purine metabolism
Chromosome 5,819,152 5,820,675 + guaB3 Inosine-5’-
monophosphate dehydrogenase
Purine metabolism
Chromosome 5,820,702 5,821,841 + guaB4 Inosine-5’-
monophosphate dehydrogenase
Purine metabolism
Chromosome 843,891 841,156 - xdhA1 Xanthine dehydrogenase,
molybdenum binding subunit
Purine metabolism
Chromosome 1,475,762 1,478,485 + xdhA2 Xanthine dehydrogenase,
molybdenum binding subunit
Purine metabolism
Chromosome 844,697 843,888 - xdhB1 Xanthine dehydrogenase, FAD binding subunit Purine metabolism
Chromosome 1,474,938 1,475,765 + xdhB2 Xanthine dehydrogenase, FAD binding subunit Purine metabolism
Chromosome 845,696 844,767 - pucL Uricase (urate oxidase) Purine metabolism Chromosome 866,473 865,529 - puuE Uricase (urate oxidase) Purine metabolism Chromosome 846,028 845,699 - pucM 5-Hydroxyisourate
hydrolase Purine metabolism
Chromosome 846,540 846,028 - uraD 2-oxo-4-hydroxy-4-
carboxy--5-ureidoimidazoline
(OHCU) decarboxylase Purine metabolism
Chromosome 867,465 866,470 - alc Allantoicase Purine metabolism Chromosome 3,505,899 3,504,739 - carA Carbamoyl-phosphate
synthase large chain Pyrimidine metabolism
Chromosome 3,504,739 3,501,371 - carB Carbamoyl-phosphate synthase small chain
Pyrimidine metabolism
Chromosome 3,507,772 3,506,456 - pyrC Dihydroorotase Pyrimidine metabolism
Chromosome 3,508,743 3,507,799 - pyrR Aspartate carbamoyltransferase
Pyrimidine metabolism
Chromosome 2,979,743 2,978,673 - pyrD Dihydroorotate dehydrogenase
Pyrimidine metabolism
Chromosome 5,063,466 5,063,999 + pyrE Orotate phosphoribosyltransferase
Pyrimidine metabolism
Chromosome 3,501,374 3,500,535 - pyrF Orotidine 5’-phosphate decarboxylase
Pyrimidine metabolism
Chromosome 6,185,523 6,186,251 + pyrH Uridine monophosphate kinase
Pyrimidine metabolism
Chromosome 2,943,519 2,945,288 + pyrG CTP synthase Pyrimidine metabolism
Chromosome 6,061,354 6,063,537 + nrdE Ribonucleotide reductase, class Ib, alpha subunit
Pyrimidine metabolism
Chromosome 6,063,615 6,064,580 + nrdF Ribonucleotide reductase, class Ib, beta subunit
Pyrimidine metabolism

Supplementary material | Appendix II
223
Chromosome 6,060,544 6,060,831 + nrdH
Glutaredoxin-like protein NrdH, required for
reduction of Ribonucleotide reductase
class Ib
Pyrimidine metabolism
Chromosome 6,060,920 6,061,396 + nrdI Ribonucleotide reduction protein
Pyrimidine metabolism
Chromosome 4,849,022 4,849,591 + dcd Deoxycytidine triphosphate deaminase
Pyrimidine metabolism
Chromosome 6,347,206 6,347,652 + dut Deoxyuridine 5’-
triphosphate nucleotide hydrolase
Pyrimidine metabolism
Chromosome 1,539,932 1,539,132 - thyA Thymidylate synthase Pyrimidine metabolism
Chromosome 5,949,443 5,950,141 + tmk1 Thymidylate kinase Pyrimidine metabolism
Chromosome 5,373,059 5,375,026 + tmk2 Thymidylate kinase Pyrimidine metabolism
Chromosome 152,600 154,102 + fadD1 Long-chain-fatty-acid--CoA ligase Beta-oxidation
Chromosome 502,624 500,777 - fadD2 Long-chain-fatty-acid--CoA ligase Beta-oxidation
Chromosome 917,717 916,167 - fadD3 Long-chain-fatty-acid--CoA ligase Beta-oxidation
Chromosome 1,040,510 1,042,186 + fadD4 Long-chain-fatty-acid--CoA ligase Beta-oxidation
Chromosome 1,044,931 1,043,360 - fadD5 Long-chain-fatty-acid--CoA ligase Beta-oxidation
Chromosome 1,171,757 1,170,342 - fadD6 Long-chain-fatty-acid--CoA ligase Beta-oxidation
Chromosome 1,878,765 1,880,564 + fadD7 Long-chain-fatty-acid--CoA ligase Beta-oxidation
Chromosome 2,744,757 2,742,946 - fadD8 Long-chain-fatty-acid--CoA ligase Beta-oxidation
Chromosome 3,907,778 3,906,096 - fadD9 Long-chain-fatty-acid--CoA ligase Beta-oxidation
Chromosome 4,051,539 4,050,073 - fadD10 Long-chain-fatty-acid--CoA ligase Beta-oxidation
Chromosome 4,224,541 4,226,064 + fadD11 Long-chain-fatty-acid--CoA ligase Beta-oxidation
Chromosome 4,288,207 4,289,730 + fadD12 Long-chain-fatty-acid--CoA ligase Beta-oxidation
Chromosome 5,543,473 5,545,248 + fadD13 Long-chain-fatty-acid--CoA ligase Beta-oxidation
Chromosome 5,605,565 5,606,755 + fadD14 Long-chain-fatty-acid--CoA ligase Beta-oxidation
Chromosome 5,618,475 5,616,709 - fadD15 Long-chain-fatty-acid--CoA ligase Beta-oxidation
Chromosome 5,681,092 5,682,729 + fadD16 Long-chain-fatty-acid--CoA ligase Beta-oxidation
Chromosome 5,742,135 5,743,724 + fadD17 Long-chain-fatty-acid--CoA ligase Beta-oxidation
pRWAY01 606,992 605,433 - fadD Long-chain-fatty-acid--CoA ligase Beta-oxidation

Appendix II | Supplementary material
224
Chromosome 1,751,879 1,749,999 - acx Acyl-CoA oxidase Beta-oxidation Chromosome 202,429 203,574 + fadE1 Butyryl-CoA
dehydrogenase Beta-oxidation
Chromosome 217,813 216,650 - fadE2 Branched-chain acyl-CoA dehydrogenase Beta-oxidation
Chromosome 500,744 499,575 - fadE3 Butyryl-CoA dehydrogenase Beta-oxidation
Chromosome 821,632 823,794 + fadE4 Butyryl-CoA dehydrogenase Beta-oxidation
Chromosome 823,877 824,917 + fadE5 Acyl-CoA dehydrogenase Beta-oxidation Chromosome 824,902 826,053 + fadE6 Acyl-CoA dehydrogenase Beta-oxidation Chromosome 913,176 912,118 - fadE7 Butyryl-CoA
dehydrogenase Beta-oxidation
Chromosome 914,141 913,173 - fadE8 Butyryl-CoA dehydrogenase Beta-oxidation
Chromosome 915,298 914,138 - fadE9 Butyryl-CoA dehydrogenase Beta-oxidation
Chromosome 1,046,049 1,044,928 - fadE10 Butyryl-CoA dehydrogenase Beta-oxidation
Chromosome 1,135,137 1,133,836 - fadE11 Butyryl-CoA dehydrogenase Beta-oxidation
Chromosome 1,331,093 1,332,352 + fadE12 Acyl-CoA
dehydrogenase, short-chain specific
Beta-oxidation
Chromosome 1,852,221 1,853,411 + fadE13 Butyryl-CoA dehydrogenase Beta-oxidation
Chromosome 2,034,972 2,036,204 + fadE14 Butyryl-CoA dehydrogenase Beta-oxidation
Chromosome 2,054,090 2,055,238 + fadE15 Butyryl-CoA dehydrogenase Beta-oxidation
Chromosome 2,342,932 2,344,032 + fadE16 Butyryl-CoA dehydrogenase Beta-oxidation
Chromosome 2,839,029 2,840,972 + fadE17 Butyryl-CoA dehydrogenase Beta-oxidation
Chromosome 3,867,347 3,868,498 + fadE18 Butyryl-CoA dehydrogenase Beta-oxidation
Chromosome 4,055,055 4,053,814 - fadE19 Butyryl-CoA dehydrogenase Beta-oxidation
Chromosome 4,087,431 4,088,747 + fadE20 Butyryl-CoA dehydrogenase Beta-oxidation
Chromosome 4,184,512 4,185,747 + fadE21 Butyryl-CoA dehydrogenase Beta-oxidation
Chromosome 4,235,387 4,234,230 - fadE22 Butyryl-CoA dehydrogenase Beta-oxidation
Chromosome 4,354,022 4,351,809 - fadE23 Acyl-CoA dehydrogenase Beta-oxidation Chromosome 4,390,385 4,389,225 - fadE24 Butyryl-CoA
dehydrogenase Beta-oxidation
Chromosome 4,525,431 4,526,666 + fadE25 Butyryl-CoA dehydrogenase Beta-oxidation
Chromosome 6,031,073 6,029,661 - fadE26 Butyryl-CoA dehydrogenase Beta-oxidation
pRWAY02 154,775 155,296 + fadE Acyl-CoA dehydrogenase Beta-oxidation Chromosome 5,322,024 5,323,745 + acd Acyl-CoA dehydrogenase Beta-oxidation Chromosome 214,606 213,830 - paaF1 Enoyl-CoA hydratase Beta-oxidation

Supplementary material | Appendix II
225
Chromosome 2,316,794 2,317,570 + paaF2 Enoyl-CoA hydratase Beta-oxidation Chromosome 4,223,702 4,224,484 + paaF3 Enoyl-CoA hydratase Beta-oxidation pRWAY01 684,077 683,265 - paaF Enoyl-CoA hydratase Beta-oxidation
Chromosome 329,086 329,886 + echA1 Enoyl-CoA hydratase Beta-oxidation Chromosome 643,577 644,368 + echA2 Enoyl-CoA hydratase Beta-oxidation Chromosome 757,482 758,312 + echA3 Enoyl-CoA hydratase Beta-oxidation Chromosome 1,007,248 1,006,472 - echA4 Enoyl-CoA hydratase Beta-oxidation Chromosome 1,040,430 1,039,588 - echA5 Enoyl-CoA hydratase Beta-oxidation Chromosome 1,210,711 1,211,499 + echA6 Enoyl-CoA hydratase Beta-oxidation Chromosome 1,499,315 1,500,052 + echA7 Enoyl-CoA hydratase Beta-oxidation Chromosome 3,559,761 3,560,525 + echA8 Enoyl-CoA hydratase Beta-oxidation Chromosome 3,707,957 3,707,211 - echA9 Enoyl-CoA hydratase Beta-oxidation Chromosome 4,052,432 4,051,536 - echA10 Enoyl-CoA hydratase Beta-oxidation Chromosome 4,058,281 4,059,081 + echA11 Enoyl-CoA hydratase Beta-oxidation Chromosome 4,606,554 4,607,624 + echA12 Enoyl-CoA hydratase Beta-oxidation Chromosome 5,321,009 5,320,134 - echA13 Enoyl-CoA hydratase Beta-oxidation Chromosome 5,604,662 5,605,486 + echA14 Enoyl-CoA hydratase Beta-oxidation Chromosome 6,076,178 6,076,957 + echA15 Enoyl-CoA hydratase Beta-oxidation Chromosome 332,634 333,395 + hadH1 3-hydroxyacyl-CoA
dehydrogenase Beta-oxidation
Chromosome 399,565 398,741 - hadH2 3-hydroxyacyl-CoA dehydrogenase Beta-oxidation
Chromosome 1,106,236 1,105,472 - hadH3 3-hydroxyacyl-CoA dehydrogenase Beta-oxidation
Chromosome 2,037,476 2,038,243 + hadH4 3-hydroxyacyl-CoA dehydrogenase Beta-oxidation
Chromosome 4,072,974 4,072,195 - hadH5 3-hydroxyacyl-CoA dehydrogenase Beta-oxidation
Chromosome 4,239,395 4,240,159 + hadH6 3-hydroxyacyl-CoA dehydrogenase Beta-oxidation
Chromosome 4,689,368 4,690,132 + hadH7 3-hydroxyacyl-CoA dehydrogenase Beta-oxidation
pRWAY01 549,550 550,314 + hadH 3-hydroxyacyl-CoA dehydrogenase Beta-oxidation
Chromosome 603,355 604,569 + fadA1 Acetyl-CoA acetyltransferase Beta-oxidation
Chromosome 920,511 921,659 + fadA2 Acetyl-CoA acetyltransferase Beta-oxidation
Chromosome 1,127,499 1,128,644 + fadA3 Acetyl-CoA acetyltransferase Beta-oxidation
Chromosome 1,340,403 1,341,620 + fadA4 Acetyl-CoA acetyltransferase Beta-oxidation
Chromosome 1,370,895 1,372,112 + fadA5 Acetyl-CoA acetyltransferase Beta-oxidation
Chromosome 2,047,844 2,049,061 + fadA6 Acetyl-CoA acetyltransferase Beta-oxidation
Chromosome 3,621,192 3,622,406 + fadA7 Acetyl-CoA acetyltransferase Beta-oxidation
Chromosome 4,036,231 4,037,307 + fadA8 Acetyl-CoA acetyltransferase Beta-oxidation
Chromosome 4,061,756 4,063,015 + fadA9 Acetyl-CoA acetyltransferase Beta-oxidation
Chromosome 4,238,230 4,239,363 + fadA10 Acetyl-CoA acetyltransferase Beta-oxidation

Appendix II | Supplementary material
226
Chromosome 4,580,184 4,581,530 + fadA11 Acetyl-CoA acetyltransferase Beta-oxidation
Chromosome 4,688,118 4,689,248 + fadA12 Acetyl-CoA acetyltransferase Beta-oxidation
Chromosome 5,092,662 5,091,493 - fadA13 Acetyl-CoA acetyltransferase Beta-oxidation
Chromosome 5,362,086 5,360,869 - fadA14 Acetyl-CoA acetyltransferase Beta-oxidation
Chromosome 6,374,989 6,373,781 - fadA15 Acetyl-CoA acetyltransferase Beta-oxidation
pRWAY01 610,582 609,365 - fadA1 Acetyl-CoA acetyltransferase Beta-oxidation
pRWAY01 926,547 927,758 + fadA2 Acetyl-CoA acetyltransferase Beta-oxidation
pRWAY02 393,598 392,452 - fadA Acetyl-CoA acetyltransferase Beta-oxidation
Chromosome 2,036,222 2,037,421 + atoB1 Acetyl-CoA acetyltransferase Beta-oxidation
Chromosome 2,394,262 2,395,527 + atoB2 Acetyl-CoA acetyltransferase Beta-oxidation
Chromosome 4,452,922 4,451,729 - atoB3 Acetyl-CoA acetyltransferase Beta-oxidation
Chromosome 5,690,109 5,691,311 + atoB4 Acetyl-CoA acetyltransferase Beta-oxidation
pRWAY02 182,627 181,434 - atoB1 Acetyl-CoA acetyltransferase Beta-oxidation
pRWAY02 395,944 397,281 + atoB2 Acetyl-CoA acetyltransferase Beta-oxidation
Chromosome 6,115,406 6,117,001 + serA D-3-phosphoglycerate dehydrogenase Serine metabolism
Chromosome 1,741,809 1,740,832 - serB1 Phosphoserine phosphatase Serine metabolism
Chromosome 6,069,566 6,070,786 + serB2 Phosphoserine phosphatase Serine metabolism
Chromosome 1,456,832 1,455,711 - serC Phosphoserine aminotransferase Serine metabolism
Chromosome 665,396 666,661 + lysC Aspartokinase Threonine,
methionine and lysine metabolism
Chromosome 666,665 667,696 + asd Aspartate-semialdehyde dehydrogenase
Threonine, methionine and
lysine metabolism
Chromosome 2,356,594 2,357,967 + hom Homoserine dehydrogenase
Threonine and methionine metabolism
Chromosome 2,359,046 2,360,035 + thrB Homoserine kinase Threonine metabolism
Chromosome 2,357,964 2,359,046 + thrC Threonine synthase Threonine metabolism
Chromosome 1,765,222 1,766,331 + cysK1 Cysteine synthase B Cysteine metabolism
Chromosome 2,414,983 2,415,945 + cysK2 Cysteine synthase B Cysteine metabolism

Supplementary material | Appendix II
227
Chromosome 5,363,353 5,364,738 + cbs Cystathionine beta-synthase
Cysteine and methionine metabolism
Chromosome 5,365,344 5,366,516 + cth Cystathionine gamma-lyase
Cysteine metabolism
Chromosome 3,497,662 3,496,448 - metK S-adenosylmethionine synthetase
Cysteine and methionine metabolism
Chromosome 6,057,375 6,057,926 + pfs S-adenosylhomocysteine nucleosidase
Cysteine metabolism
Chromosome 1,681,725 1,684,019 + metE 5-
methyltetrahydropteroyltriglutamate--homocysteine
methyltransferase
Methionine metabolism
Chromosome 3,006,977 3,010,546 + metH 5-methyltetrahydrofolate-
-homocysteine methyltransferase
Methionine metabolism
Chromosome 5,947,902 5,949,386 + achy Adenosylhomocysteinase Methionine metabolism
Chromosome 552,431 551,289 - cdm DNA (cytosine-5-)-methyltransferase
Methionine metabolism
Chromosome 6,111,821 6,113,629 + ilvB Acetolactate synthase large subunit
Valine/Isoleucine metabolism
Chromosome 6,114,168 6,115,181 + ilvC Ketol-acid reductoisomerase
Valine/Isoleucine metabolism
Chromosome 6,110,875 6,109,031 - ilvD Dihydroxy-acid dehydratase
Valine/Isoleucine metabolism
Chromosome 2,152,655 2,153,575 + ilvE1 Branched-chain amino acid aminotransferase
Valine/Isoleucine metabolism
Chromosome 2,236,093 2,236,944 + ilvE2 Branched-chain amino acid aminotransferase
Valine/Isoleucine metabolism
Chromosome 2,714,338 2,715,441 + ivlE3 Branched-chain amino acid aminotransferase
Valine/Isoleucine metabolism
Chromosome 6,117,075 6,118,085 + leuB 3-isopropylmalate dehydrogenase
Valine/Leucine/Isoleucine metabolism
Chromosome 196,085 197,446 + leuC1 3-isopropylmalate dehydratase large subunit
Valine/Leucine/Isoleucine metabolism
Chromosome 4,332,542 4,331,142 - leuC2 3-isopropylmalate dehydratase large subunit
Valine/Leucine/Isoleucine metabolism
Chromosome 6,123,892 6,125,313 + leuC3 3-isopropylmalate dehydratase large subunit
Valine/Leucine/Isoleucine metabolism
Chromosome 197,453 198,070 + leuD1 3-isopropylmalate dehydratase small subunit
Valine/Leucine/Isoleucine metabolism
Chromosome 4,331,105 4,330,509 - leuD2 3-isopropylmalate dehydratase small subunit
Valine/Leucine/Isoleucine metabolism
Chromosome 6,125,341 6,125,949 + leuD3 3-isopropylmalate dehydratase small subunit
Valine/Leucine/Isoleucine metabolism
Chromosome 629,417 627,609 - leuA 2-isopropylmalate synthase
Leucine metabolism
Chromosome 1,660,395 1,661,798 + lpd1 Dihydrolipoamide dehydrogenase
Valine/Leucine/Isoleucine metabolism
Chromosome 2,026,644 2,025,241 - lpd2 Dihydrolipoamide dehydrogenase
Valine/Leucine/Isoleucine metabolism

Appendix II | Supplementary material
228
Chromosome 3,670,350 3,668,971 - lpd3 Dihydrolipoamide dehydrogenase
Valine/Leucine/Isoleucine metabolism
Chromosome 3,743,185 3,741,776 - lpd4 Dihydrolipoamide dehydrogenase
Valine/Leucine/Isoleucine metabolism
Chromosome 5,885,786 5,887,189 + lpdA Dihydrolipoamide dehydrogenase
Valine/Leucine/Isoleucine metabolism
Chromosome 3,709,536 3,710,474 + dapA1 4-hydroxy-
tetrahydrodipicolinate synthase
Lysine metabolism
Chromosome 4,631,178 4,632,137 + dapA2 4-hydroxy-
tetrahydrodipicolinate synthase
Lysine metabolism
Chromosome 4,806,191 4,805,298 - dapA3 4-hydroxy-
tetrahydrodipicolinate synthase
Lysine metabolism
Chromosome 6,259,951 6,260,859 + dapA4 4-hydroxy-
tetrahydrodipicolinate synthase
Lysine metabolism
Chromosome 6,254,943 6,255,701 + dapB 4-hydroxy-
tetrahydrodipicolinate reductase
Lysine metabolism
Chromosome 5,540,747 5,539,794 - dapD 2,3,4,5-
tetrahydropyridine-2,6-dicarboxylate N-
succinyltransferase Lysine metabolism
Chromosome 2,916,585 2,917,784 + argD Acetylornithine aminotransferase
Lysine and arginine metabolism
Chromosome 5,526,715 5,527,815 + dapC N-succinyl-L,L-diaminopimelate aminotransferase
alternative
Lysine and arginine metabolism
Chromosome 5,540,915 5,541,988 + dapE N-succinyl-L,L-diaminopimelate
desuccinylase Lysine metabolism
Chromosome 6,288,450 6,289,319 + dapF Diaminopimelate epimerase Lysine metabolism
Chromosome 2,355,176 2,356,597 + lysA Diaminopimelate decarboxylase Lysine metabolism
Chromosome 2,914,424 2,915,665 + argJ N-acetylglutamate synthase
Arginine metabolism
Chromosome 2,915,662 2,916,588 + argB Acetylglutamate kinase Arginine metabolism
Chromosome 2,913,372 2,914,427 + argC N-acetyl-gamma-
glutamyl-phosphate reductase
Arginine metabolism
Chromosome 2,917,781 2,918,728 + argF Ornithine carbamoyltransferase
Arginine metabolism
Chromosome 2,919,291 2,920,490 + argG Argininosuccinate synthase
Arginine metabolism
Chromosome 2,920,493 2,921,911 + argH Argininosuccinate lyase Arginine metabolism
Chromosome 2,526,075 2,527,175 + proB Glutamate 5-kinase Proline metabolism Chromosome 2,537,372 2,538,649 + proA Gamma-glutamyl
phosphate reductase Proline metabolism

Supplementary material | Appendix II
229
Chromosome 1,737,053 1,737,868 + proC Pyrroline-5-carboxylate reductase Proline metabolism
Chromosome 3,013,375 3,014,226 + hisG ATP phosphoribosyltransferase
Histidine metabolism
Chromosome 3,013,040 3,013,321 + hisE Phosphoribosyl-ATP pyrophosphatase
Histidine metabolism
Chromosome 2,849,242 2,849,586 + hisI Phosphoribosyl-AMP cyclohydrolase
Histidine metabolism
Chromosome 2,847,041 2,847,634 + hisA Phosphoribosylformimino
-5-aminoimidazole carboxamide ribotide
isomerase
Histidine metabolism
Chromosome 2,848,472 2,849,245 + hisF Imidazole glycerol phosphate synthase
cyclase subunit Histidine
metabolism
Chromosome 2,843,989 2,844,603 + hisB Imidazoleglycerol-phosphate dehydratase
Histidine metabolism
Chromosome 2,842,850 2,843,992 + hisC Histidinol-phosphate aminotransferase
Histidine metabolism
Chromosome 2,841,459 2,842,853 + hisD Histidinol dehydrogenase Histidine metabolism
Chromosome 1,643,543 1,645,090 + hutH Histidine ammonia-lyase Histidine metabolism
Chromosome 1,001,825 1,000,152 - hutU Urocanate hydratase Histidine metabolism
Chromosome 1,000,142 998,937 - hutI Imidazolonepropionase Histidine metabolism
Chromosome 998,940 997,987 - hutG Formiminoglutamase Histidine metabolism
Chromosome 2,854,221 2,855,030 + trpC Indole-3-glycerol phosphate synthase
Tryptophan metabolism
Chromosome 2,734,500 2,735,603 + trpD Anthranilate phosphoribosyltransferase
Tryptophan metabolism
Chromosome 2,851,829 2,853,427 + trpE Anthranilate synthase, aminase component
Tryptophan metabolism
Chromosome 4,523,978 4,523,388 - trpF Phosphoribosylanthranilate isomerase
Tryptophan metabolism
Chromosome 32,654 33,307 + trpG Anthranilate synthase,
amidotransferase component
Tryptophan metabolism
Chromosome 2,855,093 2,856,415 + trpB Tryptophan synthase beta chain
Tryptophan metabolism
Chromosome 2,856,412 2,857,215 + trpA Tryptophan synthase alpha chain
Tryptophan metabolism
Chromosome 5,117,800 5,117,504 - csm Chorismate mutase I Phenylalanine, tyrosine and tryptophan metabolism
Chromosome 430,018 430,935 + pheA Prephenate dehydratase Phenylalanine metabolism
Chromosome 5,006,667 5,005,414 - aspC Aspartate aminotransferase
Phenylalanine, tyrosine and tryptophan metabolism

Appendix II | Supplementary material
230
Chromosome 555,293 554,343 - tyrA Prephenate dehydrogenase
Phenylalanine, tyrosine and tryptophan metabolism
Chromosome 541,975 540,899 - tat1 Tyrosine aminotransferase
Phenylalanine, tyrosine and tryptophan metabolism
Chromosome 4,430,232 4,429,150 - tat2 Tyrosine aminotransferase
Phenylalanine, tyrosine and tryptophan metabolism
Chromosome 1,753,343 1,754,551 + hppD1 4-hydroxyphenylpyruvate dioxygenase
Tyrosine and phenylalanine metabolism
Chromosome 3,791,827 3,793,032 + hppD2 4-hydroxyphenylpyruvate dioxygenase
Tyrosine and phenylalanine metabolism
Chromosome 2,083,970 2,084,818 + kynA Tryptophan 2,3-dioxygenase
Tryptophan metabolism
Chromosome 2,084,815 2,086,050 + kynU Kynureninase Tryptophan metabolism
Central aromatic metabolism
Chromosome 2,500,526 2,499,885 - pcaG Protocatechuate 3,4-dioxygenase alpha chain Beta-ketoadipate
Chromosome 2,501,245 2,500,526 - pcaH Protocatechuate 3,4-dioxygenase beta chain Beta-ketoadipate
Chromosome 2,499,862 2,498,516 - pcaB 3-carboxy-cis,cis-muconate cycloisomerase Beta-ketoadipate
Chromosome 2,498,519 2,497,326 - pcaC 4-carboxymuconolactone decarboxylase Beta-ketoadipate
Chromosome 345,521 346,303 + pcaD1 Beta-ketoadipate enol-lactone hydrolase Beta-ketoadipate
Chromosome 1,067,030 1,067,833 + pcaD2 Beta-ketoadipate enol-lactone hydrolase Beta-ketoadipate
Chromosome 3,589,424 3,590,290 + pcaD3 Beta-ketoadipate enol-lactone hydrolase Beta-ketoadipate
Chromosome 3,693,989 3,694,861 + pcaD4 Beta-ketoadipate enol-lactone hydrolase Beta-ketoadipate
Chromosome 6,450,972 6,450,100 - pcaD5 Beta-ketoadipate enol-lactone hydrolase Beta-ketoadipate
Chromosome 2,214,986 2,215,750 + pcaI Succinyl-CoA:3-ketoacid-coenzyme A transferase
subunit A Beta--ketoadipate
Chromosome 2,215,747 2,216,415 + pcaJ Succinyl-CoA:3-ketoacid-coenzyme A transferase
subunit B Beta-ketoadipate
Chromosome 4,154,203 4,155,045 + catA Catechol 1,2-dioxygenase Beta-ketoadipate, catechol ortho-
cleavage
Chromosome 4,155,075 4,156,196 + catB Muconate cycloisomerase Beta-ketoadipate, catechol ortho-
cleavage
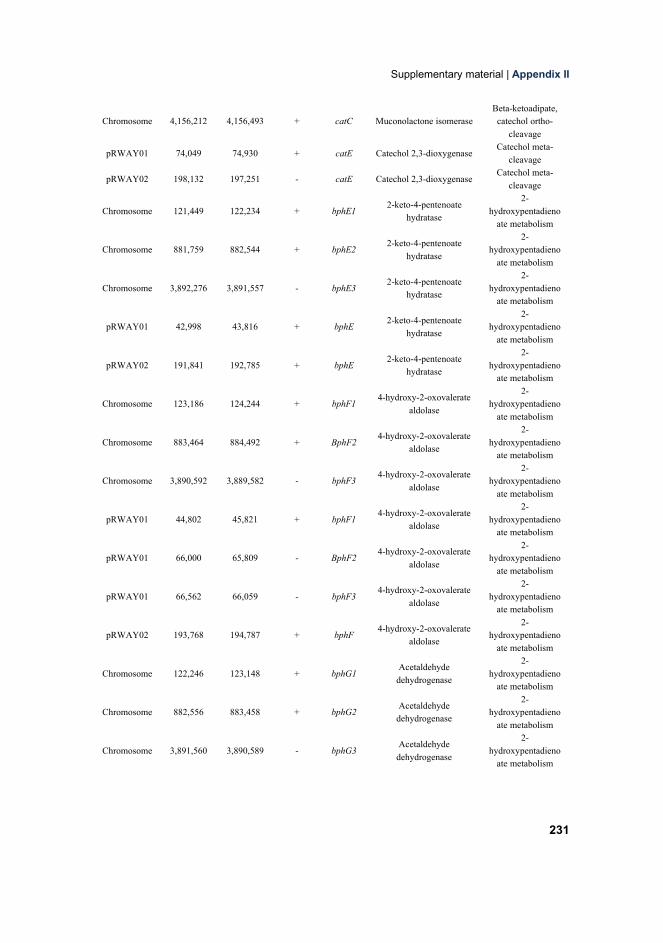
Supplementary material | Appendix II
231
Chromosome 4,156,212 4,156,493 + catC Muconolactone isomerase Beta-ketoadipate, catechol ortho-
cleavage pRWAY01 74,049 74,930 + catE Catechol 2,3-dioxygenase Catechol meta-
cleavage pRWAY02 198,132 197,251 - catE Catechol 2,3-dioxygenase Catechol meta-
cleavage
Chromosome 121,449 122,234 + bphE1 2-keto-4-pentenoate hydratase
2-hydroxypentadieno
ate metabolism
Chromosome 881,759 882,544 + bphE2 2-keto-4-pentenoate hydratase
2-hydroxypentadieno
ate metabolism
Chromosome 3,892,276 3,891,557 - bphE3 2-keto-4-pentenoate hydratase
2-hydroxypentadieno
ate metabolism
pRWAY01 42,998 43,816 + bphE 2-keto-4-pentenoate hydratase
2-hydroxypentadieno
ate metabolism
pRWAY02 191,841 192,785 + bphE 2-keto-4-pentenoate hydratase
2-hydroxypentadieno
ate metabolism
Chromosome 123,186 124,244 + bphF1 4-hydroxy-2-oxovalerate aldolase
2-hydroxypentadieno
ate metabolism
Chromosome 883,464 884,492 + BphF2 4-hydroxy-2-oxovalerate aldolase
2-hydroxypentadieno
ate metabolism
Chromosome 3,890,592 3,889,582 - bphF3 4-hydroxy-2-oxovalerate aldolase
2-hydroxypentadieno
ate metabolism
pRWAY01 44,802 45,821 + bphF1 4-hydroxy-2-oxovalerate aldolase
2-hydroxypentadieno
ate metabolism
pRWAY01 66,000 65,809 - BphF2 4-hydroxy-2-oxovalerate aldolase
2-hydroxypentadieno
ate metabolism
pRWAY01 66,562 66,059 - bphF3 4-hydroxy-2-oxovalerate aldolase
2-hydroxypentadieno
ate metabolism
pRWAY02 193,768 194,787 + bphF 4-hydroxy-2-oxovalerate aldolase
2-hydroxypentadieno
ate metabolism
Chromosome 122,246 123,148 + bphG1 Acetaldehyde dehydrogenase
2-hydroxypentadieno
ate metabolism
Chromosome 882,556 883,458 + bphG2 Acetaldehyde dehydrogenase
2-hydroxypentadieno
ate metabolism
Chromosome 3,891,560 3,890,589 - bphG3 Acetaldehyde dehydrogenase
2-hydroxypentadieno
ate metabolism

Appendix II | Supplementary material
232
pRWAY01 43,822 44,805 + bphG1 Acetaldehyde dehydrogenase
2-hydroxypentadieno
ate metabolism
pRWAY01 66,900 66,571 - bphG2 Acetaldehyde dehydrogenase
2-hydroxypentadieno
ate metabolism
pRWAY02 192,791 193,771 + bphG1 Acetaldehyde dehydrogenase
2-hydroxypentadieno
ate metabolism
pRWAY02 205,797 206,045 + bphG2 Acetaldehyde dehydrogenase
2-hydroxypentadieno
ate metabolism
pRWAY02 206,093 206,407 + bphG3 Acetaldehyde dehydrogenase
2-hydroxypentadieno
ate metabolism Chromosome 4,144,636 4,143,254 - benA Benzoate 1,2-dioxygenase
alpha subunit Benzoate
metabolism Chromosome 4,143,239 4,142,730 - benB Benzoate 1,2-dioxygenase
beta subunit Benzoate
metabolism
Chromosome 4,142,692 4,141,532 - benC benzoate dioxygenase, ferredoxin reductase
component Benzoate
metabolism
Chromosome 4,141,535 4,140,741 - benD 1,2-dihydroxycyclohexa-3,5-diene-1-carboxylate
dehydrogenase Benzoate
metabolism
Chromosome 4,623,722 4,622,622 - gdoA1 Gentisate 1,2-dioxygenase
Gentisate metabolism
Chromosome 4,661,780 4,660,668 - gdoA2 Gentisate 1,2-dioxygenase
Gentisate metabolism
pRWAY01 73,562 74,041 + gdoA Gentisate 1,2-dioxygenase
Gentisate metabolism
pRWAY02 198,619 198,140 - gdoA Gentisate 1,2-dioxygenase
Gentisate metabolism
Chromosome 4,219,043 4,220,242 + hmgA Homogentisate 1,2-dioxygenase
Homogentisate metabolism

Supplementary material | Appendix II
233
Supplementary Table 4.S6 Genes involved in peripheral metabolism of Rhodococcus sp. WAY2
Replicon Start End Strand Gene name Predicted function Cellular function
pRWAY01 509,217 507,868 - bphA1a Biphenyl dioxygenase, alpha subunit
Biphenyl/PCBs metabolism
pRWAY01 507,833 507,297 - bphA2a Biphenyl dioxygenase, alpha subunit
Biphenyl/PCBs metabolism
pRWAY01 506,547 506,209 - bphA3 Biphenyl dioxygenase ferredoxin subunit
Biphenyl/PCBs metabolism
pRWAY01 506,124 504,889 - bphA4 Ferredoxin reductase
component of biphenyl dioxygenase
Biphenyl/PCBs metabolism
pRWAY01 511,414 510,599 - bphB 2,3-dihydroxy-2,3-dihydro-biphenyl dehydrogenase
Biphenyl/PCBs metabolism
pRWAY01 510,569 509,682 - bphC 2,3-dihydroxybiphenyl 1,2-dioxygenase
Biphenyl/PCBs metabolism
pRWAY01 504,851 503,994 - bphD 2-hydroxy-6-oxo-6-
phenylhexa-2,4-dienoate hydrolase
Biphenyl/PCBs metabolism
pRWAY01 503,862 503,449 - bphE 2-keto-4-pentenoate hydratase
Biphenyl/PCBs metabolism
pRWAY01 60,245 58,839 - bphA1b Biphenyl dioxygenase, alpha subunit
Biphenyl/PCBs metabolism
pRWAY01 58,835 58,317 - bphA2b Biphenyl dioxygenase, alpha subunit
Biphenyl/PCBs metabolism
pRWAY01 58,025 57,210 - bphB 2,3-dihydroxy-2,3-dihydro-biphenyl dehydrogenase
Biphenyl/PCBs metabolism
pRWAY01 70,437 71,297 + bphD 2-hydroxy-6-oxo-6-
phenylhexa-2,4-dienoate hydrolase
Biphenyl/PCBs metabolism
pRWAY02 156,099 157,481 + etbA1a Ethylbenzene
dioxygenase, large subunit
Ethylbenzene/biphenyl/PCBs
metabolism
pRWAY02 157,504 158,052 + etbA2a Ethylbenzene
dioxygenase, small subunit
Ethylbenzene/biphenyl/PCBs
metabolism
pRWAY02 158,072 158,989 + etbC 1,2-
dihydroxyethylbenzene dioxygenase
Ethylbenzene/biphenyl/PCBs
metabolism
pRWAY02 150,062 150,874 + bphB 2,3-dihydroxy-2,3-dihydro-biphenyl dehydrogenase
Ethylbenzene/biphenyl/PCBs
metabolism
pRWAY02 159,112 159,969 + bphD 2-hydroxy-6-oxo-6-
phenylhexa-2,4-dienoate hydrolase
Ethylbenzene/biphenyl/PCBs
metabolism
pRWAY02 160,020 160,823 + bphE 2-oxo-hepta-3-ene-1,7-dioic acid hydratase
Ethylbenzene/biphenyl/PCBs
metabolism

Appendix II | Supplementary material
234
pRWAY02 160,835 161,605 + bphF 2,4-dihydroxyhept-2-
ene-1,7-dioic acid aldolase
Ethylbenzene/biphenyl/PCBs
metabolism
pRWAY02 167,930 169,312 + etbA1b Ethylbenzene
dioxygenase, large subunit
Ethylbenzene/biphenyl/PCBs
metabolism
pRWAY02 169,335 169,883 + etbA2b Ethylbenzene
dioxygenase, small subunit
Ethylbenzene/biphenyl/PCBs
metabolism
pRWAY02 169,913 170,278 + etbA3 ferredoxin Ethylbenzene/biphe
nyl/PCBs metabolism
pRWAY02 201,744 200,884 - bphD 2-hydroxy-6-oxo-6-
phenylhexa-2,4-dienoate hydrolase
Ethylbenzene/biphenyl/PCBs
metabolism
pRWAY02 216,173 217,579 + nahA1 Naphthalene
dioxygenase alpha subunit
Naphthalene/biphenyl/PCBs metabolism
pRWAY02 217,583 218,101 + nahA2 Naphthalene
dioxygenase beta subunit
Naphthalene/biphenyl/PCBs metabolism
pRWAY02 218,115 218,387 + nahC dihydrodiol dehydrogenase
Naphthalene/biphenyl/PCBs metabolism
pRWAY02 218,393 219,208 + nahB cis-naphthalene
dihydrodiol dehydrogenase
Naphthalene/biphenyl/PCBs metabolism
pRWAY01 15,833 15,171 - tmoF Oxidoreductase FAD-
binding domain-containing protein
Toluene metabolism
pRWAY01 17,197 16,160 - tmoE Toluene-4-
monooxygenase, subunit
Toluene metabolism
pRWAY01 17,495 17,199 - tmoD monooxygenase component Toluene metabolism
pRWAY01 17,882 17,514 - tmoC Toluene-4-
monooxygenase, subunit
Toluene metabolism
pRWAY01 18,124 17,879 - tmoB Toluene monooxygenase Toluene metabolism
pRWAY01 19,655 18,141 - tmoA Toluene-4-
monooxygenase, subunit
Toluene metabolism
Chromosome 942,988 944,622 + mmoX Methane
monooxygenase component A alpha
chain
Methane metabolism
Chromosome 944,707 945,750 + mmoC Methane
monooxygenase component C
Methane metabolism
Chromosome 945,801 946,907 + mmoY Methane
monooxygenase component A beta
chain
Methane metabolism

Supplementary material | Appendix II
235
Chromosome 946,904 947,245 + mmoB Methane
monooxygenase regulatory protein B
Methane metabolism
pRWAY02 238,905 240,443 + mmoX1 Methane
monooxygenase component A alpha
chain
Methane metabolism
pRWAY02 240,443 241,534 + mmoY1 Methane
monooxygenase component A beta
chain
Methane metabolism
pRWAY02 241,531 241,848 + mmoB1 Methane
monooxygenase regulatory protein B
Methane metabolism
pRWAY02 241,860 242,891 + mmoC1 Methane
monooxygenase component C
Methane metabolism
pRWAY02 274,460 276,040 + mmoX2 Methane
monooxygenase component A alpha
chain
Methane metabolism
pRWAY02 276,239 277,456 + mmoY2 Methane
monooxygenase component A beta
chain
Methane metabolism
pRWAY02 277,859 277,996 + mmoB2 Methane
monooxygenase regulatory protein B
Methane metabolism
pRWAY02 278,372 279,394 + mmoC2 Methane
monooxygenase component C
Methane metabolism
pRWAY02 279,463 279,981 + mmoZ Methane
monooxygenase component A gamma
chain
Methane metabolism
pRWAY02 318,630 317,356 - pmoB Particulate methane monooxygenase B-
subunit Methane
metabolism
pRWAY02 319,492 318,641 - pmoA Particulate methane monooxygenase A-
subunit Methane
metabolism
pRWAY02 320,498 319,620 - pmoC Particulate methane monooxygenase C-
subunit Methane
metabolism
Chromosome 5,945,530 5,946,753 + alkB Alkane 1-monooxygenase Alkane degradation
Chromosome 357,092 358,192 + ladA1 Long-chain alkane monooxygenase Alkane degradation
Chromosome 358,189 359,343 + ladA2 Long-chain alkane monooxygenase Alkane degradation
Chromosome 4,017,878 4,019,047 + ladA3 Long-chain alkane monooxygenase Alkane degradation

Supplementary material | Appendix II
236
Supplementary Table 4.S7 Genes involved in stress response found in Rhodococcus sp. WAY2.
Replicon Start End Strand Gene name Predicted function Function, pathway
Storage compounds metabolism Chromosome 5,214,900 5,215,832 + galU UTP--glucose-1-phosphate
uridylyltransferase Glycogen
biosynthesis Chromosome 5,552,557 5,553,753 + glgC Glucose-1-phosphate
adenylyltransferase Glycogen
biosynthesis Chromosome 5,552,416 5,551,247 - glgA Glycogen synthase, ADP-
glucose transglucosylase Glycogen
biosynthesis Chromosome 2,400,678 2,398,480 - glgB 1,4-alpha-glucan (glycogen)
branching enzyme Glycogen
biosynthesis Chromosome 2,402,696 2,400,678 - glgE Putative glucanase Glycogen
degradation Chromosome 2,402,921 2,405,512 + glgP Glycogen phosphorylase Glycogen
degradation Chromosome 294,183 293,515 - glgX Glycogen debranching
enzyme Glycogen
degradation Chromosome 6,039,652 6,041,283 + pgm Phosphoglucomutase Glycogen
degradation Chromosome 1,654,022 1,654,951 + ppk1 Polyphosphate kinase 2 Polyphosphate
metabolism Chromosome 1,691,319 1,690,459 - ppk2 Polyphosphate kinase 2 Polyphosphate
metabolism Chromosome 2,218,391 2,219,335 + ppk3 Polyphosphate kinase 2 Polyphosphate
metabolism Chromosome 6,130,051 6,127,847 - ppk4 Polyphosphate kinase Polyphosphate
metabolism Chromosome 1,732,260 1,733,129 + ppx1 Exopolyphosphatase Polyphosphate
metabolism Chromosome 5,347,847 5,348,791 + ppx2 Exopolyphosphatase Polyphosphate
metabolism
Chromosome 2,268,854 2,270,167 + aft1 Wax ester synthase/acyl-
CoA:diacylglycerol acyltransferase
Triacylglycerol biosynthesis
Chromosome 3,330,846 3,329,479 - aft2 Wax ester synthase/acyl-
CoA:diacylglycerol acyltransferase
Triacylglycerol biosynthesis
Chromosome 3,534,989 3,536,398 + aft3 Wax ester synthase/acyl-
CoA:diacylglycerol acyltransferase
Triacylglycerol biosynthesis
Chromosome 3,537,839 3,536,439 - aft4 Wax ester synthase/acyl-
CoA:diacylglycerol acyltransferase
Triacylglycerol biosynthesis
Chromosome 4,910,843 4,909,449 - aft5 Wax ester synthase/acyl-
CoA:diacylglycerol acyltransferase
Triacylglycerol biosynthesis
Chromosome 5,960,187 5,961,608 + aft6 Wax ester synthase/acyl-
CoA:diacylglycerol acyltransferase
Triacylglycerol biosynthesis

Supplementary material | Appendix II
237
Chromosome 6,377,931 6,376,519 - aft7 Wax ester synthase/acyl-
CoA:diacylglycerol acyltransferase
Triacylglycerol biosynthesis
Chromosome 223,037 224,734 + phaC1 Polyhydroxyalkanoic acid
synthase Polyhydroxyalkanoic
acid synthesys Chromosome
496,107 495,013 - phaC2 Polyhydroxyalkanoic acid synthase
Polyhydroxyalkanoic acid synthesys
Chromosome 498,367 496,676 - phaC3 Polyhydroxyalkanoic acid
synthase Polyhydroxyalkanoic
acid synthesys Chromosome
757,362 756,295 - phaC4 Polyhydroxyalkanoic acid synthase
Polyhydroxyalkanoic acid synthesys
Chromosome 2,922,022 2,925,006 + phaC5 Polyhydroxyalkanoic acid synthase
Polyhydroxyalkanoic acid synthesys
Lithoautotrophy Chromosome 921,751 922,080 + hypA [NiFe] hydrogenase nickel
incorporation protein Hydrogenase
Chromosome 922,086 922,853 + hypB [NiFe] hydrogenase nickel incorporation-associated
protein Hydrogenase
Chromosome 923,004 924,059 + hyaA Uptake hydrogenase small subunit Hydrogenase
Chromosome 924,140 925,882 + hyaB Uptake hydrogenase large subunit Hydrogenase
Chromosome 929,598 930,098 + hypD1 Hydrogenase maturation protease Hydrogenase
Chromosome 987,965 986,835 - hypD2 [NiFe] hydrogenase
metallocenter assembly protein
Hydrogenase
Chromosome 930,102 930,362 + hypC1 Hydrogenase assembly chaperone
Hydrogenase
Chromosome 988,251 987,979 - hypC2 [NiFe] hydrogenase
metallocenter assembly protein
Hydrogenase
Chromosome 989,377 988,277 - hypE [NiFe] hydrogenase
metallocenter assembly protein
Hydrogenase
Chromosome 993,154 990,848 - hypF [NiFe] hydrogenase
metallocenter assembly protein
Hydrogenase
Chromosome 1,446,069 1,445,215 - coxM1
Carbon monoxide dehydrogenase medium
subunit Carbon monoxide
utilization Chromosome
3,082,256 3,081,351 - coxM2 Carbon monoxide
dehydrogenase medium subunit
Carbon monoxide utilization
Chromosome 1,448,441 1,446,066 - coxL1 Carbon monoxide
dehydrogenase large chain Carbon monoxide
utilization Chromosome
3,080,767 3,078,365 - coxL2 Carbon monoxide dehydrogenase large chain
Carbon monoxide utilization
Chromosome 1,448,971 1,448,438 - coxS1 Carbon monoxide
dehydrogenase small chain Carbon monoxide
utilization Chromosome
3,081,348 3,080,767 - coxS2 Carbon monoxide dehydrogenase small chain
Carbon monoxide utilization

Appendix II | Supplementary material
238
Chromosome 1,450,183 1,449,068 - coxE1 Carbon monoxide
dehydrogenase E protein Carbon monoxide
utilization Chromosome
2,539,619 2,541,079 + coxE2 Carbon monoxide dehydrogenase E protein
Carbon monoxide utilization
Chromosome 3,075,906 3,074,692 - coxE3 Carbon monoxide
dehydrogenase E protein Carbon monoxide
utilization Chromosome
5,645,254 5,646,783 + coxE4 Carbon monoxide dehydrogenase E protein
Carbon monoxide utilization
pRWAY02 326,248 327,774 + coxE Carbon monoxide
dehydrogenase E protein Carbon monoxide
utilization Chromosome
1,451,082 1,450,189 - coxD1 Carbon monoxide oxidation accessory protein
Carbon monoxide utilization
Chromosome 3,077,445 3,076,558 - coxD2 Carbon monoxide oxidation accessory protein
Carbon monoxide utilization
Chromosome 5,644,145 5,645,251 + coxD3 Carbon monoxide oxidation accessory protein
Carbon monoxide utilization
pRWAY02 325,024 326,244 + coxD Carbon monoxide
dehydrogenase D protein Chromosome
3,076,544 3,075,903 - coxG1 Carbon monoxide oxidation accessory protein
Carbon monoxide utilization
Chromosome 3,290,423 3,289,977 - coxG2 Carbon monoxide oxidation
accessory protein Carbon monoxide
utilization
Chromosome 3,078,335 3,077,442 - coxF Aerobic carbon monoxide
dehydrogenase molybdenum cofactor insertion protein
Carbon monoxide utilization
Chromosome 3,083,474 3,082,332 - coxI
Xanthine and CO dehydrogenases maturation
factor
Carbon monoxide utilization
Chromosome 794,324 794,956 + cynT Carbonic anhydrase Carbon dioxide Chromosome 4,365,422 4,367,500 + Carbonic anhydrase Carbon dioxide Chromosome 6,032,559 6,032,065 - Carbonic anhydrase Carbon dioxide Chromosome 6,136,323 6,136,844 + Carbonic anhydrase Carbon dioxide pRWAY03 189,067 186,755 - Carbonic anhydrase Carbon dioxide
Cold shock response Chromosome 447,655 445,517 - Cold shock protein Cold shock response Chromosome 715,068 715,271 + cspA Cold shock protein CspA Cold shock response Chromosome 911,575 912,108 + Cold shock protein Cold shock response Chromosome 1,433,797 1,434,207 + cspC Cold shock protein CspC Cold shock response Chromosome 3,282,441 3,282,686 + cspA Cold shock protein CspA Cold shock response Chromosome 3,767,091 3,766,795 - cspA Cold shock protein CspA Cold shock response Chromosome 5,256,431 5,256,634 + cspA Cold shock protein CspA Cold shock response Chromosome 6,437,612 6,437,815 + cspA Cold shock protein CspA Cold shock response pRWAY01 220,873 221,223 + cspA Cold shock protein CspA Cold shock response pRWAY01 828,313 828,909 + Cold shock protein Cold shock response
Compatible solutes Chromosome
78,433 81,045 + Trehalose-6-phosphate
phosphatase Compatible solutes
Chromosome 820,735 818,291 - Trehalose-6-phosphate
phosphatase Compatible solutes
Chromosome 932,586 930,382 - treS Trehalose synthase Compatible solutes

Supplementary material | Appendix II
239
Chromosome 1,062,110 1,060,518 -
Alpha,alpha-trehalose-phosphate synthase [UDP-
forming]
Compatible solutes
Chromosome 1,192,837 1,194,078 + proP L-Proline/Glycine betaine
transporter ProP Compatible solutes
Chromosome 1,334,567 1,335,913 + Proline/betaine transporter Compatible solutes Chromosome 2,132,772 2,131,186 - betA Choline dehydrogenase Compatible solutes Chromosome 2,529,380 2,528,982 - ectC L-ectoine synthase Compatible solutes Chromosome
2,530,677 2,529,400 - ectB Diaminobutyrate-pyruvate aminotransferase
Compatible solutes
Chromosome 2,531,103 2,530,705 - ectA L-2,4-diaminobutyric acid
acetyltransferase Compatible solutes
Chromosome 2,535,912 2,534,443 - proP L-Proline/Glycine betaine
transporter ProP Compatible solutes
Chromosome 2,697,119 2,696,127 - proX
L-proline glycine betaine binding ABC transporter protein ProX / Osmotic
adaptation
Compatible solutes
Chromosome 2,699,097 2,697,886 - proV
L-proline glycine betaine ABC transport system permease protein ProV
Compatible solutes
Chromosome 2,699,746 2,699,090 -
Glycine betaine/carnitine/choline
ABC transporter, permease protein
Compatible solutes
Chromosome 2,809,617 2,807,914 - treZ Malto-oligosyltrehalose
trehalohydrolase Compatible solutes
Chromosome 2,816,988 2,814,601 - treY Malto-oligosyltrehalose
synthase Compatible solutes
Chromosome 3,318,110 3,316,680 -
Alpha,alpha-trehalose-phosphate synthase [UDP-
forming]
Compatible solutes
Chromosome 4,017,746 4,016,421 - proP L-Proline/Glycine betaine
transporter ProP Compatible solutes
Chromosome 4,447,309 4,445,984 - proP L-Proline/Glycine betaine
transporter ProP Compatible solutes
Chromosome 4,625,092 4,623,719 - proP L-Proline/Glycine betaine
transporter ProP Compatible solutes
Chromosome 4,746,029 4,747,372 + proP L-Proline/Glycine betaine
transporter ProP Compatible solutes
Chromosome 4,844,175 4,845,503 + proP L-Proline/Glycine betaine
transporter ProP Compatible solutes
Chromosome 5,164,191 5,162,467 - betT High-affinity choline uptake
protein BetT Compatible solutes
Chromosome 5,241,917 5,243,590 + betT High-affinity choline uptake
protein BetT Compatible solutes
Chromosome 5,464,351 5,465,793 + betB Betaine aldehyde
dehydrogenase Compatible solutes
Chromosome 5,579,197 5,578,478 - proZ
Glycine betaine ABC transport system permease
protein
Compatible solutes
Chromosome 5,579,844 5,579,194 - proW
L-proline glycine betaine ABC transport system
permease protein ProW
Compatible solutes

Appendix II | Supplementary material
240
Chromosome 5,581,006 5,579,849 - proV
L-proline glycine betaine ABC transport system permease protein ProV
Compatible solutes
Chromosome 5,581,994 5,581,017 - proX
L-proline glycine betaine binding ABC transporter
protein ProX
Compatible solutes
Chromosome 5,582,253 5,583,119 + lpqZ
Substrate-binding region of ABC-type glycine betaine
transport system
Compatible solutes
Chromosome 5,624,334 5,626,169 + treS Trehalose synthase Compatible solutes Chromosome 5,670,137 5,671,612 + betA Choline dehydrogenase Compatible solutes Chromosome
6,310,486 6,311,850 + proP L-Proline/Glycine betaine transporter ProP
Compatible solutes
pRWAY01 147,880 149,148 + ectB Diaminobutyrate-pyruvate
aminotransferase Compatible solutes
pRWAY01 244,656 248,291 + Trehalose-6-phosphate
phosphatase Compatible solutes
pRWAY01 544,245 542,944 - proP L-Proline/Glycine betaine
transporter ProP Compatible solutes
pRWAY01 768,642 769,964 + proP L-Proline/Glycine betaine
transporter ProP Compatible solutes
pRWAY01 797,450 798,835 + proP L-Proline/Glycine betaine
transporter ProP Compatible solutes

Supplementary material | Appendix II
241
Supplementary Table 4.S8 Genetic islands (GIs) identified in Rhodococcus sp. WAY2.
Rep
licon
GI c
oord
inat
es
GI l
engt
h (b
p)
GC%
Pred
ictio
n m
etho
d Gene start Gene end
Stra
nd Product
Chr
omos
ome
72,8
78 ..
77,
309
4,43
1
66.49
SIG
I-H
MM
72,878 73,279 - Hypothetical protein 73,582 75,363 - Biotin carboxylase of acetyl-CoA
Carboxylase 75,391 75,690 - Hypothetical protein 75,687 77,309 - Methylcrotonyl-CoA carboxylase
Carboxyl transferase subunit
Chr
omos
ome
149,
687
.. 15
4,10
2
4,41
5
58.44
SIG
I-H
MM
148,428 149,690 + Methylmalonate-semialdehyde Dehydrogenase
149,687 150,157 + Hypothetical protein 150,330 151,199 + 3-oxoacyl-[acyl-carrier protein]
reductase 152,189 152,311 - Hypothetical protein 152,600 154,102 + Acetoacetyl-CoA synthetase
Chr
omos
ome
778,
268
.. 78
5,44
8
7,18
0
64.15
Isla
ndPa
th-D
IMO
B 778,268 778,801 + Hypothetical protein
778,798 779,220 + Hypothetical protein 779,291 780,802 + Lysyl-tRNA synthetase (class II) 780,942 781,295 + Histone protein Lsr2 782,088 782,339 - Hypothetical protein 782,328 784,802 + ATP-dependent Clp protease 784,867 785,448 - Hypothetical protein
Chr
omos
ome
1,33
3,13
8 ..
1,35
0,98
0
17,8
42
64.01
Isla
ndPa
th-D
IMO
B
1,333,138 1,334,163 + Predicted aminoglycoside Phosphotransferase
1,334,372 1,334,491 - Hypothetical protein 1,334,567 1,335,913 + Proline/betaine transporter 1,336,229 1,336,360 + Hypothetical protein 1,336,507 1,337,889 + Membrane transport protein 1,337,991 1,338,803 - Transcriptional regulator, TetR family 1,339,617 1,340,255 - Transcriptional regulator, MerR family 1,340,403 1,341,620 + 3-ketoacyl-CoA thiolase 1,341,641 1,342,372 + 3-oxoacyl-[acyl-carrier protein]
reductase 1,342,404 1,344,200 + 3-methylmercaptopropionyl-CoA
dehydrogenase (DmdC) 1,344,216 1,344,977 + 3-oxoacyl-[acyl-carrier protein]
reductase 1,345,058 1,346,808 - Mobile element protein 1,347,469 1,347,636 - Hypothetical protein 1,347,667 1,347,903 + Nodulation protein N 1,348,043 1,348,180 + Hypothetical protein 1,348,486 1,348,623 + Hypothetical protein 1,349,154 1,349,453 - Hypothetical protein 1,349,434 1,349,562 + Hypothetical protein 1,349,578 1,349,712 + Hypothetical protein 1,349,835 1,350,980 - Butyryl-CoA dehydrogenase
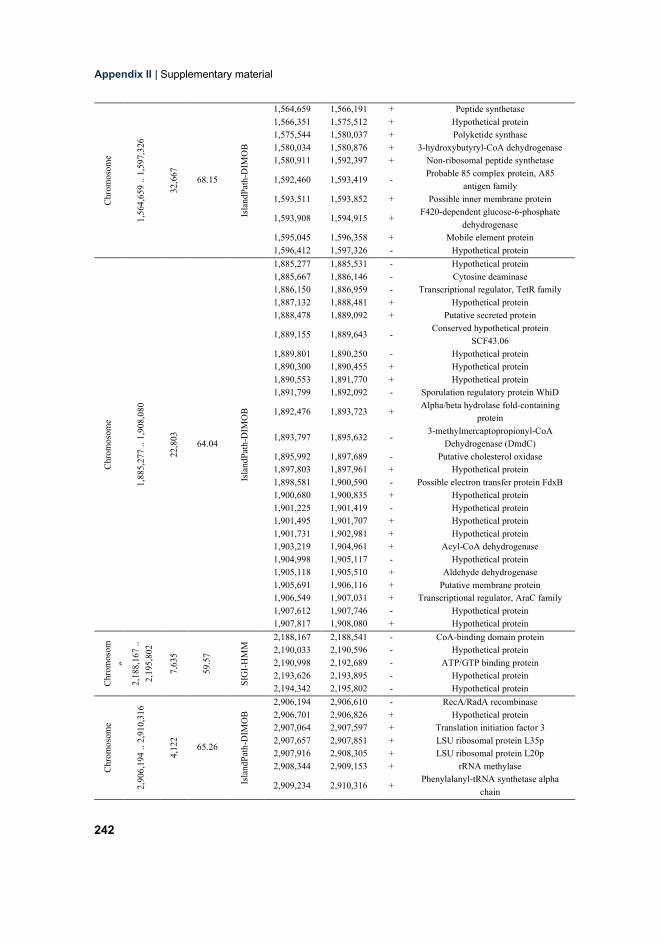
Appendix II | Supplementary material
242
Chr
omos
ome
1,56
4,65
9 ..
1,59
7,32
6
32,6
67
68.15
Isla
ndPa
th-D
IMO
B
1,564,659 1,566,191 + Peptide synthetase 1,566,351 1,575,512 + Hypothetical protein 1,575,544 1,580,037 + Polyketide synthase 1,580,034 1,580,876 + 3-hydroxybutyryl-CoA dehydrogenase 1,580,911 1,592,397 + Non-ribosomal peptide synthetase 1,592,460 1,593,419 - Probable 85 complex protein, A85
antigen family 1,593,511 1,593,852 + Possible inner membrane protein 1,593,908 1,594,915 + F420-dependent glucose-6-phosphate
dehydrogenase 1,595,045 1,596,358 + Mobile element protein 1,596,412 1,597,326 - Hypothetical protein
Chr
omos
ome
1,88
5,27
7 ..
1,90
8,08
0
22,8
03
64.04
Isla
ndPa
th-D
IMO
B
1,885,277 1,885,531 - Hypothetical protein 1,885,667 1,886,146 - Cytosine deaminase 1,886,150 1,886,959 - Transcriptional regulator, TetR family 1,887,132 1,888,481 + Hypothetical protein 1,888,478 1,889,092 + Putative secreted protein 1,889,155 1,889,643 - Conserved hypothetical protein
SCF43.06 1,889,801 1,890,250 - Hypothetical protein 1,890,300 1,890,455 + Hypothetical protein 1,890,553 1,891,770 + Hypothetical protein 1,891,799 1,892,092 - Sporulation regulatory protein WhiD 1,892,476 1,893,723 + Alpha/beta hydrolase fold-containing
protein 1,893,797 1,895,632 - 3-methylmercaptopropionyl-CoA
Dehydrogenase (DmdC) 1,895,992 1,897,689 - Putative cholesterol oxidase 1,897,803 1,897,961 + Hypothetical protein 1,898,581 1,900,590 - Possible electron transfer protein FdxB 1,900,680 1,900,835 + Hypothetical protein 1,901,225 1,901,419 - Hypothetical protein 1,901,495 1,901,707 + Hypothetical protein 1,901,731 1,902,981 + Hypothetical protein 1,903,219 1,904,961 + Acyl-CoA dehydrogenase 1,904,998 1,905,117 - Hypothetical protein 1,905,118 1,905,510 + Aldehyde dehydrogenase 1,905,691 1,906,116 + Putative membrane protein 1,906,549 1,907,031 + Transcriptional regulator, AraC family 1,907,612 1,907,746 - Hypothetical protein 1,907,817 1,908,080 + Hypothetical protein
Chr
omos
ome
2,18
8,16
7 ..
2,19
5,80
2
7,63
5
59.5
7
SIG
I-H
MM
2,188,167 2,188,541 - CoA-binding domain protein 2,190,033 2,190,596 - Hypothetical protein 2,190,998 2,192,689 - ATP/GTP binding protein 2,193,626 2,193,895 - Hypothetical protein 2,194,342 2,195,802 - Hypothetical protein
Chr
omos
ome
2,90
6,19
4 ..
2,91
0,31
6
4,12
2
65.26
Isla
ndPa
th-D
IMO
B 2,906,194 2,906,610 - RecA/RadA recombinase
2,906,701 2,906,826 + Hypothetical protein 2,907,064 2,907,597 + Translation initiation factor 3 2,907,657 2,907,851 + LSU ribosomal protein L35p 2,907,916 2,908,305 + LSU ribosomal protein L20p 2,908,344 2,909,153 + rRNA methylase 2,909,234 2,910,316 + Phenylalanyl-tRNA synthetase alpha
chain

Supplementary material | Appendix II
243
Chr
omos
ome
3,15
7,28
8 ..
3,20
0,52
4
43,2
37
62.75
Isla
ndPa
th-D
IMO
B, S
IGI-H
MM
3,157,288 3,157,683 - Nitrilotriacetate monooxygenase component B
3,157,888 3,158,643 - Creatinine amidohydrolase 3,158,652 3,160,535 - Long-chain-fatty-acid--CoA ligase 3,160,562 3,161,788 - Branched-chain amino acid ABC
transporter, amino acid-binding protein 3,161,945 3,162,664 - Branched-chain amino acid transport
ATP-binding protein LivF 3,162,651 3,163,436 - Branched-chain amino acid transport
ATP-binding protein LivG 3,163,436 3,164,386 - Branched-chain amino acid transport
system permease protein LivM 3,164,422 3,165,288 - High-affinity branched-chain amino acid
transport system permease protein LivH 3,165,299 3,166,093 - Enoyl-CoA hydratase 3,166,097 3,166,963 - Enoyl-CoA hydratase 3,166,960 3,168,153 - Luciferase family protein 3,168,507 3,169,094 + Transcriptional regulator, TetR family 3,169,453 3,169,791 + FIG00828522: hypothetical protein 3,169,826 3,170,653 - Formate dehydrogenase chain D 3,170,653 3,172,956 - Putative formate dehydrogenase
oxidoreductase protein 3,173,038 3,173,952 - Hydrogen peroxide-inducible genes
activator 3,174,286 3,177,594 + Hypothetical protein 3,177,626 3,178,207 - Hypothetical protein 3,178,433 3,179,152 - Transcriptional regulator, LuxR family 3,179,429 3,179,647 + Hypothetical protein 3,179,696 3,179,812 + Hypothetical protein 3,179,816 3,181,612 + Mobile element protein 3,182,109 3,182,579 + Hypothetical protein 3,182,591 3,183,394 + Possible flavodoxin (beta-lactamase-like) 3,183,526 3,184,392 - Probable 5-valerolactone hydrolase 3,184,660 3,186,291 - Cyclohexanone monooxygenase 3,186,338 3,187,954 - Long-chain-fatty-acid--CoA ligase 3,187,951 3,189,024 - Probable acyl-CoA dehydrogenase 3,189,027 3,190,211 - Butyryl-CoA dehydrogenase 3,190,213 3,191,055 - Enoyl-CoA hydratase 3,191,598 3,192,848 + Possible transcriptional regulator 3,193,250 3,193,591 + Hypothetical protein 3,193,836 3,194,327 + Hypothetical protein 3,194,740 3,195,585 + Oxetanocin A resistance protein 3,195,638 3,196,075 + Hypothetical protein 3,196,122 3,196,328 - Hypothetical protein 3,196,799 3,197,950 + Epoxide hydrolase 3,198,018 3,199,058 - Alcohol dehydrogenase 3,199,167 3,199,628 - Transcriptional regulator, MerR family 3,199,829 3,200,524 - Transcriptional regulator, GntR family
Chr
omos
ome
4,25
1,78
2 ..
4,27
7,26
1
25,4
79
65.16
Isla
ndPa
th-
DIM
OB 4,251,782 4,252,654 + 3-oxoacyl-[acyl-carrier protein]
reductase 4,252,669 4,252,902 + Probable ferredoxin FdxD 4,252,909 4,254,138 + Putative cytochrome P450
hydroxylase 4,254,334 4,254,912 + Transcriptional regulator, TetR family

Appendix II | Supplementary material
244
4,255,378 4,256,436 + Methionine ABC transporter ATP-binding protein
4,256,514 4,257,326 + Conserved hypothetical integral membrane protein YrbE1A
4,257,328 4,258,188 + ABC-type transport system involved in resistance to organic solvents, permease
component 4,258,250 4,259,281 + Mammalian cell entry related domain
protein 4,259,299 4,260,291 + MCE-family protein Mce1B 4,260,324 4,261,304 + Virulence factor mce family protein 4,261,306 4,262,337 + MCE-family protein Mce1D 4,262,339 4,263,346 + Possible mce-family lipoprotein lprl 4,263,343 4,264,302 + Putative Mce family protein 4,264,372 4,264,995 + Hypothetical protein 4,265,040 4,265,642 - Possible transcriptional regulator, TetR
family 4,265,714 4,266,895 + Large subunit aromatic oxygenase 4,266,892 4,267,653 + Hypothetical protein 4,267,695 4,268,369 + Hypothetical protein 4,268,366 4,269,598 + Alpha-methylacyl-CoA racemase 4,269,834 4,271,375 + O-succinylbenzoic acid--CoA ligase 4,271,440 4,272,891 + 4-hydroxybenzoate transporter 4,272,895 4,275,024 + Hypothetical protein 4,275,021 4,277,261 + Formate dehydrogenase-O, major subunit
Chr
omos
ome
4,68
5,57
5 ..
4,71
9,88
3
34,3
08
63.37
Isla
ndPa
th-D
IMO
B
4,685,575 4,686,354 + Amidohydrolase family protein 4,686,439 4,687,224 + Enoyl-CoA hydratase 4,687,262 4,688,017 + 2-deoxy-D-gluconate 3-dehydrogenase 4,688,118 4,689,248 + 3-ketoacyl-CoA thiolase 4,689,368 4,690,132 + 3-hydroxyacyl-CoA dehydrogenase 4,690,129 4,690,257 - Hypothetical protein 4,690,333 4,691,124 + Enoyl-CoA hydratase 4,691,211 4,692,332 - Alpha-methylacyl-CoA racemase 4,692,414 4,693,082 - Transcriptional regulator, TetR family 4,693,174 4,694,385 - Isobutyryl-CoA dehydrogenase 4,694,637 4,696,043 + 4-hydroxybenzoate transporter 4,696,166 4,697,059 + L-malyl-CoA/beta-methylmalyl-CoA
lyase 4,697,158 4,697,910 - Enoyl-CoA hydratase 4,698,021 4,698,191 - Alcohol dehydrogenase 4,698,308 4,700,092 - Mobile element protein 4,700,116 4,700,901 - Hypothetical protein
4,701,495 4,702,571 + F420-dependent N(5),N(10)-
Methylenetetrahydromethanopterin reductase
4,702,954 4,704,252 + 4-hydroxybenzoate transporter 4,704,289 4,704,495 + Hypothetical protein 4,704,503 4,705,213 + Transcriptional regulator, TetR family 4,705,389 4,706,855 - Aldehyde dehydrogenase 4,707,454 4,708,587 + 2,4-dienoyl-CoA reductase [NADPH] 4,708,680 4,709,414 + Hypothetical protein 4,709,722 4,710,687 + Alcohol dehydrogenase 4,710,700 4,711,257 + Gamma-BHC dehydrochlorinase 4,711,397 4,712,143 - Hypothetical protein

Supplementary material | Appendix II
245
4,712,158 4,713,642 - Drug resistance transporter EmrB/QacA subfamily
4,713,685 4,715,094 - Nitrilotriacetate monooxygenase component A
4,715,299 4,715,889 + Transcriptional regulator, TetR family 4,715,935 4,716,048 + Hypothetical protein 4,716,578 4,717,723 + Transporter, putative 4,717,817 4,718,830 - Quinone oxidoreductase 4,718,894 4,719,883 - Vanillate O-demethylase oxidoreductase
Chr
omos
ome
4,79
5,05
8 ..
4,79
9,29
9
4,24
1
66.71 SI
GI-
HM
M 4,795,058 4,796,110 - Transposase
4,796,159 4,797,073 - Probable taurine catabolism dioxygenase 4,797,112 4,798,086 - Quinone oxidoreductase 4,798,289 4,799,299 + Transcriptional regulator, AraC family
Chr
omos
ome
4,86
8,03
5 ..
4,90
2,84
2
34,8
07
66.45
Isla
ndPa
th-D
IMO
B
4,868,035 4,868,562 - Putative small integral membrane protein 4,868,603 4,871,473 - High-affinity carbon uptake protein
Hat/HatR 4,871,472 4,871,618 + Hypothetical protein 4,871,688 4,871,843 - Fic protein family protein 4,872,371 4,873,846 + Putative membrane transport protein 4,873,855 4,874,487 + Transcriptional regulator, TetR family 4,874,624 4,875,523 + Probable hydrolase 4,875,770 4,876,969 - Fic family protein 4,877,143 4,877,892 + Hypothetical protein 4,877,933 4,880,113 - Arsenical pump-driving ATPase 4,880,134 4,880,535 - Arsenate reductase 4,880,566 4,880,958 - Arsenate reductase 4,881,006 4,882,118 - Arsenate reductase 4,882,115 4,882,474 - Arsenical resistance operon repressor 4,882,593 4,882,937 + Transcriptional regulator, ArsR family 4,882,928 4,883,638 + Putative membrane protein 4,883,707 4,884,702 - Arsenical-resistance protein ACR3 4,884,801 4,885,550 - Mercuric resistance operon regulatory
protein 4,885,653 4,886,507 - Possible phosphinothricin N-
acetyltransferase 4,886,759 4,887,949 + Probable secreted protein 4,888,179 4,888,316 + hypothetical protein 4,888,487 4,889,416 + ABC transporter, ATP-binding
component 4,889,413 4,890,225 + ABC transporter, family 2 4,890,424 4,890,633 + hypothetical protein 4,890,674 4,891,333 + RNA polymerase sigma factor SigZ 4,891,523 4,891,636 + Hypothetical protein 4,891,720 4,891,833 - Hypothetical protein 4,892,075 4,892,293 + Hypothetical protein 4,892,372 4,893,517 - Chaperone protein DnaJ 4,893,524 4,893,682 - Hypothetical protein 4,894,633 4,894,806 + Hypothetical protein 4,894,877 4,896,373 + Adenylate cyclase 4,896,494 4,897,702 - Possible linoleoyl-coa desaturase
(delta(6)-desaturase)

Appendix II | Supplementary material
246
4,897,870 4,898,676 - Metal cation transporting ATPase, P-type ATPase superfamily
4,898,670 4,899,122 - Metal cation transporting ATPase, P-type ATPase superfamily
4,899,810 4,901,615 + Mobile element protein 4,901,793 4,902,122 - Hypothetical protein 4,902,213 4,902,842 - DNA-binding response regulator KdpE
Chr
omos
ome
4,94
7,13
2 ..
4,96
5,37
2
18,2
40
57.42
SIG
I-H
MM
4,947,132 4,947,296 - Hypothetical protein 4,947,981 4,949,444 + Hypothetical protein 4,949,983 4,952,109 - O-antigen acetylase 4,952,747 4,952,914 - Hypothetical protein 4,953,464 4,953,616 + Hypothetical protein 4,953,761 4,954,084 + Hypothetical protein 4,955,166 4,956,686 + Undecaprenyl-phosphate
galactosephosphotransferase 4,957,408 4,958,685 + Hypothetical protein 4,960,656 4,961,972 + Coenzyme F420-dependent
oxidoreductase 4,964,305 4,965,372 - Alpha-D-GlcNAc alpha-1,2-L-
rhamnosyltransferase
Chr
omos
ome
6,26
7,81
3 ..
6,28
9,31
9
21,5
06
66.17
Isla
ndPa
th-D
IMO
B
6,267,813 6,268,337 - Acetyltransferase, GNAT family 6,268,539 6,269,117 + CDP-diacylglycerol--glycerol-3-
Phosphate 3-phosphatidyltransferase 6,269,114 6,269,614 + C-terminal domain of CinA type S 6,269,685 6,270,047 + Hypothetical protein
6,270,239 6,271,024 + Phage shock protein A (IM30), suppresses sigma54-dependent
transcription 6,271,125 6,271,871 + Alanine-rich, phage-related, membrane
protein 6,272,063 6,272,251 + Hypothetical protein 6,272,268 6,272,984 + Hypothetical protein 6,273,020 6,273,166 + Hypothetical protein 6,273,198 6,273,821 + Probable transcriptional regulator, TetR
family 6,273,818 6,275,350 + Glycerol-3-phosphate
dehydrogenase 6,275,371 6,276,525 + Alanine rich transferase 6,276,561 6,276,755 + Hypothetical protein 6,277,018 6,278,061 + RecA protein 6,278,072 6,278,587 + Regulatory protein RecX 6,278,649 6,279,551 - Glutamate permease 6,279,548 6,280,228 - Putative glutamate transporter 6,280,317 6,281,150 - Glutamate-binding protein of ABC
transporter system 6,281,239 6,281,967 - Putative glutamate uptake system ATP-
binding protein 6,282,176 6,283,693 + tRNA-i(6)A37 methylthiotransferase 6,283,690 6,284,295 + Possible membrane protein Rv2732c 6,284,314 6,285,726 - ATPase involved in DNA repair 6,285,893 6,286,618 + Hypothetical protein 6,286,615 6,287,544 + tRNA dimethylallyltransferase 6,287,541 6,288,389 + Possible rRNA methylase 6,288,450 6,289,319 + Diaminopimelate epimerase

Supplementary material | Appendix II
247
Chr
omos
ome
6,56
8,01
6 ..
6,57
4,59
0
6,57
4 65.48
Isla
ndPa
th-D
IMO
B
6,568,016 6,568,684 + Probable oxidoreductase, short chain dehydrogenase/ reductase family
6,568,857 6,569,198 + Hypothetical protein 6,569,202 6,569,852 - Maleylpyruvate isomerase, mycothiol-
dependent 6,570,023 6,570,580 + TolA protein 6,570,609 6,571,286 + TolA protein 6,571,283 6,571,426 - Transposase and inactivated derivatives-
like 6,571,498 6,572,100 - Transcriptional regulator, TetR family 6,572,376 6,573,608 + Beta-lactamase class C and other
Penicillin binding proteins 6,573,610 6,574,590 - Hypothetical protein
pRW
AY
01
267,
189
.. 27
6,33
4
9,14
5
58.12
Isla
ndPa
th-D
IMO
B, S
IGI-H
MM
267,189 267,866 + Phosphoserine phosphatase 268,257 268,550 + Hypothetical protein 268,695 269,087 + Hypothetical protein 269,220 269,606 + Hypothetical protein 269,690 270,148 + Hypothetical protein 270,253 271,698 + Nicotinamide phosphoribosyltransferase 271,814 271,936 - Hypothetical protein 272,619 272,741 + Transposase, mutator type 272,982 274,337 - Coenzyme F420-0:L-glutamate ligase 274,586 275,521 - 2-phospho-L-lactate guanylyltransferase 275,534 276,334 - 6-phosphogluconolactonase 276,331 278,802 - 7,8-didemethyl-8-hydroxy-5-
deazariboflavin synthase subunit 1
pRW
AY
01
344,
870
.. 36
5,93
0
21,0
60
69.67
Isla
ndPa
th-D
IMO
B
344,870 345,668 - ABC-type Fe3+-siderophore transport system, ATPase component
345,712 346,824 - ABC-type Fe3+-siderophore transport system, permease 2 component
346,821 347,852 - ABC-type Fe3+-siderophore transport system, permease component
348,026 348,595 - Possible transcriptional regulator 348,636 348,788 - Hypothetical protein 348,805 349,008 + Hypothetical protein 349,011 349,529 + Hypothetical protein 349,559 350,980 - Phage peptidoglycan binding
endopeptidase 351,144 351,950 - Cytochrome c-type biogenesis protein
CcdA 351,947 352,552 - Thiol:disulfide oxidoreductase related to
ResA 352,549 353,154 - Possible thioredoxin 353,189 353,401 + Hypothetical protein 353,515 353,895 + Transcriptional regulator, MecI family 353,892 354,854 + Peptidase M48, Ste24p precursor 354,970 355,359 + Hypothetical protein 355,466 356,578 + Cysteine synthase 356,578 357,867 + Probable conserved integral membrane
transport protein 357,994 359,541 + Multicopper oxidase 359,640 360,458 + Hypothetical protein 360,465 362,405 + Copper resistance protein CopC / Copper
resistance protein CopD

Appendix II | Supplementary material
248
362,530 362,979 + Hypothetical protein 363,075 363,752 + Putative lipoprotein 363,874 365,109 + Probable conserved lipoprotein LppS 365,106 365,930 + DedA family protein paralog
pRW
AY
01
381,
580
.. 39
9,36
9
17,7
89
62.01
Isla
ndPa
th-D
IMO
B
381,580 381,696 + Hypothetical protein 382,075 382,455 + Hypothetical protein 382,602 382,748 + Hypothetical protein 382,849 383,562 + Plasmid partitioning protein ParA 383,562 384,428 + Chromosome (plasmid) partitioning
protein ParB 384,807 385,478 + Mobile element protein 385,552 385,695 - Hypothetical protein 385,709 386,551 + Hypothetical protein 386,981 387,541 + Pentapeptide repeat family protein 387,884 388,036 + Hypothetical protein 388,042 388,308 + Hypothetical protein 388,376 388,489 - Hypothetical protein 388,492 389,076 - Hypothetical protein 389,492 390,688 - Phage excisionase 390,894 391,049 - Hypothetical protein 391,340 392,128 - Chromosome (plasmid) partitioning
protein ParA 392,467 392,634 - Hypothetical protein 393,021 393,881 - Metallo-beta-lactamase superfamily
protein 393,878 395,797 - Hypothetical protein 395,956 396,084 - Hypothetical protein 396,344 397,195 + O-Methyltransferase involved in
Polyketide biosynthesis 397,173 398,156 - Hypothetical protein 398,153 398,713 - Cinorf13 protein 398,728 399,162 - Hypothetical protein 399,169 399,369 - Hypothetical protein
pRW
AY
01
453,
960
.. 46
6,85
0
12,8
90
59.95
Isla
ndPa
th-D
IMO
B
453,960 454,526 - Resolvase 455,205 455,396 + Hypothetical protein 456,542 456,727 - Hypothetical protein 456,782 457,060 + Hypothetical protein 457,292 460,009 + Type II restriction enzyme, methylase
subunit YeeA 460,006 461,991 + DNA helicase, restriction/modification
system component YeeB 461,988 463,181 + YeeC-like protein 464,971 465,741 - Hypothetical protein 466,199 466,459 - Hypothetical protein 466,554 466,850 - Hypothetical protein
pRW
AY
01
483,
867
.. 49
1,14
7
7,28
0
71.44
SIG
I-H
MM
483,867 484,511 - Organomercurial lyase 484,583 485,026 - regulatory protein, MerR 485,045 486,484 - Mercuric ion reductase 486,613 487,002 + Mercuric resistance operon regulatory
protein 487,002 487,301 + Cytochrome c-type biogenesis protein
DsbD, protein-disulfide reductase 487,298 487,804 + Hypothetical protein

Supplementary material | Appendix II
249
487,801 488,697 + Cytochrome c biogenesis protein, transmembrane region
488,694 490,073 + PF00070 family, FAD-dependent NAD(P)-disulphide oxidoreductase
490,191 491,147 + Putative integrase/recombinase
pRW
AY
01
657,
119
.. 69
2,92
8
35,8
09
66.09
Isla
ndPa
th-D
IMO
B
657,119 658,012 + short-chain dehydrogenase/reductase SDR
658,125 658,274 - Hypothetical protein 658,285 658,521 - Probable transposase for insertion
sequence element IS1533 658,804 659,511 - Alcohol dehydrogenase 659,566 659,949 + Hypothetical protein 659,922 661,118 - Amidohydrolase 661,481 661,729 + Hypothetical protein 661,828 661,950 - Hypothetical protein 662,129 662,680 + Dipeptide-binding ABC transporter,
periplasmic substrate-binding component 662,741 663,601 + Sugar phosphate isomerases/epimerases 664,518 666,494 - Membrane transport protein 666,509 666,877 - Hypothetical protein 666,926 668,413 - Aldehyde dehydrogenase 668,477 668,596 + Hypothetical protein 668,693 669,088 - Hypothetical protein 669,220 670,850 - Hypothetical protein 671,037 672,185 - Amidohydrolase 2 672,381 673,577 - 3-ketoacyl-CoA thiolase (EC 2.3.1.16) 673,649 674,155 - Transcriptional regulator, MarR family 674,225 675,340 - Oligopeptide transport ATP-binding
protein OppF 675,337 676,374 - Oligopeptide transport system permease
protein OppB 676,377 677,198 - Dipeptide transport system permease
protein DppC 677,267 678,217 - Dipeptide transport system permease
protein DppB 678,287 678,502 + Hypothetical protein 678,595 679,383 + Oxidoreductase, short-chain
dehydrogenase/reductase family 679,440 680,282 - Enoyl-CoA hydratase 680,279 681,250 - aminopeptidase 681,345 682,325 - Vanillate O-demethylase oxidoreductase 682,443 683,219 - 3-oxoacyl-acyl-carrier protein reductase 683,265 684,077 - Enoyl-CoA hydratase 684,197 684,610 + Mobile element protein 684,861 685,103 + Mobile element protein 685,100 685,999 - Hypothetical protein 686,275 686,816 - GTP cyclohydrolase I 687,052 687,795 - Transcriptional regulator, GntR family 687,963 689,540 - Dipeptide-binding ABC transporter,
periplasmic substrate-binding component 689,839 691,056 - BarH 691,143 691,811 + short-chain dehydrogenase/reductase
SDR 691,819 692,724 - 2-hydroxy-3-oxopropionate reductase

Appendix II | Supplementary material
250
692,800 692,928 - Hypothetical protein pr
RW
AY
01
706,
432
.. 71
1,57
4
5,14
2 66.86
SIG
I-H
MM
706,432 706,641 - Hypothetical protein 706,712 707,164 + Hypothetical protein 707,924 709,246 + Citrate synthase 709,355 709,507 - Hypothetical protein 709,926 710,135 - Hypothetical protein 710,336 711,574 - Hypothetical protein
pRW
AY
01
833,
420
.. 83
9,97
4
6,55
4
61.95 SI
GI-
HM
M
833,420 834,766 - Possible Rep protein 834,829 834,942 - Hypothetical protein 835,122 835,277 + Hypothetical protein 835,457 835,951 - Hypothetical protein 837,083 837,469 + Putative involvement in
Replication/partition 837,802 838,134 - Hypothetical protein 838,382 839,974 + Putative acetyltransferase
pRW
AY
02
392,
452
.. 39
9442
6,99
0
66.59
Isla
ndPa
th-D
IMO
B
392,452 393,598 - 3-ketoacyl-CoA thiolase 393,947 394,531 + Protein of unknown function 394,867 395,307 - Hypothetical protein 395,359 395,793 + Formate hydrogenlyase subunit 7 395,790 395,933 + Hypothetical protein 395,944 397,281 + 3-ketoacyl-CoA thiolase 397,726 398,361 + Mobile element protein 398,443 398,592 - Hypothetical protein 398,678 399,442 - Mobile element protein
pRW
AY
02
441,
129
.. 44
8,02
2
6,89
3
67.31
Isla
ndPa
th-D
IMO
B 441,129 442,102 - Mobile element protein
442,506 442,640 - Transposase 442,867 443,523 - Hypothetical protein 443,523 444,236 - Hypothetical protein 444,373 444,543 + Hypothetical protein 444,647 444,913 - Hypothetical protein 445,488 447,515 + Tellurium resistance protein TerD 447,873 448,022 - Hypothetical protein
pRW
AY
03
22,1
15 ..
28,
334
6,21
9
65.35
SIG
I-H
MM
20,757 22,118 + Beta-lactamase domain protein 22,115 23,413 + Major facilitator superfamily (MFS)
transporter 23,441 23,899 - Hypothetical protein 23,899 24,624 - Putative uncharacterized protein 24,862 25,128 + Hypothetical protein 25,195 25,509 + Hypothetical protein 25,901 27,250 + Hypothetical protein 27,256 28,044 - Alpha/beta hydrolase fold
pRW
AY
03
132,
522
.. 13
7,58
2
5,06
0
66.60
SIG
I-H
MM
132,522 132,728 + Copper chaperone 132,760 132,942 + Hypothetical protein
132,973 135,240 + Lead, cadmium, zinc and mercury
transporting ATPase; Copper-translocating
135,230 135,454 - Hypothetical protein 135,532 135,858 + Repressor CsoR of the copZA operon 135,883 136,266 - Putative transcriptional regulator, ArsR
family 136,854 137,582 + Protein of unknown function
pRW
AY
03
253,
769
..
259
0 5,
262
67.4
3
SIG
I-H
MM
252,879 253,772 - Mobile element protein 253,769 254,110 - Mobile element protein 254,103 255,197 + Mobile element protein

Supplementary material | Appendix II
251
255,209 256,468 - Hypothetical protein 256,465 257,553 - ATPase associated with various cellular
activities 257,751 257,948 - Hypothetical protein 258,101 258,526 - Hypothetical protein 258,591 258,818 + Hypothetical protein 258,864 259,031 + Hypothetical protein
pRW
AY
03
304,
048
.. 31
2,08
0
8,03
2
60.0
1
Isla
ndPa
th-D
IMO
B
304,048 304,380 - Hypothetical protein 304,449 305,978 - Hypothetical protein 306,136 306,576 + Putative involvement in
replication/partition 306,600 306,959 - Hypothetical protein 307,218 307,760 - unknown 309,927 310,223 + Hypothetical protein 310,747 310,935 + Hypothetical protein 311,613 312,080 + Hypothetical protein

Appendix II | Supplementary material
252
Supplementary material Chapter V Supplementary Table 5.S1 List of Rhodococcus genomes used in this study.
Name Type strain Assembly
Size (Mb)
GC% Scaffolds Genes CDSs
R. aetherivorans BCP1 no GCA_000470885.1 6.23 70.3 3 5,713 5,495 R. aetherivorans IcdP1 no GCA_000982715.1 5.92 70.6 1 5,388 5,020 R. agglutinans CCTCC AB2014297
YES GCA_004011865.1 5.43 69.2 22 4,988 4,835
R. baikonurensis JCM 18801 no GCA_001311605.1 6.82 62.4 633 - - R. biphenylivorans TG9 YES GCA_003288095.1 5.03 68 1 4,700 4,373 R. coprophilus NCTC 10994 YES GCA_900478115.1 4.58 66.8 1 4,222 4,081 R. corynebacterioides NBRC 14404
YES GCA_001894765.1 3.98 70.3 14 3655 3564
R. defluvii Ca11 T YES GCA_000738775.1 5.13 68.7 267 4,693 4,535 R. enclensis 23b-28 no GCA_002744595.1 7.21 62.3 117 6828 6532 R. erythropolis 1159 no GCA_002091935.1 7.09 62.3 112 6629 6359 R. erythropolis ACN1 no GCA_002303875.1 7.24 62.3 92 6711 6479 R. erythropolis ATCC 15903 no GCA_003388635.1 7.24 62.4 86 6870 6512 R. erythropolis AV96 no GCA_002233715.1 6.44 62.4 45 6047 4918 R. erythropolis B7g no GCA_003444715.1 7.14 62.4 93 6696 6475 R. erythropolis BG43 no GCA_000975175.1 6.87 62.3 4 6396 6233 R. erythropolis CAS922i no GCA_001020225.1 7.20 62.3 108 6727 6496 R. erythropolis CCM2595 no GCA_000454045.1 6.37 62.5 2 5895 5776 R. erythropolis DN1 no GCA_000454425.1 6.55 62.4 78 6152 5629 R. erythropolis IEGM 267 no GCA_001900745.1 7.18 62.3 231 6745 6481 R. erythropolis JCM 3201 YES GCA_003990875.1 6.65 62.4 3 6150 5976 R. erythropolis JCM 6824 no GCA_000747745.1 7.02 62.3 198 6608 6372 R. erythropolis JCM 9803 no GCA_001312725.1 6.87 62.3 212 - - R. erythropolis JCM 9804 no GCA_001313245.1 6.55 62.4 260 6309 3200 R. erythropolis JCM 9805 no GCA_001312745.1 6.96 62.4 235 6669 4261 R. erythropolis MI2 no GCA_001766885.1 7.18 62.3 123 6765 6533 R. erythropolis NCTC8036 no GCA_900455855.1 6.55 62.4 3 6044 5886 R. erythropolis NRRL B-16532
no GCA_000719985.1 6.94 62.4 160 6522 6300
R. erythropolis NSX2 no GCA_001715845.1 6.28 62.4 37 5820 5692 R. erythropolis PR4 no GCA_000010105.1 6.90 62.3 4 6491 6321 R. erythropolis R138 no GCA_000696675.2 6.81 62.3 3 6301 6130 R. erythropolis S-43 no GCA_000830355.1 6.81 62.2 533 6678 3687 R. erythropolis SK121 no GCA_000174835.1 6.79 62.5 124 6369 6158 R. erythropolis VSD3 no GCA_001831305.1 6.55 62.4 38 6064 5659 R. erythropolis XP no GCA_000225665.2 7.23 62.3 9 6826 6569 R. fascians 02-815 no GCA_000760835.1 6.24 64.4 30 5817 5674 R. fascians 02-816c no GCA_000760855.1 6.08 64.6 45 5830 5674 R. fascians 04-516 no GCA_000760685.1 5.82 64.3 23 5472 5315 R. fascians 05-339-1 no GCA_000760895.1 5.73 64.7 21 5454 5307 R. fascians 05-561-1 no GCA_000760875.1 5.61 64.5 30 5311 5187 R. fascians 14-2632c-1 no GCA_002259325.1 5.95 64.4 41 5639 5477 R. fascians 14-2632-D2 no GCA_002259295.1 5.93 64.4 44 5621 5459 R. fascians 15-508-1b no GCA_002258705.1 5.95 64.4 41 5637 5478

Supplementary material | Appendix II
253
R. fascians A2 no GCA_002259505.1 5.97 64.4 44 5662 5500 R. fascians A21d2 no GCA_000760905.1 5.98 64.1 30 5624 5470 R. fascians A22b no GCA_000759005.1 5.91 64.3 67 5574 5354 R. fascians A25f no GCA_000760935.1 5.87 64.2 17 5551 5404 R. fascians A3b no GCA_000760675.1 6.03 64.3 34 5758 5579 R. fascians A44A no GCA_000760735.1 5.95 64.6 9 5564 5416 R. fascians A73a no GCA_000760755.1 5.93 64.4 23 5489 5333 R. fascians A76 no GCA_000760955.1 6.03 64.6 29 5709 5566 R. fascians A78 no GCA_000760775.1 6.00 64.4 41 5659 5503 R. fascians B3 no GCA_002259465.1 5.93 64.4 46 5621 5461 R. fascians D188 no GCA_001620305.1 5.50 64.6 3 5149 5015 R. fascians F7 no GCA_001037935.1 5.25 64.7 21 4929 4819 R. fascians GIC26 no GCA_000760795.1 5.33 64.5 49 4991 4831 R. fascians GIC36 no GCA_000760815.1 5.56 64.5 46 5232 5060 R. fascians LMG 3602 no GCA_000760995.1 5.36 64.6 25 5113 4961 R. fascians LMG 3605 no GCA_000761015.1 5.44 64.6 28 5123 4976 R. fascians LMG 3616 no GCA_000761035.1 5.76 64.4 42 5455 5283 R. fascians LMG 3623 YES GCA_000761055.1 5.77 64.4 30 5427 5271 R. fascians LMG 3625 no GCA_000761075.1 5.94 64.2 17 5719 5576 R. globerulus NBRC 14531 YES GCA_001894805.1 6.74 61.7 30 6231 6054 R. globerulus WS3306 no GCA_003097035.1 6.77 61.7 2 6220 5996 R. gordoniae NCTC13296 YES GCA_900455725.1 4.87 67.9 3 4,458 4,287 R. hoagii 103S no GCA_000196695.1 5.04 68.8 1 4,649 4,540 R. hoagii ATCC 33707 no GCA_000164155.2 5.26 68.7 1 4,899 4,775 R. hoagii DSM 20295 YES GCA_001646645.1 4.97 68.8 279 4,757 4,427 R. hoagii DSM 20307 no GCA_002094305.1 5.20 68.8 37 4,850 4,735 R. hoagii DSSKP-R-001 no GCA_003013675.1 5.44 68.7 3 5,118 4,987 R. hoagii N1288 no GCA_001646885.1 5.17 68.8 47 4,845 4,685 R. hoagii N1295 no GCA_001646905.1 5.31 68.7 156 5,034 4,769 R. hoagii N1301 no GCA_001646925.1 5.65 68.5 61 5,297 5,099 R. hoagii NBRC 101255 - C 7 no GCA_001552575.1 5.20 68.8 48 4,879 4,725 R. hoagii NCTC1621 no GCA_900455845.1 5.24 68.8 3 4,885 4,760 R. hoagii NCTC5650 no GCA_900455885.1 5.31 68.7 7 4,962 4,785 R. hoagii PAM1204 no GCA_002078545.1 5.23 68.8 42 4,829 4,713 R. hoagii PAM1216 no GCA_002095175.1 5.20 68.8 41 4,838 4,719 R. hoagii PAM1271 no GCA_002095045.1 5.20 68.8 41 4,849 4,732 R. hoagii PAM1340 no GCA_002095085.1 5.06 68.8 25 4,710 4,599 R. hoagii PAM1354 no GCA_002095035.1 5.37 68.7 37 4,983 4,862 R. hoagii PAM1357 no GCA_002095125.1 5.01 68.8 24 4,658 4,547 R. hoagii PAM1413 no GCA_002095115.1 5.04 68.8 39 4,693 4,558 R. hoagii PAM1422 no GCA_002095195.1 5.20 68.8 41 4,842 4,729 R. hoagii PAM1475 no GCA_002095185.1 5.21 68.8 60 4,823 4,703 R. hoagii PAM1496 no GCA_002095155.1 5.09 68.8 41 4,726 4,603 R. hoagii PAM1533 no GCA_002095235.1 5.13 68.8 82 4,814 4,657 R. hoagii PAM1557 no GCA_002095255.1 5.35 68.7 34 4,976 4,851 R. hoagii PAM1571 no GCA_002094265.1 5.42 68.6 61 5,027 4,886 R. hoagii PAM1572 no GCA_002078535.1 5.12 68.8 29 4,735 4,631 R. hoagii PAM1593 no GCA_002078625.1 5.24 68.7 49 4,865 4,739 R. hoagii PAM1600 no GCA_002078515.1 5.14 68.8 41 4,757 4,661 R. hoagii PAM1637 no GCA_002095295.1 5.08 68.9 45 4,686 4,588 R. hoagii PAM1643 no GCA_002094235.1 5.09 68.8 31 4,765 4,650 R. hoagii PAM2012 no GCA_002094445.1 5.33 68.7 31 4,932 4,815 R. hoagii PAM2274 no GCA_002094225.1 5.22 68.7 44 4,869 4,745 R. hoagii PAM2276 no GCA_002094315.1 5.61 68.6 840 5,192 4,879

Appendix II | Supplementary material
254
R. hoagii PAM2279 no GCA_002094375.1 5.03 68.8 32 4,693 4,578 R. hoagii PAM2282 no GCA_002094295.1 5.27 68.7 41 4,887 4,791 R. hoagii PAM2285 no GCA_002094395.1 5.19 68.8 40 4,814 4,708 R. hoagii PAM2287 no GCA_002094405.1 5.14 68.9 40 4,744 4,643 R. hoagii PAM2288 no GCA_002094325.1 5.48 68.7 182 5,127 4,967 R. imtechensis RKJ300 YES GCA_000260815.1 8.23 67.2 178 7,962 7,245 R. jostii DSM 44719 no GCA_900105375.1 9.91 66.9 6 9,052 8,473 R. jostii NBRC 16295 YES GCA_001894825.1 9.73 66.9 286 8,983 8,358 R. jostii RHA1 no GCA_000014565.1 9.70 67 4 9,256 8,690 R. koreensis DSM 44498 YES GCA_900105905.1 10.31 67.4 9 9,491 8,902 R. kroppenstedtii DSM 44908 YES GCA_900111805.1 4.08 70.1 30 3789 3652 R. kunmingensis DSM 45001 YES GCA_001646865.1 5.62 66.2 330 5,268 4,885 R. kyotonensis JCM 23211 YES GCA_900188125.1 6.31 64.2 50 5860 5698 R. kyotonensis KB10 no GCA_001645385.1 5.47 65.2 41 5056 4893 R. maanshanensis DSM 44675 YES GCA_900109405.1 5.67 69.2 61 5,143 4,972 R. marinonascens NBRC 14363
YES GCA_001894885.1 4.92 64.4 156 4619 4269
R. opacus 04-OD7 no GCA_002968035.1 9.32 66.9 220 8,884 8,099 R. opacus 1CP no GCA_001685605.1 8.64 67 3 7,973 7,380 R. opacus 8 no GCA_001292845.1 8.51 67.2 507 8,310 7,401 R. opacus ATCC 51882 YES GCA_004365075.1 9.87 66.8 3 9,215 8,486 R. opacus B4 no GCA_000010805.1 8.83 67.6 6 8,227 7,837 R. opacus DSM 44186 no GCA_003626495.1 8.81 67.1 2 8,261 7,611 R. opacus M213 no GCA_000264745.2 9.19 67 483 8,743 7,979 R. opacus NRRL B-24011 no GCA_000719995.1 6.38 62.4 334 5835 5672 R. opacus PD630 no GCA_000599545.1 9.17 67.2 10 8,402 7,903 R. opacus R7 no GCA_000736435.1 10.12 66.9 6 9,273 8,731 R. phenolicus DSM 44812 YES GCA_001646785.1 6.28 68.4 232 5,916 5,600 R. pyridinivorans AK37 no GCA_000236965.2 5.24 67.9 98 4,938 4,482 R. pyridinivorans DSM 44555 YES GCA_900105195.1 5.26 67.8 3 4,864 4,604 R. pyridinivorans GF3 no GCA_002269365.1 5.30 67.9 1 4,966 4,644 R. pyridinivorans KG-16 no GCA_001465325.1 5.83 67.7 87 5,286 5,074 R. pyridinivorans SB3094 no GCA_000511305.1 5.59 67.8 3 5,165 4,893 R. pyridinivorans YF3 no GCA_005944105.1 6.09 - 5 - - R. pyridinivorans ZKA33 no GCA_003633655.1 5.71 67.7 4 5,371 5,011 R. pyridinivorans ZKA49 no GCA_003610315.1 6.42 67.6 4 5,850 5,626 R. qingshengii BKS 20-40 no GCA_000341815.1 6.60 62.4 104 6208 5999 R. qingshengii CS98 no GCA_001662505.1 6.71 62.4 25 6278 6096 R. qingshengii CW25 no GCA_001623435.1 6.40 62.5 10 6022 5876 R. qingshengii JCM 15477 YES GCA_001646745.1 7.26 62.4 131 6820 6574 R. qingshengii MK1 no GCA_002087025.1 6.47 62.5 40 6039 5871 R. qingshengii TUHH-12 no GCA_000698455.1 7.43 61.7 349 7064 5249 R. rhodnii NBRC 100604 YES GCA_001894925.1 4.46 69.7 70 4,265 4,080 R. rhodochrous 11Y no GCA_002003765.1 8.58 70.4 1809 8,676 7,062 R. rhodochrous ATCC 17895 no GCA_000469645.1 6.87 62.3 423 6396 6122 R. rhodochrous ATCC 21198 no GCA_000517665.1 6.48 70.2 161 5,957 5,692 R. rhodochrous BKS6-46 no GCA_000239135.3 6.21 67.4 609 5,664 5,348 R. rhodochrous EP4 no GCA_003004765.2 5.72 67.9 1 5,198 4,942 R. rhodochrous J3 no GCA_900177695.1 6.11 67.9 68 5,576 5,343 R. rhodochrous KG-21 no GCA_001278665.1 6.10 69.6 232 5,633 5,215 R. rhodochrous NCTC 10210 YES GCA_900187265.1 5.27 68.2 1 4,841 4,668 R. rhodochrous NCTC 630 no GCA_900455745.1 6.51 70.6 2 6,049 5,808 R. rhodochrous NRRL B-1306 no GCA_000716895.1 6.78 61.7 85 6293 6074 R. rhodochrous TRN71 no GCA_001511235.1 4.87 70.2 173 4,594 3,147
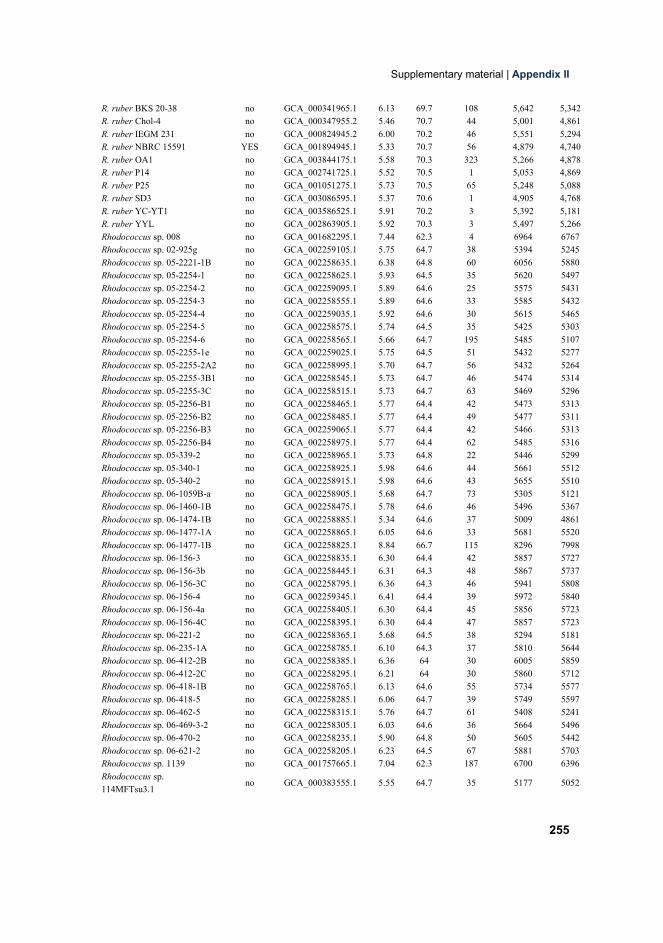
Supplementary material | Appendix II
255
R. ruber BKS 20-38 no GCA_000341965.1 6.13 69.7 108 5,642 5,342 R. ruber Chol-4 no GCA_000347955.2 5.46 70.7 44 5,001 4,861 R. ruber IEGM 231 no GCA_000824945.2 6.00 70.2 46 5,551 5,294 R. ruber NBRC 15591 YES GCA_001894945.1 5.33 70.7 56 4,879 4,740 R. ruber OA1 no GCA_003844175.1 5.58 70.3 323 5,266 4,878 R. ruber P14 no GCA_002741725.1 5.52 70.5 1 5,053 4,869 R. ruber P25 no GCA_001051275.1 5.73 70.5 65 5,248 5,088 R. ruber SD3 no GCA_003086595.1 5.37 70.6 1 4,905 4,768 R. ruber YC-YT1 no GCA_003586525.1 5.91 70.2 3 5,392 5,181 R. ruber YYL no GCA_002863905.1 5.92 70.3 3 5,497 5,266 Rhodococcus sp. 008 no GCA_001682295.1 7.44 62.3 4 6964 6767 Rhodococcus sp. 02-925g no GCA_002259105.1 5.75 64.7 38 5394 5245 Rhodococcus sp. 05-2221-1B no GCA_002258635.1 6.38 64.8 60 6056 5880 Rhodococcus sp. 05-2254-1 no GCA_002258625.1 5.93 64.5 35 5620 5497 Rhodococcus sp. 05-2254-2 no GCA_002259095.1 5.89 64.6 25 5575 5431 Rhodococcus sp. 05-2254-3 no GCA_002258555.1 5.89 64.6 33 5585 5432 Rhodococcus sp. 05-2254-4 no GCA_002259035.1 5.92 64.6 30 5615 5465 Rhodococcus sp. 05-2254-5 no GCA_002258575.1 5.74 64.5 35 5425 5303 Rhodococcus sp. 05-2254-6 no GCA_002258565.1 5.66 64.7 195 5485 5107 Rhodococcus sp. 05-2255-1e no GCA_002259025.1 5.75 64.5 51 5432 5277 Rhodococcus sp. 05-2255-2A2 no GCA_002258995.1 5.70 64.7 56 5432 5264 Rhodococcus sp. 05-2255-3B1 no GCA_002258545.1 5.73 64.7 46 5474 5314 Rhodococcus sp. 05-2255-3C no GCA_002258515.1 5.73 64.7 63 5469 5296 Rhodococcus sp. 05-2256-B1 no GCA_002258465.1 5.77 64.4 42 5473 5313 Rhodococcus sp. 05-2256-B2 no GCA_002258485.1 5.77 64.4 49 5477 5311 Rhodococcus sp. 05-2256-B3 no GCA_002259065.1 5.77 64.4 42 5466 5313 Rhodococcus sp. 05-2256-B4 no GCA_002258975.1 5.77 64.4 62 5485 5316 Rhodococcus sp. 05-339-2 no GCA_002258965.1 5.73 64.8 22 5446 5299 Rhodococcus sp. 05-340-1 no GCA_002258925.1 5.98 64.6 44 5661 5512 Rhodococcus sp. 05-340-2 no GCA_002258915.1 5.98 64.6 43 5655 5510 Rhodococcus sp. 06-1059B-a no GCA_002258905.1 5.68 64.7 73 5305 5121 Rhodococcus sp. 06-1460-1B no GCA_002258475.1 5.78 64.6 46 5496 5367 Rhodococcus sp. 06-1474-1B no GCA_002258885.1 5.34 64.6 37 5009 4861 Rhodococcus sp. 06-1477-1A no GCA_002258865.1 6.05 64.6 33 5681 5520 Rhodococcus sp. 06-1477-1B no GCA_002258825.1 8.84 66.7 115 8296 7998 Rhodococcus sp. 06-156-3 no GCA_002258835.1 6.30 64.4 42 5857 5727 Rhodococcus sp. 06-156-3b no GCA_002258445.1 6.31 64.3 48 5867 5737 Rhodococcus sp. 06-156-3C no GCA_002258795.1 6.36 64.3 46 5941 5808 Rhodococcus sp. 06-156-4 no GCA_002259345.1 6.41 64.4 39 5972 5840 Rhodococcus sp. 06-156-4a no GCA_002258405.1 6.30 64.4 45 5856 5723 Rhodococcus sp. 06-156-4C no GCA_002258395.1 6.30 64.4 47 5857 5723 Rhodococcus sp. 06-221-2 no GCA_002258365.1 5.68 64.5 38 5294 5181 Rhodococcus sp. 06-235-1A no GCA_002258785.1 6.10 64.3 37 5810 5644 Rhodococcus sp. 06-412-2B no GCA_002258385.1 6.36 64 30 6005 5859 Rhodococcus sp. 06-412-2C no GCA_002258295.1 6.21 64 30 5860 5712 Rhodococcus sp. 06-418-1B no GCA_002258765.1 6.13 64.6 55 5734 5577 Rhodococcus sp. 06-418-5 no GCA_002258285.1 6.06 64.7 39 5749 5597 Rhodococcus sp. 06-462-5 no GCA_002258315.1 5.76 64.7 61 5408 5241 Rhodococcus sp. 06-469-3-2 no GCA_002258305.1 6.03 64.6 36 5664 5496 Rhodococcus sp. 06-470-2 no GCA_002258235.1 5.90 64.8 50 5605 5442 Rhodococcus sp. 06-621-2 no GCA_002258205.1 6.23 64.5 67 5881 5703 Rhodococcus sp. 1139 no GCA_001757665.1 7.04 62.3 187 6700 6396 Rhodococcus sp. 114MFTsu3.1
no GCA_000383555.1 5.55 64.7 35 5177 5052

Appendix II | Supplementary material
256
Rhodococcus sp. 1163 no GCA_002091985.1 4.46 62.3 43 4099 3953 Rhodococcus sp. 1168 no GCA_002091955.1 5.06 62.1 97 4663 4421 Rhodococcus sp. 14-1411-2a no GCA_002259485.1 5.61 64.7 27 5288 5147 Rhodococcus sp. 14-2470-1a no GCA_002259425.1 6.07 64.6 67 5680 5494 Rhodococcus sp. 14-2470-1b no GCA_002259415.1 5.91 64.4 73 5533 5341 Rhodococcus sp. 14-2483-1-1 no GCA_002259335.1 5.78 64.3 36 5421 5292 Rhodococcus sp. 14-2483-1-2 no GCA_002259405.1 5.87 64.6 27 5464 5295 Rhodococcus sp. 14-2496-1d no GCA_002259365.1 5.92 64.8 55 5683 5510 Rhodococcus sp. 14-2686-1-2 no GCA_002259285.1 6.20 64.3 58 5855 5646 Rhodococcus sp. 15-1154-1 no GCA_002258715.1 5.98 64.5 47 5614 5438 Rhodococcus sp. 15-1189-1-1a no GCA_002259155.1 6.24 64.3 69 5894 5679 Rhodococcus sp. 15-2388-1-1a no GCA_002259145.1 6.21 64.5 55 5896 5732 Rhodococcus sp. 15-649-1-2 no GCA_002258685.1 5.78 64.6 42 5393 5269 Rhodococcus sp. 15-649-2-2 no GCA_002258645.1 6.03 64.1 52 5726 5587 Rhodococcus sp. 15-725-2-2b no GCA_002259075.1 6.12 64.6 33 5738 5577 Rhodococcus sp. 164Chir2E no GCA_900101565.1 6.26 62.5 46 5884 5718 Rhodococcus sp. 1R11 no GCA_004563845.1 5.48 64.5 38 5156 4989 Rhodococcus sp. 29MFTsu3.1 no GCA_000382105.1 5.58 64.6 57 5250 5102 Rhodococcus sp. 2G no GCA_001886355.1 5.60 67.5 2 5,256 4,930 Rhodococcus sp. 311R no GCA_001242945.1 6.34 62.6 128 5935 5735 Rhodococcus sp. 4J2A2 no GCA_001373455.1 6.44 61.8 60 5988 5762 Rhodococcus sp. 66b no GCA_002076325.1 6.68 62.4 57 6253 6069 Rhodococcus sp. 852002-51564 SCH6189132-a
no GCA_001665495.1 4.86 68.2 87 4,504 4,250
Rhodococcus sp. ABRD24 no GCA_004328705.1 5.10 66.4 1 4,572 4,381 Rhodococcus sp. ACPA1 no GCA_002300195.1 10.06 66.9 47 9,292 8,798 Rhodococcus sp. ACPA4 no GCA_002300185.1 7.07 61.6 9 6475 6269 Rhodococcus sp. ACS1 no GCA_002300155.1 10.89 67 40 10,089 9,459 Rhodococcus sp. AD45 no GCA_000949305.1 6.79 61.7 9 6252 6070 Rhodococcus sp. AD45-ID no GCA_003023755.1 6.45 61.8 8 5957 5787 Rhodococcus sp. ADH no GCA_001297885.1 7.08 62.3 129 6602 6389 Rhodococcus sp. AG1013 no GCA_003350365.1 5.86 68.2 55 5,585 5,258 Rhodococcus sp. AJR001 no GCA_001652355.1 7.26 62.4 167 6833 6556 Rhodococcus sp. AQ5-07 no GCA_003313445.1 6.75 62.4 33 6352 6149 Rhodococcus sp. ARP2 no GCA_001029585.1 6.30 62.4 120 5946 5730 Rhodococcus sp. AW25M09 no GCA_000333955.1 5.64 64.1 167 5384 5101 Rhodococcus sp. B7740 no GCA_000954115.1 5.34 64.9 1 5018 4875 Rhodococcus sp. BH4 no GCA_002079265.1 7.02 62.3 2 6533 6362 Rhodococcus sp. Br-6 no GCA_001748445.2 5.50 68.7 23 5,155 5,012 Rhodococcus sp. BS-15 no GCA_000813105.1 5.50 64.4 656 5547 4101 Rhodococcus sp. BUPNP1 no GCA_002215235.1 5.56 68.1 89 5,092 4,924 Rhodococcus sp. C9-28 no GCA_005434945.1 4.40 69.1 67 - - Rhodococcus sp. Chr-9 no GCA_000801125.1 5.34 67.7 142 5,047 4,651 Rhodococcus sp. CUA-806 no GCA_001942265.1 5.80 63.9 67 5645 3966 Rhodococcus sp. D-1 no GCA_001976025.1 6.93 62.3 57 6535 6356 Rhodococcus sp. DK17 no GCA_000263875.1 9.11 67.1 135 8,611 7,954 Rhodococcus sp. ENV425 no GCA_002887785.1 6.21 70.3 313 5,819 5,171 Rhodococcus sp. EPR-134 no GCA_001647205.1 6.99 62.4 811 6928 6120 Rhodococcus sp. EPR-147 no GCA_001647185.1 5.35 64.8 596 5363 4773 Rhodococcus sp. EPR-157 no GCA_001647195.1 5.94 63.5 695 5840 5203 Rhodococcus sp. EPR-279 no GCA_001647175.1 5.35 64.8 602 5366 4750 Rhodococcus sp. EsD8 no GCA_000382865.1 6.63 70.1 287 6,081 5,747 Rhodococcus sp. Eu-32 no GCA_003336925.1 5.61 65.1 83 5236 5079 Rhodococcus sp. HA99 no GCA_001312925.1 5.89 65.4 1267 - -

Supplementary material | Appendix II
257
Rhodococcus sp. H-CA8f no GCA_002501585.1 6.50 62.5 2 6122 5979 Rhodococcus sp. HS-D2 no GCA_001651055.1 5.75 67.5 202 5,432 5,103 Rhodococcus sp. IITR03 no GCA_001017865.1 6.29 67.3 657 6,123 2,676 Rhodococcus sp. JCM 9791 no GCA_001312645.1 6.34 65.3 947 - - Rhodococcus sp. JCM 9793 no GCA_001312665.1 6.28 65.3 1101 - - Rhodococcus sp. JG-3 no GCA_000482405.1 5.29 64.5 6 4968 4848 Rhodococcus sp. JVH1 no GCA_000280725.1 9.18 67 173 8,610 8,073 Rhodococcus sp. KB6 no GCA_001445685.1 7.00 62.5 165 6578 6348 Rhodococcus sp. KBS0724 no GCA_005938745.1 7.85 59.5 1556 8118 7831 Rhodococcus sp. KBW08 no GCA_003852455.1 6.95 62.4 87 6405 6206 Rhodococcus sp. LB1 no GCA_001583455.1 10.75 66.6 448 10,008 9,213 Rhodococcus sp. Leaf225 no GCA_001426145.1 4.71 68.3 26 4402 4274 Rhodococcus sp. Leaf233 no GCA_001426165.1 5.53 64.5 15 5209 5089 Rhodococcus sp. Leaf247 no GCA_001426185.1 4.53 67.1 5 4241 4119 Rhodococcus sp. Leaf258 no GCA_001426065.1 4.71 68.4 19 4412 4293 Rhodococcus sp. Leaf278 no GCA_001426085.1 5.72 64.1 45 5386 5215 Rhodococcus sp. Leaf7 no GCA_001425985.1 4.54 67.1 7 4244 4120 Rhodococcus sp. LHW50502 no GCA_004011835.1 3.97 66.5 29 3,607 3,453 Rhodococcus sp. LHW51113 no GCA_004011825.1 3.71 66.5 22 3,373 3,243 Rhodococcus sp. LP 11 YM no GCA_004364595.1 7.42 62.2 63 6969 6671 Rhodococcus sp. LP 3 YM no GCA_004363395.1 7.42 62.2 65 6967 6671 Rhodococcus sp. M8 no GCA_001890475.2 6.32 70.3 13 5,746 5,561 Rhodococcus sp. MEB064 no GCA_000834565.1 4.66 67 81 4373 4239 Rhodococcus sp. MTM3W5.2 no GCA_001984015.1 5.67 69 1 5,165 4,272 Rhodococcus sp. NCIMB 12038
no GCA_002165735.1 9.27 67.2 109 8,498 8,035
Rhodococcus sp. NEAU-CX67 no GCA_005049235.1 5.37 - 31 - - Rhodococcus sp. NJ-530 no GCA_003860625.1 7.32 62.3 5 6899 6491 Rhodococcus sp. OK269 no GCA_003386655.1 6.08 63.2 30 5706 5522 Rhodococcus sp. OK270 no GCA_900215125.1 5.73 69 42 5,356 5,143 Rhodococcus sp. OK302 no GCA_002245895.1 6.79 61.3 2 6315 5976 Rhodococcus sp. OK519 no GCA_003051005.1 5.28 67.8 28 4,895 4,727 Rhodococcus sp. OK551 no GCA_003387295.1 7.02 61.7 63 6570 6314 Rhodococcus sp. OK611 no GCA_003050885.1 5.73 69 41 5,349 5,147 Rhodococcus sp. P1Y no GCA_003641205.1 5.87 63.2 1 5453 5253 Rhodococcus sp. P27 no GCA_000454285.1 6.26 62.4 60 5956 4982 Rhodococcus sp. p52 no GCA_000763325.2 5.41 67.8 4 5,076 4,753 Rhodococcus sp. PAMC28705 no GCA_004795875.1 4.73 62.1 1 4302 4117 Rhodococcus sp. PAMC28707 no GCA_004795915.1 4.73 62.1 1 4307 4122 Rhodococcus sp. PBTS 1 no GCA_001620025.1 4.25 70 1 3918 3793 Rhodococcus sp. PBTS 2 no GCA_001620005.1 5.32 64.7 2 4985 4864 Rhodococcus sp. PMG 084 no GCA_004296005.1 2.78 66.8 407 2,931 2,620 Rhodococcus sp. PMG 254 no GCA_004211705.1 6.90 61.7 63 6323 6103 Rhodococcus sp. PMG 259 no GCA_004211695.1 8.47 66.6 1043 8,392 7,409 Rhodococcus sp. PML026 no GCA_000963615.1 5.18 64.6 16 4840 4694 Rhodococcus sp. Q1 no GCA_004153645.1 4.97 67.9 26 4,552 4,367 Rhodococcus sp. R04 no GCA_000219395.2 8.84 69.6 2113 - - Rhodococcus sp. R1101 no GCA_000278445.1 4.65 68 990 4,606 3,765 Rhodococcus sp. RD6.2 no GCA_001040705.1 5.57 68.4 13 5,089 4,947 Rhodococcus sp. RS1C4 no GCA_002258225.1 5.92 64.5 79 5558 5415 Rhodococcus sp. S2-17 no GCA_003130705.1 8.01 65.6 4 7,531 6,877 Rhodococcus sp. SBT000017 no GCA_003688915.1 5.65 64.6 5 5399 5169 Rhodococcus sp. SC4 no GCA_001555475.1 10.57 66.7 345 9,793 9,118

Appendix II | Supplementary material
258
Rhodococcus sp. UNC23MFCrub1.1
no GCA_000686025.1 4.70 68.5 24 4394 4258
Rhodococcus sp. UNC363MFTsu5.1
no GCA_000686785.1 5.67 69.3 69 5,257 5,079
Rhodococcus sp. WAY2 no Unpublished 8.44 65.8 5 8,236 7,631 Rhodococcus sp. WB1 no GCA_001700945.1 6.15 70.5 2 5,565 5,390 Rhodococcus sp. WMMA185 no GCA_001767395.1 4.44 64.1 1 4014 3885 Rhodococcus sp. WWJCD1 no GCA_002258735.1 5.86 64.2 41 5505 5352 Rhodococcus sp. X156 no GCA_004006015.1 3.72 72.2 1 3504 3389 Rhodococcus sp. YH3-3 no GCA_001653035.1 7.32 62.1 38 6967 6613 Rhodococcus sp. YL-0 no GCA_002165495.1 7.23 62.4 174 6800 6548 Rhodococcus sp. YL-1 no GCA_001942025.1 7.59 62.4 6 7109 6887 R. triatomae BKS 15-14 no GCA_000341795.1 5.82 69 74 5,340 5,183 R. triatomae DSM 44892 YES GCA_900099725.1 4.73 68.7 38 4,430 4,297 R. tukisamuensis JCM 11308 YES GCA_900101735.1 5.49 69.8 40 4,976 4,759 R. wratislaviensis C31-06 no GCA_003851765.1 9.54 67.2 193 8,914 8,364 R. wratislaviensis IFP 2016 no GCA_000325625.1 9.69 67 927 9,777 8,187 R. wratislaviensis NBRC 100605
YES GCA_000583735.1 10.40 66.8 151 9,514 8,883
R. wratislaviensis NCTC 13229
no GCA_900455735.1 7.78 67.4 29 7,174 6,835
R. wratislaviensis WS3308 no GCA_003385055.1 7.84 67.4 1 7,200 6,890 R. yunnanensis NBRC 103083 YES GCA_001895005.1 6.37 63.9 68 5826 5650 R. zopfii NBRC 100606 YES GCA_001895025.1 6.30 68.2 146 5,848 5,575
Supplementary Table 5.S2 GGDC intergenomic distances of the reciprocal Rhodococcus genomes comparisons.
XSLX file. Only available in the electronic version.

Supplementary material | Appendix II
259
Supplementary Table 5.S3 Specific genomic fractions of the Rhodococcus PGs identified in this study.
GROUP Genomes number
Orthogroups number avg.
CORE GENOME
% orthogroups
SPECIFIC GENOME % core
PG_1 36 4526.67 3096 68.39% 7 0.23% PG_2 31 4392.42 3379 76.93% 17 0.50% PG_3 3 3599.67 3194 88.73% 28 0.88% PG_4 1 2991.00 2991 100.00% 286 9.56% PG_5 1 4410.00 4410 100.00% 188 4.26% PG_6 1 4047.00 4047 100.00% 109 2.69% PG_7 1 4484.00 4484 100.00% 221 4.93% PG_8 1 4389.00 4389 100.00% 221 5.04% PG_9 1 3196.00 3196 100.00% 274 8.57%
PG_10 - - - - - PG_11 1 4323.00 4323 100.00% 165 3.82% PG_12 22 4474.23 3366 75.23% 14 0.42% PG_13 3 3323.33 2913 87.65% 23 0.79% PG_14 3 3722.00 3423 91.97% 24 0.70% PG_15 2 3615.00 3613 99.94% 94 2.60% PG_16 8 4534.38 3956 87.24% 40 1.01% PG_17 1 4447.00 4447 100.00% 271 6.09% PG_18 26 4724.31 2614 55.33% 60 2.30% PG_19 - - - - - PG_20 1 3311.00 3311 100.00% 123 3.71% PG_21 2 5248.50 4322 82.35% 199 4.60% PG_22 13 5421.92 3699 68.22% 63 1.70% PG_23 14 3998.21 2985 74.66% 18 0.60% PG_24 1 3509.00 3509 100.00% 103 2.94% PG_25 - - - - - - PG_26 12 4130.50 3283 79.48% 91 2.77% PG_27 - - - - - - PG_28 1 3634.00 3634 100.00% 165 4.54% PG_29 6 4008.83 2965 73.96% 54 1.82% PG_30 1 3890.00 3890 100.00% 141 3.62% PG_31 1 4040.00 4040 100.00% 107 2.65% PG_32 1 4099.00 4099 100.00% 148 3.61% PG_33 2 3002.00 2779 92.57% 37 1.33% PG_34 1 3434.00 3434 100.00% 229 6.67% PG_35 1 3697.00 3697 100.00% 163 4.41% PG_36 1 4252.00 4252 100.00% 193 4.54% PG_37 1 3948.00 3948 100.00% 81 2.05%
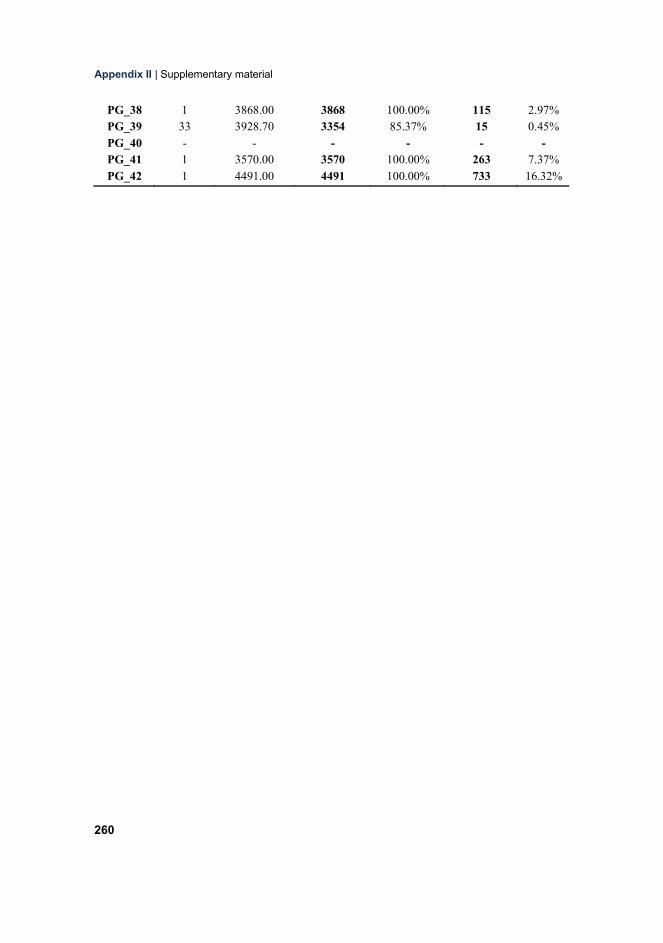
Appendix II | Supplementary material
260
PG_38 1 3868.00 3868 100.00% 115 2.97% PG_39 33 3928.70 3354 85.37% 15 0.45% PG_40 - - - - - - PG_41 1 3570.00 3570 100.00% 263 7.37% PG_42 1 4491.00 4491 100.00% 733 16.32%