Morphogenesis and clinicopathologic characteristics of recurrent carotid disease
Upload
khangminh22Category
view
3download
0
Université Paris DescartesÉcole Doctorale 474 Frontières du Vivant
Genetic control of
bacterial morphogenesis
par Antoine Vigouroux
Thèse de doctorat de biophysiqueDirigée par David Bikard et Sven van Teeffelen
Présentée et soutenue publiquement le 27 mai 2019, devant un jury composé de :David Bikard Directeur Institut PasteurSven van Teeffelen Directeur Institut PasteurMeriem El Karoui Rapporteuse University of EdinburghJohannes Hohlbein Rapporteur Wageningen UniversityOlivier Tenaillon Examinateur Université Paris DiderotLydia Robert Examinatrice Université Pierre et Marie CurieIvanMatic Examinateur Université Paris Descartes
RésuméDepuis la découverte de l’ADN, notre compréhension de la morphogénèse bactérienne a beaucoup
progressé mais aussi donné lieu à de nouvelles questions. La bactérie Escherichia coli est capable demaintenir une forme de bâtonnet de façon robuste, mais son génome ne contient aucun de plan de con-struction précis. La forme des cellules est déterminée dynamiquement par les enzymes qui synthétisentla paroi cellulaire, un polymère rigide qui entoure la cellule. Pour étudier quantitativement comment labiogénèse de la paroi et la forme des cellules dépend des concentrations des enzymes essentielles, nousutilisons un dérivé sans activité nucléase de CRISPR/Cas9 pour bloquer partiellement la transcription.Cette méthode n’ayant pas été utilisée avant, nous avons étudié ses propriétés en détail sur des rappor-teurs fluorescents. Cela nous a conduit à des découvertes surprenantes: on considérait auparavant quela répression dépendait de la fréquence de fixation de dCas9 à sa cible. Nous avons démontré un mécan-isme différent: la complémentarité guide/cible détermine la probabilité que la RNA polymérase déplaceactivement dCas9 lors de la transcription. Cela conduit à des propriétés désirables: la force de répressionne dépend pas du niveau d’expression natif de la cible, et n’ajoute pas de bruit extrinsèque à l’expression.Armés de cet outil, nous avons pour objectif de comprendre globalement comment les différents com-posants de la machinerie de synthèse de la paroi cellulaire sont articulés entre eux. Pour polymériser laparoi cellulaire, qui donne sa forme à la cellule, deux groupes d’enzymes ont été décrits: le complexe Rodet les PBPde classe A.Nous avons créé des souches exprimant ces deux catégories d’enzymes à des niveauxvariables et caractérisé leurs phénotypes par différents moyens biophysiques (résistance mécanique, dif-fusion de molécules uniques, sensibilité à des antibiotiques...). Nous avons pu mettre en évidence quedes enzymes avec des activités biochimiques similaires peuvent provoquer des réponses complètementdifférentes lorsque leurs niveaux sont changés. Ces travaux ont permis de mieux comprendre commentces différents mécanismes sont coordonnés pour maintenir l’intégrité de la paroi à de multiples échelles.
AbstractSince the discovery ofDNA, our understanding of themorphogenesis of bacterial cells hasmade great
advance and also gave rise to new questions. Even though the bacterium Escherichia coli is able to main-tain rod shape robustly, the genome does not encode any internal blueprint of what the cell should looklike. Rather, cell shape is dynamically determined by the enzymes synthesizing the cell-wall, a rigid poly-mer that surrounds the cell. To quantitatively study the dependence of cell-wall biogenesis and cell shapeon levels of essential cell-wall synthesis proteins, we use a nuclease-deficient CRISPR/Cas9 to partiallyblock transcription. As this method had no been put into practice before, we thoroughly investigated itsproperties on a model system using fluorescent reporters. This led us to surprising findings: it was previ-ously assumed that decreased levels of guide RNA complementarity would decrease repression strengthby virtue of reduced occupancy of the target. We demonstrated a different mechanism: complementaritydetermines the probability that RNA polymerase kicks out dCas9 during the transcription attempt, whilethe rate of spontaneous dCas9 unbinding is negligibly small. If dCas9 levels are high enough to saturatethe target this mechanism alone determines repression strength. This leads to desirable properties: First,relative repression strength is independent of native expression levels. Second, repression does not addany extrinsic noise to gene expression. Armed with this tool, we aim get a global understanding of the in-terplay between the different components of the cell-wall machinery. To polymerize the cell wall , whichgives its shape to the cell, two groups of enzymes were described: the Rod Complex and class A PBPs.We created strains expressing this two categories of enzyme at variable levels, then characterized theirphenotypes by different biophysical means (mechanical resistance, single-molecule diffusion, antibioticsensitivity...). This way, we could show that enzymes that share similar biochemical activities can elicitvery different responses when their levels are changed. This work allowed to better understand howthese different mechanisms are coordinated to maintain cell wall integrity at multiple scales.

Genetic control ofbacterial morphogenesis

Remerciements
First of all, I would like to thank my advisors David and Sven, for guiding me duringthese 3.5 years and always putting me back on track. Thanks to the members of myThesis Advisory Committee, Ivo Boneca and Pascal Hersen, for their precious adviceand support. I also thank the jury for taking the time to examine this work.
A big thank to all the peoplewhodirectly participated in the projects discussed in thisthesis: Baptiste Cordier, Lun Cui, Alicia Calvo-Villamañan, Gizem Özbaykal, FrançoisSimon, Enno Oldewurtel, Richard Wheeler and Martin Sachse, and my two interns,Lucas and Dimitrije.
For bearing with me during all these years, I address special thanks to the past andpresent members of my two labs. I met so many exceptional people here. Aude, Élise,Gizem, Alicia, Yuki, François, François, it was great to share the PhD experience withyou. You’d better not forget me in your acknowledgements after I’m gone.
Mes parents, même si l’on ne s’est pas vus si souvent, merci pour le réconfort, l’aideinestimable et les trucs bons. Diane, Augustin, on s’est tous retrouvés à travailler dur enmême temps, vers la fin. Heureusement que vous étiez là.
Lyam, Florian, Eugénie, Julien et Corentin, merci pour l’élévation philosophique etl’illumination spirituelle que leur sagesse et leur érudition m’ont apportées. Mes con-fères de pharma, Julien, Éric, William, Reynald, Quentin, vousm’avez tout appris. Mercià l’Ernestophone, ma fanfare, pour cette joie débordante et pour m’avoir fait me sentirà ma place. Mention particulière pour le personnel de la vigoumobile, le feat est lourd,vous êtes la peufra. Ma team iGEM, que des numéros dix. L’an 2015 est passé, maisl’équipe reste. Thanks CRI friends, Miza, Guillermo, Roberta, Anna, Olga, Aamir, Juli-ette and all others. To Pasteur people, Marisaõ, Corentin, Christiane, Dariusz, Lukas,Mélanie, Sarah, the RSG lab, and so many more. To my former neighbors from CitéU, you were the best neighbors I ever had and our crêpes were unrivaled. Merci auxacrimoines, qui ne trouveront jamais cette dédicace. Thanks to the developers of LATEXand R, my unsung heroes. Please don’t blame me too much if I forgot you, I did notsleep so much during the last few days.
1
Contents
1 How can bacteria be so large? 8
1.1 Introduction . . . . . . . . . . . . . . . . . . . . . . . . . . . . . . . . . 81.2 A matter of scales . . . . . . . . . . . . . . . . . . . . . . . . . . . . . . 101.3 Understanding bacterial morphogenesis . . . . . . . . . . . . . . . . . 12
1.3.1 The shape of a bacterial cell . . . . . . . . . . . . . . . . . . . . 121.3.2 The cell wall . . . . . . . . . . . . . . . . . . . . . . . . . . . . 131.3.3 A bacterial cytoskeleton? . . . . . . . . . . . . . . . . . . . . . 141.3.4 Local coordination of cell wall synthesis . . . . . . . . . . . . 15
1.4 Investigating cell wall synthesis as a dynamical system . . . . . . . . . 15
2 Progress and mysteries in CRISPR control of bacterial transcription 17
2.1 Introduction . . . . . . . . . . . . . . . . . . . . . . . . . . . . . . . . . 172.2 Turning theCRISPR adaptative immune system into artificial transcrip-
tion factors . . . . . . . . . . . . . . . . . . . . . . . . . . . . . . . . . 182.3 Molecular and systemic mechanism . . . . . . . . . . . . . . . . . . . . 20
2.3.1 A roadblock on the way of the RNA-polymerase . . . . . . . . 202.3.2 Consequences of the collision . . . . . . . . . . . . . . . . . . 202.3.3 Mismatched guides and off-targets . . . . . . . . . . . . . . . . 222.3.4 Temporal dynamics and the search for target . . . . . . . . . . 22
2.4 Improving CRISPR control of transcription . . . . . . . . . . . . . . . 232.4.1 Tunable gene repression and activation . . . . . . . . . . . . . 232.4.2 Simultaneous control of multiple targets . . . . . . . . . . . . 242.4.3 From one bacterium to all others . . . . . . . . . . . . . . . . 252.4.4 Addressing side effects . . . . . . . . . . . . . . . . . . . . . . 25
2.5 Current applications . . . . . . . . . . . . . . . . . . . . . . . . . . . . 272.5.1 Genome-wide CRISPR screens . . . . . . . . . . . . . . . . . . 272.5.2 Synthetic biology and metabolic engineering . . . . . . . . . . 28
2.6 Conclusion . . . . . . . . . . . . . . . . . . . . . . . . . . . . . . . . . 28
3 Tuning dCas9’s ability to block transcription enables robust, noiseless
knockdown of bacterial genes 30
2
4 The ppppredictor 68
4.1 Introduction . . . . . . . . . . . . . . . . . . . . . . . . . . . . . . . . . 684.2 Cloning a large number of guide-target pairs . . . . . . . . . . . . . . 694.3 Principle of the measurement . . . . . . . . . . . . . . . . . . . . . . . 70
4.3.1 By mRNA sequencing . . . . . . . . . . . . . . . . . . . . . . . 704.3.2 By fluorescence-activated cell sorting (FACS) . . . . . . . . . . 70
4.4 General structure of the library . . . . . . . . . . . . . . . . . . . . . . 714.5 Designing the guide RNA pool . . . . . . . . . . . . . . . . . . . . . . . 71
4.5.1 Maximizing the sequence diversity . . . . . . . . . . . . . . . 714.5.2 Avoid gRNAs with a known toxic effect on the cells . . . . . . 74
4.6 Designing the target pool . . . . . . . . . . . . . . . . . . . . . . . . . . 744.7 Planned analysis . . . . . . . . . . . . . . . . . . . . . . . . . . . . . . . 75
5 Class A PBPs maintain cell wall homeostasis at an intermediate scale in
diderm bacteria 77
5.1 Introduction . . . . . . . . . . . . . . . . . . . . . . . . . . . . . . . . . 775.2 Results . . . . . . . . . . . . . . . . . . . . . . . . . . . . . . . . . . . . 79
5.2.1 Class A PBPs have an “all-or-nothing” behaviour . . . . . . . . 795.2.2 At a critically low level, cells insert as much peptidoglycan as
wild-type cells but have different mechanical properties . . . . 815.2.3 PBP1B maintains cell wall integrity and repairs it after stress . 835.2.4 PBP1B and LpoB sense the need for cell wall insertion . . . . 85
5.3 Discussion . . . . . . . . . . . . . . . . . . . . . . . . . . . . . . . . . . 875.4 Experimental procedures . . . . . . . . . . . . . . . . . . . . . . . . . . 89
5.4.1 Strains and media . . . . . . . . . . . . . . . . . . . . . . . . . 895.4.2 Genetic constructions . . . . . . . . . . . . . . . . . . . . . . . 895.4.3 mDAP incorporation measurement . . . . . . . . . . . . . . . 905.4.4 Chromatography of peptidoglycan content . . . . . . . . . . . 905.4.5 Morphological measurements . . . . . . . . . . . . . . . . . . 905.4.6 Growth measurements . . . . . . . . . . . . . . . . . . . . . . 905.4.7 Single-particle tracking of PBP1B . . . . . . . . . . . . . . . . 915.4.8 Quantification of PBP1AB levels . . . . . . . . . . . . . . . . . 91
5.5 Acknowledgements . . . . . . . . . . . . . . . . . . . . . . . . . . . . . 925.6 Supplementary information . . . . . . . . . . . . . . . . . . . . . . . . 93
5.6.1 Single-particle tracking of PBP1B . . . . . . . . . . . . . . . . 93
6 A CRISPRi screen in E. coli reveals sequence-specific toxicity of dCas9 100
6.1 Impact on the project . . . . . . . . . . . . . . . . . . . . . . . . . . . . 100
7 Subcellular localization of class A PBPs changes in response to stress 138
7.1 Introduction . . . . . . . . . . . . . . . . . . . . . . . . . . . . . . . . . 1387.2 Results . . . . . . . . . . . . . . . . . . . . . . . . . . . . . . . . . . . . 139
7.2.1 PBP1A and PBP1B have different sub-cellular localization . . 1397.2.2 PBP1AB localization patterns are amplified after osmotic shocks 1417.2.3 Polar localization increases with medium osmolarity . . . . . 1427.2.4 The peptidoglycan hydrolase MepS enhances the localization
pattern . . . . . . . . . . . . . . . . . . . . . . . . . . . . . . . 1437.2.5 Localization patterns do not require LpoAB . . . . . . . . . . 143
7.3 Discussion . . . . . . . . . . . . . . . . . . . . . . . . . . . . . . . . . . 144
8 Interaction between D-aminoacids and cell wall synthesis 146
8.1 Introduction . . . . . . . . . . . . . . . . . . . . . . . . . . . . . . . . . 1468.2 Results . . . . . . . . . . . . . . . . . . . . . . . . . . . . . . . . . . . . 146
8.2.1 At low aPBPs concentration, cells become highly sensitive toD-aminoacids . . . . . . . . . . . . . . . . . . . . . . . . . . . 146
8.2.2 D-methionine prevents PBP1A activity, much more than PBP1B 1488.2.3 D-methionine treatment is more severe when MepS is over-
expressed . . . . . . . . . . . . . . . . . . . . . . . . . . . . . . 1498.2.4 Genome-wide CRISPR screen identifies processes related to D-
methionine . . . . . . . . . . . . . . . . . . . . . . . . . . . . . 149
9 More CRISPR exploration 152
9.1 Genetic regulation of the mreBCD operon . . . . . . . . . . . . . . . . 1529.2 Anti-CRISPR proteins to reverse the repression . . . . . . . . . . . . . 153
10 Discussion 155
10.1 Summary of the results . . . . . . . . . . . . . . . . . . . . . . . . . . . 15510.2 Status of the projects . . . . . . . . . . . . . . . . . . . . . . . . . . . . 157
10.2.1 Publications . . . . . . . . . . . . . . . . . . . . . . . . . . . . 15710.2.2 Manuscripts . . . . . . . . . . . . . . . . . . . . . . . . . . . . 15710.2.3 Ongoing projects . . . . . . . . . . . . . . . . . . . . . . . . . 157
10.3 Future work . . . . . . . . . . . . . . . . . . . . . . . . . . . . . . . . . 15810.3.1 Mistakes and dead ends . . . . . . . . . . . . . . . . . . . . . . 15810.3.2 Technological improvements . . . . . . . . . . . . . . . . . . . 15810.3.3 Next steps . . . . . . . . . . . . . . . . . . . . . . . . . . . . . 159
11 Appendix 185
List of Figures
1.1 Nicolaas Hartsoeker, “le petit infant”. . . . . . . . . . . . . . . . . . . . 91.2 Ernst Haeckel, “Diatomea” and “Mycetozoa” . . . . . . . . . . . . . . . 111.3 A negative-curvature cactus. . . . . . . . . . . . . . . . . . . . . . . . . 111.4 Phylogenetic tree of diverse bacteria and their morphology. . . . . . . 131.5 Purified sacculus from E. coli observed under a transmission electron
microscope . . . . . . . . . . . . . . . . . . . . . . . . . . . . . . . . . 141.6 Early model of actin-like polymers forming a skeleton inside B. subtilis
cells. . . . . . . . . . . . . . . . . . . . . . . . . . . . . . . . . . . . . . 14
2.1 Targeting the right strand for efficient repression. . . . . . . . . . . . . 212.2 Unnoticed “bad seed” effect in Wang et al.’s CRISPR screen. . . . . . . 26
3.1 Rainbow plate obtained by setting RFP and GFP to various levels usingCRISPR knock-down. . . . . . . . . . . . . . . . . . . . . . . . . . . . 30
4.1 Comparison of crRNA and sgRNA on GFP and mCherry . . . . . . . . 694.2 Expression cassette used to measure PPPs in high-throughput. . . . . 704.3 The library contains every 4-gram, in every position, four times. . . . 734.4 Simplified version of the graph used to generate the “universe”. . . . . 74
5.1 Class A PBPs have an “all-or-nothing” behavior. . . . . . . . . . . . . . 805.2 Strong repression of PBP1AB does not change peptidoglycan insertion
rate, but changes the mechanical properties of the cell. . . . . . . . . . 825.3 Depletion of peptidoglycan precursors by D-cycloserine. . . . . . . . . 845.4 PBP1B’s bound fraction adapts to the need for PG synthesis. . . . . . . 865.5 Confirmation by bocillin-labeling . . . . . . . . . . . . . . . . . . . . . 935.6 Genetic feedback regulates PBP1B but not PBP1A. . . . . . . . . . . . 945.7 Dimensions of cells in the instant before death. . . . . . . . . . . . . . 945.8 HPLC analysis of the peptidoglycan. . . . . . . . . . . . . . . . . . . . 955.9 Raw distributions of apparent diffusion coefficients for GFP-PBP1B
single-molecule tracking. . . . . . . . . . . . . . . . . . . . . . . . . . . 96
6.1 Repression of PBP1AB appears to increase growth rate. . . . . . . . . 1016.2 Expressing less dCas9 alleviates the bad seed artifacts. . . . . . . . . . 101
7.1 Different localization for PBP1A and PBP1B. . . . . . . . . . . . . . . 140
5
7.2 The localization of PBP1AB during an osmotic downshock. . . . . . . 1417.3 The distribution of PBP2 (right) is not as smooth as PBP1A (left). . . . 1427.4 FM4-64 localization during an osmotic downshock. . . . . . . . . . . 1427.5 Steady-state localization depends on osmotic pressure. . . . . . . . . . 1437.6 MepS overexpression enhances PBP1AB patterns. . . . . . . . . . . . . 1447.7 The deletion of LpoB does not suppress patterns of PBP1B. . . . . . . 145
8.1 Strong repression of the class A PBPs increases sensitivy toD-methionine.1478.2 D-methionine sensitivity at different levels of PBP1A and PBP1B. . . . 1488.3 The over-expression of the hydrolase MepS makes cells more sensitive
to D-methionine. . . . . . . . . . . . . . . . . . . . . . . . . . . . . . . 1498.4 CRISPR screen identify genes that affect D-methionine treatment. . . 1508.5 Validating the hits from the CRISPR screen. . . . . . . . . . . . . . . . 151
9.1 Strong genetic feedback regulates MreBCD expression . . . . . . . . . 1539.2 Anti-CRISPR proteins can be used to restore expression after knock-
down by dCas9. . . . . . . . . . . . . . . . . . . . . . . . . . . . . . . . 154
List of Tables
1.1 Orders of magnitude of the size of different components in life. . . . . 10
2.1 List of the seed sequence that have the highest toxic effect. . . . . . . . 26
5.1 Summary of the measured levels of PBP1AB in different strains. . . . . 795.2 Fit parameters for the mDAP incorporation experiment . . . . . . . . 955.3 Strains used in this study. . . . . . . . . . . . . . . . . . . . . . . . . . 975.4 Plasmids used in this study . . . . . . . . . . . . . . . . . . . . . . . . . 985.5 Fragments used to assemble plasmids by Gibson assembly. . . . . . . . 985.6 Oligonucleotides used to make the fragments in table 5.5. . . . . . . . 995.7 Oligonucleotides used to clone single-guide RNAs . . . . . . . . . . . 99
7
Chapter 1
How can bacteria be so large?
1.1 Introduction
The question of morphogenesis was settled by natural philosopher andtheologian Nicolas Malebranche in 1680. Microscopes had recentlybeen introduced to biologists by Antonie van Leeuwenhoek, revealingthe existence of creatures so small the naked eye could not see them.As there were no reasons, at the time, think that there was lower limit
to the size of living creatures, Malebranche suggested that there were, in fact, infinitelysmall creatures so that one could always discover new species by building better mi-croscopes. This solved the problem of the origin of organisms: animals simply carryminiature versions of themselves in their body, which in turn carry even smaller ver-sions of themselves, and so forth ad infinitum. This way, all past, present and futureliving organisms were already imbricated there, waiting for their turn since the timeGod created the Universe1.
However, this theory was still obscured by two clouds. The first cloud was that itwas not entirely clear whether these infinite lineages of animals were stored in male orfemale gonads (figure 1.1), a debate that would enrage natural philosophers for decades.The second cloudwas that, in the following centuries, the development of atomic theoryput quite a hard limit on the minimal size of living bodies. On top of that, the theoryof natural selection and evolution cast some doubt on the hypothesis that God createdthe living realm. Eventually, it was found that all living organisms had one thing incommon: instructions about how to build an entire organism are stored inside eachcell, in the form of long molecules of DNA.
This information includes morphological traits [1], as mutants can have differentmorphologies.
How can DNA, a one-dimensional, structure-less molecule that is hundreds of timessmaller than the full organism, describe such complex shapes?
1Nicolas Malebranche, Traité de la nature et de la grâce, 1680.
8

CHAPTER 1 HOW CAN BACTERIA BE SO LARGE?
Figure 1.1: Nicolaas Hartsoeker, “le petit infant”, in Essay de dioptrique, 1694.This famous woodcut shows of a sperm cell, and the pre-formed human that itsupposedly contains.
9
CHAPTER 1 HOW CAN BACTERIA BE SO LARGE?
1.2 A matter of scales
To give a better idea of the problem, here is a summary of the scale of different com-ponents of life (table 1.1). For example, the typical size of a bacterial protein is about5 nm [2], which is about one hundredth of the size of the bacterium itself. On top ofthat, enzymes have no long distance sight and no memory, so they cannot build struc-tures larger than themselves by refering to a determined construction plan. A majorchallenge in building the shape of organisms is thus to transmit information from onescale to another.
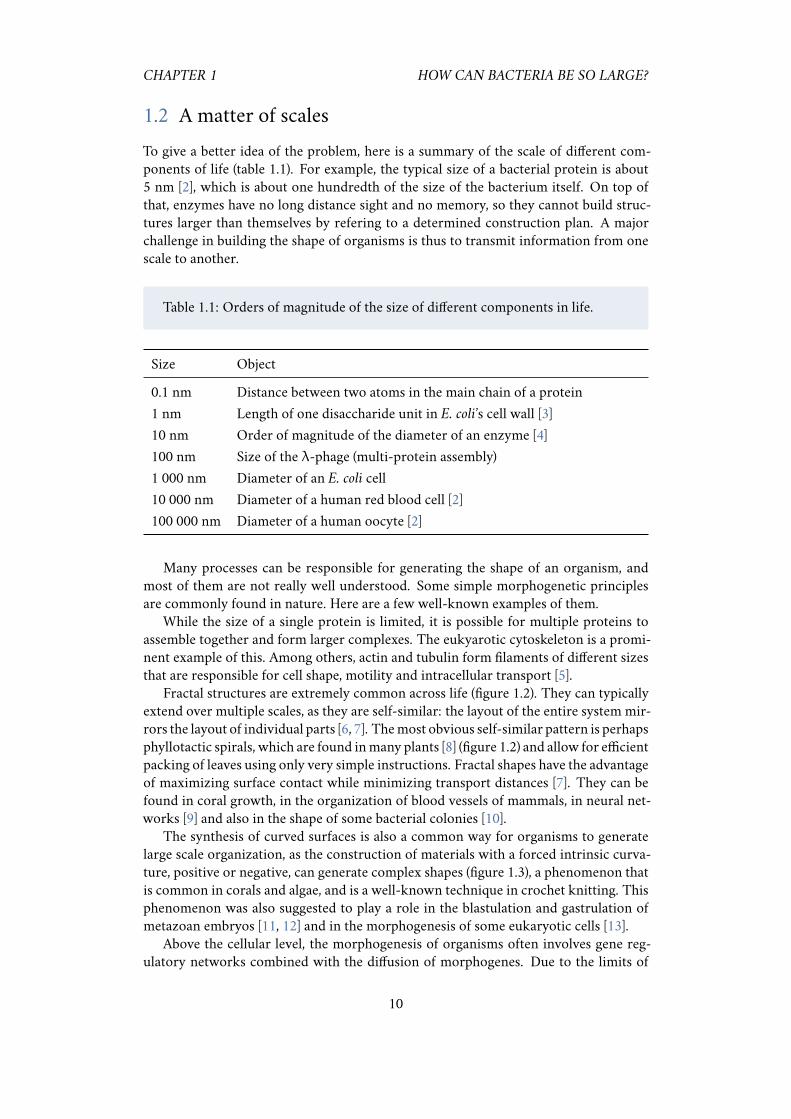
Table 1.1: Orders of magnitude of the size of different components in life.
Size Object
0.1 nm Distance between two atoms in the main chain of a protein1 nm Length of one disaccharide unit in E. coli’s cell wall [3]10 nm Order of magnitude of the diameter of an enzyme [4]100 nm Size of the λ-phage (multi-protein assembly)1 000 nm Diameter of an E. coli cell10 000 nm Diameter of a human red blood cell [2]100 000 nm Diameter of a human oocyte [2]
Many processes can be responsible for generating the shape of an organism, andmost of them are not really well understood. Some simple morphogenetic principlesare commonly found in nature. Here are a few well-known examples of them.
While the size of a single protein is limited, it is possible for multiple proteins toassemble together and form larger complexes. The eukyarotic cytoskeleton is a promi-nent example of this. Among others, actin and tubulin form filaments of different sizesthat are responsible for cell shape, motility and intracellular transport [5].
Fractal structures are extremely common across life (figure 1.2). They can typicallyextend over multiple scales, as they are self-similar: the layout of the entire system mir-rors the layout of individual parts [6, 7]. Themost obvious self-similar pattern is perhapsphyllotactic spirals, which are found inmany plants [8] (figure 1.2) and allow for efficientpacking of leaves using only very simple instructions. Fractal shapes have the advantageof maximizing surface contact while minimizing transport distances [7]. They can befound in coral growth, in the organization of blood vessels of mammals, in neural net-works [9] and also in the shape of some bacterial colonies [10].
The synthesis of curved surfaces is also a common way for organisms to generatelarge scale organization, as the construction of materials with a forced intrinsic curva-ture, positive or negative, can generate complex shapes (figure 1.3), a phenomenon thatis common in corals and algae, and is a well-known technique in crochet knitting. Thisphenomenon was also suggested to play a role in the blastulation and gastrulation ofmetazoan embryos [11, 12] and in the morphogenesis of some eukaryotic cells [13].
Above the cellular level, the morphogenesis of organisms often involves gene reg-ulatory networks combined with the diffusion of morphogenes. Due to the limits of
10

CHAPTER 1 HOW CAN BACTERIA BE SO LARGE?
Figure 1.2: Ernst Haeckel, “Diatomea” and “Mycetozoa”, in Kunstformen derNatur, 1904. Notice the potential fractal organization, reaction-diffusion pat-terns and phyllotactic spirals.
Figure 1.3: A negative-curvature cactus, belonging to the author’s mother.Mathematically, it is not possible to tile an Euclidian surface such that the averagenumber of neighbors per tile is larger than six [11]. I speculate that, in this cactus,because each spine bundle tends to have more than six equally-spaced neighbors,a negatively-curved surface is created, resulting in large folds.
protein size, long distances cannot be directly encoded in genetic information. How-ever, DNA sequences can encode for products with specific diffusion speeds and reac-tion rates, which in turn allow to describe structures much bigger than the size of theprotein themselves [14].
This has been studied in depth for the development of drosophila embryo [15], where
11
CHAPTER 1 HOW CAN BACTERIA BE SO LARGE?
the diffusion of morphogenes (e.g. bicoid and hunchback) serves as a basis for the devel-opment of the anterior-posterior axis. Positive feedback in the expression of a diffusingmorphogene can be used for symmetry-breaking and axial patterning [16]. The dif-ferential expression of cell-cell adhesion molecules can reorganize the cells spatially, aproperty that has been used to generate artificial multi-cellular structures [17]. Turingpatterns are another famous example of reaction-diffusion process, where two mor-phogenes with different diffusion constants generate complex motifs (figure 1.2). Thisis found, among many others, in the stripes of the zebra fish [18, 19]. Amusingly, somebacterial proteins are also able to generate dynamic patterns. This was observed bytransfering proteins from E. coli’s Min system on a supported lipid bilayer [20, 21], al-though the origin of these patterns is still controversial [22]. The scale of such patternsis much larger than the size of the cells of E. coli. Inside living cells, theMinDE proteinsform a dynamical system that oscillates from pole to pole and acts as a sensor for cellgeometry [23]. The resulting gradient allows to find the middle of the cell and deter-mines the position of the FtsZ ring to initiate cell division. They may also influence thelocalization of many other membrane proteins in E. coli [24].
1.3 Understanding bacterial morphogenesis
The shape of a bacterial cell
Bacteria are relatively simple organisms, as they are made of only one cell without anyorganelle. In particular, model organisms like Escherichia coli or Bacillus subtilis havebeen studied extensively, a large part of their genomes is annotated, and they are ar-guably the organisms that scientists know the best. Yet, the origin of their shape is stillpoorly understood.
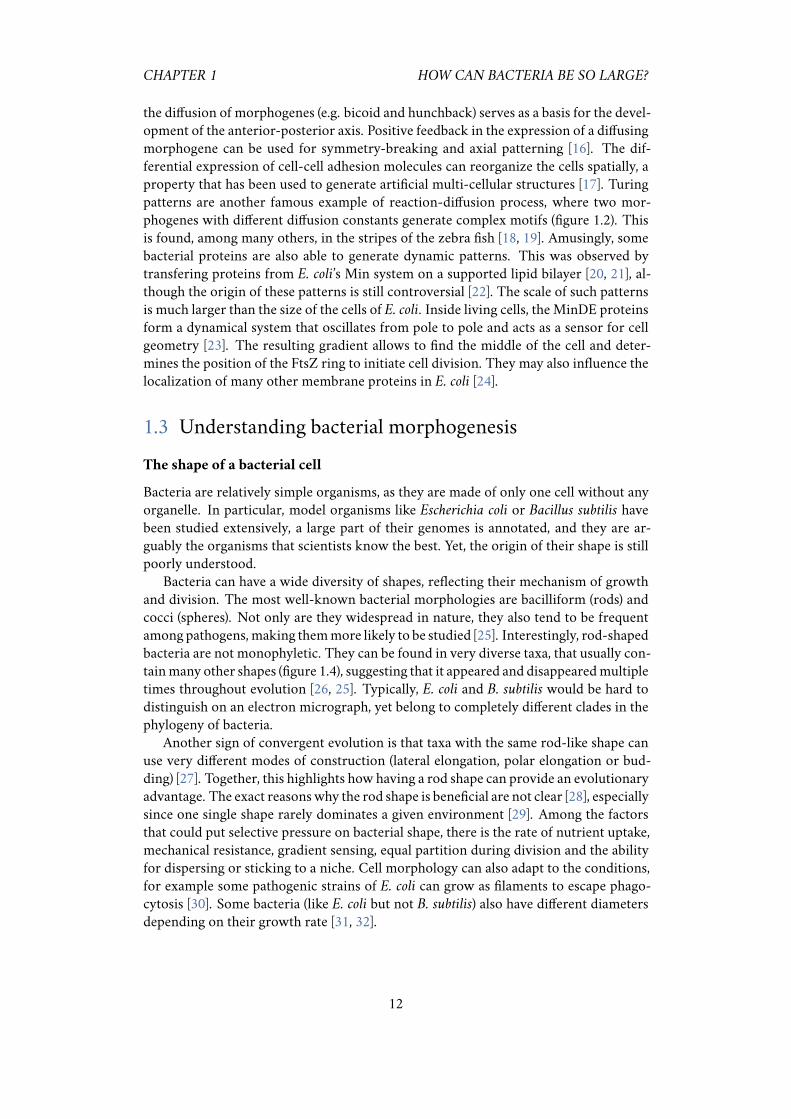
Bacteria can have a wide diversity of shapes, reflecting their mechanism of growthand division. The most well-known bacterial morphologies are bacilliform (rods) andcocci (spheres). Not only are they widespread in nature, they also tend to be frequentamong pathogens, making themmore likely to be studied [25]. Interestingly, rod-shapedbacteria are not monophyletic. They can be found in very diverse taxa, that usually con-tainmany other shapes (figure 1.4), suggesting that it appeared and disappearedmultipletimes throughout evolution [26, 25]. Typically, E. coli and B. subtilis would be hard todistinguish on an electron micrograph, yet belong to completely different clades in thephylogeny of bacteria.
Another sign of convergent evolution is that taxa with the same rod-like shape canuse very different modes of construction (lateral elongation, polar elongation or bud-ding) [27]. Together, this highlights how having a rod shape can provide an evolutionaryadvantage. The exact reasonswhy the rod shape is beneficial are not clear [28], especiallysince one single shape rarely dominates a given environment [29]. Among the factorsthat could put selective pressure on bacterial shape, there is the rate of nutrient uptake,mechanical resistance, gradient sensing, equal partition during division and the abilityfor dispersing or sticking to a niche. Cell morphology can also adapt to the conditions,for example some pathogenic strains of E. coli can grow as filaments to escape phago-cytosis [30]. Some bacteria (like E. coli but not B. subtilis) also have different diametersdepending on their growth rate [31, 32].
12
CHAPTER 1 HOW CAN BACTERIA BE SO LARGE?
Figure 1.4: Phylogenetic tree of diverse bacteria and their morphology.Reprinted with permission from [26].
The cell wall
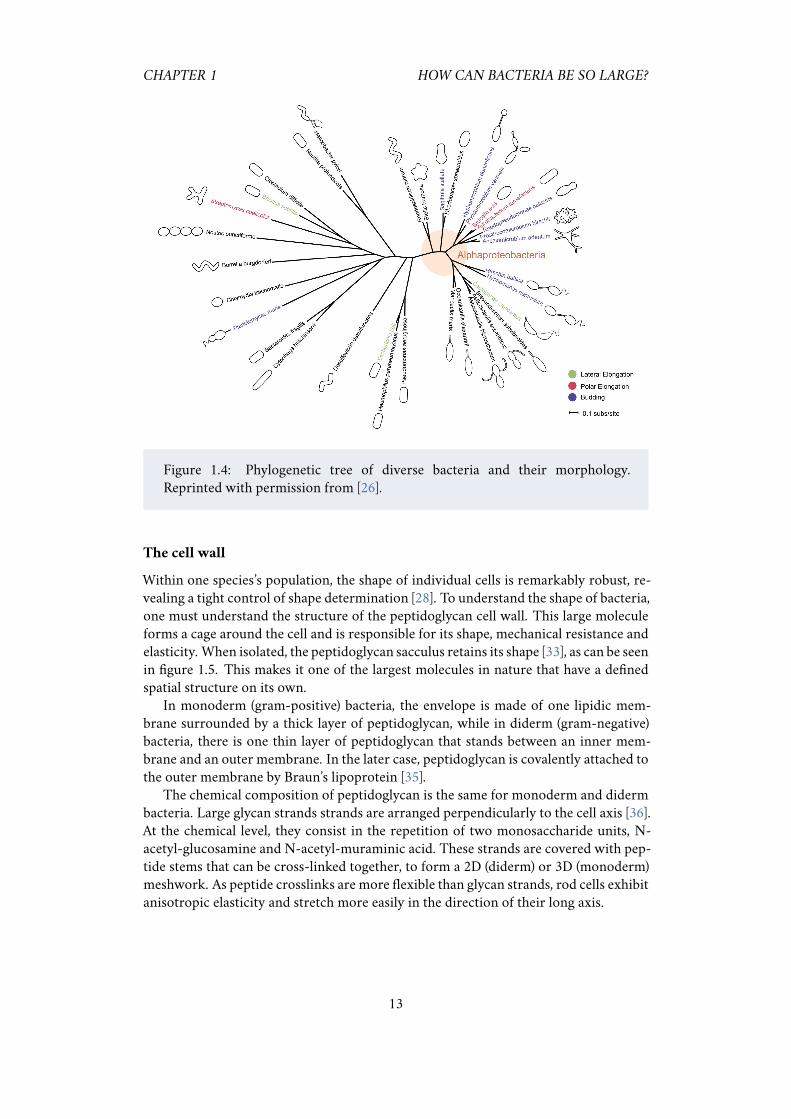
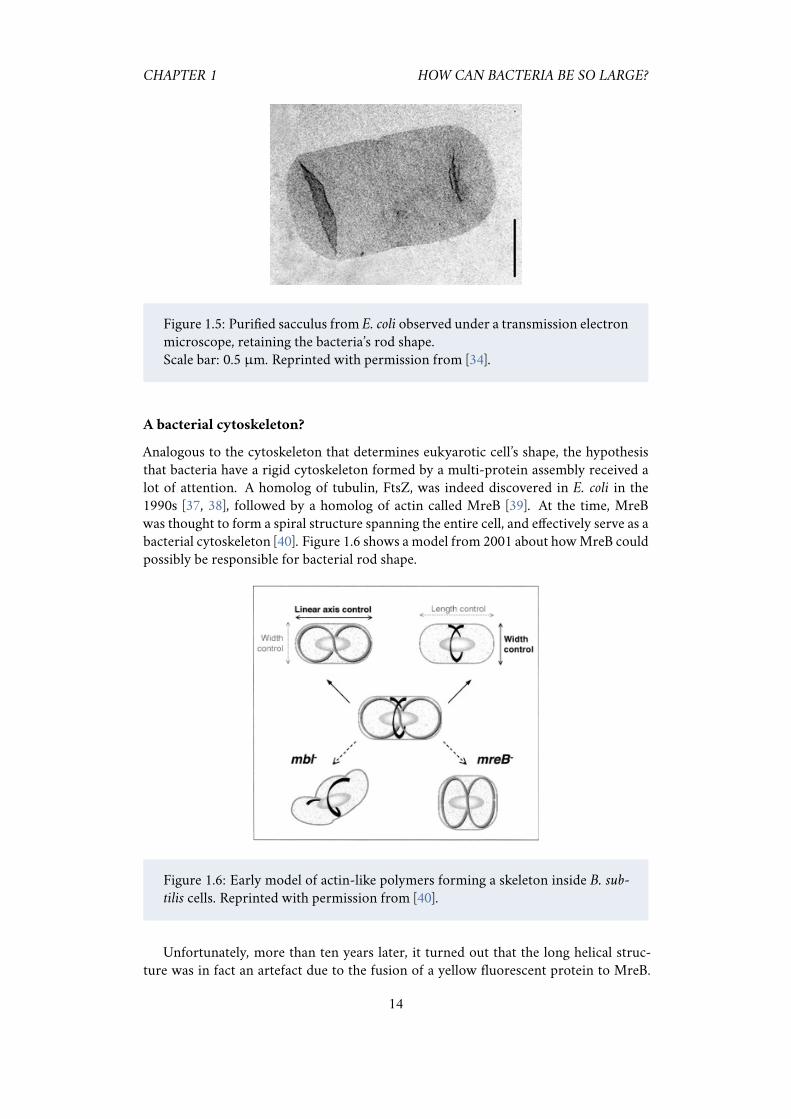
Within one species’s population, the shape of individual cells is remarkably robust, re-vealing a tight control of shape determination [28]. To understand the shape of bacteria,one must understand the structure of the peptidoglycan cell wall. This large moleculeforms a cage around the cell and is responsible for its shape, mechanical resistance andelasticity. When isolated, the peptidoglycan sacculus retains its shape [33], as can be seenin figure 1.5. This makes it one of the largest molecules in nature that have a definedspatial structure on its own.
In monoderm (gram-positive) bacteria, the envelope is made of one lipidic mem-brane surrounded by a thick layer of peptidoglycan, while in diderm (gram-negative)bacteria, there is one thin layer of peptidoglycan that stands between an inner mem-brane and an outer membrane. In the later case, peptidoglycan is covalently attached tothe outer membrane by Braun’s lipoprotein [35].
The chemical composition of peptidoglycan is the same for monoderm and didermbacteria. Large glycan strands strands are arranged perpendicularly to the cell axis [36].At the chemical level, they consist in the repetition of two monosaccharide units, N-acetyl-glucosamine and N-acetyl-muraminic acid. These strands are covered with pep-tide stems that can be cross-linked together, to form a 2D (diderm) or 3D (monoderm)meshwork. As peptide crosslinks are more flexible than glycan strands, rod cells exhibitanisotropic elasticity and stretch more easily in the direction of their long axis.
13
CHAPTER 1 HOW CAN BACTERIA BE SO LARGE?
Figure 1.5: Purified sacculus from E. coli observed under a transmission electronmicroscope, retaining the bacteria’s rod shape.Scale bar: 0.5 µm. Reprinted with permission from [34].
A bacterial cytoskeleton?
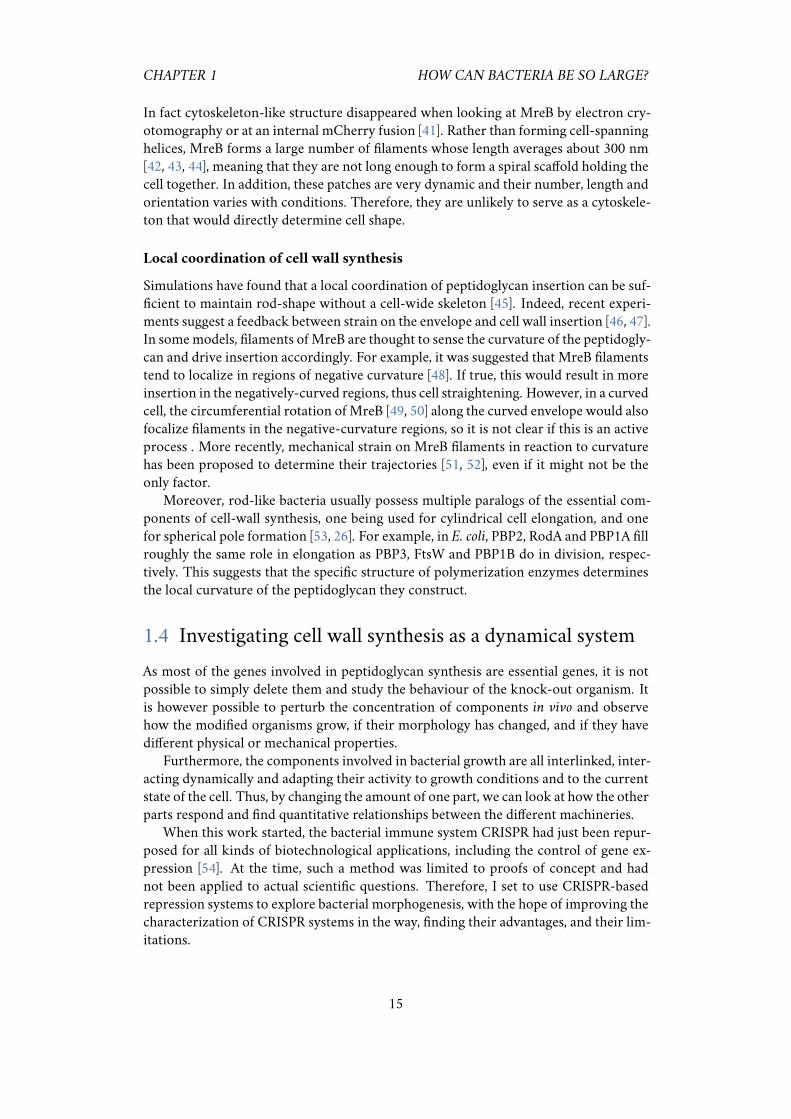
Analogous to the cytoskeleton that determines eukyarotic cell’s shape, the hypothesisthat bacteria have a rigid cytoskeleton formed by a multi-protein assembly received alot of attention. A homolog of tubulin, FtsZ, was indeed discovered in E. coli in the1990s [37, 38], followed by a homolog of actin called MreB [39]. At the time, MreBwas thought to form a spiral structure spanning the entire cell, and effectively serve as abacterial cytoskeleton [40]. Figure 1.6 shows amodel from 2001 about howMreB couldpossibly be responsible for bacterial rod shape.
Figure 1.6: Early model of actin-like polymers forming a skeleton inside B. sub-tilis cells. Reprinted with permission from [40].
Unfortunately, more than ten years later, it turned out that the long helical struc-ture was in fact an artefact due to the fusion of a yellow fluorescent protein to MreB.
14
CHAPTER 1 HOW CAN BACTERIA BE SO LARGE?
In fact cytoskeleton-like structure disappeared when looking at MreB by electron cry-otomography or at an internal mCherry fusion [41]. Rather than forming cell-spanninghelices, MreB forms a large number of filaments whose length averages about 300 nm[42, 43, 44], meaning that they are not long enough to form a spiral scaffold holding thecell together. In addition, these patches are very dynamic and their number, length andorientation varies with conditions. Therefore, they are unlikely to serve as a cytoskele-ton that would directly determine cell shape.
Local coordination of cell wall synthesis
Simulations have found that a local coordination of peptidoglycan insertion can be suf-ficient to maintain rod-shape without a cell-wide skeleton [45]. Indeed, recent experi-ments suggest a feedback between strain on the envelope and cell wall insertion [46, 47].In somemodels, filaments ofMreB are thought to sense the curvature of the peptidogly-can and drive insertion accordingly. For example, it was suggested that MreB filamentstend to localize in regions of negative curvature [48]. If true, this would result in moreinsertion in the negatively-curved regions, thus cell straightening. However, in a curvedcell, the circumferential rotation ofMreB [49, 50] along the curved envelope would alsofocalize filaments in the negative-curvature regions, so it is not clear if this is an activeprocess . More recently, mechanical strain on MreB filaments in reaction to curvaturehas been proposed to determine their trajectories [51, 52], even if it might not be theonly factor.
Moreover, rod-like bacteria usually possess multiple paralogs of the essential com-ponents of cell-wall synthesis, one being used for cylindrical cell elongation, and onefor spherical pole formation [53, 26]. For example, in E. coli, PBP2, RodA and PBP1A fillroughly the same role in elongation as PBP3, FtsW and PBP1B do in division, respec-tively. This suggests that the specific structure of polymerization enzymes determinesthe local curvature of the peptidoglycan they construct.
1.4 Investigating cell wall synthesis as a dynamical system
As most of the genes involved in peptidoglycan synthesis are essential genes, it is notpossible to simply delete them and study the behaviour of the knock-out organism. Itis however possible to perturb the concentration of components in vivo and observehow the modified organisms grow, if their morphology has changed, and if they havedifferent physical or mechanical properties.
Furthermore, the components involved in bacterial growth are all interlinked, inter-acting dynamically and adapting their activity to growth conditions and to the currentstate of the cell. Thus, by changing the amount of one part, we can look at how the otherparts respond and find quantitative relationships between the different machineries.
When this work started, the bacterial immune system CRISPR had just been repur-posed for all kinds of biotechnological applications, including the control of gene ex-pression [54]. At the time, such a method was limited to proofs of concept and hadnot been applied to actual scientific questions. Therefore, I set to use CRISPR-basedrepression systems to explore bacterial morphogenesis, with the hope of improving thecharacterization of CRISPR systems in the way, finding their advantages, and their lim-itations.
15
CHAPTER 1 HOW CAN BACTERIA BE SO LARGE?
Chapter 2 will cover the progress that has been made in recent years in the develop-ment of CRISPR-based tools to control transcription. It is meant as a review of thedifferent biotechnological applications of CRISPR knock-down and the mechanisticknowledge that could be gained from them. Chapter 3 is a published article about theuse of mismatched CRISPR guides to change the level of genes by fractional amounts.This work studied the outcome of collisions between RNA polymerases and dCas9 ona strand of DNA, and uncovered a new parameter, the passage probability of the poly-merase, that has important consequences for the strength of the repression. In chapter4, I present a design for a high-throughput experiment to understand how the sequenceof a guide RNA influences the polymerase’s passage probability. The measurement hasnot been done yet, but I will discuss the theoretical considerations that drove the librarydesign.
In chapter 5, I put the CRISPR knock-down technology into practice and system-atically modulate the concentration of the core components of the cell wall synthesismachinery. I find that, even for enzymes with the same biochemical activity, a pertur-bation in concentration can elicit completely different responses in cell morphology.As our method allows to observe strains with essential enzymes repressed close to thelethal level while they are still growing steadily, I perform biophysical and biochemi-cal measurements to better understand the function of these enzymes. This work high-lights fundamental differences between the Rod complex and class A PBPs, and suggeststhat the later act on a smaller scale, repairing the cell wall and maintaining its integrity.Chapter 6 recounts how an unexpected side effect of CRISPR knock-down affected thestudy of cell wall synthesis. I discuss how the so-called Bad Seed Effect led to false con-clusions, and how we could overcome it.
In chapter 7, I focus on another aspect of class A PBPs’ function, which is their sub-cellular localization. I find that these enzymes have specific patterns of localizationalong the cell, and discover multiple factors that contribute to these patterns. In chap-ter 8, I investigate the effect of D-aminoacids on the cells, as they seem to interact withclass A PBPs, though their biological significance is unknown. We perform a series ofgenome-wide CRISPR screens to find which cellular processes are related to it, andvalidate them. Finally, in chapter 9, I present two small side projects, both related toCRISPR knock-down, that gave promising and interesting results, but that I could notturn into complete stories due to the lack of time.
16
Chapter 2
Progress and mysteries in CRISPRcontrol of bacterial transcription
2.1 Introduction
The ability to control gene expression levels in live bacteria is attractive for many rea-sons. First, modifying the concentration of a protein or enzyme is a classical way ofunderstanding gene function. This is especially relevant in the case of essential geneswere a simple knock-out is impossible. By comparing the phenotypes of cells at differ-ent levels of a gene of interest, one can gain fundamental insight on its function, and onthe importance of this function for the organism’s fitness. Controlling gene expressionis also a way to discover regulatory circuits, by applying a perturbation and measuringhow the expression of other genes adapts as a response. Furthermore, recent researchin systems biology has aimed to understand the biological significance of gene expres-sion levels in a broader context. Experimenting with gene expression levels has helpedunderstand the evolutionary dynamics of gene regulation [55, 56], and the importanceof stochastic processes in protein expression [57, 58]. Finally, the fine-tuning of geneexpression level has great potential for the engineering of organisms with the aim ofmaking them more efficient for industrial metabolite production or to create artificialregulatory circuits to be used in bio-sensors and diagnostic tools [59, 60].
Thus, there is a great interest for biotechnological methods that would allow tochange gene expression in a programmable way, in the sense that the expression of anyprotein of interest can be set to arbitrary levels, according to some user-defined input inthe formof aDNA sequence. However, the development of programmable biological de-vices has remained limited by a longstanding barrier: the complexity of macromoleculefolding and their interactions makes it very difficult to design sequences de novo suchthat they have the desired function in vivo. For this reason, biotechnological designhas typically been limited to the recycling of components from nature, or the artificialgeneration of many random devices followed by selection. In particular, inducible pro-moters are established as the standard tool for the control of gene expression in bacteria,allowing to link the expression level of a gene to the concentration of a chemical in themedium. While this method is extremely useful for a range of applications, the recentemergence of programmable methods has brought up new possibilities, especially in
17
CHAPTER 2 CRISPR CONTROL OF BACTERIAL TRANSCRIPTION
conjunction with high-throughput sequencing and DNA-synthesis technologies. Suchtechnologies offer many advantages in principle: as they are generative, it is easy tocreate large scale libraries, or to make multiple orthogonal systems to be used at oncein the same cell. As they are genetically-encoded, they can themselves act as barcodes,allowing for identification by sequencing. The field of eukaryotic biology was first tobe revolutionized by programmable control of gene expression, with the developmentof RNA interference (RNAi) during the 1990s [61]. It took a few more years beforesimilar methods were discovered for bacteria: the first tools based on antisense RNA(asRNA) were developped in the 2000s [62, 63, 64], before the rise of CRISPR in the2010s [65, 54, 66].
In both cases, the target of repression is specified by cloning a part of the gene se-quence next to a short scaffold sequencewhichmay serve as a recognition site for helperproteins. Antisense RNAs act by forming a duplex with cognate messenger RNA andrecruiting host-specific proteins, such as Hfq in E. coli, which leads to the degradationof the messenger [67]. The strength of asRNA knock-down is tunable by changing thebinding energy between the asRNA and the target mRNA [68, 69] and it can be used onmultiple targets in parallel [70]. Unfortunately, some technical constraints have limitedthe use of asRNAs for engineering gene expression. First, their efficiency strongly de-pends on the concentration of the antisense RNA, making it necessary to express it inexcess compared to the target mRNA [67]. The scaffold sequence is also specific to eachspecies, and the presence of endogenous nucleases may greatly impair the applicabilityof the method, in particular in E. coli, a problem that can be alleviated by using pairedtermini [64].
A few years ago, the discovery of the CRISPR bacterial immune system brought analternative repression method to the spotlights.
2.2 Turning the CRISPR adaptative immune system into ar-tificial transcription factors
By analogy with RNAi, gene knockdown using CRISPR effectors has been dubbedCRISPRi. However, unlike RNAi, which acts on translation, CRISPRi typically worksby stopping transcription. CRISPR systems are an extremely diverse ensemble of adap-tative immune systems found in bacteria and archea, that can be grouped in two classes,each comprising many types and subtypes (reviewed in Koonin et al. [71]) with verydifferent mechanisms. To grant protection against bacteriophage infection, CRISPRsystems work in two phases. The first one, called adaptation, is responsible for sam-pling short DNA sequences from the genomes of phages, and storing them in the formof a series of fixed-length sequences called the CRISPR array (for Clustered RegularlyInterspaced Short Palindromic Repeats). The second phase is called interference and usesthe collection of stored phage sequences to recognize their invading DNA and destroyit.
The machinery involved in the interference step can be repurposed to artificiallycontrol transcription. In nature, the CRISPR array is first transcribed and processedinto individual guide RNAs, which are then associated with one or several enzymes (theCRISPR effectors) to form a nucleoproteinwith nuclease activity. Upon phage infection,this nuclease will recognize the invading genome through base pairing and introducea double-strand break to stop the infection. The nature of CRISPR effectors can be
18
CHAPTER 2 CRISPR CONTROL OF BACTERIAL TRANSCRIPTION
very different depending on the class and type of CRISPR system. For some types, theeffector is one single enzyme, making them very popular for biotechnology. This is thecase for the Type II which uses the famous Cas9 protein, as well as the Type V systems,with their effector Cas12a (formerly Cpf1) which have recently gained a lot of attention.In other cases, the effector consists in a large multi-protein complex, like the Cascadecomplex of Type I systems. By disabling the nuclease activity of the CRISPR effectors,it is possible to create an artificial DNA-binding protein, that can then be sent to anyDNA sequence by putting arbitrary addresses in the CRISPR array.
To reprogram a CRISPR system, one can simply replace the native sequences in theCRISPR array by the desired target sequences and rely on natural processing and assem-bly of the nucleoprotein complex. Type II systems rely on a ternary complex comprisingCas9, the processed guide RNA and a linker called the tracrRNA. As an alternative, it ispossible to use a pre-processed construct called single-guide RNA (sgRNA) [72]. In typeV systems, there is no tracrRNA and the effector Cas12a is able to process the arrays byitself, so there is no major advantage in a single-guide design.
Not any position can be targeted by CRISPR effectors. The target sequence mustbe flanked by a DNA motif called the PAM1. The sequence of the PAM is different de-pending on which ortholog of CRISPR is being used, but is typically between 3 and 8nucleotides long, meaning that there are usually many discrete possible targeting sitesthroughout a given sequence. Some CRISPR effectors have strict PAM requirementswhile others recognize a more variable range of motifs. For example, the PAM for thewidely popular Cas9 from Streptococcus pyogenes (SpCas9) is NGG in 3’ of the target [65],while Eubacterium eligens’s Cas12a requires TTTV in 5’ of the target [73]. The lengthof the PAM determines the frequency of possible targets: on average, SpCas9 has onetarget every 8 bp in E. coli’s genome if both DNA strands are considered. This of coursedepends on the characteristics of the target genome: as SpCas9’s PAM is NGG, it is notas common in genomes with a low GC-content. After binding to the DNA, the CRISPReffector starts to unwrap the DNA starting from the side of the PAM [74]. As the DNAunwinds, the guide RNA progressively forms an hybrid with the target DNA [75, 76].This structure is called the R-loop. When the entire guide is annealed, a conformationshift occurs and a double-strand break is introduced in the DNA.
To simply block gene expression without cutting the target DNA, the nuclease ac-tivity of the CRISPR effectors must be eliminated. For the types II and V, this is doneby mutating the catalytic residues [65, 66]. The resulting enzymes are marked with theletter “d” (for “dead”), for example the inactive variant of Cas9 is called dCas9. For typeI, where the CRISPR effector is a multi-protein complex, the deletion of one of the sub-units is also possible to abolish nuclease activity [77].
Owing to the remarkable effectiveness of CRISPR systems, many applications werequickly developed even with a limited knowledge of its exact mechanism. As a result,many rules of thumb were discovered during the testing and optimization of particularapplications and research is still on going to develop an unified, predictive biophysicalmodel.
1 PAM stands for Protospacer Adjacent Motif. This name goes back to the time where the functionof CRISPR systems was not well understood. Protospacer designates the part of phage DNA that willeventually be incorporated into the CRISPR array as a spacer during CRISPR adaptation.
19
CHAPTER 2 CRISPR CONTROL OF BACTERIAL TRANSCRIPTION
2.3 Molecular and systemic mechanism
A roadblock on the way of the RNA-polymerase
To repress a gene, multiple choices of target are possible. If the effector (e.g. thedCas9/sgRNA complex) binds to the promoter region of the target, it lowers the num-ber of mRNA transcripts by blocking the initiation of transcription. If the target islocated within the coding sequence of the target gene, it interrupts elongation bystanding in the way of the RNA-polymerase (RNAP) [66, 78].
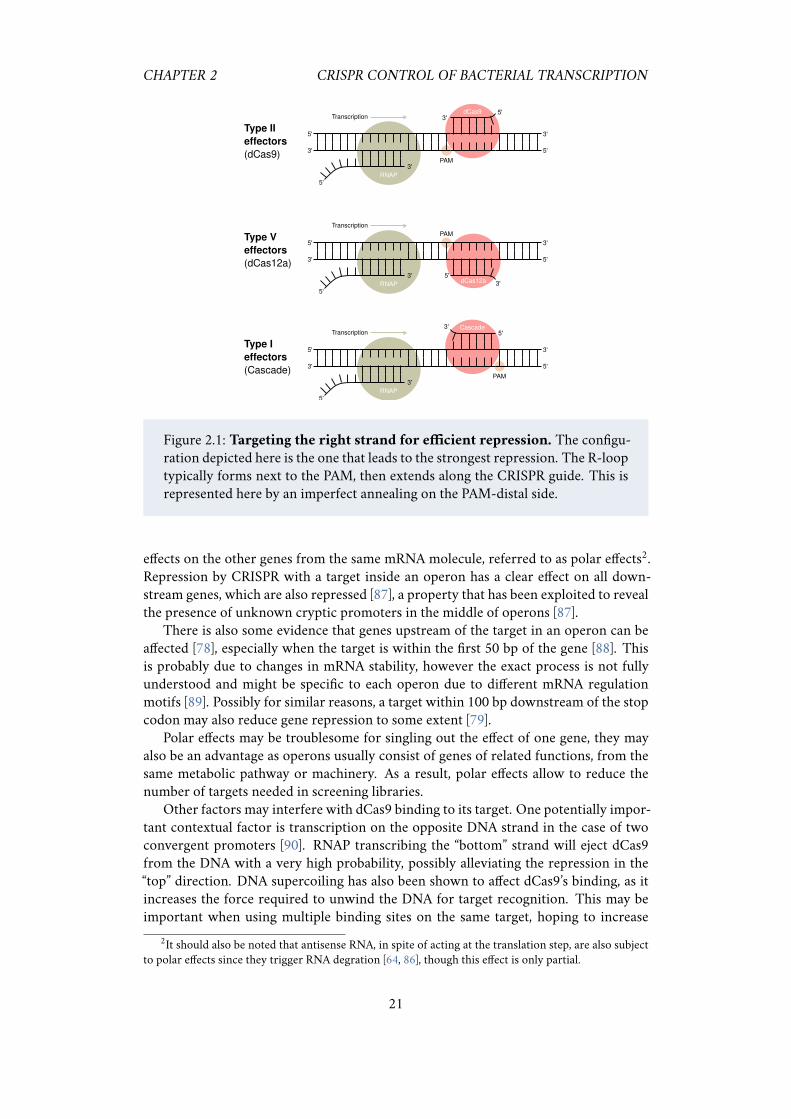
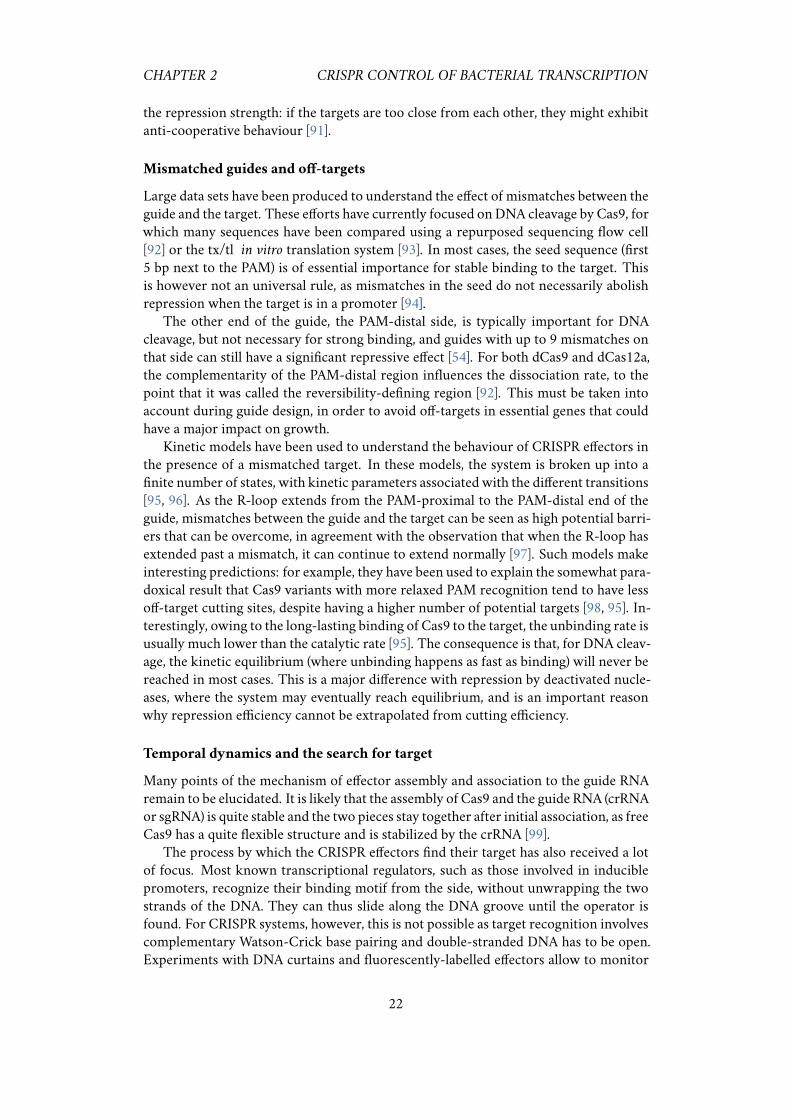
When the target is in the promoter sequence, any DNA strand can be targeted andthe repression will be equally strong. This has been observed for all types of CRISPRused so far: Type II [54, 79], Type V [73, 80] or Type I [77]. On the contrary, when the tar-get is downstream of the promoter, within the coding sequence, target orientation hasa crucial importance and the best orientation varies depending on the type of CRISPRsystem. For dCas9 (type II), repression is effective only if the guide RNA pairs with thenon-template strand (i.e. when the guide RNA is homologous to the template strand,figure 2.1, top). If dCas9 is in the other orientation, the repressive effect virtually disap-pears [79]. Interestingly, an opposite behaviour has been observed for dCas12a (type V),which produces a stronger repressionwhen it binds to the template strain [73] (figure 2.1,middle). For Type-I CRISPR of E. coli, the guide RNA must bind to the non-templatestrain to produce a strong repression [77] (figure 2.1, bottom). Together, these indicatethat no simple rule determines which orientation is most effective for a given type ofCRISPR system, be it PAM position, the direction of R-loop extension or the nature ofthe targeted strand. The exact mechanism of the collision thus remains to be elucidatedon amore structural level, especially for effectors other than S. pyogenes’s dCas9. Impor-tantly, for dCas9, the ability to stop the RNAP strongly depends on temperature, highertemperatures leading to weaker repression [81, 82]. It is not known if other effectors(such a dCas12a) are affected in the same way.
Consequences of the collision
Early experiments on the effect of target position within a gene suggested that targetsfarther away from the initiation codon tend to be less efficient for target repression [66],with no conclusive molecular explanation. More recent studies have since contradictedthis phenomenon [79, 83], showing that on average the position of the target does notsystematically affect the repression strength, as long as the target is far enough from thepromoter to avoid interactions with the initiation step.
When elongation by the RNAP is interrupted, an incomplete mRNA is generated.If the target is inside the coding sequence of a protein, the incomplete transcript mayhave a ribosome binding site but no stop codon. In that case, it will likely be subject todegradation to avoid ribosome stalling [84], however the exact fate of the incompletemRNA is hard to predict. Sequencing of the incomplete transcripts suggested that, af-ter encountering dCas9, the RNAP may remain in place for some time, giving birth totrains of stalled polymerases [85]. There is also evidence that, depending on the interac-tion strength between the dCas9/sgRNA complex and the target, the RNAP can activelydisplace dCas9 and continue elongation to produce a full mRNA transcript [82].
Another crucial aspect of transcription interruption in bacteria is that genes are of-ten co-transcribed in operons. As a result, interfering with one gene will likely have
20
CHAPTER 2 CRISPR CONTROL OF BACTERIAL TRANSCRIPTION
3'5'
3'
3'
3'
5'
5'
5'
dCas9
RNAP
PAM
Transcription
3'
5'
3'
3'
3'
5'
5'
5'
dCas12aRNAP
PAM
Transcription
3'5'
3'
3'
3'
5'
5'
5'
Cascade
RNAP
PAM
Transcription
Type II
effectors
(dCas9)
Type V
effectors
(dCas12a)
Type I
effectors
(Cascade)
Figure 2.1: Targeting the right strand for efficient repression. The configu-ration depicted here is the one that leads to the strongest repression. The R-looptypically forms next to the PAM, then extends along the CRISPR guide. This isrepresented here by an imperfect annealing on the PAM-distal side.
effects on the other genes from the same mRNA molecule, referred to as polar effects2.Repression by CRISPR with a target inside an operon has a clear effect on all down-stream genes, which are also repressed [87], a property that has been exploited to revealthe presence of unknown cryptic promoters in the middle of operons [87].
There is also some evidence that genes upstream of the target in an operon can beaffected [78], especially when the target is within the first 50 bp of the gene [88]. Thisis probably due to changes in mRNA stability, however the exact process is not fullyunderstood and might be specific to each operon due to different mRNA regulationmotifs [89]. Possibly for similar reasons, a target within 100 bp downstream of the stopcodon may also reduce gene repression to some extent [79].
Polar effects may be troublesome for singling out the effect of one gene, they mayalso be an advantage as operons usually consist of genes of related functions, from thesame metabolic pathway or machinery. As a result, polar effects allow to reduce thenumber of targets needed in screening libraries.
Other factors may interfere with dCas9 binding to its target. One potentially impor-tant contextual factor is transcription on the opposite DNA strand in the case of twoconvergent promoters [90]. RNAP transcribing the “bottom” strand will eject dCas9from the DNA with a very high probability, possibly alleviating the repression in the“top” direction. DNA supercoiling has also been shown to affect dCas9’s binding, as itincreases the force required to unwind the DNA for target recognition. This may beimportant when using multiple binding sites on the same target, hoping to increase
2It should also be noted that antisense RNA, in spite of acting at the translation step, are also subjectto polar effects since they trigger RNA degration [64, 86], though this effect is only partial.
21
CHAPTER 2 CRISPR CONTROL OF BACTERIAL TRANSCRIPTION
the repression strength: if the targets are too close from each other, they might exhibitanti-cooperative behaviour [91].
Mismatched guides and off-targets
Large data sets have been produced to understand the effect of mismatches between theguide and the target. These efforts have currently focused on DNA cleavage by Cas9, forwhich many sequences have been compared using a repurposed sequencing flow cell[92] or the tx/tl in vitro translation system [93]. In most cases, the seed sequence (first5 bp next to the PAM) is of essential importance for stable binding to the target. Thisis however not an universal rule, as mismatches in the seed do not necessarily abolishrepression when the target is in a promoter [94].
The other end of the guide, the PAM-distal side, is typically important for DNAcleavage, but not necessary for strong binding, and guides with up to 9 mismatches onthat side can still have a significant repressive effect [54]. For both dCas9 and dCas12a,the complementarity of the PAM-distal region influences the dissociation rate, to thepoint that it was called the reversibility-defining region [92]. This must be taken intoaccount during guide design, in order to avoid off-targets in essential genes that couldhave a major impact on growth.
Kinetic models have been used to understand the behaviour of CRISPR effectors inthe presence of a mismatched target. In these models, the system is broken up into afinite number of states, with kinetic parameters associated with the different transitions[95, 96]. As the R-loop extends from the PAM-proximal to the PAM-distal end of theguide, mismatches between the guide and the target can be seen as high potential barri-ers that can be overcome, in agreement with the observation that when the R-loop hasextended past a mismatch, it can continue to extend normally [97]. Such models makeinteresting predictions: for example, they have been used to explain the somewhat para-doxical result that Cas9 variants with more relaxed PAM recognition tend to have lessoff-target cutting sites, despite having a higher number of potential targets [98, 95]. In-terestingly, owing to the long-lasting binding of Cas9 to the target, the unbinding rate isusually much lower than the catalytic rate [95]. The consequence is that, for DNA cleav-age, the kinetic equilibrium (where unbinding happens as fast as binding) will never bereached in most cases. This is a major difference with repression by deactivated nucle-ases, where the system may eventually reach equilibrium, and is an important reasonwhy repression efficiency cannot be extrapolated from cutting efficiency.
Temporal dynamics and the search for target
Many points of the mechanism of effector assembly and association to the guide RNAremain to be elucidated. It is likely that the assembly of Cas9 and the guide RNA (crRNAor sgRNA) is quite stable and the two pieces stay together after initial association, as freeCas9 has a quite flexible structure and is stabilized by the crRNA [99].
The process by which the CRISPR effectors find their target has also received a lotof focus. Most known transcriptional regulators, such as those involved in induciblepromoters, recognize their binding motif from the side, without unwrapping the twostrands of the DNA. They can thus slide along the DNA groove until the operator isfound. For CRISPR systems, however, this is not possible as target recognition involvescomplementary Watson-Crick base pairing and double-stranded DNA has to be open.Experiments with DNA curtains and fluorescently-labelled effectors allow to monitor
22
CHAPTER 2 CRISPR CONTROL OF BACTERIAL TRANSCRIPTION
the target search process in vitro. Such data exists for type II (Cas9) and type V (Cas12a).For both, there is a first step of 3D-diffusion until a DNAmolecule is encountered [100].This is followed by 1D-diffusion along DNA [101] though the contact with DNA isonly intermittent. For Cas9, the 1D-diffusion is limited to very short distances (along20 bp) but allows to jump from one PAM to another. For Cas12a, however, the 1D-diffusion step is dominant [102], and a molecule of Cas12a can appear to diffuse alongthe DNAmolecule for extended periods of time. Another core difference between Cas9and Cas12a regarding target search is that Cas9 needs only a PAM to bind to the DNA,even without any matching sequence. Cas12a will typically not stay associated with aPAM if the sequence next to it has no complementarity with the guide. In fact, Cas9transiently associates with non-matching sites, with a residence time that depends oncomplementarity [99]. As a result, it spends a few milliseconds on each potential bind-ing site, and a single dCas9 molecule may take several hours to find its target [103]. Thissearch time has been evaluated to about 6 hours for E. coli’s 4Mbp genome. Thus a largenumber of Cas9 complexes might be required for quick response, which is of particularimportance for anti-phage defense. The importance of this for gene knock-down is stillunclear.
The dissociation of dCas9 from the target is also very slow [100], in the order ofa few hours in vitro. Because of that, the amount of effector that is required for genesilencing is very small. In fact, one single complex per target locus might be sufficientto shut down expression until it gets kicked out by the RNAP or the replication fork.After stopping the expression of dCas9, it takes up to five hours to reach the originalexpression level [66, 104]. This process can be made faster by using antisense RNA totrigger guide RNA degradation [105].
2.4 Improving CRISPR control of transcription
While the repurposing of natural CRISPR systems quickly lead to impressive results,a lot of effort has been undertaken to extend their capabilities. Here we discuss re-cent advances in improving the repression strength, controlling multiple targets at thesame time and extending the application of CRISPR knock-down to a broader rangeof species, including some organisms that are not standard laboratory models. We alsoreview the efforts that have been made to detect the potential undesirable effects ofCRISPR systems, and strategies to tamper with them.
Tunable gene repression and activation
To obtained partial repression of the gene of interest, multiple approaches have beenundertaken. The most straightforward one is to express the CRISPR system from aninducible promoter such at Pbad in E. coli [104, 106], or Pxyl in B. subtillis [78]. In thatcase, the repression strength is controlled by using variable amounts of a chemical inthemedium, using a single strain. Changing the amount of sgRNA, rather than of dCas9,may provide better control [107]. Alternatively, by expressing a mismatched guide RNAand a constant amount of effector, it is possible to repress genes by a well-defined frac-tion [82]. While the later strategy requires several plasmids for different repression fac-tors, it is easier to multiplex and is less noisy.
Inducible promoters, that are often used to turn CRISPR knock-down on or off,usually produce a base rate of leaky expression even when they are not induced. As pre-
23
CHAPTER 2 CRISPR CONTROL OF BACTERIAL TRANSCRIPTION
viously discussed, due the long residence time of CRISPR effectors on the DNA, a smallnumber of repressor complexes are enough to silence a target. Thus, even tight promot-ers can produce significant repression of the target in the absence of inducer [78, 104, 80].One way to improve the dynamic range is to use a genetically recoded organism, with anon-natural aminoacid in dCas9. In this case, the leaky repression is strongly alleviatedunless the non-natural aminoacid is also present [108]. While effective, this method iscurrently limited to one heavily-modified strain of E. coli and cannot be easily adaptedto other organisms. Using anti-sense RNA targeted at the CRISPR guide itself, it is pos-sible to antagonize repression, probably by actively triggering degradation of the guideRNA [109]. This provides another layer of regulation to construct genetic circuits, anda way to quickly recover gene expression once the repression is established.
Finally, CRISPR-based programmable transcription factors are not restricted togene repression. By linking dCas9 to a transcription activator, it is also possible toincrease the expression level of a target. Initial studies used the σ sub-unit from theRNA polymerase to induce expression [54], but subsequent screening found muchmore potent activators, in particular SoxS [110], an activator normally involved inoxydative stress response. When SoxS is tethered to dCas9 and the complex is targetedupstream of a promoter, expression of the reporter can be increased by more than10-fold, making it possible to look at over-expression phenotypes for many genes in aneasy way. Gene activation is also possible in B. subtilis using a similar approach [111].A potential drawback for this method is that it requires a PAM at the right distancefrom the promoter, as the range of target positions that are effective for activation isvery narrow, highlighting the importance of developing CRISPR effectors variant withdifferent PAM specificities.
Simultaneous control of multiple targets
Natural CRISPR arrays often contain several dozens, sometimes hundreds, of guides[112]. Accordingly, is it possible to express multiple guides with a deactivated effectorto repress multiple target at the same time. The upper limit on the number of guidesused simultaneously for repression is unknown, but up to 8 sgRNAs have been used atthe same time without any loss in repression strength [78]. Multiplex gene repressionhas been useful to find pairs of synthetic lethal gene and measure epistatic interactions[78, 113], as well as for metabolic engineering. Moreover, activation and repression canbe used in the same cell by using a sgRNA-linked aptamer to recruit the activation tagonly on certain targets [110].
Co-expressing sgRNAs can be quite cumbersome, as each of them requires its ownpromoter and transcription terminator. CRISPR arrays, similar to what is found in na-ture, might be more practical for the expression of many guides. Owing to the minimalprocessing of the array, dCas12a is particularly attractive for this purpose [114]. Dueto their very repetitive nature, it is challenging to produce long CRISPR arrays withmultiple spacers using standard DNA synthesis. However, by splitting the array intomultiple parts to separate the repeats, streamlined protocols to assemble large CRISPRarrays have been designed, either using iterative [115, 77] or single-step assembly meth-ods [107]. As the pool of effectors is shared between all CRISPR guides, having moreguides in one array makes each individual complex less abundant, which can lead toreduced efficiency when targeting the promoter [77]. The number of complexes car-rying each guide may also be different depending on the guide’s context and positionwithin the array. However, if the target is in the coding region and if the concentration
24
CHAPTER 2 CRISPR CONTROL OF BACTERIAL TRANSCRIPTION
of dCas9 is sufficient to saturate the binding sites, the strength of repression should notbe affected [82].
From one bacterium to all others
One reason for the popularity of CRISPR systems is the fact that they are remarkablyportable. Within just a few years after their discovery, CRISPR-based technologies weresuccessfully used in all kingdoms of life [116, 117, 118, 119, 120]. Systems for geneknock-down are readily available for many bacteria, including species for which theavailable genetic tools are limited [121], bacteria used in industrial context [122, 123] orclinical pathogenic strains [124]. By using easily transferable, modular plasmid systemsrelying on bacterial conjugation, it is possible to perform genetic screens on non-modelbacteria, including many human pathogens [85]. Furthermore, a thermostable variantof dCas9 was characterized for use in thermophilic organisms [125].
As about 45% of bacterial species possess a native CRISPR immune system [112], itis also possible to use it for repression. This has been done with E. coli’s endogenousType I CRISPR system, where a simple deletion of the Cas3 protein, which carries thenuclease activity, allowed to create a programmable repressor [77].
Addressing side effects
When expressed at an excessive level, dCas9 itself can have some toxic effects on bacte-ria [126]. Morphological defects have been reported upon over-expression [127]. Butthe main source of side effects when using CRISPR knock-down is off-target binding.Even if a good complementarity between the guide and the target is necessary for strongrepression, only a few matching bases in the PAM-proximal region may be enough toproduce a small repressive effect [79]. If this effect happens on an essential gene, a severegrowth defect may ensue. For some applications, off-target binding can be greatly re-duced by replacing the PAM-binding domain of dCas9 with a binding domain from thePhlF repressor [128]. Consequently, dCas9 can only be targeted at regions containingthe PhlF operator sequence, which restricts the application of this system to syntheticbiology.
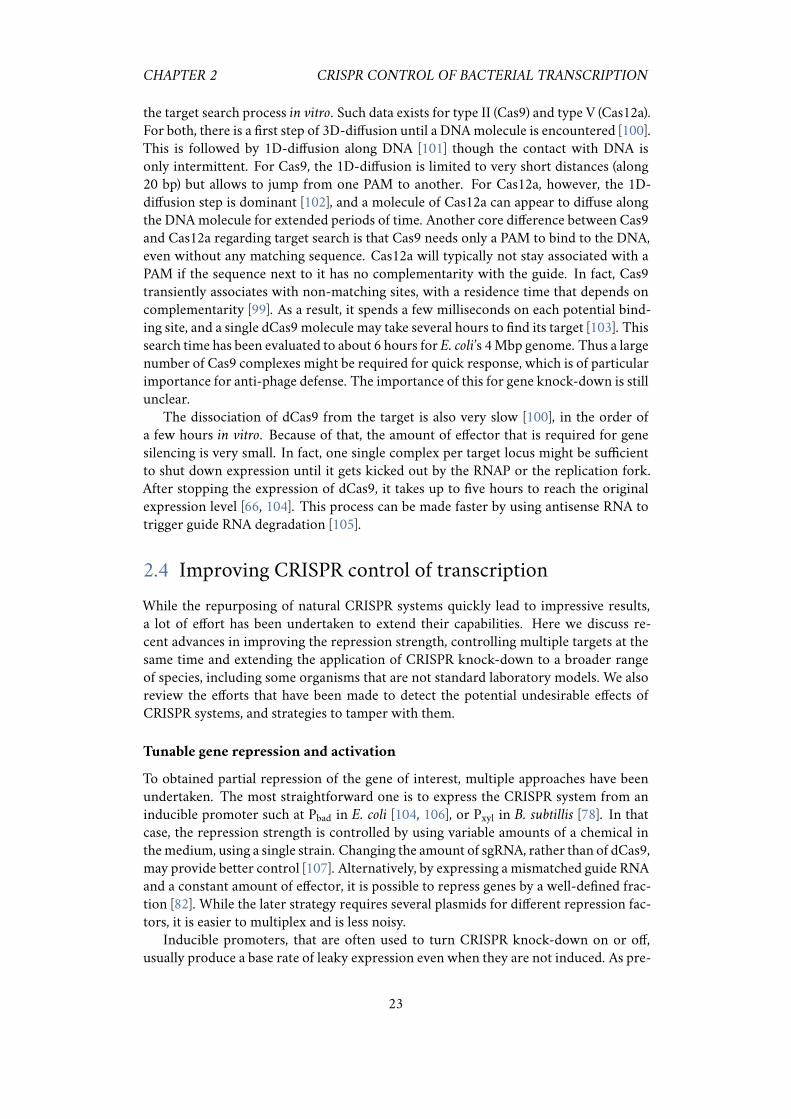
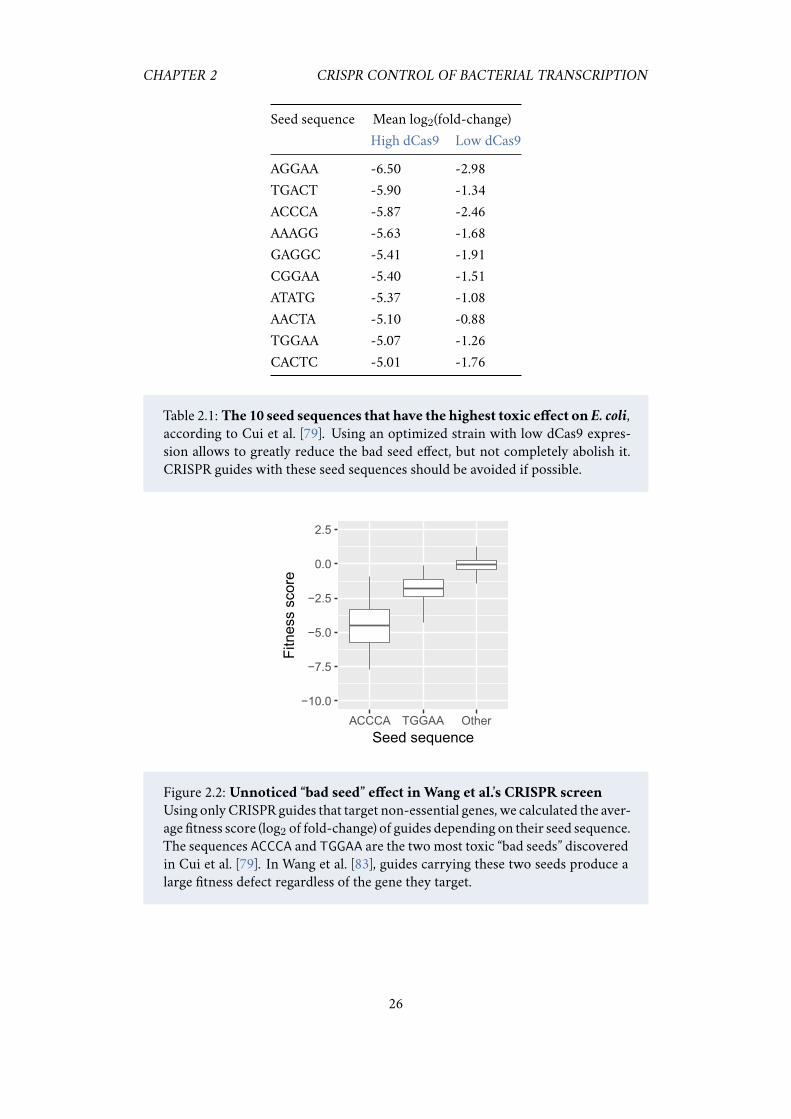
Another unresolved problem is the “bad seed effect” (BSE) [79]. Among all the possi-ble seed sequences (the last five nucleotides in 3’ of a guide), a few of them systematicallycause a strong fitness defect when used with S. pyogenes’s dCas9. For instance, when aguide finishing in ACCCA is expressed in K-12 E. coli, it causes a near-complete death ofthe population. About 130 seed sequences (out of 1024 possible) cause this kind of sick-ness. A list of the ten most toxic ones is provided in table 2.1. The origin of this effect isstill unknown. It does not appear to be due to off-target binding to a particularly criticallocus, but may involve multiple simultaneous binding events, or binding to substratesother than genomic DNA [79]. This effect is very pervasive and can go unnoticed: forexample, we could find evidence for BSE in data previously published by others [83](figure 2.2), showing that it could be an unsuspected source of noise. To date, the bestsolution to avoid the BSE is simply to avoid bad seeds when designing a CRISPR guide.However, it was also shown that the BSE depends on dCas9’s concentration, and that itcan be almost erased by using a carefully-chosen expression cassette [79], while still re-taining a strong repression capacity. We hope that future work will elucidate the originof the BSE.
25
CHAPTER 2 CRISPR CONTROL OF BACTERIAL TRANSCRIPTION
Seed sequence Mean log2(fold-change)High dCas9 Low dCas9
AGGAA -6.50 -2.98TGACT -5.90 -1.34ACCCA -5.87 -2.46AAAGG -5.63 -1.68GAGGC -5.41 -1.91CGGAA -5.40 -1.51ATATG -5.37 -1.08AACTA -5.10 -0.88TGGAA -5.07 -1.26CACTC -5.01 -1.76
Table 2.1: The 10 seed sequences that have the highest toxic effect on E. coli,according to Cui et al. [79]. Using an optimized strain with low dCas9 expres-sion allows to greatly reduce the bad seed effect, but not completely abolish it.CRISPR guides with these seed sequences should be avoided if possible.
−10.0
−7.5
−5.0
−2.5
0.0
2.5
ACCCA TGGAA Other
Seed sequence
Fitn
ess
scor
e
Figure 2.2: Unnoticed “bad seed” effect in Wang et al.’s CRISPR screen
Using onlyCRISPR guides that target non-essential genes, we calculated the aver-age fitness score (log2 of fold-change) of guides depending on their seed sequence.The sequences ACCCA and TGGAA are the twomost toxic “bad seeds” discoveredin Cui et al. [79]. In Wang et al. [83], guides carrying these two seeds produce alarge fitness defect regardless of the gene they target.
26
CHAPTER 2 CRISPR CONTROL OF BACTERIAL TRANSCRIPTION
2.5 Current applications
Genome-wide CRISPR screens
For a fewmodel organisms, large collections of knock-out strains have been developpedand used successfully. This includes the Keio collection for E. coli [129] and two bar-coded deletion libraries in B. subtilis [130]. While these work-intensive constructionprojects are extremely valuable for the people working on these two models bacteria,they are impossible to transfer to new strains or species and, most importantly, they arelimited to non-essential genes.
Early screens for essential genes were conducted using antisense RNA [63, 62, 86]though they were limited by the DNA synthesis and sequencing capabilities of the time.More recently, the random insertion of transposons in the genomehas been leveraged tofind essential genes in bacteria, a technique called Tn-Seq [131, 132]. As the insertion israndom and not necessarily homogeneous across all the chromosome, deep sequencingis required to cover the entire genome. Long genes aremore likely to be disrupted, whileshort sequences like non-coding RNAs are unlikely to be targeted, making it difficult toreach the desired precision on fitness measurement.
As an alternative, the fact that CRISPR knock-down and activation can control theexpression of chromosomal genes remotely, even from a plasmid, makes it a promisingtool for genome-wide screens. To create a CRISPR guide, one just needs to insert a shortsequence (20 bp in the case of SpdCas9) in a well-defined locus. Thus, the constructionprocedure can be standardized and streamlined so that a large number of guides can beassembled in parallel, allowing to make customized screening libraries using on-chipoligonucleotide synthesis. Several cloning methods, using homologous assembly [115],golden-gate assembly [79, 133] or direct oligo integration coupled with a negative selec-tion [104], have made it possible to assemble CRISPR guides in a single-step. Moreover,strains repressed by a CRISPR effector can easily be genotyped by simply sequencingthe CRISPR guide, eliminating the need for a barcode or for a complex amplificationprotocol to locate an inserted sequence in the genome like in Tn-Seq.
Multiple CRISPR screens have already been used to find essential genes in variousconditions [83, 87, 134, 135]. The applications of these data include discovery of drugtargets, searching for synthetic lethal pairs, or genomeminimization. Partial repressioncan also be useful to find phenotypes for essential genes [78]. CRISPR screens are alsomore versatile than TnSeq, as one can target only a subset of genes of interest, for ex-ample by targeting only genes implicated in a function of interest, or taking advantageof closely-related paralogs which are likely to be functionally identical [83]. If CRISPRguides are expressed from a plasmid, the same library can easily be re-used on manystrains and in many conditions, making the method more cost-effective in the long run.
Measuring fitness through competition assays is perhaps the most evident outputfor a genome-wide CRISPR screening, but it is not the only one. For example, by per-forming a complete phage replication cycle in a population repressed by such a screen-ing library, it was possible to identify host factors necessary for the production of in-fectious phage particles [87]. A CRISPR library has been combined with high-contentmicroscopy to find the effect on growth, morphology, and identify the function of un-known genes in the pathogen S. pneumoniae [134]. In another study, comparing growthof a CRISPR strain library in the presence of a variety of chemicals allowed to recon-struct genetic networks and identify the target of antibiotics [78]. These last two ap-proaches required isolated cultures of the different librarymembers, greatly limiting the
27
CHAPTER 2 CRISPR CONTROL OF BACTERIAL TRANSCRIPTION
throughput of the screen. Recently, a method was developed to identify the genotypeof CRISPR-repressed strains in-situ during a pooled assay, using fluorescence measure-ments [136]. While this proof of concept was only using a small number of strains, thisprinciple could be scaled up to analyse large-scale libraries by high-content microscopy.
Synthetic biology and metabolic engineering
The programmability of CRISPR has made it popular among synthetic biologists. Byexpressing multiple guides at the same time, targeting them at each other, it is possi-ble to construct predictable genetic circuits. As these circuits can interface with nativechromosomal genes, it makes it easy to build artificial regulatory networks that controlthe bacteria’s natural functions [126]. Such genetic circuits have been used to improvethe yield of protein expression, by creating a feedback between metabolic burden andtranscription [137], so that protein expression is regulated to an optimal level. Theemergence of high-throughput transcriptomics and proteomics methods [138] makesit possible to measure how organisms respond to perturbations at the genome-scale,making the method very promising for deciphering regulatory motifs.
Aside from gene repression or activation, dCas9 has been programmed to interferewith various processes in the cell. This includes modifying the spatial structure of E.coli’s chromosome to create artificial DNA loops [139], blocking the initiation of repli-cation to take control on cell cycle [81], and triggering cell filamentation in a reversiblemanner [140].
Another successful domain of application of CRISPR knock-down ismetabolic engi-neering. CRISPR-based methods allow to quickly identify competing pathways and op-timizemetabolic fluxes [141] for the production of a compound of interest. CRISPRi hasbeen set-up in multiple industrially-relevant organisms, such as Lactococcus lactis [122],Clostridium beijerinckii [88] or Corynebacterium glutamicum [123]. A review of other in-dustrial strains were CRISPRi has been used can be found in [142], along with strategiesused to improve production yield. Guides targeted at genes involved in rod-shapemain-tenance were used to diversify the morphology of cells and optimize production of abiodegradable plastic [143]. Finally, by inhibition of cell growth, one can optimize thebalance between the production of biomass and the synthesis of metabolites [144].
2.6 Conclusion
Compared to the usual speed of biotechnological development, CRISPR systems wererepurposed as tools in a particularly short time after their discovery. Owing to the mul-tiplicity of their components, many degrees of freedom, like the sequence of the guideRNA scaffold or the stoichiometry of different parts were not fully explored. After afew years, we now know better the importance of each part, and begin to have a clearoverview of how CRISPR interference happens, including the assembly of dCas9 com-plex, the search for target, the extension of theR-loop and the outcomeof collisionswithRNA polymerase. While many questions remain open, the control of transcription byCRISPR is becoming a mature technology, that can now be used for more ambitiouslarge-scale projects.
Modern biology is in need for precise and quantitative results, as opposed to qualita-tive differences that simply pass the test for significance. Hence, it is crucial to identifyall potential artifacts and false-positive that are likely to arise when using CRISPR sys-
28

CHAPTER 2 CRISPR CONTROL OF BACTERIAL TRANSCRIPTION
tems. Off-target binding, time- and concentration-dependence, and the bad seed effectare all important challenges that need to be understood better to take full advantage ofCRISPR’s capabilities.
29
Chapter 3
Tuning dCas9’s ability to blocktranscription enables robust, noiseless
knockdown of bacterial genes
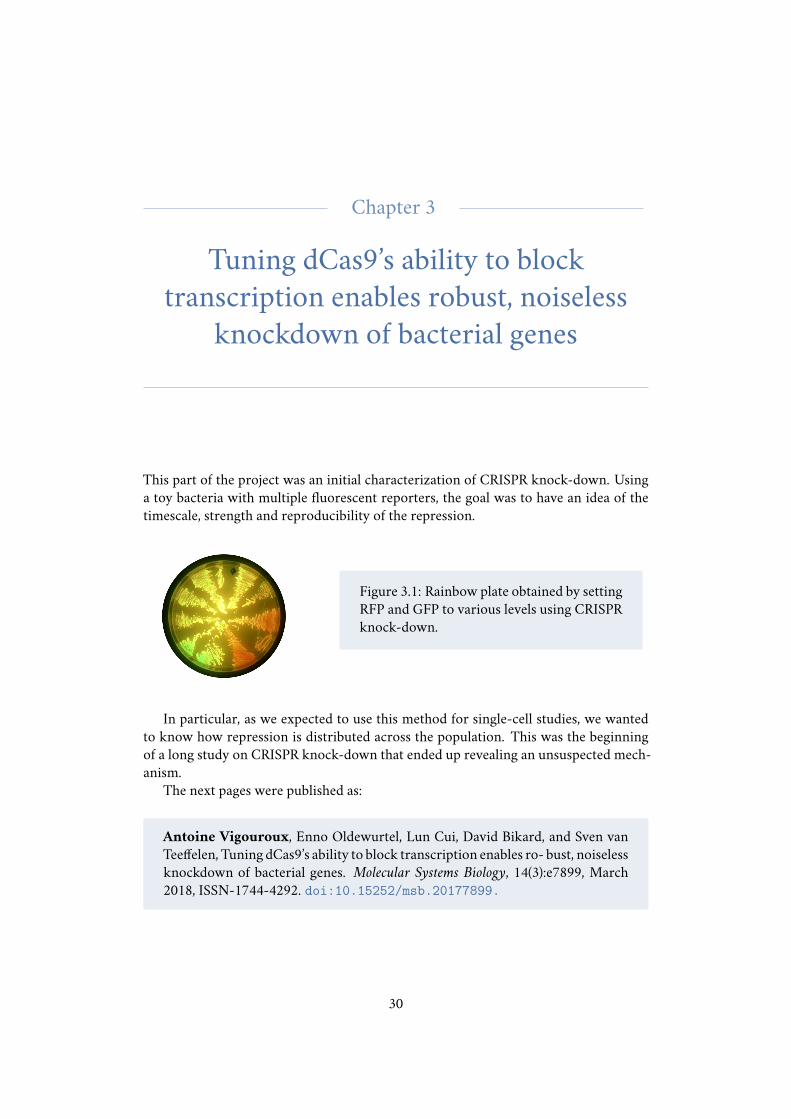
This part of the project was an initial characterization of CRISPR knock-down. Usinga toy bacteria with multiple fluorescent reporters, the goal was to have an idea of thetimescale, strength and reproducibility of the repression.
Figure 3.1: Rainbow plate obtained by settingRFP and GFP to various levels using CRISPRknock-down.
In particular, as we expected to use this method for single-cell studies, we wantedto know how repression is distributed across the population. This was the beginningof a long study on CRISPR knock-down that ended up revealing an unsuspected mech-anism.
The next pages were published as:
Antoine Vigouroux, Enno Oldewurtel, Lun Cui, David Bikard, and Sven vanTeeffelen, Tuning dCas9’s ability to block transcription enables ro- bust, noiselessknockdown of bacterial genes. Molecular Systems Biology, 14(3):e7899, March2018, ISSN-1744-4292. doi:10.15252/msb.20177899.
30
Article
Tuning dCas9’s ability to block transcriptionenables robust, noiseless knockdown ofbacterial genesAntoine Vigouroux1,2, Enno Oldewurtel2 , Lun Cui1 , David Bikard1,* & Sven van Teeffelen2,**
Abstract
Over the past few years, tools that make use of the Cas9 nucleasehave led to many breakthroughs, including in the control of geneexpression. The catalytically dead variant of Cas9 known as dCas9can be guided by small RNAs to block transcription of target genes,in a strategy also known as CRISPRi. Here, we reveal that the levelof complementarity between the guide RNA and the targetcontrols the rate at which RNA polymerase “kicks out” dCas9 fromthe target and completes transcription. We use this mechanism toprecisely and robustly reduce gene expression by defined relativeamounts. Alternatively, tuning repression by changing dCas9concentration is noisy and promoter-strength dependent. Wedemonstrate broad applicability of this method to the study ofgenetic regulation and cellular physiology. First, we characterizefeedback strength of a model auto-repressor. Second, we study theimpact of amount variations of cell-wall synthesizing enzymes oncell morphology. Finally, we multiplex the system to obtain anycombination of fractional repression of two genes.
Keywords CRISPR-dCas9; CRISPRi; gene-expression noise; peptidoglycan cell
wall; single-cell
Subject Categories Quantitative Biology & Dynamical Systems; Synthetic
Biology & Biotechnology; Transcription
DOI 10.15252/msb.20177899 | Received 4 August 2017 | Revised 8 February
2018 | Accepted 14 February 2018
Mol Syst Biol. (2018) 14: e7899
Introduction
A powerful way to investigate genes and their regulation in bacteria
is to vary their expression levels and investigate the response of the
cell. To that end, genes are typically placed under inducible promot-
ers. While easy to implement, this approach has multiple disadvan-
tages: First, native expression can lie outside the dynamic range of
the inducible promoter. Second, inducible promoters typically
increase expression noise in comparison with native promoters
(Elowitz et al, 2002). And third, only few orthogonal inducible
systems exist, thus making multiplexing difficult. Recently, different
strategies have been devised to knock down gene expression by rela-
tive amounts from their native levels: Specifically, antisense tran-
scription can reduce gene expression in a defined manner (Brophy &
Voigt, 2016). While this approach works well for moderate promoter
strength, it becomes less efficient the stronger the promoter. As an
alternative strategy, genes can be knocked down from their native
locus to varying degrees using CRISPR technology (Bikard et al,
2013; Qi et al, 2013). The catalytic mutant form of the RNA-guided
Cas9 nuclease from Streptococcus pyogenes (dCas9) can be easily
programmed to bind any position of interest on the chromosome,
with the requirement of an “NGG” protospacer adjacent motif
(PAM). dCas9 is unable to cleave target DNA, but still binds DNA
strongly. If the target is chosen downstream of the promoter, dCas9
serves as a roadblock that blocks transcription elongation. Here, we
characterize this system at the single-cell level, with interesting
implications for the native CRISPR immune system. We then develop
a strategy to use this system for precise and noise-preserving relative
gene repression that is independent of promoter strength.
Target search of Cas9 begins by probing DNA for the presence of
a PAM motif followed by DNA melting and complementarity-depen-
dent RNA strand invasion (Sternberg et al, 2014; Szczelkun et al,
2014). While complementarity in the PAM-proximal region known
as the seed sequence is important for binding, several mismatches
in the PAM-distal region can be tolerated as demonstrated by DNA
binding assays (Kuscu et al, 2014; Wu et al, 2014) and by monitor-
ing target-gene repression in Eschericha coli (Bikard et al, 2013).
The degree of gene repression can then be controlled quantitatively
in two different ways: first, by changing the level of dCas9 expres-
sion from an inducible promoter, which impacts the probability of
dCas9 binding to target DNA. This has recently been demonstrated
in Bacillus subtilis where dCas9 was placed under the control of a
xylose-inducible promoter (Peters et al, 2016), as well as in an
E. coli strain modified to enable tunable control of expression from
a PBAD promoter (Li et al, 2016); second, by introducing mismatches
between the guide RNA and the target DNA, as demonstrated in E.
coli (Bikard et al, 2013). While a perfectly matched guide RNA leads
1 Synthetic Biology Laboratory, Institut Pasteur, Paris, France2 Microbial Morphogenesis and Growth Laboratory, Institut Pasteur, Paris, France
*Corresponding author. Tel: +33 1 45 61 39 24; E-mail: [email protected]**Corresponding author. Tel: +33 1 45 68 80 16; E-mail: [email protected]
ª 2018 The Authors. Published under the terms of the CC BY 4.0 license Molecular Systems Biology 14: e7899 | 2018 1 of 14
Published online: March 8, 2018
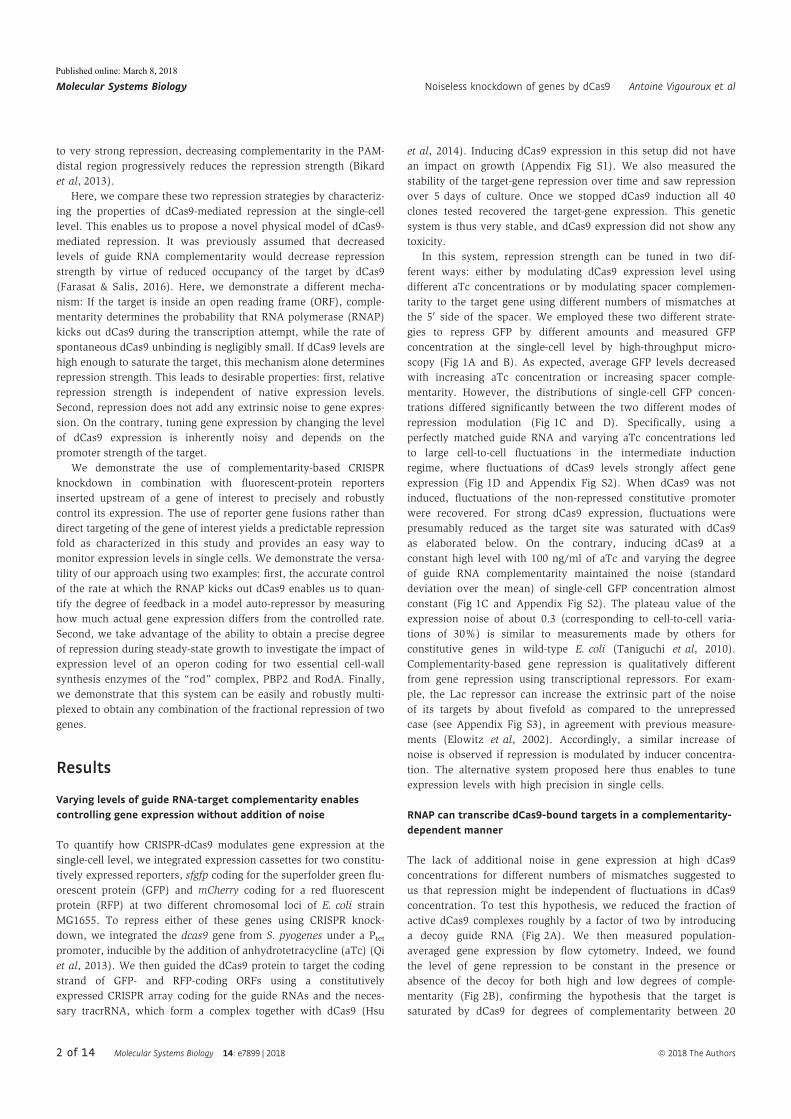
to very strong repression, decreasing complementarity in the PAM-
distal region progressively reduces the repression strength (Bikard
et al, 2013).
Here, we compare these two repression strategies by characteriz-
ing the properties of dCas9-mediated repression at the single-cell
level. This enables us to propose a novel physical model of dCas9-
mediated repression. It was previously assumed that decreased
levels of guide RNA complementarity would decrease repression
strength by virtue of reduced occupancy of the target by dCas9
(Farasat & Salis, 2016). Here, we demonstrate a different mecha-
nism: If the target is inside an open reading frame (ORF), comple-
mentarity determines the probability that RNA polymerase (RNAP)
kicks out dCas9 during the transcription attempt, while the rate of
spontaneous dCas9 unbinding is negligibly small. If dCas9 levels are
high enough to saturate the target, this mechanism alone determines
repression strength. This leads to desirable properties: first, relative
repression strength is independent of native expression levels.
Second, repression does not add any extrinsic noise to gene expres-
sion. On the contrary, tuning gene expression by changing the level
of dCas9 expression is inherently noisy and depends on the
promoter strength of the target.
We demonstrate the use of complementarity-based CRISPR
knockdown in combination with fluorescent-protein reporters
inserted upstream of a gene of interest to precisely and robustly
control its expression. The use of reporter gene fusions rather than
direct targeting of the gene of interest yields a predictable repression
fold as characterized in this study and provides an easy way to
monitor expression levels in single cells. We demonstrate the versa-
tility of our approach using two examples: first, the accurate control
of the rate at which the RNAP kicks out dCas9 enables us to quan-
tify the degree of feedback in a model auto-repressor by measuring
how much actual gene expression differs from the controlled rate.
Second, we take advantage of the ability to obtain a precise degree
of repression during steady-state growth to investigate the impact of
expression level of an operon coding for two essential cell-wall
synthesis enzymes of the “rod” complex, PBP2 and RodA. Finally,
we demonstrate that this system can be easily and robustly multi-
plexed to obtain any combination of the fractional repression of two
genes.
Results
Varying levels of guide RNA-target complementarity enablescontrolling gene expression without addition of noise
To quantify how CRISPR-dCas9 modulates gene expression at the
single-cell level, we integrated expression cassettes for two constitu-
tively expressed reporters, sfgfp coding for the superfolder green flu-
orescent protein (GFP) and mCherry coding for a red fluorescent
protein (RFP) at two different chromosomal loci of E. coli strain
MG1655. To repress either of these genes using CRISPR knock-
down, we integrated the dcas9 gene from S. pyogenes under a Ptetpromoter, inducible by the addition of anhydrotetracycline (aTc) (Qi
et al, 2013). We then guided the dCas9 protein to target the coding
strand of GFP- and RFP-coding ORFs using a constitutively
expressed CRISPR array coding for the guide RNAs and the neces-
sary tracrRNA, which form a complex together with dCas9 (Hsu
et al, 2014). Inducing dCas9 expression in this setup did not have
an impact on growth (Appendix Fig S1). We also measured the
stability of the target-gene repression over time and saw repression
over 5 days of culture. Once we stopped dCas9 induction all 40
clones tested recovered the target-gene expression. This genetic
system is thus very stable, and dCas9 expression did not show any
toxicity.
In this system, repression strength can be tuned in two dif-
ferent ways: either by modulating dCas9 expression level using
different aTc concentrations or by modulating spacer complemen-
tarity to the target gene using different numbers of mismatches at
the 50 side of the spacer. We employed these two different strate-
gies to repress GFP by different amounts and measured GFP
concentration at the single-cell level by high-throughput micro-
scopy (Fig 1A and B). As expected, average GFP levels decreased
with increasing aTc concentration or increasing spacer comple-
mentarity. However, the distributions of single-cell GFP concen-
trations differed significantly between the two different modes of
repression modulation (Fig 1C and D). Specifically, using a
perfectly matched guide RNA and varying aTc concentrations led
to large cell-to-cell fluctuations in the intermediate induction
regime, where fluctuations of dCas9 levels strongly affect gene
expression (Fig 1D and Appendix Fig S2). When dCas9 was not
induced, fluctuations of the non-repressed constitutive promoter
were recovered. For strong dCas9 expression, fluctuations were
presumably reduced as the target site was saturated with dCas9
as elaborated below. On the contrary, inducing dCas9 at a
constant high level with 100 ng/ml of aTc and varying the degree
of guide RNA complementarity maintained the noise (standard
deviation over the mean) of single-cell GFP concentration almost
constant (Fig 1C and Appendix Fig S2). The plateau value of the
expression noise of about 0.3 (corresponding to cell-to-cell varia-
tions of 30%) is similar to measurements made by others for
constitutive genes in wild-type E. coli (Taniguchi et al, 2010).
Complementarity-based gene repression is qualitatively different
from gene repression using transcriptional repressors. For exam-
ple, the Lac repressor can increase the extrinsic part of the noise
of its targets by about fivefold as compared to the unrepressed
case (see Appendix Fig S3), in agreement with previous measure-
ments (Elowitz et al, 2002). Accordingly, a similar increase of
noise is observed if repression is modulated by inducer concentra-
tion. The alternative system proposed here thus enables to tune
expression levels with high precision in single cells.
RNAP can transcribe dCas9-bound targets in a complementarity-dependent manner
The lack of additional noise in gene expression at high dCas9
concentrations for different numbers of mismatches suggested to
us that repression might be independent of fluctuations in dCas9
concentration. To test this hypothesis, we reduced the fraction of
active dCas9 complexes roughly by a factor of two by introducing
a decoy guide RNA (Fig 2A). We then measured population-
averaged gene expression by flow cytometry. Indeed, we found
the level of gene repression to be constant in the presence or
absence of the decoy for both high and low degrees of comple-
mentarity (Fig 2B), confirming the hypothesis that the target is
saturated by dCas9 for degrees of complementarity between 20
2 of 14 Molecular Systems Biology 14: e7899 | 2018 ª 2018 The Authors
Molecular Systems Biology Noiseless knockdown of genes by dCas9 Antoine Vigouroux et al
Published online: March 8, 2018
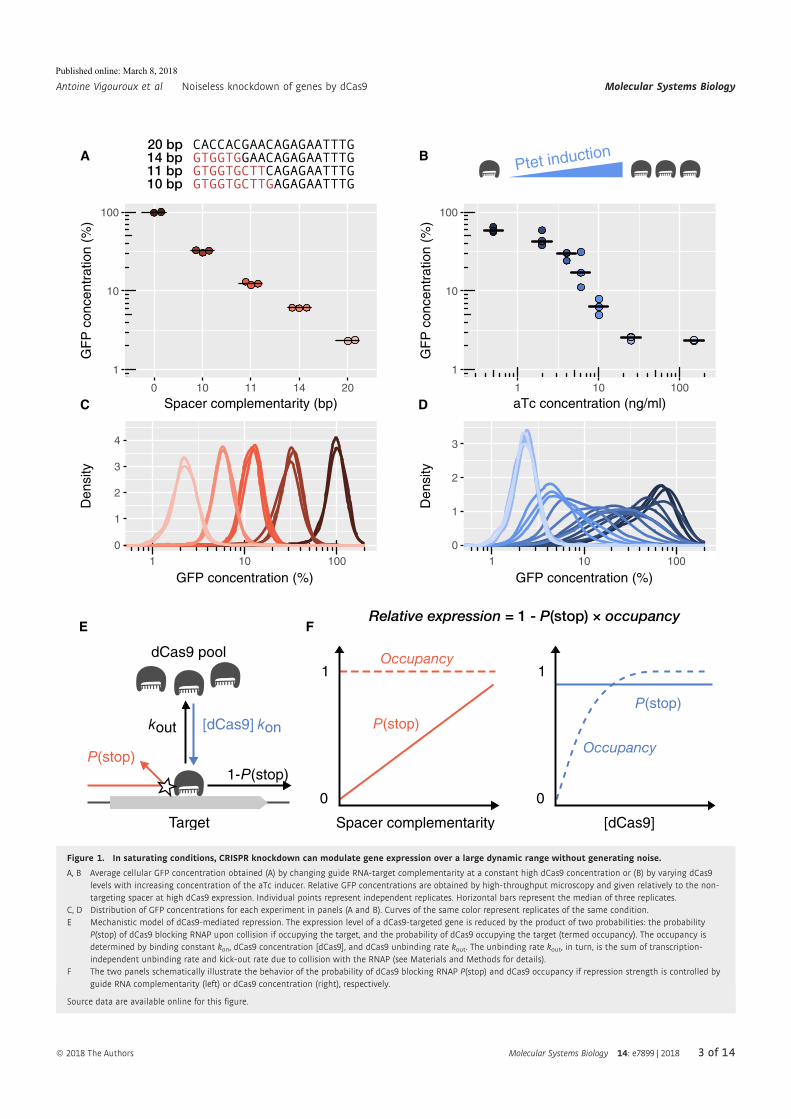
Ptet induction
Target
dCas9 pool
kout [dCas9] kon
P(stop)1-P(stop)
P(stop)
1
0
Spacer complementarity
Occupancy
P(stop)
1
0
[dCas9]
Occupancy
A B
E F
C D
1
10
100
0 10 11 14 20
Spacer complementarity (bp)
1
10
100
1 10 100
aTc concentration (ng/ml)
0
1
2
3
1 10 100
Den
sity
0
1
2
3
4
1 10 100
Den
sity
GFP concentration (%) GFP concentration (%)
GF
P c
once
ntra
tion
(%)
GF
P c
once
ntra
tion
(%)
Figure 1. In saturating conditions, CRISPR knockdown can modulate gene expression over a large dynamic range without generating noise.
A, B Average cellular GFP concentration obtained (A) by changing guide RNA-target complementarity at a constant high dCas9 concentration or (B) by varying dCas9levels with increasing concentration of the aTc inducer. Relative GFP concentrations are obtained by high-throughput microscopy and given relatively to the non-targeting spacer at high dCas9 expression. Individual points represent independent replicates. Horizontal bars represent the median of three replicates.
C, D Distribution of GFP concentrations for each experiment in panels (A and B). Curves of the same color represent replicates of the same condition.E Mechanistic model of dCas9-mediated repression. The expression level of a dCas9-targeted gene is reduced by the product of two probabilities: the probability
P(stop) of dCas9 blocking RNAP upon collision if occupying the target, and the probability of dCas9 occupying the target (termed occupancy). The occupancy isdetermined by binding constant kon, dCas9 concentration [dCas9], and dCas9 unbinding rate kout. The unbinding rate kout, in turn, is the sum of transcription-independent unbinding rate and kick-out rate due to collision with the RNAP (see Materials and Methods for details).
F The two panels schematically illustrate the behavior of the probability of dCas9 blocking RNAP P(stop) and dCas9 occupancy if repression strength is controlled byguide RNA complementarity (left) or dCas9 concentration (right), respectively.
Source data are available online for this figure.
ª 2018 The Authors Molecular Systems Biology 14: e7899 | 2018 3 of 14
Antoine Vigouroux et al Noiseless knockdown of genes by dCas9 Molecular Systems Biology
Published online: March 8, 2018
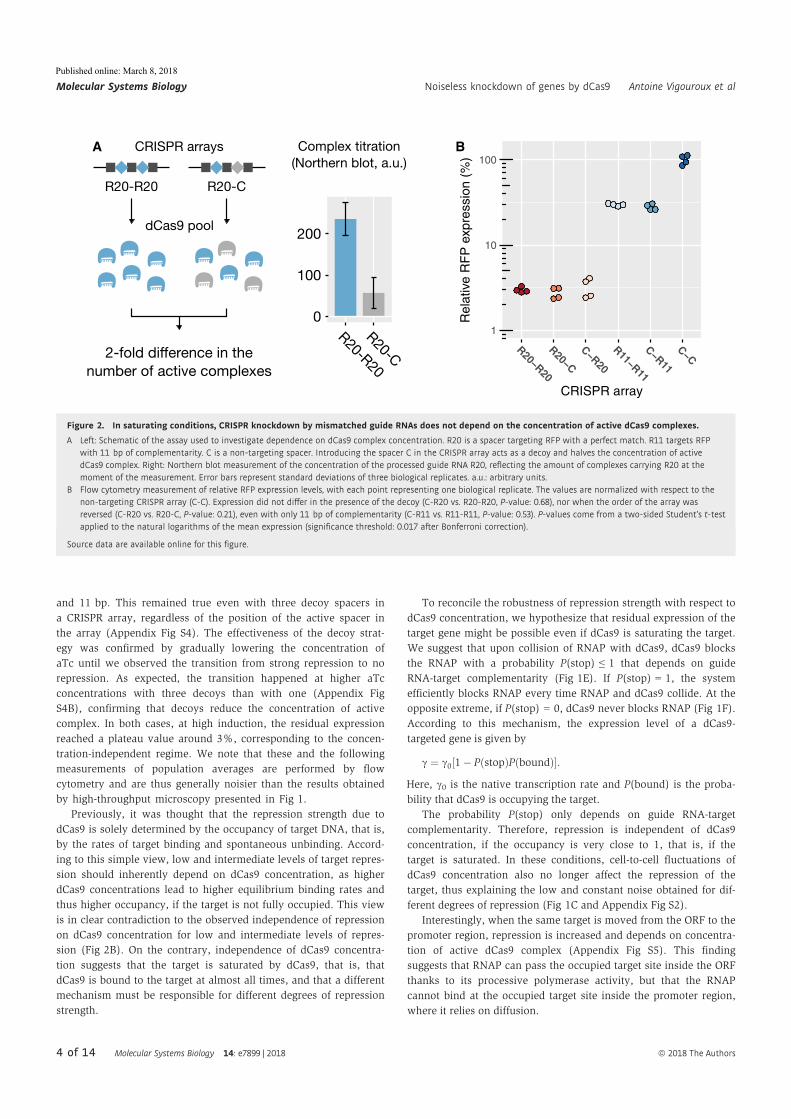
and 11 bp. This remained true even with three decoy spacers in
a CRISPR array, regardless of the position of the active spacer in
the array (Appendix Fig S4). The effectiveness of the decoy strat-
egy was confirmed by gradually lowering the concentration of
aTc until we observed the transition from strong repression to no
repression. As expected, the transition happened at higher aTc
concentrations with three decoys than with one (Appendix Fig
S4B), confirming that decoys reduce the concentration of active
complex. In both cases, at high induction, the residual expression
reached a plateau value around 3%, corresponding to the concen-
tration-independent regime. We note that these and the following
measurements of population averages are performed by flow
cytometry and are thus generally noisier than the results obtained
by high-throughput microscopy presented in Fig 1.
Previously, it was thought that the repression strength due to
dCas9 is solely determined by the occupancy of target DNA, that is,
by the rates of target binding and spontaneous unbinding. Accord-
ing to this simple view, low and intermediate levels of target repres-
sion should inherently depend on dCas9 concentration, as higher
dCas9 concentrations lead to higher equilibrium binding rates and
thus higher occupancy, if the target is not fully occupied. This view
is in clear contradiction to the observed independence of repression
on dCas9 concentration for low and intermediate levels of repres-
sion (Fig 2B). On the contrary, independence of dCas9 concentra-
tion suggests that the target is saturated by dCas9, that is, that
dCas9 is bound to the target at almost all times, and that a different
mechanism must be responsible for different degrees of repression
strength.
To reconcile the robustness of repression strength with respect to
dCas9 concentration, we hypothesize that residual expression of the
target gene might be possible even if dCas9 is saturating the target.
We suggest that upon collision of RNAP with dCas9, dCas9 blocks
the RNAP with a probability P(stop) ≤ 1 that depends on guide
RNA-target complementarity (Fig 1E). If P(stop) = 1, the system
efficiently blocks RNAP every time RNAP and dCas9 collide. At the
opposite extreme, if P(stop) = 0, dCas9 never blocks RNAP (Fig 1F).
According to this mechanism, the expression level of a dCas9-
targeted gene is given by
c ¼ c0½1� PðstopÞPðboundÞ�:Here, c0 is the native transcription rate and P(bound) is the proba-
bility that dCas9 is occupying the target.
The probability P(stop) only depends on guide RNA-target
complementarity. Therefore, repression is independent of dCas9
concentration, if the occupancy is very close to 1, that is, if the
target is saturated. In these conditions, cell-to-cell fluctuations of
dCas9 concentration also no longer affect the repression of the
target, thus explaining the low and constant noise obtained for dif-
ferent degrees of repression (Fig 1C and Appendix Fig S2).
Interestingly, when the same target is moved from the ORF to the
promoter region, repression is increased and depends on concentra-
tion of active dCas9 complex (Appendix Fig S5). This finding
suggests that RNAP can pass the occupied target site inside the ORF
thanks to its processive polymerase activity, but that the RNAP
cannot bind at the occupied target site inside the promoter region,
where it relies on diffusion.
BA
200
100
0
Complex titration(Northern blot, a.u.)
R20-C
R20-R20
R20-CR20-R20
2-fold difference in thenumber of active complexes
dCas9 pool
CRISPR arrays
1
10
100
R20−R20
R20−C
C−R20
R11−R11
C−R11
C−C
Rel
ativ
e R
FP
exp
ress
ion
(%)
CRISPR array
Figure 2. In saturating conditions, CRISPR knockdown by mismatched guide RNAs does not depend on the concentration of active dCas9 complexes.
A Left: Schematic of the assay used to investigate dependence on dCas9 complex concentration. R20 is a spacer targeting RFP with a perfect match. R11 targets RFPwith 11 bp of complementarity. C is a non-targeting spacer. Introducing the spacer C in the CRISPR array acts as a decoy and halves the concentration of activedCas9 complex. Right: Northern blot measurement of the concentration of the processed guide RNA R20, reflecting the amount of complexes carrying R20 at themoment of the measurement. Error bars represent standard deviations of three biological replicates. a.u.: arbitrary units.
B Flow cytometry measurement of relative RFP expression levels, with each point representing one biological replicate. The values are normalized with respect to thenon-targeting CRISPR array (C-C). Expression did not differ in the presence of the decoy (C-R20 vs. R20-R20, P-value: 0.68), nor when the order of the array wasreversed (C-R20 vs. R20-C, P-value: 0.21), even with only 11 bp of complementarity (C-R11 vs. R11-R11, P-value: 0.53). P-values come from a two-sided Student’s t-testapplied to the natural logarithms of the mean expression (significance threshold: 0.017 after Bonferroni correction).
Source data are available online for this figure.
4 of 14 Molecular Systems Biology 14: e7899 | 2018 ª 2018 The Authors
Molecular Systems Biology Noiseless knockdown of genes by dCas9 Antoine Vigouroux et al
Published online: March 8, 2018
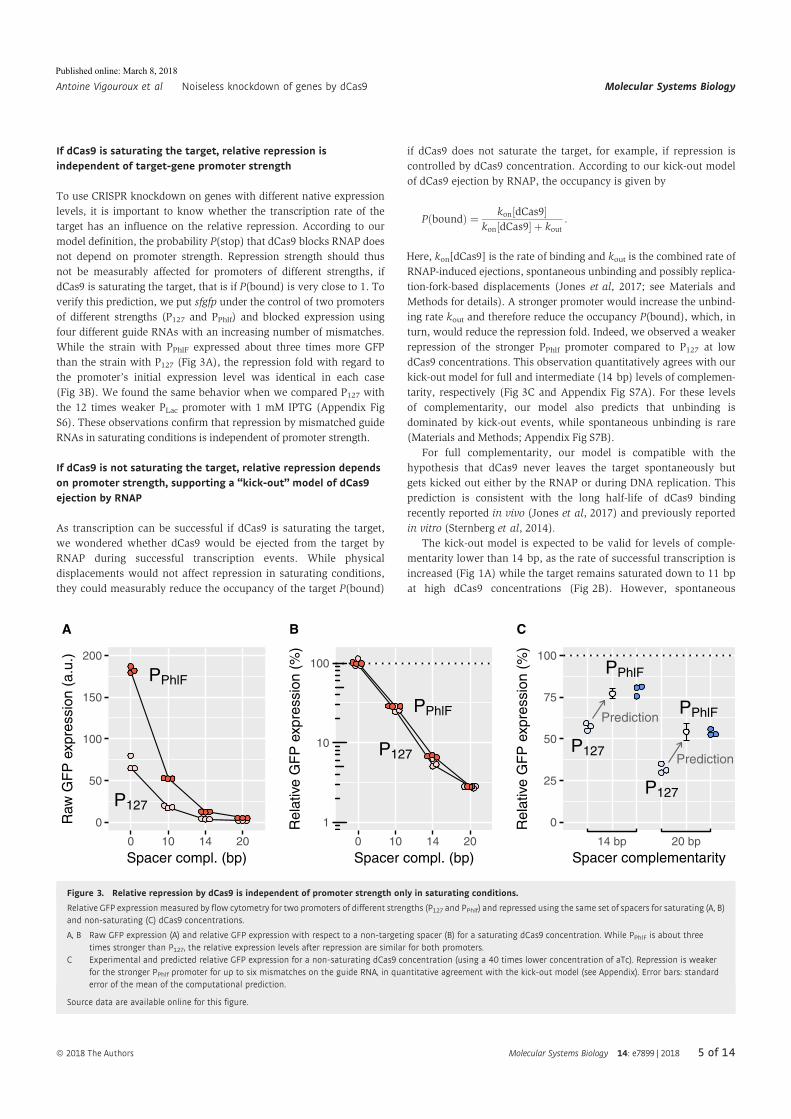
If dCas9 is saturating the target, relative repression isindependent of target-gene promoter strength
To use CRISPR knockdown on genes with different native expression
levels, it is important to know whether the transcription rate of the
target has an influence on the relative repression. According to our
model definition, the probability P(stop) that dCas9 blocks RNAP does
not depend on promoter strength. Repression strength should thus
not be measurably affected for promoters of different strengths, if
dCas9 is saturating the target, that is if P(bound) is very close to 1. To
verify this prediction, we put sfgfp under the control of two promoters
of different strengths (P127 and PPhlf) and blocked expression using
four different guide RNAs with an increasing number of mismatches.
While the strain with PPhlF expressed about three times more GFP
than the strain with P127 (Fig 3A), the repression fold with regard to
the promoter’s initial expression level was identical in each case
(Fig 3B). We found the same behavior when we compared P127 with
the 12 times weaker PLac promoter with 1 mM IPTG (Appendix Fig
S6). These observations confirm that repression by mismatched guide
RNAs in saturating conditions is independent of promoter strength.
If dCas9 is not saturating the target, relative repression dependson promoter strength, supporting a “kick-out” model of dCas9ejection by RNAP
As transcription can be successful if dCas9 is saturating the target,
we wondered whether dCas9 would be ejected from the target by
RNAP during successful transcription events. While physical
displacements would not affect repression in saturating conditions,
they could measurably reduce the occupancy of the target P(bound)
if dCas9 does not saturate the target, for example, if repression is
controlled by dCas9 concentration. According to our kick-out model
of dCas9 ejection by RNAP, the occupancy is given by
PðboundÞ ¼ kon dCas9½ �kon dCas9½ � þ kout
:
Here, kon[dCas9] is the rate of binding and kout is the combined rate of
RNAP-induced ejections, spontaneous unbinding and possibly replica-
tion-fork-based displacements (Jones et al, 2017; see Materials and
Methods for details). A stronger promoter would increase the unbind-
ing rate kout and therefore reduce the occupancy P(bound), which, in
turn, would reduce the repression fold. Indeed, we observed a weaker
repression of the stronger PPhlf promoter compared to P127 at low
dCas9 concentrations. This observation quantitatively agrees with our
kick-out model for full and intermediate (14 bp) levels of complemen-
tarity, respectively (Fig 3C and Appendix Fig S7A). For these levels
of complementarity, our model also predicts that unbinding is
dominated by kick-out events, while spontaneous unbinding is rare
(Materials and Methods; Appendix Fig S7B).
For full complementarity, our model is compatible with the
hypothesis that dCas9 never leaves the target spontaneously but
gets kicked out either by the RNAP or during DNA replication. This
prediction is consistent with the long half-life of dCas9 binding
recently reported in vivo (Jones et al, 2017) and previously reported
in vitro (Sternberg et al, 2014).
The kick-out model is expected to be valid for levels of comple-
mentarity lower than 14 bp, as the rate of successful transcription is
increased (Fig 1A) while the target remains saturated down to 11 bp
at high dCas9 concentrations (Fig 2B). However, spontaneous
PPhlF
P1270
50
100
150
200
0 10 14 20
Spacer compl. (bp)
Raw
GF
P e
xpre
ssio
n (a
.u.)
PPhlF
P127
1
10
100
0 10 14 20
Spacer compl. (bp)
Rel
ativ
eG
FP
exp
ress
ion
(%)
P127
PPhlF
P127
PPhlFPrediction
Prediction
0
25
50
75
100
14 bp 20 bp
Spacer complementarity
Rel
ativ
e G
FP
exp
ress
ion
(%)
A B C
Figure 3. Relative repression by dCas9 is independent of promoter strength only in saturating conditions.
Relative GFP expression measured by flow cytometry for two promoters of different strengths (P127 and PPhlf) and repressed using the same set of spacers for saturating (A, B)and non-saturating (C) dCas9 concentrations.
A, B Raw GFP expression (A) and relative GFP expression with respect to a non-targeting spacer (B) for a saturating dCas9 concentration. While PPhlF is about threetimes stronger than P127, the relative expression levels after repression are similar for both promoters.
C Experimental and predicted relative GFP expression for a non-saturating dCas9 concentration (using a 40 times lower concentration of aTc). Repression is weakerfor the stronger PPhlf promoter for up to six mismatches on the guide RNA, in quantitative agreement with the kick-out model (see Appendix). Error bars: standarderror of the mean of the computational prediction.
Source data are available online for this figure.
ª 2018 The Authors Molecular Systems Biology 14: e7899 | 2018 5 of 14
Antoine Vigouroux et al Noiseless knockdown of genes by dCas9 Molecular Systems Biology
Published online: March 8, 2018
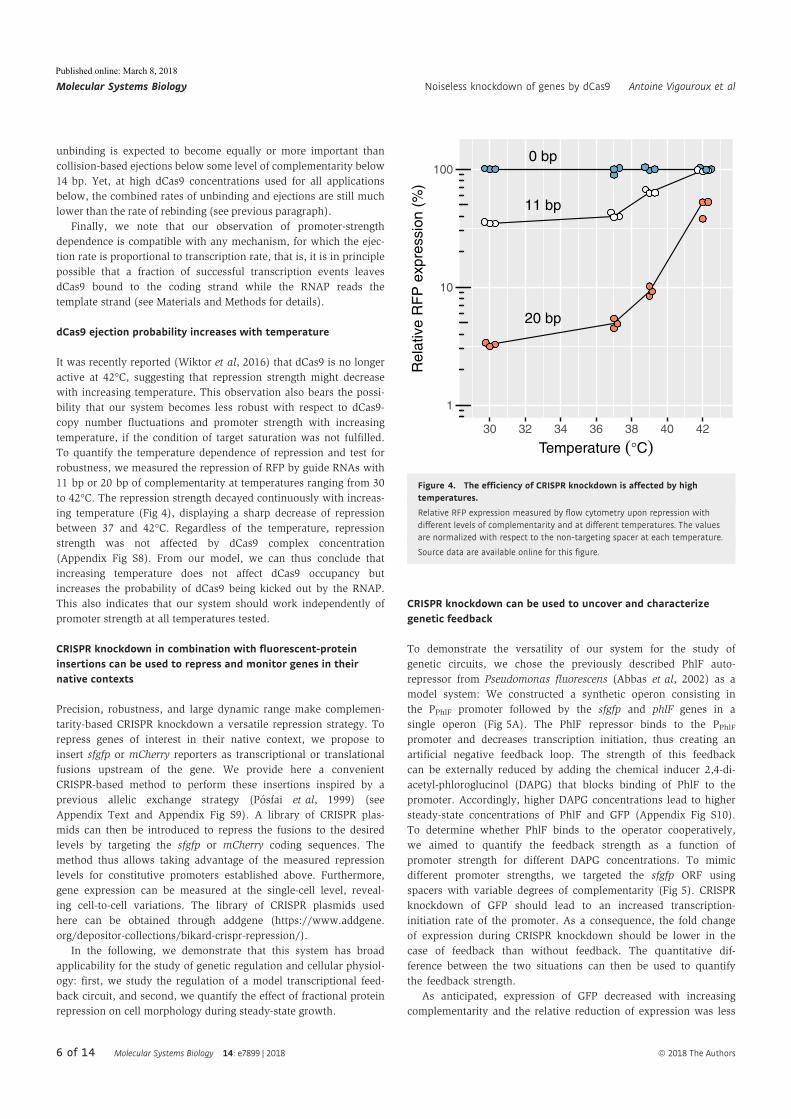
unbinding is expected to become equally or more important than
collision-based ejections below some level of complementarity below
14 bp. Yet, at high dCas9 concentrations used for all applications
below, the combined rates of unbinding and ejections are still much
lower than the rate of rebinding (see previous paragraph).
Finally, we note that our observation of promoter-strength
dependence is compatible with any mechanism, for which the ejec-
tion rate is proportional to transcription rate, that is, it is in principle
possible that a fraction of successful transcription events leaves
dCas9 bound to the coding strand while the RNAP reads the
template strand (see Materials and Methods for details).
dCas9 ejection probability increases with temperature
It was recently reported (Wiktor et al, 2016) that dCas9 is no longer
active at 42°C, suggesting that repression strength might decrease
with increasing temperature. This observation also bears the possi-
bility that our system becomes less robust with respect to dCas9-
copy number fluctuations and promoter strength with increasing
temperature, if the condition of target saturation was not fulfilled.
To quantify the temperature dependence of repression and test for
robustness, we measured the repression of RFP by guide RNAs with
11 bp or 20 bp of complementarity at temperatures ranging from 30
to 42°C. The repression strength decayed continuously with increas-
ing temperature (Fig 4), displaying a sharp decrease of repression
between 37 and 42°C. Regardless of the temperature, repression
strength was not affected by dCas9 complex concentration
(Appendix Fig S8). From our model, we can thus conclude that
increasing temperature does not affect dCas9 occupancy but
increases the probability of dCas9 being kicked out by the RNAP.
This also indicates that our system should work independently of
promoter strength at all temperatures tested.
CRISPR knockdown in combination with fluorescent-proteininsertions can be used to repress and monitor genes in theirnative contexts
Precision, robustness, and large dynamic range make complemen-
tarity-based CRISPR knockdown a versatile repression strategy. To
repress genes of interest in their native context, we propose to
insert sfgfp or mCherry reporters as transcriptional or translational
fusions upstream of the gene. We provide here a convenient
CRISPR-based method to perform these insertions inspired by a
previous allelic exchange strategy (Posfai et al, 1999) (see
Appendix Text and Appendix Fig S9). A library of CRISPR plas-
mids can then be introduced to repress the fusions to the desired
levels by targeting the sfgfp or mCherry coding sequences. The
method thus allows taking advantage of the measured repression
levels for constitutive promoters established above. Furthermore,
gene expression can be measured at the single-cell level, reveal-
ing cell-to-cell variations. The library of CRISPR plasmids used
here can be obtained through addgene (https://www.addgene.
org/depositor-collections/bikard-crispr-repression/).
In the following, we demonstrate that this system has broad
applicability for the study of genetic regulation and cellular physiol-
ogy: first, we study the regulation of a model transcriptional feed-
back circuit, and second, we quantify the effect of fractional protein
repression on cell morphology during steady-state growth.
CRISPR knockdown can be used to uncover and characterizegenetic feedback
To demonstrate the versatility of our system for the study of
genetic circuits, we chose the previously described PhlF auto-
repressor from Pseudomonas fluorescens (Abbas et al, 2002) as a
model system: We constructed a synthetic operon consisting in
the PPhlF promoter followed by the sfgfp and phlF genes in a
single operon (Fig 5A). The PhlF repressor binds to the PPhlFpromoter and decreases transcription initiation, thus creating an
artificial negative feedback loop. The strength of this feedback
can be externally reduced by adding the chemical inducer 2,4-di-
acetyl-phloroglucinol (DAPG) that blocks binding of PhlF to the
promoter. Accordingly, higher DAPG concentrations lead to higher
steady-state concentrations of PhlF and GFP (Appendix Fig S10).
To determine whether PhlF binds to the operator cooperatively,
we aimed to quantify the feedback strength as a function of
promoter strength for different DAPG concentrations. To mimic
different promoter strengths, we targeted the sfgfp ORF using
spacers with variable degrees of complementarity (Fig 5). CRISPR
knockdown of GFP should lead to an increased transcription-
initiation rate of the promoter. As a consequence, the fold change
of expression during CRISPR knockdown should be lower in the
case of feedback than without feedback. The quantitative dif-
ference between the two situations can then be used to quantify
the feedback strength.
As anticipated, expression of GFP decreased with increasing
complementarity and the relative reduction of expression was less
20 bp
11 bp
0 bp
Rel
ativ
e R
FP
exp
ress
ion
(%)
1
10
100
30 32 34 36 38 40 42
Temperature (°C)
Figure 4. The efficiency of CRISPR knockdown is affected by hightemperatures.
Relative RFP expression measured by flow cytometry upon repression withdifferent levels of complementarity and at different temperatures. The valuesare normalized with respect to the non-targeting spacer at each temperature.
Source data are available online for this figure.
6 of 14 Molecular Systems Biology 14: e7899 | 2018 ª 2018 The Authors
Molecular Systems Biology Noiseless knockdown of genes by dCas9 Antoine Vigouroux et al
Published online: March 8, 2018
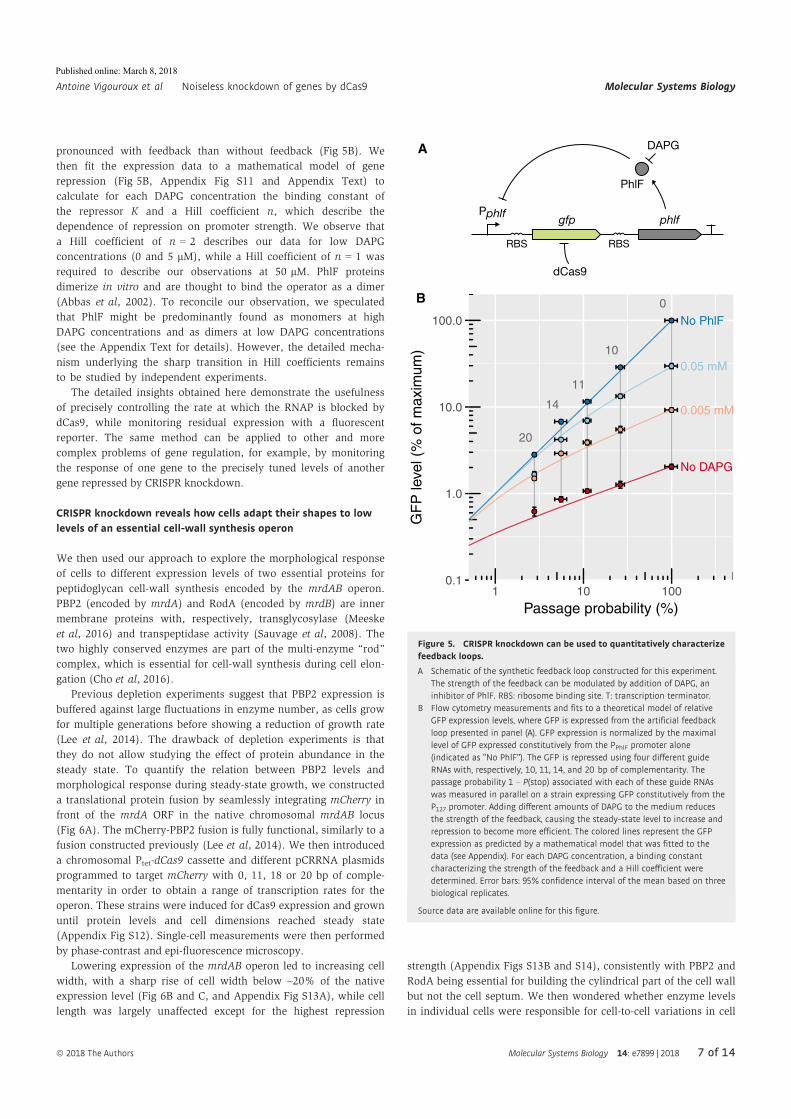
pronounced with feedback than without feedback (Fig 5B). We
then fit the expression data to a mathematical model of gene
repression (Fig 5B, Appendix Fig S11 and Appendix Text) to
calculate for each DAPG concentration the binding constant of
the repressor K and a Hill coefficient n, which describe the
dependence of repression on promoter strength. We observe that
a Hill coefficient of n = 2 describes our data for low DAPG
concentrations (0 and 5 lM), while a Hill coefficient of n = 1 was
required to describe our observations at 50 lM. PhlF proteins
dimerize in vitro and are thought to bind the operator as a dimer
(Abbas et al, 2002). To reconcile our observation, we speculated
that PhlF might be predominantly found as monomers at high
DAPG concentrations and as dimers at low DAPG concentrations
(see the Appendix Text for details). However, the detailed mecha-
nism underlying the sharp transition in Hill coefficients remains
to be studied by independent experiments.
The detailed insights obtained here demonstrate the usefulness
of precisely controlling the rate at which the RNAP is blocked by
dCas9, while monitoring residual expression with a fluorescent
reporter. The same method can be applied to other and more
complex problems of gene regulation, for example, by monitoring
the response of one gene to the precisely tuned levels of another
gene repressed by CRISPR knockdown.
CRISPR knockdown reveals how cells adapt their shapes to lowlevels of an essential cell-wall synthesis operon
We then used our approach to explore the morphological response
of cells to different expression levels of two essential proteins for
peptidoglycan cell-wall synthesis encoded by the mrdAB operon.
PBP2 (encoded by mrdA) and RodA (encoded by mrdB) are inner
membrane proteins with, respectively, transglycosylase (Meeske
et al, 2016) and transpeptidase activity (Sauvage et al, 2008). The
two highly conserved enzymes are part of the multi-enzyme “rod”
complex, which is essential for cell-wall synthesis during cell elon-
gation (Cho et al, 2016).
Previous depletion experiments suggest that PBP2 expression is
buffered against large fluctuations in enzyme number, as cells grow
for multiple generations before showing a reduction of growth rate
(Lee et al, 2014). The drawback of depletion experiments is that
they do not allow studying the effect of protein abundance in the
steady state. To quantify the relation between PBP2 levels and
morphological response during steady-state growth, we constructed
a translational protein fusion by seamlessly integrating mCherry in
front of the mrdA ORF in the native chromosomal mrdAB locus
(Fig 6A). The mCherry-PBP2 fusion is fully functional, similarly to a
fusion constructed previously (Lee et al, 2014). We then introduced
a chromosomal Ptet-dCas9 cassette and different pCRRNA plasmids
programmed to target mCherry with 0, 11, 18 or 20 bp of comple-
mentarity in order to obtain a range of transcription rates for the
operon. These strains were induced for dCas9 expression and grown
until protein levels and cell dimensions reached steady state
(Appendix Fig S12). Single-cell measurements were then performed
by phase-contrast and epi-fluorescence microscopy.
Lowering expression of the mrdAB operon led to increasing cell
width, with a sharp rise of cell width below ~20% of the native
expression level (Fig 6B and C, and Appendix Fig S13A), while cell
length was largely unaffected except for the highest repression
strength (Appendix Figs S13B and S14), consistently with PBP2 and
RodA being essential for building the cylindrical part of the cell wall
but not the cell septum. We then wondered whether enzyme levels
in individual cells were responsible for cell-to-cell variations in cell
RBS RBS
gfp phlfPphlf
DAPG
dCas9
PhlF
A
B
0.05 mM
0.005 mM
No PhlF
No DAPG
0
10
11
14
20
0.1
1.0
10.0
100.0
1 10 100
Passage probability (%)
GF
P le
vel (
% o
f max
imum
)
Figure 5. CRISPR knockdown can be used to quantitatively characterizefeedback loops.
A Schematic of the synthetic feedback loop constructed for this experiment.The strength of the feedback can be modulated by addition of DAPG, aninhibitor of PhlF. RBS: ribosome binding site. T: transcription terminator.
B Flow cytometry measurements and fits to a theoretical model of relativeGFP expression levels, where GFP is expressed from the artificial feedbackloop presented in panel (A). GFP expression is normalized by the maximallevel of GFP expressed constitutively from the PPhlF promoter alone(indicated as “No PhlF”). The GFP is repressed using four different guideRNAs with, respectively, 10, 11, 14, and 20 bp of complementarity. Thepassage probability 1 – P(stop) associated with each of these guide RNAswas measured in parallel on a strain expressing GFP constitutively from theP127 promoter. Adding different amounts of DAPG to the medium reducesthe strength of the feedback, causing the steady-state level to increase andrepression to become more efficient. The colored lines represent the GFPexpression as predicted by a mathematical model that was fitted to thedata (see Appendix). For each DAPG concentration, a binding constantcharacterizing the strength of the feedback and a Hill coefficient weredetermined. Error bars: 95% confidence interval of the mean based on threebiological replicates.
Source data are available online for this figure.
ª 2018 The Authors Molecular Systems Biology 14: e7899 | 2018 7 of 14
Antoine Vigouroux et al Noiseless knockdown of genes by dCas9 Molecular Systems Biology
Published online: March 8, 2018
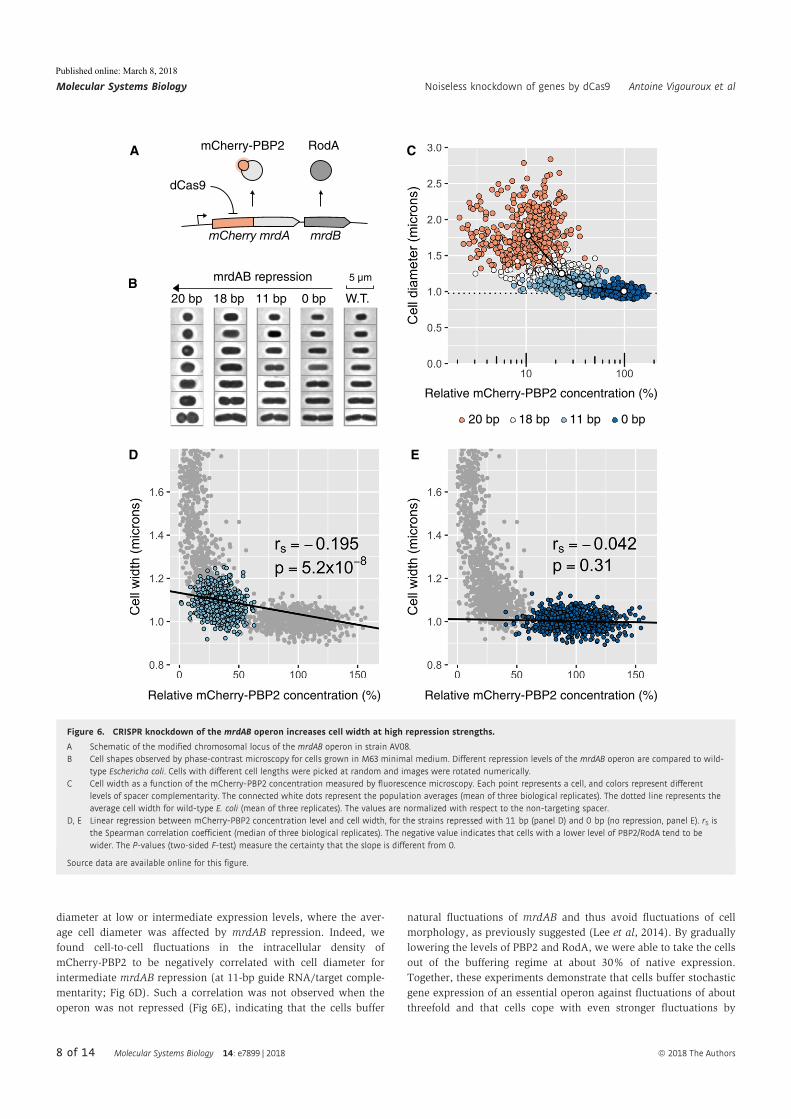
diameter at low or intermediate expression levels, where the aver-
age cell diameter was affected by mrdAB repression. Indeed, we
found cell-to-cell fluctuations in the intracellular density of
mCherry-PBP2 to be negatively correlated with cell diameter for
intermediate mrdAB repression (at 11-bp guide RNA/target comple-
mentarity; Fig 6D). Such a correlation was not observed when the
operon was not repressed (Fig 6E), indicating that the cells buffer
natural fluctuations of mrdAB and thus avoid fluctuations of cell
morphology, as previously suggested (Lee et al, 2014). By gradually
lowering the levels of PBP2 and RodA, we were able to take the cells
out of the buffering regime at about 30% of native expression.
Together, these experiments demonstrate that cells buffer stochastic
gene expression of an essential operon against fluctuations of about
threefold and that cells cope with even stronger fluctuations by
yrrehCm BdrmAdrm
dCas9
mCherry-PBP2 RodAA
20 bp 18 bp 11 bp 0 bp W.T.
5 µmmrdAB repressionB
D E
C
20 bp 18 bp 11 bp 0 bp
Relative mCherry-PBP2 concentration (%)
Relative mCherry-PBP2 concentration (%)Relative mCherry-PBP2 concentration (%)
Figure 6. CRISPR knockdown of the mrdAB operon increases cell width at high repression strengths.
A Schematic of the modified chromosomal locus of the mrdAB operon in strain AV08.B Cell shapes observed by phase-contrast microscopy for cells grown in M63 minimal medium. Different repression levels of the mrdAB operon are compared to wild-
type Eschericha coli. Cells with different cell lengths were picked at random and images were rotated numerically.C Cell width as a function of the mCherry-PBP2 concentration measured by fluorescence microscopy. Each point represents a cell, and colors represent different
levels of spacer complementarity. The connected white dots represent the population averages (mean of three biological replicates). The dotted line represents theaverage cell width for wild-type E. coli (mean of three replicates). The values are normalized with respect to the non-targeting spacer.
D, E Linear regression between mCherry-PBP2 concentration level and cell width, for the strains repressed with 11 bp (panel D) and 0 bp (no repression, panel E). rS isthe Spearman correlation coefficient (median of three biological replicates). The negative value indicates that cells with a lower level of PBP2/RodA tend to bewider. The P-values (two-sided F-test) measure the certainty that the slope is different from 0.
Source data are available online for this figure.
8 of 14 Molecular Systems Biology 14: e7899 | 2018 ª 2018 The Authors
Molecular Systems Biology Noiseless knockdown of genes by dCas9 Antoine Vigouroux et al
Published online: March 8, 2018
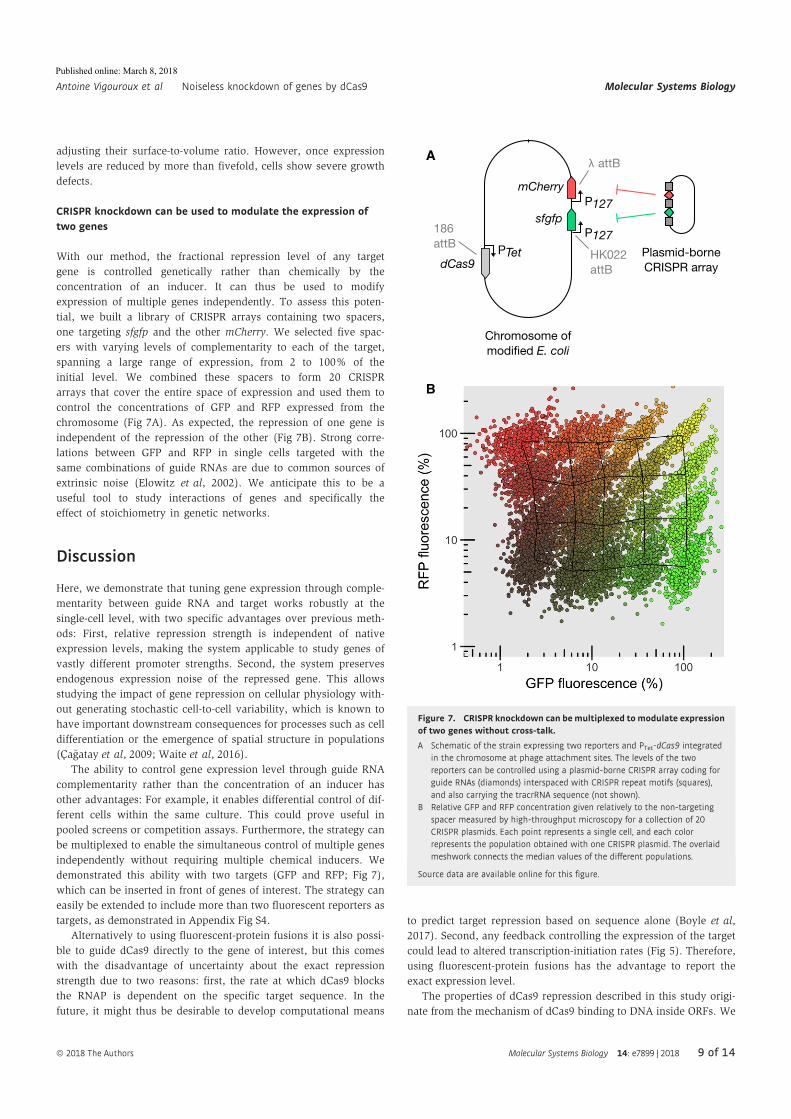
adjusting their surface-to-volume ratio. However, once expression
levels are reduced by more than fivefold, cells show severe growth
defects.
CRISPR knockdown can be used to modulate the expression oftwo genes
With our method, the fractional repression level of any target
gene is controlled genetically rather than chemically by the
concentration of an inducer. It can thus be used to modify
expression of multiple genes independently. To assess this poten-
tial, we built a library of CRISPR arrays containing two spacers,
one targeting sfgfp and the other mCherry. We selected five spac-
ers with varying levels of complementarity to each of the target,
spanning a large range of expression, from 2 to 100% of the
initial level. We combined these spacers to form 20 CRISPR
arrays that cover the entire space of expression and used them to
control the concentrations of GFP and RFP expressed from the
chromosome (Fig 7A). As expected, the repression of one gene is
independent of the repression of the other (Fig 7B). Strong corre-
lations between GFP and RFP in single cells targeted with the
same combinations of guide RNAs are due to common sources of
extrinsic noise (Elowitz et al, 2002). We anticipate this to be a
useful tool to study interactions of genes and specifically the
effect of stoichiometry in genetic networks.
Discussion
Here, we demonstrate that tuning gene expression through comple-
mentarity between guide RNA and target works robustly at the
single-cell level, with two specific advantages over previous meth-
ods: First, relative repression strength is independent of native
expression levels, making the system applicable to study genes of
vastly different promoter strengths. Second, the system preserves
endogenous expression noise of the repressed gene. This allows
studying the impact of gene repression on cellular physiology with-
out generating stochastic cell-to-cell variability, which is known to
have important downstream consequences for processes such as cell
differentiation or the emergence of spatial structure in populations
(Ca�gatay et al, 2009; Waite et al, 2016).
The ability to control gene expression level through guide RNA
complementarity rather than the concentration of an inducer has
other advantages: For example, it enables differential control of dif-
ferent cells within the same culture. This could prove useful in
pooled screens or competition assays. Furthermore, the strategy can
be multiplexed to enable the simultaneous control of multiple genes
independently without requiring multiple chemical inducers. We
demonstrated this ability with two targets (GFP and RFP; Fig 7),
which can be inserted in front of genes of interest. The strategy can
easily be extended to include more than two fluorescent reporters as
targets, as demonstrated in Appendix Fig S4.
Alternatively to using fluorescent-protein fusions it is also possi-
ble to guide dCas9 directly to the gene of interest, but this comes
with the disadvantage of uncertainty about the exact repression
strength due to two reasons: first, the rate at which dCas9 blocks
the RNAP is dependent on the specific target sequence. In the
future, it might thus be desirable to develop computational means
to predict target repression based on sequence alone (Boyle et al,
2017). Second, any feedback controlling the expression of the target
could lead to altered transcription-initiation rates (Fig 5). Therefore,
using fluorescent-protein fusions has the advantage to report the
exact expression level.
The properties of dCas9 repression described in this study origi-
nate from the mechanism of dCas9 binding to DNA inside ORFs. We
Chromosome ofmodified E. coli
A
dCas9
mCherry
sfgfp
PTet
P127
P127
λ attB
HK022attB
186attB
B
Plasmid-borneCRISPR array
Figure 7. CRISPR knockdown can bemultiplexed tomodulate expressionof two genes without cross-talk.
A Schematic of the strain expressing two reporters and PTet-dCas9 integratedin the chromosome at phage attachment sites. The levels of the tworeporters can be controlled using a plasmid-borne CRISPR array coding forguide RNAs (diamonds) interspaced with CRISPR repeat motifs (squares),and also carrying the tracrRNA sequence (not shown).
B Relative GFP and RFP concentration given relatively to the non-targetingspacer measured by high-throughput microscopy for a collection of 20CRISPR plasmids. Each point represents a single cell, and each colorrepresents the population obtained with one CRISPR plasmid. The overlaidmeshwork connects the median values of the different populations.
Source data are available online for this figure.
ª 2018 The Authors Molecular Systems Biology 14: e7899 | 2018 9 of 14
Antoine Vigouroux et al Noiseless knockdown of genes by dCas9 Molecular Systems Biology
Published online: March 8, 2018
show that at high concentrations, dCas9 is saturating the target site
even when using guide RNAs with large numbers of mismatches,
where repression of the target gene is weak. We explain these obser-
vations by a “kick-out” model of repression, according to which
RNAP kicks out dCas9 with a probability that can be tuned by
spacer complementarity. The exact passage probability depends on
the crRNA sequence. Here we provide a collection of guide RNAs
against mcherry and sfgfp with known passage probabilities. Further
work and larger datasets of diverse sequences will help to design
new guides with predictable repression strength on arbitrary targets.
The model predicts that repression is promoter-strength dependent
in non-saturating conditions, in quantitative agreement with experi-
ments (Fig 3C).
For full complementarity, our model is compatible with the
hypothesis that dCas9 never leaves the target spontaneously but
gets kicked out either by the RNAP or during DNA replication,
consistent with the long half-life of dCas9 binding recently
observed by single-molecule tracking and by restriction-protection
assays (Jones et al, 2017) and previously also observed in vitro
(Sternberg et al, 2014). A recent high-throughput study of dCas9
off-target binding and unbinding suggests that mutations in the
PAM-distal region control the unbinding kinetics of dCas9
(Boyle et al, 2017). Since unbinding is dominated by RNAP-dCas9
collisions for the promoters tested here and as rebinding to the
target is fast at high dCas9 concentrations, spontaneous unbinding
plays no significant role for gene repression in our model system.
However, if dCas9 targets the promoter rather than the coding
region, spontaneous unbinding or replication-fork-based displace-
ments might be the only modes allowing residual gene expression.
This view is supported by the higher repression strength observed
when targeting the promoter region (Bikard et al, 2013; Qi
et al, 2013) and by the dependence on concentration (Appendix
Fig S5).
Our results also suggest that dCas9 ejection does not lead to
bursts of transcription, but that instead dCas9 returns to the target
site after ejection in a time that is small with respect to the typical
time interval between transcription initiations. It is still conceivable
that such bursts may occur for transcription rates higher than the
strongest promoter we used.
The results presented here argue for the use of high levels of
dCas9 when performing CRISPRi assays in order to ensure that the
target position is saturated. It is however important to highlight that
the overexpression of dCas9 has been reported to be toxic for E. coli
(Nielsen & Voigt, 2014). It is therefore preferable not to overexpress
dCas9 far above the saturation point.
Our strategy enables to precisely control gene expression with-
out introducing cell-to-cell variability, and should be useful for
any quantitative measurements that depend on the expression
level of a gene. By taking advantage of the ability to precisely
control the rate at which dCas9 blocks the RNAP we could char-
acterize a synthetic feedback loop, revealing unexpected proper-
ties of Phlf repression activity. In a second example, we took
advantage of the ability to fine-tune expression levels at the
steady state to quantitatively measure cell shape as a function of
the levels of PBP2 and RodA. The level of precision achieved
here would be hard to establish with conventional methods.
Accordingly, this is the first study to establish a quantitative rela-
tionship between the abundance of cell-wall synthesizing proteins
and cell morphology at the population and single-cell levels. We
anticipate that our method will be useful to study many other
systems and in particular genetic circuits that include high levels
of noise, such as stochastic switches, or other noise-dependent
processes, where preservation of a well-defined level of expres-
sion noise is desirable.
Materials and Methods
Kick-out model of CRISPR knockdown
As already described in the main text, dCas9 is thought to bind to
target DNA where it provides a roadblock for RNAP, thus blocking
transcription. According to this mechanism, the expression level cof a dCas9-targeted gene is given by
c ¼ c0½1� PðstopÞPðboundÞ�: (1)
Here, c0 is the native transcription rate, P(stop) is the probability
of dCas9 blocking RNAP if dCas9 is occupying the target, and
P(bound) is the probability that dCas9 is occupying the target
(henceforth also termed occupancy).
While the probability P(stop) only depends on guide RNA-target
complementarity, the occupancy P(bound) generally depends on
complementarity, dCas9 concentration, and possibly on transcrip-
tion-initiation rate (see the following paragraph). Therefore, repres-
sion is independent of dCas9 concentration only if the occupancy is
very close to one (1 – P(bound) � 1), that is, if the target is
saturated.
According to straight-forward reaction kinetics, the occupancy is
given by
PðboundÞ ¼ kon dCas9½ �kon dCas9½ � þ kout
; (2)
where kout is the rate of dCas9 leaving the target. dCas9 can in
principle leave the target by two different mechanisms, by tran-
scription-independent unbinding (with rate koff if bound to the
target), or by being kicked out from the target during all or part of
the successful RNAP passage events, that is, during collisions
where transcription continues. Alternatively, dCas9 could stay
bound during all successful passage events. According to the two
different models, kout is given by
kout ¼ d½1� PðstopÞ�c0 þ koff; (3)
where we introduced an ejection frequency d. If d = 1, all
successful passage events lead to dCas9 ejection. On the contrary,
d = 0 corresponds to the scenario, where dCas9 stays bound
during successful passage events. If the kick-out model was
correct (d > 0), higher transcription-initiation rates c0 should thus
lead to lower target occupancy. If the spontaneous unbinding
model was correct (d = 0), occupancy should be independent
of c0.To identify the correct collision mechanism, we measured repres-
sion of msfgfp placed under two promoters with different promoter
strengths at an intermediate level of dCas9 concentration, where the
10 of 14 Molecular Systems Biology 14: e7899 | 2018 ª 2018 The Authors
Molecular Systems Biology Noiseless knockdown of genes by dCas9 Antoine Vigouroux et al
Published online: March 8, 2018
target is not saturated by dCas9 and where changes of occupancy
due to promoter strength should be clearly visible. We found that
the relative GFP expression (normalized with respect to the unre-
pressed case) of a promoter with 2.6-fold higher promoter strength
is increased by 1.7-fold as compared to the weaker promoter for full
complementarity between guide RNA and target (Fig 3C). Thus,
repression shows a strong dependence on promoter strength. This
observation suggests that dCas9 is kicked out of the target site
during all or part of the successful passage events. Plugging
equation (2) into equation (1) and using equation (3) for kout, the
kick-out model of dCas9-based gene repression thus predicts a
normalized transcription rate
c� ¼ 1� PðstopÞkon dCas9½ �kon dCas9½ � þ d 1� PðstopÞ½ �c0 þ koff
; (4)
where we defined c* = c/c0. Equation (4) is the central result of
our model.
Quantitative comparison with the experiment
Here, we compare model prediction and experimental expression
rates for two different promoters in saturating and non-saturating
conditions (Fig 3B and C, respectively). We first consider the case
of full complementarity between guide RNA and target. For a quan-
titative comparison, we eliminate one of the three experimentally
unknown parameters, the dCas9 rebinding rate kon[dCas9], by intro-
ducing the following dimensionless quantities: k = dc0/(kon[dCas9])is the ratio of the rate of induced dCas9 displacements over the rate
of dCas9 rebinding, a = koff/(kon[dCas9]) is the ratio of transcrip-
tion-independent unbinding rate over rebinding rate, and r = 1 � P
(stop) is the probability of successful transcription in the presence
of target-bound dCas9. The latter probability is known to be
r = 0.026 � 0.003 for full complementarity between guide RNA and
target from independent experiments in saturating conditions
(Fig 3B). Equation (4) can then be written as
c� ¼ r þ kr þ a1þ kr þ a
(5)
leaving two unknown parameters, k and a.The lifetime of dCas9-DNA complexes is greater than 45 min
in vitro (Sternberg et al, 2014), suggesting that the unbinding rate
koff is low in vivo. We thus hypothesized that the dimensionless
transcription-independent unbinding rate might be negligibly small,
that is, a � 1 + kr, which would allow us to simplify
c� � r þ kr1þ kr
; if a � 1þ kr (6)
thus leaving only one unknown parameter k.To test this hypothesis, we compare the predicted expression
level (equation 5) for zero and finite values of a to our experimen-
tally obtained data of GFP expression from the two promoters PPhlFand P127 (Fig 3C). In Appendix Fig S7A, the predicted expression
c* is plotted as a function of kr for two values of a (a = 0, a = 0.3).
To obtain the prediction of GFP expression, we used the
measurements of P127-GFP as a reference to infer the normalized
kick-out rate k(P127)r corresponding to the experimental GFP
expression levels of c*ex(P127) = 0.32 � 0.04 (Fig 2C),
k P127ð Þr ¼ ð1þ aÞc�ex P127ð Þ � r � a1� c�ex P127ð Þ (7)
also indicated by the gray vertical lines in Appendix Fig S5A for
the two values of a = 0 and a = 0.3. Then, we asked for the
predicted relative expression level of the repressed PPhlF-GFP, given
prior knowledge that the PPhlF promoter is (2.6 � 0.2)-times
stronger than P127 (Fig 3A) and therefore k(PPhlF) = (2.6 � 0.2)k(P127). The predicted expression level of the PPhlF promoter is thus
c� PPhlFð Þ ¼ r þ k PPhlFð Þr þ a1þ k PPhlFð Þr þ a
: (8)
According to our hypothesis of a = 0, we obtain c*(PPhlf) =0.54 � 0.05. This value is in great quantitative agreement with the
measured expression level of c*ex(PPhlF) = 0.54 � 0.02. On the
contrary, values of a > 0.14 lead to predicted expression levels
significantly lower than the experimental value (Appendix Fig S7B).
Together, these results confirm that the kick-out model quantita-
tively describes the mechanism of dCas9 repression and suggest that
the transcription-independent unbinding rate for guide RNAs of full
complementarity to their targets is indeed much lower than the
rebinding rate (koff � kon[dCas9]).
We then wondered whether the transcription-independent
unbinding rate a would increase for reduced degrees of complemen-
tarity. To that end, we performed the same analysis as above on
experimental data for GFP expression from the two promoters at
non-saturating levels of dCas9 but now for guide RNA that carries
six mismatches (corresponding to a increased passage probability of
r = 0.056 � 0.001). As in the case of full complementarity, we
found an excellent agreement between the experimental and
predicted GFP expression levels (c*ex(PPhlF) = 0.79 � 0.04 vs. c*(PPhlF) = 0.77 � 0.03) for a transcription-independent unbinding
rate of a = 0 while predicted expression values for a > 0.35 are
significantly lower than the measured expression level. We also
carried out experiments with a guide RNA of 10 mismatches.
However, the experimental data showed uncertainties too large to
make conclusions about the level of a. We thus conclude that the
dCas9-target complex is stable even for reduced degrees of comple-
mentarity of down to 14 bp and maybe less.
A lower limit for the lifetime of the dCas9-DNA complex
To obtain a quantitative estimate of the rate koff in the case of full
complementarity, we took advantage of the relationship
koff . 0:14kon½dCas9� ¼ 0:14dc0k
� 8� 10�3dc0;
where we used kr(P127) � 0.43 and r � 0.026. P127 is based on the
consensus promoter sequence and thus not expected to be stronger
than well-studied model promoters in E. coli, which display
transcription rates of not more than about 20min�1 (Kennell &
Riezman, 1977; So et al, 2011). This suggests that the unbinding
rate of dCas9 in the absence of RNAP-based collisions is smaller
than 1/6 min�1. This is based on the conservative assumption that
ª 2018 The Authors Molecular Systems Biology 14: e7899 | 2018 11 of 14
Antoine Vigouroux et al Noiseless knockdown of genes by dCas9 Molecular Systems Biology
Published online: March 8, 2018
all successful transcription events lead to a displacement of dCas9
from the target, that is, d = 1. For the reduced complementarity of
6 mismatches we obtain a lower limit of 1/2.4 min�1.
The average number of chromosomal loci per cell coding for
msfgfp is about 2, given a doubling time of about td � 30 min in
our growth conditions, an average DNA replication time of about
tC � 60 min at 30°C (Breier et al, 2005), and assuming a D-period
of tD = 20 min. The gene copy number per cell is then given by
nðUÞ ¼ 2tCð1�jUjÞ þ tD � 2, where Φ = 0.66 is the relative distance of
the gene locus from the origin of replication, if distance is normal-
ized with respect to the distance between origin and terminus. Thus,
the lifetime of a single dCas9-DNA complex (n/koff) is greater than
about 12 min (full complementarity) or 5 min (6 mismatches).
Notably, these timescales should be regarded as lower bounds,
while the actual lifetimes might be significantly larger. This estimate
is thus in agreement with recent single-molecule tracking and
restriction-protection assays (Jones et al, 2017), which demonstrate
that the lifetime of the dCas9-DNA complex is equal to the cellular
doubling time in the case of full complementarity. It is also in agree-
ment with in vitro data, which suggest that the lifetime is greater
than 45 min (Sternberg et al, 2014). Given that the lower limit of
the in vivo lifetime is of the same order of magnitude as the cell
doubling time of 30 min, it is conceivable that dCas9 virtually never
leaves the target site by equilibrium unbinding but instead is kicked
out during DNA replication events by the DNA replication machin-
ery, as also strongly supported by (Jones et al, 2017).
Genome modifications
All the strains used for measurements derive from E. coli MG1655.
Appendix Table S1 details the construction of the strains used in this
study.
For integration of cassettes at phage attachment sites, we used
the “clonetegration” method (St-Pierre et al, 2013). Integrated
backbones were excised by expressing a flippase from pE-FLP.
Plasmid pLC97 can be used to easily integrate Ptet-dCas9 at the
lambda attB site.
For scarless integration of mCherry-mrdA in the native mrdAB
operon, we used the pCas/pTarget system (Jiang et al, 2015). The
PAmCherry-PBP2 protein fusion present in strain TKL130 (Subach
et al, 2009; Lee et al, 2014) was replaced by a translational fusion
with mCherry extracted from plasmid pFB262 (Bendezu et al, 2009).
To this end, the pAV06 variant of pTarget was constructed and
genome editing was performed as described in reference (Jiang
et al, 2015). The deletion of the lacY gene in AV76 was done by P1
transduction using the strain JW0334 from the Keio collection (Baba
et al, 2006) as a donor.
We also propose a novel CRISPR-Cas9 allelic exchange strategy
for the scarless integration of mCherry or sfgfp in front of genes of
interest. This strategy is detailed in the Appendix Fig S9.
The sequences of the sfgfp and mCherry genes used in this study
can be found on the GenBank database with accession codes
KT192141.2 and JX155246.1, respectively.
Plasmid design and construction
The CRISPR targets were chosen next to the beginning of the ORF,
but at least 50 bp away from the initiation codon, in order to
preclude unwanted interactions with the native regulation of tran-
scription. None of the spacers used in this study have any off-target
position with more than 8 bp of complementarity in the PAM-
proximal region. Spacers were cloned into the CRISPR array of plas-
mid pCRRNA using Golden-Gate assembly as previously described
(Bikard et al, 2014; Cui & Bikard, 2016). The oligonucleotide
sequences are available in Appendix Table S4.
The other plasmids from this study were constructed by Gibson
assembly (Gibson et al, 2009). The fragments are described in
Appendix Table S2 and the primer sequences in Appendix Table S3.
DNA constructions were electroporated in E. coli strain DH5a or Pi1
for pir-dependent origins of replication (Shafferman & Helinski,
1983).
Media and reagents
For all flow cytometry measurements, the cells were grown in
Luria-Bertani (LB) broth. As a minimal medium for the mrdAB
measurements, we used M63 medium supplemented with 2 g/l of
glucose, 10 mg/l of thiamine, 10 mM of MgSO4, and 1 g/l of casa-
minoacids. When needed, we used various antibiotics (25 lg/ml
chloramphenicol, 100 lg/ml carbenicillin, 50 lg/ml kanamycin,
100 lg/ml spectinomycin). Di-acetyl-phloroglucinol (DAPG), anhy-
drotetracycline (aTc), and isopropyl b-D-1-thiogalactopyranoside(IPTG) were used, respectively, for induction of PPhlF, PTet, and PLacpromoters. All oligonucleotides were obtained from Eurofins
Genomics.
Preparation of steady-state exponential cultures
Unless stated otherwise, all cultures were grown at 30°C. Strains were
first re-streaked from a freezer stock. Independent single colonies
were picked for each replicate. Cells were then grown overnight in
96-deep-well plates using a tabletop shaker in 1 ml of medium with
100 ng/ml of aTc and 50 lg/ml of kanamycin (Eppendorf). The day
of the measurement, cultures were back-diluted 250 times in fresh
medium with aTc and kanamycin, and grown for 1 h 45 min into
exponential phase. We then fixed the cells with 4% formaldehyde
(30 min on ice) and washed with phosphate-buffered saline (PBS).
Growth rate measurements
To determine the doubling times of E. coli with various induction
levels of dCas9, we prepared the cells into steady-state exponential
growth then diluted the cultures 1/250 in a flat-bottomed 96-micro-
well plate (Greiner) and recorded optical density along growth using
a microplate reader (Tecan). We fitted an exponential function to
the data points corresponding to the exponential phase in order to
calculate the doubling time.
Flow cytometry
Fluorescence of single cells was recorded using a Miltenyi MACS-
quant flux cytometer. 10,000 events were recorded per replicate. In
all cases, the AV01 strain (with no reporters) carrying a non-
targeting pCRRNA plasmid was used to measure the auto-fluores-
cence background. We calculated the mean fluorescence signal of
each population and subtracted the mean auto-fluorescence signal.
12 of 14 Molecular Systems Biology 14: e7899 | 2018 ª 2018 The Authors
Molecular Systems Biology Noiseless knockdown of genes by dCas9 Antoine Vigouroux et al
Published online: March 8, 2018
To test whether differences in expression were significant, we
performed Student’s t-test on the natural logarithms of the average
fluorescence (Beal et al, 2016).
High-throughput microscopy (imaging cytometry)
An Amnis ImageStreamX (EMD Millipore) imaging cytometer was
used to image the cells in high-throughput in brightfield, GFP, and
RFP channels. Images were analyzed using the IDEAS� (EMD Milli-
pore) software suite. For each condition, at least 10,000 events were
recorded per replicate. Cells that were out of focus or tilted were
identified by calculating the average gradient of a pixel normalized
for variations in intensity levels (Gradient RMS feature in IDEAS�).
Additionally, we used the Feature Finder script of IDEAS� to remove
contaminating particles, images with multiple cells and beads. After
filtering, at least 2,000 images remained per sample. The fluores-
cence channels were not used for filtering. A color compensation
matrix was calculated to account for spectral overlap of GFP and
RFP emission spectra, so cultures of AV02 (GFP only) and AV04
(RFP only) would each have a null signal on the converse channel.
As a proxy for the reporter’s intracellular concentration, we used
the average image intensity inside the area corresponding to each
cell. The cell area was determined by using a threshold on the bright
field images. Single points located more than three standard devia-
tions away from the population average were discarded as outliers,
as they can disrupt the noise computations. The average fluores-
cence l of each sample was calculated by taking the mean of the
single-cell fluorescence. The noise was defined as r/l, with
r ¼ ffiffiffiffiffiffiffiffiffiffiffiffiffiffiffiffiffiffiffiffiffiffiffiffiffiffiffiffiffiffiffiffi
rsample � rblankp
where rsample is the standard deviation of the
intracellular average intensity of the sample, and rblank is the stan-
dard deviation of a sample with no fluorescent reporter (noise from
auto-fluorescence).
Fluorescence and phase-contrast microscopy
Fixed cells were transferred to PBS microscopy pads with 1.5%
UltraPure Agarose (Invitrogen) and imaged using an inverted micro-
scope (TI-E, Nikon Inc.) equipped with a 100× phase-contrast objec-
tive (CFI PlanApo LambdaDM100× 1.4NA, Nikon Inc.), a solid-state
light source (Spectra X, Lumencor Inc.), a multiband dichroic
(69002bs, Chroma Technology Corp.). mCherry fluorescence was
measured using excitation (560/32) and emission (632/60) filters.
Images were acquired using a sCMOS camera (Orca Flash 4.0,
Hamamatsu) with an effective pixel size of 65 nm.
MATLAB code adapted from the Morphometrics package (Ursell
et al, 2017) was used to find cell contours from phase-contrast
images. Background intensity, uneven illumination, and cell auto-
fluorescence were accounted for in the analysis. For the analysis
of fluorescence signal, we corrected the raw mCherry values for
uneven illumination, background intensity, and cell auto-fluores-
cence. Intracellular protein concentration was obtained as the
mean pixel intensity inside the cell area. Total regression was used
to find the major axis of the cell. Cell width was defined as the
average distance between the cell contour and this axis, excluding
the poles.
Measurements of cell morphology during steady-state exponen-
tial growth (Appendix Fig S12) were performed after overnight
induction of dCas9, followed by 1/250 dilution of the culture in
fresh M63 medium with aTc and while the culture was kept in expo-
nential growth phase at an optical density below 0.1. Samples were
taken from the culture, fixed, and imaged after 2 and 4 h.
Northern blot
Total RNA was extracted from cultures in early stationary phase
using TRIzol. Electrophoresis on Novex� TBE-Urea Gels (10% poly-
acrylamide gels containing 7 M urea, Invitrogen) was used to sepa-
rate RNAs. The gels were blotted onto Nylon membranes
(Invitrogen), which were subsequently cross-linked with 1-ethyl-3-
(3-dimethylaminopropyl) carbodiimide (EDC, Thermo Scientific)
buffer (Pall & Hamilton, 2008). The probes were labeled as follows:
100 pmol of oligonucleotide was heat denatured, labeled, and phos-
phorylated by mixing 40 lCi of 32P-c-ATP (PerkinElmer) and T4
PNK (NEB) reagents. A labeled probe specific to the guide RNA R20
(50 GCATAGCTCTAAAACTCCGTATGAAGGCACCCAGA 30) was
column purified (Macherey-Nagel PCR cleanup kit) and used for
overnight hybridization. The intensity of the shortest band, corre-
sponding to the fully processed guide RNA, was quantified using the
Fiji software package.
Expanded View for this article is available online.
AcknowledgementsWe thank T. K. Lee and K.C. Huang for providing strain TKL130, F. Bendezù for
providing plasmid pFB262, H. Cho and T. Bernhardt for providing plasmid
pHC942, and D. Mazel for providing plasmid pSW23t. We thank J. Fernández-
Rodríguez for providing the PPhlf-sfgfp-phlF DNA fragment. We thank E. Bram-
billa and E. Oldewurtel for support in microscopy, as well as A. Soler and M.
Hasan for support regarding flux cytometry and imaging cytometry. We
acknowledge the Technology Core of the Center for Translational Science (CRT)
at Institut Pasteur for support in conducting this study. This work was
supported by the European Research Council (ERC) under the Europe Union’s
Horizon 2020 research and innovation program [Grant Agreement No.
(677823) to DB and No. (679980) to SvT]; the French Government’s Investisse-
ment d’Avenir program Laboratoire d’Excellence “Integrative Biology of Emerg-
ing Infectious Diseases” (ANR-10-LABX-62-IBEID) to SvT, DB, and AV; the Marie
de Paris “Emergence(s)” program and the Volkswagen Foundation to SvT; and
the Pasteur-Weizmann consortium to DB.
Author contributionsDB, SvT, and AV designed the study. AV constructed the strains and plasmids
and performed all measurements and data analysis. SvT developed the mathe-
matical models. LC took part in strain construction, and EO performed the
compensation of uneven illumination for the measurement of mCherry-PBP2
by microscopy. AV, DB, and SvT wrote the manuscript.
Conflict of interestThe authors declare that they have no conflict of interest.
References
Abbas A, Morrissey JP, Marquez PC, Sheehan MM, Delany IR, O’Gara F (2002)
Characterization of interactions between the transcriptional repressor
PhlF and Its binding site at the phlA promoter in Pseudomonas fluorescens
F113. J Bacteriol 184: 3008 – 3016
ª 2018 The Authors Molecular Systems Biology 14: e7899 | 2018 13 of 14
Antoine Vigouroux et al Noiseless knockdown of genes by dCas9 Molecular Systems Biology
Published online: March 8, 2018
Baba T, Ara T, Hasegawa M, Takai Y, Okumura Y, Baba M, Datsenko KA, Tomita M,
Wanner BL, Mori H (2006) Construction of Escherichia coli K-12 in-frame,
single-gene knockout mutants: the Keio collection. Mol Syst Biol 2: 2006.0008
Beal J, Haddock-Angelli T, Gershater M, de Mora K, Lizarazo M, Hollenhorst J,
Rettberg R, iGEM Interlab Study Contributors (2016) Reproducibility of
fluorescent expression from engineered biological constructs in E. coli.
PLoS One 11: e0150182
Bendezú FO, Hale CA, Bernhardt TG, de Boer PAJ (2009) RodZ (YfgA) is
required for proper assembly of the MreB actin cytoskeleton and cell
shape in E. coli. EMBO J 28: 193 – 204
Bikard D, Jiang W, Samai P, Hochschild A, Zhang F, Marraffini LA (2013)
Programmable repression and activation of bacterial gene expression
using an engineered CRISPR-Cas system. Nucleic Acids Res 41: 7429 – 7437
Bikard D, Euler CW, Jiang W, Nussenzweig PM, Goldberg GW, Duportet X,
Fischetti VA, Marraffini LA (2014) Exploiting CRISPR-Cas nucleases to
produce sequence-specific antimicrobials. Nat Biotechnol 32: 1146 – 1150
Boyle EA, Andreasson JOL, Chircus LM, Sternberg SH, Wu MJ, Guegler CK,
Doudna JA, Greenleaf WJ (2017) High-throughput biochemical profiling
reveals sequence determinants of dCas9 off-target binding and unbinding.
Proc Natl Acad Sci USA 114: 5461 – 5466
Breier AM, Weier H-UG, Cozzarelli NR (2005) Independence of replisomes in
Escherichia coli chromosomal replication. Proc Natl Acad Sci USA 102: 3942– 3947
Brophy JA, Voigt CA (2016) Antisense transcription as a tool to tune gene
expression. Mol Syst Biol 12: 854
Ça�gatay T, Turcotte M, Elowitz MB, Garcia-Ojalvo J, Süel GM (2009)
Architecture-dependent noise discriminates functionally analogous
differentiation circuits. Cell 139: 512 – 522
Cho H, Wivagg CN, Kapoor M, Barry Z, Rohs PDA, Suh H, Marto JA, Garner EC,
Bernhardt TG (2016) Bacterial cell wall biogenesis is mediated by SEDS
and PBP polymerase families functioning semi-autonomously. Nat
Microbiol 1: 16172
Cui L, Bikard D (2016) Consequences of Cas9 cleavage in the chromosome of
Escherichia coli. Nucleic Acids Res 44: 4243 – 4251
Elowitz MB, Levine AJ, Siggia ED, Swain PS (2002) Stochastic gene expression
in a single cell. Science 297: 1183 – 1186
Farasat I, Salis HM (2016) A biophysical model of CRISPR/Cas9 activity for
rational design of genome editing and gene regulation. PLoS Comput Biol
12: e1004724
Gibson DG, Young L, Chuang RY, Venter JC, Hutchison CA III, Smith HO (2009)
Enzymatic assembly of DNA molecules up to several hundred kilobases.
Nat Methods 6: 343 – 345
Hsu PD, Lander ES, Zhang F (2014) Development and applications of CRISPR-
Cas9 for genome engineering. Cell 157: 1262 – 1278
Jiang Y, Chen B, Duan C, Sun B, Yang J, Yang S (2015) Multigene editing in
the Escherichia coli genome via the CRISPR-Cas9 system. Appl Environ
Microbiol 81: 2506 – 2514
Jones DL, Leroy P, Unoson C, Fange D, �Curi�c V, Lawson MJ, Elf J (2017)
Kinetics of dCas9 target search in Escherichia coli. Science 357: 1420 – 1424
Kennell D, Riezman H (1977) Transcription and translation initiation
frequencies of the Escherichia coli lac operon. J Mol Biol 114: 1 – 21
Kuscu C, Arslan S, Singh R, Thorpe J, Adli M (2014) Genome-wide analysis
reveals characteristics of off-target sites bound by the Cas9 endonuclease.
Nat Biotechnol 32: 677 – 683
Lee TK, Tropini C, Hsin J, Desmarais SM, Ursell TS, Gong E, Gitai Z, Monds RD,
Huang KC (2014) A dynamically assembled cell wall synthesis machinery
buffers cell growth. Proc Natl Acad Sci USA 111: 4554 – 4559
Li X, Jun Y, Erickstad MJ, Brown SD, Parks A, Court DL, Jun S (2016) tCRISPRi:
tunable and reversible, one-step control of gene expression. Sci Rep 6: 39076
Meeske AJ, Riley EP, Robins WP, Uehara T, Mekalanos JJ, Kahne D, Walker S,
Kruse AC, Bernhardt TG, Rudner DZ (2016) SEDS proteins are a widespread
family of bacterial cell wall polymerases. Nature 537: 634 – 638
Nielsen AA, Voigt CA (2014) Multi-input CRISPR/Cas genetic circuits that
interface host regulatory networks. Mol Syst Biol 10: 763
Pall GS, Hamilton AJ (2008) Improved northern blot method for enhanced
detection of small RNA. Nat Protoc 3: 1077 – 1084
Peters JM, Colavin A, Shi H, Czarny TL, Larson MH, Wong S, Hawkins JS, Lu
CHS, Koo B-M, Marta E, Shiver AL, Whitehead EH, Weissman JS, Brown ED,
Qi LS, Huang KC, Gross CA (2016) A comprehensive, CRISPR-based
functional analysis of essential genes in bacteria. Cell 165: 1493 – 1506
Pósfai G, Kolisnychenko V, Bereczki Z, Blattner FR (1999) Markerless gene
replacement in Escherichia coli stimulated by a double-strand break in the
chromosome. Nucleic Acids Res 27: 4409 – 4415
Qi LS, Larson MH, Gilbert LA, Doudna JA, Weissman JS, Arkin AP, Lim WA
(2013) Repurposing CRISPR as an RNA-guided platform for sequence-
specific control of gene expression. Cell 152: 1173 – 1183
Sauvage E, Kerff F, Terrak M, Ayala JA, Charlier P (2008) The penicillin-binding
proteins: structure and role in peptidoglycan biosynthesis. FEMS Microbiol
Rev 32: 234 – 258
Shafferman A, Helinski DR (1983) Structural properties of the beta origin of
replication of plasmid R6K. J Biol Chem 258: 4083 – 4090
So L-H, Ghosh A, Zong C, Sepúlveda LA, Segev R, Golding I (2011) General
properties of transcriptional time series in Escherichia coli. Nat Genet 43:
554 – 560
Sternberg SH, Redding S, Jinek M, Greene EC, Doudna JA (2014) DNA
interrogation by the CRISPR RNA-guided endonuclease Cas9. Nature 507:
62 – 67
St-Pierre F, Cui L, Priest DG, Endy D, Dodd IB, Shearwin KE (2013) One-step
cloning and chromosomal integration of DNA. ACS Synth Biol 2: 537 – 541
Subach FV, Patterson GH, Manley S, Gillette JM, Lippincott-Schwartz J,
Verkhusha VV (2009) Photoactivatable mCherry for high-resolution two-
color fluorescence microscopy. Nat Methods 6: 153 – 159
Szczelkun MD, Tikhomirova MS, Sinkunas T, Gasiunas G, Karvelis T, Pschera P,
Siksnys V, Seidel R (2014) Direct observation of R-loop formation by single
RNA-guided Cas9 and Cascade effector complexes. Proc Natl Acad Sci USA
111: 9798 – 9803
Taniguchi Y, Choi PJ, Li G-W, Chen H, Babu M, Hearn J, Emili A, Xie XS (2010)
Quantifying E. coli proteome and transcriptome with single-molecule
sensitivity in single cells. Science 329: 533 – 538
Ursell T, Lee TK, Shiomi D, Shi H, Tropini C, Monds RD, Colavin A, Billings G,
Bhaya-Grossman I, Broxton M, Huang BE, Niki H, Huang KC (2017) Rapid,
precise quantification of bacterial cellular dimensions across a genomic-
scale knockout library. BMC Biol 15: 17
Waite AJ, Frankel NW, Dufour YS, Johnston JF, Long J, Emonet T (2016) Non-
genetic diversity modulates population performance. Mol Syst Biol 12: 895
Wiktor J, Lesterlin C, Sherratt DJ, Dekker C (2016) CRISPR-mediated control of
the bacterial initiation of replication. Nucleic Acids Res 44: 3801 – 3810
Wu X, Scott DA, Kriz AJ, Chiu AC, Hsu PD, Dadon DB, Cheng AW, Trevino AE,
Konermann S, Chen S, Jaenisch R, Zhang F, Sharp PA (2014) Genome-wide
binding of the CRISPR endonuclease Cas9 in mammalian cells. Nat
Biotechnol 32: 670 – 676
License: This is an open access article under the
terms of the Creative Commons Attribution 4.0
License, which permits use, distribution and reproduc-
tion in any medium, provided the original work is
properly cited.
14 of 14 Molecular Systems Biology 14: e7899 | 2018 ª 2018 The Authors
Molecular Systems Biology Noiseless knockdown of genes by dCas9 Antoine Vigouroux et al
Published online: March 8, 2018
Appendix to the manuscript:
Tuning dCas9’s ability to block transcription enables robust,noiseless knockdown of bacterial genes
Antoine Vigouroux, Enno Oldewurtel, Lun Cui, David Bikard and Sven van Teeffelen
Table of contents
1. A novel method of allelic exchange using CRISPR/Cas9
2. Autorepressor model
3. Appendix figures
4. Appendix tables
5. Appendix references
1 A novel method of allelic exchange using CRISPR/Cas9
To make scar-less genome modifications easier, we developed a new method which relieson the integration of a non-replicating plasmid through homologous recombination fol-lowed by backbone removal promoted by Cas9 cleavage in the antibiotic resistance gene(Appendix Fig S9). This method was inspired from a similar strategy that makes use ofthe I-SceI nuclease instead of Cas9 (Posfai et al., 1999).
The chromosomal modifications are carried out using a plasmid typically made byassembling together four PCR fragments: 1) a chloramphenicol-resistant backbone withthe R6K conditional origin of replication (such as pSW23t), 2) a homology region of about1 kbp matching the sequence before the desired site of insertion, 3) a reporter sequence,possibly using a linker for protein fusions, or a stop codon and a ribosome binding sitefor mRNA fusions, 4) a second homology region of 1 kbp matching the sequence afterthe site of insertion, i.e. the beginning of the gene of interest.
This plasmid is electroporated in the recipient strain. Cells that have integrated theplasmid by homologous recombination (HR) are selected by plating on chloramphenicol.Either one or the other homology arm will be used for HR. The two insertion orders canbe told apart by colony PCR with one primer in the backbone and one primer on the chro-mosome. We then pick a colony from each insertion order, dilute them in 500 ul of LB andgrow them during 1h30, after which cells are centrifuged and recovered in 100 ul of TSS(Transformation and Storage Solution) (Chung, Niemela and Miller, 1989).The cells arethen transformed with plasmid pAV10, expressing Cas9 under the control of a DAPG-inducible promoter and a sgRNA targeting the cat gene of the suicide vector, followed byplating on LB agar with kanamycin and DAPG at 30°C. Cleavage by Cas9 in the chromo-some triggers the resolution of the co-integrate in two possible ways: recombination caneither restore the wild-type locus, or lead to the desired seamless modification. Severalcolonies from each insertion order are re-streaked on LB agar without kanamycin andgrown at 42°C to eliminate thermo-sensitive pAV10 and obtain clonal populations. Ex-cising the backbone from both insertion orders greatly increases the chances of findinga good clone, as for each order the recombination might be biased towards a particular
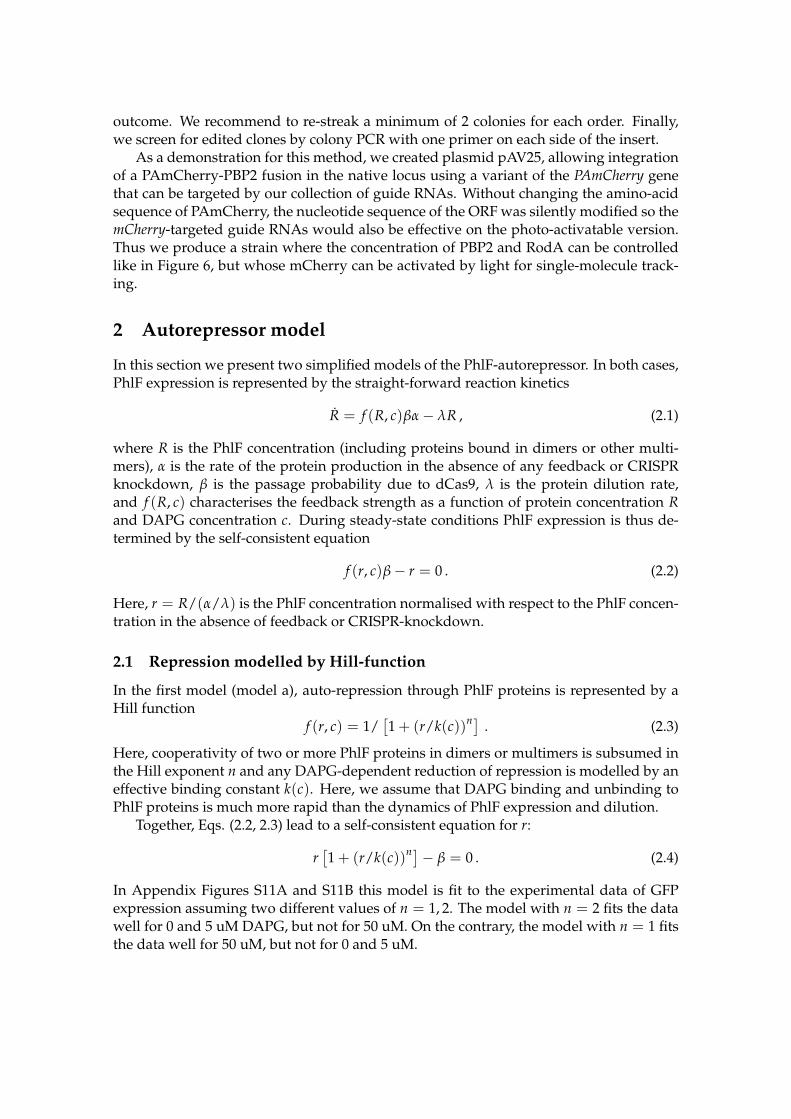
outcome. We recommend to re-streak a minimum of 2 colonies for each order. Finally,we screen for edited clones by colony PCR with one primer on each side of the insert.
As a demonstration for this method, we created plasmid pAV25, allowing integrationof a PAmCherry-PBP2 fusion in the native locus using a variant of the PAmCherry genethat can be targeted by our collection of guide RNAs. Without changing the amino-acidsequence of PAmCherry, the nucleotide sequence of the ORF was silently modified so themCherry-targeted guide RNAs would also be effective on the photo-activatable version.Thus we produce a strain where the concentration of PBP2 and RodA can be controlledlike in Figure 6, but whose mCherry can be activated by light for single-molecule track-ing.
2 Autorepressor model
In this section we present two simplified models of the PhlF-autorepressor. In both cases,PhlF expression is represented by the straight-forward reaction kinetics
R = f (R, c)ba � lR , (2.1)
where R is the PhlF concentration (including proteins bound in dimers or other multi-mers), a is the rate of the protein production in the absence of any feedback or CRISPRknockdown, b is the passage probability due to dCas9, l is the protein dilution rate,and f (R, c) characterises the feedback strength as a function of protein concentration Rand DAPG concentration c. During steady-state conditions PhlF expression is thus de-termined by the self-consistent equation
f (r, c)b � r = 0 . (2.2)
Here, r = R/(a/l) is the PhlF concentration normalised with respect to the PhlF concen-tration in the absence of feedback or CRISPR-knockdown.
2.1 Repression modelled by Hill-function
In the first model (model a), auto-repression through PhlF proteins is represented by aHill function
f (r, c) = 1/⇥1 + (r/k(c))n⇤ . (2.3)
Here, cooperativity of two or more PhlF proteins in dimers or multimers is subsumed inthe Hill exponent n and any DAPG-dependent reduction of repression is modelled by aneffective binding constant k(c). Here, we assume that DAPG binding and unbinding toPhlF proteins is much more rapid than the dynamics of PhlF expression and dilution.
Together, Eqs. (2.2, 2.3) lead to a self-consistent equation for r:
r⇥1 + (r/k(c))n⇤� b = 0 . (2.4)
In Appendix Figures S11A and S11B this model is fit to the experimental data of GFPexpression assuming two different values of n = 1, 2. The model with n = 2 fits the datawell for 0 and 5 uM DAPG, but not for 50 uM. On the contrary, the model with n = 1 fitsthe data well for 50 uM, but not for 0 and 5 uM.
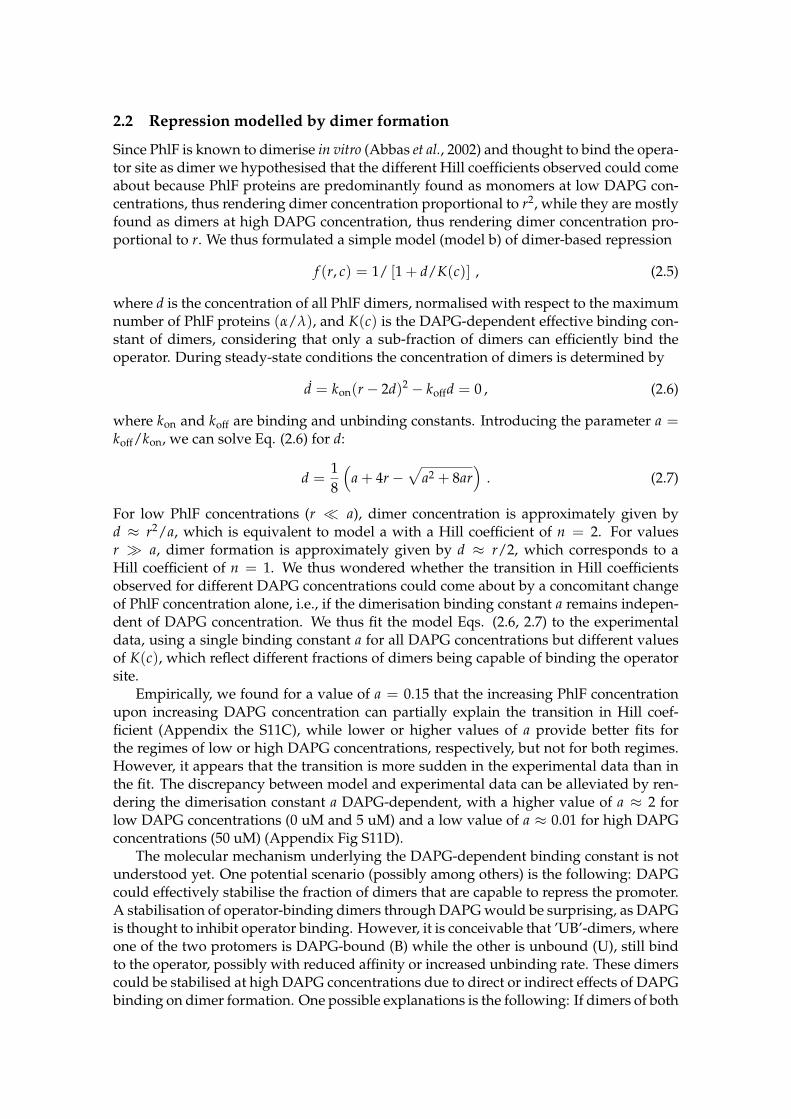
2.2 Repression modelled by dimer formation
Since PhlF is known to dimerise in vitro (Abbas et al., 2002) and thought to bind the opera-tor site as dimer we hypothesised that the different Hill coefficients observed could comeabout because PhlF proteins are predominantly found as monomers at low DAPG con-centrations, thus rendering dimer concentration proportional to r2, while they are mostlyfound as dimers at high DAPG concentration, thus rendering dimer concentration pro-portional to r. We thus formulated a simple model (model b) of dimer-based repression
f (r, c) = 1/ [1 + d/K(c)] , (2.5)
where d is the concentration of all PhlF dimers, normalised with respect to the maximumnumber of PhlF proteins (a/l), and K(c) is the DAPG-dependent effective binding con-stant of dimers, considering that only a sub-fraction of dimers can efficiently bind theoperator. During steady-state conditions the concentration of dimers is determined by
d = kon(r � 2d)2 � koffd = 0 , (2.6)
where kon and koff are binding and unbinding constants. Introducing the parameter a =koff/kon, we can solve Eq. (2.6) for d:
d =18
⇣a + 4r �
pa2 + 8ar
⌘. (2.7)
For low PhlF concentrations (r ⌧ a), dimer concentration is approximately given byd ⇡ r2/a, which is equivalent to model a with a Hill coefficient of n = 2. For valuesr � a, dimer formation is approximately given by d ⇡ r/2, which corresponds to aHill coefficient of n = 1. We thus wondered whether the transition in Hill coefficientsobserved for different DAPG concentrations could come about by a concomitant changeof PhlF concentration alone, i.e., if the dimerisation binding constant a remains indepen-dent of DAPG concentration. We thus fit the model Eqs. (2.6, 2.7) to the experimentaldata, using a single binding constant a for all DAPG concentrations but different valuesof K(c), which reflect different fractions of dimers being capable of binding the operatorsite.
Empirically, we found for a value of a = 0.15 that the increasing PhlF concentrationupon increasing DAPG concentration can partially explain the transition in Hill coef-ficient (Appendix the S11C), while lower or higher values of a provide better fits forthe regimes of low or high DAPG concentrations, respectively, but not for both regimes.However, it appears that the transition is more sudden in the experimental data than inthe fit. The discrepancy between model and experimental data can be alleviated by ren-dering the dimerisation constant a DAPG-dependent, with a higher value of a ⇡ 2 forlow DAPG concentrations (0 uM and 5 uM) and a low value of a ⇡ 0.01 for high DAPGconcentrations (50 uM) (Appendix Fig S11D).
The molecular mechanism underlying the DAPG-dependent binding constant is notunderstood yet. One potential scenario (possibly among others) is the following: DAPGcould effectively stabilise the fraction of dimers that are capable to repress the promoter.A stabilisation of operator-binding dimers through DAPG would be surprising, as DAPGis thought to inhibit operator binding. However, it is conceivable that ’UB’-dimers, whereone of the two protomers is DAPG-bound (B) while the other is unbound (U), still bindto the operator, possibly with reduced affinity or increased unbinding rate. These dimerscould be stabilised at high DAPG concentrations due to direct or indirect effects of DAPGbinding on dimer formation. One possible explanations is the following: If dimers of both

protomers DAPG-bound (’BB’-dimers) were energetically unfavourable to form, the poolof DAPG-bound monomers would be high at high DAPG levels. This pool would theneffectively facilitate dimerisation of ’UB’-dimers. We note that this hypothesis remainshighly speculative and other mechanisms might be responsible for the transition in Hillcoefficients observed.

AppendixFigureS1–ExpressionofdCas9fromPtetwithupto100ng/mlofaTcdoesnotproducegrowthdefects.HerethedoublingtimeismeasuredonthestrainAV03withanon-
targetingCRISPRarray,inLBat30°C.
●●
●●
●
●
●●
●●●●
●●
●●
●● ●
●
●●●●●●
●●
●●
●●●●●
● ●●●●
●● ●
●
●●●●
0
10
20
30
0.1 1.0 10.0 100.0aTc concentration (ng/ml)
Dou
blin
g tim
e (m
in)
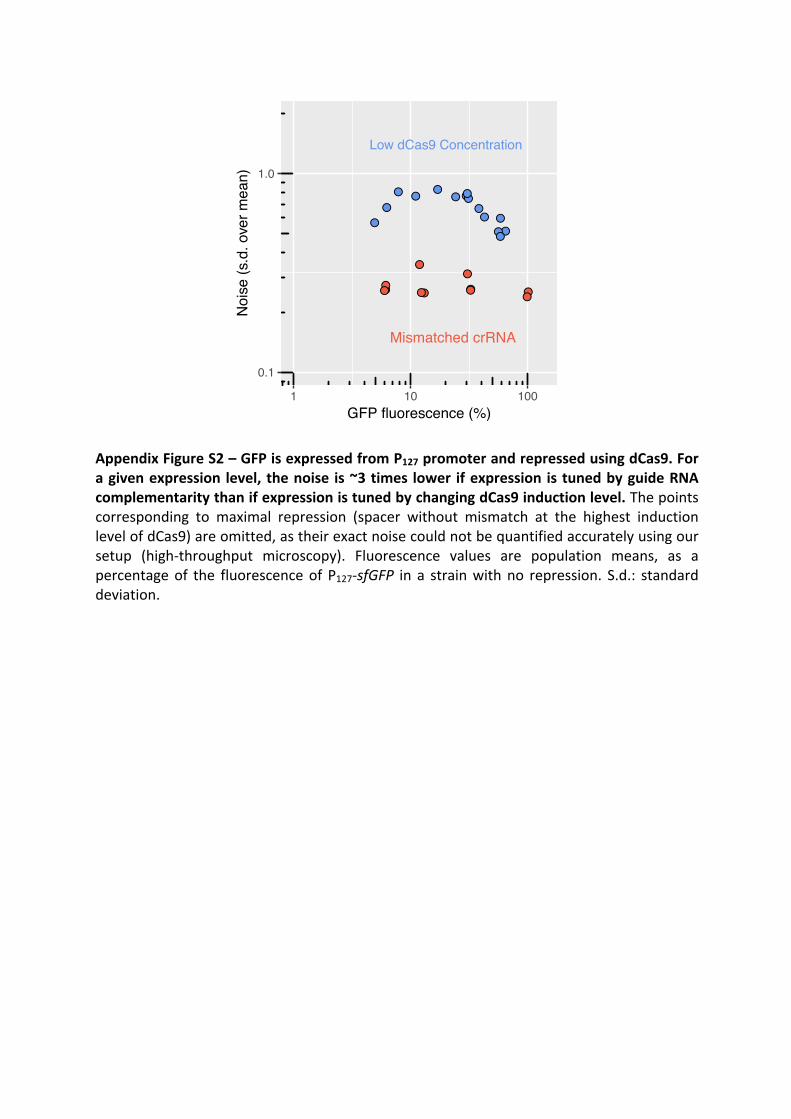
AppendixFigureS2–GFPisexpressedfromP127promoterandrepressedusingdCas9.Foragivenexpression level, thenoise is~3times lower ifexpression is tunedbyguideRNAcomplementaritythanifexpressionistunedbychangingdCas9inductionlevel.Thepointscorresponding to maximal repression (spacer without mismatch at the highest induction
levelofdCas9)areomitted,astheirexactnoisecouldnotbequantifiedaccuratelyusingour
setup (high-throughput microscopy). Fluorescence values are population means, as a
percentageof the fluorescenceof P127-sfGFP in a strainwithno repression. S.d.: standarddeviation.
●●
●
●●●
●
●●●●
●●
●●●
●
●●●
●
●
●
●●
●
Mismatched crRNA
Low dCas9 Concentration
0.1
1.0
1 10 100GFP fluorescence (%)
Noi
se (s
.d. o
ver m
ean)
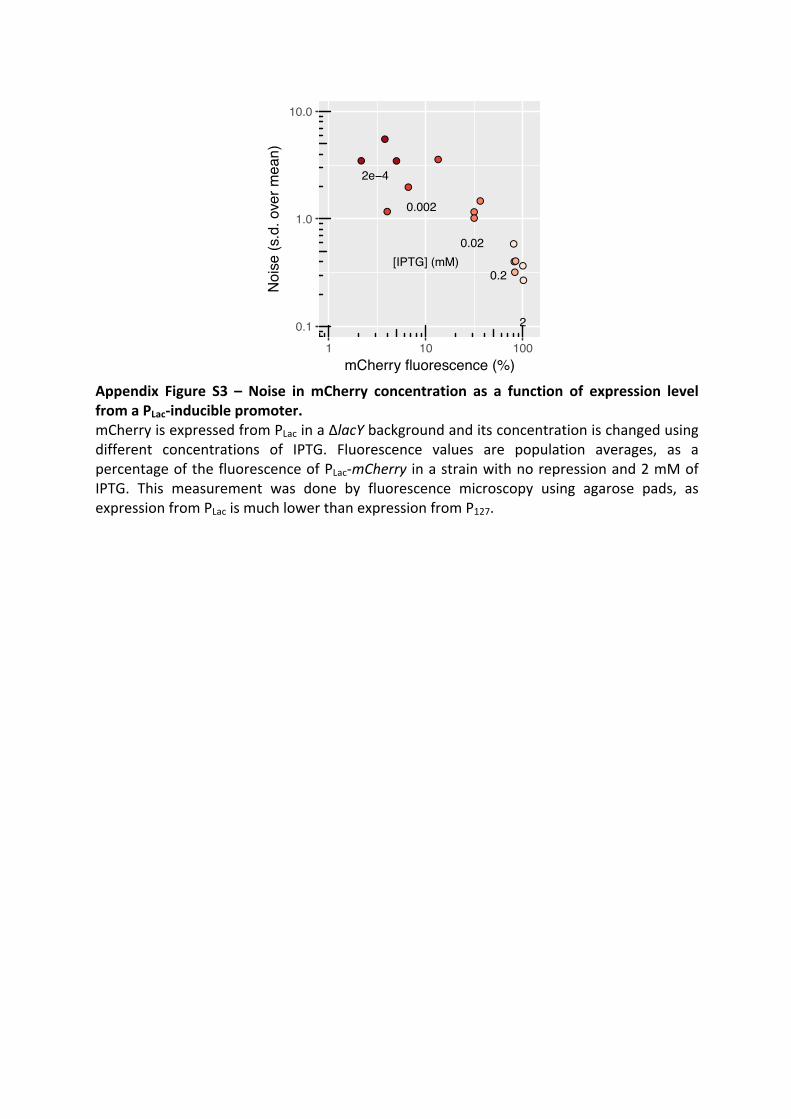
Appendix Figure S3 – Noise inmCherry concentration as a function of expression levelfromaPLac-induciblepromoter.mCherryisexpressedfromPLacinaΔlacYbackgroundanditsconcentrationischangedusingdifferent concentrations of IPTG. Fluorescence values are population averages, as a
percentageofthefluorescenceofPLac-mCherry inastrainwithnorepressionand2mMof
IPTG. This measurement was done by fluorescence microscopy using agarose pads, as
expressionfromPLacismuchlowerthanexpressionfromP127.
●
●
●●
●
●
●
●
●
●●
●
●
●
●
2e−4
0.002
0.02
0.2
2
[IPTG] (mM)
0.1
1.0
10.0
1 10 100mCherry fluorescence (%)
Noi
se (s
.d. o
ver m
ean)
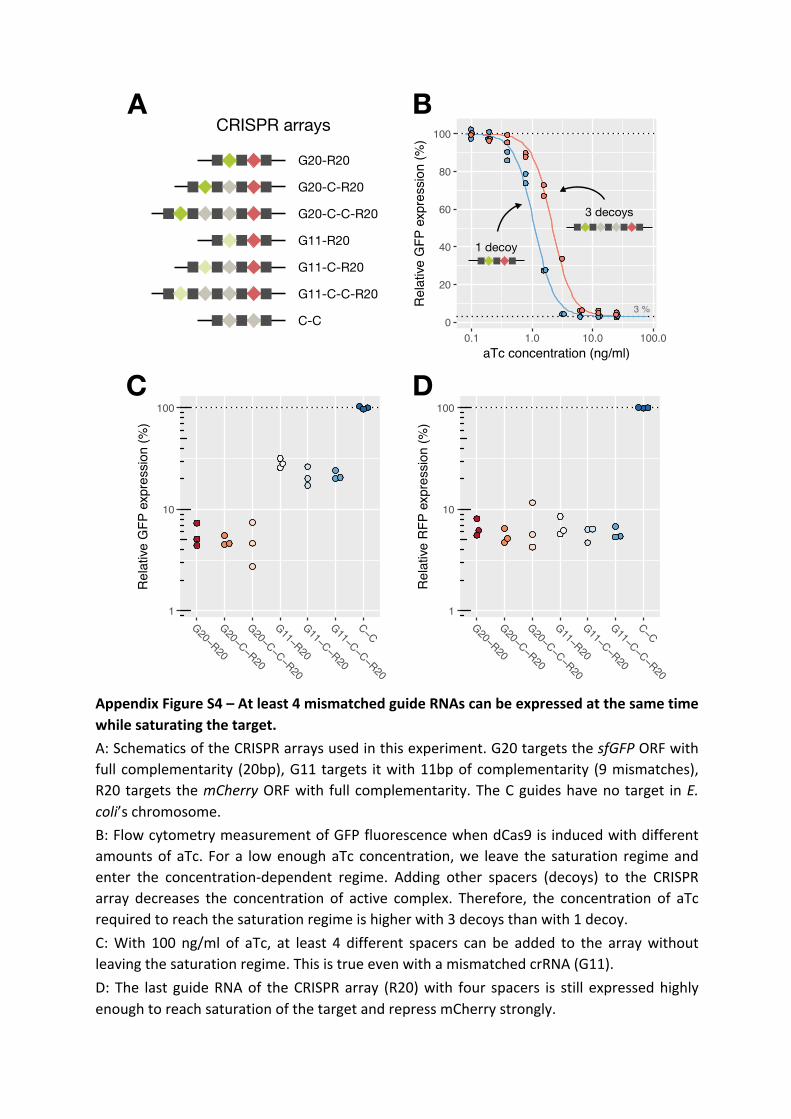
AppendixFigureS4–Atleast4mismatchedguideRNAscanbeexpressedatthesametimewhilesaturatingthetarget.A:SchematicsoftheCRISPRarraysusedinthisexperiment.G20targetsthesfGFPORFwithfullcomplementarity (20bp),G11targets itwith11bpofcomplementarity (9mismatches),
R20targets themCherryORFwith full complementarity.TheCguideshavenotarget inE.coli’schromosome.
B:FlowcytometrymeasurementofGFPfluorescencewhendCas9isinducedwithdifferent
amountsofaTc. Fora lowenoughaTc concentration,we leave the saturation regimeand
enter the concentration-dependent regime. Adding other spacers (decoys) to the CRISPR
array decreases the concentration of active complex. Therefore, the concentration of aTc
requiredtoreachthesaturationregimeishigherwith3decoysthanwith1decoy.
C:With 100 ng/ml of aTc, at least 4 different spacers can be added to the arraywithout
leavingthesaturationregime.ThisistrueevenwithamismatchedcrRNA(G11).
D: The last guideRNAof theCRISPRarray (R20)with four spacers is still expressedhighly
enoughtoreachsaturationofthetargetandrepressmCherrystrongly.
●
●
●●●●
●
●
● ●
●
● ●
●
●●●
●
●●●
1
10
100
G20−R20
G20−C−R20
G20−C−C−R20
G11−R20
G11−C−R20
G11−C−C−R20
C−C
Rel
ativ
e R
FP e
xpre
ssio
n (%
)
●
●
● ●●●
●
●
●
●●●
●●
●
●●●
●●●
1
10
100
G20−R20
G20−C−R20
G20−C−C−R20
G11−R20
G11−C−R20
G11−C−C−R20
C−C
Rel
ativ
e G
FP e
xpre
ssio
n (%
)
3 %
●
●●●
●●●●
●●
●●
●
●
●●
●●
●
●
●●
●
●●●
●●●●
●●●●
0
20
40
60
80
100
0.1 1.0 10.0 100.0aTc concentration (ng/ml)
Rel
ativ
e G
FP e
xpre
ssio
n (%
)
CRISPR arrays
G20-R20
G20-C-R20
G20-C-C-R20
G11-R20
G11-C-R20
G11-C-C-R20
C-C
3 decoys
1 decoy
A B
C D
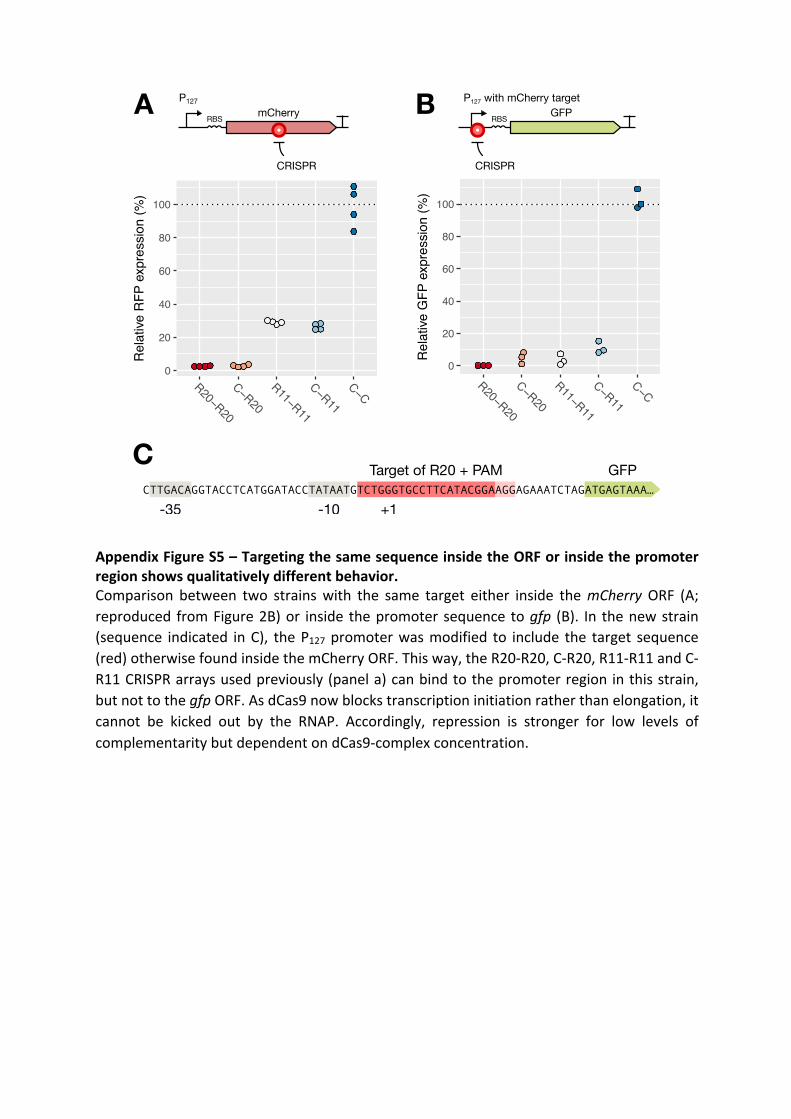
AppendixFigureS5–TargetingthesamesequenceinsidetheORForinsidethepromoterregionshowsqualitativelydifferentbehavior.Comparison between two strainswith the same target either inside themCherry ORF (A;reproduced fromFigure2B)or inside thepromotersequence togfp (B). In thenewstrain(sequence indicated inC), theP127promoterwasmodified to include the target sequence
(red)otherwisefoundinsidethemCherryORF.Thisway,theR20-R20,C-R20,R11-R11andC-
R11CRISPRarraysusedpreviously(panela)canbindtothepromoterregioninthisstrain,
butnottothegfpORF.AsdCas9nowblockstranscriptioninitiationratherthanelongation,itcannot be kicked out by the RNAP. Accordingly, repression is stronger for low levels of
complementaritybutdependentondCas9-complexconcentration.
●●●
●●● ●
●
●
●●●
●
●●
0
20
40
60
80
100
R20−R20
C−R20
R11−R11
C−R11
C−C
Rel
ativ
e G
FP e
xpre
ssio
n (%
)
●● ●● ●● ●●
●●●● ●●
●●
●
●
●●
0
20
40
60
80
100
R20−R20
C−R20
R11−R11
C−R11
C−C
Rel
ativ
e R
FP e
xpre
ssio
n (%
)RBS mCherry
P127
CRISPR
RBS GFPP127 with mCherry target
CRISPR
CTTGACAGGTACCTCATGGATACCTATAATGTCTGGGTGCCTTCATACGGAAGGAGAAATCTAGATGAGTAAA…
-35 -10
Target of R20 + PAM GFP
+1
A B
C
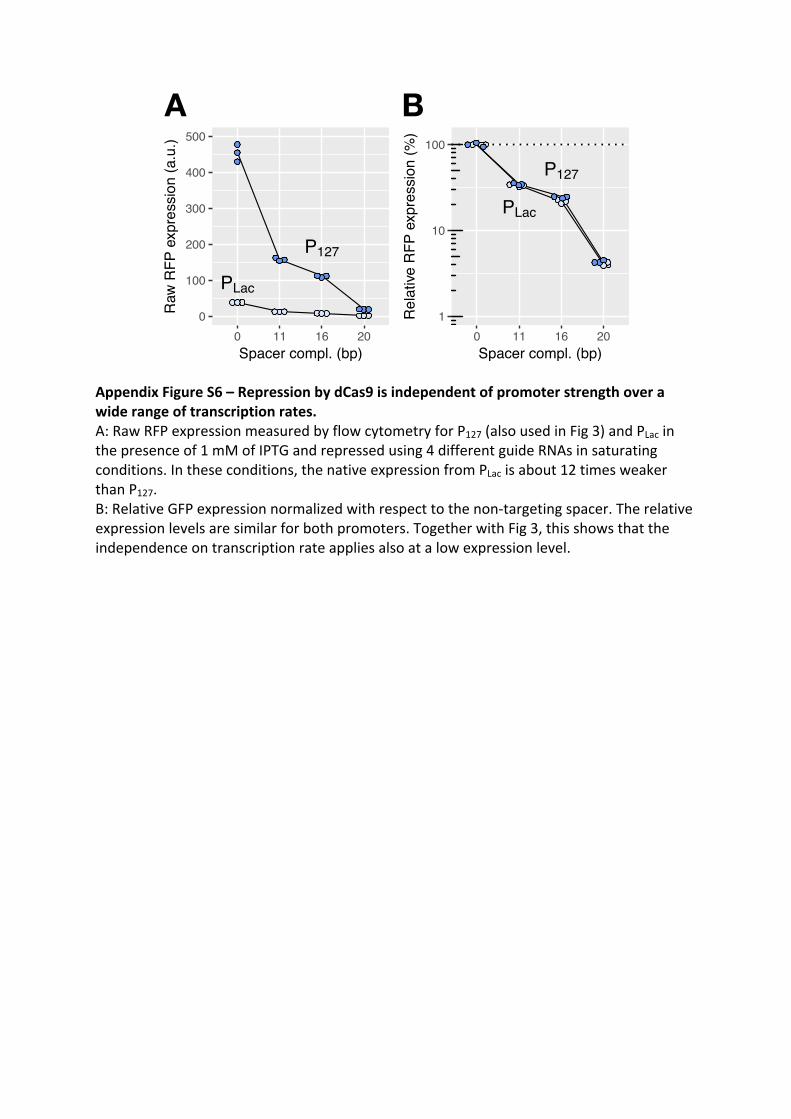
AppendixFigureS6–RepressionbydCas9isindependentofpromoterstrengthoverawiderangeoftranscriptionrates.A:RawRFPexpressionmeasuredbyflowcytometryforP127(alsousedinFig3)andPLacin
thepresenceof1mMofIPTGandrepressedusing4differentguideRNAsinsaturating
conditions.Intheseconditions,thenativeexpressionfromPLacisabout12timesweaker
thanP127.
B:RelativeGFPexpressionnormalizedwithrespecttothenon-targetingspacer.Therelative
expressionlevelsaresimilarforbothpromoters.TogetherwithFig3,thisshowsthatthe
independenceontranscriptionrateappliesalsoatalowexpressionlevel.
P127
PLac● ●●
●
●●
●●●
●●●
●●●
●●●
●●●●●●
0
100
200
300
400
500
0 11 16 20Spacer compl. (bp)
Raw
RFP
exp
ress
ion
(a.u
.)P127
PLac
●● ●●●●
●●●●●●
●●●●●●
●●●●●●
1
10
100
0 11 16 20Spacer compl. (bp)
Rel
ativ
e R
FP e
xpre
ssio
n (%
)
A B
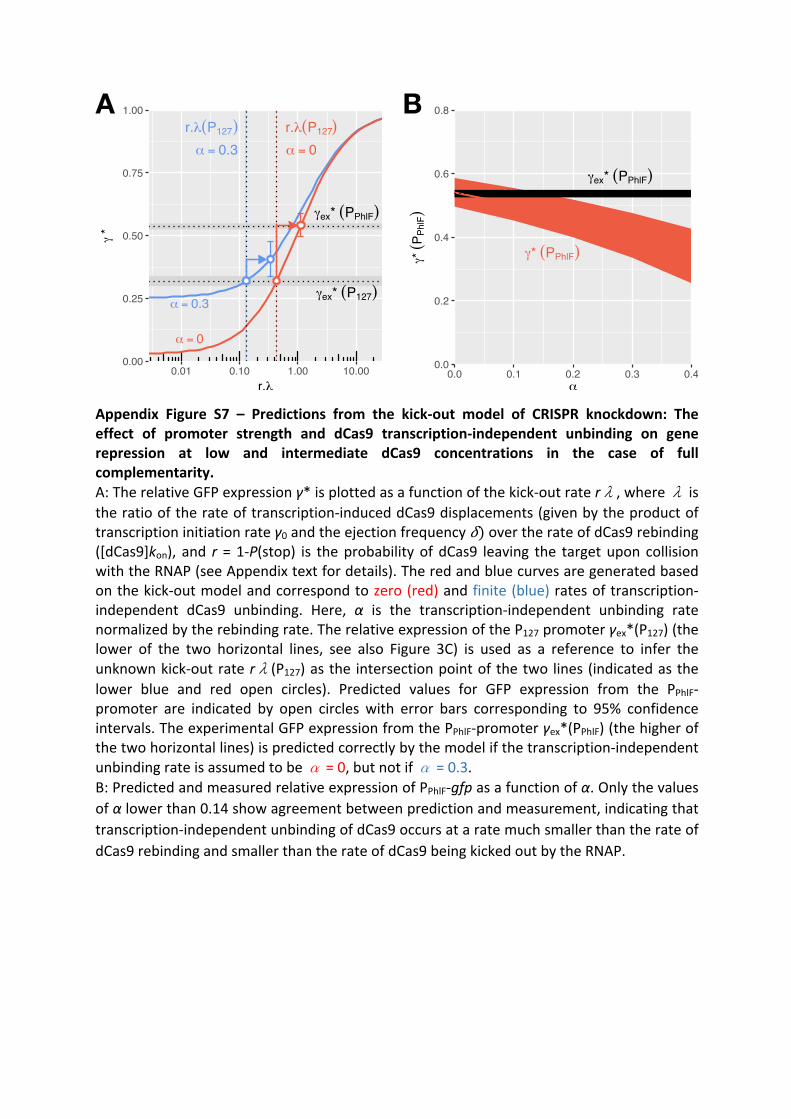
Appendix Figure S7 – Predictions from the kick-out model of CRISPR knockdown: Theeffect of promoter strength and dCas9 transcription-independent unbinding on generepression at low and intermediate dCas9 concentrations in the case of fullcomplementarity.A:TherelativeGFPexpressionγ*isplottedasafunctionofthekick-outrater�,where�is
theratiooftherateoftranscription-induceddCas9displacements(givenbytheproductof
transcriptioninitiationrateγ0andtheejectionfrequency!)overtherateofdCas9rebinding([dCas9]kon), and r = 1-P(stop) is theprobabilityofdCas9 leaving the targetupon collisionwiththeRNAP(seeAppendixtextfordetails).Theredandbluecurvesaregeneratedbased
onthekick-outmodelandcorrespondtozero(red)andfinite(blue)ratesoftranscription-
independent dCas9 unbinding. Here, α is the transcription-independent unbinding ratenormalizedbytherebindingrate.TherelativeexpressionoftheP127promoterγex*(P127)(thelower of the two horizontal lines, see also Figure 3C) is used as a reference to infer the
unknownkick-outrater�(P127)asthe intersectionpointofthetwolines(indicatedasthe
lower blue and red open circles). Predicted values for GFP expression from the PPhlF-
promoter are indicated by open circles with error bars corresponding to 95% confidence
intervals.TheexperimentalGFPexpressionfromthePPhlF-promoterγex*(PPhlF)(thehigherofthetwohorizontallines)ispredictedcorrectlybythemodelifthetranscription-independent
unbindingrateisassumedtobe�=0,butnotif�=0.3.B:PredictedandmeasuredrelativeexpressionofPPhlF-gfpasafunctionofα.Onlythevaluesofαlowerthan0.14showagreementbetweenpredictionandmeasurement,indicatingthat
transcription-independentunbindingofdCas9occursataratemuchsmallerthantherateof
dCas9rebindingandsmallerthantherateofdCas9beingkickedoutbytheRNAP.
γex* (PPhlF)
γ* (PPhlF)
0.0
0.2
0.4
0.6
0.8
0.0 0.1 0.2 0.3 0.4α
γ*(P
PhlF)
BA
γex* (P127)
γex* (PPhlF)
α = 0.3r.λ(P127)
α = 0r.λ(P127)
α = 0
α = 0.3
●●
●
●
0.00
0.25
0.50
0.75
1.00
0.01 0.10 1.00 10.00r.λ
γ*

AppendixFigureS8–RelativeRFPexpressionfordifferenttemperatureswitheither20or11bpofcomplementarity,inthepresenceorabsenceofadecoyguideRNA.RFP expression levels are first normalized with respect to a constitutively expressed GFP
reporter. RFP/GFP ratios are then normalized with respect to the non-targeting CRISPR
array. Doubling of dCas9 concentration does not affect the repression strength at any
temperatureevenwithpartialcomplementarity.
● ●● ●●●
●●● ●●●
●●● ●●●
●●● ●●●
●●● ●
●●
●● ● ●●
37°C 39°C 42°C
20bp
11bp
Twospacers
One spacer+ Decoy
Twospacers
One spacer+ Decoy
Twospacers
One spacer+ Decoy
1
10
100
1
10
100
CRISPR array
Rel
ativ
e R
FP e
xpre
ssio
n (%
)
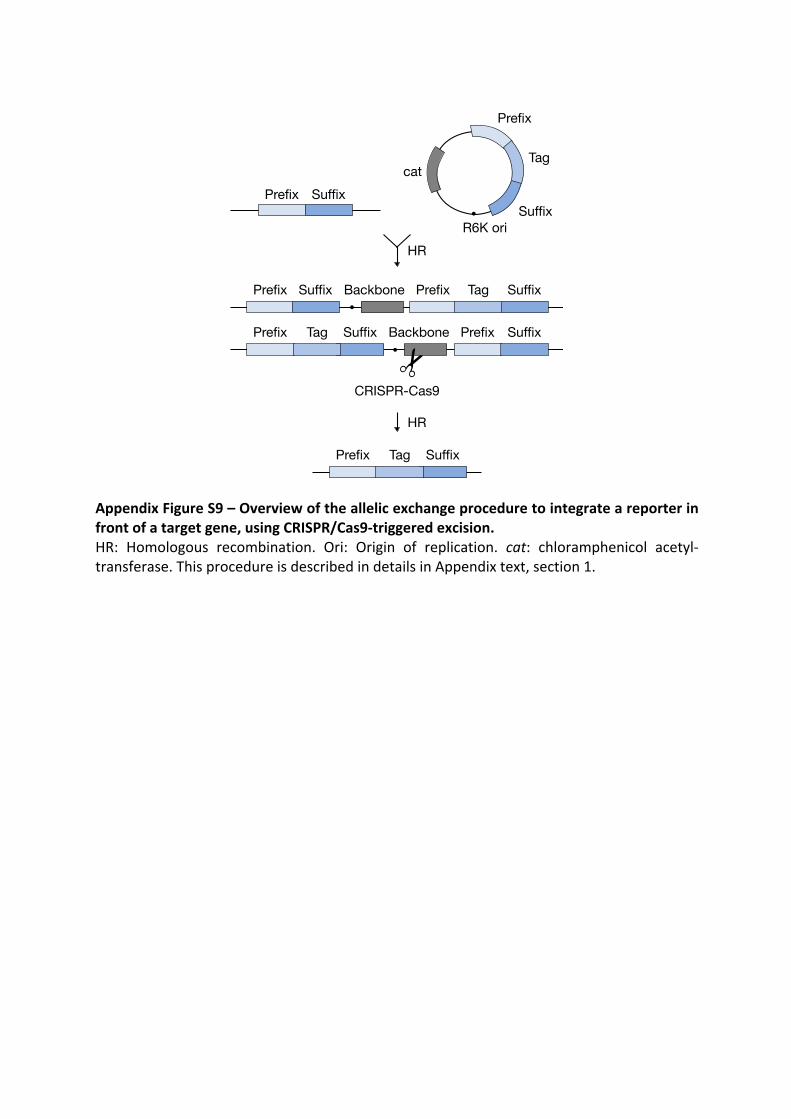
AppendixFigureS9–Overviewoftheallelicexchangeproceduretointegrateareporterinfrontofatargetgene,usingCRISPR/Cas9-triggeredexcision.HR: Homologous recombination. Ori: Origin of replication. cat: chloramphenicol acetyl-
transferase.ThisprocedureisdescribedindetailsinAppendixtext,section1.
R6K ori
cat
Prefix
Tag
SuffixPrefix Suffix
Prefix SuffixTag
Prefix Suffix TagPrefix Suffix
Prefix SuffixTag Prefix Suffix
Backbone
CRISPR-Cas9
Backbone
HR
HR
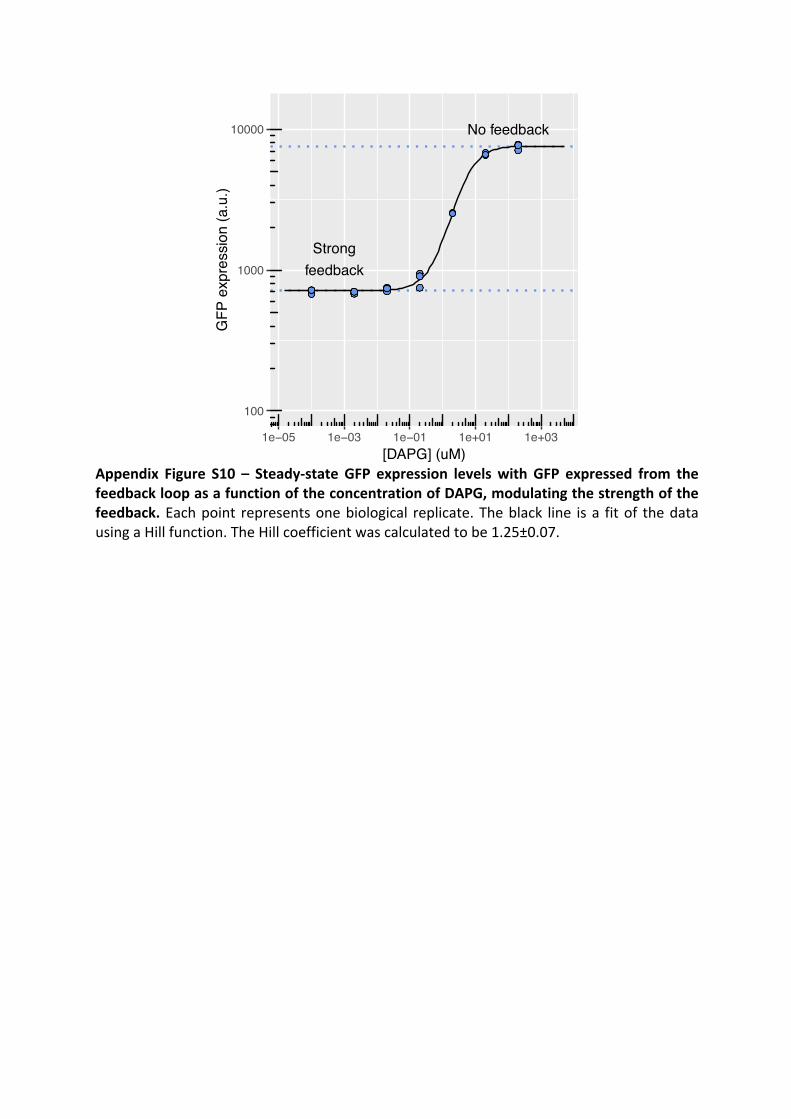
Appendix Figure S10 – Steady-state GFP expression levelswith GFP expressed from thefeedbackloopasafunctionoftheconcentrationofDAPG,modulatingthestrengthofthefeedback.Eachpoint representsonebiological replicate.Theblack line isa fitof thedatausingaHillfunction.TheHillcoefficientwascalculatedtobe1.25±0.07.
●●●
●●●
●●●
●●●
●
●●
●●●●●●
Strongfeedback
No feedback
100
1000
10000
1e+031e+011e−011e−031e−05[DAPG] (uM)
GFP
exp
ress
ion
(a.u
.)
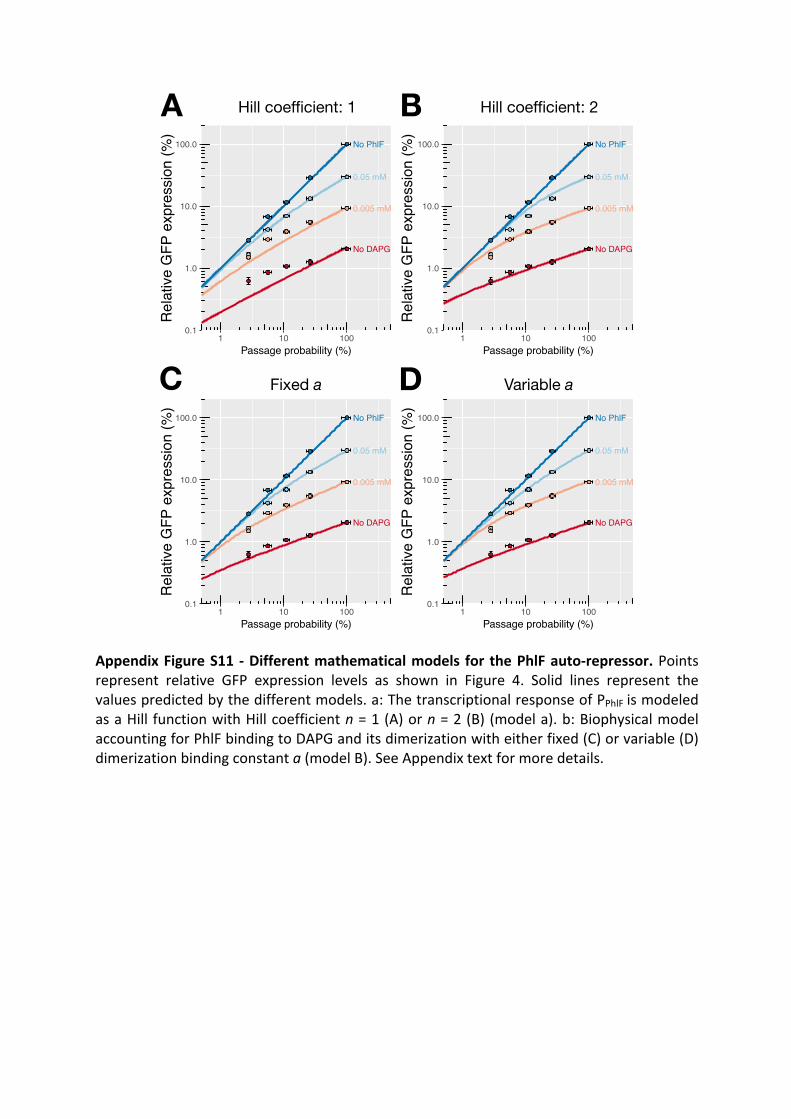
AppendixFigureS11 -Differentmathematicalmodels for thePhlFauto-repressor.Pointsrepresent relative GFP expression levels as shown in Figure 4. Solid lines represent the
valuespredictedbythedifferentmodels.a:ThetranscriptionalresponseofPPhlFismodeled
asaHill functionwithHillcoefficientn=1(A)orn=2(B)(modela).b:Biophysicalmodel
accountingforPhlFbindingtoDAPGanditsdimerizationwitheitherfixed(C)orvariable(D)
dimerizationbindingconstanta(modelB).SeeAppendixtextformoredetails.
0.05 mM
0.005 mM
No PhlF
No DAPG
●
●
●
●
●
●
●
●
●
●
●
●
●
●
●
●
●●
●
●
0.1
1.0
10.0
100.0
1 10 100Passage probability (%)
0.05 mM
0.005 mM
No PhlF
No DAPG
●
●
●
●
●
●
●
●
●
●
●
●
●
●
●
●
●●
●
●
0.1
1.0
10.0
100.0
1 10 100Passage probability (%)
0.05 mM
0.005 mM
No PhlF
No DAPG
●
●
●
●
●
●
●
●
●
●
●
●
●
●
●
●
●●
●
●
0.1
1.0
10.0
100.0
1 10 100Passage probability (%)
Hill coefficient: 1 Hill coefficient: 2
0.05 mM
0.005 mM
No PhlF
No DAPG
●
●
●
●
●
●
●
●
●
●
●
●
●
●
●
●
●●
●
●
0.1
1.0
10.0
100.0
1 10 100Passage probability (%)
Fixed a Variable a
Rel
ativ
e G
FP e
xpre
ssio
n (%
)
Rel
ativ
e G
FP e
xpre
ssio
n (%
)
Rel
ativ
e G
FP e
xpre
ssio
n (%
)
Rel
ativ
e G
FP e
xpre
ssio
n (%
)
A
C
B
D

Appendix FigureS12 –UponpartialdepletionofPBP2andRodAbyCRISPRknockdown,the cells maintain their alteredmorphology stably over time. ThemCherry-mrdA fusiongenewasrepressedusingaguideRNAwith18bpofcomplementarity(loweringmrdAB to20%ofthenativelevel)thentheculturewasmaintainedinexponentialphase.Attwotime
points(after2handafter4h)asampleoftheculturewasfixedandimagedbymicroscopy.
0.0
0.5
1.0
1.5
2.0
2 4Time after dilution (h)
Cel
l wid
th (m
icro
ns)
0
1
2
3
4
2 4Time after dilution (h)
Cel
l len
gth
(mic
rons
)
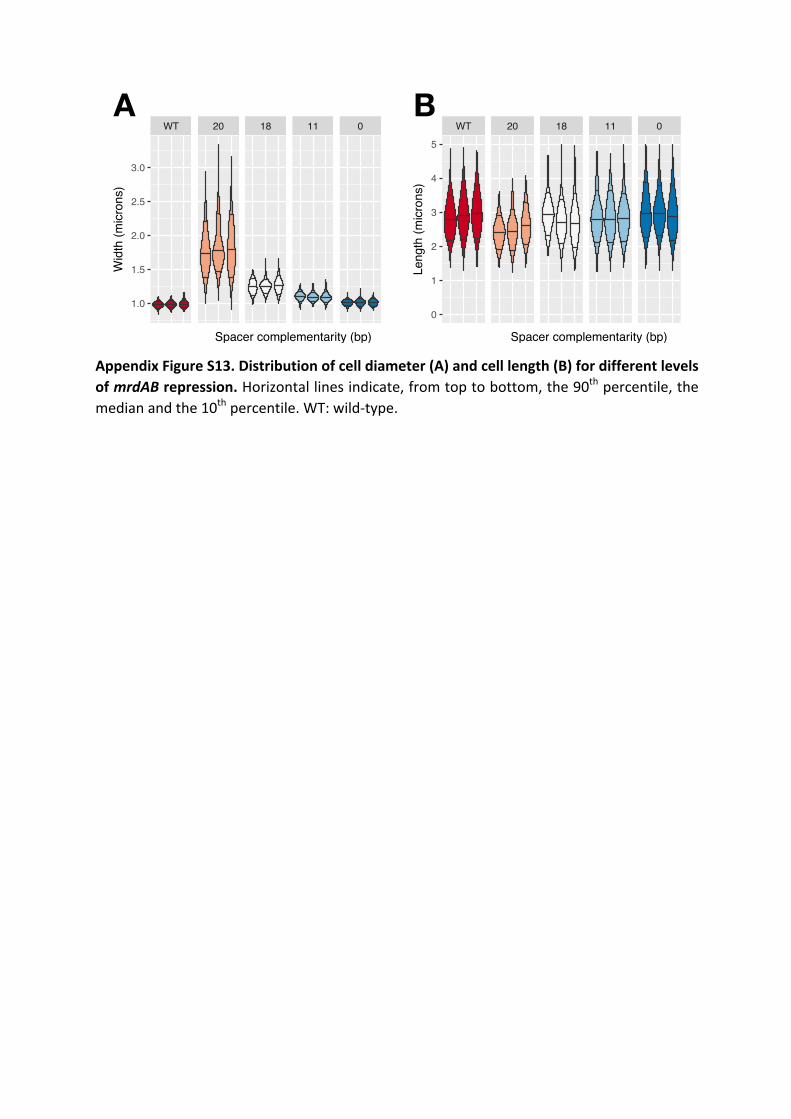
AppendixFigureS13.Distributionofcelldiameter(A)andcelllength(B)fordifferentlevelsofmrdABrepression.Horizontallinesindicate,fromtoptobottom,the90
thpercentile,the
medianandthe10thpercentile.WT:wild-type.
WT 20 18 11 0
1.0
1.5
2.0
2.5
3.0
Spacer complementarity (bp)
Wid
th (m
icro
ns)
WT 20 18 11 0
0
1
2
3
4
5
Spacer complementarity (bp)
Leng
th (m
icro
ns)
A B
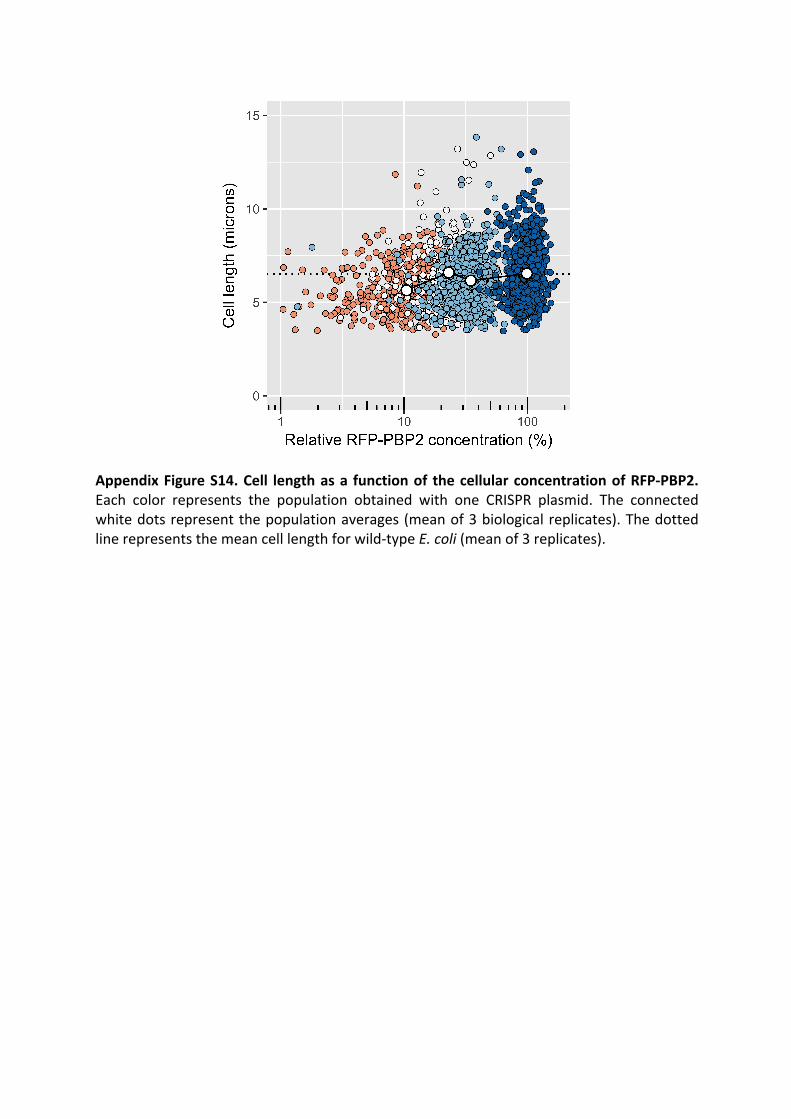
AppendixFigureS14.Cell lengthasa functionof thecellularconcentrationofRFP-PBP2.Each color represents the population obtained with one CRISPR plasmid. The connected
whitedotsrepresentthepopulationaverages(meanof3biologicalreplicates).Thedotted
linerepresentsthemeancelllengthforwild-typeE.coli(meanof3replicates).
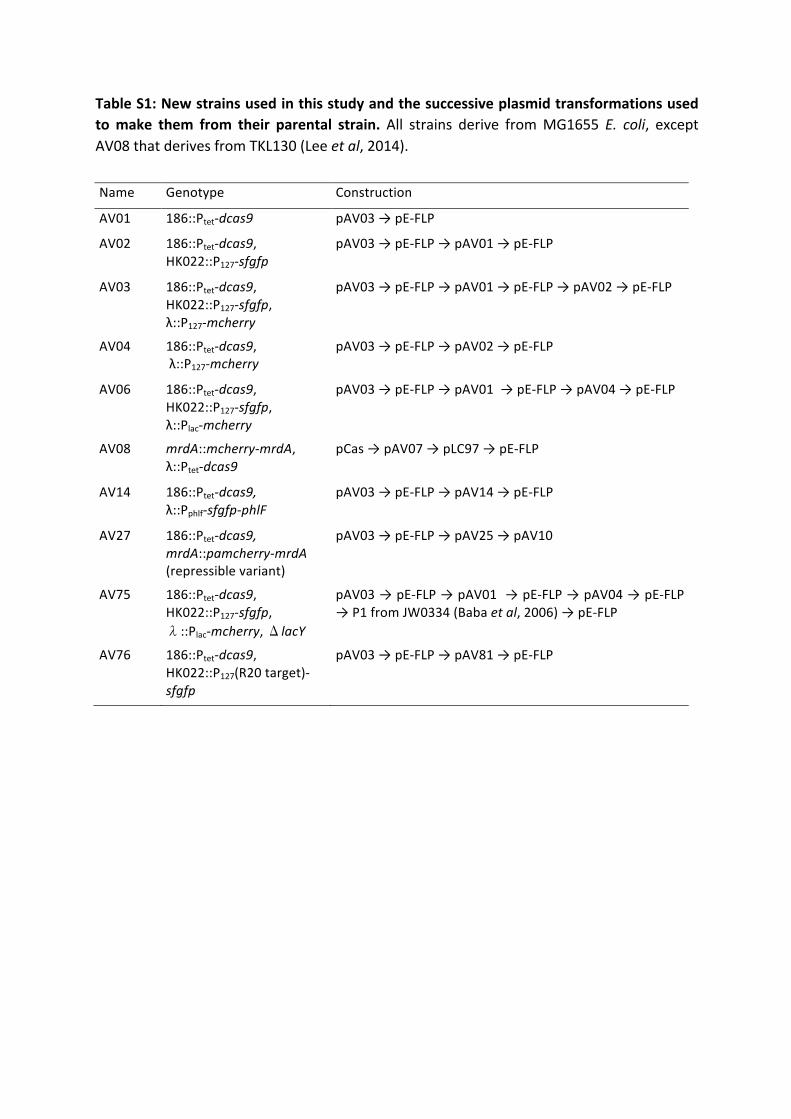
TableS1:Newstrainsusedinthisstudyandthesuccessiveplasmidtransformationsusedtomake them from their parental strain.All strains derive fromMG1655 E. coli, exceptAV08thatderivesfromTKL130(Leeetal,2014).
Name Genotype Construction
AV01 186::Ptet-dcas9 pAV03→pE-FLP
AV02 186::Ptet-dcas9,HK022::P127-sfgfp
pAV03→pE-FLP→pAV01→pE-FLP
AV03 186::Ptet-dcas9,HK022::P127-sfgfp,λ::P127-mcherry
pAV03→pE-FLP→pAV01→pE-FLP→pAV02→pE-FLP
AV04 186::Ptet-dcas9,λ::P127-mcherry
pAV03→pE-FLP→pAV02→pE-FLP
AV06 186::Ptet-dcas9,HK022::P127-sfgfp,λ::Plac-mcherry
pAV03→pE-FLP→pAV01→pE-FLP→pAV04→pE-FLP
AV08 mrdA::mcherry-mrdA,λ::Ptet-dcas9
pCas→pAV07→pLC97→pE-FLP
AV14 186::Ptet-dcas9,λ::Pphlf-sfgfp-phlF
pAV03→pE-FLP→pAV14→pE-FLP
AV27 186::Ptet-dcas9,mrdA::pamcherry-mrdA(repressiblevariant)
pAV03→pE-FLP→pAV25→pAV10
AV75 186::Ptet-dcas9,HK022::P127-sfgfp,�::Plac-mcherry,�lacY
pAV03→pE-FLP→pAV01→pE-FLP→pAV04→pE-FLP
→P1fromJW0334(Babaetal,2006)→pE-FLP
AV76 186::Ptet-dcas9,HK022::P127(R20target)-
sfgfp
pAV03→pE-FLP→pAV81→pE-FLP
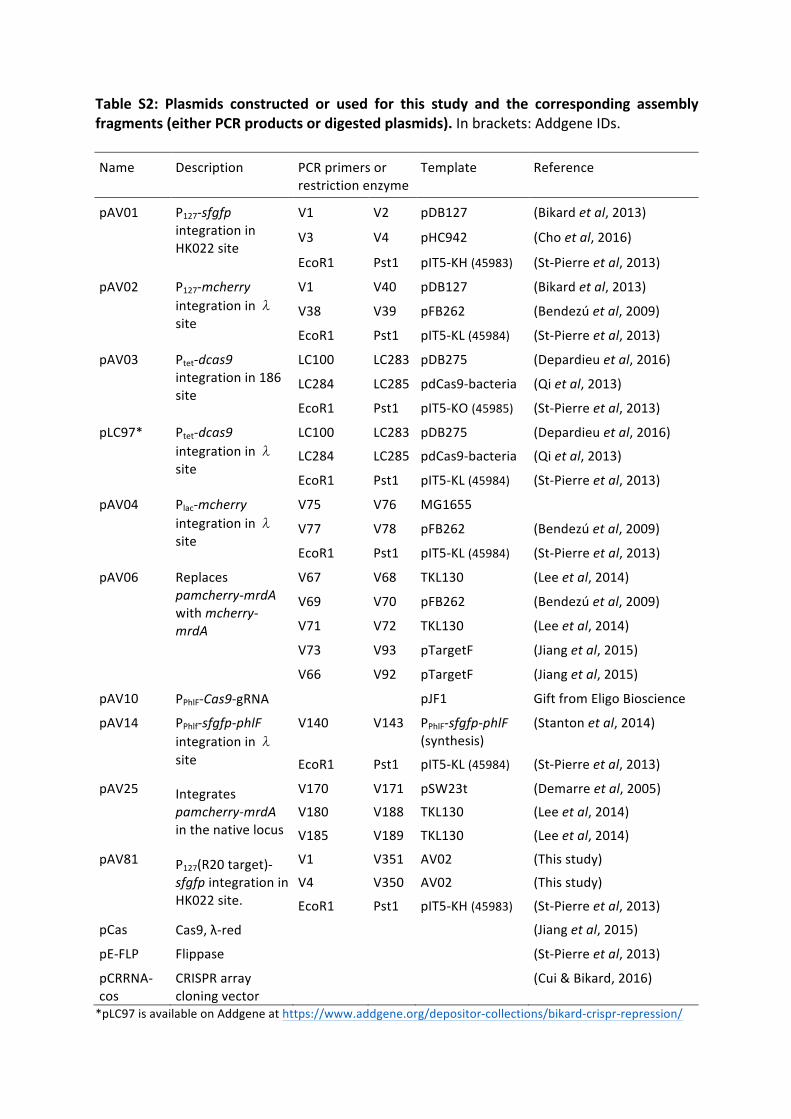
Table S2: Plasmids constructed or used for this study and the corresponding assemblyfragments(eitherPCRproductsordigestedplasmids).Inbrackets:AddgeneIDs.
Name Description PCRprimersor
restrictionenzyme
Template Reference
pAV01 P127-sfgfpintegrationin
HK022site
V1 V2 pDB127 (Bikardetal,2013)
V3 V4 pHC942 (Choetal,2016)
EcoR1 Pst1 pIT5-KH(45983) (St-Pierreetal,2013)
pAV02 P127-mcherryintegrationin�
site
V1 V40 pDB127 (Bikardetal,2013)
V38 V39 pFB262 (Bendezúetal,2009)
EcoR1 Pst1 pIT5-KL(45984) (St-Pierreetal,2013)
pAV03 Ptet-dcas9integrationin186
site
LC100 LC283 pDB275 (Depardieuetal,2016)
LC284 LC285 pdCas9-bacteria (Qietal,2013)
EcoR1 Pst1 pIT5-KO(45985) (St-Pierreetal,2013)
pLC97* Ptet-dcas9integrationin�
site
LC100 LC283 pDB275 (Depardieuetal,2016)
LC284 LC285 pdCas9-bacteria (Qietal,2013)
EcoR1 Pst1 pIT5-KL(45984) (St-Pierreetal,2013)
pAV04 Plac-mcherryintegrationin�
site
V75 V76 MG1655
V77 V78 pFB262 (Bendezúetal,2009)
EcoR1 Pst1 pIT5-KL(45984) (St-Pierreetal,2013)
pAV06 Replaces
pamcherry-mrdAwithmcherry-mrdA
V67 V68 TKL130 (Leeetal,2014)
V69 V70 pFB262 (Bendezúetal,2009)
V71 V72 TKL130 (Leeetal,2014)
V73 V93 pTargetF (Jiangetal,2015)
V66 V92 pTargetF (Jiangetal,2015)
pAV10 PPhlF-Cas9-gRNA pJF1 GiftfromEligoBioscience
pAV14 PPhlf-sfgfp-phlFintegrationin�
site
V140 V143 PPhlF-sfgfp-phlF(synthesis)
(Stantonetal,2014)
EcoR1 Pst1 pIT5-KL(45984) (St-Pierreetal,2013)
pAV25 Integrates
pamcherry-mrdAinthenativelocus
V170 V171 pSW23t (Demarreetal,2005)
V180 V188 TKL130 (Leeetal,2014)
V185 V189 TKL130 (Leeetal,2014)
pAV81 P127(R20target)-
sfgfpintegrationinHK022site.
V1 V351 AV02 (Thisstudy)
V4 V350 AV02 (Thisstudy)
EcoR1 Pst1 pIT5-KH(45983) (St-Pierreetal,2013)
pCas Cas9,λ-red (Jiangetal,2015)
pE-FLP Flippase (St-Pierreetal,2013)
pCRRNA-
cos
CRISPRarray
cloningvector
(Cui&Bikard,2016)
*pLC97isavailableonAddgeneathttps://www.addgene.org/depositor-collections/bikard-crispr-repression/
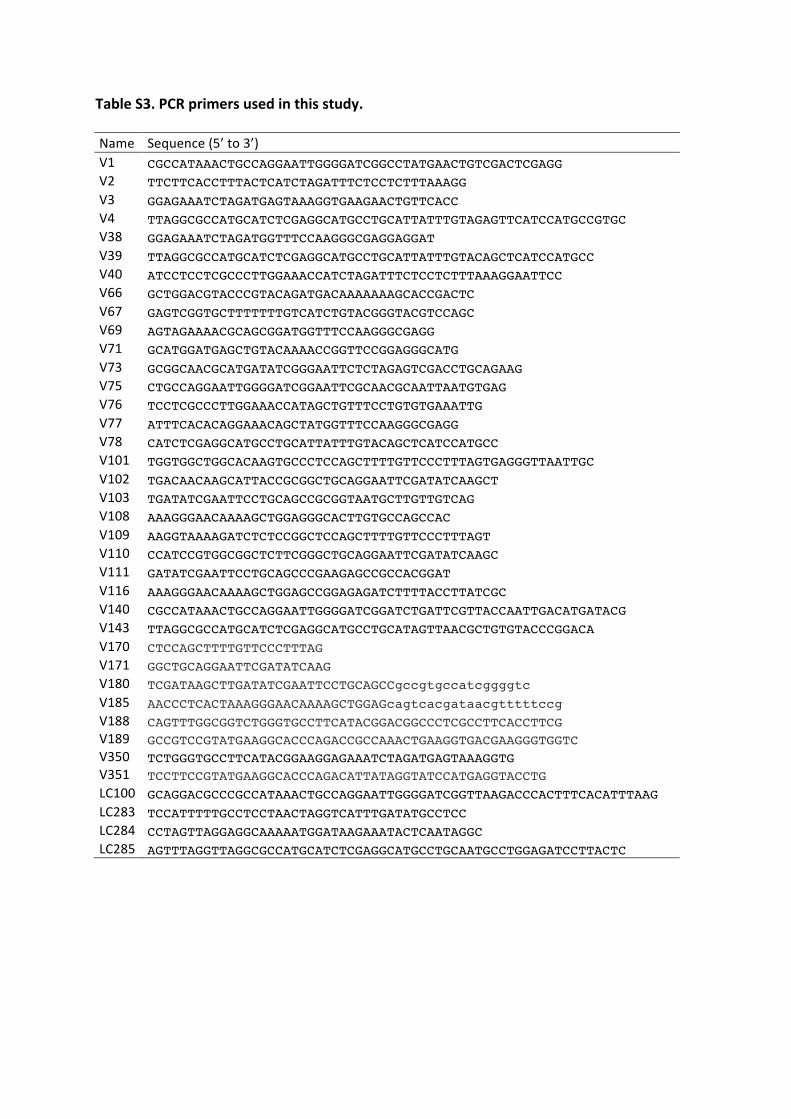
TableS3.PCRprimersusedinthisstudy.
Name Sequence(5’to3’)
V1 CGCCATAAACTGCCAGGAATTGGGGATCGGCCTATGAACTGTCGACTCGAGG V2 TTCTTCACCTTTACTCATCTAGATTTCTCCTCTTTAAAGG V3 GGAGAAATCTAGATGAGTAAAGGTGAAGAACTGTTCACC V4 TTAGGCGCCATGCATCTCGAGGCATGCCTGCATTATTTGTAGAGTTCATCCATGCCGTGC V38 GGAGAAATCTAGATGGTTTCCAAGGGCGAGGAGGAT V39 TTAGGCGCCATGCATCTCGAGGCATGCCTGCATTATTTGTACAGCTCATCCATGCC V40 ATCCTCCTCGCCCTTGGAAACCATCTAGATTTCTCCTCTTTAAAGGAATTCC V66 GCTGGACGTACCCGTACAGATGACAAAAAAAGCACCGACTC V67 GAGTCGGTGCTTTTTTTGTCATCTGTACGGGTACGTCCAGC V69 AGTAGAAAACGCAGCGGATGGTTTCCAAGGGCGAGG V71 GCATGGATGAGCTGTACAAAACCGGTTCCGGAGGGCATG V73 GCGGCAACGCATGATATCGGGAATTCTCTAGAGTCGACCTGCAGAAG V75 CTGCCAGGAATTGGGGATCGGAATTCGCAACGCAATTAATGTGAG V76 TCCTCGCCCTTGGAAACCATAGCTGTTTCCTGTGTGAAATTG V77 ATTTCACACAGGAAACAGCTATGGTTTCCAAGGGCGAGG V78 CATCTCGAGGCATGCCTGCATTATTTGTACAGCTCATCCATGCC V101 TGGTGGCTGGCACAAGTGCCCTCCAGCTTTTGTTCCCTTTAGTGAGGGTTAATTGC V102 TGACAACAAGCATTACCGCGGCTGCAGGAATTCGATATCAAGCT V103 TGATATCGAATTCCTGCAGCCGCGGTAATGCTTGTTGTCAG V108 AAAGGGAACAAAAGCTGGAGGGCACTTGTGCCAGCCAC V109 AAGGTAAAAGATCTCTCCGGCTCCAGCTTTTGTTCCCTTTAGT V110 CCATCCGTGGCGGCTCTTCGGGCTGCAGGAATTCGATATCAAGC V111 GATATCGAATTCCTGCAGCCCGAAGAGCCGCCACGGAT V116 AAAGGGAACAAAAGCTGGAGCCGGAGAGATCTTTTACCTTATCGC V140 CGCCATAAACTGCCAGGAATTGGGGATCGGATCTGATTCGTTACCAATTGACATGATACG V143 TTAGGCGCCATGCATCTCGAGGCATGCCTGCATAGTTAACGCTGTGTACCCGGACA V170 CTCCAGCTTTTGTTCCCTTTAG V171 GGCTGCAGGAATTCGATATCAAG V180 TCGATAAGCTTGATATCGAATTCCTGCAGCCgccgtgccatcggggtc V185 AACCCTCACTAAAGGGAACAAAAGCTGGAGcagtcacgataacgtttttccg V188 CAGTTTGGCGGTCTGGGTGCCTTCATACGGACGGCCCTCGCCTTCACCTTCG V189 GCCGTCCGTATGAAGGCACCCAGACCGCCAAACTGAAGGTGACGAAGGGTGGTC V350 TCTGGGTGCCTTCATACGGAAGGAGAAATCTAGATGAGTAAAGGTG V351 TCCTTCCGTATGAAGGCACCCAGACATTATAGGTATCCATGAGGTACCTG LC100 GCAGGACGCCCGCCATAAACTGCCAGGAATTGGGGATCGGTTAAGACCCACTTTCACATTTAAG LC283 TCCATTTTTGCCTCCTAACTAGGTCATTTGATATGCCTCC LC284 CCTAGTTAGGAGGCAAAAATGGATAAGAAATACTCAATAGGC LC285 AGTTTAGGTTAGGCGCCATGCATCTCGAGGCATGCCTGCAATGCCTGGAGATCCTTACTC
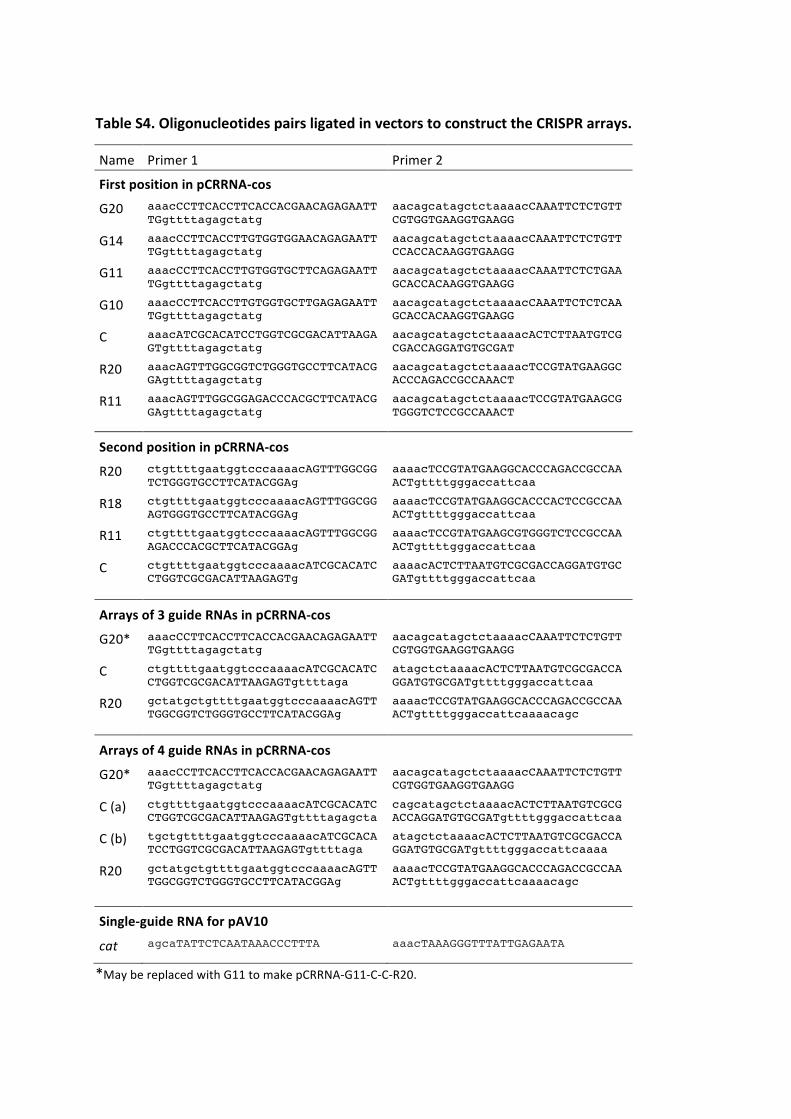
TableS4.OligonucleotidespairsligatedinvectorstoconstructtheCRISPRarrays.
Name Primer1 Primer2
FirstpositioninpCRRNA-cos
G20 aaacCCTTCACCTTCACCACGAACAGAGAATTTGgttttagagctatg
aacagcatagctctaaaacCAAATTCTCTGTTCGTGGTGAAGGTGAAGG
G14 aaacCCTTCACCTTGTGGTGGAACAGAGAATTTGgttttagagctatg
aacagcatagctctaaaacCAAATTCTCTGTTCCACCACAAGGTGAAGG
G11 aaacCCTTCACCTTGTGGTGCTTCAGAGAATTTGgttttagagctatg
aacagcatagctctaaaacCAAATTCTCTGAAGCACCACAAGGTGAAGG
G10 aaacCCTTCACCTTGTGGTGCTTGAGAGAATTTGgttttagagctatg
aacagcatagctctaaaacCAAATTCTCTCAAGCACCACAAGGTGAAGG
C aaacATCGCACATCCTGGTCGCGACATTAAGAGTgttttagagctatg
aacagcatagctctaaaacACTCTTAATGTCGCGACCAGGATGTGCGAT
R20 aaacAGTTTGGCGGTCTGGGTGCCTTCATACGGAgttttagagctatg
aacagcatagctctaaaacTCCGTATGAAGGCACCCAGACCGCCAAACT
R11 aaacAGTTTGGCGGAGACCCACGCTTCATACGGAgttttagagctatg
aacagcatagctctaaaacTCCGTATGAAGCGTGGGTCTCCGCCAAACT
SecondpositioninpCRRNA-cos
R20 ctgttttgaatggtcccaaaacAGTTTGGCGGTCTGGGTGCCTTCATACGGAg
aaaacTCCGTATGAAGGCACCCAGACCGCCAAACTgttttgggaccattcaa
R18 ctgttttgaatggtcccaaaacAGTTTGGCGGAGTGGGTGCCTTCATACGGAg
aaaacTCCGTATGAAGGCACCCACTCCGCCAAACTgttttgggaccattcaa
R11 ctgttttgaatggtcccaaaacAGTTTGGCGGAGACCCACGCTTCATACGGAg
aaaacTCCGTATGAAGCGTGGGTCTCCGCCAAACTgttttgggaccattcaa
C ctgttttgaatggtcccaaaacATCGCACATCCTGGTCGCGACATTAAGAGTg
aaaacACTCTTAATGTCGCGACCAGGATGTGCGATgttttgggaccattcaa
Arraysof3guideRNAsinpCRRNA-cos
G20* aaacCCTTCACCTTCACCACGAACAGAGAATTTGgttttagagctatg
aacagcatagctctaaaacCAAATTCTCTGTTCGTGGTGAAGGTGAAGG
C ctgttttgaatggtcccaaaacATCGCACATCCTGGTCGCGACATTAAGAGTgttttaga
atagctctaaaacACTCTTAATGTCGCGACCAGGATGTGCGATgttttgggaccattcaa
R20 gctatgctgttttgaatggtcccaaaacAGTTTGGCGGTCTGGGTGCCTTCATACGGAg
aaaacTCCGTATGAAGGCACCCAGACCGCCAAACTgttttgggaccattcaaaacagc
Arraysof4guideRNAsinpCRRNA-cos G20* aaacCCTTCACCTTCACCACGAACAGAGAATT
TGgttttagagctatg aacagcatagctctaaaacCAAATTCTCTGTTCGTGGTGAAGGTGAAGG
C(a) ctgttttgaatggtcccaaaacATCGCACATCCTGGTCGCGACATTAAGAGTgttttagagcta
cagcatagctctaaaacACTCTTAATGTCGCGACCAGGATGTGCGATgttttgggaccattcaa
C(b) tgctgttttgaatggtcccaaaacATCGCACATCCTGGTCGCGACATTAAGAGTgttttaga
atagctctaaaacACTCTTAATGTCGCGACCAGGATGTGCGATgttttgggaccattcaaaa
R20 gctatgctgttttgaatggtcccaaaacAGTTTGGCGGTCTGGGTGCCTTCATACGGAg
aaaacTCCGTATGAAGGCACCCAGACCGCCAAACTgttttgggaccattcaaaacagc
Single-guideRNAforpAV10
cat agcaTATTCTCAATAAACCCTTTA aaacTAAAGGGTTTATTGAGAATA
*MaybereplacedwithG11tomakepCRRNA-G11-C-C-R20.
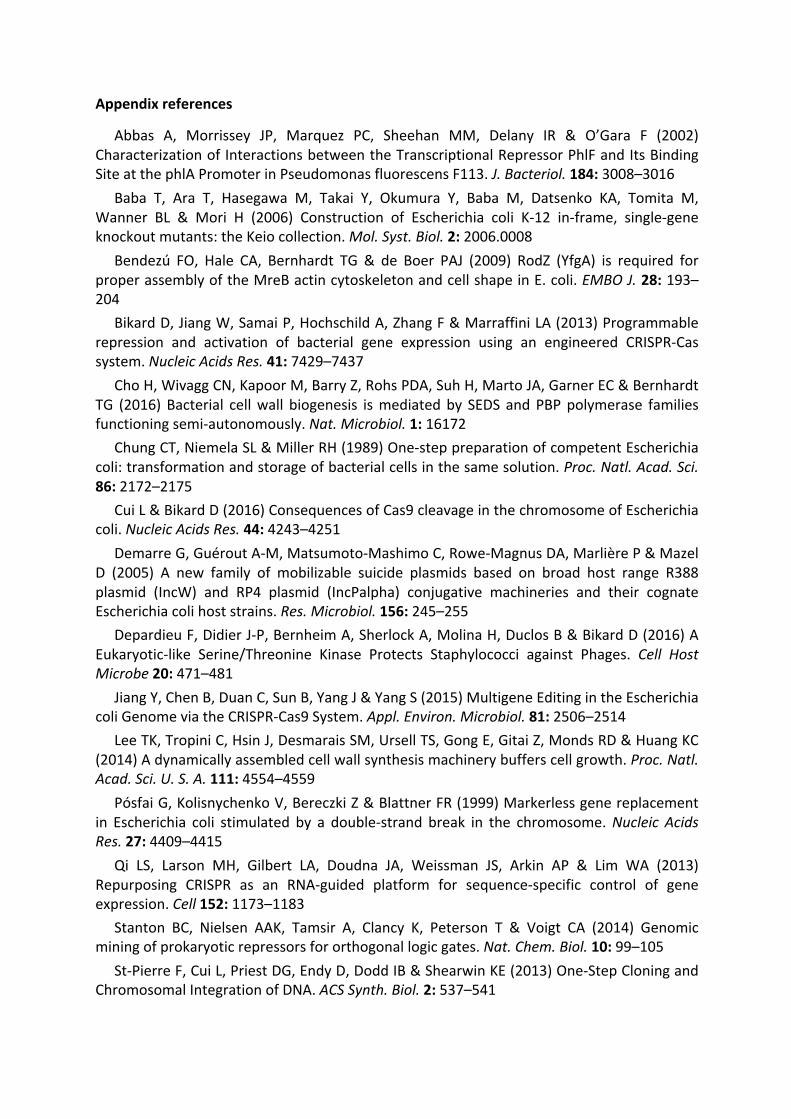
Appendixreferences
Abbas A, Morrissey JP, Marquez PC, Sheehan MM, Delany IR & O’Gara F (2002)
CharacterizationofInteractionsbetweentheTranscriptionalRepressorPhlFandItsBinding
SiteatthephlAPromoterinPseudomonasfluorescensF113.J.Bacteriol.184:3008–3016Baba T, Ara T, Hasegawa M, Takai Y, Okumura Y, Baba M, Datsenko KA, Tomita M,
Wanner BL & Mori H (2006) Construction of Escherichia coli K-12 in-frame, single-gene
knockoutmutants:theKeiocollection.Mol.Syst.Biol.2:2006.0008Bendezú FO, Hale CA, Bernhardt TG & de Boer PAJ (2009) RodZ (YfgA) is required for
properassemblyoftheMreBactincytoskeletonandcellshapeinE.coli.EMBOJ.28:193–204
BikardD,JiangW,SamaiP,HochschildA,ZhangF&MarraffiniLA(2013)Programmable
repression and activation of bacterial gene expression using an engineered CRISPR-Cas
system.NucleicAcidsRes.41:7429–7437ChoH,WivaggCN,KapoorM,BarryZ,RohsPDA,SuhH,MartoJA,GarnerEC&Bernhardt
TG (2016) Bacterial cellwall biogenesis ismediatedby SEDS andPBPpolymerase families
functioningsemi-autonomously.Nat.Microbiol.1:16172ChungCT,NiemelaSL&MillerRH(1989)One-steppreparationofcompetentEscherichia
coli:transformationandstorageofbacterialcellsinthesamesolution.Proc.Natl.Acad.Sci.86:2172–2175
CuiL&BikardD(2016)ConsequencesofCas9cleavageinthechromosomeofEscherichia
coli.NucleicAcidsRes.44:4243–4251DemarreG,GuéroutA-M,Matsumoto-MashimoC,Rowe-MagnusDA,MarlièreP&Mazel
D (2005) A new family of mobilizable suicide plasmids based on broad host range R388
plasmid (IncW) and RP4 plasmid (IncPalpha) conjugative machineries and their cognate
Escherichiacolihoststrains.Res.Microbiol.156:245–255DepardieuF,DidierJ-P,BernheimA,SherlockA,MolinaH,DuclosB&BikardD(2016)A
Eukaryotic-like Serine/Threonine Kinase Protects Staphylococci against Phages. Cell HostMicrobe20:471–481
JiangY,ChenB,DuanC,SunB,YangJ&YangS(2015)MultigeneEditingintheEscherichia
coliGenomeviatheCRISPR-Cas9System.Appl.Environ.Microbiol.81:2506–2514LeeTK,TropiniC,HsinJ,DesmaraisSM,UrsellTS,GongE,GitaiZ,MondsRD&HuangKC
(2014)Adynamicallyassembledcellwallsynthesismachinerybufferscellgrowth.Proc.Natl.Acad.Sci.U.S.A.111:4554–4559
PósfaiG,KolisnychenkoV,BereczkiZ&BlattnerFR(1999)Markerlessgenereplacement
in Escherichia coli stimulated by a double-strand break in the chromosome.Nucleic AcidsRes.27:4409–4415
Qi LS, Larson MH, Gilbert LA, Doudna JA, Weissman JS, Arkin AP & Lim WA (2013)
Repurposing CRISPR as an RNA-guided platform for sequence-specific control of gene
expression.Cell152:1173–1183Stanton BC, Nielsen AAK, Tamsir A, Clancy K, Peterson T & Voigt CA (2014) Genomic
miningofprokaryoticrepressorsfororthogonallogicgates.Nat.Chem.Biol.10:99–105St-PierreF,CuiL,PriestDG,EndyD,DoddIB&ShearwinKE(2013)One-StepCloningand
ChromosomalIntegrationofDNA.ACSSynth.Biol.2:537–541
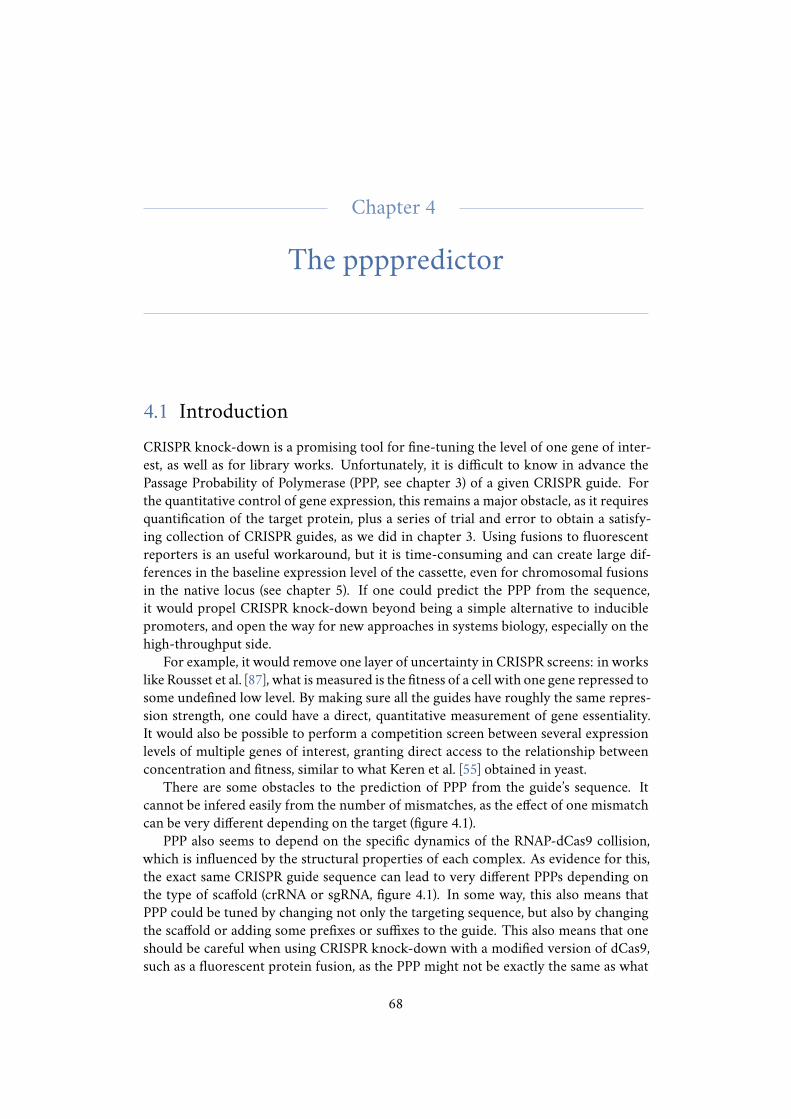
Chapter 4
The ppppredictor
4.1 Introduction
CRISPR knock-down is a promising tool for fine-tuning the level of one gene of inter-est, as well as for library works. Unfortunately, it is difficult to know in advance thePassage Probability of Polymerase (PPP, see chapter 3) of a given CRISPR guide. Forthe quantitative control of gene expression, this remains a major obstacle, as it requiresquantification of the target protein, plus a series of trial and error to obtain a satisfy-ing collection of CRISPR guides, as we did in chapter 3. Using fusions to fluorescentreporters is an useful workaround, but it is time-consuming and can create large dif-ferences in the baseline expression level of the cassette, even for chromosomal fusionsin the native locus (see chapter 5). If one could predict the PPP from the sequence,it would propel CRISPR knock-down beyond being a simple alternative to induciblepromoters, and open the way for new approaches in systems biology, especially on thehigh-throughput side.
For example, it would remove one layer of uncertainty in CRISPR screens: in workslike Rousset et al. [87], what is measured is the fitness of a cell with one gene repressed tosome undefined low level. By making sure all the guides have roughly the same repres-sion strength, one could have a direct, quantitative measurement of gene essentiality.It would also be possible to perform a competition screen between several expressionlevels of multiple genes of interest, granting direct access to the relationship betweenconcentration and fitness, similar to what Keren et al. [55] obtained in yeast.
There are some obstacles to the prediction of PPP from the guide’s sequence. Itcannot be infered easily from the number of mismatches, as the effect of one mismatchcan be very different depending on the target (figure 4.1).
PPP also seems to depend on the specific dynamics of the RNAP-dCas9 collision,which is influenced by the structural properties of each complex. As evidence for this,the exact same CRISPR guide sequence can lead to very different PPPs depending onthe type of scaffold (crRNA or sgRNA, figure 4.1). In some way, this also means thatPPP could be tuned by changing not only the targeting sequence, but also by changingthe scaffold or adding some prefixes or suffixes to the guide. This also means that oneshould be careful when using CRISPR knock-down with a modified version of dCas9,such as a fluorescent protein fusion, as the PPP might not be exactly the same as what
68
CHAPTER 4 THE PPPPREDICTOR
33.2±2.3
11.8±0.9
5.1±0.4
1.2±0.3
●●●●●●●●●
●●●●●
●●●
●●
●●●●●●
●●●●●●●●
●●●●
●
●●●
100
0.1
1.0
10.0
100.0
0 10 11 14 20
Complementary of crRNA (bp)
GF
P e
xpre
ssio
n (
%)
A
42.2±2.7
15.7±0.9
5.3±0.4
●●●●●●● ●● ●●
●● ●●●●● ●●●
●●●●
●●●●●●
●●● ●●●●●●●
100
0.1
1.0
10.0
100.0
0 11 18 20
Complementary of crRNA (bp)
mC
herr
y exp
ress
ion (
%)
100
26.3±5.4
1.7±0.4
0.7±0.1
●●●●
●●●●
●●●●
●●●●
0.1
1.0
10.0
100.0
5 10 14 20
Complementary of sgRNA (bp)
GF
P e
xpre
ssio
n (
%)
100
64.2±7.5
1.3±0.41±0.2
●●●●
●●●●
●●
●● ●●
●
●
0.1
1.0
10.0
100.0
5 11 18 20
Complementary of sgRNA (bp)
mC
herr
y exp
ress
ion (
%)
B
Figure 4.1: Comparison of the same set of guide RNAs, targeting either GFP ormCherry, in the form of crRNA or sgRNA. crRNA are embedded in a CRISPRarray in the pcrRNA vector. sgRNA are expressed from the pAV20 vector. 5 bpof complementarity is not enough to produce repression.
we measure on normal dCas9.To date, no large-scale dataset of sequences and associated PPPs in vivo has been
reported. There are datasets of binding kinetics in vitro [92, 100], which can help findingthe parameters that determine dCas9’s affinity to its target, and those paramaters maybe important for PPP as well, but the outcome of dCas9/RNAP collisions cannot bedetermined from the kinetic parameters alone. Also, a lot of data exists about cleavageby Cas9, but the cutting probability is very different from the binding affinity, due tothe peculiar kinetics of Cas9 cleavage [95, 96].
4.2 Cloning a large number of guide-target pairs
To determine the PPP of CRISPR guides with mismatches between the guide and thetarget, we must be able to control both sequences simultaneously. Using on-chip oligosynthesis, we synthesize a library of oligos constisting in an assembly prefix, a single-guide RNA sequence, a restriction cloning site, a target sequence with a NGG PAM, andan assembly suffix. This is inserted in a plasmid, which carries a promoter for the sgRNAin 5’ upstream of the library insertion site, and a mCherry coding sequence in 3’ down-stream. After the first cloning step, a round of sequencing will be done to check theintegrity of the library, and in particular identify which targets have a defect in the asso-
69
CHAPTER 4 THE PPPPREDICTOR
ciated CRISPR guides. Thanks to an unique molecular identifier (UMI) in the sequence,individual clones that have an assembly problem can be discarded during the analysis,and the other clones carrying the same sequence can still be exploited. Subsequently,a fragment containing the GFP coding sequence is inserted between the guide and thetarget, using the restriction site present in the middle of the library’s oligos (figure 4.2).This allows to decouple the guide expression cassette from the target, as they wouldotherwise be very close from each other and likely to interact.
Figure 4.2: Schematic of the expression cassette used to measure PPPs in
high-throughput. The guide sequence is cloned next to the scaffold, then acassette with a constitutive promoter and GFP is inserted between the guide andthe target. Image courtesy of Alicia Calvo-Villamañan.
This collection of plasmids is then transformed in a strain able to express dCas9.All the strains and plasmids supporting this library were designed and constructed byAlicia Calvo-Villamañan.
4.3 Principle of the measurement
Using this strain library, there are two ways to measure the PPP for each pair of guideand target:
By mRNA sequencing
The most direct measurement of PPP is by extracting the mRNA of the pooled cells,performing reverse-transcription of the mRNA that contains the CRISPR target, thensequencing the cDNA. The number of times each target appears in the sequencing runreflects the number of times the RNAP could displace the dCas9 complex for this partic-ular guide/target pair. This is compared to the number of reads obtained with a controltarget that does not have a PAM.
By fluorescence-activated cell sorting (FACS)
The intensity of mCherry reflects the amount of transcripts which extend beyond thetarget site. The cells are sorted into bins of fluorescence intensity, then we sequence thetarget sites of all cells present in each bin. As each sequence will be found in differentproportions in each bin, it will be possible to fit a lognormal distribution and obtain theaveragemCherry intensity of each sequence. The intensity of GFP can also be used, as itreflects the total amount of transcripts that get initiated. TheGFP/mCherry ratiowouldthen be proportional to the PPP. An advantage of using FACS is that we can estimatethe noise on gene expression following the repression.
As, in both case, the PPP is determined by sequencing only the target, and not thefull guide/target pair, it is essential that the sequence of the guide can be identified using
70
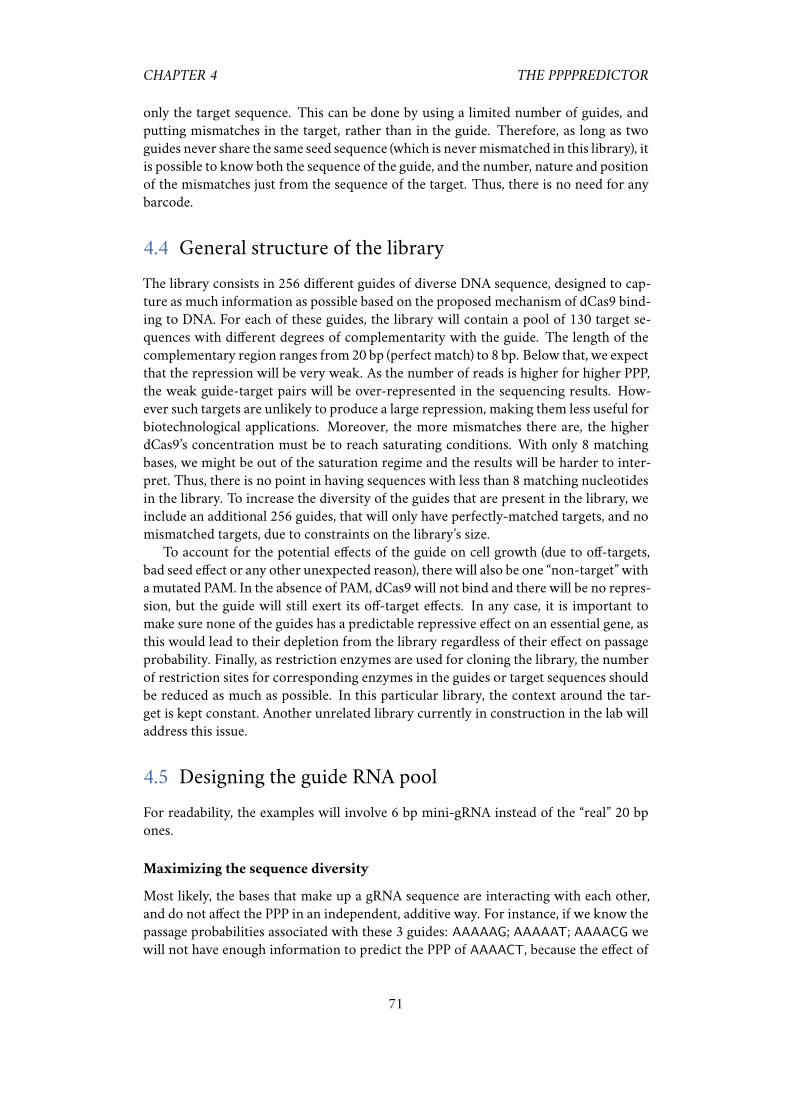
CHAPTER 4 THE PPPPREDICTOR
only the target sequence. This can be done by using a limited number of guides, andputting mismatches in the target, rather than in the guide. Therefore, as long as twoguides never share the same seed sequence (which is nevermismatched in this library), itis possible to know both the sequence of the guide, and the number, nature and positionof the mismatches just from the sequence of the target. Thus, there is no need for anybarcode.
4.4 General structure of the library
The library consists in 256 different guides of diverse DNA sequence, designed to cap-ture as much information as possible based on the proposed mechanism of dCas9 bind-ing to DNA. For each of these guides, the library will contain a pool of 130 target se-quences with different degrees of complementarity with the guide. The length of thecomplementary region ranges from 20 bp (perfect match) to 8 bp. Below that, we expectthat the repression will be very weak. As the number of reads is higher for higher PPP,the weak guide-target pairs will be over-represented in the sequencing results. How-ever such targets are unlikely to produce a large repression, making them less useful forbiotechnological applications. Moreover, the more mismatches there are, the higherdCas9’s concentration must be to reach saturating conditions. With only 8 matchingbases, we might be out of the saturation regime and the results will be harder to inter-pret. Thus, there is no point in having sequences with less than 8 matching nucleotidesin the library. To increase the diversity of the guides that are present in the library, weinclude an additional 256 guides, that will only have perfectly-matched targets, and nomismatched targets, due to constraints on the library’s size.
To account for the potential effects of the guide on cell growth (due to off-targets,bad seed effect or any other unexpected reason), there will also be one “non-target” witha mutated PAM. In the absence of PAM, dCas9 will not bind and there will be no repres-sion, but the guide will still exert its off-target effects. In any case, it is important tomake sure none of the guides has a predictable repressive effect on an essential gene, asthis would lead to their depletion from the library regardless of their effect on passageprobability. Finally, as restriction enzymes are used for cloning the library, the numberof restriction sites for corresponding enzymes in the guides or target sequences shouldbe reduced as much as possible. In this particular library, the context around the tar-get is kept constant. Another unrelated library currently in construction in the lab willaddress this issue.
4.5 Designing the guide RNA pool
For readability, the examples will involve 6 bp mini-gRNA instead of the “real” 20 bpones.
Maximizing the sequence diversity
Most likely, the bases that make up a gRNA sequence are interacting with each other,and do not affect the PPP in an independent, additive way. For instance, if we know thepassage probabilities associated with these 3 guides: AAAAAG; AAAAAT; AAAACG wewill not have enough information to predict the PPP of AAAACT, because the effect of
71
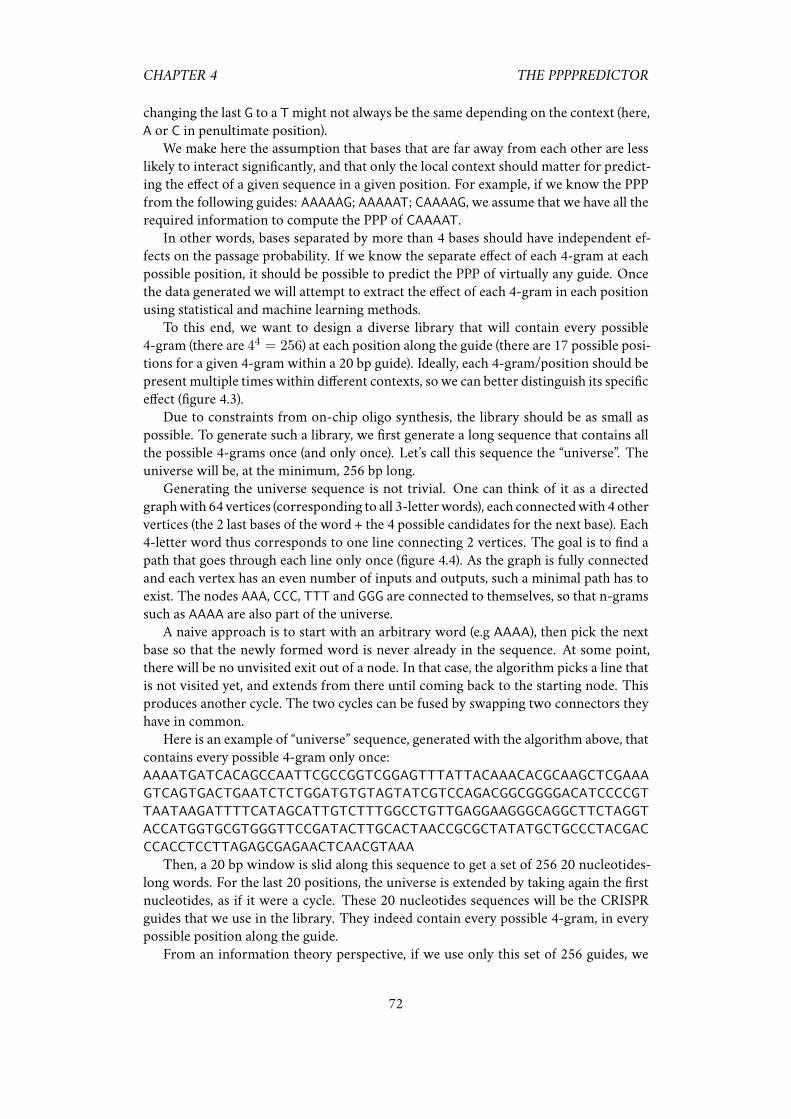
CHAPTER 4 THE PPPPREDICTOR
changing the last G to a T might not always be the same depending on the context (here,A or C in penultimate position).
We make here the assumption that bases that are far away from each other are lesslikely to interact significantly, and that only the local context should matter for predict-ing the effect of a given sequence in a given position. For example, if we know the PPPfrom the following guides: AAAAAG; AAAAAT; CAAAAG, we assume that we have all therequired information to compute the PPP of CAAAAT.
In other words, bases separated by more than 4 bases should have independent ef-fects on the passage probability. If we know the separate effect of each 4-gram at eachpossible position, it should be possible to predict the PPP of virtually any guide. Oncethe data generated we will attempt to extract the effect of each 4-gram in each positionusing statistical and machine learning methods.
To this end, we want to design a diverse library that will contain every possible4-gram (there are 44 = 256) at each position along the guide (there are 17 possible posi-tions for a given 4-gram within a 20 bp guide). Ideally, each 4-gram/position should bepresent multiple times within different contexts, so we can better distinguish its specificeffect (figure 4.3).
Due to constraints from on-chip oligo synthesis, the library should be as small aspossible. To generate such a library, we first generate a long sequence that contains allthe possible 4-grams once (and only once). Let’s call this sequence the “universe”. Theuniverse will be, at the minimum, 256 bp long.
Generating the universe sequence is not trivial. One can think of it as a directedgraphwith 64 vertices (corresponding to all 3-letterwords), each connectedwith 4 othervertices (the 2 last bases of the word + the 4 possible candidates for the next base). Each4-letter word thus corresponds to one line connecting 2 vertices. The goal is to find apath that goes through each line only once (figure 4.4). As the graph is fully connectedand each vertex has an even number of inputs and outputs, such a minimal path has toexist. The nodes AAA, CCC, TTT and GGG are connected to themselves, so that n-gramssuch as AAAA are also part of the universe.
A naive approach is to start with an arbitrary word (e.g AAAA), then pick the nextbase so that the newly formed word is never already in the sequence. At some point,there will be no unvisited exit out of a node. In that case, the algorithm picks a line thatis not visited yet, and extends from there until coming back to the starting node. Thisproduces another cycle. The two cycles can be fused by swapping two connectors theyhave in common.
Here is an example of “universe” sequence, generated with the algorithm above, thatcontains every possible 4-gram only once:AAAATGATCACAGCCAATTCGCCGGTCGGAGTTTATTACAAACACGCAAGCTCGAAAGTCAGTGACTGAATCTCTGGATGTGTAGTATCGTCCAGACGGCGGGGACATCCCCGTTAATAAGATTTTCATAGCATTGTCTTTGGCCTGTTGAGGAAGGGCAGGCTTCTAGGTACCATGGTGCGTGGGTTCCGATACTTGCACTAACCGCGCTATATGCTGCCCTACGACCCACCTCCTTAGAGCGAGAACTCAACGTAAA
Then, a 20 bp window is slid along this sequence to get a set of 256 20 nucleotides-long words. For the last 20 positions, the universe is extended by taking again the firstnucleotides, as if it were a cycle. These 20 nucleotides sequences will be the CRISPRguides that we use in the library. They indeed contain every possible 4-gram, in everypossible position along the guide.
From an information theory perspective, if we use only this set of 256 guides, we
72
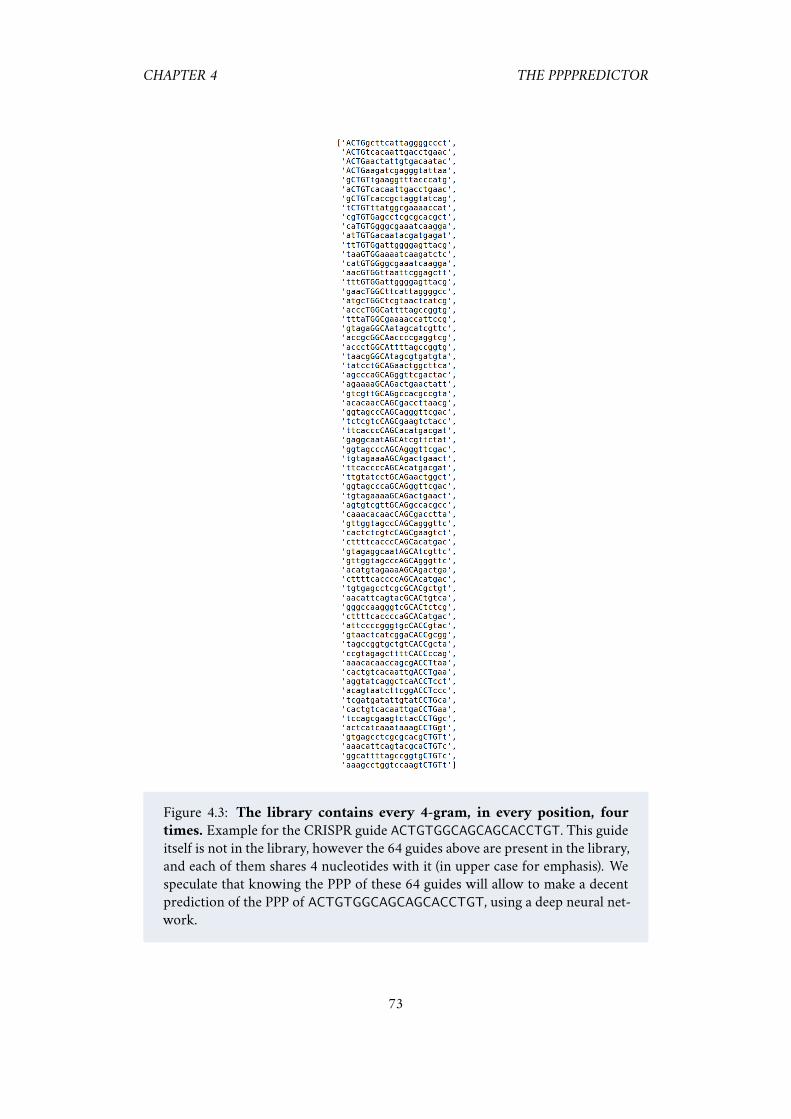
CHAPTER 4 THE PPPPREDICTOR
Figure 4.3: The library contains every 4-gram, in every position, four
times. Example for the CRISPR guide ACTGTGGCAGCAGCACCTGT. This guideitself is not in the library, however the 64 guides above are present in the library,and each of them shares 4 nucleotides with it (in upper case for emphasis). Wespeculate that knowing the PPP of these 64 guides will allow to make a decentprediction of the PPP of ACTGTGGCAGCAGCACCTGT, using a deep neural net-work.
73
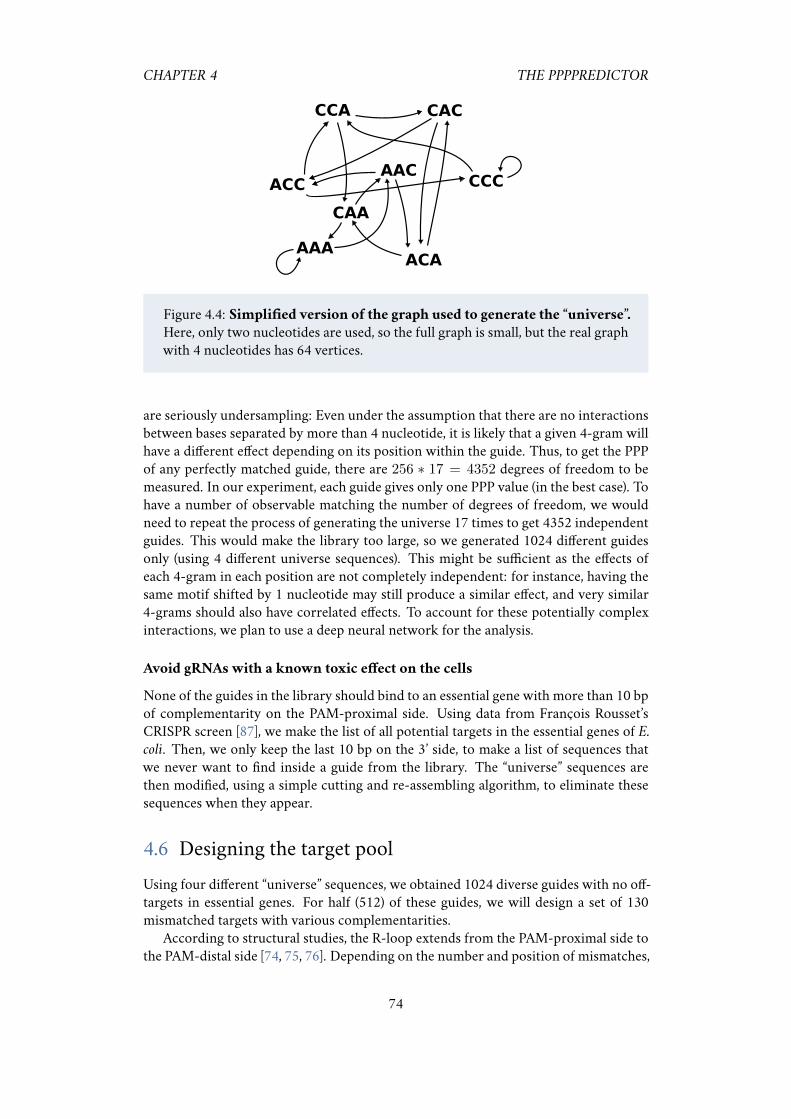
CHAPTER 4 THE PPPPREDICTOR
ACC
CCA
AAAACA
CCC
CAC
AAC
CAA
Figure 4.4: Simplified version of the graph used to generate the “universe”.
Here, only two nucleotides are used, so the full graph is small, but the real graphwith 4 nucleotides has 64 vertices.
are seriously undersampling: Even under the assumption that there are no interactionsbetween bases separated by more than 4 nucleotide, it is likely that a given 4-gram willhave a different effect depending on its position within the guide. Thus, to get the PPPof any perfectly matched guide, there are 256 ∗ 17 = 4352 degrees of freedom to bemeasured. In our experiment, each guide gives only one PPP value (in the best case). Tohave a number of observable matching the number of degrees of freedom, we wouldneed to repeat the process of generating the universe 17 times to get 4352 independentguides. This would make the library too large, so we generated 1024 different guidesonly (using 4 different universe sequences). This might be sufficient as the effects ofeach 4-gram in each position are not completely independent: for instance, having thesame motif shifted by 1 nucleotide may still produce a similar effect, and very similar4-grams should also have correlated effects. To account for these potentially complexinteractions, we plan to use a deep neural network for the analysis.
Avoid gRNAs with a known toxic effect on the cells
None of the guides in the library should bind to an essential gene with more than 10 bpof complementarity on the PAM-proximal side. Using data from François Rousset’sCRISPR screen [87], we make the list of all potential targets in the essential genes of E.coli. Then, we only keep the last 10 bp on the 3’ side, to make a list of sequences thatwe never want to find inside a guide from the library. The “universe” sequences arethen modified, using a simple cutting and re-assembling algorithm, to eliminate thesesequences when they appear.
4.6 Designing the target pool
Using four different “universe” sequences, we obtained 1024 diverse guides with no off-targets in essential genes. For half (512) of these guides, we will design a set of 130mismatched targets with various complementarities.
According to structural studies, the R-loop extends from the PAM-proximal side tothe PAM-distal side [74, 75, 76]. Depending on the number and position of mismatches,
74
CHAPTER 4 THE PPPPREDICTOR
the R-loop may not be fully extended at equilibrium, and will rather be extended onlyup to a certain position along the guide. Thus, a naive model would say that the PPP isdetermined by the affinity of the part of the guide that is effectively annealed to the DNAat the moment of the collision. This affinity can be determined by multiple things, in-cluding the GC-content, the nature of mismatches and the presence of position-specificmotifs that could fit more or less well with dCas9’s molecular structure.
Among the many ways we could introduce mismatches between the target and theguide, only a few are relevant for biotechnological applications. If the mismatches arespread out along the sequence, the R-loopmay be able to overcome them andwe expectthe PPP of such guides to be quite unpredictable. When mismatches are clustered, onthe contrary, it is very unlikely that the R-loop will extend through them. Rather, theR-loop should, in most cases, extend until it reaches the mismatch cluster. If we assumethis, it follows that the sequence that comes after a mismatch cluster will never really beinterrogated, and therefore should not have a tremendously important effect. For mostapplications, it is thus preferable to work with guides that comprise a matching region(of variable length, depending on the desired PPP), followed by a mismatch cluster thatextends until the end of the guide.
In our library, we vary the 3’ complementarity from 8 to 20 bases. It is still possiblethat the few bases directly following the first mismatch have an effect on PPP, especiallyif they are matching the target, so we will also investigate their effect. Thus, with N thenumber of matching bases:
• Base N+1 is mismatched, to each of the 3 other nucleotides (3 combinations)
• Base N+2 is either opposite or matched (2 combinations)
• Base N+3 is either opposite or matched (2 combinations)
• Bases N+4 to 20 are all opposite mismatches (1 combination)
By « opposite » mismatches, we mean that Gs are swapped with Cs, and Ts areswapped with As. By using different ways to select the mismatches, we hope to havemore degrees of freedom for guide design rather than just the number of mismatches.
4.7 Planned analysis
Unfortunately, our first attempt at synthesizing this library did not succeed, as the qual-ity of on-chip synthesis was quite poor and the vast majority of the sequences containederrors, rpreventing any exploitation. Another attempt using amore compact designwillbe done in the future.
In the meantime, the analysis can already be planned. Rather than making assump-tions about the additivity, or multiplicativity, of the effects of different motifs, we planto use a deep neural network such as what was already used in Cui et al. [79]. In addition,a convolutional neural network could be used to identify motifs that influence the PPPregardless of their position within the guide. Using the raw data and the predictionsfrom the model, we can gain mechanistic information about the mechanism of R-loopextension and the outcome of collisions:
• Which features (e.g., GC content) of a motif determine the R-loop transition rates?
75

CHAPTER 4 THE PPPPREDICTOR
• Does the sequence that follow the first mismatch matter for the PPP? Does it de-pend on the nature of the mismatch?
• Does the transition rate change depending of the position of a motif along theguide?
• Is the degree of R-loop extension at equilibrium a good predictor of PPP?
• Can cleavage efficiency be predicted better using the R-loop transition rates?
On a longer term, it is in principle possible to use this library in vitro, for examplein a cell extract, similar to what is used in Marshall et al. [93]. This would allow toeliminate all effects of the CRISPR guides on cell growth, and get a cleaner and moredirect measurement of the passage probabilities.
76
Chapter 5
Class A PBPs maintain cell wallhomeostasis at an intermediate scale in
diderm bacteria
5.1 Introduction
The cylindrical shape of E. coli is determined by the peptidoglycan cell wall, a rigidmolecule that surrounds the bacterium [53, 145]. This two-dimensional polymer ismade of parallel glycan strands organized circumferentially around the cell [36], andpeptide cross-links that connect adjactent glycan strands together. Cell wall polymeri-sation involves two kinds of enzymatic reactions: transglycosylase (TGase) to extend theglycan strands, and transpeptidase (TPase) to create crosslinks between them. These ac-tivities are present in two different sets of machineries: the Rod complex and class APBPs (aPBPs). The Rod complex comprises a variety of proteins (including the essen-tial PBP2 and RodA) that accompany the cytoskeletton MreB in its rotation around thecell [146, 147]. On the other hand, class A PBPs (including the redundantly essentialPBP1A and PBP1B) are not known to follow cytoskeletton motion [147]. PBP1A andPBP1B are bifunctional: each of them carry both the TPase and TGase activities. Im-portantly, PBP1A and 1B need to be activated through the peptidoglycan layer by twoouter-membrane lipoprotein cofactors called LpoA and LpoB [53, 148]. Until recently,only aPBPswere known to possess transglycosylase activity and thuswere thought to bethe main actors of cell wall insertion [149], though it is now known that SEDS proteins(RodA, FtsW) can also perform this activity [150].
While there is evidence for physical interaction and cooperativity between the Rodcomplex and aPBPs [151, 152, 153], each complex remains partially active upon inhibi-tion of the other one. First, in the absence of aPBP activity, the cytoskeletton proteinMreB does not stop its circumferential motion [147], which itself depends on pepti-doglycan polymerisation [49]. Second, when Rod complex activity is abolished by theMreB-depolymerizing drug A22, PBP1B remains partially active [147]. Peptidoglycaninsertion is then reduced by two thirds.
Combined with the fact that both groups are necessary for cell growth, this suggeststhat, in spite of catalysing the same chemical reactions, these two categories of pepti-
77
CHAPTER 5 CLASS A PBPS MAINTAIN CELL WALL HOMEOSTASIS
doglycan polymerases serve different purposes in vivo. Recent work in the monoderm(gram-positive) B. subtillis showed that the Rod complex and aPBPs have opposing ac-tions on cell diameter [133], but it is not known whether this holds true for E. coli.
On the basis of their subcellular localization and interactions, PBP1A is presumedto be involved primarily in cell wall elongation [154] and PBP1B in cell division [152],although each of them is able to complement for the other when it is deleted. Thetwo paralogs also exhibit different pH sensitivities, suggesting that the presence of twoenzymes allows the bacteria to grow over a wider range of pH [? ]. Yet, the precisefunction of PBP1A and PBP1B is currently unknown.
The absence of PBP1B causes a few changes in cellular phenotype: First, strainslacking PBP1B have been shown to have greater mechanical plasticity [155]. They arealsomore sensitive to certain chemicals includingD-methionine [156], mecillinam [157]and A22 [158]. Second, the total peptidoglycan insertion rate is lower in the absence ofPBP1B [159].
To better understand these properties, we systematically change the levels of PBP1Aand PBP1B to well-defined amounts using CRISPR/dCas9 with mismatched guideRNAs. This repression strategy preserves the original noise on gene expression [82],thus facilitating precise gene repression. In addition, it allows observation of cells witha reduced level of the gene(s) of interest during steady-state growth. Compared todepletion experiments, where the concentration of enzymes continuously decreasesuntil cell lysis, steady-state measurements eliminate the effect of transient memory ofcell shape, and leave time for enzyme levels to have repercussions on the peptidoglycan.This is particularly relevant in our case, as it is known that aPBP’s inactivation onlyaffects cell wall synthesis after a 20 min delay [153].
We examine the phenotype of cells at various concentrations of PBP1AB and showthat variations in the level of Rod complex enzymes and aPBPs lead to very differentreactions from the cells. Strikingly, the concentration of enzymes from theRod complexhas direct repercussions on cell shape, while the concentration of aPBPs can be changedover a hundred-fold range with virtually no effect on cell shape or growth rate. Belowthis range, the cells abruptly lyse in an “all-or-nothing” behavior.
It is tempting to think that themechanical and chemical defects observed in∆PBP1Bare the consequence of a thinner or sparser cell wall, but this has never been verified.Here, we nuance this hypothesis by creating cells with low levels of PBP1AB, that insertpeptidoglycan at the normal rate but still exhibit alteredmechanical properties. Further-more, by submitting cells to the depletion of cytoplasmic precursors of the cell wall, weshow that PBP1B is important not only to protect cells from subsequent stress, but alsoto recover from the damage after the stress.
By measuring the motion of single molecules, we show that aPBPs are increasinglyimmobile with increasing need for cell wall insertion or with increasing LpoAB levels,providing direct quantification of the interplay between the cell wall, aPBPs and theirouter-membrane activators LpoA and B.
This suggests that PBP1AB are required to maintain the integrity and structural or-ganization of the peptidoglycan on a local scale.
78
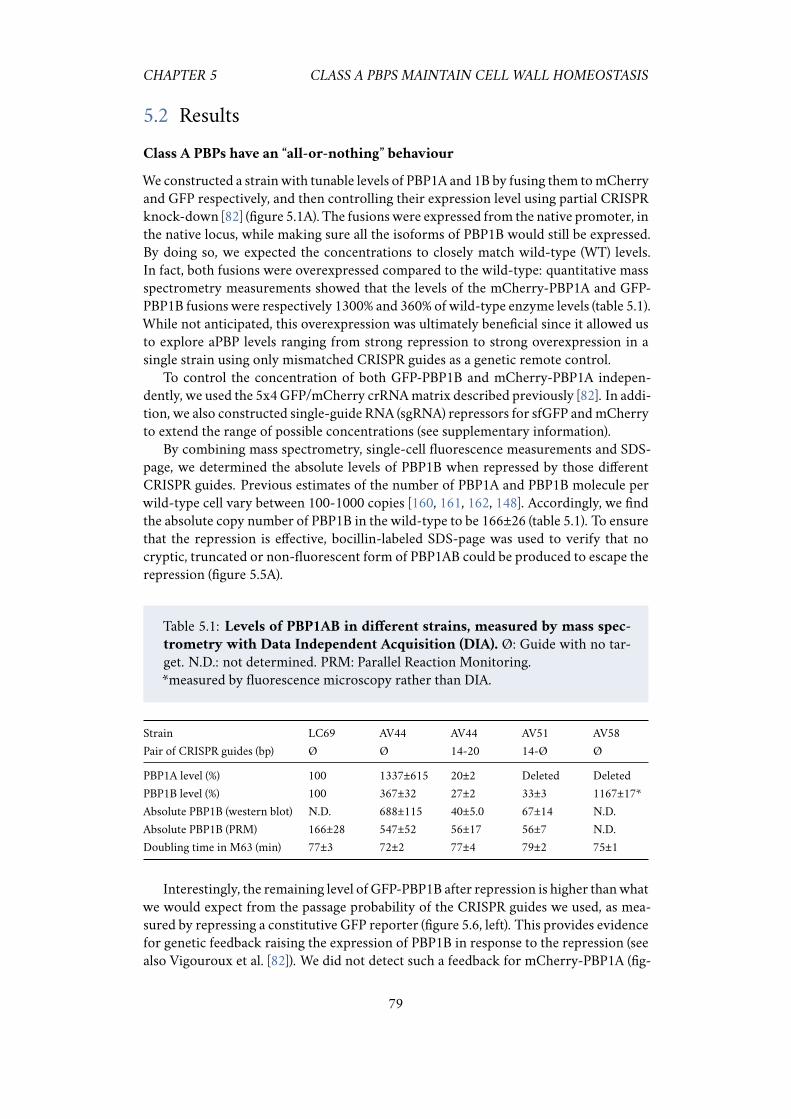
CHAPTER 5 CLASS A PBPS MAINTAIN CELL WALL HOMEOSTASIS
5.2 Results
Class A PBPs have an “all-or-nothing” behaviour
We constructed a strainwith tunable levels of PBP1A and 1B by fusing them tomCherryand GFP respectively, and then controlling their expression level using partial CRISPRknock-down [82] (figure 5.1A). The fusionswere expressed from the native promoter, inthe native locus, while making sure all the isoforms of PBP1B would still be expressed.By doing so, we expected the concentrations to closely match wild-type (WT) levels.In fact, both fusions were overexpressed compared to the wild-type: quantitative massspectrometry measurements showed that the levels of the mCherry-PBP1A and GFP-PBP1B fusions were respectively 1300% and 360% of wild-type enzyme levels (table 5.1).While not anticipated, this overexpression was ultimately beneficial since it allowed usto explore aPBP levels ranging from strong repression to strong overexpression in asingle strain using only mismatched CRISPR guides as a genetic remote control.
To control the concentration of both GFP-PBP1B and mCherry-PBP1A indepen-dently, we used the 5x4 GFP/mCherry crRNAmatrix described previously [82]. In addi-tion, we also constructed single-guide RNA (sgRNA) repressors for sfGFP andmCherryto extend the range of possible concentrations (see supplementary information).
By combining mass spectrometry, single-cell fluorescence measurements and SDS-page, we determined the absolute levels of PBP1B when repressed by those differentCRISPR guides. Previous estimates of the number of PBP1A and PBP1B molecule perwild-type cell vary between 100-1000 copies [160, 161, 162, 148]. Accordingly, we findthe absolute copy number of PBP1B in the wild-type to be 166±26 (table 5.1). To ensurethat the repression is effective, bocillin-labeled SDS-page was used to verify that nocryptic, truncated or non-fluorescent form of PBP1AB could be produced to escape therepression (figure 5.5A).
Table 5.1: Levels of PBP1AB in different strains, measured by mass spec-
trometry with Data Independent Acquisition (DIA). Ø: Guide with no tar-get. N.D.: not determined. PRM: Parallel Reaction Monitoring.*measured by fluorescence microscopy rather than DIA.
Strain LC69 AV44 AV44 AV51 AV58Pair of CRISPR guides (bp) Ø Ø 14-20 14-Ø Ø
PBP1A level (%) 100 1337±615 20±2 Deleted DeletedPBP1B level (%) 100 367±32 27±2 33±3 1167±17*Absolute PBP1B (western blot) N.D. 688±115 40±5.0 67±14 N.D.Absolute PBP1B (PRM) 166±28 547±52 56±17 56±7 N.D.Doubling time in M63 (min) 77±3 72±2 77±4 79±2 75±1
Interestingly, the remaining level of GFP-PBP1B after repression is higher thanwhatwe would expect from the passage probability of the CRISPR guides we used, as mea-sured by repressing a constitutive GFP reporter (figure 5.6, left). This provides evidencefor genetic feedback raising the expression of PBP1B in response to the repression (seealso Vigouroux et al. [82]). We did not detect such a feedback for mCherry-PBP1A (fig-
79
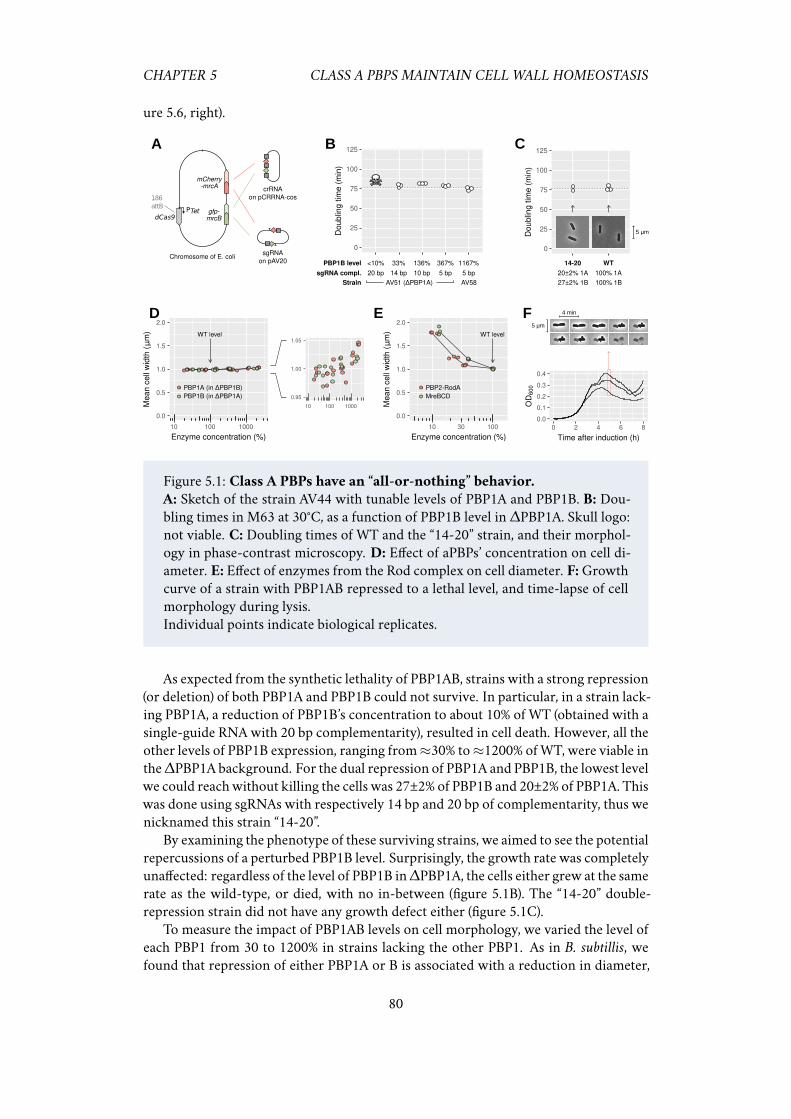
CHAPTER 5 CLASS A PBPS MAINTAIN CELL WALL HOMEOSTASIS
ure 5.6, right).
5 μm
4 min
Time after induction (h)
0.0
0.1
0.2
0.3
0.4
0 2 4 6 8
OD
60
0
dCas9PTet
186attB
sgRNAon pAV20
Chromosome of E. coli
mCherry-mrcA
gfp-mrcB
crRNAon pCRRNA-cos
A B C
D E F WT level
0.0
0.5
1.0
1.5
2.0
10 30 100
Enzyme concentration (%)
Mean c
ell
wid
th (μ
m)
PBP2-RodA
MreBCD0.95
1.00
1.05
10 100 1000
WT level
0.0
0.5
1.0
1.5
2.0
10 100 1000
Enzyme concentration (%)
Mea
n c
ell
wid
th (μ
m)
PBP1A (in ΔPBP1B)
PBP1B (in ΔPBP1A)
0
25
50
75
100
125
20 bp
Doublin
g tim
e (
min
)
14 bp 10 bp 5 bp 5 bp
AV51 (ΔPBP1A) AV58
<10% 33% 136% 367% 1167%
sgRNA compl.
PBP1B level
Strain
5 μm
0
25
50
75
100
125
Doublin
g tim
e (
min
)
20±2% 1A
27±2% 1B
14-20
100% 1A
100% 1B
WT
Figure 5.1: Class A PBPs have an “all-or-nothing” behavior.
A: Sketch of the strain AV44 with tunable levels of PBP1A and PBP1B. B: Dou-bling times in M63 at 30°C, as a function of PBP1B level in ∆PBP1A. Skull logo:not viable. C: Doubling times of WT and the “14-20” strain, and their morphol-ogy in phase-contrast microscopy. D: Effect of aPBPs’ concentration on cell di-ameter. E: Effect of enzymes from the Rod complex on cell diameter. F:Growthcurve of a strain with PBP1AB repressed to a lethal level, and time-lapse of cellmorphology during lysis.Individual points indicate biological replicates.
As expected from the synthetic lethality of PBP1AB, strains with a strong repression(or deletion) of both PBP1A and PBP1B could not survive. In particular, in a strain lack-ing PBP1A, a reduction of PBP1B’s concentration to about 10% of WT (obtained with asingle-guide RNA with 20 bp complementarity), resulted in cell death. However, all theother levels of PBP1B expression, ranging from≈30% to≈1200% ofWT, were viable inthe∆PBP1A background. For the dual repression of PBP1A and PBP1B, the lowest levelwe could reachwithout killing the cells was 27±2% of PBP1B and 20±2% of PBP1A. Thiswas done using sgRNAs with respectively 14 bp and 20 bp of complementarity, thus wenicknamed this strain “14-20”.
By examining the phenotype of these surviving strains, we aimed to see the potentialrepercussions of a perturbed PBP1B level. Surprisingly, the growth rate was completelyunaffected: regardless of the level of PBP1B in∆PBP1A, the cells either grew at the samerate as the wild-type, or died, with no in-between (figure 5.1B). The “14-20” double-repression strain did not have any growth defect either (figure 5.1C).
To measure the impact of PBP1AB levels on cell morphology, we varied the level ofeach PBP1 from 30 to 1200% in strains lacking the other PBP1. As in B. subtillis, wefound that repression of either PBP1A or B is associated with a reduction in diameter,
80
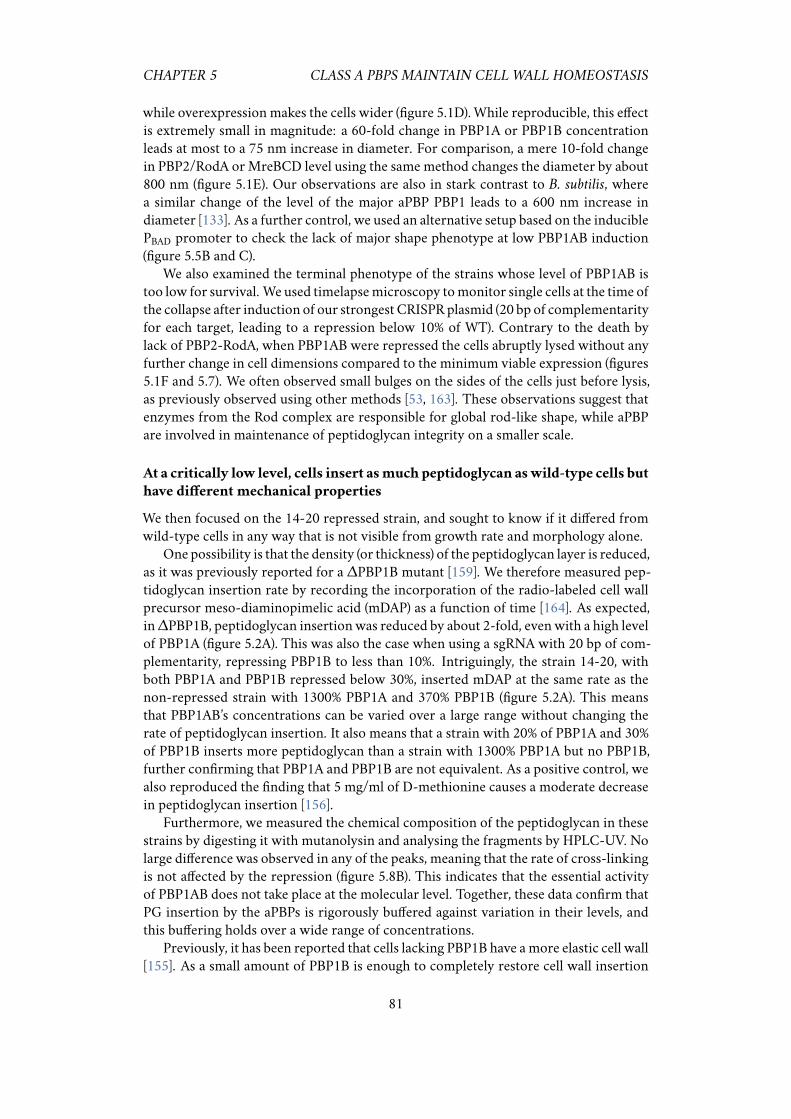
CHAPTER 5 CLASS A PBPS MAINTAIN CELL WALL HOMEOSTASIS
while overexpression makes the cells wider (figure 5.1D). While reproducible, this effectis extremely small in magnitude: a 60-fold change in PBP1A or PBP1B concentrationleads at most to a 75 nm increase in diameter. For comparison, a mere 10-fold changein PBP2/RodA orMreBCD level using the same method changes the diameter by about800 nm (figure 5.1E). Our observations are also in stark contrast to B. subtilis, wherea similar change of the level of the major aPBP PBP1 leads to a 600 nm increase indiameter [133]. As a further control, we used an alternative setup based on the induciblePBAD promoter to check the lack of major shape phenotype at low PBP1AB induction(figure 5.5B and C).
We also examined the terminal phenotype of the strains whose level of PBP1AB istoo low for survival. We used timelapsemicroscopy tomonitor single cells at the time ofthe collapse after induction of our strongest CRISPR plasmid (20 bp of complementarityfor each target, leading to a repression below 10% of WT). Contrary to the death bylack of PBP2-RodA, when PBP1AB were repressed the cells abruptly lysed without anyfurther change in cell dimensions compared to the minimum viable expression (figures5.1F and 5.7). We often observed small bulges on the sides of the cells just before lysis,as previously observed using other methods [53, 163]. These observations suggest thatenzymes from the Rod complex are responsible for global rod-like shape, while aPBPare involved in maintenance of peptidoglycan integrity on a smaller scale.
At a critically low level, cells insert asmuch peptidoglycan aswild-type cells but
have different mechanical properties
We then focused on the 14-20 repressed strain, and sought to know if it differed fromwild-type cells in any way that is not visible from growth rate and morphology alone.
One possibility is that the density (or thickness) of the peptidoglycan layer is reduced,as it was previously reported for a ∆PBP1B mutant [159]. We therefore measured pep-tidoglycan insertion rate by recording the incorporation of the radio-labeled cell wallprecursor meso-diaminopimelic acid (mDAP) as a function of time [164]. As expected,in∆PBP1B, peptidoglycan insertionwas reduced by about 2-fold, evenwith a high levelof PBP1A (figure 5.2A). This was also the case when using a sgRNA with 20 bp of com-plementarity, repressing PBP1B to less than 10%. Intriguingly, the strain 14-20, withboth PBP1A and PBP1B repressed below 30%, inserted mDAP at the same rate as thenon-repressed strain with 1300% PBP1A and 370% PBP1B (figure 5.2A). This meansthat PBP1AB’s concentrations can be varied over a large range without changing therate of peptidoglycan insertion. It also means that a strain with 20% of PBP1A and 30%of PBP1B inserts more peptidoglycan than a strain with 1300% PBP1A but no PBP1B,further confirming that PBP1A and PBP1B are not equivalent. As a positive control, wealso reproduced the finding that 5 mg/ml of D-methionine causes a moderate decreasein peptidoglycan insertion [156].
Furthermore, we measured the chemical composition of the peptidoglycan in thesestrains by digesting it with mutanolysin and analysing the fragments by HPLC-UV. Nolarge difference was observed in any of the peaks, meaning that the rate of cross-linkingis not affected by the repression (figure 5.8B). This indicates that the essential activityof PBP1AB does not take place at the molecular level. Together, these data confirm thatPG insertion by the aPBPs is rigorously buffered against variation in their levels, andthis buffering holds over a wide range of concentrations.
Previously, it has been reported that cells lacking PBP1B have amore elastic cell wall[155]. As a small amount of PBP1B is enough to completely restore cell wall insertion
81
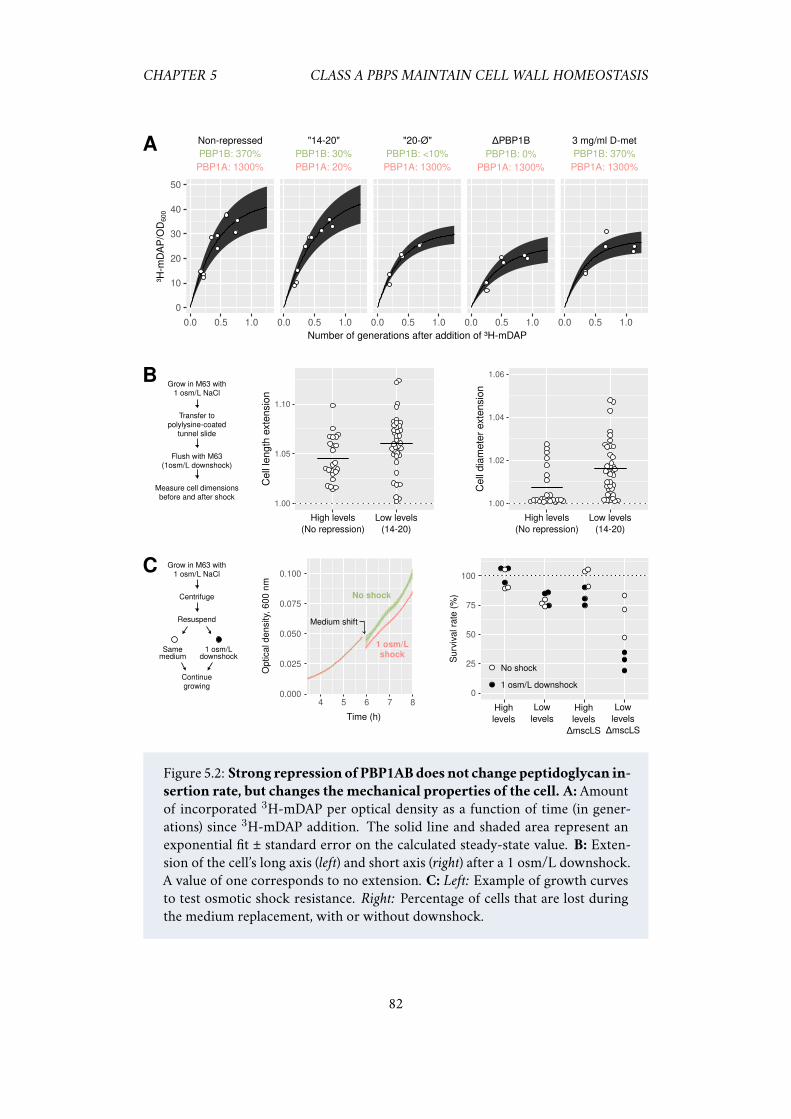
CHAPTER 5 CLASS A PBPS MAINTAIN CELL WALL HOMEOSTASIS
Grow in M63 with1 osm/L NaCl
Centrifuge
Resuspend
Continuegrowing
Samemedium
1 osm/Ldownshock
Grow in M63 with1 osm/L NaCl
Transfer topolylysine-coated
tunnel slide
Flush with M63(1osm/L downshock)
Measure cell dimensionsbefore and after shock
A
B
1.00
1.05
1.10
Cell
len
gth
exte
nsio
n
Low levels(14-20)
High levels(No repression)
1.00
1.02
1.04
1.06
Cell
dia
mete
r exte
nsio
n
Low levels(14-20)
High levels(No repression)
Medium shift
0.000
0.025
0.050
0.075
0.100
4 5 6 7 8
No shock
1 osm/Lshock
Time (h)
Optic
al d
en
sity
, 600 n
m
0
25
50
75
100
1 osm/L downshock
No shock
Highlevels
Lowlevels
Highlevels
ΔmscLS
Lowlevels
ΔmscLS
Surv
ival r
ate
(%
)
0.0 0.5 1.0 0.0 0.5 1.0 0.0 0.5 1.0 0.0 0.5 1.0 0.0 0.5 1.0
0
10
20
30
40
50
PBP1A: 1300%
PBP1B: 370%
PBP1A: 20%
PBP1B: 30%
PBP1A: 1300%
PBP1B: 0%
PBP1A: 1300%
PBP1B: <10%
PBP1A: 1300%
PBP1B: 370%
3 mg/ml D-met"14-20"Non-repressed "20-Ø" ΔPBP1B
Number of generations after addition of ³H-mDAP
³H-m
DA
P/O
D6
00
C
Figure 5.2: Strong repression of PBP1ABdoes not change peptidoglycan in-
sertion rate, but changes themechanical properties of the cell. A: Amountof incorporated 3H-mDAP per optical density as a function of time (in gener-ations) since 3H-mDAP addition. The solid line and shaded area represent anexponential fit ± standard error on the calculated steady-state value. B: Exten-sion of the cell’s long axis (left) and short axis (right) after a 1 osm/L downshock.A value of one corresponds to no extension. C: Left: Example of growth curvesto test osmotic shock resistance. Right: Percentage of cells that are lost duringthe medium replacement, with or without downshock.
82
CHAPTER 5 CLASS A PBPS MAINTAIN CELL WALL HOMEOSTASIS
rate, we sought to know whether it also restores normal mechanical properties. Onemethod to measure the elasticity of cell surface is to submit the cells to an osmoticdownshock. The sudden intake of water causes the cell to expand, and the differencein cell size before and after the shock allows to estimate the rigidity of the cell wall[165]. To make the expansion more visible, we deleted the mechano-sensitive channelsmscS and mscL that normally open after a shock to equilibrate the osmotic pressure. Adownshock going fromM63 supplemented with 1 osm/L of NaCl, to normal M63 wasperformed in a “tunnel slide” setup [165]. As the fluorescence from the GFP-PBP1Band mCherry-PBP1A fusions is sufficient to distinguish the non-repressed strain fromthe repressed one, we pooled both strains in the same tunnel slide and used single-cellfluorescence to identify the two genotypes during analysis. This way, we ensure that thetemporal dynamics andmagnitude of the osmotic shock were exactly the same for bothstrain, greatly improving the sensitivity of the measurement. When PBP1A and PBP1Bare strongly repressed (strain 14-20), both the axial and circumferential elasticity of thecell are larger than in the non-repressed case, indicating structural differences in the cellwall (figure 5.2B). For both the repressed and non-repressed strains, the expansion alongthe long axis of the cells was much larger than along the short axis. This is presumablydue to the greater elasticity of peptide crosslinks compared to the glycan strands [166].
To rapidly quantify the survival of our strains after an osmotic shock, we developeda simple assay based on optical density in a plate reader: the cells are grown in a high-osmolarity (1 osm/L NaCl) medium up to an optical density of 0.1, then the medium iswashed away and replaced either with the same salted medium (no osmotic shock) orwith normal medium (1 osm/L downshock). We then continue to monitor growth andestimate the fraction of cells that stopped growing by fitting an exponential curve beforeand after the shock (figure 5.2C). When bothmechanosensitive channels are present, wedo not detect any difference between the two resuspension media, meaning that mostcells survived the osmotic downshock (black dots versus white dots in Fig. 5.2C), evenat a low level of PBP1AB. In the ∆mscLS strain, however, the osmotic shock caused thedeath of a large fraction of the cells, especially for the repressed strain, where about twothirds of the cells died due to the shock. In contrast, at high PBP1AB levels, only 20% ofthe cells died from the shock.
Surprisingly, the 14-20 repressed strain showed some significant mortality even inthe absence of any osmotic shock, when the cells were simply pelleted and resuspendedin an identical medium (white dots in figure 5.2C). While this washout process had noeffect on the strain with high PBP1AB, about 25% of the cells were lost in the repressedcase. This suggests that cellswith lowPBP1AB aremore vulnerable to the centrifugationor resuspension step, or have lower adherence. Interestingly, this happened regardlessof the presence of the mechano-sensitive channels MscLS.
It is counter-intuitive that cells with normal peptidoglycan insertion rate can havealtered mechanical properties. This indicates that, at low PBP1B levels, peptidoglycanpolymerization is quantitatively normal, but qualitatively different, in the sense that thestructural organization of the peptidoglycan is altered.
PBP1B maintains cell wall integrity and repairs it after stress
Themaintenance of cell wall integrity englobes two different tasks: First, PBP1AB couldhave a preventive effect, making the cell wall more resistant and less likely to break dur-ing stress. Second, PBP1AB could have a repair function and help restore peptidoglycanintegrity after a damaging event.
83
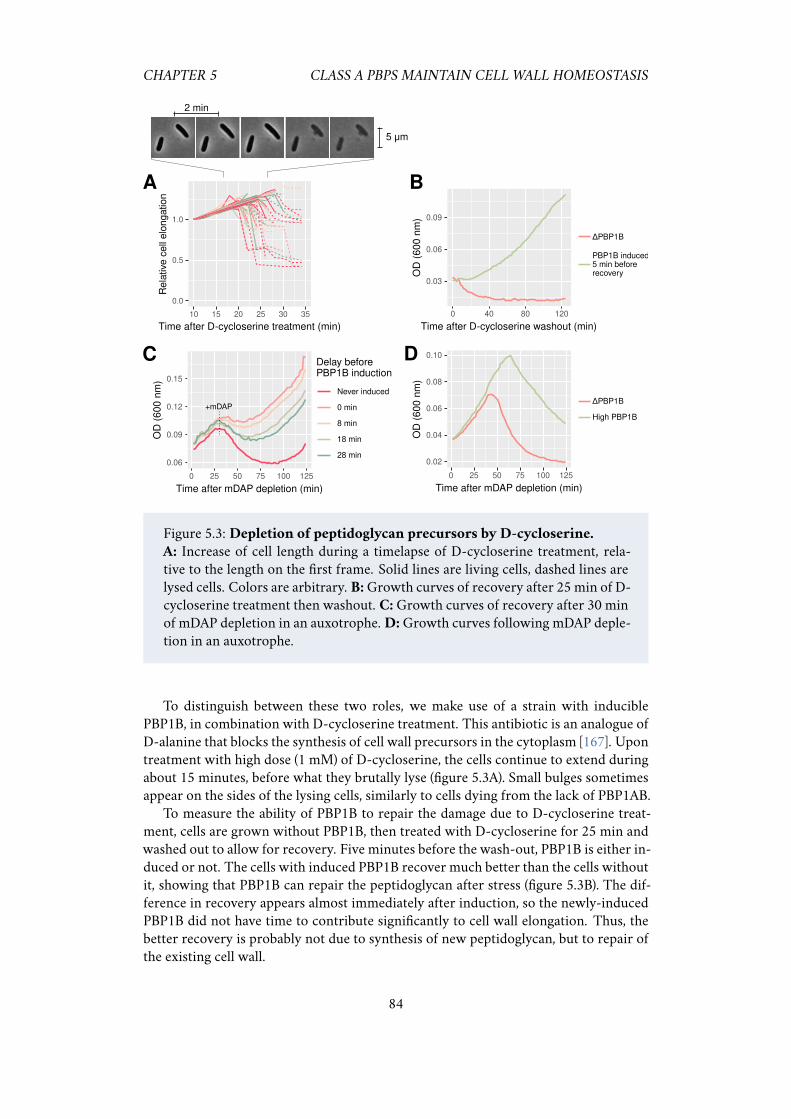
CHAPTER 5 CLASS A PBPS MAINTAIN CELL WALL HOMEOSTASIS
2 min
5 μm
A B
C
0.0
0.5
1.0
10 15 20 25 30 35
Rela
tive
cell
elo
ngatio
n
0.02
0.04
0.06
0.08
0.10
OD
(600 n
m)
0 25 50 75 100 125
Time after mDAP depletion (min)
ΔPBP1B
High PBP1B
0.06
0.09
0.12
0.15
OD
(600 n
m)
+mDAP
0 25 50 75 100 125
Time after mDAP depletion (min)
Delay beforePBP1B induction
Never induced
0 min
8 min
18 min
28 min
0.03
0.06
0.09
OD
(600 n
m)
0 40 80 120
Time after D-cycloserine washout (min)
PBP1B induced5 min beforerecovery
PBP1BΔ
Time after D-cycloserine treatment (min)
D
Figure 5.3: Depletion of peptidoglycan precursors by D-cycloserine.
A: Increase of cell length during a timelapse of D-cycloserine treatment, rela-tive to the length on the first frame. Solid lines are living cells, dashed lines arelysed cells. Colors are arbitrary. B:Growth curves of recovery after 25 min of D-cycloserine treatment then washout. C:Growth curves of recovery after 30 minof mDAP depletion in an auxotrophe. D:Growth curves following mDAP deple-tion in an auxotrophe.
To distinguish between these two roles, we make use of a strain with induciblePBP1B, in combination with D-cycloserine treatment. This antibiotic is an analogue ofD-alanine that blocks the synthesis of cell wall precursors in the cytoplasm [167]. Upontreatment with high dose (1 mM) of D-cycloserine, the cells continue to extend duringabout 15 minutes, before what they brutally lyse (figure 5.3A). Small bulges sometimesappear on the sides of the lysing cells, similarly to cells dying from the lack of PBP1AB.
To measure the ability of PBP1B to repair the damage due to D-cycloserine treat-ment, cells are grown without PBP1B, then treated with D-cycloserine for 25 min andwashed out to allow for recovery. Five minutes before the wash-out, PBP1B is either in-duced or not. The cells with induced PBP1B recover much better than the cells withoutit, showing that PBP1B can repair the peptidoglycan after stress (figure 5.3B). The dif-ference in recovery appears almost immediately after induction, so the newly-inducedPBP1B did not have time to contribute significantly to cell wall elongation. Thus, thebetter recovery is probably not due to synthesis of new peptidoglycan, but to repair ofthe existing cell wall.
84
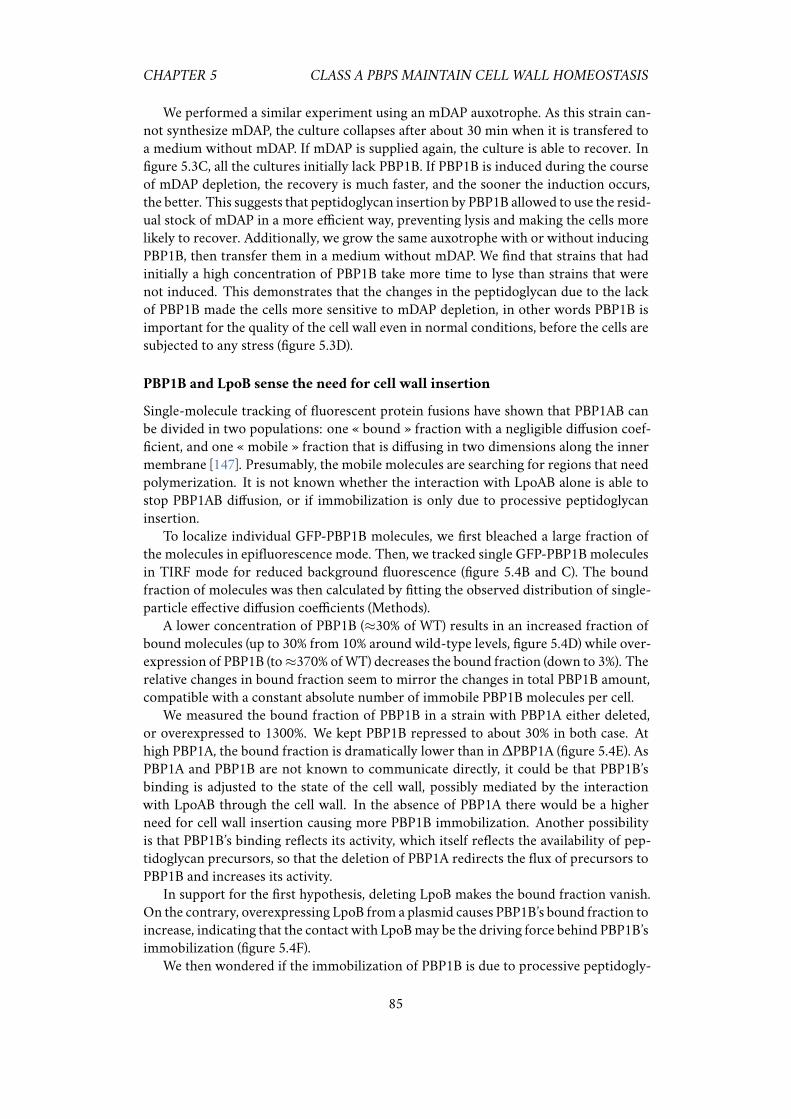
CHAPTER 5 CLASS A PBPS MAINTAIN CELL WALL HOMEOSTASIS
We performed a similar experiment using an mDAP auxotrophe. As this strain can-not synthesize mDAP, the culture collapses after about 30 min when it is transfered toa medium without mDAP. If mDAP is supplied again, the culture is able to recover. Infigure 5.3C, all the cultures initially lack PBP1B. If PBP1B is induced during the courseof mDAP depletion, the recovery is much faster, and the sooner the induction occurs,the better. This suggests that peptidoglycan insertion by PBP1B allowed to use the resid-ual stock of mDAP in a more efficient way, preventing lysis and making the cells morelikely to recover. Additionally, we grow the same auxotrophe with or without inducingPBP1B, then transfer them in a medium without mDAP. We find that strains that hadinitially a high concentration of PBP1B take more time to lyse than strains that werenot induced. This demonstrates that the changes in the peptidoglycan due to the lackof PBP1B made the cells more sensitive to mDAP depletion, in other words PBP1B isimportant for the quality of the cell wall even in normal conditions, before the cells aresubjected to any stress (figure 5.3D).
PBP1B and LpoB sense the need for cell wall insertion
Single-molecule tracking of fluorescent protein fusions have shown that PBP1AB canbe divided in two populations: one « bound » fraction with a negligible diffusion coef-ficient, and one « mobile » fraction that is diffusing in two dimensions along the innermembrane [147]. Presumably, the mobile molecules are searching for regions that needpolymerization. It is not known whether the interaction with LpoAB alone is able tostop PBP1AB diffusion, or if immobilization is only due to processive peptidoglycaninsertion.
To localize individual GFP-PBP1B molecules, we first bleached a large fraction ofthe molecules in epifluorescence mode. Then, we tracked single GFP-PBP1Bmoleculesin TIRF mode for reduced background fluorescence (figure 5.4B and C). The boundfraction of molecules was then calculated by fitting the observed distribution of single-particle effective diffusion coefficients (Methods).
A lower concentration of PBP1B (≈30% of WT) results in an increased fraction ofbound molecules (up to 30% from 10% around wild-type levels, figure 5.4D) while over-expression of PBP1B (to≈370% ofWT) decreases the bound fraction (down to 3%). Therelative changes in bound fraction seem to mirror the changes in total PBP1B amount,compatible with a constant absolute number of immobile PBP1B molecules per cell.
We measured the bound fraction of PBP1B in a strain with PBP1A either deleted,or overexpressed to 1300%. We kept PBP1B repressed to about 30% in both case. Athigh PBP1A, the bound fraction is dramatically lower than in∆PBP1A (figure 5.4E). AsPBP1A and PBP1B are not known to communicate directly, it could be that PBP1B’sbinding is adjusted to the state of the cell wall, possibly mediated by the interactionwith LpoAB through the cell wall. In the absence of PBP1A there would be a higherneed for cell wall insertion causing more PBP1B immobilization. Another possibilityis that PBP1B’s binding reflects its activity, which itself reflects the availability of pep-tidoglycan precursors, so that the deletion of PBP1A redirects the flux of precursors toPBP1B and increases its activity.
In support for the first hypothesis, deleting LpoB makes the bound fraction vanish.On the contrary, overexpressing LpoB from a plasmid causes PBP1B’s bound fraction toincrease, indicating that the contact with LpoBmay be the driving force behind PBP1B’simmobilization (figure 5.4F).
We then wondered if the immobilization of PBP1B is due to processive peptidogly-
85
CHAPTER 5 CLASS A PBPS MAINTAIN CELL WALL HOMEOSTASIS
C D
B
PBP1A: DeletedPBP1A levels
PBP1B: 30% of WT
LpoB levels
PBP1A: ~WT / PBP1B: ~WT
PBP1B: 30%ΔPBP1A
Fre
quen
cy (
%)
Apparent diffusioncoefficient (μm²/s)
GFP-PBP1B trackingPBP1B: 370%ΔPBP1A
GFP-PBP1B tracking
Fre
quen
cy (
%)
E
A
PBP1B levels
0
10
20
30
40
50
0.00 0.05 0.10
0
10
20
30
40
50
Overexp. WT Repressed
Bo
un
d f
ractio
n (
%)
0.0
2.5
5.0
7.5
10.0
Overexp. WT Deleted
Bo
un
d f
ractio
n (
%)
0
10
20
30
40
50
Overexp. Deleted
Bo
un
d f
ractio
n (
%)
0
10
20
30
40
50
0.00 0.05 0.10
0
20
40
60
Bo
un
d f
ractio
n (
%)
Initial Treatment Recovery
-30 0 30 60 90
Time after treatment (min)
0
25
50
75
100 Initial Treatment Recovery
-30 0 30 60 90
Time after treatment (min)
F G
Dead cell
Living cell
Apparent diffusioncoefficient (μm²/s)
H
Diff
usio
n c
oe
fficie
nt
(×1
0⁻³
μm
²/s)
Figure 5.4: PBP1B’s bound fraction adapts to the need for PG synthesis.
A, B: Sample tracks of GFP-PBP1B within the cells, and distribution of apparentdiffusion coefficients. C, D, E: Calculated bound fraction of PBP1B at differentlevels of PBP1B, PBP1A or LpoB. F: Propidium iodide allows to exclude deadcells from the analysis. G: Bound fraction andH: diffusion coefficient of PBP1Bduring D-cycloserine treatment. The vertical black ticks are the time when wetook samples for microscopy. Circle size reflects the number of tracks per point,ranging from 200 to 1500.
86
CHAPTER 5 CLASS A PBPS MAINTAIN CELL WALL HOMEOSTASIS
can insertion, or if it simply reflects the demand for cell wall insertion, perhaps throughstable interaction with LpoB. We performed single-molecule tracking at three steps ofD-cycloserine treatment: before adding the drug, during the treatment and after wash-ing out the antibiotic, all in the absence of PBP1A. As we expected some cells to diebecause of D-cycloserine, we stained the cells with the vital dye propidium iodide todistinguish living cells from lysed ones (figure 5.3F).
During treatment, the bound fraction of PBP1B goes up to 35-40% compared to 20%for untreated cells (figure 5.3C). This confirms the hypothesis that PBP1B diffusion isgoverned by the state of the cell wall and not by PBP1’s activity or precursor availabil-ity, as it is impossible for it to perform cell wall synthesis in the absence of precursors.However, it does not exclude that PBP1B can have some repair activity using just thematerial already present in the cell wall. At the same time, the diffusion coefficient goesdown, from 0.050 to 0.025 µm2/s (figure 5.3D). After washing the D-cycloserine away,the production of lipid II starts again, allowing the cells to recover. During recovery, thebound fraction remains as high as during treatment, however the diffusion coefficientincreases again to pre-treatment values.
These observations support the following model: upon precursor depletion, the hy-drolases continue to cleave the peptidoglycan for cell wall elongation, uncovering LpoBmolecules from the outer membrane. When PBP1B encounters LpoB, it immobilizes.If the D-cycloserine treatment is prolonged, the cells eventually lyse. If it is washed out,newly synthesized precursors can be incorporated and the cell continues to grow, soPBP1B’s bound fraction remains high. Such a model would explain why the amount ofPBP1B is important for recovery: when cell wall precursors become available again, thedemand for cell wall insertion is high and a higher PBP1B concentration allows the cellto catch up quicker.
5.3 Discussion
Using a systematic CRISPR knock-down strategy, we investigated the importance ofaPBP’s concentration in E. coli. Overall, class A PBPs have an “all-or-nothing” behaviour.We estimated the minimum amount of PBP1A and PBP1B for survival to be around20%. Below this level, the cultures lysed a few hours after induction. All the other levelsgrew at the same speed as the wild-type. For the surviving strains, we did not find anylarge variation of cell dimensions. Upon careful examination, the level of PBP1AB ispositively correlated with cell diameter, something that was also observed in B. subtilis[133], but the magnitude of the effect was much smaller.
Focusing on a strain called “14-20”, that expresses critically low amounts of PBP1A(20%) and PBP1B (30%), we find that it inserts as much peptidoglycan as the wild-typebut has different mechanical properties. It is more elastic and less resistant to osmoticshocks than wild-type. This indicates that the repression of class A PBPs affects the cellnot by reducing peptidoglycan polymerization, but by doing so in a structurally differ-ent way. By examining how cells react to the depletion of peptidoglycan precursors, weshowed that PBP1B was at the same time capable of making the cell more resistant tofuture damage, but also to repair the damage once it is done.
In our experiments and others, the deletion of PBP1B resulted in stronger pheno-types than the deletion of PBP1A (in insertion rate, elasticity, antibiotic sensitivity). Thiscould mean that PBP1B is intrinsically more important than PBP1A, but may also de-pend on the experimental conditions, such as pH [? ]. Perhaps, in certain ranges of pH,
87
CHAPTER 5 CLASS A PBPS MAINTAIN CELL WALL HOMEOSTASIS
the absence of PBP1A has a larger effect on cell stiffness.Wemeasured the 2D-diffusion of PBP1B at the single-molecule level, and found that
the immobile fraction of PBP1B increases or decreases depending of the total concen-tration, so that the number of bound molecules is roughly constant. The lack of PBP1Aalso causes an increase in PBP1B bound fraction, showing that PBP1B’s mobility adaptsto the need for cell wall insertion. During precursors depletion by D-cycloserine, thebound fraction of PBP1B becomes higher, confirming that it is the state of the cell wall,and not the polymerization activity, that determines immobilization. This change in dif-fusion dynamics is likely mediated by LpoB, as the deletion of LpoB greatly decreasesthe immobile fraction of PBP1B.
There are large discrepancies between our single-molecule tracking measurementson PBP1B, and similar measurements from Lee et al. [168]. First, they found that thedeletion of PBP1A did not change the diffusion coefficient of single PBP1B molecules,while we find that it causes quite a large increase in bound fraction. Second, they findthat removing LpoB did not change PBP1B’s diffusion coefficient either. This is sur-prising, as they observed a large increase in PBP1A’s diffusion coefficient when LpoA isdeleted. In our measurements, a deletion of LpoB makes PBP1B’s bound fraction dis-appear, so the average diffusion coefficient would be higher. A likely explanation forthis discrepancy is that Lee et al. fused the PAmCherry fluorescent protein to PBP1Bin its native chromosomal locus, very similarly to the native GFP-PBP1B fusion we usein this study. It is possible that the fusion largely increased the level of PBP1B in theirstrain, exactly like it did in ours. At a very large level of PBP1B, most molecules arediffusive and it becomes very difficult to see differences in bound fraction, somethingthat we saw ourselves when working with overexpressed GFP-PBP1B. If this explana-tion is true, then both PBP1A and PBP1B’s diffusion are affected by LpoA and LpoBrespectively, a result that seems more plausible biologically.
At a critically low level of PBP1AB (in the 14-20 strain), there is no difference withthe wild-type in terms of peptidoglycan insertion rate, density of cross-linking, and cellmorphology. However, the mechanical properties of the cells are modified. This indi-cates that class A PBPs maintain the local integrity of the peptidoglycan at an intermedi-ate spatial scale, larger than the molecular scale but smaller than the general rod-shape.The defect in elasticity could come from a difference in length or orientation of glycanstrands, or in homogeneity of the cross-linking rate across the cell surface.
When the polymerases from the Rod complex are lacking, the orientation of glycanstrands is disorganised [169], something that was also observed in B. subtilis [133]. AsPBP1AB are not known to co-localize with the rotating cytoskeletton MreB, it seemsthat PBP1AB insert glycan strands in a randomorientation, contrary to theRod complexwhich extends glycan strands circumferentially. One can speculate that the aPBPs makehomogeneous, but disorganized cell wall, while the Rod complex makes well-alignedcell wall, but does not know where to insert it to have an homogeneous density. Po-tentially, these two systems could act in a synergistic way, each of them extending orreinforcing strands initiated by the other. This model is compatible with the terminalphenotypes we observe: When there is no class A PBPs, some points in the cell wall be-come too fragile and bulges appear around the cell (as in figure 5.1F). When there is noRod complex, the cell wall is resistant and there are no bulges, but there is no large-scaleorganization, as the class A PBPs are not able to sense the general geometry of the cell.
While aPBPs may not be involved in rod-shape determination, they may still play arole in the sensing of mechanical strain and be important for the straightening of cells
88
CHAPTER 5 CLASS A PBPS MAINTAIN CELL WALL HOMEOSTASIS
after bending [51]. These hypotheses will be interesting to explore in the future.
5.4 Experimental procedures
Strains and media
All the strains and plasmids used in this study are described in the supplementary text.Cloning and strain preparation were done in Luria-Bertani (LB) medium. Unless men-tionned otherwise, every measurement was done in M63 minimal medium with 0.2%glucose, 0.1% casaminoacids and 0.5% thiamine. To induce the Pbad promoter, we used0.5% lactose instead of glucose as a carbon source. For single-molecule tracking, theconcentration of casaminoacids was reduced to 0.01% tominimize background fluores-cence.
As needed, media were supplemented with kanamycine (50 µg/ml), carbenicilline(100µg/ml), chloramphenicol (25µg/ml) or spectinomycine (50µg/ml), all from Sigma-Aldrich. CRISPR repression is induced with 100 ng/ml of anhydro-tetracycline (AcrosOrganics). For overexpression of PBP1A, PBP1B or LpoB from Pbad, 10 mg/ml of arabi-nose were added to the medium. The concentration of propidium iodide used to revealdead cells was 0.4 µM.
Biological replicates result from independent cultures grown from separate colonies.
Genetic constructions
All strains used in this study derive from the MG1655 E. coli wild-type strain. Table 2gives the genotypes of all strains used here, with the series of plasmids that were usedto modify them. Gene deletions were carried out starting from the Keio collection[129]. P1 phage lysate was prepared from the Keio strain, then used to infect the re-cipient strain and the cells were plated on kanamycine to select for transducers. Aftereach phage P1 transduction, as well as all “clonetegrations” [170], the kanamycine re-sistance marker was removed by transforming pE-FLP. Integration of mCherry-PBP1Aand GFP-PBP1B in the native locus was done using the allelic exchange procedure de-scribed in [82].
The plasmids constructed for this study were assembled by Gibson assembly, fromthe fragments indicated in table 3. The fragments were obtained either by PCR, or byenzymatic digestion, as described in table 4. Oligonucleotide sequences can be foundin table 5.
The CRISPR plasmids are either from the pcrRNA collection described in [82],or were assembled using the pAV20 double-sgRNA vector [133] and oligo pairs men-tionned in table 6. In the later case, complementarity oligos (forward and reverse) werephosphorylated with T4 PNK in the presence of T4 ligase buffer (New England Biolabs),then annealed together. A mix containing the pAV20 vector, the two pairs of annealedoligos, the Bsa1 restriction enzyme (New England Biolabs), T4 ligase (New EnglandBiolabs) and ATP was subjected to thermal cycles for digestion, annealing and ligation.The assembly product was subsequently electroporated in DH5α and the resultingplasmids were sequenced. The control guides, producing no repression, still containthe same 5 bp seed sequence as the sfGFP- and mCherry-targeting guides. This is toaccount for potential mild “bad seed effect” [79].
89
CHAPTER 5 CLASS A PBPS MAINTAIN CELL WALL HOMEOSTASIS
mDAP incorporation measurement
Overnight cultures of ∆lysA strains were grown with induction of the CRISPR system.They were then diluted to OD600 = 0.1 in M63 Glucose 0.2% with 50 µg/ml of lysine.When OD reached 0.4, 3H-labelled mDAP was added for a final activity of 5 µCi/ml.For each point, 200 µl of culture were transferred to tubes containing 800 µl of boiling5%SDS. After at least one hour of boiling, the samples were transferred to 0.22 µmGSWP filters. After applying vacuum, the filters were washed twice with 50 ml of hotwater. The filters were then moved to 5 ml scintillation vials, treated overnight with400 µl of 10 mg/ml lysozyme, and dissolved in 5 ml FilterCount cocktail (PerkinElmer)before counting.
The amount of 3H-mDAP per cell was calculated by dividing the total counts by theoptical density of the culture, with the assumption that changes in cell shape are negligi-ble (see Fig. 5.1). The number of generations since 3H-mDAP addition was obtained byfitting an exponential to OD600 as a function of time, giving the doubling time τ . Thenumber of generations is defined as G = T/τ . To calculate the incorporation rate λand steady-state value Imax, we fit the data with formula I = Imax(1 − e−λG) withnon-linear least squares (Supplementary Table 1).
Chromatography of peptidoglycan content
The chromatography of mutanolysin-digested peptidoglycan was done on a ShimatzuHPLC system with a hypersil Gold eQ 250x4.6 mm column with 3 µm particle size.The mobile phase was a gradient from water with 0.05% TFA to 50% acetonitrile with0.05%TFA over 135 min. The flow was set to 0.5 ml/min.
Morphological measurements
Cells were grown to steady-state exponential phase (OD600 ≈0.1) and fixed with4% formaldehyde in phosphate-buffered saline (PBS) during 30 minutes. Fixed cellswere transferred to PBS microscopy pads with 1.5% UltraPure Agarose (Invitrogen)and imaged using an inverted microscope (TI-E, Nikon Inc.) equipped with a 100×phase-contrast objective (CFI PlanApo LambdaDM100× 1.4NA, Nikon Inc.), a solid-state light source (Spectra X, Lumencor Inc.), a multiband dichroic (69002bs, ChromaTechnology Corp.). GFP and mCherry fluorescence were measured using excitationfilters (560/32 and 485/25 resp.) and emission (632/60 and 535/50 resp.) filters. Imageswere acquired using a sCMOS camera (Orca Flash 4.0, Hamamatsu) with an effectivepixel size of 65 nm. The Morphometrics package [171] was used to find cell contoursfrom phase-contrast images. The analysis accounted for background intensity, unevenillumination, and cell auto-fluorescence. Intracellular concentration was obtained byintegrating the corrected fluorescence intensity inside cell contours. Total regressionwas used to find themajor axis of the cell. Cell widthwas defined as the average distancebetween the cell contour and this axis, excluding the poles. Cell length was calculatedas the maximal distance between contour points projected on the cell axis.
Growth measurements
Overnight cultures were diluted 1/500 and grown in a tabletop shaker (Eppendorf) for90 min to obtain exponential growth. The cultures were then transferred to a flat-bottomed 96-microwell plate (Greiner) and optical density at 600 nm was recorded
90
CHAPTER 5 CLASS A PBPS MAINTAIN CELL WALL HOMEOSTASIS
along growth using a microplate reader (Tecan). To calculate the doubling time, wefit an exponential function to the data points corresponding to the exponential phase.The exponential phase was checked by using Durbin-Watson statistics on the residualsof exponential fit. Optical density at the peak was determined by calculating the firstzero of the derivative of OD600 after mean-filtering with a bandwidth of 10 min.
Single-particle tracking of PBP1B
Single particle tracking of sfGFP-PBP1B was performed on a custom-designed fluores-cence microscope, in a custom-built temperature controlled chamber at 29°C. Prior toimaging the cells were transferred to a pre-heated 1% agarose pad (Invitrogen) then leftto dry in the dark for 3 minutes. After covering with a 0.1 mm cover slip, the slide wasmounted on themicroscope and incubated 5min to equilibrate sample temperature andminimize drift. The microscope was equipped with a 100x TIRF objective (Apo TIRF,100x, NA 1.49, Nikon), three laser lines: 405 nm (Obis, Coherent), 488 nm (Sapphire,Coherent), 561 nm (Sapphire, Coherent), a dichroic beamsplitter (Di03-R488/561-t3-25x36, Semrock) and a laser-line filter (NF561-18, Thorlabs). Shuttering of the 488 nmlaser was controlled with an acusto optic tunable filter (AA Optoelectronics) or withshutters (Uniblitz, LS3 and TS6B, Vincent Associates). Images were acquired with anEMCCD camera (iXon Ultra, Andor). All components were controlled and synchro-nized usingMicroManager [172]. For high-frequency imaging of sfGFP-PBP1B, imageswere acquired with exposure time and intervals of 60 ms for a duration of 1 min. Todistinguish single molecules, this requires a photo bleaching phase prior to image ac-quisition. The sample was exposed to 488 nm laser in epifluorescence mode in ordernot to bias our analysis towards diffusive molecules as exposure to light in TIR modewould dominantly bleach bound PBP1B in the field of view. After photo bleaching, weimmediately switched to TIRmode for image acquisition. Bleaching time is adjusted ac-cording to the level of PBP1B and varies between 100 ms and 5 s. The analysis pipelineis described in details in the supplementary text.
Quantification of PBP1AB levels
Bocillin-labeling of the PBPs
The bocillin-binding assay used to check the absence of non-fluorescent PBP1AB is sim-ilar towhat is used in [147, 173]. We prepared exponentially-growing cells atOD600≈0.4.We washed 1.8 ml of each culture in PBS, resuspended them in 200 µl PBS and kept cul-tures on ice. We disrupted cells by sonication (FB120, Fisher Scientific) and centrifugedthem for 15 min at 4°C (21,000 g). We subsequently resuspended the pellet correspond-ing to the membrane fraction in 50 µl PBS containing 15 µM fluorescently labelledBocillin-FL (Invitrogen). Membranes were incubated at 37°C for 30 min and washedonce in 1ml PBS.We centrifuged themembranes for 15min (21,000 g) and resuspendedthem in 50 µl PBS. We measured the protein concentration of each sample with a col-orimetric assay based on the Bradford method (#5000006, Bio-Rad) and loaded equalamounts of protein mixed with 4X Laemmli buffer onto a 10% polyacrylamide gel. Wevisualized the labelled proteins with a Typhoon 9000 fluorescence imager (GE Health-care): excitation at 488 nm and emission at 530 nm. We quantified the relative amountsof PBP2 in each sample by quantifying the grey values of each lane in ImageJ [174].
91

CHAPTER 5 CLASS A PBPS MAINTAIN CELL WALL HOMEOSTASIS
Content analysis of the peptidoglycan
Extraction of peptidoglycan from exponentially-growing cells was done according tothe protocol described in [175]. Mutanolysin digestion was done following the samereference’s protocol.
5.5 Acknowledgements
We thank Tom Bernhardt for providing the pHC942 plasmid. The bocillin labelling,SDS-page and growth curves for D-cycloserine treatment and mDAP auxotrophy weredone by Baptiste Cordier. The meso-DAP incorporation experiments and osmoticshocks were done with help from Enno Oldewurtel . Thanks to Richard Wheelerfor assistance with peptidoglycan extraction and chromatography analysis and to EvaWollrab for help in the single-molecule tracking.
92
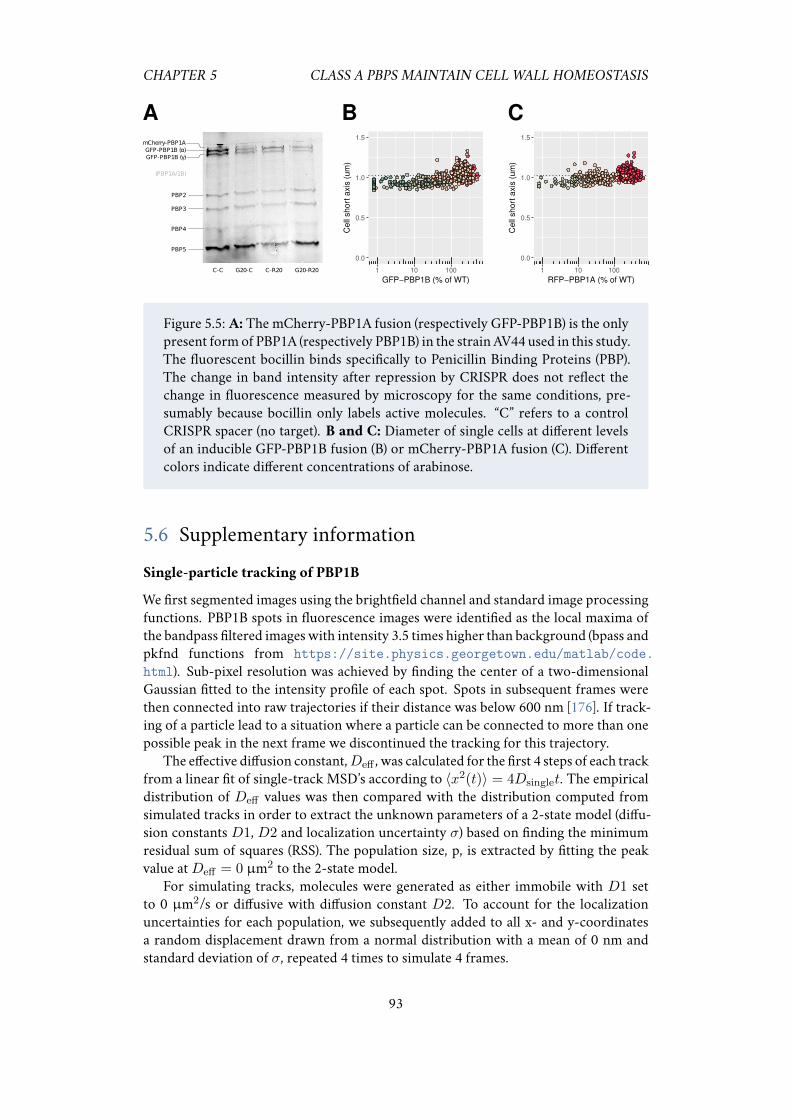
CHAPTER 5 CLASS A PBPS MAINTAIN CELL WALL HOMEOSTASIS
G20-C C-R20C-C G20-R20
mCherry-PBP1AGFP-PBP1B (α)GFP-PBP1B (γ)
PBP2
PBP3
PBP4
PBP5
(PBP1A/1B)
A B C
●
●
●●●
●
●●●
●
●●
●●●
●●●●
●●●● ●●
● ●●
●●●
●
●
●●
●● ●
●●● ● ●●●
●●●●
●
●●
●●●
●
●
●
●●
●●
●●
●
●●●●
● ●
●
●●
●●●●
●
●
●●
●●
●
●● ●●
●●●
●●
●●
●●
●
●●
●
●●
●
●
●
●●●●
●
●●
●●●●●●
●
●●
●
●
●●
●●●
●
●●
●
●
●
●
●●●
●●●
●
●
●●
●
●●
●●
●●
●●●
●
●●●
●
●
●
●
●
●●● ●
●● ●
●●●●●●●
● ●●●●
●
●●●
●●●●●
●●●
●●
●
●●●●●
●● ●●
●●
●●●
●●●●●
● ●
●
●● ●
●
●
●
● ●● ●
●
●● ●
● ●●
●●
●
●●
●● ● ●
●
●●
●
●●
●
●● ●●
●●●
●●
●
●● ●
●
●●
● ●
●●
●● ●
●
●●●
●
●●
●●●
●
●
●
●
●●
●
●
●
●
●
●●●● ●●●●●●
●
● ●
●
●
●
●●
●●●
●
● ●
●
●
●
●
●
●●
●●
●
●
●
●●
●
●●
●
●
●
●
●
●
●
●
●
●●
●
●●
●
●
●●
● ●●●●
●●●
● ● ●
●
●● ●
●
●● ●
●
●●●● ●
●●
●
●
●
● ●●● ●
●●
●
●
●●
●
●●
●
●
●●● ●●
●●
●●
●
●
●●
●●●
● ●●
●●●
●
●●
●
●● ●
●
●●
●● ●
●
●●
●●
●●
●●
●●●●●
●●●
●
●●
●●
● ●
●
●
● ●
●
●
●
●
●●●
●●
●
●
●
●
●
●●● ●
●
●● ●
●
●
●
● ●
●●
●●●
●●
●●●
●
●
●●●
●●
●
●●●
●
●
●
●●●
●●● ●●
●● ●
●● ●● ●●
●●●
●● ●●●
●
●
● ●●●● ●
●
●
●
●
● ●
●●●●
●
●
●●●
● ● ●●●●●
●
●●●●
●●
●●●
●●
● ●● ●●
●● ●●●●
●●●● ● ●●
●● ●●
●●●● ●●
●
●
●● ●● ● ●
●● ●●● ●
●●●●
●●●
●● ●●
●
●
0.0
0.5
1.0
1.5
1 10 100
GFP−PBP1B (% of WT)
Ce
ll sh
ort
axi
s (u
m)
●●
●
●●
●
●●●●●
●
●●●
●
●●●
●
●
●
●
●●●●●●
●● ●●●
●●
●
● ●●●●
●●
●
●●●
●
●●
●
● ●●●●
●●●●
● ●●●
●●●●
● ●●
●●
●●
●
●
●●
●●●● ●
●●● ●●●●●●
●
●●
● ●●
●●●●
●●●● ●●
●
●●●●●
●●●
● ●●●
●●●●
●
●●●
●●●●●● ●●
●●●●
● ●●
●
●●● ●●●● ●●
●●
●●●●
●●●●● ●●
● ●●
● ●
●
●●
●●
●●●●
●
●●
●
●
●●●
●●●●●● ●
●
●● ●●
●
●
●
●●
●
●●●●●● ●
●
●
●●
●●
●●●
●●●
●●
●
●
●●●
●
●●●
●
●●●●●
●●
●
●●
●
●
●●●●
●●
●
●
●●● ●●
●
●●●
●●●●●
●●●●●
● ●
●●
●●●●
●●●
●●●
●
●● ●●●● ●●●●●●●
●●●●
● ●●
●●
●●
●●●● ●
● ●●●● ●●●●●●
●
●●●● ●
●
●●● ●●
●●●●
●
●
●● ●
●
●
●
● ●●
●● ●●
●●●
●●●●●
●
● ●
●● ● ●● ●●●●
●●●
●●
●
●●
●●●
●
●
●
●
● ●●
●
●● ●●
●●
●●●● ●●●●
●●
●●● ●
●
●
●
●●
●
●
●
●
●●●
●●
●
●●
●●
●
●
● ●●
●●
●●
●
●
●●● ●● ●●
●●●●●
●●
●
●● ●
●
●●
●
●
●●●●●●
●
●●
●
●
●●● ●●
●●●● ●
●
●●●
●●●
●
●●●●●
●
●● ●
●
●●●
●● ●
●●
●●●
● ●●
●● ●●● ●●● ●●●
●
● ●● ● ●
●●
●● ●●● ●
●●●
●●
●●●
● ●
●● ●
●
●
●
●●●
0.0
0.5
1.0
1.5
1 10 100
RFP−PBP1A (% of WT)
Ce
ll sh
ort
axi
s (u
m)
Figure 5.5: A: The mCherry-PBP1A fusion (respectively GFP-PBP1B) is the onlypresent form of PBP1A (respectively PBP1B) in the strain AV44 used in this study.The fluorescent bocillin binds specifically to Penicillin Binding Proteins (PBP).The change in band intensity after repression by CRISPR does not reflect thechange in fluorescence measured by microscopy for the same conditions, pre-sumably because bocillin only labels active molecules. “C” refers to a controlCRISPR spacer (no target). B and C: Diameter of single cells at different levelsof an inducible GFP-PBP1B fusion (B) or mCherry-PBP1A fusion (C). Differentcolors indicate different concentrations of arabinose.
5.6 Supplementary information
Single-particle tracking of PBP1B
We first segmented images using the brightfield channel and standard image processingfunctions. PBP1B spots in fluorescence images were identified as the local maxima ofthe bandpass filtered images with intensity 3.5 times higher than background (bpass andpkfnd functions from https://site.physics.georgetown.edu/matlab/code.html). Sub-pixel resolution was achieved by finding the center of a two-dimensionalGaussian fitted to the intensity profile of each spot. Spots in subsequent frames werethen connected into raw trajectories if their distance was below 600 nm [176]. If track-ing of a particle lead to a situation where a particle can be connected to more than onepossible peak in the next frame we discontinued the tracking for this trajectory.
The effective diffusion constant,Deff , was calculated for the first 4 steps of each trackfrom a linear fit of single-track MSD’s according to 〈x2(t)〉 = 4Dsinglet. The empiricaldistribution of Deff values was then compared with the distribution computed fromsimulated tracks in order to extract the unknown parameters of a 2-state model (diffu-sion constants D1, D2 and localization uncertainty σ) based on finding the minimumresidual sum of squares (RSS). The population size, p, is extracted by fitting the peakvalue atDeff = 0 µm2 to the 2-state model.
For simulating tracks, molecules were generated as either immobile with D1 setto 0 µm2/s or diffusive with diffusion constant D2. To account for the localizationuncertainties for each population, we subsequently added to all x- and y-coordinatesa random displacement drawn from a normal distribution with a mean of 0 nm andstandard deviation of σ, repeated 4 times to simulate 4 frames.
93
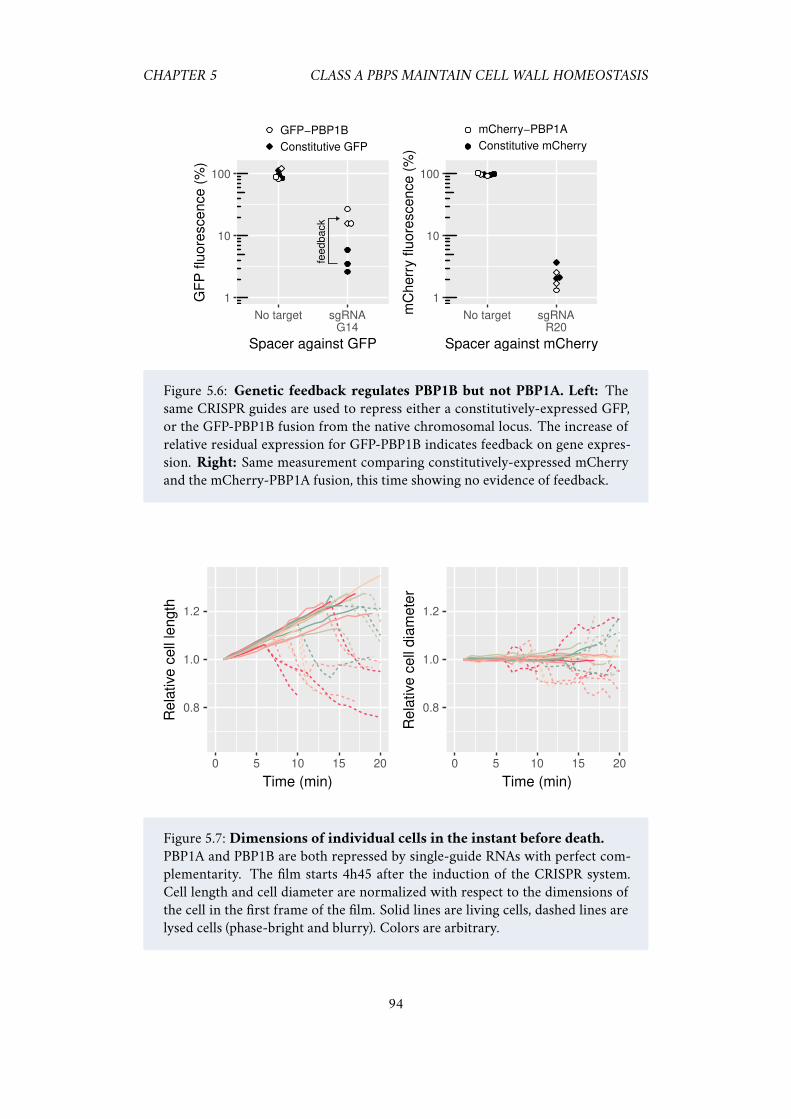
CHAPTER 5 CLASS A PBPS MAINTAIN CELL WALL HOMEOSTASIS
●●●●●●
●●
●
●
●
●
1
10
100
No target sgRNAG14
Spacer against GFP
GF
P flu
ore
sce
nce
(%
)
●
●
GFP−PBP1B
Constitutive GFP
●●●●●●
●●
●
●
●
●
1
10
100
No targetR20
Spacer against mCherry
mC
herr
y flu
ore
scence (
%)
●
●
mCherry−PBP1A
Constitutive mCherry
sgRNAfe
ed
ba
ck
Figure 5.6: Genetic feedback regulates PBP1B but not PBP1A. Left: Thesame CRISPR guides are used to repress either a constitutively-expressed GFP,or the GFP-PBP1B fusion from the native chromosomal locus. The increase ofrelative residual expression for GFP-PBP1B indicates feedback on gene expres-sion. Right: Same measurement comparing constitutively-expressed mCherryand the mCherry-PBP1A fusion, this time showing no evidence of feedback.
0.8
1.0
1.2
Rela
tive c
ell
length
0.8
1.0
1.2
Rela
tive c
ell
dia
mete
r
0 5 10 15 20
Time (min)
0 5 10 15 20
Time (min)
Figure 5.7: Dimensions of individual cells in the instant before death.
PBP1A and PBP1B are both repressed by single-guide RNAs with perfect com-plementarity. The film starts 4h45 after the induction of the CRISPR system.Cell length and cell diameter are normalized with respect to the dimensions ofthe cell in the first frame of the film. Solid lines are living cells, dashed lines arelysed cells (phase-bright and blurry). Colors are arbitrary.
94
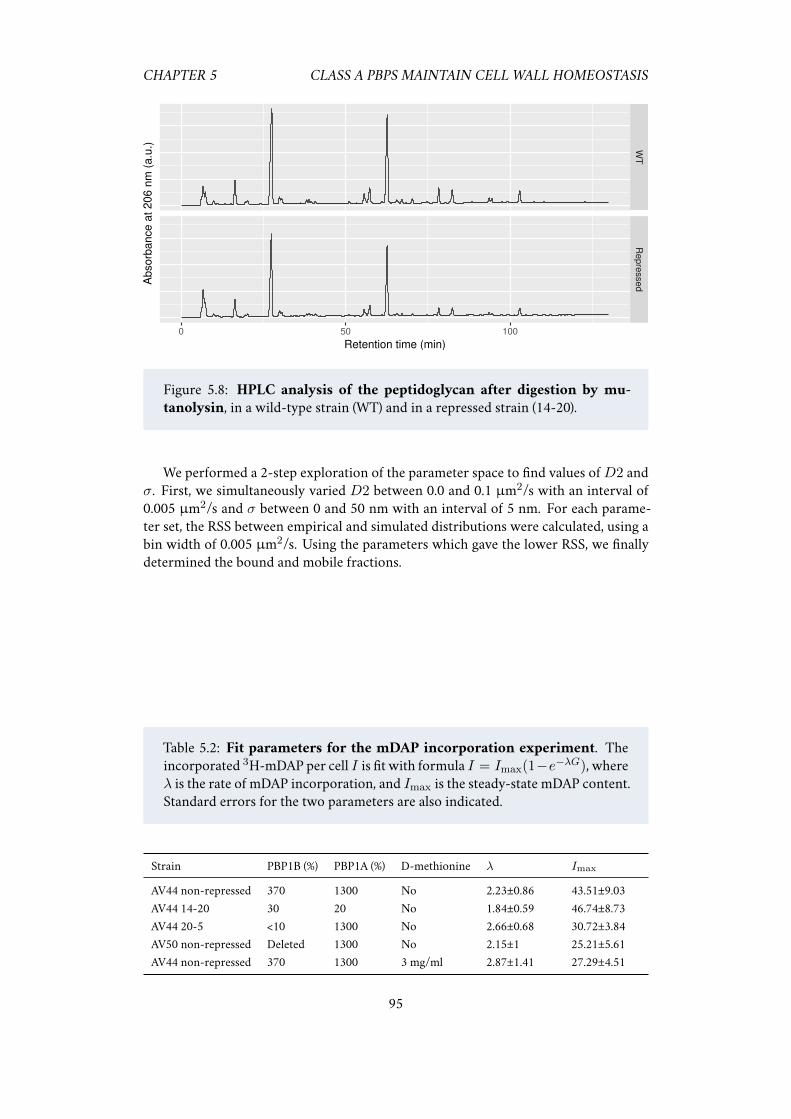
CHAPTER 5 CLASS A PBPS MAINTAIN CELL WALL HOMEOSTASIS
Figure 5.8: HPLC analysis of the peptidoglycan after digestion by mu-
tanolysin, in a wild-type strain (WT) and in a repressed strain (14-20).
We performed a 2-step exploration of the parameter space to find values ofD2 andσ. First, we simultaneously varied D2 between 0.0 and 0.1 µm2/s with an interval of0.005 µm2/s and σ between 0 and 50 nm with an interval of 5 nm. For each parame-ter set, the RSS between empirical and simulated distributions were calculated, using abin width of 0.005 µm2/s. Using the parameters which gave the lower RSS, we finallydetermined the bound and mobile fractions.
Table 5.2: Fit parameters for the mDAP incorporation experiment. Theincorporated 3H-mDAP per cell I is fit with formula I = Imax(1−e−λG), whereλ is the rate of mDAP incorporation, and Imax is the steady-state mDAP content.Standard errors for the two parameters are also indicated.
Strain PBP1B (%) PBP1A (%) D-methionine λ Imax
AV44 non-repressed 370 1300 No 2.23±0.86 43.51±9.03AV44 14-20 30 20 No 1.84±0.59 46.74±8.73AV44 20-5 <10 1300 No 2.66±0.68 30.72±3.84AV50 non-repressed Deleted 1300 No 2.15±1 25.21±5.61AV44 non-repressed 370 1300 3 mg/ml 2.87±1.41 27.29±4.51
95
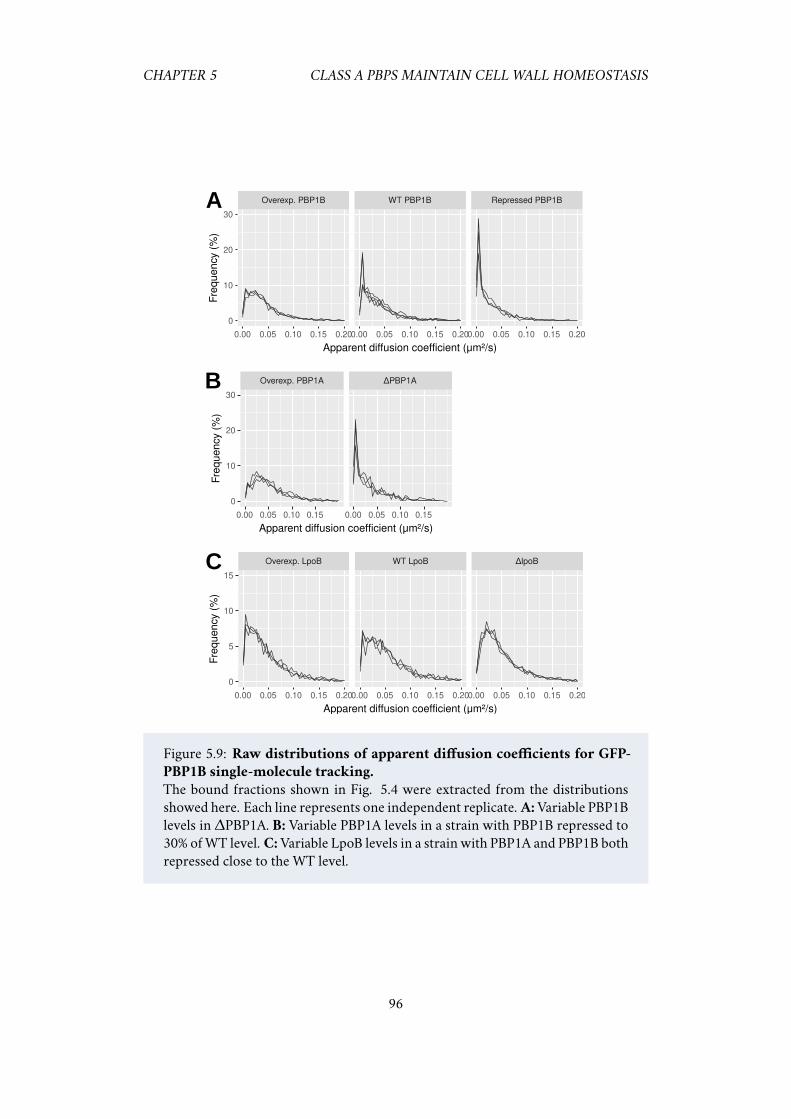
CHAPTER 5 CLASS A PBPS MAINTAIN CELL WALL HOMEOSTASIS
A
B
C
Overexp. PBP1A ΔPBP1A
0.00 0.05 0.10 0.15 0.00 0.05 0.10 0.15
0
10
20
30
Apparent diffusion coefficient (μm²/s)
Fre
quency
(%
)
Overexp. PBP1B WT PBP1B Repressed PBP1B
0.00 0.05 0.10 0.15 0.200.00 0.05 0.10 0.15 0.200.00 0.05 0.10 0.15 0.20
0
10
20
30
Apparent diffusion coefficient (μm²/s)
Fre
quency
(%
)
Overexp. LpoB WT LpoB ΔlpoB
0.00 0.05 0.10 0.15 0.200.00 0.05 0.10 0.15 0.200.00 0.05 0.10 0.15 0.20
0
5
10
15
Apparent diffusion coefficient (μm²/s)
Fre
quency
(%
)
Figure 5.9: Raw distributions of apparent diffusion coefficients for GFP-
PBP1B single-molecule tracking.
The bound fractions shown in Fig. 5.4 were extracted from the distributionsshowed here. Each line represents one independent replicate. A:Variable PBP1Blevels in ∆PBP1A. B: Variable PBP1A levels in a strain with PBP1B repressed to30% ofWT level. C:Variable LpoB levels in a strain with PBP1A and PBP1B bothrepressed close to the WT level.
96
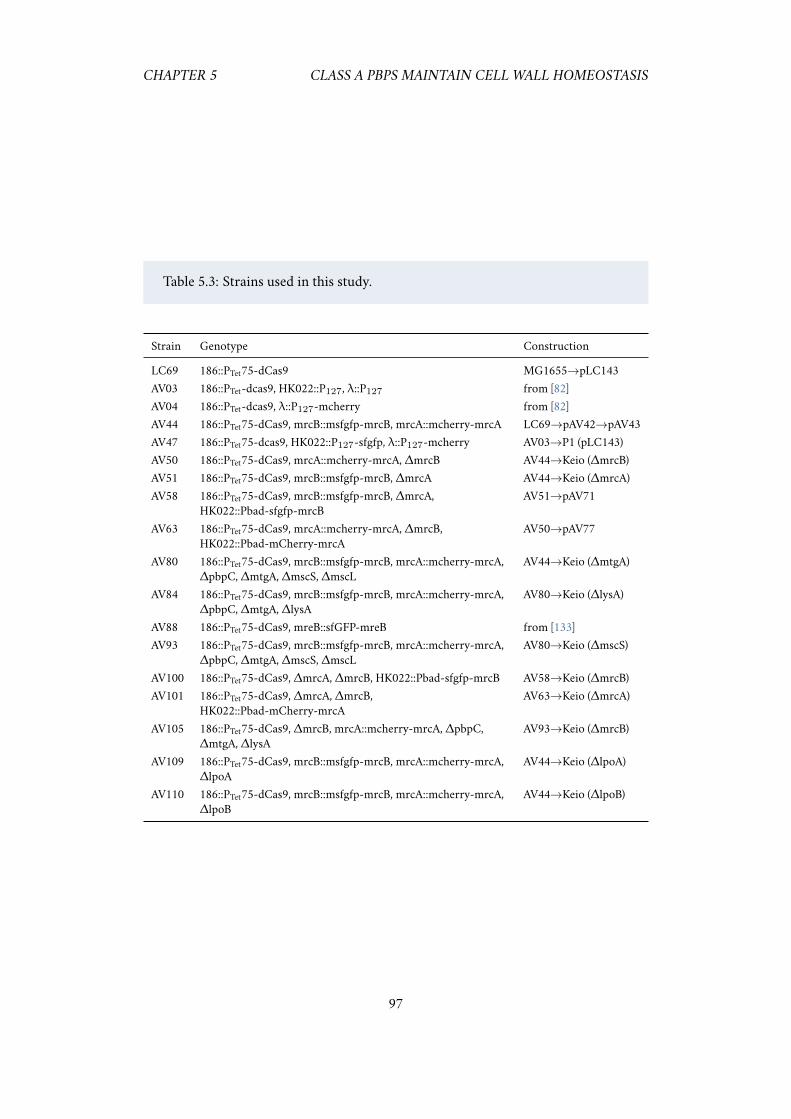
CHAPTER 5 CLASS A PBPS MAINTAIN CELL WALL HOMEOSTASIS
Table 5.3: Strains used in this study.
Strain Genotype Construction
LC69 186::PTet75-dCas9 MG1655→pLC143AV03 186::PTet-dcas9, HK022::P127, λ::P127 from [82]AV04 186::PTet-dcas9, λ::P127-mcherry from [82]AV44 186::PTet75-dCas9, mrcB::msfgfp-mrcB, mrcA::mcherry-mrcA LC69→pAV42→pAV43AV47 186::PTet75-dcas9, HK022::P127-sfgfp, λ::P127-mcherry AV03→P1 (pLC143)AV50 186::PTet75-dCas9, mrcA::mcherry-mrcA, ∆mrcB AV44→Keio (∆mrcB)AV51 186::PTet75-dCas9, mrcB::msfgfp-mrcB, ∆mrcA AV44→Keio (∆mrcA)AV58 186::PTet75-dCas9, mrcB::msfgfp-mrcB, ∆mrcA,
HK022::Pbad-sfgfp-mrcBAV51→pAV71
AV63 186::PTet75-dCas9, mrcA::mcherry-mrcA, ∆mrcB,HK022::Pbad-mCherry-mrcA
AV50→pAV77
AV80 186::PTet75-dCas9, mrcB::msfgfp-mrcB, mrcA::mcherry-mrcA,∆pbpC, ∆mtgA, ∆mscS, ∆mscL
AV44→Keio (∆mtgA)
AV84 186::PTet75-dCas9, mrcB::msfgfp-mrcB, mrcA::mcherry-mrcA,∆pbpC, ∆mtgA, ∆lysA
AV80→Keio (∆lysA)
AV88 186::PTet75-dCas9, mreB::sfGFP-mreB from [133]AV93 186::PTet75-dCas9, mrcB::msfgfp-mrcB, mrcA::mcherry-mrcA,
∆pbpC, ∆mtgA, ∆mscS, ∆mscLAV80→Keio (∆mscS)
AV100 186::PTet75-dCas9, ∆mrcA, ∆mrcB, HK022::Pbad-sfgfp-mrcB AV58→Keio (∆mrcB)AV101 186::PTet75-dCas9, ∆mrcA, ∆mrcB,
HK022::Pbad-mCherry-mrcAAV63→Keio (∆mrcA)
AV105 186::PTet75-dCas9, ∆mrcB, mrcA::mcherry-mrcA, ∆pbpC,∆mtgA, ∆lysA
AV93→Keio (∆mrcB)
AV109 186::PTet75-dCas9, mrcB::msfgfp-mrcB, mrcA::mcherry-mrcA,∆lpoA
AV44→Keio (∆lpoA)
AV110 186::PTet75-dCas9, mrcB::msfgfp-mrcB, mrcA::mcherry-mrcA,∆lpoB
AV44→Keio (∆lpoB)
97
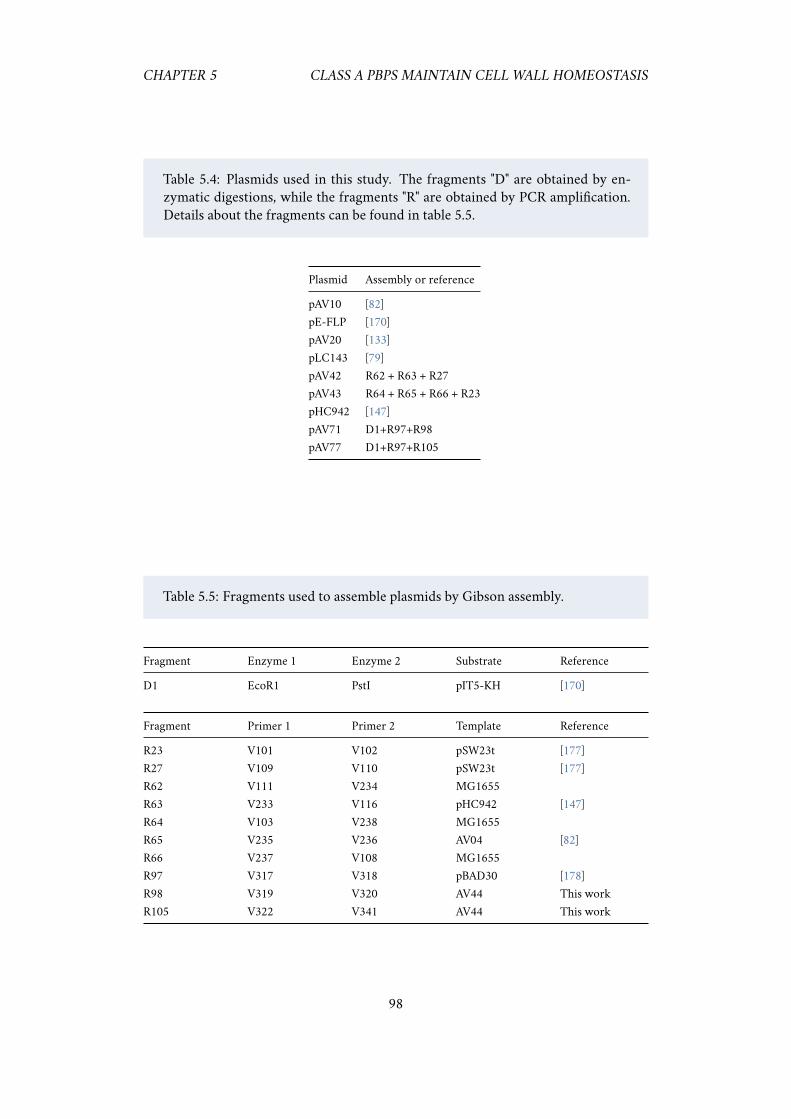
CHAPTER 5 CLASS A PBPS MAINTAIN CELL WALL HOMEOSTASIS
Table 5.4: Plasmids used in this study. The fragments "D" are obtained by en-zymatic digestions, while the fragments "R" are obtained by PCR amplification.Details about the fragments can be found in table 5.5.
Plasmid Assembly or reference
pAV10 [82]pE-FLP [170]pAV20 [133]pLC143 [79]pAV42 R62 + R63 + R27pAV43 R64 + R65 + R66 + R23pHC942 [147]pAV71 D1+R97+R98pAV77 D1+R97+R105
Table 5.5: Fragments used to assemble plasmids by Gibson assembly.
Fragment Enzyme 1 Enzyme 2 Substrate Reference
D1 EcoR1 PstI pIT5-KH [170]
Fragment Primer 1 Primer 2 Template Reference
R23 V101 V102 pSW23t [177]R27 V109 V110 pSW23t [177]R62 V111 V234 MG1655R63 V233 V116 pHC942 [147]R64 V103 V238 MG1655R65 V235 V236 AV04 [82]R66 V237 V108 MG1655R97 V317 V318 pBAD30 [178]R98 V319 V320 AV44 This workR105 V322 V341 AV44 This work
98
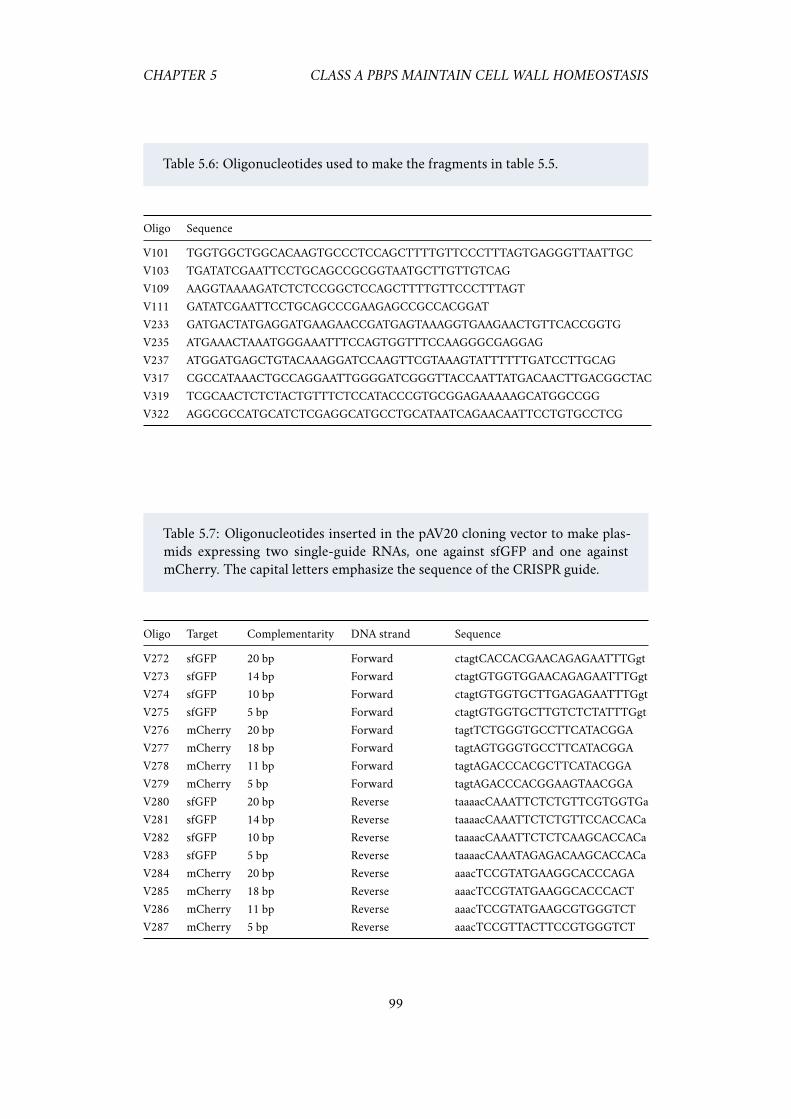
CHAPTER 5 CLASS A PBPS MAINTAIN CELL WALL HOMEOSTASIS
Table 5.6: Oligonucleotides used to make the fragments in table 5.5.
Oligo Sequence
V101 TGGTGGCTGGCACAAGTGCCCTCCAGCTTTTGTTCCCTTTAGTGAGGGTTAATTGCV103 TGATATCGAATTCCTGCAGCCGCGGTAATGCTTGTTGTCAGV109 AAGGTAAAAGATCTCTCCGGCTCCAGCTTTTGTTCCCTTTAGTV111 GATATCGAATTCCTGCAGCCCGAAGAGCCGCCACGGATV233 GATGACTATGAGGATGAAGAACCGATGAGTAAAGGTGAAGAACTGTTCACCGGTGV235 ATGAAACTAAATGGGAAATTTCCAGTGGTTTCCAAGGGCGAGGAGV237 ATGGATGAGCTGTACAAAGGATCCAAGTTCGTAAAGTATTTTTTGATCCTTGCAGV317 CGCCATAAACTGCCAGGAATTGGGGATCGGGTTACCAATTATGACAACTTGACGGCTACV319 TCGCAACTCTCTACTGTTTCTCCATACCCGTGCGGAGAAAAAGCATGGCCGGV322 AGGCGCCATGCATCTCGAGGCATGCCTGCATAATCAGAACAATTCCTGTGCCTCG
Table 5.7: Oligonucleotides inserted in the pAV20 cloning vector to make plas-mids expressing two single-guide RNAs, one against sfGFP and one againstmCherry. The capital letters emphasize the sequence of the CRISPR guide.
Oligo Target Complementarity DNA strand Sequence
V272 sfGFP 20 bp Forward ctagtCACCACGAACAGAGAATTTGgtV273 sfGFP 14 bp Forward ctagtGTGGTGGAACAGAGAATTTGgtV274 sfGFP 10 bp Forward ctagtGTGGTGCTTGAGAGAATTTGgtV275 sfGFP 5 bp Forward ctagtGTGGTGCTTGTCTCTATTTGgtV276 mCherry 20 bp Forward tagtTCTGGGTGCCTTCATACGGAV277 mCherry 18 bp Forward tagtAGTGGGTGCCTTCATACGGAV278 mCherry 11 bp Forward tagtAGACCCACGCTTCATACGGAV279 mCherry 5 bp Forward tagtAGACCCACGGAAGTAACGGAV280 sfGFP 20 bp Reverse taaaacCAAATTCTCTGTTCGTGGTGaV281 sfGFP 14 bp Reverse taaaacCAAATTCTCTGTTCCACCACaV282 sfGFP 10 bp Reverse taaaacCAAATTCTCTCAAGCACCACaV283 sfGFP 5 bp Reverse taaaacCAAATAGAGACAAGCACCACaV284 mCherry 20 bp Reverse aaacTCCGTATGAAGGCACCCAGAV285 mCherry 18 bp Reverse aaacTCCGTATGAAGGCACCCACTV286 mCherry 11 bp Reverse aaacTCCGTATGAAGCGTGGGTCTV287 mCherry 5 bp Reverse aaacTCCGTTACTTCCGTGGGTCT
99
Chapter 6
A CRISPRi screen in E. coli revealssequence-specific toxicity of dCas9
6.1 Impact on the project
When I started to work on changing the levels of class A PBPs, the Bad Seed Effect (BSE,see chapter 2) had not yet been identified. However, in my early experiments on PBP1Aand PBP1B, the BSE was already apparent. The fact that it went unnoticed for such along time is the consequence of several unfortunate choices.
For growth measurements, it was preferable to have all the compared strains in theexact samemedium, meaning that all conditions should carry the same antibiotic mark-ers. Also, to avoid potential unexpected effects of dCas9’s expression and only mea-sure the effect of gene repression by CRISPR, my initial experiments involved a randomCRISPR guide, called “C”, that had no target anywhere in E. coli’s genome, even when ac-counting for highly-mismatched potential off-targets. Unfortunately, this control guideproduced a mild, non-lethal Bad Seed Effect: any strain expressing dCas9 with the “C”guide would suffer from a slight reduction of growth rate.
A typical experiment would involve a strain with tunable GFP-PBP1A andmCherry-PBP1B, that expressed either the control CRISPR plasmid, or CRISPR arrays againstGFP and mCherry to change the levels of the genes. In addition, I usually included astrain without the fusions, but still able to express dCas9 and also carrying the controlguide. This is to make sure that the simple presence of GFP- andmCherry- fusions doesnot affect the measured phenotype in any way.
Due to the bad seed effect of the control guide, the non-repressed strains grew alittle slower than the rest. On the contrary, the strains where PBP1A and PBP1B wereboth repressed did not carry the control guide. As partial repression of PBP1AB doesnot reduce growth rate (something that was unknown at the time, see chapter 5), allthese strains grew at a normal rate and, therefore, faster than the strains carrying the“C” control guide. Thus, in appearance, it was as if the repression of PBP1AB made thecells grow faster (figure 6.1).
To add more confusion, this experiment included strains with either PBP1A orPBP1B deleted, and then a variable level of the remaining one. The CRISPR plasmidscontain two guides (one for PBP1A, one for PBP1B). When one of them is deleted, there
100
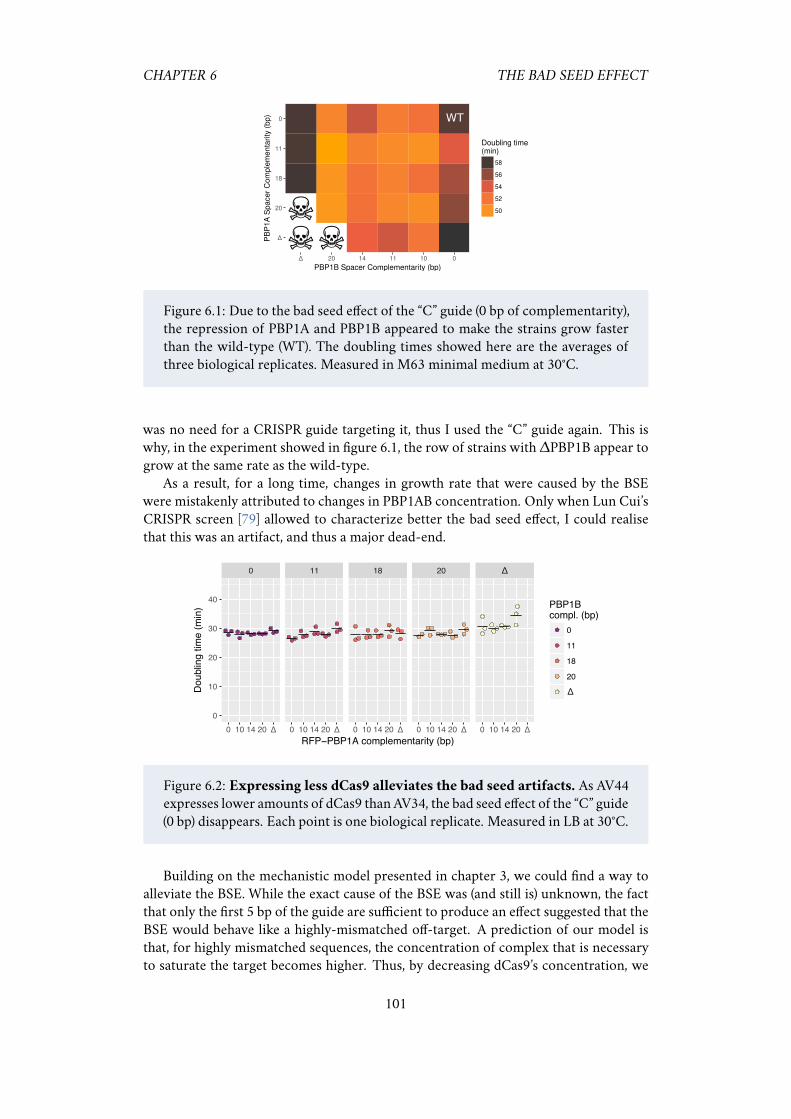
CHAPTER 6 THE BAD SEED EFFECT
WT
Δ
20
18
11
0
Δ 20 14 11 10 0
PBP1B Spacer Complementarity (bp)P
BP
1A
Space
r C
om
ple
menta
rity
(bp)
Doubling time(min)
50
52
54
56
58
Figure 6.1: Due to the bad seed effect of the “C” guide (0 bp of complementarity),the repression of PBP1A and PBP1B appeared to make the strains grow fasterthan the wild-type (WT). The doubling times showed here are the averages ofthree biological replicates. Measured in M63 minimal medium at 30°C.
was no need for a CRISPR guide targeting it, thus I used the “C” guide again. This iswhy, in the experiment showed in figure 6.1, the row of strains with∆PBP1B appear togrow at the same rate as the wild-type.
As a result, for a long time, changes in growth rate that were caused by the BSEwere mistakenly attributed to changes in PBP1AB concentration. Only when Lun Cui’sCRISPR screen [79] allowed to characterize better the bad seed effect, I could realisethat this was an artifact, and thus a major dead-end.
Δ
●●● ●●
●●●● ●●●
●●●
●●●
●●●
●
●● ●●●
●
●
●●
●●●
●
● ●●
●
●●
●
●
●
●
●● ●
●●●●● ●
●●
●
●●
●●
●
●●
●●●● ●
●
●
0 11 18 20
0 10 14 20 0 10 14 20 0 10 14 20 0 10 14 20 0 10 14 20
0
10
20
30
40
RFP−PBP1A complementarity (bp)
Do
ublin
g tim
e (
min
) PBP1Bcompl. (bp)
●
●
●
●
●
0
11
18
20
Δ
ΔΔΔΔΔ
Figure 6.2: Expressing less dCas9 alleviates the bad seed artifacts. As AV44expresses lower amounts of dCas9 than AV34, the bad seed effect of the “C” guide(0 bp) disappears. Each point is one biological replicate. Measured in LB at 30°C.
Building on the mechanistic model presented in chapter 3, we could find a way toalleviate the BSE. While the exact cause of the BSE was (and still is) unknown, the factthat only the first 5 bp of the guide are sufficient to produce an effect suggested that theBSE would behave like a highly-mismatched off-target. A prediction of our model isthat, for highly mismatched sequences, the concentration of complex that is necessaryto saturate the target becomes higher. Thus, by decreasing dCas9’s concentration, we
101

CHAPTER 6 THE BAD SEED EFFECT
could find a regime where the well-matched targets would be saturated, but the weaktargets would be in the concentration-dependent regime and have attenuated effects.Accordingly, we found a range of expression levels for dCas9 where on-target repres-sion is still efficient, but where the BSE is minimal. Using this new expression system,the mild BSE that we observed for the “C” guide completely vanished, allowing us topursue the experiments on PBP1AB (figure 6.2).
In the bad seed study, I performed the fluorescence measurements, designed thestrains and plasmids used for flow cytometry and constructed most of them.
The next pages are published as:
Lun Cui, Antoine Vigouroux, François Rousset, Hugo Varet, Varun Khanna &David Bikard, A CRISPRi screen in E. coli reveals sequence-specific toxicity ofdCas9. Nature Communications, 9(1):1912, May 2018, ISSN 2041-1723.doi: 10.1038/s41467-018-04209-5.
102

ARTICLE
A CRISPRi screen in E. coli reveals sequence-specific toxicity of dCas9Lun Cui 1, Antoine Vigouroux1, François Rousset 1,2, Hugo Varet3, Varun Khanna3 & David Bikard 1
High-throughput CRISPR-Cas9 screens have recently emerged as powerful tools to decipher
gene functions and genetic interactions. Here we use a genome-wide library of guide RNAs to
direct the catalytically dead Cas9 (dCas9) to block gene transcription in Escherichia coli. Using
a machine-learning approach, we reveal that guide RNAs sharing specific 5-nucleotide seed
sequences can produce strong fitness defects or even kill E. coli regardless of the other 15
nucleotides of guide sequence. This effect occurs at high dCas9 concentrations and can be
alleviated by tuning the expression of dCas9 while maintaining strong on-target repression.
Our results also highlight the fact that off-targets with as little as nine nucleotides of
homology to the guide RNA can strongly block gene expression. Altogether this study
provides important design rules to safely use dCas9 in E. coli.
DOI: 10.1038/s41467-018-04209-5 OPEN
1 Synthetic Biology Group, Department of Microbiology, Institut Pasteur, Paris 75015, France. 2 Sorbonne Université, Collège Doctoral, Paris F-75005, France.3 Hub Bioinformatique et Biostatistique, Institut Pasteur - C3BI, USR 3756 IP CNRS, Paris 75015, France. Correspondence and requests for materials should beaddressed to D.B. (email: [email protected])
NATURE COMMUNICATIONS | (2018) 9:1912 | DOI: 10.1038/s41467-018-04209-5 |www.nature.com/naturecommunications 1
1234
5678
90():,;
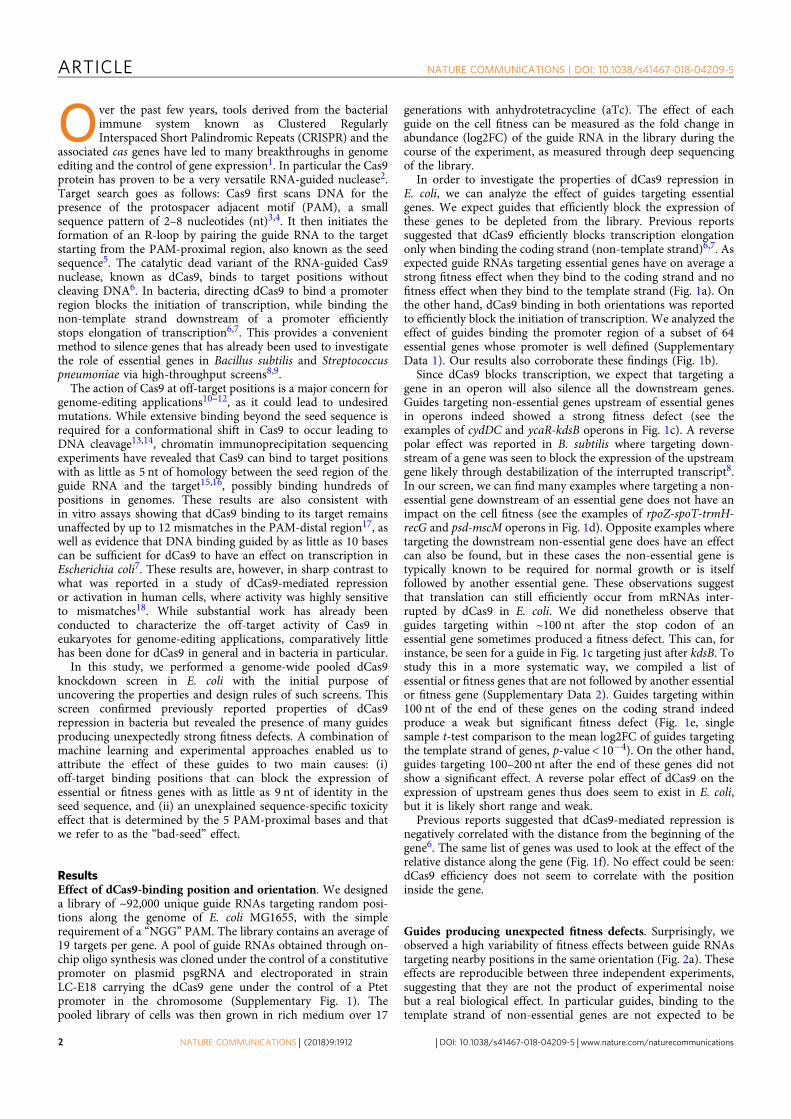
Over the past few years, tools derived from the bacterialimmune system known as Clustered RegularlyInterspaced Short Palindromic Repeats (CRISPR) and the
associated cas genes have led to many breakthroughs in genomeediting and the control of gene expression1. In particular the Cas9protein has proven to be a very versatile RNA-guided nuclease2.Target search goes as follows: Cas9 first scans DNA for thepresence of the protospacer adjacent motif (PAM), a smallsequence pattern of 2–8 nucleotides (nt)3,4. It then initiates theformation of an R-loop by pairing the guide RNA to the targetstarting from the PAM-proximal region, also known as the seedsequence5. The catalytic dead variant of the RNA-guided Cas9nuclease, known as dCas9, binds to target positions withoutcleaving DNA6. In bacteria, directing dCas9 to bind a promoterregion blocks the initiation of transcription, while binding thenon-template strand downstream of a promoter efficientlystops elongation of transcription6,7. This provides a convenientmethod to silence genes that has already been used to investigatethe role of essential genes in Bacillus subtilis and Streptococcuspneumoniae via high-throughput screens8,9.
The action of Cas9 at off-target positions is a major concern forgenome-editing applications10–12, as it could lead to undesiredmutations. While extensive binding beyond the seed sequence isrequired for a conformational shift in Cas9 to occur leading toDNA cleavage13,14, chromatin immunoprecipitation sequencingexperiments have revealed that Cas9 can bind to target positionswith as little as 5 nt of homology between the seed region of theguide RNA and the target15,16, possibly binding hundreds ofpositions in genomes. These results are also consistent within vitro assays showing that dCas9 binding to its target remainsunaffected by up to 12 mismatches in the PAM-distal region17, aswell as evidence that DNA binding guided by as little as 10 basescan be sufficient for dCas9 to have an effect on transcription inEscherichia coli7. These results are, however, in sharp contrast towhat was reported in a study of dCas9-mediated repressionor activation in human cells, where activity was highly sensitiveto mismatches18. While substantial work has already beenconducted to characterize the off-target activity of Cas9 ineukaryotes for genome-editing applications, comparatively littlehas been done for dCas9 in general and in bacteria in particular.
In this study, we performed a genome-wide pooled dCas9knockdown screen in E. coli with the initial purpose ofuncovering the properties and design rules of such screens. Thisscreen confirmed previously reported properties of dCas9repression in bacteria but revealed the presence of many guidesproducing unexpectedly strong fitness defects. A combination ofmachine learning and experimental approaches enabled us toattribute the effect of these guides to two main causes: (i)off-target binding positions that can block the expression ofessential or fitness genes with as little as 9 nt of identity in theseed sequence, and (ii) an unexplained sequence-specific toxicityeffect that is determined by the 5 PAM-proximal bases and thatwe refer to as the “bad-seed” effect.
ResultsEffect of dCas9-binding position and orientation. We designeda library of ~92,000 unique guide RNAs targeting random posi-tions along the genome of E. coli MG1655, with the simplerequirement of a “NGG” PAM. The library contains an average of19 targets per gene. A pool of guide RNAs obtained through on-chip oligo synthesis was cloned under the control of a constitutivepromoter on plasmid psgRNA and electroporated in strainLC-E18 carrying the dCas9 gene under the control of a Ptetpromoter in the chromosome (Supplementary Fig. 1). Thepooled library of cells was then grown in rich medium over 17
generations with anhydrotetracycline (aTc). The effect of eachguide on the cell fitness can be measured as the fold change inabundance (log2FC) of the guide RNA in the library during thecourse of the experiment, as measured through deep sequencingof the library.
In order to investigate the properties of dCas9 repression inE. coli, we can analyze the effect of guides targeting essentialgenes. We expect guides that efficiently block the expression ofthese genes to be depleted from the library. Previous reportssuggested that dCas9 efficiently blocks transcription elongationonly when binding the coding strand (non-template strand)6,7. Asexpected guide RNAs targeting essential genes have on average astrong fitness effect when they bind to the coding strand and nofitness effect when they bind to the template strand (Fig. 1a). Onthe other hand, dCas9 binding in both orientations was reportedto efficiently block the initiation of transcription. We analyzed theeffect of guides binding the promoter region of a subset of 64essential genes whose promoter is well defined (SupplementaryData 1). Our results also corroborate these findings (Fig. 1b).
Since dCas9 blocks transcription, we expect that targeting agene in an operon will also silence all the downstream genes.Guides targeting non-essential genes upstream of essential genesin operons indeed showed a strong fitness defect (see theexamples of cydDC and ycaR-kdsB operons in Fig. 1c). A reversepolar effect was reported in B. subtilis where targeting down-stream of a gene was seen to block the expression of the upstreamgene likely through destabilization of the interrupted transcript8.In our screen, we can find many examples where targeting a non-essential gene downstream of an essential gene does not have animpact on the cell fitness (see the examples of rpoZ-spoT-trmH-recG and psd-mscM operons in Fig. 1d). Opposite examples wheretargeting the downstream non-essential gene does have an effectcan also be found, but in these cases the non-essential gene istypically known to be required for normal growth or is itselffollowed by another essential gene. These observations suggestthat translation can still efficiently occur from mRNAs inter-rupted by dCas9 in E. coli. We did nonetheless observe thatguides targeting within ~100 nt after the stop codon of anessential gene sometimes produced a fitness defect. This can, forinstance, be seen for a guide in Fig. 1c targeting just after kdsB. Tostudy this in a more systematic way, we compiled a list ofessential or fitness genes that are not followed by another essentialor fitness gene (Supplementary Data 2). Guides targeting within100 nt of the end of these genes on the coding strand indeedproduce a weak but significant fitness defect (Fig. 1e, singlesample t-test comparison to the mean log2FC of guides targetingthe template strand of genes, p-value < 10−4). On the other hand,guides targeting 100–200 nt after the end of these genes did notshow a significant effect. A reverse polar effect of dCas9 on theexpression of upstream genes thus does seem to exist in E. coli,but it is likely short range and weak.
Previous reports suggested that dCas9-mediated repression isnegatively correlated with the distance from the beginning of thegene6. The same list of genes was used to look at the effect of therelative distance along the gene (Fig. 1f). No effect could be seen:dCas9 efficiency does not seem to correlate with the positioninside the gene.
Guides producing unexpected fitness defects. Surprisingly, weobserved a high variability of fitness effects between guide RNAstargeting nearby positions in the same orientation (Fig. 2a). Theseeffects are reproducible between three independent experiments,suggesting that they are not the product of experimental noisebut a real biological effect. In particular guides, binding to thetemplate strand of non-essential genes are not expected to be
ARTICLE NATURE COMMUNICATIONS | DOI: 10.1038/s41467-018-04209-5
2 NATURE COMMUNICATIONS | (2018) 9:1912 | DOI: 10.1038/s41467-018-04209-5 | www.nature.com/naturecommunications
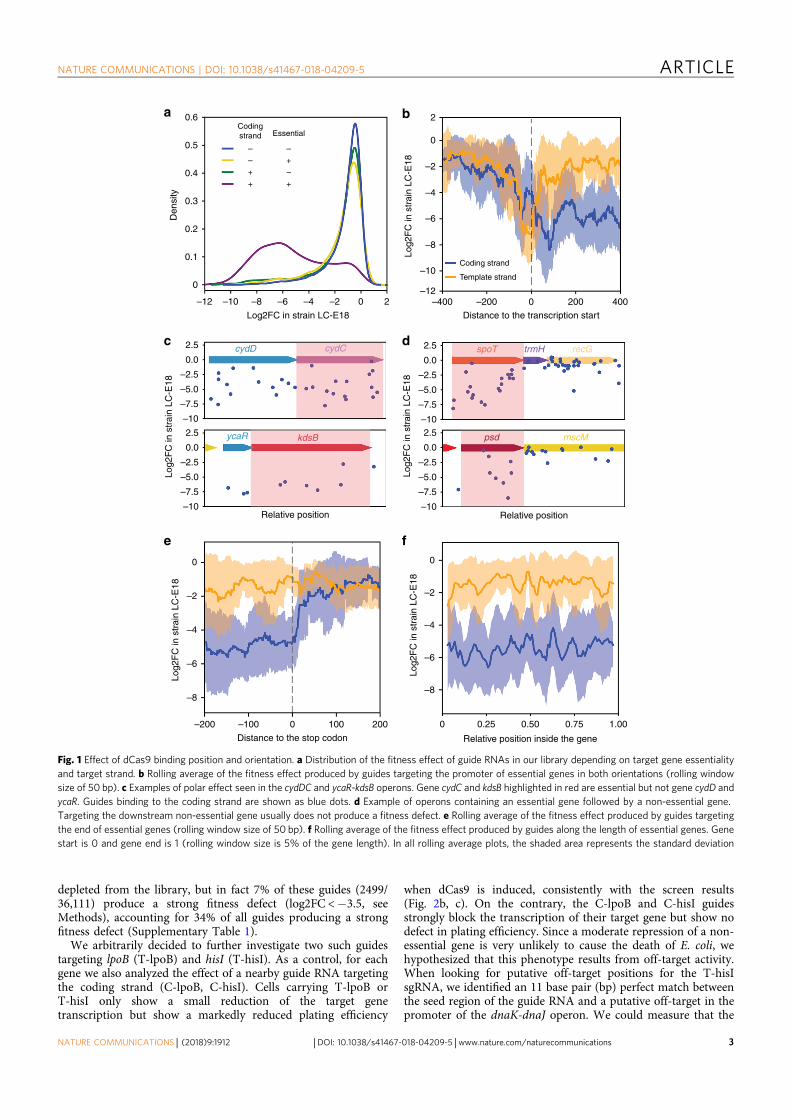
depleted from the library, but in fact 7% of these guides (2499/36,111) produce a strong fitness defect (log2FC <−3.5, seeMethods), accounting for 34% of all guides producing a strongfitness defect (Supplementary Table 1).
We arbitrarily decided to further investigate two such guidestargeting lpoB (T-lpoB) and hisI (T-hisI). As a control, for eachgene we also analyzed the effect of a nearby guide RNA targetingthe coding strand (C-lpoB, C-hisI). Cells carrying T-lpoB orT-hisI only show a small reduction of the target genetranscription but show a markedly reduced plating efficiency
when dCas9 is induced, consistently with the screen results(Fig. 2b, c). On the contrary, the C-lpoB and C-hisI guidesstrongly block the transcription of their target gene but show nodefect in plating efficiency. Since a moderate repression of a non-essential gene is very unlikely to cause the death of E. coli, wehypothesized that this phenotype results from off-target activity.When looking for putative off-target positions for the T-hisIsgRNA, we identified an 11 base pair (bp) perfect match betweenthe seed region of the guide RNA and a putative off-target in thepromoter of the dnaK-dnaJ operon. We could measure that the
a b
c
e f
d
0.6 2
0
–2
–4
–6
–8
–10
–12
Codingstrand
–
–
+
+ +
+
–
–
Essential
Coding strand
Template strand
0.5
0.4D
ensi
ty
0.3
0.2
0.1
0
2.5 cydD spoT trmH recG
ycaR kdsB psd mscM
cydC
–2.5
–5.0
–5.0
–7.5
–7.5
2.5
–2.5
0
–2
–4
–6
–8
0
–2
–4
–6
–8
–200 0 0.25 0.50
Relative position inside the gene
0.75 1.00–100 100 2000
Distance to the stop codon
0.0
–10
–10Relative position Relative position
0.0
2.5
–2.5
–5.0
–7.5
–10
0.0
2.5
–2.5
–5.0
–7.5
–10
0.0
–12 –10 –8
Log2FC in strain LC-E18
Log2
FC
in s
trai
n LC
-E18
Log2
FC
in s
trai
n LC
-E18
Log2
FC
in s
trai
n LC
-E18
Log2
FC
in s
trai
n LC
-E18
Log2
FC
in s
trai
n LC
-E18
–6 –4 –2 0 2 –400 –200
Distance to the transcription start
0 200 400
Fig. 1 Effect of dCas9 binding position and orientation. a Distribution of the fitness effect of guide RNAs in our library depending on target gene essentialityand target strand. b Rolling average of the fitness effect produced by guides targeting the promoter of essential genes in both orientations (rolling windowsize of 50 bp). c Examples of polar effect seen in the cydDC and ycaR-kdsB operons. Gene cydC and kdsB highlighted in red are essential but not gene cydD andycaR. Guides binding to the coding strand are shown as blue dots. d Example of operons containing an essential gene followed by a non-essential gene.Targeting the downstream non-essential gene usually does not produce a fitness defect. e Rolling average of the fitness effect produced by guides targetingthe end of essential genes (rolling window size of 50 bp). f Rolling average of the fitness effect produced by guides along the length of essential genes. Genestart is 0 and gene end is 1 (rolling window size is 5% of the gene length). In all rolling average plots, the shaded area represents the standard deviation
NATURE COMMUNICATIONS | DOI: 10.1038/s41467-018-04209-5 ARTICLE
NATURE COMMUNICATIONS | (2018) 9:1912 | DOI: 10.1038/s41467-018-04209-5 |www.nature.com/naturecommunications 3
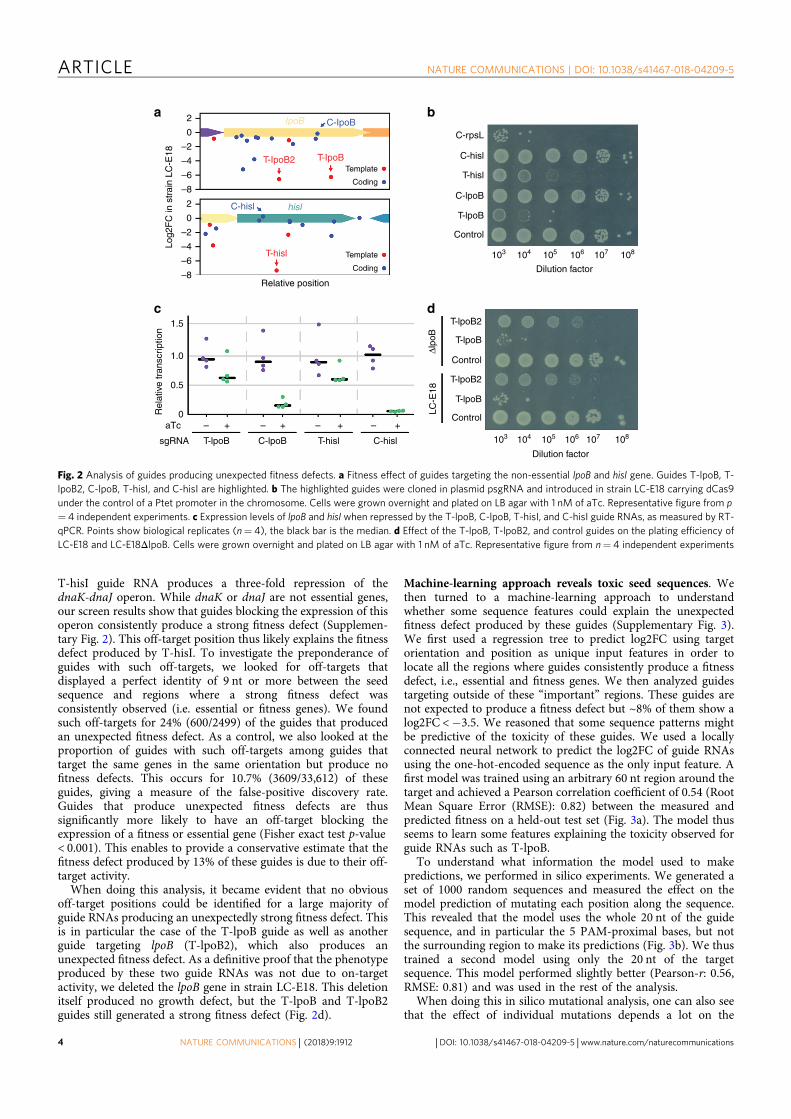
T-hisI guide RNA produces a three-fold repression of thednaK-dnaJ operon. While dnaK or dnaJ are not essential genes,our screen results show that guides blocking the expression of thisoperon consistently produce a strong fitness defect (Supplemen-tary Fig. 2). This off-target position thus likely explains the fitnessdefect produced by T-hisI. To investigate the preponderance ofguides with such off-targets, we looked for off-targets thatdisplayed a perfect identity of 9 nt or more between the seedsequence and regions where a strong fitness defect wasconsistently observed (i.e. essential or fitness genes). We foundsuch off-targets for 24% (600/2499) of the guides that producedan unexpected fitness defect. As a control, we also looked at theproportion of guides with such off-targets among guides thattarget the same genes in the same orientation but produce nofitness defects. This occurs for 10.7% (3609/33,612) of theseguides, giving a measure of the false-positive discovery rate.Guides that produce unexpected fitness defects are thussignificantly more likely to have an off-target blocking theexpression of a fitness or essential gene (Fisher exact test p-value< 0.001). This enables to provide a conservative estimate that thefitness defect produced by 13% of these guides is due to their off-target activity.
When doing this analysis, it became evident that no obviousoff-target positions could be identified for a large majority ofguide RNAs producing an unexpectedly strong fitness defect. Thisis in particular the case of the T-lpoB guide as well as anotherguide targeting lpoB (T-lpoB2), which also produces anunexpected fitness defect. As a definitive proof that the phenotypeproduced by these two guide RNAs was not due to on-targetactivity, we deleted the lpoB gene in strain LC-E18. This deletionitself produced no growth defect, but the T-lpoB and T-lpoB2guides still generated a strong fitness defect (Fig. 2d).
Machine-learning approach reveals toxic seed sequences. Wethen turned to a machine-learning approach to understandwhether some sequence features could explain the unexpectedfitness defect produced by these guides (Supplementary Fig. 3).We first used a regression tree to predict log2FC using targetorientation and position as unique input features in order tolocate all the regions where guides consistently produce a fitnessdefect, i.e., essential and fitness genes. We then analyzed guidestargeting outside of these “important” regions. These guides arenot expected to produce a fitness defect but ~8% of them show alog2FC <−3.5. We reasoned that some sequence patterns mightbe predictive of the toxicity of these guides. We used a locallyconnected neural network to predict the log2FC of guide RNAsusing the one-hot-encoded sequence as the only input feature. Afirst model was trained using an arbitrary 60 nt region around thetarget and achieved a Pearson correlation coefficient of 0.54 (RootMean Square Error (RMSE): 0.82) between the measured andpredicted fitness on a held-out test set (Fig. 3a). The model thusseems to learn some features explaining the toxicity observed forguide RNAs such as T-lpoB.
To understand what information the model used to makepredictions, we performed in silico experiments. We generated aset of 1000 random sequences and measured the effect on themodel prediction of mutating each position along the sequence.This revealed that the model uses the whole 20 nt of the guidesequence, and in particular the 5 PAM-proximal bases, but notthe surrounding region to make its predictions (Fig. 3b). We thustrained a second model using only the 20 nt of the targetsequence. This model performed slightly better (Pearson-r: 0.56,RMSE: 0.81) and was used in the rest of the analysis.
When doing this in silico mutational analysis, one can also seethat the effect of individual mutations depends a lot on the
a
c d
b2
Template
C-rpsL
C-hisl
T-hisl
C-lpoB
T-lpoB
T-lpoB2
T-lpoB2
T-lpoB
T-lpoB
Control
Control
Control
Dilution factor
103 104 105 106 107 108
Dilution factor
103 104 105 106 107 108
Template
Coding
Coding
IpoB
hisl
T-hisl
C-IpoB
C-hisl
T-IpoB2 T-IpoBR
elat
ive
tran
scrip
tion
Δlpo
BLC
-E18
Log2
FC
in s
trai
n LC
-E18
2
–2
–2
–4
–4
–6
–6
–8
–8
1.5
1.0
0.5
0aTc – + + + +– – –
sgRNA T-lpoB T-hisl C-hislC-lpoB
Relative position
0
0
Fig. 2 Analysis of guides producing unexpected fitness defects. a Fitness effect of guides targeting the non-essential lpoB and hisI gene. Guides T-lpoB, T-lpoB2, C-lpoB, T-hisI, and C-hisI are highlighted. b The highlighted guides were cloned in plasmid psgRNA and introduced in strain LC-E18 carrying dCas9under the control of a Ptet promoter in the chromosome. Cells were grown overnight and plated on LB agar with 1 nM of aTc. Representative figure from p= 4 independent experiments. c Expression levels of lpoB and hisI when repressed by the T-lpoB, C-lpoB, T-hisI, and C-hisI guide RNAs, as measured by RT-qPCR. Points show biological replicates (n= 4), the black bar is the median. d Effect of the T-lpoB, T-lpoB2, and control guides on the plating efficiency ofLC-E18 and LC-E18ΔlpoB. Cells were grown overnight and plated on LB agar with 1 nM of aTc. Representative figure from n= 4 independent experiments
ARTICLE NATURE COMMUNICATIONS | DOI: 10.1038/s41467-018-04209-5
4 NATURE COMMUNICATIONS | (2018) 9:1912 | DOI: 10.1038/s41467-018-04209-5 | www.nature.com/naturecommunications
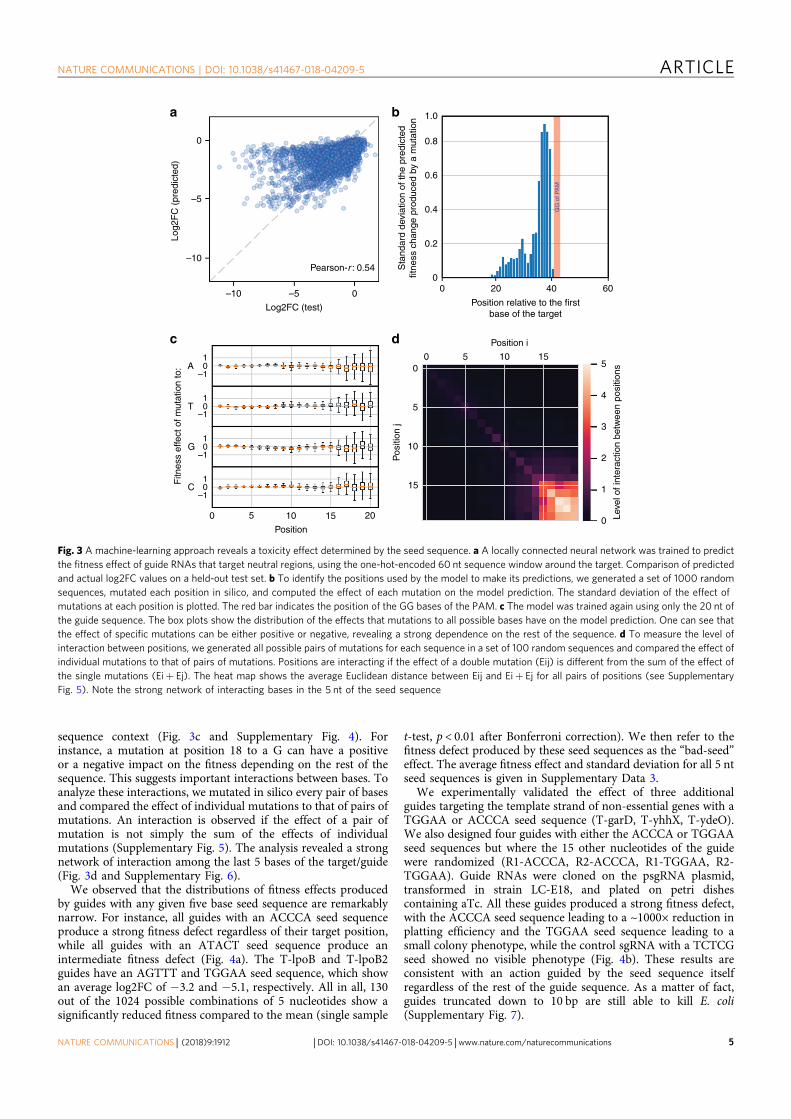
sequence context (Fig. 3c and Supplementary Fig. 4). Forinstance, a mutation at position 18 to a G can have a positiveor a negative impact on the fitness depending on the rest of thesequence. This suggests important interactions between bases. Toanalyze these interactions, we mutated in silico every pair of basesand compared the effect of individual mutations to that of pairs ofmutations. An interaction is observed if the effect of a pair ofmutation is not simply the sum of the effects of individualmutations (Supplementary Fig. 5). The analysis revealed a strongnetwork of interaction among the last 5 bases of the target/guide(Fig. 3d and Supplementary Fig. 6).
We observed that the distributions of fitness effects producedby guides with any given five base seed sequence are remarkablynarrow. For instance, all guides with an ACCCA seed sequenceproduce a strong fitness defect regardless of their target position,while all guides with an ATACT seed sequence produce anintermediate fitness defect (Fig. 4a). The T-lpoB and T-lpoB2guides have an AGTTT and TGGAA seed sequence, which showan average log2FC of −3.2 and −5.1, respectively. All in all, 130out of the 1024 possible combinations of 5 nucleotides show asignificantly reduced fitness compared to the mean (single sample
t-test, p < 0.01 after Bonferroni correction). We then refer to thefitness defect produced by these seed sequences as the “bad-seed”effect. The average fitness effect and standard deviation for all 5 ntseed sequences is given in Supplementary Data 3.
We experimentally validated the effect of three additionalguides targeting the template strand of non-essential genes with aTGGAA or ACCCA seed sequence (T-garD, T-yhhX, T-ydeO).We also designed four guides with either the ACCCA or TGGAAseed sequences but where the 15 other nucleotides of the guidewere randomized (R1-ACCCA, R2-ACCCA, R1-TGGAA, R2-TGGAA). Guide RNAs were cloned on the psgRNA plasmid,transformed in strain LC-E18, and plated on petri dishescontaining aTc. All these guides produced a strong fitness defect,with the ACCCA seed sequence leading to a ~1000× reduction inplatting efficiency and the TGGAA seed sequence leading to asmall colony phenotype, while the control sgRNA with a TCTCGseed showed no visible phenotype (Fig. 4b). These results areconsistent with an action guided by the seed sequence itselfregardless of the rest of the guide sequence. As a matter of fact,guides truncated down to 10 bp are still able to kill E. coli(Supplementary Fig. 7).
a
c d
b
0
1.0
0.8
0.6
0.4 GG
of P
AM
0.2
0
0 0 20 40
Position relative to the firstbase of the target
60
Pearson-r : 0.54
Log2
FC
(pr
edic
ted)
Fitn
ess
effe
ct o
f mut
atio
n to
:
Pos
ition
j
Leve
l of i
nter
actio
n be
twee
n po
sitio
ns
Position i
Sta
ndar
d de
viat
ion
of th
e pr
edic
ted
fitne
ss c
hang
e pr
oduc
ed b
y a
mut
atio
n
–5
–5
Log2FC (test)
–10
A 00
5
5
4
3
2
1
0
5
10
10
15
15
T
G
C
0 5 10
Position
15 20
1
–10
1
–10
1
–10
1
–10
–10
Fig. 3 A machine-learning approach reveals a toxicity effect determined by the seed sequence. a A locally connected neural network was trained to predictthe fitness effect of guide RNAs that target neutral regions, using the one-hot-encoded 60 nt sequence window around the target. Comparison of predictedand actual log2FC values on a held-out test set. b To identify the positions used by the model to make its predictions, we generated a set of 1000 randomsequences, mutated each position in silico, and computed the effect of each mutation on the model prediction. The standard deviation of the effect ofmutations at each position is plotted. The red bar indicates the position of the GG bases of the PAM. c The model was trained again using only the 20 nt ofthe guide sequence. The box plots show the distribution of the effects that mutations to all possible bases have on the model prediction. One can see thatthe effect of specific mutations can be either positive or negative, revealing a strong dependence on the rest of the sequence. d To measure the level ofinteraction between positions, we generated all possible pairs of mutations for each sequence in a set of 100 random sequences and compared the effect ofindividual mutations to that of pairs of mutations. Positions are interacting if the effect of a double mutation (Eij) is different from the sum of the effect ofthe single mutations (Ei+ Ej). The heat map shows the average Euclidean distance between Eij and Ei+ Ej for all pairs of positions (see SupplementaryFig. 5). Note the strong network of interacting bases in the 5 nt of the seed sequence
NATURE COMMUNICATIONS | DOI: 10.1038/s41467-018-04209-5 ARTICLE
NATURE COMMUNICATIONS | (2018) 9:1912 | DOI: 10.1038/s41467-018-04209-5 |www.nature.com/naturecommunications 5
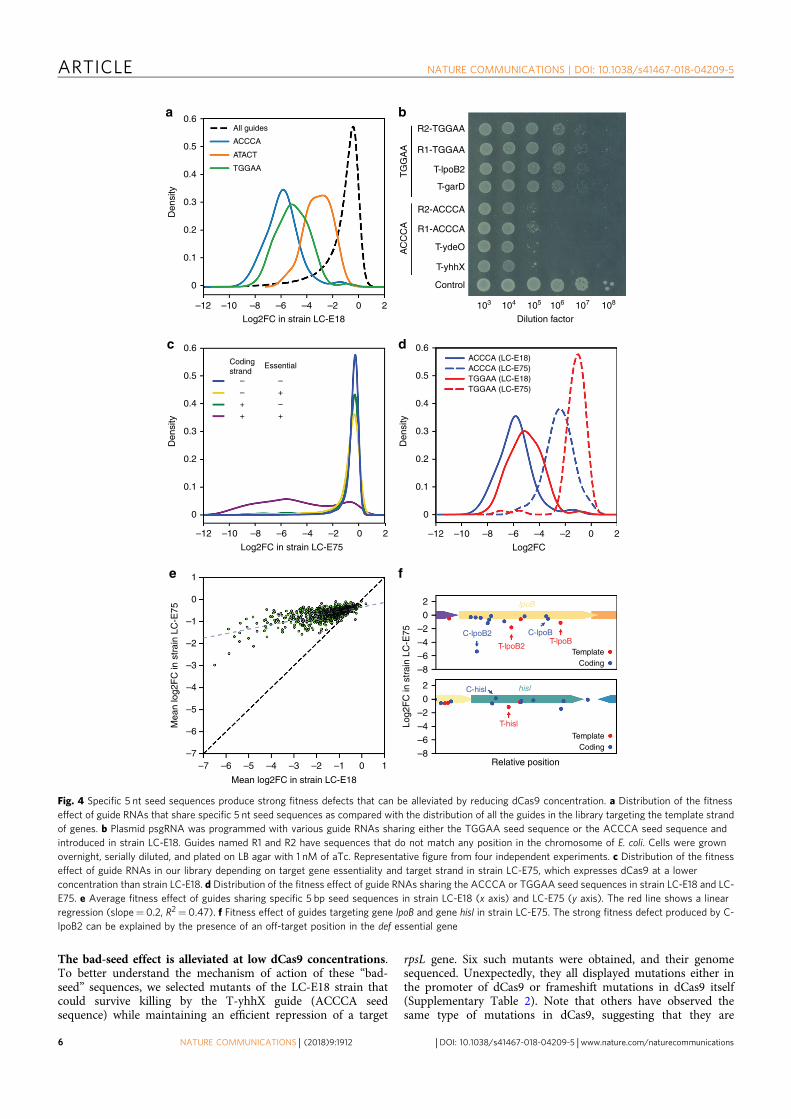
The bad-seed effect is alleviated at low dCas9 concentrations.To better understand the mechanism of action of these “bad-seed” sequences, we selected mutants of the LC-E18 strain thatcould survive killing by the T-yhhX guide (ACCCA seedsequence) while maintaining an efficient repression of a target
rpsL gene. Six such mutants were obtained, and their genomesequenced. Unexpectedly, they all displayed mutations either inthe promoter of dCas9 or frameshift mutations in dCas9 itself(Supplementary Table 2). Note that others have observed thesame type of mutations in dCas9, suggesting that they are
a
c
e f
d
bR2-TGGAA
T-lpoB2
T-garD
T-ydeO
T-yhhX
Control
R1-TGGAA
R2-ACCCA
R1-ACCCA
All guides
ACCCA
ATACT
TGGAA
ACCCA (LC-E18)ACCCA (LC-E75)TGGAA (LC-E18)TGGAA (LC-E75)
TemplateCoding
TemplateCoding
Codingstrand
–
–
–
–+
+ +
+
Essential
0.5
0.6
Den
sity
TG
GA
AA
CC
CA
0.4
0.3
0.2
0.1
0
0.5
0.6
Den
sity
Mea
n lo
g2F
C in
str
ain
LC-E
75
Log2
FC
in s
trai
n LC
-E75
0.4
0.3
0.2
0.1
0
1
–1
–2
–2 C-lpoB2
C-hisl
C-lpoB
T-lpoB2
T-hisl
T-lpoB–4
–6
–8
2 lpoB
hisl
–3
–4
–5
–6
–7
0
0
–2
–4
–6
–8
2
0
0.5
0.6
Den
sity
0.4
0.3
0.2
0.1
0
–12 –10 –8
Log2FC in strain LC-E18
–6 –4 –2 0 103 104 105
Dilution factor
106 107 1082
–12
–7 –6 –5 –4 –3
Mean log2FC in strain LC-E18
Relative position–2 –1 0 1
–10 –8
Log2FC in strain LC-E75
–6 –4 –2 0 2 –12 –10 –8
Log2FC
–6 –4 –2 0 2
Fig. 4 Specific 5 nt seed sequences produce strong fitness defects that can be alleviated by reducing dCas9 concentration. a Distribution of the fitnesseffect of guide RNAs that share specific 5 nt seed sequences as compared with the distribution of all the guides in the library targeting the template strandof genes. b Plasmid psgRNA was programmed with various guide RNAs sharing either the TGGAA seed sequence or the ACCCA seed sequence andintroduced in strain LC-E18. Guides named R1 and R2 have sequences that do not match any position in the chromosome of E. coli. Cells were grownovernight, serially diluted, and plated on LB agar with 1 nM of aTc. Representative figure from four independent experiments. c Distribution of the fitnesseffect of guide RNAs in our library depending on target gene essentiality and target strand in strain LC-E75, which expresses dCas9 at a lowerconcentration than strain LC-E18. d Distribution of the fitness effect of guide RNAs sharing the ACCCA or TGGAA seed sequences in strain LC-E18 and LC-E75. e Average fitness effect of guides sharing specific 5 bp seed sequences in strain LC-E18 (x axis) and LC-E75 (y axis). The red line shows a linearregression (slope= 0.2, R2= 0.47). f Fitness effect of guides targeting gene lpoB and gene hisI in strain LC-E75. The strong fitness defect produced by C-lpoB2 can be explained by the presence of an off-target position in the def essential gene
ARTICLE NATURE COMMUNICATIONS | DOI: 10.1038/s41467-018-04209-5
6 NATURE COMMUNICATIONS | (2018) 9:1912 | DOI: 10.1038/s41467-018-04209-5 | www.nature.com/naturecommunications
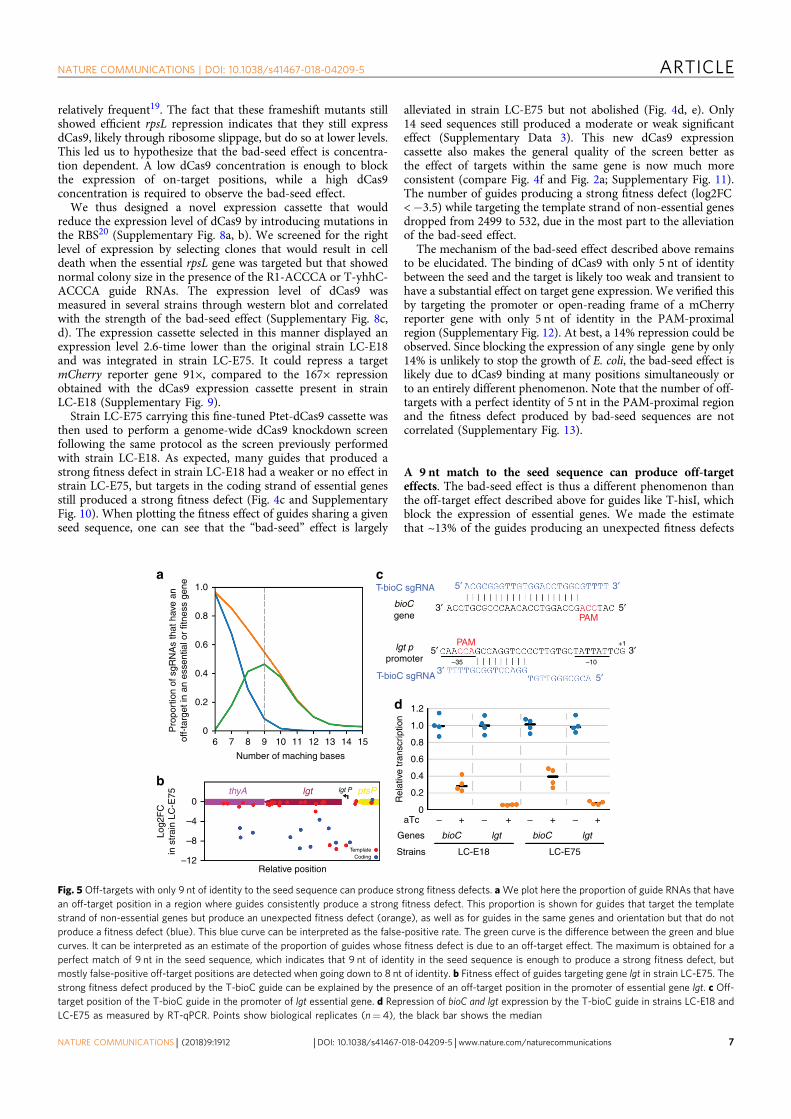
relatively frequent19. The fact that these frameshift mutants stillshowed efficient rpsL repression indicates that they still expressdCas9, likely through ribosome slippage, but do so at lower levels.This led us to hypothesize that the bad-seed effect is concentra-tion dependent. A low dCas9 concentration is enough to blockthe expression of on-target positions, while a high dCas9concentration is required to observe the bad-seed effect.
We thus designed a novel expression cassette that wouldreduce the expression level of dCas9 by introducing mutations inthe RBS20 (Supplementary Fig. 8a, b). We screened for the rightlevel of expression by selecting clones that would result in celldeath when the essential rpsL gene was targeted but that showednormal colony size in the presence of the R1-ACCCA or T-yhhC-ACCCA guide RNAs. The expression level of dCas9 wasmeasured in several strains through western blot and correlatedwith the strength of the bad-seed effect (Supplementary Fig. 8c,d). The expression cassette selected in this manner displayed anexpression level 2.6-time lower than the original strain LC-E18and was integrated in strain LC-E75. It could repress a targetmCherry reporter gene 91×, compared to the 167× repressionobtained with the dCas9 expression cassette present in strainLC-E18 (Supplementary Fig. 9).
Strain LC-E75 carrying this fine-tuned Ptet-dCas9 cassette wasthen used to perform a genome-wide dCas9 knockdown screenfollowing the same protocol as the screen previously performedwith strain LC-E18. As expected, many guides that produced astrong fitness defect in strain LC-E18 had a weaker or no effect instrain LC-E75, but targets in the coding strand of essential genesstill produced a strong fitness defect (Fig. 4c and SupplementaryFig. 10). When plotting the fitness effect of guides sharing a givenseed sequence, one can see that the “bad-seed” effect is largely
alleviated in strain LC-E75 but not abolished (Fig. 4d, e). Only14 seed sequences still produced a moderate or weak significanteffect (Supplementary Data 3). This new dCas9 expressioncassette also makes the general quality of the screen better asthe effect of targets within the same gene is now much moreconsistent (compare Fig. 4f and Fig. 2a; Supplementary Fig. 11).The number of guides producing a strong fitness defect (log2FC<−3.5) while targeting the template strand of non-essential genesdropped from 2499 to 532, due in the most part to the alleviationof the bad-seed effect.
The mechanism of the bad-seed effect described above remainsto be elucidated. The binding of dCas9 with only 5 nt of identitybetween the seed and the target is likely too weak and transient tohave a substantial effect on target gene expression. We verified thisby targeting the promoter or open-reading frame of a mCherryreporter gene with only 5 nt of identity in the PAM-proximalregion (Supplementary Fig. 12). At best, a 14% repression could beobserved. Since blocking the expression of any single gene by only14% is unlikely to stop the growth of E. coli, the bad-seed effect islikely due to dCas9 binding at many positions simultaneously orto an entirely different phenomenon. Note that the number of off-targets with a perfect identity of 5 nt in the PAM-proximal regionand the fitness defect produced by bad-seed sequences are notcorrelated (Supplementary Fig. 13).
A 9 nt match to the seed sequence can produce off-targeteffects. The bad-seed effect is thus a different phenomenon thanthe off-target effect described above for guides like T-hisI, whichblock the expression of essential genes. We made the estimatethat ~13% of the guides producing an unexpected fitness defects
a
b
c
d
Pro
port
ion
of s
gRN
As
that
hav
e an
off-
targ
et in
an
esse
ntia
l or
fitne
ss g
ene
Log2
FC
in s
trai
n LC
-E75 Rel
ativ
e tr
ansc
riptio
n
1.0
0.8
0.6
0.4
0.2
0
1.2
T-bioC sgRNA
T-bioC sgRNA
5′
5′3′
3′
bioCgene
lgt ppromoter
3′
5′–35 –10
5′
3′+1
PAM
PAM
1.0
0.8
0.6
0.4
0.2
0aTc
Genes
Strains LC-E18 LC-E75
bioC lgt bioC lgt
– + + + +– – –
0thyA lgt ptsPlgt P
–4
–8
–12Template
Coding
6 7 8 9 10 11 12
Number of maching bases
Relative position
13 14 15
Fig. 5 Off-targets with only 9 nt of identity to the seed sequence can produce strong fitness defects. aWe plot here the proportion of guide RNAs that havean off-target position in a region where guides consistently produce a strong fitness defect. This proportion is shown for guides that target the templatestrand of non-essential genes but produce an unexpected fitness defect (orange), as well as for guides in the same genes and orientation but that do notproduce a fitness defect (blue). This blue curve can be interpreted as the false-positive rate. The green curve is the difference between the green and bluecurves. It can be interpreted as an estimate of the proportion of guides whose fitness defect is due to an off-target effect. The maximum is obtained for aperfect match of 9 nt in the seed sequence, which indicates that 9 nt of identity in the seed sequence is enough to produce a strong fitness defect, butmostly false-positive off-target positions are detected when going down to 8 nt of identity. b Fitness effect of guides targeting gene lgt in strain LC-E75. Thestrong fitness defect produced by the T-bioC guide can be explained by the presence of an off-target position in the promoter of essential gene lgt. c Off-target position of the T-bioC guide in the promoter of lgt essential gene. d Repression of bioC and lgt expression by the T-bioC guide in strains LC-E18 andLC-E75 as measured by RT-qPCR. Points show biological replicates (n= 4), the black bar shows the median
NATURE COMMUNICATIONS | DOI: 10.1038/s41467-018-04209-5 ARTICLE
NATURE COMMUNICATIONS | (2018) 9:1912 | DOI: 10.1038/s41467-018-04209-5 |www.nature.com/naturecommunications 7
in strain LC-E18 have a likely off-target position to an essential orfitness gene, with 9 nt of identity or more to the seed sequence. Inthe screen performed in strain LC-E75, this number can now beestimated to be 45%. The same analysis was also performed whileconsidering a minimum perfect match in the PAM-proximalregion ranging from 6 to 15 bp (Fig. 5a and SupplementaryFig. 14). A seed size of length nine gave the largest differencebetween the positive detection rate (proportion of guides pro-ducing an unexpected fitness defect for which an off-target to animportant region is detected) and false-positive detection rate(proportion of guides that do not produce an effect and for whichan off-target to an important region is detected), suggesting that9 nt of identity can be sufficient to block gene expression. Weexperimentally verified the fitness defect produced by one suchguide, T-bioC, which has a candidate off-target position of 9 ntand a proper NGG PAM in the promoter of the essential gene lgt(Fig. 5b, c). This guide is indeed able to efficiently block theexpression of lgt as measured by quantitative PCR (qPCR;Fig. 5d).
Note that, in strain LC-E75, the reduced dCas9 concentrationnot only alleviated the bad-seed effect but to a lesser extent alsolimited off-targeting. This can, for instance, be seen for the T-hisItarget described above that showed a strong fitness defect in strainLC-E18 and no effect in the new screen (compare Fig. 2a and Fig.4f). Conversely, the T-bioC off-target effect on lgt is still as strongin strain LC-E75 as in strain LC-E18 (Fig. 5d). Another example ofa guide that still shows a strong off-target effect can be found atthe beginning of the lpoB gene (C-lpoB2, Fig. 4f). This guide RNAhas a perfect match of 14 bp between its seed sequence and atarget on the coding strand of the essential def gene.
DiscussionWe performed here an unbiased screen of dCas9 effect on thegrowth of E. coli. Our results shed light on important design rulesto consider when performing CRISPRi assays:
(i) Targeting promoter regions in both orientations leads tostrong silencing, but targeting the coding strand is requiredto block transcription elongation as described previously6,7.
(ii) Guides targeting genes in operons block the expression ofall the downstream genes, while guides targeting down-stream genes do not substantially affect the expression ofthe upstream genes.
(iii) Guides that have off-targets in the genome with 9 nt of perfectidentity or more to the seed sequence should be avoided.Unfortunately, such off-target positions are too frequent to beavoided easily. Guides that target the chromosome of E. coliMG1655 have a median of 4 off-targets that carry a perfectmatch of 9 nt or more with the seed sequence and a NGGPAM motif (see distribution in Supplementary Fig. 15). Onecan limit the chances that these off-targets will influence thephenotype under study by making sure that they fall inneutral regions, away from regulatory elements, and on thetemplate strand of genes rather than on their coding strand,but researchers should be aware that this could be aconfounding factor in their experiments.
(iv) dCas9 concentration needs to be tuned to avoid the “bad-seed” effect while maintaining good on-target repression.Even under such conditions, it is preferable to avoid usingguides that carry the strongest “bad seeds” identified here.
(v) For the reasons described above, the effects of genes on agiven phenotype should ideally not be inferred from theeffect of a single guide but rather from the statisticalanalyses of several guides.
All in all, the results of the new screen performed with areduced dCas9 concentration are much more consistent than theinitial screen, but there remains a few hundred guide RNAs out ofthe 84,215 whose fitness effect could not be easily assigned to thebad-seed effect, a polar effect, or an off-target effect. Under-standing the effect of these guides on fitness will require furtheranalysis and might reveal interesting biology.
The dataset generated will also likely prove useful in futurestudies to decipher the determinants of dCas9 repressionstrength. Indeed, we observed some variability among guidestargeting within the same essential gene in the same orientation,suggesting that some guides block expression better than others.
Perhaps the most puzzling question raised by this work is thatof the mechanism responsible for the “bad-seed” effect. Otherspreviously reported a dCas9 toxicity at high concentrations,which is likely the same as what we report here21. On average, wecan find 280 positions in the chromosome of E. coli that can bebound by any 5 nt seed sequence with the requirement of a NGGPAM. It is unclear whether weak dCas9 binding at one, a few, orhundreds of positions simultaneously is required for this effect.The fact that it is observed at high dCas9 concentrations and thatwe were not able to identify mutants that can rescue cells by othermeans than reducing dCas9 expression suggests that binding toseveral positions is required. Our work also does not allowexcluding the hypothesis that binding to other substrates thanDNA might be responsible for the effect. While we furtherinvestigate this phenomenon, the results presented here aredirectly relevant to anyone using dCas9 in bacteria.
MethodsBacterial strains and media. E. coli strain MG1655 was obtained from thelaboratory of Didier Mazel, Institut Pasteur. Cells were grown in Luria-Bertani (LB)broth. LB agar 1.5% was used as solid medium. Different antibiotics (20 μg/mlchloramphenicol, 100 μg/ml carbenicillin, 50 μg/ml kanamycin) were used asneeded and lower concentrations were used to select for the integration of vectorsin the chromosome (10 μg/ml chloramphenicol or 20 μg/ml kanamycin). E. colistrain DH5α (New England Biolabs) or MG1655 were used as transformationrecipients for plasmid construction.
Plasmid cloning and strain construction. Linear vectors and inserts were gen-erated by digestion with restriction enzymes or PCR and assembled throughGibson assembly22 as detailed in Supplementary Table 3. Primers and plasmids arelisted in Supplementary Tables 4, 5. Guide RNAs were cloned into plasmidpsgRNA or psgRNAc by golden gate assembly23. The sequence of these plasmids isprovided as supplementary Data 4. A list of all guides and corresponding primers isgiven in Supplementary Table 6.
The pOSIP plasmids24 were used to integrate genetic elements at phage-attachment sites in the chromosome of E. coli K12 (MG1655). All the integrationswere verified by PCR, and the backbones were flipped out using the pE-FLPplasmid24. Supplementary Table 7 summarizes the construction of strains LCE-18,LCE-75, and AV04.
Deletion of gene lpoB was performed using the lambda red recombineeringstrategy25. A linear DNA fragment was generated by PCR using pKD3 as atemplate with primers LC961 and LC962, followed by electroporation intoMG1655 carrying plasmid pKOBEG-A26. Colonies resistant to chloramphenicolwere selected and the resistance gene was removed using plasmid pE-FLP.
Library construction. The library was designed by randomly choosing targets witha proper NGG PAM around the genome of E. coli strain MG1655 (NC_000913.2).A pool of 92,919 oligonucleotides (synthesized by CustomArray) was amplifiedwith primers LC296 and LC297 using the Phusion DNA polymerase (ThermoScientific) over 18 cycles. The psgRNA backbone was PCR amplified using primersLC293 and LC294. Both the vector backbone and library insert were gel purified,followed by Gibson assembly. To avoid the introduction of bottlenecks in thelibrary, a total of 19 transformation assays were performed each using 0.2 μl ofGibson assembly product and 20 μl of MG1655 electro-competent cells and platedon 12 × 12 cm2 petri dishes resulting in a total of about 107 colonies. Colonies wereallowed to grow for only 4–5 h at 37 °C before pooling all the cells together. Theplasmid library was then extracted from 5ml of pooled colonies using a miniprepkit (Macherey-Nagel). The resulting plasmid library DNA was further transferredto strains LC-E18 and LC-E75 by electroporation.
ARTICLE NATURE COMMUNICATIONS | DOI: 10.1038/s41467-018-04209-5
8 NATURE COMMUNICATIONS | (2018) 9:1912 | DOI: 10.1038/s41467-018-04209-5 | www.nature.com/naturecommunications
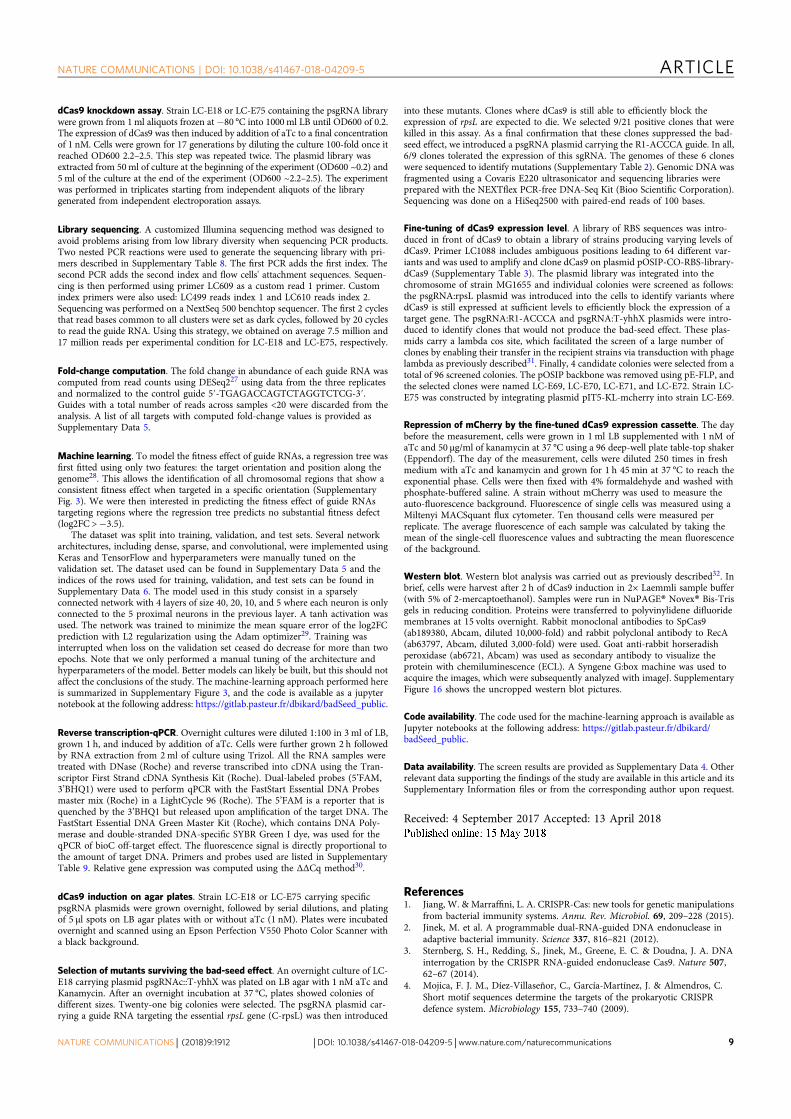
dCas9 knockdown assay. Strain LC-E18 or LC-E75 containing the psgRNA librarywere grown from 1ml aliquots frozen at −80 °C into 1000ml LB until OD600 of 0.2.The expression of dCas9 was then induced by addition of aTc to a final concentrationof 1 nM. Cells were grown for 17 generations by diluting the culture 100-fold once itreached OD600 2.2–2.5. This step was repeated twice. The plasmid library wasextracted from 50ml of culture at the beginning of the experiment (OD600 ~0.2) and5ml of the culture at the end of the experiment (OD600 ~2.2–2.5). The experimentwas performed in triplicates starting from independent aliquots of the librarygenerated from independent electroporation assays.
Library sequencing. A customized Illumina sequencing method was designed toavoid problems arising from low library diversity when sequencing PCR products.Two nested PCR reactions were used to generate the sequencing library with pri-mers described in Supplementary Table 8. The first PCR adds the first index. Thesecond PCR adds the second index and flow cells' attachment sequences. Sequen-cing is then performed using primer LC609 as a custom read 1 primer. Customindex primers were also used: LC499 reads index 1 and LC610 reads index 2.Sequencing was performed on a NextSeq 500 benchtop sequencer. The first 2 cyclesthat read bases common to all clusters were set as dark cycles, followed by 20 cyclesto read the guide RNA. Using this strategy, we obtained on average 7.5 million and17 million reads per experimental condition for LC-E18 and LC-E75, respectively.
Fold-change computation. The fold change in abundance of each guide RNA wascomputed from read counts using DESeq227 using data from the three replicatesand normalized to the control guide 5′-TGAGACCAGTCTAGGTCTCG-3′.Guides with a total number of reads across samples <20 were discarded from theanalysis. A list of all targets with computed fold-change values is provided asSupplementary Data 5.
Machine learning. To model the fitness effect of guide RNAs, a regression tree wasfirst fitted using only two features: the target orientation and position along thegenome28. This allows the identification of all chromosomal regions that show aconsistent fitness effect when targeted in a specific orientation (SupplementaryFig. 3). We were then interested in predicting the fitness effect of guide RNAstargeting regions where the regression tree predicts no substantial fitness defect(log2FC >−3.5).
The dataset was split into training, validation, and test sets. Several networkarchitectures, including dense, sparse, and convolutional, were implemented usingKeras and TensorFlow and hyperparameters were manually tuned on thevalidation set. The dataset used can be found in Supplementary Data 5 and theindices of the rows used for training, validation, and test sets can be found inSupplementary Data 6. The model used in this study consist in a sparselyconnected network with 4 layers of size 40, 20, 10, and 5 where each neuron is onlyconnected to the 5 proximal neurons in the previous layer. A tanh activation wasused. The network was trained to minimize the mean square error of the log2FCprediction with L2 regularization using the Adam optimizer29. Training wasinterrupted when loss on the validation set ceased do decrease for more than twoepochs. Note that we only performed a manual tuning of the architecture andhyperparameters of the model. Better models can likely be built, but this should notaffect the conclusions of the study. The machine-learning approach performed hereis summarized in Supplementary Figure 3, and the code is available as a jupyternotebook at the following address: https://gitlab.pasteur.fr/dbikard/badSeed_public.
Reverse transcription-qPCR. Overnight cultures were diluted 1:100 in 3 ml of LB,grown 1 h, and induced by addition of aTc. Cells were further grown 2 h followedby RNA extraction from 2ml of culture using Trizol. All the RNA samples weretreated with DNase (Roche) and reverse transcribed into cDNA using the Tran-scriptor First Strand cDNA Synthesis Kit (Roche). Dual-labeled probes (5’FAM,3’BHQ1) were used to perform qPCR with the FastStart Essential DNA Probesmaster mix (Roche) in a LightCycle 96 (Roche). The 5’FAM is a reporter that isquenched by the 3’BHQ1 but released upon amplification of the target DNA. TheFastStart Essential DNA Green Master Kit (Roche), which contains DNA Poly-merase and double-stranded DNA-specific SYBR Green I dye, was used for theqPCR of bioC off-target effect. The fluorescence signal is directly proportional tothe amount of target DNA. Primers and probes used are listed in SupplementaryTable 9. Relative gene expression was computed using the ΔΔCq method30.
dCas9 induction on agar plates. Strain LC-E18 or LC-E75 carrying specificpsgRNA plasmids were grown overnight, followed by serial dilutions, and platingof 5 μl spots on LB agar plates with or without aTc (1 nM). Plates were incubatedovernight and scanned using an Epson Perfection V550 Photo Color Scanner witha black background.
Selection of mutants surviving the bad-seed effect. An overnight culture of LC-E18 carrying plasmid psgRNAc::T-yhhX was plated on LB agar with 1 nM aTc andKanamycin. After an overnight incubation at 37 °C, plates showed colonies ofdifferent sizes. Twenty-one big colonies were selected. The psgRNA plasmid car-rying a guide RNA targeting the essential rpsL gene (C-rpsL) was then introduced
into these mutants. Clones where dCas9 is still able to efficiently block theexpression of rpsL are expected to die. We selected 9/21 positive clones that werekilled in this assay. As a final confirmation that these clones suppressed the bad-seed effect, we introduced a psgRNA plasmid carrying the R1-ACCCA guide. In all,6/9 clones tolerated the expression of this sgRNA. The genomes of these 6 cloneswere sequenced to identify mutations (Supplementary Table 2). Genomic DNA wasfragmented using a Covaris E220 ultrasonicator and sequencing libraries wereprepared with the NEXTflex PCR-free DNA-Seq Kit (Bioo Scientific Corporation).Sequencing was done on a HiSeq2500 with paired-end reads of 100 bases.
Fine-tuning of dCas9 expression level. A library of RBS sequences was intro-duced in front of dCas9 to obtain a library of strains producing varying levels ofdCas9. Primer LC1088 includes ambiguous positions leading to 64 different var-iants and was used to amplify and clone dCas9 on plasmid pOSIP-CO-RBS-library-dCas9 (Supplementary Table 3). The plasmid library was integrated into thechromosome of strain MG1655 and individual colonies were screened as follows:the psgRNA:rpsL plasmid was introduced into the cells to identify variants wheredCas9 is still expressed at sufficient levels to efficiently block the expression of atarget gene. The psgRNA:R1-ACCCA and psgRNA:T-yhhX plasmids were intro-duced to identify clones that would not produce the bad-seed effect. These plas-mids carry a lambda cos site, which facilitated the screen of a large number ofclones by enabling their transfer in the recipient strains via transduction with phagelambda as previously described31. Finally, 4 candidate colonies were selected from atotal of 96 screened colonies. The pOSIP backbone was removed using pE-FLP, andthe selected clones were named LC-E69, LC-E70, LC-E71, and LC-E72. Strain LC-E75 was constructed by integrating plasmid pIT5-KL-mcherry into strain LC-E69.
Repression of mCherry by the fine-tuned dCas9 expression cassette. The daybefore the measurement, cells were grown in 1 ml LB supplemented with 1 nM ofaTc and 50 μg/ml of kanamycin at 37 °C using a 96 deep-well plate table-top shaker(Eppendorf). The day of the measurement, cells were diluted 250 times in freshmedium with aTc and kanamycin and grown for 1 h 45 min at 37 °C to reach theexponential phase. Cells were then fixed with 4% formaldehyde and washed withphosphate-buffered saline. A strain without mCherry was used to measure theauto-fluorescence background. Fluorescence of single cells was measured using aMiltenyi MACSquant flux cytometer. Ten thousand cells were measured perreplicate. The average fluorescence of each sample was calculated by taking themean of the single-cell fluorescence values and subtracting the mean fluorescenceof the background.
Western blot. Western blot analysis was carried out as previously described32. Inbrief, cells were harvest after 2 h of dCas9 induction in 2× Laemmli sample buffer(with 5% of 2-mercaptoethanol). Samples were run in NuPAGE® Novex® Bis-Trisgels in reducing condition. Proteins were transferred to polyvinylidene difluoridemembranes at 15 volts overnight. Rabbit monoclonal antibodies to SpCas9(ab189380, Abcam, diluted 10,000-fold) and rabbit polyclonal antibody to RecA(ab63797, Abcam, diluted 3,000-fold) were used. Goat anti-rabbit horseradishperoxidase (ab6721, Abcam) was used as secondary antibody to visualize theprotein with chemiluminescence (ECL). A Syngene G:box machine was used toacquire the images, which were subsequently analyzed with imageJ. SupplementaryFigure 16 shows the uncropped western blot pictures.
Code availability. The code used for the machine-learning approach is available asJupyter notebooks at the following address: https://gitlab.pasteur.fr/dbikard/badSeed_public.
Data availability. The screen results are provided as Supplementary Data 4. Otherrelevant data supporting the findings of the study are available in this article and itsSupplementary Information files or from the corresponding author upon request.
Received: 4 September 2017 Accepted: 13 April 2018
References1. Jiang, W. & Marraffini, L. A. CRISPR-Cas: new tools for genetic manipulations
from bacterial immunity systems. Annu. Rev. Microbiol. 69, 209–228 (2015).2. Jinek, M. et al. A programmable dual-RNA-guided DNA endonuclease in
adaptive bacterial immunity. Science 337, 816–821 (2012).3. Sternberg, S. H., Redding, S., Jinek, M., Greene, E. C. & Doudna, J. A. DNA
interrogation by the CRISPR RNA-guided endonuclease Cas9. Nature 507,62–67 (2014).
4. Mojica, F. J. M., Díez-Villaseñor, C., García-Martínez, J. & Almendros, C.Short motif sequences determine the targets of the prokaryotic CRISPRdefence system. Microbiology 155, 733–740 (2009).
NATURE COMMUNICATIONS | DOI: 10.1038/s41467-018-04209-5 ARTICLE
NATURE COMMUNICATIONS | (2018) 9:1912 | DOI: 10.1038/s41467-018-04209-5 |www.nature.com/naturecommunications 9
5. Semenova, E. et al. Interference by clustered regularly interspaced shortpalindromic repeat (CRISPR) RNA is governed by a seed sequence. Proc. Natl.Acad. Sci. USA 108, 10098–10103 (2011).
6. Qi, L. S. et al. Repurposing CRISPR as an RNA-guided platform for sequence-specific control of gene expression. Cell 152, 1173–1183 (2013).
7. Bikard, D. et al. Programmable repression and activation of bacterial geneexpression using an engineered CRISPR-Cas system. Nucleic Acids Res. 41,7429–7437 (2013).
8. Peters, J. M. et al. A comprehensive, CRISPR-based functional analysis ofessential genes in bacteria. Cell 165, 1493–1506 (2016).
9. Liu, X. et al. High‐throughput CRISPRi phenotyping identifies new essentialgenes in Streptococcus pneumoniae. Mol. Syst. Biol. 13, 931 (2017).
10. Fu, Y. et al. High-frequency off-target mutagenesis induced by CRISPR-Casnucleases in human cells. Nat. Biotechnol. 31, 822–826 (2013).
11. Pattanayak, V. et al. High-throughput profiling of off-target DNA cleavagereveals RNA-programmed Cas9 nuclease specificity. Nat. Biotechnol. 31,839–843 (2013).
12. Hsu, P. D. et al. DNA targeting specificity of RNA-guided Cas9 nucleases. Nat.Biotechnol. 31, 827–832 (2013).
13. Sternberg, S. H., LaFrance, B., Kaplan, M. & Doudna, J. A. Conformationalcontrol of DNA target cleavage by CRISPR–Cas9. Nature 527, 110–113(2015).
14. Jinek, M. et al. Structures of Cas9 endonucleases reveal RNA-mediatedconformational activation. Science 343, 1247997 (2014).
15. Kuscu, C., Arslan, S., Singh, R., Thorpe, J. & Adli, M. Genome-wide analysisreveals characteristics of off-target sites bound by the Cas9 endonuclease. Nat.Biotechnol. 32, 677–683 (2014).
16. Wu, X. et al. Genome-wide binding of the CRISPR endonuclease Cas9 inmammalian cells. Nat. Biotechnol. 32, 670–676 (2014).
17. Singh, D., Sternberg, S. H., Fei, J., Doudna, J. A. & Ha, T. Real-timeobservation of DNA recognition and rejection by the RNA-guidedendonuclease Cas9. Nat. Commun. 7, 12778 (2016).
18. Gilbert, L. A. et al. Genome-scale CRISPR-mediated control of gene repressionand activation. Cell 159, 647–661 (2014).
19. Zhao, H. et al. Depletion of undecaprenyl pyrophosphate phosphatasesdisrupts cell envelope biogenesis in Bacillus subtilis. J. Bacteriol. 198,2925–2935 (2016).
20. Farasat, I. et al. Efficient search, mapping, and optimization of multi‐proteingenetic systems in diverse bacteria. Mol. Syst. Biol. 10, 731 (2014).
21. Nielsen, A. A. & Voigt, C. A. Multi-input CRISPR/Cas genetic circuits thatinterface host regulatory networks. Mol. Syst. Biol. 10, 763 (2014).
22. Gibson, D. G. et al. Enzymatic assembly of DNA molecules up to severalhundred kilobases. Nat. Methods 6, 343–345 (2009).
23. Engler, C., Kandzia, R. & Marillonnet, S. A one pot, one step, precisioncloning method with high throughput capability. PLoS ONE 3, e3647 (2008).
24. St-Pierre, F. et al. One-step cloning and chromosomal integration of DNA.ACS Synth. Biol. 2, 537–541 (2013).
25. Sharan, S. K., Thomason, L. C., Kuznetsov, S. G. & Court, D. L.Recombineering: a homologous recombination-based method of geneticengineering. Nat. Protoc. 4, 206–223 (2009).
26. Chaveroche, M.-K., Ghigo, J.-M. & d’Enfert, C. A rapid method for efficientgene replacement in the filamentous fungus Aspergillus nidulans. Nucleic AcidsRes. 28, e97 (2000).
27. Love, M. I., Huber, W. & Anders, S. Moderated estimation of fold change anddispersion for RNA-seq data with DESeq2. Genome Biol. 15, 550 (2014).
28. Pedregosa, F. et al. Scikit-learn: machine learning in Python. J. Mach. Learn.Res. 12, 2825–2830 (2011).
29. Kingma, D. P. & Ba, J. Adam: a method for stochastic optimization. arXivarXiv:1412.6980 (2014).
30. Schmittgen, T. D. & Livak, K. J. Analyzing real-time PCR data by thecomparative CT method. Nat. Protoc. 3, 1101–1108 (2008).
31. Cronan, J. E. Improved plasmid-based system for fully regulated off-to-ongene expression in Escherichia coli: application to production of toxic proteins.Plasmid 69, 81–89 (2013).
32. Cinesi, C., Aeschbach, L., Yang, B. & Dion, V. Contracting CAG/CTG repeatsusing the CRISPR-Cas9 nickase. Nat. Commun. 7, 13272 (2016).
AcknowledgementsWe are grateful to Oz Solomon and Zohar Yakhini for helpful discussions, to ChristianeBouchier from the Institut Pasteur sequencing Platform, to Charlotte Cockram and AimeeWessel for providing experimental assistance, and to Jerome Wong Ng for his assistancewith data analysis. E. coli mutants were sequenced by the Institut Pasteur GenomicsPlatform, a member of “France Génomique” consortium (ANR10-INBS-09-08). Thiswork was supported by the European Research Council (ERC) under the Europe Union’sHorizon 2020 research and innovation program (grant agreement No. [677823]); theFrench Government’s Investissement d’Avenir program; Laboratoire d’Excellence‘Integrative Biology of Emerging Infectious Diseases’ [ANR-10-LABX-62-IBEID]; and thePasteur-Weizmann consortium and Pasteur-Roux Fellowship to L.C.
Author contributionsL.C. and D.B. designed the study and wrote the manuscript. L.C. performed theexperiments. A.V. performed the mcherry fluorescence measurements. D.B., F.R, V.K.,H.V. and L.C. analyzed the data.
Additional informationSupplementary Information accompanies this paper at https://doi.org/10.1038/s41467-018-04209-5.
Competing interests: The authors declare no competing interests.
Reprints and permission information is available online at http://npg.nature.com/reprintsandpermissions/
Publisher's note: Springer Nature remains neutral with regard to jurisdictional claims inpublished maps and institutional affiliations.
Open Access This article is licensed under a Creative CommonsAttribution 4.0 International License, which permits use, sharing,
adaptation, distribution and reproduction in any medium or format, as long as you giveappropriate credit to the original author(s) and the source, provide a link to the CreativeCommons license, and indicate if changes were made. The images or other third partymaterial in this article are included in the article’s Creative Commons license, unlessindicated otherwise in a credit line to the material. If material is not included in thearticle’s Creative Commons license and your intended use is not permitted by statutoryregulation or exceeds the permitted use, you will need to obtain permission directly fromthe copyright holder. To view a copy of this license, visit http://creativecommons.org/licenses/by/4.0/.
© The Author(s) 2018
ARTICLE NATURE COMMUNICATIONS | DOI: 10.1038/s41467-018-04209-5
10 NATURE COMMUNICATIONS | (2018) 9:1912 | DOI: 10.1038/s41467-018-04209-5 | www.nature.com/naturecommunications
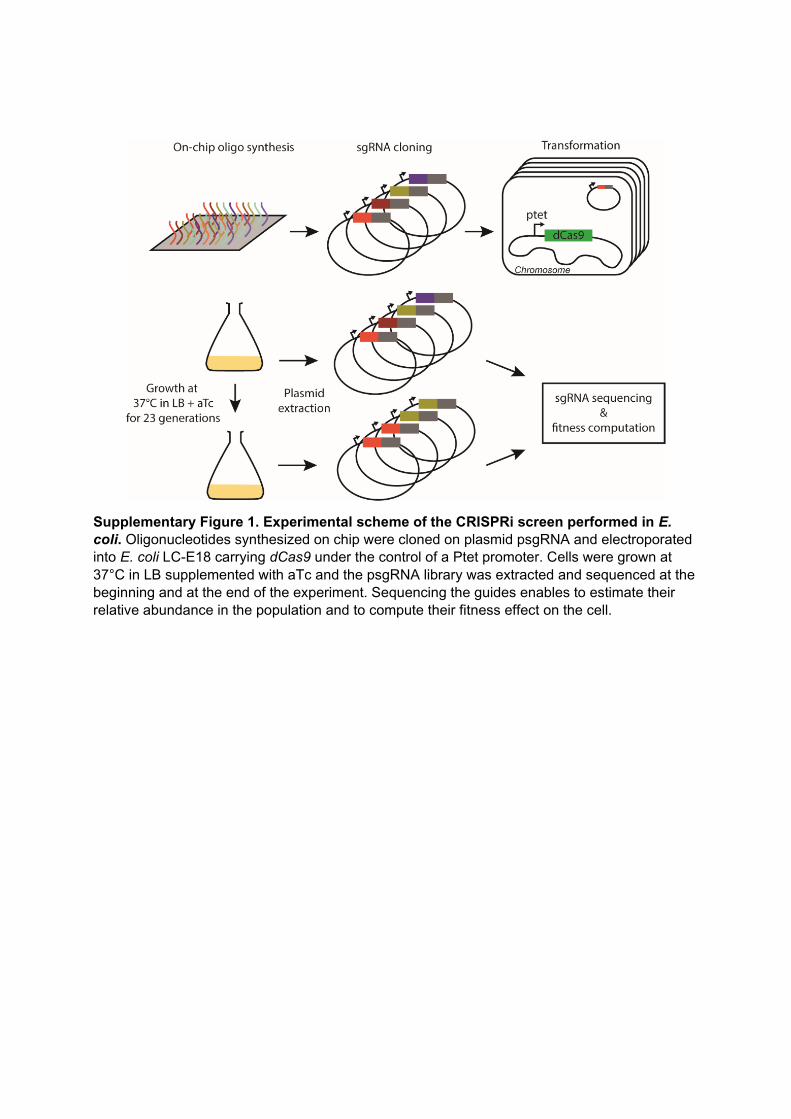
Supplementary Figure 1. Experimental scheme of the CRISPRi screen performed in E. coli. Oligonucleotides synthesized on chip were cloned on plasmid psgRNA and electroporated into E. coli LC-E18 carrying dCas9 under the control of a Ptet promoter. Cells were grown at 37°C in LB supplemented with aTc and the psgRNA library was extracted and sequenced at the beginning and at the end of the experiment. Sequencing the guides enables to estimate their relative abundance in the population and to compute their fitness effect on the cell.
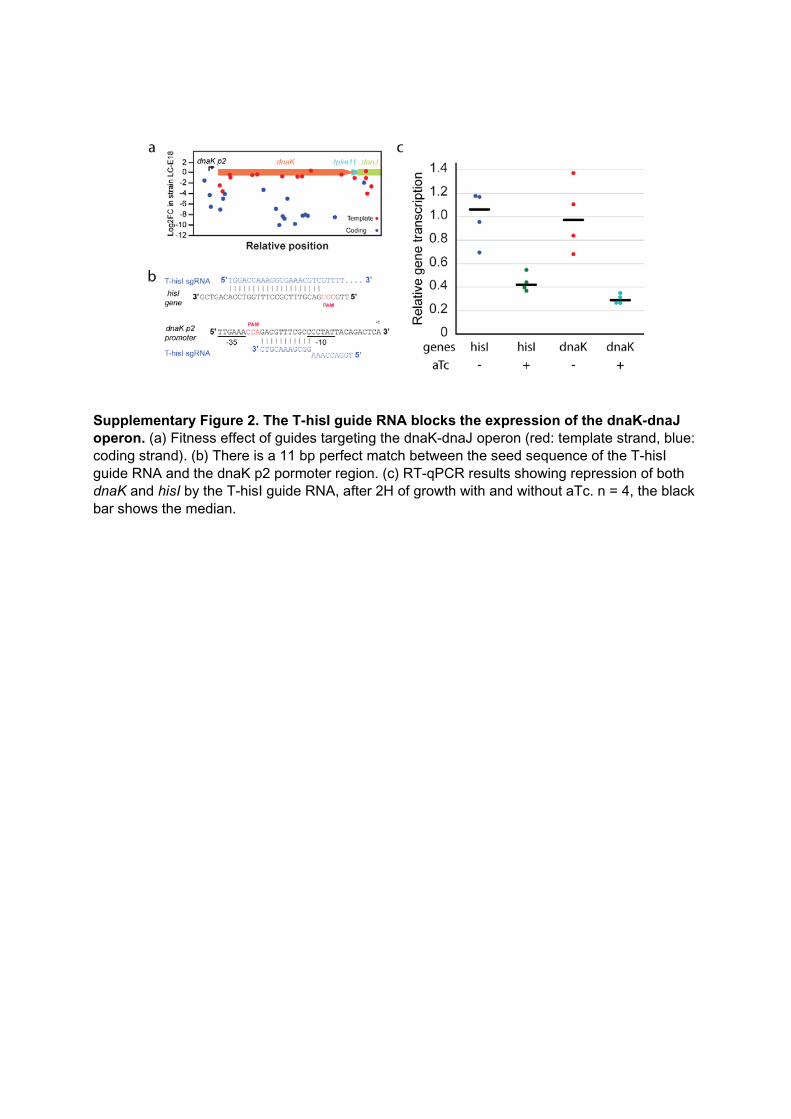
Supplementary Figure 2. The T-hisI guide RNA blocks the expression of the dnaK-dnaJ operon. (a) Fitness effect of guides targeting the dnaK-dnaJ operon (red: template strand, blue: coding strand). (b) There is a 11 bp perfect match between the seed sequence of the T-hisI guide RNA and the dnaK p2 pormoter region. (c) RT-qPCR results showing repression of both dnaK and hisI by the T-hisI guide RNA, after 2H of growth with and without aTc. n = 4, the black bar shows the median.
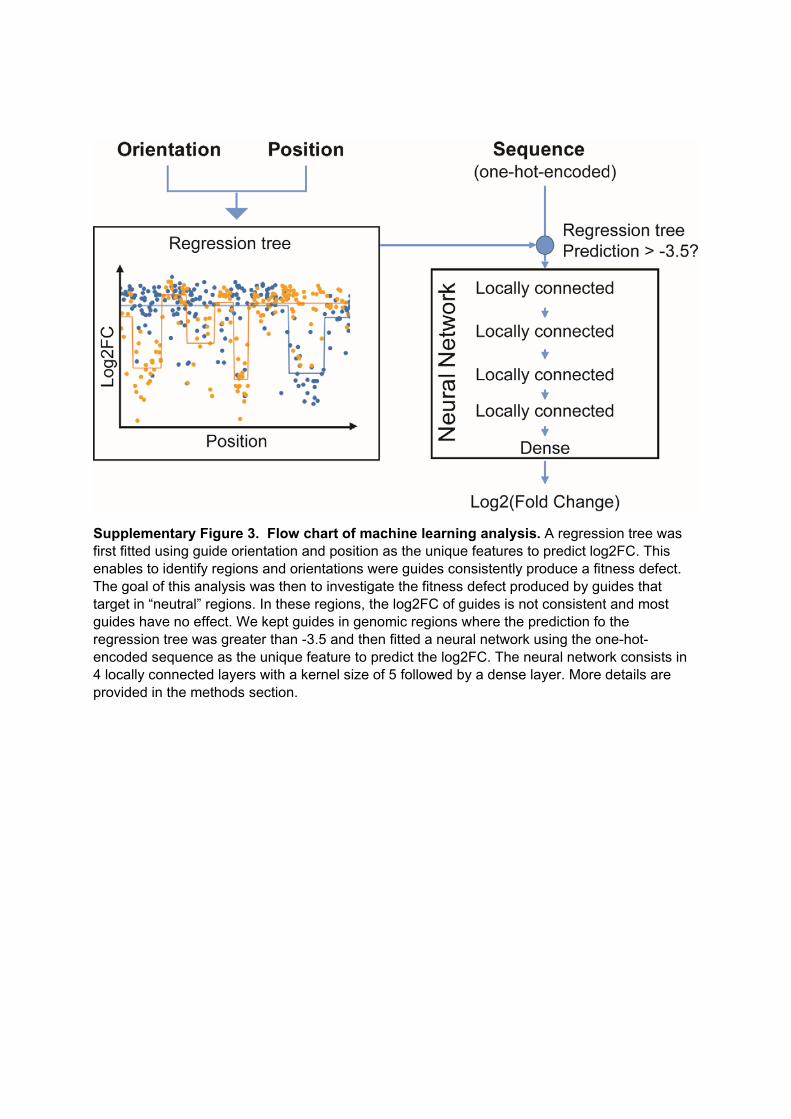
Supplementary Figure 3. Flow chart of machine learning analysis. A regression tree was first fitted using guide orientation and position as the unique features to predict log2FC. This enables to identify regions and orientations were guides consistently produce a fitness defect. The goal of this analysis was then to investigate the fitness defect produced by guides that target in “neutral” regions. In these regions, the log2FC of guides is not consistent and most guides have no effect. We kept guides in genomic regions where the prediction fo the regression tree was greater than -3.5 and then fitted a neural network using the one-hot-encoded sequence as the unique feature to predict the log2FC. The neural network consists in 4 locally connected layers with a kernel size of 5 followed by a dense layer. More details are provided in the methods section.
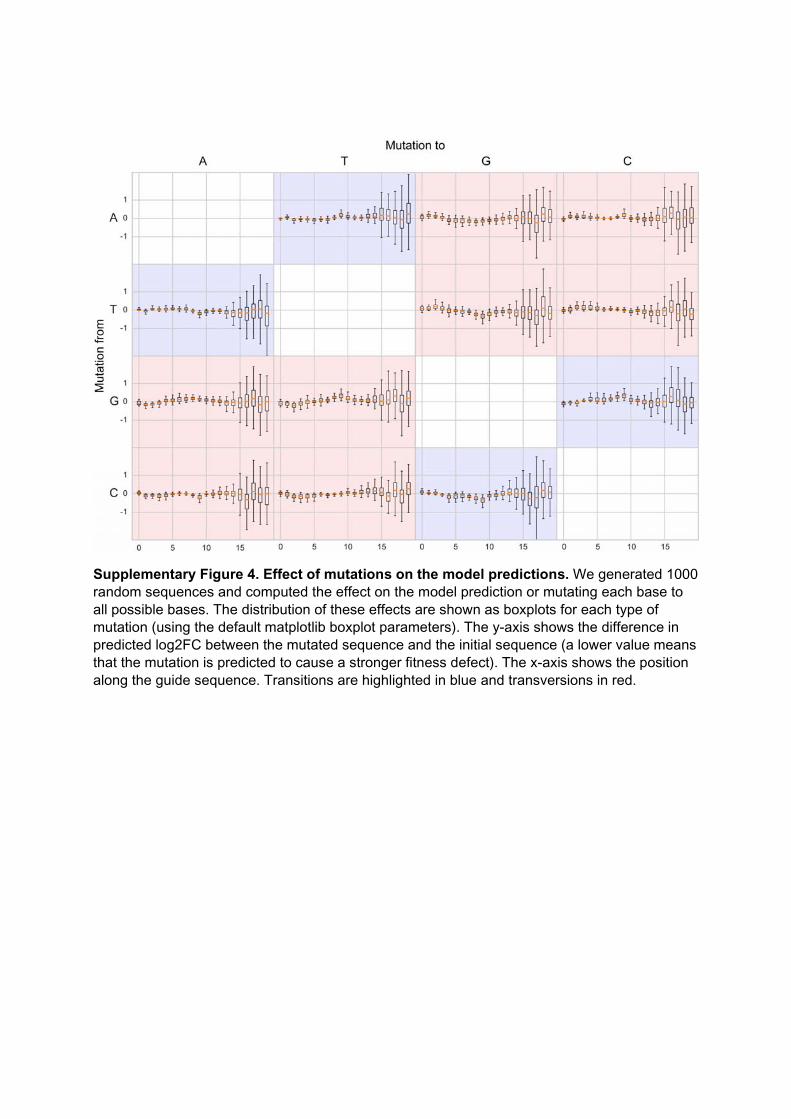
Supplementary Figure 4. Effect of mutations on the model predictions. We generated 1000 random sequences and computed the effect on the model prediction or mutating each base to all possible bases. The distribution of these effects are shown as boxplots for each type of mutation (using the default matplotlib boxplot parameters). The y-axis shows the difference in predicted log2FC between the mutated sequence and the initial sequence (a lower value means that the mutation is predicted to cause a stronger fitness defect). The x-axis shows the position along the guide sequence. Transitions are highlighted in blue and transversions in red.
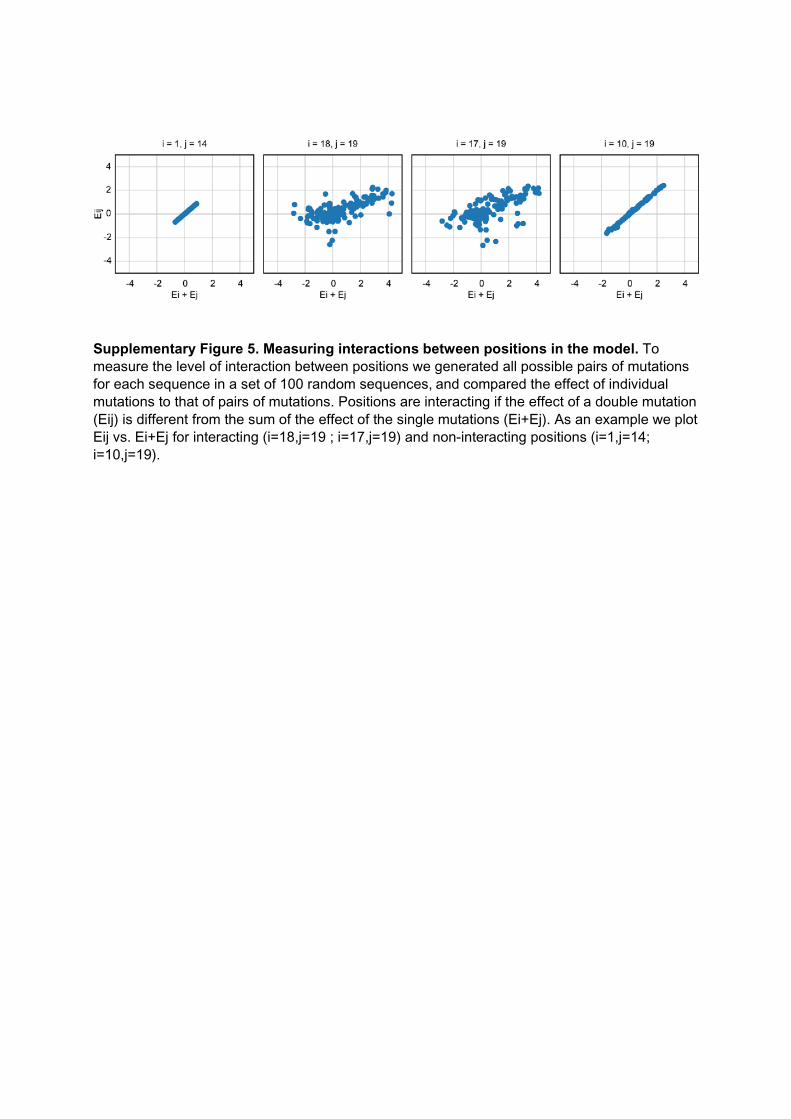
Supplementary Figure 5. Measuring interactions between positions in the model. To measure the level of interaction between positions we generated all possible pairs of mutations for each sequence in a set of 100 random sequences, and compared the effect of individual mutations to that of pairs of mutations. Positions are interacting if the effect of a double mutation (Eij) is different from the sum of the effect of the single mutations (Ei+Ej). As an example we plot Eij vs. Ei+Ej for interacting (i=18,j=19 ; i=17,j=19) and non-interacting positions (i=1,j=14; i=10,j=19).
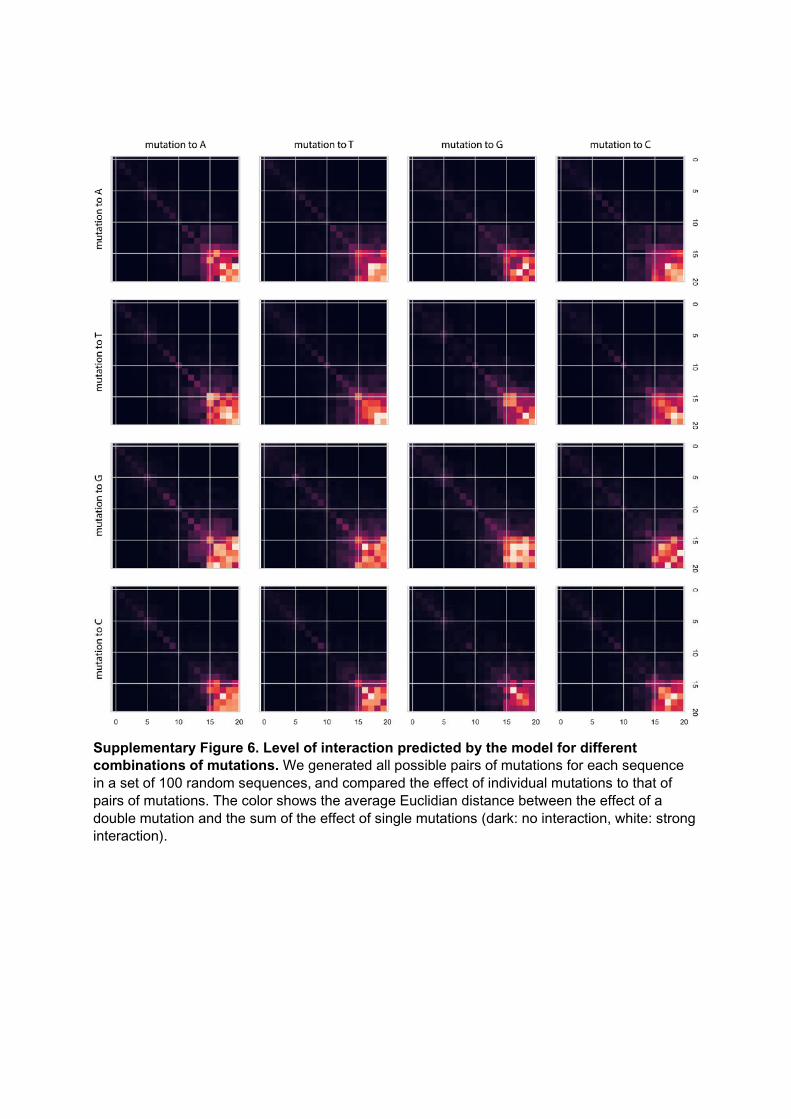
Supplementary Figure 6. Level of interaction predicted by the model for different combinations of mutations. We generated all possible pairs of mutations for each sequence in a set of 100 random sequences, and compared the effect of individual mutations to that of pairs of mutations. The color shows the average Euclidian distance between the effect of a double mutation and the sum of the effect of single mutations (dark: no interaction, white: strong interaction).

Supplementary Figure 7. Truncated guides with a bad seed sequence can still kill E. coli. Truncated single guide RNAs with the ACCCA seed sequence were cloned on plasmid psgRNA and transformed in strain LC-E18. Serial dilutions were then plated on LB supplemented with aTc and kanamycin. The C-rpsL lane shows a positive control where the transcription of rpsL essential gene is repressed by dCas9. n = 3.
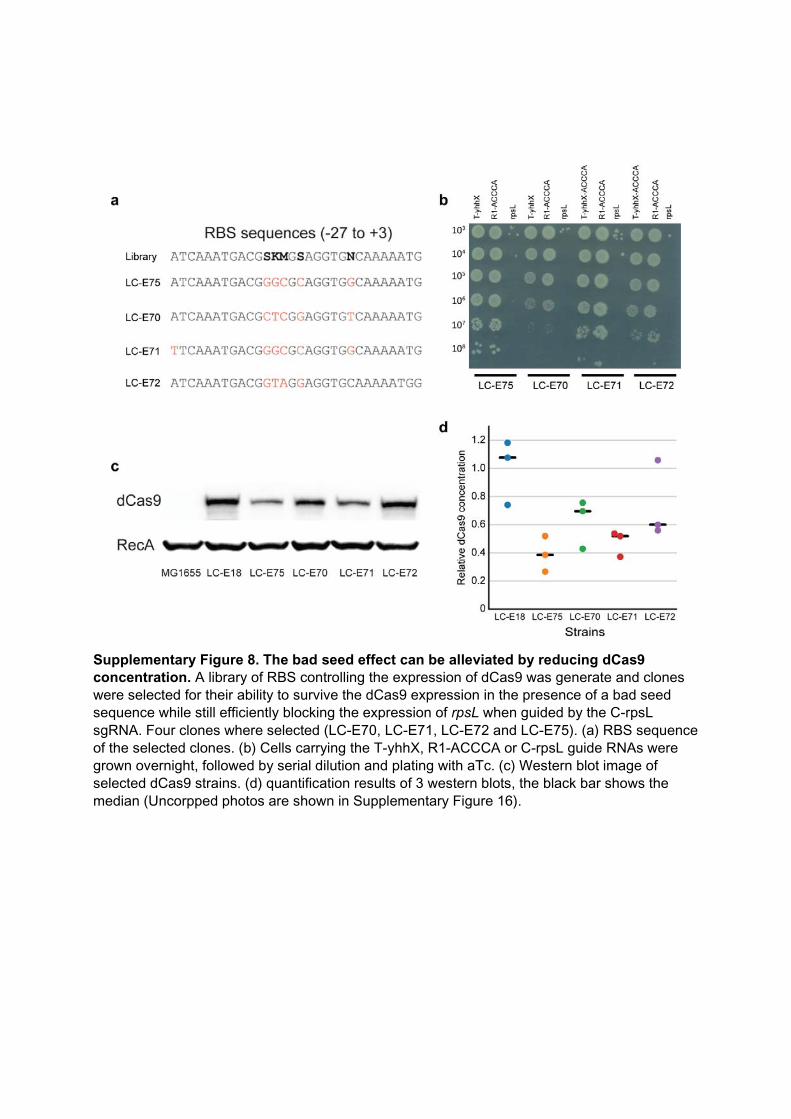
Supplementary Figure 8. The bad seed effect can be alleviated by reducing dCas9 concentration. A library of RBS controlling the expression of dCas9 was generate and clones were selected for their ability to survive the dCas9 expression in the presence of a bad seed sequence while still efficiently blocking the expression of rpsL when guided by the C-rpsL sgRNA. Four clones where selected (LC-E70, LC-E71, LC-E72 and LC-E75). (a) RBS sequence of the selected clones. (b) Cells carrying the T-yhhX, R1-ACCCA or C-rpsL guide RNAs were grown overnight, followed by serial dilution and plating with aTc. (c) Western blot image of selected dCas9 strains. (d) quantification results of 3 western blots, the black bar shows the median (Uncorpped photos are shown in Supplementary Figure 16).
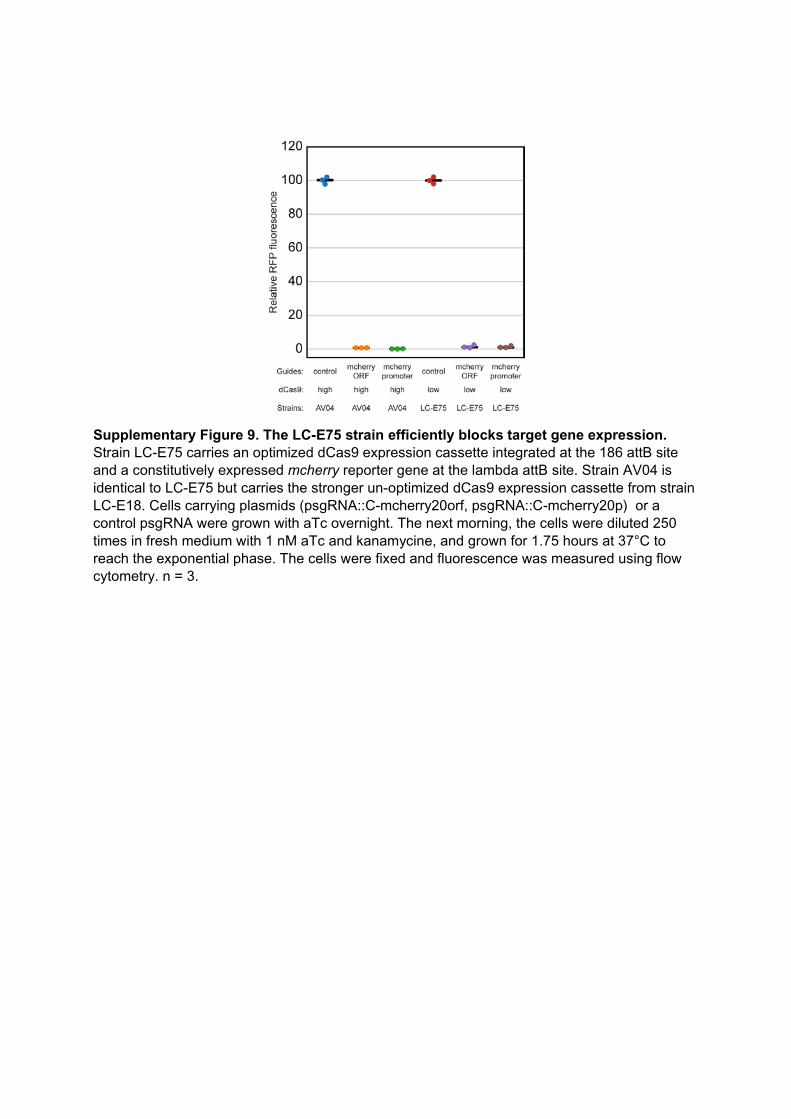
Supplementary Figure 9. The LC-E75 strain efficiently blocks target gene expression. Strain LC-E75 carries an optimized dCas9 expression cassette integrated at the 186 attB site and a constitutively expressed mcherry reporter gene at the lambda attB site. Strain AV04 is identical to LC-E75 but carries the stronger un-optimized dCas9 expression cassette from strain LC-E18. Cells carrying plasmids (psgRNA::C-mcherry20orf, psgRNA::C-mcherry20p) or a control psgRNA were grown with aTc overnight. The next morning, the cells were diluted 250 times in fresh medium with 1 nM aTc and kanamycine, and grown for 1.75 hours at 37°C to reach the exponential phase. The cells were fixed and fluorescence was measured using flow cytometry. n = 3.
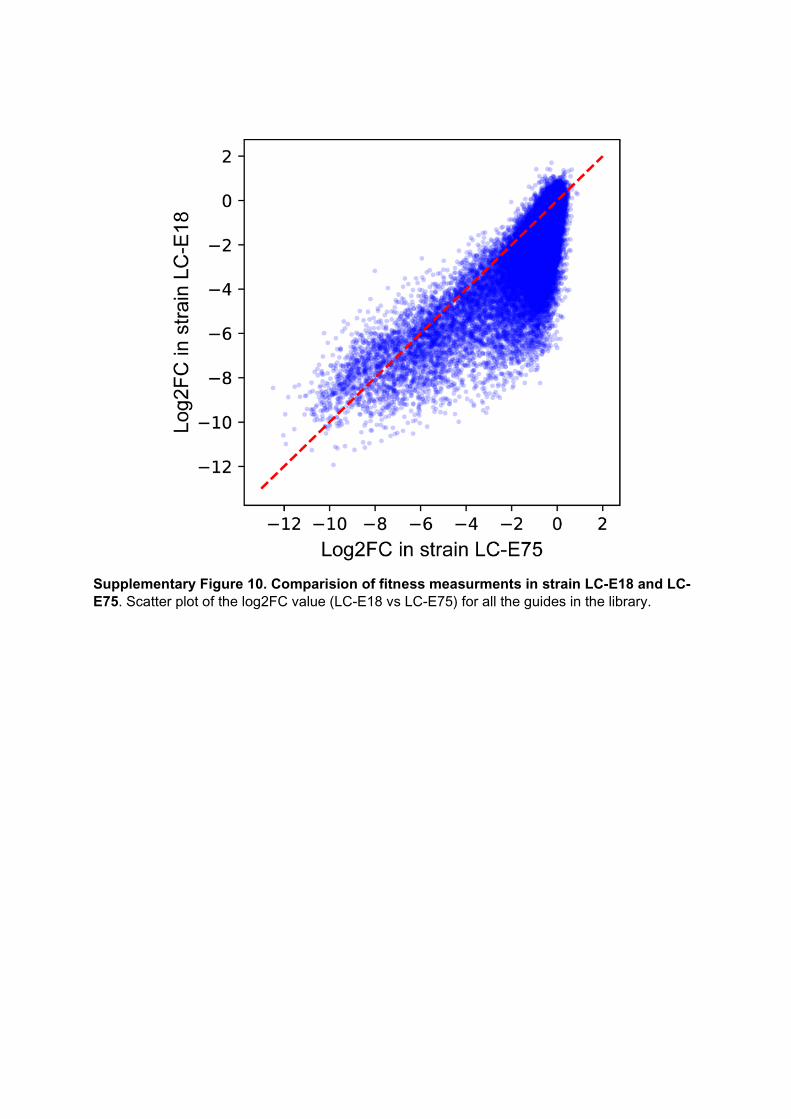
Supplementary Figure 10. Comparision of fitness measurments in strain LC-E18 and LC-E75. Scatter plot of the log2FC value (LC-E18 vs LC-E75) for all the guides in the library.
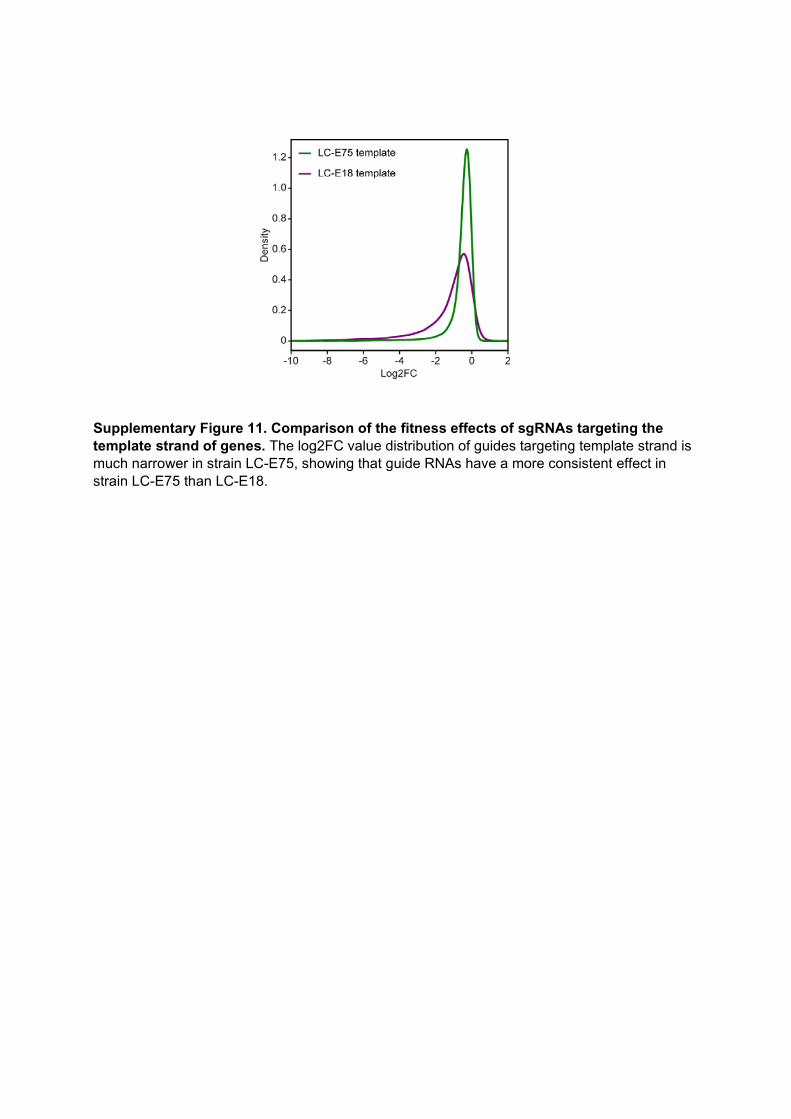
Supplementary Figure 11. Comparison of the fitness effects of sgRNAs targeting the template strand of genes. The log2FC value distribution of guides targeting template strand is much narrower in strain LC-E75, showing that guide RNAs have a more consistent effect in strain LC-E75 than LC-E18.
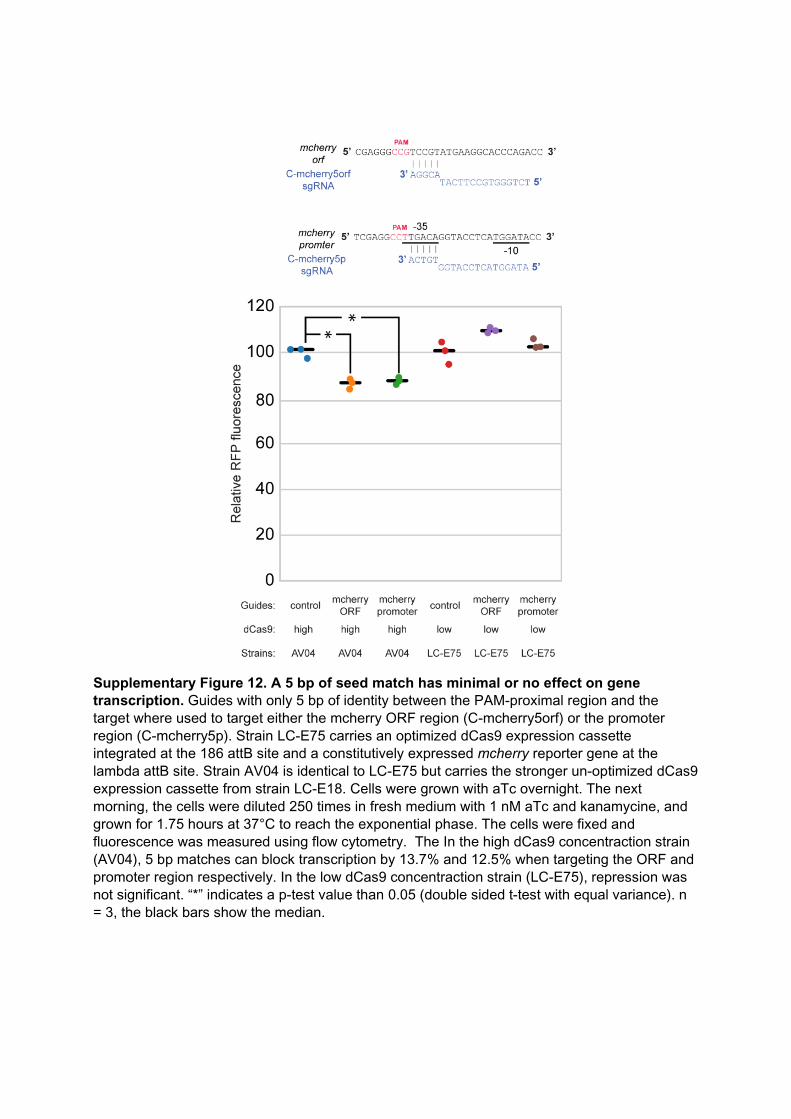
Supplementary Figure 12. A 5 bp of seed match has minimal or no effect on gene transcription. Guides with only 5 bp of identity between the PAM-proximal region and the target where used to target either the mcherry ORF region (C-mcherry5orf) or the promoter region (C-mcherry5p). Strain LC-E75 carries an optimized dCas9 expression cassette integrated at the 186 attB site and a constitutively expressed mcherry reporter gene at the lambda attB site. Strain AV04 is identical to LC-E75 but carries the stronger un-optimized dCas9 expression cassette from strain LC-E18. Cells were grown with aTc overnight. The next morning, the cells were diluted 250 times in fresh medium with 1 nM aTc and kanamycine, and grown for 1.75 hours at 37°C to reach the exponential phase. The cells were fixed and fluorescence was measured using flow cytometry. The In the high dCas9 concentraction strain (AV04), 5 bp matches can block transcription by 13.7% and 12.5% when targeting the ORF and promoter region respectively. In the low dCas9 concentraction strain (LC-E75), repression was not significant. “*” indicates a p-test value than 0.05 (double sided t-test with equal variance). n = 3, the black bars show the median.
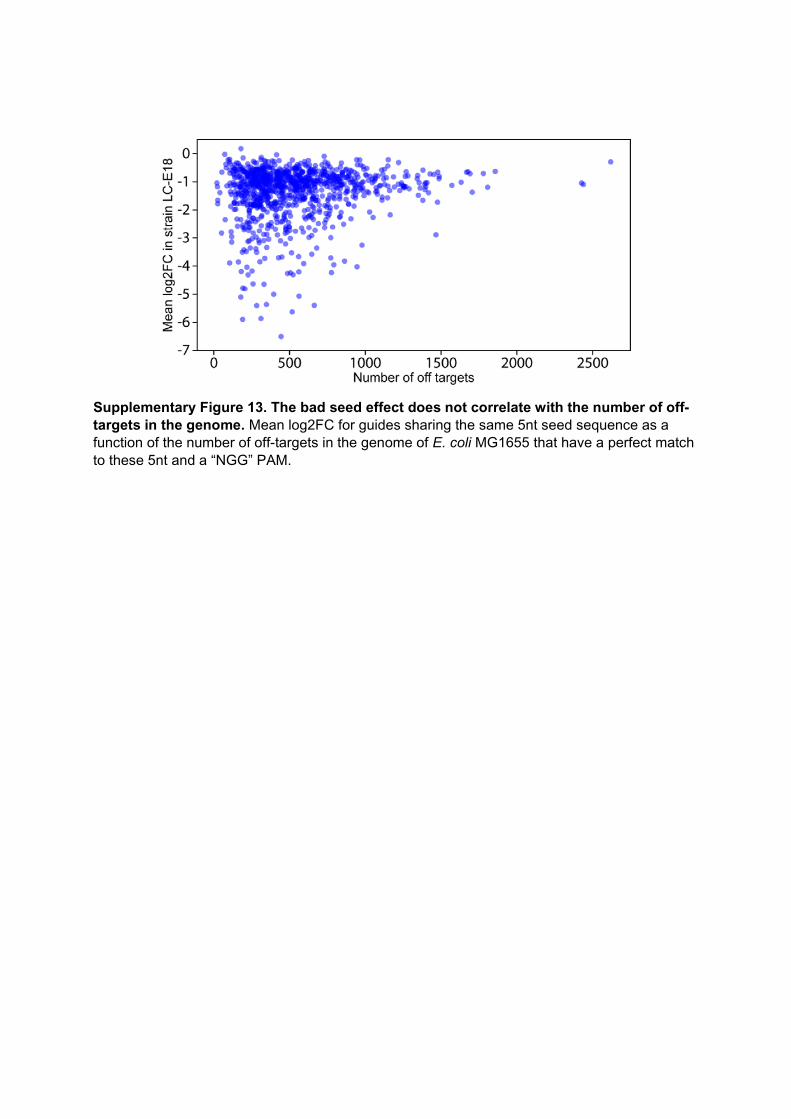
Supplementary Figure 13. The bad seed effect does not correlate with the number of off-targets in the genome. Mean log2FC for guides sharing the same 5nt seed sequence as a function of the number of off-targets in the genome of E. coli MG1655 that have a perfect match to these 5nt and a “NGG” PAM.
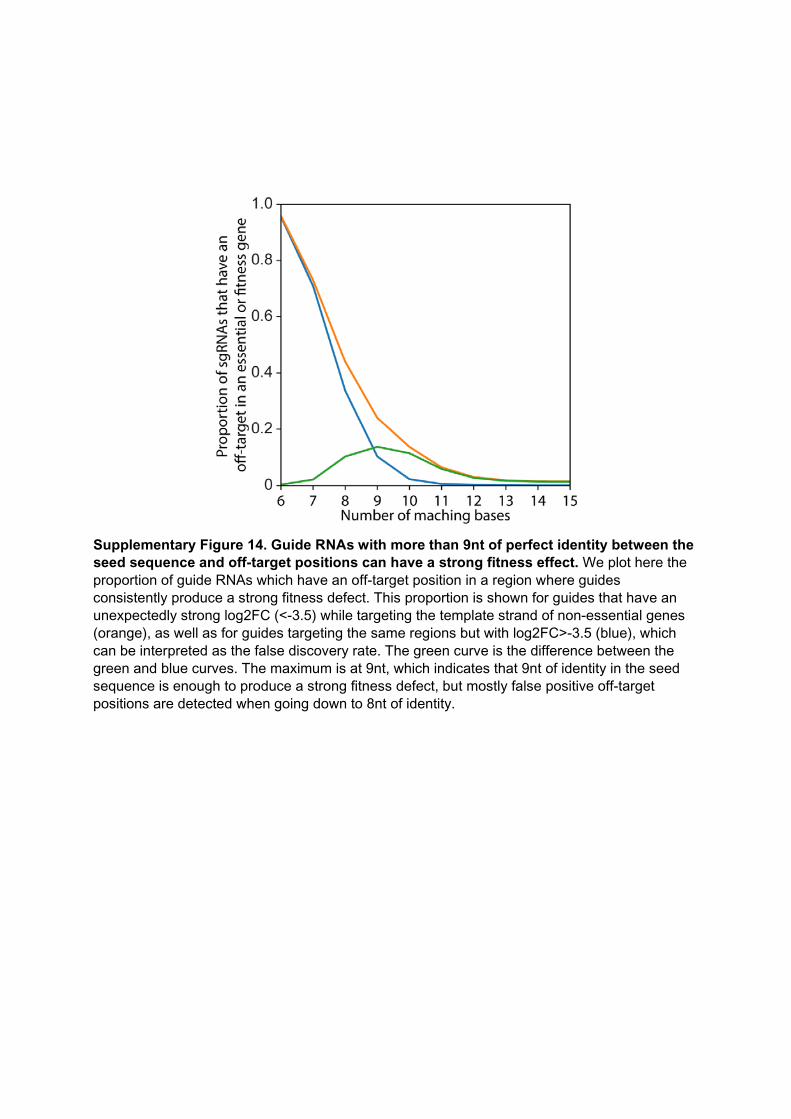
Supplementary Figure 14. Guide RNAs with more than 9nt of perfect identity between the seed sequence and off-target positions can have a strong fitness effect. We plot here the proportion of guide RNAs which have an off-target position in a region where guides consistently produce a strong fitness defect. This proportion is shown for guides that have an unexpectedly strong log2FC (<-3.5) while targeting the template strand of non-essential genes (orange), as well as for guides targeting the same regions but with log2FC>-3.5 (blue), which can be interpreted as the false discovery rate. The green curve is the difference between the green and blue curves. The maximum is at 9nt, which indicates that 9nt of identity in the seed sequence is enough to produce a strong fitness defect, but mostly false positive off-target positions are detected when going down to 8nt of identity.
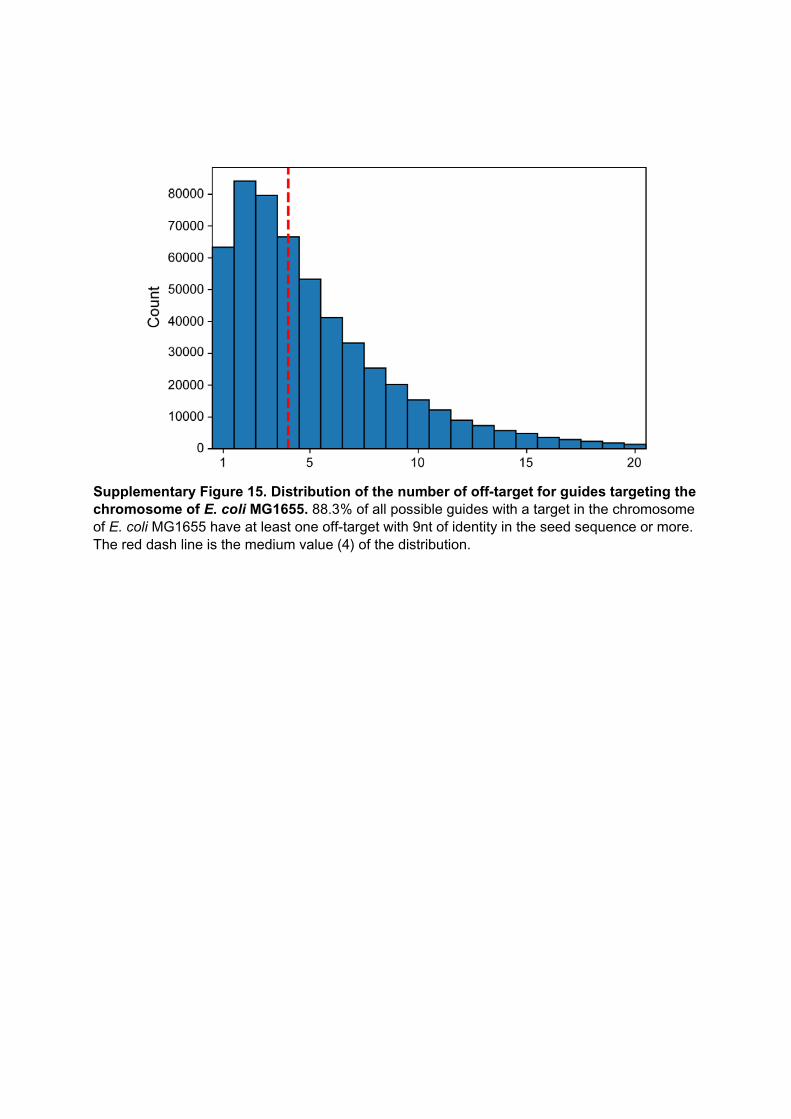
Supplementary Figure 15. Distribution of the number of off-target for guides targeting the chromosome of E. coli MG1655. 88.3% of all possible guides with a target in the chromosome of E. coli MG1655 have at least one off-target with 9nt of identity in the seed sequence or more. The red dash line is the medium value (4) of the distribution.
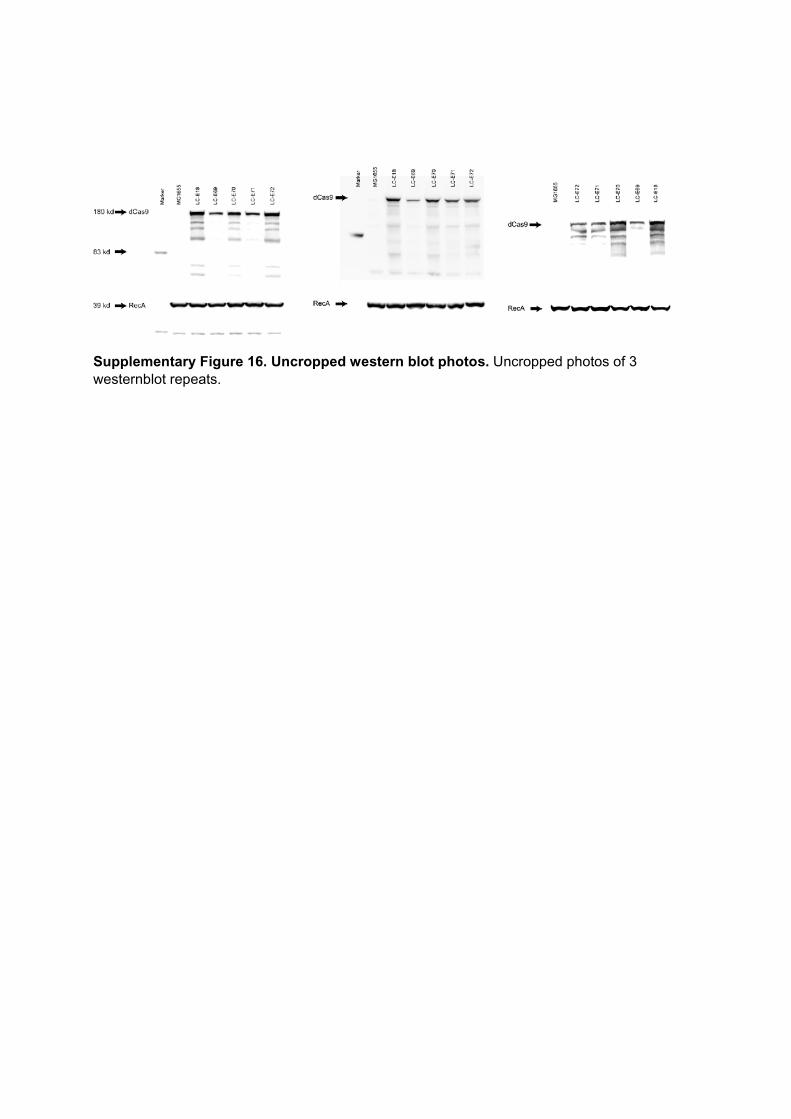
Supplementary Figure 16. Uncropped western blot photos. Uncropped photos of 3 westernblot repeats.
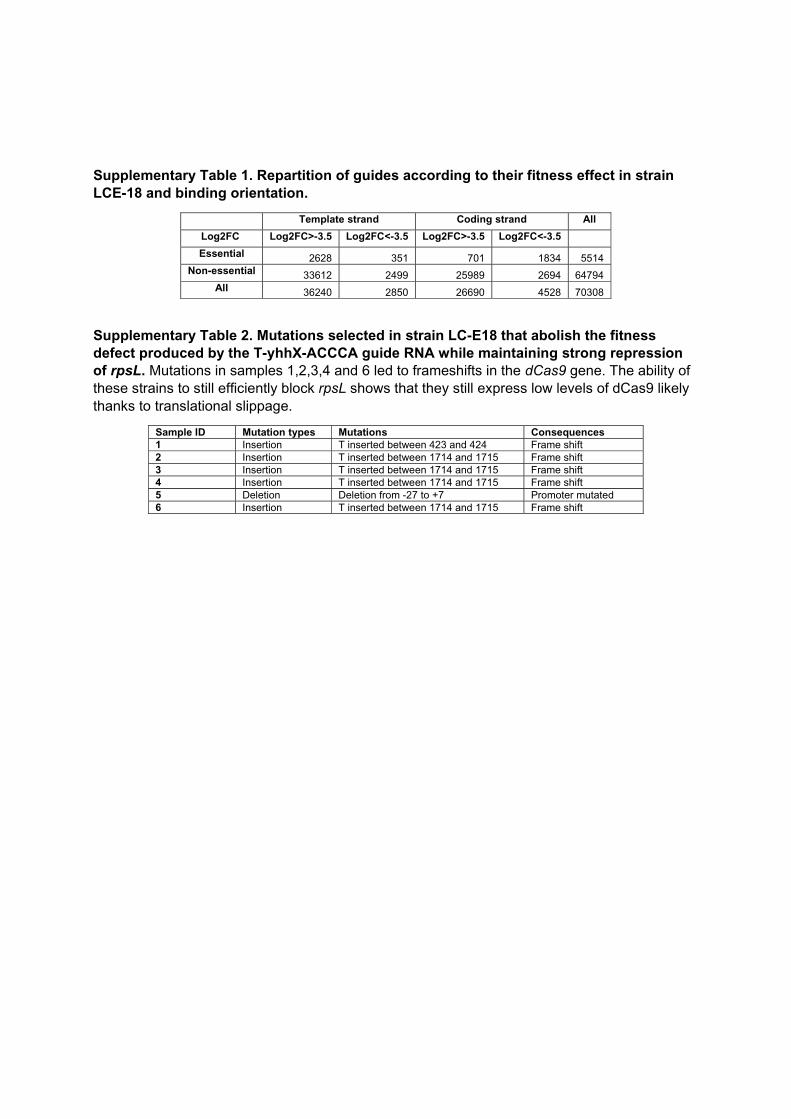
Supplementary Table 1. Repartition of guides according to their fitness effect in strain LCE-18 and binding orientation.
Template strand Coding strand All
Log2FC Log2FC>-3.5 Log2FC<-3.5 Log2FC>-3.5 Log2FC<-3.5
Essential 2628 351 701 1834 5514 Non-essential 33612 2499 25989 2694 64794
All 36240 2850 26690 4528 70308
Supplementary Table 2. Mutations selected in strain LC-E18 that abolish the fitness defect produced by the T-yhhX-ACCCA guide RNA while maintaining strong repression of rpsL. Mutations in samples 1,2,3,4 and 6 led to frameshifts in the dCas9 gene. The ability of these strains to still efficiently block rpsL shows that they still express low levels of dCas9 likely thanks to translational slippage.
Sample ID Mutation types Mutations Consequences 1 Insertion T inserted between 423 and 424 Frame shift 2 Insertion T inserted between 1714 and 1715 Frame shift 3 Insertion T inserted between 1714 and 1715 Frame shift 4 Insertion T inserted between 1714 and 1715 Frame shift 5 Deletion Deletion from -27 to +7 Promoter mutated 6 Insertion T inserted between 1714 and 1715 Frame shift
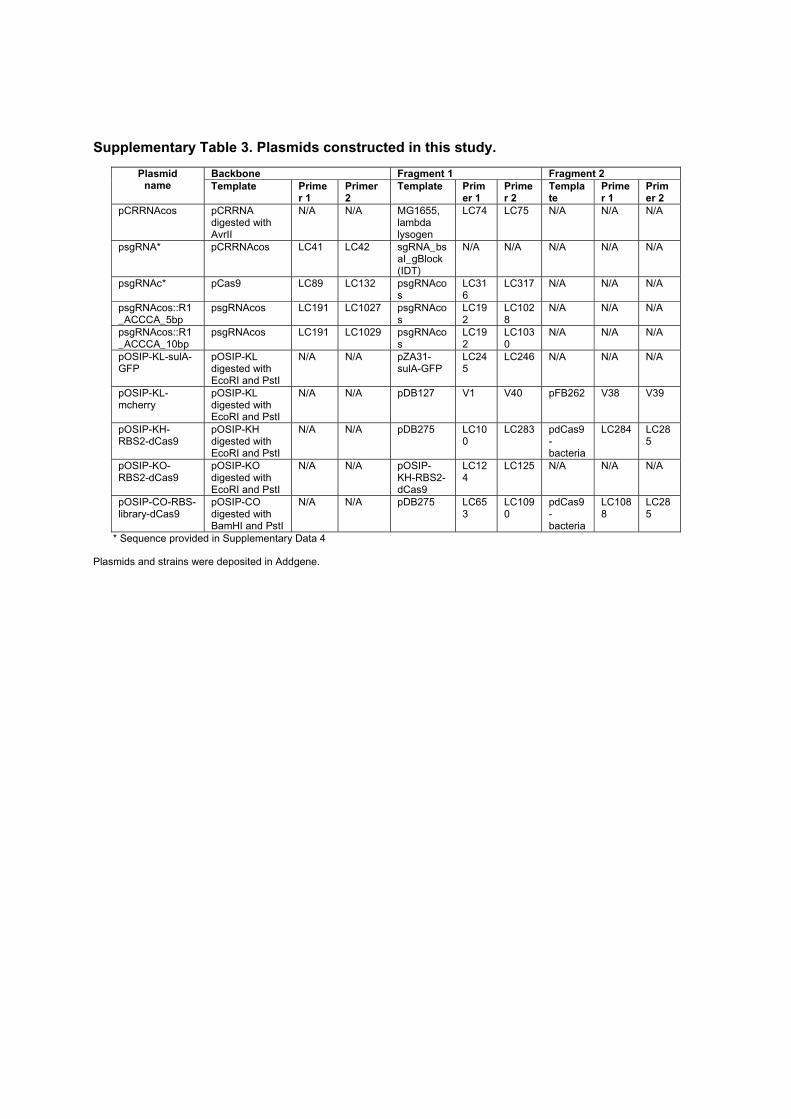
Supplementary Table 3. Plasmids constructed in this study.
Plasmid name
Backbone Fragment 1 Fragment 2 Template Prime
r 1 Primer 2
Template Primer 1
Primer 2
Template
Primer 1
Primer 2
pCRRNAcos pCRRNA digested with AvrII
N/A N/A MG1655, lambda lysogen
LC74 LC75 N/A N/A N/A
psgRNA* pCRRNAcos LC41 LC42 sgRNA_bsaI_gBlock (IDT)
N/A N/A N/A N/A N/A
psgRNAc* pCas9 LC89 LC132 psgRNAcos
LC316
LC317 N/A N/A N/A
psgRNAcos::R1_ACCCA_5bp
psgRNAcos LC191 LC1027 psgRNAcos
LC192
LC1028
N/A N/A N/A
psgRNAcos::R1_ACCCA_10bp
psgRNAcos LC191 LC1029 psgRNAcos
LC192
LC1030
N/A N/A N/A
pOSIP-KL-sulA-GFP
pOSIP-KL digested with EcoRI and PstI
N/A N/A pZA31-sulA-GFP
LC245
LC246 N/A N/A N/A
pOSIP-KL-mcherry
pOSIP-KL digested with EcoRI and PstI
N/A N/A pDB127 V1 V40 pFB262 V38 V39
pOSIP-KH-RBS2-dCas9
pOSIP-KH digested with EcoRI and PstI
N/A N/A pDB275 LC100
LC283 pdCas9-bacteria
LC284 LC285
pOSIP-KO-RBS2-dCas9
pOSIP-KO digested with EcoRI and PstI
N/A N/A pOSIP-KH-RBS2-dCas9
LC124
LC125 N/A N/A N/A
pOSIP-CO-RBS-library-dCas9
pOSIP-CO digested with BamHI and PstI
N/A N/A pDB275 LC653
LC1090
pdCas9-bacteria
LC1088
LC285
* Sequence provided in Supplementary Data 4
Plasmids and strains were deposited in Addgene.
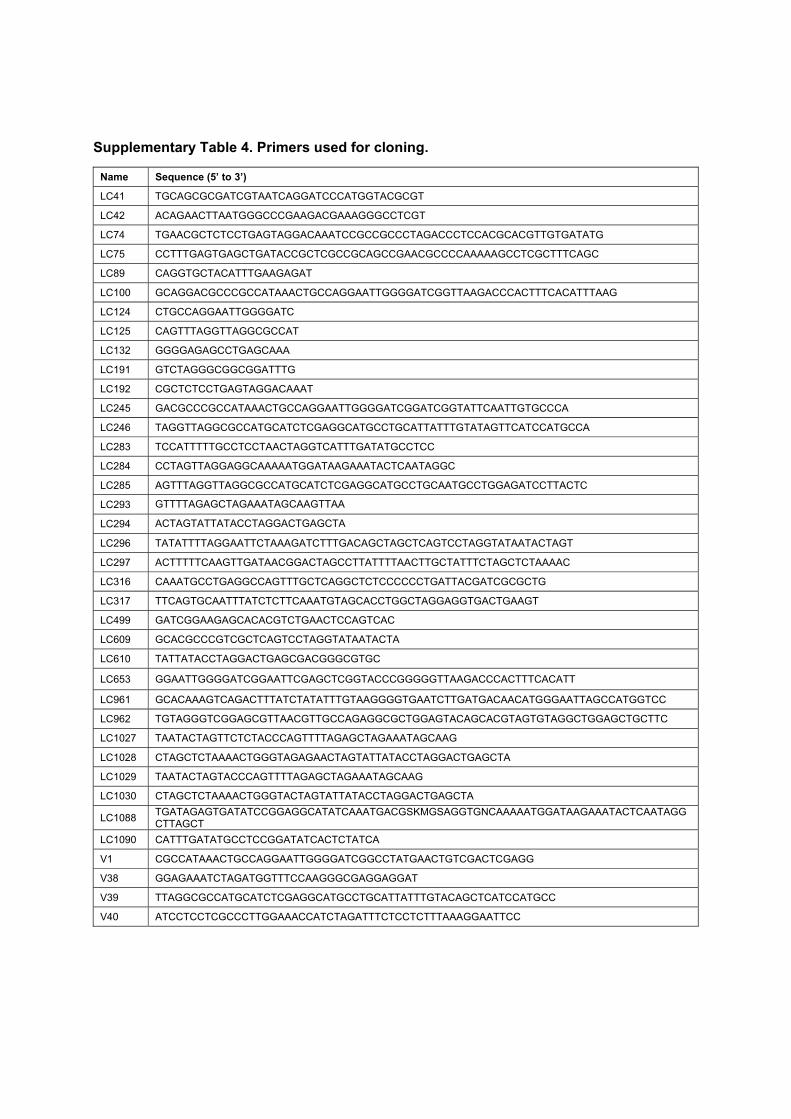
Supplementary Table 4. Primers used for cloning.
Name Sequence (5’ to 3’)
LC41 TGCAGCGCGATCGTAATCAGGATCCCATGGTACGCGT
LC42 ACAGAACTTAATGGGCCCGAAGACGAAAGGGCCTCGT
LC74 TGAACGCTCTCCTGAGTAGGACAAATCCGCCGCCCTAGACCCTCCACGCACGTTGTGATATG
LC75 CCTTTGAGTGAGCTGATACCGCTCGCCGCAGCCGAACGCCCCAAAAAGCCTCGCTTTCAGC
LC89 CAGGTGCTACATTTGAAGAGAT
LC100 GCAGGACGCCCGCCATAAACTGCCAGGAATTGGGGATCGGTTAAGACCCACTTTCACATTTAAG
LC124 CTGCCAGGAATTGGGGATC
LC125 CAGTTTAGGTTAGGCGCCAT
LC132 GGGGAGAGCCTGAGCAAA
LC191 GTCTAGGGCGGCGGATTTG
LC192 CGCTCTCCTGAGTAGGACAAAT
LC245 GACGCCCGCCATAAACTGCCAGGAATTGGGGATCGGATCGGTATTCAATTGTGCCCA
LC246 TAGGTTAGGCGCCATGCATCTCGAGGCATGCCTGCATTATTTGTATAGTTCATCCATGCCA
LC283 TCCATTTTTGCCTCCTAACTAGGTCATTTGATATGCCTCC
LC284 CCTAGTTAGGAGGCAAAAATGGATAAGAAATACTCAATAGGC
LC285 AGTTTAGGTTAGGCGCCATGCATCTCGAGGCATGCCTGCAATGCCTGGAGATCCTTACTC
LC293 GTTTTAGAGCTAGAAATAGCAAGTTAA
LC294 ACTAGTATTATACCTAGGACTGAGCTA
LC296 TATATTTTAGGAATTCTAAAGATCTTTGACAGCTAGCTCAGTCCTAGGTATAATACTAGT
LC297 ACTTTTTCAAGTTGATAACGGACTAGCCTTATTTTAACTTGCTATTTCTAGCTCTAAAAC
LC316 CAAATGCCTGAGGCCAGTTTGCTCAGGCTCTCCCCCCTGATTACGATCGCGCTG
LC317 TTCAGTGCAATTTATCTCTTCAAATGTAGCACCTGGCTAGGAGGTGACTGAAGT
LC499 GATCGGAAGAGCACACGTCTGAACTCCAGTCAC
LC609 GCACGCCCGTCGCTCAGTCCTAGGTATAATACTA
LC610 TATTATACCTAGGACTGAGCGACGGGCGTGC
LC653 GGAATTGGGGATCGGAATTCGAGCTCGGTACCCGGGGGTTAAGACCCACTTTCACATT
LC961 GCACAAAGTCAGACTTTATCTATATTTGTAAGGGGTGAATCTTGATGACAACATGGGAATTAGCCATGGTCC
LC962 TGTAGGGTCGGAGCGTTAACGTTGCCAGAGGCGCTGGAGTACAGCACGTAGTGTAGGCTGGAGCTGCTTC
LC1027 TAATACTAGTTCTCTACCCAGTTTTAGAGCTAGAAATAGCAAG
LC1028 CTAGCTCTAAAACTGGGTAGAGAACTAGTATTATACCTAGGACTGAGCTA
LC1029 TAATACTAGTACCCAGTTTTAGAGCTAGAAATAGCAAG
LC1030 CTAGCTCTAAAACTGGGTACTAGTATTATACCTAGGACTGAGCTA
LC1088 TGATAGAGTGATATCCGGAGGCATATCAAATGACGSKMGSAGGTGNCAAAAATGGATAAGAAATACTCAATAGGCTTAGCT
LC1090 CATTTGATATGCCTCCGGATATCACTCTATCA
V1 CGCCATAAACTGCCAGGAATTGGGGATCGGCCTATGAACTGTCGACTCGAGG
V38 GGAGAAATCTAGATGGTTTCCAAGGGCGAGGAGGAT
V39 TTAGGCGCCATGCATCTCGAGGCATGCCTGCATTATTTGTACAGCTCATCCATGCC
V40 ATCCTCCTCGCCCTTGGAAACCATCTAGATTTCTCCTCTTTAAAGGAATTCC

Supplementary Table 5. Plasmids used in this study.
Plasmids from other studies Addgene Catalog # (or References) pCRRNAcos Plasmid #78493pCas9 Plasmid #42876 pOSIP-KH Plasmid #45983pOSIP-KL Plasmid #45984pOSIP-KO Plasmid #45985 pOSIP-CO Ref1 pZA31-sulA-GFP Plasmid #78492 pDB127 Ref2 pDB275 Ref3 pdCas9-bacteria Plasmid #44249pE-FLP Plasmid #45978 pKD3 Plasmid #45604pKOBEG-A Ref4 pFB262 Ref5

Supplementary Table 6. sgRNA guide sequences and corresponding primers
Target name Target sequences Forward primer Reverse primer
T-lpoB TTGTCGCCGCAGGACAGT
TT
TAGTTTGTCGCCGCAGGACAGTTT
AAACAAACTGTCCTGCGGCGACAA
T-lpoB2 ATTCGCCATTATGACTGG
AA
TAGTATTCGCCATTATGACTGGAA
AAACTTCCAGTCATAATGGCGAAT
C-lopB CGCCATCGACAGTTGCTG
GG
TAGTCGCCATCGACAGTTGCTGGG
AAACCCCAGCAACTGTCGATGGCG
T-hisI TGGACCAAAGGCGAAAC
GTC
TAGTTGGACCAAAGGCGAAACGTC
AAACGACGTTTCGCCTTTGGTCCA
C-hisI GGTGACTTTGCCGCTTTC
GA
TAGTGGTGACTTTGCCGCTTTCGA
AAACTCGAAAGCGGCAAAGTCACC
C-rpsL AGCGCGGAGTTCGGTTTT
TT
TAGTAGCGCGGAGTTCGGTTTTTT
AAACAAAAAACCGAACTCCGCGCT
R1-ACCCA TCGAACACACTCTCTACC
CA
TAGTTCGAACACACTCTCTACCCA
AAACTGGGTAGAGAGTGTGTTCGA
R1-ACCCA GCTACCTTAACGCCTACC
CA
GCTACCTTAACGCCTACCCA AAACTGGGTAGGCGTTAAGGTAGC
T-yhhX TTGTATCAAACCATCACC
CA
TAGTTTGTATCAAACCATCACCCA
AAACTGGGTGATGGTTTGATACAA
T-ydeO ACATGAAGCCGGCGCAC
CCA
TAGTACATGAAGCCGGCGCACCCA
AAACTGGGTGCGCCGGCTTCATGT
R1-TGGAA CCGCTATGTCAGGCGTG
GAA
TAGTCCGCTATGTCAGGCGTG
GAA
AAACTTCCACGCCTGACATAGCG
G
R2-TGGAA GTCAGTCATATTAACTGG
AA
TAGTGTCAGTCATATTAACTGG
AA
AAACTTCCAGTTAATATGACTGAC
T-garD TGAGCGCCTGCTGACTG
GAA
TAGTTGAGCGCCTGCTGACTG
GAA
AAACTTCCAGTCAGCAGGCGCTC
A
R1-ACCCA_15bp CACACTCTCTACCCA TAGTCACACTCTCTACCCA AAACTGGGTAGAGAGTGTG
T-bioC ACGCGGGTTGTGGACCT
GGC
TAGTACGCGGGTTGTGGACCTGGC
AAACGCCAGGTCCACAACCCGCGT
C-mcherry20orf TCTGGGTGCCTTCATACG
GA
TAGTTCTGGGTGCCTTCATACGGA
AAACTCCGTATGAAGGCACCCAGA
C-mcherry20p TATCCATGAGGTACCTGT
CA
TAGTTATCCATGAGGTACCTGTCA
AAACTGACAGGTACCTCATGGATA
C-mcherry5orf AGACCCACGGAAGTAACG
GA
TAGTAGACCCACGGAAGTAACGGA
AAACTCCGTTACTTCCGTGGGTCT
c-mcherry5p ATAGGTACTCCATGGTGTCA
TAGTATAGGTACTCCATGGTGTCA
AAACTGACACCATGGAGTACCTAT

Supplementary Table 7. Strains made using the OSIP system.
Strain Name
Original strain Integration at lambda attB Integration at primary 186 attB
Integration at HK022 attB
LC-E18 MG1655 pOSIP-KL-sulA-GFP N/A pOSIP-KH-RBS2-dCas9 LC-E75 MG1655 pOSIP-KL-mcherry pOSIP-CO-RBS-library-
dCas9 (2-3)* N/A
AV04 MG1655 pOSIP-KL-mcherry pOSIP-KO-RBS2-dCas9 N/A *The number in the parentheses is corresponding to the selected colony number.

Supplementary Table 8. Primers and corresponding indexes used to prepare the sequencing libraries.
Primer name
Index primer sequences PCR function
LC606 AGAT TTCCCTACACGACGCTCTTCCGATCTTAGANNNNGCACGCCCGTCGCTCAGTCCTAGGTATAATACTA
1st PCR forward
LC607 TCTC TTCCCTACACGACGCTCTTCCGATCTCTCTNNNNGCACGCCCGTCGCTCAGTCCTAGGTATAATACTA
1st PCR forward
LC608 CTTA TTCCCTACACGACGCTCTTCCGATCTATTCNNNNGCACGCCCGTCGCTCAGTCCTAGGTATAATACTA
1st PCR forward
LC863 N/A GTGACTGGAGTTCAGACGTGTGCTCTTCCGATCTNNNNNNAAAGGACCCGTAAAGTGATAATGAT
1st PCR reverse
LC415 N/A AATGATACGGCGACCACCGAGATCTACACTCTTTCCCTACACGACGCT 2nd PCR forward LC416 CGAGTAAT CAAGCAGAAGACGGCATACGAGATCGAGTAATGTGACTGGAGTTCAGAC
G 2nd PCR reverse
LC417 TCTCCGGA CAAGCAGAAGACGGCATACGAGATTCTCCGGAGTGACTGGAGTTCAGACG
2nd PCR reverse
LC420 TTCTGAAT CAAGCAGAAGACGGCATACGAGATTTCTGAATGTGACTGGAGTTCAGACG 2nd PCR reverse LC421 ACGAATTC CAAGCAGAAGACGGCATACGAGATACGAATTCGTGACTGGAGTTCAGAC
G 2nd PCR reverse

Supplementary Table 9. qPCR primers and probes.
Targeted gene rrsA hisI lpoB bioC lgt
Forward
primer
(5'----- 3' )
GGATAACTACTGGAAACGGTAGC
CAGTGGCTGTTCCTGTATCAA
CGCTCATTACGTGCTGTACT
GATATCGAATCCCTGCCGTTAG
GCCACCCATCACAGCTTTA
Reverse primer
(5'----- 3' )
CTAATCCCATCTGGGCACATC
ATACAGTTTGGCGGTGTAGG
CCAGATAATTTCGCCCGTCT
CGGAGTGCCGTGGATAAAT
GCCGTAACCAATCAGGAACA
Probe (5'----- 3' )
FAM --TACCGCATAACGTCGCAAGACCAA --BHQ1
FAM --CGCAAATCTGCCGATCCGGAAAC--BHQ1
FAM --TAACGCTCCGACCCTACAAATGCA--BHQ1
N/A N/A

Supplementary References:
1. St-Pierre, F. et al. One-Step Cloning and Chromosomal Integration of DNA. ACS Synth. Biol. 2, 537–
541 (2013).
2. Jiang, W., Bikard, D., Cox, D., Zhang, F. & Marraffini, L. A. RNA-guided editing of bacterial genomes
using CRISPR-Cas systems. Nat. Biotechnol. 31, 233–239 (2013).
3. Depardieu, F. et al. A Eukaryotic-like Serine/Threonine Kinase Protects Staphylococci against Phages.
Cell Host Microbe 20, 471–481 (2016).
4. Chaveroche, M.-K., Ghigo, J.-M. & d’Enfert, C. A rapid method for efficient gene replacement in the
filamentous fungus Aspergillus nidulans. Nucleic Acids Res. 28, e97 (2000).
5. Teeffelen, S. van et al. The bacterial actin MreB rotates, and rotation depends on cell-wall assembly.
Proc. Natl. Acad. Sci. 108, 15822–15827 (2011).
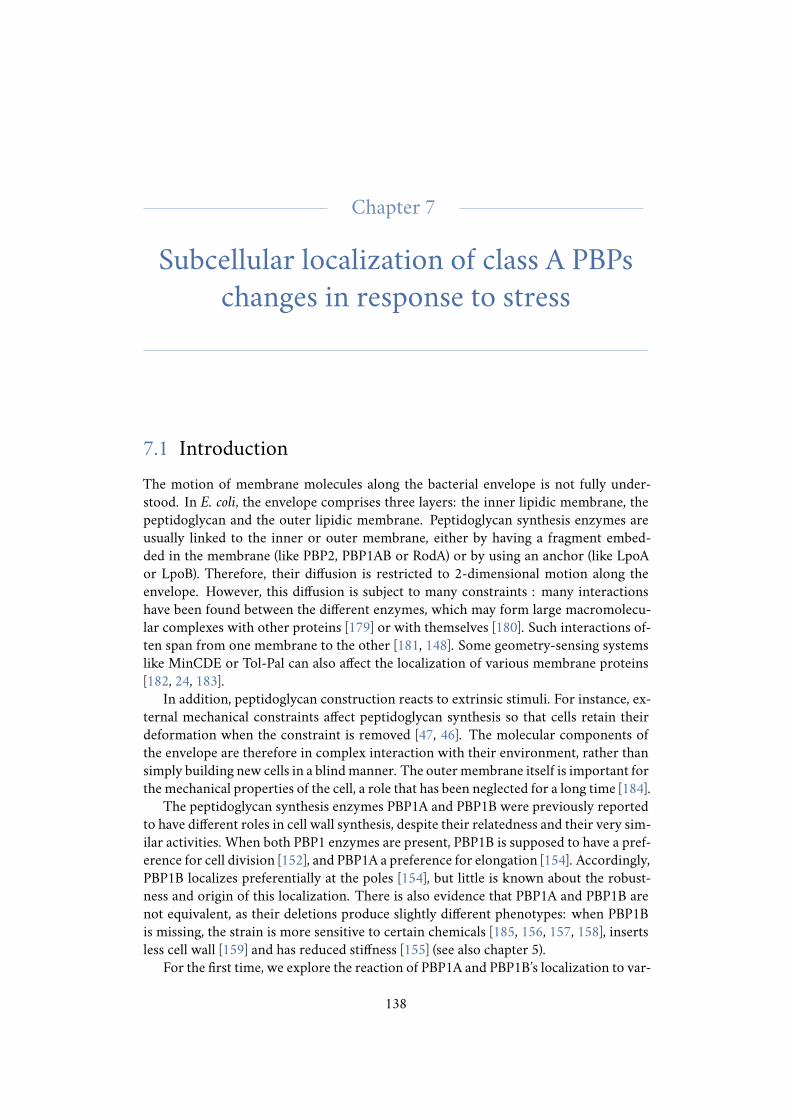
Chapter 7
Subcellular localization of class A PBPschanges in response to stress
7.1 Introduction
The motion of membrane molecules along the bacterial envelope is not fully under-stood. In E. coli, the envelope comprises three layers: the inner lipidic membrane, thepeptidoglycan and the outer lipidic membrane. Peptidoglycan synthesis enzymes areusually linked to the inner or outer membrane, either by having a fragment embed-ded in the membrane (like PBP2, PBP1AB or RodA) or by using an anchor (like LpoAor LpoB). Therefore, their diffusion is restricted to 2-dimensional motion along theenvelope. However, this diffusion is subject to many constraints : many interactionshave been found between the different enzymes, which may form large macromolecu-lar complexes with other proteins [179] or with themselves [180]. Such interactions of-ten span from one membrane to the other [181, 148]. Some geometry-sensing systemslike MinCDE or Tol-Pal can also affect the localization of various membrane proteins[182, 24, 183].
In addition, peptidoglycan construction reacts to extrinsic stimuli. For instance, ex-ternal mechanical constraints affect peptidoglycan synthesis so that cells retain theirdeformation when the constraint is removed [47, 46]. The molecular components ofthe envelope are therefore in complex interaction with their environment, rather thansimply building new cells in a blindmanner. The outermembrane itself is important forthe mechanical properties of the cell, a role that has been neglected for a long time [184].
The peptidoglycan synthesis enzymes PBP1A and PBP1B were previously reportedto have different roles in cell wall synthesis, despite their relatedness and their very sim-ilar activities. When both PBP1 enzymes are present, PBP1B is supposed to have a pref-erence for cell division [152], and PBP1A a preference for elongation [154]. Accordingly,PBP1B localizes preferentially at the poles [154], but little is known about the robust-ness and origin of this localization. There is also evidence that PBP1A and PBP1B arenot equivalent, as their deletions produce slightly different phenotypes: when PBP1Bis missing, the strain is more sensitive to certain chemicals [185, 156, 157, 158], insertsless cell wall [159] and has reduced stiffness [155] (see also chapter 5).
For the first time, we explore the reaction of PBP1A and PBP1B’s localization to var-
138
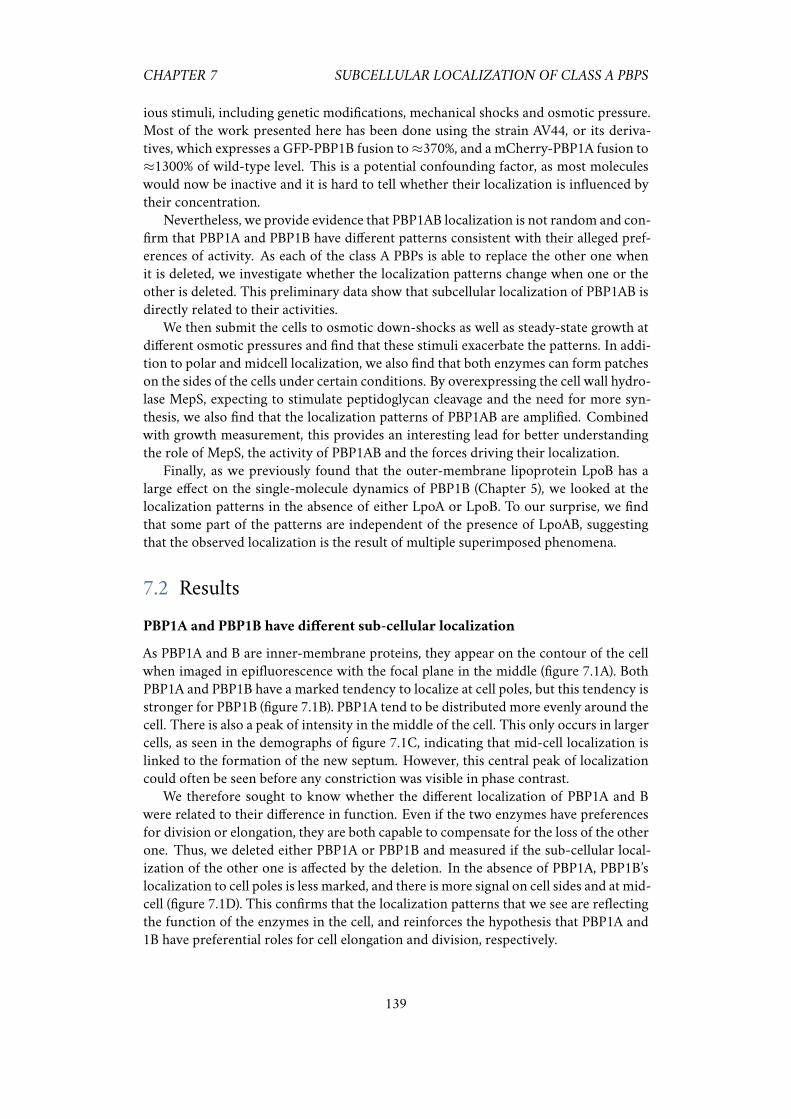
CHAPTER 7 SUBCELLULAR LOCALIZATION OF CLASS A PBPS
ious stimuli, including genetic modifications, mechanical shocks and osmotic pressure.Most of the work presented here has been done using the strain AV44, or its deriva-tives, which expresses a GFP-PBP1B fusion to≈370%, and a mCherry-PBP1A fusion to≈1300% of wild-type level. This is a potential confounding factor, as most moleculeswould now be inactive and it is hard to tell whether their localization is influenced bytheir concentration.
Nevertheless, we provide evidence that PBP1AB localization is not random and con-firm that PBP1A and PBP1B have different patterns consistent with their alleged pref-erences of activity. As each of the class A PBPs is able to replace the other one whenit is deleted, we investigate whether the localization patterns change when one or theother is deleted. This preliminary data show that subcellular localization of PBP1AB isdirectly related to their activities.
We then submit the cells to osmotic down-shocks as well as steady-state growth atdifferent osmotic pressures and find that these stimuli exacerbate the patterns. In addi-tion to polar and midcell localization, we also find that both enzymes can form patcheson the sides of the cells under certain conditions. By overexpressing the cell wall hydro-lase MepS, expecting to stimulate peptidoglycan cleavage and the need for more syn-thesis, we also find that the localization patterns of PBP1AB are amplified. Combinedwith growth measurement, this provides an interesting lead for better understandingthe role of MepS, the activity of PBP1AB and the forces driving their localization.
Finally, as we previously found that the outer-membrane lipoprotein LpoB has alarge effect on the single-molecule dynamics of PBP1B (Chapter 5), we looked at thelocalization patterns in the absence of either LpoA or LpoB. To our surprise, we findthat some part of the patterns are independent of the presence of LpoAB, suggestingthat the observed localization is the result of multiple superimposed phenomena.
7.2 Results
PBP1A and PBP1B have different sub-cellular localization
As PBP1A and B are inner-membrane proteins, they appear on the contour of the cellwhen imaged in epifluorescence with the focal plane in the middle (figure 7.1A). BothPBP1A and PBP1B have a marked tendency to localize at cell poles, but this tendency isstronger for PBP1B (figure 7.1B). PBP1A tend to be distributed more evenly around thecell. There is also a peak of intensity in the middle of the cell. This only occurs in largercells, as seen in the demographs of figure 7.1C, indicating that mid-cell localization islinked to the formation of the new septum. However, this central peak of localizationcould often be seen before any constriction was visible in phase contrast.
We therefore sought to know whether the different localization of PBP1A and Bwere related to their difference in function. Even if the two enzymes have preferencesfor division or elongation, they are both capable to compensate for the loss of the otherone. Thus, we deleted either PBP1A or PBP1B and measured if the sub-cellular local-ization of the other one is affected by the deletion. In the absence of PBP1A, PBP1B’slocalization to cell poles is less marked, and there is more signal on cell sides and at mid-cell (figure 7.1D). This confirms that the localization patterns that we see are reflectingthe function of the enzymes in the cell, and reinforces the hypothesis that PBP1A and1B have preferential roles for cell elongation and division, respectively.
139
CHAPTER 7 SUBCELLULAR LOCALIZATION OF CLASS A PBPS
0
50
100
150
200
250
Cell
size
pe
rce
ntil
e (
%)
Cell axis coordinate
mCherry-PBP1A GFP-PBP1B
A
C D
GFP-PBP1B
mCherry-PBP1A
0.0
0.5
1.0
1.5
0 25 50 75 100
Cell axis coordinate (%)
Inte
nsi
ty (
a.u
.)
WT
ΔPBP1A
0.0
0.5
1.0
1.5
0 25 50 75 100
Cell axis coordinate (%)
PB
P1
B in
ten
sity
(a.u
.)
Cell axis coordinate
6.5
μm
B
GFP-PBP1B mCherry-PBP1A Merge
Figure 7.1:Different localization forPBP1AandPBP1B.A: Sample images ofthe PBP1AB fusions. B:Mean density of PBP1A (left) and PBP1B (right) along cellcontour (0% and 100% are poles). C:Demographs of PBP1AB cell contour, sortedby area. Lighter pixels correspond to higher fluorescence. C: Mean density ofPBP1B along cell contour, with or without PBP1A.
140
CHAPTER 7 SUBCELLULAR LOCALIZATION OF CLASS A PBPS
PBP1AB localization patterns are amplified after osmotic shocks
4 μm
A
PoleCenter
PoleCenter
PoleCenter
PoleCenter
PoleCenter
PoleCenter
PoleCenter
PoleCenter
0
10
20
30
40
Tim
e (
s)S
hock
Shock
B
Figure 7.2: Localization of PBP1ABduring an osmotic downshock. A: Fluo-rescence images of representative cells before and after a 1 osm/L osmotic down-shock. B: Kymographs of PBP1A localization of a few cells during a 1 osm/Losmotic downshock. Lighter pixels correspond to a higher density of mCherry-PBP1A.
When measuring the elasticity of cells by trapping them in polylysine-coated tun-nel slides [165], we noticed that sharp patterns of fluorescence appear during osmoticdownshock (figure 7.2A and B). As the cells expand due to the drop in osmotic pres-sure, both GFP-PBP1B and mCherry-PBP1A relocalize to the poles and to the middleof the cell quickly after the shock. The localization to mid-cell was observed in mostcells after shock, even in cells without any sign of constriction. This indicates that thecause of PBP1AB localization is already present at a very early stage of cell division. Thechange of localization appeared within seconds of the osmotic downshock, narrowingdown the kind of cellular processes that could explain the pattern. For example, it is un-likely that any mechanism involving genetic control is involved. Asymmetric patchesalso appear frequently on the sides of the cells (figure 7.2B, first cell from the left).
This is reminiscent of a previous study in C. crescentus where PBP2 was found tolocalize at the poles after an osmotic shift [186]. In E. coli, the localization of PBP2 ismore heterogenous than PBP1AB, possibly due to its association with MreB [146, 147],making it harder to follow its motion after an osmotic shock (figure 7.3).
As the osmotic downshock produces a sudden expansion of the cell, there may belarge perturbations in the peptidolycan as well as the membranes. Many phenomenacould give rise to the patterns we observed, however when doing a similar osmoticdownshock on cells labelled with the outer-membrane dye FM4-64 (figure 7.4), the pat-tern of FM4-64 fluorescence remained uniform, meaning that simple movement of theouter membrane is not enough to account for the observed patterns.
141
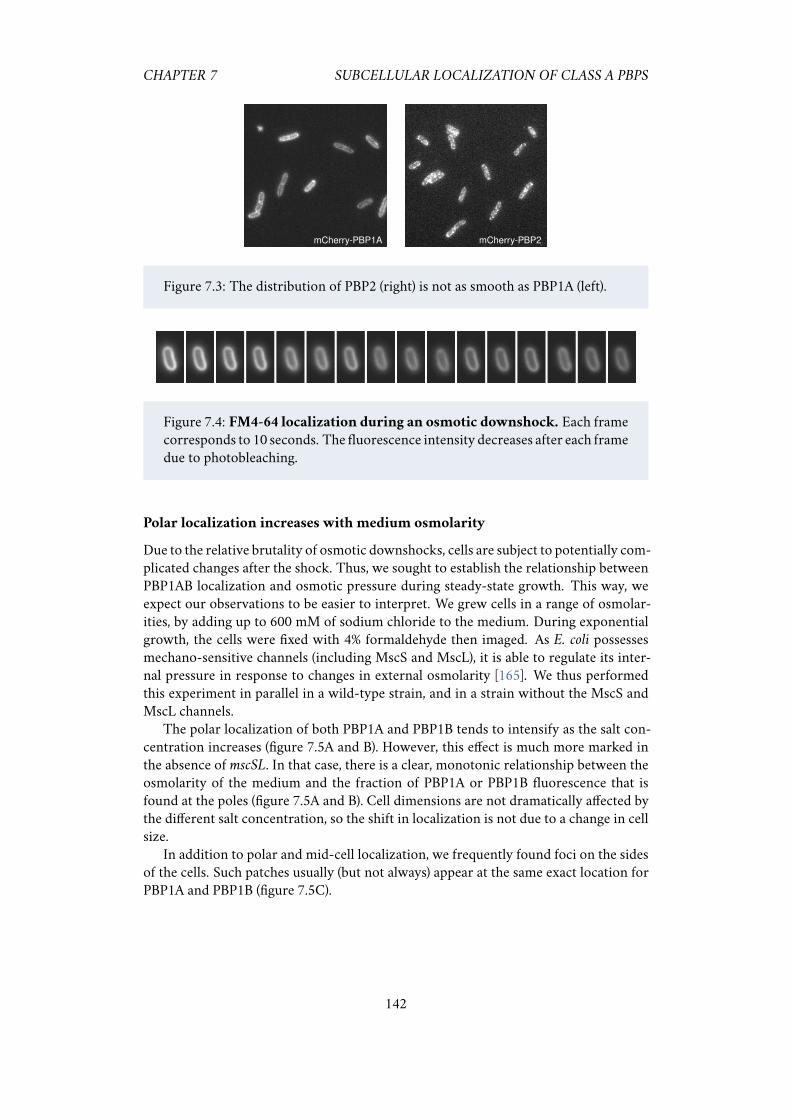
CHAPTER 7 SUBCELLULAR LOCALIZATION OF CLASS A PBPS
mCherry-PBP1A mCherry-PBP2
Figure 7.3: The distribution of PBP2 (right) is not as smooth as PBP1A (left).
Figure 7.4: FM4-64 localization during an osmotic downshock. Each framecorresponds to 10 seconds. The fluorescence intensity decreases after each framedue to photobleaching.
Polar localization increases with medium osmolarity
Due to the relative brutality of osmotic downshocks, cells are subject to potentially com-plicated changes after the shock. Thus, we sought to establish the relationship betweenPBP1AB localization and osmotic pressure during steady-state growth. This way, weexpect our observations to be easier to interpret. We grew cells in a range of osmolar-ities, by adding up to 600 mM of sodium chloride to the medium. During exponentialgrowth, the cells were fixed with 4% formaldehyde then imaged. As E. coli possessesmechano-sensitive channels (including MscS and MscL), it is able to regulate its inter-nal pressure in response to changes in external osmolarity [165]. We thus performedthis experiment in parallel in a wild-type strain, and in a strain without the MscS andMscL channels.
The polar localization of both PBP1A and PBP1B tends to intensify as the salt con-centration increases (figure 7.5A and B). However, this effect is much more marked inthe absence of mscSL. In that case, there is a clear, monotonic relationship between theosmolarity of the medium and the fraction of PBP1A or PBP1B fluorescence that isfound at the poles (figure 7.5A and B). Cell dimensions are not dramatically affected bythe different salt concentration, so the shift in localization is not due to a change in cellsize.
In addition to polar and mid-cell localization, we frequently found foci on the sidesof the cells. Such patches usually (but not always) appear at the same exact location forPBP1A and PBP1B (figure 7.5C).
142
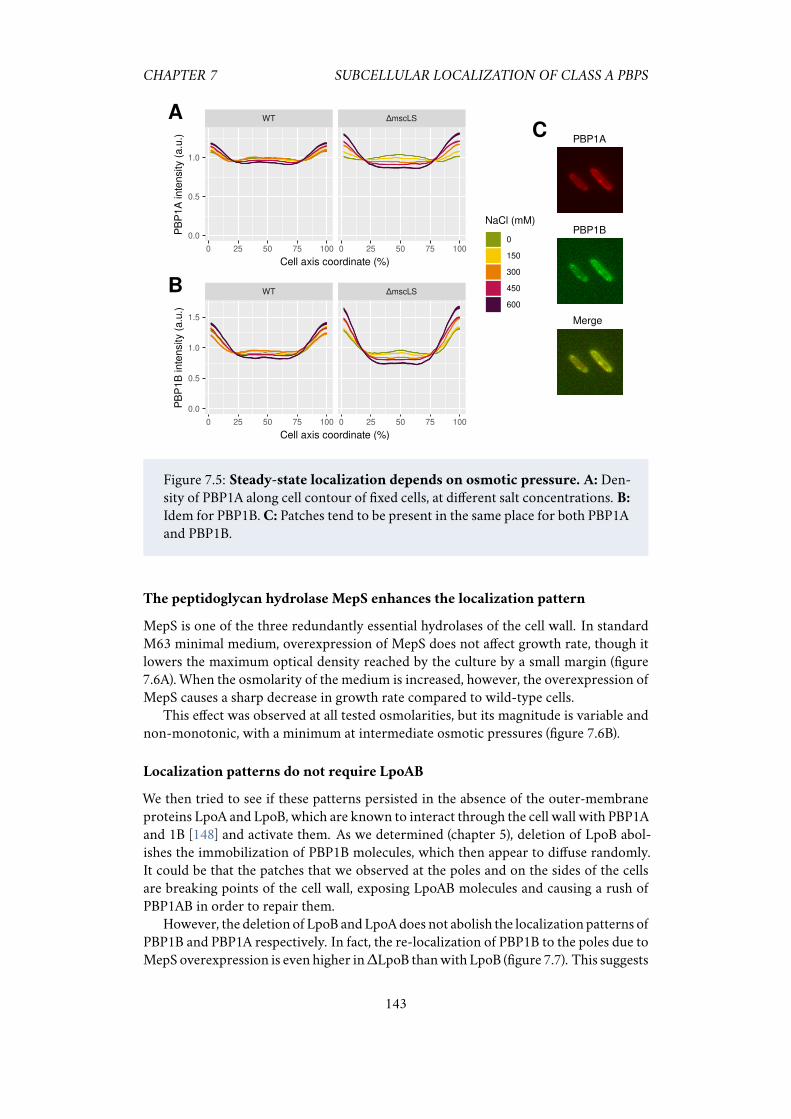
CHAPTER 7 SUBCELLULAR LOCALIZATION OF CLASS A PBPS
NaCl (mM)
0
150
300
450
600
A
B
CPBP1A
PBP1B
Merge
WT ΔmscLS
0 25 50 75 100 0 25 50 75 100
0.0
0.5
1.0
Cell axis coordinate (%)
PB
P1A
inte
nsi
ty (
a.u
.)
WT ΔmscLS
0 25 50 75 100 0 25 50 75 100
0.0
0.5
1.0
1.5
Cell axis coordinate (%)
PB
P1B
inte
nsi
ty (
a.u
.)
Figure 7.5: Steady-state localization depends on osmotic pressure. A: Den-sity of PBP1A along cell contour of fixed cells, at different salt concentrations. B:Idem for PBP1B.C: Patches tend to be present in the same place for both PBP1Aand PBP1B.
The peptidoglycan hydrolase MepS enhances the localization pattern
MepS is one of the three redundantly essential hydrolases of the cell wall. In standardM63 minimal medium, overexpression of MepS does not affect growth rate, though itlowers the maximum optical density reached by the culture by a small margin (figure7.6A). When the osmolarity of the medium is increased, however, the overexpression ofMepS causes a sharp decrease in growth rate compared to wild-type cells.
This effect was observed at all tested osmolarities, but its magnitude is variable andnon-monotonic, with a minimum at intermediate osmotic pressures (figure 7.6B).
Localization patterns do not require LpoAB
We then tried to see if these patterns persisted in the absence of the outer-membraneproteins LpoA and LpoB, which are known to interact through the cell wall with PBP1Aand 1B [148] and activate them. As we determined (chapter 5), deletion of LpoB abol-ishes the immobilization of PBP1B molecules, which then appear to diffuse randomly.It could be that the patches that we observed at the poles and on the sides of the cellsare breaking points of the cell wall, exposing LpoAB molecules and causing a rush ofPBP1AB in order to repair them.
However, the deletion of LpoB andLpoAdoes not abolish the localization patterns ofPBP1B and PBP1A respectively. In fact, the re-localization of PBP1B to the poles due toMepS overexpression is even higher in∆LpoB thanwith LpoB (figure 7.7). This suggests
143
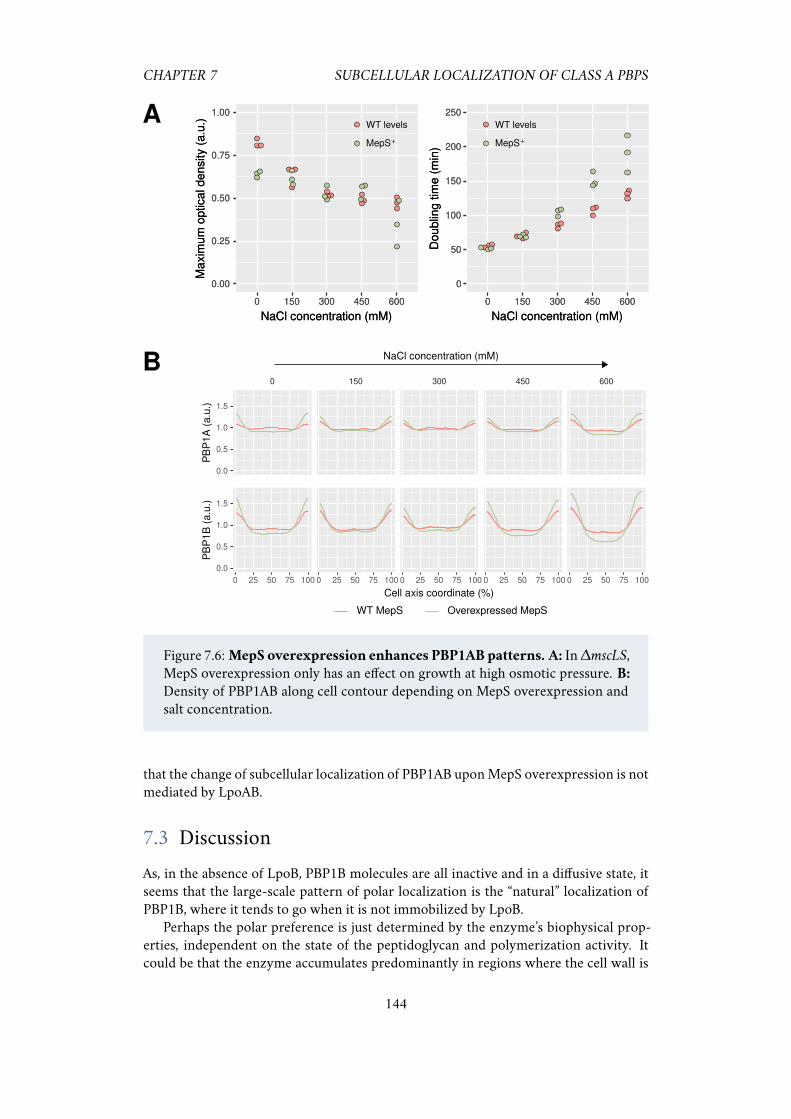
CHAPTER 7 SUBCELLULAR LOCALIZATION OF CLASS A PBPS
0.00
0.25
0.50
0.75
1.00
Ma
xim
um
optic
al d
ensity (
a.u
.)
0
50
100
150
200
250
Dou
blin
g tim
e (
min
)
WT levels
MepS⁺
WT levels
MepS⁺
0 150 300 450 600
NaCl concentration (mM)
0 150 300 450 600
NaCl concentration (mM)
0.00
0.25
0.50
0.75
1.00
Ma
xim
um
optic
al d
ensity (
a.u
.)
0
50
100
150
200
250
Dou
blin
g tim
e (
min
)
WT levels
MepS⁺
WT levels
MepS⁺
0 150 300 450 600
NaCl concentration (mM)
0 150 300 450 600
NaCl concentration (mM)
A
B
Overexpressed MepSWT MepS
NaCl concentration (mM)
0.0
0.5
1.0
1.5
PB
P1
A (
a.u
.)
0.0
0.5
1.0
1.5
PB
P1
B (
a.u
.)
0 150 300 450 600
0 25 50 75 100 0 25 50 75 100 0 25 50 75 100 0 25 50 75 100 0 25 50 75 100
Cell axis coordinate (%)
Figure 7.6:MepS overexpression enhances PBP1AB patterns. A: In∆mscLS,MepS overexpression only has an effect on growth at high osmotic pressure. B:Density of PBP1AB along cell contour depending on MepS overexpression andsalt concentration.
that the change of subcellular localization of PBP1AB uponMepS overexpression is notmediated by LpoAB.
7.3 Discussion
As, in the absence of LpoB, PBP1B molecules are all inactive and in a diffusive state, itseems that the large-scale pattern of polar localization is the “natural” localization ofPBP1B, where it tends to go when it is not immobilized by LpoB.
Perhaps the polar preference is just determined by the enzyme’s biophysical prop-erties, independent on the state of the peptidoglycan and polymerization activity. Itcould be that the enzyme accumulates predominantly in regions where the cell wall is
144
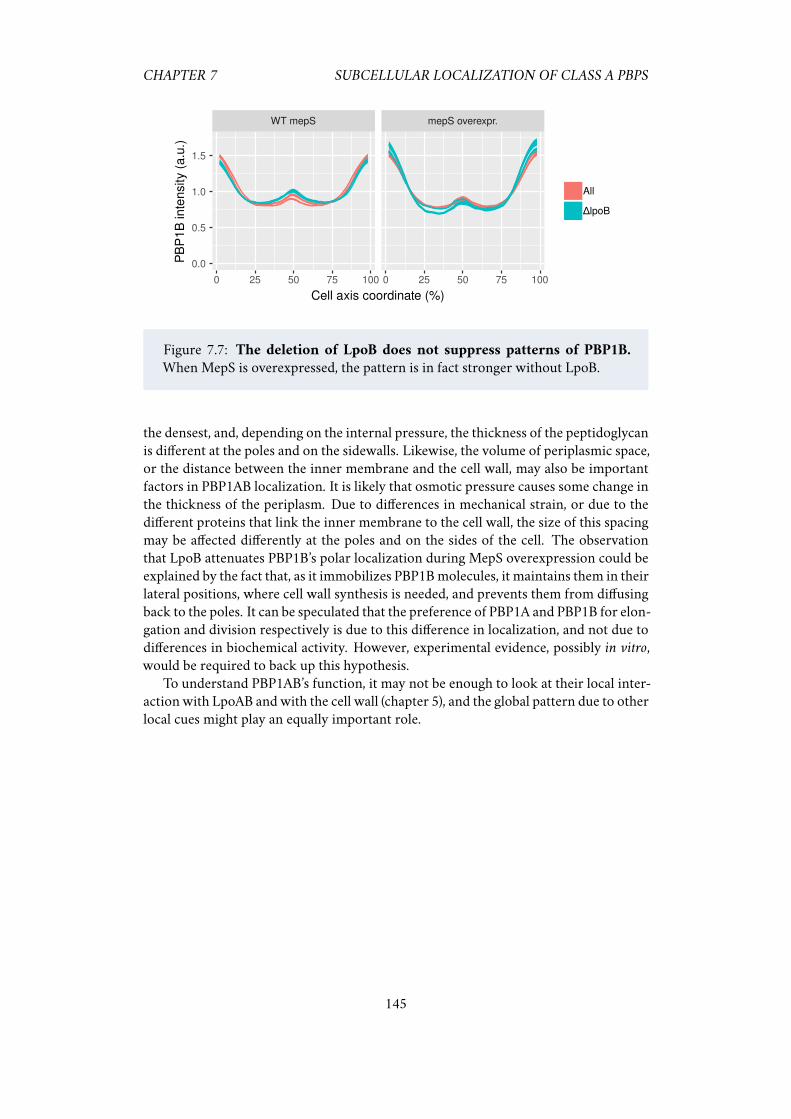
CHAPTER 7 SUBCELLULAR LOCALIZATION OF CLASS A PBPS
WT mepS mepS overexpr.
0 25 50 75 100 0 25 50 75 100
0.0
0.5
1.0
1.5
Cell axis coordinate (%)
PB
P1B
inte
nsity (
a.u
.)All
ΔlpoB
Figure 7.7: The deletion of LpoB does not suppress patterns of PBP1B.
When MepS is overexpressed, the pattern is in fact stronger without LpoB.
the densest, and, depending on the internal pressure, the thickness of the peptidoglycanis different at the poles and on the sidewalls. Likewise, the volume of periplasmic space,or the distance between the inner membrane and the cell wall, may also be importantfactors in PBP1AB localization. It is likely that osmotic pressure causes some change inthe thickness of the periplasm. Due to differences in mechanical strain, or due to thedifferent proteins that link the inner membrane to the cell wall, the size of this spacingmay be affected differently at the poles and on the sides of the cell. The observationthat LpoB attenuates PBP1B’s polar localization during MepS overexpression could beexplained by the fact that, as it immobilizes PBP1Bmolecules, it maintains them in theirlateral positions, where cell wall synthesis is needed, and prevents them from diffusingback to the poles. It can be speculated that the preference of PBP1A and PBP1B for elon-gation and division respectively is due to this difference in localization, and not due todifferences in biochemical activity. However, experimental evidence, possibly in vitro,would be required to back up this hypothesis.
To understand PBP1AB’s function, it may not be enough to look at their local inter-action with LpoAB andwith the cell wall (chapter 5), and the global pattern due to otherlocal cues might play an equally important role.
145
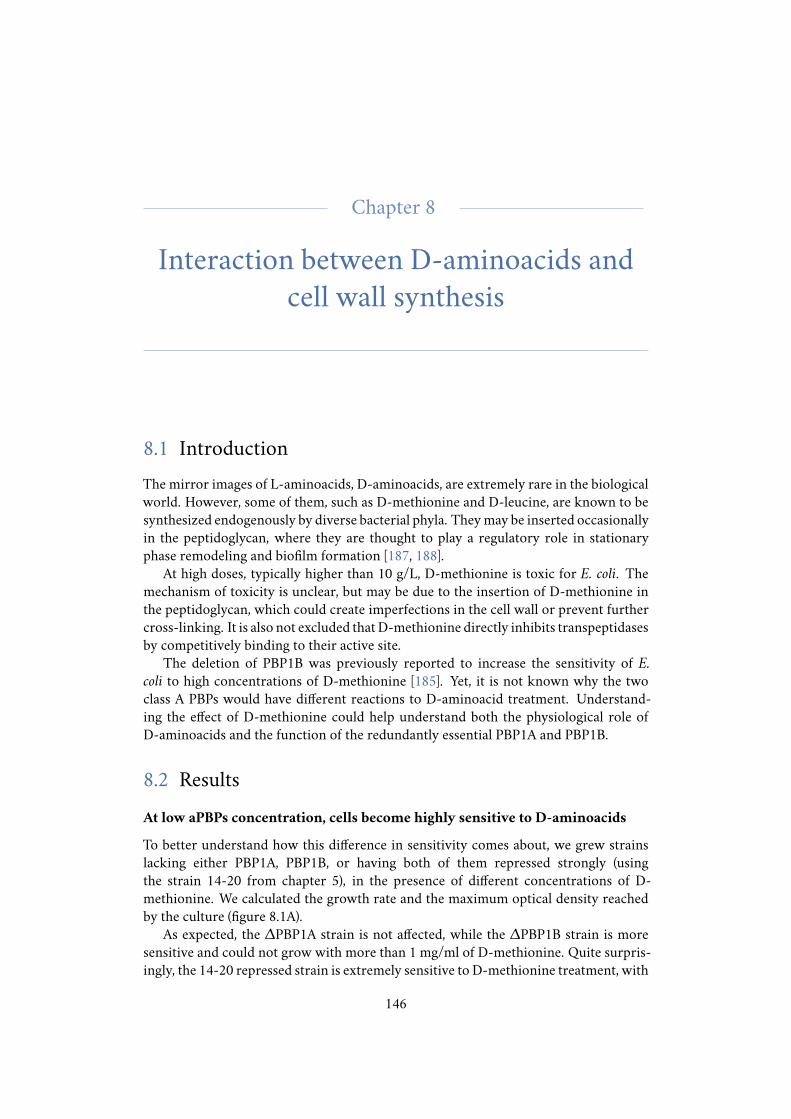
Chapter 8
Interaction between D-aminoacids andcell wall synthesis
8.1 Introduction
The mirror images of L-aminoacids, D-aminoacids, are extremely rare in the biologicalworld. However, some of them, such as D-methionine and D-leucine, are known to besynthesized endogenously by diverse bacterial phyla. Theymay be inserted occasionallyin the peptidoglycan, where they are thought to play a regulatory role in stationaryphase remodeling and biofilm formation [187, 188].
At high doses, typically higher than 10 g/L, D-methionine is toxic for E. coli. Themechanism of toxicity is unclear, but may be due to the insertion of D-methionine inthe peptidoglycan, which could create imperfections in the cell wall or prevent furthercross-linking. It is also not excluded thatD-methionine directly inhibits transpeptidasesby competitively binding to their active site.
The deletion of PBP1B was previously reported to increase the sensitivity of E.coli to high concentrations of D-methionine [185]. Yet, it is not known why the twoclass A PBPs would have different reactions to D-aminoacid treatment. Understand-ing the effect of D-methionine could help understand both the physiological role ofD-aminoacids and the function of the redundantly essential PBP1A and PBP1B.
8.2 Results
At low aPBPs concentration, cells become highly sensitive to D-aminoacids
To better understand how this difference in sensitivity comes about, we grew strainslacking either PBP1A, PBP1B, or having both of them repressed strongly (usingthe strain 14-20 from chapter 5), in the presence of different concentrations of D-methionine. We calculated the growth rate and the maximum optical density reachedby the culture (figure 8.1A).
As expected, the ∆PBP1A strain is not affected, while the ∆PBP1B strain is moresensitive and could not grow with more than 1 mg/ml of D-methionine. Quite surpris-ingly, the 14-20 repressed strain is extremely sensitive to D-methionine treatment, with
146
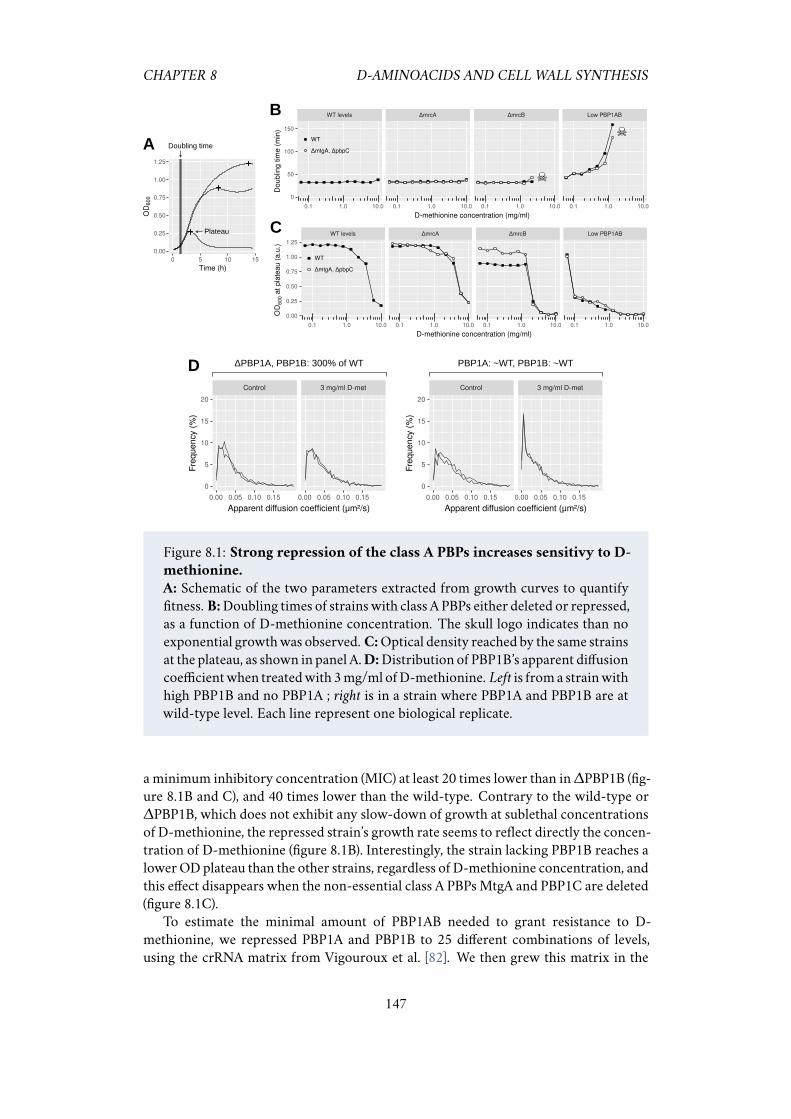
CHAPTER 8 D-AMINOACIDS AND CELL WALL SYNTHESIS
WT levels ΔmrcA ΔmrcB Low PBP1AB
0.1 1.0 10.0 0.1 1.0 10.0 0.1 1.0 10.0 0.1 1.0 10.0
0.00
0.25
0.50
0.75
1.00
1.25
D-methionine concentration (mg/ml)
OD
600
at
pla
tea
u (
a.u
.)
WT
ΔmtgA, ΔpbpC
C
B WT levels ΔmrcA ΔmrcB Low PBP1AB
0.1 1.0 10.0 0.1 1.0 10.0 0.1 1.0 10.0 0.1 1.0 10.0
0
50
100
150
D-methionine concentration (mg/ml)
Do
ub
ling
tim
e (
min
)
WT
ΔmtgA, ΔpbpC
0.00
0.25
0.50
0.75
1.00
1.25
0 5 10 15
Time (h)
OD
60
0Doubling time
Plateau
A
PBP1A: ~WT, PBP1B: ~WTΔPBP1A, PBP1B: 300% of WTDControl 3 mg/ml D-met
0.00 0.05 0.10 0.15 0.00 0.05 0.10 0.15
0
5
10
15
20
Apparent diffusion coefficient (μm²/s)
Fre
qu
en
cy (
%)
Control 3 mg/ml D-met
0.00 0.05 0.10 0.15 0.00 0.05 0.10 0.15
0
5
10
15
20
Apparent diffusion coefficient (μm²/s)
Fre
qu
en
cy (
%)
Figure 8.1: Strong repression of the class A PBPs increases sensitivy to D-
methionine.
A: Schematic of the two parameters extracted from growth curves to quantifyfitness. B:Doubling times of strainswith class A PBPs either deleted or repressed,as a function of D-methionine concentration. The skull logo indicates than noexponential growthwas observed. C:Optical density reached by the same strainsat the plateau, as shown in panel A.D:Distribution of PBP1B’s apparent diffusioncoefficientwhen treatedwith 3mg/ml ofD-methionine. Left is froma strainwithhigh PBP1B and no PBP1A ; right is in a strain where PBP1A and PBP1B are atwild-type level. Each line represent one biological replicate.
a minimum inhibitory concentration (MIC) at least 20 times lower than in∆PBP1B (fig-ure 8.1B and C), and 40 times lower than the wild-type. Contrary to the wild-type or∆PBP1B, which does not exhibit any slow-down of growth at sublethal concentrationsof D-methionine, the repressed strain’s growth rate seems to reflect directly the concen-tration of D-methionine (figure 8.1B). Interestingly, the strain lacking PBP1B reaches alowerODplateau than the other strains, regardless of D-methionine concentration, andthis effect disappears when the non-essential class A PBPsMtgA and PBP1C are deleted(figure 8.1C).
To estimate the minimal amount of PBP1AB needed to grant resistance to D-methionine, we repressed PBP1A and PBP1B to 25 different combinations of levels,using the crRNA matrix from Vigouroux et al. [82]. We then grew this matrix in the
147
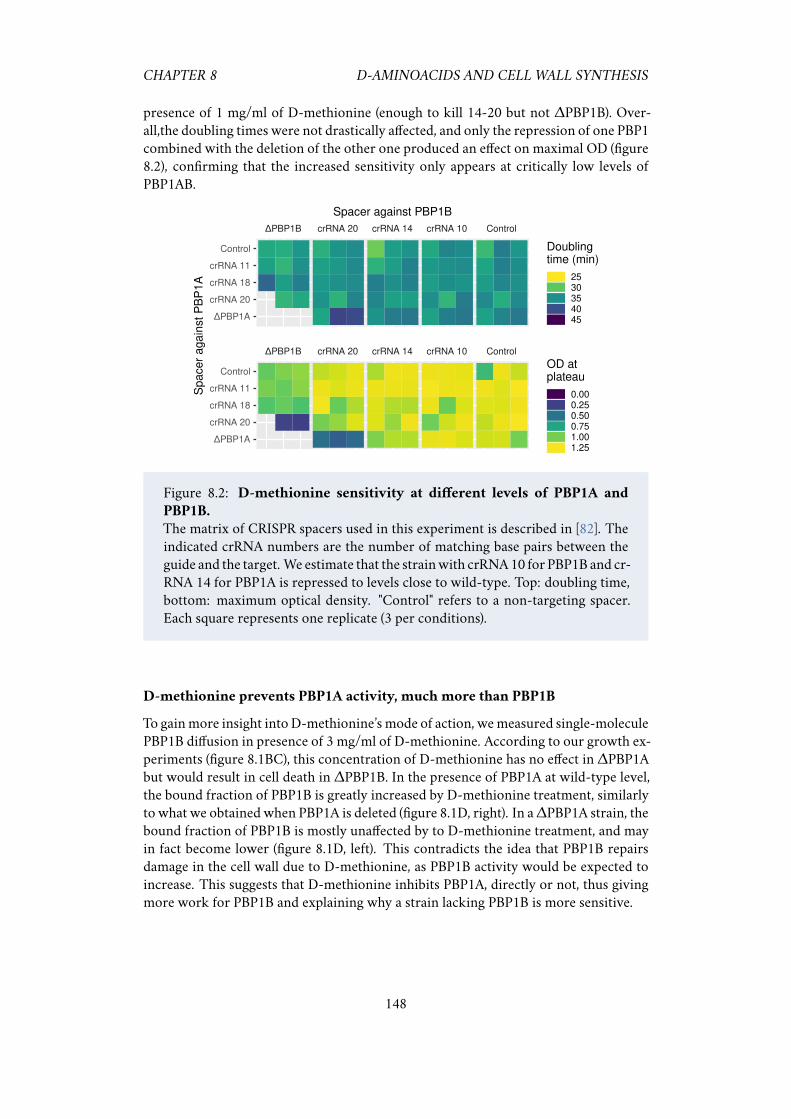
CHAPTER 8 D-AMINOACIDS AND CELL WALL SYNTHESIS
presence of 1 mg/ml of D-methionine (enough to kill 14-20 but not ∆PBP1B). Over-all,the doubling times were not drastically affected, and only the repression of one PBP1combined with the deletion of the other one produced an effect on maximal OD (figure8.2), confirming that the increased sensitivity only appears at critically low levels ofPBP1AB.
Figure 8.2: D-methionine sensitivity at different levels of PBP1A and
PBP1B.
The matrix of CRISPR spacers used in this experiment is described in [82]. Theindicated crRNA numbers are the number of matching base pairs between theguide and the target. We estimate that the strainwith crRNA10 for PBP1B and cr-RNA 14 for PBP1A is repressed to levels close to wild-type. Top: doubling time,bottom: maximum optical density. "Control" refers to a non-targeting spacer.Each square represents one replicate (3 per conditions).
D-methionine prevents PBP1A activity, much more than PBP1B
To gainmore insight into D-methionine’s mode of action, wemeasured single-moleculePBP1B diffusion in presence of 3 mg/ml of D-methionine. According to our growth ex-periments (figure 8.1BC), this concentration of D-methionine has no effect in ∆PBP1Abut would result in cell death in ∆PBP1B. In the presence of PBP1A at wild-type level,the bound fraction of PBP1B is greatly increased by D-methionine treatment, similarlyto what we obtained when PBP1A is deleted (figure 8.1D, right). In a∆PBP1A strain, thebound fraction of PBP1B is mostly unaffected by to D-methionine treatment, and mayin fact become lower (figure 8.1D, left). This contradicts the idea that PBP1B repairsdamage in the cell wall due to D-methionine, as PBP1B activity would be expected toincrease. This suggests that D-methionine inhibits PBP1A, directly or not, thus givingmore work for PBP1B and explaining why a strain lacking PBP1B is more sensitive.
148
CHAPTER 8 D-AMINOACIDS AND CELL WALL SYNTHESIS
D-methionine treatment is more severe when MepS is over-expressed
While the exact effect of D-methionine on E. coli is not clear, we previously found thatit interferes with PBP1A’s activity and provokes cell lysis if the level of PBP1AB is notsufficient. The peptidoglycan-hydrolaseMepS, that we use extensively in chapter 7, alsoseems related to D-methionine treatment in some way: the deletion of nlpI, an outer-membrane protein the negatively regulates MepS, also makes the strain more sensitivetoD-methionine [189], but only ifMepS is present. This negative regulation presumablyrelies on the protease Prc, that uses NlpI as an adaptator to degrade MepS [190, 191].Using a strain expressingMepS from an inducible promoter, we found that overexpres-sion of MepS itself also made cells more vulnerable to D-methionine treatment (figure8.3).
0.00
0.25
0.50
0.75
1.00
0.1 1.0 10.0
D-methionine (mg/ml)
OD
600 a
t p
late
au
(a.u
.)
Empty vector
MepS⁺
WT levels
mrcB⁺
mrcA⁺
Figure 8.3: The over-expression of the hydrolase MepS makes cells more
sensitive to D-methionine. “+” means that the enzyme in question is over-expressed from an inducible promoter. When MepS is overexpressed, the min-imal inhibitory concentration of MepS become lower. The cells are still able togrow to some extent, but the population collapses before reaching a high opticaldensity. The over-expression of PBP1A or PBP1B does not seem to compensatethis effect in a major way.
Genome-wide CRISPR screen identifies processes related to D-methionine
As many processes seem to be interlinked and there is a lot of uncertainty about thefunction of each part, we decided to scale up and find if other genes are affected byD-methionine treatment. For this, we used the CRISPR library presented in [79] in avariety of deletion strains, either in the presence or absence of a sublethal concentrationof D-methionine. The library is transfered to each strain by cosmid transduction, thenthe pooled collection of strains are induced and grown in competition. Finally, high-throughput sequencing of the CRISPR guides in the population allows to find the fitnessof each strain.
149
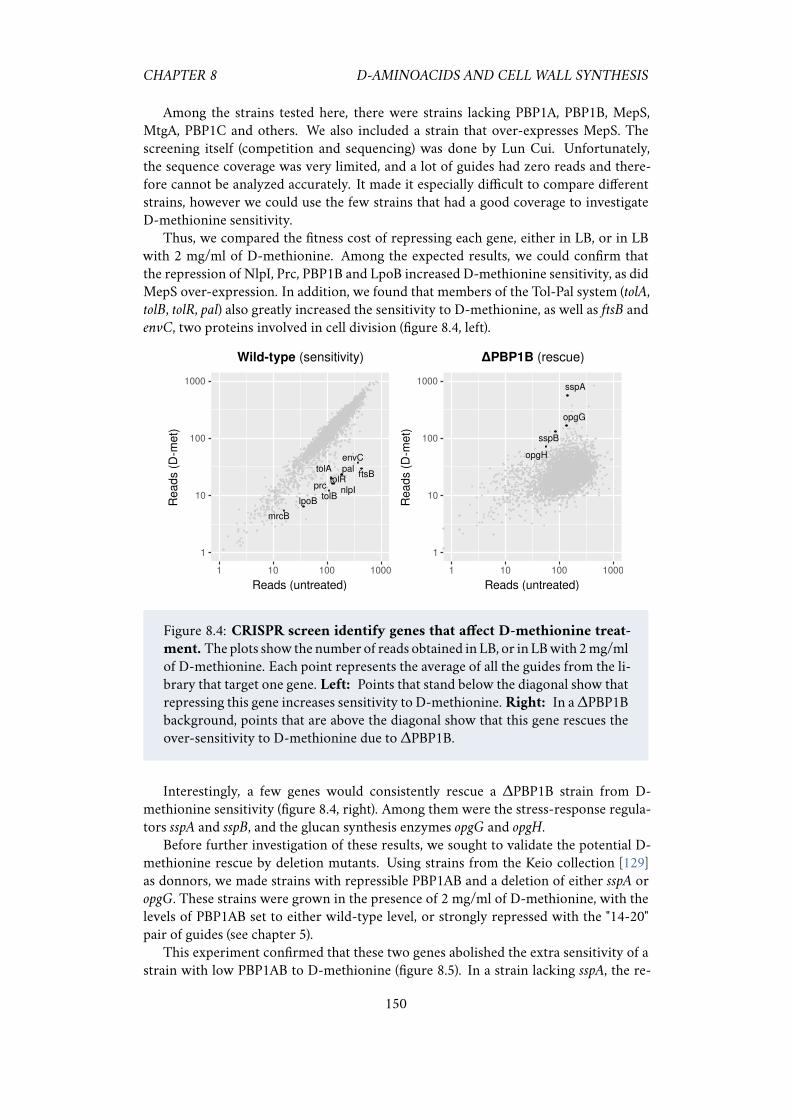
CHAPTER 8 D-AMINOACIDS AND CELL WALL SYNTHESIS
Among the strains tested here, there were strains lacking PBP1A, PBP1B, MepS,MtgA, PBP1C and others. We also included a strain that over-expresses MepS. Thescreening itself (competition and sequencing) was done by Lun Cui. Unfortunately,the sequence coverage was very limited, and a lot of guides had zero reads and there-fore cannot be analyzed accurately. It made it especially difficult to compare differentstrains, however we could use the few strains that had a good coverage to investigateD-methionine sensitivity.
Thus, we compared the fitness cost of repressing each gene, either in LB, or in LBwith 2 mg/ml of D-methionine. Among the expected results, we could confirm thatthe repression of NlpI, Prc, PBP1B and LpoB increased D-methionine sensitivity, as didMepS over-expression. In addition, we found that members of the Tol-Pal system (tolA,tolB, tolR, pal) also greatly increased the sensitivity to D-methionine, as well as ftsB andenvC, two proteins involved in cell division (figure 8.4, left).
1
10
100
1000
Rea
ds
(D-m
et)
1
10
100
1000
Rea
ds
(D-m
et)
envC
ftsB
lpoB
mrcB
nlpI
pal
prc
tolA
tolB
tolR
opgG
opgH
sspA
sspB
1 10 100 1000
Reads (untreated)
1 10 100 1000
Reads (untreated)
Wild-type (sensitivity) ΔPBP1B (rescue)
Figure 8.4: CRISPR screen identify genes that affect D-methionine treat-
ment. The plots show the number of reads obtained in LB, or in LBwith 2mg/mlof D-methionine. Each point represents the average of all the guides from the li-brary that target one gene. Left: Points that stand below the diagonal show thatrepressing this gene increases sensitivity to D-methionine. Right: In a∆PBP1Bbackground, points that are above the diagonal show that this gene rescues theover-sensitivity to D-methionine due to ∆PBP1B.
Interestingly, a few genes would consistently rescue a ∆PBP1B strain from D-methionine sensitivity (figure 8.4, right). Among them were the stress-response regula-tors sspA and sspB, and the glucan synthesis enzymes opgG and opgH.
Before further investigation of these results, we sought to validate the potential D-methionine rescue by deletion mutants. Using strains from the Keio collection [129]as donnors, we made strains with repressible PBP1AB and a deletion of either sspA oropgG. These strains were grown in the presence of 2 mg/ml of D-methionine, with thelevels of PBP1AB set to either wild-type level, or strongly repressed with the "14-20"pair of guides (see chapter 5).
This experiment confirmed that these two genes abolished the extra sensitivity of astrain with low PBP1AB to D-methionine (figure 8.5). In a strain lacking sspA, the re-
150
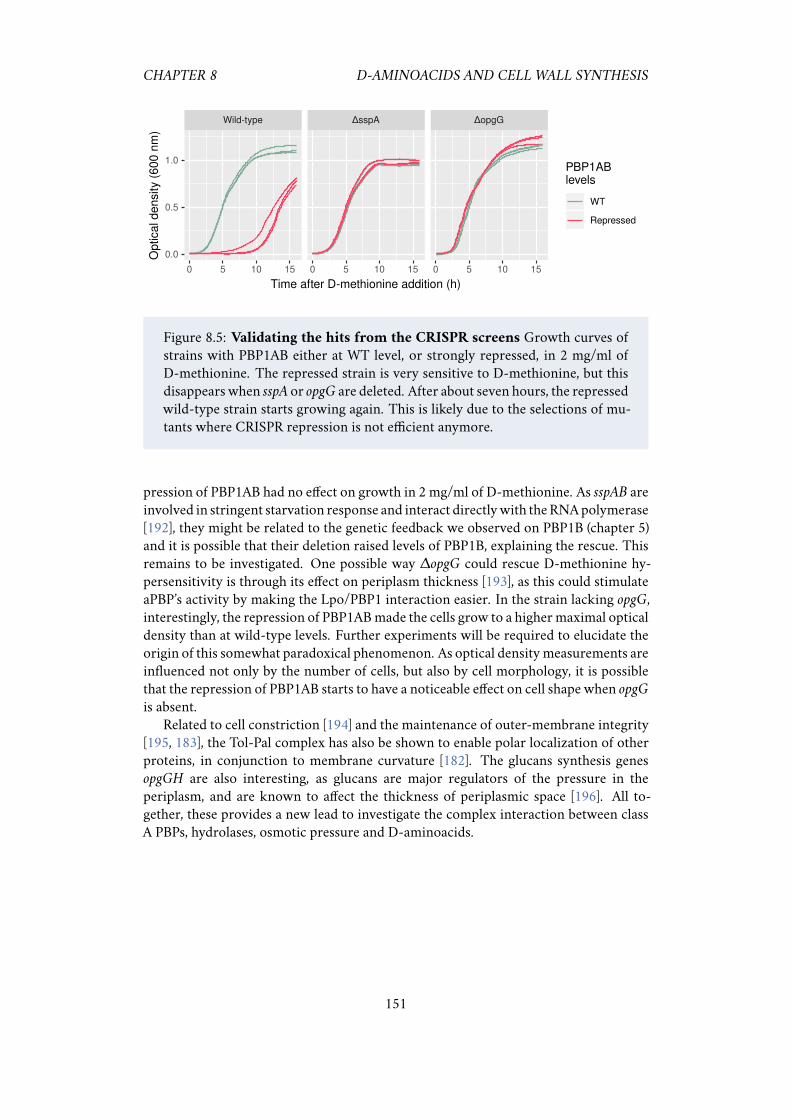
CHAPTER 8 D-AMINOACIDS AND CELL WALL SYNTHESIS
Wild-type ΔsspA ΔopgG
0 5 10 15 0 5 10 15 0 5 10 15
0.0
0.5
1.0
Time after D-methionine addition (h)
Optic
al density
(600 n
m)
PBP1ABlevels
WT
Repressed
Figure 8.5: Validating the hits from the CRISPR screens Growth curves ofstrains with PBP1AB either at WT level, or strongly repressed, in 2 mg/ml ofD-methionine. The repressed strain is very sensitive to D-methionine, but thisdisappears when sspA or opgG are deleted. After about seven hours, the repressedwild-type strain starts growing again. This is likely due to the selections of mu-tants where CRISPR repression is not efficient anymore.
pression of PBP1AB had no effect on growth in 2 mg/ml of D-methionine. As sspAB areinvolved in stringent starvation response and interact directlywith theRNApolymerase[192], they might be related to the genetic feedback we observed on PBP1B (chapter 5)and it is possible that their deletion raised levels of PBP1B, explaining the rescue. Thisremains to be investigated. One possible way ∆opgG could rescue D-methionine hy-persensitivity is through its effect on periplasm thickness [193], as this could stimulateaPBP’s activity by making the Lpo/PBP1 interaction easier. In the strain lacking opgG,interestingly, the repression of PBP1ABmade the cells grow to a highermaximal opticaldensity than at wild-type levels. Further experiments will be required to elucidate theorigin of this somewhat paradoxical phenomenon. As optical densitymeasurements areinfluenced not only by the number of cells, but also by cell morphology, it is possiblethat the repression of PBP1AB starts to have a noticeable effect on cell shape when opgGis absent.
Related to cell constriction [194] and the maintenance of outer-membrane integrity[195, 183], the Tol-Pal complex has also be shown to enable polar localization of otherproteins, in conjunction to membrane curvature [182]. The glucans synthesis genesopgGH are also interesting, as glucans are major regulators of the pressure in theperiplasm, and are known to affect the thickness of periplasmic space [196]. All to-gether, these provides a new lead to investigate the complex interaction between classA PBPs, hydrolases, osmotic pressure and D-aminoacids.
151
Chapter 9
More CRISPR exploration
9.1 Genetic regulation of the mreBCD operon
In chapter 5 and [133], we usedCRISPR to change the level of aGFP-MreB fusion. Whenthe concentration of MreB becomes lower, the cell diameter increases but the growthrate is not dramatically affected until very low levels. However, it quickly appearedthat the repression was not as strong as expected, hinting at the possibility of a negativefeedback onMreB’s expression. As themreB gene is part of an operon that also containsmreC and mreD, that would mean that the three proteins are affected by the feedbackloop.
At first, we sought to use fluorescence microscopy to measure the strength of the po-tential feedback, but to quantify the number of GFP proteins per generation, we wouldneed to find the total amount of GFP per cell. This is made difficult by the large changesin shape that the cells undergo, especially as the cells become spherical and thus a largerpart of it may escape the focal plane. Rather than using themicroscope, we used flow cy-tometry instead. In that case, the fluorescence signal is recorded by a photo-multiplier,without any focal plane, so we can make a less biased measurement of the total amountof GFP by integrating the area under the fluorescence peak.
This way, we confirmed the presence of a strong feedback loop on the level of GFP-MreB (figure 9.1), as the same CRISPR guides would produce a much weaker repressionon PmreB-gfp-mreBCD than on the constitutive P127-gfp. To investigate the origin andmechanism of this feedback, we performed the same experiment in a mutant lackingbolA. BolA was shown to regulate MreB’s expression [197], as well as other enzymesrelated to cell wall synthesis. In the absence of bolA, the strength of the feedback onMreB was attenuated, but not quite suppressed (figure 9.1, right). This suggests thatBolA is implicated in the negative feedback on MreB’s expression level. However, theexact genetic network is likely to be complex and tightly linked to cell wall synthesisand growth, as multiple cell wall carboxpeptidases (PBP5, PBP6) are also regulated byBolA [198], and their function is not well understood.
This experiment demonstrates that CRISPR knock-down can be used easily to dis-cover genetic regulations and to find genes that are responsible for such genetic control.
152
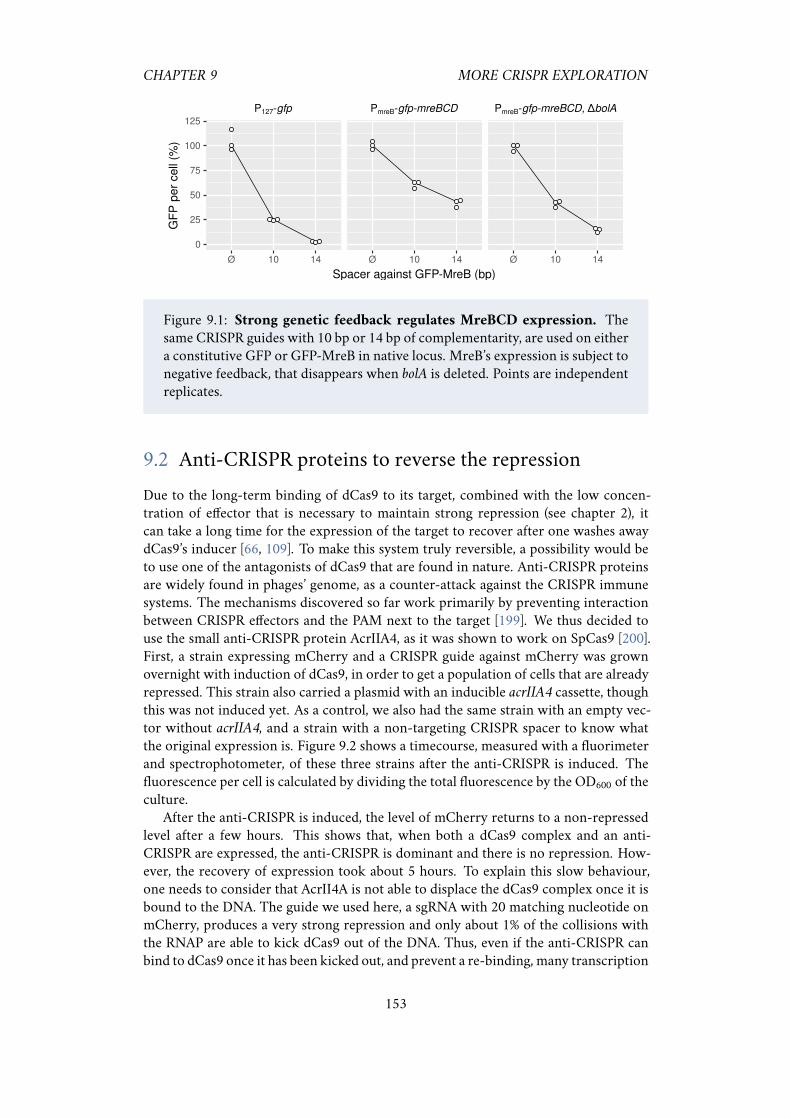
CHAPTER 9 MORE CRISPR EXPLORATION
10 14 10 14 10 14
0
25
50
75
100
125
Spacer against GFP-MreB (bp)
GF
P p
er
cell
(%)
Ø Ø Ø
P127-gfp PmreB-gfp-mreBCD PmreB-gfp-mreBCD, ΔbolA
Figure 9.1: Strong genetic feedback regulates MreBCD expression. Thesame CRISPR guides with 10 bp or 14 bp of complementarity, are used on eithera constitutive GFP or GFP-MreB in native locus. MreB’s expression is subject tonegative feedback, that disappears when bolA is deleted. Points are independentreplicates.
9.2 Anti-CRISPR proteins to reverse the repression
Due to the long-term binding of dCas9 to its target, combined with the low concen-tration of effector that is necessary to maintain strong repression (see chapter 2), itcan take a long time for the expression of the target to recover after one washes awaydCas9’s inducer [66, 109]. To make this system truly reversible, a possibility would beto use one of the antagonists of dCas9 that are found in nature. Anti-CRISPR proteinsare widely found in phages’ genome, as a counter-attack against the CRISPR immunesystems. The mechanisms discovered so far work primarily by preventing interactionbetween CRISPR effectors and the PAM next to the target [199]. We thus decided touse the small anti-CRISPR protein AcrIIA4, as it was shown to work on SpCas9 [200].First, a strain expressing mCherry and a CRISPR guide against mCherry was grownovernight with induction of dCas9, in order to get a population of cells that are alreadyrepressed. This strain also carried a plasmid with an inducible acrIIA4 cassette, thoughthis was not induced yet. As a control, we also had the same strain with an empty vec-tor without acrIIA4, and a strain with a non-targeting CRISPR spacer to know whatthe original expression is. Figure 9.2 shows a timecourse, measured with a fluorimeterand spectrophotometer, of these three strains after the anti-CRISPR is induced. Thefluorescence per cell is calculated by dividing the total fluorescence by the OD600 of theculture.
After the anti-CRISPR is induced, the level of mCherry returns to a non-repressedlevel after a few hours. This shows that, when both a dCas9 complex and an anti-CRISPR are expressed, the anti-CRISPR is dominant and there is no repression. How-ever, the recovery of expression took about 5 hours. To explain this slow behaviour,one needs to consider that AcrII4A is not able to displace the dCas9 complex once it isbound to the DNA. The guide we used here, a sgRNA with 20 matching nucleotide onmCherry, produces a very strong repression and only about 1% of the collisions withthe RNAP are able to kick dCas9 out of the DNA. Thus, even if the anti-CRISPR canbind to dCas9 once it has been kicked out, and prevent a re-binding, many transcription
153
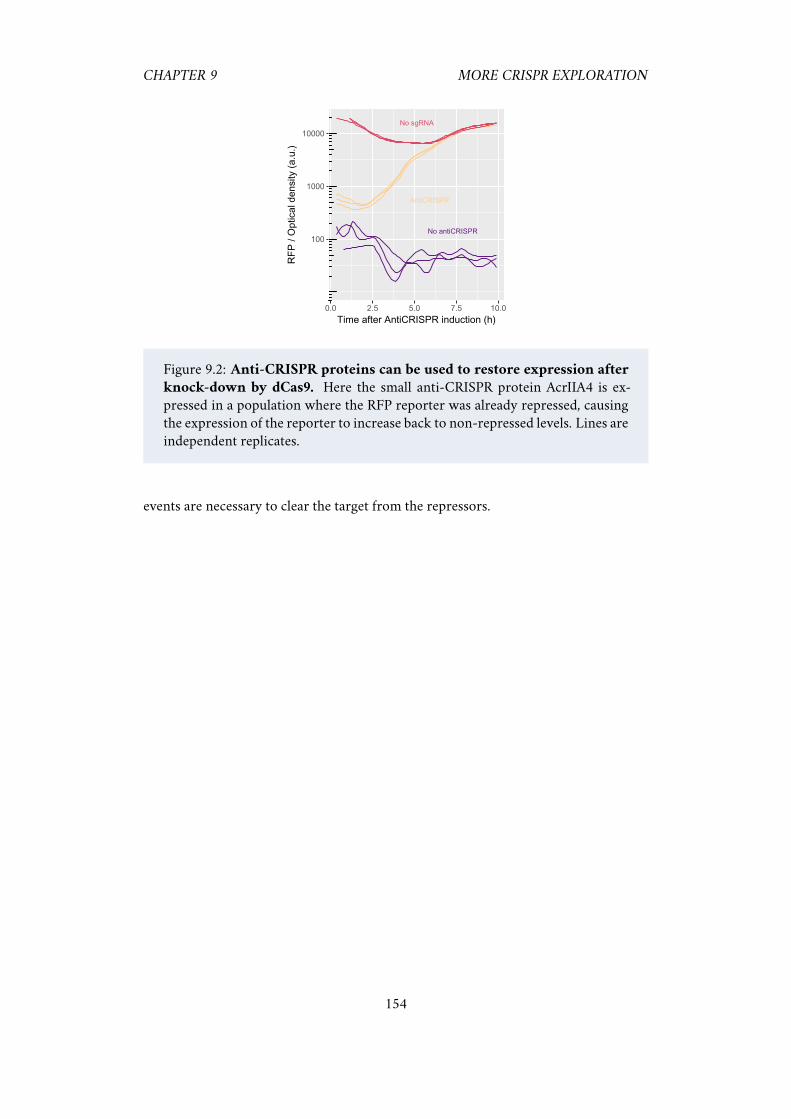
CHAPTER 9 MORE CRISPR EXPLORATION
No sgRNA
AntiCRISPR
No antiCRISPR100
1000
10000
0.0 2.5 5.0 7.5 10.0
Time after AntiCRISPR induction (h)
RF
P /
Opt
ical
den
sity
(a.
u.)
Figure 9.2: Anti-CRISPR proteins can be used to restore expression after
knock-down by dCas9. Here the small anti-CRISPR protein AcrIIA4 is ex-pressed in a population where the RFP reporter was already repressed, causingthe expression of the reporter to increase back to non-repressed levels. Lines areindependent replicates.
events are necessary to clear the target from the repressors.
154
Chapter 10
Discussion
10.1 Summary of the results
Bacteria exhibit a vast range of possible shapes, yet each species maintains its own shapewith a great precision. It is an important characteristic, that has been selected throughevolution and is passed on from generation to generation using specific instructionsfrom the genome. In the case of bacteria, the relationship between the DNA sequenceand the shape of the whole organism is very complex, as there is no construction planand no cell-wide cytoskeleton to use as a canvas. Rather, the shape information is spreadout within many enzymes that continuously construct and remodel the peptidoglycan.Together, these enzymes form a dynamical system with many essential parts. To under-stand what the different parts do, we constructed modified strains with various concen-trations of each components, and looked at the resulting organisms.
To gain control over the concentration of these enzymes, we used the ability ofCRISPR effectors to knock-down bacterial genes. The first part of this project was tocharacterize the properties andmechanismof thismethod on a toymodel that expressestwo fluorescent proteins. We showed that RNAP can transcribe targets even when theyare occupied by dCas9, by actively kicking dCas9 out with a probability that depends onguide/target complementarity. If dCas9 is saturating the target, the relative repressiondepends only of the passage probability of the polymerase (PPP), and is independent ofthe target gene’s transcription rate. If dCas9 is not saturating the target, relative repres-sion depends on promoter strength, and we developed a mathematical model to predictthe resulting expression level. Based on this model, we found interesting properties ofCRISPR knock-down that could be harnessed as a technology.
In particular, mismatched guides allow to repress the target without addition ofnoise. CRISPR knockdown can also be used to uncover and characterize genetic feed-back, as the change in protein level affects the transcription rate from the promoter.This situation turned out to be very frequent. We found a strong genetic feedback onPBP1B expression (chapter 5), that was, curiously, not found on PBP1A. The genes sspAand sspB, identified in the D-methionine CRISPR screen (chapter 7), could be involvedin this feedback, and future measurements on deletion strains will confirm or dismissthis hypothesis. MreBwas also found to be involved in a negative feedback loop (chapter9).
155
CHAPTER 10 DISCUSSION
Currently, the main limitation of CRISPR knock-down is that the relationship be-tween the guide’s sequence and the PPP is quite unpredictable. To address this issue,we designed an experiment to provide a clean data set of guide RNAs, target sequencesand associated PPPs, that will in future works be used to build predictive models of PPPfrom the target sequence information.
Armed with this tool, we perturbed the concentration of the different enzymes thatpolymerize the cell wall and play an important role in determining cell shape.
First, by repressing the mrdAB operon, we could show that below wild-type level,stochastic fluctuations of PBP2/RodA levels createdmorphological diversity in the pop-ulation. In an echo to this work, another laboratory showed that the stoichiometry ofPBP2 and RodA must be tightly regulated [44], hightlighting the advantage of acting ongenes in their native operon with a low-noise method.
We then used dCas9 to change the levels of the redundantly-essential cell wall poly-merases PBP1A and PBP1B. We estimated the minimum amount of PBP1A and PBP1Bfor survival to be around 20%. Below this level, the cultures lysed a few hours after in-duction. At all the other levels, the cells grew at the same speed as the wild-type and wedid not find a large variation of cell dimensions. Upon careful examination, the level ofPBP1AB is positively correlated with cell diameter, something that was also observedin B. subtilis [133], but the magnitude of the effect is much smaller. Overall, class A PBPshave an “all-or-nothing” behaviour.
Focusing on a strain called “14-20”, that expresses low amounts of PBP1A (20%) andPBP1B (30%), we found that it inserts as much peptidoglycan as the wild-type but hasdifferent mechanical properties: cell elasticity is increased and it is less resistant to os-motic shocks. This indicates that the repression of class A PBPs affects the cell notby reducing peptidoglycan polymerization, but by doing so in a structurally differentway. By looking at the 2D-diffusion of PBP1B, we found that the immobile fraction ofPBP1B increases or decreases depending of the total concentration, so that the numberof bound molecules is roughly constant. The lack of PBP1A also causes an increase inPBP1B bound fraction, showing that PBP1B’s mobility adapts to the need for cell wallinsertion. This change in diffusion dynamics is likely mediated by LpoB, as the deletionof LpoB greatly decreases the immobile fraction of PBP1B. Finally, by examining resis-tance and recovery to D-cycloserine treatment and to mDAP depeletion, we showedthat PBP1B was useful for maintaining cell wall integrity, thus making it more resistantto future stress, and also for repairing it after stress.
Within the cell, PBP1A and PBP1B have different sub-cellular localization. Bothtend to be enriched at the poles, but this pattern is stronger for PBP1B. When one ofthem is deleted, the localization of the other changes to compensate, showing that thelocalization patterns are related to the enzyme’s function. After an osmotic downshock,PBP1AB localization patterns are amplified and patches often appear on the sides of thecell. Polar localization is also magnified by high osmotic pressures. As a further demon-stration of the link between peptidoglycan state and PBP1AB localization, we showedthat an over-expression of the hydrolase MepS enhances the localization pattern. Inter-estingly, this happened even in the absence of outer-membrane activators, suggestingthat the localization is not due to LpoAB sensing the state of the peptidoglycan, butrather to a more indirect phenomenon, possibly involving periplasmic volume or mem-brane dynamics.
When PBP1A and PBP1B are low, cells become highly sensitive to D-methionine,even more so that a ∆PBP1B strain. It is likely that D-methionine impairs PBP1A’s ac-
156

CHAPTER 10 DISCUSSION
tivity, as our single-molecule tracking data suggests. We performed a series of genome-wide CRISPR screens to find which other processes are associated with D-methioninesensitivity and resistance, and found a link with the stringent starvation response andto the synthesis of periplasmic glucans.
Finally, in addition to the work presented in this thesis, I also contributed to otherprojects, for example by designing and constructing strains with tunable levels of vari-ous genes.
10.2 Status of the projects
Publications
Antoine Vigouroux, Enno Oldewurtel, Lun Cui, David Bikard, and Sven vanTeeffelen, Tuning dCas9’s ability to block transcription enables robust, noiselessknockdown of bacterial genes. Molecular Systems Biology, 14(3):e7899, March2018, ISSN-1744-4292. doi:10.15252/msb.20177899.
Lun Cui, Antoine Vigouroux, François Rousset, Hugo Varet, Varun Khanna& David Bikard, A CRISPRi screen in E. coli reveals sequence-specific toxicityof dCas9. Nature Communications, 9(1):1912, May 2018, ISSN 2041-1723. doi:10.1038/s41467-018-04209-5.
Michael Dion*, Mrinal Kapoor*, Yingjie Sun*, Sean Wilson, Joel Ryan, AntoineVigouroux, Sven van Teeffelen, Rudolf Oldenbourg, Ethan C Garner, Bacillussubtilis cell diameter is determined by the opposing actions of two distinct cellwall synthetic systems. Nature Microbiology, accepted, 2019.
Manuscripts
Antoine Vigouroux, Baptiste Cordier, Enno Oldewurtel, François Simon,Gizem Özbaykal, David Bikard & Sven van Teeffelen, Class A PBPs maintain cellwall homeostasis at an intermediate scale in diderm bacteria Submitted.
Eva Wollrab*, Gizem Özbaykal*, Antoine Vigouroux, Baptiste Cordier, Fran-cois Simon, Enno Oldewurtel, David Bikard, and Sven van Teeffelen, Binding ofthe major transpeptidase PBP2 determines localization of rod-complex forma-tion independently of cell-envelope curvature. Submitted.
Ongoing projects
The ppppredictor: designing CRISPR guides with defined polymerase passageprobability. Experimental part coming soon.
157
CHAPTER 10 DISCUSSION
Sub-cellular localization of class A PBPs changes in response to stress.Requires verification at wild-type levels of PBP1AB expression.
Interaction between D-aminoacids and cell wall synthesis.Still in exploration.
* Equal contribution.
10.3 Future work
Mistakes and dead ends
On the way to understand cell wall synthesis, there were many dead ends and artifacts,and there will continue to be. The extensive use of fusions with fluorescent tags is acommon source of artifacts in the field of microscopy-heavy molecular biology. Forabout ten years, it was believed that MreB formed a spiral cytoskeleton within B. sub-tillis’s cells, a structure that was in fact created artificially by the presence of the yellowfluorescent protein on the N-terminus of MreB. In my case, fusing mCherry and GFPto PBP1A and PBP1B caused a dramatic change in their expression levels. This wasunfortunate, given that the main goal of the fusions was to study the concentration ofthese enzymes. The fact that overexpression of PBP1AB did not produce any obviousphenotype, something that was not known at the time, helped this accidental overex-pression go unnoticed. In addition, it is likely that the difference of expression happensat the translational level, making it impossible to detect by quantitative PCR. We evenperformed absolute quantification of GFP-PBP1B, using GFP fluorescence and an anti-GFP antibody, without noticing the over-expression as all these measurements reliedonGFP.Onlymass spectrometry allowed us to compare directly the levels of the fusionsto the levels of the wild-type enzymes.
Another major impediment for this work was the Bad Seed Effect. While still unex-plained, we ended up finding a workaround and the CRISPRmethod could still be used,after a fewweeks of reconstructing every strain. Further work is currently being under-taken in the lab to identify the cause of the Bad Seed Effect. More generally, this kindof unpredictable problem is hard to avoid, aside from systematically testing every partseparately to find potential effects of allegedly innocuous vectors. Fortunately, this hap-pened in the context of fundamental research, and I hope nothing similar ever happensto the people using CRISPR to edit human embryos.
Technological improvements
Among the countless technologies that are flourishing in the field of molecular biology,a few seem particularly promising, especially when they allow to have more confidencein experimental results.
The rise of large-scale proteomics, and their increasing accessibility, will be benefi-cial for all studies concerned about gene expression levels. Data-Independent Acquisi-tion (DIA), as we used in chapter 5, allows to quantify proteins without any label. Thus,it is one of the best tools to check the level of protein fusions. It also does not requireantibodies specific to the protein of interest, although specific fragmentation peptides
158
CHAPTER 10 DISCUSSION
are necessary for absolute quantification. Moreover, it directly measures the amount ofprotein, so translational effects can be accounted for. This is not the case with quanti-tative PCR or RNA-sequencing, for example, as they only count the number of mRNAtranscripts. As it is proteome-wide, we can also monitor changes in the expression lev-els of other genes in the cell, which may be a way to explain puzzling results that wouldbe confusing otherwise.
When preparing strains for molecular biology, we usually sequence only some partsof the plasmids we construct, typically the insert, by Sanger sequencing. In addition,strain construction often requires to grow the cells over multiple nights, making mu-tations inevitable. As high-throughput sequencing becomes more widely available, re-searchers should be able to check the full genome of their working strains more oftenand avoid many non-reproducible results.
The use of fluorescent fusions for single-molecule tracking opens the way for moredirect measurements of the dynamics of cell-wall synthesis. As new tags and dyes arebeing developed, a lot ofwork is still required tomake sure they give the expected resultsin bacteria. For example, a tag that binds a fluorescent molecule with a fast turnovercan be used to circumvent the problem of photo-bleaching [201]. To bypass the needfor fusions, an interesting perspective can be found in genetically recoded organisms[202, 203]. In the genome of these organisms, all TAG stop codons have been replaced byTAA, and the release factor RF1 is deleted. This turns the TAG stop codon into a regularcodon that can code for an aminoacid as long as a corresponding tRNA is provided.This way, it is possible to incorporate unnatural aminoacids in proteins, and possiblyfluorescent dyes. This should minimize the effect of the tagging on protein’s functionand localization and hopefully help to avoid artifacts.
Another rapidly improving technology is electron microscopy, as well as atomic-force microscopy (AFM) [204]. As these methods achieve better resolution, they shouldallow to analyse the state of the bacterial cell wall in more detail and distinguish struc-tural features that cannot be seen by optical microscopy. For instance, AFM has alreadybeen used to see individual glycan strands from the peptidoglycan of E. coli [169]. Thisinformation will be valuable to understand whether the pre-existing features of the cellwall, such as the glycan strands that are already present, play a role in determiningwherethe polymerases are going to insert new material. It is possible, for example, that themotion of MreB filaments is in part influenced by the position and orientation of theprevious generation of glycan strands. As it allows to see the structure of peptidoglycanat an intermediate scale between the molecular level and the global cell shape, AFM,could help knowing why a strain with a low level of PBP1A and PBP1B is more elasticthan normal, despite having the same amount of peptidoglycan (chapter 5).
Next steps
More research will be required to clarify some points that remain unclear in this work.The CRISPR-based method to control the levels of genes still has room for improve-
ment, in particular regarding the predictability of repression. When succesfully syn-thesized, the “ppppredictor” CRISPR library should allow to understand better the se-quence determinants of repression, to identify potential off-target binding sites and todesign tailored CRISPR guides to get a range of repression on new targets, without theneed for fusions. This big dataset should require a large amount of bio-informatics toexploit it as much as possible. In the best case, the model could bring valuable informa-tion on the mechanism of R-loop extension and RNAP/dCas9 collisions.
159
CHAPTER 10 DISCUSSION
Our experiments on the role of PBP1AB in cell wall synthesis brought new informa-tion and allowed to exclude some previous hypothesis, but they also revealed that thismachinery has many interacting parts. In particular, we observedmany unexplained re-lationships between the class A PBPs, the hydrolase MepS, D-aminoacids, osmotic pres-sure and the subcellular organization of membrane proteins. All these elements appearto be connected, and step by step progress on the characterization of each part shouldhopefully allow to solve this puzzle. Another interesting point is whether PBP1AB canrepair damage in the peptidoglycanwithout relying on new cell wall synthesis, meaningthat they can bring together material that is already in the cell wall without the need fornew precursors. One way to address this question would be to deplete cell wall pre-cursors using D-cycloserine, then measure cell wall elasticity as a proxy for repair. Asmany time-sensitive parameters need to be adjusted, this kind of experiment is difficultto perform. It is likely that in vitro studies will be necessary before this question can besolved in vivo. It would also be interesting to look at the TPase and TGase activities ofPBP1AB separately, by using site-specific mutants.
Another research direction is to investigate the apparition of blebs on the sides ofthe cell in response to D-cycloserine or D-methionine or to PBP1AB depletion. Wepreviously sought to know whether PBP1AB would localize at the spots where theseblebs appear, but this is difficult to do as blebs can be anywhere around the cell, notnecessarily in the focal plane, so 3D-imaging has to be used. Moreover, the fact thatpatches of PBP1AB still appear in the absence of LpoA or LpoB makes this hypothesisless attractive.
Finally, a mutant of PBP1B, PBP1B(E313D), was reported to insert cell wall with-out the need for activation by LpoB [205]. We previously attempted to work with thismutant, including a sfGFP-PBP1B(E313D) fusion, as it could provide insight on the dif-ferences between E. coli and B. subtilis control of diameter. However, our preliminarywork involved strainswith numerous chromosomalmodifications andmany scars fromgenome editing. As these strains gave very variable results, this part of the project wasset aside. Making a new, simpler strain would be useful to study the importance ofLpoB as a sensing mechanism, and to know the effects of processive cell-wall insertionon PBP1B(E313D)’s diffusion. Now that we knowmore about this protein, a new set ofexperiments involving the mutant could be undertaken. By changing the level of thismutant, we could see if its concentration has a larger effect on cell morphology thanwild-type PBP1B, maybe more similar to what is seen in B. subtilis [133]. It would alsobe possible to look at the mechanical properties of the cell with such a mutant, to knowwhether the lack of sensing by LpoB leads to a cell wall of lower quality and thus toless mechanical resistance. As a caveat, it is not clear whether the rate of peptidogly-can insertion by this mutant is identifical to the wild-type protein. In particular, as theneed for activation by LpoB no longer limits insertion, the E313D mutant may insertmuch more peptidoglycan than the wild-type. In addition, LpoB may still be able toincrease the activity of the mutant, so it is preferable to work in a strain lacking LpoB.Finally, by using a fluorescent fusion to this hyper-active mutant, we could performsingle-molecule tracking to know if it immobilizes, and which factors this depends on.
The project to understand PBP1AB’s subcellular localization is still in an early phase.With the revelation that the strains used in these experiment are over-expressing classA PBPs, the biological significance of our previous results is to be examined. When ex-pressing a high level of a fusion protein, it is possible that its localization is altered andthat excess proteins form aggregation bodies. While some of the results seem indepen-
160
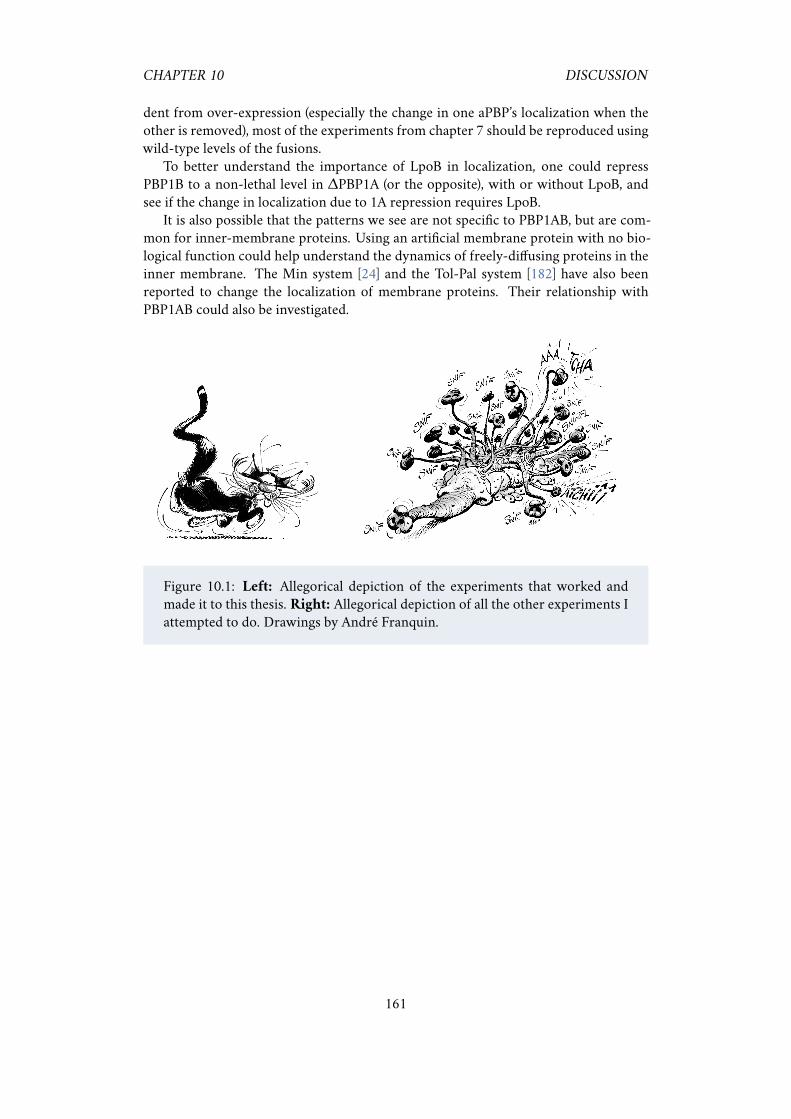
CHAPTER 10 DISCUSSION
dent from over-expression (especially the change in one aPBP’s localization when theother is removed), most of the experiments from chapter 7 should be reproduced usingwild-type levels of the fusions.
To better understand the importance of LpoB in localization, one could repressPBP1B to a non-lethal level in ∆PBP1A (or the opposite), with or without LpoB, andsee if the change in localization due to 1A repression requires LpoB.
It is also possible that the patterns we see are not specific to PBP1AB, but are com-mon for inner-membrane proteins. Using an artificial membrane protein with no bio-logical function could help understand the dynamics of freely-diffusing proteins in theinner membrane. The Min system [24] and the Tol-Pal system [182] have also beenreported to change the localization of membrane proteins. Their relationship withPBP1AB could also be investigated.
Figure 10.1: Left: Allegorical depiction of the experiments that worked andmade it to this thesis. Right: Allegorical depiction of all the other experiments Iattempted to do. Drawings by André Franquin.
161

Bibliography
[1] E. B. Lewis. A gene complex controlling segmentation in Drosophila. Nature,276(5688):565, December 1978. ISSN 1476-4687. doi: 10.1038/276565a0. URLhttps://www.nature.com/articles/276565a0.
[2] RonMilo & Ron Philips. » How big is the “average” protein? URL http://book.bionumbers.org/how-big-is-the-average-protein/.
[3] Waldemar Vollmer and Stephen J. Seligman. Architecture of peptidoglycan: moredata and more models. Trends in Microbiology, 18(2):59–66, February 2010. ISSN0966-842X. doi: 10.1016/j.tim.2009.12.004. URL http://www.sciencedirect.com/science/article/pii/S0966842X09002601.
[4] M.-T. Sung, Y.-T. Lai, C.-Y. Huang, L.-Y. Chou, H.-W. Shih, W.-C. Cheng, C.-H.Wong, and C. Ma. Crystal structure of the membrane-bound bifunctional trans-glycosylase PBP1b from Escherichia coli. Proceedings of the National Academyof Sciences, 106(22):8824–8829, June 2009. ISSN 0027-8424, 1091-6490. doi:10.1073/pnas.0904030106. URL http://www.pnas.org/cgi/doi/10.1073/pnas.0904030106.
[5] Geoffrey M. Cooper. Structure and Organization of Actin Filaments. The Cell: AMolecular Approach. 2nd edition, 2000. URL https://www.ncbi.nlm.nih.gov/books/NBK9908/.
[6] Kohei Koyama, Ken Yamamoto, and Masayuki Ushio. A lognormal distributionof the lengths of terminal twigs on self-similar branches of elm trees. Proceedings.Biological Sciences, 284(1846), 2017. ISSN 1471-2954. doi: 10.1098/rspb.2016.2395.
[7] Geoffrey B. West, James H. Brown, and Brian J. Enquist. The Fourth Dimen-sion of Life: Fractal Geometry and Allometric Scaling of Organisms. Science,284(5420):1677–1679, June 1999. ISSN 0036-8075, 1095-9203. doi: 10.1126/science.284.5420.1677. URL http://science.sciencemag.org/content/284/5420/1677.
[8] Richard S. Smith, Soazig Guyomarc’h, Therese Mandel, Didier Reinhardt, CrisKuhlemeier, and Przemyslaw Prusinkiewicz. A plausible model of phyllotaxis.Proceedings of the National Academy of Sciences of the United States of America, 103(5):1301–1306, January 2006. ISSN 0027-8424. doi: 10.1073/pnas.0510457103.
162
CHAPTER 10 BIBLIOGRAPHY
[9] Tyler M. Reese, Antoni Brzoska, Dylan T. Yott, and Daniel J. Kelleher. Analyzingself-similar and fractal properties of the C. elegans neural network. PloS One, 7(10):e40483, 2012. ISSN 1932-6203. doi: 10.1371/journal.pone.0040483.
[10] ToheyMatsuyama andMitsuguMatsushita. FractalMorphogenesis by a BacterialCell Population. Critical Reviews in Microbiology, 19(2):117–135, January 1993.ISSN 1040-841X. doi: 10.3109/10408419309113526. URL https://doi.org/10.3109/10408419309113526.
[11] Eugene Presnov, Valeria Isaeva, and Nikolay Kasyanov. Topological determina-tion of early morphogenesis in Metazoa. Theory in Biosciences, 129(4):259–270,December 2010. ISSN 1611-7530. doi: 10.1007/s12064-010-0103-y. URLhttps://doi.org/10.1007/s12064-010-0103-y.
[12] F. W. Cummings. A model of morphogenetic pattern formation. Journal of The-oretical Biology, 144(4):547–566, June 1990. ISSN 0022-5193. doi: 10.1016/S0022-5193(05)80089-X. URL http://www.sciencedirect.com/science/article/pii/S002251930580089X.
[13] Yuting Zhao, Jianglan Liu, Changsong Yang, Benjamin R. Capraro, Tobias Baum-gart, Ryan P. Bradley, N. Ramakrishnan, Xiaowei Xu, Ravi Radhakrishnan,Tatyana Svitkina, and Wei Guo. Exo70 Generates Membrane Curvature forMorphogenesis and Cell Migration. Developmental Cell, 26(3):266–278, August2013. ISSN 1534-5807. doi: 10.1016/j.devcel.2013.07.007. URL http://www.sciencedirect.com/science/article/pii/S1534580713004152.
[14] Patrick Müller, Katherine W. Rogers, Ben M. Jordan, Joon S. Lee, Drew Robson,Sharad Ramanathan, and Alexander F. Schier. Differential Diffusivity of Nodaland Lefty Underlies a Reaction-Diffusion Patterning System. Science, 336(6082):721–724, May 2012. ISSN 0036-8075, 1095-9203. doi: 10.1126/science.1221920.URL http://science.sciencemag.org/content/336/6082/721.
[15] Rolando Rivera-Pomar and Herbert Jãckle. From gradients to stripes inDrosophila embryogenesis: filling in the gaps. Trends in Genetics, 12(11):478–483, November 1996. ISSN 0168-9525. doi: 10.1016/0168-9525(96)10044-5. URL http://www.sciencedirect.com/science/article/pii/0168952596100445.
[16] Martin J .Cohn and Cheryll Tickle. Developmental basis of limblessness and axialpatterning in snakes. Nature, 399(6735):474–479, June 1999. ISSN 1476-4687.doi: 10.1038/20944. URL https://www.nature.com/articles/20944.
[17] Satoshi Toda, Lucas R. Blauch, Sindy K. Y. Tang, LeonardoMorsut, andWendell A.Lim. Programming self-organizing multicellular structures with synthetic cell-cell signaling. Science, page eaat0271,May 2018. ISSN0036-8075, 1095-9203. doi:10.1126/science.aat0271. URL http://science.sciencemag.org/content/early/2018/05/30/science.aat0271.
[18] Larissa B. Patterson, Emily J. Bain, and David M. Parichy. Pigment cell interac-tions and differential xanthophore recruitment underlying zebrafish stripe reit-eration and Danio pattern evolution. Nature Communications, 5:5299, November2014. doi: 10.1038/ncomms6299. URL https://www.nature.com/articles/ncomms6299.
163
CHAPTER 10 BIBLIOGRAPHY
[19] Volkening Alexandria and Sandstede Björn. Modelling stripe formation in ze-brafish: an agent-based approach. Journal of The Royal Society Interface, 12(112):20150812, November 2015. doi: 10.1098/rsif.2015.0812. URL https://royalsocietypublishing.org/doi/10.1098/rsif.2015.0812.
[20] Martin Loose, Elisabeth Fischer-Friedrich, Jonas Ries, Karsten Kruse, and PetraSchwille. Spatial Regulators for Bacterial Cell Division Self-Organize into SurfaceWaves in Vitro. Science, 320(5877):789–792, May 2008. ISSN 0036-8075, 1095-9203. doi: 10.1126/science.1154413. URL http://science.sciencemag.org/content/320/5877/789.
[21] Martin Loose, Elisabeth Fischer-Friedrich, Christoph Herold, Karsten Kruse, andPetra Schwille. Min protein patterns emerge from rapid rebinding andmembraneinteraction of MinE. Nature Structural & Molecular Biology, 18(5):577–583, May2011. ISSN 1545-9985. doi: 10.1038/nsmb.2037. URL https://www.nature.com/articles/nsmb.2037.
[22] Dominik Thalmeier, Jacob Halatek, and Erwin Frey. Geometry-induced proteinpattern formation. Proceedings of the National Academy of Sciences of the UnitedStates of America, 113(3):548–553, January 2016. ISSN 1091-6490. doi: 10.1073/pnas.1515191113.
[23] Jakob Schweizer, Martin Loose, Mike Bonny, Karsten Kruse, Ingolf Mönch, andPetra Schwille. Geometry sensing by self-organized protein patterns. Pro-ceedings of the National Academy of Sciences, 109(38):15283–15288, September2012. ISSN 0027-8424, 1091-6490. doi: 10.1073/pnas.1206953109. URLhttps://www.pnas.org/content/109/38/15283.
[24] Beatrice Ramm, Philipp Glock, Jonas Mücksch, Philipp Blumhardt, Daniela A.García-Soriano, Michael Heymann, and Petra Schwille. The MinDE system isa generic spatial cue for membrane protein distribution in vitro. Nature Commu-nications, 9(1):3942, 2018. ISSN 2041-1723. doi: 10.1038/s41467-018-06310-1.
[25] David T. Kysela, Amelia M. Randich, Paul D. Caccamo, and Yves V. Brun. Di-versity Takes Shape: Understanding the Mechanistic and Adaptive Basis of Bac-terial Morphology. PLOS Biology, 14(10):e1002565, October 2016. ISSN 1545-7885. doi: 10.1371/journal.pbio.1002565. URL https://journals.plos.org/plosbiology/article?id=10.1371/journal.pbio.1002565.
[26] Amelia M. Randich and Yves V. Brun. Molecular mechanisms for the evolu-tion of bacterial morphologies and growth modes. Frontiers in Microbiology, 6,2015. ISSN 1664-302X. doi: 10.3389/fmicb.2015.00580. URL https://www.frontiersin.org/articles/10.3389/fmicb.2015.00580/full.
[27] Richard A. Daniel and Jeff Errington. Control of Cell Morphogenesis in Bacte-ria: Two Distinct Ways to Make a Rod-Shaped Cell. Cell, 113(6):767–776, June2003. ISSN 0092-8674. doi: 10.1016/S0092-8674(03)00421-5. URL http://www.sciencedirect.com/science/article/pii/S0092867403004215.
[28] Kevin D. Young. The Selective Value of Bacterial Shape. Microbiology andMolecular Biology Reviews, 70(3):660–703, September 2006. ISSN 1092-2172.doi: 10.1128/MMBR.00001-06. URL https://www.ncbi.nlm.nih.gov/pmc/articles/PMC1594593/.
164
CHAPTER 10 BIBLIOGRAPHY
[29] Chao Jiang, Paul D. Caccamo, and Yves V. Brun. Mechanisms of bacterialmorphogenesis: Evolutionary cell biology approaches provide new insights.BioEssays, 37(4):413–425, April 2015. ISSN 0265-9247. doi: 10.1002/bies.201400098. URL https://onlinelibrary.wiley.com/doi/full/10.1002/bies.201400098.
[30] Dennis J. Horvath, Birong Li, Travis Casper, Santiago Partida-Sanchez, David A.Hunstad, Scott J. Hultgren, and Sheryl S. Justice. Morphological plasticity pro-motes resistance to phagocyte killing of uropathogenic Escherichia coli. Microbesand Infection, 13(5):426–437, May 2011. ISSN 1769-714X. doi: 10.1016/j.micinf.2010.12.004.
[31] Leigh K. Harris and Julie A. Theriot. Relative Rates of Surface and Volume Syn-thesis Set Bacterial Cell Size. Cell, 165(6):1479–1492, June 2016. ISSN 1097-4172.doi: 10.1016/j.cell.2016.05.045.
[32] Michaela E Sharpe, Philippe M Hauser, Robert G Sharpe, and Jeffery Errington.Bacillus subtilis Cell Cycle as Studied by FluorescenceMicroscopy: Constancy ofCell Length at Initiation of DNA Replication and Evidence for Active NucleoidPartitioning. J. BACTERIOL., 180:9, 1998.
[33] Robert D. Turner, Alexander F. Hurd, Ashley Cadby, Jamie K. Hobbs, and Si-mon J. Foster. Cell wall elongation mode in Gram-negative bacteria is deter-mined by peptidoglycan architecture. Nature Communications, 4(1), December2013. ISSN 2041-1723. doi: 10.1038/ncomms2503. URL http://www.nature.com/articles/ncomms2503.
[34] Waldemar Vollmer, Didier Blanot, and Miguel A. De Pedro. Peptidoglycanstructure and architecture. FEMS Microbiology Reviews, 32(2):149–167, March2008. ISSN 0168-6445. doi: 10.1111/j.1574-6976.2007.00094.x. URL https://academic.oup.com/femsre/article/32/2/149/2683904.
[35] V. Braun and H. Wolff. Attachment of lipoprotein to murein (peptidoglycan) ofEscherichia coli in the presence and absence of penicillin FL 1060. Journal ofBacteriology, 123(3):888–897, September 1975. ISSN 0021-9193.
[36] Lu Gan, Songye Chen, and Grant J. Jensen. Molecular organization of Gram-negative peptidoglycan. Proceedings of the National Academy of Sciences, 105(48):18953–18957, December 2008. ISSN 0027-8424, 1091-6490. doi: 10.1073/pnas.0808035105. URL https://www.pnas.org/content/105/48/18953.
[37] E. F. Bi and J. Lutkenhaus. FtsZ ring structure associated with division in Es-cherichia coli. Nature, 354(6349):161–164, November 1991. ISSN 0028-0836.doi: 10.1038/354161a0.
[38] H. P. Erickson. FtsZ, a prokaryotic homolog of tubulin? Cell, 80(3):367–370,February 1995. ISSN 0092-8674.
[39] F. van den Ent, L. A. Amos, and J. Löwe. Prokaryotic origin of the actin cy-toskeleton. Nature, 413(6851):39–44, September 2001. ISSN 0028-0836. doi:10.1038/35092500.
165
CHAPTER 10 BIBLIOGRAPHY
[40] Laura J. F. Jones, Rut Carballido-López, and Jeffery Errington. Control of CellShape in Bacteria: Helical, Actin-like Filaments in Bacillus subtilis. Cell, 104(6):913–922, March 2001. ISSN 0092-8674. doi: 10.1016/S0092-8674(01)00287-2. URL http://www.sciencedirect.com/science/article/pii/S0092867401002872.
[41] Matthew T. Swulius and Grant J. Jensen. The helical MreB cytoskeleton in Es-cherichia coli MC1000/pLE7 is an artifact of the N-Terminal yellow fluorescentprotein tag. Journal of Bacteriology, 194(23):6382–6386, December 2012. ISSN1098-5530. doi: 10.1128/JB.00505-12.
[42] Nikolay Ouzounov, Jeffrey P. Nguyen, Benjamin P. Bratton, David Jacobowitz,Zemer Gitai, and Joshua W. Shaevitz. MreB Orientation Correlates with CellDiameter in Escherichia coli. Biophysical Journal, 111(5):1035–1043, Septem-ber 2016. ISSN 0006-3495. doi: 10.1016/j.bpj.2016.07.017. URL http://www.sciencedirect.com/science/article/pii/S000634951630580X.
[43] Cyrille Billaudeau, Arnaud Chastanet, Zhizhong Yao, Charlène Cornilleau, Nico-las Mirouze, Vincent Fromion, and Rut Carballido-López. Contrasting mecha-nisms of growth in two model rod-shaped bacteria. Nature Communications, 8:15370, 2017. ISSN 2041-1723. doi: 10.1038/ncomms15370.
[44] Patricia D. A. Rohs, Jackson Buss, Sue I. Sim, Georgia R. Squyres, VeerasakSrisuknimit, Mandy Smith, Hongbaek Cho, Megan Sjodt, Andrew C. Kruse,Ethan C. Garner, SuzanneWalker, Daniel E. Kahne, and Thomas G. Bernhardt. Acentral role for PBP2 in the activation of peptidoglycan polymerization by the bac-terial cell elongation machinery. PLOS Genetics, 14(10):e1007726, October 2018.ISSN 1553-7404. doi: 10.1371/journal.pgen.1007726. URL https://journals.plos.org/plosgenetics/article?id=10.1371/journal.pgen.1007726.
[45] Lam T. Nguyen, James C. Gumbart, Morgan Beeby, and Grant J. Jensen. Coarse-grained simulations of bacterial cell wall growth reveal that local coordinationalone can be sufficient to maintain rod shape. Proceedings of the National Academyof Sciences, 112(28):E3689–E3698, July 2015. ISSN 0027-8424, 1091-6490. doi:10.1073/pnas.1504281112. URL https://www.pnas.org/content/112/28/E3689.
[46] Shoji Takeuchi, WillowR. DiLuzio, Douglas B.Weibel, andGeorgeM.Whitesides.Controlling the Shape of Filamentous Cells of Escherichia Coli. Nano letters, 5(9):1819–1823, September 2005. ISSN 1530-6984. doi: 10.1021/nl0507360. URLhttps://www.ncbi.nlm.nih.gov/pmc/articles/PMC2519610/.
[47] Ariel Amir, Farinaz Babaeipour, Dustin B. McIntosh, David R. Nelson, and Suck-joon Jun. Bending forces plastically deform growing bacterial cell walls. Proceed-ings of the National Academy of Sciences, 111(16):5778–5783, April 2014. ISSN0027-8424, 1091-6490. doi: 10.1073/pnas.1317497111. URL http://www.pnas.org/content/111/16/5778.
[48] Tristan S. Ursell, Jeffrey Nguyen, Russell D. Monds, Alexandre Colavin, GabrielBillings, Nikolay Ouzounov, Zemer Gitai, JoshuaW. Shaevitz, and Kerwyn CaseyHuang. Rod-like bacterial shape ismaintained by feedback between cell curvature
166
CHAPTER 10 BIBLIOGRAPHY
and cytoskeletal localization. Proceedings of the National Academy of Sciences, 111(11):E1025–E1034, March 2014. ISSN 0027-8424, 1091-6490. doi: 10.1073/pnas.1317174111. URL https://www.pnas.org/content/111/11/E1025.
[49] Sven van Teeffelen, Siyuan Wang, Leon Furchtgott, Kerwyn Casey Huang, Ned S.Wingreen, JoshuaW. Shaevitz, and Zemer Gitai. The bacterial actinMreB rotates,and rotation depends on cell-wall assembly. Proceedings of the National Academyof Sciences, 108(38):15822–15827, September 2011. ISSN 0027-8424, 1091-6490.doi: 10.1073/pnas.1108999108. URL https://www.pnas.org/content/108/38/15822.
[50] Ethan C. Garner, Remi Bernard, Wenqin Wang, Xiaowei Zhuang, David Z. Rud-ner, and TimMitchison. Coupled, Circumferential Motions of the Cell Wall Syn-thesis Machinery and MreB Filaments in B. subtilis. Science, 333(6039):222–225,July 2011. ISSN 0036-8075, 1095-9203. doi: 10.1126/science.1203285. URLhttp://science.sciencemag.org/content/333/6039/222.
[51] Felix Wong, Lars D. Renner, Gizem Özbaykal, Jayson Paulose, Douglas B. Weibel,Sven van Teeffelen, and Ariel Amir. Mechanical strain sensing implicated in cellshape recovery in Escherichia coli. Nature Microbiology, 2(9):17115, September2017. ISSN 2058-5276. doi: 10.1038/nmicrobiol.2017.115. URL https://www.nature.com/articles/nmicrobiol2017115.
[52] Saman Hussain, Carl N. Wivagg, Piotr Szwedziak, Felix Wong, Kaitlin Schae-fer, Thierry Izoré, Lars D. Renner, Matthew J. Holmes, Yingjie Sun, Alexan-dre W. Bisson-Filho, Suzanne Walker, Ariel Amir, Jan Löwe, and Ethan C. Gar-ner. MreB filaments align along greatest principal membrane curvature to ori-ent cell wall synthesis. eLife, 7:e32471, February 2018. ISSN 2050-084X. doi:10.7554/eLife.32471. URL https://elifesciences.org/articles/32471.
[53] Athanasios Typas, Manuel Banzhaf, Bart van den Berg van Saparoea, JolandaVerheul, Jacob Biboy, Robert J. Nichols, Matylda Zietek, Katrin Beilharz, KaiKannenberg, Moritz von Rechenberg, Eefjan Breukink, Tanneke den Blaauwen,Carol A. Gross, and Waldemar Vollmer. Regulation of Peptidoglycan Synthesisby Outer-Membrane Proteins. Cell, 143(7):1097–1109, December 2010. ISSN0092-8674. doi: 10.1016/j.cell.2010.11.038. URL http://www.sciencedirect.com/science/article/pii/S0092867410013607.
[54] David Bikard, Wenyan Jiang, Poulami Samai, Ann Hochschild, Feng Zhang,and Luciano A. Marraffini. Programmable repression and activation of bacte-rial gene expression using an engineered CRISPR-Cas system. Nucleic AcidsResearch, 41(15):7429–7437, August 2013. ISSN 0305-1048. doi: 10.1093/nar/gkt520. URL https://academic.oup.com/nar/article/41/15/7429/2411254/Programmable-repression-and-activation-of.
[55] Leeat Keren, Jean Hausser, Maya Lotan-Pompan, Ilya Vainberg Slutskin, HadasAlisar, Sivan Kaminski, Adina Weinberger, Uri Alon, Ron Milo, and Eran Se-gal. Massively Parallel Interrogation of the Effects of Gene Expression Levelson Fitness. Cell, 166(5):1282–1294.e18, August 2016. ISSN 0092-8674. doi:10.1016/j.cell.2016.07.024. URL http://www.sciencedirect.com/science/article/pii/S009286741630931X.
167
CHAPTER 10 BIBLIOGRAPHY
[56] Yolanda Schaerli, Alba Jiménez, José M. Duarte, Ljiljana Mihajlovic, Julien Reng-gli, Mark Isalan, James Sharpe, and Andreas Wagner. Synthetic circuits revealhow mechanisms of gene regulatory networks constrain evolution. MolecularSystems Biology, 14(9):e8102, September 2018. ISSN 1744-4292, 1744-4292. doi:10.15252/msb.20178102. URL http://msb.embopress.org/content/14/9/e8102.
[57] Daniel L. Jones, Robert C. Brewster, and Rob Phillips. Promoter architecture dic-tates cell-to-cell variability in gene expression. Science (NewYork, N.Y.), 346(6216):1533–1536, December 2014. ISSN 1095-9203. doi: 10.1126/science.1255301.
[58] LuiseWolf, Olin K Silander, and Erik vanNimwegen. Expression noise facilitatesthe evolution of gene regulation. eLife, 4:e05856, June 2015. ISSN2050-084X. doi:10.7554/eLife.05856. URL https://doi.org/10.7554/eLife.05856.
[59] Mark Mimee, Phillip Nadeau, Alison Hayward, Sean Carim, Sarah Flanagan, Lo-gan Jerger, Joy Collins, Shane McDonnell, Richard Swartwout, Robert J. Citorik,Vladimir Bulović, Robert Langer, Giovanni Traverso, Anantha P. Chandrakasan,and Timothy K. Lu. An ingestible bacterial-electronic system to monitor gas-trointestinal health. Science, 360(6391):915–918, May 2018. ISSN 0036-8075,1095-9203. doi: 10.1126/science.aas9315. URL http://science.sciencemag.org/content/360/6391/915.
[60] Mark Mimee, Alex C. Tucker, Christopher A. Voigt, and Timothy K. Lu. Pro-gramming a Human Commensal Bacterium, Bacteroides thetaiotaomicron, toSense and Respond to Stimuli in the Murine Gut Microbiota. Cell systems, 1(1):62–71, July 2015. ISSN 2405-4712. doi: 10.1016/j.cels.2015.06.001. URLhttps://www.ncbi.nlm.nih.gov/pmc/articles/PMC4762051/.
[61] George L. Sen and Helen M. Blau. A brief history of RNAi: the silence of thegenes. The FASEB Journal, 20(9):1293–1299, July 2006. ISSN 0892-6638. doi:10.1096/fj.06-6014rev. URL https://www.fasebj.org/doi/abs/10.1096/fj.06-6014rev.
[62] Y. Ji, B. Zhang, S. F. Van, null Horn, P. Warren, G. Woodnutt, M. K. Burnham, andM. Rosenberg. Identification of critical staphylococcal genes using conditionalphenotypes generated by antisense RNA. Science (New York, N.Y.), 293(5538):2266–2269, September 2001. ISSN 0036-8075. doi: 10.1126/science.1063566.
[63] R. Allyn Forsyth, Robert J. Haselbeck, Kari L. Ohlsen, Robert T. Yamamoto,Howard Xu, John D. Trawick, Daniel Wall, Liangsu Wang, Vickie Brown-Driver,Jamie M. Froelich, Kedar G. C, Paula King, Melissa McCarthy, Cheryl Malone,Brian Misiner, David Robbins, Zehui Tan, Zhan-yang Zhu Zy, Grant Carr, Deb-orah A. Mosca, Carlos Zamudio, J. Gordon Foulkes, and Judith W. Zyskind. Agenome-wide strategy for the identification of essential genes in Staphylococcusaureus. Molecular Microbiology, 43(6):1387–1400, March 2002. ISSN 0950-382X.
[64] Nobutaka Nakashima, Tomohiro Tamura, and Liam Good. Paired termini stabi-lize antisense RNAs and enhance conditional gene silencing in Escherichia coli.Nucleic Acids Research, 34(20):e138, 2006. ISSN 1362-4962. doi: 10.1093/nar/gkl697.
168
CHAPTER 10 BIBLIOGRAPHY
[65] Wenyan Jiang, David Bikard, David Cox, Feng Zhang, and Luciano A. Marraffini.RNA-guided editing of bacterial genomes using CRISPR-Cas systems. NatureBiotechnology, 31(3):233, March 2013. ISSN 1546-1696. doi: 10.1038/nbt.2508.URL https://www.nature.com/articles/nbt.2508.
[66] Lei S. Qi, Matthew H. Larson, Luke A. Gilbert, Jennifer A. Doudna, Jonathan S.Weissman, Adam P. Arkin, and Wendell A. Lim. Repurposing CRISPR asan RNA-Guided Platform for Sequence-Specific Control of Gene Expression.Cell, 152(5):1173–1183, February 2013. ISSN 0092-8674. doi: 10.1016/j.cell.2013.02.022. URL http://www.sciencedirect.com/science/article/pii/S0092867413002110.
[67] N. Nakashima and T. Tamura. Gene silencing in Escherichia coli using antisenseRNAs expressed from doxycycline-inducible vectors. Letters in Applied Microbi-ology, 56(6):436–442, June 2013. ISSN 1472-765X. doi: 10.1111/lam.12066.
[68] Dokyun Na, SeungMin Yoo, Hannah Chung, Hyegwon Park, Jin Hwan Park, andSang Yup Lee. Metabolic engineering of Escherichia coli using synthetic smallregulatory RNAs. Nature Biotechnology, 31(2):170–174, February 2013. ISSN1546-1696. doi: 10.1038/nbt.2461.
[69] James M. Carothers, Jonathan A. Goler, Darmawi Juminaga, and Jay D. Keasling.Model-driven engineering of RNAdevices to quantitatively programgene expres-sion. Science (New York, N.Y.), 334(6063):1716–1719, December 2011. ISSN 1095-9203. doi: 10.1126/science.1212209.
[70] Nobutaka Nakashima and Tomohiro Tamura. Conditional gene silencing ofmultiple genes with antisense RNAs and generation of a mutator strain of Es-cherichia coli. Nucleic Acids Research, 37(15):e103, August 2009. ISSN 0305-1048. doi: 10.1093/nar/gkp498. URL https://www.ncbi.nlm.nih.gov/pmc/articles/PMC2731896/.
[71] Eugene V. Koonin, Kira S. Makarova, and Feng Zhang. Diversity, classificationand evolution of CRISPR-Cas systems. Current Opinion in Microbiology, 37:67–78, June 2017. ISSN 1879-0364. doi: 10.1016/j.mib.2017.05.008.
[72] John G. Doench, Nicolo Fusi, Meagan Sullender, Mudra Hegde, Emma W. Vaim-berg, Katherine F. Donovan, Ian Smith, Zuzana Tothova, Craig Wilen, RobertOrchard, Herbert W. Virgin, Jennifer Listgarten, and David E. Root. OptimizedsgRNA design to maximize activity and minimize off-target effects of CRISPR-Cas9. Nature Biotechnology, 34(2):184–191, February 2016. ISSN 1546-1696. doi:10.1038/nbt.3437. URL https://www.nature.com/articles/nbt.3437.
[73] Seong Keun Kim, Haseong Kim, Woo-Chan Ahn, Kwang-Hyun Park, Eui-JeonWoo, Dae-Hee Lee, and Seung-Goo Lee. Efficient Transcriptional Gene Repres-sion by Type V-A CRISPR-Cpf1 from Eubacterium eligens. ACS synthetic biology,6(7):1273–1282, 2017. ISSN 2161-5063. doi: 10.1021/acssynbio.6b00368.
[74] Fuguo Jiang, Kaihong Zhou, Linlin Ma, Saskia Gressel, and Jennifer A. Doudna.STRUCTURAL BIOLOGY. A Cas9-guide RNA complex preorganized for targetDNA recognition. Science (New York, N.Y.), 348(6242):1477–1481, June 2015.ISSN 1095-9203. doi: 10.1126/science.aab1452.
169
CHAPTER 10 BIBLIOGRAPHY
[75] Yibei Xiao, Min Luo, Robert P. Hayes, Jonathan Kim, Sherwin Ng, Fang Ding,Maofu Liao, and Ailong Ke. Structure Basis for Directional R-loop Formationand Substrate Handover Mechanisms in Type I CRISPR-Cas System. Cell, 170(1):48–60.e11, June 2017. ISSN 00928674. doi: 10.1016/j.cell.2017.06.012. URLhttps://linkinghub.elsevier.com/retrieve/pii/S0092867417306955.
[76] Mark D. Szczelkun, Maria S. Tikhomirova, Tomas Sinkunas, Giedrius Gasiu-nas, Tautvydas Karvelis, Patrizia Pschera, Virginijus Siksnys, and Ralf Seidel.Direct observation of R-loop formation by single RNA-guided Cas9 and Cas-cade effector complexes. Proceedings of the National Academy of Sciences of theUnited States of America, 111(27):9798–9803, July 2014. ISSN 1091-6490. doi:10.1073/pnas.1402597111.
[77] Michelle L. Luo, Adam S. Mullis, Ryan T. Leenay, and Chase L. Beisel. Repur-posing endogenous type I CRISPR-Cas systems for programmable gene repres-sion. Nucleic Acids Research, 43(1):674–681, January 2015. ISSN 1362-4962. doi:10.1093/nar/gku971.
[78] Jason M. Peters, Alexandre Colavin, Handuo Shi, Tomasz L. Czarny, Matthew H.Larson, Spencer Wong, John S. Hawkins, Candy H. S. Lu, Byoung-Mo Koo, Eliza-bethMarta, Anthony L. Shiver, EvanH.Whitehead, Jonathan S.Weissman, Eric D.Brown, Lei S. Qi, Kerwyn Casey Huang, and Carol A. Gross. A Comprehensive,CRISPR-based Functional Analysis of Essential Genes in Bacteria. Cell, 165(6):1493–1506, June 2016. ISSN 1097-4172. doi: 10.1016/j.cell.2016.05.003.
[79] Lun Cui, Antoine Vigouroux, François Rousset, Hugo Varet, Varun Khanna, andDavid Bikard. A CRISPRi screen in E. coli reveals sequence-specific toxicity ofdCas9. Nature Communications, 9(1):1912, May 2018. ISSN 2041-1723. doi:10.1038/s41467-018-04209-5. URL https://www.nature.com/articles/s41467-018-04209-5.
[80] Chensi Miao, Huiwei Zhao, Long Qian, and Chunbo Lou. Systematically inves-tigating the key features of the DNase deactivated Cpf1 for tunable transcrip-tion regulation in prokaryotic cells. Synthetic and Systems Biotechnology, 4(1):1–9,November 2018. ISSN 2405-805X. doi: 10.1016/j.synbio.2018.11.002. URLhttps://www.ncbi.nlm.nih.gov/pmc/articles/PMC6251280/.
[81] Jakub Wiktor, Christian Lesterlin, David J. Sherratt, and Cees Dekker. CRISPR-mediated control of the bacterial initiation of replication. Nucleic AcidsResearch, 44(8):3801–3810, May 2016. ISSN 0305-1048. doi: 10.1093/nar/gkw214. URL https://academic.oup.com/nar/article/44/8/3801/2467335/CRISPR-mediated-control-of-the-bacterial.
[82] Antoine Vigouroux, Enno Oldewurtel, Lun Cui, David Bikard, and Sven van Teef-felen. Tuning dCas9’s ability to block transcription enables robust, noiselessknockdown of bacterial genes. Molecular Systems Biology, 14(3):e7899, March2018. ISSN 1744-4292, 1744-4292, 1744-4292. doi: 10.15252/msb.20177899.URL http://msb.embopress.org/lookup/doi/10.15252/msb.20177899.
[83] Tianmin Wang, Changge Guan, Jiahui Guo, Bing Liu, Yinan Wu, Zhen Xie,Chong Zhang, and Xin-Hui Xing. Pooled CRISPR interference screening en-
170
CHAPTER 10 BIBLIOGRAPHY
ables genome-scale functional genomics study in bacteria with superior perfor-mance. Nature Communications, 9(1):2475, June 2018. ISSN 2041-1723. doi:10.1038/s41467-018-04899-x. URL https://www.nature.com/articles/s41467-018-04899-x.
[84] K. C. Keiler, P. R. Waller, and R. T. Sauer. Role of a peptide tagging system indegradation of proteins synthesized fromdamagedmessenger RNA. Science (NewYork, N.Y.), 271(5251):990–993, February 1996. ISSN 0036-8075.
[85] Jason M. Peters, Byoung-Mo Koo, Ramiro Patino, Gary E. Heussler, Cameron C.Hearne, Jiuxin Qu, Yuki F. Inclan, John S. Hawkins, Candy H. S. Lu, Melanie R.Silvis, M. Michael Harden, Hendrik Osadnik, Joseph E. Peters, Joanne N. En-gel, Rachel J. Dutton, Alan D. Grossman, Carol A. Gross, and Oren S. Rosen-berg. Enabling genetic analysis of diverse bacteria with Mobile-CRISPRi. Na-ture Microbiology, 4(2):244–250, February 2019. ISSN 2058-5276. doi: 10.1038/s41564-018-0327-z.
[86] Jia Meng, Gregory Kanzaki, Diane Meas, Christopher K. Lam, Heather Crum-mer, Justina Tain, and H. Howard Xu. A genome-wide inducible phenotypicscreen identifies antisense RNA constructs silencing Escherichia coli essentialgenes. FEMS microbiology letters, 329(1):45–53, April 2012. ISSN 1574-6968.doi: 10.1111/j.1574-6968.2012.02503.x.
[87] François Rousset, Lun Cui, Elise Siouve, Christophe Becavin, Florence De-pardieu, and David Bikard. Genome-wide CRISPR-dCas9 screens in E.coli identify essential genes and phage host factors. PLOS Genetics, 14(11):e1007749, November 2018. ISSN 1553-7404. doi: 10.1371/journal.pgen.1007749. URL https://journals.plos.org/plosgenetics/article?id=10.1371/journal.pgen.1007749.
[88] Yi Wang, Zhong-Tian Zhang, Seung-Oh Seo, Patrick Lynn, Ting Lu, Yong-SuJin, and Hans P. Blaschek. Gene transcription repression in Clostridium bei-jerinckii using CRISPR-dCas9. Biotechnology and Bioengineering, 113(12):2739–2743, 2016. ISSN 1097-0290. doi: 10.1002/bit.26020.
[89] Daniel Dar and Rotem Sorek. Extensive reshaping of bacterial operons by pro-grammed mRNA decay. PLOS Genetics, 14(4):e1007354, April 2018. ISSN 1553-7404. doi: 10.1371/journal.pgen.1007354. URLhttps://journals.plos.org/plosgenetics/article?id=10.1371/journal.pgen.1007354.
[90] Nan Hao, Adam C. Palmer, Alexandra Ahlgren-Berg, Keith E. Shearwin, andIan B. Dodd. The role of repressor kinetics in relief of transcriptional inter-ference between convergent promoters. Nucleic Acids Research, 44(14):6625–6638, August 2016. ISSN 0305-1048. doi: 10.1093/nar/gkw600. URL https://academic.oup.com/nar/article/44/14/6625/2468218.
[91] ImanFarasat andHowardM. Salis. A BiophysicalModel ofCRISPR/Cas9Activityfor Rational Design of Genome Editing and Gene Regulation. PLoS computationalbiology, 12(1):e1004724, January 2016. ISSN 1553-7358. doi: 10.1371/journal.pcbi.1004724.
171
CHAPTER 10 BIBLIOGRAPHY
[92] Evan A. Boyle, Johan O. L. Andreasson, Lauren M. Chircus, Samuel H. Sternberg,Michelle J. Wu, Chantal K. Guegler, Jennifer A. Doudna, andWilliam J. Greenleaf.High-throughput biochemical profiling reveals sequence determinants of dCas9off-target binding and unbinding. Proceedings of the National Academy of Sciencesof the United States of America, 114(21):5461–5466, May 2017. ISSN 1091-6490.doi: 10.1073/pnas.1700557114.
[93] Ryan Marshall, Colin S. Maxwell, Scott P. Collins, Thomas Jacobsen, Michelle L.Luo, Matthew B. Begemann, Benjamin N. Gray, Emma January, Anna Singer,Yonghua He, Chase L. Beisel, and Vincent Noireaux. Rapid and Scalable Char-acterization of CRISPR Technologies Using an E. coli Cell-Free Transcription-Translation System. Molecular cell, 69(1):146–157.e3, January 2018. ISSN 1097-2765. doi: 10.1016/j.molcel.2017.12.007. URL https://www.ncbi.nlm.nih.gov/pmc/articles/PMC5976856/.
[94] Brady F. Cress, J. Andrew Jones, Daniel C. Kim, Quentin D. Leitz, Jacob A.Englaender, Shannon M. Collins, Robert J. Linhardt, and Mattheos A. G. Koffas.Rapid generation of CRISPR/dCas9-regulated, orthogonally repressible hybridT7-lac promoters for modular, tuneable control of metabolic pathway fluxes inEscherichia coli. Nucleic Acids Research, 44(9):4472–4485, May 2016. ISSN 1362-4962. doi: 10.1093/nar/gkw231.
[95] Namita Bisaria, Inga Jarmoskaite, and Daniel Herschlag. Lessons from EnzymeKinetics Reveal Specificity Principles for RNA-Guided Nucleases in RNA Inter-ference and CRISPR-Based Genome Editing. Cell Systems, 4(1):21–29, January2017. ISSN 2405-4712. doi: 10.1016/j.cels.2016.12.010. URL http://www.sciencedirect.com/science/article/pii/S2405471216304203.
[96] Misha Klein, Behrouz Eslami-Mossallam, Dylan Gonzalez Arroyo, and MartinDepken. Hybridization Kinetics Explains CRISPR-Cas Off-Targeting Rules. CellReports, 22(6):1413–1423, February 2018. ISSN 2211-1247. doi: 10.1016/j.celrep.2018.01.045. URL https://www.cell.com/cell-reports/abstract/S2211-1247(18)30077-9.
[97] Isabel Strohkendl, Fatema A. Saifuddin, James R. Rybarski, Ilya J. Finkelstein, andRick Russell. Kinetic Basis for DNA Target Specificity of CRISPR-Cas12a. Molec-ular Cell, 71(5):816–824.e3, September 2018. ISSN 1097-4164. doi: 10.1016/j.molcel.2018.06.043.
[98] Johnny H. Hu, Shannon M. Miller, Maarten H. Geurts, Weixin Tang, Liwei Chen,Ning Sun, Christina M. Zeina, Xue Gao, Holly A. Rees, Zhi Lin, and David R. Liu.Evolved Cas9 variants with broad PAM compatibility and high DNA specificity.Nature, 556(7699):57–63, 2018. ISSN 1476-4687. doi: 10.1038/nature26155.
[99] Mikihiro Shibata, Hiroshi Nishimasu, Noriyuki Kodera, Seiichi Hirano, ToshioAndo, Takayuki Uchihashi, and Osamu Nureki. Real-space and real-time dy-namics of CRISPR-Cas9 visualized by high-speed atomic force microscopy.Nature Communications, 8(1):1430, November 2017. ISSN 2041-1723. doi:10.1038/s41467-017-01466-8. URL https://www.nature.com/articles/s41467-017-01466-8.
172
CHAPTER 10 BIBLIOGRAPHY
[100] Samuel H. Sternberg, Sy Redding, Martin Jinek, Eric C. Greene, and Jennifer A.Doudna. DNA interrogation by theCRISPRRNA-guided endonucleaseCas9.Na-ture, 507(7490):62–67, March 2014. ISSN 1476-4687. doi: 10.1038/nature13011.
[101] Viktorija Globyte, Seung Hwan Lee, Taegeun Bae, Jin-Soo Kim, and ChirlminJoo. CRISPR/Cas9 searches for a protospacer adjacent motif by lateral diffu-sion. The EMBO Journal, page e99466, December 2018. ISSN 0261-4189, 1460-2075. doi: 10.15252/embj.201899466. URL http://emboj.embopress.org/content/early/2018/12/20/embj.201899466.
[102] Yongmoon Jeon, You Hee Choi, Yunsu Jang, Jihyeon Yu, Jiyoung Goo, Gyejun Lee,You Kyeong Jeong, Seung Hwan Lee, In-San Kim, Jin-Soo Kim, Cherlhyun Jeong,Sanghwa Lee, and Sangsu Bae. Direct observation of DNA target searching andcleavage by CRISPR-Cas12a. Nature Communications, 9(1):2777, July 2018. ISSN2041-1723. doi: 10.1038/s41467-018-05245-x. URL https://www.nature.com/articles/s41467-018-05245-x.
[103] Daniel Lawson Jones, Prune Leroy, Cecilia Unoson, David Fange, Vladimir Ćurić,Michael J. Lawson, and Johan Elf. Kinetics of dCas9 target search in Escherichiacoli. Science, 357(6358):1420–1424, September 2017. ISSN 0036-8075, 1095-9203. doi: 10.1126/science.aah7084. URL http://science.sciencemag.org/content/357/6358/1420.
[104] Xin-Tian Li, Yonggun Jun, Michael J. Erickstad, Steven D. Brown, Adam Parks,Donald L. Court, and Suckjoon Jun. tCRISPRi: tunable and reversible, one-stepcontrol of gene expression. Scientific Reports, 6:39076, December 2016. ISSN2045-2322. doi: 10.1038/srep39076.
[105] Jason Fontana, Chen Dong, Jennifer Y. Ham, Jesse G. Zalatan, and James M.Carothers. Regulated Expression of sgRNAs Tunes CRISPRi in E. coli. Biotech-nology Journal, 13(9):1800069, 2018. ISSN 1860-7314. doi: 10.1002/biot.201800069. URL https://onlinelibrary.wiley.com/doi/abs/10.1002/biot.201800069.
[106] Fangwei Si, Dongyang Li, Sarah E. Cox, John T. Sauls, Omid Azizi, Cindy Sou,Amy B. Schwartz, Michael J. Erickstad, Yonggun Jun, Xintian Li, and SuckjoonJun. Invariance of Initiation Mass and Predictability of Cell Size in Escherichiacoli. Current Biology, 27(9):1278–1287, May 2017. ISSN 0960-9822. doi:10.1016/j.cub.2017.03.022. URL http://www.sciencedirect.com/science/article/pii/S0960982217302919.
[107] Chunyu Liao, Fani Ttofali, Rebecca A. Slotkowski, Steven R. Denny, Taylor D.Cecil, Ryan T. Leenay, Albert J. Keung, and Chase L. Beisel. One-step assembly oflarge CRISPR arrays enables multi-functional targeting and reveals constraintson array design. bioRxiv, page 312421, May 2018. doi: 10.1101/312421. URLhttps://www.biorxiv.org/content/10.1101/312421v1.
[108] Balwina Koopal, Aleksander J. Kruis, Nico J. Claassens, Franklin L. Nobrega, andJohn van derOost. Incorporation of a Synthetic Amino Acid into dCas9 ImprovesControl of Gene Silencing. ACS Synthetic Biology, January 2019. doi: 10.1021/acssynbio.8b00347. URL https://doi.org/10.1021/acssynbio.8b00347.
173
CHAPTER 10 BIBLIOGRAPHY
[109] Young Je Lee, Allison Hoynes-O’Connor, Matthew C. Leong, and Tae SeokMoon.Programmable control of bacterial gene expression with the combined CRISPRand antisense RNA system. Nucleic Acids Research, 44(5):2462–2473, March 2016.ISSN 1362-4962. doi: 10.1093/nar/gkw056.
[110] Chen Dong, Jason Fontana, Anika Patel, James M. Carothers, and Jesse G. Zala-tan. Synthetic CRISPR-Cas gene activators for transcriptional reprogrammingin bacteria. Nature Communications, 9, June 2018. ISSN 2041-1723. doi:10.1038/s41467-018-04901-6. URL https://www.ncbi.nlm.nih.gov/pmc/articles/PMC6021436/.
[111] Z. Lu, S. Yang, X. Yuan, Y. Shi, L. Ouyang, S. Jiang, L. Yi, and G. Zhang. CRISPR-assisted multi-dimensional regulation for fine-tuning gene expression in Bacillussubtilis. Nucleic acids research, February 2019. ISSN 0305-1048. doi: 10.1093/nar/gkz072. URL http://europepmc.org/abstract/MED/30767015.
[112] Rodolphe Barrangou and Luciano A. Marraffini. CRISPR-Cas Systems: Prokary-otes Upgrade to Adaptive Immunity. Molecular Cell, 54(2):234–244, April2014. ISSN 1097-2765. doi: 10.1016/j.molcel.2014.03.011. URL http://www.sciencedirect.com/science/article/pii/S1097276514002160.
[113] Heng Zhao, Yingjie Sun, Jason M. Peters, Carol A. Gross, Ethan C. Garner, andJohn D. Helmann. Depletion of Undecaprenyl Pyrophosphate Phosphatases Dis-rupts Cell Envelope Biogenesis in Bacillus subtilis. Journal of Bacteriology, 198(21):2925–2935, 2016. ISSN 1098-5530. doi: 10.1128/JB.00507-16.
[114] Xiaochun Zhang, Jingman Wang, Qiuxiang Cheng, Xuan Zheng, Guoping Zhao,and Jin Wang. Multiplex gene regulation by CRISPR-ddCpf1. Cell Discovery, 3:17018, 2017. ISSN 2056-5968. doi: 10.1038/celldisc.2017.18.
[115] Brady F. Cress, Ö Duhan Toparlak, Sanjay Guleria, Matthew Lebovich, Jessica T.Stieglitz, Jacob A. Englaender, J. Andrew Jones, Robert J. Linhardt, and MattheosA. G. Koffas. CRISPathBrick: Modular Combinatorial Assembly of Type II-ACRISPR Arrays for dCas9-Mediated Multiplex Transcriptional Repression in E.coli. ACS synthetic biology, 4(9):987–1000, September 2015. ISSN 2161-5063. doi:10.1021/acssynbio.5b00012.
[116] Dipti D. Nayak and William W. Metcalf. Cas9-mediated genome editing in themethanogenic archaeon Methanosarcina acetivorans. Proceedings of the NationalAcademy of Sciences, 114(11):2976–2981, March 2017. ISSN 0027-8424, 1091-6490. doi: 10.1073/pnas.1618596114. URL https://www.pnas.org/content/114/11/2976.
[117] Levi G. Lowder, Aimee Malzahn, and Yiping Qi. Plant Gene Regulation UsingMultiplex CRISPR-dCas9 Artificial Transcription Factors. In L. Mark Lagrim-ini, editor, Maize: Methods and Protocols, Methods in Molecular Biology, pages197–214. Springer New York, New York, NY, 2018. ISBN 978-1-4939-7315-6. doi: 10.1007/978-1-4939-7315-6_12. URL https://doi.org/10.1007/978-1-4939-7315-6_12.
[118] Tang Hai, Fei Teng, Runfa Guo, Wei Li, and Qi Zhou. One-step generation ofknockout pigs by zygote injection of CRISPR/Cas system. Cell Research, 24(3):
174
CHAPTER 10 BIBLIOGRAPHY
372–375, March 2014. ISSN 1748-7838. doi: 10.1038/cr.2014.11. URL https://www.nature.com/articles/cr201411.
[119] S. G. McInally, K. D. Hagen, C. Nosala, J. Williams, K. Nguyen, J. Booker, K. Jones,and Scott C. Dawson. Robust and stable transcriptional repression in Giardiausing CRISPRi. Molecular Biology of the Cell, 30(1):119–130, January 2019. ISSN1939-4586. doi: 10.1091/mbc.E18-09-0605.
[120] Christina S. Nødvig, Jakob B. Nielsen, Martin E. Kogle, and Uffe H. Mortensen.A CRISPR-Cas9 System for Genetic Engineering of Filamentous Fungi. PLOSONE, 10(7):e0133085, July 2015. ISSN 1932-6203. doi: 10.1371/journal.pone.0133085. URL https://journals.plos.org/plosone/article?id=10.1371/journal.pone.0133085.
[121] Sue Zanne Tan, Christopher R. Reisch, and Kristala L. J. Prather. A RobustCRISPR Interference Gene Repression System in Pseudomonas. Journal of Bacte-riology, 200(7), 2018. ISSN 1098-5530. doi: 10.1128/JB.00575-17.
[122] Aleš Berlec, Katja Škrlec, Janja Kocjan, Maria Olenic, and Borut Štrukelj. Sin-gle plasmid systems for inducible dual protein expression and for CRISPR-Cas9/CRISPRi gene regulation in lactic acid bacterium Lactococcus lactis.Scientific Reports, 8(1):1009, 2018. ISSN 2045-2322. doi: 10.1038/s41598-018-19402-1.
[123] Jaehyun Park, Hyojung Shin, Sun-Mi Lee, Youngsoon Um, and Han Min Woo.RNA-guided single/double gene repressions in Corynebacterium glutamicum us-ing an efficient CRISPR interference and its application to industrial strain. Mi-crobial Cell Factories, 17(1):4, January 2018. ISSN 1475-2859. doi: 10.1186/s12934-017-0843-1.
[124] Yusuke Sato’o, Junzo Hisatsune, Liansheng Yu, Tetsushi Sakuma, Takashi Ya-mamoto, and Motoyuki Sugai. Tailor-made gene silencing of Staphylococcusaureus clinical isolates by CRISPR interference. PloS One, 13(1):e0185987, 2018.ISSN 1932-6203. doi: 10.1371/journal.pone.0185987.
[125] Ioannis Mougiakos, Prarthana Mohanraju, Elleke F. Bosma, Valentijn Vrouwe,Max Finger Bou, Mihris I. S. Naduthodi, Alex Gussak, Rudolf B. L. Brinkman,Richard van Kranenburg, and John van der Oost. Characterizing a thermostableCas9 for bacterial genome editing and silencing. Nature Communications, 8(1):1647, November 2017. ISSN 2041-1723. doi: 10.1038/s41467-017-01591-4.URL https://www.nature.com/articles/s41467-017-01591-4.
[126] Alec AK Nielsen and Christopher A. Voigt. Multi-input CRISPR/Cas genetic cir-cuits that interface host regulatory networks. Molecular Systems Biology, 10(11):763, November 2014. ISSN1744-4292, 1744-4292. doi: 10.15252/msb.20145735.URL http://msb.embopress.org/content/10/11/763.
[127] Suhyung Cho, Donghui Choe, Eunju Lee, Sun Chang Kim, Bernhard Ø. Pals-son, and Byung-Kwan Cho. High-level dCas9 expression induces abnormalcell morphology in Escherichia coli. ACS Synthetic Biology, March 2018. doi:10.1021/acssynbio.7b00462. URL https://cdn-pubs.acs.org/doi/abs/10.1021/acssynbio.7b00462.
175
CHAPTER 10 BIBLIOGRAPHY
[128] Shuyi Zhang and Christopher A. Voigt. Engineered dCas9 with reduced toxic-ity in bacteria: implications for genetic circuit design. Nucleic Acids Research,2018. doi: 10.1093/nar/gky884. URL https://academic.oup.com/nar/advance-article/doi/10.1093/nar/gky884/5115820.
[129] Tomoya Baba, Takeshi Ara, Miki Hasegawa, Yuki Takai, Yoshiko Okumura, MikiBaba, Kirill A Datsenko, Masaru Tomita, Barry L Wanner, and Hirotada Mori.Construction of Escherichia coli K-12 in-frame, single-gene knockout mutants:the Keio collection. Molecular Systems Biology, 2:2006.0008, February 2006. ISSN1744-4292. doi: 10.1038/msb4100050. URL http://www.ncbi.nlm.nih.gov/pmc/articles/PMC1681482/.
[130] Byoung-Mo Koo, George Kritikos, Jeremiah D. Farelli, Horia Todor, KennethTong, Harvey Kimsey, Ilan Wapinski, Marco Galardini, Angelo Cabal, Jason M.Peters, Anna-Barbara Hachmann, David Z. Rudner, Karen N. Allen, AthanasiosTypas, and Carol A. Gross. Construction and Analysis of Two Genome-ScaleDeletion Libraries for Bacillus subtilis. Cell Systems, 4(3):291–305.e7,March 2017.ISSN 2405-4712. doi: 10.1016/j.cels.2016.12.013.
[131] Kelly M. Wetmore, Morgan N. Price, Robert J. Waters, Jacob S. Lamson, JenniferHe, Cindi A. Hoover, Matthew J. Blow, James Bristow, Gareth Butland, Adam P.Arkin, and Adam Deutschbauer. Rapid Quantification of Mutant Fitness in Di-verse Bacteria by Sequencing Randomly Bar-Coded Transposons. mBio, 6(3):e00306–15, July 2015. ISSN 2150-7511. doi: 10.1128/mBio.00306-15. URLhttps://mbio.asm.org/content/6/3/e00306-15.
[132] MorganN. Price, KellyM.Wetmore, R. JordanWaters, MarkCallaghan, JayashreeRay, Hualan Liu, Jennifer V. Kuehl, Ryan A. Melnyk, Jacob S. Lamson, Yumi Suh,Hans K. Carlson, Zuelma Esquivel, Harini Sadeeshkumar, Romy Chakraborty,Grant M. Zane, Benjamin E. Rubin, Judy D. Wall, Axel Visel, James Bristow,Matthew J. Blow, Adam P. Arkin, and Adam M. Deutschbauer. Mutant pheno-types for thousands of bacterial genes of unknown function. Nature, 557(7706):503, May 2018. ISSN 1476-4687. doi: 10.1038/s41586-018-0124-0. URLhttps://www.nature.com/articles/s41586-018-0124-0.
[133] Michael Dion, Mrinal Kapoor, Yingjie Sun, Sean Wilson, Joel Ryan, AntoineVigouroux, Sven van Teeffelen, Rudolf Oldenbourg, and Ethan C. Garner. Cell Di-ameter in Bacillus subtilis is Determined by theOpposing Actions of TwoDistinctCell Wall Synthetic Systems. bioRxiv, page 392837, August 2018. doi: 10.1101/392837. URL https://www.biorxiv.org/content/10.1101/392837v3.
[134] Yuchen Liu, Jinghong Han, Zhicong Chen, Hanwei Wu, Hongsong Dong, andGuohui Nie. Engineering cell signaling using tunable CRISPR–Cpf1-based tran-scription factors. Nature Communications, 8, December 2017. ISSN 2041-1723.doi: 10.1038/s41467-017-02265-x. URL https://www.ncbi.nlm.nih.gov/pmc/articles/PMC5727435/.
[135] Henry H. Lee, Nili Ostrov, Brandon G. Wong, Michaela A. Gold, Ahmad S. Khalil,andGeorgeM. Church. Functional genomics of the rapidly replicating bacteriumVibrio natriegens by CRISPRi. Nature Microbiology, page 1, April 2019. ISSN2058-5276. doi: 10.1038/s41564-019-0423-8. URL https://www.nature.com/articles/s41564-019-0423-8.
176
CHAPTER 10 BIBLIOGRAPHY
[136] Michael J. Lawson, Daniel Camsund, Jimmy Larsson, Özden Baltekin, DavidFange, and Johan Elf. In situ genotyping of a pooled strain library after char-acterizing complex phenotypes. Molecular Systems Biology, 13(10):947, Octo-ber 2017. ISSN 1744-4292, 1744-4292. doi: 10.15252/msb.20177951. URLhttp://msb.embopress.org/content/13/10/947.
[137] Francesca Ceroni, Alice Boo, Simone Furini, Thomas E. Gorochowski, OlivierBorkowski, Yaseen N. Ladak, Ali R. Awan, Charlie Gilbert, Guy-Bart Stan, andTom Ellis. Burden-driven feedback control of gene expression. Nature Methods,15(5):387–393, May 2018. ISSN 1548-7105. doi: 10.1038/nmeth.4635.
[138] Alexander Schmidt, Karl Kochanowski, Silke Vedelaar, Erik Ahrné, BenjaminVolkmer, Luciano Callipo, Kèvin Knoops, Manuel Bauer, Ruedi Aebersold, andMatthiasHeinemann. The quantitative and condition-dependent Escherichia coliproteome. Nature Biotechnology, 34(1):104–110, January 2016. ISSN 1087-0156,1546-1696. doi: 10.1038/nbt.3418. URL http://www.nature.com/articles/nbt.3418.
[139] NanHao, Keith E. Shearwin, and Ian B. Dodd. Programmable DNA looping usingengineered bivalent dCas9 complexes. Nature Communications, 8(1):1628, 2017.ISSN 2041-1723. doi: 10.1038/s41467-017-01873-x.
[140] Andrea Mückl, Matthaeus Schwarz-Schilling, Katrin Fischer, and Friedrich C.Simmel. Filamentation and restoration of normal growth in Escherichia coliusing a combined CRISPRi sgRNA/antisense RNA approach. PLOS ONE,13(9):e0198058, September 2018. ISSN 1932-6203. doi: 10.1371/journal.pone.0198058. URL https://journals.plos.org/plosone/article?id=10.1371/journal.pone.0198058.
[141] Tian Tian, JingWei Kang, Aram Kang, and Taek Soon Lee. RedirectingMetabolicFlux via CombinatorialMultiplex CRISPRi-Mediated Repression for IsopentenolProduction in Escherichia coli. ACS synthetic biology, February 2019. ISSN 2161-5063. doi: 10.1021/acssynbio.8b00429.
[142] Suhyung Cho, Jongoh Shin, and Byung-Kwan Cho. Applications of CRISPR/CasSystem to Bacterial Metabolic Engineering. International Journal of MolecularSciences, 19(4), April 2018. ISSN 1422-0067. doi: 10.3390/ijms19041089.
[143] Dina Elhadi, Li Lv, Xiao-Ran Jiang, HongWu, and Guo-Qiang Chen. CRISPRi en-gineering E. coli for morphology diversification. Metabolic Engineering, 38:358–369, 2016. ISSN 1096-7184. doi: 10.1016/j.ymben.2016.09.001.
[144] Songyuan Li, Christian Bille Jendresen, Alexander Grünberger, Carlotta Ronda,Sheila Ingemann Jensen, Stephan Noack, and Alex Toftgaard Nielsen. Enhancedprotein and biochemical production using CRISPRi-based growth switches.Metabolic Engineering, 38:274–284, 2016. ISSN 1096-7184. doi: 10.1016/j.ymben.2016.09.003.
[145] Waldemar Vollmer and Ute Bertsche. Murein (peptidoglycan) structure, ar-chitecture and biosynthesis in Escherichia coli. Biochimica et Biophysica Acta(BBA) - Biomembranes, 1778(9):1714–1734, September 2008. ISSN 0005-2736.doi: 10.1016/j.bbamem.2007.06.007. URL http://www.sciencedirect.com/science/article/pii/S0005273607002210.
177
CHAPTER 10 BIBLIOGRAPHY
[146] Timothy K. Lee, Carolina Tropini, Jen Hsin, Samantha M. Desmarais, Tristan S.Ursell, Enhao Gong, Zemer Gitai, Russell D. Monds, and Kerwyn Casey Huang.A dynamically assembled cell wall synthesis machinery buffers cell growth. Pro-ceedings of the National Academy of Sciences of the United States of America, 111(12):4554–4559, March 2014. ISSN 1091-6490. doi: 10.1073/pnas.1313826111.
[147] Hongbaek Cho, Carl N. Wivagg, Mrinal Kapoor, Zachary Barry, Patricia D. A.Rohs, Hyunsuk Suh, Jarrod A.Marto, Ethan C. Garner, and Thomas G. Bernhardt.Bacterial cell wall biogenesis is mediated by SEDS and PBP polymerase familiesfunctioning semi-autonomously. Nature Microbiology, 1:16172, September 2016.ISSN 2058-5276. doi: 10.1038/nmicrobiol.2016.172. URL http://www.nature.com/articles/nmicrobiol2016172.
[148] Catherine Paradis-Bleau, Monica Markovski, Tsuyoshi Uehara, Tania J. Lupoli,Suzanne Walker, Daniel E. Kahne, and Thomas G. Bernhardt. LipoproteinCofactors Located in the Outer Membrane Activate Bacterial Cell Wall Poly-merases. Cell, 143(7):1110–1120, December 2010. ISSN 0092-8674. doi:10.1016/j.cell.2010.11.037. URL http://www.sciencedirect.com/science/article/pii/S0092867410013590.
[149] Jun-ichi Nakagawa and Michio Matsuhashi. Molecular divergence of a ma-jor peptidoglycan synthetase with transglycosylase - transpeptidase activities inEscherichia coli — Penicillin-binding protein 1bs. Biochemical and Biophysi-cal Research Communications, 105(4):1546–1553, April 1982. ISSN 0006-291X.doi: 10.1016/0006-291X(82)90964-0. URL http://www.sciencedirect.com/science/article/pii/0006291X82909640.
[150] Alexander J.Meeske, EammonP. Riley,WilliamP. Robins, TsuyoshiUehara, John J.Mekalanos, Daniel Kahne, Suzanne Walker, Andrew C. Kruse, Thomas G. Bern-hardt, and David Z. Rudner. SEDS proteins are a widespread family of bacterialcell wall polymerases. Nature, 537(7622):634–638, September 2016. ISSN 0028-0836. doi: 10.1038/nature19331. URL http://www.nature.com/nature/journal/v537/n7622/full/nature19331.html.
[151] Sophie Leclercq, Adeline Derouaux, Samir Olatunji, Claudine Fraipont, Alexan-der J. F. Egan, Waldemar Vollmer, Eefjan Breukink, and Mohammed Terrak. In-terplay between Penicillin-binding proteins and SEDS proteins promotes bacte-rial cell wall synthesis. Scientific Reports, 7:43306, 2017. ISSN 2045-2322. doi:10.1038/srep43306.
[152] Ute Bertsche, Thomas Kast, Benoît Wolf, Claudine Fraipont, Mirjam E. G. Aars-man, Kai Kannenberg, Moritz von Rechenberg, Martine Nguyen-Distèche, Tan-neke den Blaauwen, Joachim-Volker Höltje, and Waldemar Vollmer. Interactionbetween two murein (peptidoglycan) synthases, PBP3 and PBP1b, in Escherichiacoli. Molecular Microbiology, 61(3):675–690, August 2006. ISSN 0950-382X. doi:10.1111/j.1365-2958.2006.05280.x.
[153] F. B. Wientjes and N. Nanninga. On the role of the high molecular weightpenicillin-binding proteins in the cell cycle of Escherichia coli. Research inMicrobiology, 142(2):333–344, January 1991. ISSN 0923-2508. doi: 10.1016/0923-2508(91)90049-G. URL http://www.sciencedirect.com/science/article/pii/092325089190049G.
178
CHAPTER 10 BIBLIOGRAPHY
[154] Manuel Banzhaf, Bart van den Berg van Saparoea, Mohammed Terrak, ClaudineFraipont, Alexander Egan, Jules Philippe, André Zapun, Eefjan Breukink,MartineNguyen-Distèche, Tanneke den Blaauwen, andWaldemar Vollmer. Cooperativityof peptidoglycan synthases active in bacterial cell elongation. Molecular Microbi-ology, 85(1):179–194, July 2012. ISSN 1365-2958. doi: 10.1111/j.1365-2958.2012.08103.x.
[155] George K. Auer, Timothy K. Lee, Manohary Rajendram, Spencer Cesar, AmandaMiguel, Kerwyn Casey Huang, and Douglas B. Weibel. Mechanical GenomicsIdentifies Diverse Modulators of Bacterial Cell Stiffness. Cell Systems, 2(6):402–411, June 2016. ISSN 2405-4712. doi: 10.1016/j.cels.2016.05.006. URL http://www.sciencedirect.com/science/article/pii/S2405471216301818.
[156] M Caparrós, A G Pisabarro, and M A de Pedro. Effect of D-amino acids onstructure and synthesis of peptidoglycan in Escherichia coli. Journal of Bacteri-ology, 174(17):5549–5559, September 1992. ISSN 0021-9193, 1098-5530. doi:10.1128/jb.174.17.5549-5559.1992. URL http://jb.asm.org/lookup/doi/10.1128/jb.174.17.5549-5559.1992.
[157] F. García del Portillo and M. A. de Pedro. Penicillin-binding protein 2 is essen-tial for the integrity of growing cells of Escherichia coli ponB strains. Journal ofBacteriology, 173(14):4530–4532, July 1991. ISSN 0021-9193.
[158] Robert J. Nichols, Saunak Sen, Yoe Jin Choo, Pedro Beltrao, Matylda Zietek,Rachna Chaba, Sueyoung Lee, Krystyna M. Kazmierczak, Karis J. Lee, AngelaWong, Michael Shales, Susan Lovett, Malcolm E. Winkler, Nevan J. Krogan,Athanasios Typas, and Carol A. Gross. Phenotypic landscape of a bacterial cell.Cell, 144(1):143–156, January 2011. ISSN 1097-4172. doi: 10.1016/j.cell.2010.11.052.
[159] Marta Caparrós, JoséCarlos Quintela, and Miguel A. de Pedro. Variability ofpeptidoglycan surface density in Escherichia coli. FEMS Microbiology Letters,121(1):71–76, August 1994. ISSN 1574-6968. doi: 10.1111/j.1574-6968.1994.tb07077.x. URL https://onlinelibrary.wiley.com/doi/abs/10.1111/j.1574-6968.1994.tb07077.x.
[160] T. J. Dougherty, K. Kennedy, R. E. Kessler, and M. J. Pucci. Direct quantitationof the number of individual penicillin-binding proteins per cell in Escherichiacoli. Journal of Bacteriology, 178(21):6110–6115, November 1996. ISSN 0021-9193, 1098-5530. doi: 10.1128/jb.178.21.6110-6115.1996. URL https://jb.asm.org/content/178/21/6110.
[161] Yuichi Taniguchi, Paul J. Choi, Gene-Wei Li, Huiyi Chen, Mohan Babu, JeremyHearn, Andrew Emili, and X. Sunney Xie. Quantifying E. coli proteome and tran-scriptomewith single-molecule sensitivity in single cells. Science (New York, N.Y.),329(5991):533–538, July 2010. ISSN 1095-9203. doi: 10.1126/science.1188308.
[162] Jacek R. Wiśniewski and Dariusz Rakus. Quantitative analysis of the Escherichiacoli proteome. Data in Brief, 1:7–11, December 2014. ISSN 2352-3409. doi:10.1016/j.dib.2014.08.004. URL http://www.sciencedirect.com/science/article/pii/S2352340914000079.
179
CHAPTER 10 BIBLIOGRAPHY
[163] Hak SukChung, Zhizhong Yao, NathanW. Goehring, Roy Kishony, Jon Beckwith,and Daniel Kahne. Rapid -lactam-induced lysis requires successful assembly ofthe cell division machinery. Proceedings of the National Academy of Sciences, 106(51):21872–21877, December 2009. ISSN 0027-8424, 1091-6490. doi: 10.1073/pnas.0911674106. URL https://www.pnas.org/content/106/51/21872.
[164] F. B. Wientjes, C. L. Woldringh, and N. Nanninga. Amount of peptidoglycan incell walls of gram-negative bacteria. Journal of Bacteriology, 173(23):7684–7691,December 1991. ISSN 0021-9193, 1098-5530. doi: 10.1128/jb.173.23.7684-7691.1991. URL https://jb.asm.org/content/173/23/7684.
[165] Renata Buda, Yunxiao Liu, Jin Yang, Smitha Hegde, Keiran Stevenson, Fan Bai,and Teuta Pilizota. Dynamics of Escherichia coli’s passive response to a suddendecrease in external osmolarity. Proceedings of the National Academy of Sciences ofthe United States of America, 113(40):E5838–E5846, 2016. ISSN 1091-6490. doi:10.1073/pnas.1522185113.
[166] X. Yao, M. Jericho, D. Pink, and T. Beveridge. Thickness and Elasticity of Gram-NegativeMurein SacculiMeasured byAtomic ForceMicroscopy. Journal of Bacte-riology, 181(22):6865–6875, November 1999. ISSN 0021-9193, 1098-5530. URLhttp://jb.asm.org/content/181/22/6865.
[167] Mary P. Lambert and Francis C. Neuhaus. Mechanism of d-Cycloserine Action:Alanine Racemase from Escherichia coli W1. Journal of Bacteriology, 110(3):978–987, June 1972. ISSN0021-9193. URL https://www.ncbi.nlm.nih.gov/pmc/articles/PMC247518/.
[168] Timothy K. Lee, Kevin Meng, Handuo Shi, and Kerwyn Casey Huang. Single-molecule imaging reveals modulation of cell wall synthesis dynamics in live bac-terial cells. Nature Communications, 7:13170, 2016. ISSN 2041-1723. doi:10.1038/ncomms13170.
[169] Robert D. Turner, StéphaneMesnage, Jamie K. Hobbs, and Simon J. Foster. Molec-ular imaging of glycan chains couples cell-wall polysaccharide architecture to bac-terial cell morphology.Nature Communications, 9(1):1263, 2018. ISSN 2041-1723.doi: 10.1038/s41467-018-03551-y.
[170] François St-Pierre, LunCui, DavidG. Priest, DrewEndy, Ian B. Dodd, andKeith E.Shearwin. One-Step Cloning and Chromosomal Integration of DNA. ACS Syn-thetic Biology, 2(9):537–541, September 2013. doi: 10.1021/sb400021j. URLhttp://dx.doi.org/10.1021/sb400021j.
[171] Tristan Ursell, Timothy K. Lee, Daisuke Shiomi, Handuo Shi, Carolina Tropini,Russell D. Monds, Alexandre Colavin, Gabriel Billings, Ilina Bhaya-Grossman,Michael Broxton, Bevan Emma Huang, Hironori Niki, and Kerwyn Casey Huang.Rapid, precise quantification of bacterial cellular dimensions across a genomic-scale knockout library. BMC Biology, 15(1):17, February 2017. ISSN 1741-7007. doi: 10.1186/s12915-017-0348-8. URL https://doi.org/10.1186/s12915-017-0348-8.
180
CHAPTER 10 BIBLIOGRAPHY
[172] Arthur Edelstein, Nenad Amodaj, Karl Hoover, Ron Vale, and Nico Stuurman.Computer Control of Microscopes Using µManager. Current Protocols in Molec-ular Biology, 92(1):14.20.1–14.20.17, 2010. ISSN 1934-3647. doi: 10.1002/0471142727.mb1420s92. URL https://currentprotocols.onlinelibrary.wiley.com/doi/abs/10.1002/0471142727.mb1420s92.
[173] Ozden Kocaoglu, Bryan Lanning, Loralyn Cozy, Rebecca Calvo, Daniel Kearns,and Erin E. Carlson. Activity-Based Probes for Penicillin-Binding Protein Imag-ing. The FASEB Journal, 26(1_supplement):1000.1–1000.1, April 2012. ISSN0892-6638. doi: 10.1096/fasebj.26.1_supplement.1000.1. URL https://www.fasebj.org/doi/abs/10.1096/fasebj.26.1_supplement.1000.1.
[174] Caroline A. Schneider, Wayne S. Rasband, and Kevin W. Eliceiri. NIH Imageto ImageJ: 25 years of image analysis. Nature Methods, 9:671–675, June 2012.ISSN 1548-7105. doi: 10.1038/nmeth.2089. URL https://www.nature.com/articles/nmeth.2089.
[175] Richard Wheeler, Frédéric Veyrier, Catherine Werts, and Ivo Gomperts Boneca.PeptidoglycanPeptidoglycanand Nod Receptor. In Tamao Endo, Peter H. See-berger, Gerald W. Hart, Chi-Huey Wong, and Naoyuki Taniguchi, editors, Glyco-science: Biology and Medicine, pages 1–10. Springer Japan, Tokyo, 2021. ISBN978-4-431-54836-2. doi: 10.1007/978-4-431-54836-2_147-1. URL https://doi.org/10.1007/978-4-431-54836-2_147-1.
[176] John C. Crocker and David G. Grier. Methods of Digital Video Microscopy forColloidal Studies. Journal of Colloid and Interface Science, 179(1):298–310, April1996. ISSN 00219797. doi: 10.1006/jcis.1996.0217. URL http://linkinghub.elsevier.com/retrieve/pii/S0021979796902179.
[177] Gaëlle Demarre, Anne-Marie Guérout, Chiho Matsumoto-Mashimo, Dean A.Rowe-Magnus, Philippe Marlière, and Didier Mazel. A new family of mobiliz-able suicide plasmids based on broad host range R388 plasmid (IncW) and RP4plasmid (IncPalpha) conjugative machineries and their cognate Escherichia colihost strains. Research in Microbiology, 156(2):245–255, March 2005. ISSN 0923-2508. doi: 10.1016/j.resmic.2004.09.007.
[178] L. M. Guzman, D. Belin, M. J. Carson, and J. Beckwith. Tight regulation, modu-lation, and high-level expression by vectors containing the arabinose PBAD pro-moter. Journal of Bacteriology, 177(14):4121–4130, July 1995. ISSN 0021-9193.
[179] Athanasios Typas, Manuel Banzhaf, Carol A. Gross, and Waldemar Vollmer.From the regulation of peptidoglycan synthesis to bacterial growth and morphol-ogy. Nature Reviews Microbiology, 10(2):123–136, February 2012. ISSN 1740-1526. doi: 10.1038/nrmicro2677. URL http://www.nature.com/nrmicro/journal/v10/n2/full/nrmicro2677.html.
[180] C. A. Zijderveld, M. E. Aarsman, and N. Nanninga. Differences between innermembrane and peptidoglycan-associated PBP1b dimers of Escherichia coli. Jour-nal of Bacteriology, 177(7):1860–1863, April 1995. ISSN 0021-9193, 1098-5530.doi: 10.1128/jb.177.7.1860-1863.1995. URL https://jb.asm.org/content/177/7/1860.
181
CHAPTER 10 BIBLIOGRAPHY
[181] Patrice Rassam, Kathleen R. Long, Renata Kaminska, David J. Williams, Grig-orios Papadakos, Christoph G. Baumann, and Colin Kleanthous. Intermem-brane crosstalk drives inner-membrane protein organization in Escherichia coli.Nature Communications, 9(1):1082, 2018. ISSN 2041-1723. doi: 10.1038/s41467-018-03521-4.
[182] Terrens N. V. Saaki, Henrik Strahl, and Leendert W. Hamoen. Membrane Cur-vature and the Tol-Pal Complex Determine Polar Localization of the Chemore-ceptor Tar in Escherichia coli. Journal of Bacteriology, 200(9), May 2018. ISSN1098-5530. doi: 10.1128/JB.00658-17.
[183] Yi-Chun Yeh, Luis R. Comolli, Kenneth H. Downing, Lucy Shapiro, and Harley H.McAdams. The caulobacter Tol-Pal complex is essential for outer membrane in-tegrity and the positioning of a polar localization factor. Journal of Bacteriology,192(19):4847–4858, October 2010. ISSN 1098-5530. doi: 10.1128/JB.00607-10.
[184] Enrique R. Rojas, Gabriel Billings, Pascal D. Odermatt, George K. Auer, LillianZhu, Amanda Miguel, Fred Chang, Douglas B. Weibel, Julie A. Theriot, andKerwyn Casey Huang. The outer membrane is an essential load-bearing ele-ment in Gram-negative bacteria. Nature, 559(7715):617, July 2018. ISSN 1476-4687. doi: 10.1038/s41586-018-0344-3. URL https://www.nature.com/articles/s41586-018-0344-3.
[185] M. Caparrós, J. L. M. Torrecuadrada, andM. A. de Pedro. Effect of D-amino acidson Escherichia coli strains with impaired penicillin-binding proteins. Researchin Microbiology, 142(2):345–350, January 1991. ISSN 0923-2508. doi: 10.1016/0923-2508(91)90050-K. URL http://www.sciencedirect.com/science/article/pii/092325089190050K.
[186] Jason Hocking, Richa Priyadarshini, Constantin N. Takacs, Teresa Costa, Na-talie A. Dye, Lucy Shapiro, Waldemar Vollmer, and Christine Jacobs-Wagner.Osmolality-dependent relocation of penicillin-binding protein PBP2 to the divi-sion site in Caulobacter crescentus. Journal of Bacteriology, 194(12):3116–3127,June 2012. ISSN 1098-5530. doi: 10.1128/JB.00260-12.
[187] Felipe Cava, Hubert Lam,Miguel A. de Pedro, andMatthew K.Waldor. Emergingknowledge of regulatory roles ofD-amino acids in bacteria.Cellular andmolecularlife sciences: CMLS, 68(5):817–831, March 2011. ISSN 1420-9071. doi: 10.1007/s00018-010-0571-8.
[188] Hubert Lam, Dong-Chan Oh, Felipe Cava, Constantin N. Takacs, Jon Clardy,Miguel A. de Pedro, and Matthew K. Waldor. D-Amino Acids Govern StationaryPhase Cell Wall Remodeling in Bacteria. Science, 325(5947):1552–1555, Septem-ber 2009. ISSN 0036-8075, 1095-9203. doi: 10.1126/science.1178123. URLhttp://science.sciencemag.org/content/325/5947/1552.
[189] Carmen Schwechheimer, Daniel L Rodriguez, and Meta J Kuehn. NlpI-mediatedmodulation of outer membrane vesicle production through peptidoglycan dy-namics in Escherichia coli. MicrobiologyOpen, 4(3):375–389, June 2015. ISSN2045-8827. doi: 10.1002/mbo3.244. URL https://www.ncbi.nlm.nih.gov/pmc/articles/PMC4475382/.
182
CHAPTER 10 BIBLIOGRAPHY
[190] Ming-Yuan Su, Nilanjan Som, Chia-Yun Wu, Shih-Chieh Su, Yi-Ting Kuo, Lu-Chu Ke, Meng-Ru Ho, Shiou-Ru Tzeng, Ching-Hao Teng, Dominique Mengin-Lecreulx, Manjula Reddy, and Chung-I. Chang. Structural basis of adaptor-mediated protein degradation by the tail-specific PDZ-protease Prc. Na-ture Communications, 8(1):1516, November 2017. ISSN 2041-1723. doi:10.1038/s41467-017-01697-9. URL https://www.nature.com/articles/s41467-017-01697-9.
[191] Akiko Tadokoro, Hidemi Hayashi, Toshihiko Kishimoto, Yasutaka Makino,Shingo Fujisaki, and Yukinobu Nishimura. Interaction of the Escherichia coliLipoprotein NlpI with Periplasmic Prc (Tsp) Protease. The Journal of Biochemistry,135(2):185–191, February 2004. ISSN 0021-924X. doi: 10.1093/jb/mvh022. URLhttps://academic.oup.com/jb/article/135/2/185/800433.
[192] Anne-MarieHansen, YuQiu, NormanYeh, FrederickR. Blattner, TimDurfee, andDing Jun Jin. SspA is required for acid resistance in stationary phase by downreg-ulation of H-NS in Escherichia coli. Molecular Microbiology, 56(3):719–734, May2005. ISSN 0950-382X. doi: 10.1111/j.1365-2958.2005.04567.x.
[193] J. V. Höltje, W. Fiedler, H. Rotering, B. Walderich, and J. van Duin. Lysis inductionof Escherichia coli by the cloned lysis protein of the phage MS2 depends on thepresence of osmoregulatory membrane-derived oligosaccharides. The Journal ofBiological Chemistry, 263(8):3539–3541, March 1988. ISSN 0021-9258.
[194] Matthew A. Gerding, Yasuyuki Ogata, Nicole D. Pecora, Hironori Niki, and PietA. J. de Boer. The trans-envelope Tol-Pal complex is part of the cell divisionmachinery and required for proper outer-membrane invagination during cellconstriction in E. coli. Molecular Microbiology, 63(4):1008–1025, February 2007.ISSN 0950-382X. doi: 10.1111/j.1365-2958.2006.05571.x.
[195] J. C. Lazzaroni, P. Germon, M. C. Ray, and A. Vianney. The Tol proteins of Es-cherichia coli and their involvement in the uptake of biomolecules and outermembrane stability. FEMS microbiology letters, 177(2):191–197, August 1999.ISSN 0378-1097. doi: 10.1111/j.1574-6968.1999.tb13731.x.
[196] Sébastien Bontemps-Gallo, Jean-Pierre Bohin, and Jean-Marie Lacroix. Osmoreg-ulated Periplasmic Glucans. EcoSal Plus, 7(2), 2017. ISSN 2324-6200. doi:10.1128/ecosalplus.ESP-0001-2017.
[197] Patrick Freire, Ricardo Neves Moreira, and Cecília Maria Arraiano. BolA In-hibits Cell Elongation and Regulates MreB Expression Levels. Journal of Molecu-lar Biology, 385(5):1345–1351, February 2009. ISSN 0022-2836. doi: 10.1016/j.jmb.2008.12.026. URL http://www.sciencedirect.com/science/article/pii/S0022283608015350.
[198] Jorge M. Santos, Mónica Lobo, António P. A. Matos, Miguel A. De Pedro, and Ce-cilia M. Arraiano. The gene bolA regulates dacA (PBP5), dacC (PBP6) and ampC(AmpC), promoting normal morphology in Escherichia coli. Molecular Microbiol-ogy, 45(6):1729–1740, 2002. ISSN 1365-2958. doi: 10.1046/j.1365-2958.2002.03131.x. URL https://onlinelibrary.wiley.com/doi/abs/10.1046/j.1365-2958.2002.03131.x.
183
CHAPTER 10 BIBLIOGRAPHY
[199] April Pawluk, Alan R. Davidson, and Karen L. Maxwell. Anti-CRISPR: discov-ery, mechanism and function. Nature Reviews. Microbiology, 16(1):12–17, January2018. ISSN 1740-1534. doi: 10.1038/nrmicro.2017.120.
[200] Chuan Dong, Ge-Fei Hao, Hong-Li Hua, Shuo Liu, Abraham Alemayehu Labena,Guoshi Chai, Jian Huang, Nini Rao, and Feng-Biao Guo. Anti-CRISPRdb: a com-prehensive online resource for anti-CRISPR proteins. Nucleic Acids Research, 46(D1):D393–D398, January 2018. ISSN 0305-1048. doi: 10.1093/nar/gkx835.URL https://academic.oup.com/nar/article/46/D1/D393/4191329.
[201] Saumya Saurabh, AdamM. Perez, Colin J. Comerci, Lucy Shapiro, and W. E. Mo-erner. Super-resolution Imaging of Live Bacteria Cells Using a Genetically Di-rected, Highly Photostable Fluoromodule. Journal of the American Chemical Soci-ety, 138(33):10398–10401, 2016. ISSN 1520-5126. doi: 10.1021/jacs.6b05943.
[202] Marc J. Lajoie, Alexis J. Rovner, Daniel B. Goodman, Hans-Rudolf Aerni, AdrianD.Haimovich, Gleb Kuznetsov, Jaron A. Mercer, Harris H. Wang, Peter A. Carr,Joshua A. Mosberg, Nadin Rohland, Peter G. Schultz, Joseph M. Jacobson, JesseRinehart, George M. Church, and Farren J. Isaacs. Genomically Recoded Organ-isms Expand Biological Functions. Science, 342(6156):357–360, October 2013.ISSN 0036-8075, 1095-9203. doi: 10.1126/science.1241459. URL http://science.sciencemag.org/content/342/6156/357.
[203] Daniel J. Mandell, Marc J. Lajoie, Michael T. Mee, Ryo Takeuchi, Gleb Kuznetsov,Julie E. Norville, Christopher J. Gregg, Barry L. Stoddard, and GeorgeM. Church.Biocontainment of genetically modified organisms by synthetic protein design.Nature, 518(7537):55–60, February 2015. ISSN 1476-4687. doi: 10.1038/nature14121. URL https://www.nature.com/articles/nature14121.
[204] Robert D. Turner, Jamie K. Hobbs, and Simon J. Foster. Atomic Force Mi-croscopy Analysis of Bacterial Cell Wall Peptidoglycan Architecture. Methodsin Molecular Biology (Clifton, N.J.), 1440:3–9, 2016. ISSN 1940-6029. doi:10.1007/978-1-4939-3676-2_1.
[205] Monica Markovski, Jessica L. Bohrhunter, Tania J. Lupoli, Tsuyoshi Uehara,Suzanne Walker, Daniel E. Kahne, and Thomas G. Bernhardt. Cofactor bypassvariants reveal a conformational control mechanism governing cell wall poly-merase activity. Proceedings of the National Academy of Sciences of the United Statesof America, 113(17):4788–4793, April 2016. ISSN 1091-6490. doi: 10.1073/pnas.1524538113.
184

Chapter 11
Appendix
185
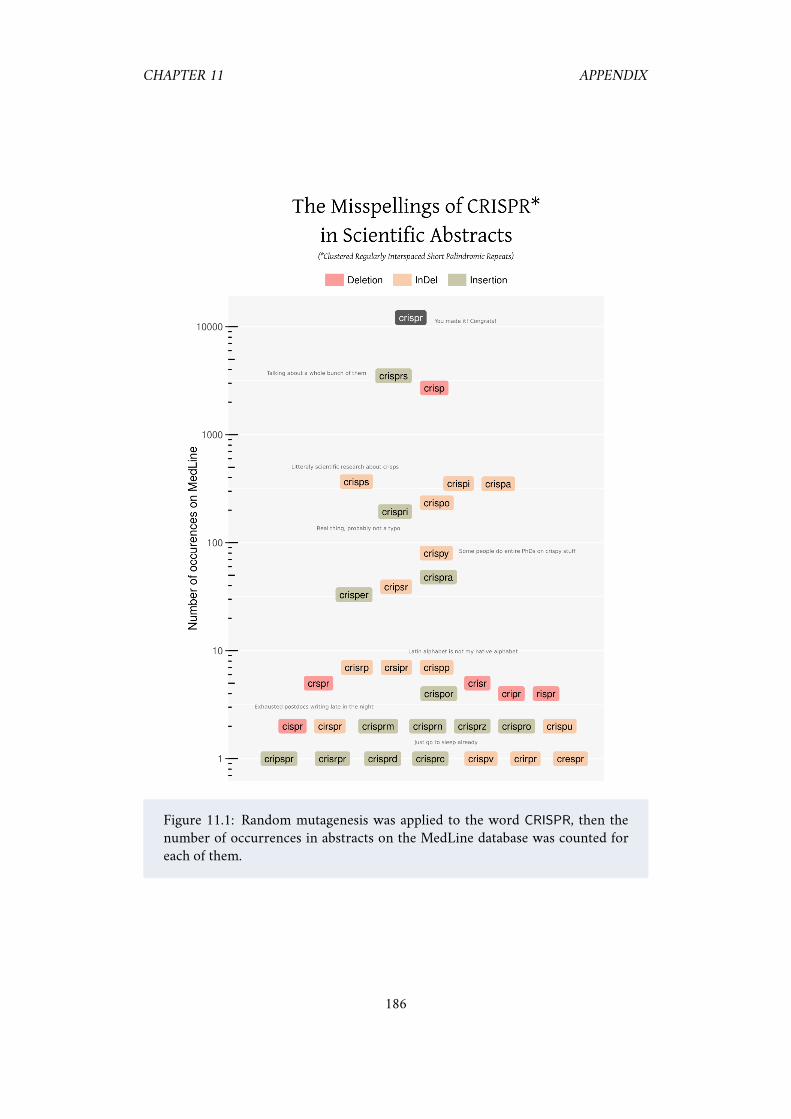
CHAPTER 11 APPENDIX
Figure 11.1: Random mutagenesis was applied to the word CRISPR, then thenumber of occurrences in abstracts on the MedLine database was counted foreach of them.
186

CHAPTER 11 APPENDIX
Figure 11.2: Current state of my bench. I will come back in 10 years and checkthat nothing has moved.
187
Copyright © 2022 FDOKUMEN