PROPERTIES OF RICE STRAW CEMENTITIOUS COMPOSITE
169
PROPERTIES OF RICE STRAW CEMENTITIOUS COMPOSITE Submitted to Department of Civil Engineering and Geodesy For the Degree of Doctor of Engineering M.Sc. Mohamed Ibrahim Nasr Morsy Alexandria, Egypt Supervisors: Prof. Dr. Ing. Harald Garrecht Prof. Dr. Farouk Abbas Heider Date of Submission: 02.11.2011 Date of Examination: 25.11.2011 Darmstadt 2011 D 17 I
-
Upload
khangminh22 -
Category
Documents
-
view
2 -
download
0
Transcript of PROPERTIES OF RICE STRAW CEMENTITIOUS COMPOSITE

PROPERTIES OF RICE STRAW CEMENTITIOUS COMPOSITE Submitted to Department of Civil Engineering and Geodesy For the Degree of Doctor of Engineering M.Sc. Mohamed Ibrahim Nasr Morsy Alexandria, Egypt
Supervisors: Prof. Dr. Ing. Harald Garrecht Prof. Dr. Farouk Abbas Heider Date of Submission: 02.11.2011 Date of Examination: 25.11.2011
Darmstadt 2011 D 17
I


TECNISCHE UNIVERSITÄT DARMSTADT DEPARTMENT OF CIVIL ENGINEERING AND GEODESY
PROPERTIES OF RICE STRAW CEMENTITIOUS COMPOSITE
By Mohamed Ibrahim Nasr Morsy M.Sc. in Agricultural Engineering
A thesis Submitted to Department of Civil Engineering and Geodesy
For the Degree of Doctor of Engineering
Supervised by: Prof. Dr.Ing.-Harald Garrecht Chair of Building Materials, Building Physics and Building Chemistry Institute of Concrete, Masonry Structures and Building Materials Darmstadt University of Technology, Germany Prof. Dr. Farouk Abbas Heider Professor of Rural Architecture and Planning Department of Agricultural Engineering Faculty of Agriculture Alexandria University , Egypt.
II


ABSTRACT
Utilization of rice straw as a building material is the main aim of this work. The study is divided into four divisions; study the effect of treatments on the constituents and tensile properties of rice straw, hydration of rice straw with Portland cement, development of high content fly ash cementitious binder, and determination physical and mechanical properties of straw fly ash cementitious binder composites. Treating rice straw with 1% NaOH solution, it is classified as a filler or reinforcement for cementitious building materials. Whereas, the addition of 6% CaCl2 to the mixture improves the compatibility due to the decrease of the inhibitor effect of soluble materials. An acceleration of the cement hydration process can be observed. On the other hand, optimum curing temperature will be given during the first 24 hours at 85oC for all the studied systems. Fly ash -calcium hydroxide- gypsum- cement mixture with 70%:3.5%:7%:19.5% weight ratio results in the highest compressive strength (50 MPa at 28 days). According to compressive strength and flexural strength data, rice straw cementitious mixture could be classified as carrying material for making bricks with straw content up to 10 %.
III


KURZFASSUNG
Die vorliegende Dissertation befasst sich mit der Erforschung der Verwendung von Reisstroh als Baustoff. Die durchgeführten Forschung wurde in 4 Abschnitte unterteilt: Untersuchungen zum Einfluss der Aufbereitung auf die Beschaffenheit und Zugfestigkeit von Reisstroh, Untersuchungen zur Hydratation von Portlandzement bei Verwendung von Reisstroh, Untersuchungen zur Entwicklung von Bindemitteln mit sehr hohem Anteil an Flugasche und Untersuchungen zur Ermittlung der physikalischen und mechanischen Eigenschaften von Baustoffen aus Bindemittelkompositionen mit Strohasche. Eine Tränkung von Reisstroh mit 1-prozentiger Natriumhydroxidlösung bewirkt, dass Reisstroh als Füller oder Bewehrung für mineralische Baustoffe verwendet werden kann. Zusätzlich verbessert die Zugabe von 6 Prozent Calciumchlorid zur Mischung die Eignung des Reisstrohs, bedingt durch die Abnahme der Hydratation von lösbaren Stoffen, was eine signifikante Beschleunigung des Hydratationsprozesses von Zement zur Folge hat. Es konnte nachgewiesen werden, dass durch eine Wärmebehandlung, dabei betrug für alle untersuchten Gemische die optimale Nachbehandlungstemperatur 85°C in den ersten 24 Stunden, der Hydratationsprozess beschleunigt wird. Mischungen bestehend aus Flugasche, Calciumhydroxid, Gips und Zement mit den Massenverhältnissen 70 % : 3,5 % : 7 % : 19,5 % führten zur höchsten Druckfestigkeit (50 MPa nach 28 Tagen). Auf Basis der vorliegenden Ergebnisse Druckfestigkeit und Biegezugfestigkeit können Mischungen aus Reisstroh und entwickelter Bindemittel-zusammensetzung durchaus mit einem Strohgehalt von bis zu 10 % zur Herstellung von Mauersteinen verwendet weden. Diese lassen sich dann zum Bau von tragendem Mauerwerk einsetzen.
IV


ACKNOWLEDGEMENTS Praise and Glory be to Almighty ALLAH for bestowing me with health and power to complete
this work.
It is my pleasure to express my deep and faithful appreciation and profound gratitude to my
thesis supervisor Prof. Dr.Ing.-Harald Garrecht, Chair of Building Materials, Building
Physics and Building Chemistry, Institute of Concrete, Masonry Structures and Building
Materials, Darmstadt University of Technology, for suggesting this research, his continues
supervision, his helpful instructions and guidance throughout this thesis with the farthest
care, and great contributions.
My deepest appreciation and indebtedness extended to Prof. Dr.Farouk Abbas Heidar, Professor
of Rural Architecture and planning, Agricultural engineering department, Faculty of
agriculture, Alexandria university, who had guided and supported me in the compilation of
this thesis.
I am also indebted to Prof. Dr.Ing.Dr.h.c. Hartmut Fuess, Professor of Materials Science,
Institute of Materials Science, Darmstadt University of Technology, for his great concern to
make this work better.
My gratitude also due to all the staff and technicians of the Institute of Concrete, Masonry
Structures and Building Materials, Darmstadt University of Technology for their cooperation
and help. I was very lucky to work with all of them.
I wish to acknowledge Darmstadt University of Technology for providing me wonderful and
all needed research facilities.
Thanks should also be given to the staff member of the Agricultural engineering department,
Faculty of agriculture, Alexandria University.
I wish to acknowledge with gratitude and appreciation the ( Egyptian Cultural Bureau and
Study Mission in Berlin, Germany ) for being supportive and helpful.
Last but not least, my deepest gratitude goes to my beloved parents, brother and also to my
sisters for their endless love, prayers and encouragement. Also special thanks to my wife for
her love and care. To those who indirectly contributed to this research, your kindness meant a
lot to me. Thank you very much.
V


VI
TABLE OF CONTENTS Title Page
ABSTRACT III KURZFASSUNG IV ACKNOWLEDGEMENTS V TABLE OF CONTENTS VI LIST OF TABLES X LIST OF FIGURES XI 1 THESIS OUTLINES 1.1 Problem definition…………………………………………………………….. 1 1.2 Aims of the study……………………………………………………………... 2 1.3 Content and structure of the thesis……………………………………………. 2 2 LITERATURE REVIEW 2.1 Introduction…………………………………………………………………… 3 2.2 Composite materials…………………………………………………………... 3 2.2.1 Classification of wood and lignocelluloses material composite ……………… 4 2.2.1.1 Classification of composites based on the type of fibers……………………… 4 2.2.1.2 Classification of composites based on the type of matrix…………………….. 5 2.2.2 Composite mechanical properties …………………………………………….. 6 2.2.3 Concept of critical volume fraction …………………………………………... 7 2.2.4 Critical fiber aspect ratio……………………………………………………… 8 2.3 Natural fibers ………………………………………………………………..... 10 2.3.1 Surceases and classification of natural fiber …………………………………. 10 2.3.2 Lignocelluloses structure …………………………………………………..… 11 2.3.2.1 Cell wall structure ……………………………………………………………. 11 2.3.2.2 Chemical constituents of natural fibers ………………………………………. 14 2.3.3 Lignocelluloses fibers strength and physical properties ……………………… 16 2.4 Inorganic binders used in the production of lignocelluloses composites ……. 18 2.4.1 Hydration of gypsum plaster …………………………………………………. 18 2.4.2 Hydration of magnesia cement ……………………………………………... 19 2.4.3 Hydration of Portland cement ………………………………………………… 19 2.4.3.1 Hydration reaction of C3S and C2S …………………………………………… 19 2.4.3.2 Hydration reaction of C3A …………………………………………………… 19 2.4.3.3 Hydration reaction of C4AF ………………………………………………….. 20 2.4.4 Effect of lignocelluloses material on cement hydration ……………………… 23 2.4.5 Improvements of lignocelluloses cement compatibility ……………………… 23 2.4.5.1 Compatibility determination ………………………………………………….. 24 2.5 Inorganic binder lignocelluloses material bonding mechanisms ……………... 25 2.5.1 Chemical bonding …………………………………………………………….. 25 2.5.2 Mechanical bonding …………………………………………………………... 26 2.6 Pozzolanic materials……………………….………………………………….. 27 2.6.1 Definition of pozzolanic materials ………………………………………….... 27 2.6.2 Pozzolana activity …………………………………………………………….. 27 2.6.3 Sources of pozzolanic materials ……………………………………………… 28 2.6.3.1 Rice straw and husk ash ……………………………………………………… 28 2.6.3.2 Fly ash ………………………………………………………………………… 31

VII
TABLE OF CONTENTS (contd.) Page 2.6.3.3 Silica fume ……………………………………………………………………. 32 2.6.3.4 Blast furnace slag ……………………………………………………………... 32 2.6.4 Major activation techniques of pulverized fuel ash …………………………... 33 2.6.4.1 Activation of chemical substances and its application ……………………….. 33 2.6.4.2 Mechanical methods …………………………………………………….…… 34 2.6.4.3 Physicochemical methods …………………………………………………….. 34 2.6.5 Mechanical and physical properties of high content pozzolana binder ………. 35 3 MATERIALS AND EXPERIMENTAL DETAILS 3.1 Introduction…………………………………………………………………… 38 3.2 Materials ………………………………………………………………...……. 38 3.2.1 Water………………………………………………………………………….. 38 3.2.2 Rice straw…………………………………………………………………….. 38 3.2.3 Binding materials……………………………………………………………... 38 3.2.4 Chemical additives……………………………………………………………. 38 3.3 Experimental parts 38 3.3.1 Part 1: Determination of physical and mechanical properties of non-treated
and treated rice straw……………………………………………………….… 38 3.3.2 Part 2: Hydration of rice straw with Portland cement ………………………... 40 3.3.3 Part 3: Development of high content fly ash cementitious binder…………….. 42 3.3.3.1 Mixes design and curing conditions ………………………….......................... 42 3.3.3.2 Mixture preparation………………………… 42 3.3.4 Part 4: Determination of physical and mechanical properties of straw fly ash
cementitious binder ………………………………………………………….. 43 3.4 Methods……………………………………………………………………….. 45 3.4.1 Determination of chemical component of rice straw………………………….. 45 3.4.2 Density measurements…………………………………………………..……. 46 3.4.3 Water absorption, thickness swelling, and porosity tests…………………..… 47 3.4.4 Measurement of pore size distribution……………………………………..… 48 3.4.5 Hydration test…………………………………………………………………. 49 3.4.6 X-ray diffraction tests………………………………………………………… 50 3.4.7 Scanning electron microscopy………………………………………………… 52 3.4.8 Thermogravimety analysis (TG/DTG)………………………………………... 53 3.4.9 Thermal conductivity test…………………………………………………….. 53 3.4.10 Straw tensile test ……………………………………………………………… 54 3.4.11 Compressive test………………………………………………………………. 55 3.4.12 Flexural test…………………………………………………………………… 56 4 EFFECT OF STRAW TREATMENT ON RICE STRAW
PROPERTIES
4.1 Introduction…………………………………………………………………… 57 4.2 Chemical component of rice straw……………………………………………. 57 4.3 Scanning electron microscopy………………………………………………… 58 4.4 X-ray diffraction………………………………………………………………. 59 4.5 Straw density………………………………………………………………….. 60 4.6 Straw tensile strength…………………………………………………………. 61 4.7 Conclutions……………………………………………………………………. 62

VIII
TABLE OF CONTENTS (contd.) Page 5 HYDRATION OF RICE STRAW WITH PORTLAND CEMENT 5.1 1ntroduction…………………………………………………………………… 63 5.2 Effect of rice straw particles addition on cement hydration…………………... 63 5.3 Effect of straw particle treatment and particle size on the hydration of cement
straw composites……………………………………………………………… 66 5.4 Effect of CaCl2 addition on straw cement mixture hydration……………….. 71 5.5 Conclusions…………………………………………………………………… 77 6 STRENGTH DEVELOPMENT OF HIGH CONTENT FLY ASH
CEMENTITIOUS BINDER
6.1 Introduction……………………………………………………………………. 78 6.2 Strength development of fly ash-calcium hydroxide mixtures………………... 78 6.2.1 Strength development of fly ash calcium-hydroxide mixture under room
curing condition………………………………………………………………. 78 6.2.2 Strength development of fly ash-calcium hydroxide mixture under 45, 65, 85,
and 105 oC curing conditions…………………………………………………. 79 6.3 Strength development of fly ash-calcium hydroxide-gypsum mixtures………. 80 6.3.1 Effect of curing temperature on the strength development…………………… 80 6.3.2 Effect of gypsum content and calcium hydroxide content on the strength
development under 85 oC curing condition………………………………….. 80 6.3.3 Effect of water to binder ratio on the strength development………………….. 83 6.3.4 Effect of curing condition on the strength development ……………………... 84 6.3.4.1 Water curing vs. air curing……………………………………………………. 84 6.3.4.2 Effect of heating time on the strength development………………………….. 86 6.4 Strength development of fly ash/calcium hydroxide/gypsum/Portland cement
mixtures……………………………………………………………………….. 88 6.4.1 Influence of calcium hydroxide content on the strength development ……..... 88 6.4.2 Influence of gypsum content on the strength development 89 6.4.3 Influence of calcium hydroxide with gypsum on the strength development….. 89 6.5 Conclusions……………………………………………………………………. 91 7 HYDRATION AND PORE STRUCTURE OF FLY ASH
CEMENTITIOUS BINDER
7.1 Introduction……………………………………………………………………. 92 7.2 Thermogravimetry analysis…………………………………………………… 92 7.3 XRD analysis………………………………………………………………….. 96 7.3.1 XRD analysis of row material………………………………………………… 96 7.3.2 XRD analysis of hydration products…………………………………………... 96 7.3.2.1 Fly ash-cement system………………………………………………………… 96 7.3.2.2 Fly ash-gypsum-cement system………………………………………………. 97 7.3.2.3 Fly ash-calcium hydroxide-cement system…………………………………… 98 7.3.2.4 Fly ash-calcium-hydroxide-gypsum-cement system………………………….. 99 7.4 Pore structure………………………………………………………………….. 100 7.4.1 Total porosity………………………………………………………………….. 100 7.4.2 Pore size distribution………………………………………………………….. 102 7.4.3 Classification of the pore structure………………………………….………... 105

IX
TABLE OF CONTENTS (contd.) Page 7.5 ESEM observation…………………………………………………………….. 107 7.6 Conclusions……………………………………………………………………. 108 8 PROPERTIES OF RICE STRAW CEMENTITIOUS COMPOSITE 8.1 Introduction……………………………………………………………………. 109 8.2 Dry density of the rice straw cementitious composite.……………………….. 109 8.3 Porosity of rice straw cementitious composite.……………………………….. 111 8.4 Compressive strength…………………………………………………………. 113 8.5 Flexural strength………………………………………………………………. 114 8.6 Thermal conductivity………………………………………………………….. 115 8.7 Water absorption………………………………………………………………. 116 8.8 Thickness swelling…………………………………………………………….. 119 8.9 Conclusion…………………………………………………………………….. 120 9 SUMMARY AND RECOMMENDATION 9.1 Summary………………………………………………………………………. 121 9.2 Recommendation……………………………………………………………… 122 10 REFERENCES………………………………………………………………. 123
11 APPENDIX…………………………………………………………………… 138

X
LIST OF TABLES
No. Page 2.1 Chemical compositions of some common plant fibers……………………... 17
2.2 Typical properties of fibres of second category (Low modulus of elasticity fibres)………………………………………………………………………… 18
2.3 Typical composition of ordinary Portland cement.………………………….. 19 2.4 Characteristics of hydration of the cement compound.……………………… 20 2.5 Ash and silica content of some plants ………………………………………. 29 2.6 Physical properties of rice husk……………………………………………… 29 2.7 Elemental composition of ash …..…………………………………………... 29 2.8 Silica content of silica fume in different alloy making industries…………… 32 3.1 Distributing tests during study parts…………………………………………. 45 3.2 Standards followed for chemical analysis…………………………………… 45 4.1 Soluble extractive of straw particles………………………………………… 57 4.2 Crystallintiy Index of Rice Straw…………………………………………… 60 4.3 Typical density measurement of untreated and treated rice straw…………... 61 4.4 Tensile strength and Young’s modulus of untreated and treated rice straw… 62 5.1 Inhibitory index which is used to classify the compatibility level…………….. 65 5.2 Effect of CaCl2 addition on the maximum hydration temperature and time to
reach maximum hydration temperature for untreated and treated straw- cement composites at 7.5% straw content………………………………….. 71
7.1 Percentage of increases or reduction on hydration phase due to curing the fly ash cementitious pastes at 85ºC relative to the tested pastes cured at 20ºC…………………………………………………………………………. 99
7.2 Summary of Threshold Pore Diameters of unheated and heated fly ash cementitious mixtures……………………………………………………….. 102
11.1 Chemical compositions of binders ………………………………………...... 139 11.2 Fineness of binders………………………………………………………….. 139 11.3 Compressive and flexural strength of Portland cement and gypsum……….. 139 11.4 Fly ash cementitious binder mixtures design and its curing conditions …...... 140 11.5 Specifications for thermal conductivity machine…………………………… 142 11.6 Parameter values of cement hydration test for different straw content……… 142 11.7 Mean values of compressive strength CS and relative strength RS for rice
straw cement composites at different straw content………………………… 142 11.8 Parameter-values of cement hydration test and compressive test with7.5%
of untreated and treated straw for different particle size. …………………... 143 11.9 Effect of CaCl2 addition on the hydration parameter-values of untreated and
treated straw cement composites at 7.5% straw content…………………… 143 11.10 Least square means ± SEM (error mean square) of rice straw cementitious
composites properties………………………………………………………... 144

XI
LIST OF FIGURES
No. Page 2.1 Composite material……………………………………………………… 3 2.2 Basic wood ligno-cellulose elements, from largest to smallest…………. 4 2.3 Types of composites material based on the form of reinforcement……... 5 2.4 Types of binding materials used in wood /lignocelluloses composites
matrix……………………………………………………………………. 5 2.5 Schematic of crack propagation inside the cement matrix with fibers….. 6 2.6 Composites tensile strength as a function of fiber volume fraction……... 8 2.7 Composite stress strain curve……………………………………………. 8 2.8 Tensile and shear stress variation along with fiber length embedded in
continuous matrix and subjected to tensile force in fiber direction……... 9 2.9 Effect of fiber length on fiber tensile strength………………………….. 10 2.10 Categories of natural fiber………………………………………………. 11 2.11 Structure of lignocellulose and wood plant…………………………….. 12 2.12 Schematic illustration of the cell wall of lignocellulose cells…………… 13 2.13 Schematic illustration of the layers of lignocellulose fibers……………. 13 2.14 The chemical structure of glucose showing the carbon number and two
glucose to form cellulose………………………………………………… 14 2.15 Example of two hemicellulose sugar monomers………………………… 15 2.16 Lignin structure. …………………………………………...……………. 16 2.17 Rate of hydration of cement compound…………………………………. 21 2.18 Compressive strength development in pastes of pure cement compounds 21 2.19 Rate of heat evolution and hydration stages verse hydration time of
Portland cement………………………………………………………….. 22 2.20 Possible coupling mechanism between wood fibre and cement matrix. .. 26 2.21 Flow chart of the slip forming process………………………………….. 35 2.22 Flow chart of pressure forming process……………………………….… 35 3.1 Rice straw treatment diagram and its experiment tests………………….. 39 3.2 Soaking treatments of rice straw……………………………………….... 39 3.3 Straw particles used in the study………………………………………… 40 3.4 Compatibility tests diagram of rice straw cement composites…………... 41 3.5 Hand mixer and steel mould for straw cement composite………............. 41 3.6 Mortar mixer and vibrating machine. …………………………………… 43 3.7 Experimental diagram of Rice straw -fly ash cementitious binder
composites……………………………………………………………….. 44 3.8 Soxhlet apparatus………………………………………………………... 46 3.9 Helium pycnometer……………………………………………………… 46 3.10 Mercury intrusion porosimetry machine………………………………… 48 3.11 Hydration test experimental set-up……………………………………… 49 3.12 Schematic representation of typical hydration curve. …………………... 50 3.13 Rice straw XRD setup…………………………………………………… 51 3.14 A plot of the angular dependence of the intensity of x-ray photons
detected as a function of 2θ, the angle between the detector position and the direction of the incident beam……………………………………….. 51

XII
LIST OF FIGURES(contd.) No. Page 3.15 STOE STADI P XRD machine………………………………………….. 52 3.16 Environmental scanning electron microscopy machine…………………. 52 3.17 A. thermal conductivity plastic form and B. sample of thermal
conductivity……………………………………………………………… 53
3.18 Thermal conductivity test machine……………………………………… 54 3.19 Rice straw tensile test……………………………………………………. 55 3.20 Compressive test machine……………………………………………….. 56 3.21 Flexural test machine…………………………………………………….. 56 4.1 Plots of the rice straw chemical component for both treated and
untreated fiber……………………………………………………………. 58 4.2 SEM micrographs of rice straw fiber surface of: (a) untreated fiber; (b)
water treated fiber;(c) NaOH treated fiber………………………………. 59 4.3 X-Ray diffractograms of treated and untreated rice straw………………. 60 4.4 Load displacement curve for untreated and treated rice straw………….. 61 5.1 Variation of the hydration temperature vs. time for neat cement and
composites containing different amounts of straw particles…………….. 63 5.2 Effect of straw content on maximum hydration temperature and time to
reach maximum hydration temperature for untreated straw-cement composites……………………………………………………………….. 64
5.3 Effect of straw content on heat energy released (ET) and hydration rate (R) for untreated straw-cement composites……………………………… 65
5.4 Effect of straw content on untreated straw-cement composites compressive strength…………………………………………………….. 65
5.5 ESEM image for untreated straw-cement composite containing 7.5% straw particles…………………………………………………………… 66
5.6 Effect of straw particle size and treatment on (a) time to reach maximum hydration temperature and (b) maximum hydration temperature……….. 67
5.7 Effect of straw particle size and treatment on hydration rate of rice straw cement…………………………………………………………………… 68
5.8 Effect of straw particle size and treatment on heat energy released from rice straw cement composites……………………………………………. 68
5.9 Effect of straw particle size and treatment on rice straw-cement composites compressive strength………………………………………... 69
5.10 ESEM micrograph for water treated straw cement composite………….. 70 5.11 ESEM micrograph for NaOH treated straw-cement composite…………. 70 5.12 Effect of CaCl2 content on hydration curve of (20~40 mesh) untreated
straw-cement composites at straw content 7.5%....................................... 71 5.13 Effect of CaCl2 content, straw size, and straw treatment on the hydration
rate of straw-cement composites at straw content 7.5 wt.%...................... 72 5.14 Effect of CaCl2 content and straw treatment on the total energy released
(ET) of straw-cement composites at straw content 7.5%.......................... 73 5.15 Effect of CaCl2 content, straw size, and straw treatment on compressive
strength of straw-cement composites at straw content of 7.5 % by weight……………………………………………………………………. 74

XIII
LIST OF FIGURES(contd.) No. Page 5.16 ESEM image of the polished surface of untreated and treated rice straw-
cement composites with CaCl2 obtained after 28 days of curing. EDS spots are signalized in the images (spots 1-6)…………………………… 76
6.1 Strength development of fly ash-calcium hydroxide pastes under room curing condition…………………………………………………………. 78
6.2 Strength development of heated fly ash-calcium hydroxide pastes at 1 day……………………………………………………………………….. 79
6.3 Effect of curing temperature in the first 24 h and gypsum content on strength development of fly ash-calcium hydroxide-gypsum Mixtures... 81
6.4 Effect of calcium hydroxide content and gypsum content on strength development of fly ash -calcium hydroxide-gypsum paste cured at 85oC in the first 24 h…………………………………………………………… 82
6.5 Effect of water to powder ratio on the strength of the fly ash-calcium hydroxide-gypsum mixtures……………………………………………... 83
6.6 Effect of water curing (WC) and air curing (AC) on the strength development of fly ash-calcium hydroxide-gypsum mixtures at 28 day... 85
6.7 Percentage of reduction in compressive strength of fly ash-calcium hydroxide-gypsum mixtures due to curing in water for 27 days relative to air cured mixtures……………………………………………………... 86
6.8 Crack formation due to curing fly ash-calcium hydroxide-gypsum specimens in water at 20oC for 27 days………………………………… 86
6.9 Effect of heating time at 85oC on the strength development of fly ash-calcium hydroxide-gypsum mixtures, …………………………………... 87
6.10 Effect of replacing the cement by calcium hydroxide on the strength development of unheated and heated fly ash- calcium hydroxide-cement mixtures containing 70 wt% fly ash from the total weight……………… 88
6.11 Effect of replacing the cement by gypsum on the strength development of unheated and heated fly ash- gypsum-cement mixtures containing 70 wt% fly ash content from the total weight………………………………. 89
6.12 Effect of replacing the cement by gypsum on the strength development of unheated and heated fly ash-calcium hydroxide-gypsum-cement mixtures containing 70 wt % fly ash and 3.5 wt % calcium hydroxide from the total weight…………………………………………………….. 90
6.13 Effect of replacing the cement by gypsum on the strength development of unheated and heated fly ash-calcium hydroxide-gypsum-cement mixtures containing 70 wt % fly ash and 7 wt % calcium hydroxide from the total weight…………………………………………………….. 90
7.1 Thermalgravimetric curves for fly ash cementitious mixtures…………... 93 7.2 Weight reduction due to the dehydration or decomposition of each
hydration phase and total weight reduction for the tested cementitious mixtures; (a) mixtures cured at 20oC and (b) mixtures cured at 85oC…... 95
7.3 XRD patterns of fly ash cement mixtures……………………………….. 97 7.4 XRD patterns of fly ash gypsum cement mixtures……………………… 98 7.5 XRD patterns of fly ash calcium hydroxide cement mixtures…………... 99 7.6 XRD patterns of fly ash calcium hydroxide gypsum cement mixtures…. 99 7.7 Total porosity of 20 ˚C cured cementitious mixtures at 1 and 28 days…. 100

XIV
LIST OF FIGURES(contd.) No. Page 7.8 Total porosity of 85˚C cured cementitious mixtures at 1 and 28 days….. 101 7.9 Pore size distribution of 20oC cured cementitious mixtures at 1 and 28
days……………………………………………………………………… 103 7.10 Pore size distribution of 85oC cured cementitious mixtures at 1 and 28
days……………………………………………………………………… 104 7.11 Classification of pore sizes of fly ash cematitious mixtures…………….. 106 7.12 SEM micrograph of fly ash cementitious mixtures cured at 20oC………. 107 7.13 SEM micrograph of fly ash cementitious mixtures cured at 80oC………. 108 8.1 Effects of straw content and particle size on composites density………………. 109 8.2 Effects of straw content and particle size on density reduction percent……….. 110 8.3 Correlation between straw content and density ………………………………... 111 8.4 Porosity as a function of straw content and particle size……………………….. 112 8.5 Correlation between density and Porosity of rice straw cementitious
composites……………………………………………………………………… 112 8.6 Effect of straw content and partial size on compressive strength………………. 113 8.7 Correlation between density and compressive strength………………………… 114 8.8 Effect of straw content on composite flexural strength for different straw
particle sizes……………………………………………………………………. 115 8.9 Effect of straw content on composite thermal conductivity for different straw
particle sizes……………………………………………………………………. 116 8.10 Correlation between density and thermal conductivity at 10, 25, and 40 ˚C…… 117 8.11 Effect of straw content on composite water absorption for different straw
particle sizes……………………………………………………………………. 117 8.12 Correlation between density and water absorption of straw cementitious
composite………………………………………………………………………. 118 8.13 Effect of straw content on Thickness swelling for different straw particle sizes. 119 8.14 Correlation between density and thickness swelling of straw cementitious
composite……………………………………………………………………….. 120 11.1 Thermal conductivity test setup…………………………………………. 146 11.2 Summarize the thermal conductivity steps measurements………………. 146 11.3 XRD pattern of fly ash………………………………………………….., 147 11.4 XRD pattern of gypsum…………………………………………………. 147 11.5 XRD pattern of calcium hydroxide……………………………………… 148 11.6 XRD pattern of Portland cement………………………………………… 148

Chapter 1. Thesis outlines
1
1 THESIS OUTLINES The urgent need to develop suitable and affordable housing is born as a consequence of the fact that over one billion people in the world, most of them are living in the developing nations, are either homeless or live in very poor housing. On the other hand, the sustainable world’s economic growth and people’s life improvement greatly depend on the use of alternative products in the architecture and construction, such as industrial wastes conventionally called “green materials” (BASIN news, 2001). Cement bonded boards (CBB) are well established in market place and widely applied in many developed countries. It combines the properties of two important materials: cement and any fibrous materials like wood or agricultural residues. It is a panel product made up of either strands, flakes, chips, particles or fibres of wood or some agricultural residues bonded with ordinary Portland cement (Pererira et al., 2006). Wood particles-cement composites have been produced from a number of agro-forestry material including sawdust, construction waste, bagasse, coffee husk, maize husk, and ratten furniture waste among others (Kasai et al. 1998, Olorunnisola & Adefisan 2002, Ajayi 2002). Lignocellulosic materials are available on a worldwide basis and considered from renewable resources. They can be obtained at low cost and low levels energy using local manpower and technology (Frybort et al., 2008). Composites made of cement and lignocelluloses materials have many advantages; better dimensional stability, better resistance to biodeterioration and fire, have no formaldehyde emission originating from the binder and can be used as means of recycling wood residues . On the other hand, they can be used to face the insufficiency of wood fibers and the increasing in lumber prices (Pererira et al., 2006). On the other hand, the manufacture of ordinary Portland cement (OPC) is a highly energy intensive and environment unfriendly process required about 4 GJ of energy per tone of the finished product in addition to produce 0.8 – 1.3 ton of CO2 per ton of cement production. Also, the contribution of Portland cement production worldwide to the greenhouse gas emission is estimated to be about 1.35 billion ton annually or about 7% of the total greenhouse gas emission to the earth atmosphere (Malhotra, 2002). In order to produce environmentally friendly concrete, Mehta (2002) suggested the use of fewer natural resources, less energy, and minimize carbon dioxide emissions. McCaffrey (2002) suggested that the amount of CO2 emissions by cement industries can be reduced by decreasing the amount of calcined material in cement, by decreasing the amount of cement in concrete , and by decreasing the number of buildings using cement. Literature reveals that alternative binders in developing nations are called Fal-G binders, made from fly ash (as a source of pozzolan), lime and calcined gypsum (Garg et al., 1996 and Tishmack et al., 2001). However, using Fal-G binders to make low calcium fly ash-wood or lignocelluloses particles composites are not certain in literature yet.
1.1. Problem identification The Egyptian rice yield is one of the highest in the world (3.7 tons per feddan in 2009). Thus, rice straw is a major agricultural by-product in Egypt, where its production in 2009 estimated to 4 million tons (FAO, 2010). The methods for disposing of the straw and stubble residue remaining in the fields after harvest are either burning or baling. Although some limited uses of rice straw such as animal feed or paper making are maintained, yet burning, the principal disposal method for most of the rice straw residue, is efficient, effective and cheap, even after being
Chapter 1. Thesis outlines
2
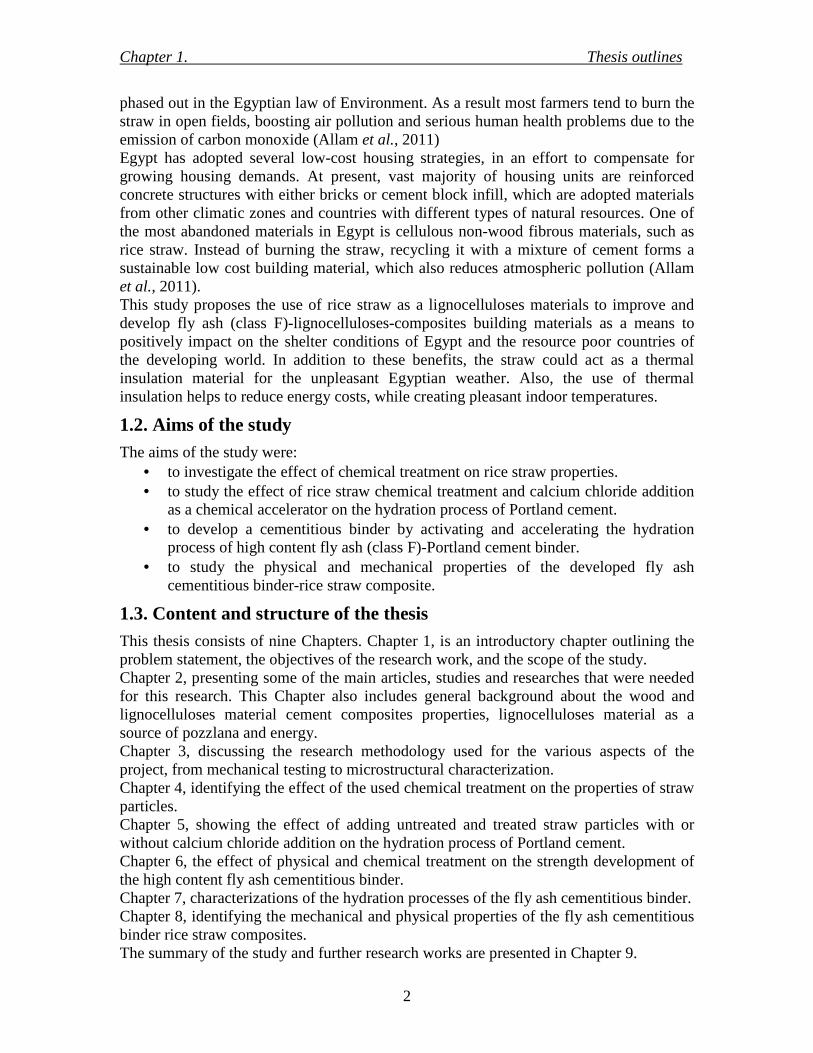
phased out in the Egyptian law of Environment. As a result most farmers tend to burn the straw in open fields, boosting air pollution and serious human health problems due to the emission of carbon monoxide (Allam et al., 2011) Egypt has adopted several low-cost housing strategies, in an effort to compensate for growing housing demands. At present, vast majority of housing units are reinforced concrete structures with either bricks or cement block infill, which are adopted materials from other climatic zones and countries with different types of natural resources. One of the most abandoned materials in Egypt is cellulous non-wood fibrous materials, such as rice straw. Instead of burning the straw, recycling it with a mixture of cement forms a sustainable low cost building material, which also reduces atmospheric pollution (Allam et al., 2011). This study proposes the use of rice straw as a lignocelluloses materials to improve and develop fly ash (class F)-lignocelluloses-composites building materials as a means to positively impact on the shelter conditions of Egypt and the resource poor countries of the developing world. In addition to these benefits, the straw could act as a thermal insulation material for the unpleasant Egyptian weather. Also, the use of thermal insulation helps to reduce energy costs, while creating pleasant indoor temperatures.
1.2. Aims of the study The aims of the study were:
• to investigate the effect of chemical treatment on rice straw properties. • to study the effect of rice straw chemical treatment and calcium chloride addition
as a chemical accelerator on the hydration process of Portland cement. • to develop a cementitious binder by activating and accelerating the hydration
process of high content fly ash (class F)-Portland cement binder. • to study the physical and mechanical properties of the developed fly ash
cementitious binder-rice straw composite.
1.3. Content and structure of the thesis This thesis consists of nine Chapters. Chapter 1, is an introductory chapter outlining the problem statement, the objectives of the research work, and the scope of the study. Chapter 2, presenting some of the main articles, studies and researches that were needed for this research. This Chapter also includes general background about the wood and lignocelluloses material cement composites properties, lignocelluloses material as a source of pozzlana and energy. Chapter 3, discussing the research methodology used for the various aspects of the project, from mechanical testing to microstructural characterization. Chapter 4, identifying the effect of the used chemical treatment on the properties of straw particles. Chapter 5, showing the effect of adding untreated and treated straw particles with or without calcium chloride addition on the hydration process of Portland cement. Chapter 6, the effect of physical and chemical treatment on the strength development of the high content fly ash cementitious binder. Chapter 7, characterizations of the hydration processes of the fly ash cementitious binder. Chapter 8, identifying the mechanical and physical properties of the fly ash cementitious binder rice straw composites. The summary of the study and further research works are presented in Chapter 9.

Chapter 2. Literature review
3
Figure (2.1): Composite material.
2 LITERATURE REVIEW
2.1 Introduction This chapter presents a review of research on the development of natural material cementitious matrix composites to produce building materials for non-conventional construction. This literature review consists of five parts; the first part describes the definition of the composite material, types, classification, mechanical aspects and factors affecting on the properties of the composite materials. The main topic in the second part describes classification of the sources, chemical composition, mechanical properties of natural plant fibers and particles. Types of inorganic binder and the main factor affecting on the hydration process of natural plant fiber or particles with inorganic (cementitious) binder are presented in the third part. Bonding mechanism between natural plant material and cementitious binder are discussed in the fourth part. Last part describes the types of pozzolana material, properties of plant material ash as a sources of Pozzolana material and energy, activation techniques for pozzolana hydration, mechanical and physical properties of pozzolana binders and effects of adding pozzolana material on the properties of lignocelluloses cement composites.
2.2 Composite materials In the most general case a composite material consists of one or more discontinuous phases distributed in one continuous phase. In the case of several discontinuous phases of different natures the composite is said to be a hybrid. The discontinuous phase is usually harder and with the mechanical properties superior to those of the continuous phase. The continuous phase is called the matrix. The discontinuous phase is called the reinforcement or reinforcing materials (Figure 2.1). The reinforcement is shaped as particles, whiskers or short fibers, continuous fibers or sheet. Figure (2.2) shows the classification of wood material according to its shape (Nallis, 2009).

Chapter 2. Literature review
4
2.2.1 Classification of wood and lignocelluloses material composite Composites can be classified based on the type of fibers or matrix used as follows:
2.2.1.1 Classification of composites based on the type of fibers Figure (2.3) shows the classification of the composite materials (Clyne and Hull, 1996 and Mallick, 1993), which consists of three main divisions: particle-reinforced, fiber-reinforced, and structural composites. Also, at least two subdivisions exist for each. The dispersed phase for particle-reinforced composites is equalized (i.e., particle dimensions are approximately the same in all directions); for fiber reinforced composites, the dispersed phase has the geometry of a fiber (i.e., a large length to diameter ratio).
Figure (2.2): Basic wood ligno-cellulose elements, from largest to smallest [Source: Nallis, 2009].

Chapter 2. Literature review
5
2.2.1.2 Classification of composites based on the type of matrix According to the nature of the matrix, composite materials are classified as natural, synthetic and inorganic matrix composites as shown in figure (2.4) (Roger et al., 1993 and John, 1999).
Figure (2.3): Types of composites material based on the form of reinforcement [Source: Clyne and Hull, 1996 and Mallick, 1993].
Particles
Continuous Fibers
Sheet Laminate
Whiskers Short Fibers
Binding Materials
• Animal glue • Casein glue • Planting glue (starch)
Natural binding materials
• Thermosetting adhesive (Phenol-formaldehyde)
• Thermoplastic adhesive (Polyester, Polyvinylchloride, etc.)
Synthetic adhesive
• Gypsum • Magnesia cement • Portland cement
Inorganic binding materials
Figure (2.4): Types of binding materials used in wood /lignocelluloses composites matrix [Source: Roger et al., 1993 and John, 1999].
Chapter 2. Literature review
6
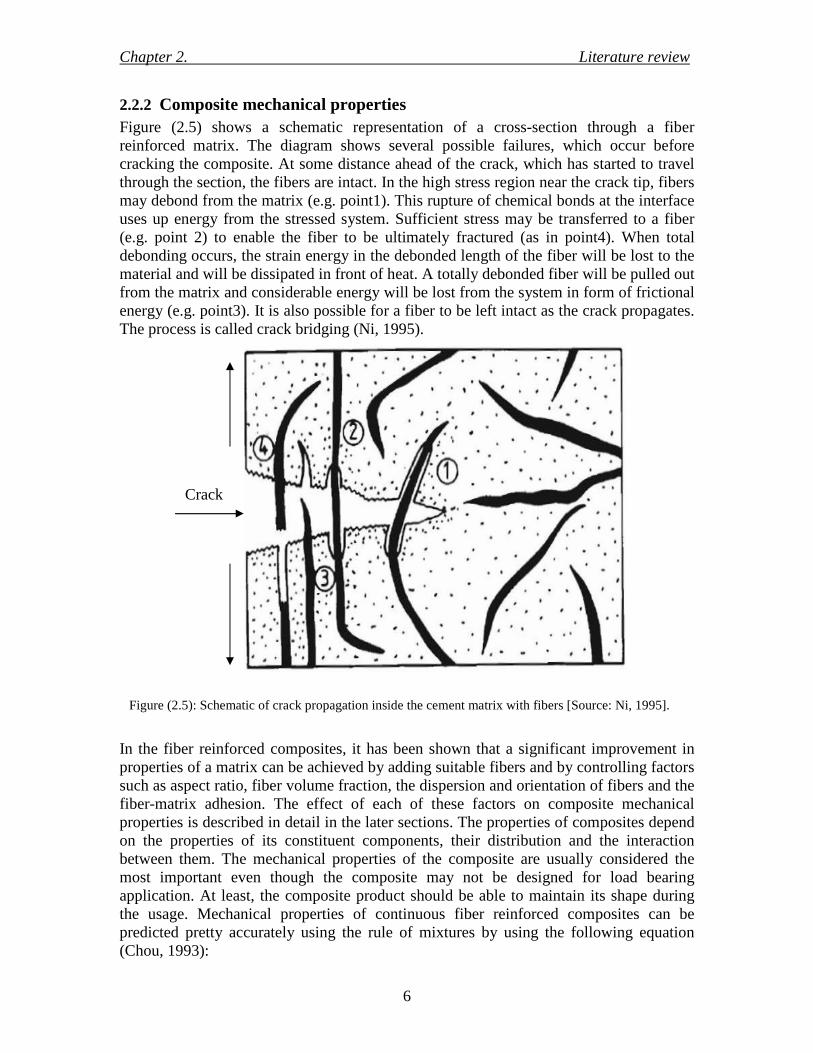
2.2.2 Composite mechanical properties Figure (2.5) shows a schematic representation of a cross-section through a fiber reinforced matrix. The diagram shows several possible failures, which occur before cracking the composite. At some distance ahead of the crack, which has started to travel through the section, the fibers are intact. In the high stress region near the crack tip, fibers may debond from the matrix (e.g. point1). This rupture of chemical bonds at the interface uses up energy from the stressed system. Sufficient stress may be transferred to a fiber (e.g. point 2) to enable the fiber to be ultimately fractured (as in point4). When total debonding occurs, the strain energy in the debonded length of the fiber will be lost to the material and will be dissipated in front of heat. A totally debonded fiber will be pulled out from the matrix and considerable energy will be lost from the system in form of frictional energy (e.g. point3). It is also possible for a fiber to be left intact as the crack propagates. The process is called crack bridging (Ni, 1995).
In the fiber reinforced composites, it has been shown that a significant improvement in properties of a matrix can be achieved by adding suitable fibers and by controlling factors such as aspect ratio, fiber volume fraction, the dispersion and orientation of fibers and the fiber-matrix adhesion. The effect of each of these factors on composite mechanical properties is described in detail in the later sections. The properties of composites depend on the properties of its constituent components, their distribution and the interaction between them. The mechanical properties of the composite are usually considered the most important even though the composite may not be designed for load bearing application. At least, the composite product should be able to maintain its shape during the usage. Mechanical properties of continuous fiber reinforced composites can be predicted pretty accurately using the rule of mixtures by using the following equation (Chou, 1993):
Crack
Figure (2.5): Schematic of crack propagation inside the cement matrix with fibers [Source: Ni, 1995].

Chapter 2. Literature review
7
E1 = (1-f) Em + f Ef (2.1)
Where:
E1 = composite axial elastic modulus
f = fiber volume fraction
Em = matrix elastic modulus
Ef = fiber elastic modulus
In contrast, for short fiber reinforced composites these properties are difficult to predict. This is due to factors such as fiber dispersion, fiber orientation distribution, fiber volume fraction and the quality of interface between fiber and matrix that influence the composite properties. These factors, due to variation in fiber length and fiber length distribution in short fibers, along with inherent process variability, cannot be controlled precisely during manufacturing from part to part or from batch to batch (Vigo and Kinzig, 1992 and Clyne and Hull, 1996).
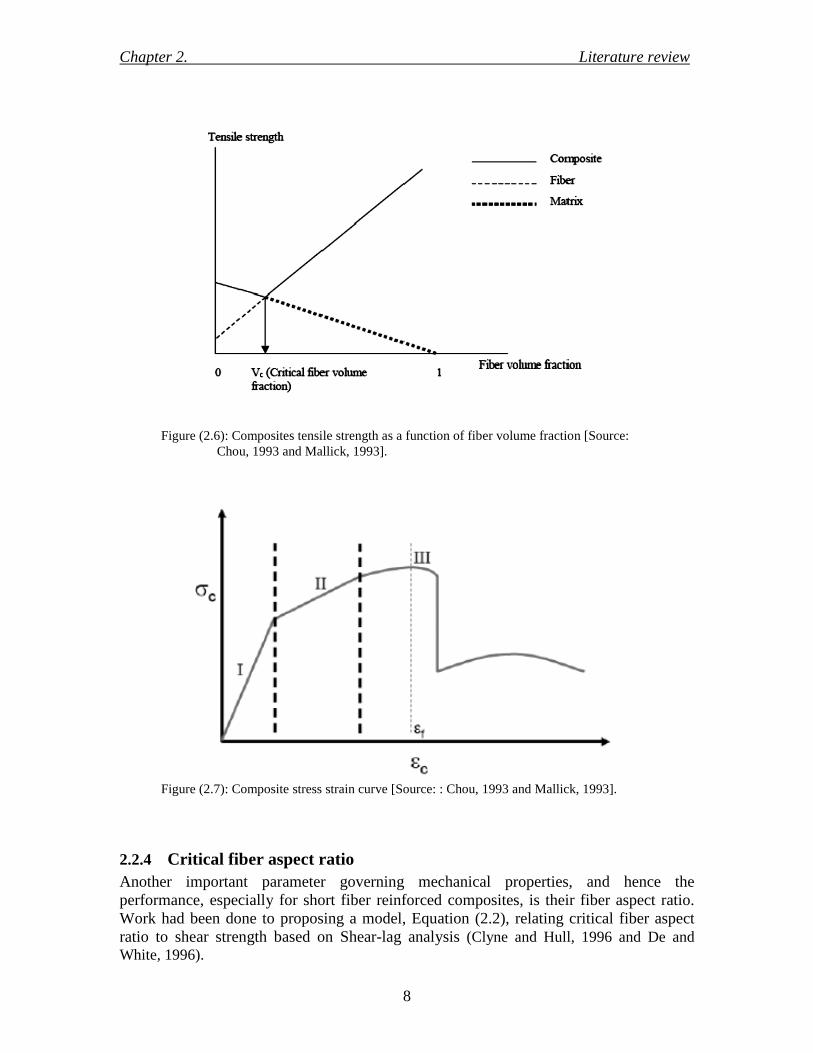
2.2.3 Concept of critical volume fraction The equations for predicting the mechanical properties of both short and continuous fibers reinforced composites have fiber volume fraction as a common factor. This is because fiber volume fraction relates directly to composite strength (Chou, 1993 and Mallick, 1993). This variation of axial strength in continuous fiber reinforced composite with fiber volume fraction is very well predicted by the rule of mixtures and can be depicted by Figure (2.6). As it is shown in the figure, tensile strength decrease drastically at low fiber volume fraction, which can be explained by a dilution of the matrix and the flaws in the matrix at the fiber ends, i.e. where the stress concentration occurs. At high volume fraction tensile strength improves, which can be explained by the effects of fiber reinforcement outweighing the influence of matrix dilution. The tensile properties of composites improve with an increasing fiber volume fraction. The fiber volume fraction at which strength of composites stops declining and begins to improve is known as the critical fiber volume fraction. For the fibers to have reinforcing effect their proportion should be at least equal to the critical volume fraction. However, in order for the composite to perform well the fiber volume fraction must be above the volume fraction at which composite strength is more than that of the matrix strength. Figure (2.6) shows the strength of composite as a function of volume fraction. Once the critical fiber volume fraction is reached, the composite failure might be governed by either failure due to matrix (shown by dotted line) or by failure of fibers (shown by solid line). The behavior of a composite during tensile loading is shown in figure (2.7). As can be seen from the diagram, the composite undergoes three different phases under the load cycle before it breaks as follows:
• Phase I: Both fibers and matrix deform elastically. • Phase II: Fibers continue to deform elastically, but matrix deforms plastically. • Phase III: Occurs only if fibers deform plastically. Fibers fracture followed by
fracture of the composite material.
Chapter 2. Literature review
8
Figure (2.6): Composites tensile strength as a function of fiber volume fraction [Source: Chou, 1993 and Mallick, 1993].
Figure (2.7): Composite stress strain curve [Source: : Chou, 1993 and Mallick, 1993].
2.2.4 Critical fiber aspect ratio Another important parameter governing mechanical properties, and hence the performance, especially for short fiber reinforced composites, is their fiber aspect ratio. Work had been done to proposing a model, Equation (2.2), relating critical fiber aspect ratio to shear strength based on Shear-lag analysis (Clyne and Hull, 1996 and De and White, 1996).

Chapter 2. Literature review
9
lc /d= σf / 2τy (2.2)
Where:
d = fiber diameter
lc = critical fiber length
σf = ultimate fiber strength in tension
τy = interfacial shear stress
If we consider ultimate fiber strength in tension as constant, then Equation (2.2) shows an inverse relationship between critical aspect ratio and interfacial shear strength. It can thus be deduced that in order to have a lower critical fiber aspect ratio, better interfacial shear strength is required (Clyne and Hull, 1996 and De and White, 1996). Interfacial shear strength can be varied by using coating/grafting on fiber surface, to improve the quality of the fiber/matrix interface. In composites, the load is transferred from the fiber to matrix by shear along the fiber/matrix interface. Figure (2.8) shows the variations in fiber stress and shear stress at the fiber/matrix interface along the fiber length. For maximum reinforcement, the fiber aspect ratio of any composite system should be above its critical value to ensure maximum stress transfer to the fiber before composite failure (Rowell et al., 2000). Fiber aspect ratio lower than the critical value. This results in an insufficient stress transfer to fiber and thus the reinforcement is improper and in some cases, fiber just acts as fillers (Mallick, 1993; Clyne and Hull, 1996 and De and White, 1996).
Figure (2.8): Tensile and shear stress variation along with fiber length embedded in continuous matrix and subjected to tensile force in fiber direction [Source: Rowell et al., 2000].
Stress
Tensile stress in fiber Shear stress at
interface
Force Force
Fiber
l
lc/2

Chapter 2. Literature review
10
In contrast if the fiber aspect ratio is too high, the fibers may get entangled during processing leading to poor mechanical properties, due to poor dispersion (De and White, 1996). The fibers may be used as reinforcement in many different forms, i.e. short or long staple fibers, yarn, nonwoven web or fabric. Depending on the fiber form used for reinforcing the matrix, the fiber dispersion and hence the load transfer behavior from the matrix polymer to the fibers will be different. Figure (2.9) shows the effect of he fiber length on transferred fiber stress (Leao et al., 1997). The Problem with high performance fibers is that they tend to break during processing. This changes the fiber length, and the fiber length distribution making predictions for the mechanical properties of composite a little complex (Mallick, 1993 and Wool and Khot, 2001). However, celluloses fibers are flexible and less prone to breakage during processing (Lee, 1991). This ensures that the input fiber length distribution remains the same even after processing. Thus, it is important to know fiber length/ fiber length distribution (in case of natural/short fibers) in order to determine the efficacy of reinforcement material.
2.3 Natural fibers
2.3.1 Surceases and classification of natural fiber The cellulose based fibers can be classified to wood fibers and non-wood fibers as shown in figure (2.10). In non-wood fibers, they can be further classified into straw, plant (such as bast, leaf and seeds) and grass. On the other hand, woods are grouped into two main classes, namely softwood and hardwood, which are based mainly on timbers produced in the northern hemisphere. More correctly, the softwoods or coniferous types (pines, firs and spruces) are called gymnosperms, and the hardwoods (gums, oaks and ashes) are all classed as angiosperms. The hardwood-softwood grouping has little meaning on a world
Figure (2.9): Effect of fiber length on fiber tensile strength [Source: Leao et al., 1997] .
Tensile stress
l < lc l = lc l > lc

Chapter 2. Literature review
11
scale, as some hardwoods (such as balsa wood) are extremely soft (Mukherjee and Satyanarayana, 1986 and Mieck et al., 1994).
2.3.2 Lignocelluloses structure
2.3.2.1 Cell wall structure Figures from (2.11) to (2.13) illustrated the cell wall structure of lignocellulose and wood fiber (Ni, 1995). Between the cells, there is a component that acts as glue to join the cells together. It is known as middle lamella (ML). Toward inside, the cell wall called the primary wall (P). The primary wall can be divided into an outer and an inner surface. The arrangement of the microfibrils in the primary wall is increasingly disperse from inner to outer surface. Following the primary wall is the secondary wall, which consists of three layers. They are outer layer (S1), middle layer (S2) and inner layer (S3). In the outer layer of the secondary wall (S1), the microfibrils are oriented in a cross-helical structure (S helix and Z helix). The middle layer of the secondary wall (S2), which is the thickest layer, has relatively consistent orientation of microfibrils. In contrast, the microfibrils in the inner layer of the secondary wall (S3) may arrange in two or more orientations. Lastly, in some cases, there is a warty layer (W) on the inner surface of the cell wall. In addition, some authors mention that there is a tertiary wall (T) between (S3) and (W).
Figure (2.10): Categories of natural fiber [Source: Ni,1995].
Soft and Hard
Woods
Bamboo Fibers, Switch
Grass, etc..
Cotton, Coir
Sisal, Henequen, Pineapple
Kenaf, Flax, Jute,
Hemp.
Corn, Wheat, Rice
Straws

Chapter 2. Literature review
12
Figure (2.11): Structure of lignocellulose and wood plant [Source: Rubin, 2008] .

Chapter 2. Literature review
13
Figure (2.12): Schematic illustration of the cell wall of lignocellulose cells[Source: Ni,1995].
Figure (2.13): Schematic illustration of the layers of lignocellulose fibers [Source: Ni,1995].

Chapter 2. Literature review
14
Figure (2.14): The chemical structure of glucose showing the carbon number and two glucose to form Cellulose [Source: Sjostrom, 1993].
2.3.2.2 Chemical constituents of natural fibers The components of natural fibers are cellulose, hemicellulose, lignin, pectin, waxes and water-soluble substances. The cellulose, hemicellulose and lignin are the basic components of natural fibers, governing the physical properties of the fibers. Bledzki and Gassan (1999) reported that cellulose, lignin, hemicellulose and pectin cell walls differ in their composition and structure. The chemical composition of plant fibers is important, since it can affect their ultimate utilization. Sjostrom (1993) reported that the chemical constituents of plant fiber have specialized functions in the cell wall: cellulose forms strong and stiff crystalline regions, cellulose and hemicellulose form semi-crystalline regions which provide necessary flexibility while the amorphous regions of lignin give toughness and cohesion. Bledzki and Gassan (1999) also stated that climatic conditions, age and the digestive process influence not only the structure of fibers but also the chemical composition. The chemical constituents of natural fiber are discussed in detail below:
2.3.2.2.1 Cellulose Cellulose is the basic structural component of all plant fibers. In 1938, Anselme Payen suggested that the cell wall of large numbers of plants consists of the same substance, to which he gave the name cellulose (Bledzki and Gassan, 1999). Cellulose is a linear condensation polymer consisting of D-anhydroglucopyranose units (glucose units) joined together by β- 1, 4-glycosidic bonds. Glucose unit is bonded to the next through 1 and 4 carbons as shown in figure (2.14) to form celloboise. Sjostrom (1993) reported that each cellobiose unit is approximately 1 nm long. The average length of a cellulose chain is 5000 cellobiose units (5 µm). These long flat chains can bond tightly together to form crystalline regions. The molecular structure of cellulose is responsible for its supra-molecular structure and this determines many of its chemical and physical properties. According to Bledzki and Gassan (1999), the mechanical properties of natural fibers depend on its cellulose type because each type of cellulose has its own cell geometry which determines the chemical properties. Cellulose content is an important parameter, because in chemical pulping, the pulp yield corresponds to the cellulose content of the raw material.

Chapter 2. Literature review
15
2.3.2.2.2 Hemicellulose Hemicellulose is made up of chains of sugars. They comprise a group of polysaccharides (excluding pectin) bonded together in relatively short, branching chains and remains associated with the cellulose after lignin has been removed. These sugars include glucose and other monomers such as galactose, mannose, xylose and arabinose as shown in figure (2.15). The hemicellulose differs from cellulose in three important aspects. In the first place, they contain several different sugar units whereas cellulose contains only 1, 4-β-D-glucopyranose units (Sjostrom, 1993).
Secondly, they exhibit a considerable degree of chain branching, whereas cellulose is strictly a linear polymer. Thirdly, the degree of polymerization of native cellulose is between 10 - 100 times higher than that of hemicellulose. Bledzki and Gassan (1999) confirmed that hemicellulose can not pack together as tightly as cellulose. Unlike cellulose, the constituents of hemicellulose differ from plant to plant. Stamboulis et al. (2001) reported that hemicelluloses bond to cellulose by hydrogen bonding and act as cross linking molecules between the cellulose microfibrils forming the cellulose- hemicellulose network, which is thought to be the main structural component of the fiber cell.
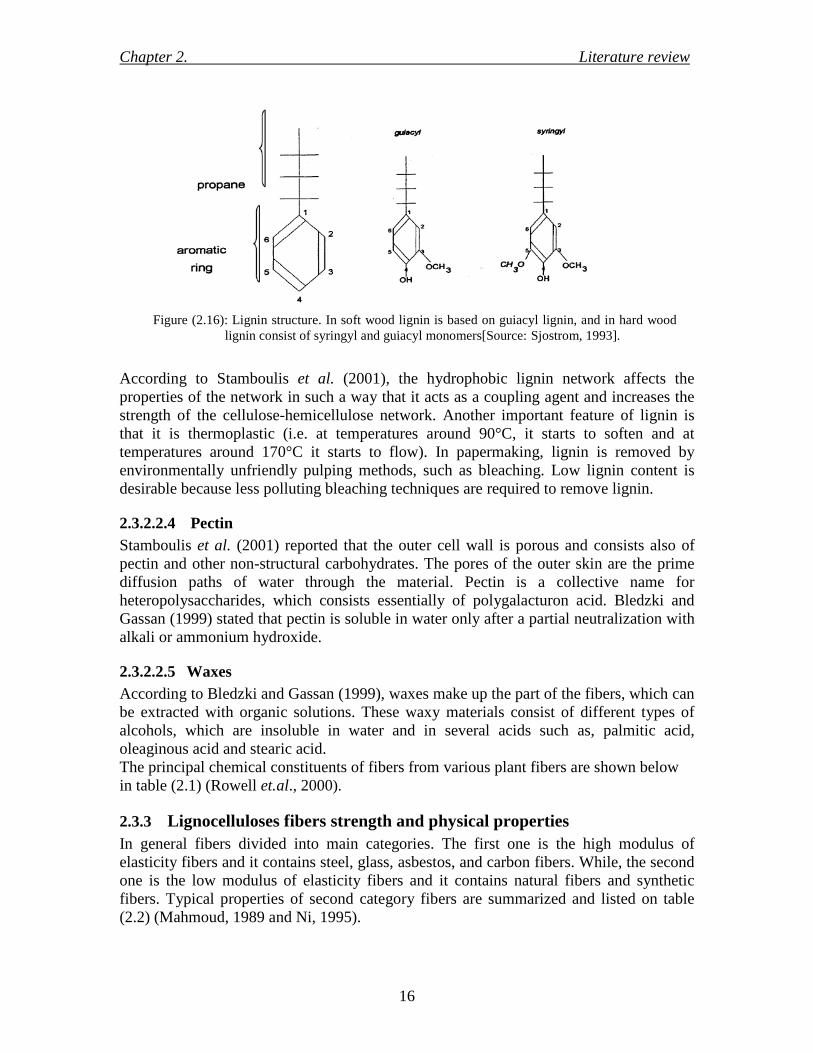
2.3.2.2.3 Lignin Lignin is the compound that gives rigidity to the fiber. Natural fibers could not attain great heights or rigidity without lignin. Lignin is complex hydrocarbon polymer with both aliphatic and aromatic constituents. Their main monomer units are the various ring substituted phenyl-propane linked together in ways which are still not fully understood. Structural details differ from one source to another (Bledzki and Gassan, 1999). Lignin is one of the major constituents of wood and is the extractive component of wood that binds the cellulose fibers together. The monomers of wood lignin are shown in figure (2.16). The main chemical difference between lignin and cellulose and hemicellulose is the amount of potential cross linking sites on lignin. Cross linking can occur along the propane chain, through the C4 oxygen and at the vacant aromatic ring carbons. The cross linking of lignin gives it an irregular amorphous (non-crystalline) structure. An extracted lignin is often used as a phenol substitute in matrix materials. Bledzki and Gassan (1999) reported that the mechanical properties of isotropic lignin are distinctly lower than those of cellulose.
Figure (2.15): Example of two hemicellulose sugar monomers [Source: Sjostrom, 1993].
Glucose Xylose
H
Chapter 2. Literature review
16
Figure (2.16): Lignin structure. In soft wood lignin is based on guiacyl lignin, and in hard wood lignin consist of syringyl and guiacyl monomers[Source: Sjostrom, 1993].
According to Stamboulis et al. (2001), the hydrophobic lignin network affects the properties of the network in such a way that it acts as a coupling agent and increases the strength of the cellulose-hemicellulose network. Another important feature of lignin is that it is thermoplastic (i.e. at temperatures around 90°C, it starts to soften and at temperatures around 170°C it starts to flow). In papermaking, lignin is removed by environmentally unfriendly pulping methods, such as bleaching. Low lignin content is desirable because less polluting bleaching techniques are required to remove lignin.
2.3.2.2.4 Pectin Stamboulis et al. (2001) reported that the outer cell wall is porous and consists also of pectin and other non-structural carbohydrates. The pores of the outer skin are the prime diffusion paths of water through the material. Pectin is a collective name for heteropolysaccharides, which consists essentially of polygalacturon acid. Bledzki and Gassan (1999) stated that pectin is soluble in water only after a partial neutralization with alkali or ammonium hydroxide.
2.3.2.2.5 Waxes According to Bledzki and Gassan (1999), waxes make up the part of the fibers, which can be extracted with organic solutions. These waxy materials consist of different types of alcohols, which are insoluble in water and in several acids such as, palmitic acid, oleaginous acid and stearic acid. The principal chemical constituents of fibers from various plant fibers are shown below in table (2.1) (Rowell et.al., 2000).
2.3.3 Lignocelluloses fibers strength and physical properties In general fibers divided into main categories. The first one is the high modulus of elasticity fibers and it contains steel, glass, asbestos, and carbon fibers. While, the second one is the low modulus of elasticity fibers and it contains natural fibers and synthetic fibers. Typical properties of second category fibers are summarized and listed on table (2.2) (Mahmoud, 1989 and Ni, 1995).

Chapter 2. Literature review
17
Table (2.1)*: Chemical compositions of some common plant fibers [% by weight].
Fibre type cellulose Lignin Pentosan Ash Silica Stalk fibre Straw Rice 28-48 12-16 23-28 15-20 9-14 Wheat 29-51 16-21 26-32 4.5-9 3-7 Barley 31-45 14-15 24-29 5-7 3-6 Oat 31-48 16-19 27-38 6-8 4-6.5 Rye 33-50 16-19 27-30 2-5 0.5-4 Cane fiber Bagasse 32-48 19-24 27-32 1.5-5 0.7-3.5 Bamboo 26-43 21-31 15-26 1.7-5 0.7 Grass fiber Esparto 33-38 19-24 27-32 6-8 - Sabai - 22 24 6 - Reed fiber Phragmites Communis
44-46 22-24 20 3 2
Bast fiber Seed flax 43-47 21-23 24-26 5 - Kenaf 44-57 15-19 22-23 2-5 - Jute 45-63 21-26 18-21 0.5-2 Hemp 57-77 9-13 14-17 0.8 - Ramie 87-91 - 5-8 - - Core fiber Kenaf 37-49 15-21 18-24 2-4 - Jute 41-48 21-24 18-22 0.8 - Leaf fiber Abaca (manila)
56-63 7-9 15-17 1-3 -
Sisal fiber (agave) 43-62 7-9 21-24 0.6-1 - Seed Hull fiber cotton 85-96 0.7-1.6 1-3 0.8-2 - Wood fiber Soft wood 40-44 18-25 20-32 1-2 - Hard wood 40-44 15-35 15-35 1-2 -
* Source: Rowell et.al., 2000.

Chapter 2. Literature review
18
Table (2.2)*: Typical properties of fibres of second category (Low modulus of elasticity fibres).
Type of fibers Tensile strength (MPa)
Young’s modulus (MPa)
Ultimate elongation
(%)
Specific gravity
Water absorption
(%)
Synthetic Fiber Acrylic 210-420 2100 25-45 1.1 -
Nylon 770-840 4200 16-20 1.1 -
Polyester 740-880 8400 11-13 1.4 -
Polyethylene ~703 140-420 ~10 0.95 -
Polypropylene 560-770 350 ~25 0.9 -
Rayon 420-630 7030 10-25 1.5 -
Natural Fibers Cotton 420-985 4900 3-10 1.5 -
Coconut 120-200 19000-26000 10-25 1.12-1.15 130-180
Sisal 280-568 13000-26000 3-5 1.24-1.4 60-70
Sugar-cane bagasse
170-290 15000-19000 - 1.3 70-75
Bamboo 350-500 33000-40000 - 1.5 40-45
Jute 250-350 26000-32000 1.5-1.9 1.02-1.04 110
Flax 1000 100000 1.8-2.2 - 20-45
Elephant grass 178 4900 3.6 0.30 -
Water reed 70 5200 1.2 - -
Coir 720 20000 - 1.33 66 * Source: Mahmoud, 1989 and Ni, 1995.
2.4 Inorganic binders used in the production of lignocelluloses composites
Wood and lignocellulose composites fabricated with different types of inorganic binders such as gypsum, Portland cement, and magnesia cement (Simatupang and Geimer, 1990). Hydration reaction of each binder and the effect of lignocellulose fiber of particles on the hydration of inorganic binder were presented in the following sections.
2.4.1 Hydration of gypsum plaster Gypsum (CaSO4-2H2O) and anhydrite (CaSO4) are the two calcium sulphate minerals occurring in nature. Gypsum is the hydrated form of calcium sulphate (CaSO4) or calcium sulphate hemihydrate (CaSO4-1/2H2O) in which the water and calcium sulphate are intimately bound together (Taylor, 1990). During the hydration reaction, the hardening of calcium sulphate hemihydrate and the anhydrate (the main component of gypsum binder) is mainly caused by the formation of dihydrate crystals (CaSO4·2 H2O) as follows: • Hydration of anhydrite to dehydrate
CaSO4+2 H2O CaSO4.2H2O • Hydration of hemihydrate to dihydrate
2CaSO4 .0.5 H2O+3 H2O 2CaSO4.2H2O

Chapter 2. Literature review
19
2.4.2 Hydration of magnesia cement Magnesia cement (MgO), also known as Sorel cement, is a two component inorganic binder. The major and minor portions are caustic magnesia and a magnesium salt, respectively. Caustic magnesia (MgO) is obtained from magnesium carbonate, magnesium hydroxide, or dolomite (Taylor, 1990).
2.4.3 Hydration of Portland cement Hydration is the result of a chemical reaction that occurs between water and the chemical compounds present in Portland cement. Portland cement is predominately composed of two calcium silicates which account for 70 % to 80 % of the cement. The common nation is summarized in table (2.3) (Taylor, 1990). The two calcium silicates are dicalcium silicate (C2S) and tricalcium silicate (C3S). The other compounds present in Portland cement are tricalcium aluminate (C3A), tetracalcium aluminoferrite (C4AF) and gypsum (Taylor, 1990). Table (2.3)*: Typical composition of ordinary Portland cement.
Chemical Name Chemical Formula Shorthand Notation
Weight Percent
Tricalcium silicate 3CaO.SiO2 C3S 50 Dicalcium silicate 2CaO.SiO2 C2S 25 Tricalcium aluminate 3CaO.Al2O3 C3A 12 Tetracalcium aluminoferrite 4CaO.Al2O3.Fe2O3 C4AF 8 Calcium sulfate dihydrate (gypsum) CaSO4.2H2O CSH2 3.5 *Source: Taylor,1990. All chemical reaction between the main cement chemical component and water can be described as follows:
2.4.3.1 Hydration reaction of C3S and C2S The reaction of dicalcium silicate and tricalcium silicate with water (abbreviated as “H”) produces calcium silicate hydrate (C-S-H) and calcium hydroxide (CH), as illustrated in the following chemical equations (Taylor, 1990):
2.4.3.2 Hydration reaction of C3A Tricalcium aluminate C3A reacts with water to form C2AH8 and C4AH13 (hexagonal phases). These products are thermodynamically unstable so that without stabilizers or admixtures they convert to the C3AH6 phase (cubic phase). In a paste, hydration is slightly retarded in the presence of CH. In dilute suspensions the first hydrate formed is C4AH19. Therefore, the hydration of the C3A phase is controlled by the addition of gypsum to the cement clinker. Then, the flash set is avoided. C3A reacts with sulfate ions supplied by the dissolution of gypsum and produces ettringite as illustrated in the following equation:
2C2S + 9H(water) C3S2H8 + CH 2C3S + 11H(water) C3S2H8 + 3CH
C3A + 3CSH2 + 26H C6AS3H32

Chapter 2. Literature review
20
Ettringite is stable only when there is an ample supply of sulfate. If sulfate is consumed before the C3A has completely hydrated, ettringite transforms into monosulfoaluminate as follows:
On the other hand, if calcium hydroxide is present the compound C4AH13 will also form (Taylor, 1990).
2.4.3.3 Hydration reaction of C4AF The ferrite phase has received much less attention than others with regard to its hydration and physico-mechanical characteristics. This may partly be ascribed to the assumption that the ferrite phase and the C3A phase behave in a similar manner. The C4AF phase is known to yield the same sequence of products as C3A. The reactions are slower, however. In the presence of water, calcium hydroxide and gypsum C4AF reacts as follows (Taylor, 1990):
The hydration characteristics of the cement compound are summarized in table (2.4) (Mindess and Young, 1990). Table (2.4)*: Characteristics of hydration of the cement compound.
Contribution to Cement Compounds
Reaction Rate
Amount of Heat Liberated Strength
Heat liberation
C3S Moderate Moderate high High
C2S Slow Low Low
initially, high later
Low
C3A+CSH2 Fast Very high Low Very high C4AF+CSH2 Moderate Moderate Low Moderate
*Source: Mindess and Young, 1990. The rate of hydration of Portland cement compounds is plotted in figure (2.17), where it can be seen that C3S (alite) and C2S (belite) react more rapidly, and C4AF hydrates more slowly than C3S. The actual rate of hydration depends on the particular cement (Mindess and Young, 1990). Figure (2.18) illustrated the strength development from each compound in Portland cement (Mindess and Young, 1990). Clearly, the calcium silicates provide most of the strength developed by Portland cement; C3S provides most of the early strength (in the first 3 to 4 weeks); and both C3S and C2S contribute equally to ultimate strength. The hydration reactions of Portland cement are all exothermic; that is, they liberate heat. Thus, during the hardening process the concrete is being continually warmed by the internal heat generated. The extent of temperature rise in a concrete section well depends on how quickly the heat is liberated and how quickly it is lost from the concrete to the
2C3A + C6AS3H32 +4H 3C4ASH12
C4AF + 10H + 2CH C6AFH12 C4AF + 3CSH2 + 21H C6(A,F)SH32 + (F,A)H3 C4AF+ C6(A,F)S3H32+ 7H 3C4(A,F)SH12 + (F,A)H3

Chapter 2. Literature review
21
surroundings. Thus, the rate of heat evolution is an important quantity. Rate of heat evolution, hydration stage, and characteristics of each stage verses hydration time are shown in figure (2.19) (Mindess and Young, 1990).
Figure (2.17): Rate of hydration of cement compound [Source: Mindess and Young, 1990].
Figure (2.18): Compressive strength development in pastes of pure cement compounds [Source: Mindess and Young, 1990].

Chapter 2. Literature review
22
Figure (2.19): Rate of heat evolution and hydration stages verse hydration time of Portland cement [Source: Mindess and Young, 1990].
Stage 1 Initial hydrolysis
Stage 2 Induction period
Stage 3 Acceleration
period
Stage 4 Deceleration
period
Stage 5 Steady state
• First contact with water
• Ca++ & OH- into solution
• pH > 12 rapidly • 15 minutes
• Hydrolysis slows down
• Slow dissolution of C3S
• Paste remains fluid
• Initial set starts at 2 to 4 hours
• CH crystallizes from solution
• C-S-H develops at surface of C3S grain.
• Final set occurs • Hardening begin.
• C-S-H layer thickens
• Barrier formed around C3S
• Mass transport through C-S-H determines rate of reaction.
• Hydration becomesdiffusion controlled
• Hydration proceeds at decreasing rate
• 100% hydration approached asymptotically
• Hydration products fill in space between cement grains

Chapter 2. Literature review
23
2.4.4 Effect of lignocelluloses material on cement hydration One problem limits wood-cement particleboard development, is the low level of wood-cement compatibility. This is due, up to a degree, to natural incompatibility exiting among wood, an organic material, cement and an inorganic binder. However, wood extractives have been thought to be responsible for this incompatibility problem (Sandermann, et al., 1960; Biblis and Lo, 1968; Moslemi et al., 1983; Fengel and Wegener, 1984 and Liu and Moslemi, 1985). These extractives are generally composed of the following main groups: terpones, fatty acides, tannins, carohydrates and inorganic materials (Fengel and Wegener, 1984). Hydrolyzable tannins are soluble in hot water. The acid derivatives of these tannins (sugar acids, gallic acid, and ellagic acid) have been found to inhibit cement setting and reduce cement strength (Milestone, 1979 and Miller, 1991). No single pure compound can completely explain wood-cement compatibility variation. However, the total amount of these hydrolyzable phenolic and carbohydrate products of wood extractives influences on the overall effect of wood extractives on cement hydration behavior. In fact, the water-soluble materials have the greatest inhibitory effect (Frybort et.al. 2008). Organic substances, as mentioned above, are well known inhibitors of cement setting. These compounds have HO–C-H groups which were considered as the active group of retarding the Portland cement hydration process. The mechanism of retardation is explained by adsorption. The HO–C-H group can be adsorbed on the surface of triclium aluminate C3A and tricalcium sillicate C3S to form a layer on the grain which interrupts the water supply into the core of grains. Also the – OH group in carboxylic acids was considered the adsorption group. With organic admixture, C3A hydration is hindered seriously. At early stage of hydration, but silicates and ferrites are affected to a lesser degree. The organic admixture also affects the nucleation of calcium hydroxide of C3S hydration causing the retardation of the length of dormant period of the hydration. The effect of sugars on retarding the hydration is differently based on the alkali stability of sugars in solution. The gluconates retard the hydration of all phases of cement (Ahn, 1981).
2.4.5 Improvements of lignocelluloses cement compatibility Some “aggressive” wood species, such as Larix deciduas, are able to completely stop hydration of cement (Sandermann and Kohler, 1964), which can be seen in a degradation of the physical properties (Jorge et al., 2004). On this account, strong inhibiting species need some special treatment to make them suitable for the production of cement bonded wood based materials (Moslemi et al.,1983). By removing soluble compounds, the compatibility can be improved. There are different methods to accomplish this aim, conventional hot or cold water extraction and soaking, respectively (Moslemi and Lim, 1984; Schwarz and Simatupang 1984; Eusebio et al., 2000; Sutigno, 2000 and Okino et al., 2005), long time storing of the raw materials (Cabangon et al., 2002), many chemical extraction methods (Moslemi et al.,1983; Schwarz and Simatupang, 1984; Kavvouras, 1987 and Alberto et al., 2000) and even treatment by fungi (Thygesen et al., 2005), whereby the latter can cause more or less severe damage that will manifest itself in declined mechanical properties of the cement bonded composites (CBCs). Several accelerators, including NaOH, CaCl2, Na2CO3, and NH4Cl, were tested concerning their potency to shorten the setting time and curing time as well as improving the specific properties of CBCs (Moslemi et al., 1983; Hofstrand et al., 1984; Kavvouras,

Chapter 2. Literature review
24
1987; Badejo, 1988; Hermawan et al., 2002b; Bejo, et al., 2005 and Papadopoulos et al., 2006). In some cases, the addition of small amounts of cement setting accelerators, such as CaCl2 or MgCl2, can even eliminate the need to pre soak wood particles (Semple and Evans, 2004). The coating of the wooden particles prior to mixing with cement is a possibility to improve compatibility. On this issue, Okino et al. (2005) describe the use of CaCl2 as an aqueous solution. Also quite common is the use of Na2SiO3, which can either be applied as described above or for extraction of the raw material. However, improvement of the mechanical properties as well as mitigation of thickness swelling by the use of Na2SiO3 is weak compared to water or NaOH extraction (Kavvouras, 1987). In addition, Simatupang et al. (1987) mention the possibility of applying different kinds of blocking layers around wood particles. Naturally, this method could have the disadvantage of hindering the direct contact between wood particles and matrix, which could result in weakened mechanical properties. Another promising method, which additionally accelerates setting as well as curing time and improves mechanical properties, is the use of gaseous or supercritical CO2 (Simatupang et al.,1991; Simatupang and Habighorst, 1992; Geimer et al.,1994; Hermawan et al.,2002b). The high production levels of calcium silicate hydrate and calcium carbonate during the hydration of cement, and the interaction between those hydration products with wood surface are considered to be the main reasons for superior strength properties obtained in CO2 cured boards (Hermawan et al., 2001a). Another approach is the replacement of part of cement by fumed silica (SiO2) in combination of super plasticizers. This combination should increase the cohesiveness of the fresh composite and reduce the water content (Okino et al., 2005). Also, Meneeis et al. (2007) observed an improvement of mechanical properties as well as mitigation of thickness swelling when fumed silica (10%) was added. However, Moslemi et al. (1994) could not confirm the positive effect of fumed silica. Fast setting cement mixtures are also promising as the binder set much faster and give no time to wash out extractives in to cement slurry (Bietz and Uschmann 1984 and Simatupang et al., 1991). The total water amount of the bonding components also represents an important factor in the hydration of cement. This total amount is made up of the moisture content of the solid wood and the water from the cement slurry. If too dry wood is used, water, which is necessary for the cement hydration , will be withdrawn from the slurry. This will lead to a decrease in final strength (Dewitz et al., 1984). Contrarily, if too much water is added, negative effect on the strength properties can also be expected (Miyatake et al., 2000).
2.4.5.1 Compatibility determination The compatibility of lignocelluloses with cement can be measured by different methods as follows:
• Testing the exothermic behavior during the cement hydration process of the cement lignocelluloses mixture (Sandermann et al., 1960; Sandermann and Kohler 1964; Weatherwax and Tarkow, 1964; Schubert and Wienhaus, 1984; Hachmi et al., 1990; Hachmi and Mosalemi 1990; Sauvat et al.,1999; Alberto et al., 2000; Wei et al., 2000a; 2000b; Brandstetr et al., 2001 and Karade et al.,2003).

Chapter 2. Literature review
25
• Measuring some strength properties of wood cement mixture (Lee and Hong, 1986)
• The visual elevation of the microstructural properties (Ahn and Moslemi, 1980; Davies et al., 1981; Wei et al., 2003 and 2004)
• Measuring the electrical conductivity during setting (Simatupang et al., 1991; Backe et al., 2001 and Govin et al., 2005)
• Monitoring the hydration phases production during cement hydration by using X-ray diffraction and Thermogravimety Analysis (TG/DTG) (Alexandre et al., 2006 and Pereira et al., 2006).
2.5 Inorganic binder lignocelluloses material bonding mechanisms The performance of inorganic binder lignocelluloses composite is depending on the type and arrangement of bonds linking the two materials together. According to composite theory, the interface (that is the region of intimate contact between fiber and matrix) plays the dual role of transmitting the stress between the two phases and of increasing the fracture energy of the composite by deflecting cracks and delocalizing stress at the crack tip (Ni, 1995). The interfacial bond itself can be physical or chemical in nature, or a combination of both. Too strong a bond between fiber and matrix results in a brittle material which has strength whereas a weak bond results in a tough material lacking strength. The mechanical performance of inorganic binder lignocelluloses composite is therefore directly related to the nature and properties of the fiber-matrix interface (Ni, 1995).
2.5.1 Chemical bonding The chemistry and morphology of the matrix material has been well documented and will not be considered further. Apart from stating that cement is strongly alkaline (pH > 12) and presents metal hydroxy groups at its surface, such as -Ca-OH, -Si- OH, -Al-OH and -Fe-OH (due to hydration and hydrolysis of silicates, aluminates and a lesser extent ferrites of calcium that are present in the cement matrix). Cellulose fibers such as wood fibers contain covalent hydroxyl groups, -C-OH, either phenolic (from residual lignin) or alcoholic (from the cellulose component) and carboxylic groups, O=C-OH, due to oxidation of end groups. Hydrogen bonding and / or hydroxide bridges may play a major role in the bonding of NFRC composites. The chemical implications will not be considered quantitatively; it suffices to say that hydrogen bonds may form between fibers or between fibers and matrix (Lea, 1976). Coutts and co-workers (Coutts, 1979 and Coutts and Campbell, 1979) considered the possibility of using chemical pretreatments of the wood fibers to enhance the bond between fiber and cement. The most acceptable theory for the development of coupling agents is the "chemical bonding theory", which suggests that the coupling agent acts as a link between fiber and matrix by the formation of a chain of covalent chemical bonds (figure (2.20)). Although small improvements in composite mechanical performance have been recorded from the use of pretreated fibers, the costs of such operations are currently considered prohibitive. The initial hypothesis that some form of coupling agent or additive was needed to achieve bonding stemmed from the general belief that the bond between wood fiber and cement would be weak. It has subsequently been suggested that this may not be the case (Coutts and Kightly, 1984) and that the presence of hydroxyl groups on the
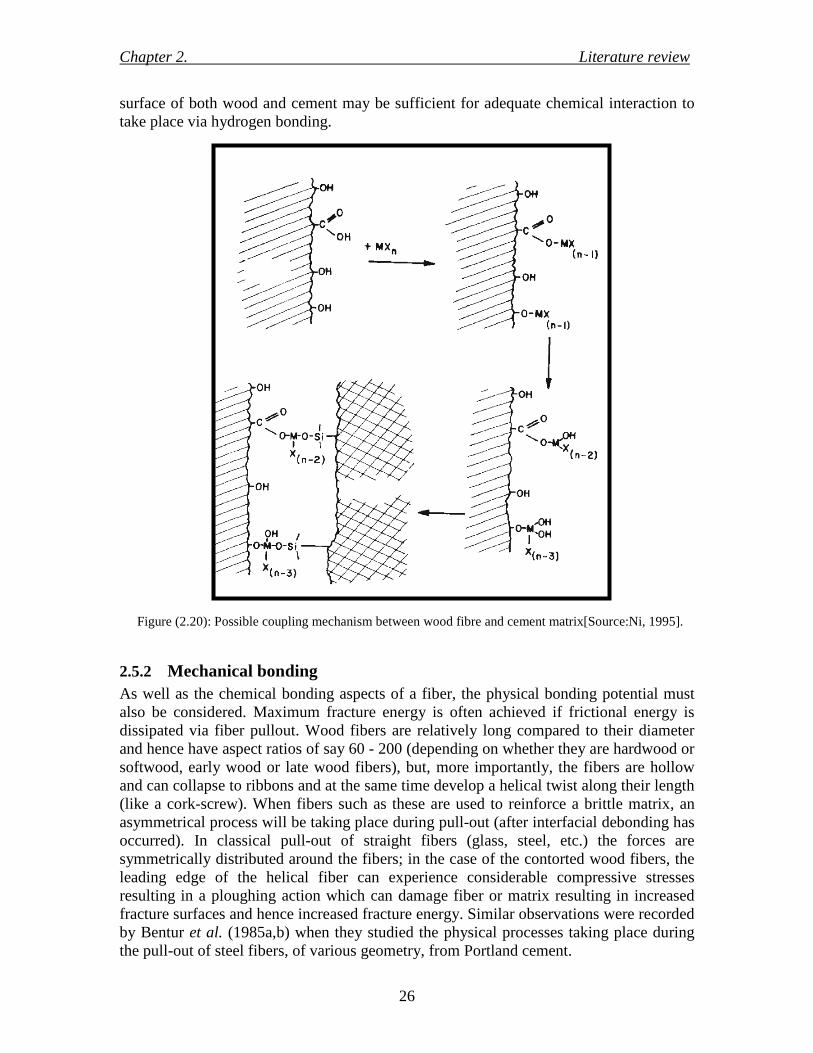
Chapter 2. Literature review
26
surface of both wood and cement may be sufficient for adequate chemical interaction to take place via hydrogen bonding.
2.5.2 Mechanical bonding As well as the chemical bonding aspects of a fiber, the physical bonding potential must also be considered. Maximum fracture energy is often achieved if frictional energy is dissipated via fiber pullout. Wood fibers are relatively long compared to their diameter and hence have aspect ratios of say 60 - 200 (depending on whether they are hardwood or softwood, early wood or late wood fibers), but, more importantly, the fibers are hollow and can collapse to ribbons and at the same time develop a helical twist along their length (like a cork-screw). When fibers such as these are used to reinforce a brittle matrix, an asymmetrical process will be taking place during pull-out (after interfacial debonding has occurred). In classical pull-out of straight fibers (glass, steel, etc.) the forces are symmetrically distributed around the fibers; in the case of the contorted wood fibers, the leading edge of the helical fiber can experience considerable compressive stresses resulting in a ploughing action which can damage fiber or matrix resulting in increased fracture surfaces and hence increased fracture energy. Similar observations were recorded by Bentur et al. (1985a,b) when they studied the physical processes taking place during the pull-out of steel fibers, of various geometry, from Portland cement.
Figure (2.20): Possible coupling mechanism between wood fibre and cement matrix[Source:Ni, 1995].

Chapter 2. Literature review
27
Coutts and co-workers (Coutts, 1982a, 1984a) reported that mechanical refining or beating of wood fibers result in an improved flexural strength from autoclaved mortars reinforced with such fibers. This phenomenon can again be discussed in terms of mechanical bonding. The external surface of the fiber is "unwound" and the fibrils form offers extra anchoring points by which the fibers can accept stresses from the matrix and so become more effective reinforcing elements. Although refining the fiber can assist in mechanical bonding. Its main value is an improvement of the drying rate and a retention of the solids in the commercial process (Anon, 1981 and Coutts, 1982a). Michell and Freischmidt (1990) studied curly fibers in the cement and silica matrix to improve the bonding between fiber and matrix. The use of curly fibers in reinforced cement and silica sheets gave sheets with an improved wet interlaminate bond strength, relative to sheets prepared from conventionally treated fibers. On the other hand, this usage have only little effect on the values of modulus of rupture and fracture toughness. Mechanical bonding has been discussed in other systems, such as asbestos fiber cement, in which Akers and Garrett (1983a) showed that asbestos can be fiberized like wood fibers, steel fibers can be kinked, as we have noted in the work of Bentur et al. (1985a), or polypropylene can be fibrillated into a netlike form, as reported by Hannant (1978).
2.6 Pozzolanic materials
2.6.1 Definition of pozzolanic materials
Pozzolana as defined by ASTM C 618 (1997), is siliceous or siliceous and aluminous material that in itself possesses little or no cementing property, but will in a finely divided form - and by the presence of moisture will chemically react with alkali and alkaline earth hydroxides at ordinary temperatures to form or assist in forming compounds possessing cementations properties.
2.6.2 Pozzolana activity The action of pozzolans is partly physical and partly chemical. The physical effects are related particularly to specific gravity, particle shape, fineness and water absorption capacity. The addition of a material with lower specific gravity such as zeolitic tufts with a specific gravity of 2.1-2.2 g/cm3 compared with the 2.8 g/cm3 of Portland cement, gives greater volume for the cement part in the cement-aggregates mix for a constant weight ratio. The consequent increase in the volume of cement in such mixtures causes an increase in the workability, the plasticity and water requirement (Lea and Desch, 1956). Price (1975) showed that pozzolanic activity can be the result of the presence of: (a) volcanic glass; (b) opal; (c) clay minerals; (d) zeolites; (e) hydrated oxides of aluminium. Depending on the phase present the pozzolans can be characterised as materials of an activity type a, b, c, d or e. When more than one phase is present, the material is referred to as pozzolan of mixed activity. Therefore as the tufts may owe their activity not only to glass but also to opal, clay and zeolite, they can be characterized as mixed activity type pozzolans. Taking into account the chemical component, the potential activity of pulverized fuel ash is determined by the content of activated aluminum oxide and silicon oxide. According to the prescript of ASTM C 618 in the United States, total content of SiO2, Al2O3, and Fe2O3
must be over 70%. While in consideration of phase structure, the potential activity is

Chapter 2. Literature review
28
related to the content of vitreous body as well as that of amorphous aluminum oxide and silicon oxide. Moreover, as for the pulverized fuel ash with the same specifications or characteristics, the major factor is the degree of fineness. Usually, higher degree of fineness corresponds to larger specific area, higher surface energy and more acting faces, which illustrate higher activity. These factors mentioned above are important to improve activity of ash coal, and should be studied specifically.
2.6.3 Sources of pozzolanic materials Pozzolanic material is coming from two main sources; natural and artificial sources.
Natural materials used as pozzolans are volcanic diatomaceous earth or sometimes tropical soils rich in amorphous silica and alumina and with large proportions of very poorly ordered clay minerals (Cabrera and Nwaubani, 1993 and Werner et al., 1994). Fly-ash, silica fume, some burnt products of clays and shales such as high aluminous clays and kaolin, burnt gaize, pulverised bauxite and blast-furnace slag have been reported as artificial pozzolans (Ambroise et al., 1987; Sayanam et al., 1989; Johansson and Andersen, 1990; Bhatnagar et al., 1993; Dunster et al., 1993; Ambroise et al., 1994; Oriol and Pera, 1995 and Salvador, 1995).
2.6.3.1 Rice straw and husk ash Rice straw and husk were an agricultural residue from rice cultivation and milling process. According to the United Nation FAO (2008), the annual world rice production for 2007 was estimated by 649.7 million tons, the husk constitute approximately 20 % of it. Rice wastes are residue production in significant quantities on a global basis. While they are utilized in some regions, in others are a waste causing pollution and problems with disposal. When rice straw and rice husk burnt, the ash is highly pozzolanic and suitable for use in lime-pozzolana mixes and Portland cement replacement (EL-Sayed and El-Samni, 2006). Amongst the agricultural waste, rice husk and straw has a very high potential for the production of very effective secondary raw material. It is mainly due to its random availability, very high silica content and relatively low cost. After burning rice straw and husk in controlled temperature and duration using properly small plants, 14.6 % and 22% of mass rice straw and husk respectively are converted into high quality value added ash which unique secondary raw material due to the high amount of silica in the ash. Table (2.5) shows the ash and silica content of some plants waste (EL-Sayed and El-Samni, 2006), table (2.6) gives the physical properties of the rice husk ash (Govindarao, 1980). Table (2.7) shows the elemental composition of rice straw, rice husk, and wheat straw ashes (Jenkins et al., 1998). Rice husk ash resembles silica fume in term of high silica content and its large surface area is mainly due to its internal voids and certainly not due mainly to its particle size. However silica fume has sub–micron level particle size, as identified in scanning electron microscopy (SEM), which also gives rise to high surface area. Inclusion of rice husk ash in a cement based system improves its properties (Mehta and Polivka, 1976 and Hawang and Wu, 1989).

Chapter 2. Literature review
29
Table (2.5)*: Ash and silica content of some plants.
Plant Part of plant Ash % Silica% Sorghum Leaf sheath epidermis 12.25 88.75 Wheat Leaf sheath 10.48 90.56 Corn Leaf sheath 12.15 64.32 Bamboo Nodes (inner portion) 1.44 57.44 Bagasse ----------- 14.71 73.00 Lantana Leaf and stem 11.24 23.38 Sunflower Leaf and stem 11.53 25.32 Rice husk ----------- 22.15 93.00 Rice straw ----------- 14.65 82.00 Bread fruittree Stem 8.64 81.8 *Source: EL-Sayed and El-Samni, 2006
2.6.3.1.1 Nature of rice straw and husk material Rice straw and husk are composed of both organic and inorganic matter. Organic matter consists of cellulose, lignin, hemi cellulose, some proteins and vitamins while the major component of inorganic minerals is silica. The actual composition of rice straw and husk varies with the type of paddy, inclusion of bran and broken rice in the husk, geographical factors, crop season, samples preparation and relative humidity etc. (Houston, 1972 and Govindarao, 1980). Table (2.6)*: Physical properties of rice husk.
Parameter Nature/ Value Color Golden Length 4.5 mm (average) Hardness 6 Mohr’s Scale Bulk Density 96-160 kg/m3 Thermal conductivity 3.3 K Cal-cm/ g m2/oC Angle of repose 35 o (ungrounded) Fuel value 2800-3700 K-cal/kg *Source: Govindarao, 1980 Table (2.7): Elemental composition of ash (%). Chemical analysis % Rice straw Rice husk Wheat straw SiO2 74.67 91.42 55.32 CaO 3.01 3.21 6.14 MgO 1.75 <0.01 1.06 Na2O 0.96 0.21 1.71 K2O 12.32 3.71 25.60 *Source: Jenkins et al., 1998. Yoshida et al., (1959) stated that silicon component is taken up from soil by roots of plant as monosilicat acid. This soluble silica moves to the outer surfaces of the plants where it eventually polymerises to form a cellulose silica membrane. The organic matter decomposes during combustion of the rice husk and residue is an ash rich in silica.

Chapter 2. Literature review
30
2.6.3.1.2 Composition of rice husk ash Rice husk has a cellular structure. On combustion, the cellulose – lignin matrix of rice husk burns away leaving behind a porous silica skeleton with extremely small domains of 3-120 nm in size (Real et al., 1996). This structure would yield very fine particles if ash were ground. Due to the highly porous structure of ash, a large surface area is given. The mostly internal surface area depend strongly on burning regime parameters like temperature. James and Rao (1986) have reported changes in surface area. They state that at 500 oC, the surface area reaches a maximum value of 170 m2/g. Within 500 – 600 oC, the surface area decreases but actual values remained quite high (100-150 m2/g). Ibrahim et al. (1980) and (1981) boiled the rice husk with water, washed it and then dried. For a constant burning time of 3 hours, the surface area was increased from 200 to 274 m2/g on heating husk from 500 to 600 oC, respectively. Beyond 600 oC, the surface area and total pores volume decrease with an increasing temperature of thermal treatment. Treatment with diluted hydrochloric acid before burning the husks was reported to be very effective for obtaining ashes with a large internal surface area (Real et al., 1996 and Liou and Chang, 1996). The surface area of an ash sample produced by burning the acid treated husks at temperature 600oC for 3 hours under inert atmosphere, followed by the combustion of residue carbon in oxygen atmosphere was found to be 260 m2/g (Real et al., 1996). Liou and Chang (1996) reported that a surface area for ash sample obtained by burning treated husks with acid at temperature of 900 oC for an hour was 261 m2/g. Other literatures suggeste a variety of burning regimes for producing high surface area ash.
2.6.3.1.3 Rice straw and husk combustions Utilization of biomass waste in energy production is a promising option since biomass is a renewable and CO2 neutral fuel. Utilization of biomass fuel preserves the diminishing conventional fossil fuels and alleviates the growing waste disposal problem (ACI 363R-92 and Malhotra, 1993). Fluidized bed combustion is widely considered for burning different biomass fuels. Fluidized bed reactors are reported to be very suitable for the utilization of heat value of rice husks (Kaupp, 1984). The reactors can be used either for combustion or for gasification of rice husk. Since the bed temperature can be kept below the crystallization temperature of silica, the ash produced is amorphous and hence highly reactive (Cincotto et al., 1990). Hexo and Mehata (1977) argued that the porosity is the primary factor controlling the surface area of rice husk ash (RHA). Unburnt carbon particles are very porous; hence an ash sample with grater unburnt carbon content will have higher internal surface area. Since the pore volume mainly controls the specific surface area of RHA, collapsing the pore structure will result in a decrease of the surface area. This would happen when particle size is reduced to value similar to the average micro pore spacing. The mean diameter of RHA particles burnt below 800 oC is about 50~60 µm. It can be expected that when particle size of the ash approaches 5~10 µm due to milling process, a noticeable drop in specific area will occur.
2.6.3.1.4 Role of unburnt carbon Since unburnt carbon has a very large surface area, the water demand is higher for the ash sample with a higher unburnt carbon content. A carbon rich ash is considered to be a pozzolanic material of lower quality because unburnt carbon particles increases the specific area and hence the water demand increases (Bui, 2001). A high loss on ignition (LOI) value needs a higher dosage of super plasticizers for a given level of workability.
Chapter 2. Literature review
31
2.6.3.1.5 Fuel value of rice straw and husk The energy content of rice straw is around 14 MJ/kg at a moisture content of 10%. However, the fuel value of husks is reported to range from 13.8 to 15 MJ/kg. By way of comparison, oven dry timber averages 18.8 MJ/kg while typical values for coal and fuel oil are 29.7 and 39.8 MJ/kg. Hence the fuel value of one ton of rice straw or husk is equivalent to 0.48 ton of coal or 0.36 ton of fuel oil. In addition, rice husk has good insulating properties. Depending upon its degree of compaction, its thermal conductivity ranges from 0.036 to 0.086 W/mK. This compares with 0.041 W/mK for shredded asbestos, 0.03 for mineral wool and 0.028 for granulated cork (UNIDO, 1984).
2.6.3.2 Fly ash According to committee 116R of the American Concrete Institute (ACI), fly ash is defined as the finely divided residue that results from the combustion of ground or powdered coal and that is transported by flue gasses from the combustion one to the particle removal system (ACI Committee 232, 2004). Fly ash is removed from the combustion gases by the dust collection system, either mechanically or by using electrostatic precipitators, before they are discharged to the atmosphere. Fly ash particles are typically spherical, finer than Portland cement and lime, ranging in diameter from less than 1 µm to no more than 150 µm. The types and relative amounts of incombustible matter in the coal determine the chemical composition of fly ash. The chemical composition is mainly composed of the oxides of silicon (SiO2), aluminium (Al2O3), iron (Fe2O3), and calcium (CaO), whereas magnesium, potassium, sodium, titanium, and sulphur are also present in a lesser amount. The major influence on the fly ash chemical composition comes from the type of coal. The combustion of sub-bituminous coal contains more calcium and less iron than fly ash from bituminous coal. The physical and chemical characteristics depend on the combustion methods, coal source and particle shape (Taylor, 1990) The chemical compositions of various fly ashes show a wide range, indicating that there is a wide variations in the coal used in power plants all over the world (Malhotra and Ramezanianpour, 1994). Fly ash that results from burning sub-bituminous coals is referred as ASTM Class C fly ash or high-calcium fly ash, as it typically contains more than 20 % of CaO. On the other hand, fly ash from the bituminous and anthracite coals is referred as ASTM Class F fly ash or low-calcium fly ash. It consists of mainly an aluminosilicate glass, and has less than 10 % of CaO. The colour of fly ash can be tan to dark grey, depending upon the chemical and mineral constituents (Malhotra and Ramezanianpour, 1994 and ACAA, 2003). The typical fly ash produced from Australian power stations is light to mid-grey in colour, similar to the colour of cement powder. The majority of Australian fly ash falls in the category of ASTM Class F low calcium fly ash, and contains 80 to 85% of silica and alumina (Heidrich, 2002). Aside from the chemical composition, the other characteristics of fly ash that generally considered are loss on ignition (LOI), fineness and uniformity. LOI is a measurement of unburnt carbon remaining in the ash. Fineness of fly ash mostly depends on the operating conditions of coal crushers and the grinding process of the coal itself. Finer gradation generally results in a more reactive ash and contains less carbon.

Chapter 2. Literature review
32
In 2001, the annual production of fly ash in the USA was about 68 million tons. Only 32 % of this was used in various applications, such as in concrete, structural fills, waste stabilisation/solidification etc. (ACAA, 2003). Ash production in Australia in 2000 was approximated 12 million tons, with some 5.5 million tons have been utilised (Heidrich, 2002). Worldwide, the estimated annual production of coal ash in 1998 was more than 390 million tons. The main contributors for this amount were China and India. Only about 14 % of this fly ash was utilized, while the rest was disposed in landfills (Malhotra, 1999). By the year 2010, the amount of fly ash produced worldwide is estimated to be about 780 million tons annually (Malhotra, 2002). The utilization of fly ash, especially in concrete production, has significant environmental benefits, and improved concrete durability, reduced use of energy, diminished greenhouse gas production, reduced amount of fly ash that must be disposed in landfills, and saving of the other natural resources and materials (ACAA, 2003).
2.6.3.3 Silica fume Silica fume is an industrial by product mainly from Ferro – silicon producing industries during reduction of high purity quartz with coal or coke in an electrical arc furnace during reduction of silicon metal or ferro-silicon alloy. The SiO2 content of silica fume is highly dependent on the type of alloy product as shown in table (2.8) (Chandra and Berntsson, 1996). Silica fume comes in various forms including powder, slurride, densified, and pelletized silica fume. Silica fume generally produces filler and pozzolanic effect when added into cement based materials. The pozzolanic activity is due to the reaction between silica of silica fume and the Ca (OH)2, produced due to cement hydration (Taylor, 1990). Table (2.8)*: Silica content of silica fume in different alloy making industries.
Alloy type SiO2 content 50% ferrosilicium 61-64% 75% ferrosilicium 84-91% 98% silicon metal 87-98%
*Source: Chandra and Berntsson, 1996. The transition zone, also some time known as interfacial transition zone is the inter phase between aggregate and the hydrated cement paste. It is very important both from the view point of mechanical strength as well as durability. With the increase of w/c ratio, both the thickness of interfacial transition zone and the degree of Ca(OH)2 orientation crystals is increased due to internal bleeding. Addition of silica fume improves the microstructure of interfacial transition zone if silica fume replacement level is 15% or more (Chandra and Berntsson, 1996).
2.6.3.4 Blast furnace slag Granulated blast furnace slag is one of the most useful latent hydraulic material, because the amount produced is large in the industrial countries and has stable properties compared to other industrial by-products. The granulated blast furnace slag is made by rapid quenching of molten slag formed during the manufacture process of iron. The blast furnace slag has been used as a pozzolanic admixture in Portland cement (Brandt, 1995). The major oxides of the blast furnace slag are SiO2, CaO, MgO and Al2O3.

Chapter 2. Literature review
33
2.6.4 Major activation techniques of pulverized fuel ash.
2.6.4.1 Activation of chemical substances and its application: Chemical substances are widely used to excite the potential activity of pulverized fuel ash (Bao-min and Li-jiu, 2004).
2.6.4.1.1 Description of pozzolanic reaction (fly ash lime system): Activating substances mainly include Ca(OH)2, NaOH, etc. Ca(OH)2 is precipitated through the process of hydration, reacts with activated SiO2 and activated Al2O3, then produces hydrated calcium silicate and hydrated calcium aluminate, etc. This kind of substances can break the Si-O and Al-O bands in the vitreous body of pulverized fuel ash, and accelerate the dissolution of Si4+and Al 3+, as illustrated in the following chemical equations (Bao-min and Li-jiu, 2004): • Silicates: SiO2 + Ca (OH)2 + H2O CaO-SiO2-H2O (calcium silicate C-S-H) • Aluminates: Al 2O3+ Ca(OH)2+H2O CaO- Al2O3- H2O (calsuium aluminate C-A-H) • Ferro Aluminates: Fe2O3+Al2O3+Ca(OH)2 CaO- Al2O3-Fe2O3- H2O (calcium Ferroaluminate)
2.6.4.1.2 Description of pozzolanic - alkali salt reaction: This kind of salt involves Na2CO3, Na2O•nSiO2, etc. When sodium silicate salt solution was added to the pozzolanic cement mixture, it hydrolyzes as shown in the following equation (Bao-min and Li-jiu, 2004): Na2SiO3 + nH2O 2NaOH + SiO2•(n-1) H2O The hydrate of Na2SiO3 could maintain the concentration of alkali in solution, and on the other side its product, silica gel, would change to gel with solid properties when the gel loses water gradually. In fact this gelatinization is the process of transformation from linear structure to reticular structure. The active effect of Na2CO3 is not ideal; liquid alkali (such as water glass) is a better active agent, due to several disadvantages: inconvenient; not easy to control setting time because of fast gelatinization, and must add retardant in it, which will increase the price; about 1.5% of alkali would be carried into cement.
2.6.4.1.3 Description of sulfo-pozzolanic reaction (fly ash lime gypsum system): CaSO4 and Na2SO4 belong to sulfate. In alkaline conditions, gypsum reacts with Al2O3 to produce hydrated aluminium calcium sulfate crystal. As illustrated in the following chemical equations (Bao-min and Li-jiu, 2004): • Na2SO4 reaction: Na2SO4 + Ca(OH)2 + 2H2O CaSO4 . 2H2O + 2NaOH
Al 2O3 (active) + 3Ca(OH)2 + 3(CaSO4 .2H2O) + 23H2O 3CaO.Al2O3 . 3CaSO4. 32H2O

Chapter 2. Literature review
34
• CaSO4 reaction: 2Ca(OH)2 + 3CaSO4.H2O+CaOAl2O3+30 H2O 3CaO.Al2O3.3CaSO4.32H2O The reactions described above continuously consume Al 3+, which accelerates the hydration of pulverized fuel ash, and makes the activity fully exploited. It is rare to adopt individually the methods mentioned above. The active effect of Na2SO4
is not ideal either, and the amount of alkali carried into cement is about 1.0%–1.4% (Yushou and Qisheng, 2000).
2.6.4.1.4 Composite activation In most cases, the chemical substances mentioned above are optimizationally combined together through orthogonality experiments to complement each other. The effect of composite admixture is better than that of the individual activators (Bao-min and Li-jiu, 2004).
2.6.4.2 Mechanical methods Mechanical methods improve the degree of fineness, increase the surface area and surface energy greatly. There are many reports about this subject. The action principle could be explained as follows (Bao-min and Li-jiu, 2004): • Pulverization breaks the vitreous body and increases their surface area, which makes
activity higher. The pulverized fly ash not only has the effect of filling with micro-particles, but also changes from the guest to the host in hydration reaction and becomes an important component. Calcium silicate and calcium aluminate generated can effectively block the capillary channels of cement mortar, which enhances the tightness of hardened cement paste.
• The pulverized fuel ash has larger surface energy as well as more effective “ball bearing” lubrication. Hence the performance of fresh cement concrete is improved, either with that of hardening concrete.
• Through pulverization, the substitution ratio is increased and the micro crack caused by the heat of hydration could be decreased also, which leads to the improvement of properties of cement and concrete.
2.6.4.3 Physicochemical methods
2.6.4.3.1 Low temperature calcinations Rongli (1999) reported that low temperature calcinations (800-1000oC, 80-150 min.) of fly ash would change the chemical components and mineral structure when adding some limestone and mineralized agent. It was quenched after calcination, and then pulverized fuel ash of very high activity was obtained. When content amounts to 50%, the 32.5 grade cement could be made. But the high cost of the calcination equipment limits the extensive use of this method.
2.6.4.3.2 Heat activation Rongli (1999) operates heat activation as described in the following: First, blend the pulverized lime and pulverized fuel ash in a certain proportion, and then put this mixture in the autoclave. After heat activation with appropriate time and temperature, process

Chapter 2. Literature review
35
continues with dehydration and cooling. The optimum conditions of pulverized fuel ash with different properties could be found out from experiments. The pulverized fuel ash obtained with this method has very high activity, and similar to the low temperature calcinations method The major disadvantages of this method are its large investment and complicated techniques because an autoclave is needed.
2.6.5 Mechanical and physical properties of high content pozzolana binder
Several factors have been identified as an important parameter affecting on the properties of fly ash - lime - gypsum system. In this section, the effect of various salient parameters on the fly ash lime gypsum mixture properties are discussed as follows:
Ikeda and Tomiska (1989) have studied a slip casting process where anhydrite gypsum–fly ash –lime and water (produced by thermal treatment at 150 oC of gypsum) were combined to produce a flowable mixture which was poured into forms, remolded after 30 min, and then cured with steam. By using this technique (Figure 2.21), lightweight bricks can be manufactured with a specific gravity of about 1 g/cm3 and with a flexural and compressive strength of about 1 and 6 MPa, respectively. On the other hand, Coppola et al. (1996) studied the pressure casting process for a wet powder from fly ash, bottom ash, lime, gypsum by using 10% of water, including the moisture content of the individual component, which was poured into forms, pressed, and then steam cured (Figure 2.22). By this technique prefabricated building material, such as bricks, slabs or blocks can be manufactured through a molding forming process at 0.5~40 MPa followed by thermal treatment at 35~80 oC. A compressive strength of 45~85 MPa, a tensile strength of 6~8
Figure (2.21): Flow chart of the slip forming process.
Figure (2.22): Flow chart of pressure forming process.

Chapter 2. Literature review
36
MPa, an elastic modulus of 10~12 GPa, water absorption of 8~9%, a specific gravity of 1.6~1.8 g/cm3, negligible drying shrinkage and water swelling of a bout 0.1% were obtained when the amount of the bottom ash is not higher than 30% of total ash, molding pressure of wet powder is at least 20 MPa, and the temperature of thermal treatment is not lower than 60 oC.
Kumar (2000) investigated the compressive strength, water absorption, density, and durability of fly ash-lime-gypsum (Fal-G) bricks manufactured with different proportion of fly ash, lime, and phosphogypsum. The bricks mix proportions were as follows: fly ash 20~80%, lime 10~60%, and phosphogypsum 10~40%. The experimental results showed that, the strength of Fal-G bricks increases with age, phosphogypsum has more pronounced binding action than lime, Fal-G bricks with high fly ash content have sufficient strength for their use in low cost housing and non-load bearing construction (compressive strength for Fal-G bricks with 80% fly ash was 5.9 MPa after 96 days of casting). Water absorption of Fal-G bricks increases by increasing the fly ash content, ranging from 18.8 to 36.3 %. The density of bricks ranged between 1.1 and 1.4 g/cm3. Finally, the curing conditions such as ordinary water curing or sulfate curing do not make any significant difference in bricks quality.
Jaturapitakkul and Roongreung (2003) studied the effect of calcium carbide residue (as a source of Ca(OH)2) to rice husk ash mixing ratio on the setting time of cementitious binder and compressive strength for mortar containing 1 part binder : 2.75 part sand. The water to binder ratio was kept constant at 0.65 for all mixes. They found that, setting time decreases with the increasing of calcium carbide content until reaching a mixing ratio of 50% rice husk ash: 50% calcium carbide. After this ratio, an increase of calcium carbide ratio, rises the setting time of this binder. The initial and final setting times for this paste were 345 and 635 min, respectively (The initial setting time for this mixture was about 3.2 times longer than for cement paste). On the other hand, the same trend obtained for the mortar compressive strength, the maximum compressive strength was obtained at 50%: 50% binder mixing ratio. It’s strength was 0.9, 10,15.6,18.6 and 19.1 MPa, respectively, at the age of 1, 7, 28, 90, and 180 days.
Singh and Grag (2006) investigated the durability of cementitious binder, as examined both by its performance in water and by alternate wetting and drying as well as heating and cooling cycles at 27 oC and 60 oC. This cementitious binder was produced by blending an equal proportion of phosphogypsum with fly ash and 10 % each of the Portland cement and hydrated lime. The results indicate a sharp rise in the early age strength with an increase in temperature. The strength of cementitious binder at 40o and 50o, as compared with that of binder cured at 27 oC , has been found to be from 1.5 to 2 times at 3 days, and from 2 to 2.5 times at 7, 28, 90 days. Also, they found that, the porosity of cementitious binder decreases with the increase of curing time and curing temperature. On the other hand, the strength of the cementitious binder cured at 27oC was higher than the pristine strength even after 50 wetting and drying cycles at 27oC. Also, cementitious binder cured at 50oC exhibited a much lower drop in strength than of the binder cured at 27 oC, with a rise in temperature from 27o to 60 oC and with wetting and drying cycles. Finally, cementitious binder cured at 50oC exhibited a much higher strength than of the binder cured at 27 oC with an increase in temperature.
Marinkovic and Pulek (2007) studied the influence of two different curing conditions (water and ambient air) on the compressive strength of binder containing 40% fly ash,

Chapter 2. Literature review
37
20% lime, and 40% gypsum with water to solid ratio 0.5. Also, the durability of the binder after 28 days of hardening in ambient air was studied by alternate heating and cooling cycles. They reported that, compressive strength of the binder increases with an increasing time of hardening. Ambient air curing is preferable to water curing with regards to the compressive strength of the binder. After the same period of 28 days, the air cured specimen had 1.95 times greater compressive strength compared to the water cured specimen. On the other hand, alternate heating - cooling and cooling heating cycles of the air cured specimens had no negative effect on the compressive strength. On the contrary, the compressive strength of the specimens subjected to heating – cooling or cooling heating cycles were larger than before these treatments.
Degirmenci and Okucu (2007) determined the physical and mechanical properties of Fal-G binder under two different curing conditions, air curing and water curing. The binders were composed of varying percentage of fly ash and phosphogypsum by holding the lime content at 10 % from the binder weight. They found that, the 28 days compressive and flexural strength of Fal-G specimens cured in air or in water, decrease with the increase of phosphogypsum content. Also, the specimens which were cured in water, showed lower strength than air cured specimens. The lowest 28 days compressive strength was obtained as 1.81 MPa for specimen cured in air and 0.73 MPa for specimens cured in water at 50% phosphogypsum content. On the other hand, water absorption increases and dry unit weight decreases with the increase of phosphogypsum content. Water absorption of Fal-G binder varies from 29% to 41%, and the unit weight varies from 14.64 to 12.12 kN/m3. Also, the thermal conductivity of the test specimens increases from 0.360 to 0.378 W/m.oK due to an increasing of phosphogypsum content from 0% to 50%.
Min et al. (2008) determined the compressive strength of cementitious binder containing different proportions of fly ash, lime, and phosphogypsum cured at room temperature and at 45 oC in over 90 % relative humidity for the first 12 hours. They found that, the binder compressive strength increases by an increase of the lime content up to 30% from the total weight of the binder with out any addition of phosphogypsum. Also, the heat curing improves the strength of the binder compared to the curing at room temperature. On the other hand, addition of phosphogypsum greatly developes the compressive strength, compared to the binder without phosphogypsum. After 28 days, compressive strength for the binder containing 70% fly ash and 30% lime increases from 1.57 MPa to 14.32 MPa (when the binder cured at room temperature), and from 1.75 MPa to 17.45 MPa (when the binder cured first at 45oC in over than 90% R.H. for 12 h), due to the addition of 8% phosphogypsum by mass to the binder.

Chapter 3. Materials and experimental details.
38
3 MATERIALS AND EXPERIMENTAL DETAILS
3.1 Introduction The present study was carried out during the period 2008-2010. The study aimed to develop a green composite from rice straw, which can be used for making bricks or boards.
3.2 Materials The used materials in this study included water, rice straw, binding materials and chemicals.
3.2.1 Water Used water in all study parts was the normal tap water.
3.2.2 Rice straw Rice straw was taken from Rakta company for paper making, Alexandria, Egypt, then transported to laboratory of the institute for Concrete and Masonry Structures, Darmstadt University, Germany.
3.2.3 Binding materials Throughout this study, three different types of binders namely, Portland cement, gypsum and calcium hydroxide were used and mixed with fly ash. Cement (CEM I 52.5R) was obtained from Heidelberg cement company. Other binders, gypsum and calcium hydroxide were obtained from Protec class and Schaefer Kalk companies, respectively. While, fly ash was obtained from Safa Company. XRF analysis was used to determine the oxide composition of the binders and fly ash (Table 11.1) in appendix. Whereas; Table (11.2) in appendix explains the fineness of binders. According to the related standards (DIN EN 196-1), the compressive and flexural strength of Portland cement and gypsum were determined (Table 11.3) in appendix.
3.2.4 Chemical additives Sodium hydroxide and calcium chloride were available from Merck Company with purity 97% and 95%, respectively.
3.3 Experimental parts The experiments were divided into four successive parts as follows:
3.3.1 Part 1: Determination of physical and mechanical properties of non-treated and treated rice straw
The main aim of this part is to determine the chemical treatment effect on the physical and chemical properties of rice straw. Rice straw was divided according to its chemical treatment to three different treatments; untreated, treated with water and with sodium hydroxide (Figure 3.1). According to (ASTM-D1109-84), treated rice straw was prepared by soaking it in tap water or 1 % sodium hydroxide (Figure 3.2) for 24 hours then filtered through 2 mm

Chapter 3. Materials and experimental details.
39
screen. The ratio between rice straw and soaking solution was 1:10 by weight, respectively. After filtration, rice straw washed with tap water until washing water became clear. Treated rice straw was dried in an oven at 105 ± 2 C and packed in
polyethylene bags until using. Chemical component, density, tensile strength, scanning electron microscopy (SEM) and x-ray diffraction were determined in the three types of rice straw.
Figure (3.2): Soaking treatments of rice straw; A. in tab water and B. in NaOH.
A B
Figure (3.1): Rice straw treatment diagram and its experiment tests.
Tensile strength Density XRD SEM Chemical components
Water treated Untreated
Rice straw
NaOH treated
Determination of straw characteristics

Chapter 3. Materials and experimental details.
40
Figure (3.3): Straw particles used in the study.
3.3.2 Part 2: Hydration of rice straw with Portland cement Four sizes from treated and untreated rice straw were prepared; 20~40 mesh, 10, 20 and 30 mm. Rice straw was milled using manual grinder then sieved to get the first size, whereas other sizes were made by cutting rice straw with scissors (Figure 3.3). Figure (3.4) shows a diagram for the hydration tests parameters and experiments. Different sizes were mixed separately with Portland cement type 1 (52.5 R) with different ratios; 0, 1.5, 3.0, 4.5 and 7.5% from cement weight. The mixing was done in a dry face for 2 minutes until homogeneous mixture was obtained. On the other hand, three calcium chloride ratios (3, 6 and 9 % from cement weight) were added as a hydration accelerator to the mixture by dissolving it in tap water. The amount of water was calculated using Equation (3.1), which was presented by (Hachimi et al., 1990).
WC = 0.35 C+ 1.7 (WS – M) (3.1) Where:
WC: The amount of water (g), C: Weight of cement (g),
WS: Weight of straw (g), M: Weight of moisture in the straw (g).
After that, prepared rice straw-cement mixture was mixed with prepared water for one minute by using a hand mixer (Figure 3.5a). The cement-straw mixture was divided into two parts. The first one was formed in a steel mold 40 mm /40 mm / 160 mm (Figure 3.5b) to measure the mechanical properties, whereas the second part was poured in isolated plastic bags for the hydration test experiment. Also, environmental scanning electron microscopy was determined in some of the previous mixtures to explore the interaction zone between the straw particle and the cement matrix.
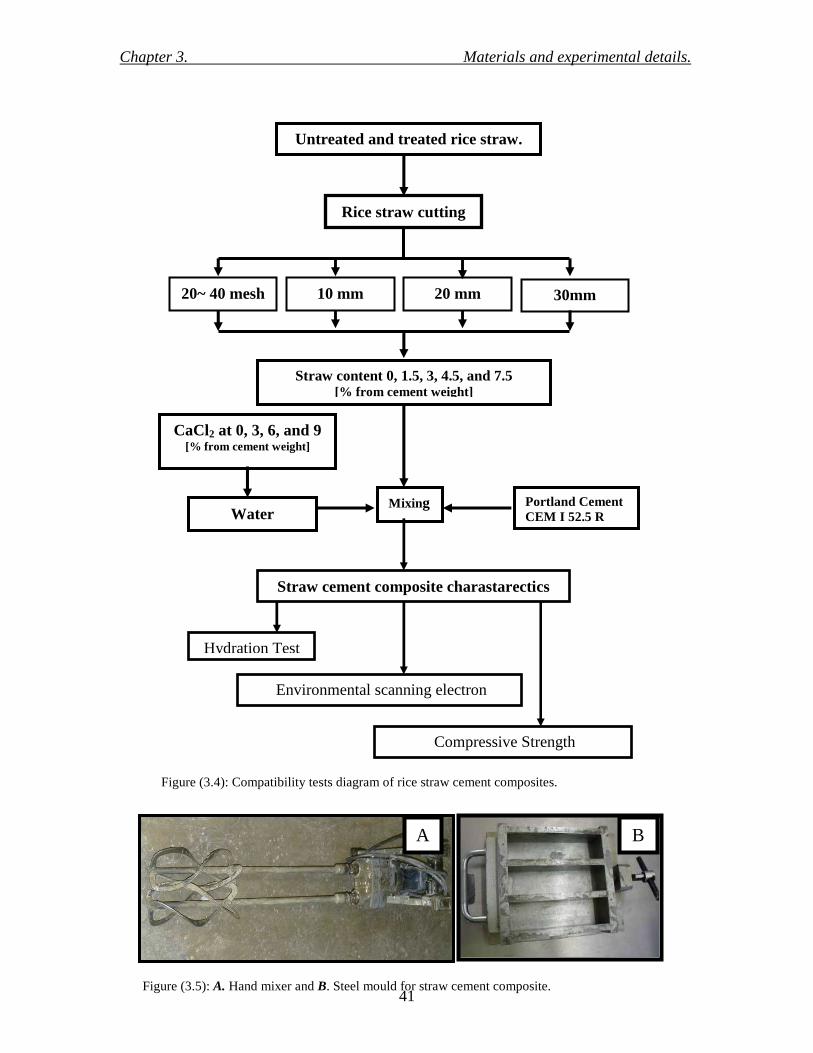
Chapter 3. Materials and experimental details.
41
Compressive Strength
Hydration Test
Straw cement composite charastarectics
Rice straw cutting
20~ 40 mesh
Straw content 0, 1.5, 3, 4.5, and 7.5 [% from cement weight]
Portland Cement CEM I 52.5 R
CaCl2 at 0, 3, 6, and 9 [% from cement weight]
Untreated and treated rice straw.
10 mm 20 mm 30mm
Water Mixing
Environmental scanning electron microscopy
Figure (3.4): Compatibility tests diagram of rice straw cement composites.
Figure (3.5): A. Hand mixer and B. Steel mould for straw cement composite.
B A

Chapter 3. Materials and experimental details.
42
3.3.3 Part 3: Development of high content fly ash cementitious binder This part aimed to develop a green cementitious binder, containing high weight content of pozzolane materials. In addition to identify the salient parameters, influences on the mixture proportions and the strength properties. Therefore, physical and chemical activation methods were used to accelerate the pozzolane reactions and produce an inorganic binder for lignocelluloses material. Low calcium fly ash (ASTM class F), calcium hydroxide, gypsum and cement were used as cementitious binders to prepare the different mixtures. Curing age, heating time, temperature, cement content, ratios of calcium hydroxide/ fly ash, gypsum/ fly ash and water/ binder, were taken in consideration.
3.3.3.1 Mixes design and curing conditions 57 mixtures were made to achieve the desired objective. Table (11.4) in appendix shows that the experimental design was divided into four main groups as follows:
• Group1 contain fly ash-calcium hydroxide mixtures and fly ash-calcium hydroxide-gypsum mixtures. The main aims of these mixtures were to investigate the effect of calcium hydroxide content, gypsum content, and curing temperature on the first 24 h, and air curing vs. water curing after the heating treatment on the strength development from 1 to 28 days. Therefore, the ratio of calcium hydroxide to fly ash in mixtures were 10:100, 30:100 and 50:100 by weight, whereas gypsum to fly ash ratio were 8:100, 10:100, 12:100, 14:100 and 16:100 by weight and curing temperature of 20, 45, 65, 85, and 105 C in the first 24 hours of hydration were used.
• Group 2 was made to test the effect of water to total solid content on the strength development at the optimum condition obtained from group1. Therefore, fly ash-calcium hydroxide-gypsum-mixtures were mixed by different water to total solids ratio changed from 0.3 to 0.7 with 0.05 steps. All the mixtures in this group were cured inside an oven at 85 C for the first 24 h, then under room condition (20 C and 65% humidity) for 27 days.
• Group 3 was made to test the effect of heating time at the optimum conditions obtained from groups 1 and 2 on the strength development of fly ash-calcium hydroxide-gypsum-mixtures. Therefore, mixtures were heated inside the oven at 85
C for 8, 12, 16, 18, 24, 48, and 73 hours as shown in Table (11.4). • Group 4 was made to test the effect of Portland cement content on the strength
development and stability of fly ash-calcium hydroxide-gypsum mixture against water. Therefore, mixtures were prepared by the weight ratios as shown in Table (11.4), then cured at the optimum conditions obtained from latter three groups.
3.3.3.2 Mixture preparation Fly ash cementitious salary as described in Table (11.4) was mixed using mortar mixture (Figure 3.6a) for 60 second , formed in steel molds 40 mm /40 mm / 160 mm (Figure 3.5b), compacted with vibrating machine (Figure 3.6b) for 60 second, surface smoothed and covered with steel plates. After that, the specimens were cured as described in section 3.3.3.1. After that compressive strength was measured after 1, 7 and 28 days. In addition, porosity, pore size distribution, x-ray diffraction and thermogravimtry analysis were

Chapter 3. Materials and experimental details.
43
determined in some mixtures to indicate the effect of the chemical and physical treatment on the fly ash cementitious binder hydration process.
3.3.4 Part 4: Determination of physical and mechanical properties of straw fly ash cementitious binder
According to the best conditions obtained from previous study parts, the steps for this part were designed. Figure (3.7) shows the diagram of the successive steps in last part. Two variables used for composite production were straw-fly ash cementitious binder mixing ratio (by weight) and straw particle size. The five binder to straw mixing ratios used were 1: 0, 1: 0.05, 1:0.08, 1:0.11, 1: 0.19, and 1:0.25, i.e., 0, 5, 7.5, 10, 15, and 20% straw content, respectively. While the four straw particle sizes used were (a) straw particles 20~ 40 mesh, (b) straw particles having 10 mm length, (c) straw particles having 20 mm length and (d) straw particles having 30mm length. Treated rice was dry mixed in a container with fly ash cementitious binder using hand mixer (Figure 3.5a). After that water containing CaCl2 was added to the dry mixture and mixed until having a homogeneous salary. Water amount was calculated according to Equation (3.1), whereas CaCl2 was added with 3% from the fly ash cementitious binder weight. The blend was poured in a different moulds shape related to the test type. Then, compacted with a tamping bar. For each test three specimens were prepared, then covered with steel sheet. After that, Rice straw fly ash cementitious binder composites were cured in an oven at 85 C for 24 h except, the thermal conductivity test specimens cured in room conditions because its mold made from plastic. Then the specimens were removed from the molds and packed in plastic pages at room temperature until tested at day 28 for compressive strength, flexural strength, thermal conductivity, density, porosity, water absorption, and thickness swelling.
Figure (3.6): A. mortar mixer and B. vibrating machine.
A B

Chapter 3. Materials and experimental details.
44
Mechanical properties • Compressive strength test • Bending strength test
Physical properties: • Density • Porosity • Water absorption • Thickness swelling • Thermal conductivity
Straw cement composite charastarectics
Rice straw cutting
20~ 40 mesh
Straw content 0, 5, 7.5, 10, 15, and 20% [% from cementitious weight]
Fly ash cementitious binder [70% fly ash, 3.5% Lime, 7% gypsum, and 19.5% cement, by weight]
CaCl2 at 3 [% from binder weight]
NaOH treated rice straw.
10 mm 20 mm 30mm
Water Mixing
Figure (3.7): Experimental diagram of Rice straw -fly ash cementitious binder composites.

Chapter 3. Materials and experimental details.
45
3.4 Methods Table (3.1) shows the tests during the four parts of study. It could be described as follows: Table (3.1): Distributing tests during study parts
Study part Test 1 2 3 4
Chemical component of rice straw • Hydration test • Density • • • Porosity • • Water absorption • Thickness swelling • Environmental scanning electron microscopy • • • X-ray Diffraction • • Thermogravimety Analysis (TG/DTG) • Pore size distribution • Thermal conductivity test • Straw Tensile Test • Compressive test • • • Flexural test •
3.4.1 Determination of chemical component of rice straw For chemical composition determination, rice straw particles of 40 mesh fraction were used. The procedures were performed according to the standards of American Society for Testing and Materials (ASTM methods). The exact standard that was followed for each chemical property performed is presented in Table (3.2). Figure (3.8) shows the soxhlet apparatus which was used in the study. Table (3.2): Standards followed for chemical analysis Property Standard Alcohol- benzene solubility ASTM D 1107-96 Hot-water solubility ASTM D 1110-84 Klason lignin ASTM D 1106-96 Holocellulose ASTM D 1104-56 Alpha-cellulose ASTM D 1103-60 Ash Content ASTM D 1102-84

Chapter 3. Materials and experimental details.
46
3.4.2 Density measurements Through the study bulk and true density of rice straw particles, straw cementitious composites, and for hardened fly ash cementitious binder were measured as follow:
3.4.2.1 Bulk density and true density of rice straw particles True density of rice straw was measured as ratio between the oven dry weight and its volume. Samples volumes were measured by using helium pycnometer as shown in Figure (3.9).
Figure (3.8): Soxhlet apparatus.
Figure (3.9): Helium pycnometer

Chapter 3. Materials and experimental details.
47
On the other hand, straw particles bulk density was determined by filling a 5 liter plastic tank with oven dried straw particles. Then straw particles bulk density was calculated using the following equation:
ρs = {w1- w2 } / 5000 (3.2) Where: ρs : Bulk density of straw particles (g/cm3), W1: Weight of the plastic tank with straw particles( g), W2: Weight of empty tank (g).
3.4.2.2 Bulk density of straw cementitious composites and hardened fly ash cementitious binder
For determination of density of hardened composite, a set of samples measured 4/4/4 cm3 were used. Samples were tested at 28 days, all the samples were dried at 105 ± 5ºC until constant weight achieved and then placed in desiccators to cool down. Density was measured based on the oven dry weight and green volume of the sample as explained in equation (3.3). Three replicate samples were used for each test.
ρC = Wd / V (3.3) Where: ρc : Bulk density composite (g/cm3), Wd : Weight of the oven dry sample (g), V: Green volume of the sample (cm3).
3.4.3 Water absorption, thickness swelling, and porosity tests A set of samples measured 4/4/6 cm3 were used. Three replicate samples were used for each test. Samples were tested at 28 days, all the samples were dried at 105 ± 5ºC until constant weight achieved and then placed in desiccators to cool down. Water absorption and thickness swelling were determined according to ASTM (D- 1037) as follow: After conditioning, the test specimens were weighed to the nearest 0.01 gram and measured in width, length and thickness to the nearest 0.01 mm. Then the test specimens were soaked in water at the room temperature. After 24-hour, the specimens were suspended to drain the water for 10 minutes and the excess surface water was removed and immediately weighed to determine the weight of absorbed water, and its length, width and thickness were measured. Then the amount of water absorbed and thickness increase after 24-hour water soak was calculated as a percentage of the original weight and thickness of test specimens. While, the porosity was calculated after 7 days from soaking in water, using the following equation: P = [{wa- wd } / {wa- ww}] x 100 (3.4)

Chapter 3. Materials and experimental details.
48
Where: P : Saturated porosity (%), Wa : Specimen weight in air of saturated sample ( g), Wd: Specimen dry weight after 24 h in oven at 105 ± 5ºC (g), Ww: Specimen weight in water (g).
This method has been used to measure cement based materials porosity successfully (Papadakis et al, 1992; Cabrera et al, 1988; Rossignolo and Agnesini, 2004; Gonen and Yazicioglu, 2007).
3.4.4 Measurement of pore size distribution The porosity and pore size distribution in the paste was measured by mercury intrusion porosimetry (MIP) as shown in Figure (3.10). The 5 mm thick samples used were obtained from fracture pieces of the cubes after the compression test. The fragments were soaked in methanol for 5 minutes to stop the hydration, and dried in the desiccators for 2 days. The pressure of mercury intrusion porosimeter ranges from 1.4 MPa to 414 MPa. The pressure required is a function of the pore size can be converted to equivalent pore width using the Washburn equation, as in equation (3.5). D =-4γ cosθ/Pa (3.5) Where: D: Equivalent pore width (m), Pa: Absolute pressure exerted (Pa), γ : Surface tension of mercury (N/m), θ : Contact angle between solid and mercury (o).
Figure (3.10):Mercury intrusion porosimetry machine

Chapter 3. Materials and experimental details.
49
3.4.5 Hydration test Cement straw salary with straw weight ratio as described in section 3.3.2 were transferred to a plastic bag and putted in thermo flask with thermocouple. Within 24 hour the exothermic phenomenon of the rice straw–cement– water mixture was observed and plotted against time. The hydration experiment in this study was conducted at the ambient temperatures ranging from 18 0C to 20 0C. Temperatures were recorded at 5 min intervals using a data logger. The whole experimental set-up is shown in Figure (3.11). The temperatures versus time curves were smoothed by plotting the progressive average of each successive reading. The typical hydration temperature-time curve is shown in Figure (3.12). The experiment steps and composition in the mixture were based on the research reported by Hachimi et al. 1990. The inhibitory index (I), hydrations rate (R) and the total heat energy released (ET) were calculated using the following equations: I = 100[((T-T\)/T) *((t-t \)/t) *((S-S\)/S\)] (3.6) R = (T-Tmin)/t (3.7) ET = area under the time temperature curve for the first 24 h (3.8) Where:
I: Inhibitory index (%), R: Hydration rate (oC/h), ET: Total heat energy released (oC.h), T and T\:
Maximum hydration temperatures of neat cement and straw cement mixture respectively (oC ),
Tmin: Minimum temperature attained during the first 5 hours of hydration, measured by (oC),
t and t\ : The required time to reach maximum hydration temperature of neat cement and straw cement mixture respectively, measured by (h),
S and S\: Maximum slopes of curves for neat cement and mixture respectively, measured by (oC/h).
A C B
Figure (3.11): Hydration test experimental set-up: A. Put samples in the experimental box, inserting the thermocouple wire, B. Cover the box with Styrofoam board and wood paneland C. Connect the wires with data logger and scan every 5 minutes interval.

Chapter 3. Materials and experimental details.
50
3.4.6 X-ray diffraction tests Through the study to types of x- ray diffraction tests were used. The first one was used to get the x- ray diffraction of untreated and treated rice straw in reflectivity mode. While, the second one was used to get the x-ray diffraction of the powder fly ash cementitious binder in transmission mode.
3.4.6.1 Rice straw x-ray diffraction test 0.5 g of straw was compressed in to 20 mm tablets with 5 mm thickness using a hydraulic press at 5 MPa pressure. A SEIFERT 3003 X-ray diffractometer (Figure3.13a), employing CuKα radiation and a graphite monochromator with a current of 40 mA and a voltage of 40 mV was used with diffraction intensity in the range of 5 to 45o. A setup of a continuously recording X-ray diffractometer is shown in Figures (3.13b& 3.13c) and that of a plot of the angular dependence of the intensity of X-ray photons as a function of 2θ (angle range) in Figure (3.14). The three peaks for native cellulose I are (101) at 2θ=14.9o, (101\) at 2θ=16.6o and (002) at 2θ=22.7o. Segal and Conrad 1957 and Segal et al 1959 developed an empirical method for estimating the degree of crystallinity of native cellulose (cellulose I). The amount of crystalline Cellulose (I) in the total cellulose can be expressed by the x-ray “crystallinity index CI” as follows:
CI=100[(I002-I am) /I002] (3.9) Where:
I 002 : The intensity of the principal cellulose (I) peak at 2θ=22.7o, and I am : The intensity due to the amorphous part of the sample at 2θ=18o.
Figure (3.12): Schematic representation of typical hydration curve. A. temperature-time curve of cement and B. temperature-time curve of straw cement mixture.

Chapter 3. Materials and experimental details.
51
Figure (3.13): Rice straw XRD setup. A. SEIFER 3003 X-ray machine. B. and C. An x-ray beam is shown incident on a sample diffracting a beam whose angular dependence was measured by a photomultiplier detector traveling along a goniometer
C
A B
Figure (3.14): A plot of the angular dependence of the intensity of x-ray photons detected as a function of 2θ, the angle between the detector position and the direction of the incident beam.
2ϴ, O
(002)
(101)
(101)
(040)
(I00
2)
(Iam
)
Inte
nsit
y

Chapter 3. Materials and experimental details.
52
3.4.6.2 Fly ash cementitious binder X-Ray diffraction test Powder X-ray diffraction is used to monitor the hydration phases with the progress of cementitious hydration from 1day to 28 day. The X-ray diffraction analyses were carried out using STOE STADI P (Figure 3.15) diffractometer (Mo K_1-radiation, _ = 0.709703 Å) in transmission mode. The XRD scan was between 3° to 45° (2θ) with a scan speed of 0.2°/min. The range of 2θ was selected because it contained major peaks of interested phases, including possible ettringite AFt and monosulfoaluminate AFm
3.4.7 Scanning electron microscopy Environmental scanning electron microscopy (ESEM) used in the study to investigate the morphology of : (a) the untreated and treated straw particles in part 1, (b) the straw cement-composite in part 2, and (c) the fly ash cementitious binder in part 3. Figure (3.16) Shows the ESEM used in the study. ESEM was operated at 20KV. Untreated and treated rice straw samples were prepared by cutting 5mm x 5mm from straw stem by Scissors. While, for straw-cement composite and fly ash cementitious binder, samples were prepared by taken 5/5/2 mm3 from the center of the tested samples in compression test.
Figure (3.15): STOE STADI P XRD machine.
Figure (3.16): Environmental scanning electron microscopy machine.

Chapter 3. Materials and experimental details.
53
3.4.8 Thermogravimety analysis (TG/DTG) Thermo gravimetric analysis (TG/DTG) is used to monitor the increase or the decrease in the hydration phases with the progress of cementitious hydration from 1day to 28 day. The weight loss over specific temperature ranges provides information on the dehydration, decomposition or phase changes of samples. For each test, approximately 100 mg of powdered sample was heated from room temperature to 950 oC at a rate of 10 oC/min.
3.4.9 Thermal conductivity test Thermal conductivity test was made in part4 of this study to investigate the effect of straw fiber size and content in the thermal conductivity of cementitious composites. The guarded hot plate apparatus (GHPA) is widely accepted as a primary apparatus to determine the apparent thermal conductivity of insulating materials. Figure (11.1) in appendix) shows the principal characterizes of a GHPA. The hot and cold plate maintains the boundary conditions constants (temperature) in the superior and interior surfaces of the specimen. In the ideal case, the plates are in perfect thermal contact with the specimen and the heat flow through it is one-dimensional and independent of time. The specification for the thermal conductivity equipment k-Meter EP 500 can be seen in Table (11.5) in appendix. The single-specimen conductivity test tool k-Meter EP 500 is a guarded hot plate apparatus and measures the thermal conductivity, thermal resistance as well as the k-value and U-value respectively of an insulating material and other products.
3.4.9.1 Test procedure 18 block samples of different cementitious materials were used for the thermal conductivity test. The samples were prepared by using a plastic form of dimensions 8/15/15 cm for length /width/ height respectively (Figure3.17a). For each straw type and each treatment two samples of the same material were used as replicates as shows in Figure (3.17b). Figure (3.17): A. thermal conductivity plastic form and B. sample of thermal conductivity.
A B

Chapter 3. Materials and experimental details.
54
Before placing straw cementitious composites samples in the thermal conductivity device, the samples were dried in oven at 105 C until its have a constant weight, and then insulated with ‘‘Polystyrene”, which has a thermal conductivity of 0.025 W/mK Figure (3.18). The guarded hot plate apparatus k-Meter EP 500 can test the thermal conductivity at exactly the desired test temperature. Its heat control does not switch off when thermal conditions within the specimen are almost stationary to allow for adjusting to the test temperature. This is common for heat flow meters and in most cases leads to marginal differences between real and desired test temperatures. For the evaluation of λ10 on the guarded hot plate apparatus only a single test is needed. The guarded hot plate apparatus k-Meter EP 500 can automatically complete three subsequent tests on one specimen at different temperatures between 10 and 40 oC. The average of measuring temperature was 10, 25, 40 oC. The difference between cool and heat plate was 5 oC for all test sequent. The average temperature was calculated from the cold and heating plates. The software is determining the thermal conductivity for the obtained data from the instrument through data logger. The instrument is change digitally to the second point condition, when the thermal conductivity line is stable. This means that the thermal conductivity at these conditions was evaluated as shown in Figure (11.2 in appendix).
3.4.10 Straw tensile test 20 cm length rice straw stem samples with a gage length of 10 cm were used to determine the tensile strength of rice straw. All the specimens have been tested for tensile strength and tensile elastic strains by means of Instron testing machine (Figure 3.19). All the results were recorded by PC directly in Newton and millimeter units. The average specimens diameter was measured by means of micrometer and their gauge length were measured by means of a metallic ruler.
Figure (3.18): Thermal conductivity test machine.

Chapter 3. Materials and experimental details.
55
The first trial test has failed because the specimen was cute at the machine clamps due to the pressure which caused fiber tearing. This means that the break happened before the maximum strength of the fiber has been reached. To overcome these drawbacks, the specimen was fixed between two pieces of wood with epoxy adhesive as shown in Figure (3.19). This modification improved the machine’s efficiency for testing smooth specimen.
3.4.11 Compressive test Trough the study compressive test was used to evaluate the strength development of straw cement composites in part1, fly ash cementitious binder paste in part 3 and straw cementitious composites in part 4. Compressive strength of cubic specimens 40/40/40 mm accordance with the standard EN 196-1 was performed using servo hydraulic material testing system with maximum load of 200 kN as shown in Figure(3-20).The compressive strength is calculated using following equation: CS=P/(B*L) (3.10) Where:
CS: Compressive strength (MPa), P: Maximum load (N), L: Length of sample (mm), B: Width of sample (mm).
(a) (b) (c)
Figure (3.19):Rice straw tensile test. (a) overview of the sample and instron testing machine, (b) overview of the instron clamp and sample edges, (c) overview of sample after testing and cutting zone.

Chapter 3. Materials and experimental details.
56
3.4.12 Flexural test Trough the study, three point Flexural test was used to evaluate the strength development of straw cementitious composites in part 4. Flexural specimens have a rectangular shape measuring approximately 4/4/16 cm. The flexural test was carried out in accordance with the standard EN 196-1, using a universal testing machine (Figure 3.21). Maximum load reading was taken and MOR calculated using the following formula for three point bending test: MOR=3PL/2BD2 (3.11) Where:
MOR: Flexural strength (MPa), P: Maximum load (N), L: Length of sample (mm), B: Width of sample (mm), D: Thickness of sample (mm).
Figure (3.20): Compressive test machine.
Figure (3.27): Flexural test machine.

Chapter 4. Effect of straw treatment on constituent and tensile properties of rice straw
57
4 EFFECT OF STRAW TREATMENT ON RICE STRAW PROPERTIES
4.1 Introduction This chapter presents the effect of treating rice straw with water or with sodium hydroxide solution on the constituent and tensile properties of rice straw. Chemical composition, surface morphology, straw destiny and tensile strength are presented and discussed in the following paragraphs.
4.2 Chemical component of rice straw Table (4.1) shows the benzene-ethanol, cold-water, hot-water, and 1% NaOH extractives content of untreated, water treated, and sodium hydroxide treated rice straw. Extractives are the materials extracted by water and some organic solvents such as ethanol, acetone, dichloromethane, chloroform, or a mixture of ethanol/benzene. Extractives usually consist of lipids, phenolic compounds, terpenoids, fatty acids, resin acids, steryl esters, sterol, waxes, etc. They also play an important role in enhancing the bond between straw and cement matrix. In NaOH-treated rice straws, the contents of benzene-ethanol, cold-water and hot-water extractives were increased with 23.5%, 50.9%, and 16.4%, respectively, as compared with untreated rice straws. On the other hand, the water treated straw, the contents of benzene-ethanol, cold-water and hot-water extractives were decreased with 12.9%, 49%, and 40.6 %, respectively as compared with untreated rice straw. Also, the untreated and water treated straws has the highest content of NaOH extractives as compared with NaOH treated straws as shown in Table (4.1). The proportions of organic cell wall component of untreated and treated rice straw are presented in Figure (4.1). Treating the straw fibers with water and NaOH were increased the cellulose content with relative percentages 25% and 104%, respectively. This increase was due to decrease the water soluble and amorphous component (hemicelluloses and lignin) in water treatment and alkali treatment, respectively (Sarkar et al., 1948; Ray and Sarkar, 2001; Bledziki and Gassan, 1999 and Ndazi et al., 2005). Treating rice straws were caused to decrease hemicellulose and lignin contents. Hemiceluulose contents were 27% and 10.5% and lignin contents were 12.4% and 3.6% for water and NaOH treated rice straws, respectively. Table (4.1):Soluble extractive of straw particles
Parameter Untreated Water treated NaOH treated Content,% by weight Benzene-ethanol extractives 8.5 7.4 10.5 Cold water extractive 10.4 5.3 15.8 Hot water extractive 17.7 10.5 20.6 1% NaOH extractive 47.6 46 15.7

Chapter 4. Effect of straw treatment on rice straw properties
58
4.3 Scanning electron microscopy
Figure (4.2) shows the scanning electron microscopy (SEM) micrographs of untreated and treated rice straw. Figure (4.2a) shows that regular and compact surface structures were displayed in raw materials of rice straw. Also, the surface of the straw fiber is covered with a layer of substances such as oils, waxes and extractives. Vilay et al. (2008) and Carvalho et al. (2010) detected this layer of substances in the analysis of the untreated coconut fiber, sugarcane bagasse, and brown coir fiber, which considered a part of natural constitutions for lignocellulosic fiber. Treating rice straw fibers with water were not affecting on the surface morphology, which due to the decrease in molecular weight of extractives components (Asasutjarit et al., 2009). On the other hand, treating rice straw fibers with NaOH showed a rough surface morphology (Figure 4.2c). According to Troedec et al. (2008), this chemical treatment removes extractives, waxes, oil and amorphous constituents such as hemicellulose and lignin from fiber surfaces and thus increases the overall roughness of the surface. By removing these substances, it was possible to verify the presence of parenchyma cells that are the natural constituent of lignocellulosic fibers (Rout et al., 2001).
Figure (4.1): Plots of the rice straw chemical component for both treated and untreated fiber
0
10
20
30
40
50
60
70
80
cellulose hemicellulose liginin ash
Straw treatment
Ch
emic
al C
on
ten
t,%
by
wei
gh
t untreatedwater treated NaOH treated
Chemical component

Chapter 4. Effect of straw treatment on constituent and tensile properties of rice straw
59
4.4 X-ray diffraction Figure (4.3) shows the X-ray diffractogram for untreated, water and NaOH treated rice straw fibers. The occurrence of two intense peaks was observed, close to values of 2θ= 18o and 2θ= 22o, representing the cellulose crystallographic planes I101 and I002, respectively. The X-ray diffraction peaks can be attributed to crystalline scattering and diffuse background associated with disordered regions. The spectrum corresponding to untreated and treated fiber shows the same diffraction peaks at 2θ= 18o and 2θ= 22o, which mean that, the fibers with different treatment were almost similar. However, signal characteristics of NaOH treatment were more intense than others, which due to remove part of the amorphous materials in addition expose the cellulose by NaOH. The crystallinity index (CI), calculated according to equation (3.9) and observed in Table (4.2). The water and NaOH treated rice straw fibers were higher values than untreated
Figure (4.2): SEM micrographs of rice straw fiber surface of: (a) untreated fiber;(b) water treated fiber ; and (c) NaOH treated fiber.
(a) (b)
(c) Parenchyma Cell

Chapter 4. Effect of straw treatment on rice straw properties
60
rice straw fibers (39.6 and 42 vs. 33.3, respectively), which also due to remove a part of the amorphous materials. On the other hand, crystallinity index of alkali treated rice straw fiber was higher value than water treated rice straw fiber (about 6%), which due to the effective in removing a sufficient amount of hemicellulose and lignin in order to expose the cellulose. Also, NaOH in alkaline treatment reacts with the OH groups in the fiber according to the following reaction: Fiber - OH + NaOH Fiber - O – Na +H2O Na+ ions come to fit in the unit cell of cellulose, increasing the cell parameter (Troedec et al., 2008).
4.5 Straw density Density was measured as the ratio of weight to volume using a helium pycnometer. Samples of dried treated and untreated straw fibers were cut in lengths between 10 and 20 mm, weighed and placed in a pycnometer. Table (4.3) shows that the rice straw density values were differed insignificantly between the treated and untreated rice straw.
Table (4.2): Crystallinity index of rice straw. Material I002 Iam CI,% Untreated 2364 1576 33.3
Water treated 3445 2080 39.6 NaOH treated 4527 2585 42.0
Figure (4.3): X-Ray diffractograms of treated and untreated Rice straw.
0
500
1000
1500
2000
2500
3000
3500
4000
4500
5000
10 15 20 25 30
2-Theta, o
Inte
nsit
y
untreatedwater treatedNaOH treared

Chapter 4. Effect of straw treatment on constituent and tensile properties of rice straw
61
Table (4.3): Typical density measurement of untreated and treated rice straw. Straw treatment Straw density, g/cm3
Untreated 0.97 Water treated 0.95 NaOH treated 0.99
4.6 Straw tensile strength Figure (4.4) shows the load displacement curve for untreated and treated rice straw. The curves of treating rice straw with cold water and untreated rice straw were comparable in the load displacement. However, treating rice straw with NaOH tended to reduce the maximum load. On the other hand, the reaching to the maximum load for NaOH treated rice straw (at displacement 2 mm) was more persistence than untreated and water treated fiber (at displacement 1.4 mm). This might be due to a degree of degradation of cellulose chains upon alkali treatment (Islam et al., 2005). In the calculation of the stress, the cross sectional area of the fibers was obtained from the mass, length and density of rice straw fibers. The average Young’s modulus and strength of untreated and treated straw were illustrate in Table (4.4). The untreated samples has the best tensile strength and Young’s modulus of 48.3 and 3864 MPa, respectively, followed by water treated samples with a close values of 47.5 and 3800 MPa. NaOH treated fiber had the lowest tensile strength and young’s modulus of 29.1 and 1455 MPa, respectively.
0
20
40
60
80
100
120
140
0 0.5 1 1.5 2 2.5 3
Displacement,mm
Lo
ad,N
Untreated water treatedNaOH treated
Figure (4.4): Load displacement curve for untreated and treated rice straw.
Max
imu
m d
isp
lace
men
t fo
r N
aOH
tre
ated
str
aw
Max
imu
m d
isp
lace
men
t fo
r u
ntr
eate
d a
nd
w
ater
tre
ated
str
aw

Chapter 4. Effect of straw treatment on rice straw properties
62
4.7 Conclutions Based on the findings of this chapter, the following conclusions are drawn :
• NaOH treatment of rice straw was effective for removing the extractives, increasing the roughness of the surfaces and increases the crystallinity index of the fibre.
• NaOH treatment reduced the straw strength than water treatment due to removing the amorphous compounds like lignin and hemicellulose.
• The removal of non-cellulosic surface impurities could be resulting in stronger composites consistent due to enhanced chemical bonding and mechanical interlocking between the straw and cementitious matrix.
Table (4.4): Tensile strength and Young’s modulus of untreated and treated rice straw.
Straw treatment No. of sample
tested Avg. tensile
strength, MPa Avg. Young’s modulus, MPa
Untreated 15 48.3 3864 Water treated 15 47.5 3800 NaOH treated 15 29.1 1455

Chapter 5. Hydration of rice straw with Portland cement
63
Figure (5.1): Variation of the hydration temperature vs. time for neat cement and composites containing different amounts of untreated straw particles
0
10
20
30
40
50
60
70
80
0 2 4 6 8 10 12 14 16 18 20 22 24
Time,h
Hyd
ratio
n te
mp
ratu
re,
oC
Room Temp.Neat cement SC =1.5%SC =3%SC =4.5%SC =7.5%
5 HYDRATION OF RICE STRAW WITH PORTLAND CEMENT
5.1 1ntroduction In this chapter, the effects of adding untreated, water treated, and NaOH treated rice straw particles with and without CaCl2 addition on the hydration process of Portland cement are investigated. Straw particles were mixed with cement at different levels, namely, 0%, 1.5%, 3%, 4.5% and 7.5% by weight. Also, four sizes of straw particles (20~40 mesh, 10mm, 20mm,and 30mm) were used to prepare straw-cement composites. CaCl2 was used as an accelerator for the cement hydration with four levels (0%, 3%, 6%, and 9% from cement weight). Hydration process of Portland cement–rice straw composite was investigated with two main tests, hydration test (as described in section 3.4.5) and compressive test (as described in section 3.4.11). On the other hand, ESEM images were taken to investigate the straw matrix interface for each treatment. Hydration reaction of Portland cement with rice straw are presented and discussed in the following paragraphs.
5.2 Effect of rice straw particles addition on cement hydration Figure (5.1) illustrates the variation on the hydration temperature with time for composites containing different levels from 20~40 mesh untreated straw particles. The correspondent parameter-values of untreated straw-cement composites hydration are illustrates in Figures (5.2) and (5.3) and listed in Table (11.6) in appendix.
The addition of straw particles 20 ~40 mesh to cement, clearly reduces the maximum hydration temperature attained (T) and increases the time to achieve the maximum temperature (t) as compared with control cement as shown in Figure (5.1). Figure (5.2) shows the relationship between the straw content and the variation of t values and T values. The time to reach the maximum hydration temperature (t) of the composites increased from 9.5 h (for neat cement paste) to 18.5, 44, 50.4 and 73 h for 1.5, 3, 4.5 and 7.5% straw content, respectively. While, maximum hydration temperature

Chapter 5. Hydration of rice straw with Portland cement
64
Figure (5.2): Effect of straw content on maximum hydration temperature and time to reach maximum hydration temperature for untreated straw-cement composites.
(T) decreased from 70.9 oC (for neat cement paste) to 36.2, 35.2, 33.2 and 30 oC for 1.5, 3, 4.5 and 7.5% straw content, respectively. Therefore, hydration rate (R) was decreased with increasing straw content in the composite (see Figure 5.3), because its calculated based on T and t values as described in equation (3.7). Also, the heat energy released (ET) was reduced with increasing the straw content in the composite (see Figure 5.3) due to the reduction in the area under hydration curve with increasing the straw content in the composite as shown in Figure (5.1). R value decreased from 4.7 oC/h (for neat cement paste) to 0.62, 0.34, 0.29 and 0.13 oC/h for 1.5, 3, 4.5 and 7.5% straw content, respectively. While, ET value decreased from 956.02 oC.h (for neat cement paste) to 706.25, 533.35, 514.25 and 503.24 oC.h for 1.5, 3, 4.5 and 7.5% straw content, respectively. From the earlier figures it is clearly that, the addition of 20~40 mesh straw particles to cement exerted a certain inhibitory influence on cement hydration. Therefore, the inhibitory index was calculated according to equation (3.6) at each straw content. Then, the effect of the inhibited cement setting was classified according to Table (5.1) (Hachmi et al. 1990). Based on the obtained results, for the mixture containing 1.5% of straw particles, the correspondent inhibitory index value of 39.9 % classifies the mixture as being of “moderate inhibition”. While, the inhibitory index of 164 %, corresponds to the “extreme inhibition” classification at 3% straw content. Therefore, the level of inhibition of the cement hydration due to the presence of straw particles in composite, is unsuitable for developing cement composite. This inhibitory effect is due to the chemical constituents of rice straw particles. Sugars and lignin are the main inhibitors of cement hydration process (Blankenhorn et al. 2001). Inhibition of cement occurs when the calcium silicate hydrate nucleation sites, on the originally positively charged surface, are poisoned by the sugar acid and lignin anions (Pehanich et al. 2004). However, high content of straw particles are not suitable to be mixed with cement. The chemical treatment evident to be necessary in order to improve the cement-straw particles compatibility.

Chapter 5. Hydration of rice straw with Portland cement
65
Figure (5.3): Effect of straw content on heat energy released (ET) and hydration rate (R) for untreated straw-cement composites.
Table 5.1. Inhibitory index which is used to classify the compatibility level. Inhibitory index I, % Composite Grade I< 10 Low inhibition I =10 ~50 Moderate inhibition I= 50~100 High inhibition I>100 Extreme inhibition On the other hand, the increase of straw particles content in the composites decreases the compressive strength as shown in Figure (5.4). Compressive strength at 28 day decreases from 57.17 MPa (for neat cement paste) to 8.7, 4.79, 1.45 and 0.54 MPa for composites containing 1.5, 3, 4.5 and 7.5% straw content, respectively (Table 11.7 in appendix).
Figure (5.4): Effect of straw content on untreated straw-cement composites compressive strength.
Straw size: 20~40 mesh

Chapter 5. Hydration of rice straw with Portland cement
66
Figure (5.5): ESEM image for untreated straw-cement composite containing 7.5% straw particles
The decrease in the mechanical strength is attributed to the physical properties of straw particles and the bond between the straw particles with cement matrix. Straw particles are less stiff than the surrounding cement paste. Therefore, under loading, cracks are initiated around the straw particles and accelerated the failure in the matrix. On the other side, there is a high correlation between the strength development and the heat of hydration released from the straw cement composite as shown in Figure (5.4). Compressive strength decreased with the reduction of the heat of energy released. In addition environmental scanning electron microscope (ESEM) image shows a decrease in the composite strength. Poor gel of hydrated cement was observed for untreated straw cement composite as shown in Figure (5.5). Results shown an increase of the porosity in the matrix with a decrease of in the bond between cement matrix and straw particles. Therefore, mechanical strength is reduced. Therefore, chemical treatment of rice straw or the admixture of additives to the composite will be necessary in order to improve the straw cement compatibility, and to improve the hydration of cement matrix
5.3 Effect of straw particle treatment and particle size on the hydration of cement straw composites.
The result obtained from the hydration test for the composites containing 7.5% of untreated and treated straw particles with different sizes are shown in Figures (5.6) to (5.8) and listed in Table (11.8) in appendix. The selected treatment has been tested in order to minimize detrimental effect of straw particles on cement hydration by reducing the amount of extractive and straw particles surface area. Figure (5.6a) shows the relationship between straw particle size and time to reach maximum hydration temperature for untreated and treated straw cement composites. It is clearly that (t) value decreased significantly by increasing the straw particle size from 20~40 mesh to 30 mm for untreated and treated straw cement composites. Also, treating rice straw with water or NaOH had a significant effect on reducing (t) value up to 10mm
Straw particles
Poor gel hydration
Voids
10 µm

Chapter 5. Hydration of rice straw with Portland cement
67
0
10
20
30
40
50
60
70
80
20~40 10mm 20mm 30mm
Tim
e to
max
imu
m h
ydra
tion
tem
pra
ture
(t),
h
Straw particel size
Untreated straw
water treated straw
water treated straw
Straw content 7.5 %, by weight
0
5
10
15
20
25
30
35
40
20~40 10mm 20mm 30mm
Max
imu
m h
ydra
tio
n t
emp
ratu
re (
T),
oC
Straw particle sizel
Untreated straw water treated straw NaOH treated straw
Straw content 7.5 %, by weight
Figure (5.6): Effect of straw particle size and treatment on (a) time to reach maximum hydration temperature and (b) maximum hydration temperature
straw particle size (Figure 5.6a). Due to increasing straw particle size from 20~40 mesh to 10, 20, and 30mm (t) value decreases from 73.2 h to 40, 16.5 and 14.5 h (for untreated straw cement composite), from 47.5 h to 16, 14.5 and 13.5 h (for water treated straw cement composite) and from 52.2 h to 18, 18 and 16 h (for NaOH treated straw cement composite). (a) (b) On the other hand, Figure (5.6b) illustrates the variation on maximum hydration temperature with straw particle size and treatment. Results show that treating straw particles with water or with NaOH and increasing the straw particle size from 20~40 mesh to 30 mm had a little effect on increasing (T) value of straw cement composites. Therefore, hydration rate (R) was increased significantly by treating rice straw particles with water or with NaOH when compared at the same straw particle size as shown in Figure (5.7). Also, (R) value increased significantly by increasing the straw particle size

Chapter 5. Hydration of rice straw with Portland cement
68
Figure (5.7): Effect of straw particle size and treatment on hydration rate of rice straw cement
Figure (5.8): Effect of straw particle size and treatment on heat energy released from rice straw cement composites.
0
100
200
300
400
500
600
700
800
20~40 10mm 20mm 30mm
Hea
t en
erg
y re
leas
ed (
ET
),o C
.h
Straw particle size
Untreated straw water treated straw NaOH treated straw
0
0,1
0,2
0,3
0,4
0,5
0,6
0,7
0,8
0,9
20~40 10mm 20mm 30mm
Hyd
rati
on
rat
e (R
),o C
/h
Straw particle size
Untreated straw water treated straw NaOH treated straw
when compared at the same treatment. Due to increasing straw particle size from 20~40 mesh to 10, 20, and 30mm (R) value increased from 0.13 oC/h to 0.16, 0.16 and 0.28 oC/h (for untreated straw cement composite), from 0.26 oC/h to 0.42, 0.52 and 0.78 oC/h (for water treated straw cement composite) and from 0.21oC/h to 0.41, 0.47 and 0.56 oC/h (for NaOH treated straw cement composite). Straw content: 7.5 % by weight Furthermore, heat energy released (ET) from straw cement composite increased due to treating rice straw with water or with NaOH when compared at the same particle size. Also, increasing the straw particle size from 20~40 mesh to 30 mm improving (ET) value when compared at the same treatment as shown in Figure (5.8).

Chapter 5. Hydration of rice straw with Portland cement
69
Treated and untreated straw cement composites was graded as „ Extreme inhibition“ for straw particles size 20~40 mesh because inhibitory index more than 100 % , and graded as „Moderate inhibition“ for treated straw particle size between 10mm to 30 mm because inhibitory index ranges between 10% and 50 % as shown in Table (11.8). However, the result of compressive test shows a significant improvement in compressive strengths of straw cement composites, duo to the better hydration process of cement as shown in Figure (5.9). Increasing straw particles from 20~40 mesh to 10 mm length increasing the compressive strengths from 0.54 to 0.72 MPa for untreated straw particles, from 0.79 to 6.72 MPa for water treated straw particles, and from 1.24 to 6.63 MPa for NaOH treated straw particles. Also, an increasing straw particle size from 10mm length to 30 mm length decreases the compressive strength for untreated ,water treated, and NaOH treated straw particles to 0.33, 4.63, and 5.56 MPa, respectively. The ESEM of interfaces between cement matrix and water treated straw particles is illustrated in Figure (5.10). The ESEM for water treated straw shows that the interface layers are loose and some cracks appear between matrix and straw particles. On the other side, ESEM image of the interface situation with straw treated by NaOH is given in Figure (5.11). It is indicated that the fiber and matrix combine tightly with gel embedded into the space and small holes appearing on the concave surface spots of the straw particles which improves the bond between straw particles and matrix. Comparing the Figures (5.10), (5.11), and (5.5), it can be seen that treating straw with water or NaOH an improve of the cement hydration processes takes place and causes an increase of the gel production and a decrease of the porosity of the matrix specially for NaOH treated straw particles. Therefore, mechanical strength is improved.
0
1
2
3
4
5
6
7
8
9
20~40 10mm 20mm 30mm
Straw particle size
Co
mp
ress
ive
stre
ng
th, M
Pa
Untreated straw water treated straw NaOH treated straw
Figure (5.9): Effect of straw particle size and treatment on rice straw-cement composites compressive strength.

Chapter 5. Hydration of rice straw with Portland cement
70
Figure 5.10. ESEM micrograph for water treated straw cement composite.
Gap zone
Straw particle
Cement Matrix
Figure 5.11. ESEM micrograph for NaOH treated straw-cement composite.
Cement matrix
Straw particle

Chapter 5. Hydration of rice straw with Portland cement
71
5.4 Effect of CaCl2 addition on straw cement mixture hydration In order to improve compatibility between straw and cement, the effect of an addition of CaCl2 on the cement hydration processes for composites containing 7.5% of untreated and treated straw particles with different particle sizes was analyzed. Figure (5.12) shows the hydration curve for untreated straw particles (20~40 mesh) cement mixture with different levels of CaCl2. The addition of CaCl2 accelerates the hydration rate in both cases of treated and untreated straw cement composites.
As shown in Table (5.2), (T) values of straw cement composites rises up with increase of straw size and CaCl2 content. The opposite effect occurs with the (t) values. Table 5.2. Effect of CaCl2 addition on the maximum hydration temperature and time to reach maximum hydration temperature for untreated and treated straw- cement composites at 7.5% straw content.
Treatment Untreated Water treated NaOH treated CaCl2
content,% 3 6 9 3 6 9 3 6 9
Straw size T “maximum hydration temperature”, oC 20~40 mesh 30.0 55.9 64.9 51.3 56.0 65.3 39.0 52.5 56.9 10 mm 50.9 63.6 66.5 56.8 65.1 68.3 47.6 61.8 65.2 20 mm 54.6 63.5 67.2 58.8 67.3 71.9 47.5 63.9 67.7 30 mm 56.2 63.7 67.2 59.5 68.2 70.2 48.5 64.0 70.2 t “time to reach maximum hydration temperature” , h 20~40 mesh 24.0 5.0 2.5 10.0 4.5 2.0 19.0 7.5 4.0 10 mm 5.0 2.5 2.0 5.0 3.5 1.5 8.5 4.5 2.5 20 mm 6.0 2.5 1.8 5.0 3.0 1.5 8.0 4.0 2.0 30 mm 5.5 2.0 1.8 4.5 3.0 1.5 8.0 3.5 2.0
0
10
20
30
40
50
60
70
80
0 2 4 6 8 10 12 14 16 18 20 22 24
Time, h
Tem
prat
ure
,oC
airCementCaCl2 3%
CaCl2 6%CaCl2 9%
Figure (5.12): Effect of CaCl2 content on hydration curve of (20~40 mesh) untreated straw-cement composites at straw content 7.5%
Tem
per
atu
re, o
C
Time, h

Chapter 5. Hydration of rice straw with Portland cement
72
The hydration rates (R) of untreated and treated straw cement composites with CaCl2 addition were also increased. Furthermore, hydration rate of water treated straw cement mixture was higher than NaOH treated straw and untreated straw cement mixtures when compared at the same level of CaCl2. As a general trend straw partials (20~40 mesh) have a lower hydration rate than the other straw particles as shown in Figure (5.13).
CaCl2 content, wt.%.
Hyd
rati
on
rat
e (R
), o
C/h
.
Figure (5.13): Effect of CaCl2 content, straw size, and straw treatment on the hydration rate of straw-cement composites at straw content 7.5 Wt.%

Chapter 5. Hydration of rice straw with Portland cement
73
Figure (5.14) shows the average value of the ETs of the treated and untreated straw cement composites. The ET of straw cement composites increases with the addition of CaCl2 up to 6% from the cement weight. As shown in Figure 5.14, with a higher CaCl2 content ET decreases again.The interpretation for that, the straw cement composites with 9% CaCl2 gives all the energy in a small duration of time. This effect may decreases the area under the hydration curve (the maximum hydration temperature is reached after 1.5 h, then the temperature falls down faster than in the case of straw cement composites containing 6% CaCl2 as shown in Figure (5.12)). Also, ET of water treated straw cement composites is higher than the ET of NaOH treated straw and untreated straw cement composites when compared at the same levels of CaCl2 (Figure 5.14). On the other hand, all the straw cement composites with CaCl2 addition having an inhibitory index (I) value less than 10 ,which is classified as “Low inhibition”, while the untreated straw participles (20~ 40 mesh) cement composites with 3% CaCl2 content having an I value equal to 83.6%, which is classified as “High inhabition”. The addition of CaCl2 to untreated straw particles (20 ~40 mesh) cement composites must be more than 3%. Figure (5.15) shows the results obtained from the compressive test of the composite containing 7.5% of straw for the untreated and treated straw particles with different levels of CaCl2. the results demonstrates that the compressive strength will be improved by the addition of CaCl2 up to 6%. It is almost clear that, smallest straw particles have highest compressive strength and that is due to the orientation of particles in the specimen and the highly compaction for the specimens containing small particle compared with the specimens containing particles of largest sizes. Same results between compressive strength and particle sizes were reported by Olorunnisola (2007).
500
600
700
800
900
1000
0 3 6 9 12
CaCl2 content, % by weight
ET,
oC.h
un treated
water
NaOH
Figure (5.14): Effect of CaCl2 content and straw treatment on the total energy released (ET) of straw-cement composites at straw content 7.5%
CaCl2 content, % by weight
Hea
t en
erg
y re
leas
ed (
ET
),oC
.h

Chapter 5. Hydration of rice straw with Portland cement
74
CaCl2 content, wt %.
Co
mp
ress
ive
stre
ng
th, M
Pa
Figure (5.15): Effect of CaCl2 content, straw size, and straw treatment on compressive strength of straw-cement composites at straw content of 7.5 % by weight.

Chapter 5. Hydration of rice straw with Portland cement
75
On the other hand, straw particles 20~40 mesh treated with water will have a higher compressive strength than NaOH and untreated particles at 3% CaCl2 content. After this ratio, the type of treatment of straw will show no difference in compressive strength. So, after 3% CaCl2 content, the composite strength is more pronounced with CaCl2 addition ratio. For straw particle sizes between 10mm and 30 mm, straw treatment shows no differences in compressive strength when compared at the same level of CaCl2 content. Compressive strength of the composites ranged between 8.2 and 24.6 MPa for untreated straw particles, between 5.8 and 25.1 MPa for water treated straw particles, and between 5.5 and 25.7 MPa for NaOH treated straw particle. In order to get some evidence on the effect of CaCl2 addition on straw cement composite morphology, ESEM/EDS observation was used. Figures (5.16) shows the ESEM/EDS micrographs of untreated and treated straw particles cement composites with 6 % CaCl2. Composites which were prepared with untreated straw particles exhibits a gap zone at the straw /cement interface. The rise in this gap zone leads to a decrease in mechanical strength. This gap zone is reduced with water treated straw particles and disappeared with NaOH treated straw particles due to the good adhesion between the straw particle and the cement matrix as shown in Figure (5.16). On the other hand, EDS spots 3, 4, 5, and 6 in Figure (5.16) shows evidence of ettringite / monosulphate and calcium hydroxide formation between the straw particles and the matrix, where calcium is the predominate element observed between straw particles and matrix, and within the straw lumen. The same observation was reported by Mohr et. al., 2005 and Tonoli et. al., 2009. In the untreated straw particles cement composites, the majority of the straw is not filled with the hydration products of the cement, indicating that untreated straw extractives dissolve in the solution and cover the surface of the particle. The amount of carbon in the cell wall of the untreated straw particle is higher than that observed to treated straw particle. In this case, it is believed that the hydration products of cement were deposited mainly around the particle (Figure 5.16). EDS spots 1 and 2 shows the sulphate phases (e.g., ettringite and monosulphate) around the surface of the particles. Therefore, the increase in mechanical strength can also be attributed to the improvement in the adhesion between cement matrix and straw particles. Finally, straw cement composites shows a positive correlation between compressive strength and the total energy released ET by composites

Chapter 5. Hydration of rice straw with Portland cement
76
Un
trea
ted
Str
aw
CSH
Wat
er t
reat
ed s
traw
N
aOH
tre
ated
str
aw
Figure (5.16): ESEM image of the polished surface of untreated and treated rice straw-cement composites with CaCl2 obtained after 28 days of curing. EDS spots are signalized in the images (spots 1-6).

Chapter 5. Hydration of rice straw with Portland cement
77
5.5 Conclusions Conclusions drawn from the findings of this chapter:
• The shape and size of straw particles affect all the performance of the hydration process and the compressive strength capacity.
• Small straw particles must be treated to decrease its inhibitory influence on the cement hydration.
• The addition of CaCl2 to untreated straw cement composites enhances the performance of the mixture compared to that obtained from treated straw cement composite without an addition of CaCl2.
• The addition of 3% CaCl2 to small for untreated straw cement composites and does not accelerate the hydration processes.
• The addition of 6% CaCl2 to treated and untreated straw cement composites results in the highest increase in compressive strength and the best hydration values.
• Small straw particles results in a high compressive strength, also compressive strength is higher than the composites with big straw particles.
• Treated straw particles have a better interaction zone than with untreated particles. • NaOH treated rice straw with an addition of CaCl2 has the best adhesion between
straw fiber and cement matrix. • The mechanical properties can be predicted from the total energy released by the
straw cement composites.

Chapter 6. Strength development of high content fly ash cementitious binder
78
6 STRENGTH DEVELOPMENT OF HIGH CONTENT FLY ASH CEMENTITIOUS BINDER
6.1 Introduction In this Chapter, the experimental results of the development of high content fly ash cementitious binder are presented and discussed. Each of the compressive strength tests data plotted in Figures corresponds to the mean value of the compressive strengths of three test samples in a series. The effects of various salient parameters on the compressive strength of low calcium fly ash cementitious binder pastes are discussed. The parameters considered are as follows: Ratio of calcium hydroxide to fly ash (by mass), Ratio of gypsum to fly ash (by mass), Effect of Portland cement content (by mass), Heating temperature & heating time in the early age, Water content in mixtures, and Dry curing versus Water curing.
6.2 Strength development of fly ash-calcium hydroxide mixtures 6.2.1 Strength development of fly ash calcium-hydroxide mixture under room
curing condition. To quantify the effect of calcium hydroxide content on the strength development of fly ash-calcium hydroxide mixtures, calcium hydroxide was mixed with fly ash at three weight ratios; 10%, 30%, and 50% from the fly ash weight ( Mixes L10, L30, and L50 in Table 11.4 in appendix). Compressive strength results of the fly ash-calcium hydroxide mixtures which were cured under room condition (20oC in 65% R.H.) are illustrated in Figure (6.1). It can be observed that the compressive strength rises by increasing both the calcium hydroxide content and curing age. Fly ash-calcium hydroxide mixtures have very low strength at early ages, because no chemical reactions take place at the initial stage of interaction between the calcium hydroxide and the fly ash. As the curing ages increases, pozzolanic reaction between the fly ash and calcium hydroxide begins and hydration product like calcium silicate hydrate (CSH) is formed (Min et al. 2008). At 90 days of curing under room condition (20oC in 65% R.H.), maximum compressive strength of 1.2 MPa at 50% calcium hydroxide content was achieved (Figure 6.1). Figure (6.1): Strength development of fly ash-calcium hydroxide pastes under room curing condition.
0
0.2
0.4
0.6
0.8
1
1.2
1.4
0 10 20 30 40 50 60 70 80 90
Curing Age, day
Co
mp
ress
ive
stre
ng
th, M
Pa
L10
L30
L50

Chapter 6. Strength development of high content fly ash cementitious binder
79
6.2.2 Strength development of fly ash-calcium hydroxide mixture under 45, 65, 85, and 105 oC curing conditions
To increase the reactivity between the fly ash and calcium hydroxide, mixes L10, L30, and L50 were heated in oven at different temperatures (45, 65, 85 and 105oC) for 24 h. Figure (6.2) shows the compressive strength of fly ash-calcium hydroxide mixtures under heating treatment for the first day of hydration. It can be observed that the compressive strength were greatly developed compared with unheated mixes (cured at 20oC in 65% RH) in Figure (6.1). Up to 85oC compressive strength increased significantly because higher curing temperature accelerates the polymerization reaction and more hydration products were formed (Mandal and Majumdar 2009). Furthermore, increasing the curing temperature from 85oC to 105oC results in a reduction of the compressive strength. The reason for this may be to the formation of thermal creaks inside the specimens. On the other hand, increasing the calcium hydroxide content from 10% to 50% increases the strength development when compared at the same temperature (Figure 6.2). The highest 1 day compressive strength of fly ash-calcium hydroxide mixtures of 7.5 MPa is achieved at 85oC curing temperature with 50% calcium hydroxide content (from the fly ash weight).
Figure (6.2): Strength development of heated fly ash-calcium hydroxide pastes at 1 day.
0
1
2
3
4
5
6
7
8
9
10
40 45 50 55 60 65 70 75 80 85 90 95 100 105 110
Curing temperature,oC
Co
mp
ress
ive
stre
ng
th,M
Pa
L10L30L50

Chapter 6. Strength development of high content fly ash cementitious binder
80
6.3 Strength development of fly ash-calcium hydroxide-gypsum mixtures
6.3.1 Effect of curing temperature on the strength development In table (11.4), the mixes from 9 to 13 were prepared to determine the effect of adding gypsum and curing temperatures (in the first 24 h) on the compressive strength of fly ash-calcium hydroxide-gypsum mixtures. Firstly all the fly ash and the calcium hydroxide were brought together in all mixtures. Then gypsum was added with different levels (8% - 16% from the fly ash weight). The results of the compressive strength are given in Figure (6.3). It can be observed that the compressive strength of the mixes containing gypsum were greatly developed compared with the mix without gypsum. At curing temperature of 20oC, there are small increases in the 1 day compressive strength by increasing the gypsum content from 0% to 16% (from fly ash weight). This indicates that the hardening of gypsum during the hydration process contributes to an early growth of strength mostly. But when curing age increases up to 28 days, differences among mixes become more evident (Figure 6.3). Also, compressive strength significantly increases by increasing the curing temperature above 20oC in the first 24 hour in all mixtures. On the other hand, for the heated mixtures, one day compressive strength increases by increasing the gypsum content and differences among mixes became evident, specially by increasing the curing temperature more than 45oC. The compressive strength increases with increasing curing temperature up to 85oC in all the studied mixtures. Increasing the curing temperature above 85oC results in a reduction of the strength development. Therefore, the curing condition had an influence on the degree of hydration process. At curing temperature of 85oC, maximum compressive strength increased from 7.8 to 21 MPa at 1 day and from 7.9 to 29.7 MPa at 28 days, due to the increase of the gypsum content from 0% to 14% (from the fly ash weight). Furthermore, no significant difference in the strength development due to the increase of the gypsum content from 14% to 16% at higher curing temperature can be seen. Based on the obtained results, temperature of 85oC in the first 24 h seems to be the optimum curing method for the strength development.
6.3.2 Effect of gypsum content and calcium hydroxide content on the strength development under 85 oC curing condition.
To quantify the effect of the interaction between calcium hydroxide content and gypsum content on the strength development, mixes from 4 to 18 in Table (11.4) were made. For this, three contents of calcium hydroxide are added to the fly ash, namely, 10 ,30 and 50% (from the fly ash weight). For each mixture, gypsum is added with different weight ratios (from the fly ash weight) ranged between 8% and 16%. Curing temperature in the first 24 h is fixed at 85oC based on the obtained results in sections 6.2.2 and 6.4.1. Figure (6.4) shows the effect of calcium hydroxide content and gypsum content on the strength development of fly ash-calcium hydroxide-gypsum mixtures of an age of 1 and 28 days. Compressive strength increases by increasing both content of calcium hydroxide and gypsum in the mixtures. Up to 12% gypsum content (from the fly ash weight) compressive strength increases by increasing the calcium hydroxide content from 10 to 50% (from the fly ash weight). From Figure (6.4), it can be seen: when the content of gypsum is more than 12%, the strength of mixtures increases with an increasing calcium hydroxide content up to 30%. The maximum value of strength is gained, when the

Chapter 6. Strength development of high content fly ash cementitious binder
81
content of calcium hydroxide not exceeds 30% and gypsum content vary from 14% to 16% (Figure 6.4).
Figure (6.3): Effect of curing temperature in the first 24 h and gypsum content on strength development of fly ash-calcium hydroxide-gypsum Mixtures.
Temperature, oC
Co
mp
ress
ive
stre
ng
th, M
Pa
0
5
10
15
20
25
30
35
15 20 25 30 35 40 45 50 55 60 65 70 75 80 85 90 95 100 105 110
gypsum/fly ash =0
gypsum/fly ash =0.08
gypsum/fly ash =0.1
gypsum/fly ash =0.12
gypsum/fly ash =0.14
gypsum/fly ash =0.16
1 day
0
5
10
15
20
25
30
35
15 20 25 30 35 40 45 50 55 60 65 70 75 80 85 90 95 100 105 110
7 days
0
5
10
15
20
25
30
35
15 20 25 30 35 40 45 50 55 60 65 70 75 80 85 90 95 100 105 110
28 days

Chapter 6. Strength development of high content fly ash cementitious binder
82
Calcium hydroxide content, wt % (from fly ash weight)
Co
mp
ress
ive
stre
ng
th, M
Pa.
0
5
10
15
20
25
30
35
0 10 20 30 40 50 60
Gypsum/fly ash ratio = 0Gypsum/fly ash ratio = 0.08Gypsum/fly ash ratio =0.1Gypsum/fly ash ratio = 0.12Gypsum/fly ash ratio = 0.14Gypsum/fly ash ratio = 0.16
1 day
0
5
10
15
20
25
30
35
0 10 20 30 40 50 60
7 days
0
5
10
15
20
25
30
35
0 10 20 30 40 50 60
28 days
Figure (6.4): Effect of calcium hydroxide content and gypsum content on strength development of fly ash -calcium hydroxide-gypsum paste cured at 85oC in the first 24 h.

Chapter 6. Strength development of high content fly ash cementitious binder
83
6.3.3 Effect of water to binder ratio on the strength development To quantify the effect of water content on the strength development of fly ash-calcium hydroxide-gypsum mixtures, mixes from 19 to 33 in Table (11.4) were made. Two contents of calcium hydroxide were added to the fly ash, namely, 10 and 30 % (from the fly ash weigh). At each mixture, gypsum is added with 14% (from the fly ash weight). Curing temperature in the first 24 h is fixed at 85oC. Water to total powder content ratios are increased from 0.3 to 0.7 with 0.05 step. Compressive strength decreases with increasing the water to powder ratio in a linear rate as shown in Figure (6.5). A reduction of the compressive strength is always reached when the water content increases and the calcium hydroxide content decreases. Compressive strength decrease from 14 MPa to 9 MPa (for 10% calcium hydroxide content) and from 23 MPa to 15 MPa (for 30% calcium hydroxide content) due to an increase of the water to powder ratio from 0.5 to 0.7. On the other hand, Compressive strength increases from 14 MPa to 26 MPa (for 10% calcium hydroxide content) and from 23 MPa to 28 MPa (for 30% calcium hydroxide content) due to decrease of the water to powder ratio from 0.5 to 0.35.
y = -50.872x + 41.861
R2 = 0.9385
y = -42.429x + 44.278
R2 = 0.9786
0
5
10
15
20
25
30
0.25 0.3 0.35 0.4 0.45 0.5 0.55 0.6 0.65 0.7 0.75 0.8
L10 G14
L30 G14
Water to powder ratio
Co
mp
ress
ive
stre
ng
th, M
Pa.
Figure (6.5): Effect of water to powder ratio on the strength of the fly ash-calcium hydroxide-gypsum mixtures.

Chapter 6. Strength development of high content fly ash cementitious binder
84
6.3.4 Effect of curing condition on the strength development
6.3.4.1 Water curing vs. air curing The influence of water curing versus air curing on the strength development of fly ash-calcium hydroxide-gypsum mixtures was analyzed. For this, several mixtures were prepared (mixes from 1 to 18 in Table11.4). All the specimens were cured in an oven at 85oC for the first 24 h. After that specimens were cooled down to room temperature inside the oven. Then the half of the specimens were cured under water (WC) at 20oC and the second half were cured under room condition (AC) for 27 days. Figure (6.6) shows the compressive strength development at 10%, 30% and 50% calcium hydroxide content with different gypsum content ranged between 0% to 16%. It was observed that the compressive strength of fly ash-calcium hydroxide mixtures increases if instead of an air curing. Compressive strength increases with 28%, 43% and 60% for the specimens cured in water for the mixtures with calcium hydroxide content of 10%, 30% and 50%, respectively as shown in Figure (6.7). On the other side, compressive strength of fly ash-calcium hydroxide-gypsum mixtures decreases with water curing because these mixtures exhibit crack formation as shown in Figure (6.8). Also, it was observed that the reduction in the compressive strength relates to the content of gypsum. Furthermore, the reduction of compressive strength is significantly influenced by the calcium hydroxide content as shown in Figure (6.7).

Chapter 6. Strength development of high content fly ash cementitious binder
85
Gypsum content, wt% (from fly ash weight)
0
5
10
15
20
25
30
35
0 2 4 6 8 10 12 14 16 18
L10 -WC
L10-AC
0
5
10
15
20
25
30
35
0 2 4 6 8 10 12 14 16 18
L30 -WC
L30-AC
0
5
10
15
20
25
30
35
0 2 4 6 8 10 12 14 16 18
L50 -WC
L50-AC
Co
mp
ress
ive
stre
ng
th, M
Pa
Figure (6.6): Effect of water curing (WC) and air curing (AC) on the strength development of fly ash-calcium hydroxide-gypsum mixtures at 28 day.

Chapter 6. Strength development of high content fly ash cementitious binder
86
6.3.4.2 Effect of heating time on the strength development To determine the effect of heating time on compressive strength development, fly ash-calcium hydroxide-gypsum mixtures with water to powder ratio of 0.35 were prepared and cured at 85oC inside the oven for 4, 8, 16, 24, 48 and 72 h (mixes from 34 to 43 in Table 11.4). Compressive strength was determined for each analyzed heating time. Figure (6.9) shows the strength development for the mixtures with 10% and 30% calcium hydroxide content with a different gypsum content which was ranged between 8 % to 16%. From Figure (6.9), it can be seen: the compressive strength of all the mixtures increases significantly with heating tine up to 24 h. By increasing the heating time from
Figure (6.8): Crack formation due to curing fly ash-calcium hydroxide-gypsum specimens in water at 20oC for 27 days.
-60
-40
-20
0
20
40
60
80%
of
red
uct
ion
in
co
mp
ress
ive
stre
ng
th
L10 L30 L50
Calcium hydroxide content, wt% (from fly ash weight).
Gypsum content = 0, wt% Gypsum content = 8, wt% Gypsum content = 10, wt% Gypsum content = 12, wt% Gypsum content = 14, wt% Gypsum content = 16, wt%
Figure (6.7): Percentage of reduction in compressive strength of fly ash-calcium hydroxide-gypsum mixtures due to curing in water for 27 days relative to air cured mixtures.

Chapter 6. Strength development of high content fly ash cementitious binder
87
24h to 72 h the compressive strength is almost the same. Therefore, a heating of 24h is considered as an optimum heating time.
Gypsum content, wt% (from fly ash weight)
Co
mp
ress
ive
stre
ng
th, M
Pa
0
5
10
15
20
25
30
35
6 8 10 12 14 16 18
4 h 8h 16h 24h 48 h 72 h
0
5
10
15
20
25
30
35
6 8 10 12 14 16 18
Figure (6.9): Effect of heating time at 85oC on the strength development of fly ash-calcium hydroxide-gypsum mixtures, (A) mixes containing 10 wt% calcium hydroxide and (B) mixes containing 30 wt % calcium hydroxide (from fly ash weight).
(A) 10% Calcium hydroxide
(B) 30% Calcium hydroxide

Chapter 6. Strength development of high content fly ash cementitious binder
88
6.4 Strength development of fly ash/calcium hydroxide/gypsum/Portland cement mixtures
Mixtures from 44 to 56 in Table (11.4) contained Portland cement to increase the resistance of the fly ash- calcium hydroxide-gypsum mixtures to water. Thus, the mixtures containe 70% fly ash from the total weight, while cement content is varried by replacing it with calcium hydroxide, gypsum, or both of them. The optimum curing condition, worked out in the previously parts, were used.
6.4.1 Influence of calcium hydroxide content on the strength development Figure (6.10) shows the effect of heating treatment and of replacing the Portland cement by calcium hydroxide on the strength development for the mixtures with 70 wt% fly ash. As a general trend for unheated mixtures (cured in 20oC and 65% RH for 28 days), the replacing the cement by calcium hydroxide decreases the compressive strength of the mixtures especially in an early age (at 1 day). The higher the content of calcium hydroxide, the lower the strength. This behavior may be due to the reduction of the cement content and the lower speed of the pozzolanic reaction between the fly ash and calcium hydroxide. Also, with an increase of the age of specimens, the compressive strength increases. Compressive strength increases with an increase of the calcium hydroxide content up to 5% at later ages (7 and 28 days). For a higher contents of calcium hydroxide the strength decreases. On the other hand, heating of the specimens in the first 24h in an oven at 85oC improves the strength development at early and later ages as shown in Figure (6.10). Similar results were report by Barbhuiya et al. (2009). Also, results confirm that replacing of the cement by calcium hydroxide will improve the pozzolanic reaction of high content fly ash-cement blends. Figure (6.10): Effect of replacing the cement by calcium hydroxide on the strength development of unheated and heated fly ash- calcium hydroxide-cement mixtures containing 70 wt% fly ash from the total weight.
0
10
20
30
40
50
0 5 10 15
Calcium hydroxide, wt% (from fly ash weight)
Co
mp
ress
ive
stre
ng
th, M
Pa
1d-heated 7d-heated 28d-heated
1d-unheated 7d-unheated 28d-unheated

Chapter 6. Strength development of high content fly ash cementitious binder
89
6.4.2 Influence of gypsum content on the strength development The influence of replacing the cement by gypsum on the compressive strength of unheated and heated fly ash cementitious blended mixes are illustrated in Figure (6.11). As a general trend for the unheated mixtures, replacing the cement with gypsum causes a decrease of the compressive strength for all curing times from 1 day to 28 days. More over, the higher the content of gypsum, the lower the strength. This effect can be explained by the reduction of the cement content and the lower speed of the pozzolanic reaction of the fly ash. Also, as the age of specimens increases an increase of the compressive strength can be observed. On the other side, heating treatment improves the strength development at early and later ages as shown in Figure (6.11). Compressive strength increases with an increase of gypsum content up to 10% (from fly ash weight) for all curing times from 1 day to 28 days.
6.4.3 Influence of calcium hydroxide with gypsum on the strength development
Figure (6.12) represents the effect of replacing the cement by gypsum when the mixtures contain 5 wt% calcium hydroxide (from the fly ash weight) on the compressive strength of the fly ash-calcium hydroxide-gypsum-cement mixtures. On the other hand, Figure (6.13) represents the effect of replacing the cement with gypsum when the mixtures contains 10 wt% calcium hydroxide (from the fly ash weight) on the compressive strength of the fly ash-calcium hydroxide-gypsum-cement mixtures.
Figure (6.11): Effect of replacing the cement by gypsum on the strength development of unheated and heated fly ash- gypsum-cement mixtures containing 70 wt% fly ash content from the total weight.
0
5
10
15
20
25
30
35
40
45
50
0 5 10 15
Gypsum content ,wt% (from fly ash weight)
Co
mp
ress
ive
stre
ng
th, M
Pa
1d-heated 7d-heated 28d-heated
1d-unheated 7d-unheated 28d-unheated

Chapter 6. Strength development of high content fly ash cementitious binder
90
Figure (6.12): Effect of replacing the cement by gypsum on the strength development of unheated and heated fly ash-calcium hydroxide-gypsum-cement mixtures containing 70 wt % fly ash and 3.5 wt % calcium hydroxide from the total weight.
05
101520253035404550556065
0 5 10 15
Gypsum content,wt%(from fly ash weight)
Co
mp
ress
ive
stre
ng
th, M
Pa
1d-heated 7d-heated 28d-heated
1d-unheated 7d-unheated 28d-unheated
Figure (6.13): Effect of replacing the cement by gypsum on the strength development of unheated and heated fly ash-calcium hydroxide-gypsum-cement mixtures containing 70 wt % fly ash and 7 wt % calcium hydroxide from the total weight.
05
101520253035404550556065
0 5 10 15
Gypsumcontent,wt%(from fly ash weight)
Co
mp
ress
ive
stre
ng
thS
, MP
a
1d-heated 7d-heated 28d-heated
1d-unheated 7d-unheated 28d-unheated

Chapter 6. Strength development of high content fly ash cementitious binder
91
As a general trend for unheated pastes, replacing the cement with gypsum decreases the compressive strength of the fly ash calcium hydroxide cement pastes in all ages from 1 day to 28 days. At the same calcium hydroxide content, the more gypsum is used the lower is compressive strength. On the other hand, at the same gypsum content, the more calcium hydroxide is used the lower is the compressive strength. Furthermore, heating treatment improves the strength development for the fly ash- calcium hydroxide-gypsum-cement mixes at early and later ages. Compressive strength increases by an increase of the gypsum content up to 10 wt% from the fly ash weight for both calcium hydroxide contents, as shown in Figures (6.12) and (6.13). A slight reduction on the compressive strength with an increasing of the calcium hydroxide content from 5 wt% to 10 wt% at the same gypsum content can be observed, as shown in Figures (6.12) and (6.13). Compressive strength increases from 43 to 53 MPa for the mixes containing 5 wt% from the fly ash weight calcium hydroxide due to an increase of the gypsum content from 0 wt% to 10 wt%. At 10 wt% calcium hydroxide content, compressive strength increases from 35 MPa to 50 MPa with an increase of the gypsum content from 0 wt% to 10 wt%.
6.5 Conclusions The following are the conclusions drawn from the findings of this chapter:
• Higher content of calcium hydroxide results in higher compressive strength of unheated and heated fly ash - calcium hydroxide mixes.
• Gypsum addition up to 14 % from the fly ash weight improves the compressive strength of the fly ash calcium hydroxide mixes significantly.
• As the curing temperature in the range of 20oC to 85oC increases, the compressive strength of fly ash-calcium hydroxide mixes and fly ash-calcium hydroxide-gypsum mixes increases.
• Longer curing time, in the range of 4 to 72 hours (3 days), results in a higher compressive strength for the fly ash-calcium hydroxide-gypsum mixes. However, the increase in strength beyond 24 hours is not significant.
• After heating treatment, air curing (at 20oC and RH 65%) improves the strength of fly ash-calcium hydroxide-gypsum mixes more than water curing at 20oC.
• Portland cement addition improves the strength of the unheated and heated fly ash-calcium hydroxide- gypsum mixtures.
• Compressive strength of unheated and heated fly ash - cement mixtures increases if the cement is replaced by calcium hydroxide up to 5% from the fly ash weight.
• Compressive strength of heated fly ash-cement mixtures increases by replacing the cement with gypsum up to 10% from the fly ash weight. While, replacing the cement with gypsum reduces the strength of the unheated mixtures.
• Compressive strength of heated fly ash-cement mixtures with 5% calcium hydroxide (from fly ash weight) increases by replacing the cement with gypsum up to 10% (from the fly ash weight). While, replacing the cement with gypsum reduces the strength of the unheated mixtures.
• All the fly ash cementitious mixtures under heat curing show a sufficient compressive strength to produce pre cast building materials as wall blocks or bricks.
• The making of lower-cost and durable building materials may be realized using these cementitious mixtures.
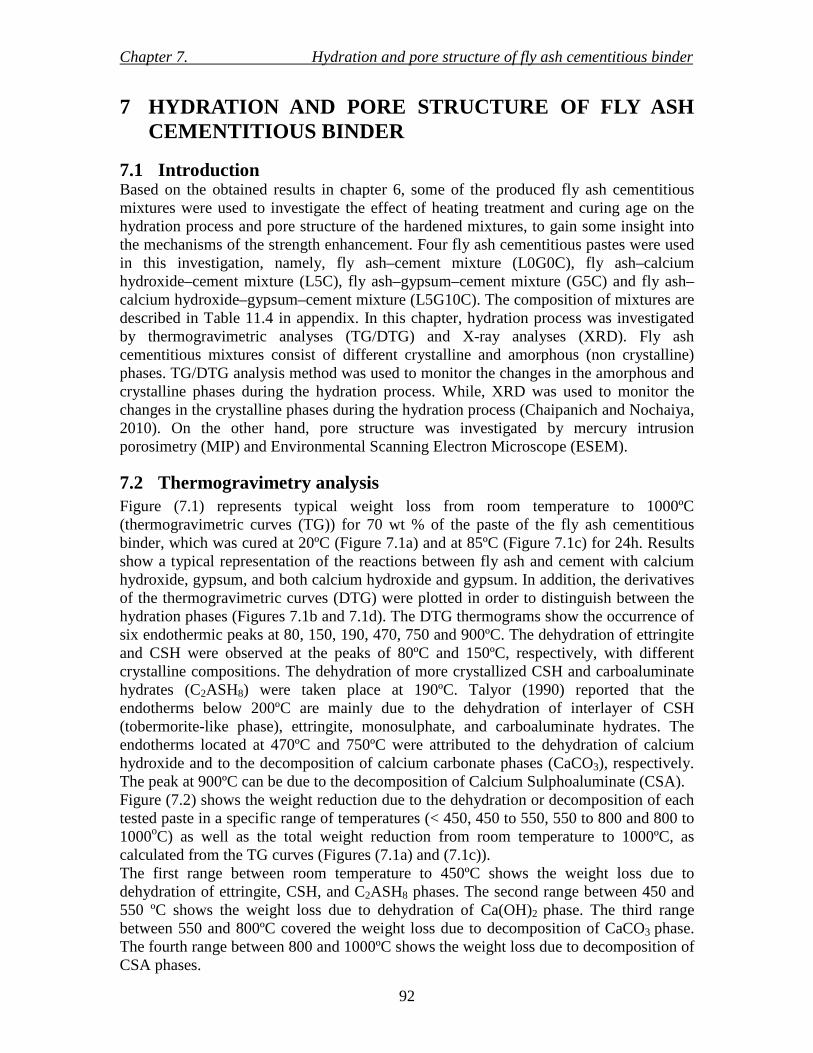
Chapter 7. Hydration and pore structure of fly ash cementitious binder
92
7 HYDRATION AND PORE STRUCTURE OF FLY ASH CEMENTITIOUS BINDER
7.1 Introduction Based on the obtained results in chapter 6, some of the produced fly ash cementitious mixtures were used to investigate the effect of heating treatment and curing age on the hydration process and pore structure of the hardened mixtures, to gain some insight into the mechanisms of the strength enhancement. Four fly ash cementitious pastes were used in this investigation, namely, fly ash–cement mixture (L0G0C), fly ash–calcium hydroxide–cement mixture (L5C), fly ash–gypsum–cement mixture (G5C) and fly ash–calcium hydroxide–gypsum–cement mixture (L5G10C). The composition of mixtures are described in Table 11.4 in appendix. In this chapter, hydration process was investigated by thermogravimetric analyses (TG/DTG) and X-ray analyses (XRD). Fly ash cementitious mixtures consist of different crystalline and amorphous (non crystalline) phases. TG/DTG analysis method was used to monitor the changes in the amorphous and crystalline phases during the hydration process. While, XRD was used to monitor the changes in the crystalline phases during the hydration process (Chaipanich and Nochaiya, 2010). On the other hand, pore structure was investigated by mercury intrusion porosimetry (MIP) and Environmental Scanning Electron Microscope (ESEM).
7.2 Thermogravimetry analysis Figure (7.1) represents typical weight loss from room temperature to 1000ºC (thermogravimetric curves (TG)) for 70 wt % of the paste of the fly ash cementitious binder, which was cured at 20ºC (Figure 7.1a) and at 85ºC (Figure 7.1c) for 24h. Results show a typical representation of the reactions between fly ash and cement with calcium hydroxide, gypsum, and both calcium hydroxide and gypsum. In addition, the derivatives of the thermogravimetric curves (DTG) were plotted in order to distinguish between the hydration phases (Figures 7.1b and 7.1d). The DTG thermograms show the occurrence of six endothermic peaks at 80, 150, 190, 470, 750 and 900ºC. The dehydration of ettringite and CSH were observed at the peaks of 80ºC and 150ºC, respectively, with different crystalline compositions. The dehydration of more crystallized CSH and carboaluminate hydrates (C2ASH8) were taken place at 190ºC. Talyor (1990) reported that the endotherms below 200ºC are mainly due to the dehydration of interlayer of CSH (tobermorite-like phase), ettringite, monosulphate, and carboaluminate hydrates. The endotherms located at 470ºC and 750ºC were attributed to the dehydration of calcium hydroxide and to the decomposition of calcium carbonate phases (CaCO3), respectively. The peak at 900ºC can be due to the decomposition of Calcium Sulphoaluminate (CSA). Figure (7.2) shows the weight reduction due to the dehydration or decomposition of each tested paste in a specific range of temperatures (< 450, 450 to 550, 550 to 800 and 800 to 1000oC) as well as the total weight reduction from room temperature to 1000ºC, as calculated from the TG curves (Figures (7.1a) and (7.1c)). The first range between room temperature to 450ºC shows the weight loss due to dehydration of ettringite, CSH, and C2ASH8 phases. The second range between 450 and 550 ºC shows the weight loss due to dehydration of Ca(OH)2 phase. The third range between 550 and 800ºC covered the weight loss due to decomposition of CaCO3 phase. The fourth range between 800 and 1000ºC shows the weight loss due to decomposition of CSA phases.

93
(a)
(b)
(c)
(d)
Figure (7.1): Thermogravimetric curves for fly ash cementitious mixtures; (a) TG curves for mixtures cured at 20oC, (b) DTG curves for mixtures cured at 20oC, (c) TG for mixtures cured at 85oC and (d) DTG curves for mixtures cured at 85oC.

Chapter 7. Hydration and pore structure of fly ash cementitious binder
94
For the pastes which were cured at 20ºC (Figure 7.2 a), there is an increase in the total weight loss due to replacing the cement content in L0G0C mixture by gypsum (G5C mixture), calcium hydroxide (L5C mixture) or by a combination of them (L5G10C mixture). Also, there is a slight increase in the weight loss from the dehydration of ettringite, CSH and C2ASH8 phases due to replacing the cement by gypsum, calcium hydroxide or by a combination of gypsum and calcium hydroxide (Figure 7.2a). The weight loss from the dehydration of calcium hydroxide and decomposition of calcium carbonate phases decreases by replacing the cement by gypsum. While, replacing the cement by calcium hydroxide or by a combination of calcium hydroxide and gypsum an increase of the weight loss of calcium hydroxide phase can be seen, which not affects the weight loss of calcium carbonate phase. Replacing the cement by gypsum or by a combination of calcium hydroxide and gypsum an increase of the weight loss due to decomposition of calcium sulphoaluminate phases occurs. For the pastes which are cured at 85ºC (Figure 7.2b), the total weight loss increase by replacing the cement content by gypsum, calcium hydroxide or by a combination of them. While, replacing the cement by gypsum or calcium hydroxide a decrease of the weight loss of dehydration of ettringite, CSH and C2ASH8 phases can be seen. The replacement of cement content by a combination of calcium hydroxide and gypsum, results in an increase of the weight loss due to the dehydration of ettringite, CSH and C2ASH8 phases as shown in Figure (7.2b). The weight loss due to the dehydration of calcium hydroxide and decomposition of calcium carbonate phases increases by replacing cement by gypsum, calcium hydroxide or by a combination of them (Figure 7.2b). The replacement of cement by gypsum or by a combination of gypsum and calcium hydroxide results in an increase of the weight loss due to the decomposition of calcium sulphoaluminate phase. By comparing the obtained results of cementitious mixtures cured at 20ºC in Figure (7.2a) with those obtained for mixtures cured at 85ºC in Figure (7.2b), a dramatically loss of weight due to dehydration of ettringite, CSH and C2ASH8 phases can be observed. A great reduction on the weight losses is detected due to dehydration of calcium hydroxide and decomposition of calcium carbonate phases. Table (7.1) shows the percentage of reduction on each hydration phase due to curing the tested pastes at 85ºC compared to the tested pastes which cured at 20ºC. Fly ash-calcium hydroxide-gypsum-cement mixture (L5G10C) have the highest increase in CSH like phase and the highest reduction in calcium hydroxide phase when compared with the other cementitious mixtures as shown in Table (7.1).

Chapter 7. Hydration and pore structure of fly ash cementitious binder
95
Figure (7.2): Weight reduction due to the dehydration or decomposition of each hydration phase and total weight reduction for the tested cementitious mixtures; (a) mixtures cured at 20oC and (b) mixtures cured at 85oC.
(a)
(b)

Chapter 7. Hydration and pore structure of fly ash cementitious binder
96
Table (7.1): Percentage of increase or reduction on hydration phase due to curing the fly ash cementitious pastes at 85ºC compared to the tested pastes cured at 20ºC Hydration phase Percentage of increasing (+) or reduction (-) in hydration phases L0G0C G5C L5C L5G10C CSH + Et + 67 + 35 +55 +76 Ca(OH)2 - 45 - 35 - 46 - 50 CaCO3 - 22 - 9 +1 - 16 CaSA - 16 + 4 +2 +1.7
7.3 XRD analysis
7.3.1 XRD analysis of row material The mineralogical composition of inorganic binders and fly ash were determined qualitatively by X-ray diffraction (XRD). XRD patterns of fly ash (FA), calcium hydroxide (L), gypsum (G) and Portland cement (C) are displayed in Figures (11.3), (11.4), (11.5) and (11.6) in appendix, respectively. According to XRD analyses, fly ash composed mainly of Mullite, SiO2 and Fe2O3; whereas Portland cement containe mainly C3S, C2S, and C3A. On the other hand, calcium hydroxide compose mainly of Ca(OH)2 and CaO, whereas CaSO4.1/2H2O, and CaSO4 are the available dominant phases in gypsum.
7.3.2 XRD analysis of hydration products Figures (7.3), (7.4), (7.5) and (7.6) show the obtained XRD patterns at 1 and 28 days of 70 wt% fly ash cementitious pastes, which were cured at two different temperatures 20˚C and 85˚C, in the first 24h then in room condition (20˚C and RH 65% ) for 27 days. The obtained XRD patterns indicate that, no substantial differences can be seen in the mineralogical composition. The same crystalline phases were identified in all cementitious samples of both curing conditions. Hydration products in each cementitious system are discussed in the following paragraphs.
7.3.2.1 Fly ash-cement system The activation of fly ash is actually a co-functioning of calcium hydroxide and gypsum. The former mainly playe an active part on the fly ash and gypsum took part in the reaction. The degree of activation of the fly ash can be described by the absorption of calcium hydroxide. Figure 7.3 shows the XRD patterns for fly ash-cement system (L0G0C mixture). The main mineral components are mullite, quartz, calcium hydroxide, ettringite, and calcium carbonate. Partially unreacted fly ash can be observed due to the presence of the mullite and quartz peaks in all fly ash cement pastes at 1 day and 28 days. Calcium hydroxide peak appeared at 1 day for both curing temperature (20˚C & 85˚C) due to the hydration reaction of Portland cement. Calcium hydroxide intensity increases for a fly ash cement paste which is cured at 85˚C due to an accelerating of the hydration process of cement by heating. On the other hand, the intensity of calcium hydroxide has decreased by increasing the curing time from 1 day to 28 days. This is due to the transformation of calcium hydroxide to CSH through the pozzolanic reaction of fly ash, and to calcium carbonate through the carbonation process. As shown in Figure (7.3),

Chapter 7. Hydration and pore structure of fly ash cementitious binder
97
curing the fly ash cement paste at 85˚C for 24h reducing the intensity of calcium carbonate peak when compared to the paste cured at 20˚C. Therefore, carbonation process in the paste cured in room condition was faster than fly ash pozzolanic reaction. On the other side, heat curing at 85˚C for 24h improves the fly ash pozzolanic reaction faster than carbonation process. Ettringite peaks in all fly ash-cement mixtures have a very low intensity due to the lower content of gypsum in the mixture (70wt% fly ash and 30 wt% Portland cement). Figure (7.3) shows that ettringite is stable and dose not decompose at 85˚C.
7.3.2.2 Fly ash-gypsum-cement system Figure (7.4) shows the XRD patterns and main mineral components for fly ash-gypsum-cement system (G5C mixture), which were cured at 20˚C and 85˚C for 24h then in room conditions for 27 days. The main mineral compounds are quartz, mullite, calcium hydroxide, ettringite, and calcium carbonate. As shown in Figure (7.4), quartz and mullite still appeared in the XRD pattern until 28 days in both curing condition due to unreacted fly ash. The intensity of the mullite peak decreases by increasing the curing time from 1 to 28 days in both curing conditions. This is due to the reaction between mullite and gypsum which forms the ettringite phase. Therefore, ettringite peak intensity in fly ash gypsum cement system is higher than in the fly ash cement system. No difference was observed in ettringite peak intensity by increasing curing temperature from 20˚C to 85˚C. Calcium hydroxide pack appeared at 1 day in both curing temperatures due to the hydration reaction of Portland cement. The observed calcium hydroxide peak intensity was lower in fly ash cement system due to replacing the cement by gypsum. The observed calcium hydroxide peak intensity in the paste cured under 85˚C was lower than the paste cured under 20˚C. the reason could be an acceleration of the fly ash pozzolanic reaction by heating, which absorb calcium hydroxide. As time elapses, calcium hydroxide peak intensity reduces because of its interaction with the quartz phase in the fly ash to
20oC- 1 day
20oC- 28 days
85oC- 1 day
85oC- 28 days
F0G0C mixture
E
M
P
P
M Q
M &Q
CC M
P
Figure (7.3): XRD patterns of fly ash cement mixtures; E: Ettringite, M: Mullite, P: Portlandit, Q: Quartz, andC C: Calsit.
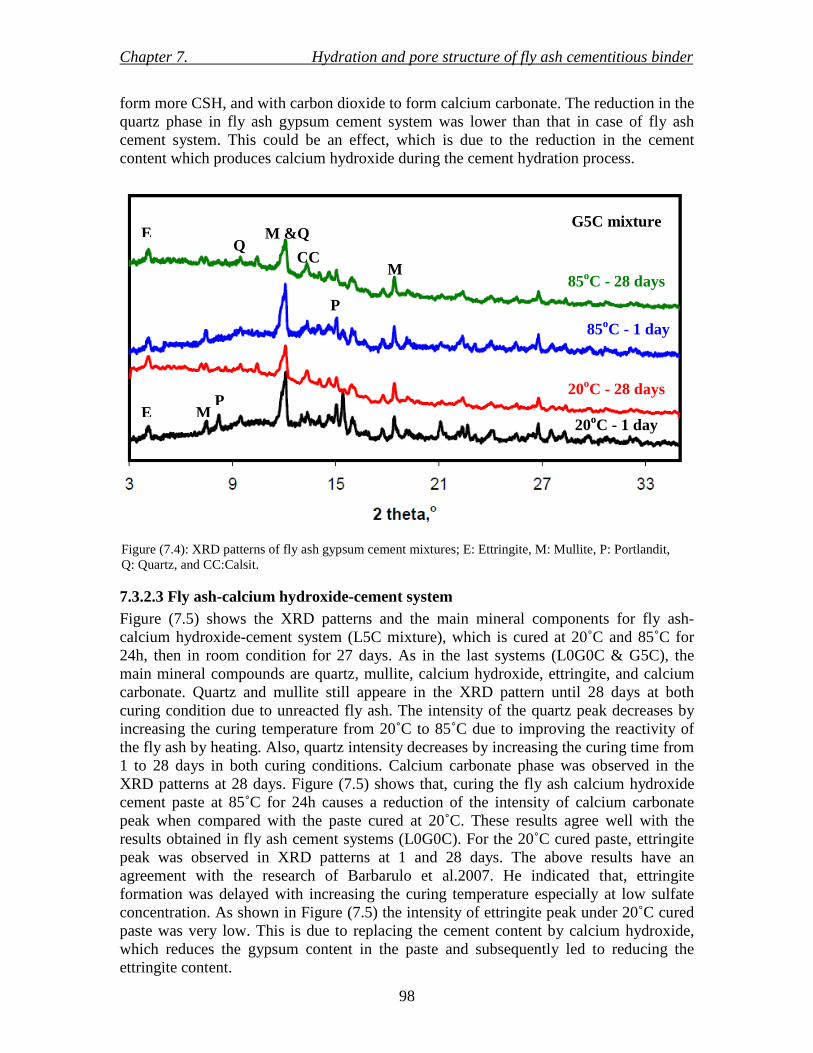
Chapter 7. Hydration and pore structure of fly ash cementitious binder
98
form more CSH, and with carbon dioxide to form calcium carbonate. The reduction in the quartz phase in fly ash gypsum cement system was lower than that in case of fly ash cement system. This could be an effect, which is due to the reduction in the cement content which produces calcium hydroxide during the cement hydration process.
7.3.2.3 Fly ash-calcium hydroxide-cement system Figure (7.5) shows the XRD patterns and the main mineral components for fly ash- calcium hydroxide-cement system (L5C mixture), which is cured at 20˚C and 85˚C for 24h, then in room condition for 27 days. As in the last systems (L0G0C & G5C), the main mineral compounds are quartz, mullite, calcium hydroxide, ettringite, and calcium carbonate. Quartz and mullite still appeare in the XRD pattern until 28 days at both curing condition due to unreacted fly ash. The intensity of the quartz peak decreases by increasing the curing temperature from 20˚C to 85˚C due to improving the reactivity of the fly ash by heating. Also, quartz intensity decreases by increasing the curing time from 1 to 28 days in both curing conditions. Calcium carbonate phase was observed in the XRD patterns at 28 days. Figure (7.5) shows that, curing the fly ash calcium hydroxide cement paste at 85˚C for 24h causes a reduction of the intensity of calcium carbonate peak when compared with the paste cured at 20˚C. These results agree well with the results obtained in fly ash cement systems (L0G0C). For the 20˚C cured paste, ettringite peak was observed in XRD patterns at 1 and 28 days. The above results have an agreement with the research of Barbarulo et al.2007. He indicated that, ettringite formation was delayed with increasing the curing temperature especially at low sulfate concentration. As shown in Figure (7.5) the intensity of ettringite peak under 20˚C cured paste was very low. This is due to replacing the cement content by calcium hydroxide, which reduces the gypsum content in the paste and subsequently led to reducing the ettringite content.
20oC - 1 day
20oC - 28 days
85oC - 1 day
85oC - 28 days
G5C mixture
E
E
M P
P
M &Q Q
CC M
Figure (7.4): XRD patterns of fly ash gypsum cement mixtures; E: Ettringite, M: Mullite, P: Portlandit, Q: Quartz, and CC:Calsit.

Chapter 7. Hydration and pore structure of fly ash cementitious binder
99
7.3.2.4 Fly ash-calcium-hydroxide-gypsum-cement system Figure (7.6) shows the XRD patterns and the main mineral components for fly ash-calcium hydroxide-gypsum-cement systems, which cured at 20˚C and 85˚C for 24h, then under room conditions for 27 days. The main mineral compounds are quartz, mullite, calcium hydroxide, ettringite, and calcium carbonate. A large amount of ettringite was formed in the fly ash-calcium hydroxide-gypsum-cement system (L5G10C) as compared with the other fly ash cementitious systems, due to an increase of the gypsum content in this system than in the others fly ash systems. Calcium hydroxide peak intensity in 85˚C cured paste nearly disappeared at 1 day. Thus, calcium carbonate peak intensity in 85˚C cured paste reduces at 28 days as compared with the other fly ash systems.
20oC- 1 day
20oC- 28 days
85oC- 1 day
85oC- 28 days
L5C mixture
E
M P
Q M&Q
CC
P
M
Figure (7.5). XRD patterns of fly ash calcium hydroxide cement mixtures; E: Ettringite, M: Mullite, P: Portlandit, Q: Quartz, and CC:Calsit.
Figure (7.6): XRD patterns of fly ash calcium hydroxide gypsum cement mixtures; E: Ettringite, M: Mullite, P: Portlandit, Q: Quartz, and CC:Calsit.
20oC- 1 day
20oC- 28 days
85oC- 1 day
85oC- 28 days
L5G10C mixture E
P
M Q M&Q
CC P M

Chapter 7. Hydration and pore structure of fly ash cementitious binder
100
7.4 Pore structure
7.4.1 Total porosity The total porosity versus hydration time for L0G0C, G5C, L5C and L5G10C cementitious mixtures cured at 20˚C and 85˚C in the first 24h then in room condition for 27 days are shown in Figures (7.7) and (7.8), respectively. Cementitious mixtures total porosities were determined by using water method at 28 days, and Mercury porosimetry method (MIP) method at 1 and 28 days. It can be noticed that the mercury porosity ɸHg is inferior to water porosity ɸW. Mercury porosimetry method can only identify pores in limits from approximately 2 nm to around 60 µm (Galle´, 2001). All porosities below and above these limits are not detected. This is the reason why mercury porosimetry gives an underestimated value of total porosity for cement-based materials compared with water porosity. After 1 day (Figure 7.7), all the cured mixtures at 20˚C show very similar total porosities. Mercury porosities ranged between 36.1 and 40.2% at 1day, and between 30.7 and 34.9 % at 28 days. On the other hand, water porosities ranged between 40.2% and 47.1%. Figure (7.7) show that, the porosity value increase by replacing the cement content in the cementitious blend by calcium hydroxide, gypsum or by both of them. This could be due to the coarser particle sizes of calcium hydroxide and gypsum than the used cement. The minimum and maximum value of porosities at 1 day corresponds to the blended mixtures L0G0C and L5G10C, respectively. The minimum and maximum values of porosities at 28 days correspond to the blended mixtures L5C and L5G10C, respectively (Figure 7.7). Figure (7.7): Total porosity of 20˚C cured cementitious mixtures at 1 and 28 days, measured
with mercury intrusion and with the water absorption.

Chapter 7. Hydration and pore structure of fly ash cementitious binder
101
After 28 days, total porosity of the mixtures cured at 20oC are generally more less than the porosity of the mixtures cured for 1day. The reason for this is the production of more hydration phases like CSH, which fill the spaces between the cementitious particles. The minimum and maximum value of porosity at 28 days corresponds to the blended mixtures L5C and L5G10C, respectively. The results also indicate that the reduction ratio of the total porosity between the mixtures of the 1 day to 28 days curing relates to the type of cement replacement. L5C and L5G10C mixtures produce the largest porosity reduction ratio of 16.5% and 13.18% respectively. While, G5C mixture produce the lowest porosity reduction ratio of 4.38%. The results obtained for the 85˚C cured mixtures in Figure (7.8) and for the 20˚C cured mixtures in Figure (7.7); show differences in the total porosity of the mixtures. A great reduction in the total porosity of cementitious mixtures can be observed due to increasing of the curing temperature in the first 24h from 20oC to 85oC. It is well known that an increase in curing temperature accelerates the hydration reaction of cementitious binder, which reduces the total porosity (Rojas and de Rojas 2004). In 20˚C cured cementitious mixtures pastes (Figure 7.7), a continuous reduction of the porosity takes place with hydration time up to 28 days. For the same blended mixtures cured at 85oC, the total porosities given in Figure (7.8) show small non- systematic variations for hydration time of more than 1 day. This suggests that the most important microstructure changes occur in the early hours of the hydration process under heating treatment.
Figure (7.8):Total porosity of 85˚C cured cementitious mixtures at 1 and 28 days, measured with mercury intrusion and with the water absorption.

Chapter 7. Hydration and pore structure of fly ash cementitious binder
102
7.4.2 Pore size distribution The identification of cement-based materials microstructure (pore size distribution) is essential to understand and to model transport mechanisms such as diffusion and convection. It is thus a priority to know what is the influence of the heating treatment and curing time on pore structure when performing a intrusion mercury porosimetry investigation. The effect of the heating treatment (curing in 20˚C and 85˚C in the first 24h) and curing age on materials MIP spectrum is analyzed in the following paragraphs. Cumulative intruded pore volume curves and differential intruded pore volume obtained for 20˚C and 85˚C cured cementitious mixtures at 1 day and 28 days are provided in Figures (7.9) and (7.10). Ye 2003 reported that, for pure cement paste there are two pore systems: capillary pore and gel pore. For fly ash cementitious mixtures, the differential curve measured with MIP shows two principal peaks, corresponding to the capillary and the gel pores (Figures 7.9c, 7.9d, 7.10c and 7.10d), respectively. This indicates that the high content fly ash blended cementitious pastes also consists of these two pore systems. As shown in Figures (7.9) and (7.10), with an elapse of curing time, the size and volume of capillary pores decrease for all the cementitious mixtures. Table (7.2) summarizes the results of threshold pore diameters for 20˚C and 85˚C cured cementitious pastes at 1 and 28 days. By comparing the obtained differential intruded pore volume curve for 20˚C cured cementitious pastes in Figure (7.9c) with those obtained for 85˚C cured pastes in Figure (7.10c), the first peak correspond to large capillary pores (located between pore radius of 550 nm and 160 nm) disappears by heating treatment at 1 day. Also, the amount of small capillary pores (which are located between pore radius 10 nm and 50 nm) and gel pores (pore radius < 10nm) increases with heating treatment and the duration of curing. At the beginning, the paste comprises the unhydrated cementitious binder particles, and water-filled space, i.e. capillary pores. As the hydration proceeds, the capillary pores will generally be filled with hydration products. Then, the formed CSH can be distinguished in two parts; (1) outer CSH, with larger gel pores, in the originally water-filled spaces, (2) inner CSH, with very fine gel pores, within the boundaries of the original unhydrated grains (Richardson and Cabrera 2000). The former CSH is rapidly formed during the first few days and followed by the formation of the latter. Thus, the formation of hydration products decreases the size and the volume of capillary pores and increases the amount of gel pores. Then with the increase of curing time the amount of inner CSH increases and subsequently a reduction in the gel pore occurs. Meanwhile, the size and the volume of capillary pores and gel pore gradually decreases by using heating treatment due to the acceleration of hydration process.
Table(7.2): Summary of Threshold Pore Diameters of unheated and heated fly ash cementitious mixtures.
Threshold pore diameters,nm Unheated (20oC) Heated (85oC) Mix type
1 day 28 day 1 day 28 day L0G0C 506.3 319.1 307.4,45.9,11.9 163.8, 26.2 G5C 319.1 307.4 45.8,11.9 20.4 L5C 298.7 179.4 28.3 20.4 L5G10C 506.1 507 25.0, 11.9 11

103
(a)
(b)
(c)
(d)
Figure (7.9): Pore size distribution of 20oC cured cementitious mixtures at 1 and 28 days.

104
(a)
(b)
(c)
(d)
Figure (7.10): Pore size distribution of 85oC cured cementitious mixtures at 1 and 28 days

Chapter 7. Hydration and pore structure of fly ash cementitious binder
105
7.4.3 Classification of the pore structure The volume of mercury intruded in a specified range of pore is normalized with the total volume of mercury intrusion for each paste. To determine the distribution of pores, the normalized volume of mercury intrusion with various ranges of pore sizes of <10 nm (gel pores), 10~50 nm (small capillaries), 50~1000 nm (large capillaries) and > 1000 nm (Macro pores) is calculated. The results in Figure (7.11) show the differences in the structures of L0G0C, G5C, L5C and L5G10C mixtures at 1 and 28 days. For the 20˚C cured mixtures, all the cementitious mixtures show no difference in the pore size distribution at 1day (as shown in Figure 7.11a ). That’s due to the lower speed of the pozzlanic reaction of the fly ash especially at early ages. With curing time elapses from 1 to 28 day, the volume of large capillaries decreases and the volume of gel and small capillaries increases due to filling the large capillaries with the hydration products like CSH (Figuer 7.11b). At 28 days, L5C mixture shows lower volume of large capillaries pores than the other fly ash cementitious mixtures, whereas the L0G0C, G5C and L5G10C mixtures show no changes in the large capillaries pores (Figure 7.11b). By replacing the cement by calcium hydroxide (L5C mixture), the small capillaries and gel pores increase significantly in relation to L0G0C mixture. Replacing the cement by gypsum or by gypsum and calcium hydroxide (G5C and L5G10C mixtures), the small capillaries pores are slightly reduced and gel pores are slightly increased than L0G0C mixture. This results indicate that, replacing the cement content by calcium hydroxide in high fly ash cementitious blend improving the pozzolanic reaction of the fly ash more than replacing the cement by gypsum or by a combination of gypsum and calcium hydroxide. For the 85˚C cured mixtures (Figure 7.11c and 7.11d), the large capillaries pores significantly decrease, while the small capillaries and gel pores are greatly increased in all pastes at 1 day in comparison to those of the 20˚C cured pastes (Figure 7.11a). By replacing the cement content by gypsum (G5C mixture), calcium hydroxide (L5C mixture), or by both of them (L5G10C mixture) the volume of small capillaries and gel pores are significantly increased than the fly ash cement blend (L0G0C mixture) as shown in Figure (7.11c). With an elapse of curing time from 1 to 28 days, the amount of large capillaries pores is reduced and the amount of small capillaries and gel pores is increased (Figure 7.11d). L5G10C mixture shows the higher content of gel and small capillaries pores than G5C and L5C mixtures. This is due to an increase of the amount of reacted calcium hydroxide by gypsum addition specially under heating condition (Valenti et al. 1988). Therefore, replacing the cement content by a combination of calcium hydroxide and gypsum produce higher amount of hydration products like CSH and ettringite as determined with thermal gravimetric and XRD analysis in sections (7.2 and 7.3). As a result, the total amount of gel and small capillaries increase in as comparison to G5C and L5C mixtures.

106
Figure (7.11): Classification of pore sizes of fly ash cematitious mixtures; (a) mixtures cured at 20oC - 1 day, (b) mixtures cured at 20oC - 28 days, (c) mixtures cured at 85oC - 1 day and (d) mixtures cured at 85oC -28 days
(a) (b)
(c) (d)

Chapter 7. Hydration and pore structure of fly ash cementitious binder
107
7.5 ESEM observation The microstructure morphology of the fly ash cementitious mixtures was studied by ESEM. Two tested mixtures were investigated at 28 days, namely, fly ash-cement (L0G0C) and fly ash-calcium hydroxide–gypsum-cement (L5G10C). Each mixture was cured at 20oC or 85oC for 24h, then under room condition for 27 days. Figures (7.12a) and (7.12b) show the typical morphology for L0G0C and L5G10C mixtures, respectively, which was cured at 20oC. There is less amorphous gel and a smaller number of partially dissolved fly ash spheres. Microstructure examination in the ESEM did not reveal evidence of CSH like phases that may have contributed to the lower strength of these mixtures. It is a common view that the pozzolanic reaction in fly ash cement occurs slowly at low temperatures (Ma and Brown 1997). Figures (7.13a) and (7.13b) show the micrographs of L0G0C and L5G10C mixtures, respectively, which were cured at 85oC in the first 24 h. From the micrographs it can be seen that curing of high content fly ash blends under elevated temperature causes a finer homogeneous microstructure than the cured mixtures at ambient temperature. Also, replacing the cement content by calcium hydroxide and gypsum causes more compacted and finer microstructure which contributed to the higher strength of this mixture. As shown in Figures (7.13a) and (7.13b), calcium containing compounds were formed by interaction of calcium hydroxide with dissolved aluminosilicats. The probable reaction products would be calcium silicate hydrate CSH or calcium aluminosilicates. Furthermore, replacing the cement content by calcium hydroxide and gypsum an increase of the reactivity of the fly ash due to an increase of calcium containing compounds than in the fly ash – cement mixture can be seen.
Figure (7.12): SEM micrograph of fly ash cementitious mixtures cured at 20oC; (a) L0G0C mixture and (b) L5G10C mixture.
(a) (b)

Chapter 7. Hydration and pore structure of fly ash cementitious binder
108
7.6 Conclusions: • The main hydration compounds formation in the fly ash cementitious pastes are
ettringite, calcium silicate hydrates and calcium carbonate phases as determined by TG/DTG and XRD analysis.
• Heating treatment at 85oC in the first 24 h improves and accelerates the potzzolanic reaction for high content fly ash cementitious blend than ambient curing.
• Replacing the cement content by calcium hydroxide, gypsum or by combination of gypsum and calcium hydroxide improves the potzzolanic reaction of the fly ash when cured under elevated temperature as determined by XRD, TG/DTG and ESEM observations.
• Curing the fly ash cementitous mixtures under elevated temperature reduces the total porosity more than the pastes cured at ambient temperatures as determined with MIP.
• Curing the fly ash cementitious mixtures under elevated temperature reduces the content of the capillary pores and increases the content of gel pores. While, cured fly ash cementitious mixtures at ambient temperatures has higher content of capillary pores than of gel pores.
Figure (7.13): SEM micrograph of fly ash cementitious mixtures cured at 80oC; (a) L0G0C mixture and (b) L5G10C mixture.
(a) (b)

Chapter 8 Properties of rice straw cementitious composite
109
1
1,1
1,2
1,3
1,4
1,5
1,6
1,7
1,8
1,9
2
0 2,5 5 7,5 10 12,5 15 17,5 20
Den
sity
,g/c
m3
Straw content,%
20~40 mesh 10mm 20mm 30mm
8 PROPERTIES OF RICE STRAW CEMENTITIOUS COMPOSITE
8.1 Introduction This chapter presents a parametric experimental study, which investigate the potential use of high content fly ash cementitious binder in combination with rice straw (as a waste material) to produce green composites as a building material. A fly ash-calcium hydroxide-gypsum-cement mixture with a weight ratio of 70%: 3.5%: 7%: 19.5% respectively was chosen and used as a green binder for composite making (based on the obtained experimental results in chapters 6 and 7). Treated rice straw with NaOH was used (based on the obtained experimental results in chapters 4 and 5). Some of the physical and mechanical properties of the composite material with various levels of straw content and different particle sizes are investigated. Physical and mechanical properties of the straw cementitious composites are presented and discussed in the following paragraphs.
8.2 Dry density of the rice straw cementitious composite The densities of the rice straw–cementitious composites produced (using four particle sizes (20~40 mesh, 10mm, 20mm and 30mm) at different straw content (5, 7.5, 10, 15 and 20 wt%)) are shown in Figure (8.1). The values obtained ranged between 1.09 g/cm3 (for composites produced using a cementitious–straw mixing ratio of 1 : 0.19, i.e., 20 wt% straw content with 30 mm straw particles) and 1.82 g/cm3 (for composites produced using a cementitious–straw mixing ratio of 1 : 0.053, i.e., 5 wt% straw content with 20~40 mesh straw particles). Generally, the higher the straw content, the lower the composite density. This is a common phenomenon in wood–cementitious composites since wood particles generally tend to have lower bulk densities than cement. As shown in Figure (8.1), the 20~40 mesh straw particles produced are relatively denser composites than the 10, 20, and 30 mm particles. A possible reason for this is that the smaller particles are likely to be better bonded with the cementitious matrix (with a tiny particle size) than with bigger particles, thereby minimizing the presence of air voids. Figure (8.1): Effects of straw content and particle size on composites density

Chapter 8 Properties of rice straw cementitious composite
110
Analysis of variance of materials density (Table 11.10 in appendix) shows that the straw content and the combination of straw content and particle size have a significant effect on the density of the composites at 5% level of significance. Furthermore, the straw particle size has no significant effect on composite density. A comparison between the four particle sizes at the same mixing ratio and different mean values of composite density (at 5% level of significance) showed that the values obtained at 5%, 7.5%, 10%, 15%, and 20% straw contents, respectively, were significantly different from each other. These values of bulk density are used to classify the straw–cementitious composite as a medium in class weight (according to the Egyptian standard specification of cement bricks number 1349-1991). The standard bulk density of sand cement materials is 2 g/cm3. So, to give a clear picture of how much reduction in weight will be induced due to the use of straw particles as a component in the process of bricks making, the reduction percentage of each treatment was calculated and given in Figure (8.2). The highest reduction was found for a straw particle size of 30 mm at 20% straw content. While, the lowest reduction was for straw particle size of 20 to 40 mesh at 5% straw content. This results indicate that the straw cementitious composite is in the acceptable range of weight. Therefore, this reduction of weight compared with the cement sand materials can be considered as an advantage. Figure (8.3) shows the relationship between the dry density of the straw cement composites and straw content. A strong correlation is obtained as given in the following equation:
0.0288 21.9279 , 0.9311sce Rρ −= = (8.1)
Where: ρ = composite density, g/cm3 sc = straw content, % by weight. This relationship closely matches to the flax cement composites which were made by
5.15
13.
40
20.6
2
34.
54
40.
72
11.
86
19.0
7
24.
74
38.
14
42.
27
17.5
3 20.6
2
27.
84
39.
18
43.
30
19.0
7
25.
26
31.9
6
40.2
1 43.8
1
0
5
10
15
20
25
30
35
40
45
50
5 7.5 10 15 20
Straw content,wt%
Per
cent
age
of r
educ
tion
in d
ensi
ty
20-40 mesh
10mm
20mm
30mm
Figure (8.2): Effects of straw content and particle size on density reduction percent.

Chapter 8 Properties of rice straw cementitious composite
111
Aamr-Daya et al. (2008), who used similar specimen size and test conditions.
8.3 Porosity of rice straw cementitious composite Porosity is defined as the volume of voids in a solid material expressed as a percentage of the total volume. The porosity of the rice straw –cementitious composites produced using the four particle sizes at different straw content are shown in Figure (8.4). Generally, the higher the straw content, the higher the composite porosity. Porosity values range between – 30 % (for 0 wt% straw content) and 51.16% (for 10 mm straw particle size at 20 wt% straw content). It is observed that an addition of certain amount of straw fibers (up to 20%) to cementitious matrix results in an incensement of voids especially when bigger straw particles are used. This effect provides an explanation of the possibility of reducing the composite compressive strength. Analysis of variance (Table 11.10 in appendix) shows that the straw content and the combination of straw content and particle size have a significant effect on the porosity of the composites at 5% level of significance. However, straw particle size has no significant effect on composites porosity. A comparison of mean values of composite porosity (at 5% level of significance) between the four particle sizes at the same mixing ratio showed that the values obtained at 5%, 7.5%, 10%, 15%, and 20% straw contents, respectively, were significantly different from each other. A regression analysis was performed to determine the relationship between density and porosity of rice straw cementitious composites as shown in Figure (8.5). An equation for the relation of the composites porosity to the density is shown below with R2 value of 0.97.
2 2P 14 .406 67 .419 10 6 .57 , 0 .9 7Rρ ρ= − + = (8.2)
Where: P= composite porosity, %. ρ= composites dry density, g/cm3
.
Figure (8.3): Correlation between straw content and density
y = 1 .9 2 7 9 e -0 .02 88x
R 2 = 0 .9 3 1 1
1
1 .1
1 .2
1 .3
1 .4
1 .5
1 .6
1 .7
1 .8
1 .9
2
0 5 1 0 1 5 2 0
straw co n ten t, wt%
Den
sity
,g/c
m3

Chapter 8 Properties of rice straw cementitious composite
112
y = 14.406x2 - 67.419x + 106.57
R2 = 0.9701
20
25
30
35
40
45
50
55
1 1.2 1.4 1.6 1.8 2
Density,g/cm3
Por
osit
y, %
Figure (8.5): Correlation between density and Porosity of rice straw cementitious composites
Figure (8.4): Porosity as a function of straw content and particle size.

Chapter 8 Properties of rice straw cementitious composite
113
0
10
20
30
40
50
60
0 2,5 5 7,5 10 12,5 15 17,5 20
Com
pres
sive
stre
ngth
,MP
a
Straw content, wt%.
20~40 mesh 10mm 20mm 30mm
8.4 Compressive strength The compressive strength of the composites with respect to the straw particle content and size at 28 days is presented in Figure (8.6). The results show that the increase of the straw content decreases the compressive strength of the composites. Also, compressive strength decrease with an increase of the straw particles size at the same level of straw content. The compressive strength of the composites ranges from 3.8 to 30 MPa. The compressive strength values fall within the range of values reported by Karade (2003) for cork cement composites with 10 – 30 % cork incorporation, i.e., 1.05 to 26.18 MPa. Compressive strength value decrease from 51 MPa, for neat cementitious paste, to 6.6, 5.14, 4.5 and 3.8 MPa, for 20-40 mesh, 10mm, 20mm and 30mm straw particles at 20 % straw content. A plausible explanation for this phenomenon was provided by Li (1992), who describes the effect of the presence of various fibers on the compressive strength in cementitious materials. The strength properties of cement-based materials are influenced by porosity. At low levels (0.5–1.0% by volume) of inclusion, fibers enhance compressive strength by resisting the growth of cracks. However, higher fiber content increases porosity of the composite material and results in a loss of compressive strength. Other possible reasons for an increase in porosity at higher levels of straw addition include the higher amount of water input and poor compaction (Karade 2003). Also, the decrease in the compressive strength is attributing to the physical properties of the straw particles, since they are less stiff than the cement matrix. Under loading, cracks are initiated around the particles, which accelerate the failure of the cement matrix. The straw content and the combination of straw content and particle size have a significant effect on the compressive strength of the composites as shown in Table (11.10 in appendix). A comparison of mean values of compressive strength (at 5% level of significance) between the four particle sizes at the same mixing ratio shows that the values obtained at 5%, 7.5%, 10%, 15%, and 20% straw contents, respectively, are significantly different
Figure (8.6): Effect of straw content and partial size on compressive strength.

Chapter 8 Properties of rice straw cementitious composite
114
y = 0,1961e2,8167x
R² = 0,9558
0
10
20
30
40
50
60
1 1,1 1,2 1,3 1,4 1,5 1,6 1,7 1,8 1,9 2
Com
pres
sive
stre
ngth
,MP
a
Density,g/cm 3
from each other. Also, Figure (8.7) shows the relationship between the compressive strength and the dry density of the straw cementitious composites. A strong correlation is obtained as given in the following equation:
2.8167 20.1961 , 0.9558SCCS e R= = (8.3) Where CS = composite compressive strength, MPa. SC = straw content, % by weight. This relationship again closely matches that of lightweight composite produced from flax partials waste by Aamr-Daya et al. (2008), who used similar specimen size and test conditions. The Egyptian standard specification number 1349- 1991 indicates that the compressive strength of cement sand bricks should not be less than 7 MPa for carrying bricks and not less than 2.5 MPa for non-carrying bricks. Based on this fact, all the rice straw cementitious composites up to 7.5 % straw content are accepted as carrying bricks. Also, straw cementitious composites with 20% straw content were accepted as non-carrying bricks.
8.5 Flexural strength The variation in 28 day flexural strength as a function of the straw content and straw particle size is shown in Figure (8.8). The flexural strength of the composites increases with an increasing straw content up to 7.5 wt%. Value of flexural strength increases from 3.62 MPa, for neat cementitious mixture, to 4.46, 5.49, and 5.88 MPa for 10 mm, 20 mm, and 30 mm straw particles at 7.5 % straw content. While, for straw particles size (20 -40) mesh, flexural strength decrease with an increasing straw content. This behavior is caused by an increase of the critical length of the straw particles. The higher strength of the
Figure (8.7): Correlation between density and compressive strength

Chapter 8 Properties of rice straw cementitious composite
115
0
1
2
3
4
5
6
7
0 2,5 5 7,5 10 12,5 15 17,5 20
Fle
xura
l stre
ngth
,MP
a
straw content, wt%.
20~40 mesh 10mm 20mm 30mm
composites with longer fiber fractions can be attributed to the increase of the critical length of the straw particles. The straw critical fracture length is defined as twice the length of straw embedment, which will cause straw fiber failure during pullout. Therefore, when the embedment is shorter (20- 40 mesh Straw particles), fiber tends to be pulled out, and when it is longer, fiber tends to break. The longer straw fiber fraction had better strength property. The length contribution however was not that significant to the strength improvement. For example at 7.5% fiber content, with straw length nearly tripled from 10mm to 30mm, the composites strength values increase from 4.46 MPa to 5.88 MPa. The straw content, straw particle size and the combination of both variables had a significant effect on the flexural strength of the composites as shown in Table (11.10). A comparison of mean values of flexural strength (at 5% level of significance) between the four particle sizes at the same mixing ratio show that the values obtained at 5%, 7.5%, 10%, 15%, and 20% straw content, respectively, were significantly different from each other. Egyptian standard specification number 1349-1991 for cement sand bricks indicated that flexural strength should not be less than 3 MPa. Based on this value, all rice straw cementitious composites under investigation are accepted for use except the ones made from 20 to 40 mesh straw particle sizes with straw content of more than 10 %.
8.6 Thermal conductivity The thermal conductivity of the composites with respect to the straw particle content and size is presented in Figure (8.9). The results show that an increase of the straw content
Figure (8.8): Effect of straw content on composite flexural strength for different straw particle sizes

Chapter 8 Properties of rice straw cementitious composite
116
0,16
0,2
0,24
0,28
0,32
0,36
0 2,5 5 7,5 10 12,5 15 17,5 20
The
rmal
con
duct
ivity
, W/m
K
Straw content, wt %
λ10-10mm
λ25-10mm
λ40-10mm
λ10-30mm
λ25-30mm
λ40-30mm
decreases the thermal conductivity of the composites. Also, thermal conductivity decreases with an increasing straw particles size at the same straw content. For 10 mm straw size, with increasing the straw content from 0 wt% to 20 wt%, thermal conductivity decreases from 0.336 to 0.22 W/m˚K, from 0.346 to 0.23 W/m˚K and from 0.351 to 0.24 W/m˚K at 10, 25 and 40 oC, respectively. While, for 30 mm straw size, with an increase of straw content from 0 wt% to 20 wt%, thermal conductivity decreases from 0.336 to 0.174 W/m˚K, from 0.346 to 0.183 W/m˚K and from 0.351 to 0.191 W/m˚K at 10, 25 and 40 oC, respectively. The thermal conductivity values fall within the range of values reported by Ashour et al. (2010) for natural fiber soil composites with 10 to 20 % natural fiber incorporation, i.e., 0.16 to 0.29 W/m˚K at 10˚C, and within the range of values which were reported by Gündüz (2007) for pumice aggregate cement lightweight concrete, i.e., 0.2 to 0.35 W/m˚K at 10˚C. Figure (8.10) shows the relationship between the thermal conductivity and the dry density of the straw cementitious composites. A strong correlation is obtained as given in the following equations:
210 0.1493 0.0442, 0.8974Rλ ρ= + = (8.4)
225 0.1464 0.0582, 0.8904Rλ ρ= + = (8.5)
240 0.1425 0.0719, 0.8841Rλ ρ= + = (8.6)
Where: λ10 = composite thermal conductivity at 10oC, W/moK. λ25 = composite thermal conductivity at 25oC W/moK. λ40 = composite thermal conductivity 40oC, W/moK. ρ= composites dry density, g/cm3.
Figure (8.9): Effect of straw content on composite thermal conductivity for different straw particle sizes.
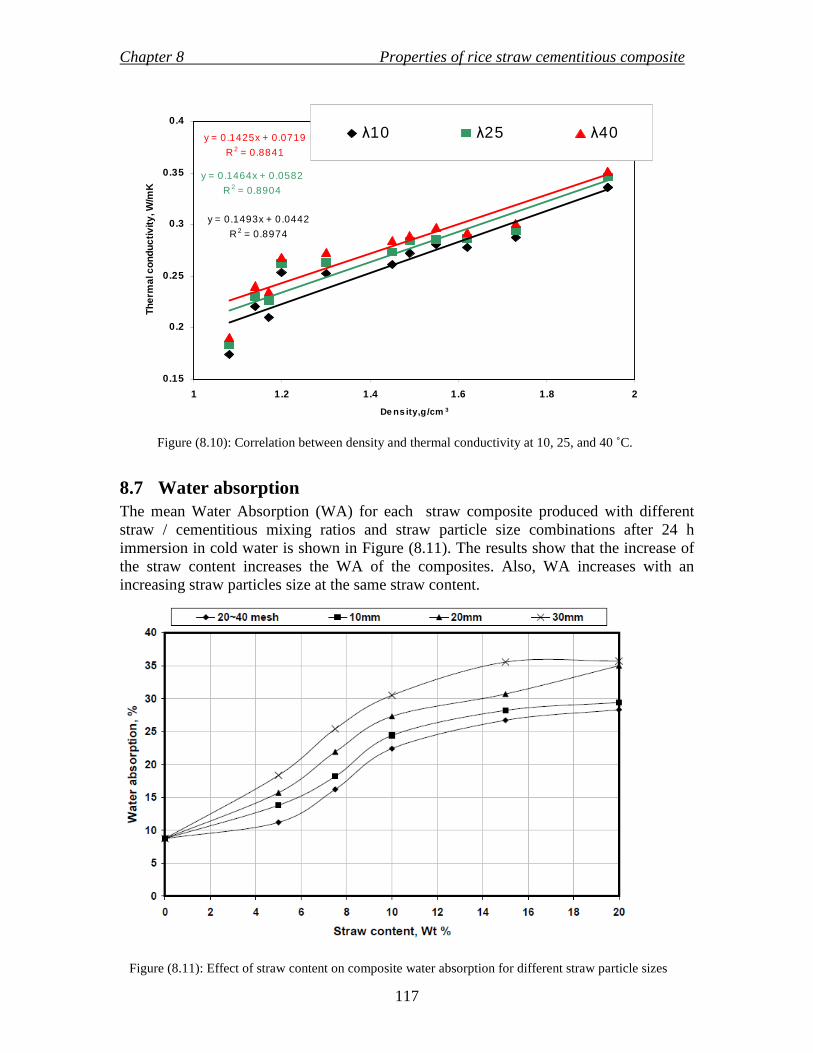
Chapter 8 Properties of rice straw cementitious composite
117
Figure (8.11): Effect of straw content on composite water absorption for different straw particle sizes
8.7 Water absorption The mean Water Absorption (WA) for each straw composite produced with different straw / cementitious mixing ratios and straw particle size combinations after 24 h immersion in cold water is shown in Figure (8.11). The results show that the increase of the straw content increases the WA of the composites. Also, WA increases with an increasing straw particles size at the same straw content.
y = 0.1425x + 0.0719
R 2 = 0.8841
y = 0.1464x + 0.0582
R 2 = 0.8904
y = 0.1493x + 0.0442
R 2 = 0.8974
0.15
0.2
0.25
0.3
0.35
0.4
1 1.2 1.4 1.6 1.8 2
De ns ity,g /cm 3
Ther
mal
con
duct
ivity
, W/m
K
λ10 λ25 λ40
Figure (8.10): Correlation between density and thermal conductivity at 10, 25, and 40 ˚C.

Chapter 8 Properties of rice straw cementitious composite
118
Table (11.10) shows that the straw content and the interaction of both, straw particle size and straw content have a significant effect on WA of the composites. As the straw content and particle size increase, the ability of the composite to absorb water increases significantly. This may be explained by the fact that straw, like other lignocellulosics, is hygroscopic, with a relatively high affinity for water. Also, the cementitious matrix apparently better encapsulate the smaller straw particles. Therefore; the smaller capsulated particles absorb less water than the bigger straw particles. A comparison of mean values of WA (at 5% level of significance) between the four particle sizes at the same mixing ratio show that the values obtained at 5%, 7.5%, 10%, 15%, and 20% straw contents, respectively, were significantly different from each other. WA after 24 h of immersion in cold water ranges from 11.2 to 35.7%. The WA after 24 h of immersion values fall within the range of values for wood cement composites produced at similar density range and soaked in cold water for 24 h, i.e., bagasse (41.52%), coconut husk (30.55%) and gmelina (Gmelina arborea Roxb.) sawdust (28.93%) (Oyagade 2000) and spruce (Stricka stiepensis) (6.5–28.1%) ( Fuwape and Fuwape 1995). WA values suggest that the straw – cementitious composite have a low affinity for water. Figure (8.12) shows the relationship between the WA and the dry density of the straw cementitious composites. A strong correlation is obtained as given in the following equation:
229.88 66.53, 0.94WA Rρ= − + = (8.7)
Where; WA= composite Water absorption, % ρ= composites dry density, g/cm3 Figure (8.12): Correlation between density and water absorption of straw cementitious composite

Chapter 8 Properties of rice straw cementitious composite
119
8.8 Thickness swelling The mean Thickness Swelling (TS) for each straw composite produced with different straw content and straw particle size after 24 h immersion in cold water is shown in Figure (8.18). The results show that an increase of the straw content increases TS of the composites. Also, TS increases with an increase straw particles size at the same straw content. Table (11.10) shows that the straw content and the interaction of both of straw particle size and straw content have a significant effect on TS of the composites. As the straw content and particle size increase, a less resistance to swelling is given. A comparison of mean values of TS (at 5% level of significance) between the four particle sizes at the same mixing ratio however show that the values obtained at 5%, 7.5%, 10%, 15%, and 20% straw contents, respectively, were significantly different from each other. TS after 24 h of immersion in cold water ranges from 0.47 to 2.77%. These values are relatively low in comparison with TS by wood cement composites produced at a similar density range and soaked for the same time duration from bagasse (3.98%), gmelina sawdust (4.45%) (Oyagade 2000) and spruce (1.01–3.4%) ( Fuwape and Fuwape 1995). Hence, it can be said that the straw cementitious composites are relatively dimensionally stable when exposed to water at room temperature. Also, Figure (8.14) shows the relationship between the TS and the dry density of the straw cement composites. A strong correlation is obtained with the following relationship:
22.84 5.5117, 0.94TS Rρ= − + = (8.8)
Where: TS= Thickness swelling, % ρ= composites dry density, g/cm3
Figure (8.13): Effect of straw content on Thickness Swelling for different straw particle sizes.

Chapter 8 Properties of rice straw cementitious composite
120
8.9 Conclusion: Based on the experimental investigation reported in this chapter, the following conclusions can be drawn:
• The physical and mechanical properties of rice straw cementitious composite were determined. The test results showed that the rice straw – fly ash cementitious composite has a potential to be used in the production of a new lighter building material like brick.
• The inclusion of rice straw fibers to the cementitious matrix reduces the density, compressive strength, and thermal conductivity. Furthermore, porosity, water absorption, and thickness swelling increase with an increasing of the straw content in the composites.
• Rice straw cementitious composites which are made with smallest rice straw particles have a higher density, compressive strength and thermal conductivity than the composites made with bigger straw particles.
• The inclusion of 10mm, 20 mm and 30 mm straw particles fibers to the cementitious matrix increases the flexural strength up to 7.5 % straw content.
• Up to 10% straw content of each rice straw particle size, the straw cementitious composite can be used to produce bricks for carrying walls.
• Water absorption and thickness swelling of straw cementitious composites were in the same range of wood cement composite materials.
• The experimental test program demonstrates that the rice straw cementitious composite could be used as a building and thermal insulation unit at the same time.
Therefore, the presented study shows that straw-cement blocks as building materials have two main advantages: 1) a thermal insulation effects for energy conservation and 2) a cheap recyclable building material compared to traditional bricks or blocks. Overall, the findings of the study show that the new straw-cementitious blocks represent a good low-cost sustainable building material for low-cost housing projects in Egypt.
Figure (8.14): Correlation between density and thickness swelling of straw cementitious composite

Chapter 9. Summary and recommendation
121
9 SUMMARY AND RECOMMENDATION
9.1 Summary The objective of this work was to evaluate the possibility of using rice straw as a building material. The experiments were divided into four divisions; study the effect of treatments on the constituent and tensile properties of rice straw, hydration of rice straw with Portland cement, development of high content fly ash cementitious binder, and determination physical and mechanical properties of straw fly ash cementitious binder composites. In first division, rice straw was treated by soaking in water or 1% sodium hydroxide (NaOH) solution for 24h. Straw chemical component, density, surface morphology, cellulose crystalline and straw tensile properties were studied. Effect of treating rice straw with NaOH was higher than that treating with water, which was negative on hemicelluloses and lignin contents and positive on crystalline cellulose content. Moreover, NaOH treatment roughened the rice straw particle surface more than other treatments. On the other hand, tensile strength of untreated, water and NaOH treated rice straw were 48, 47 and 29 MPa, respectively. Therefore, the treatment effect classified NaOH treated rice straw as a filler or reinforcement for cementitious building materials. The compatibility between rice straw and Portland cement was studied in the second division. Thus, different mixtures were made according to straw particle size, straw treatments (soaking in water or 1% NaOH solution) and calcium chloride (CaCl2) as a chemical additive (3%, 6% and 9% of cement weight) From hydration, compressive strength and ESEM observations data, it is clarified that rice-cement mixture had low level of compatibility under untreated conditions. Treating rice straw (with water or NaOH) and adding CaCl2 had a significant effect on the compatibility. Thus, treating rice straw and adding 6% CaCl2 to the mixture had the best compatibility, due to decrease the inhibitor effect of soluble (terpenes, fatty acids, carbohydrates, etc.) by treating and accelerating the cement hydration process by adding CaCl2. In the third division, experimental work was made to develop a green cementitious binder by activating the acceleration of pozzolanice reaction of type F fly ash. Binary, ternary and quaternary systems were studied. Namely, fly ash - calcium hydroxide system, fly ash- gypsum- calcium hydroxide system, fly ash - cement system, fly ash-calcium hydroxide - cement system, fly ash- gypsum- cement system, and fly ash- calcium hydroxide- gypsum - cement system were investigated. Fly ash cementitious systems were cured under different curing temperatures in the first 24 h. Compressive strength development, hydration phases, pore size distribution and structural morphology were determined. The optimum curing temperature in the first 24 hours was 85oC for all the studied systems. Also in fly ash-calcium hydroxide – gypsum systems, room curing conditions (20oC and RH 65%) were better than water curing after the heating treatment, because water curing decreases the strength value. Fly ash -calcium hydroxide- gypsum- cement

Chapter 9. Summary and recommendation
122
mixture with 70%:3.5%:7%:19.5 weight ratios had the highest compressive strength (50 MPa at age 28 day) than the other tested systems. In the fourth division, two factors were studied; straw particle size and straw content. The effects on the density, porosity, compressive strength, flexural strength, thermal conductivity, water absorption and thickness swelling of rice straw –fly ash cementitious composite were investigated. A reduction in compressive strength of the rice straw composite was observed due to the increase of rice straw content. Also, compressive strength increased when straw particle size decreased at the same fiber content. Generally, the compressive strength for rice straw - fly ash cementitous mixture ranged between 3.8 MPa at 20% rice straw content and 30 MPa at 5% rice straw content. Rice straw cementitious composite flexural strength increased by increasing the straw content up to 7.5% for 10, 20 and 30 mm rice straw particle. Also, flexural strength increased when flake length increased at the same fiber content. The flexural strength for rice straw cement mixture ranged from 1 MPa to 5.88 MPa. The results of the compressive strength and flexural strength indicated that rice straw cementitious mixture could be classified as carrying material for making bricks with straw content up to 10 %.
9.2 Recommendations: The following recommendation briefly describes the area in which further research work valuable.
• Trail section has to be constructed in order to validate the results obtained in this research.
• Research should be done on the utilization of the water waste from treating the straw with NaOH by producing cement superplactizer.
• Research should be done to use the sun energy in the curing process of straw fly ash cementitious composite under the Egyptian conditions.
• Further researches should be conducted to determine the durability of rice straw cementitious mixtures products under heating and cooling cycles and under wetting and drying cycles and the effect of both cycles on the adhesion zone between the straw particles and the matrix by using ESEM.
• Research should be conducted to determine the straw cementitious composite mixing ratios and its properties when the cementitious matrix in the composite replaced with natural earth soil.
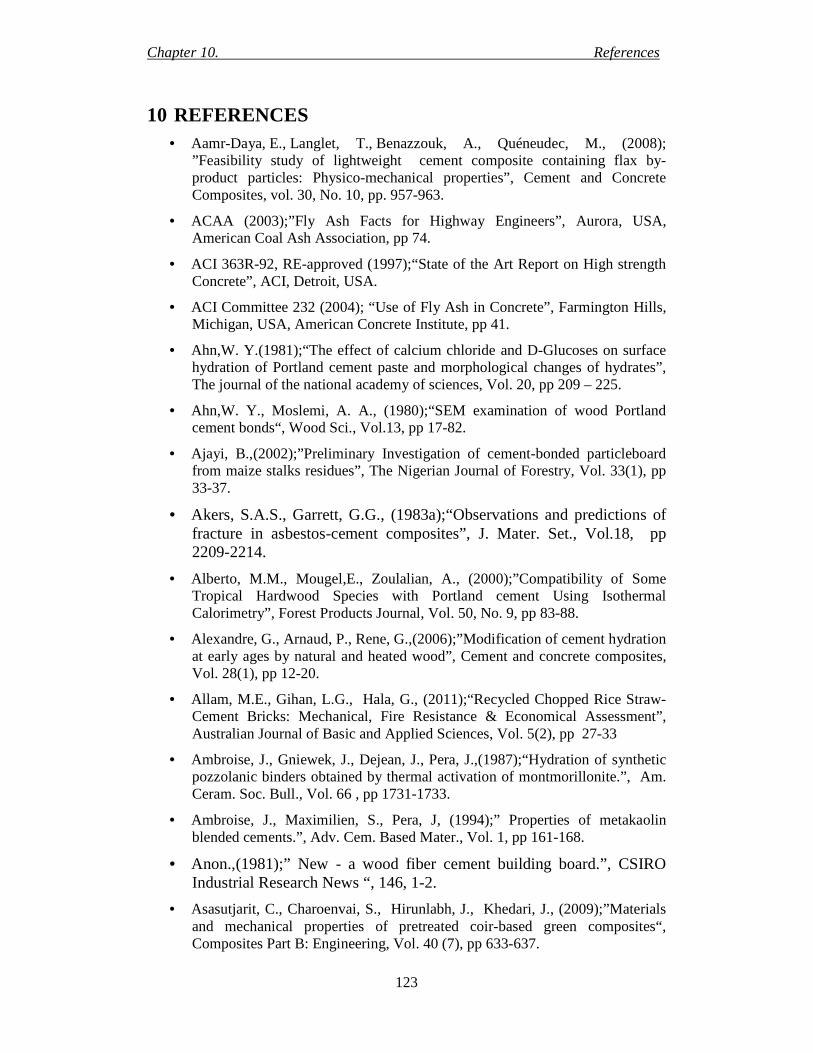
Chapter 10. References
123
10 REFERENCES • Aamr-Daya, E., Langlet, T., Benazzouk, A., Quéneudec, M., (2008);
”Feasibility study of lightweight cement composite containing flax by-product particles: Physico-mechanical properties”, Cement and Concrete Composites, vol. 30, No. 10, pp. 957-963.
• ACAA (2003);”Fly Ash Facts for Highway Engineers”, Aurora, USA, American Coal Ash Association, pp 74.
• ACI 363R-92, RE-approved (1997);“State of the Art Report on High strength Concrete”, ACI, Detroit, USA.
• ACI Committee 232 (2004); “Use of Fly Ash in Concrete”, Farmington Hills, Michigan, USA, American Concrete Institute, pp 41.
• Ahn,W. Y.(1981);“The effect of calcium chloride and D-Glucoses on surface hydration of Portland cement paste and morphological changes of hydrates”, The journal of the national academy of sciences, Vol. 20, pp 209 – 225.
• Ahn,W. Y., Moslemi, A. A., (1980);“SEM examination of wood Portland cement bonds“, Wood Sci., Vol.13, pp 17-82.
• Ajayi, B.,(2002);”Preliminary Investigation of cement-bonded particleboard from maize stalks residues”, The Nigerian Journal of Forestry, Vol. 33(1), pp 33-37.
• Akers, S.A.S., Garrett, G.G., (1983a);“Observations and predictions of fracture in asbestos-cement composites”, J. Mater. Set., Vol.18, pp 2209-2214.
• Alberto, M.M., Mougel,E., Zoulalian, A., (2000);”Compatibility of Some Tropical Hardwood Species with Portland cement Using Isothermal Calorimetry”, Forest Products Journal, Vol. 50, No. 9, pp 83-88.
• Alexandre, G., Arnaud, P., Rene, G.,(2006);”Modification of cement hydration at early ages by natural and heated wood”, Cement and concrete composites, Vol. 28(1), pp 12-20.
• Allam, M.E., Gihan, L.G., Hala, G., (2011);“Recycled Chopped Rice Straw- Cement Bricks: Mechanical, Fire Resistance & Economical Assessment”, Australian Journal of Basic and Applied Sciences, Vol. 5(2), pp 27-33
• Ambroise, J., Gniewek, J., Dejean, J., Pera, J.,(1987);“Hydration of synthetic pozzolanic binders obtained by thermal activation of montmorillonite.”, Am. Ceram. Soc. Bull., Vol. 66 , pp 1731-1733.
• Ambroise, J., Maximilien, S., Pera, J, (1994);” Properties of metakaolin blended cements.”, Adv. Cem. Based Mater., Vol. 1, pp 161-168.
• Anon.,(1981);” New - a wood fiber cement building board.”, CSIRO Industrial Research News “, 146, 1-2.
• Asasutjarit, C., Charoenvai, S., Hirunlabh, J., Khedari, J., (2009);”Materials and mechanical properties of pretreated coir-based green composites“, Composites Part B: Engineering, Vol. 40 (7), pp 633-637.

Chapter 10. References
124
• Ashour, T., Wieland, H., Georg, H., Bockisch, F. J., Wu, W.,(2010);“ The influence of natural reinforcement fibres on insulation values of earth plaster for straw bale buildings”, Materials and design, Vol. 31; No. 10, pp 4676-4685.
• ASTM C 618, (1997); “Specification for Fly Ash and Raw or Calcined Natural Pozzolan for Use as a Mineral Admixture in Portland Cement Concrete”, Philadelphia, Pa USA.
• ASTM D1102 - 84(2007) Standard Test Method for Ash in Wood.
• ASTM D1103-60(1977) Method of Test for Alpha-Cellulose in Wood.
• ASTM D1104-56(1978) Method of Test for Holocellulose in Wood.
• ASTM D1106 - 96(2007) Standard Test Method for Acid-Insoluble Lignin in Wood.
• ASTM D1107 - 96(2007) Standard Test Method for Ethanol-Toluene Solubility of Wood.
• ASTM D1109 - 84(2007) Standard Test Method for 1% Sodium Hydroxide Solubility of Wood.
• ASTM D1110 - 84(2007) Standard Test Methods for Water Solubility of Wood.
• ASTM. D 1037, (1984);”Evaluating of wood base fiber and particle panel materials”. Philadelphia, Pa U.S.A.
• Backe, K. R., Lile, O. B., Lyomov, S. K.,(2001); “Characterizing curing cement slurries by electrical conductivity”, SPE Drill Completion, Vol. 16, No.4, pp 201-207.
• Badejo, S. O. j., (1988);”Effect of flake geometry on properties of cement bonded particleboard from mixed tropical hardwoods”, Wood Sci. Technol., Vol. 22, pp 357-370.
• Bao-min, W., Li-jiu, W., (2004);“ Development of studies and applications of activation techniques of fly ash”, International Workshop on Sustainable Development and Concrete Technology, pp 159- 169.
• Barbarulo, R., Peycelon, H., Leclercq S.,(2007); “ Chemical equilibria between CSH and ettringite, at 20 and 85 °C”, Cement and concrete research, Vol. 37(8), pp 1176-1181.
• Barbhuiya, S.A., Gbagbo, J.K., Russell, M.I., Basheer, P.A.M., (2009);” Properties of fly ash concrete modified with hydrated lime and silica fume”,
Construction and Building Materials, Vol.23, pp 3233–3239.
• Basin News, Building Advisory Service and Information Network (BASIN), (2001);” Changing Education for Sustainable Construction”, Vol. 22.
• Bejo, L., Takats, P., Vass, N.,(2005);”Development of cement bonded composite beams”, Acta Silv. Lign. Hung., Vol. 1, pp 111-119.
• Bentur, A., Diamond, S. and Mindess, S.,(1985b);“The microstructure of the steel fiber cement interface”, J. Mater. Set., Vol.20, pp 3610-3620.

Chapter 10. References
125
• Bentur, A., Mindess, S. and Diamond, S.,(1985a);”Pull-out processes m steel fiber reinforced cement”, Int. J. Cement Comp. Lightweight Conor., Vol. 7(1), pp 29-37.
• Bhatnagar, R.C., Gupta, S., Seehra, S.S, (1993);”Some experiences with highly aluminous clays and their pozzolanic potenlials: a case study”, Res. Ind., Vol. 38, pp 273-277.
• Biblis, E.j., Lo, C.F.,(1968);”Sugars and other wood extractives: Effect on the setting of southern pine-cement mixtures”, Forest Prod J., Vol. 15 (8), pp 28- 34.
• Bietz, H., Uschmann,W.,(1984);“Zum Verfestigungsverhalten von Holz- Zement-Verbunden beim Einsatz von Holzresten”, Holztechnologie, Vol. 25, No. 3, pp116-118. (In German).
• Blankenhorn, R.P., Blankenhorn, D.B., Silsbee,M.R, Dicola, M., (2001);”Effect of fiber surface treatments on mechanical properties of wood fiber cement composites”, Cem Concr Res., Vol 31, pp 49-55.
• Bledzki, A. K., Gassan, J. ,(1999);” Composites reinforced with cellulose based fibers”, Progress in Polymer Science, Vol. 24, pp 221-274.
• Brandstetr, J., Polcer, J., Kratky, J., Holesinsky, R., Havlica, J.,(2001);“ Possibilities of the use of isoperibolic caloroimetry for assessing the hydration behaviour of cementitious systems”, Cement Concrete Res., Vol. 31, pp 941-947.
• Brandt, A. M., (1995); “Cement Based Composites”, E & FN SPON, UK, pp 415- 419, 299- 304.
• Bui, D. D. (2001);”Rice Husk Ash as a Mineral Admixture for High Performance Concrete”, PhD Thesis, Delf University, The Hetherlands.
• Cabangon, R. J., Cunningham, R. B., Evans, P.D., (2002);”Manual strand orientation as a means of improving the flexural properties of wood wool cement boards in the Philippines”, Forest Prod. J., Vol. 52, No. 4, pp 53-59.
• Cabrera J.S., Lynsdale, C.J.,(1988);“A new gas parameter for measuring the permeability of mortar and concrete”, Mag Concr Res., Vol. 40, pp177-182.
• Cabrera, J.G., Nwaubani, S.O.; (1993); “Strength and chloride permeability of concrete containing red tropical soils”, Mag. Concr. Res., Vol. 45, pp169-178.
• Carvalho, K. C. C., Mulinari, D. R., Voorwald, H. J., Cioffi, M. O. H., (2010); “Chemical modification effect on the mechanical properties of HIPS/ Coconut fiber composites”, BioResources, Vol. 5 (2), pp 1143-1155.
• Chaipanich, A., Nochaiya, T., (2010);”Thermal analysis and microstructure of Portland cement-fly ash-silica fume pastes”, J Therm Anal Calorim, Vol. 99, pp 487-493.
• Chandra, S., and Berntsson, L., (1996);”Use of Silica Fume in Concrete”, in Waste Materials Used in Concrete Manufacturing, (Ed. S. Chandra), Noyes Publication, USA, pp 554-623.
• Chou, T. W., (1993);“Polymer-matrix composites”. VCH, NewYork

Chapter 10. References
126
• Cincotto, M. A., Agopyan, V., John, V.M., ( 1990);”Optimization of Rice Husk Ash Production” , Vegetable Plants and their Fiber as Building Materials, Proc. Secand Int. RILEM Symposium, Salvador, Bahia, Brazil, sep 17-21, (Ed. H. S. Sobral), Chapman and Hall, London, pp 334-341.
• Clyne T. W., and Hull, D., (1996); “Introduction to composite materials”, 2nd ed.
• Coppola L, Belz G, Dinelli G, Collepardi M., (1996);” Prefabricated building elements based on FGD gypsum and ashes from coal-fired electric generating plants.” Mater and Structures, Vol. 29, pp 305–311
• Coutts, R.S.P., (1979);”Wood fibre reinforced cement composites”. CSIRO Division of Chemical Technology. Research Review 1979.
• Coutts, R.S.P., (1984a);” Autoclaved beaten wood fiber reinforced cement composites.”, Composite, Vol. 15(2), pp 139-143.
• Coutts, R.S.P., Campbell, M.D., (1979);”Coupling agents in wood fibre-reinforced cement composites”. Composites 10, 228-232.
• Coutts, R.S.P., Kightly, P., (1984b);”Bonding in wood fibre-cement composites”, J. Mater. Sci., Vol. 19, pp 3355-3359.
• Coutts, R.S.P., Ridikas, V., (1982a);”Refined wood fiber cement products”,. Appita, Vol. 35(5), pp 395-400.
• Davies, G.W., Campbell, M.D., Coutts, R. S. P.,(1981);”A SEM study of wood fibre reinforced cement composites”. Holzforschung, Vol.35, pp 201-204.
• De, S. K., White, J. R., (1996); “Short fiber polymer composites”.
• Değirmenci, N., Okucu, A., (2007);“Usability of Fly Ash and Phosphogypsum in Manufacturing of Building Products”, Journal of Engineering Sciences, Vol. 13, No. 2, pp 273-278.
• Dewitz, K., Kuschy, B., Otto, T., (1984);“Stofftransporte bei der Abbindung zemmentgebundener Holzwerkstoffe“, Holztechnologie, Vol. 3, pp 151-154. (In German).
• DIN EN 196-1, (2005-05);”Methods of testing cement - Part 1: Determination of strength”, Beuth Verlag, Berlin.
• Dunster, A.M., Parsonage, J.R., Thomas, M.J.K., (1993);” The pozzolanic reaction of metakaolinite and its effects on Portland cement hydration.”, J. Mater. Sci., Vol. 28, pp 1345-1350.
• Ebid, A., Ueno, H., Ghoneim, A., Asagi, N., (2008); “ Uptake of carbon and nitrogen derived from carbon-13 and nitrogen-15 dual-labeled maize residue compost applied to radish, komatsuna, and chingensai for three consecutive croppings “, Plant Soil, Vol. 304, pp 241–248.
• Egyptian standard number 1349, (1991);”specification of cement bricks”.
• El-Sayed, M. A., El-Samni, T. M.,(2006);“Physical and Chemical Properties of Rice Straw Ash and Its Effect on the Cement Paste Produced from Different Cement Types,” J. King Saud Univ., Vol. 19, Eng. Sci. (1), pp. 21~30.

Chapter 10. References
127
• Eusebio, D. A., Soriano, F. P., Cabangon, R. J., Evans, P. D., (2000a);“Manufactre of low- cost wood cement composites in the Philippines using plantation grown Australian species: II. Acacias”, Wood Cement Composietes in the Asia Pacific Region, Canberra, Australia, pp 115-122.
• Eusebio, D. A., Soriano, F. P., Cabangon, R. J., Evans, P. D., (2000b);“Manufactre of low- cost wood cement composites in the Philippines using plantation grown Australian species: I. Eucalyptus ”, Wood Cement Composietes in the Asia Pacific Region, Canberra, Australia, pp 104-114.
• FAO (2008);”FAO statistical yearbook” http://www.fao.org/economic/ess/ess-publications/ess-yearbook/ess-yearbook2008/en/
• FAO (2010);“FAO statistical yearbook” http://www.fao.org/economic/ess/ess-publications/ess-yearbook/ess-yearbook2010/en/
• Fengel, Wengener., (1984);”Wood, Chemistry , Ultrastructure, Reactions”, walter de Gruyter. (from Hachmi and Moslemi 1989).
• Frybort, S., Mauritz, R., Teischinger, A., Muller, U., (2008);”Cement bonded composites – A meshanical review“, BioResources, Vol.3(2), pp. 602-626.
• Fuwape, J.A, Fuwape, I.A, (1995); “Technical assessment of three layer cement wood particleboard”, The Nigerian Journal of Forestry, Vol. 24(1/2), pp 57-60.
• Galle´, C., (2001);“Effect of drying on cement-based materials pore structure as identified by mercury intrusion porosimetry: A comparative study between oven-, vacuum-, and freeze-drying”, Cement and Concrete Research, Vol. 31, pp 1467–1477.
• Garg, M., Singh, M., Kumar, R., (1996);“Some aspects of the durability of a phosphogypsum-lime-fly ash binder”, Construction and Building Materials, Vol.10, No. 4, pp. 273-279.
• Geimer, R.L., Leao, A., Armbruster, D., Pablo, A., (1994);“Property enhancement of wood composites using gas injection”, Proceedings of the 28th Washington State University, Pullman, Washington, USA, pp 143-259.
• Gonen T., Yazicioglu, S., (2007);“The influence of compaction pore on sorptivity and carbonation of concrete”, Constr Build Mater, Vol. 21, pp 1040-1045.
• Govin, A., Peschard, A., Fredon, E., Guyonnet, R., (2005),”New insights into wood and cement interaction”, Holzforschung, Vol. 59, pp 330-335.
• Govindarao, V. M. H.,(1980) “Utilization of rice husk- A Preliminary Analysis”, J. Sci & Ind. Res., Vol. 39, pp 495-515.
• Grace, P.R., Jain, M.C., Harrington, L., Robertson, G.P., (2003);“Long-term sustainability of the tropical and subtropical rice-wheat system: An environmental perspective”, pp. 27–43, In J.K. Ladha et al. (ed.) Improving the productivity and sustainability of rice-wheat systems: Issues and impact. ASA Spec. Pub. 65, ASA, Madison, WI.
• Gündüz, L., (2007);“The effects of pumice aggregate/cement ratios on the low-strength concrete properties”, Construction and Building Materials, Vol. 22, No.5, pp 721-728.

Chapter 10. References
128
• Hachmi, M.H., Moslemi, A.A., (1989);”Correlation between wood cement compatibility and wood extractives”, Forest Products Journal, Vol. 39, pp 55-58.
• Hachmi, M.H., Moslemi, A.A., Campbell, A.G.,(1990);”A new technique to classify the compatibility of wood with cement”, Wood Sci Technol., Vol. 24, pp 345-354
• Hachmi, M.H., Moslemi, A.A.,(1990);“Effect of wood pH and buffering capacity on wood cement compatibility”, Holzforschung, Vol. 44, pp 425-430.
• Hannant, D.J., (1978);”Fiber Cements and Fiber Concretes”, John Wiley, Chichester, 1-50, 61-134.
• Hardjito, D. and B. V. Rangan (2005);“ Development and Properties of Low-Calcium Fly Ash-Based Geopolymer Concrete”, Perth, Curtin University of Technology, pp 103.
• Hawang, C.L and Wu, D. S., (1989);“Properties Of Cement Paste Containing Rice Husk Ash”, Fly ash, Silica Fume, Slag, and natural Pozzlanas in concrete, Proc. Third Int. conf., Trondheim, Norway, (Ed. V. M; Malhotra), ACI, Detroit, 1989, Vol.2, pp 733-765.
• Haxo, H. E., Mehata, P. K., (1977);“Ground Rice Hull Ash as a Filler for Rubber”, Rubber Chemeistry and Thechnology, Vol. 48, pp 271-283.
• Heidrich, C., (2002);“Ash Utilisation - An Australian Perspective” Geopolymers 2002 International Conference, Melbourne, Australia, Siloxo.
• Hermawan, D., Hata, T., Kawai, S., Nagadomi, W., Kuroki, Y.(2002b);“Manufacturing oil palm fronds cement bonded board cured by gaseous or supercritical carbon dioxide“, J.Wood Sci., Vol. 48, pp 20-24.
• Hermawan, D., Hata, T., Umemura, K., Kawai, S., Kaneko, S., Kuroki, Y.(2000); New technology for manufacturing high strength cement bonded particleboard using supercritical carbon dioxide” J. Wood Sci, Vol. 46, pp 85-88.
• Hermawan, D., Hata, T., Umemura, K., Kawai, S., Nagadomi, W., Kuroki, Y.(2001a); “Rapid production of high strength cement bonded particleboard using gaseous or supercritical carbon dioxide” J. Wood Sci, Vol. 47, pp 294-300.
• Hofstrand, A. D., Moslemi A. A., Garcia, J. F., (1984);“Curing characteristics of wood particles from nine northern Rocky Mountain species mixed with Portland cement” Forst Prod. J., Vol. 34, pp 57-61.
• Houston, D. F., (1972);“Rice Hulls”, rice chemistry and Technology, (Ed. D. F. Houston), American Association of Cerreal Chemists, St. Oaul, Minnesota, pp. 301-352.
• Ibrahim, D. M. , El Hemaly, S. A., Abo El Enein, S. A., Hanafi, S. and Helmy, M., (1980); “Thermal Treatment of Rice Husk Ash: Effect of Time of Firing on Pore structure and Crystallite Size”, Thermochimica Acta, Vol. 37, pp 347-351.
• Ibrahim, D. M. and Helmy, M., (1981); “Crystallite Growth of Rice Husk Ash Silica”, Thermochimica Acta, Vol. 45, pp 79 – 85.

Chapter 10. References
129
• Ikeda, K., Tomisaka, T., (1989);” Fundamental studies on the preparation and strength of steam-cured porous materials made from mixture of fly ash, gypsum and lime”, Journal Ceramic Japanese Society, Vol. 97, pp 468-474.
• Islam, M. S., Pickering, K. L., Beckermann, G. W., Foreman, N. J., (2005);”The effect of fibre treatment using alkali on industrial hemp fibre / epoxy resin composites”, Proceedings of the International Conference on Mechanical Engineering, (ICME2005), 28- 30 December 2005, Dhaka, Bangladesh.
• James, J., Rao, M.S., (1986);“Characterization of silica in rice husk ash”, The American ceramic society bulletin, Vol. 65, No. 8, pp 1177- 1180.
• Jaturapitakkul, C., and Roongreung, B. (2003). “Cementing material from calcium carbide residue-rice husk ash.” J. Mater. Civ. Eng., Vol.15(5), pp 470–475.
• Jenkins B.M, Baxter, L.L, Miles, T.R. Jr., Miles, T.R, (1998); “Combustion properties of biomass”, Fuel Process. Technol., Vol 54, pp 17-46.
• Johansson, S., Andersen, P.J., (1990);“ Pozzolanic activity of calcined Moler clay.”, Cem. Concr. Res., Vol. 20, pp 447-452.
• John, A.,(1999);” Wood –based Composites and Panel Products”. From, Forest Product Laboratory. Wood handbook – wood as an engineering material. Gen. Tech. Rep. FPL-GTR- 113. Madison, WI: U.S. Department of Agriculture, Forest Service, Forest Product Laboratory.463p.
• Jorge, F. C., Pereira, C., Ferreira, J. M. F., (2004); “ Wood cement composites: A review”, Holz Roh Werkst., Vol. 62, pp 370-377.
• Karade, S. R., Irle, M., Maher, K.,(2003); “Assessment of wood cement compatibility: A new Approach.” Holzforschung, Vol. 57, pp 672-680.
• Kasai, Y., Kawamura, M., Zhou, J.D.,(1998);” Study on Wood Chip Concrete with Timber”, In V.M. Malhotra (Ed.), Recent Advances in concrete Technology: Proceedings: 4th CANMT/ACI/JCI International Conference, SP 179, Tokushima, Japan, pp. 905-928.
• Kaupp, A., (1984);”Gasification of Rice Hulls”, Vieweg, Braunschweig.
• Kavvouras, P. K.,(1987);”Suitability of Quercus conferta Wood for the manufacture of cement bonded flakeboards”, Holzforschung, Vol. 41, pp 159-163.
• Kumar S., (2000);”Fly ash–lime–phosphogypsum cementitious binder-a new trend in bricks.”, Mater Struct., Vol. 33, pp59 – 64.
• Kumar, K., Goh, K.M.,(2000);”Crop residue management: Effects on soil quality, soil nitrogen dynamics, crop yield, and nitrogen recovery”, Adv. Agron. 68, pp 197–319.
• Lea, F.M. (1976);“The Chemistry of Cement and Concrete”, 3rd edn., Edward Arnold, London.
• Lea, F.M., Desch, C.H., (1956);”The chemistry of cement and concrete.” ,Arnold Ltd, London, 637 pp.

Chapter 10. References
130
• Leao, A. L. ; Carvalho, F. X. ; Frollini, E. , (1997); “ Eds. Lignocellulosic-Plastics Composites”; USP: Sao Paulo, Brazil.
• Lee, A. W. C., Hong, Z., (1986);”Compressive strength of cylindrical samples as an indicator of wood cement compatibility”. Forest Products Journal, Vol. 36(11/12), pp 87-90.
• Lee, S. M., (1991); “International encyclopedia of composites” 2nd edition.
• Li, V.C., (1992);”Post crack scaling relations for fiber reinforced cementitious composite”, ASCE J. of materials in civil engineering, Vol. 4, No. 1, pp 41-57.
• Liou, T. H. and Chang, F. W., (1996);”the Nitridation Kinetics of Pyrolyzed Rice Husk”, Industrial Engineering and Chemical Research, Vol. 35, No. 10, pp 3375-3383.
• Liu, Z., Moslemi, A.A., (1985);”Influence of chemical additives on the hydration characteristics of western larch wood-cementwater mixtures”, Forest Prod. J., 35 (7/8): 37-43.
• Ma, W., Brown, P.W., (1997); " Hydro-thermal reactions of fly ash with Ca(OH)2 and CaSO4 .2H2O", Cement and Concrete Research, Vol. 27, No. 8, pp.1237-1248.
• Mahmoud, H.H., (1989);”Enhancement of material properties using fibres”, PhD Thesis, Faculty of engineering, Alexandria university, Egypt.
• Malhotra, V. M., (1999); "Making Concrete "Greener" With Fly Ash." ACI Concrete International, Vol. 21, No. 5, pp 61-66.
• Malhotra, V. M., (2002); "High-Performance High-Volume Fly Ash Concrete." ACI Concrete International Vol. 24, No. 7, pp 1-5.
• Malhotra, V. M., Ramezanianpour, A. A., (1994);”Fly Ash in Concrete”, Ottawa, Ontario, Canada, CANMET.
• Malhotra, V.M., (1993);”Fly Ash, Slag, Silica Fume, and Rice husk Ash in Concrete: A Review”, Concrete International, Vol. 15, pp 23-28.
• Malhotra, V.M., (2006);“Reducing CO2 Emissions”, ACI Concrete International, vol. 28, pp 42-45.
• Mallick, P. K., (1993);“Fiber reinforced composites: materials, manufacturing and design”, 2nd edition.
• Mandal, S., Majumdar, D., (2009);” Study on the alkali activated fly ash mortar”, The open civil engineering journal, Vol. 3, pp 98-101.
• Marinkovic, S., Pulek, A., (2007);” Examination of the system fly ash–lime-calcined gypsum-water.”, J. Phys. Chem. Solids., Vol. 68(5–6), pp1121–1125.
• McCaffrey, R., (2002);“Climate Change and the Cement Industry”, Global Cement and Lime Magazine (Environmental Special Issue), pp 15-19
• Mehta, P. K., (2002);"Greening of the Concrete Industry for Sustainable Development", ACI Concrete International, Vol.24(7), pp 23-28.
• Mehta, P. K., Polivka, M.,(1976);“Use of high Active Pozzolans for reducing Expansion in Concrete Containing Reactive Aggregate”, Living with Marginal Aggregates, ASTM STP 597, pp 25-35.

Chapter 10. References
131
• Meneeis, C. H.S., Castro, V. G., Souza, M. R. (2007),”Production and properties of a medium density wood cement boards produced with oriented strand and silica fume”, Maderas: Ciencia y tecnologia, Vol. 9 (2), pp 105-116.
• Michell, A.J., Freischmidt, G., (1990);” Effect of fiber curl on the properties of wood pulp fibre-cement and silica sheets”, J. Mater. Sci.,Vol.25, pp 5225-5230.
• Mieck KP, Nechwatal A., Knobelsdorf, C., (1994);“Melliand Textilberichte”, Vol. 11, pp 892–898.
• Milestone, N. B.,(1979);”Hydration of tricalcium silicat in the presence of lignosulfonate, glucose and sodium gluconate”, J. Am. Ceram. Soc., Vol. 62, pp 321-324.
• Miller, D.P., Moslemi A.A.,(1991 b);” Wood-cement composites: Effect of model compounds on hydration characteristics and tensile strength”, Wood and Fiber Science., Vol. 23, No. 4, pp 472-482.
• Miller, D.P., Moslemi A.A.,(1991a);“ Wood-cement composites: species and heartwood-sapwood effects on Hydration and tensile strength”, Forest Products J., Vol. 41, No. 3, pp 9-14.
• Min, Y., Jueshi, Q., Ying, P., (2008);” Activation of fly ash–lime systems using calcined phosphogypsum”, Construction and Building Materials, Vol. 22, pp 1004-1008
• Mindess, S , Young, J.F., (1990); “Concrete”, Prentice Hall, INC. Englewood Cliffs, New jersey 07632. (Text Book).
• Miyatake, A., Fiujii, T., Hiramatsu, Y., Abe, H., Tonosaki,M., (2000);” Manufacture of wood strand cement composite for structural use”, Wood Cement Composietes in the Asia Pacific Region, Canberra, Australia, pp 148-152.
• Mohr, B.J, Nanko, H., Kurtis, K.E, (2005);“Durability of kraft pulp fiber–cement composites to wet/dry cycling”, Cement Concrete Comp., Vol. 27,pp 435-448.
• Moslemi, A.A, Pfister, S.C., (1987);”The Influence of Wood/Cement Ratio and Cement Type on Bending Strength and Dimensional Stability of Wood-Cement Composites Panels”, Wood and Fiber Science, Vol.19(2), pp 165-175.
• Moslemi, A.A., Garacia, J.F., Hofstrand, A.D., (1983);“ Effect of various treatments and additives on wood-port1and cement-water systems”, Wood and Fiber Science,Vol. 15, No. 2, pp 165-176.
• Moslemi, A.A., Lim, Y.T, (1984);”Compatibility of southern hardwoods with portland cement”, Forest Products J., Vol. 34(7/8), pp 22-26.
• Moslemi, A.A., Souza, M., Geimer, R., (1994);”Accelerated ageing of cement bonded particleboard”, 4th International inorganic bonded wood and fiber composite Materials conference, Spokane, Washington, USA, pp 83-88.
• Mukherjee PS and Satyanarayana KG.,(1986);”Structure and properties of some vegetable fibres”, Journal of Materials Science; 21: 51–56.

Chapter 10. References
132
• Nallis, K., (2009); “Comparative study on the properties of rice straw / polypropylene and micacceous clay/polypropylene composites”, Master of Science, University SALNS Malaysia.
• Ndazi, B., Tesha, J. V., Nyahumwa, C., Kalsoon, S.,(2005);“Effect of steam curing and alkali treatment on the properties of rice husks.”, In: K. Ghavami, H. Savastano, Joagum, A.P., (eds.), Proceedings of the Inter-American Conference on Non Conventional Materials and technologies (IAC-NOCMAT 2005- Rio), PUC-Rio, Rio de Janeiro, Brazil, ABMETNC, November 11-15 2005 ISBN 85-98073-05-9.
• Ni,Y. (1995); “Natural Fibre Reinforced cement composites” PhD Thesis, Department of mechanical engineering, Victoria university of technology, Australia.
• Okino, E.Y. A., Souza, M. R., Santana, M. A. E., Alves, M. V., Sousa, M. E., Teixeira, D. E., (2005);” Physico mechanical properties and decay resistance of Cupressus spp. Cement bonded particleboards”, Cement Concrete Comp., Vol. 27, pp 333-338.
• Olorunnisola, A.O., Adefisan, O.O., (2002);”Trail production and testing of cement-bonded particleboard from ratten furniture waste”, Wood &Fiber Science, Vol. 34(1), pp 116-124.
• Olorunnisola, A.O., (2007);”Effect of Particle Geometry and Chemical Accelerator on Strength properties of Rattan- Cement Composites”, AJST, Vol. 8, No. 1, pp 22-27.
• Oriol, M., Pera, J., (1995);”Pozzolanic activity of metakaolin under microwave treatment“, Cem. Concr. Res., Vol. 25, pp 265-270.
• Oyagade,S.O.O, (2000);”Thickness swelling component and water absorbation of cement–bonded particleboards made from gmelina wood, bagasse and coconut husk”, The Nigerian Journal of Forestry, Vol. 30(1), pp 10-14.
• Papadakis, V.G., Fardins, M.N., Veyenas, C.G., (1992);“Hydration and Carbonation of Pozzolanic Cement”, ACI Mater J Technical Paper 89; 2.
• Papadopoulos, A. N., Ntalos, G.A., Kakaras, I., (2006);”Mechanical and physical properties of cement bonded OSB”, Holz Roh Werkst., Vol. 64, pp 517-518.
• Pehanich, J.L., Blankenhorn, R.P., Silsbee,M.R, (2004);”Wood fiber surface treatment level effects on selected mechanical properties of wood fiber cement composites” Cem Concr Res., Vol. 34, pp 59-65.
• Pererira, C., Jorge. F.C., Irle, M., Ferreira, J.M., (2006);”Characterizing the setting of cement when mixed with cork, blue gum, or maritime pine, grown in Portugal I: temperature profiles and compatibility indices“, J Wood Sci., Vol. 52, pp 311-317.
• Price, W.H., (1975);”Pozzolans. A review”, Am. Concr. Inst. J., May 1975 , pp 225-232.

Chapter 10. References
133
• Ray, D., Sarkar, B.K.,(2001); “Characterization of Alkali-Treated Jute Fibres for Physical and Mechanical Properties”, Journal of Applied Polymer Science, Vol.80, pp1013-1020
• Real, C., Alcala, M.D., and Criado, J. M., (1996);“Preparation of Silica From Rice Husk”, J. of the American ceramic society, Vol. 79, No. 8, pp 2012 - 2016.
• Richardson, I.G; Cabrera, J.G, (2000);”The nature of C-S-H in model slag-cements”, Cement and Concrete Composites, vol. 22, pp.259-266.
• Roger.M., Speleter, H., Arola, R., Davis, P., Friberg, T., Hemingaway, R., Rials, T., Luneke, D., Narayan, R., John, S., and White, D., (1993); “Opportunities for composites from recycled waste wood- based resources : a problem analysis and research plan”, Forest Products J., Vol. 43(1), pp 55-63.
• Rojas, M. F., Sánchez de Rojas, M. I.,(2005);”Influence of metastable hydrated phases on the pore size distribution and degree of hydration of MK-blended cements cured at 60 oC”, Cement and Concrete Research, Vol. 35, pp 1292 – 1298
• Rongli, F., (1999);“Study of Methods of Enhancing Activity of Fly Ash”, Cement, pp. 9-10.
• Rossignolo J.A., Agnesini, M.V.,( 2004);“Durability of polymer-modifid lightweight aggregate concrete”, Cem. Concr. Compos., Vol. 26, pp 375-380.
• Rout, J., Misra, M.,Tripathy, S. S., Nayak, S. K., Mohanty, A. k., (2001);”The influence of fiber treatment on the performance of coir polyester composites.’, Comp. Sci. and Tech., Vol. 61(9), pp 1303-1310.
• Rowell, R. M., Han, and Rowe, J. S., (2000); “Characterization and factors effecting fiber properties”. Natural polymer and agrofiber composites; San Carlos, Brazil, 115-134.
• Rubin, E. M., (2008): “Genomics of cellulosic biofuels”, Nature 454, pp 841-845.
• Salvador, S., (1995);”Pozzolanic properties of flash-calcined kaolinite. A comparative study with soak-calcined products”, Cem. Concr. Res., Vol. 25, pp 102-112.
• Sandermann, W.,Preusser, H., Schweers, W, (1960);“ Studies on mineral bonded wood materials: The effect of wood extractives on the setting of cement bonded wood materials”, Holzforschung, Vol. 14, pp 70- 77.(C.F. Forest Abstracts. 1961,22: 2568).
• Sandermann,W., Kohler,R., (1964);”Studies on mineral-bonded wood materials . IV. A short test of the aptitudes of woods for cement bonded materials”, Holzforschung, Vol. 18, pp 53-59.
• Sarkar, P. B., Mazumda, A. K., Pal, K. B., (1948),”Hemicelluloses of jute fiber.”, Journal of the textile institute 39,T44-T58 CODEN: JTINA&; ISSN: 0040-5000.
• Sauvat, N., Sell, R., Mougel, E., Zoulailan, A., (1999);”A study of ordinary Portland cement hydration with wood by isothermal calorimetry”, Holzforschung, Vol. %3, PP104-108.

Chapter 10. References
134
• Sayanam, R.A., Kalsotra, A.K., Mehta, S.K., Singh, R.S.A., Mandal, G., (1989);“ Studies on thermal transformation and pozzolanic activities of clay from Jammu region (India)”, J. Therm. Anal., Vol. 35, pp 99-106.
• Schubert, B., Wienhaus, O.,(1984);”Die Messung des Temperaturverlaufes der Zementhydratation als Pruefmethode fuer die Herstellung von Holz-Zement-Wekstoffen“, Holztechnologie, Vol. 25(3), pp 118-122. (In German).
• Schwarz , H.G, Simatupang, M.H., (1984);”Suitability of beech for use in the manufacture of wood cement”, Holz als Roh und werksotff., Vol. 42, pp 265-270 (C.F. Forest Products Abstract . 1985 , 008 :02893).
• Segal, L., Conrad,C.M., (1957);”The characterization of cellulose derivatives using x-ray diffractometry”, American Dyestuff Reporter 637-642.
• Segal, L., Creely, J.J., Martin, A.E., Conrad, C.M., (1959);”An empirical method for estimating the degree of crystallinity of native cellulose using the X-ray diffractometer”, Text. Resear. J., Vol. 29, pp 764-786.
• Semple, K. E., Evans, P. D., (2004);“Wood cement composites – Suitability of Wastern Australian mallee eucalypt, blu gum and melaleucas”, RIRDC/Land & Water Australia / FWPRDC / MDBC.
• Semple, K.E., Cunningham, R.B., Evans, P.D., (1999);”Cement hydration tests using wood flour may not predict the suitability of Acacia mangaium and Eucalyptus pellita for the manufacture of wood –wool cement boards”, Holzforschung, Vol. 53, pp 327-332
• Simatupang, M. H., Geimer, R., (1990);“Inorganic binder for wood composite: Feasibility and Limitations”, Wood adhesives, Madison, Wisconsin, USA, pp 169-176.
• Simatupang, M. H., Habighorst, C., (1992);”The carbon dioxide process to enhance cement hydration in manufacturing of cement bonded composites- comparison with common production method”, 3rd international inorganic bonded wood and fiber composite materials, Spokane, Washington, USA, pp 114-120.
• Simatupang, M. H., Lange, H., Neubauer, A., (1987);“Einfluss der Lagerung von Pappel, Birke, Eiche, und Laerche sowie des Zusatzes von SiO2- Feinstaub auf die Biegefestigkeit zementgebundener Spanplatten“, Holz Roh Werkst., Vol. 45, pp 131-136. ( In German.).
• Simatupang, M. H., Sedding, N., Habighorst, C., Geimer, R., (1991);”Technologies for rapid production of mineral bonded wood composites boards”, For. Prod. Res. Soc., vol. 2, pp 18-27.
• Singh,M., Grag, M., (2006);”Strength and Durability of cementitious binder produced from fly ash- lime sludge-Portland cement.”, Indian J. of Eng. & Mat. Sci., Vol.13, pp 75-79.
• Sjostrom, E., (1993); “Wood Chemistry, Fundamentals and Applications” , Second edition. AcademicPress, San Diego, CA, USA, 293 p.
• Stamboulis, A., Baillie, C. A., Peijs, T.,(2001);” Effects of environmental conditions on mechanical and physical properties of flax fibers”, Composites Part A: Applied Science and Manufacturing, Vol. 32, pp 1105 – 1115.

Chapter 10. References
135
• Sutigno, P., (2000);“Effect of aqueous extraction of wood-wool on the properties of wood wool cement board manufactured from teak (Tectona grandis)”, Wood Cement Composietes in the Asia Pacific Region, Canberra, Australia, pp 24-28.
• Tames, J and Rao, M. S., (1986);“Characterization of Silica in Rice Husk Ash”, The American Ceramic Society Bulletin, Vol. 65, No. 8, pp 1177-1180.
• Taylor, H.F.W.,(1990); “Cement Chemistry”, London, Thomas Telford.
• Tempest, B., Sanusi, O., Gergely, J., Ogunro, V., and Weggel, D., (2009);” Optimization of Fly Ash based Geopolymer Concrete by Measurement of Free Hydroxyl Ions”, 2009 World of Coal Ash Conference, Lexington, Kentucky, May 4-7.
• Thygesen, A., Daniel, G., Lilholt, H., Thomsen, A.B., (2005);“Hemp fibre microstructure and use of fungal defibration to obtain fibres for composite materials”, J. Natural Fibers, Vol. 2, pp 19-37.
• Tishmack J.K., Peterson J.R., and Flanagan D.C., (2001);”Use of coal combustion by-products to reduce soil erosion”, Proc. Int. Symp. Ash Utilization, University of Kentucky, October 22-24, Lexington, KN, USA.
• Tonoli, G.H.D, Rodrigues Filho, U.P., Savastano, Jr. H., Bras, J., Belgacem, M.N., Rocco Lahr, F.A.,(2009);”Cellulose modified fibers in cement based composites”, Composites: Part A, Vol. 40, pp 2046–2053.
• Torgal, F. M. Alves S. P.;Castro Gomes, J. P.;Jalali, Said., (2007);”Investigations on mix design of tungsten mine waste geopolymeric binder”, Construction and Building Materials.
• Troedec, M., Sedan, D., Peyratout, C., Bonneta, J., Smith, A., Guinebretiereb, R., Gloaguenc, V., Krausz, P., (2008);”Influence of various chemical treatments on the composition and structure of hemp fibres“, Compos. Part A, Vol. 39, pp 514-522.
• UNIDO, (1984),United nations Industrial Development Orgnaization,;”Rice Husk Ash Cements; Their Development and Application “, Vienna, 100 pp.
• Valenti, G.L., Santoro, L., Beretka, J., (1988);”Studies on the formation of cementitious compounds using phosphogypsum.”, Proc. 2nd Int. Symp. on Phosphogypsum, Florida Inst. Phosphate Res., Bartow, Florida, 2: 167-172.
• Vigo, T. L. and Kinzig, B. J., (1992);“An overview of organic polymeric matrix resins for composites”. VCH, pp 3-30.
• Vilay, V., mariatti, M., Mat, T., Todo, M., (2008);”Effect of fibre surface treatment and fibre loading on the properties of bagasse fibre reinforced unsaturated polyester composites”, Comp. Sci Tech, Vol. 68 (3-4), pp 631-638.
• Weatherwax, R.C., Tarkow, H., (1964), “Effect of wood on setting of Portland cement”, Forest Products Journal, Vol. 14(12), pp 567-570

Chapter 10. References
136
• Wei, Y. M., Fujii, T., Hiramatsy, Y., Miyatake, A., Yoshinaga, S., Tomita, B., (2004); “A preliminary investigation on microsturctural Characteristics of interfacial zone between cement and exploded wood fibre strand by using SEM-EDS”, J. Wood Sci, Vol. 50, pp 327- 336.
• Wei, Y. M., Tomita, B., Hiramatsu, Y., Miyatake, A., Fujii, T., Yoshinaga, S., (2003);”Hydration behavior and compressive strength of cement mixed with exploded wood fiber strand optained by the water vapor explosion process”, J. Wood Sci, Vol. 49, pp 317-326.
• Wei, Y. M., Zhou, Y. G., Tomita, B., (2000a);“Study of hydration behavior of wood cement based composite II: Effect of chemical additives on the hydration characteristics and strength of wood cement composites”, J. Wood Sci, Vol. 46, pp 444-461.
• Werner, O.R., Tikalsky, P.J., Mather, B., Mielenz, R.C., Patzias, T.,(1994):” Proposed report. Use of natural pozzolans in concrete.”,Am. Concr. Inst. Mater. J., Vol. 91, pp 410-426.
• Wie, Y.M., Zhou Y.G., Tomita, B., (2000b);”Hydration behavior of wood cement – based composite I: evaluation of wood species effects on compatibility and strength with ordinary Portland cement”, J Wood Sci., Vol. 46, pp 296-302.
• Wool, R. P., Khot, S. N., (2001); “Composites, ASM Handbook: Volume 21” Ed. Miracle, D. B., and Donaldson, S. L. p 184-193.
• Ye, G., (2003);“Experimental Study and Numerical Simulation of the Development of the Microstructure and Permeability of Cementitious Materials”, PhD thesis, Delft University of Technology, Delft.
• Yoshida, S, Ohnishi, Y., and Kitagishi., (1959);“The Chemical Nature of Silicon in Rice Plant”, Journal Soil, Plant and Food, No. 5, pp 23-27.
• Yushou, L., Qisheng, W., (2000);“Sudy on Slag and Fly Ash Cement and Concrete Activated by Alkali.” Concrete and Cement Product, pp. 42.
• Zhengtian, L., Moslemi, A.A., (1986);”Effect of Western Larch Extractive on Cement Setting”, Forest Products Journal, Vol. 36(1), pp 53-54.

Chapter 11 Appendix
138
APPENDIX

Chapter 11 Appendix
139
Table (11.1): Chemical compositions of binders.
Oxides (%) Portland cement
Fly ash Calcium hydroxide
Gypsum
SiO2 19.6 48.72 0.21 0.23 Al 2O3 4.89 30.66 0.23 0.09 Fe2O3 2.62 5.23 0.05 0.04 CaO 63.07 6.5 58.56 32.7 MgO 2.03 1.13 0.60 0.46 SO3 3.9 0.88 0.36 43.68
Na2O 0.18 0.45 0 0.03 K2O 0.85 1.02 0.01 0 LOI 2.9 5.41 - 18.95
Table (11.2): Fineness of binders. Specific Surface Area , cm2/g Fly ash 3110 Calcium hydroxide 3360 Gypsum 3070 Portland cement 6190
Table (11.3): Compressive and Flexural strength of Portland Cement and Gypsum. Compressive strength, MPa Flexural Strength, MPa
Portland Cement at 2 day 36.0 5.3
at 28 day 55.0 7.9
Gypsum at 2 day 7.0 1.9 at 28 day 10.0 2.5

140
Table (11.4): Fly ash cementitious binder mixtures design and its curing conditions. F L G C Heating temperatures,
oC Heating time, hour
No
Mix ID.
% by weight
W/B
20 45 65 85 105 8 12 16 20 24 48 72
RC* WC**
Group1 Effect of Curing temperatures, calcium hydroxide content, and gypsum content on strength development.
1 L10 100 10 - - 0.50 x x x x x x x x
2 L30 100 30 - - 0.50 x x x x x x x x
3 L50 100 50 - - 0.50 x x x x x x x x
4 L10G8 100 10 8 - 0.50 x x x x
5 L10G10 100 10 10 - 0.50 x x x x
6 L10G12 100 10 12 - 0.50 x x x x
7 L10G14 100 10 14 - 0.50 x x x x
8 L10G16 100 10 16 - 0.50 x x x x
9 L30G8 100 30 8 - 0.50 x x x x x x x x
10 L30G10 100 30 10 - 0.50 x x x x x x x x
11 L30G12 100 30 12 - 0.50 x x x x x x x x
12 L30G14 100 30 14 - 0.50 x x x x x x x x
13 L30G16 100 30 16 - 0.50 x x x x x x x x
14 L50G8 100 50 8 - 0.50 x x x x
15 L50G10 100 50 10 - 0.50 x x x x
16 L50G12 100 50 12 - 0.50 x x x x
17 L50G14 100 50 14 - 0.50 x x x x
18 L50G16 100 50 16 - 0.50 x x x x
Group2 Effect of water to binder ratio on strength development.
19 L10G14 100 10 14 - 0.30 x x x
20 L10G14 100 10 14 - 0.35 x x x
21 L10G14 100 10 14 - 0.40 x x x
22 L10G14 100 10 14 - 0.45 x x x
23 L10G14 100 10 14 - 0.55 x x x
24 L10G14 100 10 14 - 0.60 x x x
25 L10G14 100 10 14 - 0.65 x x x
26 L10G14 100 10 14 - 0.70 x x x
27 L30G14 100 30 14 - 0.30 x x x
28 L30G14 100 30 14 - 0.35 x x x
29 L30G14 100 30 14 - 0.40 x x x
30 L30G14 100 30 14 - 0.55 x x x
31 L30G14 100 30 14 - 0.60 x x x
32 L30G14 100 30 14 - 0.65 x x x
33 L30G14 100 30 14 - 0.70 x x x
*Room curing (in air at 20 C and RH 65%) **Water curing at 20 C

141
Table (11.4): Continue . F L G C Heating temperatures,
oC Heating time, hour
% by weight 20 45 65 85 105 8 12 16 20 24 48 72
No
Mix ID.
% by weight
W/B
20 45 65 85 105 8 12 16 20 24 48 72
RC* WC**
Group 3 Effect of heating time on strength development.
34 L10G8 100 10 8 - 0.35 x x x x x x x x x
35 L10G10 100 10 10 - 0.35 x x x x x x x x x
36 L10G12 100 10 12 - 0.35 x x x x x x x x x
37 L10G14 100 10 14 - 0.35 x x x x x x x x x
38 L10G16 100 10 16 - 0.35 x x x x x x x x x
39 L30G8 100 30 8 - 0.35 x x x x x x x x x
40 L30G10 100 30 10 - 0.35 x x x x x x x x x
41 L30G12 100 30 12 - 0.35 x x x x x x x x x
42 L30G14 100 30 14 - 0.35 x x x x x x x x x
43 L30G16 100 30 16 - 0.35 x x x x x x x x x
Group 4 Effect of calcium hydroxide content, gypsum content, cement content, and curing methods on strength development.
44 L0G0C 70 - - 30 0.35 x x x x x
45 L5C 70 3.5 - 26.5 0.35 x x x x x
46 L10C 70 7 - 23 0.35 x x x x x
47 L15C 70 10.5 19.5 0.35 x x x x x
48 G5C 70 - 3.5 26.5 0.35 x x x x x
49 G10C 70 - 7 23 0.35 x x x x x
50 G15C 70 - 10.5 19.5 0.35 x x x x x
51 L5G5C 70 3.5 3.5 23 0.35 x x x x x
52 L5G10C 70 3.5 7 19.5 0.35 x x x x x
53 L5G15C 70 3.5 10.5 16 0.35 x x x x x
54 L10G5C 70 7 3.5 19.5 0.35 x x x x x
55 L10G10C 70 7 7 16 0.35 x x x x x
56 L10G15C 70 7 10.5 12.5 0.35 x x x x x
57 C100 - - - 100 0.35 x x x x x
* Room curing (in air at 20 C and RH 65%) **Water curing at 20 C

Chapter 11 Appendix
142
Table (11.5):. Specifications for thermal conductivity machine. Model λ –Meter EP500 Measurement temperatures Random choice of temperature in the range
of 10-40 C Temperature difference between sensor plates
Range random choice in range of 5-15 C
Measurement range R=0.250- 5 m2K/W and λ=4-250 mW/mK Specimen thickness 10-200 mm Maximum specimen dimension 500 X 500 mm Accuracy <1.5% for specimen thickness< 90mm and
λ = 10-60 mW/mK (mostly< 0.5) Total dimension 630 X630 X880 mm Mass Ca.85 kg Voltage 220 V/50 Hz Maximum power input 450 W
Table (11.6): Parameter values of cement hydration test for different straw content. SC,% T,oC t,h R,oC/h ET,oC.h I,% 0 70.9 9.5 4.7 956.02 - 1.5 36.2 18.5 0.62 706.25 39.91 3 35.2 44.38 0.34 533.35 164.38 4.5 33.2 50.4 0.29 514.25 209.28 7.5 30 73.2 0.13 503.24 374.3
Table (11.7): Mean values of compressive strength CS and relative strength RS for rice straw cement composites at different straw content.
Compressive strength CS, MPa Relative strength RS,% SC,%
7 day 14 day 28 day 7 day 14 day 28 day 0 48 50.9 57.17 - - - 1.5 7.5 8.66 8.7 15.62 17.01 15.21 3 3.02 4.13 4.79 6.29 8.11 8.37 4.5 0.62 1.17 1.45 1.29 2.29 2.53 7.5 0.22 0.42 0.54 0.45 0.82 0.94

Chapter 11 Appendix
143
Table (11.8): Parameter-values of cement hydration test and compressive test with7.5% of untreated and treated straw for different particle size.
Table (11.9): Effect of CaCl2 addition on the hydration parameter-values of untreated and treated straw cement composites at 7.5% straw content.
Treatment Untreated Water treated NaOH treated CaCl2
content,% 3 6 9 3 6 9 3 6 9
Straw size T “maximum hydration temperature”, oC 20~40 mesh 30.0 55.9 64.9 51.3 56.0 65.3 39.0 52.5 56.9 10 mm 50.9 63.6 66.5 56.8 65.1 68.3 47.6 61.8 65.2 20 mm 54.6 63.5 67.2 58.8 67.3 71.9 47.5 63.9 67.7 30 mm 56.2 63.7 67.2 59.5 68.2 70.2 48.5 64.0 70.2 t “time to reach maximum hydration temperature” , h 20~40 mesh 24.0 5.0 2.5 10.0 4.5 2.0 19.0 7.5 4.0 10 mm 5.0 2.5 2.0 5.0 3.5 1.5 8.5 4.5 2.5 20 mm 6.0 2.5 1.8 5.0 3.0 1.5 8.0 4.0 2.0 30 mm 5.5 2.0 1.8 4.5 3.0 1.5 8.0 3.5 2.0 R “ hydration rate”, oC/h 20~40 mesh 0.18 2.12 4.36 2.29 3.60 8.80 0.76 2.37 4.45 10 mm 3.64 10.24 9.60 5.60 9.60 21.20 2.04 6.13 8.32 20 mm 3.61 10.12 12.10 6.25 12.13 19.00 2.50 6.90 15.75 30 mm 4.60 11.90 12.90 7.07 12.06 17.6 2.67 8.51 15.80
Straw size T,oC t, h R,oC/h I, % ET,oC.h CS,MPa 20~40 mesh 30.00 73.2 0.13 374.30 503.34 0.54 10mm 30.00 40 0.16 175.0 589.85 0.72 20mm 27.50 16.5 0.16 43.3 607.35 0.42
Unt
reat
ed
30mm 30.40 14.5 0.28 28.09 663.40 0.33 20~40 mesh 31.80 47.5 0.26 202.15 519.27 0.79 10mm 31.16 16 0.42 34.78 654.80 6.72 20mm 32.22 14.5 0.52 25.74 669.45 5.31 W
ater
30mm 35.60 13.5 0.78 17.49 710.47 4.63 20~40 mesh 31.20 52.2 0.21 236.64 515.50 1.24 10mm 31.80 18 0.41 44.09 630.30 6.63 20mm 32.20 18 0.47 42.36 680.43 5.49 N
aOH
30mm 33.30 16 0.56 29.92 693.69 5.56

144
Table (11.10): Least square means ± SEM (error mean square) of rice straw cementitious composites properties Item N Density
(1) Porosity
(1) Compressive
(1) Flexural
(1) WA
(1) TS
(1)
Effect of Straw Content
0% 12 1.94a 30.00
f 51.00
a 3.62
bc 8.783
e 0.216
f
5% 12 1.68b 32.84
e 23.08
b 4.29
ab 14.75
d 0.582
e
7.5% 12 1.56c 36.91
d 15.99
c 4.82
a 20.42
c 0.914
d
10% 12 1.43d 41.18
c 9.89
d 4.33
ab 26.79
b 1.496
c
15% 12 1.20e 45.35
b 6.82
de 3.65
bc 29.79
a 2.250
b
20% 12 1.11f 49.97
a 4.88
e 2.98
c 32.10
a 2.422
a
SEM 0.021352 0.373741 1.637652 0.258041 0.86071 0.054755
Significant ** ** ** ** ** **
Effect of Straw Size
20-40 mesh 18 1.57 38.15 24.44 2.79c 18.94 1.135
10 mm 18 1.50 39.19 18.48 3.87b 20.45 1.248
20 mm 18 1.46 39.76 16.99 4.36ab
23.25 1.390
30 mm 18 1.42 40.40 14.51 4.76a 25.37 1.521
SEM 0.068643 1.695121 3.931797 0.180028 2.033937 0.199587
Significant ns ns ns ** ns ns
**= highly significant at α = 0.01
ns = not significant.
(1) = values with the same latter had no significant differences.

145
Table (11.10): cont.
Item N Density(1)
Porosity(1)
Compressive(1)
Flexural(1)
WA(1)
TS(1)
Effect of Straw Content & Straw Size
20-40 mesh 3 1.94a 30.00
n 51.00
a 3.62
ij 8.783
n 0.21
p
10 mm 3 1.94a 30.00
n 51.00
a 3.62
ij 8.783
n 0.21
p
20 mm 3 1.94a 30.00
n 51.00
a 3.62
ij 8.783
n 0.21
p
0 %
30 mm 3 1.94a 30.00
n 51.00
a 3.62
ij 8.783
n 0.21
p
20-40 mesh 3 1.84b 31.76
m 41.77
b 3.70
ij 11.19
m 0.47
o
10 mm 3 1.71c 32.46
ml 19.49
d 3.83
ih 13.76
l 0.546
no
20 mm 3 1.60d 33.20
kl 18.33
de 4.60
f 15.71
k 0.61
mn
5 %
30 mm 3 1.57de
33.94k 12.70
gh 5.02
d 18.34
j 0.70
m
20-40 mesh 3 1.68c 35.66
j 23.29
c 3.55
j 16.26
k 0.83
l
10 mm 3 1.57de
36.33ij 16.42
fe 4.46
f 18.16
j 0.90
kl
20 mm 3 1.54e 37.26
hi 14.80
gf 5.45
b 21.90
i 1.006
k
7.5%
30 mm 3 1.45f 38.40
gh 9.45
ji 5.82
a 25.36
h 1.15
j
20-40 mesh 3 1.54e 39.10
fg 15.56
gfe 3.01
l 22.43
i 1.28
i
10 mm 3 1.46f 39.80
f 10.47
hi 4.22
g 24.43
h 1.39
i
20 mm 3 1.40g 41.83
e 7.85
kjli 4.84
de 27.36
ef 1.59
h
10%
30 mm 3 1.32h 44.01
d 5.67
klm 5.26
c 30.51
c 1.71
g
20-40 mesh 3 1.27i 43.53
d 8.60
kji 1.90
m 26.69
fg 1.88
f
10 mm 3 1.20j 45.40
c 8.36
kji 3.90
h 28.19
de 2.13
e
20 mm 3 1.18jk 46.40
c 5.54
klm 4.02
h 30.74
c 2.40
cd
15%
30 mm 3 1.16jkl
46.06c 4.69
lm 4.80
e 33.55
b 2.57
b
20-40 mesh 3 1.14klm
48.83b 6.40
kjlm 1.00
n 28.30
de 2.11
e
10 mm 3 1.12lmn
51.16a 5.16
lm 3.24
k 29.37
cd 2.30
d
20 mm 3 1.10mn
49.90b 4.43
m 3.66
ij 35.03
a 2.50
bc
20%
30 mm 3 1.09n 50.01
b 3.52
m 4.03
gh 35.70
a 2.77
a
SEM 0.016195 0.399825 0.997043 0.066826 0.48559 0.040893
Significant ** ** ** ** ** **
**= highly significant at α = 0.01, ns = not significant., (1) = values with the same latter had no significant differences.
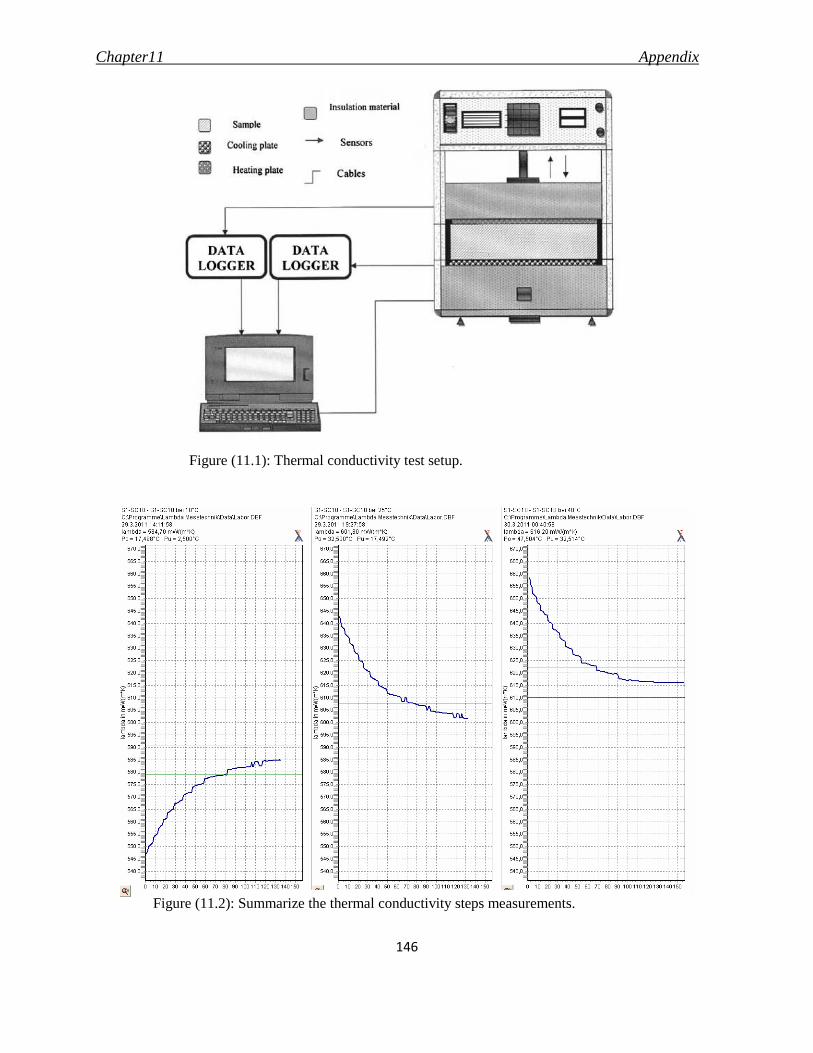
Chapter11 Appendix
146
Figure (11.2): Summarize the thermal conductivity steps measurements.
Figure (11.1): Thermal conductivity test setup.

Chapter11 Appendix
147
Figure (11.3): XRD pattern of fly ash.
Figure (11.4): XRD pattern of gypsum.

Chapter11 Appendix
148
Figure (11.5): XRD pattern of calcium hydroxide.
Figure (11.6): XRD pattern of Portland cement.
C3A
C3S
C3S
0
2000
4000
6000
8000
10000
0 20 40 60
2-Thetea [degrees]
Inte
nsity
C3S
C2 S
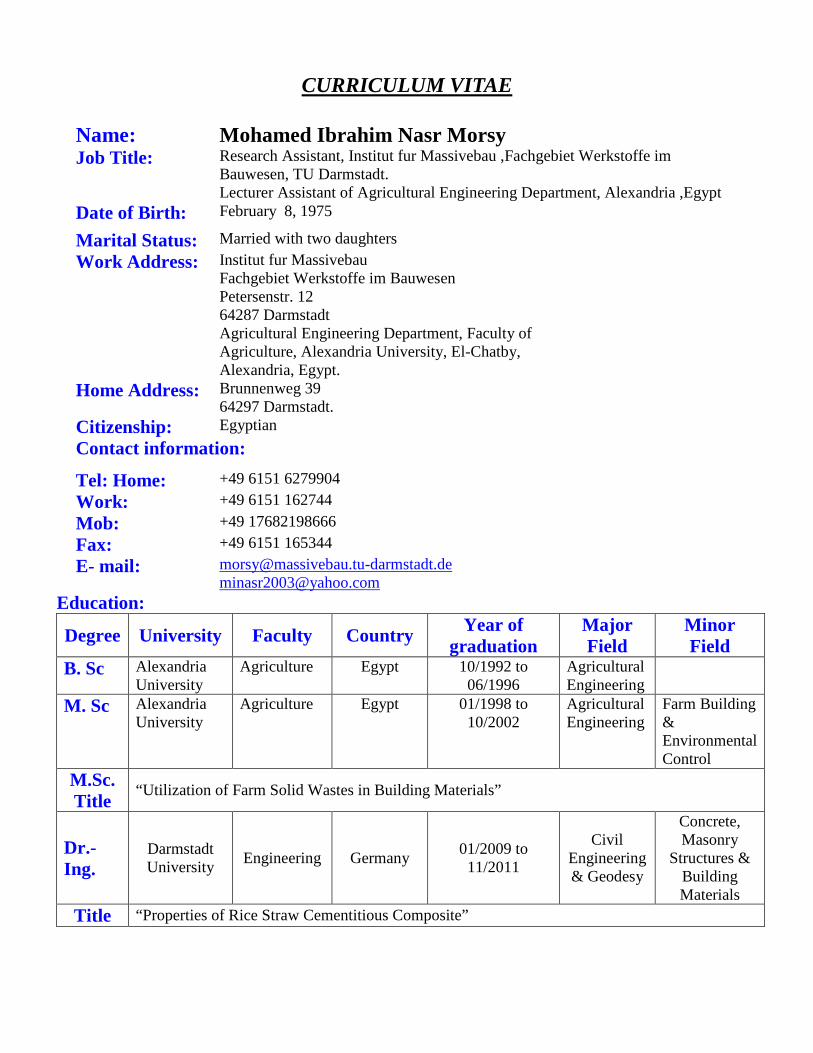
CURRICULUM VITAE
Name: Mohamed Ibrahim Nasr Morsy Job Title: Research Assistant, Institut fur Massivebau ,Fachgebiet Werkstoffe im
Bauwesen, TU Darmstadt. Lecturer Assistant of Agricultural Engineering Department, Alexandria ,Egypt
Date of Birth: February 8, 1975
Marital Status: Married with two daughters
Work Address: Institut fur Massivebau Fachgebiet Werkstoffe im Bauwesen Petersenstr. 12 64287 Darmstadt Agricultural Engineering Department, Faculty of Agriculture, Alexandria University, El-Chatby, Alexandria, Egypt.
Home Address: Brunnenweg 39 64297 Darmstadt.
Citizenship: Egyptian
Contact information:
Tel: Home: +49 6151 6279904
Work: +49 6151 162744
Mob: +49 17682198666
Fax: +49 6151 165344
E- mail: [email protected] [email protected]
Education:
Degree University Faculty Country Year of graduation
Major Field
Minor Field
B. Sc Alexandria University
Agriculture Egypt 10/1992 to 06/1996
Agricultural Engineering
M. Sc Alexandria University
Agriculture Egypt 01/1998 to 10/2002
Agricultural Engineering
Farm Building & Environmental Control
M.Sc. Title
“Utilization of Farm Solid Wastes in Building Materials”
Dr.-Ing.
Darmstadt University
Engineering Germany 01/2009 to 11/2011
Civil Engineering & Geodesy
Concrete, Masonry
Structures & Building Materials
Title “Properties of Rice Straw Cementitious Composite”

Professional Experience and Employment:
Association Field Years Form: to:
Institute fur Massibau Fachgebiet Werkstoffe im Bauwesen
Research Assistant
1/2009 to now
Agricultural Engineering Department, Faculty of Agriculture, Alexandria University, Alexandria, Egypt
Lecture assistant for undergraduate course
11/2002 to now
Agricultural Engineering Department, Faculty of Agriculture, Alexandria University, Alexandria, Egypt
Research & Demonstrator
12/1997 to 10/2002
Languages:
� Arabic: mother tongue.
� English: fluent (both written & spoken).
� Germany: Good written & spoken (finished 400 hours from Goethe Institute,
Alexandria/Egypt).
Work Experience:
� Ten years in the Department of Agriculture Engineering.
� Concerning teaching and research.
Lecture assistant for undergraduate course:
1- Engineering drawing. 2- Surveying. 3- Static and Dynamic (Mechanics). 4- Machine design. 5- Farm Machinery. 6- Internal Combustion Engines. 7- Civil Constructions. 8- Farm Building. 9- Heat Transfer. 10- Thermodynamics. 11- Food Engineering.
Computer Skills:
� ICDL (International Computer Driving License).
Presentation Skills:
Using M. Media tools and presentation software and Hardware.

Prizes Awarded a Japanese kesheda prize for best research of Agric. Engineering.
Interests:
Reading, travelling, having good friends, scientific research, sports. and internet
navigation.