Behavior of Open and Closed-Ended Piles Driven Into Sands
11
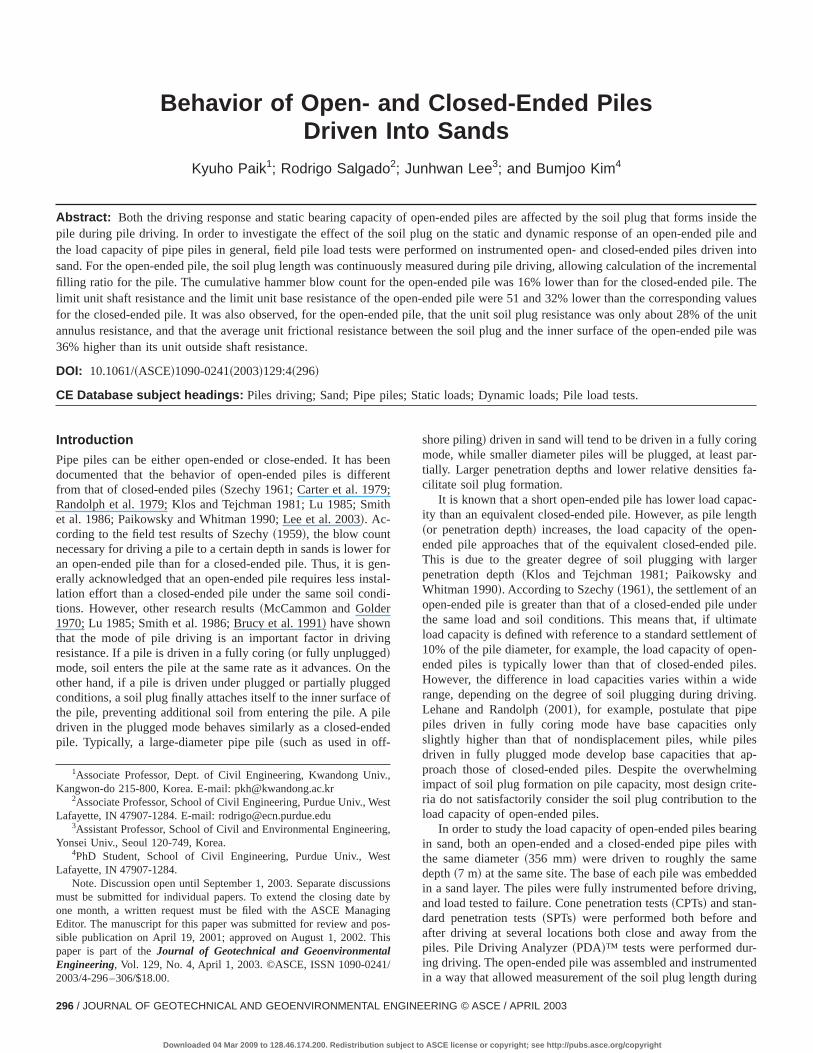
Behavior of Open- and Closed-Ended Piles Driven Into Sands Kyuho Paik 1 ; Rodrigo Salgado 2 ; Junhwan Lee 3 ; and Bumjoo Kim 4 Abstract: Both the driving response and static bearing capacity of open-ended piles are affected by the soil plug that forms inside the pile during pile driving. In order to investigate the effect of the soil plug on the static and dynamic response of an open-ended pile and the load capacity of pipe piles in general, field pile load tests were performed on instrumented open- and closed-ended piles driven into sand. For the open-ended pile, the soil plug length was continuously measured during pile driving, allowing calculation of the incremental filling ratio for the pile. The cumulative hammer blow count for the open-ended pile was 16% lower than for the closed-ended pile. The limit unit shaft resistance and the limit unit base resistance of the open-ended pile were 51 and 32% lower than the corresponding values for the closed-ended pile. It was also observed, for the open-ended pile, that the unit soil plug resistance was only about 28% of the unit annulus resistance, and that the average unit frictional resistance between the soil plug and the inner surface of the open-ended pile was 36% higher than its unit outside shaft resistance. DOI: 10.1061/~ASCE!1090-0241~2003!129:4~296! CE Database subject headings: Piles driving; Sand; Pipe piles; Static loads; Dynamic loads; Pile load tests. Introduction Pipe piles can be either open-ended or close-ended. It has been documented that the behavior of open-ended piles is different from that of closed-ended piles ~Szechy 1961; Carter et al. 1979; Randolph et al. 1979; Klos and Tejchman 1981; Lu 1985; Smith et al. 1986; Paikowsky and Whitman 1990; Lee et al. 2003!. Ac- cording to the field test results of Szechy ~1959!, the blow count necessary for driving a pile to a certain depth in sands is lower for an open-ended pile than for a closed-ended pile. Thus, it is gen- erally acknowledged that an open-ended pile requires less instal- lation effort than a closed-ended pile under the same soil condi- tions. However, other research results ~McCammon and Golder 1970; Lu 1985; Smith et al. 1986; Brucy et al. 1991! have shown that the mode of pile driving is an important factor in driving resistance. If a pile is driven in a fully coring ~or fully unplugged! mode, soil enters the pile at the same rate as it advances. On the other hand, if a pile is driven under plugged or partially plugged conditions, a soil plug finally attaches itself to the inner surface of the pile, preventing additional soil from entering the pile. A pile driven in the plugged mode behaves similarly as a closed-ended pile. Typically, a large-diameter pipe pile ~such as used in off- shore piling! driven in sand will tend to be driven in a fully coring mode, while smaller diameter piles will be plugged, at least par- tially. Larger penetration depths and lower relative densities fa- cilitate soil plug formation. It is known that a short open-ended pile has lower load capac- ity than an equivalent closed-ended pile. However, as pile length ~or penetration depth! increases, the load capacity of the open- ended pile approaches that of the equivalent closed-ended pile. This is due to the greater degree of soil plugging with larger penetration depth ~Klos and Tejchman 1981; Paikowsky and Whitman 1990!. According to Szechy ~1961!, the settlement of an open-ended pile is greater than that of a closed-ended pile under the same load and soil conditions. This means that, if ultimate load capacity is defined with reference to a standard settlement of 10% of the pile diameter, for example, the load capacity of open- ended piles is typically lower than that of closed-ended piles. However, the difference in load capacities varies within a wide range, depending on the degree of soil plugging during driving. Lehane and Randolph ~2001!, for example, postulate that pipe piles driven in fully coring mode have base capacities only slightly higher than that of nondisplacement piles, while piles driven in fully plugged mode develop base capacities that ap- proach those of closed-ended piles. Despite the overwhelming impact of soil plug formation on pile capacity, most design crite- ria do not satisfactorily consider the soil plug contribution to the load capacity of open-ended piles. In order to study the load capacity of open-ended piles bearing in sand, both an open-ended and a closed-ended pipe piles with the same diameter ~356 mm! were driven to roughly the same depth ~7m! at the same site. The base of each pile was embedded in a sand layer. The piles were fully instrumented before driving, and load tested to failure. Cone penetration tests ~CPTs! and stan- dard penetration tests ~SPTs! were performed both before and after driving at several locations both close and away from the piles. Pile Driving Analyzer ~PDA!™ tests were performed dur- ing driving. The open-ended pile was assembled and instrumented in a way that allowed measurement of the soil plug length during 1 Associate Professor, Dept. of Civil Engineering, Kwandong Univ., Kangwon-do 215-800, Korea. E-mail: [email protected] 2 Associate Professor, School of Civil Engineering, Purdue Univ., West Lafayette, IN 47907-1284. E-mail: [email protected] 3 Assistant Professor, School of Civil and Environmental Engineering, Yonsei Univ., Seoul 120-749, Korea. 4 PhD Student, School of Civil Engineering, Purdue Univ., West Lafayette, IN 47907-1284. Note. Discussion open until September 1, 2003. Separate discussions must be submitted for individual papers. To extend the closing date by one month, a written request must be filed with the ASCE Managing Editor. The manuscript for this paper was submitted for review and pos- sible publication on April 19, 2001; approved on August 1, 2002. This paper is part of the Journal of Geotechnical and Geoenvironmental Engineering, Vol. 129, No. 4, April 1, 2003. ©ASCE, ISSN 1090-0241/ 2003/4-296 –306/$18.00. 296 / JOURNAL OF GEOTECHNICAL AND GEOENVIRONMENTAL ENGINEERING © ASCE / APRIL 2003 Downloaded 04 Mar 2009 to 128.46.174.200. Redistribution subject to ASCE license or copyright; see http://pubs.asce.org/copyright
-
Upload
independent -
Category
Documents
-
view
0 -
download
0
Transcript of Behavior of Open and Closed-Ended Piles Driven Into Sands
side thepile andriven intorementalile. Theing valuesf the unit
ed pile was
Behavior of Open- and Closed-Ended PilesDriven Into Sands
Kyuho Paik1; Rodrigo Salgado2; Junhwan Lee3; and Bumjoo Kim4
Abstract: Both the driving response and static bearing capacity of open-ended piles are affected by the soil plug that forms inpile during pile driving. In order to investigate the effect of the soil plug on the static and dynamic response of an open-endedthe load capacity of pipe piles in general, field pile load tests were performed on instrumented open- and closed-ended piles dsand. For the open-ended pile, the soil plug length was continuously measured during pile driving, allowing calculation of the incfilling ratio for the pile. The cumulative hammer blow count for the open-ended pile was 16% lower than for the closed-ended plimit unit shaft resistance and the limit unit base resistance of the open-ended pile were 51 and 32% lower than the correspondfor the closed-ended pile. It was also observed, for the open-ended pile, that the unit soil plug resistance was only about 28% oannulus resistance, and that the average unit frictional resistance between the soil plug and the inner surface of the open-end36% higher than its unit outside shaft resistance.
DOI: 10.1061/~ASCE!1090-0241~2003!129:4~296!
CE Database subject headings: Piles driving; Sand; Pipe piles; Static loads; Dynamic loads; Pile load tests.
n
h
ona
td
e
ar-fa-
ac-gthn-pile.erd
nderatet of
en-es.deng.ely
esap-inge-he
ringwith
dedg,
dthe-nteding
,
s
t
o
gss
IntroductionPipe piles can be either open-ended or close-ended. It has bedocumented that the behavior of open-ended piles is differefrom that of closed-ended piles~Szechy 1961; Carter et al. 1979;Randolph et al. 1979; Klos and Tejchman 1981; Lu 1985; Smitet al. 1986; Paikowsky and Whitman 1990; Lee et al. 2003!. Ac-cording to the field test results of Szechy~1959!, the blow countnecessary for driving a pile to a certain depth in sands is lower fan open-ended pile than for a closed-ended pile. Thus, it is geerally acknowledged that an open-ended pile requires less instlation effort than a closed-ended pile under the same soil condtions. However, other research results~McCammon and Golder1970; Lu 1985; Smith et al. 1986; Brucy et al. 1991! have shownthat the mode of pile driving is an important factor in drivingresistance. If a pile is driven in a fully coring~or fully unplugged!mode, soil enters the pile at the same rate as it advances. Onother hand, if a pile is driven under plugged or partially pluggeconditions, a soil plug finally attaches itself to the inner surface othe pile, preventing additional soil from entering the pile. A piledriven in the plugged mode behaves similarly as a closed-endpile. Typically, a large-diameter pipe pile~such as used in off-
1Associate Professor, Dept. of Civil Engineering, Kwandong Univ.Kangwon-do 215-800, Korea. E-mail: [email protected]
2Associate Professor, School of Civil Engineering, Purdue Univ., WeLafayette, IN 47907-1284. E-mail: [email protected]
3Assistant Professor, School of Civil and Environmental EngineeringYonsei Univ., Seoul 120-749, Korea.
4PhD Student, School of Civil Engineering, Purdue Univ., WesLafayette, IN 47907-1284.
Note. Discussion open until September 1, 2003. Separate discussimust be submitted for individual papers. To extend the closing date bone month, a written request must be filed with the ASCE ManaginEditor. The manuscript for this paper was submitted for review and posible publication on April 19, 2001; approved on August 1, 2002. Thipaper is part of theJournal of Geotechnical and GeoenvironmentalEngineering, Vol. 129, No. 4, April 1, 2003. ©ASCE, ISSN 1090-0241/2003/4-296–306/$18.00.
296 / JOURNAL OF GEOTECHNICAL AND GEOENVIRONMENTAL ENGIN
Downloaded 04 Mar 2009 to 128.46.174.200. Redistribution subject to
ent
r-l-
i-
he
f
d
shore piling! driven in sand will tend to be driven in a fully coringmode, while smaller diameter piles will be plugged, at least ptially. Larger penetration depths and lower relative densitiescilitate soil plug formation.
It is known that a short open-ended pile has lower load capity than an equivalent closed-ended pile. However, as pile len~or penetration depth! increases, the load capacity of the opeended pile approaches that of the equivalent closed-endedThis is due to the greater degree of soil plugging with largpenetration depth~Klos and Tejchman 1981; Paikowsky anWhitman 1990!. According to Szechy~1961!, the settlement of anopen-ended pile is greater than that of a closed-ended pile uthe same load and soil conditions. This means that, if ultimload capacity is defined with reference to a standard settlemen10% of the pile diameter, for example, the load capacity of opended piles is typically lower than that of closed-ended pilHowever, the difference in load capacities varies within a wirange, depending on the degree of soil plugging during driviLehane and Randolph~2001!, for example, postulate that pippiles driven in fully coring mode have base capacities onslightly higher than that of nondisplacement piles, while pildriven in fully plugged mode develop base capacities thatproach those of closed-ended piles. Despite the overwhelmimpact of soil plug formation on pile capacity, most design critria do not satisfactorily consider the soil plug contribution to tload capacity of open-ended piles.
In order to study the load capacity of open-ended piles beain sand, both an open-ended and a closed-ended pipe pilesthe same diameter~356 mm! were driven to roughly the samedepth~7 m! at the same site. The base of each pile was embedin a sand layer. The piles were fully instrumented before drivinand load tested to failure. Cone penetration tests~CPTs! and stan-dard penetration tests~SPTs! were performed both before anafter driving at several locations both close and away frompiles. Pile Driving Analyzer~PDA!™ tests were performed during driving. The open-ended pile was assembled and instrumein a way that allowed measurement of the soil plug length dur
t
,
nsy
-
EERING © ASCE / APRIL 2003
ASCE license or copyright; see http://pubs.asce.org/copyright
gu
asdes
ionnte
lyret
llytif
e-
m-velly
are
thense
po-, basences
havetotal
e inandmpo-pilendetion
tru-e dif--haft
e2.7erepileerto be
twothe
pile driving, measurement of the friction between the soil pluand the inner surface of the pile, and separation of the contribtions of annulus resistance and soil plug resistance to total bresistance. These data, which offer a unique opportunity to avance the understanding of the load response behavior of thpiles, are described and analyzed in this paper.
Site Description
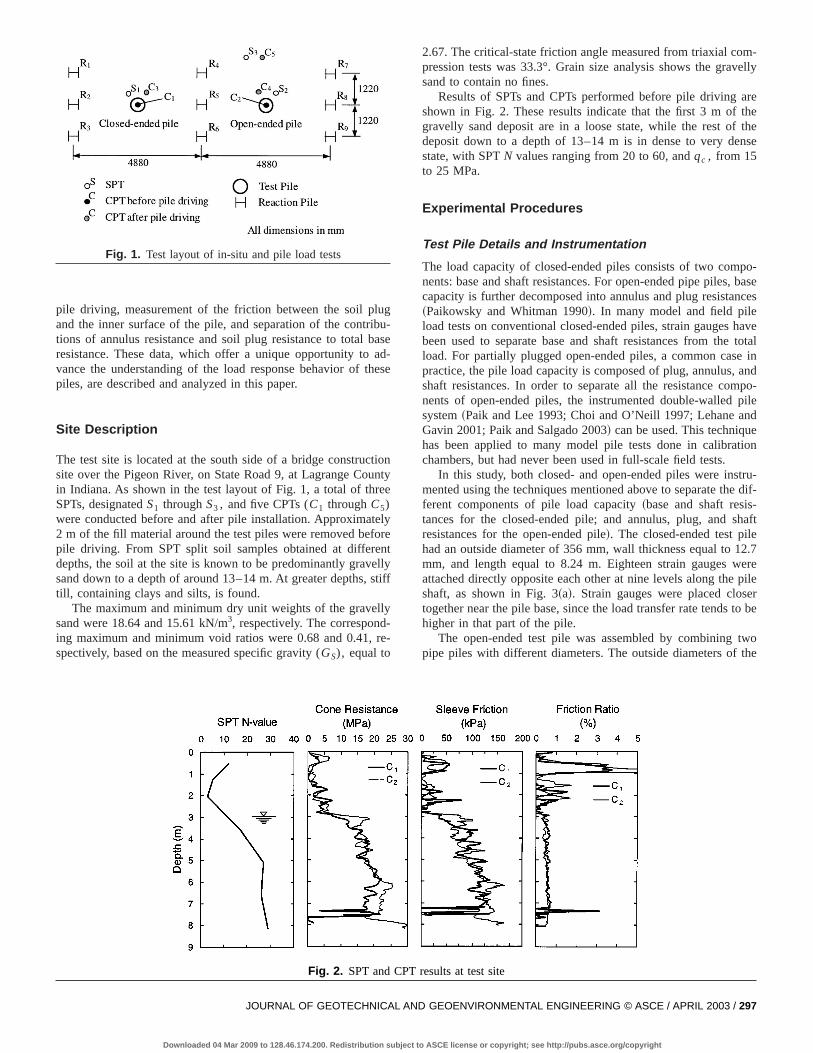
The test site is located at the south side of a bridge constructsite over the Pigeon River, on State Road 9, at Lagrange Couin Indiana. As shown in the test layout of Fig. 1, a total of threSPTs, designatedS1 throughS3 , and five CPTs (C1 throughC5)were conducted before and after pile installation. Approximate2 m of the fill material around the test piles were removed befopile driving. From SPT split soil samples obtained at differendepths, the soil at the site is known to be predominantly gravesand down to a depth of around 13–14 m. At greater depths, still, containing clays and silts, is found.
The maximum and minimum dry unit weights of the gravellysand were 18.64 and 15.61 kN/m3, respectively. The correspond-ing maximum and minimum void ratios were 0.68 and 0.41, rspectively, based on the measured specific gravity (GS), equal to
Fig. 1. Test layout of in-situ and pile load tests
JOURNAL OF GEOTECHNICAL AN
Downloaded 04 Mar 2009 to 128.46.174.200. Redistribution subject to A
-e-e
y
f
2.67. The critical-state friction angle measured from triaxial copression tests was 33.3°. Grain size analysis shows the grasand to contain no fines.
Results of SPTs and CPTs performed before pile drivingshown in Fig. 2. These results indicate that the first 3 m of thegravelly sand deposit are in a loose state, while the rest ofdeposit down to a depth of 13–14 m is in dense to very destate, with SPTN values ranging from 20 to 60, andqc , from 15to 25 MPa.
Experimental Procedures
Test Pile Details and Instrumentation
The load capacity of closed-ended piles consists of two comnents: base and shaft resistances. For open-ended pipe pilescapacity is further decomposed into annulus and plug resista~Paikowsky and Whitman 1990!. In many model and field pileload tests on conventional closed-ended piles, strain gaugesbeen used to separate base and shaft resistances from theload. For partially plugged open-ended piles, a common caspractice, the pile load capacity is composed of plug, annulus,shaft resistances. In order to separate all the resistance conents of open-ended piles, the instrumented double-walledsystem~Paik and Lee 1993; Choi and O’Neill 1997; Lehane aGavin 2001; Paik and Salgado 2003! can be used. This techniquhas been applied to many model pile tests done in calibrachambers, but had never been used in full-scale field tests.
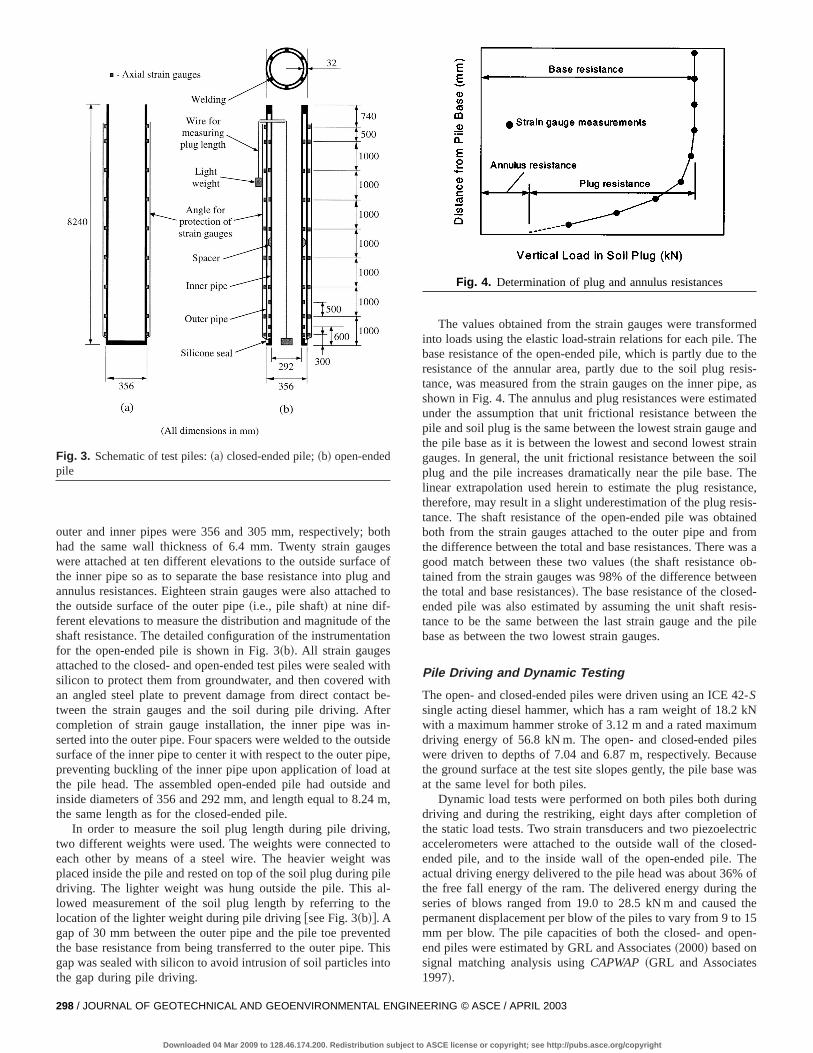
In this study, both closed- and open-ended piles were insmented using the techniques mentioned above to separate thferent components of pile load capacity~base and shaft resistances for the closed-ended pile; and annulus, plug, and sresistances for the open-ended pile!. The closed-ended test pilhad an outside diameter of 356 mm, wall thickness equal to 1mm, and length equal to 8.24 m. Eighteen strain gauges wattached directly opposite each other at nine levels along theshaft, as shown in Fig. 3~a!. Strain gauges were placed clostogether near the pile base, since the load transfer rate tendshigher in that part of the pile.
The open-ended test pile was assembled by combiningpipe piles with different diameters. The outside diameters of
Fig. 2. SPT and CPT results at test site
D GEOENVIRONMENTAL ENGINEERING © ASCE / APRIL 2003 / 297
SCE license or copyright; see http://pubs.asce.org/copyright
edhethe
sis-e, asatedtheandtrainsoilThe
Fig. 3. Schematic of test piles:~a! closed-ended pile;~b! open-endedpile
oge
ge
f tti
witb
teintsipaa
gdwpialth
ntTt
ce,is-inedomas a
eend-sis-pile
2-kNumlesusewas
ngoftriced-heof
hethe15en-
outer and inner pipes were 356 and 305 mm, respectively; bhad the same wall thickness of 6.4 mm. Twenty strain gauwere attached at ten different elevations to the outside surfacthe inner pipe so as to separate the base resistance into pluannulus resistances. Eighteen strain gauges were also attachthe outside surface of the outer pipe~i.e., pile shaft! at nine dif-ferent elevations to measure the distribution and magnitude oshaft resistance. The detailed configuration of the instrumentafor the open-ended pile is shown in Fig. 3~b!. All strain gaugesattached to the closed- and open-ended test piles were sealedsilicon to protect them from groundwater, and then covered wan angled steel plate to prevent damage from direct contacttween the strain gauges and the soil during pile driving. Afcompletion of strain gauge installation, the inner pipe wasserted into the outer pipe. Four spacers were welded to the ousurface of the inner pipe to center it with respect to the outer ppreventing buckling of the inner pipe upon application of loadthe pile head. The assembled open-ended pile had outsideinside diameters of 356 and 292 mm, and length equal to 8.24the same length as for the closed-ended pile.
In order to measure the soil plug length during pile drivintwo different weights were used. The weights were connecteeach other by means of a steel wire. The heavier weightplaced inside the pile and rested on top of the soil plug duringdriving. The lighter weight was hung outside the pile. Thislowed measurement of the soil plug length by referring tolocation of the lighter weight during pile driving@see Fig. 3~b!#. Agap of 30 mm between the outer pipe and the pile toe prevethe base resistance from being transferred to the outer pipe.gap was sealed with silicon to avoid intrusion of soil particles inthe gap during pile driving.
298 / JOURNAL OF GEOTECHNICAL AND GEOENVIRONMENTAL ENGI
Downloaded 04 Mar 2009 to 128.46.174.200. Redistribution subject to
thesof
andd to
heon
ithhe-r-idee,tnd
m,
,toasle-e
edhiso
The values obtained from the strain gauges were transforminto loads using the elastic load-strain relations for each pile. Tbase resistance of the open-ended pile, which is partly due toresistance of the annular area, partly due to the soil plug retance, was measured from the strain gauges on the inner pipshown in Fig. 4. The annulus and plug resistances were estimunder the assumption that unit frictional resistance betweenpile and soil plug is the same between the lowest strain gaugethe pile base as it is between the lowest and second lowest sgauges. In general, the unit frictional resistance between theplug and the pile increases dramatically near the pile base.linear extrapolation used herein to estimate the plug resistantherefore, may result in a slight underestimation of the plug restance. The shaft resistance of the open-ended pile was obtaboth from the strain gauges attached to the outer pipe and frthe difference between the total and base resistances. There wgood match between these two values~the shaft resistance ob-tained from the strain gauges was 98% of the difference betwthe total and base resistances!. The base resistance of the closeended pile was also estimated by assuming the unit shaft retance to be the same between the last strain gauge and thebase as between the two lowest strain gauges.
Pile Driving and Dynamic Testing
The open- and closed-ended piles were driven using an ICE 4Ssingle acting diesel hammer, which has a ram weight of 18.2with a maximum hammer stroke of 3.12 m and a rated maximdriving energy of 56.8 kN m. The open- and closed-ended piwere driven to depths of 7.04 and 6.87 m, respectively. Becathe ground surface at the test site slopes gently, the pile baseat the same level for both piles.
Dynamic load tests were performed on both piles both duridriving and during the restriking, eight days after completionthe static load tests. Two strain transducers and two piezoelecaccelerometers were attached to the outside wall of the closended pile, and to the inside wall of the open-ended pile. Tactual driving energy delivered to the pile head was about 36%the free fall energy of the ram. The delivered energy during tseries of blows ranged from 19.0 to 28.5 kN m and causedpermanent displacement per blow of the piles to vary from 9 tomm per blow. The pile capacities of both the closed- and opend piles were estimated by GRL and Associates~2000! based onsignal matching analysis usingCAPWAP~GRL and Associates1997!.
Fig. 4. Determination of plug and annulus resistances
NEERING © ASCE / APRIL 2003
ASCE license or copyright; see http://pubs.asce.org/copyright

othsible
N;test.d att thein.
theaugee of
ayn aaticbout
entad.
Fig. 5. Measurement of soil plug length during pile driving
forofenth
twoth
heonthet
liedbyheenThezs inpi
ile
ehe
-
aluestillaci-hoseasityad
ola-
ac-
esperbeeed-nallowded
be-ini-sed.
During pile driving, the hammer blow count necessarydriving the test piles was recorded to investigate the drivabilitysimilar closed- and open-ended piles under the same drivingergy and soil conditions. As shown in Fig. 5, the soil plug lengduring pile driving was also measured continuously using theweights described earlier. The heavier weight rested on top ofsoil plug during pile driving, and the lighter weight hanged by twire joining the two weights outside the pile. A scale, markedthe outside of the pile, allowed measurement of the length ofsoil plug inside the pile. This, in turn, allows calculation of thincremental filling ratio~IFR!, which is defined as the incremenin soil plug length per unit increase of penetration depth.
Static Load Tests
The load test setup is illustrated in Fig. 6. The total load appto the pile head during each static load test was measuredload cell with a capacity of 2.0 MN. The vertical settlement of tpile head was measured by two dial gauges attached to referbeams with supports placed at least 6.8 pile diameters away.values of all strain gauges attached to both test piles were rroed both before pile driving and at the start of the load testorder to independently measure both the residual loads afterdriving and the loads induced along the length of the test p
Fig. 6. Schematic view of static load test
JOURNAL OF GEOTECHNICAL AN
Downloaded 04 Mar 2009 to 128.46.174.200. Redistribution subject to
-
e
e
a
cee
e-
les
during the load tests. The soil plug length was measured bbefore and after the static load tests in order to detect any poschange of IFR.
The load was applied to the test pile in increments of 147 kthis increment was reduced to 49–98 kN near the end of theEach load was maintained until the settlement rate stabilizeless than 0.5 mm/h. During each load step, the settlements apile head were recorded at 5, 15, 35, 55, 75, 95, and 120 mWhen settlement stabilization required longer than two hours,settlement was measured after stabilization ensued. Strain gmeasurements were taken for every loading step at the timsettlement stabilization.
Determination of Limit Load Capacity
The limit load capacity of a pile may be defined in a general was the load at which the increase of pile settlement for evesmall load increment becomes very high. In this study, the stload tests were continued until the pile settlement reached a146–152 mm~about 42% of the outside pile diameter! for boththe open- and closed-ended piles.
There are different ways to extrapolate the load-settlemcurves beyond 42% of the pile diameter to estimate the limit loIn this study, the method of Chin~1970! was used to estimate thlimit load capacity of both piles. This method is based on tassumption that the load-settlement relation is hyperbolic:
s
Q5C1•s1C2 (1)
in which Q5 load applied to the pile;s5settlement corresponding to the loadQ; and C1 and C25slope and intercept of theload-settlement curve ins/Q versuss space. The limit load ca-pacity is equal to 1/C1 .
Test results show that the shaft resistance reached a limit vwell before the final load step, while the base resistance wasincreasing at the final load step. Thus, the limit shaft load capties of the closed- and open-ended piles were determined as tmobilized at the final load step. The limit total load capacity wobtained for each pile by adding the limit base load capacestimated by the method of Chin to the measured limit shaft locapacity. In the case of the open-ended pile, the Chin extraption was done for the base load (Qb), which is a summation ofthe plug load (Qplug) and the annulus load (Qann). The resultinglimit base capacity was then separated into a limit annulus capity and a limit plug capacity in the same proportion asQann/Qplug
for the last loading step of the pile load test.
Experimental Results
Driving Resistance
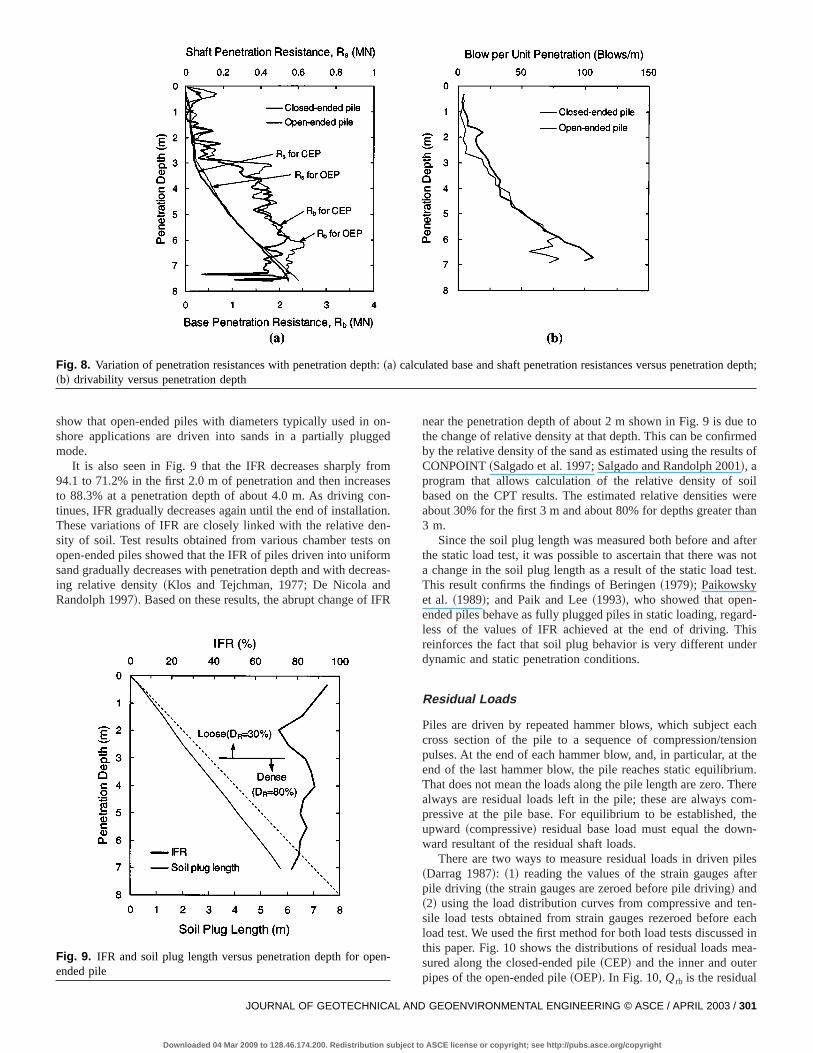
The hammer blow count required for driving the two test pildown to the final penetration depth and penetration depthblow are plotted versus pile penetration depth in Fig. 7. It canseen in Fig. 7~a! that the cumulative hammer blow count for thopen-ended pile was consistently lower than that for the closended pile. For a penetration depth of 6.87 m, which is the fipenetration depth for the closed-ended pile, the cumulative bcounts were 250 and 211 blows for the closed- and open-enpiles, respectively. The difference in hammer blow countstween the open- and closed-ended piles was quite significanttially, but decreased gradually as the penetration depth increa
D GEOENVIRONMENTAL ENGINEERING © ASCE / APRIL 2003 / 299
ASCE license or copyright; see http://pubs.asce.org/copyright
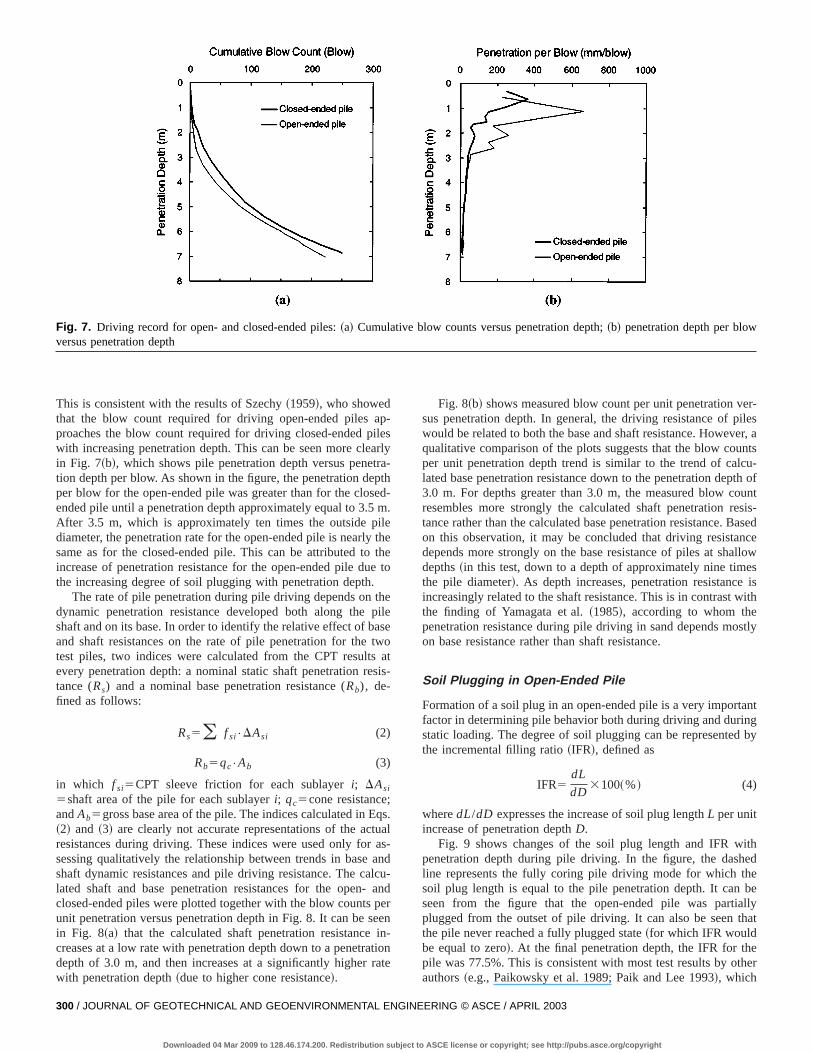
Fig. 7. Driving record for open- and closed-ended piles:~a! Cumulative blow counts versus penetration depth;~b! penetration depth per blowversus penetration depth
eratd
methth
eis
ai
a
ncaee
nio
r-ileser, antsu-th ofuntsis-asedcellowsisith
stly
ntgby
thedebellyat
er
This is consistent with the results of Szechy~1959!, who showedthat the blow count required for driving open-ended piles approaches the blow count required for driving closed-ended pilwith increasing penetration depth. This can be seen more cleain Fig. 7~b!, which shows pile penetration depth versus penetrtion depth per blow. As shown in the figure, the penetration depper blow for the open-ended pile was greater than for the closeended pile until a penetration depth approximately equal to 3.5After 3.5 m, which is approximately ten times the outside pildiameter, the penetration rate for the open-ended pile is nearlysame as for the closed-ended pile. This can be attributed toincrease of penetration resistance for the open-ended pile duethe increasing degree of soil plugging with penetration depth.
The rate of pile penetration during pile driving depends on thdynamic penetration resistance developed both along the pshaft and on its base. In order to identify the relative effect of baand shaft resistances on the rate of pile penetration for the twtest piles, two indices were calculated from the CPT resultsevery penetration depth: a nominal static shaft penetration restance (Rs) and a nominal base penetration resistance (Rb), de-fined as follows:
Rs5( f si•DAsi (2)
Rb5qc•Ab (3)
in which f si5CPT sleeve friction for each sublayeri; DAsi
5shaft area of the pile for each sublayeri; qc5cone resistance;andAb5gross base area of the pile. The indices calculated in Eq~2! and ~3! are clearly not accurate representations of the acturesistances during driving. These indices were used only for asessing qualitatively the relationship between trends in base ashaft dynamic resistances and pile driving resistance. The callated shaft and base penetration resistances for the open-closed-ended piles were plotted together with the blow counts punit penetration versus penetration depth in Fig. 8. It can be sein Fig. 8~a! that the calculated shaft penetration resistance icreases at a low rate with penetration depth down to a penetratdepth of 3.0 m, and then increases at a significantly higher rawith penetration depth~due to higher cone resistance!.
300 / JOURNAL OF GEOTECHNICAL AND GEOENVIRONMENTAL ENGIN
Downloaded 04 Mar 2009 to 128.46.174.200. Redistribution subject to
-sly-h-.
eeto
leeots-
s.l
s-d
u-ndrn
-n
te
Fig. 8~b! shows measured blow count per unit penetration vesus penetration depth. In general, the driving resistance of pwould be related to both the base and shaft resistance. Howevqualitative comparison of the plots suggests that the blow couper unit penetration depth trend is similar to the trend of calclated base penetration resistance down to the penetration dep3.0 m. For depths greater than 3.0 m, the measured blow coresembles more strongly the calculated shaft penetration retance rather than the calculated base penetration resistance. Bon this observation, it may be concluded that driving resistandepends more strongly on the base resistance of piles at shadepths~in this test, down to a depth of approximately nine timethe pile diameter!. As depth increases, penetration resistanceincreasingly related to the shaft resistance. This is in contrast wthe finding of Yamagata et al.~1985!, according to whom thepenetration resistance during pile driving in sand depends moon base resistance rather than shaft resistance.
Soil Plugging in Open-Ended Pile
Formation of a soil plug in an open-ended pile is a very importafactor in determining pile behavior both during driving and durinstatic loading. The degree of soil plugging can be representedthe incremental filling ratio~IFR!, defined as
IFR5dL
dD3100~%! (4)
wheredL/dD expresses the increase of soil plug lengthL per unitincrease of penetration depthD.
Fig. 9 shows changes of the soil plug length and IFR wipenetration depth during pile driving. In the figure, the dashline represents the fully coring pile driving mode for which thsoil plug length is equal to the pile penetration depth. It canseen from the figure that the open-ended pile was partiaplugged from the outset of pile driving. It can also be seen ththe pile never reached a fully plugged state~for which IFR wouldbe equal to zero!. At the final penetration depth, the IFR for thepile was 77.5%. This is consistent with most test results by othauthors~e.g., Paikowsky et al. 1989; Paik and Lee 1993!, which
EERING © ASCE / APRIL 2003
ASCE license or copyright; see http://pubs.asce.org/copyright
depth;
Fig. 8. Variation of penetration resistances with penetration depth:~a! calculated base and shaft penetration resistances versus penetration~b! drivability versus penetration depthonge
omse
onionnormreadIFR
eds of
ileren
fternotst.
rd-iser
chionhem.erem-the-
lesr
n-achd ina-
en
show that open-ended piles with diameters typically used inshore applications are driven into sands in a partially plugmode.
It is also seen in Fig. 9 that the IFR decreases sharply fr94.1 to 71.2% in the first 2.0 m of penetration and then increato 88.3% at a penetration depth of about 4.0 m. As driving ctinues, IFR gradually decreases again until the end of installatThese variations of IFR are closely linked with the relative desity of soil. Test results obtained from various chamber testsopen-ended piles showed that the IFR of piles driven into unifosand gradually decreases with penetration depth and with decing relative density~Klos and Tejchman, 1977; De Nicola anRandolph 1997!. Based on these results, the abrupt change of
Fig. 9. IFR and soil plug length versus penetration depth for opended pile
JOURNAL OF GEOTECHNICAL AN
Downloaded 04 Mar 2009 to 128.46.174.200. Redistribution subject to
-d
s-.
-n
s-
near the penetration depth of about 2 m shown in Fig. 9 is due tothe change of relative density at that depth. This can be confirmby the relative density of the sand as estimated using the resultCONPOINT~Salgado et al. 1997; Salgado and Randolph 2001!, aprogram that allows calculation of the relative density of sobased on the CPT results. The estimated relative densities wabout 30% for the first 3 m and about 80% for depths greater tha3 m.
Since the soil plug length was measured both before and athe static load test, it was possible to ascertain that there wasa change in the soil plug length as a result of the static load teThis result confirms the findings of Beringen~1979!; Paikowskyet al. ~1989!; and Paik and Lee~1993!, who showed that open-ended piles behave as fully plugged piles in static loading, regaless of the values of IFR achieved at the end of driving. Threinforces the fact that soil plug behavior is very different unddynamic and static penetration conditions.
Residual Loads
Piles are driven by repeated hammer blows, which subject eacross section of the pile to a sequence of compression/tenspulses. At the end of each hammer blow, and, in particular, at tend of the last hammer blow, the pile reaches static equilibriuThat does not mean the loads along the pile length are zero. Thalways are residual loads left in the pile; these are always copressive at the pile base. For equilibrium to be established,upward ~compressive! residual base load must equal the downward resultant of the residual shaft loads.
There are two ways to measure residual loads in driven pi~Darrag 1987!: ~1! reading the values of the strain gauges aftepile driving ~the strain gauges are zeroed before pile driving! and~2! using the load distribution curves from compressive and tesile load tests obtained from strain gauges rezeroed before eload test. We used the first method for both load tests discussethis paper. Fig. 10 shows the distributions of residual loads mesured along the closed-ended pile~CEP! and the inner and outerpipes of the open-ended pile~OEP!. In Fig. 10,Qrb is the residual
-
D GEOENVIRONMENTAL ENGINEERING © ASCE / APRIL 2003 / 301
ASCE license or copyright; see http://pubs.asce.org/copyright
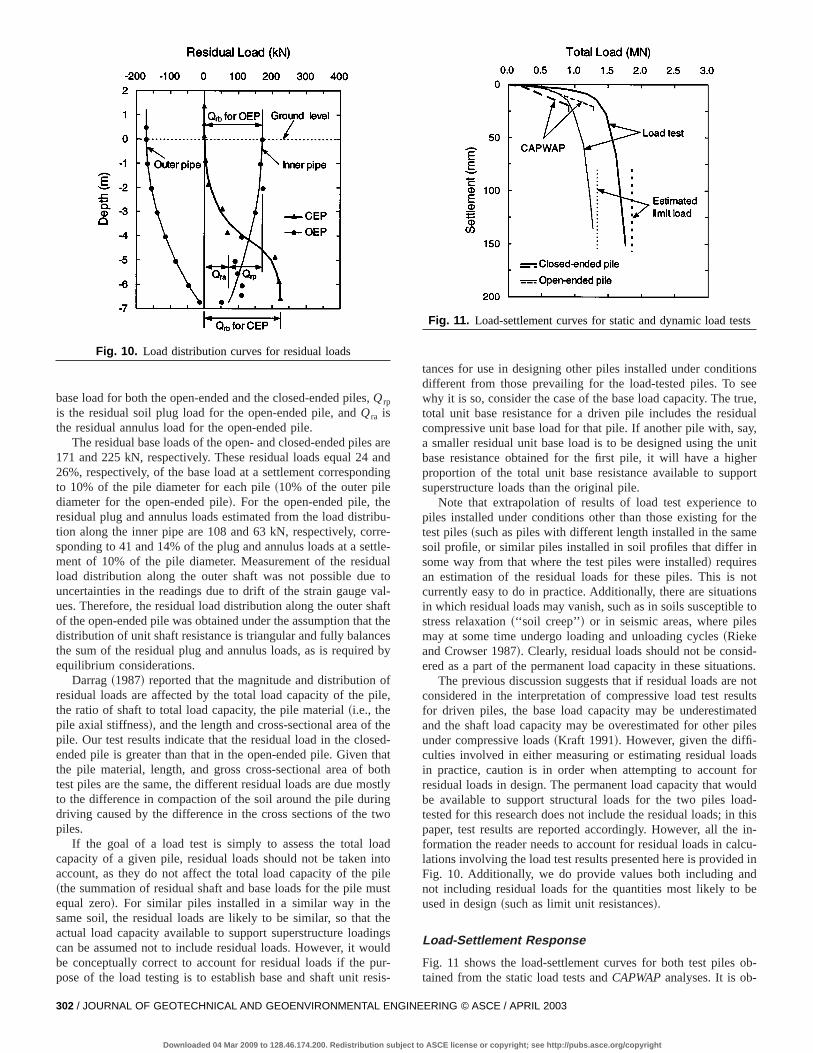
Fig. 10. Load distribution curves for residual loads
,
s aandin
iburrettleuatoal
hat thesb
ofile
theedthaot
ostngtwo
adntoileus
theinguldur-si
nse
ue,aly,nit
errt
toe
e
otsto
-ns.notltsedles
srld-
hisin-u-in
e
b-
302 / JOURNAL OF GEOTECHNICAL AND GEOENVIRONMENTAL ENGIN
Downloaded 04 Mar 2009 to 128.46.174.200. Redistribution subject to A
redg
---
l
-fte
y
,
-thly
t
s
s-
tances for use in designing other piles installed under conditiodifferent from those prevailing for the load-tested piles. To sewhy it is so, consider the case of the base load capacity. The trtotal unit base resistance for a driven pile includes the residucompressive unit base load for that pile. If another pile with, saa smaller residual unit base load is to be designed using the ubase resistance obtained for the first pile, it will have a highproportion of the total unit base resistance available to supposuperstructure loads than the original pile.
Note that extrapolation of results of load test experiencepiles installed under conditions other than those existing for thtest piles~such as piles with different length installed in the samsoil profile, or similar piles installed in soil profiles that differ insome way from that where the test piles were installed! requiresan estimation of the residual loads for these piles. This is ncurrently easy to do in practice. Additionally, there are situationin which residual loads may vanish, such as in soils susceptiblestress relaxation~‘‘soil creep’’! or in seismic areas, where pilesmay at some time undergo loading and unloading cycles~Riekeand Crowser 1987!. Clearly, residual loads should not be considered as a part of the permanent load capacity in these situatio
The previous discussion suggests that if residual loads areconsidered in the interpretation of compressive load test resufor driven piles, the base load capacity may be underestimatand the shaft load capacity may be overestimated for other piunder compressive loads~Kraft 1991!. However, given the diffi-culties involved in either measuring or estimating residual loadin practice, caution is in order when attempting to account foresidual loads in design. The permanent load capacity that woube available to support structural loads for the two piles loadtested for this research does not include the residual loads; in tpaper, test results are reported accordingly. However, all theformation the reader needs to account for residual loads in calclations involving the load test results presented here is providedFig. 10. Additionally, we do provide values both including andnot including residual loads for the quantities most likely to bused in design~such as limit unit resistances!.
Load-Settlement Response
Fig. 11 shows the load-settlement curves for both test piles otained from the static load tests andCAPWAPanalyses. It is ob-
Fig. 11. Load-settlement curves for static and dynamic load tests
base load for both the open-ended and the closed-ended pilesQrp
is the residual soil plug load for the open-ended pile, andQra isthe residual annulus load for the open-ended pile.
The residual base loads of the open- and closed-ended pile171 and 225 kN, respectively. These residual loads equal 2426%, respectively, of the base load at a settlement corresponto 10% of the pile diameter for each pile~10% of the outer pilediameter for the open-ended pile!. For the open-ended pile, theresidual plug and annulus loads estimated from the load distrtion along the inner pipe are 108 and 63 kN, respectively, cosponding to 41 and 14% of the plug and annulus loads at a sement of 10% of the pile diameter. Measurement of the residload distribution along the outer shaft was not possible dueuncertainties in the readings due to drift of the strain gauge vues. Therefore, the residual load distribution along the outer sof the open-ended pile was obtained under the assumption thadistribution of unit shaft resistance is triangular and fully balancthe sum of the residual plug and annulus loads, as is requiredequilibrium considerations.
Darrag~1987! reported that the magnitude and distributionresidual loads are affected by the total load capacity of the pthe ratio of shaft to total load capacity, the pile material~i.e., thepile axial stiffness!, and the length and cross-sectional area ofpile. Our test results indicate that the residual load in the closended pile is greater than that in the open-ended pile. Giventhe pile material, length, and gross cross-sectional area of btest piles are the same, the different residual loads are due mto the difference in compaction of the soil around the pile duridriving caused by the difference in the cross sections of thepiles.
If the goal of a load test is simply to assess the total locapacity of a given pile, residual loads should not be taken iaccount, as they do not affect the total load capacity of the p~the summation of residual shaft and base loads for the pile mequal zero!. For similar piles installed in a similar way in thesame soil, the residual loads are likely to be similar, so thatactual load capacity available to support superstructure loadcan be assumed not to include residual loads. However, it wobe conceptually correct to account for residual loads if the ppose of the load testing is to establish base and shaft unit re
EERING © ASCE / APRIL 2003
SCE license or copyright; see http://pubs.asce.org/copyright

ateisilear-ethitb
ts
eds.
ileaded
ble
sthe
ap-59,oadchingthebydu-thele.ternerade,e.erence
dis-the.29,n inulartheof
ob-lugside
total,the
cifi-f thebothl to
served that the settlement of the open-ended pile is always grethan that of the closed-ended pile for any given load. Thisexpected, as the closed-ended pile is a full-displacement pwhile the open-ended pile was installed under conditions of ptial plugging and is not therefore a full-displacement pile. Thmaximum loads applied to the open- and closed-ended piles instatic load tests were 1.28 and 1.77 MN, respectively. The limload capacities of the open- and closed-ended piles estimatedChin’s method were 1.33 and 1.86 MN, respectively.
The load-settlement curves byCAPWAPanalysis were some-what in contrast with what was observed in the static load tesThe pile capacity predicted by theCAPWAPanalysis was 1.28MN for the open-ended pile and 0.90 MN for the closed-endpile. TheseCAPWAPpredictions are based on the restrike testThe load-settlement curve estimated usingCAPWAPfor the open-ended pile is stiffer than that estimated for the closed-ended pThis is not consistent with either the observations from the lotests or with the expected load response of open- versus closended piles. It is likely that theCAPWAPpile capacity estimatedfor the open-ended pile is not reliable because the pile is dou
Fig. 12. Load distribution curves for closed-ended pile
JOURNAL OF GEOTECHNICAL AN
Downloaded 04 Mar 2009 to 128.46.174.200. Redistribution subject to A
r
,
e
y
.
.
-
walled. TheCAPWAPpile capacity for the closed-ended pile waalso off, corresponding to only 51% of the load at the end ofstatic load test, an estimate that is clearly conservative.
Base and Shaft Load Capacity
In the static load test on the closed-ended pile, the load wasplied in eleven increments taking the load to 0.29, 0.44, 0.0.74, 0.88, 1.03, 1.18, 1.32, 1.47, 1.62, and 1.77 MN. The ldistribution along the test pile length is shown in Fig. 12 for eaload step. For the final load step, the load distribution includresidual loads is also plotted as a dotted line. It is seen fromfigure that the load applied to the pile is mainly supportedshaft resistance for initial loading stages. The load is then graally transferred to the pile base. It is also found that most ofshaft resistance is developed along the lower 3.0 m of the pi
Fig. 13 shows the load distributions for the inner and oupipes of the open-ended pile. The load distribution in the inpipe, shown in Fig. 13~a!, represents changes of transferred loalong the soil plug, while the load distribution in the outer pipshown in Fig. 13~b!, shows the distribution of the shaft resistancSome of the strain gauges at the lower part of the outer pipe wdamaged during pile driving, and the interrupted shaft resistadistributions for some of the load steps reflect this. The loadtributions in the inner and outer pipes were measured forloading steps corresponding to applied loads equal to 0.15, 00.44, 0.59, 0.74, 0.88, 0.98, 1.13, 1.23, and 1.28 MN. As showFig. 13~a!, the total base load was solely supported by the annarea, with nearly zero soil plug resistance mobilized, up to0.59 MN loading step. For loads greater than 0.74 MN, somethe applied load was transferred to the soil plug. It is alsoserved that, for the final load increments, most of the soil presistance was mobilized within a distance of 6.8 times the inpile diameter measured from the pile base.
Table 1 shows both measured and estimated values of thebase, and shaft load capacities of both test piles. It also hassoil plug and annulus capacities of the open-ended pile. Specally, the table contains, for each test, the loads at the end otest, the loads extrapolated using Chin’s method, the loadsincluding and not including residual loads at a settlement equa10% of the pile diameter, and theCAPWAPpredictions based on
Fig. 13. Load distribution curves:~a! for base resistance of open-ended pile;~b! for shaft resistance of open-ended pile
D GEOENVIRONMENTAL ENGINEERING © ASCE / APRIL 2003 / 303
SCE license or copyright; see http://pubs.asce.org/copyright
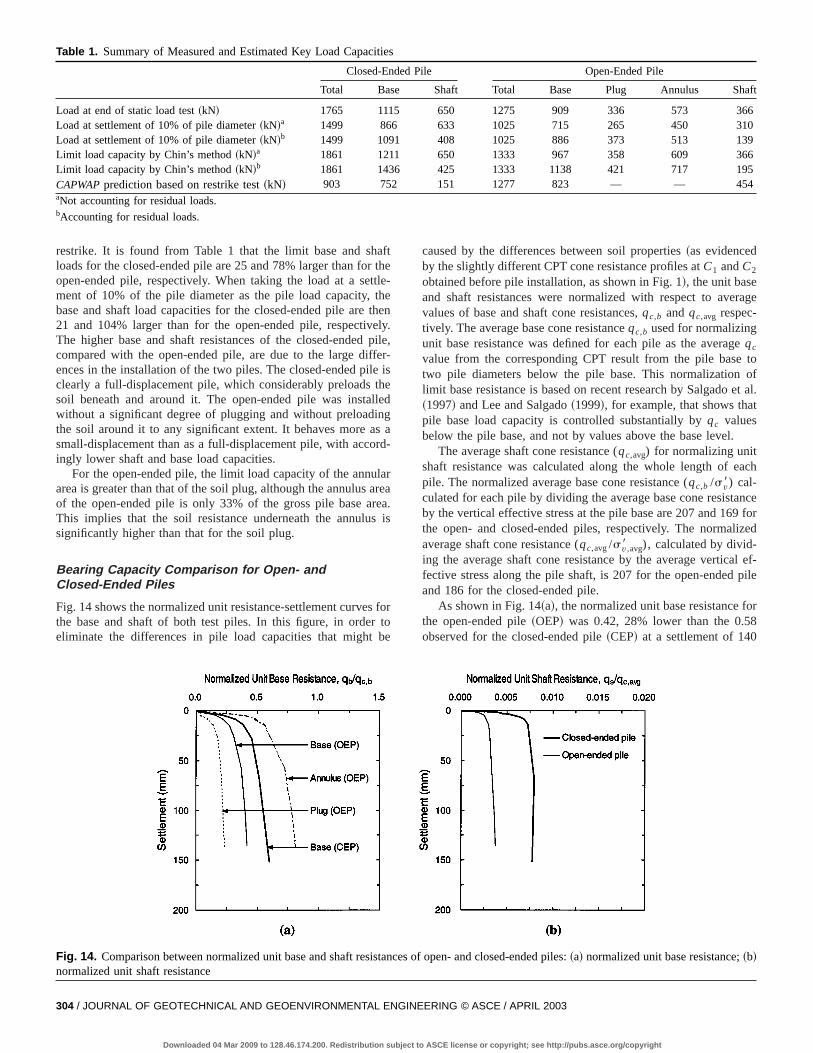
Table 1. Summary of Measured and Estimated Key Load Capacities
Closed-Ended Pile Open-Ended Pile
Total Base Shaft Total Base Plug Annulus Shaft
Load at end of static load test~kN! 1765 1115 650 1275 909 336 573 366Load at settlement of 10% of pile diameter~kN!a 1499 866 633 1025 715 265 450 310Load at settlement of 10% of pile diameter~kN!b 1499 1091 408 1025 886 373 513 139Limit load capacity by Chin’s method~kN!a 1861 1211 650 1333 967 358 609 366Limit load capacity by Chin’s method~kN!b 1861 1436 425 1333 1138 421 717 195CAPWAPprediction based on restrike test~kN! 903 752 151 1277 823 — — 454aNot accounting for residual loads.bAccounting for residual loads.
fhle
hl
eeg
d
ar
fte
e
al.
h
erd
f-e
304 / JOURNAL OF GEOTECHNICAL AND GEOENVIRONMENTAL ENGIN
Downloaded 04 Mar 2009 to 128.46.174.200. Redistribution subject to
te-
eeny.ile,r-is
d
a-
reaa.is
oro
caused by the differences between soil properties~as evidencedby the slightly different CPT cone resistance profiles atC1 andC2
obtained before pile installation, as shown in Fig. 1!, the unit baseand shaft resistances were normalized with respect to averagvalues of base and shaft cone resistances,qc,b andqc,avg respec-tively. The average base cone resistanceqc,b used for normalizingunit base resistance was defined for each pile as the averageqc
value from the corresponding CPT result from the pile base totwo pile diameters below the pile base. This normalization oflimit base resistance is based on recent research by Salgado et~1997! and Lee and Salgado~1999!, for example, that shows thatpile base load capacity is controlled substantially byqc valuesbelow the pile base, and not by values above the base level.
The average shaft cone resistance (qc,avg) for normalizing unitshaft resistance was calculated along the whole length of eacpile. The normalized average base cone resistance (qc,b /sv8) cal-culated for each pile by dividing the average base cone resistancby the vertical effective stress at the pile base are 207 and 169 fothe open- and closed-ended piles, respectively. The normalizeaverage shaft cone resistance (qc,avg/sv,avg8 ), calculated by divid-ing the average shaft cone resistance by the average vertical efective stress along the pile shaft, is 207 for the open-ended piland 186 for the closed-ended pile.
As shown in Fig. 14~a!, the normalized unit base resistance forthe open-ended pile~OEP! was 0.42, 28% lower than the 0.58observed for the closed-ended pile~CEP! at a settlement of 140
Fig. 14. Comparison between normalized unit base and shaft resistances of open- and closed-ended piles:~a! normalized unit base resistance;~b!normalized unit shaft resistance
restrike. It is found from Table 1 that the limit base and shaloads for the closed-ended pile are 25 and 78% larger than for topen-ended pile, respectively. When taking the load at a settment of 10% of the pile diameter as the pile load capacity, thbase and shaft load capacities for the closed-ended pile are t21 and 104% larger than for the open-ended pile, respectiveThe higher base and shaft resistances of the closed-ended pcompared with the open-ended pile, are due to the large diffeences in the installation of the two piles. The closed-ended pileclearly a full-displacement pile, which considerably preloads thsoil beneath and around it. The open-ended pile was installwithout a significant degree of plugging and without preloadinthe soil around it to any significant extent. It behaves more assmall-displacement than as a full-displacement pile, with accoringly lower shaft and base load capacities.
For the open-ended pile, the limit load capacity of the annularea is greater than that of the soil plug, although the annulus aof the open-ended pile is only 33% of the gross pile base areThis implies that the soil resistance underneath the annulussignificantly higher than that for the soil plug.
Bearing Capacity Comparison for Open- andClosed-Ended Piles
Fig. 14 shows the normalized unit resistance-settlement curvesthe base and shaft of both test piles. In this figure, in ordereliminate the differences in pile load capacities that might b
EERING © ASCE / APRIL 2003
ASCE license or copyright; see http://pubs.asce.org/copyright
032038
038014020020
Table 2. Summary of Normalized Unit Resistances
Unit resistance normalized with respect toqc Residual loads
Closed-Ended Pile Open-Ended Pile
Base Shaft Base Plug Annulus Shaft
Based on load at settlement of 10% of pile diameter 0.47 0.0076 0.33 0.18 0.64 0.0Based on load at end of static load test Not included 0.58 0.0078 0.42 0.23 0.81 0.0Based on load estimated by Chin’s method 0.65 0.0078 0.44 0.24 0.86 0.0Based on load at settlement of 10% of pile diameter 0.59 0.0049 0.41 0.23 0.67 0.0Based on load at end of static load test Included 0.70 0.0051 0.50 0.28 0.84 0.0Based on load estimated by Chin’s method 0.77 0.0051 0.52 0.29 0.89 0.0
Note: Base, plug, and annulus resistances normalized with respect toqc,b ; shaft resistance normalized with respect toqc,avg.
teaot
f
a
n
i
c
ah
dt
n
no
u
au
ne
bythewasg
e-ishesiththevededthe
the
sons toin alp-a-edsis-iedthe
de
mm ~corresponding to a settlement equal to around 40% ofpile diameter!. However, the annular area in the open-ended tpile was approximately 33% of the gross cross-sectional arethe pile. This is significantly greater than the typical 11% fconventional open-ended pipe piles. Accordingly, in practice,difference between the base loads of geometrically similar opand closed-ended piles installed in the same soil to the same dwould be more pronounced.
It is also seen in Fig. 14~a! that the unit annulus resistance othe open-ended pile is higher than the unit base resistance oclosed-ended pile. The unit annulus resistance of the open-enpile and the unit base resistance of the closed-ended pilesettlement of 140 mm are about 81 and 58% of the average cresistance (qc,b) values obtained fromC1 andC2 . The unit soilplug resistance is about one third of the unit annulus resistaThese results justify the assumption made by some authors~e.g.,Lehane and Randolph 2002! that the unit annulus resistanceapproximately the same as the cone resistance at the same d
Fig. 14~b! shows that the normalized unit limit shaft resistanis, as discussed earlier, much greater for the closed-endedthan for the open-ended pile, even though they have the sdiameter and were installed to the same penetration depth. Twere 0.0078 for the closed-ended pile and 0.0038 for the opended pile. This large difference is due to the different amountsradial displacements experienced by the soil around the pilesing pile driving, as discussed earlier, and is consistent withfindings of Randolph et al.~1979! and Nauroy and Le Tirant~1983!. The normalized unit base and shaft resistances for btest piles are summarized in Table 2.
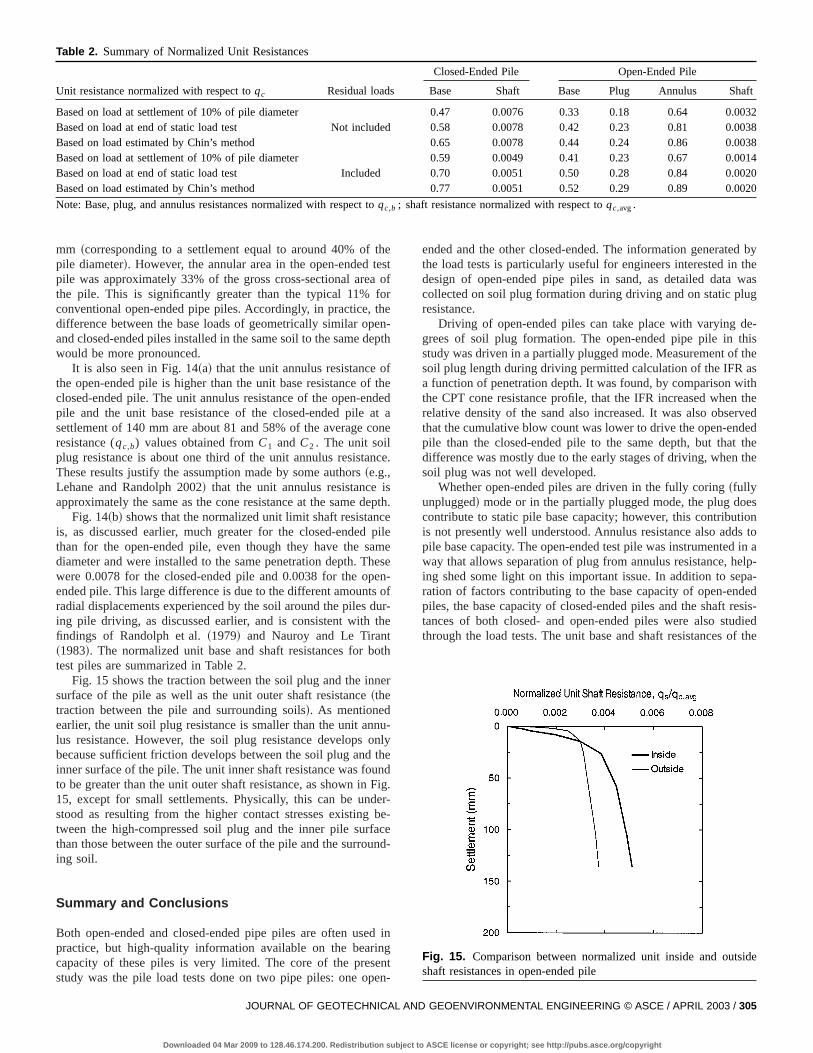
Fig. 15 shows the traction between the soil plug and the insurface of the pile as well as the unit outer shaft resistance~thetraction between the pile and surrounding soils!. As mentionedearlier, the unit soil plug resistance is smaller than the unit anlus resistance. However, the soil plug resistance developsbecause sufficient friction develops between the soil plug andinner surface of the pile. The unit inner shaft resistance was foto be greater than the unit outer shaft resistance, as shown in15, except for small settlements. Physically, this can be undstood as resulting from the higher contact stresses existingtween the high-compressed soil plug and the inner pile surfthan those between the outer surface of the pile and the surroing soil.
Summary and Conclusions
Both open-ended and closed-ended pipe piles are often usepractice, but high-quality information available on the bearicapacity of these piles is very limited. The core of the presstudy was the pile load tests done on two pipe piles: one op
JOURNAL OF GEOTECHNICAL
Downloaded 04 Mar 2009 to 128.46.174.200. Redistribution subject
hestofrheen-epth
fthededt a
one
ce.
septh.epilemeese
en-ofur-he
oth
er
u-nlythendFig.er-be-cend-
d ingnt
en-
ended and the other closed-ended. The information generatedthe load tests is particularly useful for engineers interested indesign of open-ended pipe piles in sand, as detailed datacollected on soil plug formation during driving and on static pluresistance.
Driving of open-ended piles can take place with varying dgrees of soil plug formation. The open-ended pipe pile in thstudy was driven in a partially plugged mode. Measurement of tsoil plug length during driving permitted calculation of the IFR aa function of penetration depth. It was found, by comparison wthe CPT cone resistance profile, that the IFR increased whenrelative density of the sand also increased. It was also obserthat the cumulative blow count was lower to drive the open-endpile than the closed-ended pile to the same depth, but thatdifference was mostly due to the early stages of driving, whensoil plug was not well developed.
Whether open-ended piles are driven in the fully coring~fullyunplugged! mode or in the partially plugged mode, the plug doecontribute to static pile base capacity; however, this contributiis not presently well understood. Annulus resistance also addpile base capacity. The open-ended test pile was instrumentedway that allows separation of plug from annulus resistance, heing shed some light on this important issue. In addition to sepration of factors contributing to the base capacity of open-endpiles, the base capacity of closed-ended piles and the shaft retances of both closed- and open-ended piles were also studthrough the load tests. The unit base and shaft resistances of
Fig. 15. Comparison between normalized unit inside and outsishaft resistances in open-ended pile
AND GEOENVIRONMENTAL ENGINEERING © ASCE / APRIL 2003 / 305
to ASCE license or copyright; see http://pubs.asce.org/copyright
zedthapennite s
unit
thetha
nd
.’’iles
o
,
lsg,
is
n
n-
.’’
e
’’g
,
,
.
-
open-ended pile at settlement of 10% of pile diameter, normaliby average cone resistances, resulted in 30 and 58% lowerthe corresponding values for the closed-ended pile. For the oended pile, the unit plug resistance was only 28% of the uannulus resistance, and the average shear stress between thplug and inner surface of the pile was 36% higher than theoutside shaft resistance.
Acknowledgments
This research was supported by INDOT and FHWA throughJoint Transportation Research Program. The assistance of AKhan, Nayyar Zia, and Mir Zaheer of INDOT was invaluable ais greatly appreciated.
References
Beringen, F. L.~1979!. ‘‘Results of loading tests on driven piles in sandProc., Recent developments in the design and construction of p,London, 213–225.
Brucy, F., Meunier, J., and Nauroy, J. F.~1991!. ‘‘Behavior of pile plug insandy soils during and after driving.’’Proc., 23rd Annual OffshoreTechnology Conf., Houston, 1, 145–154.
Carter, J. P., Randolph, M. F., and Wroth, C. P.~1979!. ‘‘Some aspects ofthe performance of open- and closed-ended piles.’’Numerical methodin offshore piling, London, 165–170.
Chin, F. V.~1970!. ‘‘Estimation of the ultimate load of piles not carried tfailure.’’ Proc., 2nd Southeast Asian Conf. on Soil Engineering, Sin-gapore, 81–90.
Choi, Y., and O’Neill, M. W. ~1997!. ‘‘Soil plugging and relaxation inpipe pile during earthquake motion.’’J. Geotech. Geoenvir. Eng.123~10!, 975–982.
Darrag, A. A. ~1987!. ‘‘Capacity of driven piles in cohesionless soiincluding residual stress.’’ PhD thesis, School of Civil EngineerinPurdue Univ., West Lafayette, Ind.
De Nicola, A., and Randolph, M. F.~1997!. ‘‘The plugging behavior ofdriven and jacked piles in sand.’’Geotechnique,47~4!, 841–856.
GRL and Associates, Inc.~1997!. GRL software: Case pile wave analysprogram ~CAPWAP!, Cleveland.
GRL and Associates, Inc.~2000!. ‘‘INDOT pile load tests-SR 9 inLaGrange, Indiana.’’GRL Job No. 007060, Cleveland, 7.
Klos, J., and Tejchman, A.~1977!. ‘‘Analysis of behavior of tubular pilesin subsoil.’’ Proc., 9th Int. Conf. on Soil Mechanics and FoundatioEngineering, Toyko, 1, 605–608.
Klos, J., and Tejchman, A.~1981!. ‘‘Bearing capacity calculation for pipepiles.’’ Proc., 10th Int. Conf. on Soil Mechanics and Foundation Egineering, Stockholm, Sweden, 2, 751–754.
Kraft, L. M. ~1991!. ‘‘Performance of axially loaded pipe piles in sandJ. Geotech. Eng.,117~2!, 272–296.
306 / JOURNAL OF GEOTECHNICAL AND GEOENVIRONMENTAL ENGINE
Downloaded 04 Mar 2009 to 128.46.174.200. Redistribution subject to A
n-
oil
r
Lee, J. H., and Salgado, R.~1999!. ‘‘Determination of pile base resistancin sands.’’J. Geotech. Geoenviron. Eng.,125~8!, 673–683.
Lee, J. H., Salgado, R., and Paik, K. H.~2003!. ‘‘Estimation of the loadcapacity of pipe piles in sand based on CPT results.’’J. Geotech.Geoenviron. Eng., in press.
Lehane, B. M., and Gavin, K. G.~2001!. ‘‘Base resistance of jacked pipepiles in sand.’’J. Geotech. Geoenviron. Eng.,127~6!, 473–480.
Lehane, B. M., and Randolph, M. F.~2002!. ‘‘Evaluation of a minimumbase resistance for driven pipe piles in siliceous sand.’’J. Geotech.Geoenviron. Eng.,128~3!, 198–205.
Lu, S. S.~1985!. ‘‘Pile driving practice in china.’’Proc., Int. Symposiumon Penetrability and drivability of piles, San Francisco, 1, 13–20.
MaCammon, N. R., and Golder, H. Q.~1970!. ‘‘Some loading tests onlong pipe piles.’’Geotechnique,20~2!, 171–184.
Nauroy, J. F., and Le Tirant, P.~1983!. ‘‘Model tests of calcareous sands.Proc., Conf. on Geotechnical Practice in Offshore Engineerin,ASCE, New York, 356–369.
Paik, K. H., and Lee, S. R.~1993!. ‘‘Behavior of soil plugs in open-endedmodel piles driven into sands.’’Marine Georesources Geotech.,11,353–373.
Paik, K. H., and Salgado, R.~2003!. ‘‘Determination of the bearing ca-pacity of open-ended piles in sand.’’J. Geotech. Geoenviron. Eng.129~1!, 46–57.
Paikowsky, S. G., and Whitman, R. V.~1990!. ‘‘The effect of plugging onpile performance and design.’’Can. Geotech. J.,27, 429–440.
Paikowsky, S. G., Whitman, R. V., and Baligh, M. M.~1989!. ‘‘A newlook at the phenomenon of offshore pile plugging.’’Marine Geore-sources Geotech.,8, 213–230.
Randolph, M. F., Steinfelt, J. S., and Wroth, C. P.~1979!. ‘‘The effect ofpile type on design parameters for driven piles.’’Proc., 7th EuropeanConf. on Soil Mechanics, British Geotechnical Society, London, 2107–114.
Rieke, R. D., and Crowser, J. C.~1987!. ‘‘Interpretation of pile load testconsidering residual stresses.’’J. Geotech. Geoenviron. Eng.,113~4!,320–334.
Salgado, R, Michell, J. K., and Jamiolkowski, M.~1997!. ‘‘Cavity expan-sion and penetration resistance in sand.’’J. Geotech. GeoenvironEng.,123~4!, 344–354.
Salgado, R., and Randolph, M. F.~2001!. ‘‘Analysis of cavity expansionin sands.’’Int. J. Geomech.,1~2!, 175–192.
Smith, I. M., To, P., and Wilson, S. M.~1986!. ‘‘Plugging of pipe piles.’’Proc., 3rd Int. Conf. on Numerical Method in Offshore Piling, Nantes,France, 53–73.
Szechy, C. H.~1959!. ‘‘Tests with tubular piles.’’Acta Technica,24,181–219.
Szechy, C. H.~1961!. ‘‘The effect of vibration and driving upon the voidsin granular soil surrounding a pile.’’Proc., 5th Int. Conf. on SoilMechanics and Foundation Engineering, Paris, 2, 161–164.
Yamagata, K., Fukuya, T., and Omote, S.~1985!. ‘‘Penetrability of open-ended steel pipe piles on land.’’Proc., Int. Symposium on Penetrability and Drivability of Piles, San Francisco, 1, 123–126.
ERING © ASCE / APRIL 2003
SCE license or copyright; see http://pubs.asce.org/copyright