Skill assessment of three earth system models with common marine biogeochemistry
ARTICLE IN PRESS
Journal of AridEnvironments
Journal of Arid Environments 71 (2007) 259–279
0140-1963/$ -
doi:10.1016/j
�CorrespoE-mail ad
www.elsevier.com/locate/jaridenv
Review
Biogeochemistry of Kalahari sands
L. Wanga,�, P. D’Odoricoa, S. Ringroseb, S. Coetzeec, S.A. Mackoa
aDepartment of Environmental Sciences, University of Virginia, 291 McCormick Road,
Charlottesville, VA 22904, USAbHarry Oppenheimer Okavango Research Centre, University of Botswana, Private Bag 285, Maun, Botswana
cSEM Unit, Department of Physics, University of Botswana, Private Bag 0022, Gaborone, Botswana
Received 3 November 2006; received in revised form 15 March 2007; accepted 19 March 2007
Available online 9 May 2007
Abstract
The Kalahari sand sheet, with a 2.5-million ha area, is probably the largest continuous surface of
sand in the world. The Kalahari Transect (KT) is one of a set of IGBP ‘‘megatransects’’ identified for
global change studies and provides an ideal setting to investigate changes in ecosystem dynamics,
vegetation composition and structure, and carbon or nutrient cycles along a spatial precipitation
gradient without confounding soil effects. Soil physical properties remain poorly characterized along
the KT. The present work provides a review of previous studies on the Kalahari soils combined with
new results from recent analyses of physical (mostly hydraulic) and biogeochemical properties of the
soil. In summary, the Kalahari soil is acidic, dominated by sand and nutrient poor. Nutrient
contents, soil textures and soil hydraulic properties differ under and between canopies. Roots are
concentrated in the top 80 cm of the soil, with grass roots more abundant and dominant close to the
surface. Moreover, the distribution of tree roots does not exhibit a clear dominance over grasses at
deeper soil layers. This review provides important baseline information for this system, as well as
insights as to how biochemical processes vary along a rainfall gradient.
r 2007 Elsevier Ltd. All rights reserved.
Keywords: Biogeochemistry; Hydraulic properties; Kalahari transect; Sand deposits; Stable isotopes
Contents
1. Introduction . . . . . . . . . . . . . . . . . . . . . . . . . . . . . . . . . . . . . . . . . . . . . . . . . . . . . . 260
2. Materials and methods. . . . . . . . . . . . . . . . . . . . . . . . . . . . . . . . . . . . . . . . . . . . . . . 262
see front matter r 2007 Elsevier Ltd. All rights reserved.
.jaridenv.2007.03.016
nding author. Tel.: +1434 924 6845; fax: +1 434 982 2137.
dress: [email protected] (L. Wang).

ARTICLE IN PRESSL. Wang et al. / Journal of Arid Environments 71 (2007) 259–279260
2.1. Field sampling . . . . . . . . . . . . . . . . . . . . . . . . . . . . . . . . . . . . . . . . . . . . . . . . 262
2.2. Measurement of physical/hydraulic properties . . . . . . . . . . . . . . . . . . . . . . . . . . 263
2.3. Geochemical analyses . . . . . . . . . . . . . . . . . . . . . . . . . . . . . . . . . . . . . . . . . . . 264
3. Physical properties of Kalahari sands . . . . . . . . . . . . . . . . . . . . . . . . . . . . . . . . . . . . 264
3.1. Soil texture. . . . . . . . . . . . . . . . . . . . . . . . . . . . . . . . . . . . . . . . . . . . . . . . . . . 264
3.2. Soil hydraulic properties . . . . . . . . . . . . . . . . . . . . . . . . . . . . . . . . . . . . . . . . . 268
4. Biogeochemical properties of Kalahari sands . . . . . . . . . . . . . . . . . . . . . . . . . . . . . . . 269
4.1. Vertical profiles of soil C, N and their isotopic composition . . . . . . . . . . . . . . . . 269
4.2. Soil surface C, N and their isotopic composition changes along the transect. . . . . 272
4.3. Soil respiration before and after wetting . . . . . . . . . . . . . . . . . . . . . . . . . . . . . . 273
5. Root distribution in the Kalahari . . . . . . . . . . . . . . . . . . . . . . . . . . . . . . . . . . . . . . . 273
6. Soil crusts in Kalahari sand formations . . . . . . . . . . . . . . . . . . . . . . . . . . . . . . . . . . . 275
7. Summary . . . . . . . . . . . . . . . . . . . . . . . . . . . . . . . . . . . . . . . . . . . . . . . . . . . . . . . . 276
Acknowledgments . . . . . . . . . . . . . . . . . . . . . . . . . . . . . . . . . . . . . . . . . . . . . . . . . . 276
References . . . . . . . . . . . . . . . . . . . . . . . . . . . . . . . . . . . . . . . . . . . . . . . . . . . . . . . 277
1. Introduction
The north–south transect of the Kalahari (known as the Kalahari Transect, KT) is oneof a set of International Geosphere–Biosphere Programme (IGBP) ‘‘megatransects’’ (e.g.,Koch et al., 1995; Scholes et al., 2002) identified for global change studies. This workfocuses on an analysis of the biogeochemistry of the Kalahari sands in order to developinsights as to how biochemical processes vary along the north–south rainfall gradient. TheKT provides an ideal setting to investigate changes in ecosystem dynamics, compositionand structure of vegetation, and carbon (C) or nutrient cycles along a spatial gradient ofprecipitation while minimizing the confounding effects of soil heterogeneity.The Kalahari is essentially a plateau area uplifted following the breakup of
Gondwanaland, at least 65 million years ago (Thomas and Shaw, 1991). The plateauedges were uplifted as the continent moved northwards. Both fluvial and dune sedimentsare believed to have infilled the uplifted basin with mainly sands interbedded with calcreteand silcrete. Areas within the basin have also been shown to comprise weathered material(Haddon, 2000; McFarlane and Eckardt, 2004). Most of the sands have assumed diversepost Gondwana histories including up to 5.0Ma of weathering, resorting and depositionon previously exposed African surface(s) (Baillieul, 1975; Huntsman-Mapila et al., 2005;Ringrose et al., 2002; Thomas and Shaw, 1991). Most palaeo-environmental work hasfocused in the central Kalahari Makgadikgadi-Okavango-Zambezi (MOZ) basin areaeither on Kalahari dune sequences (e.g. Grove, 1969; Lancaster, 1986, 2000; Thomas andShaw, 2002; Thomas et al., 2003) or on multiple palaeo lake sequences as described inCooke (1980) and Cooke and Verstappen (1984). Thomas and Shaw (1991, 1993, 2002)and Huntsman-Mapila et al. (2006) attribute wetter (flooding) periods to ca. 40,000 BP orlater partially based on 14C ages. Multiple periods of aeolian activity have been age-datedas occurring in the late Pleistocene with optical stimulated luminescence (OSL) agesindicating more arid episodes between 95 and 115, 41 and 46 and 20 and 26Ka (Stokeset al., 1997).The present day Kalahari climate ranges from arid to semi-arid/subhumid with
relatively strong seasonal and interannual variations in precipitation. Major characteristics

ARTICLE IN PRESSL. Wang et al. / Journal of Arid Environments 71 (2007) 259–279 261
are the potential evapotranspiration (PET), which is typically 3 times the annual rainfall;the rainfall variability ranges from less than 200mm in southwest Botswana to over1000mm in the north (i.e., western Zambia). The rainy season (Fig. 1) is typically fromOctober to April during the austral summer months when maximum growth is experiencedwhile dormancy is characteristic of the dry winter months (Shugart et al., 2004).
Vegetation on the KT is dominated by different types of savannas ranging from the fine-leafed ones (nutrient-rich) in the south to the broad-leafed plants (nutrient-poor) in thenorth. The distribution of Kalahari vegetation has been investigated through a number offield observations (e.g. Caylor et al., 2003; Privette et al., 2004; Ringrose et al., 1998;Scholes et al., 2002, 2004) and modeling studies (Caylor et al., 2004; Jeltsch et al., 1998,1999; Privette et al., 2004). Some key findings from these studies include the assessmentsthat (1) woody plant biomass increases from south to north. Above the minimum level of200mm MAP, the woody basal area increases at a rate of ca. 2.5m2 ha�1 per 100mmMAP. The mean height of the 10% tallest trees also increases along the gradient, reaching20m at ca. 800mm MAP (Scholes et al., 2002); (2) aggregation of plant individuals has
0
50
100
150
200
250
S O N D J F M
Month
Per
cipit
atio
n (
mm
)
0
50
100
150
200
250
S O N D J F M A
Month
Per
cipit
atio
n (
mm
)
0
50
100
150
200
250
S O N D J F M
Month
Per
cipit
atio
n (
mm
)
0
50
100
150
200
250
S O N D J F M
Month
Per
cipit
atio
n (
mm
)
Sampling Locations
Kalahari Sands
200 6002000Kilometers
Fig. 1. Location of the field sites established for this study along the Kalahari transect. The bar charts indicate the
mean annual cycle of precipitation (1961–1990) at four sampling locations. Modified after Shugart et al. (2004).

ARTICLE IN PRESSL. Wang et al. / Journal of Arid Environments 71 (2007) 259–279262
been observed in the vegetation communities at most sites, with the exception of the aridsouthernmost sites. The spatial distribution for the largest 25% of individuals ispredominantly random but juveniles tend to cluster around mature individuals (Cayloret al., 2003); (3) interactions among different life forms play a crucial role on vegetationproductivity across the rainfall gradient (Caylor et al., 2004).Despite the relevance of the KT to regional and global change studies, the soil physical
properties remain poorly characterized (cf. Joshua, 1981). This is a major limitation as theresponse of arid and semiarid ecosystems to changes in rainfall regime is mediated byvariations in the soil moisture dynamics, which, in turn, depend on the soil hydraulicproperties. In contrast, a few studies have investigated the biogeochemical properties of theKalahari sands (Aranibar et al., 2004; Bird et al., 2004; Dougill et al., 1998; Feral et al.,2003; Hudak et al., 2003; Pardo et al., 2003; Skarpe and Bergstrom, 1986), although acomprehensive synthesis of the main results remains to be accomplished. This paperprovides a brief review of previous studies on the sandy Kalahari soils (hereafter called theKalahari sands) combined with previously unpublished results from recent analyses of thesoil physical (mostly hydraulic) and biogeochemical properties.
2. Materials and methods
2.1. Field sampling
The new results presented in this review were obtained from soil samples collected atfour locations (Tshane, Ghanzi, Pandamatenga and Mongu) along the Kalahari transectduring the dry season (August) of 2004 (Fig. 1). The climate and vegetation characteristicsof these field sites are reported in Table 1. At each site, soil samples were collected (in fivereplicates) from both beneath tree canopies and in open areas. Two 1-m-deep soil pits weredug from each of the four locations: one in an open area and the other under a tree canopy.The soil pits were used to establish the soil profile at different depths (at 10 cm intervals).All soil samples were air-dried in the field and stored in plastic bags. In the wet season of2006, 2–3 soil pits were dug from each location and soil samples from every 10 cm intervalwere collected for soil particle analysis, soil color and soil scanning electron microscope(SEM) analysis.
Table 1
Location and general characteristic of four sampling sites along the Kalahari transect
Location Elevation
(m)
Rainfall
(mmyear)aVegetation type Woody
covera
Tshane 24.171S 1115 365 Open Acacia savanna 14
21.891E
Ghanzi 21.651S 1125 400 Acacia– Terminalia
woodland
20
21.811E
Pandamatenga 18.661S 1082 698 Baikea woodland 40
25.501E
Mongu 15.441S 1076 879 Miombio woodland 65
23.251E
aRainfall, woody cover data are from Caylor et al. (2006).

ARTICLE IN PRESSL. Wang et al. / Journal of Arid Environments 71 (2007) 259–279 263
2.2. Measurement of physical/hydraulic properties
Soil physical properties were measured on composite samples obtained by mixing fivesoil samples collected at each site, either from intercanopy or from subcanopy soils. Thesize of soil grains was expressed using phi (f) units defined as f ¼ �log2(Dmm/1mm), whereDmm is the grain diameter in mm. Soil samples were dry-sieved at 1 and 0.5f intervals(cf. Lancaster, 1986) after passing through a sample splitter. Sieving took place usingnested sieves (2.0–0.063 mm or �1 to 4f) on an automatic Retsch shaker whereby 100 g ofloose sand was sieved for 15min. Size analysis followed procedures devised by Folk andWard (1957) as updated in Tucker (2001). The saturated hydraulic conductivity (Ks) wasmeasured using a falling-head permeameter on composite samples (�300 g) from sub-canopy and inter-canopy soils at each site. Five or six measurements were made for eachsample and averaged (Table 2). One-way ANOVA was used to compare the difference(at 0.05 significance level) in Ks between intercanopy and subcanopy soils at each samplinglocation.
The bulk density, rb was calculated at each site for both subcanopy and intercanopysoils by determining the weight of 40ml of oven-dried samples (105 1C for 48 h). Soilporosity, n, was estimated as n ¼ 1�rb/rs, assuming a value of 2.65 g cm�3 for the density,rs, of the grains of quartz sand (Brady and Weil, 1999).
Soil pH values were measured using a portable pH meter (Hanna Instruments-HI 9023,Woonsocket, RI, USA) on 5-g samples of composite soil mixed with DI water. The mixingconsisted of 1 h of shaking, followed by a half-hour-long settling before makingmeasurements (Thomas, 1996). To quantify the soil surface CO2 along the transect, soilrespiration was measured in 24 random locations using EGM-4 CO2 analyzer at each sitein January 2006. To examine the effect of precipitation on the soil surface CO2 flux, 600mlwater was poured into a soil collar (40 cm� 20 cm) before measurement, and CO2 fluxeswere measured immediately after the water had infiltrated.
The water retention curves for composite soil samples from both intercanopyand subcanopy soils were determined at each site by measuring the water potentialvalues—using a water activity meter, DECAGON AquaLab Series 3T (DECAGONDevices, Pullman, WA, USA) and gravimetric moisture content. Water activity readings,
Table 2
Soil physical and hydraulic properties of Kalahari sands
Tshane Ghanzi Okwa Pandamatenga Mongu
Porosity n 0.47a, 0.45b 0.49a, 0.47b 0.45a, 0.43b 0.44a, 0.43b
Sat. hydr.
conductivity
Ks
(m day�1)
6.39aA, 3.73bB 5.02aA, 5.01bA 13.23aA,
15.54bB20.09aA, 12.72bB
Bulk density (g cm�3) 1.41a, 1.47b 1.34a, 1.42b 1.46a, 1.51b 1.47a, 1.50b
Soil texure3 98.0–0.0–2.01 96–1–32 95.9–2.4–1.61 96.8–2.1–1.11 97.5–1.9–0.61
pH 5.21, 6.36a, 6.10b 6.12a, 6.16b 5.61 6.62a, 6.10b 5.02a, 5.11b
1Aranibar et al. (2004), Global Change Biology 10, 359–373.2Ravi et al. (2006), Sedimentology 53, 597–609.3Sand–silt–clay ratio.
Different capital letters in Ks indicate different means between under canopy and intercanopy at 0.05 significance
level.aUnder canopy.bInter-canopy.

ARTICLE IN PRESSL. Wang et al. / Journal of Arid Environments 71 (2007) 259–279264
aw ¼ RH/100, (with RH being the relative humidity), were converted into matric potentialvalues as Cm ¼ (RT/Mw)�ln(RH/100) (Edlefson and Anderson, 1943), where R is theuniversal gas constant (8.314472 JK�1mol�1), T the absolute temperature (K) and Mw isthe molecular mass of water. The water potentials in the wetter range (4�0.5MPa) weremeasured using a WP4-T Dewpoint Potential Meter (DECAGON Devices, Pullman, WA,USA).
2.3. Geochemical analyses
Soil samples for isotopic and elemental analysis were oven dried (at 60 1C) in thelaboratory, sieved and homogenized using mortar and pestle. Each of the five replicates ofsamples collected from soils beneath tree canopies and open areas was analyzed for soilorganic C, total nitrogen (N), d13C and d15N. Total C and N content were measured usingan Elemental Analyzer (EA, Carlo Erba, NA1500, Italy). Stable C/N isotopic analysis wasperformed using a Micromass Optima Isotope Ratio Mass Spectrometer (IRMS)connected to the EA (GV/Micromass, Manchester, UK). Stable isotopic compositionsare reported in the conventional form
dxEð%Þ ¼ ½ðxE=yEÞsample=ðxE=yEÞstandard � 1� � 1000,
where E is the element being measured, x the heavier isotope and y the lighter isotope.So that ðxE=yEÞsample and ð
xE=yEÞstandard are the isotopic ratios of the sample and standard,respectively. The stable isotopic composition of C and N will be denoted as d13C (%) andd15N (%), respectively. The standards for C and N stable isotopes are Pee Dee Belemnite(PDB) and atmospheric molecular N (N2), respectively. Reproducibility of thesemeasurements is typically better than 0.2%. One-way ANOVA was used to test thesignificance of differences (0.05 significance level) found in each parameter betweenintercanopy and subcanopy soils at each site.
3. Physical properties of Kalahari sands
3.1. Soil texture
With the exception of the fine-textured soils found in pan and fluvial deposits, theKalahari is dominated by sandy soils, including mostly white, pink, and red in color(Leistner, 1967). The Kalahari sands are chiefly quartz, with small contributions of zircon,garnet, felspar, ilmenite and tourmaline. Compared to other sand deposits in Africa (e.g.,the Namib or the Sahara) the sand grains in the Kalahari are less well-rounded (Leistner,1967) likely the results of weathering (Ringrose et al., 2006). The porosity of the Kalaharisands ranges between 0.43 and 0.49 for the four locations considered in this study(Table 2), whereas the bulk density is between 1.34 and 1.51 gm�3 (Table 2). Both theporosities and the bulk densities of the Kalahari sands have limited variation between thecanopy and intercanopy (Table 2).The soil texture is dominated by sand (495%) at all sites (Table 2). Soils are acidic
(pHo7.0) along the entire transect. Soils at Ghanzi and Pandamatenga have a slightlyhigher pH than the other sites, possibly resulting from a proximity of near surface bedrockin these areas (Table 2). In the case of Ghanzi, the higher pH is probably due to thecalcareous substrate while the higher pH value in Pandamatenga is likely influenced by

ARTICLE IN PRESSL. Wang et al. / Journal of Arid Environments 71 (2007) 259–279 265
agriculture practices taking place in the commercial farms surrounding this site (e.g.fertilizer use, tillage). There are also only limited differences in soil pH between areaslocated under tree canopy and in open canopy at all sites (Table 2). At the dry end ofthe Kalahari transect the carbonate rich layer is deeper under the canopy than inopen canopy areas, while these differences are much smaller at the wet end (D’Odoricoet al., in review). In addition, the depth of the carbonate rich layer increases with the meanannual precipitation along the rainfall gradient, with a mean depth (between canopyand intercanopy sites) of 40 cm at Tshane, 65 cm at Pandamatenga and 72 cm atMongu (D’Odorico et al., in review). The variations in the depth of the carbonate richlayer between the soils under the canopy and in open canopy areas are indicative ofdifferences in long-term soil moisture dynamics, with deeper moisture percolation in thesoils under tree canopies. This fact has implications for the nutrient distribution reportedin Section 4.
Based on particle size distributions, the sands from Ghanzi are the finest among the foursites with mean particle size of 2.15f under the canopies (0–192 cm) and 2.56f forintercanopy samples (0–190 cm). No significant change in grain size is observed until thelower calcrete layer is reached, where the grain size increases to 1–1.8f. Sand particle sizesfrom Tshane are the second finest with a mean particle size of 2.23f under the canopy and2.11f for intercanopy (20–200 cm), and the particle size did not change along depth(20–500 cm) in both cases. Mean particle size in Pandamatenga is 1.84f under canopy(0–200 cm) and 1.79f for intercanopy (0–200 cm) with limited variation with depth in bothcases. Mean particle size in Mongu is similar to Pandamatenga with particle size of 1.72funder the canopy (10–300 cm) and 1.71f (10–300 cm) for intercanopy with limitedvariation with depth in both cases (Table 3). These results suggest that the soil profiles arerelatively uniform and that at the wet end of the transect (Mongu and Pandamatenga)there are no significant differences in grain size between canopy and intercanopy soils,while the drier (Tshane and Ghanzi) sites have finer soils under the canopy. Moreover, atthe drier sites soils are slightly finer than at the wetter sites.
For the surface soil (0–20 cm), there is no noticeable particle size difference betweeninter-canopy sands and those from under the canopy from Mongu. In Tshane, however,there is an obvious difference in particle size distribution between intercanopy and undercanopy. In fact, the fine particle size fraction (i.e., with size o0.063mm) was 1.44% and0.34% in the soils located under and between the tree canopies, respectively (Table 4).
The portion of the sample finer than 0.063mm was comprised of sub-rounded to sub-angular quartz particles, with evidence of a secondary Si coating for under canopy soils inMongu (Fig. 2A). Coatings do not occur extensively around the grains although there islocalized evidence of greater Si accumulation with subsequent coating disintegration in theform of pock-marking. There is no evidence of chemical etching on the grain surfaces withsome of the surfaces being angular and depicting the original crystal structure. The undercanopy sample from Mongu is chiefly quartz with less than 5% non-quartz. The non-quartz particles, which are mainly feldspars and micas, show more weathering effects (andare therefore more disintegrated) than the quartz. Fungal hyphae and organic remnantswere also evident (Fig. 2A).
Similar patterns are evident in the intercanopy samples in Mongu. In the sample fractionfiner than 0.063mm, cleaner sub-rounded but mainly sub-angular quartz particles wereevident with less evidence of a secondary Si coating (Fig. 2B). Again, the sample consistsmainly of quartz particles with less than 5% non-quartz, comprising feldspars and micas

ARTICLE IN PRESS
Table 3
Soil color and particle distribution with depth for under canopy and intercanopy soil samples for the four
Kalahari-transect sites
Soil name Mean (phi units) Munsell color
Mongu pit1-10 cma 1.70 5YR 6/4 light reddish brown
Mongu pit1-50 cma 1.70 5YR 6/6 reddish yellow
Mongu pit1-100 cma 1.75 5YR 6/6 reddish yellow
Mongu pit1-150 cma 1.65 7.5YR 6/8 reddish yellow
Mongu pit1-200 cma 1.72 5YR 6/6 Reddish yellow
Mongu pit1-300 cma 1.75 5YR 6/6 reddish yellow
Mongu pit2-10 cmb 1.62 5YR 6/2 pinkish gray
Mongu pit2-50 cmb 1.70 5YR 6/6 reddish yellow
Mongu pit2-100 cmb 1.75 5YR 6/6 reddish yellow
Mongu pit2-150 cmb 1.72 5YR 6/6 reddish yellow
Mongu pit2-200 cmb 1.73 7.5YR 7/6 reddish yellow
Mongu pit2-300 cmb 1.78 7.5YR 7/8 reddish yellow
Mongu pit3-150 cmb 1.77 5YR 6/6 reddish yellow
Mongu pit3-200 cmb 1.78 5YR 7/8 reddish yellow
Mongu pit3-300 cmb 1.80 5YR 7/8 reddish yellow
Pandamatenga 0 cmb 1.77 10YR 4/2 dark grayish brown
Pandamatenga 50 cmb 1.81 10YR 6/4 light yellowish brown
Pandamatenga 100 cmb 1.76 7.5YR 6/6 reddish brown
Pandamatenga 150 cmb 1.79 7.5YR 6/6 reddish yellow
Pandamatenga 200 cmb 1.81 10YR 6/6 brownish yellow
Pandamatenga 0 cma 1.67 10YR 4/2 Dark grayish brown
Pandamatenga 50 cma 2.13 10YR 6/4 Light yellowish brown
Pandamatenga 100 cma 1.80 7.5YR 6/6 reddish yellow
Pandamatenga 150 cma 1.75 10YR 6/8 brownish yellow
Pandamatenga 200 cma 1.85 7.5YR 6/6 reddish brown
Ghanzi 0 cma 2.50 5YR 4/6 yellowish red
Ghanzi 50 cma 2.40 2.5YR 4/6 Red
Ghanzi 100 cma 2.45 2.5YR 4/6 Red
Ghanzi 150 cma 2.45 5YR 5/8 yellowish red
Ghanzi 192 cma (reaching calcrete layer) 0.97 10YR 6/4 Light yellowish red
Ghanzi 0 cma 2.55 5YR 5/6 yellowish red
Ghanzi 50 cma 2.52 5YR 5/6 yellowish red
Ghanzi 100 cma 2.50 5YR 5/8 yellowish red
Ghanzi 0 cmb 2.50 5YR 4/4 reddish brown
Ghanzi 50 cmb 2.90 2.5YR 4/6 red
Ghanzi 100 cmb 2.37 2.5YR 4/6 red
Ghanzi 150 cmb (reaching calcrete layer) 1.53 2.5YR 6/4 light reddish brown
Ghanzi 190 cmb (reaching calcrete layer) 1.83 2.5YR 6/4 light reddish brown
Tshane 20 cma 2.32 5YR 5/6 yellowish red
Tshane 50 cma 2.20 5YR 5/6 yellowish red
Tshane 100 cma 2.27 5YR 6/8 yellowish red
Tshane 150 cma 2.30 5YR 6/6 yellowish red
Tshane 200 cma 2.10 5YR 6/8 yellowish red
Tshane 500 cma 2.18 5YR 6/8 yellowish red
Tshane 20 cmb 1.92 5YR 5/6 yellowish red
Tshane 50 cmb 2.18 5YR 5/6 yellowish red
Tshane 100 cmb 2.15 5YR 5/6 yellowish red
Tshane 150 cmb 2.02 5YR 5/8 yellowish red
Tshane 200 cmb 2.30 5YR 5/8 yellowish red
Munsell color system has three components: hue (a specific color), value (lightness and darkness), and chroma
(color intensity). Soil color is noted as hue value/chroma and actual color.aUnder canopy.bInter-canopy.
L. Wang et al. / Journal of Arid Environments 71 (2007) 259–279266

ARTICLE IN PRESS
Table 4
Surface soil (0–20 cm) particle distribution for under canopy and inter-canopy sands at the Mongu and Tshane
locations
Depth
(cm)
%Coarse sand (f�1to 1 or 2–0.5mm)
%Medium sand (f1–2or 0.5–0.25mm)
%Fine sands (f2–4 or
0.25–0.063mm)
%Silt and Clay (f44
or 40.063mm)
Mongu
Under
canopy
10 1.96 72.39 25.01 0.43
Inter-
canopy
10 0.88 77.83 20.89 0.40
Tshane
Under
canopy
20 0.45 37.27 60.84 1.44
Inter-
canopy
20 7.44 73.15 19.07 0.34
Fig. 2. Scanning electron microscope analysis of soil particles under canopy (A), inter-canopy (B) in Mongu and
under canopy (C), inter-canopy (D) in Tshane.
L. Wang et al. / Journal of Arid Environments 71 (2007) 259–279 267
which show more disintegrated weathering effects than the quartz. Fungal hyphae werealso evident (Fig. 2B).
More equi-granular quartz grains were found in the under canopy in Tshane which alsoexhibited relatively abundant fungal hyphae. The sample consisted of mixed coated andangular (faces showing) fragments but at this location the secondary silica-rich SiO2

ARTICLE IN PRESSL. Wang et al. / Journal of Arid Environments 71 (2007) 259–279268
coating was more apparent and much of the coating was pitted and disintegrated. Thedisintegration was flaking off the coating, adding fine particles which may be mixed withpossible clay flakes and organic fragments (Fig. 2C).The intercanopy sample in Tshane also consisted of equi-granular grains, which are
coated and weathered with evidence of coating disintegration. There was a higherproportion of quartz grains in the Tshane samples with non-quartz grains approximating2%. There is more evidence of particle fracturing/fragmentation and coating inducedangularity, i.e. when coating peels off, angular particles remain beneath, as the coatingitself induces a form of weathering preferentially along the crystal faces as seen inOkavango delta samples. Organic fragments and fungal hyphae were also evident(Fig. 2D).
3.2. Soil hydraulic properties
The saturated hydraulic conductivity (Ks) was found to increase, from south to northalong the rainfall gradient (Table 2), presumably due to a higher soil organic matterexisting at the more humid sites. At Tshane and Mongu (the two extreme ends of thetransect), Ks was significantly higher under canopy than in open areas, while no differenceexisted at Ghanzi.Moisture retention curves obtained for a range of soil water potentials vary between 0
and �7MPa (Fig. 3). These curves were used to calculate the moisture content atthe wilting point separately for areas located beneath the canopy and in the intercanopy
|Ψ| = 445.06s-6.4
R2 = 0.63
|Ψ| = 1645.3s-5.42
R2 = 0.94
0
1
2
3
4
5
6
7
8
1.8 2.3 2.8 3.3 3.8 4.3
s
Ψ|(
MP
a)|
Under Canopy
Between Canopy
Tshane
|Ψ| = 17521s-6.41
R2 = 0.83
|Ψ| = 25057s-7.96
R2 = 0.76
0
1
2
3
4
5
6
7
8
2.5 3.5 4.5 5.5
s
Ψ|(
MP
a)|
Ghanzi
|Ψ|= 255.96s-4.17
R2 = 0.94
|Ψ| = 10028s-6.06
R2 = 0.92
0
1
2
3
4
5
6
7
2.2 2.7 3.2 3.7 4.2 4.7 5.2
s
Ψ|(
MP
a)|
Pandamatenga
|Ψ| = 6.17s-4.05
R2 = 0.93
|Ψ| = 2.73s-2.24
R2 = 0.94
0
1
2
3
4
5
6
7
0.8 1.3 1.8 2.3 2.8 3.3
s
Ψ|(
MP
a)|
Mongu
Fig. 3. Water retention curves for both beneath canopy (solid line) and intercanopy (dashed line) soils at the four
sampling locations (�7 to 0MPa).

ARTICLE IN PRESS
Table 5
Relative soil moisture at wilting point between inter-canopy and under canopy soils of the four locations along the
Kalahari transect
Species Cw
(MPa)
Tshane (%) Ghanzi (%) Pandamatenga (%) Mongu (%)
Between
canopy
Under
canopy
Between
canopy
Under
canopy
Between
canopy
Under
canopy
Between
canopy
Under
canopy
Typical value for
crops
�1.5 2.41 3.63 3.43 4.34 3.41 4.28 1.10 1.35
Burkea africana
(Woody)
�3.1a 0.69
Ochna pulchra
(Woody)
�3.2a 0.66
Terminalia sericea
(Woody)
�1.9a 3.48 4.21
Digitaria eriantha
(Grass)
�2.9a 2.26 3.23 3.22 3.98 2.94 3.88 0.25 0.76
Eragrostis pallens
(Grass)
�3.9a 2.10 3.07 3.13 3.83 2.75 3.71 0.13 0.47
Elionurus muticus
(Grass)
�2.9a 2.26 3.23 3.22 3.98 2.94 3.88
aThe values are from Scholes and Walker (1993).
L. Wang et al. / Journal of Arid Environments 71 (2007) 259–279 269
(Table 5). The soil water potential at the wilting point, Cw, for crops is typically assumedto be at �1.5MPa; however, dryland vegetation is generally well adapted to more aridconditions and can tolerate dryer soil moistures. Thus, the values of Cw for southernAfrican vegetation have been observed to be significantly lower (Scholes and Walker,1993). Values from the literature have been compiled for species observed at the differentsites along the KT (Table 5). The moisture retention curves were used to calculate thecorresponding relative soil water contents (fraction of pore space filled by water) at thewilting point. Because grasses have been observed to grow also beneath tree canopies, soilmoisture values at the wilting point were calculated both for between canopy and undercanopy soils. Moisture contents at the wilting point were found to be consistently higherunder the canopy than in the interspace areas, suggesting the existence of slight differencesin soil texture, i.e., the existence of higher clay fractions under the canopy (see Fig. 3),consistent with the differences in fine fractions found at the drier sites. Whether thisdifference implies higher likelihoods of water stress in vegetation growing under thecanopy cannot be assessed on the basis of these data. In fact, differences in soil texture arealso associated with different moisture contents which, in turn, could offset the effect of thehigher wilting points on water stress conditions in vegetation (e.g., D’Odorico andPorporato, 2006; Noy-Meir, 1973).
4. Biogeochemical properties of Kalahari sands
4.1. Vertical profiles of soil C, N and their isotopic composition
The vertical profile of soil organic carbon (SOC) exhibits higher concentrations in thetop 10–20 cm at all sites along the KT for both the open areas and the areas under the

ARTICLE IN PRESS
N%
0
20
40
60
80
100
0 0.02 0.04 0.06 0.08 0.1
between
canopy
N%
0
20
40
60
80
100
0 0.02 0.04 0.06 0.08 0.1
under
canopy
0
20
40
60
80
100
0 0.5 1 1.5
C%
Soil
Dep
th (
cm)
under
canopy
0
20
40
60
80
100
0 0.5 1 1.5
C%
Soil
Dep
th (
cm)
Tshane
Ghanzi
Pandamatenga
Mongu
between
canopy
Fig. 4. Depth profiles of carbon (left) and nitrogen (right) content of soil samples collected along the Kalahari
transect both from intercanopy and canopy areas.
L. Wang et al. / Journal of Arid Environments 71 (2007) 259–279270
canopy. The SOC is typically higher in the areas under canopy than in the intercanopy soil(Fig. 4). The soil total N content is also concentrated in the top 10 cm both in intercanopyand canopy areas with the total N content being higher under the canopy (Fig. 4).Furthermore, the variation in C and N content in the soil column is higher under thecanopy than in the open area for all four sites. At depth, the soil N content is higher at thedrier sites (e.g. Tshane and Ghanzi) than at the wetter end of the KT (e.g. Mongu andPandamatenga) both in intercanopy and canopy areas (Fig. 4), possibly suggesting that Nis more limiting at the wetter sites of this transect (Aranibar et al., 2004; Scanlon andAlbertson, 2003).The d13C values increase with depth under canopy whereas there is no clear pattern of
d13C in the soil profiles in intercanopy areas (Fig. 5). The d13C values in Pandamatengaexhibit large variations both in open areas and under the canopy, although in a differentway, in that the d13C values were more variable in the top 40 cm under canopy but lessvariable in open areas (Fig. 5). The anomalous and high variability in soil d13C along thesoil column observed in Pandamatenga was likely influenced by the two major soil typesexisting in Pandamatenga, the vertisol and arenosols (Almendros et al., 2003; Pardo et al.,2003). The arenosols are light-textured soils like those found in most of the Kalahariregion. The vertisols, however, are heavy, clayey, nutrient-rich soils used for dryland cropproduction in the Pandamatenga area (Pardo et al., 2003). Field sampling was carried outin the woodlands underlain by arenosols; however, the proximity to the vertisols existingon the surrounding commercial farms inevitably influenced the soil chemical and physicalproperties of soils at the woodland site in Pandametenga.

ARTICLE IN PRESS
Soil δδ13C Soil δ15N
0
20
40
60
80
100
-40 -30 -20 -10 0
Soil
Dep
th (
cm)
under
canopy
0
20
40
60
80
100
0 4 8 10 12 14
between
canopy
0
20
40
60
80
100
0 4 6 8 10 12 14
under
canopy
0
20
40
60
80
100
-40 -30 -20 -10 0
Soil
Dep
th (
cm)
Tshane
Ghanzi
Pandamatenga
Mongu
between
canopy
2 6
2
Fig. 5. Depth profiles of soil d15N (left) and soil d13C (right) both for canopy and intercanopy soils along the
Kalahari transect.
L. Wang et al. / Journal of Arid Environments 71 (2007) 259–279 271
Depending on climate conditions, the vertical profile of soil d15N can either exhibit littlevariation like in montane elevation gradients, random distributions like in gravelly desertsoil or, most commonly, a consistent (exponential) increase with depth like in grasslands(Amundson et al., 2003). Multiple factors contribute the soil d15N variation along depth(Amundson et al., 2003) including N transport processes, depth-dependent plant N inputsas dead roots, and multiple N pools other than those from plant tissues (e.g., microbialbiomass). Despite the presence of greater fluctuations in the vertical profile of soil d15N,similar to those observed in gravelly desert soils (Brenner, 1999) (Fig. 5), the d15N in theKalahari increases with depth through the ‘‘bulk’’ of the root zone (top 50 cm, see Section5) to a maximum value and then decreases at greater depths; this pattern can be observedboth in open areas and under canopy (Fig. 5). The variation of soil d15N content withdepth is an important contributing factor to the plant d15N signature (e.g. plants taking upN from deeper soil layers should have higher values of d15N). The fact that grass rootsdominate the surface soil (see Section 5), and the tendency of surface soils to have lowerd15N values, explains the lower foliar d15N values found in grasses than tree tissues acrosssouthern Africa (Swap et al., 2004) as well as in semiarid and mesic sites of Australia(Cook, 2001). Although early hypotheses that trees and grasses utilize water from differentlayers (Walter, 1971) have been recently challenged both by field observations (Hipondokaet al., 2003; Scholes and Walker, 1993; Williams and Albertson, 2004), and theoreticalmodels (Rodriguez-Iturbe et al., 1999), the fact that different plant functional types take Nfrom different layers, at different times (e.g. grasses take up the recently mineralized N andtrees take up the remaining N) or utilize different forms of N, could be one of themechanisms contributing to tree–grass co-dominance in savannas.
ARTICLE IN PRESSL. Wang et al. / Journal of Arid Environments 71 (2007) 259–279272
4.2. Soil surface C, N and their isotopic composition changes along the transect
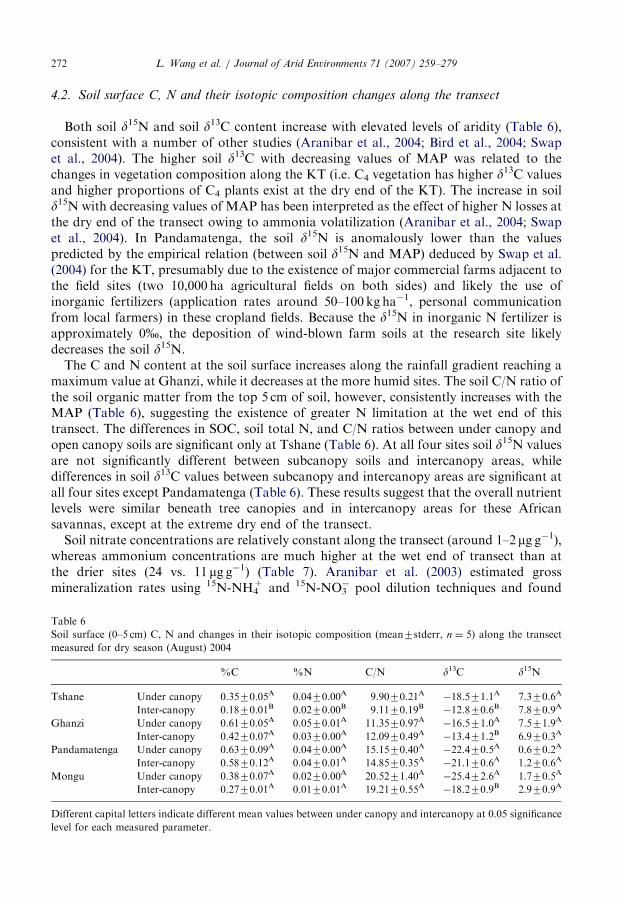
Both soil d15N and soil d13C content increase with elevated levels of aridity (Table 6),consistent with a number of other studies (Aranibar et al., 2004; Bird et al., 2004; Swapet al., 2004). The higher soil d13C with decreasing values of MAP was related to thechanges in vegetation composition along the KT (i.e. C4 vegetation has higher d13C valuesand higher proportions of C4 plants exist at the dry end of the KT). The increase in soild15N with decreasing values of MAP has been interpreted as the effect of higher N losses atthe dry end of the transect owing to ammonia volatilization (Aranibar et al., 2004; Swapet al., 2004). In Pandamatenga, the soil d15N is anomalously lower than the valuespredicted by the empirical relation (between soil d15N and MAP) deduced by Swap et al.(2004) for the KT, presumably due to the existence of major commercial farms adjacent tothe field sites (two 10,000 ha agricultural fields on both sides) and likely the use ofinorganic fertilizers (application rates around 50–100 kg ha�1, personal communicationfrom local farmers) in these cropland fields. Because the d15N in inorganic N fertilizer isapproximately 0%, the deposition of wind-blown farm soils at the research site likelydecreases the soil d15N.The C and N content at the soil surface increases along the rainfall gradient reaching a
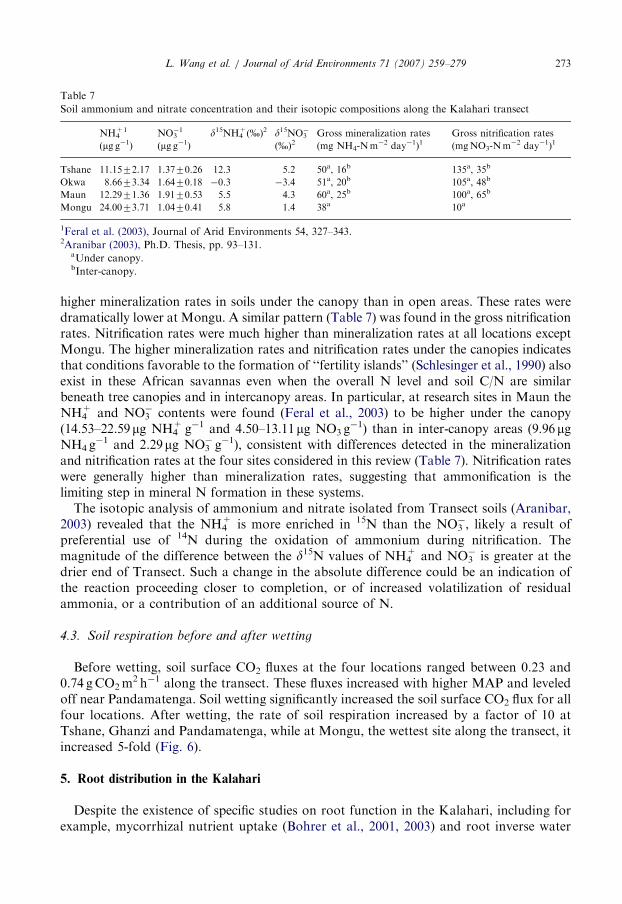
maximum value at Ghanzi, while it decreases at the more humid sites. The soil C/N ratio ofthe soil organic matter from the top 5 cm of soil, however, consistently increases with theMAP (Table 6), suggesting the existence of greater N limitation at the wet end of thistransect. The differences in SOC, soil total N, and C/N ratios between under canopy andopen canopy soils are significant only at Tshane (Table 6). At all four sites soil d15N valuesare not significantly different between subcanopy soils and intercanopy areas, whiledifferences in soil d13C values between subcanopy and intercanopy areas are significant atall four sites except Pandamatenga (Table 6). These results suggest that the overall nutrientlevels were similar beneath tree canopies and in intercanopy areas for these Africansavannas, except at the extreme dry end of the transect.Soil nitrate concentrations are relatively constant along the transect (around 1–2 mg g�1),
whereas ammonium concentrations are much higher at the wet end of transect than atthe drier sites (24 vs. 11 mg g�1) (Table 7). Aranibar et al. (2003) estimated grossmineralization rates using 15N-NH4
+ and 15N-NO3� pool dilution techniques and found
Table 6
Soil surface (0–5 cm) C, N and changes in their isotopic composition (mean7stderr, n ¼ 5) along the transect
measured for dry season (August) 2004
%C %N C/N d13C d15N
Tshane Under canopy 0.3570.05A 0.0470.00A 9.9070.21A �18.571.1A 7.370.6A
Inter-canopy 0.1870.01B 0.0270.00B 9.1170.19B �12.870.6B 7.870.9A
Ghanzi Under canopy 0.6170.05A 0.0570.01A 11.3570.97A �16.571.0A 7.571.9A
Inter-canopy 0.4270.07A 0.0370.00A 12.0970.49A �13.471.2B 6.970.3A
Pandamatenga Under canopy 0.6370.09A 0.0470.00A 15.1570.40A �22.470.5A 0.670.2A
Inter-canopy 0.5870.12A 0.0470.01A 14.8570.35A �21.170.6A 1.270.6A
Mongu Under canopy 0.3870.07A 0.0270.00A 20.5271.40A �25.472.6A 1.770.5A
Inter-canopy 0.2770.01A 0.0170.01A 19.2170.55A �18.270.9B 2.970.9A
Different capital letters indicate different mean values between under canopy and intercanopy at 0.05 significance
level for each measured parameter.
ARTICLE IN PRESS
Table 7
Soil ammonium and nitrate concentration and their isotopic compositions along the Kalahari transect
NH4+1
(mg g�1)NO3�1
(mg g�1)d15NH4
+(%)2 d15NO3�
(%)2Gross mineralization rates
(mg NH4-Nm�2 day�1)1Gross nitrification rates
(mgNO3-Nm�2 day�1)1
Tshane 11.1572.17 1.3770.26 12.3 5.2 50a, 16b 135a, 35b
Okwa 8.6673.34 1.6470.18 �0.3 �3.4 51a, 20b 105a, 48b
Maun 12.2971.36 1.9170.53 5.5 4.3 60a, 25b 100a, 65b
Mongu 24.0073.71 1.0470.41 5.8 1.4 38a 10a
1Feral et al. (2003), Journal of Arid Environments 54, 327–343.2Aranibar (2003), Ph.D. Thesis, pp. 93–131.
aUnder canopy.bInter-canopy.
L. Wang et al. / Journal of Arid Environments 71 (2007) 259–279 273
higher mineralization rates in soils under the canopy than in open areas. These rates weredramatically lower at Mongu. A similar pattern (Table 7) was found in the gross nitrificationrates. Nitrification rates were much higher than mineralization rates at all locations exceptMongu. The higher mineralization rates and nitrification rates under the canopies indicatesthat conditions favorable to the formation of ‘‘fertility islands’’ (Schlesinger et al., 1990) alsoexist in these African savannas even when the overall N level and soil C/N are similarbeneath tree canopies and in intercanopy areas. In particular, at research sites in Maun theNH4
+ and NO3� contents were found (Feral et al., 2003) to be higher under the canopy
(14.53–22.59mg NH4+g�1 and 4.50–13.11mg NO3 g
�1) than in inter-canopy areas (9.96mgNH4 g
�1 and 2.29mg NO3� g�1), consistent with differences detected in the mineralization
and nitrification rates at the four sites considered in this review (Table 7). Nitrification rateswere generally higher than mineralization rates, suggesting that ammonification is thelimiting step in mineral N formation in these systems.
The isotopic analysis of ammonium and nitrate isolated from Transect soils (Aranibar,2003) revealed that the NH4
+ is more enriched in 15N than the NO3�, likely a result of
preferential use of 14N during the oxidation of ammonium during nitrification. Themagnitude of the difference between the d15N values of NH4
+ and NO3� is greater at the
drier end of Transect. Such a change in the absolute difference could be an indication ofthe reaction proceeding closer to completion, or of increased volatilization of residualammonia, or a contribution of an additional source of N.
4.3. Soil respiration before and after wetting
Before wetting, soil surface CO2 fluxes at the four locations ranged between 0.23 and0.74 gCO2m
2 h�1 along the transect. These fluxes increased with higher MAP and leveledoff near Pandamatenga. Soil wetting significantly increased the soil surface CO2 flux for allfour locations. After wetting, the rate of soil respiration increased by a factor of 10 atTshane, Ghanzi and Pandamatenga, while at Mongu, the wettest site along the transect, itincreased 5-fold (Fig. 6).
5. Root distribution in the Kalahari
Despite the existence of specific studies on root function in the Kalahari, including forexample, mycorrhizal nutrient uptake (Bohrer et al., 2001, 2003) and root inverse water

ARTICLE IN PRESS
0
1
2
3
4
5
6
7
8
9
Original Wetting Original Wetting Original Wetting Original Wetting
g (
CO
2)
m2 H
ou
r-1
Site
Tshane Ghanzi Pandamatenga Mongu
Fig. 6. Soil surface CO2 flux before and after the soil wetting in four locations along Kalahari transect.
L. Wang et al. / Journal of Arid Environments 71 (2007) 259–279274
transport phenomena (Schulze et al., 1998), a comprehensive study of root distribution forthe different tree, shrub and grass species existing in the region is still unreported. In anearly exploration of the southern Kalahari soils, Leistner (1967) noticed that, although thedepth of root systems varies considerably depending on local conditions and plant species,the rooting depths generally range from 20 cm to more than 300 cm, with the highest rootconcentration being between 8 and 50 cm. Leistner (1967) also found a number ofmorphological and anatomical features such as sand coats, spongy cortex, and succulentroots, which seems to play an important role for plant adaptation to the semi-deserthabitats of the southern Kalahari. Laterally, most shrubs and trees in the Kalahari possessroot systems that extend horizontally beyond the footprint of their canopies. For example,the horizontal roots of Acacia Erioloba (formerly Acacia giraffae) and Albizia
anthelmintica can be longer than 20m, whereas those of Albizia mellifera can extendlaterally for more than 10m (Leistner, 1967). More recently, Hipondoka et al. (2003)explored the vertical root distribution of the two main life forms (i.e. trees and grasses)existing in the savannas at Tshane and Ghanzi. These authors used the profile counttechnique (Bohm, 1979) to determine the vertical root distribution and composition bothat sites located beneath tree canopies and in open areas. Both plant functional types werefound to develop most of their roots at the surface. Grass roots were found to be moreabundant and dominant close to the surface (i.e., in the top 30 cm of the soil column) evenin the soil pits located under the tree canopies. Moreover, the distribution of tree roots didnot exhibit a clear dominance over grasses at deeper soil layers as suggested by previousstudies (e.g., Walter, 1971; Knoop and Walker, 1984). The vertical profile of rootdistribution measured by Hipondoka et al. (2003) exhibits a well-defined decrease in grassroot density with depth, whereas smaller variations can be noticed in the tree root profile,with a peak in tree root density at 20–50 cm depth (Fig. 7A and B). A similar pattern ofroot profile (Fig. 7C) was found at the same site (Ghanzi) by Williams and Albertson(2004), though the actual values of root density differed by almost an order of magnitude,possibly owing to the different root sampling techniques used by those authors.By measuring the isotopic composition of both root C and soil organic matter C at
different depths, Hipondoka et al. (2003) determined the proportion of soil C contributed

ARTICLE IN PRESS
0
10
20
30
40
50
60
70
80
90
100
0 50 100 150 200 250 300 350 400
Root Density (No. roots per square meter)
Soil
Dep
th (
cm)
Tree roots, intercanopy
Grass roots, intercanopy
Tree roots, canopy
Grass roots, canopy
Ghanzi
0
10
20
30
40
50
60
70
80
90
100
0 50 100 150 200 250 300 350
Root Density (No. roots per square meter)
Soil
Dep
th (
cm)
Tree roots, intercanopy
Grass roots, intercanopy
Tree roots, canopy
Grass roots, canopy
Tshane
0
10
20
30
40
50
60
70
80
90
100
0 500 1000 1500 2000 2500 3000
Root Density (No. roots per square meter)
Soil
Dep
th (
cm)
Tree roots
Grass roots
Ghanzi
Fig. 7. Root density profiles for tree and grass functional types in different locations. A and B are from
Hipondoka et al. (2003) and C is from Williams and Albertson (2004).
L. Wang et al. / Journal of Arid Environments 71 (2007) 259–279 275
by each life form and found a dominance of grass root biomass at most depths, inagreement with their profiles of root density (Fig. 7A and B).
6. Soil crusts in Kalahari sand formations
Biological soil crusts (a complex soil surface community dominated by cyanobacteria,microfungi, mosses, and lichens) are a recurrent feature of arid and semi-arid ecosystems(Belnap and Lange, 2003). Numerous studies have documented the importance of thesecrusts to the stabilization of the soil surface (i.e., the increase in the resistance to wind andwater erosion (Campbell et al., 1989), the enhancement of seedling establishment (St. Clairet al., 1984), and soil fertilization through biological N fixation (Skarpe and Henriksson,1986; Zaady et al., 1998). In addition, soil crust communities are very sensitive to smallpulsed water events (desert precipitation are usually less than 3mm per event), a commonfeature in arid and semi-arid environment. For larger rainfall events, crusts may reduce therate of soil drying, giving vascular plants more time to respond to increased wateravailability (Austin et al., 2004). However, the diverse functions of soil crusts in theKalahari are still relatively understudied with only few reports available in the literature.
Aranibar et al. (2003) quantified the N-fixing activity of soil crusts in the Kalahariduring the wet season using in situ acetylene reduction assays. The estimated annual ratesof N fixation ranged from 8 to 44 g Nha�1 year�1 with higher N fixing activity at the dryend of the transect (Table 8). The N fixing activity of the soil crusts along the Kalahari

ARTICLE IN PRESS
Table 8
Soil crusts N fixing activities along the Kalahari transect estimated by in situ acetylene reduction assays
g N fixed ha�1 year�1
Tshane 37
Okwa 44
Maun 14
Mongu (disturbed) 30
Mongu 8
Aranibar et al. (2003), Journal of Arid Environments 54, 345–358.
L. Wang et al. / Journal of Arid Environments 71 (2007) 259–279276
transect were several orders of magnitude lower than those estimated by other authors forthe Kalahari desert (Skarpe and Henriksson, 1986), and for other regions like the Negevdesert (Zaady et al., 1998), or Tucson desert (MacGregor and Johnson, 1971). Aranibar etal. (2003) argued that this was due to the anomalously wet conditions experienced duringthe year of their study (2000), which may have temporarily increased the availability of soilmineral N, thereby leading to a decrease in N fixation rates.The spatial distribution of cyanobacterial soil crusts has been recently investigated
(Berkeley et al., 2005) in the context of bush encroachment studies in the Kalahari at siteswith two different dominant plant species (A. mellifera and Grewia flava) and differentdisturbance regimes. They found the highest degree of crust cover under the canopies ofA. mellifera, interemediate levels of crust cover under G. flava and the lowest cover in thebare soil interspaces. This pattern was clearer in the presence of disturbances. Those resultsshowed an enhanced cyanobacterial crust cover under A. mellifera canopies, where the crustcover was found to be resistant to even higher levels of disturbance. Conversely, disturbanceswere observed to limit the development of soil crust under the canopies of G. flava and in thebare soil interspaces. Thus, this canopy-crust association suggests that the encroachment ofA. mellifera is intrinsically more resilient because of the ability of the crust to stabilize the soilsurface and increase both nutrient retention and the soil nutrient content.
7. Summary
The data presented in this review show that the Kalahari soil is acidic, dominated bysand and nutrient poor. Soil nutrient dynamics in the Kalahari are significantly determinedby the relatively strong rainfall gradient, whereas the soil physical properties remainoverall the same along the transect. Differences in rainfall regime, vegetation compositionand structure determine important changes in the soil organic matter, and verticaldistribution of soil N content along the Kalahari Transect, as evidenced by the comparisonof experimental results obtained at different sites, as well as at each site in canopy andinter-canopy areas.
Acknowledgments
The project was supported by NASA-IDS2 (NNG-04-GM71G). We greatly appreciatethe team-work and field assistance from Lydia Ries, Natalie Mladenov, Kelly Caylor, MattTherrell, Todd Scanlon, Ian McGlynn (University of Virginia), Greg Okin (UCLA), BillyMogojwa and Thoralf Meyer (University of Botswana), Barney Kgope (South African

ARTICLE IN PRESSL. Wang et al. / Journal of Arid Environments 71 (2007) 259–279 277
National Biodiversity Institute). We thank Dr. Howard Epstein from University of Virginiafor lending the EGM-4 CO2 analyzer. We thank Bill Gilhooly, Parameswar Sahu, and SujithRavi for their help with the laboratory instrumentation. The University of Botswana (UB)team was funded in part through a research award granted through the UB research andPublication Committee. The strength of this paper is improved by comments from twoanonymous reviewers and the associate editor.
References
Almendros, G., Kgathi, D., Sekwhela, M., Zancada, M.C., Tinoco, P., Pardo, M.T., 2003. Biogeochemical
assessment of resilient humus formations from virgin and cultivated northern Botswana soils. Journal of
Agricultural and Food Chemistry 51, 4321–4330.
Amundson, R., Austin, A.T., Schuur, E.A.G., Yoo, K., Matzek, V., Kendall, C., Uebersax, A., Brenner, D.,
Baisden, W.T., 2003. Global patterns of the isotopic composition of soil and plant nitrogen. Global
Biogeochemical Cycles 17 (1), 31, 1-31-10.
Aranibar, J., 2003. Nitrogen cycling in southern African soils and plants along rainfall and land-use gradients: a
stable isotope study. Ph.D. Dissertation, University of Virginia, Charlottesville, USA, p. 270.
Aranibar, J.N., Anderson, I.C., Ringrose, S., Macko, S.A., 2003. Importance of nitrogen fixation in soil crusts of
southern African arid ecosystems: acetylene reduction and stable isotope studies. Journal of Arid
Environments 54, 345–358.
Aranibar, J.N., Otter, L., Macko, S.A., Feral, C.J.W., Epstein, H.E., Dowty, P.R., Eckardt, F., Shugart, H.H.,
Swap, R.J., 2004. Nitrogen cycling in the soil–plant system along a precipitation gradient in the Kalahari
sands. Global Change Biology 10, 359–373.
Austin, A.T., Yahdjian, L., Stark, J.M., Belnap, J., Porporato, A., Norton, U., Ravetta, D.A., Schaeffer, S.M.,
2004. Water pulses and biogeochemical cycles in arid and semiarid ecosystems. Oecologia 141, 221–235.
Baillieul, T.A., 1975. A reconnaissance survey of the cover sands in the Republic of Botswana. Journal of
Sedimentary Petrology 45, 494–503.
Belnap, J., Lange, O.L., 2003. Biological Soil Crusts: Structure, Function, and Management. Ecological Studies.
Springer, Berlin, p. 150.
Berkeley, A., Thomas, A.D., Dougill, A.J., 2005. Cyanobacterial soil crusts and woody shrub canopies in
Kalahari rangelands. African Journal of Ecology 43, 137–145.
Bird, M.I., Veenendaal, E.M., Lloyd, J.J., 2004. Soil carbon inventories and d13C along a moisture gradient in
Botswana. Global Change Biology 10, 342–349.
Bohrer, G., Kagan-Zur, V., Roth-Bejerano, N., Ward, D., 2001. Effects of environmental variables on
vesicular–arbuscular mycorrhizal abundance in wild populations of Vangueria infausta. Journal of Vegetation
Science 12 (2), 279–288.
Bohrer, G., Kagan-Zur, V., Roth-Bejerano, N., Ward, D., Beck, G., Bonifacio, E., 2003. Effects of different
Kalahari-desert VA mycorrhizal communities on mineral acquisition and depletion from the soil by host
plants. Journal of Arid Environments 55, 193–208.
Bohm, W., 1979. Methods of Studying Root Systems. Springer, New York, USA.
Brady, N.C., Weil, R.R., 1999. The Nature and Properties of Soil, 12th ed. Prentice-Hall, Upper Saddle River, USA.
Brenner, D.L., 1999. Soil nitrogen isotopes along natural gradients: models and measurements. MS Thesis,
University of California, Berkeley, California.
Caylor, K.K., Shugart, H.H., Dowty, P.R., Smith, T.M., 2003. Tree spacing along the Kalahari transect in
southern Africa. Journal of Arid Environments 54, 281–296.
Caylor, K.K., Dowty, P.R., Shugart, H.H., Ringrose, S., 2004. Relationship between small-scale structural
variability and simulated vegetation productivity across a regional moisture gradient in southern Africa.
Global Change Biology 10, 374–382.
Caylor, K.K., D’Odorico, P., Rodriguez-Iturbe, I., 2006. On the ecohydrology of structurally heterogeneous
semiarid landscapes. Water Resources Research 42, W07424.
Campbell, S.E., Seeler, J., Goulic, S., 1989. Desert crust formation and soil stabilization. Arid Soil Research and
Rehabilitation 3, 217–228.
Cook, G.D., 2001. Effects of frequent fires and grazing on stable nitrogen isotope ratios of vegetation in northen
Australia. Austral Ecology 26, 630–636.
ARTICLE IN PRESSL. Wang et al. / Journal of Arid Environments 71 (2007) 259–279278
Cooke, H.J., 1980. Landform evolution in the context of climatic changes and neotectonics in the middle Kalahari
of north-central Botswana. Transactions of the Institute of British Geographers NS-5, 80–99.
Cooke, H.J., Verstappen, H.Th., 1984. The landforms of the western Makgadikgadi basin in northern Botswana,
with consideration of the chronology of the evolution of Lake Palaeo-Makgadikgadi. Zeitschrift fur
Geomorphologie 1, 1–19 (N.F.Bd28. Heft).
D’Odorico, P., Porporato, A., 2006. Soil moisture dynamics in water-limited ecosystems. In: D’Odorico, P.,
Porporato, A. (Eds.), Dryland Ecohydrology. Springer, Berlin, pp. 31–46.
Dougill, A.J., Heathwaite, A.L., Thomas, D.S.G., 1998. Soil water movement and nutrient cycling in semi-arid
rangeland: vegetation change and system resilience. Hydrological Processes 12, 443–459.
Edlefson, N.E., Anderson, A.B.C., 1943. Thermodynamics of soil moisture. Hilgardia 15, 31–298.
Feral, C.J.W., Epstein, H.E., Otter, L., Aranibar, J.N., Shugart, H.H., Macko, S.A., Ramontsho, J., 2003.
Carbon and nitrogen in the soil–plant system along rainfall and land-use gradients in southern Africa. Journal
of Arid Environments 54, 327–343.
Folk, R.L., Ward, W.C., 1957. Brazos River bar: a study in the significance of grain size parameters. Journal of
Sedimentary Petrology 27, 3–26.
Grove, A.T., 1969. Landforms and climate change in the Kalahari and in Ngamiland. Geographical Journal 135,
191–212.
Haddon, I.G., 2000. Kalahari Group Sediments. In: Partridge, T.C., Maud, R.R. (Eds.), The Cenozoic of
Southern Africa, Oxford Monographs on Geology and Geophysics, No. 40. pp. 73–87.
Hipondoka, M.H.T., Aranibar, J.N., Chirara, C., Lihavha, M., Macko, S.A., 2003. Vertical distribution of grass
and tree roots in arid ecosystems of Southern Africa: niche differentiation or competition? Journal of Arid
Environments 54, 319–325.
Hudak, A.T., Wessman, C.A., Seastedt, T.R., 2003. Woody overstorey effects on soil carbon and nitrogen pools
in South African savanna. Austral Ecology 28 (2), 173–181.
Huntsman-Mapila, P., Kampunzu, A.B., Vink, B., Ringrose, S., 2005. Cryptic indicators of provenance from the
geochemistry of the Okavango Delta sediments. Botswana. Sedimentary Geology 174, 123–148.
Huntsman-Mapila, P., Kampunzu, A.B., Vink, B., Ringrose, S., 2006. Geochemical record of water quality in the
sediments of Lake Ngami, NW Botswana: implications for Quaternary lake levels and climate change.
Quaternary International 148 (1), 51–64.
Jeltsch, F., Milton, S.J., Dean, W.R.J., Rooyen, N.V., Moloney, K.A., 1998. Modelling the impact of small-scale
heterogeneities on tree–grass coexistence in semi-arid savannas. Journal of Ecology 86, 780–793.
Jeltsch, F., Moloney, K., Milton, S.J., 1999. Detecting process from snapshot pattern: lessons from tree spacing in
the southern Kalahari. Oikos 85, 451–466.
Joshua, W.D., 1981. Physical Properties of the Soils of Botswana. Soil Mapping and Advisory Services, FAO/
UNDP/Government of Botswana, Gaborone, Botswana, 64pp.
Knoop, W.T., Walker, B.H., 1984. Interactions of woody and herbaceous vegetation in two savanna communities
at Nyesvley. Journal of Ecology 73, 235–253.
Koch, G.W., Scholes, R.J., Steffen, W.L., Vitousek, P.M., Walker, B.H., 1995. The IGBP terrestrial transects:
science plan, Report No. 36. International Geosphere–Biosphere Programme, Stockholm, 61pp.
Lancaster, N., 1986. Grain size characteristics of linear dunes in the southwestern Kalahari. Journal of
Sedimentary Petrology 56, 395–400.
Lancaster, N., 2000. Aeolian Deposits. In: Partridge, T.C., Maud, R.R. (Eds.), The Cenozoic of Southern Africa.
Oxford University Press, New York, pp. 73–87.
Leistner, O.A., 1967. The plant ecology of the southern Kalahari. Botanical Survey Memoir No. 38, 172pp.
McFarlane, M.J., Eckardt, F.D., 2004. The ‘transparent’ linear dunes of northwest Ngamiland, Botswana.
Botswana Notes and Records 36, 136–139.
MacGregor, A.N., Johnson, D.E., 1971. Capacity of desert algal crusts to fix atmospheric nitrogen. Soil Science
Society of America Proceedings 35, 843–844.
Noy-Meir, I., 1973. Desert ecosystems: environment and producers. Annual Review of Ecology and Systematics
4, 25–51.
Pardo, M.T., Ristori, L.P., D’Acqui, L.P., Almendros, G., 2003. An assessment of soil fertility and agronomic
constraints in southern African savannas: a case study of the Pandamatenga area, Botswana. South African
Geographical Journal 85, 35–41.
Privette, J.L., Tian, Y., Roberts, G., Scholes, R.J., Wang, Y., Caylor, K.K., Frost, P., Mukelabai, M., 2004.
Vegetation structure characteristics and relationships of Kalahari woodlands and savannas. Global Change
Biology 10, 281–291.

ARTICLE IN PRESSL. Wang et al. / Journal of Arid Environments 71 (2007) 259–279 279
Ravi, S., Zobeck, T.M., Over, T.M., Okin, G.S., D’Odorico, P., 2006. On the effect of moisture bonding forces in
air-dry soils on threshold friction velocity of wind erosion. Sedimentology 53, 597–609.
Ringrose, S., Matheson, W., Vanderpost, C., 1998. Analysis of soil organic carbon and vegetation cover trends
along the Botswana Kalahari Transect. Journal of Arid Environments 38, 379–396.
Ringrose, S., Huntsman-Mapila, P., Kampunzu, A.B., Matheson, W., Downey, W.S., Vink, B., 2002.
Geomorphological evidence for MOZ palaeo-wetlands in northern Botswana; implications for wetland
change. Presentation to Monitoring of Tropical and Sub-tropical Wetlands Conference, Maun, Botswana,
Published by HOORC and the University of Florida, Center for Wetlands /http://www.cfw.ufl.eduS.
Ringrose, S., Jellema, A., Huntsman-Mapila, P., Baker, L., Brubaker, K., 2006. Use of remotely sensed data in
the analysis of soil–vegetation changes along a drying gradient peripheral to the Okavango Delta, Botswana.
International Journal of Remote Sensing 26 (19), 4293–4320.
Rodriguez-Iturbe, I., D’Odorico, P., Porporato, A., Ridolfi, L., 1999. Tree–grass coexistence in savannas: the role
of spatial dynamics and climate fluctuations. Geophysical Research Letters 26 (2), 247–250.
Scanlon, T.M., Albertson, J.D., 2003. Inferred controls on tree/grass composition in a savanna ecosystem:
combining 16-year NDVI data with a dynamic soil moisture model. Water Resources Research 39 (8), 1224.
Schlesinger, W.H., Reynolds, J.F., Cunningham, G.L., Huenneke, L.F., Jarrell, W.M., Virginia, R.A., Whitford,
W.G., 1990. Biological feedbacks in global desertification. Science 247, 1043–1048.
Scholes, R.J., Walker, B.H., 1993. An African savanna. Cambridge University Press, Cambridge.
Scholes, R.J., Dowty, P.R., Caylor, K., Parsons, D.A.B., Frost, P.G.H., Shugart, H.H., 2002. Trends in savanna
structure and composition along an aridity gradient in the Kalahari. Journal of Vegetation Science 13,
419–428.
Scholes, R.J., Frost, P.G.H., Tian, Y., 2004. Canopy structure in savannas along a moisture gradient on Kalahari
sands. Global Change Biology 10, 292–302.
Schulze, E.D., Caldwell, M.M., Canadell, J., Mooney, H.A., Jackson, R.B., Parson, D., Scholes, R., Sala, O.E.,
Trimborn, P., 1998. Downward flux of water through roots (i.e. inverse hydraulic lift) in dry Kalahari sands.
Oecologia 115, 460–462.
Shugart, H.H., Macko, S.A., Lesolle, P., Szuba, T.A., Mukelabai, M.M., Dowty, P., Swap, R.J., 2004. The
SAFARI 2000 Kalahari Transect Wet Season Campaign of Year 2000. Global Change Biology 10, 273–280.
Skarpe, C., Bergstrom, R., 1986. Nutrient content and digestibility of forage plants in relation to plant phenology
and rainfall in the Kalahari. Journal of Arid Environments 11, 147–164.
Skarpe, C., Henriksson, E., 1986. Nitrogen fixation by cyanobacterial crusts and by associative-symbiotic bacteria
in Western Kalahari, Botswana. Arid Soil Research and Rehabilitation 1, 55–59.
St. Clair, L.L., Webb, B.L., Johansen, J.R., Nebeker, G.T., 1984. Cryptogamic soil crusts: enhancement of
seedling establishment in disturbed and undisturbed areas. Reclamation and Revegetation Research 3,
129–136.
Stokes, S., Thomas, D.S.G., Washington, R., 1997. Multiple episodes of aridity in southern Africa since the last
interglacial period. Nature 388, 154–158.
Swap, R.J., Aranibar, J.N., Dowty, P.R., Gilhooly, W.P., Macko, S.A., 2004. Natural abundance of 13C and 15N
in C3 and C4 vegetation of southern Africa: patterns and implications. Global Change Biology 10, 350–358.
Thomas, G.W., 1996. Soil pH and soil acidity. In: Bigham, J.M. (Ed.), Methods of Soil Analysis Part 3—
Chemical Methods. American Society of Agronomy Inc. and Soil Science Society of America Inc., Madison,
pp. 475–490.
Thomas, D.S., Shaw, P.A., 1991. The Kalahari Environment. Cambridge University Press, Cambridge, 284pp.
Thomas, D.S.G., Shaw, P.A., 1993. The evolution and characteristics of the Kalahari, southern Africa. Journal of
Arid Environments 25, 97–108.
Thomas, D.S.G., Shaw, P.A., 2002. Late Quaternary environmental change in central southern Africa: new data,
synthesis, issues and prospects. Quaternary Science Reviews 21, 783–797.
Thomas, D.S.G., Brook, G., Shaw, P., Bateman, M., Haberyan, K., Appleton, C., Nash, D., Mclaren, S., Davies,
F., 2003. Late Pleistocene wetting and drying in the NW Kalahari, an integrated study from the Tsodilo Hills,
Botswana. Quaternary International 104, 53–67.
Tucker, M.E., 2001. Sedimentary Petrology, third ed. Blackwell Science, Oxford, 262pp.
Williams, C.A., Albertson, J.D., 2004. Soil moisture controls on canopy-scale water and carbon fluxes in an
African savanna. Water Resources Research 40, W09302.
Walter, H., 1971. Ecology of Tropical and Subtropical Vegetation. Oliver and Boyd, Edinburgh, 539pp.
Zaady, E., Groffman, P., Shachak, M., 1998. Nitrogen fixation in macro- and microphytic patches in the Negev
desert. Soil Biology and Biochemistry 30, 449–454.
Copyright © 2022 FDOKUMEN