A hydrologic assessment of a saline-spring fen in the Athabasca oil sands region, Alberta, Canada -...
16
A hydrologic assessment of a saline-spring fen in the Athabasca oil sands region, Alberta, Canada – a potential analogue for oil sands reclamation Corey M. Wells* and Jonathan S. Price Dept. of Geography and Environmental Management, University of Waterloo, Waterloo, Ontario, N2L 3G1, Canada Abstract: Canada’s post-mined oil sands will have a higher concentration of salts compared with freshwater peatlands that dominate the landscape. While rare, naturally occurring saline wetlands do exist in Alberta’s Boreal Plains and may function as analogues for reclamation, however, little is known about their hydrology. This paper investigates the geochemical and hydrologic characteristics of a natural saline-spring peatland in Alberta’s oil sands region. The fen is located within a saline groundwater discharge area connected to the erosional edge of the Grand Rapids Formation. Na + (195–25,680 mgl 1 ) and Cl (1785–56,249 mg l 1 ) were the dominant salts, and the fen transitioned sharply to freshwater along its margins because in part of subsurface mineral ridges that restricted shallow groundwater exchange. Salinity decreased from hypersaline to brackish along the local groundwater flow path but no active spring outlets were observed over the two-year study. Vertical groundwater discharge was minimal because of the very low permeability of the underlying sediments. Subsurface storage was exceeded during periods of high flow, resulting in flooding and surface runoff that was enhanced by the ephemerally connected pond network. These findings have implications for reclamation, as mechanisms such as subsurface mineral ridges may function as effective saline groundwater-control structures in the post-mined environment. Incorporating saline wetlands into regional monitoring networks will help to better quantify natural discharge, which has implications for belowground wastewater storage related to in situ bitumen extraction. Copyright © 2015 John Wiley & Sons, Ltd. KEY WORDS wetland; salt; springs; water balance; oil sands; reclamation Received 30 September 2014; Accepted 10 April 2015 INTRODUCTION Open-pit mining, which involves the stripping and stockpiling of overburden to access the near-surface bitumen, is expected to affect roughly 2000 km 2 of the Boreal landscape within the Athabasca oil sands region (AOSR) once fully operational (Woynillowicz et al., 2005). Because of the nature of the regional geology and the bitumen extraction process, the post-mined landscape will have a much higher concentration of dissolved salts than it did prior to mining (Purdy et al., 2005; Trites and Bayley, 2009a). High concentrations of these ions may pose a serious challenge for wetland reclamation because of the adverse effects of salts on endemic wetland species (Renault et al., 1998; Apostol et al., 2004; Purdy et al., 2005; Pouliot et al., 2012). Consequently, saline wetlands that grow spontaneously or are built on the post-mined landscape will not support vegetation typical of ‘freshwater’ peatlands within the AOSR. With oil sands production expected to double in the present decade (ERCB, 2011), reclamation strategies will require a sound understanding of the form and function of saline wetlands in the post-mined landscape. Within the AOSR, wetlands comprise up to 65% of the landscape, the majority of which are fens (Andriashek, 2003; Devito et al., 2012). Extensive peatland complexes function as important water conservation and redistribu- tion mechanisms in the subhumid Boreal climate and comprise a massive pool of terrestrial carbon for Canada (Gorham, 1991; Devito et al., 2012). While treed and open freshwater fens make up the primary peatland classes within the AOSR, rare saline wetlands can be found throughout low-lying plains and river systems and may serve as appropriate reference analogues for reclamation (Grasby and Londry, 2007; Trites and Bayley, 2009a; Wells and Price, in review). Naturally saline wetlands exist worldwide under a variety of settings, the most common of which are coastal wetlands that receive inputs of salts through tidal action *Correspondence to: Corey M. Wells, Dept. of Geography and Environmental Management, University of Waterloo, Waterloo, Ontario, N2L 3G1. E-mail: [email protected] HYDROLOGICAL PROCESSES Hydrol. Process. (2015) Published online in Wiley Online Library (wileyonlinelibrary.com) DOI: 10.1002/hyp.10518 Copyright © 2015 John Wiley & Sons, Ltd.
Transcript of A hydrologic assessment of a saline-spring fen in the Athabasca oil sands region, Alberta, Canada -...
HYDROLOGICAL PROCESSESHydrol. Process. (2015)Published online in Wiley Online Library(wileyonlinelibrary.com) DOI: 10.1002/hyp.10518
A hydrologic assessment of a saline-spring fen in the Athabascaoil sands region, Alberta, Canada – a potential analogue for oil
sands reclamation
Corey M. Wells* and Jonathan S. PriceDept. of Geography and Environmental Management, University of Waterloo, Waterloo, Ontario, N2L 3G1, Canada
*CEnN2E-m
Co
Abstract:
Canada’s post-mined oil sands will have a higher concentration of salts compared with freshwater peatlands that dominate thelandscape. While rare, naturally occurring saline wetlands do exist in Alberta’s Boreal Plains and may function as analogues forreclamation, however, little is known about their hydrology. This paper investigates the geochemical and hydrologic characteristicsof a natural saline-spring peatland in Alberta’s oil sands region. The fen is located within a saline groundwater discharge areaconnected to the erosional edge of the Grand Rapids Formation. Na+ (195–25,680 mgl�1) and Cl� (1785–56,249 mg l�1) were thedominant salts, and the fen transitioned sharply to freshwater along its margins because in part of subsurface mineral ridges thatrestricted shallow groundwater exchange. Salinity decreased from hypersaline to brackish along the local groundwater flow pathbut no active spring outlets were observed over the two-year study. Vertical groundwater discharge was minimal because of thevery low permeability of the underlying sediments. Subsurface storage was exceeded during periods of high flow, resulting inflooding and surface runoff that was enhanced by the ephemerally connected pond network. These findings have implications forreclamation, as mechanisms such as subsurface mineral ridges may function as effective saline groundwater-control structures inthe post-mined environment. Incorporating saline wetlands into regional monitoring networks will help to better quantify naturaldischarge, which has implications for belowground wastewater storage related to in situ bitumen extraction. Copyright © 2015John Wiley & Sons, Ltd.
KEY WORDS wetland; salt; springs; water balance; oil sands; reclamation
Received 30 September 2014; Accepted 10 April 2015
INTRODUCTION
Open-pit mining, which involves the stripping andstockpiling of overburden to access the near-surfacebitumen, is expected to affect roughly 2000km2 of theBoreal landscape within the Athabasca oil sands region(AOSR) once fully operational (Woynillowicz et al.,2005). Because of the nature of the regional geology andthe bitumen extraction process, the post-mined landscapewill have a much higher concentration of dissolved saltsthan it did prior to mining (Purdy et al., 2005; Trites andBayley, 2009a). High concentrations of these ions maypose a serious challenge for wetland reclamation becauseof the adverse effects of salts on endemic wetlandspecies (Renault et al., 1998; Apostol et al., 2004; Purdyet al., 2005; Pouliot et al., 2012). Consequently, salinewetlands that grow spontaneously or are built on the
orrespondence to: Corey M. Wells, Dept. of Geography andvironmental Management, University of Waterloo, Waterloo, Ontario,L 3G1.ail: [email protected]
pyright © 2015 John Wiley & Sons, Ltd.
post-mined landscape will not support vegetation typicalof ‘freshwater’ peatlands within the AOSR. With oil sandsproduction expected to double in the present decade(ERCB, 2011), reclamation strategies will require a soundunderstanding of the form and function of saline wetlandsin the post-mined landscape.Within the AOSR, wetlands comprise up to 65% of the
landscape, the majority of which are fens (Andriashek,2003; Devito et al., 2012). Extensive peatland complexesfunction as important water conservation and redistribu-tion mechanisms in the subhumid Boreal climate andcomprise a massive pool of terrestrial carbon for Canada(Gorham, 1991; Devito et al., 2012). While treed andopen freshwater fens make up the primary peatlandclasses within the AOSR, rare saline wetlands can befound throughout low-lying plains and river systems andmay serve as appropriate reference analogues forreclamation (Grasby and Londry, 2007; Trites andBayley, 2009a; Wells and Price, in review).Naturally saline wetlands exist worldwide under a
variety of settings, the most common of which are coastalwetlands that receive inputs of salts through tidal action

C. M. WELLS AND J. S. PRICE
(Price and Woo, 1988; Mitsch and Gosselink, 2007).Saline marshes and peatlands are also common through-out North America’s interior, such as within the GreatPlains region, where salts accumulate over many yearswithin regional and local discharge zones (Harvey et al.,2007; van der Kamp and Hayashi, 2009; Heagle et al.,2013). In northern Alberta, saline-spring wetlands areoften found close to or along major river systems, wheregroundwater discharges to the surface throughsubcropping or exposed Paleozoic rocks (Hitchon et al.,1969; Timoney and Lee, 2001; Grasby, 2006; Jasechkoet al., 2012). In some cases, these wetlands can be foundfar removed from riverbanks, as was observed by Wellsand Price (in review), where a low flow discharge wetlandreceived its salts from a near-surface aquifer. Speciesrichness is often low and dominated by salt-tolerantvegetation, with typical peat-forming mosses such asSphagnum absent (Timoney and Lee, 2001; Trites andBayley, 2009a). These saline wetlands provide habitat fora variety of vegetation communities rare to northernAlberta, including samphire (Salicornia europaea),narrow reed grass (Calamagrostis stricta), seaside arrowgrass (Triglochin maritime), Nuttal’s salt meadow grass(Puccinellia nutalliana), and alkali marsh aster (Asterpauciflorus) (Timoney and Lee, 2001).Saline wetlands have been the focus of a number of
studies looking into the relationship between vegetationcommunities and their abiotic conditions both withinnatural and reclaimed settings (Timoney and Lee, 2001;Purdy et al., 2005; Trites and Bayley, 2009a,2009b).Yet, despite the fact that hydrology is a fundamentalcontrol on wetland biogeochemistry, little is knownabout the hydrologic function of these saline systems atthe site scale (Scarlett and Price, 2013; Phillips, 2013).With this in mind, the overall objective of this study wasto investigate the hydrologic and geochemical functionsof a natural-saline ecosystem that could be used as areference analogue for the saline post-mined landscape.Specific objectives are to (1) examine the source, storage,and transmission characteristics of a saline wetlandthrough an assessment of its water balance components;(2) characterize spatial and temporal patterns of salinity;and (3) identify key processes in natural-saline wetlandsthat can be used to improve land-use decisions in theAOSR, particularly in the post-mined reclamationsetting.
STUDY SITE
The saline fen (56°34’28.84" N, 111°16’38.39" W) islocated approximately 10 km south-southeast of theAOSR hub of Fort McMurray, Alberta, Canada (Figure 1).Cold winters and warm summers characterize the climate,with 30-year daily average temperatures of �18.8 °C in
Copyright © 2015 John Wiley & Sons, Ltd.
January to 16.8 °C in July (Environment Canada, 2012).Annual precipitation (P) is low (455mm), and themajority of annual P (65–75%) falls during the summergrowing season (May–September) as convective cellstorms with daily rainfall rates of >10mm (Smerdonet al., 2005; Devito et al., 2012; Environment Canada,2012). Potential evapotranspiration is high (annualaverage of 520mm) and exceeds P for most years,creating a long-term water deficit that is satisfied byinfrequent wet years that occur on a 10- to 15-year cycle(Ferone and Devito, 2004; Petrone et al., 2007).The fen lies at approximately 400 m.a.s.l within the
McMurray lowlands subdivision of the Dover Plains, arelatively flat region characterized by widespread andcontinuous organic deposits (Andriashek, 2003). Glacialsediment is relatively thin around the study area (15–20m)and overlies Cretaceous shale and sandstones of theClearwater and bitumen bearing McMurray formations(Value Creations Inc., 2012).The saline fen covers an area of approximately 27ha,
with a large pond network comprising ~19% of the fensurface. The fen’s surface elevation declines northwardand is characterized by a steeper gradient in the south(0.6% slope) that transitions into a gently sloping plain inthe north half of the fen (0.2% slope) (Figure 2). Thevegetation composition of the saline fen containscharacteristic salt-tolerant vascular and non-vascular plantspecies. The dominant vegetation includes sweetgrass(Hierochloehirta ssp. arctica) around the outer fringe,narrow reed grass (C. stricta) and foxtail barley(Hordeum jubatum) in the ridges, seaside arrow grass(T.maritima) and redwool plantain (Plantago eriopoda)in the inter-ridge depressions, and samphire (Salicorniarubra) in the salt flats and pools. Patches of birch(Betula spp.) and willow (Salix spp.) are found alongthe fen’s outer margins and in low-salinity zones in thenorth half of the fen. Stands of black spruce (Piceamariana) and tamarack (Larix laricina) also occuralong the margins which transition sharply into non-saline forested bog and/or fen peatlands. No significantmoss cover is present in the main portions of the fenwhere there is elevated salinity (Borkenhagen, pers.comm.).
METHODS
Groundwater
Nests of wells and piezometers (2.5-cm inner diameterpolyvinyle chloride) were installed in four transectsacross the fen and into adjacent wetlands (30 total nests;Figure 1) using hand augers. Each nest consisted of aslotted well and between 2 and 5 piezometers (17-cmslotted screens covered in well sock). Pipes were
Hydrol. Process. (2015)

Figure 1. Map of the Saline Fen with site topography and location within Alberta on insets. Note the location of the future steam assisted gravitydrainage (SAGD) facility just east of the fen. Vertical legend to the left of the map divides the site into three distinct sections that are referred to as such
throughout the text
HYDROLOGY OF A SALINE PEATLAND IN ALBERTA
measured manually at least once per week between Juneand September in 2011, and April and September in 2012.Continuous water level measurements were made at twowells located in the north and south ends of the primarytransect (A–A’, Figure 1) using pressure transducers. Atthe end of each study season, fen topography and pipe topelevations were measured and referenced to sea level usinga dual-frequency survey-grade global positioning system.
Copyright © 2015 John Wiley & Sons, Ltd.
Horizontal saturated hydraulic conductivities were mea-sured in the field using bail tests for 30 piezometers in peatand 11 piezometers in the underlying till using the methodof Hvorslev (1951). For shallow peat (<50cm), themodified cube method was used (Beckwith et al., 2003).The vertical and horizontal fluxes of groundwater to
and from the peatland were calculated using Darcy’s Law(Freeze and Cherry, 1979) as
Hydrol. Process. (2015)
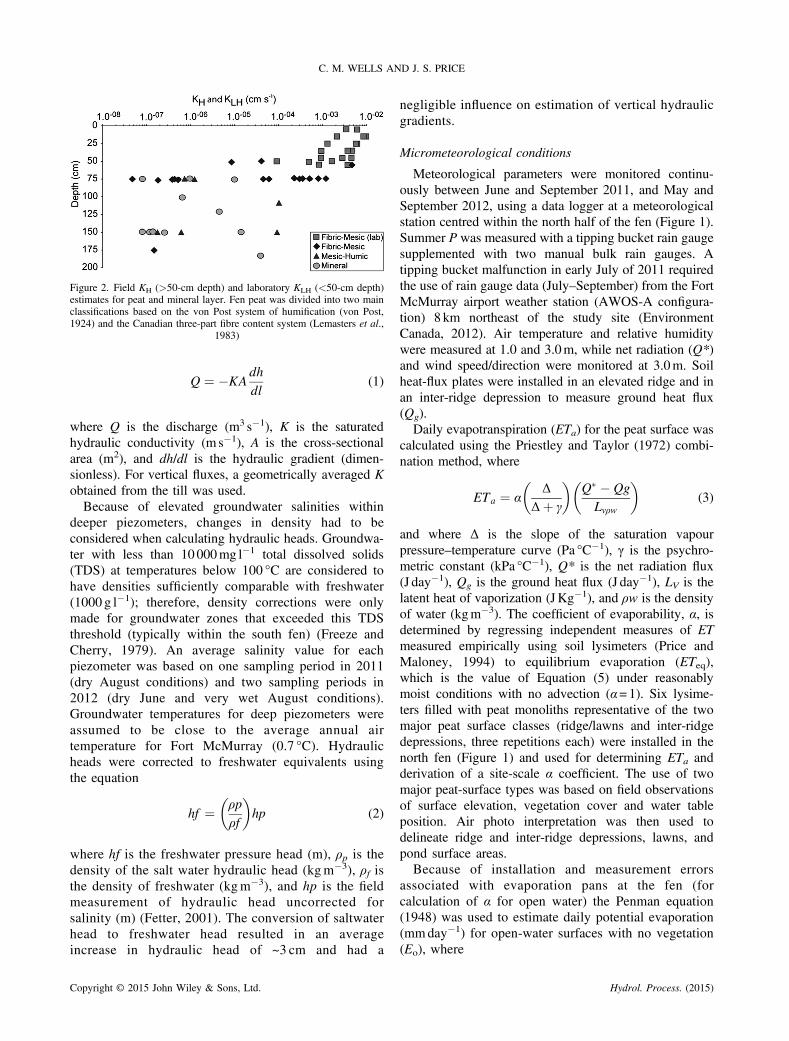
Figure 2. Field KH (>50-cm depth) and laboratory KLH (<50-cm depth)estimates for peat and mineral layer. Fen peat was divided into two mainclassifications based on the von Post system of humification (von Post,1924) and the Canadian three-part fibre content system (Lemasters et al.,
1983)
C. M. WELLS AND J. S. PRICE
Q ¼ �KAdh
dl(1)
where Q is the discharge (m3 s�1), K is the saturatedhydraulic conductivity (m s�1), A is the cross-sectionalarea (m2), and dh/dl is the hydraulic gradient (dimen-sionless). For vertical fluxes, a geometrically averaged Kobtained from the till was used.Because of elevated groundwater salinities within
deeper piezometers, changes in density had to beconsidered when calculating hydraulic heads. Groundwa-ter with less than 10000mg l�1 total dissolved solids(TDS) at temperatures below 100 °C are considered tohave densities sufficiently comparable with freshwater(1000 g l�1); therefore, density corrections were onlymade for groundwater zones that exceeded this TDSthreshold (typically within the south fen) (Freeze andCherry, 1979). An average salinity value for eachpiezometer was based on one sampling period in 2011(dry August conditions) and two sampling periods in2012 (dry June and very wet August conditions).Groundwater temperatures for deep piezometers wereassumed to be close to the average annual airtemperature for Fort McMurray (0.7 °C). Hydraulicheads were corrected to freshwater equivalents usingthe equation
hf ¼ ρpρf
� �hp (2)
where hf is the freshwater pressure head (m), ρp is thedensity of the salt water hydraulic head (kgm�3), ρf isthe density of freshwater (kgm�3), and hp is the fieldmeasurement of hydraulic head uncorrected forsalinity (m) (Fetter, 2001). The conversion of saltwaterhead to freshwater head resulted in an averageincrease in hydraulic head of ~3 cm and had a
Copyright © 2015 John Wiley & Sons, Ltd.
negligible influence on estimation of vertical hydraulicgradients.
Micrometeorological conditions
Meteorological parameters were monitored continu-ously between June and September 2011, and May andSeptember 2012, using a data logger at a meteorologicalstation centred within the north half of the fen (Figure 1).Summer P was measured with a tipping bucket rain gaugesupplemented with two manual bulk rain gauges. Atipping bucket malfunction in early July of 2011 requiredthe use of rain gauge data (July–September) from the FortMcMurray airport weather station (AWOS-A configura-tion) 8 km northeast of the study site (EnvironmentCanada, 2012). Air temperature and relative humiditywere measured at 1.0 and 3.0m, while net radiation (Q*)and wind speed/direction were monitored at 3.0m. Soilheat-flux plates were installed in an elevated ridge and inan inter-ridge depression to measure ground heat flux(Qg).Daily evapotranspiration (ETa) for the peat surface was
calculated using the Priestley and Taylor (1972) combi-nation method, where
ETa ¼ αΔ
Δþ γ
� �Q� � Qg
Lvρw
� �(3)
and where Δ is the slope of the saturation vapourpressure–temperature curve (Pa °C�1), γ is the psychro-metric constant (kPa °C�1), Q* is the net radiation flux(J day�1), Qg is the ground heat flux (J day�1), LV is thelatent heat of vaporization (JKg�1), and ρw is the densityof water (kgm�3). The coefficient of evaporability, α, isdetermined by regressing independent measures of ETmeasured empirically using soil lysimeters (Price andMaloney, 1994) to equilibrium evaporation (ETeq),which is the value of Equation (5) under reasonablymoist conditions with no advection (α=1). Six lysime-ters filled with peat monoliths representative of the twomajor peat surface classes (ridge/lawns and inter-ridgedepressions, three repetitions each) were installed in thenorth fen (Figure 1) and used for determining ETa andderivation of a site-scale α coefficient. The use of twomajor peat-surface types was based on field observationsof surface elevation, vegetation cover and water tableposition. Air photo interpretation was then used todelineate ridge and inter-ridge depressions, lawns, andpond surface areas.Because of installation and measurement errors
associated with evaporation pans at the fen (forcalculation of α for open water) the Penman equation(1948) was used to estimate daily potential evaporation(mmday�1) for open-water surfaces with no vegetation(Eo), where
Hydrol. Process. (2015)
HYDROLOGY OF A SALINE PEATLAND IN ALBERTA
E0 ¼ ΔQ� þ γLvρwKEva e�a � eaf gLvρw Δþ γf g (4)
and where Δ is the slope of the saturation vapourpressure versus temperature relationship at the ambientair temperature (kPa °C�1), KE is the mass transfercoefficient (kPa�1) (Dingman, 2002), va is the velocityof air (m day�1), e*a is the saturation vapour pressure atambient air temperature (kPa�1), and ea is the watervapor pressure (kPa�1). Estimates of ETa for peat andE for open water were then fractionally weightedbased on their aerial coverage and summed to obtain asite-scale estimation of daily ET for the entire fen.Because of the flooding in 2012, the fractionalweighting of the peat and pond surface classes wereadjusted to account for the increase in open-watersurface at the fen.
Geochemistry & soil physical parameters
Groundwater was sampled from each piezometer inJuly of 2011, and in June and August of 2012, whilepond-surface water samples were obtained only in 2012(both June and August) from selected ponds and pools.Piezometers were purged before sampling and ground-water samples were extracted using clear flexible PVCtubing connected to a foot valve rinsed with distilledwater prior to each use. Unstable parameters (pH,temperature, electrical conductivity (EC)) were obtainedin situ by a handheld device (YSI 63m) calibrated beforeeach day. Electrical conductivity measurements werecorrected in the field to 25°C. Major ions were collectedand frozen before laboratory analyses at the Universityof Waterloo. Samples were passed through a 0.45-μmfilter, and saline samples were diluted before analyses.Alkalinity was determined using automated spectropho-tometric analyses. Cations were measured by inductive-ly coupled plasma-optical emission spectrometry, while
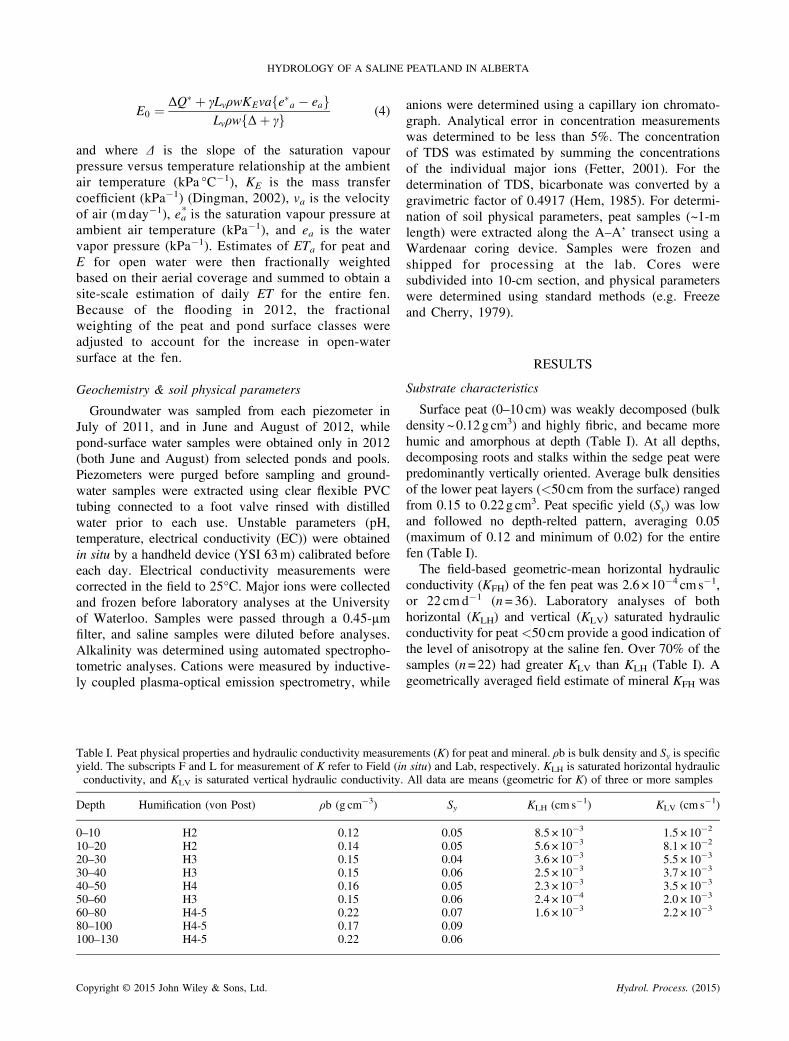
Table I. Peat physical properties and hydraulic conductivity measureyield. The subscripts F and L for measurement of K refer to Field (inconductivity, and KLV is saturated vertical hydraulic conductivity.
Depth Humification (von Post) ρb (g cm�3)
0–10 H2 0.1210–20 H2 0.1420–30 H3 0.1530–40 H3 0.1540–50 H4 0.1650–60 H3 0.1560–80 H4-5 0.2280–100 H4-5 0.17100–130 H4-5 0.22
Copyright © 2015 John Wiley & Sons, Ltd.
anions were determined using a capillary ion chromato-graph. Analytical error in concentration measurementswas determined to be less than 5%. The concentrationof TDS was estimated by summing the concentrationsof the individual major ions (Fetter, 2001). For thedetermination of TDS, bicarbonate was converted by agravimetric factor of 0.4917 (Hem, 1985). For determi-nation of soil physical parameters, peat samples (~1-mlength) were extracted along the A–A’ transect using aWardenaar coring device. Samples were frozen andshipped for processing at the lab. Cores weresubdivided into 10-cm section, and physical parameterswere determined using standard methods (e.g. Freezeand Cherry, 1979).
RESULTS
Substrate characteristics
Surface peat (0–10 cm) was weakly decomposed (bulkdensity ~0.12g cm3) and highly fibric, and became morehumic and amorphous at depth (Table I). At all depths,decomposing roots and stalks within the sedge peat werepredominantly vertically oriented. Average bulk densitiesof the lower peat layers (<50 cm from the surface) rangedfrom 0.15 to 0.22g cm3. Peat specific yield (Sy) was lowand followed no depth-relted pattern, averaging 0.05(maximum of 0.12 and minimum of 0.02) for the entirefen (Table I).The field-based geometric-mean horizontal hydraulic
conductivity (KFH) of the fen peat was 2.6 ×10�4 cm s�1,or 22 cmd�1 (n= 36). Laboratory analyses of bothhorizontal (KLH) and vertical (KLV) saturated hydraulicconductivity for peat <50 cm provide a good indication ofthe level of anisotropy at the saline fen. Over 70% of thesamples (n=22) had greater KLV than KLH (Table I). Ageometrically averaged field estimate of mineral KFH was
ments (K) for peat and mineral. ρb is bulk density and Sy is specificsitu) and Lab, respectively. KLH is saturated horizontal hydraulicAll data are means (geometric for K) of three or more samples
Sy KLH (cm s�1) KLV (cm s�1)
0.05 8.5 × 10�3 1.5 × 10�2
0.05 5.6 × 10�3 8.1 × 10�2
0.04 3.6 × 10�3 5.5 × 10�3
0.06 2.5 × 10�3 3.7 × 10�3
0.05 2.3 × 10�3 3.5 × 10�3
0.06 2.4 × 10�4 2.0 × 10�3
0.07 1.6 × 10�3 2.2 × 10�3
0.090.06
Hydrol. Process. (2015)

C. M. WELLS AND J. S. PRICE
found to be 5.5 ×10�7 cm s�1, or 0.05 cm d�1 (n=11).Spatially, mineral KFH varied between 10�5 and10�8 cm s�1, with the highest KFH observed in the high-salinity zones in the fen’s southern section (Figure 2).
Rainfall and evapotranspiration
During the 2011 study, between June and mid-September, 192mm of rain fell compared with 333mmin 2012 for the same period (Figure 3). In 2011, monthlyrainfall totals were all below the long-term average for theFort McMurray region, while the extended 2012 studyseason saw a total of 366mm of rain between 1 April and17 September. The most significant contribution occurredin July, when 40% (152mm) of the study’s total rainfalloccurred.The areal average daily ETa rate for the fen peat
surface in 2011 was 2mm (maximum 5mmd�1) based
Figure 3. Micrometeorological conditions (P and ETsite) and water table eleva2012 study seasons. Well locations can be found in Figure 1. The dashed hor
lines bracket the water balanc
Copyright © 2015 John Wiley & Sons, Ltd.
on a site-scale α coefficient of 0.75 for peat (Table II,Figure 3). Calculated ETa losses from peat were greatestin the ridge/lawns, totaling 223mm compared with185mm for the inter-ridge depressions despite anequivalent average ETa (Table II). Eo from the pondnetwork totaled 368mm for the season (Table II). For theentire fen, including all peat surface classes and the pondnetwork, ETsite totaled 236mm between 1 June and 17September. Taking into account an unusually dry springin 2012, the areal average daily ETa rate for the peat was2mm, with a maximum of 5mm in early July. Unlike2011, ETa was greatest in the inter-ridge depressions(406mm) compared with the ridge/lawns (380mm)(Table II). Total Eo from the pond network was526mm between 1 April and 17 September (Table II).The aerially weighted total ETsite for the entire fen in2012 was 421mm between 1 April and 17 September.
tions for the north (a) and south (b) portions of the fen during the 2011 andizontal lines on the hydrographs represent the peat surface. Dashed verticale period calculated in 2012
Hydrol. Process. (2015)

Table II. Percent cover, α values for ETa, Eo for ponds and ETa for each peat-surface type along with a site-scale seasonal ETsite rate forthe entire saline fen. 2011 values are from 1 June to 17 September (108 days), and 2012 is from 1 April to 17 September (170 days).
Values of ET have been rounded to the nearest mm to account for uncertainty in methods
Inter-ridge depressions Ridge/lawn Ponds
% Total Cover 33 48 192011 α† 0.63 0.81
ETa and Eo (mmd�1) 2 2 3Total ETa and Eo (mm) 185 223 368Seasonal ETsite (mm)a 236
2012 α† 1.06 1.00ETa and Eo (mmd�1) 2 2 3Total ETa and Eo (mm) 406 380 526Seasonal ETsite (mm)a 421
† Calculated only for peat
HYDROLOGY OF A SALINE PEATLAND IN ALBERTA
Groundwater and wetland connectivity
In 2011, the water table rose rapidly throughout the fenduring the wet early summer period in June then declinedgradually for the remainder of the summer season(Figure 3). A small but gradual rise in water tableoccurred between late December and early February, andthis was followed by a stable water table regime up untilthe 2012 spring freshet in late March, where snowmeltreplenished the winter storage deficit. Over 40% of thetotal rainfall for the 2012 study season fell during themonth of July, satisfying the spring storage deficitdeveloped in May. A shift in the hydrologic regimebetween the north and south sections of the fen can beseen after this point, with the water table in the north fenpersisting mostly above the peat surface for the remainderof the season (Figure 4). In the south, these floodingevents were episodic and followed by a rapid decline inwater table.
Figure 4. A cross-sectional profile of the fen along the primary A–A’ transefigure. (•) indicate the location of piezometer intakes while (?) refer to locatio
represent typical water table elevations under dry (1
Copyright © 2015 John Wiley & Sons, Ltd.
Lateral subsurface flow patterns were consistentbetween years, and the overall topographic gradientdrove a south-to-north groundwater-flow regime(Figure 4). Along the primary transect (A–A’), dh/dlwere steepest (≥0.007) and more variable in the south fen(south of Lager Pond), with an average specific dischargerate of 2mmd�1. North of Lager Pond, dh/dl were alsostable between years (<0.004) and reflected the mildrelief, decreasing gradually towards the bog-fen marginwhere dh/dl reversed and groundwater between the fenand north bog converged (Figure 4). An average rate ofspecific discharge for the north fen peat was calculated as0.6mmd�1.Groundwater exchange between the saline fen and
surrounding wetlands was variable and sensitive to short-term weather changes; however, because of weak dh/dl,rates of specific discharge were typically no greater than2mmd�1. In the north fen (B–B’ transect), groundwater
ct. General fen boundaries are indicated by the legend along the top of thens where depth to mineral till is unknown. The two dashed horizontal lines5 June 2011) and wet (12 July 2012) conditions
Hydrol. Process. (2015)

C. M. WELLS AND J. S. PRICE
discharged into the adjacent-treed west fen for both studyseasons (Figure 5A, all dates), while along the eastmargin, ephemeral groundwater mounds typically imped-ed flow between wetlands (Figure 5A). In the south fen,water tables sloped towards the fen for both years(Figure 5B, all-dates). Groundwater mounding and flowreversals similar to the north fen were observed along thewestern margin of the C–C’ transect (Figure 5B, 25 June2012); during wet periods, these mounds were eliminated,initiating short lived (i.e. ~5 days) east-to-west flowthrough conditions (Figure 5B, 12 July 2012).For both years, vertical dh/dz were generally weak, and
strong spatial patterns were difficult to identify. However,because of the very low hydraulic conductivity of theunderlying sediment (geometric mean of 5.5×10�7 cms�1,minimum of 7.9×10�8 cms�1), the authors were cautiousin interpreting vertical flux patterns in greater detail becauseof possible inaccuracies in dh/dz calculations (e.g. piezom-eter time-lag errors in low hydraulic-conductivity substrates
Figure 5. Cross-sectional profile of the B–B’ in the north fen (a) and C–C’ tstudy seasons. General fen boundaries are indicated by the legend along the t
identifiers are located above each piezometer nest (e.g. NS180). N
Copyright © 2015 John Wiley & Sons, Ltd.
and issues with piezometer recharge post-sampling).Nevertheless, the weak dh/dz observed coupled with lowhydraulic-conductivity sediments resulted in estimates ofdeep-groundwater discharge and recharge that were negli-gible over the entire study. The pond network did not revealany active spring outlets or discharge mounds.
Pond–peatland dynamics
Pond stage was spatially and temporally variable overthe two-year study. While not directly measured in 2011,a steady summer decline in pond stage throughout the fenwas visually recorded. In 2012, pond stage graduallydeclined after the spring freshet (Figure 3) until a series ofhigh-intensity rain events in early July (day of year(DOY) 183-188, Figure 6). The majority of the pondsfilled completely, and in some cases, spilled over theirbanks, creating a large network of interconnected pondsand pools. During rain events, some ponds exhibited anincrease in stage that roughly matched the amount of
ransect in the south fen (b) with typical daily water table trends over bothop of the figure. (•) indicate the location of piezometer intakes, while nestote the difference in scales on the x-axis between cross-sections
Hydrol. Process. (2015)

Figure 6. Pond stage elevations during the 2012 study period. Ponds wereselected based on their position within the fen and can be found in
Figure 1. Pond stage was measured manually
HYDROLOGY OF A SALINE PEATLAND IN ALBERTA
rainfall for that period (e.g. 1 : 1 slope), while for otherponds, stage level increase exceeded precipitation depths.In some cases, pond stage continued to increase post rainevents (DoY 187-194, Figure 6).Pond–peatland interaction was studied in detail in 2012
by examining a 0.25 ha, irregularly shaped saline pond inthe south fen (Pilsner Pond, Figure 7). The pond’ssubsurface connection followed topography, receivingpeat groundwater along its southern (up-gradient) margins(mean dh/dl of �0.02, with �dh/dl indicating ground-water inflow) while supplying fen groundwater along itsnorthern (down-gradient) perimeter (mean dh/dl of 0.04).During wetting events, dh/dl along the pond’s southernmargins became steeper (mean dh/dl of �0.05 on DoY187) while an opposite trend was observed along itsnorthern margins (mean dh/dl of 0.02 on DoY 187).Groundwater interaction between the pond and peatlandwas dynamic, and complete flow reversals occurred in aslittle as 6 days during periods of low or intermittentrainfall.
Summary of water balance components
The water balance equation for the saline fen can bewritten as
P þ Gin þ Din –E –Gout –Dout ¼ ΔS þ ξ (5)
Copyright © 2015 John Wiley & Sons, Ltd.
where P is precipitation, Gin and Din are shallowhorizontal groundwater and deep vertical inflow, respec-tively; E is evapotranspiration; Gout and Dout are shallowhorizontal groundwater and deep vertical outflow,respectively; ΔS is change in storage; and ξ is theresidual error term. No surface runoff was observedbetween the fen and adjacent wetlands and thus is notincluded in the water balance equation.Precipitation (217mm) and water loss through evapo-
transpiration (280mm) were the largest components overthe water balance period (8 May 2012 to 9 August 2012).Subsurface connectivity between the saline fen andadjacent wetlands was minimal, with shallow groundwa-ter inflow and outflow comprising less than 1mm eachover the 94-day period. Estimates of both deep ground-water recharge (2mm) and discharge (5mm) were lowover the water-balance period because of the lowhydraulic conductivity of the underlying mineral layer.Change in storage (ΔS) was estimated using the Sy of thepeat and change in water table elevation (Δh), such thatΔS=ΔhSy. ΔS was estimated to be 3mm in the peat and18mm in the pools (Sy=1). Based on pool and peatsurface area, the net ΔS in the fen was approximately6mm and contrasts sharply with a negative ΔS calculatedas the residual of Equation (5), in this case, �59 mm. Anegative ΔS indicates that outputs exceeded inputsdespite flooding in the north fen and an estimated ΔSof 6mm, pointing to the possibility of an underestimationof inputs and overestimation of ET for this period.
Salinity patterns
Groundwater within peat (≥50 cm depth), theunderlying mineral sediment, and the entire pondnetwork was dominated by Na+ (195–25 680mg l�1)and Cl- (1785–56249mg l�1) and to a lesser extentSO4
2� (28–3080mg l�1) (Table III). In the north fen, Na+
and Cl- levels within the mineral sediments were higheron average than in the overlying peat, while this trend wasreversed in the south fen (Table III). A clear spatial trendof decreasing EC and major ion concentration wasobserved northward (Figure 8. and Table III). Near-surface EC (<50-cm depth) decreased from an average of39mScm�1 in the south fen to 19mScm�1 in the northfen, with the area around Lager Pond marking the generalboundary between brackish (<10000mg l�1 TDS) andsaline groundwater (>10 000mg l�1 TDS). In the southfen, ‘hotspots’ of elevated EC were observed(>30mScm�1). EC and major ion concentrations weremarkedly lower within the adjacent wetlands; however,the concentration of Na+ and Cl� increased dramaticallywithin the basal peat and underlying mineral sediment,most notably within the west fen (Table III). This trendwas not observed for the north bog, where HCO3
�
Hydrol. Process. (2015)

Figure 7. Pilsner pond–groundwater interactions over the 2012 study season. Pond stage and water table elevations were measured manually
C. M. WELLS AND J. S. PRICE
formed the dominant anion, followed by Ca2+ and Mg2+
as the dominant cations (Table III).
DISCUSSION
Hydrologic setting
The dynamic hydrologic and geochemical characteris-tics of the fen were largely a function of its configurationwithin the landscape. A saline plume originating from theerosional edge of the lower Cretaceous Grand RapidsFormation was identified as a probable source for theaccumulation of Na+ and Cl� salts at the surface (Wellsand Price, in review). Despite the fen’s proximity to asubsurface plume, deep-groundwater input was estimatedto be low because of the influence of an underlying low-conductivity mineral layer (Figure 2; Figure 5), and noactive discharge outlets were observed. However, it isunclear at the resolution of this study whether or notdiscrete spring outlets, diffuse seepage, or a combinationof the two are driving the discharge of saline water at thefen. Potential errors with the piezometer network resulted
Copyright © 2015 John Wiley & Sons, Ltd.
in many of the vertical dh/dz being discarded from theanalysis. Thus, the true magnitude of discharge may begreater than what was estimated during this study and mayrepresent a significant portion of inputs unaccounted for inthe water balance. Sandy lenses with hydraulic conductiv-ities several orders of magnitude greater than the siteaverage were identified underlying the peat in the southfen, which may dramatically increase the bulk hydraulicconductivity of the system (Sharp, 1984; Keller et al.,1988; Stephenson et al., 1988; Haldorsen and Kruger,1990; Hinton et al., 1993).Historically, variability in spring discharge has been
observed throughout the region, with rates fluctuating orstopping entirely for some springs over the last 100years(McKillop et al., 1992; Grasby and Londry, 2007). Someponds and high-salinity zones exhibited surface featuresassociated with once active spring seeps (e.g. microbialbiofabrics, Grasby and Londry, 2007), while preliminaryanalysis of microfossil assemblages in peat cores points todramatic shifts in salinity over time (Wells and Price, inreview; Volik, unpublished data). A period of lowgroundwater input at the fen may be indicative of the
Hydrol. Process. (2015)

Table III. Major ion and total dissolved solids concentrations for the saline fen (n= 48) and adjacent wetlands (n= 8) for the 2012 studyseason. Each wetland parameter is divided into peat (P) and mineral (M) substrates. Concentrations for each substrate type in the
adjacent wetlands comprise a maximum of three samples, and so only averages are provided. Alk is alkalinity. All concentrations arein mg l�1
Saline fen Adjacent wetlands
North fen South fen Pond West fen East bog North bog
P M P M P M P M P M
Cl Mean 5393 6943 26 338 17799 5668 306 10 543 335 3895 4 3Max 10 273 13 193 56 249 33 884 12 095Min 2647 2362 9491 4624 1785
HCO3� Mean 179 135 203 132 84 71 65 80 99 397 347
Max 391 241 627 318 129Min 20 34 40 61 52
SO42� Mean 80 96 1561 959 418 10 695 8 <1 3
Max 157 157 3080 2741 1590Min 28 43 512 277 48
Ca2+ Mean 183 243 721 534 150 24 650 30 157 36 22Max 262 435 1696 1235 515Min 127 132 231 88 48
Mg2+ Mean 493 147 407 301 73 9 330 9 94 17 14Max 2875 299 903 758 208Min 62 51 112 71 25
Na+ Mean 2307 3491 13 015 9090 2903 151 5148 167 1937 3 5Max 5285 6596 25 680 15 920 6474Min 108 1153 5534 2644 892
Alk Mean 147 111 166 108 69 59 54 65 81 325 285Max 321 197 514 261 105Min 16 28 33 50 42
TDS Mean 10 284 12 004 42 114 28 857 9254 535 17 399 620Max 16 327 20 801 87 708 54 361 20 947Min 4175 4220 17 463 8060 2825
HYDROLOGY OF A SALINE PEATLAND IN ALBERTA
sensitivity of the regional aquifer responsible for fendischarge to long-term drought and precipitation cycles(Winter and Rosenberry, 1998; Hayashi and Farrow,2014), which is supported by the fact that the BorealPlains region is currently in a long-term regional waterdeficit (Devito et al., 2012).
Water storage and transmission
A thin peat profile (Figure 4) combined with a low Sy(Table I) reduced the fen’s subsurface storage capacity,which was exceeded under periods of sustained rainfall(Figure 3). Water table fluctuations were exaggeratedacross the fen, most notably south of Lager Pond wherethe peat profile thinned and where the pond–pool networkwas most extensive (Figures 1 and 4). Flooding within thefen’s northern reaches was enhanced by its position in thelandscape and the ridge-dominated microtopography thatcollected and detained surface water. Steeper hydraulicgradients within the south fen supplied surface andsubsurface flow northward, and this flow was enhancedwhen the water table was elevated because of higherhydraulic conductivities within upper peat layers
Copyright © 2015 John Wiley & Sons, Ltd.
(Figures 2 and 4). In general, groundwater exchangewas minimal and often restricted by transient groundwatermounds that mirrored the underlying mineral substrate,creating bands of elevated water table along the fenmargins (Scarlett and Price, 2013) (Figures 4 and 5A andB). Groundwater exchange was sensitive to seasonal andshort-term weather changes, and in some cases, watertables sloped against surface topography during droughtconditions (Figure 5B, 7 June 2012), supporting thenotion that topographically derived catchment delineationmay be invalid in such settings (Devito et al., 2005).Similar to other studies, the ponds and pools became
interconnected during very wet periods and functioned asa drainage network for surface flow northward (Price andMaloney, 1994). Although not quantified in this study,these infrequent wetting events are likely important in theflushing and redistribution of solutes throughout the fen,and the actual magnitude of solute fluxes during theseevents warrants further exploration. The connectivity ofthe pond network was spatially variable, and followingrain events, some ponds filled rapidly then dried graduallyuntil the next wetting event, suggesting many are semi-
Hydrol. Process. (2015)

Figure 8. Near-surface groundwater salinity distributions for the fen in 2011 shown as contours of electrical conductivity. Note the location of the saline‘hot spots’ in the south fen
C. M. WELLS AND J. S. PRICE
permanent features that are sensitive to short-termweather changes. The influence of these open waterponds as water-loss features on fen hydrology is strong,as indicated by the high rates of evaporation for bothyears and the complete dry out of almost all ponds in2011 (Table II). While groundwater helped other pondsresist drying out completely as a result of seasonaldrought conditions and long-term water deficits typicalfor the region, these inputs were short-lived (Figure 7)(Smerdon et al., 2005; Devito et al., 2012). Thus, underperiods of high water stress, even large ponds fed by bothrainfall and groundwater can be susceptible to dry outwithin relatively short time-scales.
Water budget of a saline fen
The largest probable sources of error in the closure ofthe saline fen water balance were the calculation of site-scale ET and groundwater exchange. The Priestley andTaylor (1972) method for calculating ET is accurate towithin ±15% under ideal conditions, and error iscompounded by impacts related to the accuracy oflysimeter measurements (e.g. weighing errors) (Allenet al., 1991). Because of the remote nature of the site,extended periods of time elapsed between lysimeter
Copyright © 2015 John Wiley & Sons, Ltd.
measurements. A relatively small sample size could alsohave led to inaccurate estimations of ET at the fen forboth years, especially because seasonal variation couldnot be accounted for. Because the meteorological stationwas not located over or adjacent to a pond, factors that arenot representative of the true pond surface had to be usedfor the estimation open water evaporation; the influenceof pond storage both diurnally and seasonally was notaccounted for.The definition of pond surface area and an underesti-
mation of groundwater input likely contributed to theexaggerated negative ΔS term (–59mm) in the fen waterbalance. The large, irregularly shaped pond networkcould not be monitored entirely, and a fixed pond surfacearea of 19% was used for open water E, assuming pondswere at bank-full width. Consequently, pond E wasoverestimated during baseflow or drought conditionswhen many ponds began to dry up. Errors in estimatingshallow groundwater fluxes are large (as high as 70%,Ferone and Devito, 2004), and the calculation of marginground and surface water flux at the fen may have beenoversimplified. Flow zones with hydraulic conductivitiesgreater than what were estimated may have been missed,most notably during periods of elevated water table.Moreover, while surface runoff along the fen margins was
Hydrol. Process. (2015)

HYDROLOGY OF A SALINE PEATLAND IN ALBERTA
not observed, it is possible that some surface waterexchange occurred during periods of inundation. Theestimation of deep groundwater input through theunderlying mineral sediments may also have beenunderestimated because of the potential influence ofhigh-conductivity zones not captured by the piezometernetwork.
Salinity dynamics
Na and Cl dominated the ground and surface waterswithin the fen, consistent with other springs in the AOSRconnected to regional aquifers found within subcroppingDevonian-aged carbonate and Cretaceous formations(Hitchon et al., 1969; Grasby, 2006). Salinity (EC, Cl�,and Na+, Table III) was markedly higher than othernatural-saline wetlands observed in the region (Purdyet al., 2005; Trites and Bayley, 2009a,2009b). Whilenorth fen salinities compared more closely to what hasbeen observed in the natural-saline wetland setting, southof Lager Pond the concentration of dissolved salts wereproportional to the Na+�Cl� dominated high flow-brinesprings of the Fort McMurray and Wood Buffalo regions(Grasby and Londry, 2007). Despite such elevatedsalinities, the fen contained peat-forming plant assem-blages (e.g. T.maritime, P. eriopoda, and H. jubatum) thathave been shown to survive in oil sands process waterswith typically much lower salinities (Purdy et al., 2005;Trites and Bayley, 2009a). However, in the south fenwhere mean Cl- was over 20000mg l�1, a clear shift invegetation was observed and halophytes such asSalicornia and other non-peat forming vegetation com-prised a large portion of the landscape (Borkenhagen,unpublished data). In the context of vegetation establish-ment, the saline fen functions as a suitable referenceanalogue, with a natural spatial-salinity gradient thatprovides some indication to the upper limits of salinitythat can be expected before dramatic shifts to non-peatforming vegetation may occur in the post-mined setting.The spatial distribution of solutes at the fen is counter
to what would be interpreted by the local topographicgradient; elevated ground, and surface-water salinitiesoccur at the topographic high point of the fen. Whilevertical groundwater flux patterns through the underlyingtill are difficult to interpret, the overall model of focusedsaline-groundwater discharge south of Lager Pond, andthe re-distribution of saline groundwater northward issupported by the spatial patterns in ground and surfacewater geochemistry and the fen’s hydrogeologic position(Figure 8, Table III). The fen’s topographic gradientpromoted the lateral movement of groundwater north-ward, and the gradual reduction in slope north of LagerPond worked to retard subsurface flow where it is dilutedby precipitation (Figure 4). The steady northward
Copyright © 2015 John Wiley & Sons, Ltd.
migration of saline groundwater over time is supportedanecdotally by a successive southward decrease in blackspruce health along the local groundwater flow path;complete mortality has occurred for all trees within thefen, while trees towards the outermost margins showsymptoms of salt toxicity (Redfield, 2001). Along fenmargins near surface salinity was low, but within thebasal peat and underlying mineral layers of the adjacentwetlands salts increased dramatically. Additionally, highTDS concentrations were found along nearby tributaries(e.g. Salt Creek), and discharge features similar to the fenwere found throughout the study area (Wells and Price, inreview), suggesting that saline discharge plays a muchlarger role in groundwater quality in the region.
CONCLUSIONS AND IMPLICATIONS FOR OILSANDS RECLAMATION
The reclamation of peatlands within the post-minedsetting will be complicated by elevated ground andsurface-water salinities (Renault et al., 1998; CONRAD,1999; Purdy et al., 2005). Consequently, reclamationstrategies should focus on wetland designs that can adaptto high-salinity conditions and support salt-tolerantvegetation communities. The management of salt withinthe reclaimed landscape as a whole will also need to beconsidered. Although rare, saline wetlands do exist in theAOSR and serve as natural benchmarks by which wetlandreclamation plans can be compared.At the saline fen, the lack of peat-forming freshwater
vegetation (e.g. Sphagnum) combined with a dense andgenerally shallow peat profile reflects what can beexpected in the reclaimed wetland setting (Johnson andMiyanishi, 2008; Trites and Bayley, 2009a). The lowstorage potential of the peat enhanced the fen’s responseto rainfall causing flooding, which more closely mim-icked the shallow open-water marshes typical of currentreclamation prescriptions (Rooney and Bayley, 2011).Managers should consider the effect of peat propertiesand depth on reclamation design, as low storage canpotentially enhance the rapid transmission of water andsalts across landscapes. However, the flushing of salt isalso an important mechanism by which wetlands caneffectively manage salinity. The capacity of a constructedwetland to flush salts should influence their placementwithin the landscape, where ecosystems sensitive to saltshould be located away from the local flow path.Freshwater wetlands placed at the head of the watershedcan provide enhanced flushing potential by providing afreshwater source to the saline wetland below. As wasseen at the saline fen, a well-developed pond network canenhance this flushing potential during wet periods.However, reclamation managers should consider the
Hydrol. Process. (2015)

C. M. WELLS AND J. S. PRICE
susceptibility of open water features to drying. Aconnection to a groundwater source may preventcomplete drying but wetland–pond connectivity may bedifficult to predict in the subhumid Boreal climate.Belowground, the exchange of water between the
saline fen and adjacent wetlands was controlled in somecases by small mineral ridges running along the wetlandperimeter. Water table mounds formed as a result of theseridges effectively restricted groundwater exchange betweenthe saline fen and adjacent freshwater wetlands, creatingsharp boundaries between saline and non-saline wetlands.In situations where managers may need to limit thehydrologic connectivity between landscape units, such aswhen the placement of a reclaimed saline wetland beside afreshwater ecosystem cannot be avoided, subsurfacemineral ridges along wetland boundaries may function aseffective groundwater control structures. While the ex-change of saline groundwater was minimal across the salinefen boundary, high salinities within nearby streams andbasal peat and mineral layers of adjacent wetlandsthroughout the study area point to regional-scale salinedischarge that would otherwise not be apparent based onlandscape type and surface observations alone.Similar to other saline wetlands throughout northeast-
ern Alberta, the saline fen exhibited a distinct net-patterned microtopography built on a gradual slopingplain, both of which influenced the distribution of salts.Despite flooding within the fen’s lower reaches in 2012,runoff across the fen was minimal, because in part of thedamming effect of ridges and the large surface storagecapacity of the inter-ridge depressions. The rough surfacefeatures may serve as a self-limiting mechanism,developing over time as they detain surface waters whileslowing the conveyance of water northward and thus theoverall extent of the saline fen. In this way, total salinityis re-distributed within the wetland but retained within itsboundaries. While a general trend of decreasing salinitynorthward (down-gradient) was observed, the linkbetween hydrologic function and geochemistry was notalways clear. Obtaining a reliable estimate of deepgroundwater input was challenging because of the denseunderlying mineral sediments and difficulty in capturinglocally conductive zones accurately. This has implicationsfor in-situ operators storing wastewater within thesubsurface, as the potential for leakage and the upwardmigration of disposal fluids may be enhanced by thepresence of surface features such as springs (Carrigy andMcLaws, 1973; Hackbarth and Nastasa, 1979; Bachuet al., 1989; Gordon et al., 2002). The apparent difficultyin estimating groundwater input in systems underlain bylow permeability sediments may complicate the develop-ment of an accurate baseline for natural-saline discharge,which would be of considerable interest to in situoperators in the AOSR.
Copyright © 2015 John Wiley & Sons, Ltd.
The sharp salinity gradient observed at the fen, fromslightly brackish in its northern reach to hypersaline along itstopographic high, appears to parallel a shift to non-peatforming vegetation. Nevertheless, the fen supported herba-ceous species determined to be best suited to the saline post-mined environment despite ground and surface-watersalinities much higher than other natural-saline wetlandstargeted as analogues for oil sands reclamation (Purdy et al.,2005; Trites andBayley, 2009a). Field-based evidence of theupper limits of salt tolerance in the natural setting allowsreclamation managers to better gauge the trajectory ofwetland development in the post-mined environment.This study highlights the baseline hydrologic setting of
a saline wetland in the AOSR. Because of the likelihoodof increased salinity within the post-mined landscape,naturally saline wetlands constitute potential referenceanalogues for oil sands reclamation. Furthermore, becauseof the influence of salinity on ecosystem-water quality,features like the saline fen should be incorporated intomonitoring networks to better quantify the amount ofnaturally occurring saline discharge in the region.Developing an improved understanding of saline systemswill aid in the management of an important ecologicalresource while supporting reclamation strategies anddesign within the post-mined oil sands environment.
ACKNOWLEDGEMENTS
The authors wish to thankR.Andersen, J. Goetz, P.Macleod,S. Scarlett, S. Ketcheson, J. Sherwood, S. Brown, and E.Bocking for their assistance in the field. We gratefullyacknowledge funding from a grant to J.S. Price fromNSERC, co-funded by Suncor Energy Inc., Imperial OilResources Limited, and Shell Canada Energy. Data anddiscussion provided by Value Creations Inc. on the localhydrogeologic setting of the saline-fen study area is alsogreatly appreciated. The authors would also like to thank twoanonymous reviewers for their comments, which haveimproved the overall manuscript.
REFERENCES
Allen RG, Pruitt WO, Jensen ME. 1991. Environmental requirements oflysimeters. In Lysimeters for evapotranspiration and environmentalmeasurements, Allen RG, Howell TA, Pruitt WO, Walter IA, JensenME (eds). American Society of Civil Engineers: New York; 170–181.
Andriashek L. 2003. Quaternary geological setting of the Athabasca oilsands (in situ) area, northeast Alberta. Alberta Energy and UtilitiesBoard, EUB/AGS Geo-Note. 2002–03; 295.
Apostol KG, Zqiazek JJ, MacKinnon MD. 2004. Naphthenic acids affectplant water conductance but do not alter shoot Na+ and Cl�
concentrations in jack pine (Pinusbanksiana) seedlings. Plant and Soil263: 183–190.
Bachu S, Perkins EH, Hitchon B, Lytviak AT, Undershultz JR. 1989.Evaluation of effects of deep waste injection in the Cold Lake area,Alberta. Bulletin 60. Alberta Research Council; 64.
Hydrol. Process. (2015)

HYDROLOGY OF A SALINE PEATLAND IN ALBERTA
Beckwith CW, Baird AJ, Heathwaite AL. 2003. Anisotropy and depth-related heterogeneity of hydraulic conductivity in a bog peat. I:laboratory measurements. Hydrological Processes 17: 89–101.
Carrigy MA, McLaws IJ. 1973. Athabasca tar sands study. Theenvironmental impact of in-situ technology. Research Council ofAlberta. Edmonton, Alberta, Canada; 88.
CONRAD (Canadian Oil Sands Network for Research and Development).1999. Reclamation research and development strategy developmentsessions. Canadian Oil Sands Network for Research and DevelopmentEnvironmental Technical Planning Group, Alberta Research Council,Calgary, Canada.
Devito K, Creed IF, Fraser JD. 2005. Controls on runoff from a partiallyharvested aspen-forested headwater catchment, Boreal Plain, Canada.Hydrological Processes 19: 3–25.
Devito K, Mendoza C, Qualizza C. 2012. Conceptualizing watermovement in the boreal plains - implications for watershed reconstruc-tion. Synthesis report prepared for the Canadian Oil Sands Network forResearch and Development. Environmental and Reclamation ResearchGroup; 164.
Dingman SL. 2002. Physical hydrology, 2nd edition. Waveland Press:Illinois; 656.
Environment Canada. 2012. Canadian climate normal 1971–2000 stationdata. Government of Canada. http://climate.weather.gc.ca/climate_normals/index_e.html. (Accessed September 23, 2013)
ERCB. 2011. Alberta’s reserves and supply/demand outlook 2010–2020,ST98. Energy Resources and Conservation Board. Calgary, Alberta,Canada.
Ferone JM, Devito KJ. 2004. Shallow groundwater–surface waterinteractions in pond–peatland complexes along a Boreal Plainstopographic gradient. Journal of Hydrology 292: 75–95.
Fetter CW. 2001. Applied hydrogeology 4th edition. Prentice-Hall: NewJersey; 598.
Freeze RA, Cherry JA. 1979. Groundwater. Prentice-Hall: NewJersey; 604.
Gordon TM, Kokot SL, Parks KP. 2002. Guide to recent publications oninorganicwater-rock interactions relevant to deep-well wastewater disposalin carbonate-evaporite formations in the Athabasca Oil Sands Area. Alta.Energy and Utilities Board, EUB/AGS Special Report 52; 17.
Gorham E. 1991. Northern peatlands: role in the carbon cycle andprobable responses to climate warming. Ecological Applications 1:182–195.
Grasby SE. 2006. Brine springs of northern Alberta. In Potential forcarbonate-hosted lead-zinc Mississippi Valley-type mineralization innorthern Alberta and southern Northwest Territories, Geosciencecontributions, targeted geological survey of Canada, bulletin, vol. 591,Hannigan PK (ed). Geological Survey of Canada: Calgary, Alberta,Canada; 241–254.
Grasby SE, Londry KL. 2007. Biogeochemistry of hypersaline springssupporting a mid-continent marine ecosystem : an analogue for Martiansprings? Astrobiology 7: 662–683.
Hackbarth D,Nastasa N. 1979. The hydrogeology of theAthabascaOil SandsArea, Bulletin 98. Alberta Research Council, Alberta, Canada; 64.
Haldorsen S, Kruger J. 1990. Till genesis and hydrogeological properties.Nordic Hydrology 21: 81–94.
Harvey FE, Ayers JF, Gosselin DC. 2007. Ground water dependence ofendangered ecosystems: Nebraska’s eastern saline wetlands. Ground-water 45: 736–752.
Hayashi M, Farrow C. 2014. Watershed-scale response of groundwaterrecharge to inter-annual and inter-decadal variability in precipitation(Alberta, Canada). Hydrogeology Journal 22: 1825–1839.
Heagle D, Hayashi M, van der Kamp G. 2013. Surface-subsurface salinitydistribution and exchange in a closed-basin prairie wetland. Journal ofHydrology 478: 1–14.
Hem JD. 1985. The study and interpretation of the chemical characteristicsof natural water, 3rd Ed. Department of the Interior, US GeologicalSurvey; 264
Hinton MJ, Schiff SL, English MC. 1993. Physical properties governinggroundwater flow in a glacial till catchment. Journal of Hydrology 142:229–249.
Hitchon B, Levinson A, Reeder S. 1969. Regional variations of river watercomposition resulting from halite solution, Mackenzie River DrainageBasin, Canada. Water Resource Research 5: 1395–1403.
Copyright © 2015 John Wiley & Sons, Ltd.
Hvorslev MJ. 1951. Time lag and soil permeability in ground-waterobservations, Waterways Experimental Station, Bulletin 36. US ArmyCorps of Engineers, Vicksburg, Mississippi; 57.
Jasechko S, Gibson JJ, Birks SJ, Yi Y. 2012. Quantifying salinegroundwater seepage to surface waters in the Athabasca oil sandsregion. Applied Geochemistry 27: 2068–2076.
Johnson EA, Miyanishi K. 2008. Creating new landscapes andecosystems: the alberta oil sands. Annals of the New York Academyof Sciences 1143: 120–145.
Keller CK, van der Kamp G, Cherry JA. 1988. Hydrogeology of twoSaskatchewan tills, I. Fractures, bulk permeability, and spatialvariability of downward flow. Journal of Hydrology 101: 97–121.
Lemasters GS, Bartelli LJ, Smith MR. 1983. Characterization of organicsoils as energy sources. In Testing of peats and organic soils, ASTMSTP 820, Jarrett PM (ed). American Society for Testing and Materials:Michigan; 122–137.
McKillop WB, Patterson RT, Delorme LD, Nogrady T. 1992. The origin,physico-chemistry and biotics of sodium chloride dominated salinewaters of the western shore of Lake Winnipegosis, Manitoba. CanadianField Naturalist 106: 454–473.
Mitsch WJ, Gosselink JG. 2007. Wetlands, 4th edition. Wiley: New York;600.
Penman HL. 1948. Natural evaporation from open water, bare soil andgrass. Proceedings of the Royal Society of London. Series A:Mathematical and Physical Sciences 193: 120–145.
Petrone RM, Silins U, Devito KJ. 2007. Dynamics of evapotranspirationfrom a riparian pond complex in the Western Boreal Forest, Alberta,Canada. Hydrological Processes 21: 1391–1401.
Phillips T. 2013. Quantifying and characterizing evapotranspiration in asaline fen within the Western Boreal Plain, Fort McMurray, AB. M.Scthesis, Wilfred Laurier University; 127.
Pouliot R, Rochefort L, Graf MD. 2012. Impacts of oil sands processwater on fen plants: implications for plant selection in requiredreclamation projects. Environmental Pollution 167: 132–137.
Price JS, Maloney DA. 1994. Hydrology of a patterned bog-fencomplex in southeastern Labrador, Canada. Nordic Hydrology 25:313–330.
Price JS, Woo MK. 1988. Studies of a subarctic coastal marsh, I.Hydrology. Journal of Hydrology 103: 275–292.
Priestley CHB, Taylor RJ. 1972. On the assessment of surface heat fluxand evaporation using large-scale parameters. Monthly WeatherReview 100: 81–92.
Purdy B, Macdonald SE, Lieffers VJ. 2005. Naturally saline borealcommunities as models for reclamation of saline oil sands tailings.Restoration Ecology 13: 666–677.
Redfield EB. 2001. Tolerance mechanisms of black spruce(Piceamariana) seedlings exposed to saline oil sands tailings; M.Scthesis, University of Calgary; 89.
Renault Lait C, Zwiazek JJ, MacKinnon M. 1998. Effect of highsalinity tailings waters produced from gypsum treatment of oil sandstailings on plants of the boreal forest. Environmental Pollution 102:177–184.
Rooney R, Bayley S. 2011. Setting reclamation targets and evaluationprogress: submersed aquatic vegetation in natural and post-oil sandsmining wetlands in Alberta, Canada. Ecological Engineering 37(4):569–579.
Scarlett SJ, Price JS. 2013. The hydrological and geochemical isolation ofa freshwater bog within a saline fen in northeastern Alberta. Mires andPeat 12: 1–12.
Sharp JM. 1984. Hydrogeologic characteristics of shallow glacial driftaquifers in dissected till plains (North-Central Missouri). Groundwater22(6): 683–689.
Smerdon BD, Devito KJ, Mendoza CA. 2005. Interaction of groundwaterand shallow lakes on outwash sediments in the sub-humid Boreal Plainsof Canada. Journal of Hydrology 314: 246–262.
Stephenson DA, Fleming AH, Mickelson DM. 1988. The hydrogeology ofglacial deposits. In Hydrogeology, vol. 0-2, Back W, Rosenhein JS,Seaber PR (eds.). Geological Society of America Decade of NorthAmerican Geology: Boulder, CO; 301–314.
Timoney K, Lee P. 2001. String and net-patterned salt marshes: rarelandscape elements of Boreal Canada. Canadian Field-Naturalist 115:406–412.
Hydrol. Process. (2015)

C. M. WELLS AND J. S. PRICE
Trites M, Bayley SE. 2009a. Vegetation communities in continental borealwetlands along a salinity gradient: implications for oil sands miningreclamation. Aquatic Botany 91: 27–39.
Trites M, Bayley SE. 2009b. Organic matter accumulation in westernboreal saline wetlands: a comparison of undisturbed and oil sandswetlands. Ecological Engineering 35(12): 1734–1742.
Value Creations Inc. 2012. TriStar pilot project - application and projectdevelopment plan. Calgary, Alberta, Canada; 463.
van der Kamp G, Hayashi M. 2009. Groundwater-wetland ecosysteminteraction in the semiarid glaciated plains of North America.Hydrogeology Journal 17: 203–214.
von Post L. 1924. Das genetische System der organogenen BildungenSchwedens (The genetic system of the organogenic formations of
Copyright © 2015 John Wiley & Sons, Ltd.
Sweden). Memoires sur la nomenclature et la classification des sols287–304.
Wells CW, Price JS. In review. The hydrogeologic connectivity of a low-flow saline spring fen peatland within the Athabasca oil sands region,Canada. Hydrogeology Journal .
Winter TC, Rosenberry DO. 1998. Hydrology of prairie potholewetlands during drought and deluge: a 17-year study of thecottonwood lake wetland complex in north Dakota in perspective tolong term measured and proxy hydrological records. Climate Change40: 189–209.
Woynillowicz D, Severson-Baker C, Raynolds M. 2005. Oil sands fever:the environmental implications of Canada’s oil sands rush. ThePembina Institute: Alberta; 84.
Hydrol. Process. (2015)