The Extraction of Bitumen From Western Oil Sands
614
DE-Fg1-93MC30256-99 (5879) - -_. REC fF1WED 0 8-7- I JUN 19 898 The Extraction of Bitumen From Western Oil Sands Final Report November 26,1997 BY Alex G. Oblad; Donald A. Dahlstrom Milind D. Deo; John V. Fletcher Francis V. Hanson; Jan D. Miller J.D. Seader Work Performed Under Contract No.: DE-FC21-93MC30256 For U.S. Department of Energy Office of Fossil Energy Federal Energy Technology Center P.O. Box 880 Morgantown, West Virginia 26507-0880 BY University of Utah Department of Chemical and Fuels Engineering Department of Metallurgical Engineering Salt Lake City, Utah 841 12
-
Upload
khangminh22 -
Category
Documents
-
view
4 -
download
0
Transcript of The Extraction of Bitumen From Western Oil Sands

DE-Fg1-93MC30256-99 (5879) - -_.
REC fF1WED
0 8-7- I JUN 1 9 898
The Extraction of Bitumen From Western Oil Sands
Final Report November 26,1997
BY Alex G. Oblad; Donald A. Dahlstrom
Milind D. Deo; John V. Fletcher Francis V. Hanson; Jan D. Miller
J.D. Seader
Work Performed Under Contract No.: DE-FC21-93MC30256
For U.S. Department of Energy
Office of Fossil Energy Federal Energy Technology Center
P.O. Box 880 Morgantown, West Virginia 26507-0880
BY University of Utah
Department of Chemical and Fuels Engineering Department of Metallurgical Engineering
Salt Lake City, Utah 841 12
Disclaimer
This report was prepared as an account of work sponsored by an agency of the United States Government. Neither the United States Government nor any agency thereof, nor any of their employees, makes any warranty, express or implied, or assumes any legal liability or responsibility for the accuracy, completeness, or usefulness of any information, apparatus, product, or process disclosed, or represents that its use would not infringe privately owned rights. Reference herein to any specijic commercial product, process, or service by trade name, trademark, manufacturer, or otherwise does not necessarily constitute or imply its endorsement, recommendation, or favoring by the United States Government or any agency thereof. The views and opinions of authors expressed herein do not necessarily state or reflect those of the United States Government or any agency thereof.
DISCLAIMER
Portions of this document may be illegible in electronic image products~. Images are produced from the best available original document.

549 -__ -..
TWO-STAGE THERMAL RECOVERY OF BITUMEN USING HEAT PIPES
Principal Investigator: J.D. Seader Graduate Student: Charles J. Coronella Graduate Student: Atul S . Bhadkamkar Graduate Student: Kiran R. Khot
INTRODUCTION
In these days of plentiful fuel supplies, synthetic fuels are not in demand; but
with the current rate of consumption of oil the importance of synthetic fuels will only
increase. The United States currently imports 50% of its transportation fuel and such a
dependence could be potentially dangerous, as was evidenced by the 1973 Arab oil
embargo. Hence it is important to develop technologies that will make it economically
feasible to utilize reserves to produce synthetic fuels. Natural bitumen, which includes
materials commonly termed as tar sands, oil sands, or natural asphalt, is a significant
potential source of synthetic fuel and this work deals with optimizing the operation of a
thermally-coupled fluidized-bed tar sands extraction process.
Tar Sand Resources
The demonstrated resources of natural bitumen amount to about 2500 billion
barrels (181). Of these resources, about 90% is found in North America, mainly in
Alberta, Canada; 4% in South America, 2% in Russia; 1% in Europe; and small amounts
elsewhere. Figure 139 shows this distribution on a world map. In the United States the
resource in place is estimated to total about 42 billion barrels half of which is in Utah
550 ...
(52, 182-184). Ritzma and Campbell conducted one of the most detailed studies on Utah
tar sands (185). Table 50 shows the aerial extent, gross oil in place, and other important
reservoir properties of these deposits. The estimates of Table 50 have not changed
during the last decade, except for the Sunnyside deposit, which, due to drilling and
characterization, has been reported to contain 6.1 billiodbbls (186).
Bitumen Recovery Methods
Bitumen recovery processes can be generally classified into two types - in-situ
and ex-situ methods. The selection of a bitumen recovery process is dependent on the
nature of the bitumen, the properties of the sand substrate, and the geological and
topographical setting of the deposit (51). Ex-situ methods are possible if mining of the
deposit is economically feasible, which is the case if the ratio of the depth of the
overburden layer to the depth of the bitumen-impregnated layer is less than or equal to
unity.
The in-situ processes include:
1. Thermal processes:
. a) Cyclic Steaming,
b) Steam Flooding,
c) Hot Water Flooding,
d) In-situ Combustion and
2. Solvent processes.
All these processes involve introduction of some type of fluid or energy into the
tar sand reservoir to reduce the viscosity and mobilize the bitumen to a production well
(187). The temperature of the reservoir can be increased by injection of steam followed
by in-situ combustion or by other heating processes such as radio frequency radiation.
The advantages of these methods are that no mining is necessary and more total resource
can be recovered as compared to the ex-situ methods. Steamflooding accounts for three-
quarters of all Enhanced Oil Recovery @OR) production. Its success is attributed to the
low cost of steam. In-situ combustion processes have numerous operational problems
such as channeling, corrosion, and pumping problems. However they are used where
steamflooding is not applicable, for example in thin or dwp formations containing
medium gravity oil (188).
The ex-situ methods include:
1. Thermal,
2. Water-Assisted,
3. Solvent,
4. Combination of Water-Assisted and Solvent.
Thermal methods include. heating the tar sand to pyrolyze the nonvolatile
molecules and vaporize the volatile compounds. There is a loss of bitumen to gases and
coke, but this method is still desirable because the product is a synthetic oil ready to be
upgraded to a refinery feedstock. The water-assisted process depends upon the intense
mechanical shear forces to detach the bitumen from the sand particles. Chemical forces
are the primary separation mechanism in solvent extraction processes. Bitumen-solvent
separation, solvent recovery and tailings disposal determine the economics of this
process.

552
One of the ex-situ methods of extracting bitumen is by pyrolysis of tar sands in
fluidized-bed reactors. An energy-efficient process using two thermally coupled
fluidized beds has been developed, over the last several years, by researchers in the
Chemical Engineering Department at the University of Utah and is described by a
patent and several dissertations and theses (115-117, 189). A schematic diagram of the
process is presented in Figure 140. Crushed tar sand is fed to the first reactor, which
operates at 450 to 500OC and is fluidized by an inert gas such as nitrogen, by recycled
pyrolysis gas, or by steam. The bitumen pyrolyzes and cracks to lighter products that
are carried out with the fluidizing gas to a product recovery system where the
condensable oils are separated from the light gases. Part of the bitumen undergoes
condensation reactions to form a carbonaceous residue, called coke, which remains on
the sand. The coked sand is then passed into a second reactor, fluidized by air and
operating at 550 to 600OC, where the coke undergoes a first-stage combustion.
Vertically mounted heat pipes, extending into both the beds, transfer the heat evolved
during combustion to the endothermic pyrolysis reactor. Sand from the combustion
bed is then transferred to a third bed, fluidized or moving, where the remaining coke
is combusted. The hot spent sand is then passed through a heat recovery system.
The fraction of the original bitumen that is converted to condensable oils is
called the oil yield, and has been found to vary from 50 to 80% depending on the
operating conditions and the nature of the tar sand deposit. The operating conditions
that primarily influence the oil yield are the pyrolysis bed temperature and the average
residence time of the solids in the reactor. Different researchers, working with
different tar sands, have arrived at different conclusions regarding the optimum
operating conditions to maximize the oil yield. Dorius (51), working with the PR
Spring tar sand deposit, found an optimum pyrolysis temperature of 525OC whereas
Venkatesan (50) found that for Sunnyside tar sand feed the optimal value was about
450% Wang (114) found that the oil yield and the optimum temperature increased
with decreasing residence time over the range of 16 to 30 minutes. Clearly, much
more experimental data is required of various tar sands to reach any definite conclusion
about the optimum operating conditions.
An alternative approach to the determination of optimal operating conditions is
mathematical modeling and computer simulation of the operation of the coupled
fluidized bed process. Such a model must incorporate fluidization hydrodynamics,
heat and mass transfer, mass and energy balances, as well as the reaction kinetics and
stoichiometry of the pyrolysis and combustion reactions. An accurate model may then
be used to develop an optimum commercial design, cost estimate, and financial analysis
of the process to produce an upgraded refinery feedstock from tar sands.
Research Objectives
The objectives of the research during this reporting period were as follows:
1. Completion of the mathematical model for the coupled fluidized beds by adding: (a)
a submodel for the transfer of heat across the heat pipes, (b) an expression for the heat
of pyrolysis, and (c) a correlation for the transfer of heat to and from the fluidized beds
and the heat pipes. The model could then be used to solve the energy balance equations
554 I
for the reactor system, while accounting for heat input from an external energy source
or removal of excess heat from the system. Runs could then be conducted with the
model to predict yields of oil and determine optimal operating conditions for the reactors.
2. Experimental verification of the mathematical model. The model incorporates mass
transport, heat transport, hydrodynamic phenomena, and a novel pyrolysis network,
developed by Coronella (1994). The model predicts the light gas, coke, oil yields, and
oil density for a wide range of operating conditions. In this model it is found that oil
field depends primarily on two operating parameters, the pyrolysis bed temperature and
the average solids residence time. The reaction network in this model determines the
product yield and distribution; which can also be found experimentally, from the material
balance and simulated distillation runs. The model assumes certain physical
characteristics associated with the pseudo components in the reaction network, which can
be used to compare the results of the simulated distillation runs. The rate constants and
the reaction mechanism can then be modified so that the model approaches the observed
results. Experiments can also be used to justify or modify certain terms in the energy
balance used in the model. Finally, the experimental data points obtained for the oil
yield, gas yield and oil density as a function of the pyrolysis temperature and pyrolysis
residence time can be compared with the results obtained from the model.
3. Analysis of products from experimental runs. The liquid product analysis makes it
possible to determine the attractiveness of the synthetic oil as a refinery feedstock. The
liquid analysis includes the following properties: (a) specific gravity, @) viscosity, (c)
pour point, (d) Conradson carbon residue, (d) ash content, (e) simulated distillation and
( f ) sulfur content.
I
555
4. Determination of process control methods. Possible control objectives included the
following:
(a) Maximize the oil yield. It might be desirable to maximize the total amount of oil
produced or it might be desirable to maximize the amount of heavy or light oil or a
certain distribution of the heavy, medium and light oils.
(b) Minimize or produce a desired amount of light gases.
(c) Minimize the amount of heat used by making efficient use of heat pipes.
(d) Minimize production by maximizing feed rate, or minimizing residence time
(e) Minimize the amount of coke produced.
All these objectives can be incorporated into a cost function. This cost function is then
minimized, by an optimal control strategy using variational calculus, giving the optimal
path to be taken by the control variables.
556 ...
REVIEW OF PREVIOUS MODELING WORK
In spite of being one of the most researched areas of chemical engineering, the
various phenomena that take place in fluidized beds are not completely understood.
Most researchers would agree that there is no universally applicable model for the
various types of fluidization. Models for a gas-solid fluidized bed, which is the most
common type of fluidization, range from the simple 1-D models, where the properties
are assumed to vary only in the axial direction, to the more realistic, but highly
complicated and computationally intensive, 3-D models, where properties are
assumed to vary in all directions. The choice of model is dictated by the level of
accuracy desired and the limitations of the computer available.
In this study, a simple 1-D, two-phase model was selected for the reactors. A
brief overview of the model, the hydrodynamics, the mass transfer and the reaction
kinetics is presented below. Detailed description of the derivation and solution of the
fluidized-bed model is available elsewhere (1 18,190,191).
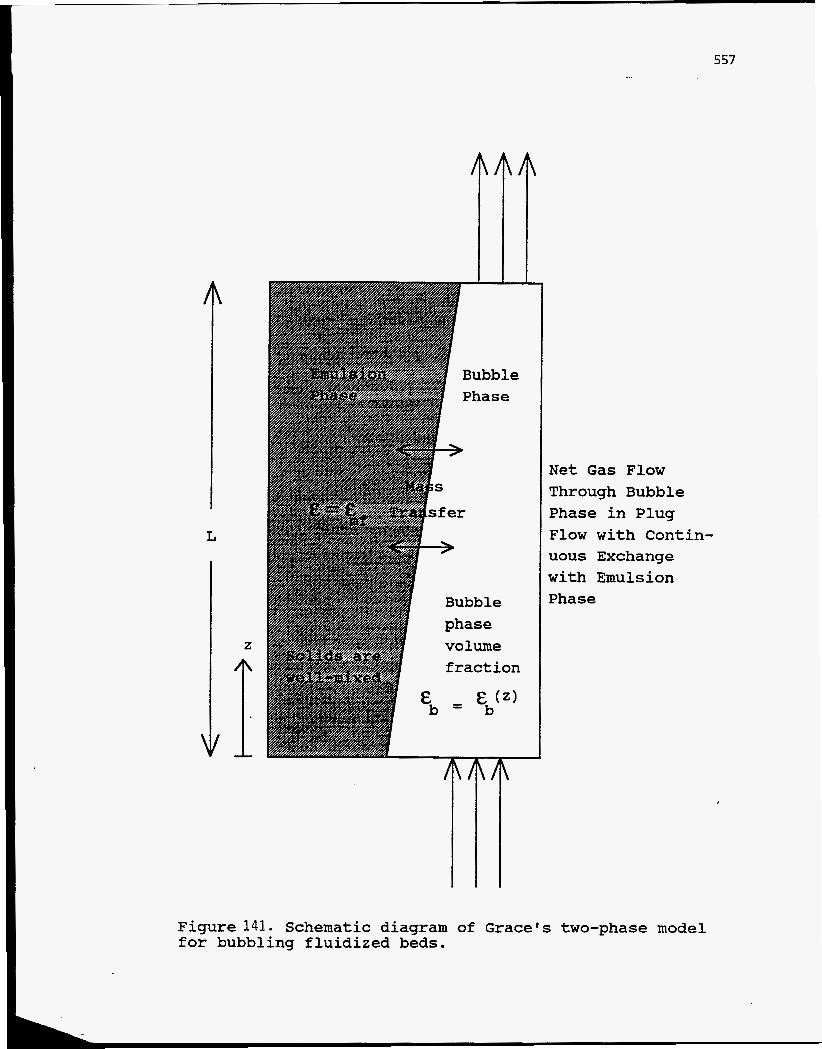
Fluidized bed model
The two-phase bubbling-bed model of Grace was adopted to model the
fluidization hydrodynamics and the mass balances of the gas phase species. The
model, shown schematically in Figure 141, assumes that: 1) the bed operates in the
bubbling regime; 2) the bed is made of two phases, a bubble phase containing very
few solids and a dense phase containing most of the solids; 3) the dense phase has a
constant void fraction corresponding to minimum fluidization (emf); 4) the solids are
well mixed in the bed; 5) the gas flows in plug flow through the bubble phase while
being exchanged continuously with the dense phase; 6) the bed operates isothermally,
and 7) properties vary only in the axial direction. In addition, bubble growth in the
bed is accounted for by Stubington's modified model (192) of Darton et al. (193):
L
\
Z
1' 1
Figure 141. Schematic diagram for bubbling fluidized beds.
T
Net Gas Flow Through Bubble Phase in Plug Flow with Contin- uous Exchange with Emulsion Phase
of Grace's two-phase model

db = 0.43(u - U ~ ) O . ~ ( Z + 0.4&) 0.8 g -0.2
With the assumptions stated above, a mass balance for a species in the bubble
phase gives
and in the dense phase
where Cb and Cd are the bubble-phase and dense-phase gaseous concentrations,
respectively, on a mass or molar basis. In Equation (39), the first term represents
convection, the second represents mass transfer between the bubble and dense phases,
and the last term represents chemical reaction. In Equations (39) and (40), the specific mass transfer area of the bubble, ab,
is equal to 6/db, while the interphase mass transfer coefficient, q, is evaluated by
the following correlation by Grace (194):
4 Di E , u, k, =- 3
The model assumes that the solid particles in the reactor are well-mixed and
therefore the particles leaving the reactor may be assumed to have a residence time
distribution (RTD)(195) given by
E(t) = = 1 exp( 7) t
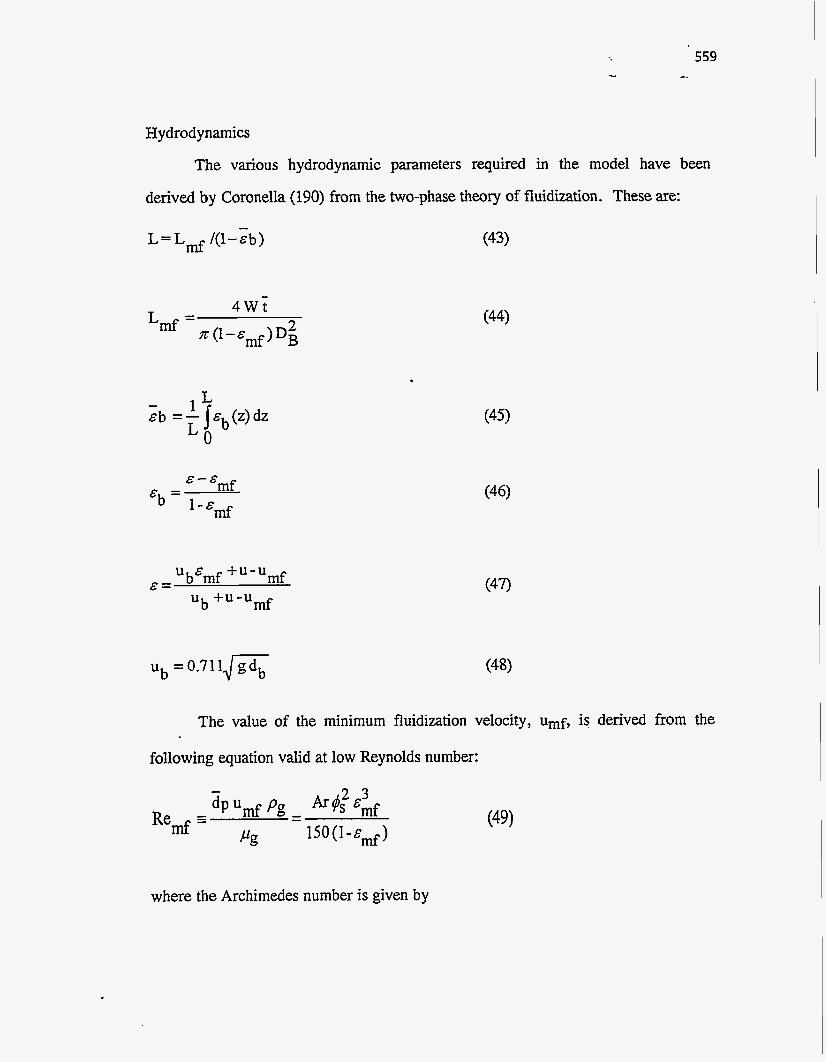
Hydrodynamics
The various hydrodynamic parameters required in the model have been
derived by Coronella (190) from the two-phase theory of fluidization. These are:
L=Ld /(l-ib) (43)
559 -.
mf Ub&mf + u - u E =
mf u + u - u b
= 0.71 14 g db Ub
(47)
The value of the minimum fluidization velocity, umf, is derived from the
following equation valid at low Reynolds number:
2 3 - dp 'rnf pg - - 4 4 Emf Red 3
& 1 5 0 ( 1 - ~ r n f )
where the Archimedes number is given by
(49)
560
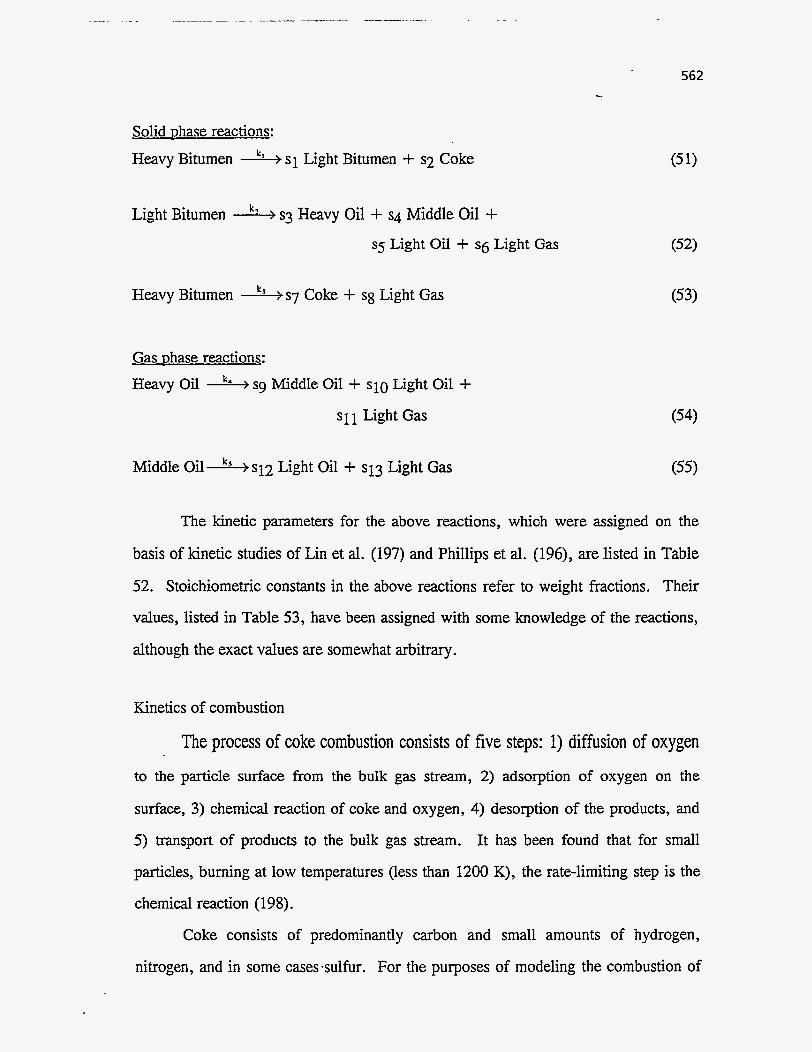
Pyrolysis reaction network and kinetics
Bitumen is made up of a large number of chemical compounds including
cross-linked hydrocarbon chains attached to aromatic groups. During pyrolysis, these
compounds undergo volatilization and cracking to form lighter products, including
light hydrocarbon gases. Since the number of cracking reactions taking place is very
large, bitumen pyrolysis is modeled by limiting the number of compounds and the
number of reactions to a small finite number.
Coronella (1 18) proposed a novel reaction network for the pyrolysis of tar-
sand bitumen, using pseudo-reactants and products to replace the actual chemical
species. The fundamental physical properties assigned to these pseudo-components
are listed in Table 51. Bitumen is said to be comprised of a light fraction, which
undergoes volatilization, and a heavy fraction that cracks to lighter products. The
products of pyrolysis are light gases, condensable oils, and a solid carbonaceous
residue called coke. Physical properties of ethylene are used to characterize the light gas product, although it consists of all volatile compounds up through nC5. The
liquid product is divided into light oil, middle oil, and heavy oil, as suggested by
Phillips et al. (196), and the boiling ranges, densities, etc., of these fractions
correspond approximately to those of the products of crude distillation. Any
unreacted bitumen and products residing on the sand, leaving the reactor, are
included in the coke since these cannot be recovered as products.
The pseudo-components described above have been incorporated into the
following network of first-order reactions to model the pyrolysis reactions.
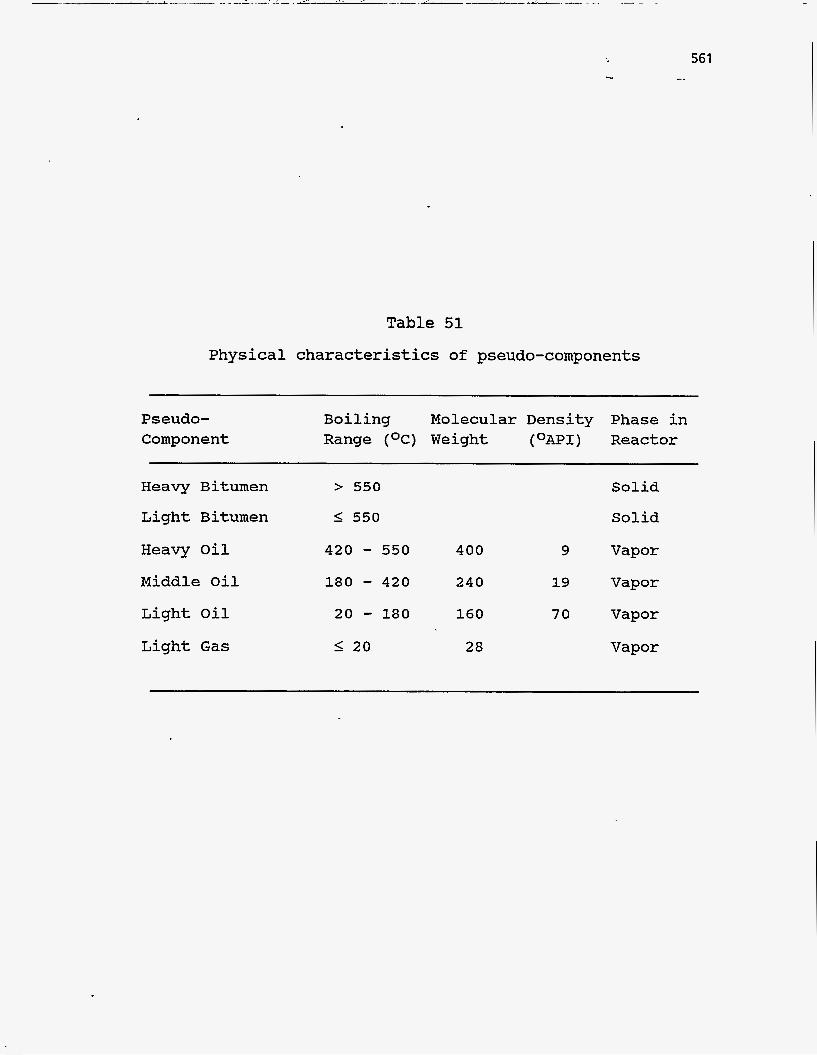
Table 51
Physical characteristics of pseudo-components
561 I.
Pseudo- Component
Boiling Molecular Density Phase in Range (OC) Weight (OAPI) Reactor
Heavy Bitumen
Light Bitumen
Heavy Oil
Middle Oil
Light Oil
Light Gas
> 550
I 550
420 - 550 180 - 420 20 - 180 I 2 0
400
240
160
28
9
19
70
Solid
Solid
Vapor
Vapor
Vapor
Vapor
562
Solid phase reactions: Heavy Bitumen s i Light Bitumen + s2 Coke
Light Bitumen k2 s3 Heavy Oil + s4 Middle Oil + s5 Light Oil + s6 Light Gas
Heavy Bitumen A s 7 Coke + s8 Light Gas
Gas phase reactions: Heavy Oil '' > sg Middle Oil + si0 Light Oil +
si1 Light Gas
Middle Oil-%s12 Light Oil + si3 Light Gas
(53)
(54)
(55)
The kinetic parameters for the above reactions, whioh were assigned on the
basis of kinetic studies of Lin et al. (197) and Phillips et al. (196), are listed in Table
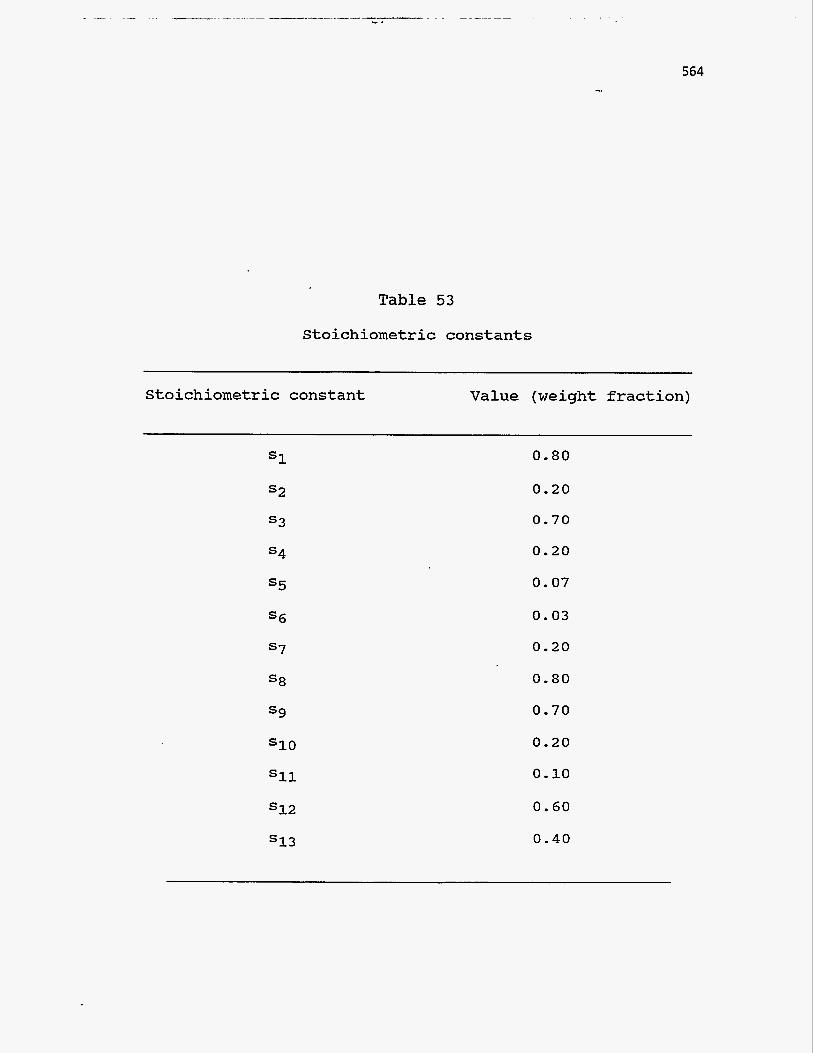
52. Stoichiometric constants in the above reactions refer to weight fractions. Their
values, listed in Table 53, have been assigned with some knowledge of the reactions,
although the exact values are somewhat arbitrary.
Kinetics of combustion
The process of coke combustion consists of five steps: 1) diffusion of oxygen
to the particle surface from the bulk gas stream, 2) adsorption of oxygen on the
surface, 3) chemical reaction of coke and oxygen, 4) desorption of the products, and
5) transport of products to the bulk gas stream. It has been found that for small
particles, burning at low temperatures (less than 1200 K), the rate-limiting step is the
chemical reaction (198).
Coke consists of predominantly carbon and small amounts of hydrogen,
nitrogen, and in some casessulfur. For the purposes of modeling the combustion of

563 -.
Table 52
Fi r s t -o rde r k i n e t i c ra te cons t an t s
Pre-exponen- Activation Temperature Reference
t i a l Fac tor Energy Range
(S’l) (kJ/ gmo 1 1 (OC)
kl 6. 5x1O6 121.1 100 - 500 197
k2 1.7~105 82.97 100 - 500 197
k3 6.78~109 176.7 360 - 420 19 6’)
k4 1 . 0 5 ~ 1 0 ~ ~ 230.0 360 - 420 196
k5 1.05~1015 230.0 360 - 420 196
1)Derived from r e f e r e n c e 196
564
Table 53
Stoichiometric constants
Stoichiometric constant Value (weight fraction)
S1
s2
s3
s4
s5
s6
s7
s8
S9
s10
Sll
s12
s13
0.80
0.20
0.70
0.20
0.07
0.03
0.20
0.80
0.70
0.20
0.10
0.60
0.40

565 .- .
coke, any reactions involving nitrogen and sulfur have been neglected. The primary
combustion reactions are thus as follows:
H(s) + 0.25 02(g) + 0.5 H20(g) (59)
The combustion of coke is modeled as a surface reaction, as mentioned
earlier, and is given by the rate expression
where r c is the rate of combustion of coke, Ap is the external surface area @fs2dp2)
and po2 is the partial pressure of oxygen. The rate constant, k, is given by:
k = exp (-E/RT)
The values of and E have been taken to be 8.71 x 10³ gm/cm2 atm 0 2 and
35.7 kcal/mol respectively, as suggested by Field et al. (198). The relative amounts
of carbon monoxide and carbon dioxide produced by the oxidation of carbon are
given by the empirical correlation of Arthur (1951):
6240 K -- r co,

566 5
where 730 K < T < 1170 K. The oxidation of carbon monoxide to carbon dioxide
is modeled by the empirical rate equation of Hottel et al. (199)
where T is in Kelvin, P is in atmosphere, and R is equal to 82.057 ml atmlgmol K.
Additional modeling work required
The modeling work done previously has incorporated hydrodynamics, reaction
kinetics, and stoichiometry and mass transfer considerations into Grace's bubbling-
bed model to give independent comprehensive models for the combustion and
pyrolysis reactors. For analyzing the laboratory results, the operating conditions
specified in the model, such as fluidizing-gas flow rate and tar-sand feed rate, and the
diameter of the reactor were taken to be the ones used by Smart (117). The default
sand properties are those measured for a Whiterocks tar-sand deposit. The solutions
of these models have been obtained by independently specifying the operating
temperature of each of the two reactors.
The operating conditions in the pyrolysis reactor affect the yield of coke and
hence the amount of coke deposited on the sand particles. This, in turn, affects the
total heat evolved during the combustion of this coke. The combustion and pyrolysis
reactors are thermally coupled through the heat pipes that transfer this heat to the
pyrolysis reactor, thereby affecting the pyrolysis temperature. Clearly, the simulation
of the whole reactor system requires the solution of the energy balance equations. This
requires correlations for heat transfer between the fluidized bed and the heat pipes and

5 67 -._ ...
a model for heat transfer across the heat pipes. Also, any energy supplied, removed,
or lost from the reactor system has to be included in the energy balance. This was
accomplished in the reporting period covered by this report as presented in the next
section.
568
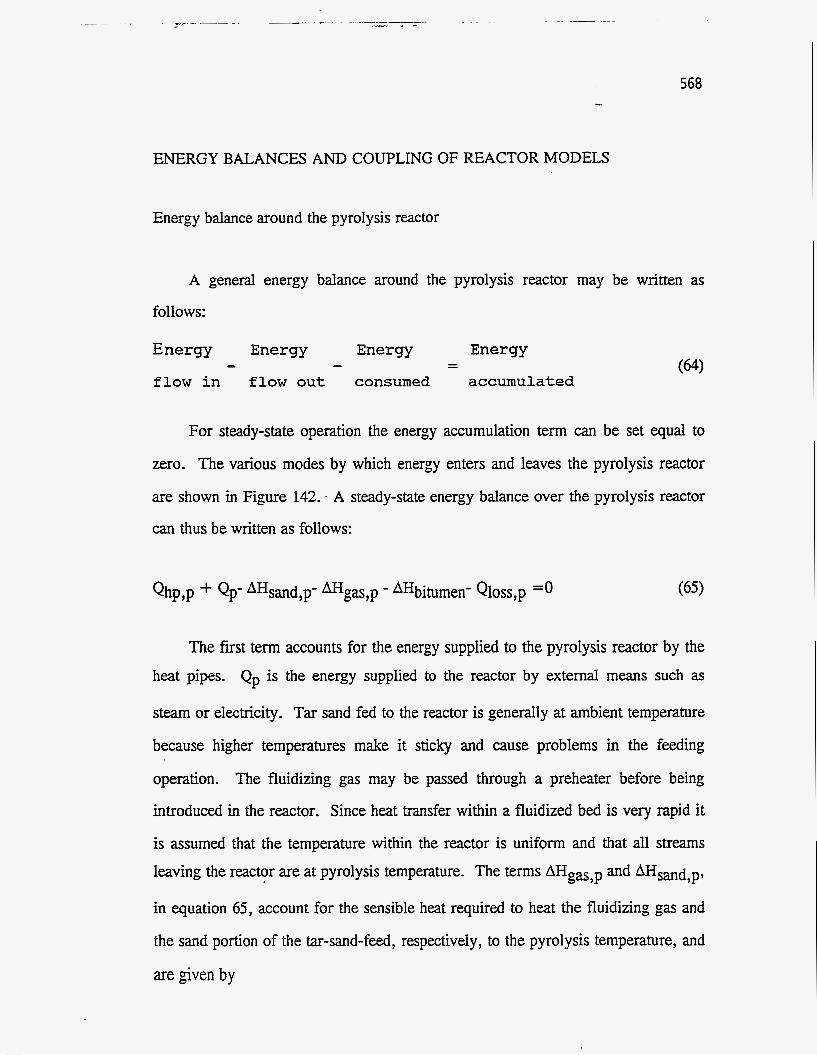
ENERGY BALANCES AND COUPLING OF REACTOR MODELS
Energy balance around the pyrolysis reactor
A general energy balance around the pyrolysis reactor may be written as
follows:
Energy Energy Energy Energy
f l o w in f l o w out consumed accumulated - - - -
For steady-state operation the energy accumulation term can be set equal to
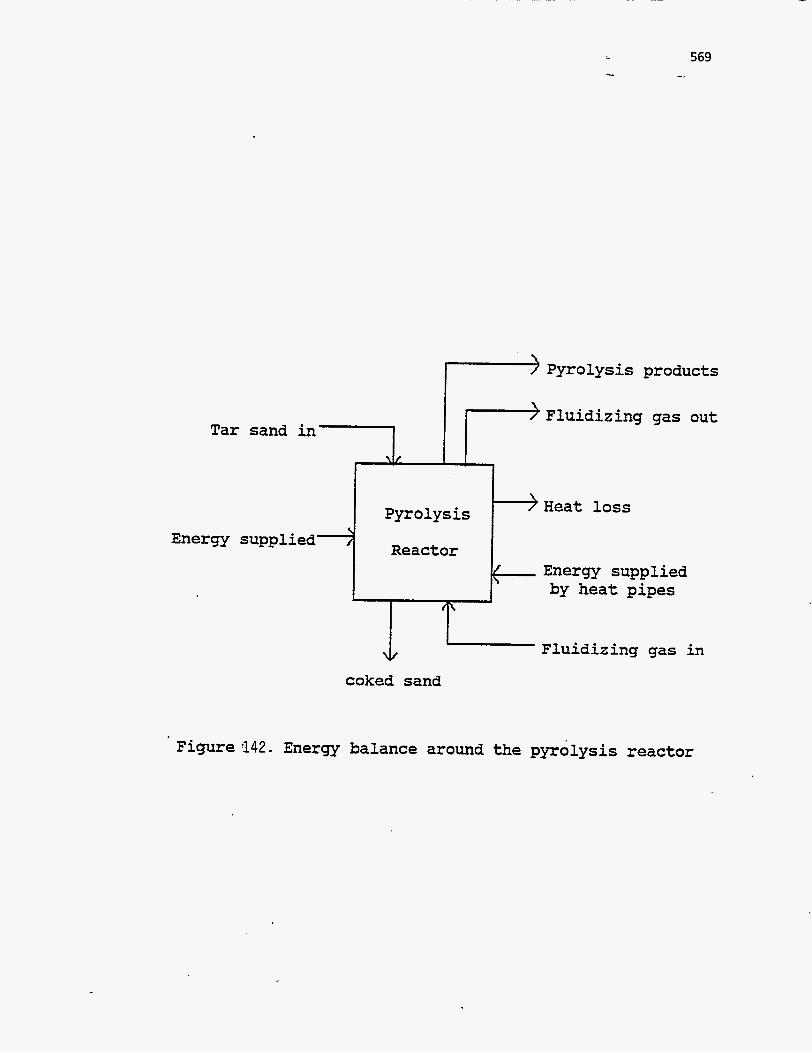
zero. The various modes by which energy enters and leaves the pyrolysis reactor
are shown in Figure 142. . A steady-state energy balance over the pyrolysis reactor
can thus be written as follows:
Qhp,p $- Qp- AHsand,p- AHgas,p - AHbitumen- QIoss,p =O
The first term accounts for the energy supplied to the pyrolysis reactor by the heat pipes. Qp is the energy supplied to the reactor by external means such as
steam or electricity. Tar sand fed to the reactor is generally at ambient temperature
because higher temperatures make it sticky and cause problems in the feeding
operation. The fluidizing gas may be passed through a preheater before being
introduced in the reactor. Since heat transfer within a fluidized bed is very rapid it
is assumed that the temperature within the reactor is uniform and that all streams leaving the reactor are at pyrolysis temperature. The terms AHgas,p and dHs,d,p,
in equation 65, account for the sensible heat required to heat the fluidizing gas and
the sand portion of the tar-sand-feed, respectively, to the pyrolysis temperature, and
are given by
Tar sand
Reactor Energy
{
Pyrolysis products
Fluidizing gas out
loss
Energy supplied by heat pipes
Fluidizing I 4 coked sand
in
. Figure 142. Energy balance around the pyrolysis reactor

570
It should be noted, however, that Si02, which is the main constituent of sand,
undergoes a phase change from a-quartz to p-quartz at about 848 K (200), so the
heat of this phase change must be included in equation 67 if Tp is greater than 848
K. The term AHbitumen, in equation 65, includes the sensible heat for bitumen
and the heat of the thermal pyrolysis reactions. The sensible heat component can be
calculated similarly to that of sand or gas. Specific heat capacity of the bitumen is
evaluated from the following generalized correlation for all petroleum-like liquids
(201):
C, = Ip.6811 - 0.308s + (8.15 - 3.06s) T x ~ O - ~ ]
x (0.055K + 0.035)
where Cp is the heat capacity in Btu/lboF, s is the specific gravity at 60°F, T is the
temperature in OF, and K is the Watson characterization factor. The second component of AHbihmen, the heat of pyrolysis reactions, AHpyr,
is evaluated by assuming that the pyrolysis process can be represented by a single
reaction as follows:
Bitumen + xi Gas + x2 Oil + x3 Coke (69)
where xi, x2, and x3 represent the weight fractions of bitumen going to gas, oil
I
\/
57 1 -..
\ Energy supplied 2’
) H e a t loss Combustion
Reactor } Energy removed
by heat pipes
c lean sand out
Fluidizing a i r i n
Figure 143. Energy balance around the combustion reactor .
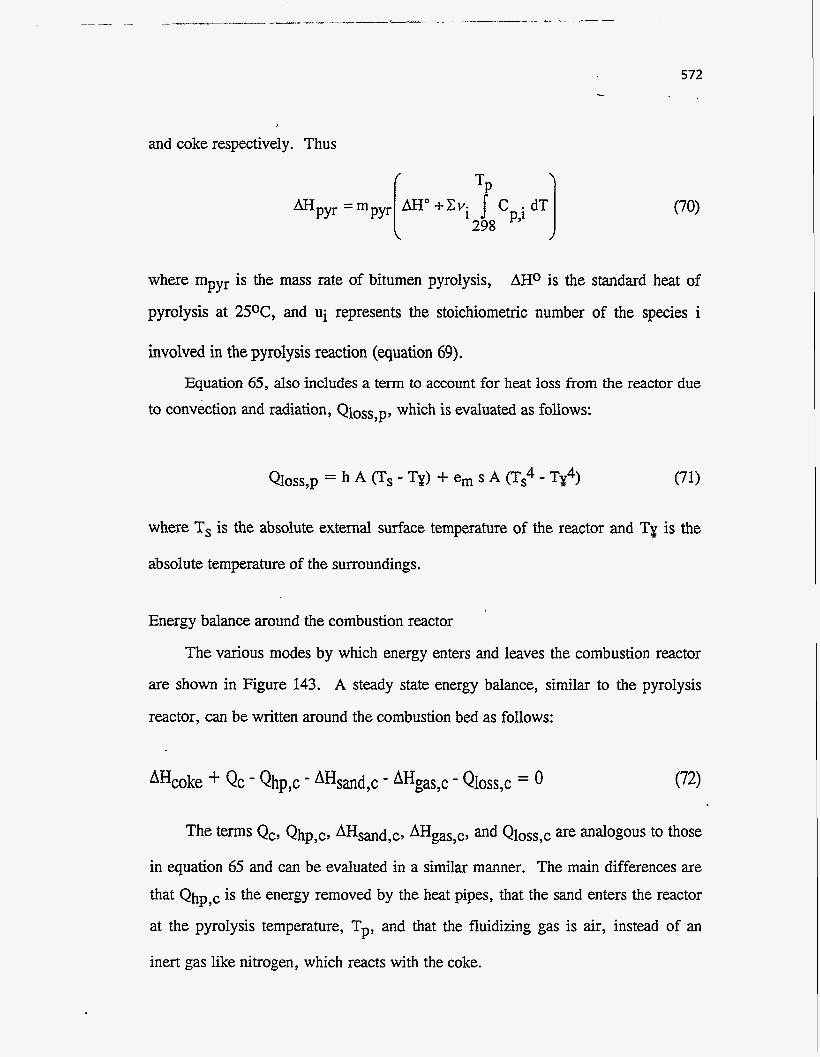
and coke respectively. Thus
AHo+Cvi j C . dT PY' 298
572
where mpyr is the mass rate of bitumen pyrolysis, AHo is the standard heat of
pyrolysis at 25OC, and Ui represents the stoichiometric number of the species i
involved in the pyrolysis reaction (equation 69).
to conv&tion and radiation, Qloss p, which is evaluated as follows: Equation 65, also includes a term to account for heat loss from the reactor due
where Ts is the absolute external surface temperature of the reactor and Tx is the
absolute temperature of the surroundings.
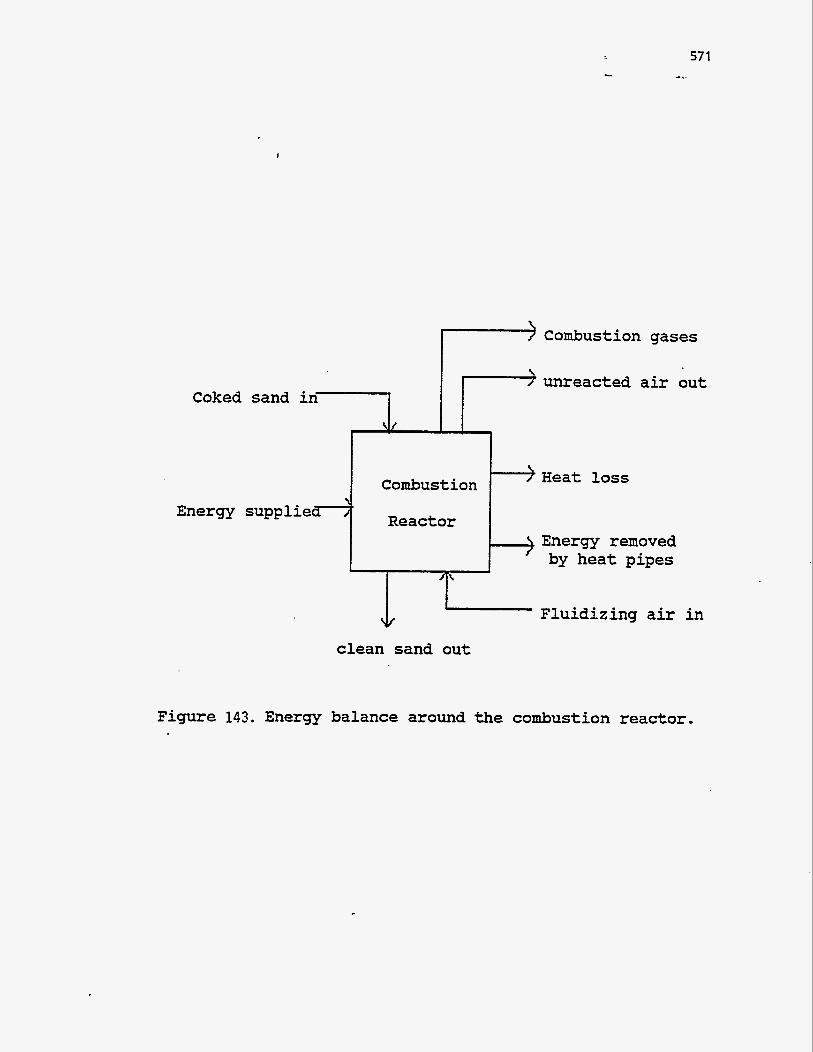
Energy balance around the combustion reactor
The various modes by which energy enters and leaves the combustion reactor
are shown in Figure 143. A steady state energy balance, similar to the pyrolysis
reactor, can be written around the combustion bed as follows:
AHcoke -I- Qc - Qhp 7 c - AHsand,c - AHgas,c QIoss,c = 0
The terms Qc, Qhp,c, AHsand,c, AHgas,c, and Qloss are analogous to those
in equation 65 and can be evaluated in a similar manner. The main differences are
that Qhp is the energy removed by the heat pipes, that the sand enters the reactor
at the pyrolysis temperature, Tp, and that the fluidizing gas is air, instead of an
inert gas like nitrogen, which reacts with the coke.
573 -.
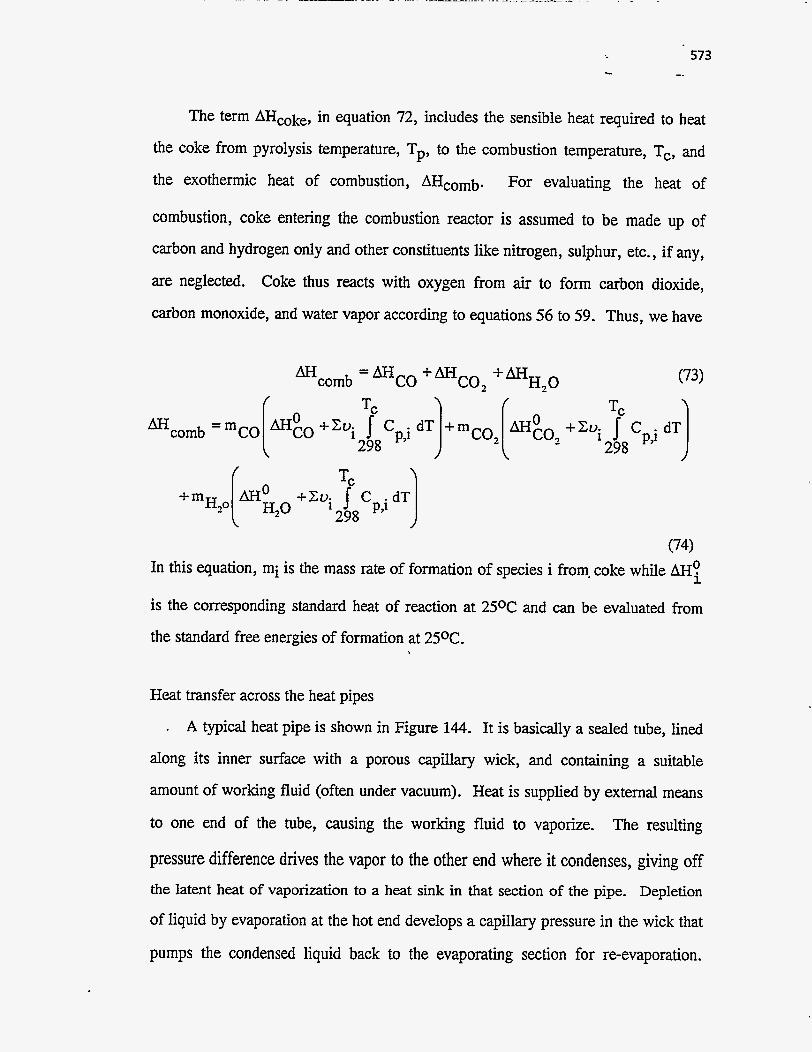
The term AHcoke, in equation 72, includes the sensible heat required to heat
the coke from pyrolysis temperature, Tp, to the combustion temperature, Tc, and
the exothermic heat of combustion, AHcomb. For evaluating the heat of
combustion, coke entering the combustion reactor is assumed to be made up of
carbon and hydrogen only and other constituents like nitrogen, sulphur, etc., if any,
are neglected. Coke thus reacts with oxygen from air to form carbon dioxide,
carbon monoxide, and water vapor according to equations 56 to 59. Thus, we have
H*O +m co2 mcomb =AHc0+m (73)
TC TC +Xui C PA - dT]
mcomb =mCO( mEO +"i 298 f 'p,i dT]+mC02[ &EO2 298
(74) In this equation, mi is the mass rate of formation of species i from- coke while AH!
is the corresponding standard heat of reaction at 25OC and can be evaluated from
the standard free energies of formation at 25%
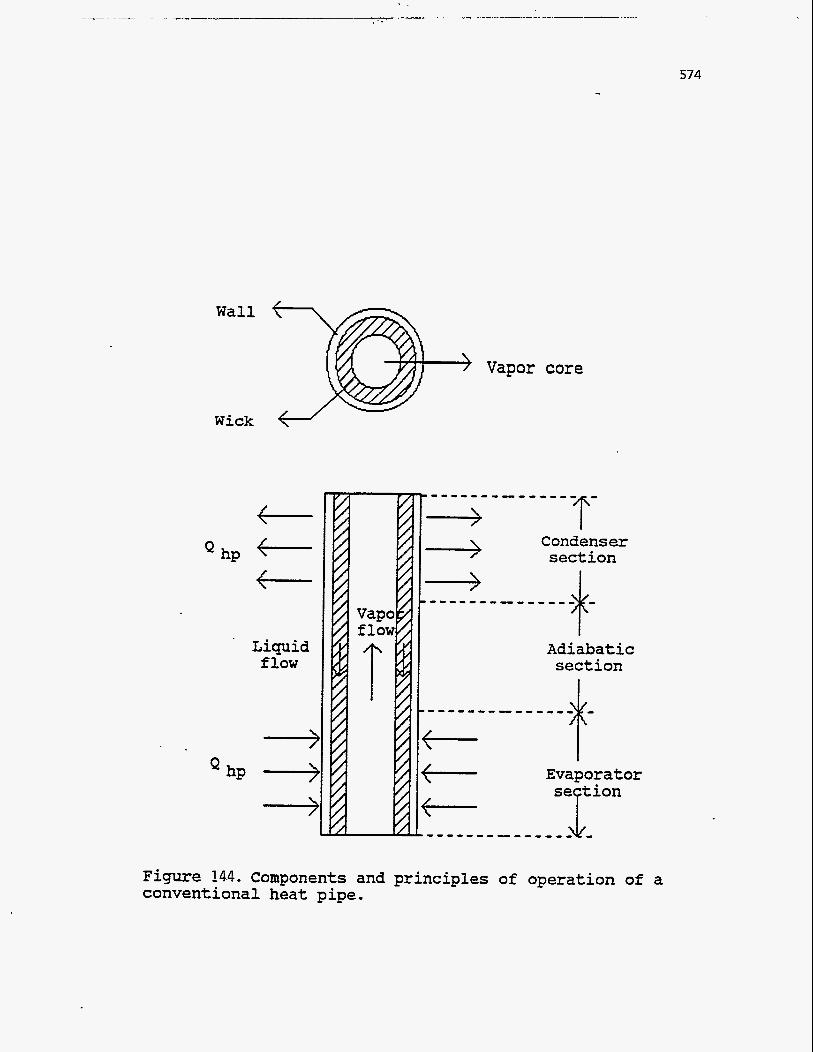
Heat transfer across the heat pipes
. A typical heat pipe is shown in Figure 144. It is basically a sealed tube, lined
along its inner surface with a porous capillary wick, and containing a suitable
amount of working fluid (often under vacuum). Heat is supplied by external means
to one end of the tube, causing the working fluid to vaporize. The resulting
pressure difference drives the vapor to the other end where it condenses, giving off the latent heat of vaporization to a heat sink in that section of the pipe. Depletion
of liquid by evaporation at the hot end develops a capillary pressure in the wick that
pumps the condensed liquid back to the evaporating section for re-evaporation.
574
Wall
Vapor core
Wick t--/
t--
t-- ‘hp
Liquid flow
hP .+ Q
Condenser section
I
Adiabatic section
Evaporator
Figure 14.4. Components and principles of operation of a conventional heat pipe.
575 -._
Since the latent heat of vaporization is generally quite large, considerable quantities
of heat can be transported continuously with a very small temperature difference
from end to end. Detailed descriptions of the heat pipe operation can be found in
the literature (202, 203).
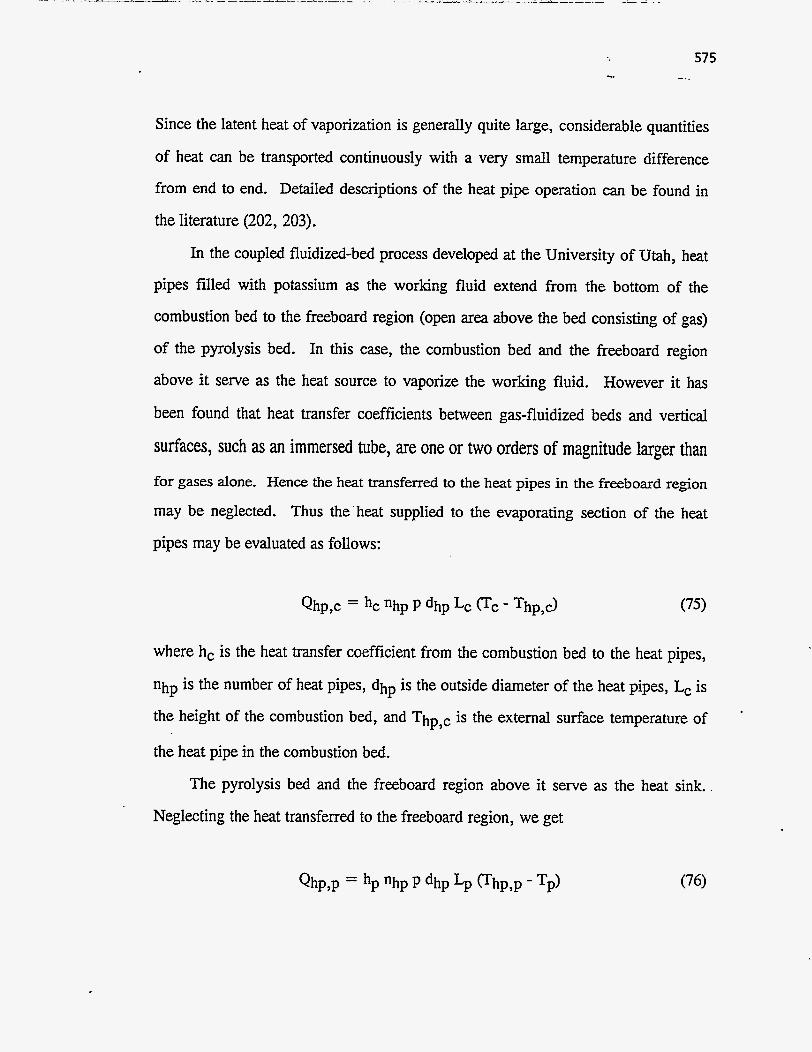
In the coupled fluidized-bed process developed at the University of Utah, heat
pipes filled with potassium as the working fluid extend from the bottom of the
combustion bed to the freeboard region (open area above the bed consisting of gas)
of the pyrolysis bed. In this case, the combustion bed and the freeboard region
above it serve as the heat source to vaporize the working fluid. However it has
been found that heat transfer coefficients between gas-fluidized beds and vertical
surfaces, such as an immersed tube, are one or two orders of magnitude larger than
for gases alone. Hence the heat transferred to the heat pipes in the freeboard region
may be neglected. Thus the'heat supplied to the evaporating section of the heat
pipes may be evaluated as follows:
where hc is the heat transfer coefficient from the combustion bed to the heat pipes,
nhp is the number of heat pipes, dhp is the outside diameter of the heat pipes, Lc is
the height of the combustion bed, and Thp,c is the external surface temperature of
the heat pipe in the combustion bed.
The pyrolysis bed and the freeboard region above it serve as the heat sink.
Neglecting the heat transferred to the freeboard region, we get
Qhp,p = hp "hp P dhp $ (Thp,p - Tp)

.
It is assumed here that the heat pipes extend through the entire length, $, of the
pyrolysis bed. If the heat pipes do not extend to the entire bed height, % in
equation 76 should be replaced by the height to which they actually extend into the
bed. In addition it is also assumed that the section between the combustion and
pyrolysis reactors is adiabatic and hence there is negligible heat loss. Therefore an
energy balance around the heat pipes can be written as follows:
Thus all the energy supplied to the heat pipes by the combustion bed is
assumed to be transferred to the pyrolysis bed. The path of heat flow across the
heat pipes consists of the following three steps: 1) heat conduction across the pipe
wall and the liquid-saturated wick in the combustion section followed by
evaporation at the liquid-vapor interface in that section, 2) *al convective
transport of the latent heat by vapor from the evaporator to the condenser section,
3) condensation of vapor at the liquid-vapor interface in the condenser section of
the heat pipe, and subsequent heat conduction across the liquid-saturated wick and
pipe wall in that section. The temperature drop across the heat pipe wall and in the
liquid-saturated wick can be derived by using Fourier's law of conduction. Thus
the temperature drop across the heat pipe wall in the evaporator section is given by
where Tpw,e is the temperature at the pipe wall-wick interface in the evaporating section, ro and ri are the outside and inside diameters of the heat pipe respectively,
Le is the length of the evaporator section and kp is the thermal conductivity of the
heat pipe material. As discussed earlier, Le is taken as the length of heat pipe
’ immersed in the combustion bed and does not include the length of the freeboard
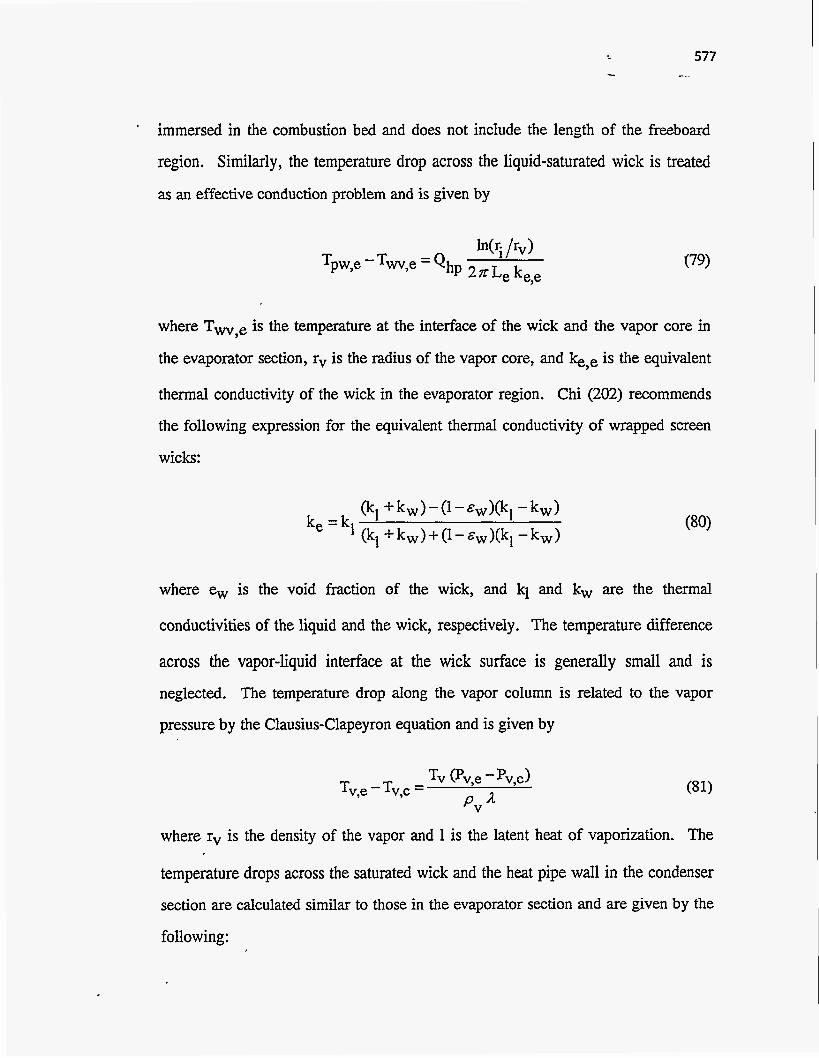
region. Similarly, the temperature drop across the liquid-saturated wick is treated
as an effective conduction problem and is given by
where Tw,e is the temperature at the interface of the wick and the vapor core in
the evaporator section, rv is the radius of the vapor core, and kee is the equivalent
thermal conductivity of the wick in the evaporator region. Chi (202) recommends
the following expression for the equivalent thermal conductivity of wrapped screen
wicks:
where e, is the void fraction of the wick, and kl and kw are the thermal
conductivities of the liquid and the wick, respectively. The temperature difference
across the vapor-liquid interface at the wick surface is generally small and is neglected. The temperature drop along the vapor column is related to the vapor
pressure by the Clausius-Clapeyron equation and is given by
Tv (%,e - PV,,)
P V %,e - Tv,c =
where rv is the density of the vapor and 1 is the latent heat of vaporization. The
temperature drops across the saturated wick and the heat pipe wall in the condenser
section are calculated similar to those in the evaporator section and are given by the
following:
In (r /r. ) -T = 0 1
PW7C hP7P QhP 27rL k T
c c
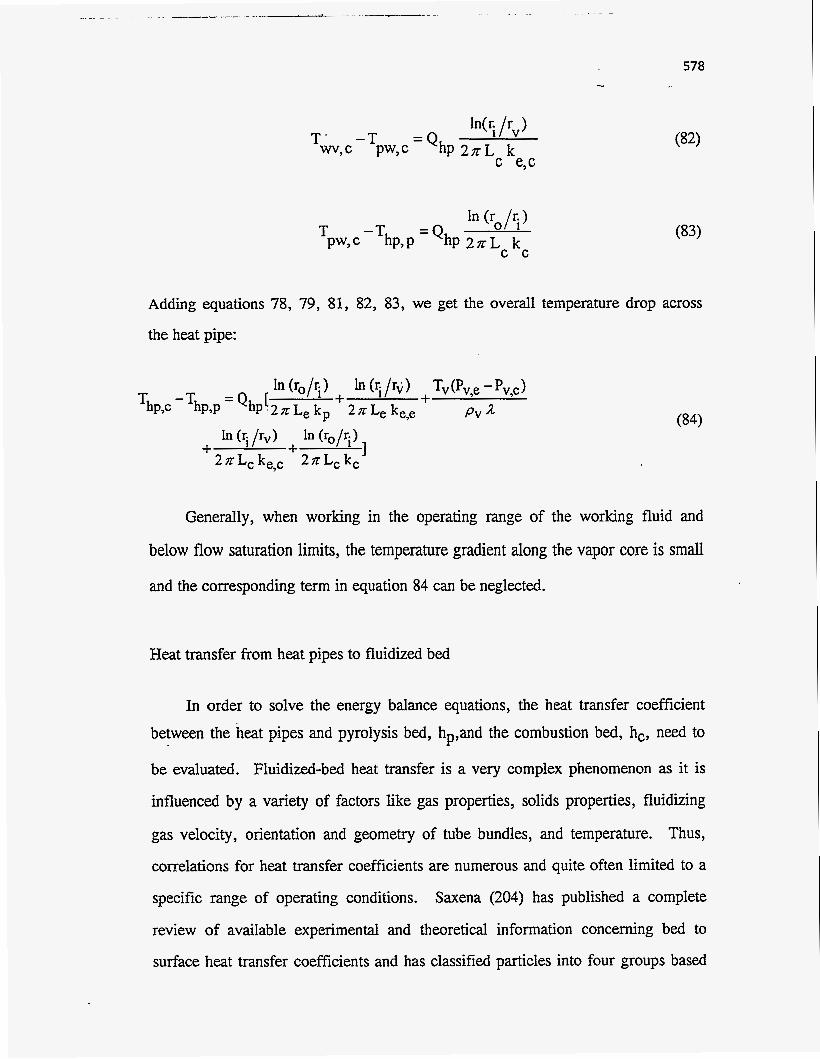
578
(83)
Adding equations 78, 79, 81, 82, 83, we get the overall temperature drop across
the heat pipe:
Generally, when working in the operating range of the working fluid and
below flow saturation limits, the temperature gradient along the vapor core is small
and the corresponding term in equation 84 can be neglected.
Heat transfer from heat pipes to fluidized bed
In order to solve the energy balance equations, the heat transfer coefficient between the heat pipes and pyrolysis bed, hp,and the combustion bed, hc, need to
be evaluated. Fluidized-bed heat transfer is a very complex phenomenon as it is
influenced by a variety of factors like gas properties, solids properties, fluidizing
gas velocity, orientation and geometry of tube bundles, and temperature. Thus,
correlations for heat transfer coefficients are numerous and quite often limited to a
specific range of operating conditions. Saxena (204) has published a complete
review of available experimental and theoretical information concerning bed to
surface heat transfer coefficients and has classified particles into four groups based
on hydrodynamic and heat transfer considerations (205). Bubbling beds of sand
fluidized by nitrogen or air falls into their Group I powders characterized by
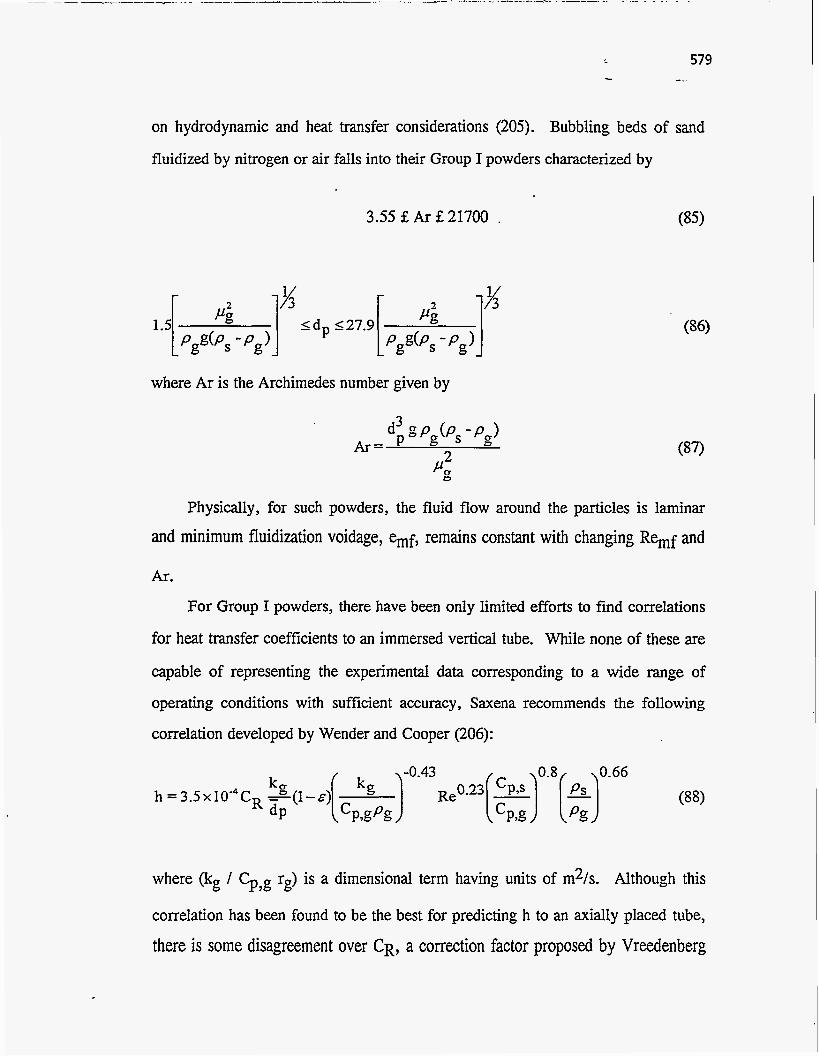
3.55 € Ar € 21700
where Ar is the Archimedes number given by
Physically, for such powders, the fluid flow around the particles is laminar
and minimum fluidization voidage, emf, remains constant with changing Re,f and
Ar.
For Group I powders, there have been only limited efforts to find correlations
for heat transfer coefficients to an immersed vertical tube. While none of these are
capable of representing the experimental data corresponding to a wide range of
operating conditions with sufficient accuracy, Saxena recommends the following
correlation developed by Wender and Cooper (206):
-0.43 0.8 0.66
(88) h = 3 . 5 ~ 1 0 - ~ C ~ - ( 1 - ~ ) kg dP
where (kg / Cp,g rg) is a dimensional term having units of m2/s. Although this
correlation has been found to be the best for predicting h to an axially placed tube,
there is some disagreement over CR, a correction factor proposed by Vreedenberg
(207) for nonaxial tube location. In the actual process, although the heat pipes are
located nonaxially, they tend to compartmentalize the fluidized bed into smaller units and hence the correction factor, CR, is ignored.
Considering the limited accuracy of the empirical correlations, theoretical
models were evaluated to derive an expression for the heat transfer coefficient. The
most successful type of model used is the packet model of Mickley and Fairbanks
(208) where the heat transfer surface is assumed to be bathed alternately by
emulsion packets and gas bubbles. Heat transfer occurs due to particle convection,
gas convection, and radiation between the heat transfer surface and the emulsion or
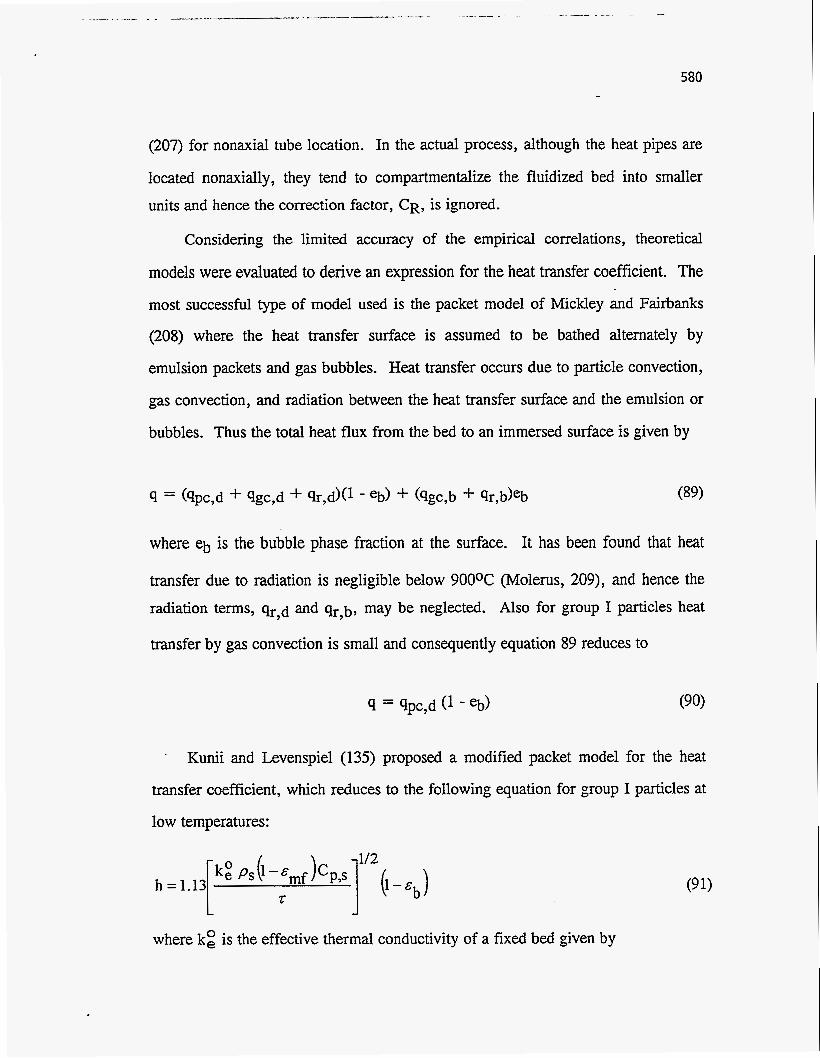
bubbles. Thus the total heat flux from the bed to an immersed surface is given by
where eb is the bubble phase fraction at the surface. It has been found that heat
transfer due to radiation is negligible below 9OOOC (Molerus, 209), and hence the radiation terms, qr,d and qr b, may be neglected. Also for group I particles heat
transfer by gas convection is small and consequently equation 89 reduces to
. Kunii and Levenspiel (135) proposed a modified packet model for the heat
transfer coefficient, which reduces to the following equation for group I particles at
low temperatures:
where kz is the effective thermal conductivity of a fixed bed given by

581 -._
k: =zmf kg +(l-cd)k #b k s / k g +2/3
The mean contact time, t, of the emulsion with the surface and the bubble phase fraction at the surface, eb, are evaluated by the following formulas proposed by
Thring (1977): 0.0756 0.5
(93)
L J
The Kunii-Levenspiel model accounts for the effect of thermal conductivity of
solids and gas, the specific heat capacity, density, and mean diameter of solids, as
well as the effect of the superficial velocity. However there is no term in the model
that suggests the dependence of the heat transfer coefficient on the void fraction of
the bed, e, which changes with the size, location and orientation of the immersed
tubes. On the other hand the Wender-Cooper correlation accounts for the effect of
gas properties, solids properties, superficial velocity and also bed voidage. Thus, a
qualitative comparison suggests that the latter may be more suitable.
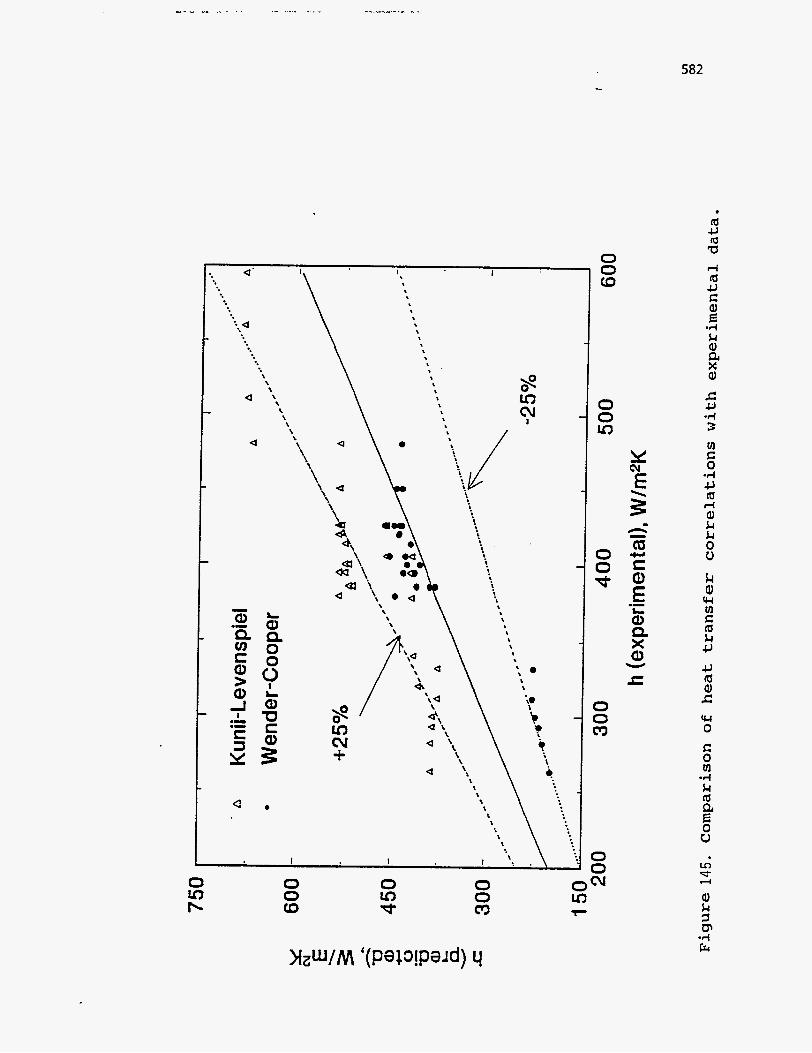
. The heat transfer coefficients predicted by the two methods were further
compared with experimental data of Gelperin and Einstein (211) and Verma and
Saxena (212), on heat transfer to immersed vertical tubes in beds of Group I
particles. The results are shown in Figure 145. The Kunii-Levenspiel model is
found to over predict the data by 30% on an average with maximum deviation of
about 40%. Wender and Cooper’s correlation (205), on the other hand, predicts
more conservative and accurate values, the average and maximum deviation being
10% and 30% respectively. In light of these observations, the latter correlation is
a' ' \ 1. I
,
0 0 (D
0 Ln d
0 0 c'3
582
. m c, (d a
f-4 m u E: al E -4 k al a X al
.G a -4 3
cu 0
E: 0 rn -4 k m a
u E In d 4
al k =I F -4 E

chosen for predicting the heat transfer coefficients between the fluidized beds and
the heat pipes in the coupled reactor system. The predicted values were found to be
in the range of 500-650 W/(m2 K) depending on the fluidizing gas used and its flow
rate.
Thermal coupling of models and solution of the energy balance equations
The coupling of the models involves solving the equations 65, 72, 75, 76, 77,
and 84. Equations 65 and 72 are nonlinear in temperature because of the nonlinear
dependence of specific heat capacities on temperature. Equations 75, 76, 77, and 84, on the other hand, are linear algebraic equations. A degrees of freedom
analysis of the system of six equations gives 10 variables, viz. Tp, Tc, Qext,p,
Qext,c, QIoss,pY QIoss,c, Qhp,p, Qhp,cy Thp,p, and Thp,p- TkefOre the solution
of the system of equations requires four variables to be independently specified. The heat losses from the reactors, QlossYp and Q1oSs,c, can be specified by
using equation 71 to evaluate them. The possible choices for the other two are Tp,
Tc, Qext,p, or Qext,c. The pyrolysis model and the combustion model require the
specification of the operating temperatures, Tp and Tc. Thus by not specifying Tp
and Tc, an iterative procedure is required, where at first Tp is assumed and the
pyrolysis model is solved. Then the combustion model is solved by assuming Tc
followed by solution of the coupling and energy balance equations, which give new values of Tp and Tc. The procedure may be repeated until convergence is attained.
On the other hand, by specifying Tp and Tc,
the need for an iterative procedure is eliminated. This choice of variables is logical
considering the fact that in a large-scale plant, the operating temperatures would be
maintained at a given set point and controlled by supplying or removing heat from the reactors.- Hence Tp and Tc are chosen as the variables to be specified.
... -
584 ...
The variables in the coupling and energy balance equations are thus Qext,p,
Qext,c, Qhp, Thp,p, and Thp,c.. By fixing Tp and Tc, the energy balance
equations, 65 and 72, are reduced to linear form and now we have a system of
simple linear algebraic equations to be solved. This can be done by using any
suitable technique such as the Gaussian Elimination method.
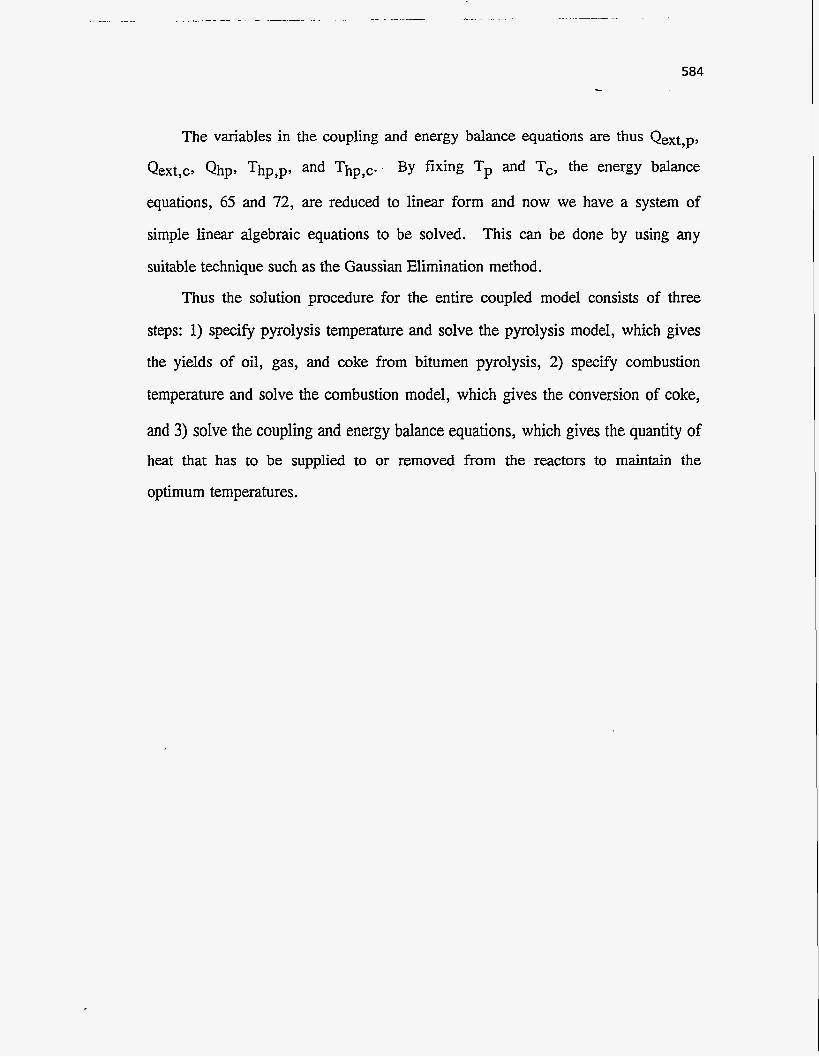
Thus the solution procedure for the entire coupled model consists of three
steps: 1) specify pyrolysis temperature and solve the pyrolysis model, which gives
the yields of oil, gas, and coke from bitumen pyrolysis, 2) specify combustion
temperature and solve the combustion model, which gives the conversion of coke,
and 3) solve the coupling and energy balance equations, which gives the quantity of heat that has to be supplied to or removed from the reactors to maintain the
optimum temperatures.
585 -. .
MODEL STUDIES TO OPTIMIZE PROCESS
A model of this type can be used to optimize the operation of the coupled
fluidized-bed process. An objective function to be optimized could be oil yield, or
operating and annualized capital costs, or the overall plant profitability. Coronella
(118) has presented the results of optimizing the pyrolysis operating conditions, of
which temperature is the most important. Oi1,yield was found to be a maximum at
about 475OC and a solids residence time of 20 minutes, as shown in Figure 146.
The other operating parameters do not directly influence the oil yield and hence the
optimum values for these are taken as those which minimize the energy requirement
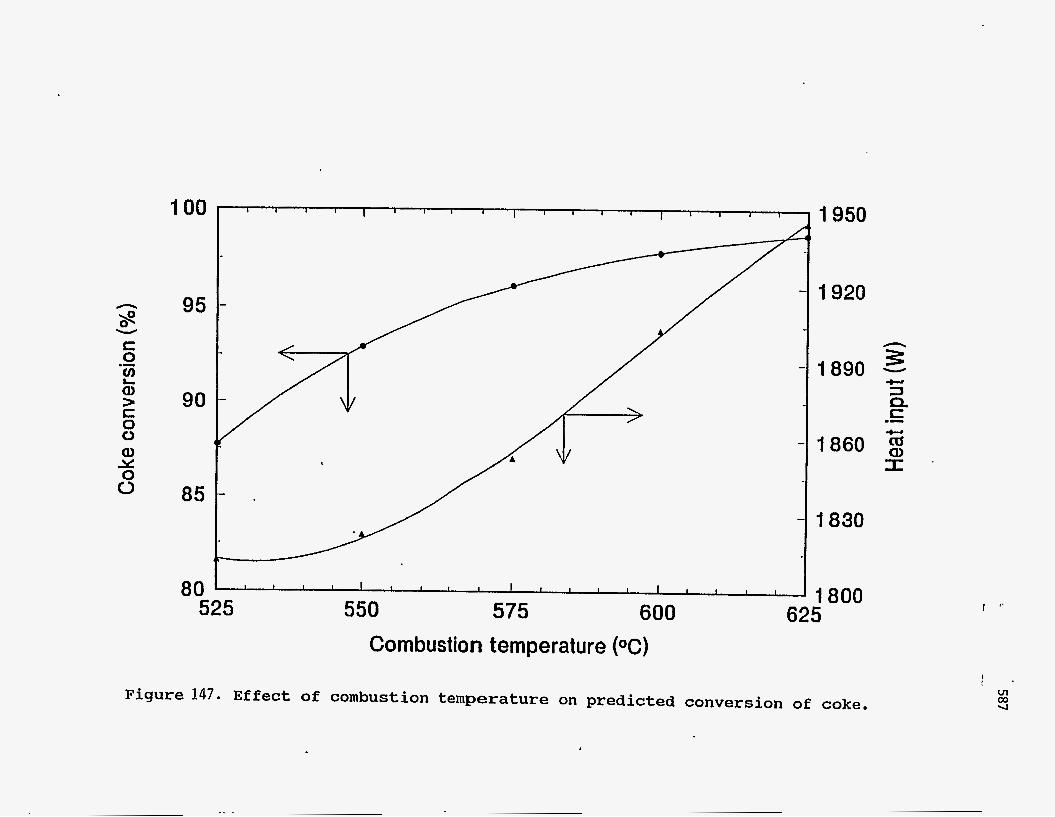
of the process. Figure 147 shows the effect of combustion temperature on the
conversion of coke and the energy input required for the process. The operating
temperature is dictated by environmental concerns for disposal of the spent sand.
However, the higher the combustion temperature, the higher is the energy
requirement for heating the fluidizing air. An optimum temperature of 600OC is
indicated. At higher temperatures, there is no significant improvement in the
conversion of coke, while the energy required increases very rapidly.
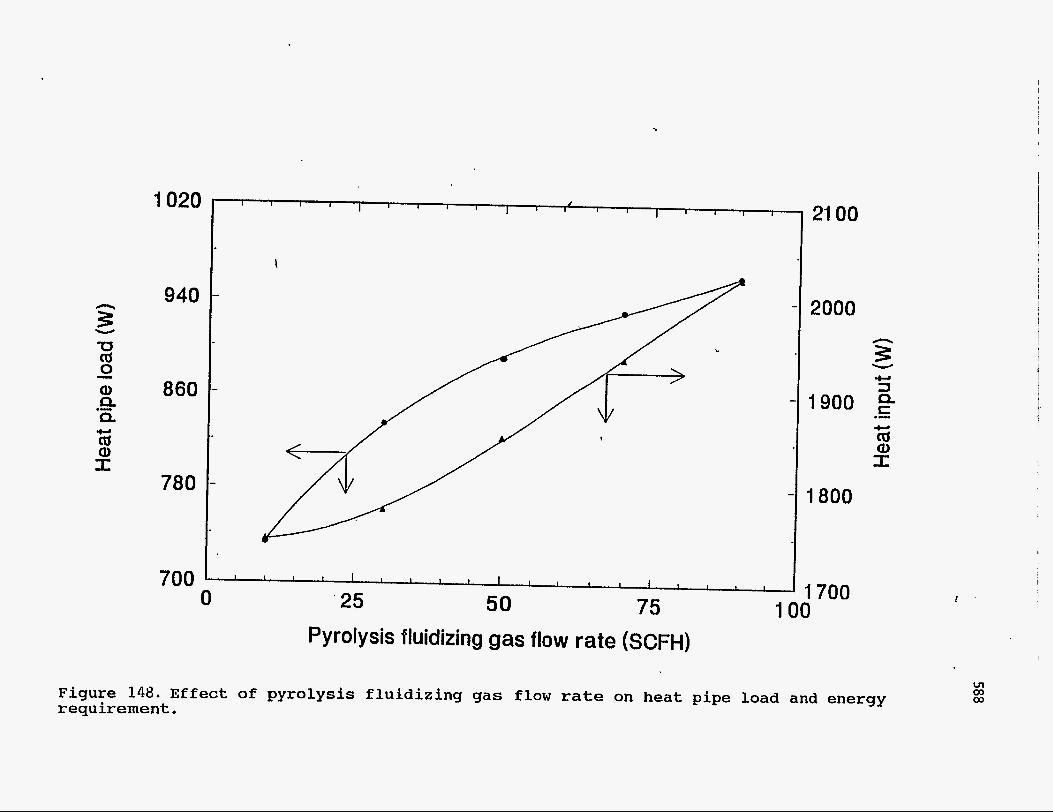
The effect of flow rate of pyrolysis fluidizing gas on the heat pipe load and the
' heat requirement of the process is shown in Figure 148. Increased gas flow rate
increases the bed height thereby increasing heat transfer between the bed and heat
pipes. The gas flow rate has almost no effect on oil yields as long as the pyrolysis
reactor is well fluidized in the bubbling regime. Thus, low flow rates would be
desirable since higher flow rates only increase the energy requirement of the
process.
On the other hand, in the combustion reactor, low flow rates of fluidizing air
are not desirable, as shown by Figure 149, since oxygen becomes the limiting
reactant. Only part of the coke gets combusted and less energy is available for

r- /
/ /
I / i
1 I
\
\ /
/ / \
\
\
\
\
I I I I 1 I \ \
%
/ \ /
586
0 m Iu3
0 0 m
0 m w
a al k a c 0
m k a, a 4 v1 -4 v1 h r( 0 k h a
IW 0
f
Y s
100
95
90
85
80
I I I I I I I I I I I I I I 1 I I 1 I
525
1950
1920
. .
3 1890 - 1860
I
1830
I I I I I I I I I I I I I I I I I I I 1800 550 575 600 625
Combustion temperature (OC)
Figure 147. Effect of combustion temperature on predicted conversion of coke.
..
I
1020
940 n
3 v
U cd 0
Q) 860 CL
.II.
.- Q + a a, I:
780
700
I I I I I I I I I d I I I I I I I 1 I I
\
21 00
2000
3 1900 .-
I I I I I I I I I I I I 1 I I I I I I
50 75 100 0 ‘25
1800
1700 i
Pyrolysis fluidizing gas flow rate (SCFH)
Figure 148. E f f e c t of p y r o l y s i s f l u i d i z i n g g a s flow rate on heat pipe load and energy requirement.

589 -_ .
Q) x 0 u w 0
E: 0 -4 rn k
c 0 0
c 0 Q) 4J m k
$
‘ 4 w k -4 m F c 4 N -4 a -4 I ri w c 0 -4 4 rn 1 A
0 v.l 0
4J u Q) w w w
5
m d
Q) k 5 F -4 E
4
590 -..
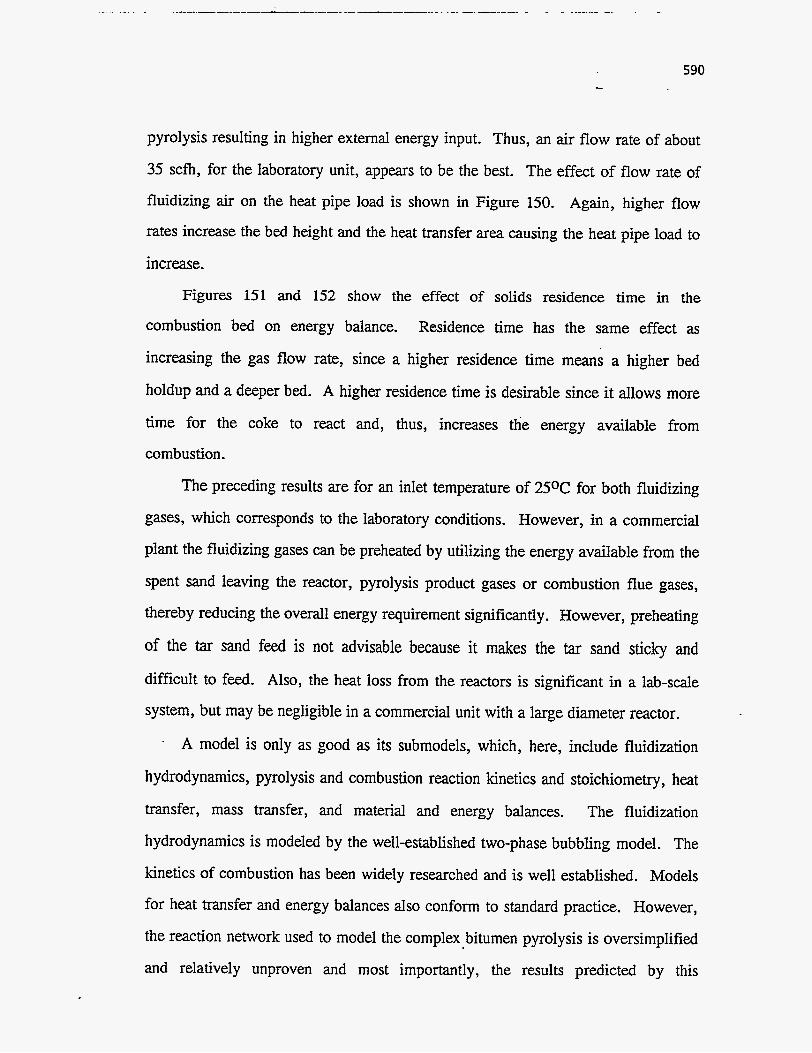
pyrolysis resulting in higher external energy input. Thus, an air flow rate of about
35 scfh, for the laboratory unit, appears to be the best. The effect of flow rate of
fluidizing air on the heat pipe load is shown in Figure 150. Again, higher flow
rates increase the bed height and the heat transfer area causing the heat pipe load to
increase.
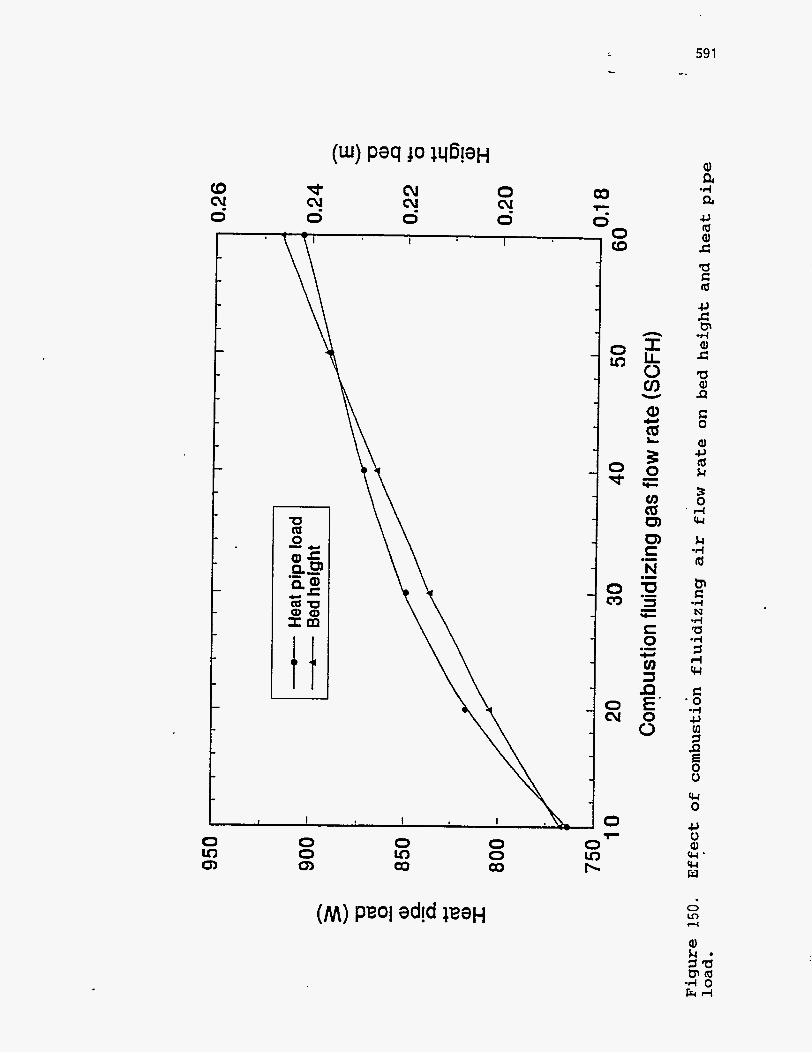
Figures 151 and 152 show the effect of solids residence time in the
combustion bed on energy balance. Residence time has the same effect as
increasing the gas flow rate, since a higher residence time means a higher bed
holdup and a deeper bed. A higher residence time is desirable since it allows more
time for the coke to react and, thus, increases the energy available from
combustion.
The preceding results are for an inlet temperature of 25OC for both fluidizing
gases, which corresponds to the laboratory conditions. However, in a commercial
plant the fluidizing gases can be preheated by utilizing the energy available from the
spent sand leaving the reactor, pyrolysis product gases or combustion flue gases,
thereby reducing the overall energy requirement significantly. However, preheating
of the tar sand feed is not advisable because it makes the tar sand sticky and
difficult to feed. Also, the heat loss from the reactors is significant in a lab-scale
system, but may be negligible in a commercial unit with a large diameter reactor. . A model is only as good as its submodels, which, here, include fluidization
hydrodynamics, pyrolysis and combustion reaction kinetics and stoichiometry, heat
transfer, mass transfer, and material and energy balances. The fluidization
hydrodynamics is modeled by the well-established two-phase bubbling model. The
kinetics of combustion has been widely researched and is well established. Models
for heat transfer and energy balances also conform to standard practice. However,
the reaction network used to model the complex bitumen pyrolysis is oversimplified
and relatively unproven and most importantly, the results predicted by this
d. 0 cu 0 cv
0
I
0 0 rn
00 7 0 0 (D
0 Ln
0 -3-
0 rn
0 cv
0 0 0 00
59 1 -.

1180
1060
940
820
I I I I 1 I I I I
700 20 30 40 50 60
Residence time in combustion bed (minutes)
0.55
0.45
0.35
0.25
0.1 5 70
I '
Figure 151. Effect of s o l i d s res idence t i m e on combustion bed height and heat pipe load.
I
ul N
593 -.
. c, c a,
k -4 I F a, k si F k a, E; a, a E; la
c 0 4
3
z s L: 0 u Q) x 0 0
c 0
d 4 c, a u a, 5 -4 u1 a, k u1 a -4 d 0 u1
c c c ' 0
c, u Q) ccl ccl w
cd In l-4
a, k I dr -4 E

594
submodel affect those of the combustion and energy balance models. For example,
the amount of coke predicted determines the extent of combustion of coke and the
energy generated during combustion.
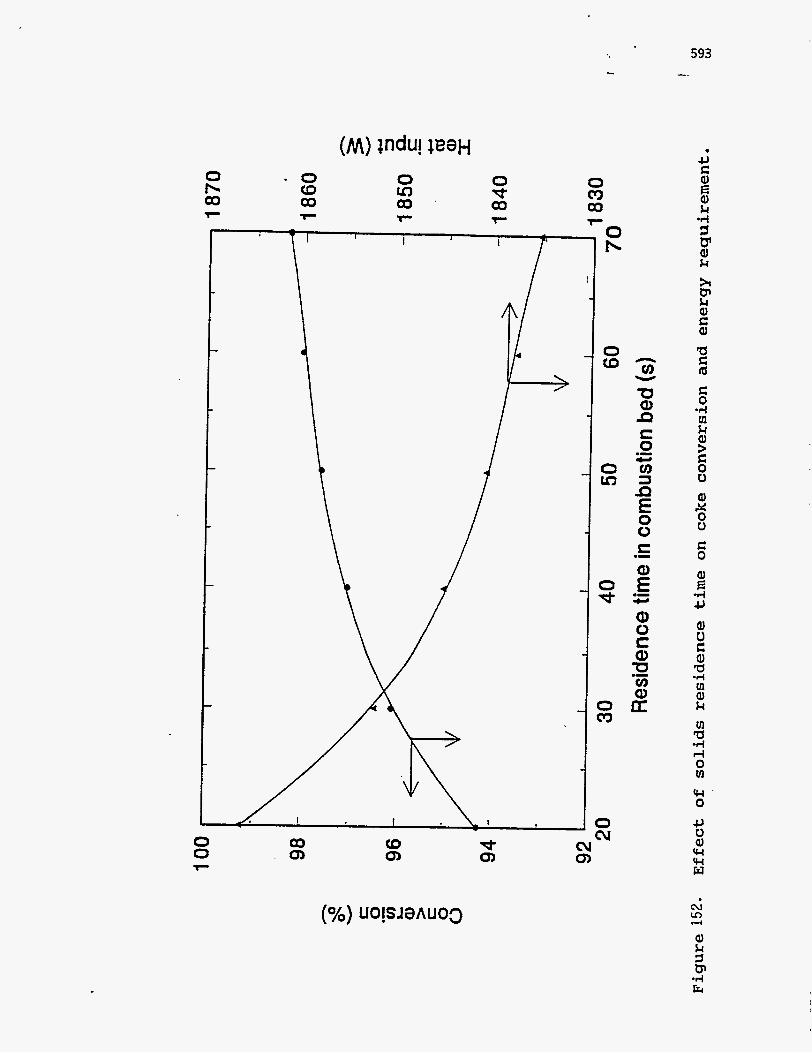
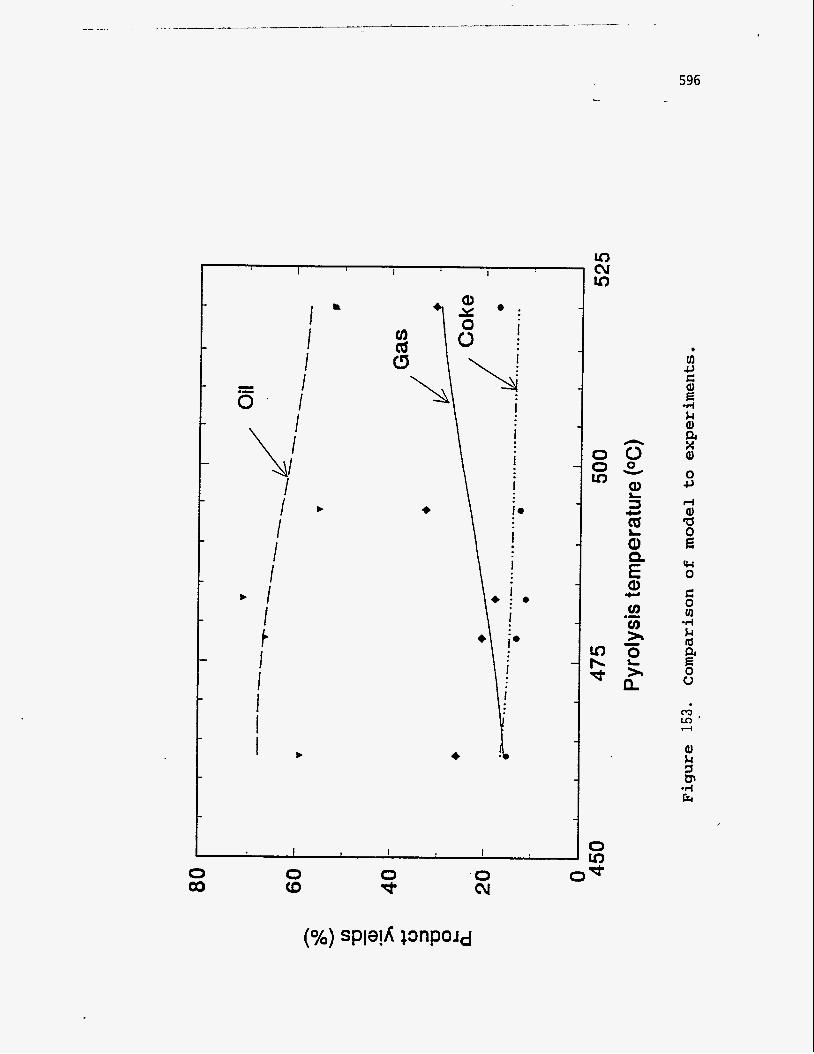
The pyrolysis model is compared to values obtained by Bhadkamkar (213) in
experiments with Whiterocks tar sand. The results are listed in Table 54. The
experimental yields have been normalized to 100% for comparison. Base case
values of the data were used for the simulation except those for the operating
conditions. The results are plotted in Figure 153 and show fairly good agreement
between predicted and experimental results.
However, it is well known that the characteristics of the different tar sand
bitumens affect the product distribution. The compounds present in tar sand
bitumens can be classified into three types based on solubility, viz. asphaltenes,
resins, and oils (65). Asphaltenes have high molecular weights and very low H/C
ratios of 1.03 to 1.20 indicating a highly aromatic structure. Heteroatom (N, S , or
0) content is generally highest in asphaltenes compared to the other fractions.
Asphaltenes are believed to be made of a highly condensed aromatic structure with
the number of rings as high as sixteen with substituted alkyl side chains. Metallic
impurities in bitumen are also known to be concentrated in the asphaltenes
compared to the other fractions. ' Resins have higher H/C ratios varying from 1.4 to 1.7, indicating lesser
aromatic character. The quantity of heteroatoms is also lower, with metallic
compounds present in negligible amounts. Structurally, resins are believed to
consist of aromatic and naphthenic rings with long paraffinic side chains. Oils have
a much higher H/C ratio compared to the other fractions indicating predominance
of paraffinic and naphthenic compounds over aromatics. Heteroatoms and metal
impurities are absent or present in very small amounts. Structurally, oils are
595 -_ ...
Table 54
Comparison of model w i t h experiments
Temperature Experimental Yields Model Predictions
(OC) Oil Gas Coke Oil Gas Coke
463 58.9 25.9 15.2 67.8 15.7 16.5
478 66.3 20.5 13.2 66.6 18.8 14.6
483 71.0 17.7 11.3 65.8 19.7 14.5
495 54.9 32.6 12.5 62.9 23.1 14.0
520 52.0 30.7 17.3 57.1 29.6 13.3
Residence time of solids : 27 min
Experimental yields are normalized to 100%
1 I I 0 " . / I
\; I 1 I I
I 4
I 1 f I i I I b
0 e 0 cu
m b W
596
e
0 u
w 0 c 0 u1 -#-I k lu a
0
al k 1 F 4 tr
597 -
I
i ;
believed to be composed of naphthenic rings with one or more side chains of
varying length. Thus, a higher fraction of asphaltenes tends to give more coke as observed by
Bunger (214). Alkyl side chains substituted on aromatic and naphthenic rings tend
to break off during pyrolysis. Thus, smaller side chains give higher gas yields. On
the other hand, oils and
resins pyrolyze mainly to liquid products with very little coke formation. However,
present knowledge of the chemistry of bitumen constituents is limited, and although
the relative amounts of the various fractions can be obtained, this alone is not
adequate to predict pyrolysis behavior with certainty. More subtle factors such as
degree and type of alkyl substitution, type of ring condensation and presence of
coke precursors may shed more light on the chemistry of pyrolysis of bitumens
Tar sands from different sources have been found to contain varying quantities
of bitumen ranging from 5 % to as high as 16%. This is accounted for in the model
by XBO, the initial bitumen weight fraction in the tar sand. The other parameter
that distinguishes between tar sands is the fraction of "heavy bitumen". This is
taken as the fraction of nondistillables in the bitumen. Thus, this parameter
characterizes the bitumen in terms of boiling point. Whereas the light bitumen
fraction is said to volatilize (equation 52), the heavy bitumen fraction reacts through
a high-temperature pathway comprised of the two cracking reactions (equations 51
and 53). Thus, a lower fraction of heavy bitumen means that a lesser fraction of
bitumen will crack to coke and gas, and more bitumen will be volatilized, giving
higher liquid yields at lower temperatures. The relative amounts of asphaltenes,
resins, and oils in the non-volatile fraction of bitumen may also be used as a basis
for assigning different numerical values to the stoichiometric constants si, s2, s7,
and sg for different tar sands. Thus, higher values of s2 and s7 could possibly be
1.
used for bitumens with a higher fraction of asphaltenes, whereas presence of a

598
number of alkyl side chains would possibly increase the value of s8. However,
without substantial information about the bitumen structure, exact correlations for
the stoichiometric coefficients cannot be obtained.
As mentioned earlier, the pyrolysis-reaction network is critical for the overall
accuracy of the model. Hence a discussion of the activation energies assigned to
the pyrolysis reactions is given below. The gas phase reactions involve cracking of
the oil vapor, which consists mainly of paraffinic, olefinic, and naphthenic
compounds, to lighter products of a similar nature. The activation energies for
thermal cracking of n-paraffins heavier than hexane are in the range of 230-275
kJ/mole while those of corresponding olefins and naphthenes are about 20-40
kJ/mole lower (215). The value assigned to the activation energy for the gas phase
reactions (equations 54 and 55), 230 kJ/mole, compares well with these
experimental data.
Hydrocarbon cracking reactions proceed by a free-radical mechanism
involving scission of the C-C bond p to the radical site and internal hydrogen
transfer to form isomeric free radicals. For example,
f! scission:
Hydrogen transfer:
Hydrogen transfer can take place between C-atoms separated by five other atoms.
Thus, heavier compounds with longer chain lengths have a greater tendency to form
599 -.
isomeric radicals and, therefore, are easier to crack. Thus, relatively low activation
energy values for cracking of heavy bitumen seem reasonable. Also, the so-called
volatilization reaction takes place at lower temperatures and, hence, the value for
the activation energy is much lower.
Increased secondary cracking gives a lighter product (Le., higher API
gravity), but does not significantly change the oil yield and does not affect the coke
yield. Thus, pyrolysis product distribution is influenced by the solid-phase cracking
and volatilization, whereas the gas-phase secondary cracking reactions mainly affect
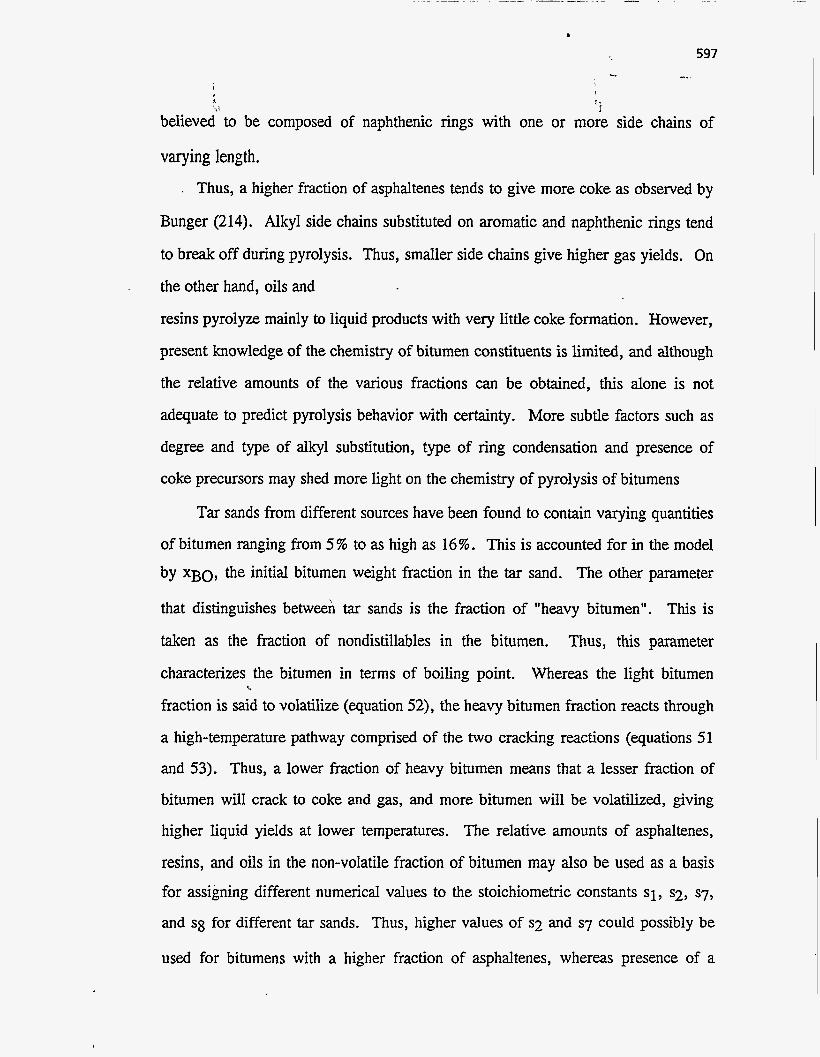
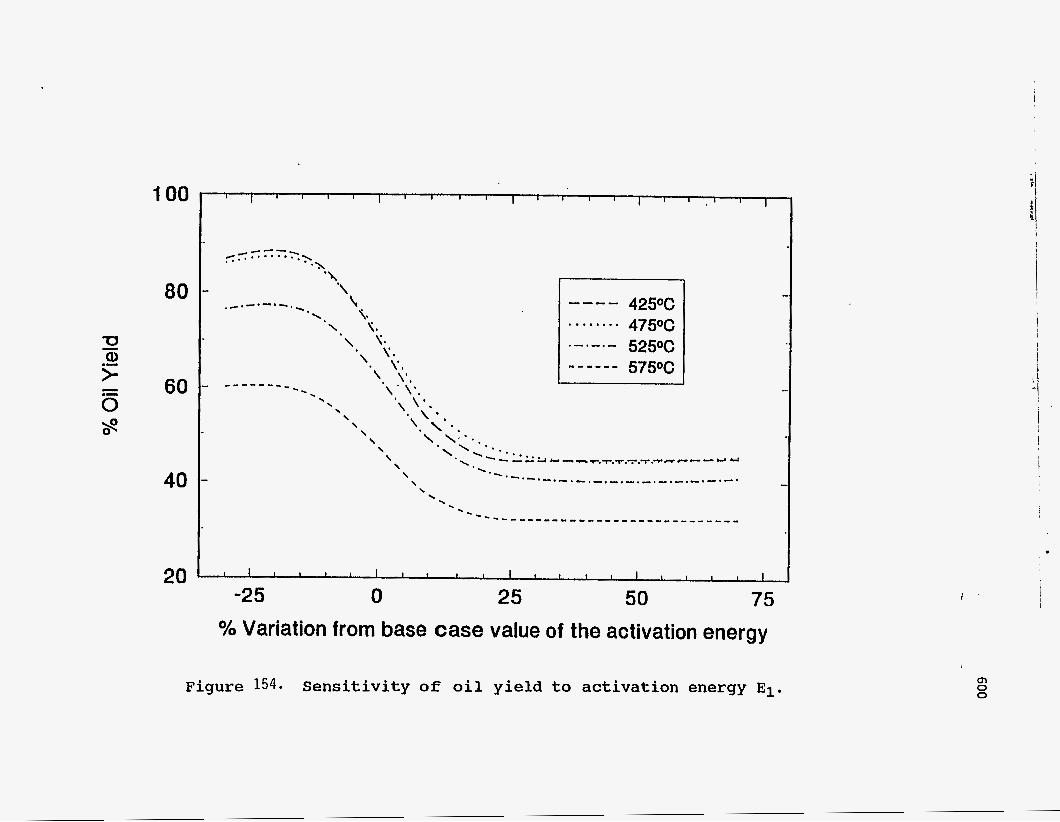
the quality of the liquid product. Hence, the sensitivity of oil yield was investigated
by arbitrarily varying the activation energy values for the solid-phase reactions.
Figure 154 shows the effect of varying the activation energy of the
volatilization reaction. Although lower values of activation energy have no effect,
higher values drastically reduce the oil yield. This happens because the
volatilization reaction becomes the rate-controlling step in the pyrolysis process,
and although the bitumen gets cracked, it is unable to be vaporized at the same rate.
Since vaporization is a physical process, it should take place more easily than
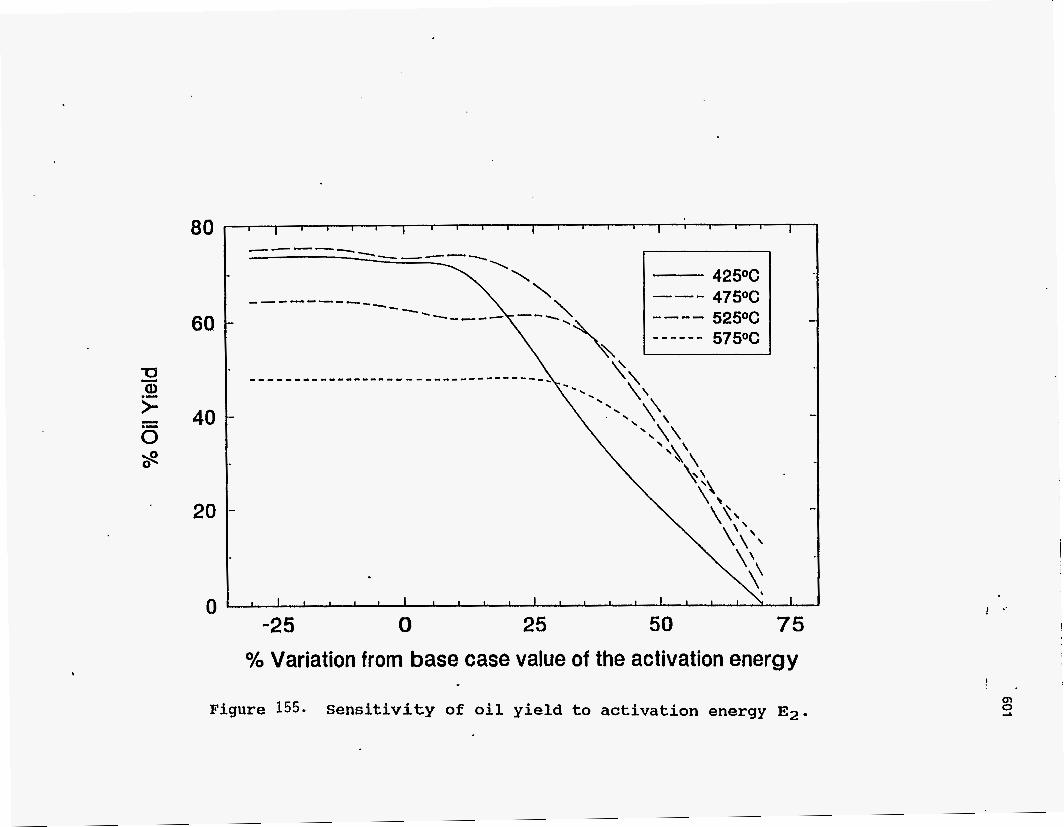
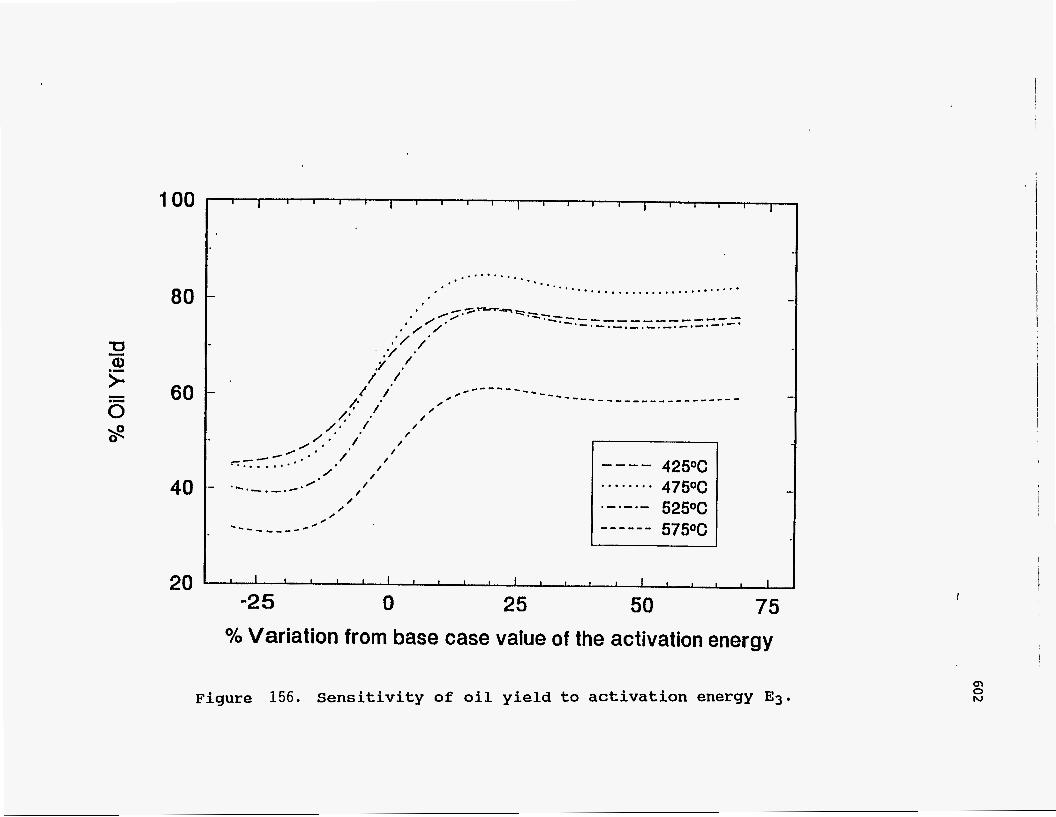
cracking. Hence, a higher value for the activation energy is not justified. Figures 155 and 156 show the effect of changing the activation energies for the
cracking reactions involving heavy bitumen. The oil yield is found to be very sensitive
to any changes in the value of either activation energy. The explanation for this effect
is that the two reactions are in parallel, one going to coke and g as and the other to
light bitumen, which is a precursor of oil. An expression for the rate of formation of
oil relative to the heavy bitumen reacted may be derived as follows:
- s1 kl meavy Bitumen] - d[Oil]
- d[Heavy bitumen] (kl + k3) [Heavy bitumen]
100
80
60
40
20
425OC 475% 525% 575oc
. . . . . . . .
.-.-.- A - - - - - -
% Variation from base case value of the activation energy
Figure 154. Sensitivity of oil yield to activation energy El.
I '
m 0 0
80
60
40
20
0
1 I I l l 1 I I I I I I I I I I , I I I
\ \ \
I I I I l l I 1 1 1 1 1 1 1 1 1 ) I I \
I I
0 25 50 75 % Variation from base case value of the activation energy
-25
Figure 155. Sensitivity of oil y i e l d to ac t iva t ion energy E2 .
I ’.
I
m EI
I
80
60
40
20 I 1 I I I I , I 1 I l l , I I I , , , I
-2 5 25 75 % Variation from base case value of the activation energy
Figure 156. Sensitivity of oil y i e l d to activation energy E3.
I
QI 0 N
603
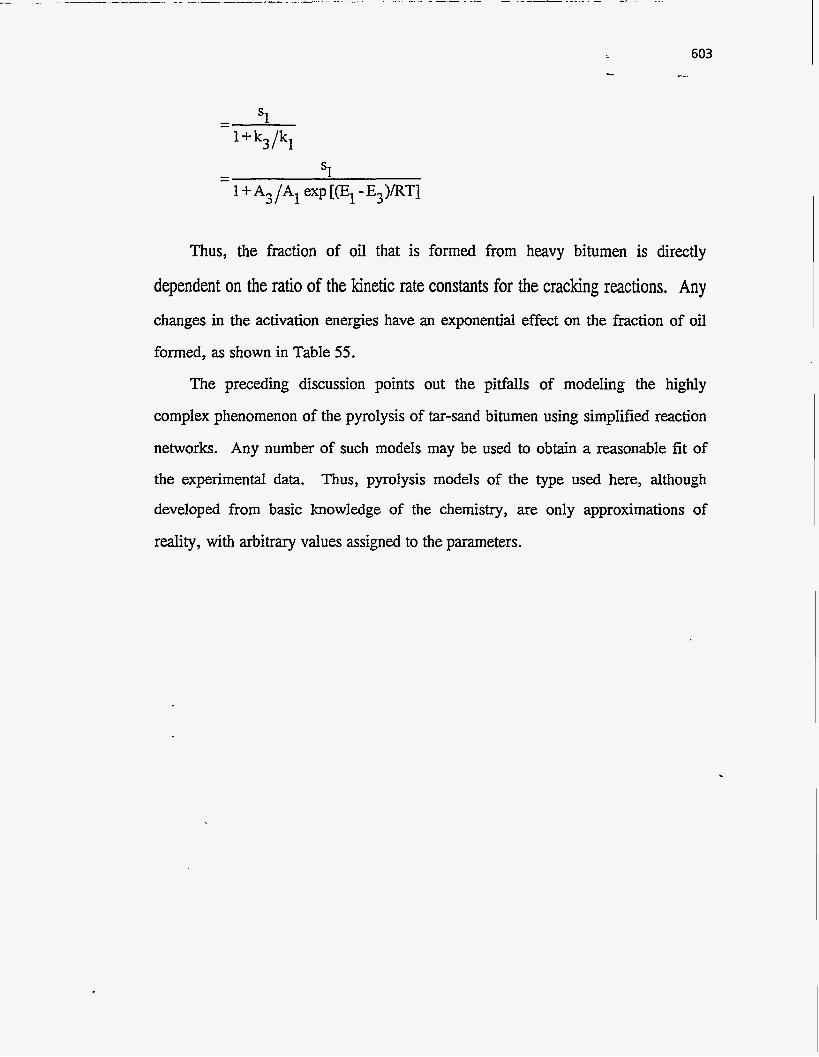
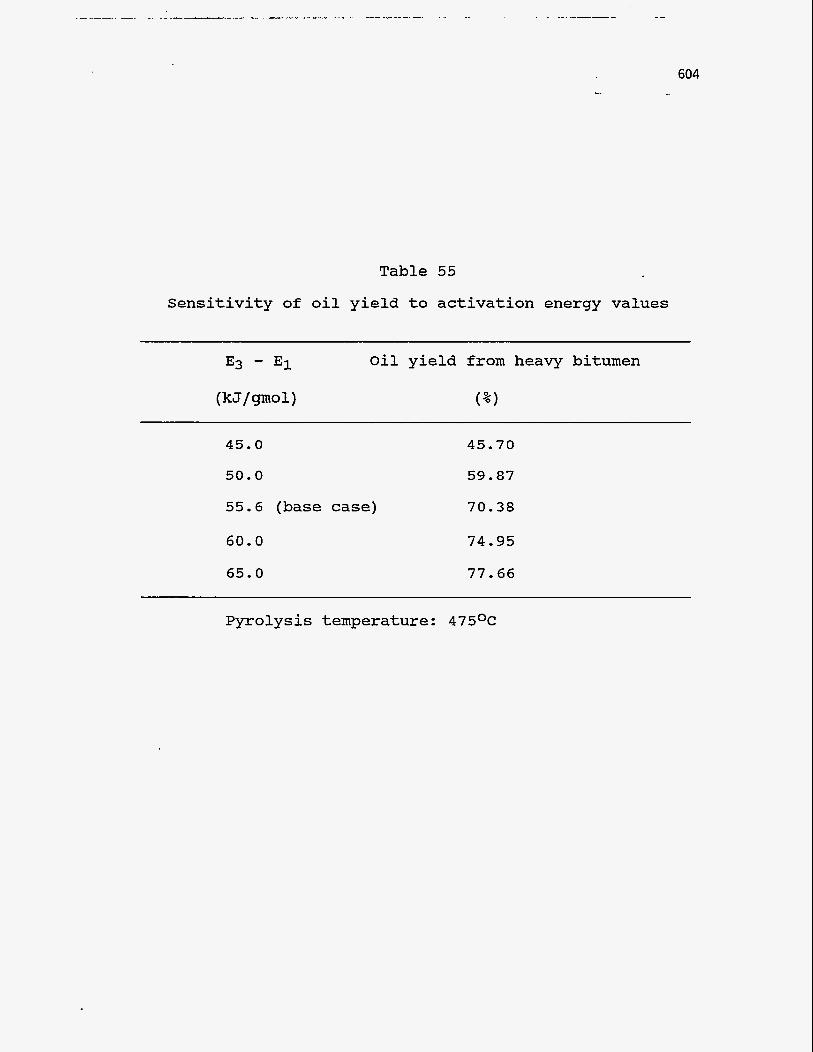
Thus, the fraction of oil that is formed from heavy bitumen is directly
dependent on the ratio of the kinetic rate constants for the cracking reactions. Any changes in the activation energies have an exponential effect on the fraction of oil
formed, as shown in Table 55.
The preceding discussion points out the pitfalls of modeling the highly
complex phenomenon of the pyrolysis of tar-sand bitumen using simplified reaction
networks. Any number of such models may be used to obtain a reasonable fit of
the experimental data. Thus, pyrolysis models of the type used here, although
developed from basic knowledge of the chemistry, are only approximations of
reality, with arbitrary values assigned to the parameters.
604
Table 55
Sensitivity of oil yield to activation energy values
Oil yield from heavy bitumen
~ ~ ~~ ~ ~
45.0 45.70
50.0 59.87
55.6 (base case) 70.38
60.0 74.95
65.0 77.66
Pyrolysis temperature: 475%
605 -_ .
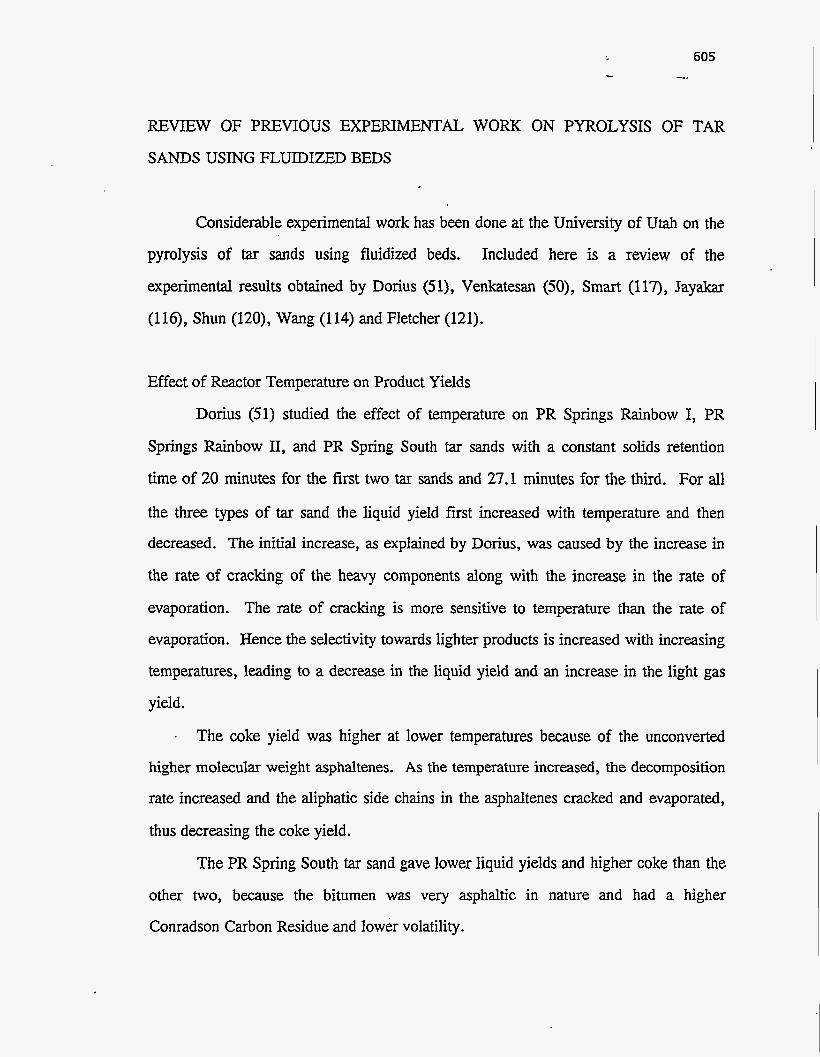
REVIEW OF PREVIOUS EXPERIMENTAL WORK ON PYROLYSIS OF TAR
SANDS USING FLUIDIZED BEDS
Considerable experimental work has been done at the University of Utah on the
pyrolysis of tar sands using fluidized beds. Included here is a review of the
experimental results obtained by Dorius (51), Venkatesan (50), Smart (117), J a y a h
(116), Shun (120), Wang (114) and Fletcher (121).
Effect of Reactor Temperature on Product Yields
Donus (51) studied the effect of temperature on PR Springs Rainbow I, PR
Springs Rainbow 11, and PR Spring South tar sands with a constant solids retention
time of 20 minutes for the first two tar sands and 27.1 minutes for the third. For all
the three types of tar sand the liquid yield first increased with temperature and then
decreased. The initial increase, as explained by Dorius, was caused by the increase in
the rate of cracking of the heavy components along with the increase in the rate of
evaporation. The rate of cracking is more sensitive to temperature than the rate of
evaporation. Hence the selectivity towards lighter products is increased with increasing
temperatures, leading to a decrease in the liquid yield and an increase in the light gas
yield.
. The coke yield was higher at lower temperatures because of the unconverted
higher molecular weight asphdltenes. As the temperature increased, the decomposition
rate increased and the aliphatic side chains in the asphaltenes cracked and evaporated,
thus decreasing the coke yield.
The PR Spring South tar sand gave lower liquid yields and higher coke than the
other two, because the bitumen was very asphaltic in nature and had a higher
Conradson Carbon Residue and lower volatility.
606 ...
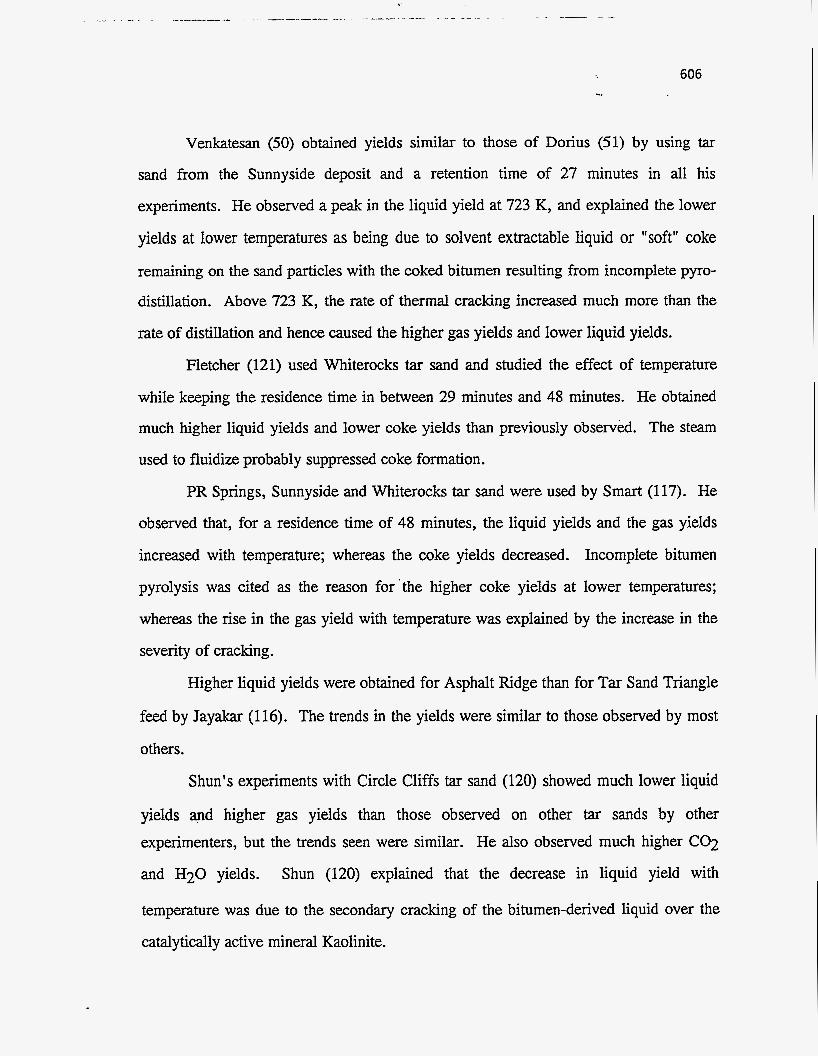
Venkatesan (50) obtained yields similar to those of Dorius (51) by using tar
sand from the Sunnyside deposit and a retention time of 27 minutes in all his
experiments. He observed a peak in the liquid yield at 723 K, and explained the lower
yields at lower temperatures as being due to solvent extractable liquid or "soft" coke
remaining on the sand particles with the coked bitumen resulting from incomplete pyro-
distillation. Above 723 K, the rate of thermal cracking increased much more than the
rate of distillation and hence caused the higher gas yields and lower liquid yields.
Fletcher (121) used Whiterocks tar sand and studied the effect of temperature
while keeping the residence time in between 29 minutes and 48 minutes. He obtained
much higher liquid yields and lower coke yields than previously observed. The steam
used to fluidize probably suppressed coke formation.
PR Springs, Sunnyside and Whiterocks tar sand were used by Smart (117). He
observed that, for a residence time of 48 minutes, the liquid yields and the gas yields
increased with temperature; whereas the coke yields decreased. Incomplete bitumen
pyrolysis was cited as the reason for 'the higher coke yields at lower temperatures;
whereas the rise in the gas yield with temperature was explained by the increase in the
severity of cracking.
Higher liquid yields were obtained for Asphalt Ridge than for Tar Sand Triangle
feed by Jayakar (116). The trends in the yields were similar to those observed by most
others.
Shun's experiments with Circle Cliffs tar sand (120) showed much lower liquid
yields q d higher gas yields than those observed on other tar sands by other experimenters, but the trends seen were similar. He also observed much higher C02
and H20 yields. Shun (120) explained that the decrease in liquid yield with
temperature was due to the secondary cracking of the bitumen-derived liquid over the
catalytically active mineral Kaolinite.
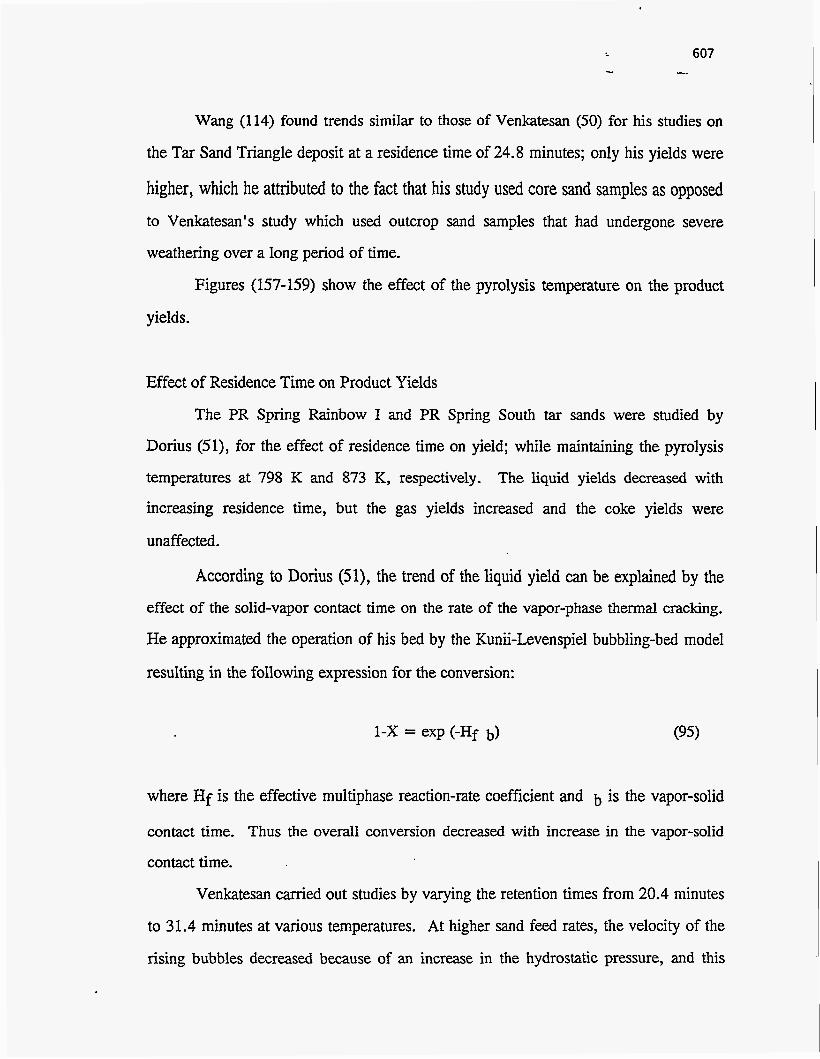
Wang (1 14) found trends similar to those of Venkatesan (50) for his studies on
the Tar Sand Triangle deposit at a residence time of 24.8 minutes; only his yields were
higher, which he attributed to the fact that his study used core sand samples as opposed to Venkatesan's study which used outcrop sand samples that had undergone severe
weathering over a long period of time.
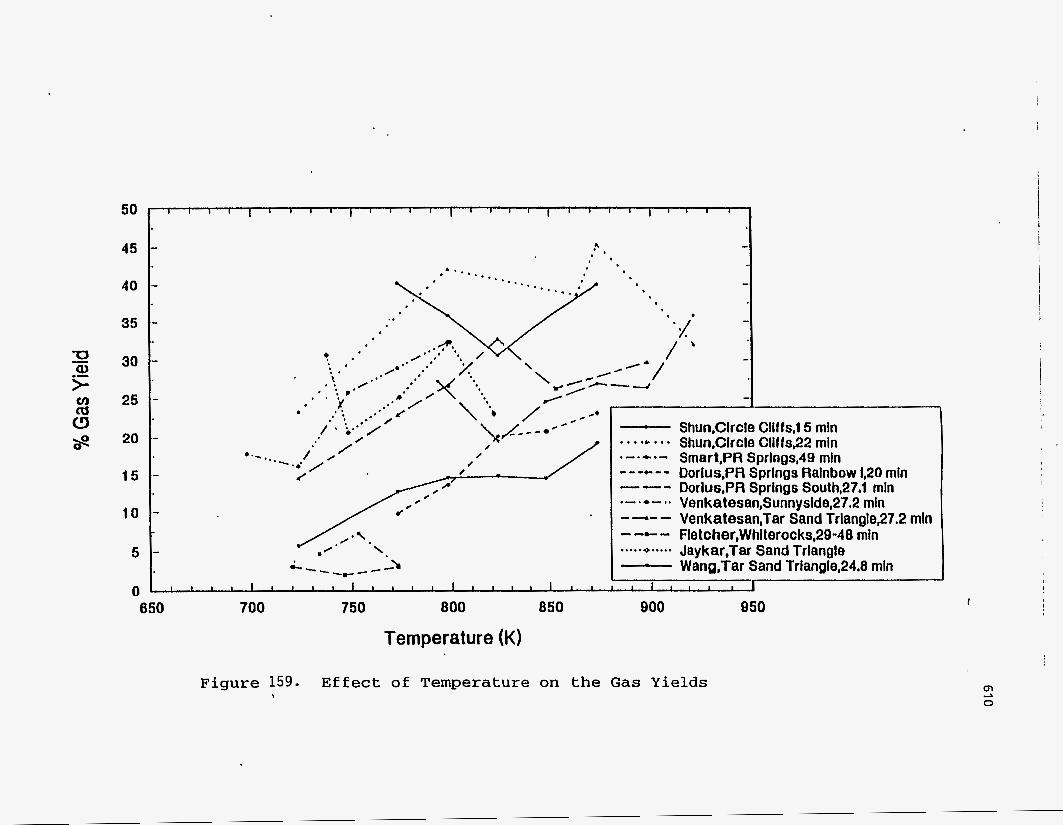
Figures (157-159) show the effect of the pyrolysis temperature on the product
yields .
Effect of Residence Time on Product Yields
The PR Spring Rainbow I and PR Spring South tar sands were studied by
Dorius (51), for the effect of residence time on yield; while maintaining the pyrolysis
temperatures at 798 K and 873 K, respectively. The liquid yields decreased with
increasing residence time, but the gas yields increased and the coke yields were
unaffected.
According to Dorius (51), the trend of the liquid yield can be explained by the
effect of the solid-vapor contact time on the rate of the vapor-phase thermal cracking.
He approximated the operation of his bed by the Kunii-Levenspiel bubbling-bed model
resulting in the following expression for the conversion:
I-X = exp (-Hf b) (95)
where Hf is the effective multiphase reaction-rate coefficient and b is the vapor-solid
contact time. Thus the overall conversion decreased with increase in the vapor-solid
contact time.
Venkatesan carried out studies by varying the retention times from 20.4 minutes
to 31.4 minutes at various temperatures. At higher sand feed rates, the velocity of the
rising bubbles decreased because of an increase in the hydrostatic pressure, and this

80
I ’
I
---+.-- Liq,Dorlus,PR Sprlngs S0uth~27.1 rnln - 4- - Llq,Venkatesan,Sunnyside,27.2 min - LIq,Venkatesan,Tar Sand Trlan~le~27.2 rnln -..-&-- LiqlFletcher,Whlterocks12~-48 min -4-- Llq,SmartlSunnyside136 mln
*’ - 5
‘X sic - - -
Figure 157. E f f e c t of T e m p e r a t u r e on t h e Liquid Yields
- 4 - - - - CT 5 $ 40 - -
. x. -
/x 30 - *x 0 - ‘*.a /- - 0 .
0.
20 - )(-.-.-a - . - . - e -*.-,*-*-* +.-.L.-. ’ . \ ’ *\
X ‘ LI” -
10 I I I I I 1 1 1 1 1 1 1 1 l , * 1 1 I I I 1 , ( , 1 , (
cn 0 03
I

30
20 v)
al z 5
0
R \ . . .‘ \ CY\....... . . . Q
-.’... . I * +....\.:’ \
y‘*@>‘.
.-em.- Coke,DorIus,PR Springs Rainbow 1,20 mln * - .o- .. Coke,Dorlus,PR Sprlngs S0uth~27.1 mln ....+..... Coke,Venkatesan,Sunnyslde,27.2 mln .-.+.- Coke,Venkatesan,Tar Sand Trlangle,27.2 rnln .-.--.. CokelFlstcher,Whlterocks,20-48 min .-,+.- Coke,Smart,Sunnyslde136 mln - H- - Coke.Smart,PR Sprlng~~48.4 rnln ....,+..... Coke, Jaykar,Tar Sand Triangle *-.)+.- Coke,Wang,Tar Sand Triangle,24.8 min -
700 760 800 860 900 os0 1000 Temperature (K)
E f t s a t : of Tamparakurs on the Coke Y i e l d a
I
m 0 co
40 1- 45 .4 a '
-
I
c 0' \ / I . e a . * *.- , \.'- - - 0
/ . i.' / . * s . * * \ .*. / /YO/ /'- /
/
-4
/%. .' '. '
-.
__c_ Shun,Circle Cllffs,l5 rnln . . . .* . . . Shun,Circle Cliffs32 rnln .-.-.- Smart,PR Sprlngs,49 mln --..e..- Dorlus,PR Sprlngs Rainbow 1,20 mln --- Dorius,PR Springs S0ulh~27.1 mln .-.e-.. Venkatesan,Sunnyside,27.2 rnln - -.- - Venkatesan,Tar Sand Trlanglep7.2 mln - -c - Fletcher,Whlterocks,29-48 rnln ..... 4..... Jaykat,Tar Sand Triangle - Wang,Tar Sand Trianglq24.8 min
I I l l I
Temperature (K)
Figure 159. Effect of Temperature on the Gas Yields ,
i
I
2 0
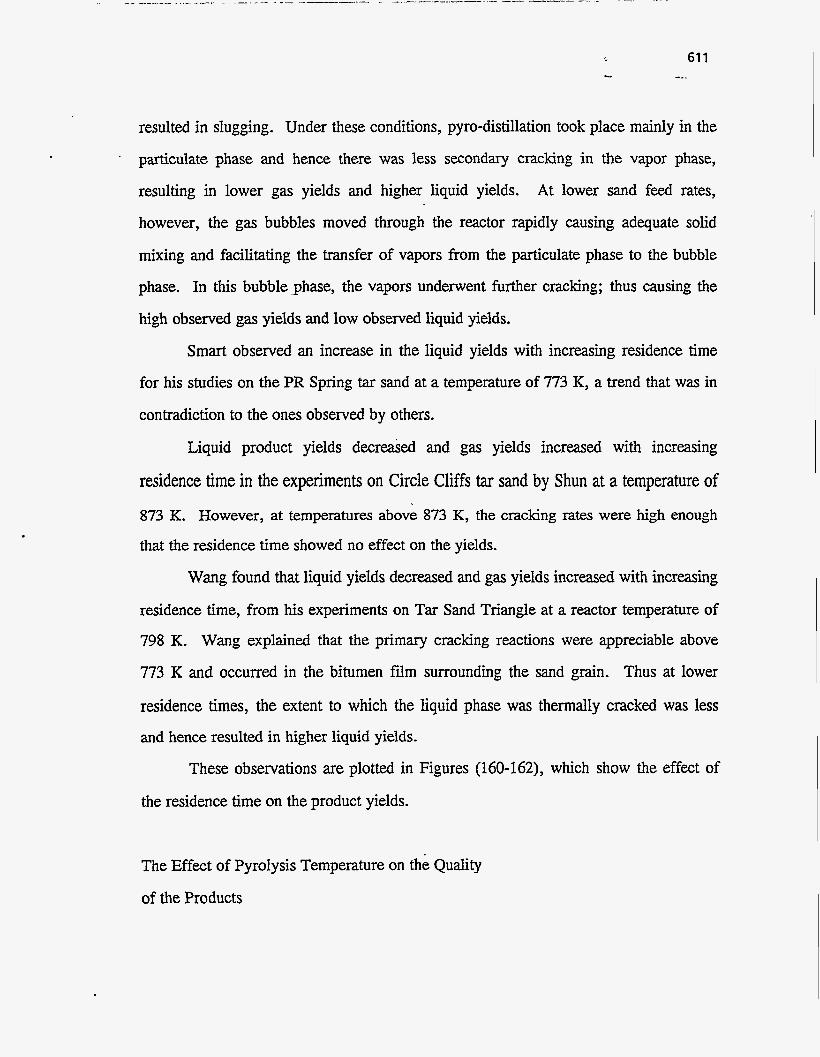
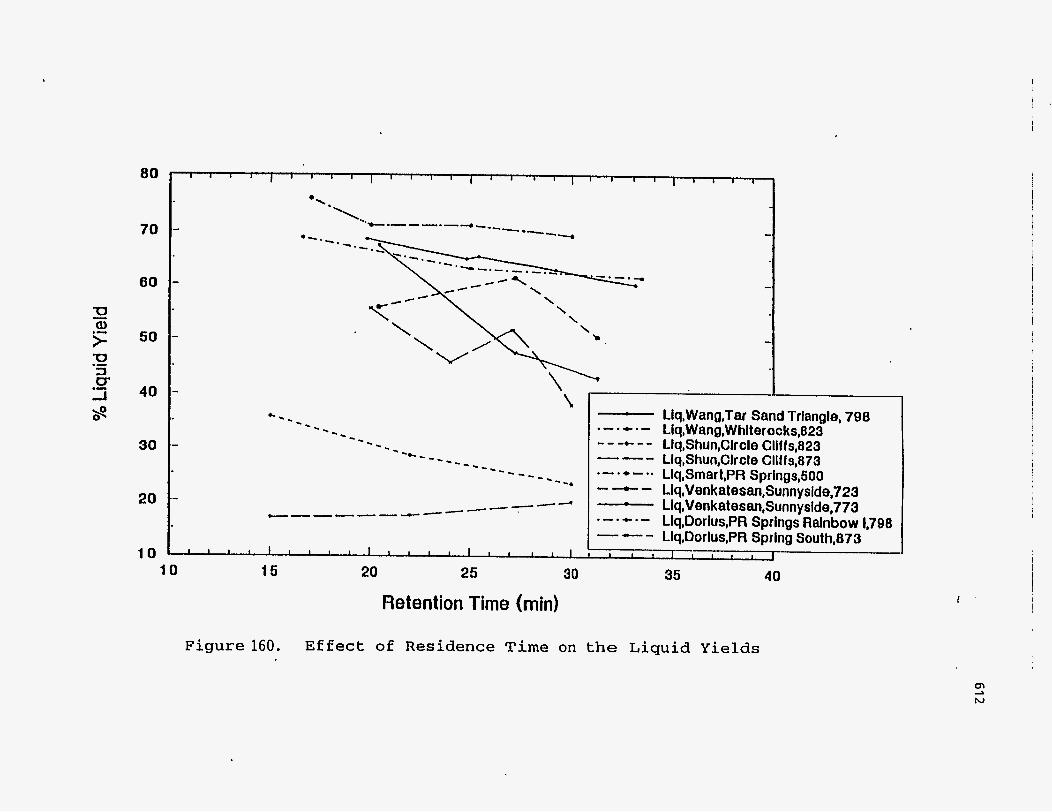
resulted in slugging. Under these conditions, pyro-distillation took place mainly in the
particulate phase and hence there was less secondary cracking in the vapor phase,
resulting in lower gas yields and higher liquid yields. At lower sand feed rates,
however, the gas bubbles moved through the reactor rapidly causing adequate solid
mixing and facilitating the transfer of vapors from the particulate phase to the bubble
phase. In this bubble-phase, the vapors underwent further cracking; thus causing the
high observed gas yields and low observed liquid yields.
Smart observed an increase in the liquid yields with increasing residence time
for his studies on the PR Spring tar sand at a temperature of 773 K, a trend that was in
contradiction to the ones observed by others.
Liquid product yields decreased and gas yields increased with increasing
residence time in the experiments on Circle Cliffs tar sand by Shun at a temperature of
873 K. However, at temperatures above 873 K, the cracking rates were high enough
that the residence time showed no effect on the yields.
Wang found that liquid yields decreased and gas yields increased with increasing
residence time, from his experiments on Tar Sand Triangle at a reactor temperature of
798 K. Wang explained that the primary cracking reactions were appreciable above
773 K and occurred in the bitumen film surrounding the sand grain. Thus at lower
residence times, the extent to which the liquid phase was thermally cracked was less
and hence resulted in higher liquid yields.
These observations are plotted in Figures (160-162), which show the effect of
the residence time on the product yields.
The Effect of Pyrolysis Temperature on the Quality
of the Products
80
30
20
70
-
I-
60
50 I
40 I-
*\.\
---- --- - ---- ---- \... *-.-.
\ \ \ '.
\ \
----- ------+--e-
10 1 1 1 1 1 1 1 ( 1 1 1 1 1 , ~ 1 , 1 I
10 15 20 25 30
Retention Time (min)
I
Llq,WanQ,TW Sand Triangle, 798 .-.*.- Llq,Wang,Whlterocks,823 ---+..- Llq,Shun,Clrcle Cllffs,823 _.-- Liq,Shun,Clrcle Cliffs,873 .- .*- .. LIq,Smart,PR Springs,SOO --.- Llq,Venkatesan,Sunnyslde,723 - Llq,Venkat esan,Sunnyside,773
--- Llq,Dorlus,PR Sprlng South,873 - 35 40
Liq,DorIus,PR Springs Ralnbow 1,708 .-.+.-
I
i
!
I
Figure 160. Effect of Residence Time on the Liquid Yields

40
....................(..'*. . e...* . e +;. '.
30 Coke,Smart,PR SprIngs,500 Coke,Venkatesan,Sunnyside,723 . . . .t . . . Coke,Venkatesan,Sunnyside,773
-..-- Coke,Dorlus,PR Springs Rainbow 1,798 .-.--.. Coke,Wang,Tar Sand Trlangie,798 ---- Coke,Dorius,PR Spring South,873
- -- - .....* .....
20
10
r
1 1 1 1 1 1 1 1 1 1 1 1 , 1 1 1 1 1 ) 1 I I I I I I I
30 35 40 10 15 20 25
Retention Time (min) I '
Figure 161. Effect of Residence Time on the Coke Yields I !
2 W

614
Y
-. \ \ \ \ \ \ \ \
\
* I I m
4
\ a \ \ .
\ - \ i
\ \ b
.
0 0 0 0 0 Q) tn v (Y
m m u a, c u c 0
m a, 0: IU 0 u u a, w w1
N w 4
Q) k 3 tn -4 E4
61 5 --.
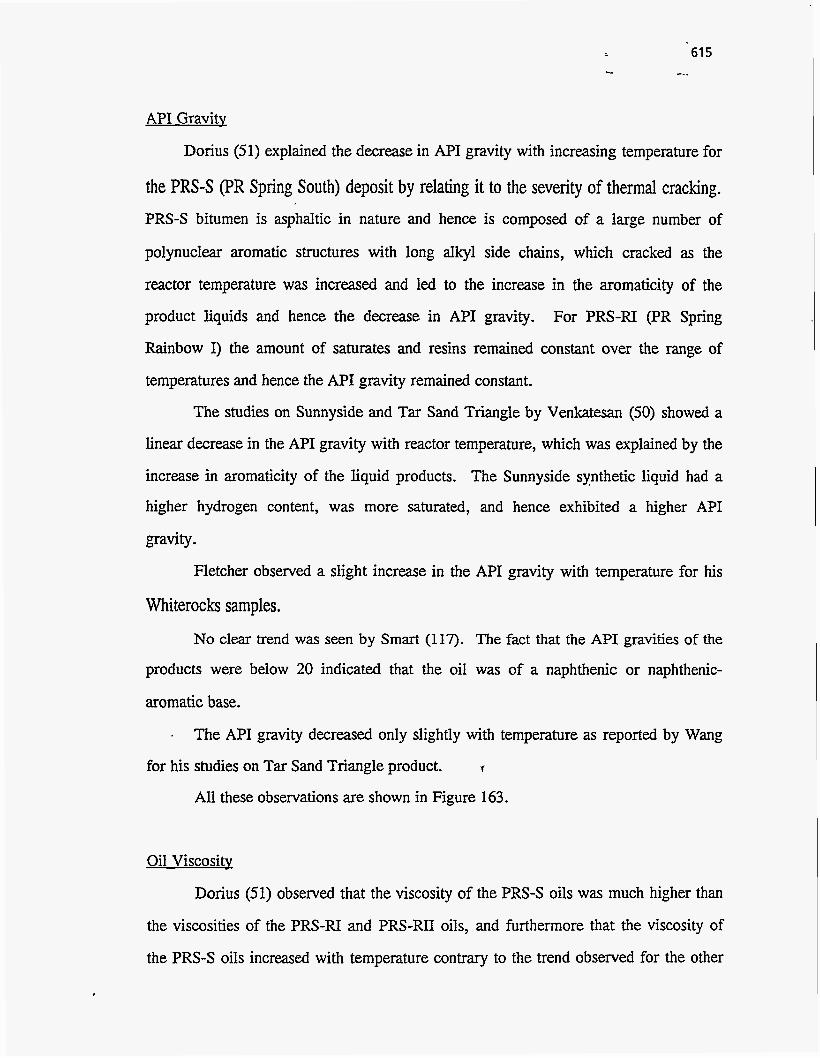
API Gravitv
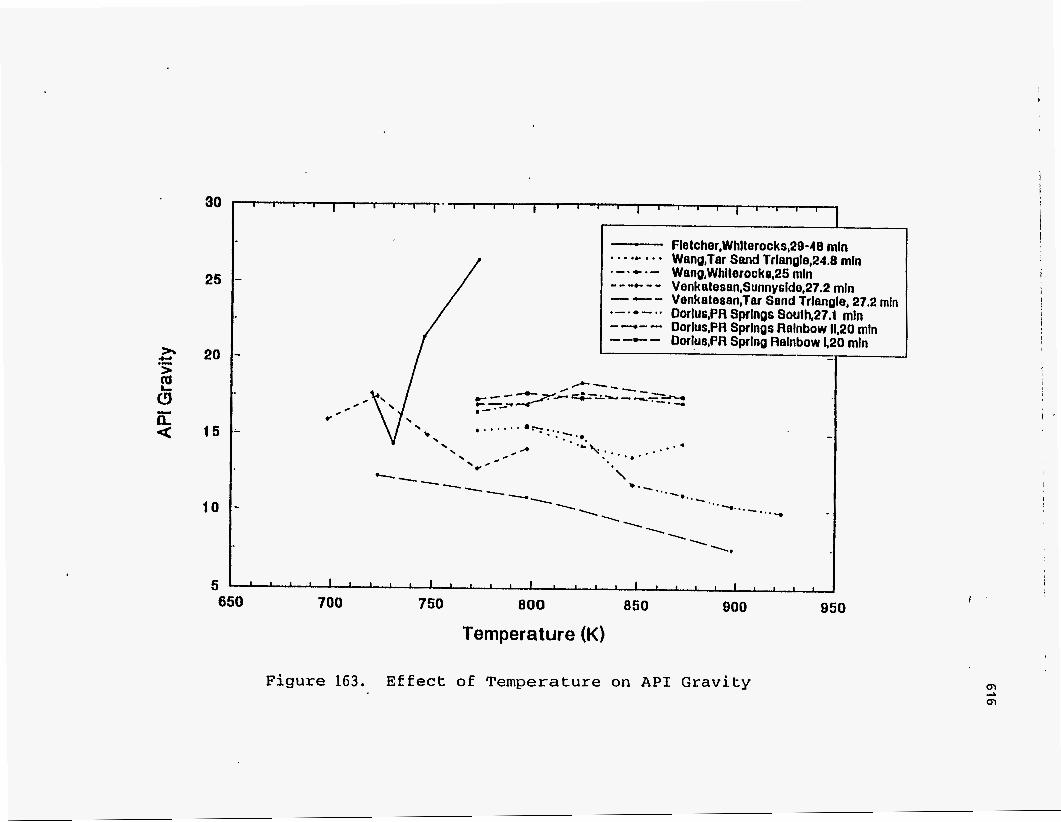
Dorius (51) explained the decrease in API gravity with increasing temperature for
the PRS-S (PR Spring South) deposit by relating it to the severity of thermal cracking. PRS-S bitumen is asphaltic in nature and hence is composed of a large number of
polynuclear aromatic structures with long alkyl side chains, which cracked as the
reactor temperature was increased and led to the increase in the aromaticity of the
product liquids and hence the decrease in API gravity. For PRS-RI (PR Spring
Rainbow I) the amount of saturates and resins remained constant over the range of
temperatures and hence the API gravity remained constant.
The studies on Sunnyside and Tar Sand Triangle by Venkatesan (50) showed a
linear decrease in the API gravity with reactor temperature, which was explained by the
increase in aromaticity of the liquid products. The Sunnyside synthetic liquid had a
higher hydrogen content, was more saturated, and hence exhibited a higher API
gravity.
Fletcher observed a slight increase in the API gravity with temperature for his
Whiterocks samples. No clear trend was seen by Smart (117). The fact that the API gravities of the
products were below 20 indicated that the oil was of a naphthenic or naphthenic-
aromatic base.
. The API gravity decreased only slightly with temperature as reported by Wang
for his studies on Tar Sand Triangle product. I
All these observations are shown in Figure 163.
Oil Viscositv
Dorius (51) observed that the viscosity of the PRS-S oils was much higher than
the viscosities of the PRS-RI and PRS-RII oils, and furthermore that the viscosity of
the PRS-S oils increased with temperature contrary to the trend observed for the other
30
25
2 20 .- >
6 z < 15
10
5
Fletcher,Whlterocks,29-48 rnln . . . .C . . . Wenq,Tar Sand Trlangle,24.8 rnln .-.*.- Wang,Whllerocko,25 rnln ---e-- Venkalesan,Sunnyside,27.2 rnln
Venkalesen,Tar Sand Trlangle, 27.2 rnln Dorlus,PR Sprlngs SauIh,27.1 mln Dorlus,PR Sprlngs Relnbow 11,20 rnln - -c - Dorlu8,PR Sprlnq Relnbow 420 rnln
--- .-1.-.. ----
850 800 950 700 750 800 650
Temperature (K)
Figure 163. Effect of Temperature on A P I Gravity
I
617 -*.
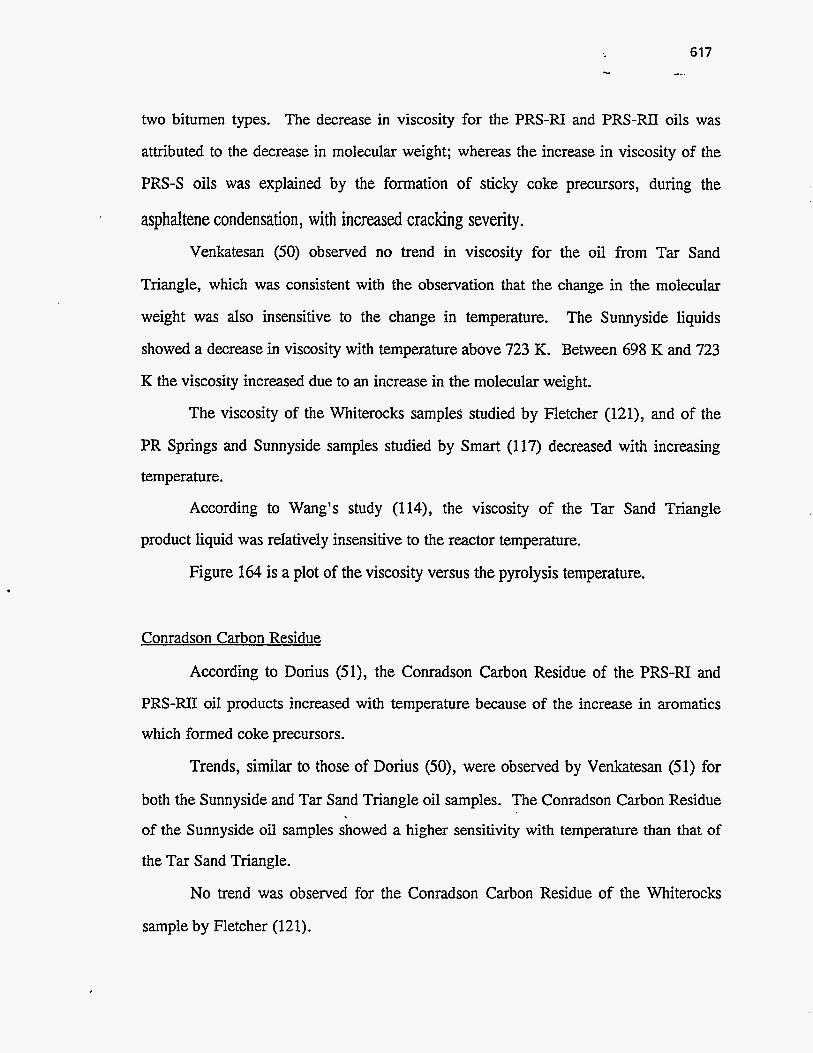
two bitumen types. The decrease in viscosity for the PRS-RI and PRS-RII oils was
attributed to the decrease in molecular weight; whereas the increase in viscosity of the
PRS-S oils was explained by the formation of sticky coke precursors, during the
asphaltene condensation, with increased cracking seventy. Venkatesan (50) observed no trend in viscosity for the oil from Tar Sand
Triangle, which was consistent with the observation that the change in the molecular
weight was also insensitive to the change in temperature. The Sunnyside liquids
showed a decrease in viscosity with temperature above 723 K. Between 698 K and 723
K the viscosity increased due to an increase in the molecular weight.
The viscosity of the Whiterocks samples studied by Fletcher (121), and of the
PR Springs and Sunnyside samples studied by Smart (117) decreased with increasing
temperature.
According to Wang's study (114), the viscosity of the Tar Sand Triangle
product liquid was relatively insensitive to the reactor temperature.
Figure 164 is a plot of the viscosity versus the pyrolysis temperature.
Conradson Carbon Residue
According to Dorius (51), the Conradson Carbon Residue of the PRS-RI and
PRS-RII oil products increased with temperature because of the increase in aromatics
which formed coke precursors.
Trends, similar to those of Donus (50), were observed by Venkatesan (51) for
both the Sunnyside and Tar Sand Triangle oil samples. The Conradson Carbon Residue
of the Sunnyside oil samples showed a higher sensitivity with temperature than that of
the Tar Sand Triangle.
No trend was observed for the Conradson Carbon Residue of the Whiterocks
sample by Fletcher (121).
1200
900
600
300
0
I I
i I i
I
./? \
, . - Dorius,PR Sprlng Ralnbow 1,20 mln . , . .C .. * Dorius,PR Spring Ralnbow II, 20mln e - . - . - Dorlus,PR Spring South,27.1 rnln ---c-- Venkatesan,Tar Sand Trianglep7.2 mln --- Venkatesan,Sunnyside,27.2 rnln . - . * - a . Fletcher,Whlterocks,29-48 rnln - -- - Wang,Tar Sand Triangle,24.8 mln - - - Wang,Whlterocks,25 rnln I
J l l l l l l l l l l l l l j I 1 l j l l , 1 1 1 1 1 ~ 1 1 , I 900 950 1000 650 700 750 800 850
Temperature (K)
I
I
Figure 164. E f f e c t of Temperature on Viscosity

619 -.. -..
Refer to Figure 165 to see the effect of pyrolysis temperature on the Conradson
Carbon Residue, as observed by the various experimenters.

7 -
I I I I 1 I 1
2 700
1 I I I I I I I I I 1 1 1 I I I I 1 1 750 800 850 900
f f
* - * +.-.- f .e'
f 0 f
f . / *
f /
/ * f / *
f /- f /- ,L *
, ' I
Pyrolysis Temperature (K)
Dorius,PR Spings Rainbow 1,20 min - Dorlus,PR Springs Rainbow ii,20 mln . . . ... . . ,
.-.)..- Venkatesan,Tar Sand Trlan~le~27.2 mln -..e-- Venkatesan,SunnysideI27.2 mln
Wang,Tar Sand Trlangle,24.8 mln Wang,Whlterocks,25 rnin
-c-
e-..-..
!
/ * #+
/ I -
f f
I f /
f / :y ' * * . . . . . . * . . . . . . . . . . . . - . ' . . . . b - f
. / ' f
.' I
f
---+
I - . . . * . f
I , . .a , . a /
4 a * '., .../ .../ .../ * \ -
I
Figure 165. Effect of Temperature on Conradson Carbon Coke Value

EXPERIMENTAL APPARATUS AND PROCEDURE
In 1950 Peter and Gishler (108) proposed the first thermal fluidized bed process
for extracting and upgrading tar sand bitumen. Seader and coworkers (116, 117, 189-
19 1, 2 16, 2 17) developed an energy-efficien t thermally coupled fluidized-bed reactor
system for the pyrolysis of tar sand bitumen.
Fluidized Bed Reactor System
A detailed description of the apparatus is found in Smart's thesis (117). The
modifications done on the control system and the data acquisition unit and the feeding
system are described by Coronella (1 18).
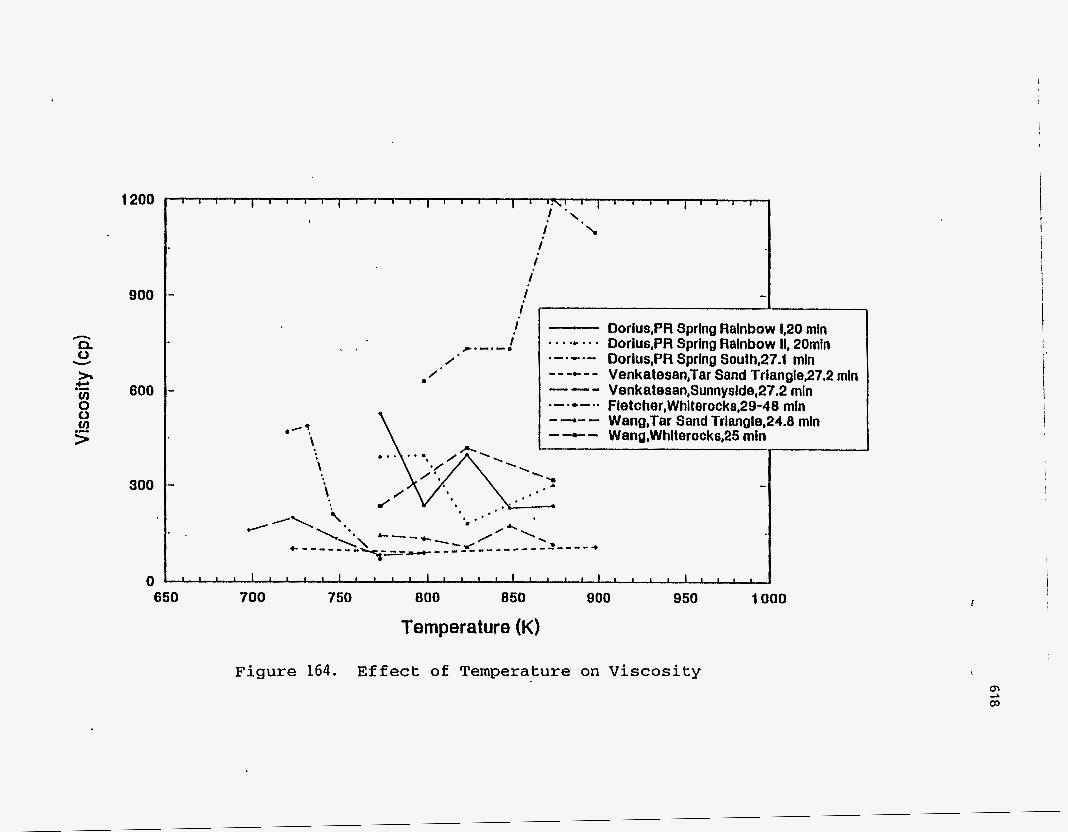
A schematic of the reactors is shown in Figure 166. Figure 167 shows the
schematic for the product recovery system. The tar sand is fed into the pyrolysis
reactor, which is fluidized using nitrogen and typically operated between 450°C to 500"
C. The bitumen on the sand particles cracks and evaporates and is canied by the
fluidizing gases to a product recovery system; where it passes through water-cooled
heat exchangers is condensed and collected. The coked sand from the pyrolysis reactor
is passed continuously through a downcomer to the combustion reactor, typically maintained between 55OoC to 60O0C, where the fluidizing air bums the coke on the
sand. Three heat pipes, mounted vertically and extending into both the beds, transfer
the heat of combustion to the pyrolysis bed to preheat the tar sand and supply the heat
of pyrolysis.
Before the current experiments were performed, a few modifications were made
to the reactors to improve their operation. The vertical pipe, connecting the feeder
output to the pyrolysis reactor, was replaced by a larger pipe whose internal diameter
was 4 inches. This was done because the tar sand would get stuck in a smaller
diameter pipe and would cause the feed auger to get twisted.
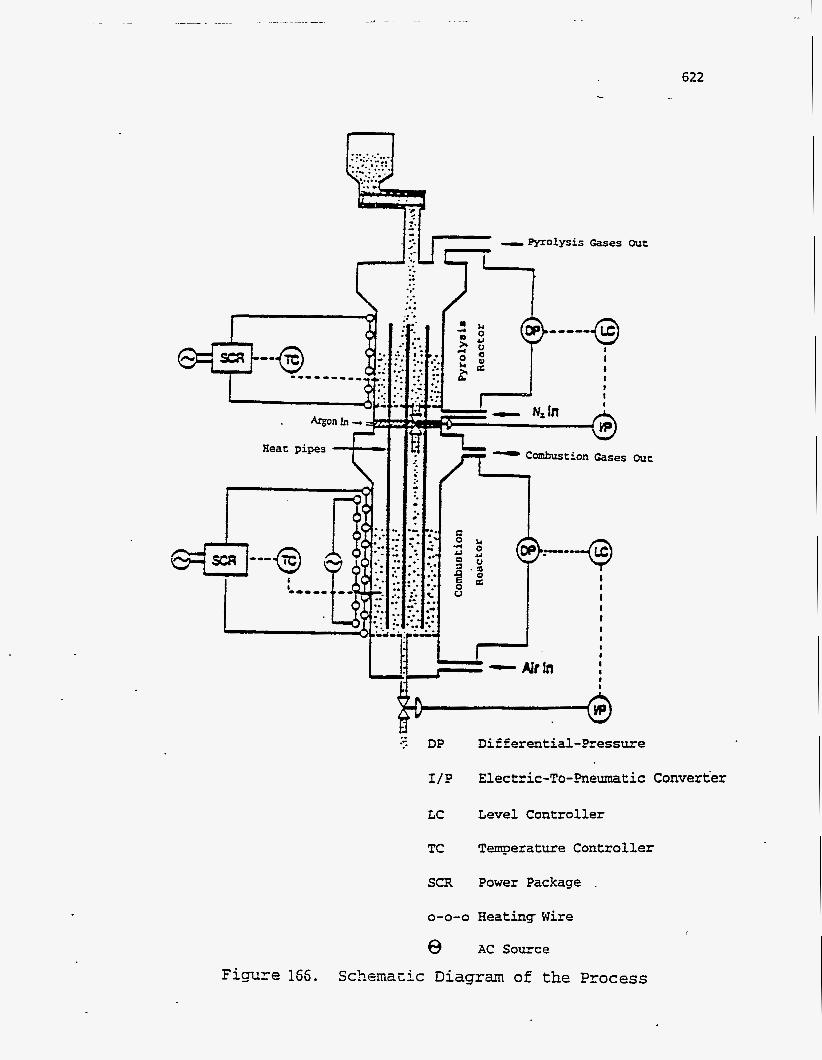
622
'. - - -pYrobsis w e s Out
..
.. .. .. . . ...
I
Heat pipes
\ 1 ; JJ 0 'J Q a
I I I I I
- Combustion Gases
I I I I
8
n Y
:? DP Differential-Pressure
I/?
LC
TC
SCR
Elec tric-To-?neumatic Converter
Level Controller
Temperature Controller
Power Package
0-0-0 Heating Wire
9 AC Source
Schematic D i a g r a m of the Process Figure 1SS.
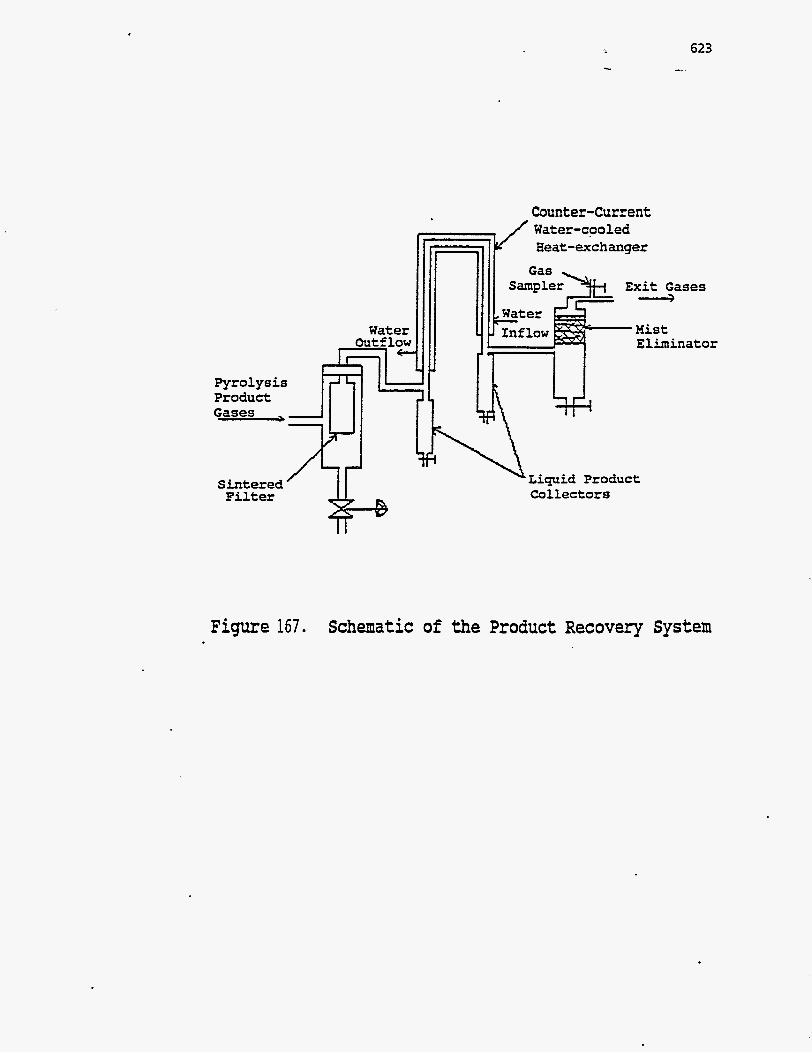
... 623
-_ ~
Counter-Current
Heat-exchanger
Exit Gases * H i s t Eliminator
Pyrolysis Product Gases ,
Sintered ’ 1 1 - P F i l t e r Collectors
Figure 157. Schematic of the Product Recovery System
624
In addition, an argon seal was introduced in the downcomer, connecting the
pyrolysis and combustion reactors. The purpose of the seal was to maintain the
pressure in the downcomer high enough so that there was no upflow of the combustion
gases to the pyrolysis reactor and no downflow of the pyrolysis gases into the
combustion reactor. This pressure was usually maintained at a value of 1 psig greater
than the pressure at the bottom of the pyrolysis reactor or 1 psig greater than the
pressure at the top of the combustion reactor, whichever was greater.
Experimental Procedure
Before every run the following steps were completed to prepare the reactor:
(1) The sintered filter unit shown in Figure 167 was disassembled and cleaned. This
was necessary because of the build-up of solid sand particles on the sintered filter.
(2) The elbow connection between the pyrolysis reactor and the filter was also cleaned
because the entrained sand would collect in it.
(3) The cyclone at the exit of the combustion reactor was cleaned. The copper tubing
in the combustion exit line was cleaned. (4) A bucket of Whiterocks tar sand, weighing approximately 6.8 kg, was crushed in a
grinding machine. Clean sand was then added to the tar sand such that the final ratio
of the tar sand to the clean sand was 86:14. The clean sand reduced the agglomeration
of the tar sand and improved its fluidizing properties.
(5) The feeder was emptied of all the tar sand left in it from the previous run. The left
over tar sand was then weighed and this weight was later used in the material balance
calculations for the previous run. The expansion unit had to be disconnected to empty
the feeder.
(6) The oil from the two product collectors was drained out over a period of 2 days.
The collectors were then disconnected from the reactor system and weighed; and then
cleaned with acetone and weighed again; after which they were reconnected.
(7) The oil in the tubing leading from the collector to the mist eliminator was drained
out. The oil collected in the mist eliminator vessel was also drained out. The material
of the mist eliminator was checked once in every four to five runs. Since there was not
much accumulation of oil on the mist eliminator material, the entire material was
changed only twice during the course of all the runs.
(8) Once in every few runs, the graphite packing material in the control valve was
checked. This packing prevented the gases from leaking during the operation of the
valve. The packing was replaced once every three to five runs.
(9) The sampler from which the pyrolysis sand samples were obtained would get
plugged with the pyrolysed tar sand after almost every run. This problem was usually
solved by pushing a wire through the sampler. But in the case of severe caking, the
sampler was first wetted with acetone by using a pippete and then a long syringe needle
was pushed into the sampler, thus clearing it.
(10) The flange connecting the exit of the pyrolysis reactor to the filter unit was
tightened after cleaning the gas2ets and the surface of the flanges. The other end of the
filter unit was connected to one end of the water-cooled condensers.
(1 1) The water-cooled condensers were cleaned with acetone, once in every four or five
runs, to remove the oil lining the inner walls and improve the heat transfer.
(12) Two layers of ceramic wool insulation were wrapped around the filter unit; and
the top surface of the pyrolysis reactor was also covered with insulation.
(13) The electrical connections to the filter were tightened and all other electrical
connections were checked to ensure that they were properly connected.
(14) It was made sure, that there was one full N2 cylinder and an Ar cylinder with a
minimum pressure of 800 psi, prior to each run.
The following procedure was implemented to start up and run the reactor.
(1) The heating of the filter was started about 8 hours prior to starting the run by
keeping the variac setting of the filter at about 40% of its maximum value. This was
626
necessary because the filter heated up more slowly compared to the rest of the reactor
and needed to be at about 350°C during the course of the run.
(2) Eight kilograms of coked sand were weighed in a bucket. A PC-based data
acquisition system was used. A Quickbasic program named "level" was used to control
the sand content of the two reactors. The "level" program was started on the computer
and air flowrates to the pyrolysis and combustion reactors were started and maintained
at about 40 SCFH. The setpoints for the pyrolysis and combustion reactors were 5 lb
and 8 lb respectively. The coked sand was poured slowly from the top of the reactor.
Quite often the downcomer would get plugged with the sand, and then the air purge
would be used to dislodge the sand. This procedure was stopped when there was about
5 lb in the pyrolysis reactor and 8 lb in the combustion reactor.
(3) The expansion unit was then reconnected by tightening the flange connection.
(4) The electrical heating was started and carried out in steps. The pyrolysis and
combustion temperature setpoints were kept at 200°C initially and then slowly
increased to the desired values. The variac settings for heating the combustion reactor
and the exit of the pyrolysis reactor were kept at about 40% of the maximum. The
wattmeter reading for the combustion heating was noted.
(5) The "level" program recorded the pressure drop across the pyrolysis and
combustion reactors and the temperatures in both the reactors, every 6 seconds. The
pressure drop readings, which were continuously displayed on the screen, gave a good
indication of the amount of sand in the reactors and also if the the bed was properly
fluidized.
(6) The "level" program also calculated the amount of electricity supplied to the
pyrolysis and combustion reactors by measuring the amount of time that the
temperature controller remained on.
(7) The water flow to the condensers was started.
*
627 -_
(8) When the reactor temperatures had reached the desired values, a measured amount
of tar sand was put into the feeder. Vacuum grease was applied on the gaskets lining
the lid of the feeder and then the lid was clamped onto the feeder.
(9) If the filter had been cleaned properly and heated to about 3OO0C for about 3 hours
prior to the run, then the pressure at the bottom of the pyrolysis reactor read about 3
psig. (10) The air flow to the pyrolysis reactor was changed to a N2 flow of about 60 SCFH
and the N2 purge flow to the top of the reactor was adjusted to about 1 SCFH. This
purge flow minimized any flow of the pyrolysis product gases to the feeder.
(1 1) The Ar flow was started and maintained at a pressure of about 1 psi greater than
the pressure at the bottom of the pyrolysis reactor. The pressure at the top of the
combustion reactor was usually lower than that at the bottom of the pyrolysis reactor;
hence the Ar flow was used to prevent any downflow of the pyrolysis products.
(12) The feeder setting was set to the appropriate value and the feeder was started.
After about 5 minutes when the temperature in the pyrolysis reactor dropped, the time
was noted as the time at which the feed was actually started.
(13) Before the start of the run, the temperature of the reactor was kept about 10°C
greater than desired, because once the feed was introduced the cold feed caused the
temperature to drop. If the temperature dropped below the desired value, the feed was
turned off for a few seconds. This was done only during the initial few minutes of the
run until the temperature stabilized.
(14) During the course of the run, a constant watch was kept on: the bed levels
displayed on the screen, the Ar pressure, the pressure at the bottom of the pyrolysis
reactor, and the temperature of the pyrolysis reactor.
(15) While the reactor was operating stably, two to three gas samples were collected.
(16) A normal run lasted for about 1 to 1.5 hour. At the end of the run, the tap on the
pyrolysis sand sampler was opened and a wire was pushed into the sampler to get the

628
pyrolysis sand flowing. Once a suitable amount of coked sand was collected, the tap
on the sampler was closed. (17) At the end of the run, the feeder was stopped and the control valve at the pyrolysis
exit was manually closed.
(18) The electrical heating was turned off.
(19) All the gas flows were turned off.
(20) The pyrolysis gases were immediately analyzed using a gas chromatography
instrument.
(21) The "level" program was terminated and the data files collected were saved.
(22) The next day, after the reactor had cooled down, the sand from the combustion
and pyrolysis reactors was emptied.
(23) The oil from the collectors was collected in bottles that were previously weighed.
Material Balance
The purpose of the material balance was to find out what fractions of the
bitumen fed were converted to liquid, gas, and coke. A poor material balance is
indicative of an unstable operation of the reactor or errors in method of analysis of the
products. Most of the material balances obtained were above 90% and hence were
considered reliable. . The feeder was filled with a weighed amount of tar sand before a run. After the
run, the feeder was emptied of all the tar sand, and this tar sand was then weighed.
The difference in the two weighings was the amount of tar sand fed during the entire
run. This value divided by the time interval of the run was the average feed rate. The
sand coming out of the combustion bed was collected and the sand left in the
combustion and pyrolysis reactors after the run was also collected. This value when
corrected for its coke content should equal the total clean sand fed to the reactor. The
total clean sand fed was also calculated by correcting the total amount of tar sand fed
from the feeder for its bitumen content. The two values usually agreed to within 10%.
The average sand holdup in the bed was calculated from the collected data, and this
when divided by the average feed rate gave the average residence time of the reactor.
The average pyrolysis and combustion reactor temperatures were also calculated from
the data.
The bitumen content of the feed was obtained by burning small weighed
samples in a muffle furnace for 16 to 20 hours at 798 K, since carbonate decomposition
does not occur below 923 K. The weight loss was attributed to the bitumen content.
From the bitumen content and the total feed, the total bitumen fed is obtained.
Besides the pyrolysis sand sampler, the coked sand samples were also obtained
from the sand left in the pyrolysis and combustion reactors after the run. The coke
content of all these samples was obtained by burning small weighed samples in a muffle
furnace for 16 to 20 hours at 798 K. The coke content on the sand obtained from the
pyrolysis sampler was, usually, slightly higher than the coke content on the sand in the
pyrolysis reactor. An average value was taken.
The total amount of liquid was obtained by emptying both the oil collectors and
the mist eliminator. The empty oil collectors were weighed to make sure that there was
no significant oil left inside them. Any oil left inside the tubing, connecting the exit
gases to the mist eliminator, was collected and weighed. If the filter was not heated to
a high enough temperature, some oil would collect inside the sintered filter. The filter
was then held turned upside down in a vise over a period of a couple of days and all the
oil was drained out and weighed. During normal runs, a sand layer collected on the
outside walls of the filter, in the bottom of the filter unit and in the exit pipe connecting
the pyrolysis reactor to the filter unit. This sand was collected, weighed and then
weighed samples of it were burned in a muffle furnace for 16 to 20 hours at 798 K.
The weight loss was taken as the oil on the sand, after it was corrected for the coke
content on the sand. The coke content on the sand was assumed to be the same as that

on the sand in the pyrolysis reactor. This weight loss was then added to the total oil
yield.
The gas analysis was done on a Hewlett Packard Model 5890 I1 gas
chromatograph with thermal conductivity and flame ionization detectors. The response
factors were calculated from calibration experiments.
Energy Balance
The electrical heat input to the pyrolysis and combustion reactors was measured
using the data acquisition system. Temperature sensitive stickers from Omega were
used to find the temperature at the surface of the insulation, and this was used to
estimate the heat loss from the system. The coke content of the sahd entering and
exiting the combustion bed was found as mentioned above. The heat of combustion
was estimated from the amount of coke burned in the reactor. All other terms in the
energy balance were calculated.
Product Quality Analysis
Standard ASTM procedures were followed in determining the various
properties. The ASTM 1747 method was used for viscosity determination, ASTM D
70 for specific gravity, ASTM D 189 for Conradson Carbon Residue, and ASTM D 97
for pour point. Simulated distillation was performed on a Hewlett Packard 5890 Series
11 gas chromatograph with a FID detector and a Supleco 5 meter capillary column (Cat.
No. 2-5337). The column was heated from 35OC to 38OoC at rate of 12°C/minute and
kept at 38OoC for 8.75 minutes. The helium flowrate used was 20 ml/minute.
63 1 -__ ...
DISCUSSION OF EXPERIMENTAL RESULTS
The driving force for the conversion of bitumen in tar sands to lighter products
is thermal activation. At the pyrolysis temperature, the C-C, C-H, and C-heteroatom
bonds are broken resulting in reactive free radicals. These radicals can either continue
to crack by b scission to give oil and light gas as products, or can condense to low H/C
carbonaceous material referred to as coke. Thus the time and temperature of the
reaction dictate the severity of the reaction and thus determine the final distribution of
the products (2 18).
This was confirmed by the mathematical model developed by Coronella (1 l8),
which showed that the pyrolysis temperature and the residence time of the solids in the
pyrolysis reactor determined the yield and distribution of the -products. The same
conclusion was reached by various experimenters as discussed below. In this research,
a number of experiments were carried out at different pyrolysis temperatures and
residence times to find the optimal pyrolysis temperature and residence time. A
summary of the results is shown in Table 56.
Effect of Pyrolysis Temperature on the Product Yields
A number of experiments were Carried out at various pyrolysis temperatures
using Whiterocks tar sand with a bitumen saturation of about 7%. The stability of the
operation during the run and the material balance obtained for the run were the
criterion used in determining the quality of the run. The results from five good-quality
runs are presented in Figure 168.
The pyrolysis temperature was varied in the range from 463OC to 52OoC at a
residence time of about 27 minutes. The highest liquid yield, which was 65.1 % , was
obtained at a temperature of 478OC. The liquid yield, at first, increased with
temperature and then decreased. Figure 169 shows another run at a pyrolysis
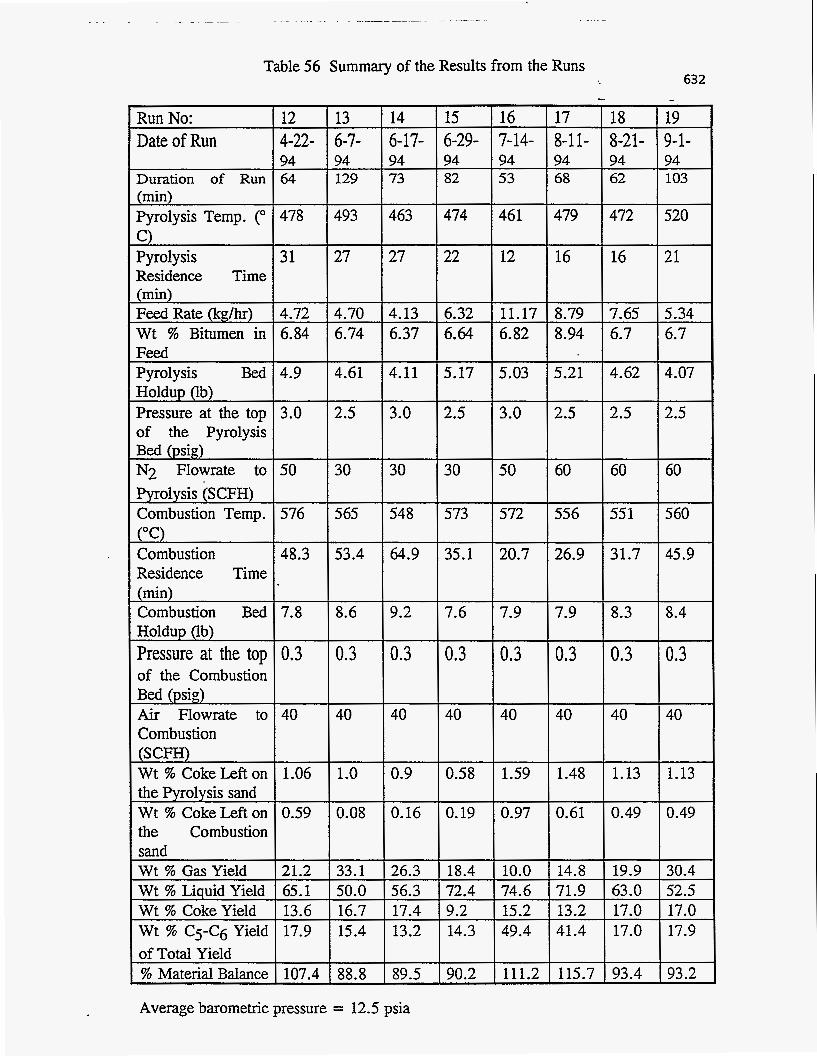
Table 56 Summary of the Results from the Runs
Run No: Date of Run
Duration of Run (min) Pyrolysis Temp. (" C) Pyrolysis Residence Time (min) Feed Rate (kg/hr) Wt % Bitumen in Feed Pyrolysis Bed Holdup Ob) Pressure at the top of the Pyrolysis Bed (psig) N2 Flowrate to Pyrolysis (SCFH) Combustion Temp. ("C) Combustion Residence Time (min) Combustion Bed Holdup Ob)
of the Combustion Bed (psig) Air Flowrate to Combustion (SCFH) Wt % Coke Left on the Pyrolysis sand Wt % CokeLeft on the Combustion sand Wt % Gas Yield Wt % Liquid Yield Wt % Coke Yield Wt % C 5 - c ~ Yield of Total Yield % Material Balance
Pressure at the top
632
12 13 14 15 16 17 4-22- 6-7- 6-17- 6-29- 7-14- 8-11- 94 94 94 94 94 94 64 129 73 82 53 68
478 493 463 474 461 479
31 27 27 22 12 16
4.72 4.70 4.13 6.32 11.17 8.79 6.84 6.74 6.37 6.64 6.82 8.94
4.9 4.61 4.11 5.17 5.03 5.21
3.0 2.5 3.0 2.5 3.0 2.5
50 30 30 30 50 60
576 565 548 573 572 556
48.3 53.4 64.9 35.1 20.7 26.9
7.8 8.6 9.2 7.6 7.9 7.9
0.3 0.3 0.3 0.3 0.3 0.3
40 40 40 40 40 40
1.06 1.0 0.9 0.58 1.59 1.48
0.59 0.08 0.16 0.19 0.97 0.61
21.2 33.1 26.3 18.4 10.0 14.8 65.1 50.0 56.3 72.4 74.6 71.9 13.6 16.7 17.4 9.2 15.2 13.2 17.9 15.4 13.2 14.3 49.4 41.4
107.4 88.8 89.5 90.2 111.2 115.7
-
31.7
8.3
0.3
40
1.13
45.9
8.4
0.3
40
1.13
T
T 63.0 52.5
17.0 17.9
Average barometric pressure = 12.5 psia
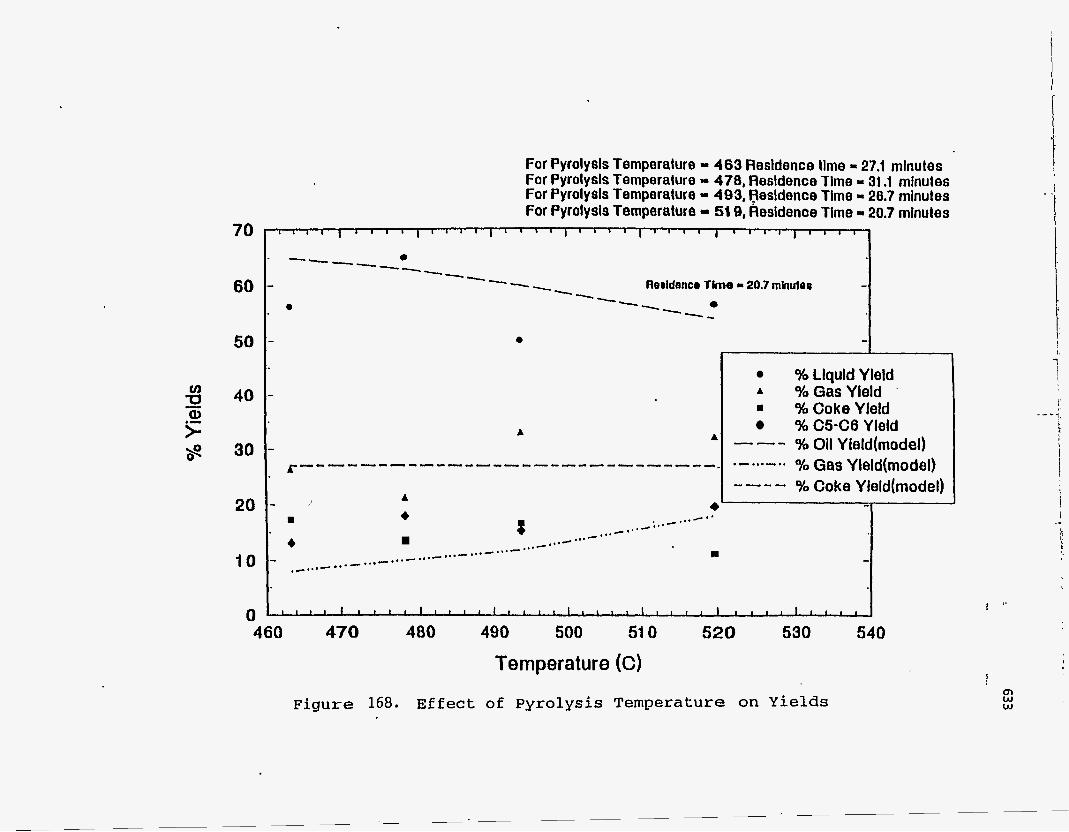
e
7 0 . 1
60
50
40
30
20
I O
0
I 1 1 1 1 1 1 1 1 1 1 1 I ' 0 1 I 1 1 1 I 1 1 1 1 I 1 I 1 1 I 1 1 I I
0 . ---- --- -+-- fleoldencr Tlme - 20.7 mhulor - -- a
--- - ---+, e
- -
% Liquid Yield - A %Gas Yield ' . % Coke Yield
A % C5-C6 Yield A --- % Oil Yleld(mode1)
YO Gas Yleld(mode1) =----- ------------------------_ .-*..-.* YO Coke Yield(mode1)
-
---- A
4 - . . .C. '*
,,.-:.*- *,.- * ' * - :
..,- ...- ... - ..*- *.*-".-
4 -
m
4 *..+.**+ - - *-...- *.*-
1 I I 1 l I I 1 1 I I I I I l I I I I I I I , l l , I I I l 1 1 1 1 1 1 1 1 1
n
Temperature (C)
Figure 168. Effect of Pyrolysis Temperature on Yie lds
! ---I
F
i
i I ..
I Q) W W
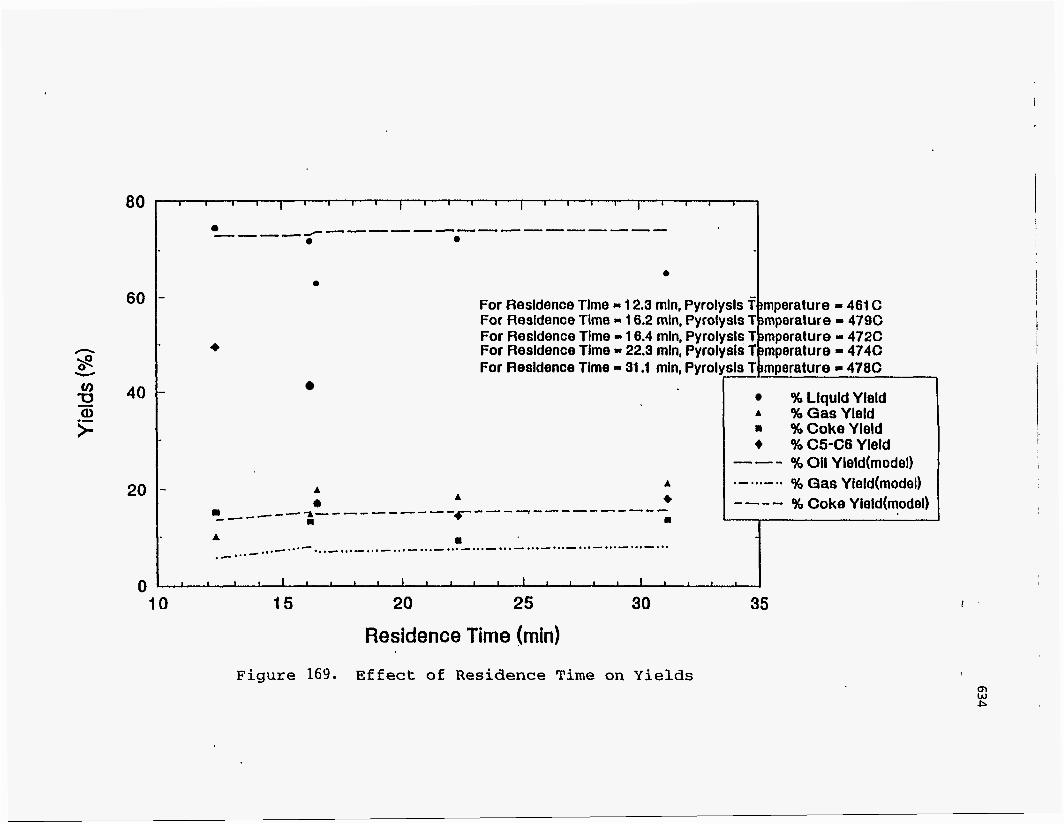
I
e
For Resldence Time - 1 2.3 mln, Pyrolysls 7 For Resldence Time .I 1 6.2 min, Pyrolysis T For Resldence Time 16.4 mln, Pyrolysls
3mperature - 461 C jmperature = 479C
Tjmperature = 472C
For Resldence Time - 31.1 mln, Pyrol
A 6
% Liquid Yield 1, %Gas Yleld 1 %Coke Yield
--- % Oil Yleld(mode1) + % C5-C6 Yleld
.-...e.. % Gas Yield(model) ---- % Coke Yleld(model) I
10 15 20 25 30 35
Residence Time (mid Figure 169. Effect of Residence Time on Yields
Q) w P
635 --.
temperature of 472OC and a residence time of 16.44 minutes with a liquid yield of
63 %, which is higher than the liquid yield of 56% observed at a temperature of 463OC.
Thus there are sufficient data to justify the statement that at lower temperatures the
liquid yield increased with temperature. The gas yield increased with increasing temperature. The gas yield at the pyrolysis temperature of 52OoC is slightly lower than
the yield at 494'C, and the liquid yield at the temperature of 52OoC is slightly higher
than the yield at 494OC. This can be explained by the fact that the run at 52OoC was at
a much lower residence time of 20.7 minutes as compared to the run at 494'C, which
was at a residence time of 26.7 minutes. The amount of "unreacted,bitumen + coke"
remained almost constant for all the temperatures. These trends are similar to those
observed by most experimenters.
The liquid yields obtained from the model, shown by continuous lines in Figure
168, are in reasonably good agreement with the experimental data points. The model
also shows an increase in the liquid yield with temperature at lower temperatures;
however, it predicts a maximum liquid yield at a temperature of 46OoC, which is much
lower than the experimentally observed peak. The model also predicts a constant value
for the amount of "unreacted bitumen + coke" at all temperatures, but this value is much higher than the experimentally observed values. Also, the model predicts much smaller quantities of C1-C4 light gases.
. The observed yields can be explained by considering the reaction mechanism
used in the mathematical model. The model assumes that the bitumen consists of two
fractions, namely, the heavy bitumen and the light bitumen (118). The heavy bitumen
undergoes a cracking reaction and the lighter bitumen undergoes distillation as shown
in Equations 96 and 97.
636
kl Heavy Bitumen + sc Light Bitumen + SD Coke
Light Bitumen SE Heavy Oil + SF Middle Oil + SG Light Oil + SH Light Gas (97)
The significant quantities of the light gas formed by the pyrolysis of asphaltenes
are accounted by the reaction:
Heavy Bitumen kl + SA Coke + sg Light Gas
The gas-phase cracking reactions are:
k5 Heavy Oil +
Middle Oil + kg SL Light Oil + SM Light Gas
SI Middle Oil + SJ Light Oil + SK Light Gas
(99)
( 100)
Thus, at higher,pyrolysis temperatures, the cracking severity is increased due to
greater thermal activation and hence the ease of formation of radicals. The product
selectivity is shifted towards the lighter products and hence the liquid yields are
decreased and the gas yields increased. At lower temperatures, however, cracking is
not .severe and some of the bitumen remains unreacted. Thus, with increasing
temperatures, more of the bitumen is cracked giving more light bitumen and this
increases the liquid yield at lower temperatures. At lower temperatures, there is more
unreacted bitumen and less coke formation, but the opposite is true at higher
temperatures; which explains the reason why the amount of "unreacted bitumen + coke" remains constant at all temperatures.

637 -.
Compared to resins and asphaltenes, oils are much more paraffinic and their
H/C atomic ratios are much higher. Oils may be composed of a naphthene ring with
one of more side chains of varying length.
The pyrolysis behavior of various hydrocarbons varies (219). N-paraffins
pyrolyze to form olefins by dehydrogenation. The olefin yields from pyrolysis of i-
paraffins is less than from n-paraffins, but i-paraffins undergo more chain scission to
give methane and hydrogen. Olefins undergo chain scission to give lower molecular 3
weight olefins and dehydrogenate to form alkynes. Naphthenes dehydrogenate to yield
aromatics, whose ring structure is not easy to rupture. The -1 side chains of the
aromatic rings undergo chain scission of the C-C bond, while the rings condense to
give polynuclear aromatics, which later form coke. The pyrolysis of a complex
mixture of hydrocarbons, such as bitumen, is extremely complex because the large
number of free radicals formed during pyrolysis can react with one another in a number
of ways and can promote and inhibit certain cracking reactions. The reaction
mechanism used in the mathematical model, though a very simplified representation of
the actual pyrolysis process, gives the general picture of the type of reactions occurring
and also gives a good explanation of the yields obtained.
Effect of the Solids Retention Time on the Product Yields
. The effect of the solids retention time on the product yields was studied, using
the same Whiterocks tar sand, by varying the residence time of the solids from about
12 minutes to 31 minutes, while keeping the pyrolysis temperature at about 47OoC.
The yields are shown in Figure 169.
As seen from the figure, the yields predicted by the model are in close
agreement with the experimental data. The liquid yield appeared to be constant for the
different residence times. The gas yield showed a slight increase with residence time
and the "unreacted bitumen + coke" yield remained constant.
638 ...
-However, a very striking trend is noticed in the formation of C5-Cg gases,
which is not a product that is predicted by the model of Coronella. At low residence
times, more than 40% of the total product formed was in the form of Cg-Cg gases. At a residence time of about 16 minutes, there was a sharp decrease in the amount of C5-
Cg gases produced; and with further increase in the residence time the C5-Cg gas yield
remained almost constant. The model only predicts total gas yields, and certain
modifications in the reaction mechanism would be necessary to approach the observed
results.
Any trends that could have been observed in the liquid yields are masked by the
large amounts of c 5 - C ~ gases formed, since the error in the measurement of the c 5 - C ~
gases is sufficient to offset any trends in the liquid yields.
As mentioned earlier, pyrolysis is a very complex process with a number of
reactions occurring simultaneously. Hence a number of reaction mechanisms are
possible. One such mechanism is described here (220). In pyrolysis every compound
can undergo, both concurrently and consecutively, many reactions’. The concept of
primary and secondary reactions has been widely accepted by many researchers.
Primary reactions are reactions occumng first, whereas secondary reactions are the
subsequent reactions of products formed in the primary reaction.
Whiterocks tar sand consists of 18.5% saturates, 5.5% mono-nuclear and di-
nuclear aromatics, l l .3 % polynuclear aromatics, 18.4% resins, and 46.5 % asphaltenes
(82). Primary reactions, which are reactions with faster kinetics, occur predominantly
at residence times lower than 16 minutes. The paraffins and cycloparaffins crack by
the free-radical mechanism which involves: (1) Initiation, where free radicals are
created by thermal activation. (2) Propagation, where products are formed from
reactants without any change in the radical concentration. (3) Termination, where the
radicals combine to form stable products. The products formed are lighter olefins and
paraffins (215). As described above, the aromatics with alkyl groups mainly undergo
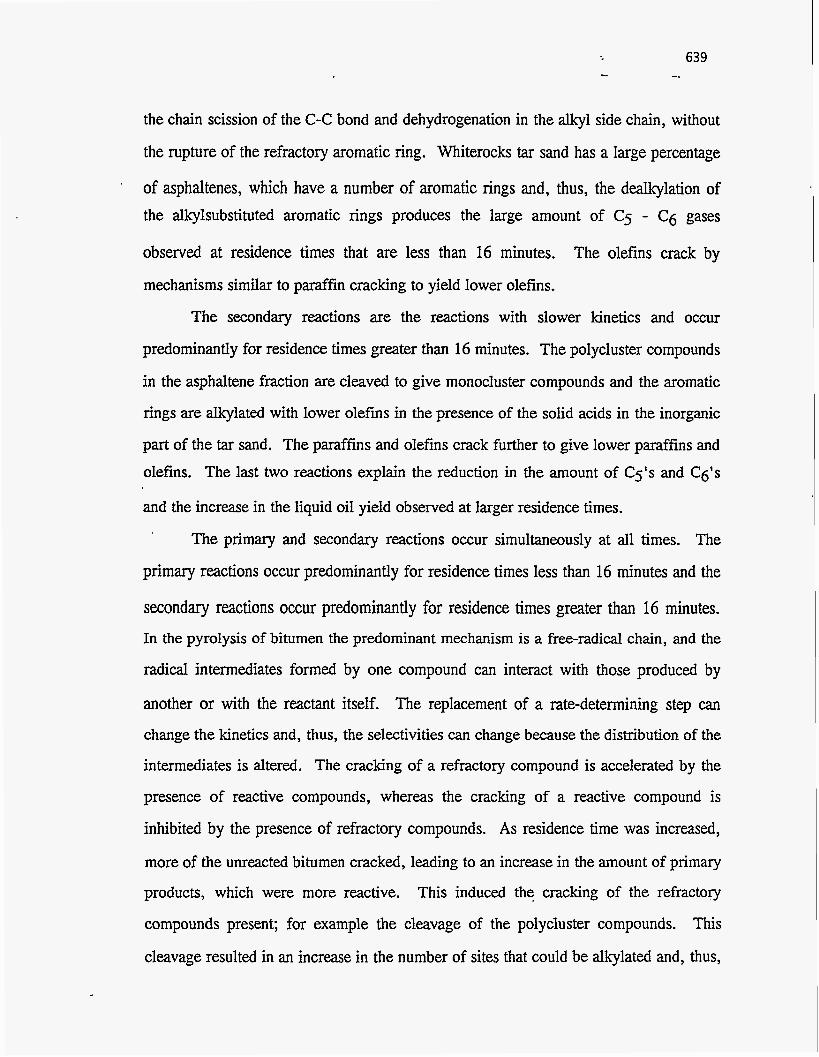
the chain scission of the C-C bond and dehydrogenation in the alkyl side chain, without
the rupture of the refractory aromatic ring. Whiterocks tar sand has a large percentage
of asphaltenes, which have a number of aromatic rings and, thus, the dealkylation of the alkylsubstituted aromatic rings produces the large amount of C5 - c 6 gases
observed at residence times that are less than 16 minutes. The olefins crack by
mechanisms similar to paraffin cracking to yield lower olefins.
The secondary reactions are the reactions with slower kinetics and occur
predominantly for residence times greater than 16 minutes. The polycluster compounds
in the asphaltene fraction are cleaved to give monocluster compounds and the aromatic
rings are alkylated with lower olefins in the presence of the solid acids in the inorganic
part of the tar sand. The paraffins and olefins crack further to give lower paraffins and
olefins. The last two reactions explain the reduction in the amount of C5's and Cg's
and the increase in the liquid oil yield observed at larger residence times.
The primary and secondary reactions occur simultaneously at all times. The
primary reactions occur predominantly for residence times less than 16 minutes and the
secondary reactions occur predominantly for residence times greater than 16 minutes. In the pyroIysis of bitumen the predominant mechanism is a free-radical chain, and the
radical intermediates formed by one compound can interact with those produced by
another or with the reactant itself. The replacement of a rate-determining step can
change the kinetics and, thus, the selectivities can change because the distribution of the
intermediates is altered. The cracking of a refractory compound is accelerated by the
presence of reactive compounds, whereas the cracking of a reactive compound is
inhibited by the presence of refractory compounds. As residence time was increased,
more of the unreacted bitumen cracked, leading to an increase in the amount of primary
products, which were more reactive. This induced the cracking of the refractory
compounds present; for example the cleavage of the polycluster compounds. This
cleavage resulted in an increase in the number of sites that could be alkylated and, thus,
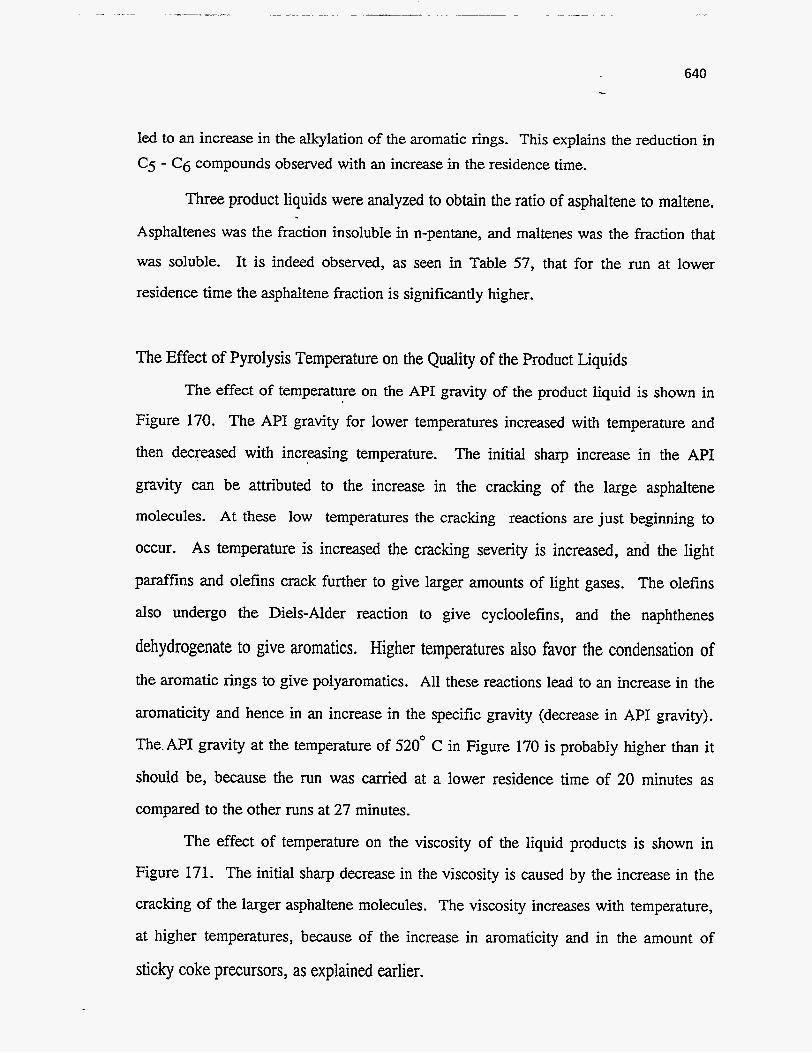
led to an increase in the alkylation of the aromatic rings. This explains the reduction in C5 - Cg compounds observed with an increase in the residence time.
Three product liquids were analyzed to obtain the ratio of asphaltene to maltene.
Asphaltenes was the fraction insoluble in n-pentane, and maltenes was the fraction that
was soluble. It is indeed observed, as seen in Table 57, that for the run at lower
residence time the asphaltene fraction is significantly higher.
The Effect of Pyrolysis Temperature on the Quality of the Product Liquids
The effect of temperature on the API gravity of the product liquid is shown in
Figure 170. The API gravity for lower temperatures increased with temperature and
then decreased with increasing temperature. The initial sharp increase in the API
gravity can be attributed to the increase in the cracking of the large asphaltene
molecules. At these low temperatures the cracking reactions are just beginning to
occur. As temperature is increased the cracking severity is increased, and the light
paraffins and olefins crack further to give larger amounts of light gases. The olefins
also undergo the Diels-Alder reaction to give cycloolefins, and the naphthenes
dehydrogenate to give aromatics. Higher temperatures also favor the condensation of the aromatic rings to give polyaromatics. All these reactions lead to an increase in the
aromaticity and hence in an increase in the specific gravity (decrease in API gravity).
The.AP1 gravity at the temperature of 520' C in Figure 170 is probably higher than it
should be, because the run was carried at a lower residence time of 20 minutes as
compared to the other runs at 27 minutes.
The effect of temperature on the viscosity of the liquid products is shown in
Figure 171. The initial sharp decrease in the viscosity is caused by the increase in the
cracking of the larger asphaltene molecules. The viscosity increases with temperature,
at higher temperatures, because of the increase in aromaticity and in the amount of
sticky coke precursors, as explained earlier.

641
Table 57
Weight Fraction of Asphaltenes in the Product Liquid
Run Number Residence Pyrolysis % %-c6 Weight
Time Temperature Yield of Total Fraction of
(minutes) ("C) Product Asphaltenes
14 27 463 13 0.072
17 16.1 479 41 0.122
18 16.4 472 17 0.058
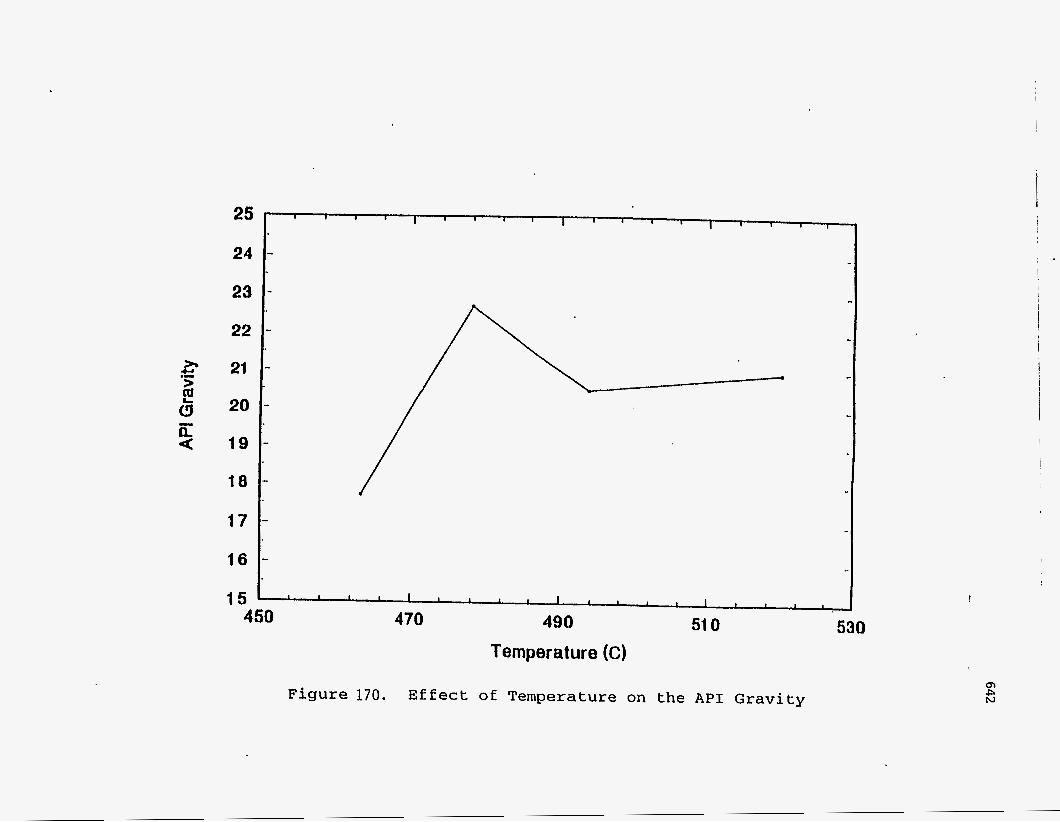
25
24
23
22
21
20
19
18
17
16
15
I 1 I I I I I I I I 1 I I I I 1 1 b I
-
I 1 1 I I I I 1 I 1 1 1 I I I I
51 0 530 470 490 450
Temperature (C)
Figure 170. E f f e c t of Temperature on t h e API Gravity
i
I
m R

n 0 Y
>1 u -4 u) 0 . u v1 -4 3 c 0
a, k 3 u a k Q) a E a, fi
0
LJ U Q)
W W El
W
r( h 4
Q) k I 0 -4 c4

644
The effect of temperature on the Conradson Carbon Residue of the liquid
products is shown in Figure 172. A correlation exists between the H/C ratio and the
Conradson Carbon Residue (CCR) value as follows (221):
H/C = 1.71 - 0.0115"CCR
This equation holds within two limits; at H/C values 1.71, CCR = 0; at H/C values f
0.5, CCR = 100. This correlation was based on 114 data points from 15 crude oils.
At lower temperatures, because of the increase in the cracking of the larger asphaltene
molecules, there is an increase in the H/C ratio, which explains the decrease in the
Conradson Carbon Residue value. With further increase in temperature, the
aromaticity increases and the H/C ratio decreases and thus the observed increase in the
Conradson Carbon Residue value.
The effect of temperature on the pour point of the liquid products is shown in
Figure 173. The product liquids are chilled without disturbance at a standard rate
(ASTM D-97). As cooling is continued, the oil becomes more and more viscous and
the flow becomes slower and slower. The pour point is the lowest temperature at
which the oil flows. As seen in Figure 173 the pour point increases with increase in
aromaticity at higher temperatures. The initial decrease in pour point is only slight.
Figure 174 shows the effect of pyrolysis temperature on the simulated
distillation cuts. As the temperature increases, there is an increase in the proportion of
lighter fractions, namely, gasoline and middle distillate and a decrease in the proportion
of the heavier fractions, namely, gas oil and residue. The data point at a pyrolysis
temperature of 520" C was obtained at a residence time of 20.7 minutes and, hence,
the proportion of the lighter fractions is probably less than it would be for the same
pyrolysis temperature but for a residence time of 27 minutes. All the other runs were
carried out at residence times close to 27 minutes.

2.0
1.5
1 .o
0.5
0.0
I I I I I I I 1 I 1 I I I I I I I I
I I I I I 1 I I I I I I 1 1 I I I I
490 51 0 530 450 470 Temperature (C)
Figure 172. Effect of Temperature on Conradson Carbon Residue
I '
Q,
R
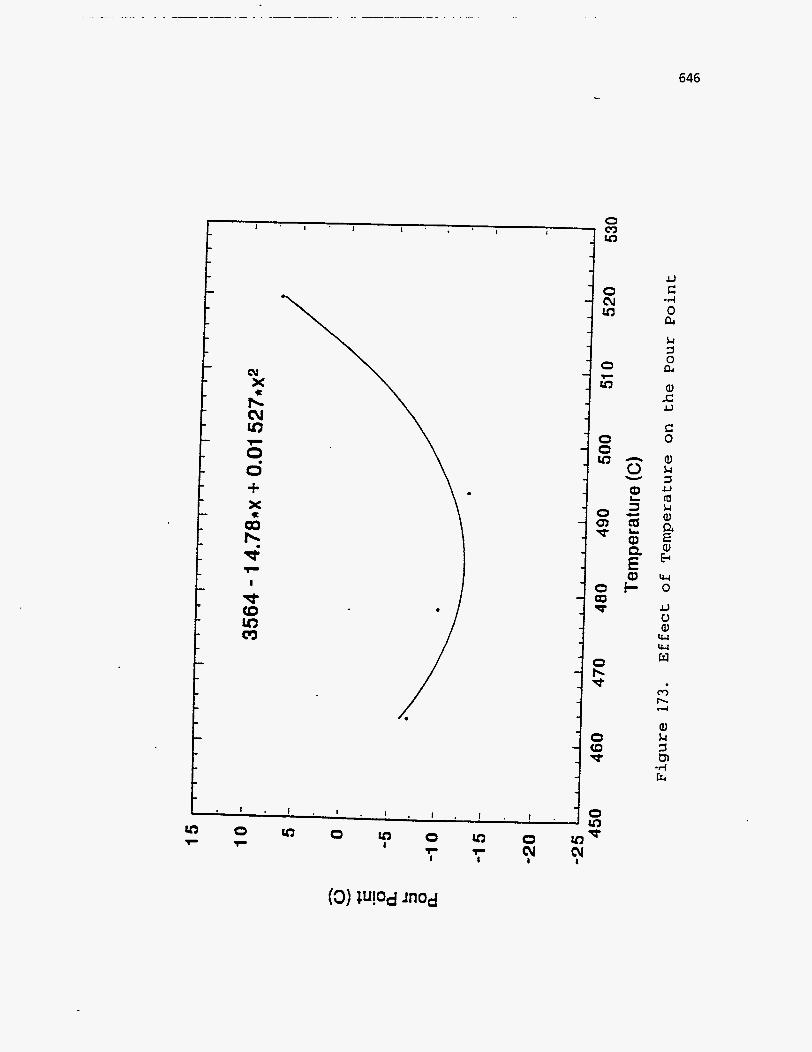
m
646
JJ c -4 0 nl k 3 0 a4
a, .c L)
c 0
a, k 3 u m k a, a E a, i3 W 0
JJ 0 a, ru W w
m b l-l
a, k 3 ul -4 E
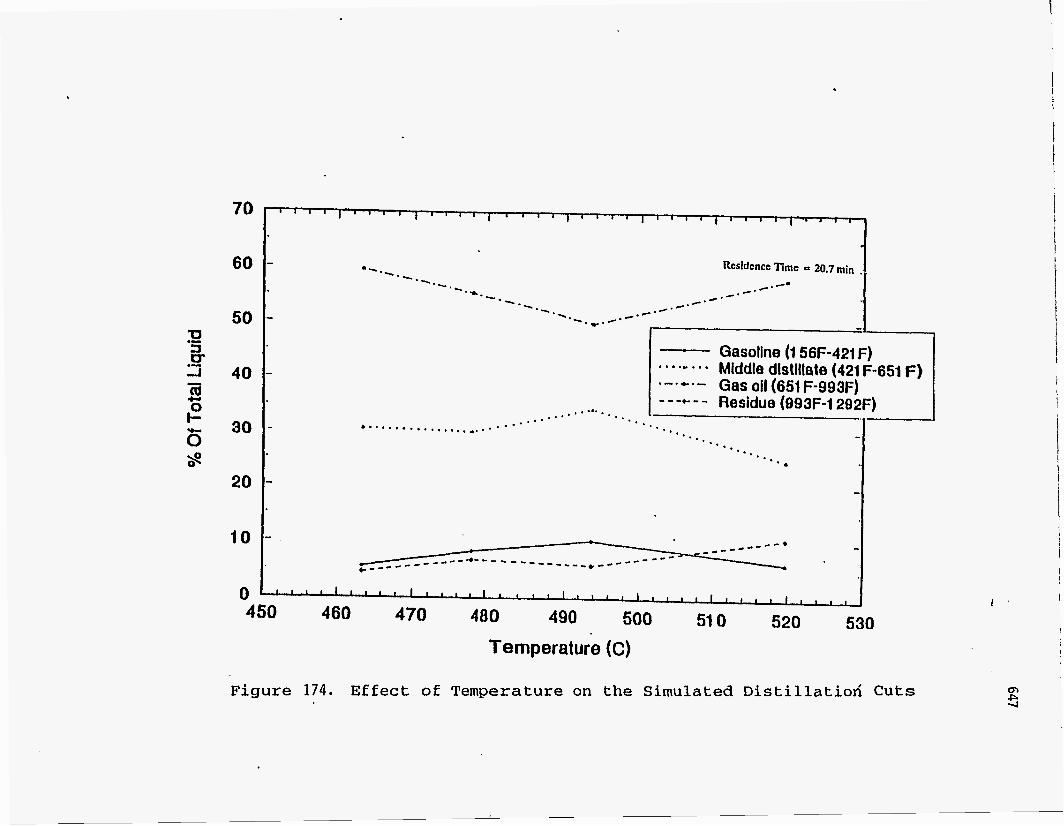
a I , ~ ,
- Gasoline (1 56F-421 F) . . . .- . . . Middle distillate (421 F-651 F) .-.*.- Gas oil (651 F-993F) - - -+-- Residue (093F-1292F)
1
Figure 174. Effec t of Temperature on the Simulated Distillatioh Cuts
-I 40 CrJ ' 30 - *
6 s
20
10
0 I
i I '
-
-
1 1 1 , 1 1 1 1 1 ( 1 1 I l l 1 , 1 ( , 1 , 1 ~ 1 1 1 1 I 1 1 , 1 1 I I
I
648
The Effect of Residence Time on the Quality of the Product Liquids
The effect of residence time on the API gravity of the product liquid is shown in
Figure 175, where it is seen that the specific gravity is high at lower residence times
and decreases with increase in residence time. The specific gravity at the residence
time of 16.4 minutes is higher than that at a residence time of 16.2 minutes, because
the pyrolysis temperatures for the two runs are 472OC and 479OC, and as seen in
Figure 170, the specific gravity at lower temperatures is higher. The product liquids at
the low residence times of 12.3 minutes and 16.2 minutes do not include the large amounts of C5 and C6 compounds formed at these low residence times because these
compounds did not condense appreciably. Thus, a large amount of the olefins and
paraffins formed during the dealkylation of the alkylsubstituted aromatic rings escape,
leaving behind the aromatic ring structures of the asphaltene molecules, resulting in the
higher specific gravities and viscosities observed at the lower residence times.
The effect of residence time on the viscosity of the product liquid is shown in Figure 176. As pointed out in the previous discussion, the viscosity at the lower
residence times is higher than that at higher residence times. The product liquid from
the run at a residence time of 16.4 minutes and pyrolysis temperature of 472OC had the
highest observed viscosity of 473 cp. For this run, the amount of C5 and Cg gases
formed were much less compared to the runs carried at lower residence times. Hence
it may be assumed that there was some cleavage of the polycluster compounds and the C5 and Cg compounds were consumed in the alkylation of the aromatic rings.
However, it is possible that a large number of polycluster groups were not cleaved, and
hence the viscosity and Conradson Carbon Residue of the product liquid was high.
The effect of residence time on the Conradson Carbon Residue of the product
liquid is shown in Figure 177. For the reason explained above, the Conradson Carbon
Residue of the product liquid, for the run at residence time of 16.4 minutes, is high.
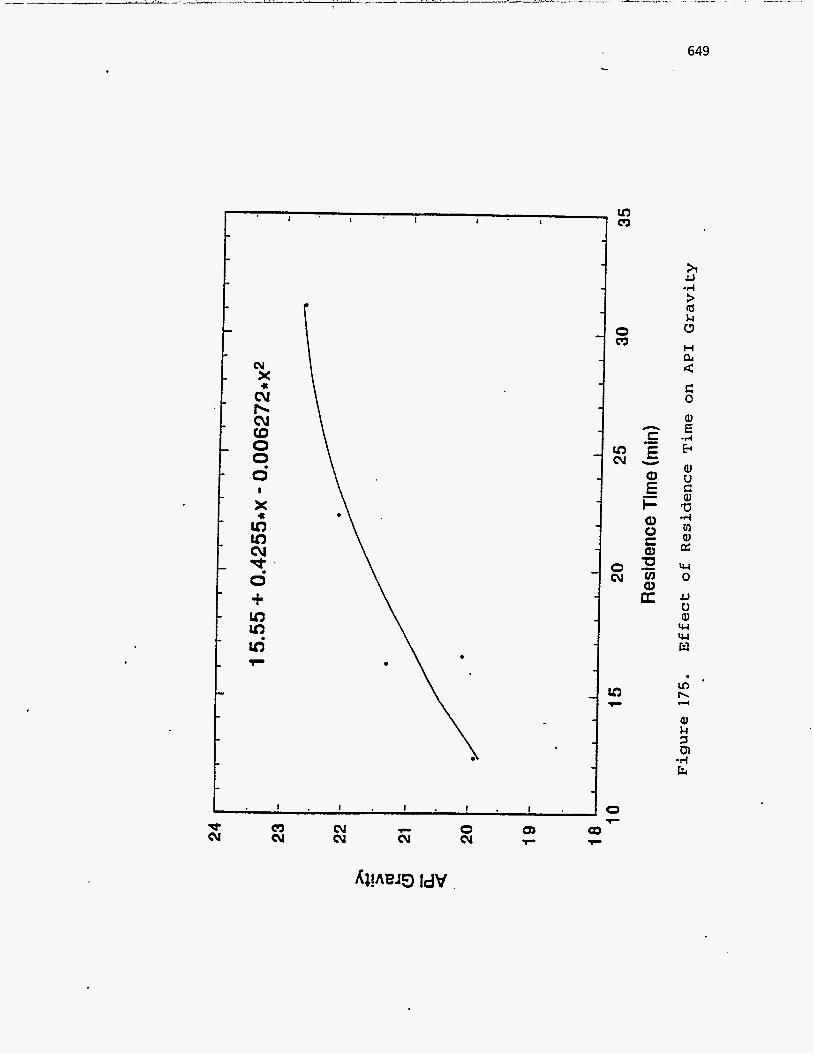
1 ' 1 ' I I I I
cy
U X cv b cv (D 0 0 0 I
x
. w
+ 0
c3 cu
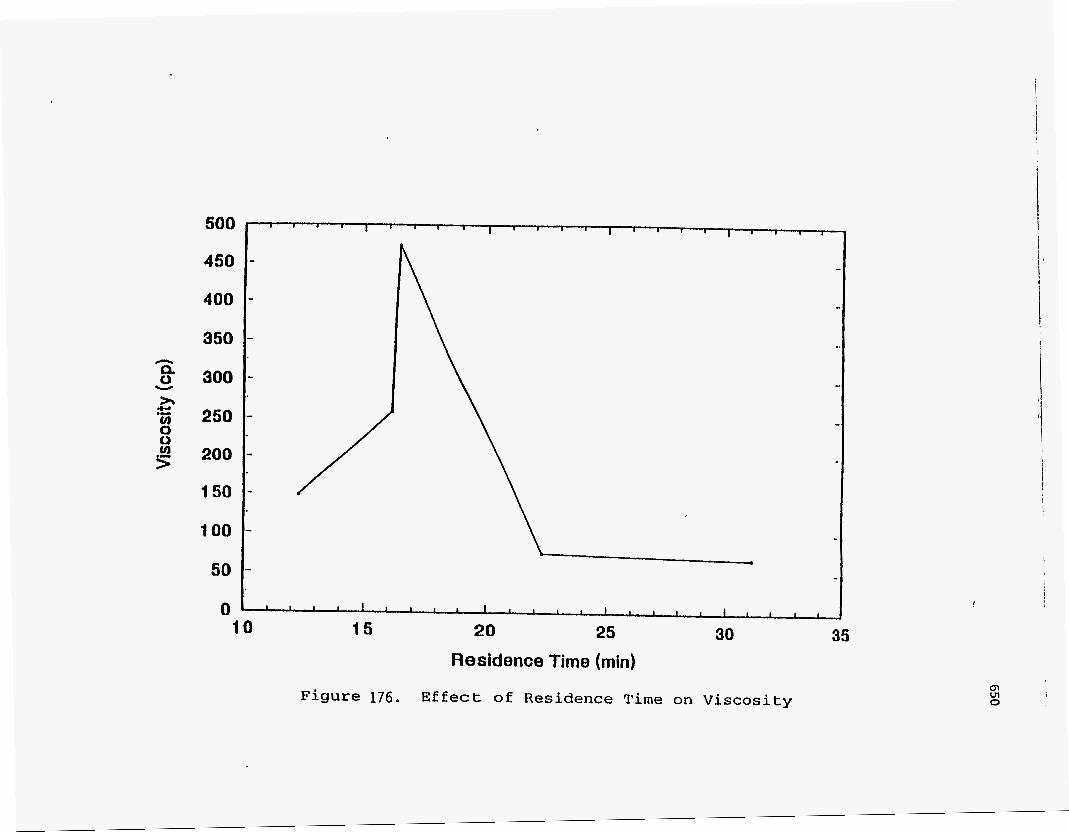
500
450
400
350
300
250
200
150
100 1
Residence Time (min)
Figure 176. Effect of Residence Time on Viscosity
i
!
ol VI 1 0

...
L / Ln c3
651 -_
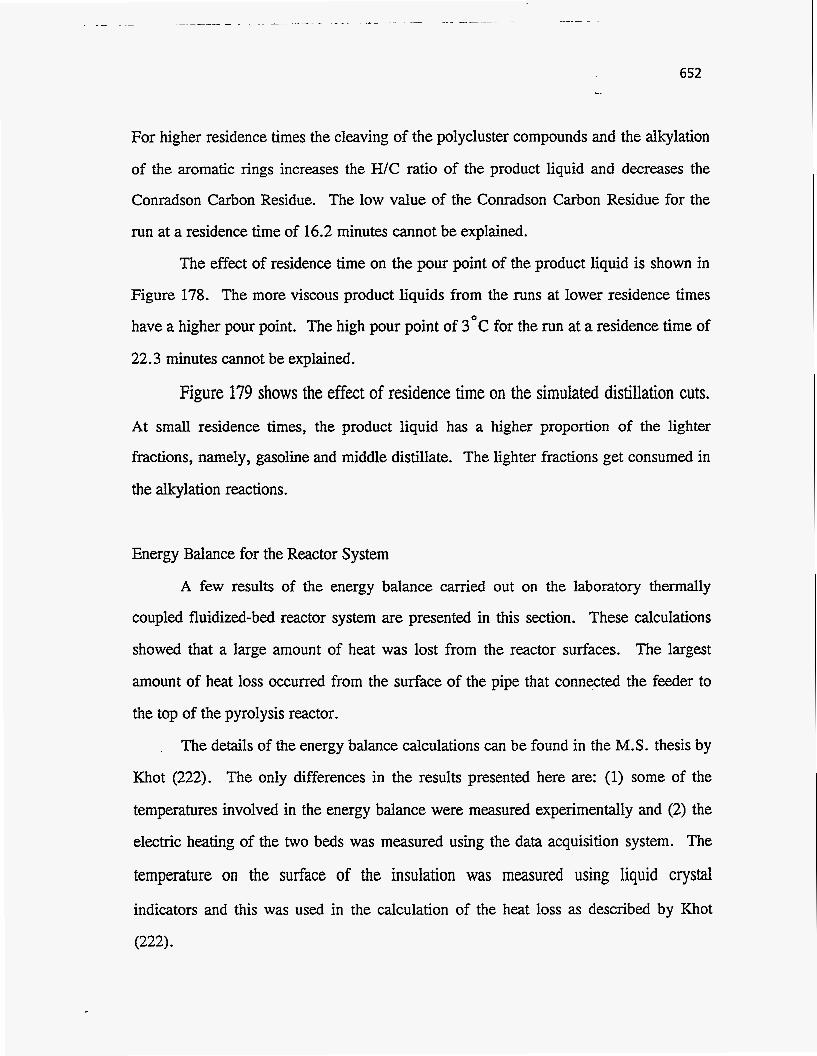
652
For higher residence times the cleaving of the polycluster compounds and the alkylation
of the aromatic rings increases the H/C ratio of the product liquid and decreases the
Conradson Carbon Residue. The low value of the Conradson Carbon Residue for the
run at a residence time of 16.2 minutes cannot be explained.
The effect of residence time on the pour point of the product liquid is shown in
Figure 178. The more viscous product liquids from the runs at lower residence times
have a higher pour point. The high pour point of 3 O C for the run at a residence time of
22.3 minutes cannot be explained.
Figure 179 shows the effect of residence time on the simulated distillation cuts.
At small residence times, the product liquid has a higher proportion of the lighter
fractions, namely, gasoline and middle distillate. The lighter fractions get consumed in
the allqlation reactions.
Energy Balance for the Reactor System
A few results of the energy balance carried out on the laboratory thermally
coupled fluidized-bed reactor system are presented in this section. These calculations
showed that a large amount of heat was lost from the reactor surfaces. The largest
amount of heat loss occurred from the surface of the pipe that connqcted the feeder to
the top of the pyrolysis reactor.
. The details of the energy balance calculations can be found in the M.S. thesis by
Khot (222). The only differences in the results presented here are: (1) some of the
temperatures involved in the energy balance were measured experimentally and (2) the
electric heating of the two beds was measured using the data acquisition system. The
temperature on the surface of the insulation was measured using liquid crystal
indicators and this was used in the calculation of the heat loss as described by Khot
(222).
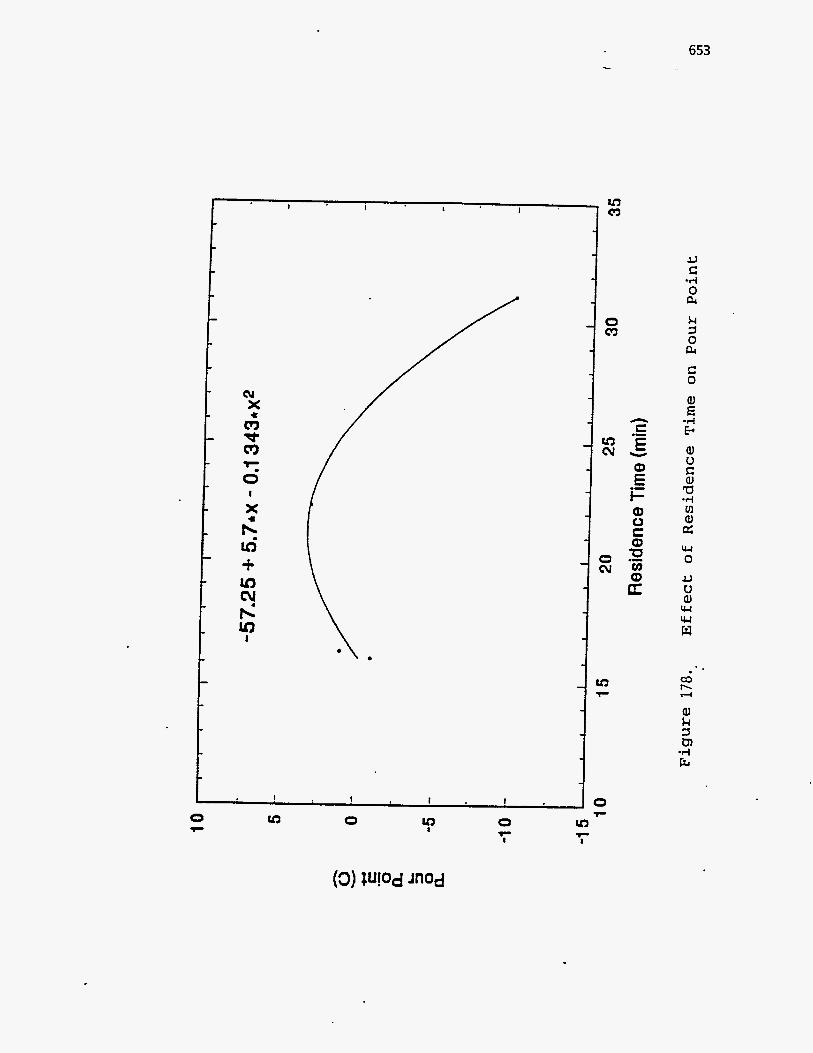
653
t
I
UY
JJ c
-I4 0
k 3 0 nl c 0
E -I4 e a, U c a, a -4 Ul a, p: u-1 0
JJ U al Iu W w
co h 4
a, k 3 ul -4 fa
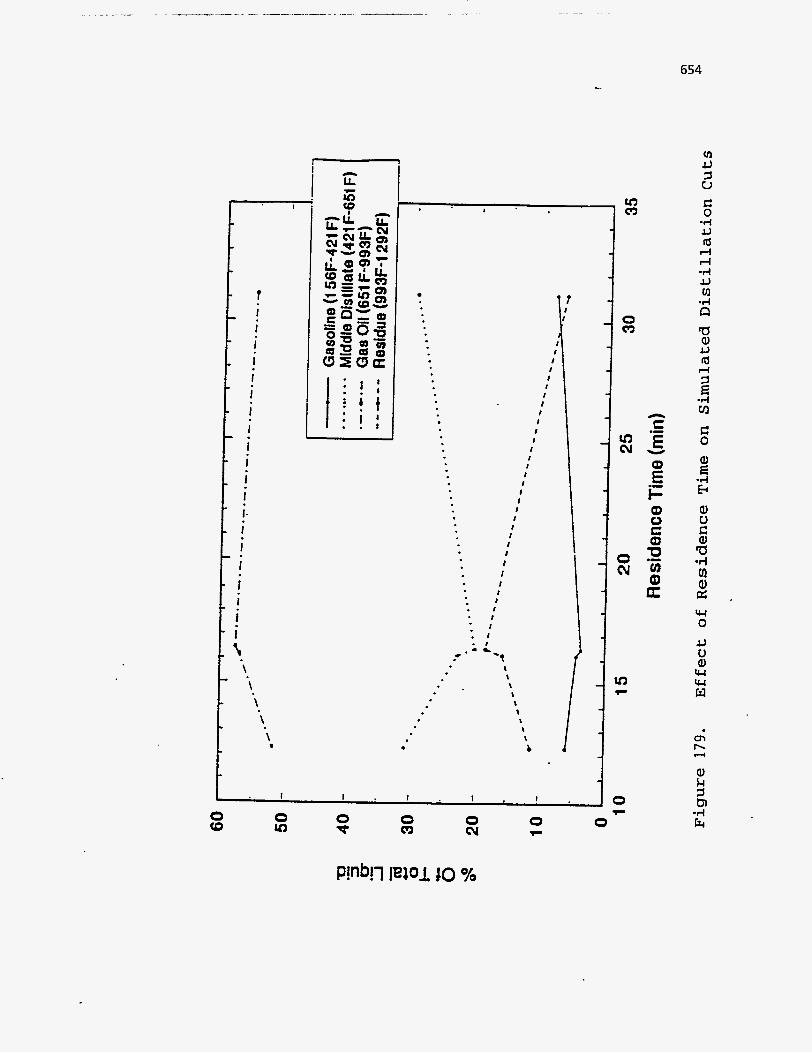
r I I I I I I I
I I J I I I - 1 I
- i U
: r ;
. . I
.
I
654
I I I I I I I I I I I I I I I I I I I I I
I I I
I . I
‘t .- - c
\ \ \
\ \
0 v 0 0
0 cv 0 F
n C .- E
E i=
W
Q)
a 0 E a 0 v) Q)
.- a

A 43-inch long steel pipe connected the feeder to the top of the pyrolysis
reactor. The temperature at the bottom of this pipe was assumed to be the same as the
pyrolysis temperature, and a steady-state energy balance for the pipe was written as:
Heat lost by + Heat lost by + Heat conducted upward = 0 radiation convection through the pipe
Starting from the temperature at the bottom of the pipe, the heat loss by radiation and
convection was calculated for the bottom two-inch length of pipe. Using this, the heat
conducted upward through the pipe was calculated and the temperature gradient for the
bottom two-inch length was obtained. This was used to calculate the temperature of the’
pipe at two inches from the bottom. This procedure was repeated and the total heat loss was calculated by adding all the heat lost by radiation and convection and the heat
conducted out by the pipe at its top end. The results from the energy balance
calculations for three different runs are shown in Table 58. The heat transferred to the
pyrolysis reactor from the heat pipes and the heat transferred from the combustion
reactor to the heat pipes are both calculated by difference. Ideally these two quantities
should be equal, since conditions are assumed to be adiabatic. However, the difference
could be from unaccounted heat losses, and errors, in each of the energy balance terms.
Table 58 shows that the heat pipes do transfer a significant amount of energy.
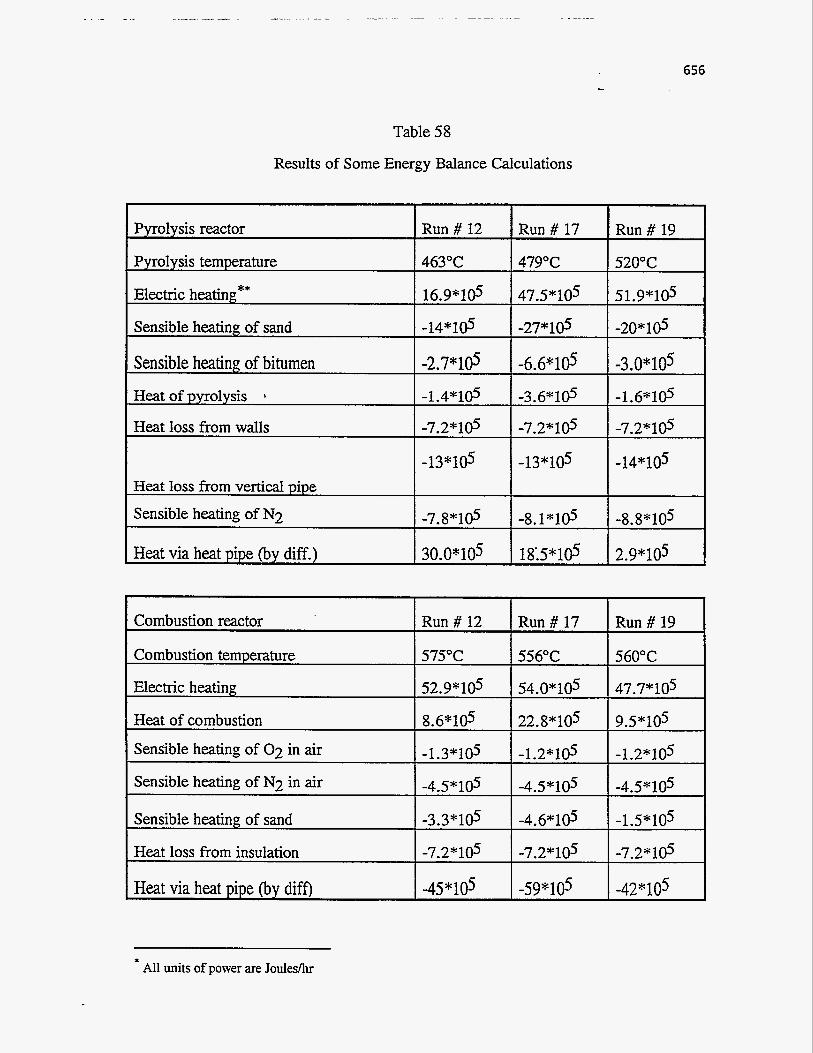
656 ...
Table 58
Results of Some Energy Balance Calculations
Pyrolysis reactor
Pyrolysis temperature
Electric heating **
Sensible heating of sand
Sensible heating of bitumen Heat of pyrolysis I
Heat loss from walls
Heat loss from vertical pipe
Sensible heating of N2
Heat via heat pipe (by diff.)
Run # 12
463°C
16.9*1@
-14*1@
-2.7" 16 -1.4*1@
-7.2* 1 @ -13*16
-7.8*1@
30.0*1@
Run # 17
479°C
47.5" 105
-27*1@
-6.6*1@
-3.6" l@
-7.2" 1 @ -13*16
-8.1.10s
18:5*1@
Run # 19
520°C
51.9*1@
-20*105
-3.0" 105
-1.6*1@
-7.2" 1 @ - 14" 105
-8.8*105
2.9" 105
* All units of power are Joulesnlr
657
OPTIMIZING THE OPERATION OF A THERMALLY-COUPLED
1 FLUIDIZED-BED TAR-SANDS EXTRACTION PROCESS
Optimization of the Mathematical Model
Coronella (118) developed a complex mathematical model for the
thermally coupled fluidized-bed tar-sands extraction process. This model incorporates
hydrodynamics, heat and mass transfer, and detailed reaction mechanisms and kinetics.
In this research, this model was optimized to obtain the optimal operating conditions
for the reactor system. A heat recovery network was added to this model to efficiently
recover the heat from the hot streams leaving the reactor. This entire model was also
optimized.
Since the cost function in this optimization problem could vary from day
to day because of the variation of the bitumen content of the mined tar sands, it would
be essential to be able to convert the reactor from one set of operating conditions to a
new set of conditions in an optimal manner. An optimal control strategy developed for
this purpose is also presented.
ODtimization Problem DescriDtion
Optimization of this process is desirable to see the effects of the changes in
the operating conditions on the product yields and the process economics. Optimization
of the operating conditions can also provide advantages in fluctuating situations, i.e.,
raw material costs, operating costs, product sales and product prices.
The inputs to the mathematical model are:
*Pyrolysis temperature
*Pyrolysis residence time
*Pyrolysis gas flowrate
658
*Weight fraction of heavy bitumen in bitumen
*Weight fraction of bitumen in tar sand
*Mean particle diameter and sphericity of solids
*Molecular weights of light gas, light oil, middle oil and heavy oil.
*Stoichiometric constants
*Pressures at bottom of combustion and pyrolysis beds
*Combustion bed temperature
*Combustion bed residence time
*Combustion bed gas flowrate
*Cross-sectional area of beds
*Volume fraction of bubble phase occupied by solids
*Weight fraction of hydrogen and carbon in coke entering the combustion bed
The outputs from the model are
"Gaseous concentration profiles in bubble and dense phases
*Pressure profiles
*Product yields
Pyrolysis temperature, pyrolysis sand residence time, and combustion
temperature are varied to obtain optimal values of the outputs. Both the pyrolysis
temperature and pyrolysis sand residence time dictate the product yields and quality.
The combustion temperature affects the heat of combustion supplied to the pyrolysis
reactor and also the electrical heating consumed during the process. The objective
function included the value of the light oil, middle oil, and heavy oil produced during
the process. The sum of all these terms were maximized. Also, the sum of the coke
and gas formed during the process, and the electrical heating utilized were minimized.
A model of a heat recovery unit consisting of six heat exchangers, three
steam generators, three turbines, two compressors and a separator was added to the
659 -_
process to recover the heat from the outflowing hot sand and hot process gases. The
flowsheet for this unit is shown in Figure 180. The heat exchanger network, in the
flowsheet, was optimized using pinch-poin t technology calculations by a previous
student. The objective is to preheat the pyrolysis and combustion fluidization gases as
much as possible, while simultaneously producing as much power as possible. Again
the operating parameters varied to minimize the objective function are the pyrolysis
temperature and sand residence time and the combustion temperature.
Calculation of Cost Coefficients
The value of the different fractions of oil produced is determined by their API
gravity. A plot of some recent price data as a function of API gravity is shown in
Figure 181. From this plot and the known values of the API gravities of the light,
middle and heavy oil; the relative values of the three fractions were Calculated. The
cost of electricity was taken as $.08/kWhr. The heat recovered is calculated in
Joules/sec and this leads to a reduction in the electrical heating and hence the same cost
coefficient as the cost of electricity is used.
Optimization Methodologv A nonlinear programming constraint optimization technique called the method
of feasible directions was applied (223). The basic idea is to choose a starting point
satisfying the constraint and then move to a better point according to the iterative scheme: Xi+l = Xi + is the step Si where Si is the direction of movement and
length. The usable feasible direction is taken as Si=-Vf(Xi). The only constraint used
is that the combustion temperature should not exceed 600 "C. If the temperature
reaches 600 "C, then movement into the constrained region was prevented by not
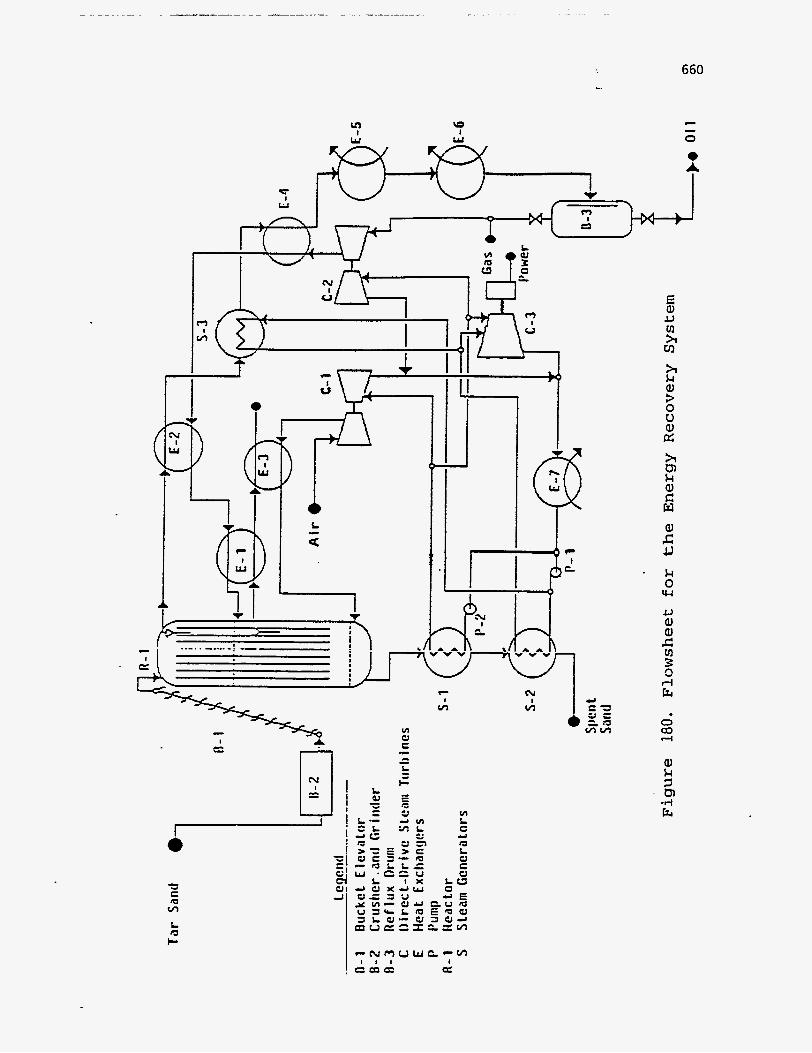
660
6 k a, c w Ql c u
- k 0 W
a, k 3 &I
Lc -4
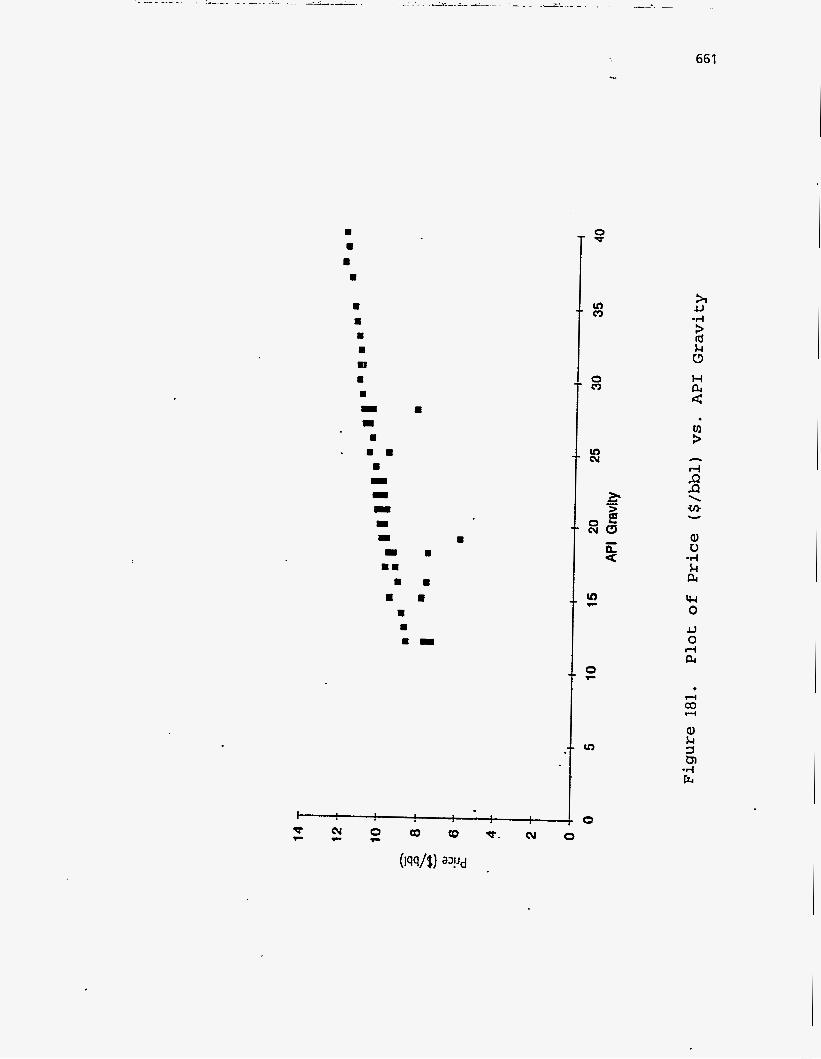
661 ...
I 8 8 8
0 0
8
v) 0
0 m
ln 01
t
ln
h JJ -4 > (d k c3 H PC 4
J h
Q) u -4 k PI
W 0 JJ 0 d pc
k 3 tn -4 b4
662
taking steps in the combustion temperature. The derivative of the objective function
was calculated by numerical differentation.
A trial and error method was used to determine the step length. If the step
length was too large, leading to an increase in the objective function or constraint
violation, then the step length was halved. This procedure was continued until the
objective funtion was reduced. The initial step length was chosen as =-0.01” * If1 I IT1 I ’
As f‘1 approached zero, a finite step length was chosen.
If the variations obtained in the objective function and the operating variables
were less than a certain small number, the procedure was stopped.
This algorithm was implemented using a Fortran code with a Unix operating
system.
Results of Optimization
The optimization code was run both without and with the heat recovery
network. The optimal operating parameters found for the two cases are as listed
below.
Case 1 Optimization without Heat Recovery:
Cost function = -0.24*(Light Oil)-O.l79*(Middle Oil)-O.l44*(Heavy Oil) +7.9E-9*(Pyrolysis heating) -7.9E-9*(Heat transferred by heat pipe) +7.9E-9*(Combustion heating)
Optimal Parameters
Pyrolysis temperature
Pyrolysis residence time of sand
Combustion temperature
449°C
50 min
600°C
663 *.
Case 2 Optimization with Heat Recovery:
Cost function = -0.24*(Light Oil)-O.l79*(Middle Oil)-O.l44*(I3eavy Oil) +7.9E-9*(Pyrolysis heating) -7.9E-9 * (Heat transferred by heat pipe) + 7.9E-9 *(Combustion heating) -7.9E- 9*(Sensible heating of the fluidizing N2 gas)-7.9E-9*(Sensible heating of the fluidizing
air)-7.9E-9*(Energy generated in the turbine)
Optimal Parameters
Pyrolysis temperature 548°C
Pyrolysis residence time of sand
Combustion temperature 600°C
20.2 min
These results were obtained using different starting points. More experiments
need to be carried out to-see if there are multiple minimums. An upper bound of 3000
sec was used for the residence time so that the bed height obtained is within reasonable
limits. An upper bound of 600°C was used for the combustion temperature to ensure
the safety of the material of construction. As seen from the results for Case 1, the
optimum was obtained at these constraints. According to Coronella (118), the
maximum liquid yield was obtained at a temperature of 460°C and residence time of 20
minutes. Since the cost function in this study involves the yields of light, middle and
heavy oil and the electrical heating of the two reactors, the optimum was expected to be
different from the case that considers only the total yield of the liquid. This is indeed
observed in the results. For the case with heat recovery, the cost to operate the reactor
at higher temperatures is smaller as compared to the cost when the heat is not
recovered. Hence the optimum shifts to a higher pyrolysis temperature and lower
residence time.
664 -
Optimal Control of the Fluidized Bed System
The objective function defined in the optimization problem is constantly
changing. The demand and hence the value of the light, middle, and heavy oil could
change from day to day or the feed may vary in quality leading to different amounts of
products formed. Hence it might be necessary to take the process from one set of
operating conditions to the new set of optimum operating conditions, which are found
by solving an optimization problem of a form similar to the above one. Hence an
optimal control strategy was designed to achieve this.
ODtimal Control Problem Description
A numb& of laboratory experiments were conducted on the fluidized-bed
reactor system at different pyrolysis temperatures and sand residence times with the aim
of finding the optimal operating conditions. Simulated distillation was carried out on
the liquid products to find the relative amounts of the oil fractions formed for a given
set of operating conditions. Equations were fitted to the data points obtained from the simulated distillation runs. Plots of these yields and the total liquid yield as a function
of the pyrolysis temperature and sand residence time are shown in Figures 182-185.
Since these yields differed substantially from the yields predicted by the model, they
were chosen in preference to the model. . The mathematical model developed is a steady-state model and hence cannot
predict the dynamic behavior of the process. While the experiments were conducted,
a l l the operating parameters, including the pyrolysis and combustion temperatures, the
pyrolysis and combustion residence times, and the heat inputs to the two reactors were
monitered by a data acquisition system using a Quickbasic program. The process was
disturbed when the feed was introduced into the pyrolysis reactor, and the dynamic
data, obtained during the minutes following the introduction of the feed were fitted to a
couple of unsteady-state equations representing the process.
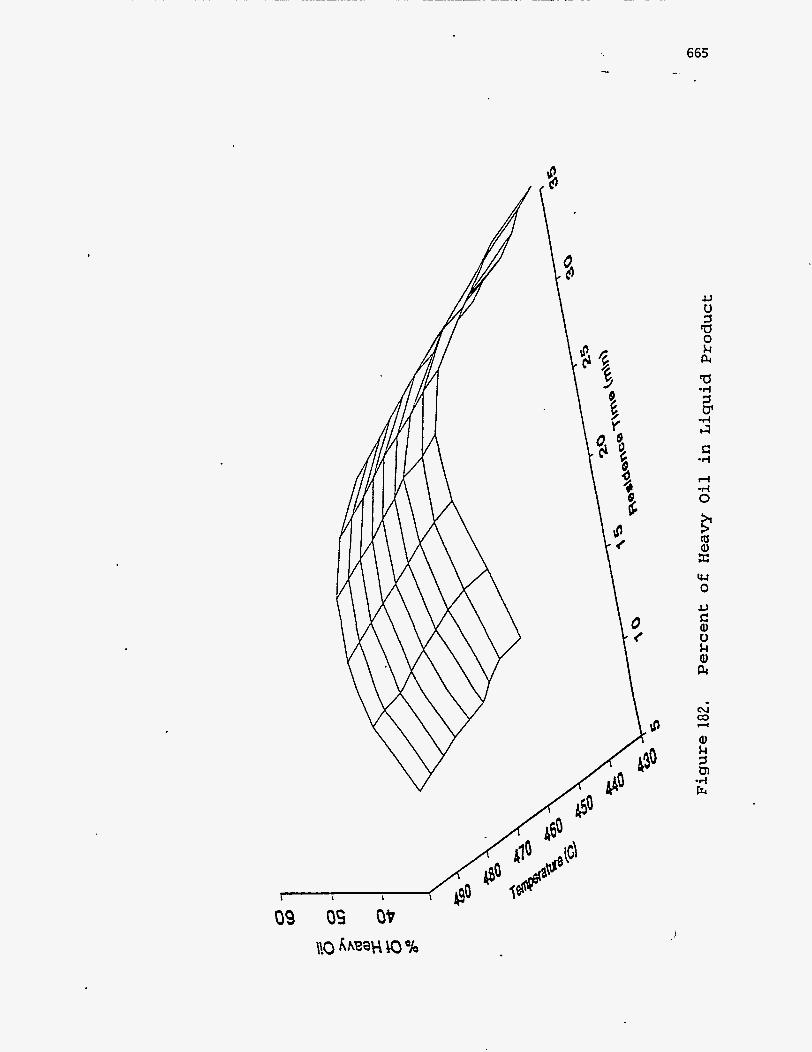
5
665 -.
09
a -4
W 0
N co 4
al k 7 ul -4 E
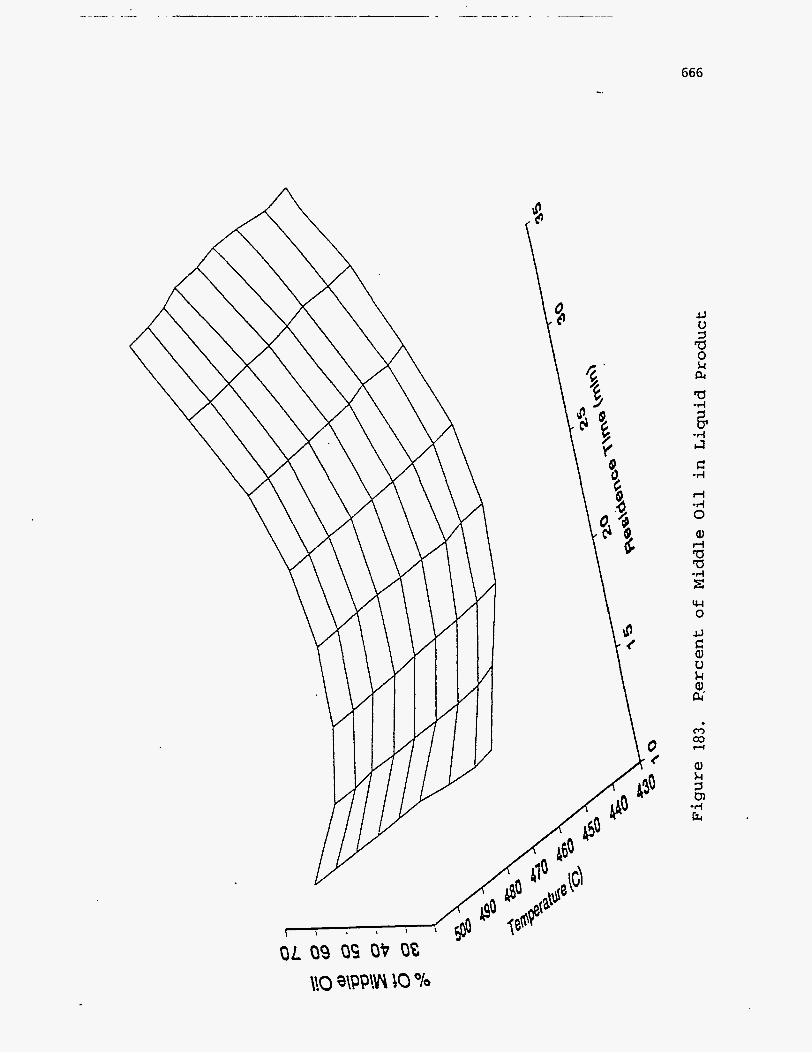
666
c -4
d -4 0 Q) d a a E W 0
L, G Q) U k a, &’
-4
Q) k 7 tr, -4 Lc
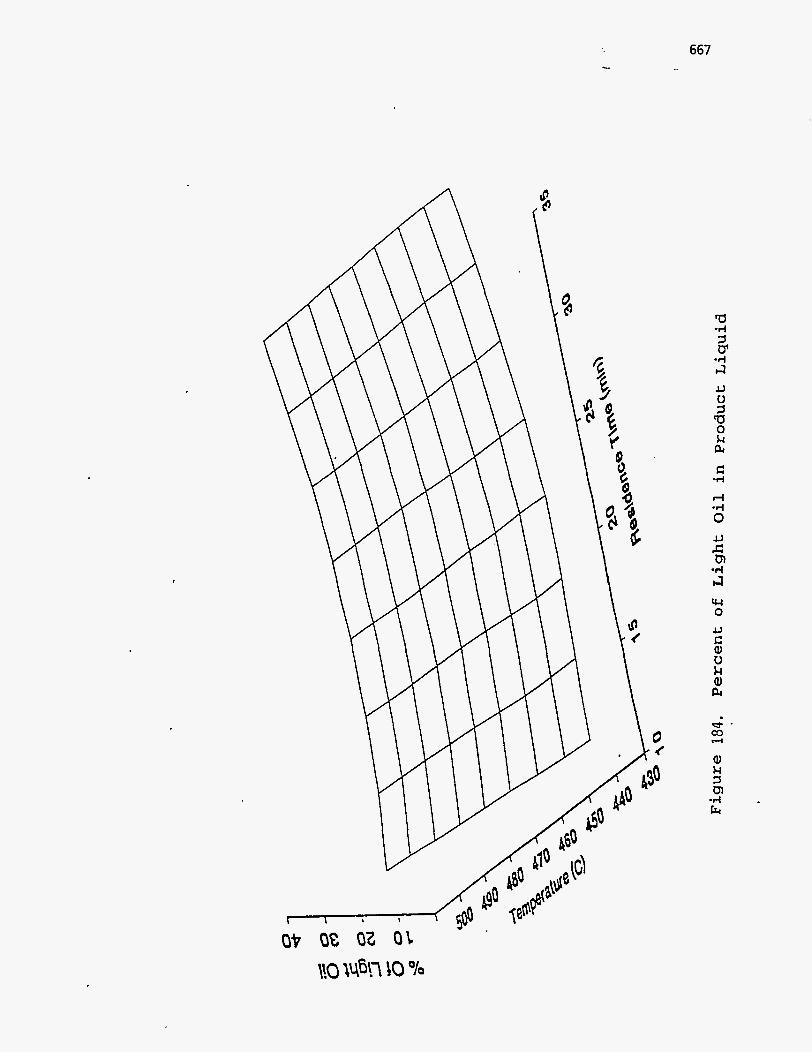
u-c 0
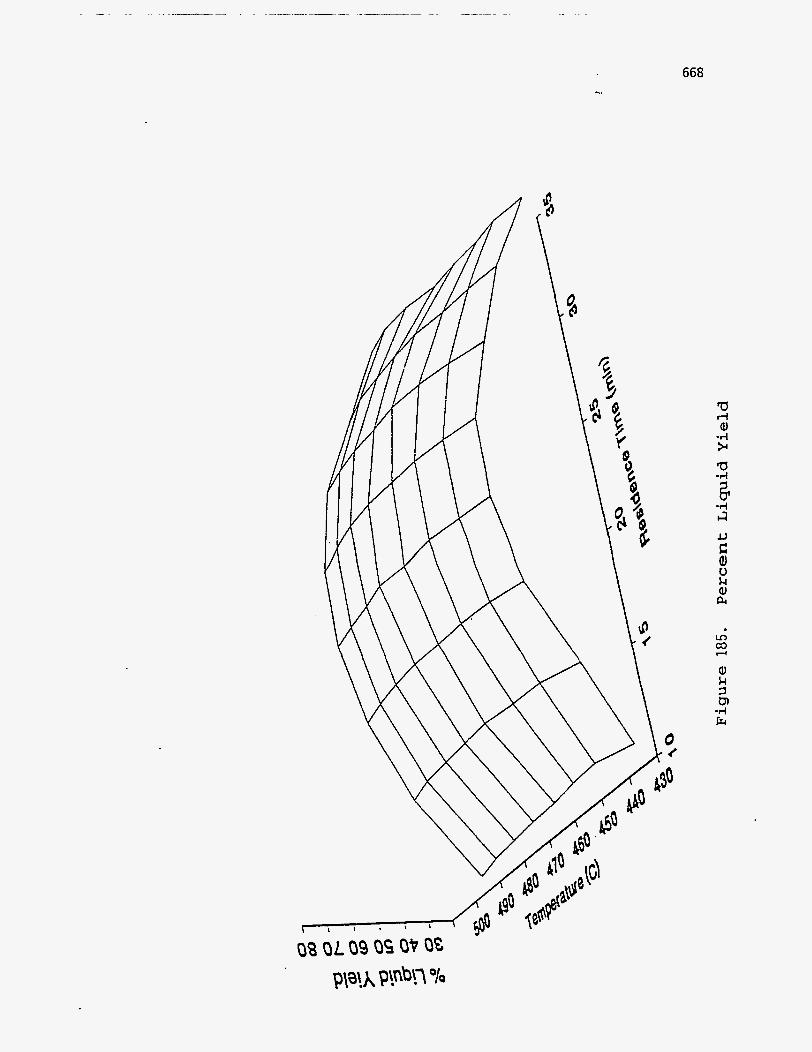
668 ...
L, c Q1 u k a, pc
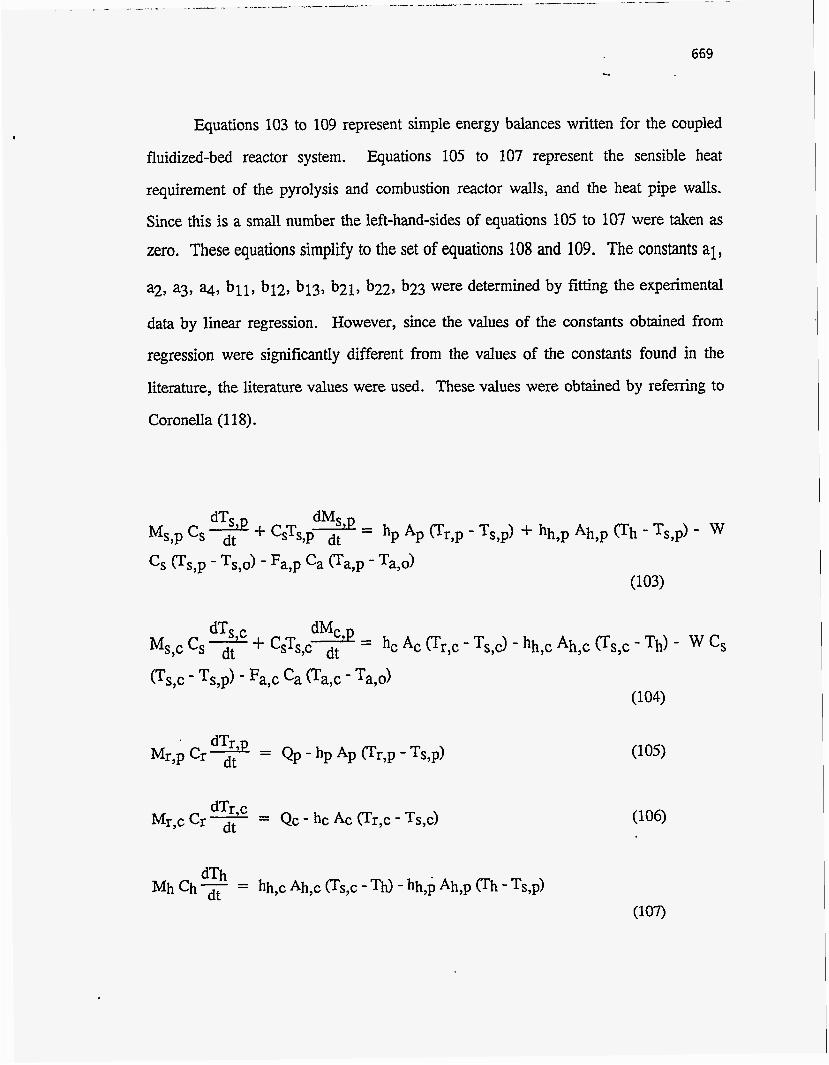
Equations 103 to 109 represent simple energy balances written for the coupled
fluidized-bed reactor system. Equations 105 to 107 represent the sensible heat
requirement of the pyrolysis and combustion reactor walls, and the heat pipe walls.
Since this is a small number the left-hand-sides of equations 105 to 107 were taken as
zero. These equations simplify to the set of equations 108 and 109. The constants ai ,
a2, a3, aq, bl l , b12, b13, b21, b22, b23 were determined by fitting the experimental
data by linear regression. However, since the values of the constants obtained from
regression were significantly different from the values of the constants found in the
literature, the literature values were used. These values were obtained by referring to
Coronella (1 18).
= Qp - hp Ap (Tr,p - Ts,p) Mr7p Cr dt

670
Simplified state equations
Loss
Heat Loss
where:
T - Temperature
Q - Rate of electrical heating
M - Mass of sand in the bed
h - heat transfer coefficient
A - Area for heat transfer
C - Specific heat
F - Fluidizing gas flowrate
W - Tar-sand feedrate
Subscripts:
c - Combustion bed
p - Pyrolysis bed
r - reactor walls
s-sand hp- heat pipe
The objective function was the amounts of the light, middle and heavy oil
produced, with the appropriate cost coefficients as determined in the optimization
problem. The objective function also included the cost of electrical heating inputs to
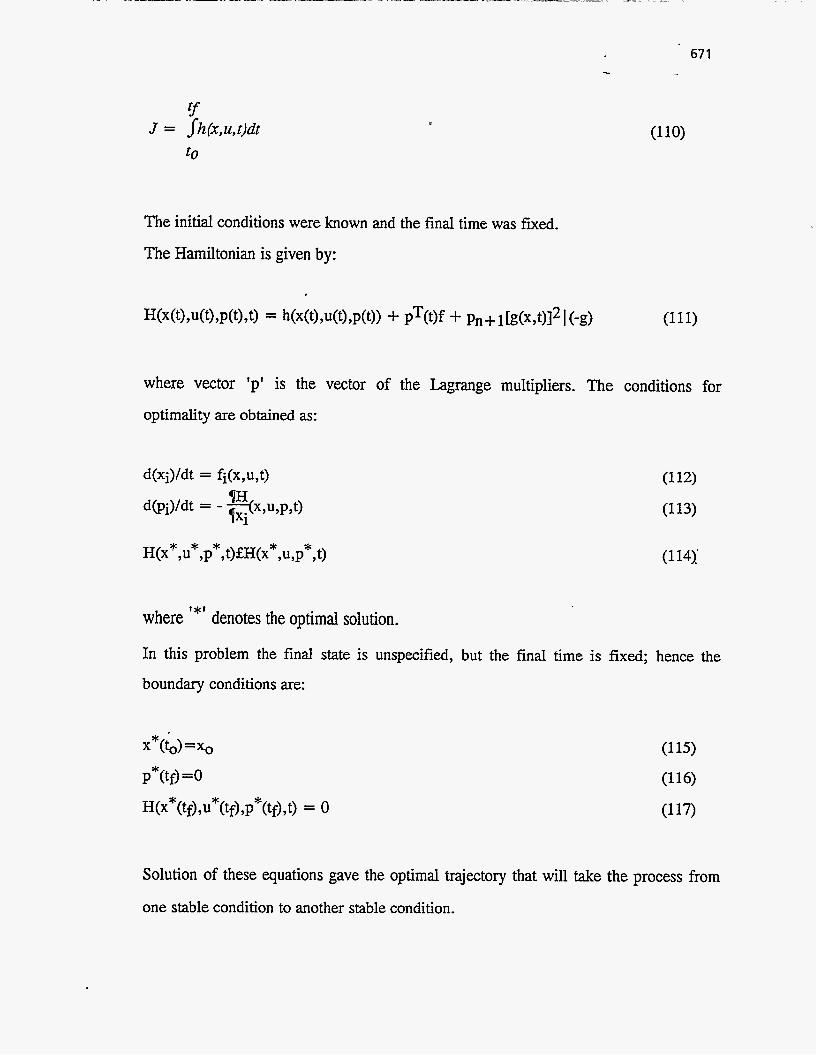
tf
t0
J = sh(x,u,t)dt
The initial conditions were known and the final time was fixed.
The Hamiltonian is given by:
67 1
where vector 'p' is the vector of the Lagrange multipliers. The conditions for
optimality are obtained as:
where I*' denotes the optimal solution.
In this problem the final state is unspecified, but the final time is fixed; hence the
boundary conditions are:
Solution of these equations gave the optimal trajectory that will take the process from
one stable condition to another stable condition.

672
Optimal Control Algorithm *
The steepest descent algorithm (223) was used to obtain the optimal solution.
The steps in the algorithm are as follows:
(1) A discrete approximation to the control trajectory is initially stored. The iteration
index is 0.
(2) The state equations are integrated from the initial conditions and the state trajectory
is stored.
(3) Using the value of pi(tf) and the stored state trajectory, the costate equations are dH integrated from tf to to. - is evaluated and stored. Pu
the procedure is terminated. If the stopping criteria is not satisfied, a new control
trajectory is generated by
The step length , is chosen to decrease the objective funct,m by a certain percent q. It
is known that
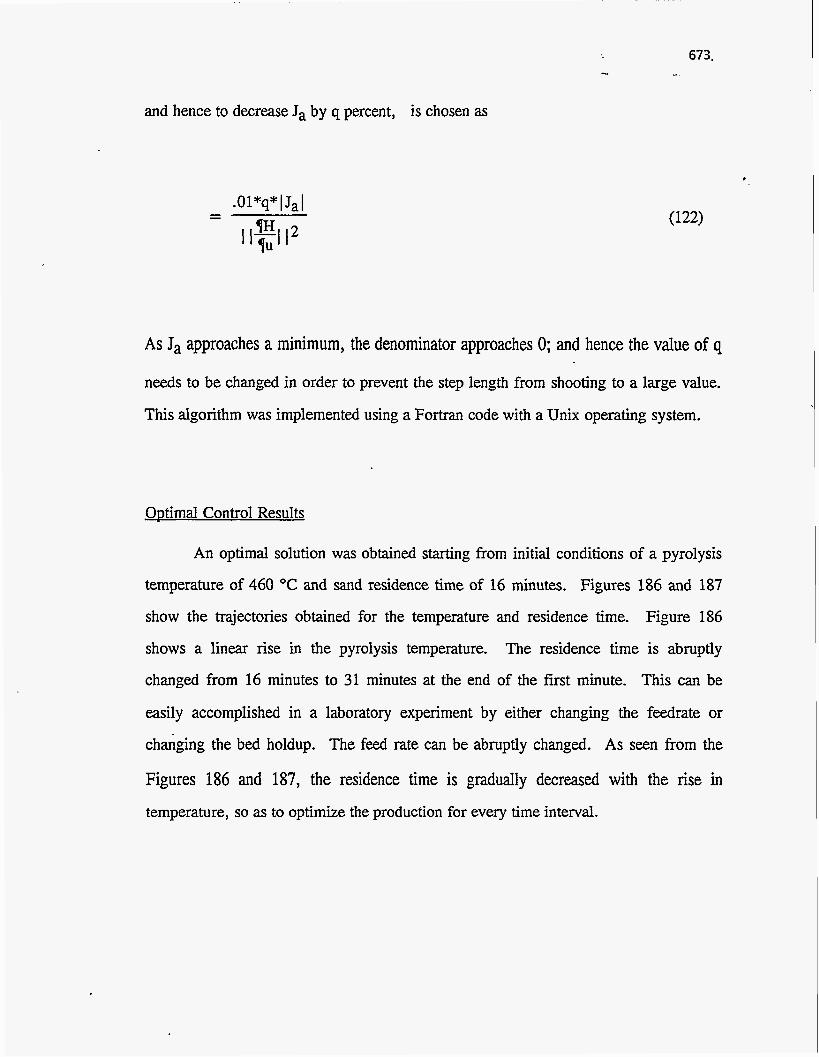
673. I
and hence to decrease Ja by q percent, is chosen as
As Ja approaches a minimum, the denominator approaches 0; and hence the value of q
needs to be changed in order to prevent the step length from shooting to a large value.
This algorithm was implemented using a Fortran code with a Unix operating system.
ODtimal Control Results
An optimal solution was obtained starting from initial conditions of a pyrolysis
temperature of 460 "C and sand residence time of 16 minutes. Figures 186 and 187
show the trajectories obtained for the temperature and residence time. Figure 186
shows a linear rise in the pyrolysis temperature. The residence time is abruptly
changed from 16 minutes to 31 minutes at the end of the first minute. This can be
easily accomplished in a laboratory experiment by either changing the feedrate or
changing the bed holdup. The feed rate can be abruptly changed. As seen from the
Figures 186 and 187, the residence time is gradually decreased with the rise in
temperature, so as to optimize the production for every time interval.
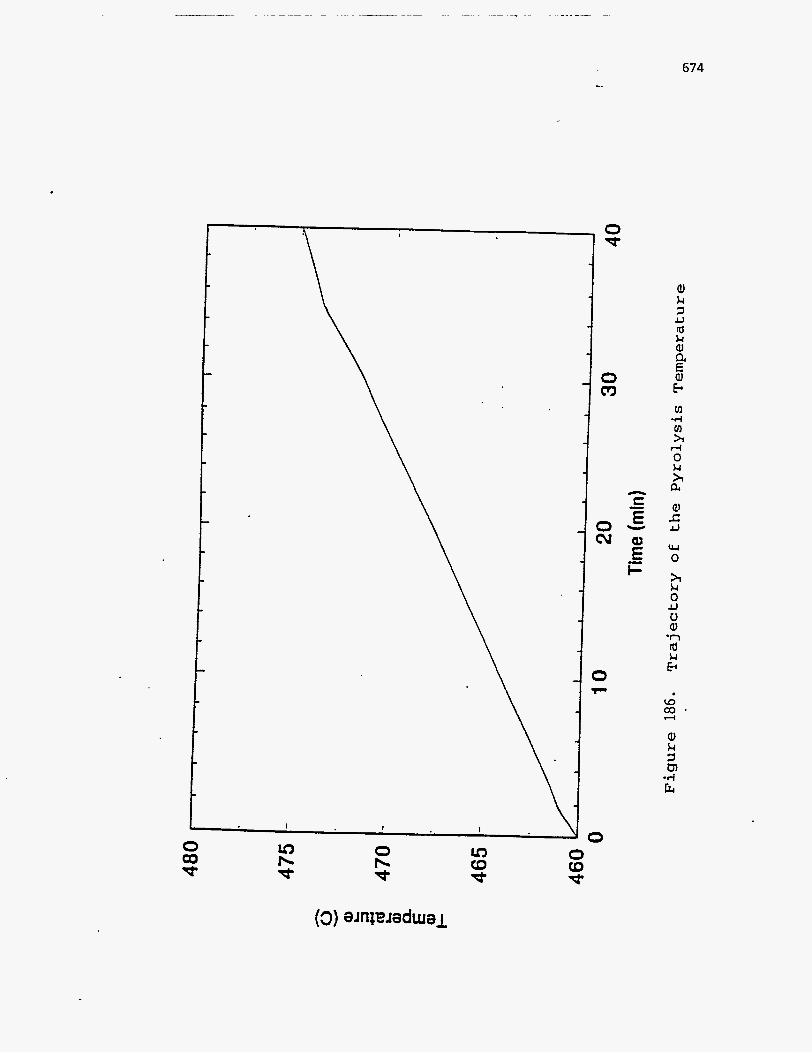
674
Q) k 3 u a k a, a E F v1 -4 v) >( rl 0 k >.I CL
J
ru 0
h k 0
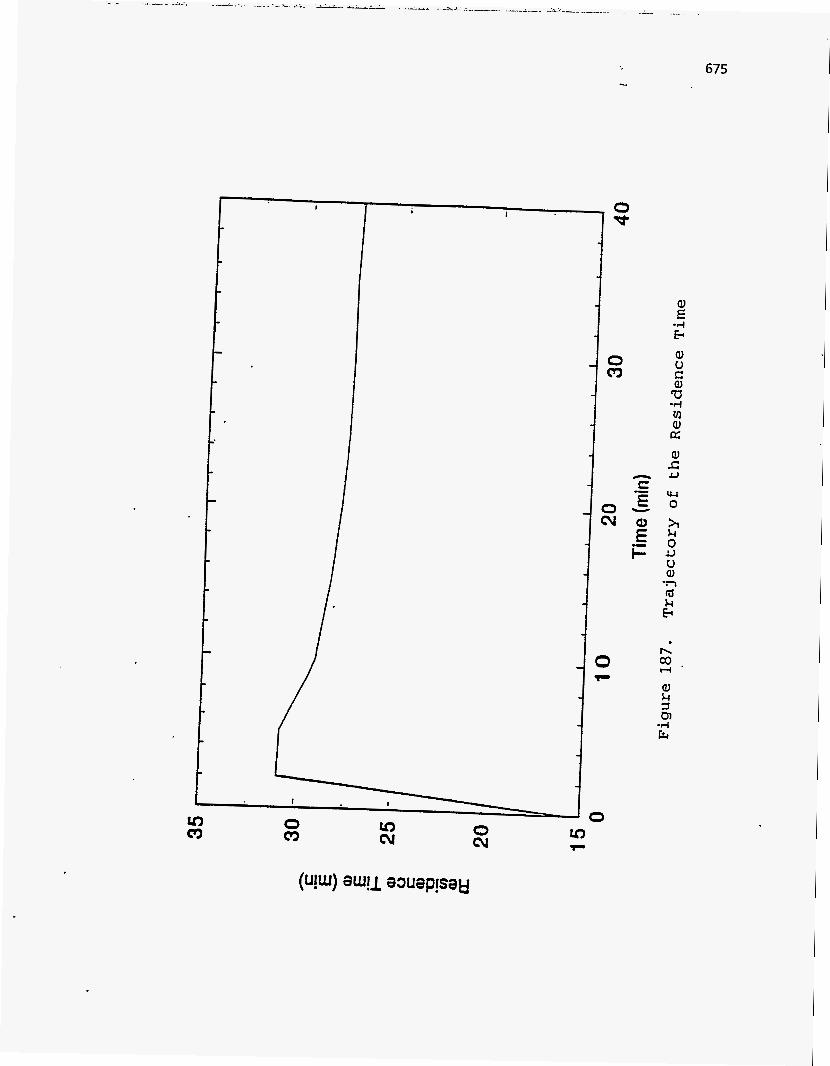
I I
0 c'3 0 cu
n c - E
i=
Y
E
675
676
SUMMARY AND CONCLUSIONS
The development of a comprehensive model for the coupled fluidized-bed
process was completed during the work reported here. It incorporates models for
fluidization hydrodynamics, pyrolysis and combustion kinetics, mass transfer, heat
transfer, material and energy balances, and the heat pipes that couple the two
fluidized beds.
The temperature of the pyrolysis reactor is found to be the most important
parameter affecting the yields of bitumen and an optimum value of about 475OC is
indicated. The energy requirement of the process is affected by operating
temperatures, residence times of solids in the reactors, and flow rates and incoming
temperatures of the fluidizing gases. Based on the results. for the laboratory unit, a
combustion temperature of 600OC and a combustion air flow rate of 35 scfh seem to
be optimum.
The simulation results compare well with experimental results for Whiterocks
tar sand. The model is also able to account for differences in the nature of bitumen
from different deposits. However, an exact correlation of model parameters with
bitumen properties is not possible at this time because of limited knowledge about the chemistry of the pyrolysis process. Extensive studies need to be conducted on the
structure of compounds present in the bitumen so that the pyrolysis product
distribution can be predicted with certainty.
The completed model, which is a steady-state model, can be used for the
development of a dynamic simulation of the process that could be used to demonstrate
the effect of perturbing the system through the input parameters.
In this work a number of laboratory experiments were carried out in order to
verify the mathematical model developed for the process and determine the optimal

operating conditions. A produc quality analysis wa done to s 2 the effect of the
operating conditions on the product quality. The mathematical model was optimized to
find the optimal operating parameters. An optimal control strategy was developed to
minimize a selected cost function, while taking the process from one steady-state to
another.
The yields obtained experimentally were very similar to those predicted by the
The high C5-Cg gas yields observed at low residence times were not model.
determined by the model. A deeper understanding of the chemistry of the bitumen and
of the reaction mechanisms is required to fully understand the reason behind these high
yields. The remaining observations were in accordance with the observations of
previous experimenters. A maximum liquid yield was observed at 478°C and a
residence time of 27 minutes. The specific gravities of the products were in the range
from 0.9 to 0.93, and the viscosities were in the range from 50 Cp to 500 Cp. The
Conradson Carbon Residue values varied between 0.25% to 2.0% and the pour points
were from 10°C to -15°C. The residue obtained from simulated distillation results was
always less than 10%. Thus the product liquids of pyrolysis were of good quality.
An optimization code was developed to find the optimal operating pyrolysis
temperature, residence time, and combustion temperature in order to minimize a
selected cost function, which included the costs of light, middle and heavy oils and the
costs of electric heating to the two reactors. More runs need to be made with the code,
using different starting points to find if there are multiple minima. This is a time- consuming process since the code takes about one hour to converge from one starting
point.
The optimal control strategy gave the optimal trajectories for the pyrolysis
temperature and residence time, while minimizing a cost function that included the

678
yields of the light oil, middle oil and heavy oil and the electric heating to the two
reactors. This strategy needs to be implemented to prove its usefulness.
In situ Technologies: Steam Assisted Gravity Drainage (SAGD)
Principal Investigator: M. D. Deo Graduate Student: A. Hobbs
Introduction
Horizontal Wells
Geologist and petroleum engineers have long known that vertical wells are not the best means
of extracting fluids fiom the ground. The geology of the earth is essentially that of layers stacked
upon layers, much like that of an onion. In the production of an oil field, the engineer is interested
in the relatively narrow band of layers that contain the oil and the layers immediately above and
below. Engineers refer to this area as the pay zone. A main goal of the reservoir engineer is to
maximize well bore/pay zone interface area. Vertical wells, which may be tens of thousands of feet
deep, are in contact with the pay zone for only a small fiaction of the well's length. This limited
contact area greatly reduces the well's production capabilities, resulting in the need to drill more wells
to effectively produce the field. Undoubtedly, the best method of improving the contact area between
the well bore and the formation would be to drill a well that parallels the formation, in essence, an
horizontal well. The idea of the horizontal well has been around for more than 50 years. Attempts
at drilling horizontal wells were made as early as 1937 by the Russians (224). Table 59 gives a brief
overview of how horizontal drilling has progressed in the last 50 years.
Early horizontal wells were invariably drilled fiom tunnels, but stating in the 1940's attempts
were made to drill horizontally fiom already existing vertical wells. Using pre-existing wells
offered several advantages, such as immediate access to the pay zone and a good knowledge of
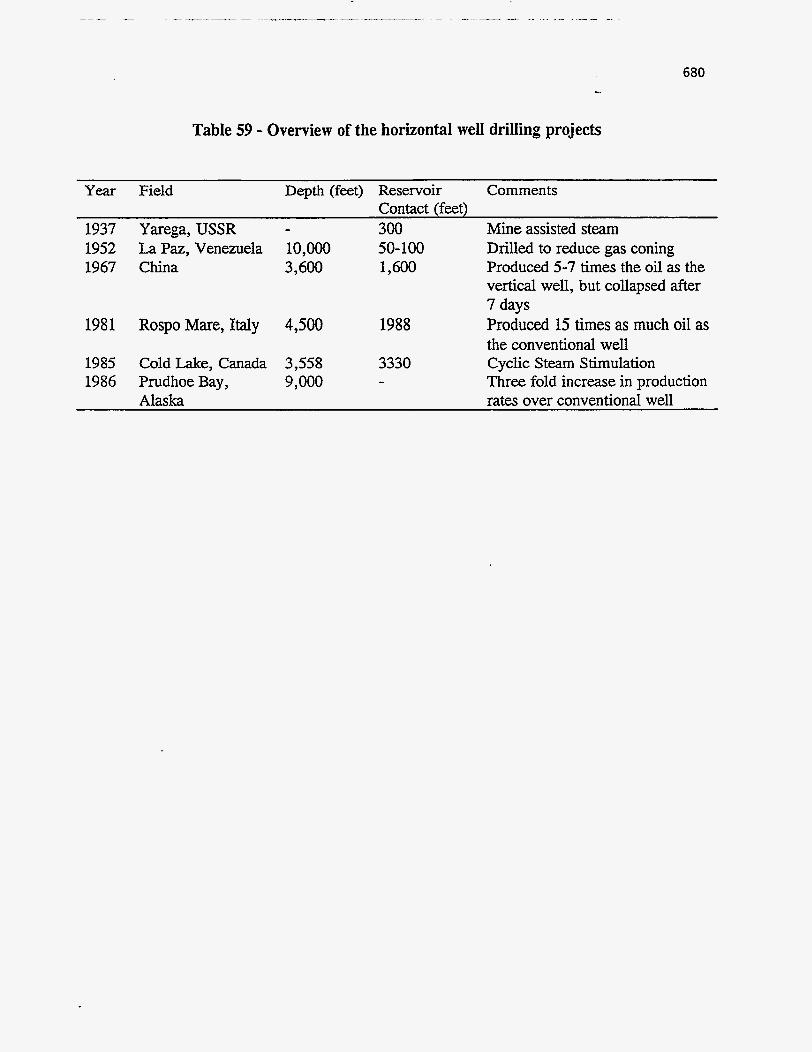
680
Table 59 - Overview of the horizontal well drilling projects
Year Field Depth (feet) Reservoir Comments Contact (feet)
1988
3330 -
1937 Yarega, USSR - 300 Mine assisted steam 1952 La Paz, Venezuela 10,OOO 50- 100 Drilled to reduce gas coning 1967 China 3,600 1,600 Produced 5-7 times the oil as the
vertical well, but collapsed after 7 days
the conventional well 1981 Rospo Mare, Italy 4,500 Produced 15 times as much oil as
1985 Cold Lake, Canada 3,558 Cyclic Steam Stimulation 1986 Prudhoe Bay, 9,000 Three fold increase in production
Alaska rates over conventional well
68 1 .. . -
the formation dimensions. Still, the technology remained commercially unattractive. What
horizontal wells were drilled were prohibitively expensive in comparison to vertical wells and
exhibited structural and geomechanical problems. When performing as designed, the horizontal
wells often produced 2 or 3 or even up to 15 times more oil than their vertical counterparts. Such
improved rates prompted the oil industry to keep trying.
By the mid 198O's, drilling technology had reached a point where horizontal wells were
beginning to be viewed as a viable recovery tool. The cost of horizontal wells still is 1.5 to 2.5
times that of a conventional well, but the increased production rate results in few wells having to
be drilled so overall capitalization cost can be lower with some horizontal wells. In the past 5
years, great progress has been made in the area of short radius drilling. Previously, a horizontal
well was created by slowly angling a vertically initiated well towards the horizontal. This method
worked in the sense that it eventually drilled a horizontal well, but the long horizontal distances
required by the minimal curvature radius often resulted in unacceptable losses of precious lease
footage. Recent advances in drilling techniques have lead to short radius drilling systems. Such
systems can dramatically reduce the distance required to change from a vertical system to a
horizontal system. Jurgens and Bitto (225), describe one case in which 1,000 feet of horizontal
displacement are desired. Using older techniques that operate with a medium radius well curvature
would consume a minimum of 300 feet of lease before the well would reach the target zone.
Drilling the same well with a short radius profile resulted in a loss of only 40 feet of lease. The
shorter radius has the advantages of greatly enhancing the chances of placing the well within the
target zone, avoiding the common problem of having to drill a long distance through a tough over
layer, and simplifying the completion work.
682 -
This is not to suggest that horizontal wells are quickly becoming the industry standard.
Vertical wells still constitute the vast majority of drilling projects, but horizontal wells offer an
additional means to produce the field. Nor should it be inferred that all the technological problems
of horizontal drilling have been solved. Completion work remains a-complex job and horizontal
wells remain susceptible to collapse and clogging. Additionally, remediation of horizontal wells
has proven to be much more difficult than in conventional wells. Remedial stimulations to clean
up perforations or near well bore damage are expensive and difficult to perform in horizontal wells.
These difficulties result in wells that produce from only parts of the completed horizontal interval.
\
The primary advantages of horizontal wells are as follows.
1.
2.
3.
4.
Horizontal wells provide flexibility in selecting appropriate well configurations for a project.
Various combinations of vertical and horizontal wells can be attempted for optimal process
implementation.
Horizontal wells increase direct contact between wellbore and pay zone. The perforated
interval per vertical well is limited to the pay zone thickness.
It is possible to drill several horizontal wells from the same location. This advantage becomes
particulady important in environmentally sensitive or offshore areas where preparation of drill
sites is a major expense.
For certain thin formations with bottom water table, horizontal wells defer and reduce water
coning by providing a low-pressure area over a long distance than at a single point as with
vertical wells.
5. Horizontal wells inject and/or produce fluids orthogonal to vertical wells. This provides
potential of improving the sweep efficiency of a flood and therefore, the recovery efficiency.
Some of the disadvantages of horizontal wells are summarized below.
1. For a successful horizontal well project, a good geologic description of the field is necessary.
In some instances, horizontal wells have been drilled outside the producing formation because
of a lack of good knowledge of geology or formation dip. On the other hand, a highly
characterized field may not have enough-well spacing for drilling horizontal wells.
2. Horizontal well drilling costs are high. Typical drilling cost for an ultra-short turning radius
horizontal well in the U.S. is about $ 25,000 to $30,000 per radial. The typical cost for a
short-radius well at 5000 ft depth is approximately $ 120,000 to $200,000 for a 250 ft long
horizontal well, whereas a medium radius well at the same depth costs about $600,000 without
completion (226).
3. Sand control is a serious problem in all the horizontal well field projects. Sands that come into
the well with fluids cause serious permeability reduction around the wellbore. Unlike the
vertical wells, these sands cannot be removed by gravity. So, horizontal wells are to be
completed with specialized liners with wire wraps or gravel packed to reduce the sand control
problems. These completion techniques are complex and expensive.
Steam Assisted Gravity Drainage
Steam Assisted Gravity Drainage (SAGD) is considered by many to be one of the most
promising methods for large scale in-situ bitumen production. The theory behind the process and
the development of viable SAGD models has been actively pursued by Butler (227) and others.
A major problem with conventional lateral steam flooding is the tendency for steam to ovemde
the oil zone and break through at the production well. This effect can be reduced by completing
the producer near to the base of the reservoir and by removing product at a controlled rate in order
to allow gravity to keep &e steam zone segregated. A considerable improvement can be achieved
if the reservoir dips and if the steam is injected so that it flow down dip. The concept of steam
assisted gravity drainage is a natural consequence of this process. Butler and coworkers
implemented the fundamental gravity drainage theory of Cardwell and Parsons in the development
of a semi-analytical computer model for simulating the SAGD process for the production of tar-
sand bitumen using horizontal wells (227). In this production process, two horizontal wells are
placed one above the other at the base of a tar sand reservoir. The spacing between the wells
averages about 20 feet. Around the tubing of the upper well, the steam penetrates the reservoir and
condenses, transferring its heat to the reservoir. Any uncondensed steam or hot water is produced
to the surface via the annulus.
At the end of the induction period, the viscosity of the bitumen between the upper and lower
wells has been reduced sufficiently enough to allow for drainage via the lower horizontal well. At
this point, a small steam chamber has developed, which encloses the both of the horizontal well.
Due to the small vertical spacing between the two horizontal wells, care must be taken to maintain
a negligible pressure between the two wells. If the pressure difference is too great, injected steam
would bypass the reservoir and be produced by the lower well. Bypassing is a serious concern with
this process.
With no pressure drop between the two wells, but with a steam pressure higher than the
reservoir pressure, the steam flows up through the sand within the developing chamber and
condenses when it reaches the cooler tar sand at the chamber-reservoir interface. The heat liberated
from the condensation of the steam is transferred via conduction into the tar sand, reducing the
viscosity of the trapped oil. With it's greatly reduced viscosity, the oil now flows toward the
production well under the influence of gravity. As the heated oil is drained, it is replaced by steam, *
which rises into the steam chamber above and along the length of the horizontal well pair. As the
entrained oil is produced the steam chamber continues to grow, with steam replacing the produced
oil. Eventually, the chamber will grow large enough to reach the prevailing overburden. Although
the vertical growth is now arrested, the chamber can continue to grow through lateral spreading.
These phases of growth are referred to as the rising-steam chamber phase and the spreading-steam-
chamber phase, respectively.
A major potential for the steam assisted gravity drainage process lies in overcoming the
shortcomings of conventional steam flooding that are created by the tendency of the steam to
override. With conventional wells the pressure gradients associated with radial flow to the
production well make the maximum rate that is achievable without steam coning relatively low.
In the steam assisted gravity drainage process, vertical wells are dispensed with in favor of the
horizontal wells, and production rates of the order of 0.3 B/d per foot of horizontal well are
indicated to be practical without steam coning; with long horizontal wells this provides an
economic drainage rate.
686 ...
Numerical Simulations of Steam Assisted Gravity Drainage
A good deal of research has gone into the development of semi-analytical models to describe
the complex flow patterns of in-situ processes. While providing a solid basis from which to work,
analytical models are often incapable of completely describing real, physical phenomena. One tool
available to engineers to help overcome the limitations of analytical models is the computer
Simulator. All of the results in this report were obtained via computer simulation, specifically, the
commercial reservoir simulator, STARS. STARS is an adaptively implicit, finite-difference
computer model that can be used to simulate the fluid flow and heat transfer processes for the
thermally stimulated production of oil in a reservoir. It has been developed by Computer Modeling
Group (CMG) of Calgary, Alberta, Canada (228).
The purpose of numerical research was two-fold: (1) optimization of such operational
parameters as injection temperature and pressure, well patterns, and the examination of the effects
of pressure drop between the injecting and producing wells and (2) determination of some of the
inherent limitations of the simulator, particularly with respect to grid size. Since SAGD involves
vertical drainage of oil, it has been speculated in the literature that the resolution on the vertical
scale need to be of an order of a meter for stable results. The simulations to test the effect of grid
size on simulator predictions were run in order to verify this hypothesis.
Input Data
In order to run thermal simulators, the user must provide input data describing the reservoir,
the oil, and the rock-fluid properties. The input must also include a description of the well
geometry as well as initial and boundary conditions concerning the injection and production
temperatures, target flow rates, and flow rate constraints. Numerical control input parameters
687
allow for either a fully implicit calculation sequence or internally controlled switching between
explicit and implicit calculation sequences.
Grid and Reservoir Description
The STARS simulator allows for either rectangular or cylindrical coordinates. Rectangular
coordinates were chosen for all simulation runs. A general grid size of 1,000 feet long by 1,000
feet wide by 100 feet thick was adopted. Initial runs, where the main objective was to determine
the effect of grid size on simulation output, consisted of five 200 fmt long blocks in both the I and
J directions. 1.n subsequent runs, the J parameter was generally set at 50 feet, but
occasionally reduced to just 10 feet. The vertical dimension K was allowed to vary from 20 to 0.5
feet, resulting in a range of 5 to 200 grid blocks. Overall, the total number of grid blocks varied
from 125 to 10,OOO. STARS allows for the porosity and absolute permeability to be specified for
element individually. Porosity values for all runs stayed constant at 0.30 % . Some runs were made
with varying permeabilities, but eventually, values of 2.0 Darcy in the horizontal direction and
0.50 Darcy in the vertical direction were selected as standards.
Fluid Properties
STARS allows for any number of components and phases. In all of these simulation runs only
two components, oil and water, were used. Also the number of phases present in the reservoir was
limited to two. Finally, the water and oil phases were treated as homogeneous, so the number of
components in water and oil were 1, resulting in 2 total components.
STARS has the capability to internally correlate vi.scosity data directly from temperature values,
but the oil viscosity values used in these simulations were determined as a function of temperature
based on the data found in Table 60. The values are calculated for field conditions.

688
Table 60 - Oil and water viscosities as functions of temperature
689 L
Rock-Fluid Properties
A table relating typical water-oil relative permeabilities water saturation is supplied under the
rockfluid keyword in the STARS input data file. Also given in this table are typical liquid-gas
relative permeabilities.
Initial Conditions
In all simulations, the initial reservoir temperature was set at 74%. Initial reservoir pressure
varied from a low of 80 psi to a high of 500 psi, with most of the simulations initially set at 250
psi or 500 psi. Values of 0.20 and 0.80 were assigned to water and oil saturation, respectively.
Well Configurations
Two types of well configurations were used in this study: a vertical steam injector coupled with
a horizontal producer and a horizontal injector/producer pair. In both configurations, the injector
was located 20 feet above the producer. Both configurations were utilized in three different types
of well patterns. The vertical well system used only one production well, but the number of
injectors varied from 1 to 3 wells.
SAGD Simulation Results
In the previous section, the general range of properties for all the simulations was described.
Table 61 lists the reservoir properties common to all of the simulations. The data was originally
presented by Edmunds et al. (229) at the 1988 UWAR Conference (major differences among the
individual cases include well configuration and well spacing).
Grid Block Size
The first step in the modeling process was determining appropriate grid sizes to use in the
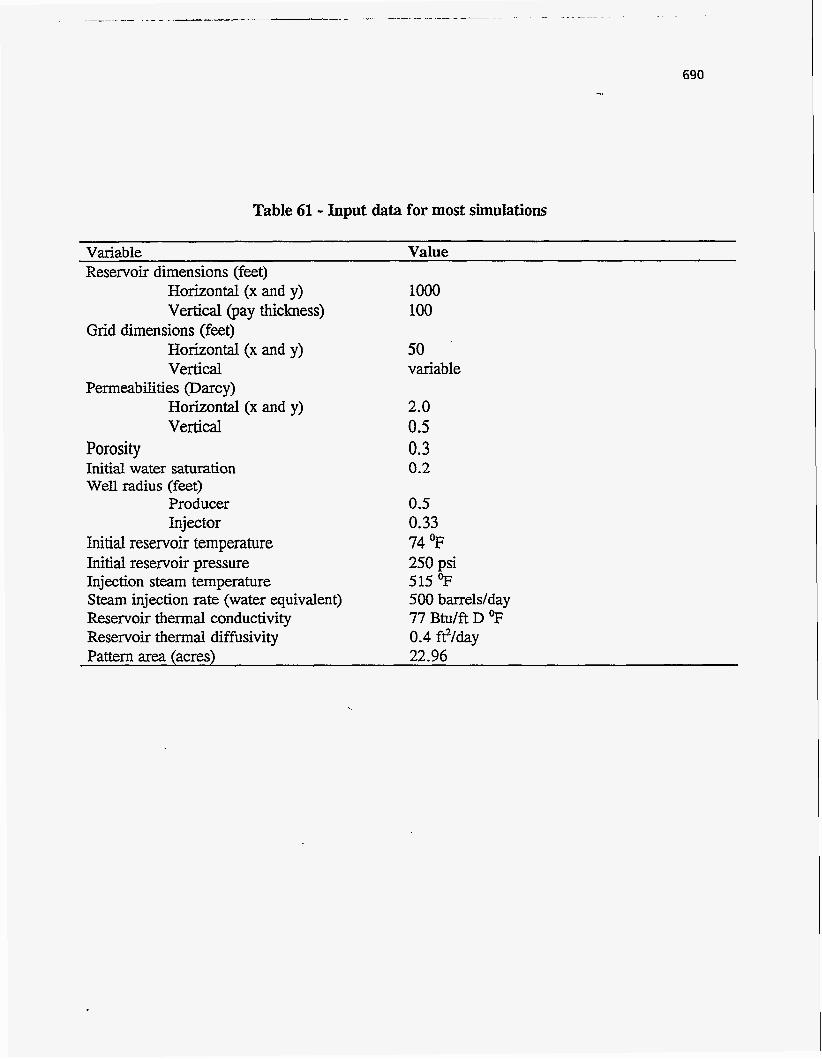
Table 61 - Input data for most simulations
Variable Value Reservoir dimensions (feet)
Horizontal (x and y) Vertical (pay thickness)
Horizontal (x and y) Vertical
Horizontal (x and y) Vertical
Grid dimensions (feet)
Permeabilities (Darcy)
Porosity Initial water saturation Well radius (feet)
Producer Injector
Initial reservoir temperature Initial reservoir pressure Injection steam temperature Steam injection rate (water equivalent) Reservoir thermal conductivity
lo00 100
50 variable
2.0 0.5 0.3 0.2
0.5 0.33 74 OF 250 psi 515 9 500 barreldday 77 Btu/ft D 9
Reservoir thermal diffusivity 0.4 f?/day Pattern area (acres) 22.96

69 1 -. -..
simulations. Previous studies had used grid-block sizes ranging from 2 inches (229) to 20 feet
(230). Closemann and Smith (231) observed that the grid-block thickness had a strong effect on
the rate of rise of the horizontal steam chamber. Using a vertical permeability of 0.5 Darcy, the
rise nte was observed to level off at a value of 1.02 inches/day, for a vertical grid block thickness
of 1.0 feet. Further decreases in block thickness produced no further increase in rise rate. A block
thichess of 10 feet produced a rate that was 95% of the value obtained for a thickness of 1 foot.
In order to obtain an optimal block thickness for the STARS program, eight simulations were
run with the only variable being the vertical block thickness. Thicknesses ranged from 2 feet to
20 feet. The criteria for comparison was the water-to-oil ratio (WOR) found in the production
well. The effects of vertical block size on WOR are listed in Table 62. Also included are the
times required for the simulations to run.
Table 62: Effect of grid block size (z) on WOR and CPU time
Vertical Grid Block Size (feet) WOR Time (hours) 20 3.199 0.2 10 3.527 0.55 6.6 3.452 0.75 5 3.421 1.05 4 3.455 2.0 2 3.455 12.2
692 ...
The results parallel the findings of Closemann and Smith, in that the WOR value associated
with grid size of 10 feet was within 95% of the WOR value obtained using 2.0 foot blocks. Of
obvious importance is the length of time required to run the simulations. The simulation with the
larger grid blocks took just over an half hour, while the second simulation required one full day
In an effort to optimize numerical efficiency and to stay below the maximum number of grid blocks
allowed by STARS (12,500), the 10 foot thick grid block was chosen as an acceptable value for
vertical thickness.
After obtaining a suitable grid size for the vertical direction, similar test were run to find
acceptable dimensions in the horizontal directions. Final simulation results indicated that the WOR
was not as sensitive to horizontal grid block size as it was to vertical differences. One possible
explanation is that the modeled process is inherently vertical, with gravity being one of the prime
influences. Such a force, by its very nature, would be more susceptible to variations in the vertical
direction as opposed to the horizontal direction. Model results showed that grid blocks up to 50
feet in length were acceptable.
One method used to maximize accuracy while minimizing computer time involved using grid
blocks of various sizes. Near the well bores, blocks measuring 5 feet high by 20 feet long by 20
feet thick were employed. Further away from the well bores, the blocks measured 10 x 30 x 30
feet, and towards the boundaries grid size was increased to 20 x 50 x 50. The viability of such a
configuration is effectively demonstrated in the following chapter, where the reader can see that
the peripheral areas of the reservoir are essentially unaffected by the steam injection process.
A typical configuration, using the prescribed thicknesses, might consist of six blocks 5 feet
thick, three blocks 10 feet thick, and two blocks 2 feet thick. Such a pattern keeps the number
of vertical elements to a manageable size (1 1) and allows for a more flexible allocation of the
693
remaining horizontal grid blocks.
Permeabilities
Reservoir permeabilities play a significant role in the development of any oil field. In order
to determine the magnitude of the effects of permeability, simulations were run with absolute
permeabilities (Darcy) of (0.2, 0.2, O.l), (0.7,0.7, 0.2), (1.5, 1.5, OS), and (2.0, 2.0, 0.5), with
respect to the x, y, and z directions. The first range of values is common for many of the Utah
tar sands (232), while the last set of values is typical of Athabasca sands (233). The middle sets
represents values which can be found in either Utah or Alberta sands, although the Utah sands tend
to have values predominantly at the lower end of the range.
In order to determine how reservoir permeability would effect cumulative oil production and
water-to-oil ratios, a number of simulations were run with the only variable being permeability.
Figures 188 and 189 summarize the results of these runs. Base case physical parameters, as
described above (Table 62), were used as input. Figure 188 shows the marked difference in oil
production between the 0.2 Darcy sand and the 0.7 Darcy sand. The 0.5 Darcy increase in
permeability resulted in a difference of over 200,000 barrels of oil produced over a seven year
period. Increased permeability resulted in increased oil production in all of the simulations, but
the size of the increase was not as dramatic as between the first two values. It should be noted that
although the scale of the figure does not really show it, the difference in production between 0.7
Darcy sand and 2.0 Darcy sand is a not insignificant 75,000 barrels.
Figure 189 gives a comparison of the effects various permeabilities on WOR. Not
unexpectedly, the tightest formation (Le. the one with the lowest permeabilities) had the highest
WOR. As can be seen from the figure, the overall WOR decreases with increasing permeabilities.
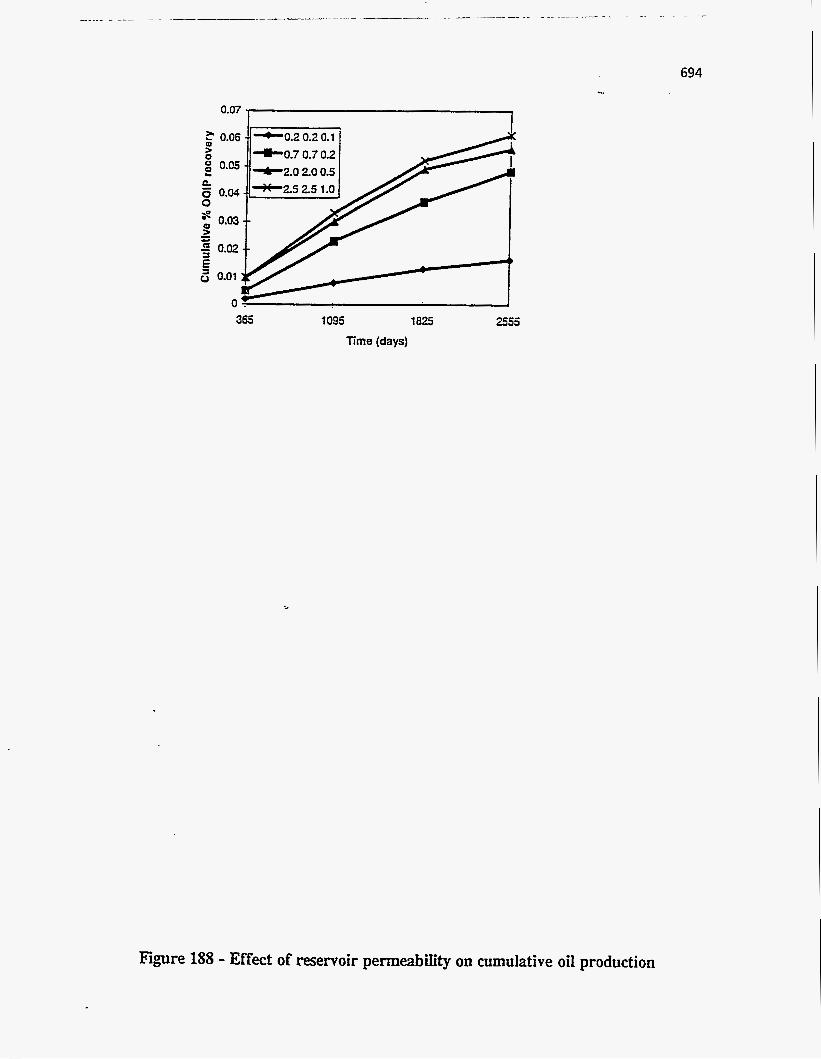
694 ...
0.07 - ?’ 0.06 -. -0.2 0.2 0.1 a2
- 0 0.04 *2s 25 1.0 0
365 1095 1825 2555 Erne (days)
Figure 188 - Effect of reservoir permeabiiity on cumulative oil production
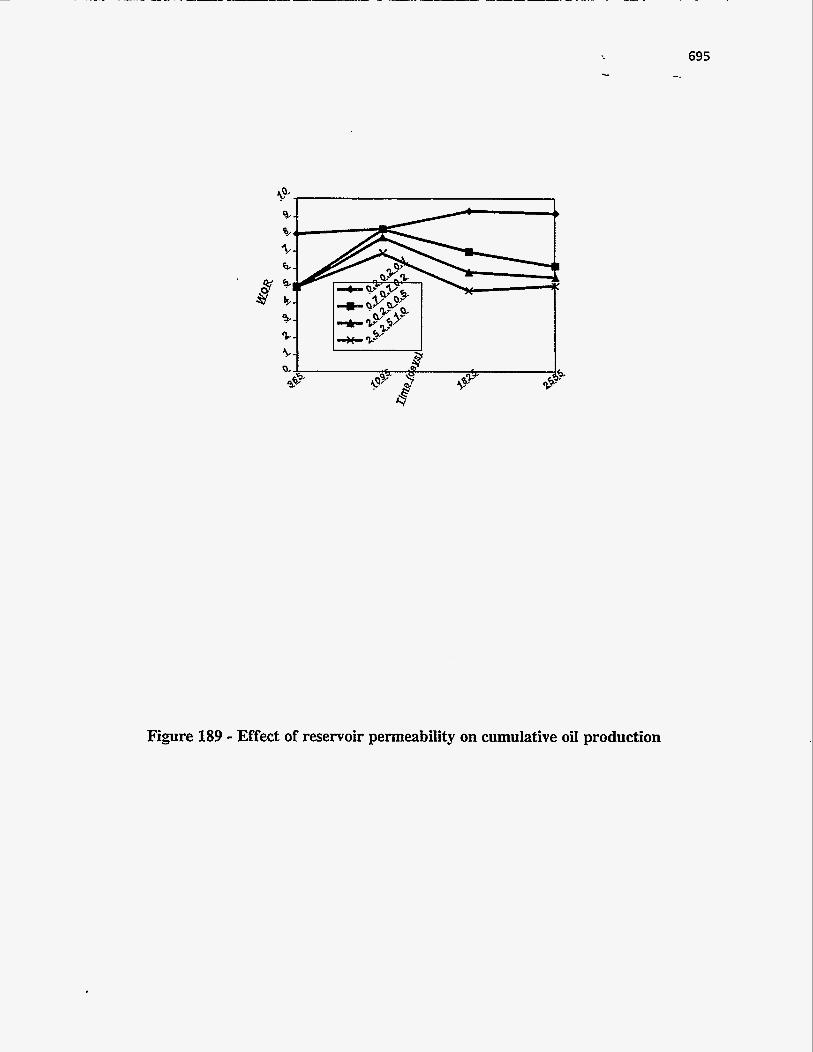
I
695 -. .
Figure 189 - Effect of reservoir permeability on cumulative oil production

696
An interesting note is that all four cases showed an increase of water-oil-ratio after three years with
respect to first year values. This may result from a combination of depleted oil sands in the region
between the well-bores and the still relatively small area of the steam chamber. After reaching a
critical Size, the oivsteam interface grows large enough to produce oil from the unaffected, oil-rich
regions of the reservoir. The increased oil production results in a lower WOR.
Although the figures do not explicitly show it, the period of peak efficiency occurred near the
seven year mark. Between years 7 and 8, overall production did not change much and daily
volumes experienced severe decreases. A correspondingly large increase in WORs was observed
across the board. The optimal length of operation for each of the projects was within the time range
of 7 to 7.5 years.
Injection Pressure and Reservoir Pressure
Like permeabilities, another reservoir property which is beyond the control of the engineer is
reservoir pressure. Having established the importance of permeabilities on recovery performance,
similar steps were taken to asses the effects of reservoir pressure on production performance. The
injection pressure in all the cases was set at 775 psi, which resulted from using an injection
temperature of 515 %. Figures 190 and 191 show that production values and WOR values are
essentially iidependent of reservoir pressure.
This independent relationship appears to hold true as long as the injection pressure is
substantially higher than the initial reservoir pressure. (AP > 50psi) One simulation, where
the difference between injection and reservoir pressures was on the order of 5 psi, showed
negligible production even after 5 years. Where as system with large pressure drops produced
oil on the order of 100,000 barrels, the project with the smaller pressure drop produced less than
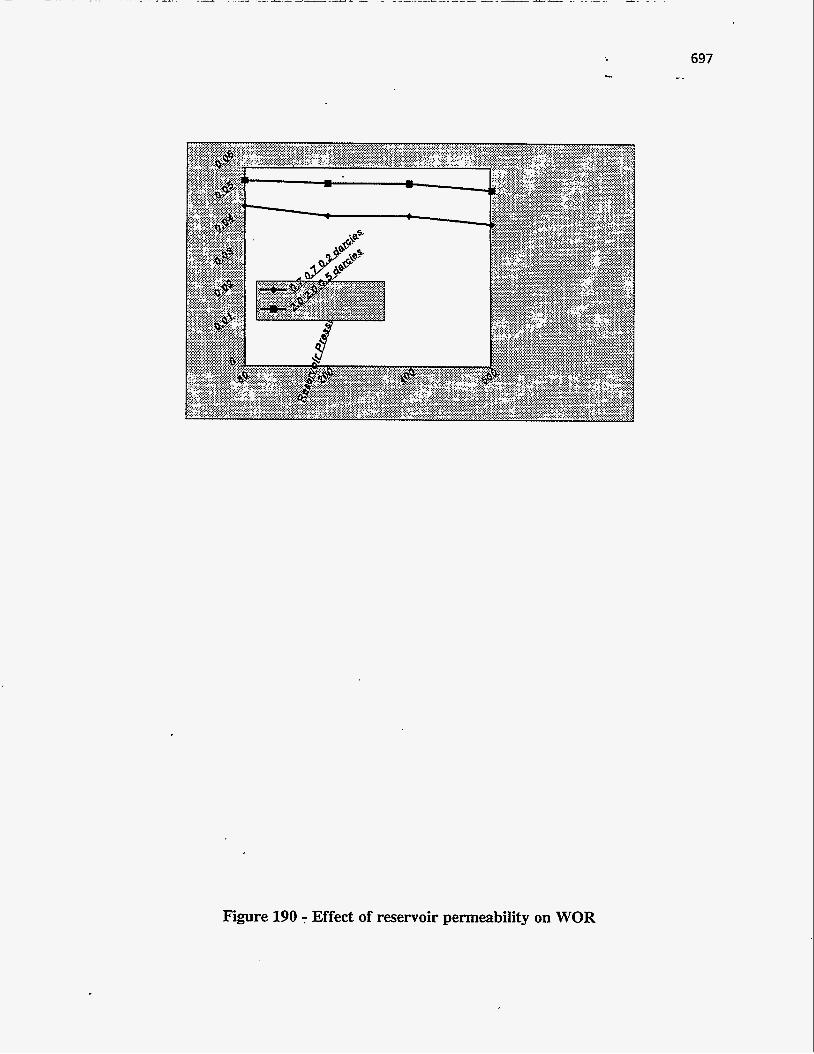
Figure 190 - Effect of reservoir permeability on WOR
697 -.
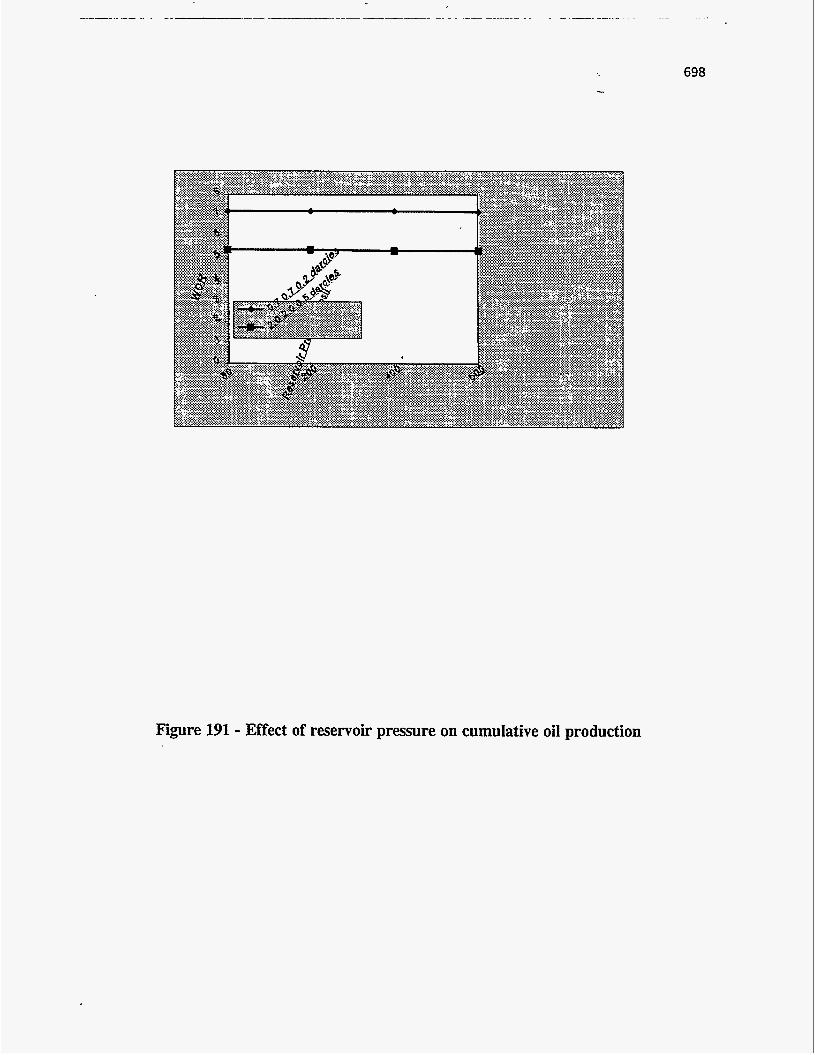
698
Figure 191 - Effect of reservoir pressure on cumulative oil production

699 ~. . ...
1,000 barrels of oil. Additionally, the best WOR obtained in the latter case was 33.40.
Ideally this problem could be circumvented by always injecting the steam at a substantially
higher pressure than the reservoir of interest. Such a solution works well with deeper, higher
pressure reservoirs, although care must be taken to avoid fracturing the reservoir, but using high
injection pressures in shallow reservoirs can result in the steam breaking through the overburden
and short circuiting to the surface. Once break through occurs, the overall effectiveness of the
process is greatly reduced, most often to the point of having to abandon the project.
Injection Pressure and Production Pressure
One factor which can be regulated within the reservoir with a high degree of control and which
greatly influences recovery results is the pressure drop between the injection wells and the
production wells. When there is a substantial difference between the injection and production
pressures, steam does not spread through the reservoir. Instead, it drains directly to the production
well. This process is referred to as "short circuiting". The main cause for short circuiting in this
process was the initially low production pressure. Initially the pressure drop between injector and
producer was over 400 psi Subsequent simulation runs with a continuously decreasing pressure
differential, resulted in better and better recovery ratios until a leveling off effect was noted in the
range of 5 to 20 psi. See Figure 192. It appears that reservoirs with relatively low pressures ( 80-
200 psi) required pressure drops in the area of 5 psi before WORs stabilized, but reservoirs with
pressures near 500 psi stabilized with pressure drops near 20 psi.
Discretized Wellbore
Several simulations were run using the STARS discrefized wellbore option. This option results

700 ...
Figure 192 - Effect of injector/producer pressure drop on WOR
701 -..
in the simulation carrying out a much more detailed and robust analysis of the physical processes
occurring inside the wellbores, albeit at the cost of a considerably increased run time ( four or more
times longer). When a well is not specifically discretized, the simulator does not account for the
actual physical presence of the wellbore. Instead, the simulator simply allocates a point "source"
for the injector and a point "sink" for the producer. With the discretized wellbore option, the
physical dimensions and properties associated with the wellbore are incorporated into the
calculations. Comparisons made between a single injection/production pair and a discretized
injectiordproduction pair indicated no significant differences in oil production or WORS. A similar
comparison between wells in a 3 well pair system produced parallel results. Discretization did not
noticeably affect production performance.
The comparisons used identical reservoir sizes and identical grid block configurations, with the
only difference being the inclusion of the physical presence of the wellbore in the discretized
option. In both the single well pair and three well pair simulations, oil production and WORs were
comparable for the two different models.
Well Pattern Effects
Initial spacing between injectors, both vertical and horizontal, was 300 feet. Subsequent
simulations indicated a strong correlation between well spacing and overall oil recovery. Decreases
in well spacing resulted in improved production performance. Performance reached peak
efficiency with a spacing on the order of 100 feet. Further reductions in the well spacing yielded
lower oil recoveries and higher WOR's. This behavior is attributed to the interaction of individual
steam chambers associated with the various injectors. At a spacing of 100 feet, interaction between
the steam chambers is not observed until near the 3-year mark. With smaller spacing distances,
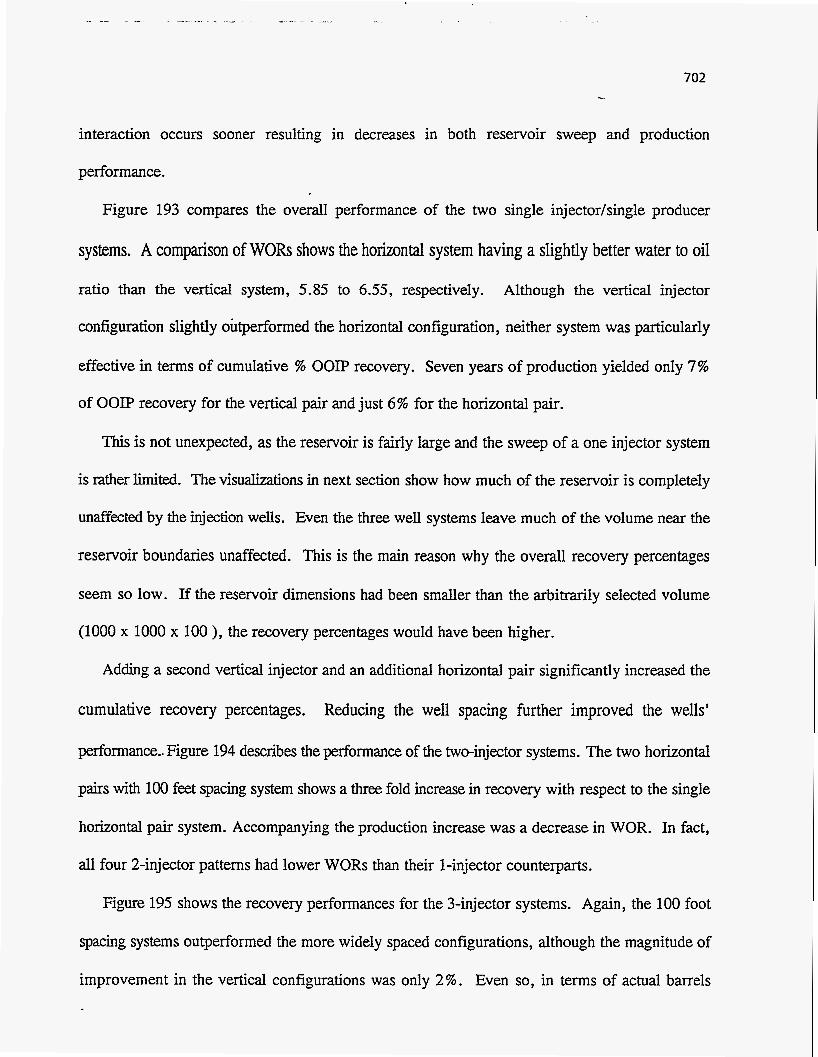
702
interaction occurs sooner resulting in decreases in both reservoir sweep and production
performance.
Figure 193 compaes the overall performance of the two single injector/single producer
systems. A comparison of WORs shows the horizontal system having a slightly better water to oil
ratio than the vertical system, 5.85 to 6.55, respectively. Although the vertical injector
configuration slightly outperformed the horizontal configuration, neither system was particularly
effective in terms of cumulative % OOIP recovery. Seven years of production yielded only 7%
of OOIP recovery for the vertical pair and just 6% for the horizontal pair.
This is not unexpected, as the reservoir is fairly large and the sweep of a one injector system
is rather limited. The Visualizations in next section show how much of the reservoir is completely
unaffected by the injection wells. Even the three well systems leave much of the volume near the
reservoir boundaries unaffected. This is the main reason why the overall recovery percentages
seem so low. If the reservoir dimensions had been smaller than the arbitrarily selected volume
(1000 x 1000 x 100 ), the recovery percentages would have been higher.
Adding a second vertical injector and an additional horizontal pair significantly increased the
cumulative recovery percentages. Reducing the well spacing further improved the wells'
performance.. Figure 194 describes the performance of the two-injector systems. The two horizontal
pairs with 100 feet spacing system shows a three fold increase in recovery with respect to the single
horizontal pair system. Accompanying the production increase was a decrease in WOR. In fact,
all four 2-injector patterns had lower WORs than their 1-injector counterparts.
Figure 195 shows the recovery performances for the 3-injector systems. Again, the 100 foot
spacing systems outperformed the more widely spaced configurations, although the magnitude of
improvement in the vertical configurations was only 2%. Even so, in terms of actual barrels

703 1
Figure 193 - Comparison of a horizontal well pair with single vertical injector/horizontal
producer

704 ...
Figure 194 - Comparison of two-well patterns

produced, the closer spaced vertical pattern produced 50,000 more barrels of oil, with a
corresponding lower WOR, than the vertical system with 300 foot spacing.
Further review of Figure 194 and Figure 195 demonstrates the strong trend towards increased
well performance as well spacing decreases. At an initial spacing of 250 feet the 3 pair system
shows no sign of interaction between the well pairs. Essentially they operate as three independent
wells. Once the well spacing is reduced to 150 feet and from there to 100 feet a significant amount
of constructive interaction takes place. Not only does percent OOIP recovery increase, but overall
WOR demeases. In the case with 100 foot spacing, the operating WOR centered around 4.8 with
production of over 740,000 barrels of oil. In earlier work, Sarkar (230) demonstrated the potential
of a vertical injection/horizontal production configuration. Figure 195 supports his findings.
Visualizations of Simulation Results
The following pages contain visual represen'tations of oil saturation and temperature profiles
derived from STARS output files. In order to produce the visualizations several sed and awk
scripts were applied to the original START output file. Sed and awk are editing tools which operate
under the Unix operating system. Appropriately fashioned scripts can accurately cull the significant
numerical data from a 5,000 line long alpha-numeric output file in a few seconds. During the
paring process, the bulk of the output file was stripped away, leaving a core of oil saturation and
temperature data in tabular form.
The revised output file was then processed through a third program and converted into a format
compatible with Spyglass visualization software. During the conversion process, the files were
reduced from tabular form into vertical stacks of 2-dimensional arrays. In order to maintain a
706 ...
Figure 195 - Comparison of the performance of various well configurations
'certain degree of consistency in the visualizations, the depths of the vertical stacks were held at a
constant value of 10, although the dimensions in the x and y directions were allowed to vary
depending upon how the grid systems in the original STARS files were defined.
Even with the help of the sed and awk scripts and the conversion program, the actual process
of inputting the data into Spyglass proved to be quite time intensive. Spyglass did not allow for
the inputting of 3-dimensional blocks, so each visualization required all ten vertical arrays to be
processed one at a time. Once the data was input, Spyglass reconstructed the data into 3
dimensions.
Although time intensive, the results obtained by producing visualizations cannot be over
emphasized. Trying to decipher a typical STARS output file, which is usually on the order of
thousands of lines, is not a trivial matter. The following pictures present a clear, concise view of
the direction of oil and temperature flow. Such views give immediate insight into the differences
associated with various well configurations, operating conditions, and reservoir characteristics.
Furthermore, the visualizations allow an analyst to quickly spot trends in economically important
areas such as vertical and lateral spread.
Absolute Permeabilities and Permeability Ratios
Figures 1.96 and 197 show two related comparisons of oil saturation profiles for a horizontal
injector-horizontal producer pair. Both figures were developed from data taken at the end of the
fifth year of production. In both instances, the reader is looking down the axis of the production
well, i.e. the producer and injector are perpendicular to the plane of the page. Note the volume
of the reservoir that remains unaffected by the injection process even after five years.
The first group of three profiles indicates the differences in the flow of oil associated with
actual permeability differences. All three cases exhibit increased oil saturation along the steam
708
A. Permeabilities 0.3. 0.2.0.1 in x. y. and z
B. Permeabiiites 2.0. 2.0.0.5 in x. y. and z
C. Permeabilities 10. 10. 1.0 in x. y, and z
Oil Saturation
0.3 0.4 0.5 0.6 0.7 0.5
Figure 195 - Oil saturations for reservoirs with different permeabiIities: Single horizontal injector and a single horizontal producer
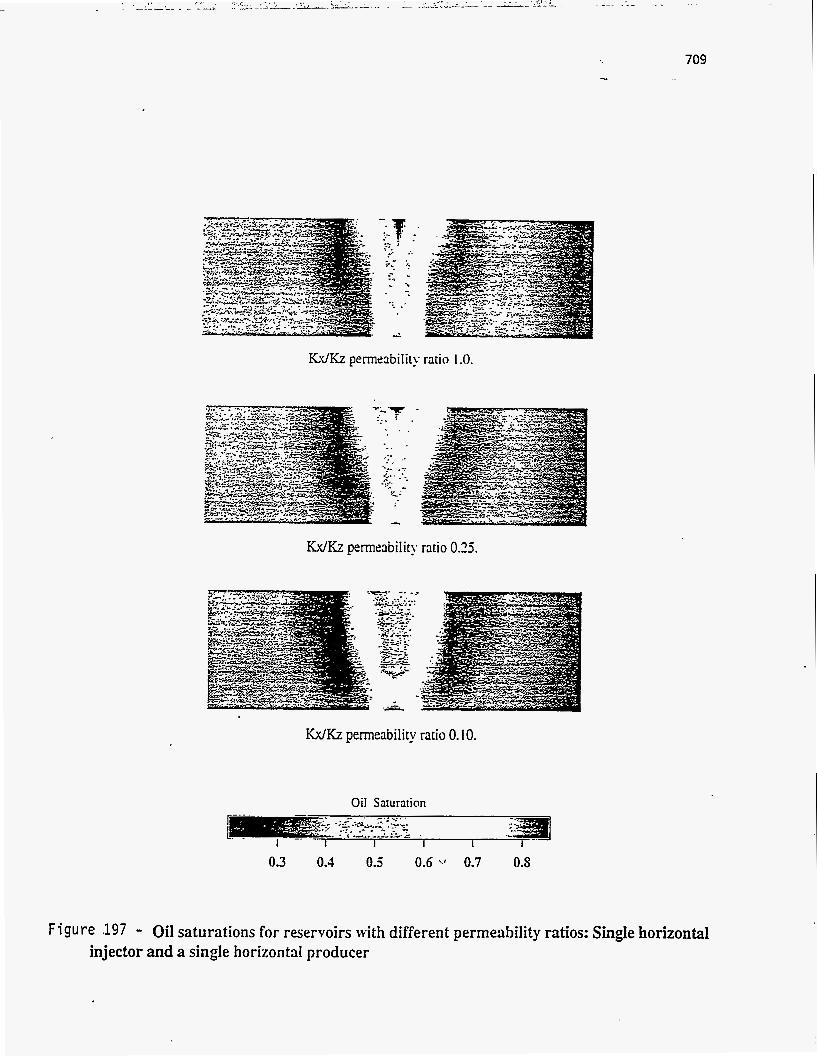
K?dKz permeability ratio 1.0.
K d k permeability ratio 0.25.
WKz permeability ratio 0.10.
Oil Saturation
0.3 0.4 0.5 0.6 0.7 O.S
Figure ,197 - Oil saturations for reservoirs with different permeability ratios: SingIe horizontal injector and a single horizontal producer
710 ...
chambedreservoir boundary. Not surprisingly, this phenomenon is most pronounced in the
reservoir with the greatest permeability. The greater permeability allows for improved transport
and dispersion of the steam, which in turn leads to a greater volume of the reservoir being effected
by the process. The predominant color seen in the visualizations is the orange associated with the
original reservoir oil saturation of 0.80, but along the steam chamber boundary, the main color is
red. Red indicates an oil saturation greater than 0.80. These areas of increased oil saturation
indicated the flow lines of the free flowing oil. Figure 196A, with its very low permeabilities,
shows almost vertical flow lines. In this case, the steam chamber is expanding, not in the preferred
horizontal direction, but in the unwanted and energy wasteful vertical direction. In a shallow
reservoir, steam following this model would soon break through to the surface and effectively end
the project. While a vertical trend can still be seen in Figure 196B, a marked increase in horizontal
spread is observed. Again, the reservoir with the greatest permeability, Figure 196C, demonstrates
the most desired characteristics.
Towards the center of each colored plate, the colors go from yellow to green to blue. Each
change in color represents a decrease in oil saturation. Certain areas of the lower permeability
simulations show a greater oil depletion than the corresponding areas of higher permeability
simulations. .This may result from the continued introduction of high temperature steam into the
relatively small volume of previously drained reservoir. This could lead to short circuiting, a
process where connecting channels between the injector and producer are more quickly formed,
leading to a more rapid depletion process centered around the well bores. While initially
appahg, this process soon leads to vertical growth and ultimately results in poorer returns than
found in the high permeability models.
As can be seen in Figure 197, not only are absolute permeabilities important, but so are

permeability ratios. When the ratio of k, to k, or k,, is near 1.0, the steam chamber tends to be
more vertical than horizontal. Whereas, when the permeability ratio tends toward 0.10 the lateral
spread of the steam chamber is much more pronounced.
Time dependence of Steam Chamber Development
Figures 198 and 199 help demonstrate the significance of two major factors which effect the
economic viability of any recovery project: the length of time involved before any meaningful
volumes of bitumen are recovered and the importance of proper well spacing. The wells are
located two hundred feet apart, with each well being 400 feet from the nearest edge of the
reservoir. (The ends of the reservoir have been cropped off by 150 feet on both sides. This was
done to give a more detailed view of the area near the well bores.)
Figures 198 and 199 show the oil saturntion in the reservoir at 1, 3,5, and 7 years, respectively
for a 2 pair horizontal injector/horizontal producer system. One year into the project, the overall
effects of steam injection are negligible. Not until the third year are significant areas of depletion
noticeable. Between the fifth and seventh years, substantial volumes of bitumen are recovered and
large areas of oil depletion are created. (Again, it must be stressed that the pictures shown are
expanded views of the areas near the well bores and that large volumes of space near the edges of
the reservoir 'are not affected at all during the lifetime of the project.) A minimal increase in the
size of the depletion zone is noted between the 7 and 10 year mark, but the efficiency of the
recovery process during this time period decreases dramatically because most of the heat injected
during this time span flows to the overburden where it is quickly dissipated.
As the figures show, no real interaction between the two wells is observed, even after 5.years
of operation. Essentially, the two wells act as independent systems and no signs of interference
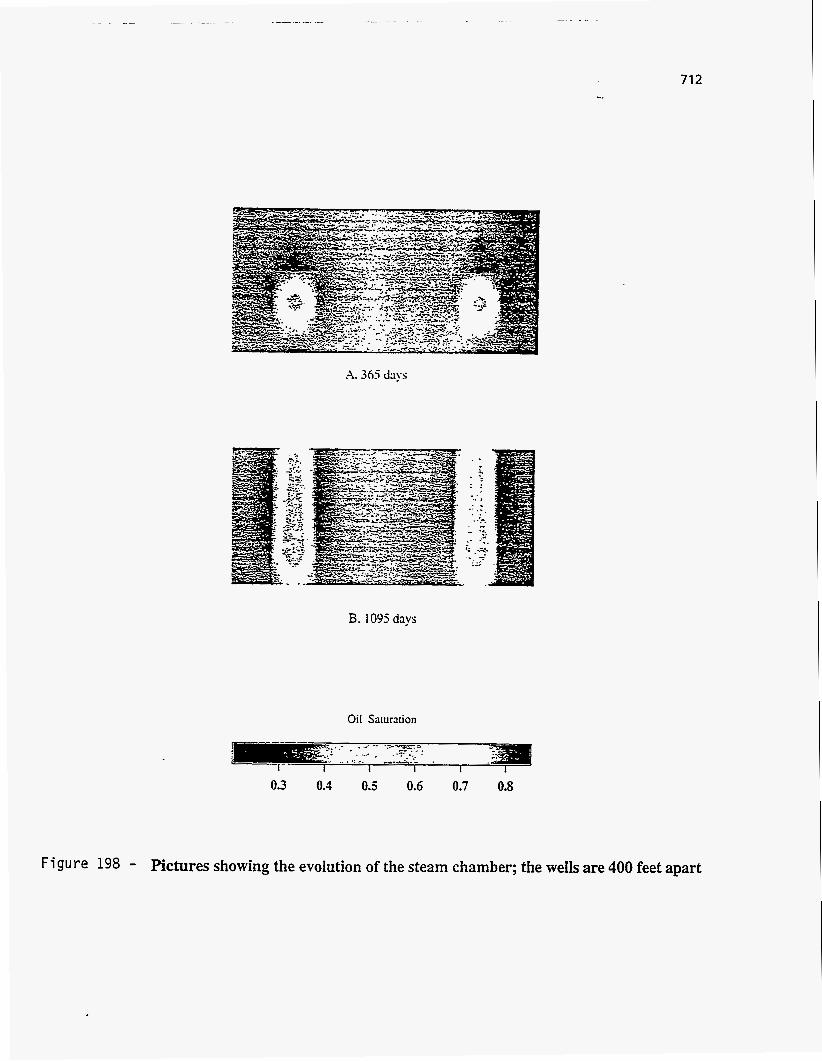
71 2 -..
B. 1095 days
Oil Saturation
- .,. :.: , . - . .. ':'-*=" .-:. .-.- . .... . .: L,- . .. . .: r .
I 1 1 1
0.3 0.4 0.5 0.6 0.7 0.8
Figure 198 - Pictures showing the evolution of the steam chamber; the wells are 400 feet apart

C. 1825 days
D. 2555 days
Oil 'Saturation -. ..----.',' A:&;,..-
.&:.: . ., .-. I I
0.3 0.4 0.5 0.6. 0.7 0.8
713 -_
Figure 199 - Pictures showing the evolution of the steam chamber; the wells are 400 feet apart
714 ...
(positive or negative) are noted. Findings reported in i..e previous chapter indicate t..at overlap
in adjacent steam chambers resul6 in significant gains in both productivity and process efficiency.
It appears that 200 foot well spacing is still too much to efficiently produce bitumen reservoirs. \
A clearer picture of the effects of well spacing appears in Figure 200. In the three horizontal
pair system, there is a stark contrast in temperature profiles between the system with 200 foot
spacing and the one with 100 foot spacing. Although the pattern in Figure 200A encompasses
more of the total reservoir volume, the wells exhibit no signs of interacting with each other, and
as was seen in Figure 200B, act as if they were isolated pairs. In Figure 200B the interaction
between the three well pairs is immediately obvious. A larger, interconnected area of high, 3009
steam encompasses all the wells, resulting in more efficient heat transfer to the reservoir and a
corresponding decrease in viscosity and greatly enhanced oil recovery. This figure, in fact,
represents the best case well pattern studied.
Reservoir Sweep and Lateral Spread
Enhancing reservoir sweep, the volume of the reservoir actually effected by the process, is one
of the main objectives in any recovery project. Ultimately, the decision to go ahead with a
recovery project is determined by the value of the product (Le. volume of bitumen produced)
versus the cost associated with injecting steam into the ground. With this in mind, the reservoir
engineer must try to maximize the volume of reservoir bitumen that is heated, while limiting the
volume of steam injected. One method of determining the process efficiency is to compare the
water injected to oil produced ratios. Such analyses are presented in the previous chapter. Figures
201-203 show the lateral spread produced by one, two, and three injector systems. (In each of the
figures, the reader is looking down the axis of the producing well bore). Time is 7 years.
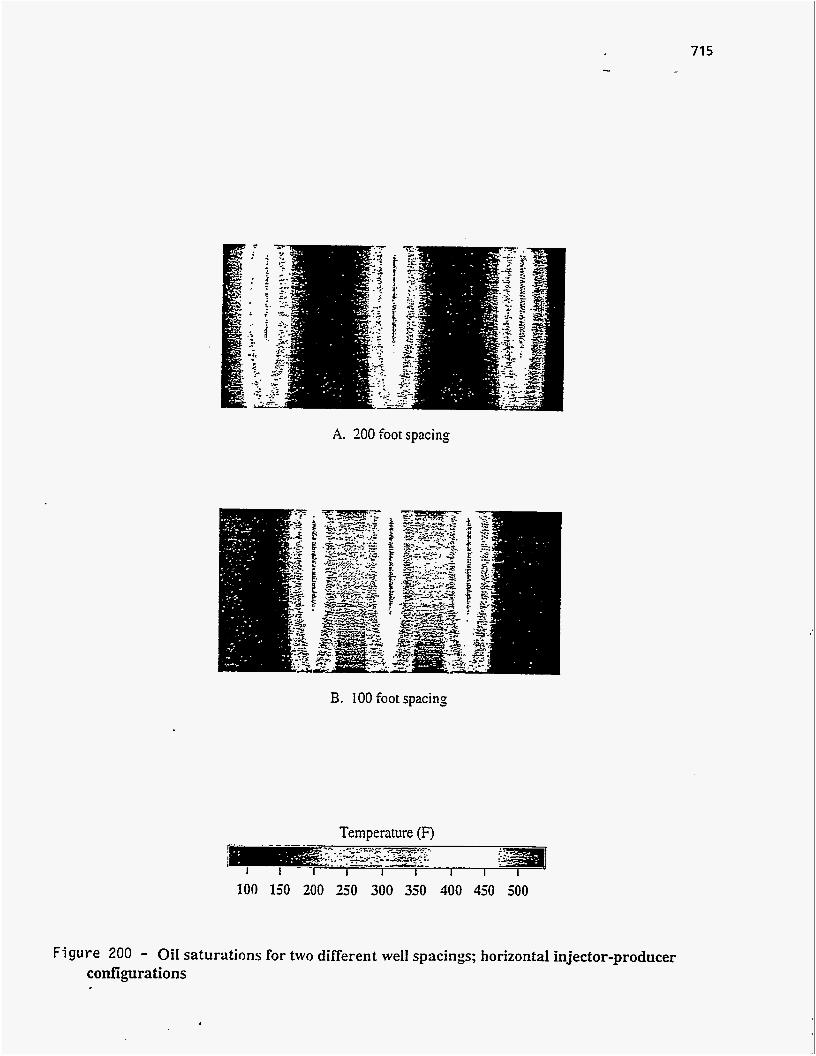
715
~-
A. 200 foot spacing
B. 100 foot spacing
Temperature (F)
100 150 200 250 300 350 300 450 500
Figure 200 - Oil saturations for two different we11 spacings; horizontal injector-producer configurations
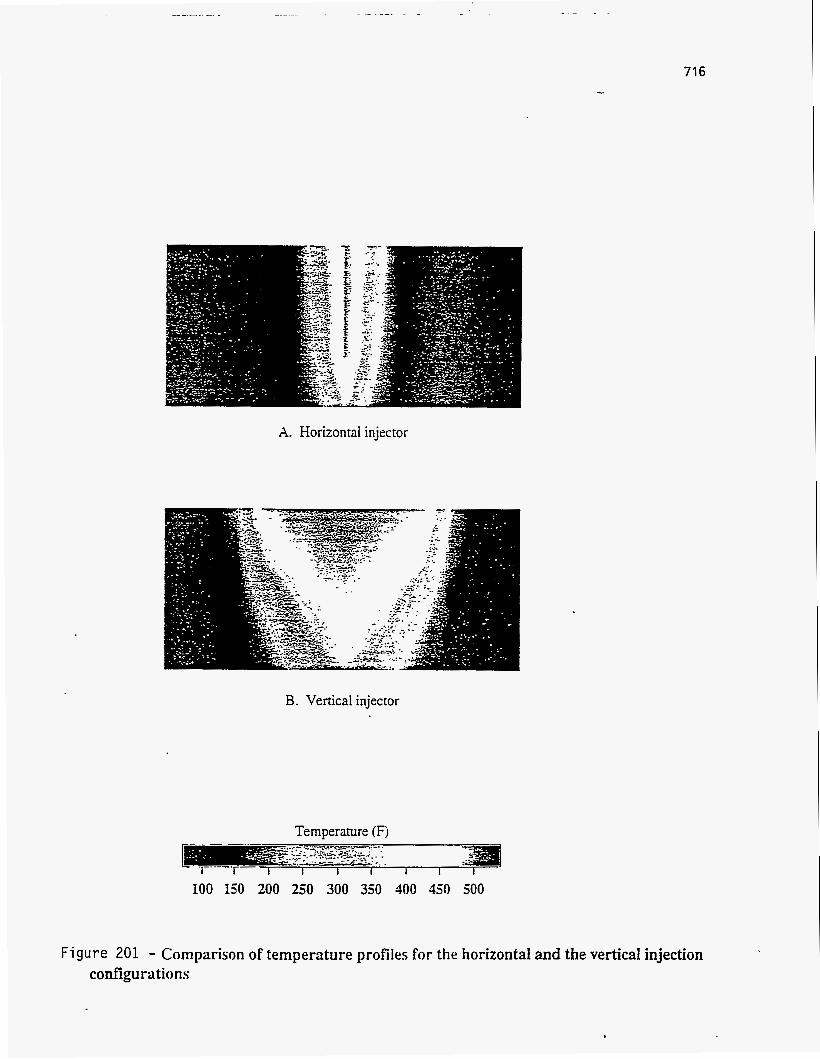
71 6
A. Horizontal injector
B. Vertical injector
Temperature [F)
100 150 200 250 300 350 400 450 500
Figure 201 - Comparison of temperature profiles for the horizontal and the vertical injection configu ria tio ns
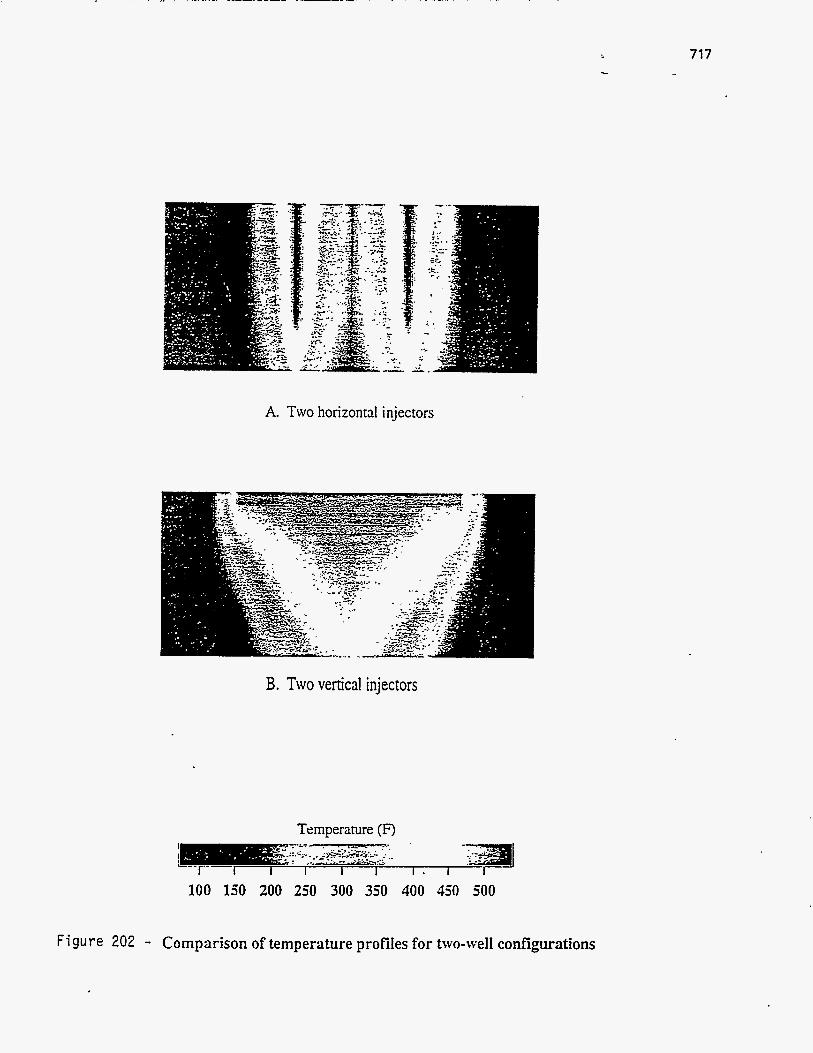
... 717 I
A. Two horizontal injectors
B. Two vertical injectors
Temperature (F)
100 150 200 250 300 350 400 450 500
Figure 202 - Comparison of temperature profiles for two-well configurations
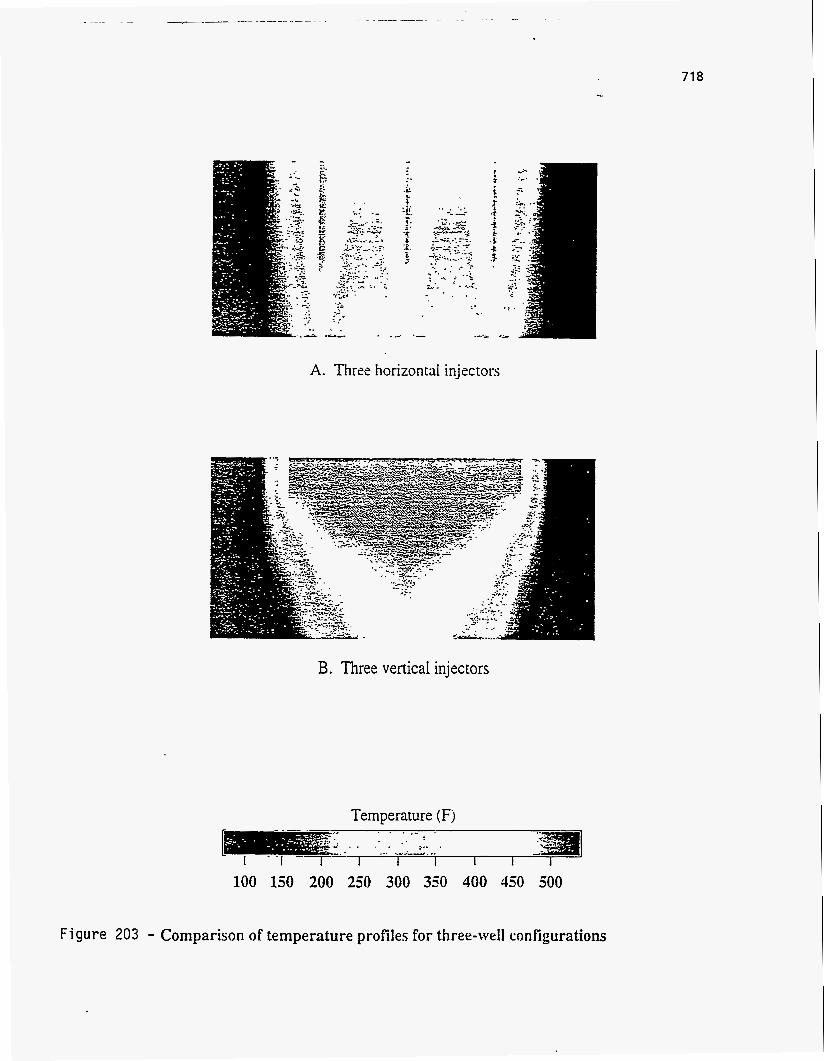
71 8
A. Three horizontal injectors
B. Three vertical injectors
Temperature (Fj
100 150 200 250 300 350 400 450 500
Figure 203 - Comparison of temperature profiles for three-we11 configurations
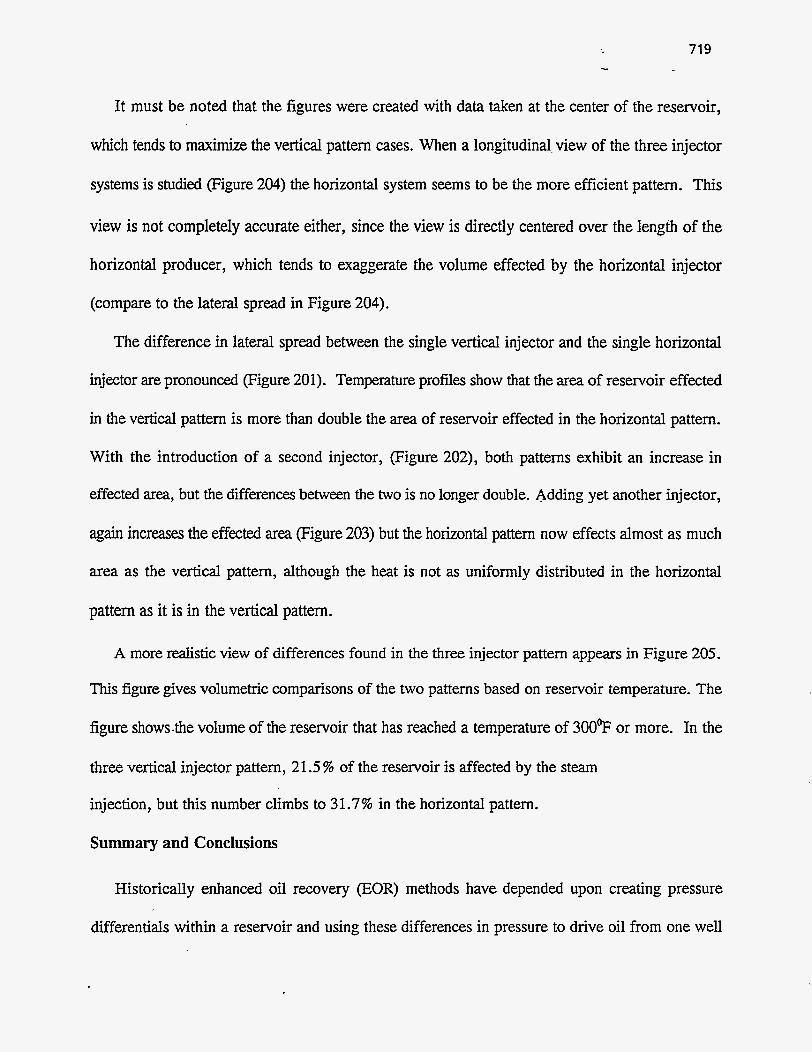
719 - L
It must be noted that the figures were created with data taken at the center of the reservoir,
which tends to maximize the vertical pattern cases. When a longitudinal. view of the three injector
systems is studied (Figure 204) the horizontal system seems to be the more efficient pattern. This
view is not completely accurate either, since the view is directly centered over the length of the
horizontal producer, which tends to exaggerate the volume effected by the horizontal injector
(compare to the lateral spread in Figure 204).
The difference in lateral spread between the single vertical injector and the single horizontal
injector are pronounced (Figure 201). Temperature profiles show that the area of reservoir effected
in the vertical pattern is more than double the area of reservoir effected in the horizontal pattern.
With the introduction of a second injector, (Figure 202), both patterns exhibit an increase in
effected area, but the differences between the two is no longer double. Adding yet another injector,
again increases the effected area (Figure 203) but the horizontal pattern now effects almost as much
area as the vertical pattern, although the heat is not as uniformly distributed in the horizontal
pattern as it is in the vertical pattern.
A more realistic view of differences found in the three injector pattern appears in Figure 205.
This figure gives volumetric comparisons of the two patterns based on reservoir temperature. The
figure showshe volume of the reservoir that has reached a temperature of 300v or more. In the
three vertical injector pattern, 21.5% of the reservoir is affected by the steam
injection, but this number climbs to 31.7% in the horizontal pattern.
Summary and Conclusions
Historically enhanced oil recovery @OR) methods have depended upon creating pressure
differentials within a reservoir and using these differences in pressure to drive oil from one well

720
Temperature (F)
100 150 200 250 300 350 400 450 500
Figure 204 - A different cross-section OF the temperature profiles for the three-we11 systems
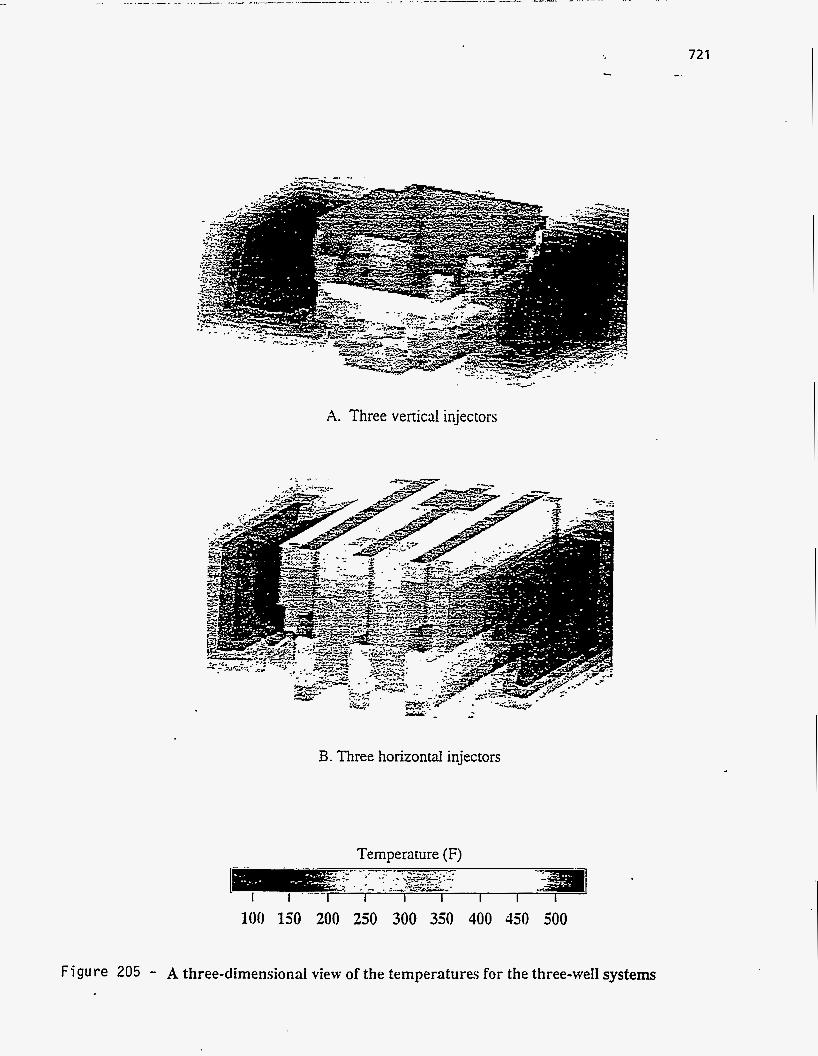
A. Three vertical injectors
-
B. Three horizontal injectors
Temperature (F)
100 130 200 250 300 350 400 450 500
721 --.
F igu re 205 - A three-dimensional view of the temperatures for the three-we11 systems

722 ...
(injector) to another well (producer). Due to the extremely high viscosities predominantly found
in oil sands, traditional thermal processes do not work well. One promising new method for the
recovery of oil from oil bearing sands is the steam assisted gravity drainage (SAGD) method.
SAGD centers around reducing the viscosity of the entrained oil via thermal methods instead of
attempting to initiate pressure driven viscous flow.
This thesis has examined the relationship between reservoir permeability, well patterns, and
well spacing with regards to steam assisted gravity drainage. Additionally, numerous sensitivity
studies helped determine critical simulation parameters such as grid block size and the overall
number of grid blocks.
Grid size sensitivity studies revealed that using blocks of two to three meters thickness provided
adequate resolution without requiring inordinate amounts of computer time. Best results were
obtained by using grid blocks of various size. Regions of high activity such as near the well bore
consisted of 5 foot thick grid blocks, while areas near the edge of the reservoir were adequately
represented with 20 foot thick grid blocks. Length and width parameters were not found to be as
critical as in the vertical dimension and were generally 2.5 times greater than the vertical thickness.
Several sensitivity comparisons were made between the source-sink model and the discretized
well bore model. A discretized well bore model allocates space within the simulation to account
for the actual physical presence of the well bore while the source-sink model wells to be point
sources. The discretized method is much more rigorous, but also much more time intensive, than
the source-sink model. Results indicated no significant differences in the output data between the
two models.
Changes in reservoir pressures did not noticeably effect the amount of oil recovered as long as
the pressure difference between injector and reservoir was greater than 50 psi. Smaller pressure

723 -. . c
differences greatly reduced the recovery efficiencies. Output from the simulations indicates a
strong correlation between high recovery efficiencies and high reservoir permeability. This
relationship is most noticeable at lower permeability levels, where a permeability increase of just
0.1 darcies, in the vertical direction, resulted in a four-fold increase in recovery efficiency.
Simulation results have shown that high permeabilities combined with larger numbers of wells
and reduced spacing between the wells resulted in the highest efficiency processes. Generally, the
horizontal pairs provided a slight efficiency edge over the vertical/horizontal pairs, but the
difference was not large enough to rule out vertical/horizontal pairs as the preferred economic
method of developing a particular reservoir. A significant advantage of the three vertical injectors
/ one horizontal producer was the ratio of vertical wells to horizontal wells. Although horizontal
drilling technologies have made impressive gains in the last five years, the drilling of horizontal
wells is still relatively expensive and risk filled in comparison to the drilling of vertical wells.
Additionally, the completion of a vertical well is routine, while the completion of a horizontal well
is still more art than science.
Substantial well communication was also a significant contributor to maximizing recovery
efficiencies. Well visualizations demonstrated that if the wells were too far apart and no
communication was developed between them, multiple wells would essentially act as isolated
systems. Data analysis showed the performance gains, based on recovery percentages of original
oil in place, obtained with increasing the number of wells and decreasing the spacing between the
wells. However, in the case of horizontal pairs, the desire to pack wells in closer and closer must
be tempered with the observation that such wells exhibit a tendency to short-circuit under modest
pressure differences if the injector and producer are too close together.
At the moment, the low permeabilities predominantly found in Utah tar sands would preclude
724 I
the implementation of a SAGD system using current technologies. Canadian reservoirs, however,
Seem well suited for future SAGD development. Since reservoir permeability has such a pervasive
influence on recovery efficiencies and ultimately economic viability, future studies into SAGD
should include simulations which incorporate the effects of both natural and man-made fractures.
Pertinent data from the massive output files were extracted using appropriate sed and awk
UNM: scripts. Although all the data is contained in large two-dimensional arrays, tabular arrays
do not lend themselves to easy analysis. The scripts along with additional Fortran and C programs
were used in reading the data to a form suitable for visualization.
... 725
-..
UINTA BASIN BITUMEN HYDROTBATING: CATALYTIC UPGRADING OF THE PR SPRING BITUMEN
OVER A COMMERCIAL HDM CATALYST
Principal Investigator: Francis V. Hanson Postdoctoral Fellow: D.C. Longstaff Graduate Student: J. Kim
INTRODUCTION
Bitumen-containing oil sands have been studied in Canada and the United States as
alternative fuel sources and have been commercially developed in Canada. Technical alternatives
that have been suggested for upgrading bitumens and heavy oils are based on carbon rejection
(coking processes) or on hydrogen addition (hydroprocessing). Coking is presently utilized to
upgrade bitumen (234,235) and is based on carbon rejection as coke. Hydroprocessing may have.
greater potential for upgrading heavy oils than coking processes because of nearly complete
utilization of the feed (236,237). Many heavy oils and bitumens contain high heteroatom (sulfur
and nitrogen), asphaltene and metal concentrations (65, 238, 239). Sulfur and nitrogen
compounds are removed in the form of H2S and NH3; respectively, however, metals are deposited
on the catalyst surface. This can lead to catalyst deactivation and short catalyst cycle life.
Hydrodemetallation is necessary to protect downstream hydrotreating catalysts from being
poisoned via metal deposition (240). HDM catalysts with wide pore radii are required for
upgrading bitumens or heavy oils prior to subsequent hydroprocessing (65, 240) because the HDM
catalyst can accommodate high metal deposition without excessive deactivation.
A Mo-on-alumina catalyst was employed for HDM because the catalyst had a higher pore
volume than primary hydrotreating catalysts. Several researchers have reported that metal sulfides
on low-acidity supports exhibit residuum conversion activity (238, 239) in which gas oil, distillate,
726
naphtha, and gases are produced via mild hydrocracking.
The objectives of this study were to determine the effects of temperature, space velocity,
and pressure on the extent of heteroatom and nickel removal, Conradson carbon residue (CCR)
and residuum conversion and on the product distributions and yields when processing the bitumen
from the PR Spring oil sands.
EXPERIMENTAL
The bitumen used in this study was obtained by reflux extraction of the PR Spring oil sands
with toluene. The oil sand ore was mined, crushed and sieved to a particle size of < 0.6 cm prior
to solvent extraction. The majority (85-90%) of the toluene in the bitumen-toluene solution was
removed by rotary evaporation. The remaining toluene was removed by batch vacuum distillation.
The physical and chemical properties of the PR Spring bitumen are presented in Table 63. The
bitumen contains high levels of asphaltenes and potential coke precursors. It also contains high
levels of sulfur relative to the Athabasca bitumens.
The fixed-bed reactor system was operated in the upflow mode to facilitate isothermal
operation and to insure complete wetting of the catalyst (241, 242). The liquid and gas products
from the reactor were separated in a high pressure vapor-liquid separator. The gaseous products
were withdrawn from the separator through a back pressure regulating valve (BPRV) which also
controlled the system pressure. The liquid product was removed from the separator through an
Annin control valve. A schematic of the hydrotreater system is presented in Figure 206. The
reactor consisted of three zones whose temperatures were independently controlled: the preheating
zone, the catalyst bed and the postreaction zone. The catalyst bed was located in the central 30.5
cm of the reactor and contained 152 cm3 of catalyst. Preheating and postreaction zones were filled
with inert a-alumina spheres (0.32 cm) and supported the catalyst bed. The reactor was heated
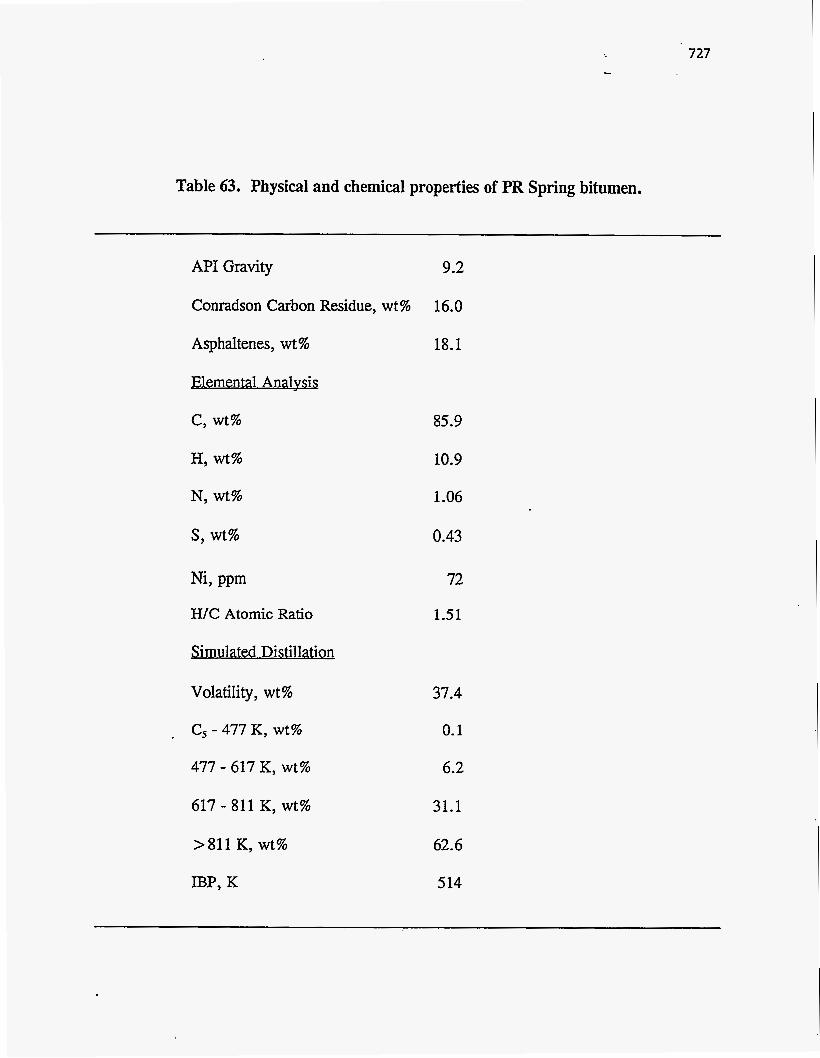
... 727
Table 63. Physical and chemical properties of PR Spring bitumen.
API Gravity 9.2
Conradson Carbon Residue, wt% 16.0
Asphaltenes, wt %
Elemental Analvsis
c, wt%
H, wt%
N, wt%
s, wt%
Ni, ppm
H/C Atomic Ratio
Simulated Distillation
Volatility, wt%
c5 - 477 K, wt%
477 - 617 K, wt%
617 - 811 K, wt%
> 81 1 K, wt%
IBP, K
18.1
85.9
10.9
1.06
0.43
72
1.51
37.4
0.1
6.2
31.1
62.6
5 14
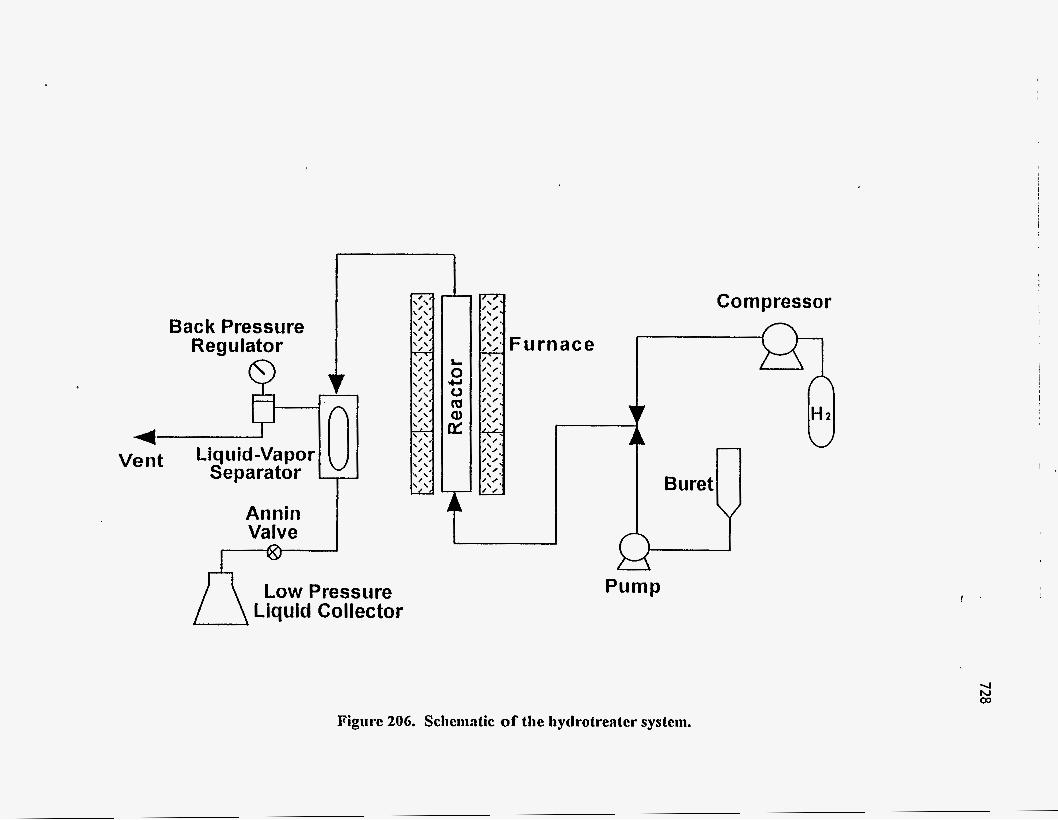
Back Pressure Regulator
L i q u i d -Va po r 4
Vent Separator
Annin Valve
Low Pressiire Liquid Co I lector
\ \
\ \
\ \ \ \
', \
H Pump
Figure 206. Sclienintic of the hyclrotrenter system.
!
I
by a three zone electrical furnace. The axial temperature profile in the catalyst zone was measured
by a traveling thermocouple.
A commercial Mo/Al,O, HDM catalyst in the form of 1.6 mm trilobe shaped extrudates
was used in this study. The catalyst contained 6.0 wt% MOO, and had a surface area of 130 m2/g
and a pore volume of 0.85 cc/g. The catalyst was dried in-situ in flowing nitrogen at 700 K for
one hour and was mled to ambient temperature prior to sulfiding. The catalyst was sulfided with
a 2 wt% sulfur solution of dimethyldisulfide in kerosene. The sulfiding procedure consisted of
feeding the sulfiding solution and hydrogen upflow through the catalyst. The catalyst bed was
heated from ambient temperature to 505 K at a rate of 27.8"C/h. The reactor temperature was
held at 505 K for 2 hours to insure that the catalyst was properly sulfided. Sulfiding was
completed when the reactor temperature reached 645 K. The hydrogen-to-sulfiding solution ratio
was 890 m3 (STP)/m3. The reactor pressure and the sulfiding solution feed rate were 6.1 - 6.3
MPa and 1 LHSV; respectively.
After the catalyst had attained a stable activity, experiments were conducted by varying
the reactor temperature (625 - 685 K), WHSV (0.26-1.55 h-I) and reactor pressure (11.1-16.6
MPa). Experiments were performed in a cyclic mode (base case condition-operating condition-
base case condition) to assess the extent of catalyst deactivation. The aging rate was estimated by
monitoring the API gravity of the total liquid product produced at base case conditions with
respect to time-on-stream (TOS). Base case conditions were 642 K, 0.41 h-' LHSV and 13.7
MPa. The experimental apparatus and procedures have been described in detail elsewhere (243).
RESULTS AND DISCUSSION
Reactor operating variables were selected so that only one of the three process variables

730
was changed at a time while the remaining two were kept constant. The range of process
operating conditions is summarized as a function of TOS in Table 64.
Effects of Temperature
Temperature effects were investigated by varying the temperature at fixed pressure (13.7
MPa) and space velocity (0.78 h-'WHSV). The effects of temperature on nitrogen, sulfur and
nickel removals, on CCR and residuum conversions and on product distributions and yields are
presented in Table 65. Increasing temperature resulted in an increase in the API gravity, the H/C
atomic ratio relative to the bitumen and an increase in H2 consumption. The increase in API
gravity was large compared to the increase in H/C atomic ratio over the entire range of
temperatures studied.
Fractional conversions of nitrogen, sulfur, residuum, nickel and CCR with respect to
temperature are presented in Figure 207. Nitrogen, sulfur and nickel removals, and CCR and
residuum conversions over the HDM catalyst increased as temperature increased. The degree of
sulfur removal was higher than residuum conversion and nitrogen removal. Nitrogen was the least
reactive species. The fact that the extent of sulfur removal was higher than nitrogen removal is
in agreement with Ho (244) who observed that sulfur compounds are easier to convert than
nitrogen compounds.
The relative percent decrease in the residuum, sulfur and nitrogen contents of the total
liquid products were 4, 12, and 2%; respectively, when the reaction temperature increased from
625 to 642 K. The CCR and nickel contents decreased by 6 and 7%; respectively, for the same
increase in temperature. Sulfur removal was significant at lower temperatures. The residuum and
nitrogen contents of the liquid product decreased by 21 and 22%; respectively, as the temperature
increased from 664 to 685 K. The sulfur content decreased by 8%, the CCR content by 16% and
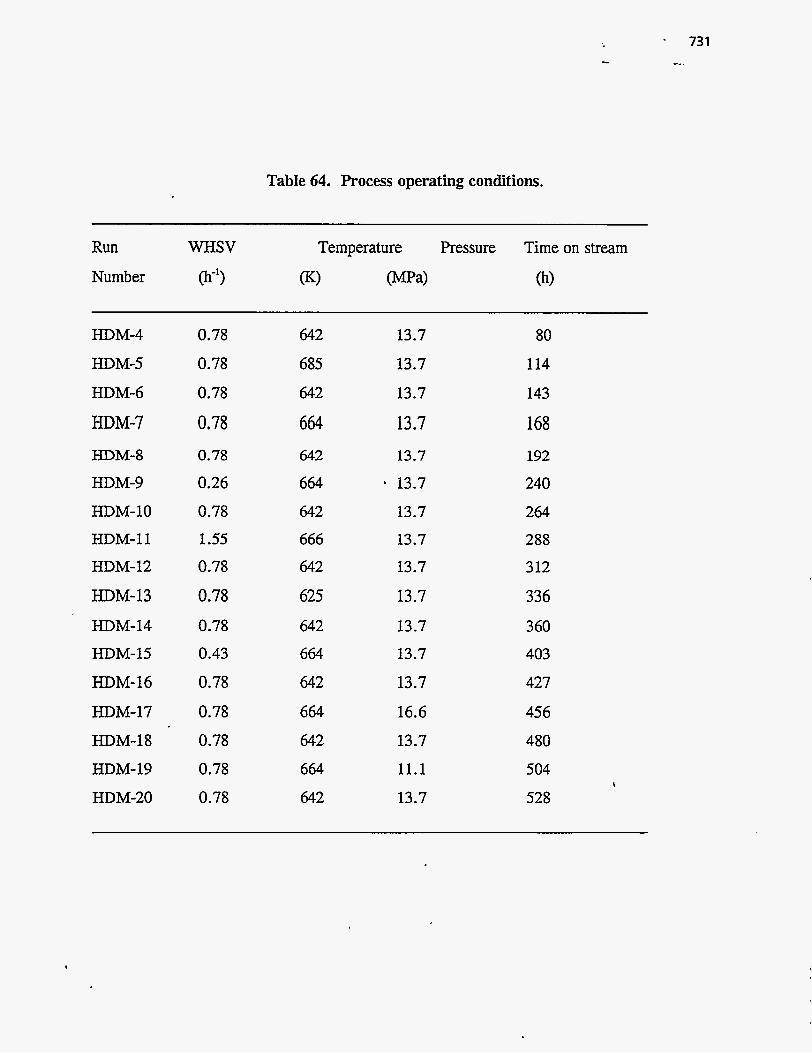
Table 64. Process operating conditions.
Run WHSV Temperature Pressure Time on stream
Number @-9 (K) W a ) (h)
HDM-4
HDM-5
HDM-6
HDM-7 HDM-8
HDM-9
HDM-10 HDM-11 HDM-12
HDM-13
HDM- 14 HDM-15
HDM-16
HDM-17
HDM-18
HDM-19
HDM-20
0.78
0.78
0.78
0.78 0.78
0.26
0.78 1.55 0.78
0.78 0.78 0.43
0.78
0.78
0.78
0.78
0.78
642
685
642
664 642
664
642 666 642
625 642 664
642 664
642
664
642
13.7
13.7
13.7
13.7 13.7
13.7
13.7 13.7 13.7
13.7
13.7 13.7
13.7
16.6
13.7
11.1
13.7
80
114
143
168 192
240
264 288 3 12
336
360 403
427
456
480
504
528 I

0.6 WHSV = 0.78/h
0.5 c 0 !!! 0.4 a, > . c 0 0 0.3 m c 0
..I
- .II 3 0.2 E U
0.1
P = 13.7 MPa
61 5 635 655 675 695
Residuum
Nitrogen
A Sulfur
+ Nickel
0 CCR
I .'
Temperature, K
4 w N
Figiire 207. Fractioiinl coiiversimis of residiiiiiii, nitrogen, srilfiir nickel and CCR vs teiiiper:itnre.
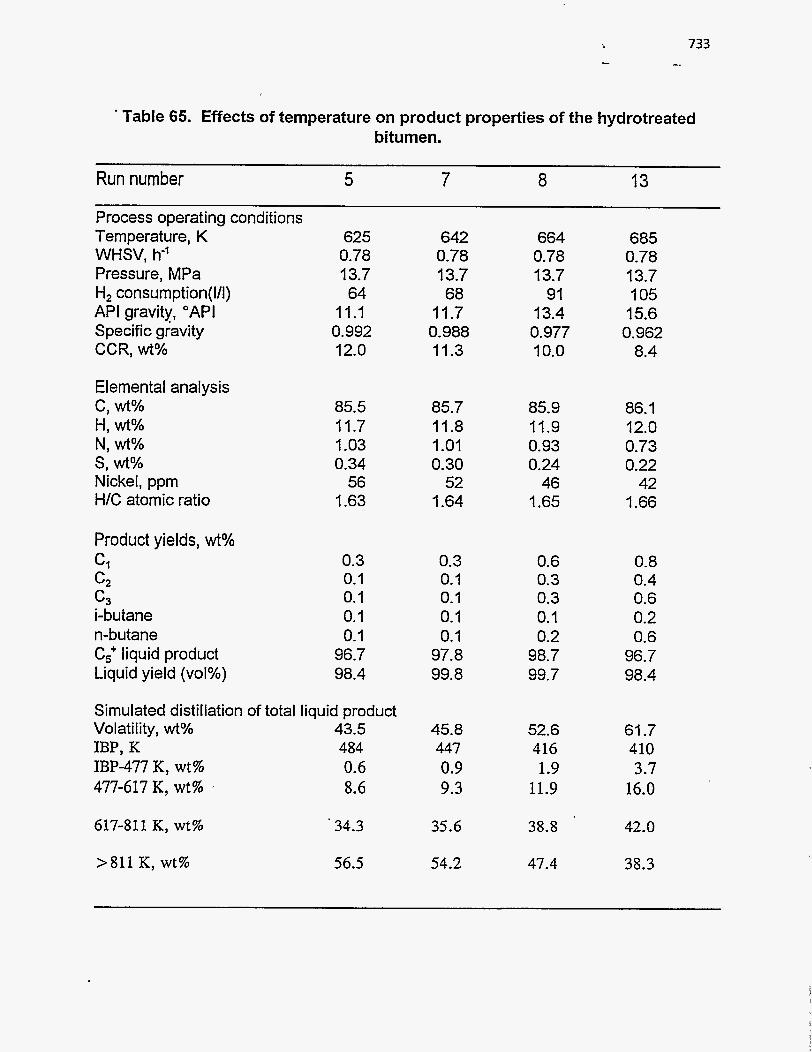
733 -.
Table 65. Effects of temperature on product properties of the hydrotreated bitumen.
Run number 5 7 8 13
Process operating conditions Temperature, K 625 642 664 685 WHSV, h-l 0.78 0.78 0.78 0.78 Pressure, MPa 13.7 13.7 13.7 13.7 H2 consumption(l/l) 64 68 91 105 API gravity, "API 11.1 11.7 13.4 15.6 Specific gravity 0.992 0.988 0.977 0.962 CCR, wt% 12.0 11.3 10.0 8.4
El em en t a I ana lysis c, wt% H, wt% N, wt% s, wt% Nickel, ppm H/C atomic ratio
Product yields, wt% Cl c2
c3 i-butane n-butane Cg liquid product Liquid yield (~01%)
85.5 11.7 1.03 0.34
56 1.63
0.3 0.1 0.1 0.1 0.1
96.7 98.4
Simulated distillation of total liquid product Volatility, wt% 43.5 IBP, K 484 IBP-477 K, wt% 0.6 477-617 K, wt% 8.6
617-811 K, wt%
>811 K, wt%
.34.3
56.5
85.7 11.8 1.01 0.30
52 1.64
0.3 0.1 0.1 0.1 0.1
97.8 99.8
45.8 447 0.9 9.3
35.6
54.2
85.9 11.9 0.93 0.24
46 1.65
0.6 0.3 0.3 0.1 0.2
98.7 99.7
52.6 416 1.9
11.9
38.8
47.4
86.1 12.0 0.73 0.22
42 1.66
0.8 0.4 0.6 0.2 0.6
96.7 98.4
61.7 410 3.7
16.0
42.0
38.3
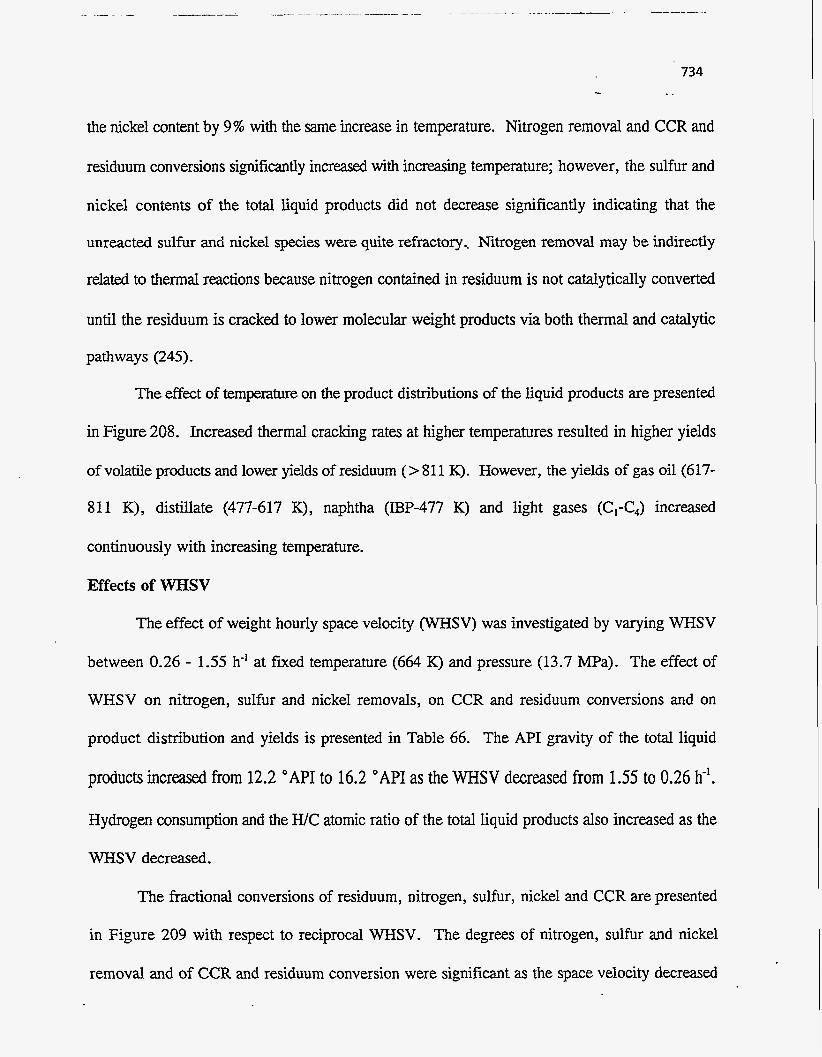
734
the nickel content by 9% with the Same increase in temperature. Nitrogen removal and CCR and
residuum conversions significantly increased with increasing temperature; however, the sulfur and
nickel contents of the total liquid products did not decrease significantly indicating that the
unreacted sulfur and nickel species were quite refractory, Nitrogen removal may be indirectly
related to thermal reactions because nitrogen contained in residuum is not catalytically converted
until the residuum is cracked to lower molecular weight products via both thermal and catalytic
pathways (245).
The effect of temperature on the product distributions of the liquid products are presented
in Figure 208. Increased thermal cracking rates at higher temperatures resulted in higher yields
of volatile products and lower yields of residuum (> 81 1 IS). However, the yields of gas oil (617-
811 K), distillate (477-617 K), naphtha (IBP-477 K) and light gases (C,-C,) increased
continuously with increasing temperature.
Effects of WHSV
The effect of weight hourly space velocity (WHSV) was investigated by varying WHSV
between 0.26 - 1.55 h-' at fixed temperature (664 K) and pressure (13.7 MPa). The effect of
WHSV on nitrogen, sulfur and nickel removals, on CCR and residuum conversions and on
product distribution and yields is presented in Table 66. The API gravity of the total liquid
products increased from 12.2 "API to 16.2 "API as the WHSV decreased from 1.55 to 0.26 h-'.
Hydrogen consumption and the WC atomic ratio of the total liquid products also increased as the
WHSV decreased.
The fractional conversions of residuum, nitrogen, sulfur, nickel and CCR are presented
in Figure 209 with respect to reciprocal WHSV. The degrees of nitrogen, sulfur and nickel
removal and of CCR and residuum conversion were significant as the space velocity decreased
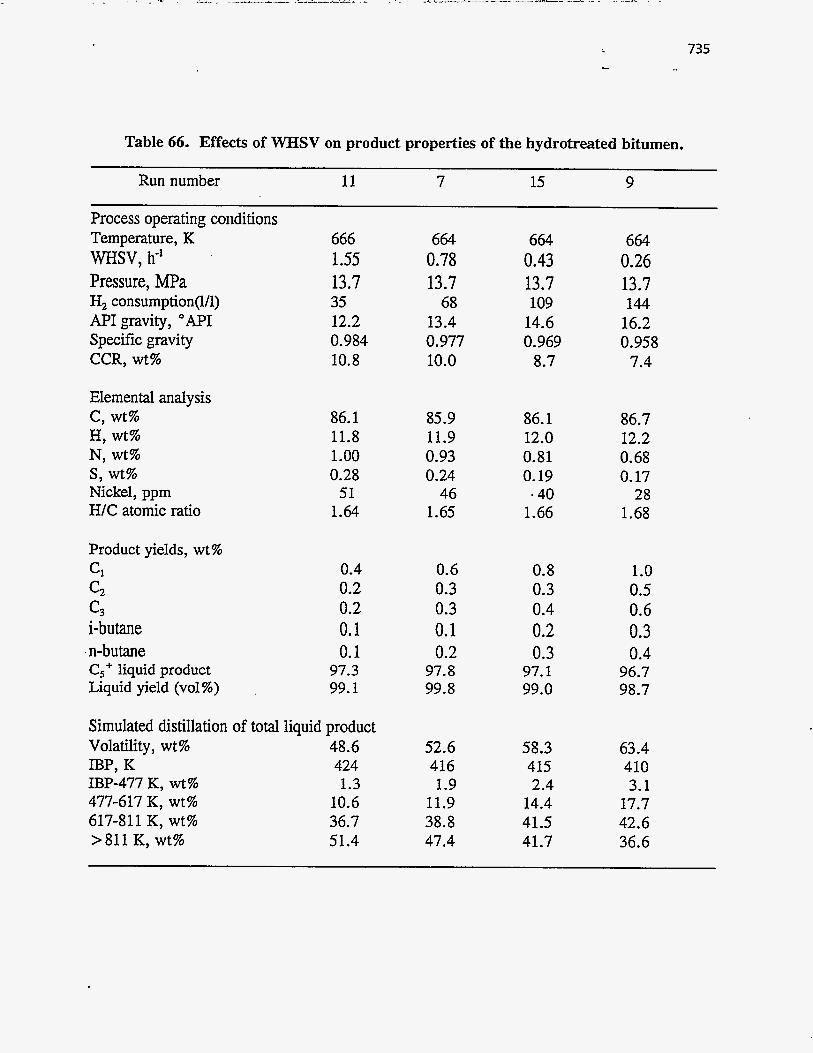
735
Table 66. Effects of WHSV on product properties of the hydrotreated bitumen.
Run number 11 7 15 9
Process operating conditions Temperature, K 666 664 664 664 WHSV, h' 1.55 0.78 0.43 0.26 Pressure, MPa 13.7 13.7 13.7 13.7 H, consumption(l/l) 35 68 109 144 API gravity, "API 12.2 13.4 14.6 16.2 Specific gravity 0.984 0.977 0.969 0.958 CCR, wt% 10.8 10.0 8.7 7.4
Elemental analysis c, wt% H, wt% N, wt% s, wt% Nickel, ppm H/C atomic ratio
Product yields, wt% c, c2
c3 i-butane
I n-butane C5+ liquid product Liquid yield (~01%)
86.1 11.8 1.00 0.28
51 1.64
0.4 0.2 0.2 0.1 0.1
97.3 99.1
Simulated distillation of total liquid product Volatility, wt% 48.6 IBP, K 424 IBP-477 K, wt% 1.3 477-617 K, wt% 10.6 617-811 K, wt% 36.7 >811 K, wt% 51.4
85.9 11.9 0.93 0.24
46 1.65
0.6 0.3 0.3 0.1 0.2
97.8 99.8
52.6 416 1.9
11.9 38.8 47.4
86.1 12.0 0.81 0.19
- 40 1.66
0.8 0.3 0.4 0.2 0.3
97.1 99.0
58.3 415 2.4
14.4 41.5 41.7
86.7 12.2 0.68 0.17
28 1.68
1 .o 0.5 0.6 0.3 0.4
96.7 98.7
63.4 410 3.1
17.7 42.6 36.6

0.7
0.6 F P = 13.7 MPa WHSV = 0.78/h
0.5 c 0 - . ,.I
0.4
6 0.3
lk .r
.- 0.2
620 630 640 650 660 670 680 690
Temperature, K
Resid
GasOil
A Distillate
+ Naphtha
o Gas
Figrrre 208. ETTect of ternperatrrre on yields of residrrrrrll, gas oil, distillate, napl~tl~a, anti gases.
I
I
I
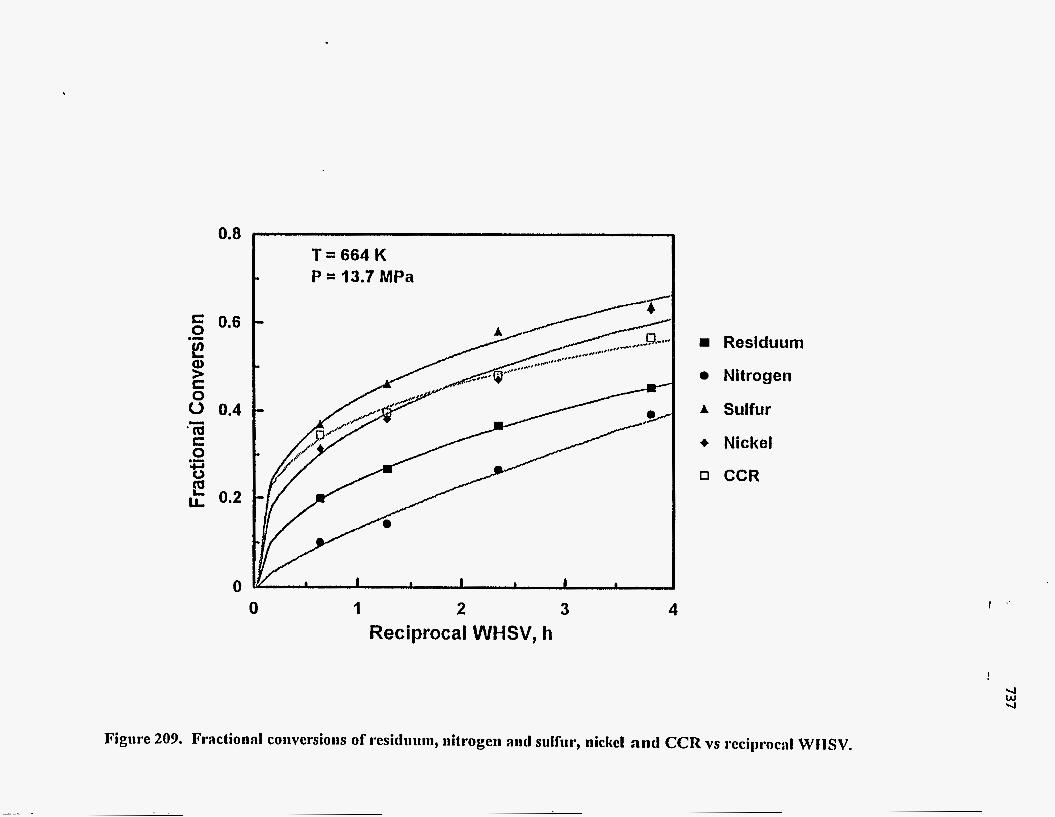
0.8
0.6 .I
!!! d, > c 0 0 0.4 'tu c 0 0
I
.- .r e! 0.2
0
T = 6 6 4 K P = 13.7 MPa
1 I 1 I 1 I b
0 I 2 3 Reciprocal WHSV, h
4
Residuum
Nitrogen
A Sulfur
+ Nickel
0 CCR
I
Figrire 209. Fractional coiiversioiis of rcsidimii, nitrogen aad sulfur, nickel arid CCR vs rcciprac:tl WIISV.

738
from 1.55 to 0.26 h” WHSV. The extent of sulfur removal was greater than residuum conversion
which was grater than nitrogen conversion over the entire range of reciprocal WHSV. Residuum
conversion surpassed nitrogen removal in all cases over the commercial HDM catalyst. It was
expected that sulfur removal would exceed nitrogen removal because sulfur compounds are known
to be more reactive than nitrogen compounds (244).
At 1.55 h-’ WHSV, the sulfur content decreased by 33 %; the residuum content decreased
by 18%; the nitrogen content decreased by 6%; the CCR content decreased by 30%; and, the
nickel content decreased by 26% relative to the feed. The extent of sulfur removal was highest
at 1.55 h-’ WHSV relative to the other compounds. This suggests that a large portion of the sulfur
is significantly more reactive than the residuum and/or nitrogen. It is thought that PR Spring
bitumen may contain aliphatic sulfides such as have been detected in Canadian bitumens (246).
The presence of aliphatic sulfides in PR Spring bitumen would explain the significant sulfur
conversion which occurs at large WHSV. The nitrogen, sulfur and nickel removal increased by
19%, 34% and 25%; respectively, as the space velocity decreased from 1.55 to 0.43 h-’ WHSV.
Both residuum and CCR conversion increased by 19 % as the space velocity decrhsed from 1.55
to 0.43 h-’ WHSV. The extent of sulfur removal was higher than that of the other compounds at
high space velocity. 30% nickel removal was achieved as the space velocity decreased from 0.43
to 0.26 h” WHSV. 11% sulfur and 16% nitrogen removals and 12% residuum and 15% CCR
conversions were achieved as the space velocity decreased from 0.43 to 0.26 h-’ WHSV. The
slope of sulfur removal decreased substantially with increasing reciprocal WHSV. The reduction
in nitrogen content was almost linear over the entire range of reciprocal WHSV. The slope of
residuum and CCR conversion also decreased with increasing reciprocal WHSV.
The effect of reciprocal WHSV on the product yields are presented in Figure 210. Yields
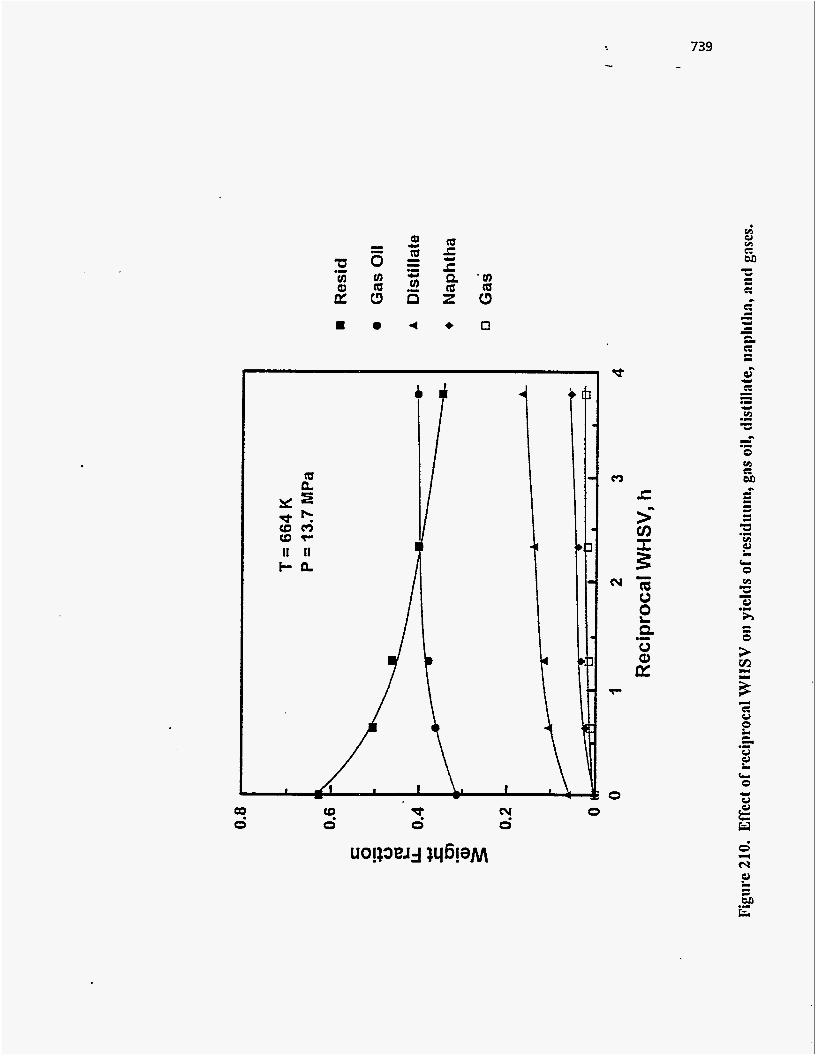
a? 0
u)
d
(0
t P Q z
s
Q
'9 0
s 0
r'! 0
0
739 -.
v)
c M z: I w c I c: c c L I
L d n f.
c. I .I
0 rA c 00 c. E: 3 I
I L I Y .I
v)
P, I
L 0
. . . . . -. . ... . . . -I . .. . _. ____. .. . -. . __ __ .. . .. - - - -.
of the various fractions changed with varying WHSV at constant temperature and pressure. The .
volatile product increased at higher reciprocal WHSV because higher residuum conversion was
achieved at longer contact times. The residuum fraction ( > 81 1 K) was significantly converted
with increasing residence time whereas the yields of gas oil (617-81 1 K), distillate (477-617 K),
naphtha (lBP-477) and C, - C, gases increased monotonically. The yields of gas oil, distillate and
naphtha exhibited an initial rapid increase at lower reciprocal WHSV. This is attributed to the
rapid conversion of native residuum into volatile fractions.
Effects of Pressure
The effect of pressure was studied by varying pressure between 11.1 - 16.6 MPa at a fixed
space velocity (0.78 h-' WHSV) and reaction temperature (664 K). The product distributions and
yields, nitrogen and sulfur removals and CCR and residuum conversions are reported as a function
of reactor pressure in Table 67. The fractional conversions of residuum, nitrogen, sulfur and
CCR are presented in Figure 21 1 with respect to reactor pressure. Reactor pressure exhibited little
influence on the liquid product distributions and yields. Even though hydrogen consumption
increased as the reactor pressure increased from 1 1.1 to 16.6 MPa, the API gravity increased only
slightly from 9.7 to 10.2"API. The H/C atomic ratio increased from 1.62 to 1.66 because of
increased hydrogenation due to the higher pressure. Nitrogen and sulfur removals and CCR and
residuum conversions were only slightly enhanced with increasing reactor pressure (Figure 21 1).
Liquid product distributions and yields are most strongly affected by thermal and catalytic
cracking. The contribution of hydrogen to cracking is primarily indirect in that hydrogen
suppresses coke formation and saturates the olefinic products produced in cracking reactions. The
only direct contribution that hydrogen can make is to saturate aromatic rings to hydroaromatics
which can then be cracked; however, this contribution is minor and will only result in minor
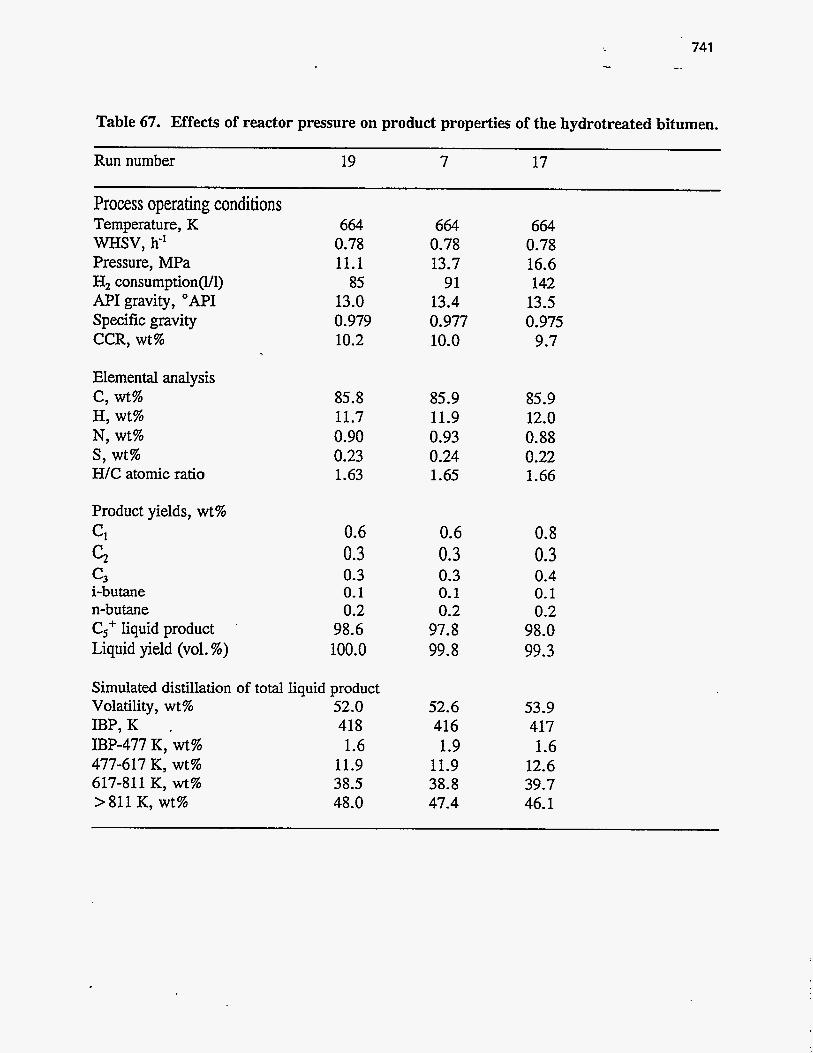
Table 67. Effects of reactor pressure on product properties of the hydrotreated bitumen.
Run number 19 7 17
Process operating conditions Temperature, K WHSV, h" Pressure, MPa H, consumption(U1) API gravity, "API Specific gravity CCR, wt%
Elemental analysis c, wt% H, wt% N, wt% s, wt% H/C atomic ratio
Product yields, wt% Cl c2 c3 i-butane n-butane C,+ liquid product Liquid yield (vol. %)
664 0.78 11.1
85 13.0 0.979 10.2
85.8 11.7 0.90 0.23 1.63
0.6 0.3 0.3 0.1 0.2
98.6 100.0
Simulated distillation of total liquid product Volatility, wt% 52.0 B P , K . 418 IBP-477 K, wt% 1.6 477-617 K, wt% 11.9 617-811 K, wt% 38.5 >811 K, wt% 48.0
664 0.78 13.7
91 13.4 0.977 10.0
85.9 11.9 0.93 0.24 1.65
0.6 0.3 0.3 0.1 0.2
97.8 99.8
52.6 416 1.9
11.9 38.8 47.4
664 0.78 16.6 142
13.5 0.975
9.7
85.9 12.0 0.88 0.22 1.66
0.8 0.3 0.4 0.1 0.2
98.0 99.3
53.9 417 1.6
12.6 39.7 46.1
I
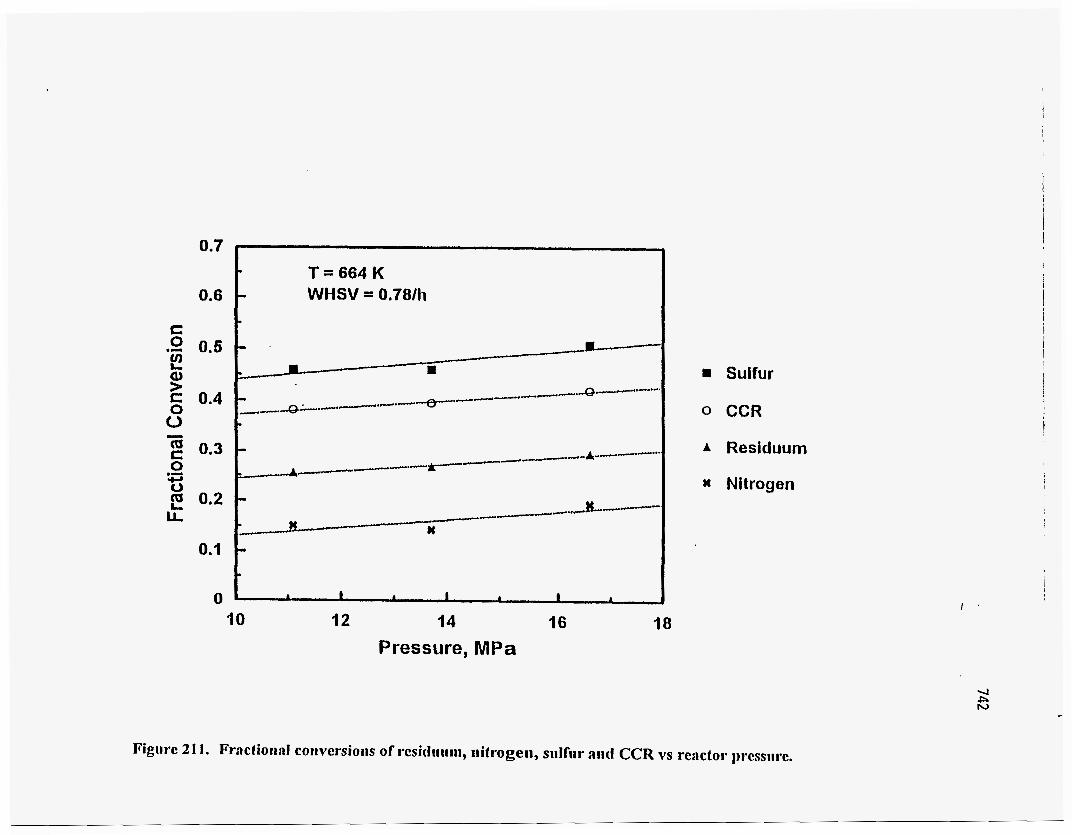
i
i 1
I '
c
Figure 21 1. Fmctioaal coiiversiorls of resitfrrlrrn, nitrogen, sllllilr aad CCR vs reactor l~rcssrlre.
increases in cracking. Based on pure compound studies hydrogen pressure should be more
important for heteroatom and CCR conversions than it is for residuum conversion. However,
since heteroatoms and CCR in high molecular weight moieties are unreactive (247) residuum
cracking may be the rate limiting step for a substantial portion of the removal of heteroatoms in
PR Spring bitumen (248). In this situation, heteroatoms and CCR removal would not be
substantially affected by hydrogen pressure.
SUMMARY AND CONCLUSIONS
Sulfur compounds were substantially converted with increasing temperature and contact
time over the commercial HDM catalyst whereas the nitrogen removal remained low over the
entire range of temperature and space velocities. Nickel removal was increased significantly with
increasing contact time. Residuum conversion and nickel removal increased significantly with
increasing temperature. The yield of distillate, naphtha and gas oil increased rapidly at higher
temperatures because thermal cracking of residuum increased. The yield of gas oil, distillate and
naphtha rapidly increased with decreasing WHSV. There was an initial rapid decrease of
residuum yield at lower reciprocal WHSV. This was attributed to the conversion of residuum to
volatile products. I t is expected that the main reaction of residuum conversion is cracking of
paraffinic side chains.
The effect of reactor pressure was minimal on nitrogen and sulfur removal and CCR and
residuum conversion. The influence of reactor pressure on the product distribution and yields was
also small. The catalyst deactivation was about 0.02"API/day during the hydrotreating.
UINTA BASIN BITUMEN HYDROTREATING: CATALYTIC UPGRADING OF THE PR SPRING BITUMEN
OVER A COMMERCIAL HDN CATALYST
Principal Investigator: F.V. Hanson Post Doctoral Fellow: D.C. Longstaff Graduate Student: J. Kim
INTRODUCTION
As the worldwide supply of light crude oil decreased, more attention has been paid to the
refining of heavy oils (including bitumens) and residuums into lighter and more valuable liquid
products. The heavy oils and residuums contain high concentrations of sulfur, nitrogen and metals
(238). SuKr and nitrogen are sources of air pollution during combustion and play a significant role
in poisoning of reforming and cracking catalysts (249). Minute amounts of metal elements can
severely affect the activity of cracking catalysts (65). Therefore, the removal of heteroatoms and
metals from heavy oils is an important goal in hydrotreating.
The feed oil sand used in this investigation was obtained fiom the PR Spring U-Tar pit deposit
which is located in SE 114 NE 1/4, Section 5, Township 16 South, Range 24 East in eastern Utah.
The oil sand ore was mined, crushed and sized to yield the desired distribution of oil sand particles
(0.6 cm) for solvent extraction. The bitumen ecxtracted fiom the PR Spring oil sand was used in this
study and has high nitrogen and low sulfbr contents.
A NMo on alumina hydrodenitrogenation catalyst was employed to hydrotreat this oil
because NMo on alumina is more effective for removing high concentrations of nitrogen than CoMo
on alumina (244). Several researchers have reported that metal sulfides on low-acidity supports
catalyze residuum conversion (239,250). Mild hydrocracking (MHC) is defined as the conversion
of residuum from heavy oils into gas oil, distillate, naphtha, and gases and can be achieved under the
process conditions utilized in this study (250).
745 x.
The objective of this study was to determine the effect of process variables on heteroatom and
metal removal and on Conradson carbon residue and residuum conversions. The process variables
investigated were reactor temperature and space velocity at fixed reactor pressure (13.7 Mpa).
EXPERWIENTAL
Feedstocks used in this study were the bitumen-derived heavy oils produced from the PR
Spring oil sand by continuous reflux extraction with toluene . The toluene in the bitumen-toluene
solution was removed by rotary evaporation followed by batch vacuum distillation. The physical and
chemical properties of the bitumen-derived heavy oils used in this study are presented in Table 68.
The reactor system was constructed so that the hydrogen and oil were delivered to the packed
constrained catalyst bed in an upflow mode to insure efficient contacting of the oil with the catalyst
(241, 242). The liquid and gas products from the reactor were separated in a high pressure vapor-
liquid separator. The gas product was removed fiom the separator through a back pressure
regulating valve (BPRV) which controlled the system pressure. The liquid product was removed
fiom the separator through a control valve (Annin valve).
The reactor had three different zones: the preheatiig zone, the catalyst bed zone, and the post
heating zone. The catalyst zone was located in the central 30.5 cm of the reactor. 152 cm of 3
catalyst was loaded in the catalyst zone. Inert a-alumina spheres (0.32 cm) were placed in the
preheating and post heating zones to support the catalyst bed, and to insure efficient distribution of
the liquid and hydrogen. The preheating and the post heating zones volumes were 128.3 and 126.7
cm , respectively. The reactor was heated by a three zone electrical &mace. The temperatures in
the catalyst zone were measured by a traveling thermocouple located within an axial thermowell(O.32
cm O.D.). The reactor operated in the upflow mode to minimize thermal gradients in the catalyst bed
,and to ensure complete wetting of the catalyst. A detailed schematic of the reactor system is
3

746
Table 68: Physical and chemical properties of PR Spring bitumen-derived heavy oil
API Gravity7 "MI Conradson Carbon Residue, wt% Specific Gravity Pour Point, 5 Asphaltenes wt%
Elemental Analvsis
c, wt% y wt% N, wt% s, wt% Ni7 ppm VY PPm As, PPm
WC Atomic Ratio
Simulated Distillation
Volatility, wt% c, - 477 K, wt% 477 - 617 K, wt% 617 - 811 K, wt% >811 K, wt% IBP. K
9.2 16.0
1.005 333 18.1
85.9 10.9 1.06 0.43
72 17
<4
1.5
37.4 0.1 6.2
31.1 62.6 5 14
a Pentane-insolubles
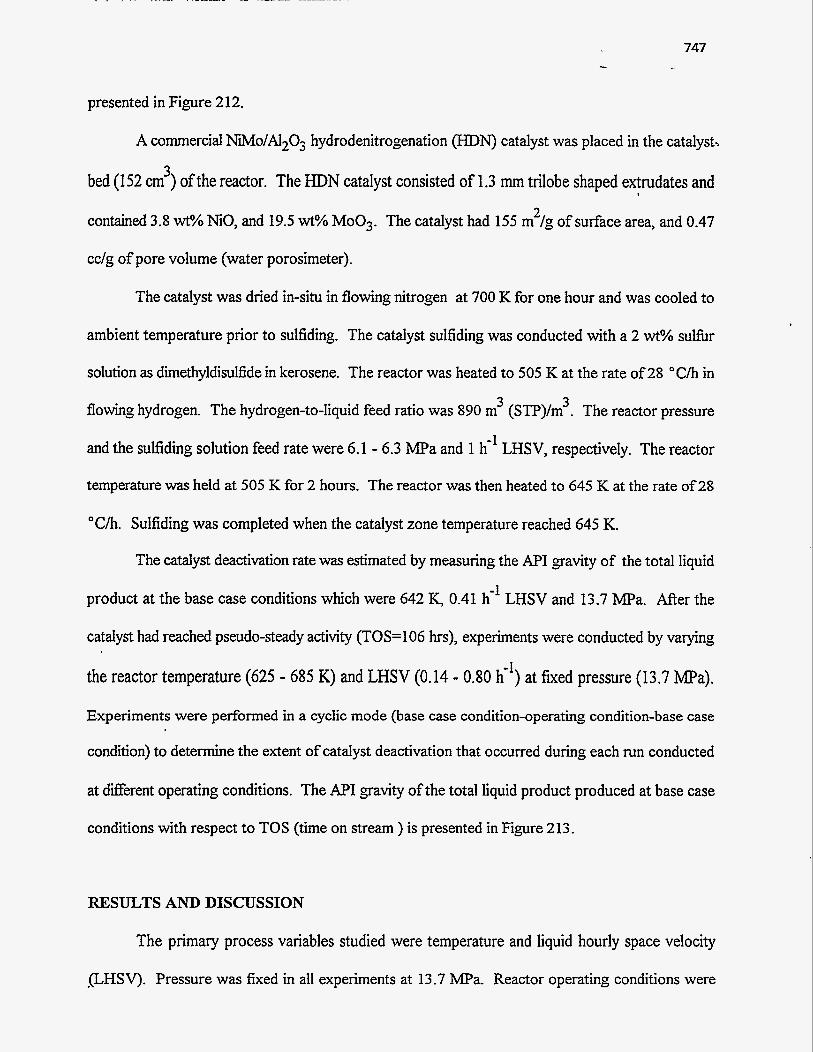
747
presented in Figure 212.
A commercial NM0/A1203 hydrodenitrogenation (HDN) catalyst was placed in the catalyst.
bed (152 cm ) of the reactor. The HDN catalyst consisted of 1.3 m trilobe shaped extrudates and
contained 3.8 wt% NiO, and 19.5 wt% MOO,. The catalyst had 155 m /g of surface area, and 0.47
cc/g of pore volume (water porosimeter).
3
2
The catalyst was dried in-situ in flowing nitrogen at 700 K for one hour and was cooled to
ambient temperature prior to sulfiding. The catalyst sulfiding was conducted with a 2 wt% sulfur
solution as dimethyldisulfide in kerosene. The reactor was heated to 505 K at the rate of 28 "C/h in
flowing hydrogen. The hydrogen-to-liquid feed ratio was 890 m (STP)/m . The reactor pressure
and the sulfiding solution feed rate were 6.1 - 6.3 MPa and 1 h-' LHSV, respectively. The reactor
temperature was held at 505 K for 2 hours. The reactor was then heated to 645 K at the rate of 28
"Ch . Sulfiding was completed when the catalyst zone temperature reached 645 K.
3 3
The catalyst deactivation rate was estimated by measuring the API gravity of the total liquid
product at the base case conditions which were 642 K, 0.41 h-' LHSV and 13.7 m a . After the
catalyst had reached pseudo-steady activity (TOS=106 hrs), experiments were conducted by varying
the reactor temperature (625 - 685 K) and LHSV (0.14 - 0.80 h-I) at fixed pressure (13.7 m a ) .
Experiments were performed in a cyclic mode (base case condition-operating condition-base case
condition) to determine the extent of catalyst deactivation that occurred during each run conducted
at different operating conditions. The API gavity of the total liquid product produced at base case
conditions with respect to TOS (time on stream ) is presented in Figure 213.
RESULTS AND DISCUSSION
The primary process variables studied were temperature and liquid hourly space velocity
[LHSV). Pressure was fixed in all experiments at 13.7 MPa. Reactor operating conditions were

748
22.8 cm
Catalyst
30scm I
Themowell
fl/ Gas Proccc: '
Alumina
Process Tubing Connection
I I Threaded End
Reactor 7
Aluminum Gasket
I I
'ube
Screen Ring
' GIassWool
f Hydrogen I I Liquid Feed
Figure 2 12. Schematic of Reactor.
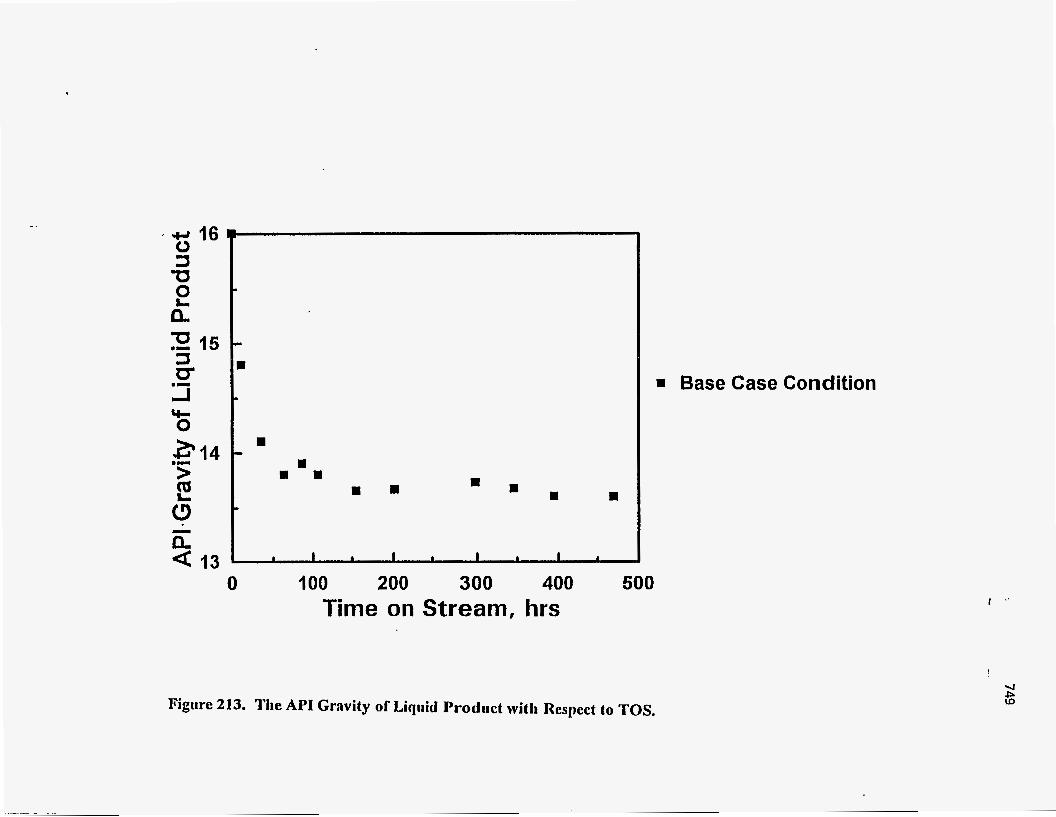
I
0 100 200 300 400 500 Time on Stream, hrs
w Base Case Condition
Figure 213. The API Gravity of Liquid Prodmt with Respect to TOS.
I ( '
! 4 i%
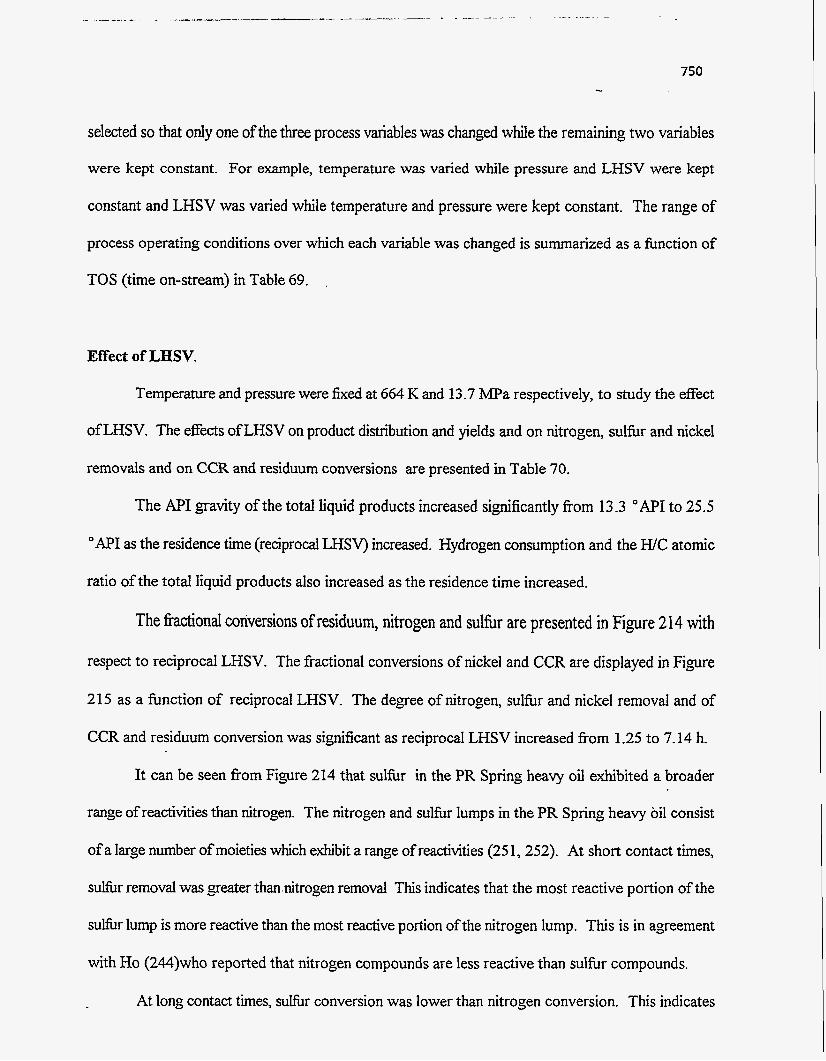
.. .
750 ...
selected so that only one of the three process variables was changed while the remaining two variables
were kept constant. For example, temperature was varied while pressure and LHSV were kept
constant and LHSV was varied while temperature and pressure were kept constant. The range of
process operating conditions over which each variable was changed is summarized as a function of
TOS (time on-stream) in Table 69.
Effect of LHSV.
Temperature and pressure were fixed at 664 K and 13.7 MPa respectively, to study the effect
of LHSV. The effects of LHSV on product distribution and yields and on nitrogen, sulfbr and nickel
removals and on CCR and residuum conversions are presented in Table 70.
The API gravity of the total liquid products increased significantly from 13.3 "API to 25.5
"API as the residence time (reciprocal LHSV) increased. Hydrogen consumption and the W C atomic
ratio of the total liquid products also increased as the residence time increased.
The fractional coriversions of residuum, nitrogen and sulfbr are presented in Figure 214 with
respect to reciprocal LHSV. The fractional conversions of nickel and CCR are displayed in Figure
215 as a function of reciprocal LHSV. The degree of nitrogen, sulfur and nickel removal and of
CCR and residuum conversion was significant as reciprocal LHSV increased fiom 1.25 to 7.14 h.
It can be seen fiom Figure 214 that sulfur in the PR Spring heavy oil exhibited a broader
range of reactivities than nitrogen. The nitrogen and sulfur lumps in the PR Spring heavy oil consist
of a large number of moieties which exhibit a range of reactivities (25 1, 252). At short contact times,
sulfur removal was greater than nitrogen removal This indicates that the most reactive portion of the
sufir lump is more reactive than the most reactive portion of the nitrogen lump. This is in agreement
with Ho (244)who reported that nitrogen compounds are less reactive than sulfur compounds.
At long contact times, sufir conversion was lower than nitrogen conversion. This indicates
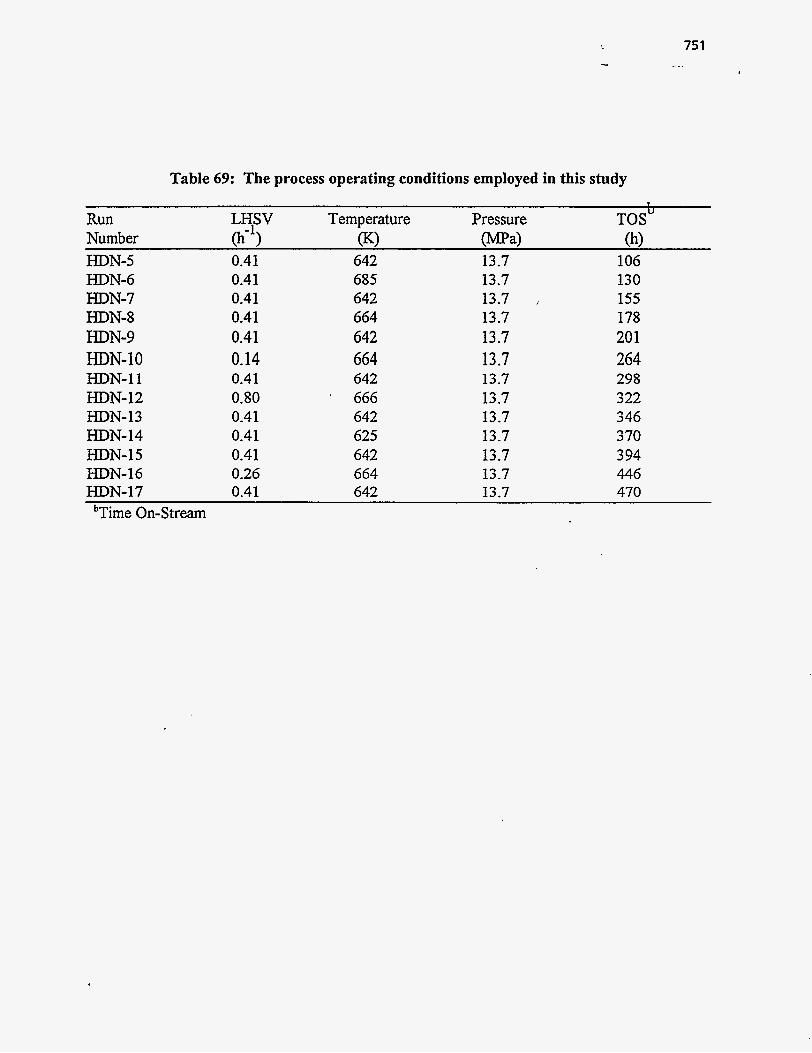
751 . I . .
Table 69: The process operating conditions employed in this study
Run LHSV Temperature Pressure TOS" Number (h-3 6) W a ) (h) HDN-5 HDN-6 HDN-7 HDN-8 HDN-9 HDN-10 HDN-11 HDN-12 HDN- 13 HDN- 1 4 HDN- 1 5 HDN-16
0.41 0.41 0.41 0.41 0.41 0.14 0.41 0.80 0.41 0.41 0.41 0.26
642 685 642 664 642 664 642 666 642 625 642 664
13.7 13.7 13.7 , 13.7 13.7 13.7 13.7 13.7 13.7 13.7 13.7 13.7
106 130 155 178 201 264 298 322 346 3 70 3 94 446
HDN-17 0.41 642 13.7 470 bTime On-Stream
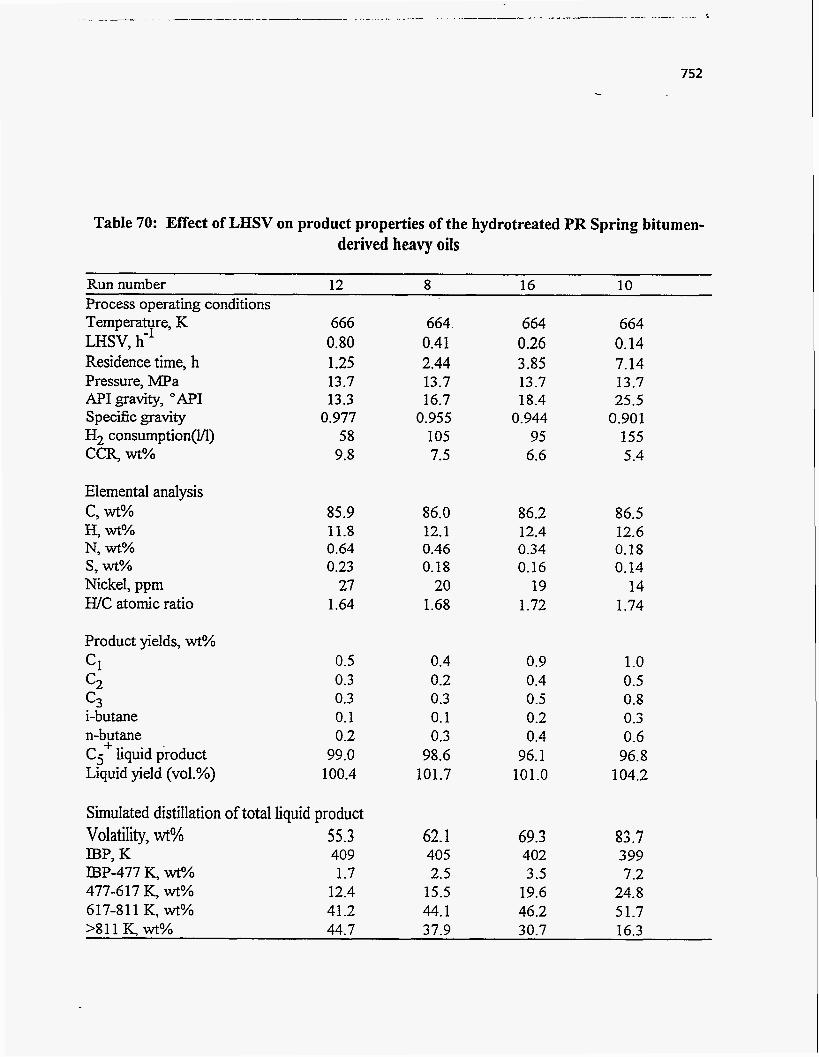
Table 70: Effect of LHSV on product properties of the hydrotreated PR Spring bitumen- derived heavy oils
Run number 12 8 16 10 Process operating conditions Temperature, K LHSV, h-l Residence time, h Pressure, MPa APIgravity, "API Specific gravity HZ consumption(lA) CCR, wt%
Elemental analysis c, wt% y wt% N, wt% s, wt% Nickel, ppm H/C atomic ratio
Product yields, wt% Cl c2 c3 i-butane n-butane C; liquid product Liquid yield (vol.%)
666 0.80 1.25 13.7 13.3
0.977 58
9.8
85.9 11.8 0.64 0.23
27 1.64
0.5 0.3 0.3 0.1 0.2
99.0 100.4
Simulated distillation of total liquid product Volatility, wt% 55.3 IBP, K 409 LBP-477 K, wtY0 1.7 477-6 17 K, wt% 12.4 617-811 K, wt% 41.2 >811 K wt% 44.7
~ ~~~
37.9 30.7 16.3
664 0.41 2.44 13.7 16.7
0.955 105 7.5
86.0 12.1 0.46 0.18
20 1.68
0.4 0.2 0.3 0.1 0.3
98.6 101.7
62.1 405 2.5
15.5 44.1
664 0.26 3.85 13.7 18.4
0.944 95
6.6
86.2 12.4 0.34 0.16
19 1.72
0.9 0.4 0.5 0.2 0.4
96.1 101.0
69.3 402 3.5
19.6 46.2
664 0.14 7.14 13.7 25.5
0.901 155 5.4
86.5 12.6 0.18 0.14
14 1.74
1 .o 0.5 0.8 0.3 0.6 96.8
104.2
83.7 3 99 7.2
24.8 51.7
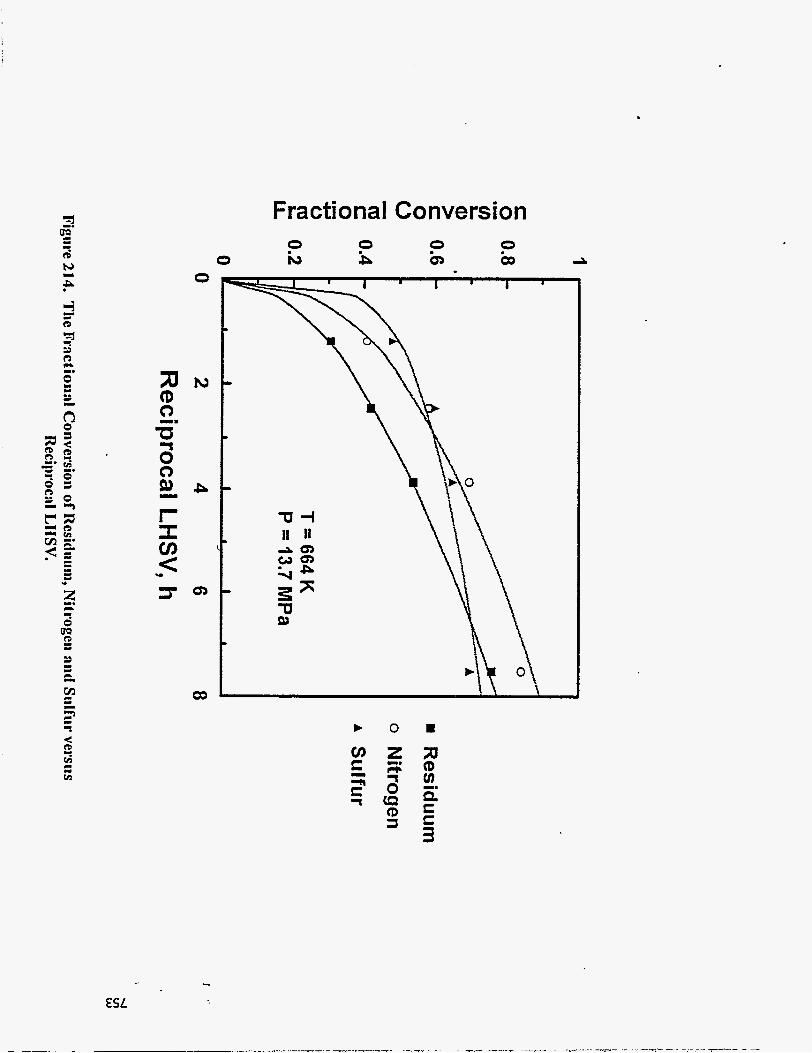
Z -. cc a 2 L
0 0
N
P
Q)
W
Fractional Conversion 0 i*,
0 b
0 in A
ESL
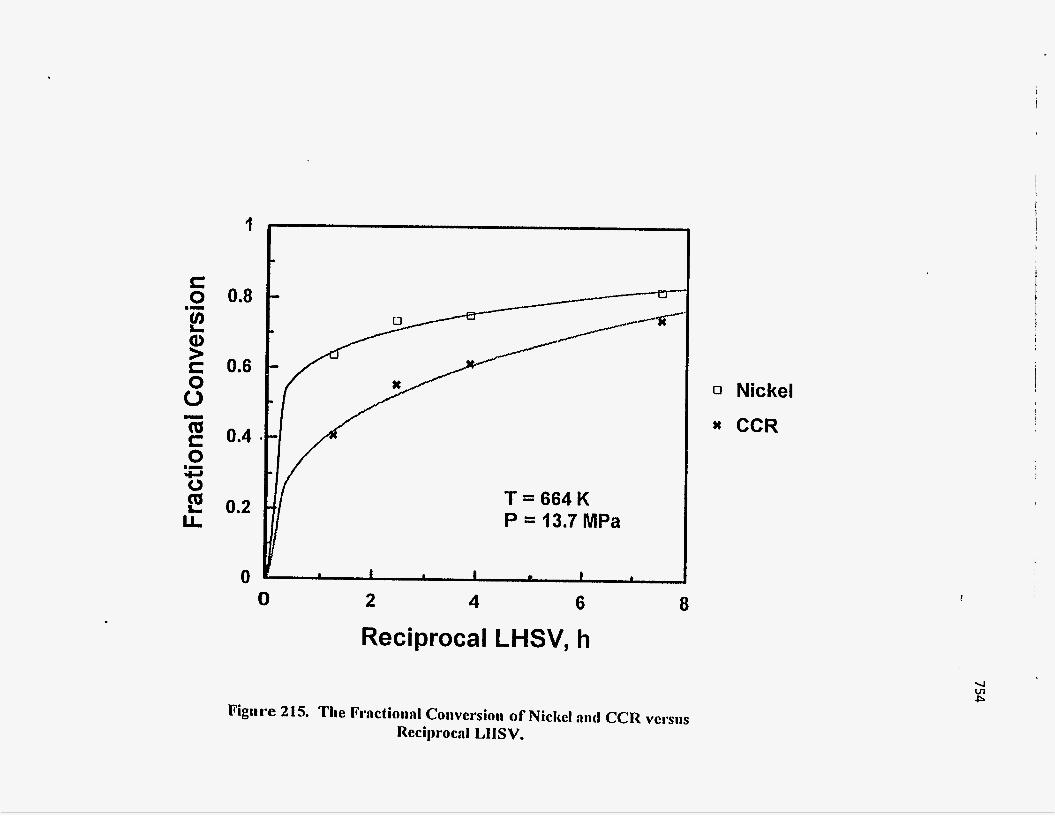
1
0.8
0.6
0.4
0.2
0 0
I T = 664 K P = 13.7 MPa
1 I * I I 1
2 4 6
Reciprocal LHSV, h 8
Figure 215. The Fractional Conversion of Nickel and CCR VCI'SIIS
Reciprocal LIISV.
0 Nickel CCR
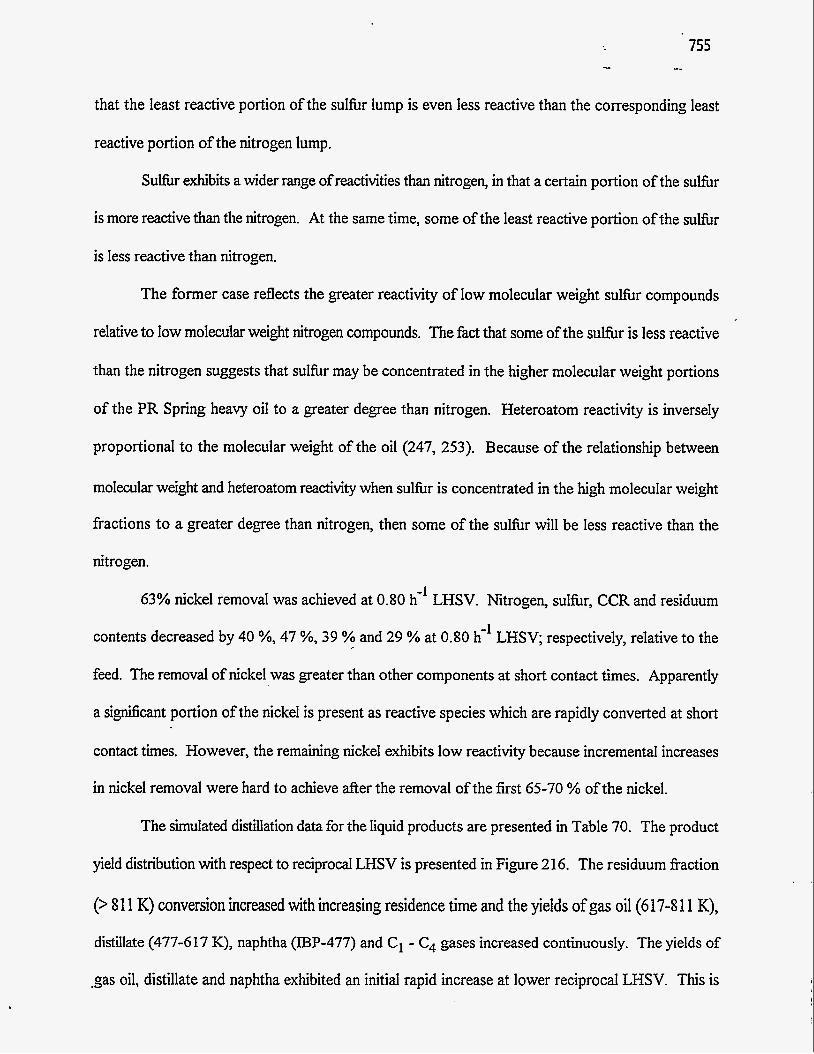
755 -
that the least reactive portion of the sulfur lump is even less reactive than the correspondin,o least
reactive portion of the nitrogen lump.
Sulfbr exhibits a wider range of reactivities than nitrogen, in that a certain portion of the sulfur
is more reactive than the nitrogen. At the same time, some of the least reactive portion of the sulfur
is less reactive than nitrogen.
The former case reflects the greater reactivity of low molecular weight sulfur compounds
relative to low molecular weight nitrogen compounds. The fact that some of the sulfur is less reactive
than the nitrogen suggests that sulfur may be concentrated in the higher molecular weight portions
of the PR Spring heavy oil to a greater degree than nitrogen. Heteroatom reactivity is inversely
proportional to the molecular weight of the oil (247, 253). Because of the relationship between
molecular weight and heteroatom reactivity when sulfur is concentrated in the high molecular weight
fractions to a greater degree than nitrogen, then some of the sulfur will be less reactive than the
nitrogen.
63% nickel removal was achieved at 0.80 h-' LHSV. Nitrogen, sulfur, CCR and residuum
contents decreased by 40 %, 47 %, 39 % and 29 % at 0.80 h-' LHSV; respectively, relative to the
feed. The removal of nickel was greater than other components at short contact times. Apparently
a sipficant portion of the nickel is present as reactive species which are rapidly converted at short
contact times. However, the remaining nickel exhibits low reactivity because incremental increases
in nickel removal were hard to achieve after the removal of the first 65-70 % of the nickel.
The simulated distillation data for the liquid products are presented in Table 70. The product
yield distribution with respect to reciprocal LHSV is presented in Figure 216. The residuum fraction
(> 81 1 K) conversion increased with increasing residence time and the yields of gas oil (617-8 11 K),
distillate (477-617 K), naphtha (IBP-477) and C , - C, gases increased continuously. The yields of
.gas oil, distillate and naphtha exhibited an initial rapid increase at lower reciprocal LHSV. This is
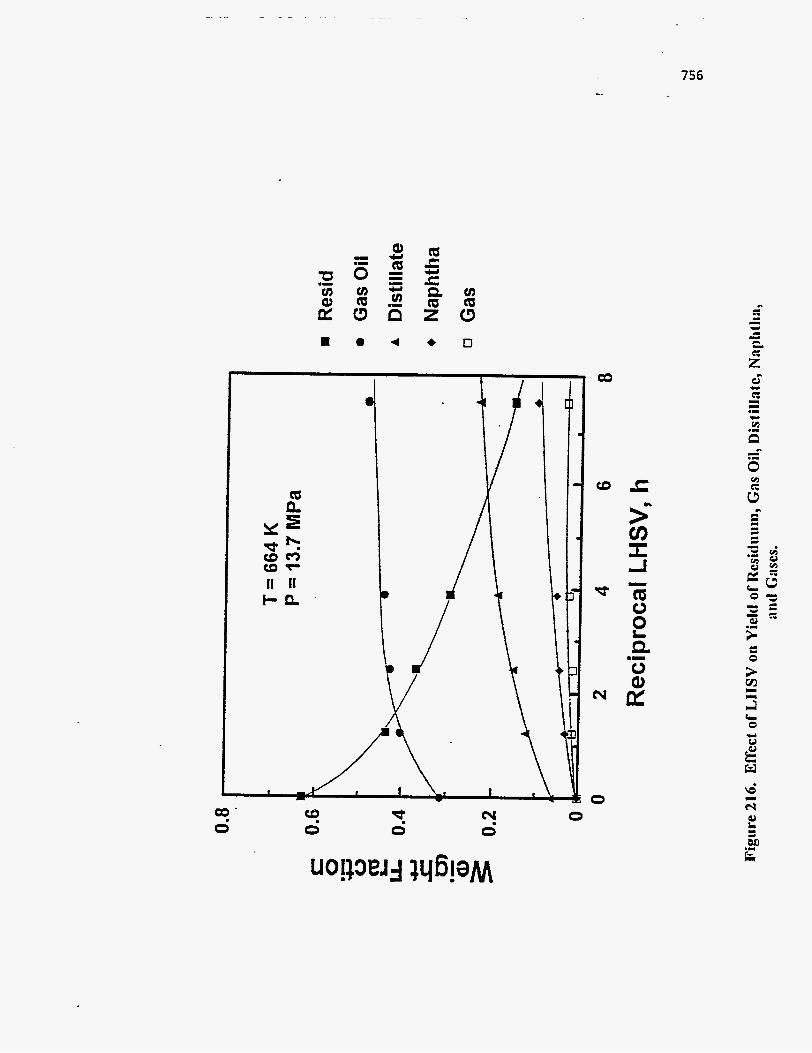
756
v)
d
Q 3 ’ 0
co
CD
N
0 CB 0
s 0
cv 0
0

757 ...
attributed to the rapid conversion of native residuum into volatile fractions. After the initial rapid
increase of gas oil, a slow increase of gas oil yield was observed. This indicates that some portion
of the gas oil produced fiom residuum conversion converted to lighter fractions at higher reciprocal
LHSV (254).
Effect of Temperature
The influence of temperature was determined by varying the reactor temperature at fixed
pressure (13.7 MPa) and liquid hourly space velocity (0.41 h-'). The effects of temperature on
product distribution and yields and on nitrogen, sulfir and nickel removals and on CCR and residuum
conversions are presented in Table 7 1.
The increase in reaction temperature resulted in a significant increase in the MI gravity of the
total liquid product relative to the native bitumen. It also led to an increase in hydrogen consumption
and in the WC atomic ratio of the total liquid product.
The extents of nitrogen, sulfur and residuum removal with respect to temperature are
presented in Figure 217. The fractional conversions of nickel and CCR are presented in Figure 218
with respect to temperature. Increasing temperature resulted in increased nitrogen, sulfur and nickel
removals as well as increased CCR and residuum conversions over the HDN catalyst. The degree
of su&r removal was lower than residuum conversion and nitrogen removal at higher temperature.
This again indicates that a certain portion of the sulfur exhibits a low reacti~ty. The degree of
nitrogen and sulfur removal was higher than residuum conversion at low temperatures. The extent
of nickel removal was greater than CCR conversion in all cases. Nickel removal was high at low
temperatures and remained high throughout the temperature range.
A majority of nitrogen and sulfur moieties are distributed in the less reactive fractions such
as resins and asphaltenes (239,255, 256). Nitrogen removal was higher than residuum conversion
,within the entire range of temperature and indicated that the HDN catalyst exhibited more activity
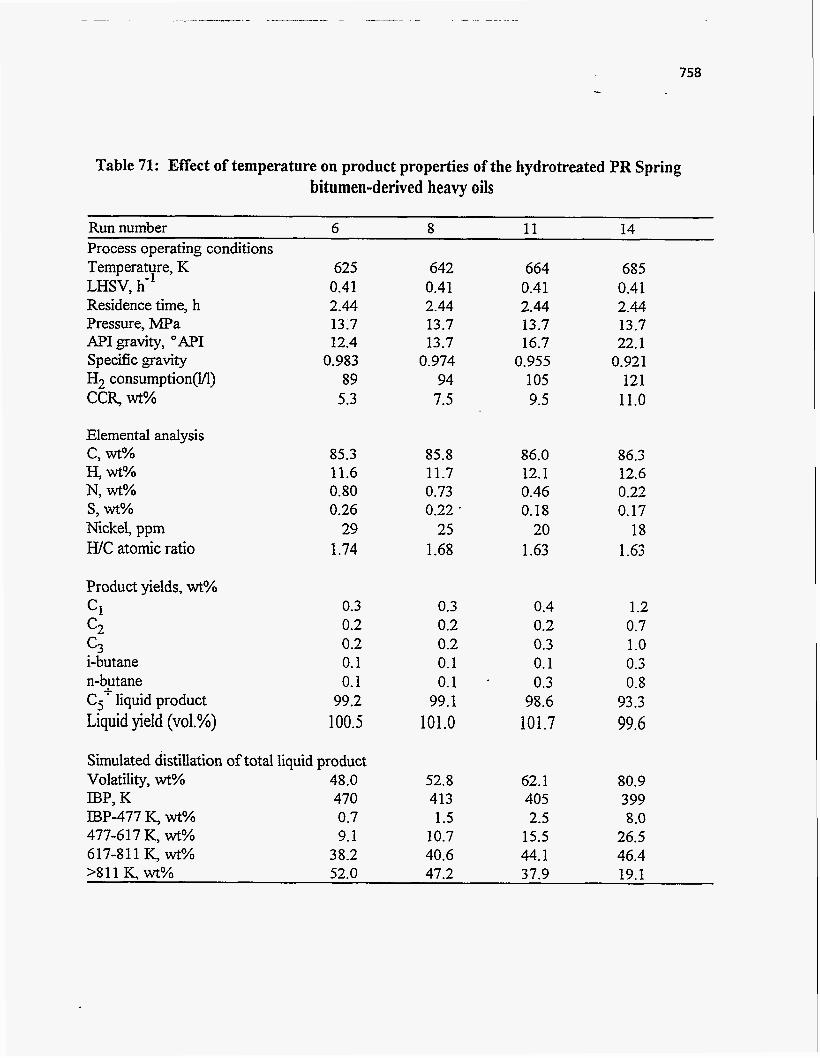
758
Table 71: Effect of temperature on product properties of the hydrotreated PR Spring bitumen-derived heavy oils
Run number 6 8 11 14 Process operating conditions Temperature, K LHSV, h-' Residence time, h Pressure, MPa APIgravity, "API Specific gravity H2 consumption(l/l) CCR, wt%
Elemental analysis c, wt% H, wt% N, wt% s, wt% Nickel, ppm WC atomic ratio
Product yields, wt% Cl c2 c3 i-butane n-butane C j+ liquid product Liquid yield (vel.%)
625 0.41 2.44 13.7 12.4
0.983 89 5.3
85.3 11.6 0.80 0.26
29 1.74
0.3 0.2 0.2 0.1 0.1
99.2 100.5
Simulated distillation of total liquid product Volatility, wt% 48.0 IBP, K 470 IBP-477 K, wt% 0.7 477-617 K, wt% 9.1 617-811 K, WYO 38.2
642 0.41 2.44 13.7 13.7
0.974 94
7.5
85.8 11.7 0.73 0.22 .
25 1.68
0.3 0.2 0.2 0.1 0.1
99.1 101.0
52.8 413 1.5
10.7 40.6
664 0.41 2.44 13.7 16.7
0.955 105 9.5
86.0 12.1 0.46 0.18
20 1.63
0.4 0.2 0.3 0.1 0.3
98.6 101.7
62.1 405 2.5
15.5 44.1
685 0.41 2.44 13.7 22.1
0.921 121
11.0
86.3 12.6 0.22 0.17
18 1.63
1.2 0.7 1 .o 0.3 0.8
93.3 99.6
80.9 3 99 8.0
26.5 46.4
>811 K, wt% 52.0 47.2 37.9 19.1
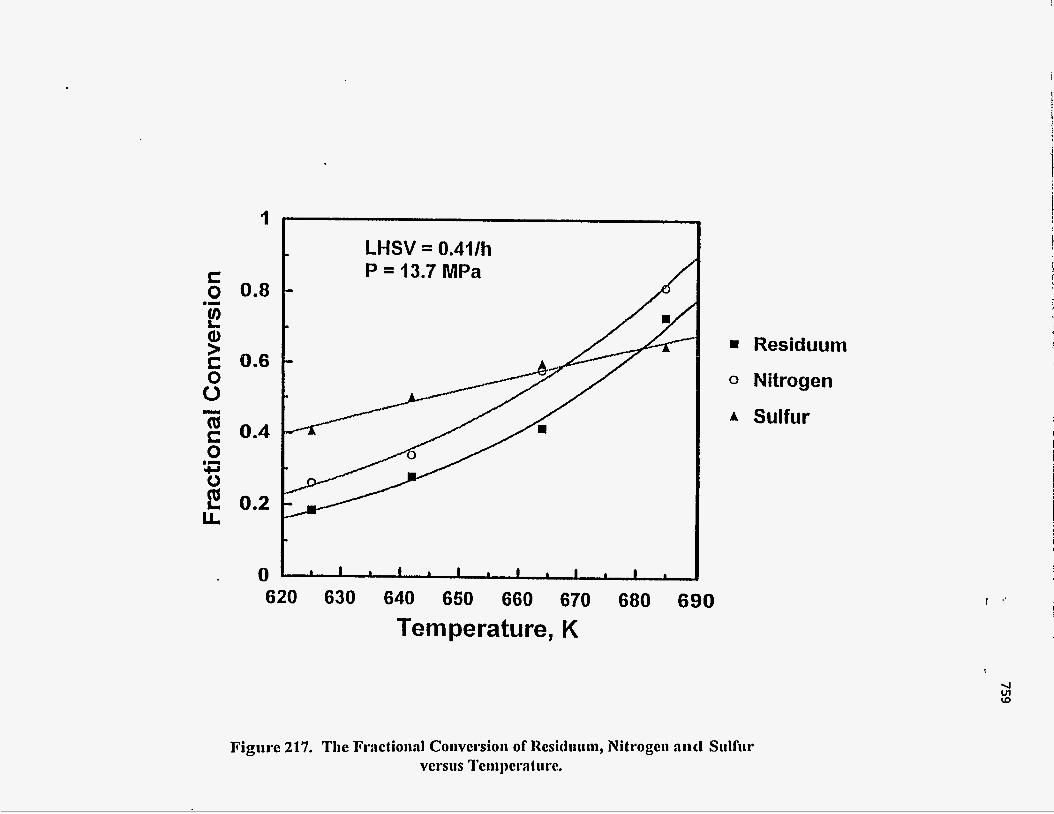
I LHSV = 0.41/h P = 13.7 MPa
0.8
8.6
0.4
0.2
0 ' b I b 1 1 1 1 I b I 1 I b
620 630 640 650 660 670 680 690 Temperature, K
= Residuum
0 Nitrogen
A Sulfur
I '.
Figure 217. Tlic Fr:rctionaI Conversion of Residuum, Nitrogen and Sulfur vers~is ?'eml)erntiire.
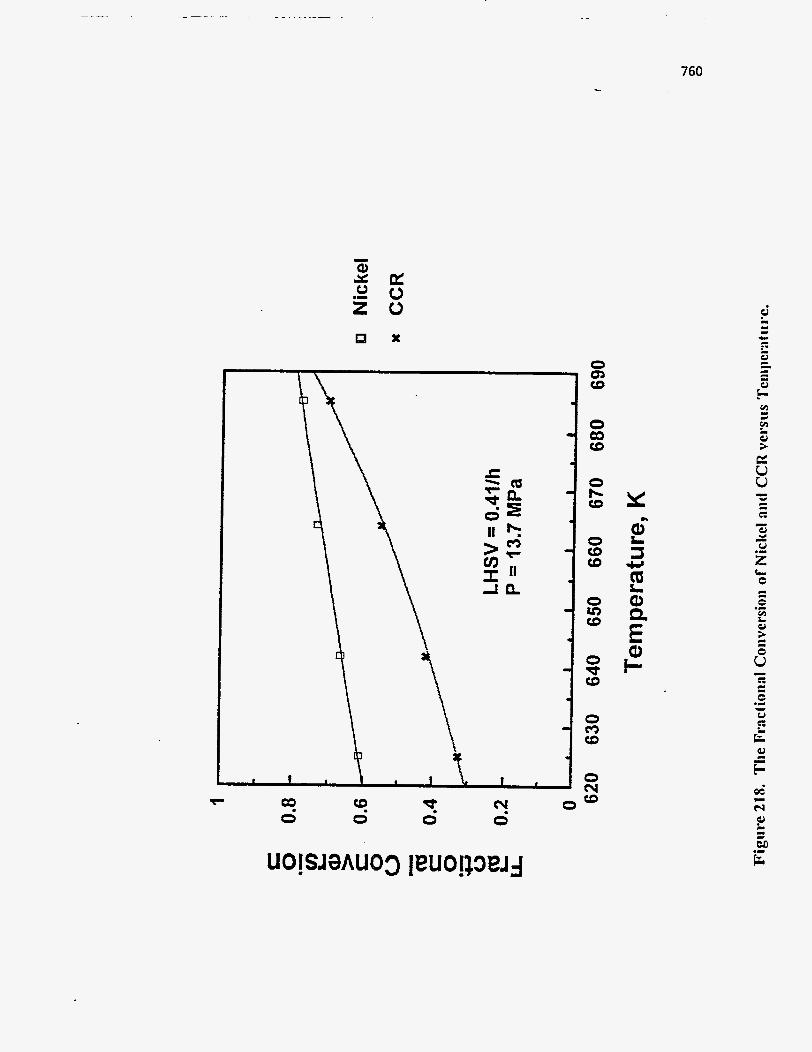
. . . . . - -
760
x
Q3 0
W 0
-? 0
0 4 0
0 aa W
0 co (D
0 r- W
0 W (D
0 v ) W
C u u - " c I
c

for nitrogen removal than it did for residuum conversion. Residuum conversion increased by 50%
as the reaction temperature increased fiom 664 to 685 K. Nitrogen removal also increased by 52%.
Sulfur, nickel and CCR contents decreased by 5%, 10% and 38%, respectively, over the same
temperature range.
The simulated distribution data for the liquid products are presented in Table 71 with respect
to temperature. The product yield distribution is presented in Figure 219 with respect to temperature.
Residuum was significantly converted to volatiles at higher temperatures. The yield of distillate,
naphtha and gas increased rapidly at higher temperatures. It is presumed that parSnic side chains
and paraffinic bridges exposed to acidic sites were rapidly cracked into volatile products and into
lower molecular weight residuum at low temperatures. As temperature increased thermal conversion
of residuum became more important (257). The yield of gas oil passed through a broad maximum
at about 670 K, indicating that gas oil produced fiom residuum conversion underwent secondary .
cracking to yield lower molecular weight volatile products. This is in agreement with Mosby et al.
(25 1) who proposed that gas oil produced fiom resid recracks to lighter products.
SUMMARY AND CONCLUSIONS
The degree of nitrogen removal substantially increased with increasing temperature at a fixed
residence time and with increased residence time at a fixed temperature over the commercial HDN
catalyst whereas sulhr removal increased uniformly. Nickel removal was high at mild conditions.
Only modest increases in nickel removal were observed with increasing severity. Residuum rapidly
converted into volatiles at low contact times. The degree of residuum conversion increased with
increasing temperature because of increased thermal cracking of residuum. CCR was also reduced
with increasing temperature and residence time.
Molecular weight reduction was significant during upgrading of bitumen-derived heavy oils.
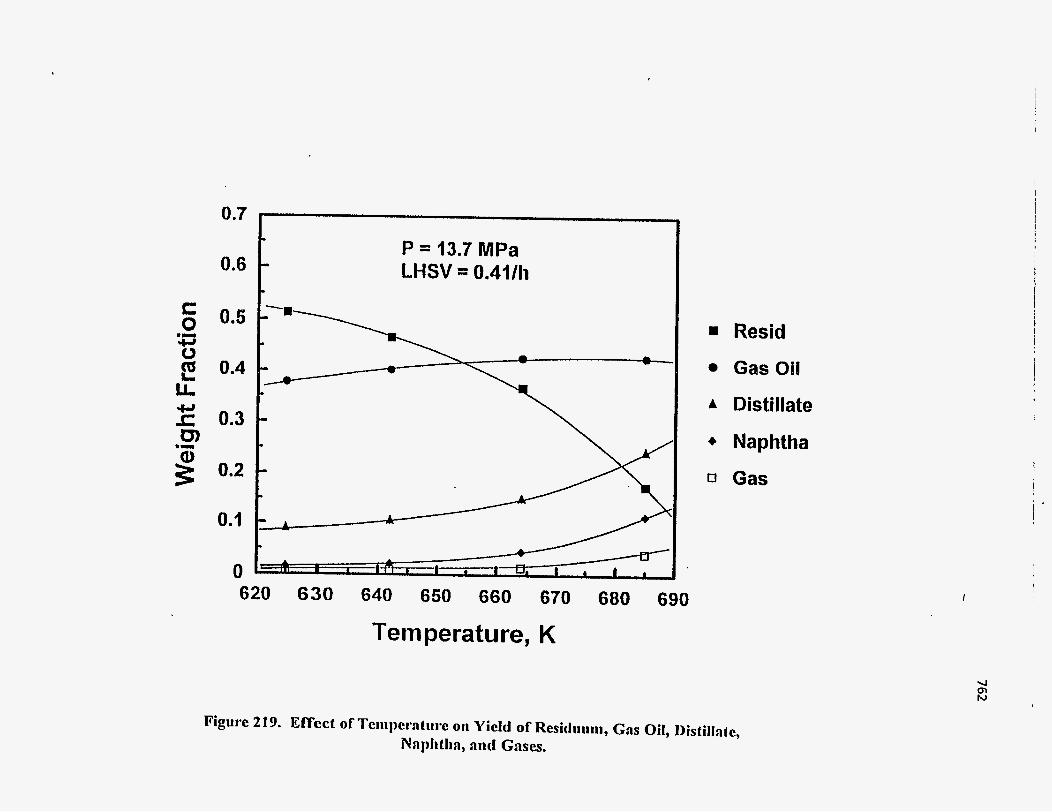
0.6
0.5
0.4
0.3
0.2
0.1
0
P = 13.7 MPa LHSV = 0.41/h
620 630 640 650 660 670 680 690
Temperature, K
Resid
GasOil
A Distillate
+ Naphtha
0 Gas
Figure 219. Effect of Teml)eratei*e 0 1 1 Yield of Resitluem, Gas Oil, Distillate, Naplitlia, and Gases.

763 c -.
The yield of gas oil, distillate and Zaphtha rapidly increased at lower reciprocal LHSV. The yield of
distillate, naphtha and light gases increased substantially at higher temperature because of increased
thermal cracking.
764
UINTA BASIN BITUMEN HYDROTREATING: Thermal Conversion of PR Spring Bitumen-Derived
Heavy Oil in the Presence of Na/Alumina
Principal Investigator: Postdoctoral Fellow: Graduate Student:
Francis V. Hanson D.C. Longstaff J. Kim
INTRODUCTION
Heavy oils and bitumens have low H/C atomic ratios and contain significant residuum
fractions (> 81 1 K) relative to conventional petroleum. The molecular weight and boiling range
distributions of these heavy oils and bitumens must be reduced by hydrogen addition and/or
carbon rejection before integration into refining feed states.
Mosby et al. (254) and Heck et al. (236) have reported that residuum conversion proceeds
primarily via a thermal pathway and that catalysts used to hydrotreat heavy oils promote sulfur,
nitrogen and metal removal and aromatics saturation. Several researchers (239, 258, 259)
reported that light oil fractions are selectively formed during thermal cracking, even during
catalytic hydroprocessing. Product distributions and yields and the chemical and physical property
changes associated with the processing of the PR Spring bitumen-derived heavy oil over
hydrodenitrogenation (HDN) and hydrodemetallation (HDM) catalysts have been reported (243).
Reactions catalyzed by these HDN and HDM catalysts competed with noncatalytic thermal
reactions which produced reactive free radicals by breaking C-C, C-H and C-heteroatom bonds
(260). Thermal reactions have been reported to be more important than catalytic reactions at
higher temperatures (261) due to the high activation energies for thermal cracking. However,
the importance of thermal reactions can be most easily delineated in the absence of catalytic
reactions.
765 -.
A 2 wt% sodium-impregnated hydrodenitrogenation catalyst support was used to
investigate thermal reactions which occur during hydrotreating. The sodium-impregnated catalyst
support was presumed to have little or no Br4nsted acidity as indicated by the alpha test (262,
263) used to determine the degree of acidity. Mild hydrocracking (MHC); defined as the
conversion of the residuum fraction of bitumen into distillate fractions, was achieved under the
process conditions used in this study. Gas oil, distillate, naphtha, and gases were produced during
mild hydrocracking of the bitumen-derived heavy oil.
The bitumen used in this investigation was extracted from the oil sands ore from the U-tar
pit (SE 1/4 NE 1/4, Section 5, Township 16 South, Range 24 East) on the PR Spring oil sands
deposit in the Uinta Basin of eastern Utah. The oil sand ore was mined, crushed and sieved to
yield the desired distribution of sand particles (< dp=0.64 cm) for solvent extraction.
The objective of this study was to determine the extent of thermal reactions in heteroatom
and metal removal and Conradson carbon residue and residuum conversion as a function of
process variables. The process variables investigated were reactor temperature (642-683 K) and
space velocity (0.25-0.74 h-') at fixed reactor pressure (13.7 m a ) .
EXPERIMENTAL
The hydrotreater feedstocks used in this study were the bitumen-derived heavy oils
exmcted from the PR Spring oil sands by refluxing with toluene in a Dean-Stark apparatus. The
toluenehiturnen solutions were distilled in a rotary evaporator to concentrate the oil. The residual
6-8wt% toluene in the rotoevaporated solution was removed by vacuum batch distillation.
Simulated distillation analyses indicated that the final heavy oil feedstock contained less than 0.1
wt% toluene. Selected physical and chemical properties of the bitumen-derived heavy oil used
in this study are presented in Table 72.

766
Table 72 Physical and chemical properties of PR Spring Bitumen-derived heavy oiI
9.2 API Gravity Conradson Carbon Residue, wt% 16.0
Elemental Analvsis
c, wt% H, wt% N, wt% s, wt% Ni, ppm
W C Atomic Ratio
85.9 10.9 1.06 0.43
72
1.51
Simulated Distillation
Volatility, wt% 37.4 c5 - 477 y wt% 0.1 477 - 617 K, wt% 6.2 617 - 811 K, wt% 31.1 >811 K, wt% 62.6 IBP, K 5 14
767
in this study are presented in Table 72.
Thermal hydrocracking runs were conducted in a futed-bed reactor which was operated in
the upflow mode to maintain isothermal conditions and to ensure complete wetting of the catalyst
support. The liquid and gas products from the reactor flowed into a high pressure vapor-liquid
separator. The gas product was withdrawn from the separator through a back pressure regulating
valve (BPRV) which also controlled the system pressure. The liquid product was removed from
the separator through a liquid level control valve (Annin valve).
The reactor consisted of three distinct zones: the preheating zone, the catalyst bed zone,
and the post heating zone. The reactor was independently heated by a three zone electrical furnace
3 to facilitate isothermal operation of the catalyst zone. The catalyst zone consisted of 152 cm of
catalyst in the central 30.5 cm of the reactor. Inert a-alumina spheres (0.32 cm) were placed in
the preheating and post heating zones to support the catalyst bed and to provide efficient liquid
contacting with hydrogen. The temperatures in the catalyst zone were measured by a movable
thermocouple in an axial thermowell. A schematic of the reactor system is presented in Figure
220.
-
Sodium-impregnated alumina was used to approximate the same reactor hydrodynamics
as was obtained with the HDN catalyst. The alumina was impregnated with sodium to moderate
its Br4nsted acidity (264). Pines (264) has reported that alumina, containing 0.08 % K+ was
significantly inhibited in its ability to skeletally isomerize cyclohexane which proceeds by a
cationic mechanism (Br$nsted acidity). Sodium-exchanged alumina is unreactive for skeletal
isomerization of butenes at 811 K (265). The catalyst support consisted of 1.3 mm trilobe shaped
alumina extrudates The catalyst support had a surface area of 255 m2/g and a pore volume of
'0.74 cc/g. The 2 wt% sodium-impregnated alumina was prepared by impregnating the catalyst

4- Ve 11 t
8- L i q u id -Va po r
Separator
-I Back Pressure Reg 11 la t o r
0 Anniri Valve
Low Pressure Liquid Collector
* '. \'\' \
\ \
\'\. \ \ -L \ \
0 , \ \
\ \
\ \ '. \ / r
\'\*
2 3 Pump
I
,
F i gurc 220. Sclieiiia(ic of (lie liytl~.oLre:rIcr s y s l c ~ i ~ .
activity was measured using the alpha test (263). The a-activity of a catalyst is a measure of its
cracking activity relative to a standard silica-alumina catalyst (260,261). The alpha numbers of
the sodium-impregnated alumina catalyst support and the unimpregnated catalyst support were 0.3
and 0.8; respectively. The lower a-activity of the sodium-impregnated alumina relative to the
unimpregnated alumina indicated that the sodium had been effective in eliminating the Br4nsted
acidity of the alumina.
The catalyst deactivation rate was estimated by monitoring the API gravity of the
hydroprocessed liquid product with time at the base case conditions which were 642 K, 0.73 h-'
WHSV and 13.7 MPa. After the catalyst had reached a pseudo-steady state activity, experiments
were conducted by varying the reactor temperature (642 - 683 K) and WHSV (0.25 - 0.74 h-')
at fixed pressure (13.7 m a ) . The experimental procedures have been described in detail
elsewhere (264).
RESULTS AND DISCUSSION
Reactor operating conditions were selected so that only one of the two process variables
was varied while the other variable was kept constant; Le. temperature was varied while WHSV
was kept constant and WHSV was varied while temperature was kept constant. The range of
process operating conditions over which each variable was changed is summarized as a function
of time-on-stream in Table 73.
Effect of WHSV
The effects of space velocity (WHSV) on nitrogen, sulfur and nickel removal and on CCR
and residuum conversion were studied by varying the WHSV (0.25-0.74 h-') at a fixed
temperature (664 K) and pressure (13.7 MPa) and are presented in Table 74.
The API gravity of the total liquid products increased from 11.7 EAPI to 13.7 EAPI as

770
TabIe 73 The process operating conditions employed in this study
Run WHSV Temperature Pressure TOSb Number (h-1) W a ) (h) TH-4 0.73 642 13.7 48 TH-5 0.75 683 13.7 70
TH-7 0.74 664 13.7 117 TH-8 0.73 642 13.7 142
TH-10 0.73 642 13.7 250 TH-11 0.43 665 13.7 287 TH-12 0.73 664 13.7 3 14
TH-6 0.73 642 13.7 93
TH-9 0.25 665 13.7 190
b T i e On Stream
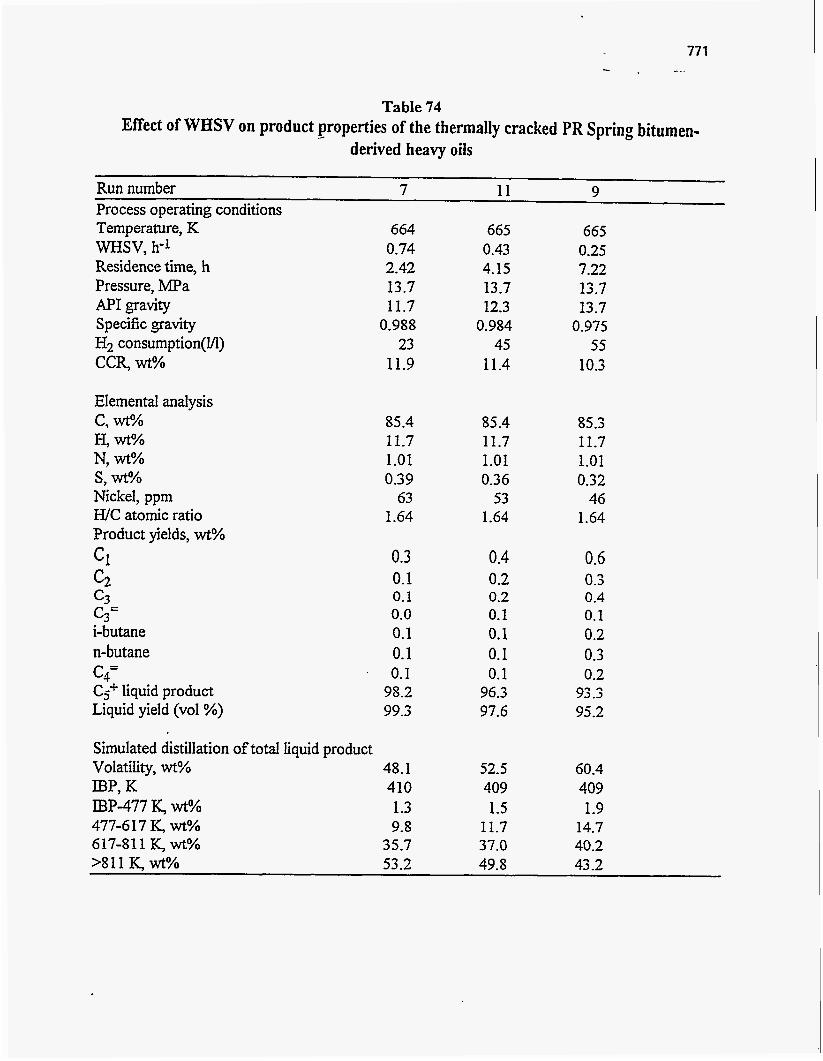
Table 74 Effect of WHSV on product properties of the thermally cracked PR Spring bitumen-
derived heavy oiIs /
Run number 7 11 9 Process operating conditions TemperaGre, K - WHSV, h-1 Residence time, h Pressure, MPa MI gravity Specific gravity H2 consumption(yl) CCR, wt%
Elemental analysis c, wt% H, wt% N, wt% s, WYO Nickel, ppm W C atomic ratio Product yields, wt%
C1 c2 c3 c3= i-butane n- but ane Cq= C,-+ liquid product Liquid yield (~01%)
664 0.74 2.42 13.7 11.7
0.988 23
11.9
85.4 11.7 1.01 0.39
63 1.64
0.3 0.1 0.1 0.0 0.1 0.1 0.1
98.2 99.3
Simulated distillation of total liquid product Volatility, wt% 48.1 IBP, K 410 IBP-477 K, wt% 1.3 477-617 K, wt% 9.8 617-811 K, wt% 35.7 >811 K wt% 53 2
665 0.43 4.15 13.7 12.3
0.984 45
11.4
85.4 11.7 1.01 0.36
53 1.64
0.4 0.2 0.2 0.1 0.1 0.1 0.1
96.3 97.6
52.5 409 1.5
11.7 37.0 49.8
665 0.25 7.22 13.7 13.7
0.975 55
10.3
85.3 11.7 1.01 0.32
46 1.64
0.6 0.3 0.4 0.1 0.2 0.3 0.2
93.3 95.2
60.4 409 1.9
14.7 40.2 43.2

772 -
WHSV decreased from 0.74 to 0.25 h-l. This increase is low and is attributed to thermal
reactions in the absence of a catalytically active species on the sodium-impregnated alumina.
Higher increases in the API gravities have been observed at similar conditions in the presence of
HDN catalysts [6,15]. Hydrogen consumption increased from 23 to 55 1/1 as the WHSV
decreased from 0.74 to 0.25 h-l. This was not accompanied by an increase in the H/C ratio of
the liquid product. Presumably this is due to the lack of a hydrogenation function on the sodium-
impregnated alumina.
The fractional conversions of residuum, nitrogen and sulfur and of nickel and CCR are
plotted with respect to reciprocal WHSV in Figures 221 and 222, respectively. The extent of
nitrogen, sulfur and nickel removal and of CCR and residuum conversion increased as the WHSV
decreased from 0.74 to 0.25 h-l. The extent of residuum conversion over the sodium-impregnated
catalyst support was greater in all cases relative to nitrogen and sulfur removal. This reflects the
greater importance that thermal reaction pathways play in residuum conversion relative to
heteroatom removal. The extent of nitrogen removal over the sodium-impregnated catalyst
support was lower than that of all other classes of compound-types investigated (ie, sulfur, metals,
CCR and residuum). CCR conversion exceeded residuum conversion and metal and heteroatom
removal at all conditions. However, CCR conversion appears to have been approaching a limiting
value, beyond which further CCR conversion would have been difficult to achieve.
Some researchers (236, 254, 258, 259) have reported that the presence of a catalyst does
not affect residuum conversion and that residuum conversion occurs primarily via thermal reaction
pathways. The fact that the sodium-impregnated catalyst support did not contain any impregnated,
sulfided metals explains why residuum conversion was greater than nitrogen and sulfur removal.
Sulfur removal, 26 wt%, O C C U K ~ at 0.25 h-' WHSV and 665 K. Khorasheh et al.(261) reported
that the observed sulfur removal from bitumen-derived coker gas oil was accomplished due to
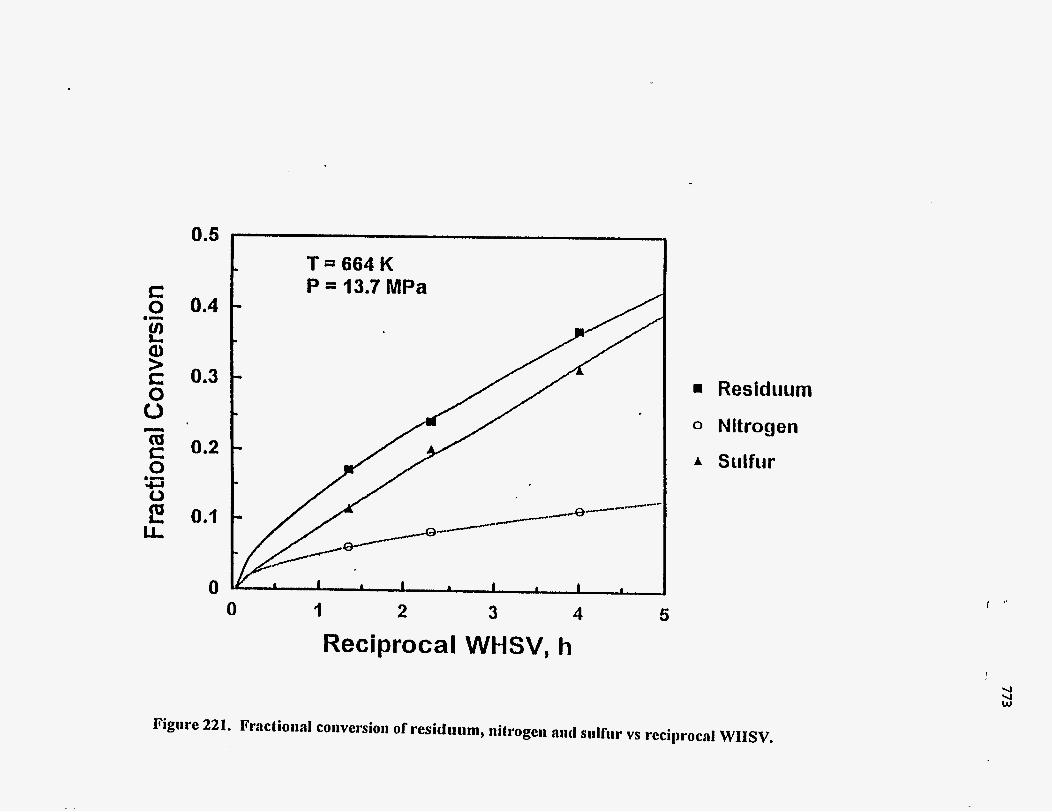
0.5
0.4
0.3
0.2
0.1
0 0
T a 6 6 4 K P = 13.7 MPa
I 2 3 4 Reciprocal WHSV. h
5
n
0
A
Res id 11 11 m Nitrogen
S til fu r
I
U U w
Figure 221. Fractional conversioa of residuum, nitrogen m t l srdftilr vs recilwocnl WIISV.

0.5
0.4
0.3
0.2
0.1
0 0 I 2 3 4
Reciprocal WHSV, h
0 Nickel
0 CCR
5
Figure 222. Fractional conversion of nickel and CCR vs reciprocal WIISV.
thermal reactions in the absence of either catalyst or catalyst support. Gray et al.(266)] also
proposed that small amounts of sulfur compounds in vacuum residua may be converted by thermal
reactions. Aliphatic and cyclic sulfides have been reported to be present in bitumens (267, 268)
and may be present in the PR Spring bitumen-derived heavy oil. These saturated sulfides may
undergo thermal C-S bond hydrogenolysis in the absence of hydrogenation and/or hydrogenolysis
activity. The presence of species is inferred from the detection of saturated sulfur in Athabasca
bitumens by Gray et al.(266,267) and Asaoka, et al. (268) and the naphthenic nature of the Uinta
Basin bitumens. Thus, the sulfur conversion was attributed to thermal conversion of saturated
sulfur in PR Spring bitumen-derived heavy oil. Furthermore, some aromatic sulfur compounds
may undergo direct C-S bond scission without aromatic ring hydrogenation (269).
The observed nitrogen conversion was unexpected because it is generally accepted that
there is no aliphatic nitrogen in petroleum. Since the majority of sulfur and nitrogen in PR Spring
bitumenderived heavy oils is aromatic or bound to aromatic carbon, the absence of impregnated
metal sulfides on the alumina severely limits the degree of nitrogen and sulfur removal. In
contrast to nitrogen and sulfur removal it is expected that deep residuum conversion is possible
by thermal reactions alone. Thermal conversion of residuum is so prominent that catalytic
residuum conversion is difficult to observe even in the presence of a catalyst (236, 254). For that
reason the absence of catalytically active metal sulfides affected nitrogen and sulfur removal to
a greater degree than residuum conversion.
Although the sodium-impregnated alumina was not impregnated with metal components,
some nickel removal (36 wt%) was detected at 0.25 h-' WHSV and 665 K. This agreed with a
previous report (270) that metal removal may occur under thermal hydroprocessing conditions.
Takeuchi et al.(270) tested the catalytic activity of nickel and vanadium deposited on a metal-free
'alumina base. The activity for metal removal changed with the extent of metal deposition. The
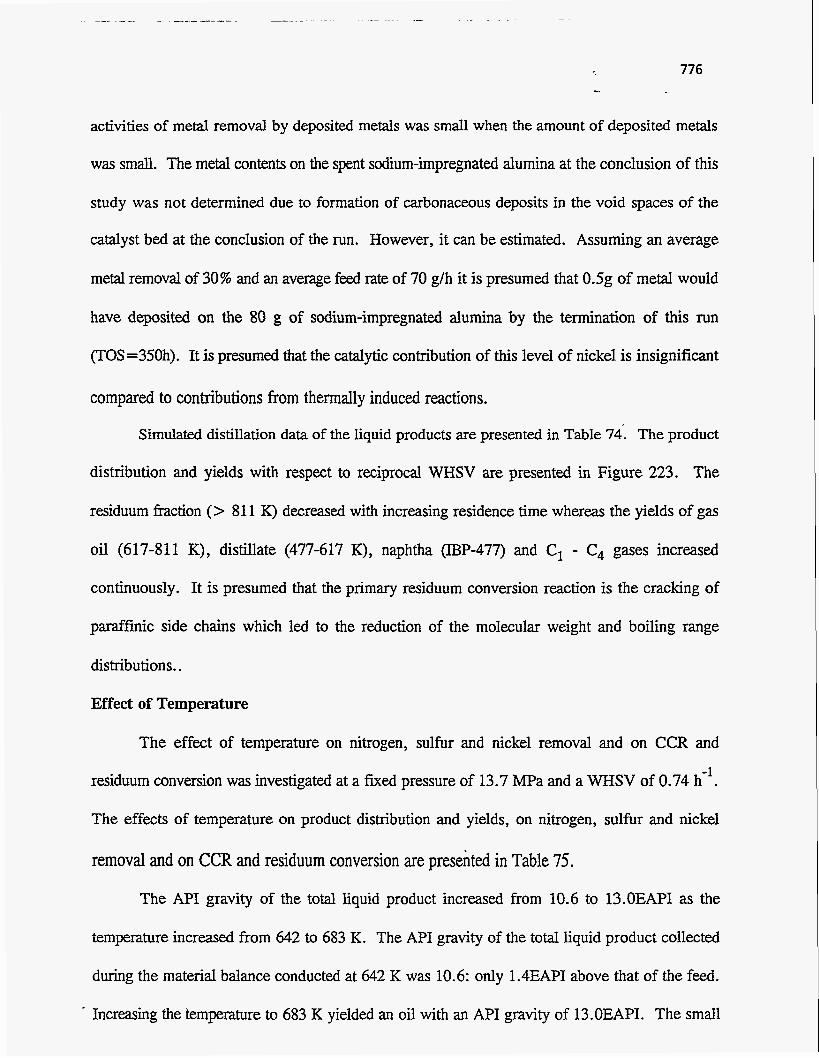
- - - I- I - __ - _- -- -
776 -
activities of metal removal by deposited metals was small when the amount of deposited metals
was small. The metal contents on the spent sodium-impregnated alumina at the conclusion of this
study was not determined due to formation of carbonaceous deposits in the void spaces of the
catalyst bed at the conclusion of the run. However, it can be estimated. Assuming an average
metal removal of 30% and an average feed rate of 70 g/h it is presumed that 0.5g of metal would
have deposited on the 80 g of sodium-impregnated alumina by the termination of this run
(TOS=35Oh). It is presumed that the catalytic contribution of this level of nickel is insignificant
compared to contributions from thermally induced reactions.
Simulated distillation data of the liquid products are presented in Table 74. The product
distribution and yields with respect to reciprocal WHSV are presented in Figure 223. The
residuum fraction (> 81 1 K) decreased with increasing residence time whereas the yields of gas
oil (617-811 K), distillate (477-617 K), naphtha (IBP-477) and C, - C, gases increased
continuously. It is presumed that the primary residuum conversion reaction is the cracking of
paraffinic side chains which led to the reduction of the molecular weight and boiling range
distributions..
Effect of Temperature
The effect of temperature on nitrogen, sulfur and nickel removal and on CCR and
residuum conversion was investigated at a fixed pressure of 13.7 MPa and a WHSV of 0.74 h-'.
The effects of temperature on product distribution and yields, on nitrogen, sulfur and nickel
removal and on CCR and residuum conversion are presented in Table 75.
The API gravity of the total liquid product increased from 10.6 to 13.OEAPI as the
temperature increased from 642 to 683 K. The API gravity of the total liquid product collected
during the material balance conducted at 642 K was 10.6: only 1.4EAPI above that of the feed.
- Increasing the temperature to 683 K yielded an oil with an API gravity of 13.OEAPI. The small

777 -.
Table 75 Effect of temperature on product properties of the thermally cracked PR Spring bitumen-
derived heavy oils
Run number 5 7 10 Process operating conditions Temperature, K WHSV, h-1 Residence time, h Pressure, MPa MI gravity Specific gravity H2 consumption(l/l) CCR, wt%
Elemental analysis c, wt% H, wt% N, wt% s, wt% Nickel, ppm H/C atomic ratio Product yields, wt% C1 c2 c3 C3=
Cq=
i-butane n-butane
Cs+ liquid product Liquid yield (~01%)
683 0.75 2.40 13.7 13.0
0.979 56
10.4
84.1 11.7 1.01 0.3 8
62 1.64
0.5 0.2 0.3 0.1 0.1 0.1 0.1
98.6 100
664 0.74 2.42 13.7 11.7
0.988 23
11.9
85.2 11.7 1.01 0.39
63 1.64
0.3 0.1 0.1 0.0 0.1 0.1 0.1 ,
98.2 99.3
642 0.73 2.46 13.7 10.6
0.996 12
13.2
85.2 11.7 1.05 0.41
66 1.63
0.1 0.0 0.0 0.0 0.0 0.0 0.0
98.9 99.7
Simulated distillation of total liquid product Volatility, wt% 58.1 48.1 41.8 IBP, K 407 410 489. IBP-477 K, wt% 2.3 1.3 0.4 477-617 K, wt% 15.1 9.8 7.4 617-811 K, wt% 39.6 35.7 33.2 >811 K, wt% 43 .O 53.2 59.0
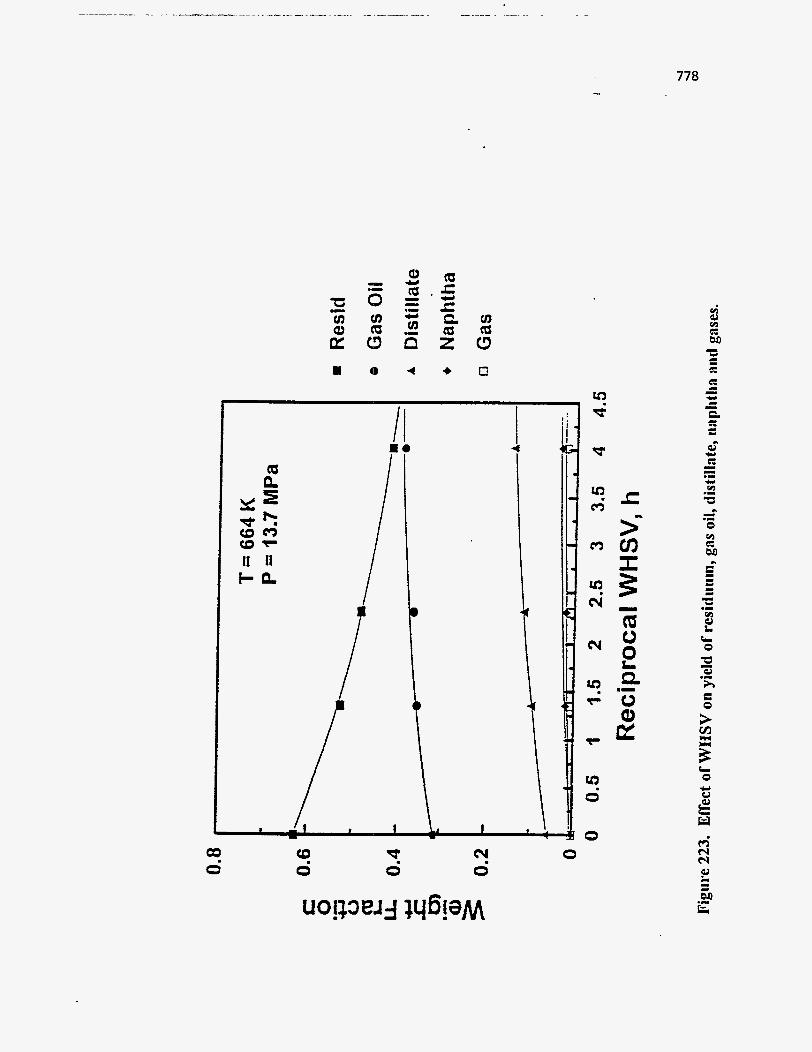
778
Q3 0
v 0
N 0
0
P
tn cj
c3
v )
cu'
v )
0
0
a? Y
n n
Y v)
Q .I
.I Ir w
v) c, bD
(r 0
increase in the API gravity of the total liquid product relative to the PR Spring bitumen-derived
heavy oil is indicative of the absence of any significant catalytic hydrogenation and cracking
activity on the sodium-impregnated alumina and is attributed to thermal reactions which only
become significant at higher temperatures.
The fractional conversions of nitrogen, sulfur and residuum and of nickel and CCR are
presented in Figures 224 and 225; respectively, as a function of temperature. The extent of CCR
conversion was greater in all cases than the extent of residuum conversion, and of sulfur, nickel
and nitrogen removal. Residuum conversion was greater than nitrogen and sulfur removal as it
was when WHSV was varied. Nitrogen removal was lower than the conversions of the other
component-type classes.
The material in the bitumenderived heavy oil which gives rise to CCR is thought to consist
of polar, high molecular weight species which readily convert to coke during thermal processing
(271). This class of components can be thought to consist of the polar, heteroatomic cores of
residuum molecules which are denuded of aliphatic side chains during hydrotreating. It would be
therefore expected that CCR conversion would be related to catalytic processes such as aromatic I
ring hydrogenation. Accordingly, in thermal processing, CCR reduction should be as difficult to
achieve as .nitrogen conversion. The opposite was observed in this research because in some
instances, CCR conversion exceeded even residuum conversion. Thermal CCR conversion is
counterintuitive because CCR is defined as the material that is not converted to volatiles in a test
which strongly favors thermal conversion. Perhaps the thermal CCR conversion that was
observed is related to the presence of hydrogen which stabilized free radical intermediates formed
due to thermal cracking and which are precursors to carbonaceous residues. Thus, it was
presumed that the observed CCR conversion was not purely thermal, but was .a result of
hydrothermal reactions. ' I
780
a 0 4 0 aa (0
d 0
c3 0
cy 0
v= 0
0 E % s
0 (3
L 0
I
5 I
E
0
u .I Y
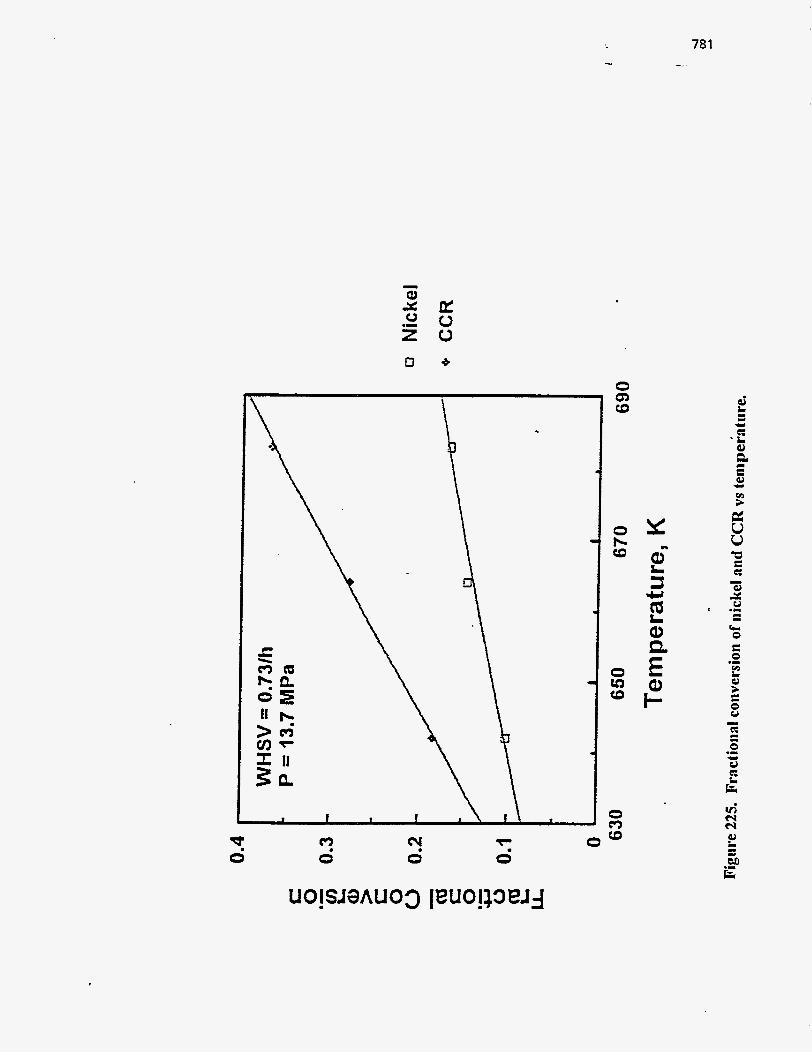
781
o a
\
0 Q1 CD
o x 6 , -
L 3 a aa Q
.c1
L
I
o t z g
I
I
.I s I .. L 0 E: 0
W > V
.I
2
6 I
782 -
The residuum fraction of the total liquid product decreased by 19% as the reaction
temperature increased from 664 to 683 K. The sulfur content decreased by 3 % , nickel content
decreased by 2%, the CCR content decreased by 13% and no nitrogen removal was observed
when the reaction temperature increased from 664 K to 683 K. Residuum conversion was
significant at higher temperatures. This is attributed to residuum being more susceptible to
thermal conversion than nitrogen and sulfur removal.
Increasing contact time led to a much higher increase in CCR conversion than did
increasing temperature. This is in contrast to nickel conversion which was affected equally by
longer contact times and higher temperatures. This suggests that the apparent activation energy
for thermal CCR conversion is low. However, the kinetic and molecular transformations of
thermal and catalytic CCR conversion are not well understood. Consequently, the development
of an explanation for this observation will require additional experiments. The simulated
distribution data for the liquid products are presented in Table 75 and the product distributions and
yields with respect to temperature are presented in Figure 226. Residuum conversion to volatiles
was significant at higher temperatures. Gas oil, distillate, naphtha and gas yields increased rapidly
at higher temperatures. The significant increase in residuum conversion with increasing
temperature attributed to the high activation energies of thermal cracking.
SUMMARY AM) CONCLUSIONS
Residuum conversion exceeded heteroatom removal over the sodium-impregnated alumina
because residuum conversion involves a thermal pathway which is largely unavailable for
heteroatom removal. CCR conversion was also higher than heteroatom removal indicating that
CCR conversion can occur in the absence of a catalyst and is presumed to be related to thermal
reactions occumng in the presence of hydrogen. The degree of conversion of CCR was

783 -.
Q x U E 2
d Q) v)
SJ
i/ \ L
\ h I .I
0 v) cz M > I I \
f l I f I I) - 5 .I v) a2 L (I 0
u s I I I
3 a2 h
I
.I
E: 0
Q3 0
(D d cy 0 0 d
i B .I ra
substantially increased with increasing temperature and residence time. The extent of residuum
conversion increased at higher temperatures because thermal cracking of residuum increased at
higher temperatures.
Molecular weight reduction was observed during thermal hydrocracking of bitumen-
derived heavy 02s and was attributed to thermal reactions. The yield of gas oil, distillate, naphtha
and light gases increased at higher temperatures due to the increase of thermal cracking of
residuum at higher temperatures.
785 -.
UINTA BASIN BITUMEN HYDROTREATING: A Comparison of Catalytic and Thermal Effects during Hydrotreating
of Bitumen-Derived Heavy OiIs
Principal Investigator: Francis V. Hanson Post Doctoral Fellow: Graduate Student: J.-W. Kim
Daniel C. Longstaff
INTRODUCTION
The primary purpose of hydrotreating is to remove objectionable elements such as
sulfur, nitrogen, oxygen and metals from the oil being hydrotreated. The catalysts used in
hydrotreating also promote hydrogenation of aromatic carbon and conversion of residuum into
volatile fractions. During hydrocracking the catalyst functions to supply hydrogen to oil
fractions which are otherwise deficient in hydrogen (258). Catalytic reactions may compete
and/or be coupled with noncatalytic thermal reactions which produce reactive free radicals by
breaking C-C, C-H and C-heteroatom bonds (239, 272). Thermal reactions have higher
activation energies than catalytic reactions for a given class of compounds.
Thermal reactions become more important with increasing temperature (273). Thermal
and catalytic reactions occur in parallel in the conversion of asphaltenes and coal (274, 275).
It has been reported that light oil fractions are formed exclusively by thermal cracking in the
oil phase, even during catalytic hydroprocessing (239). Mosby et al. (254) and Heck et al.
(254) have reported that residuum conversion is primarily thermal and that heavy oil
hydrotreating catalysts promoted sulfur, nitrogen and metal removal, as well as, aromatics
saturation. Thermal cracking converts high molecular weight species to lower molecular
weight species which are accessible to the active surface of the catalyst through the pores.
Therefore, thermal and catalytic reactions act sequentially via thermal scission and
hydrogenation.

786
The oil sands used in this investigation were obtained from the U-tar pit on the PR
Spring oil sands deposit. The pit is located in SE 1/4 NE 1/4, Section 5, Township 16 South,
Range 24 East in eastern Utah. The bitumen-derived heavy oil from the PR Spring oil sand
used as the feedstock in this study is unusual in that it exhibits a high nitrogen content (> 1
wt%) and a low sulfur content (<0.5 wt%). The catalysts used in these studies were
commercial alumina supported metal sulfide catalysts. The catalyst series consisted of a NiMo
(HDN) catalyst, a Mo (HDM) catalyst and a 2 wt% sodium-impregnated alumina.
The objective of this study was to determine the relative magnitudes of the catalytic and
thermal reactions during the upgrading of the bitumen-derived heavy oil over the HDN and
HDM catalysts and the sodium-impregnated alumina. This was evaluated by investigating the
role of catalyst on heteroatom and metal removal and on CCR and residuum conversion as a
function of process variables. The process variables investigated were reactor temperature
(625-685 K) and space velocity (0.14-0.81 h-l) at a fixed reactor pressure (13.7 m a ) .
EXPERlMENTAL
The feedstock used in this study was the bitumen-derived heavy oil produced from the
PR Spring oil sands. The physical and chemical properties of the feedstock are presented in
Table 76. Properties of the catalysts are listed in Table 77. The HDN and HDM catalysts, as
well as the sodium-impregnated alumina (Ndalumina) were presulfided in the reactor with 2
wt% sulfur as dimethyldisulfide in kerosene. The Ndalumina catalyst was prepared by
impregnating a high surface area alumina with 2 wt% sodium nitrate. This was done to poison
the Br4nsted acidity of the alumina. Detailed procedures for the preparation of the Ndalumina
and the catalyst sulfiding procedure have been described by Kim (243).
Hydrotreating runs were conducted in a fixed-bed reactor which was operated in the
upflow mode to facilitate isothermal operation and to ensure complete wetting of the catalyst
bed (242). The gas and liquid products from the reactor passed into the high pressure vapor-
liquid separator. The gas product was removed from the separator through a back pressure
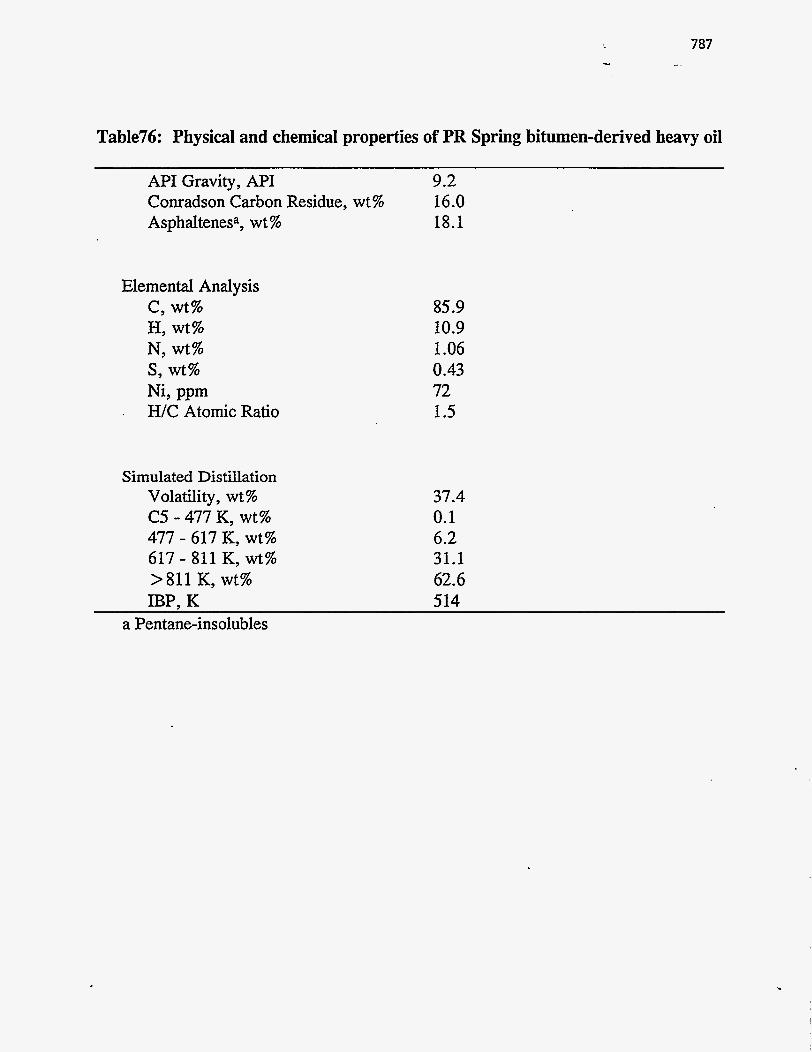
-"
787 I
Table76: Physical and chemical properties of PR Spring bitumen-derived heavy oil
API Gravity, API 9.2 Conradson Carbon Residue, wt% 16.0 Asphaltenesa, wt % 18.1
Elemental Analysis c, wt% H, wt% N, wt% s, wt% Ni, ppm H/C Atomic Ratio
Simulated Distillation Volatility, wt % C5 - 477 K, wt% 477 - 617 K, wt% 617 - 811 K, wt% >811 K, wt% IBP. K
85.9 10.9 1.06 0.43 72 1.5
37.4 0.1 6.2 31.1 62.6 514
a Pentane-insolubles
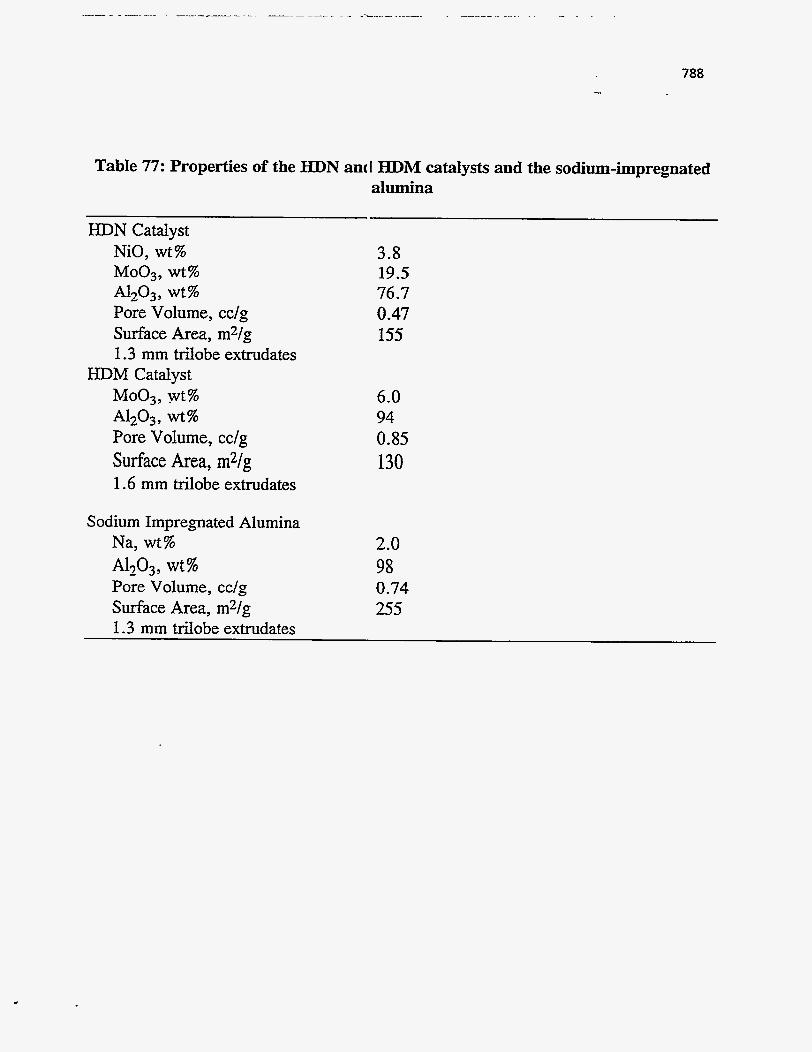
788
Table 77: Properties of the HDN ant I HDM catalysts and the sodium-impregnated alumina
Surface Area, m21g 1.6 mm trilobe extrudates
3.8 19.5 76.7 0.47 155
6.0 94 0.85 130
HDN Catalyst NiO, wt % Moo3, wt% A1203, wt% Pore Volume, cc/g Surface k e a , m2/g 1.3 mm trilobe extrudates
HDM Catalyst M003, wt% A1203 , wt % Pore Volume, cc/g
Sodium Impregnated Alumina Na, wt% 2.0 A1703, I wt% 98 Pore Volume, cc/g 0.74 Surface Area, m2/g 255 1.3 mm trilobe extrudates

I regulating valve (BPRV) which vented the vapor from the high pressure vapor liquid separator
to ambient pressure. The system pressure was controlled by the BPRV in that excess pressure
was released as vapor through the BPRV. Liquid product was continually withdrawn from the
separator through an Annin valve. The reactor tube consisted of a 2.54 cm inside diameter
stainless steel tube which was mounted in a three zone furnace. The temperature in each zone
of the furnace was independently controlled to segregate the reactor tube into three zones: a
preheating zone, a catalyst bed zone and a post-reaction zone. The central reactor zone
contained 152 cm3 of catalyst. Inert low surface area a-alumina spheres (0.32 cm) were
placed in the preheating (128 cm3) and postheating (127 cm3) zones to support the catalyst bed
and to insure efficient contacting of the liquid feed and hydrogen. Temperature profiles in the
reactor were measured with a movable thermocouple in an axial thermowell which had an
outside diameter of 0.32 cm.
The API gravity of the hydrotreated liquid product was known to correlate with the
nitrogen content of the liquid product. Therefore, the extent of catalyst deactivation during the
process variable studies was estimated by measuring the API gravity of the hydrotreated liquid
product as a function of time on-stream at the base case conditions. The base case conditions
were as follows: reactor pressure, 13.7 MPa; liquid hourly space velocity (LHSV), 0.41 h-1;
and reactor temperature 642 K. At the beginning of each experiment the freshly sulfided
catalyst was contacted with oil at the base case conditions until the catalyst attained a pseudo-
steady stateactivity.
After the catalyst had reached pseudo-steady state activity, experiments were
conducted in which the reactor temperature (625-685 K) and LHSV (0.14-0.81 h-1) were
varied at fixed reactor pressure (13.7 MPa). The experiments were conducted in a random
fashion to circumvent systematic errors. Detailed experimental procedures have been
described elsewhere by Kim (243).
790
RESULTS AND DISCUSSION
The performance of the HDN and the HDM catalysts and of the Ndalumina support
were evaluated as a function of process variables to determine the relative magnitude of
catalytic and thermal effects during nitrogen, sulfur and nickel removal and during CCR and
residuum conversion at comparable operating conditions.
Residuum Conversion
The effects of residence .time (reciprocal LHSV), temperature and catalyst selection on
residuum conversion for the bitumen-derived heavy oil are presented in Figures 227 and 228.
Catalyst activity for residuum conversion was ranked as follows: HDN catalyst > HDM
catalyst > Ndalumina. This ranking obtained at all temperatures and space velocities.
Pines (264) has reported that alumina, containing 0.08 % K+ was significantly
inhibited in its ability to skeletally isomerize cyclohexane which proceeds by a cationic
mechanism (Br4nsted acidity). However, up to 40% residuum conversion was observed over
the Ndalumina (Figures 227 and 228). This conversion was attributed to thermal reactions
because the Ndalumina catalyst contained 2 wt% sodium. The residuum conversion over the
Ndalumina provides a baseline to determine the effect of catalyst on residuum conversion over
the HDN and HDM catalysts.
Higher levels of residuum conversion were observed with the HDN catalyst relative to
the HDM catalyst and the Ndalumina. This is due to its higher metal loading and to its higher
surface acidity relative to the HDM catalyst and the Ndalumina.
It was not possible in this work to differentiate between catalytic activity originating
from the metal and catalytic activity originating from the alumina surface area. In some
situations, such as nitrogen conversion, catalytic activity is probably strongly determined by
the metal loading. However, in residuum conversion, the surface area and acidity of the
alumina support may play a role that is approximately equivalent in importance to the role of
the supported metals.
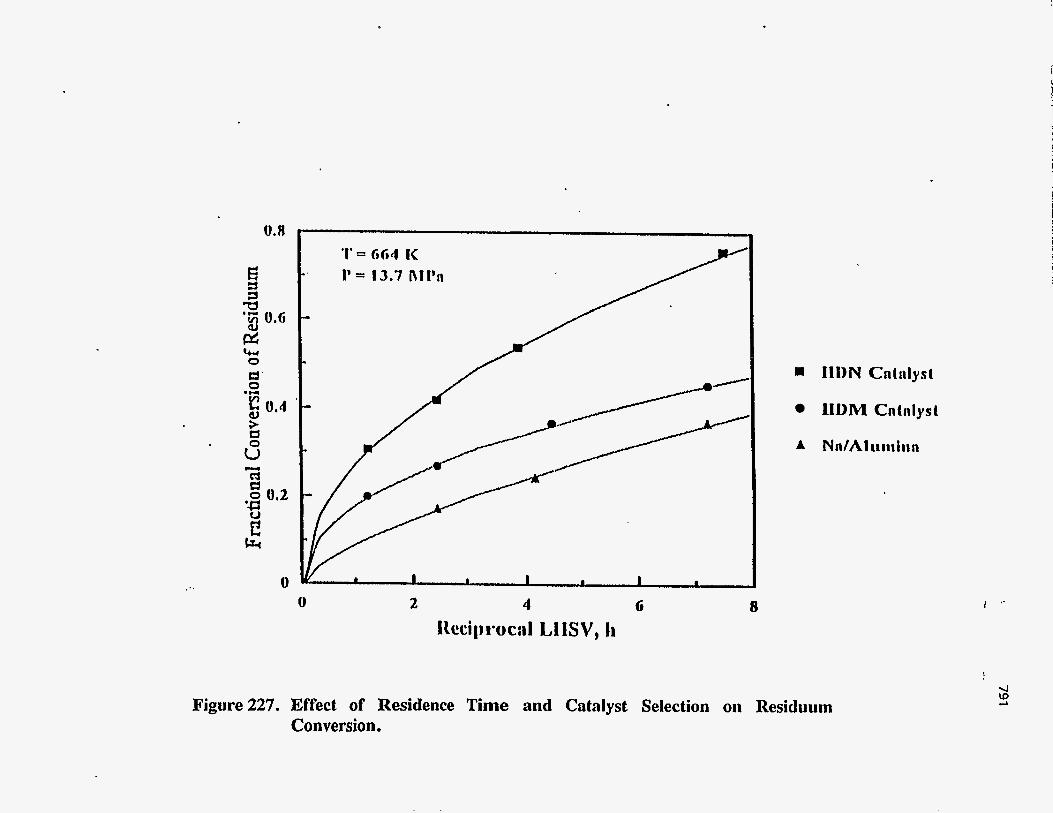
.'. 0 0
.
2
IIDN Cntnlyst
11DM Cntnlyst
A Nn/Al t inh in
4 Ihxip*oc:tl LI lSV, Ir
G 8
Figure 227. Effect of Residence Time and Catalyst Selection on Residuum Conversion.
I 4 '
I
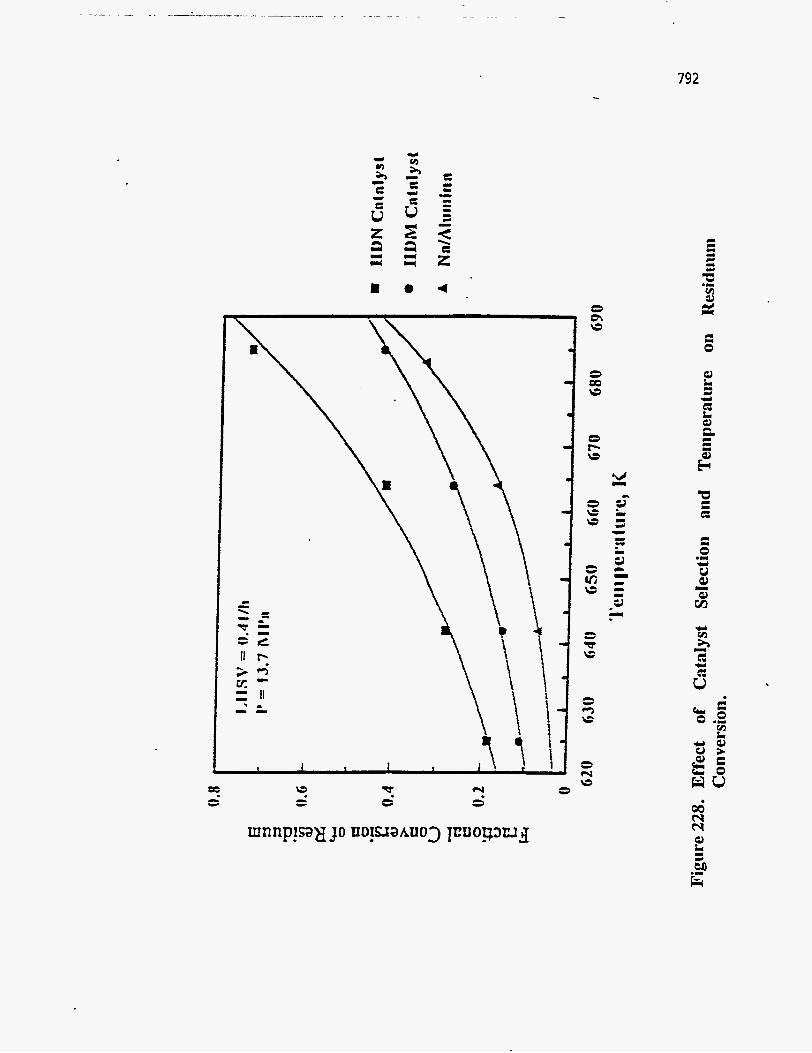
792
m . 4
y. 3 3
9 0
u. - F
There is disagreement on the role of catalyst in residuum conversion. Some researchers
(254, 259) have reported that catalyst does not affect residuum conversion and that residuum
conversion occurs primarily by thermal reaction pathways. This conclusion was based on
hydroprocessing heavy oils in stirred autoclave reactors where the catalyst-to-oil ratios were
low. The opposite conclusion was reached in this work. It is clear from Figures 227 and 228
that catalyst selection played an important role in determining the extent of residuum
conversion. The reason for the discrepancy between this work and that of other researchers
(254, 259) may be related to the fact that catalyst densities were higher in the packed bed
' reactor used in this work than in stirred autoclaves used in other investigations.
In dilute catalyst systems such as stirred autoclave or ebullieted bed reactors (276),
thermal conversion is emphasized relative to catalytic cracking. This is because the extent of
thermal conversion is determined by the residence time of the oil in the reactor. The extent of
catalytic conversion is determined by the contact time between the oil and the active catalyst
surface. This is directly related to the catalyst-to-oil ratio in the reactor. Packed bed reactors
with a high catalyst density will result in higher residuum conversion than stirred autoclave
reactors or ebullieted bed reactors with low catalyst densities (257). In this research the
catalyst density was high enough for the presence of the catalyst to noticeably increase the
extent of residuum conversion relative to thermal conversion alone.
The reactor was operated in the upflow mode to ensure complete contacting of the
liquid with-the catalyst because of the small scale of this reactor system. This resulted in a
reactor system where the oil phase was continuous and the vapor phase was discontinuous.
This increased the liquid holdup of the reactor relative to industrial reactors operated in the
downflow mode where liquid flows as a thin film on the outside of the catalyst particles and
both liquid and vapor phases are continuous. It is expected that catalytic reactions play an
even greater role in industrial downflow packed bed reactors than they did in this bench scale
system that was operated in the upflow mode.
794
Several researchers (274, 275) have reported that a combination of catalytic and
thermal reactions may be involved in residuum conversion. This is because catalysts promote
hydrogenation of aromatic rings and opening of those rings occurs by either thermal reactions
or reactions catalyzed by acidic sites.
Residuum cracking over the Ndalumina consisted mainly of free radical cracking
reactions. It is known that free radical cracking reactions preferentially affect aliphatic side
chains, aliphatic bridges and naphthenes. Gray (277) reported that paraffin groups are likely
to cleave f3 or y to aromatic or naphthenic rings when thermal cracking occurs at pressures of
over 10 MPa. Alkyl aromatics are formed by opening of naphthenic rings during thermal
conversion of residuum (252). Tsai et A. (252) performed GUMS of bitumens,
hydroprocessed bitumens and hydroprocessed liquids derived from bitumen pyrolysis. They
reported that normal and methylsubstituted paraffins are absent in bitumen but are formed
during bitumen hydroprocessing. Tsai et al. (252) attributed their formation to the cleavage of
side chains from polycyclic clusters.
Nitrogen Removal The effects of residence time, temperature and catalyst selection on nitrogen removal
from -the bitumen-derived heavy oil are presented in Figures 229 and 230. Catalyst activity for
nitrogen removal was ranked as follows: HDN catalyst > HDM catalyst > Ndalurnina as
was anticipated. Catalyst selection played an even greater role on nitrogen conversion than it
did with residuum conversion. This is because the thermal conversion pathway is largely non-
existent for nitrogen conversion while it makes a significant contribution to the conversion of
residuum.
The nitrogen removal that was observed with the HDN catalyst is attributed to its high
metal loading relative to the HDM catalyst and the Ndalumina. Surface acidity may also have
played a role because it is known that higher acidity supports can increase nitrogen conversion
(278) -
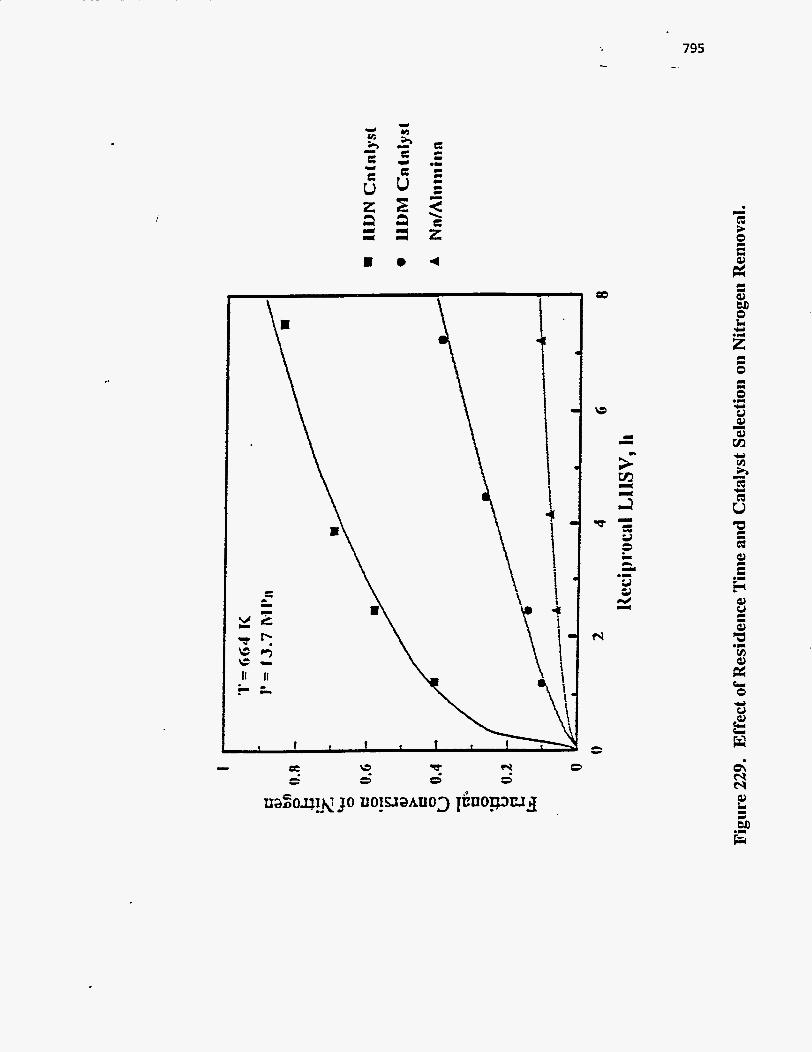
795
m . 4
I I 1
i I I
1 1
.
u. 3 2
u
t
r: a2 M 0 Ll Y
2
Y v1 h 3 6
6 N
2 GJ - ." La
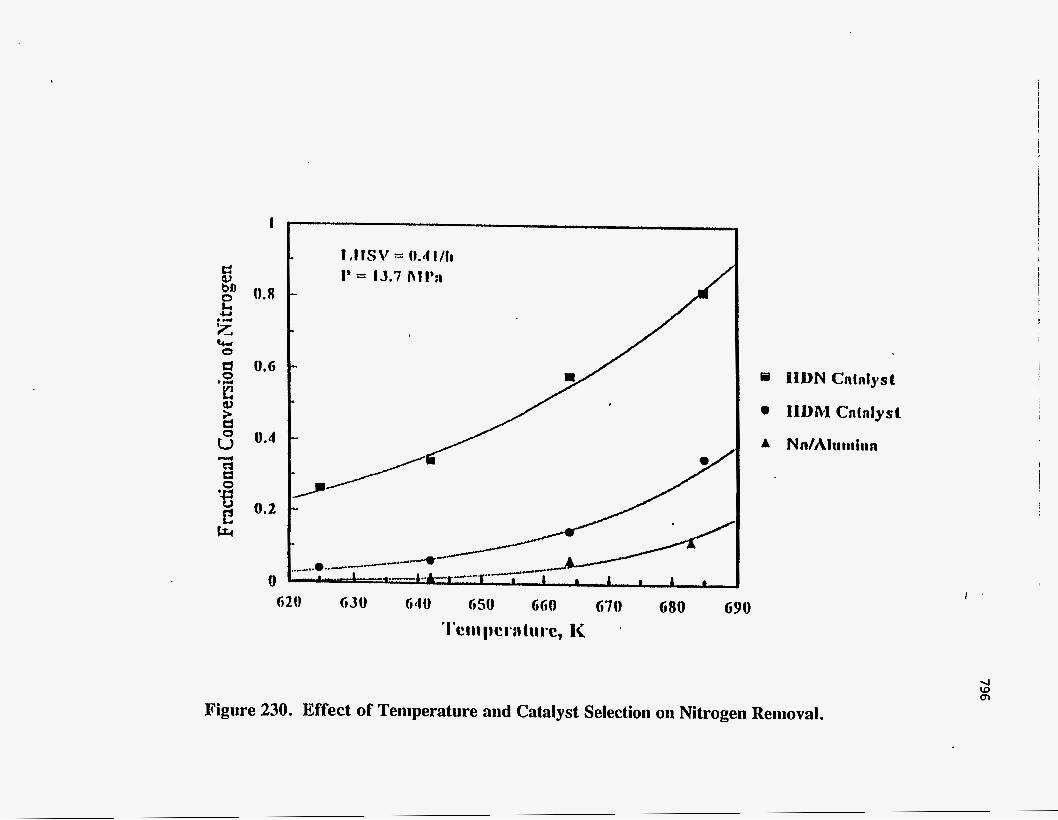
i
0
1 , I IS\' = 0.1 1/11
I' = 13.7 Ill I'II
I G90
Figure 230. Effect of Temperature aiid Catalyst Selection on Nitrogen Removal. 4 W cn
0
797 .̂.
Sulfur Removal The effects of catalyst selection, residence time and temperature on sulfur removal
from the bitumen-derived heavy oil are presented in Figures 231 and 232. Some sulfur
removal was detected with the Ndalumina. The observed sulfur removal with the Ndalumina
was presumably the result of thermal reactions involving aliphatic sulfides which have been
detected in some heavy oils (266). Khorasheh et al. (261) have reported that sulfur can be
removed from coker gas oil in the absence of catalyst or support. Gray et al. (266) have also
proposed that small amounts of sulfur compounds in vacuum residua from different sources
may be converted by thermal reactions over a-alumina. Trytten et al. (247) reported that the
reactivity of sulfur compounds decreased with increasing molecular weight because of steric
hindrance.
The rank of catalyst activity in sulfur removal was as follows: HDN catalyst > HDM
catalyst > Ndalumina. The ranking of catalyst activity appears to be related to metal loading
because both hydrogenation and hydrogenolysis pathways are catalyzed by supported metal
sulfides. Catalyst acidity may play a role in that residuum conversion on the-active alumina of
the HDN catalyst may be a rate limiting step for the conversion of a significant portion of the
sulfur (248). Gray et al. (266) reported that sulfur removal increased with increasing metal
loading on the same support.
Sulfur conversion over the HDN catalyst leveled off with increasing residence time.
Nitrogen conversion and the slope of the nitrogen removal increased with increasing
temperature (Figure 229). The opposite trend was observed with sulfur. This is because
sulfur conversion reached a point at which further conversion was limited because the
remaining sulfur is considerably less reactive than the sulfur which had been converted. The
presence of a significant portion of low reactivity sulfur may be related to the higher
asphaltene and Conradson carbon content precursors in the PR Spring bitumen relative to other
high nitrogen bitumens from the Uinta Basin.

n o 4
f 3
s 3
Y e 0
0
798
c
E;
Y 0 CE 2
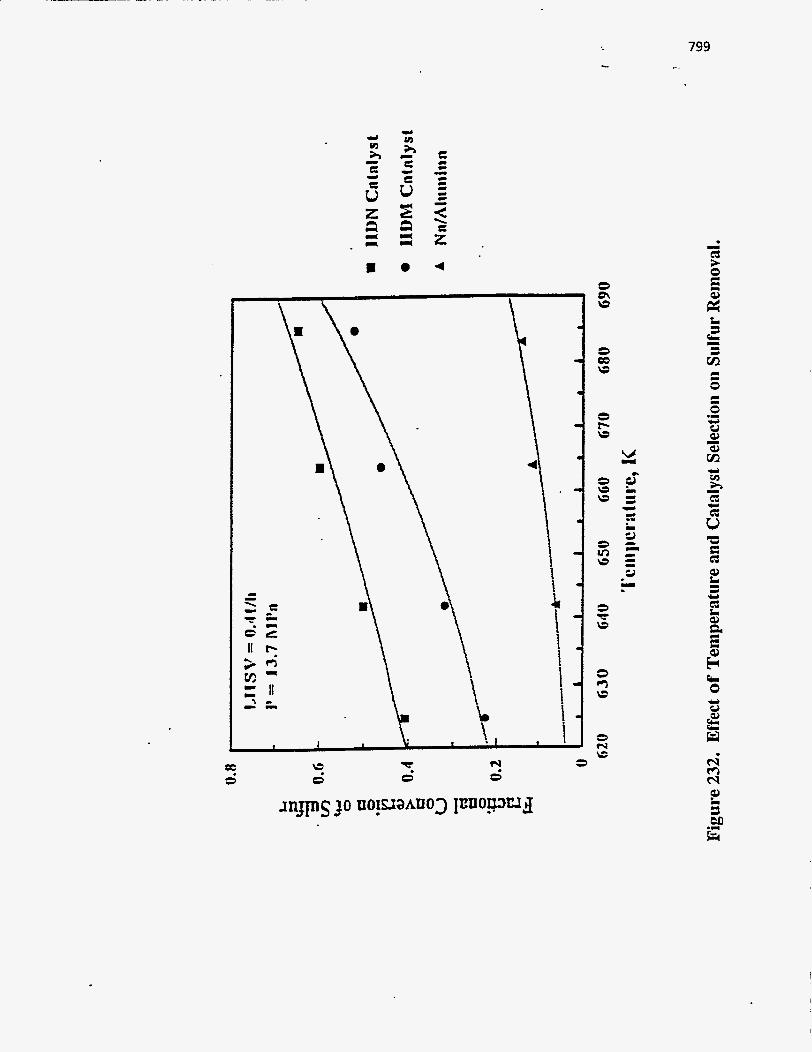
u, 0
9 0
Y m
Y . I-
=
0 tz u
9 u u
v
3 F G
3 r? W
3 N \=
Ccl 0
N' rn N a2 t 3 ED 2
800
Nitrogen removal is plotted with respect to sulfur removal in Figure 233. The sulfur in
the PR Spring bitumen-derived heavy oil exhibited a broader range of reactivities than the
nitrogen. At low severities sulfur conversion exceeded nitrogen conversion. This indicates
that a certain portion of the sulfur was more reactive than the nitrogen. At higher severities,
nitrogen conversion exceeded sulfur conversion. This was because a significant portion of the
sulfur was less reactive than the nitrogen.
Metal Removal
The effects of catalyst selection, residence time and temperature on nickel removal for
the PR Spring bitumen are presented in Figures 234 and 235. Catalyst activity was again
ranked according to metal content which was unexpected due to the differences in support
structure.
The catalyst activity for nickel removal increased according to metal loading and
surface acidity of the catalyst. Hydrogenation catalyzed by the supported metals may be linked
with thermal reactions because the nickel is removed through a sequential mechanism
involving hydrogenation followed by a thermal hydrogenolysis step (279-281). Some nickel
removal was observed with the Ndalumina, although the Ndalumina did not contain any
metals. This activity was presumed to be completely thermal.
The difference between the activity of the supported metal sulfide catalysts and the
Ndalumina . indicated that catalytic and thermal hydrodemetallation pathways were in
operation. These different pathways may affect porphyrinic and non-porphyrinic metals to
different degrees. Some researchers (279) reported that HDM of nickel etioporphyrin was
negligible with alumina alone, but that some vanadyl etioporphyrin was converted with
alumina. It is possible that thermal conversion is limited to non-porphyrinic metals.
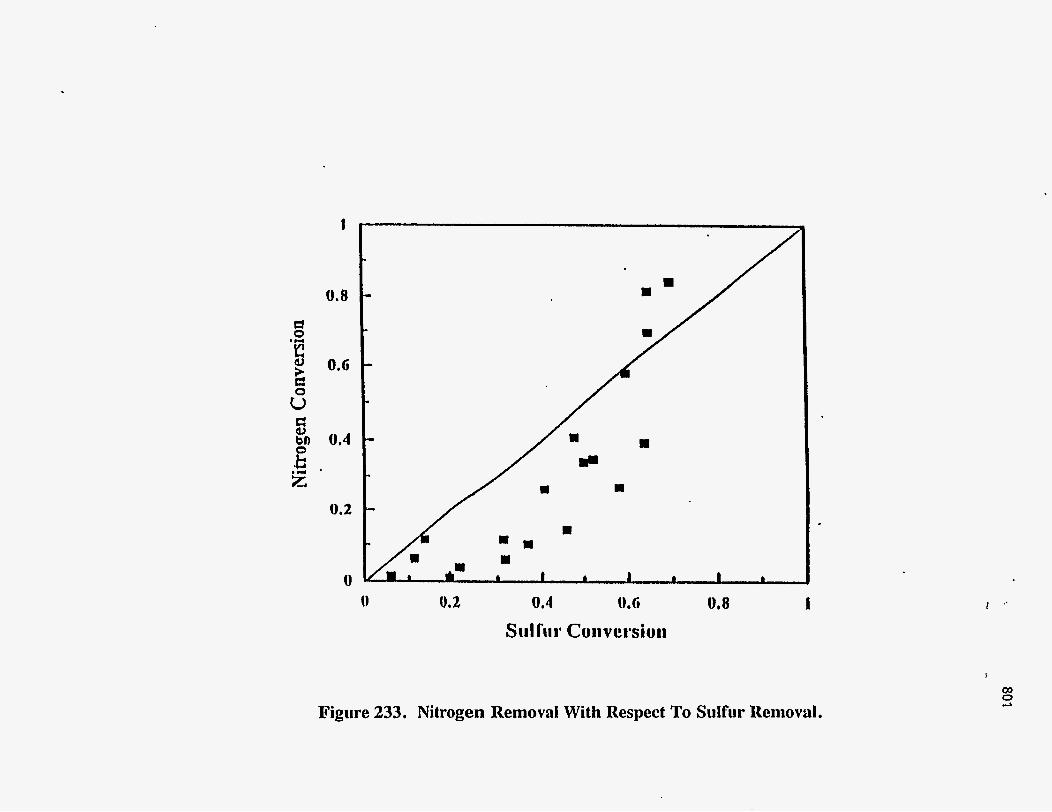
0.8
0.G
0.2
0 0
I
0.2 0.4 0.6
St11 rtlr Coirvwsioir 0.8 I "
Figirre 233. Nitrogen Removal With Respect To Sulfur Removal.
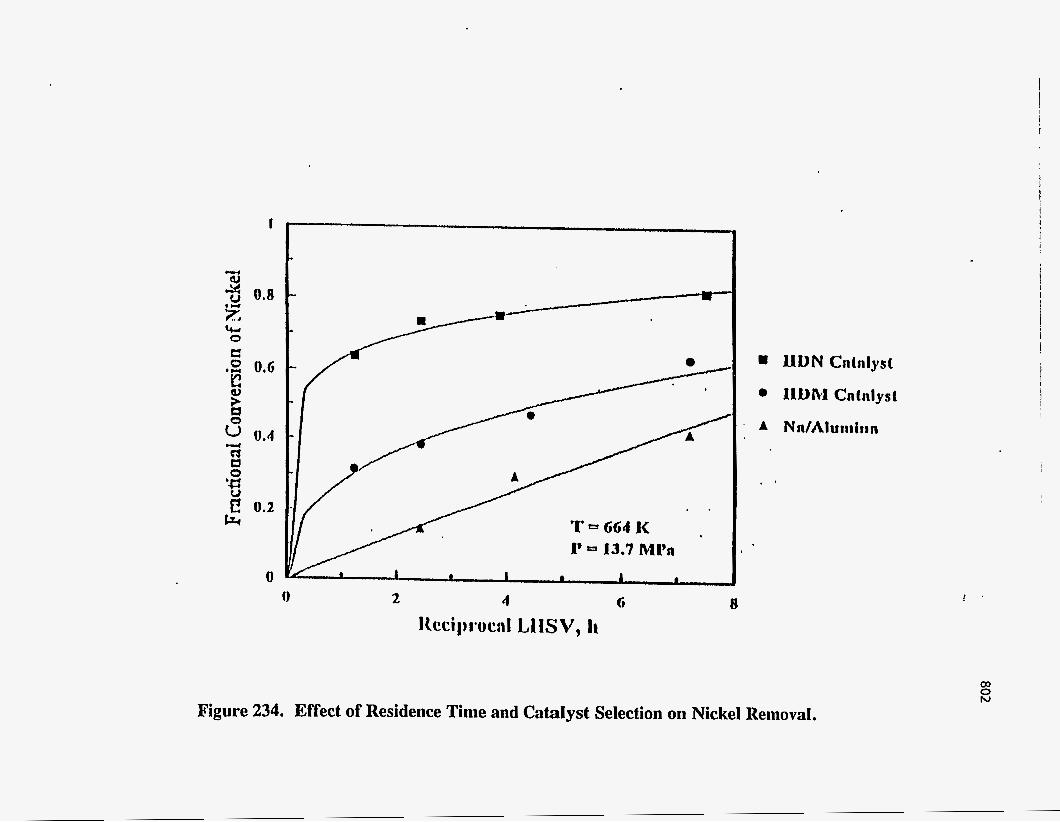
‘L 0.8
0.G
0.4
0.2
0
T=GG4K I’ = 13.7 MI’A
0 2 4 G 8
LIDN Cntnlyst
IlDM Cntnlyst
N n/A I u ni i t i n
I ’
Figure 234. Effect of Residence Tirile and Catalyst Selection on Nickel Removal. aJ 0 N
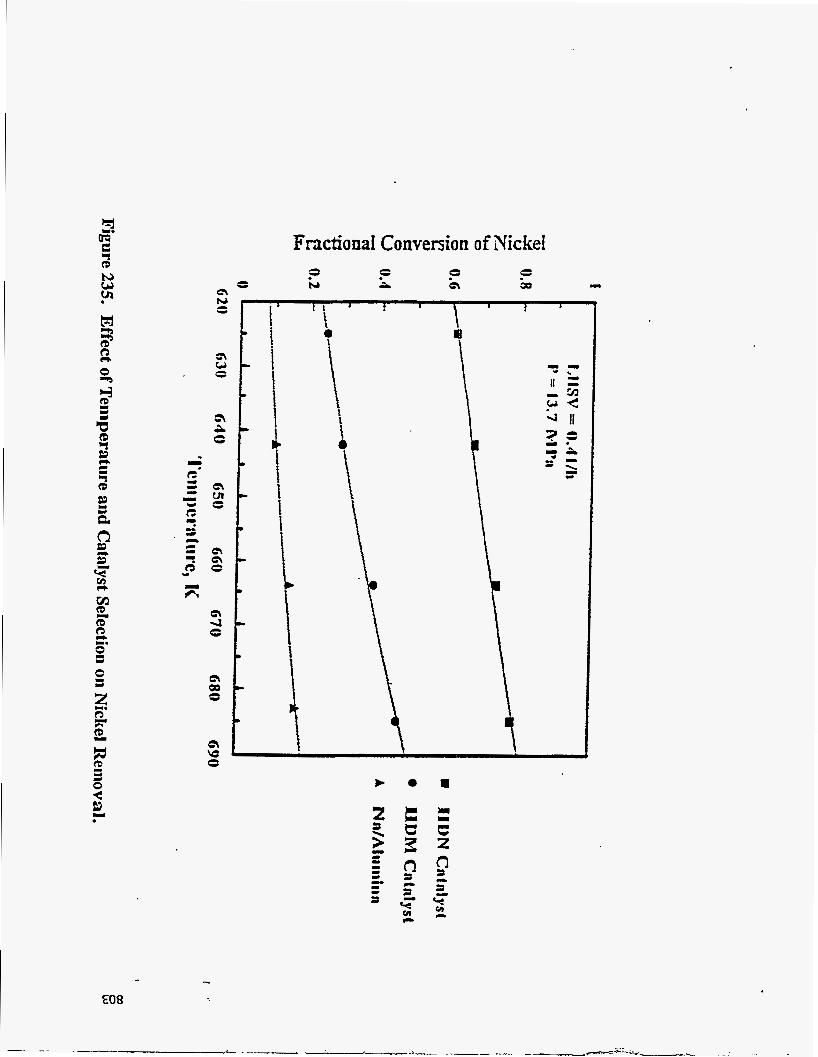
h, w VI
M 2 c tn
na J a
C J
.
.-
€08
Fractionai Conversion o f Nickei
Conradson Carbon Residue Conversion The effects of catalyst selection, residence time and temperature on the Conradson
carbon residue conversion for the bitumen-derived heavy oil are presented in Figures 236 and
237. Catalyst activity for Conradson carbon residue conversion was ranked as follows: HDN
catalyst > HDM catalyst > Ndalumina. This ranking for Conradson carbon residue
conversion is again due to some combination of metal loadings and surface ardacidities of the
various catalysts. The suggested mechanism for Conradson carbon residue conversion consists
of cracking of aliphatic side chains followed by the saturation of aromatic rings and the
opening of hydroaromatic rings. Residuum conversion occurs by the same mechanism. The
fact that Conradson carbon residue and residuum conversion occur in parallel is indicated by
comparing the increase in Conradson . carbon residue conversion with increasing temperature
with the increase in resid and heteroatom conversion observed with increasing temperature.
The levels of nitrogen, sulfur and metal removal obtained with the NdHDN catalyst were
much lower than the levels of Conradson carbon residue and residuum conversion. The fact
that levels of Conradson carbon residue and resid conversion were similar is probably because
of the significant overlap between what is considered Conradson carbon residue and residuum.
This overlap also occurs between heteroatoms and residuum but to a lesser degree.
Sanford (282) observed Conradson carbon residue conversion over a deactivated
catalyst and suggested that both thermal and catalytic reactions are involved in the conversion
of Conradson carbon residue. Conradson carbon residue conversion does not increase as fast
with increasing temperature as does residuum conversion. This indicates that one of the
differences between residuum and Conradson carbon residue conversion is that a greater
portion of resid conversion is thermal relative to Conradson carbon residue conversion.
High pressure hydrogen can reduce coke yields during hydrocracking by more than
50% (236, 282). Conradson carbon residue conversion is achieved by three mechanisms: 1)
catalytic, 2) thermal and 3) extractive in that molecules which normally form the residue in the
Conradson carbon residue test are deposited as coke in the reactor and on the catalyst.
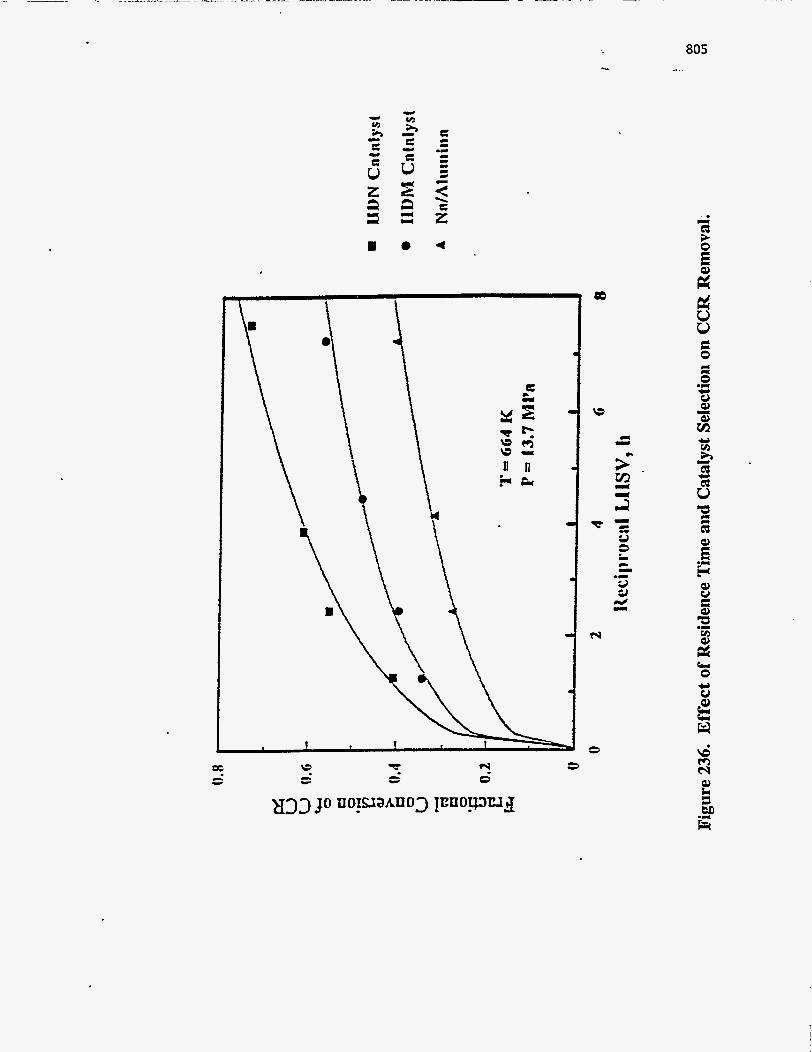
9 3
3
805 -.
u
3
a f eo
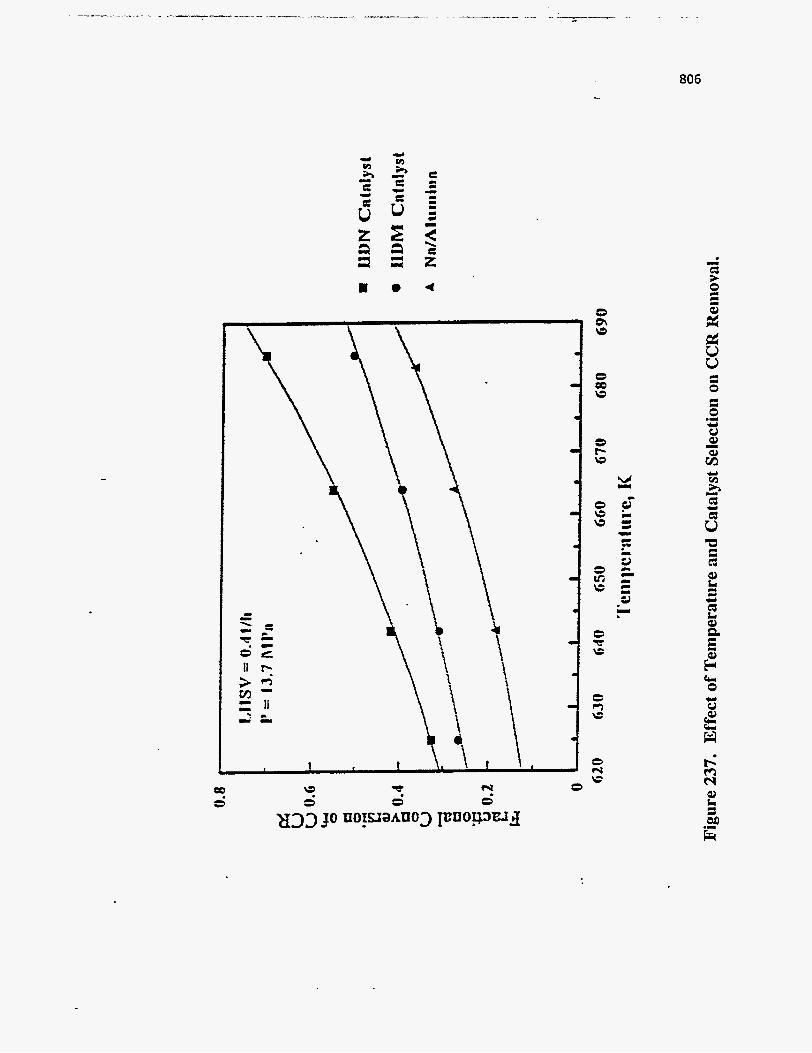
806 ...
d V V c 0

807
Extractive Conradson carbon residue conversion is reduced due to the presence of hydrogen
because hydrogen acts to cap free radicals formed by thermal scission of carbon-carbon and
carbon-heteroatom bonds.
When easy-to-break bonds are thermally broken and saturated by hydrogen these bonds
are less likely to cleave during the Conradson carbon residue test and the measured Conradson
carbon residue will be reduced. Catalytic Conradson carbon residue conversion is achieved by
direct and indirect means in that large polar moieties are catalytically converted to lighter, less
polar moieties which will volatilize in the Conradson carbon residue test rather than form
coke. In addition, catalytic conversion will also indirectly reduce Conradson carbon residue
by boosting the hydroaromatic content of the oil so that free radicals formed during the
Conradson carbon residue test can be saturated by hydroaromatic hydrogen instead of
condensing to form coke. Some Conradson carbon residue was converted over the
Ndalumina, even though the Ndalumina did not contain any metal sulfides and was not
acidic. Presumably this was due to hydrothermal conversion.
Heteroatom and metal removal and Conradson carbon residue and residuum conversion
may be also catalyzed by metals in the feed. LePage et al. (283) reported that porphyrinic and
nonporph yrinic metal complexes derived from the presence of H2S during hydroprocessing participate in the partial hydrogenation of condensed aromatic rings and play the role of
hydrogen donors. Catalytic activity which arises from deposited metal complexes may explain
why Conradson carbon residue conversion O C C U K ~ over the Ndalumina.
SUMMARY AND CONCLUSIONS
Heteroatom and nickel removal and CCR and residuum conversion were sensitive to
catalyst selection because metal sulfides on the catalyst played a significant role in heteroatom
and nickel removal, and CCR conversion. The catalyst activity for all reactions was as
follows: HDN catalyst > HDM catalyst > sodium-impregnated alumina. The rank of
catalyst activity is strongly dependent on the metal loading. The rank may also be dependant
808
to a lesser degree on the residual acidity of the catalyst support. The deactivation rates of
HDN and HDM catalysts were 0.06 and 0.02"API/day, respectively.
809 r -
HYDROTREATING KINETIC STUDY FOR PR SPRING
HEAVY OILS OVER HDN AND HDM CATALYSTS BITUMEN-DERIVED
Principal Investigator: Post Doctoral Fellow: Graduate Student:
INTRODUCTION
Francis V. Hanson Daniel C. Longstaff J.-W. Kim
Heavy oil and bitumen hydrotreating has been extensively studied in pilot plant and
bench-scale reactors (237, 247, 261, 284, 285). The objective of heavy oil hydrotreating is to
achieve hydrodesulfurization (HDS) , hydrodenitrogenation (HDN) , hydrodemetallation
(HDM) and conversion of residuum into volatile materials. Bitumen is a complex mixture
which contains an abundance of aromatic, sulfur, nitrogen and metal containing moieties.
Simple intrinsic kinetics cannot be applied to mixed feeds such as bitumen and heavy oils
because the various components exhibit a wide range of reactivities and may even exhibit
synergistic interactions.
The more reactive compounds are preferentially removed at low conversions.
Increasing conversion results in a residual feed which becomes increasingly less reactive.
Because of this refractory components play a significant role in the apparent kinetics at high conversion levels. These kinetics are further complicated by the presence of multiple pathways
in that individual molecules can react by parallel and consecutive reactions that change the
reactivity of the material being treated (286).
Commercial NiMo on alumina hydrodenitrogenation (HDN) and Mo on alumina
h ydrodemetallation (HDM) catalysts were employed in these hydrotreating studies. Alumina
supported molybdenum HDM catalysts are necessary to protect downstream hydrotreating
81 0 -..
catalysts from being poisoned by coke and metal deposition. This is because HDM catalysts
generally contain wider pore radii and larger pore volumes relative to HDN catalysts (287).
The aim of this study was to determine which kinetic models can be used to describe
the conversion or removal of the various classes of compound types which occur in the PR
Spring bitumen and to also determine the kinetic parameters which apply to those compound classes: nitrogen, sulfur, nickel, CCR and residuum.
EXPERIMENTAL
The PR Spring bitumen was obtained by solvent extraction of the PR Spring oil sand.
The feed oil sand used in this investigation was obtained from the U-Tar pit on the PR Spring
oil sands deposit which is located in SE 1/4 NE 1/4, Section 5, Township 16 South, Range 24
East in eastern Utah. The oil sand ore was mined, crushed and sieved to pass through 0.63
mm (0.25 in) prior to solvent extraction. PR Spring bitumen was removed from the oil sand
by solvent extraction with refluxing toluene. Toluene was removed from the extract solution
by a combination of rotary evaporation and batch vacuum distillation. The chemical and
physical properties of feedstock are presented in Table 78. PR Spring and other Uinta Basin
bitumens contain low levels of vanadium and sulfur and high levels of nitrogen relative to the
Athabasca bitumens. This is related to their freshwater origin.
Commercial NiMo/Al?Os - h ydrodenitrogenation (HDN) ' and Mo/A1203
hydrodemetallation O M ) catalysts were used in this study. The HDN catalyst consisted of
1.3 mm trilobe shaped extrudates and contained 3.8 wt% NiO, 19.5 wt% Moos, 155 mz/g of
surface area and 0.47 cc/g of pore volume. The HDM catalyst was a 1.6 mm trilobe shaped
extrudates and contained 6.0 wt% Moos, had a surface area of 130 m2/g and a pore volume of
0.85 cclg.
The catalysts were dried in-situ in flowing nitrogen at 700 K for one hour. The reactor
was then cooled to ambient temperature prior to sulfiding. Catalyst sulfiding started at
ambient temperature with 2 wt% sulfur solution of dimethyldisulfide in kerosene. The

81 1 -..
Table 78: Physical and Chemical Properties of Native PR Spring Bitumen
API Gravity 9.2
Conradson Carbon Residue, wt% 16.0
Specific Gravity 1.0
Asphaltenesa, wt% 18.1
Elemental Analvsis
c, wt% H, wt% N, wt% s, wt% Ni, PPm
Simulated Distillation Volatility, wt% c5 - 477 K, wt% 477 - 617 K, wt% 617 - 811 K, wt% >811 K, wt%
85.9 10.9 1.06 0.43
72
37.4 0.1 6.2
31.1 62.6
IBP, K 514 a Pentane-insolubles
812 -..
hydrogen to liquid feed ratio was 890 m3(STP)/m3. The reactor pressure and the sulfiding
solution feed rate were 6.1 - 6.3 MPa and 1 h-1 LHSV, respectively. The reactor was heated
to 505 K at the rate of 27.8 "C/h (50 "F/h) in flowing hydrogen. The sulfiding solution was
started over the catalyst and the reactor temperature was held at 505 K for 2 hours to ensure
complete sulfiding. The reactor was then heated to 645 K at a rate of 27.8 "C/h. Sulfiding
was completed when the reactor temperature reached 645 K.
The reactor had a 2.54 cm inside diameter and consisted of three different beds whose
temperatures were independently controlled to provide a uniform temperature profile
throughout the catalyst zone. The catalyst bed zone consisted of the central 30.5 cm of the
reactor. 152 cm3 of either catalyst was loaded in the catalyst zone. The preheat and the
postheat zones were filled with 3.2 mm alundum (a-alumina beads) to ensure efficient
contacting and distribution of hydrogen and liquid feeds. The hydrotreating experiments were
conducted in a fixed-bed reactor which was operated in the upflow mode to maintain
isothermal conditions and to ensure complete wetting of the catalyst.
After catalyst sulfiding was complete oil was fed over the catalyst at the base case
conditions while the catalyst attained a pseudo-steady state activity. The base case conditions
were a temperature of 642 K, a LHSV of 0.41 h-l and a pressure of 13.7 m a . After the
catalysts had attained pseudo steady state activities process variable studies were conducted in
which reactor temperature, space velocity and total reactor pressure were varied. The studies
were conducted in a random, cyclic mode in which a process variable material balance was
followed by a base case material balance. This method of operation permitted the
determination of the extent of catalyst deactivation with time on stream. The process operating
conditions are presented in Table 79. The hydrotreater system and experimental procedures
have been described in detail by Kim (243).
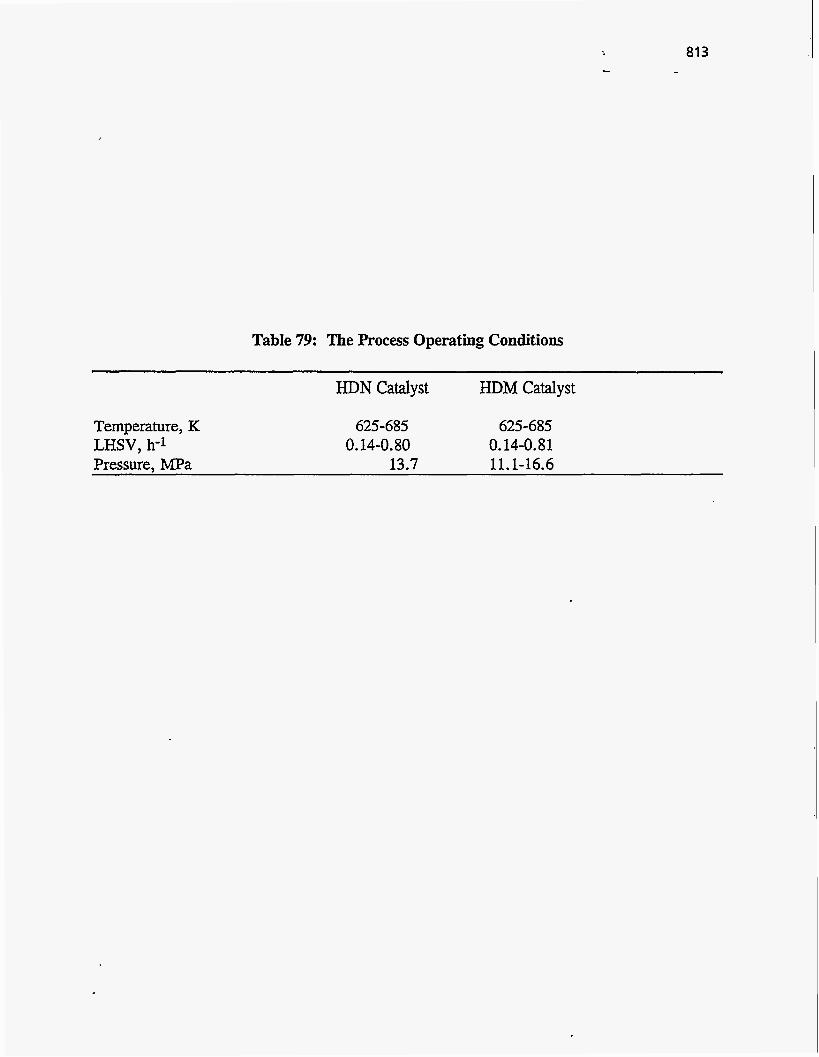
I
Table 79: The Process Operating Conditions
HDN Catalyst HDM Catalyst
Temperature, K 625-685 625-685 LHSV, h-1 0.14-0.80 0.14-0.81 Pressure, MPa 13.7 11.1-16.6
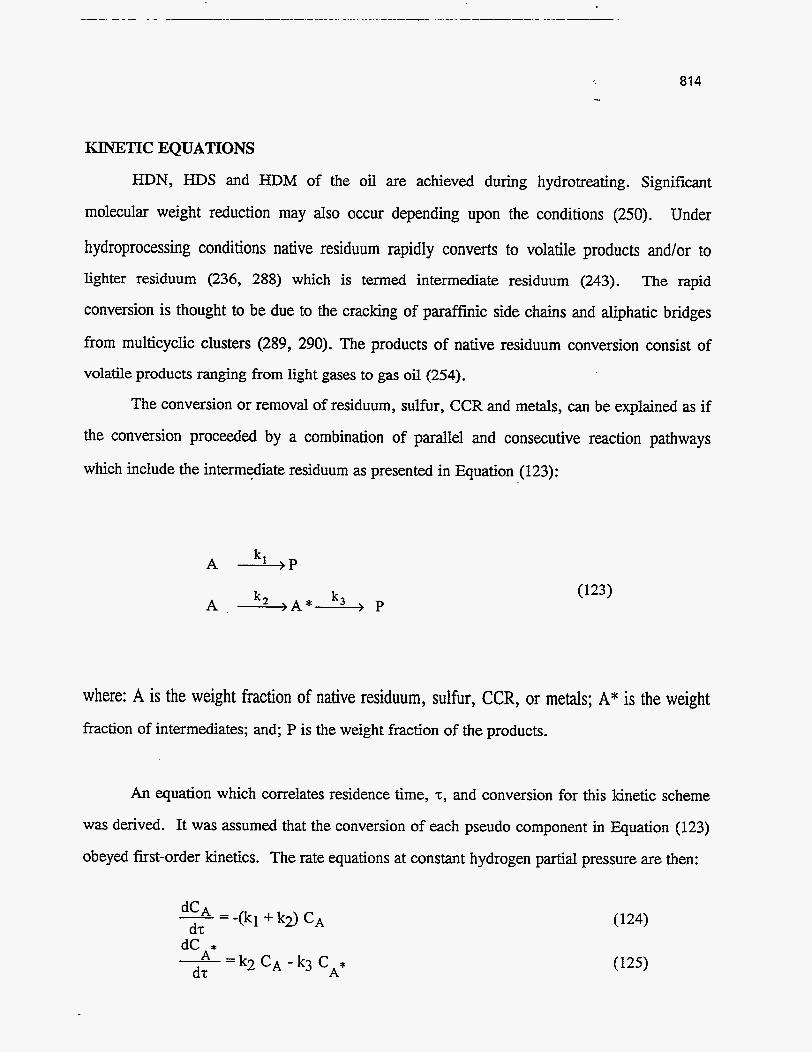
814
KINETIC EQUATIONS
HDN, HDS and HDM of the oil are achieved during hydrotreating. Significant
molecular weight reduction may also occur depending upon the conditions (250). Under
hydroprocessing conditions native residuum rapidly converts to volatile products and/or to
lighter residuum (236, 288) which is termed intermediate residuum (243). The rapid
conversion is thought to be due to the cracking of paraffiiic side chains and aliphatic bridges
from multicyclic clusters (289, 290). The products of native residuum conversion consist of
volatile products ranging from light gases to gas oil (254).
The conversion or removal of residuum, sulfur, CCR and metals, can be explained as if
the conversion proceeded by a combination of parallel and consecutive reaction pathways
which include the intermediate residuum as presented in Equation (123):
where: A is the weight fraction of native residuum, sulfur, CCR, or metals; A* is the weight fraction of intermediates; and; P is the weight fraction of the products.
An equation which correlates residence time, z, and conversion for this kinetic scheme
was derived. It was assumed that the conversion of each pseudo component in Equation (123)
obeyed first-order kinetics. The rate equations at constant hydrogen partial pressure are then:
-- dCA - -(kl + k2) CA ds
where kl, k2 and k3 are the apparent rate constants for each step; CA, CA* and Cp are the
weight percentages of A, A* and P at T; respectively, and T is the reciprocal LHSV.
The solution for the native species A from Equation (124) is as follows:
where C A ~ is the weight fraction of the native species A in the feed. Classification of residuum and other lumps into native and intermediate portions is
based on kinetics only and is not based on the results of an analytical test. The intermediate
portion of the lump, A*, is not present in the feed.
The initial condition for A* is therefore given by the following:
@=O: CA* = o
Equation (127) for CA (native species A) can be substituted into Equation (125). Integration of
Equation (125) with the initial condition given in Equation (128) yields:
A new equation for fractional conversion, XA, can be obtained by combining
Equations (127) and (129):

816 ...
The objective of bitumen hydrotreating is to reduce the total amount of each lump which
consists of the sum of both native and intermediate portions.
Because A*, the intermediate portion of the lump, cannot be measured there is no
differentiation between A and A* in the liquid product. The fractional conversion of the total
lump is therefore defined as the conversion of both A and A* to products:
Certain lumps, such as nitrogen, do not follow parallel-consecutive kinetics, but follow
pseudo nth order kinetics instead. The parallel-consecutive kinetic model may reflect the actual
conversion pathways which occur. On the other hand, pseudo nth order kinetics are purely
correlative. Thus the rate of bitumen HDN can be described by a power rate law equation:
1= dC* -k'C, n P PH d'I: 2
where i represents reacting component; 'I: is the reciprocal LHSV or WHSV; k' is the apparent rate constant; C; is the concentration of species i; PH is the hydrogen partial pressure; n is the
2
pseudo reaction order and p is the reaction order with respect to hydrogen partial pressure. When the total system pressure was held constant PH was also assumed to be constant and the
2
pressure term was incorporated into an apparent overall rate constant. Thus equation (132) can
be simplified to give:
where k=k'PP : For nth-order kinetics, the solution is as follows: H2
817 -. ...
(134) 1 n -1 (C:-” - C$)(-) = kz for n#l
, where Ci,o is the feed concentration; and Ci is the product concentration.
Equation (133) can be rearranged in terms of the fractional conversion of i, X; to give:
the fractional conversion of i, Xi, is defined as follows:
the value of n is determined by non-linear regression or by plots of ‘I: versus of f(x) where f(x) is
the left hand side of Equation (132).
The solution for first order kinetics (n=l) is as follows:
Equation (137) can be rearranged in terms of the fiactional conversion of i, Xl:
-ln(l-Xl) = kz (138)
Pseudo nth order kinetics are used when the reaction order is equal to or less than two because
pseudo second order kinetics generally represent the practical limit of pseudo nth order kinetics
(291). This is because the presence of unreactive components in the lumped quantity will
increase the apparent reaction order up to, but not beyond, two (291).
818
RESULTS AND DISCUSSION
The effect of temperature, space velocity and total system pressure on the upgrading of
the PR Spring bitumen was investigated over the hydrodenitrogenation (HDN) catalyst and the
hydrodemetallation (HDM) catalyst. The primary process variables investigated in this
research were LHSV, reactor temperature and hydrogen partial pressure. Only two process
variables, LHSV and temperature, were investigated over the HDN catalyst because the HDN
catalyst deactivated before the effect of pressure could be studied. The results of the HDN and
HDM catalyst studies have been reported by Kim (243).
Reaction Orders
Reaction orders can be broadly defined to include both apparent reaction orders and
This definition includes pseudo nth order kinetics and the
The reaction orders are determined by varying the
apparent reaction pathways.
consecutive parallel reaction model.
residence time at constant temperature and pressure.
Nitrogen Removal
Reaction order, n, was determined by fitting Equations (135) and (138) to the data for
nitrogen removal over the HDN and HDM catalysts. A plot of the left hand side of Equation
(135), f(x); with respect to reciprocal LHSV, z, is presented in Figure 238 for an apparent
reaction order of 1.5 which gave the best fit of the measured data over the HDN catalyst.
Nitrogen conversion over the HDM catalyst did not exhibit pseudo 1.5 order kinetics as
it did with the HDN catalyst. When the negative natural log of the fraction of nitrogen
remaining in the liquid product was plotted with respect to reciprocal LHSV (Figure 239) the
data plotted as a straight line because nitrogen conversion was first order.
Ho and Ans (291) suggested that reaction orders greater than unity are observed when
a lumped component consists of many individual components which exhibit a distribution of
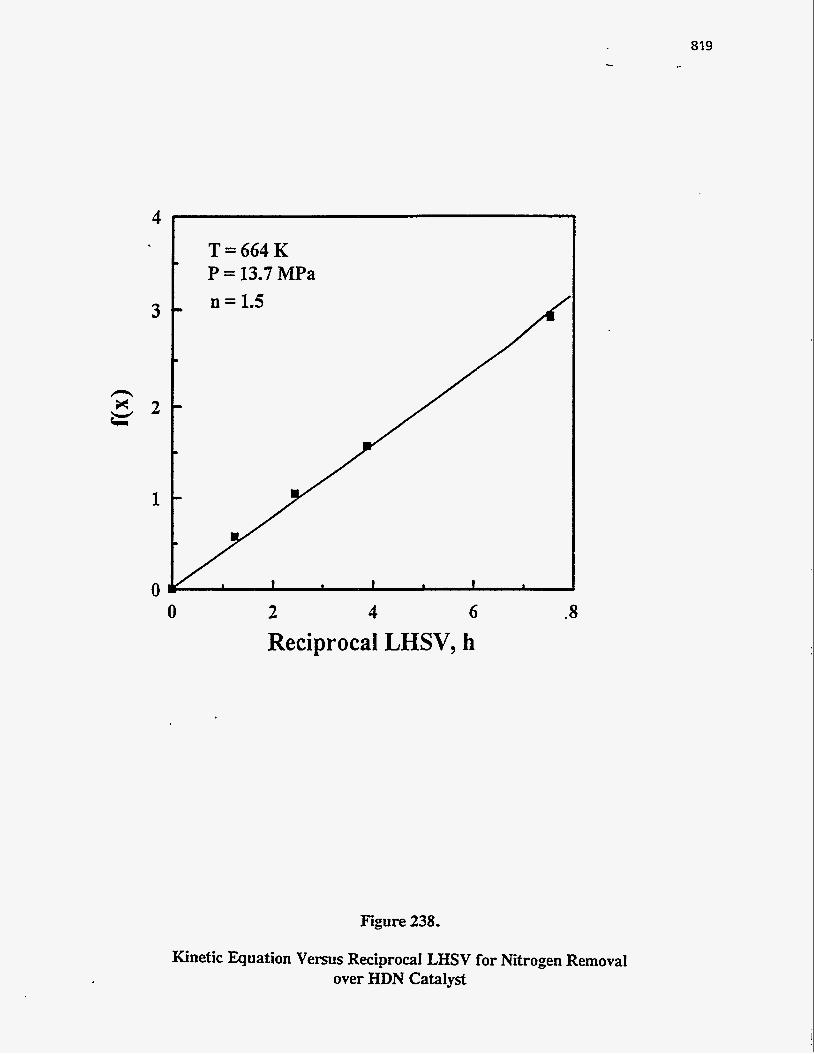
819 I.
4
3
1
0
T=664K P = 13.7 MPa
0
n = 1.5
2 4 6 Reciprocal LHSV, h
Figure 238.
.8
Kinetic Equation Versus Reciprocal LHSV for Nitrogen Removal over HDN Catalyst
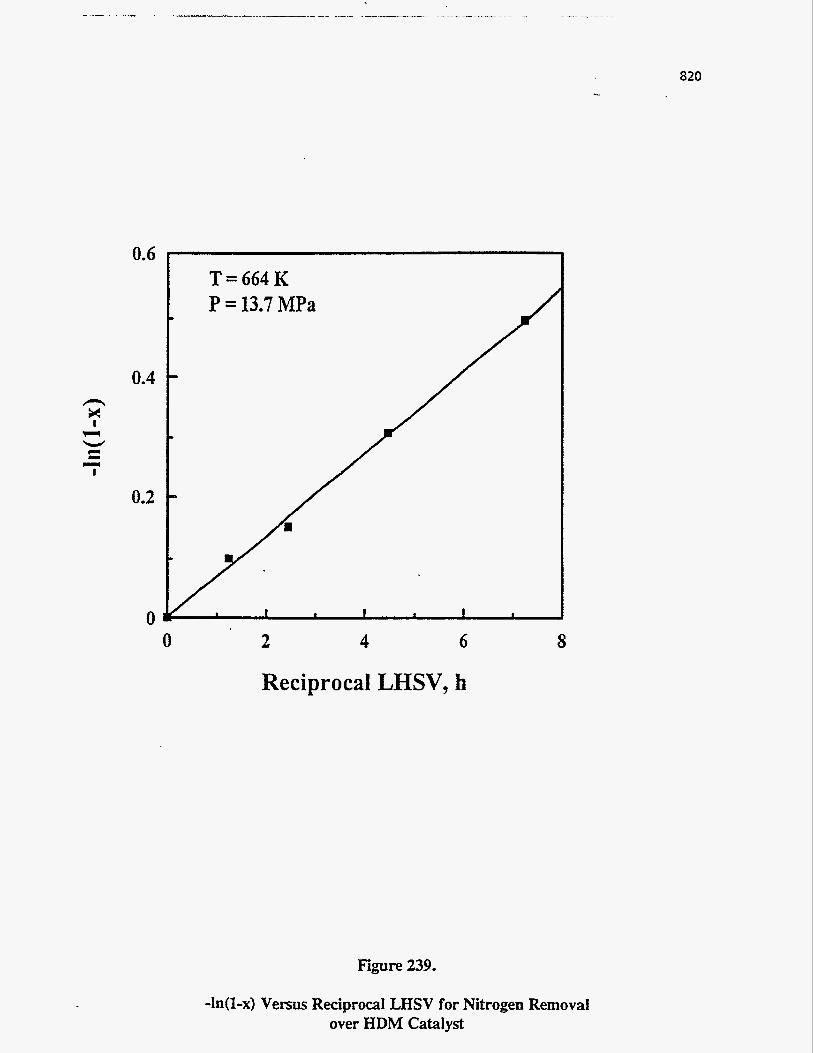
820
0.6
0.4
0.2
0 ’
T=664K
0 2 4 6 8
Reciprocal LHSV, h
Figure 239.
-h(l-x) Versus Reciprocal LHSV for Nitrogen Removal over HDM Catalyst
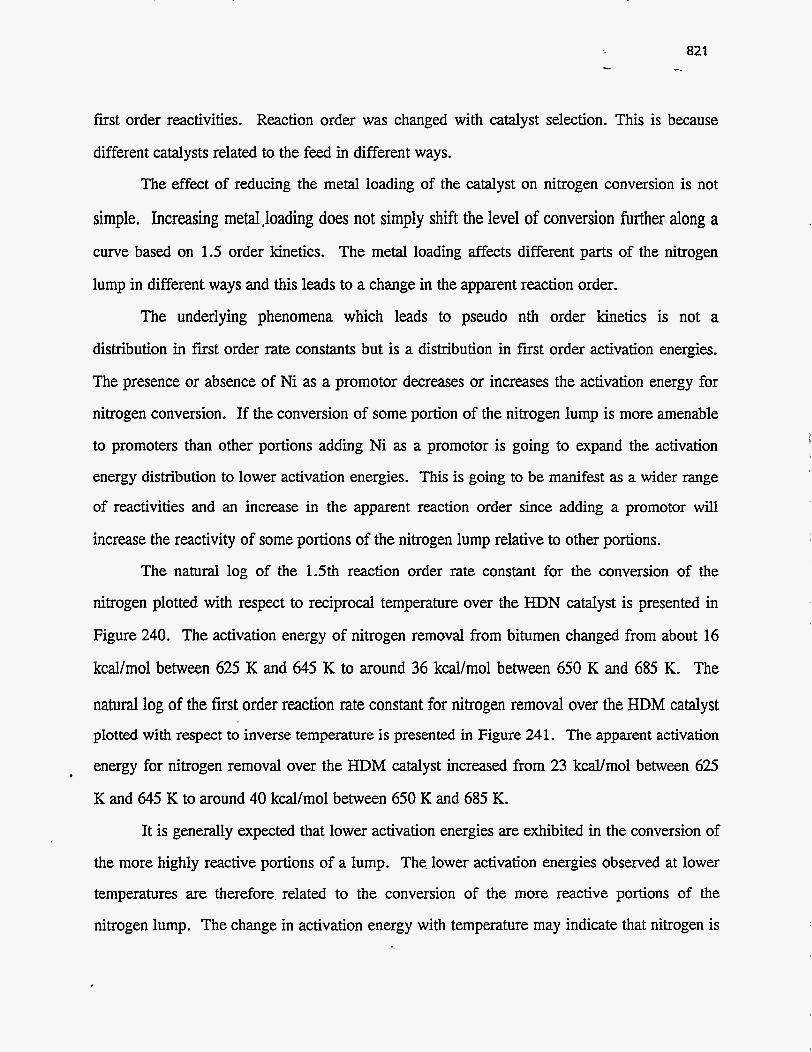
first order reactivities. Reaction order was changed with catalyst selection. This is because
different catalysts related to the feed in different ways.
The effect of reducing the metal loading of the catalyst on nitrogen conversion is not
simple. Increasing metal’loading does not simply shift the level of conversion further dong a curve based on 1.5 order kinetics. The metal loading affects different parts of the nitrogen
lump in different ways and this leads to a change in the apparent reaction order.
The underlying phenomena which leads to pseudo nth order kinetics is not a
distribution in ftrst order rate constants but is a distribution in first order activation energies.
The presence or absence of Ni as a promotor decreases or increases the activation energy for
nitrogen conversion. If the conversion of some portion of the nitrogen lump is more amenable
to promoters than other portions adding Ni as a promotor is going to expand the activation
energy distribution to lower activation energies. This is going to be manifest as a wider range
of reactivities and an increase in the apparent reaction order since adding a promotor will
increase the reactivity of some portions of the nitrogen lump relative to other portions.
The natural log of the 1.5th reaction order rate constant for the conversion of the
nitrogen plotted with respect to reciprocal temperature over the HDN catalyst is presented in
Figure 240. The activation energy of nitrogen removal from bitumen changed from about 16
kcal/mol between 625 K and 645 K to around 36 kcal/mol between 650 K and 685 K. The
natural log of the first order reaction rate constant for nitrogen removal over the HDM catalyst
plotted with respect to inverse temperature is presented in Figure 241. The apparent activation
energy for nitrogen removal over the HDM catalyst increased from 23 kcal/mol between 625
K and 645 K to around 40 kcal/mol between 650 K and 685 K.
It is generally expected that lower activation energies are exhibited in the conversion of
the more highly reactive portions of a lump. The. lower activation energies observed at lower
temperatures are therefore, related to the conversion of the more reactive portions of the
nitrogen lump. The change in activation energy with temperature may indicate that nitrogen is
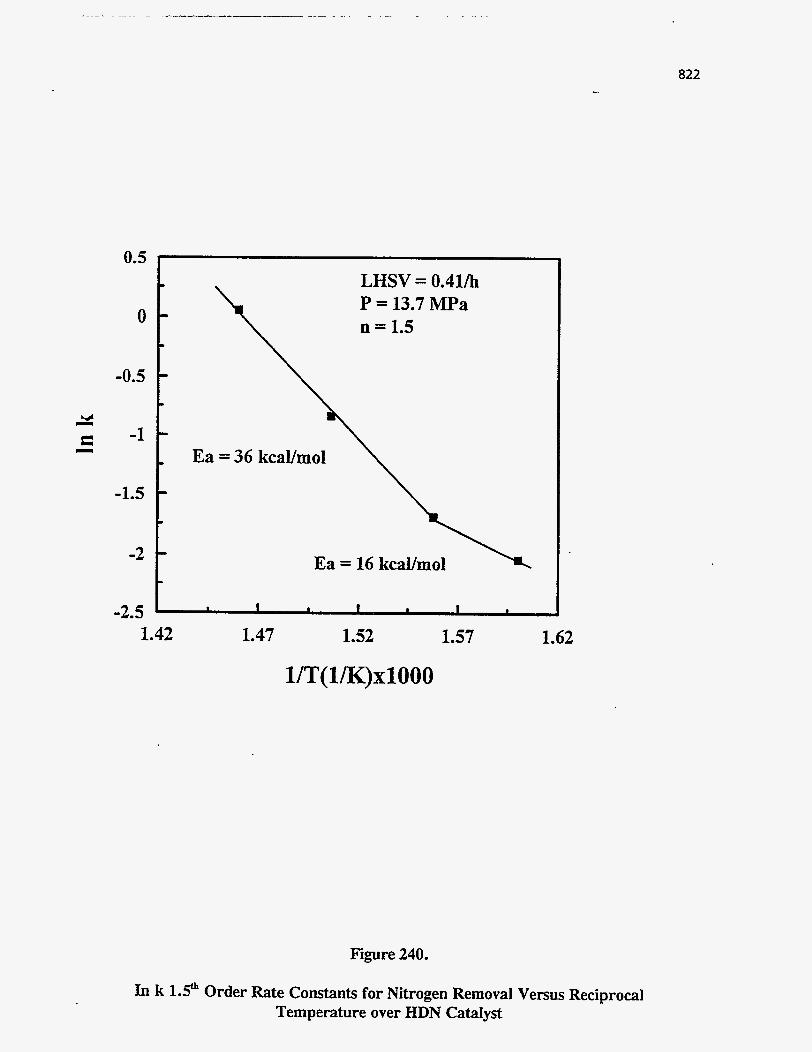
0.5
0
-0.5
-1.5
-2
-2.5
Ea = 16 kcaYmol
1.42 1.47 1.52 1.57 1.62
l/T(l/K)xlOOO
Figure 240.
822
LHSV = 0.41/h P = 13.7 MPa n = 1.5
-1 Ea = 36 kcaYmol
In k 1.9 Order Rate Constants for Nitrogen Removal Versus Reciprocal Temperature over HDN Catalyst
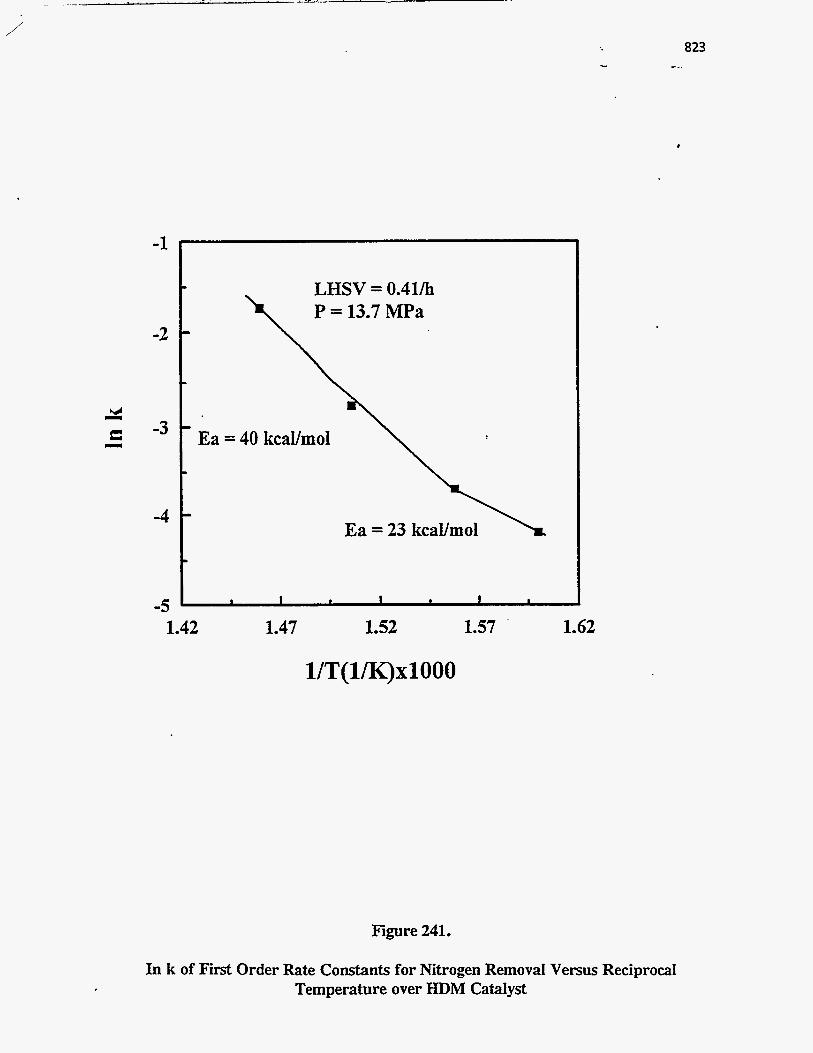
/ ...
-1
-2
2 - E -3
-4
-5
823 -__
- LHSV = 0.41h P = 13.7 MPa -
-
- Ea = 40 kcaVmo1 m
- .
4 I * I * I *
Ea = 23 kcaVmol \ 1.42 1.47 1.52 1.57 1.62
l/T(l/K)x1000
Figure 241.
In k of First Order Rate Constants for Nitrogen Removal Versus Reciprocal Temperature over HDM Catalyst
,
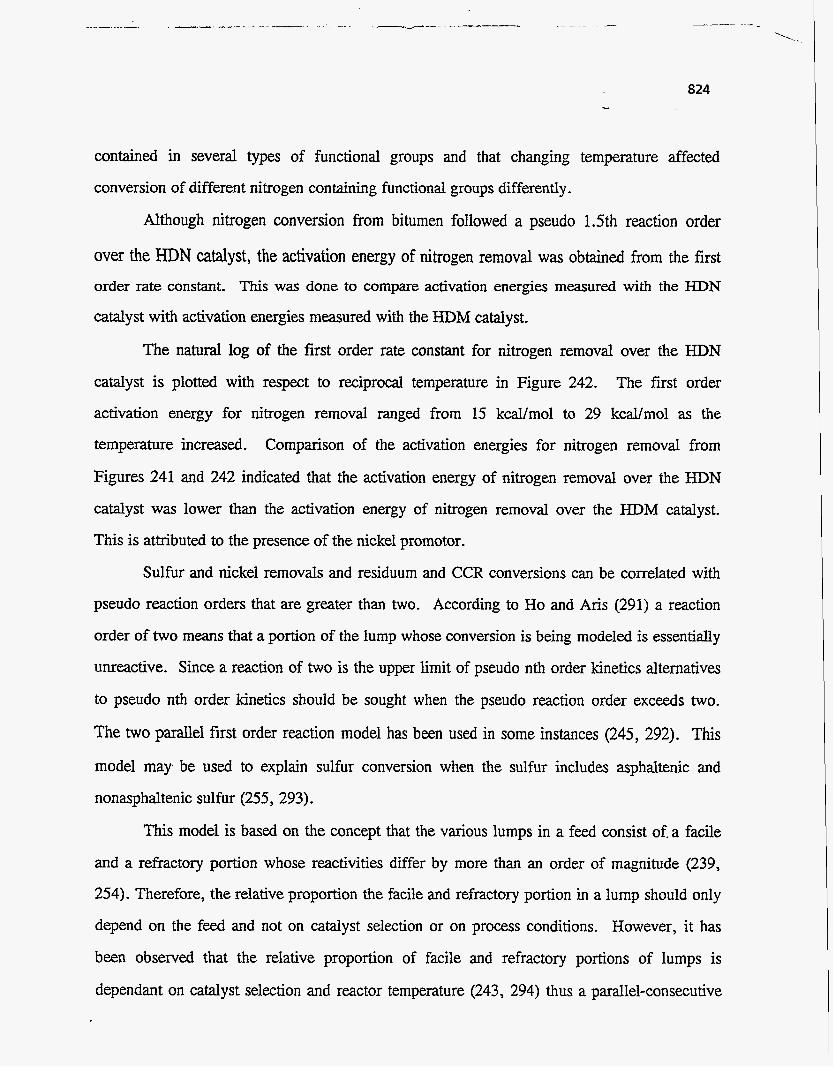
824
contained in several types of functional groups and that changing temperature affected
conversion of different nitrogen containing functional groups differently.
Although nitrogen conversion from bitumen followed a pseudo 1.5th reaction order
over the HDN catalyst, the activation energy of nitrogen removal was obtained from the first
order rate constant. This was done to compare activation energies measured with the HDN
catalyst with activation energies measured with the HDM catalyst.
The natural log of the first order rate constant for nitrogen removal over the HDN
catalyst is plotted with respect to reciprocal temperature in Figure 242. The first order
activation energy for nitrogen removal ranged from 15 kcal/mol to 29 kcal/mol as the
temperature increased. Comparison of the activation energies for nitrogen removal from
Figures 241 and 242 indicated that the activation energy of nitrogen removal over the HDN
catalyst was lower than the activation energy of nitrogen removal over the HDM catalyst.
This is attributed to the presence of the nickel promotor.
Sulfur and nickel removals and residuum and CCR conversions can be correlated with
pseudo reaction orders that are greater than two. According to Ho and Aris (291) a reaction
order of two means that a portion of the lump whose conversion is being modeled is essentially
unreactive. Since a reaction of two is the upper limit of pseudo nth order kinetics alternatives
to pseudo nth order kinetics should be sought when the pseudo reaction order exceeds two.
The two parallel first order reaction model has been used in some instances (245, 292). This
model may be used to explain sulfur conversion when the sulfur includes asphaltenic and
nonasphaltenic sulfur (255, 293).
This model is based on the concept that the various lumps in a feed consist of. a facile
and a refractory portion whose reactivities differ by more than an order of magnitude (239,
254). Therefore, the relative proportion the facile and refractory portion in a lump should only
depend on the feed and not on catalyst selection or on process conditions. However, it has
been observed that the relative proportion of facile and refractory portions of lumps is
dependant on catalyst selection and reactor temperature (243, 294) thus a parallel-consecutive
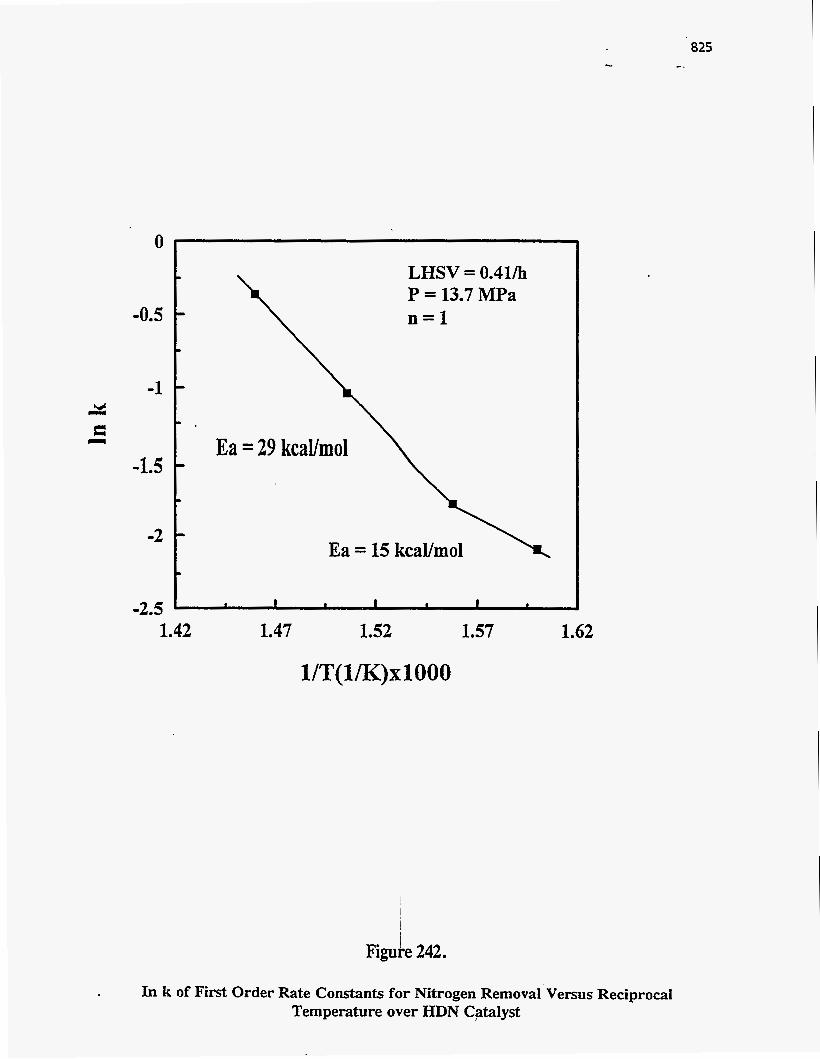
825 -.
U
0
-0.5
-1
-1.5
-2
-2.5
\ LHSV = 0.41h
Ea
P = 13.7 MPa
Ea = 15 kcaYmoI
I I I I I I 9
1.42 1.47 1.52 1.57
l/T(l/K)xl000
1.62
Figure 242.
. In k of First Order Rate Constants for Nitrogen Removal Versus Reciprocal Temperature over HDN Catalyst
reaction model was used in place of the two parallel first order reaction model presented in
Equation 123.
Residuum Conversion
First order rate constants for the parallel-consecutive reaction model were determined
using nonlinear regression. The plot of the remaining fraction versus reciprocal LHSV for
residuum conversion over the HDN and HDM catalysts is displayed in Figure 243. The rate
constants of the parallel-consecutive reaction model for residuum conversion are presented in
Table 80. In Table 80, kl represents the direct conversion of the native portion of the lump to
products, k2 represents the conversion of the native portion of the lump to intermediates and k3
represents the conversion of intermediates to products.
It is clear from the relative magnitudes of kl, k2 and k3 for residuum conversion that
native residuum is much more reactive than intermediate residuum. Native residuum is
quickly converted to intermediate residuum and to volatile products. Intermediate residuum is
only slowly converted to volatile products. The low reactivity attributed to intermediate
residuum agrees with the observation that product gas oil derived from residuum conversion is
less reactive for cracking than native gas oil (254), Le., intermediates are less reactive than
feed moieties.
It is presumed that the conversion of native residuum consists principally of cleaving
side chains from polycyclic clusters. The cleaved side chain will then be in the boiling range
of volatile .products. The polycyclic cluster will be classified as intermediate residuum or
volatile product depending on its molecular weight and polarity (295). The feedstock did not
contain any intermediate residuum. The ratio kl/(kl+kd measures the fraction of residuum
directly converted to products because residuum either converted directly to volatile products (k1) or to less reactive intermediates (kd. The fraction of the native residuum which was
directly converted to products over the HDN and the HDM catalysts was about 0.15 and 0.20.
This means that the majority of the residuum was only slowly converted to volatile products
through intermediates.
... 827
-.,
1
0.8
0.6
0.4
0.2
0 0
T =664K P =13.7MPa
2 4 6
Reciprocal LHSV, h 8
HDM Catalyst
HDN Catalyst
Calculated
Figure 243.
Remaining Fraction of Residuum Conversion Versus Reciprocal LHSV from Parallel-Consecutive Reaction Model
over HDN and HDM CataIysts
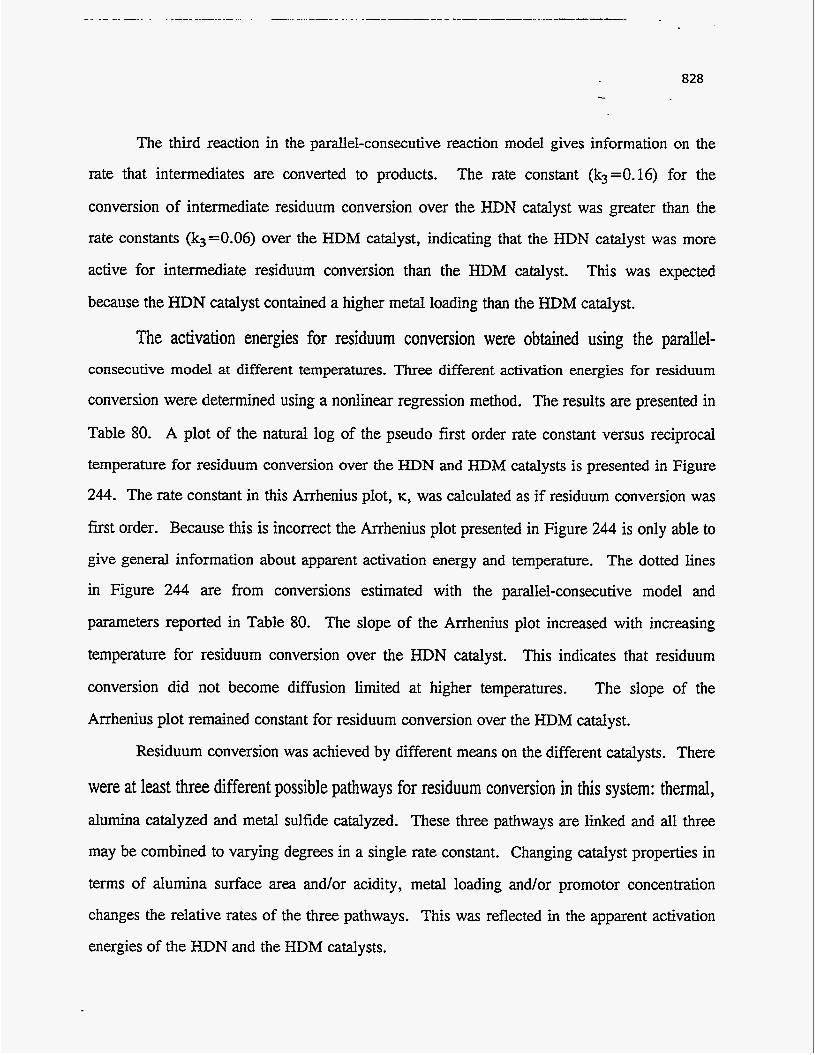
The third reaction in the parallel-consecutive reaction model gives information on the
The rate constant (k3=0.16) for the rate that intermediates are converted to products.
conversion of intermediate residuum conversion over the HDN catalyst was greater than the
rate constants (k3=0.06) over the HDM catalyst, indicating that the HDN catalyst was more
active for intermediate residuum conversion than the HDM catalyst. This was expected
because the HDN catalyst contained a higher metal loading than the HDM catalyst.
The activation energies for residuum conversion were obtained using the parallel- consecutive model at different temperatures. Three different activation energies for residuum
conversion were determined using a nonlinear regression method. The results are presented in
Table 80. A plot of the natural log of the pseudo first order rate constant versus reciprocal
temperature for residuum conversion over the HDN and HDM catalysts is presented in Figure
244. The rate constant in this Arrhenius plot, K, was calculated as if residuum conversion was
first order. Because this is incorrect the Arrhenius plot presented in Figure 244 is only able to
give general information about apparent activation energy and temperature. The dotted lines
in Figure 244 are from conversions estimated with the parallel-consecutive model and
parameters reported in Table 80. The slope of the Arrhenius plot increased with increasing
temperature for residuum conversion over the HDN catalyst. This indicates that residuum
conversion did not become diffusion limited at higher temperatures. The slope of the
Arrhenius plot remained constant for residuum conversion over the HDM catalyst.
Residuum conversion was achieved by different means on the different catalysts. There
were at least three different possible pathways for residuum conversion in this system: thermal, alumina catalyzed and metal sulfide catalyzed. These three pathways are linked and all three
may be combined to varying degrees in a single rate constant. Changing catalyst properties in
terms of alumina surface area and/or acidity, metal loading and/or promotor concentration
changes the relative rates of the three pathways. This was reflected in the apparent activation
energies of the HDN and the HDM catalysts.
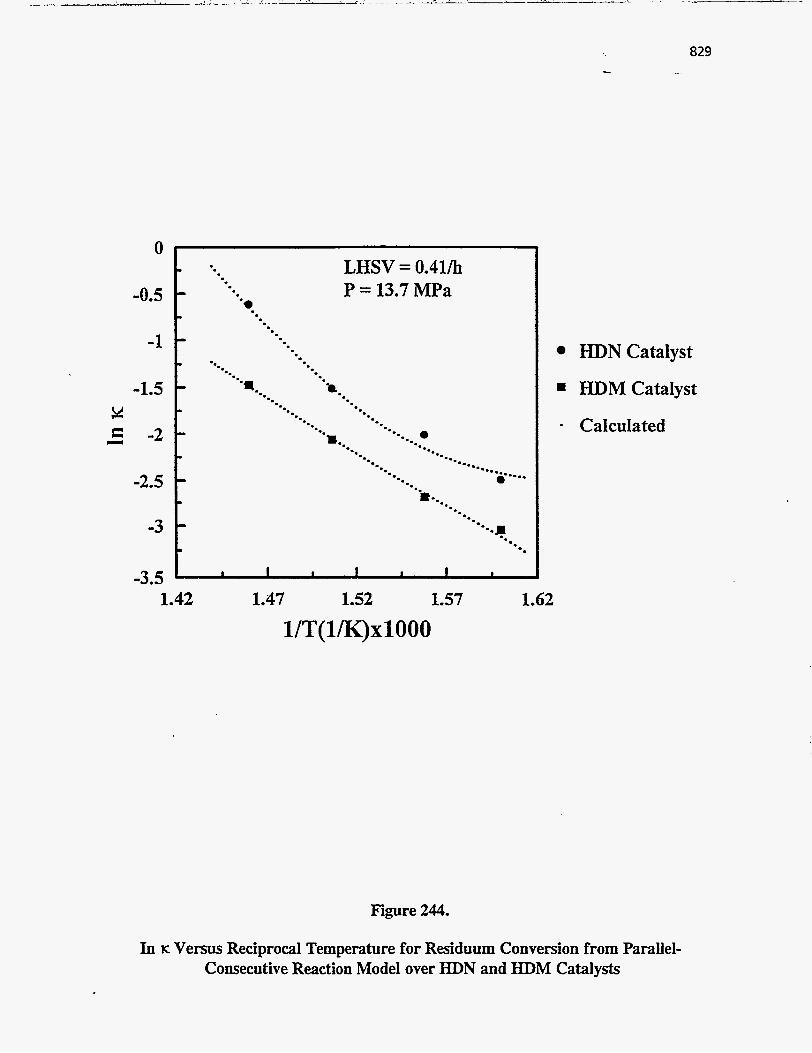
829 .. . -
LHSV = 0.41/h P = 13.7 MPa
'e
-3.5 ' I I I I I I I
1.42 1.47 1.52 1.57 1.62
l/T(l/K)x1000
HDN Catalyst . HDM Catalyst
- Calculated
Figure 244.
In K Versus Reciprocal Temperature for Residuum Conversion from Parallel- Consecutive Reaction Model over HDN and HDM Catalysts

Table 80: Kinetic Parameters from Parallel-Consecutive Reaction Model
Residuum Sulfur Nickel CCR
HDN Catalyst k101-9 1.92 0.72 k2@-9 10.9 0.47 k301-9 0.16 0.04 k1/fi2+k3> 0.15 0.61 E1 (kd/mol) 8 21 Q(kcallmo1) 10 11 %(kcal/mol) 46 2
1.25 0.58 0.55 0.58 0.07 0.10 0.69 0.50
11 21 2 21 3 43
HDM Catalyst k101-9 0.28 0.55 2.55 0.72 k2m-l) 1.13 0.74 8.79 1.45 k3(h-') 0.06 0.07 0.10 0.06 k1/@2+k3) 0.20 0.43 0.23 0.33 El ( k d m o l ) 20 35 15 11 %@&mol) 1 29 3 1 E3(kd/mol) 34 1 10 23
Residuum conversion activation energies for k,, k2, and k3 over the HDN catalyst were
8 kcal/mol, 10 kcal/mol and 46 kcal/mol; respectively, and the apparent activation energies for
kl, k2, and k3 over the HDM catalyst were 20 kcal/mol, 1 kcal/mol and 34 kcal/mol;
respectively. Because the rate constants for the conversion of the native residuum were so
high kinetic parameters associated with the conversion of native residuum have wider margins
of error, than kinetic parameters for the conversion of intermediate residuum. The apparent
activation energy for the direct conversion of native residuum over the HDM catalyst was 20
kcal/mol. The activation energy for the conversion of native residuum to intermediate
residuum over the HDM catalyst was 1 kcal/mol. This difference explains why increasing
temperature significantly favors conversion of the native residuum through the direct pathway.
The difference between the activation energies for the direct and indirect conversion of native
residuum over the HDN catalyst was smaller indicating that temperature did not significantly
affect whether or not the native residuum converted by the direct or the indirect pathway.
The activation energy for intermediate residuum conversion over the HDN catalyst was
46 kcal/mol over the HDN catalyst and 34 kcal/mol for the HDM catalyst. It is expected that
in the competition between thermal and catalytic contributions in a conversion mechanism for a
given lump, increasing catalytic activity will result in a decrease in the activation energy for
the conversion of the lump. The opposite has occurred in that the activation energy observed
with the high metal loading HDN catalyst is higher than it is with the lower metal content
HDM catalyst. Heavy oil conversion is extremely complicated and it is unlikely that a simple
model can be developed that will reflect the actual mechanisms that are occurring. However,
kinetic model development consists of presenting and verifying models. Models which are not
verified by data are useful in that they may suggest new experiments or improvements in the
model (296). In this process there is a continuum between a purely correlative model such as
a polynomial and a very complicated model based on physical principles. The parallel-
consecutive model is better at correlating data than the two parallel first order reaction model
and pseudo nth order reaction model. This is because it accounts for the direct vs. indirect
832
conversion of native resi’duum with different catalysts. However, it still does not reflect the
intrinsic chemistry of residuum conversion.
Sulfur Removal
Removal of heteroatoms and metal compounds may involve several intermediate steps
before heteroatom and metal compounds are completely removed as NH3, H2S or metal
sulfides (297, 298). Heteroatom and metal removal may also be sterically hindered during
hydrotreating because of the complexity of bitumen (299).
The plots of the fraction remaining versus reciprocal LHSV for sulfur removal over the
HDN and HDM catalysts are presented in Figure 245. The rate constants for the parallel-
consecutive model for sulfur removal are presented in Table 80. The ratios kl/(kl+k2) for the
direct sulfur removal route over the HDN and HDM catalysts were 0.61 and 0.43,
respectively. The rate constant (k3=0.04) for the conversion of the intermediate sulfur over
the HDN catalyst was lower than that for the HDM catalyst (k3=0.07). Although the data is
well correlated by the parallel-consecutive model the conclusion that the HDN catalyst was less
active than the HDM catalyst for intermediate sulfur conversion is implausible. It is apparent
from Figure 245 that sulfur conversion is initially rapid with both catalysts and that the more
active HDN catalyst reaches a kinetic barrier between about 60 and 65 % sulfur conversion.
Very little additional sulfur conversion was achieved beyond this barrier. It appears that 35-
40% of the sulfur in the high asphaltene PR Spring bitumen was so unreactive that further
conversion was extremely slow. Sulfur conversion kinetics for other Uinta Basin bitumens that
exhibit lower asphaltene contents than the PR Spring bitumen did not exhibit a kinetic barrier
that was as severe as that for the higher asphaltene PR Spring bitumen (245, 294). Because
the HDM catalyst was less active than the HDN catalyst sulfur conversion over the HDM
catalyst did not encounter the kinetic barrier that was observed with the HDM catalyst. Thus
the activity of the HDM catalyst appeared to be higher than that of the HDN catalyst for the
conversion of intermediate sulfur. This higher apparent activity was related to the fact that the
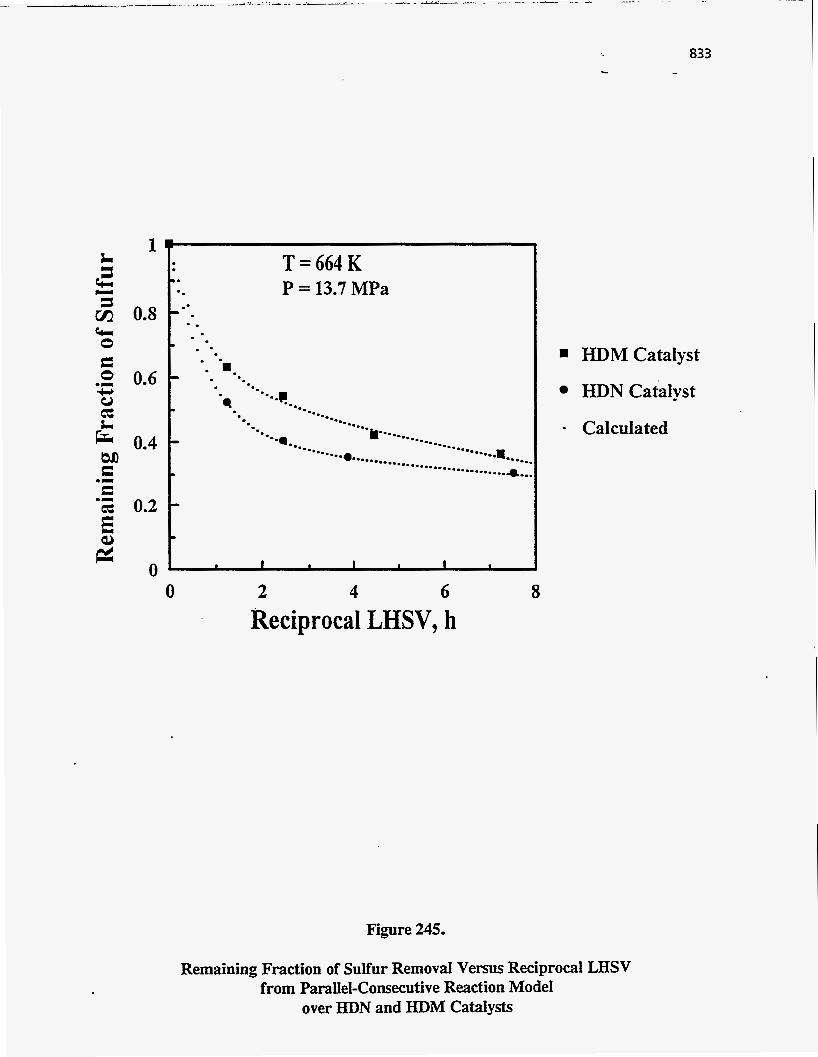
1
0.8
0.6
0.4
0.2
0 0
'. .. -. . - I .
I =- . . .
T = 664 K P = 13.7 MPa
-. --.+ -.. -.. e..
-.. .. -. -. 1.1.
h-....... a.
4
.. a... ......... ......... --r...... ......... ........... *.., ............. e.
2 4 6 Reciprocal LHSV, h
8
HDM Catalyst
HDN Catalyst
Calculated
Figure 245.
Remaining Fraction of Sulfur Removal Versus Reciprocal LHSV from Parallel-Consecutive Reaction Model
over HDN and HDM Catalysts
834
sulfur conversion over the HDM catalyst was not high enough to approach the kinetic barrier
within the range of experimental conditions investigated in these studies. This observation
suggests that if more data was available the parallel-consecutive model could be hybridized
with the two parallel first order reaction model. The hybridized model would account for the
presence of unreactive sulfur in the PR Spring bitumen feed and would also account for the
conversion of the reactive sulfur through direct and indirect pathways.
A second alternative would be to consider a distributed activated energy model (300).
A distributed activation model accounts for a range of first order reactivities within a lump and
that the distribution of reactivities is being driven by a distribution of activation energies. At
higher processing severities and/or with higher activity catalysts further conversion consists of
converting less reactive portions with higher activation energies. A distribution of activation
energies would therefore explain why some activation energies are higher with the HDN
catalyst than with the HDM catalyst. Because the HDN catalyst cuts deeper into the sulfur
lump at low severities, the sulfur that is not converted at low severities exhibits less reactivity
with the HDN catalyst than with the HDM catalyst. At low conversions the portions of the
lump with lower activation energies are converted first. At longer residence times and/or with
higher activity catalysts further conversion consists of converting less reactive portions with
higher activation energies. A distribution of activities would therefore explain why some
activation energies are higher with the HDN catalyst and why the HDN catalyst appears to be
less active than the HDM catalyst at longer residence times.
The plots of the natural log of the apparent first order rate constant for sulfur removal
versus reciprocal temperature over the HDN and HDM catalysts are displayed in Figure 246
and the kinetic parameters of the parallel-consecutive reaction model for sulfur removal are
presented in Table 80. The apparent activation. energy for sulfur removal decreases with
increasing temperature. If the data were truly first order the decreasing slope in the Arrhenius
plot observed with increasing temperature would indicate that diffusion resistance is
significant. The conclusion that diffusion resistance is significant is erroneous for the

835 L -
0
-0.5
-1
' I -1.5
-2
-2.5
-3 1.42
i-.,
LHSV = 0.41h P = 13.7 MPa
1.47 1.52 1.57
1/T( l/K)xlOOO
c
Figure 246.
1.62
HDN Catalyst
HDM Catalyst
Calculated
In K Versus Reciprocal Temperature for Sulfur RemovaI from ParalleI- Consecutive Reaction Model over HDN and HDM Catalysts

following reasons. The apparent diffusion resistance is strongest with the less active HDM
catalyst and it is not observed with other lumps that are at least as reactive as sulfur. The
decreasing slope was an artifact because sulfur conversion kinetics were not simple first order.
The decrease in slope was because the temperature was high enough for the most reactive
sulfur to be conversion but yet high enough for significant conversion of the unreactive sulfur
to occur. It is presumed that if process temperatures were increased to the point that the
unreactive sulfur in the PR Spring bitumen became reactive the Arrhenius plot would begin to
curve up with increasing temperature.
Sulfur conversion O C C U K ~ ~ by a parallel-consecutive mechanism as did residuum
conversion. HDS of bitumen (267) and model compounds (261, 266) have shown that sulfur
can be removed by direct hydrogenolysis of aliphatic and aromatic sulfur (301, 302). HDS
can also occur through a series reaction in which heteroatomic rings are first hydrogenated.
Sulfur removal then occurs through hydrogenolysis of C-S bonds (301, 303). This
combination of intermediate and direct pathways may explain why HDS appeared to proceed
through a parallel-consecutive mechanism. It has also been proposed that sulfur conversion in
heavy oils is partly linked to residuum conversion in that sulfur contained in residuum cannot
be converted until the residuum is converted to lower molecular weight products (245, 292).
Nickel Removal
It has been proposed that metaIs are removed by direct metal abstraction in the presence
of hydrogen and hydrogen sulfide (304). Metals may also be removed in a series reaction in
which metal porphyrins are first hydrogenated and then the metal is removed by
hydrogenolysis (305-307). Feed metal compounds may be changed into intermediate metal
species by the removal of side chains and functional groups that impart steric hinderance.
Nickel removal from the PR Spring bitumen was modeled with the parallel-consecutive
model. The plots of the fraction remaining versus reciprocal LHSV for nickel removal over
the HDN and HDM catalysts are presented in Figure 247. The rate constants of the parallel-

T = 664 K P = 13.7 MPa
0.8
0.6
0.4
.
*a. . 0.
- 0.
-. -. H-. -. -..-
I..
-. - . I..
--.. rn - .. -. . .. e..
-... .. .. -. e. -.. -.. -.
.-.... -
0.2 1 0 -
0 2 4 6
Recitxocal LHSV, h I
Figure 247.
837 -.
HDM Catalyst
HDN Catalyst
- Calculated
8
Remaining Fraction of NickeI Removal Versus Reciprocal LHSV from Parallel-Consecutive Reaction Model
over HDN and HDM Catalysts
838
consecutive model for nickel removal are presented in Table 80. The direct route for nickel removal was the prime conversion pathway over the HDN catalyst (kl/(kl+k=?) = 0.69) and
was significantly less important with the HDM catalyst (k,/(k,+ki) = 0.23). The higher
activity of the HDN catalyst was manifest in favoring direct nickel removal relative to indirect
removal. The rate constant (k3 =0.07) for the conversion of intermediate nickel over the HDN
catalyst was lower than the HDM catalyst (k3=0.10). This is the same phenomena that was
observed with sulfur. It 'was concluded that the consecutive-parallel model is a correlative
model and that nickel and sulfur conversion are more complicated than the mechanism that is
suggested by this model.
The plots of the natural log of the apparent first order rate constant for nickel removal
versus reciprocal temperature over the HDN and HDM catalysts are presented in Figure 248
and the kinetic parameters of the parallel-consecutive reaction model for nickel removal are
presented in Table 80. The activation energy for the conversion of intermediate nickel was as
low as 3 kcal/mol over the HDN catalyst. Generally there is an inverse relationship between
activation energy and the rate constant. This is related to the compensation effect (308-310).
The rate constant for intermediate nickel removal was low over the HDN catalyst. Because of
compensation effect it is expected that low rate constants would be accompanied by high
activation energies. The opposite was observed with intermediate nickel removal. This may
be because the rate constant for intermediate nickel conversion was so low at these conditions
that intermediate nickel conversion was dwarfed by feed nickel conversion when the two were
lumped. It is presumed that if the temperature had been raised intermediate nickel removal
would have become increasingly important relative to native nickel conversion and the
apparent activation energy for intermediate nickel removal would have increased.
The rate constant for intermediate nickel removal over the HDM catalyst was higher
than it was for the HDN catalyst in spite of the higher metal loading of the HDN catalyst.
This suggests that some of the intermediate nickel in the model is actually refractory nickel in
the feed. The same phenomena was also observed with the sulfur and suggests that a more
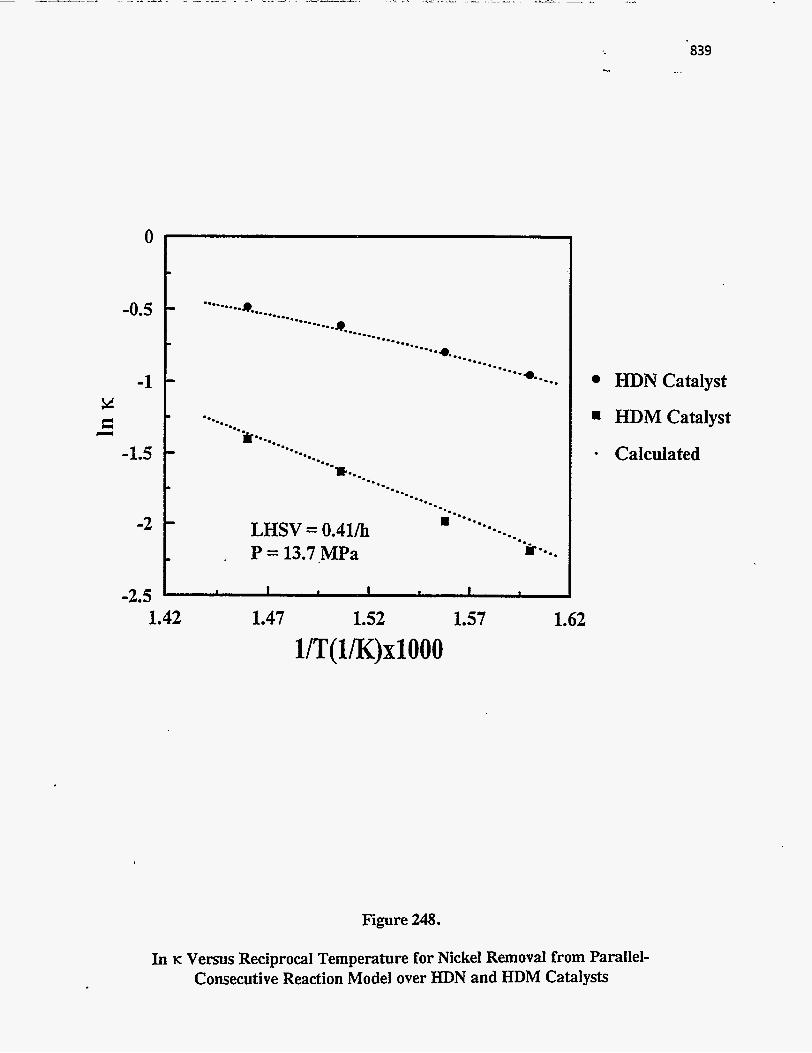
0
-0.5
-1 Y E LI
-1.5
-2
-2.5
-.. .. -. -0 .
+--.... .... -.. a. -0 . -
=.*. -. -. -.. -. -. I-.
.. --. H --.... LHSV = 0.41h -.
P = 13.7 MPa e.
-. a.
- i-. ..
I . I I I I I
1.42 1.47 1.52 UT( 1IK)xlOOO
1.57 1.62
839 -.
HDN Catalyst
HDM Catalyst
Calculated
Figure 248.
In K Versus Reciprocal Temperature for Nickel Removal from Parallel- Consecutive Reaction Model over HDN and HDM Catalysts
840
appropriate model would be a hybrid of the consecutive-parallel and the two parallel first order
reaction model.
Because the HDN catalyst was more active than the HDM catalyst it was able to make
faster progress until it encountered the kinetic barrier provided by the unreactive nickel.
Further progress was extremely slow because of the low reactivity of the remaining nickel.
Nickel removal with the less active HDM catalyst trails nickel removal with the HDN catalyst
at all residence times. Because of this nickel removal over the HDM catalyst did not reach the
kinetic barrier as quickly as the nickel removal with the HDN catalyst. Greater incremental
nickel conversions were observed with the HDM catalyst at long residence times than with the
HDN catalyst. This evidence incorrectly suggests that the HDM catalyst was more active for
removal of intermediate nickel than the HDN catalyst.
Moieties that have been partially processed without actually being converted are less
reactive (3 11). The lower reactivity of the intermediate nickel formed over the HDN catalyst
could be because the HDN catalyst was able to produce deeper conversion of the nickel. A
secondary effect of that higher activity was production of an intermediate nickel which was
less reactive than the intermediate nickel formed over the HDM catalyst.
CCR Conversion
It is known that CCR is reduced by hydrogenation of aromatic rings (intermediate
CCR), followed by hydrogenolysis of the rings (239). Feed CCR may also go through
intermediate CCR by the removal of side chains. Some CCR moieties that are not sterically
hindered may undergo direct catalytic conversion. For this reason, the apparent reaction order
for CCR conversion may be higher than first order. Beaton et al. (239) proposed that the
reduction of CCR did not follow a simple first order reaction, and that the reaction is coupled
thermally and catalytically. The direct conversion of CCR and the consecutive reduction of
CCR via an intermediate route may be illustrated by a parallel-consecutive reaction model.
841
The plots of the fraction remaining versus reciprocal LHSV for CCR conversion over
the HDN and HDM catalysts are presented in Figure 249. The rate constants of the parallel-
consecutive model for CCR conversion are presented in Table 80. The rate constant (k3 =
0.1) for the conversion of intermediate CCR over the HDN catalyst was higher than the
corresponding rate constant over the HDM catalyst (k3 = 0.06). The direct route for CCR
removal over the HDN catalyst (k1/(lc1+k2) = 0.50) was greater than with HDM catalyst
(k1/(k1+k2) = 0.33). The greater proportion of the CCR that was converted through the
faster direct route was the result of the apparently greater activity of the HDN catalyst.
The plots of the natural log of the apparent first order rate constant for CCR conversion
versus reciprocal temperature over the .HDN and HDM catalysts are presented in Figure 250
and the kinetic parameters of the parallel-consecutive reaction model for CCR conversion are
presented in Table 80. The activation energy for the conversion of the native CCR to
intermediate CCR was 1 kcal/mol. This activation energy is unrealistic and does not agree
with values of 22-26 kcal/mol that have been reported for the activation energy of CCR
conversion (294). The consecutive-parallel is a good correlative model but it does not
completely represent the actual mechanism which is occurring. This could also be because the
range of experimental conditions was not broad enough to accurately determine the activation
energy of the faster reactions.
CCR conversion appears to be similar in some respects to residuum conversion in that
the HDM catalyst gave a higher activation energy for intermediate CCR conversion than the
HDN catalyst. The same trend was observed with residuum conversion and was expected due
to the higher catalytic activity of the HDN catalyst. This may be because the reactivities of the
residuum and CCR in the PR Spring bitumen feed are more homogenous than the reactivities
of the sulfur and nickel. Because of this the parallel-consecutive model is a better
representation of residuum and CCR conversion than it is for sulfur and nickel removal.
Conversion of intermediate residuum consisted mainly of hydrogenation of aromatic
rings, followed by C-C bond cleavage. For that reason the higher metal HDN catalyst
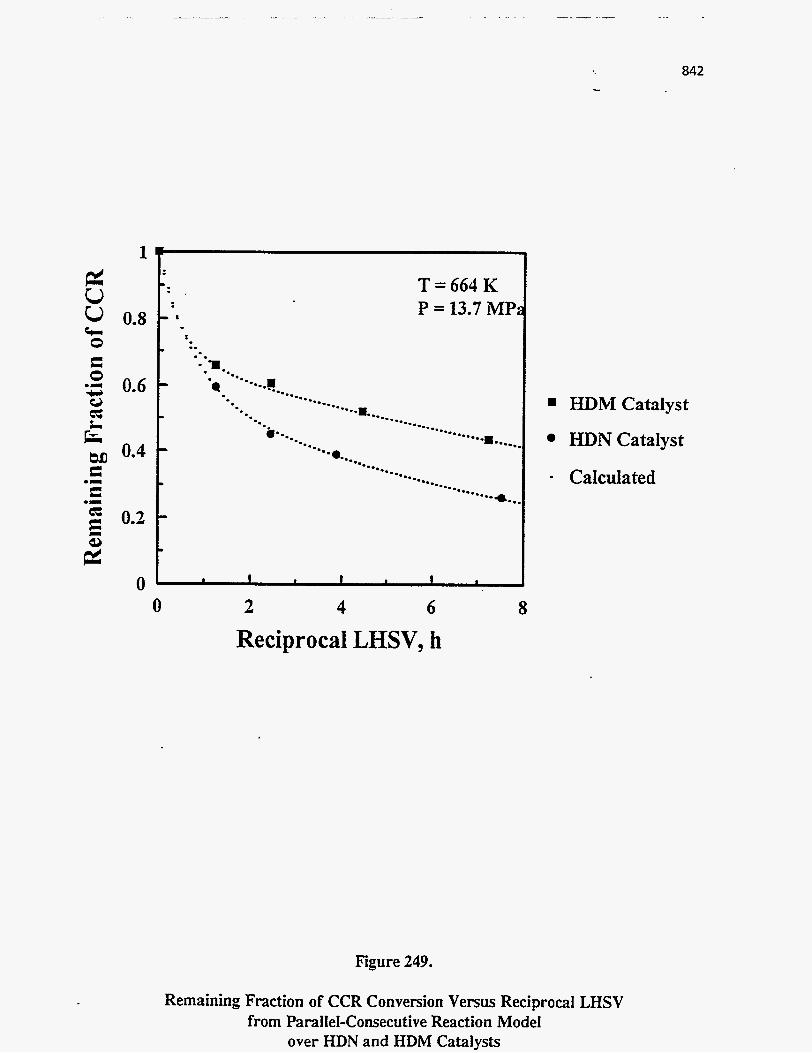
1
0.8
0.6
0.4
0.2
- . T=664K . I P = 13.7 MP
I. I. .. -3.
0 . I I . I . 0 2 4 6
Reciprocal LHSV, h *
Figure 249.
... 842
HDM Catalyst
HDN Catalyst
- Calculated
8
Remaining Fraction of CCR Conversion Versus Reciprocal LHSV from ParaIleI-Consecutive Reaction Model
over HDN and HDM Catalysts
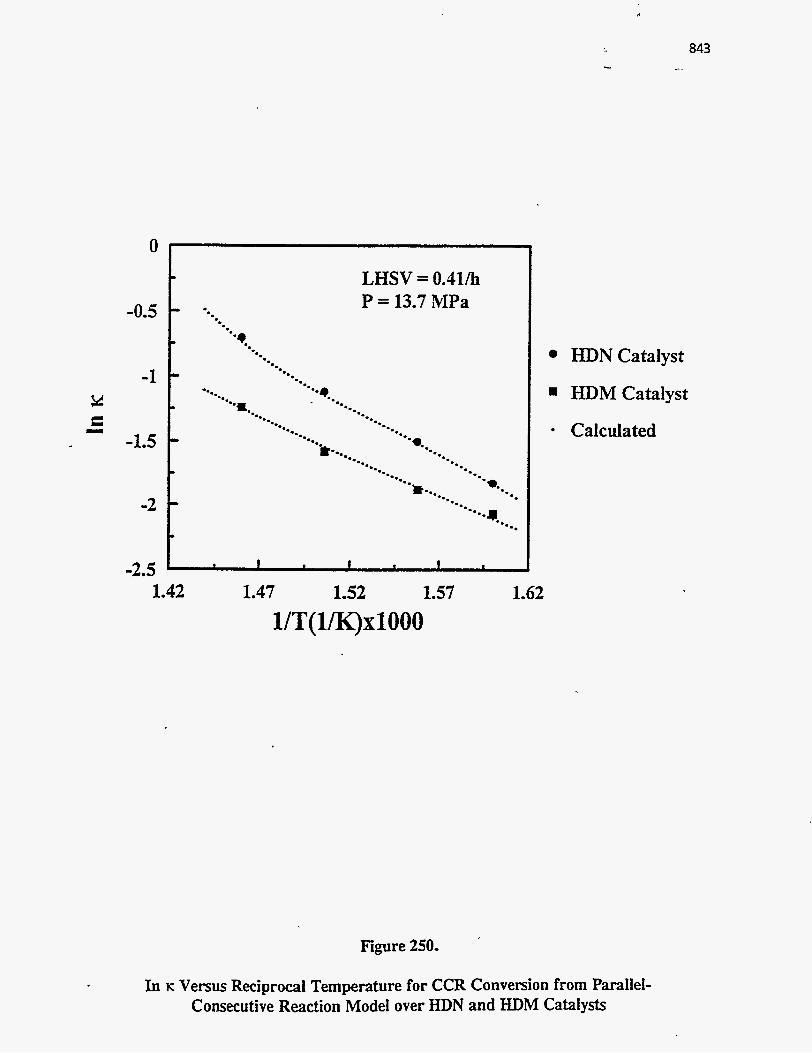
c
843 -.
f R
0
-0.5
-1
-1.5
-2
-2.5
t LHSV = O.Il/h
1.42 1.47 1.52 1.57 1.62 UT( l/K)xlOOO
Figure 250.
HDN Catalyst
HDM Catalyst
Calculated
In K Versus Reciprocal Temperature for CCR Conversion from Parallel- Consecutive Reaction Model over HDN and HDM Catalysts
844
exhibited higher activity for intermediate residuum conversion than the lower metal content
HDM catalyst.
Effect of Reactor Pressure
The effect of pressure on PR Spring heavy oil upgrading was only investigated with the
HDM catalyst. When the effect of temperature and LHSV was studied over the HDM
catalyst, total system pressure was kept constant so that the apparent rate constant, kapp,
would not be affected by pressure variations. The effect of hydrogen partial pressure may be
correlated by using a power term, p, on the hydrogen partial pressure in the rate expression
(312, 313). Equations (124), (125), (126) and (130) may then be modified in the following
manner in order to describe the dependence of conversion on hydrogen partial pressure:
-- dCA - -(kl PPI + k2 PP’ ) CA dt H2 H2
k2Pp2 H2
H2 H2 k3Pi’ - kl Pf:’ - k2 Pp’ 2 2 H2
2 HZ 2
(1-xJ = exp(-(kl PPI +k2 PP’ ) t)+
[exp(-(kl P! +k2 PP2 ) t) - exp(-( k3 P t ) t)]
(139)
The partial pressure of hydrogen was determined from vapor-liquid equilibrium
calculations for feed and product streams at reactor conditions. Vapor-liquid equilibrium
calculations are described in detail by Kim (243). Hydrogen partial pressures were used to estimate p for the various rate constants which appear in the pseudo nth order and in the
parallel-consecutive models.
Because nickel and sulfur removal and CCR and residuum conversion over the HDM
catalyst did not follow nth order kinetics, the magnitude of p was determined by nonlinear
regression to calculate the parameters which appear in Equation (142). Non-linear regression
was also used to correlate kapp and Eapp for the various reactions in the parallel-consecutive
reaction model. These values for kapp and Eapp were slightly different than the original
values because the addition of p terms in the regression permitted a slightly improved fit. The
results of the regression analysis are presented in Table 8 1.
Pressure exhibited little influence on native sulfur removal, and on the conversions of
native CCR and residuum. It is therefore concluded that conversion of feed moieties consisted
. of reactions which are not strongly dependant on hydrogen. In residuum conversion these
reactions would probably consist of cleavage of alkyl side chains from polynuclear clusters.
The low value of p for the conversion of feed residuum is in agreement with McColgan et al.
[241] who reported that hydrogen partial pressure did not affect residuum cracking.
Pressure exhibited a significant influence on the removal of intermediate sulfur and on the conversion of intermediate CCR and intermediate residuum. This suggests that hydrogen
is directly involved in the conversion of these intermediate species. Perhaps the conversion of
these intermediates involves the hydrogenation of aromatic rings in polycyclic clusters.
The suggested mechanism for residuum conversion is that alkyl side chains are quickly
removed from polycyclic clusters at low severities. The polycyclic clusters which remain in
the gas oil or residuum boiling range depend on their molecular weight and polarity. If these
clusters are in the residuum boiling range they would be classified as intermediate residuum in
the consecutive-parallel reaction model. Aromatic ring hydrogenation should be important for
further conversion of these polycyclic clusters which is consistent with the p of 1.3 for the
conversion of intermediate residuum. CJ .
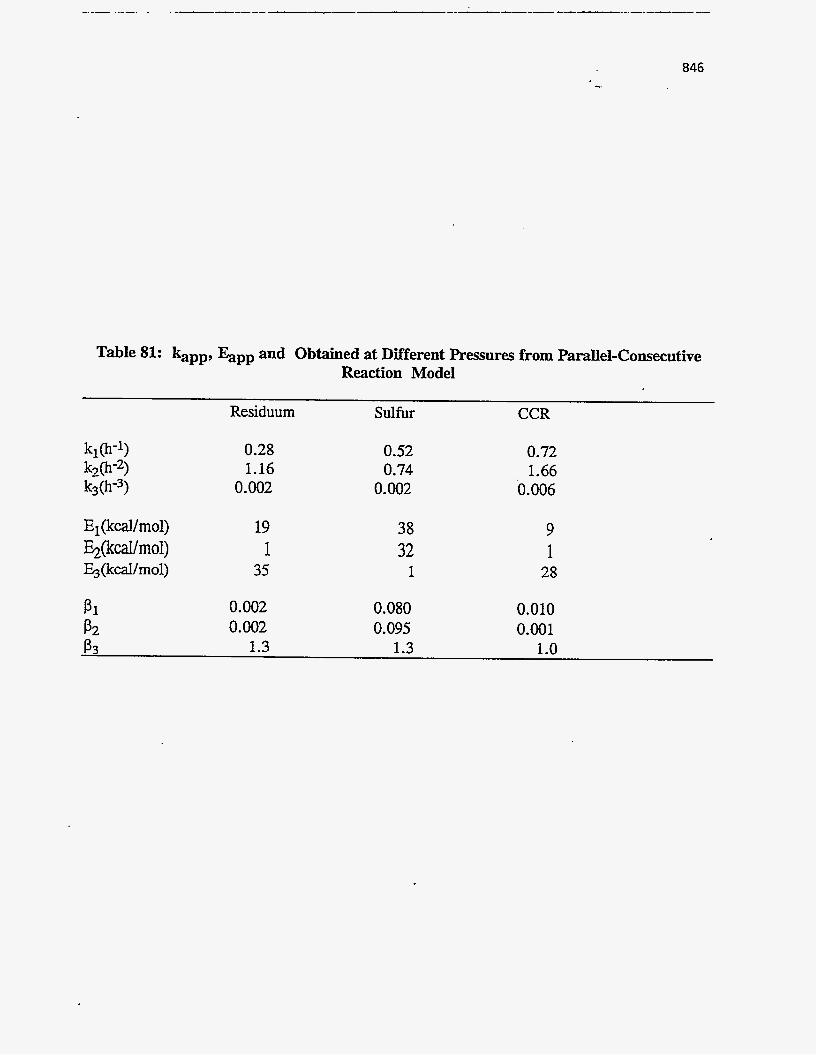
846
Table 81: kapp, Eapp and Obtained at Different Pressures from Parallel-Consecutive Reaction Model
El(kcal/mol) %(kcal/mol)
(kcal/mol)
P1 P2
Residuum
0.28 1.16
0.002
19 1
35
0.002 0.002
Sulfur
0.52 0.74
0.002
38 32
1
0.080 0.095
CCR
0.72 1.66
0.006
9 1
28
0.010 0.001
P3 1.3 1.3 1.0
847 -,
Because nitrogen removal over the HDM catalyst followed first order kinetics, the
magnitude of p was determined by plotting the logarithm of the frrst order rate constant
determined for runs conducted at different pressure versus the logarithm of the hydrogen partial pressure. The slope of the plot of In k versus In P gives a value of p for nitrogen
removal. A plot of the natural log of the first order rate constant for nitrogen removal versus In P is presented in Figure 251. The slope was 0.7. This is consistent with the role that
H2
H2
hydrogenation plays in the conversion of organic nitrogen.
Speight (314) found that the extent of heteroatom removal was improved by increasing
hydrogen partial pressure because heteroatom removal, aromatics saturation and cracking are
dependent on hydrogen pressure. Yui (312) reported that the reaction order with respect to
hydrogen partial pressure varied from 1.2 to 1.8 for nitrogen removal of Athabasca bitumen- derived coker gas oil. The lower value obtained in these studies may be because these
experiments were conducted in the upflow mode instead of in the downflow mode as was done
by Yui (312).
SUMMARY AM) CONCLUSIONS
Kinetics for conversion of CCR and residuum, as well as for removal of sulfur and
metal were described by the parallel-consecutive reaction model over the HDN catalyst and the
HDM catalyst. Pseudo nth order kinetics were used to correlate nitrogen removal over both
catalysts. Nitrogen conversion over the nickel promoted HDN catalyst exhibited a 1.5 reaction
order and was first order over the unpromoted HDM catalyst. The difference in reaction
orders may be related to the nickel promotion of the HDN catalyst which creates active sites
that enhance the conversion of some portions of the nitrogen lump to a greater extent than
other portions. This broadened the range of the nitrogen reactivity and increased the apparent reaction order.

848
-1.5
-2
-2.5
-3
-3.5 2.3
~ ~~~~ ~
T = 664 K LHSV = 0.41h
2.5
In P, 2.7 2.9
figure 251.
In K Versus In for Nitrogen RemovaI over HDM CataIyst

849 -. ...
Pressure exhibited little influence on the conversion of feed sulfur, CCR and feed
residuum conversion. However, pressure exhibited a significant influence on the conversion
of intermediate sulfur, CCR and residuum over the HDM catalyst.
UINTA BASIN BITUMEN HYDROTREATING: CATALYTIC UPGRADING OF THE ASPHALT RIDGE
BITUMEN
Principal Investigator: Francis V. Hanson Postdoctoral FelIow: D.C. Longstaff Graduate Student: T.-F. Yeh
INTRODUCTION
As the world supply of the light crude oil i preferentially depleted, bitum , heavy oils, and petroleum residues will become more and more important to meet the
demand for fbels and petrochemical feedstocks. The combination of higher he1 prices and more stringent environmental reslations has given rise to a new generation of process alternatives and focused attention on the efficient upgrading of bitumens,
heavy oils and residues(3 15).
The depletion of conventional crude oil reserves may lead to the use of oil
sands resources which are estimated at about 2.3 trillion barrels of original bitumen in- place as an alternate fossil fuel resource(l81, 316). Oil sand bitumens contain high
molecular weight species and more oxygen, nitrogen, and sulhr than conventional
crude oils. Hence, oil sand bitumens must be upgraded before being integrated as
refinery feedstocks.
Traditionally upgrading is classified according to whether carbon rejection or
hydrogen addition is used to increase the hydrogedcarbon ratio. Carbon rejection is
intended to remove asphaltenes and carbon residues in the form of coke by thermal
cracking. Hydrogen addition is intended to increase the hydrogedcarbon ratio by hydrotreating(3 17, 3 18). The products from hydrotreating are of higher quality than
those produced via the carbon rejection route(3 19).
The primary purpose of hydrotreating is to reduce the concentration of heteroatoms such as sulfbr, nitrogen, oxygen. and metals in the total liquid product produced from the bitumen. Hydrogen addition may be conducted with or without a
catalyst. Catalytic hydroprocesses are executed at moderately high temperatures (648-
851 c
693 K) and pressures (3.5-13.8 MPa) with CoMo/alumina or NiMo/alumina
catalysts(320). Noncatalytic hydroprocesses are conducted at temperatures of 602-71 5 K and pressures of 11.8-15.2 MPa. Thus thermal reactions may occur during catalytic
hydroprocesses(32 1). The bitumen from the Asphalt Ridge (Utah) oil sands is higher in nitrogen and
lower in sulfur content compared with the Athabasca bitumen fiom Canadian oil sands
and residue fiom petroleum feedstocks(82) and has a lower metals content. These
properties led to the selection of hydrodenitrogenation catalysts as potential candidates
for hydrotreating the Asphalt Ridge bitumen. Sulfur and nitrogen removals are required to minimize SO, and NO,
production during fuel combustion. Environmental regulations will be more stringent
in the future. Thus deep desulfurization and denitrogenation will be required to
upgrade bitumen and heavy oils prior to integation into refinery feed slates. Metals deposition causes the deactivation of desulfirization and denitrogenation catalysts; thus metals reduction is a primary objective of preliminary upgrading. Conradson
carbon residue is an important property which measures the coking tendency of a feedstock. Asphaltenes consist of highly condensed polyaromatic units bearing long
aliphatic and alicyclic substitutents with heteroatoms and trace metals and cause
severe disadvantages during processing such as the tendency to form coke, catalyst deactivation, and poisoning. Thus the reduction of the Conradson carbon residue and
asphaltenes in a preliminary upgrading step should enhance the product yields and
qualities in subsequent hydroprocessing. The residuum fraction containing
asphaltenes and resins must be upgraded and converted to more valuable lighter liquids such as naphthas, distillates, and gas oils in order to gain economic advantage in processing heavy oils.
The primary objective of oil sands research and development studies is to develop processes to produce transportation fiels fiom oil sand bitumens. Thus this
study had two goals: (1) to improve product quality through denitrogenation,
desulfurization, demetallation, and saturation and (2) to convert residuum fraction to
more valuable lighter liquids. The effects of process variables ( temperature, pressure, and space velocity) and catalysts on sulfur, nitrogen, and nickel removal, conversion

852 ...
of Conradson carbon residue, residuum, and asphaltenes, and viscosity reduction were
investigated to accomplish these goals. First and second pass hydrotreating were also
compared. Finally, an attempt was made to model the kinetics of the global
transformation taking place.
853 - .. .
EXPERIMENTAL APPARATUS AND PROCEDURES
Feedstock Preparation The oil sands used in this study were mined from the Asphalt Ridge oil sands
deposit in the Uinta Basin. The bitumen was obtained from the crushed, sieved oil sands
by solvent extraction. The solvent was toluene. The toluene in the bitumen-toluene solutions was then removed using rotary evaporation followed by high temperature
vacuum distillation.
Solvent Extraction
The bitumen-toluene solution was obtained from the oil sands by refluxing
toluene in Soxhlet extractors. The extraction thimbles were filled with oil sands (SOO-
1000 g) and were placed inside Soxhlet extractors. Approximately 2 liters of toluene and
a few boiling chips to eliminate bumping were placed in the solvent reservoir. Filter
papers were placed on top of the extraction thimbles to prevent fine sands fiom
overflowing into the bitumen-toluene solutions. The extraction thimbles were also
wrapped with shark skin filter papers to retain fine sands. The extractor reservoir was
heated by electric heating mantles to vaporize the solvent.
During the extraction process water was evaporated fiom the oil sands and settled
to the bottom of the trap mounted between the extractor and the water cooled condenser. The water was periodically drained off to prevent it fiom overflowing into the extraction
thimble. The extracted bitumen-toluene solutions were therefore relatively water-free.
The color of the bitumen-toluene solutions dripping from thimbles indicated the
extent of extraction. The solution turned from a dark bitumen-rich solution at the beginning of the extraction to clear toluene after 12 h. The clear toluene meant the
completion of the extraction of bitimen fiom oil sands in the thimble. Spent sands in the
thimbles were removed fiom the extractors, fresh toluene and boiling chips were added to
the reservoirs, and fiesh oil sands were placed in the thimbles inside extractors for the
next extraction. After every eight extractions, the bitumen-toluene solutions were removed fiom
extractors and stored in 19-liter plastic containers. The bitumen-toluene solutions in the
19-liter plastic containers were allow to stand for at least four days to permit fines to
settle fiom the solutions prior to rotary evaporation.
Rotary Evaporation
Most of the toluene was removed from the bitumen-toluene solution by rotary evaporation. A vacuum pump was connected to the evaporator in the water bath. The evaporation was carried out at a pressure of 8-14 E a , the evaporator was rotated at 120
rpm and the water bath temperature was held at 348 K. M e r rotary evaporation, about 6-
S wt% solvent remained in the bitumen-rich solutions(292). This residual solvent was
removed by high temperature vacuum distillation.
High Temperature Vacuum Distillation
A Podbielniak batch distillation still packed with stainless steel wire coil packing
was used to remove the residual solvent. The 12-liter kettle of the still was filled with
about S liters of the bitumen-toluene solution in each distillation. Air in the column and kettle was purged with flowing nitrogen. After purging, the system was evacuated and the kettle heater was actuated to start the vacuum distillation. During the distillation, the
system was purged with nitrosen to prevent oxidation or coking of the bitumen.
The system pressure, kettle temperature and reflux temperature were monitored
by a mercury manometer and J-type thermocouples, respectively. The pressure was held
in the range of 5.3-10.7 kPa. The kettle temperature was kept below 600 K because the bitumen would thermally crack when the temperature reached 620-650 K.Io9 The final
reflux temperature was the boiling point of a 50150 mole fraction of hexylcyclopentane
and xylene mixture and was calculated based on the Antoine equation and Raoult law at a
specified system pressure because the lightest materials in the bitumen were C11 naphthenes which have very nearly the same vapor pressure properties as
hexylcyclopentane. The commercial grade of toluene used in the extraction contained
impurities such as xylene. The reflux ratios were controlled with a solenoid valve timer and changed based
on a compromise between efficient separation and rapid solvent recovery. The reflux
\
855
ratio was set at 5 initially, increased to 10 near the end point of the distillation and then to 20 at the end point to give a sharp separation.,
The vacuum distillation ,was terminated when the final reflux temperature was
reached. The kettle temperature, reflux temperature and the reflux ratio versus the
volume of distillated liquid collected in a graduated receiver are presented in F i p r e 252.
The bitumen was analyzed by simulated distillation to check residual solvent concentration. The results showed that the solvent concentration was less than the
detectable limits (< 0.1 wt%). The solvent-free bitumen was collected and stored in one
23-liter and two 57-liter steel drums and blanketed with nitrogen to prevent oxidation.
Because the bitumen viscosity was very high at room temperature, the bitumen in the
drum was heated to 400 K with a heating tape and transferred to the liquid feed burettes
in the hydrotreating system as required.
Ca talvs t Characterization
Three HDN catalysts were used in this study. One was provided by a commercial
catalyst manufacturer, and the others were impregated by the Engel hard Corporation
using an HDN catalyst support provided by UNOCAL.
The adsorption-desorption isotherms of the fresh and spent catalyst were
measured with a Micromeritics AccuSorb 2 1 OOE analyzer, using nitrogen as adsorbate at
the liquid nitrosen temperature. Approximately 0.4 g of catalyst were placed in the sample flask and degassed at 493 K overnight. The surface areas, pore volumes, and pore size distributions were calculated according to the procedure provided by Micromeritics.
Hvdro trea t i w Svs tern
The hydrotreating system used in this research consisted of five main parts: the
liquid feed system, the hydrogen feed system, the reactor system, the product separation and sampling system, and the safety system. The system was designed to operate at
hydrogen pressures of 20.7 MPa and 773 K and was designed for either upflow or downflow mode by placing three-way manifold valves at the inlet and outlet of the
catalytic reactor. L

856
Figure 252
Reflux and kettle temperature versus volume of distillated liquid
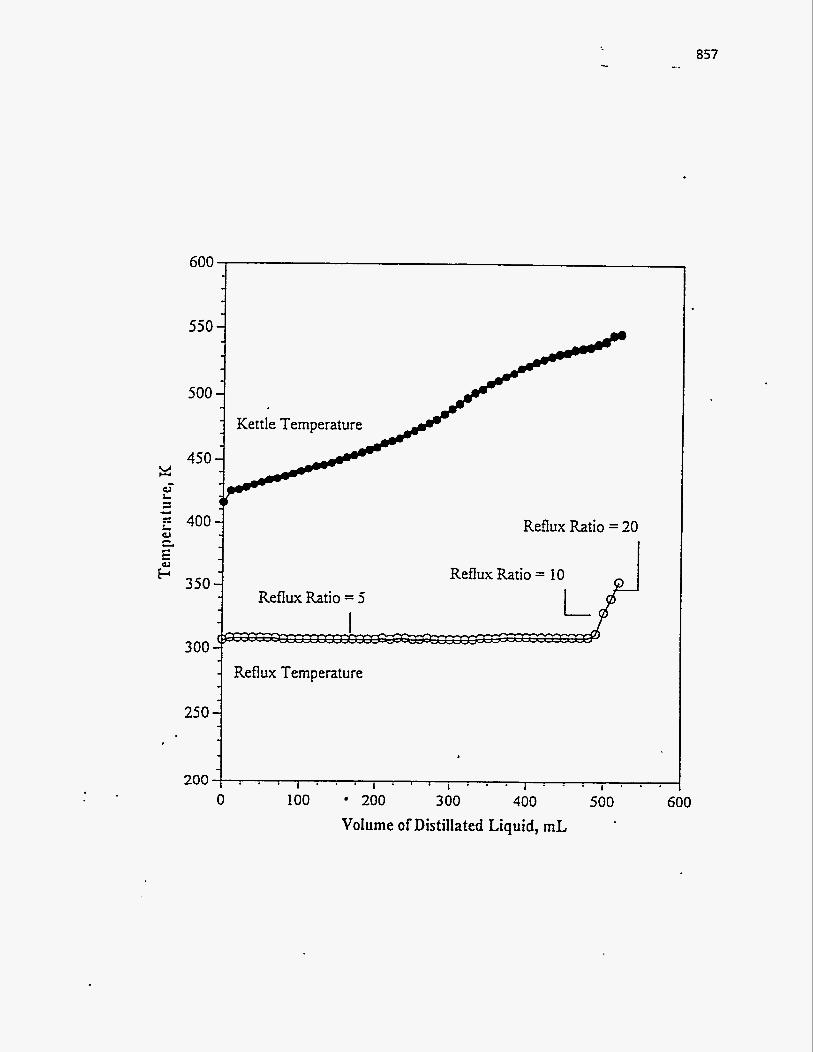
...
Kettle Temperature
Reflux Ratio = 2
Reflux Ratio = 10
Reflux Temperature
250 -
- I " ' . . I 1 " ' l 200 . . * , . . , . . .
8 57
0 100 200 3 00 400 500 600 Volume of DistiIIated Liquid, mL
858
The bitumen and hydrogen were fed to the reactor in the upflow mode in this
study. The liquid and gas products were separated in the high pressure vapor-liquid
separator. The gas product was removed via a back pressure regulating valve (BPRV)
which also controlled the system pressure. The liquid product was withdrawn through a
liquid-liquid control valve (Annin valve) and collected in a liquid receiver at ambient
pressure. The schematic of the hydrotreating system is presented in Figre 253.
Liquid Feed System
Liquid was pumped fiom the burettes into the reactor at a controlled flow rate
using a reciprocating pump which had a variable stroke lensh. The maximum flow rate
was 1400 cm3/h at the maximum operating discharse pressure, 34.4 MPa, of the pump and the minimum flow rate was 20 cm3/h at the operating pressure, 13.8 MPa.
. .
Two heat traced burettes were employed as feedstock reservoirs to supply
feedstock to the reactor. The small burette with 500 cm3 capacity was used to set or measure liquid feed flow rate accurately over short time periods. The large burette with
4000 cm3 capacity was used to supply liquid feed during periods of steady state
operation.
The temperature of the liquid in the burettes was controlled by a proportional
temperature controller. Liquid density in the small burette was measured with an MI
hydrometer (1 9-3 1 'MI). During hydrotreating of bitumen, the burettes were heated to
400 K to allow the bitumen to flow and the liquid bitumen level to be observed easily.
Several drops of xylene were added to the bitumen pool in the small burette also to
improve the observation of the liquid level. The vapor space in the burettes were purged with nitrogen gas to reduce oxidation of the hot bitumen.
A check valve was located between the pump and the pump outlet manifold to
prevent back flow of pressurized gas into the liquid feed system. A valve connected to
the discharge line of the pump was used to permit priming of the pump. A pressure relief
valve was installed at the pump outlet to avoid pump damage when the pump outlet
manifold was closed unintentionally or if the feed line between the pump and the pump
outlet manifold was plugged.

Figure 253
Schematic of the hydrotreating system
859 c.
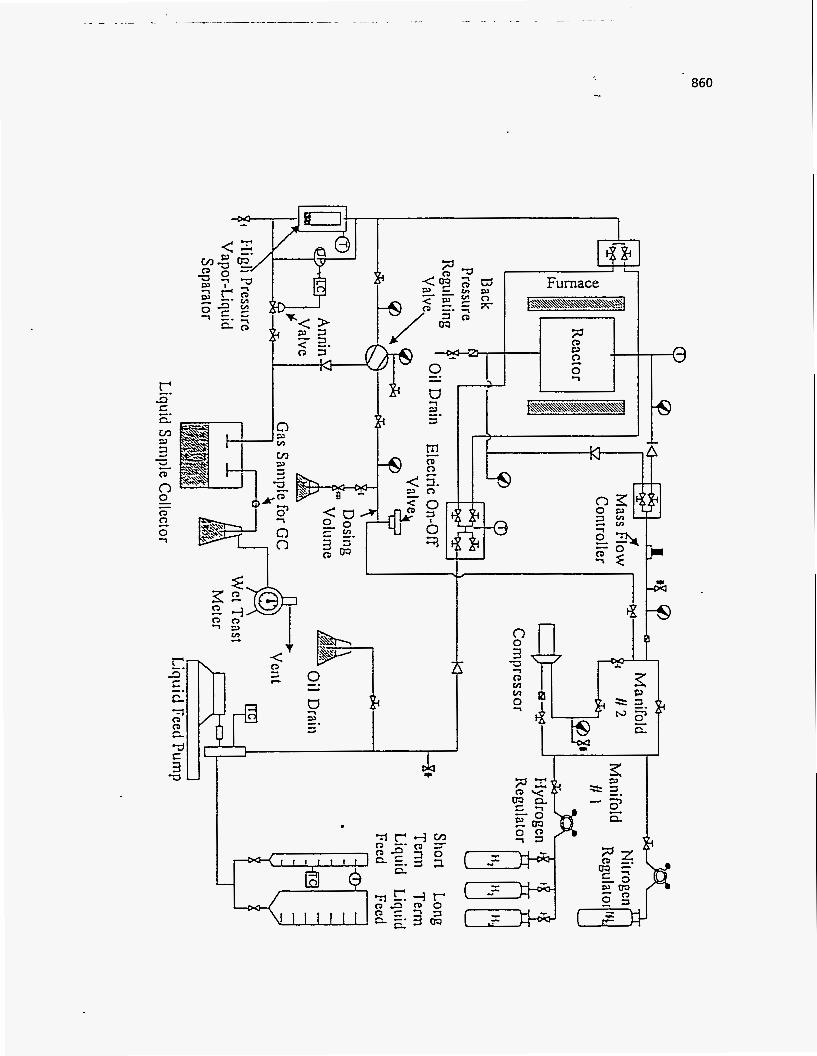
I
U
860

861 -.
Because the pump could process liquids with a maximum viscosity of 1500 cp,
the pump head, valves and liquid transfer lines were heated to 390-400 K by heat trace
tapes when pumping Asphalt Ridge bitumen. The temperature of the heat trace lines were controlled by a proportional controller.
Hydrogen Feed System
Hydrogen was supplied from three hydrogen cylinders connected in parallel through a gas manifold and compressed to the desired pressure by a compressor and then
passed through a mass flow controller into the reactor.
A variable stroke length, single stage compressor (Whitey Laboratory Model LC 10) whose maximum output pressure was 20.7 MPa was used to raise the hydrogen
pressure to the reactor inlet pressure. The compressor would be damaged if operated with an inlet pressure below 0.35 MPa. Owing to this limit, the compressor power supply
was connected to a pressure switch designed to turn off the compressor when the
compressor inlet pressure dropped below 1.38 MPa.
The compressor outlet pressure was a function of both the compressor inlet (regdator supply) pressure and the compressor stroke length. In most cases, the desired compressor outlet pressure was obtained by adjusting regulator supply pressure at fixed stroke length. Typically the compressor inlet pressure was 3.4-5.5 MPa. Therefore, the
hydrogen supply gas cylinders were changed when the pressure of the hydrogen gas
cylinders dropped to 5.5 MPa.
The hydrogen flow rate was controlled by a mass flow controller @rooks model 5850 TR) which included a Dual Power Supply (Brooks model 5878) and a Readout
Control Unit. The mass flow controller was placed between the compressor outlet and .
the reactor inlet manifold valves. Check valves were installed in the gas lines to the
reactor to prevent the back flow of? liquid into the mass flow controller. A pressure relief
valve was located between the compressor outlet and the mass flow controller inlet to
protect the controller on the occasion of system overpressurizing.
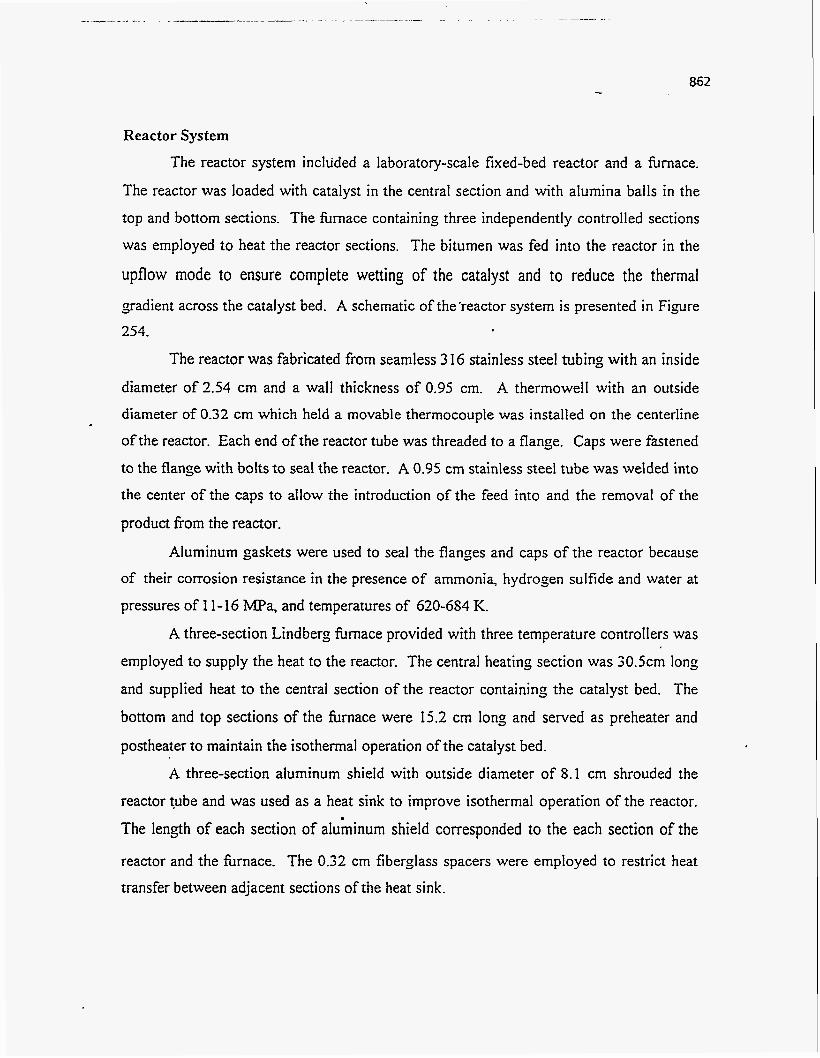
Reactor System
The reactor system included a laboratory-scale fixed-bed reactor and a fbmace.
The reactor was loaded with catalyst in the central section and with alumina balls in the
top and bottom sections. The fbrnace containing three independently controlled sections
was employed to heat the reactor sections. The bitumen was fed into the reactor in the
upflow mode to ensure complete wetting of the catalyst and to reduce the thermal gradient across the catalyst bed. A schematic of the-reactor system is presented in Figure 254.
The reactor was fabricated from seamless 3 16 stainless steel tubing with an inside
diameter of 2.54 cm and a wall thickness of 0.95 cm. A thermowell with an outside diameter of 0.32 cm which held a movable thermocouple was installed on the centerline
of the reactor. Each end of the reactor tube was threaded to a flange. Caps were fastened
to the flange with bolts to seal the reactor. A 0.95 cm stainless steel tube was welded into
the center of the caps to allow the introduction of the feed into and the removal of the
product fiom the reactor.
Aluminum gaskets were used to seal the flanges and caps of the reactor because of their corrosion resistance in the presence of ammonia, hydrogen sulfide and water at
pressures of 11-16 I”a, and temperatures of 620-634 K. A three-section Lindberg furnace provided with three temperature controllers was
employed to supply the heat to the reactor. The central heating section was 30.5cm long
and supplied heat to the central section of the reactor containing the catalyst bed. The
bottom and top sections of the furnace were 15.2 cm long and served as preheater and
postheater to maintain the isothermal operation of the catalyst bed.
A three-section aluminum shield with outside diameter of 8.1 cm shrouded the
reactor tube and was used as a heat sink to improve isothermal operation of the reactor.
The length of each section of ahminum shield corresponded to the each section of the
reactor and the furnace. The 0.32 cm fiberglass spacers were employed to restrict heat
transfer between adjacent sections of the heat sink.

... 863 -_
Figure 254
Schematic of the reactor system
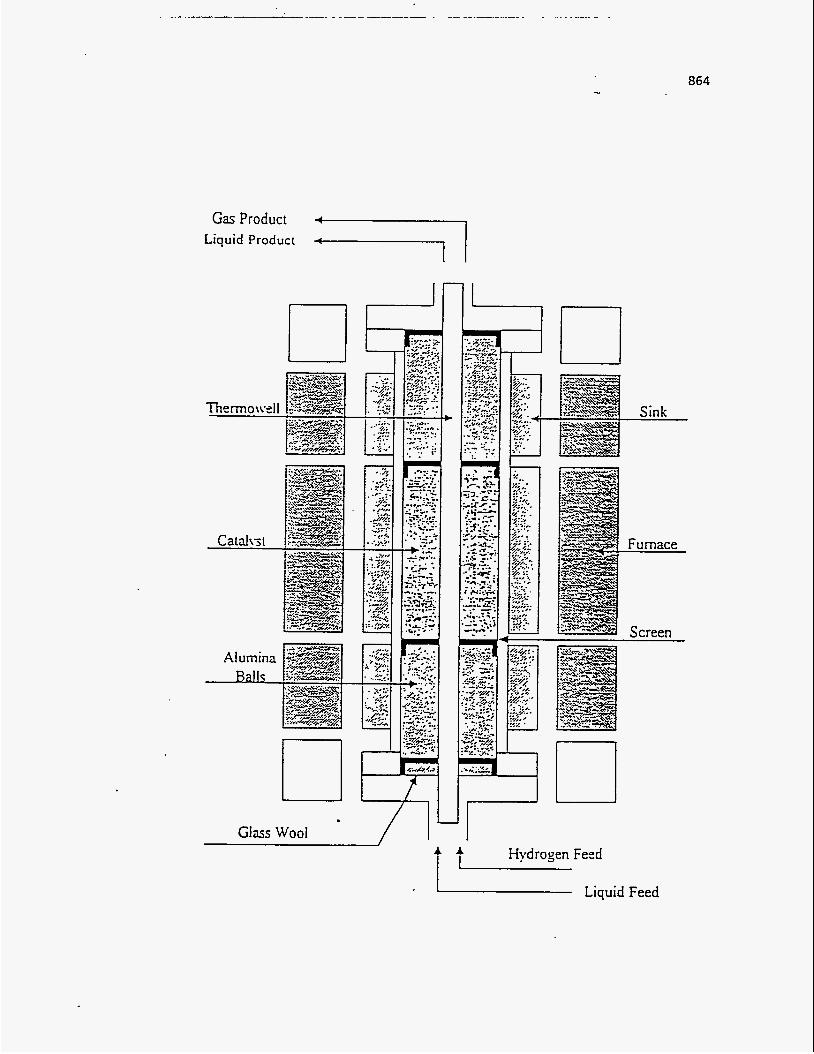
864
I Gas Product
Liquid Product
U c
II r l Sink
c /
Hydrogen Feed i i
Furnace
Screen
- a Liquid Feed
865 -..
Product Separation and Sampling System
The liquid and gas products exited fiom the reactor and entered the high pressure
vapor-liquid separator. The gas product passed through a back pressure regulating valve
which decreased the gas pressure from the reactor outlet pressure to ambient pressure.
The BPRV also allowed the gas to escape fiom the system when the system's pressure
surpassed the BPRV loading pressure, thus controlling the system pressure at the desired
value. The system pressure was monitored by a pressure indicator (Omega Engineering Model DP-354).
The BPRV loading pressure was replated by a manifold located between the
BPRV and the compressor outlet. A micrometering valve was employed to vent the
BPRV loading pressure slowly.
The liquid product was withdrawn fiom the high pressure vapor-liquid separator
by the liquid level control system which included a differential pressure @P) transducer,
liquid level controller, I/P converter, and an Annin valve. The DP transducer monitored
the liquid level in the vapor-liquid separator and then sent a signal through liquid level
controller, I/P converter, and finally to the positioner on the Annin valve. The Annin
valve had a variable maximum stroke length fiom 0.025 to 0.38 cm. The maximum
stroke length of 0.25 cm was set during the hydrotreating of bitumen.
The liquid product was collected in a 500-mL flask during mass balance periods
and in a 19-liter polyethylene container during steady state or transition time periods.
Safety System
A safety alarm relay was connected to the liquid level control system and the heat trace fuse. If the liquid level in the vapor-liquid separator rose above the set point or the
4 amp heat tracing fuse burned out, the audible alarm would sound and the liquid pump
would shut ofT A timer connected to the liquid level alarm recorded the time when the
alarm was activated.
The heat tracing lines, 25 gauge Nichrome wire coated with glass fabric
insulation. were used to heat the liquid transfer lines, the valves, the vapor-liquid separator, the Annin valve, and the pump. The two heat tracing lines were powered by a
120 V power supply and connected in parallel. One line extended from the liquid feed

866
system to the reactor inlet and had a resistance of 60 ohms; the other line went from the
reactor outlet to the product separation system and had a resistance of 70 ohms. The heat
tracing controller used the temperature of the pump check valve as the reference
temperature.
Experimental Procedures
Three different hydrodenitrogenation catalysts were employed to investigate the
extent of heteroatom (N, S) and nickel removal, and the asphaltenes, Conradson carbon
residue, and residuum conversion and to study the change of viscosity. The product
distribution and yields were also determined.
The effects of process variable, that is, temperature. pressure, and liquid hourly
space velocity, were studied after the activity of the catalyst reached an a stationary state.
The hydrotreated products produced under the base case condition and the highest
severity condition with the A-HDN catalyst were used as feedstocks for the second pass
studies at the same conditions.
Before each experiment, the reactor was cleaned to remove the solid particles on
the reactor wall. The pressure indicator and wet test meter were also calibrated.
Catalyst Calcination
The catalyst adsorbed moisture during storage. Water. vapor may damase the
catalyst during sulfiding(305). The following calcination procedure was provided by
manufacture: ( I ) place the catalyst in a thin layer in a container suitable to be put into a
muffle furnace, (2) start with the muffle hrnace at room temperature and pressure, (3)
increase muffle firnace temperature to 644 K at 56-83 wh and hold the catalyst at 644 K for 1 h, and (4) cool the catalyst to room temperature in a desiccator that does not contain
any desiccant.
Catalyst Loading
The reactor system had three sections in which temperature was controlled
independently. Preheating and postheating sections were filled with inert low surface
area symbol 224 \f "MS LineDraw" \s 13a}-alumina balls to support the catalyst bed and

to supply space for uniform distribution of hydrogen in the liquid. The catalyst was
loaded in the central reactor section with volume of 152 cm3. The reactor was tapped
frequently during the loading of the symbol 334 \f "MS LineDrawl' \s 12a}-alumina balls
and catalysts to ensure the proper packing density. Each section of the reactor was separated by a screen with a 0.32 cm hole drilled
through the centerline of the screen to fit the thermowell. A thennowell with 0.32. cm
outside diameter was located on the centerline of the reactor before the reactor was
loaded and then passed through the screen of each section.
Pressure Test After the reactor was loaded and connected to the hydrotreating system, the
system pressure test was conducted with nitrogen at 6.9 and 13.8 MPa to detect major leaks using soap bubbles. Any detected leaks were eliminated.
The BPRV and the system pressure was increased from atmospheric pressure to 6.9 MPa. The system was isolated into four sections: the line from compressor outlet to
the inlet of the reactor, the reactor, the line fiom the outlet of the reactor to the vapor- liquid separator, and line fiom the vapor-liquid separator to the BPRV. The system was
monitored over 16 h. If there was no pressure loss, the system pressure was increased
rom 6.9 MPa to 13.8 MPa. The system was also isolated into four sections and the pressure were monitored overnight.
Mass Flow Con troller Cali bra tion
The mass flow controller was calibrated with a wet test meter. The system was
operated at 13.7 MPa and room temperature. During calibration, the hydrogen flow rate in the absence of chemical reaction was measured with a test wet meter at different mass
flow controller set points. The calibration curve for the mass flow controller is presented
in Figure 255. 1
Catalyst Presulfiding
The hydrotreating catalysts are produced ind supplied in the oxide form; however, t h e metal sulfide form of the hydrotreating catalysts are more active than the

Figure 255
Mass flow controller calibration curve
868
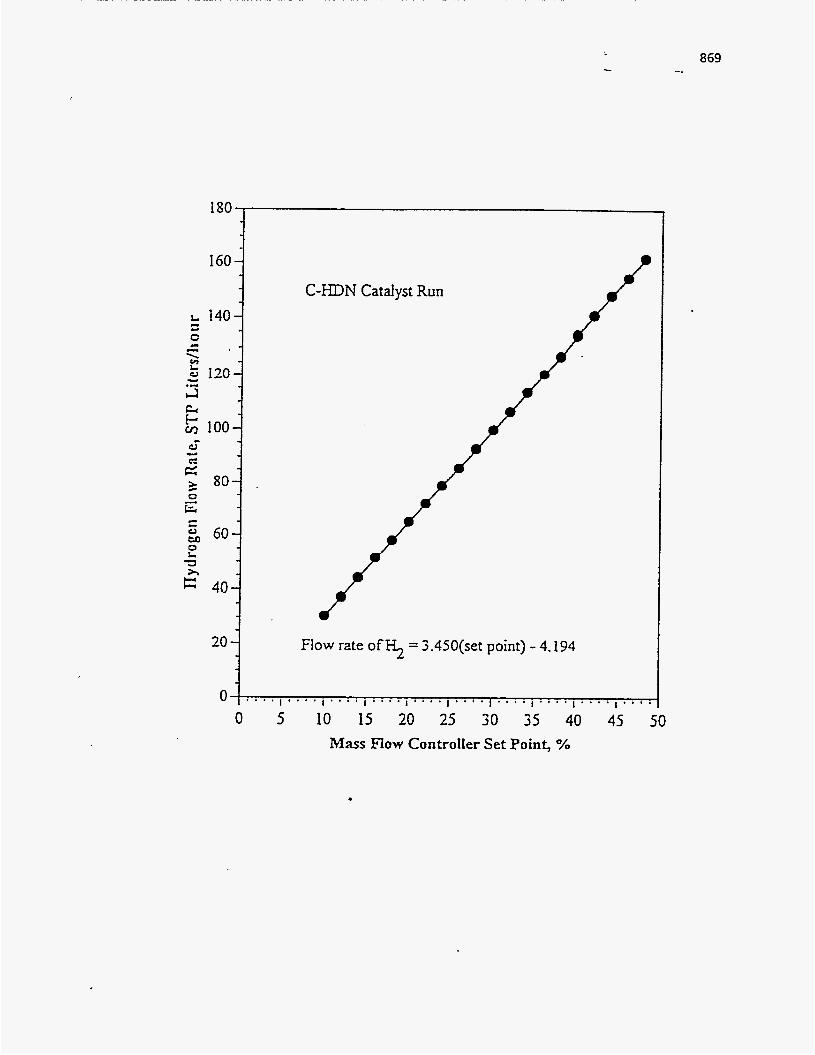
869 -.
180
160 -
L 140- - L 0 I
5 CI 2 120- ;rj
g 100-
2
G
.. u .L
80- 2 E t n ' 60- 0
c
0 L 3 e 40-
20 -
0
C-HDN Catalyst Run
.
Flow rate of 3 = 3.450(set point) - 4.194
I * * * * I " " l ' * * . I ' * * * l * ' ' ' I . * - - I * * * ' I * * * * I " " . . . .
0 5 10 15 20 25 30 35 40 45 50 Mass Flow Controller Set Point, %

870
metal oxide form. The catalyst presulfiding process, therefore, was conducted in-situ before contact with liquid feed and hydrogen. After presulfiding, the active component
of the metal in the catalyst changed from a metal oxide to a metal sulfide.
1
The presulfiding solution was 2 wt% sulfur as dimethyldisulfide in kerosene and
was conducted in upflow mode through the reactor at a feed rate of 1 LHSV. The
hydrogen to liquid ratio was 890 m3(STP)/m3. The reactor pressure was held between
6.1-6.3 MPa.
. The reactor was heated from ambient temperature to 505 K at a heating rate of 28
Wh. When the reactor temperature reached 500-510 K, the exchange of oxygen and
s u h r increased dramatically. The reactor temperature was kept at about 505 K for at
least 4 h depending upon the metal contents of the catalyst to ensure complete sulfiding. M e r the holding time, the liquid feed pump was shut off and the hydrogen flow
was reversed to remove the liquid in the reactor. The reactor temperature was decreased
to 490-500 K and the hydrogen flow rate was then lowered to the set point of the mass
flow controller at 2 to maintain hydrogen pressure overnight.
The sulfiding process was resumed with hydrogen and the sulfiding solution at the
previous flow conditions. The reactor temperature was heated to 644 K at a heating rate
28 K/h. At 644 K the liquid feed pump was shut off, the hydrogen flow was reversed to
flush the sulfiding solution out of the reactor, and the reactor temperature was lowered to
61 5 K under hydrogen flow rate with the set point of the mass flow controller at 2.
Reactor Startup and Experimental Strategy
The bitumen and hydrogen entered the reactor in the upflow mode for all
experiments. Initially, the catalyst was deactivated until the activity of the catalyst
reached a stable state at the base case conditions. After the initial catalyst deactivation,
the experiments were executed in a cyclic mode. During the experiment. a mass balance
and temperature measurement were conducted, and gas samples and the liquid product
were collected.
87 1 -. .
Initial Catalvst Deactivation
The bitumen and hydrogen were fed to the reactor at the base case conditions: 642 K, 0.48 h-' LHSV, and 13.7 MPa, to monitor catalyst deactivation for three different
HDN catalysts. S90
m3 (S TP)/m3.
In a11 experiments, the hydrogen-to-liquid ratio was fixed at
The time that the hydroprocessed liquid product entered the vapor-liquid separator
was taken as zero time on-stream (TOS), which served as the basis to estimate the
catalyst deactivation rate. The catalyst deactivation was determined by monitoring the MI' gravity of the hydroprocessed liquid product which decreased with TOS as the
catalyst equilibrated. The API gravity of the liquid product was calculated with Equation
145:
"API = 141.5 / ( Specific gravity) - 13 1.5 (143)
The specific gravity was measured with a pyconometer according to Syncrude Analytical Methods-Method 5.5(322).
The API gravity of the hydrotreated liquid product indicated that the catalyst had attained a stationary or stable state after about 144 h on-stream. The initial catalyst
deactivation reflected by the API gravity of the total liquid product as a function of TOS is presented in Figure 256.
Process Variables Studv The studies were conducted in a cyclic mode: base case condition-desired
operating conditions-base case condition. The base case condition was employed to
monitor the extent of deactivation that occurred at the desired operating conditions. The
process variables studied were temierature (620-684 K), space velocity (LHSV 0.2-0.9 h'
'), and pressure (11.0-15.3 MPa). Two of the variables were kept constant while the
other was varied to determine independently the effect of each process variable.

Figure 256
API gravity versus time on stream during the initial catalyst deactivation
872
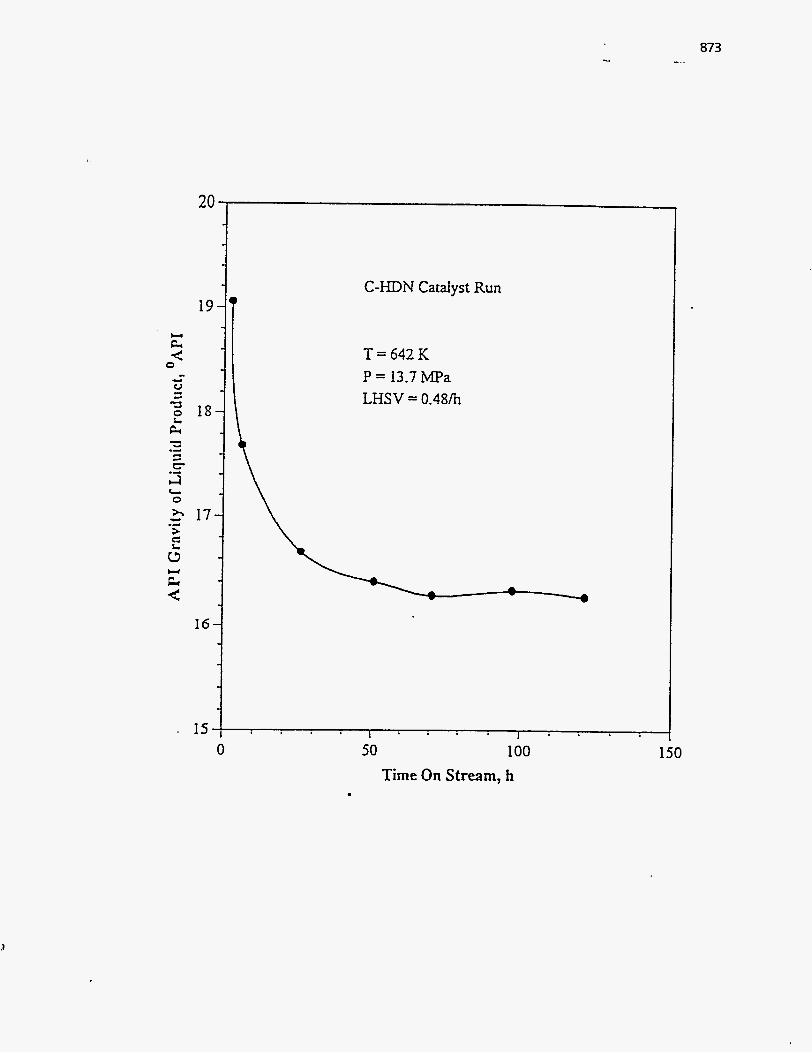
20
O N Catalyst Run
T=642K P = 13.7 MPa LHSV = 0.48h
16
. 15 0 50 100
Time On Stream, h 150
874
Mass Balance
Mass balances were conducted to monitor the liquid and hydrogen feed to the
reactor system during discrete time periods and to collect the representative gas and
liquid samples for subsequent analysis.
Mass balances were employed after the system had attained a stable state at each
new set of operating conditions. It required from 9 to 36 h to allow the system to attain a
steady state when the LHSV was changed fiom 0.9 to 0.2 h'.
During the mass balance, the liquid product was collected in the 500-mL flask at
ambient pressure; the gas product stream passing through the flask was sampled for gas
chromatographic analysis. The gas sample was collected at 76 K in a container immersed
in a liquid nitrogen bath; and then the gas flow rate was measured with a wet test meter.
The liquid and condensed gas products were weighed at the end of each mass
balance. The mass balances were in the range of 97-102 wt% for each of the three runs.
The gas product sampled was analyzed with a Hewlett Packard (HP) gas chromatograph
before the next mass balance to determine the relative amounts of hydrocarbon gases. The hydrogen consumption was calculated by difference between the hydrogen flowing
into the reactor system and the gas product exiting the hydrotreating system.
Temperature Measurement
The axial temperature profiles of the catalyst bed along the center line of the
reactor were measured with a movable J-type thermocouple. Temperature profiles were
metered from 33.0 cm to 63.5 cm above the bottom of the thennowell in 2.5 cm intervals.
The average temperature was calculated in two ways: the kinetic and arithmetic average
temperature.
The kinetic average temperature was calculated from Equation 146:
K & =

875 -. ...
where, Tk is the kinetic averase temperature (Ec), Ea is the activation energy (kcal/mol), R
is the ,oas constant (1.987 kcal/mol), L is the total length of the catalyst bed (cm), T(1) is
the axial temperature profile along the catalyst bed. The value of the Ea, 25.5 kcal/mol,
obtained fiom the previous study(292) was used in this calculation.
The arithmetic average temperature, T,, was calculated based on the weighted
average method. The difference between Tk and T, was in the range of 0.02-0.3 K indicating that the reactor operation was near isothermal. A typical temperature profile
with position metered from the bottom of the themowell is displayed in Figure 257.
System Shutdown
The system shutdown procedures were conducted to clean the residual oil from
the reactor and liquid transfer lines. At the completion of each run, the bitumen was
withdrawn from the two burettes and the system pressure was lowered to 5.9 MPa.
Kerosene was pumped into the system to flush the bitumen and hydrotreated bitumen
from the hydrotreating system. The reactor temperature was gradually decreased and
then held at 500 K until the liquid product and the bitumen were flushed by monitoring
the color change of the liquid leaving the reactor.
The reactor temperature and system pressure were decreased to 400 K and 1.4 MPa, respectively. The heat tracing was turned off and then hexane was pumped into the
system to flush the kerosene until the liquid was colorless. The reactor and transfer lines
were dried with flowing nitrogen at ambient pressure and then cooled to ambient
temperature. The reactor was disconnected from the system and then the spent catalyst
and alumina balls were removed from the reactor. The reactor was finally cleaned with
toluene.
. Liqriid Products Analvsis
The liquid products were analyzed for elemental analysis, simulated distillation,
asphaltenes, viscosity, and Conradson carbon residue.
876
Figure 257
Temperature profile with position metered from the bottom of themowell

877
700 -
600- - u L
e L
4 - 2 I c e - 500-
400 -
800 J
300 . * . - 1
20 30
C-HDN Catalyst Run-2 1
,.. . . . . . . . . . I
Tk = 684.13 K T =684.17K a
+ CataIyst Bed
Direction of Flow
I " I . . . . . . , . . a .
40 50 60
--D
. . I . . "
70 80 Position from ThermoweII Bottom, cm
.

Elemental Analysis
The liquid product samples were flushed with flowing helium to remove
dissolved hydrogen sulfide and ammonia and then sent to Galbraith Laboratory, Inc. to be
analyzed for carbon, hydrogen, nitrogen, sulfur, and nickel concentrations. The test tube fitted with a side arm was filled with the liquid product, about 25 g,
and placed in a 250-mL Erlenmeyer flask containing 175 mL of water. The flask was
heated with a hot plate until water boiled, and then the helium was bubbled through the
liquid product at 50 cm3/min for 4 h. The light liquid ends were recovered From the
helium in another test tube immersed in a water-ice bath and then were mixed with the
purged liquid product.
The liquid samples were analyzed for carbon, hydrogen, and nitrogen with a Leco
CHN 800 determinator and measured for sulfur by using Leco 432DR sulfbr analyzer.
The Inductively Coupled Plasma Emission Spectroscopy was employed to determine the
nickel concentration.
Sirnula ted Distillation The boiling point distribution of the liquid products was determined by simulated
distillation using a HP 5890 series I1 gas chromatogaph with an integrator CHp 3396
series 11) and a controller CHp 7673). A &sed silica capillary column which was 5 m
long, 0.53 mm internal diameter, with a 0.1 symbol 109 \f "Symbol" \s 12pm bonded
phase film (Supelco Petrocol EX2887) was connected From injector to detector on the
sas chromatography.
A temperature program was employed for the blank, the boiling point calibration
samples, the liquid product samples, and the liquid product samples plus internal standard
mixture. The initial oven temperature was set at 308 K and then the oven temperature
was kept at 308 K for 4.5 min. The oven was then heated to 653 K at the rate of 12 Wmin
and held at 653 K for 8.75 min. Helium was used as the carrier gas, hydrogen was used
as the fie1 gas, and air was employed to aid the combustion of hydrogen. The initial
pressure was 1 1.7 P a .
The samples were diluted with carbon disulfide in a 1 mi vial. The samples were mixed the internal standard mixture in the weight ratio of about 1O:l . The internal

standard mixture contained CIj-C17 paraffins. The calibration curve was obtained from
running the boiling point calibration samples which were supplied by Hewlett Packard
and Supelco.
The simulated distillation data ( naphtha. middle distillate. Sas oil and residuum
weight fraction) were calculated from the boiling point distribution by using a modified ASTM D5307 method. .
Asphaltenes Analysis
Asphaltenes are a class of compounds defined by solubility and has been
restricted to n-pentane or n-heptane insoluble materials that dissolve in benzene.
The procedure for fractionation consisted of the following steps: (1) samples
(bitumen and hydroprocessed liquid products) were weighed in a tarred 250-mL
Erlenmeyer flask to which toluene was added in the ratio of 1 mL per gram of samples
and heated on the water bath to obtain a homogeneous mixture: (2) the mixture was
cooled. followed by gradual addition of n-pentane in a ratio of 40-to-1 volumes of
pentane-to-toluene with constant mixing: (3) the resulting mixture was completely shaken
and placed in the dark for overnight: (4) the insoluble solids (asphaltenes) were separated
from the mixture by filtration using a fritted glass funnel: and (5) the solids were washed
completely with n-pentane until the washings were colorless. dried in the oven at 383 K for 2 h, and then weighed.
Viscosity Measirremerrt The viscosities of samples were measured by using a Brookfield viscometer
(model DV-11) with a Brookfield refrigerated bathkirculator (model TC-500) and a
Brookfield temperature controller (model HT- 105). The viscosity measurements were
made at several shear rates and temperatures with a conelplate viscometer.
Coriradsori Carbon Residue Measurenien t
Carbon residues were measured according to Syncrude Analytical Methods-
Method 5.4(323). The amount of Conradson carbon residue is intended to provide some
indication of r e l a t i v e cok+forrning properti::.
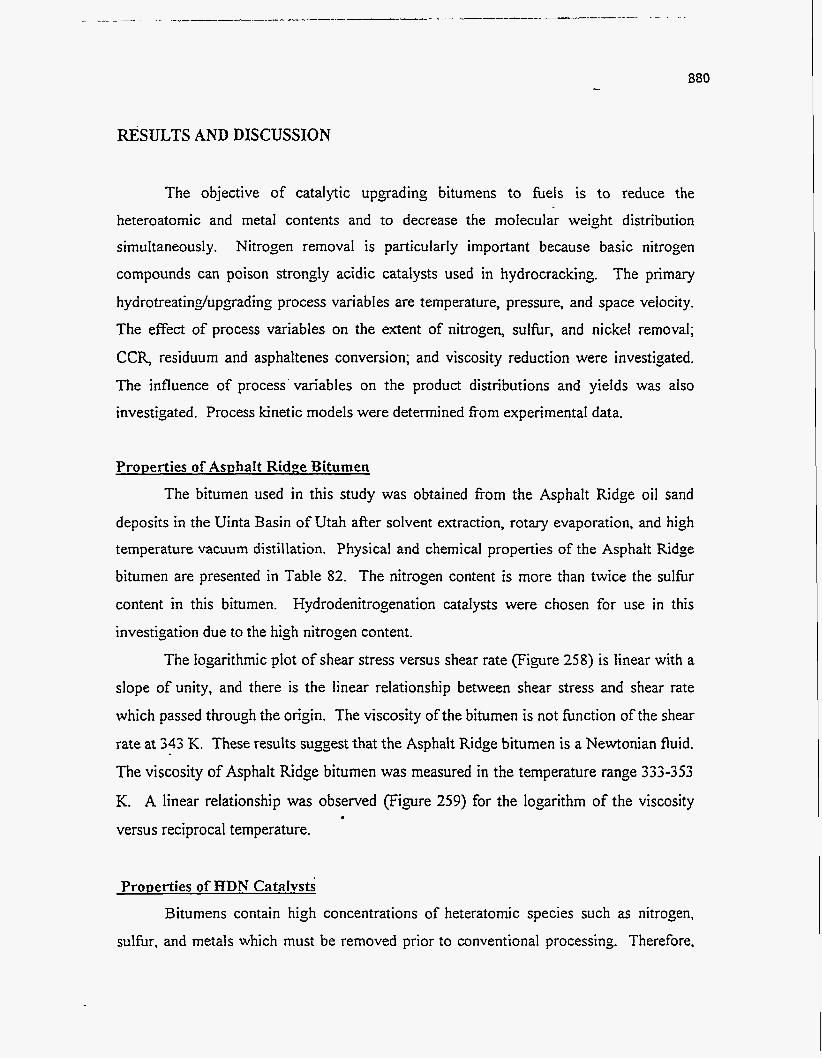
880
RESULTS AND DISCUSSION
The objective of catalytic upgrading bitumens to fuels is to reduce the
heteroatomic and metal contents and to decrease the molecular weight distribution
simultaneously. Nitrogen removal is particularly important because basic nitrogen
compounds can poison strongly acidic catalysts used in hydrocracking. The primary
hydrotreatinghpgrading process variables are temperature, pressure, and space velocity.
The effect of process variables on the extent of nitrogen, sulfkr, and nickel removal;
CCR, residuum and asphaltenes conversion; and viscosity reduction were investigated.
The influence of process’variables on the product distributions and yields was also
investigated. Process kinetic models were determined fiom experimental data.
Properties of Asuhalt Ridge Bitumen
The bitumen used in this study was obtained fiom the Asphalt Ridge oil sand
deposits in the Uinta Basin of Utah after solvent extraction, rotary evaporation, and high temperature vacuum distillation. Physical and chemical properties of the Asphalt Ridge
bitumen are presented in Table 82. The nitrogen content is more than twice the sulfur
content in this bitumen. Hydrodenitrogenation catalysts were chosen for use in this
investigation due to the high nitrogen content.
The logarithmic plot of shear stress versus shear rate (Figure 258) is linear with a
slope of unity, and there is the linear relationship between shear stress and shear rate
which passed through the origin. The viscosity of the bitumen is not function of the shear
rate at 343 K. These results suggest that the Asphalt Ridge bitumen is a Newtonian fluid.
The viscosity of Asphalt Ridge bitumen was measured in the temperature range 333-353
K. A linear relationship was observed (Figure 259) for the logarithm of the viscosity
versus reciprocal temperature.
Prouerties of HDN Catalvsts
Bitumens contain high concentrations of heteratomic species such as nitrogen,
sulfur, and metals which must be removed prior to conventional processing. Therefore,

Table 82
Physical and Chemical Properties of the Asphalt Ridge Bitumen
881 -.
Gravity, "MI Conradson Carbon Residue, wt% Pour Point, K Viscosity, cp
@J 333 K @ 343 K @J 348 K a 3 5 3 K
Asphaltenes', wt %
Simulated DistilIation
Volatility, wt% Naphtha ( D3P - 477 K ), wt% Distillate ( 477 K - 6 I7 K ), wt% Gas Oil ( 617 K - 81 I K ), wt%
Residuum ( > 8 1 1 K ), wt%
Elemental .4naIvsis
c, wt% H, wt% N, wt% s, wt% Ni, ppm v* PPm
PP"
€3 / C Atomic Ratio
Molecular Weight, g / mol
11.4 11.0 3 12
37590 11750 8227 5583 10.1
45.2 0.5 10.2 34.5 '
54.8
84.9 11.2 0.97 0.42 86 3 2
1.58
62 1
Insoluble in n-Pentane

882
Figure 258
Shear diagram for Asphalt Ridge bitumen at 343 K
in logarithm and linear plot
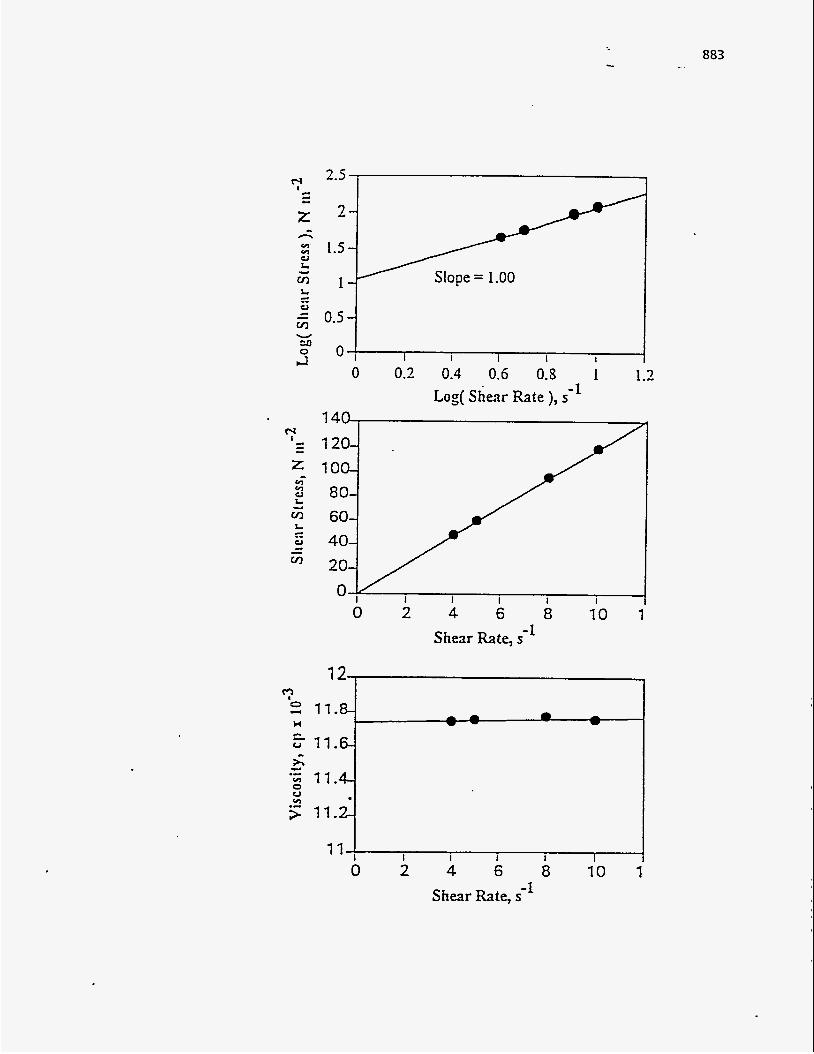
1 I I I I
0 0.2 0.4 0.6 0.S 1 1.2 ~ o g ( Shear Rate >, s-'
0 2 4 6 8 10 shear Rate, s-'
I I I I 1 0 2 4 6 8 10 1
Shear Rate, s-'
883 -.

...
Figure 259
The viscosity of Asphalt Ridge bitumen as a function of temperature
884
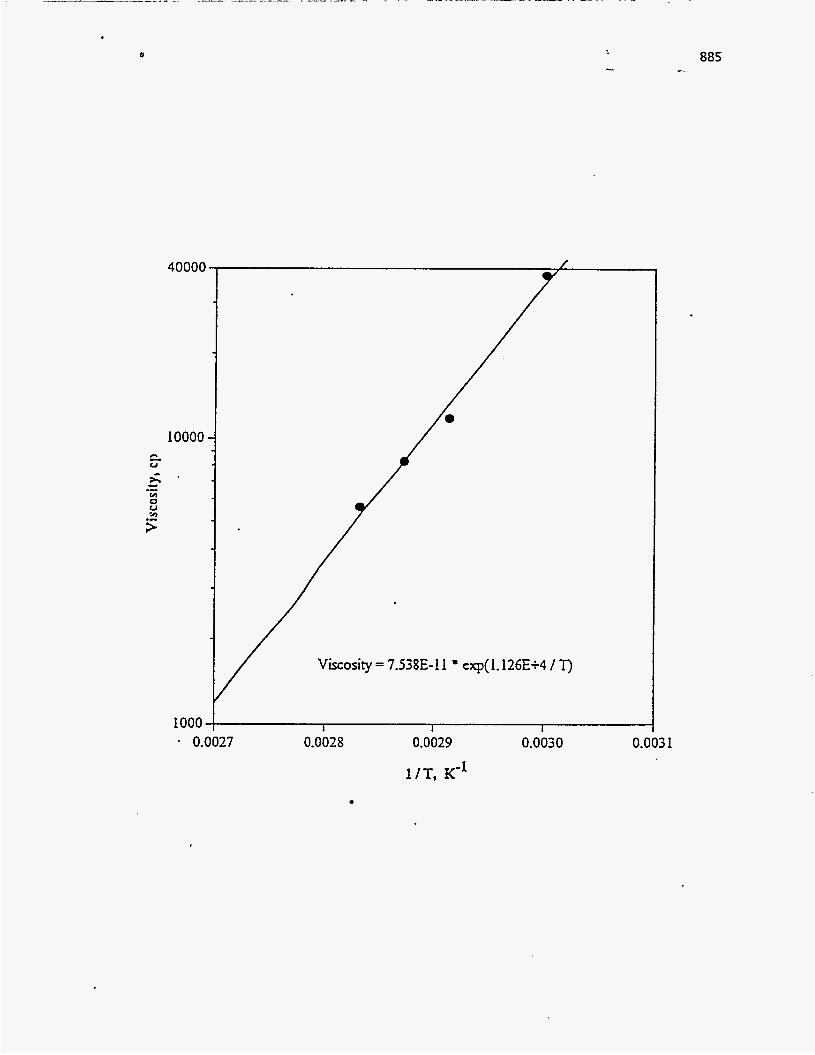
a -
40000
10000
Viscosity = 7.538E-1 I * cxp( 1.126€+4 / T)
1000 . 0.0027 0.0028 0.0029 0.0030 0.003 1
885 -.
886 z
the primary objective of this hydrotreating study was heteratom removal, especially
nitrogen removal.
In hydrotreating catalysts, the most common combinations of active elements are
CoMo, NMo, and NiW. In general, NiMo catalysts are more active for both nitrogen removal and the hydrogenation of aromatics, which gives rise to higher hydrogen
consumption(283. 324). Three different NiMo catalysts were used in this research. The
catalyst properties are outlined in Table 83. t
B-HDN catalyst was obtained fiom a commercial catalyst manufacturer and A- and C-HDN catalysts were impregnated with the active elements by the Engelhard
Corporation using the HDN catalyst alumina support provided by UN0C.A.L. B- and C-
HDN catalysts have similar chemical composition but different physical properties. A- HDN catalyst has lower a metals content and higher surface area than B- and C-HDN catalysts. A- and C-HDN catalyst surface areas and pore volumes were determined with
a BET apparatus using nitrogen as the adsorbate at liquid nitrogen temperature.
Adsorption-desorption isotherms for the fresh HDN catalysts and extracted spent
catalysts are shown in Figures 260 and 261. Comparison of the isotherms of fresh and
extracted spent catalyst A-HDN in Figure 260 indicated that the size and shape of the
hysteresis loops are little different, indicating pore mouth restriction by coke. C-HDN
catalyst also exhibits the same trends (Figure 261).
Pore size distributions were determined employing the desorption loop of the
adsorption-desorption isotherms. Pore size distributions for the fresh A- and C-HDN catalysts are compared in Figure 262. The pore size distributions were unimodal and the
A- and C- HDN catalyst have similar narrow pore size distributions. Pore size
distributions of the fresh and extracted HDN spent catalysts are shown in Figures 263 and
264. A slight shift to smaller pore radii was observed for each of the extracted spent
catalysts.
Physical properties af the fresh catalysts and the extracted spent catalysts are
compared in Table 84. The pore volumes and surface areas of the HDN catalysts
exhibited loss caused by coke and metals deposition. A- and C-HDN catalysts exhibited
the same losses, about one third, because the TOS for both catalysts processing the same
feedstock were almost the same. 626 and 650 h, respectively. Koyama et al.’” measured
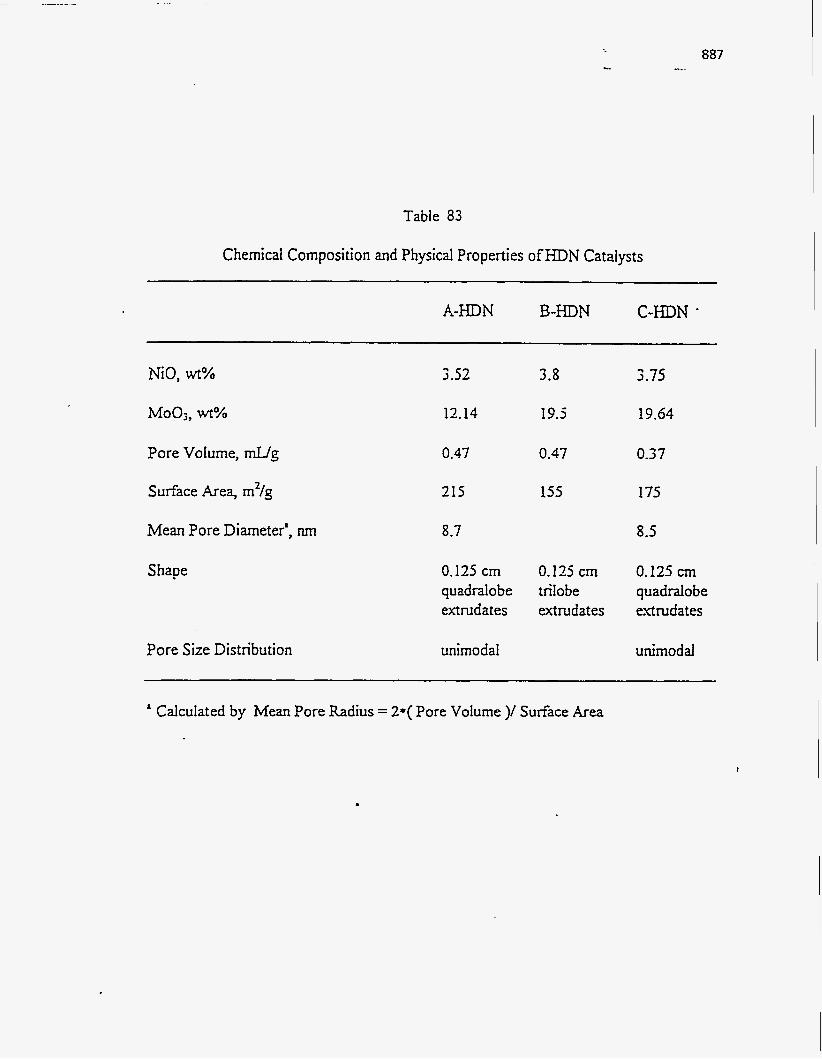
Table 83
Chemical Composition and Physical Properties of HDN Catalysts
887
A-HD N B-HDN C-HDN -
NiO, wt%
M003, wt%
Pore Volume, mUg
Surface Area, m2/g
Mean Pore Diameter', nm
Shape
Pore Size Distribution
3.52
12.14
0.47
215
8.7
3.8
19.5
0.47
155
0.125 cm 0.125 cm quadralobe trilobe extrudates extrudates
unimodal
3.75
19.64
0.3 7
175
8.5
0.125 m quaddobe extrudates
unimodal
a Calculated by Mean Pore Radius = 2*( Pore Volume )/ Surface Area
I

888
Figure 260
Adsorption-desorption isotherm of A-HDN catalyst
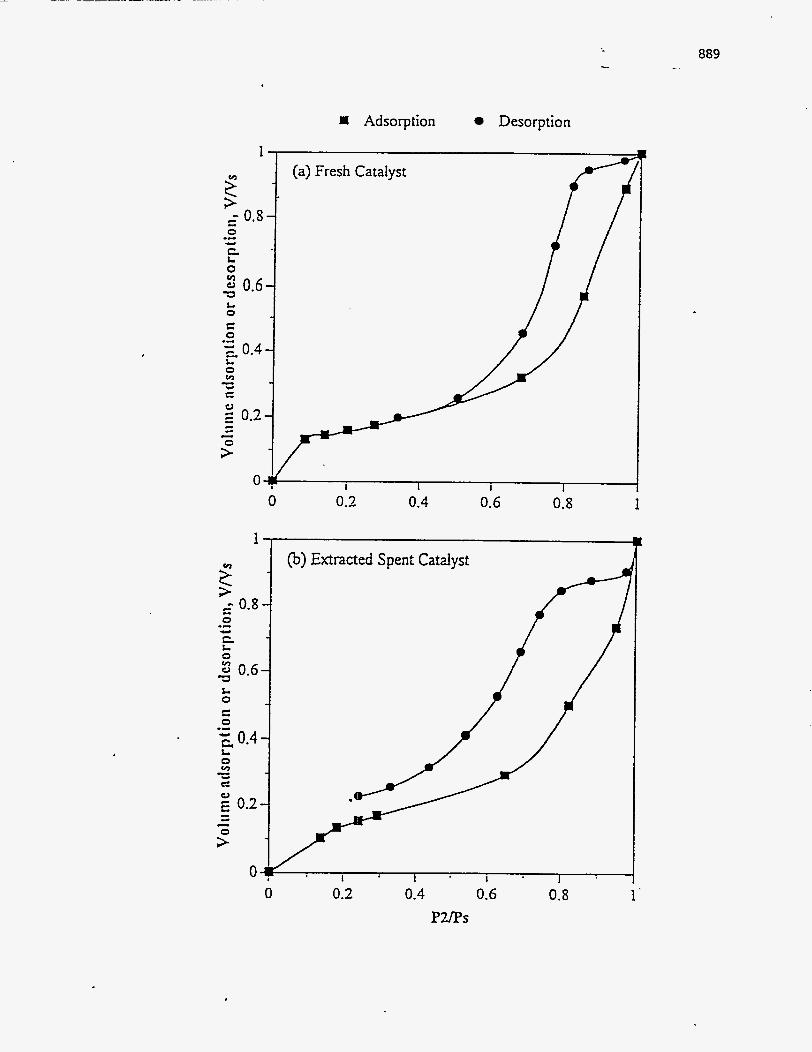
Adsorption Desorption
1
0 .- 4
0
3 L
3 0.6-
C 0 .-
0.4- L
.-
I
1
Y
f. 0
3 v)
0 0.6 L 0 C 0
0
0 0.2 0.4 0.6 0.8 1
I @) Extracted Spent Catalyst
0.2 0.4 0.6 0.8 Pups
1
889

890
Figure 261
Adsorption-desorption isotherm of C-HDN catalyst
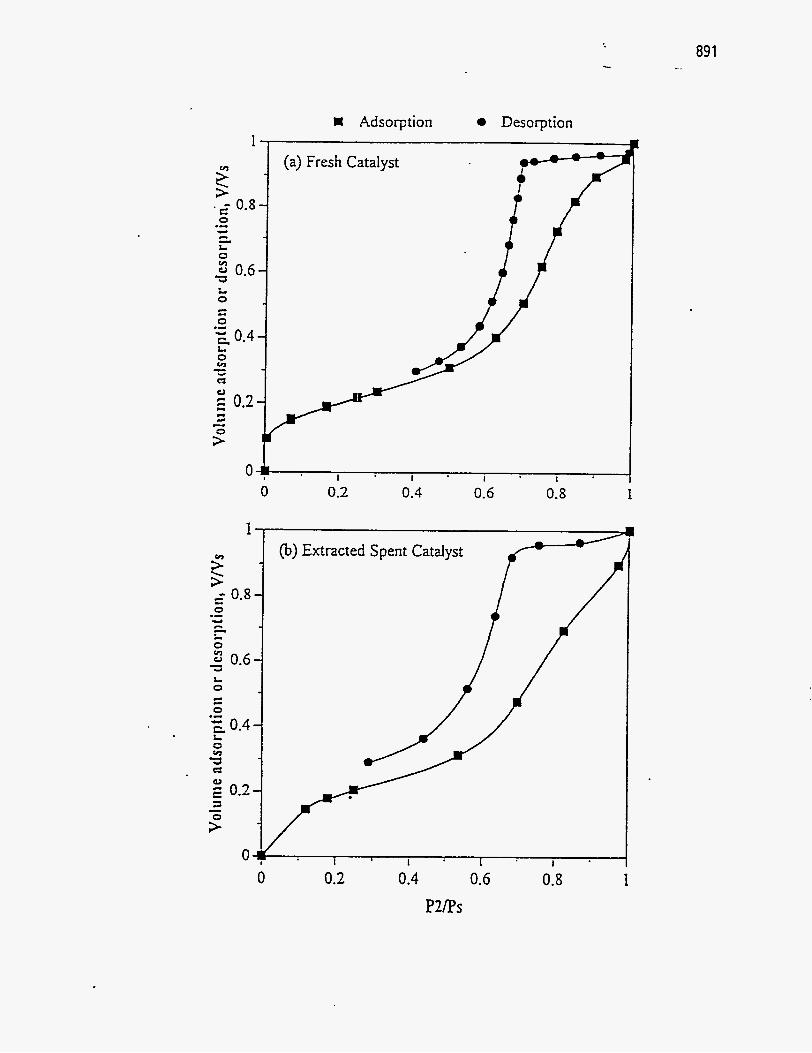
1
c L
L 0
J 3 0.6 L 0 E 0 .L - 0.4 2 0 v)
n - "
0
1 Adsorption 0 Desorption
...
I (a) Fresh Catalyst
i /
0 0.2 0.4 0.6 0.8 I
I
0 0.2 0.4 0.6
P2PS 0.8 I
89 1 -.

892
Figure 262
Pore size distribution of fresh HDN catalysts
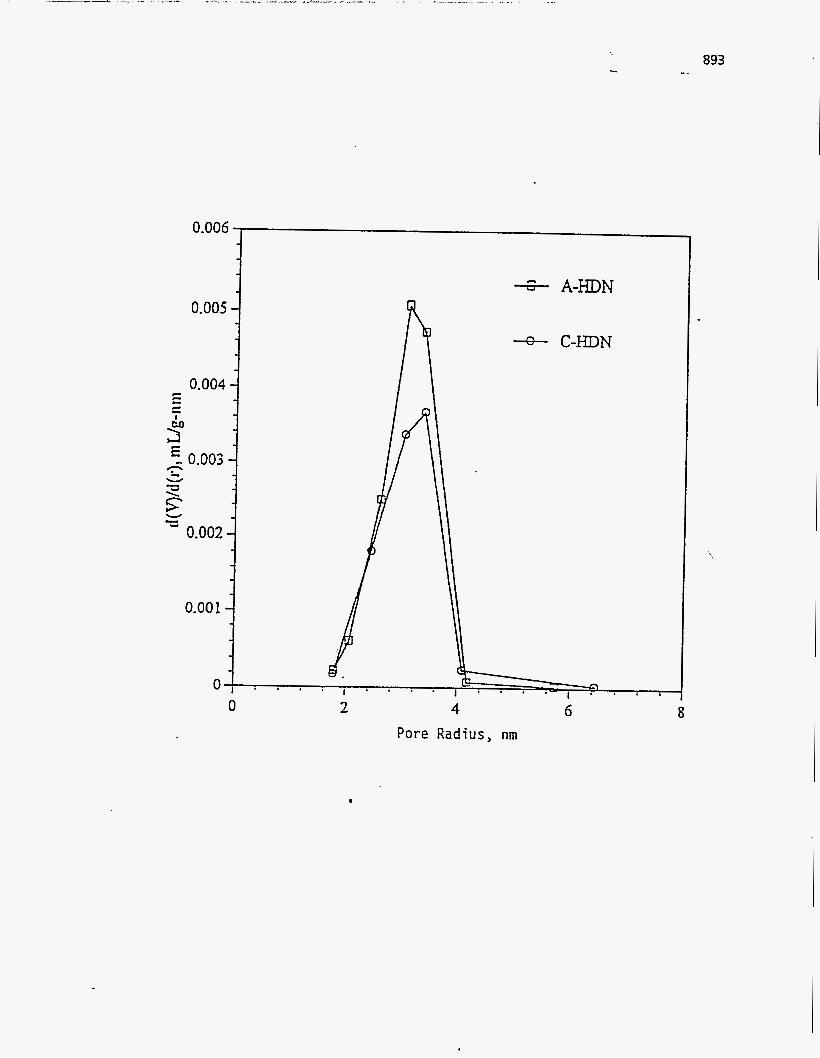
893
0 2 4 Pore Radius, nm
-E+ A-HDN
-8- C-HDN
.
6 8

894
Figure 263
Comparison with pore size distribution of fresh and extracted
spent A-HDN catalysts
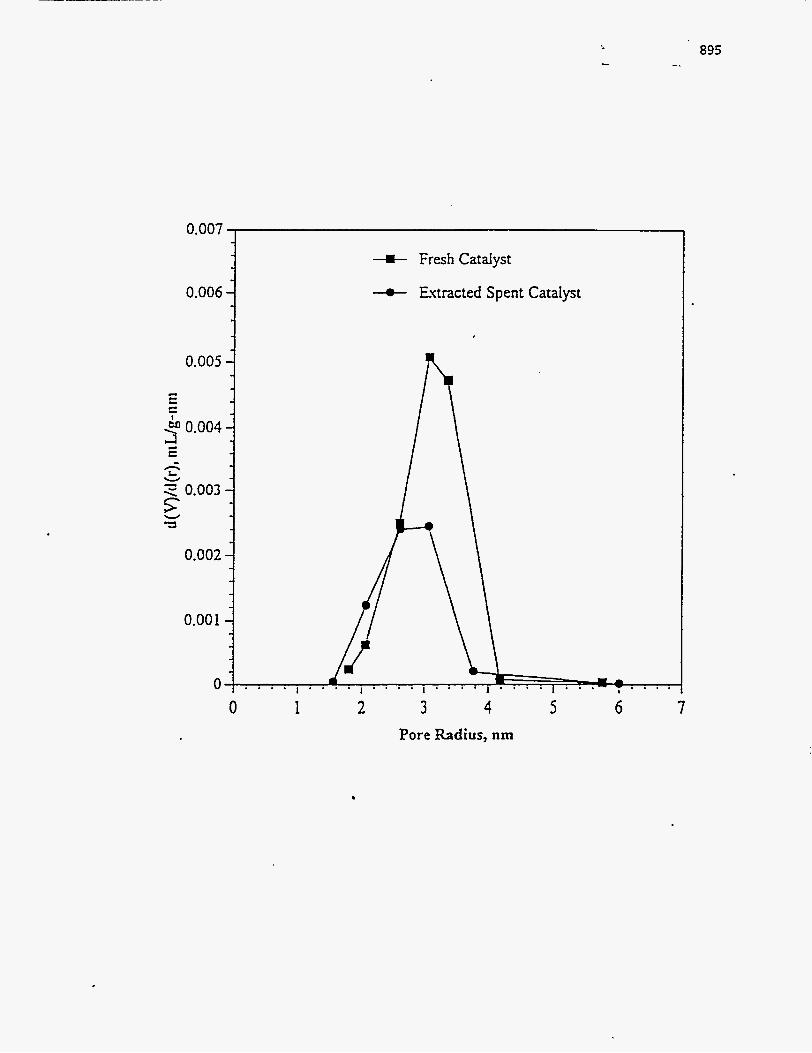
895 -.
0.007 ,
I 0.006
0
+ Fresh Catalyst
-o- Extracted Spent Catalyst
1 2 3 4 5 Pore Radius, nm
6 7
896
Figure 264
Comparison with pore size distribution of fresh and extracted
spent C-HDN catalysts
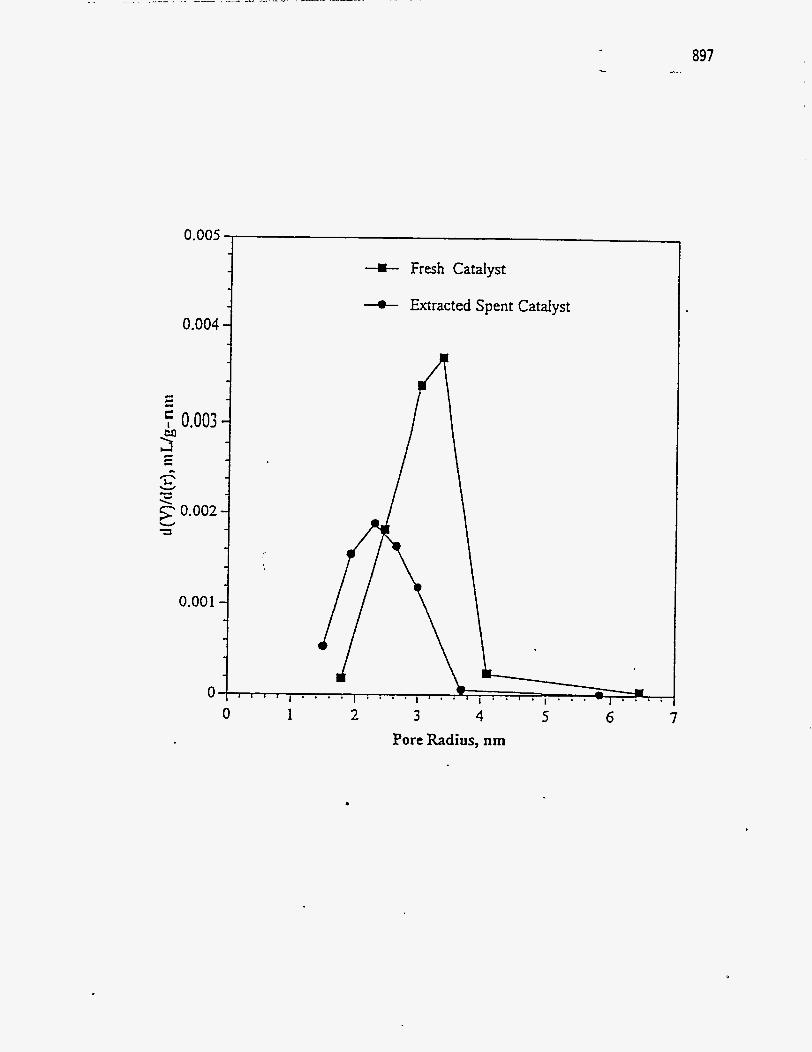
897
0.004 -
0
c ..,
+ Fresh Catalyst
-e- Extracted Spent CataIyst
A
1 2 3 4 5 Pore Radius, nm
6 7
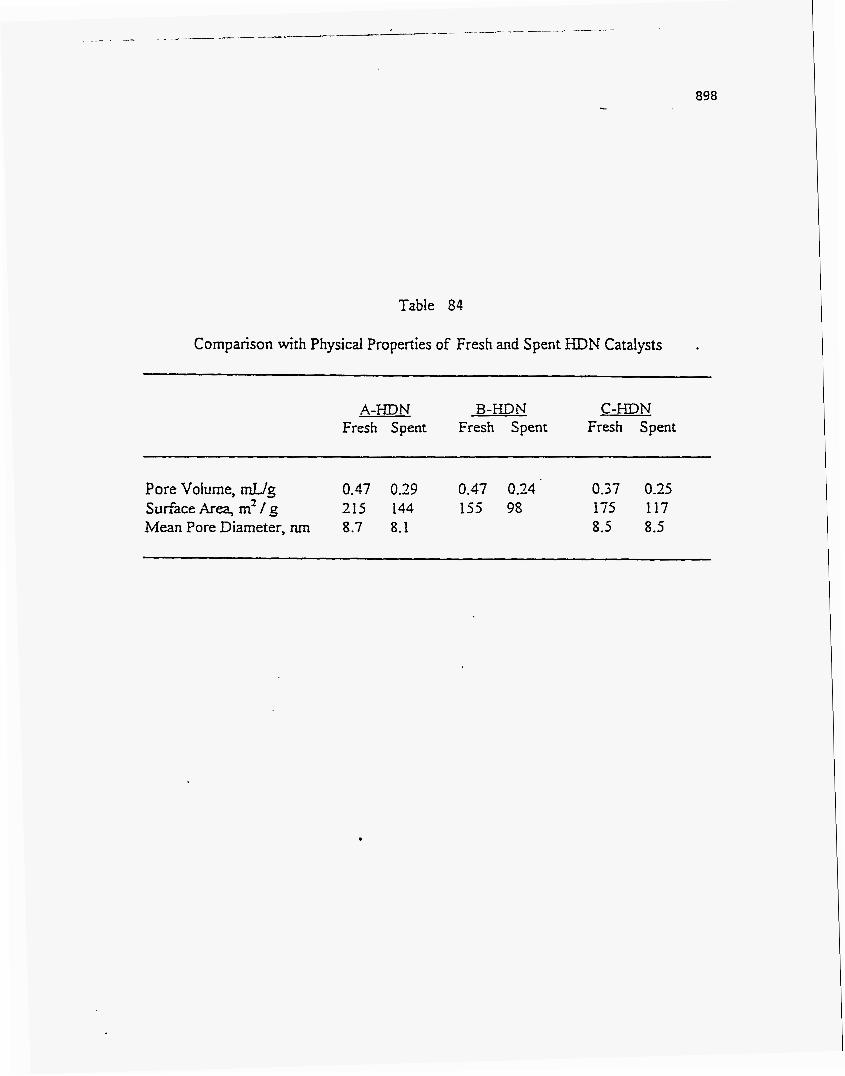
898
Table 84
Comparison with Physical Properties of Fresh and Spent HDN Catalysts .
A-HDN B-HDN C-HDN Fresh Spent Fresh Spent Fresh Spent
Pore Volume, mL/g 0.47 0.29 0.47 0.24 0.37 0.25 Surface *ea, m2 1 g 215 144 155 98 175 117 Mean Pore Diameter, nm 8.7 8.1 8.5 8.5

the pore volumes and surface areas of the commercial NiMo catalyst using in vacuum
residue HDS unit after 2 weeks (336 h). The losses calculated from their measured pore volume and surface area data were 30% and lo%, respectively. Chu et aL(325) reported that the coke generated from bitumen contributed significant surface area loss to the
coked catalyst. Thus, the results of this study are consistent with the literature.
Reaction Conditions When the catalyst activity had stabilized, process data were obtained which
related reactor operating conditions to bitumen upgrading. The effect of temperature,
pressure and liquid (or weight) hourly space velocity on sulfur, nitrogen, and nickel
removal and on asphaltenes. Conradson carbon residue, and residuum conversion were determined under stable catalyst activity in this research.
Reactor operating conditions were varied such that only one of the three process
variables was changed at a time and the other two variables were kept constant in
successive runs. For example, LHSV was varied while the temperature and pressure
were kept constant. The process operating strategies are displayed in Figures 265 and
266 for all the conditions employed in the three runs. Additionally, temperatures of 650 and 658 K'were used to study the temperature effect in detail in Run Y ; second pass
hydrotreating was employed in Run F to obtain higher conversion of the product. The
process operating conditions studied in Run Y. T, and F are listed in Tables 85-87,
respectively. The base case conditions were a temperature of 642 K, a pressure of 13.7 MPa,
and a LHSV of 0.48 K'. The base case experiments were used to determine the extent of catalyst'deactivation which was estimated by the change of the API gravity of the total liquid product. The process variable study was conducted in a cyclic mode, that is. base
case condition-process variable experiment(s)-base case condition.
Presentation of Results .
Heteroatom Removal
The conditions employed to upgrade the bitumen, as well as MI gravity and the
results of the elemental analyses (C. H, N, S and Ni) for the total liquid products
Figure 265
Experimental conditions as a function of temperature and LHSV
at constant pressure
900
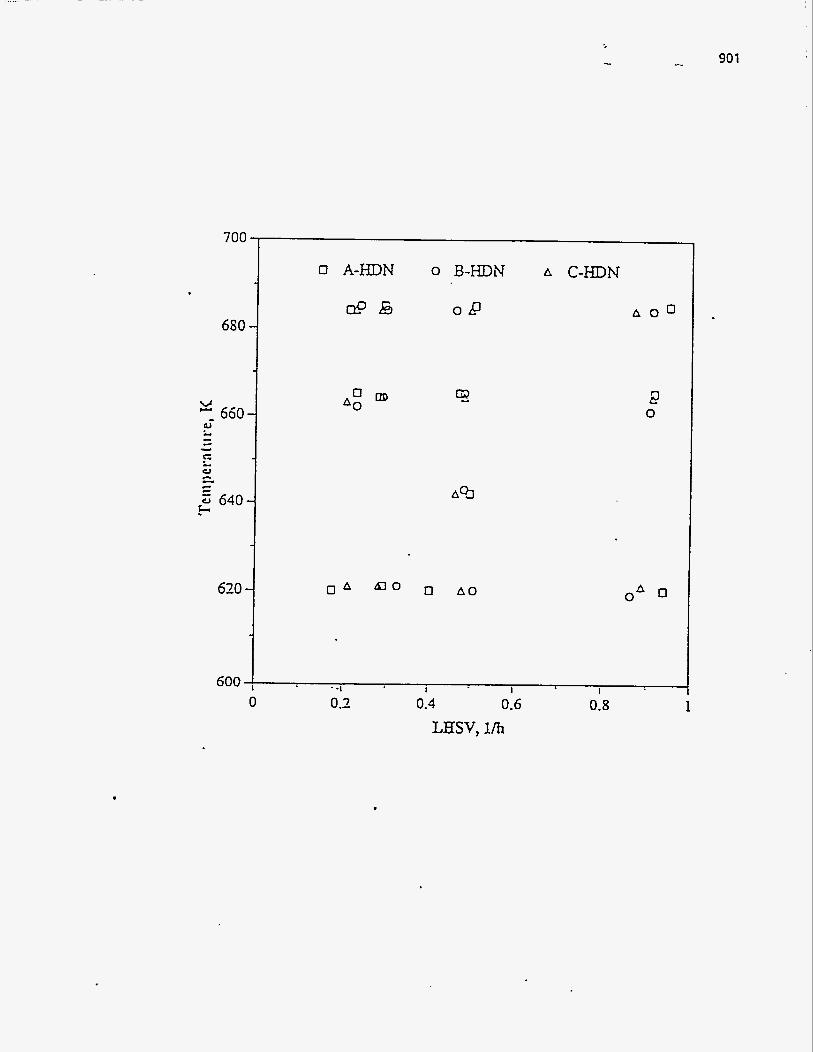
901
68C
620
600 0
0 B-HDN
O B
O A-HDN
O P E +
a A & l o 0 A 0
A C-HDN
A O o
2 0
oA 0
. -1 I I I
0.2 0.4 0.6
LHSV, lh 0.8 1

Figure 266
Experimental conditions as a function of temperature and pressure
at constant LHSV
902
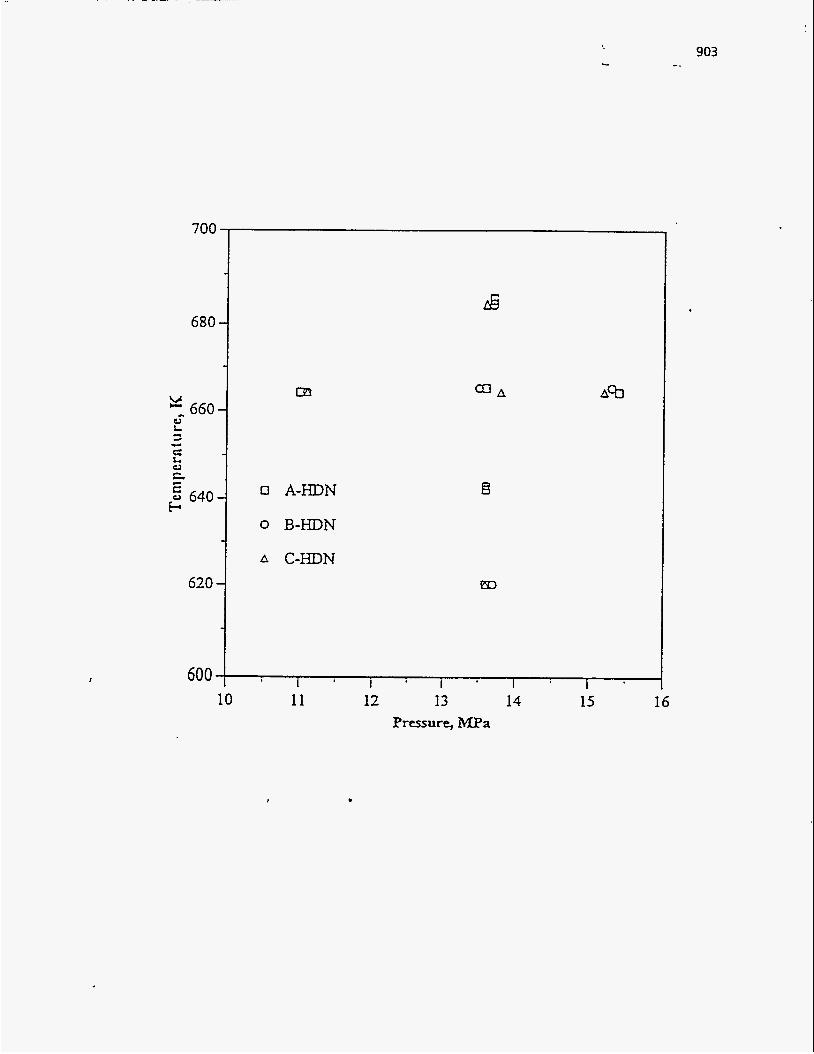
I
660- a L - 4
Y
E
,E 640-
0 c c
r
620 -
O A-HDN
0 B-HDN
b. C-HDN
8
600 I I I I I 1 10 11 12 13 14 15 16
Pressure, MPa
.
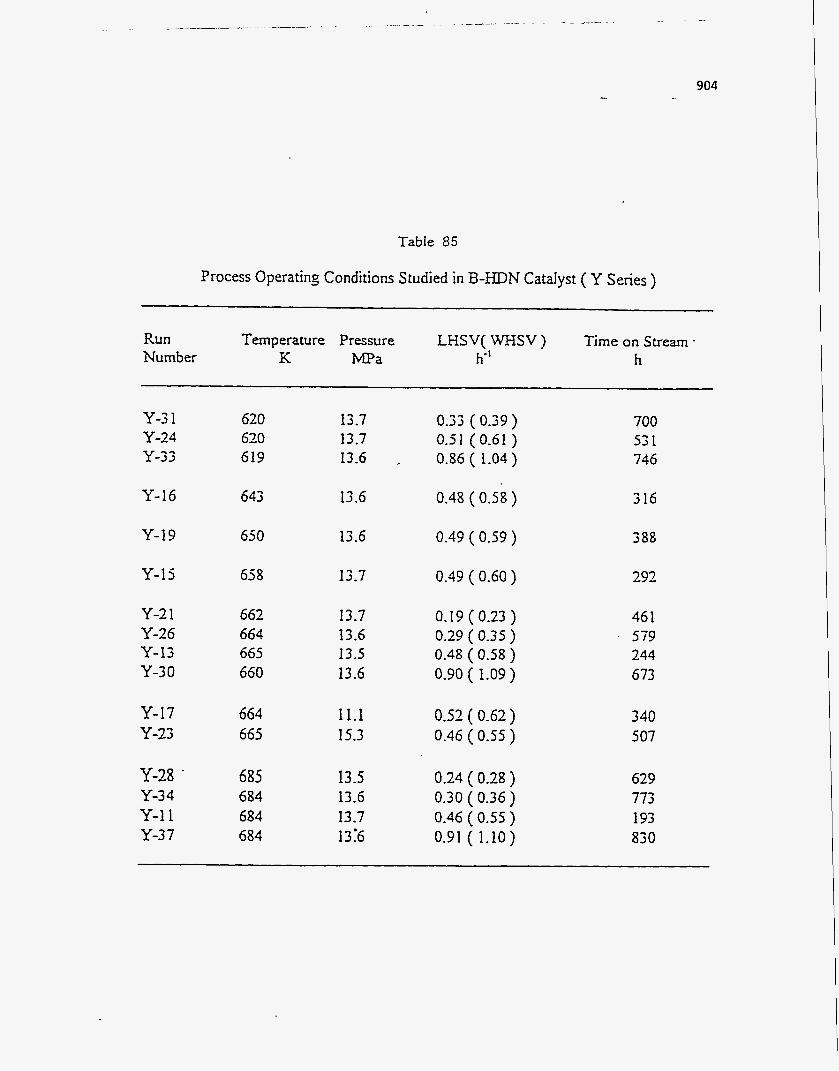
904
Table 85
Process Operating Conditions Studied in B-HDN Catalyst ( Y Series )
Run Number
Temperature Pressure K MPa
LHSV( WHSV ) h"
Time on Stream - h
Y-3 1 Y-24 Y-33
620 620 619
13.7 13.7 13.6
0.33 (0.39) 0.5 1 ( 0.61 ) 0.86 ( 1.04 )
700 53 I 746
Y-16 643 13.6 0.48 ( O S S ) 3 16
Y-19 65 0 13.6 0.49 ( 0.59 ) 3 88
Y-15 658 13.7 0.49 (0.60) 292
Y-2 1 Y-26 Y-13 Y-30
662 664 665 660
13.7 13.6 13.5 13.6
0.19 ( 0.23 ) 0.29 ( 0.35 ) 0.48 ( 0.58 ) 0.90 ( 1.09)
46 1 ' 579 244 6 73
Y-17 Y-23
664 665
11.1 15.3
0.52 ( 0.62) 0.46 ( 0.55 )
340 507
Y-28 . Y-34 Y-11 Y-3 7
685 684 684 684
13.5 13.6 13.7 1316
0.24 ( 0.28) 0.30 ( 0.36) 0.46 ( 0.55 ) 0.91 ( 1.10)
629 773 I93 830
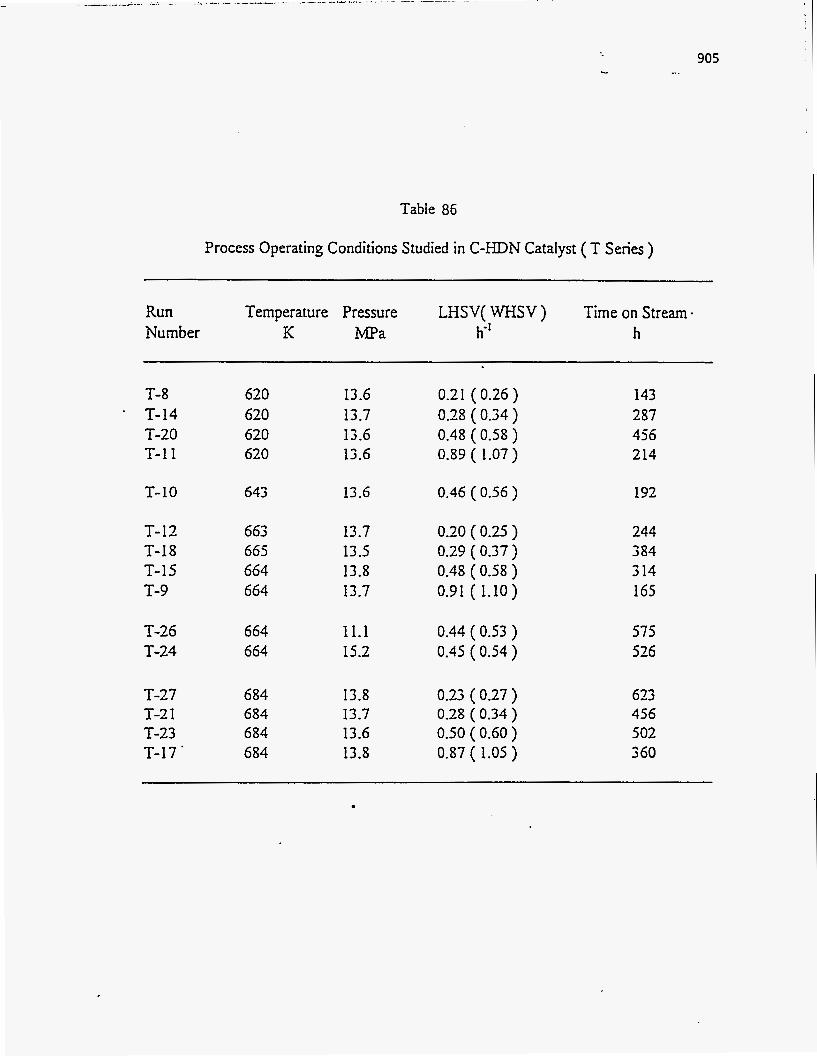
Table 86
Process Operating Conditions Studied in C-HDN CataIyst ( T Series )
905 -. .
Run Temperature Pressure LHSV( WHSV) Time on Stream- Number K MPa h” h
T-8 620 13.6 0.21 ( 0.26 ) 143 * T-14 620 13.7 0.28 (0.34) 287
T-20 620 13.6 0.48 ( 0.58 ) 456 T-11 620 13.6 0.89 ( 1.07) 214
T-10 643 13.6 0.46 ( 0.56 ) 192
T-I2 663 13.7 0.20 ( 0.25 ) 244 T-18 665 13.5 0.29 (0.37) 3 84 T-15 664 13.8 0.48 ( 0.58 ) 3 14 T-9 664 13.7 0.91 ( 1.10) 165
T-26 664 11.1 0.44 ( 0.53 ) 575 T-24 664 15.2 0.45 (0.54) 526
T-27 684 13.8 0.23 (0.27) 623 T-2 1 684 13.7 0.28 ( 0.34 ) 456 T-23 684 13.6 0.50 ( 0.60 ) 502 T-17 ’ 684 13.8 0.87 ( 1.05 ) 3 60
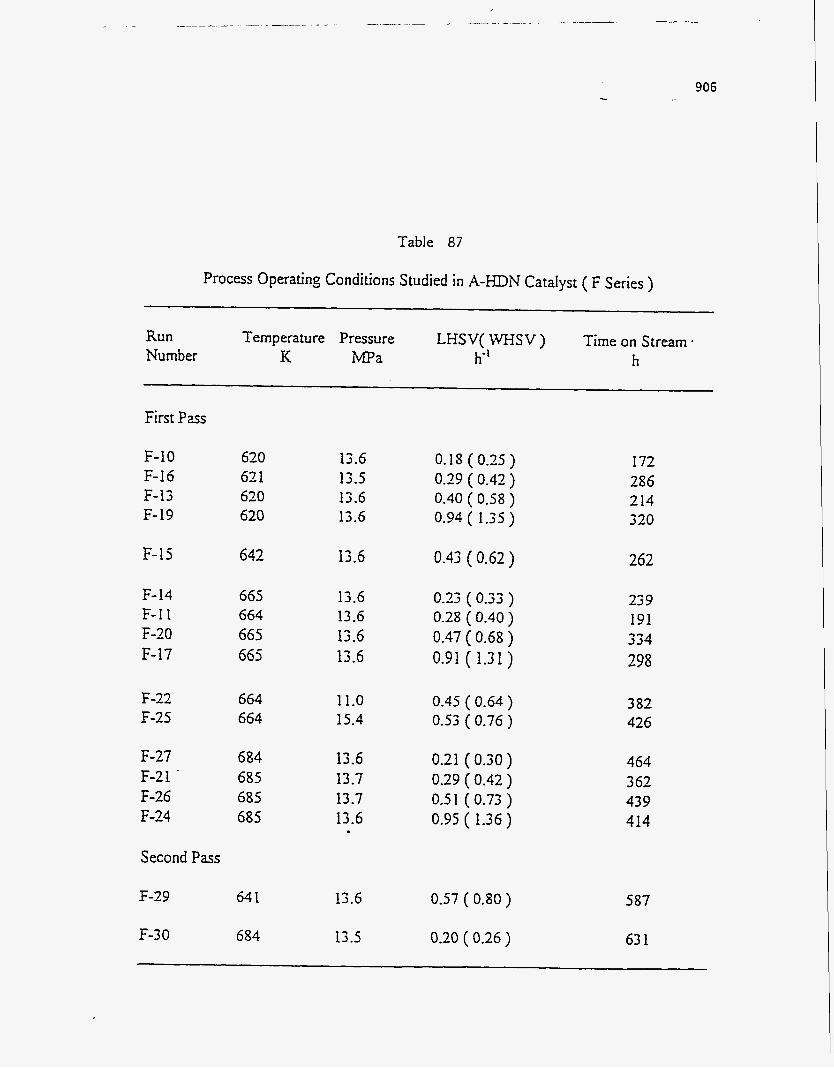
906
Table 87
Process Operating Conditions Studied in A-KDN Catalyst ( F Series )
Run Number
Temperature Pressure K MPa
LHSV( WHSV ) h-'
Time on Stream - h
First Pass
F-IO F-16 F-13 F-19
620 62 1 620 620
13.6 13.5 13.6 13.6
0. IS ( 0.25 ) 0.29 (0.42) 0.40 ( 0.58 ) 0.94 ( 1.35 )
172 286 2 14 3 20
F-15 642 13.6 0.43 (0.62) 262
F- 14 F-11 F-20 F-17
665 664 665 665
13.6 13.6 13.6 13.6
0.23 ( 0.33 ) 0.28 ( 0.40 ) 0.47 ( 0.68 ) 0.91 ( 1.31 )
23 9 I91 334 298
F-22 F-25
664 664
11.0 15.4
0.45 ( 0.64 ) 0.53 ( 0.76 )
3 82 426
F-27 F-21 . F-26 F-24
684 685 685 685
13.6 13.7 13.7 13.6
0.21 (0.30) 0.29 (0.42) 0.51 ( 0.73 ) 0.95 ( 1.36 )
464 362 43 9 414
Second Pass
64 1
684
13.6
13.5
0.57 ( 0.80 )
0.20 ( 0.26 )
F-29 587
63 1 F-3 0

907
produced over the HDN catalysts, are presented in Tables SS-90, respectively. The significant removal of nitrogen, sulfur, and nickel were accomplished with each of the
three HDN catalysts. The molar ratios of hydrogen to carbon (WC), an indication of heating value and combustion properties, of the liquid products were also improved. The
atomic WC ratios of liquid products were 1.7-1.8 at higher temperatures and close to that
of light crudes, 1.8(3 15).
Although the primary purpose of hydrotreating the bitumens was to decrease their heteroatom contents, API gravity was employed as the primary on-line indicator of
process performance. Figures 267 and 268 shows that the API gravity correlates with
sulfur and nitrogen contents in the total liquid products for the three HDN catalysts, thus
confirming the validity of the API gravity as an on-line monitor of catalyst performance. The results of run number Y-28, Y-34, and Y-11 are compared in Table 88. The
reported API gavity i d elemental analysis data for Y-34 appeared out of line and indicated that the catalyst activity had decreased steeply. The reason may be that the API
gravity of base case condition Y-32 and Y-36 drop significantly, from 15.6 to 15.1.
Therefore, the data of Y-34 and Y-37 must be corrected in the evaluation of catalyst
performance. Tables 88-90 show that nitrogen, sulfur, and nickel removal increased strongly as
residence time (reciprocal WHSV) and temperature increased for the Asphalt Ridge
bitumen over the three HDN catalysts. However, the effect of pressure on nitrogen and
sulfur removal was not significant.
Under the highest severity condition in the first pass hydrotreating study, sulfur"
contents in the liquid products meet the environmental product specification of unleaded
gasoline in US, max. 0.04 wt% (expected future, to 2000 year)(325). After second pass hydrotreating, the sulfur concentration, 0.0023 wt%, in the liquid product meet the severe restrictions of unleaded gas'oline in California, m a . 0.003 wt% (expected future,
to 2000 year)(325). The nitrogen concentration dropped also to '500 ppm which better
than the requirement for catalytic cracking, 1500 ppm(336).

908
Table 88
Elemental Analyses of the Total Liquid Products Produced over the B-HDN Catalyst
Run T P W S V Gravity No. K MPa h-' "MI
Ni H/C C H N S wt% wt% wt% ppm ppm Ratio
Feed: Asphalt Ridge Bitumen 11.44
Y-31 620 13.7 0.39 14.37 Y-24 620 13.7 0.61 14.59 Y-33 619 13.6 1.04 14.84
Y-16 643 13.6 0.58 15-86
Y-19 650 13.6 0.59 16.56
Y-15 658 13.7 0.60 17.14
Y-21 662 13.7 0.23 27.07 Y-26 664 13.6 0.35 24.06 Y-13 665 13.5 0.58 19.08 Y-30 660 13.6 1.09 16.75
Y-17 664 11.1 0.62 18.04 Y-23 665 15.3 0.55 18.80
Y-28 685 13.5 0.28 28.34 Y-34 684 ,13.6 0.36 24.96 Y-11 684 13.7 0.55 25.58 Y-37 684 13.6 1.10 17.66
54.93 11.21 0.97 4200 86
85.99 11.53 0.81 1300 36 85.65 11.43 0.87 I500 28 85.75 11.71 0.93 2000 49
55.98 12.08 0.73 890 33
86.05 11.90 0.60 830 31
86.68 12.36 0.52 690 24
86.84 12.77 0.25 201 18 87-09 12.40 0.37 200 38 85.80 11.94 0.54 570 24 86.76 12.02 0.83 I100 42
86.25 12.15 0.70 620 28 87.1 I 12.15 0.43 580 23
86.80 12.71 0.13 152 8 87.08 12.81 0.32 195 20 86.02 12.13 0.29 165 18 86.09 11.89 0.69 910 33
1.58
1.61 1.60 1.64
1.69
1.66
1.71
1.76 1.71 1.67 1.66
1.69 1.67
1.76 1.77 1.69 1.66

Table 89
EIementaI Analyses of the Total Liquid Products Produced over the C-HDN Catalyst
Run T P WHSV Gravity C H N S Ni WC
No. K m a h" "API wt% wt% wt% ppm ppm Ratio
Feed: Asphalt Ridge Bitumen 11.44 54-93 11.21 0.97 4200
T-8 620 T-14 620 T-20 620 T-11 620
"-10 643
T-12 663 T-18 665 T-15 664 T-9 664
T-26 664 T-24 664
T-27 684 T-21 ,684 T-23 684 T-17 684
13.6 0.26 15.98 85.95 12.01 0.76 1000 13.7 0.34 15.48 86.66 12.17 0.77 1190 13.6 0.58 15.01 86.48 11.91 0.91 1410 13.6 1.07 15.23 85.87 11.94 0.94 1720 47
13.6 0.56 16.24 86.03 11.95 0.71 1000
13.7 0.25 22.78 85.84 12.58 0.31 410 13.5 0.37 20.69 86.55 12.51 0.46 550 31 13.8 0.58 18-45 86.01 12.25 0.54 800 34 13.7 1.10 16.81 I 86.29 12.38 0.69 950
11.1 0.53 17.79 86.72 12.33 0.68 1210 15.2 0.54 18.03 86.50 12.60 0.67 1000
13.8 0.27 27.34 87.55 13.21 0.29 240 25 13.7 0.34 25.37 87.21 12.92 0.30 300 13.6 0.60 21.45 87.09 12.61 0.51 600 13.8 1.05 19.45 86.75 12.28 0.56 790
1.58
1.65 1.69 1.65 1-67
1.67
1.76 1.73 1.71 1.72
1.71 1.75
1.81 1.78 1.74 1.71
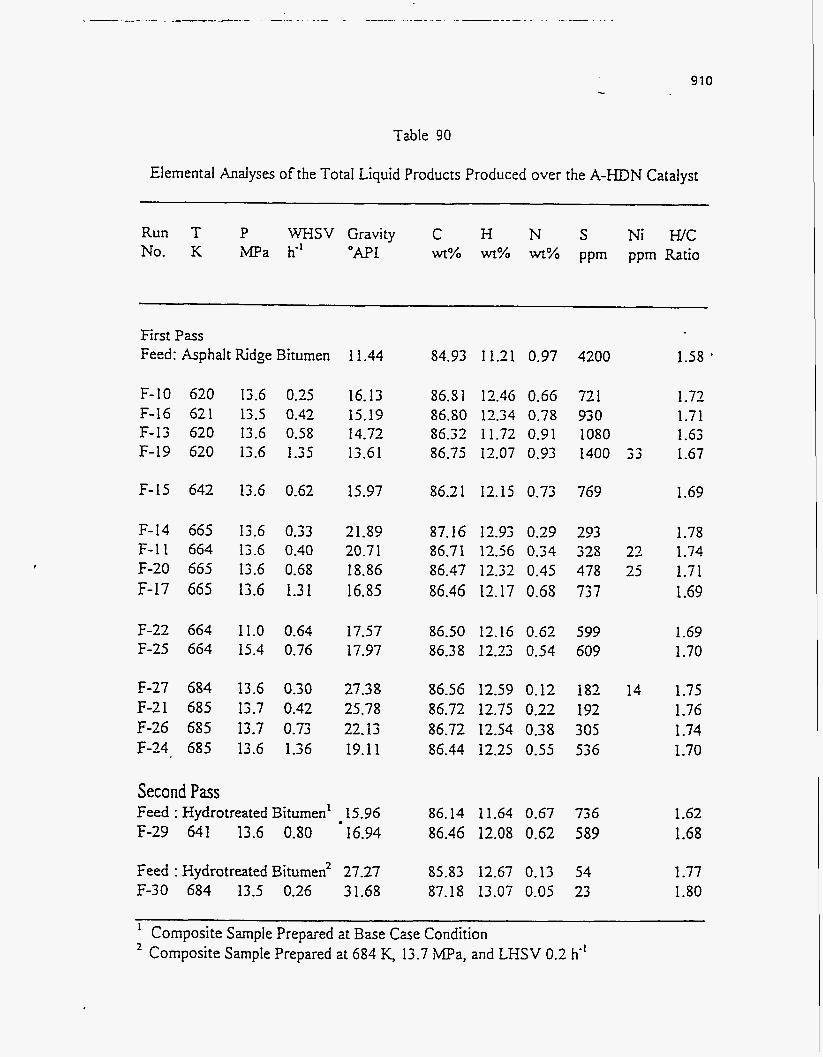
910
Table 90
EIementaI Analyses of the Total Liquid Products Produced over the A-HDN Catalyst
Run T No. K
P WHSV Gravity lMPa h" "MI
C H N S Ni WC wt% wt% wt% pprn ppm Ratio
First Pass Feed: Asphalt Ridge Bitumen 11.44
F-10 620 F-16 621 F-13 620 F-19 620
F-15 642
F-14 665 F-11 664 F-20 665 F-17 665
F-22 664 F-25 664
F-27 684 F-21 685 F-26 685 F-24 685
Second Pass
13.6 0.25 13.5 0.42 13.6 0.58 13.6 1.35
13.6 0.62
13.6 0.33 13.6 0.40 13.6 0.68 13.6 1.31
11.0 0.64 15.4 0.76
13.6 0.30 13.7 0.42 13.7 0.73 13.6 1.36
16.13 15.19 14.72 13.61
15.97
21.89 20.7 1 18.86 16.85
17.57 17.97
27.38 25.78 22.13 19.1 1
Feed : Hydrotreated Bitumen' 15.96 F-29 641 13.6 0.80 16.94
Feed : Hydrotreated Bitumen' 27.27 F-30 684 13.5 0.26 31.68
S4.93 11.21 0.97 4200
86.51 12.46 0.66 721 86.SO 12.34 0.78 930 86.32 11.72 0.91 1080 86.75 12.07 0.93 1400 33
86.21 12.15 0.73 769
87.16 12.93 0.29 293 86.71 12.56 0.34 325 22 86.47 12.32 0.45 478 25 86.46 12.17 0.65 737
86.50 12.16 0.62 599 86.38 12.23 0.54 609
86.56 12.59 0.12 182 14 86.72 12.75 0.22 192 86.72 12.54 0.38 305 86.44 12.25 0.55 536
86.14 11.64 0.67 736 86.46 12.08 0.62 589
85.83 12.67 0.13 54 87.18 13.07 0.05 23
1.58 '
1.72 1.71 1.63 1.67
1.69
1.78 1.74 1.71 1.69
1.69 1.70
1.75 1.76 1.74 1.70
1.62 1.68
1.77 1.80
Composite Sample Prepared at Base Case Condition Composite Sample Prepared zt 684 K, 13.7 ma, and LHSV 0.2 h"
1
2
Figure 267
The correlation of API gravity vems sulfur content in the total liquid
products produced over the three HDN catalysts
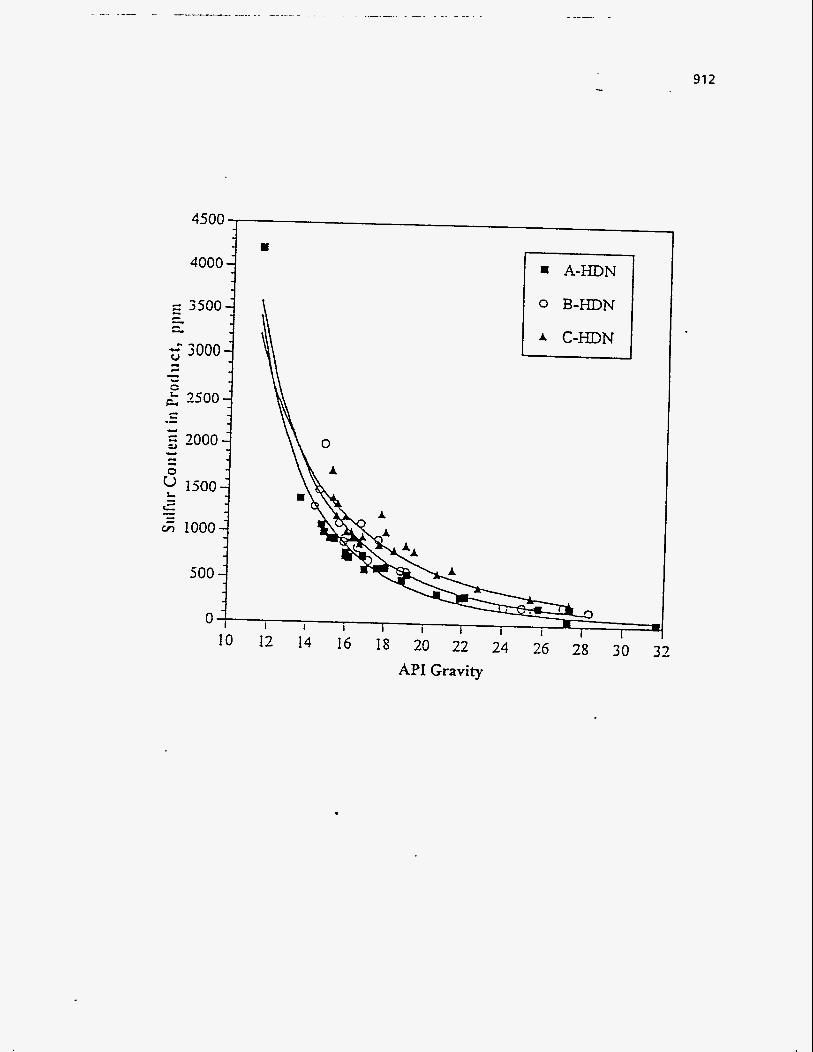
4 o o o j
I I 1-
2 25oo-j
i -. = Q) 2000
u 1500
Is 1000
.L
c - 0
t: s
n l
.
91 2
A-HDN
0 B-HDN
* C-HDN
\ h A
" i I 1 I 1 L
10 12
API Gravity

Figure 268
The correlation of API gravity versus nitrogen content in the total liquid
products produced over the three HDN catalysts
913 -.

0 1 1 I I I I I I 1 I 10 12 14 16 18 20 22 24 26 28 30 32
914
915 -.
CCR and Asphaltenes Conversion
Tables 9 1-93 show, respectively, that CCR and asphaltene conversions and liquid
yields are correlated to the operating conditions at which the total liquid products were produced over the HDN catalysts. Significant conversions of asphaltenes and CCR were
obtained for all three catalysts. The conversion of CCR increased significantly with increasing residence time
(reciprocal WHSV) and temperature for the bitumen over all three HDN catalysts. The
asp haltenes conversion increased as temperature increased. The conversion of
asphaltenes increased with increasing residence time at higher temperature (664 and 684
K) but exhibited the opposite trend at lower temperature, 620 K, for each catalyst. As pressure increased, the conversion of CCR and asphaltenes increased, however, not
significantly like in the case of the residence time and temperature. Table 93 also presents a comparison between first and second pass hydrotreating
at two operating conditions. Under the highest severity condition, the conversion of CCR and asphaltenes was over 90% after second pass hydrotreating.
Viscosity The viscosities of liquid products produced over the HDN catalysts conelated
with the operating conditions and are presented in Tables 94-96. As the temperature and
residence time increased, the viscosity of the liquid product decreased significantly. With increasing pressure, the viscosities of the liquid products produced over the A- and C- HDN catalysts increased slightly, whereas the viscosity of the liquid product produced
over the B-HDN catalyst decreased slightly. For the same operating conditions, the viscosity of liquid product was a function of the reactor temperature.
The viscosities of liquid products after second pass hydrotreating, compared to the
liquid product produced during 'first pass hydrotreating and the bitumen, are also
presented in Table 96. At the highest severity, the viscosity was 23.9 cp at 283.2 I(, a
reduction of three to four orders of magnitude..
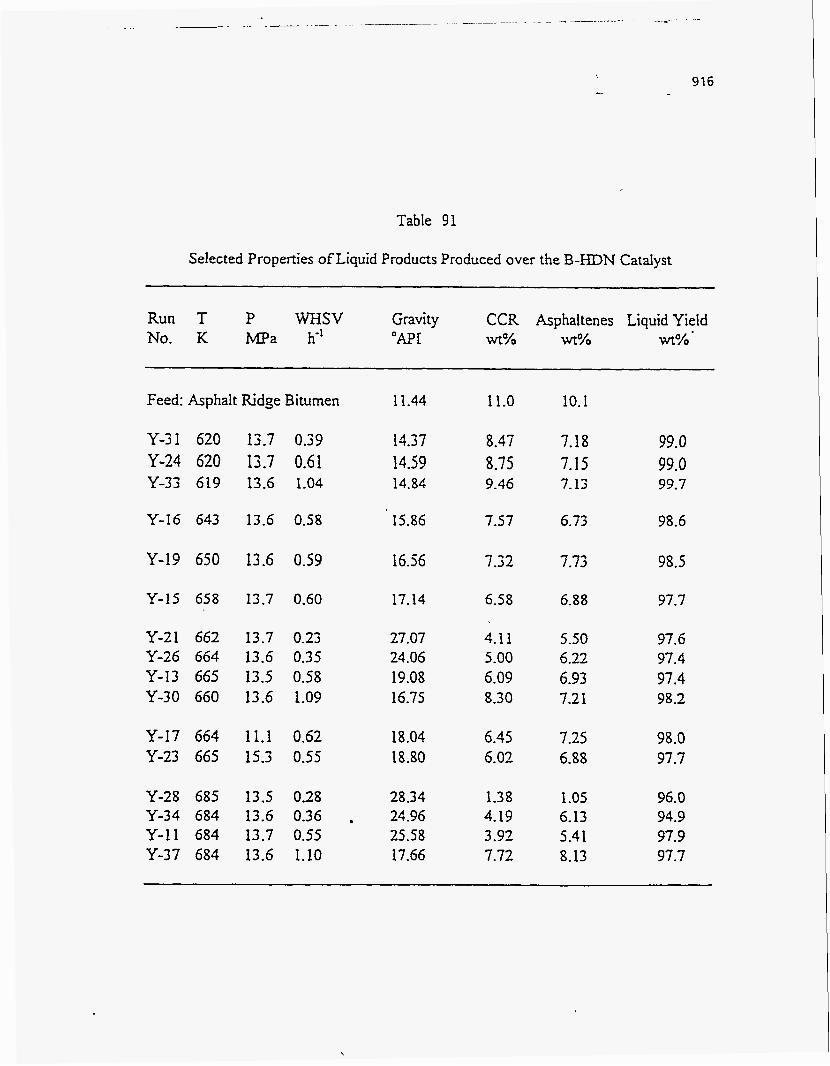
Table 91
Selected Properties of Liquid Products Produced over the B-HDN Cataiyst
Run T P WHSV Gravity CCR Asphaltenes Liquid Yield No. K MPa h" "API wt% wt% M%'
Feed: Asphalt Ridge Bitumen 1 1.44 11.0 10.1
Y-31 620 Y-24 620 Y-33 619
Y-16 643
Y-19 650
Y-15 658
Y-21 662 Y-26 664 Y-13 665 Y-30 660
Y-17 664 Y-23 665
Y-28 685 Y-34 684 Y-11 684 Y-37 684
13.7 0.39 14.37 13.7 0.61 14.59 13.6 1.04 14.84
13.6 0.58 15.86
13.6 0.59 16.56
13.7 0.60 17.14
13.7 0.23 27.07 13.6 0.35 24.06 13.5 0.58 19.08 13.6 1.09 16.75
11.1 0.62 18.04 15.3 0.55 18.80
13.5 0.28 28.34 13.6 0.36 . 24.96 13.7 0.55 25-58 13.6 1-10 17.66
8.47 8.75 9.46
7.57
7.32
6.58
4.1 1 5.00 6.09 8.30
6.45 6.02
1.38 4.19 3.92 7.72
7.18 7.15 7.13
6.73
7.73
6.88
5.50 6.22 6.93 7.2 1
7.25 6.88
1 .os 6.13 5.41 8.13
99.0 99.0 99.7
98.6
98.5
97.7
97.6 97.4 97.4 98.2
98.0 97.7
96.0 94.9 97.9 97.7
,

917 -.
. I
Table 92
Selected Properties of Liquid Products Produced over the C-HDN Catalyst
Run T No. K
P WHSV m a K*
Gravity "I
CCR Asphaltenes Liquid Yield wt% wt% wt%
Feed: Asphalt Ridge Bitumen 11-44 11.0 10. I
98.9 98.3 98.3 98.5
T-8 620 13.6 0.26 T-14 620 13.7 0.34 T-20 620 13.6 0.58 T-11 620 13.6 1-07
15.98 15-48 15-01 15.23
7.39 7.89 8.78 8.71
7.30 7.03 6.78 6.6 1
T-10 643 13.6 0.56 16.24 7.3 0 6.65 99.2
T-12 663 13.7 0.25 T-18 665 13.5 0.37 T-15 664 13.8 0.58 "-9 664 13.7 1.10
22.78 20.69 18.45 16.81
4.43 5.87 6.8 I 7.58
5.88 6.34 6.50 8.00
96.5 97.5 97.2 98.5 I
T-26 664 11.1 T-24 664 15.2
0.53 0.54
17.79 18.03
7.83 7.47
7.42 7.3 0
97.2 97.7
T-27 684 13.8 T-21 684 13.7 T-23 684 13.6 T-17 684 13.8
0.27 0.34 0.60 1.05
27.34 25.37 21.45 19.45
3 -34 4.05 6.07 6.75
5.58 6.42 7.28 7.26
93.8 93.4 9s. 1 96.3
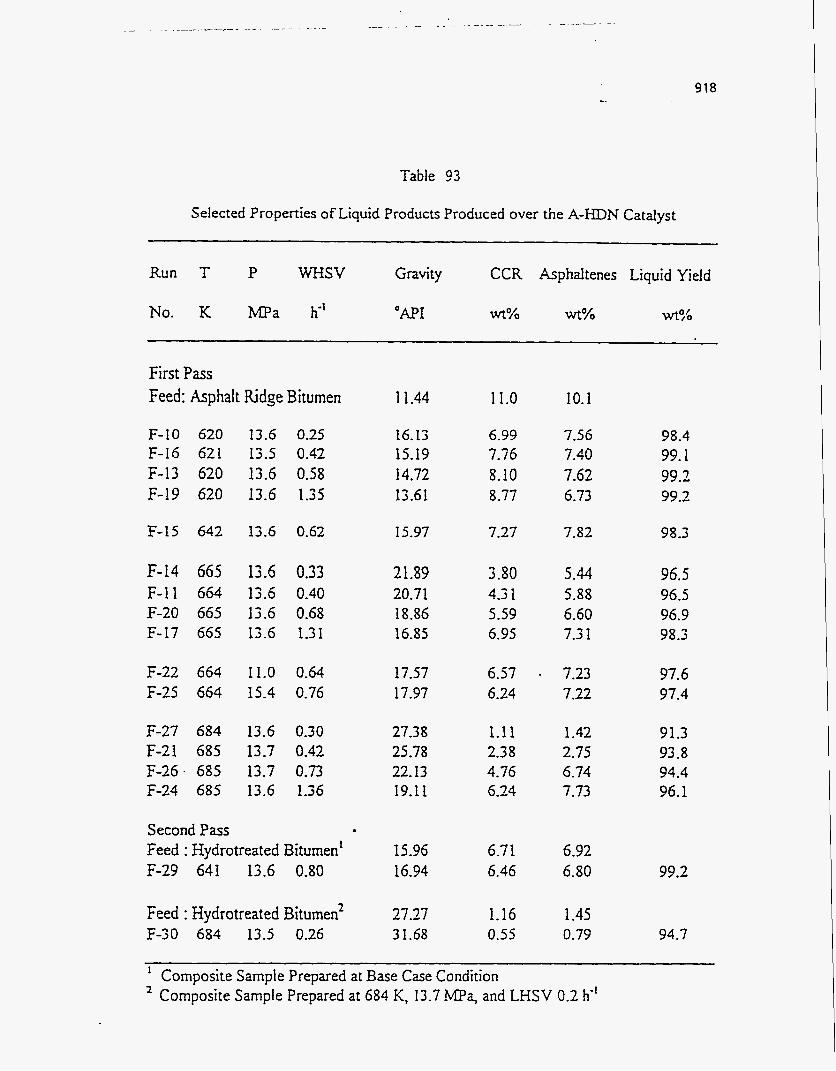
918
Table 93
Selected Properties of Liquid Products Produced over the A-HDN Catalyst
CCR Asphaltenes Liquid Yield Run T P WHSV
h"
Gravity
No. K MPa "API w% wt%
First Pass Feed: Asphalt Ridge Bitumen 11.44 11.0 10.1
F-IO 620 F-16 621 F-13 620 F-19 620
13.6 0.25 13.5 0.42 13.6 0.58 13.6 1.35
16.13 15-19 14.72 13.61
6.99 7.76 8.10 8.77
7.56 7.40 7.62 6.73
98.4 99.1 99.2 99.2
F-15 642 13.6 0.62 15.97 7.27 7.82 98.3
F-14 665 F-I1 664 F-20 665 F-17 665
13.6 0.33 13.6 0.40 13.6 0.68 13.6 1.31
21.89 20.71 18.86 16.85
3.80 4.3 I 5.59 6.95
5.44 5.88 6.60 7.3 I
96.5 96.5 96.9 98.3
F-22 664 F-25 664
11.0 0.64 15.4 0.76
17.57 17.97
6.57 . 7.23 6.24 7.22
97.6 97.4
F-27 684 F-21 685 F-26. 685 F-24 685
13.6 0.30 13.7 0.42 13.7 0.73 13.6 1.36
27.38 25.78 22.13 19.11
1.11 2.38 4.76 6.24
1.42 2.75 6.74 7.73
91.3 93.8 94.4 96.1
Second Pass Feed : Hydrotreated Bitumen! F-29 641 13.6 0.80
15.96 16.94
6.7 1 6.46
6.92 6.80 99.2
Feed : Hydrotreated Bitumen' F-30 684 13.5 0.26
27.27 3 1.68
1.16 0.55
1.45 0.79 94.7
Composite Sample Prepared at Base Case Condition Composite Sample Prepared at 684 K, 13.7 ma, and LHSV 0.2 h-'
1
2
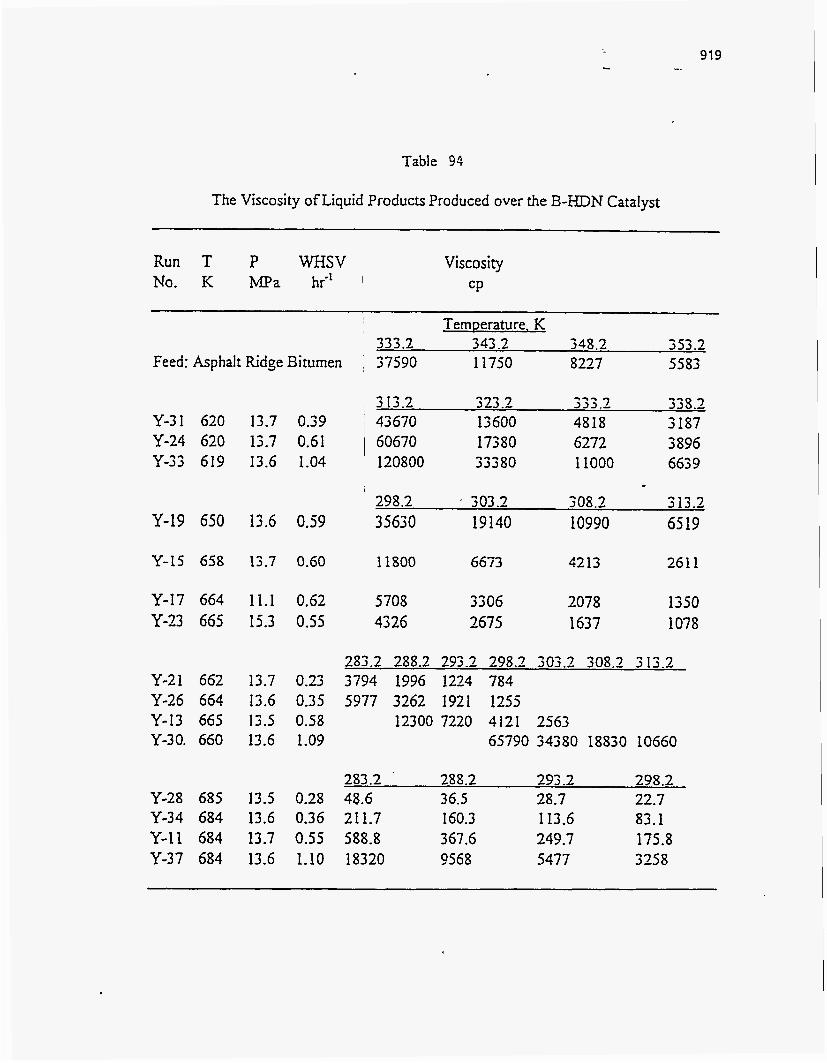
919 -.
Table 94
The Viscosity of Liquid Products Produced over the B-HDN Catalyst
Run T P WHSV Viscosity No. K MPa h i ' 1 C P
~~
Temperature. K 333.2 343.2 348.2 353.2
Feed: Asphalt Ridge Bitumen 37590 1 1750 8227 5583
-*- -* ' 313.2 323 2 222.2 328.2
Y-31 620 13.7 0.39 I 43670 13 600 4818 3 187 Y-24 620 13.7 0.61 1 60670 17380 6272 3 896 Y-33 619 13.6 1.04 120800 33380 1 1000 663 9
298.2 ' 303.2 308.2 313.2 Y-19 650 13.6 0.59 35630 19140 10990 65 19
Y-I5 658 13.7 0.60 11800 6673 4213 261 1
Y-17 664 11.1 0.62 5708 3306 2078 1350 Y-23 665 15.3 0.55 4326 2675 I637 1078
283.2 288.2 293.2 298.2 303.2 308.2 313.2 Y-21 662 13.7 0.23 3794 1996 1224 784 Y-26 664 13.6 0.35 5977 3262 1921 1255 Y-I3 665 13.5 0.58 12300 7220 4121 2563 Y-30. 660 13.6 1.09 65790 34380 18830 10660
283.2 288.2 293.2 298.2 Y-28 685 13.5 0.28 48.6 36.5 28.7 22.7 Y-34 684 13.6 0.36 211.7 160.3 113.6 83.1 Y-11 684 13.7 0.55 588.8 367.6 249.7 175.8 Y-37 684 13.6 1.10 18320 9568 5477 3258
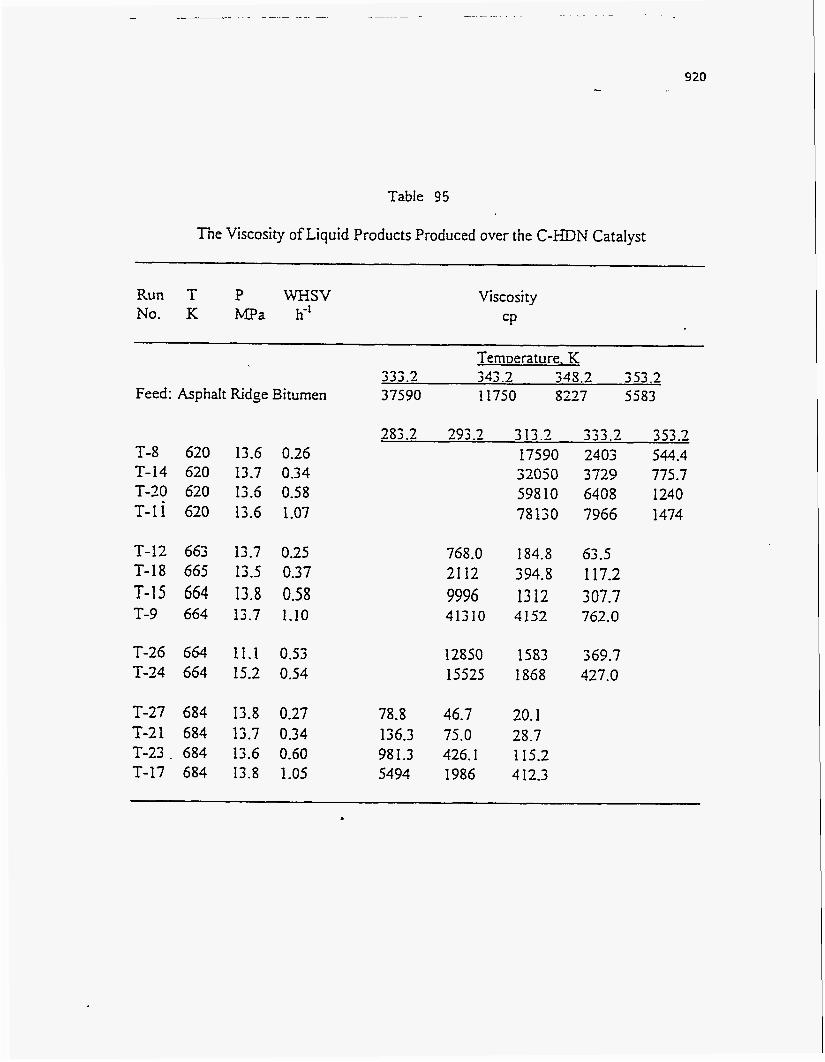
Table 95
The Viscosity of Liquid Products Produced over the C-HDN Catalyst
920
Run T P WHSV No. K MPa h-'
Viscosity CP
Feed: Asphalt Ridge Bitumen
T-8 620 13.6 0.26 T-14 620 13.7 0.34 T-20 620 13.6 0.58 T-li 620 13.6 1.07
T-12 663 13.7 0.25 T-18 665 13.5 0.37 T-15 664 13.8 0.58 T-9 664 13.7 1-10
T-26 664 11.1 0.53 T-24 664 15.2 0.54
T-27 684 13.8 0.27 T-21 684 13.7 0.34 T-23. 684 13.6 0.60 T-17 684 13.8 1-05
TemDerature. K 343.2 345.2 353.2 J J J . 2
37590 11750 8227 5583
--- 283.2. 293.3, 313 .2 3 3 3 . 2 353.2
17590 2403 544.4 32050 3729 775.7 59810 6408 1240 78130 7966 1474
768.0 184.8 63.5 21 12 394.8 117.2 9996 1312 307.7 41310 4152 762.0
12850 1583 369.7 15525 1868 427.0
78.8 46.7 20.1 136.3 75.0 28.7 981.3 426.1 115.2 5494 1986 4 12.3
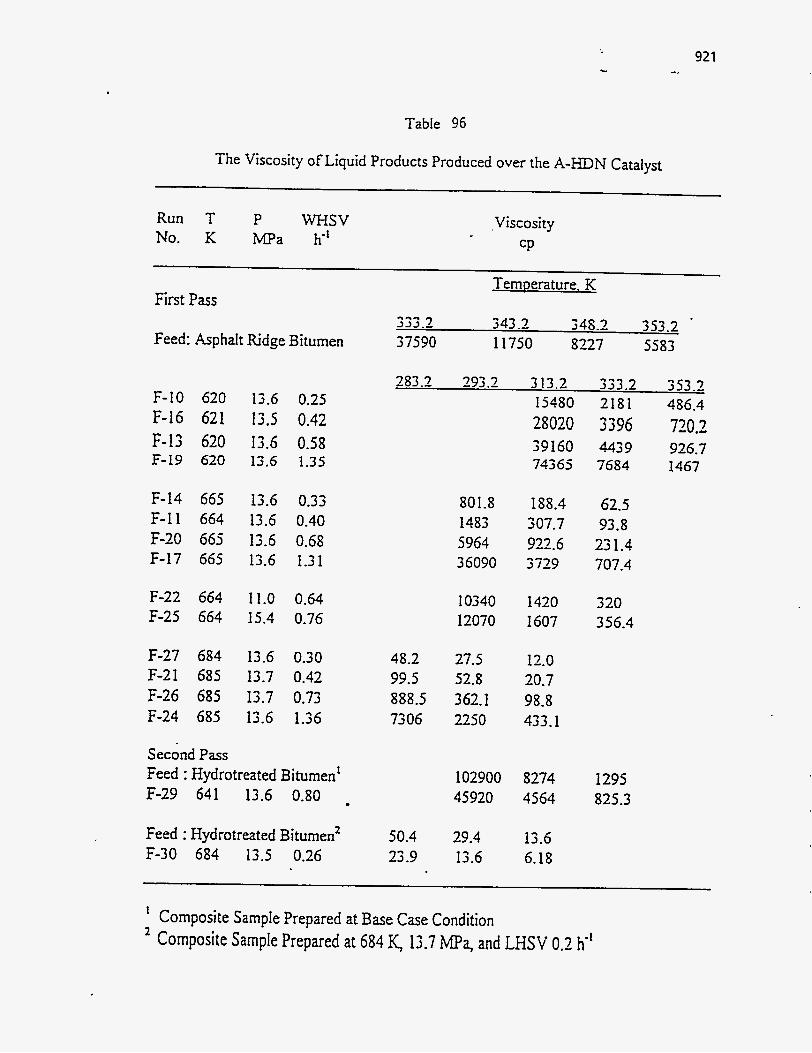
c
Table 96
921 -.
The Viscosity of Liquid Products Produced over the A-HDN Catalyst
Run T P WHSV No. K MPa h'
,Viscosity CP
Temperature. K First Pass
Feed: Asphalt Ridge Bitumen
F-10 620 13.6 0.25 F-16 621 13.5 0.42 F-13 620 13.6 0.58 F-19 620 13.6 1.35
F-14 665 13.6 0.33 F-11 664 13.6 0.40 F-20 665 13.6 0.68 F-17 665 13.6 1.31
F-22 664 11.0 0.64 F-25 664 15.4 0.76
F-27 684 13.6 0.30 F-21 685 13.7 0.42 F-26 685 13.7 0.73 F-24 685 13.6 1.36
Second Pass Feed : Hydrotreated Bitumen' F-29 641 13.6 0.80
Feed : Hydrotreated Bitumen2 F-30 684 13.5 0.26
343.2 343.2 353.2 333.2 - 9 - 8
37590 I1750 8227 5583
283.2 293.2 313.2 333.2 353.2 15480 2181 486.4 28020 3396 720.2 39160 4439 926.7 74365 7684 1467
48.2 99.5 888.5 7306
50.4 23.9
801.8 1483 5964 36090
10340 12070
27.5 52.8 362.1 2250
102900 45920
29.4 13.6
188.4 62.5 307.7 93.8 922.6 231.4 3729 707.4
1420 320 I607 356.4
12.0 20.7 98.8 433.1
8274 1295 4564 825.3
13.6 6.18
' Composite Sample Prepared at Base Case Condition 2 Composite Sample Prepared at 684 K, 13.7 MPa, and LHSV 0.2 h 1

922
Product Distribution The product distributions and yields for each of the HDN catalysts are presented
in Tables 97-102. The C1-G yields are presented in Tables 97-99. The product
distributions consisted of light hydrocarbon gases (Cl-C,), naphtha (C5-478 K), middle
distillate (478-616 K), gas oil (616-81 1 K), and residuum (X11 K) for each HDN catalyst are presented in Tables 100-102. The hydrogen consumptions reported as a
function of operating conditions for each of the HDN catalysts are also presented in
Tables 97-99.
The individual components (Cl, CZ. C3, iC4, and nC4) and total C& weight
contents of light hydrocarbon gases increased significantly with increasing temperature.
In general, the yields also increased as residence time increased. However, the
distributions of light hydrocarbon gases were not significantly influenced by pressure.
The effects of process variables on the hydrogen consumption exhibited the same trends
Molecular weight reduction of the bitumen increased with increasing residence
time and temperature over the three catalysts, however it was not significantly influenced
by pressure.
observed for light hydrocarbon gases.
Process Kinetic Models for Bitumen Hvdrotreating
Bitumen is a complex mixture containing a very-large number of components that
cannot be resolved and identified. The conversion of individual organic sulfur, nitrogen,
and residuum moieties, and carbon residues in the bitumen cannot be represented by
simple intrinsic kinetics. However, the apparent kinetic models for the removal of these
compounds can be expressed by treating the total organic sulfur, nitrogen, residuum
moieties, and carbon residues in .the bitumen as individual, composite lumps of sulfbr, nitrogen, residuum, and carbon residue as a first approximation.
The kinetic models may be divided into three general categories: models
assuming a single reaction, a limited number of reactions in parallel, and an infinite
number of reactions in parallel.
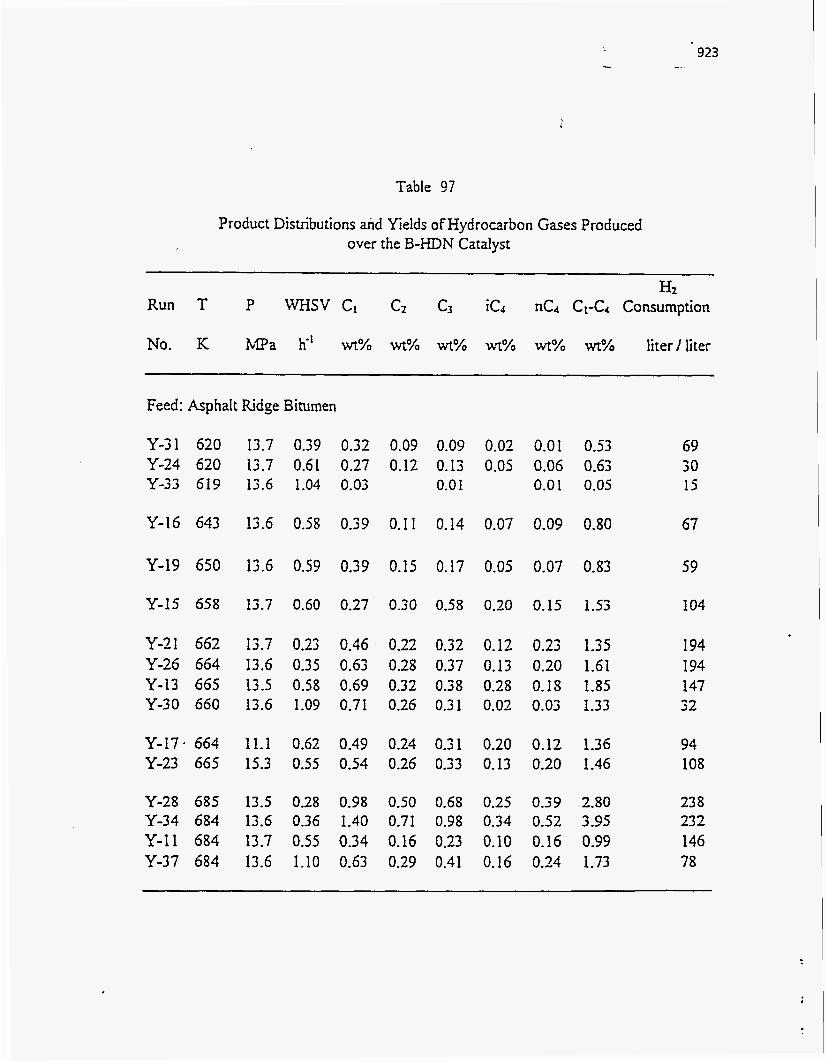
Table 97
Product Distributions and Yields of Hydrocarbon Gases Produced over the B-HDN Catalyst
923 I
H2
Run T P WHSV C1 Ct C3 iC4 nC4 C& Consumption
Feed: Asphalt Ridge Bitumen
Y-31 620 Y-24 620 Y-33 619
Y-16 643
Y-19 650
Y-15 658
Y-21 662 Y-26 664 Y-13 665 Y-30 660
Y-17. 664 Y-23 665
Y-28 685 Y-34 684 Y-11 684 Y-37 684
13.7 0.39 0.32 0.09 0.09 0.02 0.01 0.53 13.7 0.61 0.27 0.12 0.13 0.05 0.06 0.63 13.6 1.04 0.03 0.0 I 0.01 0.05
13.6 0.58 0.39 0.11 0.14 0.07 0.09 0.80
13.6 0.59 0.39 0.15 0.17 0.05 0.07 0.83
13.7 0.60 0.27 0.30 0.58 0.20 0.15 1.53
13.7 0.23 0.46 0.22 0.32 0.12 0.23 1.35 13.6 0.35 0.63 0.28 0.37 0.13 0.20 1.61 13.5 0.58 0.69 0.32 0.38 0.28 0.18 1.85 13.6 1.09 0.71 0.26 0.31 0.02 0.03 1.33
11.1 0.62 0.49 0.24 0.31 0.20 0.12 1.36 15.3 0.55 0.54 0.26 0.33 0.13 0.20 1.46
13.5 0.28 0.98 0.50 0.68 0.25 0.39 2.80 13.6 0.36 1.40 0.71 0.98 0.34 0.52 3.95 13.7 0.55 0.34 0.16 0.23 0.10 0.16 0.99 13.6 1-10 0.63 0.29 0.41 0.16 0.24 1.73
69 30 15
67
59
104
194 194 147 32
94 108
23 8 23 2 146 78

- . ... _- .. .
...
Table 98
924 -.
Product Distributions and Yields of Hydrocarbon Gases Produced over the C-HDN Catalyst
H2
Run T P WHSV CI C? C3 iC4 nCd CI-Cd Consumption
No. K liter / liter
Feed: Asphait Ridge Bitumen
T-8 620 13.6 0.26 0.60 0.17 0.05 0.20
T-20 620 13.6 0.58 0.87 0.20 0.53 T-14 620 13.7 0.34 0.89 0.25 0.37 0.07
T-ll 620 13.6 1.07 0.85 0.19 0.50
1-10 643 13.6
0.10 1.12 0.12 1.70 0.06 1.66
1.54
0.56 0.18 0.05 0.05 0.02 0.04 0.34
T-12 663 13.7 0.25 2.00 0.72 0.11 0.23 0.44 3.50 T-18 665 13.5 0.37 1-38 0.47 0.14 0.17 0.32 2.48 T-15 664 13.8 0.58 1.42 0.49 0.21 0.15 0.29 2.56 T-9 664 13.7 1.10 0.85 0.29 0.08 0.10 0.10 1.47
T-26 664 11.1 0.53 1.66 0.43 0.17 0.19 0.34 2.79 T-24 664 15.2 0.54 1-20 0.44 0.15 0.18 0.33 2-30
T-27 684 13.8 0.27 3.08 1.23 0.14 0.61 1.17 5.62 T-21 684 13.7 0.34 329 1.35 0.33 0.56 1.10 6.63 T-23 684 13.6 0.60 2.48 1.00 0.15 0.46 0.84 4.93 T-17 684 13.8 1.05 2.23 0.59 0.20 0.25 0.45 3.72
168 84 78 55
96
3 17 173 I35 99
118 139
234 217 167 123
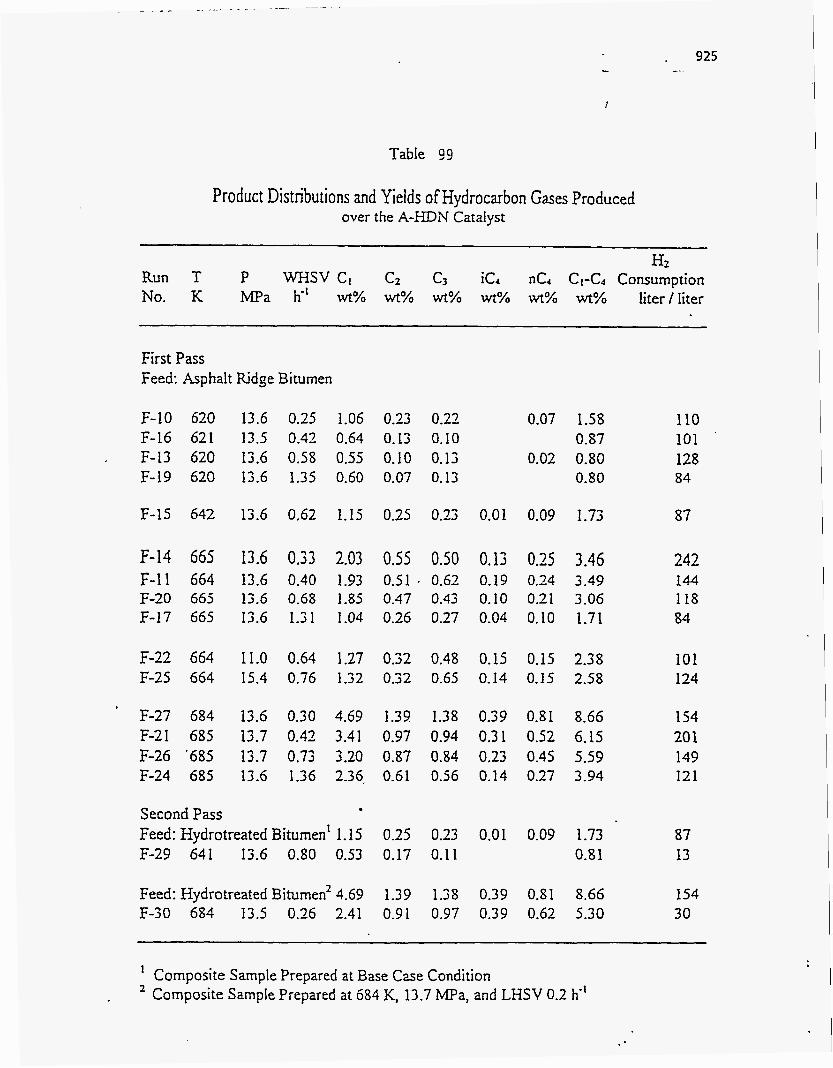
__ ~. . . -. - - -
Table 99
. 925 --
I
Product Distributions and Yields of Hydrocarbon Gases Produced over the A-HDN Catalyst
~~
H' Run T P WHSV Ct CZ C3 iC4 nCa C1-G Consumption No. K MPa h-' wt% wt% wt% wt% wt% wt% liter/liter
First Pass Feed: Asphalt Ridge Bitumen
F-10 620 F-16 621
I F-13 620 F-19 620
F-15 642
F-14 665 F-11 664 F-20 665 F-17 665
F-22 664 F-25 664
F-27 684 F-21 685 F-26 '685 F-24 685
13.6 0.25 1.06 0.23 0.22 0.07 1.58 13.5 0.43 0.64 0.13 0.10 0.87 13.6 0.58 0.55 0.10 0.13 0.02 0.80 13.6 1.35 0.60 0.07 0.13 0.80
13.6 0.62 1.15 0.25 0.23 0.01 0.09 1.73
13.6 0.33 2.03 0 3 0.50 0.13 0.25 3.46 13.6 0.40 1.93 0.51 0.62 0.19 0.24 3.49 13.6 0.68 1.85 0.47 0.43 0.10 0.21 3.06 13.6 1.31 1.04 0.26 0.27 0.04 0.10 1.71
11.0 0.64 1.27 0.32 0.48 0.15 0.15 2.38 15.4 0.76 1-32 0.32 0.65 0.14 0.1s 2.58
13.6 0.30 4.69 1.39 1.38 0.39 0.81 8.66 13.7 0.42 3.41 0.97 0.94 0.31 0.52 6.15 13.7 0.73 3.20 0.87 0.84 0.23 0.45 5.59 13.6 1.36 2.36, 0.61 OS6 0.14 0.27 3.94
Second Pass Feed: Hydrotreated Bitumen' 1.15 0.25 0.23 0.01 0.09 1.73 F-29 641 13.6 0.80 0.53 0.17 0.11 0.81
Feed: Hydrotreated Bitumen' 4.69 1.39 1.38 0.39 0.81 8.66 F-30 683 13.5 0.26 2.41 0.91 0.97 0.39 0.62 5.30
110 101 128 84
87
242 144 118 84
101 I24
154 20 1 149 121
87 13
154 30
* Composite Sample Prepared at Base Case Condition Composite Sample Prepared at 684 K, 13.7 MPa, and LHSV 0.2 h' 2

926
Table 100
Product Distributions and Yields Produced over the B-HDN Catalyst
Run T P WHSV Cl-Cd C5-475 K 478-616 K 616-811K >SI1 K No. K MPa h" wt% w% wt% wt% wt%
Feed: Asphalt Ridge Bitumen 0.5 10.2 34.5 54.8
Y-31 620 13.7 0.39 0.5 Y-24 620 13.7 0.61 0.6 Y-33 619 13.6 ' 1.04 0.1
2.3 2.7 2.3
10.7 10.3 9.9
41.5 40.8 40.7
45.0 45.5. 47.0
Y-16 643
Y-19 650
13.6 0.58 0.S
13.6 0.59 0.8
3. I 11.7 42.0 42.2
3.4 12.3 42.3 41.1
Y-15 658 13.7 0.60 1.5 3.9 13.1 43.3 38.1
Y-21 662 Y-26 664 Y-13 665 Y-30 660
13.7 0.23 1.4 13.6 0.35 1.6 13.5 0.58 1.9 13.6 1.09 1.3
6.5 5.5 4.6 2.7
I
16.6 14.3 11.9
14.2 14.9
24.5 22.1 20.7 24.2
47.1 45.1 43.1 40.4
27.4 3 1.3 36.1 43.7
7.
Y-17 664 Y-23 665
11.1 0.62 1.4 15.3 0.55 1.5
4.4 4.4
44.1 44.8
35.9 34.4
Y-28 685 Y-34 684 Y-11 684 Y-37 684
13.5 0.28 2.8 13.6 0.36 4.0 13.7 0.55 1.6 13.6 1-10 1.7
10.5 9.7 8.2 9.7
39.0 41.0 45.3 33.9
22.9 23.2 24.8 3 0.4
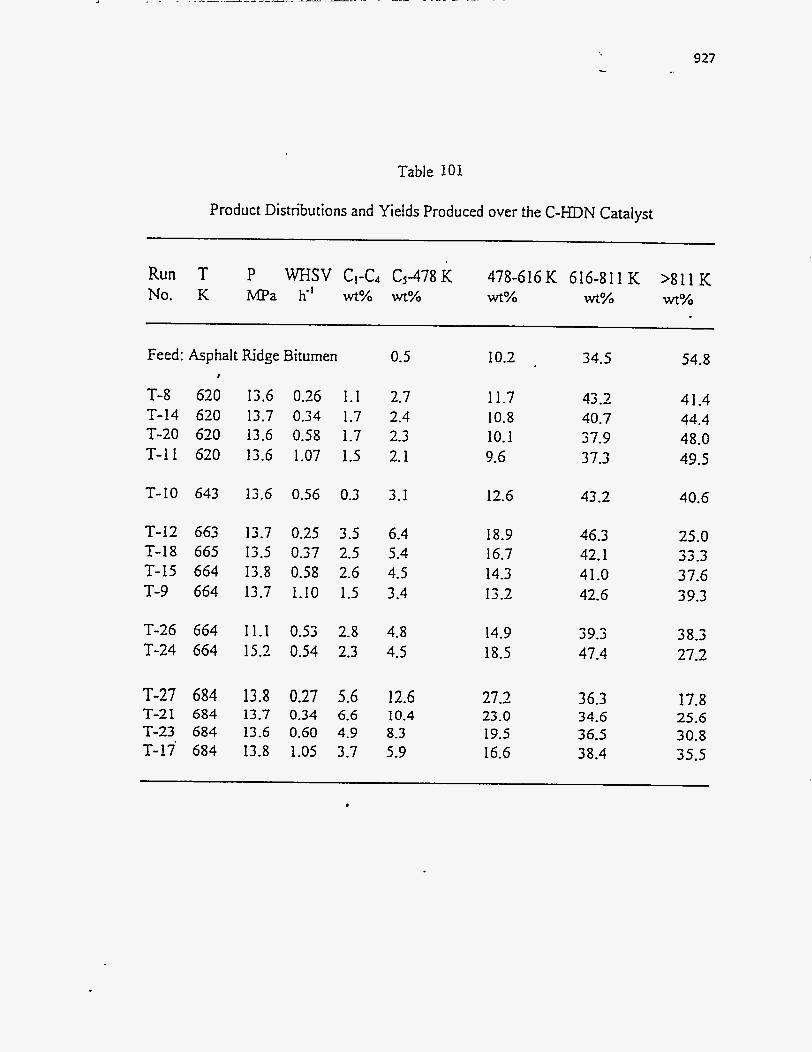
927
Table 101
Product Distributions and Yields Produced over the C-HDN Catalyst
P WHSV C l - C d C5478K 478-616K 616-811K >811K wt% wt% wt% ma h” wt% wt%
Run T No. K
Feed: Asphalt Ridge Bitumen I
T-8 620 T-14 620 T-20 620 T-11 620
0.5 10.2 34.5 54.8
13.6 0.26 1.1 13.7 0.34 1.7 13.6 0.58 1.7 13.6 1.07 1.5
2.7 2.4 2.3 2.1
11.7 10.8 10.1 9.6
43.2 40.7 37.9 37.3
41.4 44.4 48.0 49.5
T-IO 643 13.6 0.56 0.3 3.1 12.6 43.2 40.6
T-12 663 T-18 665 T-15 664 T-9 664
13.7 0.25 3.5 13.5 0.37 2.5 13.8 0.58 2.6 13.7 1.10 1.5
6.4 5.4 4.5 3.4
18.9 16.7 14.3 13.2
46.3 42.1 41.0 42.6
25.0 33.3 37.6 39.3
T-26 664 11.1 0.53 2.8 4.8 T-24 664 15.2 0.54 2.3 4.5
14.9 18.5
3 9.3 47.4
3 8.3 27.2
T-27 684 13.8 0.27 5.6 12.6 T-21 684 13.7 0.34 6.6 10.4 T-23 684 13.6 0.60 4.9 8.3 T-17 684 13.8 1.05 3.7 5.9
27.2 23.0 19.5 16.6
36.3 34.6 36.5 38.4
17.8 25.6 30.8 35.5
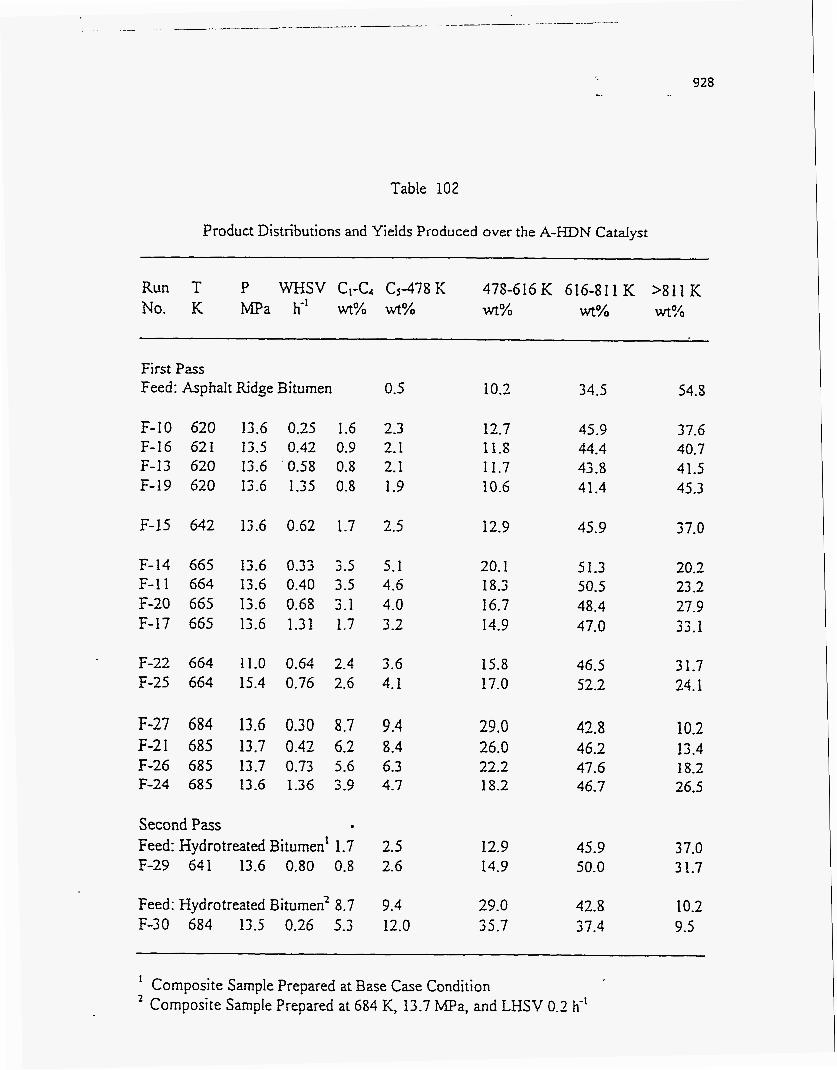
928
Table 102
Product Distributions and Yields Produced over the A-HDN Cataiyst
Run T P WHSV Ci-C4 C5478K 478-616K 616-811K >811K No. K ma K' wt% wt% wt% wt% wt%
First Pass Feed: Asphalt Ridge Bitumen 0.5 10.2 34.5 54.5
F-10 620 13.6 0.35 1.6 2.3 12.7 45.9 37.6 F-16 621 13.5 0.42 0.9 2.1 11.8 44.4 40.7
11.7 43.8 41.5 F-13 620 13.6 '0.58 0.8 2.1
F-19 620 13.6 1.35 0.8 1.9 10.6 41.4 45.3
F-15 642 13.6 0.62 1.7 2.5 12.9 45.9 37.0
F-14 665 13.6 0.33 3.5 5.1 20.1 51.3 20.2
F-I7 665 13.6 1.31 1.7 3.2 14.9 47.0 33.1
F-11 664 13.6 0.40 3.5 4.6 18.3 50.5 23.2 F-20 665 13.6 0.68 3.1 4.0 16.7 48.4 27.9
15.8 46.5 3 1.7 17.0 52.2 24.1
F-22 664 11.0 0.64 2.4 3.6 F-25 664 15.4 0.76 2.6 4.1
29.0 42.8 10.2 F-27 684 13.6 0.30 8.7 9.4 26.0 46.2 13.4 F-21 685 13.7 0.42 6.2 8.4
F-26 685 13.7 0.73 5.6 6.3 22.2 47.6 18.2 18.2 46.7 26.5 F-24 685 13.6 1.36 3.9 4.7
Second Pass Feed: Hydrotreated Bitumen' 1.7 2.5 12.9 45.9 37.0 F-29 641 13.6 0.80 0.8 2.6 14.9 50.0 3 1.7
Feed: Hydrotreated Bitumen2 8.7 9.4 29.0 42.8 10.2 F-30 684 13.5 0.26 5.3 12.0 35.7 37.4 9.5
Composite Sample Prepared at Base Case Condition Composite Sample Prepared at 684 K, 13.7 MPa, and LHSV 0.2 h-'
I
2

929 - .
Single First-Order Reaction
. Assuming a single first-order reaction is approximate, the conversion rate of the
lumped species is assumed to follow Equation 147 at constant hydrogen partial pressure,
13.7 MPa.
dC. ' d7
r. =-I- - kT!.Ci = kCi (147)
where i represents the individual, composite lumped species such as sulfur, nitrogen, etc.;
Ti is the conversion rate; Ci is the concentration of the lumped species i; 'E is the reciprocal
WHSV (or LHSV); k' is first-order rate constant; PH. is hydrogen partial pressure; J3 is
the reaction order with respect to hydrogen partial pressure; and k is the apparent first-
order rate constant. T is used in this equation instead of the real time, t, because this
equation was derived for a plug flow reactor.
If it is assumed that there is no density change during the reaction, the fractional
conversion, xi, is defined by the following equation:
where Ci0 is the initial concentration of lumped species i. Equation 148 can be
rearranged as
Ci = Cia( 1 -xi) (149) Substituting the Equation 149 into the Equation 147 and integrating gives the
following equation:
-In( I-Xi) = kT . (150)
Equation 150 indicates that if the reaction follows a simple first-order reaction,
the plot of the -h(l-Xi) versus reciprocal WHSV, T, will be a straight line through the
origin and the slope of that line will be equal to k.
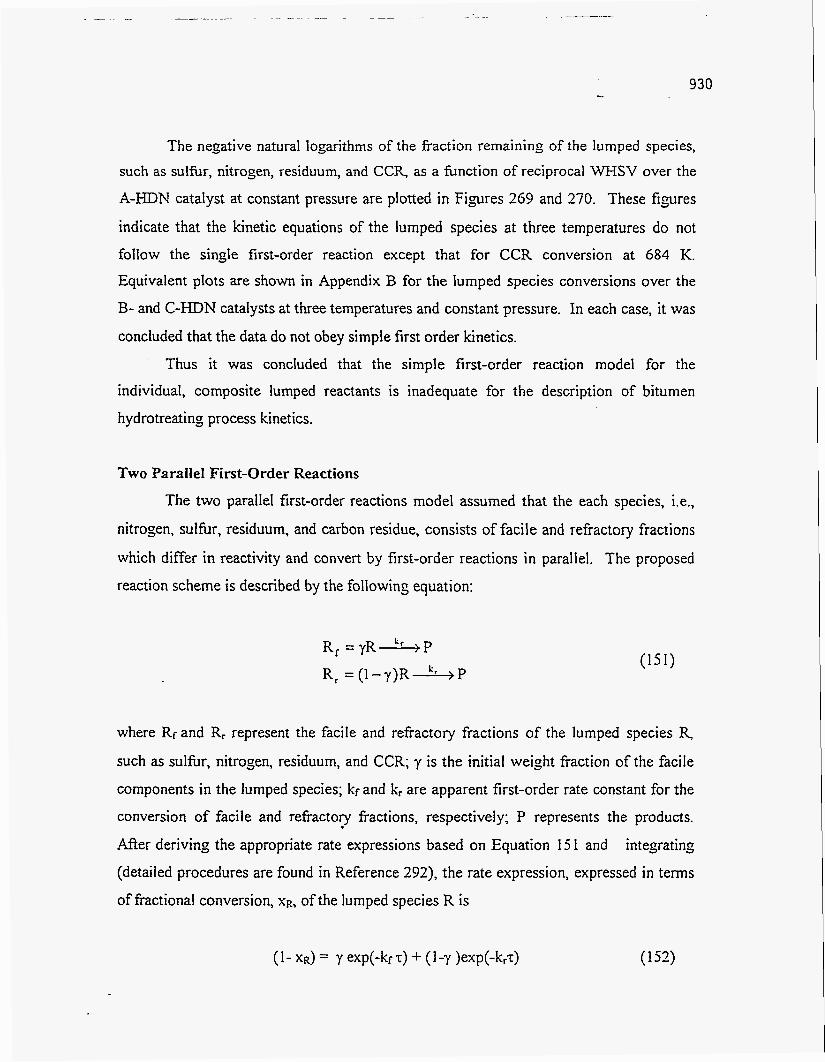
930 I
The negative natural logarithms of the fraction remaining of the lumped species, such as sulfur, nitrogen, residuum, and C C q as a function of reciprocal WHSV over the
A-HDN catalyst at constant pressure are plotted in Figures 269 and 270. These fipres
indicate that the kinetic equations of the lumped species at three temperatures do not
follow the sinzle first-order reaction except that for CCR conversion at 684 K. Equivalent plots are shown in Appendix B for the lumped species conversions over the
B- and C-HDN catalysts at three temperatures and constant pressure. In each case, it was
concluded that the data do not obey simple first order kinetics.
' Thus it was concluded that the simple first-order reaction model for the
individual, composite lumped reactants is inadequate for the description of bitumen
hydrotreating process kinetics.
Two Parallel First-Order Reactions
The two parallel first-order reactions model assumed that the each species, Le.,
nitrogen, sulfur, residuum, and carbon residue, consists of facile and refractory fractions
which differ in reactivity and convert by first-order reactions in parallel. The proposed
reaction scheme is described by the following equation:
R, =yR+P k, ,p R, = (1 -y)R
where Rfand R, represent the facile and refractory fractions of the lumped species R,
such as sulfur, nitrogen, residuum, and CCR; y is the initial weight fraction of the facile
components in the lumped species; kf and k, are apparent first-order rate constant for the
conversion of facile and refractory fractions, respectively; P represents the products.
After deriving the appropriate rate expressions based on Equation 15 1 and integrating
(detailed procedures are found in Reference 292), the rate expression, expressed in terms
of fractional conversion, xR, of the lumped species R is
(1- XR) = y exp(-kf T) -+ ( I -y )exp(-k,r) (1 52)

Figure 269
Plot of -ln(l-x) versus reciprocal WHSV for (a) sulfur @)nitrogen
conversion over the A-KDN catalyst at constant pressure (13.7 MPa)
93 1 I
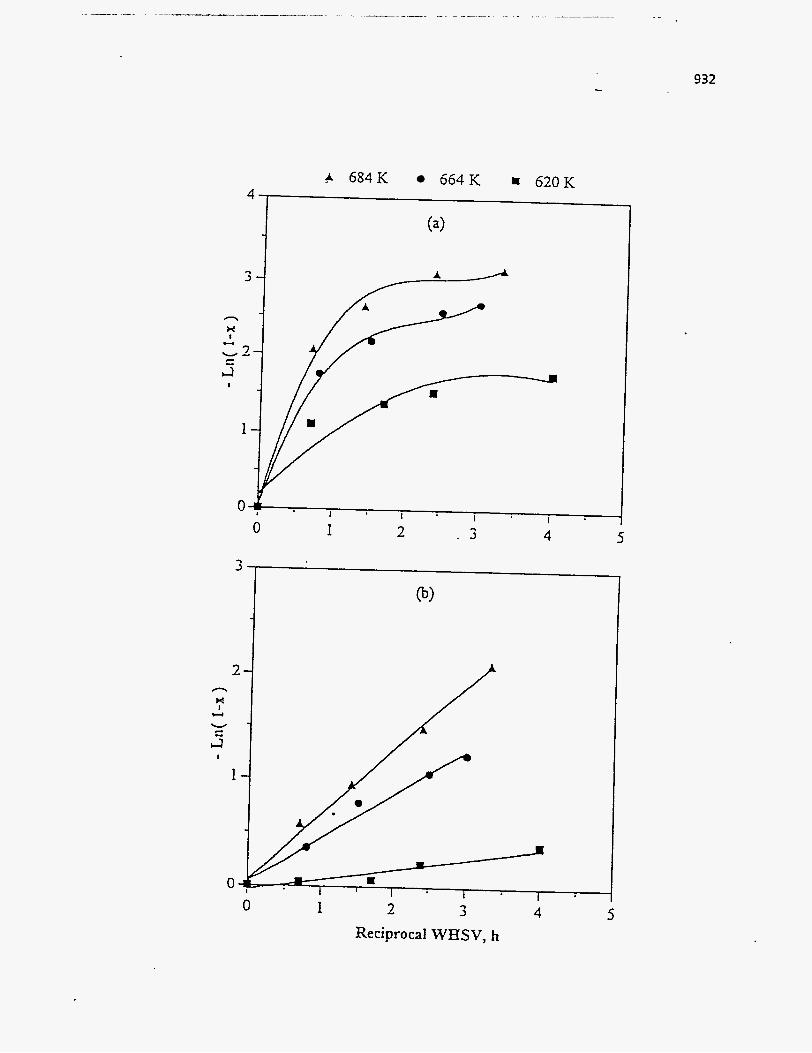
h
H I - -
w l c
J i
I
1
0
c 684K 664K = 620K
(4
0
I I I I
. 3 4 5 0 1 2
a
1 i 1 1 1
3 4 5 1 2
932
ReciprocaI WEiSV, h

c ... 933
Figure 270
Plot of -ln(l-x) versus reciprocal WHSV for (a) residuum (b) CCR
conversion over the A-HDN catalyst at constant pressure (13.7 MPa)
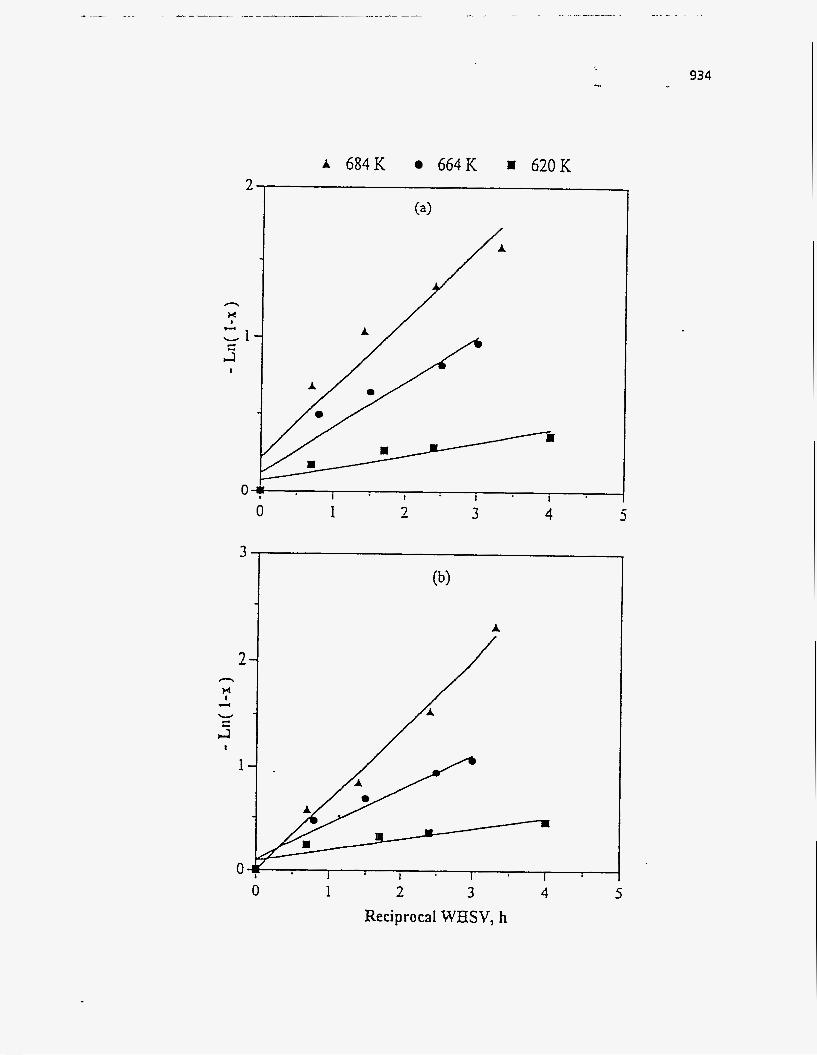
2
n
Y - 1 2 M
e
I
c L
n
?
k i
+ v c
I
I
0.
A 684K 664K 620K
(4
I I I I
1 - 3 4 5 3 0
A
/-
I i I 1 1
0 1 2 3 Reciprocal WHSV, h
4 5
934

... 935 -_ .
The initial weight fraction of the facile components and the apparent first-order rate
constants of the facile and refractory fractions can be estimated using nonlinear
regression methods. The initial weight fraction, y, of the facile components can be
determined from the plot of In(l-xR) versus reciprocal MWSV, T, which should give a
straight line with a y-axis intercept of I-y ifthe model is appropriate.
The plot of ln(1-xR) versus 7: for the lumped species, such as sulfur, nitrogen,
residuum, and CCR, over the A-HDN catalyst at constant pressure are presented in Figures 271 and 272. These figures indicate that different facile fractions were obtained
at different temperatures for each of the lumped species. Thus the relative facile fraction
of the lumped species changed with reaction temperature. Thus, the two parallel first
order reactions model suggested that the relative proportion of the facile and refractory
fraction is a function of the feedstock(292). Equivalent plots are shown in Appendix C for the lumped species conversions over the B- and C-HDN catalysts at three
temperatures and a constant pressure. These plots also indicated that the facile fractions
for the three temperatures for each lumped species were different.
The facile fractions of sulfur over the three catalysts at different temperatures and
constant pressure are presented in Figure 273. Different facile fractions for sulfur were
obtained over the different catalysts at each temperature. This implies that the relative
facile fraction of the sulfur changed with the catalyst. Similar results were observed for
the nitrogen, residuum, and CCR . Comparison with the experimental data in this investigation, the two parallel first-
order reactions model was capable of correlating kinetic data over a single catalyst at a
specific ,temperature and pressure; however, it was deemed unrealistic because the relative facile fractions for the sulfur, nitrogen, residuum. and carbon residue were functions of feedstock, catalyst, and temperature at constant pressure which is contrary to
intuition.
nth-Order Power Rate Law For the nth-order power rate law, the reaction of lumped species, i, is assumed to
occur through a number of independent nth-order reactions in parallel. The reaction rate
of the lumped species, i, is given by
936
Figure 271
Facile fraction of lumped (a) sulfur (b) nitrogen from two parallel first-order
reactions model over the A-HDN catalyst at constant pressure (13.7 MPa)
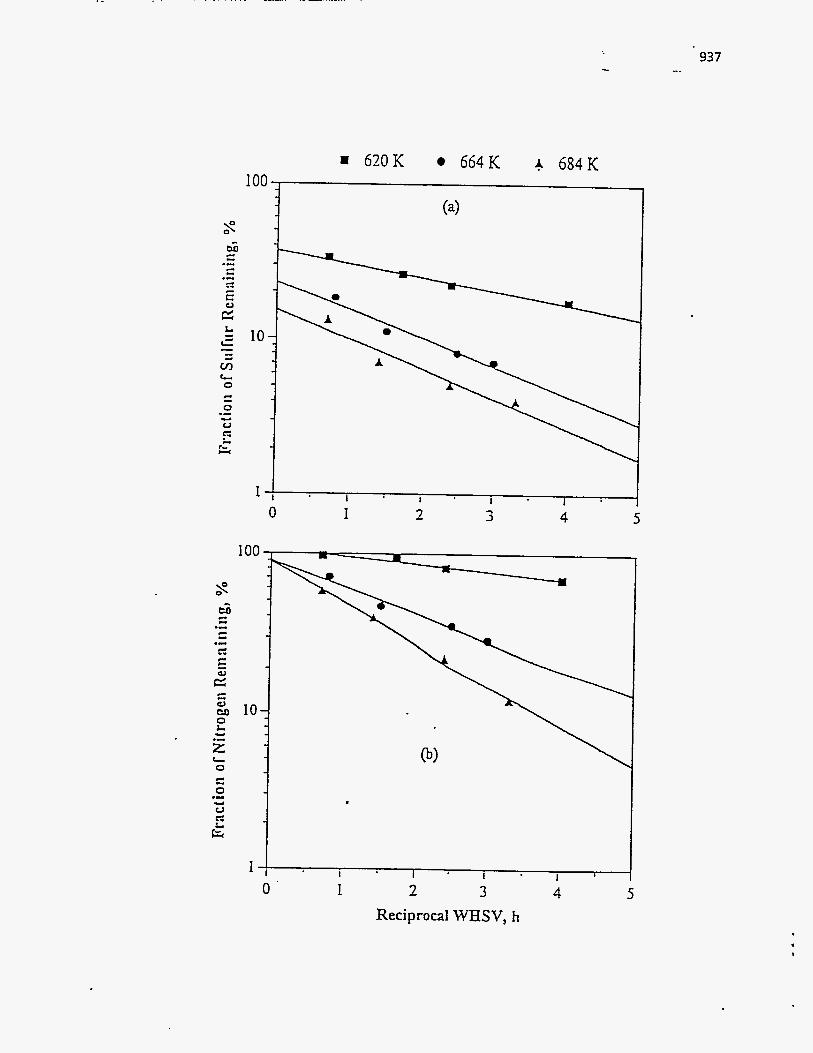
620K 664K A 684K 100,
10
I
100
10
I
I I I I
0 I
I 2 3 4 5
I-
937 -.
0 1 2 3 4 Reciprocal WHSV, h
5
.
- I- --- - __ . . . - ._-___ - _- __ -- ---
938
Figure 272
Facile fraction of lumped (a) residuum (b) CCR from two parallel first-order
reactions model over the A-HDN catalyst at constant pressure (13.7 MPa)

939 -.
L 00
10- 0
= 620K 664K A 683K
1 2 3 4
100 ,\ f I
\-
L 0 c - 0 .- Y
0
@>
1 2 3 4 Reciprocal WHSV, h
5
5

I
Figure 273
Facile fraction for sulfur for the two parallel first-order
reactions model over the three HDN catalysts at constant pressure (13.7 Mpa)
940
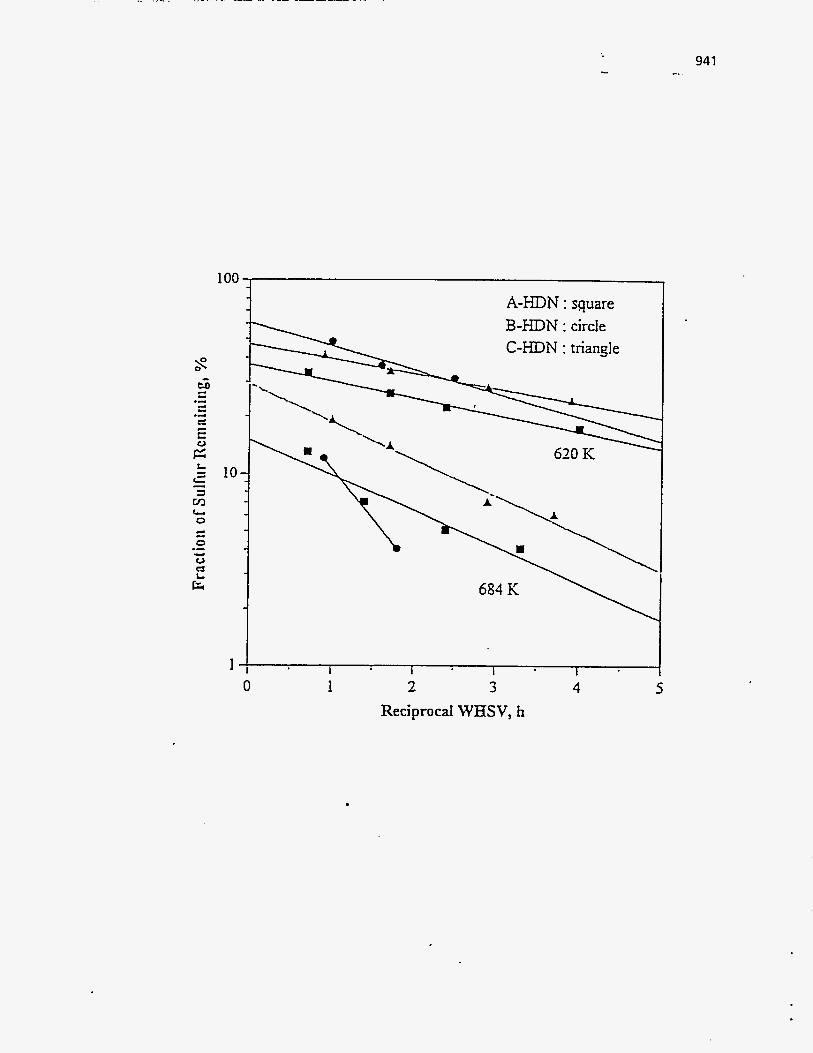
100
10
1 0
A-HDN : square B-HDN : circle C-HDN : triangle
1 I I 1 1 2 3 4 5
Reciprocal WHSV, h
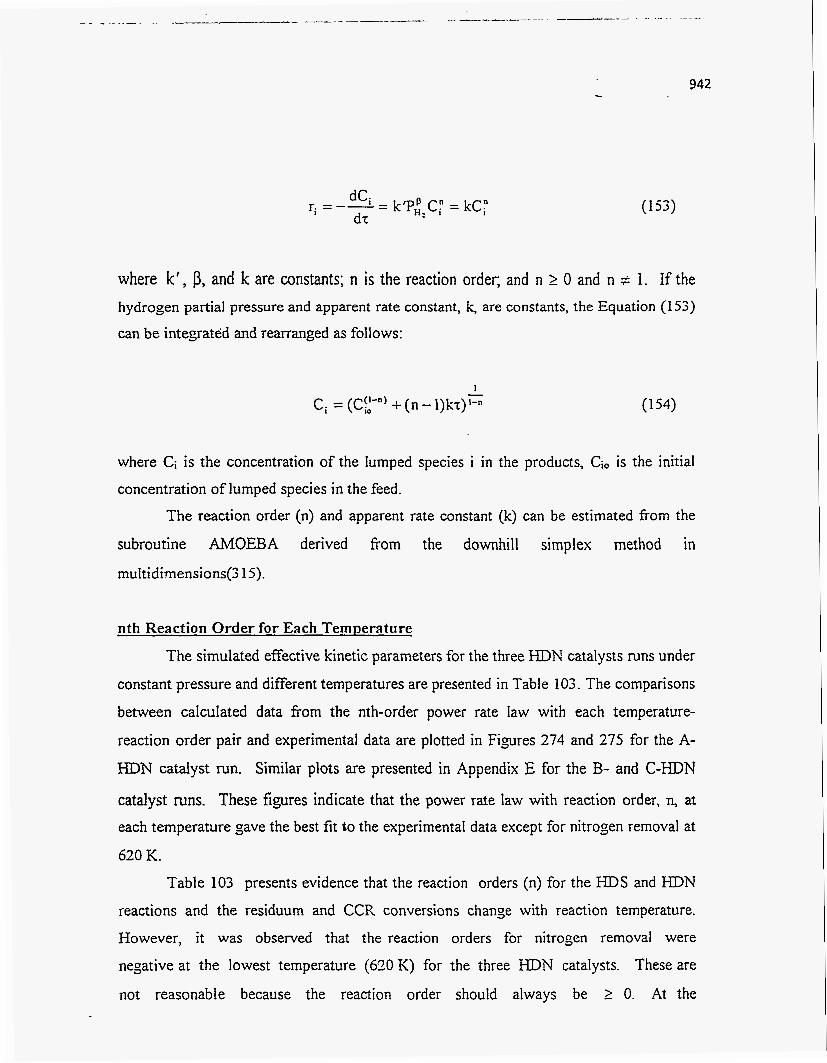
...
(153)
where k', p, and k are constants; n is the reaction order; and n 2 0 and n f 1. If the
hydrogen partial pressure and apparent rate constant, k, are constants, the Equation (1 53)
can be integrated and rearranged as follows:
where Ci is the concentration of the lumped species i in the products, Ci, is the initial
concentration of lumped species in the feed.
The reaction order (n) and apparent rate constant (k) can be estimated from the
subroutine AMOEBA derived from the downhill simplex method in multidirnensions(3 15).
nth Reaction Order for Each Temperature
The simulated effective kinetic parameters for the three HDN catalysts runs under
constant pressure and different temperatures are presented in Table 103. The comparisons
between calculated data from the nth-order power rate law with each temperature-
reaction order pair and experimental data are plotted in Figures 274 and 275 for the A-
HDN catalyst run. Similar plots are presented in Appendix E for the B- and C-HDN
catalyst runs. These figures indicate that the power rate law with reaction order, n, at
each temperature gave the best fit to the experimental data except for nitrogen removal at
620 K. Table 103 presents evidence that the reaction orders (n) for the HDS and HDN
reactions and the residuum and CCR conversions change with reaction temperature.
However, it was observed that the reaction orders for nitrogen removal were
negative at the lowest temperature (670 K) for the three HDN catalysts. These are
not reasonable because the reaction order should always be 2 0. At the
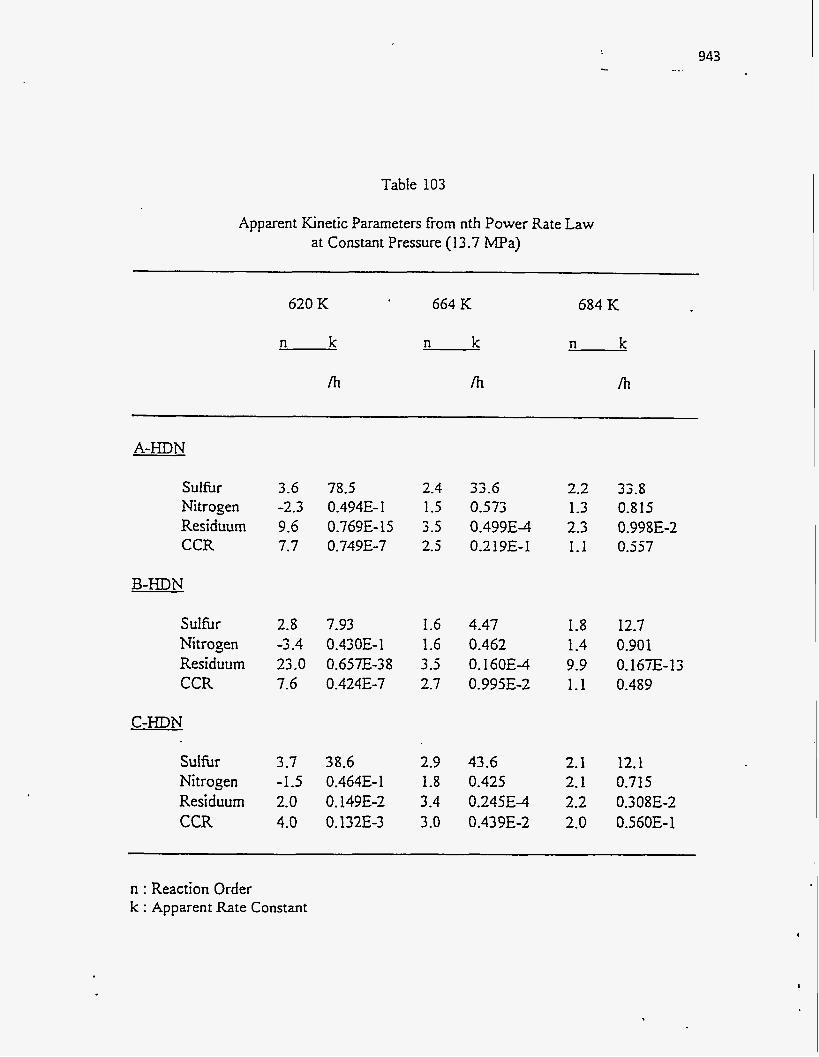
943
Table 103
Apparent Kinetic Parameters from nth Power Rate Law at Constant Pressure (13.7 MPa)
620 K
n k
Al
664 K
n k
/h
684 K
n k
/h
A-HDN
Sulfbr 3.6 Nitrogen -2.3 Residuum 9.6 CCR 7.7
B-HDN
SuIhr Nitrogen Residuum CCR
78.5 2.3 0.494E- 1 1.5 0.769E-15 3.5 0.749E-7 2.5
33.6 0.573 0.499E-4 0.2 19E- 1
2.8 7.93 1.6 4.47 -3.4 0.430E-1 1.6 0.462 23.0 0.65538 3.5 0.160E-4 7.6 0.424E-7 2.7 0.995E-2
2.2 1.3 2.3 1.1
1.8 1.4 9.9 1.1
33.8 0.8 15
0.557 0.9 9 8 E-2
12.7 0.901 0.16TE-13 0.489
C-HDN
Sulhr 3.7 38.6 2.9 43.6 2.1 12.1 Nitrogen -1.5 0.464E-1 1.8 0.425 2.1 0.715 Residuum 2.0 0.149E-2 3.4 0.245E-4 2.2 0.308E-2 CCR 4.0 0.132E-3 3.0 0.439E-2 2.0 0.560E-1
!
n : Reaction Order k : Apparent Rate Constant
944
Figure 274
Comparison with nth power rate law (three reaction orders)
and experimental data for (a) sulfur (b) nitrogen over the A-HDN catalyst
at constant pressure (13.7 MPa)
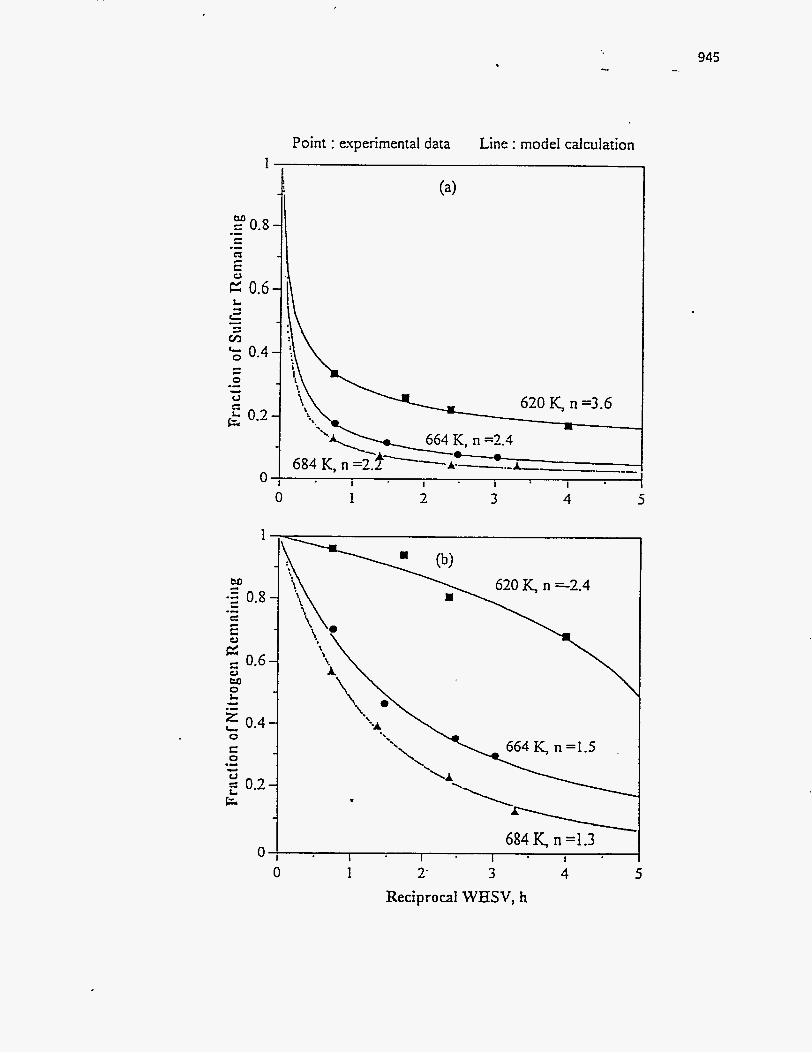
Point : experimental data Line : mode1 calculation
(a>
& I I \
0 1 2 3 4 5
1
W
0.8 - .- 9
- L 0.6
c .I
2 0 W 0 L 4 .- 5 0.4 0 E: 0 .- -
0.2 k
0
945 -_
0 1 2- 3 4 5 Reciprocal WHSV, h
946
Figure 275
Comparison with nth power rate law (three reaction orders)
and experimental data for (a) residuum (b) CCR over the A-HDN catalyst
at constant pressure (13.7 MPa)
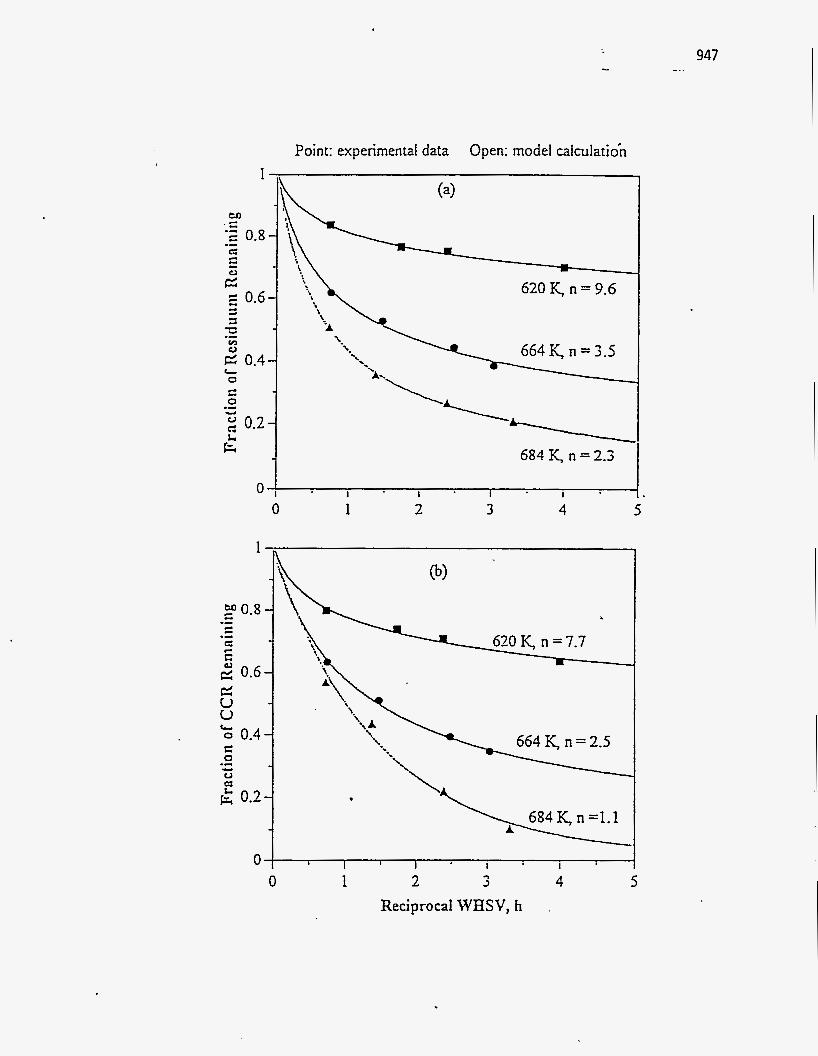
Point: experimental data Open: model calculatioh
0 1 2 3 4 5 Reciprocal WHSV, h
947
lower temperature (620 K), the nitrogen removal is small at lower residence time (less
than 2 h) and then increases steeply for residence times greater than 2 h, as shown in
F is res 276. Thus, in this case, the simulation produced unreasonable results. The same
figures also indicate that the trend for the fraction of nitrogen remaining at 620 K is not
correct compared with the trends at 664 K and 684 K reaching an apparent equilibrium
level when the residence time increases to infinity.
Different reaction orders were obtained for each lumped species, such as nitrogen,
over different catalysts for the same reaction conditions. These results (Table 103) indicate that the reaction order was also fbnction of the catalyst. The reaction orders for
the lumped species over the three HDN catalysts and at three different temperature are in
the range of 1.6 to 3.7 for sulfur, 1.3 to 2.1 for nitrogen except at 620 K, 3.0 to 23 for residuum, and 1.1 to 7.7 for CCR. The reaction orders greater than unity indicates that
lumped sulfbr, nitrogen, residuum, and CCR exhibit a wide range of reactivities(256).
Yui(3 12) found that n = 1.5 for HDS, and n = 1 .O for HDN for hydrotreating an Athabasca bitumen-derived coker gas oil. Longstaff(292) reported that n = 1.5 for H D S
and HDN for hydrotreating of Whiterocks bitumen-derived liquid, and n = 0.5 for HDN
when hydrotreating the Whiterocks bitumen. Kim(243) reported n = 1.5 for HDN when
hydrotreating the PR Spring bitumen.
Similar reaction orders, n = 1.5 and n = 1.6, for HDN were obtained when
hydrotreating of the PR Spring and Asphalt Ridge bitumens, respectively, employing the
same catalyst (B-HDN) and the same temperature (664 K) and pressure(l3.7 m a ) , but
different LHSV (0.4 1 and 0.48 h-', respectively). This would appear to indicate that these
two bitumens have similar distributions of nitrosen compounds.
Although Ho and Aris(Z.91) showed that the reaction order up to second-order
kinetics would arise if a fiaction of the feed was essentially unreactive or if the reaction
rate-concentration distribution follbwed a gamma distribution, they selected the gamma distribution based on its common occurrence and not from experimental data. Many
authors have shown that an overall reaction order higher than two is plausible using the
continuum theory of lumping(326-334).
Ozaki et a1.(335) have reponed reaction orders ranging from 1.4 to 5.4 for
hydrodesulfurization of residual oils under certain conditions. Ho and White(336) have
949
also reported a reaction order of 2.5 for HDS of light catalytic cycle oil at 603 K and 2.3 1
MPa calculated from their asymptotic lumped kinetic model. Reaction orders, between
1.6 and 3.7, for sulfir were obtained in this study.
Asvmptotic Lumped Kinetic Model
This model proposes that the kinetics of a continuum of reactions, regardless of their kinetics, are of the power rate law form at long contact times or at low space
velocities(336). Assuming plug flow, one can show for a Langmuir-Hinshelwood
reaction mixture that as t become sufficiently large, the fractional lumped species
remaining (I-x) is given by a very simple equation(336). that is, h 11 ( l -x)=- tZ (155)
In(1- x) = In(h) - zln(t)
where h and z are determined by the reactivity-concentration spectrum of the feed near
reactivity K-0. Equation 155 implies the following lumped rate expression:
where l+l/z is the reaction order. According to Equation 155, the plot of ln(1-x) versus In(t) should be a straight line with a slope equal to -z. The reaction order n = l+l/z is
then calculated.
The logarithmic plots of lumped species remaining versus reciprocal LHSV for sulfur, nitrogen, residuum, and CCR over the A-HDN catalyst under constant hydrogen
pressure are presented in Figures 276 and 277. The corresponding slopes are also shown
in the same figures. The equivalent plots are presented in Appendix F for the B- and C-
HDN catalyst runs.
The reaction orders calculated from the asymptotic lumped kinetic model are
compared to the reaction orders obtained from the nth power rate law in Table 104. The
reaction orders obtained from the two models are almost the same for sulfur conversion.
However, the reaction orders do not appear to correlate for the two models for nitrogen,
950 -..
Figure 276
Logarithmic plot of fraction remaining versus reciprocal
LHSV for (a) sulfur (b) nitrogen over the A-HDN catalyst
at constant pressure (13.7 MPa)
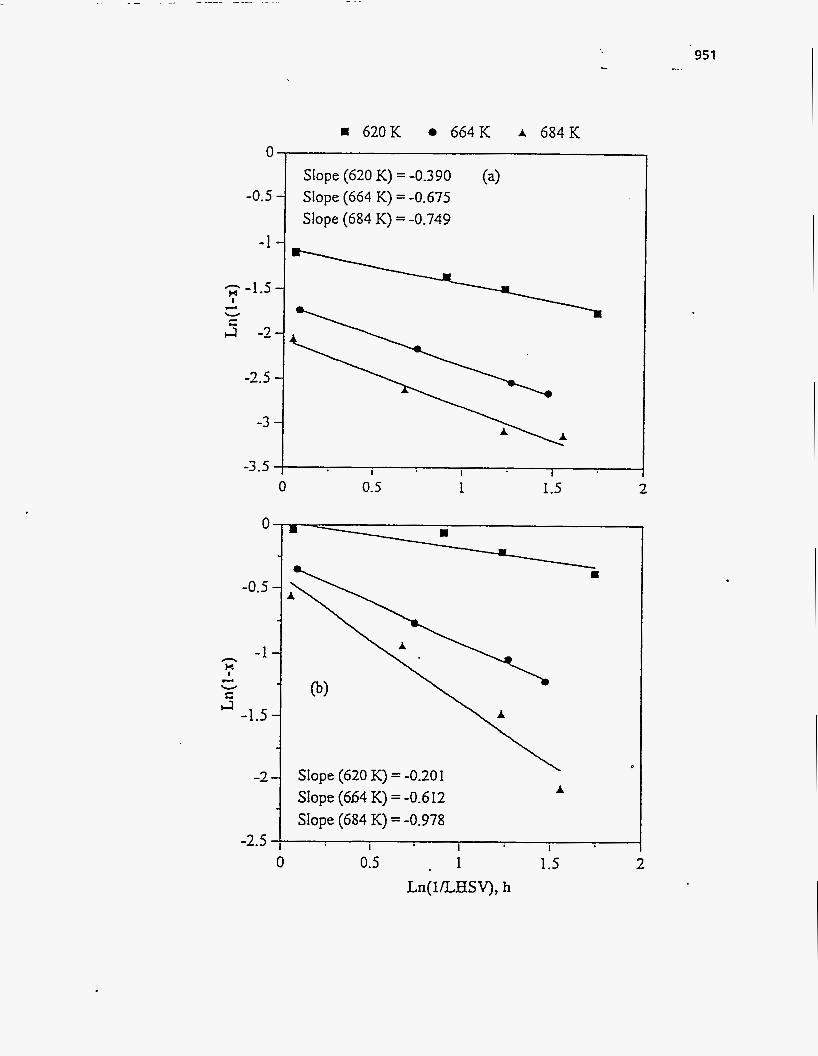
951
C
-0.5
-1
-1.5 )P
2 -2
4 v c
-2.5
-3
-3.5
a 620K 664K A 684K
Slope (620 K) = -0.390 Slope (664 K) = -0.675 Slope (684 K) = -0.749
(a)
0 0.5 1 I .5 2
952 -..
Figure 277
Logarithmic plot of fraction remaining versus reciprocal
LHSV for (a) residuum (b) CCR over the A-HDN catalyst
at constant pressure (13.7 MPa)
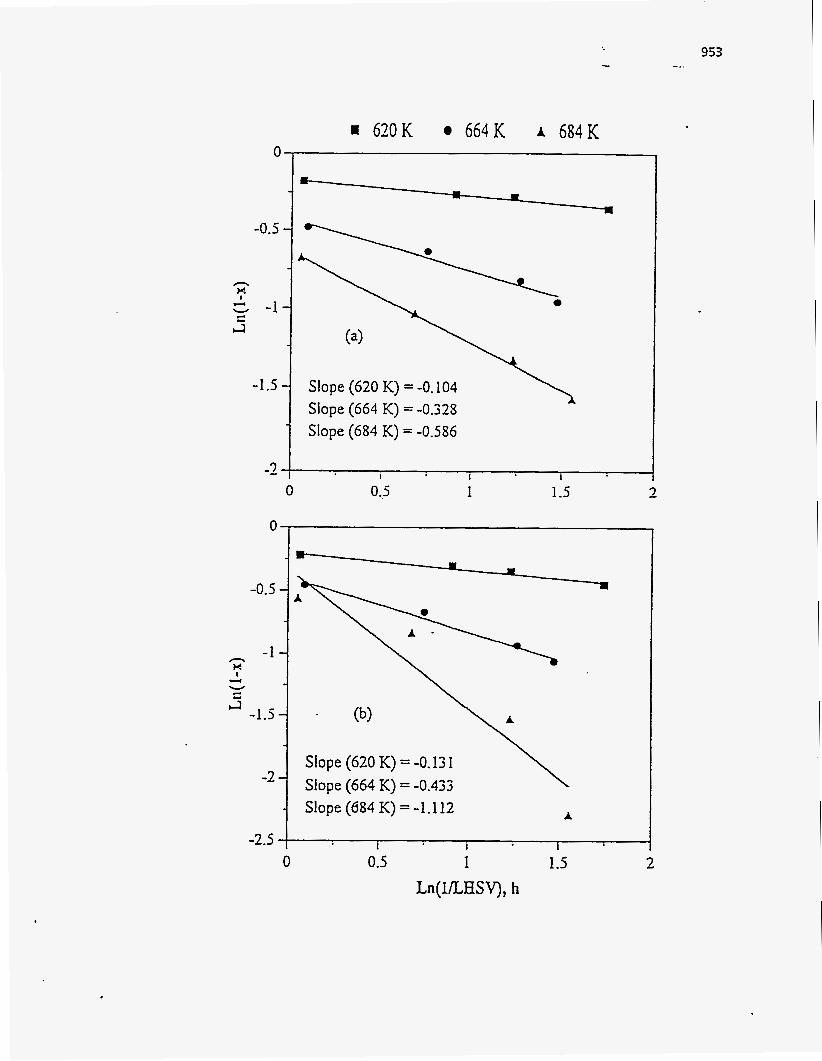
I 620K 664K A 684K 0
- Slope (684 K) = -0.586
-2 1 I I I
-
-2.5
0 0.3 1 1.5 2
A Slope (684 K) = -1.1 12
i
953 -..
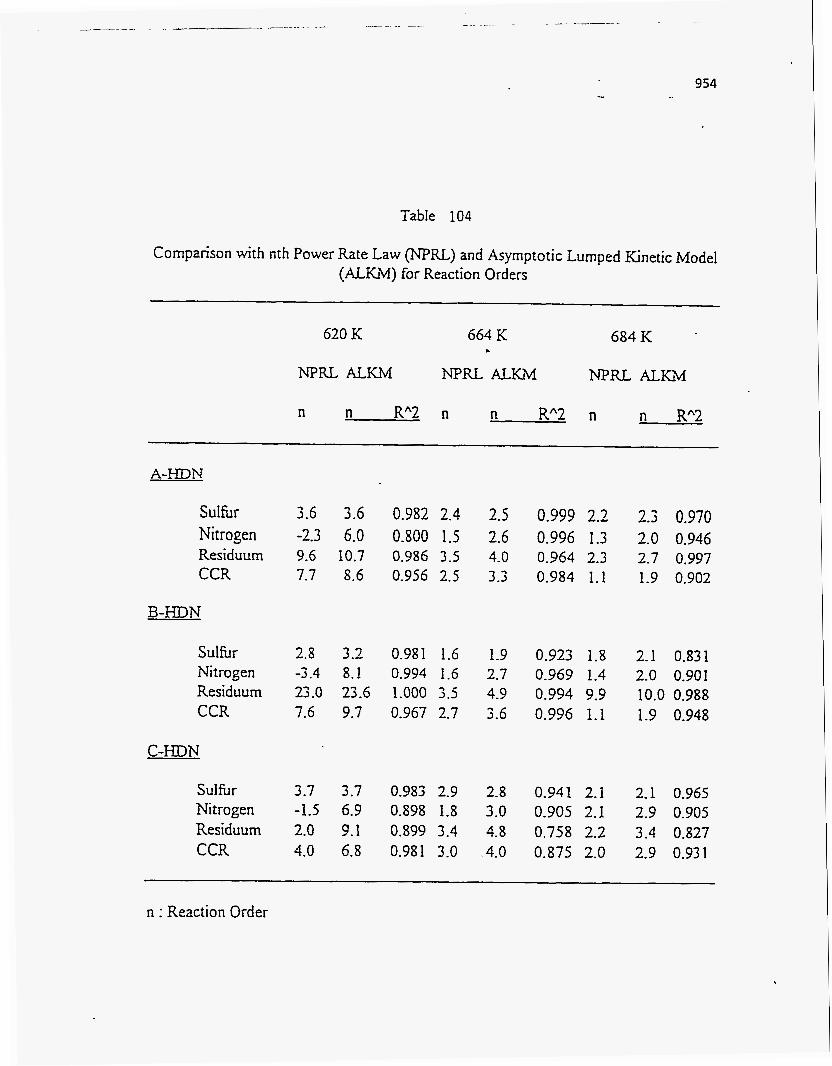
954 I
Table 104
Comparison with nth Power Rate Law o\TpRL.) and Asymptotic Lumped Kinetic Model (ALKII) for Reaction Orders
620 K 664 K 684 K . NPRL ALKM NPRL AL.Kii NPRL AL.Kh4
n R"2 n n RA2 n n R"2 n
A-HDN
Sulhr Nitrogen Residuum CCR
B-HDN
SulfiIr Nitrogen Residuum CCR
C-HDN
Sulfbr Nitrogen Residuum CCR
3.6 3.6 0.982 2.4 -2.3 6.0 0.800 1.5 9.6 10.7 0.986 3.5 7.7 8.6 0.956 2.5
2.8 3.2 0.981 1.6
23.0 23.6 1.000 3.5 7.6 9.7 0.967 2.7
-3.4 8.1 0.994 1.6
3.7 3.7 0.983 2.9 -1.5 6.9 0.898 1.8 2.0 9.1 0.899 3.4 4.0 6.8 0.981 3.0
2.5 2.6 4.0 3.3
1.9 2.7 4.9 3.6
2.8 3.0 4.8
-4.0
0.999 2.2 0.996 1.3 0.964 2.3 0.984 1.1
0.923 1.8 0.969 1.4 0.994 9.9 0.996 1.1
0.941 2.1 0.905 2.1 0.758 2.2 0.875 2.0
2.3 0.970 2.0 0.946 2.7 0.997 1.9 0.902
2.1 0.831 2.0 0.901 10.0 0.988 1.9 0.948
2.1 0.965 2.9 0.905 3.4 0.827 2.9 0.931
n : Reaction Order
residuum, and CCR conversion in higher temperature. However, the agreement is much
better at the higher temperature whereas at low temperature, 620 K, the nitrogen order
was negative for the nth power rate law and positive for the symptotic lumped kinetic
model. Furthermore, the reaction orders for residuum and CCR conversions are
unrealistic for both models in the sense of interpreting the overall kinetics of the reactions.
An Overall nth Reaction Order
An overall nth reaction order was assumed for each lumped species during
hydrotreating of bitumen over the HDN catalysts to compare the effect of process
variables, such as catalysts and reaction conditions. The reaction rates of lumped species are described by Equation 153.
The FORTRAN programs were used to estimate the overall reaction order and apparent rate constant for each temperature over the three HDN catalysts at constant
pressure. The results are listed in Table 105. The overall reaction orders over the A-, J3-
, and C-HDN catalysts are 3.1, 2.0, and 3.1 for HDS, 1.3, 1.5. and 1.9 for HDN, 2.9, 5.7,
and 2.6 for residuum conversion, 1.6, 1.6, and 2.4 for CCR conversion, respectively. The
overall activation energies (E) and pre-exponential factors (k,), also presented in Table 105, were calculated tiom the slopes and y-axis intercepts of plots of In@) versus 1/T. The apparent rate constants k (and kJ include the hydrogen pressure (MPa) terms fiom
the rate expression since Pp was assumed to be constant. Direct comparison is not
possible because the units of k are different for HDS, HDN, residuum, and CCR conversions. The overall activation energies of the lumped species are in the range of 27-
3 4 kcal/mol for sulfur, 30-34 kcal/mol for nitrogen, 25-40 kcaVmol for residuum, and 20-
24 kcal/mol for CCR. For hydrotreating of Athabasca bitumen-derived coker gas oil, the overall activation energy was 33 kcaVmol for HDS and 22 kcal/mol for HDN(3 12).
With the overall reaction orders and their apparent rate constants in Table 105, the
plots of fraction of lumped species remaining versus reciprocal WHSV over the three HDN catalysts are presented in Figures 278-283. Compared to the experimental data,
overall nth power rate law fits were satisfactory.
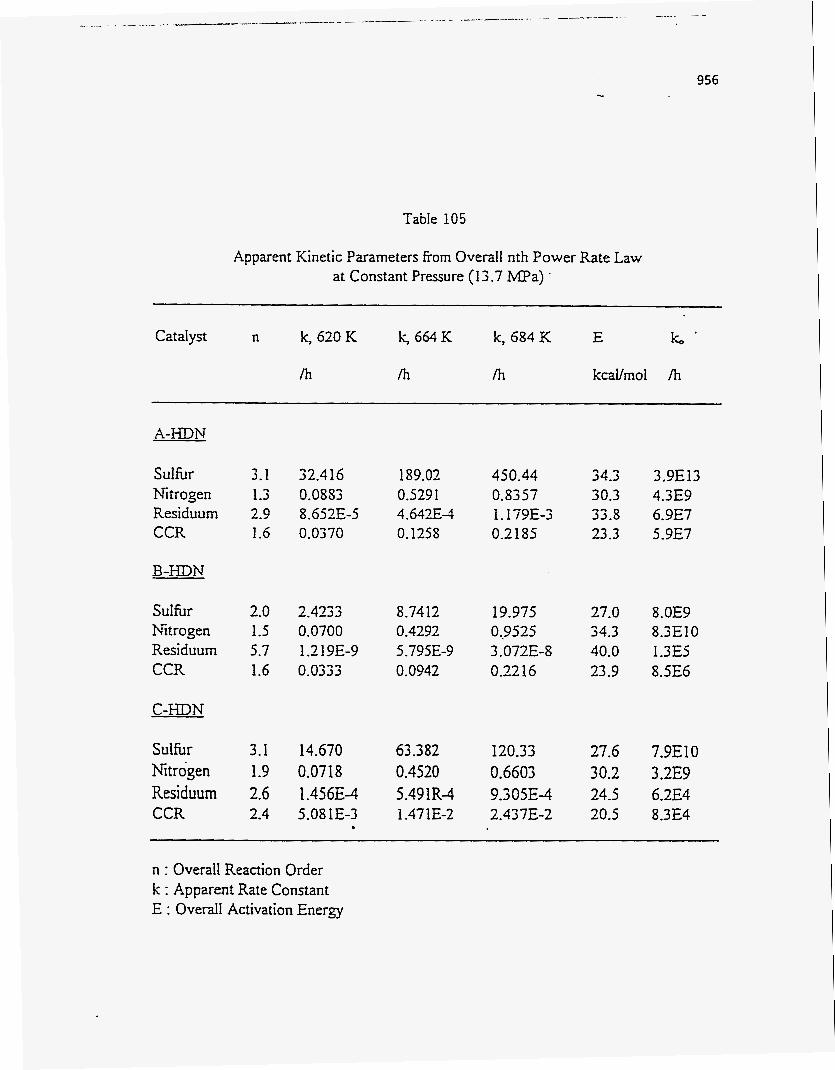
Table 105
Apparent Kinetic Parameters from Overall nth Power Rate Law at Constant Pressure (13.7 MPa) .
k, 684 K E k * Catalyst n k, 620 K iq664K
/h Ih /h kcdmol /h
A-HDN
Sulhr Nitrogen Residuum CCR
B-HDN
Sulhr Nitrogen Residuum CCR
C-HDN
Sulhr Nitrogen Residuum CCR
3.1 32.416 189.02 450.44 34.3 3.9E13 1.3 0.0553 0.529 1 0.8357 30.3 4.3E9 2.9 8.652E-5 4.642E4 I. 179E-3 33.5 6.9E7 1.6 0.0370 0.1258 0.2 185 23.3 5.9E7
2.0 2.4233 8.74 12 19.975 27.0 8.OE9 1.5 0.0700 0.4292 5.7 1.219E-9 5.795E-9 3.072E-8 40.0 1.3E5 1.6 0.0333 0.0942 0.32 16 23.9 8SE6
0,9525 34.3 8.3E10
3.1 14.670 63 -3 82 120.33 27.6 7.9E10 1.9 0.0718 0.4520 0.6603 30.2 3.2E9 2.6 1.456E4 5.491R3 9.305E-4 24.5 6.2E4 2.4 5.081E-3 1.471E-2 2.437E-2 20.5 8.3E4
n : Overall Reaction Order k : Apparent Rate Constant E : Overall Activation Energy

...
Figure 278
Comparison with nth power rate law and experimental data for
(a) sulfur (b) nitrogen conversion over the A-HDN catalyst
at constant pressure
957 -. .

958 c
2 0.4
0.2
n = 3 . I P = 13.7 MPa
Point: experimental data Line: model calculation
(4
i
620 K 664 K
I 684 K L---8..- A----.
1 I I 1 0 0 I 2 CI
'J 4 5
I I 1 I
0 1 2 3 ReciprocaI WHSV, h
4 5
c
959
Figure 279
, Comparison with nth power rate law and experimental data for
(a) residuum (b) CCR conversion over the A-HDN catalyst
at constant pressure
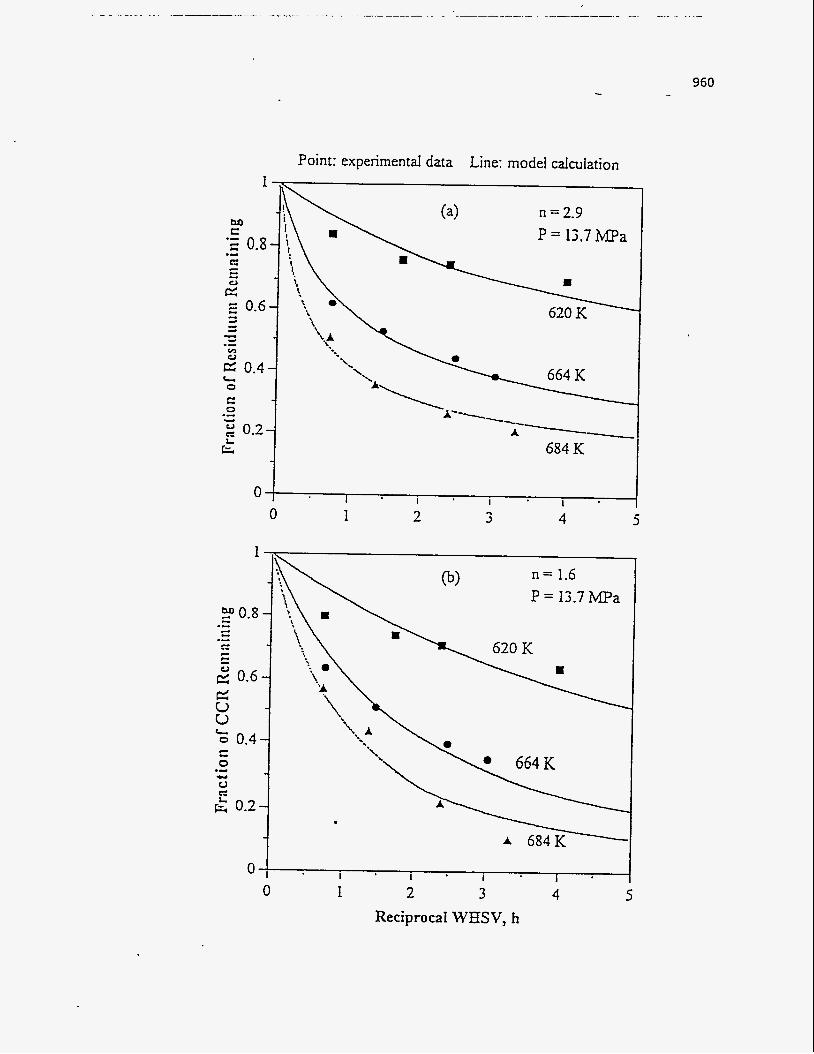
I Point: experimental data Line: model calculation
M C
I 1 1 1 0 1 2 3
Reciprocai WHSV, h 4 5

...
Figure 280
Comparison with nth power rate law and experimental data for
(a) sulfur (b) nitrogen conversion over the B-HDN catalyst
at constant pressure
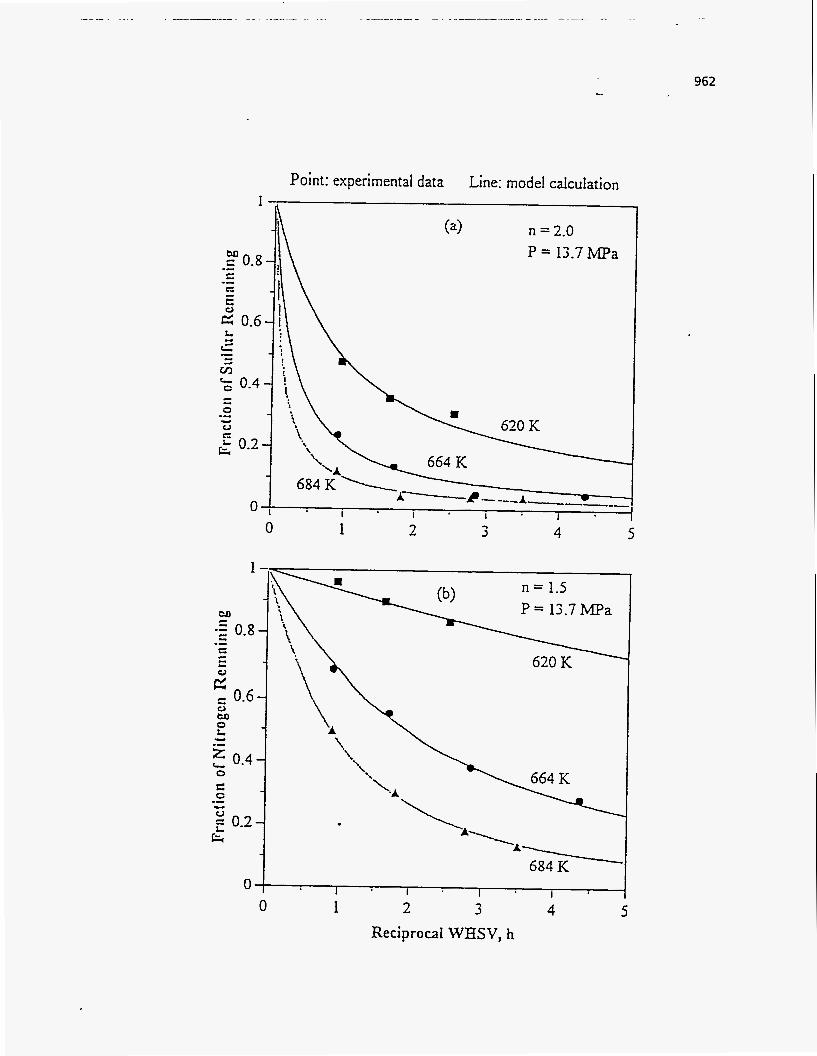
Point: experimental data Line: model calculation
tz f 0.t
0 0
i 1 1 I I
I 2 3 4 ReciprocaI WHSV, h
962
5

... 963 -.
Figure 281
Comparison with nth power rate law and experimental data for
(a) residuum (b) CCR conversion over the B-HDN catalyst
at constant pressure
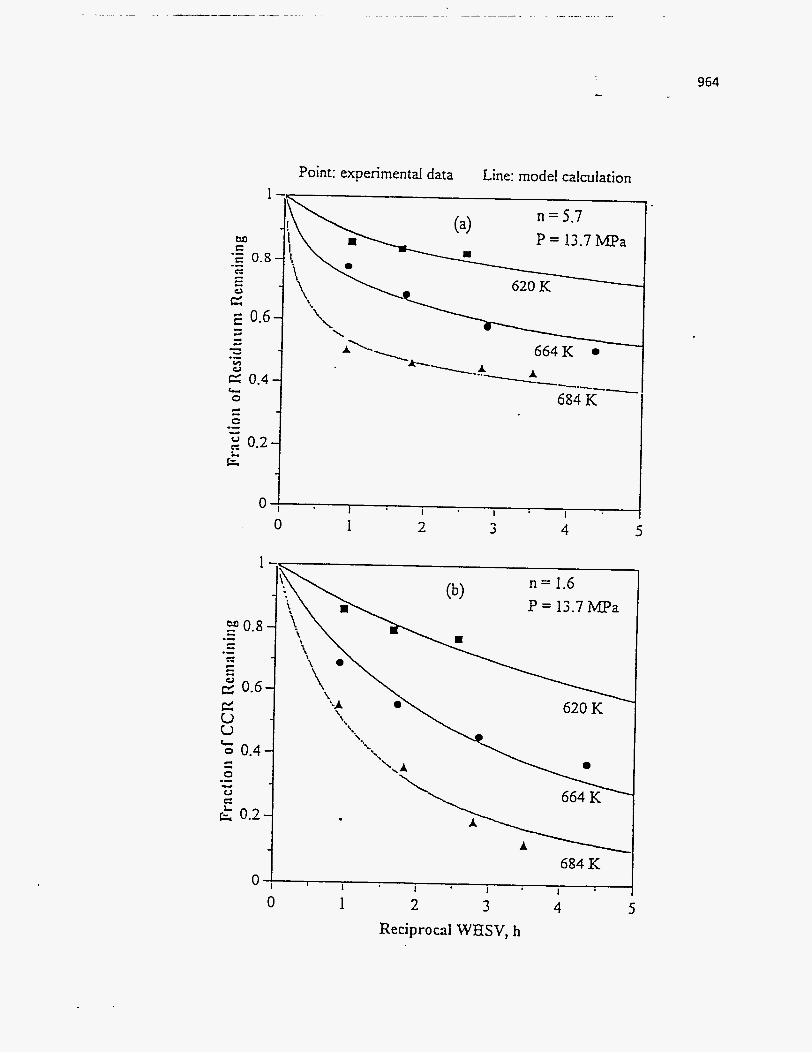
964
Point: experimental data Line: model calculation
1 I I I
I 2 3 4 5 0
c 0 0.4 c - 0
u c
.- e & 0.2
0 0
684 K L
1 I 1 I 1
1 2 3 4 Reciprocal WHSV, h
5

c
965
,
Figure 282
Comparison with nth power rate law and experimental data for
(a) sulfur (b) nitrogen conversion over the C-HDN catalyst
at constant pressure
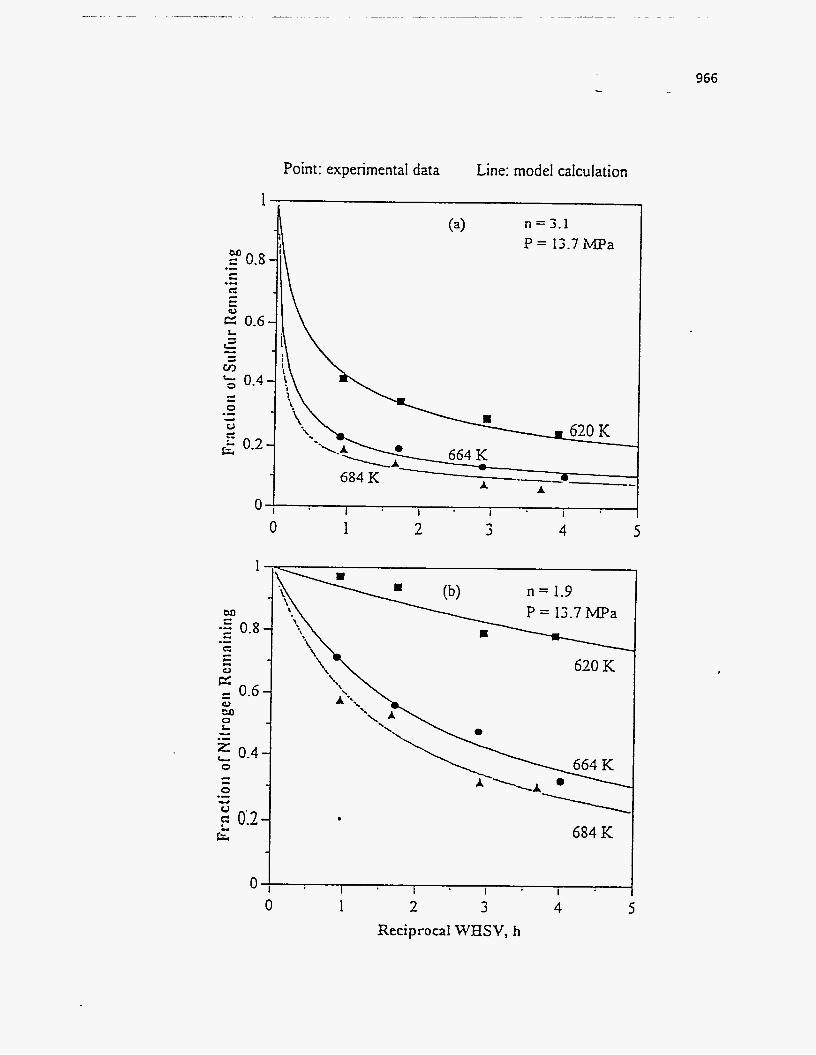
966 ...
Point: experimental data Line: model calculation
P = 13.7 MPa
684K %----e -- A
0 1 1 1 I I
0 1 2 3 4 5
a

Figure 283
Comparison with nth power rate law and experimental data for
(a) residuum (b) CCR conversion over the C-HDN catalyst
967
at constant pressure

0
cz & 0.2-
1
684 K
2 3 4 I
5
968
Point: experimental data Line: model calculation

969 -.
In general, the power rate law form is a convenient expression, even through the
actual kinetics for mixtures might be substantially different. It is also useful for
interpolation, but it cannot be employed to extrapolate reactor performance unless the
overall rate equation is exactly that of a power rate law form.
Distributed Activation Energy Model
Complex reactions for coal, oil shale, and biomass pyrolysis and petroleum
formation can often be accurately described by distribution activation energy
model(300, 337-339). /This model assumed that the complex reactions consisted of a set
of irreversible, parallel first-order reactions that have different activation energies and a constant preexponential factor(338, 340). The preexponential factor is assumed to be a
constant in general for all reactions to avoid the complexity of the analysis(33S, 340).
The reaction rate, therefore, can be expressed by Equation 147. M e r integrating and
rearranging in terms of fractional conversion, Xi, of each lumped species, Equation 147
becomes
-E -E RT RT
1- xi = exp(-j:kd.r) = exp(-kojiexp(-)ds) = exp(-k,.rexp(-)) (157)
where k is the apparent rate constant, .r is the residence time (reciprocal WHSV), k, is the
pre-exponential factor, E is the activation energy, R is the gas constant, and T is the
absolute temperature. Assuming the number of reactions is large enough to permit E to be expressed as a continuous distribution function f(E) and integrating over all energies.
Equation 157 becomes
1 - xi = jo&p(-ko-cexp(-))f(E)dE -E RT
where the distribution curve fcE) is defined to satisfy
jo?(E)dE = 1 (159)
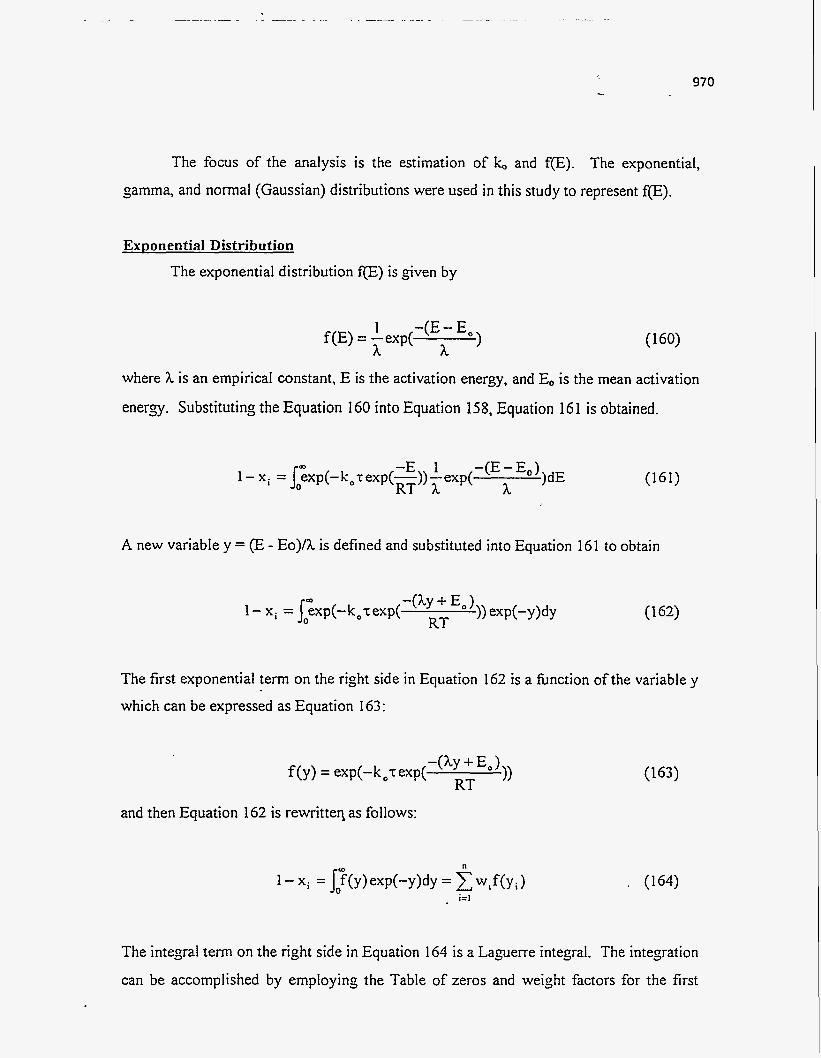
970
The focus of the analysis is the estimation of IG, and f(E). The exponential,
Samma, and noma1 (Gaussian) distributions were used in this study to represent @).
ExDonential Distribution
The exponential distribution fTE) is given by
1 1 -(E - E,
f(E) = hexp( h
where h is an empirical constant, E is the activation energy, and E, is the mean activation
enersy. Substituting the Equation 160 into Equation 158, Equation 161 is obtained.
A new variable y = (E - Eo)/h is defined and substituted into Equation 161 to obtain
exP(-Y)dY 1- xi = J$xp(-koTexp( W -(hY + E, 1
RT (1 63)
The first exponential term on the right side in Equation 162 is a finction of the variable y
which can be expressed as Equation 163:
f(y) = exp(-k,sexp( -@Y + E, ))) RT
and then Equation 162 is rewritten. as follows:
(1 63)
. (164)
The integral term on the right side in Equation 164 is a Laperre integral. The integration
can be accomplished by employing the Table of zeros and weight factors for the first
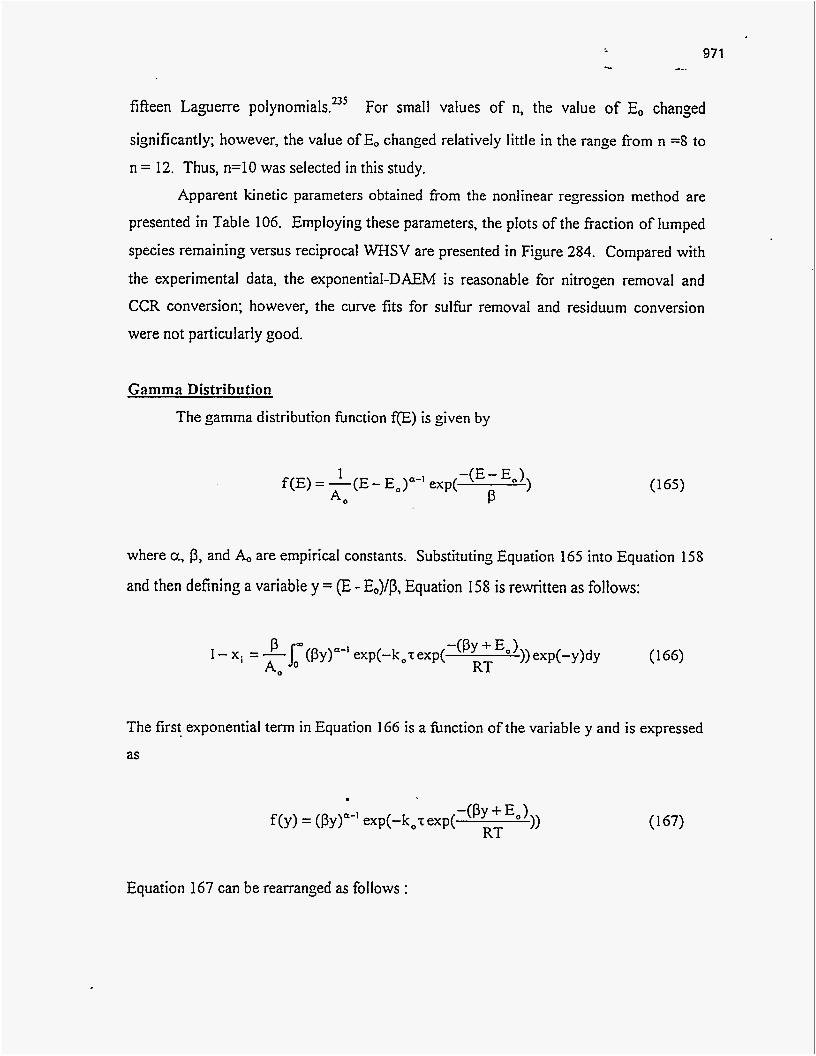
fifteen Laguerre polynomials.235 For small values of n, the value of E, chansed
significantly; however, the value of E, changed relatively little in the range from n =S to
n = 12. Thus, n=10 was selected in this study. Apparent kinetic parameters obtained fiom the nonlinear regression method are
presented in Table 106. Employing these parameters, the plots of the fiaction of lumped
species remaining versus reciprocal WHSV are presented in Figure 284. Compared with
the experimental data, the exponential-DAEM is reasonable for nitrogen removal and
CCR conversion; however, the curve fits for sulhr removal and residuum conversion
were not particularly good.
Gamma Distribution
The gamma distribution function f(E) is given by
) f(E) = -(E 1 - Eo)a-' exp( -(E- E,) A0 P
where a, p, and A,, are empirical constants. Substituting Equation 165 into Equation 158
and then defining a variable y = (E - E,)/P, Equation 158 is rewritten as follows:
The first exponential term in Equation 166 is a fimction of the variable y and is expressed
as
Equation 167 can be rearranged as follows :
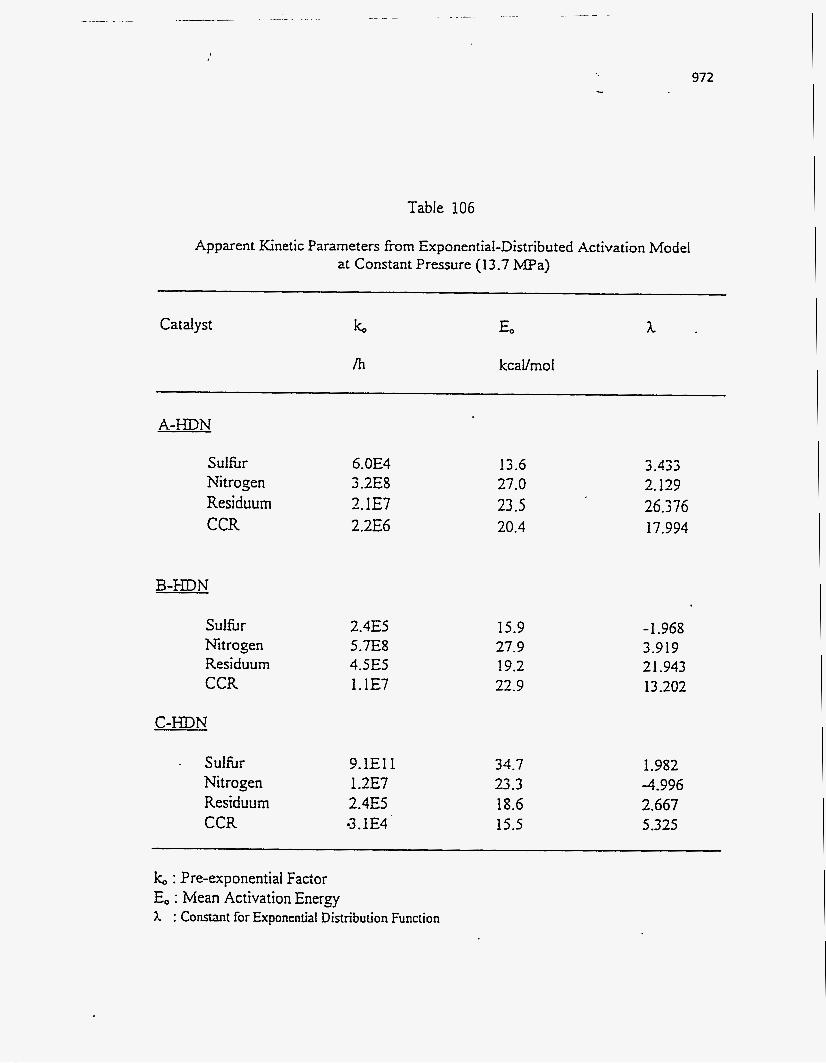
Table 106
972
Apparent Kinetic Parameters from Exponential-Distributed Activation Model at Constant Pressure (13.7 ma)
Catalyst k,
/h kcaVmoi
A-HDN
Sulfbr Nitrogen Residuum CCR
B-HDN
Sulfur Nitrogen Residuum CCR
C-HDN
Sulhr Nitrogen Residuum CCR
6.OE4 3.2E8 2.1E7 2.2E6
2.4E5 5.7E8 4.5E.5 1.1E7
9.lEl1 I .2E7 2.4E5 -3.1E4-
13.6 27.0 23.5 20.4
15.9 27.9 19.2 22.9
34.7 23.3 18.6 15.5
3.433 2.129 26.376 17.994
- 1.968 3.919 2 1.943 13 -202
1.982 4.996 2.667 5.325
k,, : Pre-exponential Factor E,, : Mean Activation Energ 1 : Constant for Exponential Distribution Function
...
Figure 284
Comparison with exponential-DAEM and experimental data for
(a) sulfur (b) nitrogen conversion over the A-HDN catalyst
at constant pressure
973 -_
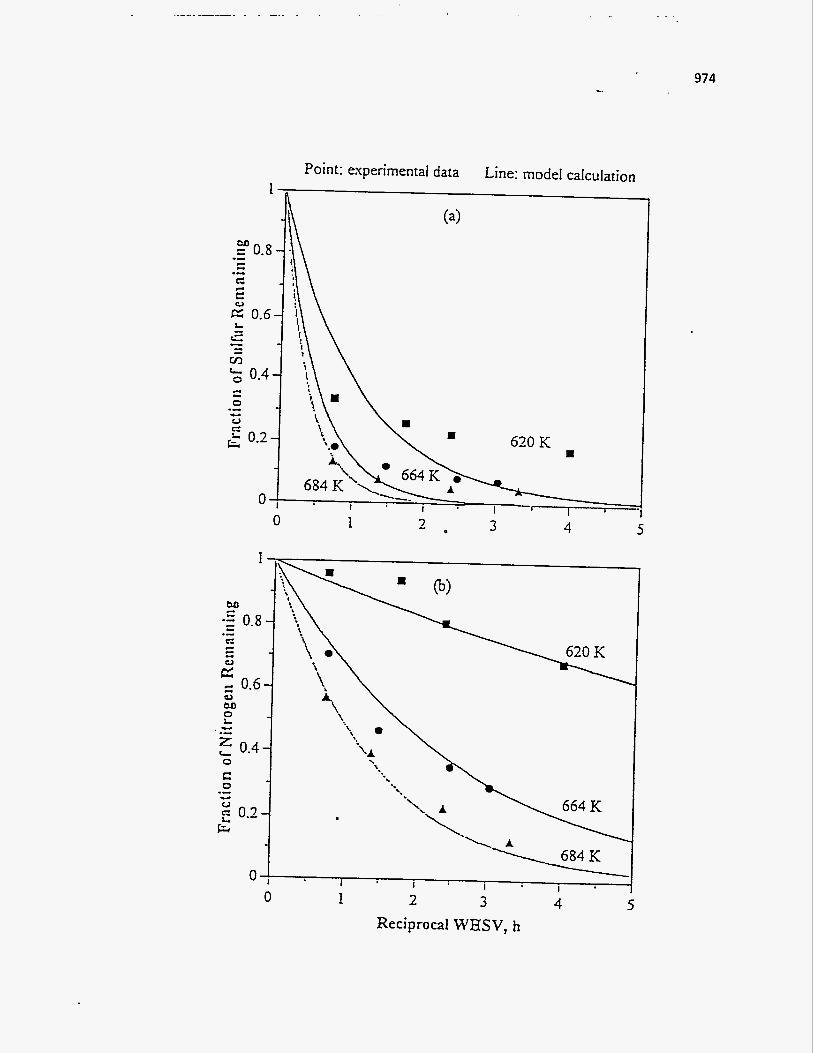
974
Point: experimental data Line: model calculation
n 1
0 e I e 3 0 1 - 3 4 5
2 3 4 5 0 1 Reciprocal WHSV, h
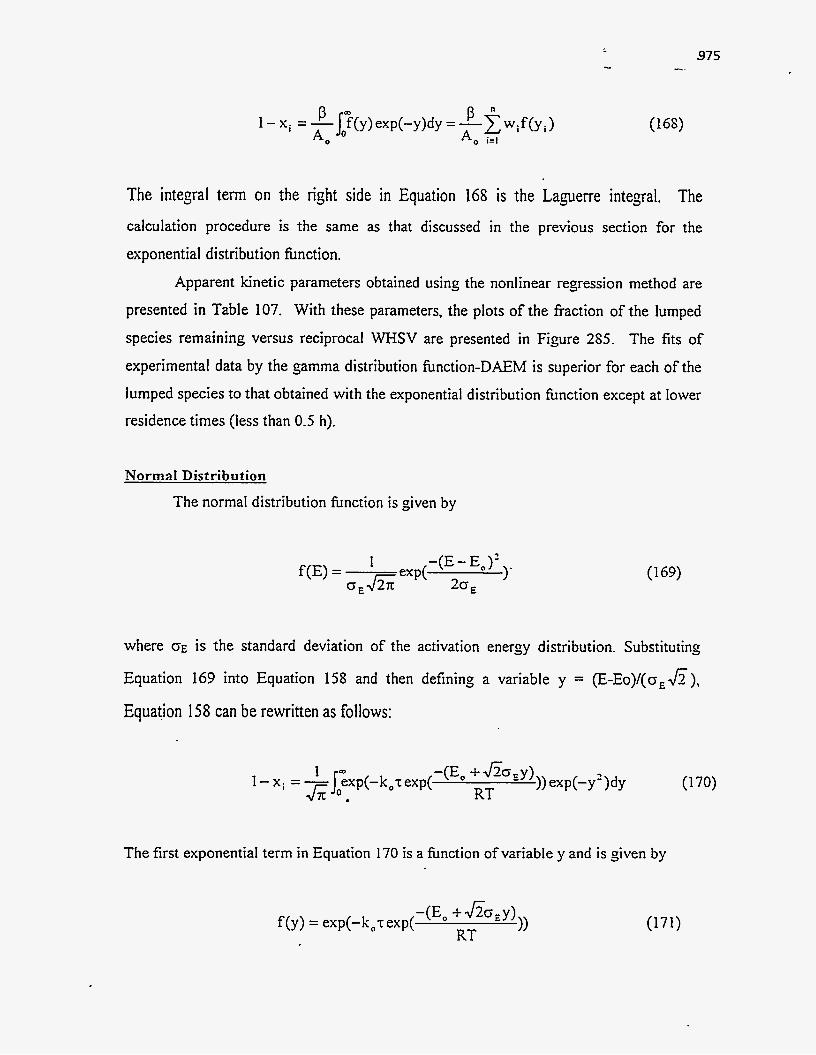
975
1 - xi = -Jl,f(y)exp(-y)dy P w = -x P ” wif(yi) A0 A0 i= l
The integral term on the right side in Equation 168 is the Laguerre inteyal. The calculation procedure is the same as that discussed in the previous section for the
exponential distribution function.
Apparent kinetic parameters obtained using the nonlinear regression method are
presented in Table 107. With these parameters, the plots of the fiaction of the lumped
species remaining versus reciprocal WHSV are presented in Figure 285. The fits of
experimental data by the samma distribution function-DAEM is superior for each of the
lumped species to that obtained with the exponential distribution hnction except at lower
residence times (less than 0.5 h).
Normal Distribution
The normal distribution finction is given by
1’ 1 -(E - Eo)2
20, f(E) =
where GE is the standard deviation of the activation energy distribution. Substituting
Equation 169 into Equation 158 and then defining a variable y = (E-Eo)/(o,&),
Equation 158 can be rewritten as follows:
The first exponential term in Equation 170 is a fbnction of variable y and is given by
f (y) = exp(-ko-r: exp( RT
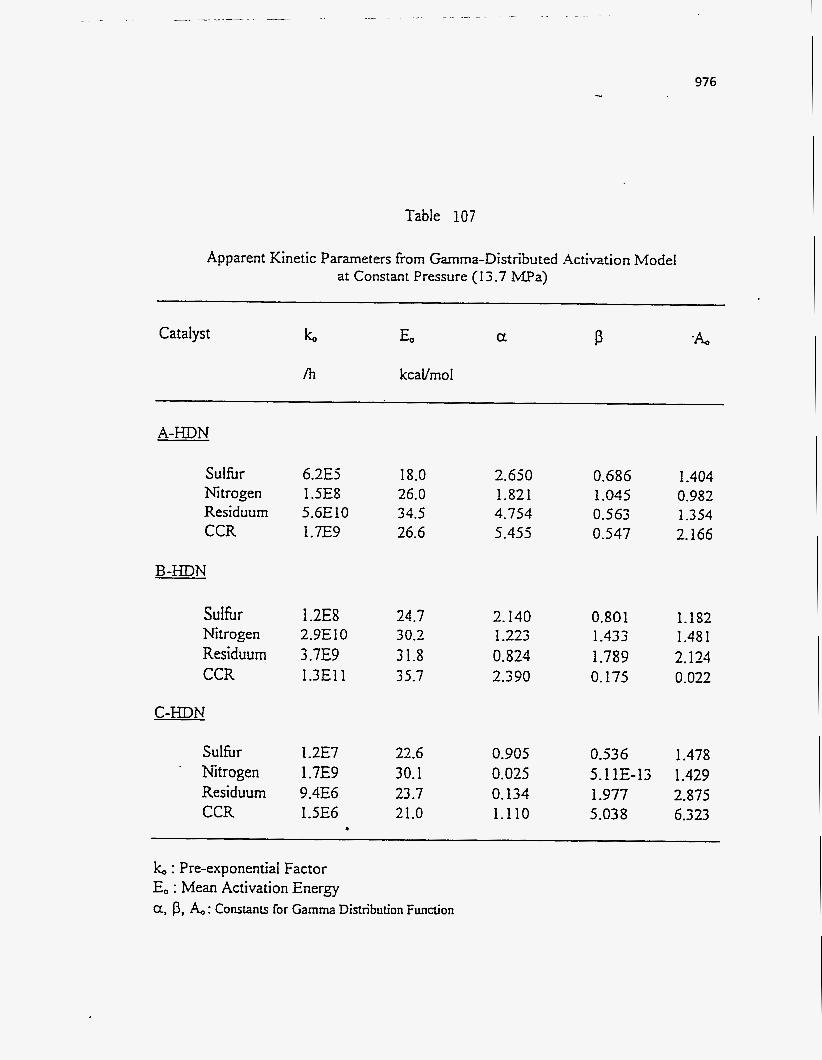
976
Table 107
Apparent Kinetic Parameters from Gamma-Distributed Activation Model at Constant Pressure (13.7 MPa)
k, E o Catalyst a P /h kcaVmol
A-HDN
Sulhr Nitrogen Residuum CCR
B-HDN
SuIhr Nitrogen Residuum CCR
6.2E5 1 SE8 5.6EIO 1 .E9
1.2ES 2.9E I O 3.7E9 1.3E1 I
18.0 26.0 34.5 26.6
24.7 30.2 3 1.8 35.7
2.650 1.821 4.754 5.455
2.140 1.223 0.824 2.390
0.686 1.045 0.563 0.547
0.801 1.433 1.789 0.175
1.404 0.982 1.354 2.166
1.182 1.481 2.123 0.022
C-HDN
22.6 0.905 0.53 6 1.478
23.7 0.134 1.977 2.875 1 SE6 21.0 1.1 10 5.038 6.323
Sulfur 1 -2E7 . Nitrogen
Residuum 9.4E6 CCR
1.7E9 30.1 0.025 5.1 1E-13 1.429
k, : Pre-exponential Factor E,, : Mean Activation Energy a, p, i%, : Constants for Gamma Distribution Function

Figure 285
Comparison with gamma-DAEM and experimental data for
(a) sulfur (b) nitrogen conversion over the A-HDN catalyst
at constant pressure
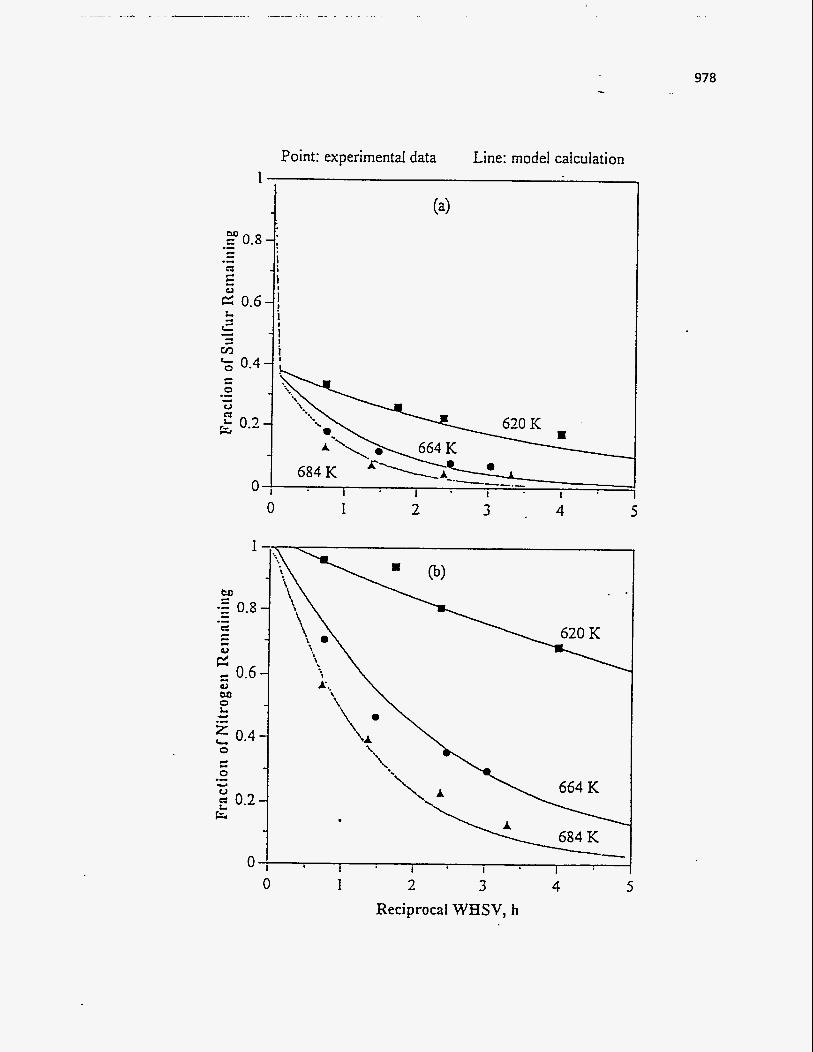
978 ...
Point: experimental data Line: model calculation
I 1
0.4 c L
0 .- - u n L 0.2 0
0
0
0 1 2
- I
3 4 5
0 I 2 3 4 5 Reciprocai WHSV, h

Equation 17 1 can be rewritten as follows:
979 -. -
( 173)
The integral term on the right-hand side of Equation 172 is the Hermite integral. The
solution of this integral can be approximated by employing the Table of zeros and weight
factors for the first twenty Hermite polynomials(34 1). The value of E,, changed relatively
little in the range of n = 8 to n=12 after computer calculation for each n. Thus, n=10 was
chosen in this study.
The apparent kinetic parameters computed fiom the nonlinear regression method
are presented in Table 108. The fraction of the lumped species remaining versus
reciprocal WHSV are plotted in Figures 286-291 using these parameters. The normal
distribution-DAEM gave a very good fit of the experimental data for each of the lumped
species over the three fIDN catalysts and gave the best fit of the data of the three
distributions.
Comparing the parameters of each species shown in Table 108, the mean
activation energies for nitrogen conversion over the three HDN catalysts are higher than
those for sulfur conversion. This result is consistent with the difficulty of removal of
nitrogen compound in the feedstock relative to sulhr compounds. The standard deviations GE for su1fi.x data are higher than those for nitrogen data. This implies that the
distribution of individual sulfur compounds is wider than that of individual nitrogen
compounds. The preexponential factor k, increased with increasing activation energy for the A-HDN catalyst. The trend was not obtained with the B- and C-HDN catalysts.
According to the above results, the curve fits to the experimental data for the nth
power rate law and the normal distributed activation energy models were better than the
other models tried. Since the best fits were obtained from models having different
viewpoints, the results for the overall nth power rate law and normal distribution
activation energy models are presented in Figures 292-297 and Table 109.
A comparison of the correlations of the experimental data fiom both models
indicates the conversions of residuum and CCR over the A- and C-HDN catalysts and of
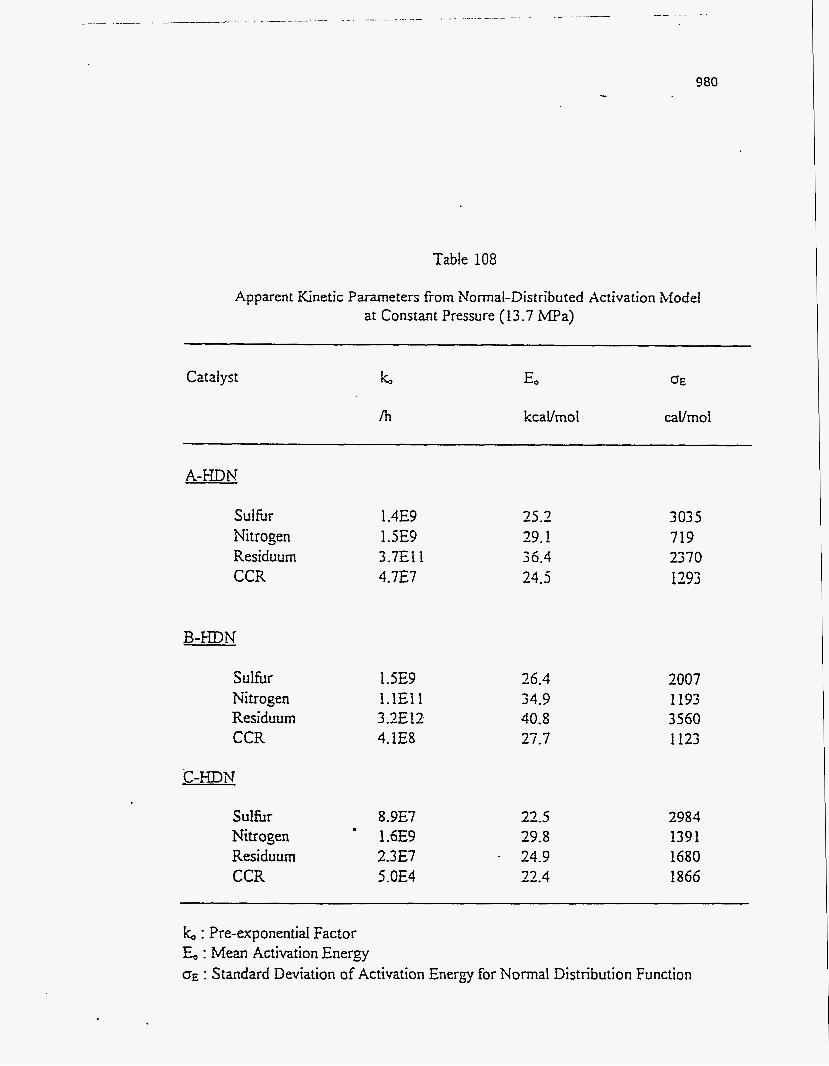
980
Table 108
Apparent Kinetic Parameters from Norrnal-Distributed Activation Model at Constant Pressure (13.7 MPa)
Catalyst k, EO
kcallmol caVmoI
A-HDN
Sulfur Nitrogen Residuum CCR
B-HDN
Sulhr Nitrogen Residuum CCR
C-HDN
Sulhr Nitrogen Residuum CCR
1.4E9 1.5E9 3.7E11 4.7E7
I SE9 1.1Ell 3.2E12 4.1E8
8.9E7 1.6E9 2.3E7 5.OE4
35.3 29.1 36.4 24.5
26.4 34.9 40.8 27.7
22.5 29.8
* 24.9 22.4
3035 719 2370 1293
2007 1193 3560 1123
2984 1391 1680 1866
k, : Pre-exponential Factor E., : Mean Activation Energy OE : Standard Deviation of Activation Energy for Normal Distribution Function

Figure 286
Comparison with normal-DAEM and experimental data for
(a) sulfur (b) nitrogen conversion over the A-HDN catalyst
at constant pressure
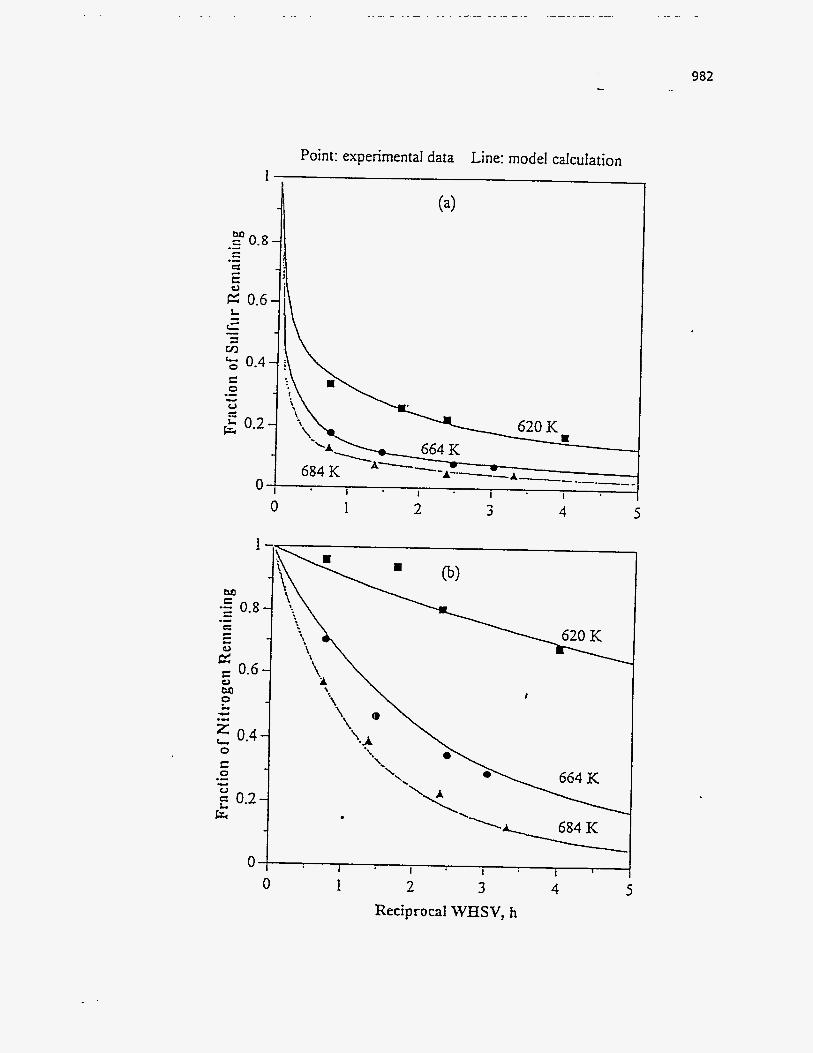
... 982
0 0
1
c e c.
2 0.6-
0 M z L. 0.4- Y .- 0 S 0
u .- c.
0.2- I% -.
Point: experimental data Line: model calculation
620 K
I 2 3 4 5
I
1 1 I I I
0 I 2 3 4 ReciprocaI WHSV, h
5

Figure 287
Comparison with normal-DAEM and experimental data for
(a) residuum (b) CCR conversion over the A-HDN catalyst
at constant pressure
983
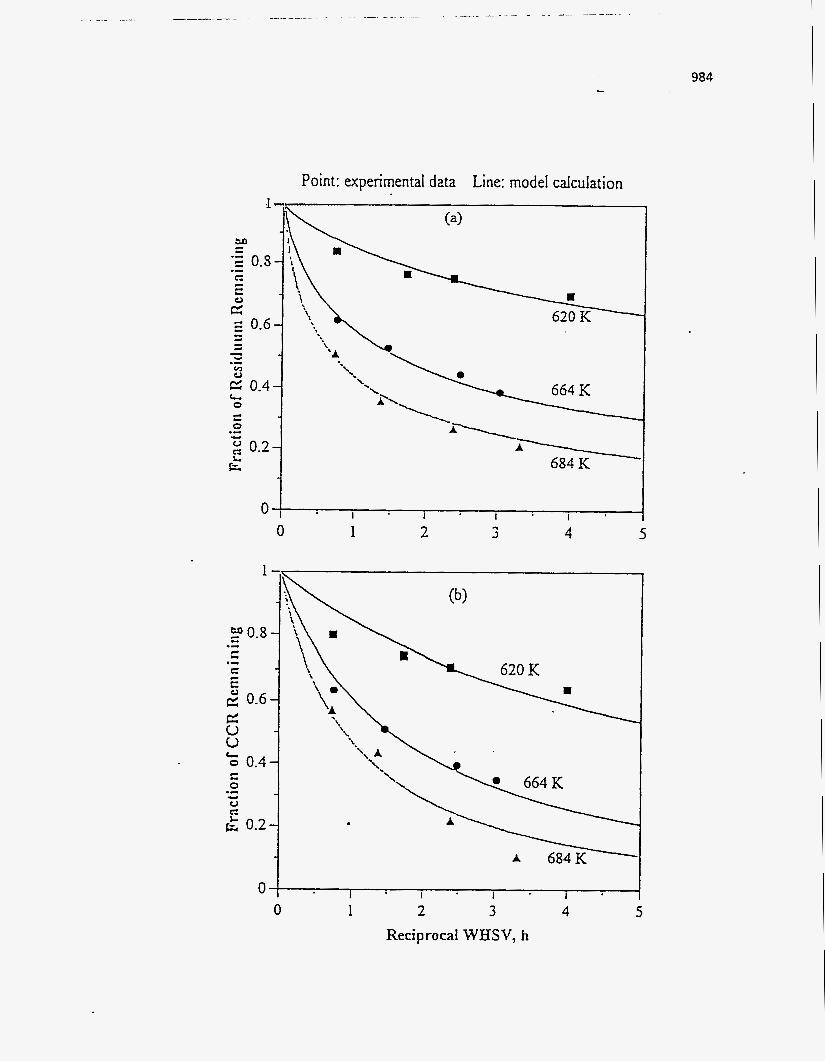
984 ...
Point: experimental data Line: model calculation
Z’ L 0.8 - .- c - .- c E 2 0.6- lz 0 u 0 0.4- L
E: 0
0 tz .- c.
0.2-
1 2 3 4 0 Reciprocal WHSV, h
5

a
Figure 288
985
Comparison with normal-DAEM and experimental data for
(a) sulfur (b) nitrogen conversion over B-HDN catalyst
at constant pressure .

986
2 0.1 .- c I .- c= E 2 0.6
0.4
0 0
Point: expenmenial data Line: model calculation
W M 0 t Y .- z 0.4 0
0 c - .- a 2 0.2 k
0 0
1 2 3 4 5
\ =
'A =Y
I I I I
1 2 3 4 ReciprocaI WHSV, h
5

Figure 289
Comparison with normal-DAEM and experimental data for
(a) residuum (b) CCR conversion over B-HDK catalyst
at constant pressure
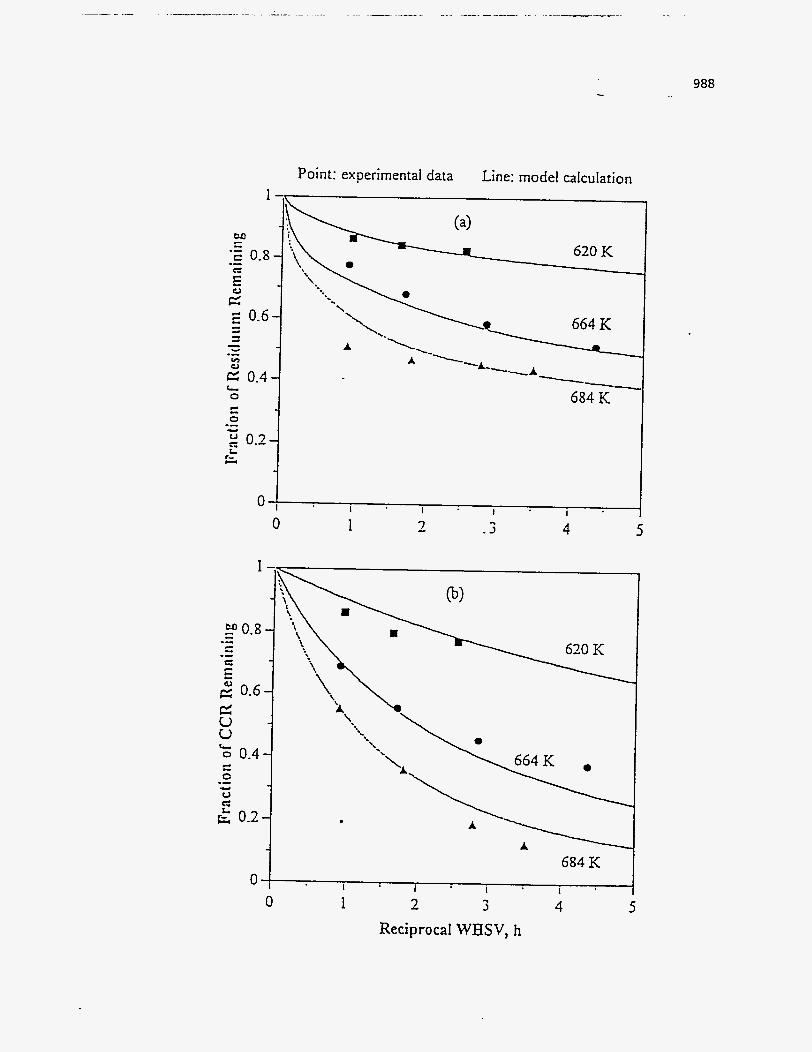
M c .- .- c' 0.E
E 0.6
0 0
1
L o 0.4 c - 0
u c
.- Y
& 0.2
0 0
988
Point: experimental data Line: model calculation
{{ 620 K
I I I I
I 3 4- 4
684 K I 1 I I
5
1 2 3 4 Reciprocal WHSV, h
5

c
989 -.
Figure 290
Comparison with normal-DAEM and experimenta1 data for
(a) sulfur (b) nitrogen conversion over C-HDN catalyst
at constant pressure
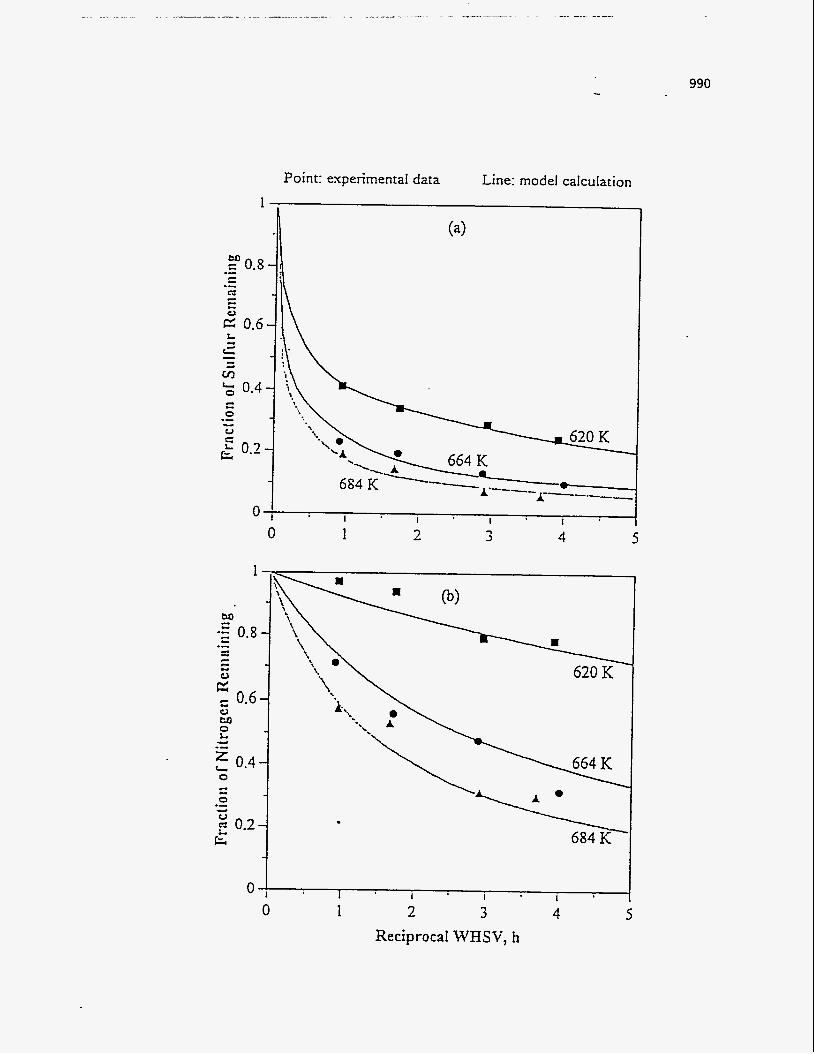
Point: experimental data
990
Line: model calculation
c---- - 1 1 I I
0
1 - 3 4 5 3 0
1
M
a to C
c - 0 .- a
0.2 L
0 0
1 1 I 1
1 2 3 ReciprocaI WHSV, h
4 5

99 1 -..
Figure 291
Comparison with normal-DAEM and experimental data for
(a) residuum (b) CCR conversion over C-HDN catalyst
at constant pressure
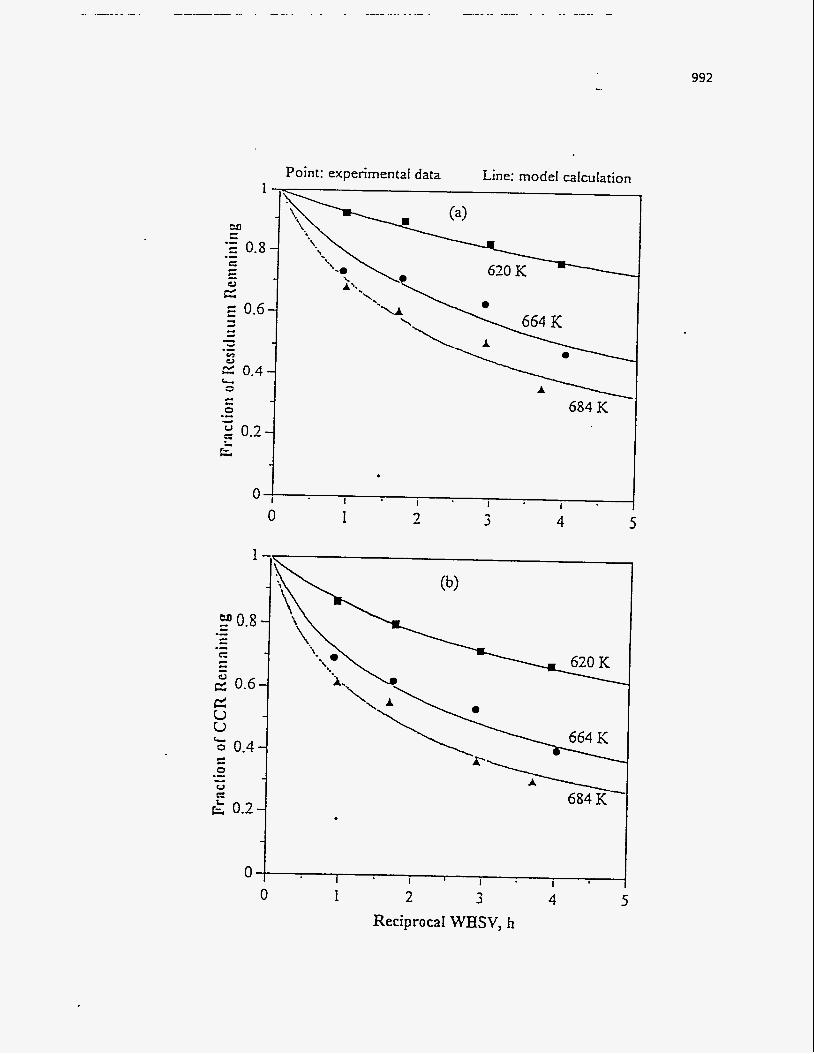
992
I I I
Point: experimental data
0 , I 1
Line: model calculation
L o 0.4
0 0
\
1 I I i
1 2 3 4 Reciprocal WHSY, h
5

993 -.
Figure 292
Comparison with experimental data from the nth power rate law
and normal DAEM for (a) sulfur (b) nitrogen conversion over A-HDN catalyst
at constant pressure (13.7 MPa)
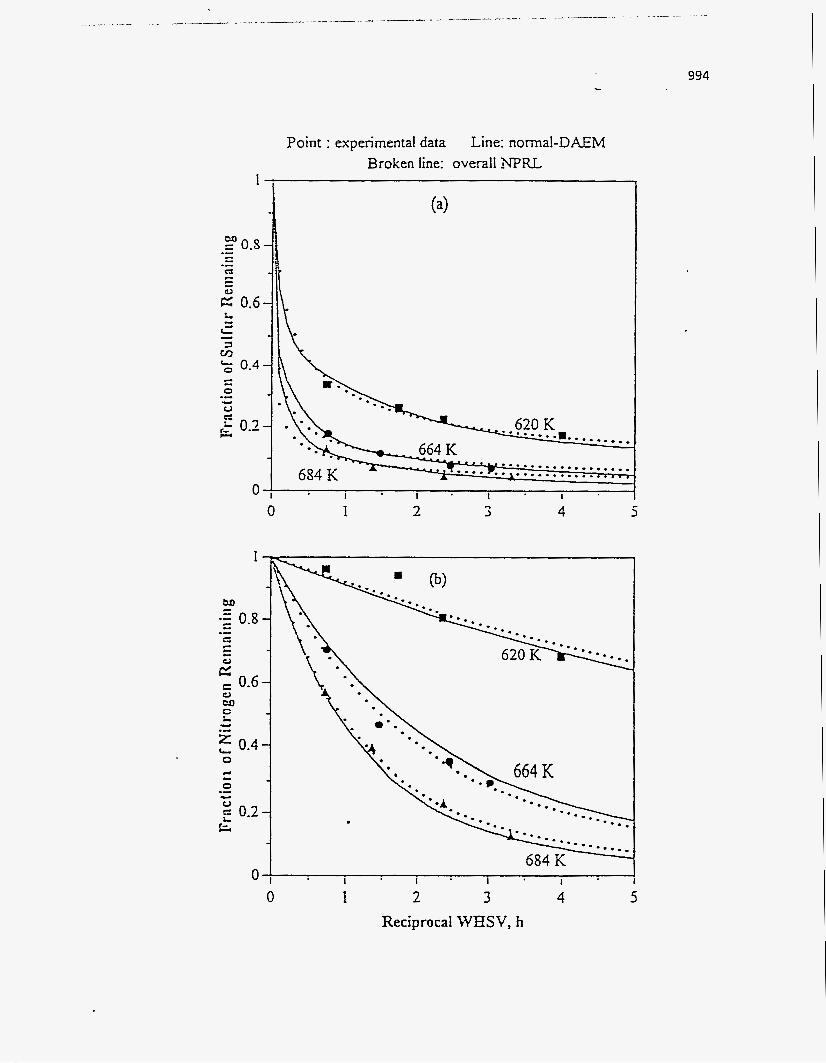
994
Point : experimental data Line: normal-DAEM Broken line: overall INHU
I
(4 2 0.s .- c .-
.....-..........*. . . . . - . . . . . . a .,..
I I I 1
0 1 2 3 4 5
e
5 0.4 0
0 0
1 I I 1
1 2 3 4 5 Reciprocal WHSV, h

Figure 293
Comparison with experimental data from nth power rate law
and normal DAEM for (a) residuum (b) CCR conversion over A-HDN catalyst
at constant pressure (13.7 MPa)
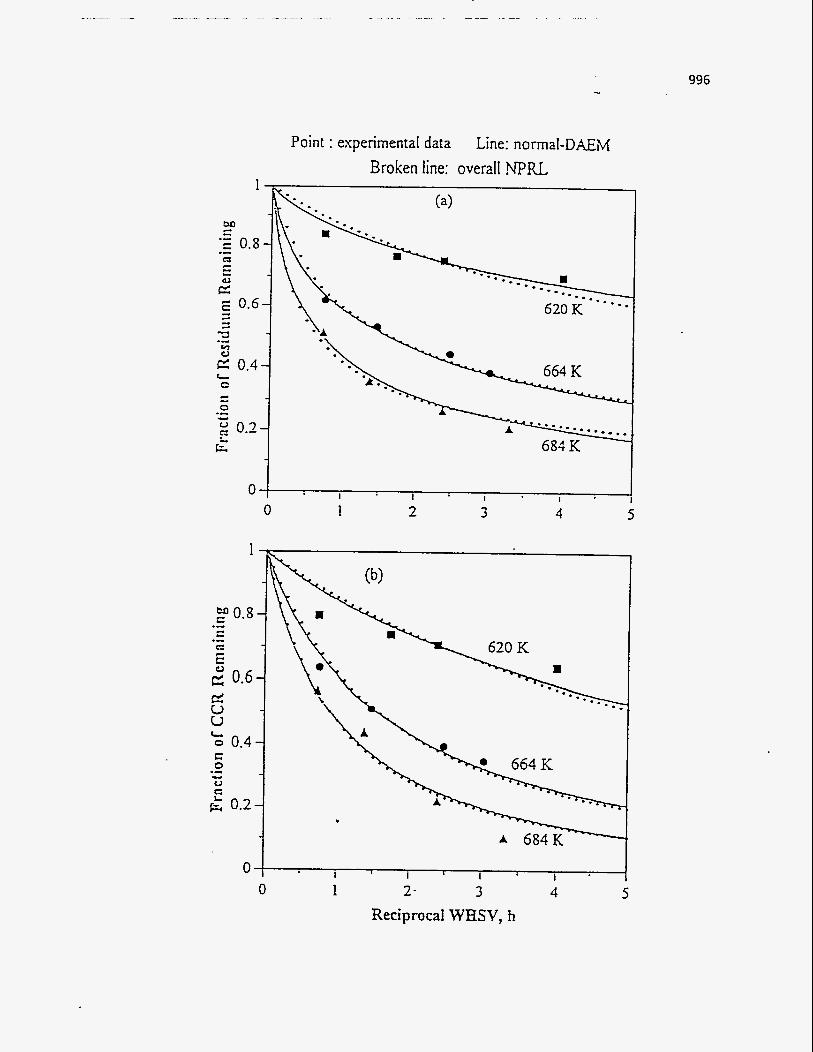
996
1
0 -
1
E 2 0.6
0
Point : experimental data Line: normal-DAEM Broken line: overall NPU
(4
.. ... 620 K
A
I 1 I I
0 1 2 3 4 5
0 1 I I I 1 L
1 2- 3 Reciprocal WHSV, h
4 5

... 997 -.
Figure 293
Comparison with experimental data from nth power rate law
and normal DAEM for (a) sulfur (b) nitrogen conversion over B-HDN catalyst
at *constant pressure (13.7 MPa)

998
0 1 2 3 4 5
0 1 2 3 4 5 Reciprocal WHSV, h
999 -.
Figure 295
Comparison with experimental data from nth power rate law
and normal DAEM for (a) residuum (b) CCR conversion over the B-HDN catalyst
at constant pressure (13.7 MPa)
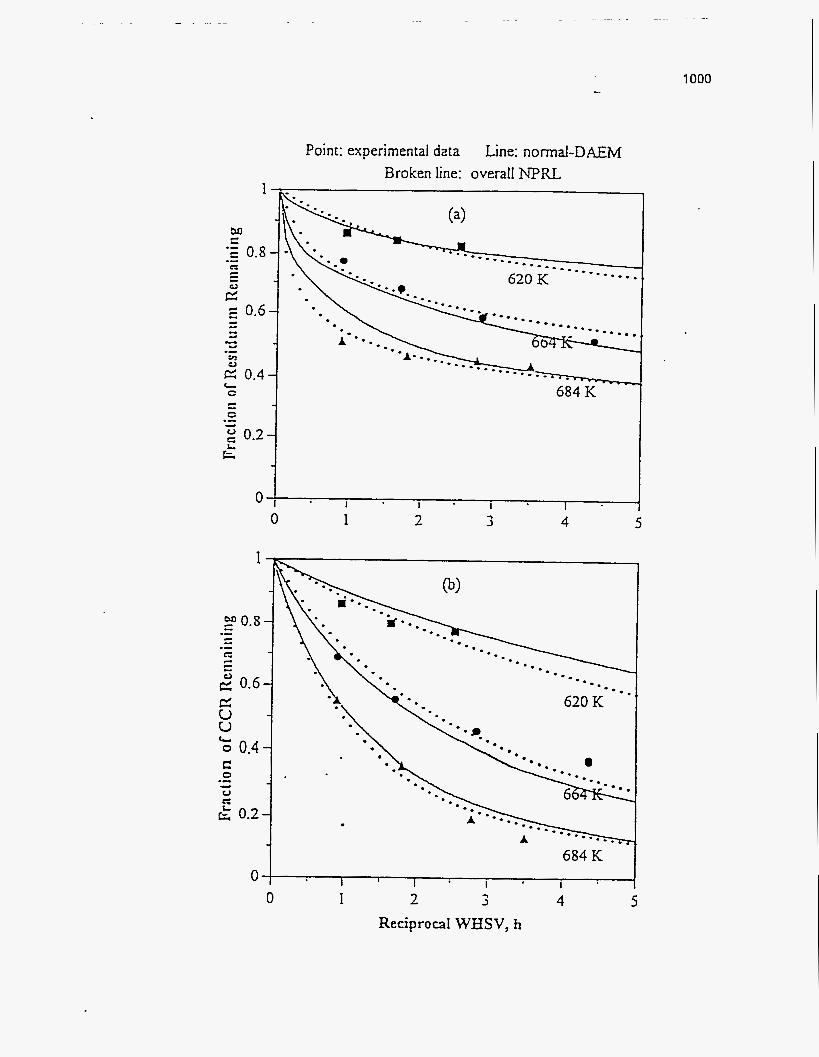
1000
1
M
ul
2 0.4 L C
C r - .- -. cz * 0.2. 2
0 -
1
Point: experimental data Line: nomd-DAEM Broken line: overall WRJ-
I I I 1
0
U c=
.- c. & 0.2
0 0
0 I 2 3 4 5
684 K 1 I 1 I I
1 2 3 4 5 ReciprocaI WHSV, h
1001 .. . 1
Figure 296
Comparison with experimental data from nth power rate law
and normal DAEM for (a) sulfur (b) nitrogen conversion over the C-XTDN catalyst
at constant pressure (13.7 MPa)

1
0 0
-..
Point : experimental data Line: normal-DAEM Broken line: overall NPRL
1 2 3 4 5
0 1 2 4 5
1002
ReciprocaI WHSV, h

Figure 297
1003 -_
Comparison with experimental data from nth power rate law
and normal DAEM for (a) residuum (b) CCR conversion over the C-HDN catalyst
at constant pressure (13.7 MPa)
0
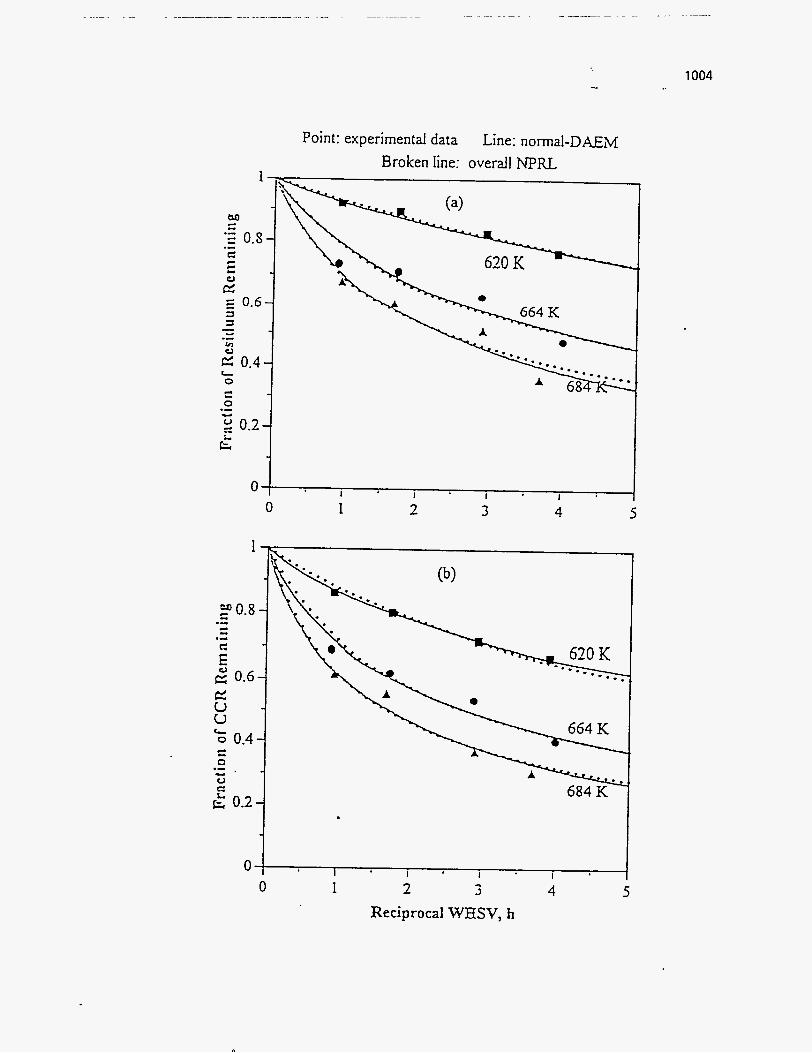
1
0 -
1
Point: experimental data Line: normal-DAElq Broken line: overdl NPRL
I i I I I
0
1 2 3 4 5 0
1 I I I
1 2 3 4 ReciprocaI WHSV, h
5
1004
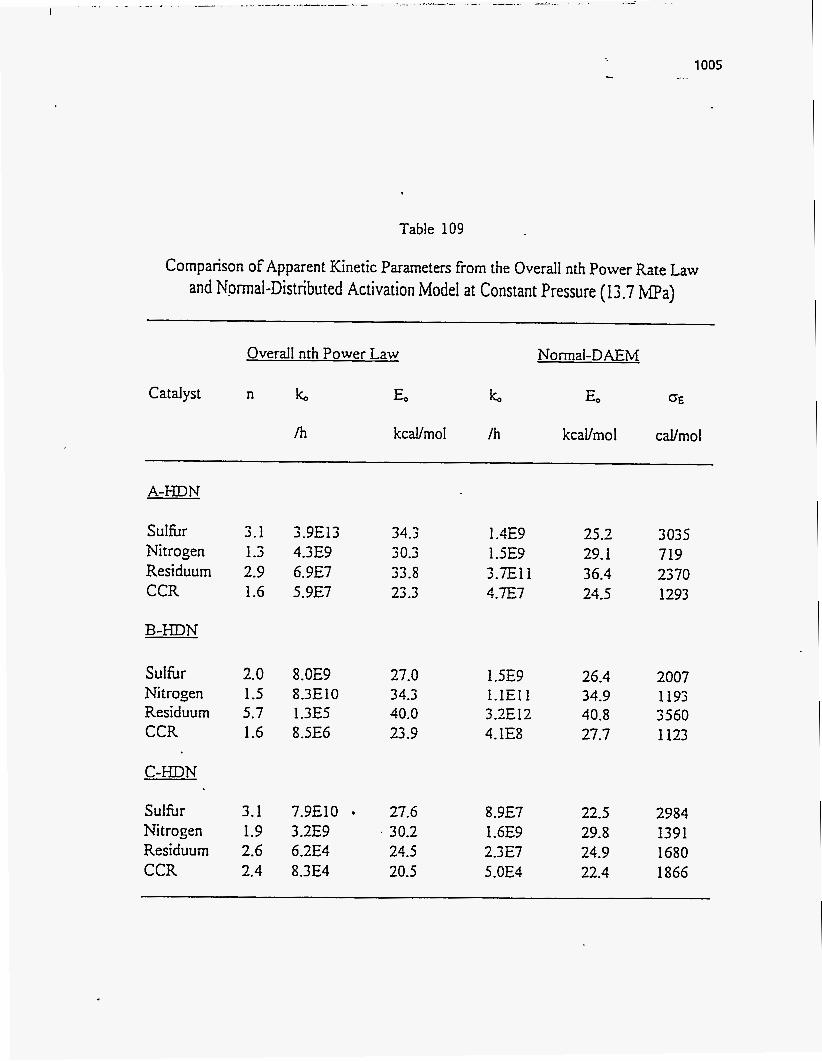
c
1005 --.
Table 109
Comparison of Apparent Kinetic Parameters from the Overall nth Power Rate Law and Normal-Distributed Activation Model at Constant Pressure (13.7 hipa)
Overall nth Power Law Normal-D AEM
E, k, E o O E Catalyst n k,
/h kcaUmol /h kcaVmol cal/mol
A-HDN
Sulhr Nitrogen Residuum CCR
B-HDN
Sulhr Nitrogen Residuum CCR
C-HDN
Sulfur Nitrogen Residuum CCR
3.1 1.3 2.9 1.6
2.0 1.5 5.7 1.6
3.1 1.9 2.6 2.4
3.9E13 4.3E9 6.9E7 5.9E7
8.OE9 8.3E10 I .3E5 8.5E6
34.3 30.3 33.8 23.3
27.0 34.3 40.0 23.9
1.4E9 25.2 I .5E9 29.1 3.7Ell 36.4 4.7E7 24.5
1.5E9 26.4 1.1EI 1 34.9 3.2E12 40.8 4.1E8 27.7
3035 719 23 70 1293
2007 1193 3560 1123
7.9ElO 27.6 8.9E7 22.5 2984 3.2E9 ' 30.2 1.6E9 29.8 1391 6.2E4 24.5 2.3E7 24.9 1680 8.3E4 20.5 5.OE4 22.4 1866
3 006
sulfur and nitrogen over B-HDN catalyst are almost the same, whereas for the other
lumped species, they are slightly different. This comparison suggests that for the
hydrotreating of bitumens the nth power rate law could be used to obtain reaction order, whereas the noma1 distribution activation energies model could be used to obtain
realistic activation energies.
Apparent kinetic parameters for both models are listed in Table 109. The pre-
exponential factors cannot be compared directly because the units of k, in two models are
different. The mean activation energy trends for both models for each lumped species
over the HDN catalysts are the same except for the activation energies o f , s u l h r
conversion over the A-HDN catalyst which is higher than that of nitrogen removal. The
mean activation energies data are similar except for sulfbr removal over the A- and C- HDN catalysts. The mean activation energies calculated from the overall nth power rate
law model are close to those calculated from the normal distribution-DAEM.
Investigation of Process Variables
The primary objective of catalytic upgrading is to remove the heteroatoms from
the bitumen and simultaneously to reduce molecular weight distribution of the bitumen.
The process variables investigated in this study were the liquid (weight) hourly space velocity, the reactor temperature, and the hydrogen partial pressure. The effects of
process variables on heteroatom and metal removal; residuum, CCR, and asphaltenes
conversion; viscosity reduction; and product distribution over three HDN catalysts were
determined.
Effect of Weight Hourly Space Velocity
Removal of Species
The WHSV was varied i t fixed temperatures and pressure to determine the
reaction orders and the rate constants for lumped species by an overall nth power rate
law. The overall reaction orders for sulfbr and nitrogen removal and residuum and CCR conversion over three HDN catalysts are presented in Table 105.
The effect of WHSV on the fractional conversions of lumped species, such as
sulfur, nitrogen, residuum, CCR, and asphaltenes, over HDN catalysts are plotted in

Figures 298-300. (The effect of WHSV on conversions of some lumped species can be
also seen in Figures 280-285.) These figures indicate that the conversions increase as the
reciprocal WHSV increased; however, the asphaltenes conversions exhibited a different trend at 620 K. The reciprocal WHSV represents residence time or contact time in the
reactor. At the higher residence times, the liquid contact time was sufficient to permit the
catalytic and thermal reactions to approach completion.
For sulfur removal, the conversion is strongly influenced by residence time,
especially below 1 h. When the reciprocal WHSV was greater than 1 h, the conversion
increased slowly with increasing residence time and then leveled off. The time at which
the conversion leveled off depended upon the reactor temperature and the catalyst
employed.
The conversion of nitrogen increased significantly as residence time increased for
reactor temperatures of 664 and 684 K. However, this positive influence decreased at
620 K. At 620 K, the nitrosen conversion doubled when the reciprocal WHSV was 2 h.
The conversions of residuum and CCR exhibited similar trends; that is. the
conversions increased with increasing residence time. Asphaltenes conversion exhibited
the same trend as residuum and CCR conversion at 664 and 684 K. However, at 620 K, the asphaltenes conversion increased to a maximum (about reciprocal WHSV = 0.9 h)
and then decreased as residence time increased. Comparing the conversion at three
reactor temperatures, the asphaltenes conversion decreased only at a LHSV of 0.9 h * . Therefore, the trend at the lower temperature of 620 K over the same catalyst may be related to the space velocity as well as the temperatures.
Comparing the conversions , sulfbr removal is much more facile than the others.
The nitrogen removal is more dificult than others at lower temperature 620 K. However,
the asphaltenes conversion is less than the others at higher temperature 664 and 684 K
where asphaltene-like species may actually be created.
Nickel removal increased with increasing residence time for the three HDN catalysts shown in Tables 88-90. respectively. A comparison of the nickel and
asphaltenes conversions over the HDN catalysts is presented in Table 110. This table
indicates nickel removal, and asphaltenes conversion are related: The greater the
asphaltenes conversion, the more nickel removal.

Figure 298
Fractional conversion of lumped species versus reciprocal WHSV
over the A-HDN catalyst at different temperatures and constant pressure
1008
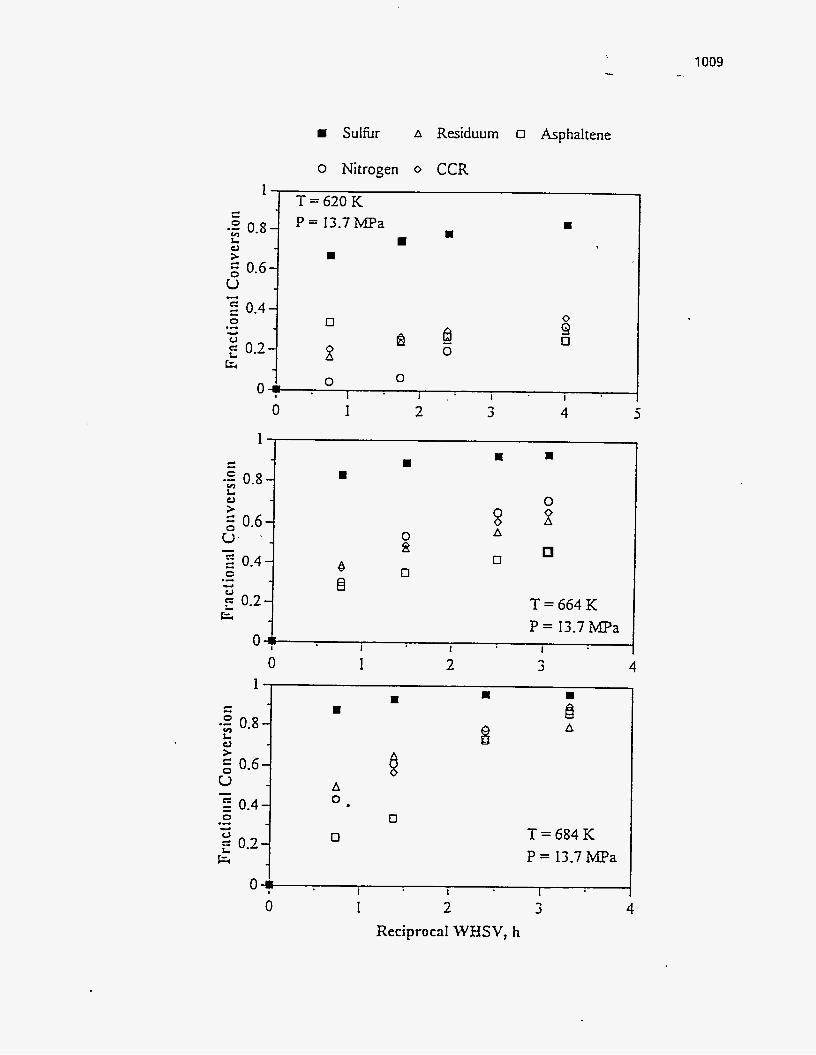
...
1 c - -2 0.8- c
0.6- u >
s - 2 0.4- .- 0 F: 0.2- E
- u
1009 -_
T=620K P = 13.7 MPa I
I
0
8 0 0
Sulfur A Residuum 0 Asphaltene
o Nitrogen 0 CCR
u
kl p - 0.2-
I
T=664K P = 13.7 MPa
f3 0
s" D
1 , m M
8 A
6 8
0
m
0 1
0.8
2 0.4 0 .- e 2 0.2
A 0.
0 0
2 3 4 I I
8 A
T=684K P = 13.7 MPa
I I I 0 1 2
Reciprocal WHSV, h 3 4

-. . . . .... .- .. . . ..
Figure 299
Fractional conversion of lumped species versus reciprocal WHSV
over the B-HDN catalyst at different temperatures and constant pressure
1010
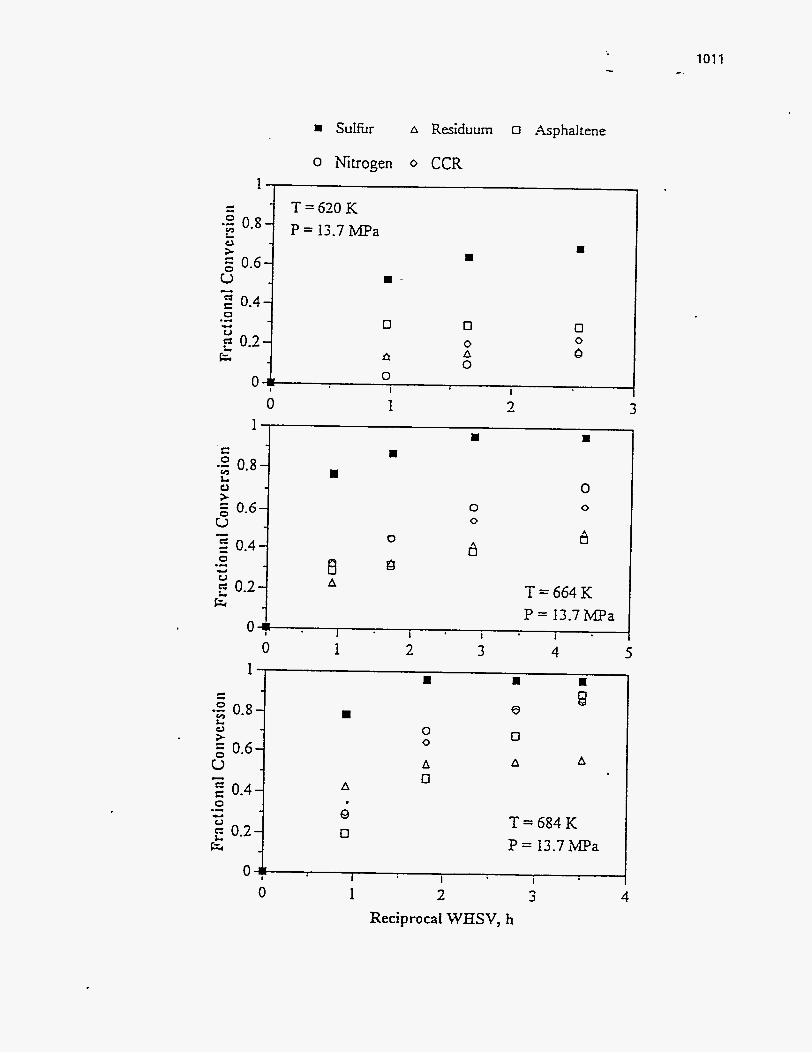
101 1 -.
m SuIfbr A Residuum 0 Asphaltene
0 Nitrogen 0 CCR 1 ,
m a
0 0 8
I -
0.4
; 0.2 0
fl
0 0 A 0
0 I 1
0 1 2 3 1
m R m
-2 0.8- 2 0 0 > 0.6- 0
u 2 0.47 a -
1 m R
0 0 0
0
0
8 - 4 2 0.4 a B
T = 664 K P = 13.7 MPa
0 1 2 3 4 5
n I a 1
El e 0 0
A 0
0
A A
A
; 0
T=684K P = 13.7 lMPa
1 I I
0 1 2 3 Reciprocal WHSV, h
4
1012
F i ~ r e 300
Fractional conversion of lumped species versus reciprocal WHSV
over the C-HDN catalyst at different temperatures and constant pressure
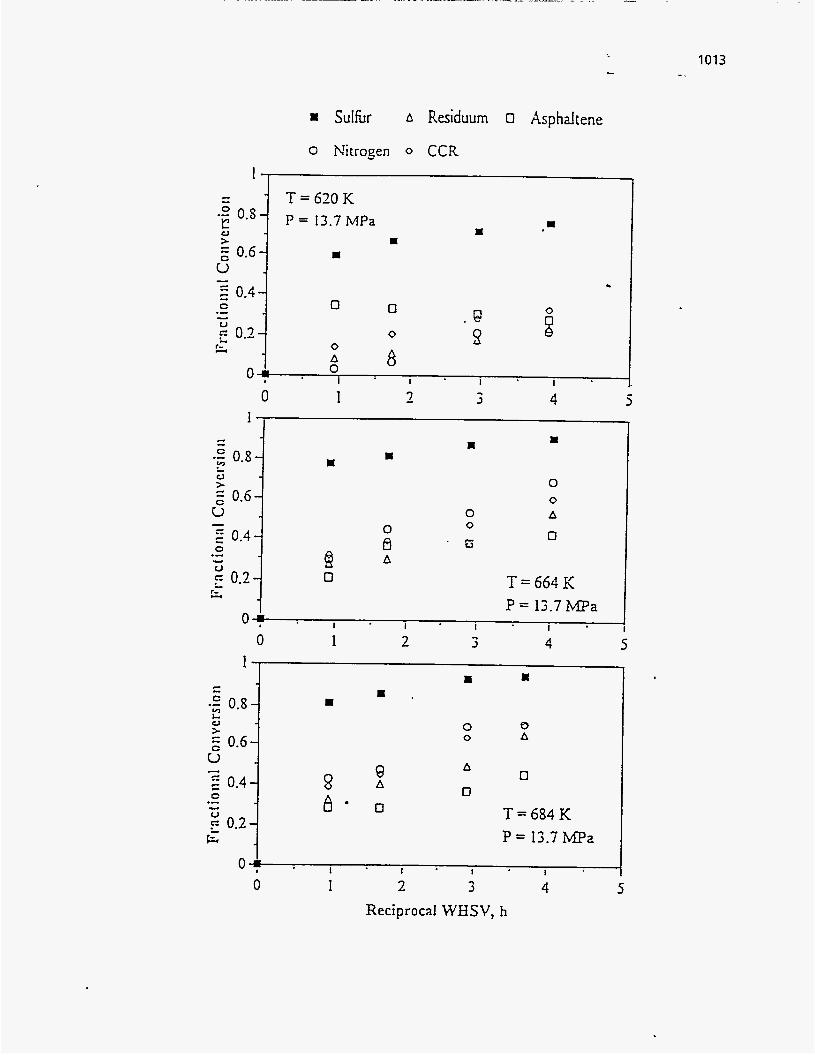
I Sulhr A Residuum o Asphdtene
c - - e '*'-
0.6- u 7
0 >.
T = 6 2 0 K P = 13.7 MPa
I I
I I
5 0.4 0 0
F 0.2 0 . @ 9
I
8 r- 0 A 0
I
5 - 0.44 b
-
. @ 9
0 -
0
I I
8 0 4
I
0 1 2 4 5 1
0
A 0
0
0 0
f3
0 A
0
0 1 - 3 4 5 3
1 , rn R
F 0.2 E " 1
0 0 0 A
8 8 A
% = 0
A 0
0
T=684K P = 13.7 1 W a
0 1 2 3 4 ReciprocaI WBSV, h
1013 -_

1014
Table 110
Comparison between Conversions of Nickel and Asphaitenes over the HDN Catalysts
T
K
Conditions Catalvst
P
A-HDN B-HDN C-HDN
LHSV Nickel Asphaltenes Nickel Asphaltenes Nickel Asphaltenes
% % % % % % MPa h"
620
664
664
13.7 0.9 61.6
13.7 0.48 70.9
13.7 0.28 74.4
33.4
34.7
41.8
43.0
55.8
28.9
38.4
45.3
60.5
64.0
34.6
35.6
37.2
684 13.7 0.2 83.7 85.9 90.7 89.6 70.9 43.9
1015
It has been observed that the conversions of suhr , nitrogen, CCR residuum, and
nickel increased as the conversion of asphaltenes increased especially at higher
temperature. The reason is that the asphaltene molecules consist of highly condensed
polyaromatic units bearing long aliphatic and alicyclic substituents with heteroatoms (S, N, and 0) as part of the aromatic system and trace metals as porphyrins(65). Physical methods indicate that high proportion of asphaltenes and resins even account for up to
50% (or higher) of the residuum(65) and moieties that give rise to CCR are distributed in the asphaltenes fraction.
Viscositv Reduction
The viscosity is a measure of its internal resistance to motion of a fluid caused by
cohesive forces between molecules and molecular groupings and is the most important
single fluid characteristic governing the motion of the fluid. For the fuel system designer, the viscosity is of primary interest as a prime factor to calculate t h e pressure drops in
lines through its relationship to Reynolds number.
The influence of reciprocal WHSV on viscosity reduction of bitumen over the
HDN catalysts is presented in Figure 301. As can be seen, the viscosities of hydrotreated
bitumens decreased with increasing residence time at specific temperature and pressure.
Product Distribution
The yields and distributions of products produced from the Asphalt Ridge
bitumen over the three HDN catalysts as a function of reciprocal W S V at specific
temperature and pressure are plotted in Figres 302-304.
With these three Figures, they exhibit the same trends as a function of residence
time at the same operating conditions. The residuum content decreased as the residence
time increased. The gas, naphtha, and distillate fractions monotonically increased with
increasing residence time. The gas oil yields increased rapidly up to residence time of 1.5 h and then increased slowly at higher residence time at 620 and 664 K. However, the
yields of gas oil reach a maximum point and then decrease as reciprocal WHSV increases
at 634 K. The same result has been reported by other authors(243,292,342).
.- . .
Figure 301
1016 ...
Effect of reciprocal WHSV on viscosity over the HDN catalysts
at different temperatures and constant pressure (13.7 MPa)

...
m 620K 664K A 684K
12 ,
8
4
2 6!
A-HDN
Viscosity Measured at 3 13 K
0 1 - 3 4 5 7
14
12 1
2 - Viscosity Measured at 298 K
0 1 I 1 1 I
0 1 2 3 4 12
LO -
8-
- Catalyst : C-HDN
6-
4-
-
I
Viscosity Measured at 3 13 K
0 1 1 I I 0 1 2 3 4
Reciprocal WHSV, h
5
5
1017 -.

1018
Figure 302
Yields of boiling fraction of bitumen conversion versus reciprocal WHSV
over the A-HDN catalyst at different temperatures

0 Residuum A Distillate
-: 0.2- > .c
0 Gas Oil
P = 13.7 MPa A 4
0 Naphtha
1 Gas
0.6 I
0 1 2 3 4 5 0.6 I
T= P =
664 K 13.7 L W a
n n rn - - - 3 I I I
0 1 ' 2 3 4 0.6
T = 684 K
0 1 2 3 Reciprocal WHSV, h
4
1019 .-.
1020
Figure 303
Yields of boiling fraction of bitumen conversion versus reciprocal WHSV
over the B-HDN catalyst at different temperatures
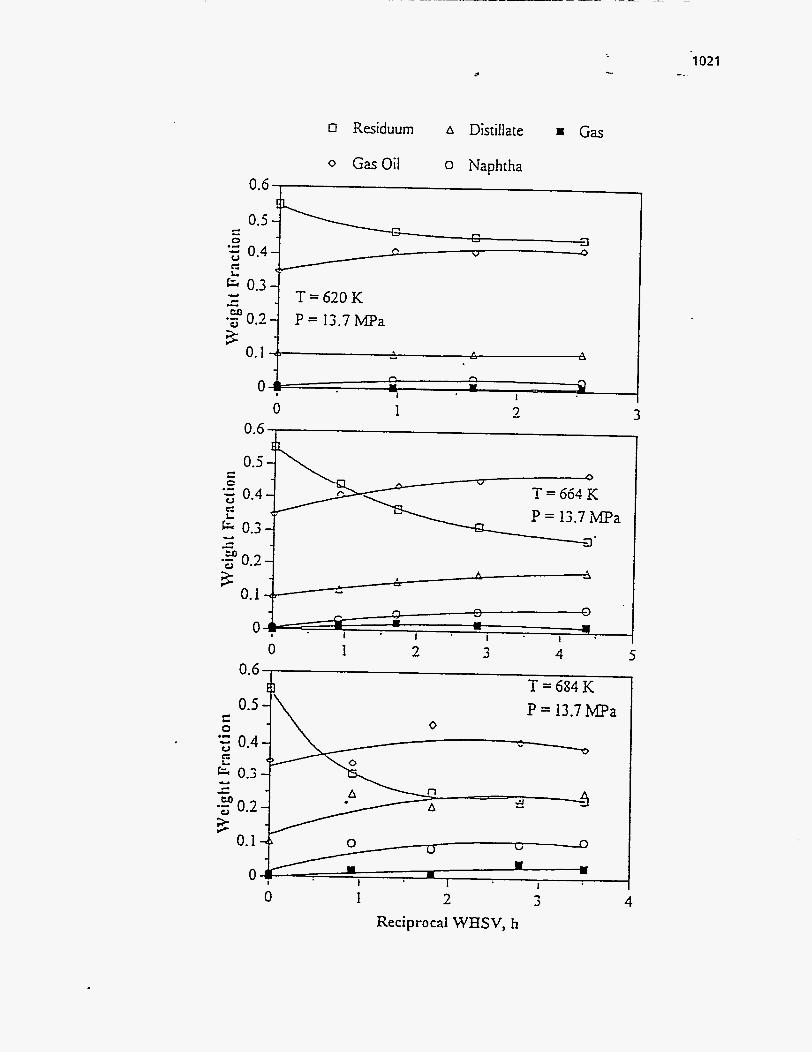
d
4 c
-3 0.2-
0.1
W
3
O I
o Residuum A Distillate
T=620K P = 13.7MPa
4 :+ - A
h I)
CI m
Gas
0 1 3 - 3
0 1 2 3 4 5 0.6
E3 T = 684 K P = 13.7 MPa
0 1 2 3 ReciprocaI WHSV, h
4
1021
1022
Figure 304
Yields of boiling fraction of bitumen conversion versus reciprocal WHSV
over the C-HDN catalyst at different temperatures
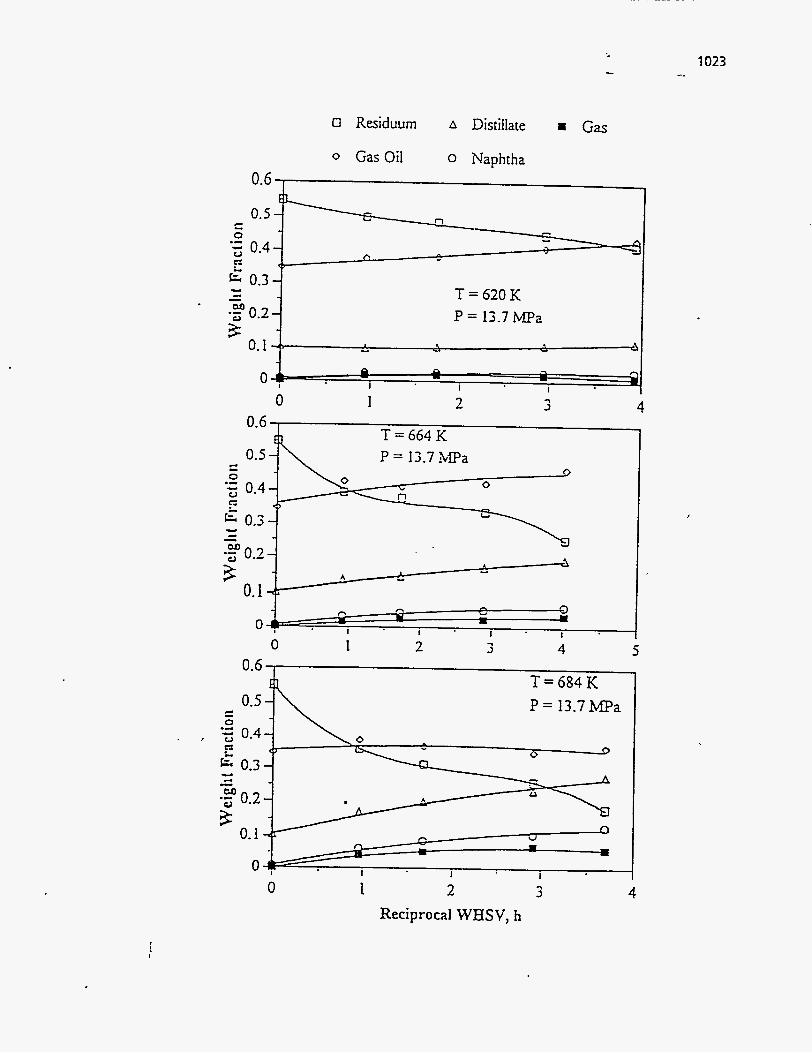
CI Residuum A Distillate rn Gas
Y I - M '3 0.2-
0.1 -i 3
0 Gas Oil 0 Naphtha
T = 620 K P = 13.7 hPa
I u I 4 \
0.6 I 1
h
I I 0 0 I
1 2 3 4 5 0 0.6
T=684K
0 1 2 3 4 ReciprocaI WHSV, h

1024 ...
The initial rapid increase in the volatiles (including gas, naphtha, and distillate) yields, and the gas oil yield having a maximum is related to the conversion of native
residuum. When the conversion of native residuum to volatiles and gas oil decreases, the
yields of volatiles increase as the residence time increase, due to the conversion of the gas oil fraction at the longer residence time, indicating that the produced gas oil undergoes
secondary cracking to lower boiling materials.
Effect of Temperature Removal of Species
The temperature was varied at fixed LHSV and pressure to determine the mean
activation energies for conversion from an overall nth power rate law model or from a
distributed activation energy model. The mean activation enersy of both models for
sulfur and nitrogen removal and residuum and CCR conversion over the three HDN catalyst are listed in Table 109 and have similar activation energies for each species
conversion except those for sulfur conversion over the A- and C-HDN catalysts.
The influence of temperature on the fiactional conversion of sulfur, nitrogen,
residuum, CCR, and asphaltenes over the HDN catalyst at constant pressure are
illustrated in Figures 305-3 10. (The effect of temperature on conversions of some species
can be also seen in Figures 280-285.) It is observed fiom the figures that the conversions
increased with increasing temperature with the exception of the asphaltenes conversions
which exhibit different trends at a LHSV of 0.9 h” for the three HDN catalysts and at a
LHSV of 0.48 h-’ for C-HDN catalyst
The relative extents of conversion among the lumped species depended upon
temperature and LHSV for each of the HDN catalysts. For example, the conversion of nitrosen over the A-HDN catalyst is the lowest at 620 K and LHSV of 0.9 h-’ compared
with other species. As the LHSV decreased to 0.2 h-’, the relative conversion of nitrogen
was higher than those of residuum and asphaltene. ~
The temperature dependencies of each species as determined by linear regression
of the fractional conversion against temperature data are listed in Table 1 I 1 These data
indicate that the conversions of the lumped species increase with increasing temperature,
1025 -
Figure 305
Fractional conversion of Iumped species versus temperature
over the A-HDN catalyst at LHSV = 0.2 and 0.28 h-' and constant pressure

1026
0
= Sulhr
I 1 I I
A Residuum 0 Asphaltene
0 Nitrogen o CCR
0
8 0
0 0 A
0
LHSV = 0.2 h-' P = 13.7 rMPa
600 620 640 660 680 700
1 ,
0
0 0 A
LHSV = 0.28 h-l P = 13.7 MPa
600 620 640 660 Temperature, K
680 700
Figure 306
Fractional conversion of lumped species versus temperature
over the A-HDN catalyst at LHSV = 0.48 and 0.9 h-' and constant pressure
1027 I.
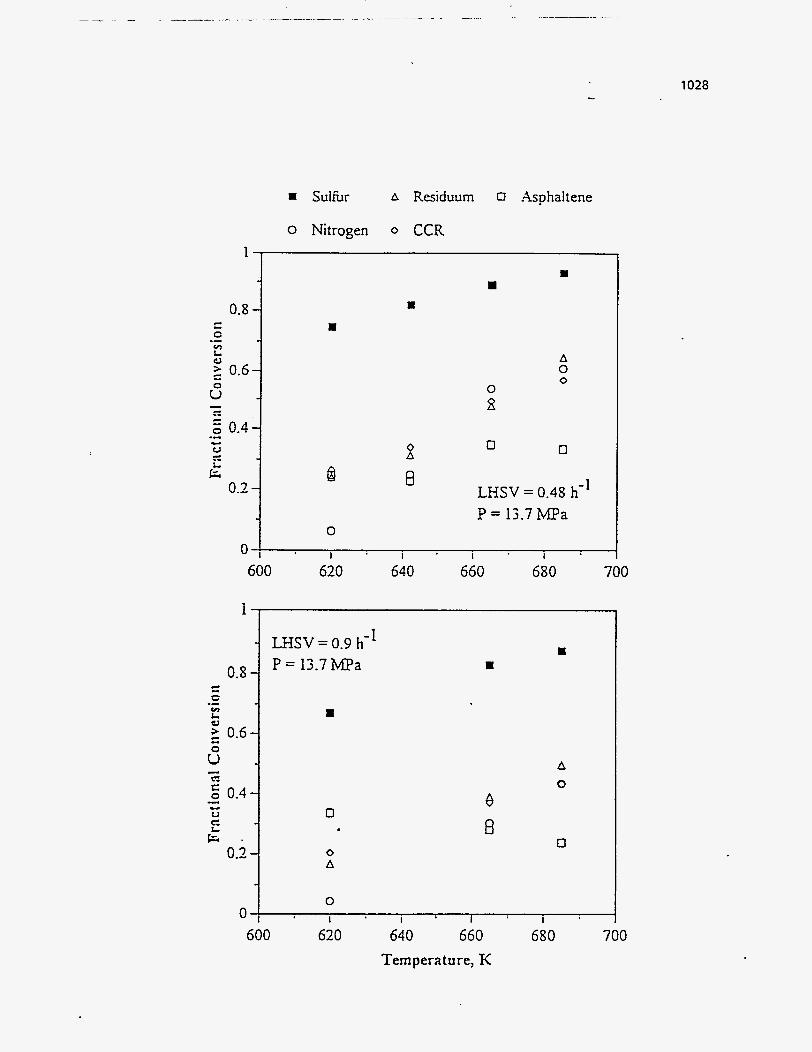
I Sulfur
P = 13.7 MPa 0
A Residuum 0 Asphaltene
- 0.8 -
r: C v) L. a,
.- 2 0.6- - s - cz E 0.4- .- c. u c, g .
0.2 -
0
0 Nitrogen 0 CCR
1 LHSV=0.9 h- P = 13.7 MPa
0 I I 1 I
8 a
0.8 1 c w
A 0 0
0 8
o 0
LHSV = 0.45 h-’
600 620 640 660 680 700
8
0
0 A
600 620
8 w
A 0 e
a
640 660 Temperature, K
0
680 700
1028

1029 -.. -..
Figure 307
Fractional conversion of lumped species versus temperature
over the B-HDN catalyst at LHSV = 0.2 and 0.28 h" and constant pressure
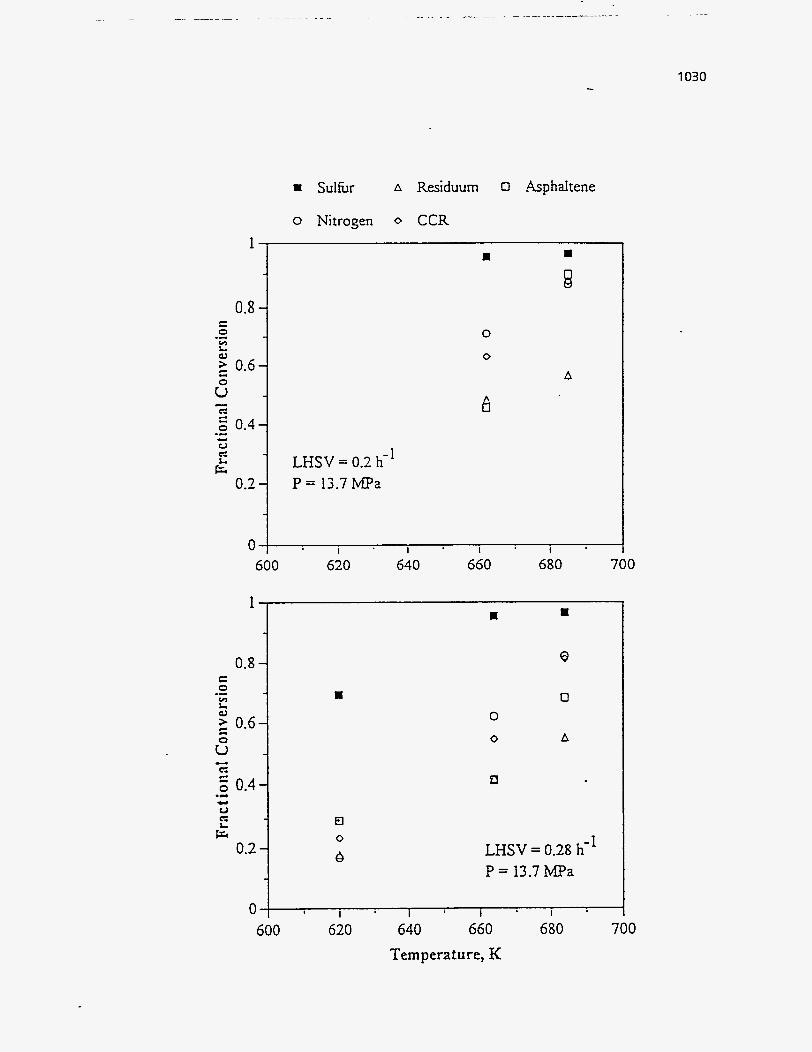
1030
1
0.8 - c c.
0 v) L c)
.- 2 0.6-
6 - Z 0.4- .L. Y u c,
r=; 0.2 -
0
0
m I
8
0
A
1 I I 1 1
I Sulhr A Residuum 0 Asphaltene
0 Nitrogen o CCR
B m
8
1 LHSV = 0.3 h- - P = 13.7MPa
I I I I
600
0
0
6 A
620 640 660 680 700
m 0
0
LHSV = 0.28 h-' P = 13.7 MPa
600 620 640 660
Temperature, K 680 700

c
1031 -.
Figure 308
Fractional conversion of lumped species versus temperature
over the B-HDN catalyst at LHSV = 0.48 and 0.9 h" and constant pressure
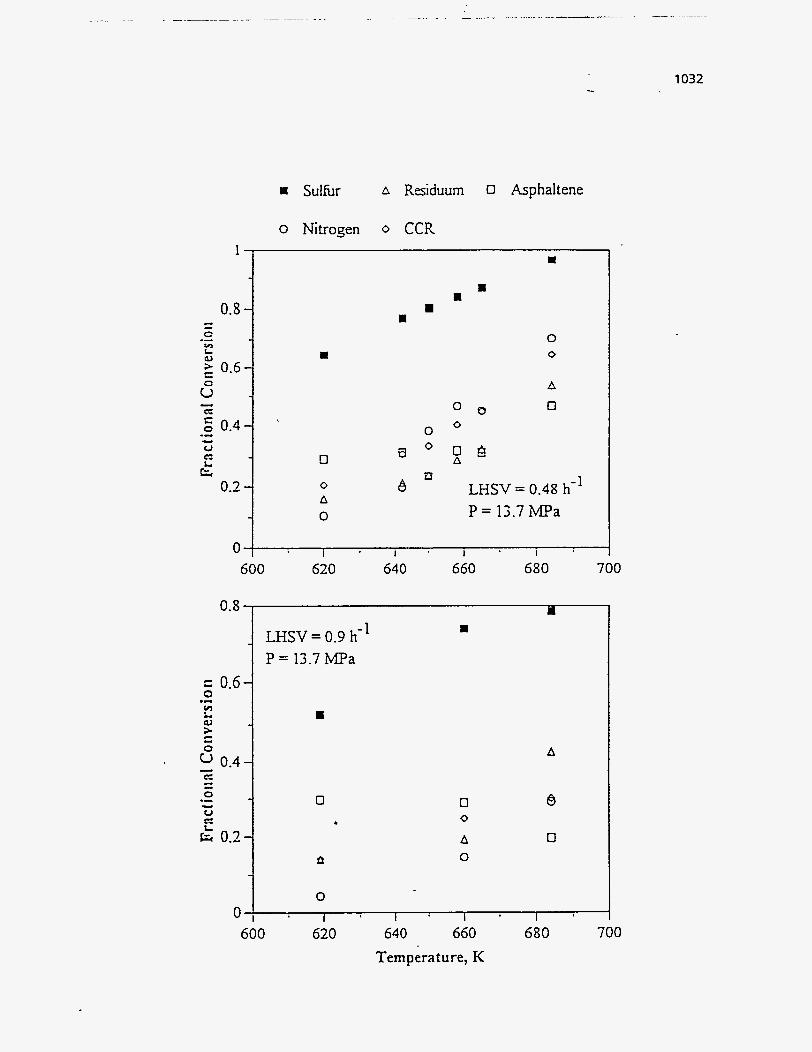
- N LHSV = 0.9 h-l
P = 13.7 MPa
fi
0
1032
A Residuum 0 Asphaltene rn Sulfur
o Nitrogen 0 CCR
'1 I
rn N
0 0
A
0 0
0 6
Q 0 0 B 0
Q 0
0 A 0
LHSV = 0.48 h-' P = 13.7 MPa
600 620 640 660 680 700
A
0 0 0
A 0
600 620 640 660 680 700 Temperature, K
1033 -.
a
Figure 309
Fractional conversion of lumped species versus temperature
over the C-HDN catalyst at LHSV = 0.2 and 0.28 h-' and constant pressure

rn Sulfbr A Residuum 0 Asphaltene
o Nitrogen 0 CCR &
0.8 - c L..
0 .- v) L 0 0.6- -
5 m .- E 0.4- .- e V cz &
0.2 -
a a
U
0 0 Q
0
0
A
0
0 A
0
1 LHSV = 0.3 h- P = 13.7 MPa
600 620 640 660 680 700
1 ,
s 0 A
0 0
a
0 0
A
0
1 LHSV = 0.28 h- P = 13.7 MPa
o f I I 1 I 1 I
1034 -
600 620 640 660 680 700 Temperature, K
c
Figure 310
Fractional conversion of lumped species versus temperature
over the C-KDN catalyst at LHSV = 0.48 and 0.9 h' and constant pressure
1035 -.

1036
I S u l h r A Residuum 0 Asphaltene
0 Nitrogen o CCR
I I
I I
rJ
0
0
0 8 8
LHSV = 0.48 h-'
A
0 A
A P = 13.7 MPa 0
I I I I
600 620 640 660 680 700 1
0.8
0.2
0
LHSV = 0.9 h-l P = 13.7 MPa
0 A 0
0
0 0
A 0
600 620 640 660 Temperature, K
680 700
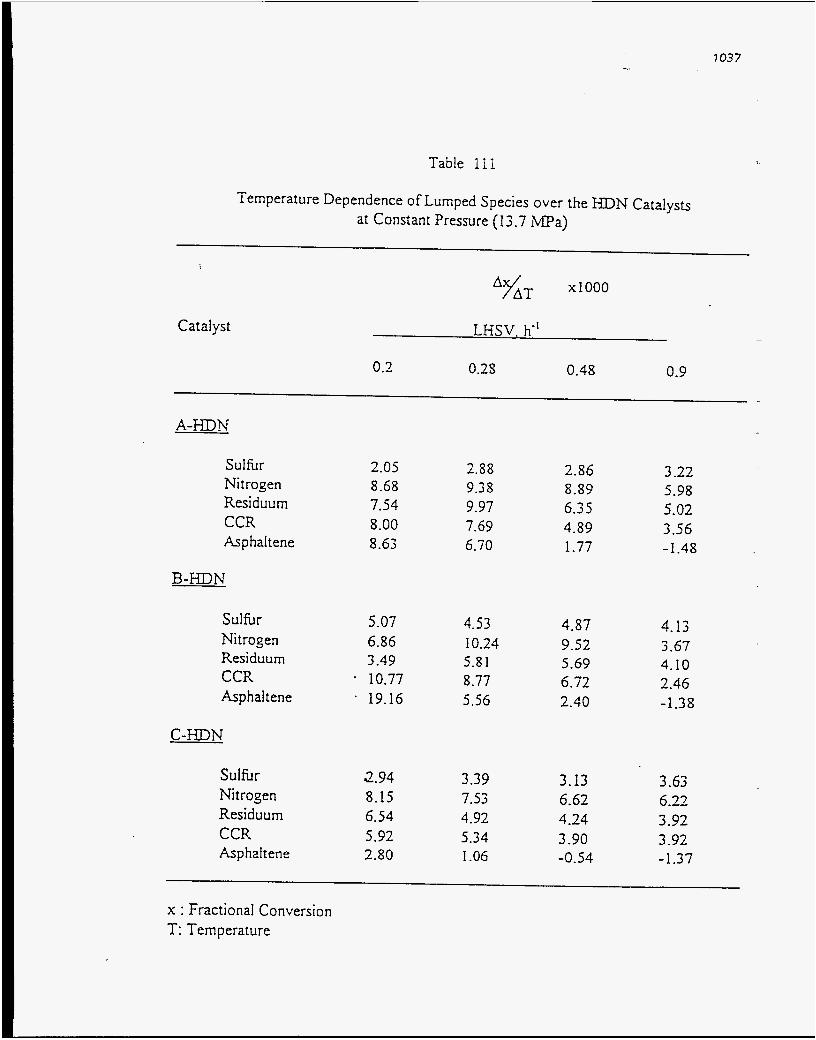
Table 111
Temperature Dependence of Lumped Species over the HDN Catalysts at Constant Pressure (13.7 MPa)
A%T x1000
Catalyst LHSV. h" ~
0.2 0.25 0.48 0.9
A-HDN
Sulfi~r Nitrogen Residuum CCR AsphaItene
2.05 8.68 7.54 8.00 8.63
2.88 9.3 8 9.97 7.69 6.70
2.86 3.22 8.89 5.98 6.35 5.02 4.89 3.56 1.77 - 1-48
B-HDN
Sulhr 5.07 4.53 4.87 4.13 6.86 10.24 9.52 3.67 Nitrogen 3 -49 5.8 1 5.69 4.10 Residuum
- 10.77 8.77 6.72 2.46 CCR Asp ha1 tene . 19.16 5.56 2.40 -1.38
C-HDN
Sulfur 2.94 3.39 3.13 3.63 Nitrogen 8.15 7.53 6.62 6.22
6.54 4.92 4.24 3.92 Residuum CCR 5.92 5.34 3.90 3.92 Asphaltene 2.80 1.06 -0.54 -1.37
x : Fractional Conversion T: Temperature

1038 -
except for the asphaltene conversions in which the temperature dependencies are positive
or negative depending upon the space velocity.
The relationship between temperature dependence and reciprocal LHSV is plotted
in Figure 3 11. The effects of temperature on sulfUr conversion decreased for the A- and
C-HDN catalysts and increased slightly for the B-HDN catalyst as the reciprocal LHSV
increased. For nitrogen and residuum conversion, the temperature dependencies
increased to a maximum (reciprocal LHSV of 3.5 h) and then decreased with increasing
reciprocal LHSV for the A- and B-HDN catalysts; however, for the C-HDN catalyst, the
temperature effect always increased as reciprocal LHSV increased. This may be related
to the fact that the A-and B-HDN catalysts had larger pore volumes than the C-HDN
catalyst. The temperature dependence of CCR and asphaltene increase with increasing
reciprocal LHSV and the order of temperature effect is B-HDN >> A-HDN > C-HDN
catalyst. This result implies that B-HDN catalyst is suitable for CCR and asphaltene
conversion.
Nickel removal increased as the temperature increased for the 3-HDN catalyst as
indicated in Table 88.
Viscositv Red ir ction
The effect of temperature on viscosity reduction of the bitumen over the HDN
catalysts at constant pressure is displayed in Figure 3 12. As can be seen, viscosity varies
considerably with temperature, and the influence of temperature is more than that of
reciprocal LHSV. From the performance of catalysts for viscosity reduction, the A-HDN
and B-HDN catalysts exhibited similar influence and were superior to the C-HDN catalyst for viscosity reduction.
Lowering the temperature of the fuel products has the influence of increasing its
viscosity. In fact, many fuel specifications specify maximum viscosity limits at low
temperature to assure pumping and flow capabilities. The variation of viscosity with
temperature was a straight line for each LHSV as presented in Figure 312. Therefore,
viscosities can be extrapolated over reasonable ranges to a desired temperature; however,
caution must be exercised not to extend the extrapolations through phase changes.

1039 -_
/
Figure 311
Relationship of temperature dependence
with reciprocal LHSV
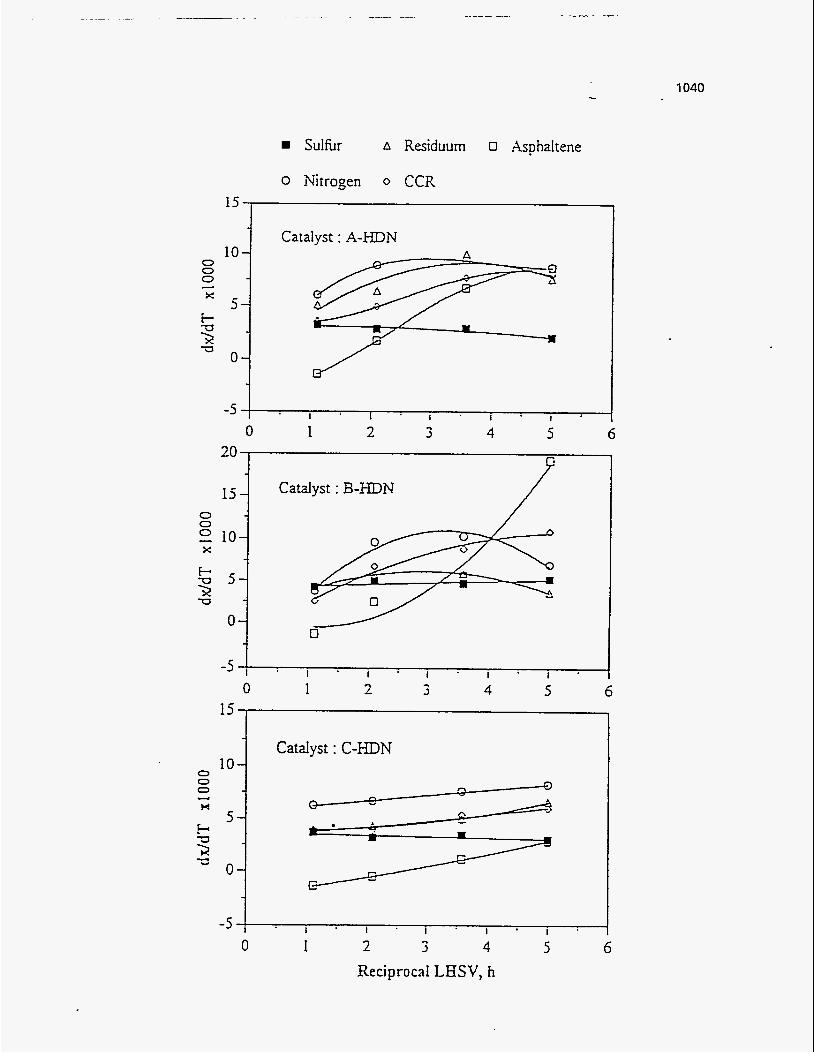
1040
Sulhr A Residuum 0 Asphaltene
Catalyst : C-HDN 10
0 5l ‘ 1 . 1 ’ 1 . I ’ I ’ -5 f
0 1 2 3 4 5 6 Reciprocal LHSV, h
Figure 312
Effect of temperature on viscosity over the HDN catalysts
at different space velocities and constant pressure (13.7 m a )
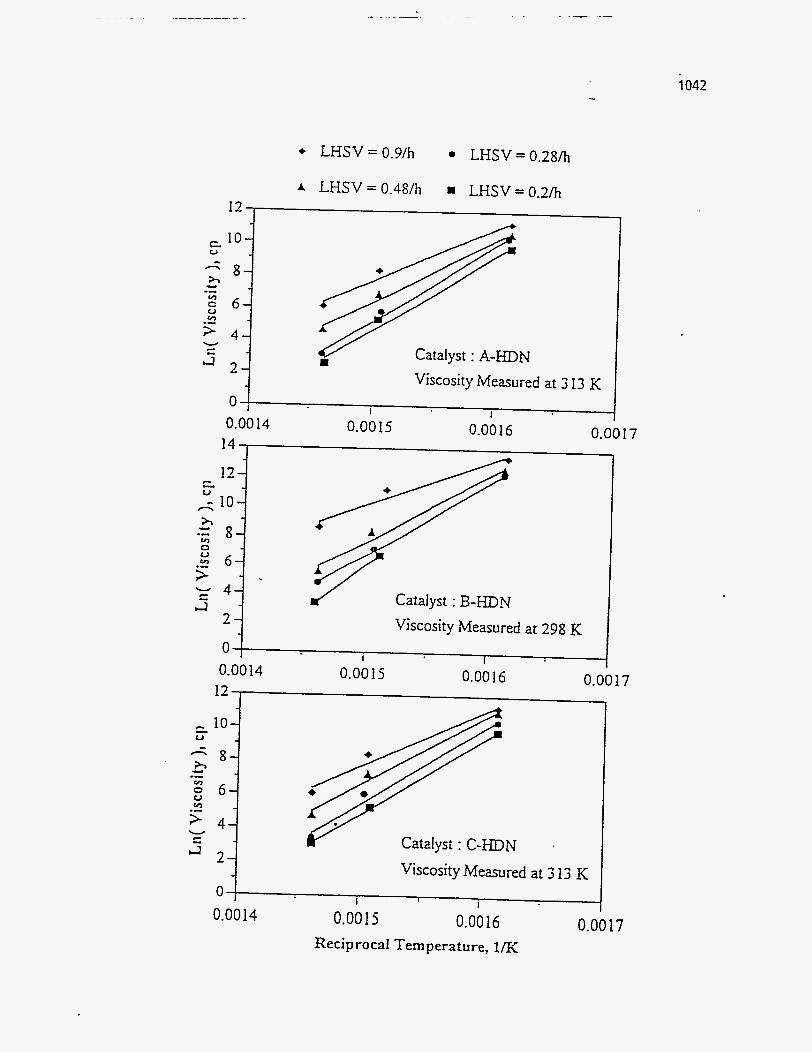
1042
I2
10-
A 8-
2 6-
c U
A -- V (0
5 4-
bJ 2-
W - -
12
c 10-
A 8-
6-
- U
h Y .- U v)
F 4- v c -
2-
0
Catalyst : A-HDN Viscosity Measured at 3 13 K
Catalyst : C-HDN Viscosity Measured at 3 13 K
I I
I 0 ; I
0.00 14 0.0015 0.00 16
17
0.0014
3 043 -*
The slopes of the straight lines in Figure 3 12 is equal to AGO / R based on the
kinetic approach of Eyring and coworkers(343, 344) where AGO is the change in the moIar Gibbs fiee energy of activation and R is gas constant. This approach is based on
the theory of rate processes applied to relaxation processes which may be important in determining the nature of the flow. Equation 173 relates the viscosity to temperature in the form of an Arrehenius equation (detailed procedures of derivation in Reference 344),
that is,
(1 73)
where p is viscosity; h is Plank's constant; K is a transmission coefficient used to correct
for the fact that not all molecules arriving at the activated state pass over the barrier; h is
the distance traveled by the particle; hl, 12, and 1 3 are molecular distances in three-
dimensional coordinates, respectively. Equation 173 is more simply expressed as
AGO
p = A exp(-) RT (1 74)
The change in the molar Gibbs fiee energies of activation, AGO, were determined by
linear regression of the logarithmic plot of viscosity against reciprocal temperature. The
AG. of hydrotreated bitumen over the three HDN catalysts under specific operating
conditions are listed in Table 112. Compared to the fiee energy of activation of water of
3.68 kcaVmo1(345), the AGO of hydrotreated bitumen are much higher. The fiee energies
of activation of liquid products -increase with increasing temperature and reciprocal
. LHSV and change slightly with pressure.
It has been shown that free energies of activation correlate well with the internal
enersy of vaporization, AE,,, , at the normal boiling point(344), that is,
AE",,, = 2.45AGO

1044 .- . -
Table 112
Gibbs Free Energy of Activation and Internal E n e r g of Vaporization of the Hydrotreated Bitumen Derived Liquid Produced over the HDN Catalysts
P LHSV A-HDN B-HDN C-HDN T
K MPa h-' kcal/mol
AG- AE,, AG- AE,,, AG* AG* E,,
First Pass Feed: Raw Bitumen 22.4 54.9 Products :
620 13.7 0.2 19.0 46.6 19.1 46.5 620 13.7 0.28 20.2 49.5 22.2 54.4 20.5 50.2 620 13.7 0.48 20.6 50.5 22.6 55.4 21.3 52.2 620 13.7 0.9 21.6 52.9 23.0 56.4 21.9 53.7
650 13.7 0.48 658 13.7 0.48
664 13.7 0.2 664 13.7 0.28 664 -13.7 0.48 664 13.7 0.9
21.0 51.5 18.5 45.3
12.4 30.4 17.5 42.9 14.1 34.5 13.4 32.5 17.5 42.9 16.3 39.9 15.8 38.7 18.3 44.8 19.6 48.0 19.1 46.8 22.5 55.1 22.5 55.1
664 11.1 0.48 17.1 41.9 17.8 43.6 17.3 42.4 664 15.3 0.48 16.9 41.4 17.3 42.4 17.5 42.9
684 13.7 0.2 684 13.7 0.28 684 13.7 0.48 684 13.7 0.9
8.1 19.8 8.5 20.8 8.0 19.6 9.1 22.3 10.6 26.0 9.1 22.3 12.8 31.4 13.5 33.1 12.5 30.6 16.4 40.2 19.2 47.0 15.1 37.0
Second Pass Feed : Hydrotreated Bitumen 21.3 52.2
(Prepared at Base Case Condition) Product : - 19.5 47.5 Feed : Hydrotreated Bitumen 7.6 18.6
(Prepared at 684 K, 13.7 MPa, and LHSV of 0.2 h-') Product : 7.5 15.4 AHvrp = E,- + RT,?
1045 -_
The internal energies of vaporization, AE,,, , of hydrotreated bitumen are presented in
Table 112. Kincaid et a1.(344) also derived an equation relatins the enthalpy of
vaporization and AEvap as follow:
the heats of vaporization of hydrotreated bitumen could be calculated from Equation 176
if the normal boiling point were known. The suitability of Equation 176 for application
to complex mixtures could be demonstrated by comparing experimental data on heat of
vaporization of hydrotreated bitumen to the calculated values.
Product Distribution
The yields and distributions of products produced fiom the bitumen over the three
HDN catalysts as a function of temperature at a specific reciprocal LHSV and pressure
are plotted in Figures 3 13-3 18.
They have the same trend, comparing these figures, as a fbnction of temperature
at the same operating conditions. The residuum content decreased increasing temperature. The gas, naphtha, and distillate fractions monotonically increased as the
temperature increased. The gas oil yield reached a maximum and then decreased as
temperature increased especially at lower reciprocal LHSV; however, the yield of gas oil at a LHSV of 0.48 h-' over the B-HDN catalyst increased monotonically.
The temperatures at which the maximum gas oil yields were produced, TmaX,
depended upon the space velocity and the catalyst. For example, Tmx at space velocities
of 0.2 and 0.28 h-' over the A-HDN catalyst were about 650 and 655 K, respectively, and
over the A- and C-HDN catalysts at a LHSV of 0.2 h" were about 650 and 645 K, respectively.
The effect of temperature on the yield of gas oil was similar to that of residence
time, The initial increase in the volatiles (including gas. naphtha, and distillate) and the
gas oil results fiom the conversion of native residuum. When the conversion of native
residuum to volatiles and gas oil decreases, the yields of volatiles kept increasing with
... 1046 -
Figure 313
Yields of boiling fraction of bitumen conversion versus temperature
over the A-HDN catalyst at LHSV = 0.2 and 0.28 h" and constant pressure
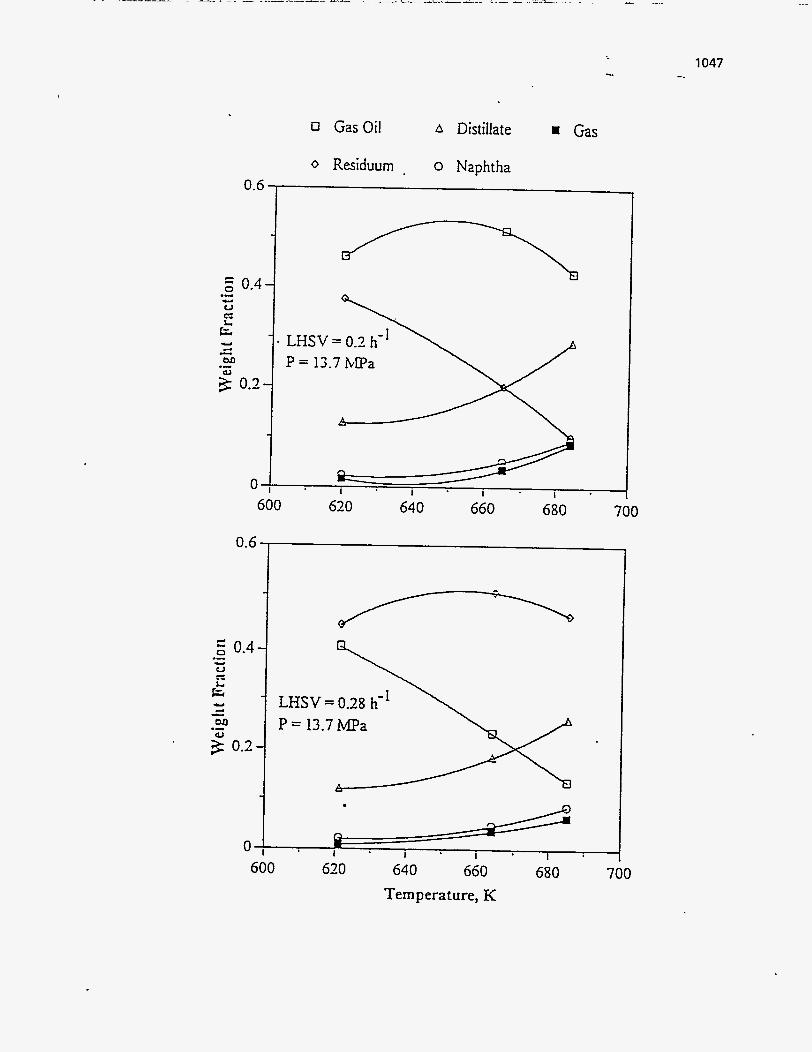
0.t
1
Y c - M a, .- 3: 0.2
o Gas Oil A Distillate Gas
0 Residuum . o Naphtha
P = 13.7 bfPa
0.t
0 I I I 1
600 620 640 660 680 700 Temperature, K

.
1048
Figure 314
Yields of boiling fraction of bitumen conversion versus temperature
over the A-HDN catalyst at LHSV = 0.48 and 0.9 h-' and constant pressure
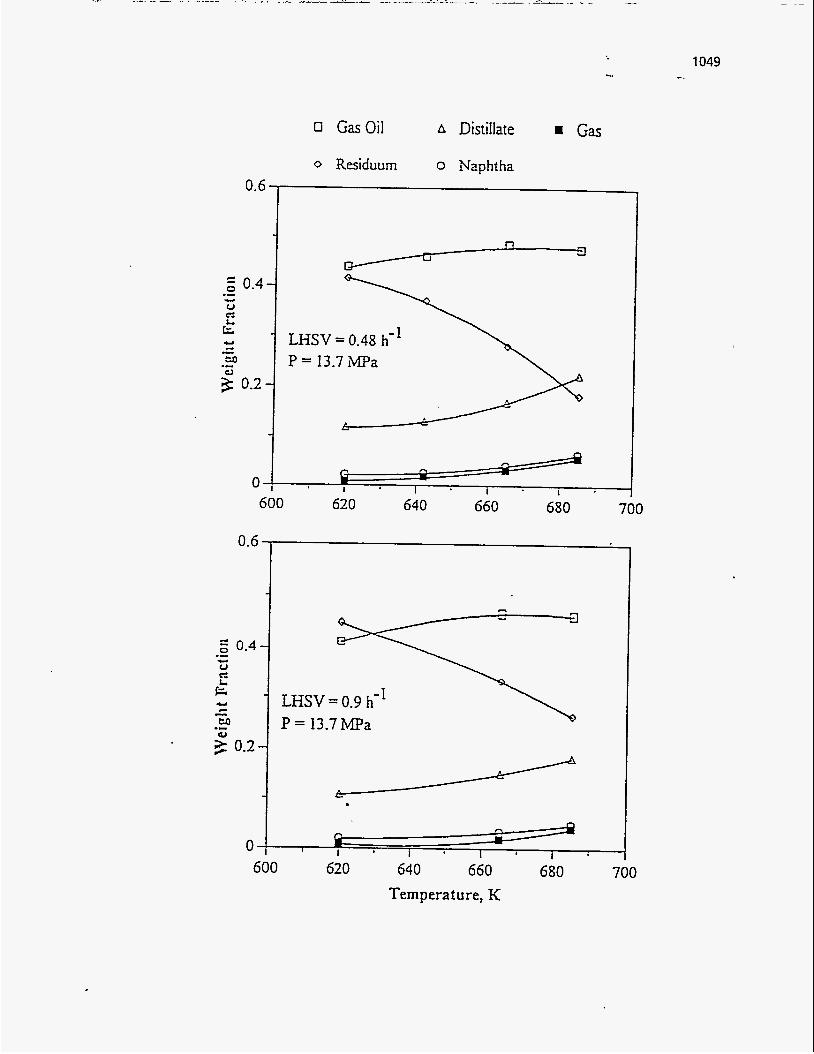
...
0 GasOil A Distillate a Gas
0 Residuum 0 Naphtha
Oq6- 1 ' El
0.4
Y LHSV = 0.48 h-' .- u, P = 13.7 lMPa
620 640 660 680 700 600
0.6
P = 13.7 MPa
U e
1 1 I I 1
600 620 640 660 680 700 Temperature, K
0
1049 -_

1050 ...
Figure 315
Yields of boiling fraction of bitumen conversion versus temperature
over the B-HDN catalyst at LHSV = 0.2 and 0.28 h-' and constant pressure
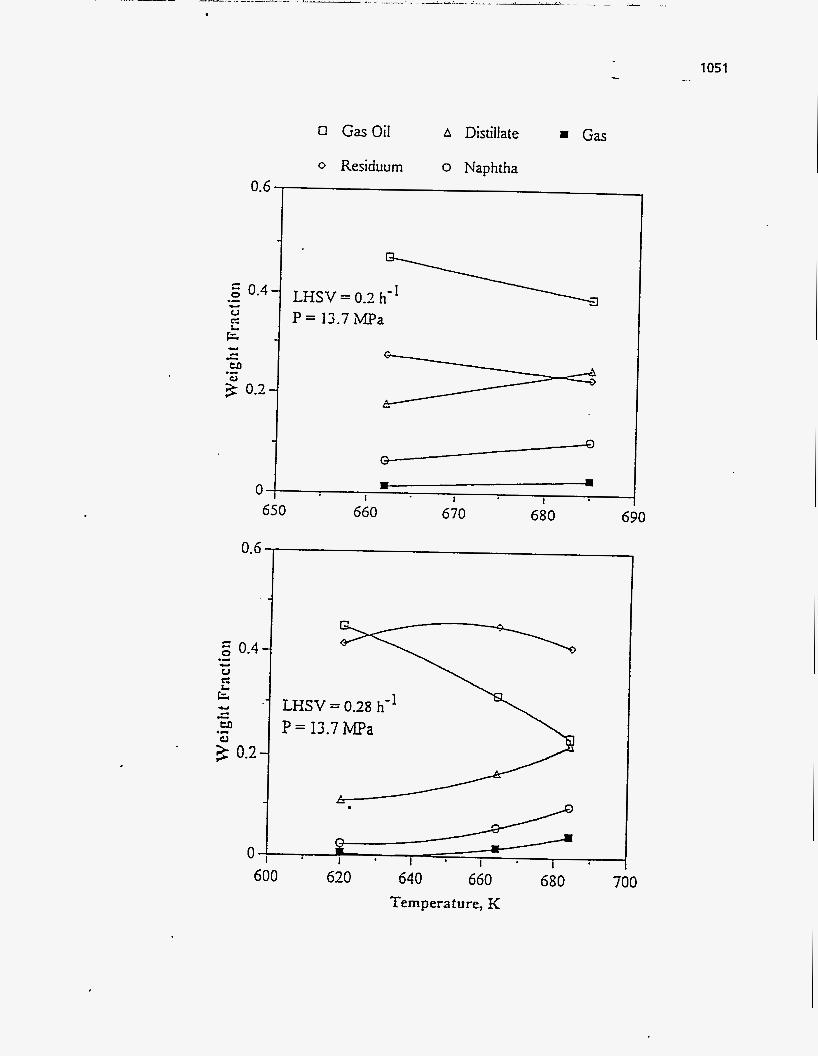
0 Gas Oil A Distillate Gas
0 Residuum o Naphtha
1 0.3 h- iMPa
.: .I I I i
650 660 670 680 690
E 0 1 1 I 1
1051 -_
600 620 640 660 680 700 Temperature, K
Figure 316
Yields of boiling fraction of bitumen conversion versus temperature
over the B-HDN catalyst at LHSV = 0.48 and 0.9 h-' and constant pressure
1052
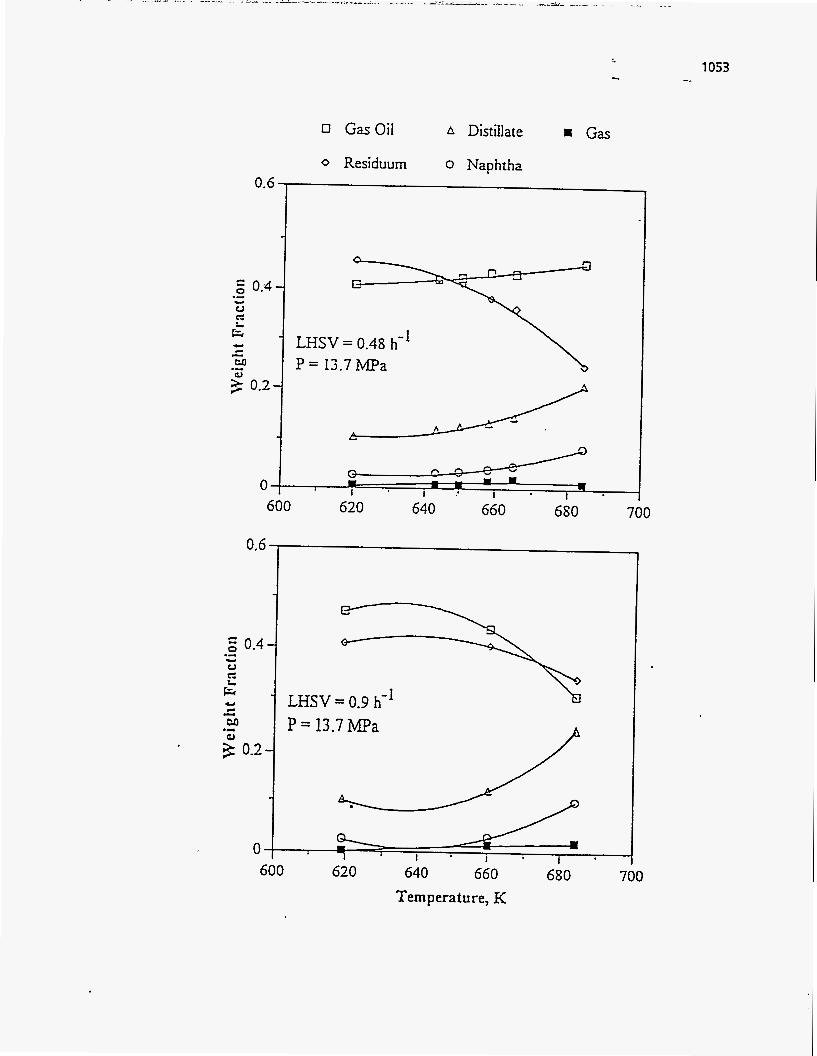
0 Gas Oil A Distillate Gas
0 Residuum 0 Naphtha
600 620 640 660 680 700
0.4
c LHSV= 0.9 h-* .- 30 P = 13.7 MPa
-l , 1 1 0
1
600 620 640 660 680 700 Temperature, K
Figure 317
Yields of boiling fraction of bitumen conversion versus temperature
over the C-HDN catalyst at LHSV = 0.2 and 0.28 h-' and constant pressure
1054
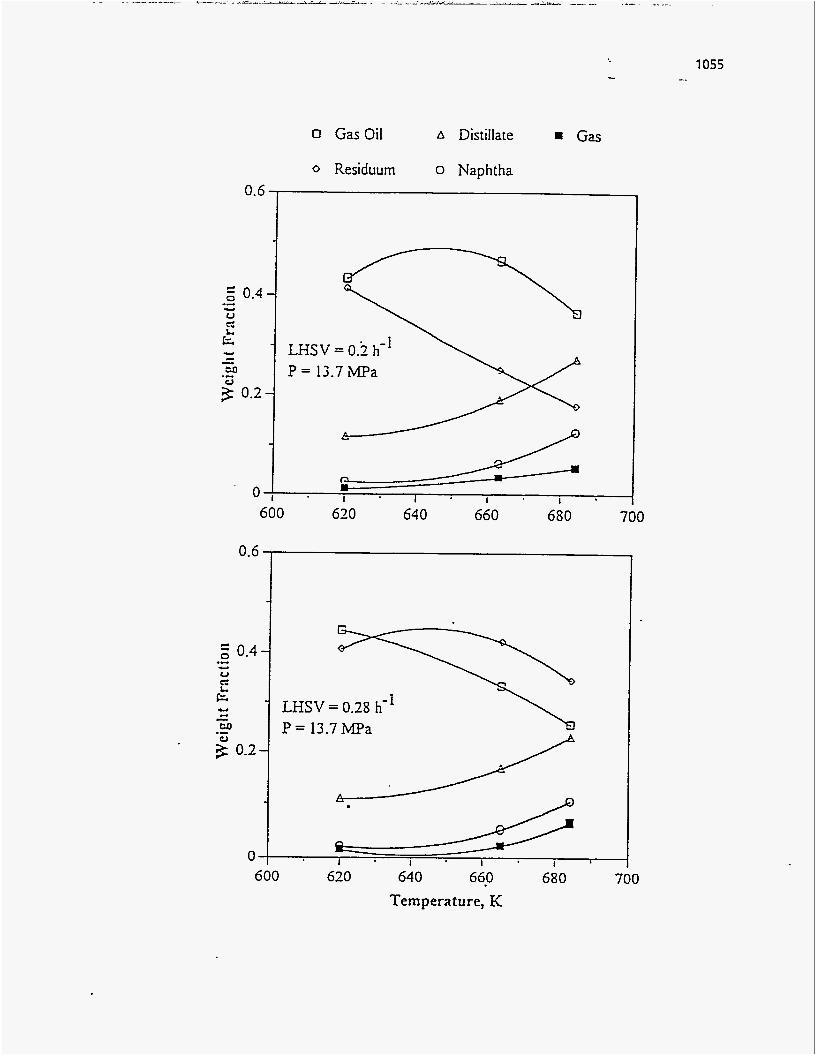
0.6
2 0.4 .- - U e & Y - M .- g 0.2
0
Gas 0 Gas Oil A Distillate
0 Residuum 0 Naphtha
600 620 640 660 680 700
- I
600 620 640 660 680 700 Temperature, K
1056 -.
Figure 318
Yields of boiling fraction of bitumen conversion versus temperature
over the C-HDN catalyst at LHSV = 0.48 and 0.9 h-' and constant pressure
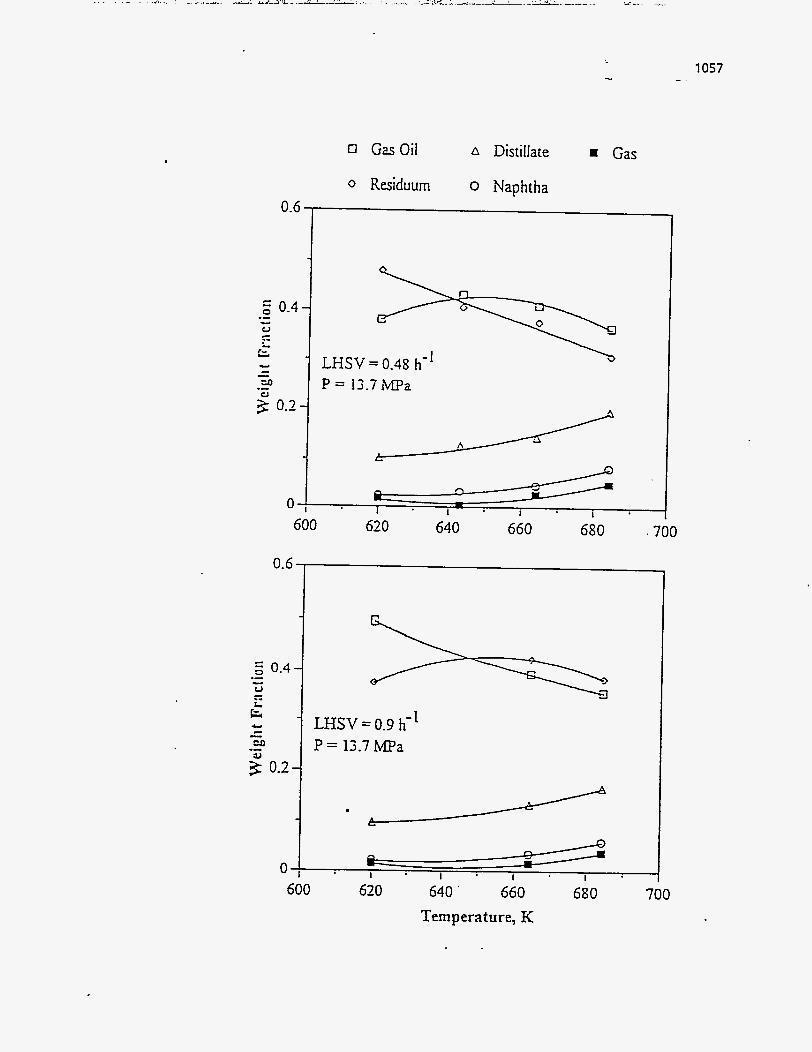
0 GaOil A Distillate Gas
0 Residuum 0 Naphtha
o-61
-I
LHSV = 0.48 h-' P = 13.7 bfPa
600 620 640 660 680 700
1057 - .
0.t
to w .- g 0.2
0 600
LHSV = 0.9 h-' P = 13.7 MPa
3 I 1 I
620 640 ' 660 Temperature, K
680 700

I 1058
increased temperature; however, the yield of gas oil passed through a maximum and then decreased with increasing temperature. This indicated that the produced gas oil
underwent secondary cracking to lower boiling materials at the higher temperature.
Effect of Pressure
Removal of Species
When the effects of W S V and temperature were investigated, the reaction order
(n) and apparent rate constant (k) were determined (shown in Table 103) at constant total
system pressure. When the system operated at fixed space velocity and temperature, the
reaction order of each species for each HDN catalyst did not change with pressure. The
effect of pressure was studied at a specific reaction order by assuming that apparent rate
constant was related to the partial pressure of hydrogen in the power rate law.
The reaction order (p) of hydrogen partial pressure was determined from the
logarithmic plot of the apparent rate constant versus hydrogen partial pressure which
yielded a straight line with a slope that is equal to p. The apparent rate constants and
hydrogen partial pressure reaction orders at a temperature of 664 I( and LHSV of 0.48 h ' over the three HDN catalysts are presented in Table 113. The values of p are positive
except for sulfur conversion over the B-HDN catalyst. Comparing the j3 for each species,
the reaction order, p, of hydrogen partial pressure depends on the catalyst employed.
The hydrosen partial pressure reaction orders (p) for sulfur conversion over the
A-, B-, and C-HDN catalysts were 0.57, -0.19, and 1.78, respectively. p < 0 for sulfur
conversion suggested that the sulfur removal was inhibited as hydrogen partial pressure
increased. This disagrees with the chemistry of hydroprocessing. The TOS should be
considered in order to understand the reason for this phenomena. The TOS of data
measured were 340, 244, and 507 for pressure at 11, 13.7, and 15 MPa, respectively.
The data obtained at 244 and 340 h of TOS indicated j3 is 0.04. The positive value but
close to zero of p is easily affected by deactivation of catalyst via increasing TOS. For
sulfur removal of Athabasca bitumen-derived coker gas oil, the p varied from 0.6 to
1.1(312). Longstaff(292) reported that the p = 0 for Whiterocks bitumen over HDN

Table 113
, Apparent Rate Constant (k) and Reaction Order (J3) of Hydrogen Partial Pressure Determined from nth Power Rate Law at T = 664 K and LHSV = 0.48 h"
Catalyst
Pressure. m a
1 1 13.7 15
k P
A-HDN
Sulhr Nitrogen Residuum CCR
Sulfur Nitrogen Residuum CCR
. C-KDN
Sulfir Nitrogen Residuum CCR
22.69 0.3 1 1 2.93E-5 1.3 1E-2
4.09 0.23 1 1.58E-5 9.2SE-2
13.87 . 0.222 1.63E-5 2.17E-3
q- - 33-25
0.587 4.59E-5 2.09E-3
4.12 0.432 1.76E-5 1 .O 1E- 1
35.12 0.44 1 I .97E-5 3.92E-3
26.17 0.49 1 8.12E-5 1.79E-3
3.82 0.605 1.85E-5 9.84E-2
20.96 0.235 5.68E-5 2.66E-3
0.57 1.55 2.95 1.06
-0. I9 3.07 0.50 0.22
1.78 0.66 3 -4s 0.98
1060 ...
catalyst. The p = 0.7 for Whiterocks bitumen over HDM catalyst was reported by
Kwak(342).
For nitrogen removal, the p’s are 1.55, 3.07, and 0.66 for the A-, B-, and C-HDN
catalysts, respectively. These data indicate that the HDN activity of the catalyst
increased with increasing the hydrogen partial pressure. This result agrees with data
relating to known mechanisms of HDN, which indicate that the hydrogenation of
aromatic ring is important for nitrogen removal. Yui(312) reported that the range of p varied from 1.2 to 1.8 for nitrogen removal of Athabasca bitumen-derived coker gas oil.
Previous studies(243, 292, 342) found that the reaction orders, p, of hydrogen partial
pressure were 0.74 and 0.67 for Whiterocks bitumen and the bitumen-derived liquid oil
over an HDN catalyst, respectively, and 1.5 for Whiterocks bitumen over an HDM catalyst, and 0.67 for the PR Spring bitumen over the B-HDN catalyst.
The hydrogen partial pressure reaction orders, p, for residuum and CCR
conversions are positive. This indicates that the activities for residuum and CCR
conversions increased as the hydrogen partial pressure increased. The A- and C-HDN
catalysts appeared to exert a greater influence on residuum and CCR conversions than the
B-HDN catalyst as indicated by the value of p. Kwak(342) reported that the reaction
orders (p) of hydrogen partial pressure were 0.8 for residuum and CCR conversions over
an HDM catalyst.
The effect of pressure on the conversions of asphaltenes and nickel is presented in
Figure 319. This figure indicates that the activities of the catalyst for asphaltenes and
nickel conversions increased with increasing the hydrogen partial pressure.
Viscositv Reduction
The influence of pressure on viscosity reduction during bitumen hydrotreating
over the three HDN catalysts is presented in Figure 320. The viscosity decreased with
increasing pressure for the B-HDN catalyst but increased as pressure increased for the A-
and C-HDN catalysts. The slope of In@) versus pressure are very small, about * 0.004.
The effect of pressure, therefore, on viscosity is not significant.

1061 -._
Figure 319
Effect of pressure on asphakenes and nickeI conversions
over the HDN catalysts at LHSV = 0.48 h-' and T = 664 K

1
1062
4 Nickel(B-HDN) 0 Asphaltene(l3-HDN)
A AsphaItene(C-HDN) I A.sphaItene(A-HDN)
t I
10 11 12 13 13 Pressure, ma
15 16

Figure 320
Effect of pressure on viscosity over the HDN catalysts
1063 _-_ .
I
at LHSV = 0.48 h"and T = 664 K

1
7.5
c - U - n
6.5
6 10
Viscosity Measured at 3 13 K B-HDN
A C-HDN
11 12 13 Pressure, iMPa
14 15 16
1064
With the effect of process variables on viscosity reduction, the order is
temperature dependence >> residence time dependence >> pressure dependence. For
example, there were a 1000-fold reduction in viscosity from 620 to 684 K, a 50-fold
reduction fiom LHSV of 0.9 to 0.2 h-', and only a 20% reduction from 11 to 15 MPa over
the B-HDN catalyst.
Product Distribution
The yields and distributions of products produced from the bitumen over the three
HDN catalysts as a function of pressure at a temperature of 664 K and a LHSV of 0.48 h'
are displayed in Figure 321.
The residuum content decreased as the pressure increased. The concentration of gas oil and distillate increased with increasing pressure, with gas oil yield increasing at a
relatively higher rate. The weight fraction of gas and naphtha did not change
significantly with pressure. Thus, the residuum converted mostly to the gas oil fraction
and to distillate fractions.
Evaluation of Ca talvst Per fo rman ce
An evaluation of the performance of the three HDN catalysts (their chemical
composition and physical properties shown in Table 83) was accomplished as a fhction
of process variables. The effect of catalysts on nitrigen, sulfur, and nickel removal; on
residuum, CCR, and asphaltenes conversion; and on viscosity reduction were determined for the Asphalt Ridge bitumen.
Hydrodenitrogenation
Nitrogen in bitumen is present mostly in heterocyclic aromatic compounds.
Nitrogen removal from these organonitrogen compounds, classed as basic and nonbasic,
requires hydrogenation of the ring containing the nitrogen atom before hydrogenolysis of
the carbon-nitrogen bond occurs. The relatively large energy of the carbon-nitrogen
bonds is reduced through the hydrogenation of the heteroring. Thus. HDN is a process in
which organonitrogen compounds are converted into hydrocarbon products and
ammonia. Nitrogen reduction is required to minimize acid catalyst poisoning, especially

1066
Figure 321
Yields of boiling fraction of bitumen conversion versus pressure
over the HDN catalysts at LHSV = 0.48 h-land T = 664 K

0 Gas Oil A Distillate I Gas
0 Residuum 0 Naphtha 0.6
0.4 Catalyst : A-HDN
: 0
0.2 A . - 4
10 11 12 13 14 15 16 0.6
I Catalyst : B-HDN
10 11 12 15 16 0.6 I
Catalyst : C-HDN
'3 0.2 3 "i
10 11 12 13 14 Pressure, Mfa
15 16
1067 -.
1068
by basic nitrogen compounds, and in subsequent processing to meet product
specifications or environmental regulations.
The effect of catalyst on nitrogen removal at different reciprocal WHSV and temperatures is displayed in Fimre 322. At 620 K, the order of nitrogen conversion was A-HDN > B-HDN = C-HDN. As the temperature increased, the rank of nitrogen
removal shifted to A-HDN > B-HDN > C-HDN at 664 K, and to A-HDN = B-HDN > C- HDN at 684 K. The HDN activity of the A-HDN catalyst was always higher than that of
C-HDN catalyst. Comparing the properties of catalyst, A-HDN catalyst has higher
surface area and pore volume, but lower metal loading than C-HDN catalyst. This higher
surface area may have resulted in a higher dispersion of the active phase which would
have contributed to higher HDN activity. The intermediate metal content as in the A-
HDN catalyst was sufficient for the removal of nitrogen compounds in the Asphalt Ridge
bitumen. For the B-HDN catalyst, its HDN activity was similar to that of the C-HDN
catalyst at 620 K and close to the activity of the A-HDN catalyst at 684 K. When
temperature increased, the rate of hydrogenolysis was favorable. Thus, the intermediate
products that contain nitrogen penetrated pores of the B-HDN catalyst and the higher
nitrogen conversion is obtained.
The HDN activities of the catalysts were ranked as A-HDN > B-HDN > C-HDN
and depended strongly on the surface area of the catalyst in this investigation.
Hydrodesulfu rization
HDS has long been one of the most important process in refining operations. The
purposes are the removal of sulfur from naphtha reformer feedstocks and fiom heavier
fractions to minimize the emissions of sulfur oxides. With increasingly stringent air
quality regulations demanding removal of even the least reactive organosulfur
compounds, deep HDS has been rGquired.
The effect of catalyst on sulfur removal at different reciprocal WHSVs and
temperatures is presented in Figure 323. At-620 K, the HDS activity of the A-HDN
catalyst which has the higher surface area was higher than for the B- and C-HDN
catalysts. For the B- and C-HDN catalysts, the sulfur conversion over C-HDN catalyst is
greater than over the B-HDN catalyst especially in the higher space velocity fegions
Figure 322
Effect of catalyst on nitrogen conversion
at different reciprocal WHSVs and temperatures
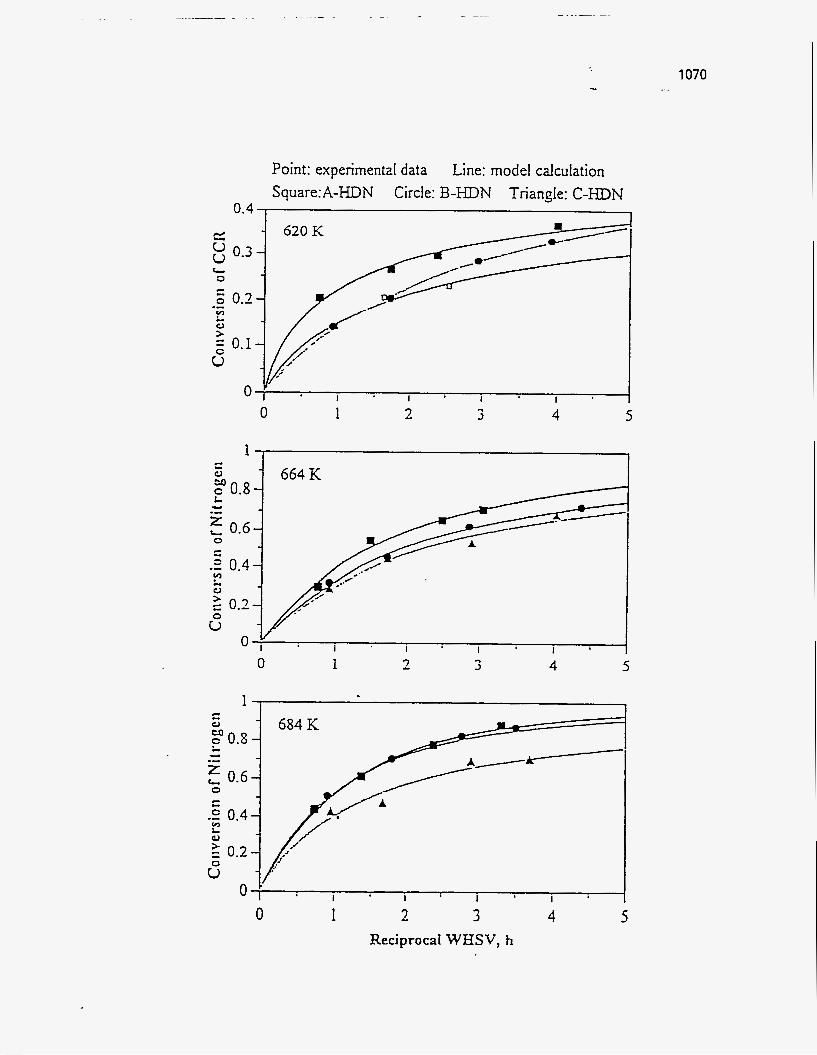
.
1070
Point: experimental data Square:A-HDN Circle: B-HDN Triangle: C-HDN
Line: model calculation
0.4 , - 620K
0 1 2 3 4 5
1 c L - 664K u 2 0.8 -
0 1 2 3 4 5
1
c
I I I I 0 ’ 8
0 1 2 3 Reciprocal WHSV, h
4 5

Figure 323
Effect of catalyst on sulfur conversion
at different reciprocal WHSVs and temperatures
1071 -* .
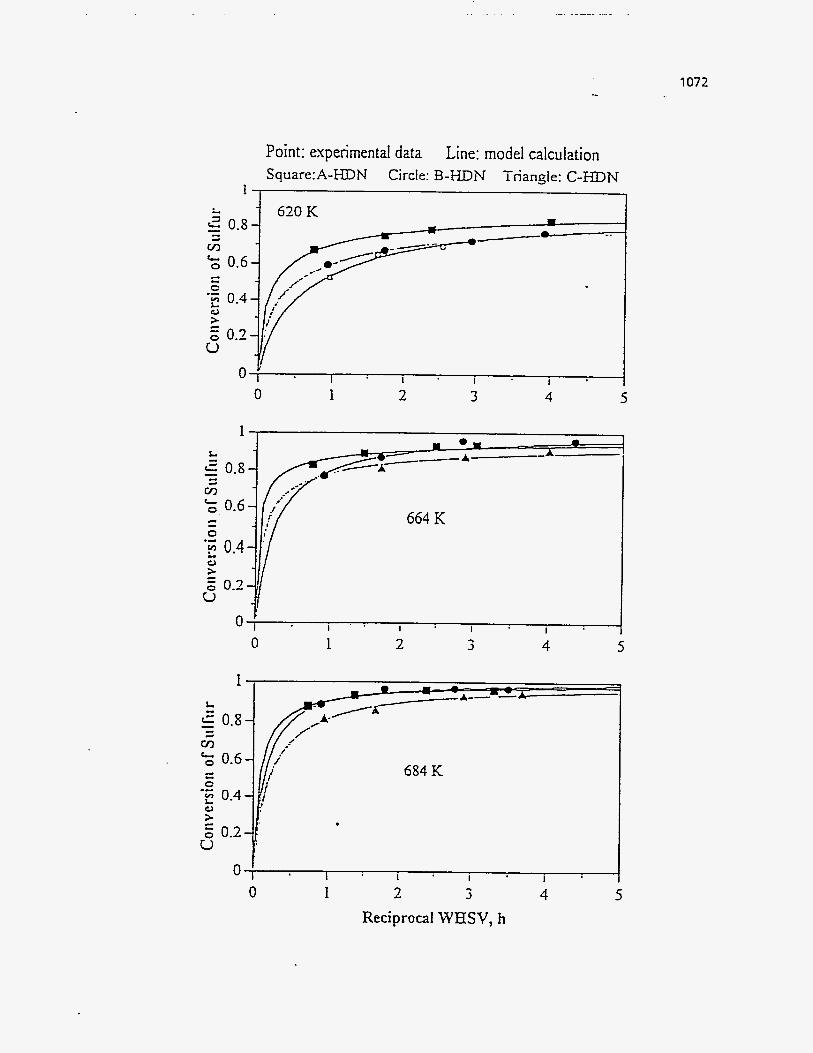
1072
Point: experimental data Line: model calculation Square:A-HDN Circle: B-HDN Triangle: C-HnN
1 L 620K - - 2 0.8- zz - v)
2 0.6
m - --- -w-
I I I I 1 0 1 2 3 4 5
1 ,
664 K
i ’ . I I I
I
0 1 2 3 4 5
684 K
I I I i 0 1 2 3 4 5
Reciprocal WHSV, h
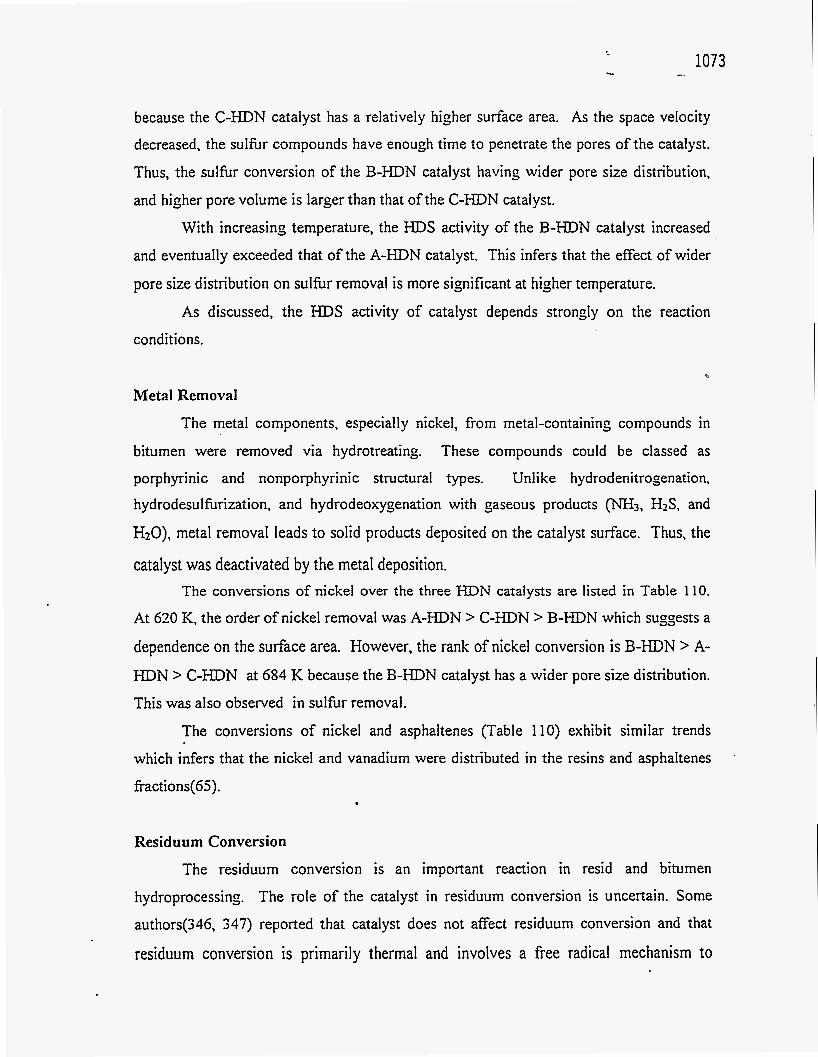
because the C-HDN catalyst has a relatively higher surface area. As the space velocity
decreased, the sulhr compounds have enough time to penetrate the pores of the catalyst.
Thus, the sulfur conversion of the B-HDN catalyst having wider pore size distribution,
and higher pore volume is larger than that of the C-HDN catalyst.
With increasing temperature, the HDS activity of the B-HDN catalyst increased
and eventually exceeded that of the A-HDN catalyst. This infers that the effect of wider
pore size distribution on sulfur removal is more significant at higher temperature.
As discussed, the HDS activity of catalyst depends strongly on the reaction
conditions.
F
Metal Removal
The metal components, especially nickel, from metal-containing compounds in
bitumen were removed via hydrotreating. These compounds could be classed as
porphyrinic and nonporphyrinic structural types. Unlike hydrodenitrogenation. hydrodesulfurization, and hydrodeoxygenation with gaseous products (NH3, HzS, and
HzO), metal removal leads to solid products deposited on the catalyst surface. Thus, the
catalyst was deactivated by the metal deposition. The conversions of nickel over the three HDN catalysts are listed in Table 110.
At 620 K. the order of nickel removal was A-HDN > C-HDN > B-HDN which suggests a
dependence on the surface area. However, the rank of nickel conversion is B-HDN > A- HDN > C-HDN at 684 K because the B-HDN catalyst has a wider pore size distribution.
This was also observed in sulfur removal.
The conversions of nickel and asphaltenes (Table 1 IO) exhibit similar trends
which infers that the nickel and vanadium were distributed in the resins and asphaltenes
fiactions(65).
Residuum Conversion
The residuum conversion is an important reaction in resid and bitumen
hydroprocessing. The role of the catalyst in residuum conversion is uncertain. Some
authors(346, 347) reported that catalyst does not affect residuum conversion and that
residuum conversion is primarily thermal and involves a free radical mechanism to
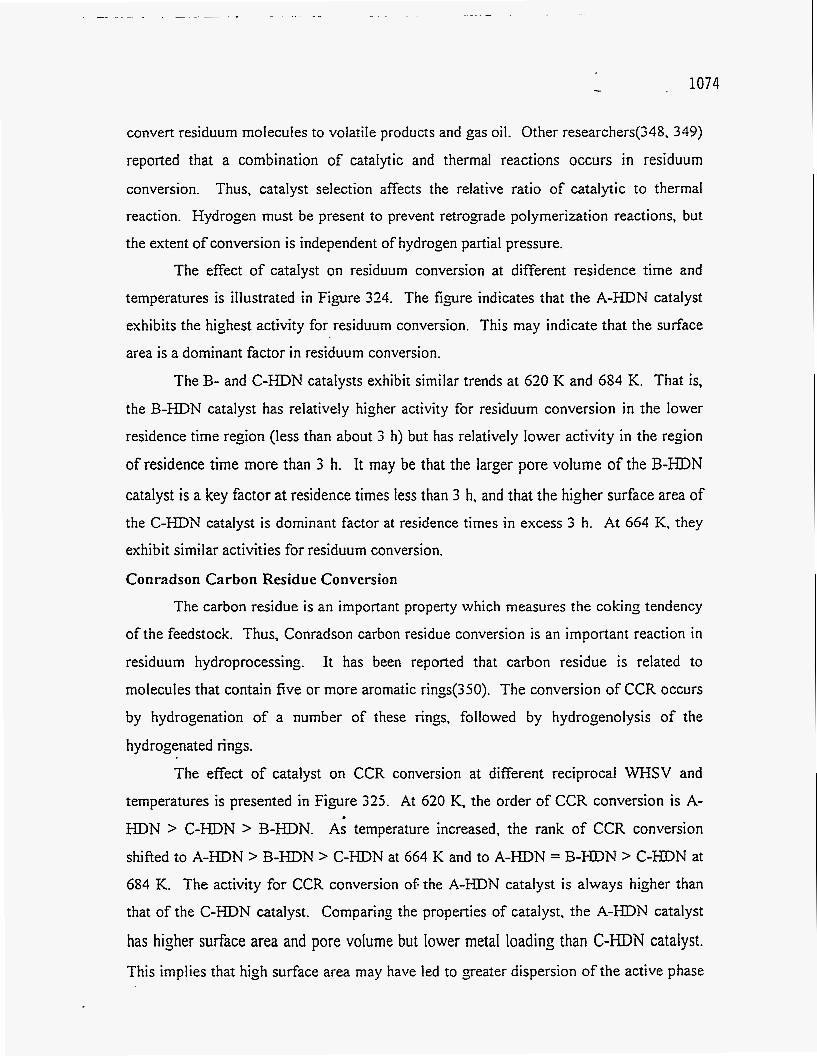
convert residuum molecules to volatile products and gas oil. Other researchers(348, 349)
reported that a combination of catalytic and thermal reactions occurs in residuum
conversion. Thus, catalyst selection affects the relative ratio of catalytic to thermal
reaction. Hydrogen must be present to prevent retrograde polymerization reactions, but
the extent of conversion is independent of hydrogen partial pressure.
The effect of catalyst on residuum conversion at different residence time and
temperatures is illustrated in Figure 324. The figure indicates that the A-HDN catalyst
exhibits the highest activity for residuum conversion. This may indicate that the surface
area is a dominant factor in residuum conversion.
The B- and C-HDN catalysts exhibit similar trends at 620 K and 684 K. That is,
the B-HDN catalyst has relatively higher activity for residuum conversion in the lower
residence time region (less than about 3 h) but has relatively lower activity in the region
of residence time more than 3 h. It may be that the larger pore volume of the B-HDN
catalyst is a key factor at residence times less than 3 h, and that the higher surface area of the C-HDN catalyst is dominant factor at residence times in excess 3 h. At 664 K, they
exhibit similar activities for residuum conversion.
Conradson Carbon Residue Conversion
The carbon residue is an important property which measures the coking tendency
of the feedstock. Thus, Conradson carbon residue conversion is an important reaction in residuum hydroprocessing. It has been reported that carbon residue is related to
molecules that contain five or more aromatic rings(350). The conversion of CCR occurs
by hydrogenation of a number of these rings, followed by hydrogenolysis of the
hydrogenated rings.
The effect of catalyst on CCR conversion at different reciprocal WHSV and
temperatures is presented in Figure 325. At 620 K, the order of CCR conversion is A-
HDN > C-HDN > B-HDN. Ai temperature increased, the rank of CCR conversion
shifted to A-HDN > B-HDN > C-HDN at 664 K and to A-HDN = B-HDN > C-HDN at
684 K. The activity for CCR conversion of: the A-HDN catalyst is always higher than
that of the C-HDN catalyst. Comparing the properties of catalyst, the A-HDN catalyst
has higher surface area and pore volume but lower metal loading than C-HDN catalyst. This implies that hish surface area may have led to greater dispersion of the active phase

1075 -_.
Figure 324
Effect of catalyst on residuum conversion
at different reciprocal WHSVs and temperatures
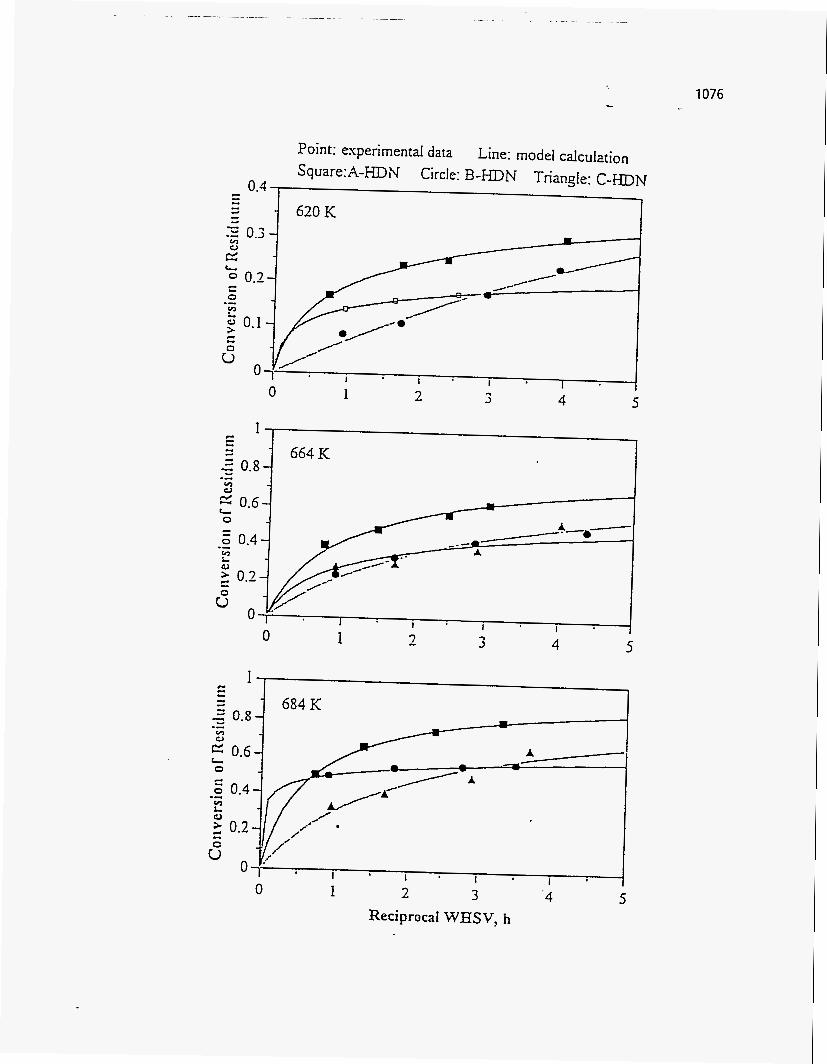
...
c - - - - 620K d
* 0.3 - I
*--------
I 0 1 2 3 4 5
0 1 2 3 4 5
1 2 3 .4 Reciprocal WHSV, h
5
1076
Figure 325
Effect of catalyst on CCR conversion
at different reciprocal WHSVs and temperatures
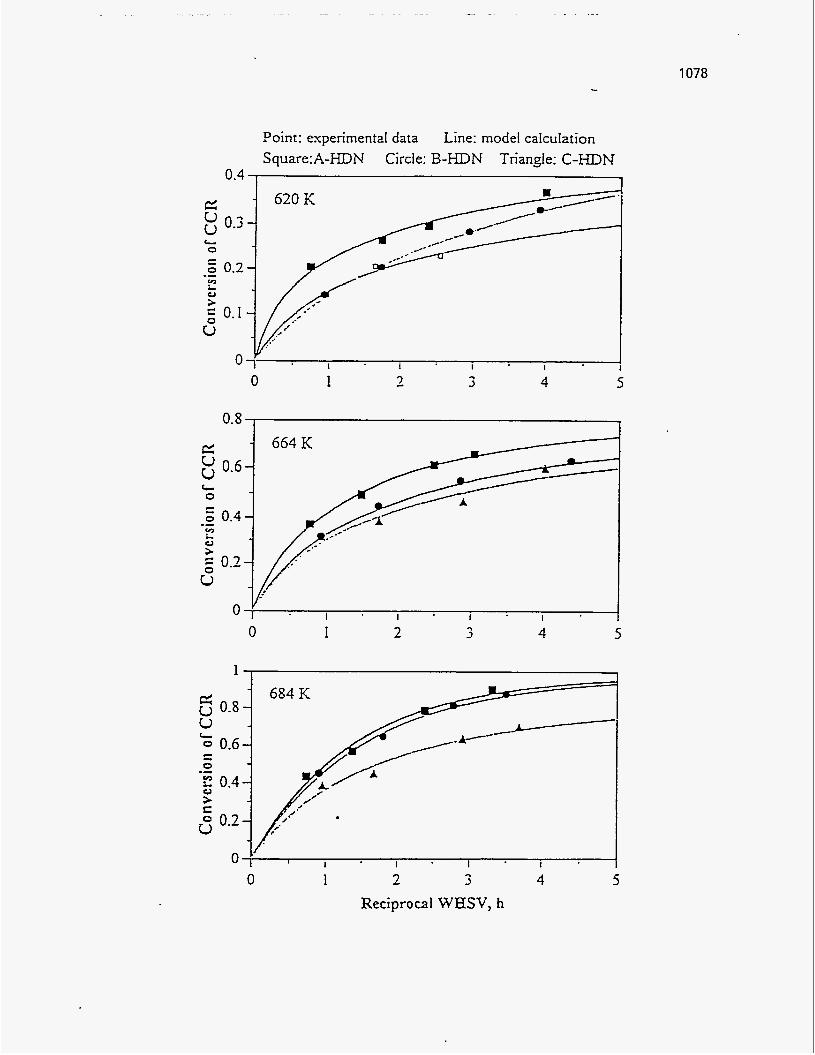
0.4
0
0.8
L 0
1078
Point: experimental data Square:A-HDN Circle: B-HDN Triangle: C-HDN
Line: model calculation
0 1 3 4 5
0 0 1 2 3 4 5
I
f 0
0 0 4 - 1 2 3
Reciprocal WHSV, h 5

which contributed to the high activity for CCR conversion, and the intermediate metal
content of the A-HDN catalyst was sufficient to maintain activity.
The activity of the B-HDN catalyst for CCR conversion was lower than that of the C-HDN catalyst at 620 K, and close to the activity of the A-HDN catalyst at 684 K. The
rate of hydrogenolysis is favorable with increasing temperature. Thus, the more
intermediate products can penetrate the pores of the B-HDN catalyst and higher CCR
conversion is obtained. The activity of CCR conversion for the catalysts was ranked as A-HDN > B-HDN
> C-HDN and depends strongly on the surface area and pore size distribution of the
catalyst .
Asphaitenes Conversion
Asphaltenes are a problem for their tendency to flocculate and precipitate during
both oil production and oil refining. In the first case, they cause a dramatic reduction in oil flow or even blockage of the formation during production. In the second case, they
cause severe drawbacks during the processing of heavy ends such as the tendency to form
coke, catalyst deactivation, and poisioning(3 5 1). Asphaltenes conversion involves a
combination of catalytic and thermal reactions. The influence of catalyst on asphaltenes conversion at different reciprocal
WHSVs and temperatures is presented in Figure 326. At 620 K, the conversion of asphaltenes rapidly increased to a maximum (at a residence time of about 1 h) and then
decreased with increasing residence time. This result contradicts current understanding
of asphaltenes conversion. The real reason is unknown but may be related to
hydrodynamics in the catalyst bed. The A-HDN catalyst with higher surface area, larger pore volume, and lower metal contents, exhibited relatively lower conversion for asphaltenes than the C-HDN catalyst at 620 I(.
At 664 K, however, the conversion of asphaltenes increased with increasing
residence time. The performance of the three HDN catalysts were similar. At 684 K, the asphaltenes conversion over the A- and B-HDN catalysts increased linearly with
increasing residence time. However, the temperature effect was not favorable for
asphaltenes conversion and was similar to that at 664 K, over the C-HDN catalyst. From

1080
Figure 326
Effect of catalyst on asphaltene conversion
at different reciprocal WHSVs and temperatures

A-HDN B-HDN A C-HDN
i 0 1 2 3 4
0 I 2 3 4 5
0 1 3 - 3 - 4
1081
Reciprocal WHSV, h
1082
the properties of catalysts, the catalyst surface area and the pore size distribution
appeared to influence asphaltenes conversion.
For asphaltenes conversion, the A- and B-HDN catalyst were preferred.
Viscosity Reduction
The effect of catalyst on viscosity reduction at different reciprocal WHSVs and
temperatures is plotted in F i p r e 327. The viscosities were measured at 313 K. As
shown in the figure. the viscosity reduction with the A-HDN catalyst with high surface
area was better than achieved with the B- and C-HDN catalysts. At 620 K, the viscosity
reduction accomplished with the B-I-IDN catalyst was less than with the C-HDN catalyst
which has relatively higher surface area.
Secondarv Hvdrotreatinq
Two experiments were conducted to evaluate second pass (secondary)
hydrotreating over the A-HDN catalyst. The comparison between first and second pass
hydrotreating is presented in Table 114. After second pass hydrotreating at 684 K and a
LHSV of 0.2 h-'. the liquid produced improved quality, including conversion.viscosity
and molecular weight reduction, and higher WC ratio of the final liquid products was
improved The hydrogen consumptions in the second pass were significantly decreased
relative to the first pass; however, this was difficult to quantify.
Conversion
For the first case (temperature = 642 K. LHSV = 0.48 h-'), the fractional
conversions of CCR and asphaltenes were very small, 3.7% and 1.7%, respectively;
however, it was 16% for residuum. Thus, the fiactional conversion of sulfur and
nitrogen, 20% and 7.5%. respectively, appear to be related to residuum conversion during
second pass hydrotreating.
For the second case (temperature = 684 K, LHSV = 0.48 h-I), the fractional
conversion of residuum is very small, 1.8%, indicating that the refiactory fraction of
residuum is 0.2 under these conditions. The fractional conversions of sulfur and nitrogen
were 85.1%, 61.5%, respectively, and higher than those of CCR and asphaltenes, 52.6%

Figure 327
Effect of catalyst on viscosity (measured at 313 K)
at different reciprocal WHSVs and temperatures
1083 -_
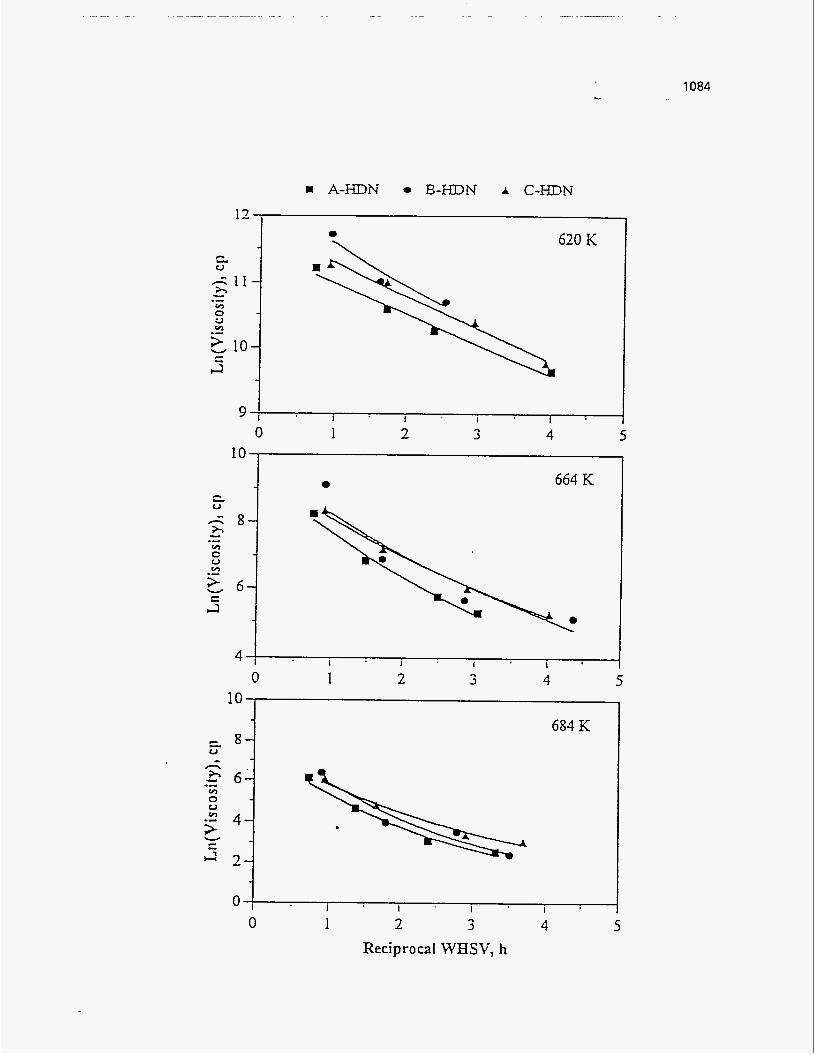
1084
c 8- U
9 1 1 I I I
683 E(
0 1 2 3 4 5 10
0 664 K
0 1 2 3 4 5
I I I I 0 1 2 3 4
ReciprocaI WHSV, h 5

Table 114
Comparison with First and Second Pass Hydrotreating over the A-HDN Catalyst at Constant Pressure (13.7 1Wa)
Operating Conditions
Properties
T, K LHSV, h" 642 0.48
First Second Pass Pus
T, K LHSV, h" 684 0.2
First Second Pass Pass
Conversion, %
Sulfbr Nitrogen Residuum CCR Asphaltenes
Total Total Fractional Total Total Fractional
82.5 86.0 20.0 30.9 36.1 7.5 30.5 41.6 16 39.0 41.3 3.7 31.5 32.7 1.7
Viscosity, mPa s (at 3 13 K) 8274 4564
Yields and Distributions of Products
c I'C4 C5-478 K 478-616 K 616-81 1 K >811K
H/C Ratio
H2 Consumption, IiterAiter
1.7 0.S 2.5 2.6 12.9 14.9 45.9 50.0 37.0 31.7
1.62 1.68
87 13
96.3 99.5 85.1 56.6 94.5 61.5 79.4 79.5 1.8 89.5 95.0 52.6 85.6 92.2 45.5
13.6 6.15
8.7 5.3 9.4 12.0 29.0 35.7 42.8 37.4 10.2 9.5
1.77 1.80
154 30
Total Conversion = I-(Cij)+llc(/(Ci,),
Fractional Conversion = 1-( Ci,z)podwl( C&d
i = Lumped Species, j = First (1) or Second (2) Pass
and 45.5%, respectively. Therefore, during second pass hydrotreating at severe
conditions, Le., higher temperature, the conversions of sulhr and nitrogen appear to be
related CCR and asphaltenes conversions.
Comparing the total and fractional conversions in the second case, the refractoxy
fraction of the residuum does not appear to contain the CCR and asphaltenes. The two
classes of molecules in residuum could be classified CCR residuum and non-CCR
residuum or asphaltenes residuum and nonasphaitenes residuum. This result asrees with
Sanford’s reports(282).
The CCR and asphaltene conversions are presumed to occur via thermal reaction
pathways as indicated by these two experiments.
Product Distribution
For the first case, the yields of gas and residuum decrease, whereas of naphtha,
distillate, and gas oil mildly increase. However, the yield of gas oil also decreases
together with gas and residuum in the second case. The yields of naphtha and distillate
increase significantly. As can be seen, the gas oil undergoes cracking to produce naphtha
and distillate at lower space velocity and higher temperature.
SUMMARY AND CONCLUSIONS
The conversions of sulfur, nitrogen, residuum, C C q and asphaltenes increased
as reciprocal WHSV increased; however, the asphaltenes conversion at 620 K increased initially and then decreased with increasing residence time. Sulfk, nitrogen,
residuum, and CCR conversion increased with increasing temperature, whereas the
asphaltenes conversion decreased with temperature at LHSV of 0.9 h-'. The effect of
pressure on the conversion was positive. The reaction order, p, of hydrogen partial
pressure depended on catalyst and the reactant species.
*
Viscosity of bitumen over HDN catalysts was reduced significantly with
increasing temperature at fixed WHSV, and also reduced as reciprocal WHSV
increased at fixed temperature, but was not affected by pressure. The relationship of
viscosity and temperature was well described by the equation, p = A exp(AG-/RT).
where AGO is the Gibbs free enersy of activation.
The yield and distribution of products produced from the bitumen over the
HDN catalysts were a hnction of process variables. The gas oil fraction underwent
secondary cracking to lower boiling materials at higher temperatures and longer
residence times.
The catalyst with higher surface area, larger pore volume, and wider pore size
distribution should be better for sulfur. nitrogen, and nickel removal; CCR,
asphaltenes, and residuum conversion; and viscosity reduction in the hydrotreating of bitumens. For example, at a lower temperature of 620 K, the performance of the 'A- HDN catalyst with higher surface area (215 m2/g) was most active for conversion of
various classes of compounds. At a higher temperature of 684 K. the A- and B-HDN
catalysts exhibited similar performance which was better than the C-HDN catalyst.
The better performance of B-HDN catalyst, in comparison with C-HDN catalyst,
results from its presumed wider pore size distribution and larger pore volume. .
Under the severest condition, the total conversions of sulfur, CCR, nitrogen,
asphaltenes, and residuum over A-HDN catalyst were 99.5%. 95.0%, 94.8%. 92.3%,
and 79.8%. respectively, after secondary hydrotreating. It was found that the sulfir
1088
and nitrogen removal resulted from CCR and asphaltenes conversion, not from
residuum conversion which was not converted during second pass hydrotreating. This
implies that the refractory fraction, 0.2, of residuum contained little CCR and
asphaltenes and was more difficult to convert than asphaltenes.
The weight fractions of naphtha, distillate, and residuum in the total liquid
product were considerably changed relative to bitumen. For example, the naphtha
increased fiom 0.5% in the feedstock to 12% in the liquid product, the distillate
fraction increased fiom 10.2% in the bitumen to 35.7% in the liquid product, and the
residuum decreased from 54.5% in the feedstock to 9.5% in the liquid product after
second pass hydrotreating. At the same time, the viscosity, measured at 313 K, was
reduced by a factor in excess of four orders of magnitude.
Pore volume and surface area of the three HDN catalysts decreased following
use in hydrotreating the Asphalt Ridge bitumen. A- and C-HDN catalysts lost about
one third of their pore volume and surface area. A slight shift to smaller pore radii is
observed for the extracted spent catalysts.
The kinetics of sulfur and nitrogen removal and CCR and residuum
conversion, in bitumen hydrotreating were well represented by nth-order power rate
law to obtain reaction orders and by a distributed activation energy model using a
normal distribution function to obtain more realistic activation energies.
The apparent reaction orders for conversion were a fiinction of temperature and
catalyst and could be higher than two. The reaction orders obtained from an nth-order
power rate law support experimentally the validity of the asymptotic lumped kinetic
model in the high conversion regime especially for deep hydrodesulfbrization.
The kinetic equations for sulfur and nitrogen removal and residuum and CCR
conversion did not follow a single first-order reaction model in the hydrotreating of
bitumen. The relative proportion of facile and refractory fraction of bitumen was a
function of temperature, catalyst, and feedstock at constant pressure.
1089 ^.
BITUMEN UPGRADING BY HYDROPYROLYSIS
Research Assistant Professor: Graduate Student: Brett Jenkins
John V. Fletcher
Introduction
Hydroprolysis (Hl?) is a novel heavy oil and bitumen upgrading process previously studied
at the University of Utah for conversion of heavy, carbonaceous feedstocks into valuable liquid
and gaseous products without major formation of coke and without the need for heterogeneous
catalysts. The HP process has been applied to conversion of feedstocks exhibiting in excess of
10 percent Conradson Carbon Residue. Production of 80 percent liquids (plus gaseous products)
has been reported (352). The important chemical reactions responsible for these results have been
identified and verified (353). Preliminary economic assessment shows that HP conversion is no
more costly than conventional refinery operations utilizing the addition of hydrogen (354). The
University of Utah has been awarded a patent on Hp technology (355).
Work on a hydropyrolysis process development unit (PDU) was suspended in December,
1987 (356). One of the primary reasons the hydropyrolysis PDU was not operated after 1987 is
the compleiity of the equipment compared to the experience and skill level of a typical graduate
student. In most experiments, the PDU required at least two persons for operation.
When the Departments of Chemical Engineering and Fuels Engineering at the University
of Utah merged in 1992, a series of laboratory consolidations and trades was initiated. This
necessitated the movement of the PDU, which had an 8' x 20' footprint.
That move was completed in the spring of 1993.

I090 ...
In the Same time frame, DOE requested that the hydropyrolysis studies be restarted in
order to develop the data base of process variables necessary for comparing hydropyrolysis to
other upgrading options. The upgrading by hydropyrolysis was funded for 1993-1994, the year
covered by this report.
As part of the disassembly and moving process, each component of the PDU was critically
evaluated. This included visual inspections and detailed discussions with previous operators (353,
354). This evaluation plus the operational complexity mentioned above led to the decision to
redesign and rebuild the PDU rather than reassemble it in its pre-move configuration.
Heavy Oil and Bitumen Upgrading
Several options are available for heavy oil and bitumen upgrading. An upgrading sequence
usually includes hydrotreating for the removal of nitrogen (and a small amount of sulfur) and a
molecular weight reducing step. Hydropyrolysis and hydrocracking are the two most promising
molecular weight reducing processes. The work performed at the University of Utah through
1987 showed hydropyrolysis to be a low-coke and high-yield technology that would be a feasible
upgrading process for oil sand bitumens and bitumen-derived liquids. Thus the project had a two-
fold mission. First, to evaluate the larger scale applicability of the hydropyrolysis process.
Second, to critically review all possible production - upgrading combinations and identify the best
possible technical and economic pathways.
The hydropyrolysis process typically operates at 45O-55O0C, 7-17 MPa pressure and
residence times of 1-50 seconds. Research at the University has yielded data on the effect of
process variables on process performance. Using this data and data on the hydropyrolysis of .
model compounds, a comprehensive kinetic model for the hydropyrolysis process scheme and
process simulations were performed using commercial process simulators. These simulations
provided optimum operating conditions based on definite criteria. Process simulations were
pexformed to. optimize the entire flow sheets with different heat exchanger configurations (354).
Operationally it was difficult to streamline the hydropyrolysis process, particularly, the
high-pressure atomizer that sprays the bitumen in the form of fine droplets into the reactor.
Variations in reactor configurations were explored in the previous work. It was therefore
necessary to evaluate the hydropyrolysis process in the context of other short residence time
processes and examine alternative reactor and process configurations that would allow streamlining
of a larger-scale hydropyrolysis operation.
1993-1994 Project Objectives
Within the context of a required move of the PDU and its history of operational complexity
the goal of the project was to return the PDU to operational status with simplified and/or
automated operating procedures. Using previous data and process simulation models PDU
improvements were also planned.
\
1.
2.
3.
4.
5.
6.
7.
1
The specific project objectives included:
Disassemble and move the hydropyrolysis PDU.
Reassemble the PDU.
Install Utilities and other process supports.
Systematically evaluate the condition and safety of each PDU component and the
assembled PDU.
Verify the opemting procedure and hardware integrity of each PDU component. Repair,
repIace, revise, as required.
Verify the operating procedure and performance of the PDU.
Assess the validity of the previously proposed process models, and compare model
1092 -
predictions with PDU results for a replicate experiment based on previous studies with this
PDU.
Accomplishments
The Old PDU
The PDU process flow diagram from 1987 (Figure 328) no longer represented the system
when disassembled. Several "visiting scholars" had attempted to operate the system over the
intervening years and left no documentation. High pressure pumps, valves, etc. were coated with
heavy hydrocarbons. Much of the electrical system was not to present code. In summary, after
disassembling the PDU and moving it to another laboratory almost every subsystem and
component had to be cleaned, repaired, and/or replaced. Given this situation , it was decided to
redesign the PDU and rebuild it based on the new design.
The New PDU
In consultation with C.H. Tsai (353), the hydropyrolysis PDU was redesigned as shown
in Figure 329. A systematic evaluation of components allowed us to begin the process of
assembling a new PDU that would be more accessible and simpler to operate. Hydrogen recycle,
an important economic consideration, was not included in this phase in the interest of simplicity.
The design .and configuration do include recycle for future inclusion.
In addition to the problems related to the PDU and its condition, two other subsystems
were identified for redesign, the hydrogen heater and the hydropyrolysis reactor.
The Hydrogen Heater
The old PDU used a fluidized sand bath heater. This was basically a box of hot sand with
H2 coils running through it. The old unit was in disrepair and deemed ineffective as well as dirty.
A large thermal block with gas coils and an external heater was found and adapted for H2 heating.

1093 -.
Figure 328
Hydropyrolysis process development unit process flow diagram
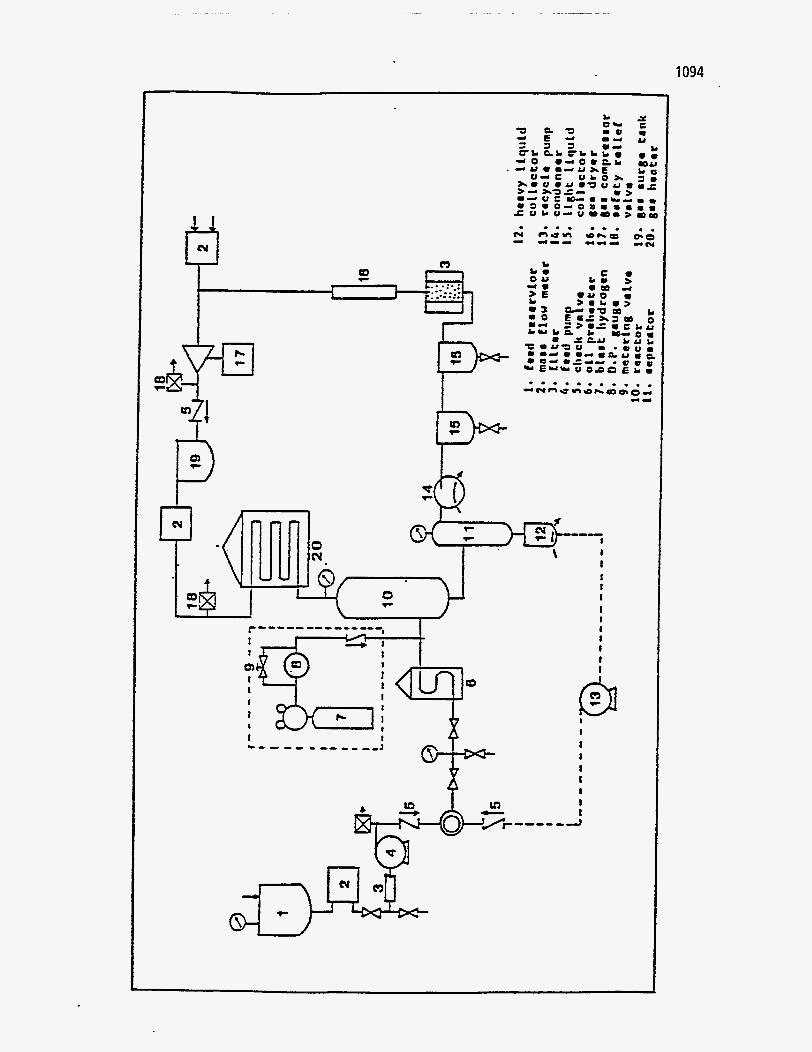
1094
P
I I
@

Figure 329
Revised Hydropyrolysis Process Flow Diagram
1095 -.
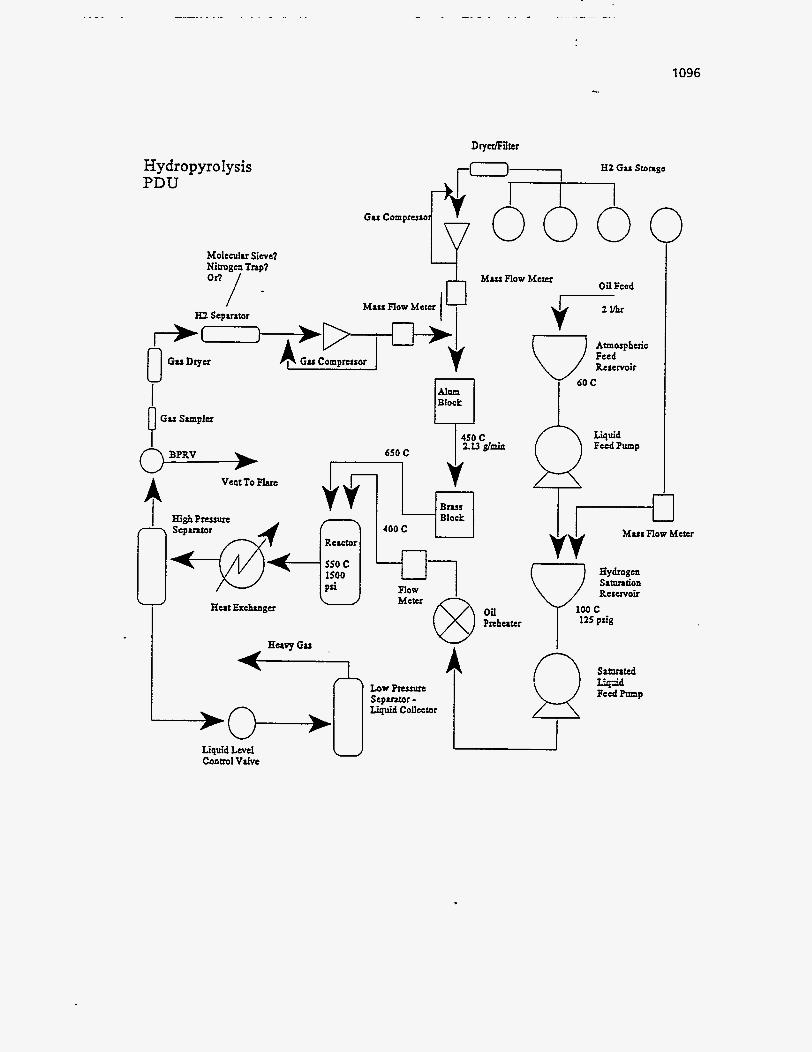
1096
Hydropyrolysis PDU
Molecuiu Sieve? Nitrogen Trap? OR / ii Mass Flow M c m
/ - M u r Flow M e w H2 scp.ruor
I
r Liquid Level Control Valve
I
Lor Prruure Seprnror - Liquid Collector
Oil Feed
Atmoaphuic
Reservoir
Liquid Feed Pump
P
1
1097 -._
A preheater was also installed.
The Hydropyrolysis Reactor
Previous PDU experiments have utilized two reactor designs with multiple lengths and
diameters. In 1984 (DOE Report 1984-87) Bunger et.al. reported on shifting from a coiled-tube
reactor to a vertical tube, downflow reactor in an effort to reduce residence times and improve
yields. Inspection of these tubes showed coke deposits 2 to 8 inches from the nozzle. A need to
redesign the reactor and the nozzle was reported by Bunger in 1987 (Tar Sand Report 1984-1987)
when the PDU was mothballed. *
Nozzle and Reactor Design
A short path reactor was chosen in order to keep residence times in the < 1 second range.
Co-current H2 flow was also chosen with the gas flow directed along the reactor walls as a
protecting envelope.
A commercial nozzle built by Lechler was obtained and tested using diesel oil and a
standard test bench for truck nozzles. Visual observation of the nozzle showed it to produce an
excellent pattern. Measurements of the pattern were used to design the recess and fan angle for
the short path reactor. The average drop diameter is 50 microns and its linear velocity is expected
to be 5000 to 6000 inchedsec. Using the time required to heat and vaporize a drop of oil and the
linear velocity, the reactor length required for these two steps is 1.27 inches. The actual length
of our new reactor is 3 inches.
Conclusion
1993-94 program year was actually extended into 1995 in order to allow students to
complete their degrees. The redesign and rebuilding of the hydropyrolysis PDU was not
completed even with the extension. The graduate student initially funded by the project was

forced to find employment before the project was completed. The PDU is approximately 60%
complete. The reactor has been redesigned and built. The nozzle was been procured and tested.
A coker gas oil has been characterized in preparation for use as a feed once the PDU is
operational.
1099
REFERENCES
1. Oblad, A.G., Bunger, J.W., Dahlstrom, D.A., Deo, M.D., Hanson, F.V., Miller, J.D., and Seader, J.D., 1992 Final Report, “The Extraction of Bitumen from Western Oil Sands”, Contract No.: DE-FC2 1-89MC26268, (August 1992).
2. Oblad, A.G., Bunger, J.W., Dahlstrom, D.A., Deo, M.D., Hanson, F.V., Miller, J.D., and Seader, J.D., 1993 Final Report, “The Extraction of Bitumen from Western Oil Sands”, Contract No.: DE-FC21-89MC26268, (December 1993).
3. Oblad, AG., Bunger, J.W., Hanson, F.V., Miller, J.D., Ritzma, H.R., and Seader, J.D., “Tar Sand Research and Development at the University of Utah”, Ami. Rev. Eiiergy, 12, 283-356, 1987.
4. Bowman, C.W., “ Molecular and Interfacial Properties of Athabasca Tar Sands”, Proc. of the 7th World Petroleum Congress, 3, Elsevier, Amsterdam, pp.583-604, 1967.
5. Drelich, J., and Miller, J.D., “ Surface and Interfacial Tension of the Whiterocks Bitumen and Its Relationship to Bitumen Release from Tar Sands during Hot Water Processing”, Fuel, 73, 1504-1510, 1994.
6. Drelich, J., “The Role of Wetting Phenomena in the Hot Water Process for Bitumen Recovery from Tar Sand”, Ph.D. Dissertation, University of Utah, Salt Lake City, Utah, 1993.
7. Deshpande, D.A., Deo, M.D., and Hanson, F.V., “Correlations for Effective Bubble Rise Velocity in Three-phase Ebullieted Beds”, Firel Proces. Techiiol., 32,3-23, 1992.
8. Hupka, J., and Miller, J.D., “Electrophoretic Characterization and Processing of Asphalt Ridge and Sunnyside Tar Sands”, hit. J. Mineral Proces., 31,2 17-23 1, 199 1.
9. Isaacs, E.E., and Smolek, K.F., “Interfacial Tension Behavior of Athabasca Bitumedaqueous Surfactant Systems”, Can. J. Cheni. Eiig., 61,233-240, 1983.
10. Potoczny, Z.M., Vargha-Butler, E.I., Zubovits, T.K., and Neumann, A.W., “Surface Tension ofBitumen”, AOSTRA .L Res., 1, 105-120, 1984.
11. Vargha-Butler, E.I., Zubovits, T.K., Budziak, C.J., Neumann, A.W., and Potoczny, Z.M., “Surface Tension of Bitumen from Contact Angle Measurements on Films of Bitumen”, EZ~WU F~els , 2, 653-656, 1988.
12. Neumann, A.W., Good, R.J., Hope, C.J., and Sejpal, M., “An Equation-of-State Approach
1100
13.
14.
15.
16.
17.
18.
19.
20.
21.
22.
23.
24.
to Determine Surface Tensions of Low-Energy Solids from Contact Angles”, J. Colloid Iiifeflace Sci., 49, 29 1-304, 1974.
Adamson, A.W., “Physical Chemistry of Surfaces”, John Wiley & Sons, Inc., New York, 1990.
Kloubek, J., “Development of Methods for Surface Free Energy Determination Using Contact Angles of Liquids on Solids”, Ads. Colloid Inke~face Sci., 38, 99-142, 1992.
Girifalco, L.A., and Good, R.J., “A Theory for the Estimation of Surface and Interfacial Energies. I. Derivation and Application to Interfacial Tensions”, J. Phys. Chern., 61, 904-909, 1957.
Li, D., and Neumann, A.W., “A Reformulation of the Equation-of-State for Interfacial Tensions”, J . Colloid Intwface Sei.* 137, 304-307, 1990.
Li, D., and Neumann, A.W., “Contact Angles on Hydrophobic Surfaces and Their Interpretation”, J. CoIIoid Inle~aee Sei., 148, 190-200, 1992.
Hupka, J., White, R.R., Yang, J.Y., Drelich, J., Miller, J.D., Hanson, F.V., and Oblad, A.G., “Residual Solvent Effect on the Viscosity of the Bitumen Extracted from the Whiterocks Oil Sand”, AOSTRA J. Res., 1994.
Bukka, K., Hanson, F.V., Miller, J.D., and Oblad, A.G., “Fractionation and Characterization of Whiterocks Tar Sand Bitumens”, Er7ergy Fuels, 6, 160-165, 1992.
Hupka, J., Oblad, A.G., and Miller, J.D., “Diluent-Assisted Hot-Water Processing of Domestic Tar Sands”, AOSTRA J. Res., 3, 95-102, 1987.
Shun, D., “The Pyrolysis of Bitumen-Impregnated Sandstone from the Circle Cliffs (Utah) Deposit in a Fluidized-Bed Reactor”, Ph.D. Dissertation, University of Utah, Salt Lake City, Utah, 1990.
Bukka, K., Miller, J.D., and Oblad, A.G., “Fractionation and Characterization of Utah Tar Sand Bitumens: Influence of Chemical Composition on Bitumen Viscosity”, E~7ergy Fuels, 5, 333-340, 1991.
Oblad, A.G., Seader, J.D., Miller, J.D., and Bunger, J.W., “Recovery of Bitumen from Oil- Impregnated Sandstone Deposits of Utah”, AIChE Symp. Ser. No. 155, Oil Shale and Tar Sands, 72,69-77, 1976.
Wu, S., “Polymer Interface and Adhesion”, Marcel Dekker, Inc., New York, 1982.
1101
25. Lee, L.H., “Scope and Limitations of the Equation of State Approach for Interfacial Tensions”, Lanpttrir, 9, 1898-1 905, 1993.
26.
27.
28.
29.
30.
3 1.
3 2.
33.
34.
35.
36.
37.
38.
Drelich, J., and Miller, J.D., “Examination of Neumann’s Equation-of-State for Interfacial Tensions”, J. Colloid Interface Sci., 167, 217-220, 1994.
Lelinski, D., “ASH Flotation of Dispersed Oil Droplets - a Model System for Bitumen Flotation from Tar Sands”, M.S. Thesis, University of Utah, Salt Lake City, Utah, 1993.
Lelinski, D., Miller, J.D., and Hupka, J., “The Potential for Air-Sparged Hydrocyclone Flotation in the Removal of Oil from Oil-in-Water Emulsions”, Paper No. 1-22-016, Proc. of the First World Congress on Emulsion, Oct. 19-22, Paris, France., 1993.
Becher, P., “Emulsions: Theory and Practice”, Reinhold Publishing Co., New York, 1965.
Fischer, E.K., and Harkins, W.D., “Monomolecular Films. The Liquid-Liquid Interface and the Stability of Emulsions”, J. Phys. Chent., 36, 98-1 10, 1932.
Dixon, W.J., and Massey, F.J., Jr., “Introduction to Statistical Analysis”, 2nd ed., McGraw- Hill Book Co., Inc., New York, 1957.
Takahashi, T., Miyahara, T., and Nishizaki, Y., “Separation of Oily Water by Bubble Column”, J . Chm. Eng Jpn, 12, 394-399, 1979.
Angelidou, C., Keshavarz, E., Richardson, M.J., and Jameson, G.J., “The Removal of Emulsified Oil Particles from Water by Flotation”, lid Eng Chem.. Process Des. Dev., 16, 43 6-44 1, 1977.
van Ham, N.J.M., Bechie, L.A., and Svrcek, W.Y., “The Effect of Air Distribution on the Induced Air Flotation of Fine Oil in Water Emulsions”, Can. J . Chent. E72g., 61, 541-547, 1983.
Leja, J., and Bowman, C.W., “Application ofThermodynarnics to the Athabasca Tar Sands”, Can. J. Chem. Eng., 46, 479-481, 1968.
Hupka, J., and Miller, J.D., “Moderate-Temperature Water-Based Bitumen Recovery from Tar Sand”, Firel, 70, 1308-1312, 1991.
Drelich, J., Hupka, J., Miller, J.D., and Hanson, F.V., “Water Recycle in Moderate- Temperature Bitumen Recovery from Whiterocks Oil Sands”, AOSTRA J. Res., 8, 139-147, 1992.
Shaw, R.C., Czarnecki, J., Schramm, L.L., and Axelson, D., “Bituminous Froths in the Hot
- . .. . .. - . - .. .
...
1102
39.
40.
41.
42.
43.
44.
45.
46.
47.
48.
49.
50.
Water Flotation Process”, in “Foams, Fundamentals and Applications in the Petroleum Industry,” Schramm, L.L. (Ed.), American Chemical Society, New York, 1994.
Petersen, J.C., “The Potential Use of Tar Sand Bitumen as Paving Asphalt”, Fziel Sci. TechnoI. Inl., 6, 225-254, 1988.
Thomas, K.P., Harnsberger, P.M., and Guffey, F.D., “An Evaluation of Asphalt Ridge (Utah) Tar Sand Bitumen as a Feedstock for the Production of Asphalt and Turbine Fuels”, Fuel Sci. Technol. Int., 12,28 1-302, 1994.
Tsai, C.H., Deo, M.D., Hanson, F.V., and Oblad, A.G., “Characterization and Potential Utilization of Whiterocks (Utah) Tar Sand Bitumen”, Fuel Sci. Technol. Int., 9, 1259-1286, 1991.
Heitzman, M.A., “Design and Construction of Asphalt Paving Materials with Crumb Rubber Modifier”, Transportation Research Report, No. 1339, Washington,, D.C., 1992.
Camp, F.W., “Tar Sands”, Kirk-Ofhmer Encyclopedia of Cheniical Technology, 3 ed., Interscience Publishers, New York, 22, 601 (1982).
Clark, H.A., and Pasternack, D.S., “Hot Water Separation of Bitumen from Alberta Bituminous Sands”, Ind Eng. Chenr., 24, 1410 (1932).
Hupka, J., Oblad, A.G., and Miller, J.D., “Diluent Assisted Hot Water Processing of Tar Sands”, AOSTRA J. Res., 3, 95 (1987).
Funk, E.W., “Behavior of Tar Sand Bitumen with Paraffinic Solvents and Its Application to Separations for Athabasca Tar Sands”, Can. J . Cheni. Eng., 57, 333 (1979).
Parks, B.D. and Meadus, F. W., “A Combined Solvent Extraction and Agglomeration Technique for the Recovery of Bitumen from Tar Sands”, Proc. 27‘’’ Can. Cheni. Eng Conji~ence on Oil Sands, Ottawa, Ontario, 45 (1 977).
Sparks, B.D. and Meadus, F.W., “A Combined Solvent Extraction and Agglomeration Technique for the Recovery of Bitumen from Tar Sands”, E m r g ~ Proc., Can., 72, 55 (1979).
Sparks, B.D. and Meadus, F.W., “A Study of Some Factors Mecting Solvent Losses in the Solvent Extraction-Spherical Agglomeration of Oil Sands”, Fric.1 Process. Tecnol., 4, 25 1 (1981).
Venkatesan, V.N., “Fluid Bed Thennal Recovery of Synthetic Crude from Bituminous Sands of Utah”, Ph.D. Dissertation, University of Utah, Salt Lake City (1 980).

1103
5 1. Dorius, J.C., “The Pyrolysis of Bitumen-Impregnated Sandstone from the PR Spring (Utah) Deposit in a Fluidized Bed”, Ph.D. Dissertation, University of Utah, Salt Lake City (1985).
52. Lynch, K.Z., Hood, R.I., Maraven, O.G., and Aquino, L.G., “Rose - A Flexible Process for Upgrading Heavy Crude and Atmospheric or Vacuum Residue”, Proc. Sixth Uiiitar/UNDP International Conference on Hemy Cnrde and Tar Sands, Houston, Texas, Paper #27 (Feb. 11-14, 1995).
53. Sprague, S., Washimi, K., and Ishibashi, M., “Upgrading Cold Lake Bitumen Using the HSC- ROSE Process”, Paper presented in the 1986 Tar Sands Symposium (1986).
54. Sanford, E.C., and Chung, K.H., “The Mechanism of Pitch Conversion During Coking, Hydrocracking and Catalytic Hydrocracking of Athabasca Bitumen”, AOSTRA J. Res. 7,37 (1991).
55. Weiss, H. and Schmalfeld, “Coking of Residue Oil by LP-Process”, Erdol Kohle, 42, 235 (1 989).
56. Nelson, L.R., MacKinnon, M., and Gulley, J.R., “Environmental Issues on Reclamation of Oil Sand Fine Tails”, Proc. Sixth Ihiitar/IJNDP In fernntional Corference on Hemy Crude and Tar Sands, 1995, Houston, Texas, Paper #I 63 (Feb. 1 1-14, 1995).
57. McHugh, M. A and Krukonis, V.J., Sipcrcrilical Fluid ~xt~nctio?i-Priiic~ies and Practice, Butterworths, Boston, (1993).
58. Bukka, K., Hanson, F.V., Miller, J.D., and Oblad, A.G., “Fractionation and Characterization of Whiterocks Tar Sand Bitumen”, Energy Ce Fuels, 6, 160 (1992).
59. Subramanian, M., Deo, M.D., and Hanson, F.V., “Compositional Analysis of Bitumen and Bitumen-Derived Products”, J. Chromo. Sci., 34,20 (1996).
60, Kehlen, H., Ratzsch, M.T., and Bergmann, J., “Continuous Thermodynamics of Multicomponent System”, AICHEJ,31, 1136 (1985).
61. Cotterman, R.L., “Phase Equilibria for Complex Fluid Mixtures at High Pressures. Development and Application of Continuous Thermodynamics”, Ph.D. Dissertation, Chapter 2, 3. University of California, Berkeley (1 985).
62. Peng, D.Y. and Robinson, D.B., “A New Two-Constant Equation of State”, Ind. Eng. Cheni. Firmhn., 15, 59 (1976).
63. Hwang, J., “Supercritical Fluid Extraction of Complex Hydrocarbon Mixtures Using CO, and Propane”, Ph.D. Dissertation, University of Utah, Salt Lake City (1992).
1104
64.
65.
66.
67.
68.
69.
70.
71.
72.
73.
74.
75.
76.
77.
Subramanian, M., “Application of Supercritical Fluid Extraction to Upgrading Oil Sand Bitumens”, M.S. Thesis, University of Utah, Salt Lake City (1 994).
Speight, J.G., The Chemistry and Technology of Petroleuni, 2 ed., Marcel Dekker, Inc., New York, New York (1991).
Bukka, K., Miller, J.D., and Oblad, A.G., “Fractionation and Characterization of Utah Tar Sands Bitumens: Influence of Chemical Composition on Bitumen Viscosity”, Energy & Fuels, 5,333 (1991).
Starling, K.E., Fluid Thermodynaniic Properties for Light Petroleum Systenis, Gulf Publishing Co., Houston, Texas (1 973).
Jamaluddin, A.K.M., Kalogerakis, N.E., and Chakma, A., “Predictions of CO, Solubility and CO, Saturated Liquid Density of Heavy Oil and Bitumens Using a Cubic Equation of State”, Fluid Phase Equilibria, 64, 22 (1 99 1).
Martin, J.J., “Cubic Equation of State - Which?’, b i d . Eiig. Cheni. Fundani., 18, 8 1 (1 979).
Floyd, R.H., Personal Communication, The M. W. Kellogg Company, Houston, TX, March 1996.
Johnston, K.P., “New Directions in Supercritical Fluid Science and Technology”, Supercritical Fluid Science and Technology, Johnston, K.P., and Penninger, J.M.L. eds., American Chemical Society, Washington, DC (1 989).
Nellesteyn, F.J., “The Colloidal Structure of Bitumen”, The Science qf Petroleimz, Oxford U. press, New York City, 4,2750 (1938).
Swanson, J., J Chemical Physics, 46, 14 1 (1 943).
Witherspoon, P.A. and Munir, Z.A., Prodiicers Monthly, 24, 20 (1960).
Dickie, J.P. and Yen, T.F., “Macrostructures of the Asphaltenic Fractions by Various Instrumental Methods”, Anal. Chemistry, 39, 1847, (1 967).
Koots, J.A. and Speight, J.C., “Relation of Petroleum Resins to Asphaltenes”, Fuel, 54, 179 (1975).
Mansoori, G.A., Jiang, T.S., and Kawanaka, S., “Asphaltene Deposition and its Role in Petroleum Production and Processing”, Arab. J . Sci. And Eng., 13, 17 (1988).

1105
78. Mitchell, D.L. and Speight, J.G., “The Solubility of Asphaltenes in Hydrocarbon Solvents”, F7d, 52, 149 (1973).
79. Speight, J.G., Long, R.B., and Trowbridge, T.D., “Factors Influencing the Separation of Asphaltenes from Heavy Petroleum Feedstocks”, FIZZ, 63(5), 616 (1 984).
80. Kokal, S.L. and Sayegh, S.G., “Gas Saturated Bitumen Density Prediction Using the Volume Translated Peng-Robinson Equation of State”, Report 1988-14, Petroleum Recovery Institute, Calgary, Canada (1 988).
81. Schumacher, M.M., “Heavy Oil and Tar Satih Recovery and [@grading, Noyes Data Corporation, Park Ridge, New Jersey (1982).
82. Oblad, AG., Bunger, J.W., Hanson, F.V., Miller, J.D., Ritzma, H.R., and Seader, J.D., “Tar Sand Research and Development at the University of Utah”, Ami. Rev. Energy, 12, 283, (1987).
83. Duerkson, C.H., “Gravity drainage processes for recovery and in-situ upgrading of heavy oil and bitumen”, 1 6Ih Rocky Mountain Fuel Society Symposium, Salt Lake City, Utah, 1993.
84. Longstaff, D.C., “Hydrotreating the Whiterocks Oil Sand Bitumen and Bitumen Derived Liquid”, Ph.D. Dissertation, University of Utah, Salt Lake City, Utah, 1992.
85. Ryu, H., “Kinetic Modeling Applied to Hydrocarbon Process Design and Engineering: I. Hydropyrolysis of Heavy Oils; 11. Acetylene from Calcium Carbide”, Ph.D. Dissertation, University of Utah, Salt Lake City, Utah, 1989.
86. Boduszinski, M.M., ‘Composition of Heavy Petroleums. 1 . Molecular weight deficiency, and heteroatom concentration as a function of atmospheric equivalent boiling point up to 1400°F (760”C)”, Energy & Fiiels, 1:2-11 (1 987).
87. Boduszinski, M.M., “Composition of Heavy Petroleums. 2. Molecular Characterization”, Energy & Fiiels, 2:597-613 (1988).
88. Altgelt, K.H., and Boduszinski, M.M., “Composition of Heavy Petroleums. 3. An improved boiling point-molecular weight relation”, Energy & F7iels, 6:68-72 (1 992).
89. Boduszinski, M.M. and Altgelt, K.H., “Composition of heavy petroleums 4. Significance of the extended atmospheric equivalent boiling point (AEBP) scale”, Eiiergy Ce- F?ie/s, 6:72-76 (1 992).
90. ASTM D2892-90, Disfillafioir of Criide Petrooleimi (I5-Theoreficnl Plate CoIimnl) (1 990).
1106
9 1. ASTM D2887-89, Boiliq Raiige Distribution of Pe/roleiiiii Frnctioia by Gas Chronratoqaphy (1 989).
92. ASTM D5307-92, Detemiriatiori of Boiling Point Distribrrtioii of Ciride Petrolelmi by Gas Chromatography (1 992).
93. Worman and Green, L.E., “Simulated Distillation of High Boiling Petroleum Fractions”, Anal, Chem., 37, 1620 (1965).
94. Neer, L. and Deo, M.D., “Simulated Distillation of Oils with a Wide Carbon Number Distribution”, J. Chromo. Sci., 33, 133 (1995).
95. “Selected values of properties of hydrocarbons and related compounds”, TRC Thermodynamic Table, API Project No. 44, October 3 1, 1972.
96. AOSTRA, “Syncrude Analytical Methods for Oil Sand and Bitumen Processing”, Syncrude Canada, Edmonton, Alberta, Canada, 1979.
97.
98.
99.
TSC, “Production of Synthetic Fuel from Tar Sands”, Rocky Mountain Oil and Gas Association, Inc., Tar Sands Committee, Technical Subcommittee, August 6 (198 1).
Probstein, R.F. and Hicks, R.E., “Synthetic Fuels”, pH Press, Cambridge, MA (1 990).
Camp, F.W., “Tar Sands”, in Kirk-Othmer, Encuclopedia of Chemical Technology, 2”” ed., Interscience Publishers, New York, 19, 682 (1969).
100. Baughman, G.L., “Synthetic Fuels Data Handbook”, 2”d ed., Cameron Engineers, Inc., Denver, Colorado (1 978).
101. Camp, F.W., “Tar Sands of Alberta, Canada”, Cameron Engineers, Denver, Colorado (1 974).
102. Clark, K.A.., “Hot Water Separation of Bitumen from Alberta Bituminous Sand’’, Research Council of Alberta, Report 1922, Edmonton, Alberta, Canada, 42 (1 923).
103. Clark K.A., “Hot Water Separation of Alberta Bituminous Sands”, Can. Insti. Min. Metall. Trans., 47,257 (1944).
104. Hanson, F.V. and Oblad, A.G., “The Fluidized Bed Pyrolysis of Bitumen-Impregnated Sandstone from the Tar Sand Deposits of Utah”, Fourth UNITAR/UNDP Proceedings, 5, Paper No. 155,421 (1988).
105, Cha, S., “Pyrolysis of Oil Sands from the Whiterocks Tar Sand Deposit in a Rotary Kiln”,
Ph.D. Dissertation, University of Utah, .Salt Lake City, Utah (1 99 1).
1107
106. Nagpal, S., “Pyrolysis of Oil Sand in a Large Diameter Fluidized Bed Reactor”, M.S. Thesis, University of Utah, Salt Lake City, Utah (1 995).
107. Gishler, P.E., “The Fluidization Technique Applied to Direct Distillation from Bituminous Sand”, Can. J . Res., F.27, 104 (1944).
108. Peterson, W.S. and Gishler, P.E., “A Small Fluidized Solids Pilot Plant for the Direct Distillation of Oil from Alberta Bituminous Sands”, Can. J. Res., 28, 62 (1950).
109. Rammler, RW., “The Production of Synthetic Crude Oil from Oil Sand by Application of the Lurgi-Ruhrgas Process”, Can. J. Chm. Eng., 48, 552 (1970).
110. Donnelly, J.K., Moore, R.G., Bennion, D.W., and Trenkwalder, A.E., “A Fluidized Bed Retort for Oil Sands”, Can. J . Chenr. Eng, 59, 68 (1 98 1).
1 1 1. Taciuk, W., “Process for Thermal Cracking a Heavy Hydrocarbon”, U.S. Patent 4, 1 SO, 455 (1 977).
112. Taciuk, W., “Apparatus and Process for Recovery of Hydrocarbon from Inorganic Host Materials”, U.S. Patent 4, 285, 773 (1 979).
113. Hanson, F.V., Cha, S.M., Deo, M.D., and Oblad, A.G., “Pyrolysis of Oil Sand from the Whiterocks Deposit in a Rotary Kiln”, Fwl, 71, 1455 (1992).
1 14. Wang, J., “The Production of Hydrocarbon Liquids from a Bitumen-Impregnated Sandstone in a Fluidized Bed Pyrolysis Reactor”, M.S. Thesis, University of Utah, Salt Lake City, Utah (1983).
115. Weeks, J.K., Jr., “Fluidized-Bed Processing of Utah Tar Sands”, M.S. Thesis, Unversity of Utah, Salt Lake City, Utah (1 977).
116. Jayakar, K.M., “Thermal Recovery of Oil from Tar Sands”, Ph.D. Dissertation, University of Utah, Salt Lake City, Utah (1 979).
117. Smart, L.M., “Thermal Processing of Utah Tar Sands”, M.S. Thesis, Unversity of Utah, Salt Lake City, Utah (1 984).
Coronella, J.C., Jr., “Optimizing a Thermal Fluidized-Bed Tar-Sands Extraction Process”, Ph.D. Dissertation, University of Utah, Salt Lake City, Utah (1 994).
11 8.
119, Sung, S.H., “The Fluidized Bed Pyrolysis of Bitumen-Impregnated Sandstone in a Large
1108
Diameter Reactor”, M.S. Thesis, University of Utah, Salt Lake City, Utah (1 988).
120. Shun, D., “The Pyrolysis of Bitumen-Impregnated Sandstone from the Circle Cliffs (Utah) Deposit in a Fluidized-Bed Reactor”, Ph.D. Dissertation, University of Utah, Salt Lake City, Utah (1990).
121. Fletcher, J.V., “Pyrolysis of Oil Sands in a Fluidized Bed at Reduced Pressure”, Ph.D. Dissertation, Fuels Engineering, University of Utah, Salt Lake City,. Utah (1992).
122. Hanson, F.V., Fletcher, J.V., and Zheng, H., ?‘Performance of Auger-Type Dry Materials Feeders when Feeding Oil Sands”, FtreZ Process. Tech., 41,289 (1995).
123. Dietz, W.A, “Response Factors for Gas Chromatographic Analysis”, .L Gas. Chronio/ogr., 5, 68, February (1 967).
124. Rosie, D.M. and Barry, E.F., “Quantitation of Thermal Conductivity Detectors”, J. Chroniafogr. Sci., 11,237 (1973).
125. Tang, H., “Combustion of Carbonaceous Residues on Spent Oil Sands in a Fluidized Bed Reactor”, MS Thesis, University of Utah, Salt Lake City, Utah (1 995).
126. Allen, T., “Particle Size Measurement”, 4“’ ed., Chapman and Hall, London (1990).
127. “Syncrude Analytical Methods for Oil Sand and Bitumen Processing”, Syncrude Canada Ltd. (1979).
128. Geldart, D., “Gas Fluidization Technology”, John Wiley & Sons, Chichester, Great Britain (1986).
129. Knowlton, T.M. and Hirsan, I., “L-Valves Characterized for Solids Flow”, Hydrocarbon Process., 3, 149 (1978).
130. Frick, A.E. and Novak, F., “Control of Solid Heat Circulation Using an L-Valve”, The Eleventh Australian Conference on Chemical Engineering, CHENECA 83, 547 (1983).
13 1. Geldart, D. and Jones, P., “The Behaviour of L-Valves with Granular Powders”, Powder Techiiol., 67, 163 (1991).
132. Yang, W.C. and Knowlton, T.M., “L-Valve Equations”, Powder Technol., 77, 49 (1993).
133. Cheremisinoff, N.P. and Cheremisinoff, P.N., “Hydrodynamics of Gas-Solids Fluidization”, Gulf Publishing Company, Houston, Texas (1 984).
1109
134.
135.
136.
137.
138.
139.
140.
141.
142.
143.
144.
145.
146.
147.
Howard, J.R., “Fluidized Bed Technology: Principles and Applications”, Adam Hilger, Bristol (1989).
Kunii, D. and Levenspiel, O., “Fluidization Engineering”, 2”d ed., Butterworth-Heinemann, Boston (1 99 1).
Knowlton, T.M., “Solid Transfer in Fluidized Systems”, Gas Fluidization Technology ed by Geldard, D., John Wiley & Sons, Chidester, Great Britain (1986).
Botterill, M.S.J., Teoman, Y., and Yuregir, K.R., “The Effect of Operating Temperature on the Velocity of Minimum Fluidization, Bed Voidage and General Behaviour”, Powder TechnoZ., 31, 101 (1982).
Saxena, S.C., Rao, N.S., and Zhou, S.J., “Fluidization Characteristics of Gas Fluidized Beds at Elevated Temperatures”, Energy, 15( 1 1) 1001 (1 990).
Kusakabe, K., Kuriyama, T., and Morooka, S., “Fluidization of Fine Particles at Reduced Pressure”, Powder Techiiol., 58, 125 (1989).
Wriath, A.E. and Harris, R., “Fluidization of a Mineral Concentrate at Reduced Pressure”, Miner. Eng., 5(9), 993 (1992).
Germain, B. and Claudel, B., “Fluidization of Mean Pressure less than 30 Torr”, Powder TechrioZ., 13, 1 15 (1 976).
Ergun, S., “Fluid Flow through Packed Columns”, Chem. Eig. Prog., 48(2), 89 (1952).
Fletcher, J.V., Deo, M.D., and Hanson, F.V., “Re-examination of Minimum Fluidization *
Velocity Correlation’s Applied in Group B Sands and Coked Sands”, Powder Techriol., 69, 147 (1 992).
Lippens, B.C. and Mulder, J., “Prediction of the Minimum Fluidization Velocity”, Powder Technol., 75, 67 (1993).
Wen, C.Y. and Yu, Y.H., “A Generalized Method for Predicting the Minimum Fluidization Velocity”, AIChE .I., 12, 6 IO (1 966).
Morgan, M.H., 111, “Analytical Expressions for the Spout/Annulus Pressure Drop and Pressure Gradient in Spout Beds of Coarse Particles”, in Fluidization V Proceedings of the Fifth Engineering Fluidization Conference on Fluidization, ed. by Comerer, Engineering Foundation, New York, 249 (1 986).
Shi, Y., Yu, Y.S., and Fan, L.T., “Incipient Fluidization Condition for a Tapered Fluidized
...
1110
Bed”. hid. Eng. CXwn. Fimdnni., 23, 484 (1 984).
148.
149.
150.
151.
152.
153.
154.
155.
156.
157.
158.
159.
160.
Toyohara, H. and Kawamura, Y. , “Fluidization of a Tapered Fluidized-Bed of a Binary, Particle-Mixture”, hit . Chem. Eirg., 32( I), 164 (1 992).
Saxena, S.C. and Vogel, G.S., “The Measurement of Incipient Fluidization Velocities in a Bed of Coarse Dolomite at Temperature and Pressure”, Trans. Insf. Chem. Erg., 55, 184 ( 1 977).
Wu, S.Y. and Baeyens, J., “Effect of Operating Temperature on Minimum Fluidization Velocity”, Powder TechnoZ., 67, 21 7 (1 99 1).
Botterill, M.S.J. and Teoman, Y., “Fluid-Bed Behaviors at Elevated Temperature”, Fluidization, Ed. By Grace, J.R. and J.M. Maten, Plenum Press, New York, 93 (1980).
Mii, T., Yoshida, K., and Kunii, D., “Temperature Effects on the Characteristics of Fluidized Bed”, J. Cheni. Eng. Japair, 6( I), 100 (1 973).
White, F.M., “Heat and Mass Transfer”, Addison-Wesley, New York ( 1 988).
Raso, R, D’Amore, M., Formisani, B., and Lignola, P.G., “The Influence of Temperature on the Properties of the Particulate Phase at Incipient Fluidization”, Poivdw Techid., 72, 71 (1 992).
Christensen, R.J., Lindberg, R.W., and Dorrence, S.M., “Viscous Characteristics of a Utah Tar Sand Bitumen”, Fiic.1, 63(9), 13 12 (1 984).
Bhadkamkar, A.S., “Optimizing the Operation of a Thermally Coupled Fluidized Bed Tar Sands Extraction Process”, Ph.D. Dissertation, University of Utah, Salt Lake City, Utah (1 995).
Oblad, A.G., Bunger, J.W., Dahlstrom, D.A., Deo, M.D., Hanson, F.V., Miller, J.D., and Seader, J.D., “The Extraction of Bitumen from Western Oil Sands”, Final Report for the Period July 6, 1992 to September 29, 1993 to U.S. Department ofEnergy, Contract No.: DE- FC21-89MC26268 (1 993).
7
Miller, J.D. and Mishra, M., “Hot Water Process Development for Utah Tar Sands”, F i d Process. Tech., 6, 27 (1 982).
Miller, J.D. and Mishra, M., “Concentration of Utah Tar Sands by an Ambient Temperature Floatation Process”, Inl. J . Min. Process.. 9(3), 269 (1 982).
Mishra, M. and Miller, J.D., “Comparison of Water-Based Physical Separation Processes for U.S. Tar Sands”, File1 Process. Tech. 27, No. 1, 3 (1991).
1111
161. Fletcher, J.V., Deo, M.D., and Hanson, F.V., “Fluidized Bed Pyrolysis of Oil Sands at Less than Ambient Pressure”, Fuel (1 995).
162. Nagpal, S., Fletcher, J.V., and Hanson, F.V., “Pyrolysis of Uinta Basin Oil Sands in Fluidized Bed and Rotary Kiln Reactors”, Sixfh INITARRJNDP Coifmiice, Papr #118 (1995).
163. Longstaff, D.C., Balaji, G., Kim, J., Kwak, S., Tsai, C.H., and Hanson, F.V., “Hydrotreating Uinta Basin Bitumen-Derived Heavy Oils”, Sixth INITAWIINDP Coiferenee, (1 995).
164. Seader, J.D. and Jayakar, K.M., “Process and Apparatus to Produce Crude Oil from Tar Sands”, U.S. Patent No. 4, 160.720 (1979).
165. Venkatesan, V.N., Hanson, F.V., and Oblad, A.G., “A Fluidized Bed Thermal Pyrolysis Process for the Recovery of a Bitumen-Derived Liquid from the Bitumen Impregnated Sandstone Deposits of Utah”, A X h E Synip. Ser., 78 (2 16), 42 (1 982).
166. Hanson, F.V., Dorius, C.J., Utley, J.K., and Nguyen, T.V., “The Application of Compound Type Analyses to the Correlation of Product Distribution and Yields from Fluidized-Bed Pyrolysis of Oil Sands”, Fuel, 71, 1365 (1992).
167. Deo, M.D., Fletcher, J.V., Shun, D., Hanson, F.V., and Oblad. A.G., “Modelling the Pyrolysis of Tar Sands in Fluidized Bed Reactors”, Firel, 70, 127 1 (1 99 1).
168. Clifi, R., in Gas Fhidizatioii Technology, D. Geldart, Ed., John Wiley, London (1986).
169. Cha, S.M., Hanson, F.V., Longstaff, D.C., and Oblad, A.G., “Pyrolysis of Bitumen- Impregnated Sandstones: A Comparison of Fluidized Bed and Rotary Kiln Reactors”, F71e1, 70, 1357-1361 (1991).
170. Kenkel, J., “Analytical Chemistry Refresher Manual’’, Lewis Publishers, Inc.: Michigan (1 992).
171. Bulmer, J.T. and Starr, J., Eds., “Syncrude Analytical Methods for Oil Sands and Bitumen Processing”, Syncrude Canada Limited, Edmonton, Alberta Canada (1 979).
172. Babu, S.P., Shah, B., and Talwalker, A., “Fluidization Correlations for Coal Gasification Materials - Minimum Fluidization Velocity and Bed Expansion Ratio”, AIChE S’np. Ser., 74, 176-186 (1978).
173. Mathur, A., Saxena, S.C., and Zhang, Z.F., “Hydrodynamic Characteristics of Gas-Fluidized Beds Over a Broad Temperature Range”, Powder Tech., 47,247 (1986),
1112
174. Grewal, N.S. and Gupta, A., “Total and Gas Convective Heat Transfer from a Vertical Tube to a Mixed Particle Gas-Solid Fluidized Bed”, Poivder Techirol., 57, 27-3 8 (1 989).
175. Baeyens, J. and Geldart, D., Chapter 5 in Gas Fliridizatioii Techiioloa, D. Geldart Ed., Chichester: John Wiley & Sons, Inc. (1 986).
176. Allred, V.D., “Kinetics of Oil Shale Pyrolysis”, Chem. Eirgr. Pros, 62, No. 8, 55 (1966).
177. Phillips, C.R., Haidar, N.I., and Poon, Y.C., “Kinetic Models for the Thermal Cracking of Athabasca Bitumen: The Effect of the Sand Matrix”, Firel, 64,678 (1 985).
178. Conesa, J.A., Marcilla, A., and Font, R., “Kinetic Model of the Pyrolysis of Polyethylene in a Fluidized Bed Reactor”, J. Amzl. A i d App. Pyrolysis, 30, 10 1 - 120 (1 994).
179. Peterson, W.S. and Gishler, P.E., “Oil from Alberta Bituminous Sands”, Petrol. E~rgr., 23, C-66 (1 95 1).
180. Carberry, J.J., Chemical arid Catalytic Reactioii Etigiiieeriiig, McGraw-Hill Book Company, Inc., New York (1976).
181. Meyer, RF. and Duford, J.M., “Resources of Heavy Oil and Natural Bitumen Worldwide”, in Proc. Fourth UNITAR/UNDP International Conference on Heavy Crude and Tar Sands, ed. by R.F. Meyer and E.J. Wiggins, August 7-12, 1988, Paper #147 (1988).
182. “Major Tar Sands and Heavy Oil Deposits of the United States”, Interstate Oil Compact Commission, U. of Oklahoma Press, Norman, Oklahoma (1 984).
183. Meyer, R.F. and Dietzman, W.D., “World Geography of Heavy Crude Oils”, A paper presented at the First International Conference on the Future of Heavy Crude and Tar Sands (UNITAR), Edmonton, Alberta, Canada, June 4-1 2 (1 979).
184. Marchant, L.C., “U.S., Tar Sands Projects, 1985”, Third International Conference on Heavy Crude and Tar Sands, Long Beach, CA (1 985).
185. Ritzrna, H.R. and Campbell, J.A., “Oil-Impregnated Sandstone Deposits in Utah”, Map 47 - Utah Geological and Mineral Survey (1 979).
186. Crysdale, B.L. and Shenk, C.J., “Bitumen-Bearing Deposits of the United States”, U.S.G.S. Bull. #1784, 45 (1988).
187. McLendon, T.R., U.S. “Department of Energy Tar Sand Program Overview”, Proceedings of the Eastern Oil Shale Symposium (1 990).

1113
188. Stosur, G.J., “Heavy Oil and Tar Sands Recovery Technology in the Year 2000 and Beyond”, U.S. Department of Energy, Fourth UNITAR/UNDP Conference on Heavy Crude and Tar Sands, 4 (1988).
189. Bezama, R.J., “An Energy-Eficient Method for Thermal Processing of Utah Tar Sands”, Ph.D. Dissertation, University of Utah, Salt Lake City, Utah (1983).
190. Coronella, C. J., “Modelling a Coupled Fluidized-Bed Reactor for Extraction of Bitumen. from Tar Sands”, MS Thesis, University of Utah, Salt Lake City, Utah (1989),
191. Coronella, C.J. and Seader, J.D., “Combustion of Coked Sand in a Two-Stage Fluidized Bed System”, Fuel, 71, 143 (1992).
192. Stubinton, J.F., Barrett, D., and Lowry, G., “Bubble Size Measurements and Correlation in a Fluidized Bed at High Temperatures”, Cheni. Erg. Res., Des., 62, 173 (1984).
193. Darton, R.C., LaNauze, R.D., Davidson, J.F., and Harrison, D., “Bubble Growth Due to Coalescence in Fluidised Beds”, Trorrs. Iirsfrr. Cheni. Eqys., 55, 274 (1 977).
194. Grace, J.R., “Generalized Models for Isothermal Fluidized-Bed Reactors”, Receril Advairces in Engineering Analysis of Cheniicnlly Reactiiig Systenis, L.K. Doraiswami, ed., Wiley Eastern, New Delhi, p. 237 (1984).
195. Levenspiel, O., Chemical Reaction Eiigiiieering, John Wiley, New York (1 969).
196. Phillips, C.R., Haidar, N.I., and Poon, Y.C., “Kinetic Models for the Thermal Cracking of Athabasca Bitumen”, Fiiel, 64, 678 (I 985).
197. Lin, L.C., Deo, M.D., Hanson, F.V., and Oblad, A.G., “Kinetics of Tar Sand Pyrolysis Using a Distribution of Activation Energy Model”, AIChE J., 36( lo), 1585 (1 990).
198. Field, M.A., Fill, D.W., Morgan, B.B.. and Hawksley, P.G.W., Clonihiistion of Piilserized Coal, Cheney and Sons, Banbury, England (1967).
199. Hottel, H.C., Williams, G.C., Nerheim, N.M., and Schneider, G.R., “Kinetic Studies in Stirred Reactors: Combustion of Carbon Monoxide and Propane”, Teiifh Synip. fl?iter?ra#ioi~at!) on Combiatioir, Combustion Institute, Pittsburgh, 1 1 1 (1965).
200. Coyle, T.D., “Silica”, Encyclopedia of Chemical Technology, R.E. Kirk and D.F. Othmer, John Wiley, New York, eds., vol. 20, p. 757 (1982) Darton, R.C., R.D. LaNauze, J.F. Davidson, and D. Harrison, “Bubble Growth Due to Coalescence in Fluidized Beds”, fi*am. Iirsf. Cheni. E17p.. 55, 274 ( 1 977).

1114
201. API, Technical Dafa Book - Petroleimi R~firiiiig, American Petroleum Institute, New York (1 966).
202. Chi, S.W., Heal Pipe 771eor-y arid Practice, McGraw-Hill, New York (1 976).
203. Dum, P. and Ray, D.A., “Heat Pipes”, Pergamon Press Ltd., Elmsford, New York (1 982).
204. Saxena, S.C., “Heat Transfer Between Immersed Surfaces and Gas-Fluidized Beds”, Adv. Hear Trans&, Academic Press, New York, 19, 97 (1989).
205. Saxena, S.C. and Ganzha, V.L., “Heat Transfer to Immersed Surfaces in Gas-Fluidized Beds of Large Particles and Powder Classification”, Powder Techiiol., 39, 199 (1 984).
206. Wender, L. and Cooper, G.T., “Heat Transfer between Fluidized-Solids Beds and Boundary Surfaces-Correlation of Data”, AIChE J., 4( 1), I5 ( 1 958).
207. Vreedenberg, H.A., J. Appl. Chem., 2, suppl. issue No. 1, S-26, (1952), cf Wender and Cooper, (1 958).
208. Mickley, H.S. and Fairbanks, D.F., “Mechanism of Heat Transfer to Fluidized Beds”, AIChE J., 1,374 (1955).
209. Molerus, O., “Arguments on Heat Transfer in Gas Fluidized Beds”, Cheni. Eiig. Sci., 48(4), 761 (1993) Oblad, A.G., Bunger, J.W., Hanson, F.V., Miller, J.D., Ritzma, H.R., and Seader, J.D., “Tar Sand Research.and Development at the University of Utah”, Am. Rev. Emrgy, 12, 283 (1 987).
210. Thring, R.H., “Fluidized Bed Combustion for the Stirling Engine”, Inf. J. Heat Mass Tranger, 20, 911 (1977).
21 1. Gelperin, N.I. and Einstein, V.G., “Heat Transfer in Fluidized Beds”, Fhidizfltion, J.F. Davidson and D. Harrison, eds., Academic Press, New York, 471 (1971).
212. Verma, R.S. and Saxena, S.C., “Heat Transfer from an Immersed Vertical Tube to a Gas Fluidized Bed”, Eiiergy, 8(12), 909 (1983).
213. Bhadkamkar, A.S., “Optimizing the Operation of Thermally Coupled Fluidized-Bed Sands Extraction Process”, Ph.D. Dissertation, University of Utah, Salt Lake City, Utah (1995).
214. Bunger, J.W., “Processing Utah Tar Sand Bitumen”, Ph.D. Dissertation, University of Utah, Salt Lake City, Utah (1979).

1115
21 5 . Albright, L.F., Crynes, B.L., and Corcoran, W.H., “Pyrolysis: Theory and Industrial Practice”, Academic Press, New York (1 983).
216. Seader, J.D. and Jayakar, K.M., “Process and Apparatus to Produce Crude Oil from Tar Sands”, U.S. Patent No. 4, 160,720 (1979).
217. Hsu, J.C.L. and Seader, J.D., “Digital Control of a Coupled Fluidized-Bed Thermal Processing System for Tar Sands”, Fuel. Processirig Technol., 21, 1 (1989).
218.
219.
220.
221.
222.
223.
224.
225.
226.
227.
228.
229.
Bianco, A.D., Panariti, N., Anelli, M., Beltrame, P.L., and Carniti, P., “Thermal Cracking of Petroleum Residues”, Fuel, 72, 75 (1 993).
Z ou Renjun, Fiiridanientals of Pyrolysis iii Petrochemisfiy and Technology, CITIC Publishing House, Beijing, China (1 993).
Shabtai, J.S., Personal Communication, University of Utah, Salt Lake City, Utah (1994).
Altgelt, K.H., “Composition and Analysis of Heavy Petroleum Fractions”, Marcel-Dekker (1 994).
Khot, K.S., “Modelling a Coupled Fluidized-Bed Process for Extraction of Tar Sand Bitumen”, M.S. Thesis, University of Utah, Salt Lake City, Utah (1995).
Rao, S.S., Optiniizatio~i: III?eoiy aiidAyplicafions, Wiley Eastern Limited, New York (1 979).
Joshi, S.D., “A Review of Horizontal Well Technology”, JPT, 1302-1304 (Nov. 1991).
Jurgens, R. and Bitto, R., “Horizontal Drilling and Completions: A Review of Available Technology”, Pet. Engineer InlerriafionaI, 15-20 (Feb. 199 1).
Gust, D., “Horizontal Drilling Evolving from Art to Science”, Oil aid GasJ., 43-52 (July 1989).
Butler, R.M., “Thermal Recovery of Oil and Bitumen”, Prentice Hall: Englewood Cliffs, New Jersey (1 99 1).
“Steam and Additive Reservoir Simulator (STARS)-Gas, Solvent and Aqueous Additives, Version 95.00”, Computer Modeling Group, Calgary, Alberta, Canada (Fall 1994).
Edmunds, N.R., Haston, J.A., Best, D.A., “Analysis and Implementation of the Steam Assisted Gravity Drainage Process at the AOSTRA UTF”, Presented at the Fourth UNITAWUNDP Conference on Heavy Crude and Tar Sands, Edmonton, Alberta, Canada, August 1988, paper 125.
. - . .
1116
230.
231.
232.
233.
234.
235.
236.
237.
238.
239.
240.
241.
242.
243.
244.
245.
Sarkar, A., “Thermal Enhances Oil Recovery Processes Using a Combination of Vertical and Horizontal Well”, M.S. Thesis, University of Utah, Salt Lake City, (1993).
Closeman, P.J. and Smith, R.A., “Temperature Observations and Steam-Zone Rise in the Vicinity of a Steam-Heated Fracture”, Soc. Pet, Eiig. J., 575-586 (August 1983).
Campbell, J.A. and Ritzma, H.R., “Geology and Petroleum Resources of the Major Oil- Impregnated Sandstone Deposits of Utah”, Utah Geol. And Miner. Survey, Special Studies 50, p. 25 (1979).
Chung, K.-H. and Butler, R.M., “A Theoretical and Experimental Study of Steam-Assisted Gravity Drainage Process”, in R.F. Meyers and E.J. Wiggins (Editors), The Fourth UNITAR/UNDP International Conf On Heavy Crude and Tar Sands, Vol. 4: In-situ Recovery, AOSTRA, Edmonton, p. 191 -2 10 (1 988).
DeBiase, R. and Elliott, J.D., Hydrocarbon Processing, 99 (May 1982).
Allan, D.w., Metrailer, W.J., and King, R.C., Chen7. E r g Prow., 49 (Dec. 1981).
Heck, R.H., Rankel, L.A., and DiGuiseppi, F.T., Fuel Proc. Technol., 30, 69 (1 992).
Heck, R.H. and DiGuiseppi, F.T., Prprnl. Am. Chenr. Soc. Div. Pel. (Them., 38, 41 7 (1 993).
Speight, J.G., Fiiels Science arid Techiiology Hamibook, Marcel Dekker, New York (1 990).
Beaton, E.I. and Bertolacini, R.J., Clczkd. Rev,-,S‘ci. Eiig. 33(3&4), 281 (1991).
Quann, R.J., Ware, RA., Hung, C., and Wei, J., Adv0rice.s iii Chemic01 Eiigiiieeriiig 14, 95 (1988).
McColgan, E.C. and Parsons, B.I., ( h i . Miiies. Br. Res. Rep., R-253 (1972).
Dewind, N., Plantenga, F.L., Heineman, J.J.L. and Homan Free, N.W., Appl. Catal., 43, 239 (1988).
Kim, J.W., “Catalytic and Thermal Effects in the Upgrading of Bitumen-Derived Heavy Oils”, Ph.D. Dissertation, University of Utah, Salt Lake City, Utah (1 995).
Ho, T.C., Cnfal. Rev.-Sci. Eng., 30, 117 (1988).
Longstaff, D.C., Deo. M.D., and Hanson, F.V., Fiiel, 73(9), 1523 (1 994).
1117
246. Strausz, O.P., Prprnt. Am. Chem. SOC. Div. Pet. Chem., 38, 417 (1989).
247. Trytten, L.C., Gray, M.G., and Sanford, E.C., hid. E i g (:hem. Res., 29(5), 725 (1990).
248. Longstaff, D.C., Deo, M.D., and Hanson, F.V., FhZ, 73, 1523 (1994).
249. Schuit, G.C.A. and Gates, B.C.. AIChEJ., 19(3), 417 (1973).
250. Homan-Free, H. and Lovink, H.J., Erdoel Kohle, 40,346 (1987).
25 1. Reynolds, J.G., Lipid Fuels Techtiol., 3, 73 (1 985).
252. Tsai, C.H., Deo, M.D., Hanson, F.V., and Oblad, A.G., F h l Sci. Technol. Itif., 9, 1259, (1991).
253. Flinn, R.A., Larson, O.A., and Beuther, H., Prprtif. Am. (Them., 7, 165 (1962).
254. Mosby, J.F., Butte, R.D., Cox, J.A., and Nickolaides,k C., Chem. Eiig. Sci., 41(2), 989 (1986).
255. Riley, K.L., Prprnf. Am. Chem. SOC. Dhr Pel. Chem., 23, 1104, (1978).
256, Absi-Halabi, M., Stanislaus, A., and Trimm, D.L., Appl. Cafal., 72, 193 (1991).
257. Longstaff, D.L., Balaji, G., Kim, J., Kwak, S., Tsai, C.H., and Hanson, F.V., Proceedings of the 6"' UNlTAR International Conference on Heavy Crude and Tar Sands, Houston, Texas, Vol. E, p. 427 (1995).
258. Miki, Y., Yamadaya, S., Oba, M., and Suggimoto, Y., J Cat& 83, 371 (1983).
259. Sanford, E.C. and Chung, K.H., AOSTRA J. Res., 7,37 (1991).
260. Bianco, A.D., Panariti, N., Anelli, N., Beltrame, P.L., and Carniti, P., FkZ, 72, 75 (1993).
261. Khorasheh, F., Rangwala, H., Gray, M.R., and Dalla Lana, I.G., Eiiergy &- F~rels, 3, 716 (1 989).
262. Miale, J.N., Chen, N.Y., and Weisz, P.B.,J. Catal., 61, 390 (1966).
263. Weisz, P.B. and Miale, J.N., J. (Talnl., 4, 527 (1965).
264. Pines, H., J. Catal., 78, 1 (1982).
1118
265. Longstaff, D.C., Personal communication (July 1996).
266. Gray, M.R., Khorasheh, F., Wanke, S.E., Achia, U., Krzywrcki, A, Sanford, E., O.K.Y. Sy and M. Ternan, Energy Ce Fuels, 6 , 478 (1 992).
267. Gray, M.R., Ayasse, A.R., Chan, E.W., and Velijkovic, M., Energy &F~iels, 9, 500 (1995).
268. Asaoka, S., Nakata, S., Shiroto, Y., and Takeuchi, C., hid. Eng. Chent. Proc. Des. Des. 22, 242 (1983).
269. Houlla, M., Broderick, D.H., Sapre, A.V., Nag, N.K., de Beer, V.H.J., Gates, B.C., and Kwart, H., J . Calal., 61, 523 (1980).
270. Takeuchi, C., Asaoka, S., Nakata, S., and Shiroto, T., ACSPrepr. Dhr Petrol. Cheni., 30, 96 (1985),
271. Speight, J.G., Proceedings of the 199 1 Eastern Oil Shale Symposium, Lexington, Kentucky, pp 17-33 (1991).
272. Komatsu, S., Hori, Y., and Shimizu, S., Hydro. Proc., 64(5), 42 (1985).
273. Nakata, S., Shimizu, S., Asaoka, S., Shiroto, Y., and Fukui, Y., Prpriifs. Ant. Chem. SOC. Div. Pet. Chm., 32, 477 (1 987).
274. Dabkowski, ,M.J., Shin, S.S. and Albison, K.R., AIChE LSynip.Ser., 87, 53 (1 99 1).
275. Gollakota, S.V., Guin, J.A. and Curtis, C.W., hid. Eug. Cheni. Proc. Des. Dei)., 24, 1148 (1985)..
276. Eccles, R.M., Fire1 Proc. Techriol., 35, 2 1 (1 993).
277. Gray, M.R., AOSTRA J. Res., 6, 185 (1 990).
278. Aboul-Gheit, A.K., Ant. Chew. Soc. Dhz Pet. Chent., 32, 278 (1987).
279. Hung, C.W. and Wei, J., h i d . Erg. Clheni. Proc. Des. Dei?. 19, 250 (1980).
280. Agrawal, R. and Wei, J., hid Eng. G e m . Proc. Des. Dei)., 23, 505 (1984).
281. Ware, R.A. mid Wei, J., J. Catal., 93, 100 (1985).
282. Sanford, E. C., Energy & Fuels, 9, 549 (1 995).

1119
Lepage, J.F., Morel, F., Trassard, A.M., and Bousquet, J., A C S Prprii1.s. Div. Pel. Chem., 32(2), 470 (1987).
283.
284. McColgan, E.C., Soutar, P.S., Denis, J.M., and Parson, B.I., Ccrit. Miiies Br. Res. Rep, R- 261 (1 973).
285. Koseoglu, R.O. and Phillips, C.R., Ftrel, 67, 1201 (1988).
286. Henderson, J.H. and Weber, L.J., Can. Pet. Tech., 206 (1965).
287. Howell, R.L., Hung, C.W., Gibson, K.R., and Chen, H., “Catalyst Selection Important for Residuum Hydroprocessing”, Oil Gas .I., 83(30), 121 (1985).
288. LePage, J.F., Morel, F., Trassard, A.M., and Bousquet, J., ACT Prep-. Div. Petrol. Chem., 32(2), 470 (1987).
289. Tsai, C.H., Longstaff, D.C., Deo, M.D., Hanson, F.V., and Oblad, A.G., “Characterization and Utilization of Hydrotreated Products from the Whiterocks (Utah) Tar Sand Bitumen- Derived Liquid”, Ftrel, 71, 1473 (1992).
290. Tsai, C.H., Longstaff, D.C., Deo, M.D., Hanson, F.V., and Oblad, A.G., “Potential of Jet Fuels from Utah Tar Sand Bitumens and Bitumen-Derived Liquids”, Am. Chem. Soc. Dhz Pet. Chem., 37(2), 521 (1 992).
291. Ho, T.C. and Ark, R.,AIChEJ., 33(6), 1050 (1987).
292. Longstaff, D.C., Ph.D. Dissertation, University of Utah, Salt Lake City, Utah (1 992).
293. Ohtsuka, T., Catal. Rev. Sei. Eiig., 16, 291 (1977).
294. Yeh, T., Ph.D. Dissertation, University of Utah, Salt Lake City, Utah (1 997).
295. Boduszynski, M.M., Energy mid Fiiels, 2, 592 (1 988).
296. Eyring, H., Ann. Rev. Phys. Chem., 28, 1 (1977).
297. Schucker, R.C. and Keweshan, C.F., Am. Chem. SOC. Div. Fuel. Chem. Prep., 25(3), 155 (1980).
298. Longstaff, D.C., private communication (1 995).
299. Larson, O.A. and Beuther, H. Preiiriit. Am. (:hem. SOC. Div. Pet. (:hem., 11, B95 (1966).
1120
300.
301.
302.
303.
3 04.
305.
306.
3 07.
308.
309.
3 10.
311.
3 12.
3 13.
3 14.
315.
3 16.
3 17.
318.
3 19.
Lakshmanan, C.C. and White, N., Eiiergv d- Fiiels, 8, 11 58 (1 994).
Geneste, P., Amblad, P., Bonnet, M., and Graffin, P., J. (bful., 61, 115 (1980).
Houlla, M., Nag, N.K., Sapre, A.V., Broderick, D.H., and Gates, B.C., AIChE J., 24, 10 15 (1 978).
Dalay, F.P., J. Catal., 42, 467 (1976).
Dautzenberg, F.M. and DeDekeu, J.C., ACS Prepr. Dhz Petrol., Cheni., 30, 8 (1985).
Hung, C.W. and Wei, J., Id. Eng. Chem. Process Des. Dev., 19, 257 (1980).
Agrawal, R. and Wei, J., Ind. Eng. Chem. Process Des. Dev., 23, 505, 515 (1984).
Ware, R.A. and Wei, J., J. Catal., 93, 100, 120, 135 (1 985).
Constable, F.H., Proc. Roy. SOC. Loiidoii Sei-. A., 108, 355 (1925).
Galway, A.K., J. Cafal., 84, 270 (1983).
Schwab, G.-M., J. Catal., 84, 1 (1983).
Voltz, S.E., Nace, D.M., and Weekman, V.W. Jr., Iiid. Eng. Chent. Process Des. Develop., 10(4), 538 (1971) and Weekman, V.J. Jr., AIChEMoiiogr. Ser., 75(11) (1979).
Yui, S.M., AOSTRA J. Res., 5 2 1 1 (1989).
Yui, S.M. and Sanford, E.C., Itid Erig Cheni. Res., 28, 1278 (1989).
Speight, J.G., “The Desulhrization of Heavy Oils and Residue”, Marcel Dekker, New York (1 98 1).
Gray, M.R., “Upgrading Petroleum Residues and Heavy Oil”, Marcel Dekker, New York (1 994).
McConville, L.B., Min. Eng., 27( l), 19-38 (1.975).
Schuetze, B. and Hofman, H., Hydro. Process., 63(2), 75 (1 984).
Murphy, J.R., Whittington, E.L., and Chang, C.P., Hydro. Process., 58(9), 119 (1979).
Topsoe, H., Clausen, B.S., and Massoth, F.E., “Hydrotreating Catalysis”, Springer-Verlag

320.
321,
322.
323.
324.
325.
326.
327.
328.
329.
330.
331.
332.
333.
334.
335.
336.
337.
1121
Berlin Heidelberg, New York, 15 (1 996).
Wei, J., “In Catalyst Design: Progress and Perspectives”, Heges, L.G. Ed., Wiely, New York (1 988).
Nakata, S., Shimizu, S., Asaoka, S., Shiroto, Y., and Fukui, Y., Prprnts. Ant. Chent. SOC. Div. Pet. Chem., ACS, 32,477 (1987).
Wei, J., “In Catalyst Design: Progress and Perspectives”, Hegedus, L., Ed., Wiley, New York, 245 (1988).
Syncrude Canada Ltd., Syncrude Analytical Methods for Oil Sand and Bitumen Processing- Method 5.4”, 1’’ ed., AOSTRA, Edmonton, Alberta (1979).
Tsai, C.H., Massoth, F.E., Lee, S.Y., and Seader, J.D., FkeIProc. Tech., 29, 153 (1991).
Topsoe, H., Clausen, B.S., and Massoth. F.E., “Hydrotreating Catalysis”, Springer-Verlag Berlin Heidelberg, New York, 3 (1996).
DeDrago, G., Guitian, J., Krasuk, J., Larrauri, J., Marzin, R., Silva, F., Solari, B., Prprnt. Ant. Chent. SOC. Div. Pet. Chem., 35, 584 (1990).
Ho, T.C., AIChE J., 42( l), 2 14 (1 996).
Ho, T.C., Chem. Eng. Science, 46( l), 28 1-289 (1 99 1).
Ocone, R., and Astarita, G., AIChEJ., 39(2), 288 (1993).
Ho, T.C. White, B.S., and Hu, R., AIChEJ., 36(5), 685, (1990).
Ark, R., AIChEJ., 35(4), 539, (1989).
Chou, M.Y, and Ho, T.C., AIChEJ., 35(4), 533 (1989).
Astarita, G. and Ocone, R., AIChE.I.,34(8), 1299 (1988).
Chou, M.Y. and Ho, T.C., AIChE J., 34(9), 15 19 (1 988).
Ozaki, H., Satomi, Y., Hisamitsu, Iir Proc. WorId Pet. Gong 6 PD, 18(4), 97 (1976).
Ho, T.C. and White, B.S., AIChEJ., 41(6), 1513 (1995).
Braun, R.L. and Burnham, A.K., Eiiergy Fziels, 1, 153-1 61 (1 987).

1122
338. Liliedahl, T. and Sjostrom, K., AIChEJ., 40(9), 15 15 (1994).
339. Lakshmanan, C.C. and White, N., Energy Fiiels, 5, 110-1 17 (1991).
340. Miura, K., Energy Fuels, 9, 302-307 (1 995).
341. Abramowitz, M. and Stegun, LA., Eds., Handbook: of Mathematical Fimcfioris, Dover Publications, New York, 923-925 (1 970).
342. Kwak, S.W., Ph.D. Dissertation, University of Utah (1994).
343. Eyring, H., Joiiriial qf Chemical Physics, 283 (1936).
344. Kincaid, J.F., Eyring, H., and Stearn, A.L., (?hem. Revs., 28, 301-365 (1941).
345. Brodkey, RS., Transport Phenomena: A lJnifed Approach, McGraw Hill, New York, 736 (1988).
346. DeJong, K.P., Ind. Chem. Res. 33, 821 (1994).
347. Mosby, J.F., Buttke, R.D., Cox, J.A., and Nikolaides, C., Chemicnl Eiigimeriiig Science, 41(4), 989 (1986).
348.
349.
350.
Sanford, E.C., Ind. Eng. Chem. Res., 33, 109 (1994).
Kennepohl, D. and Sanford, E., Enera Firels, 10, 229-234 (1 996).
Furimsky, E. and Massoth, F.E., Cafalyst Todoy, 17(4), 537-660 (1993).
351. Ignasiak, T.M., Bimer, J., Samman, N., Montgomery, O.P., and Strausz, D.S., Prep.-Am. Chem. SOC. Div. Pet. Chem., 24(4), 1001 (1979).
1123
APPENDIX A
WHITEROCKS OIL SAND DEPOSIT BIBLIOGRAPHY
Ball Associates, La., 1964, Surface and Shallow Oil-Impregnated Rocks and Shallow Oil Fields in the United States, U.S. Bureau of Mines, Monograph 12.
Ball, D., Marchant, L.C., and Goldburg, A., 1982, The IOCC Monograph Series: Tar Sands, Interstate Oil Compact Commission, Oklahoma City, Oklahoma.
Barb, C.F., 1942, Rubber from the Uinta Basin of Utah, Mines Magazine 32, #lo, 521-524.
Barb, C.F., and J.O. Ball, 1944, Hydrocarbons of the Uinta Basin of Utah and Colordo, Quarterly, Colorado School of Mines 39, #1, 115 p.
Bukka, K., Miller, J.D., Hanson, F.V., and Oblad, A.G., 1991, Mineral Matter Distribution during the Hot Water Processing of Utah Tar Sand, AOSTRA J. Res. 2, 101-109. ;
Campbell, J.A., and H.R. Ritzma, 1976, Structural Geology and Petroleum Potential of the South Flank of the Uinta Mountain Uplift [abstract], Amer. Assoc. Petrol. Geol., Bull. a, 1392-1393.
Cashion. W.B., 3r., 1964, Other Bituminous Substances, Utah G a l . Miner. Survey, Bull. a, 63-70, Mineral and Water Resources of Utah.
Cha, S., 1991, Pyrolysis of the Whiterocks Tar Sand in a rotary Kiln Reactor, Ph.D. Dissertation, University of Utah, Salt Lake City, Utah.
Cha, S., Longstaff, D.C., Hanson, F.V., and Oblad A.G., 1991, Pyrolysis of Bitumen Impregnated Sandstones, A Comparison of Fluidized - Bed and Rotary Kiln Reactors, Proc. 199Q
stem 0 il Shale Symp,, 13 6- 145.
Cha, S., Longstaff, D.C., Hanson, F.V., and Oblad, A.G., 1991, Pyrolysis of Bitumen Impregnated Sandstones, A Comparison of Fluidized-Bed and Rotary-Kiln Reactors, FUEL 3, 1357-1361.
Covington, R.E., 1963, Bituminous Sandstone and Limestone Deposits of Utah, Utah Ga l . Miner. Survey, Bull. 54, 225-247.
Covington, R.E., 1964, Bituminous Sands with Viscous Crude Oils, Brigham Young University, First Intermtn. Symp. Fossil Hydrocarbons, 364-374.
Covington, R.E., 1964, Bituminous Sandstone in the Uinta Basin, Intermtn. Assoc. of Petrol. Geol., 13th Annual Field Conference, 227-242.

1124
Covington, R.E., 1964, Thermal Recovery May Bring Industry's Quiet Revolution, Oil & Gas J. @, #47, 112-118.
Covington, R.E., 1965, Some Possible Applications of Thermal Recovery in Utah, J. Petrol. Tech. 17, #11, 1277-1284.
Deo, M.D., and Hanson, F.V., 1993, Asphaltene Precipitation: A Need for a Broader View, SPE 25193.
Deo, M.D., Hwang, J., and Hanson, F.V., 1993, The Effect of Cosolubilizing Lighter Components on the Asphaltene Content of Heavy Oils, Fuel Proc. Tech. 34, 217-228.
Deo, M.D., Hwang, J., and Hanson, F.V., 1992, Supercritical Fluid Extraction of a Crude Oil, Bitumen-Derived Liquid and Bitumen by Carbon Dioxide and Propane, FUEL 21, 1519-1526.
Dorius, J.C., 1985, The Pyrolysis of Bitumen Impregnated Sandstone from the PR Spring (Utah) Deposit in a Fluidized Bed, Ph.D. Dissertation, University of Utah, Salt Lake City, Utah.
Drelich, J., 1993, The Role of Wetting Phenomena in the Hot Water Process for Bitumen Recovery from Tar Sand, Ph.D. Dissertation, University of Utah, Salt Lake City, Utah.
Drelich, J., Hanson, F.V., Hupka, J, and Miller, J.D., 1993, Water Recycle in Moderate- Temperature Bitumen Recovery from Whiterocks Tar Sands, AOSTRA J. Res, in press.
Drelich, J., and Miller, J.D., 1993, Surface/Interfacial Tension of the Whiterocks Bitumen and its Relationship to Tar Sand Processing, Proc. 1997. Fastern Oil Shale Symp,, 265-275.
Fletcher, J.V., Deo, M.D., and Hanson, F.V., 1993, Fluidized Bed Pyrolysis of Bitumen- Impregnated Sandstone at Sub-Atmospheric Conditions, Proc. 1992 Fastern Oil Shale S y w , 247-256.
Hanson, F.V., Dorius, J.C., Utley, J.K., and Van Nguyen, T., 1992, The Application of Compound-Type Analyses to the Correlation of Product Distributions and Yields from the Fluidized-Bed Pyrolysis of Oil Sands, FUEL Z, 1365-1372.
Hunt, J.M., F. Stewart, and P.A. Dickey, 1954, Origin of Hydrocarbons of Uinta Basin, Utah, Amer. Assoc. Petrol. Geol., Bull. 38, #8, 1671-1698.
Hupka, J., Drelich, J., Miller, J.D., White, R.R., Hanson, F.V., and Oblad, A.G., 1991, Impact of Water Recycle on Water-Based Processing of Whiterocks Tar Sand, Proc. 1990 Easte rn Oil Shale Symp,, 39-44.
Hupka, J., Drelich J., Miller, J.D., White, R.R., Hanson, F.V., and Oblad, A.G., 1991, Impact
1125
of Water Recycle on Water-Based Processing of Whiterocks Tar Sand, FUEL 3, 1313-1316.
Hwang, J., 1993, Application of Supercritical Fluid Extraction to the Recovery and Upgrading of Oil Sands, Ph.D. Dissertation, University of Utah, Salt Lake City, Utah.
Keefer, T.N., and McQuivey, R.S., 1979, Water Availability for Development of Major Tar Sands Areas in Utah, U.S. Department of Energy, Final Report LETC-0013-1, 228 pp.
Kinney, D.M., 1951, Geology of Uinta River and Brush Creek-Diamond Mountain Areas, Duchesne and Uinta Counties, Utah, U.S. Geol. Survey, Bull. 1007, Map.
Kuuskra, V.V., and Hammershaimb, V.A., eds., 1984, The IOCC Monograph Series: Major Tar Sand and Heavy Oil Deposits of the United States, Interstate Oil Compact Comm., Oklahoma City, Oklahoma.
Kwak, S., Longstaff, D.C., Deo, M.D., and Hanson, F.V., 1993, Hydrotreating Process Kinetics for Bitumen and Bitumen-Derived Liquids, Proc. 1992 Easte rn Oil Shale Symp,, 208-215.
Longstaff, D.C., 1992, Hydrotreating the Whiterocks Oil Sand Bitumen and Bitumen-Derived Liquid, Ph.D. Dissertation, University of Utah, Salt Lake City, Utah.
Longstaff, D.C., Deo, M.D., Hanson, F.V., Oblad, A.G., and Tsai, C.H., 1992, Hydrotreating the Bitumen-Derived Hydrocarbon Liquid Produced in a Fluidized Bed Pyrolysis Reactor, FUEL a, 1407-1419.
Longstaff, D.C., Deo, M.D., and Hanson, F.V., 1993, Hydrotreating the Bitumen from the Whiterocks Oil Sand Deposit, Roc. 199 2 Easte m Oil Shale Symp,, 199-207.
Oblad, A.G., Bunger, J.W., Hanson, F.V., Miller, J.D., Ritzma, H.R., and Seader, J.D., 1987, Tar Sand Research and Development at the University of Utah. Ann. Rev. Energy. 12, 283-356.
Peterson, P.R., 1985, The Whiterocks Tar Sand Deposit, Utah Geolog. Assoc., Publ. 12, 243- 252.
Pruitt, R.G., Jr., 1961, The Mineral Resources of Uintah County, Utah Geol. Miner. Survey, Bull. a, 101 pp.
Resnick, B.S., Dike, D.H., English, L.M. 111, and Lewis, A.G., 1981, Evaluation of Tar Sand Mining, Volume 1 - An Assessment of Resources-Amenable to Mine Production: U.S. DOE, Final Report, DOE/ET/30201-1.
Ritzma, H.R., 1968, Preliminary Location Map Oil - Impregnated Rock Deposits of Utah, Utah G a l . Miner. Survey, Map No. 25, 1 pg.

1126
Ritzma, H.R., 1973, Oil-Impregnated Rock Deposits of Utah, Utah Geol. Miner. Survey, Map No. 33, 2pp.
Ritzma, H.R., 1979, Oil-Impregnated Rock Deposits of Utah, Utah Geol. Miner. Survey, Map No. 47, 2pp.
Sung, S.H., 1988, The Fluidized Bed Pyrolysis of Bitumen-Impregnated Sandstone in a Large Diameter Reactor, M.S. Thesis, University of Utah, Salt Lake City, Utah.
Tsai, C.H., Deo, M.D., Hanson, F.V., and Oblad, A.G., 1991, Characterization and Potential Utilization of Whiterocks (Utah) Tar Sand Bitumen, Fuel Sci. Tech. Int. 9, 1259-1286.
Tsai, C.H., Deo, M.D., Hanson, F.V., and Oblad, A.G., 1992, Characterization and Potential Utilization of Whiterocks Tar Sand Bitumen 11. Pyrolysis Man Spectrometry and Nuclear Magnetic Resonance Analyses, Fuel Sci. Tech. Int. J-Q, 1437-1459.
Wang, J., 1983, The Production of Hydrocarbon Liquids from a Bitumen-Impregnated Sandstone in a Fluidized Bed Pyrolysis Reactor, M.S. Thesis, University of Utah, Salt Lake City, Utah.
Wang, J., Hanson, F.V., Obald, A.G., 1983, The Fluidized Bed Pyrolysis of the Bitumen- Impregnated Sandstone from the Whiterocks (Utah) Deposit, Prpmt. AICHE Symp. Adv. Tar Sand Tech., Denver, Colorado, August 1983.
1127
APPENDIX B
ASPHALT RIDGE OIL SAND DEPOSIT BIBLIOGRAPHY
Abraham, H., 1969, Asphalts and Allied Substa ncg, 6th Edition, 5 Volumes, D. Van Nostrand Co., Inc., Princeton, New Jersey.
Alford, H.E., and Derby, R.E., 1981, Utah Tar Sands to be Developed, Hydrocarbon Proc. a, #6, 127-130.
Anonymous, 1974, Fairbrim & Arizona Fuels to Begin Oil Sands Recovery Tests on Sohio Property in Utah, Synthetic Fuels, September.
Anonymous, 1981, Sohio Slates Tar Sands Pilot Plant in Utah, Oil & Gas J., a, #3, 42-43.
Ball, D., Marchant, L.C., and Goldburg, A., 1982, The IOCC Monograph Series: Tar Sands, Interstate Oil Compact Comm., Oklahoma City, Oklahoma.
Ball, M.W., 1951, Oil-Impregnated Strippable Deposits in Utah, May 22, 1950, U.S. BuMines, The Synthetic Liquid Fuel Potential of Utah, Appendix D, p. 1-18.
Ball Associates, Ltd., 1965, Surface and Shallow Oil-Impregnated Rocks and Shallow Oil Fields in the United States, U.S. Bureau of Mines, Monograph 12, 375 p.
Barb, C.F., 1942, Rubber from the Uinta Basin of Utah, Mines Magazine 32, #lo, 521-524.
Barb, C.F., 1944, Hydrocarbons o f t he Uinta Basin of Utah a nd Colorado , Review of Geology and Field Work, Colorado School of Mines, Quarterly, Colorado School of Mines, 39, #1, 115.
Barb, C.F., and Ball, J.O., 1944, Hydrocarbons of the Uinta Basin of Utah and Colordo, Quarterly, Colorado School of Mines, 39, #l.
Barbour, R.V., Dorrence, S.M., Vollmer, H., and Harris, J.D., 1976, Pyroloysis of Utah Tar Sands--Products and Kinetics, Amer. Chem. SOC., Div. Fuel Chem. 21, (6), 278-289.
Bunger, J.W., 1974, Characterization of a Utah Tar Sand Bitumen, Amer. Chem. SOC., Div. Fuel Chem. fi (2), 231-241, Shale Oil, Tar Sands and Related Fuel Sources, T. F. Yen P I , Adv. Chem. Ser. El., c. 10, 121-136.
Bunger, J.W., 1974, Characterization of a Utah Tar Sand Bitumen, Amer. Chem. SOC., Div. Fuel Chem. fi (2), 231-241, Shale Oil, Tar Sands and Related Fuel Sources, T. F. Yen [Ed], Adv. Chem. Ser. El., c. 10, 121-136, 1976.
1128
Bunger, J.W., Cogswell, D.E., and Oblad, A.G., 1978, Thermal Processing of a Utah Tar Sand Bitumen, Canadian Institute of Mining and Metallurgy, CIM Special E- Proceedings of the Canada-Venezuela Oil Sands Symp.-D, 178-1 82.
Bunger, J.W., Cogswell, D.E., and Oblad, A.G., 1979, Catalytic Cracking of Asphalt Ridge Bitumen, Amer. Chem. SOC., Refining of Synthetic Crude Oils, Adv. Chem. Ser. 179, 67-84.
Campbell, J.A., and Ritzma, H.R., 1976, Structural Geology and Petroleum Potential of the South flank of the Uinta Mountain Uplift [Abstract], Amer. Assoc. Petrol. Geol., Bull. a, 1902- 1393.
Campbell, J.A., and Ritzma, H.R., 1979, Geology and Petroleum Resources of the Major Oil- Impregnated Sandstone Deposits of Utah, Utah Geol. and Miner. Survey, Special Studies 50, 25 PP.
Campbell, J.A., and Ritzma, H.R., 1979, Geology and Petroleum Resources of the Major Oil- Impregnated Sandstone Deposits of Utah, U.N. Inst. for Training and Research, First Internat. Conf. on the Future of Heavy Oil and Tar Sands, (UNITAR), June 4-12, 1979, Edmonton, Alberta, Canada.
Cashion, W.B., Jr., 1964, Other Bituminous Substances, Utah G a l . and Miner. Survey Bull, 73, Mineral and Water Resources of Utah, 63-70.
Covington, R.E., 1957, The Bituminous Sandstones of the Asphalt Ridge Area, Northeastern Utah, Intermtn. Assoc. Petrol. Geol., 8th Ann. Field Confer., 172-175.
Covington, R.E., 1963, Bituminous Sandstone and Limestone Deposits of Utah, Utah Geol. Miner. Survey, Bull. 54, 225-247.
Covington, R.E., 1964, Bituminous Sands With Viscous Crude Oils, Brigham Young University, First Intermtn. Symp. on Fossil Hydrocarbons, 364-374.
Covington, R.E., 1964, Bituminous Sandstone in the Uinta Basin, Intermtn. Assoc. Petrol. Geol. 13th Ann. Field Conf., 227-242.
Covington, R.E., 1964, Thermal Recovery May Bring Industry's Quiet Revolution, Oil & Gas J. 62, #47, 112-118.
Covington, R.E., 1965, Some Possible Applications of Thermal Recovery in Utah, J. Petrol. Tech. 17, #11, 1277-1284.
Covington, R.E., and McDonald, R.L., 1965, Stratigraphic and Structural Controls of Bituminous Sandstone Deposits in Utah [Abstract], Amer. Assoc. of Petrol. Geol., Bull. @, #9, 1577.
1129
Covington, R.E., and Young, K.J., 1985, Brief History and Recent Developments in Tar Sand Deposits of Uinta Basin, Utah Gal . Assoc. Publication 12, Geology and Energy Resources, Uinta Basin of Utah, 227-242.
Dyni, J.R., and Goodwin, J.C., 1972, American Assoc. of Petroleum Geologists Field Trip Roadlog- Vernal, Utah to Rio Blanco, Colorado, Rocky Mountain Assoc. of Geol., Intermtn. Geol. 4, #2-3, 115-134.
Eldridge, G.H., 1901, Asphalt and Bituminous Rock Deposits, U.S. Geol. Survey, Ann. Report 22, 361-364.
Erickson, R.L., Myers, A.T., and HOK, C.A., 1954, Association of Uranium and Other Metals with Crude Oil, Asphalt, and Petroliferous Rock, Amer. Assoc. Petrol. Geol., Bull. 38, #lo, 2200-22 18.
Hills, R.C., 1985, Description of an Asphalt-Like Mineral from Asphalt Wash, Utah, Colorado Sci. SOC., Proc. 2, part 1, 27-28.
Hunt, J.M., Stewart, F., and Dickey, P.A., 1954, Origin of Hydrocarbonsof Uinta Basin, Utah, Amer. Assoc. Petro. Geol., Bull. 3, #8, 1671-1698.
Hupka, J., and Miller, J.D., 1991, Temperature Water-Based Bitumen Recovery from Tar Sand, FUEL x, 1308-1312.
Hupka, J., and Miller, J.D., 1991, Electrophoretic Characterization and Processing of Asphalt Ridge arid Sunnyside Tar Sands, Internat., J. Miner. Proc. 3, 217-231.
Kayser, R.B., 1966, Bituminous Sandstone Deposits Asphalt Ridge, Utah Geol. Miner. Survey, Special Studies 19, 62 pp.
Keefer, T.N., and McQuivey, R.S., 1979, Water Availability for Development of Major Tar Sands Areas in Utah, U.S. DOE, Final Rept. LETC-0013-1, 228 p.
Kinney, D.M., 1955, Geology of Uinta River and Brush Creek-Diamond Mountain Areas, Duchesne and Uinta Counties, Utah, U.S. Geol. Survey, Bull. 1007.
Kuuskra, V.V., and Hammershaimb, V.A., eds., 1984, Major Tar Sand and Heavy Oil Deposits of the United States, Interstate Oil Compact Comm., Oklahoma City, Oklahoma.
Lowe, R.M., 1976, The Asphalt Ridge Tar Sand Deposits, AIChE Symp. Ser. 72, #155, 55-60.
Mauger, R.L., Kayser, R.B., and Gwynn, J.W., 1973, A Sulfur Isotopic Study of Uinta Basin Hydrocarbons, Utah Geol. Miner. Survey, Special Studies 41, 17 p.
...
1130
Oblad, A.G., Seader, J.D., Miller, J.D., and Bunger, J.W., 1976, Recovery of Bitumen from Oil-Impregnated Sandstone Deposists of Utah, AIChE, Oil Shale and Tar Sand Symp., AIChE Symp. Sec. JX (72), 69-78.
Oblad, A.G., Seader, J.D., Miller, J.D., Bunger, J.W., and Cogswell, D.E., 1977, Recovery of Oil from Utah's Tar Sands, NTIS Report PB-294-680.
Oblad, A.G., Bunger, J.W., Hanson, F.V., Miller, J.D., Ritzma, H.R., and Seader, J.D., 1987, Tar Sand Research and Development at the University of Utah, Ann. Rev. Energy. 12 283-356.
Pruitt, R.G., Jr., 1961, The Mineral Resources of Uinta County, Utah Ga l . Miner. Survey, Bull. - 71, 101 p.
Resnick, B.S., Dike, D.H., English, L.M., 111, and Lewis, A. G., 1981, Evaluation of Tar Sand Mining, Volume 1 - An Assessment of Resources Amenable to Mine Production: U.S. DOE, Final Report DOE/ET/30201-1.
Ritzma, H.R., 1968, Preliminary Location Map Oil - Impregnated Rock Deposits of Utah, Utah Geol. Miner. Survey, Map No. 25, 1 pg.
Ritzma, H.R., 1973, Oil-Impregnated Rock Deposits of Utah, Utah Geol. Miner. Survey, Map No. 33, 2pp.
Ritzma, H.R., 1974, Asphalt Ridge, Structure, Stratigraphy, and Oil-Impregnated Sands, Utah Geol. Assoc., Publication 4, 60.
Ritzma, H.R., 1979, Oil-Impregnated Rock Deposits of Utah, Utah Geol. Miner. Survey, Map No. 47,2pp.
Shea, G.B., and Higgins, R.V., 1952, Separation and Utilization Studies of Bitumens from Bituminous Sandstones of the Vernal and Sunnyside, Utah Deposits, U.S. BuMines ROI 4871.
Sinks, D.J., 1985, Geologic Influence on the In-Situ Process of Tar Sand at the North West Asphalt Ridge Deposit, Utah, U.S. DOE, Report No. AD-89-F-0-026-0.
Smith, R.J., 1980, Asphalt Ridge Tar Sands, Flotation Behavior and Process Design, M.S. Thesis, University of Utah, Salt Lake City, Utah.
Smith, R.J., and Miller, J.D., 1981, Flotation Behavior of Digested Asphalt Ridge Tar Sands, Mining Eng. 32, 1719-1724, Discussion of Article, 34, 1598.
Speiker, E.M., 1931, Bituminous Sandstone Near Vernal, Utah, U.S. Geol. Survey, Bull. 822-C, 77-100.

. L.
1131
Stone, G.H., 1891, Note on the Asphaltum of Utah and Colorado, Am. J. Sci. 142, 148-159.
Tsai, C.H., Deo, M.D., Hanson, F.V., and Oblad, A.G., 1993, Characterization and Potential Utilization of the Asphalt Ridge Tar Sand Bitumen I. Gas Chromatography - Mass Spectrometry and Pyrolysis - Mass Spectrometry Analysis Fuel Sci. Tech. Int'l. 11, 475-506.
U.S. Bureau of Land Management, 1986, Proposed Leased Conversion for Sohio Within the Asphalt Ridge Special Tar Sand Area, U.S. Department of Interior.
Untermann, G.E., and Untermann, B.R., 1964, Geology of Uinta County, Utah Geol. Miner. Survey, Bull. 22, 112 pp.
Walton, P.T., 1944, Geology of the Cretaceous of the Uinta Basin, Utah, Geol. SOC. Amer., Bull. 55, 91-130.
Wenger, W.J., Hubbard, R.L., and Whisman, M.L., 1952, Separation and Utilization Studies of Bitumens from Bituminous Sandstones of the Vernal and Sunnyside, Utah Deposits, U.S. BuMines, ROI 4871, Part 11, Analytical Data on Asphalt Properties and Cracked Products of the Separated Bitumens.
Wolfgramm, R.P., 1978, Asphalt Ridge Tar Sands Characterization, Honors Degree Thesis, University of Utah, Salt Lake City, Utah.
Wood, R.E., and Ritzma, H.R., 1972, Analyses of Oil Extracted from Oil-Impregnated Sandstone Deposits in Utah, Utah Geol. and Miner. Survey, Special Studies 39, 19 pp.

1132
APPENDIX C
PR SPRING OIL SAND DEPOSIT BIBLIOGRAPHY
Abraham, H., 1960, Asphalts and Allied Substances, 6th Edition, 5 volumes, D. Van Nostrand Co., Inc., Princeton, New Jersey.
Ball, D., Marchant, L.C., and Goldburg, A., 1982, The IOCC Monograph Series: Tar Sands, Interstate Oil Compact Commission, Oklahoma City, Oklahoma.
Ball, M.W., 1951, Oil-Impregnated Strippable Deposits in Utah, May 22, 1950, U.S. BuMines, The Synthetic Liquid Fuel Potential of Utah, Appendix D, 1-18.
Barbour, R.V., Dorence, S.M., Vollmer, H., and Hams, J.D., 1976, Pyroloysis of Utah Tar Sands--Products and Kinetics, Amer. Chem. SOC., Div. of Fuel Chem. 21 (6), 278-289.
Bunger, J.W., Cogswell, D.E., and Oblad, A.G., 1978, Thermal Processing of a Utah Tar Sand Bitumen, Canadian Institute of Mining and Metallurgy, CIM Special volume 17- Proc. of the Canada-Venezuela Oil Sands Symp.-77, 178-1 82.
Byrd, W.D., 11, 1967, Geology of the Bituminous Sandstone Deposits, Southeastern Uinta Basin, Uintah and Grand Counties, Utah, M.S. Thesis, University of Utah, Salt Lake City, Utah.
Byrd, W.D., II, 1970, P.R. Spring Oil-Impregnated Sandstone Deposit, Uintah and Grand Counties, Utah, Utah Geol. Miner. Survey, Special Studies 3 1 , 34 pp.
Campbell, J.A., and Ritzma, H.R., 1979, Geology and Petroleum Resources of the Major Oil- Impregnated Sandstone Deposits of Utah, Utah Geol. and Miner. Survey, Special Studies 50, 25 PP.
Campbell, J.A., and Ritzma, H.R., 1979, Geology and Petroleum Resources of the Major Oil- Impregnated Sandstone Deposits of Utah, First Internat. Conf. on the Future of Heavy Oil and Tar Sands, (UNITAR), June 4-12, 1979, Edmonton, Alberta, Canada.
Cashion, W.B., Jr., 1964, Other Bituminous Substances, Utah Geol. Miner. Survey, Bull. a, Mineral and Water Resources of Utah.
Cashion, W.B., Jr., 1967, Geology and Fuel Resources of the Green River Formation, Southeastern Uinta Basin, Utah and Colorado, U.S. Geol. Survey, Prof. Paper 548.
Clem, K.C., 1984, Economic Potential of the P.R. Spring Oil-impregnated Deposit, Uinta Basin, Utah, Utah Geol. Miner. Survey, Special Studies 65, 38 pp.
1133
Covington, R.E., 1963, Bituminous Sandstone and Limestone Deposits of Utah, Utah Geol. Miner. Survey, Bull. 54, 225-247.
Covington, R.E., 1964, Bituminous Sands with Viscous Crude Oils, Brigham Young University, First Intermtn. Symp. on Fossil Hydrocarbons, 364-374.
Covington, R.E., 1965, Some Possible Applications of Thermal Recovery in Utah, J. Petr. Tech. E, #11, 1277-1284.
Covington, R.E., and R.L. McDonald, 1965, Stratigraphic and Structural Controls of Bituminous Sandstone Deposits in Utah [abstract], Amer. Assoc. Petrol. Geol., Bull. @, #9, 1577.
Cupps, C.Q., L.A. Johnson, and L.C. Marchant, 1976-a, Properties of Utah Tar Sands, South Seep Ridge Area, P.R. Spring Deposit, U.S. DOE, ROI DOE-LC-RI-75/6.
Dahm, J.N., 1980, Tar Sand Reserves - P.R. Spring Deposit, Uintah and Grand Counties, Utah, Utah Geol. Miner. Survey, Open File Report 27.
Dahm, J.N., 1980, Tar Sand Reserves - P.R. Spring Deposit, Uintah and Grand Counties, Utah, University of Utah, State College of Mines and Mineral Industries, Utah Engineering Experiment Station, Phase I, Final Rept., 1981.
Dana, G.F., and D.J. Sinks, 1984, Characteristics of the P.R. Spring Tar Sand Deposit, Uinta Basin, Utah, U.S.A., U.N. Institute for Training and Research, 2nd Internat. Conf., The Future of Heavy Crude and Tar Sands, 220-236.
Dorius, J.C., 1985, The Pyrolysis of Bitumen-Impregnated Sandstone from the P.R. Spring (Utah) Deposit in a Fluidized Bed, Ph.D. Dissertation, University of Utah, Salt Lake City, Utah.
Eldndge, G.H., 1901, Asphalt and Bituminous Rock Deposits, U.S. Geol. Survey, Ann. Report 22, 361-364.
Fouch, T.D., W.B. Cashion, R.T. Ryder, and J.A. Campbell, 1976, Field Guide to Lacustrine and Related Nonmarine Depositational Environments in Tertiary Rocks, Uinta Basin, Utah, Professional Contributions of the Colorado School of Mines, No. 8, 358-385.
Glassett, J.M., and J.A. Glassett, 1976, The Production of Oil from Intermtn. West Tar Sands Deposits, U.S. BuMines, Contract No. S024429.
Gwynn, J.W., 1971, Instrumental Analysis of Tar and Their Correlations in Oil-Impregnated Sandstone Beds, Uintah and Grand Counties, Utah, Utah Geol. and Miner. Survey, Special Studies 37,

1134
Gwynn, J. W., 1971 , Instrumental Analysis of Tar and Their Correlations in Oil-Impregnated Sandstone Beds, Department of Geol. and Geophysical Sciences, Ph.D. Dissertation University of Utah, Salt Lake City, Utah.
Hanson, F.V., Dorius, J.C., Utley, J.K., and Van Nguyen, T., 1992, The Application of Compound-Type Analyses to the Correlation of Product Distributions and Yields from the Fluidized-Bed Pyrolysis of Oil Sands, FUEL 11, 1365-1372.
Hunt, J.M., F. Stewart, and P.A. Dickey, 1954, Origin of Hydrocarbons of Uinta Basin, Utah, Amer. Assoc. Petrol. Geol., Bull. 38, #8, 1671-1698.
Johnson, L.A., L.C. Marchant, and C.Q. Cupps, 1975, Properties of Utah Tar Sands - Asphalt Wash Area, P.R. Spring Deposit, U.S. BuMines, ROI 8030.
Johnson, L.A., L.C. Marchant, and C.Q. Cupps, 1975, Properties of Utah Tar Sands - North Seep Ridge area, P.R. Spring Deposit, U.S. DOE, ROI ERDA LERC/RI-75/6.
Johnson, L.A., L.C. Marchant, and C.Q. Cups, 1975, Properties of Utah Tar Sands - South Seep Ridge area, P.R. Spring Deposit, U.S. BuMines, ROI 8003.
Keefer, T.N., and McQuivey, R.S., 1979, Water Availability for Development of Major Tar Sands Areas in Utah, U.S. DOE, Final Report LETC-0013-1.
KuuskTa, V.V., and Hammershaimb, V.A., Eds., 1984, The IOOC Monograph Series: Major Tar Sand and Heavy Oil Deposits of the United States, Interstate Oil Compact Comm., Oklahoma City, Oklahoma.
Laramie Energy Technology Center, 1983, Unpublished Lithologic Descriptions of Oil Shale Core Holes in the P.R. Spring Area, Uintah County, Utah, U.S. DOE.
Marchant, L.C., L.A. Johnson, and C.Q. Cupps, 1974, Properties of Utah Tar Sands - Threemile Canyon, P.R. Spring Deposit, U.S. BuMines, ROI 7923.
Oblad, A.G., Bunger, J.W., Hanson, F.V. , Miller, J.D. , Ritzma, H.R., and Seader, J.D. 1987, Tar Sand Research and Development at the University of Utah, Ann. Rev. Energy. 12, 283-356.
Peterson, P.R., 1975, Lithologic Logs and Correlation of Coreholes, P.R. Spring and Hill Creek Oil-Impregnated Sandstone Deposits, Uintah County, Utah, Utah Geol. Miner. Survey, ROI 100.
Peterson, P.R., and H.R. Ritzma, 1974, Informational Core Drilling in Utah's Oil-Impregnated Sandstone Deposits, Southeast Uinta Basin, Uintah County, Utah, Utah Geol. Miner. Survey, ROI 88.
1135
Picard, M.D., 1971, Petrographic Criteria for Recognition of Lacustrine and Fluvial Sandstone, P.R. Spring Oil-Impregnated Sandstone Area, Southeast Uinta Basin, Utah, Utah Geol. Miner. Survey, Special Studies 36.
Picard, M.D., and L.R. High, Jr., 1970, Sedimentology of Oil-Impregnated Lacustrine and Fluvial Sandstone, P.R. Spring Area, Southeast Uinta Basin, Utah, Utah Geol. and Miner. Survey, Special Studies 33.
Pitman, J.K., Fouch, T.D., and Glodhaber, M.B., 1982, Depositational Setting and Diagenetic Evolution of some Tertiary Unconventional Reservoir Rocks, Uinta Basin, Utah, Amer. Assoc. Petrol. Geol., Bull. a, #lo.
Pruitt, R.G., Jr., 1961, The Mineral Resources of Uintah County, Utah Geol. Miner. Survey, Bull. 21.
Reed, W.E., 1977, Molecular Compositions of Weathered Petroleum and Comparison with its Possible Source, Geochima et Cosmochim. Acta, 41, #2, 237-247.
Resnick, B.S., D.H. Dike, L.M. English, 111, and Alan G . Lewis, 1981, Evaluation of Tar Sand Mining, Volume 1 - An Assessment of Resources Amenable to Mine Production, U S . DOE, Final Report DOE/ET/3020 1 - 1.
Ritzma, H.R., 1968, Preliminary Location Map Oil - Impregnated Rock Deposits of Utah, Utah Geol. Miner. Survey, Map No. 25, 1 pg.
Ritzma, H.R. 1973. Oil-Impregnated Rock Deposits of Utah, Utah G a l . Miner. Survey, Map No. 33, 2pp.
Ritzma, H.R., 1979, Oil Impregnated Rock Deposits of Utah, Utah Geol. Miner. Survey, Map No. 47, 2pp.
Ritzma, H.R., and Campbell, J.A., 1981, Geology and Petroleum Resources of the Major Oil- Impregnated Sandstone Deposits of Utah, United Nations Instit. for Training and Research (UNITAR), First International Conference on the Future of Heavy Crude Oils and Tar Sands, Edmonton, Alberta, Canada.
Sinks, D.J., 1985, Geologic Influence on the In-situ Process of Tar Sand at the North West Asphalt Ridge Deposit, Utah, U.S. DOE, No. AD-89-F-0-026-0.
Sinks, D.J., and G.F. Dana, 1984, Bituminous Sandstone Resource Evaluation of P.R. Spring Deposit, Uintah and Grand Counties, Utah [abstract], Amer. Assoc. Petrol. Geol., Bull. 68, #4, 528.

1136
U.S. Bureau of Land Management, 1985, P.R. Spring Combined Hydrocarbon Lease Conversion, Final Environmental Impact Statement, U.S. Department of Interior.
Utah Geol. Miner. Survey, Internal Files, PR Spring Oil Sand Deposit.
Whittier, W.H., and R.C. Becker, 1945, Geologic Map and Sections of the Bituminous Sandstone Deposits in the P.R. Spring Area, Grand and Uintah Counties, Utah, U.S. Geol. Survey, Open File Report.
Wiley, D.R., 1967, Petrology of Bituminous Sandstones in the Green River Formation, Southeastern Uinta Basin, Utah, M.S. Thesis, University of Utah, Salt Lake City, Utah.
Wood, R.E., and H.R. Ritzma, 1972. Analyses of Oil Extracted from 'Oil-Impregnated Sandstone Deposits in Utah, Utah Geol. Miner. Survey, Special Studies 39, 19 p.
1137
APPENDIX D
SUNNYSIDE OIL SAND DEPOSIT BIBLIOGRAPHY
Abraham, H., 1960, Asphalts and Allied Substa nces, 6th Edition, 5 Volumes, D. Van Nostrand Co., Inc., Princeton, New Jersey.
Ball Associates, Ltd., 1964, Surface and Shallow Oil-Impregnated Rocks and Shallow Oil Fields in the United States, U.S. BuMines, Monograph 12.
Ball, M.W., 1951, Oil-Impregnated Strippable Deposits in Utah, May 22, 1950, U.S. BuMines, The Synthetic Liquid Fud Potential of Utah, Appendix D, 1-18.
Barb, C.F., 1942, Rubber from the Uinta Basin of Utah, The Mines Magazine, 32, #lo, 521- 524.
Barb, C.F., and Ball, J.O., 1944, Hydrocarbons of the Uinta Basin of Utah and Colorado, Quarterly, Colorado School of Mines, 39, #1, 115 p.
Bukka, K., Miller, J.D., and Oblad, A.G., 1991, Fractionation and Characterization of Utah Tar Sand Bitumens, Influence of Chemical Composition on Bitumen Viscosity, Energy & Fuels 5, 333-340.
Bunger, J.W., Cogswell, D.E., and Oblad, A.G., 1979, Catalytic Cracking of Asphalt Ridge Bitumen, Refining of Sythetic Crude Oils, Amer. Chemical Soc., Adv. in Chem. Ser. 179, 67-84.
Campbell, J.A., and Ritzma, H.R., 1979, Geology and Petroleum Resources of the Major Oil- Impregnated Sandstone Deposits - of Utah, Utah Geol. and Miner. Survey, Special Studies 50, 25 PP.
Campbell, J.A., and Ritzma, H.R., 1979, Geology and Petroleum Resources of the Major Oil- Impregnated Sandstone Deposits of Utah, First Internat. Conf. on the Future of Heavy Oil and Tar Sands, (UNITAR), June 4-12, 1979, Edmonton, Alberta, Canada.
Cashion, W.B., Jr., 1964, Other Bituminous Substances, Utah Geol. Miner. Survey, Bull. 73, Mineral and Water Resources of Utah, 63-70.
Clark, F.R., 1928, Economic Geology of the Castlegate, Wellington, and Sunnyside Quadrangles, Carbon County, Utah, U.S. Geol. Survey, Bull. B, 165 p.
Clem, K.C., 1985, Economic Potential of State-Owned Lands in the Sunnyside Special Tar Sand Area, Carbon County, Utah, Utah Geol. Miner. Survey, ROI 196, 29 p.
1138
Covington, R.E., 1963, Bituminous Sandstone and Limestone Deposits of Utah, Utah Geol. Miner. Survey, Bull. 54, 225-247.
Covington, R.E., 1964, Bituminous Sands With Viscous Crude Oils, Brigham Young University, First Intermtn. Symp. on Fossil Hydrocarbons, 364-374.
Covington, R.E., 1964, Bituminous Sandstone in the Uinta Basin, Intermtn. Assoc. of Petrol. Geol., 13th Ann. Field Conf., 227-242.
Covington, R.E., 1964, Thermal Recovery May Bring Industry's Quiet Revolution, Oil & Gas J. a, #47, 112-1 18.
Covington, R.E., 1965, Some Possible Applications of Thermal Recovery in Utah, J. Petrol. Tech. 17, #11, 1277-1284.
Covington, R.E., and McDonald, R.L., 1965, Stratigraphic and Structural Controls of Bituminous Sandstone Deposits in Utah [Abstract], Amer. Assoc. Petrol. Geol., Bull. a, #9, 1577.
Covington, R.E., and Young, K.J., 1985, Brief History and Recent Developments in Tar Sand Deposits of Uinta Basin, Utah Geol. Assoc., Publication 12, Geology and Energy Resources, Uinta Basin of Utah, 227-242.
Cross, A.T., E.B. Maxfield, E. Cotter, and C.C. Cross, 1975, Field Guide and Road Log to the Western Book Cliffs, Castle Valley, and Parts of the Wasatch Plateau: Brigham Young University, Geology Studies, 22, pt. 2.
Fouch, T.D., W.B. Cashion, R.T. Ryder, and J.A. Campbell, 1976, Field Guide to Lacustrine and Related Nonmarine Depositational Environments in Tertiary Rocks, Uinta Basin, Utah, Professional Contributions of the Colorado School of Mines, #8, 358-385.
Glassett, J.M., and J.A. Glassett, 1976, The Production of Oil from Intermountain West Tar Sands Deposits, Final Rept., Contract No. S-0241129, U.S. BuMines, Department of Interior.
Gwynn, J.W., 1986, Overburden Map and Thickness Determinations Sunnyside Oil-Impregnated Sandstone Deposit, Carbon and Duchesne Counties, Utah: 'Utah Geol. Miner. Survey, ROI 210, < 4 > Leaves, Maps.
Holmes, C.N., Page, B.M., and P. Averitt, 1948, Geology of the Bituminous Sandstone Deposits near Sunnyside, Carbon County, Utah, U.S. Geol. Survey, Oil and Gas Investigations Prelim. Map 86.
Holmes, C.N., B.M. Page, and P. Averitt, 1956, Geology of the Bituminous Sandstone Deposits near Sunnyside, Carbon Co., Utah, Intermtn. Assoc. of Petrol. Geol. 7th Ann. Field Conf., U.S.
1139
Geol. Sketch Map, 171-177.
Hunt, J.M., F. Stewart, and P.A. Dickey, 1954, Origin of Hydrocarbons of Uinta Basin, Utah, Amer. Assoc. Petrol. Geol., Bull. 38, #8, 1671-1698.
Jacob, A.F., 1969, Delta Facies of the Green River Formation (Eocene), Carbon and Duchesne Counties, Utah, University of Colorado, Ph.D. Dissertation, Boulder, Colorado.
Mauger, R.L., R.B. Kayser, and J.W. Gwynn, 1973, A Sulfur Isotopic Study of Uinta Basin Hydrocarbons, Utah Geol. Miner. Survey, Special Studies 41, 17 p.
Murany, E.E., 1964, Wasatch Formation of the Uinta Basin: Intermtn. Assoc. Petrol. Geol. 13th Ann. Field Conf., 145-155.
Oblad, A.G., Seader, J.D., Miller, J.D, and Bunger, J.W., 1976, Recovery of Bitumen from Oil- Impregnated Sandstone Deposists of Utah, Oil Shale and Tar Sand Symp., AIChE Symp. Ser.,
(72), 69-78. Picard, M.D., and E.Y. Banks, 1986, Petrography and Provenance of Sandstone Sunnyside Oil- Impregnated Deposit, Uinta Basin, Utah [abstract]: Amer. Assoc. Petrol. Geol., Bull. ZQ, #5, 632-633.
Pollastro, R.M., and C.J. Schenk, 1986, Characterizing and Evaluating Tar-Sand Reservoirs with Scanning Electron Microscope- -an Example from Sunnyside, Utah [abstract], Amer. Assoc. Petrol. Geol. ZQ, #5, 633-634.
Resnick, B.S., Dike, D.H., English, L.M. 111, and Lewis, A.G., 1981, Evaluation of Tar Sand Mining, Volume 1 - An Assessment of Resources Amenable to Mine Production: U S . DOE, Final Rept., DOE/ET/30201-1.
Ritzma, H.R., 1968, Preliminary Location Map Oil - Impregnated Rock Deposits of Utah, Utah Geol. Miner. Survey, Map No. 25, 1 pg.
Ritzma, H.R. 1973, Oil-Impregnated Rock Deposits of Utah, Utah Geol. Miner. Survey, Map No. 33, 2pp.
Ritzma, H.R. 1979, Oil-Impregnated Rock Deposits of Utah, Utah Geol. Miner. Survey, Map No. 47, 2pp.
Shea, G.B., and Higgins, R.V. 1952, Separation and Utilization Studies of Bitumens from Bituminous Sandstones of the Vernal and Sunnyside, Utah Deposits, U.S. BuMines, ROI 4871.
Thurber, J.L., and M.E. Welbourn, 1977. How Shell Attempted to Unlock Utah Tar Sand,
1140
Petrol. Eng. 49, #12, 31-42.
Venkatesan, V.N., F.V. Hanson, and A.G. Oblad, 1979, The Thermal Recovery of a Synthetic Crude from the Bituminous Sands of the Sunnyside (Utah) Deposit, U.N. Instit. for Training and Research (UNITAR), First Internat. Conf. on the Future of Heavy Oil and Tar Sands.
Wenger, W.J., Hubbard, R.L., and Whisman, M.L., 1952, Separation and Utilization Studies of Bitumens from Bituminous Sandstones of the Vernal and Sunnyside, Utah Deposits, Part 11, Analytical Data on Asphalt Properties and Cracked Products of the Separated Bitumens, U.S. BuMines, ROI 4871, 28 pp.
1141
APPENDIX E
CIRCLE CLIFFS OIL SAND DEPOSIT BIBLIOGRAPHY
Bukka, K., Miller, J.D., Hanson, F.V., and Oblad, A.G., 1993, Characterization of Circle Cliffs Oil Sand of Utah, Energy & Fuels, (in Press).
Campbell, J.A., and Ritzma, H.R., 1979, Geology and Petroleum Resources of the Major Oil- Impregnated Sandstone Deposit of Utah, Utah Geol. Miner. Survey, Special Studies 50, 25 pp.
Campbell, J.A., and Ritzma, H.R., 1979, Geology and Petroleum Resources of the Major Oil Impregnated Sandstone Deposit of Utah, First Internat. Conf. on the Future of Heavy Oil and Tar Sands, (UNITAR), June 4-12, 1979, Edmonton, Alberta, Canada.
Davidson, E.S., 1967, Geology of the Circle Cliffs Area, Garfield and Kane Counties, Utah, U.S. Geol. Survey, Bull. 1229, 3 maps, 140 pp.
Enckson, R.L., Myers, A.T., and Horr, C.A., 1954, Association of Uranium and Other Metals with Crude Oil, Asphalt, and Petrolifeous Rock, Amer. Assoc. Petrol. Geol., Bull. 38, #lo, 2200-2219.
Glassett, J.M. and Glassett, J.A., 1976, The Production of Oil from Intermtn. West Tar Sands Deposits, Final Report, Contract Number SO241 129, U.S. BuMines, Department of the Interior, 91 PP*
Gregory, H.E., and Moore, R.C., 1931, The Kaiparowits Region, U.S. Geol. Survey, Prof. Paper 164.
Heylmun, E.B., 1964, Shallow Oil and Gas Possibilities in East and South Central Utah, Utah Geol. Miner. Survey, Special Studies 8, 39 pp.
Hooper, W.G., 1972, Geologic Report, Rio Vista Oil Ltd. Property, Circle Cliffs Uplift, Garfield Co., Utah.
Resnick, B.S., Dike, D.H., English, L.M. 111, and Lewis, A.G., 1981, Evaluation of Tar Sand Mining, Volume 1 - An Assessment of Resources Amenable to Mine Production: U.S. DOE, Final Rept., DOE/ET/30201-1.
Ritzma, H.R., 1968, Preliminary Location Map Oil - Impregnated Rock Deposits of Utah, Utah Geol. Miner. Survey, Map No. 25, 1 p.
Ritzma, H.R. 1973. Oil-Impregnated Rock Deposits of Utah, Utah Geol. Miner. Survey, Map No. 33, 2pp.
...
1142
Ritzma, H.R. 1979. Oil-Impregnated Rock Deposits of Utah, Utah Geol. Miner. Survey, Map No. 47, 2 pp.
Ritzma, R.H., 1980, Oil Impregnated Sandstone Deposits, Circle Cliffs Uplift, Utah, Utah Geol. Assoc. - 1980 Henry Mountains Symp., 343-35 1.
Shun, D., Hanson, F.V., and Oblad, A.G., The Fluidized-Bed Pyrolysis of Bitumen-Impregnated Sandstone from the Circle Cliffs (Utah) Tar Sand Deposit. Bitumen Characterization and Preliminary Pyrolysis Studies, Prpmt. Tar Sand Symp., AIChE Nat. Mtg., Denver, Colorado.
Shun, D., 1990, The Pyrolysis of Bitumen-Impregnated Sandstone from the Circle Cliffs (Utah) Deposit in a Fludizied-Bed Reactor, Ph.D. Dissertation, University of Utah, Salt Lake City, Utah.
Steed, R. H,, 1954, Geology of Circle Cliffs Anticline, Intermtn. Assoc. of Petrol. Geol., 5th Ann. Field Conf., Central and South-Central Utah, 102.
Sung, S.H., 1988, The Fludized Bed Pyrolysis of Bitumen-Impregnated Sandstone in a Large Diameter Reactor, M.S. Thesis, University of Utah, Salt Lake City, Utah.
Wood, R.E., & Ritzma, H.R., 1972, Analyses of Oil Extracted from Oil-Impregnated Sandstone Deposit in Utah, Utah Geol. Miner. Survey, Special Studies 39, 19 pp.
Draft Environmental Impact Statement on the Circle Cliffs Combined Hydrocarbon Lease Conversion, 1984, U.S. BLM, Department of Interior, November.
1143
APPENDIX F
UNIVERSITY OF UTAH OIL SANDS BIBLIOGRAPHY
THESES AND DISSERTATIONS
Sepulveda, J.E., 1977, Hot Water Separation of Bitumen from Utah Tar Sands, M.S. Thesis, University of Utah, Salt Lake City, Utah.
Weeks, J.K. Jr., 1977, Fluidized-Bed Processing of Utah Tar Sands, M.S. Thesis, University of Utah, Salt Lake City, Utah.
Bunger, J.W., 1979, Processing Utah Tar Sand Bitumen, Ph.D. Dissertation, University of Utah, Salt Lake City, Utah.
Hanks, K.C., 1979, Chemistry of Oil Production from Tar Sand, M.S. Thesis, University of Utah, Salt Lake City, Utah.
Jayakar, K.M., 1979, The Thermal Recovery of Oil from Tar Sand, Ph.D. Dissertation, University of Utah, Salt Lake City, Utah.
Venkatesan, V.N., 1979, Fluidized-Bed Thermal Recovery of Synthetic Crude from Bituminous Sands of Utah, Ph.D. Dissertation, University of Utah, Salt Lake City, Utah.
Smith, R.J., 1980, Asphalt Ridge Tar Sands-Flotation Behavior and Process Design, M.S. Thesis, University of Utah, Salt Lake City, Utah.
Misra, M., 1981, Physical Separation of Bitumen from Utah Tar Sands, Ph.D. Dissertation, University of Utah, Salt Lake City, Utah.
Brechtel, C.E., 1981, Hydrotrating Utah Tar Sand Products, M.S. Thesis, University of Utah, Salt Lake City, Utah.
Umoh, R.A., '1981, Steam Cracking of Utah Tar Sand Bitumen in a Kellogg Millisecond Furnace, M.S. Thesis, University of Utah, Salt Lake City, Utah.
Aguilar, R., 1982, The Importance of Bitumen Viscosity Control in the Hot Water Processing of Utah Tar Sands, M.S. Thesis, University of Utah,. Salt Lake City, Utah.
Bezama, R.J., 1983, An Energy Efficient Method for Thermal Processing of Utah Tar Sands, Ph.D. Dissertation, University of Utah, Salt Lake City, Utah.
1144
Hsu, C.L.S., 1983, Digital Control of Thermal Processing System for Tar Sands, M.S. Thesis,
University of Utah, Salt Lake City, Utah.
Wang, J., 1983, The Production of Hydrocarbon Liquids from a Bitumen-Impregnated Sandstone in a Fluidized Bed Pyrolysis Reactor, M.S. Thesis, University of Utah, Salt Lake City, Utah.
Smart, L.M., 1984, Thermal Processing of Tar Sands, M.S. Thesis, University of Utah, Salt Lake City, Utah.
Wang, C.J., 1984, The Solubility of Carbon Dioxide in Tar Sand Bitumens, M.S. Thesis, University of Utah, Salt Lake City, Utah.
Dorius, J.C., 1985, The Pyrolysis of Bitumen Impregnated Sandstone from the P.R. Spring (Utah) Deposit in a Fluidized Bed, Ph.D. Dissertation, University of Utah, Salt Lake City, Utah
TSai, C.H., 1987, Reaction Kinetics and Mechanisms of Hydropyrolysis Processing of Tar Sand Bitumen and Related Materials, M.S. Thesis, University of Utah, Salt Lake City, Utah.
Lin, L.C., 1988, The Kinetics of the Pyrolysis of Tar Sand and of the Combustion of Coked Sands, Ph.D. Dissertation, University of Utah, Salt Lake City, Utah.
Sung, S.H., 1988, The Fluidized Bed Pyrolysis of Bitumen-Impregnated Sandstone in a Large Diameter Reactor, M.S. Thesis, University of Utah, Salt Lake City, Utah.
Coronella, C.J., 1989, Modelling a Coupled Fluidized-Bed Reactor for Extraction of Bitumen from Tar Sands, M.S. Thesis, University of Utah, Salt Lake City, Utah.
Ryu, H., 1989, Kinetic Modelling Applied to Hydrocarbon Process Design and Engineering, I Hydropyrolysis of Heavy Oils, 11, Acetylene from Calcium Carbide, Ph.D. Dissertation, University of Utah, Salt Lake City, Utah.
Cogswell, D., 1990, Effect of H,S on the Hydropyrolysis of Tetralin, M.S. Thesis, University of Utah, Salt Lake City, Utah.
Shun, D., 1990, Fluidized Bed Pyrolysis of the Bitumen-Impregnated Sandstone from the Circle Cliffs Deposit, Ph-D. Dissertation, University of Utah, Salt Lake City, Utah.
Cha, S.M., 1991, Pyrolysis of Oil Sands from the Whiterocks Tar Sand Deposit in a Rotary Kiln, Ph.D. Dissertation, University of Utah, Salt Lake City, Utah.
Deshpande, D.A., 1992, Application of Three Phase Ebullieted Bed Reactors to Petroleum Upgrading, Ph.D. Dissertation, University of Utah, Salt Lake City, Utah.
1145
Fletcher, J.V., 1992, The Pyrolysis of Oil Sands in a Fludized Bed at Reduced Pressure, Ph.D. Dissertation, University of Utah, Salt Lake City, Utah.
Longstaff, D.C., 1992, Hydrotreating the Whiterocks Oil Sand Bitumen and Bitumen-Derived Liquid, Ph.D. Dissertation, University of Utah, Salt Lake City, Utah.
Coronella, C.J., 1993, Optimizing a Thermal Fluidizing-Bed Tar-Sands Extraction Process, Ph.D. Dissertation, University of Utah, Salt Lake City, Utah.
Deng, R., 1993, Evaluation of Utah Tar Sands Economics, M.S. Thesis, University of Utah, Salt Lake City, Utah.
Drelich, J., 1993, The Role of Wetting Phenomena in the Hot Water Process for Bitumen Recovery from Tar Sand, Ph.D. Dissertation, University of Utah, Salt Lake City, Utah.
Hwang, J., 1993, Application of Dynamic Supercritical Fluid Extraction to the Recovery and Upgrading of Complex Hydrocarbon Mixtures, Ph.D. Dissertation, University of Utah, Salt Lake City, Utah.
Lelinski, D., 1993, Ash Flotation of Dispersed Oil Droplets - A Model System for Bitumen Flotation from Tar Sand, M.S. Thesis, University of Utah, Salt Lake City, Utah.
Rose, P.E., 1993, Steam-Assisted Gravity Drainage of Oil Sand Reservoirs, Ph.D. Dissertation, University of Utah, Salt Lake City, Utah.
Kwak, S., 1994, Hydrotreating a Uinta Basin Bitumen over a Commercial HDM Catalyst, Ph.D. Dissertation, University of Utah, Salt Lake City, Utah.
Sarkan, A,, 1994, Thermal Enhanced Oil Recovery Processes with Vertical and Horizontal Wells, M.S. Thesis, University of Utah, Salt Lake City, Utah.
Subramanian, M., 1994, Application of Supercritical Fluid Extraction to Upgrading Oil Sand Bitumens, M.S. Thesis, University of Utah, Salt Lake City, Utah.
Bhadkamar, A.S., 1995, Optimizing a Thermally Coupled Fluidized-Bed Tar Sands Extraction Process, Ph.D. Dissertation, University of Utah, Salt Lake City, Utah.
Chu, K.-S., 1995, Effect of Bitumen-Derived Coke on Deactivation of a Hydrodemetallation Catalyst, Ph.D. Dissertation, University of Utah, Salt Lake City, Utah.
Jiazhi Pu, 1995, Economic Evaluation of Bitumen Upgrading Alternatives, Ph.D. Dissertation, University of Utah, Salt Lake City, Utah.
1146
Khot, K.R., 1995, Modeling a Coupled Fluidized-Bed Process for Extraction of Tar-Sand Bitumen, M.S. Thesis, University of Utah, Salt Lake City, Utah.
Kim, J., 1995, Catalytic and Thermal Effects in the Upgrading of Bitumen-Derived Heavy Oils, Ph.D., Dissertation, University of Utah, Salt Lake City, Utah.
Nagpal, S., 1995, Pyrolysis of Oil Sands in a Large Diameter Fluidized Bed Reactor, M.S. Thesis, University of Utah, Salt Lake City, Utah.
Subramanian, M., 1996, Supercritical Fluid Extraction of Oil Sands Bitumens from the Uinta Basin, Ph.D. Dissertation, University of Utah, Salt Lake City, Utah.
Tang, H., 1995, Combustion of Carbonaceous Residues on Spent Oil Sands in a Transport Reactor, Ph.D. Dissertation, University of Utah, Salt Lake City, Utah.
Tang, Q., 1995, Fluidization of Coked Sands and Pyrolysis of Oil Sands in a Fluidized Bed Reactor, MS Thesis, University of Utah, Salt Lake City, Utah.
Zheng, H., 1995, Performance and Calibration of Dry Materials Feeders When Feeding Oil Sands and Residence Time and Residence Time Distribution in a Rotary Kiln, ME Final ReporVThesis, University of Utah, Salt Lake City, Utah.
Balaji, G., 1996, Contribution of Thermal Effects in Hydrotreating Oil Sands Derived Heavy Oils over Commercial Ni-Mo/Al,O, Catalysts, Ph.D. Dissertation, University of Utah, Salt Lake City, Utah.
FINAL REPORTS
Oblad, A.G., Bunger, J.W., Miller, J.D., and Seader, J.D., 1977, Recovery of Oil from Utah's Tar Sands. Final Rept. Grant ASR74-21867, NSF Fdn. RANN Program.
Oblad, A.G., Bunger, J.W., Hanson, F.V., Miller, J.D., and Seader, J.D., 1979, Recovery of Oil from Utah's Tar Sands. Final Report, 1977-79. U.S. (DOE) Contract No. ET77-S-03-1762. 140 pp.
Bunger, J.W., and Wells, H.M., 1980, Economic Evaluation of Tar Sand Resources Located in the State of Utah. Phase I. Final Report. UEES, Salt Lake City, Utah, 21 1 pp.
Oblad, A.G., Bunger, J.W., Hanson, F.V., Miller, J.D., and Seader, J.D., 1984, Recovery of Oil from Utah's Tar Sands. Final Report, U.S. DOE Contract No. DE-AS20-80LC10332, May.
Oblad, A.G., Bunger, J.W., Hanson, F.V., Miller, J.D., and Seader, J.D., 1984, Recovery and Hydropyrolysis of Oil from Utah's Tar Sands. Final Report, U.S. DOE Contract No.
1147
DE-AS20-82LC10942, December.
Wells, H.M., Bunger, J.W., and Jensen, G.F., 1984, Economic Evaluation of Oil Shale and Tar Sands Located in the State of Utah. Final Report, 5 volumes, UEES, Salt Lake City, Utah.
Oblad, A.G., Bunger, J.W., Hanson, F.V., Miller, J.D., and Seader, J.D., 1985, Recovery and Upgrading of Oil from Utah Tar Sands. First Ann. Report, U.S. DOE Contract No. DE-FC20-84LC11057, September.
Oblad, A.G., Bunger, J.W., Hanson, F.V., Miller, J.D., and Seader, J.D., 1986, Recovery and Upgrading of Oil from Utah Tar Sands. Second Ann. Rept., U.S. DOE Contract No. DE-FC20-84LC11057, September.
Oblad, A.G., Bunger, J.W., Hanson, F.V., Miller, J.D., and Seader, J.D., 1987, Recovery and Upgrading of Oil from Utah Tar Sands. Final Tech. Rept., U.S. DOE Contract No. DE-FC20-84LC11057, January.
Oblad, A.G., and Hanson, F.V., 1988, Production of Bitumen-Derived Hydrocarbon Liquids from Utah's Tar Sands. Final Tech. Rept., US. DOE Contract No. DE-FC21-87MC11090, September.
Oblad, A.G., Bunger, J.W., Hanson, F.V., Miller, J.D., and Seader, J.D., 1989, The Extraction of Bitumen from Western Tar Sands, Final Tech. Rept., U.S. DOE Contract No. DE-FC21- 88MC25046.
Oblad, A.G., Bunger, J.W., Deo, M.D., Hanson, F.V., Miller, J.D., and Seader, J.D., 1990, The Extraction of Bitumen from Western Tar Sands, Final Tech. Rept., U.S. DOE Contract No. DE-FC21-89MC26268.
Oblad, A.G., Bunger, J.W., Deo, M.D., Hanson, F.V., Miller, J.D., and Seader, J.D., 1991, The Extraction of Bitumen from Western Tar Sands, Final Tech. Rept., U.S. DOE Contract No. DE-FC2 1 -89MC26268.
Oblad, A.G., Bunger, J.W., Deo, M.D., Hanson, F.V., Miller, J.D., and Seader, J.D., 1992, The Extraction of Bitumen from Western Tar Sands, Final Tech. Rept., U.S. DOE Contract No. DE-FC21-89MC26268.
Oblad, A.G., Bunger, J.W., Deo, M.D., Hanson, F.V., Miller, J.D., and Seader, J.D., 1993, The Extraction of Bitumen from Western Tar Sands, Final Tech. Rept., U.S. DOE Contract No. DE-FC2 1-89MC26268.
...
1148
PATENTS
Miller, J.D., and Sepulveda, J.E., Oct. 17, 1978, Separation of Bitumen from Dry Tar Sands. U.S. Pat. 4,120,776.
Seader, J.D., and Jayakar, K.M., July 10, 1979, Process and Apparatus to Produce Synthetic Crude Oil from Tar Sands. U.S. Pat. 4,160,720.
Oblad, A.G., and Shabtai, J.S., Nov. 3, 1981, Hydropyrolysis of Tar Sand Bitumens and Heavy Petroleum Oils. U.S. Pat. 4,298,487.
Hanson, F.V., Miller, J.D., and Oblad, A.G., June 29, 1982, Process for Obtaining Products from Tar Sands. U.S. Pat. 4,337,143.
Hanson, F.V., Miller, J.D., and Oblad, A.G., Oct. 11, 1983, Process for Recovering Products from Tar Sand. U.S. Pat. 4,409,090.
Miller, J.D., and Hupka, J., Sept. 11, 1984, Bitumen Recovery from Tar Sands. U.S. Pat. 4,470,899.
Miller, J.D., and Misra, M., DE. 4, 1984, Process for Separating High Viscosity Bitumen from Tar Sands. U.S. Pat. 4,486,294.
PUBLICATIONS
Bunger, J.W., Mon, S., Oblad, A.G., 1976, Processing of Tar Sand Bitumens, Part 1. Thermal Cracking of Utah and Athabasca Tar Sand Bitumens, Amer. Chem. SOC., Prprnts. Div. Fuel Chem., 21 (6), 147.
Oblad, A.G., Seader, J.D., Miller, J.D., and Bunger, J. W., 1976, Recovery of Bitumen from Oil-Impregnated Sandstone Deposits of Utah. Oil Shale and Tar Sands Symp., AIChE Symp. Ser. - 72, 155, 69.
Sepulveda, J.E., Miller, J.D., Oblad, A.G., 1976, Hot Water Extraction of Bitumen from Utah Tar Sands. I. Symp. on Oil Shale, Tar Sands and Related Materials-Production and Utilization of Synfuels, Amer. Chem. SOC., Prpmts. Div. Fuel Chem., 21 (h), 110.
Bunger, J.W., 1977, Development of Utah Tar Sands-A Status Report, Mines Miner. Rept. #5, 1-10, Oct.
1149
Bunger, J.W., 1977, Techniques of Analysis of Tar Sand Bitumens. Prprnts., Div. Pet. Chem., Amer. Chem. SOC. 22 (2), 716-26.
Bunger, J.W., Cogswell, D.E., and Oblad, A.G., 1977, Thermal Processing of a Utah Tar Sand Bitumen. Proc. Canada-Venezuela Oil Sand Symp.-77. Edmonton, Alberta, Canada; The Oil Sands of Canada-Venezuela-1977, ed. D.A. Redford, A.G. Winestock. 1978. CIM Special 17,178-82.1979
Bunger, J.W., Cogswell, D.E., and Oblad, A.G., 1978, Influence of Chemical Factors on Primary Processing of Utah Tar Sand Bitumen. Prpmts., Div. Fuel Chem., ACS 23(4),98-109.
Sepulveda, J.E., and Miller, J.D., 1978, Separation of Bitumen from Utah Tar Sands by a Hot Water Digestion-Flotation Technique. Min. Eng. 30(9), 131 1 (also published in Trans SME/ATME, September 1978).
Sepulveda, J.E., Miller, J.D. and Oblad, A.G., 1978, Hot Water Extraction of Bitumen from Utah Tar Sands 111. Mining Eng. 30,131 1.
Bunger, J.W., Cogswell, D.E., and Oblad, A.G., 1979, Catalytic Cracking of Asphalt Ridge Bitumen. Refining of Synthetic Crude Oils, ACS Adv. Chem., Ser. 179, 67.
Bunger, J.W., Cogswell, D.E., and Zilm, K.W., 1979, Characteristics of Tar Sand Bitumen Asphaltenes and the Effect of Asphaltenes on Conversion of Bitumen by Hydropyrolysis, Preprints, Division of Petroleum Chemistry, ACS, 24 (4), 1017-1027.
Bunger, J.W., 1979, Chemistry of Asphaltenes - Summary of Symposium, Preprints, Division of Petroleum Chemistry, ACS, 24 (4), 1028-1031.
Venkatesan, V.N., Hanson, F.V., and Oblad, A.G., 1979, The Thermal Recovery of Synthetic Crude from the Bituminous Sands of the Sunnyside (Utah) Deposit, Proc. First Int. Conf. on the Future of Heavy Crude and Tar Sands, (UNITAR), June 4-12, 1979 Edmonton, Alberta, Canada.
Bunger, J.W. and Li, N.C., (eds.), 1980, Chemistry of Asphaltenes, Advances in Chemistry Series - 195, American Chemical Society, Washington, D.C.
Hanson, F.V., Miller, J.D., and Oblad, A.G., 1980, A Combined Hot Water-Thermal Pyrolysis Strategy for the Production of Bitumen-Derived Liquids. 15th Intersoc. Energy Conversion Conf.
1150
Seattle, Washington, August.
Bunger, J.W. and Cogswell, D.E., 1981, Characteristics of Tar Sand Bitumen Asphaltenes as Studied by Conversion of Bitumen by Hydropyrolysis. Chemistry of Asphaltenes, ACS Adv. Chem. Ser., Ed. J.W. Bunger and N.C. Li. No. 195, pp. 219-36. ACS, Washington, D.C.
Bunger, J.W., Cogswell, D.E., and Oblad, A.G., 1981, Hydropyrolysis-Potential for Primary Upgrading. Oil Shale, Tar Sands and Related MatFrial, Ed. H. Stauffer, Amer. Chem. SOC., Symp. Ser., No. l6.3, 369-80.
Miller, J.D. and Misra, M., 1981, Hot Water Process Development for Utah Tar Sands. Pres. at the 90th Natl. AIChE Mtg. Houston, Texas Apr. 5-8.
Misra, M., Miller, J.D., 1981, Surface Chemistry Features in the Hot Water Processing of Utah Tar Sands. Pres. at the Symp. on Separation Sci. and Tech., Gatlinburg, Tennessee, May 5-8; Separation Sci. Tech. Lh (lo), 1523-44.
Smith, R.J. and Miller, J.D., 1981, Flotation Behavior of Digested Asphalt Ridge Tar Sands, Mining Eng. 3 (12), 1724.
Hupka, J., Miller, J.D., Aguilar, R., and Cortes, A., 1982, Modified Hot Water Processing of Domestic Tar Sands. AIME Ann. Meet., Dallas, Texas, Feb. 14-18, 1982, No. 82-85. Submitted for publication.
Miller, J.D. and Misra, M., 1982, Hot Water Process Development for Utah Tar Sands, Fuel Proc. Tech. 6, 27-59.
Miller, J.D. and Misra, M., 1982, Concentration of Utah Tar Sands by an Ambient Flotation Process, Internat. J. Miner. Proc. 9, 269-87.
Venkatesan, V.N., Hanson, F.V., and Oblad, A.G., 1982, A Fluidized Bed-Thermal Process for the Recovery of a Bitumen-Derived Liquid from the Bitumen-Impregnated Sandstone Deposits of Utah, AIChE, Symp. Ser. 216,38, 42-55.
Hupka, J., Miller, J.D., and Cortes, A., 1983, The Importance of Bitumen Viscosity in the Hot Water Processing of Domestic Tar Sands, SME/AIME, Mining

...
1151 I
Wang, J., Hanson, F.V., and Oblad, A.G., 1983, The Fluidized Bed Pyrolysis of the Bitumen-Impregnated Sandstone from the Whiterocks (Utah) Deposit, Prprnt. AIChE Symp. Adv. Tar Sand Tech. Denver, Colorado, August. Eng. 35(12),1635-41.
Bunger, J.W., 1984, Upgrading Utah Tar Sand Bitumen to Syncrude. Proc. WRI-DOE Tar Sand Symp., Vail, Colorado, June 26-29.
Dorius, J.C., Hanson, F.V., and Oblad, A.G., 1984, The Pyrolysis of the Bitumen-Impregnated Sandstone from the P.R. Spring (Utah) Deposit in a Fluidized-Bed, Proc. WRI-DOE Tar Sand Symp., Paper 5-1, Vail, Colorado, June 26-29.
Hatfield, K.E. and Oblad, A.G., 1984, Pilot Plant Program for Upgrading of Heavy Oils by Hydropyrolysis. Proc. of the Second Internat. Conf. Heavy Crude and Tar Sand, (UNITAR), Caracas, Venezuela, Feb. 7-17, UNITAR, 1175-79.
Hupka, J., Miller, J.D., and Oblad, A.G., 1984, Sands-Water Recycle and Tailing Disposal, Stud. Environ. Sci. a, 253-267.
Hot Water Processing of U.S. Tar
Smart, L. and Seader, J.D., 1984, Thermal Recovery of Bitumen. Proc. WRI-DOE Tar Sand Symp., Vail, Colorado, June 26-29.
Bunger, J.W. and Oblad, A.G., 1985, Upgrading of Bitumen by Hydropyrolysis-a Process for Low Coke and High Syncrude Yields. Proc. Third Internat. Conf. on Heavy Crude and Tar Sands, (UNITAR/UNDP), Los Angeles, California, 1717-26, Jul. 22-31.
Bunger, J.W., 1985, Reactions of Hydrogen During Hydropyrolysis Processing of Heavy Crudes, Amer. Chem. SOC., Div. Pet. Chem. 32 (4),658-63.
Bunger, J.W., 1985, Inhibition of Coke Formation in Hydropyrolysis of Residual Oils, Amer. Chem. SOC., Prpmts. Div. Pet. Chem. 32 (3,549-554.
Bunger, J.W., Tsai, C.H., and Russell, C.P., 1986, Competing Reactions During Hydropyrolysis Upgrading of Tar Sand Bitumen and Residual Materials. Proc. WRUDOE Tar Sand Symp., Westhoff, J.D., and Marchant, L.C. Eds. Jackson, Wyoming, July 7-10, 1986.
Lin, L.C., Hanson, F.V., and Oblad, A.G., 1986, A Preliminary Mathematical Model of the
1152
Pyrolysis of Bitumen-Impregnated Sandstone in a Fluidized Bed, Proc. WRUDOE Tar Sand Symp., ed. Westhoff, J.D., and Marchant, L.C. Eds. Jackson, Wyoming, July 7-10, 1986.
Seader, J.D., Bezama, R.J., and Charavarty, T., 1986, Design and Economic Evaluation of an Energy-Integrated Thermal Process for Recovery of Oil from Tar Sands, Proc. WRI/DOE Tar Sand Symp., Westhoff, J.D., and Marchant, L.C. Eds., Jackson, Wyoming, July 7-10, 1986.
Hupka, J., Miller, J.D., and Oblad, A.G., 1987, Diluent-Assisted Hot Water Processing of Tar Sands, AOSTRA J. Res. 3, 95-102.
Lin, L.C., Hanson, F.V., Oblad, A.G., and Westhoff, J.D., 1987, The Pyrolysis of Bitumen-Impregnated Sandstone in Short-Contact Time Reactors. I. Cyclone Reactor, Fuel Proc. Tech. x, 173-190.
Oblad, A.G., Bunger, J.W., Hanson, F.V., Miller, J.D., Ritzma, H.R., and Seader, J.D. , 1987, Tar Sand Research and Development at the University of Utah, Ann. Rev. Energy. 12, 283-356.
Bunger, J.W., Tsai, C.H., Ryu, H., and Devineni, P., 1988, Developments in Upgrading of Bitumen by Hydropyrolysis, Proceedings, 4th International Conference on Heavy Crude and Tar Sands, UNITAWUNDP, Edmonton, Canada.
Hanson, F.V. and Oblad A.G., 1988, The Fluidized Bed Pyrolysis of Bitumen-Impregnated Sandstone from the Tar Sand Deposits of Utah. Proc. UNITARRJNDP Internat. Conf. on Heavy Crude and Tar Sands, Vol. 5. Extraction, Upgrading, Transportation, Paper No. 155, 421-438, Edmonton, Alberta, Canada.
Hanson, F.V., Shun, D., and Oblad, A.G., 1988, The Fluidized Bed Pyrolysis of Bitumen- Impregnated Sandstone from the Circle Cliffs (Utah) Tar Sand Deposit, Preprint 36h, Advances in Synthetic Fuels Tech. Symposium, National AIChE Mtg.
Hsu, J.C.L., and Seader, J.D., 1989, Digital Control of a Coupled Fluidized-Bed Thermal Processing System for Tar Sands, Fuel Proc. Tech., 21, 1-17.
Lin, L.C., Hanson, F.V., and Oblad, A.G., 1989, Mathematical Model of the Pyrolysis of Bitumen-Impregnated Sandstone Particles. I. Diffusion Dominant Transport Regime, Fuel Proc. Tech. 22, 41-63.
1153
Yang, Y.J., Bukka, K., and Miller, J.D. 1989. Selection and Evaluation of Diluents in the Modified Hot Water Process, Energy Proc. Canada, 82 (l), 14-21.
Lin, L.C., Deo, M.D., Hanson, F.V., and Oblad, A.G., 1990, Kinetics of Tar Sands Pyrolysis Using a Distribution of Activation Energy Model. AIChE J. 36, 1585-1588.
Bukka, K., Miller, J.D., Hanson, F.V., and Oblad, A.G., 1991, Mineral Matter Distribution During the Hot Water Processing of Utah Tar Sand, AOSTRA J. Res. 7, 101-109.
Bukka, K., Miller, J.D., and Oblad, A.G., 1991, Fractionation and Characterization of Utah Tar Sand Bitumens, Influence of Chemical Composition on Bitumen Viscosity. Energy & Fuels 5, 333-340.
Cha, S., Hanson, F.V., Longstaff, D.C., and Oblad, A.G., 1991, Pyrolysis of Bitumen Impregnated Sandstones, A Comparison of Fluidized-Bed and Rotary-Kiln Reactors, FUEL 3, 1357-1361.
Cha, S., Longstaff, D.C., Hanson, F.V., and Oblad, A.G., 1991, Pyrolysis of Bitumen Impregnated Sandstones, A Comparison of Fluidized - Bed and Rotary Kiln Reactors, Roc. 199Q Fastem Oil Shale Symp,, 136-145.
Deo, M.D., Fletcher, J.V., Shun, D.W., Hanson, F.V., and Oblad, A.G., 1991, Modeling of the Pyrolysis of Tar Sand in Fluidized Bed Reactors. Proc. 1990 Easte m O il Shale Symp,, 105- 119.
Deo, M.D., Fletcher, J.V., Shun, D., Hanson, F.V., and Oblad, A.G., 1991, Modeling the Pyrolysis of Tar Sands in Fluidized Bed Reactors, FUEL, 3, 1271-1276.
Deo, M.D., Hwang, J., and Hanson, F.V., 1991, Solubility of Carbon Dioxide in Tar Sand Bitumen, Experimental Determination and Modeling, Ind. Eng. Chem. Res. 3 2 (3), 532-536.
Hupka, J., Lelinski, D., and Miller, J.D., 1991, Air Bubble Filming During Bitumen Flotation from Digested Tar Sand Slurry, Proc. 22nd Ann. Meeting of the File Particle Society, 83-84.
Hupka, J., Drelich, J., Miller, J.D., White, R.R., Hanson, F.V., and Oblad, A.G., 1991, Impact of Water Recycle on Water-Based Processing of Whiterocks Tar Sands, Proc. 1990 Easte m Oil $hale Symp,, 39-44.
Hupka, J., Drelich, J., Miller, J.D., White, R.R., Hanson, F.V., and Oblad, A.G., 1991, Impact
1154
of Water Recycle on Water-Based Processing of Whiterocks Tar Sand, FUEL a, 1313-1316.
Hupka, J., and Miller, J.D., 1991, Temperature Water-Based Bitumen Recovery from Tar Sand, FUEL n, 1308-1312.
Hupka, J., and Miller, J.D., 1991, Electrophoretic Characterization and Processing of Asphalt Ridge and Sunnyside Tar Sands, Internat., J. Miner. Proc. 3, 217-231.
Hupka, J. and Miller, J.D., 1991, Moderate-Temperature Water-Based Bitumen Recovery from Tar Sands, Proc. 1990 Easte m O il Shale Symp,, 130- 135.
Lin, L.C., Deo, M.D., Hanson, F.V., and Oblad, A.G., 1991, Nonisothermal Analysis of the Kinetics of the Combustion of Coked Sand, Ind. Eng. Chem. Res. B, 1795-1801.
Misra, M., and Miller, J.D., 1991, Comparison of Water-Based Physical Separation Processes for U.S. Tar Sands, Fuel Proc. Tech. 27, 3-20.
Seader, J.D. and Coronella, C.J., 1991, An Advanced Energy-Efficient Coupled Fluidized-Bed System for Recovering Bitumen From Tar Sands, Proc. 1990 Easte m Oil Shale Symp,, 120-129.
Tsai, C.H., Deo, M.D., Hanson, F.V., and Oblad, A.G., 1990, Characterization and Potential Utilization of Whiterocks (Utah) Tar Sand Bitumen, Fuel Sci. Tech. Int., 9, 1259-1286.
1992 Bukka K., Hanson, F.V., Miller, J.D., and Oblad, A.G., 1992, Fractionation and Characterization of Whiterocks Tar Sands Bitumen, Energy & Fuels 6, 160.
Coronella, C.J., and Seader, J.D., 1992, Combustion of Coked Sand in a Two-Stage Fluidized- Bed System, FUEL a, 143-150.
Deo, M.D., Hwang, J., and Hanson, F.V., 1992, Supercritical Fluid Extraction of a Crude Oil, Bitumen-Derived Liquid and Bitumen by Carbon Dioxide and Propane, FUEL 71, 1519-1526.
Deshpande, D.A., Deo, M.D., Hanson, F.V., and Oblad, A.G., 1992, A Model for the Prediction of Bubble Size at a Single Orifice in Two-Phase Gas-Liquid Systems, Chem. Eng. Sci. 47, 1669-1676.-
Drelich, J., Bryll, G., Kapczynski, J., Hupka, J., Miller, J.D., and Hanson, F.V., 1992, The Effect of Electric Field Pulsation Frequency on Breaking Water-in-Oil-Emulsions, Fuel Proc. Tech. 31, 105-113.
Drelich, J., Hanson, F.V., Hupka, J, and Miller, J.D., 1992, Water Recycle in Moderate- Temperature Bitumen Recovery from Whiterocks Tar Sands, AOSTRA J. Res, 8, 139-147.
Drelich, J., and Miller, J.D., 1992, The Effect of Surface Heterogeneity on Pseudo-Line Tension

1155
and the Flotation Limit of Fine Particles, Colloids and Surfaces 69, 35-43.
Drelich, J., and Miller, J.D., 1992, The LinelPseudo-Line Tension in Three-phase Systems, Particulate Sci. Tech. B, 1-20.
Fletcher, J.V., Deo, M.D., and Hanson, F.V., 1992, Reexamination of Minimum Fluidization Velocity Correlations Applied to Group B Sands and Coked Sands, Powder Technol. hp (2), 147- 155.
Hanson, F.V., Dorius, J.C., Utley, J.K., and Van Nguyen, T., 1992, The Application of Compound-Type Analyses to the Correlation of Product Distributions and Yields from the Fluidized-Bed Pyrolysis of Oil Sands, .€'roc. 1991 Easte m Oil Shale Symp,, 34-46.
Hanson, F.V., Cha, S., Deo, M.D., and Oblad, A.G., 1992, Pyrolysis of Oil Sand from the Whiterocks Deposit in a Rotary Kiln, FUEL 71, 1455-1463.
Hanson, F.V., Dorius, J.C., Utley, J.K., and Van Nguyen, T., 1992, The Application of Compound-Type Analyses to the Correlation of Product Distributions and Yields from the Fluidized-Bed Pyrolysis of Oil Sands, FUEL a, 1365-1372.
Hanson, F.V., Cha, S.M., and Oblad, A.G., 1992, Pyrolysis of Oil Sand from the Whiterocks Tar Sand Deposit in a Rotary Kiln, Roc. 199 1 Eastern 0 il Shale Symp,, 116-128.
Hupka, J., Budzich, M., and Miller, J.D., 1992, Preliminary Examination of Oil Bonding at Sand Surfaces and its Influence on Hot Water Separation, Proc. 1991 Easte m Oil Shale SvmD,, 202- 207.
Hwang, J., Deo, M.D., Hanson, F.V., and Oblad, A.G., 1992, Supercritical Fluid Extraction of a Crude Oil, Bitumen-Derived Liquid and Bitumen by Carbon Dioxide and Propane, .Proc, 1991 Easte m Oil Shale Symp,, 209-221:
Longstaff, D.C., Deo, M.D., Hanson, F.V., Oblad, A.G., and Tsai, C.H., 1992, Hydrotreating the Bitumen-Derived Hydrocarbon Liquid Produced in a Fluidized Bed Pyrolysis Reactor, FUEL a, 1407-1419.
Tsai, C.H., Deo, M.D., Hanson, F.V., and Oblad, A.G., 1992, Characterization and Potential Utilization of Whiterocks (Utah) Tar Sand Bitumen 11. Pyrolysis Mass Spectrometry and Nuclear Magnetic Resonanace Analyses, Fuel Sci. Technol. Int. lQ, 1437-1459. .
Tsai, C.H., Longstaff, D.C., Deo, M.D., Hanson, F.V., and Oblad; A.G., 1992, Characterization and Utilization of Hydrotreated Products from the Whiterocks (Utah) Tar Sand Bitumen-Derived Liquid, FUEL 71, 1473-1482.
Tsai, C.H., Deo, M.D., Hanson, F.V., and Oblad, A.G., 1992, Characterization and Utilization of Hydrotreated Products Produced from Whiterocks (Utah) Tar Sand Bitumen-Derived Liquid,

1156
Proc. 1991 Easte m Oil Shale Symp,, 79-90.
Coronella, C.J., Lee, S.Y., and Seader, J.D., 1993, Minimum Slugging Velocity in Fluidized Beds Containing Vertical Rods, Proc. 1992 Eastern 0 il Shale Symp,, 238-246.
Coronella, C.J., Lee, S.Y. and Seader, J.D., 1993, Minimum Slugging Velocity in Fluidized Beds Containing Vertical Rods, Proc. 1992 Fastem Oil &le S y m , 238-246.
Deo, M.D., Hwang, J., and Hanson, F.V., 1993, The Effect of Cosolubilizing Lighter Components on the Asphaltene Content of Heavy Oils, Fuel Proc. Technol. 34, 217-228.
Deo, M.D. and Hanson, F.V., 1993, Asphaltene Precipitation: A Need for a Broader View, SPE 25193.
Deo, M.D., and Hanson, F.V., 1993, Asphaltene Rejection from Bitumens via Supercritical Fluid Extraction, Proc. 1992 Eastern Oil Shale Symp,, 159-168.
Deshpande, D.A., Deo, M.D., and Hanson, F.V., 1993, Similitude Studies in Three-phase Ebullieted Bed Reactors, Proc. 1992 Fastern Oil Shale Symp,, 2 16-226.
Drelich, J., Miller, J.D., and Hupka, J., 1993, The Effect of Drop Size on Contact Angle over a Wide Range of Drop Volumes, Colloid Interface Sci., d5.5, 379-385.
Drelich, J., and Miller, J.D., 1993, Surface/Interfacial Tension of the Whiterocks Bitumen and its Relationship to Tar Sand Processing, Proc. 199 2 Easte m Oil Shale Symp,, 265-275.
Drelich, J., and Miller, J.D., 1993, Modification of the Cassie Equation, Langmuir 4, 619-621.
Fletcher, J.V., Deo, M.D., and Hanson, F.V., 1993, Fluidization of a Multi-Sized Group B Sand at Reduced Pressure, Powder Technol. 26 (2), 141-148.
Fletcher, J.V., Deo, M.D., and Hanson, F.V., 1993, Fluidized Bed Pyrolysis of Bitumen- Impregnated Sandstone at Sub-Atmospheric Conditions, Proc. 1992 Easte m Oil Shale Symp,, 247-256.
Hupka, J., and Miller, J.D., 1993, Tar Sand Pretreatment with Diluent, Prpmt. No. 92-122 of the 121st SME/AIME Ann. Mtg. in Phoenix, Arizona, Feb. 24-27, 1992, Minerals and Metallurgical Processing, in print.
Kwak, S., Longstaff, D.C., Deo, M.D., and Hanson, F.V., 1993, Hydrotreating Process Kinetics for Bitumen and Bitumen-Derived Liquids, Proc. 199 2 Easte m Oil Shale Symp,, 208-215.
Lee, S.Y., Coronella, C.J., Bhadkamkar, A.S., and Seader, J.D., 1993, Modeling and
1157
Temperature Regulation of a Thermally Coupled Reactor System via Internal Model Control Strategy, Ind. Eng. Chem. Res., 32, 3029-3036.
Lee, S.Y. , Coronella, C.J., Seader, J.D., and Pitt, C.H., 1993, Erosion-Corrosion of 316 Stainless Steel Rods Immersed in a Bubbling Fluidized Bed, Chem Eng. Science 48, 1437-1445.
Lelinski, D., Miller, J.D., and Hupka, J., 1993, The Potential for Air-Sprayed Hydrocyclone Flotation in the Removal of Oil from Oil-in-Water Emulsions, Proc. First World Congress on Emulsions, 1-22-016/01 to 1-22-016/06.
Longstaff, D.C., Deo, M.D., and Hanson, F.V., 1993, Hydrotreating the Bitumen from the Whiterocks Oil Sand Deposit, Proc. 1992 Easte m Oil Shale SymD,, 199-207.
Rose, P.E., Bukka, K., Deo, M.D., Hanson, F.V., and Oblad, A.G., 1993, Characterization of Uinta Basin Oil Sand Bitumens, Proc. 1992 Fxtem Oil Shale Symp,, 277-282.
Sarkan, A. and Deo, M.D., 1993, Comparison of Thermal EOR Processes Using Combinations of Vertical and Horizontal Wells, Roc. Int. Thermal Operations Symp., Bakersfield, Ca., 175.
Tsai, C.H., Deo, M.D., Hanson, F.V., and Oblad, A.G., 1993, Characterization and Potential Utilization of the Asphalt Ridge Tar Sand Bitumen I. Gas Chromatography Mass Spectrometry Analyses, Fuel Sci. Technol. Int'l. L1 (3-4), 475-506.
Bukka, K., Miller, J.D., Hanson, F.V., Misra, M., and Oblad, A.G., 1994, The Influence of Carboxylic Acid on Bitumen Viscosity, FUEL, (9), 257-268.
Bukka, K., Miller, J.D., Hanson, F.V., and Oblad, A.G., 1994, Characterization of Circle Cliffs Tar Sands of Utah, Fuel Proc. Technol. 38 (2), 11 1-125.
Chu, K.-S., Hanson, F.V., and Massoth, F.E., 1994, Effect of Bitumen-Derived Coke on Deactivation of an HDM Catalyst, Fuel Proc. Technol. 412, 79-95.
Coronella, C.J., Lee, S.Y., and Seader, J.D., 1994, Minimum Slugging Velocity in Fluidized Beds Containing Vertical Rods, FUEL, Z, 1537-1543.
Deo, M.D. and Hanson, F.V., 1994, Asphaltene Rejection via Supercritical Fluid Extraction, FUEL a (9), 1493-1498.
Drelich, J., Bukka, IS., Miller, J.D., and Hanson, F.V., 1994, Surface Tension of Toluene- Extracted Bitumens from Utah Oil Sands as Determined by Wilhemy Plate and Contact Angle Technique, Energy & Fuels 8, 700-704.
Drelich. J.. Lelinski. D.. Hu~ka. J., and Miller. J.D.. 1994. The Role of Gas Bubbles in Bitumen
1158
Recovery from Tar Sands in Hot-Water Processing, P l Q i 1 ., 100- 109.
Drelich, J., Bukka, K., Miller, J.D., and Hanson, F.V., 1994, Surface Tension of Toluene- Extracted Bitumens from Utah Oil Sands as Determined by Wilhelmy Plate and Contact Angle Techniques, Energy & Fuels, 8, 700-704.
Drelich, J., and Miller, J.D., 1994, Examination of Neumann's Equation-of-State for Interfacial Tensions, Journal of Colloid and Interface Science, Lhl, 217-220.
Drelich, J., and Miller, J.D., 1994, Surface and Interfacial Tension of the Whiterocks Bitumen and its Relations to Bitumen Release from Tar Sands during Hot Water Processing, Fuel, 23, 1504- 15 10.
Kwak, S., Longstaff, D.C., Deo, M.D., and Hanson, F.V., 1994,. Hydrotreatment Process Kinetics for Bitumen and Bitumen-Derived Liquids, FUEL Z (9), 1531-1530.
Kwak, S . , Longstaff, D.C., and Hanson, F.V., 1994, Catalytic Upgrading of a Uinta Basin Bitumen Over a Commercial HDM Catalyst, Proc. 1993 Fastem 0 il Shale SymD ,., 168-176.
Longstaff, D.C., Deo, m.D., and Hanson, F.V., 1994, Hydrotreatment of Bitumen from the Whiterocks Oil Sand Deposit, FUEL (9), 1523-1530.
Longstaff, D.C., Hanson, F.V., and Kwak, S., 1994, Uinta Basin Bitumen Hydrotreating: A Comparison of HDN and HDM Catalyst Performance, Proc. 1993 Easte m Oil Shale Symp,, 177- 185.
Subramanian, M., Deo, m.D., Fletcher, J.V., and Hanson, F.V., 1994, Supercritical Fluid Extraction of Oil Sand Bitumen, Proc. 1993 Easte m Oil Shale Svmp,, 241-252.
Tang, H.Q., Fletcher, J.V., and Hanson, F.V., 1994, Combustion of Carbonaceous Residues on Spent Oil Sands in a Laboratory Scale Dense Phase Transport Reactor, Proc. 1993 Easte m 011 Shale Symp,, 153-160.
Zheng, H., Tang, Q., Fletcher, J.V., and Hanson, F.V., 1994, Performance and Calibration of Dry Materials Feeders When Feeding Oil Sands, Proc. 1993 Easte m Oil Shale Symp,, 144-150.
Drelich, J., Lelhski, D., Hupka, J., and Miller, J.D., 1995, The Role of Gas Bubbles in Bitumen Release during Oil Sand Digestion, Fuel, 74, 1150-1 155.
Drelich, J., Lelinski, D., and Miller, J.D., 1995, Microscopic Observations of Bitumen Spreading at Gas Bubble Surfaces, Proc. 1st UBC-McGill Bi-Annual International Symp. on Fundamentals of Mineral Processing, 291-304.
1159
Fletcher, J.V., Deo, M.D., and Hanson, F.V., 1995, Fluidized Bed Pyrolysis of a Uinta Basin Oil Sand, FUEL 74 (3), 311-316.
Hanson, F.V., Fletcher, J.V., and Zheng, H., 1995, Performance of Auger-Type Dry Material Feeders When Feeding Oil Sands, Fuel Proc. Tech., 4, 289-304.
Hwang, J., Park, S.J., Deo, M.D., and Hanson, F.V., 1995, Phase Behavior of COJCrude Oil Mixtures in Supercritical System: Experimental Data and Modeling, E&EC Research 34, 1280- 1286.
Longstaff, D.C., Balaji, G., Kim, J., Kwak, S . , Tsai, C.H., and Hanson, F.V., 1995, Hydrotreating Uinta Basin Bitumen-Derived Heavy Oils, Paper #U, Proc. 6th UNITAR Intnl. Conf. Hvy. Crude Tar Sands, Edmonton, Alberta.
Nagpal, S . , Fletcher, J.V., and Hanson, F.V., 1995, Pyrolysis of Uinta Basin Oil Sands in Fluidized Bed and Rotary Kiln Reactors, Paper #JB, Proc. 6th UNITAR Intnl. Conf. Hvy. Crude Tar Sands, Edmonton, Alberta.
Rose, P.E. and Deo, M.D., 1995, Steam-Assisted Gravity Drainage in Oil Sand Reservoirs Using a Combination of Vertical and Horizontal Wells, FUEL, Vol. 74, No. 8, 1180.
Subramanian, M., Deo, M.D., and Hanson, F.V., 1995, Supercritical Fluid Extraction of Uinta Basin Bitumens, Paper #m, Proc. 6th UNITAR Intnl. Conf. Hvy. Crude Tar Sands, Edmonton, Alberta.
Drelich, J. , Lelinski, D., and Miller, J.D., 1996, Bitumenh Spreading and Formation of Thin Bitumen Films at a Water Surface, Colloids and Surfaces A: Physicochemical and Engineering Aspects, in press.
Subramanian, M., Deo, M.D., and Hanson, F.V., 1996, Compositional Analysis of Bitumen and Bitumen-Derived Products, J. Chromat. Sci. 34 (l), 20-26.