
CHARACTERIZATION OF BITUMEN-TREATED SAND FOR ...
12
Transportation Research Record 766 it does not, the limitations of the models should be identified. Mechanistic variables such as stress, strain, or stress-and-strength ratio should be con- sidered, since this may greatly increase the reli- ability of the model. The stepwise regression procedure is believed to give the best selection of independent variables. 3. The functional form of the model should be carefully selected to represent the physical real- world situation as closely as possible. This will lead to a model that considers the appropriate shape, nonlinearity, and interactions of variables; meets boundary conditions; and also gives reasonable sensitivity of the variables. Such selection re- quires extensive knowledge of the problem and the available data. 4. Various statistical criteria should be used to assess the precision of the model. The model should explain a high percentage of the total varia- tion about regression; the standard error should be less than a practical value for usefulness; there should be no discernible patterns in the residuals; the model should not suffer from significant lack of fit; and all estimated coefficients should be sig- nificant with, say, a a.as. Detailed explana- tion of regression-model development and testing may be found in the literature (11-,!il. 5. Significant progress can be made in pavement technology if agencies will begin the development of in-service pavement data bases from which reliable predictive models can be developed and used for pavement management purposes. ACKNOWLEDGMENT The research reported here was conducted under NCHRP Project 1-19 by the University of Illinois at Urbana-Champaign. The opinions and findings expressed or implied in this paper are mine. They are not necessarily those of the Transportation Re- search Board, the National Academy of Sciences, the Federal Highway Administration, the American As- sociation of State Highway and Transportation Offi- cials, or the states participating. REFERENCES 1. M. Y. Shahin, M. I. Darter, and s. D. Kohn. Development of a Pavement Maintenance Manage- ment System: Airfield Pavement Condition Rating, Volume 5. Tyndall Air Force Base, FL, AFCEC-TR-76-27, Nov. 1977. 2. M.I. Darter. Design of Zero-Maintenance Plain- Jointed Concrete Pavement: Development of De- 31 sign Procedures, Volume 1. Federal Highway Ad- ministration, U.S. Department of Transporta- tion, Rept. FHWA-RD-111-77, 1977. 3. D. A. Voss, R. L. Terrel, F. Finn, and D. Hovey. A Pavement Evaluation System for Main- tenance Management. King County Department of Public Works, Olympia, WA, Aug. 1973. 4. R. v. LeClerc, T. R. Marshall, and G. W. Bee- croft. A Pavement Condition Rating System and Its Use. Proc., Symposium on Pavement Evalua- tion, AAPT, Vol. 38, Feb. 1969, pp. 28a-295. 5. W. E. Winni toy. Rating Flexible Pavement Sur- face Condition. HRB, Highway Research Record 3aa, 1969, pp. 16-26. 6. J. P. Mahoney. Measuring Pavement Performance by Using Statistical Sampling Techniques. TRB, Transportation Research Record 715, 1979, pp. 45-52. 7. M. I. Darter, M. B. Snyder, J. s. Sawan, and R. E. Smith. Deveiopment of a System for a_ Nationwide Evaluation of Portland Cement Con- crete Pavements. Univ. of Illinois at Urbana- Champaign, NCHRP Project 1-19, Interim Rept., Nov. 1979. 8. S. H. Carpenter, M. I. Darter, and S. Herrin. A Pavement Moisture Accelerated Distress (MAD) Identification System, Volume 1. Univ. of Il- linois at Urbana-Champaign (in preparation) . 9. R. E. Smith, M. I. Darter, and S. M. Herrin. Highway Pavement Distress Identification Manual for Highway Condition and Quality of Highway Construction Survey. Federal Highway Adminis- tration, U.S. Department of Transportation, Interim Rept., March 1979. la. M. Y. Shahin and s. D. Kohn. Development of a Pavement-Condition Rating Procedure for Roads, Streets, and Parking Lots. U.S. Army Construc- tion Engineering Research Laboratory, Interim Rept. M-268, July 1979. 11. N. R. Draper and H. Smith. Applied Regression Analysis. Wiley, New York, 1966. 12. N. N. Nie and others. SPSS: Statistical Pack- age for the Social Sciences, 2nd ed. McGraw- Hill, New York, 1975. 13. F. J. Anscombe and J. W. Tukey. The Examina- tion and Analysis of Residuals. Technometrics, Vol. 5, 1963, pp. 141-16a. 14. R. Rad. Linear Statistical Inference and Its Application. Wiley, New York, 1973. 15. R. B. Darlington. Multiple Regression. Psy- chological Bulletin, pp. 161-182. Publication of this paper sponsored by Committee on Theory of Pavement Systems. Characterization of Bitumen-Treated Sand for Desert Road Construction GURDEV SINGH AND SHAFIQ KHALIL HAMDANI This paper summarizes the findings of an experimental program designed to permit evaluation of the accumulation of permanent deformation in bitumen- treated sand layers by applying the more rational methods of pavement anal· ysis and design. The primary part of the work consists of the characterization of the cumulative deformation response of bitumen-sand specimens tested un· der simulated conditions of temperature and dynamic stress. Results have been analyzed by using multiple regression analysis, and predictive relation- ships of rut depth are formulated therefrom. The developing economies of many countries in the Middle East have resulted in an increasing demand
-
Upload
khangminh22 -
Category
Documents
-
view
0 -
download
0
Transcript of CHARACTERIZATION OF BITUMEN-TREATED SAND FOR ...

Transportation Research Record 766
it does not, the limitations of the models should be identified. Mechanistic variables such as stress, strain, or stress-and-strength ratio should be considered, since this may greatly increase the reliability of the model. The stepwise regression procedure is believed to give the best selection of independent variables.
3. The functional form of the model should be carefully selected to represent the physical realworld situation as closely as possible. This will lead to a model that considers the appropriate shape, nonlinearity, and interactions of variables; meets boundary conditions; and also gives reasonable sensitivity of the variables. Such selection requires extensive knowledge of the problem and the available data.
4. Various statistical criteria should be used to assess the precision of the model. The model should explain a high percentage of the total variation about regression; the standard error should be less than a practical value for usefulness; there should be no discernible patterns in the residuals; the model should not suffer from significant lack of fit; and all estimated coefficients should be significant with, say, a ~ a.as. Detailed explanation of regression-model development and testing may be found in the literature (11-,!il.
5. Significant progress can be made in pavement technology if agencies will begin the development of in-service pavement data bases from which reliable predictive models can be developed and used for pavement management purposes.
ACKNOWLEDGMENT
The research reported here was conducted under NCHRP Project 1-19 by the University of Illinois at Urbana-Champaign. The opinions and findings expressed or implied in this paper are mine. They are not necessarily those of the Transportation Research Board, the National Academy of Sciences, the Federal Highway Administration, the American Association of State Highway and Transportation Officials, or the states participating.
REFERENCES
1. M. Y. Shahin, M. I. Darter, and s. D. Kohn. Development of a Pavement Maintenance Management System: Airfield Pavement Condition Rating, Volume 5. Tyndall Air Force Base, FL, AFCEC-TR-76-27, Nov. 1977.
2. M.I. Darter. Design of Zero-Maintenance PlainJointed Concrete Pavement: Development of De-
31
sign Procedures, Volume 1. Federal Highway Administration, U.S. Department of Transportation, Rept. FHWA-RD-111-77, 1977.
3 . D. A. Voss, R. L. Terrel, F. Finn, and D. Hovey. A Pavement Evaluation System for Maintenance Management. King County Department of Public Works, Olympia, WA, Aug. 1973.
4. R. v. LeClerc, T. R. Marshall, and G. W. Beecroft. A Pavement Condition Rating System and Its Use. Proc., Symposium on Pavement Evaluation, AAPT, Vol. 38, Feb. 1969, pp. 28a-295.
5. W. E. Winni toy. Rating Flexible Pavement Surface Condition. HRB, Highway Research Record 3aa, 1969, pp. 16-26.
6. J. P. Mahoney. Measuring Pavement Performance by Using Statistical Sampling Techniques. TRB, Transportation Research Record 715, 1979, pp. 45-52.
7. M. I. Darter, M. B. Snyder, J. s. Sawan, and R. E. Smith. Deveiopment of a System for a_ Nationwide Evaluation of Portland Cement Concrete Pavements. Univ. of Illinois at UrbanaChampaign, NCHRP Project 1-19, Interim Rept., Nov. 1979.
8. S. H. Carpenter, M. I. Darter, and S. Herrin. A Pavement Moisture Accelerated Distress (MAD) Identification System, Volume 1. Univ. of Illinois at Urbana-Champaign (in preparation) .
9. R. E. Smith, M. I. Darter, and S. M. Herrin. Highway Pavement Distress Identification Manual for Highway Condition and Quality of Highway Construction Survey. Federal Highway Administration, U.S. Department of Transportation, Interim Rept., March 1979.
la. M. Y. Shahin and s. D. Kohn. Development of a Pavement-Condition Rating Procedure for Roads, Streets, and Parking Lots. U.S. Army Construction Engineering Research Laboratory, Interim Rept. M-268, July 1979.
11. N. R. Draper and H. Smith. Applied Regression Analysis. Wiley, New York, 1966.
12. N. N. Nie and others. SPSS: Statistical Package for the Social Sciences, 2nd ed. McGrawHill, New York, 1975.
13. F. J. Anscombe and J. W. Tukey. The Examination and Analysis of Residuals. Technometrics, Vol. 5, 1963, pp. 141-16a.
14. R. Rad. Linear Statistical Inference and Its Application. Wiley, New York, 1973.
15. R. B. Darlington. Multiple Regression. Psychological Bulletin, 19~8, pp. 161-182.
Publication of this paper sponsored by Committee on Theory of Pavement Systems.
Characterization of Bitumen-Treated Sand for Desert
Road Construction
GURDEV SINGH AND SHAFIQ KHALIL HAMDANI
This paper summarizes the findings of an experimental program designed to permit evaluation of the accumulation of permanent deformation in bitumentreated sand layers by applying the more rational methods of pavement anal· ysis and design. The primary part of the work consists of the characterization of the cumulative deformation response of bitumen-sand specimens tested un· der simulated conditions of temperature and dynamic stress. Results have
been analyzed by using multiple regression analysis, and predictive relationships of rut depth are formulated therefrom.
The developing economies of many countries in the Middle East have resulted in an increasing demand
32
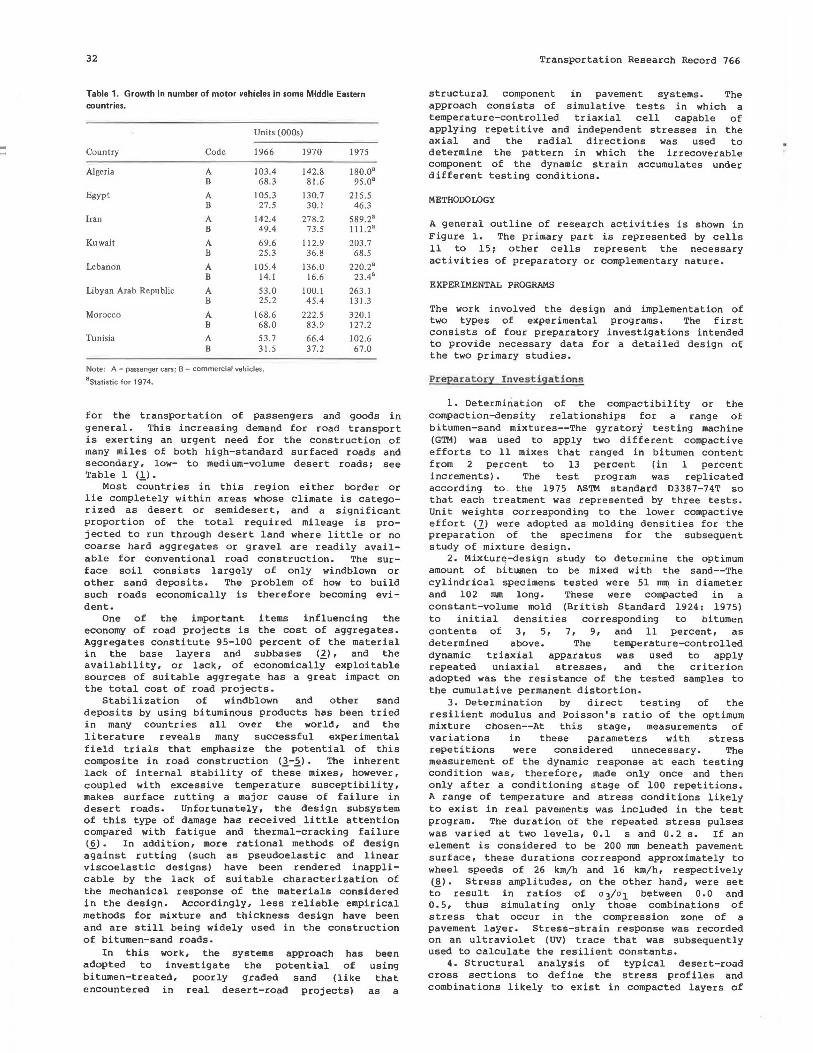
Table 1. Growth in number of motor vehicles in some Middle Eastern countries.
Units (OOOs)
Country Code 1966
Algeria A 103.4 B 68.3
Egypt A 105.3 B 27.5
Iran A 142.4 B 49.4
Kuwait A 69.6 B 25.3
Lebanon A 105.4 B 14.1
Libyan Arab Republic A 53.0 B 25.2
Morocco A 168.6 B 68.0
Tunisia A 53.7 B 31.5
Note: A = passenger cars; B = commercial vehicles. 3 Statistic for 1974.
1970
142.8 81.6
130.7 30.l
278.2 73.5
112.9 36.8
136.0 16.6
100.l 45.4
222.5 83.9
66.4 37.2
1975
180.0" 95.0"
215.5 46.3
589.2" 111.2•
203.7 68.5
220.2• 23.48
263.J 13 l.3
320.1 127.2
102.6 67.0
for the transportation of passengers and goods in general. This increasing demand for road transport is exerting an urgent need for the construction of many miles of both high-standard surfaced roads and secondary, low- to medium-volume desert roads; see Table 1 (_!).
Most countries in this region either border or lie completely within areas whose climate is categorized as desert or semidesert, and a significant proportion of the total required mileage is projected to run through desert land where little or no coarse hard aggregates or gravel are readily available for conventional road construction. The surface soil consists largely of only windblown or other sand deposits. The problem of how to build such roads economically is therefore becoming evident.
One of the important i terns influencing the economy of road projects is the cost of aggregates. Aggregates constitute 95-100 percent of the material in the base layers and subbases (1), and the availability, or lack, of economically exploitable sources of suitable aggregate has a great impact on the total cost of road projects.
Stabilization of windblown and other sand deposits by using bituminous products has been tried in many countries all over the world, and the literature reveals many successful experimental field trials that emphasize the potential of this composite in road construction <1-2>· The inherent lack of internal stability of these mixes, however, coupled with excessive temperature susceptibility, makes surface rutting a major cause of failure in desert roads. Unfortunately, the design subsystem of this type of damage has received little attention compared with fatigue and thermal-cracking failure ( 6) • In addition, more rational methods of design against rutting (such as pseudoelastic and linear viscoelastic designs) have been rendered inapplicable by the lack of suitable characterization of the mechanical response of the materials considered in the design. Accordingly, less reliable empirical methods for mixture and thickness design have been and are still being widely used in the construction of bitumen-sand roads.
In this work, the systems approach has been adopted to investigate the potential of using bitumen-treated, poorly graded sand (like that encountered in real desert-road projects) as a
Transportation Research Record 766
structural component in pavement systems. The approach consists of simulative tests in which a temperature-controlled triaxial cell capable of applying repetitive and independent stresses in the axial and the radial directions was used to determine the pattern in which the irrecoverable component of the dynamic strain accumulates under different testing conditions.
METHODOLOGY
A general outline of research activities is shown in Figure 1. The primary part is represented by cells 11 to 15; other cells represent the necessary activities of preparatory or complementary nature.
EXPERIMENTAL PROGRAMS
The work invo;i.ved the design and implementation of two types of experimental programs. The first consists of four preparatory investigations intended to provide necessary data for a detailed design of the two primary studies.
Preparatory I nvestigations
1. Determi nation of the compactibility or the compaction-density relationships for a range of bitumen-sand mixtures--The gyratory testing machine (GTM) was used to apply two different compactive efforts to 11 mixes that ranged in bitumen content from 2 percent to 13 percent (in l percent inc r ements). The test program was replicated according to . the 1975 ASTM standard D33B7-74T so that each treatment was represented by three tests. Unit weights corresponding to the lower compactive effort (7) were adopted as molding densities for the preparation of the specimens for the subsequent study of mixture design.
2. Mixture-design study to determine the optimum amount of bitU111en to be mixed with the sand--The cylindrical specimens tested were 51 llUI! in diameter and 102 lllln long. These were compacted in a constant-volume mold (Brit i.sh Standard 1924: 1975) to initial densities corresponding to bitumen contents of 3, 5, 7, 9, and 11 percent, as determined above. The temperature-controlled dynamic triaxial apparatus was used to apply repeated uniaxial stresses, and the criterion adopted was the resistance of the tested samples to the cumulative permanent distortion.
3. Determination by direct testing of the resilient modulus and Poisson ' s ratio of the optimum mixture chosen--At this stage, measurements of variations in these parameters with stress repetitions were considered unnecessary. The measurement of the dynamic response at each testing condition was, therefore, made only once and then only after a conditioning stage of 100 repetitions. A range of temperature and stress conditions likely to exist in real pavements was included in the test program. The duration of the repeated stress pulses was varied at two levels, 0.1 s and 0.2 s. If an element is considered to be 200 lllln beneath pavement surface, these durations correspond approx i mately to wheel speeds of 26 km/h and 16 km/h, respectively (B). Stress amplitudes, on the other hand, were set t~ result in ratios of 03/01 between O.O and 0.5, thus simulating only those combinations of stress that occur in the compression zone of a pavement layer. Stress-strain response was recorded on an ultraviolet (UV) trace that was subsequently used to calculate the resilient constants.
4. Structural analysis of typical desert-road cross sections to define the stress profiles and combinations likely to exist in compacted layers of

Transportation Research Record 766
the optimum mixture selected--The program consisted of analyzing 27 systems in which the treated sand acted either as the top layer or as a base under 100 mm of bituminous concrete surfacing. The subgrade in all the systems was assumed to be untreated and densely compacted sand. Resilient moduli and Poisson's ratios for the bitumen-sand layer were chosen from results of the investigation described above, and stiffness moduli for the bituminous concrete surfacing were selected by using van der Peel's nomograph (~), assuming certain temperature extremes (10). Values for the resilient modulus of the dense sand subgrade were derived from two sources: (a) experimental results reported by other investigators (11,12) and (b) by measuring the
Figure 1. Outline of research activities.
33
California bearing ratio (CBR) and using it in the correlation: Edyn (kN/m'l (5 to 20)10 3 x CBR(%), suggested by HUekelom and Foster (_!l).
The multilayer elastic analysis was facilitated by using Shell's computer program, Bitumen Structures Analysis in Roads (BISAR) •
PLimary Investigation
The selection of constitutive equations that adequately model the response of paving materials to the loading and environmental conditions can be a very complex task. Simulation is a suitable technique for solving such complex problems. It is,
I Statement of Objeclive I THE STRUCTURAL DESIGN OF BITUMEN-SAND PAVEMENTS AGAINST RUTTING
2 t 3
ldentificatio~. and determination of Realistic Levels for, the Paramelers Development of an ExperimPntal Pror.edure lo lnvP.stigate PermanP.nt Deformation Acr:umulat1nn in Bitumen-Sand M1xlures . Con!'i1der1ng
Involved in the Performance of Bitumen-Sand Roads . Exisling Approaches :
4 ' A 6 ' 7 8 • 8 9 ' COMPACTIBI LITY Simulation Approach Linear V1scoelast1c Approach Determination of the Density- Measurement of Resilient CompactiQ.n Relationships of a ran2e constants t of Bitumen-Sand Mixtures .
9
L T 5 ' r f 10 Building Dynamic I Triaxial Apparatus
MIXTURE DESIGN r-.L ,---------Determination of the Resistance to Permanenl Deformation in Repeated Loading Tests, and I I
Selection of an Optimum Bitumen-Sand Mixture
~ , ,._
i ~ I
' I 10 11 t 12 13
6 7 ~
STRUCTURAL ANALYSIS Designing and Performing an Experimental Designing and Pe1fo1ming
Elaslic Analysis of a Ranee of Desert Programme of Simulative Laboratory Tesls Experimental Programme of ..._... Roads and Dele1mination of the Likely
~ to Determine the Accumulalion of the Unconfined Compression
Conditions of stress in Bitumen-Sand Permanent Deformation in the Optimum Creep Tests on lhe Opl1mum
Layers Mixture . M1x'.ure .
11 12 ~ 13 14
Using Multiple Regression Analysis to Expressing Results in Terms Formulate Predictive Models of Permanenl of Compliance Functions for Deformation Accumulation in Bitumen-Sand Use in Multilayer Viscoelastic Elements . Analysis ,
I
• • 14 15
DESIGN RECOMMENDATIONS
Figure 2. Experimental program for the simulation of the permanent deformation accumulation in bitumen-sand layers under repetitive triaxial stresses.
(a) COMPRESSION TESTS 1 0~9 sec. lo\
"
II 1
n Ume Fm 0
25 32 .5 40
276 138 13
483
362 13
483 10 12
448 138
483 16
0 9 sec (b) TENSION TESTS
10 20
22 31
69 20 32
13 8 27 35 -55.2
69 28 36
13 .8 -82 8
26 33
69 24 34
NOTES "1 & ,,3 axial and radial repetitive slresses
Figures in cells are to idenlify the corresponding treatments ~
Mixture tested: oplimum bitumen-sand (7% B,C, ) Each treatment is represenled by 4 tests .
0 ,1
30
21
19
29
30
25
23

34
Figure 3. Specified gradation of the sand used and typical gradations in desert areas.
Figure 4. General schematic diagram of equipment.
100
90
80
70
60 ~ 0
0 0
i'1. 50 v iJ' c 40
~ Q_
30
20
10
Transportation Research Record 766
~ I ~/ ... _...-'GRAVIMETRIC DESCRIPTION
,,f. ... OF SPECIFIED GRADATION"A "
Speciried gradation "A" used in / v laboratory study --
-~ ''/ / /
I~. /
V/ ~
/ , I
//; / /
/
, I II!/ ------ Vp ~1 --· ----------, "'
/ V/ ..... /_/ ./
- .__...... _ _.......
53 75
COMPRESSED AIR STORAGE TANK
(690 kNim2)
105
U. V. RECORDER
150 212 300 425 Particle size - microns
THERMOCIRCULATOA
SIGNAL AMPLIFIER
,,. ~,
/ PARTICLE SIZE PERCENTAGE 1°ANGE . .. 'w ' /
1180 Jo 600 8 600 to 425 15 425 to 300 24 300 10 212 24 212 10 150 12 150 10 105 8 105 10 75 4
75 to 53 5
Silverton sand (arter Gregg el al. (16))
Oranjemund sand-Namibia (arter Gregg el al. (16))
Sand from Easlern Province-Saudi Arabia
(alter Aki Ii (Highways & Road Construclion , Sept .
1975))
600 1180
I valve (shul off) 7 axial transducer
air rilter 8 laleral lransducer
lubricator 9 pressure transducer
4 reservoir 10 6- digil counter
solenoid valve
pneumal ic pressure regulator
elec tric circuil
pneumatic pressure circuit
lempera\ure control circuil
Figure 5 . Transducers for load and displacement measurements in the dynamic triaxial apparatus.
(a) The Axial Displacement Tran~ducer (b) The Lateral Displacement Transducer
rubber membrane
mounting target
rapid se lling adhesive
rubber membrane

Transportation Research Record 766
however, not necessary to include most of the actual features of the problem considered, since few are vital to the particular aspect under study <!!>. The extremely arid environment of hot desert implied that moisture content of samples could be excluded as a test variable. Also reduced to constants are factors of gradation and surface characteristics of the sand. Bulk density and bitumen conteqt of tested samples were maintained at 1857 kg/m and 7 percent, respectively.
The experimental program is shown in Figure 2. Amplitudes for vertical and horizontal stress were selected with consideration of actual stress profiles in bitumen-treated sand layers produced in the previous investigation of stress analysis and with a provision that stresses should be repeated at least 100 000 times in the compression tests and 30 000 times in the tension tests before permanent distortion in the tested sample should reach 10 percent extension or contraction. Stresses in the tension tests were also kept relatively l ow to limit the number of samples that tended to fracture prematurely.
Figure 6. Compactibility of bitumen-sand mixtures in the gyratory testing machine.
DENSITY
lb g - c-;3 cu.IL a 119 1,.,
~ Bulk
/ density
b r-·-I .- .... .. ....... '--.. :R .-116 1.8
"' v, ,,,,,,,.-' \ 1,00
' ' I 0 ,99 -I l - - 0.98 112 1.e Iv "- ... _ -··-,_ .....
0.97 -
"" \ ,. ~ ~c
109 1,7 '._./ "· ~ '-~ ~ "'l
GTM Setting ·, den&fly r'\.. 106 ' .7( - --- 60 revolutions ' --- 30 revolutions "· compacting temp. 65°C ~
gyralion nngln 1°
\ .. vertical i;NO..SS.ure 1380 kN/m2 (200 psi)
103 1.6' ~ Bitumen 70/80 pen.
. Note : Each trealment is represented by a
lhree-test average (ASTM 03387)
100 , .6
2 4 6 6 10 12
Bitumen content (percent dry weight)
35
MATERIALS AND EQUIPMENT
Materials
The materials procured for preparing test specimens consisted of poorly graded quartzitic sand from Leighton Buzzard (United Kingdom) , 70/80-penetration-grade bitumen, and solvent naphtha. The sand was the only aggregate used in preparing the mixtures. Its type and gradation were selected to approximate those of windblown sand often encountered in desert-road construction. Figure 3 shows typical gradation curves for sands of this type (15), together with the distribution curve adopted for this work. The shape of the particles was classified as rounded to irregular and the surface texture as smooth. The percentage of fines was fixed at 5 percent. Possible variability because of unspecified gradation of this proportion of fines was eliminated by sieving out all dust particles smaller than 53 µm.
A rapid-curing cutback was prepared by diluting the refinery bitumen by 40 percent of its volume by solvent naphtha. The proportion of solvent was arrived at after a few preliminary trials to allow
Figure 7. Accumulation of permanent deformation in bitumen-sand mixtures under repeated uniaxial stress-tension.
~
-~ ~ 0
B.C , = 5%
... 5 I 1-1---~,/~f-+----"'-+--,.....-+-----i (j
0 0 0 5 1.5
~~5 ._ __ _, ___ ____ _,__, _ _...,
.~
I ~ 21-----l----+---...,1-1----;
"l = -35 kN/m2
T ::: 22°c
o'-'----""~=ox'----"'---'-----'------'
0 N(x1000)
"1
c
T
0.9
Axial elongalion
Radial contraction
N = Number of stress repelilions

36
adequate manual preheating.
Equipme n t
mixing with the minimum of
The triaxial cell fabricated and used here is capable of controlling the temperature and of pulsing the axial and radial stresses independently. A Perspex cylinder was placed around the pressure chamber to form an annular cavity through which water, at the predetermined temperature, was circulated. The pressure chamber was filled with a relatively incompressible fluid that served as a heating and a lateral-pressurizing medium. Amplitudes of axial and radial pressure pulses were controlled by pneumatic pressure regulators connected to the airsupply line. Durations and synchronization of pulses were ensured by using three solenoid valves connected to the pressure lines and controlled by an electric cam timer. A schematic diagram of the equipment is shown in Figure 4.
The resilient and the cumulative permanent deformation in the sample were measured by using lightweight transducers made of rigid aluminum arms connected to central pieces of thin brass plates, as
Transportation Research Record 766
shown in Figure 5. Strain gauges were bonded to these plates to form full-bridge circuits.
Axial stress was measured inside the pressure chamber by using a load transducer bearing directly on the specimen . It was manufactured so that the measurement was independent of chamber pressure (16). Finally, confining pressure was measured by using an ordinary commercial transducer.
RESULTS AND DISCUSSION
Results of the GTM compaction are plotted in Figure 6 as bitumen content versus density relationships. It can be seen that, for most of the range, dry density decreases markedly whereas bulk density increases slightly with binder content. This indicates that the reduction in mix density resulting from particle separation caused by the addition of bitumen is a little more than compensated for by the weight of the added binder. In the kneading-compaction process, the high porosity of sand seems to allow a larger proportion of the added binder to occupy existing voids rather than to force particles apart. This results in the absence of a definite optimum amount of bitumen for
Figure 8. Accumulation of permanent deformation in bitumen-sand mixtures under repeated uniaxial stress-compression.
;;; 'O i!
~ ~ ~ . > ;; -,; § u
3
2
B .C 3'!1
a1 = 103 kl<li m2
T = 22°c
N (x1000)
~ c 0
~ c 0
is 0 ~ c ~ . . E
K
~ c . ;;; ·s 2 . > ;;; -,; § u
0 N (x1000)
. §e1-11--~·1--1+~~-F--,1-~~--,~7~-;
~
--1 o1 = 206 kN./m2
T = 30°c
N(x1000)
c
"' 0
0
1.0.
Axial contraction
Radial expansion
N = Number or stress repelilions
Notes:
1 Figures on curves indica!e bllumen
content ('/o)
2 Each relationstiip is an average of three tesls.
,11 = 103 kNlm2
T ; 4o0 c
N(x1000)
Transportation Research Record 766
maximum bulk density, which is regarded as a characteristic property of the compactibility of the mixes used.
Results of the experimental program of mixture design are presented in Figures 7, 8, and 9. It is obvious that, in general, repeat.ea tension tests resulted in an increasing rate of permanent deformation, whereas compression tests produced a decreasing rate with stress repetition, probably because of the slight densification and increase in sample stiffness effected in the compression tests compared with the weakening of tension samples
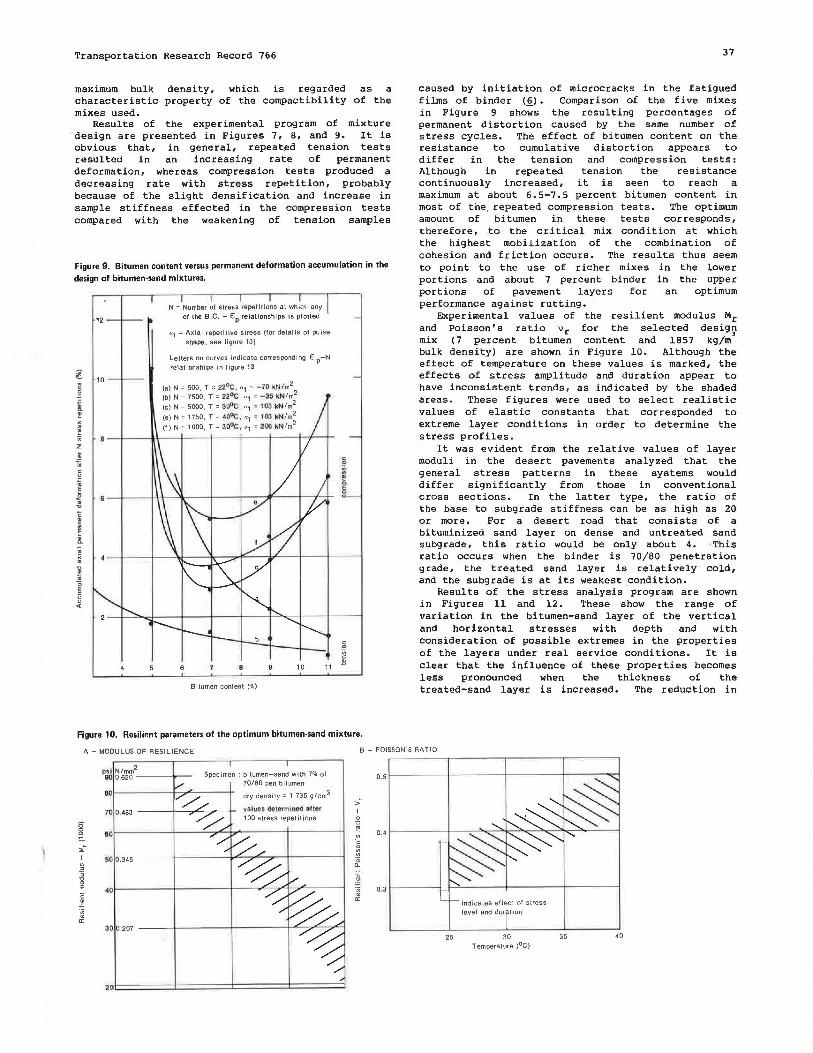
Figure 9. Bitumen content versus permanent deformation accumulation in the design of bitumen-sand mixtures.
~ ~ c
~ i e ~ ~
~ z ~
m c 0
~ s ~ c ~ ~ ~ ;;; ·;; m
dl 1ii
1 ..
12
10
N:: Number of stress repetitions at whicl• any al lhe B.C. - Ep relationships is ploHed
u1 :: Axial repetitive slress (for details of pulse shape, see figure 13)
Lelters on curves indicate corresponding Ep-N relationships in figure 13
(al N = 500, T = 22•c . o1 = - 70 •N l m2
(b) N = 7500, T = 22•c, "1 = -35 ~Nim: (c) N = 5000, T = 3o0C, a1 = 103 kN/m
(e) N:: 1750, T:: 40°C , o1 :: 103 tiLN/m2
(t l N = 1 ooo, T = ao•c, •1 ~ 200 kN /m2
10 11
Bilumen content (%)
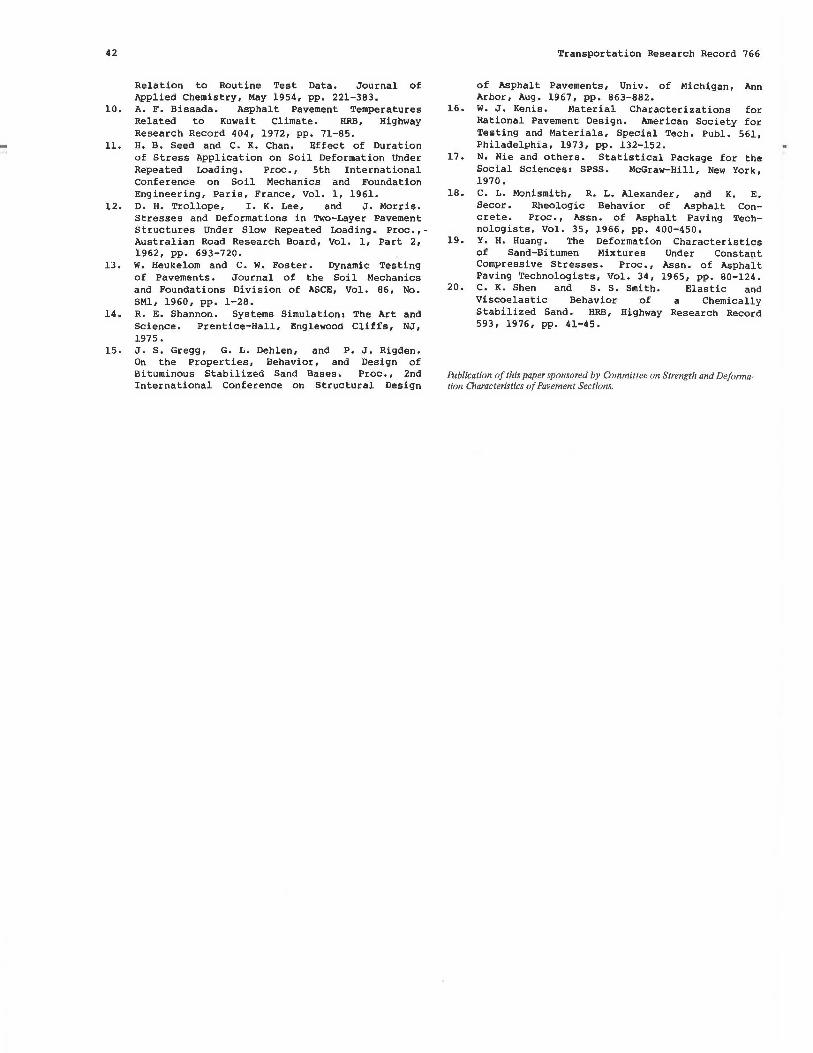
Figure 10. Resilient parameters of the optimum bitumen-sand mixture.
37
caused by initiation of microcracks in the fatigued films of binder (~). Comparison of the five mixes in Figure 9 shows the resulting percentages of permanent distortion caused by the same number of stress cycles. The effect of bitumen content on the resistance to cumulative distortion appears to differ in the tension and compression tests: Although in repeated tension the resistance continuously increased, it is seen to reach a maximum at about 6. 5-7. 5 percent bitumen content in most of the, repeated compression tests. The optimum amount of bitumen in these tests corresponds, therefore, to the critical mix condition at which the highest mobilization of the combination of cohesion and friction occurs. The results thus seem to point to the use of richer mixes in the lower portions and about 7 percent binder in the upper portions of pavement layers for an optimum performance against rutting.
Experimental values of the resilient modulus Mr and Poisson's ratio Vr for the selected desig~ mix (7 percent bitumen content and 1857 kg/m bulk density) are shown in Figure 10. Although the effect of temperature on these values is marked, the effects of stress amplitude and duration appear to have inconsistent trends, as indicated by the shaded areas. These figures were used to select realistic values of elastic constants that corresponded to extreme layer conditions in order to determine the stress profiles.
It was evident from the relative values of layer moduli in the desert pavements analyzed that the general stress patterns in these systems would differ significantly from those in conventional cross sections. In the latter type, the ratio of the base to subgrade stiffness can be as high as 20 or more. For a desert road that consists of a bituminized sand layer on dense and untreated sand subgrade, this ratio would be only about 4. ·This ratio occurs when the binder is 70/80 penetration grade, the treated sand layer is relatively cold, and the subgrade is at its weakest condition.
Results of the stress analysis program are shown in Figures 11 and 12. These show the range of variation in the bitumen-sand layer of the vertical and horizontal stresses with depth and with consideration of possible extremes in the properties of the layers under real service conditions. It is clear that the influence of these properties becomes less pronounced when the thickness of the treated-sand layer is increased. The reduction in
A - MOOULUS OF RESILIENCE B - POISSON'S RAT 10
s 8
,t I ~
" ~ E
c .~
·~ a:
os l N/mm2 900.620---
60
50 0.345
40
30 0.207
Specimen: bitumen-sand wilh 7% of 70/80 pen bilumen
dry density:: 1 735 g/cm3
v11luos delormlni;,u1' a.fuu 100 stress repetitions
20'========:±::======:±::======:±:====::==!
-~ ~ 0.3 1--~~~-j__t--=--~~~-t~~~~~r--~~~----i
~ a:
25
level and dur lion
30 Temperature (°C)
35 40

38
Figure 11 . Range of stresses in the bituminized sand layer of two-layer pavement systems.
E10 = 345 N/mm2
E11 = 620 N-/mm2
E20 = 138 N / mm2
E21 = 276 N / mm2
a = 163 mm p = 480 kNim2
the horizontal tensile stress range at the bottom amounts to about BO percent for an increase in thickness from 150 to 450 mm (Figure 11). Corresponding decrease in the vertical compressive stress at the same location is around 67 percent.
Figure 13 shows the relationships corresponding to all treatments of the program on one semilogarithmic plot that proved useful in further analysis. Al though they are nonlinear, a significant portion of the relationships in this figure can be approximated by straight-line segments, i.e., where N is greater than 1000. The least-squares technique was, therefore, applied to perform such an approximation by using the original four-test data in each treatment. In Figure 14, the resulting straight-line equations are listed in terms of the slope Sc sp /log N and the intercept with N 1000 ordinate, Ic. The formulation of equations for predicting these two dependent variables, when temperature and stress conditions are given, would allow the estimation of the amount of distortion accumulating in an element of any thickness.
Such equations were derived here by using multilinear regression analysis of the experimental data in Figure 14. The slope (Sc) or the intercept (Icl represented the dependent variable, while factors of temperature (T) and stress (o 1 and o 3) were input, in different combinations, as independent variables. The combination terms, which represented potential interaction effects, included such terms as (o l -a 3), (o 1-03) T,
Transportation Research Record 766
Figure 12. Range of stresses in the bituminized sand layer of three-layer pavement systems.
(-40psi)
-276 -138
::: 163mm
= 460 kN m2
Stress kN/m2
138 276 414
15
-1~-+-20
--i---t--+--30
NOTE Systems with I ::: 25cm a1e analysed in addiMn to lhose
1n the 01i1inal pro11amme shO'M\
45
o1T, o3T, 0103, and others. The facility of stepwise multiple regression provided by the Statistical Package for the Social Sciences (17) allowed the choice of the fewest terms with the highest predictive power of the dependent variable. The equations finally selected are included in Figure 15, together with their characterizing statistics. The figure also includes selected equations for predicting St and It associated with the tension-test results. These were derived in the same way as Sc and Ic but from an ordinary plot of £P versus N, as shown in Figures 16 a nd 17.
In any of the four equations selected, the term for the interaction between deviatoric stress and temperature proved sufficient to predict the dependent variable to an acceptable level. Values of
2 the squared multiple correlation coefficient
(R ) indicate that at least 82 percent of the variance in s or I is being accounted for by the equations selected. This reflects a simplicity in the distortion response that could be related to the very nature of the mixture used. Unlike well-graded aggregates in conventional mixes, the rounded shape and smooth texture of the stabilized sand particles produced a minimum degree of interlocking and, consequently, the least interruption to the function of the binder film in between. Minimum interlocking is also encouraged by the absence of large-sized aggregates, which implied that load transmitted between any two adjacent particles would be relatively very small. It is the presence of the

Transportation Research Record 766
Figure 13. Results of the experimental program of repeated-load triaxial tests (compression series) .
"8
7
6
l11u1es 1n cells indicate treatmenl numbers
1a2 Number ol siress repelillons-(Log.)
Figure 15. Selected predictive equations and their characteristics.
Repeated Stress Pa\lern Predictive Equation Selecled (in the Triaxial Test) STD ERROR B
Triaxlal Compression (compression zone) IC = •0 .57438 t 0.00015 '''1 - "3) T 0.00002
to3 [Jf1
ft t Sc = -1.67194 ~ 0.00057 (111 - r13 ) T 0 00004
Biaxial Compression " 3 , I~ = 0.21447 t 0 00072 (111 t ,.3 ) T 0 00006 with Uniaxial Tension "l
(tension zone)
4-111 0"3
s1 = -1 .45665 t 0.00250 (''l t ,,3 ) T 0.00014
Noles · - In the above equalions, temperature T, and slress " land r13, should be in °c and kNlm2 units.
Figure 14. Characteristics of the relationships between <p and log N approximated to linearity (compression tests: N > 1000).
u 0 0
IC Sc z w ... REPEATED STRESS a: z :::> INTERCEPT WITH w AMPLITUDE ... :. <
GRADIENTEP~0 ... a: N = 1000 ORDINATE w < AXIAL RADIAL 0.. Log N w :. a: (Eo %) ... "1 •3 w
.,· T - -3.16 -8.45 "1 u{ . ,· T • -0.95 -3.06
•1 •3' r 0.30 1.12
•1 03' T " 0.15 0.57
"1 ..
•3 T·- -0.54 ·-1.99 ..
•1 ., T " -018 -0 77
-., •3 r 1.05 4.16
o, - ... T ' 0.42 3.53
111'' .; T ' 0.27 1.96
10 ., .; T ' -0.49 -1.95 11 ., "'1-. T- 0.51 2.86 12 "1 •3" T" -1 49 -5. 97
13 "' "3. T" 0.22 o.8a 14 •1" •3" T. -1.68 -6.78
15 u,- "3 T" 0.64 3.99
16 . ,~ •3 T ~ -0.36 -1 .37
17 "' a{ T" 0.36 2.42
18 "1 . ., . r -0.95 -3 ,91
• The c subscripl is lo identily compression test parameters
"1;r11",a( :: 276 , 362, 448 kN /m2 respectively t1',11" :: 138, 483 kN/m2 rosJXtctlvely tSc T', T; T
0
:: 25, 32.5 40°c respecllvely
§ EP = lc t Sc (Log N-3) ~ .... G. .,.., ls. ..
___.-/ 8 I IC <.>
----....... '• LogN
c 0 ;; ~
§ c "' .,..., ~ I
I• z - Sc
Ep% = cumulalive permanent a•ial slrain (%)
Characterislics
BETA STANDARD R2 F ERROR
0 91 0.4427 0.62 75
0 96 1.0613 0,92 193
0 94 0.2882 0.89 135
0.97 0.6758 0.94 300
- Signs of lhe resulling paramelers I or Sare signilicanl for le and Sc a plus sign indicales shortening, a minus sign indicales elongation. For 11 and s1, a positive sign should normally be expected, indicating permanent compression.
39

40
Figure 16. Results of the experimental program of repeated-load triaxial tests (tension series).
Transportation Research Record 766
~ 10 1--1--~~~~~~~1--.1-1~~~~-I-'----~~"-""'-" .~ 0
~ 91--1--~~~~~~,/-../-J-l~~~J-~-"':--..!:..-~'---< 8
<!". 0 8 l-+-~~~~--.'--JL-,f~---+~-r~..,,c.....,,c...~,,L---.~---1
.~
~ ~ g 6 1--t-~~-r-;1-;f-~-7'-?71''-:.~~'------2'17"'«-~--::;,.....:+----:,...."'--~~~--:,....o::::::.~1---~~---1
0 . E 1l.
Figure 17. Characteristics of the relationships between €p and N approximated to linearity (tension tests: N > 1000).
0 fr'
z REPEATED STRESS w 1, s, a: I- AMPLITUDE ::J INTERCEPT WITH GRADIENT£_£_% z I-w <( N=1000 ORDINATE N
"' a: I- w <( A X IAL RADIAL a. w "' po-•) a: " 1 "3 w (£p%) I- I-
19 " I -~ T- 2 93 6.9
20 ,,, ,,.; T 0.69 0,4
21 "i 11-i_ T- 1.47 3.0
22 jli '" T ' 0.23 0 1
23 ,,; ,,; T ~ 3 07 10,3
24 " - .. ~ T ' 1.17 2.3
25 ,,,
,,~ I 2 12 4 7
26 11;-° o~ T o.as 0.5
27 ·J~ 11; T ' 0 52 03
28 .. ; .. ; T 1 08 1 2
29 .
··3 T- 1 BO 3 7 " I 30 ,,1· .. ;; T "" 3 08 B 3
31 ,, .. ; T' 1 18 0 9
32 .. ; ,,_; T " 1 87 40
33 .. , .,~ T" 1 28 2.7
34 "l .,.; T" 2 26 5.4
35 ··i ,,~ T" 1 09 1 B
36 .. , . ~ T" 2 09 4 4
The L subscripl is to idenlify tension tesl parameters
.. ; , ., 1 ·~ 11.1'. = 27 .6. 55 & 83 kNtm2 respeclively (tension)
rrj, .. 3: 13 8 & 69 kNlm2 respeclively
r: r: r-~ 10. 20 & 3o0c respectively
Ep 1, I s, (N- 1000) _____,----
~~ s,
N 1000
Ep =cumulative permanent radial strain (contraclion)
aggregate phase that contribute (18, 19).
and the complexity of its structure to the complexity of the mixture
The relatively large sample size adopted in the experimental phase (four specimens per treatment) has helped in producing more accurate estimates of the real response. It limited the variance
10 30 Number of stress repetilions (x1000)
associated with the average response in each treatment, which had the effect of reducing inconsistencies in the input data to the regression analysis. [It is interesting to note that Shen and Smith (20), in their work on chemically stabilized fine sand, observed a simplicity of response similar to the one reported here.]
The plausibility of the formulated predictive equations (Figure 15) was finally demonstrated by a numerical example. Here the equations were used to estimate the component of surface-rut depth caused in the bitumen-sand layer of two desert pavement cross sections. Certain assumptions regarding traffic and material variables were made, and the geometries of the sections were chosen to allow observation of the effects of changing the thickness of the layer on the value of the resulting rut component at relatively high average temperature . Computation and other details are included in Figures 18 and 19. It is useful to note that because of the lack of complete simulation in the tests of the mode of tensile stresses in the pavement, as well as because of the assumptions written into the BISAR program, the results reported here are overestimates of the total permanent strain in the tensile zone •
CONCLUSIONS
l. For a type of sand similar in properties to that encountered in desert road construction, design bitumen content for optimum performance under repeated uniaxial compressive stresses lies between 6 percent and 8 percent; under repeated uniaxial tension, no optimum value exists within the range of testing conditions adopted.
2. Stress pulse duration between 0.1 s and o. 2 s has no clear trend in its effect on the resilient modulus of the optimum mix in the triaxial mode of testing.
3. The permanent deformation response of the optimum mix under repeated triaxial stresses was investigated, the results were analyzed by multiple linear regression, and predictive relationships for distortion accumulation were formulated. The response correlated highly significantly with the term (o 1-o 3 )T, which represents the interactive effect among the main factors of axial stress 01, lateral stress 03, and T. This term

Transportation Research Record 766
Figure 18. Example of prediction of permanent deformation in a 45-cm bitumen-sand base.
Figure 19. Example of prediction of permanent deformation in a 25-cm bitumen-sand base.
1 • a=163mm
~ p = 480 kN/m2
II II
- ------ ------1------..... 1------- ------~ ~---
~ ------,..._ >---------- ~~~n62~~/mrn2
v = 0.4
- ----- -------
I Dense sand subgrade i E = 276 N/mm2
v = 0.4
f ~=163mm
1111 I I Ip= 480 kN/m2
--- ----- 1-- --~ - · ,__ F-- --- ____, ____,
~ -----I-i------ -
' BIN~n-Snnd
2 -~~--, = 0.
Cle.niu~ Sftnc;I
I
Subg,.do E = 276 Nimm2 v = 0 .4 '
Repealed
Slresses
(kN/m2)
"1 "3
479 358 489 280 U3 183 406 '125 384 8J
3.20 54
240 17
176 -3
129 -19
94 -36
71 -58
60 -89
Repeated Slresses lkN/m2)
"1 "3
477 398 460 274 •27 174
382 94
280 -26
196 -132
159 -273
explained the major part of treatment-to-treatment variation in the experimental results.
4. Application of the predictive relationships derived in the study produced plausible solutions, but verification against observations of real performance remains to be done and is considered essential before reliable use in real design problems can be made.
5. The solutions provided by the predictive models indicated that (a) most of the permanent deformation occurs in the tension zone and (b) increasing the thickness of the treated sand layer has the effect of reducing its contribution to the total rut depth in the pavement system.
ACKNOWLEDGMENT
we wish to thank A. M. Neville of the University of Leeds for making available the facilities of the Department of Civil Engineering to carry out this research.
REFERENCES
l.
2.
Statistical Yearbook: 1976. United Nations, New York, 1977. c. R. Marek, M. Herrin, c. E. Kesler, E. J. Barenberg. Promising Replacements Conventional Aggregates for Highway NCHRP, Rept. 135, 1972, 53 pp.
and for
Use.
T N
:; 0 0
"' "' R
T N
Tu ~
41
Solutions l.Sing Equations In Table 3 Results Using Equal ions In Table 3
Total Vertical Permanent Delormetlon In Ep at N = 1000 Ep rate a Iler N = 1000 The Element At N = 7000
IC 1, Sc st Epc EDI
% % %/Log N ~ (10-4) % mm % mm
-0.121 0.052 -0.07 -0.03 0.209 1.308 l .J1 0.33 0.401 .. ~. 2.12 "·"" 1 222 2.318 3 18 D.70
0.479 2.332 2,45 0.81
0.423 2.118 2.21 0.82
0.262 1.506 1 53 0.76
3 .436 9,731 9.27 4.63
2.878 7.793 7.55 3. 77
2 554 6.668 6 .55 3.27
2.536 6,606 6.49 3.25
2 896 7.856 7 R1 1 on
Tolal Delormation tn The Compression Zone= 3 .80 Tolal Derormation In The Tension Zone= 16.82
Total Conlribulion To Surface Rut Depth= 3.80 + 16-82 = ~
Solutions Using Equations In Table 3 Aesu1Ls Using EQualions In Table 3
EpatN=lOOO Ep rale for N >1000 Total Vertical Permanent Deformation In The Element At N = 7000
IC !t Sc SI Epc Epl
% % % /Log N i(f 110-4) % mm % mm
-0.267 -0 503 -0.69 -0,26 0.123 0.978 0.95 0.23 0.374 t.933 2 . 0.1 0 .50
0 '0' _, 40> ~.56 o.os
5.722 5.722 17-668 16 .32 8 .16
6.118 19,043 17.54 8.77
7.990 Zfi .54J ·~.~, 5.A"
Total Deformalion In The Compression Zone , 1 43 Total Deformation In The Tension Zone . 22 75 Total Conlribulion To Surface Aul Deplh = 1.43 + 22 ,75 = 24 ~ 16 mm
3. R. E. Root, E. L. Skok, Jr., and D. L. Jones. Structural and Mixture Design of Low-Volume Roads Using the Elastic Theory. Proc., 3rd International Conference on the Structural Design of Asphalt Pavements, London, 1972, pp. 1074-1084.
4. P. E. Fossberg. The Compaction and Strength Properties of Bitumen-Stabilized Windblown Sand. Konferenz Uber Bodenmechanik im Strassenbau, Vienna, Oct. 1964.
5. J. R. Davies and J. A. Stewart. An Investigation of the Strength Properties of SandEmulsif ied Asphalt Mixtures: Final Report on Project Q-11. Department of Civil Engineering, Queen's Univ., Ontario, Canada, 1969.
6. Structural Design of Asphalt Concrete Pavements to Prevent Fatigue Cracking. HRB, Special Rept. 140, 1973.
7. Tentative Method of Test for Compaction and Shear Strain Properties of Hot Bituminous Mixtures by Means of the U.S. Army Corps of Engineers Gyratory Testing Machine Using Fixed Roller. Annual Standards, ASTM D3387-74T,
8.
9.
1975, pp. 780-784. R. D. Barksdale. Compressive Stress Pulse Times in Flexible Pavements for Use in Dynamic Testing. HRB, Highway Research Record 345, 1971, pp. 32-44. c. van der Poe!. General System Describing the Visco-Elastic Properties of Bitumens and Its
42
Relation to Routine Test Data. Journal of Applied Chemistry, May 1954, pp. 221-383.
10. A. F. Bissada. Asphalt Pavement Temperatures Related to Kuwait Climate. HRB, Highway Research Record 404, 1972, pp. 71-85.
11. H. B. Seed and c. K. Chan. Effect of Duration of Stress Application on Soil Deformation Under Repeated Loading. Proc., 5th International Conference on Soil Mechanics and Foundation Engineering, Paris, France, Vol. 1, 1961.
12. D. H. Trollope, I. K. Lee, and J. Morris. Stresses and Deformations in Two-Layer Pavement Structures Under Slow Repeated Loading. Proc., -Australian Road Research Board, Vol. 1, Part 2, 1962, pp. 693-720.
13. w. Heukelom and c. W. Foster. Dynamic Testing of Pavements. Journal of the Soil Mechanics and Foundations Division of ASCE, Vol. 86, No. SMl, 1960, pp. 1-28.
14. R. E. Shannon. Systems Simulation: The Art and Science. Prentice-Hall, Englewood Cliffs, NJ, 1975.
15. J. s. Gregg, G. L. Dehlen, and P. J. Rigden. On the Properties, Behavior, and Design of Bituminous Stabilized Sand Bases. Proc., 2nd International Conference on Structural Design
Transportation Research Record 766
of Asphalt Pavements, Univ. of Michigan, Ann Arbor, Aug. 1967, pp. 863-882.
16. w. J. Kenia. Material Characterizations for Rational Pavement Design. American Society for Testing and Materials, Special Tech. Publ. 561, Philadelphia, 1973, pp. 132-152.
17. N. Nie and others. Statistical Package for the Social Sciences: SPSS. McGraw-Hill, New York, 1970.
18. c. L. Monismith, R. L. Alexander, and K. E. Secor. Rheologic Behavior of Asphalt Concrete. Proc., Assn. of Asphalt Paving Technologists, Vol. 35, 1966, pp. 400-450.
19. Y. H. Huang. The Deformation Characteristics of Sand-Bitumen Mixtures Under Consta~t Compressive Stresses. Proc., Assn. of Asphalt Paving Technologists, Vol. 34, 1965, pp. 80-124.
20. C. K. Shen and s. s. Smith. Elastic and Viscoelastic Behavior of a Chemically Stabilized Sand. HRB, Highway Research Record 593, 1976, pp. 41-45.
Publication of this paper sponsored by Committee on Strength and Deformation Characteristics o.f Pavement Sections.