Biogeochemistry of the II.A group elements in a forested catchment
115
FACULTY OF SCIENCE CHARLES UNIVERSITY PRAGUE INSTITUTE OF GEOCHEMISTRY, MINERALOGY AND NATURAL RESOURCES APPLIED GEOLOGY - GEOCHEMISTRY Biogeochemistry of the II.A group elements in a forested catchment DISSERTATION TOM NAVRÁTIL 2003 Supervisor: Doc.RNDr. Emil Jelínek, CSc. Consulting supervisor: Doc.Ing. Petr Skřivan, CSc.
Transcript of Biogeochemistry of the II.A group elements in a forested catchment

FACULTY OF SCIENCE CHARLES UNIVERSITY PRAGUE
INSTITUTE OF GEOCHEMISTRY, MINERALOGY AND NATURAL
RESOURCES
APPLIED GEOLOGY - GEOCHEMISTRY
Biogeochemistry of the II.A group elements in a forested catchment
DISSERTATION
TOM NAVRÁTIL
2003 Supervisor: Doc.RNDr. Emil Jelínek, CSc. Consulting supervisor: Doc.Ing. Petr Skřivan, CSc.

Acknowledgment
Data presented in this study are result of hard work of a research team working in laboratory
of environmental geochemistry at Institute of Geology, Academy of Science CR. This work
would never be realized without support and cooperation of the Czech Republic institutes
dealing with issues of environmental biogeochemistry. Long-lasting and fruitful cooperation
of Institute of Geology, Academy of Science CR with Czech Geological Survey and Faculty
of Science, Charles University must be pointed out.
The financial support to this study originates in number of grants and research projects. The
study covers over 8 years of research, which was financed from these main projects: grant
project ASCR B3013203 (to T. Navrátil), project of Czech Geological Survey GEOMON (to
D. Fottová), institutional project of Institute of Geology CEZ Z 3-013-912 and project
KONAKT ME 147 (to J. Veselý).
I would like to especially thank Jamie Shanley (USGS) for major help with editorial work,
Petr Skřivan for his patience with me and everybody who helped me on my way through.

Tom Navrátil Biogeochemistry of the II.A group elements in a forested catchment
TABLE OF CONTENTS 1 Introduction .............................................................................................................................................. 4
1.1 Mass cycling processes.............................................................................................................................. 4 1.2 Purpose of dissertation............................................................................................................................... 4
2 Literature review....................................................................................................................................... 5 2.1 Acid Deposition......................................................................................................................................... 5 2.2 The elements of the II.A group.................................................................................................................. 6
2.2.1 Beryllium .............................................................................................................................................. 7 2.2.2 Magnesium.......................................................................................................................................... 10 2.2.3 Calcium............................................................................................................................................... 11 2.2.4 Strontium............................................................................................................................................. 14 2.2.5 Barium ................................................................................................................................................ 16
2.3 References ............................................................................................................................................... 18 3 Methods .................................................................................................................................................. 22
3.1 Site description ........................................................................................................................................ 22 3.1.1 Climate and Hydrology....................................................................................................................... 23 3.1.2 Geology............................................................................................................................................... 24 3.1.3 Vegetation ........................................................................................................................................... 27
3.2 Sampling.................................................................................................................................................. 28 3.2.1 Rock and mineral samples .................................................................................................................. 28 3.2.2 Bulk precipitation and throughfall ...................................................................................................... 28 3.2.3 Soil solution ........................................................................................................................................ 29 3.2.4 Stem wood, roots, bark and assimilatory organs of beech and spruce ................................................ 29 3.2.5 Soil samples ........................................................................................................................................ 30 3.2.6 Surface water and shallow groundwater ............................................................................................. 30 3.2.7 Acidification experiment..................................................................................................................... 31
4 Results .................................................................................................................................................... 33 4.1 Bedrock ................................................................................................................................................... 33 4.2 Alluvial Sediments .................................................................................................................................. 35 4.3 Bulk precipitation .................................................................................................................................... 36 4.4 Throughfall fluxes ................................................................................................................................... 37 4.5 Vegetation ............................................................................................................................................... 41
4.5.1 Assimilatory organs ............................................................................................................................ 42 4.6 Soil .......................................................................................................................................................... 45 4.7 Soil solution............................................................................................................................................. 51 4.8 Stream water............................................................................................................................................ 53
4.8.1 Streambed material ............................................................................................................................. 57 4.8.2 Experimental acidification .................................................................................................................. 59
4.9 Shallow Groundwater .............................................................................................................................. 63 4.10 Fluxes and seasonal variations................................................................................................................. 64
5 Discussion............................................................................................................................................... 67 5.1 Fluxes and cycling in forest ecosystem ................................................................................................... 67
5.1.1 Sources for the watershed system ....................................................................................................... 67 5.1.2 Internal cycling ................................................................................................................................... 70 5.1.3 Losses from watershed ecosystem ...................................................................................................... 90 5.1.4 Comparison of biogeochemistry of the II.A elements......................................................................... 95
6 Conclusions ............................................................................................................................................ 97 6.1 Summary on studied ratios .................................................................................................................... 100 6.2 References ............................................................................................................................................. 101
7 Annexes ................................................................................................................................................ 104 8 Bibliography, Vita ................................................................................................................................ 113
1
Tom Navrátil Biogeochemistry of the II.A group elements in a forested catchment
List of Figures Figure 1 Location of the Lesni potok catchment in Europe, in Czech Republic and in Jevany district .................................... 22 Figure 2 Precipitation input and runoff output depth [mm], temperature [oC] ......................................................................... 23 Figure 3 Two profiles with preferential flow pathways (solid arrow low water table, unfilled arrow high water table) .......... 24 Figure 4 Geological setting of the catchment vicinity .............................................................................................................. 25 Figure 5 Distribution of the fractions throughout the alluvial profile....................................................................................... 26 Figure 6 Sampling locations inside and outside of the LP catchment ...................................................................................... 32 Figure 7 Images of the Říčany type (left) and Jevany type (right) granites .............................................................................. 34 Figure 8 Vertical distribution of Be, Mg and Ca in the alluvial profile, empty diamond represents the weathered rock in 10m
depth, triangle represents syenogranite (Jevany), square represents monzogranite (Říčany), filled diamonds represent each layer of profile ....................................................................................................................................................... 35
Figure 9 Vertical distribution of Sr and Ba in the alluvial profile, empty diamond represents the weathered rock in 10m depth, triangle represents syenogranite (Jevany), square represents monzogranite (Říčany), full diamonds represent each layer of profile ........................................................................................................................................................................ 36
Figure 10 a) The difference in SO42- flux below spruce (full squares) and beech (empty squares), b) the differences in
throughfall pH below spruce (full squares), beech (empty squares) and bulk precipitation (diamonds)........................ 38 Figure 11 Acid leachable Be concentrations throughout the soil profiles at LP catchment; the average is based on 8 profiles46 Figure 12 Acid Leachable Mg concentrations throughout the soil profiles at LP catchment; the average is based on 8 profiles
....................................................................................................................................................................................... 47 Figure 13 Leachable Ca concentrations throughout the soil profiles at LP catchment; the average is based on 8 profiles ...... 48 Figure 14 Acid Leachable Sr concentrations throughout the soil profiles at LP catchment; the average is based on 8 profiles48 Figure 15 Acid leachable Ba concentrations throughout the soil profiles at LP catchment; the average is based on 8 profiles49 Figure 16 Changes in Be concentration in surface water during period 1993 - 2001 ............................................................... 54 Figure 17 Changes in Mg concentration in surface water during period 1993 - 2001 .............................................................. 55 Figure 18 Changes in Ca concentration in surface water during period 1993 - 2001 ............................................................... 56 Figure 19 Changes in Sr concentration in surface water during period 1994 - 2001 ................................................................ 56 Figure 20 Variations in Ba concentration in surface water during period 2000 – 2001; filled diamonds represent the
theoretical Ba concentrations with respect to Ksp BaSO4............................................................................................... 57 Figure 21 Iron precipitate at the LP streambed......................................................................................................................... 58 Figure 22 Streamwater pH value at sites in the experimental stream reach. Solid lines represent changes during the
acidification phase; dashed lines represent changes during the recovery. The number in the legend is time (hours) from the beginning of experiment. ......................................................................................................................................... 59
Figure 23 The change in solute concentrations (ci – c0) at point C, 45 m below the point of acid addition. The dashed line represents no change. BC = the sum of base cations (Ca, Mg, Na, and K) .................................................................... 59
Figure 24 The relative change (ci/c0) of various analyte concentrations in time at point C, 45 m below the acid addition point....................................................................................................................................................................................... 60
Figure 25 Relationship of Ca and Mg concentrations in the LP streamwater........................................................................... 62 Figure 26 The relative change ci/c0 and absolute concentration changes (ci - c0) of the II.A group elements during the
acidification experiment ................................................................................................................................................ 62 Figure 27 Measured and calculated Ba concentrations in the LP shallow groundwater ........................................................... 64 Figure 28 Average seasonal changes of selected fluxes in and out of LP catchment (secondary Y axis attributed to output, if
included) ........................................................................................................................................................................ 66 Figure 29 The relationship of Ca and Mg concentrations in the bulk precipitation.................................................................. 69 Figure 30 Relationship of Ca and Mg fluxes in bulk precipitation (diamonds), beech (empty squares) and spruce (filled
squares) throughfall ....................................................................................................................................................... 72 Figure 31 Seasonal changes in the flux of Ca, Mg and K in beech throughfall, data are 4-year monthly averages.................. 73 Figure 32 Seasonal changes in flux of Ca, Mg and K below the spruce, data are 4-year monthly averages ............................ 73 Figure 33 Relationship of Sr and Ca fluxes in bulk (diamonds), beech (empty squares) and spruce (filled squares) throughfall
....................................................................................................................................................................................... 74 Figure 34 The Mg:Ca ratio in spruce compartments at Lesni Potok (LP), at Lysina (Lys) and at Pluhův Bor (Plb) catchment
(data on Lys and Plb from Krám 1997) ......................................................................................................................... 77 Figure 35 The (Sr:Ca)*1000 ratio in tree compartments of beech and spruce at LP catchment ............................................... 78 Figure 36 Differences of II.A leachable concentrations in soil below beech (dashed) and spruce (solid) canopies ................. 81 Figure 37 The Mg:Ca ratios in the LP catchment soil profile................................................................................................... 83 Figure 38 Ratio (Sr:Ca)*1000 through LP35 profile and in the LP bedrock ............................................................................ 85 Figure 39 Ratio of average acid leachable (Sr:Ca)*1000 in soils of LP catchment and for sites with various afforestation .... 86 Figure 40 Relationship of Ca vs Sr concentration and Mg vs Ca concentration in soil solution at LP catchment.................... 89 Figure 41 The pH dependence of Be and Al concentration in LP surface water ...................................................................... 91 Figure 42 The relationship of Ca and Mg with SO4
2- in LP streamwater and the Mg:Ca ratio through time in LP streamwater....................................................................................................................................................................................... 92
Figure 43 Changes of Mg:Ca ratio and SO42- concentration at point C during the acidification experiment ........................... 94
2
Tom Navrátil Biogeochemistry of the II.A group elements in a forested catchment
List of Tables Table 1 Selected parameters of the II.A group elements (Lide et al. 1994)................................................................................ 6 Table 2 Abundances of the II.A group elements in the Earth’s spheres (Roessler & Lange 1972), last two columns (Zýka
1971; Beneš 1994), all data in meq.kg-1 or meq.L-1 ......................................................................................................... 6 Table 3 The tree species at LP catchment and appropriate covered area in 1998..................................................................... 27 Table 4 Chemical composition of the bedrock ......................................................................................................................... 33 Table 5 Average chemical compositions of the rock-forming minerals ................................................................................... 34 Table 6 Concentrations of elements in the roots of beech and spruce at LP catchment............................................................ 41 Table 7 Concentrations of elements in the stem wood and bark of beech and spruce at LP catchment ................................... 41 Table 8 Concentrations of elements in the branches of beech and spruce at LP catchment ..................................................... 42 Table 9 Concentrations of elements in the assimilatory organs of beech and spruce at LP catchment..................................... 44 Table 10 The properties and element concentrations of LP33, LP35 and LP36 profiles, elements and CEC in meq.kg-1, N(t)
total nitrogen, C(ox) oxidable carbon ............................................................................................................................ 50 Table 11 Average values of monitored parameters in soil solutions and THB of the LP catchment in 2000........................... 51 Table 12 Discharge weighted average annual values of selected parameters of LP surface water ........................................... 53 Table 13 Chemical compositions of the streambed material and soil (calculated as average weighted by layer thickness)..... 58 Table 14 Data on changes of concentrations at points W, B, C and D during the acidification experiment............................. 61 Table 15 Mean concentrations of solutes in groundwater and surface water during year 1999................................................ 63 Table 16 The pools of elements (meq.m-2) in biomass at LP catchment and annual loss by wood and bark accretion ............ 75 Table 17 Elemental fluxes to the forest floor through the litterfall........................................................................................... 80 Table 18 Solubility constants ox the II.A group oxalates ......................................................................................................... 82 Table 19 Average pH and solute concentrations of LP surface water at three flow regimes determined according to Fe
concentrations during the monitored period 1994 - 2001 .............................................................................................. 90 Table 20 Enrichment factors of elements in solutions of the LP catchment, calculated as mean c(solution in ecosystem)/c(bulk) (data
2000 – 2001).................................................................................................................................................................. 95 Table 21 Depletion factors of elements in bedrock derived compartments of the LP catchment, calculated as mean c(compartment
of ecosystem)/c(bedrock)............................................................................................................................................................ 96 Table 22 Annual input and output fluxes of elements at the LP catchment............................................................................ 104 Table 23 Correlation matrix of the bulk fluxes at site TR ...................................................................................................... 105 Table 24 Correlation matrix of the spruce throughfall fluxes at site LP7............................................................................... 106 Table 25 Correlation matrix of the beech throughfall fluxes at site LP6 ................................................................................ 107 Table 26 Correlation matrix of the LP soil solution parameters............................................................................................. 108 Table 27 Correlation matrix for 89 samples of the solutes and parameters from the LP stream water in period 1994 - 2001 109 Table 28 Correlation matrix for solutes in 15 samples from the acidification experiment ..................................................... 110 Table 29 Correlation matrix for parameters of shallow groundwater ..................................................................................... 111 Table 30 Correlation matrix for data on soil properties at LP catchment ............................................................................... 112
List of Abbreviations ASCR - Academy of Sciences, Czech Republic AAS - atomic absorption spectrometry BC - base cations BS - base saturation C(ox) - oxidable carbon CEC - cation exchange capacity CR - the Czech Republic DF - depletion factor DI - deposition intensity of water [mm] DOC - dissolved organic carbon EF - enrichment factor HBEF - Hubbard Brook Experimental Forest ICP MS - inductively coupled plasma mass spectrometer Ksp - solubility product LP - Lesni Potok Lys - Lysina catchment N(t) - total nitrogen NA - not available Plb - Pluhův bor catchment THB - throughfall beech THS - throughfall spruce SAA - strong acid anions V/m - volume/mass ratio
3

Tom Navrátil Biogeochemistry of the II.A group elements in a forested catchment
1 Introduction
1.1 Mass cycling processes
Mass cycling is the term used to describe the movement of certain materials into, within, and
out of an ecosystem. This dynamic takes place because there are sufficient supplies of energy
in the ecosystem as well as because the energy is being further delivered into the ecosystem.
Cycling of mass is important for maintenance of the ecosystem balance. Earth’s life is
inextricably linked to climate through a variety of interacting cycles and feedback loops. The
environmental transport and transformations of substances, where living organisms are
involved, are denoted as biogeochemical cycles. These global cycles include the circulation of
certain elements, or nutrients, which directly affect the earth's life and climate.
In recent years there has been a growing awareness of the extent to which human activities,
such as deforestation and fossil fuel burning, have directly or indirectly modified the
biogeochemical and physical processes involved in determining the earth's climate. These
changes in atmospheric processes can disturb a variety of the ecosystem functions. In addition
to helping to maintain relative climate stability and a self-cleansing, oxidizing environment,
these beneficial functions include protection from most of the sun's harmful ultraviolet rays,
mediation of runoff and evapotranspiration (which affects the quantity and quality of fresh
water supplies and helps control floods and droughts), and regulation of nutrient cycling.
1.2 Purpose of dissertation
Acid deposition and air pollution are the most disturbing impacts on forest ecosystems in the
Northern Hemisphere. These phenomena are causing significant impacts in the natural cycle
of elements, which may lead to their accumulation in one compartment of the environmental
system but also to depletion in another compartment. These accumulations and deficits may
then negatively affect the health and productivity of forest ecosystems.
The major objective of this dissertation is to compare field behavior and distribution of II.A
group elements under this anthropogenic impact.
The elements of the II.A group include important nutrients (Ca, Mg), essential elements (Sr)
and also toxic elements (Be, Ba). The chemical properties and abundance of calcium and
magnesium have caused them to become not only important nutritional elements, but also
important acid buffering substances. Recent studies of calcium and strontium reveal the
importance of Sr in evaluating the calcium origin. Consequently, pathways of the essential
elements of the II.A group will also be analyzed with respect to the ratios Mg:Ca and
4
Tom Navrátil Biogeochemistry of the II.A group elements in a forested catchment
(Sr:Ca)*1000. The behavior of Be and Ba was evaluated as important because of their toxic
character. This study, however, treats all five of these elements in context and as a group.
The biogeochemical cycling of the II.A group of elements is influenced by such phenomena
as acid deposition buffering, base saturation, tree nutrition, and acidification of streamwater,
soil and soil solution. The study of anthropogenic effects on II.A group elements was
performed by means of a small catchment study at a strongly impacted part of Europe, in the
central Czech Republic.
2 Literature review
2.1 Acid Deposition
Acidic deposition is the transfer of strong acids and acid-forming substances from the
atmosphere to the surface of the Earth. R.A. Smith first identified acid deposition in the 19th
century in England (Smith 1872). The ecological effects of acid deposition emerged in the late
1960s and early 1970s in Sweden and around Scandinavia (Oden 1968). The first report of
acid deposition in the North America was made at Hubbard Brook Experimental Forest
(HBEF) in the early 1960s (Likens et al. 1972). However the acidification of soils in Orlické
Mountains was studied regularly in the Czech Republic since 1953 (Pelíšek 1984). More
scientific investigations on acidification of the environment in the Czech Republic were made
in 1970s (e.g. Pačes and Pištora 1979). Over the last quarter of the past century scientists have
identified acidification as a critical environmental stress that affects forested landscapes and
aquatic ecosystems in North America, Europe, and Asia (Driscoll et al. 2001). Effects of acid
deposition on terrestrial ecosystems include those on soils, vegetation, crops, animals and
human health (Mihaljevič 1999). Due to major negative effects of acidic deposition, North
American and European legislative actions aimed at the recovery of damaged natural
resources have resulted in recent decreases in both emissions and deposition of acidic S
compounds.
Scientists in the1960s demonstrated the relationship between sulfur emissions in continental
Europe and the acidification of Scandinavian lakes. This raised the need for international
authority action, which was fulfilled by the Convention on Long-range Transboundary Air
Pollution (LRTAP) signed in 1979. The convention established a framework for cooperation
on reducing the impact of air pollution and defined a process of negotiating particular
measures to control emissions of air pollutants by means of legally binding protocols. The
EMEP programme (Co-operative Programme for Monitoring and Evaluation of the Long-
5

Tom Navrátil Biogeochemistry of the II.A group elements in a forested catchment
Range Transmission of Air pollutants in Europe) was initiated in 1977 as a special
programme under the United Nations Economic Commission for Europe (UNECE). Its aim is
to regularly provide governments and subsidiary bodies under the LRTAP Convention with
qualified scientific information to support the development and further evaluation of the
international protocols on emission reductions negotiated within the Convention.
Acid deposition can occur as wet deposition (i.e. rain, snow, sleet, hail, vapor, fog) or as dry
deposition (i.e. particles). Acid deposition can originate from transboundary air pollution and
can affect large geographic areas. Oxides of sulfur and nitrogen, which are primarily products
of the fuel combustion, are the dominant contributors to acid deposition. The process of
acidification alters the interactions of many elements (e.g. sulfur, nitrogen, hydrogen, calcium,
magnesium and aluminum).
The major changes in the S emission budgets of Czech Republic culminated in 1999, when all
the coal power plants were largely desulphurized (Hruška et al. 2002). However, while the
controls on emissions of S were maximized, the emissions of the second major acidifier N
remain significant.
2.2 The elements of the II.A group
The II.A group is characterized by strong metallic properties, because of their electronic
configuration (ns2, where n is period) and very high third-stage ionization energies. Elements
of the II.A group are divalent with a tendency towards covalence in the lighter elements (Be
and Mg) (Greenwood & Earnshaw 1984).
Table 1 Selected parameters of the II.A group elements (Lide et al. 1994)
Element Atomic number
Atomic mass Electronic configuration
Electronegativity (Pauling)
Ionic radius (pm)
Hydrated radius (pm)
Be 4 9.012 [He]2s2 1.57 57 ? Mg 12 24.305 [Ne]3s2 1.31 72 296 Ca 20 40.078 [Ar]3s2 1.00 100 272 Sr 38 87.620 [Kr]4s2 0.95 126 274 Ba 56 137.327 [Xe]5s2 0.89 142 248
Table 2 Abundances of the II.A group elements in the Earth’s spheres (Roessler & Lange 1972), last two columns (Zýka 1971; Beneš 1994), all data in meq.kg-1 or meq.L-1
Element Continental Crust
Abundance in granitic rocks
high in Ca
Abundance in granitic rocks
low in Ca
Seawater Abundance in plants (d.m.)
Abundance in soils on granites
Be 0.53 0.40 1.20 2.2E-08 NA NA Mg 1810 1794 132 107 58 595 Ca 1921 2320 788 20 225 435 Sr 7.6 18.3 6.9 0.2 0.5 4.2 Ba 8.5 9.5 12.1 8.7E-05 0.4 11.5
6
Tom Navrátil Biogeochemistry of the II.A group elements in a forested catchment
2.2.1 Beryllium
Beryllium is a low abundance litophile trace element in geologic systems. In terms of
geochemical behavior Be shows little similarity to other alkaline earth elements. However in
terms of ionic radius Be2+ (0.45A) is closest to Al3+ and appears to substitute for Al in crystal
lattices. The most economically significant mineral of Be is beryl (Be3Al2[Si6O18]), which is
found commonly in pegmatites and less commonly in metamorphic associations. Beryllium
has two naturally occurring radioisotopes, 7Be with half-life of 53.2 days and 10Be with half-
life of 1,520,000 years, and one stable isotope 9Be. Both of the radiogenic isotopes are used in
geochemistry as tracers.
In the Czech Republic, as well as in other industrialized countries, beryllium in precipitation
has been reflecting above all the impact of the element released into the atmosphere during
the process of coal combustion in power plants (Bezačinský 1980; Kubizňáková 1987; Moore
1991). The majority of coal burned in Czech power plants comes from the Tertiary lignite
basins in the NW part of the Czech Republic. The mean Be concentration in these coal types
was 0.67 meq.kg-1 with a range of 0.0 – 14.0 meq.kg-1 (Bouška & Pešek 1999). Solid
atmospheric particles containing anthropogenic 9Be, as well as its radioisotopes 7Be and 10Be,
are transported to the Earth’s surface mostly through the wash-out effect of the liquid or solid
precipitation (Vogler et al. 1996; Tanaka et al. 1997).
Krám et al. (1998) reported an annual deposition flux of 9.9 µeq.Be.m-2 in years 1991-92 to
the Lysina forested catchment (W Bohemia, 12 km south of the Sokolov Coal Basin). Results
of Skřivan et al. (2000a) based on the monitoring of bulk precipitation at Lesní potok forested
catchment since 1994 show that the annual Be flux in bulk precipitation steadily declined
from 8.8 µeq.m-2 in 1995 to 3.1 µeq.m-2 in 1998. In 1997, 50% of values were below the
detection limit of the analytical determination (0.04 ppb, ETA AAS), whereas in 1998 it was
94%. The data from 1998 – 99 based on analyses of preconcentrated samples of bulk
precipitation show that the annual Be- flux is less than 2.2 µeq.m-2.
Neal et al. (1992) reported the volume-weighted mean concentration of Be in throughfall in
mid-Wales to be 60% higher than that in rainfall. The concentration of Be in throughfall and
stemflow was 1.5 and 3 times higher than in rain, respectively. Krám et al. (1998) reported a
higher concentration of Be in Norway spruce (Picea abies L.) throughfall than in bulk
precipitation (0.013 µeq.L-1 vs. 0.009 µeq.L-1) in the Lysina watershed. Fluxes of Be in beech
(Fagus sylvatica L.) and Norway spruce throughfall in the Lesní Potok watershed ranged
from < 2.2 to 4.4 µeq.m-2.yr-1 for 1997 to 1999. Skřivan et al. (2000) documented for 1999
7
Tom Navrátil Biogeochemistry of the II.A group elements in a forested catchment
that the flux of Be to the forest floor was dominated by litterfall (averaging 39 µeq.m-2.yr-1
and 30 µeq.m-2.yr-1, for beech and spruce, respectively), whereas bulk precipitation and
throughfall were about 0.88 to 1.77 µeq.m-2.yr-1.
The concentration of Be ranges over three orders of magnitude in natural fresh water systems,
from a few ng.L-1 to a few µg.L-1 (Veselý et al. 2002). Concentrations of Be typically
decrease in the order: soil solution > groundwater > low order stream water > rivers >
estuaries >ocean. Determination of Be in dissolved and suspended material from rivers with a
wide range of chemical composition indicates that its geochemistry is primarily controlled by
(1) its abundance in the rocks and soil of the watershed (Measures and Edmond 1983), (2) the
extent of its adsorption onto particle surfaces (Veselý et al. 1989), and (3) water chemistry.
Veselý et al. (1998) monitored Be in six acidified lakes and their tributaries during 1984 –
1995. The strong decrease of Be was concurrent with a sharp decline in acidic deposition after
1986 and increased pH in the surface water. The mean concentrations of Be in Czech surface
waters with mean pH 5 is 0.11 µeq.L-1 (Veselý 1994).
Skřivan et al. (1994) reported 0.04 to 5.3 µeq.L-1 in the Lesni Potok (LP) stream, draining a
granite catchment with high aqueous F concentrations (mean 25.8 µeq.L-1) and with highly
variable pH (4.6 to 5.9). Many other authors have reported an inverse relationship between Be
in water and pH (Measures and Edmond 1983; Veselý et al. 1989; Kaste 1999; Navrátil 2000,
Navrátil et al. 2002). Also a regional freshwater survey (13,000 water samples) in the Czech
Republic showed a clear inverse relationship between the concentration of Be and pH (Veselý
and Majer 1996). Kaste (1999) found that Be concentrations increased approximately 100% in
the stream water of the artificially acidified watershed in Bear Brook, Maine, USA.
Veselý et al. (1989) found that the relationship between Be concentration and pH is not
straightforward; there was substantial scatter at lower pH, indicating that other factors
influence dissolved Be. The main form of Be in the LP surface water is the BeF+ complex,
which always formed >50% (Navrátil 2000; Navrátil et al. 2002). Under low pH conditions
the portion of free Be2+ ion becomes important. But at high pH (such as during low flow),
BeOH- and BeF2 dominate over Be2+ and BeF+. The most important factors determining the
Be speciation in Lesni potok surface water are Al3+, F-, Be2+ concentrations and pH (Navrátil
2000; Navrátil et al. 2002).
Krám et al. (1998) reported an average concentration of Be 0.044, 0.089 and 0.24 µeq.L-1 in
soil solution from O, E and C soil horizons at the granite catchment Lysina.
Total soil Be ranges from 0.02 to 8.87 meq.kg-1, with the world average near 1.33 meq.kg-1
(Drury et al. 1978). Total and acid soluble concentrations (2M HNO3) of Be were investigated
8
Tom Navrátil Biogeochemistry of the II.A group elements in a forested catchment
in agriculture soils (Ap horizon) of the north Czech Republic region with high atmospheric
pollution (Podlešáková et al. 1994). The average total Be concentration ranged from 0.47 to
1.15 meq.kg-1. Acid soluble Be ranged from 0.12 to 0.22 meq.kg-1 (22 to 27 % of total Be).
Exchangeable Be was weakly negatively correlated with soil depth, whereas total Be
increased with depth (Veselý et al. 2002). Exchangeable Be and Al were unrelated.
Exchangeable Be in the forest floor increased nearly by 300% on a transect of 17 m from
well-drained upland soils to poorly drained riparian soil. Exchangeable Al followed a similar
trend, but Ca was the opposite, decreasing towards the riparian zone. The increased Al and Be
concentrations occurred where the soils have a higher pH because of mixing of emerging
groundwater and degassing of CO2 in the riparian zones. Soils over Be-rich granite (3.33
meq.Be.kg-1) had 0.84 to 1.62 meq.Be.kg-1, 3 to 17% of which was extractable (Skřivan et al.
2000). Profiles of concentrations of Be in two acid-sensitive soils of forested regions
receiving different loadings of acid deposition suggested the depletion of Be in humic and
upper mineral soils in more acidified areas (Veselý 1987; Gooddy et al. 1995; Veselý and
Majer 1996).
The physiological role of Be in living organisms is still not well understood. Soil
microorganisms grown in a magnesium-deficient medium grow better in the presence of
beryllium, because of the partial substitution of beryllium for magnesium in metabolism.
Similar growth-stimulating effects have been noted in algae and crop plants. This
phenomenon seems to be pH-dependent, as it only occurs at high pH. At pH 7 or below,
beryllium is toxic for aquatic and terrestrial plants, regardless of the magnesium levels in the
growth medium. Roots accumulate most of the beryllium taken up, and very little is
translocated to the upper parts of the plant (Anonymous 1962).
Stunting of roots and foliage was noted in soil cultures of beans, wheat, and ladino clover, but
no chlorosis or mottling of the foliage occurred (Romney & Childress 1965). In soil culture,
beryllium phytotoxicity is governed by the nature of soil, particularly its cation exchange
capacity and the pH of the soil solution. Apart from the magnesium-substituting effect, the
diminished phytotoxicity under alkaline conditions also results from the precipitation of
beryllium as unavailable phosphate salt. The mechanism underlying the phytotoxicity of
beryllium is probably based on the inhibition of specific enzymes, particularly plant
phosphatases. Beryllium also inhibits uptake of several essential mineral ions. (Anonymous
1962)
9
Tom Navrátil Biogeochemistry of the II.A group elements in a forested catchment
2.2.2 Magnesium
Magnesium has three naturally occurring isotopes with mass numbers (and percentage
abundances) 24 (78.99%), 25 (10.00%) and 26 (11.01%). Magnesium is a major element in
most (especially mafic) rock systems and is a major constituent of many rock-forming
minerals, where it is typically bound in 6 - fold coordination. The main Mg bearing minerals
are olivine, orthopyroxene, clinopyroxene, serpentinite, talc, brucite, chlorite, pyrope,
amphiboles, biotite, tourmaline, magnesite and spinel. Typical Mg contents of granites are
between 160 - 480 meq.kg-1.
Magnesium is concentrated in the Earth’s mantle, while in the Earth’s crust it is most
abundant in the oceanic crust and the lower continental crust. During the weathering of rocks
Mg readily dissolves in weathering solutions and enters the hydrosphere. Magnesium is
removed from ocean water by carbonate precipitation, but even so Mg is a conservative
element in the seawater.
Krám et al. (1997) reported a bulk precipitation flux of Mg of 4.4 meq.m-2.yr-1 at the granitic
catchment Lysina in 1993. Ragsdale et al. (1992) reported rates of total Mg deposition
ranging between 1.6 and 21.4 meq.m-2.yr-1 with wet and dry deposition being the predominant
processes.
The main sources of Mg in the atmosphere are sea salts (at marine areas), mineral dusts
(industrial and natural) and fly ashes (from point-source emissions). Armbruster et al. (2002)
reported an overview of European sites (including Czech sites) with Mg throughfall fluxes
ranging from 1.9 to 184 meq.m-2.yr-1. Authors have reported good correlation of Mg and Ca
fluxes in deciduous throughfall at inland sites at least 200 km from the coast. High throughfall
fluxes at some Czech sites were due to local alkaline dust emissions, however the Mg and Ca
correlation was retained. Krám et al. (1997) reported greater Mg throughfall fluxes of 33.8
meq.m-2.yr-1 on a catchment with bedrock rich in Mg (serpentinite) compared to 20.4 meq.m-
2.yr-1 on a catchment with bedrock low in Mg (granite). Enhanced fluxes of Mg in throughfall
with respect to bulk precipitation are due to both dry deposition to the canopy and leaching
from plant tissues (Armbruster et al. 2002). According to experiments with artificial trees
(Stachurski et al. 2000) magnesium flux increased below beech trees but remained unchanged
below spruce. Beech was more effective than spruce in modifying the ionic fluxes from
atmosphere; this is related to greater adsorption of H+ and greater leaching of Mg2+
(Stachurski et al. 2000).
The output from catchments did not differ according to bedrock type, however Mg losses
were higher from sites with deciduous than from those with coniferous vegetation
10
Tom Navrátil Biogeochemistry of the II.A group elements in a forested catchment
(Armbruster et al. 2002). Norton et al. (1999) reports selective depletion of Mg over Ca from
a two-catchment study in Maine, USA. The concentration of Mg in surface water of an
artificially acidified catchment increased sharply after the start of (NH4)2SO4 addition. In
periods with increased discharge the concentration of Ca and Mg sharply increased in the
acidified watershed but after 5 years of acidifying the Ca and Mg concentrations remain
unchanged during similar events. Authors attribute this behavior to the depletion of Mg and
Ca in the surface soil horizons. The soil solutions in O and A(E) horizons of the catchments
studied by Krám et al. (1997) contained 18.2 and16.4 µeq.L-1, respectively in the Mg poor
site, and 1380 and 1400 µeq.L-1 respectively in the Mg rich site. It is typical for forest
ecosystems that the Mg storage in soil is by far the largest pool, constituting more than 90%
of total Mg in the ecosystem (Feger 1997). Vegetation accounts for less than 5% of total
pools.
Magnesium is a critical structural component of the chlorophyll molecule and is necessary for
functioning of plant enzymes to produce carbohydrates and fats. Magnesium is also dissolved
in the nucleoplasma of the cells. It is involved in fruit and nut formation and is essential for
germination of seeds. Magnesium deficient plants appear chlorotic, show yellowing between
veins of older leaves; leaves may drop. Magnesium is leached by watering and must be
supplied when feeding. It can be applied as a foliar spray to correct deficiencies. However
extreme amounts of Mg may cause defects of vegetation growth and forms of plants known as
nanisms.
2.2.3 Calcium
Calcium has six naturally occurring isotopes with mass numbers (and percentage abundances)
40 (96.941%), 42 (0.647%), 43 (0.135%), 44 (2.086%), 46 (0.004%) and 48 (0.187%).
Calcium is the most common of the alkaline earth elements in the Earth’s crust (Wedepohl
1995). Common Ca bearing minerals include clinopyroxene, plagioclase, heulandite, stilbite,
laumonite, prehnite, tremolite, actinolite, hornblende, epidote, zoisite, grossularite, andradite,
calcite, dolomite, gypsum, apatite and sphene. Calcium is a lithophile element and is divalent
under natural conditions. During weathering Ca readily dissolves to weathering solutions and
enters the hydrosphere. Calcium also plays an important role in global climate through partial
buffering of carbon dioxide in the atmosphere. Feldspars constitute the most abundant
minerals in both continental and oceanic crust. Rapid feldspar weathering in mountainous
terrain enhances Ca transport to the ocean. This may also lead to CO2 extraction from the
atmosphere. The supply of CO2 from decaying organic matter in soils also enhances feldspar
11

Tom Navrátil Biogeochemistry of the II.A group elements in a forested catchment
dissolution, at least if the pH of the water is at a sufficiently low level (below about 7) to
make feldspar solubility pH dependent (Blum and Stillings 1995). The majority of Ca found
in granitoid rocks resides predominantly in plagioclase feldspar. Garrels (1968) originally
proposed that proportions of aqueous Ca and Na associated with the weathering of granitoid
rocks approximate the ratio found in plagioclase. However recent studies demonstrate that
excess Ca occurs in many surface and ground waters relative to this plagioclase stoichiometry
(Stauffer 1990). Short-term Ca excesses in water can result from selective loss of
exchangeable Ca in soils during catchment acidification (Hyman et al. 1988), loss from
biologic storage due to deforestation and fires (Chorover et al. 1994)
Longer-term excesses in Ca relative to plagioclase stoichiometry have been attributed to
accelerated weathering of other silicate phases such as hornblende (Clow et al. 1993),
selective leaching of an anorthite component of plagioclase (Clayton 1986; Williams et al.
1993), or the presence of small amounts of calcite even in plutonic rocks.
The bulk precipitation flux of Ca was 15.2 meq.m-2.yr-1 for two catchments (Lysina and
Pluhův Bor) at western part of the Czech Republic in 1993 (Krám et al. 1997). Likens et al.
(1998) reported a 21% difference between Ca flux in bulk deposition (4.38 meq.m-2.yr-1) and
wet-only deposition (3.46 meq.m-2.yr-1) during 11 years (1979 - 1989) at Hubbard Brook
HBEF, attributing the difference to vertical sedimentation of particles.
Element fluxes in throughfall may reflect the base cation status of forest ecosystems. They are
measured readily but it is difficult to separate throughfall flux into its individual components.
Nutrients in throughfall may result from (a) incident precipitation passing through a canopy;
(b) material deposited as particles, gases, or cloud droplets prior to precipitation passing
through the canopy; and (c) exchange processes within the canopy (including foliage, woody
parts, epiphytes and microorganisms) (Berger et al. 2001). Spruce throughfall flux at Lysina
catchment with granitic bedrock was 68.8 meq.m-2.yr-1, compared to 36.6 meq.m-2.yr-1 at the
Pluhův Bor catchment with low-Ca serpentinite bedrock (Krám et al. 1997).
The annual streamwater Ca concentrations reported from HBEF declined from 81.3 µeq.L-1 in
1969-70 to 42.4 µeq.L-1 in 1991-92 (Likens et al. 1998). The Ca output fluxes from the
granitic and serpentinite catchment in western Czech Rep. were 69.8 and 19.8 meq.m-2.yr-1,
respectively (Krám et al. 1997).
Calcium is relatively easily released as a soluble cation from the majority of both primary and
secondary minerals, the rate largely depending on solution pH. When liberated it moves into
the soil solution, where it may be adsorbed onto the cation exchange complex, taken up by
plants or microbial organisms, or leached through the soil profile. Due to its divalent charge,
12
Tom Navrátil Biogeochemistry of the II.A group elements in a forested catchment
relative abundance and modest extent of hydration, Ca is adsorbed strongly to clays and
humates compared to other metallic cations (Likens et al. 1998). Calcium is usually the most
abundant of the alkali and alkaline earth elements on the soil exchange complex and is
important in the regulation of soil pH (Bowen 1979). Soil acidification accompanied by
leaching of Ca from the soil exchange complex is a gradual natural process. The soil solutions
in O and A(E) horizons of the catchments studied by Krám et al. (1997) contained 78 and 56
µeq.L-1 (granite) and 176 and 48 µeq.L-1 (serpentinite), respectively. The concentrations of
exchangeable Ca at Lysina with granitic bedrock were highest in the organic horizon (50 - 90
meq.kg-1) and they decreased with depth while the lowest were in the C horizon (1.56 meq.kg-
1). Acidification of watersheds in North America and Europe has led to depletion of base
cations in soils to the extent that Ca has become a potential limiting element in forest
productivity in severely impacted areas (Shortle and Smith 1988; Bailey et al. 1996;
Lawrence et al. 1997). Rates of Ca replenishment and acid neutralization by weathering of
granitoid rocks are therefore important factors in developing regulatory constraints on
atmospheric emissions (Drever 1988).
Amounts of Ca in plants fluctuate between 250 and 2500 meq.kg-1 dry weight according to
species, organ and stage of development. Calcium is the fifth most abundant element in trees
and is an essential component for wood formation and the maintenance of cell walls. Calcium
activates enzymes, is a structural component of cell walls, influences water movement in cells
and is necessary for cell growth and division. Some plants must have calcium to take up
nitrogen and other minerals. Calcium, once deposited in plant tissue, is immobile (non-
translocatable) so there must be a constant supply for growth. Deficiency causes stunting of
new growth in stems, flowers and roots. Symptoms range from distorted new growth to black
spots on leaves and fruit. Yellow leaf margins may also appear. In contrast to potassium,
calcium is not leached readily from living foliage due to its relative immobilization in pectates
and on membranes. In forest ecosystems Ca typically cycles between plants and soil through
uptake-litterfall-mineralization processes (Likens et al. 1998). Because Ca is a macronutrient
for higher plants, spatial and temporal variations in its supply are important to the growth and
vigor within a forest ecosystem. Sufficient amounts of Ca also contribute to binding of
nutrients in soils (especially phosphoric acid). Calcium in soils may also neutralize some
organic acids in the form of calcium oxalates. Calcium accumulates in old plant parts (Asta
1992; Marschner 1986; Mostafa and Ulrich 1976). The content of Ca in the biomass increases
with time. Calcium also contributes on the movement of sacharides in plant tissues.
13

Tom Navrátil Biogeochemistry of the II.A group elements in a forested catchment
2.2.4 Strontium
Strontium has four naturally occurring stable isotopes with mass numbers (and percentage
abundances) 84 (0.56%), 86 (9.86%), 87 (7.00%) and 88 (82.58%). These proportions vary
because 87Sr is the radiogenic daughter of 87Rb (half-life 4.88x10⁸) years. Consequently the 87Sr/86Sr ratios are used in geochronology and as an isotopic tracer. In addition strontium has
24 short-lived radioactive isotopes. Strontium 90 (half-life 29.1 years) is a product of nuclear
fallout and poses a significant health hazard. Because of the similar chemical behavior of Sr
and Ca the radioactive isotope 90Sr may accumulate in the bones of humans and animals.
Strontium forms the minerals celestite (SrSO4) and strontianite (SrCO3). The chemical
properties of strontium closely follow calcium. Strontium can substitute for Ca2+and K+ in
feldspars. The ionic radius of Sr2+ is between those of Ca2+ and Ba2+ and is somewhat smaller
than the Pb2+ radius. The distribution of Sr in rock-forming and accessory minerals is
controlled by its diadochy with calcium and potassium (Wedepohl 1969). The major host
minerals of Sr are feldspars. Plagioclase and K-feldspars are almost equally important
(Wedepohl 1969). The Mg-Fe minerals usually contain less than one tenth of the strontium of
coexisting feldspars (Wedepohl 1969). Strontium is held more tightly on clay minerals as it is
more weakly hydrated than Ca (Wedepohl 1969). All studies indicate that Sr is a rather
mobile element during rock weathering, especially from feldspars, but it is less mobile than
Ca (Wedepohl 1969). The mean Sr concentration in coal types from Tertiary lignite basins in
the NW part of Czech Republic was 2.0 meq.kg-1 with a central range of 0.9 – 3.1 meq.kg-1
(Bouška & Pešek 1999).
The chemical behavior of Ca and Sr is similar, so Sr is often used as a surrogate for Ca
because Sr isotopes provide a valuable tracer of sources and pathways (Aberg 1995).
Strontium isotopes have proven to be a useful tracer of weathering sources because minerals
often have distinct 87Sr/86Sr ratios (Miller et al. 1993; Blum et al. 1993; Bain and Beacon
1994; Blum and Erel 1995; Bullen et al. 1997; Clow et al. 1997). However there are still few
data that relate the behavior of Sr during weathering to mineral dissolution kinetics (Brantley
et al. 1998; White et al. 1999). Dissolution experiments by White et al. (1999) suggested that
the initial stages of granite weathering are dominated by calcite dissolution.
In most forest ecosystems, strontium (Sr) and Ca incorporated in trees originate from two
primary sources: atmospheric inputs and primary soil minerals. Under favorable conditions
the 87Sr/86Sr ratio of atmospheric deposition and weathering differ enough to enable
measurement of the contribution of each Sr source to plant, soil exchange pool, and
streamwater (Wickman 1996).
14

Tom Navrátil Biogeochemistry of the II.A group elements in a forested catchment
The annual deposition fluxes of Sr at six rural sites in Norway were in the range 5.5 – 59.3
µeq.m-2.yr-1 and Sr was evaluated as an element atmospherically transported from marine
environments (Berg et al. 1994). Concentrations of Ca (0 – 0.46 meq.L-1) and Sr (0 – 0.54
µeq.L-1) were detected in bulk precipitation and throughfall at one site each in France and
Switzerland (Poszwa et al. 2000). Atteia (1994) found little variation of Sr concentrations in
bulk precipitation over an area of 3000 km2 in Switzerland and he reported an average Sr
concentration 0.06 µeq.L-1 (median 0.02 µeq.L-1) from six sites.
The output fluxes of Sr from a clear-cut catchment (374 µeq.m-2.y-1) increased by 200%
compared to a reference catchment (120 µeq.m-2.y-1) at Hubbard Brook Experimental Forest
(Scott et al. 2001). The initial changes of Sr concentration in the streamwater were attributed
to release of readily exchangeable Sr from soils due to increased concentrations of H+ in soil
solution.
The soil solution at one site in France (granite) and one in Switzerland (limestone, sandstone)
exhibited Sr concentrations of 0.02 – 1.30 µeq.L-1 (Poszwa et al. 2000).
The worldwide average concentration of Sr in soils is 5.4 – 6.8 meq.kg-1 (Anonymous 1962).
The exchangeable concentrations of Ca and Sr were always highest in humus layers of the soil
profiles on sites underlain by sandstone, granite and limestone (Poszwa et al. 2000).
The behavior of the Sr was studied with respect to the threat emerging from the radioactive
isotope 90Sr, which may be introduced to the environment from nuclear explosions. The
downward penetration of 90Sr in soil is slow, although it is more rapid than for 137Cs or 249Pu.
Even after several years 90Sr remains in the upper few centimeters in undisturbed soil. The
rate of movement varies with soil type; a low content of clay and humus, a high content of
electrolytes and the rapid movement of water increase penetration (Anonymous 1962). The
mechanism of movement is thought to involve both leaching and diffusion. Plants acquire 90Sr
by direct deposition onto foliage and by root uptake of 90Sr from the soil. Uptake from soil is
usually the primary mode of 90Sr entry into plants. The quantity of absorbable calcium in soil
is an important factor in determining the extent of 90Sr absorption by plants. Uptake of Sr is
greatest from soils of low calcium content. Uptake is thus reduced by the addition of lime, but
usually not by a factor exceeding 3 (Anonymous 1962).
15

Tom Navrátil Biogeochemistry of the II.A group elements in a forested catchment
2.2.5 Barium
Barium has seven stable naturally occurring isotopes with mass numbers (and percentage
abundances) 138 (71.70%), 137 (11.23%), 136 (7.854%), 135 (6.592%), 134 (2.417%), 130
(0.106%) and 132 (0.101%). Of the divalent cations, Ba2+ has the largest ionic radius except
for Ra2+. Barium ranks 14th among the elements in the order of abundance in Earth’s crust. In
terms of overall geochemical behavior barium most closely follows Sr and Ca.
Metallic barium does not occur in nature, due to its reactivity. The most important naturally
occurring minerals are barite (BaSO4) and witherite (BaCO3). However barium usually does
not form minerals of its own in igneous rocks. It is usually distributed as a trace constituent
among the silicate minerals, especially potassium feldspars and micas, where it substitutes for
potassium (Wedepohl 1969). Barium may substitute for large ions such as Pb2+ and Sr2+. It
may also substitute for Ca, usually in plagioclases, pyroxenes and amphiboles. Barium may
enter plagioclase structures depending on An-Ab series, temperature and pressure, and
competing elements. Apatite and calcite are the most important rock forming non-silicates
containing barium.
Alkali rocks are usually highly enriched in barium. Granitic rocks with low Ca content
(granites, quartzmonzonites) show extremely variable Ba values. Experimental weathering of
K feldspar in distilled water (Puchelt 1967) showed that Ba is preferentially released from the
silicate structure into solution. The factors affecting Ba behavior during weathering are: type
of clay minerals that form during decomposition; climate; amount and type of organic
material present; and sulfur or sulfate content. Barium adsorption onto clays decreases with
ionic strength of the exchange solution (Puchelt 1967). Bentonite adsorbs Ba more strongly
than NH4+, Mg2+ and Ca2+ (Komlev et al. 1965). Manganese hydroxides (γMnO(OH)) can
absorb up to 20% Ba (by weight) of its manganese content (Puchelt 1967), and electrolytes
did not influence the amount of adsorbed Ba. The mean Ba concentration in coal types from
Tertiary lignite basins in the NW part of the Czech Republic was 1.5 meq.kg-1 with a central
range of 0.4 – 2.8 meq.kg-1 (Bouška & Pešek 1999).
The annual deposition fluxes of Ba at six rural sites in Norway were in range 1.43 – 17.4
µeq.m-2.yr-1 and Ba was evaluated as both an element atmospherically transported from
anthropogenic or crustal sources (Berg et al. 1994). Atteia (1994) found significant
differences in Ba concentrations across an area of 3000 km2 in Switzerland and he reported an
average Ba concentration of 0.10 µeq.L-1 (median 0.04 µg.L-1) from six sites.
The streamwater flux of Ba from a clear-cut catchment (390 µeq.m-2.y-1) increased by 450%
compared to a reference catchment (88 µeq.m-2.y-1) at Hubbard Brook Experimental Forest
16

Tom Navrátil Biogeochemistry of the II.A group elements in a forested catchment
(Scott et al. 2001). The increased Ba concentration in streamwater was attributed to release of
readily exchangeable Ba from soils due to increased concentrations of H+ in soil solution.
Most soils contain 1.46 to 43.7 meq.kg-1 of Ba (Wedepohl 1969), of which traces can
normally be extracted by 1N NH4 acetate. Barium has a strong tendency to exchange for H+ in
peat (Bel`Kevich et al. 1966).
Barium concentrations in natural waters are controlled by the low solubility of BaSO4 and by
adsorption of Ba from solution by clays, hydroxides and organic matter. The median Ba
concentration in North American rivers is 0.66 µeq.L-1 (Durum and Haffty 1963). The highest
Ba concentrations are found in waters draining areas underlain by sedimentary rocks
(sandstone, slate). Lower Ba concentrations in surface water are typical for areas with granite
and the lowest occur in quartzite bedrock. In regions with high sulfate concentrations, Ba
concentration is low due to the low BaSO4 solubility product (10-10; Krauskopf 1979). At pH
values < 9 the Ba2+ ion is generally the dominant species, with BaSO4 becoming significant in
environments with high sulphate content. Barium forms relatively weak complexes with Cl-,
NO3- and OH- and forms complexes with organic matter to a limited extent. In many aqueous
environments the Ba concentration is controlled primarily by ion exchange and sorption
reactions (Palmer 1999). The solubility of witherite controls Ba concentration only in very
alkaline systems, while at pH values >10 BaCO3 becomes the dominant species. Increased
pressure and temperature increase the barite solubility. Barium carbonate solubility depends
largely on the CO2 partial pressure. The solubility product of witherite is 10-8.64 under 25o C
and 1 atm. CO2 pressure (Garrels et al. 1962).
There is no physiological evidence that barium is an essential element (Palmer 1999). Soluble
barium salts are known to be poisonous. Barium is present in recent and fossil plants, animals
and fuels. Several investigators found barium accumulation in plants and animals, but there is
no evidence that this element is physiologically necessary. Barium is moderately toxic for
plants and slightly toxic for mammals. Fir and spruce have 7.2 to 90.3 meq.kg-1 of Ba in ash
with the highest concentrations in twigs (Lotspeich and Markward 1963). Ba is moderately
phytotoxic in deionized water and non-toxic in river water. The low Ba phytotoxicity in river
water is due to the presence of particulate material (Wang 1986). Filtered river water with
0.73 meq.L-1 Ba inhibited the growth of duckweed by 10% compared to unfiltered water,
which caused almost no effect.
17
Tom Navrátil Biogeochemistry of the II.A group elements in a forested catchment
2.3 References
Aberg G (1995) The use of natural strontium isotopes as tracers in environmental studies. Water Air Soil Pollution 79, 309-322.
Anonymous (1962) - Beryllium. Environmental health criteria (106) Report of the United Nations Scientific Committee on the Effects of Atomic Radiation. Official Records of the General Assembly, Seventeenth Session, Supplement No. 16 (A/5216). United Nations. New York. http://www.inchem.org/documents/ehc/ehc/ehc106.htm
Anonymous (1962) – Radionuclides. Environmental Health Criteria (25). Report of the United Nations Scientific Committee on the Effects of Atomic Radiation. Official Records of the General Assembly, Seventeenth Session, Supplement No. 16 (A/5216). United Nations. New York. (http://www.inchem.org/documents/ehc/ehc/ehc25.htm)
Armbruster M, MacDonald J, Dise NB, Matzner E (2002) Throughfall and output fluxes of Mg in European forest ecosystems: a regional assessment. Forest Ecology and Management 164, 137-147.
Asta J (1992) Constitution minerale de quelque especes de Lichens. Bull. Soc. Bot. Fr., Actual. Bot. 139, 81-97.
Atteia O (1994) Major and Trace Elements in Precipitation on Western Switzerland. Atmospheric Environment 28, pp. 3617-3624.
Bailey SW, Hornbeck JW, Driscoll CT and Gaudette HE (1996) Calcium inputs and transport in a base poor forest ecosystem as interpreted by Sr isotopes. Water Res.Res. 32, 707-719.
Bain DC and Beacon JR (1994) Strontium isotopes as indicators of mineral weathering in catchments. Catena 22, 201-214.
Bel`Kevich PI, Chistova LR, Strogonova LF (1966) Effect of temperature and form of ion and anion on the ion-exchange equilibrium in peat. Vestsi Akad. Nauk Belarusk. SSR, Ser. Khim Nauk 4, 29.
Beneš S (1994) Contents and budgets of elements in the environmental spheres (in Czech). Ministry of Agriculture, Czech Republic.
Berg T, Røyset O, Steinnes E (1994) Trace elements in atmospheric precipitation at Norwegian background stations (1989-1990) measured by ICP-MS. Atmosph. Environ. 28, 3519-3536.
Berger TW, Eagar C, Likens GE, Stingeder G (2001) Effects of calcium and aluminum chloride additions on foliar and throughfall chemistry in sugar maples. Forest Ecology and Management 149, 75-90.
Bezačinský M (1980) Behaviour of some trace elements in combustion of Czechoslovak brown coals. Ochrana Ovzduší 12, 3-7 (in Czech)
Blum AE, Stillings LL (1995) Chemical weathering rates of silica minerals. Reviews in Mineralogy 31, 291-351.
Blum JD and Erel Y (1995) A silicate weathering mechanism linking increases in marine 87Sr/86Sr with global glaciation. Nature 373, 415-418.
Blum JD, Erel Y, Brown K (1994) 87Sr/86Sr ratios of Sierra Nevada stream waters: implications for relative mineral weathering rates. Gch. and Cos. Acta 57, 5019-5025.
Bouška V, Pešek J (1999) Quality parameters of lignite of the North Bohemian Basin in the Czech Republic in comparison with the world average lignite, International Journal of Coal Geology 40, 211-235.
Bowen HJM (1979) Environmental Vhemistry of the Elements. Academic Press, London. 333pp.
Brantley SL, Chen Y (1998) in Chemical Weathering Rates of Silicate Minerals (Eds. White AF, Brantley SL). Minerlogical Society of America 119-172
Bullen T, White AF, Blum A, Harden J, and Schulz M (1997) Chemical weathering of a soil chronosequence on granitoid alluvium: II. Mineralogic and isotopic constraints on the behavior of strontium. Geoch. and Cosmoch. Acta 61, 291-306.
Chorover J, Vitousek PM, Everson DA, Esperanza AM and Turner D (1994) Solution chemistry profiles of mixed-conifer forests before and after fire. Biogeochemistry 26, 115-144.
Clayton JC (1986) An estimate of plagioclase weathering rate in the Idaho Batholith based upon geochemical transport rates. In Rates of Chemical Weathering of Rocks and Minerals (ed. S.M.Coleman and D.P.Dethier), pp. 453-466. Academic.
18

Tom Navrátil Biogeochemistry of the II.A group elements in a forested catchment
Clow DW, Mast MA, Bullen TD, Turk JT (1997) Strontium 87 strontium 86 as a tracer of mineral weathering reactions and calcium sources in an alpine/subalpine watershed, Loch Vale, Colorado. Water Resources Research 33, 6, 1335-1351.
Clow DW, Mast MA, Campbell DH (1993) Controls on surface water chemistry in upper Merced River Basin, Yosemite National Park, california. Hydrological Proces. 10, 727-746.
Drever JI (1988) The Geochemistry of Natural Waters, Prentice Hall.
Driscoll CT, Lawrence GB, Bulger AJ, Butler TJ, Cronan CS, Eagar C, Lambert KF, Likens GE, Stoddard JL and Weathers KC (2001) Acidic Deposition in the Northeastern United States: Sources and Inputs, Ecosystem Effects, and Management Strategies. BioScience, 51 (3), 180 – 198.
Drury JS, Shriner CR, Lewis EB, Towil LE, Hammons AS (1978) Reviews of the Environmental Effects of Pollutants: VI. Beryllium. Unpublished Work.
Durum WH, Haffty J (1961) Occurence of minor elemnts in water. USGS Circular 445.
Feger KH (1997) Biogeochemistry of magnesium in forest ecosystems, pp.67-99. In Magnesium Deficiency in Forest Ecosystems, Eds. Huttl RF and Schaaf W, Kluwer Academic Publishers, Dordrecht, Boston, London.
Garrels RM (1968) Genesis of some ground waters from igneous rocks in Researches in Geochemistry (ed.P.H.Abelson), Vol.2, pp. 406-420. Wiley.
Garrels RM, Thompson ME, Siever R (1960) Stability of some carbonates at 25oC and one atmosphere total pressure. Am.J.Sci. 258, 402
Gooddy DC, Shand P, Kinniburgh DG, Vanriemsdijk WH (1995) Field-based partition coefficients for trace elements in soil solutions. Eur. J. Soil Sci. 46:265-285.
Greenwood NN, Earnshaw A (1984) Chemistry of Elements. Oxford: Pergamon Press,1542 pp
Hruška J, Moldan F, Krám P (2002) Recovery from acidification in central Europe—observed and predicted changes of soil and streamwater chemistry in the Lysina, catchment, Czech Republic, Environmental Pollution, 120, 261-274.
Hyman ME, Bailey SW, April RH and Hornbeck JW (1998) Chemical weathering and cation loss in a base-poor watershed. GSA Bull. 110, 85-95.
Kaste J (1999) Dynamics of Cosmogenic 7Be and Bedrock-Derived 9Be in Forested Ecosystems in Maine, U.S.A. - Unpub. M.Sc. Thesis, Department of Geological Sciences University of Maine, Orono.
Komlev OI, Tikha NI, Zherdeva NI (1965) Tricationic exchange on Transcarpathian bentonite Visn. L`viv. Derz. Univ., Ser. Khim. 8, 54.
Krám P, Hruška J, Driscoll CT (1998) Beryllium chemistry in the Lysina watershed, Czech Republic. Water Air Soil Pollut. 105: 409-415.
Krám P, Hruška J, Wenner BS, Driscoll CT, Johnson CE (1997) The biogeochemistry of basic cations in two forest catchments with contrasting lithology in the Czech Republic. Biogeochemistry 37, 173-202.
Krauskopf KB (1979) Introduction to Geochemistry. McGraw Hill Book Company, Second Edition, 617pp.
Kubizňáková J (1987) Beryllium pollution from slag and ashes from thermal power station. Water Air Soil Pollut. 34: 363-367.
Lawrence GB, David MB, Bailey SW and Shortle WC (1997) Assessment of soil calcium status in red spruce forests in the northeastern United States. Biogeochemistry, 38 19-39.
Lide DR Ed. (1994) CRC Handbook of Chemistry and Physics, 75th edition Boca Raton FL-CRC Press. 2572pp
Likens GE, Borman FH, Johnson NM (1972) Acid rain. Environment 14, 33-40.
Likens GE, Driscol CT, Buso DC, Siccama TG, Johnson CE, Lovett GM, Fahey TJ, Reiners WA, Ryan DF Martin CW, Bailey SW (1998) The biogeochemistry of calcium at Hubbard Brook, Biogeochemistry 41, 89-173.
Lotspeich FB and Markward EL (1963) Minor elements in bedrock soil, and vegetation at an outcrop of the Phosphoria formation on Snowdrift mountain, Southeastern Idaho. US Geol. Surv. Bull. 1181-F.
Marschner H (1986) Mineral nutrition of higher plants. Academic Press. London.
19

Tom Navrátil Biogeochemistry of the II.A group elements in a forested catchment
Measures CI, Edmond JM (1983) The geochemical cycle of 9Be: a reconnaissance. Earth Planet. Sci. Lett. 66: 101-110.
Mihaljevič M (1999) Acid Deposition, in Encyclopedia of Geochemistry, eds. Fairbridge, Kluwer Academic publishers.
Miller EK, Blum JD, Friedland AJ (1993) Determination of soil exchange-cation loss and weathering rates using Sr isotopes. Nature 362, 438-441.
Moore JW (1991) Beryllium in Inorganic Contaminants of Surface Water. Research and Monitoring Priorities, Springer Series on Environmental Management, Springer-Verlag New York, pp 50-56.
Mostafa MAE, Ulrich A (1976) Absorption, distribution and form of Ca in relation to Ca deficiency (tip burn) of sugarbeets. Crop. Sci. 16, 27-30.
Navrátil T, Skřivan P, Minařík L, Žigová A. (2002) Beryllium Geochemistry in the Lesni Potok Catchment (Czech Republic), 7 Years of Systematic Study, Aquatic Geochemistry 8 (2), 121-133.
Navrátil T (2000) Beryllium in waters of Czech forested ecosystems and the release of beryllium from granites. GeoLines 12, 18-40.
Neal C, Jeffrey HA, Conway T, Ryland GP, Smith CJ, Neal M, and Norton SA (1992) Beryllium concentrations in rainfall, stemflow, throughfall, mist and stream waters for an upland acidified area of mid-Wales. J. Hydrol. 136: 33-49.
Norton SA, Kahl J, Fernandez I (1999) Altered Soil-Soil Water Interactions Inferred from Stream Water Chemistry at an Artificially Acidified Watershed at Bear Brook Watershed, Maine USA. Environmental Monitoring and Assessment 55, 97-111.
Oden S (1968) The acidification of air precipitation and its consequences in the natural environment. Bulletin of Ecological Reasearch Communications NFR. Arlington (VA): Translation Consultants Ltd.
Pačes and Pištora (1979) Anthropogenous influence of thr chemical composition of the river Elbe water (in Czech), Vodní hospodářství v2/1979.
Pačes T (1983) Principles of water geochemistry (in Czech). Academia Prague.
Palmer CEA (1999) Barium, in Encyclopedia of Geochemistry, eds. Fairbridge, Kluwer Academic publishers.
Pelíšek J (1984) The changes of the forest soil acidity in the Oricke Mountains under influence of acid rain (in Czech), Lesnictvi 30 (11), 955-963.
Podlešáková E, Němeček J (1994) Contamination of soils in the North-Bohemian Region by hazardous elements. Rostl. Vyr. 40: 123-130 (in Czech).
Poszwa A, Dambrine E, Pollier B, Atteia O (2000) A comparison between Ca and Sr cycling in forest ecosystems, Plant and Soil 225, 299-310.
Puchelt H (1967) Zur Geochemie des Grubenwassers im Ruhrgebiet. Z. Deutsch. Geol. Ges. 116, 167.
Ragsdale HL, Lindberg SE, Lovett GM, Schaefer DA (1992) Atmospheric deposition and throughfall fluxes of base cations. Eds. DW Johnson, SE Lindberg. pp 235-253. Springer Verlag.
Roessler HJ, Lange H (1972) Geochemical tables, edition Liepzig 468pp
Romney EM, Childress JD (1965) Effects of beryllium in plants and soils. Soil Sci., 100: 210-217.
Scott NA, Likens GE, Eaton JS, Siccama TG (2001) Trace metal loss following whole-tree harvest of northeastern deciduous forest, USA. Biogeochemistry 54, 157-217.
Shortle W.C. and Smith K.T. (1988) Aluminum-induced calcium deficiency syndrome in declining Red Spruce. Science 240, 1017-1018.
Skřivan P, Minařík L, Burian M, Vach M (1994) Cycling of beryllium in the environment under anthropogenic impact. Scientia Agric. Bohem. 25: 65-75.
Skřivan P, Minařík L, Burian M, Martínek J, Žigová A, Kvídová O, Dobešová I, Navrátil T, Fottová D (2000) Biogeochemistry of beryllium in an experimental forested landscape of the ”Lesni potok ” watershed in Central Bohemia, CR. GeoLines 12, 41 – 62.
20
Tom Navrátil Biogeochemistry of the II.A group elements in a forested catchment
Skřivan P, Navrátil T, Burian M (2000a) 10 years of monitoring the atmospheric inputs at the Černokostelecko region, Central Bohemia. Scientia Agric. Bohem., 31(2), 139-154.
Smith RA (1872) Air and Rain. London: Longmans, Green.
Stachurski A, Zimka JR (2000) Atmospheric input of elements to forest ecosystems: a method of estimation using artificial foliage placed above rain collectors. Environmental Pollution 110, 345-356.
Stauffer R.E. (1990) Granite weathering and sensitivity of alpine lakes to acid deposition. Limonol. Oceanogr. 32, 825-839.
Tanaka S, Inoue T, Huang ZY (1982) 10Be and 10Be/9Be in near Antarctica sediment cores. Geochem. Journal 16:321-325.
Taylor AS, Blum JD, Lasaga AC, MacInnis IN (2000) Kinetics of dissolution and Sr release during biotite and phlogopite weathering. Geochimica et Cosmochimica Acta 64 (7), 1191 –1208.
Veselý J (1987) Influence of emissions on the chemical composition of forest soils. Lesnictvi 33: 385-398 (in Czech).
Veselý J (1994) Effects of Acidification on Trace Metal Transport: in Acidification of freshwater ecosystems: Implications for future, Eds. Steinberg CEW and Wright RF, John Wiley and Sons Ltd, 141-151.
Veselý J and Majer V (1996) The effect of pH and atmospheric deposition on concentration of trace elements in acidified freshwaters: A statistical approach. Water Air Soil Pollution 88: 227-246.
Veselý J, Beneš P, Ševčik K (1989) Occurrence and speciation of beryllium in acidified freshwaters. Water Res. 23: 711-717.
Veselý J, Norton SA, Skřivan P, Majer V, Krám P, Navrátil T, and Kaste JM: Chapter 7: Environmental Chemistry of Beryllium, 291-317. in Reviews in Mineralogy and Geochemistry in Beryllium: Mineralogy, Petrology, and Geochemistry. Edward S. Grew, editor (2002) Vol. 50, 691 pp.
Veselý J. and Majer V. (1998): Hydrogeochemical mapping of Czech freshwaters. – Bulletin of Czech Geological Survey 73, 3, 1998.
Vogler S, et al. (1996) Scavenging of 234Th and 7Be in Lake Constance. Limnol. Oceanogr. 41: 1384 – 1393.
Wang W (1986) The effect of River water on phytotoxicity of Ba, Cd and CR. Env. Pollution (Series B) 11, 193-204.
Wedepohl KH (1969-1978) Handbook of Geochemistry, II-1. Springer Verlag.
Wedepohl KH (1995) The composition of the continental crust, Geochimica et Cosmochimica Acta, 59, 7, 1217-1232
White AF, Blum AE, Bullen TD, Vivit DV, Schulz M, Fitzpatrick J (1999) The effect of temperature on experimental and natural chemical weathering rates of granitoid rocks. Gch. and Cos. Acta 63, 3277-3291.
Wickman T (1996) Weathering assessment and nutrient availibility in coniferous forests. Thesis, Royal Institute of Technology, Stockholm.
Wiliams et al. (1993) Geochemical and hydrologic controls on the composition of surface water in a high-elevation basin, Sierra Nevada, California. Limnol. Oceanogr. 38, 775-797.
Wollast R (1967) Kinetics of the alteration of K-feldspar in buffered solutions at low temperature. Geochim. Et Cosmochim. Acta 31, pp. 635 – 648.
Zýka V (1971) The importance of the trace elements for the living organisms (in Czech). Environmental Geochemistry, Kutna Hora.
21
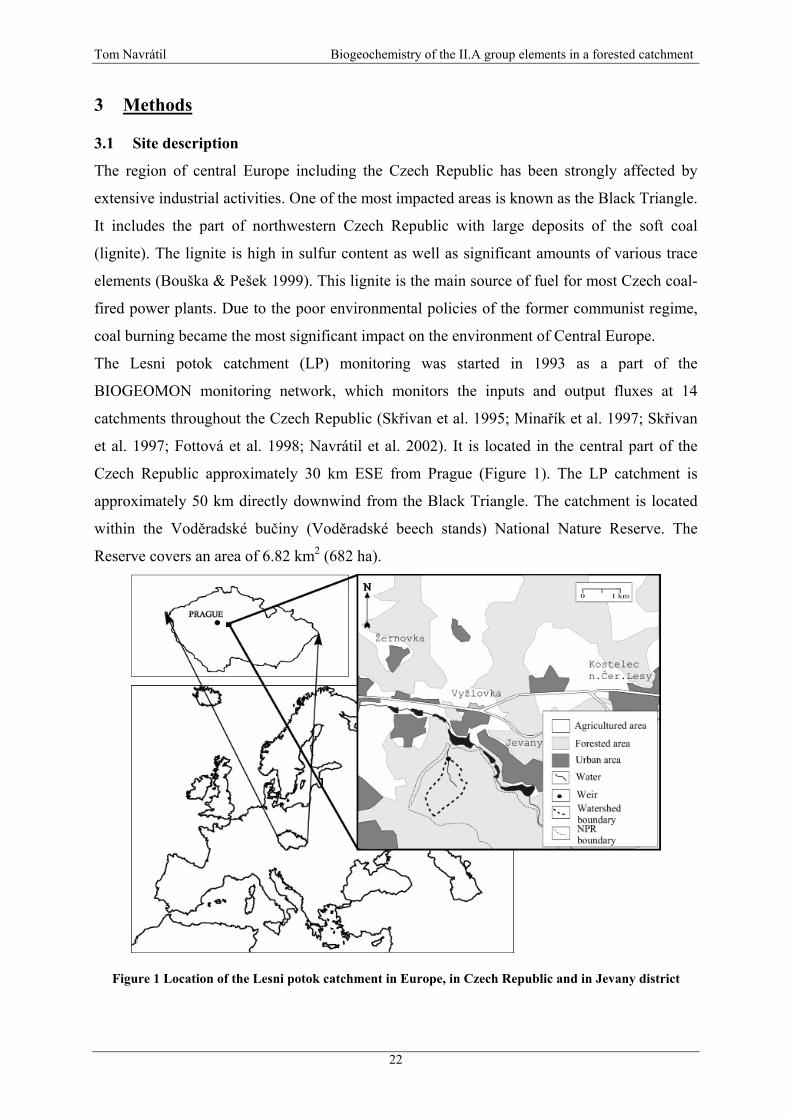
Tom Navrátil Biogeochemistry of the II.A group elements in a forested catchment
3 Methods
3.1 Site description
The region of central Europe including the Czech Republic has been strongly affected by
extensive industrial activities. One of the most impacted areas is known as the Black Triangle.
It includes the part of northwestern Czech Republic with large deposits of the soft coal
(lignite). The lignite is high in sulfur content as well as significant amounts of various trace
elements (Bouška & Pešek 1999). This lignite is the main source of fuel for most Czech coal-
fired power plants. Due to the poor environmental policies of the former communist regime,
coal burning became the most significant impact on the environment of Central Europe.
The Lesni potok catchment (LP) monitoring was started in 1993 as a part of the
BIOGEOMON monitoring network, which monitors the inputs and output fluxes at 14
catchments throughout the Czech Republic (Skřivan et al. 1995; Minařík et al. 1997; Skřivan
et al. 1997; Fottová et al. 1998; Navrátil et al. 2002). It is located in the central part of the
Czech Republic approximately 30 km ESE from Prague (Figure 1). The LP catchment is
approximately 50 km directly downwind from the Black Triangle. The catchment is located
within the Voděradské bučiny (Voděradské beech stands) National Nature Reserve. The
Reserve covers an area of 6.82 km2 (682 ha).
Figure 1 Location of the Lesni potok catchment in Europe, in Czech Republic and in Jevany district
22
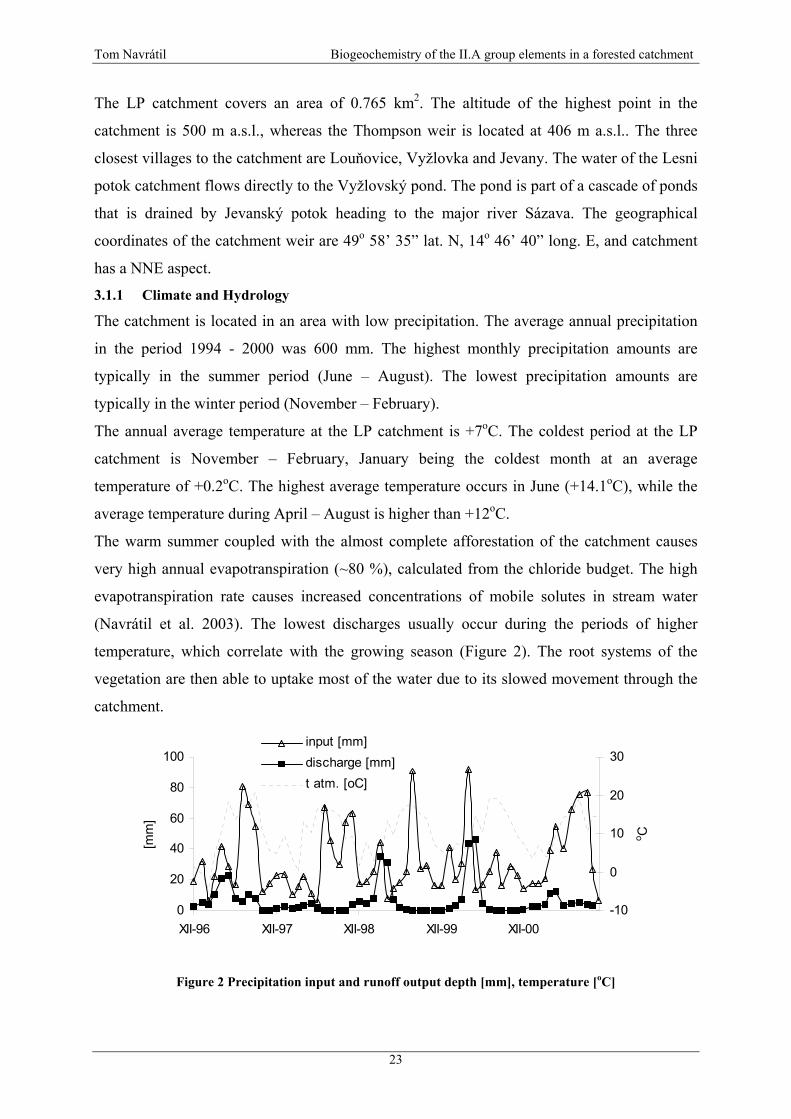
Tom Navrátil Biogeochemistry of the II.A group elements in a forested catchment
The LP catchment covers an area of 0.765 km2. The altitude of the highest point in the
catchment is 500 m a.s.l., whereas the Thompson weir is located at 406 m a.s.l.. The three
closest villages to the catchment are Louňovice, Vyžlovka and Jevany. The water of the Lesni
potok catchment flows directly to the Vyžlovský pond. The pond is part of a cascade of ponds
that is drained by Jevanský potok heading to the major river Sázava. The geographical
coordinates of the catchment weir are 49o 58’ 35” lat. N, 14o 46’ 40” long. E, and catchment
has a NNE aspect.
3.1.1 Climate and Hydrology
The catchment is located in an area with low precipitation. The average annual precipitation
in the period 1994 - 2000 was 600 mm. The highest monthly precipitation amounts are
typically in the summer period (June – August). The lowest precipitation amounts are
typically in the winter period (November – February).
The annual average temperature at the LP catchment is +7oC. The coldest period at the LP
catchment is November – February, January being the coldest month at an average
temperature of +0.2oC. The highest average temperature occurs in June (+14.1oC), while the
average temperature during April – August is higher than +12oC.
The warm summer coupled with the almost complete afforestation of the catchment causes
very high annual evapotranspiration (~80 %), calculated from the chloride budget. The high
evapotranspiration rate causes increased concentrations of mobile solutes in stream water
(Navrátil et al. 2003). The lowest discharges usually occur during the periods of higher
temperature, which correlate with the growing season (Figure 2). The root systems of the
vegetation are then able to uptake most of the water due to its slowed movement through the
catchment.
0
20
40
60
80
100
XII-96 XII-97 XII-98 XII-99 XII-00
[mm
]
-10
0
10
20
30
o C
input [mm]discharge [mm]t atm. [oC]
Figure 2 Precipitation input and runoff output depth [mm], temperature [oC]
23

Tom Navrátil Biogeochemistry of the II.A group elements in a forested catchment
Two major hydrological pathways are shown on Figure 3. Solid arrows show the major
hydrological pathway during the dry periods. During periods of drought, the chemistry of
surface water is very similar to the chemistry of shallow groundwater sampled in a well close
to the weir. The unfilled arrowheads depict hydrological pathways during periods with
increased water table, when the upper zones are saturated. Surface runoff is low at the LP
catchment, because of low annual precipitation, low soil porosity (Gleyic Cambisols),
relatively high soil thickness and high demand of trees for water.
Figure 3 Two profiles with preferential flow pathways (solid arrow low water table, unfilled arrow high water table)
3.1.2 Geology
The catchment is underlain by granite, which belongs to the Říčany Pluton. The Říčany
Pluton is a part of a complex mass Central Bohemian Pluton, which is composed of various
plutonic rocks ranging from gabbros to granites. The roughly circular Říčany intrusion (ca. 80
km2) is composed of biotite ± muscovite granites. The mineralogy of the granites is
monotonous but also structurally variable. The equigranular medium-grained rock forming the
centre of the pluton changes gradually to orthoclase porphyry on the edges. The Říčany
massif has been extensively studied by numerous authors, because of its enrichment in
elements associated with volatile compounds (Sn, W, Li, Be, F etc.) (Vejnar 1974; Němec
24

Tom Navrátil Biogeochemistry of the II.A group elements in a forested catchment
1978) and because of its position in the Central Bohemian Pluton (Fiala et al. 1976; Minařík
et al. 1986; Janoušek et al. 1995; Janoušek et al. 1997; etc.). Two types of granite are found in
the area of the catchment: monzogranitic Říčany type and syenogranitic Jevany type. The
coarser Říčany monzogranite surrounds the circular shaped body of the Jevany syenogranite.
The mineralogical composition of both types is almost identical: ~27% quartz, ~29%
orthoclase, ~35% plagioclase and ~6% biotite (Palivcová 1965; Němec 1978). The trace
mineral constituents of both granite types are muscovite, tourmaline and apatite.
Figure 4 Geological setting of the catchment vicinity
Janoušek et al. (1997) studied the differences between the two types of granites from the
Říčany massif. The Říčany granite suite is characterized by high K2O and low FeO, MgO,
CaO, Na2O/K2O and FeO/Fe2O3 compared to other members of the Central Bohemian Pluton.
Trace elements, especially Ba and Sr, show significant ranges in concentration, which is
typical for fractionated granites (Janoušek et al. 1997). The orthoclase is usually developed in
25
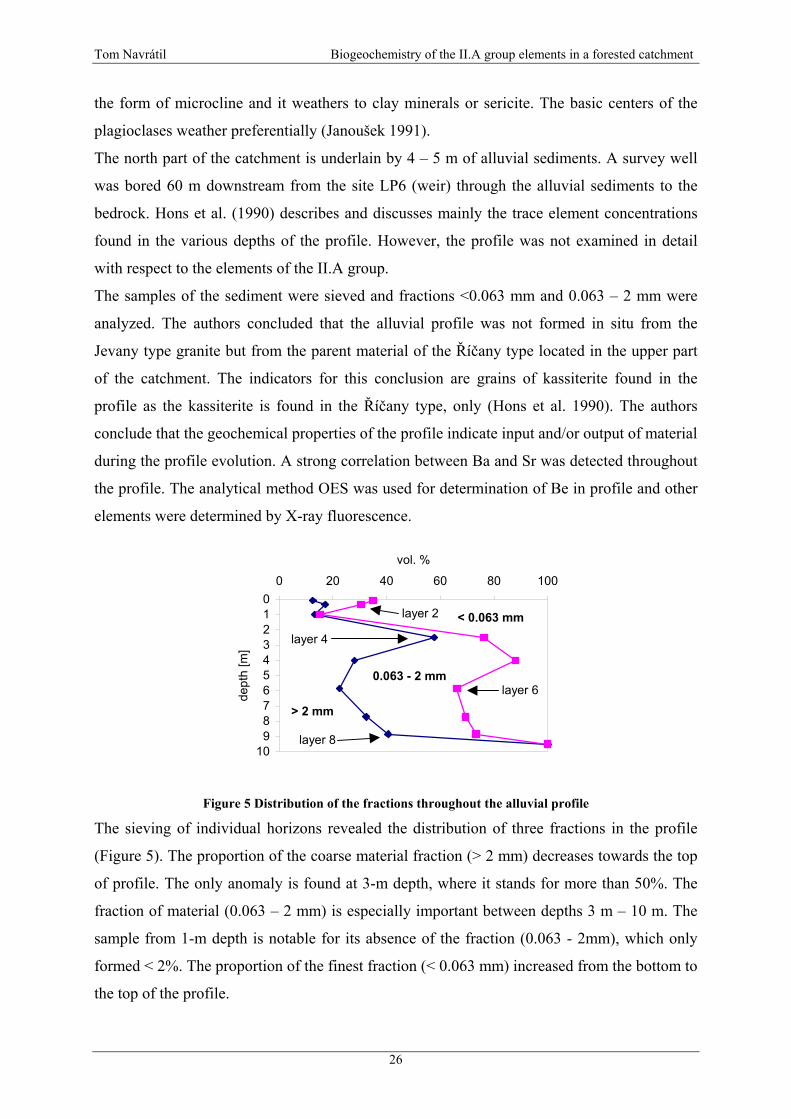
Tom Navrátil Biogeochemistry of the II.A group elements in a forested catchment
the form of microcline and it weathers to clay minerals or sericite. The basic centers of the
plagioclases weather preferentially (Janoušek 1991).
The north part of the catchment is underlain by 4 – 5 m of alluvial sediments. A survey well
was bored 60 m downstream from the site LP6 (weir) through the alluvial sediments to the
bedrock. Hons et al. (1990) describes and discusses mainly the trace element concentrations
found in the various depths of the profile. However, the profile was not examined in detail
with respect to the elements of the II.A group.
The samples of the sediment were sieved and fractions <0.063 mm and 0.063 – 2 mm were
analyzed. The authors concluded that the alluvial profile was not formed in situ from the
Jevany type granite but from the parent material of the Říčany type located in the upper part
of the catchment. The indicators for this conclusion are grains of kassiterite found in the
profile as the kassiterite is found in the Říčany type, only (Hons et al. 1990). The authors
conclude that the geochemical properties of the profile indicate input and/or output of material
during the profile evolution. A strong correlation between Ba and Sr was detected throughout
the profile. The analytical method OES was used for determination of Be in profile and other
elements were determined by X-ray fluorescence.
0123456789
10
0 20 40 60 80 100
vol. %
dept
h [m
]
> 2 mm
0.063 - 2 mm
< 0.063 mm
layer 4
layer 2
layer 6
layer 8
Figure 5 Distribution of the fractions throughout the alluvial profile
The sieving of individual horizons revealed the distribution of three fractions in the profile
(Figure 5). The proportion of the coarse material fraction (> 2 mm) decreases towards the top
of profile. The only anomaly is found at 3-m depth, where it stands for more than 50%. The
fraction of material (0.063 – 2 mm) is especially important between depths 3 m – 10 m. The
sample from 1-m depth is notable for its absence of the fraction (0.063 - 2mm), which only
formed < 2%. The proportion of the finest fraction (< 0.063 mm) increased from the bottom to
the top of the profile.
26
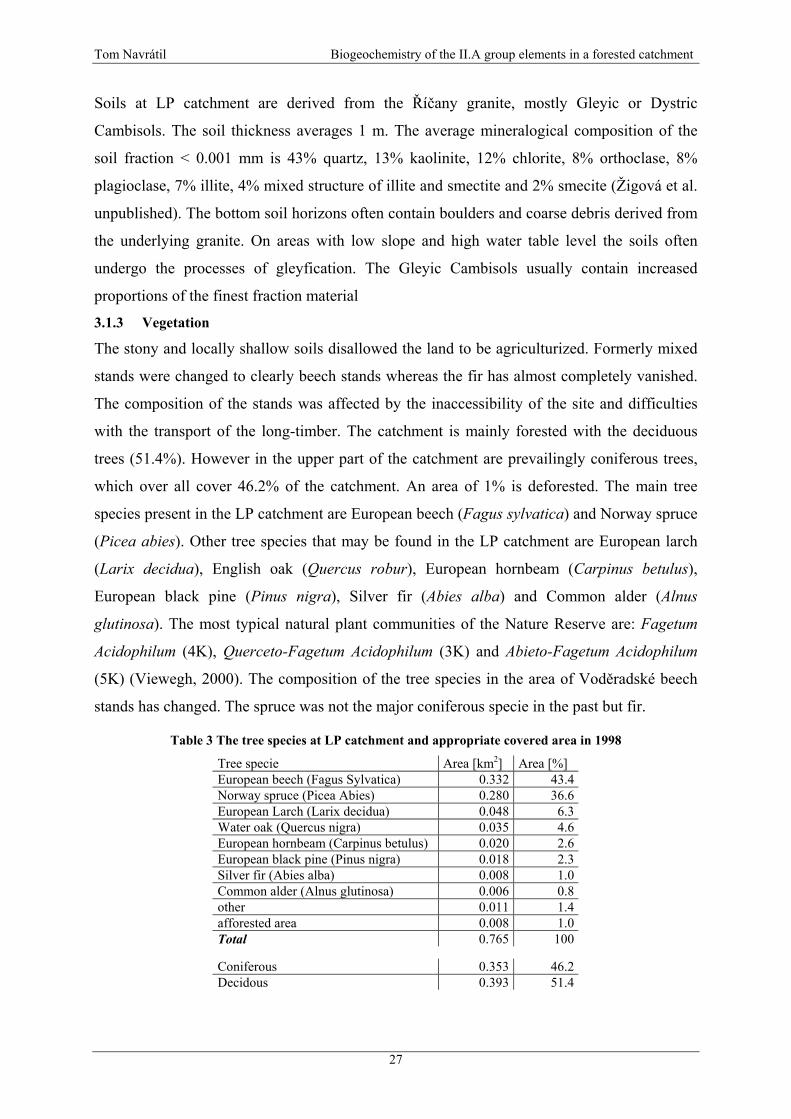
Tom Navrátil Biogeochemistry of the II.A group elements in a forested catchment
Soils at LP catchment are derived from the Říčany granite, mostly Gleyic or Dystric
Cambisols. The soil thickness averages 1 m. The average mineralogical composition of the
soil fraction < 0.001 mm is 43% quartz, 13% kaolinite, 12% chlorite, 8% orthoclase, 8%
plagioclase, 7% illite, 4% mixed structure of illite and smectite and 2% smecite (Žigová et al.
unpublished). The bottom soil horizons often contain boulders and coarse debris derived from
the underlying granite. On areas with low slope and high water table level the soils often
undergo the processes of gleyfication. The Gleyic Cambisols usually contain increased
proportions of the finest fraction material
3.1.3 Vegetation
The stony and locally shallow soils disallowed the land to be agriculturized. Formerly mixed
stands were changed to clearly beech stands whereas the fir has almost completely vanished.
The composition of the stands was affected by the inaccessibility of the site and difficulties
with the transport of the long-timber. The catchment is mainly forested with the deciduous
trees (51.4%). However in the upper part of the catchment are prevailingly coniferous trees,
which over all cover 46.2% of the catchment. An area of 1% is deforested. The main tree
species present in the LP catchment are European beech (Fagus sylvatica) and Norway spruce
(Picea abies). Other tree species that may be found in the LP catchment are European larch
(Larix decidua), English oak (Quercus robur), European hornbeam (Carpinus betulus),
European black pine (Pinus nigra), Silver fir (Abies alba) and Common alder (Alnus
glutinosa). The most typical natural plant communities of the Nature Reserve are: Fagetum
Acidophilum (4K), Querceto-Fagetum Acidophilum (3K) and Abieto-Fagetum Acidophilum
(5K) (Viewegh, 2000). The composition of the tree species in the area of Voděradské beech
stands has changed. The spruce was not the major coniferous specie in the past but fir.
Table 3 The tree species at LP catchment and appropriate covered area in 1998
Tree specie Area [km2] Area [%] European beech (Fagus Sylvatica) 0.332 43.4 Norway spruce (Picea Abies) 0.280 36.6 European Larch (Larix decidua) 0.048 6.3 Water oak (Quercus nigra) 0.035 4.6 European hornbeam (Carpinus betulus) 0.020 2.6 European black pine (Pinus nigra) 0.018 2.3 Silver fir (Abies alba) 0.008 1.0 Common alder (Alnus glutinosa) 0.006 0.8 other 0.011 1.4 afforested area 0.008 1.0 Total 0.765 100 Coniferous 0.353 46.2 Decidous 0.393 51.4
27
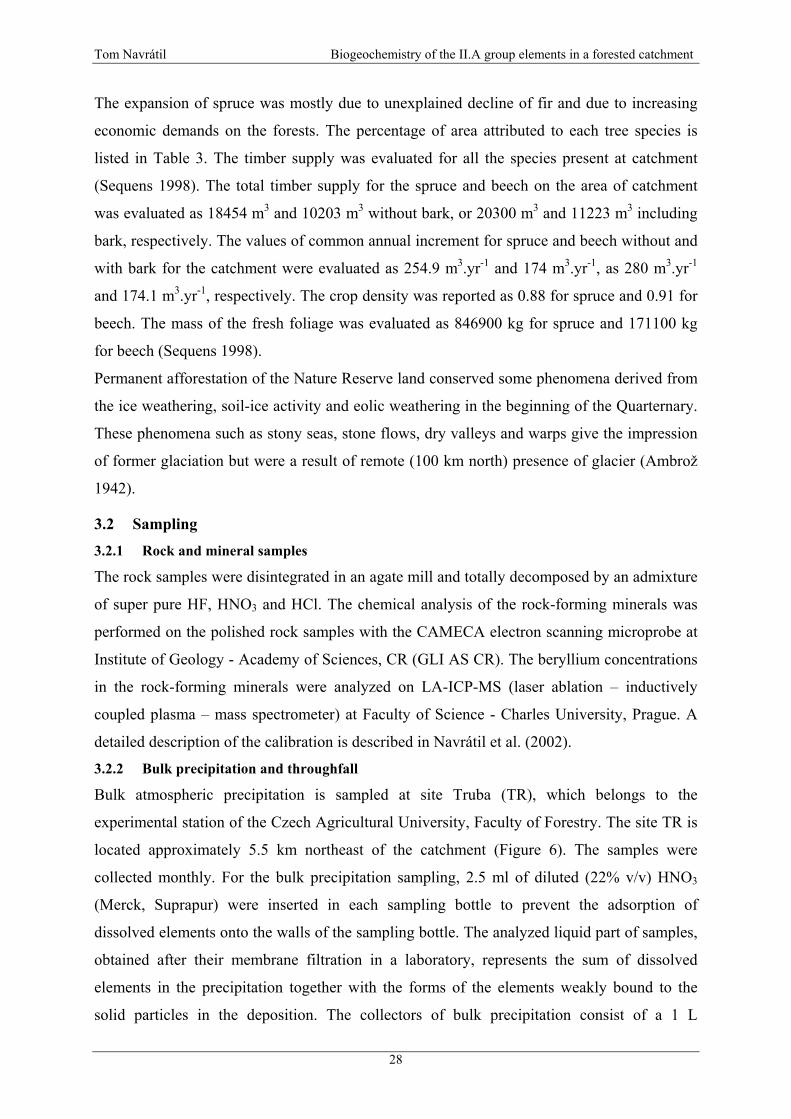
Tom Navrátil Biogeochemistry of the II.A group elements in a forested catchment
The expansion of spruce was mostly due to unexplained decline of fir and due to increasing
economic demands on the forests. The percentage of area attributed to each tree species is
listed in Table 3. The timber supply was evaluated for all the species present at catchment
(Sequens 1998). The total timber supply for the spruce and beech on the area of catchment
was evaluated as 18454 m3 and 10203 m3 without bark, or 20300 m3 and 11223 m3 including
bark, respectively. The values of common annual increment for spruce and beech without and
with bark for the catchment were evaluated as 254.9 m3.yr-1 and 174 m3.yr-1, as 280 m3.yr-1
and 174.1 m3.yr-1, respectively. The crop density was reported as 0.88 for spruce and 0.91 for
beech. The mass of the fresh foliage was evaluated as 846900 kg for spruce and 171100 kg
for beech (Sequens 1998).
Permanent afforestation of the Nature Reserve land conserved some phenomena derived from
the ice weathering, soil-ice activity and eolic weathering in the beginning of the Quarternary.
These phenomena such as stony seas, stone flows, dry valleys and warps give the impression
of former glaciation but were a result of remote (100 km north) presence of glacier (Ambrož
1942).
3.2 Sampling
3.2.1 Rock and mineral samples
The rock samples were disintegrated in an agate mill and totally decomposed by an admixture
of super pure HF, HNO3 and HCl. The chemical analysis of the rock-forming minerals was
performed on the polished rock samples with the CAMECA electron scanning microprobe at
Institute of Geology - Academy of Sciences, CR (GLI AS CR). The beryllium concentrations
in the rock-forming minerals were analyzed on LA-ICP-MS (laser ablation – inductively
coupled plasma – mass spectrometer) at Faculty of Science - Charles University, Prague. A
detailed description of the calibration is described in Navrátil et al. (2002).
3.2.2 Bulk precipitation and throughfall
Bulk atmospheric precipitation is sampled at site Truba (TR), which belongs to the
experimental station of the Czech Agricultural University, Faculty of Forestry. The site TR is
located approximately 5.5 km northeast of the catchment (Figure 6). The samples were
collected monthly. For the bulk precipitation sampling, 2.5 ml of diluted (22% v/v) HNO3
(Merck, Suprapur) were inserted in each sampling bottle to prevent the adsorption of
dissolved elements onto the walls of the sampling bottle. The analyzed liquid part of samples,
obtained after their membrane filtration in a laboratory, represents the sum of dissolved
elements in the precipitation together with the forms of the elements weakly bound to the
solid particles in the deposition. The collectors of bulk precipitation consist of a 1 L
28
Tom Navrátil Biogeochemistry of the II.A group elements in a forested catchment
polyethylene bottle equipped with glass funnel 12 cm in diameter inserted into the cap of the
bottle. The funnel is protected from birds by a casing made from another 5 L polyethylene
bottle turned upside down, with walls cut in a sawtooth pattern. The mouth of the glass funnel
is protected from falling organic debris and insects by a small glass bubble. The collectors are
placed inside opaque plastic pipes (to avoid heating and growth of algae), which are attached
to metallic rods approximately 1.5 m above the ground. For a detailed description refer to
Skřivan et al. (2000).
Throughfall samples are collected in the catchment at sites LP6 (beech) and LP7 (spruce)
(Figure 6). Four sampling devices are installed on each site. Throughfall was originally
collected in the VOSS collectors developed in the Czech Geological Survey, Prague. The
device consists of a polyethylene (PE) funnel (11.8 cm in diameter) whose upper rim is again
arranged in a sawtooth pattern to protect samples from contamination by birds. The neck of
the funnel is equipped with a nylon sieve and the funnel is screwed with a double PE screw to
a 1-L PE sampling bottle. However these sampling devices enabled unwanted contamination
by leaching of material (leaves, tree debris and insects etc.) deposited inside the funnel. This
leaching of material may overestimate the throughfall fluxes, therefore in this study GCTC
throughfall sampling devices were used. The funnel of GCTC device is protected with a glass
cone, which protects the sampler against unwanted collection of falling material, but the water
droplets deposited on the glass cone are collected. The GCTC sampler was successfully
calibrated to the VOSS sampler in order to estimate the effect of glass cone on sample
volume. Details of the samplers were described elsewhere (Skřivan et al. 2000, Skřivan and
Burian 1996).
3.2.3 Soil solution
Soil solution is sampled by zero tension lysimeters at location LP6 and LP35 (Figure 6). The
lysimeters are located at 5 cm and 15 cm depths at both sites, and at 45 cm depth at LP6 only.
Both sampling locations are forested with beech trees. The LP6 location is in the vicinity of
the stream with Gleyic Cambisol soil type, and LP35 is located on the hillslope with Dystric
Cambisols.
3.2.4 Stem wood, roots, bark and assimilatory organs of beech and spruce
Samples of the forest vegetation were collected from beech (Fagus sylvatica) and spruce
(Picea abies). A 1 cm2 square of bark was cut approximately 1.3 m above ground and the
stem wood was sampled from the most recent xylem rings into the pith of the stem with an
increment steel borer coated with PTFE (Haglöf Sweden, length 40 cm, core diameter 0.5
cm). The auger was rinsed with ethanol, diluted nitric acid and distilled water before the
29
Tom Navrátil Biogeochemistry of the II.A group elements in a forested catchment
drilling, to prevent contamination of the wood cores. The samples were divided into three 3
cm long sub-samples, which represented inner- middle- and outer parts of the tree rings. Each
subsample was then decomposed and analyzed separately. Roots with diameter > 1 cm were
sampled from the top 20cm of the soil profile. The sampled roots and branches were stripped
of their bark by means of a quartz glass chip. The consequent treatment and decomposition
was done similarly as in case of the bole wood.
The dried samples of assimilatory organs (leaves, needles) were analyzed without any
cleaning to avoid losses of the soluble portion of analyzed elements from the tissues. The
applied procedure, on the other hand, did not clear away possible dust particles attached to the
leaf surface, which were washed out by occasional precipitation events only.
All the samples of the vegetation tissue were dried and decomposed in the microwave oven in
a PTFE crucible with a mixture of HF and HNO3 acids.
3.2.5 Soil samples
Soil samples were passed through a 2 mm sieve except for the samples from O horizons were
passed through a 5 mm sieve. The fraction < 2 mm (< 5 mm) was then analyzed for total and
leachable element concentration. Decomposition of all samples was carried out in the
microwave oven in a PTFE crucible with a mixture of HF and HNO3 acids. Acid-soluble
forms of the elements in the individual soil horizons were detected by the extraction of soil
samples in 0.1 M nitric acid (Merck, Suprapur) for 24 hours at room temperature (V/m = 200)
(Minařík et al. 1998). Exchangeable forms of Ca and Mg in the soil horizons were determined
after the extraction of soil samples with 0.1 M BaCl2 for 24 hrs. at V/m = 200 and room
temperature.
The total concentrations of elements in soils were determined on 3 profiles at sites LP33,
LP35 and LP36 (Figure 6). The acid leachable and exchangeable concentrations of elements
in soils were determined on 8 sites LP33, LP35, LP36, LP50, LP51, LP52, LP53 and LP54
(Figure 6).
The detailed description of soil profiles horizons at LP33, LP35 and LP36 is in Minařík et al.
(1998) and Skřivan et al. (2000).
3.2.6 Surface water and shallow groundwater
Samples of surface water and shallow groundwater were filtered in the field through a
Sartorius filtering device equipped with the cellulose nitrate filter (pore size 0.45 µm). The
filtrate was immediately stabilized with nitric acid (Merck, Suprapur, diluted 1:3 v/v with
redistilled water), 1ml of diluted HNO3 per 100 ml of sample. Unfiltered and unstabilized
samples of surface water were collected simultaneously for the determination of bulk
30

Tom Navrátil Biogeochemistry of the II.A group elements in a forested catchment
chemical composition and for pH and conductivity measurements. Determination of pH was
made by the pH-meters HACH One (USA) and WTW pH 91, WTW 330 (Germany). All the
polyethylene (PE) bottles used for the transport of liquid samples to the laboratory were
carefully washed (hot distilled water, 0.5% HNO3, distilled and redistilled water). The sample
containers used for analysis of cations were leached with 1:3 HNO3 at least 24 hours prior to
sampling. The bottles were all transported to the laboratory in sealed PE bags.
The surface water of the LP catchment was sampled monthly, directly below the Thompson
weir at site LP6 (Figure 6). Air and water temperature were measured in situ. The actual
discharge was measured by means of a 4 L vessel. Three aliquots of the streamwater are
sampled: filtered, HNO3 stabilized (cations); unfiltered, HNO3 stabilized (cations) and
unfiltered, unstabilized (anions).
Shallow groundwater was sampled in hydrological years 1999 and 2000 from the well located
adjacent to the weir. The well is 5 m deep and made of inert material, and is screened at the
bottom 0.5 m. The stagnant water was at first pumped from the well and sample was acquired
approximately 3 hours after the water level increased. The initial water level in the well was
measured by yardstick. The samples were filtered in field in the same way as the streamwater
samples.
3.2.7 Acidification experiment
An acidification experiment was conducted on May 5th, 2001. The air temperature was 20oC
and the stream water temperature was 11oC. The discharge at the start of acidification was
2.73 L.s-1 (0.013 mm.h-1). Discharge decreased to 2.43 L.s-1 (0.011 mm.h-1) by the end of
sampling. Twenty-two moles of HCl were added to the stream during 4 hours at a point just
below the stream weir LP6 (Figure 6). The discharge of acid (4.709 M) from the Mariotte
bottle was approximately 20 ml.min-1. Samples of the stream water were taken at points W, B,
C and D. Point A and W were located 1 m below and above the acid addition point. Point B,
C, and D were 20 m, 45 m and 70 m downstream from A, respectively. Each sampling event
included 3 aliquots. The first was unfiltered; the second filtered through 0.45 µm cellulose
membrane filter. Both were stabilized with super pure HNO3 and used for cation analyses.
The third aliquot was unfiltered and analyzed for anions. For details refer to Navrátil et al. (in
review).
Concentrations of Na, K, Mg, Ca, Al, Mn and Fe were determined with flame atomic
absorption spectrometry (FAAS; Perkin Elmer 3100) in all liquid (or digested) samples in this
work. Concentrations of F-, Cl-, SO42- and NO3
- in solution were determined by ion
31

Tom Navrátil Biogeochemistry of the II.A group elements in a forested catchment
chromatography (HPLC, columns Tessek HEMA-S1000 Q-L 10mm). Concentrations of Be,
Ba and Sr were determined by Graphite Furnace AAS (GFAAS, VARIAN SpectrAA 300).
Figure 6 Sampling locations inside and outside of the LP catchment
32
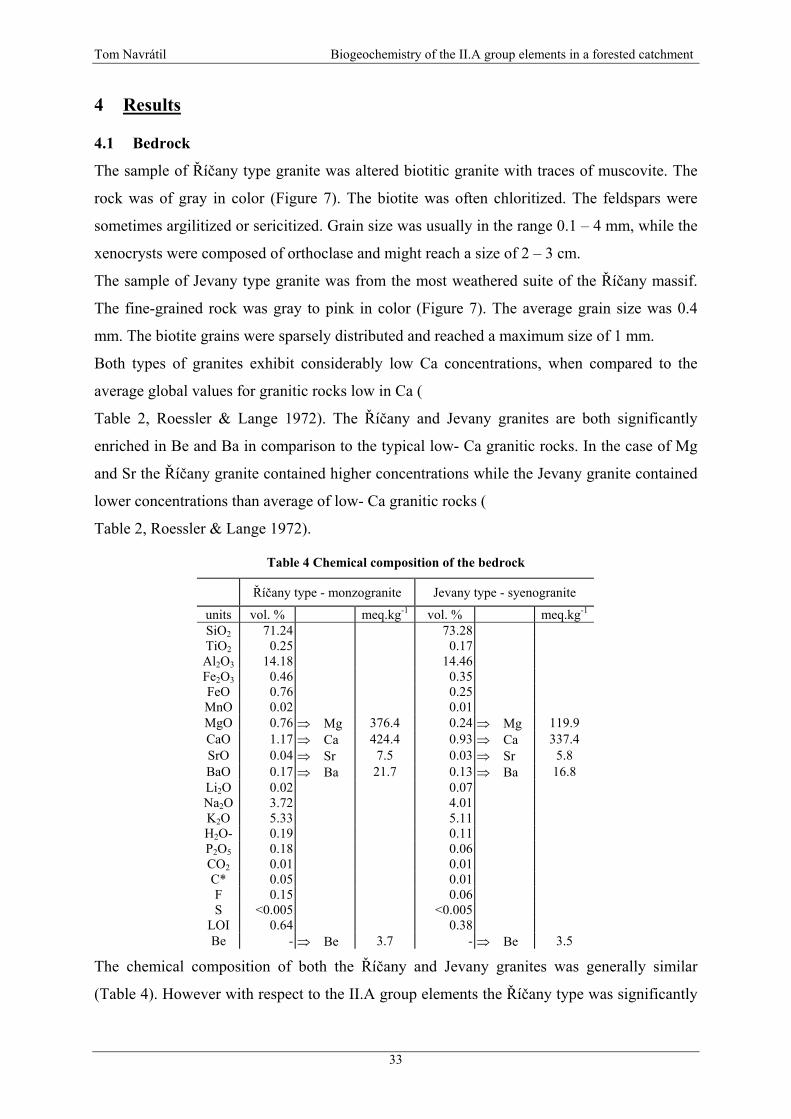
Tom Navrátil Biogeochemistry of the II.A group elements in a forested catchment
4 Results
4.1 Bedrock
The sample of Říčany type granite was altered biotitic granite with traces of muscovite. The
rock was of gray in color (Figure 7). The biotite was often chloritized. The feldspars were
sometimes argilitized or sericitized. Grain size was usually in the range 0.1 – 4 mm, while the
xenocrysts were composed of orthoclase and might reach a size of 2 – 3 cm.
The sample of Jevany type granite was from the most weathered suite of the Říčany massif.
The fine-grained rock was gray to pink in color (Figure 7). The average grain size was 0.4
mm. The biotite grains were sparsely distributed and reached a maximum size of 1 mm.
Both types of granites exhibit considerably low Ca concentrations, when compared to the
average global values for granitic rocks low in Ca (
Table 2, Roessler & Lange 1972). The Říčany and Jevany granites are both significantly
enriched in Be and Ba in comparison to the typical low- Ca granitic rocks. In the case of Mg
and Sr the Říčany granite contained higher concentrations while the Jevany granite contained
lower concentrations than average of low- Ca granitic rocks (
Table 2, Roessler & Lange 1972).
Table 4 Chemical composition of the bedrock
Říčany type - monzogranite Jevany type - syenogranite
units vol. % meq.kg-1 vol. % meq.kg-1 SiO2 71.24 73.28 TiO2 0.25 0.17 Al2O3 14.18 14.46 Fe2O3 0.46 0.35 FeO 0.76 0.25 MnO 0.02 0.01 MgO 0.76 ⇒ Mg 376.4 0.24 ⇒ Mg 119.9 CaO 1.17 ⇒ Ca 424.4 0.93 ⇒ Ca 337.4 SrO 0.04 ⇒ Sr 7.5 0.03 ⇒ Sr 5.8 BaO 0.17 ⇒ Ba 21.7 0.13 ⇒ Ba 16.8 Li2O 0.02 0.07 Na2O 3.72 4.01 K2O 5.33 5.11 H2O- 0.19 0.11 P2O5 0.18 0.06 CO2 0.01 0.01 C* 0.05 0.01 F 0.15 0.06 S <0.005 <0.005
LOI 0.64 0.38 Be - ⇒ Be 3.7 - ⇒ Be 3.5
The chemical composition of both the Říčany and Jevany granites was generally similar
(Table 4). However with respect to the II.A group elements the Říčany type was significantly
33
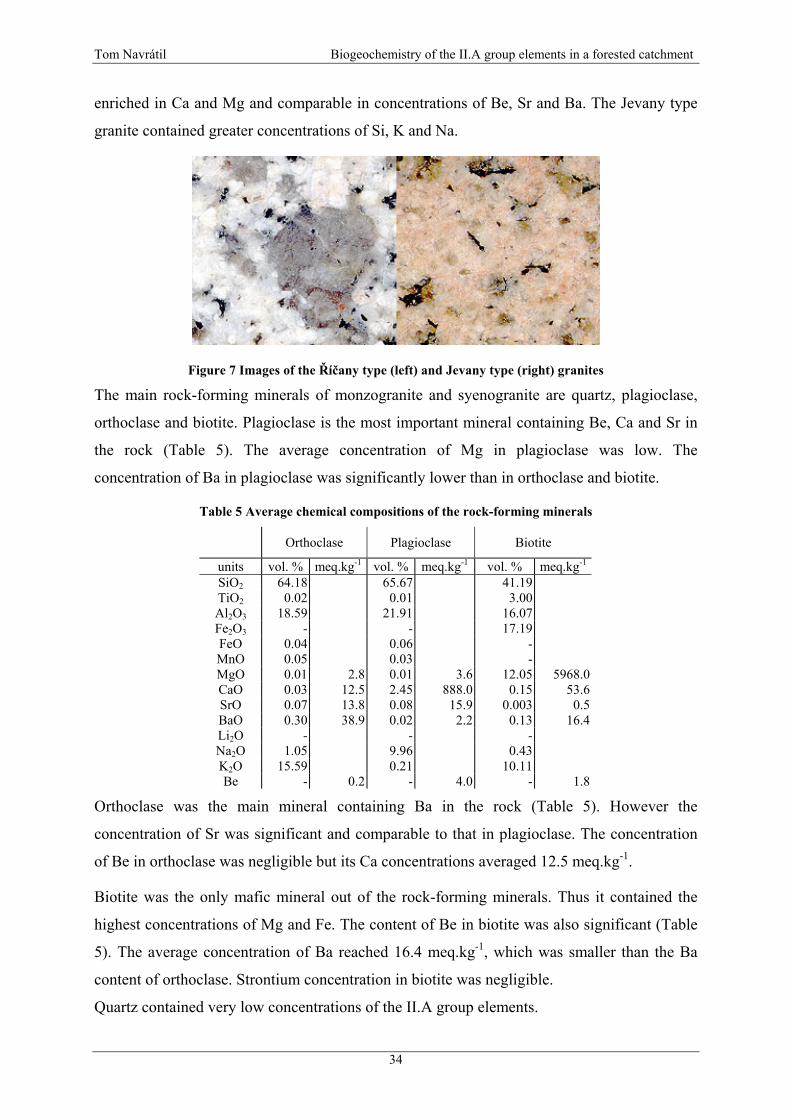
Tom Navrátil Biogeochemistry of the II.A group elements in a forested catchment
enriched in Ca and Mg and comparable in concentrations of Be, Sr and Ba. The Jevany type
granite contained greater concentrations of Si, K and Na.
Figure 7 Images of the Říčany type (left) and Jevany type (right) granites
The main rock-forming minerals of monzogranite and syenogranite are quartz, plagioclase,
orthoclase and biotite. Plagioclase is the most important mineral containing Be, Ca and Sr in
the rock (Table 5). The average concentration of Mg in plagioclase was low. The
concentration of Ba in plagioclase was significantly lower than in orthoclase and biotite.
Table 5 Average chemical compositions of the rock-forming minerals
Orthoclase Plagioclase Biotite
units vol. % meq.kg-1 vol. % meq.kg-1 vol. % meq.kg-1 SiO2 64.18 65.67 41.19 TiO2 0.02 0.01 3.00 Al2O3 18.59 21.91 16.07 Fe2O3 - - 17.19 FeO 0.04 0.06 - MnO 0.05 0.03 - MgO 0.01 2.8 0.01 3.6 12.05 5968.0 CaO 0.03 12.5 2.45 888.0 0.15 53.6 SrO 0.07 13.8 0.08 15.9 0.003 0.5 BaO 0.30 38.9 0.02 2.2 0.13 16.4 Li2O - - - Na2O 1.05 9.96 0.43 K2O 15.59 0.21 10.11 Be - 0.2 - 4.0 - 1.8
Orthoclase was the main mineral containing Ba in the rock (Table 5). However the
concentration of Sr was significant and comparable to that in plagioclase. The concentration
of Be in orthoclase was negligible but its Ca concentrations averaged 12.5 meq.kg-1.
Biotite was the only mafic mineral out of the rock-forming minerals. Thus it contained the
highest concentrations of Mg and Fe. The content of Be in biotite was also significant (Table
5). The average concentration of Ba reached 16.4 meq.kg-1, which was smaller than the Ba
content of orthoclase. Strontium concentration in biotite was negligible.
Quartz contained very low concentrations of the II.A group elements.
34
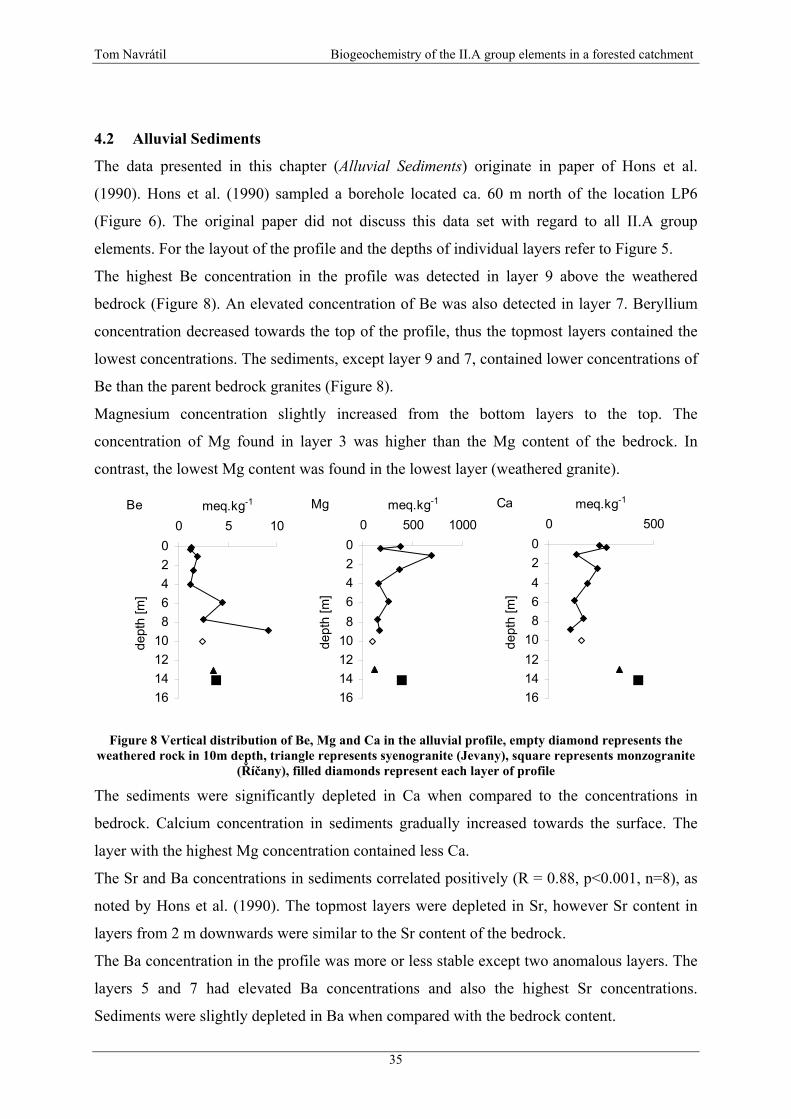
Tom Navrátil Biogeochemistry of the II.A group elements in a forested catchment
4.2 Alluvial Sediments
The data presented in this chapter (Alluvial Sediments) originate in paper of Hons et al.
(1990). Hons et al. (1990) sampled a borehole located ca. 60 m north of the location LP6
(Figure 6). The original paper did not discuss this data set with regard to all II.A group
elements. For the layout of the profile and the depths of individual layers refer to Figure 5.
The highest Be concentration in the profile was detected in layer 9 above the weathered
bedrock (Figure 8). An elevated concentration of Be was also detected in layer 7. Beryllium
concentration decreased towards the top of the profile, thus the topmost layers contained the
lowest concentrations. The sediments, except layer 9 and 7, contained lower concentrations of
Be than the parent bedrock granites (Figure 8).
Magnesium concentration slightly increased from the bottom layers to the top. The
concentration of Mg found in layer 3 was higher than the Mg content of the bedrock. In
contrast, the lowest Mg content was found in the lowest layer (weathered granite).
Be
02468
10121416
0 5 10meq.kg-1
dept
h [m
]
Mg
02468
10121416
0 500 1000meq.kg-1
dept
h [m
]
Ca
02468
10121416
0 5meq.kg-1
dept
h [m
]00
Figure 8 Vertical distribution of Be, Mg and Ca in the alluvial profile, empty diamond represents the
weathered rock in 10m depth, triangle represents syenogranite (Jevany), square represents monzogranite (Říčany), filled diamonds represent each layer of profile
The sediments were significantly depleted in Ca when compared to the concentrations in
bedrock. Calcium concentration in sediments gradually increased towards the surface. The
layer with the highest Mg concentration contained less Ca.
The Sr and Ba concentrations in sediments correlated positively (R = 0.88, p<0.001, n=8), as
noted by Hons et al. (1990). The topmost layers were depleted in Sr, however Sr content in
layers from 2 m downwards were similar to the Sr content of the bedrock.
The Ba concentration in the profile was more or less stable except two anomalous layers. The
layers 5 and 7 had elevated Ba concentrations and also the highest Sr concentrations.
Sediments were slightly depleted in Ba when compared with the bedrock content.
35
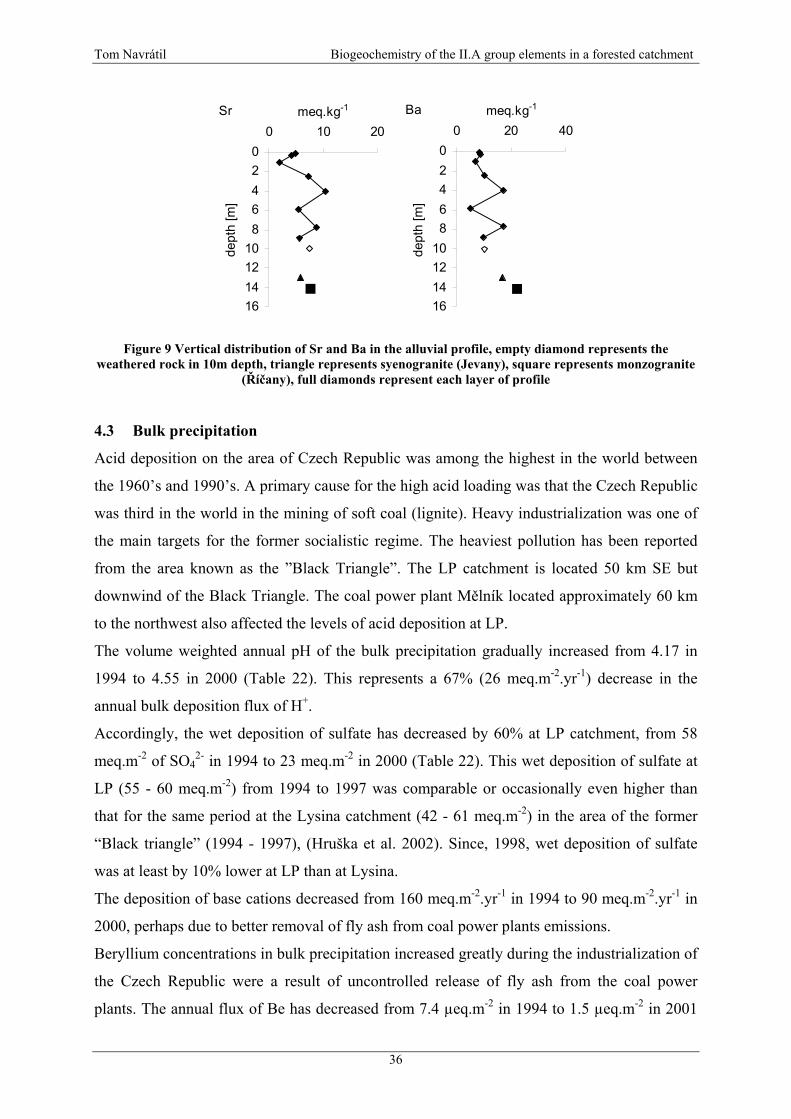
Tom Navrátil Biogeochemistry of the II.A group elements in a forested catchment
Sr
02468
10121416
0 10 2meq.kg-1
dept
h [m
]
0
Ba
02468
10121416
0 20 4meq.kg-1
dept
h [m
]
0
Figure 9 Vertical distribution of Sr and Ba in the alluvial profile, empty diamond represents the
weathered rock in 10m depth, triangle represents syenogranite (Jevany), square represents monzogranite (Říčany), full diamonds represent each layer of profile
4.3 Bulk precipitation
Acid deposition on the area of Czech Republic was among the highest in the world between
the 1960’s and 1990’s. A primary cause for the high acid loading was that the Czech Republic
was third in the world in the mining of soft coal (lignite). Heavy industrialization was one of
the main targets for the former socialistic regime. The heaviest pollution has been reported
from the area known as the ”Black Triangle”. The LP catchment is located 50 km SE but
downwind of the Black Triangle. The coal power plant Mělník located approximately 60 km
to the northwest also affected the levels of acid deposition at LP.
The volume weighted annual pH of the bulk precipitation gradually increased from 4.17 in
1994 to 4.55 in 2000 (Table 22). This represents a 67% (26 meq.m-2.yr-1) decrease in the
annual bulk deposition flux of H+.
Accordingly, the wet deposition of sulfate has decreased by 60% at LP catchment, from 58
meq.m-2 of SO42- in 1994 to 23 meq.m-2 in 2000 (Table 22). This wet deposition of sulfate at
LP (55 - 60 meq.m-2) from 1994 to 1997 was comparable or occasionally even higher than
that for the same period at the Lysina catchment (42 - 61 meq.m-2) in the area of the former
“Black triangle” (1994 - 1997), (Hruška et al. 2002). Since, 1998, wet deposition of sulfate
was at least by 10% lower at LP than at Lysina.
The deposition of base cations decreased from 160 meq.m-2.yr-1 in 1994 to 90 meq.m-2.yr-1 in
2000, perhaps due to better removal of fly ash from coal power plants emissions.
Beryllium concentrations in bulk precipitation increased greatly during the industrialization of
the Czech Republic were a result of uncontrolled release of fly ash from the coal power
plants. The annual flux of Be has decreased from 7.4 µeq.m-2 in 1994 to 1.5 µeq.m-2 in 2001
36
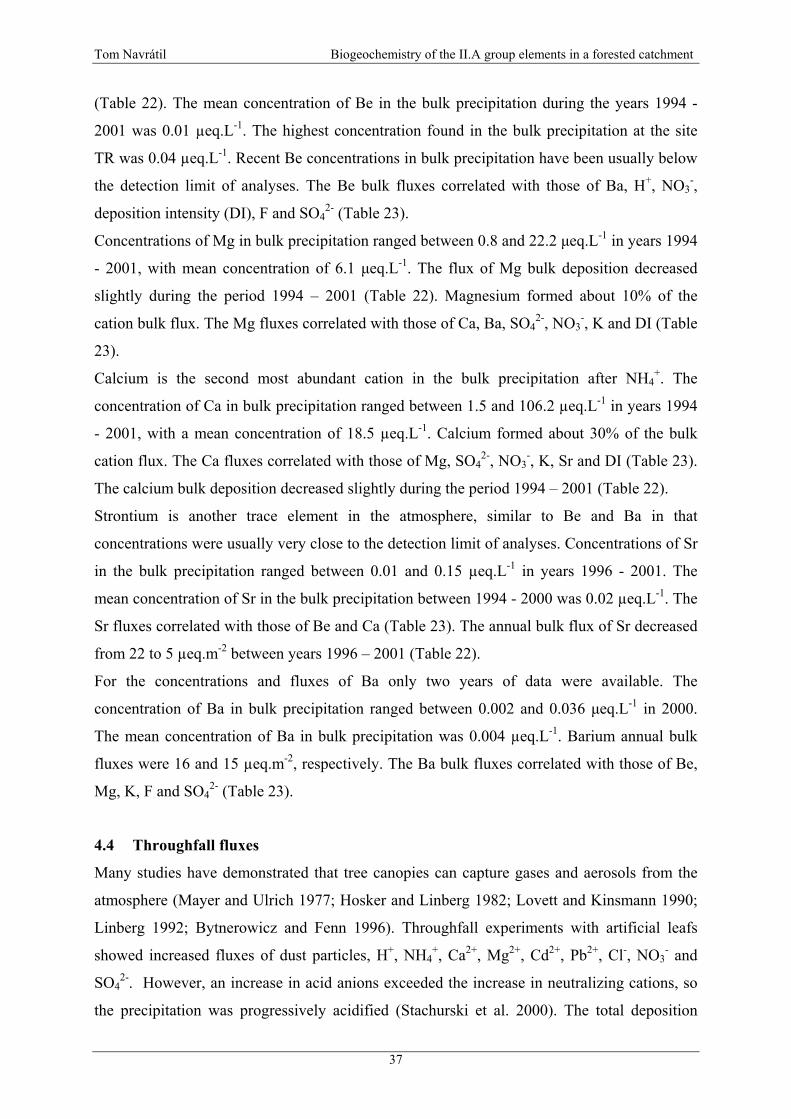
Tom Navrátil Biogeochemistry of the II.A group elements in a forested catchment
(Table 22). The mean concentration of Be in the bulk precipitation during the years 1994 -
2001 was 0.01 µeq.L-1. The highest concentration found in the bulk precipitation at the site
TR was 0.04 µeq.L-1. Recent Be concentrations in bulk precipitation have been usually below
the detection limit of analyses. The Be bulk fluxes correlated with those of Ba, H+, NO3-,
deposition intensity (DI), F and SO42- (Table 23).
Concentrations of Mg in bulk precipitation ranged between 0.8 and 22.2 µeq.L-1 in years 1994
- 2001, with mean concentration of 6.1 µeq.L-1. The flux of Mg bulk deposition decreased
slightly during the period 1994 – 2001 (Table 22). Magnesium formed about 10% of the
cation bulk flux. The Mg fluxes correlated with those of Ca, Ba, SO42-, NO3
-, K and DI (Table
23).
Calcium is the second most abundant cation in the bulk precipitation after NH4+. The
concentration of Ca in bulk precipitation ranged between 1.5 and 106.2 µeq.L-1 in years 1994
- 2001, with a mean concentration of 18.5 µeq.L-1. Calcium formed about 30% of the bulk
cation flux. The Ca fluxes correlated with those of Mg, SO42-, NO3
-, K, Sr and DI (Table 23).
The calcium bulk deposition decreased slightly during the period 1994 – 2001 (Table 22).
Strontium is another trace element in the atmosphere, similar to Be and Ba in that
concentrations were usually very close to the detection limit of analyses. Concentrations of Sr
in the bulk precipitation ranged between 0.01 and 0.15 µeq.L-1 in years 1996 - 2001. The
mean concentration of Sr in the bulk precipitation between 1994 - 2000 was 0.02 µeq.L-1. The
Sr fluxes correlated with those of Be and Ca (Table 23). The annual bulk flux of Sr decreased
from 22 to 5 µeq.m-2 between years 1996 – 2001 (Table 22).
For the concentrations and fluxes of Ba only two years of data were available. The
concentration of Ba in bulk precipitation ranged between 0.002 and 0.036 µeq.L-1 in 2000.
The mean concentration of Ba in bulk precipitation was 0.004 µeq.L-1. Barium annual bulk
fluxes were 16 and 15 µeq.m-2, respectively. The Ba bulk fluxes correlated with those of Be,
Mg, K, F and SO42- (Table 23).
4.4 Throughfall fluxes
Many studies have demonstrated that tree canopies can capture gases and aerosols from the
atmosphere (Mayer and Ulrich 1977; Hosker and Linberg 1982; Lovett and Kinsmann 1990;
Linberg 1992; Bytnerowicz and Fenn 1996). Throughfall experiments with artificial leafs
showed increased fluxes of dust particles, H+, NH4+, Ca2+, Mg2+, Cd2+, Pb2+, Cl-, NO3
- and
SO42-. However, an increase in acid anions exceeded the increase in neutralizing cations, so
the precipitation was progressively acidified (Stachurski et al. 2000). The total deposition
37
Tom Navrátil Biogeochemistry of the II.A group elements in a forested catchment
determined from bulk precipitation underestimates the real input by as much as several times
(Ross and Lindberg 1994). The following components of the input are included in throughfall:
wet deposition, dry deposition (dust particles, gases, vapours), interception of water droplets
derived from mists, fogs and clouds, and products of leaching of above ground parts of trees.
However the methods of throughfall sampling may also overestimate the throughfall fluxes.
The overestimation especially takes place when small particles of leaves or needles, insect
and debris from the tree crowns fall into the sampler funnel and may be leached until the
sample is taken (Skřivan & Burian 1996).
Two types of throughfall are sampled at the LP catchment due to equal afforestation by spruce
and beech. It is widely known that spruce throughfall contains higher amounts of solutes,
because of the spruce canopy has a high surface area for evapotranspiration and adsorption
and leaching processes. Beech throughfall is partly limited due to smaller canopy area for
adsorption and also due to seasonality (no leaves in the winter).
The chemical composition of areal throughfall deposited to the catchment was calculated
according to afforestation by the various tree species. The most important anions in
throughfall deposition flux to the LP catchment during the monitored period were SO42- and
NO3-. The most important cation fluxes in throughfall were potassium and ammonia (Table
22). Throughfall sulfate flux has decreased by 40% from 97 meq.m-2 in 1997 to 61 meq.m-2 in
2000 (Table 22). The annual deposition of nitrogen to the LP catchment remains relatively
stable between 96 – 111 meq.m-2. The deposition of base cations was also decreasing perhaps
due to better controls on the emission of solid particles from the coal power plants.
0
50
100
150
200
1996 1998 2000 2002
SO
42- m
eq.m
-2
a)
3.5
4.0
4.5
5.0
1996 1998 2000 2002
pH
b)
Figure 10 a) The difference in SO42- flux below spruce (full squares) and beech (empty squares), b) the
differences in throughfall pH below spruce (full squares), beech (empty squares) and bulk precipitation (diamonds)
The monthly deposition volumes were usually higher below the beech trees than below
spruce. The higher specific surface area of the spruce canopy causes higher area for
evapotranspiration and consequent up-concentration of precipitation solution. During the
winter season throughfall volumes under beech may be greater than those under spruce due to
38
Tom Navrátil Biogeochemistry of the II.A group elements in a forested catchment
greater canopy retention of snowfall by spruce. Greater canopy interception and evaporation
increase the concentration of spruce throughfall, so that most of the solute fluxes under the
spruce canopy are higher than their equivalents below the beech canopy. The most significant
differences between throughfall fluxes were noted for SO42- and NH4, which were at least
double below the spruce in comparison to beech.
The concentrations of Be in both types of throughfall were usually close to the detection limit
of analyses. The highest concentration found in throughfall was 0.05 µeq.L-1. The mean
concentration of Be in the bulk precipitation during the years 1994 - 2001 was 0.04 µeq.L-1.
The annual fluxes of Be in both types of throughfall were comparable with the bulk
deposition fluxes (Table 22). However Be fluxes in beech throughfall fluxes correlated with
fluxes of Sr, Ba and Mn (Table 25). The spruce Be fluxes correlated with those of H and Sr
(Table 24).
Magnesium fluxes in both types of throughfall were proportionately the most increased
elemental fluxes relative to bulk precipitation fluxes. Throughfall fluxes of Mg in the period
1994 – 2001 below the spruce and beech trees were more than 6 - and 5 - fold higher,
respectively, than fluxes in bulk precipitation (Table 22). Throughfall fluxes of Mg for spruce
and beech were in the range 18 - 24 meq.m-2.yr-1 and 9 - 30 meq.m-2.yr-1, respectively.
Throughfall fluxes below the beech were greatest in the period May to November each year.
The Mg fluxes in November were usually the highest during each year. Magnesium
throughfall fluxes below the beech trees correlated with fluxes of Ca, K, Cl, SO42-, F, Na and
DI (Table 25).
The Mg throughfall fluxes below the spruce were quite constant except for an elevated flux
measured each March in the period 1994 – 2001. The magnesium throughfall fluxes below the
spruce correlated strongly with those of Ca, Mn, Na, Cl, SO42-, H, K and DI (Table 24).
Calcium fluxes in throughfall were higher in comparison with the bulk fluxes, however only
2.5-fold for both species (Table 22). Overall the Ca throughfall flux was the highest from the
II.A group. The throughfall fluxes of Ca below beech were higher than those below spruce
during the growing season.
Calcium throughfall flux below spruce and beech was in the range 24 - 36 meq.m-2.yr-1 and 40
- 22 meq.m-2.yr-1, respectively.
Throughfall Ca fluxes below the beech increased in the period from July to November each
year. Calcium throughfall fluxes below beech correlated with fluxes of Mg, K, Cl, Mn, F, Na,
SO42-, Sr and DI (Table 25).
39

Tom Navrátil Biogeochemistry of the II.A group elements in a forested catchment
Calcium throughfall fluxes below spruce were quite constant except for an extreme flux each
March for the period 1994 – 2001. The calcium throughfall fluxes below the spruce trees
correlated strongly with those of Mg, Na, Cl, Mn, SO42-, H, K, DI and Sr (Table 24).
Strontium fluxes in throughfall were increased relative to bulk precipitation fluxes, however
only 2.7-fold for spruce and 1.8-fold for beech (Table 22). The annual throughfall flux of Sr
below spruce and beech was in the range 28 - 41 µeq.m-2.yr-1 and 17 - 28 µeq.m-2.yr-1,
respectively. The highest throughfall Sr fluxes below beech were detected in June and July.
Strontium throughfall fluxes below the beech correlated with fluxes of Ba, F, Ca, Fe, Cl and
Be (Table 25).
The Sr fluxes below spruce were quite constant except for an elevated flux usually detected in
June. The strontium throughfall fluxes below spruce correlated strongly with those of Be, Al,
Cl, Ba and Ca (Table 24).
Barium fluxes in throughfall exhibited enhanced values in comparison with bulk precipitation
fluxes, however only 2.4-fold for spruce and 1.5-fold for beech (Table 22). The annual
deposition of Ba below the spruce was 31 µeq.m-2.yr-1 in 2000 and 24 µeq.m-2.yr-1 in 2001.
The annual deposition of Ba below the beech reached 18 µeq.m-2.yr-1 in 2000 and 17 µeq.m-
2.yr-1 in 2001. The highest throughfall Ba flux below beech was detected in the period from
May to July. Barium throughfall fluxes below beech correlated with fluxes of Mn, Sr, and Al.
The beech throughfall fluxes of Ba were comparable to the bulk precipitation fluxes in the
period from November to April, but in the period from May to October the throughfall fluxes
were greater.
Barium fluxes below the spruce trees were the highest in period between May and July. The
only period when spruce throughfall Ba fluxes were lower than beech was August – October.
40

Tom Navrátil Biogeochemistry of the II.A group elements in a forested catchment
4.5 Vegetation
The chemical composition of the spruce and beech roots was variable depending on the
sampling site. The most abundant (out of the studied) element in the root mass was usually K
(Table 6). The second most abundant element was Ca except for the beech root from LP35
site. The highest concentrations of Ca corresponded to the lowest concentrations of Al in the
root mass. The highest concentration of Be was found in beech roots at site LP6.
Table 6 Concentrations of elements in the roots of beech and spruce at LP catchment
meq.kg-1 species tissue loc. Be Mg Ca Sr Ba K Mn Fe Al beech roots LP6 0.008 15 25 0.12 0.11 45 1.3 1.3 6beech roots LP35 0.004 11 7 0.08 0.13 68 1.2 4.4 36spruce roots LP35 0.004 10 58 0.23 0.11 41 1.3 1.1 1spruce roots LP7 0.004 13 31 0.12 0.13 28 8.3 0.9 3
The highest concentrations of most elements in the wooden parts of the trees were found in
bark, the stem wood contained significantly lower concentrations of elements.
The most abundant element in bark of both spruce and beech was Ca. Bark of the spruce
contained lower concentrations of Ca than that of beech (Table 7). The next two most
abundant elements in the bark were Mg and K. Similarly as for Ca the spruce bark contained
lower concentrations of K. In contrast the spruce bark contained higher concentrations of Mg
than the bark of beech. Higher concentrations in the bark of spruce were also detected for Mn,
Ba, Al and Be. Higher concentrations of Sr were found in the beech bark similarly as for Fe,
Ca and K.
Table 7 Concentrations of elements in the stem wood and bark of beech and spruce at LP catchment
meq.kg-1 species tissue loc. Be Mg Ca Sr Ba K Mn Fe Al beech bark LP6 0.015 47.6 649 2.09 1.74 48.5 13.3 2.3 5.8beech1 stem wood LP6 0.005 12.8 29 0.11 0.10 20.3 1.3 2.8 0.5beech2 stem wood LP6 0.004 10.7 38 0.15 0.11 23.4 1.3 6.1 0.1beech3 stem wood LP6 0.005 26.9 37 0.17 0.17 15.2 3.0 1.6 0.3beech stem wood AVG 0.005 16.8 35 0.14 0.12 19.7 1.9 3.5 0.3spruce bark LP7 0.017 64.9 456 1.41 2.64 28.3 50.4 2.0 8.8spruce1 stem wood LP7 0.002 8.4 38 0.13 0.26 6.2 6.5 7.1 0.3spruce2 stem wood LP7 0.002 7.3 30 0.12 0.19 7.5 6.3 13.3 0.2spruce3 stem wood LP7 0.005 8.7 53 0.13 0.19 6.8 7.3 7.0 7.4spruce4 stem wood LP7 NA 8.3 26 0.11 NA 9.5 6.1 4.3 0.7spruce5 stem wood LP35 NA 6.1 29 0.10 0.23 9.5 1.5 NA 1.0spruce6 stem wood LP35 NA 6.3 33 0.12 NA 9.0 1.1 3.1 1.4spruce stem wood AVG 0.003 7.5 35 0.12 0.22 8.1 4.8 7.0 1.8
The most abundant element in the stem wood was Ca. The concentrations of Ca in spruce and
beech stem wood are comparable in average 34.7 and 34.6 µeq.kg-1. As for K and Mg the
41
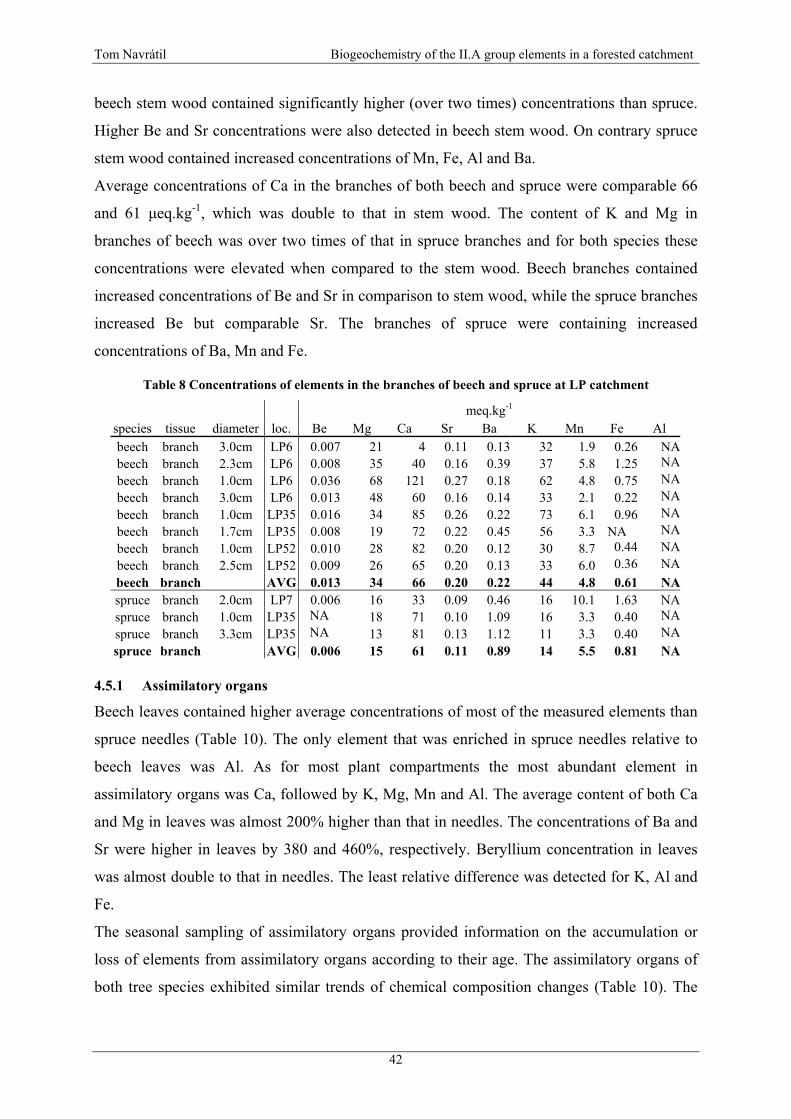
Tom Navrátil Biogeochemistry of the II.A group elements in a forested catchment
beech stem wood contained significantly higher (over two times) concentrations than spruce.
Higher Be and Sr concentrations were also detected in beech stem wood. On contrary spruce
stem wood contained increased concentrations of Mn, Fe, Al and Ba.
Average concentrations of Ca in the branches of both beech and spruce were comparable 66
and 61 µeq.kg-1, which was double to that in stem wood. The content of K and Mg in
branches of beech was over two times of that in spruce branches and for both species these
concentrations were elevated when compared to the stem wood. Beech branches contained
increased concentrations of Be and Sr in comparison to stem wood, while the spruce branches
increased Be but comparable Sr. The branches of spruce were containing increased
concentrations of Ba, Mn and Fe.
Table 8 Concentrations of elements in the branches of beech and spruce at LP catchment
meq.kg-1 species tissue diameter loc. Be Mg Ca Sr Ba K Mn Fe Al beech branch 3.0cm LP6 0.007 21 4 0.11 0.13 32 1.9 0.26 NAbeech branch 2.3cm LP6 0.008 35 40 0.16 0.39 37 5.8 1.25 NAbeech branch 1.0cm LP6 0.036 68 121 0.27 0.18 62 4.8 0.75 NAbeech branch 3.0cm LP6 0.013 48 60 0.16 0.14 33 2.1 0.22 NAbeech branch 1.0cm LP35 0.016 34 85 0.26 0.22 73 6.1 0.96 NAbeech branch 1.7cm LP35 0.008 19 72 0.22 0.45 56 3.3 NA NAbeech branch 1.0cm LP52 0.010 28 82 0.20 0.12 30 8.7 0.44 NAbeech branch 2.5cm LP52 0.009 26 65 0.20 0.13 33 6.0 0.36 NAbeech branch AVG 0.013 34 66 0.20 0.22 44 4.8 0.61 NAspruce branch 2.0cm LP7 0.006 16 33 0.09 0.46 16 10.1 1.63 NAspruce branch 1.0cm LP35 NA 18 71 0.10 1.09 16 3.3 0.40 NAspruce branch 3.3cm LP35 NA 13 81 0.13 1.12 11 3.3 0.40 NAspruce branch AVG 0.006 15 61 0.11 0.89 14 5.5 0.81 NA
4.5.1 Assimilatory organs
Beech leaves contained higher average concentrations of most of the measured elements than
spruce needles (Table 10). The only element that was enriched in spruce needles relative to
beech leaves was Al. As for most plant compartments the most abundant element in
assimilatory organs was Ca, followed by K, Mg, Mn and Al. The average content of both Ca
and Mg in leaves was almost 200% higher than that in needles. The concentrations of Ba and
Sr were higher in leaves by 380 and 460%, respectively. Beryllium concentration in leaves
was almost double to that in needles. The least relative difference was detected for K, Al and
Fe.
The seasonal sampling of assimilatory organs provided information on the accumulation or
loss of elements from assimilatory organs according to their age. The assimilatory organs of
both tree species exhibited similar trends of chemical composition changes (Table 10). The
42
Tom Navrátil Biogeochemistry of the II.A group elements in a forested catchment
concentrations of Mg and K gradually decreased with time during the growing season.
Concentrations of all the other elements (Be, Ca, Sr, Ba, Mn, Fe and Al) increased with time.
Beryllium accumulated in beech leaves through the growing season (Table 10). The leaves of
all three sampled trees from differing sites of the catchment and from different years have
shown an increase in Be from May to October each year. The Be concentrations on average
increased by more than 80%. The highest Be concentration measured in the beech leaves was
0.086 meq.kg-1. The leaves from location LP6 with soils and soil solution enriched with Be
contained elevated Be concentrations when compared to location LP35.
The spruce needles contained on average slightly higher Be concentrations than beech leaves.
Similarly to beech, Be concentrations in needles increased with time. The highest
concentrations of Be in needles were found at site LP7 perhaps due to high concentrations of
Be in soil (Figure 11).
Magnesium was readily lost from the beech leaves (Table 10), as expected from the high Mg
concentrations in beech throughfall. Beech leaves lost at least 30% of their Mg from May to
October. Leaves sampled at the end of autumn (in December) contained 70% less Mg than in
May. Beech leaves from location LP35 contained significantly lower Mg concentrations than
leaves from location LP6.
Spruce needles contained lower concentrations of Mg than beech leaves; both were sampled
at the same location LP35. The highest Mg concentrations were found in spruce needles from
location LP7. Additionally needles from site LP7 were the only assimilatory organs sampled
that had increasing Mg content with time.
Concentrations of Ca increased with time in all beech leaves sampled from various trees and
various sites. The concentration of Ca increased from May to Oct by 20 - 40% depending on
sampling location.
Calcium concentrations in spruce needles were on average lower than in beech leaves (Table
10). Similarly as for Be and Mg, the highest Ca concentrations in spruce needles were found
at location LP51. Calcium accumulated in needles of all sampled trees with increasing needle
age. The calcium concentration in needles increased by 60 - 80% during 4 years.
Strontium behaved similarly to Ca. However at location LP35 the Sr concentrations in beech
leaves remained virtually the same throughout the whole season. In general strontium
concentrations were more variable in time than Ca.
The beech leaves contained on average 60% higher concentrations of Sr than spruce needles.
A gradual increase of Sr concentration with age was detected in all the sampled spruce
needles. The highest concentrations of Sr in needles were again found at location LP51.
43

Tom Navrátil Biogeochemistry of the II.A group elements in a forested catchment
Table 9 Concentrations of elements in the assimilatory organs of beech and spruce at LP catchment
sampling age meq.kg-1 date class sample type loc. Be Mg Ca Sr Ba K Mn Fe Al
5.5.1997 beech leaves LP6 0.014 140 309 0.38 0.21 149 15 3.2 2.04.6.1997 beech leaves LP6 0.023 229 530 1.11 0.48 93 39 5.3 7.14.6.1997 beech leaves LP6 0.015 223 483 1.10 0.55 97 39 4.3 8.54.7.1997 beech leaves LP6 0.036 200 585 1.19 0.34 203 41 5.5 8.5
31.7.1997 beech leaves LP6 0.044 225 588 1.40 0.45 180 55 5.5 10.63.9.1997 beech leaves LP6 0.059 210 605 1.70 0.60 115 61 4.5 10.63.9.1997 beech leaves LP6 0.058 186 502 1.49 0.64 137 48 6.7 15.7
2.10.1997 beech leaves LP6 0.054 177 677 1.54 0.69 79 52 6.0 15.33.11.1997 beech leaves LP6 0.042 165 857 1.75 0.75 133 59 6.0 13.61.12.1997 beech leaves LP6 0.077 135 898 2.01 0.82 49 60 10.2 22.3
25.4.2000 beech leaves LP6 0.006 125 422 0.39 0.70 354 23 3.4 2.610.5.2000 beech leaves LP6 0.005 188 439 0.59 0.71 271 28 3.1 2.92.8.2000 beech leaves LP6 0.026 183 517 0.71 0.88 237 38 3.5 5.0
4.10.2000 beech leaves LP6 0.045 154 719 0.87 0.99 203 54 6.7 4.11.11.2000 beech leaves LP6 0.049 157 800 0.80 1.15 142 49 5.0 5.9
25.4.2000 beech leaves LP35 0.003 112 203 0.43 0.39 313 26 2.2 2.610.5.2000 beech leaves LP35 0.004 117 292 0.94 0.57 247 41 2.2 2.62.8.2000 beech leaves LP35 0.008 73 268 0.41 0.50 298 31 3.5 3.0
4.10.2000 beech leaves LP35 0.017 64 305 0.40 0.53 298 36 4.3 3.6
2.10.2002 beech leaves LP52 0.006 125 422 0.39 0.70 354 23 3.4 2.62.10.2002 beech leaves LP35 0.005 188 439 0.59 0.71 271 28 3.1 2.92.10.2002 beech leaves LP6-1 0.026 183 517 0.71 0.88 237 38 3.5 5.02.10.2002 beech leaves LP6-2 0.045 154 719 0.87 0.99 203 54 6.7 4.1
1997 5 spruce needles LP7 0.070 65 275 0.55 0.29 28 63 13.8 40.81997 5 spruce needles LP7 0.067 67 289 0.56 0.30 29 65 13.9 43.0
25.4.2000 0 spruce needles LP35 NA 83 36 0.02 0.02 354 6 1.1 2.010.5.2000 0 spruce needles LP35 NA 57 62 0.04 0.06 289 8 0.9 2.12.8.2000 0 spruce needles LP35 NA 62 171 0.00 0.00 232 14 0.8 2.2
25.4.2000 1 spruce needles LP35 NA 42 140 0.09 0.11 98 14 1.0 2.825.4.2000 2 spruce needles LP35 NA 39 182 0.14 0.12 80 16 1.2 3.825.4.2000 3 spruce needles LP35 NA 37 225 0.12 0.15 102 20 1.5 3.625.4.2000 4 spruce needles LP35 NA 26 266 0.14 0.18 108 28 1.8 6.3
2.10.2002 0 spruce needles LP7 0.008 106 234 0.56 0.54 189 61 0.9 6.02.10.2002 1 spruce needles LP7 0.065 116 448 0.94 0.82 128 99 0.9 7.62.10.2002 2 spruce needles LP7 0.073 132 601 1.12 0.97 92 150 1.3 10.2
2.10.2002 0 spruce needles LP35 0.016 76 182 0.28 0.20 246 15 1.6 8.32.10.2002 1 spruce needles LP35 0.073 62 266 0.38 0.25 187 18 2.1 12.52.10.2002 2 spruce needles LP35 0.025 46 282 0.38 0.25 165 16 2.3 14.7
Barium concentrations increased with time in both leaves and needles (Table 10). In some
samples of leaves and needles Ba concentrations were higher than Sr. Barium concentrations
exhibited significant changes in concentration from year to year. The highest Ba
44

Tom Navrátil Biogeochemistry of the II.A group elements in a forested catchment
concentrations in needles were found at location LP51 (identical to LP7). The increase of Ba
in the needles during 4 years growth was in the range 50-80%.
4.6 Soil
The most frequent soil type at LP catchment was Dystric Cambisol, while around the LP
stream and in the north (the lowest) part of the catchment was Gleyic Cambisol. Lithosols
covered the highest locations in the catchment. All the soils are acid due to their development
from the acidic parent granites. The lowest pH(H2O) values of the soils were found in the top
15 cm of the soil profile, ranging from 3.6 to 4.5. The pH(H2O) lower in the profiles was
slightly higher, from 4.0 to 5.2. Soil pH(H2O) was statistically related to total exchangeable
acidity (TEA), (Annexes, Table 30).
The surface horizons (O and A) contained the highest content of organic material. The content
of organic carbon C(ox) ranged between 4 and 36% and total nitrogen N(t) content ranged
between 0.2 to 1.6% in the O and A layers. The lower horizons of the soil profiles were
reduced in C(ox) and N(t), which ranged between 0.02 – 1.5%, 0.01 – 0.08% respectively.
The cation exchange capacity (CEC) of soils in the catchment averaged 160 meq.kg-1. The
highest CEC values were found in the O and A horizons (ca. top 10 cm), averaging 294
meq.kg-1, while the CEC progressively decreased to 146 meq.kg-1 in the upper B horizons
(between 10 - 20 cm) and in lower B or C horizons to 73 meq.kg-1. Elevated CEC values were
also determined in some layers enriched in the content of fine particles (e.g. profile LP33
horizons Gr1 and Gr2).
The base saturation (BS) of soils developed on granites is usually low. The highest BS of soils
at LP catchment were present in the O and A horizons rich in organic matter with mean BS of
36 % (range 10 – 73%). However, the BS of lower soil layers was significantly lower at 8 %
(range 4-15 %). The base saturation of the Gleyic Cambisols was elevated, however
proportionally they cover a small area of the catchment, mostly limited to the north (the
lowest) part.
The most abundant elements (of those studied) in LP soils were in descending order Al, K, Na
and Fe (Table 10). The highest total concentration of Mn (especially in the upper horizons)
was found at profile LP36. Elevated total concentrations of Al were found in the riparian
LP33 profile.
The acid leachable fraction of Al and Fe is also considerable but the acid leachable fraction of
Na and K is minor. The highest acid leachable concentrations of most elements were found at
45
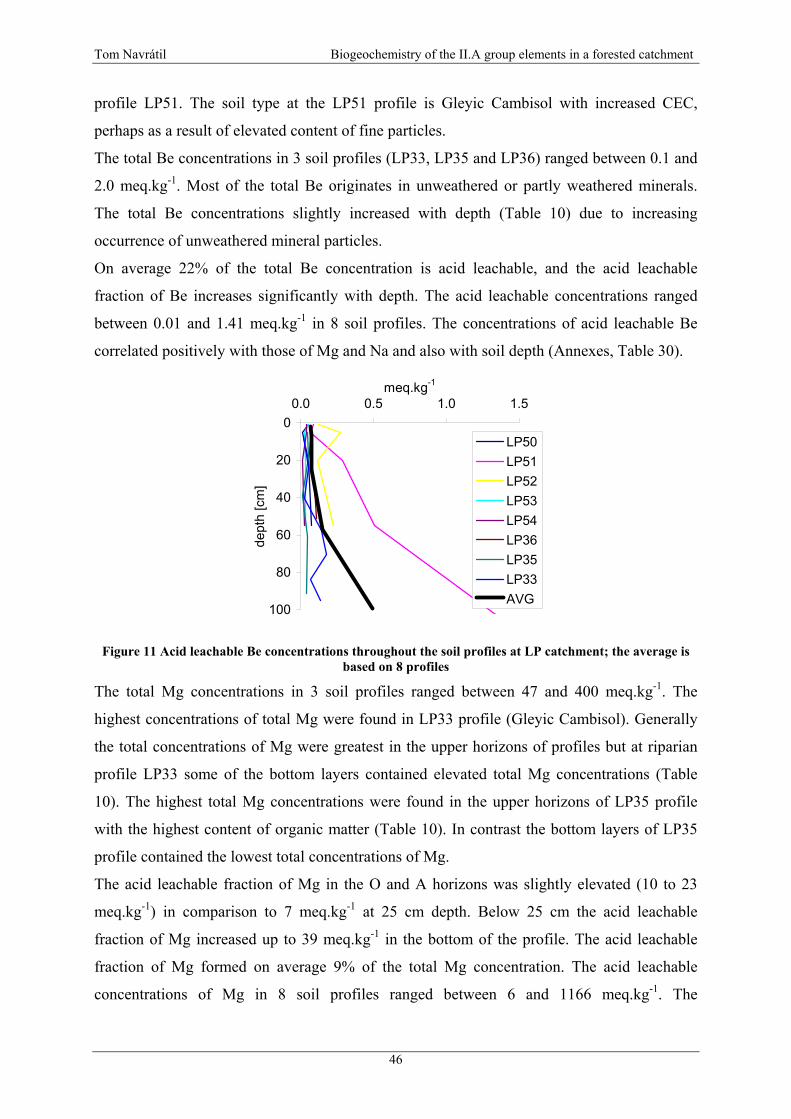
Tom Navrátil Biogeochemistry of the II.A group elements in a forested catchment
profile LP51. The soil type at the LP51 profile is Gleyic Cambisol with increased CEC,
perhaps as a result of elevated content of fine particles.
The total Be concentrations in 3 soil profiles (LP33, LP35 and LP36) ranged between 0.1 and
2.0 meq.kg-1. Most of the total Be originates in unweathered or partly weathered minerals.
The total Be concentrations slightly increased with depth (Table 10) due to increasing
occurrence of unweathered mineral particles.
On average 22% of the total Be concentration is acid leachable, and the acid leachable
fraction of Be increases significantly with depth. The acid leachable concentrations ranged
between 0.01 and 1.41 meq.kg-1 in 8 soil profiles. The concentrations of acid leachable Be
correlated positively with those of Mg and Na and also with soil depth (Annexes, Table 30).
0
20
40
60
80
100
0.0 0.5 1.0 1.5meq.kg-1
dept
h [c
m]
LP50LP51LP52LP53LP54LP36LP35LP33AVG
Figure 11 Acid leachable Be concentrations throughout the soil profiles at LP catchment; the average is based on 8 profiles
The total Mg concentrations in 3 soil profiles ranged between 47 and 400 meq.kg-1. The
highest concentrations of total Mg were found in LP33 profile (Gleyic Cambisol). Generally
the total concentrations of Mg were greatest in the upper horizons of profiles but at riparian
profile LP33 some of the bottom layers contained elevated total Mg concentrations (Table
10). The highest total Mg concentrations were found in the upper horizons of LP35 profile
with the highest content of organic matter (Table 10). In contrast the bottom layers of LP35
profile contained the lowest total concentrations of Mg.
The acid leachable fraction of Mg in the O and A horizons was slightly elevated (10 to 23
meq.kg-1) in comparison to 7 meq.kg-1 at 25 cm depth. Below 25 cm the acid leachable
fraction of Mg increased up to 39 meq.kg-1 in the bottom of the profile. The acid leachable
fraction of Mg formed on average 9% of the total Mg concentration. The acid leachable
concentrations of Mg in 8 soil profiles ranged between 6 and 1166 meq.kg-1. The
46
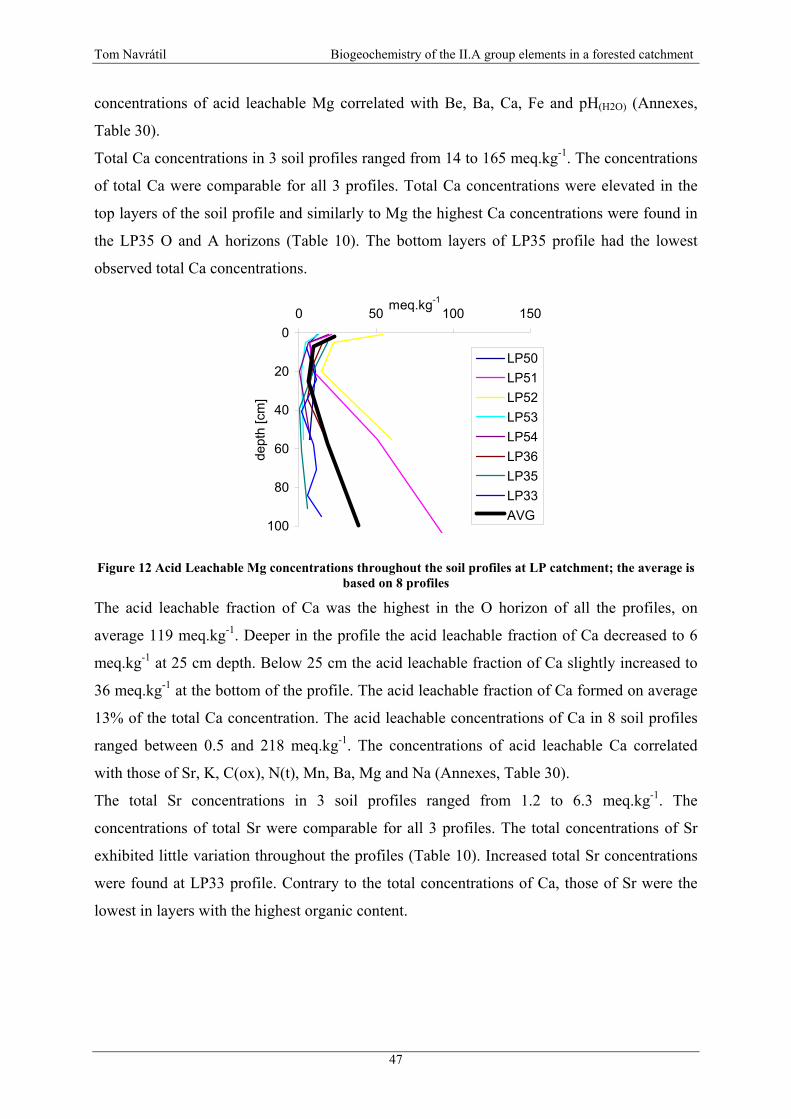
Tom Navrátil Biogeochemistry of the II.A group elements in a forested catchment
concentrations of acid leachable Mg correlated with Be, Ba, Ca, Fe and pH(H2O) (Annexes,
Table 30).
Total Ca concentrations in 3 soil profiles ranged from 14 to 165 meq.kg-1. The concentrations
of total Ca were comparable for all 3 profiles. Total Ca concentrations were elevated in the
top layers of the soil profile and similarly to Mg the highest Ca concentrations were found in
the LP35 O and A horizons (Table 10). The bottom layers of LP35 profile had the lowest
observed total Ca concentrations.
0
20
40
60
80
100
0 50 100 150meq.kg-1
dept
h [c
m]
LP50LP51LP52LP53LP54LP36LP35LP33AVG
Figure 12 Acid Leachable Mg concentrations throughout the soil profiles at LP catchment; the average is based on 8 profiles
The acid leachable fraction of Ca was the highest in the O horizon of all the profiles, on
average 119 meq.kg-1. Deeper in the profile the acid leachable fraction of Ca decreased to 6
meq.kg-1 at 25 cm depth. Below 25 cm the acid leachable fraction of Ca slightly increased to
36 meq.kg-1 at the bottom of the profile. The acid leachable fraction of Ca formed on average
13% of the total Ca concentration. The acid leachable concentrations of Ca in 8 soil profiles
ranged between 0.5 and 218 meq.kg-1. The concentrations of acid leachable Ca correlated
with those of Sr, K, C(ox), N(t), Mn, Ba, Mg and Na (Annexes, Table 30).
The total Sr concentrations in 3 soil profiles ranged from 1.2 to 6.3 meq.kg-1. The
concentrations of total Sr were comparable for all 3 profiles. The total concentrations of Sr
exhibited little variation throughout the profiles (Table 10). Increased total Sr concentrations
were found at LP33 profile. Contrary to the total concentrations of Ca, those of Sr were the
lowest in layers with the highest organic content.
47

Tom Navrátil Biogeochemistry of the II.A group elements in a forested catchment
0
20
40
60
80
100
0 100 200 300meq.kg-1
dept
h [c
m]
LP50LP51LP52LP53LP54LP36LP35LP33AVG
Figure 13 Leachable Ca concentrations throughout the soil profiles at LP catchment; the average is based on 8 profiles
0
20
40
60
80
100
0.0 0.2 0.4 0.6 0.8meq.kg-1
dept
h [c
m]
LP50LP51LP52LP53LP54LP36LP35LP33AVG
Figure 14 Acid Leachable Sr concentrations throughout the soil profiles at LP catchment; the average is based on 8 profiles
The acid leachable fraction of Sr was the highest in the O horizon of all profiles, on average
0.35 meq.kg-1. Deeper in the profiles the acid leachable fraction of Sr decreased sharply to
0.04 meq.kg-1 at 50 cm depth. Below 50 cm the acid leachable fraction of Sr slightly increased
to 0.13 meq.kg-1 in the bottom of the profile, which was comparable to the Sr leachable
fraction in the A horizon. The acid leachable fraction of Sr formed on average 8% of the total
Sr concentration. The acid leachable concentrations of Sr in 8 soil profiles ranged between
0.03 and 0.72 meq.kg-1. Statistically the acid leachable concentrations of Sr were correlated
with Ca, K, C(ox), N(t), pH(KCl) and CEC (Annexes, Table 30).
The total Ba concentrations in 3 soil profiles ranged from 0.8 to 25.6 meq.kg-1. In general the
total concentrations of Ba slightly increased with depth (Table 10). Similarly as in case of Sr,
48

Tom Navrátil Biogeochemistry of the II.A group elements in a forested catchment
barium concentrations in the upper horizons rich in organic matter were lower than those in
bottom horizons.
The acid leachable fraction of Ba was elevated in the O horizon of all profiles with an average
of 0.73 meq.kg-1. Deeper in the profile the acid leachable fraction of Ba sharply decreased to
0.19 meq.kg-1 at 25 cm depth. Below 25 cm the acid leachable fraction of Sr increased back
up to 0.94 meq.kg-1 at the bottom of the profile, which exceeded the Ba leachable fraction in
the O horizon. The acid leachable fraction of Ba formed on average 10% of the total Ba
concentration. The acid leachable concentrations of Ba in 8 soil profiles ranged between 0.03
and 1.4 meq.kg-1. The concentrations of acid leachable Ba correlated with those of Be, Na,
Mg, C(ox), N(t), pH(KCl) and CEC (Annexes, Table 30).
0
20
40
60
80
100
0.0 0.5 1.0 1.5meq.kg-1
dept
h [c
m]
LP50LP51LP52LP53LP54LP36LP35LP33AVG
Figure 15 Acid leachable Ba concentrations throughout the soil profiles at LP catchment; the average is based on 8 profiles
49

Tom
Nav
rátil
B
ioge
oche
mis
try o
f the
II.A
gro
up e
lem
ents
in a
fore
sted
cat
chm
ent
Tab
le 1
0 T
he p
rope
rtie
s and
ele
men
t con
cent
ratio
ns o
f LP3
3, L
P35
and
LP3
6 pr
ofile
s, el
emen
ts a
nd C
EC
in m
eq.k
g-1, N
(t) t
otal
nitr
ogen
, C(o
x) o
xida
ble
carb
on
LP33
pHN
(t)C
(ox)
Hum
usC
ECB
eM
gC
aSr
Ba
Na
KM
nFe
Al
cm%
%%
tota
lle
a.to
tal
lea.
tota
lle
a.to
tal
lea.
tota
lle
a.to
tal
lea.
tota
lle
a.to
tal
lea.
tota
lle
a.
A
0-
153.
803.
000.
324.
758.
224
00.
860.
0311
35.
110
60.
38.
00.
144
71.
056
42.
94.
20.
726
627
6043
143
Bw
15-3
34.
043.
460.
813
71.
190.
1324
811
.296
1.1
3.6
0.0
6.5
0.3
459
0.7
573
1.8
6.5
0.7
7892
252
Go
33
-48
4.14
3.79
0.03
0.24
0.4
511.
170.
1210
32.
011
03.
04.
36.
20.
266
81.
178
91.
42.
70.
321
118
6680
104
Gr1
48-6
74.
003.
410.
040.
281.
420.
2440
09.
492
1.4
3.1
0.1
5.0
0.6
385
0.6
557
3.0
6.7
0.2
678
26G
r2
67
-74
4.05
3.38
0.04
0.12
0.2
146
1.26
0.32
339
11.7
932.
43.
10.
112
.10.
658
62.
84.
80.
257
826
8848
237
Gr3
84-8
74.
263.
540.
020.
040.
138
112
5.8
101
4.2
3.4
0.1
10.5
0.2
658
0.4
751
1.1
3.3
0.1
181
1259
3390
Gr4
90-1
004.
333.
430.
020.
080.
157
2.03
0.27
315
14.6
165
5.5
6.3
0.3
25.6
0.4
853
1.9
4.7
0.1
534
1711
504
126
LP35
pHN
(t)C
(ox)
Hum
usC
ECB
eM
gC
aSr
Ba
Na
KM
nFe
Al
cm%
%%
tota
lle
a.to
tal
lea.
tota
lle
a.to
tal
lea.
tota
lle
a.to
tal
lea.
tota
lle
a.le
a.to
tal
lea.
tota
lle
a.
Of
0-
103.
652.
70
1.55
36
.61
63.1
926
0.19
0.03
1348
13.3
908
0.4
0.7
0.6
151
1.8
175
8.3
de
pth
pH
(H2O
)(K
Cl)
tota
lle
a.
19.2
4.2
0.08
0.45
498
310.
00.
515
210
186
259
0.5
433
1.19
0.13
0.8
976
de
pth
pH
(H2O
)(K
Cl)
tota
l
16.2
0.9
2.0
1.0
116
1399
311
9A
10-2
73.
002.
20
0.83
19
.03
32.8
812
0.64
0.04
747
7.6
540
4.9
1.3
0.3
1.0
0.5
791.
982
2.5
0.9
116
813
1416
7A
B
27
-51
3.70
2.95
0.05
0.89
1.5
861.
290.
0648
0.7
132
2.6
3.3
0.0
14.2
0.0
559
1.7
292
1.3
1.1
<0.1
124
329
2199
Bv
51
-71
4.05
3.70
0.04
0.89
1.5
591.
300.
0442
1.6
712.
02.
40.
05.
60.
140
1.5
631.
01.
7<0
.128
633
2954
260
Bc
71
-111
3.95
3.45
0.02
0.89
1.5
115
1.24
0.03
465.
353
2.2
2.4
0.0
4.8
0.1
158
1.4
116
1.1
2.6
0.2
203
1520
4411
1
LP36
dept
hpH
pHN
(t)C
(ox)
Hum
usC
ECB
eM
gC
aSr
Ba
Na
KM
nFe
Al
cm(H
2O)
(KC
l)%
%%
tota
lle
a.to
tal
lea.
tota
lle
a.to
tal
lea.
tota
lle
a.to
tal
tota
lle
a.to
tal
lea.
tota
lle
a.to
tal
lea.
tota
l
A
0-
83.
943.
22
0.57
10
.60
18.3
455
1.22
0.07
690
15.8
516
61.2
1.4
0.1
4.9
0.8
312
1.0
343
10.2
21.3
17.0
307
2522
8317
8B
v1
8-
244.
333.
930.
211.
142.
011
21.
630.
0620
79.
421
33.
82.
70.
08.
30.
262
91.
058
61.
219
.95.
232
831
4374
232
Bv2
24-4
44.
314.
120.
040.
731.
380
2.16
0.10
229
5.6
247
2.1
1.8
0.0
4.5
0.3
748
0.9
604
1.0
8.6
1.6
217
2825
4223
0B
C
44
-58
4.83
3.80
0.01
0.16
0.3
462.
620.
1113
815
.315
328
.52.
90.
14.
60.
210
411.
751
02.
25.
10.
918
812
2999
85
0.2
50

Tom Navrátil Biogeochemistry of the II.A group elements in a forested catchment
4.7 Soil solution
Soil solution at both locations of LP catchment (Figure 6) was sampled in beech stands, and
thus was derived from beech throughfall (THB); no spruce derived soil solution were
sampled. The main difference between two soil solution sampling locations (LP33 and LP35)
was the soil organic matter content. The O horizon with elevated organic matter content was
absent at LP6 and the A horizon of profile LP35 contained 4 times more humus than the A
horizon at the LP6 profile (Table 10).
Table 11 Average values of monitored parameters in soil solutions and THB of the LP catchment in 2000
LP6 LP6 soil solution LP35 soil solution
Parameter Units THB 5 cm 15 cm 45 cm 5 cm 15 cm
DOC mg.L-1 NA 15 13 12 67 34
Conduc. µS.cm-1 60 30 40 62 68 86
pH 4.75 4.55 4.63 4.40 4.05 4.44
H µeq.L-1 18 39 31 55 102 72
Be µeq.L-1 0.004 0.08 0.12 0.61 0.04 0.08
Mg µeq.L-1 47 39 68 145 34 79
Ca µeq.L-1 71 93 157 173 79 157
Sr µeq.L-1 0.06 0.18 0.32 0.66 0.24 0.45
Ba µeq.L-1 0.04 0.38 0.50 1.22 0.36 0.39
Na µeq.L-1 10 21 65 80 35 56
K µeq.L-1 102 71 45 18 211 112
Mn µeq.L-1 9.0 3.4 2.8 4.7 2.2 2.0
Fe µeq.L-1 1 32 20 10 34 27
Al µeq.L-1 6 140 125 141 146 183
F µeq.L-1 2 4 5 11 6 10
Cl µeq.L-1 28 19 44 26 49 54
NO3- µeq.L-1 56 11 63 6 79 108
SO42- µeq.L-1 95 85 144 356 161 203
Soil solution pH was lower than throughfall pH (Table 11), primarily due to the presence of
organic acids in soil solution. The organic matter content in the soil solution is termed
dissolved organic carbon (DOC). The average DOC concentration in soil solution decreased
with depth (Table 11). This decrease was accompanied by an increase in pH. However, at 45
cm depth at LP6, the pH of soil solution decreased back to 4.40 from 4.63.
Concentrations of Be, Na, Mg, Ca, Sr, F, Ba, Cl and SO42- in soil solution increased with
depth, contrary to concentrations of K and Fe, which decreased with depth at both profiles
(Table 11). Considerably higher concentrations of Cl in soil solution of the LP35 profile
51
Tom Navrátil Biogeochemistry of the II.A group elements in a forested catchment
suggested enhanced evapotranspiration, in contrast to Cl at LP6 where the soil solutions were
slightly diluted relative to throughfall.
The most significant enrichment in shallow soil solution when compared to throughfall was
found for Fe, Al, Be, Ba, H, Sr, Na, F and K (Table 11). Soil solution contained elevated
annual average concentrations of K, Fe, Al and Mn in comparison to surface waters (Table
11).
Beryllium entered the soil solution readily, as indicated by the major increase in concentration
from throughfall to soil solution. The concentration of Be in soil solution increased with
depth. Beryllium concentrations correlated positively with Mg, SO42-, Sr, F, Mn, Na, F, Ba
and Ca. Beryllium concentrations in soil solution at location LP6 were higher than those at
LP35. The concentrations of Be in soil solution were generally lower than those in
streamwater.
The soil solution from the upper 5 cm of both horizons had lower concentrations of Mg than
throughfall at both profiles. Similar behavior was observed for Mn at both profiles and for K
at LP6 only. However in soil solution from 15 cm the concentrations of Mg were higher than
those in throughfall. Mg concentrations in soil solution increased gradually with depth. Mg
concentrations correlated positively with SO42-, Sr, Na, F, Ca, Mn and Be. The Mg
concentrations in the soil solution were significantly lower than Mg concentrations in
streamwater.
Calcium concentration in soil solution from the upper 5 cm of both profiles was comparable
to or slightly greater than throughfall concentrations. The Ca concentration in soil solution
increased significantly from 5 to 15 cm. Ca concentrations correlated positively with Sr, Na,
Mg, SO42-, F, Be and Mn.
Concentrations of Sr increased gradually with depth similarly to Mg. Strontium
concentrations were moderately higher than those in throughfall. The concentrations of Sr in
soil solution from 5 and 15 cm at location LP6 were lower than those found in soil solution at
location LP35. Strontium concentrations correlated positively with SO42-, F, Mg, Ca, Na, Be
and Cl.
Barium belonged together with Al, Fe and Be to the elements that were most enriched in
shallow soil solution. The concentration of Ba in the soil solution was usually higher than the
concentration of Sr, in contrast to the pattern in throughfall and surface water. The
concentration of Ba increased with depth at both profiles. The barium and Be concentrations
were positively correlated. Barium was the only element of the II.A group with a higher
annual mean concentration in soil solution than in surface water. In general, the
52
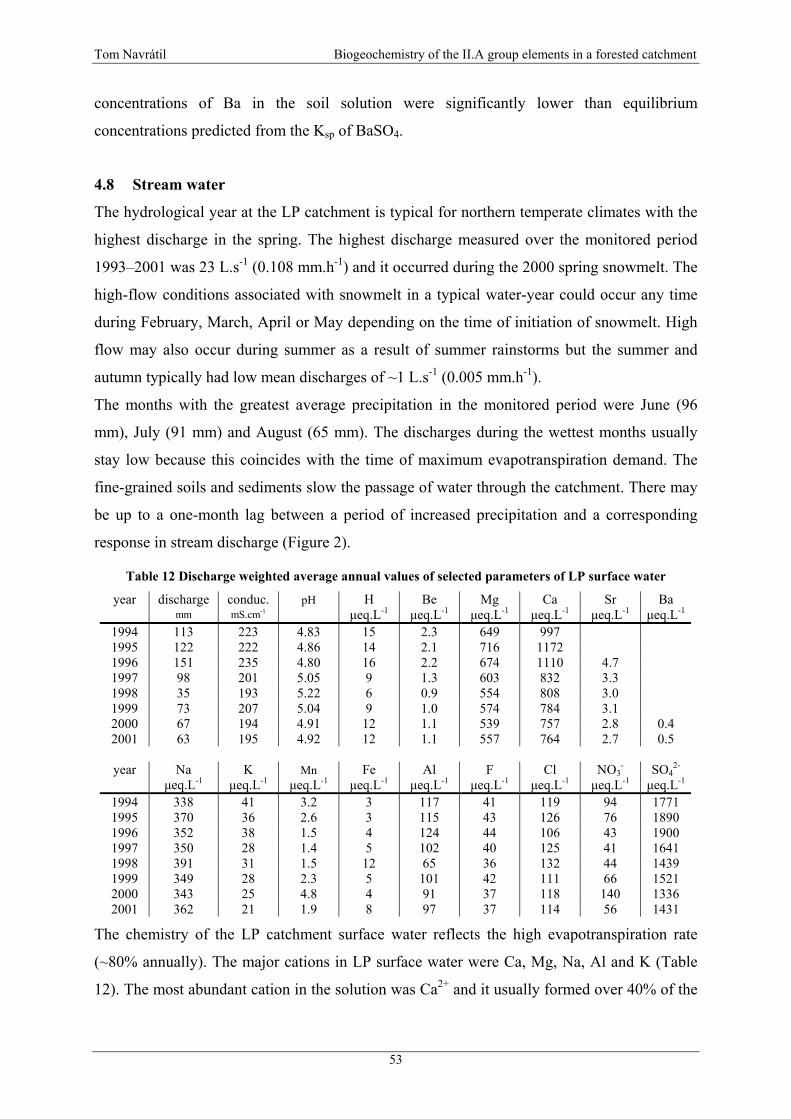
Tom Navrátil Biogeochemistry of the II.A group elements in a forested catchment
concentrations of Ba in the soil solution were significantly lower than equilibrium
concentrations predicted from the Ksp of BaSO4.
4.8 Stream water
The hydrological year at the LP catchment is typical for northern temperate climates with the
highest discharge in the spring. The highest discharge measured over the monitored period
1993–2001 was 23 L.s-1 (0.108 mm.h-1) and it occurred during the 2000 spring snowmelt. The
high-flow conditions associated with snowmelt in a typical water-year could occur any time
during February, March, April or May depending on the time of initiation of snowmelt. High
flow may also occur during summer as a result of summer rainstorms but the summer and
autumn typically had low mean discharges of ~1 L.s-1 (0.005 mm.h-1).
The months with the greatest average precipitation in the monitored period were June (96
mm), July (91 mm) and August (65 mm). The discharges during the wettest months usually
stay low because this coincides with the time of maximum evapotranspiration demand. The
fine-grained soils and sediments slow the passage of water through the catchment. There may
be up to a one-month lag between a period of increased precipitation and a corresponding
response in stream discharge (Figure 2).
Table 12 Discharge weighted average annual values of selected parameters of LP surface water
year discharge conduc. pH H Be Mg Ca Sr Ba mm mS.cm-1 µeq.L-1 µeq.L-1 µeq.L-1 µeq.L-1 µeq.L-1 µeq.L-1
1994 113 223 4.83 15 2.3 649 997 1995 122 222 4.86 14 2.1 716 1172 1996 151 235 4.80 16 2.2 674 1110 4.7 1997 98 201 5.05 9 1.3 603 832 3.3 1998 35 193 5.22 6 0.9 554 808 3.0 1999 73 207 5.04 9 1.0 574 784 3.1 2000 67 194 4.91 12 1.1 539 757 2.8 0.4 2001 63 195 4.92 12 1.1 557 764 2.7 0.5
year Na K Mn Fe Al F Cl NO3
- SO42-
µeq.L-1 µeq.L-1 µeq.L-1 µeq.L-1 µeq.L-1 µeq.L-1 µeq.L-1 µeq.L-1 µeq.L-1
1994 338 41 3.2 3 117 41 119 94 1771 1995 370 36 2.6 3 115 43 126 76 1890 1996 352 38 1.5 4 124 44 106 43 1900 1997 350 28 1.4 5 102 40 125 41 1641 1998 391 31 1.5 12 65 36 132 44 1439 1999 349 28 2.3 5 101 42 111 66 1521 2000 343 25 4.8 4 91 37 118 140 1336 2001 362 21 1.9 8 97 37 114 56 1431
The chemistry of the LP catchment surface water reflects the high evapotranspiration rate
(~80% annually). The major cations in LP surface water were Ca, Mg, Na, Al and K (Table
12). The most abundant cation in the solution was Ca2+ and it usually formed over 40% of the
53

Tom Navrátil Biogeochemistry of the II.A group elements in a forested catchment
dissolved sum of cations. The cations Mg, Na and Al followed with 30%, 20% and ~10%
respectively. Sulfate made up more than 90% of the strong acid anions (SAA) concentration
and the rest was made up by Cl-, F- and NO3-. The nearly complete afforestation of the
catchment caused regular changes of the nitrate (NO3-) concentration during the year. The
highest concentrations of NO3- occurred in the winter and the lowest in the summer as a result
of the vegetation uptake. The DOC concentrations in surface water were typically ~8 mg.L-1
(ranging from 5.2 to 13.8 mg.L-1).
The average annual concentration of Be in surface water of the Lesni potok catchment
decreased from 2.30 µeq.L-1 in 1994 to 1.10 µeq.L-1 in 2000 (Figure 16, Table 12). The mean
concentration of 1.20 µeq.L-1 during the 8 years was high compared to the regional surveys of
Czech freshwaters (Veselý & Majer 1998).
0
1
2
3
4
XI.93 XI.94 XI.95 XI.96 XI.97 XI.98 XI.99 XI.00 XI.01
Be
eq.L
-1
Figure 16 Changes in Be concentration in surface water during period 1993 - 2001
Significant correlations of element concentrations in surface water were found between Be
and Al, Sr, H, SO42-, F-, Ca and Mg (Annexes, Table 27).
The most important factors determining Be speciation were Al, F-, Be concentrations and pH
(Navrátil 2000). The main form of Be in the LP surface water was the BeF+ complex, which
formed always > 50%. Under low pH conditions the free Be2+ ion was important. But under
low discharge and high pH conditions, BeOH- and BeF2 dominated over Be2+.
The highest concentrations of Be in the LP surface waters were detected in the early years of
monitoring (1994, 1995 and 1996), in periods with increased discharge and decreased pH
value. The lowest Be concentrations were associated with dry periods in the LP catchment
(i.e. July, August, September), which were accompanied by increased pH. During periods
with higher pH the role of uncharged (adsorbed or particulate) Be became more important.
Magnesium is the third most abundant cation in the LP surface water after Ca and Na. Usually
it formed approximately 30% of the cation sum. The volume weighted average annual
54
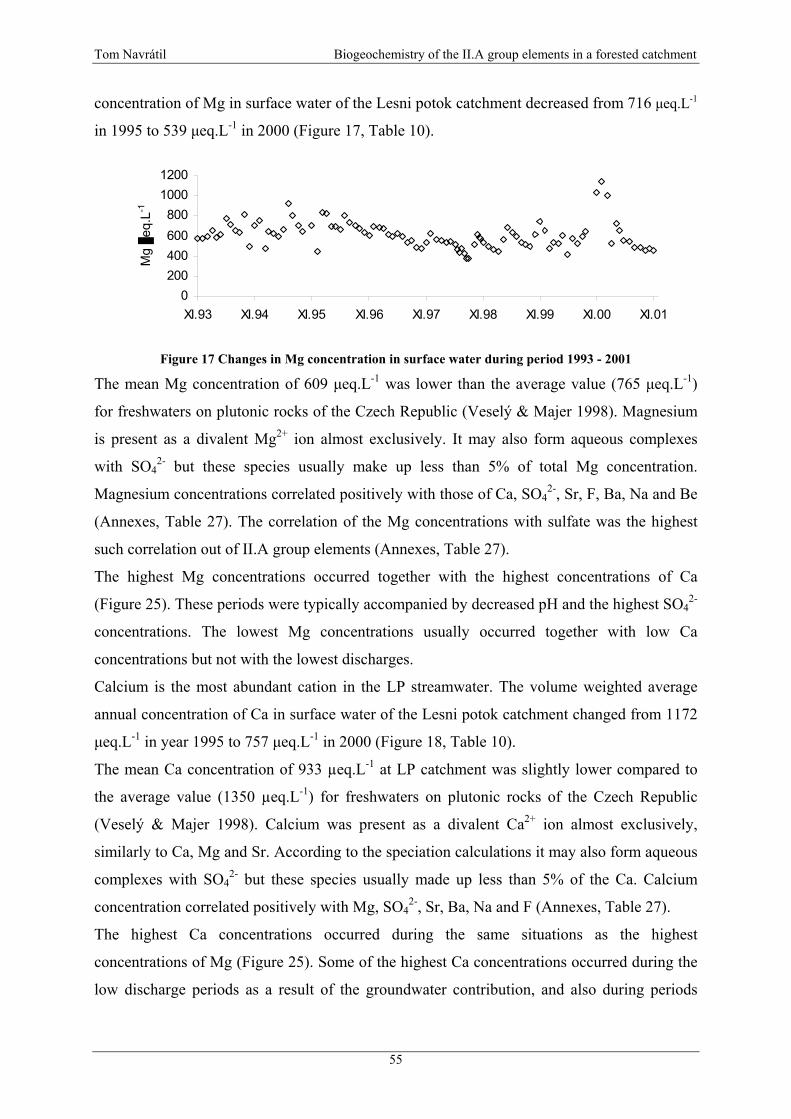
Tom Navrátil Biogeochemistry of the II.A group elements in a forested catchment
concentration of Mg in surface water of the Lesni potok catchment decreased from 716 µeq.L-1
in 1995 to 539 µeq.L-1 in 2000 (Figure 17, Table 10).
0200400600800
10001200
XI.93 XI.94 XI.95 XI.96 XI.97 XI.98 XI.99 XI.00 XI.01
Mg
eq.L
-1
Figure 17 Changes in Mg concentration in surface water during period 1993 - 2001
The mean Mg concentration of 609 µeq.L-1 was lower than the average value (765 µeq.L-1)
for freshwaters on plutonic rocks of the Czech Republic (Veselý & Majer 1998). Magnesium
is present as a divalent Mg2+ ion almost exclusively. It may also form aqueous complexes
with SO42- but these species usually make up less than 5% of total Mg concentration.
Magnesium concentrations correlated positively with those of Ca, SO42-, Sr, F, Ba, Na and Be
(Annexes, Table 27). The correlation of the Mg concentrations with sulfate was the highest
such correlation out of II.A group elements (Annexes, Table 27).
The highest Mg concentrations occurred together with the highest concentrations of Ca
(Figure 25). These periods were typically accompanied by decreased pH and the highest SO42-
concentrations. The lowest Mg concentrations usually occurred together with low Ca
concentrations but not with the lowest discharges.
Calcium is the most abundant cation in the LP streamwater. The volume weighted average
annual concentration of Ca in surface water of the Lesni potok catchment changed from 1172
µeq.L-1 in year 1995 to 757 µeq.L-1 in 2000 (Figure 18, Table 10).
The mean Ca concentration of 933 µeq.L-1 at LP catchment was slightly lower compared to
the average value (1350 µeq.L-1) for freshwaters on plutonic rocks of the Czech Republic
(Veselý & Majer 1998). Calcium was present as a divalent Ca2+ ion almost exclusively,
similarly to Ca, Mg and Sr. According to the speciation calculations it may also form aqueous
complexes with SO42- but these species usually made up less than 5% of the Ca. Calcium
concentration correlated positively with Mg, SO42-, Sr, Ba, Na and F (Annexes, Table 27).
The highest Ca concentrations occurred during the same situations as the highest
concentrations of Mg (Figure 25). Some of the highest Ca concentrations occurred during the
low discharge periods as a result of the groundwater contribution, and also during periods
55
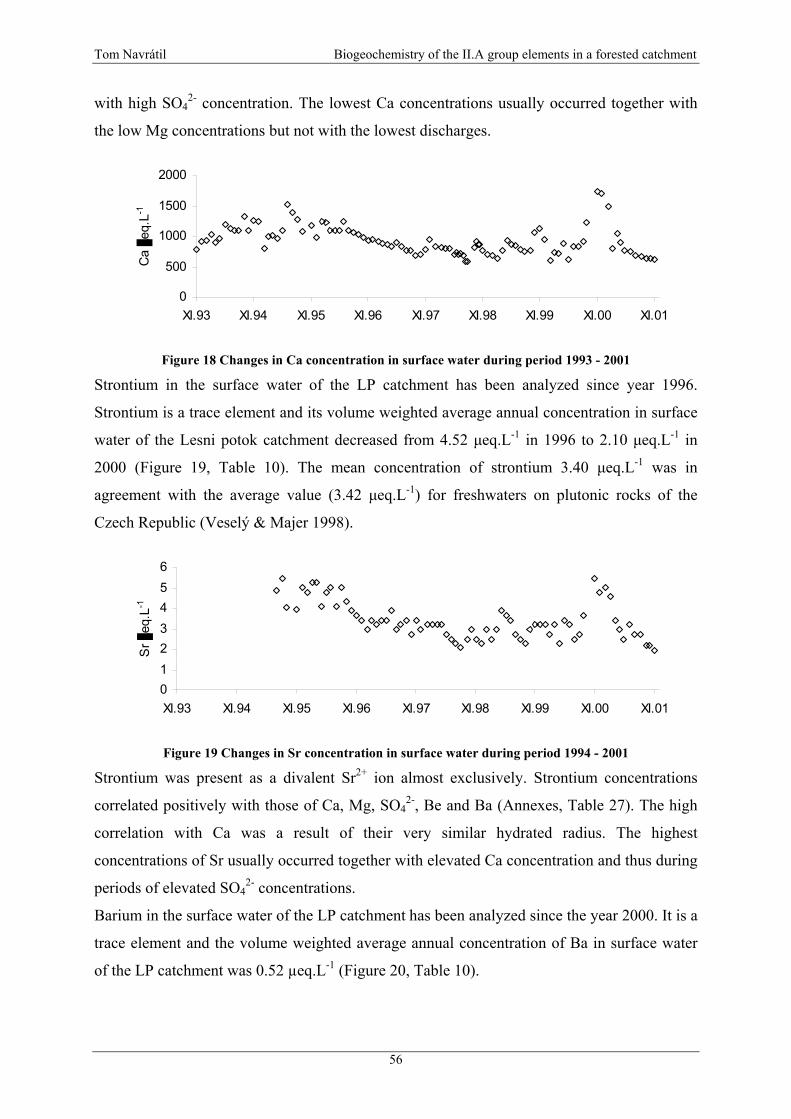
Tom Navrátil Biogeochemistry of the II.A group elements in a forested catchment
with high SO42- concentration. The lowest Ca concentrations usually occurred together with
the low Mg concentrations but not with the lowest discharges.
0
500
1000
1500
2000
XI.93 XI.94 XI.95 XI.96 XI.97 XI.98 XI.99 XI.00 XI.01
Ca
eq.L
-1
Figure 18 Changes in Ca concentration in surface water during period 1993 - 2001
Strontium in the surface water of the LP catchment has been analyzed since year 1996.
Strontium is a trace element and its volume weighted average annual concentration in surface
water of the Lesni potok catchment decreased from 4.52 µeq.L-1 in 1996 to 2.10 µeq.L-1 in
2000 (Figure 19, Table 10). The mean concentration of strontium 3.40 µeq.L-1 was in
agreement with the average value (3.42 µeq.L-1) for freshwaters on plutonic rocks of the
Czech Republic (Veselý & Majer 1998).
0123456
XI.93 XI.94 XI.95 XI.96 XI.97 XI.98 XI.99 XI.00 XI.01
Sr
eq.L
-1
Figure 19 Changes in Sr concentration in surface water during period 1994 - 2001
Strontium was present as a divalent Sr2+ ion almost exclusively. Strontium concentrations
correlated positively with those of Ca, Mg, SO42-, Be and Ba (Annexes, Table 27). The high
correlation with Ca was a result of their very similar hydrated radius. The highest
concentrations of Sr usually occurred together with elevated Ca concentration and thus during
periods of elevated SO42- concentrations.
Barium in the surface water of the LP catchment has been analyzed since the year 2000. It is a
trace element and the volume weighted average annual concentration of Ba in surface water
of the LP catchment was 0.52 µeq.L-1 (Figure 20, Table 10).
56
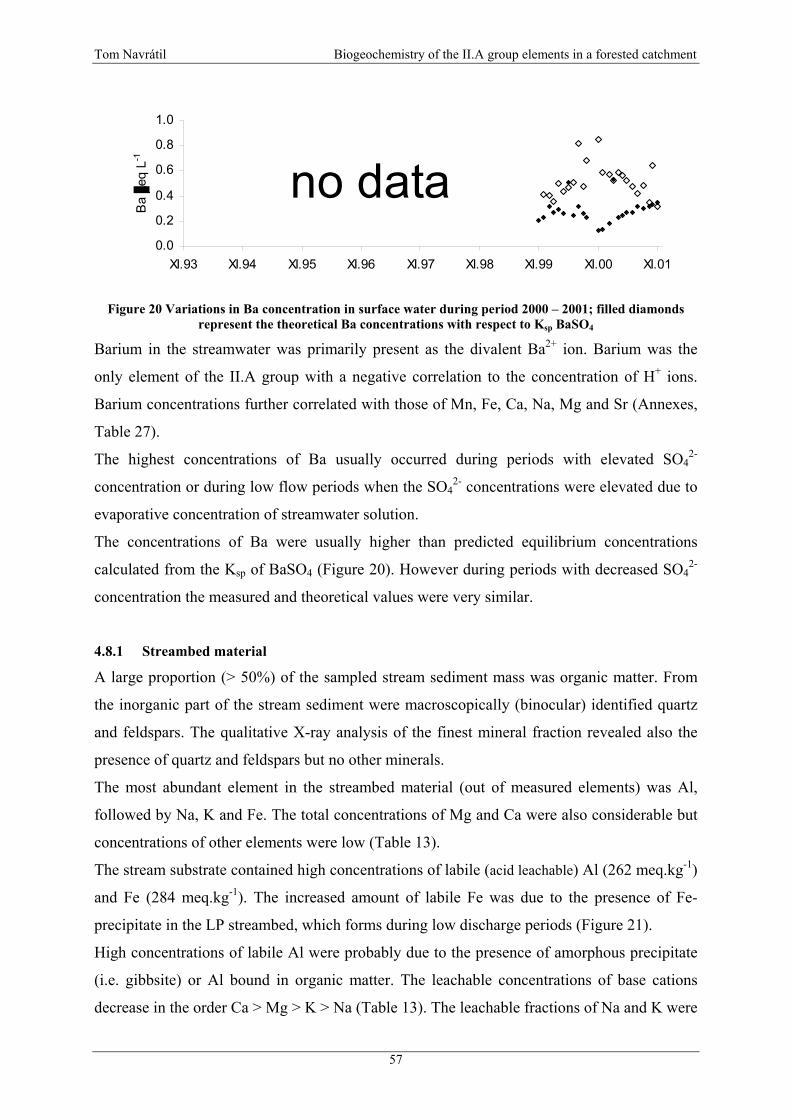
Tom Navrátil Biogeochemistry of the II.A group elements in a forested catchment
0.0
0.2
0.4
0.6
0.8
1.0
XI.93 XI.94 XI.95 XI.96 XI.97 XI.98 XI.99 XI.00 XI.01
Ba
eq L
-1
no data
Figure 20 Variations in Ba concentration in surface water during period 2000 – 2001; filled diamonds
represent the theoretical Ba concentrations with respect to Ksp BaSO4
Barium in the streamwater was primarily present as the divalent Ba2+ ion. Barium was the
only element of the II.A group with a negative correlation to the concentration of H+ ions.
Barium concentrations further correlated with those of Mn, Fe, Ca, Na, Mg and Sr (Annexes,
Table 27).
The highest concentrations of Ba usually occurred during periods with elevated SO42-
concentration or during low flow periods when the SO42- concentrations were elevated due to
evaporative concentration of streamwater solution.
The concentrations of Ba were usually higher than predicted equilibrium concentrations
calculated from the Ksp of BaSO4 (Figure 20). However during periods with decreased SO42-
concentration the measured and theoretical values were very similar.
4.8.1 Streambed material
A large proportion (> 50%) of the sampled stream sediment mass was organic matter. From
the inorganic part of the stream sediment were macroscopically (binocular) identified quartz
and feldspars. The qualitative X-ray analysis of the finest mineral fraction revealed also the
presence of quartz and feldspars but no other minerals.
The most abundant element in the streambed material (out of measured elements) was Al,
followed by Na, K and Fe. The total concentrations of Mg and Ca were also considerable but
concentrations of other elements were low (Table 13).
The stream substrate contained high concentrations of labile (acid leachable) Al (262 meq.kg-1)
and Fe (284 meq.kg-1). The increased amount of labile Fe was due to the presence of Fe-
precipitate in the LP streambed, which forms during low discharge periods (Figure 21).
High concentrations of labile Al were probably due to the presence of amorphous precipitate
(i.e. gibbsite) or Al bound in organic matter. The leachable concentrations of base cations
decrease in the order Ca > Mg > K > Na (Table 13). The leachable fractions of Na and K were
57
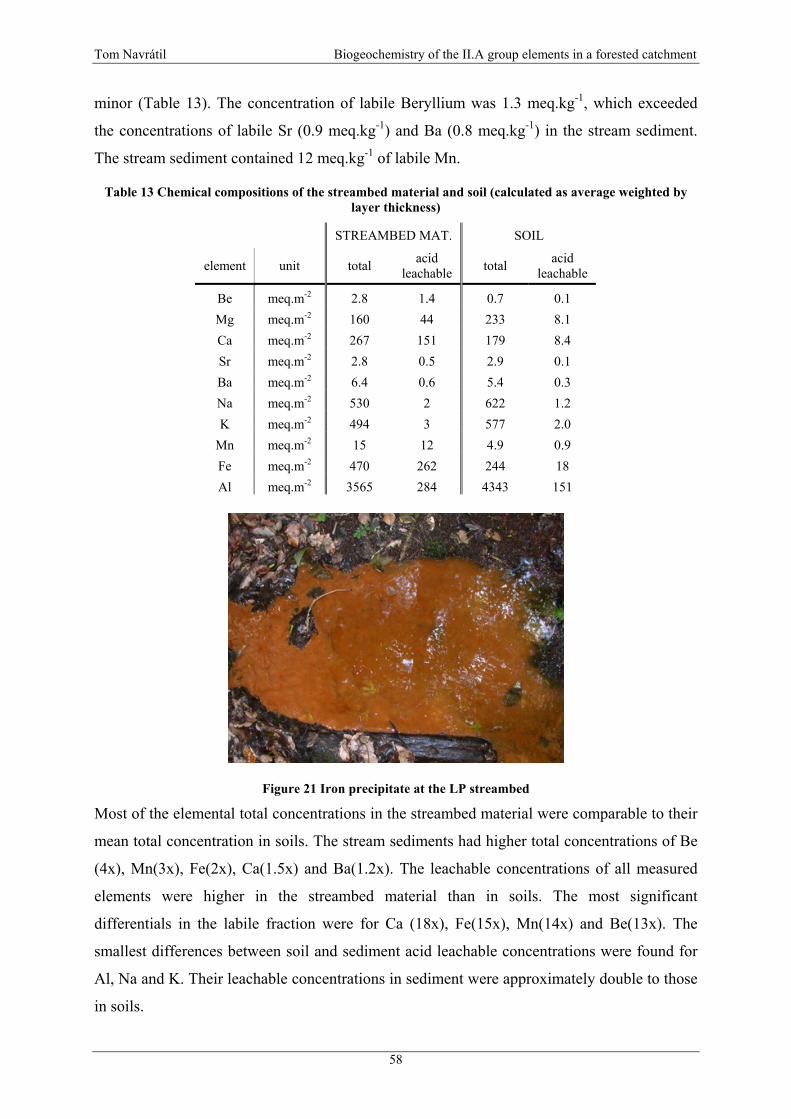
Tom Navrátil Biogeochemistry of the II.A group elements in a forested catchment
minor (Table 13). The concentration of labile Beryllium was 1.3 meq.kg-1, which exceeded
the concentrations of labile Sr (0.9 meq.kg-1) and Ba (0.8 meq.kg-1) in the stream sediment.
The stream sediment contained 12 meq.kg-1 of labile Mn.
Table 13 Chemical compositions of the streambed material and soil (calculated as average weighted by layer thickness)
STREAMBED MAT. SOIL
element unit total acid leachable total acid
leachable
Be meq.m-2 2.8 1.4 0.7 0.1 Mg meq.m-2 160 44 233 8.1 Ca meq.m-2 267 151 179 8.4 Sr meq.m-2 2.8 0.5 2.9 0.1 Ba meq.m-2 6.4 0.6 5.4 0.3 Na meq.m-2 530 2 622 1.2 K meq.m-2 494 3 577 2.0
Mn meq.m-2 15 12 4.9 0.9 Fe meq.m-2 470 262 244 18 Al meq.m-2 3565 284 4343 151
Figure 21 Iron precipitate at the LP streambed
Most of the elemental total concentrations in the streambed material were comparable to their
mean total concentration in soils. The stream sediments had higher total concentrations of Be
(4x), Mn(3x), Fe(2x), Ca(1.5x) and Ba(1.2x). The leachable concentrations of all measured
elements were higher in the streambed material than in soils. The most significant
differentials in the labile fraction were for Ca (18x), Fe(15x), Mn(14x) and Be(13x). The
smallest differences between soil and sediment acid leachable concentrations were found for
Al, Na and K. Their leachable concentrations in sediment were approximately double to those
in soils.
58
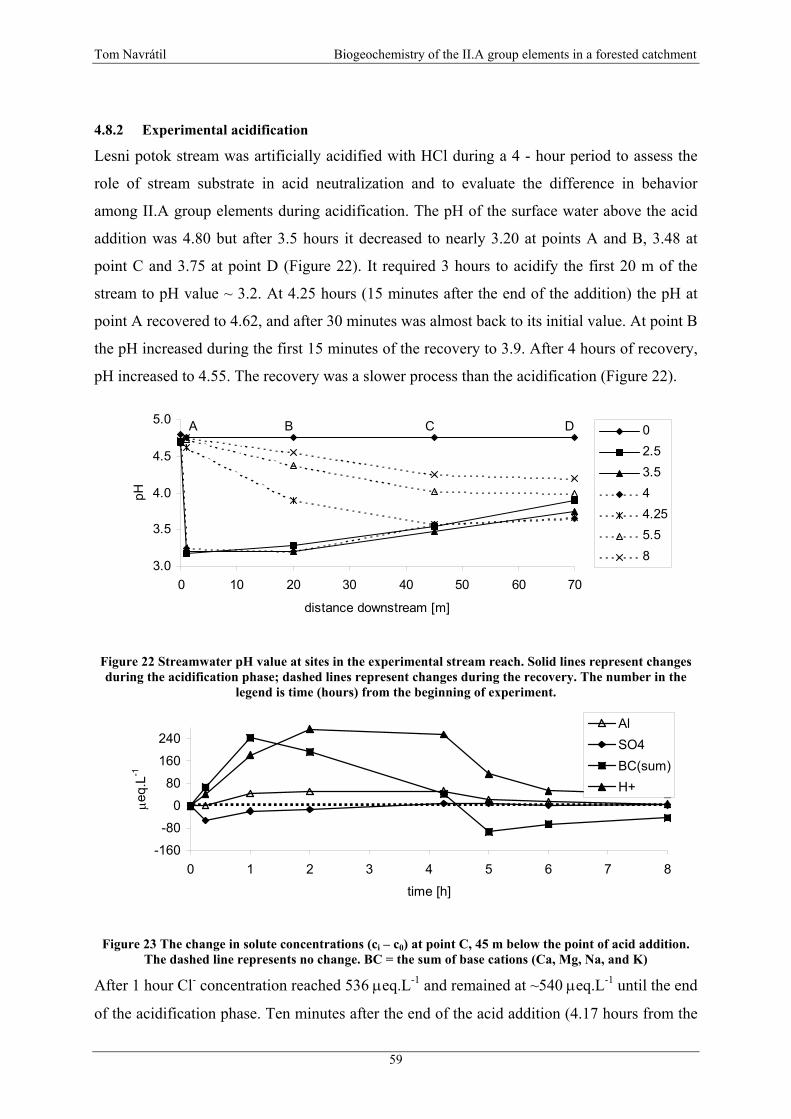
Tom Navrátil Biogeochemistry of the II.A group elements in a forested catchment
4.8.2 Experimental acidification
Lesni potok stream was artificially acidified with HCl during a 4 - hour period to assess the
role of stream substrate in acid neutralization and to evaluate the difference in behavior
among II.A group elements during acidification. The pH of the surface water above the acid
addition was 4.80 but after 3.5 hours it decreased to nearly 3.20 at points A and B, 3.48 at
point C and 3.75 at point D (Figure 22). It required 3 hours to acidify the first 20 m of the
stream to pH value ~ 3.2. At 4.25 hours (15 minutes after the end of the addition) the pH at
point A recovered to 4.62, and after 30 minutes was almost back to its initial value. At point B
the pH increased during the first 15 minutes of the recovery to 3.9. After 4 hours of recovery,
pH increased to 4.55. The recovery was a slower process than the acidification (Figure 22).
3.0
3.5
4.0
4.5
5.0
0 10 20 30 40 50 60 70
distance downstream [m]
pH
02.53.544.255.58
A B C D
Figure 22 Streamwater pH value at sites in the experimental stream reach. Solid lines represent changes during the acidification phase; dashed lines represent changes during the recovery. The number in the
legend is time (hours) from the beginning of experiment.
-160
-80
0
80
160
240
0 1 2 3 4 5 6 7 8
time [h]
µeq.
L-1
AlSO4BC(sum)H+
Figure 23 The change in solute concentrations (ci – c0) at point C, 45 m below the point of acid addition. The dashed line represents no change. BC = the sum of base cations (Ca, Mg, Na, and K)
After 1 hour Cl- concentration reached 536 µeq.L-1 and remained at ~540 µeq.L-1 until the end
of the acidification phase. Ten minutes after the end of the acid addition (4.17 hours from the
59
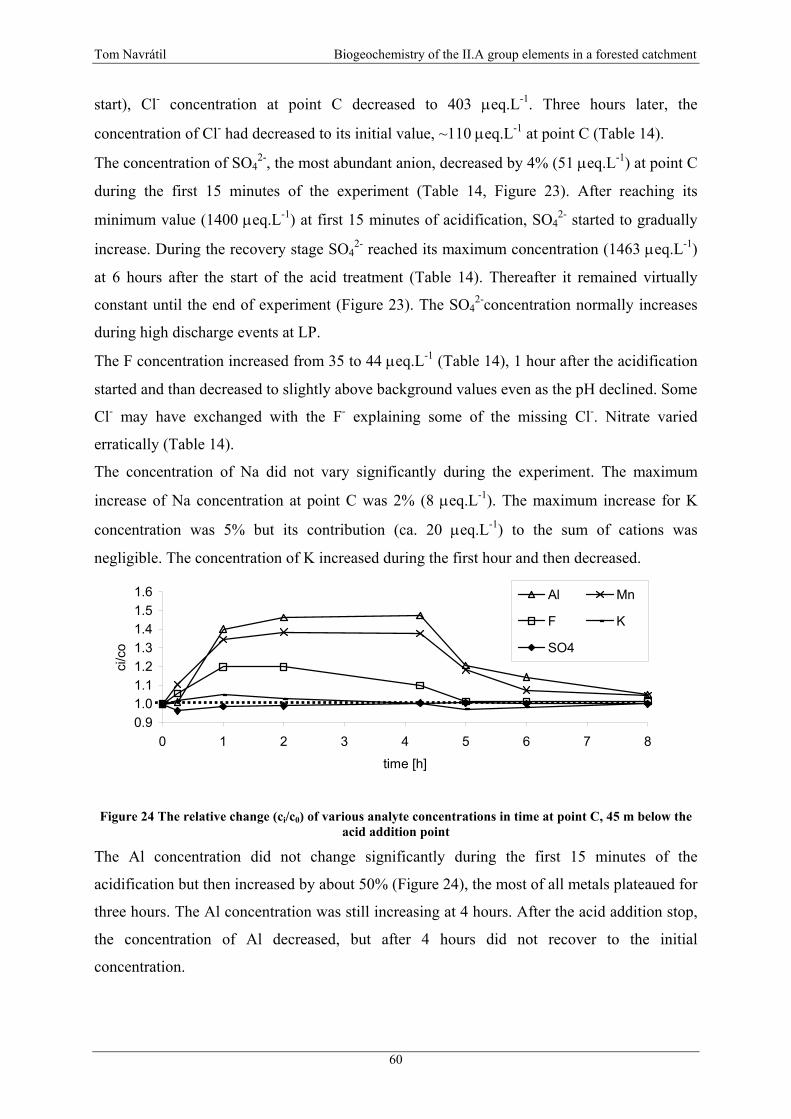
Tom Navrátil Biogeochemistry of the II.A group elements in a forested catchment
start), Cl- concentration at point C decreased to 403 µeq.L-1. Three hours later, the
concentration of Cl- had decreased to its initial value, ~110 µeq.L-1 at point C (Table 14).
The concentration of SO42-, the most abundant anion, decreased by 4% (51 µeq.L-1) at point C
during the first 15 minutes of the experiment (Table 14, Figure 23). After reaching its
minimum value (1400 µeq.L-1) at first 15 minutes of acidification, SO42- started to gradually
increase. During the recovery stage SO42- reached its maximum concentration (1463 µeq.L-1)
at 6 hours after the start of the acid treatment (Table 14). Thereafter it remained virtually
constant until the end of experiment (Figure 23). The SO42-concentration normally increases
during high discharge events at LP.
The F concentration increased from 35 to 44 µeq.L-1 (Table 14), 1 hour after the acidification
started and than decreased to slightly above background values even as the pH declined. Some
Cl- may have exchanged with the F- explaining some of the missing Cl-. Nitrate varied
erratically (Table 14).
The concentration of Na did not vary significantly during the experiment. The maximum
increase of Na concentration at point C was 2% (8 µeq.L-1). The maximum increase for K
concentration was 5% but its contribution (ca. 20 µeq.L-1) to the sum of cations was
negligible. The concentration of K increased during the first hour and then decreased.
0.91.01.11.21.31.41.51.6
0 1 2 3 4 5 6 7 8
time [h]
ci/c
o
Al Mn
F K
SO4
Figure 24 The relative change (ci/c0) of various analyte concentrations in time at point C, 45 m below the acid addition point
The Al concentration did not change significantly during the first 15 minutes of the
acidification but then increased by about 50% (Figure 24), the most of all metals plateaued for
three hours. The Al concentration was still increasing at 4 hours. After the acid addition stop,
the concentration of Al decreased, but after 4 hours did not recover to the initial
concentration.
60
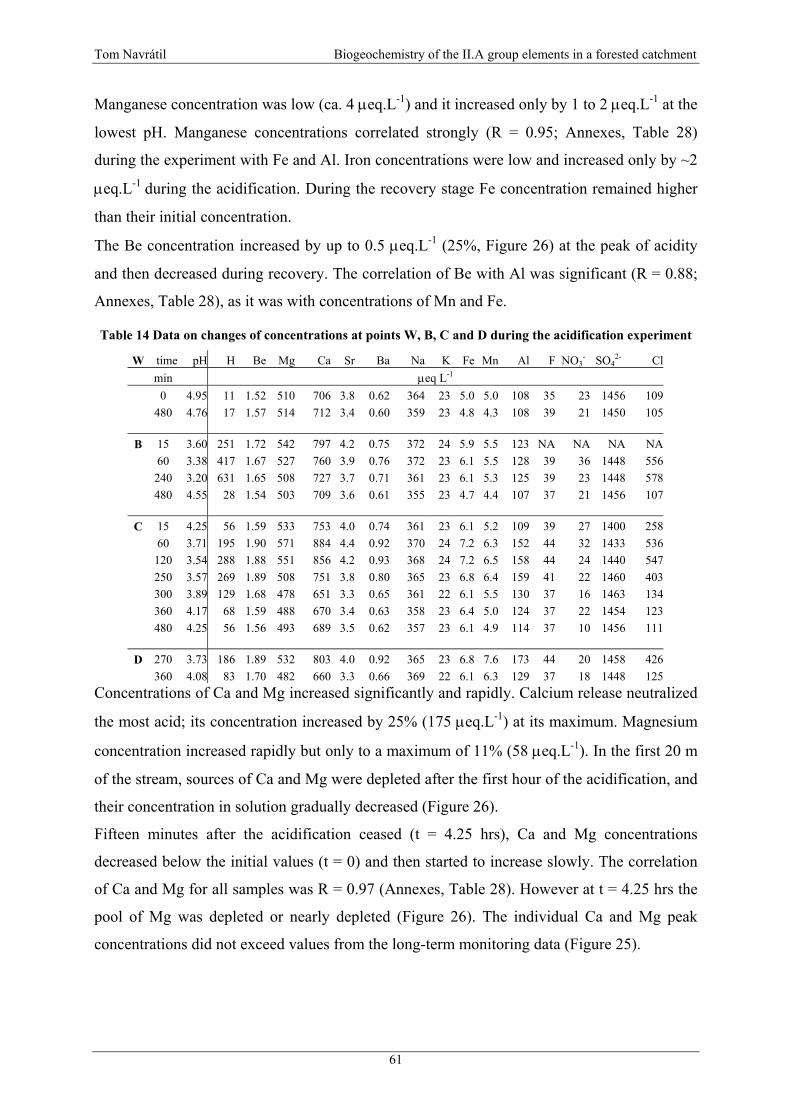
Tom Navrátil Biogeochemistry of the II.A group elements in a forested catchment
Manganese concentration was low (ca. 4 µeq.L-1) and it increased only by 1 to 2 µeq.L-1 at the
lowest pH. Manganese concentrations correlated strongly (R = 0.95; Annexes, Table 28)
during the experiment with Fe and Al. Iron concentrations were low and increased only by ~2
µeq.L-1 during the acidification. During the recovery stage Fe concentration remained higher
than their initial concentration.
The Be concentration increased by up to 0.5 µeq.L-1 (25%, Figure 26) at the peak of acidity
and then decreased during recovery. The correlation of Be with Al was significant (R = 0.88;
Annexes, Table 28), as it was with concentrations of Mn and Fe.
Table 14 Data on changes of concentrations at points W, B, C and D during the acidification experiment
W time pH H Be Mg Ca Sr Ba Na K Fe Mn Al F NO3- SO4
2- Cl min µeq L-1 0 4.95 11 1.52 510 706 3.8 0.62 364 23 5.0 5.0 108 35 23 1456 109 480 4.76 17 1.57 514 712 3.4 0.60 359 23 4.8 4.3 108 39 21 1450 105
B 15 3.60 251 1.72 542 797 4.2 0.75 372 24 5.9 5.5 123 NA NA NA NA 60 3.38 417 1.67 527 760 3.9 0.76 372 23 6.1 5.5 128 39 36 1448 556 240 3.20 631 1.65 508 727 3.7 0.71 361 23 6.1 5.3 125 39 23 1448 578 480 4.55 28 1.54 503 709 3.6 0.61 355 23 4.7 4.4 107 37 21 1456 107
C 15 4.25 56 1.59 533 753 4.0 0.74 361 23 6.1 5.2 109 39 27 1400 258 60 3.71 195 1.90 571 884 4.4 0.92 370 24 7.2 6.3 152 44 32 1433 536 120 3.54 288 1.88 551 856 4.2 0.93 368 24 7.2 6.5 158 44 24 1440 547 250 3.57 269 1.89 508 751 3.8 0.80 365 23 6.8 6.4 159 41 22 1460 403 300 3.89 129 1.68 478 651 3.3 0.65 361 22 6.1 5.5 130 37 16 1463 134 360 4.17 68 1.59 488 670 3.4 0.63 358 23 6.4 5.0 124 37 22 1454 123 480 4.25 56 1.56 493 689 3.5 0.62 357 23 6.1 4.9 114 37 10 1456 111
D 270 3.73 186 1.89 532 803 4.0 0.92 365 23 6.8 7.6 173 44 20 1458 426 360 4.08 83 1.70 482 660 3.3 0.66 369 22 6.1 6.3 129 37 18 1448 125
Concentrations of Ca and Mg increased significantly and rapidly. Calcium release neutralized
the most acid; its concentration increased by 25% (175 µeq.L-1) at its maximum. Magnesium
concentration increased rapidly but only to a maximum of 11% (58 µeq.L-1). In the first 20 m
of the stream, sources of Ca and Mg were depleted after the first hour of the acidification, and
their concentration in solution gradually decreased (Figure 26).
Fifteen minutes after the acidification ceased (t = 4.25 hrs), Ca and Mg concentrations
decreased below the initial values (t = 0) and then started to increase slowly. The correlation
of Ca and Mg for all samples was R = 0.97 (Annexes, Table 28). However at t = 4.25 hrs the
pool of Mg was depleted or nearly depleted (Figure 26). The individual Ca and Mg peak
concentrations did not exceed values from the long-term monitoring data (Figure 25).
61
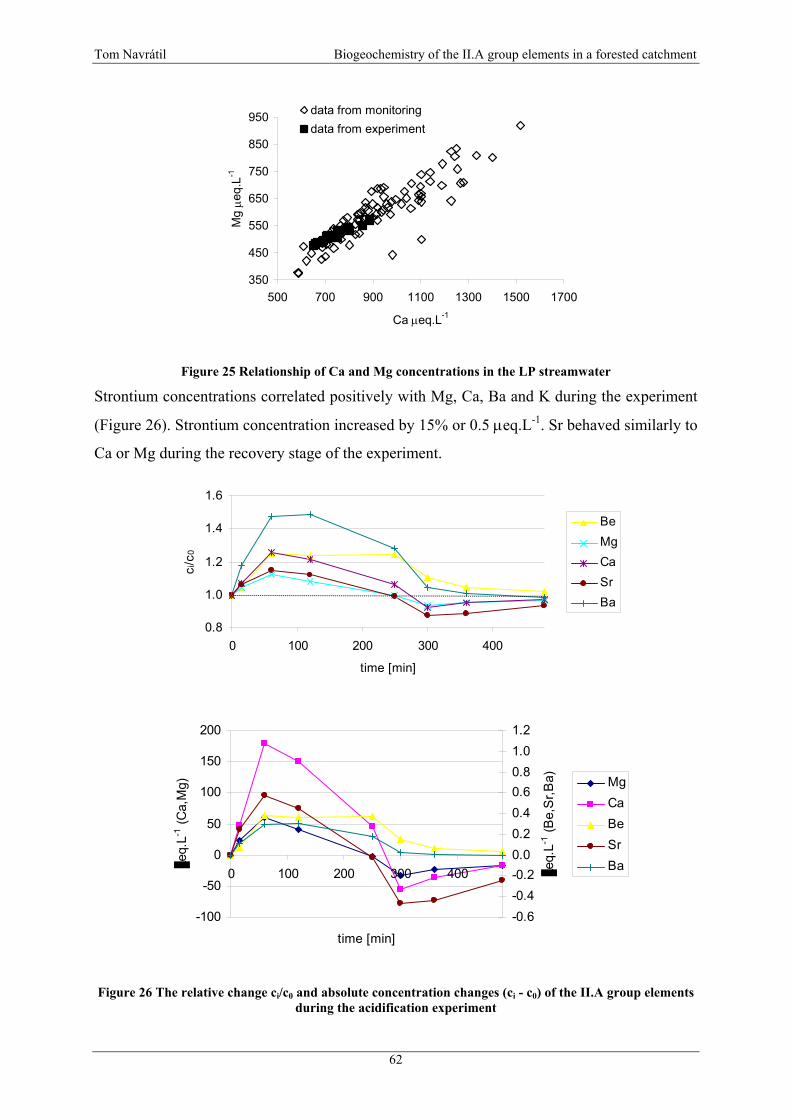
Tom Navrátil Biogeochemistry of the II.A group elements in a forested catchment
350
450
550
650
750
850
950
500 700 900 1100 1300 1500 1700
Ca µeq.L-1
Mg µe
q.L-1
data from monitoringdata from experiment
Figure 25 Relationship of Ca and Mg concentrations in the LP streamwater
Strontium concentrations correlated positively with Mg, Ca, Ba and K during the experiment
(Figure 26). Strontium concentration increased by 15% or 0.5 µeq.L-1. Sr behaved similarly to
Ca or Mg during the recovery stage of the experiment.
0.8
1.0
1.2
1.4
1.6
0 100 200 300 400
time [min]
ci/c
0
BeMgCaSrBa
-100
-50
0
50
100
150
200
0 100 200 300 400
time [min]
eq.L
-1 (C
a,M
g)
-0.6-0.4-0.20.00.20.40.60.81.01.2
eq.L
-1 (B
e,S
r,Ba) Mg
CaBeSrBa
Figure 26 The relative change ci/c0 and absolute concentration changes (ci - c0) of the II.A group elements during the acidification experiment
62
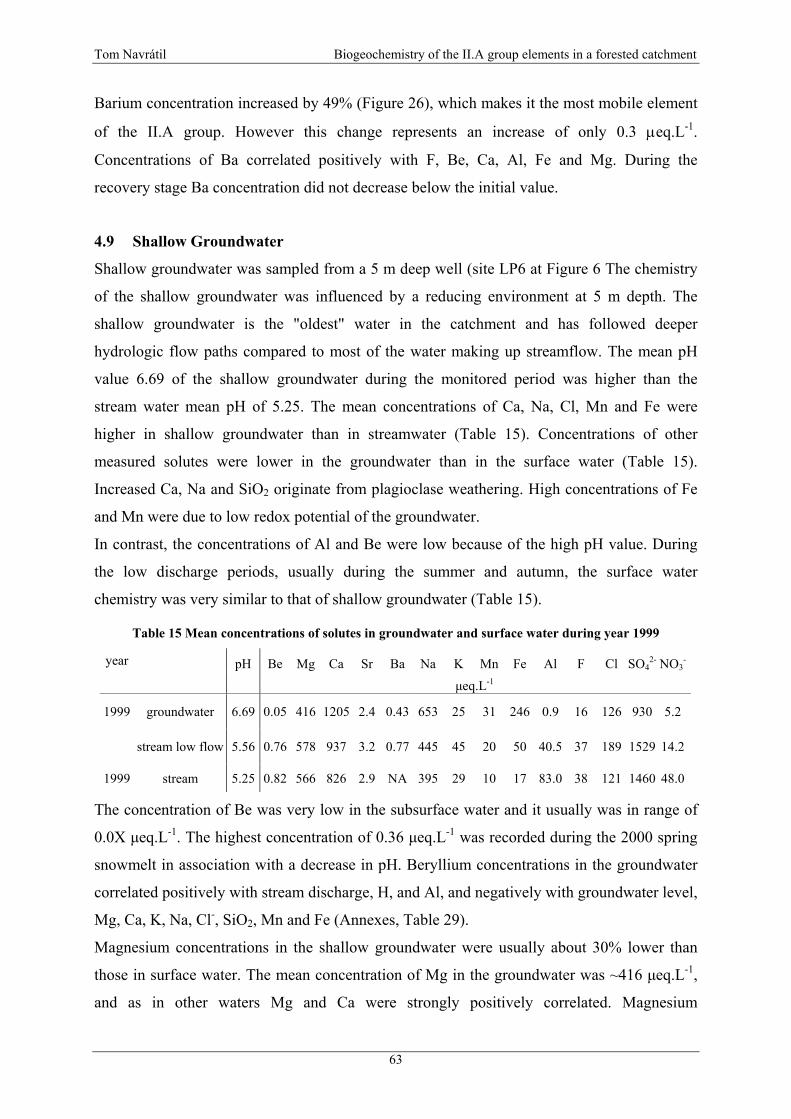
Tom Navrátil Biogeochemistry of the II.A group elements in a forested catchment
Barium concentration increased by 49% (Figure 26), which makes it the most mobile element
of the II.A group. However this change represents an increase of only 0.3 µeq.L-1.
Concentrations of Ba correlated positively with F, Be, Ca, Al, Fe and Mg. During the
recovery stage Ba concentration did not decrease below the initial value.
4.9 Shallow Groundwater
Shallow groundwater was sampled from a 5 m deep well (site LP6 at Figure 6 The chemistry
of the shallow groundwater was influenced by a reducing environment at 5 m depth. The
shallow groundwater is the "oldest" water in the catchment and has followed deeper
hydrologic flow paths compared to most of the water making up streamflow. The mean pH
value 6.69 of the shallow groundwater during the monitored period was higher than the
stream water mean pH of 5.25. The mean concentrations of Ca, Na, Cl, Mn and Fe were
higher in shallow groundwater than in streamwater (Table 15). Concentrations of other
measured solutes were lower in the groundwater than in the surface water (Table 15).
Increased Ca, Na and SiO2 originate from plagioclase weathering. High concentrations of Fe
and Mn were due to low redox potential of the groundwater.
In contrast, the concentrations of Al and Be were low because of the high pH value. During
the low discharge periods, usually during the summer and autumn, the surface water
chemistry was very similar to that of shallow groundwater (Table 15).
Table 15 Mean concentrations of solutes in groundwater and surface water during year 1999
year pH Be Mg Ca Sr Ba Na K Mn Fe Al F Cl SO42- NO3
-
µeq.L-1
1999 groundwater 6.69 0.05 416 1205 2.4 0.43 653 25 31 246 0.9 16 126 930 5.2
stream low flow 5.56 0.76 578 937 3.2 0.77 445 45 20 50 40.5 37 189 1529 14.2
1999 stream 5.25 0.82 566 826 2.9 NA 395 29 10 17 83.0 38 121 1460 48.0
The concentration of Be was very low in the subsurface water and it usually was in range of
0.0X µeq.L-1. The highest concentration of 0.36 µeq.L-1 was recorded during the 2000 spring
snowmelt in association with a decrease in pH. Beryllium concentrations in the groundwater
correlated positively with stream discharge, H, and Al, and negatively with groundwater level,
Mg, Ca, K, Na, Cl-, SiO2, Mn and Fe (Annexes, Table 29).
Magnesium concentrations in the shallow groundwater were usually about 30% lower than
those in surface water. The mean concentration of Mg in the groundwater was ~416 µeq.L-1,
and as in other waters Mg and Ca were strongly positively correlated. Magnesium
63

Tom Navrátil Biogeochemistry of the II.A group elements in a forested catchment
concentrations correlated positively with groundwater level, Ca, K, Na, SiO2, Mn, and Fe, and
negatively with stream discharge Be, and SO42- (Annexes, Table 29).
Calcium was the only element from the II.A group whose mean concentrations in the
groundwater were higher (by 50%) than in the surface water. The mean concentration of the
Ca in the groundwater during the monitored period was ~1205 µeq.L-1. The calcium
concentrations correlated positively with groundwater level, Mg, Sr, K, Na, SiO2, Mn, and Fe
and negatively with stream discharge, H, Be, and SO42- (Annexes, Table 29).
The mean concentration of Sr in groundwater during the monitored period was ~2.4 µeq.L-1,
which was moderately lower than that in surface water. The strontium concentrations
correlated positively with Ca, K, Na, and SiO2 (Annexes, Table 29).
The mean concentration of Ba in the groundwater during monitored period was ~0.43 µeq.L-1.
The barium concentrations did not correlate with any of the measured parameters. Barium
concentrations in the shallow groundwater were very similar to the theoretical equilibrium
concentrations of Ba calculated from the Ksp of BaSO4 (Figure 27).
0.2
0.3
0.4
0.5
XI-9
9
XII-
99
I-00
II-00
III-0
0
IV-0
0
V-0
0
VI-0
0
VII-
00
VIII
-00
IX-0
0
Ba
ueq.
L-1
Ba (calculated)Ba (measured)
Figure 27 Measured and calculated Ba concentrations in the LP shallow groundwater
4.10 Fluxes and seasonal variations
The annual export of most solutes was directly related to water output. This relationship of the
water mass makes the mass fluxes of elements highly predictable at the LP catchment, as has
been reported for other catchments (Likens & Bormann 1995).
The seasonal changes in bulk deposition fluxes of most elements were affected mainly by the
amount of precipitation. This was especially true for changes in the flux of Be, H+ and SO42-.
The deposition of Ca and Mg in summer months (June – August) was not significantly
elevated when compared to spring fluxes. The opposite was typical for Be, H+ and SO42-.
The comparison of throughfall H+ deposition fluxes with the bulk H+ deposition fluxes
indicated significant neutralization of precipitation by the forest canopy in the period April –
64

Tom Navrátil Biogeochemistry of the II.A group elements in a forested catchment
December. In the period November – March the H fluxes in throughfall and bulk deposition
were approximately the same. The H fluxes increase in June and July only.
The export of most elements from the catchment was affected above all by the spring
snowmelt, which usually occurred in March or April (Figure 28). A minor peak in output
fluxes curves was also observed in July and it was attributed to summer rainstorms.
Half of the annual exported mass of Be, Ca, Mg and Sr typically left the catchment in the
period March – May. In the case of Ba the exported mass between March – May comprised
76% of the annual Ba mass export. It is necessary to notice that during the same period
usually occurred 50% of the annual water runoff (Figure 28).
Of the II.A group elements, Ca had the greatest mass export from the LP catchment. However
the mass exports of Mg, Sr and Be were also considerable especially relative to their
atmospheric inputs. Barium had the least mass export in the group (Table 22).
65
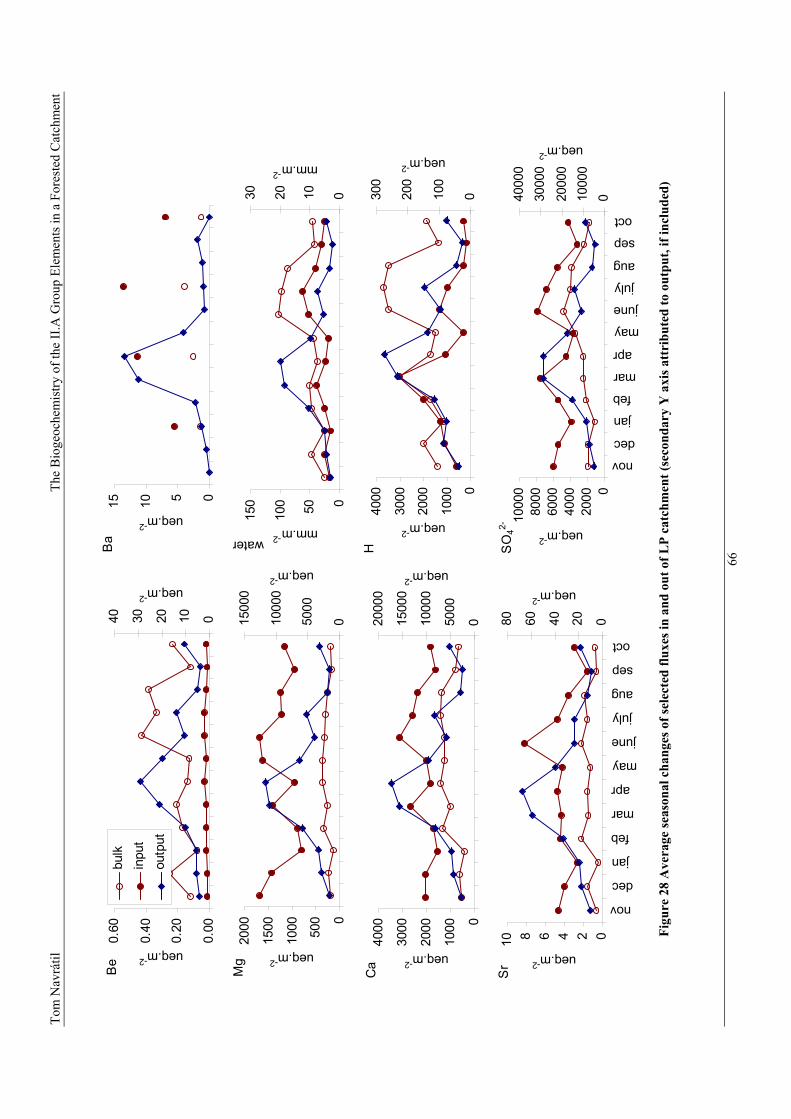
Tom
Nav
rátil
The
Bio
geoc
hem
istry
of t
he II
.A G
roup
Ele
men
ts in
a F
ores
ted
Cat
chm
ent
0.00
0.20
0.40
0.60
ueq.m-2
010203040
ueq.m-2
bulk
inpu
tou
tput
Be
051015
ueq.m-2
Ba
0
500
1000
1500
2000
ueq.m-2
05000
1000
0
1500
0
ueq.m-2
Mg
050100
150
mm.m-2
0102030
mm.m-2
water
0
1000
2000
3000
4000
ueq.m-2
05000
1000
0
1500
0
2000
0
ueq.m-2
Ca
0
1000
2000
3000
4000
ueq.m-2
0100
200
300
ueq.m-2
H
0246810
nov
dec
jan
feb
mar
apr
may
june
july
aug
sep
oct
ueq.m-2
020406080ueq.m-2
Sr
020
0040
0060
0080
0010
000
nov
dec
jan
feb
mar
apr
may
june
july
aug
sep
oct
ueq.m-2
01000
020
000
3000
040
000
ueq.m-2
SO
42-
Fi
gure
28
Ave
rage
seas
onal
cha
nges
of s
elec
ted
fluxe
s in
and
out o
f LP
catc
hmen
t (se
cond
ary
Y a
xis a
ttri
bute
d to
out
put,
if in
clud
ed)
66

Tom Navrátil Biogeochemistry of the II.A group elements in a forested catchment
5 Discussion
5.1 Fluxes and cycling in forest ecosystem
5.1.1 Sources for the watershed system
5.1.1.1 Bedrock and alluvial sediments
The average composition of the LP bedrock was calculated from the analyzed compositions of
Jevany and Říčany types of granites. This composition is considerably lower in Ca than
typical low-Ca granitic rocks (Roessler & Lange 1972). On the other hand, the Sr
concentration of the bedrock is average for low-Ca granitic rocks, while concentrations of Be,
Mg and Ba are elevated. The most significant differences with respect to typical low-Ca
granitic rocks are the 3 times higher concentration of Be, almost double concentration of Mg
and more than 50% lower concentration of Ca.
The elevated concentrations of beryllium found in plagioclase and biotite (Table 5) imply that
these minerals are the most important sources of Be for weathering. The lower modal content
of biotite makes plagioclase the major source of Be. The position of Be in plagioclase and in
biotite has not been clearly explained. It is anticipated that Be substitutes (together with Si)
for Al in the silicate crystal lattice. Beryllium is easily released from the solid materials,
especially in an acidic environment. Under circumneutral conditions it remains bound to solid
phases, e.g. clays or other secondary minerals. Weathered rock just above fresh unweathered
rock contains the highest concentrations of Be (Figure 8). The increased Be concentrations at
the bottom of the alluvial profile were most probably due to higher pH and thus decreased Be
mobility. Beryllium concentrations in the profile decreased toward the top of the profile
(Figure 8) as a result of acid leaching and enhanced chemical weathering in the upper parts of
profile.
Biotite was likely the most important source of Mg. It is the only mafic rock-forming mineral
in the Říčany granites. The biotite of the Říčany granites is typical with high Mg content and
its chemical composition was close to phlogopite modification. Magnesium enters the
weathering solution but some Mg is bound in secondary minerals, e.g. chlorite. Chlorite was
among the secondary minerals found in LP soils (Žigová - unpublished). The anomalously
high Mg concentration of 695 meq.kg-1 at 1-m depth in the alluvial sediments (Figure 8)
coincides with the layer that has the highest proportion of finest particles (Figure 5) and with
the lowest Ca concentrations (Figure 8). This elevated magnesium concentration may indicate
enrichment of secondary chlorite. Feldspar weathering may release small amounts of Mg.
Concentrations of Mg in the sediments and regolith were comparable to those in the
67
Tom Navrátil Biogeochemistry of the II.A group elements in a forested catchment
unweathered bedrock, while the slight enrichment towards the top of profile may indicate
favorable conditions for the formation of secondary minerals – possibly chlorite or others.
Calcium is a substantial structural component of plagioclase, which is the most important
source of Ca for weathering. Calcium depletion of the regolith (Figure 8) is a result of its
rapid leaching and high weathering rate (Skřivan et al. 1994). The calcium concentrations
available in biotite or orthoclase are unimportant relative to its concentration in plagioclase.
The lowest Ca concentrations were found in the same sediment layer as the highest Mg and
Fe concentrations. This pattern, coupled with the low Na and K concentrations in this layer,
may indicate greater leaching, preferential flow paths, or other processes that create favorable
conditions for the formation of secondary Mg rich chlorite. The lower concentrations of Ca at
the bottom of the profile result from its high mobility, consistent with high Ca concentrations
in the groundwater (Table 15).
Due to the similar Sr concentrations found in both orthoclase and plagioclase (Table 5), it
appears that both feldspars are important sources of Sr in Říčany granites, which is in
agreement with many previous studies. As noted by Wedepohl (1969), Mg-Fe minerals
usually have less than 10% of the Sr content of feldspars; for the biotite of the Říčany granites
this amount was 3 – 4%. The nearly unchanged Sr concentration at the bottom of the alluvial
profile is perhaps due to stronger binding of Sr to secondary minerals than is the case for Ca.
The volume of unweathered minerals (especially K feldspars) is also anticipated to be the
highest in the bottom layers of profile (White et al. 2001). The lowest Sr concentration in 1 m
depth coincided with the lowest Ca concentration.
The high concentrations of Ba found in orthoclase and biotite correspond to the high K
concentrations as crystalo-chemical properties of Ba and K enable their substitution
(Wedepohl 1969). The least important rock-forming mineral with respect to Ba was the
plagioclase due to its very low content of Ba. Weathered material and sediments contained
slightly lower concentrations of Ba than the parent rock. The strong correlation of Ba and Sr
in sediments (Hons et al. 1990) may result from the significant amounts of both elements in
orthoclase. Also orthoclase is more resistant to weathering than biotite and plagioclase (White
et al. 2001).
5.1.1.2 Atmospheric inputs in bulk precipitation
The decrease of II.A element bulk input fluxes between 1994 and 2001 (Table 22) most likely
resulted from better controls on emissions from Czech Republic coal burning power plants.
The lowest bulk fluxes for most of the elements occurred in 1999 when the desulphurization
of all Czech power plants was completed (Hruška et al. 2002). The proportional decreases of
68
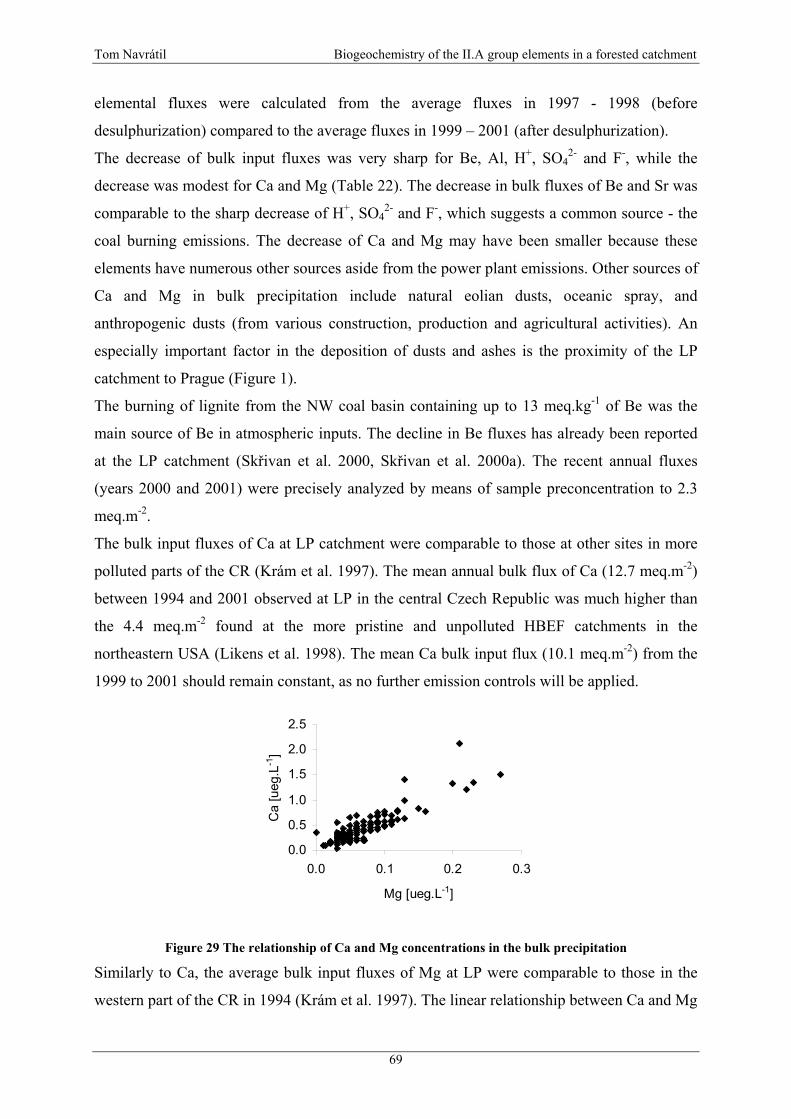
Tom Navrátil Biogeochemistry of the II.A group elements in a forested catchment
elemental fluxes were calculated from the average fluxes in 1997 - 1998 (before
desulphurization) compared to the average fluxes in 1999 – 2001 (after desulphurization).
The decrease of bulk input fluxes was very sharp for Be, Al, H+, SO42- and F-, while the
decrease was modest for Ca and Mg (Table 22). The decrease in bulk fluxes of Be and Sr was
comparable to the sharp decrease of H+, SO42- and F-, which suggests a common source - the
coal burning emissions. The decrease of Ca and Mg may have been smaller because these
elements have numerous other sources aside from the power plant emissions. Other sources of
Ca and Mg in bulk precipitation include natural eolian dusts, oceanic spray, and
anthropogenic dusts (from various construction, production and agricultural activities). An
especially important factor in the deposition of dusts and ashes is the proximity of the LP
catchment to Prague (Figure 1).
The burning of lignite from the NW coal basin containing up to 13 meq.kg-1 of Be was the
main source of Be in atmospheric inputs. The decline in Be fluxes has already been reported
at the LP catchment (Skřivan et al. 2000, Skřivan et al. 2000a). The recent annual fluxes
(years 2000 and 2001) were precisely analyzed by means of sample preconcentration to 2.3
meq.m-2.
The bulk input fluxes of Ca at LP catchment were comparable to those at other sites in more
polluted parts of the CR (Krám et al. 1997). The mean annual bulk flux of Ca (12.7 meq.m-2)
between 1994 and 2001 observed at LP in the central Czech Republic was much higher than
the 4.4 meq.m-2 found at the more pristine and unpolluted HBEF catchments in the
northeastern USA (Likens et al. 1998). The mean Ca bulk input flux (10.1 meq.m-2) from the
1999 to 2001 should remain constant, as no further emission controls will be applied.
0.0
0.5
1.0
1.5
2.0
2.5
0.0 0.1 0.2 0.
Mg [ueg.L-1]
Ca
[ueg
.L-1
]
3
Figure 29 The relationship of Ca and Mg concentrations in the bulk precipitation
Similarly to Ca, the average bulk input fluxes of Mg at LP were comparable to those in the
western part of the CR in 1994 (Krám et al. 1997). The linear relationship between Ca and Mg
69
Tom Navrátil Biogeochemistry of the II.A group elements in a forested catchment
concentrations in bulk precipitation was maintained (Figure 29), which eliminated sea
aerosols as their possible source at LP catchment. It seems that the important sources of
elevated fluxes of Ca and Mg beyond the alkali fly ash also maintain a linear relationship for
Ca and Mg in precipitation solutes. Calcium and magnesium in bulk precipitation had the
strongest correlation among the measured parameters (Annexes, Table 23).
The mean concentration of Sr in bulk precipitation was 0.03 µeq.L-1 in the period 1994 –
2001, similar to the mean Sr concentration in bulk precipitation of Switzerland (Atteia 1994).
The annual bulk flux of strontium decreased during the period 1996 – 2001 but remained well
within the range 5.5 – 59.3 meq.m-2 (Table 22) determined at the Swiss sites (Atteia 1994).
Elevated bulk Sr inputs in Norway were usually attributed to marine sources (Berg et al.
1994). However, the higher Sr bulk fluxes in 1996, 1997 and 1998 (compared to 1999 – 2001)
at the central CR site can be attributed to elevated emissions of coal ashes, as there was no
shift of the Mg:Ca ratio towards that of oceanic spray.
The two-year monitoring period of Ba fluxes in bulk precipitation was too short to make
conclusions on the trends of Ba input flux. However it enabled a comparison of Ba bulk input
fluxes and concentrations at the LP catchment with those from marine and continental sites.
The concentrations of Ba in bulk precipitation were comparable to those from Switzerland
(Atteia 1994). Also some marine sites in Norway (Berg et al. 1994) exhibited annual Ba input
fluxes similar to those at the LP catchment. The main source of Ba at the central Czech
Republic were perhaps the dusts or ashes (in keeping with the constant Mg:Ca ratio).
5.1.2 Internal cycling
5.1.2.1 Throughfall
The throughfall fluxes of most solutes were higher than the bulk precipitation fluxes. The
excess flux of elements originated in wash-off of particles from dry deposition to the
aboveground parts of trees, dissolution of atmospheric gases adsorbed to foliar surfaces in the
canopy, as well as canopy leaching of solutes originating internally from the trees.
The beech canopy was more effective in the neutralization of acid precipitation especially due
to greater canopy leaching, which was especially evident from the pH increase in beech
throughfall relative to bulk precipitation (Figure 10). In contrast the spruce canopy appeared
to be very effective in scavenging of aerosols and gases containing S and N, which resulted in
further acidification and a considerable decrease in pH of the throughfall solution.
The throughfall fluxes of most elements in both types of throughfall decreased during the
period at the LP catchment, similar to the trend in bulk precipitation inputs. For most solutes
70

Tom Navrátil Biogeochemistry of the II.A group elements in a forested catchment
this decrease was more evident in the spruce throughfall due to the greater effectiveness of the
spruce canopy in scavenging aerosols and particles from the atmosphere during the whole
year. The decrease of element input fluxes was evaluated from the difference in the average
flux from years before (1997 - 1998) versus after (1999 - 2001), the complete
desulphurization of Czech power plants. The most significant flux decrease occurred for H+,
Be, Mn, Al, F- and SO42- in spruce throughfall, and for Mn, Fe, Al and F- in beech throughfall.
The decrease of SO42- flux in beech throughfall was surprising small at 23%. The
corresponding proportional decreases of SO42- flux in bulk precipitation and spruce
throughfall were 61% and 43%, respectively. The most significant seasonal decrease in mean
sulfate flux from before (1997 - 1998) to after (1999 - 2001) power plant desulphurization
was observed in bulk precipitation and throughfall for the period June – August. The most
dramatic decrease in this seasonal sulfate flux occurred in bulk precipitation, followed by
spruce throughfall. In contrast, this seasonal sulfate flux remained almost constant for beech
throughfall through the period.
Increased fluxes of Be in throughfall relative to bulk precipitation were reported from LP as
well as other catchments (Skřivan et al. 2000, Veselý et al. 2002, Neal et al. 1992). The
sampling method is of special concern due to the possible ready leaching of Be from litter,
which was accidentally caught in funnels of the typical VOSS samplers. This was eliminated
by usage of the GCTC samplers (see Methods). The first results this artifact of increased Be
fluxes detected in VOSS samplers compared to GCTC samplers (Skřivan et al. 2000). The
higher Be fluxes in VOSS throughfall fluxes were attributed to Be leaching or washout of the
scavenged particles from the litter trapped by the collector.
The Be concentrations in throughfall collected with GCTC samplers were comparable to
those in bulk precipitation. The similarity is especially evident from precisely evaluated
deposition fluxes in 2000 and 2001 derived from analysis of preconcentrated samples.
Generally, it was inconclusive whether Be throughfall fluxes were higher or lower than those
in bulk precipitation. The uncertainty during 1994 – 1998 resulted from the high percentage of
monthly samples that had Be concentrations below the detection limit. In 1999 – 2001, when
samples were preconcentrated, throughfall Be fluxes were higher than bulk precipitation
fluxes with the exception of beech throughfall in 1999. It is not clear from the results of this
study whether Be is lost or gained as precipitation passes through the canopy.
The flux of Mg was generally much higher in throughfall than in bulk precipitation (Annexes,
Table 22), and generally greater in spruce throughfall than in beech throughfall. The average
annual Mg flux in spruce throughfall of 19.4 meq.m-2.yr-1 was comparable to that reported
71
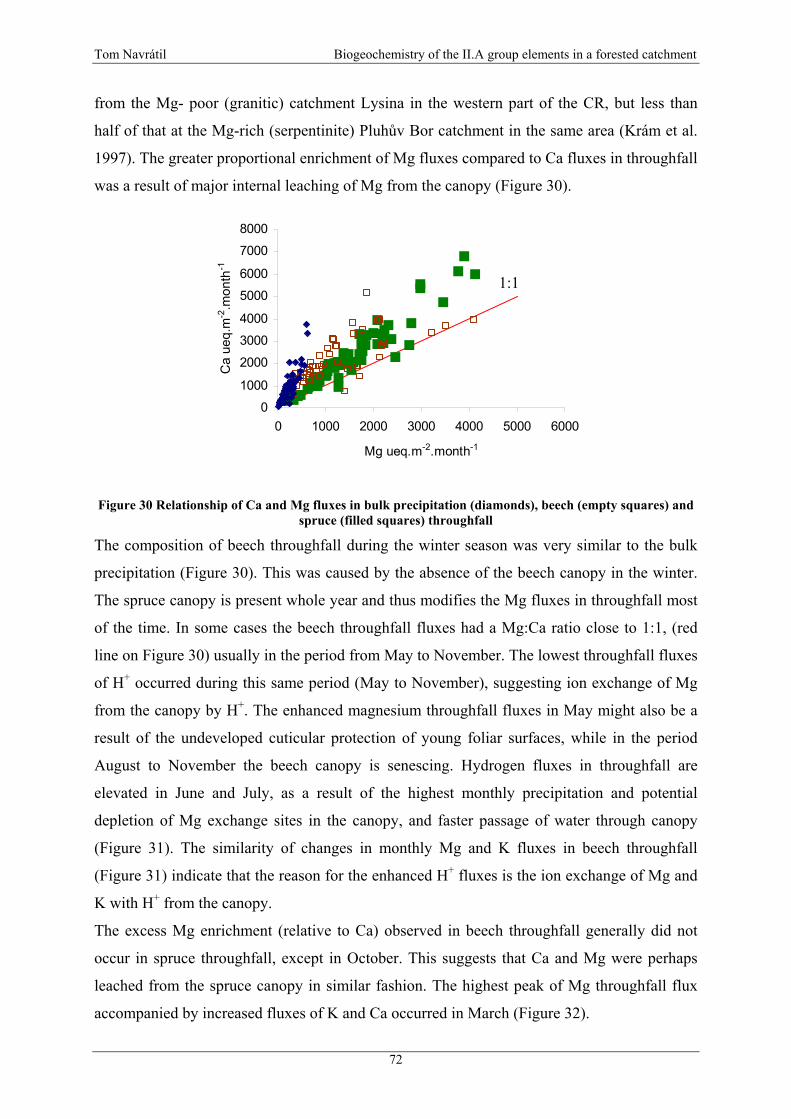
Tom Navrátil Biogeochemistry of the II.A group elements in a forested catchment
from the Mg- poor (granitic) catchment Lysina in the western part of the CR, but less than
half of that at the Mg-rich (serpentinite) Pluhův Bor catchment in the same area (Krám et al.
1997). The greater proportional enrichment of Mg fluxes compared to Ca fluxes in throughfall
was a result of major internal leaching of Mg from the canopy (Figure 30).
0
1000
2000
3000
4000
5000
6000
7000
8000
0 1000 2000 3000 4000 5000 6000
Mg ueq.m-2.month-1
Ca
ueq.
m-2
.mon
th-1
1:1
Figure 30 Relationship of Ca and Mg fluxes in bulk precipitation (diamonds), beech (empty squares) and spruce (filled squares) throughfall
The composition of beech throughfall during the winter season was very similar to the bulk
precipitation (Figure 30). This was caused by the absence of the beech canopy in the winter.
The spruce canopy is present whole year and thus modifies the Mg fluxes in throughfall most
of the time. In some cases the beech throughfall fluxes had a Mg:Ca ratio close to 1:1, (red
line on Figure 30) usually in the period from May to November. The lowest throughfall fluxes
of H+ occurred during this same period (May to November), suggesting ion exchange of Mg
from the canopy by H+. The enhanced magnesium throughfall fluxes in May might also be a
result of the undeveloped cuticular protection of young foliar surfaces, while in the period
August to November the beech canopy is senescing. Hydrogen fluxes in throughfall are
elevated in June and July, as a result of the highest monthly precipitation and potential
depletion of Mg exchange sites in the canopy, and faster passage of water through canopy
(Figure 31). The similarity of changes in monthly Mg and K fluxes in beech throughfall
(Figure 31) indicate that the reason for the enhanced H+ fluxes is the ion exchange of Mg and
K with H+ from the canopy.
The excess Mg enrichment (relative to Ca) observed in beech throughfall generally did not
occur in spruce throughfall, except in October. This suggests that Ca and Mg were perhaps
leached from the spruce canopy in similar fashion. The highest peak of Mg throughfall flux
accompanied by increased fluxes of K and Ca occurred in March (Figure 32).
72
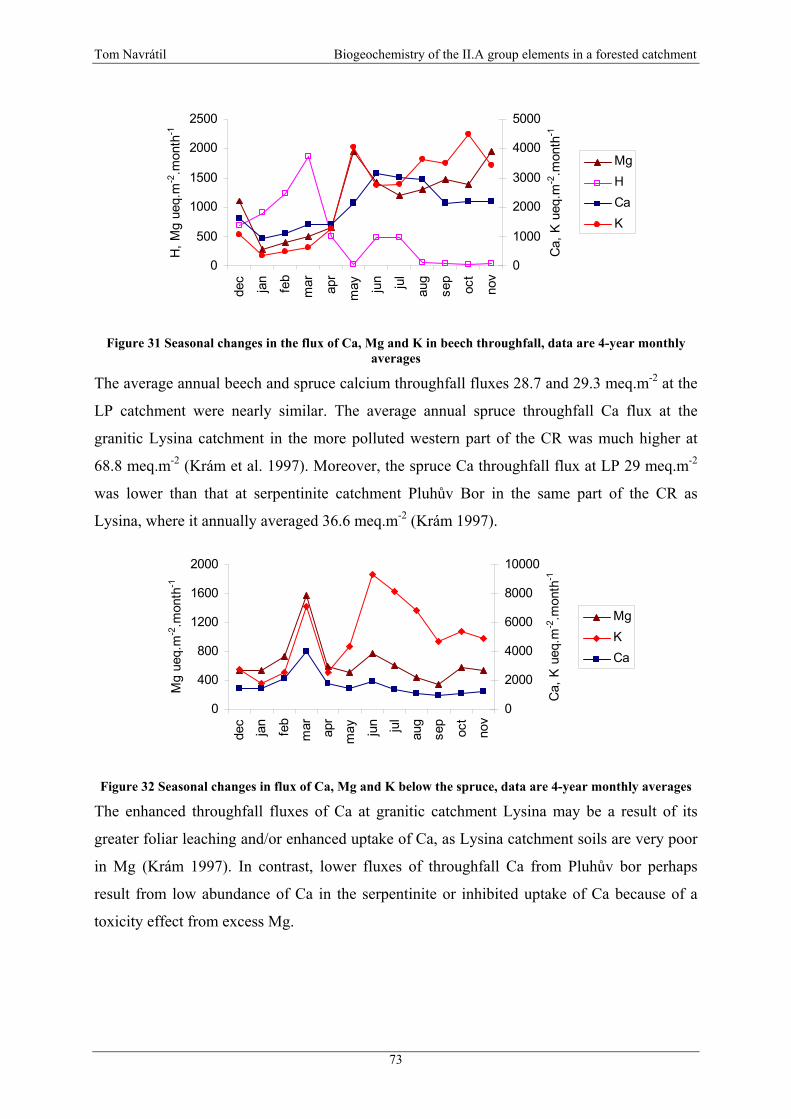
Tom Navrátil Biogeochemistry of the II.A group elements in a forested catchment
0
500
1000
1500
2000
2500
dec
jan
feb
mar apr
may jun jul
aug
sep
oct
nov
H, M
g ue
q.m
-2.m
onth
-1
0
1000
2000
3000
4000
5000
Ca,
K u
eq.m
-2.m
onth
-1
MgHCaK
Figure 31 Seasonal changes in the flux of Ca, Mg and K in beech throughfall, data are 4-year monthly averages
The average annual beech and spruce calcium throughfall fluxes 28.7 and 29.3 meq.m-2 at the
LP catchment were nearly similar. The average annual spruce throughfall Ca flux at the
granitic Lysina catchment in the more polluted western part of the CR was much higher at
68.8 meq.m-2 (Krám et al. 1997). Moreover, the spruce Ca throughfall flux at LP 29 meq.m-2
was lower than that at serpentinite catchment Pluhův Bor in the same part of the CR as
Lysina, where it annually averaged 36.6 meq.m-2 (Krám 1997).
0
400
800
1200
1600
2000
dec
jan
feb
mar apr
may jun jul
aug
sep
oct
nov
Mg
ueq.
m-2
.mon
th-1
0
2000
4000
6000
8000
10000C
a, K
ueq
.m-2
.mon
th-1
MgKCa
Figure 32 Seasonal changes in flux of Ca, Mg and K below the spruce, data are 4-year monthly averages
The enhanced throughfall fluxes of Ca at granitic catchment Lysina may be a result of its
greater foliar leaching and/or enhanced uptake of Ca, as Lysina catchment soils are very poor
in Mg (Krám 1997). In contrast, lower fluxes of throughfall Ca from Pluhův bor perhaps
result from low abundance of Ca in the serpentinite or inhibited uptake of Ca because of a
toxicity effect from excess Mg.
73

Tom Navrátil Biogeochemistry of the II.A group elements in a forested catchment
0123456789
0 2000 4000 6000 8000
Ca ueq.m-2.month-1
Sr u
eq.m
-2.m
onth
-1
Figure 33 Relationship of Sr and Ca fluxes in bulk (diamonds), beech (empty squares) and spruce (filled squares) throughfall
A similar proportional decrease of Sr fluxes in both types of throughfall was detected at LP
catchment. Average throughfall Sr fluxes before 1999 were 15% higher than those in 2000
and 2001. The relationship of Ca to Sr concentrations and fluxes was linear (Figure 33) and it
implies similar behavior of Ca and Sr in throughfall. Similar relationships of Ca and Sr were
reported from a granitic catchment Aubure for both beech and spruce throughfall (Poszwa et
al. 2000 etc.). The (Sr:Ca)*1000 ratio from Aubure (beech and spruce, 1.03 and 0.99) was
comparable to those from LP catchment (beech and spruce, 1.10 and 1.05). The slight
difference in (Sr:Ca)*1000 ratios in the two catchments can be attributed to presence of fly
ash as well as to different (Sr:Ca)*1000 ratios in soil solutions or in soils.
Only two years of data on Ba throughfall fluxes were available from LP. The scarcity of
reports on Ba throughfall fluxes precluded comparison to other monitored sites. At LP it was
possible to conclude that Ba fluxes in spruce throughfall were at least 50% higher than bulk
precipitation fluxes.
5.1.2.2 Biomass processes, pools and sinks through accretion
The content of elements in the pool of bole wood per m2 of the catchment is considerable
(Table 16). The available pool of element below one m2 of soil calculated using the acid
leachable concentrations is overestimated with respect to potential plant uptake. It would be
more precise to calculate the available pool out of exchangeable concentrations, but this was
not possible with available data. However, it was possible to conclude that the exchangeable
pool of BC is about 33% of the acid leachable fraction (Navrátil unpublished).
The pool of calcium, potassium and manganese in bole wood per m2 composed approximately
13% of the acid leachable pool of these elements in the soil per m2. This amount of essential
74
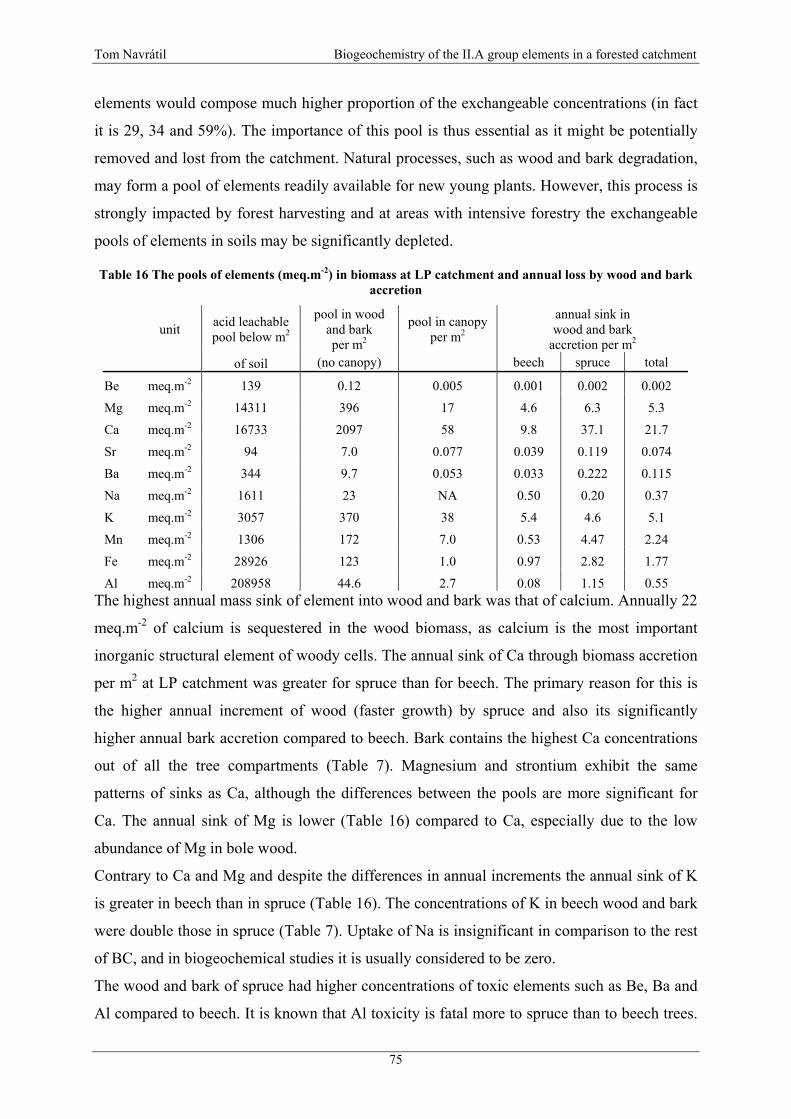
Tom Navrátil Biogeochemistry of the II.A group elements in a forested catchment
elements would compose much higher proportion of the exchangeable concentrations (in fact
it is 29, 34 and 59%). The importance of this pool is thus essential as it might be potentially
removed and lost from the catchment. Natural processes, such as wood and bark degradation,
may form a pool of elements readily available for new young plants. However, this process is
strongly impacted by forest harvesting and at areas with intensive forestry the exchangeable
pools of elements in soils may be significantly depleted.
Table 16 The pools of elements (meq.m-2) in biomass at LP catchment and annual loss by wood and bark accretion
unit acid leachable
pool below m2
pool in wood and bark per m2
pool in canopy per m2
annual sink in wood and bark
accretion per m2 of soil (no canopy) beech spruce total
Be meq.m-2 139 0.12 0.005 0.001 0.002 0.002
Mg meq.m-2 14311 396 17 4.6 6.3 5.3
Ca meq.m-2 16733 2097 58 9.8 37.1 21.7
Sr meq.m-2 94 7.0 0.077 0.039 0.119 0.074
Ba meq.m-2 344 9.7 0.053 0.033 0.222 0.115
Na meq.m-2 1611 23 NA 0.50 0.20 0.37
K meq.m-2 3057 370 38 5.4 4.6 5.1
Mn meq.m-2 1306 172 7.0 0.53 4.47 2.24
Fe meq.m-2 28926 123 1.0 0.97 2.82 1.77
Al meq.m-2 208958 44.6 2.7 0.08 1.15 0.55 The highest annual mass sink of element into wood and bark was that of calcium. Annually 22
meq.m-2 of calcium is sequestered in the wood biomass, as calcium is the most important
inorganic structural element of woody cells. The annual sink of Ca through biomass accretion
per m2 at LP catchment was greater for spruce than for beech. The primary reason for this is
the higher annual increment of wood (faster growth) by spruce and also its significantly
higher annual bark accretion compared to beech. Bark contains the highest Ca concentrations
out of all the tree compartments (Table 7). Magnesium and strontium exhibit the same
patterns of sinks as Ca, although the differences between the pools are more significant for
Ca. The annual sink of Mg is lower (Table 16) compared to Ca, especially due to the low
abundance of Mg in bole wood.
Contrary to Ca and Mg and despite the differences in annual increments the annual sink of K
is greater in beech than in spruce (Table 16). The concentrations of K in beech wood and bark
were double those in spruce (Table 7). Uptake of Na is insignificant in comparison to the rest
of BC, and in biogeochemical studies it is usually considered to be zero.
The wood and bark of spruce had higher concentrations of toxic elements such as Be, Ba and
Al compared to beech. It is known that Al toxicity is fatal more to spruce than to beech trees.
75
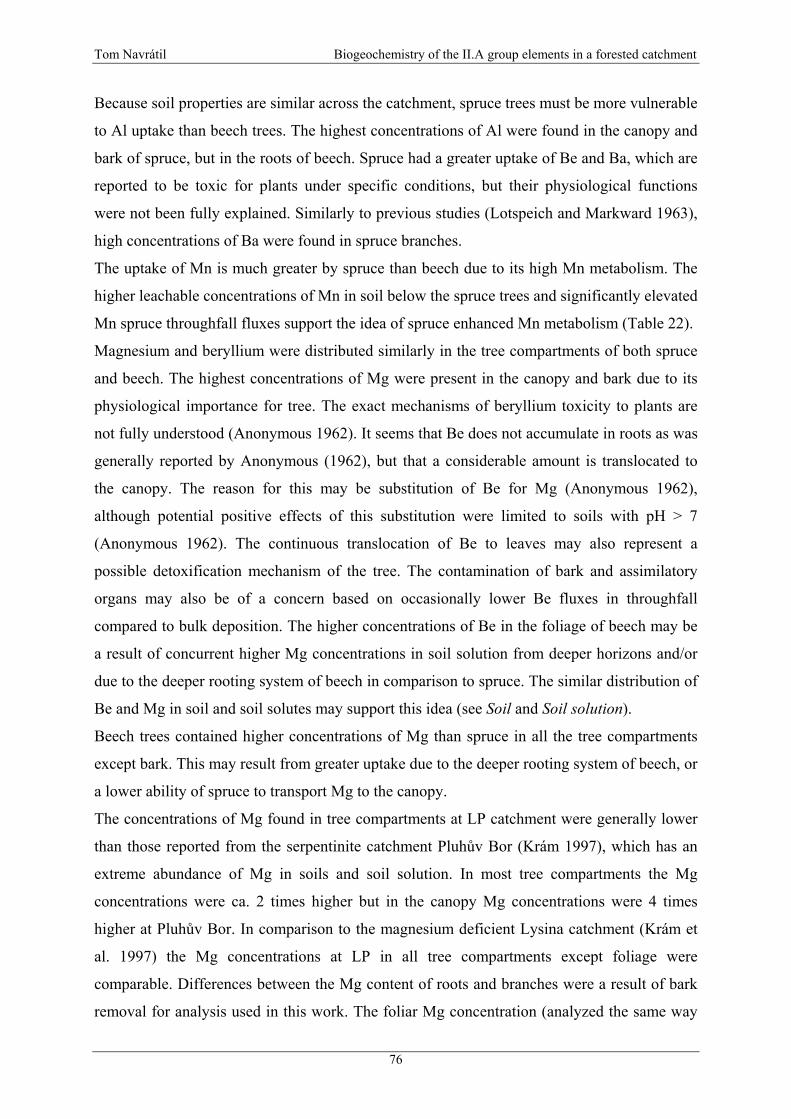
Tom Navrátil Biogeochemistry of the II.A group elements in a forested catchment
Because soil properties are similar across the catchment, spruce trees must be more vulnerable
to Al uptake than beech trees. The highest concentrations of Al were found in the canopy and
bark of spruce, but in the roots of beech. Spruce had a greater uptake of Be and Ba, which are
reported to be toxic for plants under specific conditions, but their physiological functions
were not been fully explained. Similarly to previous studies (Lotspeich and Markward 1963),
high concentrations of Ba were found in spruce branches.
The uptake of Mn is much greater by spruce than beech due to its high Mn metabolism. The
higher leachable concentrations of Mn in soil below the spruce trees and significantly elevated
Mn spruce throughfall fluxes support the idea of spruce enhanced Mn metabolism (Table 22).
Magnesium and beryllium were distributed similarly in the tree compartments of both spruce
and beech. The highest concentrations of Mg were present in the canopy and bark due to its
physiological importance for tree. The exact mechanisms of beryllium toxicity to plants are
not fully understood (Anonymous 1962). It seems that Be does not accumulate in roots as was
generally reported by Anonymous (1962), but that a considerable amount is translocated to
the canopy. The reason for this may be substitution of Be for Mg (Anonymous 1962),
although potential positive effects of this substitution were limited to soils with pH > 7
(Anonymous 1962). The continuous translocation of Be to leaves may also represent a
possible detoxification mechanism of the tree. The contamination of bark and assimilatory
organs may also be of a concern based on occasionally lower Be fluxes in throughfall
compared to bulk deposition. The higher concentrations of Be in the foliage of beech may be
a result of concurrent higher Mg concentrations in soil solution from deeper horizons and/or
due to the deeper rooting system of beech in comparison to spruce. The similar distribution of
Be and Mg in soil and soil solutes may support this idea (see Soil and Soil solution).
Beech trees contained higher concentrations of Mg than spruce in all the tree compartments
except bark. This may result from greater uptake due to the deeper rooting system of beech, or
a lower ability of spruce to transport Mg to the canopy.
The concentrations of Mg found in tree compartments at LP catchment were generally lower
than those reported from the serpentinite catchment Pluhův Bor (Krám 1997), which has an
extreme abundance of Mg in soils and soil solution. In most tree compartments the Mg
concentrations were ca. 2 times higher but in the canopy Mg concentrations were 4 times
higher at Pluhův Bor. In comparison to the magnesium deficient Lysina catchment (Krám et
al. 1997) the Mg concentrations at LP in all tree compartments except foliage were
comparable. Differences between the Mg content of roots and branches were a result of bark
removal for analysis used in this work. The foliar Mg concentration (analyzed the same way
76
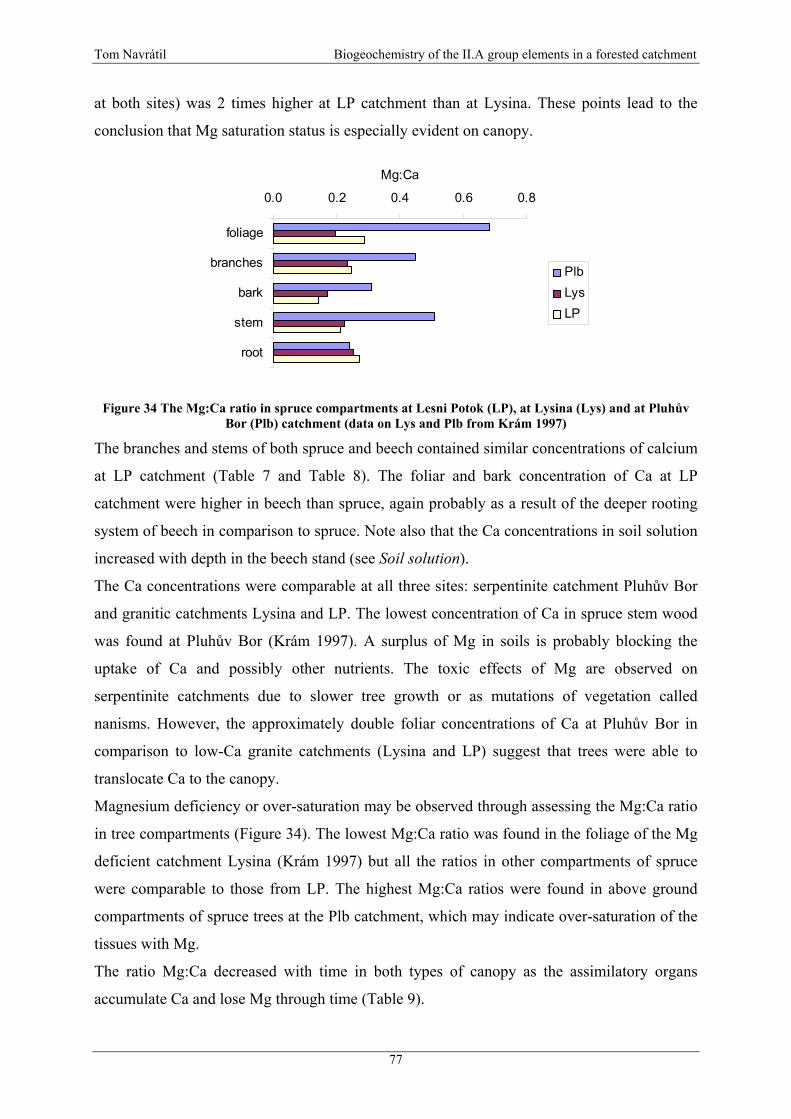
Tom Navrátil Biogeochemistry of the II.A group elements in a forested catchment
at both sites) was 2 times higher at LP catchment than at Lysina. These points lead to the
conclusion that Mg saturation status is especially evident on canopy.
0.0 0.2 0.4 0.6 0.8
foliage
branches
bark
stem
root
Mg:Ca
PlbLysLP
Figure 34 The Mg:Ca ratio in spruce compartments at Lesni Potok (LP), at Lysina (Lys) and at Pluhův Bor (Plb) catchment (data on Lys and Plb from Krám 1997)
The branches and stems of both spruce and beech contained similar concentrations of calcium
at LP catchment (Table 7 and Table 8). The foliar and bark concentration of Ca at LP
catchment were higher in beech than spruce, again probably as a result of the deeper rooting
system of beech in comparison to spruce. Note also that the Ca concentrations in soil solution
increased with depth in the beech stand (see Soil solution).
The Ca concentrations were comparable at all three sites: serpentinite catchment Pluhův Bor
and granitic catchments Lysina and LP. The lowest concentration of Ca in spruce stem wood
was found at Pluhův Bor (Krám 1997). A surplus of Mg in soils is probably blocking the
uptake of Ca and possibly other nutrients. The toxic effects of Mg are observed on
serpentinite catchments due to slower tree growth or as mutations of vegetation called
nanisms. However, the approximately double foliar concentrations of Ca at Pluhův Bor in
comparison to low-Ca granite catchments (Lysina and LP) suggest that trees were able to
translocate Ca to the canopy.
Magnesium deficiency or over-saturation may be observed through assessing the Mg:Ca ratio
in tree compartments (Figure 34). The lowest Mg:Ca ratio was found in the foliage of the Mg
deficient catchment Lysina (Krám 1997) but all the ratios in other compartments of spruce
were comparable to those from LP. The highest Mg:Ca ratios were found in above ground
compartments of spruce trees at the Plb catchment, which may indicate over-saturation of the
tissues with Mg.
The ratio Mg:Ca decreased with time in both types of canopy as the assimilatory organs
accumulate Ca and lose Mg through time (Table 9).
77
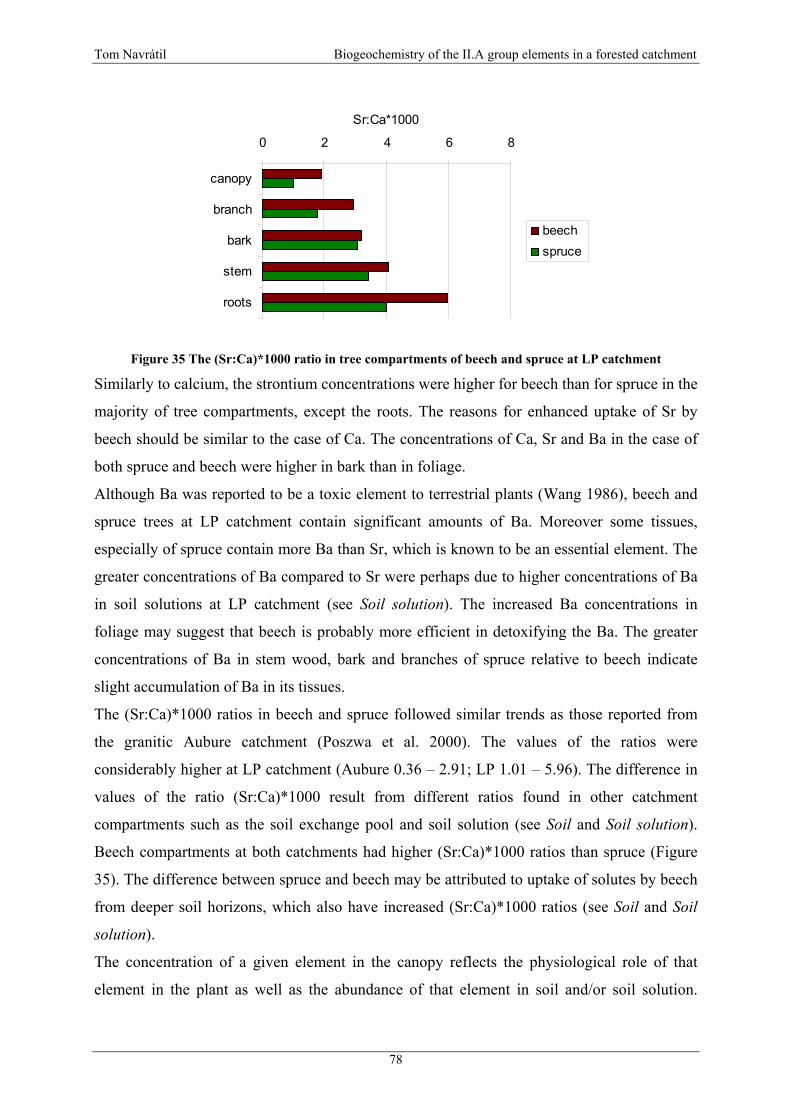
Tom Navrátil Biogeochemistry of the II.A group elements in a forested catchment
0 2 4 6 8
canopy
branch
bark
stem
roots
Sr:Ca*1000
beechspruce
Figure 35 The (Sr:Ca)*1000 ratio in tree compartments of beech and spruce at LP catchment
Similarly to calcium, the strontium concentrations were higher for beech than for spruce in the
majority of tree compartments, except the roots. The reasons for enhanced uptake of Sr by
beech should be similar to the case of Ca. The concentrations of Ca, Sr and Ba in the case of
both spruce and beech were higher in bark than in foliage.
Although Ba was reported to be a toxic element to terrestrial plants (Wang 1986), beech and
spruce trees at LP catchment contain significant amounts of Ba. Moreover some tissues,
especially of spruce contain more Ba than Sr, which is known to be an essential element. The
greater concentrations of Ba compared to Sr were perhaps due to higher concentrations of Ba
in soil solutions at LP catchment (see Soil solution). The increased Ba concentrations in
foliage may suggest that beech is probably more efficient in detoxifying the Ba. The greater
concentrations of Ba in stem wood, bark and branches of spruce relative to beech indicate
slight accumulation of Ba in its tissues.
The (Sr:Ca)*1000 ratios in beech and spruce followed similar trends as those reported from
the granitic Aubure catchment (Poszwa et al. 2000). The values of the ratios were
considerably higher at LP catchment (Aubure 0.36 – 2.91; LP 1.01 – 5.96). The difference in
values of the ratio (Sr:Ca)*1000 result from different ratios found in other catchment
compartments such as the soil exchange pool and soil solution (see Soil and Soil solution).
Beech compartments at both catchments had higher (Sr:Ca)*1000 ratios than spruce (Figure
35). The difference between spruce and beech may be attributed to uptake of solutes by beech
from deeper soil horizons, which also have increased (Sr:Ca)*1000 ratios (see Soil and Soil
solution).
The concentration of a given element in the canopy reflects the physiological role of that
element in the plant as well as the abundance of that element in soil and/or soil solution.
78
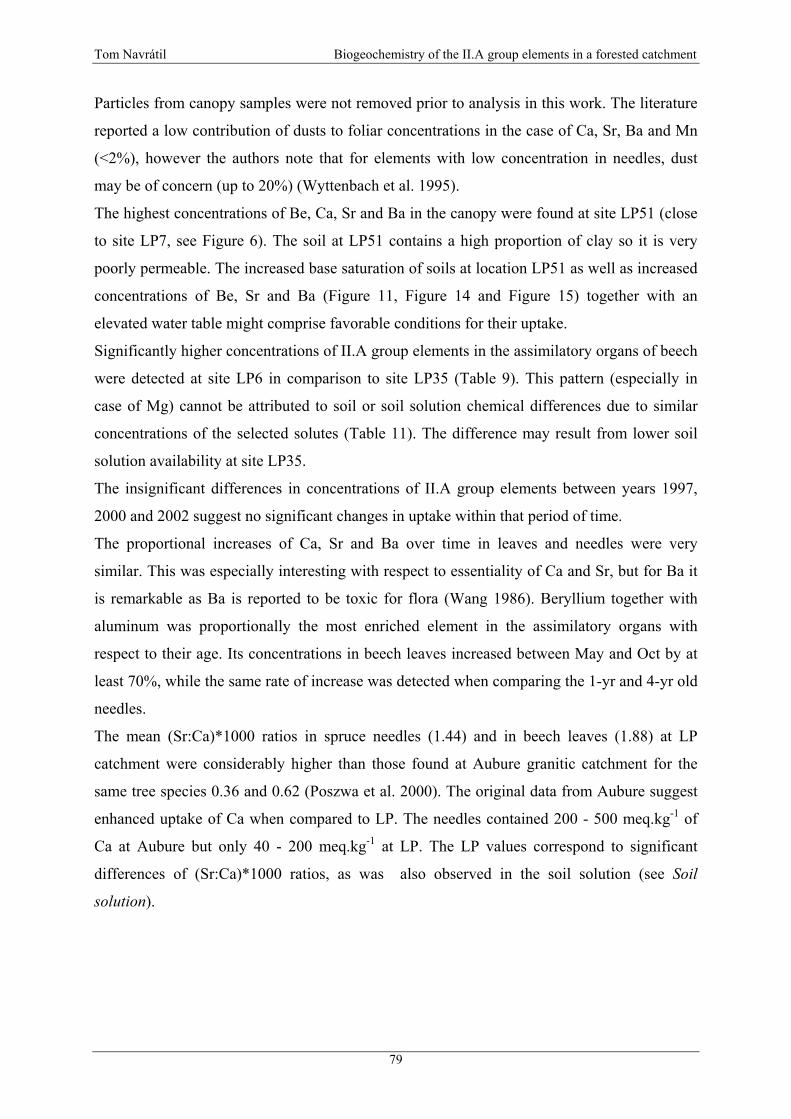
Tom Navrátil Biogeochemistry of the II.A group elements in a forested catchment
Particles from canopy samples were not removed prior to analysis in this work. The literature
reported a low contribution of dusts to foliar concentrations in the case of Ca, Sr, Ba and Mn
(<2%), however the authors note that for elements with low concentration in needles, dust
may be of concern (up to 20%) (Wyttenbach et al. 1995).
The highest concentrations of Be, Ca, Sr and Ba in the canopy were found at site LP51 (close
to site LP7, see Figure 6). The soil at LP51 contains a high proportion of clay so it is very
poorly permeable. The increased base saturation of soils at location LP51 as well as increased
concentrations of Be, Sr and Ba (Figure 11, Figure 14 and Figure 15) together with an
elevated water table might comprise favorable conditions for their uptake.
Significantly higher concentrations of II.A group elements in the assimilatory organs of beech
were detected at site LP6 in comparison to site LP35 (Table 9). This pattern (especially in
case of Mg) cannot be attributed to soil or soil solution chemical differences due to similar
concentrations of the selected solutes (Table 11). The difference may result from lower soil
solution availability at site LP35.
The insignificant differences in concentrations of II.A group elements between years 1997,
2000 and 2002 suggest no significant changes in uptake within that period of time.
The proportional increases of Ca, Sr and Ba over time in leaves and needles were very
similar. This was especially interesting with respect to essentiality of Ca and Sr, but for Ba it
is remarkable as Ba is reported to be toxic for flora (Wang 1986). Beryllium together with
aluminum was proportionally the most enriched element in the assimilatory organs with
respect to their age. Its concentrations in beech leaves increased between May and Oct by at
least 70%, while the same rate of increase was detected when comparing the 1-yr and 4-yr old
needles.
The mean (Sr:Ca)*1000 ratios in spruce needles (1.44) and in beech leaves (1.88) at LP
catchment were considerably higher than those found at Aubure granitic catchment for the
same tree species 0.36 and 0.62 (Poszwa et al. 2000). The original data from Aubure suggest
enhanced uptake of Ca when compared to LP. The needles contained 200 - 500 meq.kg-1 of
Ca at Aubure but only 40 - 200 meq.kg-1 at LP. The LP values correspond to significant
differences of (Sr:Ca)*1000 ratios, as was also observed in the soil solution (see Soil
solution).
79

Tom Navrátil Biogeochemistry of the II.A group elements in a forested catchment
5.1.2.3 Litterfall
The concentrations of elements entering the forest floor through litterfall were calculated from
the average concentrations of elements in fresh leaves in autumn for beech and in the 4-year-
old needles for conifers.
The annual input of all monitored elements through litterfall to the forest floor was generally
of similar magnitude to their throughfall fluxes (Table 17). The annual throughfall flux
represents the majority of the total annual elemental flux to the forest floor in the case of K,
Mg, Al and Fe as it amounts for 75, 66, 63 and 55%, respectively.
Table 17 Elemental fluxes to the forest floor through the litterfall
element unit litterfall beech litterfall spruce litterfall input avg.
throughfall input
Be meq.m-2 0.003 0.009 0.006 0.002
Mg meq.m-2 9 10 9 18
Ca meq.m-2 37 48 42 29
Sr meq.m-2 0.065 0.074 0.069 0.029
Ba meq.m-2 0.046 0.053 0.050 0.022
K meq.m-2 12 14 13 39
Mn meq.m-2 3.0 9.1 6.0 5.2
Fe meq.m-2 0.3 0.8 0.6 0.7
Al meq.m-2 0.8 3.4 2.1 3.5
The litterfall elemental flux represented more than 70% of annual flux to the forest floor in
the case of Be, Sr and Ba (Table 17). Litterfall also made up the majority of the input to the
forest floor for Ca (59%) and Mn (54%).
The domination of throughfall flux over litterfall in case of K and Mg was due to intensive
leaching of these elements from the canopy. The decreasing concentrations of K and Mg with
time in the living (fresh) tissues support this idea (Table 9).
The elemental flux in spruce litterfall exceeded that in beech throughfall for all measured
elements. Although the litterfall fluxes of Mg, Ca, Sr, Ba and K were nearly comparable in
the two canopy types the litterfall fluxes of Al, Mn, Be and Fe were considerably greater in
the spruce stands. Previously reported annual litterfall Be fluxes (Veselý et al. 2002) of beech
(39 ˜µeq.m-2) and spruce (30 ˜µeq.m-2) at LP were reevaluated using a more robust dataset.
Significantly lower annual litterfall fluxes (3 and 9 µeq.m-2) of Be were determined in this
study, in part through the use of dry weight instead of fresh weight for the canopy.
The increased litterfall flux of Al in spruce may result from the replacement of exchangeable
Ca by toxic Al on the cation exchangeable complex of the forest floor (Miller et al. 1993).
80
Tom Navrátil Biogeochemistry of the II.A group elements in a forested catchment
5.1.2.4 Forest floor and mineral soil pools
The soil pools (Table 16) of the II.A group elements are by far the largest pools in the
ecosystem. The average concentrations of the elements in soil were calculated from weighted
averages in individual horizons. The average concentration of total Be in the soils of LP
catchment (1.50 meq.kg-1) was slightly higher than the world average for soils (Drury et al.
1978). Beryllium must thus be readily mobilized from LP soils, which were derived from Be-
rich bedrock (3.50 meq.kg-1). The average concentration of total Mg (233 meq.kg-1) in soils of
LP catchment was 2.5 times lower than the typical Mg content in soils on granites (Beneš
1994). Similarly the average total concentration of Ca (179 meq.kg-1) in LP catchment soils
was 2.5 times lower than the usual Ca content in soils on granites (Beneš 1994). Total
concentrations of Sr (2.9 meq.kg-1) and Ba (5.4 meq.kg-1) were 1.4 and 2.2 times smaller than
typical concentrations for soils on granites (Beneš 1994). With respect to concentrations of
the II.A group in LP bedrock the soil was depleted in Be (2.4 times), Ba (3.6 times), Ca (2.2
times) and Sr (2.3 times), whilst the total concentrations of Mg were comparable.
The concentrations of elements in labile or mobile forms are more important with respect to
studies of fluxes and forest dynamics than the total concentrations. The acid leachable (0.1 M
HNO3) concentrations for each element of the II.A group were determined at 8 locations in
the LP catchment (Figure 11 - Figure 15). The main differences between patterns of the II.A
group element concentrations in these profiles were found in top 20 cm of the soil profiles.
0
25
50
75
100
0.0 0.1 0.2Be meq.kg-1
dept
h [c
m]
0
25
50
75
100
0 10 20 30Mg meq.kg-1
0
25
50
75
100
0 50 100 150Ca meq.kg-1
0
25
50
75
100
0.0 0.2 0.4 0.6Sr meq.kg-1
dept
h [c
m]
0
25
50
75
100
0 0.5 1 1.5Ba meq.kg-1
Figure 36 Differences of II.A leachable concentrations in soil below beech (dashed) and spruce (solid) canopies
81
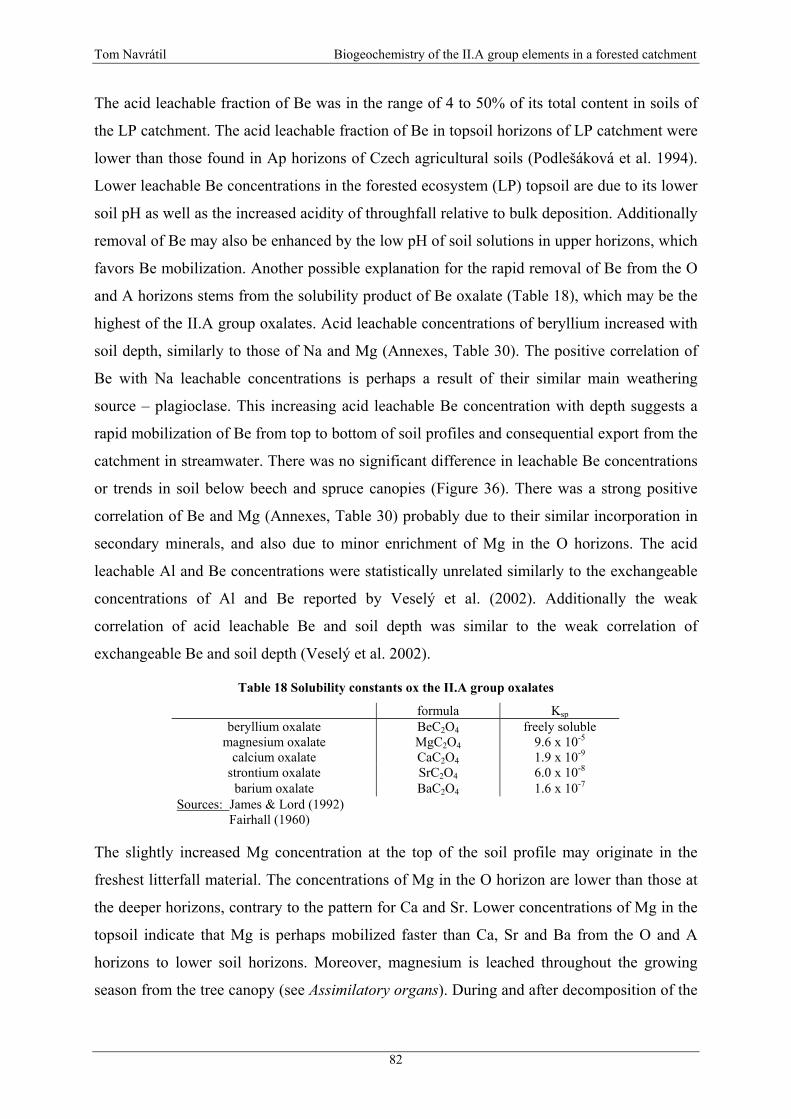
Tom Navrátil Biogeochemistry of the II.A group elements in a forested catchment
The acid leachable fraction of Be was in the range of 4 to 50% of its total content in soils of
the LP catchment. The acid leachable fraction of Be in topsoil horizons of LP catchment were
lower than those found in Ap horizons of Czech agricultural soils (Podlešáková et al. 1994).
Lower leachable Be concentrations in the forested ecosystem (LP) topsoil are due to its lower
soil pH as well as the increased acidity of throughfall relative to bulk deposition. Additionally
removal of Be may also be enhanced by the low pH of soil solutions in upper horizons, which
favors Be mobilization. Another possible explanation for the rapid removal of Be from the O
and A horizons stems from the solubility product of Be oxalate (Table 18), which may be the
highest of the II.A group oxalates. Acid leachable concentrations of beryllium increased with
soil depth, similarly to those of Na and Mg (Annexes, Table 30). The positive correlation of
Be with Na leachable concentrations is perhaps a result of their similar main weathering
source – plagioclase. This increasing acid leachable Be concentration with depth suggests a
rapid mobilization of Be from top to bottom of soil profiles and consequential export from the
catchment in streamwater. There was no significant difference in leachable Be concentrations
or trends in soil below beech and spruce canopies (Figure 36). There was a strong positive
correlation of Be and Mg (Annexes, Table 30) probably due to their similar incorporation in
secondary minerals, and also due to minor enrichment of Mg in the O horizons. The acid
leachable Al and Be concentrations were statistically unrelated similarly to the exchangeable
concentrations of Al and Be reported by Veselý et al. (2002). Additionally the weak
correlation of acid leachable Be and soil depth was similar to the weak correlation of
exchangeable Be and soil depth (Veselý et al. 2002).
Table 18 Solubility constants ox the II.A group oxalates
formula Ksp beryllium oxalate BeC2O4 freely soluble
magnesium oxalate MgC2O4 9.6 x 10⁻⁵ calcium oxalate CaC2O4 1.9 x 10⁻⁹
strontium oxalate SrC2O4 6.0 x 10⁻⁸ barium oxalate BaC2O4 1.6 x 10⁻⁷
Sources: James & Lord (1992) Fairhall (1960)
The slightly increased Mg concentration at the top of the soil profile may originate in the
freshest litterfall material. The concentrations of Mg in the O horizon are lower than those at
the deeper horizons, contrary to the pattern for Ca and Sr. Lower concentrations of Mg in the
topsoil indicate that Mg is perhaps mobilized faster than Ca, Sr and Ba from the O and A
horizons to lower soil horizons. Moreover, magnesium is leached throughout the growing
season from the tree canopy (see Assimilatory organs). During and after decomposition of the
82

Tom Navrátil Biogeochemistry of the II.A group elements in a forested catchment
organic material the residual Mg in litter becomes available for uptake or transport throughout
the soil profile. The O horizon of soil below spruce canopy contains significantly lower acid
leachable concentrations of Mg (Figure 36), than that below beech, possibly due to
significantly lower Mg concentrations found in the spruce canopy (Table 9) or due to slower
decomposition of the spruce litterfall.
The leachable concentrations of Ca are similar to those of Mg from 25 cm depth to the bottom
of the soil horizon. Calcium content is greatly enriched in the O layer. This enrichment is due
to the high abundance of Ca in the organic material (mainly assimilatory organs) in the upper
soil horizons and also due to Ca immobilization. Calcium, Sr and Ba are present in the canopy
predominantly as oxalates (Wyttenbach et al. 1995, Skřivan et al. 2002). Calcium oxalate is
the least soluble oxalate of the II.A group (Table 18), thus it is significantly retained in the O
horizon. The leachable Ca concentrations in soil below beech and spruce canopies were
comparable, except for a slightly higher concentration in the O horizon of beech (Figure 36).
This similarity is probably a result of low Ca mobility due to the low solubility of Ca oxalate
(Table 18). The positive correlation of leachable Ca concentrations with Sr, K, C(ox), N(t),
Mn and Mg (Annexes, Table 30) is a result of the linkages of these parameters with
biogeochemical recycling and decomposition of organic material in the soil.
A significantly higher proportion of Mg is non-mobile in the O and A layers than that of Ca.
This was implied from the higher total Mg:Ca ratio in soil relative to the Mg:Ca ratios in the
leachable and exchangeable fractions (Figure 37). This surplus of Mg in total soil
demonstrates its depletion and preferential removal from leachable and exchangeable Mg soil
pool (probably in the upper soil layers) as also reported by Norton et al. (1999).
-160
-140
-120
-100
-80
-60
-40
-20
00 1 2 3 4
Mg:Ca
dept
h [c
m]
AVG TOT.AVG leach.AVG exch.monzogranitesyenogranitew eathered
Figure 37 The Mg:Ca ratios in the LP catchment soil profile
83
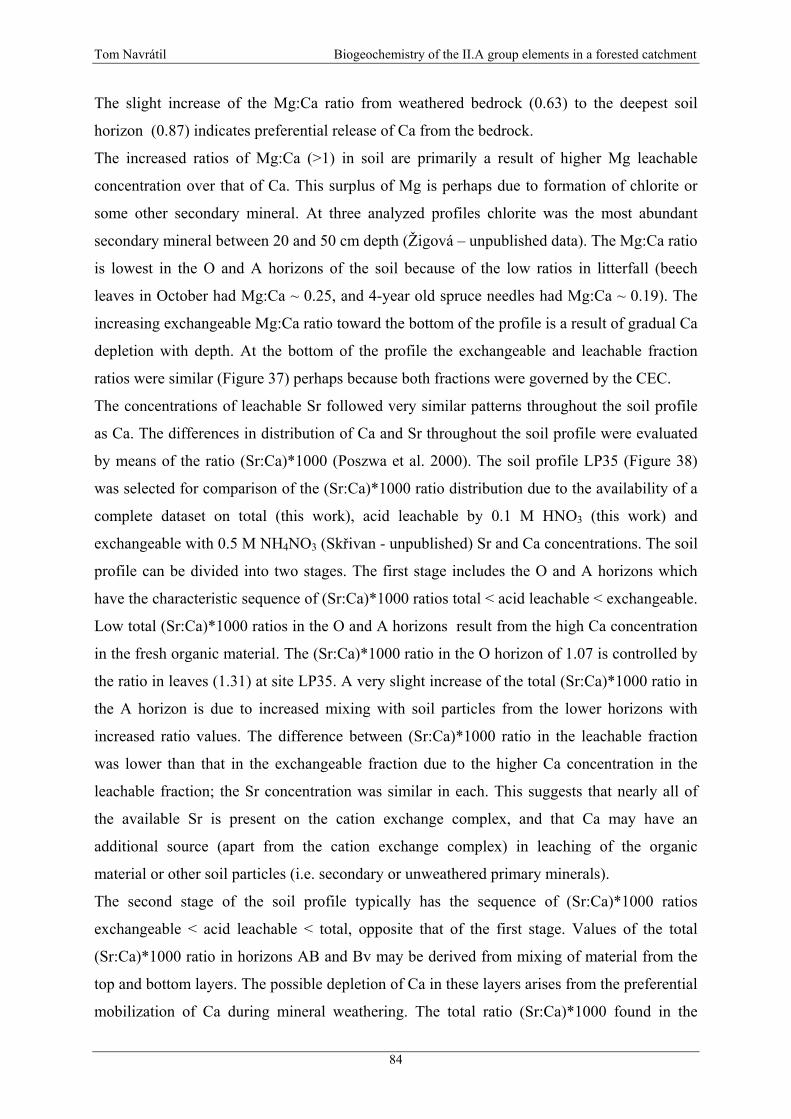
Tom Navrátil Biogeochemistry of the II.A group elements in a forested catchment
The slight increase of the Mg:Ca ratio from weathered bedrock (0.63) to the deepest soil
horizon (0.87) indicates preferential release of Ca from the bedrock.
The increased ratios of Mg:Ca (>1) in soil are primarily a result of higher Mg leachable
concentration over that of Ca. This surplus of Mg is perhaps due to formation of chlorite or
some other secondary mineral. At three analyzed profiles chlorite was the most abundant
secondary mineral between 20 and 50 cm depth (Žigová – unpublished data). The Mg:Ca ratio
is lowest in the O and A horizons of the soil because of the low ratios in litterfall (beech
leaves in October had Mg:Ca ~ 0.25, and 4-year old spruce needles had Mg:Ca ~ 0.19). The
increasing exchangeable Mg:Ca ratio toward the bottom of the profile is a result of gradual Ca
depletion with depth. At the bottom of the profile the exchangeable and leachable fraction
ratios were similar (Figure 37) perhaps because both fractions were governed by the CEC.
The concentrations of leachable Sr followed very similar patterns throughout the soil profile
as Ca. The differences in distribution of Ca and Sr throughout the soil profile were evaluated
by means of the ratio (Sr:Ca)*1000 (Poszwa et al. 2000). The soil profile LP35 (Figure 38)
was selected for comparison of the (Sr:Ca)*1000 ratio distribution due to the availability of a
complete dataset on total (this work), acid leachable by 0.1 M HNO3 (this work) and
exchangeable with 0.5 M NH4NO3 (Skřivan - unpublished) Sr and Ca concentrations. The soil
profile can be divided into two stages. The first stage includes the O and A horizons which
have the characteristic sequence of (Sr:Ca)*1000 ratios total < acid leachable < exchangeable.
Low total (Sr:Ca)*1000 ratios in the O and A horizons result from the high Ca concentration
in the fresh organic material. The (Sr:Ca)*1000 ratio in the O horizon of 1.07 is controlled by
the ratio in leaves (1.31) at site LP35. A very slight increase of the total (Sr:Ca)*1000 ratio in
the A horizon is due to increased mixing with soil particles from the lower horizons with
increased ratio values. The difference between (Sr:Ca)*1000 ratio in the leachable fraction
was lower than that in the exchangeable fraction due to the higher Ca concentration in the
leachable fraction; the Sr concentration was similar in each. This suggests that nearly all of
the available Sr is present on the cation exchange complex, and that Ca may have an
additional source (apart from the cation exchange complex) in leaching of the organic
material or other soil particles (i.e. secondary or unweathered primary minerals).
The second stage of the soil profile typically has the sequence of (Sr:Ca)*1000 ratios
exchangeable < acid leachable < total, opposite that of the first stage. Values of the total
(Sr:Ca)*1000 ratio in horizons AB and Bv may be derived from mixing of material from the
top and bottom layers. The possible depletion of Ca in these layers arises from the preferential
mobilization of Ca during mineral weathering. The total ratio (Sr:Ca)*1000 found in the
84
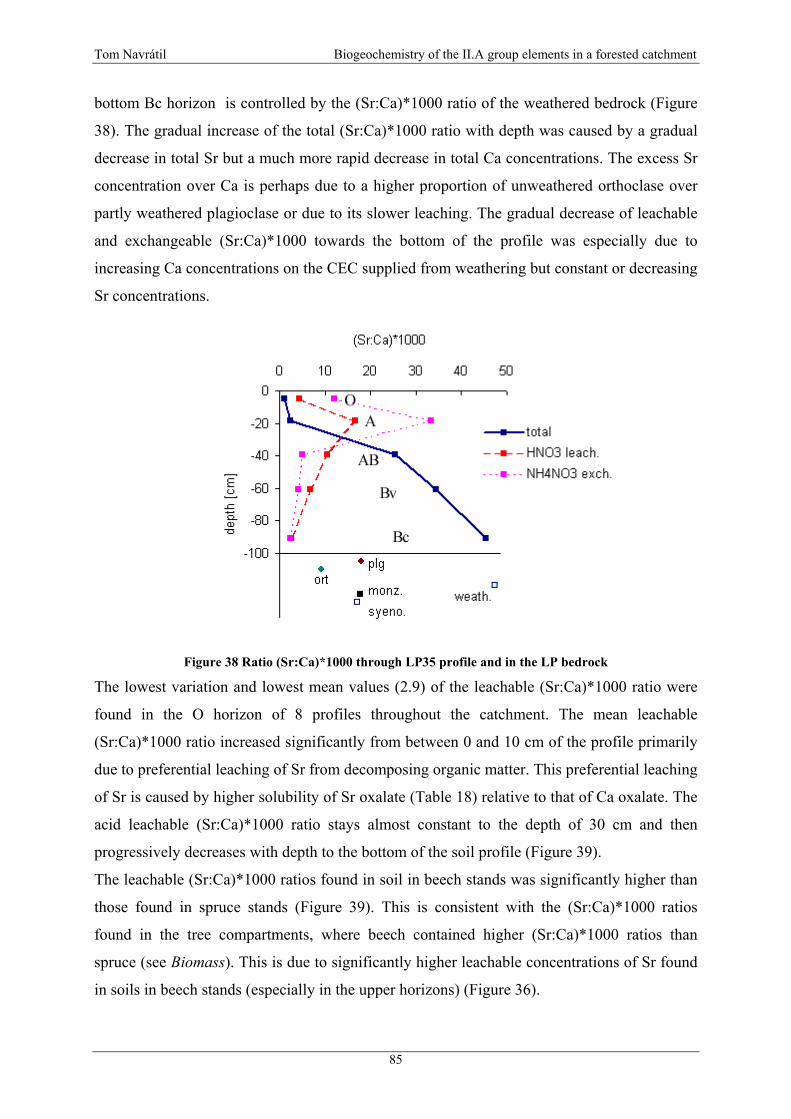
Tom Navrátil Biogeochemistry of the II.A group elements in a forested catchment
bottom Bc horizon is controlled by the (Sr:Ca)*1000 ratio of the weathered bedrock (Figure
38). The gradual increase of the total (Sr:Ca)*1000 ratio with depth was caused by a gradual
decrease in total Sr but a much more rapid decrease in total Ca concentrations. The excess Sr
concentration over Ca is perhaps due to a higher proportion of unweathered orthoclase over
partly weathered plagioclase or due to its slower leaching. The gradual decrease of leachable
and exchangeable (Sr:Ca)*1000 towards the bottom of the profile was especially due to
increasing Ca concentrations on the CEC supplied from weathering but constant or decreasing
Sr concentrations.
Figure 38 Ratio (Sr:Ca)*1000 through LP35 profile and in the LP bedrock
The lowest variation and lowest mean values (2.9) of the leachable (Sr:Ca)*1000 ratio were
found in the O horizon of 8 profiles throughout the catchment. The mean leachable
(Sr:Ca)*1000 ratio increased significantly from between 0 and 10 cm of the profile primarily
due to preferential leaching of Sr from decomposing organic matter. This preferential leaching
of Sr is caused by higher solubility of Sr oxalate (Table 18) relative to that of Ca oxalate. The
acid leachable (Sr:Ca)*1000 ratio stays almost constant to the depth of 30 cm and then
progressively decreases with depth to the bottom of the soil profile (Figure 39).
The leachable (Sr:Ca)*1000 ratios found in soil in beech stands was significantly higher than
those found in spruce stands (Figure 39). This is consistent with the (Sr:Ca)*1000 ratios
found in the tree compartments, where beech contained higher (Sr:Ca)*1000 ratios than
spruce (see Biomass). This is due to significantly higher leachable concentrations of Sr found
in soils in beech stands (especially in the upper horizons) (Figure 36).
85
Tom Navrátil Biogeochemistry of the II.A group elements in a forested catchment
The positive correlation of leachable Sr concentrations with Ca, K, C(ox), N(t) and Mn
(Annexes, Table 30) is a result of the linkages of these parameters with biogeochemical
recycling and decomposition of organic material in soil, as in the case of calcium.
-100
-80
-60
-40
-20
00 5 10 15 20
Sr:Ca*1000
dept
h [c
m]
MAXHNO3 leachMIN
-100
-80
-60
-40
-20
00 2 4 6 8
Sr:Ca*1000
dept
h [c
m]
BEECHSPRUCE
Figure 39 Ratio of average acid leachable (Sr:Ca)*1000 in soils of LP catchment and for sites with various afforestation
The pattern of Ba throughout the soil profile followed similar patterns as the essential
elements of the II.A group - Ca and Sr. The high concentrations of leachable Ba in the top
horizons of the soil were due to supplementary Ba in the assimilatory organs. Beech stand
soils contain on average less leachable Ba than soils in spruce stands (Figure 36), perhaps due
to the high concentrations of Ba in litterfall (Table 17). The enrichment of Ba in the O horizon
was not as pronounced as in case of Ca and Sr, a result of the higher Ba-oxalate solubility in
comparison to the oxalates of Ca and Sr. Thus barium may be mobilized more rapidly from
decomposing organic material and its higher concentrations in soil solution (see Soil solution)
in comparison to those of Sr support this idea.
5.1.2.5 Soil solution chemistry
Soil solution chemistry was studied only in beech stands (sites LP35 and LP6 see Figure 6).
The most important difference between the two sampling sites was soil organic matter content
(Table 10), which caused contrasting soil solution DOC concentrations. The throughfall
solutions deposited to the forest floor undergo a number of processes after infiltration into the
soil. Usually the soil solutions become more concentrated due to evaporation but they may
also be affected by adsorption, ion exchange reactions, and other processes.
The most significant difference in the average concentration of elements sampled at the same
depth at each site was found for H, K and NO3- (Table 11). The concentration of H+ was
greater at the high-organic profile LP35, due to increased production of organic acids. The
lower K and NO3- concentrations at site LP6 may be explained by lower biological activity
86
Tom Navrátil Biogeochemistry of the II.A group elements in a forested catchment
associated with the lower organic content at this site. Manganese concentration was
considerably greater at location LP6 because of higher acid leachable Mn concentrations at
that site. Aluminum concentration in soil solution was greater at site LP35 because of
significantly higher DOC concentrations. A high concentration of DOC in soil solution
induces a lower pH, which enhances Al complexing with organic acids (Hruška et al. 2001).
The differences in mean concentration of elements in throughfall and O horizon soil-water at
both sites followed similar patterns. The elements with the greatest positive concentration
change from throughfall to soil solution were Fe, Al, Be and Ba. The concentration of these
elements increased by at least 800% after the throughfall infiltrated the top 5 cm of soil. The
concentrations of Sr also increased sharply (500%) in soil solution when compared to
throughfall. Calcium concentrations remained the same from throughfall to soil solution at the
LP6 profile poor in organic material while Ca concentration approximately doubled at the
organic-rich profile LP35.
The concentrations of most elements in soil solution increased with depth, except for K and
Fe, which decreased with depth. High concentrations of K in shallow soil solution were
caused by the high content of organic material, which contains high concentrations of labile
K. The concentration of K at both profiles decreased with depth perhaps due to adsorption of
K onto the cation exchange complex or due to loss of K on behalf of the secondary minerals.
The decrease of Fe with depth is most probably due to precipitation of Fe hydroxides in the B
horizon and related loss of DOC (which complexes Fe) from solution.
Beryllium concentrations in soil solution increased with depth, in keeping with the increasing
concentrations of leachable Be with depth in soil profiles at the LP catchment. Similar
patterns of increasing Be concentrations with depth were also detected at Lysina catchment in
the western part of CR (Krám et al. 1998). Beryllium concentrations in soil solutions at
Lysina were lower than those at LP mainly due to the lower abundance of Be in soils and
bedrock (Navrátil 2000). Contrary to Al, higher Be concentrations were observed at a profile
with lower DOC concentrations in soil solution, which suggests that Be and DOC may not be
correlated (Annexes, Table 26).
Magnesium concentrations found in soil solution from all horizons of LP catchment were
higher than those reported from base poor Lysina catchment in the western part of CR (Krám
et al. 1997). Magnesium concentrations at LP were two fold higher in the O horizon and
nearly 4 fold higher in the B horizon than those at Lysina, as a result of significantly lower
Mg concentration (10 times) in the Lysina bedrock. Throughfall solutions contain
significantly elevated Mg concentrations from canopy leaching (see Throughfall) and due to
87
Tom Navrátil Biogeochemistry of the II.A group elements in a forested catchment
this some Mg may be lost to the topsoil cation exchange complex which is significantly
unsaturated in exchangeable Mg (Figure 37). The increased Mg:Ca ratio in the lower A
horizon suggests a slight increase of Mg on the cation exchange complex of A horizon soils
(Figure 37). A similar decrease of concentration from throughfall to O horizon soil solution at
both sampling sites was noted for Mn, but unlike Mg, Mn concentration continued to decrease
with increasing depth in the profile.
Calcium concentrations in throughfall increased slightly after infiltrating the first 5 cm of soil
and then more sharply after passage through another 10 cm of soil (Table 11). The cation
exchange complex of the top 5 and 15 cm of soil is more saturated with Ca in comparison to
Mg so there is more Ca available for leaching. In spite of their contrasting behavior in soil
solution with respect to throughfall, Mg and Ca concentrations in soil solution had a strong
positive correlation (Annexes, Table 26). The relationship of Ca and Mg concentrations
(Figure 40) was clearly affected by the loss of Mg from solution in the first 5 cm of the soil
profile. However at 45 cm depth at site LP6 the concentrations of Ca and Mg had a ratio close
to 1:1 (solid line).
This ratio was perhaps affected by the extreme Mg:Ca ratio (10.2) in the B layer of the LP33
profile, which is significantly enriched in acid leachable Mg (Table 10). The low acid
leachable Mg concentrations in layer Go of the LP6 profile suggest that favorable conditions
exist for Mg leaching and its consequent mobilization into deeper layers of the LP6 profile.
This mobilization of Mg towards the bottom of the profile may have caused an enrichment of
acid leachable Mg concentrations in layers below G0 (Table 10).
Calcium concentrations in soil solution from 5 cm depth at LP catchment (beech stand) were
comparable to those at Lysina (spruce stand). However, calcium concentrations in the lower
horizons of the LP catchment were approximately 3 fold higher. This difference is attributed
to the virtually complete depletion of exchangeable BC (mainly Ca) of the extremely base
poor soils (especially the lower horizons) at Lysina. The major decrease of soil base saturation
with depth to ~ 5% at Lysina (compared to ~ 14% at LP) had several possible causes: lower
content of BC in the bedrock, spruce monoculture (highly acidic throughfall, slow
decomposition of litterfall), almost double annual precipitation (greater flushing of soils), and
lower annual average temperature (slower weathering rates to re-supply cations).
The upper horizons are supplied with Ca from the litterfall and dry atmospheric deposition.
Toward the bottom of the profile, Ca is usually lost from soil solution due to biological uptake
or leaching and may be replaced in solution by soluble Al. The increase of Ca concentration
88

Tom Navrátil Biogeochemistry of the II.A group elements in a forested catchment
in soil solution with depth at LP catchment is probably due to the larger pool (2 times bigger)
of Ca in the soils and bedrock and the less intensive acidification of LP soils.
The increasing concentrations of Sr in soil solution with depth are a result of the increasing
acid leachable Sr concentration in LP catchment soils with depth (Figure 14). A linear
relationship of Ca and Sr concentrations (Figure 40) was found in LP soil solution, similar to
observations from other sites with granitic bedrock (Poszwa et al. 2000). The mean ratio of
(Sr:Ca)*1000 (2.84) in soil solution at LP catchment was much higher than the ratio at the
Aubure granitic catchment (Poszwa et al. 2000). This work reported a comparable ratio to LP
soil solution from the site Lutry (planted with spruce) on calcareous quaternary sediment
(‘molasse’) (Poszwa et al. 2000). The difference between the two granitic sites (Aubure and
LP) is a result of lower Ca concentration and higher Sr concentration in the LP soil solution.
The concentrations of Sr and Ca in soil solution are comparable to those from Lutry, however
due to lack of data (Poszwa et al. 2000) on bedrock and soil composition it was not possible to
make detailed conclusions.
0.0
0.1
0.2
0.3
0.4
0.5
0.6
0.7
0.8
0 200 400 600Ca ueq.L-1
Sr u
eq.L
-1
LP6-5cmLP6-15cmLP6-45cmLP35-5cmLP35-15cm
0
100
200
300
400
500
600
0 50 100 150 200Mg ueq.L-1
Ca
ueq.
L-1
1:1
Figure 40 Relationship of Ca vs Sr concentration and Mg vs Ca concentration in soil solution at LP catchment
Barium concentrations in soil solution were significantly lower than theoretically calculated
equilibrium Ba concentrations with respect to Ksp(BaSO4). This was perhaps due to a different
solid phase controlling the solubility and/or adsorption of Ba. There probably is no solid
phase of Ba less soluble than BaSO4 in the LP soils, so Ba concentration is probably
controlled by ion exchange and sorption reactions (Palmer 1999). The mean Ba
concentrations in soil solution were greater than those of Sr, suggesting that Sr concentration
is controlled by oxalate. Barium oxalate is more soluble than Sr oxalate (Table 18), which
explains the higher concentrations of Ba over Sr.
89

Tom Navrátil Biogeochemistry of the II.A group elements in a forested catchment
5.1.3 Losses from watershed ecosystem
5.1.3.1 Losses in stream water – concentrations, trends and patterns
The categorization of discharge conditions according to the actual stream discharge was
potentially misleading in terms of the stream chemical response. For example, a summer
rainstorm with initial discharge 0.05 L.s-1 and peak discharge 0.25 L.s-1 would be considered a
low discharge condition in the contest of the annual hydrograph, however its chemistry
corresponds to an episodic event situation. For this reason, the concentration of Fe was
selected as an indicator of high flow, low flow or base flow in the LP stream. Streamwater
chemistry at low discharge was very similar to shallow groundwater chemistry (Table 19).
The episodic events mask the groundwater signal in the surface water with more surficial
flow. During events pH decreased and concentrations of Ca, Mg, Al, Be, SO42-, F-, and NO3
-
increased. Concentrations of Na, Cl-, SiO2, Fe and Mn decreased as a result of dilution. The
increase of Be and Al concentrations during the episodic events was reported by Navrátil
2000.
Table 19 Average pH and solute concentrations of LP surface water at three flow regimes determined according to Fe concentrations during the monitored period 1994 - 2001
data for 1994 - 2001 lowest 25% central range highest 25% groundwater Q L s-1 4.84 2.11 0.09 pH 4.77 4.90 5.56 6.69 H+ µeq.L-1 17.1 12.5 2.8 0.2 Be µeq.L-1 1.51 1.33 0.76 0.05 Mg µeq.L-1 666 620 578 416 Ca µeq.L-1 1026 921 937 1205 Sr µeq.L-1 3.9 3.4 3.2 2.4 Ba µeq.L-1 0.59 0.53 0.77 0.43 Na µeq.L-1 349 377 445 653 K µeq.L-1 43 43 45 25 Mn µeq.L-1 6.5 8.5 20.2 31.3 Fe µeq.L-1 2.5 7.3 49.7 246.4 Al µeq.L-1 73.6 62.3 40.5 0.9 F- µeq.L-1 41 39 37 16 Cl- µeq.L-1 161 172 189 126 SO4
2- µeq.L-1 1700 1639 1529 930 NO3
- µeq.L-1 94.7 51.4 14.2 5.2
The concentration of SO42- in the LP surface water is decreasing rather slightly over time.
During the last 4 years the total output of SO42- was two times the input. Much of the sulfate
deposited during the period of heavy acid deposition (until 1999), which was adsorbed on the
acid soils due to the enhanced adsorption in acid conditions (Nodvin et al. 1986), is more
90

Tom Navrátil Biogeochemistry of the II.A group elements in a forested catchment
recently being exported from the catchment. The enhanced export of sulfate from the
catchment over time (with respect to its decreasing inputs to the catchment) is a result of
decreasing pH of the throughfall deposition and consequent increase of soil solution pH.
The LP surface water has a relatively high ionic strength due to a combination of chemical
weathering and high evapotranspiration in the catchment. The hydrological situation of the
catchment has a direct influence on the water chemistry (Table 19). Concentrations of Be,
Mg, Ca and Sr were higher during situations with increased discharge (Table 19). The reasons
for such increase of each element are different.
The enhanced mobility of beryllium reflects the presence of unbuffered H+ ions (decreased
pH), whose concentration in surface water increases with increasing discharge. The
concentrations of metals including Al and Be increase during high flows (Table 19, Figure 41)
and their export is enhanced.
0
1
2
3
4
4 5 6 7
pH
Be
ueq.
L-1
0
50
100
150
200
4 5 6 7
pH
Al u
eq.L
-1
Figure 41 The pH dependence of Be and Al concentration in LP surface water
The acidification of catchments results in enhanced Be export. This result is consistent with
other experimental studies (e.g. Kaste 1999, Navrátil 2000, Veselý et al. 2002). Beryllium
correlated strongly with concentrations of Al, probably due to the similarity of their charge-
to-ionic radius ratio (64.5 and 60.0 nm-1) (Krám et al. 1998), their similar behavior under
decreased pH conditions, and their similar tendency to bond with F- in the aquatic
environment.
Calcium and Mg in surface water effectively neutralize H+ ions. Less Be is exported as more
H+ that is neutralized by Ca and Mg. The slight increase of Ca concentration during low flow
situations is a result of the shallow groundwater signal in the stream. The shallow
groundwater contains lower concentrations than streamwater in all flow classes for all of the
II.A group elements except Ca. Decreasing values of the Mg:Ca ratio (Figure 42) through
91
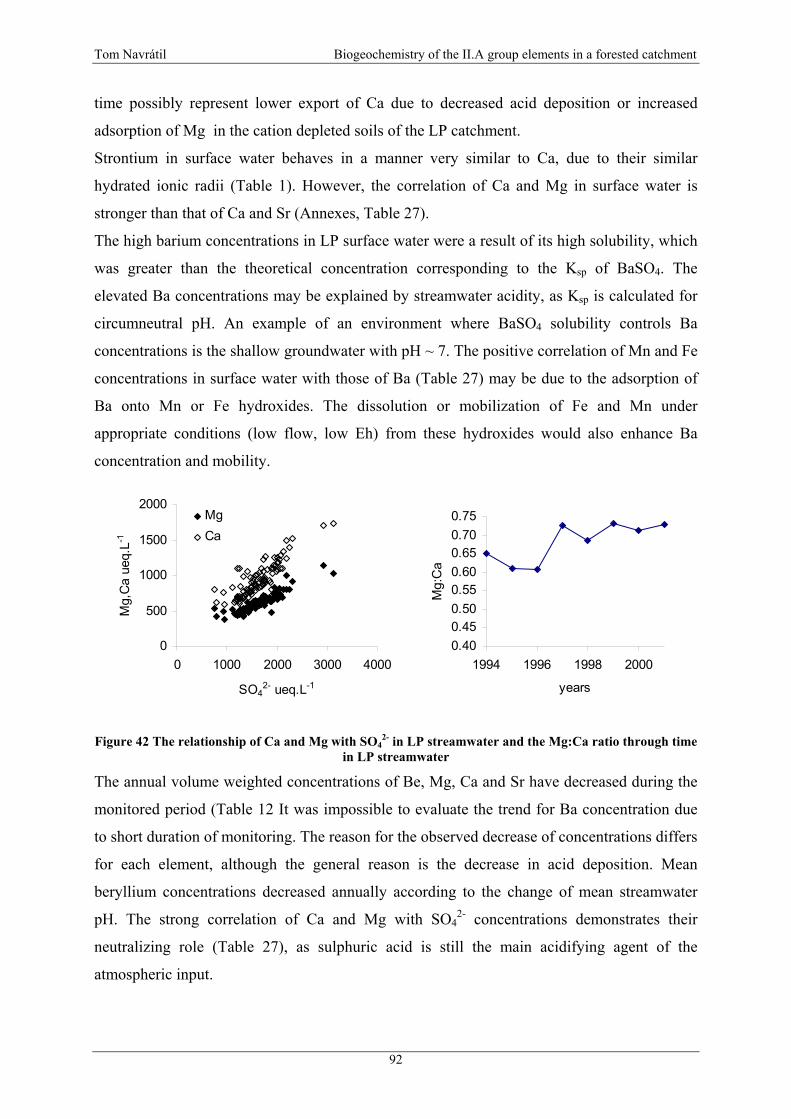
Tom Navrátil Biogeochemistry of the II.A group elements in a forested catchment
time possibly represent lower export of Ca due to decreased acid deposition or increased
adsorption of Mg in the cation depleted soils of the LP catchment.
Strontium in surface water behaves in a manner very similar to Ca, due to their similar
hydrated ionic radii (Table 1). However, the correlation of Ca and Mg in surface water is
stronger than that of Ca and Sr (Annexes, Table 27).
The high barium concentrations in LP surface water were a result of its high solubility, which
was greater than the theoretical concentration corresponding to the Ksp of BaSO4. The
elevated Ba concentrations may be explained by streamwater acidity, as Ksp is calculated for
circumneutral pH. An example of an environment where BaSO4 solubility controls Ba
concentrations is the shallow groundwater with pH ~ 7. The positive correlation of Mn and Fe
concentrations in surface water with those of Ba (Table 27) may be due to the adsorption of
Ba onto Mn or Fe hydroxides. The dissolution or mobilization of Fe and Mn under
appropriate conditions (low flow, low Eh) from these hydroxides would also enhance Ba
concentration and mobility.
0
500
1000
1500
2000
0 1000 2000 3000 4000
SO42- ueq.L-1
Mg,
Ca
ueq.
L-1
MgCa
0.400.450.500.550.600.650.700.75
1994 1996 1998 2000
years
Mg:
Ca
Figure 42 The relationship of Ca and Mg with SO42- in LP streamwater and the Mg:Ca ratio through time
in LP streamwater
The annual volume weighted concentrations of Be, Mg, Ca and Sr have decreased during the
monitored period (Table 12 It was impossible to evaluate the trend for Ba concentration due
to short duration of monitoring. The reason for the observed decrease of concentrations differs
for each element, although the general reason is the decrease in acid deposition. Mean
beryllium concentrations decreased annually according to the change of mean streamwater
pH. The strong correlation of Ca and Mg with SO42- concentrations demonstrates their
neutralizing role (Table 27), as sulphuric acid is still the main acidifying agent of the
atmospheric input.
92

Tom Navrátil Biogeochemistry of the II.A group elements in a forested catchment
5.1.3.2 Implications from the acidification experiment
The results of the acidification experiment suggested that an increase in stream acidity might
simulate long term processes, e.g. sulfate adsorption during the acidification and its
subsequent release or the depletion of base cations, leading to catchment acidification (Norton
et al. 1999) (Figure 23).
The SO42- behavior is dominated by pH-related changes in anion exchange capacity, with
adsorption increasing at lower pH. During the recovery stage, desorbed SO42- was released
from the stream substrate (Figure 43). This experiment supports the conclusions from Hruška
et al. (2002) who examined the release of SO42- from other catchment in CR. In general,
atmospheric deposition rates of SO42- have decreased in Europe and North America. Excess
SO42- in soils and stream sediment is now being desorbed and exported from many
catchments. At LP catchment the export of SO42- did not increase after the decrease of
atmospheric acidity in 1999. This may be due to variable loading (in contrast to the constant
loading in the experiment), but the output of SO42- from the catchment is higher than its
current input in throughfall (Annexes, Table 22).
Sodium behaved contrary to Ca, Mg, and K. The long-term concentration of Na correlates
negatively with discharge (Table 19) but was unaffected in the experiment. High discharge
events normally slightly enhance the export of K from the catchment but the difference
between the mean K concentrations for low and high discharge is small (Table 19). The
concentration of K changed less than 1 µeq.L-1 from the background value. Sodium and K
were relatively unaffected by in-stream processes during the acidification experiment due to
low exchangeable concentrations on the stream substrate (Table 13).
Beryllium, relatively to its streamwater concentration, was one of the most mobilized metals
during the acidification experiment. Its concentration increased throughout the experiment, in
contrast to all other II.A group elements, which decreased in concentration between 120 and
250 minutes of the experiment. The contribution of Be to neutralization was trivial. The long-
term correlation of Be and Al in streamwater was retained during the experiment (Annexes,
Table 28).
The typical positive correlation of Ca and Mg with concentrations of SO42- was not present
during the acidification experiment. Instead, Ca and Mg were positively correlated with Cl-,
which became the main acidifying anion (Annexes, Table 28). The long-standing positive
correlation of Ca and Mg in streamwater was retained during the experiment (Figure 25,
Table 28).
93

Tom Navrátil Biogeochemistry of the II.A group elements in a forested catchment
0.400.450.500.550.600.650.700.750.80
0 100 200
time
Mg:
Ca
60P
Figure 43 Changes of Mg:Ca ratio and SO42- concent
The range of the Mg:Ca ratio (0.64 – 0.73) du
Mg:Ca ratio (0.45 – 0.78) determined during
During the initial phase of the experiment, rele
the most important component of the acid neu
release of Al contributed more to the neutral
typical for chronically acidified streams drain
the bedrock or stream sediment. The Mg:Ca rat
desorption in greater proportion than Mg from
The highest Mg:Ca ratio occurred at 5 hrs,
adsorption during the recovery stage. At 5 hr
proportion to its stream concentration than was
Ca and Mg concentrations started to slowly in
recovered to its original value by the end of th
rate of recovery was slower than the rate
acidification phase.
Barium was most likely associated with the di
correlation of Ba and Be supported this idea (
detected during the recovery stage (Figure
explanation for this is the differing sources of
released Ca, Mg and Sr were mostly bound to t
substrate, where they started to re-adsorb durin
Be and Ba was most probably associated with
is generally not reversible, thus no re-adsorpt
9
L
300 400
[min]
-60
-40
-20
0
20
40
ci-c
0 of
SO
42- u
eq.L
-1
Mg:CaSO4
ration at point C during the acidification experiment
ring the experiment is within the range of the
the 7 years of monitoring the LP catchment.
ase of the divalent base cations Ca and Mg was
tralization. As this reservoir became depleted,
ization of the acid input. This mechanism is
ing catchments with low buffering capacity of
io was the lowest at 1 to 2 hours, indicating Ca
the stream substrate (Figure 43).
representing the start of the Ca and Mg re-
s (Figure 43), Mg was re-adsorbed in greater
Ca. Two hours after the acid addition stopped,
crease (Figure 26). Although the Mg:Ca ratio
e experiment, the concentrations had not. The
of mobilization of base cations during the
ssolution of phases rich in Al, Mn and Fe. The
Table 28). No re-adsorption of Ba and Be was
26) contrary to Ca, Mg and Sr. A possible
solutes released from the stream substrate. The
he cation exchange complex sites of the stream
g the recovery stage (Figure 26). But release of
dissolution of some solid phase, a process that
ion was observed. The correlation of both Be
4
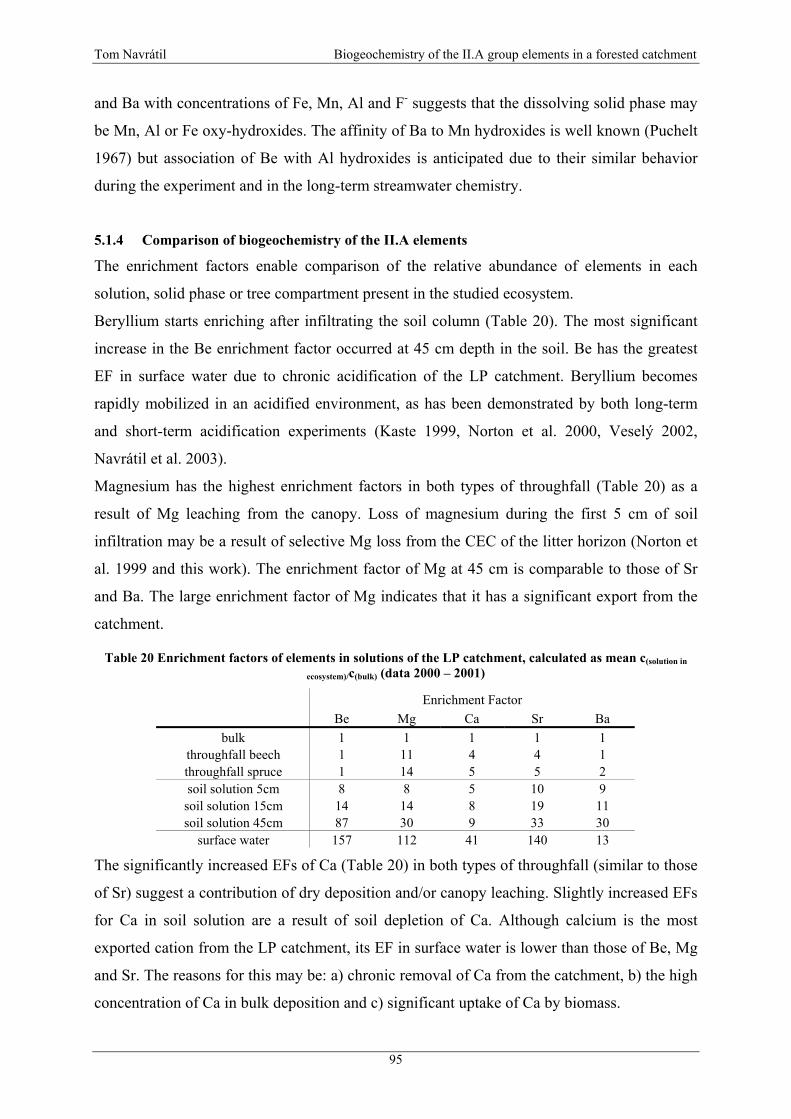
Tom Navrátil Biogeochemistry of the II.A group elements in a forested catchment
and Ba with concentrations of Fe, Mn, Al and F- suggests that the dissolving solid phase may
be Mn, Al or Fe oxy-hydroxides. The affinity of Ba to Mn hydroxides is well known (Puchelt
1967) but association of Be with Al hydroxides is anticipated due to their similar behavior
during the experiment and in the long-term streamwater chemistry.
5.1.4 Comparison of biogeochemistry of the II.A elements
The enrichment factors enable comparison of the relative abundance of elements in each
solution, solid phase or tree compartment present in the studied ecosystem.
Beryllium starts enriching after infiltrating the soil column (Table 20). The most significant
increase in the Be enrichment factor occurred at 45 cm depth in the soil. Be has the greatest
EF in surface water due to chronic acidification of the LP catchment. Beryllium becomes
rapidly mobilized in an acidified environment, as has been demonstrated by both long-term
and short-term acidification experiments (Kaste 1999, Norton et al. 2000, Veselý 2002,
Navrátil et al. 2003).
Magnesium has the highest enrichment factors in both types of throughfall (Table 20) as a
result of Mg leaching from the canopy. Loss of magnesium during the first 5 cm of soil
infiltration may be a result of selective Mg loss from the CEC of the litter horizon (Norton et
al. 1999 and this work). The enrichment factor of Mg at 45 cm is comparable to those of Sr
and Ba. The large enrichment factor of Mg indicates that it has a significant export from the
catchment.
Table 20 Enrichment factors of elements in solutions of the LP catchment, calculated as mean c(solution in
ecosystem)/c(bulk) (data 2000 – 2001)
Enrichment Factor Be Mg Ca Sr Ba
bulk 1 1 1 1 1 throughfall beech 1 11 4 4 1 throughfall spruce 1 14 5 5 2 soil solution 5cm 8 8 5 10 9
soil solution 15cm 14 14 8 19 11 soil solution 45cm 87 30 9 33 30
surface water 157 112 41 140 13
The significantly increased EFs of Ca (Table 20) in both types of throughfall (similar to those
of Sr) suggest a contribution of dry deposition and/or canopy leaching. Slightly increased EFs
for Ca in soil solution are a result of soil depletion of Ca. Although calcium is the most
exported cation from the LP catchment, its EF in surface water is lower than those of Be, Mg
and Sr. The reasons for this may be: a) chronic removal of Ca from the catchment, b) the high
concentration of Ca in bulk deposition and c) significant uptake of Ca by biomass.
95

Tom Navrátil Biogeochemistry of the II.A group elements in a forested catchment
The significantly increased EFs of Sr (Table 20) in both types of throughfall are similar to
those of Ca. The progressive enrichment of Sr in the upper horizons of the soil profile is due
to the high solubility of Sr oxalates as the upper horizons contain significant amounts of
organic material.
Table 21 Depletion factors of elements in bedrock derived compartments of the LP catchment, calculated as mean c(compartment of ecosystem)/c(bedrock)
Depletion Factor Be Mg Ca Sr Ba
bedrock 1.0 1.0 1.0 1.0 1.0 soil total 0.2 0.6 0.5 0.4 0.3
soil acid leachable 0.03 0.03 0.02 0.01 0.01 stream sediment total 0.8 0.6 0.7 0.4 0.3 stream sediment leach 0.4 0.2 0.4 0.1 0.0
Although Ba is significantly enriched in soil solution of the LP catchment (Table 20), its
enrichment in the surface water is the lowest. Barium is the least exported element of the II.A
group from the LP catchment due to the control of dissolved Ba ions by the low solubility
product of BaSO4 in deeper horizons.
The depletion factors (DFs) of catchment solid phases for II.A group elements are < 1, which
suggests gradual exhaustion of the elements with respect to bedrock, and simultaneously
ascribes low importance to their atmospheric inputs (Table 21). Depletion factors of total
element content in soils imply depletion of II.A group in the order: Be > Ba > Sr > Ca >Mg.
The lowest DF values (the highest depletion) of total soil concentration were found for Be due
to its rapid leaching and export from the catchment. Very low DF values were found for
leachable soil concentrations as these represent only a small part of the total concentrations.
Considerable DFs of II.A (with the exception of Be) were found for the total stream sediment.
Because stream sediment is partly derived from soils, DFs for soils and sediment were similar
(Table 21). However DFs of the leachable fraction were significantly higher for the elements
that had high export (Be, Mg, Ca and Sr). These increased DFs of the mobile fraction of II.A
group elements (except Ba) in surface water were reflecting (or controlling) the
concentrations of elements in surface water. The lowest DF of the mobile Ba fraction was due
to its low concentration in surface water.
96
Tom Navrátil Biogeochemistry of the II.A group elements in a forested catchment
6 Conclusions The comparative biogeochemical study of II.A group elements has proved to be a convenient
and useful tool to understand their relative dynamics in a selected experimental landscape.
The advantage of this approach is the ability to carry out the research simultaneously at
identical physicochemical conditions of the particular ecosystem. The biogeochemical
behavior of a chemical element is strongly dependent on numerous factors including the
chemistry of the bedrock, precipitation height, precipitation chemistry, mean annual
temperature, and type of vegetation cover.
Another advantage of the study was the study site, which is characterized by several
convenient features, including a relatively well-defined hydrologic area, bedrock sensitive to
acidification, bedrock rich in trace elements (Be, Ba), typical rural site with historically high
acid deposition rates, and a simplified forest cover with two dominant tree species.
Bedrock The abundance of II.A group elements in the bedrock decreased in the order Ca > Mg > Ba >
Sr > Be. The most important source of Be, Ca and Sr is plagioclase. Orthoclase is equally
important as a source of Sr and it is the major source of Ba. The highest concentrations of Mg
were found in biotite, the only mafic rock-forming mineral present.
Weathered rock was depleted in II.A elements in the following descending order: Ca (54%
lower concentration), Ba (40%), Be (31%) and Mg (17%). Surprisingly the concentration of
Sr was maintained perhaps due to resistance of orthoclase to weathering and/or the
incorporation of released Sr into secondary minerals.
Bulk precipitation The most abundant cation in bulk precipitation was Ca followed by Mg. The mean bulk fluxes
of Ca and Mg decreased after 1999 probably due to lower emissions of Czech industrial dusts
into the atmosphere. A strong correlation was present between the fluxes of Ca and Mg in
bulk precipitation had a strong positive correlation.
The concentrations and fluxes of Be, Sr and Ba in precipitation were low, especially after the
completion of desulphurization of all Czech power plants in 1999.
Throughfall The concentrations and fluxes of II.A group elements in precipitation change as a result of
interaction with tree canopy. The most significant difference between bulk and throughfall
fluxes was detected in the case of Mg as it was readily leached from the canopy. This
vigorous leaching of Mg is possible due to a different position of Mg (i.e. chlorophyll
97
Tom Navrátil Biogeochemistry of the II.A group elements in a forested catchment
molecules) in comparison to other II.A group elements in the canopy. In the case of beech,
Mg was the element with the greatest contribution to neutralization of the throughfall solutes.
In the case of spruce, the leaching of Mg and other elements was less than the contribution of
acidificants (N, S), which resulted in additional acidification of spruce throughfall. Calcium,
strontium, barium, and beryllium were leached to a lesser extent due to different position and
bonding in the assimilatory organs of the beech and spruce trees. Their concentration and
fluxes in throughfall were increased by evapotranspiration and/or washout of scavenged
particles, and also by leaching, though leaching was minor in comparison to that of Mg.
Vegetation The most important flux to the forest floor for all II.A group elements except Mg was
litterfall. Because of its high leaching rate, more than 60% of the annual flux of Mg to the
forest floor occurs as throughfall. However in the case of Be, Sr and Ba litterfall represents
more than 70% of the annual flux to the forest floor. In case of Ca the litterfall flux represents
almost 60% of the annual flux to the forest floor.
Significant uptake of toxic Ba was detected, especially in spruce trees. As in the bark and
especially the branches of spruce, Ba concentrations (similarly to the soil solution) were
higher than those of essential Sr.
Soil The acid soils at LP catchment are depleted most notably in Ca with respect to the bedrock
composition. Elevated leachable (0.1M HNO3) concentrations of Mg, Ca, Sr and Ba occurred
in the organic horizon as a result of biological recycling. The absence of a similar
accumulation of Be in the organic horizon suggests its rapid mobilization from the organic
material during and after its decomposition. Beryllium leachable concentrations increased
downwards in the soil profile due to its rapid mobilization under acid conditions. The
leachable concentrations of Mg, Ca, Sr and Ba decreased in the middle part of the profile,
then increased just above the bedrock due to weathering inputs.
Lower enrichment factors suggest depletion of II.A group elements in soil (total) with respect
to bedrock. The most significant (the lowest EF) is the depletion of Be due to its enhanced
mobility in an acidified environment. The least significant depletion was determined for Mg,
possibly due to the formation of secondary minerals (e.g. chlorite).
Soil solution Concentrations of all II.A group elements in soil solution increased with depth. The increase
from mean throughfall to soil solution concentrations of the II.A group elements indicated
98
Tom Navrátil Biogeochemistry of the II.A group elements in a forested catchment
that Be, Ba and Sr enter soil solution solution readily. The significant increase of Be and Ba in
the first 5 cm of the soil profile was especially due to rapid dissolution or leaching of
decomposing organic matter, which is supplied to the forest floor by litterfall. Beryllium, Ca,
Sr and Ba are stored in the assimilatory organs of trees in the form of oxalates. The solubility
of Be and Ba oxalates is the highest which explains their rapid leaching. Soil solution was the
only solution in the catchment that had higher concentrations of Ba than Sr.
Concentrations of Ca in soil solution remained relatively unchanged in comparison to those in
throughfall, while Mg concentrations decreased in soil solution. The decrease of Mg was
probably caused by cation exchange or biological uptake.
The highest EF of Be found in soil solution from 45 cm suggests rapid leaching of Be in the
bottom part of the soil profile due to increasing Be soil leachable concentrations. Low EF
values of Ca in soil solution are possibly a result of CEC depletion with respect to Ca or its
rapid biological uptake.
Streamwater The mean annual concentrations of Be, Ca, Mg and Sr in streamwater of LP catchment
gradually decreased due to differing reasons. The mean Be concentrations decreased as a
result of lower levels of acid deposition and consequential increased pH of streamwater.
Concentrations of Ca and Mg decreased due to the decrease of SO42- concentration in the
streamwater.
The decrease of SO42- concentration in turn is due to the decreased acid deposition loading to
the catchment.
The concentrations of Be, Mg, Ca and Sr increase during episodic events especially due to
concurrently increasing SO42- concentration.
Barium concentrations in the streamwater were higher than theoretical equilibrium
concentrations calculated with respect to the Ksp of BaSO4. The excess Ba in the streamwater
is probably the result of decreased pH, which has the effect of increasing the Ksp of BaSO4.
The solubility product of BaSO4 seems to limit the Ba concentrations in the LP circum-neutral
shallow groundwater.
Very high EF values of Be, Mg and Sr in streamwater suggest rapid export of these elements
with respect to their low concentrations in bulk precipitation. The relatively low EF of Ca for
streamwater may result from its highest concentration (from II.A group) in the bulk
precipitation or due to a significant sink of Ca in biomass uptake.
The EFs of Be, Mg, Ca and Sr leachable fractions in stream sediment were significantly
higher than those in soils. These increased EFs of the mobile fraction of the II.A group
99

Tom Navrátil Biogeochemistry of the II.A group elements in a forested catchment
(except Ba) elements in stream sediment reflected the concentrations of these elements in
surface water. Ba had the lowest EF of the leachable fraction in sediment, due to its low
abundance in surface water and low export rate from the catchment.
6.1 Summary on studied ratios
(Sr:Ca)*1000 The (Sr:Ca)*1000 ratio demonstrated that beech and spruce preferentially take up Ca over Sr.
The beech trees were more effective in preferential uptake of Ca similarly to other sites.
(Sr:Ca)*1000 ratios from the leachable fractions of soils were elevated in beech stands to a
greater extent than in spruce, particularly due to the higher Sr concentration in beech soils.
The (Sr:Ca)*1000 ratios of soil solution were significantly lower than those in the soil
exchange pool or those in the soil leachable fraction, perhaps as a result of significant Ca dry
deposition.
The lowest (Sr:Ca)*1000 ratios in total soil concentrations were found in the topmost layers O
and A are the result of preferential Ca uptake (as these layers contain significant amounts of
organic material) and also a result of increased solubility of Sr oxalates over those of Ca.
Mg:Ca High values of total soil Mg:Ca ratios contrast with low Mg:Ca ratios for exchangeable or
acid leachable ratios in the upper horizons O and A, suggesting possible preferential removal
of available Mg as has been implied by other authors. The low values of the Mg:Ca ratio of
the acid leachable and exchangeable soil fractions suggest proportionally increased
availability of Ca relative to Mg. The Mg:Ca ratios of soil solution are quite similar to the
Mg:Ca ratios of the leachable and exchangeable soil fractions. High Mg:Ca ratios of the
leachable fraction in the bottom layers of soil profiles suggest possible formation of secondary
minerals containing Mg (e.g. chlorite). The low Mg:Ca ratios of the soil exchange complex
support this idea.
Although Ca was preferentially depleted from soils during the high acid deposition period,
Mg more rapidly re-adsorbed to stream sediment. The long-term increase of the Mg:Ca ratio
in streamwater may indicate the position of the LP ecosystem on the Mg:Ca ratio curve
obtained from the acidification experiment and may represent evidence of recovery from acid
deposition induced soil acidification.
100

Tom Navrátil Biogeochemistry of the II.A group elements in a forested catchment
6.2 References Ambrož V (1942) Periglacial Views in Jevany district (in Czech), The Reports of the Central Czech Geological Institute 18, (9), 219 – 230
Anonymous (1962) - Beryllium. Environmental health criteria (106) Report of the United Nations Scientific Committee on the Effects of Atomic Radiation. Official Records of the General Assembly, Seventeenth Session, Supplement No. 16 (A/5216). United Nations. New York. http://www.inchem.org/documents/ehc/ehc/ehc106.htm
Armbruster M, MacDonald J, Dise NB, Matzner E (2002) Throughfall and output fluxes of Mg in European forest ecosystems: a regional assessment. Forest Ecology and Management 164, 137-147.
Atteia O (1994) Major and Trace Elements in Precipitation on Western Switzerland. Atmospheric Environment 28, pp. 3617-3624.
Beneš S (1994) Contents and budgets of elements in the environmental spheres (in Czech). Ministry of Agriculture, Czech Republic.
Berg T, Røyset O, Steinnes E (1994) Trace elements in atmospheric precipitation at Norwegian background stations (1989-1990) measured by ICP-MS. Atmosph. Environ. 28, 3519-3536.
Bouška V, Pešek J (1999) Quality parameters of lignite of the North Bohemian Basin in the Czech Republic in comparison with the world average lignite, International Journal of Coal Geology 40, 211-235.
Bytnerowicz A, Fenn ME (1996) Nitrogen deposition in California forests: a review. Environmental Pollution 92, l27-146.
Drury JS, Shriner CR, Lewis EB, Towil LE, Hammons AS (1978) Reviews of the Environmental Effects of Pollutants: VI. Beryllium. Unpublished Work.
Fairhall AW (1960) The Radiochemistry of Beryllium. Subcomittee on Radiochemistry, National Academy of Sciences, USA.
Fiala J, Vejnar Z, Kučerová D (1976) Composition of the biotites and coexisting biotite-hornblende pairs in granitic rocks of the Central Bohemian Pluton. Krystalinikum 12, 79-111.
Fottová D and Skořepová I (1998) Changes in mass element fluxes and their importance for critical loads: GEOMON network, Czech Republic. Water Air Soil and Pollution 105, 365-367.
Hons R, Tipková J, Minařík L, Absolon K (1990) Geochemical profile in the area of the Lesní potok stream, Říčany region. Bulletin of the Inst. Appl. Ecology, Czech Agric. University, Prague, 9, 85-95 (in Czech)
Hosker Jr. RP, Lindberg SE (1982) Review: atmospheric deposition and plant assimilation of gases and particles. Atmospheric Environment 16, 889-910.
Hruška J, Laudon H, Johnson CE, Kohler S, Bishop K (2001) Acid/base character of organic acids in a boreal stream during snowmelt. Water Resources Research, 37 (4), 1043-1056.
Hruška J, Moldan F, Krám P (2002) Recovery from acidification in central Europe—observed and predicted changes of soil and streamwater chemistry in the Lysina, catchment, Czech Republic, Environmental Pollution, 120, 261-274.
James AM and Lord MP (1992) Macmillan's chemical and physical data. Reference collection 540.212
Janoušek V (1991) Strontium isotopes in the Říčany granite. Masters thesis, Faculty of Sciences Charles University, Prague. (In Czech)
Janoušek V, Rogers G, Bowes DR (1995) Sr-Nd isotopic constraints on the petrogenesis of the Central Bohemian Pluton, Czech Republic. Geol Rundsch 84: 520-534.
Janoušek V, Rogers G, Bowes DR, Vankova V (1997) Cryptic trace-element variation as an indicator of reverse zoning in a granitic pluton: the Říčany granite, Czech Republic. Journal of the Geological Society 154: 807-815, Part 5
Kaste J (1999) Dynamics of Cosmogenic 7Be and Bedrock-Derived 9Be in Forested Ecosystems in Maine, U.S.A. - Unpub. M.Sc. Thesis, Department of Geological Sciences University of Maine, Orono.
Krám P (1997) Biogeochemistry of forest catchments in the Czech Republic with contrasting lithology under conditions of acidic deposition, Dissertation, Graduate School of Syracuse University.
101
Tom Navrátil Biogeochemistry of the II.A group elements in a forested catchment
Krám P, Hruška J, Driscoll CT (1998) Beryllium chemistry in the Lysina watershed, Czech Republic. Water Air Soil Pollut. 105: 409-415.
Krám P, Hruška J, Wenner BS, Driscoll CT, Johnson CE (1997) The biogeochemistry of basic cations in two forest catchments with contrasting lithology in the Czech republic. Biogeochemistry 37, 173-202.
Likens GE & Bormann FH (1995) Biogeochemistry of a Forested Ecosystem. Springer-Verlag, New York. Second Edition. 160pp.
Likens GE, Driscol CT, Buso DC, Siccama TG, Johnson CE, Lovett GM, Fahey TJ, Reiners WA, Ryan DF Martin CW, Bailey SW (1998) The biogeochemistry of calcium at Hubbard Brook, Biogeochemistry 41, 89-173.
Lindberg SE (1992) Atmospheric deposition and canopy interactions of sulfur. In: Johnson DW, Lindberg SE (Eds.), Atmospheric Deposition and Forest Nutrient Cycling, Ecological Studies 91. Springer, NewYork, pp.74-90.
Lotspeich FB and Markward EL (1963) Minor elements in bedrock soil, and vegetation at an outcrop of the Phosphoria formation on Snowdrift mountain, Southeastern Idaho. US Geol. Surv. Bull. 1181-F.
Lovett GM, Kinsmann JD (1990) Atmospheric pollutant deposition to high elevation ecosystems. Atmospheric Environment 24A, 2767-2786.
Mayer R, Ulrich B (1977) Acidity precipitation as influenced by altering of atmospheric sulphur and nitrogen compounds – its role in the element balance and effect on soil. Water, Air and Soil Pollution 7, 409-416.
Miller EK, Blum JD, Friedland AJ (1993) Determination of soil exchange-cation loss and weathering rates using Sr isotopes. Nature 362, 438-441.
Minařík L, Burian M and Novák JK (1997) Mobility of some metals during leaching of the rocks. Folia Fac. Sci. Nat. Univ. Mas. Brun., Geologica 39: 168-172.
Minařík L, Zigova A, Bendl J, Skrivan P, Stastny M (1998). The behaviour of REE and Y during the rock weathering and soil formation in the Ricany granite massif, Central Bohemia. The Science of the Total Environment 215: 101-111.
Minařík L, Houdková Z (1986). Element distribution during the weathering of granitic rocks and soil formation in the area of the Říčany massif. Acta Montana 74: 59-79 (in Czech).
Navrátil T (2000) Beryllium in waters of Czech forested ecosystems and the release of beryllium from granites. GeoLines 12, 18-40.
Navrátil T, Skřivan P, Minařík L, Žigová A. (2002) Beryllium Geochemistry in the Lesni Potok Catchment (Czech Republic), 7 Years of Systematic Study, Aquatic Geochemistry 8 (2), 121-133.
Navrátil T, Vach M, Norton SA, Skřivan P, Hruška J, Maggini L (2003) Chemical response of a small stream in a forested catchment (central Czech Republic) to a short-term in-stream acidification, Hydrology and Earth System Sciences 7 (3), 411-423.
Neal C, Jeffrey HA, Conway T, Ryland GP, Smith CJ, Neal M, and Norton SA (1992) Beryllium concentrations in rainfall, stemflow, throughfall, mist and stream waters for an upland acidified area of mid-Wales. J. Hydrol. 136: 33-49.
Němec D (1978). Genesis of aplite in the Říčany massif, central Bohemia. - Neues Jahrbuch fur Mineralogie, Abhandlungen, 132, 322-339.
Norton SA, Kahl J, Fernandez I (1999) Altered Soil-Soil Water Interactions Inferred from Stream Water Chemistry at an Artificially Acidified Watershed at Bear Brook Watershed, Maine USA. Environmental Monitoring and Assessment 55, 97-111.
Nodvin SC, Driscoll CT, and Likens GE (1986) The effect of pH on sulfate adsorption by a forest soil. Soil Science, 142, 69-75.
Palivcová M. (1965) The Central Bohemian pluton – a petrographic review and a attempt at new genetical interpretation. Krystalinikum, 99-131.
Podlešáková E, Němeček J (1994) Contamination of soils in the North-Bohemian Region by hazardous elements. Rostl. Vyr. 40: 123-130 (in Czech).
Poszwa A, Dambrine E, Pollier B, Atteia O (2000) A comparison between Ca and Sr cycling in forest ecosystems, Plant and Soil 225, 299-310.
102
Tom Navrátil Biogeochemistry of the II.A group elements in a forested catchment
Puchelt H (1967) Zur Geochemie des Grubenwassers im Ruhrgebiet. Z. Deutsch. Geol. Ges. 116, 167.
Roessler HJ, Lange H (1972) Geochemical tables, edition Liepzig 468pp
Ross HB, Lindberg SE (1994) Atmospheric chemical input to small catchments. In: Moldan B, Cerny J (Eds.), Biogeochemistry of Small Catchments, Scope 51.Wiley, Chichester, pp.55-84.
Sequens J (1998) Revize taxačních a přírodních poměrů na modelovém povodí Lesního potoka ve SPR Voděradské bučiny. Summarisation of results of the diploma works for the Final Report of the Research Project FRVS No. 0081/1998, 8 pp.
Skřivan P, Burian M (1996) First experience with the new type of throughfall collector. Abstract, Proc. of the Worksh. "Global Changes and Essential Elements Cycling in the Environment" Project SCOPE, GLÚ AV ČR, Praha 17. - 18.9., pp. 12-13
Skřivan P, Fottová D, Martínek J, Minařík L, Kvídová O and Burian M (1997) Biogeochemical fluxes of manganese in a Central - Bohemian forested catchment on granite bedrock. - J. Conf. Abs. 2, June 1997, 300. Cambridge Publ.
Skřivan P, Minařík L, Burian M, Martínek J, Žigová A, Kvídová O, Dobešová I, Navrátil T, Fottová D (2000) Biogeochemistry of beryllium in an experimental forested landscape of the ”Lesni potok ” watershed in Central Bohemia, CR. GeoLines 12, 41 – 62.
Skřivan P, Minařík L, Burian M, Vach M (1994) Cycling of beryllium in the environment under anthropogenic impact. Scientia Agric. Bohem. 25: 65-75.
Skřivan P, Navrátil T, Burian M (2000a) 10 years of monitoring the atmospheric inputs at the Černokostelecko region, Central Bohemia. Scientia Agric. Bohem., 31(2), 139-154.
Skřivan P, Navrátil T, Vach M, Sequens J, Burian M, Kvídová O (2002): Biogeochemical cycles of metals in the environment: factors controlling their content in the tissues of selected tree species. Scientia Agriculturae Bohemica 33, 71-78.
Skřivan P, Rusek J, Fottová D, Burian M and Minařík L (1995) Factors affecting the concentration of heavy metals in bulk atmospheric precipitation, throughfall and stemflow in central Bohemia, Czech Republic. Water, Air, and Soil Pollut. 85: 841-846.
Stachurski A, Zimka JR (2000) Atmospheric input of elements to forest ecosystems: a method of estimation using artificial foliage placed above rain collectors. Environmental Pollution 110, 345-356.
Vejnar Z (1974) Trace elements of the Central Bohemian Pluton. – Bulletin of Czech Geological Survey, 49, 1974.
Veselý J, Norton SA, Skřivan P, Majer V, Krám P, Navrátil T, and Kaste JM: Chapter 7: Environmental Chemistry of Beryllium, 291-317. in Reviews in Mineralogy and Geochemistry in Beryllium: Mineralogy, Petrology, and Geochemistry. Edward S. Grew, editor (2002) Vol. 50, 691 pp.
Veselý J. and Majer V. (1998): Hydrogeochemical mapping of Czech freshwaters. – Bulletin of Czech Geological Survey 73, 3, 1998.
Viewegh J. (2000) National Nature Reserve Voděradské Beech Stands (Národní přírodní rezervace Voděradské bučiny), (in Czech) – Czech Agricultural University, AOPK
Wang W (1986) The effect of River water on phytotoxicity of Ba, Cd and CR. Env. Pollution (Series B) 11, 193-204.
Wedepohl KH (1969-1978) Handbook of Geochemistry, II-1. Springer Verlag.
White AF, Bullen TD, Schulz M, Blum AE, Huntington TG, Peters NE (2001) Differential rates of feldspar weathering in granitic regoliths. Gch. and Cos. Acta 65, 847-869.
Wyttenbach A, Bajo S, Bucher J, Furrer V, Schleppi P, Tobler L (1995) The concentration of Ca, Sr, Ba and Mn in successive needle age classes of Norway spruce (Pice Abies L. Karst). Trees 10, 31-39.
Žigová A, Šťastný M (unpublished) The soil cover development of National Nature Reserve Voděradské Bučiny
103

Tom
Nav
rátil
B
ioge
oche
mis
try o
f the
II.A
gro
up e
lem
ents
in a
fore
sted
cat
chm
ent
7 A
nnex
es
Tab
le 2
2 A
nnua
l inp
ut a
nd o
utpu
t flu
xes o
f ele
men
ts a
t the
LP
catc
hmen
t
ye
arD
I pH
HB
eM
gC
aSr
Ba
Na
KM
n Fe
Al
FC
lSO
42-N
O3-
m
m
meq
.m-2
µe
q.m
-2m
eq.m
-2m
eq.m
-2µe
q.m
-2µe
q.m
-2m
eq.m
-2m
eq.m
-2
meq
.m-2
meq
.m-2
meq
.m-2
meq
.m-2
meq
.m-2
meq
.m-2
meq
.m-2
19
9466
6
45.9
7.
43.
616
.75.
12.
9 0.
41.
74.
01.
96
5824
19
9580
64.
21
42
.38.
9
BULK
4.
173.
511
.37.
75.
10.
71.
54.
81.
810
5927
1996
694
4.22
39.2
4.4
3.9
226.
82.
40.
71.
45.
02.
17
6029
1997
726
4.29
34.7
3.5
3.8
209.
03.
80.
81.
46.
51.
49
5632
1998
671
4.47
21.6
3.1
14.0
187.
14.
21.
01.
46.
20.
97
3824
1999
529
4.48
16.4
2.6
9.1
96.
72.
30.
51.
61.
90.
310
1220
2000
612
4.46
21.1
2.7
9.2
1216
4.5
2.0
0.6
1.5
2.6
0.4
723
2120
0174
14.
55
19
.73.
012
.05
153.
02.
40.
41.
51.
30.
45
2926
1997
366
3.91
39.6
2336
418.
949
.210
.51.
27.
93.
818
147
4719
9834
44.
08
19
.824
3335
8.3
60.7
9.4
0.9
5.2
2.7
2212
748
1999
288
4.29
12.2
1424
287.
533
.65.
30.
53.
31.
513
7547
2000
300
4.36
14.6
1829
3531
9.4
44.1
6.5
1.5
3.1
1.6
1982
57
SPRUCE THR.
2001
420
4.61
9.1
1826
3424
5.8
49.3
6.3
0.7
1.9
1.5
1375
4219
9742
74.
62
10
.914
2624
6.3
25.0
2.6
0.8
4.4
1.9
1047
2719
9839
84.
86
3.
330
4028
9.4
43.7
7.1
0.6
3.9
1.5
2047
1919
9937
34.
75
5.
89
2217
5.5
20.3
1.7
0.2
1.8
0.8
831
2820
0041
24.
84
8.
616
2724
185.
738
.22.
30.
31.
30.
913
3928
BEECH THR.
15.3
14.2
3.1
0.9
3.1
1.5
2.6
2.6
1.8
1.8
1.3
1.8
3.4
0.9
1.5
2001
484
4.75
8.2
1.7
1628
2517
4.6
36.0
2.6
0.6
3.0
1.0
938
2719
9740
0
23
.82.
118
3032
7.4
35.9
6.2
1.0
6.0
2.7
1492
3619
9837
4
10
.73.
127
3731
8.9
51.3
8.1
0.7
4.5
2.0
2083
3219
9933
5
8.
61.
312
2322
6.4
26.3
3.3
0.3
2.5
1.1
1051
2000
362
11.3
1.6
1728
2924
7.4
40.9
4.2
0.8
2.1
1.2
1559
41
INPUT
2001
456
8.6
1.5
1727
2920
5.1
42.0
4.3
0.6
2.5
1.2
1155
3419
9411
34.
83
1.
712
3.0
7311
338
.24.
70.
40.
113
.24.
613
200
1119
9512
24.
86
1.
725
9.2
8714
345
.24.
41.
20.
414
.15.
315
231
919
9615
14.
80
2.
431
5.5
102
168
681
53.3
5.7
1.4
0.5
18.7
6.6
1628
86
1997
985.
05
0.
912
7.6
5981
312
34.2
2.8
0.7
0.5
9.9
3.9
1216
04
1998
355.
15
0.
230
.719
2810
213
.51.
10.
20.
42.
21.
25
502
1999
734.
99
0.
775
.842
5722
725
.42.
00.
40.
47.
43.
18
111
520
0067
4.91
0.8
70.9
3651
192
3123
.11.
70.
30.
36.
12.
58
909
EXPORT
2001
634.
92
0.
873
.035
4816
932
22.9
1.4
0.3
0.5
6.1
2.3
791
436
10
4

Tom
Nav
rátil
B
ioge
oche
mis
try o
f the
II.A
gro
up e
lem
ents
in a
fore
sted
cat
chm
ent
Tab
le 2
3 C
orre
latio
n m
atri
x of
the
bulk
flux
es a
t site
TR
D
IpH
HB
eM
gC
aSr
Ba
Na
KFe
Mn
Al
FC
lN
O3-
SO42-
pH
1.00
n=46
; p <
0.0
01
H
0.
751.
00
B
e
0.69
0.71
1.00
Mg
0.
511.
00C
a
0.56
0.91
1.00
Sr
0.
571.
00B
a
0.82
0.88
0.79
0.59
1.00
Na
0.
571.
00K
0.57
0.61
0.65
0.89
1.00
Fe
0.
611.
00M
n
0.66
1.00
Al
0.
791.
00F
0.
570.
881.
00
NO
3-
0.69
0.76
0.71
0.61
0.66
0.82
0.51
0.73
1.00
SO42-
0.
69
0.67
0.53
0.76
0.74
0.88
0.81
1.00
DI
1.00
Cl
1.00
10
5

Tom
Nav
rátil
B
ioge
oche
mis
try o
f the
II.A
gro
up e
lem
ents
in a
fore
sted
cat
chm
ent
Tab
le 2
4 C
orre
latio
n m
atri
x of
the
spru
ce th
roug
hfal
l flu
xes a
t site
LP7
H
DI
pHB
eM
gC
aSr
Ba
Na
KM
nFe
Al
FC
lSO
42-N
O3-
NH
4+
1.
pH
1.
00n=
42; p
< 0
.001
-0
.0
1.
0
1
Mg
0.67
0.
67
1.00
Ca
0.
680.
760.
97
1.00
Sr
0.61
0.
69
0.56
0.
59
1.00
1.N
a
0.58
0.77
0.86
0.
911.
00K
0.
860.
79
0.74
0.58
1.
00M
n
0.
550.
690.
930.
900.
620.
770.
631.
001
Al
-0
.52
0.78
0.56
0.63
0.69
0.62
0.66
1.
00F
0.
560.
57
0.64
0.
81
1.00
Cl
0.
690.
630.
910.
910.
910.
790.
76
0.62
1.00
SO42-
0.69
0.69
0.80
0.91
0.92
0.80
0.73
0.86
0.65
0.63
0.85
1.00
NO
3-0.
80
0.84
0.
64
0.
560.
820.
860.
840.
660.
910.
811.
00
NH
4+0.
80
0.
52
0.
680.
710.
630.
850.
510.
660.
770.
750.
911.
00
DI
00
H
5
00
B
e
.5
3.0
0
Ba
00
Fe
.0
0
10
6
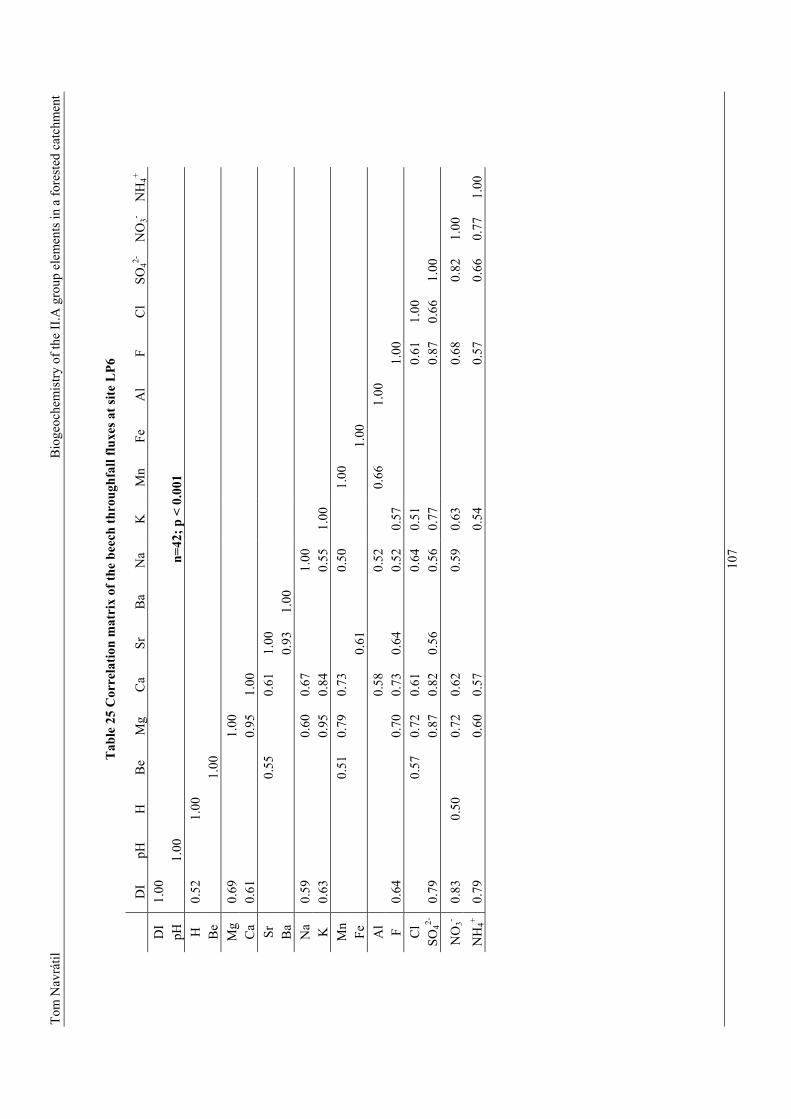
Tom
Nav
rátil
B
ioge
oche
mis
try o
f the
II.A
gro
up e
lem
ents
in a
fore
sted
cat
chm
ent
Tab
le 2
5 C
orre
latio
n m
atri
x of
the
beec
h th
roug
hfal
l flu
xes a
t site
LP6
pH
DI
HB
eM
gC
aSr
Ba
Na
KM
nFe
Al
FC
lSO
42-N
O3-
NH
4+
1.pH
1.00
n=42
; p <
0.0
01
0.
1.
1
0.
1C
a
0.61
0.95
1.
00Sr
0.
55
0.61
1.
000.
1.
Na
0.59
0.60
0.
67
1.00
K
0.63
0.95
0.
840.
55
1.00
Mn
0.
51
0.79
0.
730.
50
1.00
Fe
0.61
1.00
Al
0.58
0.
520.
66
1.00
F
0.
640.
70
0.73
0.
640.
52
0.57
1.
00C
l
0.7
5
0.72
0.
61
0.64
0.
510.
61
1.00
SO42-
0.79
0.87
0.82
0.56
0.56
0.77
0.87
0.66
1.00
NO
3-0.
83
0.
500.
720.
620.
590.
630.
680.
821.
00
NH
4+0.
79
0.
600.
570.
540.
570.
660.
771.
00
DI
00
H
52
00
B
e
.00
Mg
69
.0
0
Ba
9300
10
7

Tom
Nav
rátil
B
ioge
oche
mis
try o
f the
II.A
gro
up e
lem
ents
in a
fore
sted
cat
chm
ent
Tab
le 2
6 C
orre
latio
n m
atri
x of
the
LP
soil
solu
tion
para
met
ers
pHH
Be
Mg
Ca
SrB
aN
aK
Mn
FeA
lF
Cl
NO
3-SO
42-
1H
-0.8
3 1.
00n=
48; p
< 0
.001
1
M
g
0.
801.
00C
a
0.
690.
500.
871.
00Sr
0.
730.
940.
881.
00B
a
0.
571.
00N
a
0.
610.
930.
880.
881.
001
Mn
1.
00
0.62
0.56
Fe
0.58
1.00
Al
0.65
1.00
F
0.
690.
890.
780.
950.
801.
00C
l
0.
540.
720.
680.
680.
641.
00N
O3-
0.56
1.00
SO42-
0.57
1.00
0.
770.
960.
810.
950.
890.
94
pH
.00
Be
.00
K
.00
10
8

Tom
Nav
rátil
B
ioge
oche
mis
try o
f the
II.A
gro
up e
lem
ents
in a
fore
sted
cat
chm
ent
Tab
le 2
7 C
orre
latio
n m
atri
x fo
r 89
sam
ples
of t
he so
lute
s and
par
amet
ers f
rom
the
LP
stre
am w
ater
in p
erio
d 19
94 -
2001
pH
C
a Sr
B
a
BC
Q
HB
eM
gN
aK
FC
lN
O3-
SO42-
SiO
2A
lk.
Con
d.M
nA
lFe
1
-09
1.n=
89; p
< 0
.001
-0.
8 1.
B
e
-0
.67
0.57
1.
000
31
Ca
0.43
0.93
1.00
Sr
-0
.38
0.59
0.71
0.78
1.00
0N
a
0.
470.
570.
561.
000
1F
0.48
0.54
0.46
0.37
1.00
Cl
0.
410.
370.
640.
431.
00N
O3-
.00
1SO
42-
0.49
0.89
0.86
0.70
0.47
0.68
0.49
1.
00Si
O2
-0.5
50.
43
-0.4
10.
670.
50
-0.6
01.
00A
lk.
0.75
-0
.41
-0.4
20.
500.
530.
531.
00C
ond.
0.35
0.88
0.88
0.61
0.55
0.35
0.67
0.52
0.92
1.00
Mn
0.45
0.50
0.77
0.61
0.70
0.41
0.34
0.58
0.67
0.42
1.00
Al
0.44
-0.7
7 0.
630.
750.
520.
370.
470.
57
0.51
-0.4
3-0
.53
0.41
1.00
Fe
0.
49
0.71
0.39
0.62
0.34
0.53
0.69
0.75
1.00
BC
0.6
90.
980.
710.
680.
460.
460.
460.
860.
890.
541.
00
Q
.00
pH.3
00
H
7
00
Mg
.4
.00
Ba
.5
8
1.00
K
.4
4
.00
10
9

Tom
Nav
rátil
B
ioge
oche
mis
try o
f the
II.A
gro
up e
lem
ents
in a
fore
sted
cat
chm
ent
Tab
le 2
8 C
orre
latio
n m
atri
x fo
r so
lute
s in
15 sa
mpl
es fr
om th
e ac
idifi
catio
n ex
peri
men
t
pH
HB
eM
gC
aSr
Ba
Na
KFe
Mn
Al
FN
O3-
SO42-
Cl
BC
BC
/Al
1H
-0
.87
1.00
n
=15;
p<0
.001
1
Mg
1.
00
Ca
0.
97
1.00
Sr
0.
94
0.94
1.
00
Ba
0.91
0.
79
0.89
0.
82
1.00
Na
1.
00
K
0.92
0.
91
0.87
1.00
Fe
0.82
0.79
1.
00
Mn
0.89
0.82
0.78
1.00
Al
0.95
0.86
0.
83
0.93
1.
00
F
0.
88
0.78
0.
88
0.74
0.
93
1.
00
N
O3-
.0
0
1
SO42-
1.
00
C
l
-0
.85
0.85
0.77
0.81
1.00
BC
0.98
1.
00
0.95
0.
87
0.
90
0.
86
0.77
1.
00
B
C/A
l
pH
.00
Be
.00
-0
.81
-0.7
7 -0
.85
-0.9
11.
00
11
0

Tom
Nav
rátil
B
ioge
oche
mis
try o
f the
II.A
gro
up e
lem
ents
in a
fore
sted
cat
chm
ent
Tab
le 2
9 C
orre
latio
n m
atri
x fo
r pa
ram
eter
s of s
hallo
w g
roun
dwat
er
Q
(s
tream
) gr
ound
wr
leve
l pH
N
O3-
H
Be
Mg
Ca
SrN
aK
FC
lSO
42-Si
O2
Mn
FeA
lQ
(stre
am)
001.
gw
r lev
el-0
.88
1.
00
n=2
2; p
< 0
.001
pH
1.00
H
0.76
-0.9
41.
00
Be
0.85
-0.7
60.
741.
00
Mg
-0.8
40.
92-0
.82
1.00
C
a -0
.97
0.98
-0.7
7-0
.97
0.87
1.00
Sr
0.87
1.00
1
Na
-0.9
80.
98-0
.78
-0.9
80.
861.
000.
851.
00K
-0
.93
0.96
-0.7
1-0
.92
0.86
0.98
0.89
0.
96
1.00
F
1.00
C
l
-0.7
1-0
.77
-0.7
60.
750.
791.
00N
O3-
.0
0
1SO
42-
-0.7
10.
73
-0.7
1-0
.78
-0.7
4 -0
.81
1.
00
Si
O2
-0.9
7 0.
97
-0
.71
-0.9
70.
800.
980.
88
0.98
0.
96
0.74
1.00
M
n
-0
.78
0.75
0.97
0.97
0.95
0.70
0.96
1.00
Fe
0.
72-0
.76
-0.6
70.
700.
890.
87
0.89
0.81
0.84
1.00
Al
0.81
-0
.89
-0.9
1 -0
.82
-0.7
2
-0.8
7
1.
00
Ba
Ba
.00
11
1
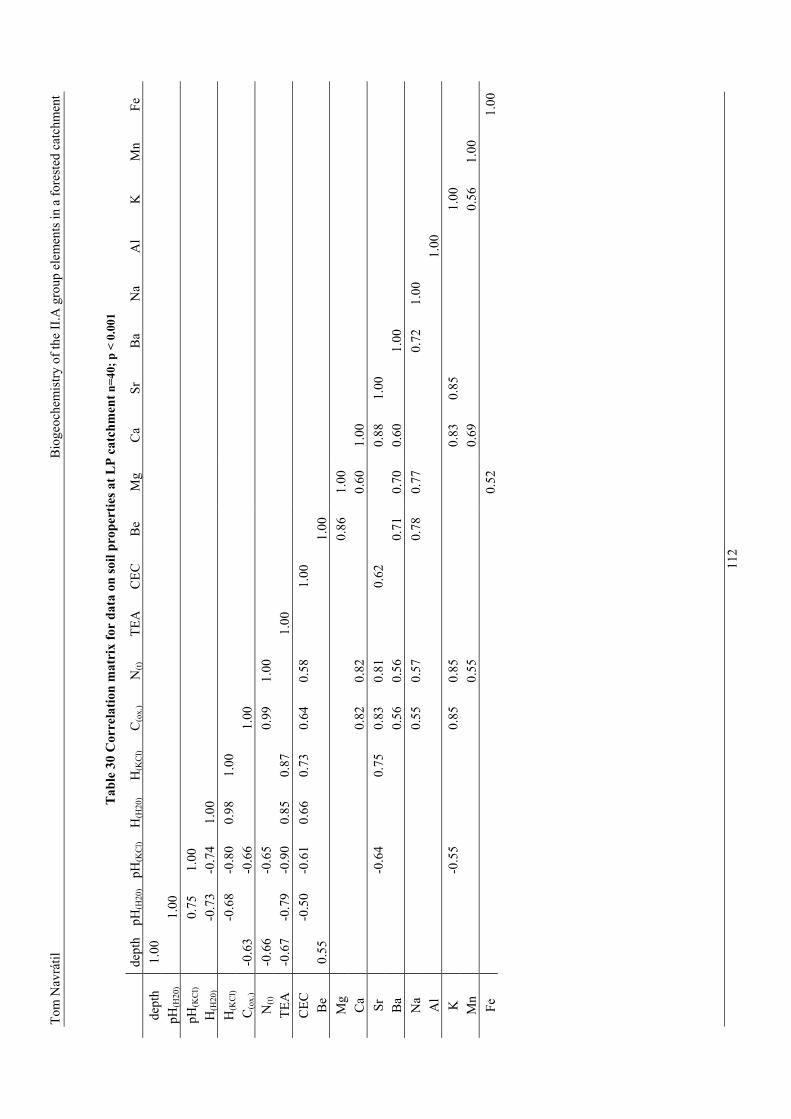
Tom
Nav
rátil
B
ioge
oche
mis
try o
f the
II.A
gro
up e
lem
ents
in a
fore
sted
cat
chm
ent
Tab
le 3
0 C
orre
latio
n m
atri
x fo
r da
ta o
n so
il pr
oper
ties a
t LP
catc
hmen
t n=4
0; p
< 0
.001
de
pth
pH(H
20)
pH(K
Cl)
H
C
N
H
(H20
)(K
Cl)
(ox.
)(t)
TEA
CEC
Be
Mg
Ca
SrB
aN
aA
lK
Mn
Fede
pth
1.
00
pH
(H20
)
1.00
pH(K
Cl)
0.
75
1.
00H
(H20
)
-0.7
3
-0
.74
1.00
H
(KC
l)
-0.6
8
-0.8
00.
981.
00C
(ox.
)
-0.6
3
-0.6
6
1.
00
N
(t)
-0
.66
-0
.65
0.99
1.00
TEA
-0.6
7-0
.79
-0.9
00.
850.
87
1.
00
C
EC
-0
.50
-0
.61
0.66
0.73
0.64
0.58
1.
00
Be
0.55
1.00
M
g
0.86
1.00
Ca
0.
82
0.
82
0.60
1.00
Sr
-0.6
4
0.75
0.83
0.81
0.
62
0.88
1.00
Ba
0.
56
0.56
0.71
0.70
0.60
1.
00
N
a
0.55
0.57
0.78
0.77
0.72
1.00
Al
1.
00
K
-0.5
5 0.
850.
850.
83
0.85
1.
00
Mn
0.55
0.
69
0.56
1.00
Fe
0.52
1.
00
11
2

Tom Navrátil The Biogeochemistry of the II.A Group Elements in a Forested Catchment
8 Bibliography, Vita NAME: Tom Navrátil
PLACE OF BIRTH: Klatovy, Czech Republic
BIRTH DATE: February 1, 1976
SCHOOLS ATTENDED
Graduate School, Faculty of Science, Charles University Prague, 1999 - 2003
Masters Degree, Faculty of Science, Charles University Prague, 1997 - 1999
Bachelors Degree, Faculty of Science, Charles University Prague, 1994 - 1997
Secondary education, Gymnazium Arabská 1990 - 1994
List of selected publications SKŘIVAN P., NAVRÁTIL T., BURIAN M. (2000): 10 years of monitoring the atmospheric inputs at the Černokostelecko region, Central Bohemia. Scientia Agriculturae Bohemica, 31(2), 139-154. NAVRÁTIL T., SKŘIVAN P., FOTTOVÁ D. (2000): Human- and Climate- Induced Changes in the Surface Stream Activity Affecting the Element Cycling. GeoLines 11, 45 - 47. SKŘIVAN, P., MINAŘÍK, L., BURIAN, M., MARTÍNEK, J., ŽIGOVÁ, A., DOBEŠOVÁ, I., KVÍDOVÁ, O., BENDL, J., NAVRÁTIL T., FOTTOVÁ, D. (2000): Biogeochemistry of beryllium in an experimental forested landscape of the “Lesní potok “ catchment in Central Bohemia, Czech Republic. GeoLines 12, 41 - 62 NAVRÁTIL T. (2000): Beryllium in Waters of Czech Forested Ecosystems and the release of Beryllium from Granites, GeoLines 12, 19 - 40 NORTON S.A., WAGAI R., NAVRÁTIL T., KASTE J.M., RISSBERGER F.A.(2000): Response of a First-order Stream in Maine to Short-term Instream Acidification, Hydrology and Earth System Sciences, 4(3), 383-391. SKŘIVAN P., NAVRÁTIL T., VACH M., SEQUENS J., BURIAN M., KVÍDOVÁ O. (2002) Biogeochemical cycles of metals in the environment: factors controlling their content in the tissues of selected tree species. Scientia Agriculturae Bohemica 33, 71-78. (ISSN 0582-2343) NAVRÁTIL T., SKŘIVAN P., MINAŘÍK L. AND ŽIGOVÁ A. (2002) Beryllium Geochemistry in the Lesni Potok Catchment (Czech Republic), 7 Years of Systematic Study, Aquatic Geochemistry 8 (2), 121-133. (ISSN 1380-6165) VESELÝ J., NORTON S.A., SKŘIVAN P., MAJER V., KRAM P., NAVRÁTIL T., and KASTE J. M.: Chapter 7: Environmental Chemistry of Beryllium, 291-317. in Reviews in Mineralogy and Geochemistry (ISSN 1529-6466) BERYLLIUM: MINERALOGY, PETROLOGY, AND GEOCHEMISTRY. Edward S. Grew, editor (2002) Vol. 50, 691 pp. ISBN 0-939950-62-6 NAVRÁTIL T., MINAŘÍK L. (2002): Trace Elements and Contaminants, in Earth’s System: History and Natural Variability, edited by CILEK V., SMITH R.H., in Encyclopedia of Life Support Systems (EOLSS), Developed under auspices of the UNESCO, Eolss Publishers, Oxford, UK, [http://www.eolss.net] NAVRÁTIL T., VACH M., NORTON S.A., SKŘIVAN P., HRUŠKA J., MAGGINI L. (2003) Chemical response of a small stream in a forested catchment (central Czech Republic) to a short-term in-stream acidification, Hydrology and Earth System Sciences 7 (3), 411-423
113