Hydrological and seasonal export mechanisms for nitrate transport from a forested catchment
9
Hydrological and seasonal export mechanisms for nitrate transport from a forested catchment This article has been downloaded from IOPscience. Please scroll down to see the full text article. 2008 IOP Conf. Ser.: Earth Environ. Sci. 4 012049 (http://iopscience.iop.org/1755-1315/4/1/012049) Download details: IP Address: 193.2.92.103 The article was downloaded on 15/05/2013 at 15:53 Please note that terms and conditions apply. View the table of contents for this issue, or go to the journal homepage for more Home Search Collections Journals About Contact us My IOPscience
Transcript of Hydrological and seasonal export mechanisms for nitrate transport from a forested catchment

Hydrological and seasonal export mechanisms for nitrate transport from a forested catchment
This article has been downloaded from IOPscience. Please scroll down to see the full text article.
2008 IOP Conf. Ser.: Earth Environ. Sci. 4 012049
(http://iopscience.iop.org/1755-1315/4/1/012049)
Download details:
IP Address: 193.2.92.103
The article was downloaded on 15/05/2013 at 15:53
Please note that terms and conditions apply.
View the table of contents for this issue, or go to the journal homepage for more
Home Search Collections Journals About Contact us My IOPscience

Hydrological and seasonal export mechanisms for nitrate transport from a forested catchment
S Rusjan, M Mikoš and M Brilly
University of Ljubljana, Faculty of Civil and Geodetic Engineering, Jamova cesta 2, 1000 Ljubljana, Slovenia
E-mail: [email protected]
Abstract. Understanding of interactions between hydrological and biogeochemical responses of catchments on rainfall events is usually unclear from periodic measurements and requires tracing of the temporal dynamics of the processes. Smaller streams reflect strong connections between hydrological processes of the rainfall runoff formation and biogeochemical processes in the catchment; consequently, the responsiveness of the streamwater chemistry to changed hydrological states is very high. The study was carried out in 2007, within the 42 km2 forested Padež catchment in the southwestern part of Slovenia, which is characterized by distinctive flushing, an almost torrential hydrological regime influenced by impermeable flysch geological settings. Recorded hydrographs which, in the hydrological and biogeochemical sense, differed substantially, disclosed a highly variable, but at the same time a strong linkage between hydrological, biogeochemical and particular topographic controls of nitrate exports from the spatial perspective of a studied catchment. The role of specific hydrological events on the nitrate mobilization proved to be important as the size of the accumulated nitrate pool available for mobilization was large throughout the observed hydrographs. The biogeochemical environment of the forest soils presumably significantly affects the size of the available nitrate pool in the studied catchment.
1. IntroductionForest hydrology studies show a great complexity of interacting influences on the water cycle. Forest systems notably affect the hydrological responses of the basins. In order to understand the formation of forest hydrologic flowpaths and the way how these flowpaths affect stream chemistry, we need chemical measurements at time scales that correspond to hydrological dynamics. Conversely, the stream chemistry tracing enables us to decipher the hydrological processes [1, 2, 3]. High frequency chemical measurements are also essential for testing hydrological models. Hydrological data alone are rarely sufficient to test the process assumptions embedded into a typical hydrological model. For analysis, future prediction and modeling of biogeochemical fluxes across land-lentic and land-lotic interfaces within the landscape, catchments become an important studying spatial unit. Both, hydrological and geochemical or other water chemistry time-series data are needed to identify appropriate model structures and constrain their parameters [4].
The understanding of how hydrological conditions trigger flushing of labile nutrients on a catchment scale is still rather poor, especially if we move from the timescale of seasonal variability towards the timescale of a single hydrological event. But it is just during hydrologically versatile periods that important interactions between hydrologic biogeochemical flowpaths can be observed.
XXIVth Conference of the Danubian Countries IOP PublishingIOP Conf. Series: Earth and Environmental Science 4 (2008) 012049 doi:10.1088/1755-1307/4/1/012049
c© 2008 IOP Publishing Ltd 1

Furthermore, the ecological zones of transition constitute soil-water interfaces where the biogeochemical environments controlling the fate of nutrient transformations change rapidly during hydrological events. Factors that affect the hydrological routing and transport of different chemical forms of nutrients in these zones include [5, 6]: antecedent wetness conditions, temperature conditions, pedologic factors, vegetation composition and topographic position (i.e. proximity to the stream channel). In addition, near-stream variable source areas typically control the stormflow hydrologic responses of upland forested catchment and are sites of rapid water-table responses [7]. Consequently, these areas express great magnitude of dynamics, both in its hydrological response and biogeochemical environment.
We believe that for progress to be made in understanding the role of integral hydrological controls on nitrate flushing, a shift away from the complexity of individual microscale processes observed at low time frequency is needed towards making improvements of observations on a time step of hydrological events. Hydrological routing through variable biogeochemical environments is undoubtedly an area of great uncertainty in regards of process understanding; however a spatially holistic view at a high-frequency temporal basis can offer additional opportunities to study the hydrologically induced biogeochemical routing of different forms of nutrients.
This paper presents a study that examines the seasonality of the nitrate dynamics in a mesoscale catchment in Slovenia covered mainly by deciduous forest with the emphasis on high-frequency measurements of streamwater nitrate concentration during rainfall events of contrasting magnitudes occurring in different seasons.
2. Study areaThe Padež stream catchment comprises 42.1 km2 and is situated in the Southwestern part of
Slovenia (Figure 1).
Figure 1. The study area and the monitoring system.
XXIVth Conference of the Danubian Countries IOP PublishingIOP Conf. Series: Earth and Environmental Science 4 (2008) 012049 doi:10.1088/1755-1307/4/1/012049
2
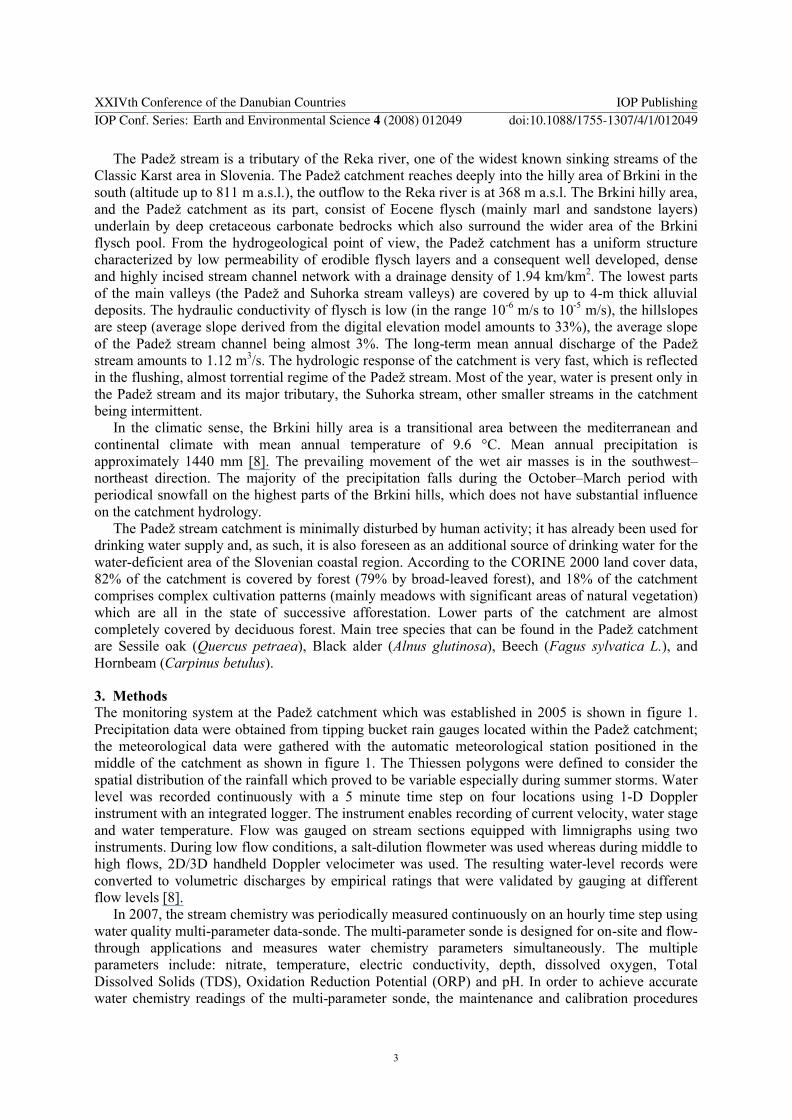
The Padež stream is a tributary of the Reka river, one of the widest known sinking streams of the Classic Karst area in Slovenia. The Padež catchment reaches deeply into the hilly area of Brkini in the south (altitude up to 811 m a.s.l.), the outflow to the Reka river is at 368 m a.s.l. The Brkini hilly area, and the Padež catchment as its part, consist of Eocene flysch (mainly marl and sandstone layers) underlain by deep cretaceous carbonate bedrocks which also surround the wider area of the Brkini flysch pool. From the hydrogeological point of view, the Padež catchment has a uniform structurecharacterized by low permeability of erodible flysch layers and a consequent well developed, dense and highly incised stream channel network with a drainage density of 1.94 km/km2. The lowest parts of the main valleys (the Padež and Suhorka stream valleys) are covered by up to 4-m thick alluvial deposits. The hydraulic conductivity of flysch is low (in the range 10-6 m/s to 10-5 m/s), the hillslopes are steep (average slope derived from the digital elevation model amounts to 33%), the average slope of the Padež stream channel being almost 3%. The long-term mean annual discharge of the Padež stream amounts to 1.12 m3/s. The hydrologic response of the catchment is very fast, which is reflected in the flushing, almost torrential regime of the Padež stream. Most of the year, water is present only in the Padež stream and its major tributary, the Suhorka stream, other smaller streams in the catchmentbeing intermittent.
In the climatic sense, the Brkini hilly area is a transitional area between the mediterranean and continental climate with mean annual temperature of 9.6 °C. Mean annual precipitation is approximately 1440 mm [8]. The prevailing movement of the wet air masses is in the southwest–northeast direction. The majority of the precipitation falls during the October–March period with periodical snowfall on the highest parts of the Brkini hills, which does not have substantial influence on the catchment hydrology.
The Padež stream catchment is minimally disturbed by human activity; it has already been used for drinking water supply and, as such, it is also foreseen as an additional source of drinking water for the water-deficient area of the Slovenian coastal region. According to the CORINE 2000 land cover data, 82% of the catchment is covered by forest (79% by broad-leaved forest), and 18% of the catchmentcomprises complex cultivation patterns (mainly meadows with significant areas of natural vegetation) which are all in the state of successive afforestation. Lower parts of the catchment are almost completely covered by deciduous forest. Main tree species that can be found in the Padež catchmentare Sessile oak (Quercus petraea), Black alder (Alnus glutinosa), Beech (Fagus sylvatica L.), and Hornbeam (Carpinus betulus).
3. MethodsThe monitoring system at the Padež catchment which was established in 2005 is shown in figure 1. Precipitation data were obtained from tipping bucket rain gauges located within the Padež catchment; the meteorological data were gathered with the automatic meteorological station positioned in the middle of the catchment as shown in figure 1. The Thiessen polygons were defined to consider the spatial distribution of the rainfall which proved to be variable especially during summer storms. Water level was recorded continuously with a 5 minute time step on four locations using 1-D Doppler instrument with an integrated logger. The instrument enables recording of current velocity, water stage and water temperature. Flow was gauged on stream sections equipped with limnigraphs using two instruments. During low flow conditions, a salt-dilution flowmeter was used whereas during middle to high flows, 2D/3D handheld Doppler velocimeter was used. The resulting water-level records were converted to volumetric discharges by empirical ratings that were validated by gauging at different flow levels [8].
In 2007, the stream chemistry was periodically measured continuously on an hourly time step using water quality multi-parameter data-sonde. The multi-parameter sonde is designed for on-site and flow-through applications and measures water chemistry parameters simultaneously. The multiple parameters include: nitrate, temperature, electric conductivity, depth, dissolved oxygen, Total Dissolved Solids (TDS), Oxidation Reduction Potential (ORP) and pH. In order to achieve accurate water chemistry readings of the multi-parameter sonde, the maintenance and calibration procedures
XXIVth Conference of the Danubian Countries IOP PublishingIOP Conf. Series: Earth and Environmental Science 4 (2008) 012049 doi:10.1088/1755-1307/4/1/012049
3

including regular cleaning of the sensors and replacement of ion-selective nitrate sensor was carefully followed. Additionally, biweekly grab water samples mainly during baseflow conditions were taken form January to November 2006 at the site where multi-parameter sonde was installed for laboratory analysis in order to control the multi-parameter sonde readings.
Measurements of stream water and rainfall electric conductivity were used to perform a two-component hydrograph separation and define the proportion of event and pre-event water in the hydrographs. The electrical conductivity of stream water was measured continuously during hydrograph episodes whereas the electrical conductivity of rainfall was measured in a bulk sample. Measurements of the nitrate concentration in bulk rainfall samples during different episodes showed small concentrations of nitrate in rainfall (i.e. bellow 0.2 mg/l). Thus the atmospheric input of nitrogen with rainfall was not considered as an important source of stream water nitrate during hydrological events.
The field measurements of water chemistry using multi-parameter data-sonde are undoubtedly less accurate than laboratory analysis and will probably never match the dependability of laboratory analysis on bottled samples, but the multi-parameter sondes provide temporal flexibility of measurements that cannot be captured by sporadic grab sampling [3, 9].
4. Results and discussion
4.1 Continuous streamwater nitrate concentration measurementsIn 2007, the continuous nitrate concentration measurements were carried out mainly in late spring summer and early autumn. Some hydrological characteristics of the observed rainfall events are summarized in table 1.
Table 1: Characteristics of the observed rainfall events.
Rainfall event
Hydro. No.
Rainfall [mm]
aAPI3
[mm]
aAPI7
[mm]
aAPI14
[mm]
bT14
[°C]
cQ[m3/s]
dEW[%]
eNO3
[mg/l-N]Maj I 1 7.0 0 0 0.4 14.2 0.27 13 2.5
2 27.0 5.6 5.6 5.9 13.9 1.39 25 4.43 8.6 26.1 26.1 26.3 13.8 0.79 21 3.5
Maj II 1 17.6 1.3 1.3 3.4 17.0 0.27 20 1.32 33.6 12.1 12.9 14.2 16.9 2.76 36 2.93 21.2 33.2 41.0 41.8 16.3 2.01 29 2.6
Avgust 1 12.8 17.0 17.0 23.6 18.2 0.27 15 1.12 23.2 18.1 18.1 23.3 18.6 1.29 24 3.5
September 1 29.6 0 0 13.3 14.0 2.12 32 4.52 42.8 55.0 55.0 63.5 13.6 5.78 56 3.83 19.2 55.0 55.0 63.5 13.5 4.98 55 3.94 19.6 0.5 1.1 14.4 13.7 0.88 27 3.5
aAPIx: Antecedent precipitation index determined for x preceding days.bTx: Average hourly temperature for x preceding days.cQ: Hydrograph peak discharge.dEW: Event water contribution to total discharge.eNO3: Streamwater nitrate concentration.
The time series of nitrate concentration shown in figures 2 and 3 point out a variety of hydrologically induced nitrate concentration oscillations during the late spring hydrological events. During the sequence of the May I hydrographs (the peak discharge during the second hydrograph reached 1.39 m3/s) the streamwater nitrate concentration varied substantially and the maximum nitrate concentration reached 4.4 mg/l-N (Figure 2).
XXIVth Conference of the Danubian Countries IOP PublishingIOP Conf. Series: Earth and Environmental Science 4 (2008) 012049 doi:10.1088/1755-1307/4/1/012049
4

0.0
0.2
0.4
0.6
0.8
1.0
1.2
1.4
1.6
5/2/2007 5/3/2007 5/4/2007 5/5/2007 5/6/2007 5/7/2007
Date
Dis
ch
arg
e [m
3/s
]
0
1
2
3
4
5
Nit
rate
[mg
/l-N
]
Discharge
Nitrate
0246810
Ra
infa
ll[m
m/h
]
2
1
3
Figure 2. Streamwater nitrate concentrations during first May rainfall event (May I).
During the second rainfall event in the end of May (Figure 3), the streamwater nitrate concentration fluxes were smaller than during the first rainfall event (Figure 2). The hydrograph peaks during the second rainfall event were higher (up to 2.76 m3/s) than during the rainfall event May I, however the streamwater nitrate concentration was less responsive to changed hydrological conditions which could indicate a minor depletion of the nitrate pool in forest soils during the rainfall event May II.
0.0
0.5
1.0
1.5
2.0
2.5
3.0
5/23/2007 5/25/2007 5/27/2007 5/29/2007 5/31/2007 6/2/2007 6/4/2007
Date
Dis
ch
arg
e [
m3/s
]
0
1
2
3
4
Nit
rate
[m
g/l-
N]
DischargeNitrate
0510152025
Ra
infa
ll [m
m/h
]
2
1
3
Figure 3. Streamwater nitrate concentrations during second May rainfall event (May II).
A situation similar to the rainfall events in May was also observed during the rainfall event in August (Figure 4). The period preceding the August rainfall event was considerably wet (values of API7 and API14 were 17 and 23.6 mm of rainfall, respectively) which might, similarly as it was the case in the May II rainfall event, indicate the washout of nitrate in the antecedent relatively moist period.
XXIVth Conference of the Danubian Countries IOP PublishingIOP Conf. Series: Earth and Environmental Science 4 (2008) 012049 doi:10.1088/1755-1307/4/1/012049
5

0.0
0.2
0.4
0.6
0.8
1.0
1.2
1.4
8/20/2007 8/22/2007 8/24/2007 8/26/2007 8/28/2007 8/30/2007
Date
Dis
cha
rge
[m
3/s
]
0
1
2
3
4
Nit
rate
[m
g/l-
N]
Discharge
Nitrate
0246810
Ra
infa
ll[m
m/h
]
1
2
Figure 4. Streamwater nitrate concentrations during the August rainfall event.
The most changeable situation in terms of streamwater nitrate concentrations was observed during the rainfall event in September (Figure 5). The period preceding the September rainfall event was relatively dry (values of API7 and API14 were 0 and 13.3 mm of rainfall, respectively). During the first hydrograph the streamwater nitrate concentration raised very sharply from 1 mg/l-N to more than 4 mg/l-N. During the consecutive hydrographs (No. 2 and 3), the streamwater nitrate concentrations decreased and increased again after the occurrence of hydrograph peaks. Signs of minor nitrate concentration dilution during the periods of hydrograph peaks No. 2 and 3 can be associated to high portions of event water in the total discharge which contained lower nitrate concentration. The event water portion was defined from hydrograph separation based on electrical conductivity measurements.In both hydrographs the event water portion exceeded 50 % (Table 1).
0.0
1.0
2.0
3.0
4.0
5.0
6.0
7.0
9/25/2007 9/27/2007 9/29/2007 10/1/2007 10/3/2007 10/5/2007 10/7/2007 10/9/2007 10/11/2007
Date
Dis
ch
arg
e [m
3 /s]
0
1
2
3
4
5
Nit
rate
[mg
/l-N
]
Discharge
Nitrate
0246810
Ra
infa
ll [m
m/h
]
1
2
3
4
Figure 5. Streamwater nitrate concentrations during the September rainfall event.
XXIVth Conference of the Danubian Countries IOP PublishingIOP Conf. Series: Earth and Environmental Science 4 (2008) 012049 doi:10.1088/1755-1307/4/1/012049
6
The overall decreases of the nitrate concentrations in the falling limbs of the hydrographs were gradual, with different time intervals necessary for the nitrate concentrations to return to the pre-event baseflow concentrations. In the case of September rainfall the time span necessary to return the streamwater nitrate concentration to pre-event values extended to more than two weeks. This presumably indicates that in autumn the size of the movable nitrate pool in forest soils is large an actually exceeds the instant flushing capacity of single rainfall event.
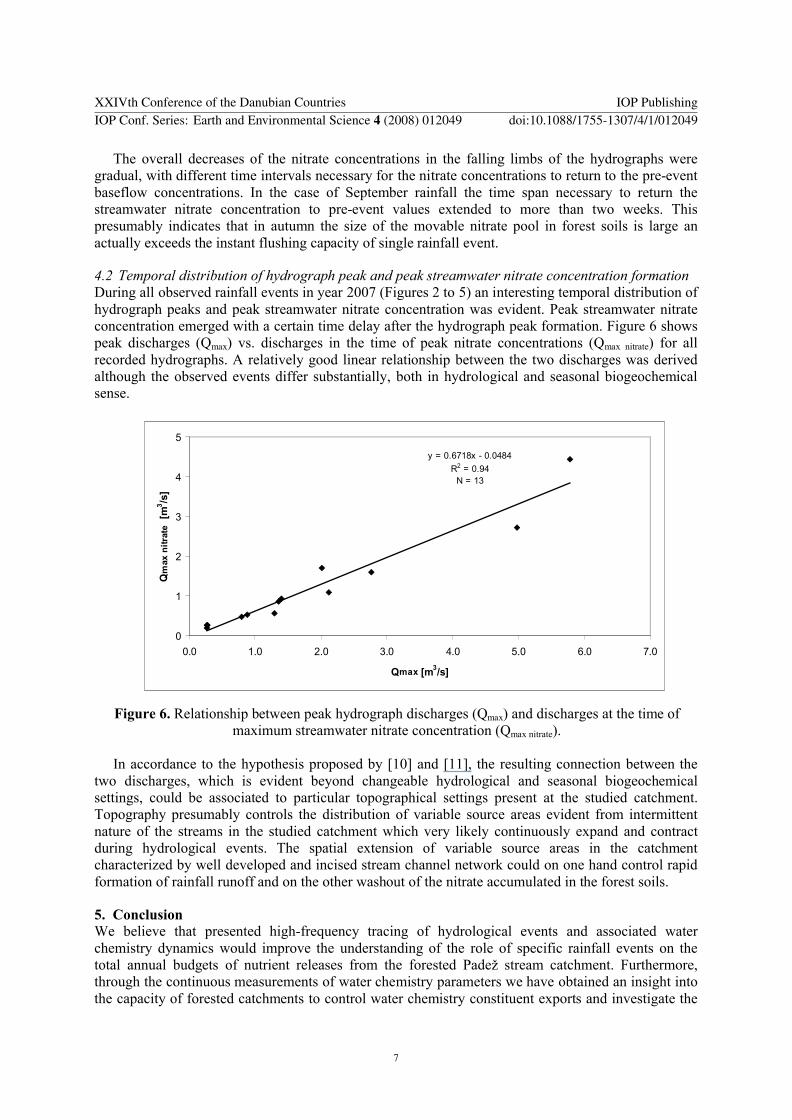
4.2 Temporal distribution of hydrograph peak and peak streamwater nitrate concentration formationDuring all observed rainfall events in year 2007 (Figures 2 to 5) an interesting temporal distribution of hydrograph peaks and peak streamwater nitrate concentration was evident. Peak streamwater nitrate concentration emerged with a certain time delay after the hydrograph peak formation. Figure 6 showspeak discharges (Qmax) vs. discharges in the time of peak nitrate concentrations (Qmax nitrate) for all recorded hydrographs. A relatively good linear relationship between the two discharges was derived although the observed events differ substantially, both in hydrological and seasonal biogeochemical sense.
y = 0.6718x - 0.0484
R2 = 0.94N = 13
0
1
2
3
4
5
0.0 1.0 2.0 3.0 4.0 5.0 6.0 7.0
Qmax [m3/s]
Qm
ax n
itra
te [
m3/s
]
Figure 6. Relationship between peak hydrograph discharges (Qmax) and discharges at the time of maximum streamwater nitrate concentration (Qmax nitrate).
In accordance to the hypothesis proposed by [10] and [11], the resulting connection between the two discharges, which is evident beyond changeable hydrological and seasonal biogeochemical settings, could be associated to particular topographical settings present at the studied catchment. Topography presumably controls the distribution of variable source areas evident from intermittent nature of the streams in the studied catchment which very likely continuously expand and contract during hydrological events. The spatial extension of variable source areas in the catchmentcharacterized by well developed and incised stream channel network could on one hand control rapid formation of rainfall runoff and on the other washout of the nitrate accumulated in the forest soils.
5. ConclusionWe believe that presented high-frequency tracing of hydrological events and associated water chemistry dynamics would improve the understanding of the role of specific rainfall events on the total annual budgets of nutrient releases from the forested Padež stream catchment. Furthermore, through the continuous measurements of water chemistry parameters we have obtained an insight into the capacity of forested catchments to control water chemistry constituent exports and investigate the
XXIVth Conference of the Danubian Countries IOP PublishingIOP Conf. Series: Earth and Environmental Science 4 (2008) 012049 doi:10.1088/1755-1307/4/1/012049
7

relations between the forest hydrological and biogeochemical export mechanisms over the nitrate which is transported from the catchment by the stream.
High frequency measurements of streamwater nitrate concentrations in the Padež stream throughout different hydrological and seasonal biogeochemical settings disclosed a highly variable butat the same time a strong linkage between the hydrological and biogeochemical controls of the nitrate export from the spatial perspective of a catchment. The role of specific hydrological events proved to be important for predicting the rates of nitrate flushing whose size in the soil pool is large, although it can vary considerably. Consequently, the predicted rates of N cycling and nitrate losses from the catchment can alter greatly from year to year due to the climatic variations and their relative effect on plant growth and soil processes of mineralization and nitrification.
AcknowledgementWe gratefully acknowledge M. Padežnik, A. Vidmar and T. Kralj for field support.
References[1] Burt T P, Heathwaite A L and Trudgill S T 1993 Nitrate: Processes, Patterns and Management,
(Chichester: John Wiley and Sons) p 444[2] Goodale C L, Lajhta K, Nadelhoffer K J, Boyer, E W and Jaworski N A 2002 Forest nitrogen
sinks in large eastern U. S. watersheds: estimates from forest inventory and an ecosystem model Biogeochemistry 57/58 239–66
[3] Kirchner J W, Feng X, Neal C and Robson A J 2004 The fine structure of water–quality dynamics: the (high-frequency) wave of the future Hydrol. Process. 18 1353–59
[4] Quinn P 2004 Scale appropriate modelling: representing cause and effect relationships in nitrate pollution at the catchment scale for the purpose of catchment scale planning J. Hydrol. 291197–217
[5] Cirmo C P and McDonnell J J 1997 Linking the hydrologic and biogeochemical controls of nitrogen transport in near-stream zones of temperate-forested catchments: a review J. Hydrol. 199 88–120
[6] Andersson L and Lepisto H 1998 Links between runoff generation, climate and nitrate–N leaching from forested catchments. Water Air Soil Poll 105 227–37
[7] McHale M R, McDonnell J J, Mitchell M J and Cirmo C P 2002 A field-based study of soil water and groundwater nitrate release in an Adirondack forested watershed. Water Resour. Res. 38 1031–47
[8] Rusjan S, Brilly M and Mikoš M 2008 Flushing of nitrate from a forested watershed: An insight into hydrological nitrate mobilization mechanisms through seasonal high-frequency stream nitrate dynamics. J. Hydrol. 354 187-202
[9] CUAHSI 2006 Advancing Biogeochemical Research in the Field Hydrological Sciences: The CUAHSI Hydrological Measurement Facility – Biogeochemical Component Consortium of Universities for the Advancement of Hydrologic Science p. 25
[10] Hornberger G M, Bencala K E and McKnight D M 1994 Hydrological controls on dissolved organic carbon during snowmelt in the Snake River near Montezuma, Colorado Biogeochemistry 25 147–65
[11] Creed I F and Band L E 1998 Export of nitrogen from catchments within a temperate forest: evidence for a unifying mechanism regulated by variable source area dynamics. Water Resour. Res. 34 3105–20
XXIVth Conference of the Danubian Countries IOP PublishingIOP Conf. Series: Earth and Environmental Science 4 (2008) 012049 doi:10.1088/1755-1307/4/1/012049
8