
LOCAL AND CATCHMENT SCALE VALIDATION OF SOIL ...
96
LOCAL AND CATCHMENT SCALE VALIDATION OF SOIL HYDRAULIC PEDOTRANSFER FUNCTIONS FOR AN INDONESIAN WATERSHED MSc Thesis Water Engineering and Management R.J.J. Oldhoff November 2015
-
Upload
khangminh22 -
Category
Documents
-
view
1 -
download
0
Transcript of LOCAL AND CATCHMENT SCALE VALIDATION OF SOIL ...

LOCAL AND CATCHMENT SCALE VALIDATION OF SOIL HYDRAULIC
PEDOTRANSFER FUNCTIONS FOR AN INDONESIAN WATERSHED
MSc Thesis Water Engineering and Management
R.J.J. Oldhoff November 2015


Faculty of Engineering Technology
Water Engineering & Management
Master’s Thesis
LOCAL AND CATCHMENT SCALE VALIDATION OF SOIL HYDRAULIC
PEDOTRANSFER FUNCTIONS FOR AN INDONESIAN WATERSHED
Author R.J.J. Oldhoff BSc. Contact [email protected]
Graduation supervisor Dr. Ir. M.J. Booij University of Twente
Daily supervisor A. Rustanto, MSc. University of Twente
Enschede, 06-11-2015


I
SUMMARY
Hydrological models are important tools used for many different purposes. In order to accurately
model the hydrological processes in a catchment, information on the soil properties are of great
importance. Data on the soil hydraulic properties can be obtained by conducting field work, this is
however costly and time consuming. An alternative to field measurements is to use pedotransfer
functions (PTFs). A PTF is an empirical relationship between easily obtainable soil characteristics and
a soil hydraulic parameter. PTFs have been developed for a range of parameters. For this thesis, PTFs
for the saturated hydraulic conductivity (Ks) and the available water content (AWC) are researched.
Models are often very sensitive to the hydraulic conductivity and moderately sensitive to AWC, which
makes an accurate estimation of these parameters important.
A problem with PTF application is that PTFs are empirically determined relations for a specific area.
Using a PTF for an area with other climatological and geographical characteristics can result in poor
performance. The success of extrapolation of a PTF depends on the comparability of the soils. Tropical
soils often have a different composition and have different hydraulic behaviour compared to
temperate soils. Application of temperate soil PTFs on tropical soils might result in poor performance.
Furthermore, not a lot of tropical soil PTFs are available from literature. The objective of this research
is to determine whether Ks and AWC can be accurately approximated using PTFs, by analysing their
performance at both the local scale and catchment scale for an Indonesian region.
Four published PTFs for Ks and AWC are validated on a data set containing 91 soil samples that were
collected during field work in four sub-catchments of the Upper Bengawan Solo catchment, located
on Java Indonesia. This showed that the AWC is predicted very poorly, with R2 values below zero for
all selected PTFs. For Ks PTFs better results were found. Two PTFs, the Wosten and Rosetta-3 PTFs,
predict the Ks moderately accurate, with R2 values of 0.28 and 0.39, respectively. New PTFs for both
AWC and Ks were made for the dataset, using Multiple Linear Regression. For the best performing
PTFs for AWC and Ks, R2 values of 0.37 and 0.55 were found, respectively. Though these are not very
high R2 values, they are significantly higher than the published PTFs. The new PTFs are sufficiently
accurate for Ks and AWC estimation at the local scale.
The SWAT model was set up for the Keduang, a sub-catchment of the Upper Bengawan Solo
catchment. With a monthly time step, the catchment outflow was modelled. Eleven cases were
defined. One based on measured inputs, six using the Digitalized Soil Map of the World (DSMW) and
the new PTFs, the Wosten and Rosetta-3 Ks PTFs, and the Van den Berg AWC PTF for soil inputs. One
case using the FAO DSMW in combination with lookup tables for Ks and AWC as input, a case using
the FAO DSMW where the Ks and AWC were calibrated and finally two uncalibrated cases.
Uncalibrated model results are moderately accurate, with Nash Sutcliffe (NS) values of 0.52 and 0.54.
For Ks the model outputs indicate that the model accuracy is not significantly different when using
measured values as opposed to PTFs. For each Ks PTF case a NS value of around 0.84 was obtained.

II
Figure I: Best simulation for each case, plus uncalibrated model results and observed discharge, validation period
Even though the model is especially sensitive to Ks, the small difference in PTF estimated values and
measured values of Ks result in equal model accuracy for the different cases. The use of AWC PTFs
resulted in slightly lower NS values, though still the differences in model accuracy are low. For the
Keduang the tested PTFs can be used as an alternative to field measurements for hydrological
modelling.
To conclude, at the local scale PTF accuracy is not very high, but at the catchment scale they perform
well. At the local scale the Wösten and Rosetta-3 PTFs can be used to predict Ks. AWC PTFs show
insufficient accuracy at the local scale. At the catchment scale, the Wösten and Rosetta-3 Ks PTFs and
the Oldhoff AWC and Ks PTFs are validated. It is recommended to use the Oldhoff PTFs in the Upper
Bengawan Solo catchment. More research is needed on the effect of PTF input on hydrological state
variables, such as soil moisture content. The effect of catchment soil heterogeneity also requires
more research.

III
PREFACE
The pages in front of you are the result of just over 7 months of work done in the Netherlands and
Indonesia to obtain my Master’s degree in Water Engineering and Management. It is the end product
of 5 years of studying and marks the end of my study period. It’s been an interesting and challenging
period, and I am looking forward to put my knowledge into practice.
I couldn’t have produced this work without the help of some people, whom I’d like to thank. First of
all, I want to sincerely thank my graduation committee, Martijn Booij and Andry Rustanto. Though
me and Andry were for large parts of my thesis work on other ends of the world, his help in Indonesia
was very useful. As Andry was in Indonesia twice for extended periods of time, Martijn was my daily
supervisor for these periods. Due to the time he freed up for me and his critical look at my work, I
stayed on track and managed to produce this thesis. Martijn, I have never received feedback with
such scrutiny and you are probably also the first person to suggest changes and improvements that I
agree with 98% of the time. Our meetings and discussions were essential to this thesis and helped
me tremendously.
Secondly I want to thank the people that helped me during my stay in Indonesia. First I’d like to thank
BPDAS. During my two month stay in Indonesia, I was located at their office in Solo. I’d like to thank
pak Sigit Haryadi and ibu Kumala Nurhayati specifically for guiding me and making me feel at home
there. I want to thank Prima Nugroho for everything he did for me in Indonesia, from arranging
housing for me to helping me find my bearings, and of course for being a great field work partner. I’d
also like to thank Irham, Alfi, Yogo and Andika for their company and help. Terimah kasih.
I would also like to thank my friends and fellow students for their company and support during my
student time in Enschede. Especially Wouter, Ron, and Koen for all the projects we successfully
completed together. I’d also like to thank Michael for showing me some essential relaxation
techniques.
Finally I’m very thankful to my parents for their faith in me, their interest in my study, and the fact
they financed it. Mom and dad, you can see this as the product of your investment.

IV

V
TABLE OF CONTENTS
Chapter 1. Introduction ......................................................................................................................... 1
1.1. Background ............................................................................................................................ 1
1.2. Problem definition ................................................................................................................. 3
1.3. Research goal and questions ................................................................................................. 4
1.4. Report outline ........................................................................................................................ 5
Chapter 2. Study area and data ............................................................................................................. 6
2.1. Location and topography ...................................................................................................... 6
2.2. Soil data ................................................................................................................................. 8
Chapter 3. Method local scale ............................................................................................................. 12
3.1. Published pedotransfer function selection ......................................................................... 12
3.2. Published PTFs validation local scale ................................................................................... 17
3.3. PTF creation ......................................................................................................................... 18
Chapter 4. Method catchment scale ................................................................................................... 21
4.1. Soil Water Assessment Tool ................................................................................................ 21
4.2. Model set-up ....................................................................................................................... 26
4.3. Warm up, calibration and validation ................................................................................... 35
4.4. Case formulation ................................................................................................................. 38
Chapter 5. Results local scale .............................................................................................................. 41
5.1. Available water content ...................................................................................................... 41
5.2. Hydraulic conductivity ......................................................................................................... 43
5.3. Oldhoff PTFs ........................................................................................................................ 45
5.4. Conclusions .......................................................................................................................... 48
Chapter 6. Results catchment scale .................................................................................................... 49
6.1. SWAT cases .......................................................................................................................... 49
6.2. Global sensitivity analysis .................................................................................................... 50
6.3. Calibration and validation ................................................................................................... 51
6.4. Conclusions .......................................................................................................................... 57
Chapter 7. Discussion .......................................................................................................................... 59
7.1. Local scale validation ........................................................................................................... 59
7.2. Catchment scale validation ................................................................................................. 60
7.3. Local versus catchment scale .............................................................................................. 62

VI
Chapter 8. Conclusions and recommendations .................................................................................. 63
8.1. Conclusions ......................................................................................................................... 63
8.2. Recommendations .............................................................................................................. 65
References ........................................................................................................................................... 66
Appendices ............................................................................................................................................. I
Appendix A: SWAT model settings ................................................................................................. I
Appendix B: Case input .................................................................................................................. II
Appendix C: Global sensitivity analysis ......................................................................................... VI
Appendix D: Calibration parameter ranges .................................................................................. IX

VII
LIST OF FIGURES
Figure 1: Soil water retention curves of typical soils (Stevenswater, n.d.) ........................................... 1
Figure 2: Location of the study area ...................................................................................................... 6
Figure 3: Upper Bengawan Solo catchment .......................................................................................... 7
Figure 4: Keduang sub-catchment streams ........................................................................................... 7
Figure 5: BPDAS Soil map of the Keduang sub-catchment .................................................................... 8
Figure 6: USDA soil texture classification of data set ............................................................................ 9
Figure 7: Soil moisture retention curves for soil types found in the Upper Bengawan Solo. C = Clay, CL
= Clay Loam, L = Loam, SaL = Sandy Loam, SiC = Silty Clay .................................................................... 9
Figure 8: Topsoil USDA soil classification ............................................................................................ 10
Figure 9: Subsoil USDA soil classification ............................................................................................ 10
Figure 10: Topsoil hydraulic conductivity ............................................................................................ 10
Figure 11: Subsoil hydraulic conductivity ............................................................................................ 10
Figure 12: Topsoil AWC (vol %)............................................................................................................ 11
Figure 13: Subsoil AWC (vol %) ............................................................................................................ 11
Figure 14: Topsoil organic content (vol %) .......................................................................................... 11
Figure 15: Subsoil organic content (vol %) .......................................................................................... 11
Figure 16: Textural distribution of the 2134 samples used to calibrate models H1 through H5. ....... 15
Figure 17: Schematic representation of the hydrological storages and fluxes incorporated in SWAT
............................................................................................................................................................. 22
Figure 18: Schematic representation of hydrological storages and fluxes relevant for modelling of the
Keduang per HRU ................................................................................................................................ 22
Figure 19: Rainfall stations for the Keduang catchment. The stars show the stations used for modelling
purposes .............................................................................................................................................. 26
Figure 20: Precipitation and discharge data available for Keduang catchment.................................. 27
Figure 21: Plot of rainfall and discharge for the Keduang catchment ................................................. 27
Figure 22: Mean monthly maximum and minimum temperature data for 2007-2014 ...................... 28
Figure 23: Mean monthly relative humidity 2007-2014 ..................................................................... 29
Figure 24: Mean monthly wind speed for 2007-2014 ......................................................................... 29
Figure 25: Mean monthly percentage of sun hours between 08:00 and 16:00 for 2007-2014 .......... 30
Figure 26: DEM used in the modelling of the Keduang. DEM values are in m above MSL ................. 31
Figure 27: Watershed delineation with 33 sub-basins ........................................................................ 31
Figure 28: Watershed delineation used in calculations ...................................................................... 31
Figure 29: Land use 2007 ..................................................................................................................... 32
Figure 30: Rainfall stations in the Keduang ......................................................................................... 34
Figure 31: Thiessen polygons for artificial rainfall station generation ................................................ 34
Figure 32: Average monthly rainfall for the artificial stations ............................................................ 34
Figure 33: Data split for model warm up, calibration, and validation ................................................ 35
Figure 34: Soil map "Base case" .......................................................................................................... 39
Figure 35: Soil map DSMW for case 2-11 ............................................................................................ 39
Figure 36: Morphological soil map ...................................................................................................... 39
Figure 37: Measured texture class. C = Clay, L = Loam, SaL = Sandy Loam ......................................... 39

VIII
Figure 38: PTF results for AWC = pF 2 - pF 4.2 .................................................................................... 41
Figure 39: PTF results for AWC – pF 2.54 - pF4.2 ................................................................................ 42
Figure 40: PTF results for Ks, samples sorted ...................................................................................... 43
Figure 41: Scatterplots for Ks PTFs. Blue = 1:1 line.............................................................................. 44
Figure 42: Scatterplots for the best performing Ks and AWC PTFs that were created. Only validation
dataset is shown. ................................................................................................................................. 47
Figure 43: GSA results for the final 6 parameters used in SWAT calibration. Higher t-stat indicates a
higher sensitivity ................................................................................................................................. 50
Figure 44: GSA results including soil parameters used in the calibration of case 9 ........................... 51
Figure 45: Left- Case 1 95PPU band, p-factor = 0.68, r-factor = 0.56. Right- Case 9 95PPU band, p-
factor = 0.46, r-factor = 0.35 (validation period) ................................................................................ 52
Figure 46: Rainfall, observed discharge, and uncalibrated model results (case 10 and 11) ............... 53
Figure 47: Best simulation for each case, plus uncalibrated model results (case 10 and 11) ............ 55
Figure 48: Catchment averaged Ks for top- and subsoil per case ....................................................... 56

IX
LIST OF TABLES
Table 1: Keduang land use (2014) ......................................................................................................... 7
Table 2: Summary of field work data .................................................................................................... 9
Table 3: Inputs used for the tested PTFs. BD = Bulk density, OC = Organic Content .......................... 16
Table 4: Inputs used for the tested PTFs. BD = Bulk density, OC = Organic Content .......................... 17
Table 5: Land use definition SWAT ...................................................................................................... 33
Table 6: List of parameters considered for calibration ....................................................................... 36
Table 7: Cases used for catchment scale PTF validation ..................................................................... 38
Table 8: R2 and RMSE values for AWC PTFs......................................................................................... 42
Table 9: R2 and RMSE for Ks PTFs ......................................................................................................... 43
Table 10: Correlations between inputs and Ks/AWC. Red = not statistically significant at 95%
confidence level ................................................................................................................................... 45
Table 11: Multiple PTFs and their R2 values for AWC. Green = used input ......................................... 45
Table 12: AWC (cm3/cm3) PTFs. BD = Bulk density (g/cm3), Elev = elevation (m +msl), OC = Organic
Content (vol %), Silt = silt content (vol %), Sand = sand content (vol %), Por = porosity (%) .............. 46
Table 13: R2 values for various combinations of input for Ks PTFs. Green = used input ..................... 46
Table 14: Ks PTFs. Sand = sand content (vol %), Clay = clay content (vol %), Por = porosity (%), BD =
Bulk Density (g/cm3), Elev = Elevation (m +msl) .................................................................................. 47
Table 15: Cases for catchment scale validation .................................................................................. 49
Table 16: List of parameters used in model calibration ...................................................................... 50
Table 17: Calibration results ................................................................................................................ 51
Table 18: Validation results ................................................................................................................. 52

X

Introduction
1
CHAPTER 1. INTRODUCTION
1.1. Background Hydrological modelling is often used for different purposes, such as supporting management
decisions for catchments, analysing effects of changes in land use on hydrology, or predicting the
effects of global warming. To allow for proper catchment management, accurate modelling results
are of great importance. Hydrological modelling is far from perfect; even though there are dozens of
advanced models that model the processes of the hydrological cycle, these models can give results
that are uncertain and inaccurate. Part of this problem is caused by the input required for hydrological
models. More advanced models require great amounts of input data such as precipitation,
evaporation, land cover, and soil parameters. Especially the latter category introduces a problem as
it is often not easily obtainable information. Almost all models require data on the soil hydraulic
parameters (SHPs), usually represented by the saturated hydraulic conductivity (Ks) and the soil water
retention curve.
Hydraulic conductivity is a measure for the ease with which water can move through the pores of a
soil. Both lateral and vertical water movement through the soil are limited by the hydraulic
conductivity. Hydraulic conductivity can vary over many orders of magnitude. An important soil
property linked to the hydraulic conductivity is the soil water retention curve. The soil's ability to
retain water is also strongly related to particle size; water molecules hold more tightly to the fine
particles of a clay soil than to coarser particles of a sandy soil, so clays generally retain more water.
Other factors such as organic content and soil structure also influence the soil water retention.
Figure 1: Soil water retention curves of typical soils (Stevenswater, n.d.)
Soil water retention is often shown as a curve (Figure 1), depicting the soil water content at various
pressure levels. This is called the soil water retention curve. On this curve, there are two main points
of interest. The field capacity (FC), and the permanent wilting point (WP). FC is the amount of water
that remains after excess water has drained from the soil, this is expressed by measuring the water
content in the soil at a matric potential (pF) of 2.54 (-33kPa), though this has often been considered

Master Thesis R.J.J. Oldhoff – Chapter 1
2
too low for tropical soils (Tomasella & Hodnett, 2004). For this reason, the FC is often determined at
pF 2 (-10kPa) in tropical regions. The WP is the amount of water at which plants start to wilt. This is
determined at pF 4.2 (-1500kPa). The difference between FC and WP is called the (plant) available
water content, or AWC.
Determining soil parameters such as Ks or AWC must be done by conducting field measurements,
which is not only very costly but also challenging as soil hydraulic parameters can vary in space and
time (Baroni et al., 2010). Adding to the problem is the fact that hydrological models are often very
sensitive to these SHPs (Kværnø & Stolte, 2012; Tomasella & Hodnett, 2004). An alternative to doing
field work, is using general soil maps of the area, either from local sources or from worldwide
databases such as the Digitalized Soil map of the World (DSMW) (FAO, 2009) or the Harmonized
World Soil Database (HWSD) (FAO/IIASA/ISRIC/ISS-CAS/JRC, 2009). For these global maps, there are
databases containing information for most SHPs related to the soil types. Often however parameters
such as Ks and AWC are not available for these maps. There are two ways of solving this problem, the
first is using lookup tables which couple soil texture class to hydraulic parameters. These lookup
tables often contain rough estimations of the SHPs based on very generalized data, and are not
accurate. Soil hydraulic parameters can vary more within a texture class than between texture classes
(Gutmann & Small, 2007).
Another option to determine these parameters is by using pedotransfer functions (PTFs). PTFs are
empirical relationships between readily available soil data (from databases), such as textural soil
properties and bulk density, and the desired –harder to determine- SHPs such as Ks or AWC.
Pedotransfer functions thus make it possible to determine difficult to measure SHPs, by using more
easily accessible information. PTFs are an empirical relation developed for an area. The applicability
of a PTF to a region is therefore strongly dependant on the comparability of the soils and climate of
the area the PTF was developed for and the area the PTF is to be applied on.
One of the main uses of soil parameterization is to allow for the hydrological modelling of an area.
Uncertainties and errors in input used in modelling result in modelling outputs of lower quality and
certainty. The use of PTFs as input for hydrological models and their effect on the output therefore
requires some attention. The effect of uncertainties in PTF output on hydrological modelling results
has been studied, and the general conclusion from these studies is that as both PTF uncertainty and
soil heterogeneity is large, the uncertainty in model outcome is also high (Christiaens & Feyen, 2001).
To reduce this uncertainty, the correct data and PTF must be used. In general, PTFs have shown to be
capable of estimating the SHPs with easily obtained data, but care must be taken in order to obtain
accurate results, as uncertainties in model outcome can still be high.

Introduction
3
1.2. Problem definition A lot of PTFs have been developed over the last decades for various SHPs, though mostly for
temperate soils. The study area for this research is the Upper Bengawan Solo catchment on Java,
Indonesia. This poses a problem, as tropical soils generally show different water retention behaviour
than temperate soils (Hodnett & Tomasella, 2002), due to their different composition, the differences
in climate and other factors. Western countries have often build up large databases of soil data,
allowing for the development of robust PTFs (Schaap et al., 2001). The problem with tropical soils is
that much less data is available, and thus PTFs are less common (Obalum & Obi, 2013).
A general weakness of PTFs is that as they are based on a data set, they are made for a specific area
or soil set; extrapolation of the PTF to different soil conditions often results in poor PTF performance
(Givi et al., 2004; Santra & Das, 2008). Besides, temperate soils vary in hydraulic behaviour from
tropical soils. Minashy and Hartemink (2011) found by comparing the ISRIC (mainly tropical) and the
USDA (mainly temperate) soil databases that tropical soils have a higher clay content, higher bulk
density and lower water content at pF 2 and pF 4.2. For the AWC multiple PTFs have been developed,
mostly for temperate soils (using FC = water content at pF2.54 instead of pF2). There have been a
couple of PTFs designed specifically for tropical soils, though due to soil heterogeneity extrapolation
of these PTFs can still result in poor approximations. For temperate regions the saturated hydraulic
conductivity and AWC are often estimated using PTFs. For tropical regions this is less common, as
tropical soil PTFs are rare, especially for Ks. The use of PTFs for predicting Ks is very problematic and
carries with it a large degree of uncertainty. This is due to the inherent variability of Ks itself; its value
is highly sensitive to conditions such as sample volume, method of measurement, measurement
error, and spatial variability (Minasny, 2000).
This research is part of the PhD research by MSc Andry Rustanto, titled “Effect of land use / land cover
changes on hydrological processes and water availability in the Upper Bengawan Solo catchment:
parameter assessment and application in hydrological model”. For this, research is needed to analyse
the use of PTFs for the Upper Bengawan Solo catchment. As was stated in the previous paragraph,
PTF results can be very uncertain due to soil heterogeneity and the fact that PTFs are designed for a
specific area. Coupled with the fact that there are few PTFs available for tropical soils, the use of PTFs
requires research.
Alternatively, a new PTF can be developed for the area. The accuracy of PTF results in the direct
estimation of parameters is not the only problem however, it is also important to determine the
propagation of the parameter approximation error as a result of PTF usage in the hydrological
modelling of a catchment. The eventual goal of the PTFs is to facilitate the hydrological modelling of
the Upper Bengawan Solo catchment, and thus model performance using PTFs as input is also part of
this research. For this thesis, validation of the PTF accuracy in the direct estimation of Ks and AWC is
defined as ‘local scale’ validation. Validation of the PTFs when used as hydrological model input is
defined as ‘catchment scale’ validation.
Little soil data is available for the Upper Bengawan Solo catchment, partly due to the lack of field
measurements being taken and partly because soil samples and measurements are not easily found
or accessible. Validating published PTFs and creating new PTFs can help in the determination of Ks
and AWC without the need for field work (local scale).

Master Thesis R.J.J. Oldhoff – Chapter 1
4
The model that will be used in Rustanto’s research is the SWAT model. This model will therefore also
be used in this research. SWAT requires, amongst other things, input on Ks and AWC. Of the soil input
parameters, these two parameters are the hardest ones to determine from maps. PTFs will have to
be validated for these two parameters on the catchment scale, this will be done by using them as
input in the SWAT model. Catchment scale validation of the PTFs will allow for their use in modelling
to be evaluated. If PTFs are a valid alternative to field work, this could increase the applicability of
hydrological models for the Upper Bengawan Solo region.
1.3. Research goal and questions The research goal is to determine whether the saturated hydraulic conductivity (Ks) and the available
water content (AWC) can be accurately approximated using pedotransfer functions (PTFs), by
analysing their performance in the direct prediction of these parameters (local scale) and their
indirect effect on the hydrological modelling output using the SWAT model (catchment scale), for the
Upper Bengawan Solo catchment, Java Indonesia.
The results of this research will allow for conclusions on the applicability of Ks and AWC pedotransfer
functions for the Upper Bengawan Solo catchment to be made. If applicable, the data collection
required for the hydrological modelling will be reduced. It will also reduce model uncertainty. In a
more general sense, it will add to current research by analysing the performance of some published
PTFs when applied to Indonesian soils, by formulating a new PTF for the area and by analysing the
effect of PTF inaccuracies when used in hydrological modelling.
The following research questions are formulated to assist in reaching the research goal:
Q1. Which PTFs are applicable for the estimation of the hydraulic conductivity and available
water content?
Q2. How well do the selected PTFs predict the hydraulic conductivity and available water
content for the Upper Bengawan Solo catchment (local scale)?
Q3. Can PTFs developed for the area, based on local measurements, be used to obtain better
estimations of the hydraulic conductivity and available water content (local scale)?
Q4. Can PTF estimated values be used as input for the SWAT model to simulate the discharge of
the Keduang catchment, and how do the PTFs influence the modelling output accuracy
(catchment scale)?

Introduction
5
1.4. Report outline The report is structured as follows:
Chapter 2: Study area and data This chapter gives an overview of the study area of this research.
Next to a description of the study area, a description of the soil data that was collected during field
work is given. This data is described and spatially visualized.
Chapter 3: Method local scale In this chapter the method used for the local scale validation of PTFs
is described (RQ 1, 2 and 3). First, the PTF selection is explained (RQ 1). Then, the method used to
validate these PTFs is described (RQ 2). The final paragraph describes the method used to create new
PTFs (RQ 3).
Chapter 4: Method catchment scale This chapter covers the method used for the catchment scale
validation (RQ 4). First, the SWAT model is described in paragraph 1. Then paragraph 2 covers the
model set-up and the hydrological data used as input. The third paragraph covers the model warm
up, calibration and validation. Finally, the cases used to research the catchment scale validation are
defined and described in paragraph 4.
Chapter 5: Results local scale The results of the local scale validation are presented in this chapter,
for both the published AWC and Ks PTFs, and the newly developed PTFs.
Chapter 6: Results catchment scale This chapter presents the catchment scale validation results. The
sensitivity analysis of the model , calibration and validation results, and the analysis of the results are
found here.
Chapter 7: Discussion This chapter describes the limitations of the chosen approach. Some
assumptions and their implications are discussed, together with the effect of the used input data.
Chapter 8: Conclusions and recommendations The final chapter gives a summarized conclusion to
each research question, and offers some recommendations based on the found results.
Master Thesis R.J.J. Oldhoff – Chapter 2
6
CHAPTER 2. STUDY AREA AND DATA
This chapter provides a description of the study area. Paragraph 2.1 gives an overview of the location
and topography of the study area. Paragraph 2.2 describes the soil data taken during field work.
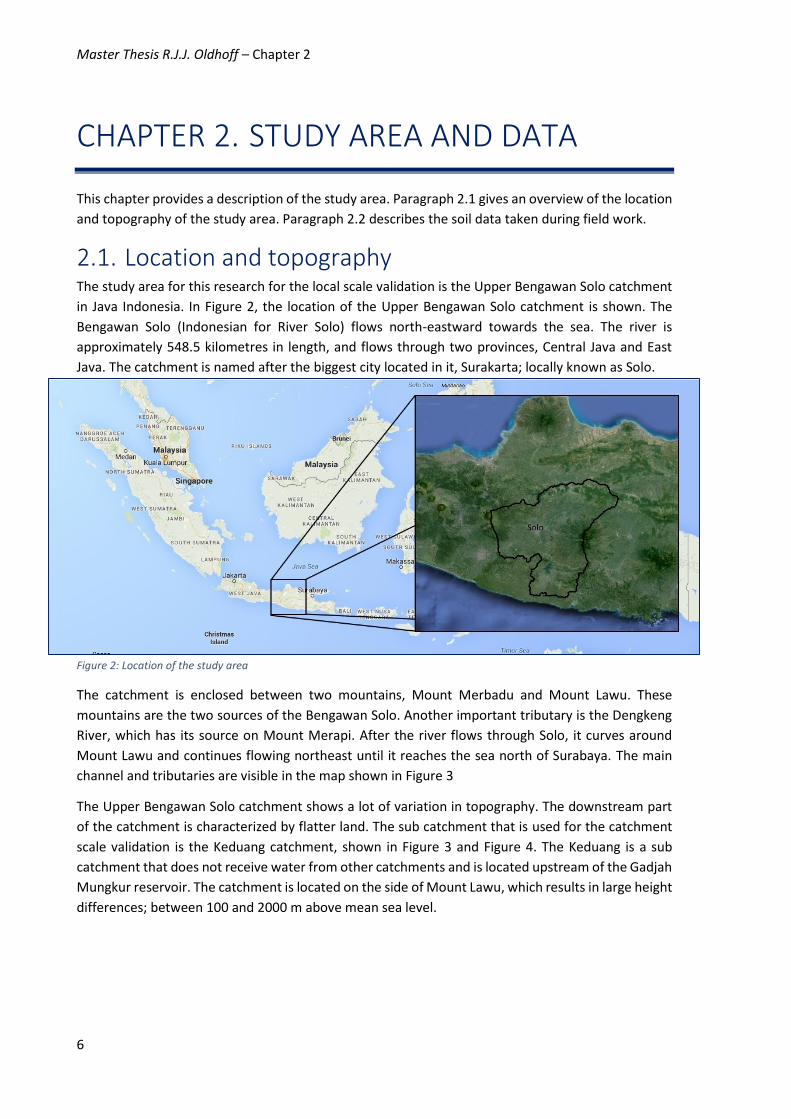
2.1. Location and topography The study area for this research for the local scale validation is the Upper Bengawan Solo catchment
in Java Indonesia. In Figure 2, the location of the Upper Bengawan Solo catchment is shown. The
Bengawan Solo (Indonesian for River Solo) flows north-eastward towards the sea. The river is
approximately 548.5 kilometres in length, and flows through two provinces, Central Java and East
Java. The catchment is named after the biggest city located in it, Surakarta; locally known as Solo.
The catchment is enclosed between two mountains, Mount Merbadu and Mount Lawu. These
mountains are the two sources of the Bengawan Solo. Another important tributary is the Dengkeng
River, which has its source on Mount Merapi. After the river flows through Solo, it curves around
Mount Lawu and continues flowing northeast until it reaches the sea north of Surabaya. The main
channel and tributaries are visible in the map shown in Figure 3
The Upper Bengawan Solo catchment shows a lot of variation in topography. The downstream part
of the catchment is characterized by flatter land. The sub catchment that is used for the catchment
scale validation is the Keduang catchment, shown in Figure 3 and Figure 4. The Keduang is a sub
catchment that does not receive water from other catchments and is located upstream of the Gadjah
Mungkur reservoir. The catchment is located on the side of Mount Lawu, which results in large height
differences; between 100 and 2000 m above mean sea level.
Figure 2: Location of the study area

Study area and data
7
Figure 3: Upper Bengawan Solo catchment Figure 4: Keduang sub-catchment streams
The Keduang catchment is part of the Wonogiri Regency, with a small part that belongs to the
Karanganyar Regency. The catchment is managed by the Balai Pengelolaan Daerah Aliran Sungai
(BPDAS), which translates to Central Management of Watershed.
In the Keduang catchment, the main land use is dry land cultivation, mainly cassava. The table below
shows the land use distribution for 2014, based on landsat images. There is a lot of agricultural activity
in the catchment, with just 4% of urban area.
Table 1: Keduang land use (2014)
Land use Percentage of area
Dryland cultivation 65.8
Forest 13.3
Plantation 12.6
Urban 4.1
Rice field 3.1
Shrub 0.73
Bare soil 0.13
Grassland 0.16
Water body 0.04
Cloud cover 0.01

Master Thesis R.J.J. Oldhoff – Chapter 2
8
2.2. Soil data The soils found in the Keduang catchment are tropical soils; with a USDA classification of alfisol, lithic
contact soil, inceptisol/ultisol and andisol. A characteristic these soil types share is the high clay
content found in them, which affects the hydraulic properties of the soils, and distinguishes the soils
from the temperate soils for which most PTFs are designed. Figure 5 shows a soil map of the Keduang
catchment (obtained from BPDAS), including the locations for which data was collected. There was
no information available on the soil properties (such as texture, Ks, AWC, etc.) for this map, so field
work was conducted. In total, 95 soil samples were taken at varying depths. A total of 85 by Rustanto,
and 10 by myself and Prima Nugroho. This was done in four catchments of the Upper Bengawan Solo;
the Keduang, Samin, Dengkeng, and Solo Hulu catchments (Figure 3). At these locations soil samples
were collected which were analysed in two laboratories (UNS in Solo and BTTP in Yogyakarta). The
laboratories tested the samples for the following parameters:
Hydraulic conductivity (mm/h)
Water content at pF 1, pF 2, pF 2.54 and pF 4.2 (cm3/cm3)
Bulk density (g/cm3)
Fraction of sand, silt, and clay (volume %)
Organic content (volume %)
pH
Porosity (cm3/cm3)
Figure 5: BPDAS Soil map of the Keduang sub-catchment
The 95 samples were taken at 38 locations. For 28 locations, samples were taken at 0-10 cm, 10-
20cm, and 20-40 cm depth. For the other 10, samples were taken only for the topsoil at 0-10 cm. Out
of the 95 soil samples that were tested, 3 samples were missing data as the laboratory was unable to
measure a parameter. Another sample seems to contain a measurement error. These samples are
omitted in the research, resulting in 91 usable samples. Furthermore, for pH and porosity, only 82
measurements are available. In total, 27 samples were taken in the Keduang (Figure 5). The remaining

Study area and data
9
67 samples were taken in three other sub catchments of the Upper Bengawan Solo; Dengkeng, Samin
and Solo Hulu. The locations were chosen based on the soil type, land use and slope class
combinations present in the catchment, using proportional sampling. By using this method, it was
attempted to capture as much of the soil variability as possible while keeping the sample frequency
for soil types representative.
Table 2: Summary of field work data
g/cm3 % % % % log(cm/h) %
BD Sand Silt Clay OC log(Ks) AWC
Keduang Mean 1.17 19.8 27.5 52.7 1.1 -0.19 23.8
n = 27 STDev 0.15 15.3 9.8 19.2 0.8 0.55 2.6
Dengkeng/Samin/Solo Hulu Mean 1.13 30.9 31.9 37.2 1.2 0.18 21.0
n = 64 STDev 0.14 21.6 9.7 22.4 1.1 0.71 4.2
All Mean 1.15 26.8 30.3 42.9 1.2 0.06 21.8
n = 91 STDev 0.14 20.3 10.0 22.5 1.0 0.70 4.0
Table 2 summarizes the field work data for the Keduang, the three other catchments and the total
data set. The bulk density and AWC show the least amount of variation, whereas the sand/silt/clay
fractions and the hydraulic conductivity show a much higher spread. The hydraulic conductivity was
logarithmically transformed because it varies by a factor 100. The data was put into soil texture
classes, as shown in Figure 6. Most of the soil is in the USDA ‘Clay’ texture class. The Keduang samples
are almost completely in the ‘Clay’ texture class. This indicates that the Keduang soils are rather
homogeneous. This is also seen in Table 2, the AWC and Ks standard deviation is low compared to the
rest of the data.
There is a big difference in the soil composition and hydraulic parameters for the topsoil layer, and
the layers beneath it. As stated before, some samples were taken at 0-10 cm depth, whilst others
were taken below that (36 topsoil, 55 subsoil). The topsoil layer is usually more permeable. This may
Figure 6: USDA soil texture classification of data set Figure 7: Soil moisture retention curves for soil types found in the Upper Bengawan Solo. C = Clay, CL = Clay
Loam, L = Loam, SaL = Sandy Loam, SiC = Silty Clay
0.10
0.15
0.20
0.25
0.30
0.35
0.40
0.45
0.50
0.55
0.60
0.5 1 1.5 2 2.5 3 3.5 4 4.5
Soil
mo
istu
re c
on
ten
t (c
m3
/cm
3)
Soil matric potential (pF)
C
CL
L
SaL
SiC

Master Thesis R.J.J. Oldhoff – Chapter 2
10
be explained by the sand fraction, which for most topsoils is higher than for the location’s
corresponding subsoil measurement. Organic content in the topsoil is also higher. AWC appears to
be rather consistent and shows little variation between top- and subsoil. It also shows little variation
between texture classes, as is visible in Figure 7. In it, for the five most common soil texture classes
the soil water retention curve is plotted. When comparing this to Figure 1, found in the introduction
of this thesis, the differences are clear.
The data may also show spatial patterns. Identifying these patterns can aid in gaining a better
understanding of the soil and its behaviour. In Figure 8 and Figure 9 the soil texture classification
(using the USDA system) is shown for both top- and subsoil. Lower areas contain more clay, while
higher areas on the mountain slopes contain more sand, generally speaking. There is little difference
between top and subsoil, except for slightly higher sand percentages in the topsoil.
Figure 8: Topsoil USDA soil classification Figure 9: Subsoil USDA soil classification
Figure 10: Topsoil hydraulic conductivity Figure 11: Subsoil hydraulic conductivity

Study area and data
11
Figure 10 and Figure 11 show the hydraulic conductivity for the four catchments. Hydraulic
conductivity for the top soil layer is generally higher, especially for the Keduang. The subsoil hydraulic
conductivity is rather uniform in the Keduang. The other catchments show some more irregular soil
behaviour, especially higher up on the mountains. Both in the Samin (northeast catchment) and Solo
Hulu (west catchment) there are parts that have a higher Ks in the subsoil than the topsoil. Figure 12
and Figure 13 show the AWC for top- and subsoil. Both images are very alike, as AWC doesn’t vary
much with soil depth. Again, the Keduang shows a very homogenous AWC throughout the catchment.
Figure 12: Topsoil AWC (vol %) Figure 13: Subsoil AWC (vol %)
Figure 14: Topsoil organic content (vol %) Figure 15: Subsoil organic content (vol %)
Finally Figure 14 and Figure 15 show the organic content data collected. Top soils clearly contain more
organic content than subsoil, which is logical. There is a bit more variation in the organic content in
the Keduang than in the soil texture, AWC and Ks. Organic content has effect on both available water
content and hydraulic conductivity, so it is interesting that this varies so much while Ks and AWC do
not.

Master Thesis R.J.J. Oldhoff – Chapter 3
12
CHAPTER 3. METHOD LOCAL SCALE
First, PTFs will be validated at a local scale; the direct prediction of Ks and AWC. This was described
with the following research questions in chapter 1.3:
Q1. Which PTFs are applicable for calculating the saturated hydraulic conductivity and available
water content?
Q2. How well do the selected PTFs perform for the Upper Bengawan Solo catchment (local
scale)?
Q3. Does a PTF developed for the area, based on local measurements, perform better (local
scale)?
Before any validation can take place, the PTFs used for the analysis must be selected. This is done in
paragraph 3.1, followed by a description of the validation of the selected PTFs at a local scale in
paragraph 3.2. The chapter concludes with a description of the method for the creation of new PTFs
using the data obtained with field work in paragraph 3.3.
3.1. Published pedotransfer function selection The selection of PTFs is based on a couple of criteria. First of all, the soil data the PTF is based on is
determined. PTFs made for comparable tropical soils are expected to perform better than PTFs based
on temperate soil data sets. Another factor increasing the extrapolating capacity of a PTF is the size
of the data set it is based on. Generally, a PTF based on a large set of soil samples is more robust than
a PTF based on a smaller set. It is important to stress that the performance of PTFs outside its
development dataset is generally unknown (Chirico et al., 2010).
Thirdly, the required input for the PTF is of importance. A limited amount of soil parameter
information is available from general databases, and the goal of using a PTF is to approximate
parameters without the need for complicated and expensive measurements. Therefore PTFs
requiring input that cannot be obtained from already available data (i.e.(Tomasella et al., 2003),
which requires the cation exchange capacity) will not be considered.
The final criterion is whether the PTF has been validated on other data sets by other researchers and
how it performed in this validation. PTFs that have proven to be useful on multiple data sets are more
robust and are more likely to be useful in this research.
3.1.1 Pedotransfer functions for available water content In the introduction it was briefly mentioned that AWC is defined as the difference between FC and
WP. The problem is that there is no real consensus on what pressure level is most appropriate for the
FC definition. Traditionally, FC is the water content at pF2.54 (-33kPa). For tropical soils however, FC
is thought to be better defined as the water content at pF2 (-10kPa) (Tomasella & Hodnett, 2004).

Method local scale
13
There are three types of PTFs found for the AWC; those that calculate the values of the field capacity
(FC) and wilting point (WP) (Water content at pF 2 and pF 4.2), PTFs that calculate the AWC directly
and PTFs that determine the parameters for the Van Genuchten retention curve. The Van Genuchten
method (van Genuchten, 1980) is the most used model to determine the shape of the water retention
curve, and requires 4 parameters to be estimated. The formula for the Van Genuchten curve is shown
in equation (1).
Van Genuchten curve 𝜃𝑟 +𝜃𝑠 − 𝜃𝑟
[1 + 𝛼|𝜓|𝑛]1−1/𝑛 (1)
Θr : residual water content (L3/L3), θs : saturated water content (L3/L3), and α and n are model parameters
From the water retention curve, the water content at any pressure level can be determined.
However, both Tomasella and Hodnett (2004) and Van den Berg et al. (1997) found that it is better
to determine the FC and WP or AWC directly instead of determining the Van Genuchten parameters
and determining the AWC from the curve. PTFs determining the latter are still considered however,
due to the low quantity of available accurate PTFs. Multiple PTFs that are made for soils in the tropics
show promising results, but are unsuitable for this research for varying reasons; some require input
that is not available, others determine only half of the Van Genuchten parameters required to
determine the AWC (Hodnett & Tomasella, 2002; Santra & Das, 2008; Tomasella et al., 2003).
3.1.1.1 Van den Berg et al.
The first PTF is the one developed by Van den Berg et al. (1997). These PTFs were developed for
ferralsols/oxisols and related soil types, taken from 10 countries. These soil types are commonly
found in the tropics. The output variables are FC, WP, AWC, and Van Genuchten (VG) parameters.
One of the conclusions of their research is that it is better to determine the AWC directly, instead of
using the VG-parameters PTFs. For this reason, the VG parameter PTFs presented in their paper are
not considered. A pro of these PTFs is that they are made for soils that might be comparable to the
ones found in the Keduang catchment, though the authors state that the results obtained do not a
priori allow extrapolation to soils somewhere else in the world. Another pro is that the method is
relatively simple to apply, as limited input is required.
For all three output parameters (FC, WP, AWC), multiple PTFs were made. As the authors state that
it is better to determine the AWC directly, their direct AWC estimation PTF shown in equation (2) will
be used.
AWC = 28.17- 13.18BD (2)
BD = Bulk Density
The selected PTF is not the best performing one Van den Berg et al. developed, though the difference
with the best performer is low. For the AWC, they found a significant correlation (at 1%) between
AWC, and the specific surface area- total surface area of a material per unit of mass- (SS), but as SS is
an unknown for the Keduang catchment, this PTF cannot be used. The selected PTF had a R2 value of
0.38 for their data set, as opposed to the R2 of 0.48 for the PTF which includes the SS.

Master Thesis R.J.J. Oldhoff – Chapter 3
14
3.1.1.2 Wösten et al.
The second PTF that will be analysed was developed by Wösten et al. (1999). Using the HYPRES
(Hydraulic Properties of European Soils) database, containing 4030 usable soil horizons from 12
European countries, PTFs for both the VG parameters and Ks were made. The data was allocated to
one of 11 possible USDA texture classes, then both class and continuous pedotransfer functions were
developed. It is widely used (cited 435 times as of 26/10/15) and used in many comparative studies
(like (Kværnø & Stolte, 2012; Liao et al., 2014)) in which it performs relatively well. A con of this PTF
is that it has been developed for European soils, which can affect the performance on tropical soils.
However, as the data set used to develop the PTFs is very large and its performance when used on
different study areas has been good, the Wösten PTFs will be applied to the Keduang catchment. The
PTF is a multivariate model with 44 parameters, which estimates the VG parameters using silt, clay,
organic content, bulk density, and the Boolean variable ‘topsoil’ vs. ‘subsoil’. The PTF formulas
developed by Wösten et al. are not as brief as the Van den Berg PTFs, and are not shown here. See
Wosten et al. (1999).
3.1.1.3 Rosetta-3
The third PTF used was developed by Schaap et al. (2001), and is known under the name “Rosetta”.
Schaap et al. developed a computer program containing multiple PTFs to determine the Van
Genuchten parameters. Rosetta uses a hierarchical approach that allows users to the VG parameters
using limited to more extended sets of predictors. The first model (H1) is a texture class PTF,
consisting of a look-up table that provides parameter averages for each USDA soil textural class. The
second model (H2) uses sand, silt, and clay percentages as input and, as opposed to H1, provides
hydraulic parameters that vary continuously with texture. The third model (H3) includes bulk density
as an additional predictor, while the fourth model (H4) also uses the water content at pF 2.54. The
last model (H5) includes the water content at pF 4.2 in addition to the input variables of H4 (Schaap
et al., 2004).
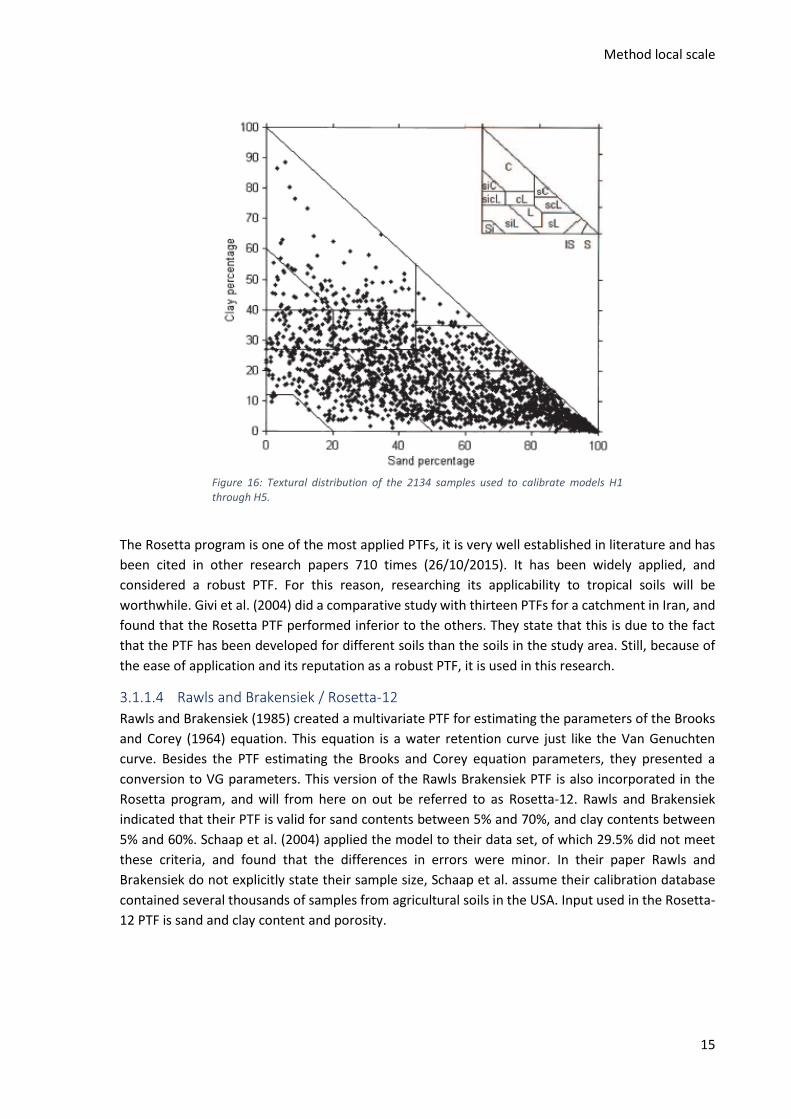
From these five models, the latter two are not useful to this research, as determining the pF values
is the goal of using the PTF. H3 is the model that will be used for this research, as it uses the maximum
amount of easily obtainable input. Figure 16 shows the textural distribution of the 2134 samples used
to calibrate the PTFs, and also illustrates a possible weakness of this PTF for application to the
Keduang. When compared to the earlier shown figure of the samples taken during the field work, it
is visible that there are much more high clay content samples in the database for the Upper Bengawan
Solo catchment. This could lower PTF performance.
Method local scale
15
Figure 16: Textural distribution of the 2134 samples used to calibrate models H1 through H5.
The Rosetta program is one of the most applied PTFs, it is very well established in literature and has
been cited in other research papers 710 times (26/10/2015). It has been widely applied, and
considered a robust PTF. For this reason, researching its applicability to tropical soils will be
worthwhile. Givi et al. (2004) did a comparative study with thirteen PTFs for a catchment in Iran, and
found that the Rosetta PTF performed inferior to the others. They state that this is due to the fact
that the PTF has been developed for different soils than the soils in the study area. Still, because of
the ease of application and its reputation as a robust PTF, it is used in this research.
3.1.1.4 Rawls and Brakensiek / Rosetta-12
Rawls and Brakensiek (1985) created a multivariate PTF for estimating the parameters of the Brooks
and Corey (1964) equation. This equation is a water retention curve just like the Van Genuchten
curve. Besides the PTF estimating the Brooks and Corey equation parameters, they presented a
conversion to VG parameters. This version of the Rawls Brakensiek PTF is also incorporated in the
Rosetta program, and will from here on out be referred to as Rosetta-12. Rawls and Brakensiek
indicated that their PTF is valid for sand contents between 5% and 70%, and clay contents between
5% and 60%. Schaap et al. (2004) applied the model to their data set, of which 29.5% did not meet
these criteria, and found that the differences in errors were minor. In their paper Rawls and
Brakensiek do not explicitly state their sample size, Schaap et al. assume their calibration database
contained several thousands of samples from agricultural soils in the USA. Input used in the Rosetta-
12 PTF is sand and clay content and porosity.

Master Thesis R.J.J. Oldhoff – Chapter 3
16
Table 3: Inputs used for the tested PTFs. BD = Bulk density, OC = Organic Content
PTF Sand Silt Clay BD OC Por. Layer Output
Berg AWC
Wösten VG
Rosetta-3 VG
Rosetta-12 VG
Table 3 shows the required inputs for the selected AWC PTFs, together with their output.
3.1.2 Pedotransfer functions for saturated hydraulic conductivity Applicable PTFs for the AWC are scarce, the same holds for the hydraulic conductivity. In a study
conducted by Sobieraj et al. (2001), eleven PTFs were used (including Rosetta) to determine the
hydraulic conductivity for La Cuenca basin in Peru, where tropical rainforest is present. All PTFs were
inadequate in predicting the hydraulic conductivity. This is most likely caused by the fact that all these
PTFs were based on temperate soil data and this again highlights the problem faced here. In the
absence of PTFs that were based on tropical soil data comparable to the study area in Indonesia,
other PTFs have to be selected with the knowledge that they most likely won’t be accurate. Adding
to the problem is that the hydraulic conductivity is a parameter that shows a lot of variability as stated
in the introduction of this chapter. The general lack of PTFs developed specifically for the tropics
forces a search for PTFs developed for soils elsewhere that exhibit good extrapolating performance.
3.1.2.1 Wösten et al
Wösten et al. (1999), besides formulating PTFs for the water content of soils, also presented a PTF
for the hydraulic conductivity in their paper. The input required for this PTF is silt content, clay
content, bulk density, organic content, and information of whether the sample is topsoil or subsoil.
For the same reasons the Wosten AWC PTF was selected, the Ks PTF will be used as well.
3.1.2.2 Balland et al.
Balland et al. (2008) developed PTFs for the wilting point, field capacity, bulk density and hydraulic
conductivity. The PTF was derived from field surveys in Nova Scotia and New Brunswick, Canada. This
would make it seem like the PTF is hardly applicable to tropical soils, though they validated the PTF
against an international database containing many different soils, and found that the PTF estimates
Ks reasonably well. It is not specified how the performance was per texture class, so it could be good
at estimating Ks for temperate soils whilst failing to estimate values for tropical soils, which is lost in
the evaluation as the data from multiple soil types are ensembled. The input variables are the bulk
density and the sand fraction. Their PTF is rather simple, as shown below (3).
Log(Ks) = 3.5-2.8*BD+2.1*sand (3)
BD = Bulk Density, Sand = Sand fraction

Method local scale
17
3.1.2.3 Santra and Das
A PTF that was actually developed for soils in the tropics was published by Santra and Das (2008). this
PTF was made for a hilly watershed in Eastern India, this is more comparable to soils in the Bengawan
Solo catchment than PTFs designed for temperate soils. The PTF for the saturated hydraulic
conductivity shows good results, and though the best results were obtained when the PTF was
applied to the catchment for which it was made, when applied outside of this range the PTF shows
comparable results to the Wösten et al. PTF (1999), which was developed for European soils. The
input variables for the Santra-Das PTF are bulk density, particle size distribution, pH and elevation
above mean sea level.
The soil type (globally) found in their study area are ultisols. This soil type is also found on parts of
Java. The authors state that the PTF may be used for different areas in (Eastern) India. The authors
also note that a significant result of their study is that robust PTFs may be developed from a limited
number of soil samples, provided that there is enough variability in soil properties. The new PTF was
compared to three PTFs, of which Hodnett & Tomasella (2002) was one. The new PTF performed
better than Hodnett-Tomasella, but the latter also provided satisfactory results. Pros are that the PTF
performed relatively well on soils outside the study area, though still in India. A con is that the PTF
hasn’t been tested on soils in the tropics in other countries.
3.1.2.4 Rosetta (Schaap et al., 2001)
The Rosetta H3 PTF will also be used, for the same reasons given earlier in this chapter.
Table 4 shows the inputs required for the selected PTFs.
Table 4: Inputs used for the tested PTFs. BD = Bulk density, OC = Organic Content
PTF Sand Silt Clay BD OC Elev. pH Layer
Wösten
Balland
Santra
Rosetta-3
3.2. Published PTFs validation local scale The performance of the selected PTFs will be tested on a local scale first. Local scale refers to the
direct approximation of Ks and AWC by PTFs. The soil data obtained from the lab measurements will
be used as input for the PTFs and the results will be compared to the measured values for Ks and AWC.
This will allow the local scale performance of the PTFs for the Upper Bengawan Solo catchment to be
determined.
Judging the accuracy and performance of the PTFs on a local scale will be done based on two
measures; the Root Mean Squared Error (RMSE), and R2. The RMSE is a frequently used measure of
the differences between values predicted by a PTF and the values actually observed, see Eq. (4).

Master Thesis R.J.J. Oldhoff – Chapter 3
18
𝑅𝑀𝑆𝐸 = √1
𝑛∗ ∑(𝑌𝑃𝑇𝐹 − 𝑌𝑜𝑏𝑠)
2
(4)
YPTF = PTF predicted values, Yobs = Observed values
The RMSE is a good predictor of accuracy but only between different models predicting the same
variable, as it is scale dependent. The coefficient of determination R2 is a measure of the goodness of
fit of a model. R2 can be calculated using Equations (5.1)-(5.3):
Total sum of squares 𝑆𝑆𝑡𝑜𝑡 = ∑(𝑌𝑜𝑏𝑠 − 𝑌𝑚𝑒𝑎𝑛)2
(5.1)
Residual sum of squares 𝑆𝑆𝑟𝑒𝑠 = ∑(𝑌𝑜𝑏𝑠 − 𝑌𝑃𝑇𝐹)2
(5.2)
Coefficient of determination 𝑅2 = 1 − 𝑆𝑆𝑟𝑒𝑠/𝑆𝑆𝑡𝑜𝑡 (5.3)
Yobs = Observed values, Ymean = mean of the observed data, YPTF = PTF predicted values
This coefficient describes how well data fits a statistical model, with R2 = 1 being a perfect fit, and R2
< 0 indicating that the mean would predict the data better than the model that is tested.
Not all of the selected PTFs will be used in the SWAT catchment scale validation. If performance on
the local scale is poor, it serves no purpose to try to validate the PTF on the catchment scale. A
maximum of two Ks PTFs and two AWC PTFs will be used for the catchment scale validation excluding
the new PTF (next paragraph).
3.3. PTF creation A pedotransfer function is a relation between input and output and therefore very dependent on the
data used for its creation. The first course of action is therefore splitting the available data set into a
calibration and validation data set. The calibration set is used for the PTF creation, the validation set
is used to judge its performance and make a comparison with the analysed published PTFs possible.
This data splitting, known as subset partitioning, can be done in various ways. In multivariate
calibration problems, it can be difficult to reproduce the variability of real samples. The challenge in
the partitioning of data is to find a representative data set for the complete pool of samples. Several
researchers have addressed the problem of selecting a representative subset from a large pool of
samples such as Galvão et al. (2005) and Wu et al. (1996). The most commonly used methods are
random sampling and Kennard-Stone sampling. Random sampling is regularly used because of its
simplicity. A subset taken from a population at random, has the same chance of getting selected as
any other subset. Subsequently, it is assumed that the subset taken reflects the statistical properties
of the population as a whole. This latter point however is dependent on the size of the data set. For
smaller data sets, the chance that a particular subset does not reflect the population as a whole is
bigger and a multivariate regression based on this set can result in a poor PTF. A solution to this, as
used by Santra & Das (2008), is to randomly sample the data set multiple times, and for each set
produce a PTF. The PTFs are then averaged in the end to produce a final PTF.

Method local scale
19
An often employed alternative is the Kennard Stone (KS) sampling algorithm (Kennard & Stone, 1969).
KS attempts to cover the multidimensional space in a uniform manner, by maximizing the Euclidean
distances between the response vectors of the samples. Various studies have found this sampling
method to be superior to random sampling, as well as some other alternatives (Galvão et al., 2005;
Rajer-Kanduč et al., 2003; Wu et al., 1996). The subset partitioning for PTF creation will be done using
the KS algorithm for this reason.
The input parameters for the PTF are determined based on correlation between the input and output
parameter (e.g. bulk density and available water content/hydraulic conductivity). Then based on the
correlations, multiple PTFs will be made using different combinations of input. Correlations are tested
for significance at the 95% confidence interval. Parameters that will be considered as input are:
Sand (vol %)
Silt (vol %)
Clay (vol %)
Bulk density (g/cm3)
Organic content (vol %)
Elevation (Santra & Das, 2008) (+m AMSL)
pH (-)
Porosity (%) This selection is based on the work done by Wosten et al. (2001) in their overview work on PTFs, on
the papers read on PTFs (for research question 1 and 2), and on the available data. These are the
most commonly used input parameters for PTFs. Sometimes harder to measure inputs such as cation
exchange capacity (CEC), specific surface are, CaCO3 content or even cropping patterns (Mandal et
al., 2013) are used for the creation of PTFs. Though selection of PTF input will mainly be based on
correlation and PTF performance (R2), it is also of importance that the PTF remains useable, and easily
measured data or already commonly available data is used as input. This makes pH and porosity less
favourable to the others, as there is generally no data available for this from maps, and it must either
be measured in the field or estimated.
Some of the techniques used for PTF development are regression analysis, neural networks and group
method of data handling (Wösten et al., 2001). Regression analysis is the most used method for PTF
development. PTFs used to be almost exclusively made using linear regression analysis, though non-
linear regression has partly replaced linear regressions (Rawls & Brakensiek, 1985). An advantage of
regression analysis PTFs is that the essential input parameters are easily found, and the PTFs are easy
to use. Drawbacks are that the use of regression mean any equation is only able to mimic part of the
particular shape of the dependence. When the number of input parameters increases, it becomes
harder and harder to find regression equations that describe the shape of all of the dependencies.
An alternative is Artificial Neural Networks (ANNs). They have become common as a tool for
modelling complex input-output dependencies (Maren et al., 1990). An ANN consists of many
interconnected computational elements called nodes or neurons. Many types of connections are
possible, and thus many types of ANNs. Though ANNs usually result in better PTFs than for instance
multiple linear regression techniques (Arshad et al., 2013; Botula et al., 2014), ANNs are not suited
for this research because of the fact that they require a larger set of data to be built than the data set
available.

Master Thesis R.J.J. Oldhoff – Chapter 3
20
As the amount of samples is limited and the amount of available input parameters is as well,
regression analysis will be used to create the new PTFs. Both linear and non-linear regression will be
evaluated. There are 91 samples available for the creation of the PTFs. The PTFs will be created using
the entire data set, with the Kennard Stone algorithm for the calibration/validation subset sampling.
PTFs have been created using similar sized data sets (Patil et al., 2010; Santra & Das, 2008), and
though a larger database results in more robust PTFs, the current database size is assumed to be large
enough. The calibration will contain two thirds (61) of the samples, the validation the other third (30).
PTF performance will be based on the coefficient of determination R2. There is no fixed value for
when a fit is ‘good’, but a higher R2 is better. The published PTFs will be compared to the new PTFs
using R2, as well as the RMSE. A qualitative analysis will also be done for the PTF outputs, to explain
differences in performance.

Method catchment scale
21
CHAPTER 4. METHOD CATCHMENT SCALE
The model that will be used for the catchment scale validation is the Soil and Water Assessment Tool
(SWAT). This model has a couple of advantages. It is an open source model that is freely available and
is widely used. Because of this, there are multiple calibration programs that are also freely available.
The model also allows the user to input land uses, allowing for an analysis of the effect of land use
changes. For this research, ArcSWAT 2012.10.0.15, a plugin for ArcGIS 10.0 was used. This plugin
allows the user to follow the modelling steps through simple user interfaces. A disadvantage of this
is that there is a risk the model becomes a black box, as the processes and equations are not visible.
It is therefore of great importance that the model’s hydrological cycle is examined before applying
the model.
The main research question for this chapter is:
Q4. Can PTF estimated values be used as input for the SWAT model to simulate the discharge of
the Keduang catchment, and how do the PTFs influence the modelling output accuracy
(catchment scale)?
In paragraph 4.1 a description of the SWAT model and the processes it simulates is given. Paragraph
4.2 describes the model set up that is used in this research. Paragraph 4.3 describes the model warm
up, calibration and validation, and the chapter is concluded with a description of the cases that will
be used to answer the research question in paragraph 4.4.
4.1. Soil Water Assessment Tool SWAT was developed by Dr. Jeff Arnold for the USDA Agricultural Research Service to predict the
impact of land management practices on water, sediment and agricultural yield in large complex
watersheds with varying soils, land use and management conditions over long periods of time. It is a
continuous time model, designed for long term simulations and less suited to simulate detailed single
flood events. The model is physically based, it requires input about weather, soil properties,
topography, vegetation, and land management practices occurring in the watershed. With this input
physical processes such as water movement, sediment movement, crop growth, nutrient cycling etc.
are modelled. A short description of the relevant hydrological processes modelled in SWAT will be
given in this paragraph.
The SWAT model partitions the basin into a number of smaller sub-basins. Within each sub-basin,
input information is grouped into the following categories: Climate, hydrological response units
(HRU), ponds/wetlands, groundwater, and the main channel. HRUs are lumped land areas within the
sub-basin that are comprised of a unique combination of land cover, soil, and slope.
The simulation of the hydrology in a catchment can be divided into two major components; the land
phase of the hydrologic cycle (how the water converges into streams) and the water routing cycle
(how the water is discharged from the catchment). The SWAT model accounts for the fluxes and
storages depicted in Figure 17.

Master Thesis R.J.J. Oldhoff – Chapter 4
22
Figure 17: Schematic representation of the hydrological storages and fluxes incorporated in SWAT
Figure 17 shows all the hydrological processes that can be simulated in SWAT. For this research however, this image can be simplified. As there is no data on irrigation, these fluxes are omitted. These are no ponds or reservoirs located in the Keduang, at least none on which data is available, so this part can also be left out. The detail in the soil modelling is limited to 2 layers as the main differences in soil hydraulic behaviour are found between topsoil and subsoil. The subsoil generally shows rather homogeneous hydraulic behaviour. Also, the curve number method will be used to calculate surface runoff and infiltration. This means the canopy storage is not modelled separately, but rather taken into account in the surface runoff calculations. Surface runoff transmission losses are also omitted, as they are only applicable when lots of ephemeral channels are present. This is often the case in arid regions, but not in the Keduang. Taking these simplifications into account, the figure can be altered to the version shown in Figure 18, with numbers referencing the equations in the next paragraphs.
Figure 18: Schematic representation of hydrological storages and fluxes relevant for modelling of the Keduang per HRU

Method catchment scale
23
4.1.1 Infiltration and surface runoff There are two options for calculating the surface runoff and infiltration. The first is to use the SCS
curve number method. When using the curve number method to compute surface runoff, canopy
storage is taken into account in the surface runoff calculations by lumping it in the term for initial
abstractions. This variable also includes surface storage and infiltration prior to runoff and is fixed at
20%.
𝑄𝑠𝑢𝑟𝑓,𝑡 =
(𝑅𝑡 − 𝐼𝑎,𝑡)2
(𝑅𝑡 − 𝐼𝑎,𝑡 + 𝑆)
(6)
𝑆 = 25.4 (
1000
𝐶𝑁− 10)
(7)
Qsurf = Surface flow (mm), Rday = Rainfall (mm), Ia = Initial abstraction (mm), S = Storage (mm), CN = Curve Number
The curve number method has been in common use since the 1950s and is an empirical relationship
between runoff and rainfall, initial abstractions and a retention parameter. It is widely used, though
it is a very basic method to predict runoff volume. A slope adjustment model has been developed by
Williams (1995) but is not implemented in the SWAT model. The CN method is assumed to be
appropriate for 5% slopes. If higher slopes are present, the Williams equation can be used to adjust
the CN, this must be done prior to entering the CNs in the management input file. This is not done in
the modelling of the Keduang, instead the CN is selected as one of the calibration parameters, where
it can be increased/decreased relative to its standard value. For each time step, SWAT calculates the
amount of water entering the soil. The water that doesn’t infiltrate becomes surface runoff.
The other available methodology to determine the infiltration and surface runoff is the Green & Ampt
equation. The Green & Ampt method requires sub-daily precipitation data and calculates infiltration
as a function of the wetting front matric potential and the effective hydraulic conductivity (which is
determined from the saturated hydraulic conductivity). Water that does not infiltrate becomes
surface runoff. When using this model, canopy storage must be modelled separately. The maximum
amount of water that can be held in canopy storage depends on the leaf area index, and can vary
from day to day. Precipitation ‘fills’ the canopy storage before it is allowed to reach the ground. As
sub-daily precipitation data is not available, this method will not be used. The model setting for the
runoff method and other settings together with a schematization of the technical implementation of
the processes described here, are found in Appendix A.
4.1.2 (Potential) evapotranspiration Potential evapotranspiration (PET) is defined as the amount of water transpired by a short green crop,
completely shading the ground, of uniform height and never short of water (defined by Penman
(1956)). Numerous methods have been developed to estimate PET. In SWAT, three options are
available; Penman-Monteith, Priestley-Taylor and Hargreaves method. As all input for the Penman-
Monteith method - solar radiation, air temperature, relative humidity, and wind speed - is available,
this method is used.
Once PET is determined, actual evaporation is calculated. SWAT calculates the maximum amount of
transpiration and the maximum amount of sublimation/soil evaporation. As there is no snowfall in

Master Thesis R.J.J. Oldhoff – Chapter 4
24
Indonesia, sublimation is not calculated. Soil water evaporation is calculated using Eq. (8) and Eq. (9).
The ESCO factor shown in Eq. (9) can be used to adjust the soil water evaporation.
𝐸𝑠𝑜𝑖𝑙,𝑧 = 𝐸𝑠" ∗
𝑧
𝑧 + exp (2.374 − 0.00713𝑧) (8)
𝐸𝑠𝑜𝑖𝑙,𝑙𝑦 = 𝐸𝑠𝑜𝑖𝑙,𝑠𝑙 − 𝐸𝑠𝑜𝑖𝑙,𝑧𝑢 ∗ 𝐸𝑆𝐶𝑂 (9)
Esoil,z = Evaporative demand at depth z (mm), Es”= max soil water evaporation (mm), z = depth below surface. Esoil,ly =
evaporative demand for layer ly, Esoil,sl = evaporative demand at lower boundary, Esoil,zu = evaporative demand at upper boundary. ESCO = soil evaporation compensation coefficient.
4.1.3 Soil storage and groundwater flows
4.1.3.1 Soil water storage
In SWAT, there are up to 10 layers of soil that can be defined, each with separate soil hydraulic
parameters. This influences the water movement through the soil profile. The biggest difference in
soil hydraulic parameters is usually found between top and subsoil, using two layers will allow this
distinction to be made. Percolation is calculated for each soil layer in the profile. Water is allowed to
percolate if the water content exceeds the field capacity for that layer and the layer below is not
saturated. The amount of percolation depends on the drainable volume of water and the travel time,
which in turn depends on the field capacity and Ks. Besides percolation, water can also leave the soil
profile through plant uptake, or evaporation. One last flux coming from the soil storage is the lateral
flow. Lateral flow will be significant in areas with high hydraulic conductivity in the surface layers and
an impermeable or semipermeable layer at a shallow depth. In such a system, rainfall will percolate
vertically until it encounters the impermeable layer, where it will pond and saturate the soil. SWAT
incorporates a kinematic storage model for subsurface flow developed by Sloan and Moore (1984).
This model simulates subsurface flow in a two-dimensional cross-section and is based on the mass
continuity equation. The speed of the flow is dependent, among other factors, on slope and hydraulic
conductivity. The water balance equation for the soil water storage is shown below in Eq. (10).
Soil water balance equation
𝑆𝑠𝑜𝑖𝑙,𝑡 = 𝑆𝑠𝑜𝑖𝑙,𝑡−1 + 𝐼𝑎,𝑡 − 𝐸𝑠𝑜𝑖𝑙,𝑡 − 𝑤𝑝𝑙𝑎𝑛𝑡,𝑡 − 𝑤𝑝𝑒𝑟𝑐,𝑡 − 𝑄𝑙𝑎𝑡,𝑡 (10)
Ssoil = Soil storage, Ia,t = infiltration, Esoil = evaporation, wplant = plant uptake, wperc = percolation, Qlat = lateral flow
Percolation is calculated for each soil layer in the profile. Water is allowed to percolate if the water
content exceeds the field capacity water content for that layer. Plant uptake is calculated based on
the plant evaporation, the rooting depth of the plants and the soil depth.
4.1.3.2 Shallow and deep aquifer
Water flows through the vadose/unsaturated zone (modelled in the soil layers) before becoming
shallow and/or deep aquifer recharge. The shallow aquifer contributes to stream flow, whereas the
flux out of the deep aquifer is assumed to leave the system by for example entering another
catchment. The partitioning of recharge between shallow and deep aquifers depends on the aquifer
percolation coefficient, which is user defined. There is no method to determine this coefficient and it
can thus be seen as a calibration parameter.

Method catchment scale
25
The water in the shallow aquifer can rise up to overlying soil profile through capillary rise, which is
labelled “revap” in SWAT. Revap is a function of water demand for evapotranspiration, and can only
occur if the amount of water stored in the shallow aquifer exceeds a threshold value specified by the
user. During periods when a stream receives no groundwater contributions, it is possible for water to
be lost from the channel via transmission through the side and bottom of the channel. This is shown
in Eq. (11) with “tloss”. Eq. (11) shows the shallow aquifer water balance, Eq. (12) shows the deep
aquifer water balance.
Shallow aquifer water balance equation
𝑆𝑠ℎ𝑎𝑙𝑙𝑎𝑞,𝑡 = 𝑆𝑠ℎ𝑎𝑙𝑙𝑎𝑞,𝑡−1 + 𝑤𝑠ℎ𝑝𝑒𝑟𝑐,𝑡 + 𝑡𝑙𝑜𝑠𝑠,𝑡 − 𝑄𝑔𝑤,𝑡
− 𝑤𝑟𝑒𝑣𝑎𝑝,𝑡 − 𝑤𝑑𝑒𝑒𝑝,𝑡 (11)
Sshallaq = Storage shallow aquifer, wshperc = percolation from soil, tloss = transmission losses from channel flow, Qgw = baseflow, wrevap = revap to soil, wdeep = percolation to deep aquifer
Deep aquifer water balance equation
𝑆𝑑𝑒𝑒𝑝𝑎𝑞,𝑡 = 𝑆𝑑𝑒𝑒𝑝𝑎𝑞,𝑡−1 + 𝑤𝑑𝑝𝑝𝑒𝑟𝑐,𝑡 + 𝑤𝑑𝑒𝑒𝑝,𝑡 (12)
Sdeepaq = Storage deep aquifer, wdpperc = percolation from soil, wdeep = percolation from shallow aquifer
4.1.4 Channel flow SWAT assumed the main channels have a trapezoidal shape, of which users are required to define
the width and depth when filled to the top of the bank. When the volume of water in the channel
exceeds the maximum capacity the water is spread across the flood plains. Manning’s equation for
uniform flow in a channel is used to calculate the rate and velocity of flow in a channel segment for
a given time step.
All fluxes not exiting the system through the deep aquifer, such as surface runoff, groundwater flow
and lateral flow, end as channel flow. The routing is done based on elevation of the area. As water
flows downstream, a portion may be lost due to evaporation and transmission through the bed of
the channel. The water balance for channel storage is shown in Eq. (13).
Channel water balance equation
𝑆𝑐ℎ,𝑡 = 𝑆𝑐ℎ,𝑡−1 + 𝑄𝑖𝑛 + 𝑄𝑙𝑎𝑡 + 𝑄𝑠𝑢𝑟𝑓 + 𝑄𝑔𝑤 − 𝑄𝑜𝑢𝑡,𝑡
− 𝑡𝑙𝑜𝑠𝑠,𝑡 − 𝐸𝑐ℎ,𝑡 (13)
Sch = Channel storage, Qin = inflow from upstream subbasin, Qlat = lateral flow, Qsurf = surface runoff, Qgw = baseflow from
shallow aquifer, Qout = outflow to next basin, tloss = transmission losses, Ech = channel water evaporation

Master Thesis R.J.J. Oldhoff – Chapter 4
26
4.2. Model set-up This paragraph describes the model set-up used in the hydrological modelling of the Keduang
catchment using SWAT, for the catchment scale validation of the selected PTFs. First the hydrological
data are described, followed by a description of the modelling steps taken, such as the watershed
delineation, land use and soil data, HRU definition, and the creation of artificial weather stations.
4.2.1 Hydrological data Hydrological data is available on the following: temperature, wind speed, relative humidity, solar
radiation, and precipitation and discharge data. Precipitation and discharge data is available for 1991-
2014. This data will be used as model input and it is therefore of great importance that a period with
sufficient data is chosen for modelling purposes. Preferably, a long period without missing data for
precipitation, discharge and climatological data is available. This however is not the case.
4.2.1.1 Precipitation and discharge data
The choice of the time period that is used for modelling is based on the availability of precipitation
data of sufficient quality and quantity. There are a total of 7 rainfall stations inside and just outside
of the Keduang catchment (Figure 19). Not all stations have been in use since 1991 and there are big
gaps in the data ranging in length from months to years. For the years 2003 and 2004 there is no data
available at all.
Figure 19: Rainfall stations for the Keduang catchment. The stars show the stations used for modelling purposes
In Figure 20, the precipitation and discharge data are shown. Selecting a period for modelling
purposes proves to be a challenge. The data from 1991-1993 contains some kind of error, as the
discharge exceeds the precipitation, it is not clear what caused this. Because of this error, the data
up until 1993 cannot be used.

Method catchment scale
27
Figure 20: Precipitation and discharge data available for Keduang catchment
In the period 1993-2002 there is hardly any variation in the discharge, which is remarkable. The
amount of precipitation does vary, so one would expect to find a similar variation in the discharge.
The lack of this variation may indicate an error in the measurements of the discharge, and for this
reason 1993-2002 is not used either. The rainfall data for 2003 and 2004 is missing completely. In
2005, precipitation data is only available from 3 stations. For the period 2007-2014, out of the seven
rainfall stations that are located in the Keduang, three stations measured continuously and one is
missing one month of measurements. The other three stations didn’t measure data for about three
years, or like the Slogohimo station contain measurement errors. The Slogohimo station noted a huge
precipitation in 2010, with daily precipitations of over 600mm recorded more than once. This is
clearly a measurement error.
The period that will be used for modelling in this research was chosen to be 2007-2014, using the
stations Ngadirojo, Jatipurno, Jatiroto and Girimarto, shown in Figure 19 with hexagons. Of these
stations, the latter misses one month of data. This month was filled in by using the average of 5
stations that did measure during that month. Using Thiessen polygon weights to obtain an average
precipitation, the precipitation graph shown in Figure 21 was calculated.
Figure 21: Plot of rainfall and discharge for the Keduang catchment
0
2000
4000
6000
8000
10000
12000
14000
1990 1995 2000 2005 2010 2015
Pre
cip
itat
ion
/dis
char
ge (
mm
/yea
r)
Jatisrono Slogohimo Girimarto Sidoharjo
Jatiroto Jatipurno Ngadirojo Discharge
0.00
200.00
400.00
600.00
800.00
1000.00
Jan-07 Jan-08 Jan-09 Jan-10 Jan-11 Jan-12 Jan-13 Jan-14
Pre
cip
itat
ion
/dis
char
ge
(mm
/mo
nth
)
Rainfall
Discharge

Master Thesis R.J.J. Oldhoff – Chapter 4
28
Things to note about Figure 21 are the missing peaks in the start and end of 2008. In end of 2007 and
start of 2008 the discharge station did not measure discharge, as well as not measuring at the end of
2008, missing two discharge peaks that likely occurred in that period (judging from the precipitation
graph). Generally speaking, the discharge line follows the precipitation line rather well. It is clearly
visible that there is a wet season and a dry season in Indonesia. The wet season lasts roughly from
October until April, the dry season from April until October. Precipitation is high in the wet season,
with short intensive rainfall.
Another interesting observation in the hydrograph is the peak of discharge around January 2011. For
this peak, it appears almost all precipitation discharges, whereas previous and later peak flows are
lower in comparison to their precipitation peaks. This can be caused by the small precipitation peak
before the January peak in October, or an error in the data.
The precipitation and discharge data for 2007-2014 appear to be of decent quality, though the errors
in the data measured between 1990 and 2007 weaken the reliability of the data. Another thing to
note is that the discharge data is often the same for multiple days in a row, mainly in the dry season
but also for higher flows. This can either be caused by the measuring frequency during this period, or
by the measuring method. It is however implausible that the discharge was exactly the same for days
in a row.
4.2.1.2 Other climatological data
Temperature, wind speed, humidity and solar radiation data were obtained from one station located
at the Adi Sumarmo airport in Surakarta, about 45-50km away from the Keduang catchment. This is
the closest location available containing data of sufficient quality. There are many gaps in the data,
sometimes of more than a year. Climatology data from 1974-2014 is available for the Adi Sumarmo
station. As the period of 2007-2014 will be used in the research, this is the only data that is presented
in this paragraph. The data presented in this paragraph is used in the determination of the potential
and actual evapotranspiration.
Figure 22: Mean monthly maximum and minimum temperature data for 2007-2014
15
20
25
30
35
40
Jan-07 Jan-08 Jan-09 Jan-10 Jan-11 Jan-12 Jan-13 Jan-14 Jan-15
Tem
per
atu
re (
oC
)

Method catchment scale
29
Indonesia is located in the tropics, on top of the equator. Java is just below the equator and this is
reflected in the temperature statistics. Throughout the year maximum and minimum temperatures
don’t vary much (compared to temperate climates). The monthly mean temperature is shown in
Figure 22, which shows that the temperature is very stable. During the day temperatures usually vary
between 22 and 35 oC. Data for 2007 is missing, and a large part of 2008 is missing as well. These are
the only missing values.
The average monthly relative humidity is shown in Figure 23, and is also very stable and repetitive. It
varies between a relative humidity of 65% and 90%. As with the temperature data, data for 2007 and
a large part of 2008 is missing. The relative humidity graph follows the precipitation graph (Figure
21), in the wet season the humidity is higher.
Figure 23: Mean monthly relative humidity 2007-2014
The wind speed data is of less quality (Figure 24). First of all, there are a lot of gaps in the data. Besides
this, there is no info on the height at which the wind speed measurement is taken, and the wind
speed is rounded to the nearest integer.
Figure 24: Mean monthly wind speed for 2007-2014
50%
55%
60%
65%
70%
75%
80%
85%
90%
95%
100%
Jan-07 Jan-08 Jan-09 Jan-10 Jan-11 Jan-12 Jan-13 Jan-14 Jan-15
Rel
ativ
e h
um
idit
y
0
2
4
6
8
10
12
Jan-07 Jan-08 Jan-09 Jan-10 Jan-11 Jan-12 Jan-13 Jan-14 Jan-15
Win
d s
pee
d (
m/s
)

Master Thesis R.J.J. Oldhoff – Chapter 4
30
Figure 25: Mean monthly percentage of sun hours between 08:00 and 16:00 for 2007-2014
The final data required for the determination of evapotranspiration is the solar radiation. Figure 25
shows the amount of sun hours between 08:00 and 16:00 as a percentage, averaged per month. Until
2010 this was not measured at all and in 2013 there is a small gap again. The amount of sun hours
can be used to calculate the solar radiation in MJ/m2. When sunshine is strong enough to burn the
measurement paper, it has an intensity of 120 W/m2. Using this and the transformation factor
between Watt and Joule, the hours of sunshine can be transformed to MJ/m2/day.
The missing values will be generated within SWAT. SWAT includes the WXGEN weather generator
model (Sharpley & Williams, 1990). WXGEN is used in SWAT to fill missing data using monthly
statistics, which must be calculated from the existing daily data. For the technical implementation of
this model in SWAT, see the SWAT theoretical documentation (Arnold et al., 2011). The WXGEN
model is not used to generate precipitation data, as the data was checked beforehand on missing
values. The WXGEN model first determines the occurrence of rain on a given day, as this has a major
impact on relative humidity, temperature and solar radiation for the day. Then based on the rainfall
the maximum temperature, minimum temperature, solar radiation and relative humidity are
generated using the average monthly statistics and absence or presence of rain for the day. Finally,
wind speed is generated independently.
4.2.2 Watershed delineation The first step in the SWAT model is delineating the watershed. This is done based on a Digital
Elevation Model (DEM). Using contour line data with a height interval of 12.5m, obtained from the
Badan Informasi Geospasial (Geospatial Information Agency Indonesia), the DEM for the Keduang
shown in Figure 26 was made, with a grid size of 50x50 meters. The basin ranges from 2000 meters
above mean sea level in the north, where Mount Lawu is located, to about 145 meters above mean
sea level in the lower part of the basin.
0
10
20
30
40
50
60
70
80
90
100
Jan-07 Jan-08 Jan-09 Jan-10 Jan-11 Jan-12 Jan-13 Jan-14 Jan-15
Sun
ho
urs
bet
wee
n 0
8:0
0-1
6:0
0
(%)

Method catchment scale
31
Figure 26: DEM used in the modelling of the Keduang. DEM values are in m above MSL
Based on the DEM, the flow direction and accumulation is determined, followed by a stream network
and outlets. Outlets are the points where water from a sub-basin enters another sub-basin. If no
outlets are deleted, the model creates a sub-basin for each tributary. In this case this would result in
33 sub-basins (Figure 27). Each sub-basin contains its own information on climate, ponds/wetlands,
the main channel draining the basin, and Hydrologic Response Units (HRUs). Therefore each sub-
basin has parameters that have to be calibrated, and using many sub-basins would result in an over-
parametrisation. Ideally, one would like to have discharge data for each sub-basin, so they can
individually be calibrated. Unfortunately, there is only one discharge series available which is at the
outlet of the entire catchment.
Figure 27: Watershed delineation with 33 sub-basins Figure 28: Watershed delineation used in calculations

Master Thesis R.J.J. Oldhoff – Chapter 4
32
Meins (2013) did research on the effect of the number of sub-basins used, on the model outcome
using the SWAT model. He found that an increased number of sub-basins results in a more accurate
simulation of stream flows when using SWAT. However, he also states that finer spatial scales of
model implementation will improve the accuracy of stream flow simulation only when data are
available at the same spatial scale. This is to make sure an accurate representation of the hydrological
processes is obtained, and over-parameterization is reduced (Meins, 2013).
There are 4 rainfall stations available and just 1 discharge station, so the number of sub-basins is
limited to this order of magnitude. It was decided based on the topology of the catchment to model
using the 7 sub-basins shown in Figure 28. The locations of the outlets (and thus the sizes of the sub-
basins) were chosen such that the area of each sub-basin is comparable.
4.2.3 Land use After these steps SWAT calculates the sub-basin parameters such as area and channel length. When
this is done, land use and soil data must be added to define HRUs. The land use data used was
obtained in 2007. Data on the land use in 2014 is also available, but the period 2007-2014 will be
modelled. Therefore, the 2007 data is used as model input. In this land use map only 4 land uses are
defined; as shown in Figure 29. The land use map was obtained from BPDAS. Multiple land uses are
grouped together in these four, especially dry land cultivation, which is a combination of the various
crops that are grown in the area. This means that a single crop must be chosen to represent the group
of crops within the Keduang, which results in a slight simplification. The accuracy of the 2007 map is
inferior of the 2014 map. There is much more urban area than in 2014 (18.1% vs 4.2%), it is however
unlikely that the area became less urban. The quality of the land use map has large effects on the
modelling output, as curve numbers and thus surface runoff is directly related to the land use.
Figure 29: Land use 2007
From the land use raster, SWAT extracts the land use per cell (again in a 50x50 grid). The land use
code from the raster has to be coupled to a land use in the SWAT database, or a user defined land
use. As there is no data available on the many parameters required for the definition of user land
uses, the following SWAT land uses were chosen to represent the land uses in the Keduang (Table 5),
based on observations made during field work.

Method catchment scale
33
Table 5: Land use definition SWAT
Land use Keduang Land use SWAT SWAT code
Rice field Rice RICE
Forest Forest-Mixed FRST
Dryland cultivation Cassava CASS
Built up area Urban Residential URBN
4.2.4 Soil The soil data is important input, as it has a large effect on the hydrology of the catchment. It is
therefore important for any modelling purpose to accurately describe the soil found in the
catchment. The soil data includes the parameters Ks and AWC, which will be varied in different cases
to research the performance of PTFs on a catchment scale. Soil data input is comparable to the land
use input; users either create their own soils based on their own data, or select soils from the SWAT
database. Soils in this database, be it created by the user or already existing, contain data on the soil
hydraulic parameters such as Ks, AWC, organic content, bulk density and texture, as well as data on
pH, soil albedo, erodibility, electrical conductivity, calcium content and layer depth. More on the
input used for soil is discussed later in this chapter, in paragraph 4.4 where the case formulation is
described, as the soil input is dependent on the case.
4.2.5 HRU definition Hydrologic Response Units, HRUs for short, are lumped areas within a sub-basin with similar land use,
soil properties and slope class. For each HRU surface, lateral and groundwater flows are calculated.
The slope classes have to be defined by the user. For this research, 4 slope classes were defined: 0-
10%, 10-20%, 20-40% and >40%. The user has a choice in the HRU definition between a dominant
HRU or multiple HRUs per sub basin. When using multiple HRUs a threshold may be selected for the
percentage of the area covered by a land use/soil/slope class. By defining a threshold the number of
HRUs is limited and calculation time can be sped up considerably. For each HRU parameters have to
be calibrated, so an excessive number of HRUs results in over-parameterization. Meins (2013) found
that an increased number of HRUs doesn’t increase model accuracy if only one calibration variable
(downstream discharge) is used, and therefore the number of HRUs in this research was limited by
using a 25% threshold for land use, soil, and slope class area coverage. SWAT looks at each subbasin
and determines which soil type, land use type, and slope class cover 25% or more of the subbasin.
Soils, land uses or slope classes that don’t cover 25% of the subbasin are split up between the others
based on relative area. The resulting selection of soil types, land use types and slope classes then get
combined into HRUs. This resulted in 39 HRUs for the Keduang, as opposed to 244 when no threshold
is defined (for case 1, see paragraph 4.4).
4.2.6 Artificial weather stations The final step before the model can be run is to define the climate data. SWAT uses five different
types of weather data; rainfall data, temperature data, solar radiation data, relative humidity data
and wind speed data.

Master Thesis R.J.J. Oldhoff – Chapter 4
34
As described in the beginning of this paragraph, a total of only four rainfall stations containing data
of sufficient quality for 2007-2014 can be used in the modelling of the Keduang. The four stations
used are Girimarto, Jatipurno, Ngadirojo, and Jaritoro. The station locations are shown in Figure 30
together with the sub basins and their centroids.
SWAT uses a rather basic approach to precipitation generation for the watersheds from these
stations; it selects the station closest to the watershed, and uses this precipitation series. For some
watersheds this may be sufficient, but for others (such as sub-basin 4 in Figure 30) more than one
station may need to be used to accurately represent the precipitation data in this area. Therefore,
for each sub-basin an artificial station is created. This was done using Thiessen polygons and weighing
the stations for each subbasin accordingly. In Figure 31 the Thiessen polygons for the rainfall stations
are shown. Figure 32 shows the average monthly rainfall for the artificial stations. The sub-basins that
are in the upper part of the catchment show a higher amount of precipitation, which is to be
expected.
Figure 32: Average monthly rainfall for the artificial stations
0
5
10
15
20
25
1 2 3 4 5 6 7 8 9 10 11 12
Pre
cip
itat
ion
(m
m)
Month1 2 3 4 5 6 7
Figure 30: Rainfall stations in the Keduang Figure 31: Thiessen polygons for artificial rainfall station generation

Method catchment scale
35
4.3. Warm up, calibration and validation Hydrological models require a “warm up” period to increase model accuracy. “Warming-up” is an
essential part of the simulation process that ensures the establishment of the basic flow conditions
for the simulations by bringing the hydrologic processes to an equilibrium condition. If the model is
run without warm up, the groundwater levels have to be estimated at the start and the first year or
two will therefore give less accurate results. For this research, two years of model warm up are used
to ensure equilibrium flow conditions. As described before, rainfall and climate data of sufficient
quality are available for 2007-2014, only 8 years. The first two years in this series however are of
lower quality. There is no climatological data (except for precipitation) for 2007, and about 7 months
of data are missing for 2008. Besides that, the discharge data for both peaks in this time period are
missing. For these reasons, 2007 and 2008 data is used as the warm up period of the model.
There will be multiple cases (see paragraph 4.4), and each case will be calibrated. Calibration is an
effort to better parameterize a model to a given set of local conditions, thereby reducing the
prediction uncertainty (Arnold et al., 2012). This is done by carefully selecting parameters and their
values for the model input, by comparing model predictions with observations. By calibrating, it is
attempted to obtain a model output as similar as possible to observations. After calibration,
validation is done by running the model with the parameter values found during calibration, and
comparing model output to the observed validation data, which is different from the calibration
conditions.
The data split for calibration and validation is shown in Figure 33. The calibration period is from 01-
01-2009 until 31-08-2012, the validation period from 01-09-2012 until 31-12-2014. This period was
chosen to ensure two complete hydrological years are in the validation period. The calibration period
contains 44 months, the validation period 28 months. Calibration and validation will be done with a
monthly time step. It is also possible to do yearly or daily calibration. The SWAT model was not
developed for peak discharge simulation and using a daily time step will make the model performance
much worse. Another thing affecting daily time step results is the fact that the discharge is often the
same for multiple days in a row, especially during the dry season. The data quality is simply not good
enough to expect sufficient model accuracy using a daily time step.
Figure 33: Data split for model warm up, calibration, and validation

Master Thesis R.J.J. Oldhoff – Chapter 4
36
In this research, calibration is done using a program called SWAT-CUP (SWAT Calibration and
Uncertainty Programs), developed by Neprash Technology (Abbaspour et al., 2007; Neprash
Technology, 2012). SWAT-CUP enables automatic sensitivity analysis, calibration, validation and
uncertainty analysis of SWAT models. The SUFI2-(Sequential Uncertainty Fitting, version 2) module is
used to calibrate and validate the model. SUFI2 uses a stochastic calibration approach, by accounting
for parameter uncertainties. See Abbaspour (2007) for an explanation of the SUFI2 module.
4.3.1 Sensitivity analysis The parameters that are used for the calibration are selected using a Global Sensitivity Analysis (GSA).
The initial list of parameters is based on both the SWAT input manual (Arnold et al., 2011) and a paper
by Arnold et al. (2012) on SWAT model use, calibration and validation. This list is shown in Table 6.
Though usually soil parameters such as AWC, Ks and bulk density are used as well, it was decided not
to use these for the cases (except one), as the goal of the catchment modelling is to assess the effect
of using pedotransfer functions for Ks and AWC, and to determine whether they are a valid alternative
to measuring soil parameters. Using them as calibration parameters doesn’t allow for the research
question to be answered.
Table 6: List of parameters considered for calibration
The sensitivities calculated are estimates of the average changes in the objective function (NS, see
next paragraph) resulting from changes in each parameter, while all other parameters are changing.
Parameter name Type Min Max Unit Description
r__CN2.mgt Relative -0.2 0.2 - SCS runoff curve number
v__ALPHA_BF.gw Replace 0 1 Days Baseflow alpha factor
v__SLSUBBSN.hru Replace 10 150 m Average slope length
v__HRU_SLP.hru Replace 0 1 - Average slope steepness
v__OV_N.hru Replace 0.01 30 s/m1/3 Manning's "n" value for overland flow
v__SLSOIL.hru Replace 0 150 m Slope length for lateral subsurface flow
v__ESCO.hru Replace 0 1 - Soil evaporation compensation factor
v__EPCO.hru Replace 0 1 - Plant uptake compensation factor
v__SURLAG.bsn Replace 0.05 24 - Surface runoff lag time coefficient
v__GW_REVAP.gw Replace 0.02 0.2 - Groundwater "revap" coefficient
v__GW_DELAY.gw Replace 0 500 Days Groundwater delay
v__GW_SPYLD.gw Replace 0 0.4 m3/m3 Specific yield of the shallow aquifer
v__RCHRG_DP.gw Replace 0 1 - Deep aquifer percolation fraction
v__GWQMN.gw Replace 0 5000 mm Threshold depth of water in the shallow aquifer
required for return flow to occur
v__SOL_ROCK.sol Replace 0 10 Vol % Rock fragment content
v__CH_N1.sub Replace 0.01 30 s/m1/3 Manning's "n" value for the tributary channels
v__CH_N2.rte Replace -0.01 0.3 s/m1/3 Manning's "n" value for the main channel
v__CH_K1.sub Replace 0 300 mm/h Effective hydraulic conductivity in tributary
channel alluvium
v__CH_K2.rte Replace -0.01 500 mm/h Effective hydraulic conductivity in main channel
alluvium

Method catchment scale
37
This gives relative sensitivities based on linear approximations and, hence, only provides partial
information about the sensitivity of the objective function to model parameters.
Parameter sensitivity is expressed with a t-stat and a p-value. The t-stat is a measure of the precision
with which the regression coefficient is measured. The t-stat of a parameter can be compared with
the values in the Student's t-distribution table to determine the p-value. The Student's t-distribution
describes how the mean of a sample with a certain number of observations is expected to behave.
The p-value for each term tests the null hypothesis that the coefficient is equal to zero (no effect). A
low p-value (< 0.05) indicates that you can reject the null hypothesis. In other words, a predictor that
has a low p-value is likely to be a meaningful addition to your model because changes in the
predictor's value are related to changes in the response variable. A p-value of < 0.05 is the generally
accepted point at which to reject the null hypothesis. With a p-value of 0.05, there is only a 5% chance
that results you are seeing would have come up in a random distribution (Abbaspour, 2015).
4.3.2 Calibration Based on the GSA results a set of calibration parameters will be selected and all cases will be
calibrated using these parameters. For the selected calibration parameters upper and lower bounds
are defined, between which the parameter values are distributed uniformly. These distributions are
then used as input, generating a set of model outputs. The program aims to capture as many
observations of the model output variable that is used for calibration (in this case the catchment
discharge) as possible in the “95PPU”, the 95% prediction uncertainty. The 95PPU is an envelope of
solutions containing 95% of the model outputs using the defined parameter value ranges.
After an iteration, the parameter ranges can be adjusted based on the previous run’s results. The new
parameter ranges are updated by calculating the sensitivity matrix, covariance matrix, 95%
confidence interval of the parameters, and a correlation matrix. Parameters are then updated in such
a way that the new ranges are always smaller than the previous ranges and are centred around the
best simulation (Abbaspour et al., 2007). This is repeated until a 95PPU plot is obtained that is, in the
users eyes, sufficiently accurate. A total of 4 iterations are done for the calibration of the cases, each
containing 250 simulations, which is recommended in the SWATCUP manual (Abbaspour et al., 2007).
Calibration is done based on the Nash Sutcliffe model efficiency coefficient (NS). The NS coefficient is
defined as follows:
𝑁𝑆 = 1 −
∑(𝑄𝑚−𝑄𝑠)𝑖2
∑(𝑄𝑚 − 𝑄𝑎𝑣𝑔,𝑚)2 Equation I
NS = Nash Sutcliffe coefficient, Qm = measured discharge, Qs = simulated discharge, Qavg,m = average measured discharge
During calibration, SWAT-CUP attempts to maximize this coefficient. NS = 1 indicates a perfect
simulation, NS < 0 indicates that the observed mean is a better predictor than the model. The Nash
Sutcliffe coefficient is actually identical to the R2 coefficient of determination used to analyse the
performance of PTFs. The NS coefficient is sensitive to extreme values. It is a very frequently used
coefficient in hydrological modelling. This goal function was chosen over the other options for these
reasons.
Though the model is calibrated using the NS coefficient, multiple other statistics are also calculated
by SWATCUP. From these the ‘r-factor’, ‘p-factor’ and the Mean Squared Error (MSE) are selected for

Master Thesis R.J.J. Oldhoff – Chapter 4
38
this research as extra statistics on which model accuracy is judged. The p-factor and r-factor are
statistics describing the 95% confidence band. A perfect simulation would result in a p-factor of 1 and
an r-factor of 0. The p‐factor is the fraction of observed data enveloped by the modelling result, the
95PPU. The r‐factor describes the thickness of the 95PPU envelop. The MSE is the average of the
squared difference between observed and modelled discharge. A smaller MSE indicates a better fit.
4.4. Case formulation To validate the selected PTFs and new PTFs on a catchment scale, they will be used as model input.
This will be done by analysing several cases, and comparing the case results. The cases will differ in
the input used for the soil data.
Table 7: Cases used for catchment scale PTF validation
Cases Soil map Ks AWC
1 Measured Measured Measured Measured
2 FAO Base FAO DSMW USDA FAO
3 Ks – 1 FAO DSMW PTF 1 FAO
4 Ks – 2 FAO DSMW PTF 2 FAO
5 Ks – Oldhoff FAO DSMW Oldhoff FAO
6 AWC – 1 FAO DSMW USDA PTF 1
7 AWC – 2 FAO DSMW USDA PTF2
8 AWC – Oldhoff FAO DSMW USDA Oldhoff
9 Oldhoff PTFs FAO DSMW Oldhoff Oldhoff
10 FAO – Soil Calibrated FAO DSMW Calibrated Calibrated
11 Measured Uncalibrated Measured Measured Measured
12 FAO base Uncalibrated FAO DSMW USDA FAO
Case 1, will use the soil data collected with field work. The soil raster is made using the measurement
locations and making Thiessen polygons for them. The resulting soil map is shown in Figure 34. For
each of these polygons, two soil layers are defined based on the measurements. The topsoil layer is
100 mm thick, the subsoil layer is assumed to be 900 mm thick. This is a rough estimate based on
road cuts and eroded soils seen during the field work. If soil characteristics were sufficiently similar,
polygons were joined to speed up computing time and reduce over parameterization, by reducing
the number of HRUs.

Method catchment scale
39
Figure 34: Soil map "Base case" Figure 35: Soil map DSMW for case 2-11
It was decided to use Thiessen polygons to model the soil. Firstly because the measurements were
taken using proportional sampling and their locations were spread throughout the catchment, they
are assumed to be representative for the polygons around them. Secondly because the soil map
shown in Figure 34 shows good agreement with the morphological soil map, shown in Figure 36. Soil
from volcanic deposits covers most of the catchment, and as visible in Figure 37 the texture class for
most of the catchment is clay. The south part of the catchments contains some soil deposited in the
Miocene era, of which the southwest part is represented by a separate polygon, and the southeast
part as well. The polygon around point 1 captures the younger volcanic deposits.
Figure 36: Morphological soil map Figure 37: Measured texture class. C = Clay, L = Loam, SaL =
Sandy Loam

Master Thesis R.J.J. Oldhoff – Chapter 4
40
Cases 2-10 will be based on the FAO DSMW; Digital Soil Map of the World (FAO, 2009). The scale of
the original map (and the vector-formatted data) is 1:5 000 000. The map contains soil type data
(Figure 35). Coupled to these soil types is a database containing data on soil depth, sand/silt/clay
content, organic content, bulk density, pH, CEC, and gravel content for both topsoil and subsoil.
Data is missing on the AWC and Ks. The AWC values in cases 2, 6-8 and 12, are estimated based on
USDA texture class lookup tables and some general values for AWC in the tropics. Lookup tables for
hydraulic parameters are usually based on PTF functions, which doesn’t allow for a fair comparison.
A FAO document (FAO, 1980) was used to estimate the value of Ks for cases 2-5 and 12, based on
texture class.
The DSMW shows four soil types for the Keduang catchment. The DSMW will be used for Case 2-10,
as it is freely available soil data. In the Keduang less than 1% of the area is classified as “I-Lc-3b” soil
in the DSMW soil map. This area was added to the “Lv5-3b” soil type which is adjacent to it (Figure
35) and the “I-Lc-3b” soil was omitted.
For the different cases, the AWC/Ks value will be replaced with a PTF determined value, using the FAO
DSMW data as input for the PTFs. Table 7 shows three cases for both Ks and AWC PTFs. Based on the
results of the local scale validation, PTFs will be validated on the catchment scale. If the local scale
validation results show that not enough PTFs for either AWC or Ks are sufficiently accurate, these
amount of cases can be reduced. Case 3-5 will replace the Ks value with a PTF calculated value while
the AWC value remains the same as in case 2. Another three cases will have different values for AWC,
based on PTFs, while using the Ks value from case 2. Case 9 will use the values determined by the new
PTFs for both AWC and Ks.
For case 10, two parameters are added to the calibration parameter list: hydraulic conductivity, and
available water content. These will only be used as calibration parameters in case 10. Finally case 11
and 12 are uncalibrated versions of case 1 and 2, to compare the uncalibrated model performance.
With these cases, it will be possible to examine whether or not the use of a more detailed soil map
increases model accuracy. Also it will be possible to determine whether PTFs for AWC and Ks can be
used to determine soil parameters for the hydrological modelling of the Keduang catchment. By
dividing the cases in a measured case (case 1, and 11), a FAO base case (case 2 and 12), and PTF cases,
comparisons between alternatives for soil modelling can be made.

Results local scale
41
CHAPTER 5. RESULTS LOCAL SCALE
The results of the local scale validation of both published and the new PTFs will be presented in this
chapter. The results of the AWC PTFs are shown in paragraph 5.1, followed by the KS PTFs in
paragraph 5.2. The results of the new PTF creation are presented in paragraph 5.3, and the chapter
is concluded in paragraph 5.4. The dataset used for the validation of the published PTFs and creation
of new PTFs is described in Chapter 2. A total of 91 soil samples taken in four sub catchments of the
Upper Bengawan Solo are used.
5.1. Available water content For this analysis, the following four PTFs were selected for the AWC:
Van den Berg (Van den Berg et al., 1997)
Wosten (Wösten et al., 1999)
Rosetta-3 (Schaap et al., 2001)
Rosetta-12 (Rawls & Brakensiek, 1985; Schaap et al., 2001)
Throughout this research, the definition for AWC used is the difference in water content between pF
2 and pF 4.2. Sometimes the difference between pF2.54 and pF4.2 is used, but this results in AWC
values that are too low for tropical soils (Tomasella & Hodnett, 2004). To test this, the PTFs are tested
using both definitions. Figure 38 and Figure 39 show scatterplots of the measured versus PTF
predicted AWC values. A perfect prediction of the AWC would result in a straight line, shown in the
figure in blue. In each graph, the coefficient of determination R2 and RMSE values are shown.
The selected PTFs predict the AWC poorly, for both AWC definitions. For all four PTFs, the R2 value is
negative indicating that the mean of the data is a better predictor than the PTFs. For AWC = pF2-
pF4.2, the Wosten, Rosetta-3 and Rosetta 12 predict the magnitude of the AWC better than Van den
Berg et al. The definition however doesn’t appear to matter, as in all cases the coefficient of
determination R2 is below zero. It is remarkable that almost none of the variability of the data is
captured by the PTFs, this may indicate other soil parameters explain the variability in the AWC better
than the parameters used as input for these PTFs.
Figure 38: PTF results for AWC = pF 2 - pF 4.2

Master Thesis R.J.J. Oldhoff – Chapter 5
42
Figure 39: PTF results for AWC – pF 2.54 - pF4.2
When AWC is defined as pF2.54-pF4.2 (Figure 39) all PTFs overestimate the AWC. This is an indication
that this definition doesn’t suit the soils encountered in the Upper Bengawan Solo. With the other
definition, pF2-pF4.2, Van den Berg et al. underestimate the AWC, while the other three PTFs both
over and underestimate. None of the scatterplots shows a clear linear trend, which is reflected in the
negative R2 values. Another thing to note is the small spread in measured AWC values for AWC = pF
2.54- pF 4.2, even though the data has large differences in texture, organic content, etc. The Wosten
PTF predicts an AWC of 0% for one of the samples, this is due to the fact that organic content in this
sample was 0%, which causes an error due to the equation form of this PTF. The results of the local
scale validation are shown in the table below (Table 8)
Table 8: R2 and RMSE values for AWC PTFs
AWC= pF2-pF4.2 AWC= pF2.54-pF4.2
AWC PTF R2 RMSE (% vol) R2 RMSE (% vol)
Van den Berg -4.72 9.51 -0.72 3.85
Wösten -3.09 8.04 -11.01 10.17
Rosetta-3 -1.30 6.04 -26.82 15.48
Rosetta-12 -2.33 7.26 -10.76 10.06
Using these PTFs for modelling is not advisable, as the AWC is predicted very poorly. This can be
attributed to a couple of things. First of all, all four PTFs were developed using soil data bases
containing samples predominantly taken from temperate soils. These soils are different in
composition and have different SHPs than tropical soils. This can explain the poor performance of the
PTFs, as they are applied to a data set that falls outside of the range of soils used for their creation. It
may be possible that other soil characteristics govern AWC in tropical soils, characteristics that were
not used as input in the tested PTFs. Van den Berg et al. (1997) found for their own PTF that the
correlation was rather weak, with an R2 value of just 0.38 for the PTF used in this research. They
ascribed this to the fact that water retained at both field capacity and permanent wilting point
increases with increasing clay content. This means the AWC does not necessarily increase with an
increase in clay content and that AWC behaves different under increasing clay content. This can
explain the poor performance of the tested PTFs, as much of the samples used for the PTF validation
contain high amounts of clay.

Results local scale
43
5.2. Hydraulic conductivity The selected PTFs which will be validated are:
Wösten et al. (1999)
Balland et al. (2008)
Santra & Das (2008)
Rosetta-3 (2001)
Figure 40: PTF results for Ks, samples sorted
It is immediately visible (Figure 40) that the PTFs for Ks perform better than the AWC PTFs,
qualitatively. Quantitatively this is the case as well, as all R2 values are positive. The PTFs seem to
predict the measured data a bit better. The best performing PTFs are the Wosten and Rosetta-3 PTFs,
which predict Ks somewhat accurately. It is interesting to note however that these two PTFs
overestimate Ks for low values, and underestimate for high values. The scatterplot shown in Figure
41 shows this a bit more clearly.
Table 9: R2 and RMSE for Ks PTFs
PTF R2 RMSE (mm/h)
Wösten 0.28 82.12
Balland 0.12 90.00
Santra 0.03 93.09
Rosetta-3 0.39 75.00

Master Thesis R.J.J. Oldhoff – Chapter 5
44
Figure 41: Scatterplots for Ks PTFs. Blue = 1:1 line
While the Santra PTF is the only selected PTF that was developed for tropical soils (it is based on
samples taken in a watershed in India), it results in the poorest performance. This is even more
remarkable when looking at the input used by the PTFs (Table 3). Santra & Das use the texture data
(sand/silt/clay fraction), bulk density, elevation and pH as input while the Rosetta-3 PTF only uses
texture data and bulk density but performs better. An explanation for the poor performance of the
Santra PTF may be that it was developed using a database containing only 100 samples, which
contained an inadequate amount of soil samples comparable to the Upper Bengawan Solo
catchment. The PTF developed by Balland et al. (2008) uses only sand and BD as input parameters.
This may explain the low R2 values, coupled with the fact that the PTF is based on soil data obtained
in Canada. The performance of Rosetta-3 is the best of the tested PTFs. This can be attributed to the
large size of the data set used to develop the PTF (2134 samples). However, Wösten et al. used the
HYPRES database, containing 4030 soil samples. As both these databases contain samples of mainly
temperate soils, the difference in performance must originate from the input used. Rosetta-3 only
requires texture and bulk density data, whilst the Wösten PTF requires additional data on the organic
content and soil layer (topsoil/subsoil). Both the HYPRES and Rosetta database appear to include
some soils that show hydraulic behaviour comparable to the soils in the Upper Bengawan Solo
catchment.

Results local scale
45
5.3. Oldhoff PTFs Now that for both Ks and AWC the selected published PTFs have been validated (on a local scale),
PTFs for both Ks and AWC will be developed using the collected soil data. The new AWC PTF will be
for the definition AWC = pF2 – pF4.2. As described in chapter 2.2, there are 91 samples with data on
Ks, AWC, texture, bulk density, organic content and elevation. For 82 of these samples, information
on the pH of the soil and the porosity is also known. The correlations between these measured soil
parameters and AWC/Ks were calculated to determine which will be used as input for the PTFs. For
calculations including the pH and porosity of the soil, 82 samples are used, the other 9 are omitted.
The data set was split up for each PTF using Kennard Stone sampling. Two thirds were used to create
the PTF (calibration) and one third was used to validate the PTF.
Table 10: Correlations between inputs and Ks/AWC. Red = not statistically significant at 95% confidence level
CORR sand silt clay BD OC Elev pH (n=82) Por(n=82)
AWC -0.1776 0.1843 0.0785 -0.4306 0.1968 0.2548 0.1282 0.4815
log(Ks) 0.5709 0.1887 -0.5964 -0.3831 0.2938 0.3245 -0.1028 0.4767
In Table 10, the correlation between AWC/Ks and possible inputs are shown (using the complete
dataset). The values shown in red are not significant at the 95% confidence level. PTFs for Ks and AWC
were made using multiple linear regression, using different combinations of input parameters. These
combinations are based on the correlations shown in the table above, with input showing high
correlation given the preference over inputs with low correlations.
Table 11: Multiple PTFs and their R2 values for AWC. Green = used input
AWC PTF BD Elev OC Silt Sand Por R2
1 0.1606
2 0.0867
3 0.1964
4 0.1532
5 0.0651
6 0.3231
7 0.2097
8 0.1696
9 0.0316
10 0.3727
Table 11 shows the R2 values for the new PTFs on the validation dataset (1/3rd of total dataset) for
different combinations of input. Even though the only correlations that are significant at the 95%
confidence level are found for bulk density, elevation and porosity, the other inputs that are
considered are Organic Content (OC), and sand and silt content (vol %). Clay content and pH are
omitted as the correlation found is very low. It is interesting to note that using only bulk density,
elevation and porosity, all significantly correlated to the AWC, results in a poor PTF performance. The
highest coefficient of determination is achieved when using all the selected inputs. The best
performing PTFs with and without porosity as input are shown in Table 12.

Master Thesis R.J.J. Oldhoff – Chapter 5
46
Table 12: AWC (cm3/cm3) PTFs. BD = Bulk density (g/cm3), Elev = elevation (m +msl), OC = Organic Content (vol %), Silt = silt content (vol %), Sand = sand content (vol %), Por = porosity (%)
The R2 value found is similar to the one found by Berg et al. (1997) in their research. The fact that the
found R2 is so low, also explains why the selected PTFs for AWC performed so poorly. The AWC in the
study area appears to be affected by other factors than the measured parameters. These could be
chemical/mineralogical properties such as the cation exchange capacity, or CaCO3 content (Wösten
et al., 2001), rock content (Tetegan et al., 2011), topographic variables such as slope (Romano &
Palladino, 2002) or other inputs not used in literature as of yet.
For Ks the same calculations were made. Ks was first transformed logarithmically (base 10) to
normalize the data. The PTFs calculate Ks in cm/day. For Ks only pH was omitted as input, because of
the low correlation between pH and Ks.
Table 13: R2 values for various combinations of input for Ks PTFs. Green = used input
Log(Ks) Sand Clay BD Elev OC Silt Por R2
1 0.466
2 0.381
3 0.4669
4 0.398
5 0.3461
6 0.3502
7 0.494
8 0.487
9 0.4562
10 0.5518
11 0.5512
The found R2 values are higher than the ones obtained for the AWC PTFs. Remarkably PTF1, which is
the linear relationship between sand and log(Ks) results in an R2 value of 0.466. The best result is
achieved when using sand and clay contents, bulk density, elevation and porosity. PTF 10 shows the
best performance. The second best performer, PTF 11, is just slightly worse but includes extra input.
PTF 7 requires no input on the porosity, but still achieves a relatively high R2, making it a good
alternative. PTF 10 is shown in Table 14.
PTF Equation R2
AWC-PTF6 AWC = -17.1431*BD + 0.00046039*Elev - 0.25537*OC +
0.032813*Silt - 0.074827*Sand + 42.2661
0.3231
AWC-PTF10 AWC = -4.1036*BD + 0.0012174*Elev - 0.38321*OC +
0.05093*Silt - 0.077608*Sand + 0.2899*Por + 11.2062
0.3727

Results local scale
47
Table 14: Ks PTFs. Sand = sand content (vol %), Clay = clay content (vol %), Por = porosity (%), BD = Bulk Density (g/cm3), Elev = Elevation (m +msl)
Figure 42 shows a scatterplot of the best PTF prediction versus the measured data for both the Ks and
AWC PTFs on the validation dataset, which contains one third of the samples. Both Ks and AWC appear
to be reasonably predicted by the developed PTFs. The AWC shows a compact cloud of points, with
just one outlier, where a very low AWC was measured. This is the lowest AWC measured in the
complete dataset, the second lowest is an AWC of 15%. It is not surprising the PTF fails to predict this
value.
Figure 42: Scatterplots for the best performing Ks and AWC PTFs that were created. Only validation dataset is shown.
All PTFs are multiple linear regression PTFs. Non-linear multiple regression was also examined, up to
including third power combinations, though this lowered the R2 values in all cases. The data was also
split into topsoil and subsoil samples, and PTFs were made for both groups. This did not increase PTF
performance, most likely due to the decreased sample size.
PTF Equation R2
KS-PTF10 Log(Ks) = 0.0031373*Sand - 0.017345*Clay + 0.051655*BD -
0.00037102*Elev + 0.037606*Por + 0.23327
0.5518

Master Thesis R.J.J. Oldhoff – Chapter 5
48
5.4. Conclusions The analysed PTFs for available water content do not perform well when applied to the Upper
Bengawan Solo dataset. All R2 values are negative, proving that the PTFs are not appropriate for the
research area. This may be due to the inherent difference in the hydraulic behaviour of the soil found
in the study area compared to the soils used for the PTF creation. Though all PTFs show poor
performance, the Van den Berg PTF will be used for catchment scale validation, as this PTF shows the
‘best’ results when defining AWC as pF2.54-pF4.2. It also predicts by far the lowest AWC values. Using
the Berg PTF will allow for a comparison between AWC definitions and their impact on the modelling
results
While not showing good results, the published Ks PTFs that were researched performed better than
the AWC PTFs. The Wosten and Rosetta-3 PTFs predict some of the variability in the hydraulic
conductivity, with R2 values around 0.3. These two PTFs will be used as model input for catchment
scale validation.
For both AWC and Ks, PTFs were made using the dataset that was collected for the Upper Bengawan
Solo catchment. These PTFs performed better than the tested published PTFs, with Ks again being
more accurately predicted than the AWC. For AWC and Ks, the PTF with the highest R2 values - in both
cases PTF10 - will be used for catchment scale validation. They are from here on out referred to as
the ‘Oldhoff PTFs’.
The AWC data shows no clear pattern and there is not a lot of variation. This partly explains the poor
performance of both published PTFs and the created PTFs for AWC. In Chapter 2.2 the spatial
variability in AWC was discussed. The data doesn’t show much variation and most of the samples
contain high amounts of clay. The water retention curves (see Figure 7 on page 9) hardly differ. This
homogeneity in the AWC explains the poor performance of AWC PTFs.

Results catchment scale
49
CHAPTER 6. RESULTS CATCHMENT SCALE
6.1. SWAT cases The cases formulated in Chapter 4.4 can be specified now, using the results of the local scale PTF
validation. Table 15 shows the used soil map, and the Ks and AWC sources used for the 11 cases.
Table 15: Cases for catchment scale validation
Cases Soil map Ks AWC
1 Measured Measured Measured Measured
2 FAO base FAO DSMW USDA FAO
3 PTF Ks – Wosten FAO DSMW Wosten FAO
4 PTF Ks – Rosetta-3 FAO DSMW Rosetta-3 FAO
5 PTF Ks – Oldhoff FAO DSMW Oldhoff FAO
6 PTF AWC – Berg FAO DSMW USDA Van den Berg
7 PTF AWC – Oldhoff FAO DSMW USDA Oldhoff
8 PTF Ks + AWC – Oldhoff FAO DSMW Oldhoff Oldhoff
9 FAO - Soil Calibrated FAO DSMW Calibrated Calibrated
10 Measured - Uncalibrated Measured Measured Measured
11 FAO - Uncalibrated FAO DSMW USDA FAO
For Ks, three PTFs were chosen to be validated at the catchment scale; the Wosten, Rosetta-3 and
Oldhoff PTFs. Local scale validation of AWC PTFs showed that the published PTFs predict AWC poorly.
Therefore only 2 cases are made for AWC PTF catchment scale validation; the Van den Berg and
Oldhoff PTFs. In Appendix B a complete overview of the soil input used in all the cases is given.
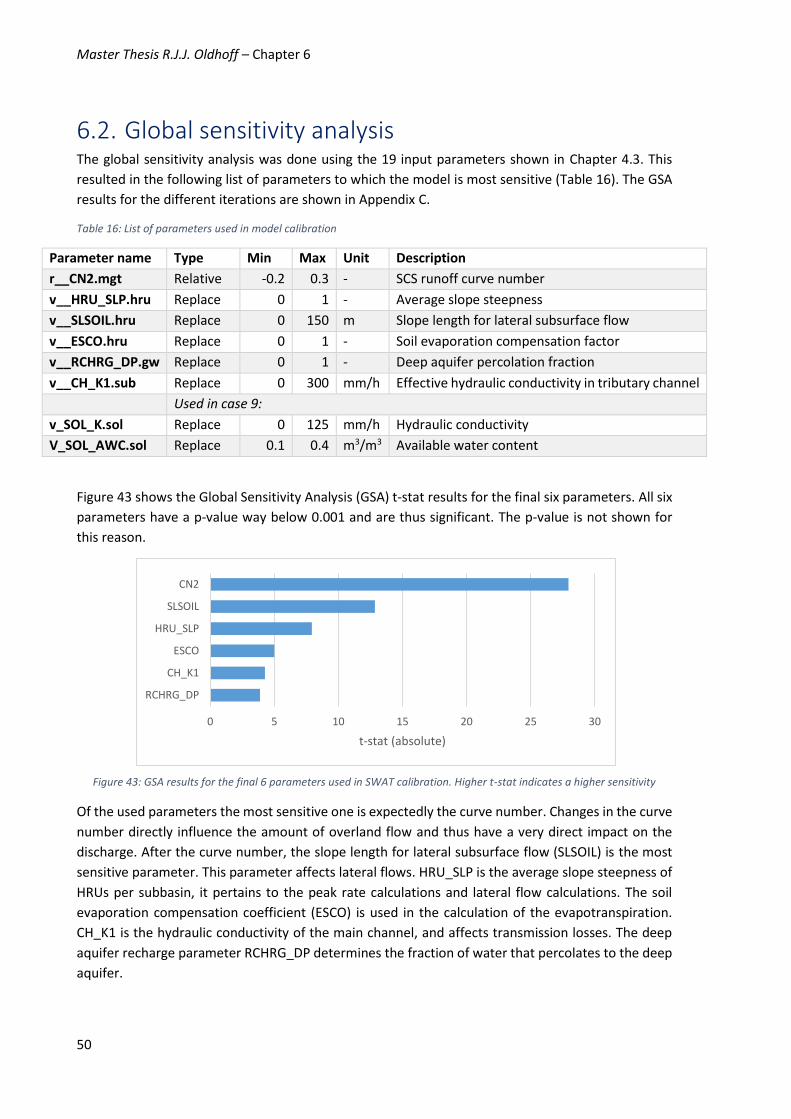
Master Thesis R.J.J. Oldhoff – Chapter 6
50
6.2. Global sensitivity analysis The global sensitivity analysis was done using the 19 input parameters shown in Chapter 4.3. This
resulted in the following list of parameters to which the model is most sensitive (Table 16). The GSA
results for the different iterations are shown in Appendix C.
Table 16: List of parameters used in model calibration
Figure 43 shows the Global Sensitivity Analysis (GSA) t-stat results for the final six parameters. All six
parameters have a p-value way below 0.001 and are thus significant. The p-value is not shown for
this reason.
Of the used parameters the most sensitive one is expectedly the curve number. Changes in the curve
number directly influence the amount of overland flow and thus have a very direct impact on the
discharge. After the curve number, the slope length for lateral subsurface flow (SLSOIL) is the most
sensitive parameter. This parameter affects lateral flows. HRU_SLP is the average slope steepness of
HRUs per subbasin, it pertains to the peak rate calculations and lateral flow calculations. The soil
evaporation compensation coefficient (ESCO) is used in the calculation of the evapotranspiration.
CH_K1 is the hydraulic conductivity of the main channel, and affects transmission losses. The deep
aquifer recharge parameter RCHRG_DP determines the fraction of water that percolates to the deep
aquifer.
0 5 10 15 20 25 30
RCHRG_DP
CH_K1
ESCO
HRU_SLP
SLSOIL
CN2
t-stat (absolute)
Parameter name Type Min Max Unit Description
r__CN2.mgt Relative -0.2 0.3 - SCS runoff curve number
v__HRU_SLP.hru Replace 0 1 - Average slope steepness
v__SLSOIL.hru Replace 0 150 m Slope length for lateral subsurface flow
v__ESCO.hru Replace 0 1 - Soil evaporation compensation factor
v__RCHRG_DP.gw Replace 0 1 - Deep aquifer percolation fraction
v__CH_K1.sub Replace 0 300 mm/h Effective hydraulic conductivity in tributary channel
Used in case 9:
v_SOL_K.sol Replace 0 125 mm/h Hydraulic conductivity
V_SOL_AWC.sol Replace 0.1 0.4 m3/m3 Available water content
Figure 43: GSA results for the final 6 parameters used in SWAT calibration. Higher t-stat indicates a higher sensitivity

Results catchment scale
51
These 6 parameters are used in case 1-8. Case 9 is also calibrated on Ks (SOL_KS) and AWC (SOL_AWC);
The Ks is calibrated for topsoil and subsoil separately. Case 10 and 11 are not calibrated. A GSA with
SOL_KS and SOL_AWC included (Figure 44) shows that the model sensitivities change slightly. The
ranges shown in Table 16 were used. The model is very sensitive to the hydraulic conductivity of the
topsoil, but not significantly sensitive to the subsoil hydraulic conductivity. AWC has less effect on the
model output than the topsoil Ks, but the model is still moderately sensitive to it.
Figure 44: GSA results including soil parameters used in the calibration of case 9
6.3. Calibration and validation All cases except cases 10 and 11 were calibrated using the parameters described in the previous
paragraph. As described in the methods chapter, the calibration period is from 01-2009 until 09-2012,
and the validation period from 10-2012 until 12-2014. The results of the calibration and validation
are shown in Table 17 and Table 18, respectively.
Table 17: Calibration results
CALIBRATION Description p-factor r-factor NS MSE (m3/s)
Case1 Measured 0.52 0.56 0.71 90
Case2 FAO base 0.55 0.42 0.72 86
Case3 PTF Ks – Wosten 0.52 0.36 0.72 85
Case4 PTF Ks – Rosetta-3 0.55 0.36 0.72 85
Case5 PTF Ks – Oldhoff 0.50 0.33 0.72 87
Case6 PTF AWC – Berg 0.30 0.40 0.66 110
Case7 PTF AWC – Oldhoff 0.43 0.50 0.68 99
Case8 PTF Ks + AWC – Oldhoff 0.52 0.42 0.73 83
Case9 FAO - Soil Calibrated 0.45 0.35 0.72 87
Case10 Measured - Uncalibrated - - -0.11 341
Case11 FAO - Uncalibrated - - -0.06 327
0 5 10 15 20
SOL_K_SUBSOIL
RCHRG_DP
CH_K1
SOL_AWC
ESCO
SOL_K_TOPSOIL
SLSOIL
HRU_SLP
CN2
t-stat (absolute)
0 0.1 0.2 0.3 0.4 0.5 0.6 0.7 0.8
SOL_K_SUBSOIL
RCHRG_DP
CH_K1
SOL_AWC
ESCO
SOL_K_TOPSOIL
SLSOIL
HRU_SLP
CN2
p-value

Master Thesis R.J.J. Oldhoff – Chapter 6
52
Table 18: Validation results
VALIDATION Description p-factor r-factor NS MSE (m3/s)
Case1 Measured 0.68 0.56 0.85 44
Case2 FAO base 0.54 0.42 0.83 49
Case3 PTF Ks – Wosten 0.50 0.36 0.84 48
Case4 PTF Ks – Rosetta-3 0.43 0.36 0.84 48
Case5 PTF Ks – Oldhoff 0.46 0.33 0.84 48
Case6 PTF AWC – Berg 0.36 0.41 0.78 64
Case7 PTF AWC – Oldhoff 0.46 0.51 0.82 54
Case8 PTF Ks + AWC – Oldhoff 0.54 0.43 0.85 45
Case9 FAO - Soil Calibrated 0.46 0.35 0.86 41
Case10 Measured - Uncalibrated - - 0.51 150
Case11 FAO - Uncalibrated - - 0.53 146
In the tables, 4 statistics for each case are shown. To visualize the r- and p-factor, the 95PPU plots for
both case 1 and case 9 are shown in Figure 45 as these cases have significant differences in p- and r-
factor. In the validation case 1 has a higher p-factor, and the 95PPU band contains more of the
observed discharges. It also has a higher r-factor meaning its band is broader which is also clearly
visible in Figure 45. It is also striking how similar the bands are, they seem to follow exactly the same
line, the only difference is their width.
The most important observations regarding the results are that the calibration NS values are lower
than the validation NS values (paragraph 6.3.1) and the cases show very similar results (paragraph
6.3.2).
Figure 45: Left- Case 1 95PPU band, p-factor = 0.68, r-factor = 0.56. Right- Case 9 95PPU band, p-factor = 0.46, r-factor = 0.35 (validation period)

Results catchment scale
53
6.3.1 Calibration vs. validation results The NS values for the calibration are lower than for the validation, this is likely due the difference in
precipitation or discharge data quality in the calibration period. An example is the high discharge
observed in 2011 (Figure 46), in January 2011 the discharge compared to precipitation is very high. It
is not clear what caused this, it could be a measurement error. The difference in calibration/validation
period data quality is especially clear in case 10. The uncalibrated model results for 01-2009 until 08-
2012 are very poor, for the 09-2012 until 12-2014 period they are significantly better. Starting in
September 2011, the uncalibrated model cases simulate the observed outcomes relatively well. The
fact that the uncalibrated model results for the validation period simulate the discharge rather
accurately (NS = 0.53), whereas the uncalibrated model predicts discharge poorly for the calibration
period (NS = -0.06) confirms the suspicion that the data quality for the calibration period is lower than
in the validation period.
Figure 46: Rainfall, observed discharge, and uncalibrated model results (case 10 and 11)
The results show that for all cases the SWAT model replicates the observed discharges relatively well,
a validation NS of ~0.83 is a good result, indicating a good fit between modelled and observed values.
It is important however to closely inspect the calibrated parameter ranges and to judge whether or
not they are realistic. It is possible to model the discharge of a catchment correctly, while incorrectly
modelling the processes that take place within the catchment. In all 9 calibrated cases the range for
the curve number change is an increase of 10-25%. This is not surprising, as the model is very sensitive
to CN changes, as shown in the previous paragraph. The increase in CN is not completely unrealistic.
As stated before, the curve number method is assumed to be accurate for slopes up to 5%. Soils with
higher slopes will have more surface runoff. Arnold (2011) states the following in the SWAT
Input/Output documentation:
“[…] the default parameter values assigned by the interface [SWAT GIS interface]
are highly generic. The interface does not vary input based on watershed size or
location in the world. For example, HRUs with corn growing on soil classified as
hydrologic group D are assigned a curve number value of 80 whether they are in
the United States or Europe, in an arid or tropical climate, on a 10% or 1% slope.”
0
100
200
300
400
500
600
700
800
900
1000
Jan-09 Jan-10 Jan-11 Jan-12 Jan-13 Jan-14 Jan-15
Dis
char
ge/r
ain
fall
(mm
/mo
nth
) Observed
Rainfall
Case 10
Case 11

Master Thesis R.J.J. Oldhoff – Chapter 6
54
During field work, it was clearly visible during rainfall events that almost no water infiltrated and most
of it discharged overland. Tests done with a double ring infiltrometer confirmed these observations.
The increase in curve numbers is therefore assumed to be realistic. For the other 5 parameters,
different ranges were found from case to case. For case 1-8, similar values were found for SLSOIL,
between 0 and 40 meters. Only case 9 shows a different range, 40-65 meters. This is likely due to the
fact that the hydraulic conductivity was used in the calibration of case 9. HRU_SLP and ESCO were
different from case to case, with no clear pattern. For RCHRG_DP and CH_K1 however, similar ranges
were found for every case. For RCHRG_DP, for every case except case 6 a range of about 0.8-1.0 was
found. This means a large part of the infiltration goes to the deep aquifer and leaves the system. All
parameter ranges are shown in Appendix D. However, closer analysis of the results show that the
percolation to the aquifers is very small (0.5 mm/year) compared to the surface runoff (~2000
mm/year). The model was shown to be sensitive to the RCHRG_DP parameter, but this sensitivity is
undone by the curve number increase, which reduces the amount of water entering the soil.
The 6 selected parameters are enough for the model to reach a high accuracy. In case 9 the soil
parameters Ks and AWC are used in calibration, which results in a slightly higher model accuracy than
the other cases. This seems to indicate that the maximum model accuracy possible is a NS of around
0.86, which is achieved with the use of the six selected parameters plus Ks and AWC. The fact that a
higher accuracy can’t be achieved is most likely caused by the accuracy of the climatological data.
The rainfall and discharge measurement stations have a dubious measurement record, as they shows
unreliable data before 2007. The quality of the hydrological data and the other climatological data is
thought to be the limiting factor in the model accuracy.
The accuracy is of course also limited by the model. No model is perfect and every model has its
uncertainties and errors, the SWAT model is no exception. The SWAT model uses the curve number
method to determine surface runoff. This is a very simple approach to calculate the surface runoff.
The model is very sensitive to changes in the CN, which is visible from the sensitivity analysis. For all
cases, the model calculated higher lateral flows than groundwater flows, which is strange as the soils
all have high clay contents and low hydraulic conductivities, which should mean that lateral flow is
limited. The groundwater processes may not have been simulated accurately. The inaccuracies in the
way SWAT models the hydrological processes limit the maximum achievable NS value.
6.3.2 Difference between cases Figure 47 (next page) shows the best simulation (validation) for each case and the uncalibrated result
of case 10 and 11, together with the observed discharge. It is clear that the results hardly vary and
the general shape of the discharge series is similar for each case. The results of both uncalibrated
cases are very alike and follow the shape of the observed discharge rather well, though discharge is
consistently underestimated. All cases predict the base flow well and except for the small discharge
peak observed around March 2014 also predict the peak flows accurately.

Results catchment scale
55
The measured soil data case, case 1, shows very similar model accuracy compared to the FAO soil
map base case, case 2. The validation results for case 1 are slightly better, with a higher p-factor and
NS value. The difference is small however, which is an interesting result. This means the available soil
map from the FAO DSMW is a valid alternative to field work for the Keduang. Though not part of the
research goals, this means the FAO DSMW can be used to model the soils for the Keduang. Cases 3-
8 show very similar results, which is strange. The only case showing significantly different results is
Case 6, using the Van den Berg PTF for AWC as input. For both calibration and validation the NS value
is lower and the MSE is larger. This case has by far the lowest AWC value (0.12 compared to around
0.19 for the other cases). This can cause the poorer performance of the model for this case. Whereas
the other cases result in a NS of about 0.84, case 6 only reaches an accuracy of 0.78. This is
unsurprising, as the Van den Berg PTF showed very poor performance on the local scale. The Oldhoff
AWC PTF case (7) also resulted in a lower NS value than the cases when measured/FAO AWC input
was used, but the difference is not large enough to call it significant.
The fact that the model results are so similar for the different PTF cases is even more curious when
considering that the model was found to be very sensitive to Ks and to a lesser extent sensitive to the
AWC. The model is sensitive enough to changes in Ks and AWC for one to expect it to be noticeable
in the cases. This is however, as seen from the results, not the case. This is likely because the
differences in Ks and AWC in the different cases are not very large. All case inputs are shown in
Appendix B. The model was found to be much more sensitive to Ks. The case input (catchment
average) is shown in Figure 48. It is clear that for case 1-8 there is hardly any difference in the Ks input.
The sensitivity analysis was done using a range of 0-125 mm/hour, which explains why the small
differences in the Ks input do not cause significant output differences. For AWC, to which the model
is less sensitive, input ranges from 0.12 to 0.23 (catchment average) in the different cases. The
sensitivity analysis was done using a range of 0.10 to 0.40.
0
10
20
30
40
50
60
70
80
Sep-12 Jan-13 May-13 Sep-13 Jan-14 May-14 Sep-14
Dis
char
ge (
m3
/s)
Case1Case2Case3Case4Case5Case6Case7Case8Case9Case10Case11Observed
Figure 47: Best simulation for each case, plus uncalibrated model results (case 10 and 11)

Master Thesis R.J.J. Oldhoff – Chapter 6
56
Figure 48: Catchment averaged Ks for top- and subsoil per case
When comparing case 9 to the other cases, it shows the highest validation NS and lowest MSE. The
values shown in Figure 48 for case 9 are the catchment averages for the best simulation (NS = 0.86).
The topsoil Ks value is much larger than the other cases, likely causing the difference in the model
accuracy. The difference however is too small to conclude with certainty that this case is the best in
terms of accuracy. It can be stated however, that a soil map and soil data obtained from a freely
accessible database can be used to model the Keduang, as both case 2 and case 9 result in model
output with the same accuracy as the PTF cases or the measured case.
No matter the case, the hydrograph of the discharge doesn’t alter radically. The differences between
the cases are not significant enough to define one case as better than the others with certainty, the
output statistics are too similar. The differences in p-factor and r-factor ranges and NS and MSE values
can be caused by the calibration method, each case finding a different local maximum in the set of
possible solutions. Simply running the calibration again for a case results in a similar NS value with a
variation of about 0.01 NS. This indicates that the SUFI2 program doesn’t find a global optimum, but
rather a local one. This conclusion is supported by the final parameter ranges for the different cases,
shown in Appendix D and discussed above. Though for some parameters the found ranges are very
different for the different cases the NS values for all cases are similar.
For all cases, the CN is increased. This causes the average curve number for the catchment to become
rather high (up to 95). Because of this, little water infiltrates into the soil, and the effect of differences
in Ks and AWC input is reduced. This also helps to explain the small differences in the cases.
0
10
20
30
40
50
60
70
80
90
100
1 2 3 4 5 6 7 8 9
Ks
(mm
/ho
ur)
Case number
Ks Subsoil Ks Topsoil

Results catchment scale
57
6.4. Conclusions It can be concluded from these results, that the minor differences in Ks and AWC input do not matter
much in the final modelling result for the Keduang. This is true when comparing PTF cases to each
other, but also when comparing the FAO soil map cases to the measured case. Differences in accuracy
are minor and not significant.
Christiaens and Feyen (2001) found similar results in their case study. They researched the
uncertainty propagation of PTFs in hydrological modelling, and found that lab measurements and
PTFs based on field texture measurements provided near equal results. Islam et al. (2006) modelled
the soil water content using PTFs as model input, and also state that texture class PTFs can be used
to estimate the soil water content accurately. Baroni et al. (2010) studied the effect of PTF input in
two hydrological models, and conclude that using measured input does not guarantee the best
performance, PTFs using site specific data provided comparable results. Of course there are also
studies where PTF input results in significantly poorer model performance when compared to using
measured data, such as the research done by Kværnø & Stolte (2012) or Sobieraj et al. (2001). The
effect of the PTFs on model output depends greatly on the modelling purpose, catchment scale,
catchment characteristics etc. and the model sensitivity to the parameters determined using PTFs,
such as Ks or AWC.
The model accuracy is limited by the quality of the climatological and discharge data, hindering better
simulation of the discharge. A general approximation of the Ks and AWC values suffice for modelling
purposes, as long as the order of magnitude is correct. For this case study, the use of lookup tables
proves to accurately approximate Ks and AWC. This may not be the case for other catchments,
therefore for Ks, PTFs that are thought to be applicable can be used to ensure that the order of
magnitude is correct. The Oldhoff PTFs which were developed and validated in Chapter 5 are based
on measurements taken throughout the Upper Bengawan Solo catchment and the cases using these
PTFs (Case 5, 7 and 8) show a slightly better model accuracy than the other cases, although this is not
significant. The comparability of the soils of other Upper Bengawan Solo catchments to the Keduang
soils is important when using the Oldhoff PTFs for local scale application, but as the PTFs are based
on four different catchments in the Upper Bengawan Solo catchment the PTFs are assumed to be
representative for the whole catchment. It is not recommended to use the Van den Berg AWC PTF,
as this resulted in the lowest model accuracy.
The catchment scale performance of PTFs in other catchments in the Upper Bengawan depends on
the comparability of both the climatological data, the discharge and the spread in the hydraulic
conductivity. Especially the latter is important. In Chapter 2.2 the spatial variability in Ks was analysed.
The Keduang has little variation compared to the Dengkeng and Solo Hulu catchments. Using PTFs for
catchments with high variability in Ks can result in more variation in model output and other results
than found for the Keduang. Based on the results of this chapter, it is assumed that PTFs can be used
in the hydrological modelling of other catchments in the Upper Bengawan Solo catchment, if the
modelling goal is to simulate basin outflow. For other modelling purposes, such as soil water content
modelling, erosion and sediment transport modelling, or biochemical modelling, the results found in
this chapter are not applicable, and research is needed to analyse the effect of using PTF soil input
on the modelling results.

Master Thesis R.J.J. Oldhoff – Chapter 6
58

Discussion
59
CHAPTER 7. DISCUSSION
This research focusses on the validation of PTF functions on both a local scale and a catchment scale.
This chapter discusses assumptions and other factors influencing the results. First, the local scale
validation is discussed, and after that the catchment scale validation. This chapter concludes with a
discussion of the link between local and catchment scale results.
7.1. Local scale validation For this thesis a total of 8 PTFs were validated, 4 for the hydraulic conductivity, 4 for the available
water content. The selection of these PTFs was based on criteria described in chapter 3. The selected
PTFs were a priori assumed to be the most suitable PTFs for the study area. For some other PTFs an
exploratory analysis was done which indicated they were not suitable, and thus the published PTFs
that were validated in this thesis are assumed to be a representative sample of the available PTFs and
their performance.
The soil data collected in the various catchments have a large influence on the validation results. For
the field work, sample locations were chosen based on the land use and the soil map obtained from
BPDAS. It is possible some soil variability was missed because of the sample distribution over the
area. In total 36 samples were taken in the upper 10 cm of the soil (topsoil) while 55 were taken at
10-40 cm depth. This split can affect PTF results, as top- and sub-soil show different hydraulic
behaviour. It is assumed the difference in hydraulic behaviour can be explained by the measured soil
parameters, though this may not be the case. Topsoil for example can show different hydraulic
behaviour because it is worked more often, or because more roots are present.
The labs that were selected to test the soil samples were only able to measure the parameters
presented in this research. Other soil parameters such as CaCO3, specific surface area, cation
exchange capacity and other parameters sometimes used in PTFs were not measured, limiting the
PTF choice and also possibly missing a predictor for AWC or Ks. However, it is important for a PTF to
use easily obtained input parameters, so even though more variability might have been explained
using extra parameters they would limit the applicability of the generated PTFs. For 10 of the samples
the bulk density was measured at both labs, and their measurements differed by 10-20%, which is
significant. The measurement error in the samples is assumed to be of the same order for the other
parameters, about 10%.
For the PTF creation, multiple linear regression equations were used. This may not be the best
method for PTF development. Artificial Neural Networks (ANNs) generally produce better results, but
the data set was assumed to be too small to use ANNs for this research. Nonlinear regression was
tested in the form of power functions for the input parameters, this produced worse results. Possibly
other transformations or equation forms can better describe the variability in the data.
Master Thesis R.J.J. Oldhoff – Chapter 7
60
7.2. Catchment scale validation First the methodological choices and assumptions are discussed, followed by a discussion of the input
data. The paragraph is concluded with a discussion on results and whether they can be extrapolated
and generalized.
7.2.1 Methodology To allow for catchment scale validation various assumptions have to be made to model the area.
Modelling always requires assumptions and simplifications, as perfect simulation of an area and its
soil is impossible. Using the four selected rainfall stations, artificial rainfall stations were made with
rainfall calculations based on Thiessen polygons. The precipitation was not corrected for elevation
because the locations of the four stations used are assumed to be distributed representatively
throughout the catchment. There is no measuring station higher than 550 meters, so the north part
of the catchment may receive more precipitation than modelled in this research. The northern
artificial station however do show a higher precipitation than the lower southern ones. The two
northern artificial stations, station 1 and 2, are both significantly higher (800 and 900 meters
respectively) than the two nearest precipitation stations, which are at a height of around 550 meters.
These two subbasins are however also the smallest subbasins, so the effect on the water balance is
assumed to be acceptable. The other subbasins all show comparable heights to the used measuring
stations.
The spatial scale used in the modelling, specifically the number of subbasins, is based on research
done by Meins (2013). He concluded that adding extra subbasins or HRUs for that matter, does not
increase model accuracy if only one discharge station is used. This conclusion was based on a case
study for Lake Naivasha in Kenya. It was assumed this conclusion holds for the Keduang as well. The
fact that only one output variable could be used severely limits the modelling accuracy. Calibrating
subbasins was impossible, so the discharge per subbasin cannot be compared to observed values.
The processes inside the catchment can therefore be wrongly simulated, while still resulting in a high
model accuracy. For this reason the research conclusions can only be extrapolated to comparable
cases in which only catchment outflow is of interest.
Due to the data quality, and the model’s performance on simulations with a daily time step, the time
step was chosen to be monthly. This may be one of the reasons the modelling output is so similar for
all cases. The variability caused by the soil differences is reduced by the time step as PTF influence on
the water balance is analysed rather than their effect on daily peak flow. Conclusions may be very
different when using a daily time step (with input data of sufficient quality). The PTF validation was
not done with a daily time step.
7.2.2 Data The climatological data quality is of decent quality, generally speaking. Excluding precipitation, all
available data contained few errors but missed data for certain periods. These missing periods were
filled in using the WXGEN algorithm available in SWAT. Wallis and Griffiths (1995) found that
especially the wind speed generation is a problem area for WXGEN. The wind speed data are missing
for several periods, so the model sensitivity to wind speed was researched. This showed that the
model is very insensitive to the wind speed. The temperature and relative humidity data show such
a clear pattern that the missing value generation is assumed not to affect the modelling results.

Discussion
61
The precipitation and discharge data has a dubious record until 2007. A lot of precipitation data was
missing and the water balance for the catchment is not correct. After 2007, the data appear to be
reliable. During the 2007-2014 period the Slogohimo station measured an extremely high discharge
for 2010. This station was not used, but the fact that this clearly faulty measurement record has not
been corrected or marked as incorrect by anyone is dubious to say the least. The precipitation data
is therefore slightly unreliable. Comparing discharge to precipitation also raises some questions, such
as the discharge compared to precipitation in 2011, which was discussed in chapter 6 as well. It is not
clear what caused this. Such anomalies have a large effect on the modelling accuracy.
The land use map of 2007 was used, which has a much lower resolution and accuracy than the 2014
map. The 2007 map has 18.1% urban area, compared to 4.2% in 2014. This difference is clearly caused
by a difference in either resolution or classification used, as the area didn’t get less urbanized. The
2014 map is assumed to be of better quality as it was obtained using landsat data. The effect on the
modelling results is that a higher curve number is used. This causes the model to be more sensitive
to changes in the CN. With higher CNs the model also gets less sensitive to the soil parameters, as
less water infiltrates. Modelling results could be improved with better quality land use data.
In all cases the CN was increased with about 15-20% on average. This caused the surface runoff/total
flow fraction to become very high (0.90+). This reduces the effects of soil hydraulic parameters such
as Ks and AWC, and thus makes the effect of PTFs less noticeable. Though during field work visual
reports confirm that very little water infiltrates, the increase in CN is still dubious, as the average
catchment CN in some cases got as high as 95. The model’s extreme sensitivity to CN in hindsight
makes it less suitable for catchment scale validation of PTFs for the Keduang.
7.2.3 Extrapolating the results The results found in the catchment scale validation are valid for the Keduang, and only for discharge
modelling. The question is how these results can be generalized and extrapolated to other
catchments. Firstly, it is important to once again note that this result is only valid for catchment
outflow modelling, and there is no way to tell if the catchment processes are modelled correctly.
The Keduang is a catchment with relatively homogeneous soils. All soils found in the Keduang
contains high amounts of clay. This causes the variability in the hydraulic conductivity to be rather
small, which in turn means the effect of PTF errors is limited, as is visible from the results. The results
are therefore limited to catchments of the same scale and with the same soil variability. With larger
soil heterogeneity, the PTF influence could be larger and modelling output could be significantly
affected. The size of the catchment also explains why some of the results are so similar. If PTFs were
used to model the entire Upper Bengawan Solo catchment, differences in the soil input would be
much bigger, and the results could be much more diverse. The scale of the catchment reduces the
effects of the already small differences in soil input. More research is needed on the effect of the
scale of the catchment. Finally the use of a different model may result in more pronounced
differences between cases, as the CN approach of the SWAT model resulted in high surface
runoff/total flow ratios.

Master Thesis R.J.J. Oldhoff – Chapter 7
62
7.3. Local versus catchment scale The results for the local and catchment scale validation are quite different. The AWC was poorly
predicted in local scale validation by PTFs, but the effect on the modelling output is small. The
hydraulic conductivity was predicted a bit better, but due to reasons described before, there is almost
no difference between the cases. This was caused by the small variability in both AWC and Ks in the
Keduang, and thus in the different cases. The small differences in the case inputs resulted in very
similar model accuracy for all cases. Therefore, the Keduang may not have been the best catchment
to validate the PTFs on, as it is so homogeneous. A different catchment with more soil heterogeneity
would be more suited to validate PTFs at the catchment scale. The quality of the climatological and
hydrological data used for the catchment scale modelling is also not optimal, which also has its effect
on the results.
The AWC definition used in this research was based on research by Tomasella and Hodnett (2004),
who state that for the tropics it should be defined as pF2-pF4.2 as opposed to pF2.54-pF4.2. The Van
den Berg PTF was validated at the catchment scale because it showed the ‘best’ performance for the
latter definition. However, the catchment scale validation shows that it is not an appropriate
definition for the Keduang, as model accuracy is poor. However, the measured catchment average
AWC (using pF2-pF4.2) is 0.23 cm3/cm3, while for case 9 the calibrated AWC catchment average is
0.16. The Van den Berg PTF predicts an AWC of 0.12. The definition that is most suitable for the
catchment modelling in SWAT is therefore still unclear.
The catchment scale validation could only be done using the catchment outflow. Calibrating solely on
the outflow aggregates all processes in the catchment and bundles them into one output. This may
not be the best variable to base the validation on. Other variables such as soil moisture content could
give a better view of the PTF performance at a catchment scale. This was not possible for the
Keduang.

Conclusions and recommendations
63
CHAPTER 8. CONCLUSIONS AND
RECOMMENDATIONS
This thesis presents a local and catchment scale validation of PTFs for hydraulic conductivity and
available water content. Published PTFs were selected based on their applicability, and were
validated on the dataset of collected soil samples in four subbasins of the Upper Bengawan Solo
catchment, Java, Indonesia. Based on this dataset, new PTFs were made for the hydraulic conductivity
and available water content as well, these PTFs were named the “Oldhoff PTFs”. The best performing
PTFs were then validated on the catchment scale by using them as input for the hydrological
modelling of the Keduang catchment, using the SWAT model. The first section will present the
conclusions that can be drawn from this thesis, per research question. Then an overview of the
recommendations which follow from this research will be given.
8.1. Conclusions Q1. Which PTFs are applicable for the estimation of the hydraulic conductivity and available
water content?
Due to the larger quantity of available soil data for temperate soils, there are multiple PTFs for
temperate regions. For tropical regions, the opposite is true. Due to a lack of PTFs developed for
similar regions as the study area, PTFs were mainly selected based on general robustness and
applicability. For the available water content (AWC), the following PTFs were selected for further
research: Van den Berg et al. (1997), Wosten et al. (1999), Rosetta-3 (Schaap et al., 2001) and Rosetta-
12 (Rawls & Brakensiek, 1985; Schaap et al., 2001). Of these PTFs, the only PTF based on tropical soil
data is the Van den Berg PTF.
For the hydraulic conductivity (Ks), tropical soil PTFs are even scarcer than AWC tropical soil PTFs. The
following PTFs were selected: Wosten et al. (1999), Balland et al. (2008), Santra and Das (2008), and
the Rosetta-3 (Schaap et al., 2001) PTF. Of these, only the Santra and Das PTF was made for a tropical
region (Eastern India).
Q2. How well do the selected PTFs predict the hydraulic conductivity and available water content
for the Upper Bengawan Solo catchment (local scale)?
PTF performance was quantified using the coefficient of determination R2. For AWC, none of the PTFs
provided sufficient estimations. The selected AWC PTFs predict the AWC very poorly at the local scale.
R2 was found to be well below zero for all PTFs, indicating that the mean of the data is a better
predictor than the PTFs. The Berg PTF was selected for catchment scale validation to research the
effect of using the temperate soil AWC definition (pF2.54 – pF4.2 as opposed to pF2 – pF4.2), as all
AWC PTFs performed insufficiently. The Berg PTF predicts very low AWC values.
For Ks, the Wosten and Rosetta-3 PTFs predict Ks relatively well, with R2 values of 0.28 and 0.39,
respectively. The worst accuracy (R2 = 0.03) was achieved by the Santra PTF, which is the only PTF

Master Thesis R.J.J. Oldhoff – Chapter 8
64
based on tropical soil data. The Wosten and Rosetta-3 PTFs were selected for catchment scale
validation.
Q3. Can PTFs developed for the area, based on local measurements, be used to obtain better
estimations of the hydraulic conductivity and available water content (local scale)?
The new ‘Oldhoff’ PTFs predict AWC and Ks relatively well. The AWC was found to be significantly
(95% confidence level) correlated to bulk density, elevation and porosity. The best performing PTF
(R2 = 0.37) uses bulk density, elevation, organic content, silt and sand fraction, and the porosity as
input. There appears to be some variation in the AWC in the Upper Bengawan Solo which is not
explained by the measured parameters. The AWC data shows no clear pattern and there is not a lot
of variation. This partly explains the poor performance of both published PTFs and the created PTFs
for AWC.
The hydraulic conductivity was found to be significantly (95% confidence level) correlated with sand
and clay fraction, bulk density, organic content, elevation and porosity. The best performing PTF (R2
= 0.55) was created using sand and clay fraction, bulk density, elevation and porosity as input.
Both of the new Oldhoff PTFs show better prediction accuracy than the selected PTFs for Ks and AWC.
This is unsurprising, as the new PTFs are based on the field measurements taken in the Upper
Bengawan Solo catchment. The Oldhoff PTFs are expected to provide better estimations for both
AWC and Ks than other PTFs in the Upper Bengawan Solo catchment, as long as soils have a similar
composition to the ones used in the creation of the PTFs.
Q4. Can PTFs be used as input for the SWAT model to simulate the discharge of the Keduang
catchment, and how do the PTFs influence the modelling output accuracy (catchment scale)?
The SWAT model was used to model the Keduang catchment discharge, using a monthly time step.
Cases were defined as follows; one case with measured input for the soil, one case using the FAO
Digital Soil Map of the World with Ks and AWC determined using lookup tables, seven cases using the
FAO DSMW with PTF determined Ks and/or AWC values, one case where Ks and AWC were used as
calibration parameters, and two uncalibrated cases differing from each other in the soil map
(measured versus FAO DSMW). Cases were judged on accuracy using the Nash Sutcliffe coefficient.
Differences between cases are small, too small to judge one case as the most accurate one with
certainty. The small differences in case accuracy are caused by the small differences in soil input.
Though the model was found to be very sensitive to Ks, and moderately sensitive to AWC, the
differences between cases in these parameters are too small to be noticeable in the model output.
The model accuracy was limited by the climatological input data and the observed discharge data.
The model is most sensitive to the curve number, and it is therefore of great importance to accurately
determine the land use and curve numbers.
For the Keduang the tested PTFs are validated at the catchment scale, and can be used as an
alternative to field measurements for hydrological modelling. The FAO DSMW is also validated, and
can be used together with lookup tables to obtain accurate modelling results. For other catchments
in the Upper Bengawan Solo catchment, these results are only valid if the soils found in these

Conclusions and recommendations
65
catchments have comparable compositions (high clay contents) to the Keduang catchment. When
there are more heterogeneous soils present in a catchment, it is expected that the results will differ.
The research objective was to determine whether PTFs can be used in the direct estimation of Ks and
AWC (local scale), and in the hydrological modelling of the Keduang (catchment scale). At the local
scale the Wösten and Rosetta-3 PTFs can be used to predict Ks. AWC PTFs show insufficient accuracy
at the local scale. At the catchment scale, the Wösten and Rosetta-3 Ks PTFs and the Oldhoff AWC
and Ks PTFs are validated.
8.2. Recommendations 8.2.1 Further research The results of this research cannot a priori be expected to be valid for other catchments, scales and
processes. Therefore it is recommended to further research the effect of PTF input on other
catchments within the Upper Bengawan Solo. This will allow the results found for the Keduang to be
generalized for the Upper Bengawan Solo region. Doing this will also allow for conclusions on the
effect of catchment size on PTF performance on the catchment scale.
Another extra research opportunity is to validate PTFs at the catchment scale for different processes
that are modelled within the model, such as soil moisture content. This validation was not done in
this thesis, and the results are therefore only valid for discharge modelling. The effect of PTFs on the
other processes requires further research. A different model could be used to simulate soil moisture
content, as the SWAT model may not be the optimal choice for this. To validate for other variables
such as soil moisture content, observations are needed on them.
A final recommendation for extra research is to research the effect of PTFs on peak flow predictions,
using a daily time step instead of a monthly time step.
8.2.2 Practical recommendations There are also some practical recommendations to be made, if further research is conducted. When
using PTFs for the Upper Bengawan Solo catchments, it is recommended to use the new Oldhoff PTFs
for both local and catchment scale purposes, as they are based on local soil measurements and are
expected to perform better than other PTFs.
An other more practical recommendation is to collect and organize relevant data. Collecting soil data
into a (local) database can be very fruitful. It allows for the development of more robust PTFs, and
better modelling efforts can be undertaken. A soil database is beneficial to all. For climatological and
discharge data the same recommendation is made, but more specifically to the relevant
organisations. There are many different organizations and measuring stations throughout the region,
but obtaining data from all of these sources is hard. It is not clear which organization is responsible
for measurements, and sometimes conflicting data records are found. By organizing the
climatological and discharge data in one location/server, research and management of the
catchment(s) is eased.

Master Thesis R.J.J. Oldhoff – 0
66
REFERENCES
Abbaspour, K. C. (2015). SWAT-CUP SWATCalibration and Uncertainty Programs.
Abbaspour, K. C., Vejdani, M., Haghighat, S., & Yang, J. (2007). SWAT-CUP Calibration and Uncertainty Programs for SWAT. The Fourth International SWAT Conference, 1596–1602. http://doi.org/10.1007/s00402-009-1032-4
Arnold, J. G., Kiniry, J., Srinivasan, R., Williams, J. R., Haney, E. B., & Neitsch, S. L. (2011). Soil and Water Assessment Tool Input/Output File Documentation Version 2009. Texas Water Resources Institute Technical Report No. 365, 661–675.
Arnold, J. G., Moriasi, D. N., Gassman, P. W., Abbaspour, K. C., White, M. J., Srinivasan, R., … Jha, M. K. (2012). Swat: Model Use, Calibration, and Validation. Asabe, 55(4), 1491–1508.
Arshad, R. R., Sayyad, G., Mosaddeghi, M., & Gharabaghi, B. (2013). Predicting Saturated Hydraulic Conductivity by Artificial Intelligence and Regression Models, 2013.
Balland, V., Pollacco, J. a. P., & Arp, P. a. (2008). Modeling soil hydraulic properties for a wide range of soil conditions. Ecological Modelling, 219(3-4), 300–316. http://doi.org/10.1016/j.ecolmodel.2008.07.009
Baroni, G., Facchi, a., Gandolfi, C., Ortuani, B., Horeschi, D., & van Dam, J. C. (2010). Uncertainty in the determination of soil hydraulic parameters and its influence on the performance of two hydrological models of different complexity. Hydrology and Earth System Sciences, 14(2), 251–270. http://doi.org/10.5194/hess-14-251-2010
Botula, Y., Ranst, E. Van, & Cornelis, W. M. (2014). Pedotransfer Functions To Predict Water Retention for Soils of the Humid Tropics : a Review ( 1 ). Revista Brasileira de Ciência Do Solo, 38(1), 679–698.
Brooks, R. H., & Corey, A. T. (1964). Hydraulic properties of porous media. Hydrologic Paper, 3.
Chirico, G. B., Medina, H., & Romano, N. (2010). Functional evaluation of PTF prediction uncertainty: An application at hillslope scale. Geoderma, 155(3-4), 193–202. http://doi.org/10.1016/j.geoderma.2009.06.008
Christiaens, K., & Feyen, J. (2001). Analysis of uncertainties associated with different methods to determine soil hydraulic properties and their propagation in the distributed hydrological MIKE SHE model. Journal of Hydrology, 246(1-4), 63–81. http://doi.org/10.1016/S0022-1694(01)00345-6
FAO. (1980). Annex 1: Estimating soil hydrological characteristics from soil texture and structure. In Drainage design factors. Rome.
FAO. (2009). Digital Soil Map of the World. FAO, Rome, Italy.

References
67
FAO/IIASA/ISRIC/ISS-CAS/JRC. (2009). Harmonized World Soil Database (version 1.2). FAO, Rome, Italy and IIASA, Laxenburg, Austria.
Galvão, R. K. H., Araujo, M. C. U., José, G. E., Pontes, M. J. C., Silva, E. C., & Saldanha, T. C. B. (2005). A method for calibration and validation subset partitioning. Talanta, 67(4), 736–740. http://doi.org/10.1016/j.talanta.2005.03.025
Givi, J., Prasher, S. O., & Patel, R. M. (2004). Evaluation of pedotransfer functions in predicting the soil water contents at field capacity and wilting point. Agricultural Water Management, 70(2), 83–96. http://doi.org/10.1016/j.agwat.2004.06.009
Gutmann, E. D., & Small, E. E. (2007). A comparison of land surface model soil hydraulic properties estimated by inverse modeling and pedotransfer functions. Water Resources Research, 43(5), 1–13. http://doi.org/10.1029/2006WR005135
Hodnett, M. G., & Tomasella, J. (2002). Marked differences between van Genuchten soil water-retention parameters for temperate and tropical soils: A new water-retention pedo-transfer functions developed for tropical soils. Geoderma, 108(3-4), 155–180. http://doi.org/10.1016/S0016-7061(02)00105-2
Islam, N., Wallender, W. W., Mitchell, J. P., Wicks, S., & Howitt, R. E. (2006). Performance evaluation of methods for the estimation of soil hydraulic parameters and their suitability in a hydrologic model. Geoderma, 134(1-2), 135–151. http://doi.org/10.1016/j.geoderma.2005.09.004
Kennard, R. W., & Stone, L. A. (1969). American Society for Quality. Technometrics, 11(1), 137–148. Retrieved from http://www.jstor.org/stable/10.2307/1266219
Kværnø, S. H., & Stolte, J. (2012). Effects of soil physical data sources on discharge and soil loss simulated by the LISEM model. Catena, 97, 137–149. http://doi.org/10.1016/j.catena.2012.05.001
Liao, K., Xua, F., Zheng, J., Zhu, Q., & Yang, G. (2014). Using different multimodel ensemble approaches to simulate soil moisture in a forest site with six traditional pedotransfer functions. Environmental Modelling & Software, 57, 27–32. http://doi.org/10.1016/j.envsoft.2014.03.016
Mandal, K. G., Kundu, D. K., Singh, R., Kumar, A., Rout, R., Padhi, J., … Sahoo, D. K. (2013). Cropping practices, soil properties, pedotransfer functions and organic carbon storage at Kuanria canal command area in India. SpringerPlus, 2(2012), 631. http://doi.org/10.1186/2193-1801-2-631
Maren, A. J., Harston, C. T., & Pap, R. M. (1990). Handbook of Neural Computing Applications.
Meins, F. M. (2013). Evaluation of spatial scale alternatives for hydrological modelling of the Lake Naivasha basin, Kenya, (April).
Minasny, B. (2000). Efficient methods predicting soil hydraulic properties, 352. http://doi.org/10.4324/9780203360316_GENERAL_INTRODUCTION
Minasny, B., & Hartemink, A. E. (2011). Predicting soil properties in the tropics. Earth-Science Reviews, 106(1-2), 52–62. http://doi.org/10.1016/j.earscirev.2011.01.005

Master Thesis R.J.J. Oldhoff – 0
68
Neitsch, S. ., Arnold, J. ., Kiniry, J. ., & Williams, J. . (2011). Soil & Water Assessment Tool Theoretical Documentation Version 2009, 1–647.
Neprash Technology. (2012). SWAT-CUP. Retrieved from http://www.neprashtechnology.ca/
Obalum, S. E., & Obi, M. E. (2013). Moisture characteristics and their point pedotransfer functions for coarse-textured tropical soils differing in structural degradation status. Hydrological Processes, 27(19), 2721–2735. http://doi.org/10.1002/hyp.9398
Patil, N. G., Rajput, G. S., Nema, R. K., & Singh, R. B. (2010). Calibration and evaluation of pedotransfer functions to estimate available water capacity of seasonally impounded shrink-swell soils of central India. Archives of Agronomy and Soil Science, 56(5), 525–538. http://doi.org/10.1080/03650340903161187
Penman, H. L. (1956). Estimating evaporation. Transactions, American Geophysical Union, 37(1), 43. http://doi.org/10.1029/TR037i001p00043
Rajer-Kanduč, K., Zupan, J., & Majcen, N. (2003). Separation of data on the training and test set for modelling: A case study for modelling of five colour properties of a white pigment. Chemometrics and Intelligent Laboratory Systems, 65(2), 221–229. http://doi.org/10.1016/S0169-7439(02)00110-7
Rawls, W. J., & Brakensiek, D. L. (1985). Prediction of soil water properties for hydrologic modeling. In Watershed Management in the Eighties (pp. 293–299). New York.
Romano, N., & Palladino, M. (2002). Prediction of soil water retention using soil physical data and terrain attributes, 265, 56–75.
Santra, P., & Das, B. S. (2008). Pedotransfer functions for soil hydraulic properties developed from a hilly watershed of Eastern India. Geoderma, 146(3-4), 439–448. http://doi.org/10.1016/j.geoderma.2008.06.019
Schaap, M. G., Leij, F. J., & Van Genuchten, M. T. (2001). Rosetta: A computer program for estimating soil hydraulic parameters with hierarchical pedotransfer functions. Journal of Hydrology, 251(3-4), 163–176. http://doi.org/10.1016/S0022-1694(01)00466-8
Schaap, M. G., Nemes, A., & van Genuchten, M. T. (2004). Comparison of Models for Indirect Estimation of Water Retention and Available Water in Surface Soils. Vadose Zone Journal, 3(4), 1455–1463. http://doi.org/10.2113/3.4.1455
Sharpley, A. N., & Williams, J. R. (1990). EPIC: The erosion-productivity impact calculator. U.S. Department of Agriculture Technical Bulletin, (1768), 235. Retrieved from http://agris.fao.org/agris-search/search.do?recordID=US9403696
Sloan, P. G., & Moore, I. D. (1984). Modeling subsurface stormflow on steeply sloping forested watersheds. Water Resources Research, 20(12), 1815–1822. http://doi.org/10.1029/WR020i012p01815

References
69
Sobieraj, J. a., Elsenbeer, H., & Vertessy, R. a. (2001). Pedotransfer functions for estimating saturated hydraulic conductivity: Implications for modeling storm flow generation. Journal of Hydrology, 251(3-4), 202–220. http://doi.org/10.1016/S0022-1694(01)00469-3
Stevenswater. (n.d.). Measuring the Soil Water Retention Curve with the Stevens pF Matric Potential Sensor and Hydra Probe II Soil Moisture Sensor. Retrieved September 29, 2015, from http://www.stevenswater.com/articles/soil-retention-curve.aspx
Tetegan, M., Nicoullaud, B., Baize, D., Bouthier, a., & Cousin, I. (2011). The contribution of rock fragments to the available water content of stony soils: Proposition of new pedotransfer functions. Geoderma, 165(1), 40–49. http://doi.org/10.1016/j.geoderma.2011.07.001
Tomasella, J., & Hodnett, M. (2004). Pedotransfer functions for tropical soils. Developments in Soil Science, 30(C), 415–429. http://doi.org/10.1016/S0166-2481(04)30021-8
Tomasella, J., Pachepsky, Y., Crestana, S., & Rawls, W. J. (2003). Comparison of Two Techniques to Develop Pedotransfer Functions for Water Retention. Soil Science Society of America Journal, 67(4), 1085. http://doi.org/10.2136/sssaj2003.1085
Van Den Berg, M., Klamt, E., Van Reeuwijk, L. P., & Sombroek, W. G. (1997). Pedotransfer functions for the estimation of moisture retention characteristics of Ferralsols and related soils. Geoderma, 78(3-4), 161–180. http://doi.org/10.1016/S0016-7061(97)00045-1
Van Genuchten, M. T. (1980). A Closed-form Equation for Predicting the Hydraulic Conductivity of Unsaturated Soils. Soil Science Society of America Journal, 44(5), 892–898. http://doi.org/10.2136/sssaj1980.03615995004400050002x
Wallis, T. W. R., & Griffiths, J. F. (1995). An assessment of the weather generator (WXGEN) used in the erosion/productivity impact calculator (EPIC). Agricultural and Forest Meteorology, 73(1-2), 115–133. http://doi.org/10.1016/0168-1923(94)02172-G
Wösten, J. H. M., Lilly, a., Nemes, a., & Le Bas, C. (1999). Development and use of a database of hydraulic properties of European soils. Geoderma, 90(3-4), 169–185. http://doi.org/10.1016/S0016-7061(98)00132-3
Wösten, J. H. M., Pachepsky, Y. a., & Rawls, W. J. (2001). Pedotransfer functions: Bridging the gap between available basic soil data and missing soil hydraulic characteristics. Journal of Hydrology, 251(3-4), 123–150. http://doi.org/10.1016/S0022-1694(01)00464-4
Wu, W., Walczak, B., Massart, D. L., Heuerding, S., Erni, F., Last, I. R., & Prebble, K. a. (1996). Artificial neural networks in classification of NIR spectral data: Design of the training set. Chemometrics and Intelligent Laboratory Systems, 33(1), 35–46. http://doi.org/10.1016/0169-7439(95)00077-1


Appendices
I
APPENDICES
Appendix A: SWAT model settings The settings shown in Table A.I were used for the modelling of the Keduang for all the SWAT cases.
Table A-1: Used SWAT model settings
Parameter Definition Setting
IEVENT Rainfall-Runoff Method Daily Rain/CN/Daily Route
(IEVENT = 0)
ICN Daily Curve number method Soil Moisture Method (ICN =
0)
ISED_DET Method used to generate daily maximum
half-hour rainfall
Monthly max HH rainfall value
(ISED_DET = 1)
IRTE Channel routing method Variable Storage method
(IRTE = 0)
IPET Potential evaporation calculation method Penman/Monteith (IPET = 1)
Crack flow Inactive
Stream Water Quality Inactive
Channel Degradation Inactive
The way SWAT models all these processes is schematized in Figure A-1. For each HRU, the command
loop is run and the water fluxes and balances are calculated.
Figure A-1: SWAT HRU/Subbasin command loop

Master Thesis R.J.J. Oldhoff –Appendices
II
Appendix B: Case input The input used for the different cases differs in two ways. Firstly, case 1 uses a different soil map as
input than case 2-9. Secondly, cases 2-9 differ from each other only in AWC and Ks input. This
appendix will first give a description of the input used for case 1 followed by a description of the input
used for cases 2-9.
Input case 1
Figure B-1: Soil map used for case 1 and 11(measured)
Table B-1: Soil inputs for case 1 (measured)
1. Base
Topsoil Hydr
group
Sol_zmx
mm
Depth
mm
BD
g/cm3
AWC
m/m
OC
%
Ks
mm/h
Clay
%
Silt
%
Sand
%
Rock
%
pH
1 C 800 100 0.9 0.25 4.56 13.9 7 36 57 5 5.5
11 D 800 100 1.29 0.244 1.1 8.1 46 29 25 5 5.5
581 D 800 100 1.12 0.255 2.15 21.2 25 29 46 5 6.61
871 D 800 100 1.04 0.25 1.34 2.4 90 22 8 5 5.48
5241 D 800 100 1.16 0.22 1.3 82 50 30 20 5 5.55
5271 D 800 100 1.27 0.275 0.88 37.4 56 26 18 5 5.38
10041 D 800 100 1.3 0.2 1.2 24 53 32 15 5 5.5
Subsoil
1 C 800 1000 1.25 0.2 0.75 4 60 30 10 5 5.6
11 D 800 1000 1.25 0.2 0.75 4 60 30 10 5 5.6
581 D 800 1000 1.1 0.25 0.75 4 74 22 4 5 6
871 D 800 1000 1.07 0.25 0.6 10 79 14 7 5 5.05
5241 D 800 1000 1.15 0.25 1.2 10 67 27 6 5 5.5
5271 D 800 1000 1.07 0.27 0.6 1.3 60 25 15 5 5.5
10041 D 800 1000 1.25 0.2 0.75 4 60 30 10 5 5.6

Appendices
III
Input case 2-9
Figure B-2: Soil map used for case 2-10
Table B-2: Soil input case 2
2. Base
Topsoil Hydr
group
Sol_zmx
mm
Depth
mm
BD
g/cm3
AWC
m/m
OC
%
Ks
mm/h
Clay
%
Silt
%
Sand
%
Rock
%
pH
Lv5-3b D 990 300 1.4 0.2 3 2 48 28 23 0 5.5
To25-2b C 1000 300 1.1 0.18 2.9 12.5 33 41 26 0 5.5
Tm23-2c C 830 300 1.1 0.16 3.1 40 16 38 46 0 5.5
Subsoil
Lv5-3b D 990 1000 1.4 0.2 1.5 2 54 20 25 0 5.5
To25-2b C 1000 1000 1.1 0.18 1.1 12.5 36 38 25 0 5.5
Tm23-2c C 830 1000 1.1 0.16 1.6 40 18 35 47 0 5.5
Table B-3: Soil input case 3
3. Wösten Ks
Topsoil Hydr
group
Sol_zmx
mm
Depth
mm
BD
g/cm3
AWC
m/m
OC
%
Ks
mm/h
Clay
%
Silt
%
Sand
%
Rock
%
pH
Lv5-3b D 990 300 1.4 0.2 3 9.3 48 28 23 0 5.5
To25-2b C 1000 300 1.1 0.18 2.9 24.3 33 41 26 0 5.5
Tm23-2c C 830 300 1.1 0.16 3.1 30.9 16 38 46 0 5.5
Subsoil
Lv5-3b D 990 1000 1.4 0.2 1.5 2.15 54 20 25 0 5.5
To25-2b C 1000 1000 1.1 0.18 1.1 16.3 36 38 25 0 5.5
Tm23-2c C 830 1000 1.1 0.16 1.6 32.7 18 35 47 0 5.5

Master Thesis R.J.J. Oldhoff –Appendices
IV
Table B-4: Soil input case 4
4. Rosetta-3 Ks
Topsoil Hydr
group
Sol_zmx
mm
Depth
mm
BD
g/cm3
AWC
m/m
OC
%
Ks
mm/h
Clay
%
Silt
%
Sand
%
Rock
%
pH
Lv5-3b D 990 300 1.4 0.2 3 4.9 48 28 23 0 5.5
To25-2b C 1000 300 1.1 0.18 2.9 21.8 33 41 26 0 5.5
Tm23-2c C 830 300 1.1 0.16 3.1 29.1 16 38 46 0 5.5
Subsoil
Lv5-3b D 990 1000 1.4 0.2 1.5 5.3 54 20 25 0 5.5
To25-2b C 1000 1000 1.1 0.18 1.1 22 36 38 25 0 5.5
Tm23-2c C 830 1000 1.1 0.16 1.6 27.3 18 35 47 0 5.5
Table B-5: Soil input case 5
5. Oldhoff Ks
Topsoil Hydr
group
Sol_zmx
mm
Depth
mm
BD
g/cm3
AWC
m/m
OC
%
Ks
mm/h
Clay
%
Silt
%
Sand
%
Rock
%
pH
Lv5-3b D 990 300 1.4 0.2 3 7 48 28 23 0 5.5
To25-2b C 1000 300 1.1 0.18 2.9 25.8 33 41 26 0 5.5
Tm23-2c C 830 300 1.1 0.16 3.1 31.8 16 38 46 0 5.5
Subsoil
Lv5-3b D 990 1000 1.4 0.2 1.5 5.6 54 20 25 0 5.5
To25-2b C 1000 1000 1.1 0.18 1.1 22.7 36 38 25 0 5.5
Tm23-2c C 830 1000 1.1 0.16 1.6 29.5 18 35 47 0 5.5
Table B-6: Soil input case 6
6. Berg AWC
Topsoil Hydr
group
Sol_zmx
mm
Depth
mm
BD
g/cm3
AWC
m/m
OC
%
Ks
mm/h
Clay
%
Silt
%
Sand
%
Rock
%
pH
Lv5-3b D 990 300 1.4 0.124 3 2 48 28 23 0 5.5
To25-2b C 1000 300 1.1 0.111 2.9 12.5 33 41 26 0 5.5
Tm23-2c C 830 300 1.1 0.095 3.1 40 16 38 46 0 5.5
Subsoil
Lv5-3b D 990 1000 1.4 0.129 1.5 2 54 20 25 0 5.5
To25-2b C 1000 1000 1.1 0.114 1.1 12.5 36 38 25 0 5.5
Tm23-2c C 830 1000 1.1 0.096 1.6 40 18 35 47 0 5.5

Appendices
V
Table B-7: Soil input case 7
7. Oldhoff AWC
Topsoil Hydr
group
Sol_zmx
mm
Depth
mm
BD
g/cm3
AWC
m/m
OC
%
Ks
mm/h
Clay
%
Silt
%
Sand
%
Rock
%
pH
Lv5-3b D 990 300 1.4 0.18 3 2 48 28 23 0 5.5
To25-2b C 1000 300 1.1 0.233 2.9 12.5 33 41 26 0 5.5
Tm23-2c C 830 300 1.1 0.224 3.1 40 16 38 46 0 5.5
Subsoil
Lv5-3b D 990 1000 1.4 0.18 1.5 2 54 20 25 0 5.5
To25-2b C 1000 1000 1.1 0.239 1.1 12.5 36 38 25 0 5.5
Tm23-2c C 830 1000 1.1 0.227 1.6 40 18 35 47 0 5.5
Table B-8: Soil input case 8
8. Oldhoff PTFs
Topsoil Hydr
group
Sol_zmx
mm
Depth
mm
BD
g/cm3
AWC
m/m
OC
%
Ks
mm/h
Clay
%
Silt
%
Sand
%
Rock
%
pH
Lv5-3b D 990 300 1.4 0.18 3 7 48 28 23 0 5.5
To25-2b C 1000 300 1.1 0.233 2.9 25.8 33 41 26 0 5.5
Tm23-2c C 830 300 1.1 0.224 3.1 31.8 16 38 46 0 5.5
Subsoil
Lv5-3b D 990 1000 1.4 0.18 1.5 5.6 54 20 25 0 5.5
To25-2b C 1000 1000 1.1 0.239 1.1 22.7 36 38 25 0 5.5
Tm23-2c C 830 1000 1.1 0.227 1.6 29.5 18 35 47 0 5.5

Master Thesis R.J.J. Oldhoff –Appendices
VI
Appendix C: Global sensitivity analysis This appendix shows the results of the Global Sensitivity Analysis (GSA). A high P value coupled with
a low t-Stat indicates that the model output is not sensitive to change in this parameter. For each
iteration 100 runs were done, between which the selected parameters were uniformly varied
between the minimum and maximum values as defined in the SWAT input documentation (Neitsch
et al., 2011). After an iteration, 2-4 parameters were eliminated from the calibration selection, and
another iteration was done. This is done because the P-value and t-stat values for the other
parameters change after removing parameters from the selection. Eliminating only 2-4 parameters
per iteration is a measure to ensure an important parameter is not removed from the selection.
Figure C-1: First GSA iteration
Figure C-2: Second GSA iteration

Appendices
VII
Figure C-3: Third GSA iteration
Figure C-4: Fourth GSA iteration

Master Thesis R.J.J. Oldhoff –Appendices
VIII
Figure C-5: Fifth GSA iteration
Figure C-6: Sixth and final GSA iteration

Appendices
IX
Appendix D: Calibration parameter ranges The tables below show the parameter ranges for the different cases found after three calibration
runs. The fourth calibration and the validation were done using these parameter ranges. After the
tables, the ranges for each case are shown per parameter, to visualize patterns.
Table D-1: Parameter ranges case 1
Case 1 Base measured
Parameter Min Max Unit
r__CN2.mgt 0.079 0.193 -
v__HRU_SLP.hru 0.357 0.646 -
v__SLSOIL.hru 2.356 33.048 m
v__ESCO.hru 0.175 0.580 -
v__RCHRG_DP.gw
0.831 1.000 -
v__CH_K1.sub 236.655 297.681 mm/hour
Table D-2: Parameter ranges case 2
Case 2 Base FAO
Parameter Min Max Unit
r__CN2.mgt 0.120 0.222 -
v__HRU_SLP.hru 0.755 0.999 -
v__SLSOIL.hru 0.000 27.655 m
v__ESCO.hru 0.000 0.239 -
v__RCHRG_DP.gw 0.822 1.000 -
v__CH_K1.sub 141.414 268.205 mm/hour
Table D-3: Parameter ranges case 3
Case 3 Wösten Ks
Parameter Min Max Unit
r__CN2.mgt 0.130 0.235 -
v__HRU_SLP.hru 0.000 0.262 -
v__SLSOIL.hru 2.708 30.656 m
v__ESCO.hru 0.539 0.846 -
v__RCHRG_DP.gw 0.834 1.000 -
v__CH_K1.sub 249.568 300.000 mm/hour

Master Thesis R.J.J. Oldhoff –Appendices
X
Table D-4: Parameter ranges case 4
Case 4 Rosetta-3 Ks
Parameter Min Max Unit
r__CN2.mgt 0.129 0.237 -
v__HRU_SLP.hru 0.278 0.501 -
v__SLSOIL.hru 0.000 33.785 m
v__ESCO.hru 0.211 0.564 -
v__RCHRG_DP.gw 0.825 1.000 -
v__CH_K1.sub 235.648 300.000 mm/hour
Table D-5: Parameter ranges case 5
Case 5 Oldhoff Ks
Parameter Min Max Unit
r__CN2.mgt 0.132 0.247 -
v__HRU_SLP.hru 0.254 0.428 -
v__SLSOIL.hru 4.136 38.332 m
v__ESCO.hru 0.108 0.529 -
v__RCHRG_DP.gw 0.841 1.000 -
v__CH_K1.sub 227.602 295.118 mm/hour
Table D-6: Parameter ranges case 6
Case 6 Berg AWC
Parameter Min Max Unit
r__CN2.mgt 0.146 0.249 -
v__HRU_SLP.hru 0.560 0.754 -
v__SLSOIL.hru 0.000 19.349 m
v__ESCO.hru 0.276 0.616 -
v__RCHRG_DP.gw 0.142 0.388 -
v__CH_K1.sub 233.936 278.247 mm/hour
Table D-7: Parameter ranges case 7
Case 7 Oldhoff AWC
Parameter Min Max Unit
r__CN2.mgt 0.124 0.274 -
v__HRU_SLP.hru 0.575 0.790 -
v__SLSOIL.hru 0.000 22.052 m
v__ESCO.hru 0.116 0.348 -
v__RCHRG_DP.gw 0.622 0.951 -
v__CH_K1.sub 94.427 186.617 mm/hour

Appendices
XI
Table D-8: Parameter ranges case 8
Case 8 Oldhoff PTFs
Parameter Min Max Unit
r__CN2.mgt 0.120 0.221 -
v__HRU_SLP.hru 0.798 1.000 -
v__SLSOIL.hru 0.313 31.303 m
v__ESCO.hru 0.000 0.235 -
v__RCHRG_DP.gw 0.807 1.000 -
v__CH_K1.sub 155.805 300.000 mm/hour
Table D-9: Parameter ranges case 9
Case 9 FAO soil calibrated
Parameter Min Max Unit
r__CN2.mgt 0.146 0.254 -
v__HRU_SLP.hru 0.432 0.836 -
v__SLSOIL.hru 38.294 64.765 m
v__ESCO.hru 0.339 0.894 -
v__RCHRG_DP.gw 0.819 1.000 -
v__CH_K1.sub 254.173 300.000 mm/hour
v__SOL_K().sol 71.819 107.369 mm/hour
v__SOL_AWC().sol 0.111 0.191 cm3/cm3

Master Thesis R.J.J. Oldhoff –Appendices
XII
Figure D-1: Plots of the parameter ranges for all cases (x-axis)
0.000
0.050
0.100
0.150
0.200
0.250
0.300
1 2 3 4 5 6 7 8 9
CN min CN max
0.000
0.100
0.200
0.300
0.400
0.500
0.600
0.700
0.800
0.900
1.000
1 2 3 4 5 6 7 8 9
HRU_SLP min HRU_SLP min
0.000
10.000
20.000
30.000
40.000
50.000
60.000
70.000
1 2 3 4 5 6 7 8 9
SLSOIL min SLSOIL max
0.000
0.100
0.200
0.300
0.400
0.500
0.600
0.700
0.800
0.900
1.000
1 2 3 4 5 6 7 8 9
ESCO min ESCO max
0.000
0.100
0.200
0.300
0.400
0.500
0.600
0.700
0.800
0.900
1.000
1 2 3 4 5 6 7 8 9
RCHRGDP min RCHRGDP max
0.000
50.000
100.000
150.000
200.000
250.000
300.000
350.000
1 2 3 4 5 6 7 8 9
CH_k1 min CH_k1 max