Fertile soil
44
Fertile soil Coromandel International Initiating Coverage | 4 August 2014 Sector: Fertilizers Niket Shah ([email protected]); +91 22 3982 5426 Atul Mehra ([email protected]); +91 22 3982 5417
-
Upload
khangminh22 -
Category
Documents
-
view
0 -
download
0
Transcript of Fertile soil

Fertile soil
Coromandel International
Initiating Coverage | 4 August 2014Sector: Fertilizers
Niket Shah ([email protected]); +91 22 3982 5426
Atul Mehra ([email protected]); +91 22 3982 5417

Coromandel International
4 August 2014 2
Coromandel International: Fertile soil
Page No.
Summary .......................................................................................................... 3-4
Story in charts: Best play in fertilizers ............................................................... 5
Best play in fertilizers; evolving into diversified agri-player ....................... 6-7
Growth set to recover; worst is behind ...................................................... 8-12
Non-subsidy EBITDA share to be 45% by FY17 ......................................... 13-14
Most efficient player in fertilizer market .................................................. 15-18
Earnings to post 30% CAGR over FY14-17 ................................................. 19-21
Initiating coverage with a Buy rating ........................................................ 22-23
Risks and concerns ............................................................................................ 24
Management ............................................................................................... 25-26
Company overview ..................................................................................... 27-30
Industry overview ....................................................................................... 31-41
Financials and valuations ........................................................................... 42-43
Investors are advised to refer through disclosures made at the end of the Research Report.

Coromandel International
4 August 2014 3
Fertile soil – from complex fertilizers to agri inputs EBITDA contribution from non-subsidy business to increase from 36% to 45%
From a lucrative complex fertilizers company, CRIN is transforming into a high quality agricultural inputs player. EBITDA contribution from non-subsidy business is set to increase from the current 36% to 45% by FY17, which warrants a re-rating.
Reduced subsidy dependence from 63% of realization pre-NBS to 35% currently, faster recovery of government dues, and reduced capex intensity with focus on increasing capacity utilization from 65% in FY14 to 83% in FY17 would drive strong free cash generation and improve return ratios.
While FY15 is likely to be a difficult year given weak monsoon, we believe inventory correction and normalization of NPK ratio would drive 14% revenue CAGR and 30% PAT CAGR over FY14-17. We initiate coverage with a Buy rating. Our target price is INR320 (15x FY16E EPS).
Best play in fertilizers; evolving into diversified agri-player CRIN is one of the few players present only in complex fertilizers. It has negligible exposure to the subsidy-led low RoE urea business. In products like 28:28:0, it has a virtual monopoly, resulting in superior pricing power. Liberty’s acquisition makes CRIN the market leader in SSP, which is gaining popularity. One of the most integrated players in the fertilizer business, it has also expanded its footprint in agro-chemicals. We believe increasing proportion of profitability from non-subsidy business makes CRIN a unique play on Indian agriculture. CRIN would be among the biggest beneficiaries of urea reforms. While increase in urea prices would result in greater demand for its complex fertilizers, urea de-canalization could open up a huge opportunity for distribution of imported urea in India. Growth set to recover; worst is behind Post NBS implementation, input price inflation drove up the price differential between phosphatic fertilizers and urea from 1.7x to 4.5x. Farmers cut consumption of phosphatic fertilizers, skewing the NPK ratio from 4.2:2:1 in FY10 to 7.7:3:1 in 2013. We believe stabilization in the prices of phosphatic fertilizers, the need to restore nutrient mix back to normal levels of 4.2:2:1, and normalization of inventories will drive growth for CRIN over FY14-17. We expect capacity utilization to improve from 65% in FY14 to 83% in FY17, driving 12% revenue CAGR for the fertilizer business. The share of subsidy in selling price has reduced from 63% pre-NBS implementation to just 35% currently, improving the quality and sustainability of the business. We expect margins in the fertilizer business to stabilize at current levels of INR2,200/tonne.
Initiating Coverage | Sector: Fertilizers
Coromandel International CMP: INR238 TP: INR320 Buy
BSE Sensex S&P CNX
25,723 7,684
Stock Info
Bloomberg CRIN IN
Equity Shares (m) 285.8
52-Week Range (INR) 280/167
1, 6, 12 Rel. Per (%) -7/-9/7
M.Cap. (INR b) 68.0
M.Cap. (USD b) 1.1
Financial Snapshot (INR Billion)
Y/E March 2015E 2016E 2017E Net Sales 108.6 127.4 147.5
EBITDA 8.6 10.8 13.0
Adj PAT 4.3 6.3 7.7
EPS (INR) 14.7 21.5 26.6
Growth (%) 14.1 45.9 23.8
BV/Sh. (INR) 86.6 100.8 119.0
RoE (%) 17.9 22.9 24.2
RoCE (%) 20.0 24.8 28.6
P/E (x) 16.1 11.0 8.9
P/BV (x) 2.7 2.4 2.0
Shareholding pattern (%)
As on Jun-14 Mar-14 Dec-13
Promoter 63.2 63.8 63.8
FII 7.0 6.8 7.5
DII 5.8 5.6 6.0
Others 24.0 23.8 22.7
Note: FII Includes depository receipts
Stock Performance (1-year)

Coromandel International
4 August 2014 4
Non-subsidy EBITDA share to be 45% by FY17 We expect 20% CAGR in non-subsidy business against 12% CAGR in subsidy business over FY14-17, resulting in revenue contribution from non-subsidy business rising from 20% to 23%. The acquisition of Sabero has strengthened CRIN’s non-subsidy portfolio. Sabero’s subsidiaries in Brazil, Argentina, Australia, and Europe would enable CRIN to expand its global footprint. We expect EBITDA mix to improve in favor of the more profitable non-subsidy business. EBITDA contribution from the non-subsidy business is likely to increase from 36% to 45% over FY14-17. This would lead to a strong improvement in CRIN’s return on capital profile.
Most efficient player in fertilizer market CRIN is the lowest cost manufacturer of phosphatic fertilizers in India. Its cost advantage translates into higher margins and return on capital. It has entered into a number of strategic agreements to ensure assured raw material supply and uninterrupted manufacturing. It sources only ~15% of its requirement from open markets; ~25% comes from its captive capacity at Vizag and ~60% from strategic tie-ups. All its plants are located along the coast, enabling it to save on the cost of inland transportation of imported raw material. Its plants are also close to its target markets, helping to reduce the cost of transporting finished goods.
Earnings to post 30% CAGR over FY14-17 We expect revenue to grow at a CAGR of 14% over FY14-17, led by 20% CAGR in non-subsidy business. EBITDA would grow at 17% CAGR, with margins expanding 80bp to 8.8%. Adjusted PAT would grow at a CAGR of 30%. Limited capex and focus on increasing capacity utilization would ensure robust free cash generation and reduction in net debt to equity from 0.5x to 0.1x. RoCE would improve from 16.6% to 28.6% and RoE from 16.3% to 24.2% over FY14-17.
Initiating coverage with a Buy rating We like CRIN for its focus on the more lucrative complex fertilizers space and its initiatives to diversify from a pure fertilizer business to a broader, agri-inputs business. It will focus on higher capacity utilization across its fertilizer and agro-chemical businesses, enhancing asset efficiency, free cash generation, and return ratios. We value the stock at 15x FY16E EPS and arrive at a target price of INR320 – 35% upside. We initiate coverage with a Buy rating.
One-year forward PE (x)
Source: Company, MOSL
One-year forward PB (x)
Source: Company, MOSL
13.4
15.0
20.6
7.4
4
8
12
16
20
24
Aug
-10
Dec
-10
Apr
-11
Aug
-11
Dec
-11
Apr
-12
Aug
-12
Dec
-12
Apr
-13
Aug
-13
Dec
-13
Apr
-14
Aug
-14
P/E (x) Avg(x) Peak(x) Min(x)
2.7
3.24.2
2.0
1.0
2.0
3.0
4.0
5.0
Aug
-10
Nov
-10
Feb-
11
May
-11
Aug
-11
Nov
-11
Feb-
12
May
-12
Aug
-12
Nov
-12
Feb-
13
May
-13
Aug
-13
Nov
-13
Feb-
14
May
-14
Aug
-14
P/B (x) Avg(x) Peak(x) Min(x)

Coromandel International
4 August 2014 5
Story in charts: Best play in fertilizers 1. India has the lowest fertilizer penetration 2. NPK ratio skewed at 7.7:3:1 against ideal ratio of 4.2:2:1 3. Revenue growth set to accelerate due to higher utilization 4. Dependence on subsidy is declining every year 5. Non-subsidy business contribution to rise to 45% 6. RoE set to improve to 24% in FY17E.
1. India has the lowest fertilizer penetration
128 133166
275
333
India Brazil Pakistan Japan China
Country-wise Fertiliser Consumption (Kgs/ha)
Source: MOSL, Company
2. NPK ratio skewed at 7.7:3:1 against ideal ratio of 4.2:2:1
5.9 5.54.6 4.3 4.3
6.97.7
2.4 2.11.6 2.0 2.0
3.1 3.0
1.0 1.0 1.0 1.0 1.0 1.0 1.0
2007 2008 2009 2010 2011 2012 2013
N P K
Source: MOSL, Company
3. Revenue growth set to accelerate due to higher utilization
3.3 3.2 3.6 3.6 3.9 3.9
76%58%
65%70% 73%
83%
FY12 FY13 FY14 FY15E FY16E FY17E
Capacity (m MT) Capacity Utilization (%)
Source: MOSL, Company
4. Dependence on subsidy is declining every year
63% 60% 52%37% 35%
37% 40% 48%63% 65%
Pre NBS FY11 FY12 FY13 FY14
Subsidy as a percentage of total realizationFarmgate price as a percentage of total realization
Source: MOSL, Company
5. Non-subsidy business contribution to rise to 50%
70% 70% 64% 61% 58% 55%
30% 30% 36% 39% 42% 45%
FY12 FY13 FY14 FY15E FY16E FY17E
Phosphatic Fertilisers Non-subsidy business
Source: MOSL, Company
6. RoE set to improve to 24% in FY17
18.8 16.3
17.9
22.9 24.2
FY13 FY14 FY15E FY16E FY17E
RoE (%)
Source: MOSL, Company

Coromandel International
4 August 2014 6
Best play in fertilizers; evolving into diversified agri-player Negligible presence in urea; contribution of non-subsidy business increasing
CRIN is one of the few players present only in complex fertilizers. It has negligible exposure to the subsidy-led low RoE urea business. In products like 28:28:0, it has a virtual monopoly, resulting in superior pricing power. Liberty’s acquisition makes CRIN the market leader in SSP, which is gaining popularity.
CRIN is one of the most integrated players in the fertilizer business. It has also expanded its footprint in agro-chemicals. We believe increasing proportion of profitability from non-subsidy business make CRIN a unique play on Indian agriculture.
CRIN would be among the biggest beneficiaries of urea reforms. While increase in urea prices would result in greater demand for its complex fertilizers, urea de-canalization could open up a huge opportunity for distribution of imported urea in India.
Present in the best sub-sector of fertilizers CRIN is one of the few players present only in complex fertilizers, with negligible exposure to the subsidy-led, low RoE urea business. Further, its presence across major agricultural states and ability to introduce innovative products gives it pricing power and puts it in a niche position in complex fertilizers.
Products like 28:28:0 are highly differentiated, with strong technology-led entry barriers. Other players have found it difficult to replicate such products. They are gaining popularity, as they provide the necessary nutrients at lower cost than DAP. Costs are lower, as consumption of phosphoric acid, the most expensive ingredient, is lower in complex fertilizers like 28:28:0 than in DAP. Liberty acquisition has made CRIN market leader in SSP CRIN acquired 75% of Liberty Phosphate and 100% of Liberty Urvarak for INR3.5b in FY13. With the acquisition of the Liberty group, CRIN accelerated its entry into the SSP segment. Liberty has the capacity to manufacture ~1mtpa of SSP and adds to CRIN’s distribution reach. Post this acquisition, CRIN has become a leading player in the SSP segment. With increase in DAP prices following price decontrol, prospects for the SSP business have improved, as farmers have started downtrading. One of the most integrated fertilizer producers CRIN is one of the most integrated players in the fertilizer business, which enables it to capture most parts of the fertilizer value chain – from manufacturing to distribution. It has strong brand recall in Gromor and Godavari, especially in key markets such as Andhra Pradesh. We believe issues faced by CRIN in the form of cheap Chinese imports and consequent high inventory levels are behind. Over the next 2-3 years, we expect CRIN to witness strong growth in its fertilizer business. Evolving into a broader agri-inputs player CRIN has also made significant in-roads and expanded its footprint in crop protection. EBITDA contribution from non-subsidy business is likely to rise from 36% in FY14 to 45% in FY17. Additionally, CRIN will look to expand its footprint in the seeds business as well, with an objective to complete its portfolio. We believe increasing proportion of profitability from non-subsidy business and aspirations of expanding in the seeds business make CRIN a unique play on Indian agriculture.
Leadership in innovative products like 28:28:0
enables CRIN to command superior margins
With increase in DAP prices following price decontrol,
prospects for the SSP business have improved
High degree of integration in fertilizer business right
from manufacturing to distribution improves long
term prospects
Higher contribution of non-subsidy businesses makes
CRIN a well diversified agri-player

Coromandel International
4 August 2014 7
Strong beneficiary of and safest play on urea reforms CRIN would be among the biggest beneficiaries of urea reforms. While increase in prices of urea would result in greater demand for its complex fertilizers, possible urea de-canalization could open up a huge opportunity for distribution of imported urea in India. Currently, urea is imported by three government agencies and distributed by companies at a fixed charge. With de-canalization, CRIN would be able to tie up overseas capacities at competitive rates and import to India. As in the case of its raw material sourcing arrangements, CRIN may also opt for equity stakes in overseas plants to secure long-term supply. Being an asset-light business, distribution of imported urea could significantly boost CRIN’s earnings and RoE. We have not factored any gains from urea reforms in our estimates. In July 2011, CRIN signed an MoU with Qatar Fertilizer Company (Qafco) for the supply of urea. Qafco is one of the world’s largest urea manufacturers, currently producing ~3m tonnes of granular urea. It is in expansion phase, post which it would become the world’s largest producer of ammonia and urea. Post expansion, it would have an ammonia capacity of 3.8m tonnes and a urea capacity of 5.6m tonnes. CRIN is among the first few companies in India to have obtained permission to import urea for captive consumption through public sector agencies like MMTC, IPL and STC. Its pact with Qafco makes CRIN well placed to capture the urea distribution opportunity that de-canalization creates. Change in policy towards urea imports in line with P&K imports, and reforms in urea pricing could be game changer events for CRIN.
Urea price hike and de-canalization of urea imports
can open up a huge opportunity for CRIN
Tie-up with Qafco puts CRIN in an advantageous position and makes it well placed to
capture the opportunity which may get created by
urea de-canalization

Coromandel International
4 August 2014 8
Growth set to recover; worst is behind Prices have stabilized; inventory situation has improved
Post NBS implementation, input price inflation drove up the price differential between phosphatic fertilizers and urea from 1.7x to 4.5x. Farmers cut consumption of phosphatic fertilizers, skewing the NPK ratio from 4.2:2:1 in FY10 to 7.7:3:1 in 2013.
We believe stabilization in the prices of phosphatic fertilizers, the need to restore nutrient mix back to normal levels of 4.2:2:1, and normalization of inventories will drive growth for CRIN over FY14-17. We expect capacity utilization to improve from 65% in FY14 to 83% in FY17, driving 12% revenue CAGR for the fertilizer business.
The share of subsidy in selling price has reduced from 63% pre-NBS implementation to just 35% currently, improving the quality and sustainability of the business. We expect margins in the fertilizer business to stabilize at current levels of INR2,200/tonne.
NPK ratio highly skewed in favor of urea Implementation of the Nutrient Based Subsidy (NBS) policy from 1 April 2010 coupled with sharp increase in input prices resulted in the prices of phosphatic fertilizers shooting up from INR9,350/tonne pre-deregulation to as high as INR24,000/tonne in October 2012. Since then, prices of phosphatic fertilizers have been stable. The price differential between phosphatic fertilizers and urea shot up from 1.7x pre-deregulation to 4.5x at the peak, and currently stands at 4.2x. Farmers have cut consumption of phosphatic fertilizers, skewing the NPK ratio from 4.2:2:1 in FY10 to 7.7:3:1 in 2013. Post deregulation, price differential between phosphatic fertilizers and urea has shot up
Source: Company, MOSL
NPK ratio has turned extremely skewed in favor of nitrogen in the last three years
5.9 5.54.6 4.3 4.3
6.97.7
2.4 2.11.6 2.0 2.0
3.1 3.0
1.0 1.0 1.0 1.0 1.0 1.0 1.0
2007 2008 2009 2010 2011 2012 2013
N P K
Source: Company, MOSL
9,350 9,350 10,750
18,200
24,000 22,500 22,700 1.7 1.7 2.0
3.4
4.5 4.2 4.2
June-08 Mar-10 Mar-11 Mar-12 Oct-12 Apr-13 Apr-14
MRP of phosphatic fertilizers (INR/MT) Price differential (Phosphatics/Urea)
Price (MRP) differential between phosphatic
fertilizers and urea shot up from 1.7x pre-deregulation
to 4.5x at its peak and stands at 4.2x currently

Coromandel International
4 August 2014 9
Domestic players better placed; market share gains to continue While demand for urea has grown at a CAGR of 2% over FY12-14, demand for phosphatic fertilizers has de-grown at 20% per annum. The de-growth in phosphatic fertilizers has largely been led by demand for imported phosphatic fertilizers shrinking at 41% per year; domestic production has de-grown at 6% per annum. Our interactions with the management as well as fertilizer dealers suggest that imports from China were of poor quality, and hence, received poor demand. We expect the preference for locally manufactured fertilizers to continue. The market share of domestic producers, which has increased from 53% in FY12 to 74% in FY14, should increase further, going forward.
While urea sales have grown at 2% CAGR over FY12-14…
29.5
30.2
30.4
FY12 FY13 FY14
Urea sales (m MT)
Source: Company, MOSL
…DAP and complex fertilizer sales have de-grown at 20% p.a
21.7
16.414.0
FY12 FY13 FY14
DAP and Complex sales (m MT)
Source: Company, MOSL
While imports have de-grown at 41% per annum…
10.6
6.1
3.7
FY12 FY13 FY14
DAP and Complex Imports (m MT)
Source: Company, MOSL
…domestic production has de-grown at 6%
11.8
9.8 10.5
FY12 FY13 FY14
DAP and Complex Production (m MT)
Source: Company, MOSL
Market share of domestic producers has increased from 53% to 74%
53%62%
74%
FY12 FY13 FY14
Market share of domestic production (DAP and Complex Fertilizers)
Source: Company, MOSL
Demand for imported fertilizers has declined by
41% annually over FY12-14 while demand for locally
manufactured fertilizers has declined by 6% annually
Market share for domestic manufactures has increased from 53% in FY12 to 74% in
FY14

Coromandel International
4 August 2014 10
Growth set to bounce back; inventory situation has improved Deviations in nutrient consumption beyond one or two years can result in serious deterioration in soil health. Given that prices of phosphatic fertilizers have stabilized at ~INR23,000/tonne over FY13-14, we expect farmers to attempt restoration of nutrient balance of soil, driving NPK ratio back to the desired level of 4.2:2:1. The resultant increase in demand for phosphatic fertilizers would drive growth for CRIN. Further, the inventory situation for DAP and complex fertilizers has improved significantly. Excess inventories in the market have declined from 5m tonnes at the beginning of FY14 to 2m tonnes at the exit of FY14. Restoration of NPK consumption ratio and normalization of inventories would support higher offtake for CRIN products over FY14-17. Higher capacity utilization to drive growth in fertilizer business CRIN has a capacity of ~4m tonnes for P&K fertilizers. We believe growth issues over the last 2-3 years due to sharp price increases and flooding of the market with low-cost, inferior-quality Chinese fertilizers are behind. We expect CRIN’s fertilizer business to grow at a CAGR of 12% over FY14-17, driven by increase in capacity utilization from 65% to 83%. Capacity utilization to improve from 59% in FY14 to 86% in FY17
3.3 3.2 3.6 3.6 3.9 3.9
76%58%
65% 68% 72%83%
FY12 FY13 FY14 FY15E FY16E FY17E
Capacity (m MT) Capacity Utilization (%)
Source: Company, MOSL
Fertilizer revenues to post 12% CAGR over FY14-17, led by higher capacity utilization
83,673 72,875 77,935 81,412 94,460 107,648
30%
-13%
7% 4%
16% 14%
FY12 FY13 FY14 FY15E FY16E FY17E
Fertilizer revenues (INR m) Growth (%)
Source: Company, MOSL
Restoration of NPK ratio will drive higher industry
growth
We expect capacity utilization to improve from 65% in FY14 to 83% in FY17 driving 12% revenue CAGR
for fertilizer business

Coromandel International
4 August 2014 11
Subsidy-dependence in fertilizer business declining Subsidy-dependence in the fertilizer business has been declining since deregulation, improving the quality and sustainability of the business. At the time of NBS implementation, subsidy constituted 63% of the selling price; this has declined to just 35% currently. The management expects subsidy-dependence to decline further, as the government looks to cut its subsidy bill. The government has been cutting its subsidy share by (a) reducing the subsidy element when raw material prices are declining, and (b) keeping subsidy contribution steady when raw material prices are escalating. Lower dependence on subsidy reduces uncertainty arising from government policies
63% 60% 52%37% 35%
37% 40% 48%63% 65%
Pre NBS FY11 FY12 FY13 FY14
Subsidy as a percentage of total realization Farmgate price as a percentage of total realization
Source: Company, MOSL
Absolute subsidy (INR/tonne)
Nutrient FY11 FY12 FY13 FY14 FY15E CAGR
N 23,227 27,153 24,000 20,875 20,875 -3%
P 26,276 32,338 21,804 18,679 18,679 -8%
K 24,487 26,756 24,000 18,833 15,500 -11%
S 1,784 1,677 1,677 1,677 1,677 -2%
Source: Company, MOSL
Trend in fertilizer subsidy
Fertilizer subsidy (INR b) FY12 FY13 FY14 FY15E CAGR
Imported (Urea) fertilizers 139 134 155 123 -4%
Indigenous (Urea) fertilizers 191 190 210 310 18%
Total Subsidy on Urea 330 324 365 433 9%
% of total fertilizer subsidy 49% 53% 55% 64%
Sale of decontrolled fertilizer with cons. 342 286 294 247 -10%
% of total fertilizer subsidy 51% 47% 45% 36%
Total Fertilizer Subsidy 672 610 660 680 0%
Source: Company, MOSL
Share of subsidy in selling price has reduced from 63% pre-NBS implementation to
just 35% currently

Coromandel International
4 August 2014 12
Margins in fertilizer business to remain stable at ~INR2,200/tonne Post NBS implementation in FY11, CRIN benefitted on softening of input prices and its EBITDA/tonne jumped to INR3,500. However, raw material issues, INR depreciation, subsidy reduction, and influx of low-priced imports from China adversely affected margins of most domestic producers. In FY14, the Ministry of Fertilizers (MoF) asked fertilizer producers to reduce prices as the international input prices had come off. The MoF also suggested passing on the benefit of falling input prices to the customer, failing which it suggested a penal action of reducing subsidy support. The said notification also required regular cost data submission. This led to fears that the government would control profitability of the segment. However, the industry acted practically and started operating on a more sustainable EBITDA margin of INR2,000/tonne. There has been no subsequent action by the government. Post the initial volatility, margins have now stabilized at ~INR2,200/tonne. We expect FY15 margins to be slightly impacted on the back of weak monsoon. We estimate margins at INR2,154/tonne in FY15. However, we build margins of ~INR2,200/tonne for FY16-17 on expected improvement in demand. EBITDA/tonne to remain stable at ~INR2,100
2,230 2,154 2,190 2,187
FY14 FY15E FY16E FY17E
EBITDA/MT (INR)
Source: Company, MOSL
Contribution of traded products to remain low; to result in stable fertilizer margins
17%
20%
12% 12% 11% 10%
FY12 FY13 FY14 FY15E FY16E FY17E
Traded products contribution to fertiulizer revenues (%)
Source: Company, MOSL
Margins in fertilizer business to remain stable at
~INR2,200/MT

Coromandel International
4 August 2014 13
Non-subsidy EBITDA share to be 45% by FY17 Acquisitions have strengthened non-subsidy portfolio
We expect 20% CAGR in non-subsidy business against 12% CAGR in subsidy business over FY14-17, resulting in revenue contribution from non-subsidy business rising from 20% to 23%.
The acquisition of Sabero has strengthened CRIN’s non-subsidy portfolio. Sabero’s subsidiaries in Brazil, Argentina, Australia, and Europe would enable CRIN to expand its global footprint.
We expect EBITDA mix to improve in favor of the more profitable non-subsidy business. EBITDA contribution from the non-subsidy business is likely to increase from 36% to 45% over FY14-17. This would lead to a strong improvement in CRIN’s return on capital profile.
Strong growth outlook for non-subsidy business In FY14, the subsidy business accounted for 80% of CRIN’s revenue. We expect 20% CAGR in the non-subsidy business against 12% CAGR in the subsidy business over FY14-17. Revenue contribution from the non-subsidy (non-fertilizer) business would increase from 20% to 23%. Strong growth outlook for the agrochemicals business (both technical and formulations) along with robust demand for water-soluble fertilizers, micronutrients, and crop protection would result in higher share of non-subsidy business. Marketing of compost from municipal waste and press mud, and sale of farm mechanization products are additional will also drive share of non-subsidy business.
Revenue mix to improve in favor of non-subsidy business
90% 90% 80% 79% 78% 77%
10% 10% 20% 21% 22% 23%
FY12 FY13 FY14 FY15E FY16E FY17E
Phosphatic Fertilisers Non-subsidy business
Source: Company, MOSL
Sabero acquisition has strengthened CRIN’s non-subsidy portfolio CRIN strengthened its non-subsidy portfolio through the acquisition of Sabero. Sabero is a Gujarat-based agrochemicals exporter, with manufacturing unit in Sarigam Industrial Area, Valsad. It has over 240 product registrations in more than 50 countries. CRIN acquired the entire promoter stake of 37% and an additional 31% stake in the open offer. Pollution-related issues had restricted Sabero’s production to 45% utilization level and it had reported a loss of INR636m in FY12 which also included one-offs. Post-acquisition, CRIN put up an effluent treatment facility, following which utilization rate increased to 70% and Sabero reported a profit of INR331m in FY14. CRIN has ensured strict adherence to effluent treatment plant (ETP) and environment management system (EMS) norms, resulting in relaxation of the restrictions imposed on Sabero. We believe CRIN will derive strong synergies
Revenue contribution from non-subsidy business to rise from 20% in FY14 to 23% in
FY17
Sabero capacity utilization is set to improve further
from current levels of 70%
Coromandel International
4 August 2014 14
from the acquisition. Sabero has four subsidiaries situated in Brazil, Argentina, Australia and Europe, which will help CRIN to increase its market share overseas. In addition, CRIN will utilize its strong domestic distribution network to sell products manufactured by Sabero. Sabero acquisition has played a large role in increasing CRIN’s revenue and EBITDA contribution from non-subsidy businesses. Going forward, the management has guided that growth in the non-subsidy portfolio would be largely organic in nature and would be driven by increase in capacity utilization from the current level of ~70% and new capacity additions. Profitability mix to improve in favor of non-subsidy business The subsidy business accounted for 64% of CRIN’s EBITDA in FY14. EBITDA margin is ~6% in the subsidy business as against ~15% in the non-subsidy business. By FY17, we expect the EBITDA contribution of the non-subsidy business to increase to 45%. The shift in EBITDA mix in favor of the more lucrative non-subsidy business would enhance the return on capital for the consolidated entity. Non-subsidy business to contribute 45% of FY17E EBITDA
70% 70% 64% 60% 57% 55%
30% 30% 36% 40% 43% 45%
FY12 FY13 FY14 FY15E FY16E FY17E
Phosphatic Fertilisers Non-subsidy business
Source: Company, MOSL
We expect EBITDA mix to improve in favor of non-
subsidy business with contribution rising from
36% to 45% over FY14-17
Coromandel International
4 August 2014 15
Most efficient player in fertilizer market Strategic raw material tie-ups; plants located near key markets
CRIN is the lowest cost manufacturer of phosphatic fertilizers in India. Its cost advantage translates into higher margins and return on capital.
CRIN has entered into a number of strategic agreements to ensure assured raw material supply and uninterrupted manufacturing. It sources only ~15% of its requirement from open markets; ~25% comes from its captive capacity at Vizag and ~60% from strategic tie-ups.
All its plants are located along the coast, enabling it to save on the cost of inland transportation of imported raw material. Its plants are also close to its target markets, helping to reduce the cost of transporting finished goods.
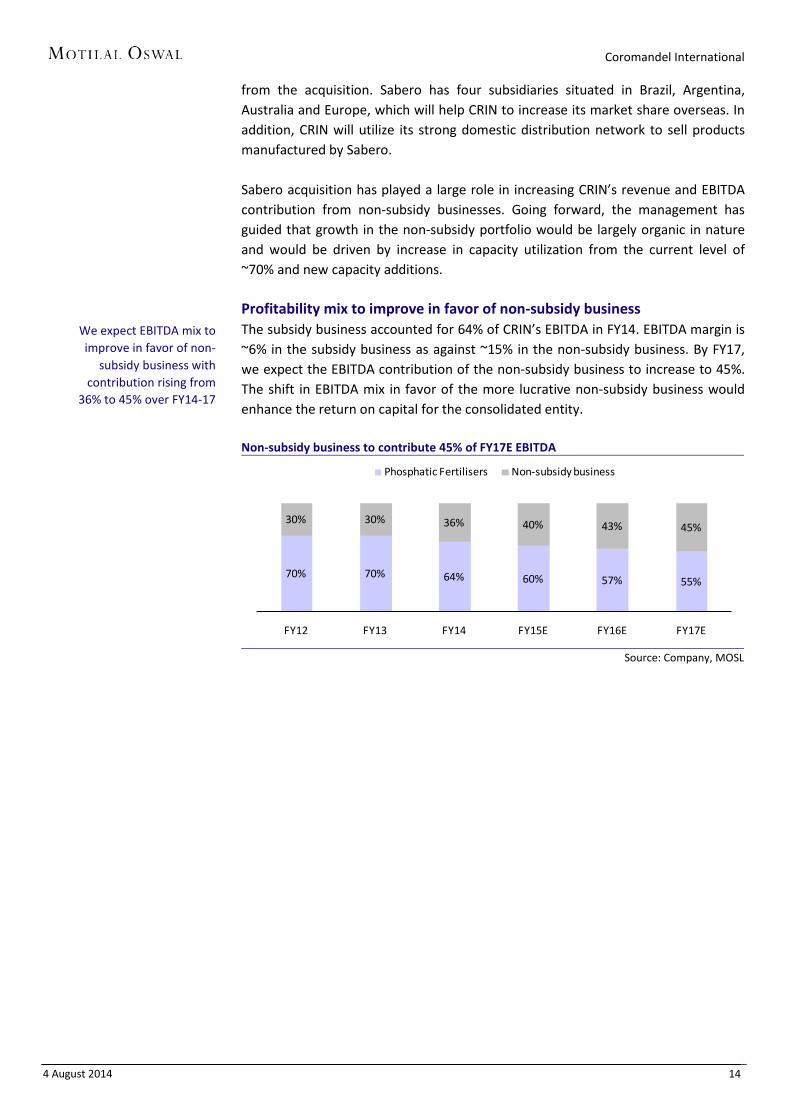
Lowest cost producer of phosphatic fertilizers in India CRIN is the lowest cost manufacturer of phosphatic fertilizers in India due to partial backward integration and ownership of logistics/support infrastructure. It manufactures phosphoric acid from rock phosphate (25% of its requirement) at its Vizag facility. It owns a captive jetty at Vizag, storage tanks and pipelines for transportation of raw materials, captive power plants at Vizag and Ennore, and a captive desalination plant at Ennore. Its manufacturing facilities are located at Vishakapatnam, Kakinada, Ennore and Ranipet. As all its plants are located along the coast, it is able to save on the cost of inland transportation of imported raw material. Its plants are also close to fertilizer target markets, which help to reduce the cost of transporting finished goods. CRIN enjoys a cost advantage over its peers, translating into higher margins and return on capital.
Strategic tie-ups ensure assured raw material availability As India has limited phosphorus reserves, the complex fertilizer industry has to rely on imports. CRIN has entered into a number of strategic agreements to ensure assured supply of raw material. It sources only ~15% of its requirement from open markets; ~25% comes from its captive capacity at Vizag and ~60% from strategic tie-ups. Assured raw material availability helps ensure uninterrupted manufacturing. CRIN has a technical assistance agreement with Foskor (South Africa), one of the world’s largest phosphoric acid producers, and holds 14% of its equity. It has invested ~USD29m for 15% equity stake in Tunisian Indian Fertilizers Company (TIFERT), a JV between Groupe Chimique Tunisien (GCT) and CPG of Tunisia, and GSFC of India, to set up a phosphoric acid plant at La Skhira in Tunisia at a cost of ~USD500m. The management has indicated that most future raw material supplies will come from overseas tie-ups. Expansion of the captive facility at Vizag, which supplies 25% of its phosphorous requirement, may not be possible due to difficulty in disposing by products.
CRIN is the lowest cost manufacturer of phosphatic
fertilizers in India
Only 15% of phosphorus requirement is sourced
from open markets
CRIN holds stakes in Foskor, TIFERT and has forged
strategic tie-ups with a number of companies
globally

Coromandel International
4 August 2014 16
Global raw material alliances
Input Alliance
MOP Potash-Canada
Rock-phosphate Israel, Togo, Algeria
WSF and MAP JV with SQM, Chile
Phosphoric acid 14% equity in FOSKOR, Africa 15% stake in Trifert, Tunisia
Ammonia and sulphur Pact with QAFCO for supply of ammonia and sulphur: Mitsui Japan
Urea Supply pact with QAFCO
Source: Company, MOSL
Sourcing arrangements aggregating to 1.23m tonnes Sourcing Mn MT %of total Captive Production 0.23 19% Strategic Tie-Ups 0.80 65% Supply contracts with FOSKOR, ICL , GCT and PhosChem 0.60 49% New JV TIFERT 0.20 16% Spot Buying 0.20 16% Total 1.23 100%
Source: Company, MOSL
Global strategic alliances
Source: Company, MOSL
Acid tie-up of 1.23m tonnes is sufficient for production
volume of 4m tonnes

Coromandel International
4 August 2014 17
Market leader in South India CRIN is the market leader in South India, with a share of over 50% in Andhra Pradesh and over 10% in Karnataka, Tamil Nadu and Maharashtra. It derives more than 80% of its revenues from these states, which the company classifies as its primary markets. On a pan-India basis, CRIN has a market share of 16% in complex fertilizers. Further, CRIN benefits from high usage of fertilizers in its primary markets, as these constitute ~50% of India’s total market for phosphatic fertilizers. Market share in various states (%)
Company Andhra Pradesh Tamil Nadu Karnataka Orissa Maharashtra
Coromandel 62 14 16 36 10
IFFCO 7 16 15 18 19
ZUARI 3 13 27 0 19
PPL 8 0 0 40 11
FACT 9 22 13 0 0
SPIC 1 27 2 0 0
Source: Company, MOSL
CRIN benefits from high usage of fertilizers in its core markets (kg/hectare)
110 100 100200 250100 150
250
250
375
Bihar MP AP TN KN
DAP Complex
Source: Company, MOSL
CRIN’s primary markets account for over 50% of India’s fertilizer market
Source: Company, MOSL
CRIN has a market share of over 50% in Andhra
Pradesh, followed by more than 10% market share in
Karnataka, Tamil Nadu and Maharashtra
Coromandel International
4 August 2014 18
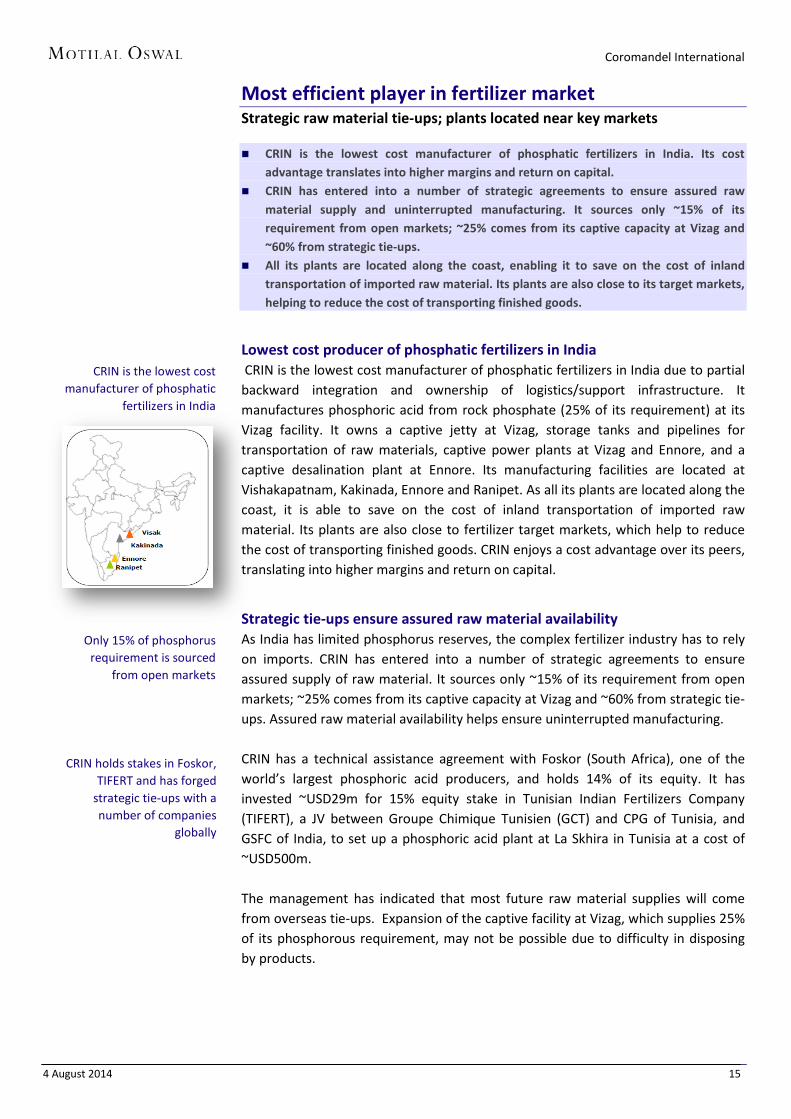
Unique farmer connect initiative, retail stores branded as MGC and NGC CRIN has a differentiated customer connect strategy. Under its retail initiative, CRIN has rolled out 650 retail stores under the brand name ‘Mana Gromor Center (MGC)’ in AP and 150 retail stores under the brand name ‘Nama Gromor Center (NGC)’ in Karnataka. The objective is to prevent black-marketing and sale of spurious fertilizers and promote its own fertilizers and agro-chemicals products. Through this initiative, CRIN also provides services like soil testing and weather updates. It runs a farmer helpline branded as ‘Hello Gromor’. Products and services offered by retail stores
Source: Company, MOSL
To expand retail stores to 1,000 stores by FY16 All retail stores work on a company-owned-company-operated (COCO) model. Each store requires a capex of ~INR1m and works on margins of ~2% on fertilizer sales and double-digit margins on other agri-inputs sales. Of the 800 stores that are currently operational, 400 have been operating for over three years now, and have achieved profitability. On an aggregate level, the retail stores achieved breakeven in FY14.
CRIN currently has one retail store for every 20 villages, which the management believes is a good ratio as far as reach goes. It intends to increase store count to over 1,000 in the next two years, led by store openings largely in new states like Maharashtra and Tamil Nadu.
Retail stores hold huge strategic value; 50% of revenues in AP from retail Retail stores hold huge strategic value. For instance in AP, ~50% of CRIN’s fertilizer and pesticide sales come from MGC stores. Sales from own stores rather than through the dealer network helps CRIN to achieve higher margins at the aggregate level, as it is able to save on dealer margins. The company can also market ancillary farm-related products through its retail stores, increasing the share of non-subsidy revenues. Currently, CRIN’s own products account for ~70% of MGC store sales. The balance 30% of sales is from third-party products, largely seeds and non-overlapping crop protection products.
CRIN has an aggregate distribution network of 14,000 dealers, which it services directly. The management believes its dealer network will co-exist with retail stores, as retail stores sell on 100% cash basis while dealers also provide credit to farmers.
CRIN has 800 stores under the retail initiative
CRIN intends to increase the store count from the
current level of 800 to over 1,000 over next two years,
led by store openings largely in new states
like Maharashtra and Tamil Nadu
CRIN derives 50% of sales in AP from its own stores

Coromandel International
4 August 2014 19
Earnings to post 30% CAGR over FY14-17 Drivers: Recovery in fertilizer demand, higher share of non-subsidy business
We expect revenue to grow at a CAGR of 14% over FY14-17, led by 20% CAGR in non-subsidy business. EBITDA would grow at 17% CAGR, with margins expanding 80bp to 8.8%. Adjusted PAT would grow at a CAGR of 30%.
Limited capex and focus on increasing capacity utilization would ensure robust free cash generation and reduction in net debt to equity from 0.5x to 0.1x. RoCE would improve from 16.6% to 28.6% and RoE from 16.3% to 24.2% over FY14-17.
Expect revenue CAGR of 14% over FY14-17 We expect consolidated revenue to grow at a CAGR of 14% over FY14-17, led by 20% CAGR in non-subsidy business. Revenue contribution from the non-subsidy business would go up from 20% in FY14 to 23% in FY17. We expect the fertilizer business to post 12% revenue CAGR over FY14-17.
Revenue to post 15% CAGR over FY14-17
90,337100,532 108,623
127,443147,484
FY13 FY14 FY15E FY16E FY17E
Revenues (INR m)
Source: Company, MOSL
EBITDA to outpace revenue growth; margins to expand by 80bp We expect EBITDA to post 17% CAGR over FY14-17. Margins should expand 80bp to 8.8%, driven by greater contribution from the high-margin agro-chemicals business. EBITDA contribution from the non-subsidy business is likely to go up from 36% in FY14 to 45% in FY17.
EBITDA to clock 16% CAGR over FY14-17
7,6798,052
8,591
10,845
13,0078.5%
8.0% 7.9%
8.5%
8.8%
FY13 FY14 FY15E FY16E FY17E
EBITDA (INR m) EBITDA Margins (%)
Source: Company, MOSL

Coromandel International
4 August 2014 20
PAT to post 30% CAGR over FY14-17 We expect PAT to grow at a CAGR of 30% over FY14-17, from INR3.5b to INR7.7b. PAT (INR m)
4,3203,565
4,286
6,252
7,738
FY13 FY14 FY15E FY16E FY17E
PAT (INR m)
Source: MOSL
Working capital cycle set to improve We expect consolidated working capital days to improve to 53 days.
Cash conversion cycle (days)
60 64 64 64 64
74 54 54 54 54
8763 60 57 54
-120 -119 -119 -119 -119
100
62 58 56 53
FY13 FY14 FY15E FY16E FY17E
Inventory Days Debtor Days Loans and Advances Days Current Liability Days Cash Conversion Cycle
Source: MOSL
Operating cash to remain robust; free cash flows to improve We expect operating cash flow to remain robust and free cash flow to improve to INR6b over FY14-17. Capex during the period would only be maintenance-related and is expected at INR1b per annum.
Operating cash flow to remain strong
9,139
13,560
6,139 5,8707,321
FY13 FY14 FY15E FY16E FY17E
Operating Cash Flow (INR m)
Source: Company, MOSL
Limited capex to aid robust free cash generation
7,255
13,497
5,139 4,8706,321
FY13 FY14 FY15E FY16E FY17E
Free Cash Flow (INR m)
Source: Company, MOSL

Coromandel International
4 August 2014 21
Net debt to improve further by FY17 Net debt to equity stood at 0.5x as at the end of FY14. We expect CRIN to utilize free cash to retire debt and consequently net debt is expected to decline to 0.1x by FY17. Net debt to equity to decline to 0x
22,514 10,291 8,456 6,421 2,913
1.0
0.50.3
0.20.1
FY13 FY14 FY15E FY16E FY17E
Net Debt (INR m) Net DER (x)
Source: Company, MOSL
Return ratios to improve significantly With higher capacity utilization, we expect CRIN’s return ratios to improve significantly over FY14-17. We expect RoCE to improve from 16.6% to 28.6%, and RoE to improve from 16.3% to 24.2%.
RoCE (%)
14.6 16.6
20.0
24.8 28.6
FY13 FY14 FY15E FY16E FY17E
RoCE (%)
Source: Company, MOSL
RoE (%)
18.8 16.3
17.9
22.9 24.2
FY13 FY14 FY15E FY16E FY17E
RoE (%)
Source: Company, MOSL

Coromandel International
4 August 2014 22
Initiating coverage with a Buy rating Target price of INR320 implies 35% upside
We like CRIN for its focus on the more lucrative complex fertilizers space and its initiatives to diversify from a pure fertilizer business to a broader, agri-inputs business.
CRIN will focus on higher capacity utilization across its fertilizer and agro chemical businesses, enhancing asset efficiency, free cash generation, and return ratios.
We value the stock at 15x FY16E EPS and arrive at a target price of INR320 – 35% upside. We initiate coverage with a Buy rating.
Better days ahead; initiate with a Buy rating We like CRIN for its focus on the more lucrative complex fertilizers space and its recent initiatives to diversify from a pure fertilizer business to a broader, agricultural inputs business. Over the next 2-3 years, CRIN would be focusing on improving capacity utilization across its fertilizer and crop protection businesses, enhancing asset efficiency, free cash generation, and return ratios. We expect earnings CAGR of 30% over FY14-17. With capex being limited to INR1b, we expect RoCE to improve from 16.6% to 28.6% and RoE from 16.3% to 24.2%. Further, CRIN would have a net debt to equity of 0.1x by FY17. The stock currently trades at 16.1x FY15E, 11.1x FY16E and 8.9x FY17E EPS. We value the stock at 15x FY16E EPS and arrive at a target price of INR320 – 35% upside. We initiate coverage with a Buy rating.
One-year forward PE (x)
Source: Company, MOSL
One-year forward PB (x)
Source: Company, MOSL
EV/EBITDA (x)
Source: Company, MOSL
13.4
15.0
20.6
7.4
4
8
12
16
20
24
Aug
-10
Dec
-10
Apr
-11
Aug
-11
Dec
-11
Apr
-12
Aug
-12
Dec
-12
Apr
-13
Aug
-13
Dec
-13
Apr
-14
Aug
-14
P/E (x) Avg(x) Peak(x) Min(x)
2.7
3.24.2
2.0
1.0
2.0
3.0
4.0
5.0
Aug
-10
Nov
-10
Feb-
11
May
-11
Aug
-11
Nov
-11
Feb-
12
May
-12
Aug
-12
Nov
-12
Feb-
13
May
-13
Aug
-13
Nov
-13
Feb-
14
May
-14
Aug
-14
P/B (x) Avg(x) Peak(x) Min(x)
Attractively valued at 8.9x FY17E earnings

Coromandel International
4 August 2014 23
Assumption sheet (INR m)
FY12 FY13 FY14 FY15E FY16E FY17E
Revenues
Phosphatic Fertilisers 90% 90% 80% 79% 78% 77%
Non-subsidy business 10% 10% 20% 21% 22% 23%
EBITDA
Phosphatic Fertilisers 70% 70% 64% 60% 57% 55%
Non-subsidy business 30% 30% 36% 40% 43% 45%
Revenues
Phosphatic Fertilisers 89,114 81,303 80,426 85,557 99,227 113,129
Non-subsidy business 9,902 9,034 20,106 23,066 28,217 34,355
Total 99,016 90,337 100,532 108,623 127,443 147,484
EBITDA
Phosphatic Fertilisers 7,381 5,376 5,154 5,219 6,251 7,127
Non-subsidy business 3,163 2,304 2,899 3,460 4,656 5,840
Total 10,544 7,679 8,052 8,679 10,907 12,967
EBITDA Margins
Phosphatic Fertilisers 8% 7% 6% 6% 6% 6%
Non-subsidy business 32% 26% 14% 15% 17% 17%
Total 11% 9% 8% 8% 9% 9%
Fertilizer
EBITDA/MT (INR) 2,979 2,920 2,230 2,154 2,190 2,187
Source: Company, MOSL

Coromandel International
4 August 2014 24
Risks and concerns Change in the government’s subsidy policies: CRIN derives ~80% of its revenues from the subsidy-led fertilizer business. Any change in the government’s subsidy policies could impact its existing business, thus posing a risk factor. The management has been working on introducing new grades/customized fertilizers as well as increasing focus on non-subsidy business to mitigate this risk factor. Subsidy receivables: CRIN derives ~26% of its revenues from government subsidies has receivable of INR11.1b. Delays in payments could result in deterioration of the balance sheet and return on capital profile. Regulatory intervention in market pricing: Regulatory intervention in market pricing can impact margins of the fertilizer business. This has happened in the past, when raw material prices were falling and the MoF asked players to cut prices. Subsequently, the industry’s margin profile moderated to levels that appeared sustainable (EBITDA of ~INR2,000/tonne). In the case of GSFC, the MoF ordered recovery of subsidy of ~INR4b on ammonium sulphate (from April 2010) and decided not to pay any further subsidy. The final order on the said case is still pending. Risk of poor monsoon: Demand for fertilizers in India depends on agriculture output, which in turn, is dependent on the monsoon. Hence, CRIN’s growth remains sensitive to climatic conditions. In case monsoon for the year is poor, growth is likely to suffer. Foreign currency risk: Adverse foreign currency movement may affect cost of raw materials. The government fixes subsidy in advance under NBS; price rise in imported raw materials can lead to escalated costs, thus impacting margins. Regulatory risk in pesticides business: CRIN’s pesticides portfolio faces regulatory risks like ban on sale of hazardous chemicals (has happened with endosulfan) due to environmental concerns.

Coromandel International
4 August 2014 25
Management
Mr A Vellayan, Chairman Mr Vellayan is the Chairman of Coromandel International Limited and EID Parry (India) Limited. He is also the Executive Chairman of the Murugappa Group. He has around 25 years of work experience. Mr Vellayan holds a Diploma in Industrial Administration from Aston University, Birmingham, UK and a Masters in Business Studies from the University of Warwick, Business School, UK. He has held the position of Vice President, Federation of Indian Export Organization (FIECO) and has been a member of the National Export Committee, Confederation of Indian Industry (CII). He has also been the Managing Director of Tube Investments of India Limited and TI Diamond Chain Limited. Mr V Ravichandran, Vice Chairman Mr V Ravichandran is an Engineering Graduate and holds a Post Graduate Diploma in Management from IIM, Ahmedabad. He is also a Cost Accountant and a Company Secretary. After having served Ashok Leyland Limited initially for a short period, he joined the Murugappa Group and worked in the Parry Group of Companies, mainly in the fields of Finance and Marketing. He also headed the Crop Protection business. He was the Managing Director of Coromandel International Limited. Currently, Mr Ravichandran is Lead Director (Fertilizers & Sugars) on the Murugappa Corporate Board. Mr Kapil Mehan, Managing Director Mr Kapil Mehan is a Graduate in Veterinary Science and Animal Health. He also holds a Post Graduate Diploma in Management from IIM, Ahmedabad, with specialization in Agriculture. Mr Mehan started his career with Rallis India and later moved on to Tata Chemicals Limited. He held various positions in the Sales and Marketing function in Rallis and Tata Chemicals before taking over as Chief Operating Officer for its fertilizer business in 2003. He became Executive Director of Tata Chemicals in 2008. He joined Coromandel in 2010. Mr M M Venkatachalam, Director Mr Venkatachalam graduated from the University of Agricultural Sciences in Bangalore and holds a Masters Degree in Business Administration from George Washington University, USA. He has held senior positions in the Murugappa Group of Companies spanning a period of two and a half decades. Mr Venkatachalam is presently the Chairman of Parry Enterprises Limited and Parry Agro Industries Limited. He also serves on the boards of Laser Words Limited, Parry Murray Limited and Ramco Systems Limited. Mr B V R Mohan Reddy, Director Mr Reddy holds a Graduate degree in Mechanical Engineering from the College of Engineering, Kakinada and Postgraduate degrees from IIT, Kanpur, and University of Michigan, Ann Arbor. He has received an honorary Doctorate from JNTU, Hyderabad. Mr Reddy is a member of the NASSCOM Executive Council. He is also a member on the National Council of CII and is the Co-Chairperson of CII’s National Committee on Design. He is the Chairman of the Board of Governors of IIT,

Coromandel International
4 August 2014 26
Hyderabad. He is the Founder Chairman and Managing Director of Infotech Enterprises Limited. He is also on the Boards of Vizag IT Park Limited, Ocimum Bio Solutions Limited, and Tele Atlas (India) P Limited. Mr Uday Chander Khanna, Director Mr Uday Khanna, a Chartered Accountant by profession, has had a distinguished career spanning close to four decades in Hindustan Lever, Unilever, and Lafarge India. He has handled a variety of roles in the finance, commercial and general management functions. He was Managing Director & CEO of Lafarge India from 2005 to 2011. Mr Khanna is currently Non-Executive Chairman of Lafarge India and Bata India Limited, and is on the Board of Castrol India. He is also the President Designate of the Bombay Chamber of Commerce & Industry and is on the Managing Committee of the Associated Chamber of Commerce & Industry. Mr Prasad Chandran, Director Mr Prasad Chandran has graduated in Chemistry (Honors) from Bombay University and MBA from University Business School Chandigarh. He had advanced management education in Wharton Business School, University of Pennsylvania, and AOTS from Tokyo University, Japan. He has opted to superannuate after 37 years of corporate life, of which the last 13 years were as Chairman & Managing Director of BASF India Limited. He is an Independent Director on the Board of Bosch India Limited. Business Today magazine has named him among the 100 most successful CEOs in the country. Mr Chandran is associated with Nobel Laureate, Dr Muhammad Yunus in launching a Social Enterprise in Bangladesh – BASF Grameen Limited. He was also the Chairman of Ciba India Limited, Cynamide India Limited, and Pushpa Polymers before they integrated into BASF. He is on the Advisory Board of TERI with Dr RK Pachauri and on the Advisory Board of IMA. He is the Chairman of the Ethics and Governance Committee of the Bombay Chamber of Commerce and Industry (BCCI). Mrs Ranjana Kumar, Director Mrs Ranjana Kumar holds a Bachelor of Arts degree, and is a Gold Medalist. She had an illustrious career in the Indian banking industry spanning over four decades. She started her career with Bank of India in the year 1966 as a probationary officer and held several senior positions in the Bank. She was CEO of US operations of Bank of India based in New York. She moved to Canara Bank as its Executive Director holding concurrent charge as Chairperson of Canara bank. Thereafter she became the Chairperson of Indian Bank and continued for a period of three and half years. She is also credited with turning around the ailing Indian Bank as its Chairperson within a period of 3 years and has authored a book on the turnaround. She also headed the National Bank of Agriculture and Rural Development (NABARD). Mrs. Ranjana Kumar retired as Vigilance Commissioner, Central Vigilance Commission, Government of India.
Coromandel International
4 August 2014 27
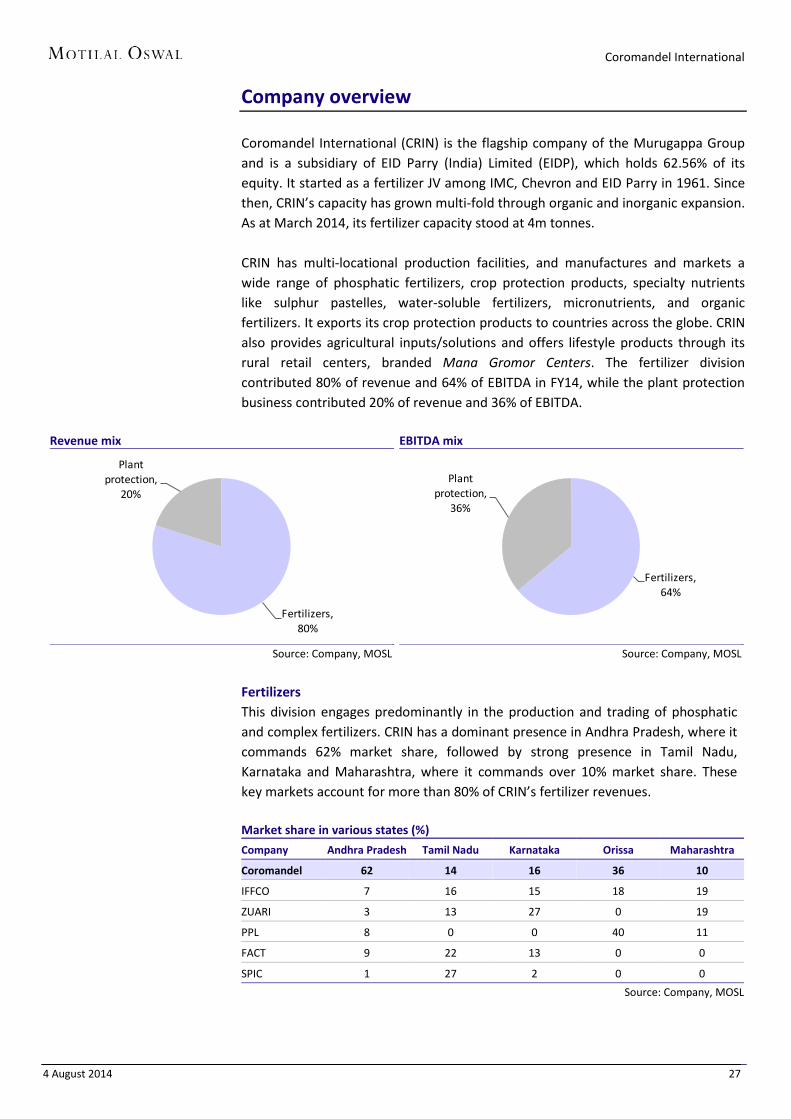
Company overview Coromandel International (CRIN) is the flagship company of the Murugappa Group and is a subsidiary of EID Parry (India) Limited (EIDP), which holds 62.56% of its equity. It started as a fertilizer JV among IMC, Chevron and EID Parry in 1961. Since then, CRIN’s capacity has grown multi-fold through organic and inorganic expansion. As at March 2014, its fertilizer capacity stood at 4m tonnes. CRIN has multi-locational production facilities, and manufactures and markets a wide range of phosphatic fertilizers, crop protection products, specialty nutrients like sulphur pastelles, water-soluble fertilizers, micronutrients, and organic fertilizers. It exports its crop protection products to countries across the globe. CRIN also provides agricultural inputs/solutions and offers lifestyle products through its rural retail centers, branded Mana Gromor Centers. The fertilizer division contributed 80% of revenue and 64% of EBITDA in FY14, while the plant protection business contributed 20% of revenue and 36% of EBITDA.
Revenue mix
Fertilizers, 80%
Plant protection,
20%
Source: Company, MOSL
EBITDA mix
Fertilizers, 64%
Plant protection,
36%
Source: Company, MOSL
Fertilizers This division engages predominantly in the production and trading of phosphatic and complex fertilizers. CRIN has a dominant presence in Andhra Pradesh, where it commands 62% market share, followed by strong presence in Tamil Nadu, Karnataka and Maharashtra, where it commands over 10% market share. These key markets account for more than 80% of CRIN’s fertilizer revenues. Market share in various states (%)
Company Andhra Pradesh Tamil Nadu Karnataka Orissa Maharashtra
Coromandel 62 14 16 36 10
IFFCO 7 16 15 18 19
ZUARI 3 13 27 0 19
PPL 8 0 0 40 11
FACT 9 22 13 0 0
SPIC 1 27 2 0 0
Source: Company, MOSL

Coromandel International
4 August 2014 28
Fertilizers – key products and brands CRIN sells its products under multiple brands, including Gromor and Godavari, which are among the most respected in the industry. Its key products and brands are: Gromor 14-35-14 Contains nitrogen, phosphorus and potassium Highest total nutrient content (63%) N&P ratio same as DAP, but has extra 14% potassium Highest in phosphate (35%) Best for cotton, groundnut, chilly, soya bean, potato, etc Not suitable for tobacco and grapes Gromor 14-35-14
Source: Company, MOSL
Gromor 28-28-0 Highest N&P in 1:1 ratio Unique granulation by coating prilled urea with ammonium phosphate layer Such granule configuration ensures efficient utilization of nutrients Highly suitable for paddy and wheat Gromor 28-28-0
Source: Company, MOSL
Gromor 20-20-0-13 High analysis complex fertilizer, containing all three major nutrients – nitrogen,
phosphorus and potassium Launched by CRIN in March 2003 Contains phosphate and potash in the ratio of 1:1, the highest among NPK
fertilizers

Coromandel International
4 August 2014 29
Gromor 20-20-0-13
Source: Company, MOSL
Godavari DAP (NP 18:46) Complex fertilizer containing two major plant nutrients – nitrogen and
phosphorus Godavari DAP (NP 18:46)
Source: Company, MOSL
Godavari 10:26:26 High analysis complex fertilizer, containing all three major plant nutrients –
nitrogen, phosphorus and potassium Contains phosphorus and potassium in the ratio of 1:1
Godavari 10:26:26
Source: Company, MOSL

Coromandel International
4 August 2014 30
Agro chemicals CRIN manufactures and markets crop protection products, including insecticides, fungicides, herbicides, and plant growth regulators. Its crop protection portfolio includes several popular brands that enjoy leadership status in India and abroad. CRIN also exports its products and has tie-ups with companies such as Nihon Nohyaku, Syngenta, DuPont, BASF, FMC, and Otsuka to market their products in India. CRIN produces its crop protection products at its plants in Ankleshwar and Ranipet and Jammu (formulations). CRIN has acquired Sabero Organics Gujarat which will be merged in FY15, strengthening its presence in agro chemicals business. Speciality nutrients CRIN’s specialty nutrients division comprises water-soluble fertilizers and micronutrients. It has strong growth potential, owing to growing drip irrigation acreage and deteriorating soil quality. The company has a dedicated field force to promote growth of this segment to optimize its potential. It has a water-soluble fertilizer business through a 50-50 JV with SQM (Coromandel SQM). CRIN has a market share of 33% in sulphur products and 16% in water-soluble fertilizers. Specialty nutrients
Source: Company, MOSL
Sulphur market share
Coromandel,33%
Others, 67%
Source: Company, MOSL
WSF market share
Coromandel, 16%
Others, 84%
Source: Company, MOSL
SPECIALITY NUTRIENTS
DIVISION (SND)
G-SULPHUR
GROMOR SULPHUR Sulphozinc
WSF
GROMOR SPRAY GROMOR POWER
Micronutrients
Boron Zinc
Mixtures

Coromandel International
4 August 2014 31
Industry overview Food grain demand in India has grown at a CAGR of 1.8% over the last decade (2002-2012). According to OECD-FAO projections, India’s cereal (wheat, rice, and coarse cereals) consumption would increase from 217m tonnes in 2012 to 266m tonnes by 2022. According to the Planning Commission, consumption of pulses is likely to grow from 19m tonnes in FY13 to 22m tonnes by FY17. Overall, food grain demand is likely to grow at a CAGR of 2.2% to 293m tonnes by 2022. India’s per capita food grain production at 207kg is among the lowest in the world, largely led by poor productivity, with yields across crops being among the lowest in the world. There exists significant room to increase production. Food grain production has grown at a modest pace of 1.8% over the last 10 years
190 193 197 200 204 208 211 215 219 224 229 234 239 244 250 255 261 267 272 278 285
FY02
FY03
FY04
FY05
FY06
FY07
FY08
FY09
FY10
FY11
FY12
FY13
FY14
FY15
FY16
FY17
FY18
FY19
FY20
FY21
FY22
India foodgrain consumption ('000 kt)
Source: Company, MOSL
India’s food grain production per capita is amongst the lowest in the world
1135
492 458 448354
291 266337
207
US Russia Thailand Brazil China South Africa Indonesia World India
Food grain production (Kgs per capita)
Source: Company, MOSL
Comparison of Indian crop productivity
Mt/ ha India China World
Rice 2.3 6.6 4.2
Corn 2.2 5.0 5.0
Soybean 0.9 1.6 2.2
Rapeseed 1.1 1.9 1.9
Peanut 0.9 3.3 1.6
Sugarcane 67.0 69.8 74.0
Wheat 2.8 4.7 3.0
Source: Industry, MOSL

Coromandel International
4 August 2014 32
Government policies supportive of agricultural growth Government policies have been supportive of growth in the agriculture sector. A case in point is the substantial increase in minimum support prices (MSPs) across crops over the last few years. Agriculture in India is supported both at input (through subsidized farm inputs like fertilizers) and output levels (through MSPs). Additionally, all income from agriculture is exempt from tax.
Minimum support prices - crop marketing season (INR/quintal)
Commodity 2008 2009 2010 2011 2012 2013 2014 Price Increase
% (08-14) Paddy 645 850 950 1,000 1,080 1,250 1,310 103 Red Gram 1,550 2,000 2,300 3,000 3,200 3,850 4,300 177 Green Gram 1,700 2,520 2,760 3,170 3,500 4,400 4,500 165 Black Gram 1,700 2,520 2,520 2,900 3,300 4,300 4,300 153 Groundnut 1,550 2,100 2,100 2,300 2,700 3,700 4,000 158 Soyabean 1,050 1,390 1,390 1,440 1,690 1,690 2,560 144 Cotton 1,800 2,500 2,500 2,500 2,800 3,600 3,700 106 Wheat 750 1,000 1,080 1,100 1,120 1,285 1,350 80
Source: Company, MOSL
Penetration of fertilizers among the lowest in the world The Indian average of 128kg/hectare compares unfavorably against other Asian countries, and is substantially lower than China, which averages 333kg/hectare. However, as evident from the table below, fertilizer consumption per hectare has been continuously growing in India. Country-wise fertilizer consumption (kg/hectare)
128 133166
275
333
India Brazil Pakistan Japan China
Country-wise Fertiliser Consumption (Kgs/ha)
Source: Company, MOSL
Growth in India’s fertilizer consumption per hectare
23.5%
5.1%
13.8%
9.0% 8.2%
2.0%
6.7%
0.2%
8.0%
1967-71 1972-76 1977-81 1982-86 1987-91 1987-91 1997-2000 2001-05 2005-09
Growth in Fertiliser Consumption per Hectare
Source: Company, MOSL

Coromandel International
4 August 2014 33
High degree of variation in use of fertilizers across India The intensity of fertilizer consumption varies greatly between regions. Among the major crop producing states, fertilizer consumption varies from 48.3kg/hectare in Rajasthan to 237kg/hectare in Punjab. Use of fertilizers per hectare is the highest in Pondicherry at 879kg/hectare.
State-wise fertiliser consumption (Kg per Hectare)
FY 1997 2004 2005 2006 2007 2008 2009 2010
EAST 60.6 72.8 80.1 88.2 97.4 101.6 110.3 113.3
Arunachal Pradesh 2.2 2.9 2.9 2.8 3 2.7 3 3
Assam 14.6 47.5 44 53.1 54.6 60.2 57.5 63.1
Bihar 79.6 88.1 93.8 124.1 144.7 159 171.6 165.6
Jharkhand NA 54.5 59.7 63.5 65.5 54.9 61.6 70
Manipur 48.6 126.3 85.7 63.7 85.5 84.9 54.8 51.2
Meghalaya 14.4 19.6 18.6 19 19.9 15.4 13 13
Mizoram 3.5 16.8 14.8 23.5 38.1 42.1 45.3 57
Nagaland 3.8 1.9 1.6 1.6 1.7 2.2 2.3 2.4
Orissa 25.8 37.1 40.8 45.3 46.2 52.1 59.3 57.6
Sikkim 5.9 3.6 5 2.8 2.8 0 0 0
Tripura 18.8 37.1 39.8 50.7 55.3 41.9 47.5 48.6
WB 102.8 114.1 134.2 130 143.2 142.7 155.8 168.6
NORTH 116.6 139.7 144.9 152 158.5 159.7 17.6 182.9
Haryana 127.7 161.7 163.4 173.5 173 190.9 199.6 209.9
HP 35.5 49 47 51 52.1 52.8 59.1 54.8
J&K 41 72 68.3 84.6 78.9 69.5 92.7 98.5
Punjab 157 190.1 193.7 208.7 209.2 212.7 224.6 237.1
UP 107.6 126.7 134.6 138 148.4 145.6 161.8 171
Uttaranchal NA 104.8 88.3 95.3 113.1 121.3 121.2 123.2
Delhi 348.7 30.4 12.4 10.2 23.6 9.1 14.5 53.4
SOUTH 102.8 110.2 130.5 152.8 150.7 161.4 183.9 188.3
AP 138.4 145.3 158.8 191 185.9 208.2 226.3 225.6
Karnataka 68.7 78.9 101 117.1 114.1 121.2 142.1 159.7
Kerala 61.5 64.1 67.3 67.8 70 71.4 94.5 95.9
TN 112.6 114.6 161.7 182.2 186.7 184.1 217.6 205.8
A & N Islands 9.1 16 10.9 12.8 13.3 62.1 14.3 17.3
Pondicherry 483.3 1,012.30 1,077.90 1,182.80 1,226.10 1,032.50 798.3 878.9
WEST 49.1 56.8 64.5 67.2 77.1 81.2 86.7 97.6
Gujarat 72.7 94.7 103.5 113.2 124.6 133 140.5 147.2
MP 39.4 51.7 52.8 48 61.5 64.7 69.7 81.4
Chhattisgarh NA 44.2 63.4 65.1 75.9 77.1 80.5 93.4
Maharashtra 62.1 64.2 77.8 87.3 100.1 103 113.3 135.3
Rajasthan 34.4 37.4 36.1 40.6 43.1 45.8 47.4 48.3
Goa 36.8 36.3 34.1 32.5 35 41.5 47.8 53.5
Daman & Diu 72 0 3.3 0 163.3 156.7 195 230
D & N Haveli 41.5 35.7 36.6 40.4 44.6 36.4 40.7 44.8
INDIA 75.5 88.3 96.6 105.5 112.3 116.5 127.2 135.2
Source: MOSL

Coromandel International
4 August 2014 34
High degree of variation in use of fertilizers across crops A study by the Food and Agriculture Organization (FAO) estimates that six crops – rice, wheat, cotton, sugarcane, rapeseed and mustard – account for over two-third of India’s total fertilizer consumption.
Fertilizer use by crops in India (2003-04)
Crop Gross Cropped
Area Share in Fertiliser
Consumption
Nutrient Consumption
(kg/ha)
(m ha) (%) N P K Total Cotton 8.5 6 89.5 22.6 4.8 116.8 Irrigated 2.9 2.7 115.7 30.9 7 153.5 Rainfed 5.6 3.3 75.8 18.2 3.6 97.7 Groundnut 6.6 2.9 24.4 39.3 12.9 76.6 Irrigated 1.2 0.8 35.3 53.8 28.9 118 Rainfed 5.4 2.1 21.9 36 9.2 67.2 Jute 0.8 0.2 38 11.5 5 54.4 Irrigated 0.3 0.1 55.9 22.4 10.2 88.6 Rainfed 0.5 0.1 28.9 6 2.3 37.1 Maize 6.6 2.3 41.7 14.7 3.8 60.2 Irrigated 1.5 0.8 59.6 27.7 4.8 92.1 Rainfed 5.1 1.5 36.6 11 3.6 51.1 Paddy 44.7 31.8 81.7 24.3 13.1 119.1 Irrigated 24 22.2 103.4 32.8 18.8 155 Rainfed 20.7 9.6 56.6 14.5 6.5 77.6 Pearl millet 9.8 1.7 21.9 5.5 0.8 28.2 Irrigated 0.8 0.4 62.2 13.9 3.4 79.5 Rainfed 9 1.3 18.4 4.8 0.6 23.8 Pigeon pea 3.6 0.8 20.9 13.3 2 36.2 Irrigated 0.2 0.1 36.9 20.9 2.2 60 Rainfed 3.5 0.7 19.6 12.6 2 34.2 Rapeseed/mustard 6 3.4 69.1 25 2.9 97 Irrigated 3.8 2.6 81.7 30.4 4.3 116.5 Rainfed 2.2 0.8 45.9 15 0.4 61.3 Sorghum 9.9 2.9 29.2 14.2 4.1 47.5 Irrigated 0.8 0.5 58.5 29.1 10.7 98.3 Rainfed 9.1 2.4 26.9 13 3.6 43.6 Sugarcane 4.3 5.4 124.8 44 38.3 207.1 Irrigated 4.2 5.3 126.4 45 40.6 212 Rainfed 0.1 0.1 106 32 12.4 150.4 Wheat 25.7 21 99.6 30.2 6.9 136.7 Irrigated 22.8 19.7 105.6 32.1 7.3 144.9 Rainfed 2.9 1.3 55.7 15.9 4.3 75.9 Other crops 60.4 21.6 34.5 18.5 7.1 60.1 Irrigated 12.6 13.3 113.5 46.8 16.5 176.7 Rainfed 47.8 8.3 13.6 11 4.7 29.3 All crops 187 100 59.2 22.1 8.5 89.8
Source: Company, MOSL While all crops require nutrients for growth, the staple crops for human and animal consumption have greater fertilizer demands. Maize accounts for 15.3% of the world’s fertilizer consumption, followed by wheat (15.1%) and rice (14.4%). Put together, cereals account for 49.7% of the world’s fertilizer consumption. Oil crops account for 9.7% of the world’s fertilizer consumption – soya bean (3.7%), oil palm (1.6%), and other oilseeds (4.4%). Other major crops include cotton (3.6%) and sugar cane/sugar beet (4.5%). Fruits and vegetables account for 17.1% of the world’s fertilizer consumption.

Coromandel International
4 August 2014 35
Paddy is the most important crop in India in terms of fertilizer use, accounting for 31.8% of total fertilizer consumption. Because the supply of N from soil and organic sources is seldom sufficient for high yield, supplemental N is essential. For rice crops, the average consumption was around 119kg/hectare in FY04, comprising primarily of N nutrients. Wheat accounts for ~21% of total fertilizer consumption. The average consumption was around 137kg/hectare in FY04. Though sugarcane accounts for only 5.4% of total fertilizer consumption, it has a high nutrient requirement because of the long lifecycle of the crop. Sugarcane requires substantial inputs of both water and N for maximum yields. Cane yield responses to N application are greatest at high irrigation levels and not as pronounced at lower irrigation levels, indicating that if water is limited, sugarcane cannot take advantage of increased N usage. Fertilizer use on irrigated sugarcane was 212kg/hectare in FY04 as compared with 150.4 kg/hectare on rain-fed sugarcane. The average use of fertilizers on sugarcane was 207.1kg/hectare in FY04. Global fertilizer industry The total size of the global fertilizer market is 179m tonnes and it is likely to grow at a CAGR of 1.8% over 2013-17 to reach 194m tonnes. India and China account for 40% of global consumption and given the low penetration of fertilizers in India, India’s share in the global fertilizer market should increase. The global NPK ratio in 2013 stood at 3.8:1.4:1. Bulk nutrient availability is concentrated in certain regions: ‘N’ in the Middle East, USA, and FSU ‘P’ in North/West Africa, USA, and Jordan ‘K’ in Canada, FSU, and Middle East
Global fertilizer market in 2013 stood at 179m tonnes
N, 109P, 41
K, 29
Source: IFA
Global fertilizer market likely to reach 194m tonnes by 2017
N, 116P, 45
K, 33
Source: IFA
N-fertilizer market is 108m tonnes
Ammonia, 4%
Urea, 52%
UAN, 5%
AN/CAN, 9%
NPK, 11%
DAP/MAP, 6%
Others, 13%
Source: IFA
P-fertilizer market is 41m tonnes
DAP/MAP, 48%
NPK, 27%
SSP, 17%
TSP, 6%Others, 2%
Source: IFA

Coromandel International
4 August 2014 36
K-fertilizer market is 29m tonnes
MOP/SOP, 70%
NPK, 29%
Others, 1%
Source: IFA
Indian fertilizer industry The size of India’s fertilizer market is 41m tonnes. Urea constitutes over 50% of the market. The Indian fertilizer industry provides for the three primary nutrients: nitrogen-N, phosphorus-P, and potassium-K. Besides these, the industry also manufactures complex fertilizers (N:P:K), which are a combination of these three nutrients. Urea (46% N), ammonium sulphate or AS (20.6% N), calcium ammonium nitrate or CAN (25% N), ammonium chloride or ACl (25% N) are the N-fertilizers manufactured. Complex fertilizers include 16:20:20, 20:20:0, 14:28:14, 14:35:14, 17:17:17, 19:19:19, 16:20:0, 15:15:15, 20.8:20.8:0, 23:23:0, 10:26:26, 12:32:16 and 20:0:10. Total installed capacity of fertilizers in India
Product No. of Units Total installed Capacity
(Mn MT per annum)
Urea 31 21
DAP 12 7
Complexes 19 5
SSP 80 8
Total 142 41
Source: Company, MOSL
Urea is the main fertilizer produced in India, accounting for 80% of N-fertilizer capacity and 62% of total fertilizer capacity. Single super phosphate or SSP (16% P) and di-ammonium phosphate or DAP are the major phosphatic fertilizers. While SSP accounts for 20.6% (8m tonnes) of India’s phosphatic fertilizer capacity, DAP accounts for 52% (7m tonnes). Potassic fertilizers are primarily imported.
N-fertilizers
Urea, 79%
NP/NPK, 4%
Nitro-phosphate,
2%
DAP, 10%
APS, 3% SSP, 2% AS, CAN, ACl, 2%
Source: Company, MOSL
P-fertilizers
DAP, 52%
APS, 6%
SSP, 21%
NP/NPK, 18%
Nitro-phosphate,
3%
Source: Company, MOSL

Coromandel International
4 August 2014 37
Nitrogenous (N) fertilizers The main straight N-fertilizers produced in India are urea, CAN, AS, and ACl. The intermediate input required is ammonia. Nitrogen is obtained from the atmosphere; the sources of hydrogen for ammonia production are naphtha, natural gas (NG), fuel/furnace oil (FO), low sulphur heavy stock (LSHS), coal and coke oven gas (COG). The total installed capacity for production of N-fertilizers in India was 12.9m tonnes as of November 2010. Capacity increased sharply from 5.2m tonnes in 1983-84 to 11.99m tonnes in 2000-01, but remained almost stagnant during 2001-09. Urea dominates N-fertilizer production and consumption in India. It accounts for 97% of straight N-fertilizer capacity, 79% of total N-fertilizer capacity, and 62% of total fertilizer production capacity. It is produced commercially from synthetic ammonia and carbon dioxide. Urea has the highest nitrogen content among all commonly used solid nitrogenous fertilizers. It has the lowest transportation cost per unit of nitrogen nutrient. Urea consumption is high because of its high nitrogen content (46.4%) and relatively low selling price. On the supply side, urea and other N-fertilizer markets are characterized by the presence of big players. The top six producers – IFFCO, NFL, RCF, CFCL, KRIBHCO and NFCL – account for ~66% of the total N-fertilizer capacity and ~64% of fertilizer production in India. IFFCO is the largest producer of urea, accounting for ~20% of India’s urea production. Anhydrous ammonia is the source of nearly all the synthetic nitrogen fertilizers produced in the world. Ammonia is produced by combining nitrogen with hydrogen. The nitrogen is obtained from the atmosphere, while the hydrogen is obtained primarily from natural gas (NG). Of India’s total urea capacity of 21.1m tonnes, ~81% is NG-based. Phosphate (P) fertilizers All P fertilizers are made from naturally occurring phosphorus-containing minerals. Such minerals are broadly called rock phosphates. The major intermediate for P-fertilizers is phosphoric acid, which is derived from rock phosphate. Phosphoric acid is manufactured through the decomposition of rock phosphate by an acid (sulphuric acid, nitric acid, or hydrochloric acid). The largest producer, IFFCO, which has 27% share in production capacity, is in the cooperative sector. Others are in the private sector and are of smaller size. They include Gujarat State Fertilizers and Chemicals Limited (GSFC), Paradeep Phosphates Limited (PPL), Godavari Fertilizers and Chemicals Limited (GFCL), SPIC, TCL, MCFL, ZIL, and Hindalco Industries Limited (HIL). N, P, and K are also applied to the soil through a number of complex fertilizers, the most important being DAP or 18:46:0. It contains 18% by weight of nitrogen and 46% by weight of phosphorus. After urea, DAP is the second most widely used fertilizer in India and accounts for ~63% of India’s P-fertilizer consumption, followed by complex NP/NPK fertilizers (30%) and SSP (7%).

Coromandel International
4 August 2014 38
Potash (K) fertilizers Potash or K fertilisers account for about 13% of India’s fertiliser consumption. Potash fertilisers are obtained by mining and purification of natural deposits containing potassium salts, which occur in various countries, notably France, Germany, Canada, US, Russia, and Israel. The major potash fertilizer consumed in the country is potassium chloride, also called muriate of potash (MOP) or 0:0:60. The principal source for manufacturing MOP is sylvinite – a mixture of sylvite (KCl) and halite (NaCl) in different proportions. In the absence of potash deposits of commercial significance in India, K fertilisers are not produced in the country and the entire requirement is met through imports. NPK ratio and trends The N:P:K (or NPK) ratio is a valuable indicator of balanced fertilization. Grain-based systems in developing agriculture systems such as in India have a target NPK use ratio of 4:2:1. In percentage terms, balanced fertilizer usage should contain 57% of N, 27% of P, and 14% of K. However, the nutrient use ratio and percentages provide no indication of the actual amounts of nutrients being applied and do not give an accurate assessment of fertilizer use among crops. Different crops require soil nutrients in different proportions. For example, legumes may need nutrients in a ratio of 0:1:1, 1:2:2, or 1:2:3; root crops require them in a ratio of 2:1:2. The long-term trend in NPK ratio indicates higher levels of N and P usage relative to K, lower level of N and P relative to K, and higher or lower level of N relative to P. However, there have been significant periodical variations. NPK use ratios in India were brought down from 7:2:1 in the 1960s to 5.96: 1.81: 1 in the 1970s, and to 5.9:2.4:1 in 1991-92. However, the removal of subsidies on P & K fertilisers in August 1992 and a decline in controlled price of urea brought about a drastic reduction in P and K consumption and widened India’s NPK ratio to 10:2.9:1 in 1996-97. The ratio narrowed down again in recent years to 5.77:2.26:1 in 2004-08, indicating continuing excess application of N. Excess usage of N may result in accelerating deficiencies of other soil nutrients. As an example, application of N alone in various crop sequences commonly depletes available soil P. Overall, against an estimated annual depletion of 29 mt of nutrients (NPK) from soil, the replenishment through fertilisers was only 21.5 mt in FY2006-08, leaving a net annual deficit of 8.5 mt. The highest negative balance (estimated at 12.7 mt) is on account of K as the use of K is much less compared to removal by crops. By comparison, nitrogen has a positive balance of around 5.6 mt, reflecting excess usage of nitrogenous fertilisers. The depletion in soil fertility due to imbalanced and unscientific use of fertiliser is also one of the major constraints in improving crop productivity.

Coromandel International
4 August 2014 39
NPK ratio trend
FY N P K
1991 6.0 2.4 1.0
1992 5.9 2.4 1.0
1993 9.5 3.2 1.0
1994 9.7 2.9 1.0
1995 8.5 2.6 1.0
1996 8.5 2.5 1.0
1997 10.0 2.9 1.0
1998 7.9 2.9 1.0
1999 .5 3.1 1.0
2000 6.9 2.9 1.0
2001 7.0 2.7 1.0
2002 6.8 2.6 1.0
2003 6.5 2.5 1.0
2004 6.9 2.6 1.0
2005 5.7 2.2 1.0
2006 5.3 2.2 1.0
2007 5.9 2.4 1.0
2008 5.5 2.1 1.0
2009 4.6 1.6 1.0
2010 4.3 2.0 1.0
2011 4.3 2.0 1.0
2012 6.9 3.1 1.0
2013 7.7 3.0 1.0
Source: Company, MOSL
Crop protection in India highly under-penetrated Crop losses in India due to insects, rodents, diseases, and weeds range between 10% and 30% per year, depending on the severity of attack, and climatic and environmental conditions. Consumption of pesticides in India is close to 0.57kg/hectare, much lower than in countries like Taiwan (17kg/hectare), US (7kg/hectare), China (13kg/hectare), and Japan (12kg/hectare). Penetration of pesticides in India
0.6
5 57 7
12 13
17
India France UK USA Korea Japan China Taiwan
Pesticides consumption (kgs/ha) of arable land
Source: Company, MOSL

Coromandel International
4 August 2014 40
With India’s crop losses on account of inadequate and improper use of pesticides exceeding USD20b per annum (source: ASSOCHAM), higher penetration of pesticide usage would be an important factor for increasing farm productivity. According to the Central Pollution Control Board, the highest food grain loss is due to weeds (28%), diseases (25%), insects (23%), during storage (10%) and others (14%). Reasons for crop losses
Weeds, 28%
Diseases, 25%Insects, 23%
Storage, 10%
Others, 14%
Source: Company, MOSL
Growing demand for food crops and high commodity prices for most crops are likely to boost consumption of agrochemicals and growth of the domestic industry should be strong, going forward. Nutrient-based subsidy policy The nutrient-based subsidy (NBS) policy was implemented for phosphatic and
potassic (P&K) fertilizers with effect from 1 April 2010. NBS would be applicable for indigenously produced and imported DAP, DAP Lite,
MAP, TSP, MOP, 15 grades of complex fertilizers, SSP, and indigenous ammonium sulphate.
Primary nutrients – nitrogen ‘N’, phosphorus ‘P’, potassium ‘K’ and secondary nutrient sulphur ‘S’ contained in the above mentioned fertilizers would be eligible for NBS.
Under the NBS regime, since the subsidy on the subsidized nutrients, and consequently, subsidized fertilizers would remain fixed, the retail prices of subsidized fertilizers at farm gate level would be decided by the fertilizer companies.
The provision of additional subsidy for fortified and supplemented fertilizers would encourage production and application of fertilizers carrying secondary and micronutrients.
Urea, the most consumed nitrogenous fertilizer in India, would remain under the current MRP regime.
The industry would receive subsidy based on certification of sale by the state governments / statutory auditors of the company, as in the past.
The implementation and distribution of fertilizers would continue to be monitored through the online web-based “fertilizer monitoring system (FMS)”.

Coromandel International
4 August 2014 41
NBS rates for FY15
Source: Company, MOSL

Coromandel International
4 August 2014 42
Financials and valuations Income statement (INR Million) Y/E March 2012 2013 2014 2015E 2016E 2017E Net Sales 99,016 90,337 100,532 108,623 127,443 147,484 Change (%) 29.6 -8.8 11.3 8.0 17.3 15.7 EBITDA 10,544 7,679 8,052 8,591 10,845 13,007 EBITDA Margin (%) 10.6 8.5 8.0 7.9 8.5 8.8 Depreciation 597 711 961 986 1,045 1,088 EBIT 9,947 6,968 7,092 7,605 9,800 11,919 Interest 1,261 2,102 2,403 2,091 1,543 1,293 Other Income 780 701 608 699 804 924 Extraordinary items 355 0 126 0 0 0 PBT 9,111 5,567 5,171 6,212 9,061 11,550 Tax 2,766 1,231 1,521 1,926 2,809 3,811 Tax Rate (%) 30.4 22.1 29.4 31.0 31.0 33.0 Reported PAT 6,345 4,336 3,649 4,286 6,252 7,738 Adjusted PAT 6,635 4,320 3,654 4,286 6,252 7,738 Change (%) -4.3 -34.9 -15.4 17.3 45.9 23.8 Min. Int. & Assoc. Share 43 -17 -84 0 0 0 Adj Cons PAT 6,635 4,320 3,654 4,286 6,252 7,738
Balance sheet (INR Million) Y/E March 2012 2013 2014 2015E 2016E 2017E Share Capital 283 283 283 291 291 291 Reserves 23,721 21,683 22,526 24,892 29,049 34,344 Net Worth 24,003 21,966 22,810 25,183 29,340 34,635 Debt 29,434 29,458 18,429 16,429 14,429 11,429 Deferred Tax 1,104 2,326 2,358 2,358 2,358 2,358 Total Capital Employed 54,699 54,812 43,850 44,223 46,380 48,675 Gross Fixed Assets 16,193 21,269 22,070 23,814 24,814 25,814 Less: Acc Depreciation 6,704 7,397 8,212 9,199 10,244 11,333 Net Fixed Assets 9,489 13,872 13,858 14,615 14,570 14,481 Capital WIP 5,267 4,201 744 0 0 0 Investments 1,495 1,599 3,416 3,416 3,416 3,416 Current Assets 59,930 59,758 54,544 57,671 65,862 74,793 Inventory 19,218 14,775 17,529 19,231 22,563 26,111 Debtors 9,579 18,201 14,835 16,028 18,805 21,763 Cash & Bank 9,847 5,346 4,722 4,556 4,591 5,100 Loans & Adv, Others 21,286 21,436 17,459 17,856 19,902 21,819 Curr Liabs & Provns 25,381 29,757 32,663 35,430 41,418 47,967 Curr. Liabilities 23,879 27,765 30,736 33,210 38,964 45,091 Provisions 1,502 1,992 1,927 2,220 2,455 2,876 Net Current Assets 34,549 30,001 21,881 22,241 24,443 26,826 Total Assets 54,699 54,812 43,850 44,223 46,380 48,675
E: MOSL Estimates

Coromandel International
4 August 2014 43
Financials and valuations Ratios Y/E March 2012 2013 2014 2015E 2016E 2017E Basic (INR) EPS 23.5 15.3 12.9 14.7 21.5 26.6 Cash EPS 25.6 17.8 16.3 18.1 25.1 30.3 Book Value 84.9 77.6 80.6 86.6 100.8 119.0 DPS 7.0 4.5 4.5 5.5 6.0 7.0 Payout (incl. Div. Tax.) 36.0 34.7 42.0 44.8 33.5 31.6 Valuation(x) P/E 10.1 15.5 18.4 16.1 11.0 8.9 Cash P/E 9.3 13.3 14.5 13.1 9.4 7.8 Price / Book Value 2.8 3.1 2.9 2.7 2.4 2.0 EV/Sales 0.9 1.1 0.9 0.8 0.7 0.5 EV/EBITDA 8.8 12.7 10.8 9.9 7.6 6.1 Dividend Yield (%) 3.0 1.9 1.9 2.3 2.5 3.0 Profitability Ratios (%) RoE 30.5 18.8 16.3 17.9 22.9 24.2 RoCE 24.2 14.6 16.6 20.0 24.8 28.6 Turnover Ratios (%) Asset Turnover (x) 1.8 1.6 2.3 2.5 2.7 3.0 Debtors (No. of Days) 35.0 72.5 53.0 53.0 53.0 53.0 Inventory (No. of Days) 70.8 59.7 63.6 64.6 64.6 64.6 Creditors (No. of Days) 87.3 106.0 106.9 106.8 107.5 107.8 Leverage Ratios (%) Net Debt/Equity (x) 0.8 1.0 0.5 0.3 0.2 0.1
Cash flow statement (INR Million) Y/E March 2012 2013 2014 2015E 2016E 2017E OP/(Loss) before Tax 9,111 5,567 5,171 6,212 9,061 11,550 Depreciation 597 711 961 986 1,045 1,088 Others 0 0 0 0 0 0 Interest 728 1,521 1,858 1,393 739 369 Direct Taxes Paid -2,760 -1,207 -1,112 -1,926 -2,809 -3,811 (Inc)/Dec in Wkg Cap -7,370 2,546 6,683 -526 -2,167 -1,874 CF from Op. Activity 954 9,841 14,611 6,139 5,870 7,321 (Inc)/Dec in FA & CWIP -2,361 -2,585 -1,114 -1,000 -1,000 -1,000 (Pur)/Sale of Invt -3,668 -2,282 -962 0 0 0 Others -1,649 79 1,878 699 804 924 CF from Inv. Activity -7,678 -4,789 -198 -301 -196 -76 Inc/(Dec) in Net Worth 37 26 -44 8 0 0 Inc / (Dec) in Debt 10,618 -5,626 -9,238 -2,000 -2,000 -3,000 Interest Paid -1,310 -2,014 -2,649 -2,091 -1,543 -1,293 Divd Paid (incl Tax) -2,296 -1,674 -1,511 -1,920 -2,095 -2,444 CF from Fin. Activity 7,048 -9,288 -13,442 -6,004 -5,638 -6,737 Inc/(Dec) in Cash 324 -4,236 971 -166 36 508 Add: Opening Balance 9,523 9,582 3,750 4,722 4,556 4,591 Closing Balance 9,847 5,346 4,722 4,556 4,591 5,100
E: MOSL Estimates

Coromandel International
4 August 2014 44
Disclosures This research report has been prepared by MOSt to provide information about the company(ies) and sector(s), if any, covered in the report and may be distributed by it and/or its affiliated company(ies). This report is for personal information of the select recipient and does not construe to be any investment, legal or taxation advice to you. This research report does not constitute an offer, invitation or inducement to invest in securities or other investments and Motilal Oswal Securities Limited (hereinafter referred as MOSt) is not soliciting any action based upon it. This report is not for public distribution and has been furnished to you solely for your general information and should not be reproduced or redistributed to any other person in any form. This report does not constitute a personal recommendation or take into account the particular investment objectives, financial situations, or needs of individual clients. Before acting on any advice or recommendation in this material, investors should consider whether it is suitable for their particular circumstances and, if necessary, seek professional advice. The price and value of the investments referred to in this material and the income from them may go down as well as up, and investors may realize losses on any investments. Past performance is not a guide for future performance, future returns are not guaranteed and a loss of original capital may occur.
MOSt and its affiliates are a full-service, integrated investment banking, investment management, brokerage and financing group. We and our affiliates have investment banking and other business relationships with a significant percentage of the companies covered by our Research Department Our research professionals provide important input into our investment banking and other business selection processes. Investors should assume that MOSt and/or its affiliates are seeking or will seek investment banking or other business from the company or companies that are the subject of this material and that the research professionals who were involved in preparing this material may participate in the solicitation of such business. The research professionals responsible for the preparation of this document may interact with trading desk personnel, sales personnel and other parties for the purpose of gathering, applying and interpreting market information. Our research professionals are paid in part based on the profitability of MOSt which include earnings from investment banking and other business. MOSt generally prohibits its analysts, persons reporting to analysts, and members of their households from maintaining a financial interest in the securities or derivatives of any companies that the analysts cover. Additionally, MOSt generally prohibits its analysts and persons reporting to analysts from serving as an officer, director, or advisory board member of any companies that the analysts cover. Our salespeople, traders, and other professionals or affiliates may provide oral or written market commentary or trading strategies to our clients that reflect opinions that are contrary to the opinions expressed herein, and our proprietary trading and investing businesses may make investment decisions that are inconsistent with the recommendations expressed herein. In reviewing these materials, you should be aware that any or all o the foregoing, among other things, may give rise to real or potential conflicts of interest . MOSt and its affiliated company(ies), their directors and employees may; (a) from time to time, have a long or short position in, and buy or sell the securities of the company(ies) mentioned herein or (b) be engaged in any other transaction involving such securities and earn brokerage or other compensation or act as a market maker in the financial instruments of the company(ies) discussed herein or act as an advisor or lender/borrower to such company(ies) or may have any other potential conflict of interests with respect to any recommendation and other related information and opinions.
Unauthorized disclosure, use, dissemination or copying (either whole or partial) of this information, is prohibited. The person accessing this information specifically agrees to exempt MOSt or any of its affiliates or employees from, any and all responsibility/liability arising from such misuse and agrees not to hold MOSt or any of its affiliates or employees responsible for any such misuse and further agrees to hold MOSt or any of its affiliates or employees free and harmless from all losses, costs, damages, expenses that may be suffered by the person accessing this information due to any errors and delays. The information contained herein is based on publicly available data or other sources believed to be reliable. Any statements contained in this report attributed to a third party represent MOSt’s interpretation of the data, information and/or opinions provided by that third party either publicly or through a subscription service, and such use and interpretation have not been reviewed by the third party. This Report is not intended to be a complete statement or summary of the securities, markets or developments referred to in the document. While we would endeavor to update the information herein on reasonable basis, MOSt and/or its affiliates are under no obligation to update the information. Also there may be regulatory, compliance, or other reasons that may prevent MOSt and/or its affiliates from doing so. MOSt or any of its affiliates or employees shall not be in any way responsible and liable for any loss or damage that may arise to any person from any inadvertent error in the information contained in this report. MOSt or any of its affiliates or employees do not provide, at any time, any express or implied warranty of any kind, regarding any matter pertaining to this report, including without limitation the implied warranties of merchantability, fitness for a particular purpose, and non-infringement. The recipients of this report should rely on their own investigations.
Recipients who are not institutional investors should seek advice of their independent financial advisor prior to taking any investment decision based on this report or for any necessary explanation of its contents.
MOSt and/or its affiliates and/or employees may have interests/positions, financial or otherwise in the securities mentioned in this report. To enhance transparency, MOSt has incorporated a Disclosure of Interest Statement in this document. This should, however, not be treated as endorsement of the views expressed in the report.
Disclosure of Interest Statement COROMANDEL INTERNATIONAL LTD Analyst ownership of the stock No
Analyst Certification The views expressed in this research report accurately reflect the personal views of the analyst(s) about the subject securities or issues, and no part of the compensation of the research analyst(s) was, is, or will be directly or indirectly related to the specific recommendations and views expressed by research analyst(s) in this report. The research analysts, strategists, or research associates principally responsible for preparation of MOSt research receive compensation based upon various factors, including quality of research, investor client feedback, stock picking, competitive factors and firm revenues.
Regional Disclosures (outside India) This report is not directed or intended for distribution to or use by any person or entity resident in a state, country or any jurisdiction, where such distribution, publication, availability or use would be contrary to law, regulation or which would subject MOSt & its group companies to registration or licensing requirements within such jurisdictions.
For U.K. This report is intended for distribution only to persons having professional experience in matters relating to investments as described in Article 19 of the Financial Services and Markets Act 2000 (Financial Promotion) Order 2005 (referred to as "investment professionals"). This document must not be acted on or relied on by persons who are not investment professionals. Any investment or investment activity to which this document relates is only available to investment professionals and will be engaged in only with such persons.
For U.S. Motilal Oswal Securities Limited (MOSL) is not a registered broker - dealer under the U.S. Securities Exchange Act of 1934, as amended (the"1934 act") and under applicable state laws in the United States. In addition MOSL is not a registered investment adviser under the U.S. Investment Advisers Act of 1940, as amended (the "Advisers Act" and together with the 1934 Act, the "Acts), and under applicable state laws in the United States. Accordingly, in the absence of specific exemption under the Acts, any brokerage and investment services provided by MOSL, including the products and services described herein are not available to or intended for U.S. persons.
This report is intended for distribution only to "Major Institutional Investors" as defined by Rule 15a-6(b)(4) of the Exchange Act and interpretations thereof by SEC (henceforth referred to as "major institutional investors"). This document must not be acted on or relied on by persons who are not major institutional investors. Any investment or investment activity to which this document relates is only available to major institutional investors and will be engaged in only with major institutional investors. In reliance on the exemption from registration provided by Rule 15a-6 of the U.S. Securities Exchange Act of 1934, as amended (the "Exchange Act") and interpretations thereof by the U.S. Securities and Exchange Commission ("SEC") in order to conduct business with Institutional Investors based in the U.S., MOSL has entered into a chaperoning agreement with a U.S. registered broker-dealer, Motilal Oswal Securities International Private Limited. ("MOSIPL"). Any business interaction pursuant to this report will have to be executed within the provisions of this chaperoning agreement.
The Research Analysts contributing to the report may not be registered /qualified as research analyst with FINRA. Such research analyst may not be associated persons of the U.S. registered broker-dealer, MOSIPL, and therefore, may not be subject to NASD rule 2711 and NYSE Rule 472 restrictions on communication with a subject company, public appearances and trading securities held by a research analyst account.
For Singapore Motilal Oswal Capital Markets Singapore Pte Limited is acting as an exempt financial advisor under section 23(1)(f) of the Financial Advisers Act(FAA) read with regulation 17(1)(d) of the Financial Advisors Regulations and is a subsidiary of Motilal Oswal Securities Limited in India. This research is distributed in Singapore by Motilal Oswal Capital Markets Singapore Pte Limited and it is only directed in Singapore to accredited investors, as defined in the Financial Advisers Regulations and the Securities and Futures Act (Chapter 289), as amended from time to time. In respect of any matter arising from or in connection with the research you could contact the following representatives of Motilal Oswal Capital Markets Singapore Pte Limited: Anosh Koppikar Kadambari Balachandran Email:[email protected] Email : [email protected] Contact(+65)68189232 Contact: (+65) 68189233 / 65249115 Office Address:21 (Suite 31),16 Collyer Quay,Singapore 04931
Motilal Oswal Securities Ltd
Motilal Oswal Tower, Level 9, Sayani Road, Prabhadevi, Mumbai 400 025 Phone: +91 22 3982 5500 E-mail: [email protected]