Establishment of a catchment monitoring network through a participatory approach in a small rural...
45
HESSD 4, 3793–3837, 2007 Establishment of a catchment monitoring network V. M. Kongo et al. Title Page Abstract Introduction Conclusions References Tables Figures Back Close Full Screen / Esc Printer-friendly Version Interactive Discussion EGU Hydrol. Earth Syst. Sci. Discuss., 4, 3793–3837, 2007 www.hydrol-earth-syst-sci-discuss.net/4/3793/2007/ © Author(s) 2007. This work is licensed under a Creative Commons License. Hydrology and Earth System Sciences Discussions Papers published in Hydrology and Earth System Sciences Discussions are under open-access review for the journal Hydrology and Earth System Sciences Establishment of a catchment monitoring network through a participatory approach in a small rural catchment in South Africa V. M. Kongo, J. R. Kosgei, G. P. W. Jewitt, and S. A. Lorentz School of Bioresources Engineering and Environmental Hydrology University of KwaZulu-Natal, PB X01, Scottville, Pietermaritzburg, South Africa Received: 10 September 2007 – Accepted: 10 September 2007 – Published: 16 October 2007 Correspondence to: V. M. Kongo ([email protected]) 3793
Transcript of Establishment of a catchment monitoring network through a participatory approach in a small rural...

HESSD4, 3793–3837, 2007
Establishment of acatchment
monitoring network
V. M. Kongo et al.
Title Page
Abstract Introduction
Conclusions References
Tables Figures
J I
J I
Back Close
Full Screen / Esc
Printer-friendly Version
Interactive Discussion
EGU
Hydrol. Earth Syst. Sci. Discuss., 4, 3793–3837, 2007www.hydrol-earth-syst-sci-discuss.net/4/3793/2007/© Author(s) 2007. This work is licensedunder a Creative Commons License.
Hydrology andEarth System
SciencesDiscussions
Papers published in Hydrology and Earth System Sciences Discussions are underopen-access review for the journal Hydrology and Earth System Sciences
Establishment of a catchment monitoringnetwork through a participatory approachin a small rural catchment in South AfricaV. M. Kongo, J. R. Kosgei, G. P. W. Jewitt, and S. A. Lorentz
School of Bioresources Engineering and Environmental Hydrology University ofKwaZulu-Natal, PB X01, Scottville, Pietermaritzburg, South Africa
Received: 10 September 2007 – Accepted: 10 September 2007 – Published: 16 October 2007
Correspondence to: V. M. Kongo ([email protected])
3793

HESSD4, 3793–3837, 2007
Establishment of acatchment
monitoring network
V. M. Kongo et al.
Title Page
Abstract Introduction
Conclusions References
Tables Figures
J I
J I
Back Close
Full Screen / Esc
Printer-friendly Version
Interactive Discussion
EGU
Abstract
The establishment of a catchment monitoring network is a process, from the inceptionof the idea to its implementation, the latter being the construction of relevant gaugingstructures and installation of the various instruments. It is useful that the local com-munities and other stakeholders are involved and participate in such a process as was5
realised during the establishment of the hydrological monitoring network in the Potshinicatchment in the Bergville district in the KwaZulu-Natal Province in South Africa. Thepaper illustrates the participatory application of various methods and techniques forestablishing a hydrological monitoring network, in a small rural inhabited catchment,to monitor hydrological processes at both field and catchment scale for research pur-10
poses in water resources management. The authors conclude that the participation ofthe local community and other stakeholders in catchment monitoring and instilling thesense of ownership and management of natural resources to the local communitiesneeds to be encouraged at all times. Success stories in water resources managementby local communities can be realized if such a process is integrated with other develop-15
ment plans in the catchment at all forums with due recognition of the social dynamicsof the communities living in the catchment.
1 Introduction
Sound decision making for water resources and environmental management has to bebased on good knowledge and factual information regarding the dominant hydrological20
processes, together with bio-physical characteristics of a catchment and in combinationwith socio-economic aspects. Such information can only be obtained through estab-lishing networks that are capable of monitoring such hydrological processes at differenttemporal and spatial scales. The establishment of a catchment monitoring network in-volves a process, from inception of the idea to the actual construction of the various25
structures and installation of the necessary equipment and instruments while engag-
3794

HESSD4, 3793–3837, 2007
Establishment of acatchment
monitoring network
V. M. Kongo et al.
Title Page
Abstract Introduction
Conclusions References
Tables Figures
J I
J I
Back Close
Full Screen / Esc
Printer-friendly Version
Interactive Discussion
EGU
ing relevant stakeholders. Such a process is normally driven by a motive to meet cer-tain research objectives (e.g. Wigmosta and Burges, 1997; Gilvear and Bradley, 2000;Hodgson et al., 2002; Ireson et al., 2006), considering the cost implications with regardto construction and acquisition of the various instruments and their maintenance. How-ever, research catchments are typically established in areas where people do not live.5
In fact, people are usually excluded from such catchments as they add uncontrollablevariables to the experiment as well as the risk of theft and vandalism. In this paper wereport on the establishment and installation of various instruments and structures for adetailed catchment monitoring network that took place in the midst of a rural commu-nity. This provides a good case study for considering the many issues and challenges10
(social, scientific and engineering) that need to be addressed in the process of estab-lishing the monitoring network in a populated rural catchment in a developing region.There are few case studies in the available literature on the establishment of detailedcatchment monitoring networks through a participatory approach involving the localcommunity and other stakeholders. A survey study by Loreta et al. (2006) indicated15
the desire by local communities and other stakeholders to be involved in water qualitymonitoring and surveillance in the Mzingwane catchment in Zimbabwe, even thoughthey were not aware of the existence of such a monitoring programme in their locality.However, the participatory approach in catchment monitoring has long term benefitsincluding the opportunity for the relevant stakeholders, notably the local community, to20
gain insight into the hydrological regime of their locality. This in turn provides a betterbasis for decision making for farming activities and understanding the impact of anthro-pogenic activities on water resources in the catchment. Thus, a participatory approachrequires a constant effort to initiate a learning process, through which the local commu-nity is able to appreciate and recognize the importance of catchment monitoring, not25
withstanding the willingness of the community to participate in the monitoring exercise.The Potshini catchment, a small headwater catchment on the foothills of the Drak-
ensburg mountains in South Africa, is inhabited by the Potshini rural community andwhose main economic activity is smallholder farming and livestock keeping. As high-
3795

HESSD4, 3793–3837, 2007
Establishment of acatchment
monitoring network
V. M. Kongo et al.
Title Page
Abstract Introduction
Conclusions References
Tables Figures
J I
J I
Back Close
Full Screen / Esc
Printer-friendly Version
Interactive Discussion
EGU
lighted above, the inclusion of people in research catchments has many challenges.Nevertheless, one can not carry out convincing studies on the interaction between wa-ter resources and food security of any rural community without considering the liveli-hoods of the rural community and the dominant hydrological processes. It is on thisunderstanding that the Potshini catchment monitoring network was established with5
various objectives as discussed below.
2 Objectives for establishing the Potshini catchment monitoring network
The Potshini catchment monitoring network was established to fulfill a threefold mis-sion in line with the overall objective of the Smallholder System Innovations in Inte-grated Watershed Management (SSI) research programme (Rockstrom et al., 2004)10
of addressing the challenges of increasing food production, improving rural livelihoodswhile safeguarding critical ecosystem functions and services. The threefold missionencompassed:
– Monitoring the hydro-climatological processes of the Potshini catchment in orderto gain an in-depth understanding of the hydrological regime of the catchment and15
investigate the hydrological and ecosystem impacts of adoption and adaptation ofwater use innovations (rainwater harvesting) in the Potshini catchment,
– Establishing a capacity to assess, monitor, and manage water and environmentalresources in the Potshini community in collaboration with various stakeholdersthrough training on the basic methodologies of catchment monitoring,20
– Providing an opportunity for future and further research through the establishmentof a catchment monitoring network with a potential for upscaling and integratinginto other larger networks in the country. This is due to the fact that the networkcomprises several permanent structures which other researchers may use in theirstudies in future after the accomplishment of the SSI research programme.25
3796

HESSD4, 3793–3837, 2007
Establishment of acatchment
monitoring network
V. M. Kongo et al.
Title Page
Abstract Introduction
Conclusions References
Tables Figures
J I
J I
Back Close
Full Screen / Esc
Printer-friendly Version
Interactive Discussion
EGU
The SSI research programme is focused on investigating the potential of small-scalewater system innovations (e.g. rainwater harvesting, conservation tillage etc.) for up-grading rainfed farming in semi-arid agro-ecosystems, including aspects such as theneed for local adaptations of these techniques, adoption of them among smallholderfarmers and possible trade-off between water for agriculture and water for surrounding5
ecosystems. However, it must be noted that SSI is a scientific programme and as suchis dedicated to delivery of innovative and high quality research, albeit in a develop-mental setting. The instrumentation which forms the Potshini hydrological monitoringnetwork ranges in sophistication from simple manually recording rainguages, to stateof the art instruments such as a Large Aperture Scintillometer and Electrical Resistivity10
Tomography instruments.The process of establishing the Potshini catchment monitoring network was initi-
ated in early 2004 under the SSI research programe (Rockstrom et al., 2004) at theSchool of Bioresources Engineering and Environmental Hydrology of the University ofKwaZulu-Natal. The process integrated two approaches (i) a participatory approach15
where the local community and other stakeholders were involved and participated (ii)a scientific approach which entailed the application of scientific and engineering prin-ciples in designing, construction and installation of various structures and instruments.It should be noted that the two approaches were not treated separately but ratherformed an integrated continuous learning process where the relevant stakeholders and20
researchers made an effort to interact and to learn from each other. The main stake-holders for the SSI programme in the Potshini catchment, at various degrees of par-ticipation, included the following (i) smallholder farmers actively participating in variousexperimental and monitoring activities (ii) members of the local community in the Pot-shini catchment in observation and construction (iii) smallholder farmers neighbouring25
the Potshini catchment in attending field days and learning sessions (iv) Neighbouringlarge scale commercial farmers in participating and supporting the catchment moni-toring initiative (v) the traditional and local leadership in assembling and motivating thecommunity (vi) the Provincial Department of Agriculture and Environment in supporting
3797

HESSD4, 3793–3837, 2007
Establishment of acatchment
monitoring network
V. M. Kongo et al.
Title Page
Abstract Introduction
Conclusions References
Tables Figures
J I
J I
Back Close
Full Screen / Esc
Printer-friendly Version
Interactive Discussion
EGU
teaching, providing material inputs, organizing field days and encouraging the commu-nity to become involved (vii) Agricultural Research Council-Institute of Climate Soil andWater in expertise from past research (viii) the Local Authority – the Okhalhamba Mu-nicipality in encouraging the community to become involved and providing materialinputs (ix) the Department of Water Affairs and Forestry in providing monitoring and5
domestic boreholes.The Potshini catchment monitoring network comprises gauging structures and in-
strumentation, mostly automated, for measuring and monitoring stream flows, over-land flow from experimental runoff plots, sediment load, shallow and deep ground wa-ter tables, subsurface resistivity using Electrical Resistivty Tomography (Loke, 2003),10
isotopic composition (Deuterium and Oxygen-18) in both surface and subsurface wa-ter, volumetric soil moisture content, soil hydraulic parameters, crop transpiration ratesand meteorological parameters. The application of scintillation techniques (Large Aper-ture Scintillometer) in estimating total evaporation in the Potshini catchment forms anintermediate observation and a calibration scale for remote sensed estimates of total15
evaporation from satellite images in the catchment and the Thukela river basin at large,using the Surface Energy Balance Algorithm for Land (SEBAL) (Bastiaanssen et al.,1998a, b; Bastiaanssen, 2000). Preliminary results on hydrological studies based ondata obtained from the Potshini catchment monitoring network are reported in Kongoand Jewitt (2006).20
2.1 Overview of a logical hydrological measurement sequence
Although hydrological processes vary continuously in time and space, they are oftendescribed and derived from point measurements. The resulting data form a time se-ries, which are typically subjected to further processing, including statistical analysisand or hydrological modelling. Chow et al. (1988) highlighted a sequence of logical25
steps (Fig. 1) which are commonly followed for hydrological measurements and mon-itoring, beginning with the instrumentation of a physical device that senses or reactsto the physical phenomenon and ending with the delivery of data to the user. Such a
3798
HESSD4, 3793–3837, 2007
Establishment of acatchment
monitoring network
V. M. Kongo et al.
Title Page
Abstract Introduction
Conclusions References
Tables Figures
J I
J I
Back Close
Full Screen / Esc
Printer-friendly Version
Interactive Discussion
EGU
sequence was adapted during the establishment of the Potshini catchment monitoringnetwork with an additional participatory component where the input from the local com-munity and other stakeholders was sought and incorporated as indicated in Fig. 1. Inthe absence of the participatory component, the sequence describes a scenario whichis biased to understanding the hydrological processes in a catchment but void of the5
social dimension of how the local community understand and respond to the hydro-logical processes being monitored. The social dimension comprises several elements,including the understanding of the knowledge base of the rural community with regardto rainfall patterns, stream flows, temperatures etc, as well as the willingness of thecommunity to learn about and quantify the various hydrological processes taking place10
in their midst and the importance of understanding such processes. Such an approachperpetuates a sense of ownership and imparts management skills of natural resourcesto the local community and hence ensures the security of the various installations com-prising the catchment monitoring network. The social dimension can be complicated ifseveral stakeholders with diverse interests are involved in the establishment of a catch-15
ment monitoring network. Nevertheless, such diversity can be a source of inspirationand strength if a common understanding is sought at the initial stages. However thismust be based on good working relationships and trust as was experienced during theestablishment of the Potshini catchment monitoring network. Although the steps indi-cated in Fig. 1 may appear to be obvious, even simple, they need to be followed and20
documented for the purpose of sharing the experience and knowledge as highlightedin this paper.
2.2 Study area
The Potshini catchment as described in Kongo and Jewitt (2006) is predominantly asmallholder farming area and a sub-catchment of the Quaternary Catchment1 number25
1Quaternary Catchments (QC) in South Africa are the smallest delimitations of a river basinupon which policies and decision with regard to water resources management are based upon.
3799
HESSD4, 3793–3837, 2007
Establishment of acatchment
monitoring network
V. M. Kongo et al.
Title Page
Abstract Introduction
Conclusions References
Tables Figures
J I
J I
Back Close
Full Screen / Esc
Printer-friendly Version
Interactive Discussion
EGU
V13D (Emmaus catchment) in the Thukela River basin in the foothills of the Drakens-berg Mountains in South Africa. The Thukela river basin is comprised of 86 Quater-nary Catchments. The Thukela river basin has an area of 29 036 km2, while the areaof Quaternary Catchment V13D is 285 km2. Figures 2a and b show an overview ofthe Thukela river basin and the Potshini catchment. The Potshini catchment comprises5
2-nested catchments, with an area of 1.2 km2(gauged by an H-Flume) and 10 km2
(gauged by a pressure transducer) respectively. The mean annual precipitation at Pot-shini is estimated to be 700 mm/a and the estimated mean annual potential evaporationis between 1600 to 2000 mm/a (Kongo and Jewitt, 2006). Due to local topography andhigh summer rainfall, a good drainage network has developed in the Potshini catch-10
ment with most of the streams being perennial and providing water for domestic use tothe upper part of the catchment, while replenishing reservoirs for commercial farmersdownstream.
3 Methodology
3.1 The participatory process15
The research approach applied in establishing the Potshini catchment monitoring net-work involved Participatory Research, a process where the smallholder farmers andother stakeholders were involved from the initial preparatory stages to the actual con-struction and instrumentation of the various structures and instruments. Local inputwas sought regarding the siting of structures and instruments and permission to de-20
velop a monitoring network was sought from the local farmer’s forum, individual farmersas well as from the traditional and local leaders of the area. A communication processand dialogue was initiated between the researchers and the relevant stakeholders inthe catchment. This involved holding meetings with the local leaders (e.g. traditionalleaders, Local Government officials, relevant Government Department officials etc.)25
The QC were defined and established by the National Department of Water Affairs and Forestry.
3800

HESSD4, 3793–3837, 2007
Establishment of acatchment
monitoring network
V. M. Kongo et al.
Title Page
Abstract Introduction
Conclusions References
Tables Figures
J I
J I
Back Close
Full Screen / Esc
Printer-friendly Version
Interactive Discussion
EGU
and the local community. Local artisans and masons were purposely involved in con-struction of various structures and installation of some of the instruments as part of awider learning platform and technology transfer to enable them appreciate the opera-tional mechanisms of the network. The local community continue to be a key stake-holder in the SSI research programme and an ongoing effort is made towards creating5
and maintaining a cordial relationship with the community based on respect, trust andfriendship. The culture and practices (e.g. abstaining from any field activities that in-volve digging or excavation of the soil during burials) of the Potshini community wererespected at all times both during and after the establishment of the Potshini catchmentmonitoring network. The approach has been proven to be effective in perpetuating a10
conducive environment for interacting with the local community and hence the goodwillof the community to safeguard any installations in the area. Several smallholder farm-ers in the Potshini community volunteered to participate in various research activitiesincluding managing experimental trials on their farms. The voluntary monitoring of dailyrainfall and soil moisture in the catchment by some of the smallholder farmers in the15
Potshini catchment was beneficial to them especially in determining the appropriatetime for planting their single summer maize crop.
3.1.1 Communication and feedback platforms for learning and sustainable adoption
A participatory learning process must involve a feedback mechanism where continuousupdating and response are integrated in the learning process. Such feedback mech-20
anisms should accommodate as much as possible, the opinions and ideas from thevarious stakeholders. In the Potshini catchment, feedback forums were promoted andencouraged for all stakeholders, at the various levels of participation, where the respec-tive stakeholders are continuously updated on the main research findings, progress ondata collection and upcoming research activities within a year. It is during such feed-25
back sessions that the respective stakeholders obtained an in-depth understanding ofthe ongoing research activities, and appreciation of their contribution to the SSI re-search programme and to understand the vagaries of hydrological processes in their
3801

HESSD4, 3793–3837, 2007
Establishment of acatchment
monitoring network
V. M. Kongo et al.
Title Page
Abstract Introduction
Conclusions References
Tables Figures
J I
J I
Back Close
Full Screen / Esc
Printer-friendly Version
Interactive Discussion
EGU
catchment.A monthly Farmers Forum, established as a communication and management plat-
form for farmers in the Emmaus ward (the administrative ward in which Potshini falls)in the Bergville District under the then Agricultural Research Council’s (ARC) LandcareProject, proved to be a useful platform for the researchers, for dialogue with farm-5
ers and for other stakeholders in the area. This forum provided an entry point forthe SSI team and through it, the researchers were able to outline the objectives ofthe SSI programme in the area, its implementation and most importantly the useful-ness of voluntary participation of farmers in the research programme. The researchersmanaged to effectively use the farmer-to-farmer learning structures previously put in10
place by the ARC Landcare project (Smith et al., 2004) for establishing contact withindividual smallholder farmers who were willing to participate in the SSI research pro-gramme, especially in the catchment monitoring exercise. It is through such forums thata good working relationship between the Provincial Department of Agriculture office inBergville and the research team were established. Since then, the SSI Programme15
continued to benefit and enjoy the support of the Bergville Agricultural office and theSSI researchers attend or are represented at relevant Department of Agriculture func-tions, which provide a forum for all stakeholders and development projects workingin the Bergville District on food security, home economics, community resources andthe agricultural sector. The research team has been participating in all field days or-20
ganized by the Department of Agriculture in Potshini and other nearby wards in theBergville District and likewise, the Department of Agriculture has actively participatedand to some extent facilitated some of the field days organized by the SSI researchprograme in Potshini.
3.1.2 Siting of stream flow gauging structures25
The establishment of the Potshini catchment monitoring network involved the initialstage of reconnaissance surveys to gain a general understanding of the catchmentbefore detailed and specific site surveys were performed as per requirements of each
3802

HESSD4, 3793–3837, 2007
Establishment of acatchment
monitoring network
V. M. Kongo et al.
Title Page
Abstract Introduction
Conclusions References
Tables Figures
J I
J I
Back Close
Full Screen / Esc
Printer-friendly Version
Interactive Discussion
EGU
structure or instrument. The siting of the streamflow gauging sites and design of thegauging structures in the Potshini catchment involved the application of the local knowl-edge, scientific and engineering techniques. In particular, the local knowledge on thedominant hydrological processes, historical peak flows and flood prone areas was vi-tal during the design and construction of one of the stream flow measuring structures,5
i.e. an H-Flume. It is interesting to note that the information obtained from the localcommunity with regard to historical peak flows, e.g. stream flow depth during historicalpeak flows, was in agreement with results obtained from a modeling exercise using theSoil Conservation Services (SCS) methodology (Schulze et al., 1992) in determiningpeak floods from the Potshini catchment.10
3.2 Estimation of peak discharge using the SCS methodology
Most of the hydraulic structures in streams and rivers (e.g. bridges, culverts, weirs,flumes etc) need to be designed based on the extreme flow events, which can be ob-tained through a flow frequency analysis or hydrological modeling. The Soil Conserva-tion Services (SCS) methodology, modified for South Africa conditions, for estimating15
peak floods in small catchments (Schulze et al., 1992), was applied to estimate thepeak discharge for selected return periods in the Potshini catchment in an effort to de-termine the design flow for an H-flume. In the SCS method, the peak discharge for anincrement of time (∆D) is defined as:
∆qp =0.2083 × A ×∆Q
∆D/2 + L(1)20
Where ∆qp is the peak discharge of incremental unit hydrograph (m3/s), A is the catch-
ment area (km2), ∆Q is the incremental stormflow depth (mm), ∆D is unit duration time(h) used with distribution of daily rainfall to account for rainfall intensity variations andL is the catchment lag (h).
The general hydrological and physical conditions in Potshini catchment favoured the25
use of the SCS lag equation for estimating catchment response time. Dry spells occur3803

HESSD4, 3793–3837, 2007
Establishment of acatchment
monitoring network
V. M. Kongo et al.
Title Page
Abstract Introduction
Conclusions References
Tables Figures
J I
J I
Back Close
Full Screen / Esc
Printer-friendly Version
Interactive Discussion
EGU
during winter (May to October) and most parts of the catchment have limited vegetationand mulch cover due to overgrazing and hence the area could be categorized as semi-arid, which suits the application of the lag equation. The SCS lag equation is givenas:
L =l0.8(S ′ + 25.4)0.7
7069 × y0.5(2)5
y =M × N × 10−4
A(3)
S ′ =25400CN − II
− 254 (4)
Where L is the catchment lag time (h), l the hydraulic length of catchment along themain channel (m), A is the catchment area (km2), y is the average catchment slope(%), M is the total length of all contour lines (m) within the catchment, N is contour10
intervals (m), A is the catchment area (km2) and CN-II is the curve number of type II.Table 1 indicates the physical and hydrological parameters for the Potshini catchmentused as inputs to the SCS model. The catchment area, number of contours, total lengthof contours and the hydraulic length of the catchment was determined from a 1:50 000topographical map covering the catchment while the Mean Annual Precipitation (MAP)15
was obtained from the nearby Bergville weather station.Based on previously mapped rainfall intensity distribution types, the location of the
catchment coincided with storm intensity distribution type 4 (Schulze et al., 1992). Witha coefficient of initial abstraction being 0.1, the catchment lag time was estimated to be0.58 h (37 min). A summary of the SCS model results is presented in Table 2.20
3.3 Design of the H-flume
The most common hydraulic structures that are used for measuring stream flows areweirs and flumes (Ackers et al., 1978). If not well designed, weirs may end up being
3804

HESSD4, 3793–3837, 2007
Establishment of acatchment
monitoring network
V. M. Kongo et al.
Title Page
Abstract Introduction
Conclusions References
Tables Figures
J I
J I
Back Close
Full Screen / Esc
Printer-friendly Version
Interactive Discussion
EGU
sediment traps leading to change of the channel geometry (width and depth), which isthe main reason why weirs need to be re-calibrated with time. This is not the case forH-flumes. The geometry and design of an H-flume allows for free flow of the streamdischarge, save for the constriction at the front end, and hence enabling the imple-mentation of a sediment load monitoring scheme as is the case with the Potshini H-5
flume. In designing the Potshini H-flume, a 2-year return peak flood was considered i.e.6.4 m3/s, although the actual design flow for the H-flume was 3.42 m3/s. The main rea-sons for adopting a lesser design flow was the fact that the available stage-dischargerelationship for H-flumes, developed by SCS, is only valid for a maximum discharge of3.42 m3/s, and it was necessary to use an H-flume rather than a weir in the catchment10
to facilitate accurate monitoring of the sediment load from the catchment. This is ratherdifficult to achieve using a weir. Also, low flows were considered important to captureaccurately, so a size smaller than that required for the 1:2 year event was accepted.Since this was the largest H-flume calibration available, it was accepted in lieu of com-plex calibration of an off-spec flume. The design of the Potshini H-flume was based15
on the criteria outlined by Ackers et al. (1978). The fundamental concern and priorityduring the design and construction of the Potshini H-flume was maintaining structuralstability during and after excessive loading events i.e. peaks floods. The SCS modelingresults were used as one of the bases for determining the design flood for the H-flumefrom which the necessary precautionary features and safety factors were incorporated20
in the design and construction of the H-flume in an effort to allow the safe passage ofa 2-year return period flood of 6.4 m3/s without affecting structural stability. Some ofthe precautionary features included reinforcing the walls of the approach channel withstarter bars drilled into the bedrock, anchoring the foundation against sliding and sta-bilizing the slopes of the stream banks both on the upstream and downstream of the25
11 m long approach channel for a distance of 4 m with reinforced rip-rap.
3805

HESSD4, 3793–3837, 2007
Establishment of acatchment
monitoring network
V. M. Kongo et al.
Title Page
Abstract Introduction
Conclusions References
Tables Figures
J I
J I
Back Close
Full Screen / Esc
Printer-friendly Version
Interactive Discussion
EGU
3.4 Streamflow measurements and monitoring of water quality parameters
Streamflow in the Potshini catchment is monitored at two sites coinciding with twonested subcatchments of 1.2 and 10 km2, respectively, as indicated in Fig. 2. Thesmaller subcatchment, 1.2 km2, is gauged by the H-Flume, while the larger catchmentis gauged by monitoring water level fluctuations using a pressure transducer installed5
at a road culvert. The monitoring of the flow rates at the Potshini H-flume is governedby a set of 3 rating equations, each describing a unique stage-discharge relationshipfor a given range of flow depths. Monitoring of level of discharge in the Potshini H-flumeis via a tube, connecting the open channel discharge to a stilling well. In the PotshiniH-flume, the approach channel is connected to a stilling well, 4.6 m away, by a 50 mm10
pipe at the floor level of the approach channel and sloping slightly in the direction of thestilling well. With this set-up, the water level in the approach channel and the stillingwell will always be the same and hence makes it possible to monitor the water levels inthe approach channel by recording the water levels in the stilling well through the use ofa float and a data logger mechanism as illustrated in Fig. 3. The float in the stilling well15
follows the rise and fall of the water level in the approach channel and such movementsare translated into rotational movements through a pulley system on a shaft encoder,which is linked to a data logger. Figure 4 shows the Potshini H-flume in operation.
3.4.1 Monitoring of sediment load and isotopic composition of stream flow
It is always a challenge to obtain a representative water sample in streams at the de-20
sired time, for analytical work on water quality. This is compounded by the fact thatstream flows emanating from head water catchments of relatively small area in semiarid areas are highly variable, with quick overland flows and interflows. A good sam-pling scheme should take into consideration such variations of flow by taking frequentsamples during changing flow. Water quality, e.g. sediment load, and isotopic com-25
position, e.g. Oxygen-18 and Deuterium (18O and 2H) of stream flow will show lessvariation at constant flow and hence less frequent sampling is required. The Potshini
3806
HESSD4, 3793–3837, 2007
Establishment of acatchment
monitoring network
V. M. Kongo et al.
Title Page
Abstract Introduction
Conclusions References
Tables Figures
J I
J I
Back Close
Full Screen / Esc
Printer-friendly Version
Interactive Discussion
EGU
H-flume was equipped with an ISCO sampler, with a capacity of 24 sampling bottles of500ml. The sampler was controlled by a Mike Cotton System (MCS) data logger whichrecorded the water levels in the stream as described above. The sampling-triggerparameters in the MCS data logger were varied accordingly to achieve an appropri-ate sampling scheme in which a sample was only taken if the depth of flow changed5
by 10 mm. For low and high constant flows, the sampling scheme was set to trig-ger a sampling event after 7 and 3 m3 of discharge respectively was recorded to havepassed the sampling point. The samples were then analyzed for suspended solids andthe isotopic composition of 18O and 2H.
3.4.2 Monitoring of stream flow depth using a pressure transducer10
The choice of using any of the stream flow gauging structures depends on a numberof factors, one being the geometry of the stream channel at the gauging site. For ex-ample, in wide channel sections where the construction of a flume or a weir may notbe feasible (e.g. due to cost constrains), a cheaper option is to use a pressure trans-ducer to monitor the water levels in the stream accurately and subsequently develop a15
rating curve for that section after carrying out a detailed survey of the cross-section atthe site, applying open channel flow theory and/or conducting flow velocity transectsat different discharges. It must be noted that the cross-section must be stable, i.e. notchanging with time, for the integrity of the developed rating curve to hold. In the Pot-shini catchment monitoring network, a pressure transducer together with a HOBO data20
logger were installed under a culvert bridge approximately 4 km downstream from thePotshini H-flume. Sediment load was not monitored at this site due to the existenceof small upstream reservoirs, which in turn trap the sediment load in the stream. Thepressure transducer was calibrated by subjecting it to pressure from a gradually in-creasing column of water, from 0 to 1000 mm while recording the output voltage signal25
from the transducer. A similar exercise was done for a decreasing water column. The
3807

HESSD4, 3793–3837, 2007
Establishment of acatchment
monitoring network
V. M. Kongo et al.
Title Page
Abstract Introduction
Conclusions References
Tables Figures
J I
J I
Back Close
Full Screen / Esc
Printer-friendly Version
Interactive Discussion
EGU
calibration equation for the pressure transducer is as indicated in Eq. (5)
H = 13.5307564 + 0.45355129 × V (5)
where H is the stream flow depth (mm) and V is voltage output from the pressuretransducer (mV). Velocity transect surveys, at different discharges, were carried outacross the culvert bridge using a propeller current meter. The concrete culvert bridge5
had a regular rectangular shape and hence made it easier to apply the Manning’s openchannel flow equation and subsequent development of the rating curve. Equation (6)shows the established rating curve at the culvert bridge.
Q = 8.267 × H1.6403 (6)
where Q is flow rate in m3/s and H is the stream flow depth (m).10
3.5 Climatic parameters
Rainfall is clearly the main parameter that drives the hydrological cycle in a catchment,hence the need to observe its occurrence accurately, both spatially and temporally.Manual raingauges, if well managed, can provide relatively accurate daily rainfall datain a catchment and their affordability, availability and the ease of installation and oper-15
ation makes them attractive, especially to smallholder farmers. After a reconnaissancesurvey in the catchment, 8 potential sites (homesteads) were identified in the 1.2 km2
Potshini catchment for installing manual raingauges. The family members in thesehomesteads were then approached, beginning with the head of the homestead, toseek permission and the goodwill from the members of the homestead to permit the20
installation of the manual raingauges and most importantly take daily rainfall readings.A rainfall data recording booklet, translated into the local language – the IsiZulu, wasgiven to the identified households to record and keep the daily rainfall records. Thesmallholder farmers record rainfall twice a day, i.e. at 09:00 and 17:00, from which thetotal daily rainfall is computed as the sum of the morning and evening readings. Various25
individuals and households in Potshini participate by monitoring manual raingauges on3808

HESSD4, 3793–3837, 2007
Establishment of acatchment
monitoring network
V. M. Kongo et al.
Title Page
Abstract Introduction
Conclusions References
Tables Figures
J I
J I
Back Close
Full Screen / Esc
Printer-friendly Version
Interactive Discussion
EGU
a daily basis. This promotes the philosophy of participatory catchment monitoring tothe Potshini community.
Rainfall data from the manual raingauges were augmented by climatic records fromtwo automatic weather stations installed in the Potshini catchment. Each weather sta-tion was positioned near a stream flow gauging station (H-flume and the pressure5
transducer) at a distance of 4 km apart, in the two nested subcatchments. One ofthe weather stations was installed in 2005 in the midst of the local community (commu-nity weather station) and upstream of an existing telemetric weather station which wasoperational since 2002 on a nearby commercial farm and managed by the AgriculturalResearch Council (ARC) of South Africa. A rainfall collector was attached to the au-10
tomatic raingauge in the community weather station to collect rainwater for analysis ofisotopic composition of 18O and 2H. The collector comprised six-400 ml bottles whichfilled sequentially during a rainfall event. The community members assisted in takingand labeling of the rainwater samples after a rainfall event and emptied the bottlesto allow fresh rainwater samples to fill the bottles during a subsequent rainfall event.15
Since their installation, each of the two weather stations was maintained by the ownerof the commercial farm and the local community, respectively. Some of the communitymembers participated in the fencing of the community weather station and maintainedtidiness within and on its surroundings. Fencing of the weather station is only meant tosafeguard the instrumentation against the cattle which graze freely, especially during20
the winter season. The security of the weather station is entrusted to the goodwill of thelocal community, through the traditional leadership of the community and the goodwillgenerated by the participatory approach. Recording of climatic data in the two weatherstations was done at a time step of 15 min and the data accessible to all researchersin the ARC, the SSI programme and any other interested stakeholder.25
3.6 Runoff plots
A standard runoff plot, as described by the Soil Conservation Services, measures22.13 m long with an appropriate width of greater than 2 m on a slope of 9%. Such
3809

HESSD4, 3793–3837, 2007
Establishment of acatchment
monitoring network
V. M. Kongo et al.
Title Page
Abstract Introduction
Conclusions References
Tables Figures
J I
J I
Back Close
Full Screen / Esc
Printer-friendly Version
Interactive Discussion
EGU
runoff plots are used in estimating the soil erodibilty factor in the Universal Soil LossEquation-USLE (Wischmeier and Smith, 1978). One of the research themes in the SSIresearch programme was aimed at investigating the hydrological processes at fieldscale (<1 hectare) and hence runoff plots were used for this purpose as controlledmicro catchments. Eighteen runoff plots, under different treatments, i.e. agricultural5
management practices, were installed in three different smallholder farms, on similarslopes, in an effort to carry out water balance studies at the field scale (smallholderfarms) and to investigate the influence and impact of different tillage and agriculturalpractices i.e. water use innovations, on surface runoff generating characteristics in thecatchment. The experimental design entailed installing a runoff plot in each conserva-10
tion agricultural practice (treatment) in the three smallholder farms and monitoring thesurface runoff, volumetric soil moisture content, soil hydraulic characteristics, crop tran-spiration rates, crop phenological properties and biomass production. The 18 runoffplots were designed while taking into account the rainfall intensities in the area. Modi-fied USLE plots were installed with dimensions of 10 m long and 2.45 m wide. Strips of15
0.245 m wide galvanized sheet metal were used to demarcate the area of each runoffplot.
A fundamental parameter that had to be determined before the installation of therunoff plots was the general slope of individual smallholder farms. This was donethrough a leveling survey exercise. A contour map for each field where the runoff plots20
were to be installed, was created and general slopes estimated. These slopes wherefound to range from 2–4%. Four sites were identified for the installation of the 18runoff plots, three of them being managed by smallholder farmers in the catchment.The fourth site was a controlled research site where experimental set up and trials,similar to the farmer managed trials, were carried out in an effort to compare and25
validate the results from the farmer managed trials. Figure 5 shows a set of runoff plotsat the controlled research site in the catchment while Fig. 6 shows runoff plots in asmallholder farmer’s field (farmer managed trial).
3810

HESSD4, 3793–3837, 2007
Establishment of acatchment
monitoring network
V. M. Kongo et al.
Title Page
Abstract Introduction
Conclusions References
Tables Figures
J I
J I
Back Close
Full Screen / Esc
Printer-friendly Version
Interactive Discussion
EGU
3.7 Tipping buckets
The flow rate of overland flow from each runoff plot was measured by use of a tippingbucket (Fig. 7), which was calibrated to hold 2 l in each bucket. The knowledge ofthe rainfall intensities in the catchment was useful in estimating the size of the tippingbuckets and subsequent calibration of the tipping volumes. The number of tips was5
recorded using a HOBO event data logger, secured in a housing (Fig. 7), and linkedto a proxy switch which was triggered at each tip. A manual counter was used as abackup data recording device. A small button-magnet was attached to one side of thetipping bucket, while a stationary proxy switch was fixed to the frame supporting thetipping buckets. As the buckets swing on their axis (oiled bearings), the proxy switch10
detects the changing magnetic field due to the movement of the magnet on the side ofthe swinging bucket. The proxy switch then sends a logging signal to the data logger.This set up eliminates “double counting” which is due to the rebounding action of thebuckets and is often observed when using manual counters.
3.8 Overland flow samplers in runoff plots for water quality analysis15
Five runoff plots in one of the experimental sites in the catchment were fitted with semi-automated sediment samplers with the objective of determining the sediment loadsfrom the different agricultural practices under investigation. The sediment samplersconsisted of flow splitting containers (flow splitters) and a sample storage tank. Theflow splitters, captured the discharge from one bucket during each runoff event. Each20
splitter, Fig. 7, was fitted with five outlet pipes of which only one pipe drained into asample holding tank, while the remaining four outlet pipes discharged to waste in adrainage channel. Thus one tenth of the total flow from the runoff plot was captured inthe sample tank. After each runoff event, and after vigorous stirring, 500 ml dischargesamples were manually taken from the sample tank and labeled by members of the25
local community for sediment load analysis and composition of stable isotopes of water.Figure 7 shows a flow splitter attached to a tipping bucket in one of the runoff plots in
3811
HESSD4, 3793–3837, 2007
Establishment of acatchment
monitoring network
V. M. Kongo et al.
Title Page
Abstract Introduction
Conclusions References
Tables Figures
J I
J I
Back Close
Full Screen / Esc
Printer-friendly Version
Interactive Discussion
EGU
Potshini. The sample tanks are emptied by the community members after the samplingexercise to allow fresh discharge to drain into the tanks in subsequent runoff events.The design of the sample collection system involved surveying the terrain of the areanear the drainage channel so as to determine the excavation depths and computingthe required capacity of the sample tanks. A simple approach was used to determine5
the tank volumes by assuming a runoff coefficient of 0.2 and using the maximum dailyrainfall event observed at the site during the prior 10 years (86 mm) and allowing for a10% freeboard volume.
3.9 Soil moisture profiling
Ongoing monitoring of the volumetric soil moisture in the Potshini catchment was im-10
plemented using a Time Domain Reflectometry (TDR) method. This involved insertinga TRIME-T3 probe into 42 mm access tubes, inserted into the soil profile to convenientdepths, and taking volumetric soil moisture content readings at different depths. Sev-eral methods have been suggested on how to insert these access tubes into the soiland one of them is by pre-boring holes with appropriate soil augers, of relatively small15
diameter, and inserting the access tubes into the augered holes. This practice was fol-lowed in the Potshini catchment. Twenty two access tubes of different depths rangingfrom 1.2 m to 1.5 m were inserted in various sites in the 1.2 km2 upper sub-catchment.The access tubes were inserted in all of the runoff plots under different land manage-ment practices, notably conservation and conventional agricultural practices. A weekly20
monitoring exercise for volumetric soil moisture content in the Potshini catchment wasthen established where readings were taken at 30 cm intervals in all access tubes. Theweekly soil moisture data was complimented with data from Watermark sensors, wherea nest of three sensors were installed in all runoff plots in the catchment at depths of30, 60 and 90 cm and attached to a HOBO data logger with a logging time step of25
15 min. The Watermark sensors were to provide a continuous and indirect measure-ment of soil matric potential after a calibration exercise, which entailed subjecting thesensors to known soil moisture conditions.
3812

HESSD4, 3793–3837, 2007
Establishment of acatchment
monitoring network
V. M. Kongo et al.
Title Page
Abstract Introduction
Conclusions References
Tables Figures
J I
J I
Back Close
Full Screen / Esc
Printer-friendly Version
Interactive Discussion
EGU
3.10 Monitoring of shallow groundwater
Subsurface flows constitute an important component in developing a water balance fora catchment. In particular, accumulated hillslope seepage forms a shallow groundwa-ter table which contributes significantly to the total stream flow. It is therefore importantto establish its occurrence, direction of flow and possible flow rates. As highlighted in5
Kongo and Jewitt (2006), the shallow groundwater in the Potshini catchment is moni-tored via 12 shallow groundwater wells, which were installed through the collaborationand participation of the local community. Since the intensively monitored upper sub-catchment (Fig. 2b) is predominantly an agricultural area for smallholder farmers, per-mission was sought from the local leaders and individual farmers to allow the augering10
of the 100 mm diameter holes in some of the farms. The holes were drilled, on tran-sects, after a reconnaissance survey. The wells were strategically installed on siteswhere they would not interfere with the farming activities since most of the farmingoperations in the area make use of animal and or tractor drawn implements. Two tran-sects, one on each side of the catchment, were identified. The transects were more or15
less perpendicular to the general slope of the catchment. 100 mm holes were augeredto depths reaching the bedrock or confining layer, but not deeper than 3.5 m. 63 mmdiameter plastic pipes of appropriate lengths were inserted into the augered holes sothat at least 0.4 m length of the pipe protruded above the ground surface. The pipeshave thin horizontal slots machined through the pipe over their bottom 0.6 m so that20
the shallow groundwater level could be recorded in the well. To avoid clogging of theslotted perforations by the fines and clay at the bottom of the wells, a clean (washed)sand screen was packed around the outer annulus of the plastic pipes, covering theperforations to a height of 0.8 m from the bottom of the wells. For each well, the restof the well’s depth was filled with the previously augered soil material save for the top25
0.3 m, where cement mortar was cast around the 63 mm plastic pipe before a 0.4 mconcrete slab was cast at the top to a level slightly above the ground surface. Suchcement and concrete works prevent preferential flows down the external wall of the
3813

HESSD4, 3793–3837, 2007
Establishment of acatchment
monitoring network
V. M. Kongo et al.
Title Page
Abstract Introduction
Conclusions References
Tables Figures
J I
J I
Back Close
Full Screen / Esc
Printer-friendly Version
Interactive Discussion
EGU
pipe when the soils are saturated during wet seasons. Pressure transducers werethen installed in 8 of the shallow groundwater wells, after a calibration exercise, andlinked to HOBO data loggers which recorded the fluctuation of the water table at atime step of 30 min. The data loggers and their respective power batteries were se-cured in metallic safe boxes embedded in concrete to safeguard the data loggers from5
unfavorable weather conditions. The other 4 shallow groundwater wells were used tosample the shallow groundwater for composition of stable isotopes of water. Table 3summarises the observation shallow groundwater installation data. The layout of the12 shallow groundwater wells in the Potshini catchment is as shown in Fig. 2b in aprevious section of this paper.10
3.11 Monitoring of deep groundwater
Through funding from the Department of Water Affairs and Forestry (DWAF) and in col-laboration with the local community, two deep groundwater observation well sites wereidentified and subsequently sunk in the Potshini catchment. One of the wells (100 mdeep) supplied water to the local community for domestic use while the other (120 m15
deep) is useful for research purposes under the ongoing SSI research programme.It should be noted that DWAF is one of the main stakeholders of the SSI researchprogramme and is supportive of the SSI research themes especially on hydrologicalstudies and institutional development on water resources management. The existing 3domestic water supply wells (greater than 50 m deep) in the Potshini community, previ-20
ously sunk by the local authorities, complimented and expanded the spatial coverage ofmonitoring deep groundwater in the catchment including monitoring for the stable iso-topes of subsurface water. The monitoring of the deep groundwater was to contributetowards closing of the gap in defining the various components of the hydrological cy-cle in the catchment. The continued support and collaboration with the Department25
of Water Affairs and Forestry facilitated a sustainable monitoring programme of thedeep groundwater in the catchment, as part of an ongoing DWAF initiative to monitor
3814

HESSD4, 3793–3837, 2007
Establishment of acatchment
monitoring network
V. M. Kongo et al.
Title Page
Abstract Introduction
Conclusions References
Tables Figures
J I
J I
Back Close
Full Screen / Esc
Printer-friendly Version
Interactive Discussion
EGU
groundwater in the larger Thukela river basin (Mkidze, 20062). DWAF was to continuemonitoring the deep groundwater in the Potshini catchment after the end of the SSIresearch programme. Figure 8 shows the borehole log information for the 120 m deepgroundwater observation well in the Potshini catchment.
3.12 Electrical Resistivity Tomography (ERT) survey5
Geophysical electrical resistivity tomography techniques are non-destructive tech-niques that provide a pseudo-section of apparent or effective resistivity of the subsur-face. These pseudo-sections are then inverted to provide an interpretation of the actualresistivity distribution in a 2-D section of the subsurface. The 2-D Electrical ResitivityTomography (ERT) surveys in the Potshini catchment was carried out with the objec-10
tive of characterizing the occurence of subsurface water. The method is useful both asa means of rapid site reconnaissance that can provide information on the subsurfacestructures and facilitates the extrapolation of observed data, e.g. observed groundwa-ter levels, between observation points. This can only be done where sufficient sitecorrelations have been established between the observed data being extrapolated and15
the information derived from the geophysical survey. The ERT methodology, as appliedin the Potshini catchment, is aimed at augmenting and up-scaling the monitoring of thepoint-shallow groundwater in the Potshini catchment using shallow groundwater wellsto a relatively larger spatial extents and depths. Six transects in the catchment wereidentified for the ERT survey; 2 of which coincided with the shallow groundwater well20
transects on the right and left bank of the stream as indicated in Fig. 9. Resistivitysurveys were carried out in collaboration with the local community where permissionwas sought from the local leaders and individual owners of the parcels of land wherethe survey transects were to pass through. The resistivity meter that was available forthis research study was the ABEM Terrameter system with four cables of 100 m long.25
2Mkidze, S.: Personal communication, KwaZulu-Natal Provincial Department of Water Af-fairs and Forestry-Durban, 2006.
3815

HESSD4, 3793–3837, 2007
Establishment of acatchment
monitoring network
V. M. Kongo et al.
Title Page
Abstract Introduction
Conclusions References
Tables Figures
J I
J I
Back Close
Full Screen / Esc
Printer-friendly Version
Interactive Discussion
EGU
Most of the smallholder farmers were eager to have the ERT survey transects pass-ing through their farms so that they could get to know the sub-surface profiling of theirfarms, especially the occurrence of groundwater. In an effort to characterize the hydro-logical processes in the catchment, the resistivity survey was scheduled to be carriedout during the wet and dry season of each year.5
During the initial ERT surveys, an electrode spacing of 1 and 5 m was used for map-ping shallow (<10 m) and deep (up to 60 m) subsurface resistivites respectively. Eachtransect was 400 m long and a total of 81 electrodes were used. The Wenner Log pro-tocol, which is sensitive to vertical changes in the subsurface resistivity (Loke, 2003)was used in the survey exercise. It is worthy noting that the resistivity survey was also10
aimed at identifying potential sites for sinking 2 deep observation groundwater wells inthe catchment in collaboration with the Department of Water Affairs and Forestry as de-scribed above. The resistivity sections were computed using the RES2DINV software,applying the 2-D inverse numerical modelling technique and optimized using standardGauss-Newton methods. Relative elevation data for each electrode on each transect15
was included in the modelling exercise to account for the effect of topography on theoccurrence of geological features (resistivities) along the respective transects.
3.13 Monitoring of total evaporation using the Large Aperture Scintillometer
According to Rockstrom (1999), in semi-arid tropical agricultural areas, direct Evapo-ration (E ) from the surface generally accounts for 30–50% while transpiration (T ) ac-20
counts for only 15–30% of total rainfall. Total evaporation (Et) is highly variable overtime and space and any effort towards enhancing the ability to confidently quantify itat large spatial scales is recognized as an important contribution in water resourcesmanagement. As highlighted in Kongo and Jewitt (2006), the challenge in determin-ing the spatial and temporal variation of Et over large areas is compounded by the25
many factors that influence its occurrence and prevalence and hence make it the mostdifficult parameter to determine in hydrology. The conventional approaches for quanti-fying Et have been based on localized point measurements which do not allow for flux
3816

HESSD4, 3793–3837, 2007
Establishment of acatchment
monitoring network
V. M. Kongo et al.
Title Page
Abstract Introduction
Conclusions References
Tables Figures
J I
J I
Back Close
Full Screen / Esc
Printer-friendly Version
Interactive Discussion
EGU
estimation over large geographical areas. These approaches include direct measure-ments (evaporation pan, Lysimeters etc.), climatic stations (eddy correlations, Penman,Bowen ratio etc.) and hydrological models (water balance).
The Large Aperture Scintillometer (LAS) is an instrument that measures the turbu-lent intensity of the refractive index fluctuations of air from the intensity fluctuations5
of a received signal (Kohsiek and Herben, 1983; Andreas, 1989; Hill, 1992; Cain etal., 2001). This signal is transmitted by a light source placed at a set distance apart(typically less than 10 km). Figure 10 shows the receiver station of the Large ApertureScintillometer at the Potshini catchment. At the receiver the spatial turbulent intensity
is measured as a refractive index structure parameter C2n (m−2/3) which can be related10
to the structure function parameter of temperature C2T (K2 m−2/3). Additional data on
temperature, pressure and humidity are necessary to compute the structure functionparameter of temperature which can then be converted to sensible heat flux (Kite andDroogers, 2000). With known net radiation and soil heat flux, the latent heat flux canbe computed as a residual in the energy balance equation as indicated in Eq. (7).15
λEt = Rn − H − G (7)
where λE t is the latent heat flux (W m−2), Rn is the net radiation (W m−2), H is the sen-sible heat flux (W m−2) and G is the soil heat flux (W m−2). The total evaporation canthen be computed from the latent heat flux. The measurement of total evaporation inthe Potshini catchment using scintillation techniques started in early 2006, though the20
exercise was interrupted briefly after the LAS was struck by lightning. The installationand siting of the LAS was done in collaboration with the local community in the Potshinicatchment. Both the transmitter and the receiver were stationed at homesteads in thecommunity, and the owners volunteered to maintain and protect the respective instru-mentation. Nevertheless, it is useful to note that the whole community was involved25
during the initial stages of installing the LAS through community meetings which weremobilised by the local leadership. As was the case with other installations in the catch-ment, the goodwill of the community was sought with regard to the safety and security
3817
HESSD4, 3793–3837, 2007
Establishment of acatchment
monitoring network
V. M. Kongo et al.
Title Page
Abstract Introduction
Conclusions References
Tables Figures
J I
J I
Back Close
Full Screen / Esc
Printer-friendly Version
Interactive Discussion
EGU
of this state of the art instrument.
3.14 Remote sensing
There are many applications of remote sensing in water resources management includ-ing hydrogeologic mapping, landuse change studies, estimation of total evaporation,mapping and monitoring of wetlands etc. The main application of remote sensing in the5
ongoing study will be the estimation of total evaporation in the Potshini catchment andthe Thukela river basin using the energy balance method. The Surface Energy BalanceAlgorithm for Land (SEBAL) (Bastiaanssen et al., 1998a, b; Bastiaanssen, 2000) will beapplied and validated in the Potshini catchment and Thukela river basin. As highlightedin Kongo and Jewitt (2006), the SEBAL was initially applied in the Potshini catchment10
and beyond using Landsat-TM data and more analysis is to be carried out using thefreely available satellite data. SEBAL is an energy partitioning algorithm comprised oftwenty-five computational sub-models that calculate Et and other energy exchangesat the earth’s surface. The algorithm computes most essential hydro-meteorologicalparameters from a satellite image and requires limited ground based meteorological15
data (Farah and Bastiaanssen, 2001). Only incoming solar radiation, air temperatureand wind speed data are required. SEBAL estimates Et as the residual of an energybalance (similar approach as in the scintillation technique) applied to the land surfacefor each pixel of the satellite image. The application of the scintillation techniques inestimating total evaporation in the catchment forms an intermediate observation and20
calibration scale for the SEBAL estimates in the catchment and beyond. Table 4 in-dicates some of the potential satellite data available for the SEBAL analysis in theongoing study.
3818

HESSD4, 3793–3837, 2007
Establishment of acatchment
monitoring network
V. M. Kongo et al.
Title Page
Abstract Introduction
Conclusions References
Tables Figures
J I
J I
Back Close
Full Screen / Esc
Printer-friendly Version
Interactive Discussion
EGU
4 Conclusion
Catchment monitoring is the fundamental approach to understanding the various hy-drological processes in a catchment. Using this understanding, researchers formulatecatchment responses which aid in water resources management. The authors havehighlighted and underscored the importance of applying Participatory Research tech-5
niques in hydrological research studies where other stakeholders are involved. Thefeedback process where various stakeholders were updated on the research activitiesincluding visual interpretation of the data collected from the catchment monitoring net-work proved to be a useful tool in instilling a sense of ownership to the local communitywhile the other stakeholders appreciated their contribution and participation in the SSI10
research programme. The experience drawn from establishing the catchment moni-toring network in Potshini, a rural community in Bergville District in South Africa, hasproved that there are more opportunities and gains (both material and ideas) to benefitfrom involving other stakeholders. The level and stage of participation of each stake-holder differs but ultimately contributes to the success of such a process. The Potshini15
catchment monitoring network has several permanent structures and instrumentationwhich will benefit other researchers for a long period of time. The structures and instru-ments have been installed in individual farms belonging to willing smallholder farmersin the Potshini community. A number of the farmers have volunteered to monitor someof the hydrological processes and take readings accordingly. The traditional leader-20
ship in Potshini agreed to host and support the SSI research programme and the localleaders (elected) facilitated, to a great extent the linking of the SSI researchers to thelocal municipality officials while the extension personnel from the Department of Agri-culture in Bergville District and the ARC-Landcare project in Bergville played a key rolein linking the SSI research programme with other similar projects and stakeholders in25
the Bergville district and beyond. Furthermore we have shown that the participation ofa local, relatively poorly educated community in a hydrological monitoring programmeneed not compromise the quality of the scientific endeavour nor the level of sophistica-
3819

HESSD4, 3793–3837, 2007
Establishment of acatchment
monitoring network
V. M. Kongo et al.
Title Page
Abstract Introduction
Conclusions References
Tables Figures
J I
J I
Back Close
Full Screen / Esc
Printer-friendly Version
Interactive Discussion
EGU
tion of the instrumentation used. The participatory process of establishing the Potshinicatchment monitoring network has emerged as a positive impact to the local com-munity and other stakeholders with regard to appreciating the research findings andabove all, the ability to sustain the goodwill of the local community in safeguarding theinstruments and structures comprising the network.5
Acknowledgements. The work reported here was undertaken as part of the Smallholder Sys-tem Innovations in Integrated Watershed Management (SSI) Programme funded by the Nether-lands Foundation for the Advancement of Tropical Research (WOTRO), the Swedish Inter-national Development Cooperation Agency (SIDA), the Netherlands Directorate-General ofDevelopment Cooperation (DGIS), the International Water Management Institute (IWMI) and10
UNESCO-IHE Institute for Water Education and Stockholm University (SU). The authors aregrateful for the goodwill and support from the Potshini community, the District Department ofAgriculture and Environment office in Bergville, Department of Water Affairs and Forestry inKwaZulu-Natal Province, the Okhalhamba Municipality and the Agricultural Research Councilof South Africa.15
References
Ackers, P., White, W. R., Perkins, J. A., and Harrison, A. J. M.: Weirs and flumes for flowMeasurement, Wiley Interscience Publication, 384 pp., 1978.
Andreas, E. L.: Two-wavelength method of measuring path-averaged turbulent surface heatfluxes, J. Atmos. Ocean Technol., 6, 280–292, 1989.20
Bastiaanssen, W. G. M., Menenti, M., Feddes, R. A., and Holtslag, A. A. M.: A remote sensingSurface Energy Balance Algorithm for Land (SEBAL), Part 1: Formulation, J. Hydrol., 212–213, 198–212, 1998a.
Bastiaanssen, W. G. M., Pelgrum, H., Wang, J., Ma, Y., Moreno, J., Roerink, G. J., and vander Wal, T.: The Surface Energy Balance Algorithm for Land (SEBAL), Part 2: Validation, J.25
Hydrol., 212–213, 213–229, 1998b.Bastiaanssen, W. G. M.: SEBAL-Based Sensible and latent heat fluxes in the irrigated Gediz
Basin, Turkey, J. Hydrol., 229, 87–100, 2000.
3820

HESSD4, 3793–3837, 2007
Establishment of acatchment
monitoring network
V. M. Kongo et al.
Title Page
Abstract Introduction
Conclusions References
Tables Figures
J I
J I
Back Close
Full Screen / Esc
Printer-friendly Version
Interactive Discussion
EGU
Cain, J. D., Rosier, P. T. W., Meijninger, W., and De Bruin, H. A. R.: Spatially averaged sensibleheat fluxes measured over barley, Agric. For. Meteorol., 107, 307–322, 2001.
Chow, T. V., Maidment, D. R., and Mays, L. W.: Applied hydrology, McGraw-Hill, 572 pp., 1988.Farah, H. O. and Bastiaanssen, W. M. G.: Impact of spatial variation of land surface parameters
on a regional evaporation: a case study with remote sensing data, Hydrol. Process., 15(9),5
1585–1607, 2001.Gilvear, D. J. and Bradley, C.: Hydrological monitoring and surveillance for wetland and
management-a UK perspective, Phys. Chem. Earth, 25, 571–588, 2000.Hill, R. J.: Review of optical scintillation methods of measuring the refractive index spectrum,
inner scale and surface fluxes, Waves and Random Media, 2, 179–201, 1992.10
Hodgson, G. A., Bartle, G. A., Silberstein, R. P., Hatton, T. J., and Ward, B. H.: Measuringand monitoring the effects of agroforestry and drainage in the ‘Ucarro’ sub-catchment, Agric.Water Manage., 53, 39–56, 2002.
Ireson, A. M., Wheater, H. S., Butler, A. P., Mathias, S. A., Finch. J., and Cooper, J. D.: Hydro-logical processes in the Chalk unsaturated zone-insights from an intensive field monitoring15
programme, J. Hydrol., 330, 29–43, 2006.Kite, G. W. and Droogers, P.: Comparing evapotranspiration estimates from satellites, hydro-
logical models and field data, J. Hydrol., 229, 3–18, 2000.Kohsiek, W. and Herben, M. H. A. J.: Evaporation derived from optical and radio wave scintilla-
tion, Appl. Optics, 22, 2566–2569, 1983.20
Kongo, V. M. and Jewitt, G. P. W.: Preliminary investigation of catchment hydrology in responseto agricultural water use innovations: a case study of the Potshini catchment-S. Africa, Phys.Chem. Earth, 31, 976–987, 2006.
Loke, M. H.: Electrical imaging surveys for environmental and engineering studies: A practicalguide to 2-D and 3-D surveys, 63 pp, available online www.abem.com, 2003.25
Lorato, N., Love, D., and Hoko, V.: Involvement of stakeholders in water quality monitoring andsurveillance system: the case of Mzingwane catchment, Zimbwabwe, Phys. Chem. Earth,31, 707–712, 2006.
Meijninger, W. M. L. and Bruin, H. R. A.: The sensible heat fluxes over irrigated areas in westernTurkey determined with large aperture scintillometer, J. Hydrol., 229, 42–49, 2000.30
Rockstrom, J.: On-farm green water estimates as a tool for increased food production in waterscarce regions, Phys. Chem. Earth, 24(4), 375–383, 1999.
Rockstrom, J., Folke, C., Gordon, L., Hatibu, N., Jewitt, G., Penning de Vries, F., Rwehumbiza,
3821

HESSD4, 3793–3837, 2007
Establishment of acatchment
monitoring network
V. M. Kongo et al.
Title Page
Abstract Introduction
Conclusions References
Tables Figures
J I
J I
Back Close
Full Screen / Esc
Printer-friendly Version
Interactive Discussion
EGU
F., Sally, H., Savenije, H., and Schulze, R.: A watershed approach to upgrade rainfed agri-culture in water scarce regions through Water System Innovations: an integrated researchinitiative on water for food and rural livelihoods in balance with ecosystem functions, Phys.Chem. Earth, 29, 1109–1118, 2004.
Schulze, R. E., Schmidt, E. J., and Smithers, J. C.: PC-based SCS design flood estimates for5
small catchments in Southern Africa, Department of Agricultural Engineering, University ofNatal, 1992.
Smith, H. J., Trytsman, G., Bloem, J. F., Everson, T., and Mthethwa, S.: Development and imple-mentation of sustainable land management practices in the Bergville district of the KwaZulu-Natal Province, Fourth progress report, Bergville/Emmaus Landcare project 2003/2004,10
2004.Wigmosta, M. S. and Burges, S. J.: An adapative modeling and monitoring approach to de-
scribe the hydrologic behavior of small catchments, J. Hydrol., 202, 48–77, 1997.
3822

HESSD4, 3793–3837, 2007
Establishment of acatchment
monitoring network
V. M. Kongo et al.
Title Page
Abstract Introduction
Conclusions References
Tables Figures
J I
J I
Back Close
Full Screen / Esc
Printer-friendly Version
Interactive Discussion
EGU
Table 1. Physical and hydrological characteristics of the Potshini catchment.
Area No. of Total length Contour Hydraulic Slope MAP(km2) contours of contours (km) interval (m) length (m) (%) (mm)
1.2 7 5.75 20 1400 10.46 675
3823

HESSD4, 3793–3837, 2007
Establishment of acatchment
monitoring network
V. M. Kongo et al.
Title Page
Abstract Introduction
Conclusions References
Tables Figures
J I
J I
Back Close
Full Screen / Esc
Printer-friendly Version
Interactive Discussion
EGU
Table 2. Summary of SCS model results.
Return period (yrs) 2 5 10 20
Design daily rainfall depth(mm) 59 81 98 117Computed curve number 74.5 74.5 74.5 74.5Runoff depth (mm) 18.4 32.8 45.2 60.0Runoff volume (thousand m3) 20.27 36.09 49.75 66.05Peak discharge (m3/s) 6.4 11.6 16.2 21.6
3824

HESSD4, 3793–3837, 2007
Establishment of acatchment
monitoring network
V. M. Kongo et al.
Title Page
Abstract Introduction
Conclusions References
Tables Figures
J I
J I
Back Close
Full Screen / Esc
Printer-friendly Version
Interactive Discussion
EGU
Table 3. Summary of the eight observation shallow groundwater installation characteristics.
Well ID Position from Column of water during Total depth of the Altitude Soil texturalthe stream installation (m) shallow groundwater well (m) (m a.s.l.) class
PRB1 1st, right bank 2.12 3.22 1308 Sandy loamPRB2 2nd, right bank 1.98 3.32 1312 Clay loamPRB3 3rd, right bank 1.24 2.84 1316 LoamPRB4 4th, right bank 0.63 3.38 1324 LoamPLB1 1st, left bank 2.06 3.32 1307 Sandy loamPLB2 2nd, left bank 1.86 3.46 1313 Loam sandPLB3 3rd, left bank 2.1 3.41 1315 LoamPLB4 4th, left bank 2.08 3.38 1328 Sandy loam
3825

HESSD4, 3793–3837, 2007
Establishment of acatchment
monitoring network
V. M. Kongo et al.
Title Page
Abstract Introduction
Conclusions References
Tables Figures
J I
J I
Back Close
Full Screen / Esc
Printer-friendly Version
Interactive Discussion
EGU
Table 4. Satellite data for SEBAL analysis in the Potshini catchment.
Imager Temporal resolution Spatial resolution (m) Archive data Availability
Landsat – TM 8 or 16 days 30 Since 1982 ClassifiedMODIS Daily 250, 500, 1000 Since 1999 FreeASTER 15 days 15 Since 1999 ClassifiedNOAA(AVHRR) Daily 1000 Since 1980 Free
3826

HESSD4, 3793–3837, 2007
Establishment of acatchment
monitoring network
V. M. Kongo et al.
Title Page
Abstract Introduction
Conclusions References
Tables Figures
J I
J I
Back Close
Full Screen / Esc
Printer-friendly Version
Interactive Discussion
EGU
Figure 1. Hydrological measurement sequence (adapted from Chow et al. 1988) with an additional participatory component indicating the role of the local community and other stakeholders in establishing the Potshini catchment monitoring network. The feed back loop indicates sharing the analysed data with the respective stakeholders
Hydrological phenomenon (e.g rainfall)
Retrieval Recover the data in the form required
Sensing Transforming the intensity of the phenomenon into an observable signal
Recording Make an electronic or paper record of the signal
Transmission Move the record to a central processing site/unit
Translation Convert the record into a computerized data sequence
Editing Check the data and eliminate errors and redundant information
Storage Archiving the data in a data base
End user
Instrumentation Setting up of a monitoring network
Input from local community and other stakeholders
Local knowledge, goodwill, participatory monitoring and recording
Feed back to the local community
and other stakeholders
Community field days, report on analysed data, share data
and information with stakeholders
Fig. 1. Hydrological measurement sequence (adapted from Chow et al., 1988) with an addi-tional participatory component indicating the role of the local community and other stakeholdersin establishing the Potshini catchment monitoring network. The feed back loop indicates shar-ing the analysed data with the respective stakeholders.
3827
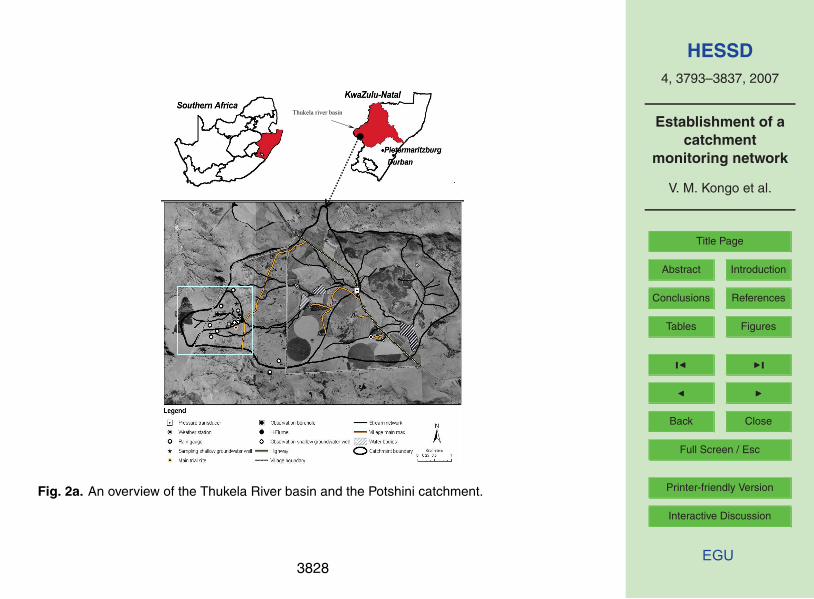
HESSD4, 3793–3837, 2007
Establishment of acatchment
monitoring network
V. M. Kongo et al.
Title Page
Abstract Introduction
Conclusions References
Tables Figures
J I
J I
Back Close
Full Screen / Esc
Printer-friendly Version
Interactive Discussion
EGU
Figure 2a. An overview of the Thukela River basin and the Potshini catchment
Thukela river basin
Fig. 2a. An overview of the Thukela River basin and the Potshini catchment.
3828

HESSD4, 3793–3837, 2007
Establishment of acatchment
monitoring network
V. M. Kongo et al.
Title Page
Abstract Introduction
Conclusions References
Tables Figures
J I
J I
Back Close
Full Screen / Esc
Printer-friendly Version
Interactive Discussion
EGU
Figure 2b. The Potshini catchment
Fig. 2b. The Potshini catchment.
3829

HESSD4, 3793–3837, 2007
Establishment of acatchment
monitoring network
V. M. Kongo et al.
Title Page
Abstract Introduction
Conclusions References
Tables Figures
J I
J I
Back Close
Full Screen / Esc
Printer-friendly Version
Interactive Discussion
EGU
Figure 3. A schematic diagram indicating the mechanism for monitoring the approach channel flow depth using a stilling well and float at the Potshini H-Flume. The width and length of the approach channel are 2.684m and 15.4m respectively
50mm x 4.6m connecting pipe sloping towards the stilling well
Stilling well
Float in the stilling well
Water level in the approach channel is same as in the stilling well
Float cable connected to a shaft encorder and a data logger
Approach channel
Fig. 3. A schematic diagram indicating the mechanism for monitoring the approach channelflow depth using a stilling well and float at the Potshini H-Flume. The width and length of theapproach channel are 2.684 m and 15.4 m, respectively.
3830

HESSD4, 3793–3837, 2007
Establishment of acatchment
monitoring network
V. M. Kongo et al.
Title Page
Abstract Introduction
Conclusions References
Tables Figures
J I
J I
Back Close
Full Screen / Esc
Printer-friendly Version
Interactive Discussion
EGU
Figure 4. An operational H-Flume in the Potshini catchment
Housing for stilling well, ISCO sampler and MCS data logger
Fig. 4. An operational H-Flume in the Potshini catchment.
3831

HESSD4, 3793–3837, 2007
Establishment of acatchment
monitoring network
V. M. Kongo et al.
Title Page
Abstract Introduction
Conclusions References
Tables Figures
J I
J I
Back Close
Full Screen / Esc
Printer-friendly Version
Interactive Discussion
EGU
Figure 5. A set of runoff plots in the controlled research site
Fig. 5. A set of runoff plots in the controlled research site.
3832

HESSD4, 3793–3837, 2007
Establishment of acatchment
monitoring network
V. M. Kongo et al.
Title Page
Abstract Introduction
Conclusions References
Tables Figures
J I
J I
Back Close
Full Screen / Esc
Printer-friendly Version
Interactive Discussion
EGU
Figure 6. A set of runoff plots under different treatments in a farmer managed trial
Tipping bucket
Drainage channel
Fig. 6. A set of runoff plots under different treatments in a farmer managed trial.
3833

HESSD4, 3793–3837, 2007
Establishment of acatchment
monitoring network
V. M. Kongo et al.
Title Page
Abstract Introduction
Conclusions References
Tables Figures
J I
J I
Back Close
Full Screen / Esc
Printer-friendly Version
Interactive Discussion
EGU
Figure 7. A flow splitter attached to a tipping bucket, showing the five outlet pipes, only one of which drains to the sample tank
Housing for HOBO data logger
Flow splitter
Fig. 7. A flow splitte attached to a tipping bucket, showing the five outlet pipes, only one ofwhich drains to the sample tank.
3834

HESSD4, 3793–3837, 2007
Establishment of acatchment
monitoring network
V. M. Kongo et al.
Title Page
Abstract Introduction
Conclusions References
Tables Figures
J I
J I
Back Close
Full Screen / Esc
Printer-friendly Version
Interactive Discussion
EGU
Figure 8. Borehole log information including the lithology, grain size and colour for one of the deep observation groundwater wells in the Potshini catchment
29-36m dark brown fine grained siltstone
36-120m grey fine grained shale
22-29m grey fine grained shale weathered
16-22m light brown fine grained clay
10-15m dark brown fine grained clay
6-10m red brown fine grained clay 3-6m yellow brown fine grained clay 0-3m brown medium grained sandy loam
15-16m dark brown grained clay
Fig. 8. Borehole log information including the lithology, grain size and colour for one of thedeep observation groundwater wells in the Potshini catchment.
3835

HESSD4, 3793–3837, 2007
Establishment of acatchment
monitoring network
V. M. Kongo et al.
Title Page
Abstract Introduction
Conclusions References
Tables Figures
J I
J I
Back Close
Full Screen / Esc
Printer-friendly Version
Interactive Discussion
EGU
Figure 9. Location of resistivity survey transects in the Potshini catchment
Fig. 9. Location of resistivity survey transects in the Potshini catchment.
3836

HESSD4, 3793–3837, 2007
Establishment of acatchment
monitoring network
V. M. Kongo et al.
Title Page
Abstract Introduction
Conclusions References
Tables Figures
J I
J I
Back Close
Full Screen / Esc
Printer-friendly Version
Interactive Discussion
EGU
Figure 10. The receiver of the Large Aperture Scintillometer in one of the homesteads in the Potshini catchment
Fig. 10. The receiver of the Large Aperture Scintillometer in one of the homesteads in thePotshini catchment.
3837