RETAIL CATCHMENT AREAS SURVEY 2004
25
SURVEY OF RETAIL CATCHMENT AREAS IN HAMMERSMITH & FULHAM 2004 Environment Department London Borough of Hammersmith & Fulham King Street London W6 9JU October 2005 1
-
Upload
khangminh22 -
Category
Documents
-
view
0 -
download
0
Transcript of RETAIL CATCHMENT AREAS SURVEY 2004

SURVEY OF RETAIL CATCHMENT AREAS IN HAMMERSMITH & FULHAM 2004 Environment Department London Borough of Hammersmith & Fulham King Street London W6 9JU October 2005
1

SURVEY OF RETAIL CATCHMENT AREAS IN HAMMERSMITH & FULHAM 2004 Table of Contents Section Page 1. Introduction 3 2. Survey Objectives 3 3. Survey Procedures 3 4. Summary of Results 4 5. Food and Grocery Shopping 5 (a) Proportions of Residents Using Each Centre 5 (b) Food Shopping Catchment Areas for First Main Centre 6 (c) Changes in Town Centre Catchments 1981-2004 7 (d) Characteristics of Food Shoppers: Means of Travel 8 : Demographic Characteristics 9 (e) Internet Shopping 12 6. Shopping for Non-Food Items 13 (a) Where People Shop for Non-food Items 13 (b) Clothing and Footwear 14 (c) Music 14 (d) Furniture 15 (e) Small Electrical Goods 15 (f) Large Electrical Goods 15 7. Town Centres 16 (a) Frequency of Visits to Town Centres 16 (b) What Residents Like About the Town Centres 17 (c) What Residents Dislike About the Town Centres 19 (d) What Facilities Residents Would Like to See Improved in Town Centres
20
(e) The Rating of Facilities in Town Centres from the Citizens Panel Survey 2004
21
8. Local Neighbourhood Facilities 23 (a) Frequency of Visits to Neighbourhood Centres 23 (b) What Residents Like About the Neighbourhood Centres 24 (c) What Residents Dislike About the Neighbourhood Centres 24
(d) What Residents Suggest as Improvements to Neighbourhood Centres
25
Martin Robson and Alan Brooks Environment Dept October 2005
2

1. Introduction As part of the process of gathering information for the new Local Development Framework process, which will involve consultation on planning issues later in 2005, a postal questionnaire survey was carried out to define the extent of the catchment areas of the Borough’s main shopping centres and to gather opinions on the Town Centres and local neighbourhood centres. Some of this data complements questions on Town Centres included in the autumn 2004 Citizens Panel Survey, and the main results from this are also included in this report. Surveys have been carried out in the past to define catchment areas within the Borough for food shopping, but this had not been done for a considerable time: Fulham was investigated in 1991, and the Borough as a whole in 1984. The current study to an extent demonstrates changes to catchments since these studies and prior to the completion of the White City Centre which will change the pattern of retailing in the Borough quite considerably. 2. Survey Objectives The survey objectives were; 1) to define the extent of the primary food shopping catchment areas1 within the
Borough 2) to define the extent of the primary catchment areas for selected non-food items
within the Borough 3) to obtain data on the three Town Centres including frequency of visit by
residents, likes and dislikes and opinions on which facilities need improving in these centres
4) to obtain data on local neighbourhood centres including frequency of visit by residents, likes and dislikes and opinions on the need for improvement in these centres
3. Survey Procedure A questionnaire was mailed to a random sample of 5,000 households in October 2004, and a reminder sent out in November. The eventual response was 1,497, or 30%, which is quite respectable for this type of survey. The response was reasonably representative, and weighting was only applied to the tenure variable. The results from any sample survey are subject to a sampling error. In the case of this survey, a response of almost 1,500 has an error of plus or minus 1.2 in a table where a value is 5%; in other words one can be 95% confident that the true value lies in the range 3.8 to 6.2. For greater values, the error margin is bigger. For a value in a table of 50%, the margin is plus or minus 2.5. This limits the degree to which one can look at groups within the population because as sample size decreases, error margins increase. 1 The primary catchment area of a centre is the area within which that centre is used for shopping by more residents than any other centre
3

4. Summary of Results The first question in the survey asked in which main shopping centre people spent most money on food and grocery shopping. The main results are: • Fulham Town Centre is used by the largest number of residents (22% of the total) • Hammersmith is next (15%), then • Tesco Brook Green (15%) • Shepherds Bush Town Centre (9%) • Sainsburys Sands End (8%) One in five people (21%) go outside the Borough for their main food and grocery shopping, such as Chiswick or Kensington High Street. One in ten people (10%) use smaller centres within the Borough for main food shopping. Getting to the Shops We found that people who mostly use smaller shopping centres usually walk (78%). The same is true of people who mostly use Fulham Town Centre (60%) and Shepherds Bush (58%). In contrast, people who mostly use Sainsburys in Sands End tend to go by car (67%) and only one in four walk (24%). The Internet At the moment only 3% of Borough residents, or 1 in 33, do most of their shopping on the internet although one in eight (12%) sometimes use it. Shopping Other than Food The Borough does not seem to be a major attraction for buying things other than food. Hammersmith does best in sales of clothing in that a quarter (25%) of residents use it as their main centre, but for music, furniture and electrical items, most trips appear to be to places outside the Borough. Residents Opinions of the Town Centres Residents told us that what they liked most about Hammersmith centre is • The variety of shops, M&S and the evening entertainment What they liked most about Fulham centre is • The pubs, restaurants, entertainment and the street market What they liked most about Shepherds Bush centre is • Entertainment and the market Residents also told what they disliked and in Hammersmith this included rubbish and dirt and traffic. In Fulham this included poor variety and lack of parking. In Shepherds Bush it included rubbish and dirt and poor variety of shops. In all three Town Centres residents want to see • Improvements to the range of shops other than food • Improvements to the markets Also, • Improvements to food shopping and restaurants in Shepherds Bush
4

Main Survey Results 5. Food and Grocery Shopping (a) Proportions of Residents Using Each Centre The first question on the survey questionnaire was: ‘Which are the two main shopping centres, streets or supermarkets where you spend most money on grocery shopping (ie food and small household items)? Table 1 shows the main results from this. Table 1: The Main and Second Centre Used by Residents for Food and Grocery Shopping
First main centre, street, parade or supermarket
Second main centre, street, parade or supermarket
Hammersmith Town Centre 14.8 20.2 Fulham Town Centre 21.6 20.1 Shepherds Bush Town Centre 8.5 8.9 Tesco Brook Green 15.4 6.5 Sainsbury’s Sands End 7.7 3.0 Out of Borough 21.4 17.5 Small centres 9.5 13.3 Other 1.0 10.5 (% of respondents) The first main shopping centre for food and groceries with the highest number of responses from the survey is Fulham Town Centre which is used by over a fifth of Borough residents (22%). The second main centre, used by 15% of residents as their main centre, is a single large supermarket, Tesco in Brook Green that is located close to Hammersmith Town Centre. Hammersmith Town Centre is the third main centre, with a similar proportion of residents, and Shepherd’s Bush Town Centre is the fourth main centre, used by one in twelve residents. Sainsburys in Sands End attracts one in thirteen. Centres outside the Borough collectively draw over one fifth of Borough residents as their main centre (21%). Of residents who use centres outside the Borough as their main centre, three quarters go to five centres, all adjacent to the Borough, which are, in order: - Tesco, Cromwell Road in Kensington - Chiswick - Putney - Asda, Park Royal - Acton
5

Fig 1: Households by Shopping centres for Food and Grocery
0.0
5.0
10.0
15.0
20.0
25.0
HammersmithTown Centre
Fulham TownCentre
ShepherdsBush Town
Centre
Tesco BrookGreen
SainsburysSands End
Out of Borough Small centres Other
First maincentre, street,parade orsupermarket
Secondcentre, street,parade orsupermarket
(b) Food Shopping Catchment Areas for First Main Centre Respondents’ postcodes are allocated to small geographical areas called Super Output Areas (SOAs), which are areas used in the Census. Each SOA is allocated to the main centre that residents within that SOA use, and this is how Map 1 is constructed. Fulham Town Centre has the largest and most distinct catchment, larger than the other two Town Centres of Hammersmith and Shepherd’s Bush. The ‘Out of Borough’ catchment is broken into four separate areas: • Tesco on Cromwell Road in Kensington • Putney • Chiswick • Asda (Park Royal) Catchment areas are in general fairly continuous areas around a centre, extending in the directions of transport routes. The Fulham Town Centre catchment covers a large part of Fulham but in the south is displaced by Putney which is more accessible to residents near Putney Bridge, and Sainsburys in Sands End. The other Town Centre catchments, Hammersmith and Shepherds Bush, are more tightly drawn around those centres. Tesco in Brook Green captures a considerable market in between the two, and both also lose out to Chiswick in the Starch Green area. In the East Acton area, smaller centres compete successfully with Shepherds Bush Town Centre.
6

(c) Changes in Town Centre Catchments for Food Shopping 1981 - 2004 There have been previous retail surveys carried out in 1981, 1984 and 1990 (for Fulham Town Centre only). Catchment areas based on ward boundaries were created in 1981, 1984 and 1990 whereas in the current survey Super Output Areas (SOAs) are used, to show more detail. Maps 2 to 4 show the change in the extent of catchments areas from 1981 to 2004 for the three Town Centres. Although the current survey does not use Wards as a basis (the boundaries of which have changed anyway), it is possible to make some assessment of the change in shopping patterns. The primary food catchment areas of all three town centre catchments appear to have shrunk over the 1981 to 2004 period. Most of this has been due to the opening of the two large edge of town superstores. In Fulham, Sainsburys in Townmead Road opened in 1989 which has captured much of the market in south Fulham, and in Shepherds Bush Tesco in Shepherds Bush Road opened in 1995, and this has captured much of the Brook Green/ Addison area from both Shepherds Bush and Hammersmith Town Centres. In Shepherds Bush the size of College Park & Old Oak Ward as a geographical unit in previous surveys has obscured the detail of what has happened to the catchment area to the north of the Town Centre, though it may well have remained fairly stable in that direction in the past 20 years. Hammersmith however does appear to have contracted, with competition from both Tesco and Chiswick.
7

(d) Characteristics of Food Shoppers Means of Travel The majority of people who use smaller shopping centres as their main centre usually walk (78%) as Fig 2 demonstrates. The same is true of people who mostly use Fulham Town Centre (60%) and Shepherds Bush (58%). In contrast, most people who use Sainsburys in Sands End tend to go by car (67%), as do those who use Tesco Brook Green (51%) and less than a third walk to these centres.
Fig 2: Means of Travel to the First Centre
0.0
10.0
20.0
30.0
40.0
50.0
60.0
70.0
80.0
90.0
WalkBusCarTubeOther
Walk 51.4 59.7 57.5 31.8 23.6 18.1 77.5 45.5
Bus 32.5 16.4 26.7 12.7 10.0 23.2 8.7 27.3
Car 9.4 18.4 9.2 50.9 65.5 54.0 10.9 18.2
Tube 3.8 1.0 3.3 0.0 0.0 3.4 2.9 0.0
Other 2.8 4.6 3.3 4.5 0.9 1.3 0.0 9.1
Hammersmith TC Fulham TC Shepherds
Bush TCTesco Brook
GreenSainsburys Sands End Out of Borough Small centres Other
Residents’ means of travel to the shopping destination listed as their second main centre is quite similar to the their means of travel to their main centre, as Fig 3 shows. The main exception is that higher proportions of residents using Town Centres as their second choice shopping centres go by bus rather than walk, presumably because they live further away than they do from their first choice centre. In 1990 a shopping survey was carried out in Fulham. Table 2 shows the proportion of people walking to both Fulham Town Centre and to Sainsburys in Townmead Road have increased over the 14 year period while the proportion of those driving to both have decreased. Use of public transport to Sainsburys has stayed the same but for the Town Centre it has dropped a little. Table 2: Main Means of Travel to Fulham Town Centre and Sainsburys Sands End Means of
Travel1990 2004 1990 2004
Walk 51.0 59.7 13.0 23.6Car 23.0 18.4 74.0 65.5Bus/Tube 21.0 17.4 10.0 10.0Other 5.0 4.6 4.0 0.9
Fulham Sainsburys Sands End
(% of respondents)
8
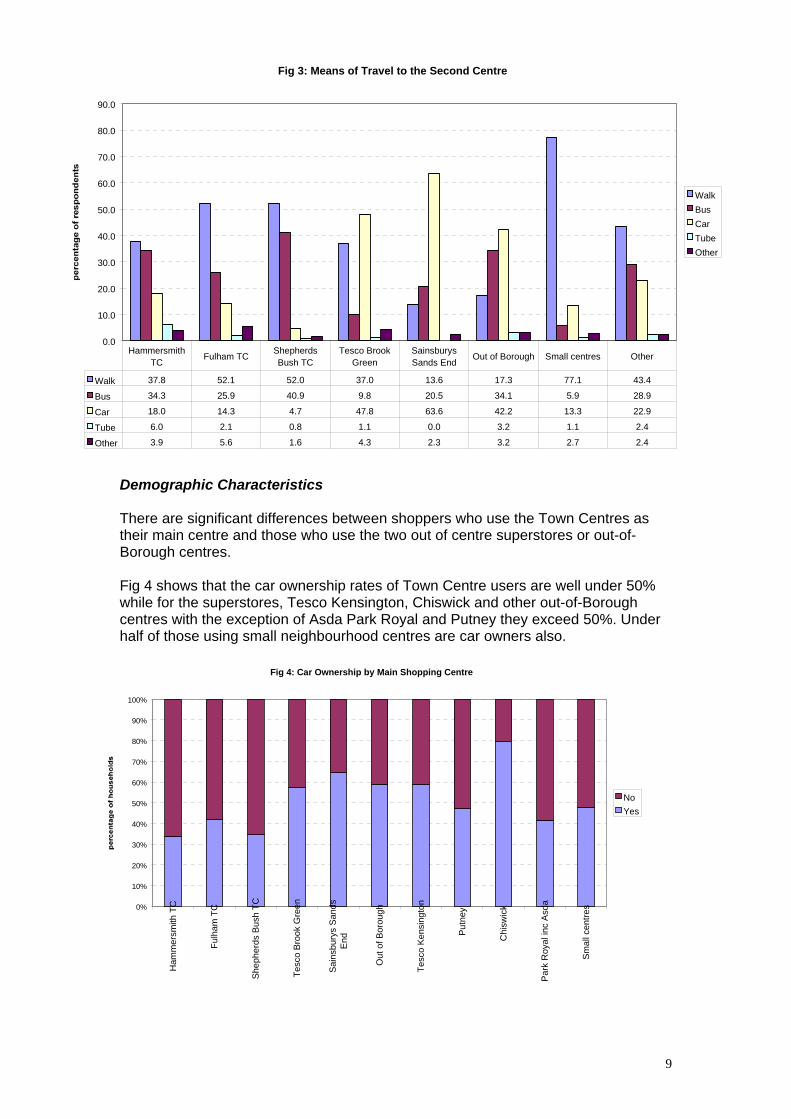
Fig 3: Means of Travel to the Second Centre
0.0
10.0
20.0
30.0
40.0
50.0
60.0
70.0
80.0
90.0
WalkBusCarTubeOther
Walk 37.8 52.1 52.0 37.0 13.6 17.3 77.1 43.4
Bus 34.3 25.9 40.9 9.8 20.5 34.1 5.9 28.9
Car 18.0 14.3 4.7 47.8 63.6 42.2 13.3 22.9
Tube 6.0 2.1 0.8 1.1 0.0 3.2 1.1 2.4
Other 3.9 5.6 1.6 4.3 2.3 3.2 2.7 2.4
Hammersmith TC
Fulham TC Shepherds Bush TC
Tesco Brook Green
Sainsburys Sands End
Out of Borough Small centres Other
Demographic Characteristics There are significant differences between shoppers who use the Town Centres as their main centre and those who use the two out of centre superstores or out-of-Borough centres. Fig 4 shows that the car ownership rates of Town Centre users are well under 50% while for the superstores, Tesco Kensington, Chiswick and other out-of-Borough centres with the exception of Asda Park Royal and Putney they exceed 50%. Under half of those using small neighbourhood centres are car owners also.
Fig 4: Car Ownership by Main Shopping Centre
0%
10%
20%
30%
40%
50%
60%
70%
80%
90%
100%
Ham
mer
smith
TC
Fulh
am T
C
She
pher
ds B
ush
TC
Tesc
o B
rook
Gre
en
Sai
nsbu
rys
San
dsE
nd
Out
of B
orou
gh
Tesc
o K
ensi
ngto
n
Put
ney
Chi
swic
k
Par
k R
oyal
inc
Asd
a
Sm
all c
entre
s
NoYes
9

A corresponding pattern is seen in the tenure of shoppers by centre as shown by Fig 5.
Fig 5: Tenure by Main Shopping Centre
0%
20%
40%
60%
80%
100%H
amm
ersm
ith T
C
Fulh
am T
C
She
pher
ds B
ush
TC
Tesc
o B
rook
Gre
en
Sai
nsbu
rys
San
dsE
nd
Out
of B
orou
gh
Tesc
o K
ensi
ngto
n
Put
ney
Chi
swic
k
Asd
a (in
c P
ark
Roy
al)
Sm
all c
entre
s
OtherCouncil rentedHou Ass/TrustPrivate RentedOwner Occupier
Those using the Town Centres or Asda Park Royal tend to have higher rates of limiting long-term illness (Fig 6).
Fig 6: Limiting Long Term Illness (LLTI) by Main Shopping Centre
0%
20%
40%
60%
80%
100%
Ham
mer
smith
TC
Fulh
am T
C
She
pher
ds B
ush
TC
Tesc
o B
rook
Gre
en
Sai
nsbu
rys
San
dsE
nd
Out
of B
orou
gh
Tesc
o K
ensi
ngto
n
Put
ney
Chi
swic
k
Asd
a (P
ark
Roy
al)
Sm
all c
entre
s
No LLTIYes LLTI
10

The three Town Centres have similar proportion shoppers with no children and with children. The highest rates of shoppers with children are in Royal Park including Asda. (Fig 7).
The highest rates of shoppers in ethnic groups other than White are in Shepherds Bush and Hammersmith Town Centres. Those who use Fulham Town Centre, Sainsburys in Sands End, Putney and Chiswick have particularly low proportions (Fig 8).
Fig 8: Ethnic Groups by Main Shopping Centre
0%
5%
10%
15%
20%
25%
30%
35%
40%
Ham
mer
smith
TC
Fulh
am T
C
She
pher
ds B
ush
TC
Tesc
o B
rook
Gre
en
Sai
nsbu
rys
San
dsE
nd
Out
of B
orou
gh
Tesc
o K
ensi
ngto
n
Put
ney
Chi
swic
k
Par
k R
oyal
inc
Asd
a
Sm
all c
entre
s
WhiteMixed ethnic originChinese/otherBlack/black BritishAsian/Asian British
Fig 7: Households with children by Main Shopping Centre
0%
10%
20%
30%
40%
50%
60%
70%
80%
90%
100%
Ham
mer
smith
TC
Fulh
am T
C
Shep
herd
s Bu
sh T
C
Tesc
o Br
ook
Gre
en
Sain
sbur
ys S
ands
End
Out
of B
orou
gh
Tesc
o Ke
nsin
gton
Putn
ey
Chi
swic
k
Park
Roy
al in
c As
da
Smal
l cen
tres
Z
Two or more childrenOne childNo Children
11

(e) Internet Shopping Very small proportions of respondents use the internet for food and grocery shopping. 11.6% sometimes use the Internet, whereas only 2.9% do most of their shopping on the internet. This low percentage contrasts with the 10.7% of respondents who use the internet to purchase music. These survey results show how online grocery shopping has yet to take off. Nationally, “In the fourth quarter of 2004, 52 per cent of households in the UK (12.6 million) could access the Internet from home, compared with just 9 per cent (2.2 million) in the same quarter of 1998.”2 In Hammersmith & Fulham 74% have access to the internet for personal use3. Table 3: Use of the Internet for Food Shopping Do you use the internet for shopping for food and groceries? % No, I never use the internet for food and groceries 85.4Yes, I sometimes use the internet for food and groceries 11.6Yes, I do most of my shopping for food and groceries on the internet 2.9(% of respondents) Table 4: Use of the Internet for Shopping by Tenure
Owner Occupier
Private Rented
Public rented
Other
Yes use internet for most or all food shopping
63 23 13 1
Yes use Internet for buying Music
60 37 3 0
All respondents 44 20 32 4 (% of respondents) Tenure as a proxy for affluence may be a reasonable guide to identifying internet users. Table 4 shows that 63% of internet food shoppers and 60% of internet music shoppers are owner occupiers, compared to 44% in the borough as a whole. Private renters are also over-represented among internet users, while public renters are very much under-represented. A population characteristic that may be important in understanding the use of the internet for shopping is car ownership, as those not owning car maybe more inclined to have their shopping delivered to their homes. However, residents who use the internet for food and music shopping who responded to this survey have a higher level of car ownership than the borough average, suggesting internet shopping is used more by more affluent residents. 2 Individuals accessing the Internet – National Statistics Omnibus Survey Access to Internet from home – Source - Family Expenditure Survey (April 1998 to March 2001); Expenditure and Food Survey (April 2001 onwards) 3 Citizens Panel survey Spring 2004
12

6. Shopping for Non-Food Items The survey asked residents about shopping for a selected range of non-food items: - clothing and footwear - music (CDs, DVDs, videos etc) - furniture - small electrical items (TVs, cameras, kettles etc) - large electrical items (washing machines, fridges etc) The response was variable on these questions (see Table 5), undoubtably in part depending on whether people had recently purchased such items. Response was lowest in relation to furniture and large electrical items, which of course are infrequently purchased. (a) Where People Shop for Non-Food Items It appears from Table 5 that for all the items specified people are more likely to shop from some other source than to use a shopping centre in the Borough. Other sources include most significantly out-of-Borough centres, but also internet or mail order. Borough centres score highest for music purchases where 13% of residents use Fulham Town Centre as their main destination, and 12% use Hammersmith Town Centre. However, the great majority of those who responded to the question shop outside the Borough for clothing and footwear, furniture and large electrical items. Of the Town Centres in the Borough, Hammersmith performs best in these selected non-food items: 25% of residents say they go there as their main centre for clothing and footwear, 12% for music and 17% for small electrical items. Fulham is clearly the second centre though it performs badly in clothing and footwear and electrical items. Shepherds Bush has no real draw for any of the items specified and is clearly in need of more volume comparison goods retailers. Table 5: Where People Shop for Non-Food Items
Clothing and Footwear
Music Furniture Small electrical Items
Large Electrical Items
Hammersmith TC 24.9 11.8 6.8 17.0 9.2Fulham TC 3.6 12.5 1.4 5.6 3.8Shepherds Bush TC 1.9 1.3 2.3 6.8 2.1Tesco Brook Green 0.0 0.6 0.0 0.1 0.0Sainsbury’s Sands End 0.0 0.3 0.0 0.1 0.0Out of Borough 52.2 28.2 35.6 31.0 30.9Small centres 1.0 0.3 2.1 6.3 6.0Unspecified Store Location
2.7 5.1 3.6 11.3 9.7
Internet 1.3 10.7 1.8 5.0 5.6Mail Order 3.4 0.8 3.5 1.5 3.4No response 9.1 28.5 42.8 15.4 29.2(% of respondents)
13

Fig 9: Shopping for things other than food and groceries
0.0
5.0
10.0
15.0
20.0
25.0
30.0
HammersmithTC
Fulham TC Shepherds BushTC
Small centres Unspecified Internet Mail Order
Clothing and FootwearMusicFurnitureSmall electrical ItemsLarge Electrical Items
(b) Clothing and Footwear The map showing catchment areas for clothing and footwear items (Map 5) shows the spatial domination of Hammersmith Town Centre. Many residents specify particular brands that they use, in particular Primark (5.6% of respondents) and M&S (2.4%). The draw of High Street Kensington penetrates the Borough on the east side, in Brook Green and west Kensington, and also some parts of Fulham. In the same way, in the south of the Borough, Chelsea/Kings Road and also the Peter Jones store in Sloane Square attracts many residents of South Fulham around New Kings Road. There are few parts of the Borough where the Fulham and Shepherds Bush Town Centres draw a majority for clothing and footwear. (c) Music The most noticeable feature of Map 6 is the large catchment area of Fulham Town Centre that dominates Fulham south of Lillie Road. That this is substantially due to the presence of the Virgin Megastore in the Fulham Broadway shopping centre and HMV in Fulham Town Centre. The Fulham music catchment is in fact larger than the Fulham Food catchment (Map 1) though here Sainsburys also competes. Hammersmith Town Centre also has a significant catchment, though not as large as in clothing and footwear, but Kensington High Street has little influence. Oxford Street/West End and the internet fragment these catchments and have a significant influence in Hammersmith and Shepherds Bush. The internet tends to be the most popular ‘destination’ in some areas away from the town centres. The opening of HMV in King Street in October 2005 will undoubtably cause a shift in the catchment for Hammersmith town Centre.
14

(d) Furniture An overwhelming majority of residents travel outside the borough to buy furniture. Of the 35% Out-of-Borough responses (see table 5) IKEA alone accounts for a third, or 11% of all responses, the next three largest destinations (all with approximately 3% of all residents) being Chelsea/Kings Road, Oxford Street/West End and Peter Jones. The IKEA catchment is spread across the borough in no clear pattern though most people probably go to the IKEA store in Brent Park to the north which is the nearest store for residents. Of the three Town Centres, Hammersmith has the largest catchment (there is a Habitat store); the other two have very limited influence (Map 7). (e) Small Electrical Goods Hammersmith Town Centre and Kensington High Street have a dominance in sales of small electrical goods in a similar way to clothing and footwear (Map 8). In this instance Shepherds Bush Shepherds Bush Town Centre has a more extensive catchment. The picture is less clear in the south of the borough with Fulham Town Centre, Peter Jones, Putney and Currys (Carnwath Road) vying each other as the most popular destinations. Currys in the retail park on Carnwath Road is the destination for 4% of respondents overall. (f) Large Electrical Goods For large electrical goods Currys in the retail park on Carnwath Road is the destination for 5% of respondents overall, only slightly more than for small electrical items but in fact the catchment area is more extensive (Map 9). Likewise the Peter Jones catchment is much more expansive for larger electrical items; its share of respondents rises from 6% for small electrical items to 9% for large ones. The catchment of Out-of-Borough destinations which are not adjacent to the Borough is also larger. John Lewis on Oxford Street has double its percentage of respondents and increases the number of areas where it is the most popular destination. Responses where the brand of the store is known but the location is unspecified grow significantly to further cloud the picture of this already fragmented catchment area distribution.
15

7. Town Centres (a) Frequency of Visits to Town Centres Residents were asked how often they visited the Town Centres for shopping or to use local services including restaurants. Hammersmith is the most frequently visited Town Centre, with almost one in two residents visiting it at least once a week (Fig 10 shows 42%, with 6% giving no response). In comparison, one in three visit Fulham at least once a week, and one in four visit Shepherds Bush. Only around one in seven (14%) say they never visit Hammersmith, but in the case of Shepherds Bush this figure rises to four in ten (40%). Of course, this is partly a matter of accessibility (for example, it is not particularly easy to get to Shepherds Bush from Fulham) and volume of local employment in a centre but it certainly also reflects the attractiveness or draw of each centre for shopping and other services. Those who never visit Hammersmith and Shepherds Bush Town Centres have a higher propensity to be owner occupiers (60% and 54% respectively) than the Borough average, and to be car owners (59% and 58%), and to be of White ethnic origins.
Fig 10: Frequency of Visit to Town Centres for shopping or use other services including restaurants
0.0
5.0
10.0
15.0
20.0
25.0
30.0
35.0
40.0
45.0
Three or more times a weekTwice a weekOnce a weekOnce a fortnightOnce a monthLess than once a monthNeverno response
Three or more times a week 15.5 15.2 10.2
Twice a week 11.4 9.5 7.2
Once a week 15.4 10.0 6.9
Once a fortnight 9.3 6.4 4.0
Once a month 10.8 6.0 6.4
Less than once a month 17.1 13.9 14.3
Never 14.3 28.4 39.6
no response 6.2 10.6 11.5
Hammersmith TC Fulham TC Shepherds Bush TC
16

(a) What Residents Like About the Town Centres Residents were asked for their opinion on what were the main attractions for them in each of the Town Centres. Multiple responses were allowed. The results for each centre are shown in Tables 6-8. In the tables, “Nothing” was an actual written answer given by people. “Nothing” has been interpreted as meaning there are no attractions for the respondent in the Town Centre in question. Shepherds Bush is the most popular Town Centre for entertainment, with 15% of residents saying this was what they liked about it. Fulham was second (10%) and Hammersmith third (6%). On the other hand Fulham is most popular for pubs, restaurants and bars with 11% of residents saying this was what they liked compared to 6% for Shepherds Bush and 5% for Hammersmith. In Hammersmith Marks and Spencer’s and Primark are singled out as main attractions for 6% and 5% respectively, while in Fulham Waitrose is a favourite brand destination for 5% of people. Shepherd’s Bush does not have an equivalent branded destination on its list of attractions. The variety of shops on offer in a centre is more of a factor in Hammersmith than the other two centres, with 14% of residents citing this. However, in Shepherds Bush 11% refer to the market as an attraction to them, as do 9% in Fulham. Some 15% of residents say that nothing is attractive to them in Shepherd’s Bush Town Centre. It was noted above that 40% of Borough residents never visit Shepherds Bush Town Centre; and three quarters (75%) of those who say that the centre has no attractions for them never visit it. For some of these people, this may mean that they are unaware of what is in the centre. Fewer residents say that nothing is attractive to them about Hammersmith or Fulham Town Centres, and here again the majority of those that do say this are people who never visit those centres. Table 6: What People Like About Hammersmith Town Centre Response description No of responses % Variety of shops 254 14.4General Convenience 136 7.7Marks and Spencer’s 100 5.7Entertainment (inc. Cinema, Theatre, Gigs) 98 5.6Pubs, restaurants and bars 87 4.9Specific type of shops (charity, ethnic) 87 4.9Primark 81 4.6Nothing 80 4.5Near public transport 71 4.0Food and grocery shopping 65 3.7Kings Mall Shopping Centre 58 3.3Parking is good 51 2.9Other responses 595 33.7Total 1763 100.0
17

Table 7: What People Like About Fulham Town Centre Response description No of responses % Pubs, restaurants and bars 163 11.1Entertainment (inc. Cinema, Theatre, Gigs) 145 9.9Variety market 134 9.1Variety of shops 120 8.2General Convenience 104 7.1Nothing 90 6.1Food and grocery shopping 73 5.0Waitrose 70 4.8Don't Shop here 68 4.6Specific type of shops (charity, ethnic) 65 4.4Other responses 438 29.8Total 1470 100.0 Table 8: What People Like About Shepherds Bush Town Centre Response description No of responses % Nothing 161 14.8Entertainment (inc. Cinema, Theatre, Gigs) 160 14.7Variety market 115 10.6Don't Shop here 65 6.0Pubs, restaurants and bars 61 5.6Variety of shops 60 5.5General Convenience 55 5.1Food and grocery shopping 52 4.8Other responses 357 32.9Total 1086 100.0
18

(a) What Residents Dislike About the Town Centres Residents were asked what they disliked about Town Centres. The first general point to make here is that for Hammersmith and Fulham Town Centres there was a greater volume of comments about likes compared to dislikes, but for Shepherds Bush the balance was more even. Poor variety of shops is cited by 14% of respondents in Hammersmith Town centre as something they dislike (Table 9), and this is referred to by 13% in relation to Shepherds Bush and 10% in relation to Fulham. The one other factor referred to in relation to the retail offer is that 5% say that Hammersmith has no quality clothing retail. One in eight (12%) say Shepherds Bush is not convenient to get to compared to 8% for Fulham and 5% for Hammersmith. This clearly has a relationship to data quoted above on frequency of visit. The perceived unsafe nature of a centre constitutes quoted 9% of responses in relation to Shepherds Bush, and 6% in both Hammersmith and Fulham. The other factors quoted in Tables 9-11 are all environmental ones. Rubbish and dirt is cited in 13% of responses in relation to Shepherds Bush, 10% in Hammersmith and 9% in Fulham. The perceived lack of parking is felt most strongly in relation to Fulham, with 10% of responses compared to 7% in Hammersmith and 6% in Shepherds Bush. A general unattractive environment is cited in 10% of responses in relation to Shepherds Bush compared to 9% in Hammersmith and 6% in Fulham. ‘Crowds’ is a factor cited in relation to Hammersmith but is not a significant issue in the other centres. Table 9: What People Dislike About Hammersmith Town Centre Response description No of responses % Poor Variety 163 13.6Rubbish/dirty 124 10.3Traffic 104 8.7Unattractive Environment 103 8.6Lack of parking 82 6.8Unsafe 67 5.6Crowds 66 5.5No quality clothes 65 5.4Nothing I don’t like 61 5.1Location (not convenient to get to) 55 4.6Other 52 4.3Other responses 257 21.4Total 1199 100.0
19

Table 10: What People Dislike About Fulham Town Centre Response description No of responses % Poor Variety 96 10.0Lack of parking 94 9.8Rubbish/dirty 89 9.3Don't shop here 78 8.1Location (not convenient to get to) 75 7.8Traffic 70 7.3Unattractive Environment 59 6.1Unsafe 56 5.8Other responses 345 35.9Total 962 100.0 Table 11: What People Dislike About Shepherds Bush Town Centre Response description No of responses % Rubbish/dirty 139 13.4Poor Variety 135 13.0Location (not convenient to get to) 121 11.6Unattractive Environment 100 9.6Unsafe 90 8.7Lack of parking 60 5.8Other responses 395 38.0Total 1040 100.0 (a) What Facilities Residents Would Like to See Improved in Town Centres Residents were asked what three facilities they would like to see improvements to in each Town Centre, with a list of items specified and a box for any other responses to be written in. The main improvement that people would like to see in all three Town Centres is an improvement in non-food shopping, as Fig 11 shows. This comment constitutes around a quarter of responses in all three centres, though the figure is lower for Hammersmith than for the other two. More respondents would like to see an improved street market in Hammersmith than in the other two town centres. The centre that attracts most responses in relation to improvements to food shopping is Shepherds Bush. Improvements to entertainment is desired by more in relation to Hammersmith than the other two centres. On the other hand Hammersmith attracts fewer responses in relation to services such as banks and building societies than the other two centres. The desire for improvements to the street market was more significant in Hammersmith (where the market had been displaced by works to Lyric Square) than Fulham or Shepherds Bush, although in Fulham this factor was also quite significant,
20

attracting 18% of responses. Satisfaction appears to be highest in relation to the market at Shepherds Bush.
Fig 11: Facilities that residents would like to see improved in the Town Centres
0.0
5.0
10.0
15.0
20.0
25.0
30.0
Hammersmith Town Centre Fulham Town Centre Shepherds Bush Town Centre
Food shopping
Non-food shopping
Street Market
Services- banks,building societies,betting shops etc
Theatre, films,entertainment
Sports, gyms, fitness
Restaurants
Pubs, bars andnightclubs
(a) The Rating of Facilities in Town Centres from the Citizens Panel Survey
2004 In November/ December 2004, just a little later than the retail survey, one of the regular Citizens Panel surveys was carried out. This was a postal questionnaire survey of 1,237 households resident in the Borough with a 54% response (667). Included in the survey were some questions that were complementary to the retail survey, including questions on people’s perception of Town Centres. Table 12: Householders’ Rating of Town Centres for Facilities in the Citizens Panel Survey % households Hammersmith Fulham Shepherds Bush High Low/ DK
don’t use High Low/ DK don’t use
High Low/ DK don’t use
Food shopping 22 24 3 32 31 5 27 32 8 Non-food shopping 20 18 3 15 33 5 11 33 8 Street market 11 32 4 28 34 4 24 31 8 Services 35 22 3 25 32 5 21 33 8 Theatre, film, entertainment
25 19 3 21 32 5 24 28 8
Sports, gym, fitness 13 35 5 15 40 6 10 43 9 Evening activities 13 29 4 18 33 5 12 33 9 Notes: Percentage Ratings do not add up to 100 because opinions which are in the categories ‘a little’, ‘not much’ or ‘don’t care either way’ are excluded from the table. ‘Services’ refers to banks, building societies, opticians, betting shops etc ‘Evening activities’ refers to restaurants, clubs, pubs, bars
21

The catchment area analysis in the retail survey demonstrated that Fulham was the most popular centre for food shopping in the Borough, with 22% of residents saying it was their main centre, and 35% visit it once a week or more. Fulham is also the most highly valued centre in the Citizens Panel survey, with 32% valuing it ‘a lot’ or highly. In fact in the above table Shepherds Bush is more highly valued for food shopping than Hammersmith (27% value Shepherds Bush highly) although in the catchment area analysis Hammersmith appears to be used by more residents (15% saying it was their main centre compared to 9% for Shepherds Bush). In accordance with catchment area results, residents value Hammersmith highest of the three centres for non-food shopping (20% rate Hammersmith highly compared to 15% for Fulham and 11% for Shepherds Bush). The street market at Fulham is the most highly rated of the three, with 28% of residents valuing it highly (Shepherds Bush 24% and Hammersmith 11%). The low rating for Hammersmith is clouded by the fact that the market was not operating at the time of the survey because of Lyric Square improvements. Residents aged 35 or over were significantly more likely to say that they valued Fulham Town Centre for the street market than those under 35. Hammersmith is the most valued centre for services including banking and so on: 35% rate it highly compared to 25% for Fulham and 21% for Shepherds Bush. Hammersmith has a higher number of service outlets than the other centres. For entertainment, the three centres have similar ratings: 25% rate Hammersmith highly, 24% Shepherds Bush and 21% Fulham. Hammersmith however has the lowest negative rating in the sense of being valued lowly or never used by only 19% of residents. This is a much lower percentage than the other two centres where nearly a third of residents give them low ratings or never use them. Fig 10 showed that Hammersmith is visited once a week or more by 42% of residents for whatever reason, compared to 35% for Fulham and 24% for Shepherds Bush. The Citizens Panel survey showed, as recounted above, that Hammersmith is the most highly valued centre for non-food shopping, services and entertainment, (though not for food shopping). It has the highest number of outlets overall in these areas, partly driven by being the major employment centre in the Borough. The three centres have similar scores have lower ratings for sports, gym and fitness facilities, partly due to the fact that not everyone in the population uses such facilities, and the three centres have similar scores in this respect. For evening activities such as restaurants, clubs, pubs and bars, Fulham has the highest rating score; 18% rate it highly compared to 13% for Hammersmith and 12% for Shepherds Bush. Residents aged under 35 were significantly more likely to say that they valued Shepherds Bush for evening activities than those aged over 35.
22

8. Local Neighbourhood Facilities The survey included a question on the main local neighbourhood parade or group of shops’ used. In response to this, 28.6% of respondents have named one of the three Town Centres and 8.4% have named a centre outside the Borough. Askew Road is the highest ranked neighbourhood centre in the Borough but this received only 3.3% of responses. Table 13: The Main Neighbourhood Centres Used by Residents Main local neighbourhood parade or group of shops % Fulham TC 14.2Hammersmith TC 12.0Out of Borough 8.4no response 6.3Shepherds Bush TC 6.0Askew Road 3.3Greyhound Road 3.2Fulham Road 2.9Blythe Road 2.6Iceland East Acton 2.6Waitrose Fulham 1.9Parsons Green 1.7Wandsworth Bridge Rd (north) 1.7Uxbridge Road East 1.6North End Road Market 1.5Other Shepherds Bush Road/ Brook Green 1.5Brackenbury 1.4Others 27.4Total 100 The Citizens Panel survey, carried out just after the retail survey, showed how highly residents value smaller local centres outside the Town Centres in that 40% of respondents value such centres in general ‘a lot’ and only 3% of respondents do not value them at all or don’t use them (the rest have less strong opinions or don’t know). (a) Frequency of Visits to Neighbourhood Centres Table 14 shows that 80% of respondents use these local shops at least once a week which is a much higher rate than residents’ visits to Town Centres. Clearly most visits relate to more frequent top-up shopping. Table 14: Frequency of Use of the Main Neighbourhood Centres Used by Residents How often do you use these local shops? % Three or more times a week 46.5Once or twice a week 33.6Less than once a week 11.1No response 8.7Note: Excludes comments made in relation to Town Centres
23

(b) What Residents Like About the Neighbourhood Centres Utilising data on neighbourhood centres only and exluding that in relation to Town Centres, general convenience and convenient location are unsurprisingly the main group of factors that people like about neighbourhood centres. Some people, albeit a minority, clearly feel that these centres meet most of their needs, citing variety, cheapness, and quality. Table 15: What People Like About Neighbourhood Centres Response description No of responses % Generally Convenient 186 11.3Food 154 9.4Location (convenient to get to) 136 8.3Specific types of shops 113 6.9Friendly 109 6.6Variety of shops 93 5.7Convenient on foot 81 4.9Near work/home 68 4.1Cheap 67 4.1Quality 65 4.0Open Late 54 3.3Fruit market 45 2.7Pubs, restaurants and bars 44 2.7Everything I need 38 2.3Others 388 23.6Total 1641 100.0Note: Excludes comments made in relation to Town Centres (c) What Residents Dislike About the Neighbourhood Centres Poor variety of shops and higher cost are the main factors that people dislike about neighbourhood centres. Table 16: What People Dislike About Neighbourhood Centres Response description No of responses % Poor Variety 233 21.8Cost/Expensive 170 15.9Nothing I don’t like 68 6.4Rubbish/dirty 61 5.7Other 39 3.6No quality clothes 30 2.8Unattractive Environment 28 2.6Others 441 41.2Total 1070 100.0Note: Excludes comments made in relation to Town Centres
24

(d) What Residents Suggest as Improvements to Neighbourhood Centres People were asked what they would suggest as improvements to neighbourhood centres, allowing completely open-ended responses. Table 17 shows the results. The main suggestions are around a wider range of shops and cleaning up and improving the environment. Table 17: What People Suggest as Improvements to Neighbourhood Centres Response description No of responses % Wider range of shops 191 18.2Clean up/improve environment 132 12.6Another supermarket 72 6.9Do Nothing 56 5.3Provide more car-parking 55 5.2Improve Safety 42 4.0Widen pavements 34 3.2Traffic 30 2.9More upmarket M&S, Waitrose 30 2.9Others 407 38.9Total 1049 100.0Note: Excludes comments made in relation to Town Centres
25