Northside Retail Market Study
88
Northside Retail Market Study September 2014 Prepared for: Prepared by: Avenue CDC 2505 Washington, Suite 400 Houston, Texas 77007
-
Upload
khangminh22 -
Category
Documents
-
view
1 -
download
0
Transcript of Northside Retail Market Study

Northside Retail Market Study
September 2014
Prepared for: Prepared by:
Avenue CDC
2505 Washington, Suite 400
Houston, Texas 77007

Northside Retail Study Houston, Texas
i
Table of Contents Introduction and Executive Summary ........................................................................................1
Introduction ............................................................................................................................................ 1
Executive Summary ................................................................................................................................. 1
Competitive Market Area (CMA) ........................................................................................................ 1
Demographic and Economic Trends ................................................................................................... 1
Existing Northside Retail Market ....................................................................................................... 2
Conclusions – Northside Retail Potential ............................................................................................ 3
Community Retail Development Strategy .......................................................................................... 6
Competitive Market Area (CMA) ................................................................................................7
Conclusions – Northside Retail Potential ............................................................................................ 7
Overview of Commercial Corridors ........................................................................................................ 10
N. Main ........................................................................................................................................... 10
Irvington ......................................................................................................................................... 10
Fulton ............................................................................................................................................. 11
Quitman .......................................................................................................................................... 12
Cavalcade ....................................................................................................................................... 12
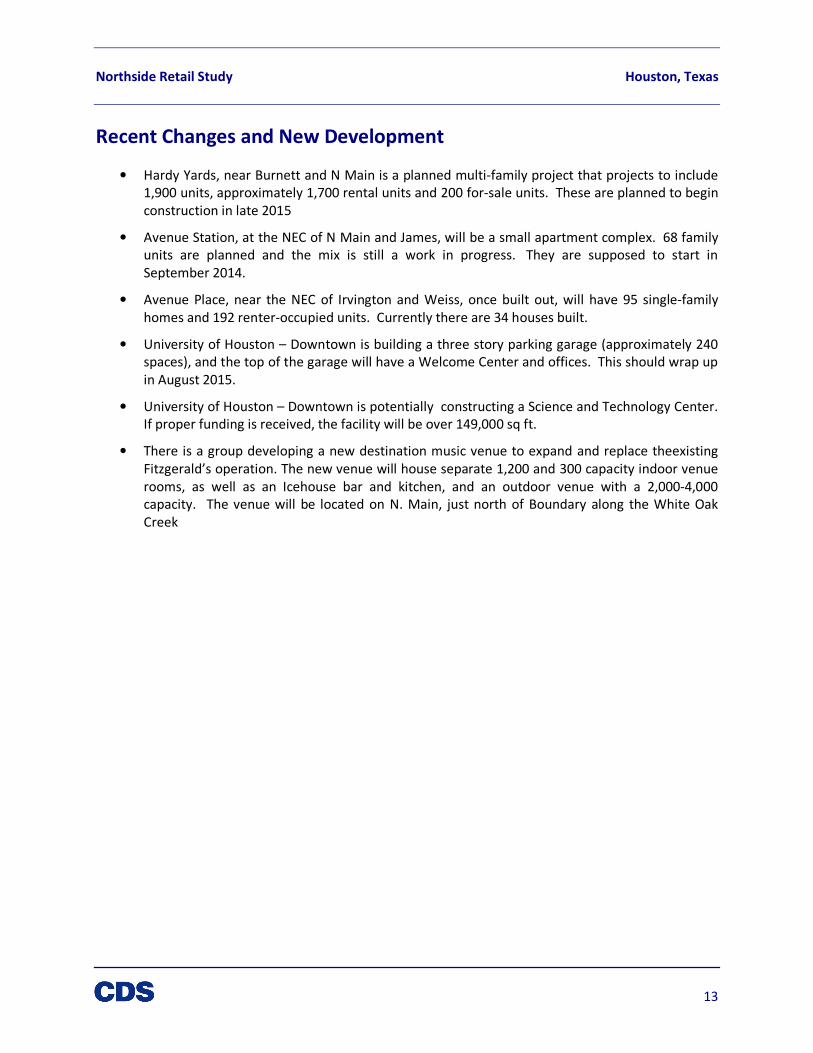
Recent Changes and New Development ................................................................................................ 13
Northside – Land Uses ........................................................................................................................... 14
North Core ...................................................................................................................................... 15
South Core ...................................................................................................................................... 15
Demographic/Economic Analysis .............................................................................................16
Historic Growth and Projections ............................................................................................................ 16
Population....................................................................................................................................... 16
....................................................................................................................................................... 17
Households ..................................................................................................................................... 17
Age Groups ..................................................................................................................................... 18
Ethnicity .......................................................................................................................................... 19
Educational Attainment................................................................................................................... 20
Household Income ........................................................................................................................... 21
Household Types ............................................................................................................................. 22
Household Tenure (Renter / Owner) ................................................................................................ 23
Psychographic Profiles ........................................................................................................................... 23

Northside Retail Study Houston, Texas
ii
Daytime Population ............................................................................................................................... 25
North Area ...................................................................................................................................... 25
South Area ...................................................................................................................................... 26
Non-Retail Commercial Activity ............................................................................................................. 27
Industrial ......................................................................................................................................... 27
Office .............................................................................................................................................. 28
Employment by Type ....................................................................................................................... 29
Long Term Area Projections ................................................................................................................... 30
Population....................................................................................................................................... 30
Households/Housing Units .............................................................................................................. 32
Employment .................................................................................................................................... 33
Summary: Key Demographic and Economic Trends ............................................................................... 34
Existing Northside Retail Market ..............................................................................................35
Retail Space and Business Inventory ...................................................................................................... 35
Businesses by Type .......................................................................................................................... 43
Retail Market Performance.................................................................................................................... 47
Retail Sales Trends................................................................................................................................. 48
Estimated Retail Leakage and Supportable Demand .............................................................................. 52
Analysis Methodology ..................................................................................................................... 52
Current Per-Household Leakage ...................................................................................................... 53
Potential Future Leakage per Household ......................................................................................... 54
CMA Leakage and Additional Supportable Retail Occupancy ........................................................... 55
Conclusions from Retail Demand Analysis ........................................................................................ 61
Findings from Interviews ..........................................................................................................62
Commercial Brokers .............................................................................................................................. 62
Northside Consumer Interviews ............................................................................................................ 63
Interview Discussion Guide and Response Summaries ...................................................................... 63
Coffee Shop Analysis ....................................................................................................................... 74
Conclusions – Northside Retail Potential..................................................................................76
General Points ....................................................................................................................................... 76
North CMA ............................................................................................................................................ 77
South CMA ............................................................................................................................................ 78
Community Retail Development Strategy ................................................................................79
Improve Existing Establishments, Especially Grocery ............................................................................. 79

Northside Retail Study Houston, Texas
iii
Attract Greater Dining Diversity ............................................................................................................. 80
Improve the Commercial Environment .................................................................................................. 80
Safety .............................................................................................................................................. 80
Parking............................................................................................................................................ 81
Streetscape and Placemaking .......................................................................................................... 81
Initiate a Community-Based Marketing Effort ........................................................................................ 82

Northside Retail Study Houston, Texas
iv
Table of Exhibits North Core and North Supplemental CMA ............................................................................................... 8
South Core and South Supplemental CMA ............................................................................................... 9
CMA Land Uses...................................................................................................................................... 14
Land Use – Study Area ........................................................................................................................... 15
Total Population Trends, 2000 - 2019 .................................................................................................... 16
Total Household Trends, 2000 - 2019 .................................................................................................... 17
Age Profiles,2014 Estimate .................................................................................................................... 18
Ethnicity Profiles, 2014 Estimate............................................................................................................ 19
Educational Attainment – Population 25 +, 2014 Estimate ..................................................................... 20
Household Income Distributions, 2014 Estimate .................................................................................... 21
Household Types, 2014 Estimate ........................................................................................................... 22
Tenure of Occupied Housing Units, 2014 Estimate ................................................................................. 23
Households by PRIZM Segment ............................................................................................................. 24
North Core and Supplemental ............................................................................................................... 25
South Core and Supplemental ............................................................................................................... 26
CMA - Industrial .................................................................................................................................... 27
Regional - Industrial ............................................................................................................................... 27
Costar Industrial Regions ....................................................................................................................... 27
CMA – Office ......................................................................................................................................... 28
Regional - Office .................................................................................................................................... 28
Costar Office Regions ............................................................................................................................ 28
Jobs By Industry Sector – North Core ..................................................................................................... 29
Population Projections .......................................................................................................................... 30
Population – Percentage Growth ........................................................................................................... 31
Households/Housing Units .................................................................................................................... 32
Employment .......................................................................................................................................... 33
Employment – Percentage Growth ........................................................................................................ 34
Population to Housing Unit Ratios ......................................................................................................... 34
Business Map – 1 of 3 ............................................................................................................................ 35
Business Map – 2 of 3 ............................................................................................................................ 36
Business Map – 3 of 3 ............................................................................................................................ 37
North Core Businesses by Type .............................................................................................................. 43
South Core Businesses by Type .............................................................................................................. 45
CMA – Retail.......................................................................................................................................... 47
Regional - Retail .................................................................................................................................... 47
Costar Retail Regions ............................................................................................................................. 47
Retail - 77009 ........................................................................................................................................ 48
Gross Sales in ZIP Code 77009 – Selected Business Categories .............................................................. 49
Gross Retail Sales 77009 ........................................................................................................................ 49
Gross Retail Sales 77009 ........................................................................................................................ 50
Total Gross Sales - 77009 ....................................................................................................................... 51
Analysis Table 1: Comparison of Sales with Expected Household Expenditures – ZIP 77009 .................. 53
Analysis Table 2: Estimation of Retail Spending per Household – South Supplemental CMA.................. 54

Northside Retail Study Houston, Texas
v
Analysis Table 3: Comparison of Sales with Expected Household Expenditures – ZIP Code 2009 Future
Gentrification Scenario .......................................................................................................................... 55
Analysis Table 4: North CMA – Current Additional Supportable Retail Space ......................................... 56
Analysis Table 5: North CMA – Future Additional Supportable Retail Space .......................................... 57
Analysis Table 6: South CMA – Current Additional Supportable Retail Space ......................................... 58
Analysis Table 7: South CMA – Future Additional Supportable Retail Space .......................................... 59
Analysis Table 8: North CMA – Sensitivty Analysis of Higher Household Growth ................................... 60
Analysis Table 9: South CMA – Sensitivty Analysis of Higher Household Growth ................................... 60

Northside Retail Study Houston, Texas
1
Introduction and Executive Summary
Introduction
In Spring 2014, Avenue Community Development Corporation contracted with CDS Market Research to
perform a study of the retail market in the area known as Northside, generally the area north of
Downtown Houston and inside Loop 610 between Interstate 45 and US 59. CDS has sought to:
• Describe the existing retail market quantitatively and qualitatively
• Understand the demographic and economic profile of the Northside to assess what amount of
retail its population can support, now and in a projected future scenario
• Identify key needs, if any, for additional retail investment by category of store or business type
• Work with Avenue CDC to develop a strategy for achieving reasonable retail use objectives
CDS conducted its research through the following approaches:
• Gathering data from secondary sources to build a demographic and economic profile of the area
regarding population, employment, income levels, etc.
• Investigating the area’s existing retail landscape through “windshield” research and contacting
commercial brokers, property owners, and business owners and managers
• Interviewing representative consumers about their opinions of existing retail offerings and their
typical shopping and spending habits
CDS combined the findings of this research with a quantitative analysis of retail activity to develop its
conclusions regarding the potential at present and in the future for additional retail investment.
Executive Summary
Competitive Market Area (CMA)
The Northside Competitive Market Area (CMA) consists of two parts, North and South. Each part has a
“Core Area” which comprises the most important customer base for retail activity and from which
Northside retail businesses will obtain the highest capture rates. The division between the two occurs
essentially at Hays Street. The South Core Area also includes the eastern portion of the 1st Ward along
Hogan / Crockett Street just west of Interstate 45. Each area is flanked by “Supplemental Areas” from
which it is reasonable they could draw additional spending, though at a lower capture rate than from
within the Core Areas.
Demographic and Economic Trends
1. The North Core Area currently has a population estimated around 13,000; the South Core Area,
approximately 16,000. In terms of households, the North Core Area has approximately 4,300, the
South Core Area 5,100.
2. Moderate growth in population and households (around 7% in the North Core Area, 2%-3% in the
South Core Area) within the Core Areas is expected through 2019. The rate of household growth
will be somewhat higher than population growth, as existing larger or family households are

Northside Retail Study Houston, Texas
2
replaced with smaller one or two-person households. However, growth rates could be significantly
larger if residential development and redevelopment occurs that is at much denser levels than the
existing low-density environment.
3. The CMAs represent an area of concentrated Hispanic population at present. This population is
typified by limited education levels and lower incomes compared to the population of the wider
region; much of its residents could fairly be called “working class.” However, nearby areas, most
notably the South Supplemental Area, feature a population that is more likely to have attended
college, earns higher annual income, and is much less likely to be Hispanic than the Core Area
population and households. CDS believes that the South Supplemental Area is more representative
of what the profile of the North and South Core Areas will be in the future, given existing trends of
gentrification affecting adjacent areas of the urban core.
4. Employment is estimated most recently at between 5,000 and 6,000 jobs within the North Core plus
Supplemental Area and over 17,000 in the South Core plus Supplemental Area. These roughly
represent a daytime population which can also contribute spending at retail businesses. The jobs in
the area generally have moderate pay scales.
Existing Northside Retail Market
1. CDS identified over 200 commercial sites housing retail and personal service businesses within the two
Core Areas.
2. A large share of businesses are located on owner-occupied sites and/or in space that is older and does
not compare to standard newer-built multitenant retail space. There are a number of vacant
commercial spaces in older buildings which would likely not be considered “move-in ready.”
3. Overall, despite some older vacant spaces, the retail market is considered healthy in the Core Areas.
Lease rates are rising, though low compared to elsewhere on the west side of the urban core of the city.
Occupancies are trending higher, and absorption has been positive, since Houston’s recession years of
2009-2010.
4. The Northside’s retail sales profile (as measured by roughly corresponding ZIP Code 77009) is
dominated by General Merchandise stores (mostly dollar stores), Food and Beverage stores (grocery
stores, liquor, and convenience stores), and Eating and Drinking Places (restaurants and bars). The area
is very weak in terms of retail sales for “soft” or “comparison” goods such as Clothing and Accessories.
5. CDS’s quantitative demand analysis produced the following results:
• In the North and South Cores, the total current leakage – spending by residents estimated to
occur outside the area – is $11,247 per Household, and with the assumptions that the
expenditure levels ramp up from gentrification in the future, the leakage jumps to $13,456 per
Household, assuming that the current retail supply does not change.
• This leads to an estimate of only 53,000 square feet of new supportable retail in the North Core
currently, and even with higher expenditure and household quantity assumptions, that number
still only demands about 67,000 square feet. In the South Core, the supportable square footage
is 61,000 currently with a jump to 73,000 with increased spending and households. A significant
share of this amount, however, consists of Motor Vehicle and Parts Dealers, and new large-scale
automobile dealerships are not likely in the area.
• The analysis also showed need for General Merchandise stores. The supportable square
footage is feasible (16,000 square feet in the North Core, 18,000 square feet in the South Core)

Northside Retail Study Houston, Texas
3
for another discount store (dollar store) if centrally located within the overall Northside, where
it could draw from both the North and South CMAs.
• Clothing and Clothing Accessories show opportunites with between 8,000 – 10,000 square feet
of supportable retail in both the North and the South Cores. Health and Personal Care Stores
also show to include opportunities with 5,000 – 6,000 square feet of supportable retail in both
the North and the South Cores.
• CDS also examined the impact of improving capture rates with regard to leaked spending in both
the Core and Supplemental areas. (The results of this analysis are not displayed in table form
within the report.) Increasing the capture rates to 30% and 15% respectively for most store
types increased total supportable square footage by 46% to 48% (both current and future) - a
substantial impact.
• Nevertheless, Food and Beverage Stores had almost nonexistent needs with less than 2,000
supportable additional square footage under even the more ambitious capture rates. This is
likely due to the current presence of the two Fiesta supermarkets, the Canino Famers’ Market
(located within the North Supplemental Area and 77009), and several smaller Hispanic-oriented
meat markets. New entrants in this category would likely be taking market share away from the
existing establishments.
• Lastly, it should be noted that not necessarily all capture of leaked spending necessarily means
additional space occupancy for retail activities. Often it will simply mean increased spending at
existing establishments, which can be accomplished by improving the goods and services profile,
customer service and experience, parking, or neighborhood quality of life factors.
Conclusions – Northside Retail Potential
General Points
1. Although many of those interviewed indicated the need for more grocery options, CDS did not find
that sufficient support exists for another full-sized grocery store, currently or in the future.
Gentrification may instead lead to a push for a change in the product lines sold at and the aesthetic
trappings of the existing stores to reflect changing resident consumer tastes.
2. Opportunity appears to exist at present for a few (no more than two or three) additional small-to-
mid-sized clothing stores targeting working-class households. Examples of such stores would be
Melrose and Citi Trends. As the area gentrifies, demand for clothing stores will remain, but the
types of products sought will likely change.
3. The Northside is seemingly underserved for General Merchandise stores. The current supply
consists of dollar stores (Family Dollar, Dollar General). More stores in this vein could be
supportable. However, demand from within the area is not strong enough to justify a full-sized
General Merchandise store such as Target or Walmart, both of which have locations close to the
Northside. One possibility for a somewhat larger scale store would be Fallas Paredes, though as
gentrification occurs its target customer base will shrink.
4. Spending within Northside at restaurants and drinking places is strong thanks to Tex-Mex and
Mexican restaurants which attract spending from those who reside outside the area. While in terms
of total spending versus potential spending there appears to be a net inflow to the Northside, the
general lack of restaurant variety was noted by CDS and by interviewees. It is likely that a few

Northside Retail Study Houston, Texas
4
establishments of different cuisine – Asian or Chinese was a particularly common desire – would be
supportable in the area, provided that they target a middle-class price level. Restaurant demand,
especially for breakfast and lunch, is boosted by the area’s working class daytime population, which
helps make such ventures more sustainable than if having to rely on evening business alone.
5. A coffee shop appears to be supportable – possibly two establishments. The area is unlikely to meet
the criteria for a Starbucks or other national chain, but a local business such as the various coffee
houses in the Heights should be encouraged.
6. An important overall finding is that the population within the Northside is simply too low to warrant
significant additional retail occupancy if conservative capture rates are assumed for spending
currently leaving the area. Furthermore, population and household projections indicate relatively
modest growth (by Houston standards) going forward, so the retail demand situation is not likely to
have significant growth either – though the goods and services demanded will evolve as higher-
income households move in. Ways to counteract this issue over time would be to:
• Attract greater population density than what is currently contemplated by demographic
projections
• Address some quality of life issues which drives some potential spending away (safety and
security concerns, limited parking, limited automobile access along the Red Line, lack of
awareness by newcomers of the area’s offerings, etc.)
• Change the quality of goods offered and the shopping environment within and around stores to
appeal to consumers who can afford a choice of shopping locations
7. Given the gentrification and upscaling of retail businesses occurring immediately to the west and
south of the Northside, it is possible that individual entrepreneurs could choose to locate a new
business – most likely a restaurant or entertainment venue – within the Northside with the intention
of making it a “destination” business drawing customers from outside the area. Addressing the
issues raised in the previous point would increase the likelihood of this occurring.
8. There is only a small amount of modern space, especially multitenant retail centers, that houses the
Northside’s existing retail businesses. Many businesses are in owner-occupied properties or older,
lower-quality buildings that are not comparable with new construction. Some older properties with
vacant ground floor space, especially in the South CMA, could be attractive for occupancy by new
businesses targeting residents of the higher end of the income spectrum in the neighborhood.
However, the cost to renovate these buildings is likely substantial, income-producing uses would
need to be found for upper floors (for structures of more than one story), and the neighborhood is
still a high risk for such investments. The “destination” businesses described in the previous point
would be appropriate candidates for catalyzing investment in older structures.
9. The new light rail line has generated mixed reactions. There appears to be a significant segment of
the Northside community which now avoids the corridor due to perceived and real access
impediments, most notably the lack of left turns. This, combined with the disappearance of the
construction crews and their daytime business, has left some establishments suffering a slowdown.
Still, there is also hope in the community that the visibility and awareness created by rail service will
eventually translate into increased commercial activity on North Main and Fulton.
10. The community feel, relatable staff, independent ownership and small physical scale make
Northside retail, limited though it is, uniquely appealing for existing customers.

Northside Retail Study Houston, Texas
5
North CMA
1. The North CMA is fortunate to contain most of the Northside’s “destination” Tex-Mex and Mexican
restaurants, which bring outside traffic to the area. Other anchors include CVS and Stokes
Hardware.
2. However, the North CMA has a lower population density compared to the South, and this
contributes strongly to the lack of support for much additional retail occupancy, even if household
incomes improve significantly. The Lindale Park area, which likely has the highest household income
profile of any part of the Northside, will remain low density due to deed restrictions.
3. Irvington from Fulton to Cavalcade will remain the premier location for any additional retail
investment in the near term. This is because of ease of car access, parcel sizes which allow for
parking, and the existing retail such as restaurants and Stokes.
4. Along the Red Line, the Cavalcade station area and the Irvington intersection are the most promising
locations for retail activity at present. Establishments may prefer to orient themselves to the cross-
streets rather than Fulton itself, due to access issues. Some parcels have been shrunk by right of
way acquisition for the rail line, reducing the amount development and required parking that is
feasible. One note: businesses serving alcohol would be impacted by buffering rules around
Jefferson Elementary School near Cavalcade Station.
South CMA
1. The South CMA has a higher total population than the North, with slightly higher projected growth
as well. The South Core Area is also highly accessible to areas where gentrification is well-advanced,
such as the 1st Ward, Woodland Heights and Downtown.
2. The intersections of Quitman at Fulton, already a principal retail node, and Quitman Station on the
Red Line (at North Main) are the key areas for retail activity. The area near Fulton / North Central
station, currently a jumble of strip centers, is less promising at the present time but does benefit
from having some established businesses at present.
3. North Main from Hogan to Boundary has significant opportunities, including vacant and
underutilized sites, older buildings that could be suitable for unique rehabs and repurposing,
exposure for light rail passengers, and intersections with streets leading directly to higher-income
areas (Hogan and Quitman).
4. However, it also has significant challenges: access in most blocks impeded by light rail, questionable
condition of several structures, and security concerns caused by a large presence of loiterers and the
indigent. The target demographic for retail uses – moderate-income residents -in the near term
may render full rehabilitation of the older buildings financially infeasible.
5. This stretch of North Main would lend itself to a risk-taking, pioneering investor who was interested
in opening a coffee shop or coffeehouse, the support for which CDS has documented earlier in the
report.
6. Hogan east of North Main is perceived very negatively due to the perception of undesirable
activities at bars and other venues along the street.
7. The Quitman Station area is also heavily impacted by the school buffer regulations of the City of
Houston. Bar and entertainment uses would be best served by locating along portions of North
Main away from the buffer. One such area could be near Burnett Station, which is largely unsuitable

Northside Retail Study Houston, Texas
6
for other retail uses because of access, visibility, and a location on the edge of the mass of
population, at least until Hardy Yards develops.
8. Better management of vagrants and loiterers could help bring this stretch of North Main to another
level of local resident acceptability.
Community Retail Development Strategy
Based on the results of the research and analysis, and its own sense of the Northside community, CDS
has developed a set of strategic recommendations to foster retail growth in the area. The key
recommendations include:
1. Improve existing establishments, especially grocery stores – Work with Northside businesses,
most notably Fiesta, to improve both the merchandising and the physical environment of their
establishments, possibly using community surveys to support the community’s position.
2. Attract greater dining diversity – Work with commercial brokers to identify independent
entrepreneurs and families to locate non-Tex-Mex or Mexican restaurants within Northside;
Asian food is a particularly ripe category for development.
3. Improve the commercial environment – Make changes to the overall public environment to
increase capture of spending from Northside residents, focusing on:
• Safety – Using lighting and other measures to enhance feelings of personal security and
lessen dangers of motor vehicle conflicts;
• Parking – Develop common management of parking supply within defined areas to unlock
the potential of smaller sites and lessen the burden on small busineses;
• Streetscape and Placemaking – Use public infrastructure and spaces to enhance identity,
draw casual visitors, and create nodes of activity; the Irvington / Collingsworth / Fulton area
is a recommended starting point.
4. Initiate a Community-Based Marketing Effort – conduct outreach and events to better
familiarize both existing and new Northside residents about the offerings of local businesses.

Northside Retail Study Houston, Texas
7
Competitive Market Area (CMA)
For the purposes of this study, CDS has defined the Competitive Market Area (CMA) as follows. There
are two “Core” areas, both north and south, along with two “Supplemental” areas, north and south.
The two core areas constitute the area for which the retail analysis will be performed. For purposes of
our analysis CDS researched demographics of the North Core, North Supplemental, South Core, and
South Supplemental and compared them to Harris County. The “Supplemental” areas were selected to
illustrate what is taking place on the fringe of the “Core” in adjacent comparable communities to better
understand what trends soon may affect the Core area.
The North Core is comprised of Census Tracts 2105, 2106, and 2107 – its northern boundary is N 610.
The eastern border runs along the rail line down to Cavalcade, and then continues down Maury St below
Cavalcade. The southern border runs along Hays St to Fulton, then along Little Whiteoak Bayou west of
Fulton, then along Trimble St to I-45. The western border is I-45. The North Supplemental contains two
Census Tracts, 2202 and 5116. The first North Supplemental borders the rail line on the north, Hardy
Toll Road on the east, N 610 on the south and I-45 on the west. The second North Supplemental
borders N 610 on the north, I-45 on the east, then extends northwest along N Main St for its southern
border and then Airline Dr on the west.
The South Core is comprised of Census Tracts 2104, 2108, 2123, 5101 – Its northern boundary is N 610.
Its eastern border is US 59. The southern border runs west from US 59 along I-10, then along I-45 south
of I-10. The western border comes up Sabine St, juts east along I-10 to Trimble St and the Little
Whiteoak Bayou. The South Supplemental contains Census Tracts 2105, 5103, and 2101. The first has a
north border of Weiss St, an eastern border of Maury St. The southern border runs along Hays St to
Fulton, then along Little Whiteoak Bayou west of Fulton, then along Trimble St to I-45, and the western
border is I-45. The second South Supplemental has I-10 as its northern border, reverses west along US
59, then Buffalo Bayou as a southern border. Its western border is Little Whiteoak Bayou. The last of
the South Supplemental tracts borders E 11th St as its northern border, I-45 as its eastern border, I-10 as
its southern border, and Studewood St as its western border. Census Tract 2105 appears in the North
Core as well as the South Supplemental.
Please refer to maps of the North Core with its corresponding North Supplemental, and the South Core
and South Supplemental of the following pages.
Conclusions – Northside Retail Potential

Northside Retail Study Houston, Texas
8
North Core and North Supplemental CMA

Northside Retail Study Houston, Texas
9
South Core and South Supplemental CMA

Northside Retail Study Houston, Texas
10
Overview of Commercial Corridors
N. Main
North end – From I-45 to Boundary, the corridor includes small service-oriented businesses, single-
family, with a few restaurants.
South end – Below Boundary, Underutilized and vacant retail and/or office buildings exist along the rail.
There is a strip center at the SEC of N. Main and Hogan with neighborhood serving retail (El Guero
Plaza).
Most of the N. Main corridor includes small parcels, which are difficult and limiting to develop for retail
uses. Assembling parcels would need to occur for any retail that is not small boutique, or a small bar /
restaurant.
Large Salvation Army facility can be a deterrent to retail as it draws homeless pedestrians.
Existing older retail building stock is interesting and has repurposing possibilities.
The planned Fitzgerald’s live music venue could be a catalyst for new commercial development.
The rail line poses a challenge for automobile access, but is good for retail visibility. The rail overpass
south of Hogan limits visibility from an automobile or train perspective.
There is no on-street parking and limited parking at any existing retail, and limited opportunities to
provide large parking options.
Irvington
Between Fulton and Cavalcade, it is a major corridor for neighborhood-level retail and decidedly
residential between Cavalcade and 610 with occasional retail or office parcels.
Irvington has more medium-sized parcels, bringing more opportunities and possibilities for different
types of retail that could include more parking options.
Irvington has more potential for being a more walkable retail restaurant corridor due to its quality and
location (off the road) of its sidewalks. Further enhancing walkability is the grass and tree-covered
median which could become an attractive esplanade.

Northside Retail Study Houston, Texas
11
Challenges include a serious stray dog problem.
There are limited retail opportunities along the northern part of Irvington due to an overwhelming
majority of the corridor being residential.
Fulton
Fulton is the most significant retail corridor in the CMA.
The northern stretch from the North Loop to Cavalcade is very mixed, including small neighborhood
retail, some single-family and light industrial. It includes numerous abandoned / boarded up structures.
Challenges include sidewalks not being set back from the road. Rail poses a challenge for car access
(similar to N. Main), but is good for business visibility.
Parking is extremely limited to all businesses, especially the smaller retail parcels.
Neighborhood retail oriented to a working-class population has a significant presence existing along
Fulton and looks relatively healthy (Dollar General, Family Dollar, two Fiestas, AutoZone). It also has one
of the newest commercial clusters at the SWC of Patton and Fulton – the Plaza Santa Maria (Subway,
Pizza Patron, Boost Mobile). There is a relatively new strip center at the SWC of Fulton and Boundary
with a mix of national tenants and neighborhood retail, while the NWC of Fulton and Boundary has
notable national tenants (McDonalds, AutoZone, Little Caesars, Wells Fargo).

Northside Retail Study Houston, Texas
12
Quitman
West of N. Main, it is single-family residences. East of N. Main, Quitman mainly includes three schools
and small neighborhood retail, with the only exception being at the two main intersections of N. Main
and Fulton where there are larger retail clusters (Walgreens, Fiesta).
Except for the N. Main and Fulton intersections with Quitman, parcels are very small and occupied with
single-family houses.
With three schools and a library along Quitman, new retail in this corridor would need to be child or
school-friendly. School zones could also be a deterrent as retail-seeking traffic could seek to avoid the
delays.
Cavalcade
Cavalcade is mostly residential except for the intersections at Fulton (neighborhood serving strip center,
Dairy Land) and Irvington (Burger King, CVS, Churches Chicken). A few residential lots have been
converted to neighborhood retail. There is a Family Dollar store amidst the residential.
Like Irvington, walkability can be enhanced by the grass and tree-covered median which could become
an attractive esplanade. Although Cavalcade is not nearly as retail focused as the lower half of Irvington,
the esplanade could enhance the appeal of the whole neighborhood enhancing all land uses.
A number of stray dogs in the area pose safety problems.
There a some retail redevelopment opportunities between Fulton and I-45 that are occupied by
warehouses and other light industrial.
Northside Retail Study Houston, Texas
13
Recent Changes and New Development
• Hardy Yards, near Burnett and N Main is a planned multi-family project that projects to include
1,900 units, approximately 1,700 rental units and 200 for-sale units. These are planned to begin
construction in late 2015
• Avenue Station, at the NEC of N Main and James, will be a small apartment complex. 68 family
units are planned and the mix is still a work in progress. They are supposed to start in
September 2014.
• Avenue Place, near the NEC of Irvington and Weiss, once built out, will have 95 single-family
homes and 192 renter-occupied units. Currently there are 34 houses built.
• University of Houston – Downtown is building a three story parking garage (approximately 240
spaces), and the top of the garage will have a Welcome Center and offices. This should wrap up
in August 2015.
• University of Houston – Downtown is potentially constructing a Science and Technology Center.
If proper funding is received, the facility will be over 149,000 sq ft.
• There is a group developing a new destination music venue to expand and replace theexisting
Fitzgerald’s operation. The new venue will house separate 1,200 and 300 capacity indoor venue
rooms, as well as an Icehouse bar and kitchen, and an outdoor venue with a 2,000-4,000
capacity. The venue will be located on N. Main, just north of Boundary along the White Oak
Creek

Northside Retail Study Houston, Texas
14
Northside – Land Uses
The CMA comprises myriad uses, ranging from residential (single-family homes, townhomes,
multifamily), as well as commercial (retail, industrial, office). As shown on the following map, the most
common use in the CMA is single family residential (shown in light yellow) and there is a notable amount
of commercial as well. Most commercial tends to be industrial (purple) and retail (pink). The North
Core is more diverse in land uses. In the South Core, there are large parcels of land primarily used for
industrial purposes.
Please refer to the following map to see the mix of land uses in all North and South Core areas within
the CMA.
CMA Land Uses
Source: Harris County Appraisal District, CDS

Northside Retail Study Houston, Texas
15
Land Use – Study Area
North Core Parcels Structures Bldg. SF Acreage
Industrial 78 177 784,308 39.1
Institution 67 137 419,694 59.9
Multifamily, Rental 121 321 563,504 26.3
Office 10 24 97,456 5.0
Religious 31 60 92,334 6.7
Retail 194 391 620,933 62.4
Single Family 3,618 7,641 4,956,336 545.1
Utilities 32 35 6,790 16.4
Vacant, Developable 688 771 9,470 165.0
Vacant,
Undevelopable 37 34 0 8.4
South Core Parcels Structures Bldg. SF Acreage
Industrial 231 545 5,286,105 349.7
Institution 141 237 487,889 99.6
Multifamily, Condo 24 48 37,141 12.6
Multifamily, Rental 316 805 1,288,292 53.3
Office 16 30 165,897 4.1
Religious 55 108 155,391 12.8
Retail 260 511 1,052,752 98.7
Single Family 3,425 7,022 5,105,978 404.8
Utilities 137 149 120,055 144.0
Vacant, Developable 1,716 1,990 7,112 524.9
Vacant, Parking 22 24 0 3.0
Vacant,
Undevelopable 97 84 0 131.7
Combined Parcels Structures Bldg. SF Acreage
Industrial 309 722 6,070,413 388.8
Institution 208 374 907,583 159.5
Multifamily, Condo 24 48 37,141 12.6
Multifamily, Rental 437 1,126 1,851,796 79.6
Office 26 54 263,353 9.0
Religious 86 168 247,725 19.6
Retail 454 902 1,673,685 161.1
Single Family 7,043 14,663 10,062,314 949.9
Utilities 169 184 126,845 160.4
Vacant, Developable 2,404 2,761 16,582 689.9
Vacant, Parking 22 24 0 3.0
Vacant,
Undevelopable 134 118 0 140.1
Source: HCAD, CDS
North Core
Parcels:
• Single Family uses represent
74% of all parcels
• Vacant Developable is 13.5%
• Retail parcels account for just
over 4%
Building Square Footage:
• Industrial accounts for 10.5%
• Retail represents around 8.3%
• Multifamily represents over
7.5%
Acreage:
• Single-family accounts for
around 58% of the acreage
• Industrial accounts for 4.2%
• Vacant Developable is 14%
• Retail represents just under 7%
South Core
Parcels:
• Single Family uses represent
53% of all parcels
• Vacant Developable is over 24%
• Retail accounts for 4%
Building Square Footage:
• Industrial accounts for 38.8%
• Retail represents 7.3%
• Multifamily is over 9%
Acreage:
• Single-family accounts for about
22% of the acreage
• Industrial accounts for over 19%
• Vacant Developable is over 24%
• Retail represents just over 5%

Northside Retail Study Houston, Texas
16
Demographic/Economic Analysis
Population and Household data are both key measures in determining the economic vitality of any
market area because increasing population is generally the result of more jobs, a higher level of in-
migration and a stable or expanding economy.
The following tables display the population and household data for both of the Core and Supplemental
areas, and compare that data with the same statistics for Harris County. All Demographics were sourced
from PCensus for Arcview, Tetrad Computer Applications, 2014. Tetrad is the licensed data provider of
Nielson data.
Historic Growth and Projections
Population
Analyzing the North Core and Supplemental areas first, it appears that both areas have experienced
significant population swings.
• From 2000-2010, the North Core lost 8% of its population (1,122) while the North Supplemental
lost over 12% of its population (1,056)
• From 2010-Present, the North Core had a slight population gain (3%) while the North
Supplemental leveled out from the previous decade’s drop
• Census Forecasts through 2019 project that the North Core will grow by 5% (673 increase) while
the North Supplemental will grow by a little more than 2% (169 increase)
Analyzing the South Core and Supplemental areas, there are very mixed observations.
• From 2000-2010, the South Core lost 12% of its population (2,225) while the South
Supplemental actually gained a very significant 26% (4,086)
• From 2010-Present, the South Core leveled out while the South Supplemental showed a modest
gain (3.9%) after huge gains in the previous decade
• Census Forecasts through 2019 project that the South Core will grow by 1.6% (251 increase)
while the South Supplemental will grow by 3.5% (729 increase)
Total Population Trends, 2000 - 2019
North
Core
North
Supple-
mental
South
Core
South
Supple-
mental CMA
Harris
County Population
2019 Projection 13,930 7,864 15,848 21,324 53,478 4,724,986
2014 Estimate 13,257 7,695 15,597 20,595 52,015 4,364,892
2010 Census 12,864 7,671 15,604 19,818 51,075 4,092,459
2000 Census 13,986 8,727 17,829 15,732 50,957 3,400,577
Growth 2014-2019 5.08% 2.20% 1.61% 3.54% 2.81% 8.25%
Growth 2010-2014 3.06% 0.31% -0.04% 3.92% 1.84% 6.66%
Growth 2000-2010 -8.02% -12.10% -12.48% 25.97% 0.23% 20.35%
Source: PCensus for Map Info, Tetrad Computer Applications 2014

Northside Retail Study Houston, Texas
17
The CMA population was stagnant from 2000-2010 and grew slightly since 2010 (1.8%). It continues to
show modest projected growth through 2019. Harris County grew by over 20.3% from 2000-2010, and
6.7% between 2010 and the present. Growth projections for Harris County are significantly higher than
the CMA, with projections of 8.2% growth expected by 2019.
Households
Analyzing the North Core and Supplemental areas first, it appears that both areas have experienced
modest swings in terms of household trends, especially relative to population trends.
• From 2000-2010, in the North Core, household numbers decreased by 2% (Population
decreased by 8%) while the North Supplemental lost 3.3% of its households (Population
decreased by over 12%)
• From 2010-Present, households in the North Core increased by 5.5% (Population increased by
3%), while the North Supplemental had household growth of 2.4% (Population even)
• 2019 Census household projections see a 6.5% increase in the North Core (297 household
additions) and a 3.7% increase in the North Supplemental (94 households)
• Regarding household growth, The North Supplemental’ s past and future growth are half the
growth rates seen in the North Core
Analyzing the South Core and Supplemental areas, there has been modest household growth, and
further evidence that percentage household growth is heavily outpacing percentage population growth
• From 2000-2010, households in the South Core decreased by 3% (Population decreased by
12%), while the South Supplemental was relatively unchanged (despite 26% Population growth)
• From 2010-Present, the South Core had a small household gain of 1.6%, while the South
Supplemental had a more aggressive gain of about 6.2%
• Census projections for 2019 see a 3.2% increase in households in the South Core (167 increase)
and a 7.5% increase in the South Supplemental (330 increase)
• Overall the number of South Supplemental households has been growing and is predicted to
continue growth at a pace twice the forecasts for the North Supplemental
• Regarding household growth, the South Supplemental’ s past and future growth more than
double the growth of the South Core
Total Household Trends, 2000 - 2019
Estimate Year
North
Core
North
Supplemental
South
Core
South
Supplemental CMA
Harris
County
2019 Projection 4,830 2,635 5,316 4,748 15,745 1,652,109
2014 Estimate 4,533 2,541 5,149 4,418 15,003 1,526,544
2010 Census 4,295 2,482 5,065 4,161 14,499 1,435,155
2000 Census 4,379 2,566 5,121 4,160 14,698 1,205,527
Growth 2014-2019 6.55% 3.70% 3.24% 7.47% 4.95% 8.23%
Growth 2010-2014 5.54% 2.38% 1.66% 6.18% 3.48% 6.37%
Growth 2000-2010 -1.92% -3.27% -1.09% 0.02% -1.35% 19.05%
Source: PCensus for Map Info, Tetrad Computer Applications 2014

Northside Retail Study Houston, Texas
18
Overall, Harris County household growth from 2000-2010 highly outpaced the CMA (19% vs -1.35%).
Future growth is in line with the North Core and South Supplemental.
Age Groups
With regards to ages of the population in the North Core and Supplemental:
• The North Core has the highest median and average age of the CMA
• In the North Core, the cohorts 65-74 and 75-84 were notably higher than other study areas
including Harris County
• North Supplemental has the lowest median and average age figures overall, approximately one
year younger than the CMA and .7 years younger than Harris County
Regarding the ages of the population in the South Core and Supplemental:
• The South Core was in the middle regarding age statistics relative to the CMA and Harris County
when comparing median ages and when comparing like cohorts
• The South Supplemental median age was in line with the CMA and the county; however, all age
brackets below the age of 14 were extremely low (approximately half of all other areas) while all
ranges between 21 and 44 years were very high (approximately 20-40% above) other areas
Age Profiles,2014 Estimate
Age
Groups North Core
North
Supplemental South Core
South
Supplemental CMA Harris County
Total 13,257 7,695 15,597 20,595 52,015 4,364,892
Age 0 -4 1,068 8.1% 637 8.3% 1,273 8.2% 810 3.9% 3,362 6.5% 346,864 8.0%
Age 5 -9 1,002 7.6% 599 7.8% 1,217 7.8% 767 3.7% 3,185 6.1% 335,705 7.7%
Age 10-14 925 7.0% 552 7.2% 1,135 7.3% 631 3.1% 2,854 5.5% 325,727 7.5%
Age 15-17 572 4.3% 321 4.2% 645 4.1% 846 4.1% 2,126 4.1% 193,774 4.4%
Age 18-20 534 4.0% 304 4.0% 596 3.8% 1,152 5.6% 2,344 4.5% 182,043 4.2%
Age 21-24 762 5.8% 448 5.8% 822 5.3% 2,053 10.0% 3,757 7.2% 244,879 5.6%
Age 25-34 1,890 14.3% 1,323 17.2% 2,424 15.5% 4,911 23.9% 9,813 18.9% 673,615 15.4%
Age 35-44 1,771 13.4% 1,075 14.0% 2,226 14.3% 3,681 17.9% 8,090 15.6% 623,611 14.3%
Age 45-54 1,638 12.4% 981 12.8% 2,059 13.2% 2,813 13.7% 6,913 13.3% 567,230 13.0%
Age 55-64 1,493 11.3% 788 10.2% 1,695 10.9% 1,739 8.4% 5,166 9.9% 465,868 10.7%
Age 65-74 843 6.4% 400 5.2% 893 5.7% 736 3.6% 2,577 5.0% 250,918 5.8%
Age 75-84 524 4.0% 206 2.7% 439 2.8% 325 1.6% 1,306 2.5% 112,245 2.6%
Age 85 + 235 1.8% 61 0.8% 173 1.1% 131 0.6% 522 1.0% 42,413 1.0%
Age 16 + 10,073 76.0% 5,802 75.4% 11,763 75.4% 18,119 88.0% 41,929 80.6% 3,293,028 75.4%
Age 18 + 9,690 73.1% 5,586 72.6% 11,327 72.6% 17,541 85.2% 40,488 77.8% 3,162,822 72.5%
Age 21 + 9,156 69.1% 5,282 68.6% 10,731 68.8% 16,389 79.6% 38,144 73.3% 2,980,779 68.3%
Age 65 + 1,602 12.1% 667 8.7% 1,505 9.7% 1,192 5.8% 4,405 8.5% 405,576 9.3%
Median
Age 34.3 32.5 33.7 33.2 33.5 33.2
Average
Age 36.2 34.2 35.0 35.2 35.3 34.7
Source: PCensus for Map Info, Tetrad Computer Applications 2014

Northside Retail Study Houston, Texas
19
Ethnicity
With regards to the population’s ethnicities in the North Core and Supplemental:
• The North Core and Supplemental have the highest concentration of Hispanic or Latino
population, both above 80% (almost 60% in the CMA)
• The North Core has the lowest White population at just over 10%, while the North Supplemental
is also extremely low at 14.4%
• The North Supplemental has the lowest Black population at 1.5% (North Core is 8%)
Regards to the South Core and Supplemental population’s ethnicities:
• The South Core has a very low White population of 11.7% with a high Hispanic or Latino
population of 72.8%
• South Supplemental has the highest concentration of White, Black and Asian populations in the
entire CMA and is the most diverse (37% White, 27% Black, 34% Hispanic or Latino)
Relative to Harris County, the CMA has a lower White population (22.5% vs 31.5%), and higher Hispanic
or Latino population (60% vs 43%). The Black population is very similar (16% vs 18%) while the Asian
population is less than 1% in the CMA while 6.2% in the county.
Ethnicity Profiles, 2014 Estimate
North Core
North
Supplemental South Core
South
Supplemental CMA Harris County
Total 13,257 7,695 15,597 20,595 52,015 4,364,892
White Alone 1,384 10% 1,108 14% 1,832 12% 7,646 37% 11,703 22% 1,376,566 32%
Black or African
American Alone 1,065 8% 112 1% 2,158 14% 5,548 27% 8,325 16% 778,592 18%
American
Indian & Alaska
Native Alone
27 0% 9 0% 32 0% 26 0% 87 0% 9,118 0%
Asian Alone 47 0% 59 1% 111 1% 180 1% 390 1% 269,410 6%
Native
Hawaiian &
Other Pacific
Islander Alone
4 0% 9 0% 1 0% 3 0% 17 0% 3,091 0%
Some Other
Race Alone 11 0% 7 0% 24 0% 26 0% 65 0% 8,184 0%
Two or More
Races 62 0% 37 0% 87 1% 149 1% 326 1% 59,214 1%
Hispanic or
Latino 10,657 80% 6,354 83% 11,352 73% 7,017 34% 31,102 60% 1,860,717 43%
Source: PCensus for Map Info, Tetrad Computer Applications 2014

Northside Retail Study Houston, Texas
20
Educational Attainment
With regards to the education levels in the North Core and Supplemental:
• Both areas have a high number of the population who have not graduated High School (41.1%
in the Core and 43.7% in the Supplemental).
• North Supplemental has the highest Less than 9th grade percentage (27.2%).
• North Core has the overall lowest with an Associate Degree or higher (13.8%), the lowest with
Some College or higher (28.4%), and the lowest with a Bachelor’s Degree or higher (10.25%).
Regarding education levels in the South Core and Supplemental:
Educational Attainment – Population 25 +, 2014 Estimate
North Core
North
Supplemental South Core
South
Supplemental CMA Harris County
Total
Population
Age 25+
8,394 4,834 9,909 14,336 34,387 2,735,900
Less than
9th grade 1,917 22.8% 1,317 27.2% 2,779 28.1% 1,854 12.9% 7,063 20.5% 321,129 11.7%
Some High
School, no
diploma
1,535 18.3% 797 16.5% 1,804 18.2% 2,573 18.0% 6,096 17.7% 272,250 10.0%
High School
Graduate
(or GED)
2,557 30.5% 1,218 25.2% 2,423 24.5% 3,625 25.3% 8,947 26.0% 649,098 23.7%
Some
College, no
degree
1,226 14.6% 703 14.5% 1,333 13.5% 2,053 14.3% 4,864 14.1% 576,381 21.1%
Associate
Degree 299 3.6% 128 2.7% 236 2.4% 641 4.5% 1,198 3.5% 161,499 5.9%
Bachelor's
Degree 591 7.0% 406 8.4% 824 8.3% 1,911 13.3% 3,556 10.3% 494,107 18.1%
Master's
Degree 206 2.5% 182 3.8% 319 3.2% 1,034 7.2% 1,698 4.9% 174,084 6.4%
Professional
School
Degree
51 0.6% 56 1.2% 143 1.4% 400 2.8% 634 1.8% 54,024 2.0%
Doctorate
Degree 12 0.1% 27 0.6% 48 0.5% 245 1.7% 331 1.0% 33,328 1.2%
Bachelor’s
Degree or
Higher
860 10.25% 671 13.88% 1,334 13.46% 3,590 25.04% 6219 18.09% 755,543 27.62%
Source: PCensus for Map Info, Tetrad Computer Applications 2014

Northside Retail Study Houston, Texas
21
• South Core has the highest percentage of the population without a High School diploma (46.3%),
but South Supplemental has under 31% below this standard.
• South Core has the second lowest percentage of Associate Degree or higher (15.8%) while the
Supplemental has the CMA’s highest (almost 30%).
Harris County does show better numbers regarding education levels of its population with only 22% not
having a High School diploma and over 33% having an Associate Degree or higher. 54% in Harris County
have some college or higher relative to 36% in the CMA.
Household Income
With regards to the household income levels in the two CMA areas:
• The North Core’s household income levels are dominated by moderate-income and middle class
income ranges up to $100,000 annually.
• The South Core area has by far the highest concentration of very low income households and
generally skews to the lower end of the income spectrum.
Household Income Distributions, 2014 Estimate
Income
Group
($000s) North Core
North
Supplemental South Core
South
Supplemental CMA Harris County
Less than
$15K 755 16.7% 385 15.2% 1,677 32.6% 561 12.7% 3,101 20.7% 198,441 13.0%
$15 - 24 946 20.9% 525 20.7% 954 18.5% 645 14.6% 2,704 18.0% 175,252 11.5%
$25 - 34 719 15.9% 394 15.5% 649 12.6% 523 11.8% 1,962 13.1% 165,040 10.8%
$35 - 49 642 14.2% 305 12.0% 582 11.3% 555 12.6% 1,855 12.4% 208,819 13.7%
$50 - 74 688 15.2% 389 15.3% 599 11.6% 687 15.6% 2,155 14.4% 263,149 17.2%
$75 - 99 390 8.6% 224 8.8% 275 5.3% 394 8.9% 1,170 7.8% 180,257 11.8%
$100 - 124 147 3.2% 129 5.1% 153 3.0% 281 6.4% 670 4.5% 110,873 7.3%
$125 - 149 96 2.1% 68 2.7% 69 1.3% 156 3.5% 366 2.4% 66,803 4.4%
$150 - 199 99 2.2% 82 3.2% 79 1.5% 252 5.7% 485 3.2% 73,012 4.8%
$200 - 249 24 0.5% 22 0.9% 31 0.6% 96 2.2% 162 1.1% 26,540 1.7%
$250 - 499 23 0.5% 16 0.6% 57 1.1% 195 4.4% 274 1.8% 41,332 2.7%
$500K + 4 0.1% 2 0.1% 24 0.5% 73 1.7% 99 0.7% 17,026 1.1%
Average HH
Income $46,905 $51,839 $41,742 $80,309 $56,002 $74,497
Median HH
Income $32,865 $34,150 $24,408 $47,973 $33,647 $51,493
Source: PCensus for Map Info, Tetrad Computer Applications 2014

Northside Retail Study Houston, Texas
22
• The South Supplemental area, in contrast, has a considerably higher median income, lower
shares of low income households, and higher shares of affluent households, including an
estimated 23.9% making over $100,000 annually.
The CMA’s income is relatively low compared to Harris County, having higher percentages of the
population in all ranges under $50,000 and lower percentages in all over $50,000. The median
household income in the CMA is 34% lower than Harris County’s.
Household Types
In the North Core and Supplemental, the representation of family households relative to non-family
households is higher than the rest of the CMA, and in line with all of Harris County. (The Census defines
“Family” households as those containing at least two related individuals.)
In the South Core, the percentage of family households is slightly higher than the CMA, but the
Supplemental is noticeably lower. Overall the CMA has a lower percentage of family households relative to
Harris County (62.5% vs 68.6%).
Household Types, 2014 Estimate
Household
Type North Core
North
Supplemental South Core
South
Supplemental CMA Harris County
Family
Households 3,169 69.9% 1,694 66.7% 3,258 63.3% 2,482 56.2% 9,369 62.5% 1,047,884 68.6%
Non-family
Households 1,364 30.1% 847 33.3% 1,891 36.7% 1,936 43.8% 5,634 37.6% 478,660 31.4%
Source: PCensus for Map Info, Tetrad Computer Applications 2014

Northside Retail Study Houston, Texas
23
Household Tenure (Renter / Owner)
In the North Core, there is higher percentage of the population, relative to the CMA, who live in owner-
occupied housing units; however, the South Supplemental breakout is nearly identical to the CMA (51%).
The South Core has a much smaller percentage of owner-occupied (38.7%), and the South Supplemental
has more (56.2%) compared to the CMA.
Overall, the CMA has noticeably more renter-occupied housing units (50% vs 43%) relative to county-wide
figures, with the North Core and South Supplemental being parallel to the county (all approximately 43%).
Psychographic Profiles
The top three segments in the North Core were City Roots, Multi-Culti Mosaic, and Close-In Couples
while the three most represented segments in the South Core were Low-Rise Living, City Roots, and
Multi-Culti Mosaic.
The definitions and descriptions of each are in the table on the following page.
Tenure of Occupied Housing Units, 2014 Estimate
North Core
North
Supplemental South Core
South
Supplemental CMA Harris County
Total 4,533 2,541 5,149 4,418 15,003 1,526,544
Owner-
Occupied 2,545 56.1% 1,287 50.7% 1,993 38.7% 2,483 56.2% 7,527 50.2% 867,879 56.9%
Renter-
Occupied 1,988 43.9% 1,254 49.4% 3,156 61.3% 1,935 43.8% 7,476 49.8% 658,665 43.2%
Average
Length of
Residence
Owner-
Occupied 26 22 26 19 23 16
Renter-
Occupied 9 7 9 8 8 6
Source: PCensus for Map Info, Tetrad Computer Applications 2014

Northside Retail Study Houston, Texas
24
Households by PRIZM Segment
North Core South Core
Top 5 PRIZM Segments % Top 5 PRIZM Segments %
61 City Roots 35.96% 66 Low-Rise Living 23.95%
54 Multi-Culti Mosaic 27.69% 61 City Roots 23.66%
40 Close-In Couples 12.16% 54 Multi-Culti Mosaic 16.35%
66 Low-Rise Living 6.64% 59 Urban Elders 7.59%
29 American Dreams 5.74% 46 Old Glories 5.05%
PRIZM Household Segments
Segment Snapshots
29 - American Dreams
American Dreams is a living example of how ethnically diverse the nation has become: just under half the
residents are Hispanic, Asian, or African-American. In these multilingual neighborhoods--one in three speaks a
language other than English--middle-aged immigrants and their children live in upper-middle-class comfort.
40 - Close-In Couples
Close-In Couples is a group of predominantly older, ethnically diverse couples living in older homes in the urban
neighborhoods of mid-sized metros. High school-educated and empty nesting, these mostly older residents
typically live in older city neighborhoods, enjoying their retirements.
46 - Old Glories
The residents of Old Glories are the nation's downscale suburban retirees, Americans aging in place in older
apartment complexes. Households in this racially-diverse segment often contain widows and widowers living on
fixed incomes who tend to lead home-centered lifestyles. They're among the nation's most ardent television
fans, watching game shows, soaps, talk shows, and news magazines at high rates.
54 - Multi-Culti Mosaic
An immigrant gateway community, Multi-Culti Mosaic is the urban home for a mixed populace of Hispanic,
Asian, and African-American singles and families. With nearly a quarter of the residents foreign born, this
segment is a mecca for first-generation Americans who are striving to improve their lower-middle-class status.
59 - Urban Elders
For Urban Elders--a segment located in the downtown neighborhoods of such metros as New York, Chicago, Las
Vegas, and Miami--life is often an economic struggle. These communities have high concentrations of Hispanics
and African-Americans and tend to be downscale, with singles living in older apartment rentals.
61 - City Roots
Found in urban neighborhoods, City Roots is a segment of downscale retirees, typically living in older homes and
duplexes they've owned for years. In these ethnically diverse neighborhoods--Over 60% are African-American or
Hispanic--residents are often widows or widowers living on fixed incomes maintaining low-key lifestyles.
66 - Low-Rise Living
The most economically challenged urban segment, Low-Rise Living is known as a transient world for middle-
aged, ethnically diverse singles and single parents. Home values are low--about half the national average--and
even then less than a quarter of residents can afford to own real estate. Typically, the commercial base of Mom-
and-Pop stores is struggling and in need of a renaissance.
Source: PCensus for Map Info, Tetrad Computer Applications 2014
Northside Retail Study Houston, Texas
25
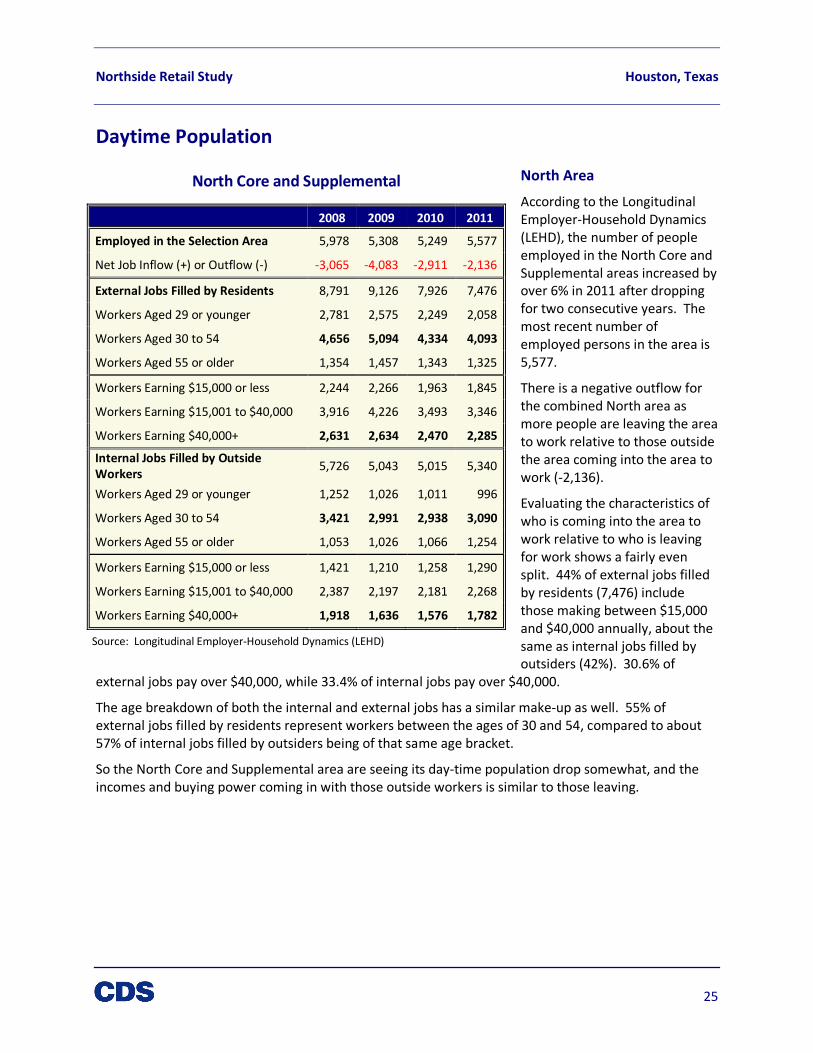
North Core and Supplemental
2008 2009 2010 2011
Employed in the Selection Area 5,978 5,308 5,249 5,577
Net Job Inflow (+) or Outflow (-) -3,065 -4,083 -2,911 -2,136
External Jobs Filled by Residents 8,791 9,126 7,926 7,476
Workers Aged 29 or younger 2,781 2,575 2,249 2,058
Workers Aged 30 to 54 4,656 5,094 4,334 4,093
Workers Aged 55 or older 1,354 1,457 1,343 1,325
Workers Earning $15,000 or less 2,244 2,266 1,963 1,845
Workers Earning $15,001 to $40,000 3,916 4,226 3,493 3,346
Workers Earning $40,000+ 2,631 2,634 2,470 2,285
Internal Jobs Filled by Outside
Workers 5,726 5,043 5,015 5,340
Workers Aged 29 or younger 1,252 1,026 1,011 996
Workers Aged 30 to 54 3,421 2,991 2,938 3,090
Workers Aged 55 or older 1,053 1,026 1,066 1,254
Workers Earning $15,000 or less 1,421 1,210 1,258 1,290
Workers Earning $15,001 to $40,000 2,387 2,197 2,181 2,268
Workers Earning $40,000+ 1,918 1,636 1,576 1,782
Source: Longitudinal Employer-Household Dynamics (LEHD)
Daytime Population
North Area
According to the Longitudinal
Employer-Household Dynamics
(LEHD), the number of people
employed in the North Core and
Supplemental areas increased by
over 6% in 2011 after dropping
for two consecutive years. The
most recent number of
employed persons in the area is
5,577.
There is a negative outflow for
the combined North area as
more people are leaving the area
to work relative to those outside
the area coming into the area to
work (-2,136).
Evaluating the characteristics of
who is coming into the area to
work relative to who is leaving
for work shows a fairly even
split. 44% of external jobs filled
by residents (7,476) include
those making between $15,000
and $40,000 annually, about the
same as internal jobs filled by
outsiders (42%). 30.6% of
external jobs pay over $40,000, while 33.4% of internal jobs pay over $40,000.
The age breakdown of both the internal and external jobs has a similar make-up as well. 55% of
external jobs filled by residents represent workers between the ages of 30 and 54, compared to about
57% of internal jobs filled by outsiders being of that same age bracket.
So the North Core and Supplemental area are seeing its day-time population drop somewhat, and the
incomes and buying power coming in with those outside workers is similar to those leaving.

Northside Retail Study Houston, Texas
26
South Core and Supplemental
South 2008 2009 2010 2011
Employed in the Selection Area 17,975 18,037 17,704 17,241
Net Job Inflow (+) or Outflow (-) +6,609 +5,724 +6,768 +4,871
External Jobs Filled by Residents 10,870 11,769 10,511 11,960
Workers Aged 29 or younger 3,052 3,303 2,861 3,268
Workers Aged 30 to 54 6,064 6,706 5,749 6,642
Workers Aged 55 or older 1,754 1,760 1,901 2,050
Workers Earning $15,000 or less 2,857 2,931 2,586 3,085
Workers Earning $15,001 - $40,000 4,331 4,799 4,156 4,482
Workers Earning $40,000+ 3,682 4,039 3,769 4,393
Internal Jobs Filled by Outside
Workers 17,479 17,493 17,279 16,831
Workers Aged 29 or younger 3,490 3,250 3,000 2,859
Workers Aged 30 to 54 11,007 10,976 10,881 10,535
Workers Aged 55 or older 2,982 3,267 3,398 3,437
Workers Earning $15,000 or less 3,142 3,121 3,027 3,289
Workers Earning $15,001 - $40,000 6,954 7,003 6,703 5,834
Workers Earning $40,000+ 7,383 7,369 7,549 7,708
Source: Longitudinal Employer-Household Dynamics (LEHD)
South Area
According to the
Longitudinal Employer-
Household Dynamics (LEHD),
the number of people
employed in the South Core
and Supplemental areas is
17,241.
There is a positive inflow for
the combined South area as
almost 17,000 jobs are filled
internally by outside workers
and around 12,000 external
jobs are filled by residents.
While 55.5% of the workers
leaving are aged 30-54, that
same age group comprises
over 62% of the workers
coming in.
Additionally, only 36.7% of
workers leaving the area
have annual income over
$40,000 per year while
45.8% of workers coming
into the area earn over
$40,000 annually. So the
South Core and Supplemental area are seeing its day-time population rise, and are seeing higher
incomes and buying power coming in with those outside workers.

Northside Retail Study Houston, Texas
27
CMA - Industrial
Year Absorption Occupancy Rental Rates
2014 (19,525) 93.3% $ 5.25
2013 (167,556) 93.5% $ 4.89
2012 (59,339) 94.5% $ 6.92
2011 (428,601) 93.4% $ 6.39
2010 15,983 95.4% $ 6.06
2009 (95,173) 95.2% $ 6.28
Source: Costar
The regions used for comparison encompass all areas north of I-10,
south of the north loop, and include area north of 610 loop between I-
45 and US 59 (Areas labeled 2, 11, 12, and 16).
Non-Retail Commercial Activity
As the retail market potential is assessed, it is imperative to understand the area daytime population and
what affects it. CDS has analyzed the Industrial and Office markets to determine their impact on the CMA’s
daytime population.
Industrial
While the industrial market is healthy in
the CMA, there are some trends that are
not very encouraging:
• Absorption has been negative the past
five years (125,000 sf decrease in the
last five years in the CMA)
• Occupancy rates are still healthy
(93.3%), but have slightly been
trending downward
• Rental rates are trending downward
over the past five years but have risen
in 2014
Looking at some other markets near the
CBA, industrial trends lend support to
the CBA being a very healthy and
sustainable industrial market.
• Average rental rates are barely
above the CMA ($0.23) or 4% higher
• CMA Occupancies are within 1.3%
of the region’s weighted average
• With the exception of the North
Outer Loop area, no area currently
boasts high absorption
With over 6 million sq ft of industrial
space, this is a very important land use
for the CMA. Even as absorption is
negative, industrial buildings account for over 28% of the all building square footage in the CMA and 14% of
the acreage. Brokers generally had positive responses regarding industrial demand in the area and
predicted that there is an attractive area due to relatively affordable pricing and excellent location.
Regional - Industrial
Regions Absorption Occupancy Rental
Rates
CBD-NW Inner Loop
Industrial 20,057 94.8% $ 6.51
North Inner Loop
Industrial 14,475 91.5% $ 4.11
North Outer Loop
Industrial 168,053 94.4% $ 5.37
Northeast Inner
Loop Industrial (18,350) 96.1% $ 5.17
Weighted Avg 184,235 94.6% $ 5.48
Source: Costar
Costar Industrial Regions

Northside Retail Study Houston, Texas
28
CMA – Office
Office Absorption Occupancy Rental Rates
2014 (77,863) 73.5% $ 14.48
2013 (6,011) 92.0% $ 14.76
2012 (1,920) 93.4% $ 23.20
2011 (2,200) 93.8% $ 19.22
2010 (11,293) 94.4% $ 14.98
2009 18,350 94.7% $ 23.33
Source: Costar
Regional - Office
Regions Absorption Occupancy Rental
Rates
I-10 East (997) 87.7% $ 16.33
North Loop
West (62,599) 78.5% $ 22.23
Northeast
Near 9,004 88.8% $ 18.02
Source: Costar
Costar Office Regions
Office
The Office market is quite small (260,000 sq
ft). Still, overall trends in the Office market
for the CBA are not very positive:
• Occupancy of the past year has
dropped to an undesirable rate of
73.5% after conservatively trending
down each year since 2009
• Absorption has been negative (over
90,000 sf) over the past five years
• Rental rates have actually dropped
slightly over the past year and are
noticeably lower than two and three
years ago
Looking at a wider region for the Office
market (data covering the last year), other
regions are boasting better statistics across
the board
• Absorption is slightly better other
regions are mostly flat, while the
CMA lost over 77,000 sq ft
• Rental rates are more attractive in
all the regions, ranging from 13%
to as high as 53%
• Retail occupancies are all below
90%, but substantially higher than
those in the CMA
Overall, the office market in the CMA is quite small, only accounting for 1.2% of all building square footage
and only .3% of all acreage. Some of these seemingly negative trends are not representative of a suffering
market. Some brokers in the area believe that as downtown rents are escalating, there will be office
demand in the CMA in five years.
The regions used for comparison encompass the CMA and
extend far to the north and east towards Lake Houston as well as
inside the loop to the west (Areas labeled 15,22, and 23)

Northside Retail Study Houston, Texas
29
Employment by Type
Jobs By Industry Sector – North Core
Industry Sector Count %
Agriculture, Forestry, Fishing and Hunting 0 0.0%
Mining, Quarrying, Oil & Gas Extraction 1 0.0%
Utilities 0 0.0%
Construction 198 3.6%
Manufacturing 391 7.0%
Wholesale Trade 460 8.2%
Retail Trade 493 8.8%
Transportation and Warehousing 170 3.0%
Information 46 0.8%
Finance & Insurance 44 0.8%
Real Estate & Rental & Leasing 370 6.6%
Professional, Scientific, & Technical Services 333 6.0%
Management of Companies & Enterprises 2 0.0%
Administration & Support, Waste Management & Remediation 326 5.8%
Educational Services 1,728 31.0%
Health Care & Social Assistance 181 3.2%
Arts, Entertainment, & Recreation 6 0.1%
Accommodation & Food Services 519 9.3%
Other Services (excl Public Administration) 173 3.1%
Public Administration 136 2.4%
Source: Longitudinal Employer-Household Dynamics (LEHD)
0200400600800
1,0001,2001,4001,6001,8002,000
North Core - Jobs by Industry Sector

Northside Retail Study Houston, Texas
30
Long Term Area Projections
Population
Population by Transportation Analysis Zone (TAZ)
Both H-GAC and CDS forecasts for most areas have parallel population projections.
Some interesting to points to note:
• H-GAC and CDS have 10-year (2010-2020) growth predictions of 6.4% and 5.1%, respectively
o H-GAC’s largest jump is in the South Supplemental (23%)
o CDS’ largest jump is in the South Core (16%)
• By the 2025 projections, H-GAC’s largest jump is 16% in the South Core, similar to CDS, but CDS
projects an even more optimistic (21.4%) growth.
• By the 2030 projections, H-GAC projects the population in the North and South Core and
Supplementals rising by 16%, while CDS is predicting almost 13%
Population Projections
H-GAC 1Q 2014
Population 2010 2015 2020 2025 2030 2035 2040
North Core 12,801 13,505 13,626 13,626 13,626 13,626 13,626
North Supplemental 7,670 7,756 7,784 7,784 7,993 7,993 7,993
South Core 14,936 15,784 16,143 17,319 18,452 20,347 20,983
South Supplemental 11,439 12,655 14,107 14,107 14,278 14,278 14,278
Total Core 22,916 23,910 24,334 25,510 26,643 28,538 29,174
Total ALL 42,025 44,321 46,225 47,401 48,914 50,809 51,445
CDS 2-19-2014
Population 2010 2015 2020 2025 2030 2035 2040
North Core 12,864 13,149 13,518 13,678 13,781 13,781 13,832
North Supplemental 7,671 7,773 8,022 8,068 8,163 8,207 8,258
South Core 15,614 16,762 18,096 18,949 19,362 19,736 19,948
South Supplemental 21,103 21,359 22,157 22,539 22,903 23,069 23,263
Total Core 23,596 24,911 26,403 27,325 27,782 28,156 28,391
TOTAL ALL 52,370 54,043 56,582 57,932 58,848 59,432 59,912
Source: H-GAC, CDS
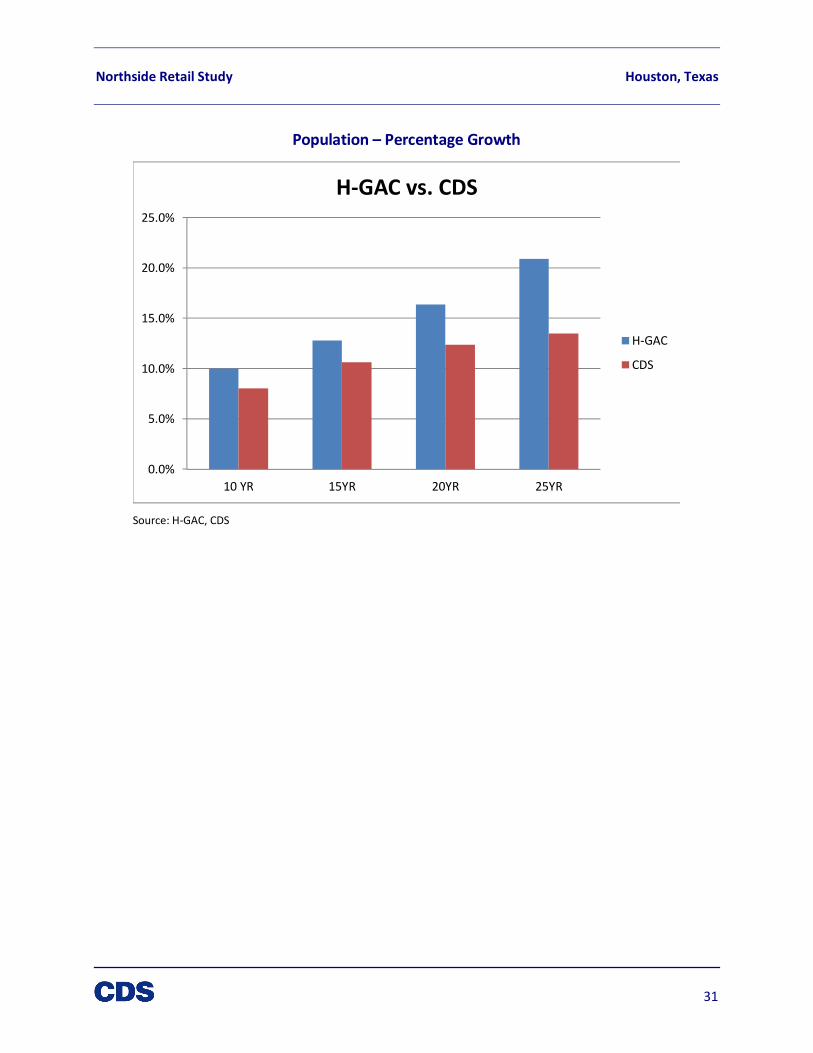
Northside Retail Study Houston, Texas
31
Population – Percentage Growth
Source: H-GAC, CDS
0.0%
5.0%
10.0%
15.0%
20.0%
25.0%
10 YR 15YR 20YR 25YR
H-GAC vs. CDS
H-GAC
CDS

Northside Retail Study Houston, Texas
32
Households/Housing Units
H-GAC projects household growth projections, while CDS projects housing units. A Household is defined as
an occupied housing unit, while housing units are counted whether occupied or not.
Some interesting to points to note:
• The two highest areas of future household growth by 2020, according to H-GAC, are the South
Supplemental and the North Core
• The two highest areas of future housing unit growth, according to CDS, are the South Core and
South Supplemental
• By the 2025 projections, H-GAC’s largest jump is 19.5% in the South Core, similar to CDS, and 12.4%
in the South Supplemental (CDS projects the biggest areas of housing unit growth to be the same)
• By the 2030 projections, H-GAC projects total household growth to be over 2,300 households
• By 2030, CDS projects there to be an additional 4,000 housing units in the CMA
Perhaps the most significant takeaway is the trend occurring in the comparison of population growth
relative to household or housing unit growth. By 2040, CDS population per housing unit is expected to drop
over 11%, with the average household size going from 3 to 2.7. This adjustment is being fueled by changes
primarily in the South Core which has population per household dropping over 15% (North Core is projected
to remain relatively constant)
Households/Housing Units
H-GAC 1Q 2014
Households 2010 2015 2020 2025 2030 2035 2040
North Core 4,295 4,628 4,672 4,672 4,672 4,672 4,672
North Supplemental 2,482 2,519 2,529 2,529 2,609 2,609 2,609
South Core 5,068 5,377 5,481 6,056 6,509 7,440 7,749
South Supplemental 4,895 5,268 5,501 5,501 5,585 5,585 5,585
Total Core 7,859 8,233 8,360 8,935 9,388 10,319 10,628
TOTAL ALL 15,236 16,020 16,390 16,965 17,582 18,513 18,822
CDS 2-19-2014
Housing Units 2010 2015 2020 2025 2030 2035 2040
North Core 4,817 4,901 5,024 5,069 5,106 5,105 5,121
North Supplemental 2,789 2,826 2,940 2,951 2,997 3,018 3,039
South Core 6,026 6,767 7,631 8,275 8,633 8,905 9,099
South Supplemental 5,462 5,641 6,132 6,383 6,622 6,757 6,882
Total Core 9,150 9,940 10,859 11,521 11,896 12,167 12,369
TOTAL ALL 17,401 18,407 19,931 20,855 21,515 21,942 22,290
Source: H-GAC, CDS

Northside Retail Study Houston, Texas
33
Employment
Overall, both H-GAC and CDS project for employment to grow in both the Core and Supplemental areas.
• H-GAC and CDS have 2020 employment projections of 7% and 34%, respectively.
o H-GAC projects over 1,200 new jobs
o CDS projects just under 8,000 new jobs
• By 2025, H-GAC ‘s largest growth is projected in the South Core (14%) with small growth in the
North Core (4.5%) while CDS forecasts 56% growth in the South Core and 17% in the North Core
• Looking at the 2030 forecasts, North Core projections by CDS continue to show significant growth
as an additional 1,700 jobs are added
Employment
H-GAC 1Q 2014
Employment 2010 2015 2020 2025 2030 2035 2040
North Core 2,664 2,672 2,782 2,785 3,005 3,005 3,216
North Supplemental 2,600 2,597 2,597 2,596 2,596 2,648 2,646
South Core 10,166 10,446 10,874 11,592 12,113 12,587 12,808
South Supplemental 3,864 4,095 4,379 4,380 4,482 4,815 4,857
Total Core 11,510 11,801 12,229 12,947 13,642 14,116 14,496
TOTAL ALL 17,974 18,493 19,205 19,923 20,720 21,579 21,999
CDS 2-19-2014
Employment 2010 2015 2020 2025 2030 2035 2040
North Core 3,061 3,293 3,390 3,587 3,619 3,675 3,732
North Supplemental 3,161 3,559 5,187 5,451 5,522 5,584 5,594
South Core 11,773 14,233 16,488 18,453 20,194 21,505 22,918
South Supplemental 6,503 7,363 7,527 7,995 8,248 8,438 8,490
Total Core 13,118 15,775 18,059 20,035 21,785 23,102 24,567
TOTAL ALL 22,782 26,697 30,773 33,481 35,555 37,124 38,651
Source: H-GAC, CDS

Northside Retail Study Houston, Texas
34
Summary: Key Demographic and Economic Trends
H-GAC anticipates higher projections in population growth. It should be noted that H-GAC only considers
household population, while CDS considers all population, which can include assisted living facilities,
dormitories, and jails. H-GAC predicts population increases of 4,000 by 2020, 7,000 by 2030 and 9,000 by
2040. CDS predicts similar increases through 2030, but a slightly different 2040 projection of about 7,500.
CDS forecasts are projecting a greater level of employment growth, which would necessitate significant new
development and redevelopment within the CMA. H-GAC’s forecasts are lower, although its projections still
do account for almost 3,000 new jobs by 2030 and over 4,000 new jobs by 2040. CDS projects nearly 8,000
new jobs by 2020, and nearly 13,000 new jobs by 2030.
The trends between population growth relative to housing unit growth are significant and will impact future
demands to be seen within the changing Study Area. The chart below shows those trends through 2040.
The South Core is showing a 15.4% drop in population per housing unit (2.6 to 2.2) while the combination of
the Core Areas project to drop from 3 to 2.7 (an 11% drop).
Population to Housing Unit Ratios
Source: CDS
2.00
3.00
4.00
2010 2015 2020 2025 2030 2035 2040
North Core North Supplemental South Core
South Supplemental Total Core TOTAL ALL
Employment – Percentage Growth
Source: H-GAC, CDS
0.0%
20.0%
40.0%
60.0%
80.0%
10 YR 15YR 20YR 25YR
H-GAC vs. CDS
H-GAC CDS

Northside Retail Study Houston, Texas
35
Existing Northside Retail Market
Retail Space and Business Inventory
The following three pages display maps showing retail properties within both core areas. Following the
maps is a list of all mapped businesses by their identification number as they appear on the three maps.
Business Map – 1 of 3
Source: CDS

Northside Retail Study Houston, Texas
36
Business Map – 2 of 3
Source: CDS

Northside Retail Study Houston, Texas
37
Business Map – 3 of 3
Source: CDS

Northside Retail Study Houston, Texas
38
Number Business
1 7 Mares Seafood
2 Abogado Irvington Clinic
3 ACG Quality Electric
4 Acme Prining & Signs
5 Alex Alaniz Automotive Center
6 ALG Truck& Trailer Repair
7 All In One Food Store
8 Amco Auto Insurance
9 America's Best Values Inn
10 Ana's Beauty Salon
11 Angela's Flowers
12 Artistic Hair Salon
13 Arturo's Automotive
14 Arturo's Mechanic Shop, Arevalo's Muffler
15 Arturo's Tire Service
16 ATC Bail Bonds
17 Auto Insurance
18 Auto Shop, Pereira's Mufflers
19 Auto Title Loans
20 AutoZone
21 Ayala's Tortilla Factory
22 B & B Grocery Store
23 B&D Washateria
24 Barber Shop
25 Bocca Deli, Liquor Store
26 Bolivar, Henderson, & Associates
27 Bonnie Wingate's Hair Affair
28 Boost Mobile, Red Hot Nails, Texan Auto Insurance, Subway, J's Hair, Window
Tinting, Tire Shop,
29 Brando Chiropractic
30 Burger King
31 C&C Party Supply, Fitness
32 Café Brussels
33 CAI Mechanical, LLC
34 Canter's
35 Capital One Bank
36 Casa De Amigos Health Center
37 Casa Grande Mexican Restaurant
38 Cash America Pawn
39 Cash America Pawn
40 Cash and Carry Furniture
41 Cash and Carry Furniture
42 Chevron
43 Chucho Transmission Service
44 Church's Chicken
45 Church's Chicken
46 Citgo
47 City Game
48 Clinica Petdiatrica
49 Convenience Store

Northside Retail Study Houston, Texas
39
Number Business
50 Corner Food Mart
51 Cross Wireless, Fresenius Medical Care, Bells Myown Cleaners, Presidente
Liquor, Texas Car Title & Payday Loan, Rent-a-Center, Dollar General
52 CVS Pharmacy
53 Dairy Land
54 Dawson Chemical & Janitorial Supplies
55 Del's Ice Cream Shop, Future Boutique
56 Diana Balderas Realty
57 Diva's, Car Wash, Metro PCS, Fulton Washateria
58 Dollars & Deals
59 ECare Medical Supplies & On the Go Process Servers
60 EDS Auto Repair
61 El Cuate Auto Repair
62 El Guero Minimart, Cricket, La Macro Taqueria, Check Cashing, Chuy's Doggie
Day Spa
63 El Guero Tire Shop
64 El Mante Tire Shop
65 El Sol Groceries and Restaurant
66 Elia's Auto Repair
67 Ellis Electric Service
68 Exxon
69 Exxon
70 F&D Tire Shop
71 Falcon Drive In Groceries
72 Family Clinic, Family Dental, Pharmacy
73 Family Dollar
74 Family Thrift Center
75 Family Thrift Center
76 Farmers Insurance
77 Fiesta
78 Fiesta
79 Fiesta En Guadalajara
80 Fiesta Tapatia
81 Firestone Car Care
82 Francos Auto Sales
83 Garcia's Tire Shop
84 Gas Station
85 GC Tire Service
86 General Auto Repair
87 Gerardi's Drive-In
88 Global Detection Systems
89 Gorditas AguasCaliente
90 Happy Fashion, Magic Nails, Magic Cleaners
91 Health Masters Massage Therapy
92 Hernandez Properties
93 Hierberia
94 Houston Bakery Panaderia
95 Houston Police Federal Credit Union
96 Ike's Place
97 Insurance, Photo Studio

Northside Retail Study Houston, Texas
40
Number Business
98 International Alliance of Theatrical Stage Employees
99 J & A Paint and Body Shop
100 J Lee Signs
101 Jefferson Dental, Sam's Dollar Store
102 Jimmy's Super Market
103 Joel's Tattoos, Hair Salon, Airbrush, Los Paisanos Discount
104 John's Formal Wear
105 K Bar
106 King's Dental Center
107 Knapp Chevrolet
108 Kuko's Taqueria
109 La Casa Bakery & Café
110 La Michoacana Meat Market
111 La Playa El Cuco
112 Label Warehouse
113 Label Warehouse
114 Laredo Taqueria #4
115 Law Office, Jessica's Hair Salon, Lilberty Tax, Dentist
116 Leon Western Wear
117 Leonel Castillo Community Center
118 Lifetime Inflatables
119 Lighthouse
120 Lindale Dental
121 Lone Star Uniforms
122 Lonehorn Resale
123 Lopez Law Office
124 Los Chavez Autobuses
125 Louisa's Beauty Salon, Quitman Discount Store, Speed Queen Laundry
126 Love's, Wendy's
127 Luxury Inn
128 Main Auto Repair
129 Maldonado & Associates Insurance
130 Martinez Resale
131 Mary Kay
132 Matamoros Meat Market
133 McDonalds
134 Medicina General
135 Medicina General
136 Memo's Record Shop
137 Mercado Rodriguez
138 Mexican Restaurant, P&H Food
139 Military Supply
140 Montalbano Lumber
141 Montalbano Tire & Auto Service
142 MT Auto Service
143 Multiservice Express
144 Norma's Insurance Agency
145 North Main Nutrition Center, Caminos de Guanajunto, La Sabrosita Ice Cream,
Solutions Beauty and Barber Shop
146 Obanions Car Wash

Northside Retail Study Houston, Texas
41
Number Business
147 OMG Print Shirts
148 Paradise Smoke Shop
149 Knapp Chevrolet
150 Pedro's Tires
151 Performance Muffler
152 Phillips 66
153 Pizza Patron, Cash Advance, Fulton Dental, Insurance, H&R Block, Las Llardas
154 Poppa's Burgers
155 Poppa's Burgers
156 Primo Food Store
157 Prince Boxing Complex
158 Prosperity Bank
159 Prosperity Bank
160 Prosperity Bank
161 Prosperity Bank
162 Pyramid Imports Tile and Flooring
163 Ramones TV Service
164 Recycling Center
165 Red Ox Bar and Grill
166 Revolution Dojo
167 Rio Verdence Restaurant
168 Roland Cleaners, Shoe Repair
169 Rosegreen Florist
170 Ruiz Wholesale
171 Salinas Garage
172 Sam's Liquor, Ace, Kinfolk Cleaners, Beauty Supply, Tax Service, Barber Shop,
Taqueria Allende
173 Santos Auto Sales, Inc
174 Santo's Lounge
175 Shell
176 Shell
177 Shell
178 Simon's Pharmacy
179 St. Arnolds Brewery
180 Stanton's City Bites
181 State Farm, Nails Plus, V&X Beauty Salon
182 Stoke's Hardware
183 Subway, Donut Delight, Hermanos Loans, Tiempo Loans
184 Sunny Food Store
185 T&L Shirts, Inc
186 Taqueria Abasolo
187 Taqueria Allende
188 Taqueria Arandas
189 Tavo's Barber Shop
190 Tax Services, Check Cashing
191 Teotihuacan Mexican Cafe
192 Texas Custom Marble & Granite
193 Tienda Mexicana, Taqueria Laredo, Laundry King
194 Tire Shop / Auto Repair
195 Top Brass Military

Northside Retail Study Houston, Texas
42
Number Business
196 Tortilleria, Irvington Family Pharmacy, Twiggy's Barber Shop, N Nails, auto shop,
Roy Cleaners
197 Troy Tax Services
198 Twilite Liquor, Eclipse Beauty Salon
199 Uncle Johnny's Good Cars
200 Uncle Johnny's Good Cars
201 United Access Scaffolding
202 Universal Preventive
203 Valero
204 Valero
205 Variedades Rosys
206 Veracruz Mexican Restaurant
207 Veracruz Seafood & Steak
208 Walgreens
209 Wells Fargo
210 Wells Fargo
211 Yerberia

Northside Retail Study Houston, Texas
43
Businesses by Type
The following tables have an inventory of all businesses by business sector in the North and South Cores,
per PCensus for Map Info, Tetrad Computer Applications 2014.
North Core Businesses by Type
North Core
Businesses by Major Sectors Total Total Sales
Establishments Employees ($ 000's)
Total Businesses 395 3,061 $888,104
Retail Trade 67 415 $134,225
Motor Vehicle and Parts Dealers 9 21 $11,468
Furniture and Home Furnishing Stores 1 3 $776
Electronics and Appliance Stores 3 8 $1,917
Building Material and Garden Equipment and Supplies Dealers 2 17 $3,512
Food and Beverage Stores 24 209 $56,521
Health and Personal Care Stores 2 25 $7,851
Gasoline Stations 8 56 $38,997
Clothing and Accessories Stores 4 17 $2,956
Sporting Goods, Hobby, Musical Instrument and Book Stores 2 3 $451
General Merchandise Stores 3 12 $2,379
Miscellaneous Store Retailers 9 44 $7,396
Nonstore Retailers 0 0 $0
Finance and Insurance 26 65 $10,417
Monetary Authorities-Central Bank 0 0 $0
Credit Intermediation and Related Activities 11 23 $2,605
Securities, Commodity Contracts, and Other Financial Investments
and Related Activities 0 0 $0
Insurance Carriers and Related Activities 15 42 $7,812
Funds, Trusts and Other Financial Vehicles 0 0 $0
Accommodation and Food Services 39 401 $20,707
Accommodation 3 23 $2,269

Northside Retail Study Houston, Texas
44
North Core
Businesses by Major Sectors Total Total Sales
Establishments Employees ($ 000's)
Food Services and Drinking Places 36 378 $18,438
Other Services (except Public Administration) 82 254 $12,224
Repair and Maintenance 20 83 $9,541
Personal and Laundry Services 21 44 $2,682
Religious, Grantmaking, Civic, Professional, and Similar Organizations 41 126 $0
Agriculture, Forestry, Fishing and Hunting 0 0 $0
Mining, Quarrying, and Oil and Gas Extraction 0 0 $0
Utilities 0 0 $0
Construction 24 172 $30,181
Manufacturing 15 160 56,616
Wholesale Trade 21 219 $534,985
Transportation and Warehousing 6 28 5,609
Information 3 6 $3,734
Real Estate and Rental and Leasing 16 157 $37,641
Professional, Scientific, and Technical Services 36 215 $10,670
Management of Companies and Enterprises 0 0 $0
Administrative and Support and Waste Management and
Remediation Services 14 232 $13,335
Educational Services 12 433 $115
Healthcare and Social Assistance 28 219 $16,844
Arts, Entertainment, and Recreation 3 11 $802
Public Administration 2 73 $0
Source: PCensus for Map Info, Tetrad Computer Applications 2014
Looking specifically at the retail categories in the North Core, the three largest in terms of number of
establishments are Food and Beverage Stores (24), Motor Vehicle and Parts Dealers (9), and

Northside Retail Study Houston, Texas
45
Miscellaneous Store Retailers (9). Regarding employee counts, the three largest are Food and Beverage
Stores (209), Gasoline Stations (56), and Miscellaneous Store Retailers (44).
Evaluating based on Sales as a percentage of Retail Trade, the three largest sub-categories of retail are
Food and Beverage Stores (42%), Gasoline Stations (29%), and Motor Vehicle and Parts Dealers (9%).
South Core Businesses by Type
South Core
Businesses by Major Sectors Total Total Sales
Establishments Employees ($ 000's)
Total Businesses 596 7,197 $2,902,596
Retail Trade 80 809 $300,665
Motor Vehicle and Parts Dealers 13 192 $110,604
Furniture and Home Furnishing Stores 5 113 $38,057
Electronics and Appliance Stores 1 2 $495
Building Material and Garden Equipment and Supplies Dealers 4 152 $52,068
Food and Beverage Stores 21 216 $60,069
Health and Personal Care Stores 3 18 $4,985
Gasoline Stations 7 20 $13,932
Clothing and Accessories Stores 11 28 $5,234
Sporting Goods, Hobby, Musical Instrument and Book Stores 2 9 $1,647
General Merchandise Stores 8 41 $9,911
Miscellaneous Store Retailers 4 12 $2,618
Nonstore Retailers 1 6 $1,046
Finance and Insurance 52 289 $123,756
Monetary Authorities-Central Bank 0 0 $0
Credit Intermediation and Related Activities 27 177 $43,583
Securities, Commodity Contracts, and Other Financial Investments
and Related Activities 2 8 $6,139
Insurance Carriers and Related Activities 23 104 $74,034
Funds, Trusts and Other Financial Vehicles 0 0 $0
Accommodation and Food Services 32 251 $12,279
Accommodation 0 0 $1
Food Services and Drinking Places 32 251 $12,279

Northside Retail Study Houston, Texas
46
South Core
Businesses by Major Sectors Total Total Sales
Establishments Employees ($ 000's)
Other Services (except Public Administration) 87 447 $23,437
Repair and Maintenance 28 166 $18,439
Personal and Laundry Services 18 75 $4,999
Religious, Grantmaking, Civic, Professional, and Similar
Organizations 41 205 $0
Agriculture, Forestry, Fishing and Hunting 2 16 $3,079
Mining, Quarrying, and Oil and Gas Extraction 0 0 $0
Utilities 0 0 $0
Construction 25 170 $63,590
Manufacturing 38 1,370 730,537
Wholesale Trade 42 914 $1,424,604
Transportation and Warehousing 25 934 81,774
Information 12 60 $21,076
Real Estate and Rental and Leasing 22 104 $27,314
Professional, Scientific, and Technical Services 53 236 $40,194
Management of Companies and Enterprises 0 0 $0
Administrative and Support and Waste Management and
Remediation Services 20 156 $23,161
Educational Services 20 927 $462
Healthcare and Social Assistance 62 253 $25,458
Arts, Entertainment, and Recreation 10 40 $1,209
Public Administration 14 219 $0
Source: PCensus for Map Info, Tetrad Computer Applications 2014
Looking specifically at the retail categories in the South Core, the three largest in terms of number of
establishments are Food and Beverage Stores (21), Motor Vehicle and Parts Dealers (13), and Clothing
and Accessories Stores(11).
Regarding employee counts, the three largest are Food and Beverage Stores (216), Motor Vehicle and
Parts Dealers (192), and Building Material and Garden Equipment and Supplies Dealers (152).

Northside Retail Study Houston, Texas
47
CMA – Retail
Retail Absorption Occupancy Rental Rates
2014 9,327 93.4% $13.29
2013 21,368 92.3% $12.67
2012 7,667 89.8% $11.05
2011 (19,340) 90.2% $11.13
2010 2,523 91.9% $11.80
2009 (8,511) 91.6% $14.13
Source: Costar
Regional - Retail
Retail Absorption Occupancy
Rental
Rates
Inner Loop/Heights
Ret 32,125 95.9% $15.51
Source: Costar
Evaluating based on Sales as a percentage of Retail Trade, the three largest sub-categories of retail are
Motor Vehicle and Parts Dealers (37%), Food and Beverage Stores (20%), and Building Material and
Garden Equipment and Supplies Dealers (17%).
Retail Market Performance
The Retail market is showing some positive
trends in the CMA:
• Occupancy of the past year has risen to
over 93% for the first time in five years
• Absorption has been positive for three
consecutive years, and four of the last
five years
• Rental rates have risen over the past
few years (5% over last year and a 20% increase since 2012)
Looking at a wider region for Retail
market (data covering the last year), the
region has more attractive numbers.
• Occupancies in the region are 2.5%
higher (almost 96%)
• Rental rates are more attractive in
the region, at over $15 per sq ft
(17% higher than the CMA)
Retail parcels account for almost 6% of the acreage in the CMA. Overall it is very healthy market with
consistent new additions (typically restaurants). Brokers in the area believe that retail opportunities are
good. A couple strip centers were speculatively built and have been able to fill with attractive tenants,
primarily restaurants and other neighborhood-serving retail. Properties along the rail line had very negative
comments regarding their retail options for their properties, but otherwise a majority of respondents were
generally bullish on the area. Typically cited were that increased populations were coming with several
noted single and multifamily developments underway or planned. Lease rates are said to be “sticky” as
several brokers say users still don’t deem properties in the CMA (rental and for sale) to be worth what they
are asking. Restaurants seem to dominate most brokers opinions of what the area needs.
The map to the left shows the region that was used for comparison,
Inner Loop/Heights Ret, number 23 on the map.
Costar Retail Regions

Northside Retail Study Houston, Texas
48
Retail Sales Trends
CDS received the figures for gross and taxable sales for the 77009 zip code which comprises the majority
of both Core areas, but also includes area to the west of I-45, ranging to Studemont/North Main. There
were a total of thirteen retail categories for which gross and taxable annual sales were obtained. Sales
figures for the smallest seven of the thirteen categories are listed below and they are shown in a graph
on the following page.
In looking at these seven categories,
• The only two categories showing noticeable gains over the past four years are General
Merchandise Stores and Miscellaneous Retailers, having increased since 2009 by 50% and 18%,
respectively.
• Clothing & Clothing Accessories Stores and Furniture & Home Furnishings Stores both saw a
significant decrease over the past four years, both dropping by over 50%.
• Furniture & Home Furnishings Stores, Personal & Laundry Services, and General Merchandise
showed a positive one-year gain, while Clothing & Clothing Accessories Stores and
Miscellaneous Store Retailers experienced one-year losses
• Over the past two years, General Merchandise, Miscellaneous Retailers, and Electronics &
Appliance Stores showed positive gains, while Clothing & Clothing Accessories Stores had a
significant decrease
Retail - 77009
Gross Sales
Retail Category 2009 2010 2011 2012 2013
Furniture & Home Furnishings Stores 553,604 536,051 375,541 244,255 267,045
Electronics & Appliance Stores 1,541,095 1,361,938 1,150,244 1,418,130 1,419,796
Clothing & Clothing Accessories Stores 2,843,375 2,633,971 2,447,237 1,856,155 1,385,914
Sporting Goods, Hobby, Musical Instrument &
Book Stores 1,993,028 1,790,389 1,910,047 2,067,435 1,916,815
General Merchandise Stores 6,451,122 6,934,081 6,866,302 7,984,205 9,689,382
Miscellaneous Store Retailers 5,962,580 5,905,371 6,169,542 7,719,757 7,008,252
Personal & Laundry Services 868,349 905,380 887,280 886,260 938,212
Source: Texas Comptroller of Public Records

Northside Retail Study Houston, Texas
49
The remaining six categories, which are the largest of the thirteen, are listed in the table below and
illustrated in the chart on the following page.
Gross Sales in ZIP Code 77009 – Selected Business Categories
Source: Texas Comptroller of Public Records
$0
$2,000,000
$4,000,000
$6,000,000
$8,000,000
$10,000,000
$12,000,000
2009 2010 2011 2012 2013
Furniture & Home Furnishings Stores Electronics & Appliance Stores
Clothing & Clothing Accessories Stores Sporting Goods, Hobby, Musical Instrument & Book Stores
General Merchandise Stores Miscellaneous Store Retailers
Personal & Laundry Services
Gross Retail Sales 77009
Gross Sales ($)
Retail Category 2009 2010 2011 2012 2013
Building Material/Garden
Equipment & Supplies 34,979,827 33,851,977 34,017,863 5,835,792 4,206,296
Food & Beverage Stores 63,832,605 57,351,080 77,083,964 71,885,600 74,438,467
Gasoline Stations 48,519,681 46,864,548 56,059,439 62,328,196 54,865,368
Food Services & Drinking Places 50,803,937 49,357,048 50,352,645 53,372,958 56,083,371
Health & Personal Care Stores 15,119,973 15,844,400 14,609,832 15,415,292 15,271,292
Motor Vehicle & Parts Dealers 18,416,025 17,411,794 16,689,044 17,922,138 17,425,724
Source: Texas Comptroller of Public Records

Northside Retail Study Houston, Texas
50
Looking at these six retail categories:
• Food & Beverage Stores, Gasoline Stations, and Food Services & Drinking Places all moved
positively between 2009 and 2013 (10-17% growth) while Building Material/Garden Equipment
& Supplies Dealers significantly dropped.
• Building Material/Garden Equipment & Supplies Dealers significantly dropped over the last two
years, while Food Services & Drinking Places increased almost $6 million.
• Food & Beverage Stores along with Food Services & Drinking Places both had decent one-year
gains, both increasing by over $2.5 million.
• Food & Beverage Stores, Gasoline Stations, and Food Services & Drinking Places were by far the
largest contributors combining for over 83% of these six categories and 76% of all thirteen.
Looking at the total gross retail sales of all thirteen of the aforementioned categories, there has not
been growth over the represented five-year period, with $252 million in 2009 and $244 million in 2013.
To evaluate the gross sales in constant 2013 dollars, taking each year’s sales figures and applying the
Consumer Price Index (CPI) to convert from nominal dollars to real dollars, the decrease becomes more
pronounced, showing approximately a 9.3% decrease from 2009. See the table and chart below.
Gross Retail Sales 77009
Source: Texas Comptroller of Public Records
$0
$10,000,000
$20,000,000
$30,000,000
$40,000,000
$50,000,000
$60,000,000
$70,000,000
$80,000,000
$90,000,000
2009 2010 2011 2012 2013
Building Material/Garden Equipment & Supplies Dealers Food & Beverage Stores
Gasoline Stations Food Services & Drinking Places
Health & Personal Care Stores Motor Vehicle & Parts Dealers

Northside Retail Study Houston, Texas
51
Total Gross Sales - 77009
Taxable Sales 2009 2010 2011 2012 2013
Total Sales 251,887,210 240,750,038 268,620,991 248,938,185 244,917,947
Total Sales (Adjusted) 270,024,056 257,364,765 278,103,275 253,033,241 244,915,934
Source: Texas Comptroller of Public Records, Bureau of Labor Statist ics
Source: Texas Comptroller of Public Records, Bureau of Labor Statistics
$220,000,000
$240,000,000
$260,000,000
$280,000,000
$300,000,000
2009 2010 2011 2012 2013
Total Gross Sales
Total Gross Sales Gross Salesl (Adjusted)

Northside Retail Study Houston, Texas
52
Estimated Retail Leakage and Supportable Demand
In a retail analysis, “leakage” describes potential spending at retail establishments from residents and
other local population within a given market area, but which is being spent elsewhere. It is an indicator
of the potential demand for additional retail investment and occupancy. CDS’s analysis objective is to
understand how much, if any, additional retail activty might be supportable in the two CMAs, now and
inf the future. The approach CDS is taking for this analysis is as described below.
Analysis Methodology
Estimate Current and Future per-Household Leakage
1. Current per-Household Leakage Because data on actual retail spending is not readily available at
geographies smaller than the ZIP code level, initial calculation of leakage will have to be done for ZIP
code 77009. Fortunately, this ZIP code shares much of the same area as the Northside CMAs’
combined Core and Supplemental areas. Furthermore, the portions of the CMAs outside 77009
have little retail activity which would be capturing the “leaked” spending. Therefore, CDS finds it
reasonable to estimate a per-household leakage amount for 77009 and assume an equal per-
household rate for the current number of households in the two CMAs. This per-household amount
is estimated in Analysis Table 1.
2. Future per-Household Leakage While this is not a housing study, CDS’s assessment of the Northside
area generally is that it is poised for residential gentrification in the near to middle term. One
finding from the demographic analysis was that the South Supplemental CMA area has a
significantly different demographic profile, in that its residents are higher-income and more well-
educated than the rest of the CMA. CDS is assuming that the profile of the South Supplemental area
is indicative of what the rest of the CMAs could evolve to as gentrification spreads. Therefore, CDS
has obtained an estimate of aggregate and per-household spending for the South Supplemental
area by retail category, depicted in Analysis Table 2. CDS used this per-household spending factor
to calculate leakage for ZIP code 77009 in a future gentrification scenario and obtain a future per-
household leakage factor, derived in Analysis Table 3.
Estimate Current and Future Leakage in CMAs
CDS then took the current and future estimated per-household leakage amounts from Analysis Table 1
and Analysis Table 3 and applied it to the North and South CMAs, to obtain an idea of how much
additional occupied retail space could be supported beyond the current inventory. The future estimated
supportable space is influenced not only by changed demographic and spending characteristics, but also
an increased number of total households (refer to the 2019 projections of households from the
Demographic / Economic Analysis section earlier in this report). These estimates are shown in Analysis
Tables 4-7.
Apply Qualitative and Development Considerations to Draw Conclusions
CDS then considered the output of the current and future supportable space demand estimates in light
of the potential for existing establishments to absorb more spending, the practicalities of typical retail
development, and qualitative factors to produce a set of general conclusions regarding the viability of
additional retail investment and development.

Northside Retail Study Houston, Texas
53
Current Per-Household Leakage
CDS used ZIP Code 77009 existing and estimated potential spending to calculate current per-household
leakage in Analysis Table 1 above. The 2013 Sales column shows the retail sales per retail category for
the 77009 zip code. The next column gives the Census figures for total aggregate expenditure estimates
per the residents of those same zip codes. This indicates the level which residents are shopping inside
the 77009 area.
Specifically, the table shows which categories are experiencing a surplus and which ones are
experiencing a leakage, comparing actual sales relative to the aggregate expenditures
The largest leakage amounts are occurring in the following segments:
• General Merchandise
• Motor Vehicle and Parts Dealers
• Clothing and Clothing Accessories Stores
• Health and Personal Care Stores
Analysis Table 1: Comparison of Sales with Expected Household Expenditures – ZIP 77009
Industry Gross Sales Aggregate
Expenditures Leakage
Leakage
per HH
Furniture and Home Furnishings
Stores $267,045 $10,820,845 $10,553,800 $735.00
Electronics and Appliance Stores $1,419,796 $10,247,005 $8,827,209 $614.75
Clothing and Clothing Accessories
Stores $1,385,914 $29,034,661 $27,648,747 $1,925.53
Sporting Goods, Hobby, Musical
Instrument & Book Stores $1,916,815 $9,625,702 $7,708,887 $536.87
General Merchandise Stores $9,689,382 $68,174,131 $58,484,749 $4,073.04
Miscellaneous Store Retailers $7,008,252 $7,475,464 $467,212 $32.54
Personal and Laundry Services $938,212 $2,509,087 $1,570,875 $109.40
Building Material/Garden
Equipment & Supplies Dealers $4,206,296 $9,415,822 $5,209,526 $362.81
Food and Beverage Stores $74,438,467 $77,424,610 $2,986,143 $207.96
Gasoline Stations $54,865,368 $43,339,300 ($11,526,068) ($802.71)
Food Services and Drinking Places $56,083,371 $37,101,172 ($18,982,199) ($1,321.97)
Health and Personal Care Stores $15,271,292 $32,221,645 $16,950,353 $1,180.47
Motor Vehicle and Parts Dealers $17,425,724 $69,027,021 $51,601,297 $3,593.66
TOTAL $244,915,934 $406,416,465 $161,500,531 $735.00
Sources: PCensus for MapInfo; Texas Comptroller of Public Records; Dollars and Cents of Shopping Centers,
CDS Market Research

Northside Retail Study Houston, Texas
54
These four industries all show a leakage of over $150,000,000. Other industries experiencing leakage on
a significant but somewhat smaller scale are Furniture and Home Furnishings Stores, Electronics and
Appliance Stores, and Sporting Goods, Hobby, Musical Instrument & Book Stores, all showing leakages
between $7,000,000 and $10,000,000.
Gasoline Stations and Food Services and Drinking Places recognize a surplus, showing $11 million and
$19 million surpluses, respectively.
Potential Future Leakage per Household
In the future, the North and South CMAs will continue to experience gentrification and redevelopment
which will bring in a more educated, higher income-earning population. With this comes a greater
buying power. The South Supplemental geography has largely already experienced this process and
continues to do so. It is expected that residents of the overall North and South CMAs will take on the
spending habits of the South Supplemental area in the future.
To generate a future scenario with higher income demographics for the CMAs, CDS obtained a per-
household estimate of retail spending for the South Supplemental CMA, shown in Analysis Table 2
below.
Analysis Table 2: Estimation of Retail Spending per Household – South
Supplemental CMA
4,418 Households
Industry
South Supplemental
Aggregate
Expenditures
South Supplemental
Expenditures per HH
Furniture and Home Furnishings Stores $4,044,223 $915.40
Electronics and Appliance Stores $3,602,139 $815.33
Clothing and Clothing Accessories Stores $9,833,867 $2,225.86
Sporting Goods, Hobby, Musical Instrument & Book
Stores $3,491,489 $790.29
General Merchandise Stores $22,426,630 $5,076.20
Miscellaneous Store Retailers $2,710,188 $613.44
Personal and Laundry Services $802,761 $181.70
Building Material/Garden Equipment & Supplies
Dealers $3,291,666 $745.06
Food and Beverage Stores $24,110,169 $5,457.26
Gasoline Stations $14,020,552 $3,173.51
Food Services and Drinking Places $12,656,829 $2,864.83
Health and Personal Care Stores $10,282,977 $2,327.52
Motor Vehicle and Parts Dealers $23,531,251 $5,326.22
TOTAL EXPENDITURES $134,804,741
Sources: PCensus for MapInfo; Texas Comptroller of Public Records; CDS Market Research

Northside Retail Study Houston, Texas
55
Analysis Table 3 below shows the leakage calculations for zip code 77009 to mimic a future
gentrification scenario where spending on a per household basis is equal to what households spend in
the South Supplemental at present.
CMA Leakage and Additional Supportable Retail Occupancy
CDS applied the current and future leakage per household figures from Analysis Tables 1 and 3 to the
number of households located in the CMA areas of North Core, North Core + Supplemental, South Core,
and South Core + Supplemental in order to arrive at an estimated leakage for those market areas. A
reasonable capture rate was then applied to reflect that not all leaked sales would be reallocated within
the CMA areas due to personal preferences and lifestyle habits of resident spenders. A lower capture
rate was used for leaked sales generated by households in the Supplemental areas, because those areas
will necessarily have equally as convenient options for spending outside the CMA and particularly
outside the Core areas.
Analysis Table 3: Comparison of Sales with Expected Household Expenditures – ZIP
Code 2009 Future Gentrification Scenario
Industry Gross Sales Aggregate
Expenditures1
Leakage Leakage
per HH
Furniture and Home Furnishings
Stores $267,045 $13,144,182 $12,877,137 $897
Electronics and Appliance Stores $1,419,796 $11,707,359 $10,287,563 $716
Clothing and Clothing Accessories
Stores $1,385,914 $31,961,181 $30,575,267 $2,129
Sporting Goods, Hobby, Musical
Instrument & Book Stores $1,916,815 $11,347,734 $9,430,919 $657
General Merchandise Stores $9,689,382 $72,889,086 $63,199,704 $4,401
Miscellaneous Store Retailers $7,008,252 $8,808,418 $1,800,166 $125
Personal and Laundry Services $938,212 $2,609,064 $1,670,852 $116
Building Material/Garden Equipment
& Supplies Dealers $4,206,296 $10,698,287 $6,491,991 $452
Food and Beverage Stores $74,438,467 $78,360,778 $3,922,311 $273
Gasoline Stations $54,865,368 $45,568,381 ($9,296,987) ($647)
Food Services and Drinking Places $56,083,371 $41,136,127 ($14,947,244) ($1,041)
Health and Personal Care Stores $15,271,292 $33,420,839 $18,149,547 $1,264
Motor Vehicle and Parts Dealers $17,425,724 $76,479,229 $59,053,505 $4,113
Total $244,915,934 $438,130,665 $193,214,731 $13,456
1 Calculated by multiplying per-household spending factors from Analysis Table 2 by estimated 77009 current
households.
Sources: PCensus for MapInfo; Texas Comptroller of Public Records; Dollars and Cents of Shopping Centers, CDS Market
Research

Northside Retail Study Houston, Texas
56
The resulting estimated leakage numbers are then used to calculate a supportable amount of occupied
square footage in the various retail categories. These square footage calculations apply a required sales
per square footage ratio to the leakage, and then are adjusted by a reasonable capture rate. The results
of this procedure, for current and future spending, are depicted in Analysis Tables 4 and 5 for the North
CMA and Analysis Tables 6 and 7 for the South CMA.
These calculations are merely designed to show what demand could be based on the current leakages
based on conservative capture rates. It is not a certainty that the Study Area could support new stores
each category that shows leakage. Often there are a number of reasons why certain retail will not be
supportable in any given geography. Furthermore, some of the leaked spending could be
accommodated or recaptured through increased spending at retail businesses which already exist within
the CMA.
Analysis Table 4: North CMA – Current Additional Supportable Retail Space
Estimated households: Core Area – 4,533, Supplemental – 2,541
Capture Rate
Sq.Ft. Supportable
Retail Category
Current
Leakage/HH
Core
CMA
Supplemental
CMA
$/Sq.Ft.
Required
Core
CMA
Core +
Supplemental
CMA
Furniture and Home Furnishings
Stores $735.00 20% 10% $150 4,442 5,687
Electronics and Appliance Stores $614.75 20% 10% $250 2,229 2,854
Clothing and Clothing
Accessories Stores $1,925.53 20% 10% $225 7,759 9,933
Sporting Goods, Hobby, Musical
Instrument & Book Stores $536.87 20% 10% $225 2,163 2,770
General Merchandise Stores $4,073.04 25% 13% $300 15,386 19,698
Miscellaneous Store Retailers $32.54 20% 10% $300 98 126
Personal and Laundry Services $109.40 20% 10% $75 1,322 1,693
Building Material/Garden
Equipment & Supplies Dealers $362.81 20% 10% $300 1,096 1,404
Food and Beverage Stores $207.96 50% 25% $450 1,047 1,341
Gasoline Stations ($802.71) 20% 10% $1,300 (560) (717)
Food Services and Drinking
Places ($1,321.97) 20% 10% $300 (3,995) (5,115)
Health and Personal Care Stores $1,180.47 20% 10% $250 4,281 5,481
Motor Vehicle and Parts Dealers $3,593.66 20% 10% $175 18,617 23,835
Total $11,247.34
53,887 68,991
Sources: PCensus for MapInfo; Texas Comptroller of Public Records; Dollars and Cents of Shopping Centers, CDS Market Research

Northside Retail Study Houston, Texas
57
Analysis Table 5: North CMA – Future Additional Supportable Retail Space
Estimated households: Core Area – 4,830, Supplemental – 2,635
Capture Rate
Sq.Ft. Supportable
Retail Category
Current
Leakage/HH Core CMA
Supplemental
CMA
$/Sq.Ft.
Required Core CMA
Core +
Supplemental
CMA
Furniture and Home Furnishings Stores $896.80 20% 10% $150 5,775 7,351
Electronics and Appliance Stores $716.45 20% 10% $250 2,768 3,524
Clothing and Clothing Accessories Stores $2,129.35 20% 10% $225 9,142 11,636
Sporting Goods, Hobby, Musical
Instrument & Book Stores $656.79 20% 10% $225 2,820 3,589
General Merchandise Stores $4,401.40 25% 13% $300 17,716 22,548
Miscellaneous Store Retailers $125.37 20% 10% $300 404 514
Personal and Laundry Services $116.36 20% 10% $75 1,499 1,908
Building Material/Garden Equipment &
Supplies Dealers $452.12 20% 10% $300 1,456 1,853
Food and Beverage Stores $273.16 50% 25% $450 1,466 1,866
Gasoline Stations ($647.47) 20% 10% $1,300 (481) (612)
Food Services and Drinking Places ($1,040.97) 20% 10% $300 (3,352) (4,266)
Health and Personal Care Stores $1,263.98 20% 10% $250 4,884 6,216
Motor Vehicle and Parts Dealers $4,112.65 20% 10% $175 22,702 28,894
Total $13,456.00
66,798 85,019
Sources: PCensus for MapInfo; Texas Comptroller of Public Records; Dollars and Cents of Shopping Centers, CDS Market Research

Northside Retail Study Houston, Texas
58
Analysis Table 6: South CMA – Current Additional Supportable Retail Space
Estimated households: Core Area – 5,149, Supplemental – 4,418
Capture Rate
Sq.Ft. Supportable
Retail Category
Current
Leakage/HH Core CMA
Supplemental
CMA
$/Sq.Ft.
Required Core CMA
Core +
Supplemental
CMA
Furniture and Home Furnishings Stores $735.00 20% 10% $150 5,046 7,211
Electronics and Appliance Stores $614.75 20% 10% $250 2,532 3,619
Clothing and Clothing Accessories Stores $1,925.53 20% 10% $225 8,813 12,594
Sporting Goods, Hobby, Musical
Instrument & Book Stores $536.87 20% 10% $225 2,457 3,511
General Merchandise Stores $4,073.04 25% 13% $300 17,477 24,975
Miscellaneous Store Retailers $32.54 20% 10% $300 112 160
Personal and Laundry Services $109.40 20% 10% $75 1,502 2,147
Building Material/Garden Equipment &
Supplies Dealers $362.81 20% 10% $300 1,245 1,780
Food and Beverage Stores $207.96 50% 25% $450 1,190 1,700
Gasoline Stations ($802.71) 20% 10% $1,300 (636) (909)
Food Services and Drinking Places ($1,321.97) 20% 10% $300 (4,538) (6,485)
Health and Personal Care Stores $1,180.47 20% 10% $250 4,863 6,949
Motor Vehicle and Parts Dealers $3,593.66 20% 10% $175 21,147 30,220
Total $11,247.34
61,210 87,470
Sources: PCensus for MapInfo; Texas Comptroller of Public Records; Dollars and Cents of Shopping Centers, CDS Market Research

Northside Retail Study Houston, Texas
59
Most of the Northside is not subject to deed restrictions, and the City of Houston does not have zoning.
These facts allow easy conversion of single family residential, vacant land, and unproductive commercial
structures to denser housing. A single residential lot may turn into several townhouse units, or larger
sites could become multifamily. This potential densification is not necessarily accounted for in the
projections of total households provided in Analysis Tables 5 and 7; thus the projected supportable retail
occupancy may be understated if household growth (particularly of more affluent households such as
those in the South Supplemental area) is much higher. CDS conducted a sensitivity test to explore such
potential in the North and South CMAs, applying household growth that was 10%, 30%, and 50% higher
than the earlier projections to both the Core and Supplemental Areas, and assuming both the more
affluent demographic characterstics and higher capture rates, generally 30% for Core resident spending
and 15% for Supplemental Area resident spending. Analysis Tables 8 and 9 display those results.
Analysis Table 7: South CMA – Future Additional Supportable Retail Space
Estimated households: Core Area – 5,316, Supplemental – 4,748
Capture Rate
Sq.Ft. Supportable
Retail Category
Current
Leakage/HH Core CMA
Supplemental
CMA
$/Sq.Ft.
Required Core CMA
Core +
Supplemental
CMA
Furniture and Home Furnishings
Stores $896.80 20% 10% $150 6,357 9,195
Electronics and Appliance Stores $716.45 20% 10% $250 3,047 4,408
Clothing and Clothing Accessories
Stores $2,129.35 20% 10% $225 10,062 14,555
Sporting Goods, Hobby, Musical
Instrument & Book Stores $656.79 20% 10% $225 3,104 4,490
General Merchandise Stores $4,401.40 25% 13% $300 19,498 28,206
Miscellaneous Store Retailers $125.37 20% 10% $300 444 643
Personal and Laundry Services $116.36 20% 10% $75 1,650 2,386
Building Material/Garden Equipment
& Supplies Dealers $452.12 20% 10% $300 1,602 2,318
Food and Beverage Stores $273.16 50% 25% $450 1,613 2,334
Gasoline Stations ($647.47) 20% 10% $1,300 (530) (766)
Food Services and Drinking Places ($1,040.97) 20% 10% $300 (3,689) (5,337)
Health and Personal Care Stores $1,263.98 20% 10% $250 5,375 7,776
Motor Vehicle and Parts Dealers $4,112.65 20% 10% $175 24,986 36,144
Total $13,456.00
73,520 106,352
Sources: PCensus for MapInfo; Texas Comptroller of Public Records; Dollars and Cents of Shopping Centers, CDS Market Research
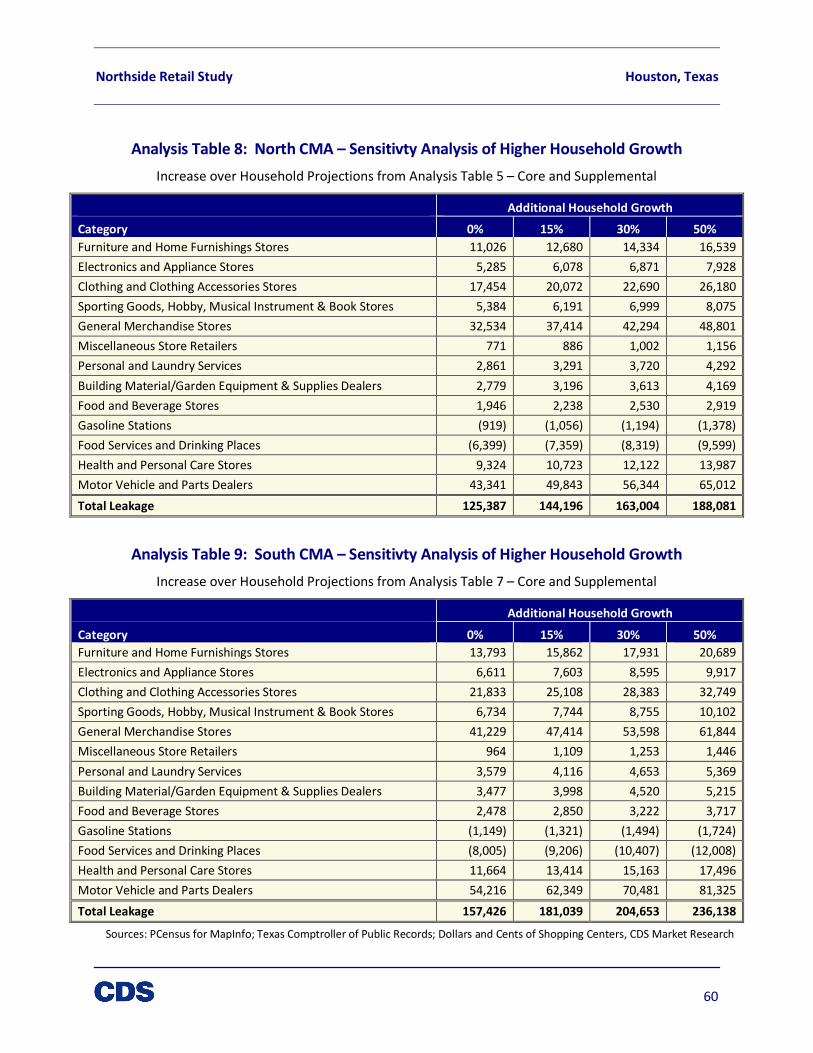
Northside Retail Study Houston, Texas
60
Analysis Table 8: North CMA – Sensitivty Analysis of Higher Household Growth
Increase over Household Projections from Analysis Table 5 – Core and Supplemental
Additional Household Growth
Category 0% 15% 30% 50%
Furniture and Home Furnishings Stores 11,026 12,680 14,334 16,539
Electronics and Appliance Stores 5,285 6,078 6,871 7,928
Clothing and Clothing Accessories Stores 17,454 20,072 22,690 26,180
Sporting Goods, Hobby, Musical Instrument & Book Stores 5,384 6,191 6,999 8,075
General Merchandise Stores 32,534 37,414 42,294 48,801
Miscellaneous Store Retailers 771 886 1,002 1,156
Personal and Laundry Services 2,861 3,291 3,720 4,292
Building Material/Garden Equipment & Supplies Dealers 2,779 3,196 3,613 4,169
Food and Beverage Stores 1,946 2,238 2,530 2,919
Gasoline Stations (919) (1,056) (1,194) (1,378)
Food Services and Drinking Places (6,399) (7,359) (8,319) (9,599)
Health and Personal Care Stores 9,324 10,723 12,122 13,987
Motor Vehicle and Parts Dealers 43,341 49,843 56,344 65,012
Total Leakage 125,387 144,196 163,004 188,081
Analysis Table 9: South CMA – Sensitivty Analysis of Higher Household Growth
Increase over Household Projections from Analysis Table 7 – Core and Supplemental
Additional Household Growth
Category 0% 15% 30% 50%
Furniture and Home Furnishings Stores 13,793 15,862 17,931 20,689
Electronics and Appliance Stores 6,611 7,603 8,595 9,917
Clothing and Clothing Accessories Stores 21,833 25,108 28,383 32,749
Sporting Goods, Hobby, Musical Instrument & Book Stores 6,734 7,744 8,755 10,102
General Merchandise Stores 41,229 47,414 53,598 61,844
Miscellaneous Store Retailers 964 1,109 1,253 1,446
Personal and Laundry Services 3,579 4,116 4,653 5,369
Building Material/Garden Equipment & Supplies Dealers 3,477 3,998 4,520 5,215
Food and Beverage Stores 2,478 2,850 3,222 3,717
Gasoline Stations (1,149) (1,321) (1,494) (1,724)
Food Services and Drinking Places (8,005) (9,206) (10,407) (12,008)
Health and Personal Care Stores 11,664 13,414 15,163 17,496
Motor Vehicle and Parts Dealers 54,216 62,349 70,481 81,325
Total Leakage 157,426 181,039 204,653 236,138
Sources: PCensus for MapInfo; Texas Comptroller of Public Records; Dollars and Cents of Shopping Centers, CDS Market Research

Northside Retail Study Houston, Texas
61
Conclusions from Retail Demand Analysis
In the North and South Cores, the total current leakage is $11,247 per Household, and with the
assumptions that the expenditure levels ramp up, the leakage jumps to $13,456 per Household.
This leads to an estimate of only 53,000 square feet of new supportable retail in the North Core
currently, and even with higher expenditure and household quantity assumptions based on non-CDS
forecasts, that number still only demands about 67,000 square feet. In the South Core, the supportable
square footage is 61,000 currently with a jump to 73,000 with increased spending and households.
For both the North and South Cores, the largest retail categories (in terms of supportable square
footage needs) are General Merchandise Stores, Motor Vehicle and Parts Dealers, and Clothing and
Clothing Accessories Stores. Large retail to fill the Motor Vehicle demand would require parcels of a size
beyond what the Study Area can provide and typically would require much higher-traffic commercial
corridors. Furthermore, auto dealerships have a limited impact on creating retail synergies with other
establishment types. The same could be said for retailers that could provide the need for General
Merchandise stores though the supportable square footage is somewhat more feasible (16,000 square
feet in the North Core, 18,000 square feet in the South Core). Another discount store (dollar store)
could be possible if centrally located within the overall Northside, where it could draw from both the
North and South CMAs.
Clothing and Clothing Accessories show opportunites with between 8,000 – 10,000 square feet of
supportable retail in both the North and the South Cores. Health and Personal Care Stores also show to
include opportunities with 5,000 – 6,000 square feet of supportable retail in both the North and the
South Cores.
CDS also examined the impact of both assuming considerably greater residential densification and
improving capture rates with regard to leaked spending in both the Core and Supplemental areas. The
impact is significant in these scenarios. Increasing the capture rates to 30% and 15% respectively for
most store types increased total supportable square footage by 46% to 48% (both current and future) - a
substantial potential amount. Further increasing household density increases the impact further. Based
on typical store sizes, the categories CDS finds would most benefit from increased capture rates and
household density include Clothing, Home Furnishings, General Merchandise, and Health / Personal
Care stores. A greater diversity of dining and entertainment establishments would also be supportable.
Despite these potential impacts, Food and Beverage Stores had almost nonexistent needs with less than
4,000 supportable additional square footage per CMA under even the more ambitious capture rates.
This is likely due to the current presence of the two Fiesta supermarkets, the Canino Famers’ Market (in
the North Supplemental Area and 77009), and several smaller Hispanic-oriented meat markets. New
entrants in this category would likely be taking market share away from the existing establishments.
Lastly, it should be noted that not necessarily all capture of leaked spending necessarily means
additional space occupancy for retail activities. Often it will simply mean increased spending at existing
establishments, which can be accomplished by improving the goods and services profile, customer
service and experience, parking, or neighborhood quality of life factors.

Northside Retail Study Houston, Texas
62
Findings from Interviews
CDS conducted two types of interviews during research: commercial brokers knowledgeable about the
Northside, and consumers who live or spend a large amount of time in the Northside CMA. The
opinions expressed by interviewees informed CDS’s overall conclusions about the potential for retail
investment in the Northside area now and in the future.
Commercial Brokers
CDS interviewed the following commercial brokers regarding retail demand and activity in the Northside
Study Area:
• Will Condrey (Cushman Wakefield)
• Shawn Baksh (Trotwood Realty)
• Trish Dinh
• Lou Rosas (Remax)
• Robert Torres
• Lance Loken (KW Commercial)
• Michael Hernandez (Hernandez Properties)
• Russell Hernandez (Hernandez Properties)
• David Huy Vo
• Michael Morris
• Clay Trozzo (Property Commerce)
• Richard Rainer (Excel Commercial)
• Scot Davis (Trammell Crow)
• Griff Bandy (NAI)
• Kristin Cavanaugh (United Equities)
• Three other local brokers who asked not to be named
They were asked about specific retail listings in the area as well as general opinions of the area. All were
asked about the CMA, and what their opinions were regarding the future demand for retail. Some who
had a broader knowledge of the market were asked about other land uses as well, and how those uses
would impact future retail demand.
Regarding the commercial corridors in the Study Area, the brokers’ views were very consistent with one
another. The corridors that were considered to be ripe for retail growth were:
• Irvington corridor between Cavalcade and Fulton
• Fulton at the intersections at Cavalcade/Fulton and Quitman/Fulton
• N. Main between Boundary and Burnett
• Cavalcade intersections at Irvington and at Fulton, and between I-45 and Fulton
Corridors that were considered to be not ideal for retail growth were
• N. Main north of Boundary
• A majority of Fulton (minus the two intersections at Cavalcade and at Quitman)
• Cavalcade (minus the intersections at Irvington and at Fulton, and west of Fulton)
• Quitman (minus the intersections at N. Main and at Fulton)

Northside Retail Study Houston, Texas
63
• Hogan Street (minus the intersection at N. Main)
The biggest demand currently is for residential development. In the corridors where retail development
was seen as not ideal (specifically Fulton), the price that residenitial developers can pay outprices what
retail developers can pay for the land. Due to the fact that most of the retail is neighborhood-serving,
developers are only able to pay up to around $14-15/ft while residential offers have been over $20/ft. It
is of the opinion of a majority of the interviewees that this dynamic will continue for a few years, and
then, as the area demographics have changed to reflect higher populations, higher income levels, and
therefore more buying power, that retail opportunities will be better and retail developers will be able
to pay more for land.
The corridors deemed attractive vs. unattractive, were typically related to traffic counts. Many of the
areas deemed unattractive or not ideal, had traffic counts below 10,000 cars per day, often in the 7,000-
8,000 cars per day range. Most of the areas deemed ideal for retail development were above 10,000
cars per day, usually in the range of 13,000-15,000.
The rail brought many polarized views as about half interviewed saw the rail as bringing great potential
demand for retail to the area. The other half saw it as creating barriers and hinderances to getting
around, and felt as if the rail prohibited retail opportunities. All generally did agree that the rail would
help with bringing traffic and visibility to the area, and that the overall impact it would have on drawing
more population (daytime or residential) would eventually create more demand for retail.
Lastly, it was common to hear that asking prices for land were too high and that the advent of the rail
had created unrealistic asking prices. This was especially considered an issue on N. Main. From what
CDS could determine from asking prices gathered, this is very accurate.
Northside Consumer Interviews
CDS conducted 20 interviews with consumers or potential consumers of retail and personal service
businesses in the Northside – the interviewees either live, work, or have other reasons to spend a large
amount of time in the area. The one-on-one interviews typically took from 20 to 30 minutes and took
place in person at either Del’s Ice Cream or the Avenue CDC Customer Center on Quitman; a few were
done by phone as well. CDS used the same discussion guide for all interviews. The results are
summarized in the framework of the discussion guide below.
Interview Discussion Guide and Response Summaries
1. Describe your relationship to the Northside:
17 Live here
16 Work or volunteer here
19 Spend leisure or family time here
2. How many times per week do you visit the following grocery stores:
Fiesta on Fulton at Quitman:
Zero 1 per 3mo 3 per wk Zero Zero Zero
Zero 3 per wk 1 per wk 3 per wk 3 per wk 2 per mo

Northside Retail Study Houston, Texas
64
3-4 per wk 1 per 3 mos 1 per 6 mos 1 per mo Rare Zero
1 per yr
Fiesta on Fulton at Patton:
Zero 1 per mo 1 per mo 1 per wk Zero Zero
Zero 1 per wk Zero Zero Zero 1 per 1.5 wks
Zero 1 per mo 1-2 per mo 1 per 6 mos 2-3 per mo Rare
2-3 per wk
What is your most important grocery store, the one where you buy most food for daily living?
Location % of grocery shopping Qualities/reasons
Kroger (Montrose) 90% Likes size/intimacy
Kroger (Studemont) 90% Quality produce, specialty items, 50%-
vegeterian selection, bigger overall
selection, 70%-quality of produce,
wider/deeper selection
Joe V’s (Shepherd/Tidwell) 60% Good value
HEB (TC Jester) 80% Safer, better selection, won’t get mugged
Trader Joe’s (Shepherd) 70% Selection, safer
Joe V’s (Shepherd/Tidwell) 90% Best prices
Walmart (Northline) 70% Convenience, best offerings
Both Fiestas 90% Close to home
HEB (Buffalo Spdwy) 70% On commute, quality, socially responsible,
safe
Walmart (Yale) 70% Prices, variety, safer
Walmart (Yale) 70% Prices
Foodtown 40% Prices and bulk goods
Kroger (Shepherd/11th) 50% On way to p.o. box, gas, healthy food
selection
Kroger (11th/Shepherd) 90% Sushi, overall selection
HEB Bunker Hill 40% Toiletries, locally sourced goods,
partnerships w/ local groups, traceable
sourcing
Walmart (Northline)

Northside Retail Study Houston, Texas
65
Trader Joes 50% Produce, unique items
3. What other stores do you purchase food at either within the Northside or elsewhere, and what do
you buy there?
Store and location Items bought
Target (Sawyer Heights) X4
CVS (Cavalcade) – can walk there Sugar, coffee, mile, tp
Whole Foods (Waugh) X3 Specialty, Healthy (organic) Items
Farmer’s Market (Caninos) X5 Specific Veggies, fruit, jelly, popcorn
Randall’s (Midtown)
Kroger (Studemont) X3
Kroger (Yale@20th) X2
Kroger (11th) Healthier Options
Bakeries (various)
Bakeries on Washington Unique Desserts
Chinese-themed stores Unique Chinese food items
Michoacana / meat markets X3 Meat
Joe V’s Bulk items
CostCo (Richmond and Katy Fwy locations)
El Bollillo (N. Main)
Kroger (W Gray) Beer
HEB (W. Alabama) Seasonal items
4. What share of your clothing and accessories purchases would you estimate that your household
makes at stores within the Northside? Ranged from 0-5%
What stores does your household patronize for clothing and accessories within the Northside or
elsewhere, and for what type of clothes?
Store and location Items bought
Marshalls - Northline X3, W. Gray Clothing, housewares
Walgreens x2 (Quitman)
Memorial City Mall X3
Galleria
Steinmart (Meyerland)
Northside Retail Study Houston, Texas
66
The Galleria X3 Clothing
TJMaxx X2 (W Gray)
Outlet Malls
Target x5
Walmart x3
Petsmart (Sawyer) X2
Ross (Shepherd)
Designer Shoe Warehouse (POBlvd)
Family Dollar (Fulton) X3 Paper goods, decorations
JCPenneys
Ross (Northline) X2
Boutiques near Montrose
Rice Village
Payless Shoes (Fulton)
The Gap (W. Gray)
Home Depot (N. Loop)
Ross – Shepherd/11th
Thrift stores (Family Thrift on N. Main)
CVS X2 Soda, candy, toiletries, makeup
Label Warehouse (not as much these days)
Family Dollars (Heights)
Palais Royal (Northline)
Autozone
5. What share of your dining out or take out food would you estimate that your household does at
restaurants, cafes, fast food places, etc. within the Northside?
10% 50% 20% 5% 0% 10%
30% 25% 50% 40% 60% 25%
50% 75% 50% 55%
What restaurants, cafes, fast food places, etc. does your household often patronize for dining out
or take out food within the Northside or elsewhere, and how often do you go there?
Restaurant / café / fast food establishment and location How often

Northside Retail Study Houston, Texas
67
Within Northside
Teotihuacan, Bocca Deli, Red Ox, Laredo Taqueria 1/mo
Taqueria Arenas, Veracruz, Red Ox, Poppa, Teotihuacan, Bocca
Rio Verdance 1/wk
Bocca, Burger King, Subway 3/wk
Teotihuacan, Bocca, Chicken Truck on Irvington 5/wk
(None) 1/wk
Houston Bakery, Poppa Burger 2/wk
Houston Bakery every day
Poppa, Taco Trucks, Aguascalientes 3/wk
Subway, McDonalds, Teohuatican, Little Caesars 3/wk
Gorditas Aguascalientes, Bocca, Houston Bakery 2/wk
Houston Bakery, La Macro, Kuko’s, Gorditas Aguascalientes 2/mo
Little Caesar’s Fulton 1-2/wk
Bocca,Teotihuacan,Subway (Patton),Trigo’s
Vercruz, Teotihuacan 2/wk
Taqueria Arandas, Gorditas Aguascalientes, Taqueria Lardeo 1-2/wk
Pizza Patron/Hut, Teotihuacan, La Macro, Red Ox, Gerardo’s 2-3/wk
Teotihuacan,El Rey (Irvington), Dairy Land, Church’s, Veracruz, Gerardo’s, Arandas
Outside Northside
Jax, Asian
Pappa’s BBQ, Connies Seafood, Spanish Flower
Chick Fil A, nicer meals
El Rey, Sonic, Fit Foods, Hunan, Le Madeline, Peiwei, Luby’s
Cafeterias on Washington
Restaurants/Bars in Heights and Washington
Chilis, Olive G, Panda Exp
Antidote Coffee, Montrose coffee shops, Andy’s on 11th, IHOP Northline 2-3/wk
Onion Creek, Bubba’s Westcott, Juicy in the Sky, Les Givrals Washington 1-2/wk
All dining out-Popeye’s Shepherd, Smoothie King 2/mo
El Rey (Washington, Ella)
Asia Café (Yale)

Northside Retail Study Houston, Texas
68
Heights and Montrose coffee houses
Montrose, Downtown, Midtown restaurants, Mam’s Ice, Heights Coffee
6. What other stores or businesses do you frequent within the Northside, for what things, and how
frequently? Include personal services, not just shopping.
Business and location Things purchased
Exxon X4 gas
Shell X2 gas
Stokes Hardware x4
Walgreens X8 prescriptions
CVS X6 very small items, prescription
Sam’s Dollar Store
Veracruz seafood
Payless Shoes shoes
Various Tires Shops tires
Bell’s Cleaners, Roland Cleaners X4
Citgo X2 gas, beer
Ruiz Wholesale X2 ice
Florist on Irvington
Chevron X2
Dollar General
TV Repair (Fulton)
Magic Nails – Alber/Irvington
Mechanic – Cavalcade/Irvington
Recycle by Design (online only)
Solutions Beauty – N. Main Hairdressing
Valero
Twilight Liquor
7. What other stores or businesses do you frequently spend time and money at outside of the
Northside, for what things, and how frequently? Include personal services and entertainment /
recreation, not just shopping.
Business and location

Northside Retail Study Houston, Texas
69
Coffee, Nails (1/mo), Hair(2/mo), Auto Parts, Petsmart, Vet
Star Copier, Antiques (Heights), Printer, Cleaners
Joe V’s, Home Depot
Target (Sawyer), Subway, Movies, Museums
Target (Sawyer),Hair/Nails (West U), Liquor (Specs D/T), Dining (Various Hts/Montrose )
Dry Cleaners, everything else
Walmart (Yale), Lucky’s, Discount Tires
Walmart (Yale), Thrift Stores
Catalina Coffee (Wash), Bookstores (everywhere), Specs, Bars/Live Music
Hobby Lobby, Michaels, WMart (Yale), Home Depot, Office Depot, Hair (Heights)
Barnes & Noble River Oaks
Luke’s Locke (W. Gray)
Sawyer Heights stores
Wabash Antiques / Feed
Staples – Sawyer Heights
Lowe’s / Home Depot
Verizon Crosstimbers or Post Oak Blvd
BofA, Green Bank
Wild West, SSQQ
CostCo
Buffalo Exchange - Montrose
O’Reilly’s (N. Main)
8. What do you think are the specific types of retail, dining, personal services, and entertainment
that are generally well-provided in the Northside – you think the quantity and quality of those
types of businesses are at least satisfactory?
Mexican restaurants X11 Hardware X2
Walgreens/CVS drug stores x5 Restaurants (in general)
Washaterias Insurance
Tire Shops X6 Dollar Stores/Thrift Stores X6
Cricket Cheap Motels
Check Cashing Auto Repair Shops x4
No more Dog Parks! Dive Bars(x3)

Northside Retail Study Houston, Texas
70
Fast food X2 Groceries (Fiestas)
Delis Attorneys
Nail salons X2
9. What do you think are the specific types of retail, dining, personal services, and entertainment
that need more or better offerings in the Northside – you think the quantity and quality of those
types of businesses are NOT satisfactory, and the community would support new businesses of
these types?
Coffee X11 Different auto parts
More Lunch Options Jack in the Box
Bars (non-dive) Early shift breakfast (<6:30 am)
Grocery (besides Fiesta)X9 Gifts/cards
Better Pharmacy Breakfast (general)
Variety of Restaurants X7 (non Mexican) Pizza X2
Cleaners X3 Mexican bakeries
Artist Gallery Cakes
Antiques Medical supplies
Farmer’s Market X4 Yogurt
General Merchandise Accessories
Healthier Options (Restaurant/Grocery) X2 Non-dive after-work / social bar
Upscale Icehouse with Live Music Donuts
More varieties of ethnic restaurants Clothing/shoes
Cafeteria (Affordable and Healthy) Shoe repair
Fresceria Discount Clothing (Ross)X2
Hair/Barber Asian restaurants X2
Dive Bars Gardening supplies
Bookstore Gym/fitness facility
10. In general, what are things that are GOOD or POSITIVE about shopping, dining, personal services,
and entertainment in the Northside?
Mom & pop/local owners X5
Easy to get around
Plenty of Mexican restaurants X2

Northside Retail Study Houston, Texas
71
Strong community (everyone tries to help each other) X3
NOTHING
Family Dollar is great
Proximity to D/T
Proximity to Loop
Metro Rails
Excellent culture!
Neighborhood has potential for walkability
A lot of stuff here! / basic necessities available X2
Nice neighborhood scale / not large retail centers X2
Close by home X4
Small stores within neighborhoods
Close to volunteering activities / work X2
11. What are things that are BAD or NEGATIVE about shopping, dining, personal services, and
entertainment in the Northside?
No big-name grocery
No clustered shopping areas X2
Not walkable X3
Not enough pride from owners in the area (facades, unclean exteriors) X2
No entertainment X2
Bad Lighting X4
No parking x2
Bad sidewalks X4
Unsafe X6
Generally bad customer service from most retailers
Homeless people X6
Stray Dogs X2
Bars on Hogan Street
Rail. Bad access to retailers X4
Early closing hours
Poor visibility of stores / bad building configurations

Northside Retail Study Houston, Texas
72
Prices too high / need more competition X2
Lack of restaurant variety
Not enough variety X3
Lack of local products from the community
12. Where in the Northside do you think represents the BEST locations for new or increased shopping,
dining, personal services, and entertainment? Why?
Along the Rail X5, access, visibility
Irvington X7, more family environment, away from train
Cavalcade X2,
Quitman
Fulton, rail X3
Fulton/Cavalcade Intersection X3
Main St (stretch from Boundary (North) to Burnett (South)) X3
Fulton/Hayes Intersection (SEC)
East side of I45
Hardy Yards X2
Abandoned church near Hogan
13. Where in the Northside do you think represents the locations that new shopping, dining, personal
services, and entertainment business should AVOID? Why?
Along the Rail (bad access)
Hogan/Lorraine (crime/prostitution) X6
Jensen
Collingsworth/Irvington (south of Collingsworth)
Nothing below Moody Park
Fulton (rail is bad for access, east side with small lots x2)
Several “I don’t know”
Hardy / Elysian X3
Burnett
N. Main X2
Neighborhood streets off main thoroughfares X2

Northside Retail Study Houston, Texas
73
14. Do you think the new light rail line is good or bad for shopping, dining, personal services, and
entertainment? Why?
Not a draw, but provides good access to DT.
Great
Good during construction, but bad now
Good, bringing better quality residents
Mixed (Yes because great for D/T access, No because of homeless people riding)
Bad, Rail has significantly hurt businesses here
Bad, Too many homeless around the rails
Good, great access to everything
Good, ease of getting to D/T
Bad, closed on weekends
Bad, can’t access places that used to be easier to get to X2
Mixed generally
Not much difference X2
Very bad in near term, unlikely to improve because Houston is car-oriented
Bad because of limited access
Evolving – construction workers left a void
Safety concerns for pedestrians
15. Do you have any other recommendations regarding what would improve shopping, dining,
personal services, and entertainment in the Northside?
Farmer’s Market, more community activities
Northside Shopping Guide (with Map)/ neighborhood coordinated marketing X2
More clustered shopping areas X2
Dog park X3
Better sidewalks X5
Better lighting X6
More national brands
Discount retailer
Coffee shops X3 – also incentives, youth program (Bohemeo’s example)
Nice Bars
Bakery

Northside Retail Study Houston, Texas
74
Public storage (high end)
Increased safety (security-separate from lighting requests)X4
Too many homeless walking around X3
Develop Main, this has the most opportunity
More walkability X3
Clean up crime-ridden areas (Hogan) X2
Offer more places to hang out - eat and drink with friends
Open up the streets near rail (fire and safety issues)
Art facilities (visual and/or performance)
Attract stronger residential demographic
Remove rail ine
Improve access to freeway
Slow traffic on Irvington
More partnerships with local businesses, connections to churches and schools
Golf cart shuttles to/from rail ine
Family businesses
Coffee Shop Analysis
Through numerous interviews conducted with local residents, business owners, and others belonging to
the day-time population of the Study Area, the most commonly mentioned retail need for the area was
a coffee shop. Currently there are zero coffee shops in the Study Area (though some restaurants and
cafes may serve coffee – Del’s Ice Cream for example).
Two geographies were used as comparables to the Study Area, Gulfgate and 8515 Gulf Freeway. Both
geographies are very similar in land area as well as demographics.
The Study Area compared favorably over both comparable areas in several demographic categories,
specifically having higher average income and a better educated population (higher percentage of those
with either a Bachelor’s Degree or a Post Graduate Degree).
Most important, when looking at the two other comparable areas, both are able to support a coffee
shop (Gulfgate has three) while having similar populations, a similar number of employees, and
somewhat less favorable demographics. CDS believes confidently that current market conditions show
that the Study Area is able to support a coffee shop, and with projected growth to the Study Area,
perhaps the ability to support two shops in the near future. Please refer to the table on the following
page.

Northside Retail Study Houston, Texas
75
Trade Area Gulfgate
8515 Gulf
Freeway
DEMOGRAPHIC DATA
Total Population 28,854 42,225 36,433
Average Income $44,159 $43,416 $40,924
Median Income $28,721 $35,260 $30,782
Education - Population Age 25 or Older
Less Than High School 26% 34% 26%
High School Degree 27% 28% 27%
Bachelor's Degree 8% 5% 6%
Post Graduate Degree 4% 2% 3%
PRIZM Top Target Segment Households
Primary Segment Households 61 City Roots 66 Low-Rise
Living
66 Low-Rise
Living
Secondary Segment Households 54 Multi-Culti
Mosaic
54 Multi-Culti
Mosaic
54 Multi-Culti
Mosaic
Tertiary Segment Households 66 Low-Rise
Living
29 American
Dreams
40 Close-In
Couples
BUSINESS & EMPLOYMENT DATA
Total Businesses 1,066 1,334 1,458
Total Employees 12,790 16,312 14,463
Population Occupation (Age 16 and Older)
Total White Collar 4,967 5,377 4,981
Percent White Collar 42% 30% 32%
Total Blue Collar 4,322 8,794 7,111
Percent Blue Collar 36% 49% 46%
COMPETITION
Total Coffee Shops 0 3 1
RATIOS
Population per Coffee Shop - 14,075 36,433
Employees per Coffee Shop - 5,437 14,463
Source: Nielsen Claritas, InterDirect USA

Northside Retail Study Houston, Texas
76
Conclusions – Northside Retail Potential
After concluding its research on the demographic and economic trends affecting the Northside area,
estimating unmet demand for retail uses in the defined market areas, and interviewing commercial
brokers and consumers, CDS synthesized the information into a set of conclusions regarding the
potential for retail investment and additional occupancy in the Northside. These conclusions are
presented below.
General Points
• Although many of those interviewed indicated the need for more grocery options, CDS did not
find that sufficient support exists for another full-sized grocery store, currently or in the future.
Gentrification may instead lead to a push for a change in the product lines sold at and the
aesthetic trappings of the existing stores to reflect changing resident consumer tastes.
• Opportunity appears to exist at present for a few (no more than two or three) additional small-
to-mid-sized clothing stores targeting working-class households. Examples of such stores would
be Melrose and Citi Trends. As the area gentrifies, demand for clothing stores will remain, but
the types of products sought will likely change.
• The Northside is seemingly underserved for General Merchandise stores. The current supply
consists of dollar stores (Family Dollar, Dollar General). More stores in this vein could be
supportable. However, demand from within the area is not strong enough to justify a full-sized
General Merchandise store such as Target or Walmart, both of which have locations close to the
Northside. One possibility for a somewhat larger scale store would be Fallas Paredes, though as
gentrification occurs its target customer base will shrink.
• Spending within Northside at restaurants and drinking places is strong thanks to Tex-Mex and
Mexican restaurants which attract spending from those who reside outside the area. While in
terms of total spending versus potential spending there appears to be a net inflow to the
Northside, the general lack of restaurant variety was noted by CDS and by interviewees. It is
likely that a few establishments of different cuisine – Asian or Chinese was a particularly
common desire – would be supportable in the area, provided that they target a middle-class
price level. Restaurant demand, especially for breakfast and lunch, is boosted by the area’s
working class daytime population, which helps make such ventures more sustainable than if
having to rely on evening business alone.
• A coffee shop appears to be supportable – possibly two establishments. The area is unlikely to
meet the criteria for a Starbucks or other national chain, but a local business such as the various
coffee houses in the Heights should be encouraged.
• An important overall finding is that the population within the Northside is simply too low to
warrant significant additional retail occupancy if conservative capture rates are assumed for
spending currently leaving the area. Furthermore, population and household projections
indicate relatively modest growth (by Houston standards) going forward, so the retail demand
situation is not likely to have significant growth either – though the goods and services
demanded will evolve as higher-income households move in. Ways to counteract this issue over
time would be to:

Northside Retail Study Houston, Texas
77
o Attract greater population density than what is currently contemplated by demographic
projections
o Address some quality of life issues which drives some potential spending away (safety
and security concerns, limited parking, limited automobile access along the Red Line,
lack of awareness by newcomers of the area’s offerings, etc.)
o Change the quality of goods offered and the shopping environment within and around
stores to appeal to consumers who can afford a choice of shopping locations
• Given the gentrification and upscaling of retail businesses occurring immediately to the west
and south of the Northside, it is possible that individual entrepreneurs could choose to locate a
new business – most likely a restaurant or entertainment venue – within the Northside with the
intention of making it a “destination” business drawing customers from outside the area.
Addressing the issues raised in the previous point would increase the likelihood of this
occurring.
• There is only a small amount of modern space, especially multitenant retail centers, that houses
the Northside’s existing retail businesses. Many businesses are in owner-occupied properties or
older, lower-quality buildings that are not comparable with new construction. Some older
properties with vacant ground floor space, especially in the South CMA, could be attractive for
occupancy by new businesses targeting residents of the higher end of the income spectrum in
the neighborhood. However, the cost to renovate these buildings is likely substantial, income-
producing uses would need to be found for upper floors (for structures of more than one story),
and the neighborhood is still a high risk for such investments. The “destination” businesses
described in the previous point would be appropriate candidates for catalyzing investment in
older structures.
• The new light rail line has generated mixed reactions. There appears to be a significant segment
of the Northside community which now avoids the corridor due to perceived and real access
impediments, most notably the lack of left turns. This, combined with the disappearance of the
construction crews and their daytime business, has left some establishments suffering a
slowdown. Still, there is also hope in the community that the visibility and awareness created
by rail service will eventually translate into increased commercial activity on North Main and
Fulton.
• The community feel, relatable staff, independent ownership and small physical scale make
Northside retail, limited though it is, uniquely appealing for existing customers.
North CMA
• The North CMA is fortunate to contain most of the Northside’s “destination” Tex-Mex and
Mexican restaurants, which bring outside traffic to the area. Other anchors include CVS and
Stokes Hardware.
• However, the North CMA has a lower population density compared to the South, and this
contributes strongly to the lack of support for much additional retail occupancy, even if
household incomes improve significantly. The Lindale Park area, which likely has the highest
household income profile of any part of the Northside, will remain low density due to deed
restrictions.

Northside Retail Study Houston, Texas
78
• Irvington from Fulton to Cavalcade will remain the premier location for any additional retail
investment in the near term. This is because of ease of car access, parcel sizes which allow for
parking, and the existing retail such as restaurants and Stokes.
• Along the Red Line, the Cavalcade station area and the Irvington intersection are the most
promising locations for retail activity at present. Establishments may prefer to orient
themselves to the cross-streets rather than Fulton itself, due to access issues. Some parcels
have been shrunk by right of way acquisition for the rail line, reducing the amount development
and required parking that is feasible. One note: businesses serving alcohol would be impacted
by buffering rules around Jefferson Elementary School near Cavalcade Station.
South CMA
• The South CMA has a higher total population than the North, with slightly higher projected
growth as well. The South Core Area is also highly accessible to areas where gentrification is
well-advanced, such as the 1st Ward, Woodland Heights and Downtown.
• The intersections of Quitman at Fulton, already a principal retail node, and Quitman Station on
the Red Line (at North Main) are the key areas for retail activity. The area near Fulton / North
Central station, currently a jumble of strip centers, is less promising at the present time but does
benefit from having some established businesses at present.
• North Main from Hogan to Boundary has significant opportunities, including vacant and
underutilized sites, older buildings that could be suitable for unique rehabs and repurposing,
exposure for light rail passengers, and intersections with streets leading directly to higher-
income areas (Hogan and Quitman).
• However, it also has significant challenges: access in most blocks impeded by light rail,
questionable condition of several structures, and security concerns caused by a large presence
of loiterers and the indigent. The target demographic for retail uses – moderate-income
residents -in the near term may render full rehabilitation of the older buildings financially
infeasible.
• This stretch of North Main would lend itself to a risk-taking, pioneering investor who was
interested in opening a coffee shop or coffeehouse, the support for which CDS has documented
earlier in the report.
• Hogan east of North Main is perceived very negatively due to the perception of undesirable
activities at bars and other venues along the street.
• The Quitman Station area is also heavily impacted by the school buffer regulations of the City of
Houston. Bar and entertainment uses would be best served by locating along portions of North
Main away from the buffer. One such area could be near Burnett Station, which is largely
unsuitable for other retail uses because of access, visibility, and a location on the edge of the
mass of population, at least until Hardy Yards develops.
• Better management of vagrants and loiterers could help bring this stretch of North Main to
another level of local resident acceptability.

Northside Retail Study Houston, Texas
79
Community Retail Development Strategy
Given the constraints on the market potential for additional retail development described in the rest of
this report, the Northside’s response needs to be realistic and tailored in its efforts. CDS recommends
the following initiatives to help ensure that retail activity potential is maximized and that the community
is achieving a higher level of satisfaction with its own retail and service offerings.
Improve Existing Establishments, Especially Grocery
Without a major increase in population density, particularly of higher-income households, CDS’s analysis
indicates that large-scale growth in retail and service establishments is unlikely. Instead, as
gentrification occurs, a more likely change is that existing retail establishments will have to change their
offerings and environment to match the changing tastes, habits, and spending power of a changing
Northside population – or be fully replaced by a business which does do that. Based on the results of
the interviews, one business category which has significant opportunity to capture a greater share of
local spending, and capture the spending of new or changing households, is grocery. This means
working with the only major grocer serving the Northside study area, Fiesta. Interviews consistently
indicated that the two Fiesta stores are not the primary grocery shopping venue for likely a significant
number of Northside residents.
CDS is aware that Fiesta did make some physical improvements to the Quitman at Fulton store after
Hurricane Ike damage in 2008. However, many of the issues cited in the one-on-one interviews with
CDS related to Fiesta’s selection of grocery items, as much or more as the physical and environmental
condition of the stores. Making both physical and merchandising changes could thus represent
opportunities to capture a greater share of local grocery spending. However, both types of changes are
a significant investment for a grocery company, because this industry operates with slim profit margins.
In order for such changes to come about, the community will have to make a convincing case for
changes to Fiesta.
CDS recommends conducting a thorough community survey directed specifically at grocery spending.
The survey should have enough sample size and breadth to be relatively statistically representative of
the Northside population, and effort should be made to have enough sample to allow for statistically
valid analysis of subgroups, such as relative newcomers to the area or higher-income households.
Survey topics should include:
• Thorough documentation of residents’ existing shopping habits – what items are purchased
where
• How often the Fiestas are patronized, and how much is spent on typical visits
• How often other grocery stores are patronized, and how much is spent there
• What products could be carried that are not currently carried, but would prompt more
purchases
• Good and bad aspects of the environment at the Fiestas
Having survey data indicating to Fiesta that certain changes could provide increased visits and spending
is what is needed for the community to make a strong case that Fiesta should make changes or
investments, which the company may view as risky or unlikely to be financially rewarding. Similar or
modified approaches to this survey might be possible for other categories of businesses as well.

Northside Retail Study Houston, Texas
80
Attract Greater Dining Diversity
While harboring a strong lineup of Tex-Mex and Mexican restaurants, the Northside has an extremely
limited array of other cuisines available, other than the usual fast food franchises. The Northside’s
demographic profile is unlikely to catch the attention of typical national restaurant chains except ones
which cater to moderate-income customers, which are not common generally apart from quick-service
establishments such as drive-through hamburgers, fried chicken, and sandwich shops. Even so, its lack
of dining diversity is somewhat remarkable, particularly for Houston.
The most glaring gap in the Northside’s offerings is for Asian food – Chinese, Vietnamese, etc. The vast
majority of such establishments in the Houston area are locally owned, often family owned, maybe only
with a single location. This works in the Northside’s favor, as such businesses are more likely to be
willing to occupy older existing spaces and take chances in less proven markets than larger corporate
chains. The Northside community could work highlight the lack of Asian restaurants to the local retail
brokerage community, many of whom have worked with independently owned Asian restaurants as
retail center tenants. Such networking will help uncover such businesses that are interested in opening
a second location or know of families who are seeking to open their first location, and help get
Northside on their radar.
As documented earlier in this report, it appears that a coffee purveyor could also be supported within
the Northside. As with dining, it is more likely at present that an independently owned business would
be willing to locate in Northside versus a corporate chain such as Starbucks.
Improve the Commercial Environment
One of the current issues with retail in Northside is that challenges exist in the overall environment
which hinder the potential for retail spending and general vibrancy. These include safety, parking, and
streetscape, plus a lack of a specific lively node with capacity to grow. While all of Northside deserves
improvements related to these items, resources (including the human capacity for effort and attention)
are limited, so CDS recommends focusing on a few key locations for early initiatives.
Safety
Many interviewees commented that they are not comfortable on public sidewalks after dark. Improved
environmental lighting, which directly addresses this issue as well as potentially improving the nighttime
aesthetic environment, has been stated as a priority by community leaders such as the Greater
Northside Management District. CDS recommends on focusing efforts to improve lighting on key streets
where conditions are most conducive to improving retail health. These include Cavalcade from the
North Freeway to Irvington, Irvington near Collingsworth and its terminus at Fulton, and North Main
from Hogan to Boundary (which has less immediate retail potential until the community is better
acclimatized to the access restrictions created by the light rail line).
In addition, measures to address key generators of transient loitering and vagrancy activity will be
necessary, particularly along North Main and the area around Fulton and Boundary. Having a visible
security presence to counteract the very visible presence of transients would help in the short term.
Lastly, many interviewees commented on the perception of nefarious activity occurring along Hogan /
Lorraine east of North Main, which kept them away from any commercial establishments in that
corridor. CDS would recommend working with the Houston Police Department to continue to
Northside Retail Study Houston, Texas
81
encourage the abatement of illegal or disruptive / nuisance activities in that area. Hogan is an important
street in that it directly and quickly connects the Northside to the fast-gentrifying First Ward area (part
of which was included as the South Core Area), and removing any deterrence from those residents’
willingness to venture into the Northside to patronize its businesses helps maximize potential retail
spending capture.
Safety not only speaks to personal security, but also the physical threat of automobile traffic. Providing
adequately wide sidewalks, in decent condition, and safe means to cross thoroughfares such as
Cavalcade when not at main intersections such as Fulton is another important safety element.
Parking
Many commercial parcels in Northside, particularly along North Main and Fulton post-METRORail, are
limited in area and thus have limited capacity for parking. Even with light rail, parking is still vital for
most businesses because of the Northside’s low density. The community should study the possibilities
for creating a communally managed parking system in this corridor, featuring common public parking
areas to serve multiple properties and reduced on-site parking requirements, in order to remove the
burden of parking provision and allow the occupancy of more indoor spaces. The City’s Parking
Management District option in the municipal code can facilitate this. Financing of communal parking
supply can come from a variety of sources. The Washington Avenue area is using on-street parking
revenue to contribute, for example.
Streetscape and Placemaking
CDS observed that existing retail activity is relatively scattered throughout the Northside study area.
The areas that could most be described as “nodes” are the Quitman / Fulton intersection, home to one
Fiesta and a Walgreens, and the conglomeration of small strip retail near the Fulton / Boundary
intersection. Both of these nodes are limited in physical development potential by nearby development,
most notably public properties such as schools, and street / infrastructure patterns. Irvington from
Fulton to just north of Cavalcade features popular dining and service establishments, but they are not
tightly clustered. Whereas vibrant retail scenes usually follow either a continuous “corridor” format or a
concentrated “node”, the Northside has neither. Furthermore, though it has two popular public
destinations (not counting schools) – the Leonel J. Castillo Community Center and Moody Park – neither
is currently well-integrated as a catalyst for nearby commercial activity, part of a concept known as
“placemaking.”
CDS suggests focusing on the general area of the Irvington / Collingsworth / Fulton intersections as a
location with potential to develop a commercial and civic activity node over the long term. Moody Park
is adjacent, and there are several vacant or underdeveloped sites which could convert to either
commercial or civic use. This area is fortunate to lie at the end of the Irvington corridor, so there is
already some successful nearby retail and dining as a precedent. A well-programmed and managed
public space, such as a plaza, with inviting gathering spaces and frequent events would serve as a
positive activity generator for the surrounding area. Improved sidewalk, landscaping, and lighting would
also be needed, both to connect to adjacent residential areas and to Moody Park, thereby helping the
latter become more synergistic with the neighborhood. Over time, by being a place where people felt
comfortable and enlivened to spend time, an increased density of retail and entertainment activities will
be more viable, and a “node” could develop.

Northside Retail Study Houston, Texas
82
Initiate a Community-Based Marketing Effort
Given that much spending by Northside residents is occurring outside the area, area businesses risk
“falling off the radar” of their own community. In addition, newly arrived residents, who are often going
to be higher income than existing residents and habituated to shopping and dining in other areas of
Houston such as Washington Avenue and the Heights, may not be motivated to seek out Northside
businesses. To address this issue, CDS recommends that community businesses band together to
highlight their offerings to residents. This could be done a variety of ways:
• A Northside shopping, dining, and services brochure including a map and descriptions of each
participating business
• Promotional specials, such as coupons, mailed or emailed to area residents
• A “dining tour” with a chartered vehicle to carry residents to a variety of local restaurants and
entertainment establishments
• A street fair with booths or other on-site presence from area businesses (this could represent an
evolution of the Sabor El Northside festival); or a more frequent food-and-crafts market where
local merchants could also have a presence (could be associated with the placemaking effort
described above)
Other marketing techniques may be worth exploring as well. Organizations such as the newly created
Chamber of Commerce and the Greater Northside Management District, which are accountable to
commercial establishments, would be appropriate for overseeing these efforts and providing seed
funding.