POST HARVEST MANAGEMENT \u0026 AGRO-FOOD RETAIL MARKET DEVELOPMENT IN DIFFERENT ALLIED SECTORS IN...
197
-
Upload
independent -
Category
Documents
-
view
0 -
download
0
Transcript of POST HARVEST MANAGEMENT \u0026 AGRO-FOOD RETAIL MARKET DEVELOPMENT IN DIFFERENT ALLIED SECTORS IN...


Volume 3, Issue 6 (June, 2013) ISSN: 2249-7307
Jou
rnal
of
Asi
an R
esea
rch
Co
nso
rtiu
m
h
ttp
://w
ww
.aij
sh.o
rg
AJRBEM
A P e e r R e v i e w e d I n t e r n a t i o n a l J o u r n a l
o f A s i a n R e s e a r c h C o n s o r t i u m
AJRBEM:
A S I A N J O U R N A L O F
R E S E A R C H I N B U S I N E S S
E C O N O M I C S A N D
M A N A G E M E N T
IMPACT FACTOR(GLOBAL)=0.376
Visit www.globalimpactfactor.com for verification
INDEX COPERNICUS VALUE (2011)=5.09

Volume 3, Issue 6 (June, 2013) ISSN: 2249-7307
Jou
rnal
of
Asi
an R
esea
rch
Co
nso
rtiu
m
h
ttp
://w
ww
.aij
sh.o
rg
AJRBEM
A P e e r R e v i e w e d I n t e r n a t i o n a l J o u r n a l
o f A s i a n R e s e a r c h C o n s o r t i u m
AJRBEM:
A S I A N J O U R N A L O F
R E S E A R C H I N B U S I N E S S
E C O N O M I C S A N D
M A N A G E M E N T
SR.
NO. P A R T I C U L A R
PAGE NO.
1.
RELATIONSHIP BETWEEN POST PURCHASE SERVICES BY PRIVATE
COMPANIES AGENTS AND FIRST YEAR POLICY LAPSATION RATE
IN LIFE INSURANCE SELLING
PROF. MITESH JAYSWAL
[PDF]
1-13
2.
A CONCEPTUAL FRAMEWORK OF EMPLOYEES’ CONTINUANCE
INTENTION TO USE E-LEARNING SYSTEM
DR. A. THIRUCHELVI, S. KOTEESWARI
[PDF] 14-20
3. PERFORMANCE OF INDEX FUNDS IN INDIA
DR. (MRS.) PRASHANTA ATHMA, MS. B. MAMATHA
[PDF] 21-29
4.
DEMOGRAPHIC DIFFERENCES & SHOPPING BEHAVIOR OF INDIAN
MIDDLE INCOME GROUP USERS WITH DEBIT CARDS:
AN EMPIRICAL ANALYSIS
VIVEK KUMAR TRIPATHI, TANU MARWAH
[PDF]
30-41
5.
INFORMAL WORKERS IN BANGLADESH: AN ANALYSIS FROM
SOCIO-ECONOMIC PERSPECTIVE
ABDUR RAZZAQUE SARKER
[PDF] 42-48
6.
IMPACT OF CREATIVE ADVERTISING STRATEGIES ON DOCTORS
BY MEDICAL REPRESENTATIVES FOR PHARMACEUTICAL
PRODUCTS
DR. P. T. CHAUDHARI, ABHIJEET HARIDAS GAHUKAR
[PDF]
49-60
7.
PROFITABILITY IN INLAND FISHERY SECTOR – A CASE STUDY IN
THE DISTRICT OF MIDNAPORE (EAST & WEST)
PRADIP KUMAR DASH
[PDF] 61-75
8.
A STUDY ON QUALITY OF WORK LIFE AT A GARMENT
MANUFACTURING UNIT IN PERNDURAI – A CASE STUDY
D. ANBUGEETHA
[PDF] 76-87
9.
EXPERIENCE IS A KEY TO SUCCESS IN POULTRY INDUSTRY
DR. S. C. VETRIVEL, DR. R. SOMASUNDARAM
[PDF] 88-95

Volume 3, Issue 6 (June, 2013) ISSN: 2249-7307
Jou
rnal
of
Asi
an R
esea
rch
Co
nso
rtiu
m
h
ttp
://w
ww
.aij
sh.o
rg
AJRBEM
10.
A STUDY ON FACTORS INFLUENCING FOR NON MIGRATION TO
URBAN AREA WITH SPECIAL REFERENCE TO KANCHEEPURAM
TALUK
DR. K. S. MEENAKSHISUNDARAM, DR. N. PANCHANATHAM
[PDF]
96-100
11.
MINOR IRRIGATION DEVELOPMENT AND POLOCIES IN MODERN
SYSTEMS UNDER DIFFERENT SOURCES IN ANDHRA PRADESH
DR. RADHA RANI KOTHAKALLA
[PDF] 101-107
12.
CORPORATE SOCIAL RESPONSIBILITY AND PHILANTHROPY –
ESSENTIAL TOOLS FOR BUILDING STRONG BRANDS;
A MARKETING PERSPECTIVE
M V A L NARASIMHA RAO, S RAMESH BABU, DR. M KISHORE BABU
[PDF]
108-121
13.
NETWORKED READINESS INDEX IN BRICS – COMPARATIVE
ANALYSIS
DR. L. KRISHNA VENI
[PDF] 122-135
14.
HIGH WORLD FOOD PRICES-CAUSES AND CONSEQUENCES
DR. U. JAYALAKSHMI SRIKUMAR
[PDF] 136-146
15.
POST HARVEST MANAGEMENT & AGRO-FOOD RETAIL MARKET
DEVELOPMENT IN DIFFERENT ALLIED SECTORS IN INDIA
MRK MURTHY, V MURALI
[PDF] 147-159
16.
TOWARD HIGHER STUDIES IN BUSINESS SCHOOLS
DR. RUKHSAR AHMED
[PDF] 160-176
17. PROFIT RE-ENGINEERING FOR BUSINESS PROGRESS
K. V. MURALI
[PDF] 177-189

Volume 3, Issue 6 (June, 2013) ISSN: 2249-7307
Jou
rnal
of
Asi
an R
esea
rch
Co
nso
rtiu
m
1
htt
p:/
/ww
w.a
ijsh
.org
AJRBEM
A P e e r R e v i e w e d I n t e r n a t i o n a l J o u r n a l
o f A s i a n R e s e a r c h C o n s o r t i u m
AJRBEM:
A S I A N J O U R N A L O F
R E S E A R C H I N B U S I N E S S
E C O N O M I C S A N D
M A N A G E M E N T
RELATIONSHIP BETWEEN POST PURCHASE SERVICES BY PRIVATE
COMPANIES AGENTS AND FIRST YEAR POLICY LAPSATION RATE
IN LIFE INSURANCE SELLING
PROF. MITESH JAYSWAL*
*Associate Professor,
S.V. Institute of Management,
Kadi, Gujarat. India.
ABSTRACT
PURPOSE: The purpose of this paper is to study the relationship between first year
policy lapsation rate and service quality provided by agents of private life insurance
companies. It check, whether first year policy lapsation rate differences is significant
on post purchase services of intermediary.
DESIGN/METHODOLOGY/APPROACH: The paper presents a survey of the
agents of private life insurance companies of Gujarat under descriptive- cross
sectional design. The statistical tools like exploratory factor analysis, confirmatory
factor analysis and MANOVA have been used.
MAJOR FINDINGS: First year policy lapsation rate differences of Private
Companies Agents is not found significant on post purchase services. It is significant
for exceptional services only.
ORIGINALITY/VALUE: The paper will be of value to those interested in insurance
distribution and specifically about agents performance of private life insurance
companies. It is suitable for academics and practitioners alike.
KEYWORDS: Service Quality, Policy Lapsation.
_____________________________________________________________________________

Volume 3, Issue 6 (June, 2013) ISSN: 2249-7307
Jou
rnal
of
Asi
an R
esea
rch
Co
nso
rtiu
m
2
htt
p:/
/ww
w.a
ijsh
.org
AJRBEM
INTRODUCTION
An agency relationship is defined as: a contract under which one or more persons (the
principal(s) engage another person (the agent) to perform some service on their behalf which
involves delegating some decision making authority to the agent (Jensen and Meckling, 1976).
Emphassing the importance of further bifarcation on this traditional meaning Lowry, Avila, &
Baird (1999) says that with increasing competition among agencies for the same clients, the need
for a strategy to differentiate one agency from another is critical. By focusing efforts on a niche
market, an agency can benefit by being the one of choice for consumers in the niche. Further
adding to marketing system Machiraju (2004) says that the job of marketing life insurance has
always been of a hybrid nature. The fact-finding and advice-giving phase at the contact level
may be considered as the work of counselor; the persuading phase as the work of a salesman.
Adding to this Cummins & Doherty (2005) specify the duty of an agent by saying that in
addition to placement of insurance, insurance intermediaries also help their clients understand
and measure their risk, advice them on how insurance can alleviate the costs of risk, help design
insurance coverage programs, and assist with claims settlement.
Emphasizing on latest change in insurance market article titled “Change Agents” (2008) mention
that the onset of competition also means that the role of the ubiquitous life insurance agent is
evolving, expanding and, in some cases, witnessing a complete turnaround. Increased
competition and proliferation of products are compelling agents to innovate and spend greater
amount of time understanding competing products. With new products from mutual funds and
insurance companies hitting the market every other day, the new-age agent is armed with
knowledge not just about his own portfolio, but also about financial products from competing
firms. Adding to this about Indian life insurance agents, Singhvi & Bhatt (2008) says that the
greater relationship and more face to face contact, consumers are used to the channel, experience
and greater knowledge of industry and cross selling ability are the strength of the agents while
higher cost for insurer and consumer because of higher commission rates, not as convenient as
other channels, old fashioned channel, not fully updated with latest technologies are the
weakness of the agent system. Not only emphasizing the role of agent in customer loyalty a
study finds evidnces that headquarters’ contribution to customer loyalty is significantly stronger
through the image path than through the delivery path (Andreassen & Lanseng, 1997).
ETHICAL ISSUES
An illuminating research by Banumathy & Manickam (2004) concludes that agents offer good
services before the policy is issued and while it is in operation but don’t offer good services at
the stage of maturity when a customer approaches them for settlement of claims. It, therefore,
makes sense to look at well-balanced, alternative channels of distribution. Talking on unethical
practices by agents Cummins & Doherty (2005) says that there is empirical evidence that most of
the contingent commissions is passed on to policyholders in the premium. On the bases of the
survey of LIC agents from Madurai district Arulsuresh & Rajamohan (2010) suggetsed that the
percentage of commission given to the agent should be the same for all policies because when
there is any differentiation between the rates of the commission of policies sold, the agent will be
attracted to policies which are giving higher rate of commission to them.
Volume 3, Issue 6 (June, 2013) ISSN: 2249-7307
Jou
rnal
of
Asi
an R
esea
rch
Co
nso
rtiu
m
3
htt
p:/
/ww
w.a
ijsh
.org
AJRBEM
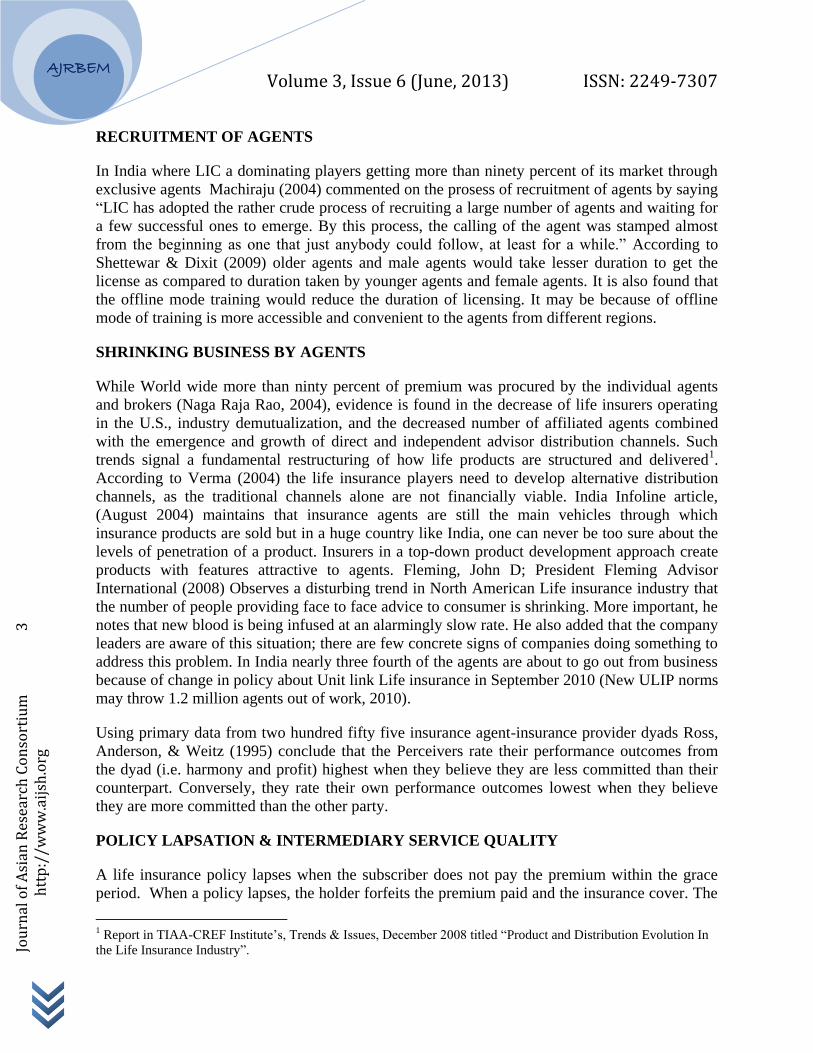
RECRUITMENT OF AGENTS
In India where LIC a dominating players getting more than ninety percent of its market through
exclusive agents Machiraju (2004) commented on the prosess of recruitment of agents by saying
“LIC has adopted the rather crude process of recruiting a large number of agents and waiting for
a few successful ones to emerge. By this process, the calling of the agent was stamped almost
from the beginning as one that just anybody could follow, at least for a while.” According to
Shettewar & Dixit (2009) older agents and male agents would take lesser duration to get the
license as compared to duration taken by younger agents and female agents. It is also found that
the offline mode training would reduce the duration of licensing. It may be because of offline
mode of training is more accessible and convenient to the agents from different regions.
SHRINKING BUSINESS BY AGENTS
While World wide more than ninty percent of premium was procured by the individual agents
and brokers (Naga Raja Rao, 2004), evidence is found in the decrease of life insurers operating
in the U.S., industry demutualization, and the decreased number of affiliated agents combined
with the emergence and growth of direct and independent advisor distribution channels. Such
trends signal a fundamental restructuring of how life products are structured and delivered1.
According to Verma (2004) the life insurance players need to develop alternative distribution
channels, as the traditional channels alone are not financially viable. India Infoline article,
(August 2004) maintains that insurance agents are still the main vehicles through which
insurance products are sold but in a huge country like India, one can never be too sure about the
levels of penetration of a product. Insurers in a top-down product development approach create
products with features attractive to agents. Fleming, John D; President Fleming Advisor
International (2008) Observes a disturbing trend in North American Life insurance industry that
the number of people providing face to face advice to consumer is shrinking. More important, he
notes that new blood is being infused at an alarmingly slow rate. He also added that the company
leaders are aware of this situation; there are few concrete signs of companies doing something to
address this problem. In India nearly three fourth of the agents are about to go out from business
because of change in policy about Unit link Life insurance in September 2010 (New ULIP norms
may throw 1.2 million agents out of work, 2010).
Using primary data from two hundred fifty five insurance agent-insurance provider dyads Ross,
Anderson, & Weitz (1995) conclude that the Perceivers rate their performance outcomes from
the dyad (i.e. harmony and profit) highest when they believe they are less committed than their
counterpart. Conversely, they rate their own performance outcomes lowest when they believe
they are more committed than the other party.
POLICY LAPSATION & INTERMEDIARY SERVICE QUALITY
A life insurance policy lapses when the subscriber does not pay the premium within the grace
period. When a policy lapses, the holder forfeits the premium paid and the insurance cover. The
1 Report in TIAA-CREF Institute’s, Trends & Issues, December 2008 titled “Product and Distribution Evolution In
the Life Insurance Industry”.
Volume 3, Issue 6 (June, 2013) ISSN: 2249-7307
Jou
rnal
of
Asi
an R
esea
rch
Co
nso
rtiu
m
4
htt
p:/
/ww
w.a
ijsh
.org
AJRBEM
agent loses the renewal commission. It also impacts the growth of the insurance business and
solvency margins of the insurer. Lapsation of a life insurance policy is discontinuation of
premium payment by the policyholder during the period of operation of the policy, due to any
reason other than the death of the policyholder. The length of life of a lapsed policy can be
defined as the period between the month when the last premium installment was paid and the
month the policy was issued. According to Gummarra (2008) a cancelation of insurance contract
during the first year demonstrates the probable customer dissatisfaction and is an indicator of
lower level services by intermediary. Policyholders who had repeated unpleasant experience with
the services of an insurance company or the advisor, most typically, would prefer to end their
relationship with the company (Mallela at al. 2008). Reasons for lapsation are wrong selling,
forced selling, over selling, bogus selling, effect of competition, introduction of new plans, bad
service, awareness levels of customers, non-receipt of notices, no follow-up by agents,
requirement of medical check-ups, change of address, inadequate explanation of the product
riders, repayment of house finance, malpractice of agents an field force (Subramanian, 2008).
From search theory a number of factors that affect the service quality provided by insurance
intermediaries can be identified (Posey/ Yavas 1995; Posey/ Tennyson 1998; Seog 1999, 2005;
Eckardt 2007). On the demand side, consumers’ preferences in regard to insurance related
information and other transaction services and their transaction costs influence their make-or-buy
decision. Besides, many information services depend on privately held information by
consumers. Thus intermediation service quality depends also on the collaboration between
consumers and intermediaries. On the supply side, the distribution of the relevant information as
well as the search technology used are important factors that affect the search costs which have
to be incurred for producing information and other services of a certain quality level (Rose 1999;
Eckardt 2007). Most important inputs are the time spent for searching, processing and evaluating
information and investment in specific insurance-related human capital (knowledge and skills).
Since consumers act either under a “free price”-illusion or simply do not know about what
percentage of the premiums they pay go to insurance intermediaries, price competition is quasi
not existent in the market for insurance intermediation (Cummins and Doherty 2006). Thus,
insurance intermediary markets are characterized by monopolistic competition (Cummins and
Doherty 2006; Eckardt 2007). Insurance intermediaries compete for customers both by
horizontal and vertical product differentiation. In the former case they offer different kinds of
services, while in the latter they offer different quality levels.
LITERATURE GAP
An article by Arnold (2000) contains a survey of 750 executives, which found that the
distribution effectiveness and technological preparedness are the big concern for the life
insurance CEOs in Europe and North America. In lately liberalized Indian market where
alternate channels are having combine share of twenty two per cent of new premium it is need to
study the reasons for reduction in adoption rate of traditional channel. For Individual Agents
(having a share of 78.69 per cent in new business, 44.05 for private companies and 96.56 per

Volume 3, Issue 6 (June, 2013) ISSN: 2249-7307
Jou
rnal
of
Asi
an R
esea
rch
Co
nso
rtiu
m
5
htt
p:/
/ww
w.a
ijsh
.org
AJRBEM
cent for LIC)2, this is a pathetic situation for the industry experts who notice the consistently
shrinking share in last ten years.
While the key success factors for distribution are Productivity, Control, Turn Over and Customer
relationship (Shelton ,1995), the literature indicates that, In India the focus has been finding out
on getting new business only. Most of the problems and issues confronting the Indian life
insurance business in today’s situation are of because of more marketing orientation less focus
on the issues like recruitment and selection of intermediaries, retention, education and training,
productivity and morale, market conduct issues and research (Machiraju, 2003). The marketing
orientation is not only limited to insurer but also associated with intermediary. Like rebating in
the insurance industry has remained a bone of contention right from the colonial era.
Rajagopalan (2008) expects the variations in the lapse experience of the business transacted
through the channels and mention that it needs to be investigated separately. As there is no
attempt found to study the service quality of private life insurance agents in Indian market, the
study to relate the first year lapsation rate with service quality is novel phenomenon in Indian
context. So it is interesting to study the relationship between first year policy lapsation rate and
post purchase service quality of Individual Agents of private Life insurance companies and fulfill
this literature gap up to some extent.
STUDY OBJECTIVE
The broad aim of the proposed study is to know that whether there is a significant difference
among first year policy lapsation rate and post purchase services of the intermediary3. The
researcher believes that the intermediaries giving more importance to post purchase services
having low first year policy lapsation rate. The researcher would also like to explore the
categories of post purchase service variables on which the first year lapsation rate differs.
HYPOTHESIS
H1: Cancellation of policy due to first year leapsation is significant on post purchase services of
intermediary
H1a: Cancellation of policy due to first year leapsation is significant on Revival Services
H1b: Cancellation of policy due to first year leapsation is significant on Routine & Alteration
Services
H1c:Cancellation of policy due to first year leapsation is significant on Exceptional services
RESEARCH METHODOLOGY
An insurance market is characterized by incomplete and asymmetric information between
insurance companies and consumers (Cummins & Doherty 2006; Eckardt 2007). Insurance
2 IRDA Annual Report 2012 3 In this paper, the word Intermediary is used for individual agents of private life insurance companies.

Volume 3, Issue 6 (June, 2013) ISSN: 2249-7307
Jou
rnal
of
Asi
an R
esea
rch
Co
nso
rtiu
m
6
htt
p:/
/ww
w.a
ijsh
.org
AJRBEM
intermediary market is also characterized by incomplete and asymmetric information.
Information and counseling services are complex and long-term insurance purchase decisions
having experience and credence goods (Nelson 1970; Darby & Karni 1973; Hirshleifer 1973).
According to principal-agent theory this information asymmetry leads to low quality provision
due to differing objectives between principals and agents. Consumers as principals have only
incomplete information about an intermediary’s characteristics, knowledge and experience
before contract conclusion as well as about the intermediary’s proper intentions and actions after
contract conclusion. Therefore the performance of the intermediary can be only incompletely
assessed by the principal. So the service quality of life insurance intermediary can better assess
through survey of intermediaries than customers. This research begins with exploratory research
design as its immediate purpose is to develop hypothesis and questions for further research. The
formal study begins after the exploration leaves off. For making the study conclusive after
exploratory research, descriptive research design is used. Post purchase services include number
of activities carried out by the intermediary after conclusion of the contract. A list of different
activities is prepared on the bases of interaction with insurance professionals. In this case the list
of intermediaries is not available, so it is decided to go with non probability sampling methods
under which convenience sampling method is used.
EXPLORATORY FACTOR ANALYSIS (EFA)
To identify sources underlying the prepurchase services of intermediary, an exploratory factor
analysis was carried out. EFA is a technique aimed to identify number of latent constructs form
set of interrelated variables. Principle components method was used to extract the factors. The
KMO Measure of Sampling Adequacy was 0.771 indicating analysis results are meritorious
(Kaiser, 1970).Bartlett’s test of sphericity was significant at 0.000 levels demonstrating that a
high elevated degree of correlation between the variables exists (Hair et al., 1998) (Table 1).
TABLE 1: KMO, BARTLETT’S TEST OF SPHERICITY AND SIGNIFICANT LEVEL
Kaiser-Meyer-Olkin Measure of Sampling Adequacy 0.771
Bartlett's Test of Sphericity
Approx. Chi-Square 1063
Df 66
Sig. 0.000*
*significant at 0.001 level
In total, there were twelve (12) variables in the data. Items with higher cross loadings (more
than 0.20) and those with lower than 0.5. Varimax rotation method was used with factors
extraction with Eigen value over 1. It resulted into extraction of three factors, which explained
51.76 per cent of variance. The minimum factor loading observed was 0.499 and the maximum
loading was seen to be 0.852.The factors, their respective items with the numbers and their
corresponding factor loading are given in Table 2 and 3.

Volume 3, Issue 6 (June, 2013) ISSN: 2249-7307
Jou
rnal
of
Asi
an R
esea
rch
Co
nso
rtiu
m
7
htt
p:/
/ww
w.a
ijsh
.org
AJRBEM
TABLE 2: DESCRIPTION OF FACTORS
Factors Description % of
Variance
% of
Cumulative
variance
Routine & Alteration
Services
Services which are used by more number of
clients & Alteration Services
19.422 19.422
Exceptional Services Services which are used by very few clients 17.268 36.691
Revival Services Services related to non-commitment by clients 15.077 51.767
TABLE 3: COMPOSITION OF EACH FACTOR IDENTIFIED IN FACTOR ANALYSIS
Factor Items Factor
loadings
Routine & Alteration
Services
Grant of loan (V7) 0.762
Assignment (V6) 0.675
Settlement of surrender value (V9) 0.574
Settlement of claims (V11) 0.519
Payment of survival benefit (V8) 0.512
Alteration in policy terms (V10) 0.499
Exceptional Services Collection of premium (V2) 0.739
Policy delivery (V1) 0.695
Change in personal information (V12) 0.612
Nomination (V5) 0.512
Revival Services Revival / reinstatement of paid up policies (V3) 0.852
Revival / reinstatement of lapsed policies (V4) 0.838
CONFIRMATORY FACTOR ANALYSIS
The first order confirmatory factor analysis model fit indices are x2 = 183.740, x
2 / df = 3.603,
df = 51, GFI = 0.933, RMSEA = 0.082, PCLOSE = 0.000, NFI = 0.829, CFI = 0.869, TLI =
0.830, RMR = 0.051, AGFI = 0.897.
From table 4 it is easy to see that the regression weights of all variable loading on their
respective factors. All critical ratios are statistically significant at the 99 per cent confidence
level. The factor intercorrelations for the three first-order factors are presented in Table 4 and are
statistically significant at 99 per cent. The moderate correlation between factors suggests
adequate discriminant validity between these related aspects of temperament. In other words, as
specified by the theory, the scale measures related but still separate aspects of temperament.

Volume 3, Issue 6 (June, 2013) ISSN: 2249-7307
Jou
rnal
of
Asi
an R
esea
rch
Co
nso
rtiu
m
8
htt
p:/
/ww
w.a
ijsh
.org
AJRBEM
TABLE 4: LOADING OF THE FIRST ORDER CONFIRMATORY ANALYSIS FOR
POST SELLING SERVICE QUALITY
Standard first – order loading a
Variables R2 Routine &
Alteration Services
Exceptional
Services
Revival Services
posgrnloan7 0.237 0.487c
posassig6 0.312 0.559 (7.169)
possurrval9 0.245 0.495 (6.690)
posclaim11 0.325 0.570 (7.246)
possurvben8 0.316 0.562 (7.192)
posaltpol10 0.318 0.564 (7.204)
Routine
&Alteration
Servicesb
--- 0.714
0.566
poscollprem2 0.294 0.542c
pospoldel1 0.355 0.596 (7.441)
posperinf12 0.377 0.614 (7.542)
posnomi5 0.176 0.420 (5.986)
Exceptional
Servicesc
--- 0.486
posrevPUpo3 0.586 0.765 c
posrevLPpo4 0.711 0.843 (9.546)
Revival Servicesc ---
Notes: aStandard first order loading is the standard regression weight of the individual variables’
loading on to one of the component factors. Figures in parentheses are critical ratios from the
unstandardized solution; b Standard first order loading for component factors (i.e. Routine &
Alteration Services, Exceptional Services, Revival Services) is the covariance between any two
of these component factors; c The critical ratio is not available, because the regression weight of
the first variable of each component factor is fixed at 1; x2 = 183.740, x
2 /df= 3.603, df = 51, GFI
= 0.933, RMSEA = 0.082, PCLOSE = 0.000, NFI = 0.829, CFI = 0.869, RMR = 0.051, AGFI =
0.897.
The graphical presentation of the model is as under.

Volume 3, Issue 6 (June, 2013) ISSN: 2249-7307
Jou
rnal
of
Asi
an R
esea
rch
Co
nso
rtiu
m
9
htt
p:/
/ww
w.a
ijsh
.org
AJRBEM
LOADING OF THE FIRST ORDER CONFIRMATORY ANALYSIS FOR POST
SELLING SERVICE QUALITY
RELATING CANCELLATION OF POLICY DUE TO FIRST YEAR LEAPSATION TO
POST PURCHASE SERVICES OF INTERMEDIARY
The major objective of this research paper is to establish the relationship between cancellation of
policy due to first year leapsation and post purchase services of intermediary. Considering this,
Cancellation of policy due to first year leapsation is taken as independent variable while post
purchase service of intermediary is dependent variable. For this, MANOVA is administered
because MANOVA is a multivariate extension of the univariate techniques used for measuring
the differences between group means. As stated by Hair et al. (1998, p.14), MANOVA ‘…is a
statistical technique that can be used to simultaneously explore the relationship between several
categorical independent variables (usually referred to as treatments) and two or more metric
variables.’
To measure significant difference related to the independent variables, one Multivariate Analysis
of Variance (MANOVA) test with repeated measures were conducted. The MANOVA and
subsequent ANOVA results are shown in Table 5, and it was found that there is statistically
insignificant difference between cancellation of policy due to first year leapsation(i.e. 0 to 20, 21
.24
posgrnloan7
.31
posassig6
.24
possurrval9.33
posclaim11.32
possurvben8.32
posaltpol10.29
poscollprem2.35
pospoldel1.38
posperinf12.18
posnomi5.59
posrevPUpo3.71
posrevLPpo4
Rout_Alt_Ser
Excep_ser
Revival ser
e1
e2
e3
e4
e5
e6
e7
e8
e9
e10
e11
e12
.49
.56
.49
.57
.56
.56
.54
.60
.61
.42
.77
.84
.71
.57
.49

Volume 3, Issue 6 (June, 2013) ISSN: 2249-7307
Jou
rnal
of
Asi
an R
esea
rch
Co
nso
rtiu
m
1
0
h
ttp
://w
ww
.aij
sh.o
rg
AJRBEM
to 40, 41 to 60 and 61 to 80) for the four dependent variables of post purchase services of
intermediary i.e. Routine & Alteration Services, Exceptional Services and Revival services
(Wilk’s Lamda = 0.847; Significance: p =0.055> 0.05).
As indicated in Table 5, the univariate F-ration were also significant for the one dependent
variables i.e. Exceptional Services (F=2.987, Sign. = 0.035) but statistically cancellation of
policy due to first year leapsation was non – significant on Calculation of Revival Services
(F=1.206, Sign. =0.312), Routine & Alteration Services (F=0.917, Sign. =0.435), In addition to
this, the means score of all the three dimensions of post purchase services of intermediary
(aggregate score) were checked and it was found that Cancellation of policy due to first year
leapsation of 0 to 20 per cent have more importance compare to other prospect in post purchase
services of intermediaries. Henceforth, overall results support H1c but H1, H1a, H1b, were not
supported (Table 5).
TABLE 5: MANOVA RESULTS FOR CANCELLATION OF POLICY DUE TO
FIRST YEAR LEAPSATION TO POST PURCHASE SERVICES OF INTERMEDIARY
(OVERALL) Effect Value F Significance
Multivariate tests
First year policy
lapsation rate
Pillai’s Trace 0.157 1.862 0.057
Wilks’ Lambda 0.847 1.886 0.055
Hotelling’s Trace 0.175 1.896 0.052
Roy’s Largest Root 0.136 4.580 0.005
ANOVA tests
Revival Services ----- 1.206 0.312
Routine & Alteration
Services
----- 0.917 0.435
Exceptional Services ----- 2.987 0.035
Cancellation of policy due to first
year leapsation
Revival Services Routine &
Alteration
Services
Exceptional Services
0 to 20 (n=79) 2.14 1.67 1.83
21 to 40 (n=21) 1.96 1.48 2.11
41 to 60 (n=14) 1.45 1.50 1.50
61 to 80 (n=10) 2.00 1.50 3.00
Note: * p < 0.05

Volume 3, Issue 6 (June, 2013) ISSN: 2249-7307
Jou
rnal
of
Asi
an R
esea
rch
Co
nso
rtiu
m
1
1
h
ttp
://w
ww
.aij
sh.o
rg
AJRBEM
LIMITATION AND FUTURE RESEARCH
There are three limitations of this study. First, the survey has been conducted in Gujarat only so
the results may not be applicable to country wide. Second, the sampling method is of non
probability type so the sample’s representation about the population is questioned. And third,
Comrey and Lee (1992) (see Tabachnick & Fidell, 1996) say the sample size is 124 only, it is
poor for factor analysis.
This research is limited to the post purchase services only but further research can be done by
considering pre-selling services of intermediaries. That is interaction on various issues before
execution of insurance contract. Such study has been conducted in Germany but not in India
(Eckardt & Doppner, 2008). Guiding results can also be obtained by comparing the results of
various insurance intermediary namely agents, brokers, direct marketing and bancassurance. The
first year policy lapsation ratio can also be replaced with other positive variables like repeat
purchase and referral sales.
REFERENCES
Anderson, E., Ross, W. T., & Weitz, B. (1998). Commitment and Its Consequences in the
American Agency System of Selling Insurance. Journal of Risk and Insurance (65), 637-669.
Andreassen, T. W., & Lanseng, E. (1997). The principal’s and agents’ contribution to customer
loyalty within an integrated service distribution channel: An external perspective. European
Journal of Marketing, , 31 (7), 487-503.
Arnold, C. (2000, December 4). Life CEOs: Distribution, Technology are Key. National
Underwriter , pp. 6.
Arulsuresh, J., & Rajamohan, S. (2010). Attitude of the Agents Towards the Marketing of
Insurance Services by the LIC of India. The IUP Journal of Risk & Insurance , VII (4), 47-71.
Banumathy, S., & Manickam, S. (2004, June). Customer services provided by Life Insurance
Corporation of India- A case study. The Insurance Times , 30-33.
Change Agents. (2008, October 19). Business Today .
Comrey, A. L., & Lee, H. B. (1992). A first course in factor analysis (2nd Edition ed.). Hillsdale,
NJ: Erlbaum.
Cummins, J. D., & Doherty, N. A. (2005). The Economics of Insurance Intermediaries. Wharton
School, University of Pennsylvania.
Cummins, J. D., & Doherty, N. A. (2005). The Economics of Insurance Intermediaries. Wharton
School, University of Pennsylvania.

Volume 3, Issue 6 (June, 2013) ISSN: 2249-7307
Jou
rnal
of
Asi
an R
esea
rch
Co
nso
rtiu
m
1
2
h
ttp
://w
ww
.aij
sh.o
rg
AJRBEM
Cummins, J. D., & Doherty, N. A. (2006). The Economics of Insurance Intermediaries. Journal
of Risk & Insurance , 73: 359-396.
Darby, M. R., & Karni, E. (1973). Free Competition and the Optimal Amount of Fraud. Journal
of Law and Economics , 16: 67-88.
Eckardt, M. (2007). Insurance Intermediation: An Economic Analysis of the Information
Services Market. (Berlin, Heidelberg: Physica-Verlag) .
Eckardt, M., & Doppner, S. R. (2008). The Quality of Insurance Intermediary Services –
Empirical Evidence for Germany. Andrássy Working Paper Series No. XXV . Andrássy Gyula
University, Budapest.
Fleming, John D; President Fleming Advisor International. (2008). The plight of Face to Face
Insurance Distribution. LIMRA's MarketFacts Quarterly , 27 (3), pg 64.
Gummarra, L. T. (2008). Reason for coexistance of diffrent distribution channels: An Empirical
test for the German Insurance Market. The Geneva Papers on Risk and Insurance- Issues and
Practice , 389-407.
Hair, J. F., Anderson, R. E., Tatham, R. L., & Black, W. C. (1998). Multivariate Data Analysis
(5th Edition ed.). New Jersey: Prentice-Hall.
Hirshleifer, J. (1973). Where are we in Theory of Information? American Economic Review , 63:
31-39.
Jensen, M. C., & Meckling, W. H. (1976). Theory of the firm: managerial behavior, agency costs
and ownership structure. Journal of Financial Economics , 3, 305-60.
Kaiser, H. F. (1970). A second generation little jiffy. Psychometrica , 35,401-415.
Lowry, J. R., Avila, S. M., & Baird, T. R. (1999, Summer ). Developing a Niching Strategy for
Insurance Agents. CPCU Journal , 74-83.
Machiraju, A. (2003, March). Training Life Agents to Serve. IRDA Journal , 22-24.
Machiraju, A. (2004, December). A Noble Pro Called An Agent. IRDA Journal , 21-24.
Naga Raja Rao, P. (2004, January). Distribution Channels in Insurance Industry -New Trends.
Bima Vidya , 15-18.
Nelson, P. (1970). Information and Consumer Behavior. Journal of Political Economy , 78:
311-329.
Posey, L. L., & Tennyson, S. (1998). The Coexistence of Distribution Systems Under Price
Search: Theory and Some Evidence from Insurance. Journal of Economic Behavior and
Organization , 35: 95-115.
Volume 3, Issue 6 (June, 2013) ISSN: 2249-7307
Jou
rnal
of
Asi
an R
esea
rch
Co
nso
rtiu
m
1
3
h
ttp
://w
ww
.aij
sh.o
rg
AJRBEM
Posey, L. L., & Yavas, A. (1995). A Search Model of Marketing Systems in Property-Liability
Insurance. Journal of Risk and Insurance , 62: 666-689.
Rajagopalan, V. (2008). Lapsation of Life Insurance Policies. IRDA Journal , 8-12
Rose, F. (1999). The Economics, Concept, and Design of Information Intermediaries.
(Heidelberg:Physica Verlag).
Seog, S. H. (1999). The Coexistence of Distribution Systems When Consumers Are Not
Informed. The Geneva Papers on Risk and Insurance Theory , 24: 173-192.
Seog, S. H. (2005). Distribution Systems and Operating Leverage. Asia-Pacific Journal of Risk
and Insurance , 1: 45-61.
Shelton, D. (1995). Distribution strategy in the life and pensions market. International Journal of
Bank Marketing , 13 No. 4, 41-44.
Shettewar, R., & Dixit, S. (2009). Life Insurance Agent Profiling: Leading Indicators to Growth.
Journal of Insurance & Risk Management , VII (14), 21-29.
Singhvi, N., & Bhatt, P. (2008). Distribution Channesl in Life Isurance. Bimaquest , VIII (1),
20-40.
Varma, V. (2004, July-December). Insurance Broking In India : Scope Challenges and Prospects.
The Journal of Insurance Institute of India , 106-116.
Volume 3, Issue 6 (June, 2013) ISSN: 2249-7307
Jou
rnal
of
Asi
an R
esea
rch
Co
nso
rtiu
m
1
4
h
ttp
://w
ww
.aij
sh.o
rg
AJRBEM
A P e e r R e v i e w e d I n t e r n a t i o n a l J o u r n a l
o f A s i a n R e s e a r c h C o n s o r t i u m
AJRBEM:
A S I A N J O U R N A L O F
R E S E A R C H I N B U S I N E S S
E C O N O M I C S A N D
M A N A G E M E N T
A CONCEPTUAL FRAMEWORK OF EMPLOYEES’ CONTINUANCE
INTENTION TO USE E-LEARNING SYSTEM
DR. A. THIRUCHELVI*; S. KOTEESWARI**
*Faculty,
Department of Management Studies,
CEG Campus, Anna University,
Chennai, India.
**Student,
Department of Management Studies,
CEG Campus, Anna University,
Chennai, India.
ABSTRACT
We are now in an era where all organizations are orienting themselves towards
strategic human resource management initiatives. One such an initiative is the use of
Virtual Learning Environment (VLE) that enables the organizations to offer
consistent and convenient training to their employees at low cost. The investments
made in implementing VLE can have fruitful returns only when there is continuous
usage by the employees which is determined by satisfaction derived from it. Though
many studies have attempted to test the relationship between perceived usefulness,
perceived ease of use, self efficacy, learning style, technical know-how, interaction
with instructor & interaction with other learners and the e- learner satisfaction, no
study has holistically tested the relationship. This paper tries to fill the gap by
proposing a single conceptual framework depicting the relationship between all such
employee related variables and e-learning satisfaction which in turn influences the
continuance intention to use. The proposed framework will help organizations in
formulating strategies to enhance employees’ satisfaction towards e-learning and
thereby increasing their intention to use the e-learning system.
KEYWORDS: e Learning, e learner Satisfaction, continuance intention.
______________________________________________________________________________

Volume 3, Issue 6 (June, 2013) ISSN: 2249-7307
Jou
rnal
of
Asi
an R
esea
rch
Co
nso
rtiu
m
1
5
h
ttp
://w
ww
.aij
sh.o
rg
AJRBEM
1 INTRODUCTION
The organizations consider training and improving the human resources as the crucial points of
development and put them on the top of their programs due to the rapid changes in technology
and knowledge raise (Hassan, Shahidi, Hosseini, & Nahad, 2011).The process of providing
consistent training to all employees spread across the world is a challenge for global firms. And
also the training and development department is highly responsible for returns on the
investments made in training the employees.
Information and Communication Technology (ICT) has become the saviour for
organisations to overcome these challenges. ICT has driven the evolution of e-learning as a
strategic initiative for training the employees (Schneckenberg, 2010). The number of e-learning
programs implemented in a corporate setting has increased dramatically over the last few years
and e-learning has become a major form of training and development within organizations (Ho &
Kuo, 2010).
There had been many research conducted on assessing success of e learning in
organisations. Though the initial acceptance of e learning is highly essential, real success can be
measured only with the continuance intentions among employees to undergo the courses through
e learning system. The Theory of Reasoned Action (TRA) and Theory of Planned Behaviour
(TPB) explain how attitudes of individuals lead to intentions. The Technology Acceptance
Model (TAM) applies TRA and TPB and explains how attitudes lead to actual usage of
information systems. The expectancy confirmation model says that satisfaction leads to
continuance intentions. Many works in the literature have used the above mentioned theories in e
learning context and have identified the measures of individual attitudes about e-learning system
resulting in satisfaction which in turn influences the continuance intention.
The purpose of this paper is to conceptualise a holistic model which brings together all
attributes that influences e learner satisfaction which leads to continuance intentions.
2 THEORETICAL DEVELOPMENT
2.1 E-LEARNING
E-Learning is the use of telecommunication technology to deliver information for education and
training (Sun, Tsa, Finger, Chen, & Yeh, 2008).
E-Learning systems include: web-based learning, computerized learning, virtual
classrooms, and digital cooperation. In an e-learning environment, learners are supplied with
learning materials via media, making e-learning systems a cost and time-effective approach to
train employees (Chen, 2010).
The shift from a product-based economy to a knowledge-based economy has resulted in
an increased demand for knowledge workers who are capable of higher-order thinking and
reasoning to solve intricate problems in the work place. There arises the need to build more cost-
effective and efficient learning environments in the workplace to meet both individual and
Volume 3, Issue 6 (June, 2013) ISSN: 2249-7307
Jou
rnal
of
Asi
an R
esea
rch
Co
nso
rtiu
m
1
6
h
ttp
://w
ww
.aij
sh.o
rg
AJRBEM
organizational objectives. This requires organizations to educate and train employees at multiple
sites and times (Govindasamy, 2002).
Organizations are using technology to offer training programs for their employees due to
its beneficiary effects such as cost reduction in travel expenses and training time, flexibility in
pace and delivery of training, variety of available content, standardized and consistent course
delivery, permanent use of material within the company, boost worker productivity, increase in
number of people trained, stay competitive, etc (Ozturan & Kutlu, 2010).
2.2 ATTITUDES, SATISFACTION AND INTENTION
An attitude is a disposition to respond favourably or unfavourably to an object, person, intuition
or event. Attitudes are evaluative in nature. TRA argues that attitudes and subjective norms are
determinants of intention. TPB which is an extension of TRA depicts that there are three major
antecedents of intention towards behaviour. First is the attitude towards a behaviour, which is
determined by the beliefs about the consequences of the behaviour, termed as behavioural beliefs
and the evaluation of its outcome. Second is the subjective norm, which is determined by the
beliefs about approval or disapproval of performing the behaviour by social referents, termed as
normative beliefs and the individual’s motivation to comply with the referents. Third is the
perceived behavioural control, which is determined by the beliefs about the factors that facilitate
or obstructs the performance of the behaviour termed as control beliefs and the power of the
factor to assist or inhibit the performance of the behaviour (Ajzen, 2010).
The Expectancy Confirmation Theory (ECT) states that confirmations with expectations
about an object or event after experiencing it, results in satisfaction leading to continuance
intentions (Oliver, 1980). Thus combining the TPB and ECT it is inferred that behavioural belief
on outcome, evaluation of outcome, concerned normative belief, individual’s motivation, control
belief on resources and power to facilitate the behaviour influences satisfaction which in turn
influences continuance intention (Roca, Chiu, & Martinez, 2006).
2.3 CONTINUANCE INTENTION TO USE E-LEARNING SYSTEM
Organisations take great efforts to develop and implement e-learning program for their
employees. Although initial acceptance of e-learning is an important first step toward achieving
e-learning success, actual success still needs continued usage. Continuance intention is the
intention of employees to use the e learning system continuously after initial usage. Intentions
often predict behaviour. People do what they intend to do. To understand their behaviour we
must identify the determinants of intentions (Ajzen, 2010). Understanding the factors affecting
employees’ intention to continue using e-learning system helps in designing strategies that are
most likely to increase the use of e learning (Lee, 2010).
2.4 SATISFACTION ON E-LEARNING SYSTEM
The organizations should make sure that the employees are satisfied with e-learning courses,
only then they will have the intention to continually undergo more courses and also encourage
their peers to use e-learning setup. After taking up e learning courses employees should be glad

Volume 3, Issue 6 (June, 2013) ISSN: 2249-7307
Jou
rnal
of
Asi
an R
esea
rch
Co
nso
rtiu
m
1
7
h
ttp
://w
ww
.aij
sh.o
rg
AJRBEM
about their decision and feel that the courses have satisfied their needs (Sun, Tsa, Finger, Chen,
& Yeh, 2008). Users’ satisfaction has a positive effect on e-learning continuance intention (Roca,
Chiu, & Martinez, 2006; Lee, 2010). Hence it is inferred that e- learner satisfaction influences
continuance intention to use e learning system.
Previous works in literature have measured e-learning success from many dimensions
like individual dimension, course dimension, technical dimension and environmental dimension,
of which individual dimension is the most important one, as the success of any system depends
on the user. Following independent variables are said to have influence on e-learning
satisfaction: perceived usefulness, perceived ease of use, self efficacy, learning style and
interaction. Apart from these variables motivation is proposed as an influential determinant of e-
learning satisfaction the framework.
2.5 PERCEIVED USEFULNESS
Davis (1989) has defined perceived usefulness as the degree to which a person believes that
using a particular system would enhance his/her job performance. Positive behavioural beliefs
help in deriving satisfaction resulting in positive intentions. The employees will be satisfied with
the e-learning system only if they perceive that it helps them to improve their job performance.
Realising that e-learning system increases their productivity and usefulness induces the
employees to derive satisfaction from it (Ong & Lai, 2006). Perceived usefulness while using the
e-learning system has a positive effect on satisfaction (Roca, Chiu, & Martinez, 2006; Lee, 2010;
Johnson, Hornik, & Salas, 2008). Hence it is inferred that perceived usefulness has influence on
e-learner satisfaction.
2.6 PERCEIVED EASE OF USE
Davis (1989) has defined perceived ease of use as the degree to which a person believes that
using a particular system would be free of physical and mental effort. Attitude towards behaviour
highly affects the level of satisfaction after performing the behaviour. Employees should believe
that the system is easily understandable and that they can easily get familiarized with the e
learning system which enables them to be satisfied with the e- learning system (Lee &
Lee, 2008).Perceived ease of use while using the e-learning system has a positive effect on
satisfaction (Roca, Chiu, & Martinez, 2006; Sun, Tsa, Finger, Chen, & Yeh, 2008). Hence it is
inferred that perceived ease of use has a role to play in e-learner satisfaction.
2.7 SELF EFFICACY
Roca (2006) has defined self efficacy as the degree to which an individual is confident that
he/she can perform a specific task or achieve a specific goal. Control beliefs of an individual
influences intentions through satisfaction. Employees should feel confident to use the e-learning
system. They should trust themselves that they have the ability to access and complete the
courses, only then they can gain satisfaction from the system. Perceived satisfaction in e-learning
will be influenced by the perceived self-efficacy (Liaw & Huang, 2013; Sun, Tsa, Finger, Chen,
& Yeh, 2008; Johnson, Hornik, & Salas, 2008). Hence it is inferred that Self Efficacy influences
the e-learner satisfaction noticeably.

Volume 3, Issue 6 (June, 2013) ISSN: 2249-7307
Jou
rnal
of
Asi
an R
esea
rch
Co
nso
rtiu
m
1
8
h
ttp
://w
ww
.aij
sh.o
rg
AJRBEM
2.8 INTERACTION
Johnson (2008) has defined interaction as the exchange of information between the various
stakeholders in the course (e.g. peers, instructors, and other support staff). The e-learning system
should facilitate employees to share knowledge with other participants and encourage them to
get the doubts clarified from the course instructor, only then the employees can attain satisfaction
(Choi, Kim, & Kim, 2007).Learner perceived interaction with others will positively influence
perceived e-Learner satisfaction with e-Learning (Liaw & Huang, 2013; Sun, Tsa, Finger, Chen,
& Yeh, 2008; Johnson, Hornik, & Salas, 2008). Hence it is inferred that Interaction has
considerable influence on e-learner satisfaction.
2.9 LEARNING STYLE
For instructor based learning, learning style is irrelevant but for web based learning, learning
style is significantly important. Learners who learn through thinking and watching and thinking
would better learn with e-learning. There is statistically significant difference among those with
different learning styles (Lu, Yu & Liu, 2003). Hence it is inferred that learning style is an
inevitable factor on E-Learner Satisfaction. But many existing works do not include learning
style in the models that are used to judge whether employees are interested in the e-learning
system. This paper proposes a model for employees’ continuance intention to use e-learning
system that includes learning style as one of its parameters.
2.10 MOTIVATION
Motivation is defined as the process that accounts for an individual’s intensity, direction, and
persistence of effort toward attaining a goal. Motivation is a part of subjective norm which
greatly influences intention through satisfaction. Porter Lawler theory of motivation (1968)
explains the process of how employee motivation helps in attaining satisfaction in workplace. In
the flow of motivation process it is well explained that extrinsic and intrinsic rewards help an
individual to attain satisfaction. Hence this paper includes motivation as a major parameter in the
model of employees’ continuance intention to use e-learning system. E-learner satisfaction is
influenced by their level of motivation with rewards as their drive. Self motivation drives
employees to have a strong desire to take-up the e-learning courses. When employees are given
rewards like credit points for the e-learning courses, their satisfaction level will be enhanced.
Hence it is inferred that motivation as an additional parameter helps to improve e-learner
satisfaction.
2.11 THE CONCEPTUAL MODEL
A framework of employees’ continuance intention to use e-learning system is conceptualized as
shown in figure 1. This framework gives a holistic view of how perceived usefulness, perceives
ease of use, self efficacy, interaction, learning style and motivation influences the satisfaction
derived from e-learning which in turn influences intention to use the e-learning system. The
major contribution of this paper is that the independent variables – learning style and motivation
are included to study about employees’ satisfaction and continuance intention towards e-learning
systems used in the organisations.

Volume 3, Issue 6 (June, 2013) ISSN: 2249-7307
Jou
rnal
of
Asi
an R
esea
rch
Co
nso
rtiu
m
1
9
h
ttp
://w
ww
.aij
sh.o
rg
AJRBEM
FIGURE 1. THE CONCEPTUAL FRAMEWORK OF EMPLOYEES’ CONTINUANCE
INTENTION TO USE E-LEARNING SYSTEM
3 CONCLUSION
To improve the continuance intention to use e-learning system among employees all factors that
have influence on e-learning satisfaction should be considered. Employees should be made to
perceive that E-Learning will be useful for improving their performance. They should also be
made to perceive that the system can be used without much effort. Organization should give
them the confidence that they can successfully learn from the system. Interaction among
employees and with instructor should be facilitated. Learning Style of employees should be
oriented towards field independence. Motivation of employees to undergo e-learning courses
should be seriously considered to improve e-learning satisfaction.
To reap the fruits of E-Learning, organizations should concentrate on all the employee
attributes as mentioned in the framework.
REFERENCES
Ajzen, I. (2010). Attitudes, personality and behaviour. Tata McGraw Hill education private
limited.
Chen, H.J. (2010). Linking employees’ e-learning system use to their overall job outcomes:
An empirical study based on the IS success model. Computers & Education, 55, 1628-1639.
Choi, D.H., Kim, J., & Kim, S.H. (2007). ERP training with a web-based electronic learning
system: The flow theory perspective. Int. J. Human-Computer Studies 65, 223–243.
E- Learning satisfaction
Learning style
Interaction
Self efficacy
Perceived ease of use
Perceived usefulness
Motivation
Intention to use

Volume 3, Issue 6 (June, 2013) ISSN: 2249-7307
Jou
rnal
of
Asi
an R
esea
rch
Co
nso
rtiu
m
2
0
h
ttp
://w
ww
.aij
sh.o
rg
AJRBEM
Govindasamy, T. (2002). Successful implementation of E-Learning: Pedagogical considerations.
Internet and Higher Education 4, 287–299.
Hassan, M., Shahidi, M.R., Hosseini., & Nahad, R.F. (2011). Classroom Training rather than
ETraining Effectiveness for Promotion Managerial Skills in Iran: A Comparative
Study.International Conference on E business, Management and Economics IPEDR vol.3.
Ho, L.A., & Kuo,T.S. (2010). How can one amplify the effect of e-learning? An examinationof
high-tech employees’ computer attitude and flow experience. Computers in Human Behavior 26,
23–31.
Johnson, R.D., Hornik,S., & Salas,E. (2008). An empirical examination of factors contributingto
the creation of successful e-learning environments. Int. J. Human-Computer Studies 66,
356–369.
Lee, J.K., & Lee, W.K. (2008). The relationship of e-Learner’s self-regulatory efficacy
andperception of e Learning environmental quality. Computers in Human Behavior 24, 32–47.
Lee, M.C. (2010). Explaining and predicting users’ continuance intention toward e-learning:
An extension of the expectation–confirmation model. Computers & Education 54, 506-516.
Liaw, S.S., & Huang, H.M. (2013). Perceived satisfaction, perceived usefulness and
interactivelearning environments as predictors to self-regulation in e-learning environments.
Computer & Education 60, 14–24.
Lu, J., Yu,C.S., & Liu, C. (2003). Learning style, learning patterns, and learning performance in
a WebCT-based MIS course. Information & Management 40, 497–507.
Oliver, R.L. (1980). A Cognitive Model of the Antecedents and Consequences of Satisfaction
Decisions. Journal of Marketing Research, 17, No. 4, 460-469.
Ong, C.S., & Lai, J.Y. (2006). Gender differences in perceptions and relationships among
dominants of e learning acceptance. Computers in Human Behavior, 22, 816–829.
Ozturan, M., & Kutlu, B. (2010). Employee satisfaction of corporate e-training programs.
Procedia Social and Behavioral Sciences 2, 5561–5565.
Rocaa, J.C., Chiu, C.M., & Martinez, F.J. (2006). Understanding e-learning continuance
intention: An extension of the Technology Acceptance Model. Int. J. Human Computer
Studies 64, 683–696.
Schneckenberg, D. (2010). Overcoming barriers for eLearning in universities—portfolio models
for e Competence development of faculty. British Journal of Educational Technology 41 No.6,
979–991.
Sun, P.C., Tsai, R.J., Finger, G., Chen, Y.Y., & Yeh, D. (2008). What drives a successful
e Learning? An empirical investigation of the critical factors influencing learner satisfaction.
Computers & Education 50, 1183-1202.

Volume 3, Issue 6 (June, 2013) ISSN: 2249-7307
Jou
rnal
of
Asi
an R
esea
rch
Co
nso
rtiu
m
2
1
h
ttp
://w
ww
.aij
sh.o
rg
AJRBEM
A P e e r R e v i e w e d I n t e r n a t i o n a l J o u r n a l
o f A s i a n R e s e a r c h C o n s o r t i u m
AJRBEM:
A S I A N J O U R N A L O F
R E S E A R C H I N B U S I N E S S
E C O N O M I C S A N D
M A N A G E M E N T
PERFORMANCE OF INDEX FUNDS IN INDIA
DR. (MRS.) PRASHANTA ATHMA*; MS. B. MAMATHA**
*Professor,
Department of Commerce,
Osmania University,
Hyderabad, A.P., India.
**Research Scholar,
Department of Commerce,
Osmania University,
Hyderabad, A.P., India.
ABSTRACT
Mutual Fund is a trust that pools money from a group of investors (sharing common
financial goals) and invest the money thus collected into asset classes that match the
stated investment objectives of the scheme. Index Funds (IFs) focuses on the
performance of specific stock indices, as opposed to other types of ETFs that are
based on oil or other commodities. Index funds spread the risk factor over the entire
index, As such; large institutional investors like pension funds as well as older
individual investors who are looking to reduce the risk in their portfolios often find
Index Funds a preferable alternative to buying stock of individual companies.
The study is based on secondary data covering a period of 14 years for Index Funds
i.e. 1999 to 2012 to reflect upon the growth of Index Funds over a period of time
since their inception.
The parameters for evaluating the performance are Net Asset Value, standard
deviation, Return, Beta, Reward to Variability (Sharpe) and Treynors Performance
Evaluation Ratio. The statistical tools like Standard Deviation, Beta, Sharpe Ratio,
and Treynors Ratio are used for data analysis.
______________________________________________________________________________
Volume 3, Issue 6 (June, 2013) ISSN: 2249-7307
Jou
rnal
of
Asi
an R
esea
rch
Co
nso
rtiu
m
2
2
h
ttp
://w
ww
.aij
sh.o
rg
AJRBEM
INTRODUCTION
Mutual Fund is a trust that pools money from a group of investors (sharing common financial
goals) and invest the money thus collected into asset classes that match the stated investment
objectives of the scheme.
The Fund Manager manages the Mutual Fund and uses his investment management skills and
necessary research works and ensures much better return than what an investor can manage on
his own. The capital appreciation and other incomes earned from these investments are passed on
to the investors (also known as unit holders) in proportion to the number of units an investor
owns.
Mutual Fund was introduced in the year 1963 in India. From an historical point of view, Mutual
Funds have been around four hundred years, but they are a relatively new investment
phenomenon to the novice investors. Mutual Funds are a conglomeration of stocks, bonds,
securities and even real estate, put together by a smart Fund Manager who hand-picks winners
for a winning combination.
INDEX FUND
An Index Fund is a Mutual Fund that aims to replicate the movements of an index of a specific
financial market. An Index Fund follows a passive investing strategy called Indexing. It involves
tracking an index say for example, the Sensex or the Nifty and builds a portfolio with the same
stocks in the same proportions as the index. The Fund makes no effort to beat the index and in
fact it merely tries to earn the same return. Index Funds, an instrument of Mutual Fund, came in
to existence in India in the year 1998.
REVIEW OF LITERATURE
Philippe Jorion (2003)1 in his article explored the risk and return relationship of active portfolios
subject to a constraint on tracking-error volatility (TEV), which can also be interpreted in terms
of value at risk. Such a constrained portfolio is the typical setup for active managers who are
given the task of beating a benchmark. The problem with this setup is that the portfolio manager
pays no attention to total portfolio risk, which results in seriously inefficient portfolios unless
some additional constraints are imposed. The study reflected that TEV-constrained portfolios are
described by an ellipse on the traditional mean–variance plane. This finding yields a number of
new insights. Because of the flat shape of this ellipse, adding a constraint on total portfolio
volatility can substantially improve the performance of the active portfolio. In general, plan
sponsors should concentrate on controlling total portfolio risk.
Manuel Ammann, Stephan Kessler and Jurg Tobler (2006)2 stated that for investors, it is
important to know what trading strategies an asset manager pursues to generate excess returns. In
this paper, they proposed an alternative approach for analyzing trading strategies used in active
investing. They used tracking error variance (TEV) as a measure of activity

Volume 3, Issue 6 (June, 2013) ISSN: 2249-7307
Jou
rnal
of
Asi
an R
esea
rch
Co
nso
rtiu
m
2
3
h
ttp
://w
ww
.aij
sh.o
rg
AJRBEM
Benchmark Funds Asset Management Company(2008)3 research department did research in
early 2008 on the topic of “Myth of Eternal Alpha” It has often been argued that individual
active fund managers are consistently able to exploit anomalies and aberrations that may exist in
the market and while considering out performance/ under performance one should look at longer
periods.
J. Christopher Hughen, Prem G. Mathew (2009)4 “The efficiency of international information
flow: Evidence from the ETF and CEF prices” stated that closed-end funds (CEFs) and
exchange-traded funds (ETFs) differ in their liquidity and ease of arbitrage. We compare their
price transmission dynamics using a sample of funds that invest in foreign securities and are
most likely to show the deficiencies in the manner in which they process information. Our
analysis shows that ETF returns are more closely related to their portfolio returns than are CEF
returns. However, both fund types under react to portfolio returns but overreact to domestic stock
market returns. A simple trading strategy using these results is profitable with roundtrip trading
costs less than 1.38% for CEFs and 0.71% for ETFs.
Sangheon Shin, Gökçe Soydemir (2010)5 “ Exchange- Traded Funds, persistence in tracking
errors and information dissemination” stated that tracking errors from 26 exchange-traded funds
(ETFs) utilizing three different methods and test their relative performance using Jensen's model.
We find that tracking errors are significantly different from zero and display persistence. Based
on Jensen's alpha, risk adjusted returns are significantly inferior to benchmark returns for all
ETFs with two exceptions at conventional significance levels revealing that passive investment
strategy does not outperform market returns. We then examine the degree to which frequently
used factors such as expense ratio, dividends, exchange rate and spreads of trading prices may be
underlying sources of tracking errors causing this underperformance.
RESEARCH GAP
The above review of literature points out that the studies are based on tracking errors, risk
returns, price Transmission etc. Though the Index Funds came in to existence in 1988 in US, and
growth over a period of time is not reflected. Hence, the study is undertaken to reflect upon the
growth of Index Funds over a period of time since their inception and evaluate its performance in
terms of risk and return.
OBJECTIVES OF THE STUDY
The objectives of the study are
To present the trends and progress of Index Funds in India and
To evaluate the performance of Index Funds in India.
SOURCES OF DATA
The study is based on secondary data. The Secondary data sources include Fact sheets of Mutual
Funds, Articles, News papers, SEBI Manuals, AMFI Reports and Websites.

Volume 3, Issue 6 (June, 2013) ISSN: 2249-7307
Jou
rnal
of
Asi
an R
esea
rch
Co
nso
rtiu
m
2
4
h
ttp
://w
ww
.aij
sh.o
rg
AJRBEM
PERIOD OF THE STUDY
The study covers a period of 14 years from 1999 to 2012 i.e. since their inception to study the
trends and evaluate the performance.
SAMPLE SIZE
There are 44 Index Funds in India. Data with regard to all the parameters selected for the
evaluation of performance are available only for 23 Index funds which were operating between
the period of 1999 – 2012. Hence, the study is made only for 23 Index Funds.
PARAMETERS
The parameters for evaluating the performance are Net Asset Value, standard deviation, Return,
Beta, Reward to Variability (Sharpe) and Treynors performance evaluation Ratio.
STATISTICAL TECHNIQUES
The data are analyzed with the help of statistical tools like Standard Deviation, Sharpe Ratio,
Treynors Ratio and Beta.
GROWTH OF INDEX FUNDS
The growth of Index Funds in terms of the number of Funds and NAV is given in Table-1.
Starting with 1 Index Fund in the year 1999 viz., Principal Index Funds the number of IFs
increased to 24 by the end of the year 2012 registering a CAGR of 25.48%.The awareness and
popularity of the Mutual Fund Schemes is reflected in the addition of 20 more Mutual Funds
Schemes in the year 2013 in addition to the existing 24 schemes, which is a welcome sign. The
same is provided in Table -2.
TABLE-2 NEWLY INTRODUCED MUTUAL FUND SCHEMES DURING 2013
S.No Name of the Fund Launch Date
1 FRANKLIN INDIA INDEX BSE SENSEX DIRECT Jan 2013
2 FRANKLIN INDIA INDEX NSE NIFTY DIRECT Jan 2013
3 HDFC INDEX NIFTY DIRECT Jan 2013
4 HDFC INDEX SENSEX DIRECT Jan 2013
5 ICICI PRUDENTIAL INDEX DIRECT Jan 2013
6 ICICI PRUDENTIAL NIFTY JUNIOR INDEX DIRECT Jan 2013
7 IDBI NIFTY INDEX DIRECT Jan 2013
8 IDBI NIFTY JUNIOR INDEX DIRECT Jan 2013
9 IIFL DIVIDEND OPPORTUITIES INDEX DIRECT Jan 2013
10 LIC NOMURA MF INDEX NIFTY DIRECT Jan 2013
11 LIC NOMURA MF INDEX SENSE X DIRECT Jan 2013

Volume 3, Issue 6 (June, 2013) ISSN: 2249-7307
Jou
rnal
of
Asi
an R
esea
rch
Co
nso
rtiu
m
2
5
h
ttp
://w
ww
.aij
sh.o
rg
AJRBEM
12 PRINCIPAL INDEX DIRECT Jan 2013
13 RELIANCE INDEX NIFTY DIRECT Jan 2013
14 RELIANCE INDEX SENSEX DIRECT Jan 2013
15 TATA INDEX NIFTY PLAN A DIRECT Jan 2013
16 TATA INDEX SENSEX PLAN A DIRECT Jan 2013
17 UTI NIFTY INDEX DIRECT Jan 2013
18 CANARA ROBACCA NIFTY INDEX DIRECT Jan 2013
19 GOLDMAN SACHS S&P 500 INDEX FUND DIRECT Jan 2013
20 BIRLA SUN LIFE INDEX DIRECT Jan 2013
Source: www.valueresearch.com
Net Asset Value (NAV) is a term used to describe the value of an entity’s assets less the value of
its liabilities. The term is most commonly used in relation to Mutual Funds due to the fact that
shares of such funds are redeemed at their Net Asset Value. It may represent the value of the
total equity, or it may be divided by the number of shares outstanding and, thereby, represent the
per share Net Asset value.
NAV as per IRDA is calculated as follows:
NAV = (Market Value of the Investment held by the Fund + Value of Current Assets-Value of
Current Liabilities and provisions) /Number of units existing on valuation date (before creation
/redemption of units)
The Table-1 shows NAV per share over a period of time for the various IFs .The overall CAGR
during the period is 42.42%. It can be observed that the Principal Index Fund and Birla Sun Life
Index Fund have a growth rate more than the overall growth rate. It is Birla Sun Life IFs which
Rank 1st with a CAGR of 84.56% followed by Principal IFs with 80.93%, TATA Index Sensex
Plan –A with 16.37% and HDFC sensex Index Fund with 15.99%.
The last five ranks were scored by Taurus Nifty, Reliance Index nifty, Quantum Index Fund,
Reliance Index Sensex and GOLDMAN SACHS S&P 500 Index Fund. Out of these 5 IFs,
excepting Quantum Index Fund, GOLDMAN SACHS S&P 500 Index Fund all other IFs are just
2 years old. Though HDFC Index Nifty .Franklin India Index BSE Sensex, Franklin India Index
NSE Sensex IFs entered early in IF Market, their ranks are in the middle order viz., 11,12,13
respectively reflecting upon the fact that it is not the age of the Fund but their efficiency level
that yields better results.
ANNUAL RETURNS OF INDEX FUNDS
One of the parameters for the evaluation of the IFs is the annual returns, which is presented in
Table-4. The Fund is rank based on the average returns which is the simple average of the returns
over a period of time. Higher the ratio better the performance of the Fund compare to the Other
IFs.

Volume 3, Issue 6 (June, 2013) ISSN: 2249-7307
Jou
rnal
of
Asi
an R
esea
rch
Co
nso
rtiu
m
2
6
h
ttp
://w
ww
.aij
sh.o
rg
AJRBEM
On the basis of average returns, TATA Index Sensex PLAN A occupied the Rank 1st with a
average return of 23.92% followed by HDFC Index Fund with 23.81%, SBI MAGNUM Index
Fund with 21.64%, LIC NOMURA MF INDEX Fund with 19.50%, TATA Index Fund with
19.24%
RISK ANALYSIS OF INDEX FUNDS
The variability in the returns is called as risk and the same is measured with the help of Standard
Deviation and Beta. Standard deviation is a measure of the deviation in the returns of the Fund.
A volatile stock would have a high standard deviation. It tells us how much the return on a Fund
is deviating from the expected returns based on its historical performance.
The below tables give the details relating to Standard deviation, Sharpe ratio, Beta and Treynors
Ratio.
TABLE – 4 RISK ANALYSIS OF INDEX FUNDS
S.No.
Name of the Fund
Standard
Dev (%)
Sharpe
Ratio (%) Beta
Treynors
Ratio (%)
1 Principal Index 34.14 15.78 (12) 0.59 1.81(11)
2 Birla Sun Life Index 39.01 14.82 (14) 0.51 -1.37( 12)
3 Franklin India Index Bse Sensex 48.66 11.73 ( 17) 0.27 -19.46(17)
4 Franklin India Index Nse Nifty 41.05 16.59 ( 8 ) 0.65 3.82(13)
5 HDFC Index Nifty 41.58 18.00 ( 6 ) 0.76 7.13(8)
6 UTI Nifty Index 39.03 17.87 ( 10 ) 0.75 6.85(9)
7 HDFC Index Sensex 40.53 23.61 ( 2 ) 1.20 16.78(4)
8 ICICI Prudential Index Reg 25.46 13.41 ( 19 ) 0.29 -15.74(17)
9 LIC Nomura Mf Index Nifty 34.56 15.79 ( 11 ) 0.41 -4.538 (-15)
10 LIC Nomura Mf Index Sensex 39.28 19.29 ( 4 ) 0.59 5.38( 10)
11 SBI Magnum Index 39.24 21.43 ( 3 ) 0.71 9.82( 6)
12 Tata Index Nifty Plan A 36.39 19.02 ( 5 ) 0.80 8.79( 7)
13 Tata Index Sensex Plan A 37.83 23.70 ( 1) 1.15 16.63( 5)
14 Canara Robecca Nifty Index Reg 38.94 14.60 ( 16 ) 0.43 -4.40( 14)
15 Quantum Index 49.01 10.98 ( 20 ) 0.18 -35.47( 21)
16 Goldman Sachs S&P 500 Index Fund 54.48 4.11 ( 23 ) -0.29 32.56( 3)
17 ICICI Prudential Nifty Junior Index 22.3 8.36 ( 21 ) -0.03 238.49( 1)
18 IDBI Nifty Index 22.36 6.03 ( 22) 0.25 -26.42( 19)
19 IDBI Nifty Junior Index 13.39 15.78 ( 12 ) 0.17 -40.40( 22)
20 Reliance Index Nifty 18.89 14.82 ( 14 ) 0.43 -14.60( 16)
21 Reliance Index Sensex 0.249 11.73 ( 17 ) -0.09 101.41( 2)
22 Tauras Nifty Index 23.55 16.59 ( 8 ) 0.23 -28.96( 20)
23 IDFC Nifty Index Fund 20.80 18.00 ( 6 ) 0.09 -85.28( 23 )
Source: www.valueresearch.com
Note: IIFL Dividend Opportunity Index is not taken for analysis as it is only one year old.

Volume 3, Issue 6 (June, 2013) ISSN: 2249-7307
Jou
rnal
of
Asi
an R
esea
rch
Co
nso
rtiu
m
2
7
h
ttp
://w
ww
.aij
sh.o
rg
AJRBEM
Figures in Parentheses indicate ranking.
STANDARD DEVIATION
It is found that among the Index Funds, Goldman Sachs S&P 500 Index Fund is having the
highest risk i.e. 54.581 per cent and Reliance Index Sensex has the lowest risk i.e. 0.2489 per
cent.
SHARPE RATIO
It shows the return to variability. Higher the ratio better would be the performance of the Fund in
terms of the returns for the risk taken. It is found that all the Index Funds are showing a positive
Sharpe ratio justifying the risk taken for earning a return,
TREYNORS RATIO
While Sharpe Ratio takes σ in the denominator, Treynors Ratio considers β as the denominator.
While total risk is considered in Sharpe Ratio, only systematic risk (β) is considered in Treynors
Ratio. A higher Ratio of Treynors indicates better performance compared to the other funds. On
the basis of ranking according to Treynors Ratio, ICICI Prudential Nifty Junior Index occupied
Rank 1st with 238.49 % followed by Reliance Index Fund with 101.41%, Goldman Sachs S&P
500 Index Fund with 32.56%, HDFC with 16.78%, and TATA Index Fund with 16.63 %.
A note worthy feature is that all the three Funds VIZ., ICICI Prudential Index Reg, Quantum
Index and Reliance Index Fund ranked the first three positions respectively which have showed
in negative Beta.
BETA VALUE
Beta measures the systematic risk and explains the nature of the volatility of the security return
with that of the market return. If beta values are less than one, it means that Funds risk is less
than the market risk; if it is one, it means the Funds risk is same as that of the market risk and if
the beta is more than one, the risk of the Funds is greater than that of the market. The beta value
can be less than zero, means the stock is losing money while the market is gaining.
We can find Beta with more than 1 in case of HDFC Index Fund and TATA Index Fund
implying higher risk in these Funds compared to market risk. In case of Goldman Sachs S&P
500 Index Fund, ICICI Prudential Nifty Junior Index and Reliance Index Fund, Beta is negative
indicating that the stocks are losing while the market is gaining, and rest of the Funds are having
a risk lower than the market risk as their Beta is less than 1.
CONCLUSION
Mutual Funds are a conglomeration of stocks, bonds, securities and even real estate, put together
by a smart Fund Manager who hand-picks winners for a winning combination. An Index Fund is

Volume 3, Issue 6 (June, 2013) ISSN: 2249-7307
Jou
rnal
of
Asi
an R
esea
rch
Co
nso
rtiu
m
2
8
h
ttp
://w
ww
.aij
sh.o
rg
AJRBEM
a Mutual Fund that aims to replicate the movements of an index of a specific financial market.
An Index Fund follows a passive investing strategy called Indexing.
The study is undertaken to reflect upon the growth of Index Funds over a period of time since
their inception and evaluate its performance in terms of risk and return. The parameters for
evaluating the performance are Net Asset Value, standard deviation, Return, Beta, Reward to
Variability (Sharpe) and Treynor’s Performance Evaluation Ratio. The data are analyzed with
the help of statistical tools like Standard Deviation, Sharpe Ratio, Treynors Ratio and Beta.
Starting with 1 Index Fund in the year 1999, the number of IFs increased to 24 by the end of the
year 2012 registering a CAGR of 25.48%. The awareness and popularity of the Mutual Fund
Schemes is reflected in the addition of 20 more Mutual Funds Schemes in the year 2013 in
addition to the existing 24 schemes, which is a welcome sign.
The overall CAGR for NAV during the period is 42.42%. The age of the Fund and the growth in
NAV are not related but their efficiency level that yields better results. It is found that among the
Index Funds, GOLDMAN SACHS S&P 500 INDEX FUND is having the highest risk i.e.
54.581 per cent and RELIANCE INDEX SENSEX has the lowest risk i.e. 0.2489 per cent. All
the Index Funds are showing a positive Sharpe ratio justifying the risk taken for earning a return;
We can find Beta with more than 1 in case of HDFC Index Fund and TATA Index Fund
implying higher risk in these Funds compared to market risk. In case of GOLDMAN SACHS
S&P 500 INDEX FUND, ICICI PRUDENTIAL NIFTY JUNIOR INDEX and Reliance Index
Fund Beta is negative indicating that the stocks are losing while the market is gaining, rest of the
Funds are having a risk lower than the market risk as their Beta is less than 1.
KEYWORDS
MF-Mutual Funds
IFs-Index Funds
NAV-Net Assets Value
REFERENCES
1. Philippe Jorion, ―Portfolio Optimization with Tracking-Error Constraints‖, Financial
Analysts Journal, September/October 2003, pp-70-82.
2. Joel T. Harper, Jeff Madura and Oliver Schnusenberg “Performance comparison between
exchange-traded funds and closed-end country funds” (2006)
3. Benchmark Funds Research Department “Myth of Ethernal Alpha” (2008), by
Benchmark Mutual Funds
4. J. Christopher Hughen, Prem G. Mathew “The efficiency of international information
flow: Evidence from the ETF and CEF prices” (2009)

Volume 3, Issue 6 (June, 2013) ISSN: 2249-7307
Jou
rnal
of
Asi
an R
esea
rch
Co
nso
rtiu
m
2
9
h
ttp
://w
ww
.aij
sh.o
rg
AJRBEM
5. Shin, Sangheon and Soydemir, Gokce, “Exchange-Traded Funds, Persistence in Tracking
Errors and Information Dissemination” (2010). Journal of Multinational Financial
Management, Vol. 20, Nos. 4-5
WEBSITES
1. www.mutualfundsindia.com
2. www.etftrends.com
3. www.indexfunds.com
4. www.moneycontrol.com
5. www.valueresearch.com
6. www.bseindia.com

Volume 3, Issue 6 (June, 2013) ISSN: 2249-7307
Jou
rnal
of
Asi
an R
esea
rch
Co
nso
rtiu
m
3
0
h
ttp
://w
ww
.aij
sh.o
rg
AJRBEM
A P e e r R e v i e w e d I n t e r n a t i o n a l J o u r n a l
o f A s i a n R e s e a r c h C o n s o r t i u m
AJRBEM:
A S I A N J O U R N A L O F
R E S E A R C H I N B U S I N E S S
E C O N O M I C S A N D
M A N A G E M E N T
DEMOGRAPHIC DIFFERENCES & SHOPPING BEHAVIOR OF INDIAN
MIDDLE INCOME GROUP USERS WITH DEBIT CARDS:
AN EMPIRICAL ANALYSIS
VIVEK KUMAR TRIPATHI*; TANU MARWAH**
*Assistant Professor,
Department of Business Studies,
Hindustan College of Science & Technology,
Mathura, India.
**Assistant Professor,
Department of Business Studies,
Hindustan College of Science & Technology,
Mathura, India.
ABSTRACT
With the advancement of technology and need towards better service provision
plastic money in form of cards- debit or credit cards are becoming common now a
days. These tools of purchase management are reaching into wallet of nearly all. As
a result companies are also eying to leverage the cards benefits as shopping /
purchase facilitator. As with the emerging equalities of men and women and their
equal and balanced role in shaping up the society, both the genders establish quite
active response patterns with respect to debit/credit card spending and use.
According to the survey of Reserve Bank of India (RBI) more card holders have
reduced the number of cards in their wallet and consolidated spending with a single
card in 2011.The proportion of single card holders has grown most in India in 2011
at 90 per cent. The second was the Philippines with 84 per cent, followed by
Malaysia (80 per cent). The use of cards is perceived differently by various
consumer classes. Women might be bigger spenders than men, but they use their
debit cards less frequently, says a survey by the RBI published in business today. The
present study explores various behavioural aspects associated with two broad
consumer classes Men and Women belonging to middle income group of tier II cities
towards this tool.

Volume 3, Issue 6 (June, 2013) ISSN: 2249-7307
Jou
rnal
of
Asi
an R
esea
rch
Co
nso
rtiu
m
3
1
h
ttp
://w
ww
.aij
sh.o
rg
AJRBEM
KEYWORDS: service provision, purchase facilitator, middle income group, tier II
cities.
____________________________________________________________________________
INTRODUCTION
Shopping is now an integral activity of today’s individual. As market goes on progressing with
the development of various avenues- merchandise stores, hyper and supermarkets, shopping
Malls and moreover emergence of e shopping destinations shopping as a necessary activity has
been replaced with the concept of enjoyment. Todays generation is becoming more and more
expense oriented as compared to the older concept of saving orientation of Indian consumers. To
facilitate the purpose of shopping marketers are always eying on various offerings that can
stimulate the purchase process, change the purchase orientation and facilitate purchase and
shopping behaviour. This can range from – opening outlets near population, heavy sales
promotion, customised service and products offerings and so on. One such major development is
the development of plastic money Debit cards. A debit card provides electronic access to ones
financial accounts any time and with much ease and convenience. Earlier model suggests use of
cash only if one wishes to purchase anything. Thus is a restricting condition and thus impulse
purchasing was much reduced. Emergence of cards thus removes this barrier of cash balance at
any point of shopping and offers more access to cash in electronic formats and thus purchase and
shopping intentions. Freedom of dispensing cash and access any time model provokes various
shopping intentions. Here Debit cards came into existence as an suitable option to shoppers. To
further lure the buyers of positive shopping intention various other tools were also introduced
viz. credit card offering cash affordability even if actual cash balance is declining or negative at a
certain point.
Statistics released by the Reserve Bank of India (RBI) in Jan2012 shows a clear shift in the use
of plastic money. Indians, especially those who are not big spenders, are increasingly using
credit cards for debit cards. Data shows that the number of debit cards issued by banks was ten
times higher than credit cards. Over the past five years, debit card usage both in terms of number
of transactions and growth in value has outstripped credit card spending by a huge margin.
According to new research report, “Indian Payment Card Market Forecast to 2012”, the number
of payment cards, categorized as credit and debit cards, is increasing rapidly in India .The
research found that credit card market have been showing tremendous growth performance and
emerged as a potential investment area for players of credit market. According to the data of
capital Mind, india has witnessed rapid and significant growth in terms of number and volume of
credit and Debit cards over a period of time. The graph below represents the use of debit and
credit cards by Indian users. Debit card is more in use as compared to credit card and there are
various contributing factors towards the popularisation of debit card.

Volume 3, Issue 6 (June, 2013) ISSN: 2249-7307
Jou
rnal
of
Asi
an R
esea
rch
Co
nso
rtiu
m
3
2
h
ttp
://w
ww
.aij
sh.o
rg
AJRBEM
Source- Secondary,Capital Mind
While analysing trends on the data furnished by RBI shows increasing trend towards use of debit
card which can be attributed to various actors viz. Consumer demographics, lifestyle orientation
of consumers, market development and encashing upon these factors banks also liberalised in
provisions for getting a debit card as a value added service to there customers and hence
facilitating sales through cards by increasing swapping machines and ATM installations at
multiple merchandisers.
USAGE OF DEBIT CARDS
Card Payments
Year/ Period No. of outstanding cards Number Amount
mn. bn.
2003-04 -- 37.76 48.74
2004-05 -- 41.53 53.61
2005-06 49.76 45.69 58.97
2006-07 74.98 60.18 81.72
2007-08 102.44 88.31 125.21
2008-09 137.43 127.65 185.47
2009-10 181.97 170.17 264.18
2010-11 227.84 237.06 386.91
Total (up to Jan 2012) 268 268.8 443.89

Volume 3, Issue 6 (June, 2013) ISSN: 2249-7307
Jou
rnal
of
Asi
an R
esea
rch
Co
nso
rtiu
m
3
3
h
ttp
://w
ww
.aij
sh.o
rg
AJRBEM
# Card Payments figures pertain only to Point of Sale (POS) transactions.
* Debit Cards figures for 2003-04 and 2004-05 are estimated based on 2005-06 figures.
** Cards issued by banks (excluding those withdrawn/blocked).
(Source: Secondary, Reserve bank of India)
The present study tries to understand various variables / factors that influence the choice of use
of cards- credit and debit cards taking into consideration two prominent demographic factors-
Gender and income group which is restricted towards rising Middle Income Group.
LITERATURE REVIEW
The usage of any product is determined by various factors and personality variables are one
prominent factor in choice and selection and usage behaviour of a product/service. In Recent
years several changes in market has happened with emergence of new markets/ products and
emerging role of females in personal and social decision making. Better education penetration ,
changing social orientation, rise of working and independent female segment has allowed
females to be more independent in there choice of purchase decision making starting from choice
of low investment product to expensive purchases. As a result it is imperative to understand
purchase behaviour individually towards different product categories. Philip Kotler mentioned-
“if you want to influence your customer you will have to understand your customer first”.
Several studies have been undertaken at various parts of globe to understand demographic
influences on purchase decisions. In line of this payment mode is also crucial in understanding
buyers choice .Today there are various payment options available to shoppers such as –cash,
credit card, debit card, shopping cards. Plastic money is increasingly replacing cash as payment
option at Point of Sale (POS). But the use of these Modern payment tools is highly subjective.
To understand demographic patterns in the adoption of payment methods, several studies have
been undertaken. Kennickell and Kwast (1997), Stavins (2001) and Zinman (2005) find that
newer technologies such as electronic banking and bill payment or debit cards are used most
frequently by younger, better-educated individuals. Carow and Staten (1999) specifically
examine debit card use early in its diffusion, while Rysman (2004) focuses on the role of
demographics in consumers’ choice of credit card brands; Hayashi and Klee (2003) examine
consumer adoption of debit cards as well as direct deposit and electronic bill payment. Also,
Jonker (2005) and Loix, Pepermans and Van Hove (2005) also worked on analysing adoption
process of payment methods.
Using cash is convenient because it is accepted almost everywhere (with the notable exception of
online retailers), but carrying large amounts of cash entails both a substantial opportunity cost
and a physical risk of being the target of crime. Credit cards, while costly from the perspective of
payees (as noted above), offer consumers many advantages. A substantial period of float, limited
liability in the case of theft or loss, dispute resolution assistance, consolidation of bill payment,
itemized bills, and the ability to borrow are just Some of the standard features of most bank
issued debit cards. These cards are accepted at the same locations where credit cards are
accepted. The major advantages of the debit card are that it normally doubles as an ATM card,

Volume 3, Issue 6 (June, 2013) ISSN: 2249-7307
Jou
rnal
of
Asi
an R
esea
rch
Co
nso
rtiu
m
3
4
h
ttp
://w
ww
.aij
sh.o
rg
AJRBEM
thus allowing the consumer to carry one less card, and it also allows the user to receive cash back
after purchases are made when used in combination with a personal identification number.
Like credit cards, debit cards also offer consolidated billing/record keeping and ease of telephone
and Internet based transactions. Drawbacks to the debit card include limited acceptance and the
loss of all float in the case of online debits and most float in the case of offline debits. One branch
of research has focused on the demographics of consumers who choose to use electronic rather
than more traditional methods of payment. Mantel (2000) finds that use of electronic payments in
general is positively related to income, wealth, and age. Kennickell and Kwast (1997) show that
those who use debit cards are younger, have higher levels of education. There are some key
differences in the findings of Mantel (2000) and those of Kennickell and Kwast (1997). For
example, Mantel’s (2000) education result differs from that of Kennickell and Kwast (1997).
Mantel (2000) argues that the education variable in his results was insignificant because of the
inclusion of other demographic variables that are closely related to level of education. On the
other hand, if one considers only debit cards, as in Kennickell and Kwast (1997), then it is
reasonable to see more use among younger people since they tend to adopt newer technologies
more quickly than older people.
Caskey and Sellon (1994) found that consumers do see debit cards as substitutes for cash and
checks, implying that small enticements could convince consumers to choose debit cards over
paper checks. They argue that the 30% growth in debit card usage between 1990 and 1993 was
most likely because of (1) the integration of the ATM networks that allow for the transfer of
funds and (2) the introduction of the VISA and MasterCard debit programs. They predicted that,
as the importance of network effects declined because of changes in technology and in the way
the banking industry did business, debit card usage would increase. Indeed, between 1993 and
1997 debit card usage grew at an average annual rate of 53.3%. Credit card usage grew at an
annual rate of only 7.8% during the same time period (Weiner, 1999). This rapid increase in
debit card usage has been attributed to consumers substituting debit for cash and check
purchases. It is clear why consumers might not see debit cards as a substitute for credit cards
(borrowing capacity), but aren’t credit cards a very close substitute for debit cards? If this were
the case, consumers should have already switched from cash and checks to credit cards and we
shouldn’t see such rapid growth in the use of debit cards. Studies have found that demographic
attributes are important determinants of consumer payment adoption (Stavins 2001, Mester 2003,
Bertaut and Haliassos 2006, Klee 2006, Zinman (2009). However, demographics leave a
substantial variation in payment behaviour unexplained. Schuh and Stavins (2010) found that
payment characteristics are significant in explaining consumer payment use. The present study
tries to further the understanding of consumer’s perception towards debit cards among particular
category- young Middle Income Group Indian consumers and tries to investigate Demographic
roles in selection of this payment method through use related behaviours.
RESEARCH METHODOLOGY
The study was conducted on Primary and Secondary data. Primary data is collected through tool
of Structured Questionnaire. Secondary data is collected by exploring the credential financial

Volume 3, Issue 6 (June, 2013) ISSN: 2249-7307
Jou
rnal
of
Asi
an R
esea
rch
Co
nso
rtiu
m
3
5
h
ttp
://w
ww
.aij
sh.o
rg
AJRBEM
data from RBI and other banking portals. The sample size of the research is 50 respondents
which consist of different age, income and of different occupation.
The research tool used for analysis:
1. factor Analysis
2. Mean standard deviation Analysis
3. ANOVA-Table
RELIABILITY TEST
The value of cronbach alpha is 0.842 which shows the significant reliability status.
Total
% of
Variance
Cumulative
% Total
% of
Variance
Cumulative
% Total
% of
Variance
Cumulative
%
1 10.503 40.395 40.395 10.503 40.395 40.395 6.834 26.286 26.286
2 2.853 10.972 51.367 2.853 10.972 51.367 4.187 16.104 42.389
3 2.118 8.146 59.513 2.118 8.146 59.513 2.694 10.361 52.751
4 1.959 7.534 67.047 1.959 7.534 67.047 2.302 8.855 61.606
5 1.531 5.888 72.935 1.531 5.888 72.935 2.264 8.709 70.316
6 1.165 4.482 77.417 1.165 4.482 77.417 1.593 6.128 76.443
7 1.039 3.997 81.414 1.039 3.997 81.414 1.293 4.971 81.414
8 0.88 3.386 84.8
9 0.756 2.908 87.708
10 0.535 2.057 89.765
11 0.476 1.831 91.596
12 0.425 1.633 93.23
13 0.381 1.465 94.695
14 0.303 1.165 95.859
15 0.251 0.966 96.825
16 0.2 0.771 97.596
17 0.14 0.54 98.136
18 0.134 0.517 98.653
19 0.104 0.399 99.053
20 0.087 0.336 99.389
21 0.067 0.257 99.646
22 0.053 0.203 99.849
23 0.019 0.074 99.923
24 0.012 0.046 99.969
25 0.005 0.017 99.987
26 0.003 0.013 100
Total Variance Explained
Component
Initial Eigenvalues Extraction Sums of Squared Loadings Rotation Sums of Squared Loadings

Volume 3, Issue 6 (June, 2013) ISSN: 2249-7307
Jou
rnal
of
Asi
an R
esea
rch
Co
nso
rtiu
m
3
6
h
ttp
://w
ww
.aij
sh.o
rg
AJRBEM
The complete set of interdependent relationship is examined by using factor analysis tool.
A varimax rotation measure is used which yields results which make it as easy as possible to
identify each variable with a single factor. The value of extraction sum of squared loading is
81.414 which limit the factors no. to 7 which reduces overlapping and makes the study more
focused. Certain factors related to association of a card user towards debit cards for consideration
which can influence a particular prospective buyer or user towards use are identified. Further
these were common factors identified in past studies leading to diffusion of this tool of payment
in market.
FACTORS AFFECTING DIFFUSION
Ease of use against traditional payment methods
Convenience in payment
Time saving in transaction (retail payments)
Safety in transaction
FACTORS TO ASSESS ROLE ON INDIVIDUAL’S LIFE
Use is related to availability of outlets accepting cards as payment tool
Carrying Card is used as status option
Card is integrated into there lives as cell phones
Confidence and Reliability factors associated with card shopping
Gender
Mean
N
SD
Mean
N
SD
Mean
N
SD 1.2752 1.08722 1.43442 1.43839 1.2911
50 50 50 50 50
1.4658 1.15281 1.52315 1.55183 1.49775
2.92 3.04 2.94 3.18 2.92
50 50 50 50 50
1.05828 1.38541 1.43684 1.15703
Total
2.88 3.24 3.08 3.2 3.04
32 32 32 32
1.55413 1.13192 1.524 1.57475 1.48106 1.46154
32 32 32 32 32 32
2.75 2.8438 3.0938 2.875 3 2.625
0.8726 1.16175 1.55193 1.42457 1.38148
FEMALE
2.8125 3.4063 3 3.1875
18 18 18 18 18
1.32842 1.16175 1.55509 1.55509 1.42343
3.0556 2.9444 3.0556 3.5 3.4444
18 18 18 18 18
availability part of life confidence reliability
MALE
3 2.9444 3.2222 3.2222 3.5556
easy to use fear of loss convenience time saving safety in
transactionstatus
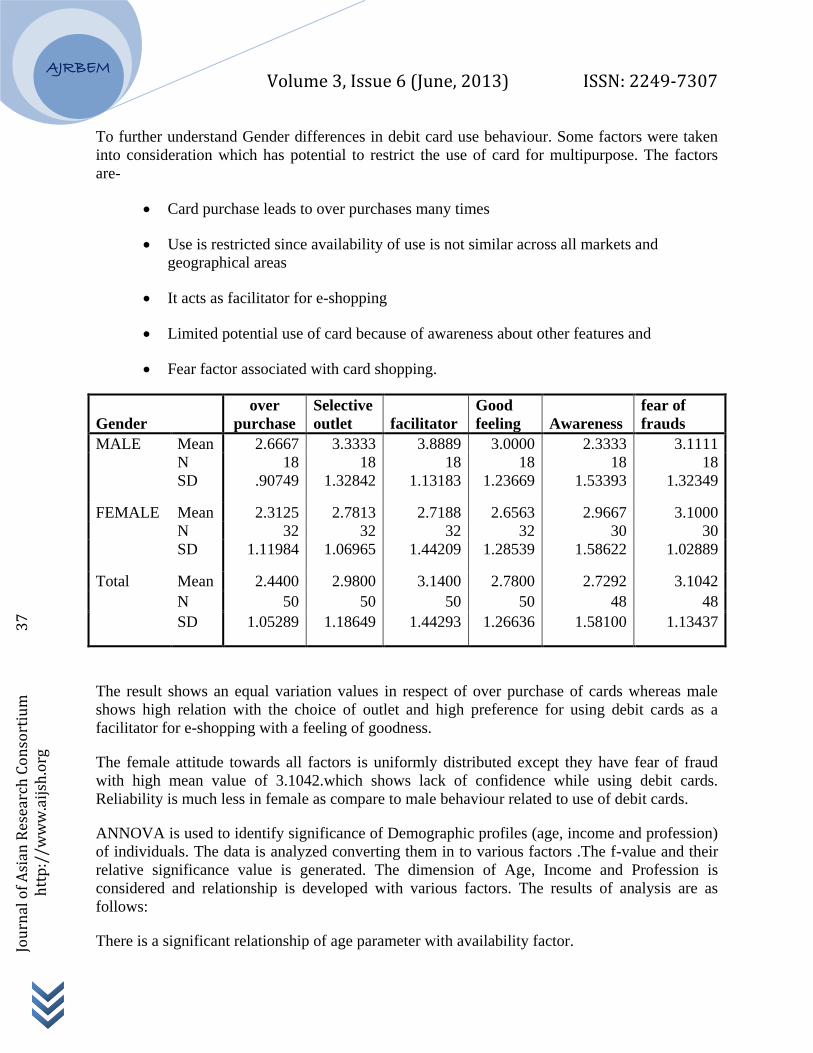
Volume 3, Issue 6 (June, 2013) ISSN: 2249-7307
Jou
rnal
of
Asi
an R
esea
rch
Co
nso
rtiu
m
3
7
h
ttp
://w
ww
.aij
sh.o
rg
AJRBEM
To further understand Gender differences in debit card use behaviour. Some factors were taken
into consideration which has potential to restrict the use of card for multipurpose. The factors
are-
Card purchase leads to over purchases many times
Use is restricted since availability of use is not similar across all markets and
geographical areas
It acts as facilitator for e-shopping
Limited potential use of card because of awareness about other features and
Fear factor associated with card shopping.
Gender
over
purchase
Selective
outlet facilitator
Good
feeling Awareness
fear of
frauds
MALE Mean 2.6667 3.3333 3.8889 3.0000 2.3333 3.1111
N 18 18 18 18 18 18
SD .90749 1.32842 1.13183 1.23669 1.53393 1.32349
FEMALE Mean 2.3125 2.7813 2.7188 2.6563 2.9667 3.1000
N 32 32 32 32 30 30
SD 1.11984 1.06965 1.44209 1.28539 1.58622 1.02889
Total Mean 2.4400 2.9800 3.1400 2.7800 2.7292 3.1042
N 50 50 50 50 48 48
SD 1.05289 1.18649 1.44293 1.26636 1.58100 1.13437
The result shows an equal variation values in respect of over purchase of cards whereas male
shows high relation with the choice of outlet and high preference for using debit cards as a
facilitator for e-shopping with a feeling of goodness.
The female attitude towards all factors is uniformly distributed except they have fear of fraud
with high mean value of 3.1042.which shows lack of confidence while using debit cards.
Reliability is much less in female as compare to male behaviour related to use of debit cards.
ANNOVA is used to identify significance of Demographic profiles (age, income and profession)
of individuals. The data is analyzed converting them in to various factors .The f-value and their
relative significance value is generated. The dimension of Age, Income and Profession is
considered and relationship is developed with various factors. The results of analysis are as
follows:
There is a significant relationship of age parameter with availability factor.
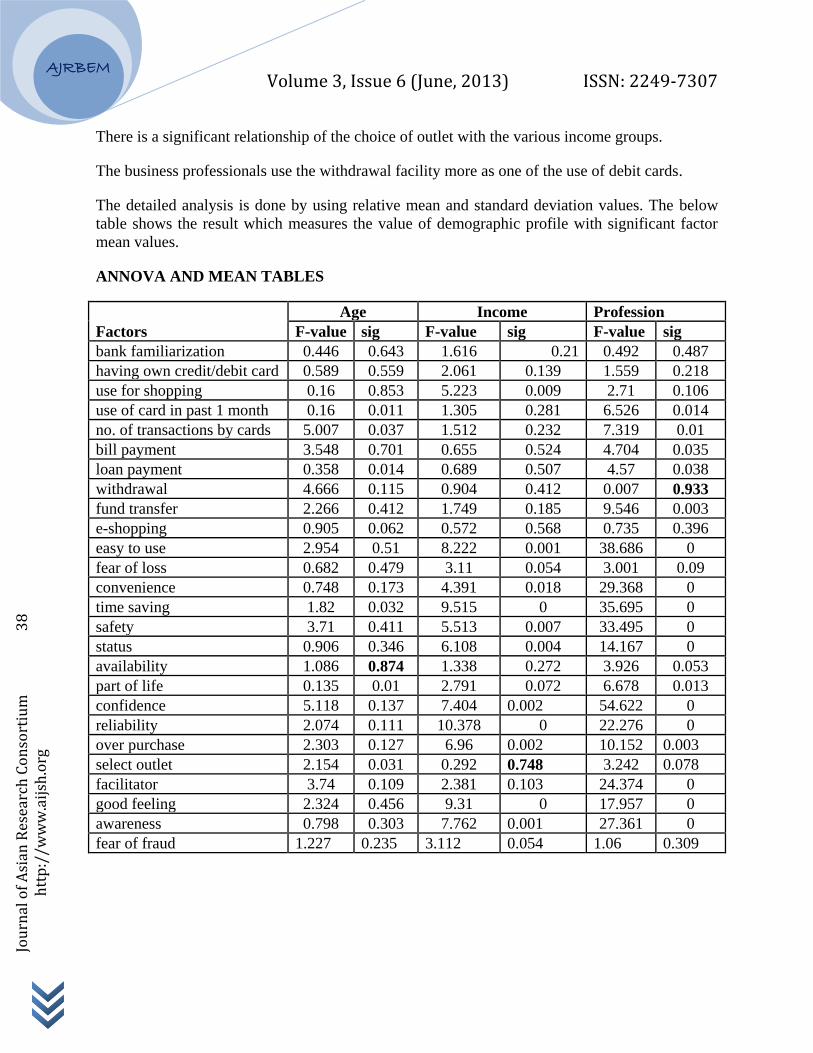
Volume 3, Issue 6 (June, 2013) ISSN: 2249-7307
Jou
rnal
of
Asi
an R
esea
rch
Co
nso
rtiu
m
3
8
h
ttp
://w
ww
.aij
sh.o
rg
AJRBEM
There is a significant relationship of the choice of outlet with the various income groups.
The business professionals use the withdrawal facility more as one of the use of debit cards.
The detailed analysis is done by using relative mean and standard deviation values. The below
table shows the result which measures the value of demographic profile with significant factor
mean values.
ANNOVA AND MEAN TABLES
Factors
Age Income Profession
F-value sig F-value sig F-value sig
bank familiarization 0.446 0.643 1.616 0.21 0.492 0.487
having own credit/debit card 0.589 0.559 2.061 0.139 1.559 0.218
use for shopping 0.16 0.853 5.223 0.009 2.71 0.106
use of card in past 1 month 0.16 0.011 1.305 0.281 6.526 0.014
no. of transactions by cards 5.007 0.037 1.512 0.232 7.319 0.01
bill payment 3.548 0.701 0.655 0.524 4.704 0.035
loan payment 0.358 0.014 0.689 0.507 4.57 0.038
withdrawal 4.666 0.115 0.904 0.412 0.007 0.933
fund transfer 2.266 0.412 1.749 0.185 9.546 0.003
e-shopping 0.905 0.062 0.572 0.568 0.735 0.396
easy to use 2.954 0.51 8.222 0.001 38.686 0
fear of loss 0.682 0.479 3.11 0.054 3.001 0.09
convenience 0.748 0.173 4.391 0.018 29.368 0
time saving 1.82 0.032 9.515 0 35.695 0
safety 3.71 0.411 5.513 0.007 33.495 0
status 0.906 0.346 6.108 0.004 14.167 0
availability 1.086 0.874 1.338 0.272 3.926 0.053
part of life 0.135 0.01 2.791 0.072 6.678 0.013
confidence 5.118 0.137 7.404 0.002 54.622 0
reliability 2.074 0.111 10.378 0 22.276 0
over purchase 2.303 0.127 6.96 0.002 10.152 0.003
select outlet 2.154 0.031 0.292 0.748 3.242 0.078
facilitator 3.74 0.109 2.381 0.103 24.374 0
good feeling 2.324 0.456 9.31 0 17.957 0
awareness 0.798 0.303 7.762 0.001 27.361 0
fear of fraud 1.227 0.235 3.112 0.054 1.06 0.309
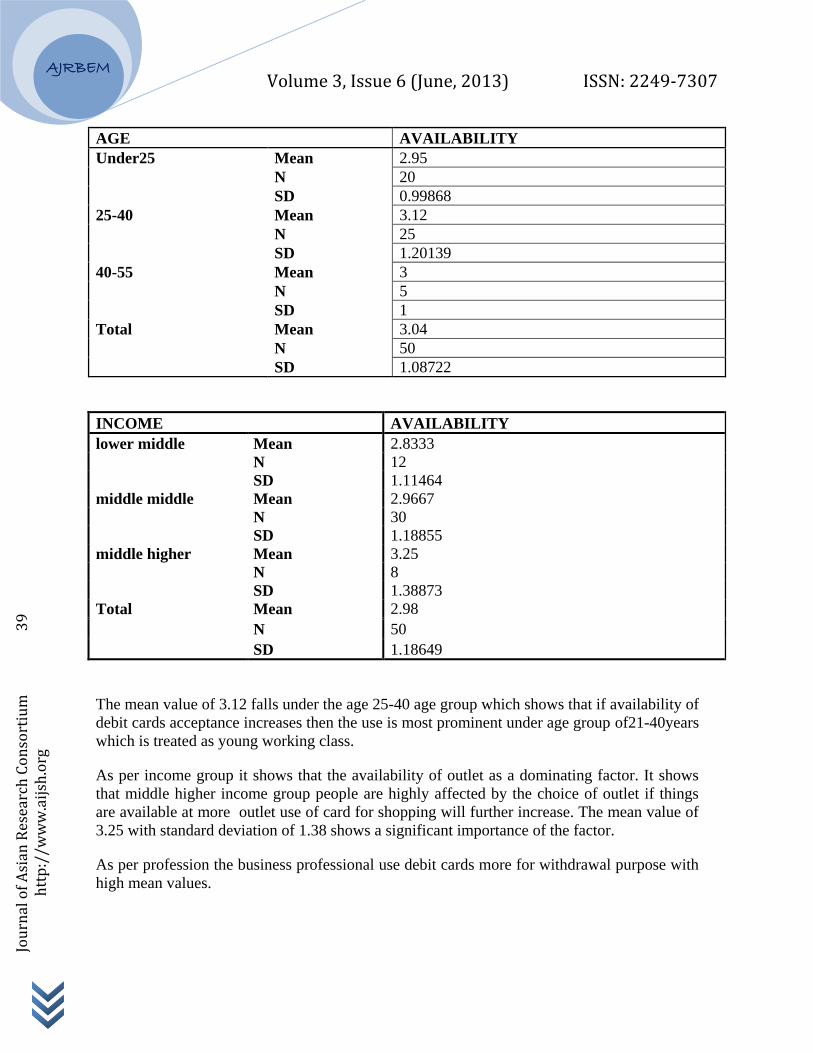
Volume 3, Issue 6 (June, 2013) ISSN: 2249-7307
Jou
rnal
of
Asi
an R
esea
rch
Co
nso
rtiu
m
3
9
h
ttp
://w
ww
.aij
sh.o
rg
AJRBEM
AGE AVAILABILITY
Under25 Mean 2.95
N 20
SD 0.99868
25-40 Mean 3.12
N 25
SD 1.20139
40-55 Mean 3
N 5
SD 1
Total Mean 3.04
N 50
SD 1.08722
INCOME AVAILABILITY
lower middle Mean 2.8333
N 12
SD 1.11464
middle middle Mean 2.9667
N 30
SD 1.18855
middle higher Mean 3.25
N 8
SD 1.38873
Total Mean 2.98
N 50
SD 1.18649
The mean value of 3.12 falls under the age 25-40 age group which shows that if availability of
debit cards acceptance increases then the use is most prominent under age group of21-40years
which is treated as young working class.
As per income group it shows that the availability of outlet as a dominating factor. It shows
that middle higher income group people are highly affected by the choice of outlet if things
are available at more outlet use of card for shopping will further increase. The mean value of
3.25 with standard deviation of 1.38 shows a significant importance of the factor.
As per profession the business professional use debit cards more for withdrawal purpose with
high mean values.
Volume 3, Issue 6 (June, 2013) ISSN: 2249-7307
Jou
rnal
of
Asi
an R
esea
rch
Co
nso
rtiu
m
4
0
h
ttp
://w
ww
.aij
sh.o
rg
AJRBEM
CONCLUSION
The use related patterns are quite common in both the Genders except certain factors that are of
concern for Males and Females using Debit card as payment tool and shopping facilitator.
Though Females are considered as more shopping savvy but Debit card as shopping facilitator
has enhanced shopping of males more as compared to there counterparts. Further cards go on for
providing confidence in transactions as this is more reliable for shopping transactions. Electronic
payment gateways are more in use by males then females. This is attributed to there better
awareness towards cards and electronic fund management as awareness factor is found to be
more in case of Male.
Female has more of fear factor associated with transactions through debit card. This is majorly
because of lack of awareness of various use functions of a card apart from withdrawal from
ATMs.
Also because of different market structures use is not homogenously dispersed. Metropolitan
cities witness more use of cards as payment mode by Middle-Middle income groups then in tier
II cities of same group because of availability of outlets offering swapping machines. Thus use is
restricted in these areas although use can increase in this income group if number of outlets
offering swapping machines increase.
REFERENCES
[1] Ashish das, Rakhi Agarwal (2010). Cashless payment system in India- A roadmap. Technical
report
[2] Carow KA, Staten M E (1999). Debit, credit, or cash: survey evidence on gasoline purchases.
Journal of Economics and Business, 51, 210–224.
[3] Durkin TA (2000). Credit cards: use and consumer attitudes 1970–2000. Federal Reserve
Bulletin, 86,623–634.
[4] Evans DS, Schmalensee R (1999). Paying with plastic. Cambridge, MA: The MIT Press.
[5] Feinberg R A (1986). Credit card as spending facilitating stimuli: a conditioning
interpretation. Journal of Consumer Research, 13, 348–356.
[6] Gerdes G, Walton JK (2002). The use of checks and other non-cash payment instruments in
the United States. Federal Reserve Bulletin, August, 360–374.
[7] Greene WH (1997). Econometric Analysis (3rd ed.) New York, NY: Prentice Hall.
[8] Jonathan Zimman (2009). Debit or credit? Journal of banking& finance, 33(2), 358-366
[9] Jinkook lee, Fahzy Abdul Rahman MS, Hyungsoo kim (2007) Debit card usage: an
examination of its impact on household debt. Financial service Review 16, 73-87

Volume 3, Issue 6 (June, 2013) ISSN: 2249-7307
Jou
rnal
of
Asi
an R
esea
rch
Co
nso
rtiu
m
4
1
h
ttp
://w
ww
.aij
sh.o
rg
AJRBEM
[10] Kennickell A B, Kwast M L (1997). Who uses electronic banking? Results from The 1995
Survey of Consumer Finance. Annual Meetings of the Western Economic Association, Seattle,
WA.
[11] King A S, King JT (2005). The decision between debit and credit: finance charges, float,
and fear. Financial Services Review, 14, 21–36.
[12] Mann R J (2002). Credit cards and debit cards in the United States and Japan. Monetary and
Economic Studies, 20, 123–159.
[13] Young Sik kim, Manjong Lee (2010) A model of debit card as a means of payment. Journal
of Economic Dynamics and control, 34(8), 1359 -1368
[14] Zinman J (2004). Why use debit instead of credit? Consumer choice in a trillion-dollar
market. Federal Reserve Bank of New York Staff Reports (191).
[15] Gerdes, G., & Walton, J. K. (2002). The use of checks and other non-cash payment
instruments in the United States. Federal Reserve Bulletin, August, 360 –374.
[16] Rook, D. W. (1987). The buying impulse. Journal of Consumer Research, 14, 189 –199
[17] www.rbi.org.in.

Volume 3, Issue 6 (June, 2013) ISSN: 2249-7307
Jou
rnal
of
Asi
an R
esea
rch
Co
nso
rtiu
m
4
2
h
ttp
://w
ww
.aij
sh.o
rg
AJRBEM
A P e e r R e v i e w e d I n t e r n a t i o n a l J o u r n a l
o f A s i a n R e s e a r c h C o n s o r t i u m
AJRBEM:
A S I A N J O U R N A L O F
R E S E A R C H I N B U S I N E S S
E C O N O M I C S A N D
M A N A G E M E N T
INFORMAL WORKERS IN BANGLADESH:
AN ANALYSIS FROM SOCIO-ECONOMIC PERSPECTIVE
ABDUR RAZZAQUE SARKER*
International Centre for Diarrhoeal Disease Research, Bangladesh
Health Economics and Financing Research Group
JAHANGIR A.M. KHAN
International Centre for Diarrhoeal Disease Research, Bangladesh
Health Economics and Financing Research Group
Associate Professor
Karolinska Institutet, Sweden
.
ABSTRACT
Informal sector is a very important area of the economy for any developing country
like Bangladesh. Workers in informal sector employment in Bangladesh are mostly
in agriculture, hunting and forestry, wholesale and retail trade, manufacturing,
transport, storage and communication. The current study have explore the present
circumstances of informal workers, contribution, wage differentials and other aspect
of informal sectors’ workers along with that of formal sectors. The mean wage of
formal and informal workers is enormously different. In agriculture sector informal
workers receive least wage but in financial intermediation they are drawing highest
among the informal workers. Since in Bangladesh informal workers are largely
dominates the labor market and constitute significant part of labor force concerned
authority should show much concern to improve their working condition, earnings,
job security and social security.
KEYWORDS: Informal worker, economy, Bangladesh.
____________________________________________________________________________
1. INTRODUCTION

Volume 3, Issue 6 (June, 2013) ISSN: 2249-7307
Jou
rnal
of
Asi
an R
esea
rch
Co
nso
rtiu
m
4
3
h
ttp
://w
ww
.aij
sh.o
rg
AJRBEM
Informal sector is a one of the most dominated area of the economy for any developing country
like Bangladesh. The informal sector represents the dominant share of many sectors across the
country, especially in manufacturing, commerce, finance and agriculture both in urban and rural
areas. The volume of this sector is growing faster in Bangladesh. Alam (2012) defined the
characteristics of informal economy where is the absence of rights and social protection of the
workers. They living in extensive poverty; exploited, with no place to go for protection; lacking
access to basic social services; no basic safety conditions at work; holding little or no hope that
life can be better; struggling on a daily basis just to survive, they are street vendors, hotel
workers, wage laborers working in small enterprises on a regular, casual or contract basis; unpaid
workers including family workers and apprentices, home-workers, paid domestic workers and
more; and a smaller number are the owners of tiny enterprises.
The concept of total employment in the informal economy is used by the ILO (2012) to refer to
the sum of the jobs in the informal sector and the jobs in informal employment as employment in
the informal sector. The informal sector consists of unregistered and/or small unincorporated
private enterprises engaged in the production of goods or services for sale or barter. The
enterprises typically operate at a low level of organization, with little or no division between
labor and capital as factors of production and on a small scale.
Kith Hart’s (1973) introduced the terminology “informal sector”, based on a research in a low-
income neighborhood in Ghana. Hart proposed that the activities of informal sector be contrasted
with the ‘formal’ economy of government and organized capitalism as ‘informal income
opportunities’. Moreover, he suggested that the aggregate intersectoral relationship between the
two sources of employment might be of some significance for models of economic development
in the long run
2. BACKGROUND
Industrialization introduced in Bangladesh in the early 1960’s. After the independent in1971
government nationalized all the major industries and factories. Then from early 1980s Govt.
starts privatization and encourages private investment and started the privatization. As a result
informal sectors are opened in large scale and non-regular workers have been increasing as well
in both formal and informal sector. Informal sector workers (in agriculture and non-agriculture
sector) alone constitute 87% of total labor force and contributed 64% of Gross Domestic Product
of Bangladesh.
3. CHARACTERISTICS OF INFORMAL SECTOR
There are many debates about the definition and characteristics of the informal sector. Generally
two characteristics signifying to the informal activities, one is based on the labor intensive and
the other this sector avoid formal state supervision and regulation. As per Alam N (2002) defined
that these two characteristics combine to reduce substantially the input costs of goods and
services, thereby cheapening the price of the outputs. Long and strenuous hours contributed by
the individual owner, by unpaid kin and others, absence of state supervision and regulation,
greater ease in avoiding taxation, avoiding rigidities of labor legislation, rare payment of official
minimum wage and inadequate access to health insurance, unemployment compensation, and old

Volume 3, Issue 6 (June, 2013) ISSN: 2249-7307
Jou
rnal
of
Asi
an R
esea
rch
Co
nso
rtiu
m
4
4
h
ttp
://w
ww
.aij
sh.o
rg
AJRBEM
age pension characterize the sector. According to ILO (2011) a matrix develops to explain the
employment in the informal economy. According this matrix informal jobs and formal jobs of
informal sector enterprises consist of the total persons employed in the informal sector. The
current study have explore the present circumstances of informal workers, contribution, wage
differentials and other aspect of informal sectors’ workers along with that of formal sectors.
3.1 PRESENT SITUATION OF INFORMAL WORKERS
In Bangladesh, informal workers become an important component of the whole economy. The
frontier of informal sector and the size of informal workers are increasing per year. In fiscal year
2002-03, total informal workers counted 35.1 million. After four years in 2005-06 informal
workers increased by closely two million. But in next four years quantity of informal workers
increased nearly ten million. In contribution of male and female worker, the male worker
increased only 5 million from 2002 to 2010. But the growth of female worker is quite prominent.
In 2010 the total number of informal female worker has been increased by exactly double rate
form the year 2002. The scenario is different in the case of formal female worker. This signifies
due to lower wage compare to formal sector (Table-3) male workers tend to work less in
informal sector and employment opportunity is created by employer for women workforce due to
cheap wage. The following table indicates employment opportunity has been increasing in
informal sector comparing formal sector which is offering unregulated, lower paid and risky job
to the workers.
TABLE 1: TOTAL INFORMAL WORKER VS. FORMAL WORKER (MILLION)
Sector Year
2002‐03 2005‐06 2010
Form
al
Sec
tor
Male 7.3 8.6 5.5
Female 2 1.6 1.3
Total 9.3 10.2 6.8
Info
rmal
Sec
tor
Male 27.2 27.5 32.4
Female 7.9 9.7 14.9
Total 35.1 37.2 47.3
Source: Bangladesh labor force survey 2002, 2006, & 2010
3.2 SECTOR WISE INFORMAL WORKERS
There is a tremendous gap between formal and informal workers employed different sub-sector
which indicates that job opportunity for informal sectors’ workers is much higher than formal
sectors’ workers. From the below table the information about total number of informal workers
per sector can be gathered along with that of formal sectors. In agricultural sector highest
(51.97%) amount of informal workers are engaged. After agriculture, wholesale, retail trade and

Volume 3, Issue 6 (June, 2013) ISSN: 2249-7307
Jou
rnal
of
Asi
an R
esea
rch
Co
nso
rtiu
m
4
5
h
ttp
://w
ww
.aij
sh.o
rg
AJRBEM
repairs absorb highest number of informal workers although the proportion of formal workers is
nearly same. Table-2 flickered that formal workers are numerously involved in manufacturing,
public administration, defense, and education sector. Where involvement of informal workers is
very low, one of the reasons might be due to lack of merit and competency. Form the simulation
it is explored that total number of informal workers is nearly four crore (1 crore =10 million) and
the summation of formal workers are nearly half crore. These indicate a large opportunity to
work with different types of informal sub sectors.
TABLE 2: FORMAL AND INFORMAL WORKERS OF DIFFERENT SECTORS IN
BANGLADESH
Type of Worker
Type of Sector Formal Informal
Frequency Percentage Frequency Percentage
Agriculture, hunting and forestry 86,076 1.48 21,585,741 51.97
Fishing 41,368 0.71 1,053,834 2.54
Mining and quarrying 5,002 0.09 46,046 0.11
Manufacturing 1,554,892 26.72 3,669,243 8.83
Electricity, gas and water supply 45,516 0.78 30,967 0.07
Construction 80,665 1.39 1,443,677 3.48
Wholesale and retail trade, repairs, etc. 770,471 13.24 6,337,639 15.26
Hotels and restaurants 100,163 1.72 612,070 1.47
Transport, storage, and communications 433,156 7.44 3,542,741 8.53
Financial intermediation 411,954 7.08 95,082 0.23
Real estate, renting, and business
activities 66,708 1.15 171,896 0.41
Public administration and defense, social
security 714,916 12.29 166,818 0.4
Education 1,028,854 17.68 277,361 0.67
Health and social work 218,841 3.76 143,268 0.34
Other community, social and personal
services 248,313 4.27 1,599,045 3.85
Private households with employed
persons 7,254 0.12 761,527 1.83
Others 4,434 0.08 1,054 0
Total 5,818,582 100 41,538,009 100
Source: Bangladesh Informal Sector Survey, 2010
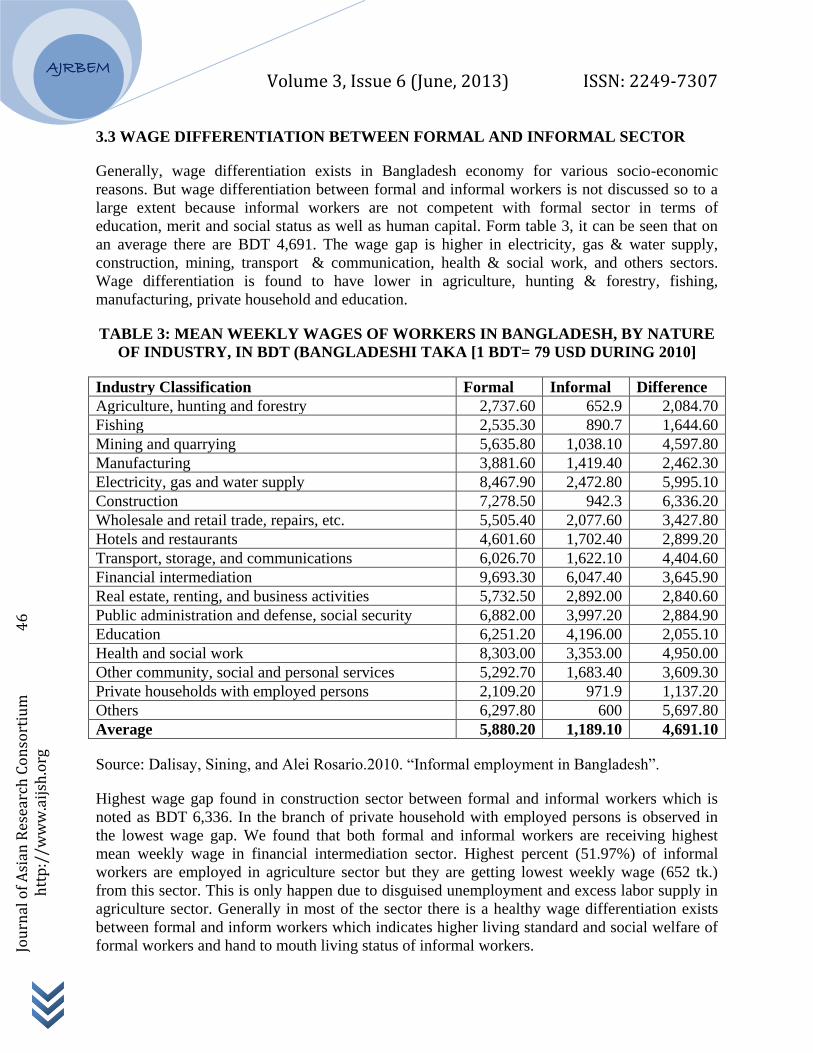
Volume 3, Issue 6 (June, 2013) ISSN: 2249-7307
Jou
rnal
of
Asi
an R
esea
rch
Co
nso
rtiu
m
4
6
h
ttp
://w
ww
.aij
sh.o
rg
AJRBEM
3.3 WAGE DIFFERENTIATION BETWEEN FORMAL AND INFORMAL SECTOR
Generally, wage differentiation exists in Bangladesh economy for various socio-economic
reasons. But wage differentiation between formal and informal workers is not discussed so to a
large extent because informal workers are not competent with formal sector in terms of
education, merit and social status as well as human capital. Form table 3, it can be seen that on
an average there are BDT 4,691. The wage gap is higher in electricity, gas & water supply,
construction, mining, transport & communication, health & social work, and others sectors.
Wage differentiation is found to have lower in agriculture, hunting & forestry, fishing,
manufacturing, private household and education.
TABLE 3: MEAN WEEKLY WAGES OF WORKERS IN BANGLADESH, BY NATURE
OF INDUSTRY, IN BDT (BANGLADESHI TAKA [1 BDT= 79 USD DURING 2010]
Industry Classification Formal Informal Difference
Agriculture, hunting and forestry 2,737.60 652.9 2,084.70
Fishing 2,535.30 890.7 1,644.60
Mining and quarrying 5,635.80 1,038.10 4,597.80
Manufacturing 3,881.60 1,419.40 2,462.30
Electricity, gas and water supply 8,467.90 2,472.80 5,995.10
Construction 7,278.50 942.3 6,336.20
Wholesale and retail trade, repairs, etc. 5,505.40 2,077.60 3,427.80
Hotels and restaurants 4,601.60 1,702.40 2,899.20
Transport, storage, and communications 6,026.70 1,622.10 4,404.60
Financial intermediation 9,693.30 6,047.40 3,645.90
Real estate, renting, and business activities 5,732.50 2,892.00 2,840.60
Public administration and defense, social security 6,882.00 3,997.20 2,884.90
Education 6,251.20 4,196.00 2,055.10
Health and social work 8,303.00 3,353.00 4,950.00
Other community, social and personal services 5,292.70 1,683.40 3,609.30
Private households with employed persons 2,109.20 971.9 1,137.20
Others 6,297.80 600 5,697.80
Average 5,880.20 1,189.10 4,691.10
Source: Dalisay, Sining, and Alei Rosario.2010. “Informal employment in Bangladesh”.
Highest wage gap found in construction sector between formal and informal workers which is
noted as BDT 6,336. In the branch of private household with employed persons is observed in
the lowest wage gap. We found that both formal and informal workers are receiving highest
mean weekly wage in financial intermediation sector. Highest percent (51.97%) of informal
workers are employed in agriculture sector but they are getting lowest weekly wage (652 tk.)
from this sector. This is only happen due to disguised unemployment and excess labor supply in
agriculture sector. Generally in most of the sector there is a healthy wage differentiation exists
between formal and inform workers which indicates higher living standard and social welfare of
formal workers and hand to mouth living status of informal workers.

Volume 3, Issue 6 (June, 2013) ISSN: 2249-7307
Jou
rnal
of
Asi
an R
esea
rch
Co
nso
rtiu
m
4
7
h
ttp
://w
ww
.aij
sh.o
rg
AJRBEM
3.4 ECONOMIC CONTRIBUTION OF INFORMAL WORKERS
The importance of informal workers is significant in the economy of Bangladesh. According to
ADB (2009) 90 percent of informal workers don’t receive any other employment benefit (i.e.
bonus, provident fund, gratuity, transportation, dress, health care, telephone service, housing,
incentives) excluding free meal and lodging but their contribution is higher than formal workers
in different economic sector. The following table distributed the total share of different types of
informal sub sector in GDP. Here the contribution of formal workers is higher only in
manufacturing, transport & communication, public administration, and education sector
compared to informal workers. In aggregate the collective share of formal workers is 36.9% to
our GDP. The highest share of informal workers is observed in agriculture, construction,
wholesale and real state. In electricity, gas, and water supply, financial intermediation, and
Public administration and defense the share of informal workers is found to have zero. Besides,
the contribution to GDP by informal workers is calculated as 63.6% which is nearly double than
that of formal workers. Only in manufacturing sector the contribution of formal workers seems
to be high than informal workers. Here the contribution of informal workers in manufacturing
sector is 12.6% out of 17.6% share to the GDP.
Source: ADB, 2010
3. ONCLUDING REMARKS
It is found that Bangladeshi labor market is largely dominated by informal workforce. More than
85% of our labor force are counted as informal and their contribution is significant in the
productive activities of the economy as a whole (Maligalig 2010). Workers in informal sector
TABLE 4: CONTRIBUTION OF INFORMAL SECTOR AS A PERCENTAGE OF GDP
(%)
Type of sector Total share of GDP Sub- share of GDP
Formal Informal
Agriculture 16.6 1 15.7
Fishing 4.7 0.7 4
Mining and quarrying 1.2 0.8 0.4
Manufacturing 17.6 12.6 5
Electricity, gas and water supply 1.6 1.6 0
Construction 9.2 2.8 6.4
Wholesale and retail trade 14.2 1.4 12.4
Hotel and restaurants 0.7 0.5 0.2
Transport, storage and communication 9.9 7.4 2.5
Financial intermediation 1.7 1.7 0
Real estate, renting and business activities 7.6 0.5 7.2
Public administration and defense 2.8 2.8 0
Education 2.5 2.1 0.5
Health and social works 2.3 2 0.3
Community, social and personal service 7.1 0.7 6.4
Total 100 36.9 63.6
Volume 3, Issue 6 (June, 2013) ISSN: 2249-7307
Jou
rnal
of
Asi
an R
esea
rch
Co
nso
rtiu
m
4
8
h
ttp
://w
ww
.aij
sh.o
rg
AJRBEM
employment are mostly in agriculture, hunting and forestry, wholesale and retail trade,
manufacturing, transport, storage and communication. The mean wage of formal and informal
workers is enormously different. In agriculture sector informal workers receive least wage but in
financial intermediation they are drawing highest among the informal workers. The total value
addition by informal workers is much higher than the wage they receive.
Government should amend and expand the labor law to ensure the workers’ right and regulate
the informal economy. Extension of small and medium entrepreneur, set up agro procession
zone, promoting agro based industry, needful training, vocational and skill development institute
can help to increase formal employment opportunity and it will reduce informal work. Since
informal workers are largely dominates the labor market and constitute significant part of labor
force concerned authority should show much concern to improve their working condition,
earnings, job security and social security.
REFERENCE (S)
Alam N (2012). “A Socio-economic Study of Informal Sector Workers of Dhaka City”,
Bangladesh e-Journal of Sociology. Volume 9, Number 2. 2012
Bangladesh Bureau of Statistics (2010) Government of the People's Republic of Bangladesh,
“Bangladesh Labor force Survey”, 2005-06 .
Bangladesh Bureau of Statistics (2010) Government of the People's Republic of Bangladesh,
“Statistical Yearbook 2010”, Dhaka, Bangladesh
Dalisay, SM., Sining, C and Rosario, A. (2009) “Informal Employment in Bangladesh”, ADB
Economics Working Paper Series No. 155.
Hart, K. 1973. Informal income opportunities and urban employment in Ghana. Journal of
Modern African Studies 11, 61–89
Hossain M. (2010) “Informal workers and Non-Regular Work: Bangladesh Perspective”,
Ministry of Labour and Employment, Bangladesh Secretariat. retrieve from www.adbi.org/conf-
seminar/3566.non.regular.workers.bangladesh/
ILO - Department of Statistics (2012). Statistical update on employment in the informal
economy. Available: http://laborsta.ilo.org/informal_economy_E.html
Informal Employment in Bangladesh. ADB Economics Working Paper Series (Number 155).
URL: http://www.adb.org/Documents/Working-Papers/2009/Economics-WP155.pdf
Maligalig, D. & Barcenas, M.(2008). “Examining Bangladesh’s Integrated Multi-Purpose
Sample Design.” Paper presented at the Inception Mission to Bangladesh for RETA 6430:
Measuring the Informal Sector, 14–18 September, Bangladesh Resident Mission, Asian
Development Bank, Dhaka.

Volume 3, Issue 6 (June, 2013) ISSN: 2249-7307
Jou
rnal
of
Asi
an R
esea
rch
Co
nso
rtiu
m
4
9
h
ttp
://w
ww
.aij
sh.o
rg
AJRBEM
Roy, Diponkor (2012) “Women in rural areas, women’s employment in informal sector and
unpaid work” paper presented at Global Forum on Gender Statistics, Jordan, 27-29 March 2012.

Volume 3, Issue 6 (June, 2013) ISSN: 2249-7307
Jou
rnal
of
Asi
an R
esea
rch
Co
nso
rtiu
m
4
9
h
ttp
://w
ww
.aij
sh.o
rg
AJRBEM
A P e e r R e v i e w e d I n t e r n a t i o n a l J o u r n a l
o f A s i a n R e s e a r c h C o n s o r t i u m
AJRBEM:
A S I A N J O U R N A L O F
R E S E A R C H I N B U S I N E S S
E C O N O M I C S A N D
M A N A G E M E N T
IMPACT OF CREATIVE ADVERTISING STRATEGIES ON DOCTORS
BY MEDICAL REPRESENTATIVES FOR PHARMACEUTICAL
PRODUCTS
DR. P. T. CHAUDHARI*; ABHIJEET HARIDAS GAHUKAR**
*Head,
Department of Commerce,
M J College,
Jalgaon.
**Research Student,
Akola.
ABSTRACT
Pharmaceutical industry is the second largest industry in India. In this era of market
competition advertising is the most important component of the marketing
communication. Pharmaceutical industry spending worldwide now exceeds 350
billion dollar per year on advertising which help to create and place our self strong
in the market. In the entire moment toward final action of purchasing starting from
awareness- knowledge- purchase, awareness which form a cognitive part of buying
is brought about by various forms of advertisements. Business of the pharmaceutical
industry is mostly depending upon the creative advertising and effective use of it by a
Medical Representative which positively strikes the sales. Advertisement is any paid
form of non-personal presentation and promotion of ideas, goods or services by an
identified sponsor. Marketing department of the pharmaceutical industry draft the
creative advertising strategies by using the promotional materials hence the impact
of the advertisement on doctors for prescribing particular product is revealed in this
research. Advertising is a key area of marketing keeping this in mind advertising
decision is of crucial importance. An advertising strategy is a campaign developed to
communicate ideas about products and services to potential consumers in the hopes
of convincing them to buy those products and services. This strategy, when built in a
rational and intelligent manner, will reflect other business considerations (overall
budget, brand recognition efforts) and objectives (public image enhancement, market

Volume 3, Issue 6 (June, 2013) ISSN: 2249-7307
Jou
rnal
of
Asi
an R
esea
rch
Co
nso
rtiu
m
5
0
h
ttp
://w
ww
.aij
sh.o
rg
AJRBEM
share growth) as well. Hence by considering the present scenario this paper
discusses the impact of creative advertising strategies adopt by a Medical
Representative.
KEYWORDS: Creative Strategies, strikes, sales, sponsor.
______________________________________________________________________________
INTRODUCTION
Advertising is the most important component of the marketing communication. “Advertising is
telling and selling.” From this pithy statement we can summed up the importance of advertising.
Through an advertisement the advertiser intends to spread his ideas about his product/offerings
among his customer and prospect popularization of the products is the basic aim of advertising
activity. Advertising, a form of commercial mass communication designed to promote the scale
of product or services, or a message on behalf of an institution, organization or candidate for
political office. Advertising can be divided into two broader categories.
A) CONSUMER ADVERTISING: Directed at public.
B) TRADE ADVERTISING: Directed at wholesaler or distributors who resale to the public.
HOW DOES ADVERTISEMENT ATTRACT AND PERSUADE THE CONSUMER
The first requirement is that the advertisement should capture the attention of the target audience
in other words it has to get through the attention filter attention of the target audience to achieve
this, it has to provide the audience with information that is of interest to them. In this case the
advertising message should interest the audience it is essential that an advertisement provide
information that is of interest to the audience it is not enough if the audience listen to the
advertisement and interprets it, the way the advertiser or communicator expects is to be
interpreted it should also be appeal to the audience and influence their attitude, through process
and purchase behavior in favor of advertised offer. Factors in an advertisement that bring about
audience persuasion are-
a) The source or the endorser,
The creditability of source
Likeability/ Attractiveness of the source
The source approach to the views and disposition of audience
b) Message structure
c) Message strategies
d) Message appeal

Volume 3, Issue 6 (June, 2013) ISSN: 2249-7307
Jou
rnal
of
Asi
an R
esea
rch
Co
nso
rtiu
m
5
1
h
ttp
://w
ww
.aij
sh.o
rg
AJRBEM
ADVERTISING STRATEGIES IN PHARMACEUTICAL INDUSTRY
Today, in pharmaceuticals most advertising strategies focus on achieving three general goals, as
1) promote awareness of a business and its product 2) stimulate sales directly and "attract
competitors' customers"; and 3) establish or modify a business' image. In other words,
advertising seeks to inform, persuade, and remind the consumer. With these aims in mind,
pharmaceutical industry follow a general process which ties advertising into the other
promotional efforts and overall marketing objectives of the business.
ELEMENTS OF CREATIVE ADVERTISING STRATEGY IN PHARMACEUTICAL
INDUSTRY
Medical Representative considered following elements of the advertising strategy: target
audience i.e. doctors, product concept, communication media, and advertising message. These
elements are at the core of an advertising strategy in pharmaceuticals, and are often referred to as
the "creative mix." Again, what most advertisers stress from the beginning is clear planning and
flexibility and key to these aims is creativity, and the ability to adapt to new market trends. A
rigid advertising strategy in pharmaceuticals often leads to a loss of market share. Therefore, the
core elements of the advertising strategy in pharmaceuticals need to mix in a way that allows the
message to envelope the target consumer, providing ample opportunity for this consumer to
become acquainted with the advertising message.
TARGET DOCTORS
The target consumer is a complex combination of persons. It includes the doctors who ultimately
prescribe the medicine, as well as those who decide what product will be prescribing (but don't
physically buy it). In order to identify the target consumer, and the forces acting upon any
purchasing decision of pharmaceutical products, it is important to define three general criteria in
relation to that consumer:
1. Demographics, age, gender, income, ethnicity, and hobbies.
2. Behaviors considering the doctor’s behavior, an advertiser need to examine the doctor’s
awareness about the medicine and its competition.
3. Needs and Desires, an advertiser must determine the doctor’s needs both in practical terms
and in terms of self-image, etc and the kind of pitch/message that will convince the doctor
that the advertiser's medicine can fulfill those needs.
PRODUCT CONCEPT
The product concept grows out of the guidelines established in the "positioning statement." How
the product is positioned within the market will dictate the kind of values the product represents,
and thus how the target consumer will receive that product. Therefore, it is important to
remember that no product is just itself, but, as Courtland L. Bovee and William F. Arens stated
Volume 3, Issue 6 (June, 2013) ISSN: 2249-7307
Jou
rnal
of
Asi
an R
esea
rch
Co
nso
rtiu
m
5
2
h
ttp
://w
ww
.aij
sh.o
rg
AJRBEM
in Contemporary Advertising, a "bundle of values" that the consumer needs to be able to identify
with.
COMMUNICATION MEDIA
The communication media is the means by which the advertising message is transmitted to the
consumer. In addition to marketing objectives and budgetary restraints in pharmaceutical
industry, the characteristics of the target consumer i.e. doctors need to be considered as an
advertiser i.e. pharmaceutical company decides what media to use. The types of media categories
from which advertisers can choose include the following:
Magazines printed with medicine name.
Literatures with the name of medicine and branded inputs with medicine name.
Infomercials and reminders for example, pen with the brand name of medicine.
Visual aid i.e. folder of products
After deciding on the medium that is 1) financially in reach, 2) most likely to reach the target
audience, an advertiser needs to schedule the broadcasting of that advertising. The media
schedule, as defined by Hills, is "the combination of specific times (for example, by day, week,
and month) when advertisements are inserted into media vehicles and delivered to target
audiences."
ADVERTISING MESSAGE
An advertising message is guided by the "advertising or copy platform," which is a combination
of the marketing objectives, copy, art, and production values. This combination is best realized
after the target consumer has been analyzed, the product concept has been established, and the
media and vehicles have been chosen. At this point, the advertising message can be directed at a
very concrete audience to achieve very specific goals. Hiam and Schewe listed three major areas
that an advertiser should consider when endeavoring to develop an effective "advertising
platform":
What are the product's unique features?
How do doctors evaluate the product? What is likely to persuade them to prescribe the
product?
How do competitors rank in the eyes of the doctors? Are there any weaknesses in their
positions? What are their strengths?
COPY
When composing advertising copy it is crucial to remember that the primary aim is to
communicate information about the business and its products. The "selling proposal" can act as a
Volume 3, Issue 6 (June, 2013) ISSN: 2249-7307
Jou
rnal
of
Asi
an R
esea
rch
Co
nso
rtiu
m
5
3
h
ttp
://w
ww
.aij
sh.o
rg
AJRBEM
blueprint here, ensuring that the advertising fits the overall marketing objectives. Many
companies utilize a theme or a slogan as the centerpiece of such efforts, emphasizing major
attributes of the business's products or services in the process of pharmaceutical industry.
When writing the copy, direct language (saying exactly what you mean in a positive, rather than
negative manner) has been shown to be the most effective. So for an advertiser trying to get
attention in a world awash in advertising images, it makes sense to try this message-in-an-eye-
blink route to the public consciousnesses it for a sales slogan or even a product name."
The copy content needs to be clearly written, following conventional grammatical guidelines. Of
course, effective headings allow the reader to get a sense of the advertisement's central theme
without having to read much of the copy.
ART, WORK AND LAYOUT
Pharmaceutical companies also need to consider the visual rhetoric of the advertisement, which
simply means that the entire advertisement, including blank space, should have meaning and
logic. Most industry experts recommend that advertisers use short paragraphs, lists, and catchy
illustrations and graphics to break up and supplement the text and make the document both
visually inviting and easy to understand. Remember, an advertisement has to capture the doctor’s
attention quickly.
RESEARCH OBJECTIVE
The objectives are as follows:
1) To study the impact of different creative advertising strategy of pharmaceutical products
on prescribing behavior of doctors.
2) To find out elements of advertising strategy that influence doctors to prescribe a
particular medicine or brand.
HYPOTHESIS
For the proposed research work, hypothesizes, which have been formulated are as stated below:
1) HYPOTHESIS ONE
Ho: Creative advertising strategies used by Medical Representatives on doctors have
impact on the prescribing behaviour of medicine.
H1: Creative advertising strategies used by Medical Representatives on doctors do
not have impact on the prescribing behaviour of medicine.

Volume 3, Issue 6 (June, 2013) ISSN: 2249-7307
Jou
rnal
of
Asi
an R
esea
rch
Co
nso
rtiu
m
5
4
h
ttp
://w
ww
.aij
sh.o
rg
AJRBEM
2) HYPOTHESIS TWO
Ho: Medical representatives not using the proper creative advertising strategies
elements because of that there is no proper impact of it on doctor and decreases sales.
H1: The elements of creative advertising strategies and their intensity used properly
by Medical representatives’ increases the sales of the medicines of a particular
company.
RESEARCH METHODOLOGY
For this study, research methodology will be presented in the context of research design, data
sources, tools of the data collection, sampling.
A. RESEARCH DESIGN
A research design appropriate for a proposed research problem, will involve the consideration
of the following factors.
1. The means of obtaining information.
2. The availability and skills of the researcher.
3. The objectives of the problems to be studied.
4. The nature of the problem to be studied.
5. The availability of time and money for the research work.
Thus, the research design in case of the proposed study is a comparative design throwing
light on all points narrated above and will be prepared keeping in view the objectives of the
study and resources available. The said design can be appropriately referred to as a survey design
since it takes into account all the steps involved in a survey concerning a phenomenon to be
studied.
B) SOURCES OF DATA COLLECTION
SECONDARY DATA: It means data that already exist or available. It refers to data that
have already been collected and analyzed by someone else.
For this various books written by prominent authors, articles / documents published in
various national and international journals are used.
PRIMARY DATA: Primary data will be collected by survey and through interviews of the
respondents.

Volume 3, Issue 6 (June, 2013) ISSN: 2249-7307
Jou
rnal
of
Asi
an R
esea
rch
Co
nso
rtiu
m
5
5
h
ttp
://w
ww
.aij
sh.o
rg
AJRBEM
TOOLS AND TECHNIQUES: Structured questionnaire will be drafted to collect the opinion;
views of the respondents. Questionnaire for this purpose will be design keeping in mind the
objectives of the research. Satisfaction variables will be measured through fill-in-the-blank
questions as well as five- point liker scale responses.
Questionnaires will be prepared to collect primary data from the following categories of
informants.
1) Medical Representatives of reputed company and registered in MRA (Medical
Representative Association).
2) Registered Doctors in IMA (Indian Medical Association).
C) SAMPLING: Sampling design begin by specifying the target population.
I) UNIVERSE: The target population is Medical representatives and doctors .
II) SAMPLING ELEMENTS: It is the object about which or from which the information is
desired for the study. Respondents are a Registered Medical Representatives of Pharmaceutical
Companies, and a registered doctor and a registered pharmacist. The age of the respondents
ranged between 20-40 years and they all belonged to middle or upper middle strata of the
society.
III) SAMPLING UNIT: It is an element or a unit containing the element, which is available for
selection at some stage of the sampling process. Registered Medical Representatives of
Pharmaceutical Companies, and a registered doctor and a registered pharmacist and some
patients will be sampling unit for the proposed study.
IV) SAMPLING TECHNIQUES: To select the sample from the universe Purposive Random
Technique will be used.
SAMPLE SIZE: The proposed research study is an in depth study focused on studying the
IMPACT OF CREATIVE ADVERTISING STRATEGIES ON DOCTORS BY MEDICAL
REPRESENTATIVE FOR PHARMACEUTICAL PRODUCTS So vast efforts are required to
get the information about the study if large proportion of the Universe is selected. Sample size of
50 respondents is selected considering the efforts possible to make by researcher during the
stipulated period of research.
RESPONDENTS (50)
1) Medical Representatives of reputed company and registered in MRA(Medical
Representative Association) -25
2) Registered Doctors of in IMA(Indian Medical Association)-25

Volume 3, Issue 6 (June, 2013) ISSN: 2249-7307
Jou
rnal
of
Asi
an R
esea
rch
Co
nso
rtiu
m
5
6
h
ttp
://w
ww
.aij
sh.o
rg
AJRBEM
CONCLUSION
1) The finding of this research indicates that, creative advertising strategies used by a
Medical Representatives have impact on doctors prescribing behavior of pharmaceutical
products.
2) Medical Representatives used the different creative advertising inputs to attract doctors
for example, table top with brand name, paper weight, costly pen having brand name of a
medicine so that when doctor write the prescription he can remember the name of the
brand which doctor have to prescribe.
3) It is found that almost all the respondents look upon creative advertising strategies of
Medical Representatives and attract towards it and prescribed medicines of the advertised
pharmaceutical company.
4) Medical representatives experienced that doctors having very less time for a call but their
creative advertising strategies really works. Product concept and advertising message this
are the two creative advertising strategies widely accepted by doctors.
5) Doctors look upon creative advertising strategies used by a Medical Representative
which have impact on them for prescribing behavior of pharmaceutical products and
literatures having the total information of the product hence it is most widely accepted
input by doctors.
6) Product content, brand name, product qualities are very important content and price and
easy availability are important content of creative advertising strategies. Advertisement
by a medical representative is the important information source which influence to
prescribe a particular brand of medicine
REFERENCES
FROM BOOKS, TEXT BOOKS, AUDIO ETC.
1. S. Batra “Advertising Management”
2 M.N. Mishra. “Advertising Management”
3. Clow Back: Integrated Advertising , Promotion And Marketing Communication
publisher- Pearson Education (Third Edition)
4. Philip Kotler , Kevin Lane Keller : “Marketing Management” Publisher- Pearson
Education (Twelfth Edition)
JOURNALS AND MAGAZINES
1. Tim Ambler - Honorary Senior Research Fellow in Marketing - London Business School,
International Journal For Advertising.
Volume 3, Issue 6 (June, 2013) ISSN: 2249-7307
Jou
rnal
of
Asi
an R
esea
rch
Co
nso
rtiu
m
5
7
h
ttp
://w
ww
.aij
sh.o
rg
AJRBEM
2. Dayna M. Porter,Grand Valley State University, Direct-to-Consumer (DTC)
Pharmaceutical Marketing: Impacts and Policy Implications.
3. Emerald, International Journal For Pharmaceutical Marketing and Management.
4. Informa Healthcare, Journal of Pharmaceutical Marketing and Management, issue 65.
5. Journal of Advertising Research, Vol. 52, No. 4, 2012.
6. Hanif M. Lakdawala, Latest Trends in A Pharmaceutical Marketing and Promotion.
7. J.H.Phillips, Journal of pharmaceutical marketing & management. 3(4):51-63.
FROM WEBSITE LINKAGES
1. Advertising Strategy of Pharma-(www.googlebook.com),
2. Pharmaceutical advertising (www.wikipedia.com)
3. Pharmaceuticals marketing (www.scholarworks.gvsu.edu.co.in),
4. E-Notes on advertising (www.enotes.com/advertising-strategy-reference/advertising-
strategy)
Volume 3, Issue 6 (June, 2013) ISSN: 2249-7307
Jou
rnal
of
Asi
an R
esea
rch
Co
nso
rtiu
m
5
8
h
ttp
://w
ww
.aij
sh.o
rg
AJRBEM
ANNEXURE
QUESTIONAIRE (FOR MEDICAL REPRESENTATIVES)
ABHIJEET H. GAHUKAR
Dear Sir/ Madam,
I am student of PhD in Sant Gadge Baba Amravati University, Amravati, undertaken a research
project as entitled IMPACT OF CREATIVE ADVERTISING STRATEGIES ON DOCTORS
BY MEDICAL REPRESENTATIVE FOR PHARMACEUTICAL PRODUCTS The information
collected from you will be kept strictly confidential and shall be use for academic purpose only.
Thanking you,
Abhijeet Haridas Gahukar
1. Name :-
2. Address :-
3. Age :-
4. Gender :- a) Male b) Female
5. Is creative advertising strategies used by you have impact on doctors prescribing behavior
of pharmaceutical products?
a) Yes b) No
6. Which information sources influence doctor for changing prescribing behavior?
a) Branded Inputs b) Books with brand name
c) Literatures d) Other (Specify)
7. Doctor having very less time for your call. Is your creative advertising strategy really
works?
a) Yes b) No
8. Which creative strategy is most widely accepted by doctors?
a) Product concept b) Communication media,
c) Advertising message d) Art and Work Layout

Volume 3, Issue 6 (June, 2013) ISSN: 2249-7307
Jou
rnal
of
Asi
an R
esea
rch
Co
nso
rtiu
m
5
9
h
ttp
://w
ww
.aij
sh.o
rg
AJRBEM
QUESTIONAIRE (FOR DOCTORS)
ABHIJEET H. GAHUKAR
Dear Sir/ Madam,
I am student of PhD in Sant Gadge Baba Amravati University, Amravati, undertaken a research
project as entitled IMPACT OF CREATIVE ADVERTISING STRATEGIES ON DOCTORS
BY MEDICAL REPRESENTATIVE FOR PHARMACEUTICAL PRODUCTS The information
collected from you will be kept strictly confidential and shall be use for academic purpose only.
Thanking you,
Abhijeet Haridas Gahukar
1. Name :-
2. Address :-
3. Age :-
4. Gender :- a) Male b) Female
5. Have you look upon creative advertising strategies used by a Medical Representative
which have impact on your prescribing behavior of pharmaceutical products?
a) Yes b) No
6. Which inputs mostly attract you while Medical Representative advertises their products?
a) Branded Inputs b) Books with brand name
c) Literatures d) Other (Specify)
7. While selecting a particular brands of pharmaceutical products which following factor
you consider most? Please tick.
Factors Very
Important
Important Slightly
Important
a. Product Contents
b. Brand Name
c. Product quality
d. Price
e. Easy availability

Volume 3, Issue 6 (June, 2013) ISSN: 2249-7307
Jou
rnal
of
Asi
an R
esea
rch
Co
nso
rtiu
m
6
0
h
ttp
://w
ww
.aij
sh.o
rg
AJRBEM
8. Which information sources influence you to prescribe a particular brand of medicine?
a) Advertisement b) Campaign
c) Friends or Colleagues d) Other (Specify)

Volume 3, Issue 6 (June, 2013) ISSN: 2249-7307
Jou
rnal
of
Asi
an R
esea
rch
Co
nso
rtiu
m 6
1
htt
p:/
/ww
w.a
ijsh
.org
AJRBEM
A P e e r R e v i e w e d I n t e r n a t i o n a l J o u r n a l
o f A s i a n R e s e a r c h C o n s o r t i u m
AJRBEM: A S I A N J O U R N A L O F
R E S E A R C H I N B U S I N E S S
E C O N O M I C S A N D
M A N A G E M E N T
PROFITABILITY IN INLAND FISHERY SECTOR –
A CASE STUDY IN THE DISTRICT OF MIDNAPORE (EAST & WEST)
DR. PRADIP KUMAR DASH*
*Associate Professor & Head,
Department of Commerce,
Vivekananda Mission Mahavidyalaya,
Chaitanyapur, Purba Medinipur.
ABSTRACT
Inland water resource is such a source, which is yet to be properly utilized by the
rural people. If the water bodies, private or public, are fully utilized to cultivate
fishes adopting scientific fish culture, it may provide huge money in the hands of the
rural people throughout the year as fish has a good market round the year in our
country and abroad. It may be noted that all sizes of ponds generate much higher
return on investment, indicating that the fish farming is one most profitable
operation. Through the types of work involved in fish cultivation, the rural people
generate extra income by way of the opportunity cost of notional wages of family
labour. As the demand of fish remains throughout the year, the fish culture is also
continued throughout the year for which the scope of employment in this sector is
never reduced. In this paper, an attempt has been made to evaluate and analyse, with
the help of relevant data and information from various Govt. institutions and field
survey, the performance of fish farmers adopting either the scientific culture or
traditional fish culture.
____________________________________________________________________________
INTRODUCTION
India is a large producer of inland fish, ranking next only to Japan. With an abundance of
freshwater resource, India has still not been able to tap even 30% of the potential area for inland
fish production. Out of the total inland fish production, more than 60% is contributed by fish
culture in ponds and reservoirs. Fish culture is adopted by all kinds of farmers – small and
marginal ones, relatively larger farmers, and those who do it on commercial scale. Ponds can be
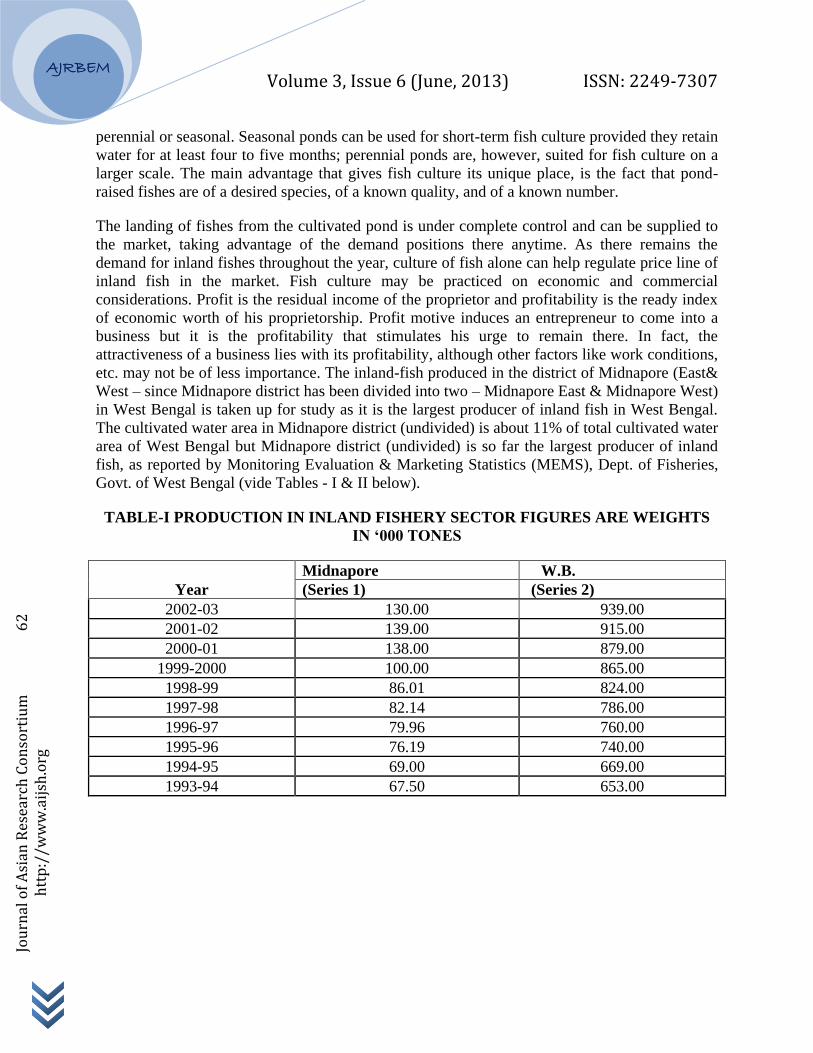
Volume 3, Issue 6 (June, 2013) ISSN: 2249-7307
Jou
rnal
of
Asi
an R
esea
rch
Co
nso
rtiu
m
6
2
h
ttp
://w
ww
.aij
sh.o
rg
AJRBEM
perennial or seasonal. Seasonal ponds can be used for short-term fish culture provided they retain
water for at least four to five months; perennial ponds are, however, suited for fish culture on a
larger scale. The main advantage that gives fish culture its unique place, is the fact that pond-
raised fishes are of a desired species, of a known quality, and of a known number.
The landing of fishes from the cultivated pond is under complete control and can be supplied to
the market, taking advantage of the demand positions there anytime. As there remains the
demand for inland fishes throughout the year, culture of fish alone can help regulate price line of
inland fish in the market. Fish culture may be practiced on economic and commercial
considerations. Profit is the residual income of the proprietor and profitability is the ready index
of economic worth of his proprietorship. Profit motive induces an entrepreneur to come into a
business but it is the profitability that stimulates his urge to remain there. In fact, the
attractiveness of a business lies with its profitability, although other factors like work conditions,
etc. may not be of less importance. The inland-fish produced in the district of Midnapore (East&
West – since Midnapore district has been divided into two – Midnapore East & Midnapore West)
in West Bengal is taken up for study as it is the largest producer of inland fish in West Bengal.
The cultivated water area in Midnapore district (undivided) is about 11% of total cultivated water
area of West Bengal but Midnapore district (undivided) is so far the largest producer of inland
fish, as reported by Monitoring Evaluation & Marketing Statistics (MEMS), Dept. of Fisheries,
Govt. of West Bengal (vide Tables - I & II below).
TABLE-I PRODUCTION IN INLAND FISHERY SECTOR FIGURES ARE WEIGHTS
IN ‘000 TONES
Year
Midnapore W.B.
(Series 1) (Series 2)
2002-03 130.00 939.00
2001-02 139.00 915.00
2000-01 138.00 879.00
1999-2000 100.00 865.00
1998-99 86.01 824.00
1997-98 82.14 786.00
1996-97 79.96 760.00
1995-96 76.19 740.00
1994-95 69.00 669.00
1993-94 67.50 653.00
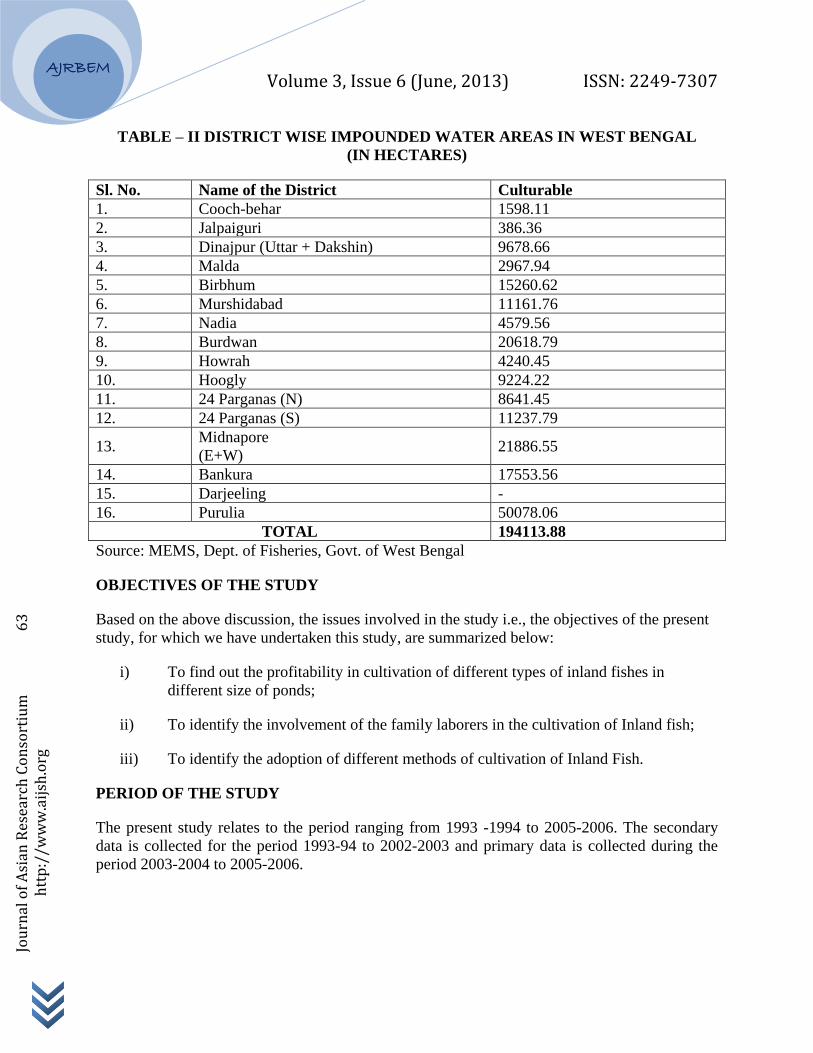
Volume 3, Issue 6 (June, 2013) ISSN: 2249-7307
Jou
rnal
of
Asi
an R
esea
rch
Co
nso
rtiu
m
6
3
h
ttp
://w
ww
.aij
sh.o
rg
AJRBEM
TABLE – II DISTRICT WISE IMPOUNDED WATER AREAS IN WEST BENGAL
(IN HECTARES)
Sl. No. Sl.No Name of the District Culturable
1. Cooch-behar 1598.11
2. Jalpaiguri 386.36
3. Dinajpur (Uttar + Dakshin) 9678.66
4. Malda 2967.94
5. Birbhum 15260.62
6. Murshidabad 11161.76
7. Nadia 4579.56
8. Burdwan 20618.79
9. Howrah 4240.45
10. Hoogly 9224.22
11. 24 Parganas (N) 8641.45
12. 24 Parganas (S) 11237.79
13. Midnapore
(E+W) 21886.55
14. Bankura 17553.56
15. Darjeeling -
16. Purulia 50078.06
TOTAL 194113.88
Source: MEMS, Dept. of Fisheries, Govt. of West Bengal
OBJECTIVES OF THE STUDY
Based on the above discussion, the issues involved in the study i.e., the objectives of the present
study, for which we have undertaken this study, are summarized below:
i) To find out the profitability in cultivation of different types of inland fishes in
different size of ponds;
ii) To identify the involvement of the family laborers in the cultivation of Inland fish;
iii) To identify the adoption of different methods of cultivation of Inland Fish.
PERIOD OF THE STUDY
The present study relates to the period ranging from 1993 -1994 to 2005-2006. The secondary
data is collected for the period 1993-94 to 2002-2003 and primary data is collected during the
period 2003-2004 to 2005-2006.
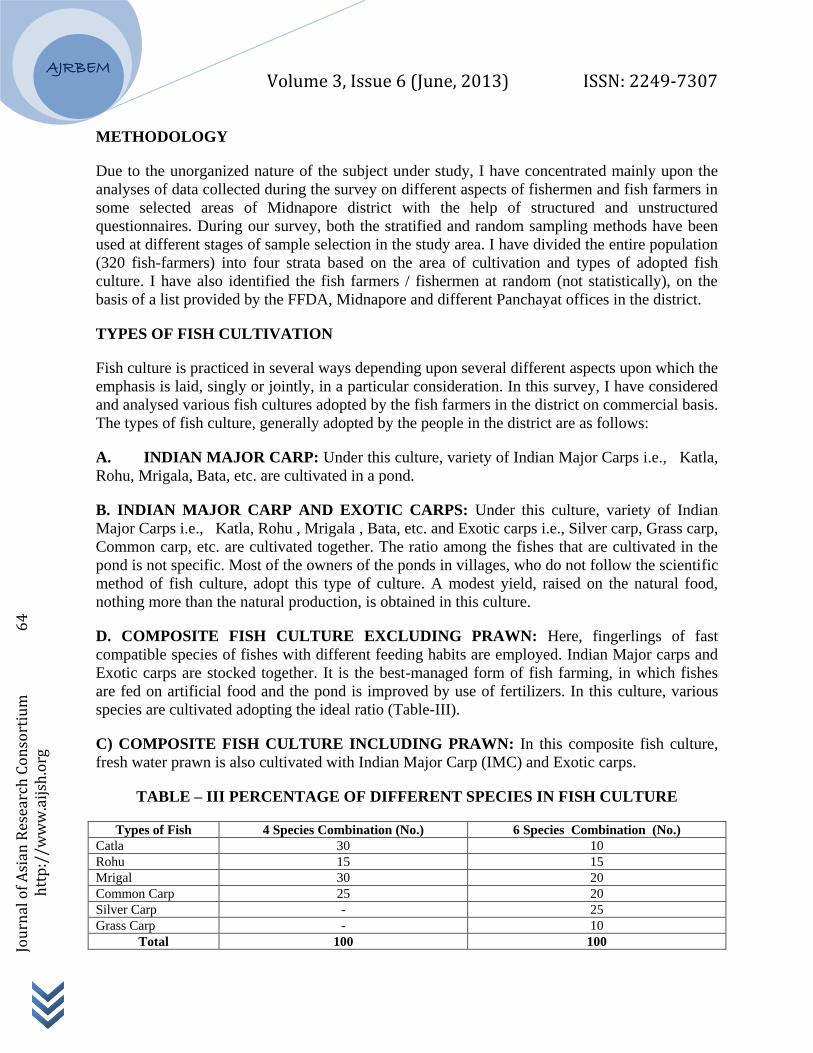
Volume 3, Issue 6 (June, 2013) ISSN: 2249-7307
Jou
rnal
of
Asi
an R
esea
rch
Co
nso
rtiu
m
6
4
h
ttp
://w
ww
.aij
sh.o
rg
AJRBEM
METHODOLOGY
Due to the unorganized nature of the subject under study, I have concentrated mainly upon the
analyses of data collected during the survey on different aspects of fishermen and fish farmers in
some selected areas of Midnapore district with the help of structured and unstructured
questionnaires. During our survey, both the stratified and random sampling methods have been
used at different stages of sample selection in the study area. I have divided the entire population
(320 fish-farmers) into four strata based on the area of cultivation and types of adopted fish
culture. I have also identified the fish farmers / fishermen at random (not statistically), on the
basis of a list provided by the FFDA, Midnapore and different Panchayat offices in the district.
TYPES OF FISH CULTIVATION
Fish culture is practiced in several ways depending upon several different aspects upon which the
emphasis is laid, singly or jointly, in a particular consideration. In this survey, I have considered
and analysed various fish cultures adopted by the fish farmers in the district on commercial basis.
The types of fish culture, generally adopted by the people in the district are as follows:
A. INDIAN MAJOR CARP: Under this culture, variety of Indian Major Carps i.e., Katla,
Rohu, Mrigala, Bata, etc. are cultivated in a pond.
B. INDIAN MAJOR CARP AND EXOTIC CARPS: Under this culture, variety of Indian
Major Carps i.e., Katla, Rohu , Mrigala , Bata, etc. and Exotic carps i.e., Silver carp, Grass carp,
Common carp, etc. are cultivated together. The ratio among the fishes that are cultivated in the
pond is not specific. Most of the owners of the ponds in villages, who do not follow the scientific
method of fish culture, adopt this type of culture. A modest yield, raised on the natural food,
nothing more than the natural production, is obtained in this culture.
D. COMPOSITE FISH CULTURE EXCLUDING PRAWN: Here, fingerlings of fast
compatible species of fishes with different feeding habits are employed. Indian Major carps and
Exotic carps are stocked together. It is the best-managed form of fish farming, in which fishes
are fed on artificial food and the pond is improved by use of fertilizers. In this culture, various
species are cultivated adopting the ideal ratio (Table-III).
C) COMPOSITE FISH CULTURE INCLUDING PRAWN: In this composite fish culture,
fresh water prawn is also cultivated with Indian Major Carp (IMC) and Exotic carps.
TABLE – III PERCENTAGE OF DIFFERENT SPECIES IN FISH CULTURE
Types of Fish 4 Species Combination (No.) 6 Species Combination (No.)
Catla 30 10
Rohu 15 15
Mrigal 30 20
Common Carp 25 20
Silver Carp - 25
Grass Carp - 10
Total 100 100

Volume 3, Issue 6 (June, 2013) ISSN: 2249-7307
Jou
rnal
of
Asi
an R
esea
rch
Co
nso
rtiu
m
6
5
h
ttp
://w
ww
.aij
sh.o
rg
AJRBEM
ECONOMIC RETURN ON FISH CULTIVATION
In this study, Economic Return on fish culture has been measured considering various types of
costs like annual costs on pond preparation, fish seeds/fingerlings, supplementary feed, netting &
medicine, wages of hired labour, notional interest on working capital, notional rent on pond, and
imputed value of family labour. I have also calculated costs under various concepts like A1
(Total Direct cost), B (Cost as per concept A1 + Notional Interest on working capital + Notional
Rent of pond), and C (Cost as per concept B + Notional cost of family labour) and have
presented that in Table-VI. Under A1 concept, the various costs included are all actual expenses
incurred by the owner in cash and kind for production. The total returns are measured in the
following way:
a) Net profit = Total Returns – Total costs(C)
b) Percentage of Net profit on Total costs = (Net profit / Total costs) x 100
c) Return on Capital Employed = [(Average net profit + Average opportunity cost of
family labour) / Average Direct costs] x 100
d) Pure profit = Net profit + Notional expenses (i.e., Interest on working capital + Rent
on pond + Opportunity cost of family labour)
e) Extra Profit on Direct costs (A1) = (Notional expenses / Direct costs) x100
f) Input-Output ratio = Total Returns / Total Costs
CASE STUDY
I have prepared four tables to find out the Return on Investment compiling the available data on
survey of 320 fish farmers of the district (undivided). In preparing the said tables, I have
categorized the opinions of fish farmers in this survey, based on four types of fish culture i.e., i)
Culture of Major Carps, ii) Culture of Major Carps & Exotic Carps, iii) Composite Fish Culture
excluding Prawn, iv) Composite Fish Culture including Prawn and also based on area of ponds
like: i) Up to 1 hectare water area (Small Pond), ii) Above 1 hectare to 1.5 hectares (Medium
Pond), iii) Above 1.5 hectares to 2 hectares (Big Pond), and iv) Above 2 hectares (Large Pond).
Calculations have been made to compute Net profit and Percentage of Net profit on Total Costs
for various types under both the bases i.e., adopted fish culture and category of pond. A table
(Table-IV) presents the results on profitability in fish culture based on various water areas. With
the help of various data on costs, incomes, and ratios, profitability is computed and presented in
various forms like Return on Capital Employed, Pure profit, Extra Profit on Direct Costs and
Input-Output ratio. The data presented in Table V have been compiled from the tables prepared
on various types of fish culture i.e., i) Culture of Major Carps, ii) Culture of Major Carps &
Exotic Carps, iii) Composite Fish Culture excluding Prawn, iv) Composite Fish Culture
including Prawn. Averages of various costs and incomes based on area of ponds i.e. i) Up to 1
hectare water area, ii) Above 1 hectare to 1.5 hectares, iii) Above 1.5 hectares to 2 hectares, and
iv) Above 2 hectares have been computed. Though the analytical financial data are not available

Volume 3, Issue 6 (June, 2013) ISSN: 2249-7307
Jou
rnal
of
Asi
an R
esea
rch
Co
nso
rtiu
m
6
6
h
ttp
://w
ww
.aij
sh.o
rg
AJRBEM
from all the fish farmers under this survey, I have tried to categorize them in a systematic way
according to the requirements. While preparing the tables, I have shown separately the notional
interest on average working capital, notional expenses for wages of family labours, and notional
rent on pond. The notional rent of pond per hectare per year is shown as Rs. 20000. The rent of
pond is not equal in all areas of the district, yet it is around the said figure of Rs. 20000.
Considering the rent on leased-in pond in various areas of the district and the opinions of sample
fish farmers in the district, the rent per hectare is considered to be Rs. 20000 at a flat rate. The
net profit has been calculated after taking into account the expenses on notional cost. I have also
prepared a table to show the pure profit which is calculated after subtracting the notional
expenses like notional rent on pond, interest on capital, and opportunity cost for wages of family
workers (Table-V). From Table-V, it is evident that the total cost for fish cultivation in small
pond is much higher than that in large pond (as per concept C); but the direct cost for fish
cultivation in small pond is much lower than that in larger pond. It indicates that the extra
expenditure on account of notional wages is actually the income in the hands of fish farmer. On
the basis of available data, I have tried to find out net profit on total cost, extra profit on direct
cost, and pure profit (deducting notional expenses) on four categories of ponds based on areas.
If we consider the FFDA (Fish Farmers Development Agency) schemes, where
composite fish culture is in operation, the economic return is 127 % (Scheme-1). In the scheme
where prawn is included in fish culture, the economic return is calculated to be 163 % on
investment due to high rate and demand of prawn (Scheme-2). In those schemes, labour cost is
not included, as it might have been thought that fish farmers and their family members would
have met the labour requirements. If we consider the labour cost (including notional wages of
family labour), which is estimated at about Rs. 50,000 calculated @ Rs.70/- per man-day, the
profit would have been lower by Rs. 50,000; at the same time if we take into account the revised
govt. rate of fish which is Rs.57 i.e., an increase of Rs.22 per kg. (Economic Review, 2002-2003)
as compared to the calculated rate in the above schemes, the income would be increased to
Rs.55000 such that the profit figure would not be so much affected in case of either of the
schemes.
So if a person cultivates fish in his pond, he may get fair return on his investment and
may also create employment opportunities not only to himself but also to other persons in the
society. Considering the earnings from notional wages of family labours and notional rent of
pond, a fish farmer, following the scientific method of fish culture in fish cultivation, earns more
profit on his investment with a minimum amount of risk. A fish farmer can also earn 100 %
profit on cost by cultivating prawn, which is measured at Rs.10, 000 in one Bigha (about 0.5
hectare ; as the total decimals for 1 Bigha varies in various parts of the district) of pond (as per
FFDA Report). It takes a period of 2½ to 3 months to make fries. So, in a pond, the cultivation of
fry may be operated 4 to 5 times a year.

Volume 3, Issue 6 (June, 2013) ISSN: 2249-7307
Jou
rnal
of
Asi
an R
esea
rch
Co
nso
rtiu
m
6
7
h
ttp
://w
ww
.aij
sh.o
rg
AJRBEM
TABLE- IV STATEMENT SHOWING THE MARGIN OF PROFIT IN VARIOUS
METHODS OF FISH CULTURE
(MARGINS IN %)
Source: Compiled from Tables based on areas of ponds.
TABLE- V STATEMENT SHOWING PROFITABILITY IN FISH CULTURE (UNIT 1H)
Aver
ag
e
91741
91.1
2
57291
2865
20000
20370
43235
77.8
1
134975
198.2
9
1.9
1
Ab
ove
2 H
98869
102.5
6
65825
3291
20000
6815
30106
45.7
4
128975
160.5
5
2.0
3
Ab
ove
1.5
H
up
to
2H
94708
95.5
7
58850
2943
20000
16775
39718
67.4
9
134426
189.4
4
1.9
6
Ab
ove
1H
Up
to
1..5 H
89957
88.1
0
53850
2693
20000
25050
47743
88.6
6
137700
213.5
7
1.8
8
Up
to
1H
83428
78.2
4
50638
2532
20000
32840
55372
104.4
1
138800
229.6
1
1.7
8
Siz
es o
f
Ponds
Surv
ey
ed
Aver
ag
e N
et
pro
fit
(Rs.
)
(A)
Rat
e of
Net
pro
fit
on
Tota
l
Cost
(%)
Tota
l
Dir
ect
Cost
(Rs.
)
(B)
Aver
ag
e Inte
rest
on
Work
in
g
Cap
ital
(Rs.
)
(C)
Noti
ona
l R
ent
on
pond
(Rs.
)
(D)
Aver
ag
e Noti
ona
l Wag
es
of
Fam
ily
labour
(Rs.
)
(E)
Extr
a
Pro
fit
(Rs.
)
(F)
Rat
e of
Extr
a
Pro
fit
on
Dir
ect
Cost
(%)
F/B
x10
0
Pure
Pro
fit
(Rs.
)
(A+
C+
D+
E)
Ret
urn
on
Cap
ital
Em
plo
y
ed (
%)
(A+
E)/
Bx100
Input
–
Outp
ut
Rat
io
Types of Fish
culture
SIZES OF PONDS SURVEYED Average
Rate Up to 1 H Above 1 H
To 1.5 H
Above 1.5H
To 2 H
Above 2 H
Major Carp 62.09% 71.94 % 80.53% 89.74% 76.08%
Major Carp &
Exotic Carp
75.28% 85.75 % 92.90% 98.53% 88.12%
Composite Fish
culture excluding
Prawn
83.07% 93.03 % 99.35% 107.68% 95.78%
Composite Fish
culture including
Prawn
92.52% 101.71 % 109.50% 114.32% 104.51%
Average 78.24% 88.10 % 95.57% 102.56% 91.12%

Volume 3, Issue 6 (June, 2013) ISSN: 2249-7307
Jou
rnal
of
Asi
an R
esea
rch
Co
nso
rtiu
m
6
8
h
ttp
://w
ww
.aij
sh.o
rg
AJRBEM
Source: Compiled from the Tables for i) Major Carp, ii) Major Carp & Exotic Carp, III)
Composite Fish culture excluding Prawn, and iv) Composite Fish culture including Prawn fish
cultivations.
TABLE-VI COST OF FISH PRODUCTION PER HECTARE UNDER DIFFERENT
COST CONCEPTS (UNIT-1 HECTARE)
(FIGURES IN RS.)
Source: Compiled from Field Survey
TABLE – VII STATEMENT SHOWING THE PROFIT ON TOTAL COST IN VARIOUS
METHODS OF FISH CULTURE (UNIT – 1 H)
(FIGURES IN RS.)
Source: Compiled from Field Survey
Cost
Concepts
Up to 1 H Above
1 H to 1.5H
Above
1.5 H to 2H
Above 2 H Average
Cost A1 50638 53850 58850 65825 57291
Cost B 73170 76543 81793 89116 80156
Cost C 106090 101593 98568 95931 100546
Types of
Fish Culture
Total
Direct
Costs
(A)
Noti
on
al
Cost
Tota
l C
ost
Sales Profit Pure
Profit
(Profit +
Notional
cost)
(B)
Rate
of
Pure
profit
(B/A x
100)
Major Carp 52712 43766 96478 169412 72934 116700 221.39
Major Carp
& Exotic
Carp
54763 43038 97801 183475 85674 128712 235.03
Composite
Fish culture
excluding
Prawn
53625 42956 96581 188800 92219 135175 252.07
Composite
Fish culture
including
Prawn
68062 43169 111241 227175 115944 159113 233.78
Average 57290.5 43232.25 100525.25 192215.50 91692.75 134925 235.57

Volume 3, Issue 6 (June, 2013) ISSN: 2249-7307
Jou
rnal
of
Asi
an R
esea
rch
Co
nso
rtiu
m
6
9
h
ttp
://w
ww
.aij
sh.o
rg
AJRBEM
SCHEME NO. 1 (AREA: 1 HECTARE): This is a scheme for fish culture in cultured tank by
introducing composite fish culture. The details of the scheme are presented below:
(A) BREAK UP OF UNIT COST OF CULTURABLE POND: RS.
I. CAPITAL COSTS
i) Rearing of embankment, leveling, de-weeding, etc. 1,200
ii) Equipments (like nets and hapas) 2,000
3,200
II. COSTS OF CULTURE
i) Mohua Oil Cake 2500 kg. @ Rs.550 per quintal (qtl.) 13,750
ii) Lime 300 kg. @ 400 per qtl. 1,200
iii) Cow Dung 100 qtl. @ Rs.35 per qtl. 3,500
iv) Single Super phosphate 500 kg @ Rs.335 per qtl. 1,675
v) Urea 350 kg. @ Rs.480 per qtl. 1,680
vi) Fish Seed (10 cm. and above) 5,000 Nos. @ Rs.600 per 1,000 Nos. 3,000
vii) Fish Feed 2500 kg. @ Rs.500 per qtl. 12,500
viii) Netting, Prophylactic, Medicine, etc. 1,200
38,505
SUMMARY
I. Capital Cost 3, 200
II. Costs of Culture 38, 505
41, 705
Total Cost per hectare Say, Rs.41, 700
(B) PRODUCTION & INCOME: RS.
a) Production 2,500 kg.
b) Income by sale of fish @ Rs.35 per kg. 87, 500
Volume 3, Issue 6 (June, 2013) ISSN: 2249-7307
Jou
rnal
of
Asi
an R
esea
rch
Co
nso
rtiu
m
7
0
h
ttp
://w
ww
.aij
sh.o
rg
AJRBEM
(C) SOURCES OF FUNDS
a) Subsidy 20 % of project cost (ceiling/hectare) 6,000
b) Bank Loan 35,000
Total 41,000
(D) ECONOMICS
a) Gross Income by sale of fish 87,500
b) Less: Fixed Costs (same per hectare p.a.): Rs.
i) Culturable Cost 38, 505
ii) Repayment of Bank Loan in equitable
installment (repayment period 3 years
including grace period of 1 year) 11,900
iii) Interest on Bank Loan @ 14 % p.a. 3, 332 53, 737
Net Profit Rs. 33, 763
Note: In case of SC/ST farmers, subsidy is available @ 25 % of project cost subject to limitation
of Rs.7500 per hectare.
Source: FFDA, Midnapore.
SCHEME NO. 2: Polyculture of Fresh Water Prawn with Carps (IMC& Exotic Carps) in
culturable ponds (Area: 1 Hectare):
(A) BREAK UP OF UNIT COST OF CULTURABLE POND: Rs.
I. CAPITAL COSTS
i) Rearing of embankment, leveling, de-weeding, dewatering,
and drying of pond bed 1,200
ii) Equipments (like tools, nets, etc.) 2,000
3,200

Volume 3, Issue 6 (June, 2013) ISSN: 2249-7307
Jou
rnal
of
Asi
an R
esea
rch
Co
nso
rtiu
m
7
1
h
ttp
://w
ww
.aij
sh.o
rg
AJRBEM
II. COSTS OF CULTURE
i) Mohua Oil Cake 2000 kg. @ Rs.550 per quintal (qtl.) 11,000
ii) Lime 300 kg. @ 400 per qtl. 1,200
iii) Cow Dung 100 qtl. @ Rs.35 per qtl. 3,500
iv) Single Super phosphate 500 kg @ Rs.335 per qtl. 1,675
v) Urea 350 kg. @ Rs.480 per qtl. 1,680
vi) Fish Seed (10 cm. and above) 3,500 Nos. @ Rs.600 per 1,000 Nos. 2,100
vii) Prawn seed (5 cm. size) 15,000 Nos. @ Rs. 1000 per 1000 Nos. 15,000
viii) Fish Feed 2000 kg. @ Rs.500 per qtl. 10,000
ix) Prawn feed 900 kg. @ Rs.21 per kg. 18,900
x) Netting, Prophylactic, Medicine, etc. 2,000
67,055
SUMMARY
I. Capital Cost 3, 200
II. Costs of Culture 67, 055
70,255
Total Cost per hectare Say, Rs. 70, 300
(B) PRODUCTION & INCOME: RS.
Production & Sale:
Prawn 500 kg. @ Rs.230 per kg. 1,15,000
Carp 2000 kg. @ Rs. 35 per kg. 70,000
1,85,000
(C) SOURCES OF FUNDS
a) Subsidy 20 % of project cost (ceiling / hectare) 13,411

Volume 3, Issue 6 (June, 2013) ISSN: 2249-7307
Jou
rnal
of
Asi
an R
esea
rch
Co
nso
rtiu
m
7
2
h
ttp
://w
ww
.aij
sh.o
rg
AJRBEM
b) Bank Loan 56,844
Total 70,255
(D) ECONOMICS
a) Gross Income by sale of fish 1,85,000
b) Less: Fixed Costs (same per hectare p.a.): Rs.
i) Culturable Cost 67,055
ii) Repayment of Bank Loan in equitable
installment (repayment period 3 years
including grace period 1 year) 18,948
iii) Interest on Bank Loan @ 14 % p.a. 5,305 91,308
Net Profit Rs. 93,692
Note: In case of SC/ST farmers, subsidy is available @ 25 % of project cost per hectare.
Source: FFDA, Midnapore.
OBSERVATION
1. It is analysed that 28 % of the sample fish farmers prefers to the historical method of
fish cultivation; rather they have lack of interest in increasing their present production. It
is also seen that 70% of the fish farmers hold less than 1.5 hectares who do not prefer fish
cultivation on commercial basis and they opt for cultivating in large area adopting
scientific method of fish culture.
2. It may be observed from Table-VI that the cost of fish production is higher on small &
medium size ponds (Cost C - about Rs. one lakh) than that in large and big ponds (Cost C
- about Rupees ninety seven thousand) but the paid out cost (Cost A1) is comparatively
lower in small and medium size ponds than that in big and large ponds. The difference
between Cost B and Cost C is comparatively higher in small and medium size ponds (Rs.
twenty eight thousand) than that of big ponds (about Rs. sixteen thousand) and large
ponds (about Rs. six thousand). It clearly indicates the use of large number of family
labour in fish production on small and medium ponds. It is also analysed that the fish
farmers operating small and medium size ponds used larger number of family labour in
fish production and they could earn extra income realizing the opportunity cost in the
form of wages of family labour (Table-V).
Volume 3, Issue 6 (June, 2013) ISSN: 2249-7307
Jou
rnal
of
Asi
an R
esea
rch
Co
nso
rtiu
m
7
3
h
ttp
://w
ww
.aij
sh.o
rg
AJRBEM
3. It is also seen that the marginal farmers are shifting towards the inland fish cultivation
for their assured income due to stable employment facility in this sector throughout the
year. As the supply of inland fish is controlled by the fish cultivator as to the demand in
the market, there is every scope of increasing income from time to time. The marginal
farmers generally cultivate fishes without adopting composite fish culture and they earn
profit at the rate of about 80% to 90% on cost excluding the income generated from the
notional wages of family workers (Table-IV).
4. It may be observed from Table IV that the net profit on total cost, on an average, is
estimated to be 91.12% in case of sample ponds but it is the highest in case of large
ponds (102.56%) followed by big ponds (95.57%), medium ponds (88.10%), and small
ponds (78.24%); it indicates that the profit is increased with the increase in size of ponds
due to decrease in direct cost for cultivation per hectare. It is analysed from Table-V that
the return on capital employed, on an average, as calculated is 198.29%. But it is the
highest in small ponds (229.61%), followed by medium ponds (213.57%), big ponds
(189.44%), and large ponds (160.55%). That reveals that the extra profit, on an average,
is estimated to be 77.81%, but it is the highest in small ponds (104.41%), followed by
medium ponds (88.66%), big ponds (67.49%), and large ponds (45.74%). It is also seen
that pure profit is highly encouraging which, on an average, is estimated at Rs. one lakh
thirty four thousand but it is the highest in small pond (Rs.1.38 lakh) followed by
medium pond (Rs.1.37 lakh), big pond (Rs. 1.34 lakh), and large pond (Rs.1.28 lakh).
5. It is measured from the Table- IV that the ‘Net profit on total cost’ per hectare of
water area in composite fish culture including prawn is the highest (104.51%) followed
by the composite fish culture excluding prawn (95.78%), culture of major carp & exotic
carp (88.12%), and culture of major carp (76.08%).
6. It may be observed that the return per rupee of investment i.e., input-output ratio, on
an average, is 1.91 but it is the highest in case of large pond (2.03), followed by big pond
(1.96), medium pond (1.88), and small pond (1.78); it indicates that fish culture is viable
in large pond in better return to own factor of production (Table- V). It may be noted that
all sizes of ponds generate much higher return on investment, indicating that the fish
farming is one most profitable operation. Moreover, it is also evident that higher return
on investment is directly related to the size of ponds; the larger the size of the pond, the
higher is the return on investment.
7. It may be observed that total cost in Composite Fish culture is the highest
(i.e. Rs. 1,11,241) in comparison to the other types of fish culture. It is measured that the
pure profit per hectare in composite fish culture with prawn is the highest (i.e. Rs. 1,
59,113) but rate of pure profit on direct cost is the highest in ‘composite fish culture
excluding prawn’ (i.e. 252.07 %) followed by i) Major Carp & Exotic Carp fish culture
(235.03 %), ii) ‘composite fish culture including prawn’ fish culture (233.78 %), and iii)
Major Carp fish culture (221.39 %). It is also observed that the rate of pure profit in
‘composite fish culture including prawn’ is lower in comparison to other types of fish
culture due to the highest direct cost in this culture (Table-VII).

Volume 3, Issue 6 (June, 2013) ISSN: 2249-7307
Jou
rnal
of
Asi
an R
esea
rch
Co
nso
rtiu
m
7
4
h
ttp
://w
ww
.aij
sh.o
rg
AJRBEM
CONCLUSION
In the district, almost every villager having land is the owner of ponds, whatever may be its size.
They cultivate fishes only to meet domestic requirement. The rural people who have some
culturable water areas may be motivated for fish cultivation at least under traditional method of
fish culture where only fingerlings are to be put into the water. Proper awareness programme
may be organized by the Govt. in every remote village to induce the villagers for cultivation of
fishes by adopting scientific method of fish culture. In this way Inland fishery may be developed
rapidly so that it may not only create a source of extra income to the villagers but also solve the
problem of rural seasonal unemployment directly or indirectly; it is more so as the demand for
Inland fishes remains more or less constant throughout the year. Incidence of labour cost in such
proportion speaks of high labour intensive nature of this type of activities. Therefore, it appears
that a reduction of wages cost may render fish culture more profitable. Due to limited
opportunities for employment and near stagnation in agriculture, people in rural areas are
compelled to live on hand to mouth and are always engaged in searching for employment, no
matter how less remunerative it might be. The problems get aggravated by the presence of
disguised unemployment along with under-employment in agriculture. In such a situation the
opportunity cost of rural labours, particularly the women and children, is almost zero. Hence,
with a view to supplementing a part of their family income, this workforce may be engaged in
less remunerative jobs in small scale household activities like inland fisheries etc. where the
marginal value of labour is, at least, positive. Besides, the workers in villages do not consider the
unpaid cost elements of wages, depreciation on assets as well as interest on capital, in their cost
estimation. They consider earnings from their traditional pursuits as sufficiently meaningful and
a way of gainful occupation for the members of their family.
Cultivation of Prawn is a profitable business. Some fish farmers cultivate prawn with carps. Due
to the nature of low survival of the prawn, all fish farmers are not interested in cultivating them.
They cannot also enjoy the reasonable price advantage due to some market players like
middlemen of the fish market. If proper training is given to the fish farmers regarding scientific
culture of ‘prawn with carps’ and the provision of sales at reasonable price is guaranteed, the
production of prawn can be increased rapidly. At present the demand as well as the selling price
of prawn is high in foreign market; so the export of prawn may be possible to earn foreign
exchange. The Govt. should extend its support in the form of provision for export facilities to the
rural people in every block of the district.
REFERENCES
1. Quoted from Shukla, M. C., Business Organization and Management, S. Chand &
Company Ltd., New Delhi, 2001, p.709.
2. First Five- Year Plan, Govt. of India.
3. Kahlon, A. S. & George, M. V., Agricultural Marketing and Price Policies, Allied
Publishers Pvt. Ltd., New Delhi, 1985, p.12.

Volume 3, Issue 6 (June, 2013) ISSN: 2249-7307
Jou
rnal
of
Asi
an R
esea
rch
Co
nso
rtiu
m
7
5
h
ttp
://w
ww
.aij
sh.o
rg
AJRBEM
4. Datta, R. & Sundaram, K. P. M., Indian Economy, S. Chand & Company Ltd., New
Delhi, 2000, p. 580.
5. Rao, Darsi Vishnu Sankar, & Raju V. T., Economics of Fisheries Technologies, Ambika
Book Agency, Jaipur-16, 1998, p. 107.
6. Srivastava, C.B.L., A textbook of Fishery Science and Indian Fisheries, Kitab Mahal,
Allahabad, 2002, p. 256.
7. Ibrahim, P., Fisheries Development in India, Classical, New Delhi, 1992, p. 51.
8. Singh, R. K. P, Economics of Aquaculture, Daya Publishing House, Delhi-110035, 2003.
9. Biswas, K. P., A Text Book of Fish, Fisheries & Technology, Narendra Publishing
House, Delhi, 1996, p. 540.

Volume 3, Issue 6 (June, 2013) ISSN: 2249-7307
Jou
rnal
of
Asi
an R
esea
rch
Co
nso
rtiu
m
7
6
h
ttp
://w
ww
.aij
sh.o
rg
AJRBEM
A P e e r R e v i e w e d I n t e r n a t i o n a l J o u r n a l
o f A s i a n R e s e a r c h C o n s o r t i u m
AJRBEM:
A S I A N J O U R N A L O F
R E S E A R C H I N B U S I N E S S
E C O N O M I C S A N D
M A N A G E M E N T
A STUDY ON QUALITY OF WORK LIFE AT A GARMENT
MANUFACTURING UNIT IN PERNDURAI – A CASE STUDY
D. ANBUGEETHA*
*Senior Research Fellow,
Bharathiar School of Management and Entrepreneur Development,
Bharathiar University,
Coimbatore, India.
ABSTRACT
Quality of work life refers to the favourable and unfavourableness of the job
environment for people. Since people and environment have changed, increased
attention needs to be given to improve the quality of work life. Quality of work life
has three aspects, the psychological, the physical and the economical aspect.
The psychological aspect of QWL is what people do at work and the way they do
work. The physical aspect of QWL is the condition in which people work and the
management’s attitude towards safety, pollution, work environment etc., The
economic aspect of QWL is what they are paid for what they do and the standard of
living.
The paper entitled “A STUDY ON QUALITY OF WORK LIFE AT A GARMENT
MANUFACTURING UNIT IN PERUNDURAI- A CASE STUDY” tries to identify,
the quality of work life in the selected organization and also to identify the factors
influencing quality of work life.
KEYWORDS: Quality of work life, Psychological aspect, Physical Aspect,
Economic aspect.
_____________________________________________________________________________

Volume 3, Issue 6 (June, 2013) ISSN: 2249-7307
Jou
rnal
of
Asi
an R
esea
rch
Co
nso
rtiu
m
7
7
h
ttp
://w
ww
.aij
sh.o
rg
AJRBEM
INTRODUCTION
THE INDUSTRY
Indian textile industry is one of the leading industries in the world. Currently it is estimated to be
around US$ 52 billion and is also projected to be around US$ 115 billion by the year 2012. The
current domestic market of textile in India is expected to be increased to US$ 60 billion by 2012
from the current US$ 34.6 billion. The textile export of the country was around US$ 19.14
billion in 2006-07, which saw a stiff rise to reach US$ 22.13 in 2007-08. The share of exports is
also expected to increase from 4% to 7% within 2012. Though during the year 2008-09, the
industry had to face adverse agro-climatic conditions, it succeeded in producing 290 lakh bales
of cotton comparing to 315 lakh bales last year, and yet managed to retain its position as world's
second highest cotton producer.
STRENGTH OF THE INDUSTRY
Vast textile production capacity
Large pool of skilled and cheap work force
Entrepreneurial skills
Efficient multi-fibre raw material manufacturing capacity
Large domestic market
Enormous export potential
Very low import content
Flexible textile manufacturing systems
WEAKNESS OF THE INDUSTRY
Increased global competition in the post 2005 trade regime under WTO
Imports of cheap textiles from other Asian neighbours
Use of outdated manufacturing technology
Poor supply chain management
Huge unorganized and decentralized sector
High production cost with respect to other Asian competitors
Volume 3, Issue 6 (June, 2013) ISSN: 2249-7307
Jou
rnal
of
Asi
an R
esea
rch
Co
nso
rtiu
m
7
8
h
ttp
://w
ww
.aij
sh.o
rg
AJRBEM
Post liberalization environment gave rise to a number of textile units which brought about
a competitive business war in India. These units have to face the competition and survive. Every
organization is facing unique problems, some organizations may have old technology, some may
lag in financial strength and some may pause by having obsolete products, some may not have
good working environment, and some may not have job security which may affect the quality of
work life. However many Indian Textile industries are not exceptional one to face the same. Any
attempt at improving the performance of the organization can be successful only if the
organization is able to develop a strong quality of work life. The basic purpose of an organisation
is to develop jobs and working conditions that are excellent for people as well as for the
economic health of the organization. The elements in QWL program include-open
communication, equitable reward systems, a concern for employee job security and satisfying
careers and participation in decision making.
THE CONCEPT
This article reviews literature on quality of work life (QWL) in terms of its meaning and
constructs specifically from the perspective of garment manufacturing. We first review the
definitions of QWL in order to come up with a conclusive meaning of QWL. As the work culture
changes drastically in the recent years, the traditional concept of work to fulfils humans’ basic
needs are also facing out. The basic needs are continued to diversify and change according to the
evolution of the work system and standards of living of a workforce. Thus a definition by Suttle
(1977) on the QWL as the degree to which work are able to satisfy important personal basic
needs through their experience in the organisation is no longer relevant.
Generally jobs in the contemporary work environment offer sufficient rewards, benefits,
recognition and control to employees over their actions. Although to some extent contemporary
workforce are compensated appropriately, their personal spending practices, lifestyles, leisure
activities, individual value systems, health and so forth can affect their levels of need. It is
similar to the argument posted in the Maslow’s hierarchy of needs in which each individual has
different level of needs because in reality what is important to some employees may not be
important to others although they are being treated equally in the same organization. This
definition, focusing on personal needs has neglected the fact that the construct of QWL is
subjective and continuously evolves due to ever growing needs of each and every employee.
Hackman and Oldhams (1980) further highlight the constructs of QWL in relation to the
interaction between work environment and personal needs. The work environment that is able to
fulfill employees’ personal needs is considered to provide a positive interaction effect, which
will lead to an excellent QWL. They emphasized the personal needs are satisfied when rewards
from the organisation, such as compensation, promotion, recognition and development meet their
expectations.
Parallel to this definition, Lawler (1982) defines QWL in terms of job characteristics and
work conditions. He highlights that the core dimension of the entire QWL in the organization is
to improve employees ’well-being and productivity. The most common interaction that relates to
improvement of employees’ well-being and productivity is the design of the job. Job design that

Volume 3, Issue 6 (June, 2013) ISSN: 2249-7307
Jou
rnal
of
Asi
an R
esea
rch
Co
nso
rtiu
m
7
9
h
ttp
://w
ww
.aij
sh.o
rg
AJRBEM
is able to provide higher employee satisfaction is expected to be more productive. However, he
accepted the fact that QWL is complex, because it comprises physical and mental well being of
employees.
Later definition by Beukema (1987) describes QWL as the degree to which employees
are able to shape their jobs actively, in accordance with their options, interests and needs. It is the
degree of power an organization gives to its employees to design their work. This means that the
individual employee has the full freedom to design his job functions to meet his personal needs
and interests. This definition emphasizes the individual’s choice of interest in carrying out the
task. However, this definition differs from the former which stresses on the organization that
designs the job to meet employees’ interest. It is difficult for the organization to fulfill the
personal needs and values of each employee. However if the organization provides the
appropriate authority to design work activities to the individual employees, then it is highly
possible that the work activities can match their employees ’needs that contribute to the
organizational performance.
In the same way Heskett, Sasser and Schlesinger (1997) define QWL as the feelings that
employees have towards their jobs, colleagues and organizations that ignite a chain leading to the
organizations’ growth and profitability. A good feeling towards their job means the employees
feel happy doing work which will lead to a productive work environment. This definition
provides an insight that the satisfying work environment is considered to provide better QWL.
Proceeding to previous definitions, Lau, Wong, Chan and Law (2001) operationalised
QWL as the favorable working environment that supports and promotes satisfaction by providing
employees with rewards, job security and career growth opportunities. Indirectly the definition
indicates that an individual who is not satisfied with reward may be satisfied with the job
security and to some extent would enjoy the career opportunity provided by the organization for
their personal as well as professional growth.
The recent definition by Serey (2006) on QWL is quite conclusive and best meet the
contemporary work environment. The definition is related to meaningful and satisfying work. It
includes (i) an opportunity to exercise one’s talents and capacities, to face challenges and
situations that require independent initiative and self-direction; (ii) an activity thought to be
worthwhile by the individuals involved; (iii) an activity in which one understands the role the
individual plays in the achievement of some overall goals; and (iv) a sense of taking pride in
what one is doing and in doing it well. This issue of meaningful and satisfying work is often
merged with discussions of job satisfaction, and believed to be more favorable to QWL. This
review on the definitions of QWL indicates that QWL is a multi-dimensional construct, made up
of a number of interrelated factors that need careful consideration to conceptualize and measure.
It is associated with job satisfaction, job involvement, motivation, productivity, health, safety
and well-being, job security, competence development and balance between work and non work
life as is conceptualized by European Foundation for the Improvement of Living Conditions.

Volume 3, Issue 6 (June, 2013) ISSN: 2249-7307
Jou
rnal
of
Asi
an R
esea
rch
Co
nso
rtiu
m
8
0
h
ttp
://w
ww
.aij
sh.o
rg
AJRBEM
A CONCEPTUAL MODEL OF QWL
Job characteristics
Significance
Autonomy
Variety
Challenge etc
Personality Traits
Need Patterns
Growth need
Work Ethic. Etc.
Job
involvement
Sense of
competence
Job Satisfaction
Low absenteeism
Low turnover
Productivity
Thus we can define QWL as the degree to which work in an organization contributes to
material and psychological well being of its members. Quality of work life represents a concern
for the human dimensions of work and has a direct response to the problems of increasing
unemployment and declining levels of productivity. It is argued that the problem is very zealous
and desires serious consideration.
The advocates of the viewpoint stress that
(a) Worker alienation and job dissatisfaction are increasing.
(b) The productivity of workers and industry is declining, while counter-productive
behaviour (eg. absenteeism, etc.) is increasing.
(c) The confidence of the public in large institutions is eroding.
Since QWL is directly related to productivity it has become the need of the hour and is
gaining more importance from the organization’s point of view.
CONSTITUENTS OF QWL
The Constituents of Quality of Work Life are Adequate and fair compensation, Safe and healthy
working conditions, Immediate opportunity to use and develop human capacities, Future
opportunity for continued growth and security, Social integration in work environment,
Constitutionalism or the ‘rule of law’ in the work organization, Work and the total life space and
the social relevance of work life.

Volume 3, Issue 6 (June, 2013) ISSN: 2249-7307
Jou
rnal
of
Asi
an R
esea
rch
Co
nso
rtiu
m
8
1
h
ttp
://w
ww
.aij
sh.o
rg
AJRBEM
The model carries the thinking about the relationship between quality of work life
interventions and productivity. It shows that if a particular quality of work life intervention
improves productivity directly, it also can influence productivity indirectly.
Where employee satisfaction increases, as a result of the intervention and improved
productivity, this can ultimately have a positive influence on productivity by attracting good
employees to work for the organisation and by reducing turnover.
MEASUREMENT OF QWL
The following indices may be used to judge the QWL in an organization.
1. JOB INVOLVEMENT
It represents the degree of an individual’s identification with or ego involvement in the job. The
more central the job is to the individual’s life, the greater is his involvement in it. Therefore the
individual spends more time and energy on the job. People with high job involvement are better
motivated and more productive. Research reveals that skill variety, achievement and challenge
help to improve job involvement.
2. JOB SATISFACTION
It implies the worker’s satisfaction with the environment of his job environment consisting of the
nature of work, quality of supervision, pay, coworkers, opportunities for promotion, etc. Job
satisfaction is related to job involvement and people involved in their jobs are satisfied with their
jobs and vice versa.
3. SENSE OF COMPETENCE
It refers to the feeling of confidence that an individual has in his own competence. Sense of
competence and job involvement reinforce each other. An individual acquires a greater sense of
competence as he engages himself more and more in work activities
4. JOB PERFORMANCE
When an individual’s job involvement, job satisfaction and sense of competence increase, there
is a rise in job performance.
5. PRODUCTIVITY
When the level of job performance increase the output per unit of input goes up. Thus match
between job characteristics and productivity traits of employees generally result in higher
productivity.

Volume 3, Issue 6 (June, 2013) ISSN: 2249-7307
Jou
rnal
of
Asi
an R
esea
rch
Co
nso
rtiu
m
8
2
h
ttp
://w
ww
.aij
sh.o
rg
AJRBEM
QWL intervention
Improved Communication
Co - ordination
Improved
Motivation
Improved
Capabilities
Improved
Productivity
Productivity
Productivity
Effect of opportunity on the Quality of work and on productivity
Enhanced
Quality of Work
Experience+
Productivity
Quality of W
ork
THE RELATIONSHIP BETWEEN QUALITY OF WORK LIFE AND PRODUCTIVITY
The figure shows that there are three primary ways a quality of work life intervention or
practice can improve productivity; it can improve communication / coordination, motivation and
employee performance capabilities. Then make a reasonable estimate regarding whether the
intervention will lead to improved productivity.
OPPORTUNITY TO USE AND DEVELOP CAPACITIES

Volume 3, Issue 6 (June, 2013) ISSN: 2249-7307
Jou
rnal
of
Asi
an R
esea
rch
Co
nso
rtiu
m
8
3
h
ttp
://w
ww
.aij
sh.o
rg
AJRBEM
There are a number of ways that a quality of work life intervention can have a positive
effect on productivity. However, improving productivity is dependent on the degree to which the
intervention increases employee satisfaction, communication, motivation, and performance
capability. Indeed, there is reason to believe that the intervention may have to influence
motivation, communication, and capability in order to lead to improved productivity. This
rationale is based on the view that for productivity to increase - motivation, performance
capability, and coordination - all needs to be high in an organisation. If any one of these is low or
missing, the organisation cannot be effective.
From the above discussion it is evident that there is relationship between QWL and
productivity and hence a study has been conducted in a garment manufacturing unit to establish
the relationship between the two variables.
INTRODUCTION TO THE COMPANY
The selected organisation was started in 1993 with 11,000 spindles; this unit has 40,000 spindles
today. The weaving department was started in the year 1997 with 184 looms, which is now
extended to 422 looms, manufacturing different varieties of cotton and synthetic fabrics. The
counts produced in this unit range from 12s to 110s in hanks and cones. The growth rate is
tremendous as reflected by the sales turnover from about Rs 126 lakhs in 1998 – 99 to Rs 462
lakhs in 2004 – 05. The current installed spinning capacity of the group is 2,184 rotors and it
produces 12,500 tonnes of cotton yarn per annum in addition to large volumes of recycled cotton
waste. Recently it has acquired one ring spinning unit having 11,800 spindles, which is
producing around 2 tonnes of yarn per day. The company wants to become an integrated textile
giant producing a range of products from fibre to garments with the most modern plants and
technology. The company is also engaged in the field of manufacturing, supplying and exporting
of high quality knitted and hosiery garments. They started with a zeal and determination to
redefine fashion in the industry. Standing on the grounds of style and elegance, they offer knitted
and hosiery garments that are abreast of the changing international trends. They combine
marketing expertise and creative imagination to deliver designer garments with unique textures,
designs and colors. Each garment is exclusively designed as per the changing fashion trends that
reflect fine craftsmanship and elegance that suit the aesthetic tastes of their clients all across the
globe. They serve their customers with high quality of products along with a wide range of
variety of designs and fabrics. The range of products they deal in are: men’s wear, ladies wear,
casual wear and knit wear. The company’s garments have made inroads in the international
market and have etched a respectable place for our company by catering to the needs and wants
of their clients in the overseas markets.
OBJECTIVES OF THE STUDY
1. To identify the opinion of the employees about the quality of work life in their
organization.
2. To identify the relationship between QWL and productivity.

Volume 3, Issue 6 (June, 2013) ISSN: 2249-7307
Jou
rnal
of
Asi
an R
esea
rch
Co
nso
rtiu
m
8
4
h
ttp
://w
ww
.aij
sh.o
rg
AJRBEM
LIMITATIONS OF THE STUDY
(a) Some of the respondents showed resistance in giving the actual facts, only the
lower level workers were considered for the study.
(b) The study was conducted only among the employees of general shift.
(c) The study may not be applicable to other companies.
RESEARCH METHODOLOGY
The research design used for the study is Descriptive. The study started with the literature survey
through various journals, magazines that helped to comprehend the various facets about work-
life balance and its importance.
DESIGN OF QUESTIONNAIRE
The questionnaire was designed, based on the objectives of the study. The questionnaire
consisted of mainly closed questions and was pilot – tested on a small group. The questionnaire
was used to collect primary data.
THE WORKING HYPOTHESIS
A working hypothesis (H0) was set, based on the objectives of the study.
H01 = There is no significant association between QWL and productivity.
SAMPLE DESIGN
The sample size was 92 respondents from the lower level. The respondents were selected based
on simple random sampling.
ANALYSIS OF DATA
The questionnaire used consisted of 30 questions, which was split into three parts. First part
elicits demographic information. The second part consisted of 17 questions, which elicited
information about the psychological, physical and economic aspects of QWL. The third part
consisted of 4 questions which elicited information about productivity.
The scale used was Likert’s scale with four points; neutral response was removed to
avoid respondent’s biasness. Fully Agree, Agree, Disagree, Fully Disagree with 1 to 4 point
respectively for positive questions points was reversed. The points gained by an individual in the
second part is calculated and the average was used to identify the opinion an employee had about
the quality of work life in the organisation. Higher the score better is his/her opinion. i.e., if the
individual’s score was between 1 to 2, then in his opinion the QWL is moderate, 2 to 3 then in
his opinion the QWL is good, 3 to 4 then in his opinion the QWL is very good in the
organisation. Similarly the points gained by an individual in the third part were calculated and

Volume 3, Issue 6 (June, 2013) ISSN: 2249-7307
Jou
rnal
of
Asi
an R
esea
rch
Co
nso
rtiu
m
8
5
h
ttp
://w
ww
.aij
sh.o
rg
AJRBEM
the average was used to identify his productivity in the organisation. Higher the score, better is
his/her productivity i.e., if the individual’s score was between 1to2, then his productivity is low,
2 to3 then his productivity is medium, 3 to 4 then his productivity is high in the organisation.
TABLE 1 SHOWING THE ASSOCIATION BETWEEN QWL AND PRODUCTIVITY
Productivity level Opinion about QWL
Good Moderate
High 12
8
7
65 Moderate
χ2 (4) = 30.83, p < 0.05
Further Chi Square test was used to infer whether there is significant relationship
between QWL and productivity. Indices used to measure productivity were job involvement, job
satisfaction, sense of competence and job performance. The null hypothesis “there is no
significant association between QWL and Productivity” was formulated for the purpose. Since
the χ2 value (table 1) has achieved the level of statistical significance at 0.05 confidence level H0
is rejected. i.e., there is significant association between QWL and productivity.
FINDINGS OF THE STUDY
Majority (66%) of the respondents felt that the quality of work life was good in the organisation,
from the respondent’s responses it can be identified that all the three aspects of QWL i.e., the
psychological, physical and economical aspects was good in the organisation. But it can also be
understood from the study that only 18% of the respondents felt happy about the career prospects
available in the organisation. Majority (63%) of the respondent’s productivity was good and
there was a significant association between QWL and productivity.
SUGGESTIONS FOR IMPROVEMENT
The survey indicates that the respondents feel that the workload is high. The management
can consider this physical aspect of QWL. Work load can be reduced so as to improve the
quality of work life.
Most of the employees feel that they are insecure in their job. The organization shall
provide for permanent employment which may reduce this anxiety
Frequent counseling programmes can be conducted by the organization, so that the
workers can be relaxed and relieved from their personal problems too.
Grievances handling cell can be introduced. The employee can write their genuine
grievance to the cell to come out of their problems.

Volume 3, Issue 6 (June, 2013) ISSN: 2249-7307
Jou
rnal
of
Asi
an R
esea
rch
Co
nso
rtiu
m
8
6
h
ttp
://w
ww
.aij
sh.o
rg
AJRBEM
CONCLUSION
Quality of work Life refers to the quality of relationship between employees and the total
working environment. It may be considered as industrial democracy or co-determination with
increased employee’s participation in decision making process. Since people and environment
have changed, increased attention needs to be given to improving the quality of work life. Jobs
are required to fit people as well as technology. It should cater to the psychological, physical and
economic aspect of QWL. Hence QWL programmes should look for active involvement of
people so that all employees can make significant contribution to the organizational goals and
purposes. Before initiating any QWL improvement programs, understanding of human
psychology at work is important. The companies that are the best at creating a good QWL will be
able to attract and retain the most skilled workers. The research study showed that the
organisation was good at providing all the aspects of QWL to its employees. On the whole, the
Quality of work life at the selected organization was good. Quality of work life exercises had a
significant influence on the productivity of the employees.
REFERENCES
1. Adhikari, D. R. (2005), Labor Legislation and Quality of Work Life in Nepal, paper
presented at International Society for Labor and Social Security Law, 8th Asian Regional
Congress, October 31- November 3, Taipei, Taiwan, 167-192.
2. Beukema L. Kwaliteit Quality of reduction of working hours. Groningen:
Karstapel, 1987.
3. Gupta. C.B, Human Resource Management, Sultan Chand and Sons, New Delhi
4. Hackman, J.R. & Oldham, G.R. (1980). Work redesign. Reading, MA: Addison-Wesley.
5. Heskett, J.L., Sasser, W.E., Jr, & Schlesinger, L.A. (1997). The service profit chain. New
York: The Free Press.
6. Kothari. C.R, Research Methodology Methods & Techniques, Wishwa Prakashan, New
Delhi, 2002.
7. Lau,T., Wong, Y.H., Chan, K.F., & Law, M (2001). Information Technology and the
work environment – does it change the way people interact at work” Human Systems
Management 20(3), pp.267 – 280.
8. Lawler, E.E. (1982). Strategies for improving the quality of work life. American
Psychologist, 37(5), 486-493.
9. Luthans Fred, Organizational Behaviour, McGraw Hill International Editions,
Singapore, 1992.

Volume 3, Issue 6 (June, 2013) ISSN: 2249-7307
Jou
rnal
of
Asi
an R
esea
rch
Co
nso
rtiu
m
8
7
h
ttp
://w
ww
.aij
sh.o
rg
AJRBEM
10. Newstrom, Davis, Organization Behaviour at Work, Tata McGraw – Hill Publishing
Company, Ltd., New Delhi.
11. Pattanayak, Biswajeet , Human Resource Management, Prentice Hall of India Pvt. Ltd.,
New Delhi, 2001
12. Serey, T.T. (2006). Choosing a robust quality of work life. Business Forum, 27(2), 7-10
13. Suttle, J. L. (1977), Improving Life at Work: Problems and Prospects, in Hackman, J. R.
and Suttle, J. L. (eds.), Improving Life at Work: Behavioral Science Approach to
Organizational Change, California: Goodyear Publishing Company, 1-29.
14. http://www.eurojournals.com/ejss_7_1_05.pdf, retrieved on September 2012
15. http://www.teonline.com/apparel-garments/industry-overview.html, retrieved on
September 2012
16. http://business.mapsofindia.com/india-industry/textile.html, retrieved on September 2012

Volume 3, Issue 6 (June, 2013) ISSN: 2249-7307
Jou
rnal
of
Asi
an R
esea
rch
Co
nso
rtiu
m
8
8
h
ttp
://w
ww
.aij
sh.o
rg
AJRBEM
A P e e r R e v i e w e d I n t e r n a t i o n a l J o u r n a l
o f A s i a n R e s e a r c h C o n s o r t i u m
AJRBEM:
A S I A N J O U R N A L O F
R E S E A R C H I N B U S I N E S S
E C O N O M I C S A N D
M A N A G E M E N T
EXPERIENCE IS A KEY TO SUCCESS IN POULTRY INDUSTRY
DR. S. C. VETRIVEL*; DR. R. SOMASUNDARAM**
*Assistant Professor,
School of Management Studies,
Kongu Engineering College,
Perundurai, Erode, Tamilnadu, India.
**Professor & Head,
Department of Management Studies,
Kongu Engineering College,
Perundurai, Erode, Tamilnadu, India.
ABSTRACT
The poultry industry provides a good employment opportunity for both males and
females along with agricultural activities. The poultry industries were involved with
live stock, which is monitored around the clock and the poultry entrepreneurs are
very much concentrated in utilizing the farm optimally enriching maximum output
through selling the eggs and other allied products like feathers, gunny bags and
poultry litters etc. The poultry entrepreneurs have gained a good profit and a
particular portion of the profit was correctly paid towards income tax. Hence, the
Indian economy gain the momentum through poultry industries. But after the
introduction of globalization, many foreign countries launched their business in
various areas namely production, marketing, transporting, banking, insurance, IT
and IT enabled industries. In order to show much glamour for the industries and
offices they had consumed heavy electricity power and make their premises fully air-
conditioned for round the clock. The state government has not planned well to
distribute the electricity power equally for already existing industries, the newly
arrived foreign originated industries and service oriented organization. This affected
drastically and the frequent power cuts were vested with the shoulders of poultry
farms and feed mills and poultry egg packaging industries. Due to this frequent
power cut, the agriculturalist in the dry land finds difficult to produce first quality
maize, which is the core raw material for poultry feed. Hence, after liberalization
many of the small poultry entrepreneurs were found very difficult to produce the
Volume 3, Issue 6 (June, 2013) ISSN: 2249-7307
Jou
rnal
of
Asi
an R
esea
rch
Co
nso
rtiu
m
8
9
h
ttp
://w
ww
.aij
sh.o
rg
AJRBEM
quality eggs in their poultry farms and these eggs finds difficult to compete in the
global market.
KEYWORDS: entrepreneurs, economy, globalization, industries, eggs.
____________________________________________________________________________
1. INTRODUCTION
India is the third largest producer of eggs the world, producing 34 billion eggs. Poultry sector
plays a pivotal role among the sub-sectors in potentiating the role of animal husbandry in the
process of rural economic development of the state. The Indian Poultry Sector within 7.3 per
cent growth in poultry population, has witnessed one of the fastest annual growth of about 6 per
cent in Eggs and 10 per cent in meat production over the last decade amongst all animal based
sectors. The high growth has placed India at 3rd position in Egg production and 5th in Chicken
meat production on global basis. Even with this development, the per capita vailability is only 52
eggs and 2.3 kg of poultry meat against the recommended levels of 180 Eggs and 11 kg of meat
per annum. Tamil Nadu is leading the states in broiler production with a record production of
397 thousand tonnes in 2009-10. Tamil Nadu ranks second in the country’s egg production with
a production of 10.8 billion eggs. Tamil Nadu accounts for 17.71 per cent of the poultry
population of the country. More than 90 per cent of poultry or poultry products exported from
India originates from Tamil Nadu. At present poultry concentration is restricted to certain poultry
belts such as Namakkal, Erode and Coimbatore. The poultry keeping has evinced great interest
among poultry farmers. There is a good potential for export of eggs, egg products and frozen
chicken meat from our State to Gulf countries, Russia etc. Further, due to the changes in
consumption behavior of the people in the state towards desi chicken and desi eggs, there is great
scope for the development of backyard poultry.
2. NEED FOR THE STUDY
In the last decades the livestock sector has been one of the fastest growing sectors in Indian
agriculture, currently accounting for about 25 percent of agricultural GDP as compared to less
than 14 percent in 1980 (GOI, 2006). These drivers include income growth and urbanization,
advances in production and processing technology and improvements along the supply chain (
Narrod et al., 2008). Within the livestock sector, poultry has been the fastest growing sub-
sector: between 1985 and 2005 poultry egg production grew by about 15% per year, compared
to an annual growth rate of 1.5 to 2% for beef, milk and mutton and lamb. At present, with an
average annual consumption of 1.5 kg of poultry meat and 1.8 kg of eggs (35-40 eggs) per
person, exclusive of milk though, poultry meat and eggs contribute almost 50 percent to the per
capita consumption of animal protein (GOI, 2006).
3. SIGNIFICANCE OF THE STUDY
The small poultry farm owners in the study area are taking more efforts to produce more
quantity of eggs through constant feeding and regular veterinary health check up for the birds.
This incurred an exorbitant cost to purchase high quality poultry feeds and high cost of

Volume 3, Issue 6 (June, 2013) ISSN: 2249-7307
Jou
rnal
of
Asi
an R
esea
rch
Co
nso
rtiu
m
9
0
h
ttp
://w
ww
.aij
sh.o
rg
AJRBEM
maintenance. With all these efforts they have finds difficulty to achieve the expected production
regularly. Simultaneously it is noted that the same poultry farm owners doesn’t have adequate
knowledge to sell the product in the market. Due to the poor literacy and fear of going to urban
area, they are totally depends on middle man to market their products. Hence, a good portion of
profit has been very easily swallowed by middle man, further it was noticed that the poultry
farm owners suffering due to non- availability of regular transport facilities, to shift the eggs
from the poultry farm to various markets located at different parts of the country. During the
transit, there were more chances of getting damaged before reaching to market. With all these
sufferings they also, drastically affected due to non availability of laboures. On the other hand,
the poultry farm owners have obtained loan from banks and financial institutions are very much
affected due to non availability of loans as well as working capital on time. Most of them were
suffered because of refusal of bank loans or purposive delay in sanctioning the loan. Hence,
they were approached private financiers with higher rate of interest and they were under the
clutches and control of private financiers. Some of the farmers have engaged in a contract with
big egg processing units and selling their eggs at very lower price during the contract period,
even though the market price was high. Having witnessed all these problems faced by the
poultry farm owners, the researcher initiated this research work in the field of poultry eggs
production and marketing.
Based on the above issues, the researcher has probed the following questions.
a) How far the poultry farm entrepreneurs were affected by their experience in the poultry
field in the study area.
b) What were the major problems faced by the poultry farm owners during production and
marketing of poultry eggs in relation to their experience.
Based on the above objectives the following hypotheses have been formed.
There is a relationship between experience of the respondents and their success in poultry
industry.
4. REVIEW OF LITERATURE
Sinha and Giri (1989)1 states egg internal quality is measured in several ways including factors
like; yolk color, albumen height, yolk height, Hough unit, yolk width and nutritive values.
Egg’s internal quality could be influenced by factors like; genetic factors, environmental factors
(such as temperature, relative humidity and the presence of CO2), hen age, nutrition status, egg
storage condition and storage time. A good quality egg should be free from internal blemishes
such as blood spots, pigment spots and meat spots.
1 Sinha, P. and A. K. Giri, 1989. Consumption of Livestock Products-Analysis and Comparison of Data of
NSS 32nd and 38th Round. Livestock Economy of India, Oxford and IBH Publishing Co. Pvt. Ltd., New
Delhi.

Volume 3, Issue 6 (June, 2013) ISSN: 2249-7307
Jou
rnal
of
Asi
an R
esea
rch
Co
nso
rtiu
m
9
1
h
ttp
://w
ww
.aij
sh.o
rg
AJRBEM
Juliet (2004)2.There are two components of yolk quality; the color of the yolk and the
strength of the perivitel line membrane which surrounds the yolk, where yolk color is measured
by using Roche color scale .
Samli (2005)3 and Kirunda et al. (2000)4 reported that the poultry industry identified
albumen quality not only to judge the freshness of an egg but also considered it as important for
the egg breaking industry because albumen and yolk have different markets. Although various
measures of albumen quality have been proposed, the Hough unit is used most commonly today
(Silversides, 1994)5.
According to the report of Shawkat (2002)8 both albumen height and Hough units
decreased over time. The color of the yolk is determined by the presence or absence of
xanthophylls, some of which are precursor of vitamin A. If the fed has plenty of yellow-orange
plant pigments, known as xanthophylls, it will be deposited in the yolk. Therefore, yolk color is
influenced by nutrition and dark yellow yolks can be produced by feeding laying birds on green
forage meal.
5. METHOD
The study was undertaken in the Namakkal District of Tamilnadu, India. The respondents were
the poultry farm entrepreneurs and selected using stratified Random Sampling method. The
study was aimed at unearthing the relationship between experience of poultry farm entrepreneurs
and managing the farm in the business success.
For this purpose, the primary data were collected from 523 poultry entrepreneurs who
were producing eggs from their poultry farms. The information was gathered through personal
interview method from the selected poultry entrepreneurs. Further, the details such as factors
influenced to start the business, knowledge on poultry business, the benefits enjoyed, the
problems faced during operational stages in the functional area were gathered. A well structured
Interview Schedule was prepared for the purpose.
6. RESULTS
EXPERIENCE AND SUCCESSFUL OPERATION OF POULTRY BUSINESS
Experience in any field will be counted for the success of any activity. In the case of poultry
business, it is considered as a vital factor for the success in the business. An attempt was made
2 Juliet Roberts, R. 2004. Factors affecting egg internal quality and egg shell quality in laying hens. Journal
of Poultry Science, 41: 161-177. 3 Samli Kondombo, R. 2005. Improvement of village chicken production in a mixed (chickenram)farming
system in Burkina Faso. Ph.D Thesis. Wageningen Institute of Animal Sciences, Animal Nutrition Group,
Wageningen University, the Netherlands. 4 Kirunda, D.F.K. and S.R. McKee. 2000. Relating quality characteristics of aged eggs and fresh eggs to
vitelline membrane strength as determined by texture analyze. Poultry Science Journal, 79: 1189 - 1193. 5 Silversides, E.G. 1994. The Haugh unit correction for egg weight is not adequate for comparing eggs from
chickens of different lines and ages. Journal of Applied Poultry Research, 3: 120-126.
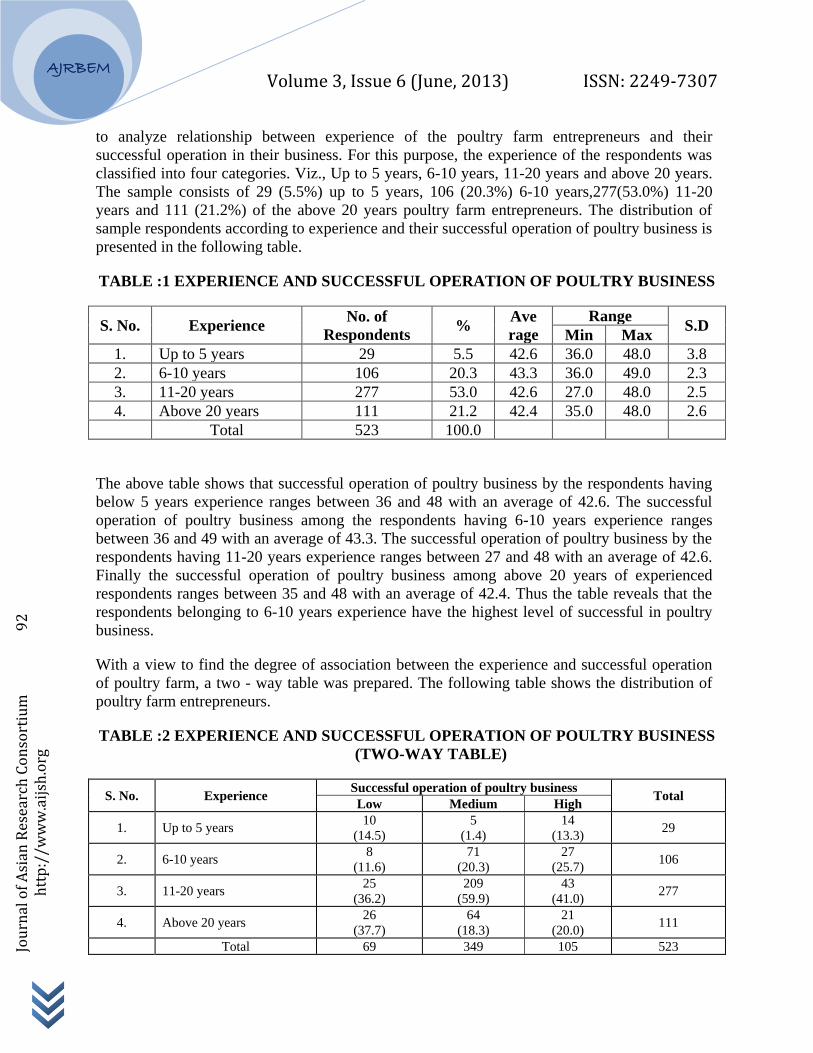
Volume 3, Issue 6 (June, 2013) ISSN: 2249-7307
Jou
rnal
of
Asi
an R
esea
rch
Co
nso
rtiu
m
9
2
h
ttp
://w
ww
.aij
sh.o
rg
AJRBEM
to analyze relationship between experience of the poultry farm entrepreneurs and their
successful operation in their business. For this purpose, the experience of the respondents was
classified into four categories. Viz., Up to 5 years, 6-10 years, 11-20 years and above 20 years.
The sample consists of 29 (5.5%) up to 5 years, 106 (20.3%) 6-10 years,277(53.0%) 11-20
years and 111 (21.2%) of the above 20 years poultry farm entrepreneurs. The distribution of
sample respondents according to experience and their successful operation of poultry business is
presented in the following table.
TABLE :1 EXPERIENCE AND SUCCESSFUL OPERATION OF POULTRY BUSINESS
S. No. Experience No. of
Respondents %
Ave
rage
Range S.D
Min Max
1. Up to 5 years 29 5.5 42.6 36.0 48.0 3.8
2. 6-10 years 106 20.3 43.3 36.0 49.0 2.3
3. 11-20 years 277 53.0 42.6 27.0 48.0 2.5
4. Above 20 years 111 21.2 42.4 35.0 48.0 2.6
Total 523 100.0
The above table shows that successful operation of poultry business by the respondents having
below 5 years experience ranges between 36 and 48 with an average of 42.6. The successful
operation of poultry business among the respondents having 6-10 years experience ranges
between 36 and 49 with an average of 43.3. The successful operation of poultry business by the
respondents having 11-20 years experience ranges between 27 and 48 with an average of 42.6.
Finally the successful operation of poultry business among above 20 years of experienced
respondents ranges between 35 and 48 with an average of 42.4. Thus the table reveals that the
respondents belonging to 6-10 years experience have the highest level of successful in poultry
business.
With a view to find the degree of association between the experience and successful operation
of poultry farm, a two - way table was prepared. The following table shows the distribution of
poultry farm entrepreneurs.
TABLE :2 EXPERIENCE AND SUCCESSFUL OPERATION OF POULTRY BUSINESS
(TWO-WAY TABLE)
S. No. Experience Successful operation of poultry business
Total Low Medium High
1. Up to 5 years 10
(14.5)
5
(1.4)
14
(13.3) 29
2. 6-10 years 8
(11.6)
71
(20.3)
27
(25.7) 106
3. 11-20 years 25
(36.2)
209
(59.9)
43
(41.0) 277
4. Above 20 years 26
(37.7)
64
(18.3)
21
(20.0) 111
Total 69 349 105 523

Volume 3, Issue 6 (June, 2013) ISSN: 2249-7307
Jou
rnal
of
Asi
an R
esea
rch
Co
nso
rtiu
m
9
3
h
ttp
://w
ww
.aij
sh.o
rg
AJRBEM
In order to find the relationship between experiences of the respondents and their level of
successful in the poultry business, a chi-square table was prepared and is shown in the following
table.
H0: There is no significant relationship between experience of the respondents in the industry
and the successful operation of poultry business.
H1: There is a significant relationship between experience of the respondents in the industry and
the successful operation of poultry business.
TABLE: 3 EXPERIENCE AND SUCCESSFUL OPERATION OF POULTRY BUSINESS
(CHI-SQUARE TEST)
Factor Calculated 2
Value Table Value D.F Remarks
Experience 56.105 16.811 6 Significant at 1% level
7. DISCUSSION
It is revealed from the analysis that the percentage of high level of successful in poultry
business was the highest (41.0%) among the 11-20 years experienced poultry farm
entrepreneurs and the lowest (13.3%) among the up to 5 years experienced entrepreneurs. The
percentage of medium level of successful in the business was highest (59.9%) among the 11-20
years experienced entrepreneurs and the lowest (1.4%) among up to 5 years experienced
entrepreneurs. On the other hand, the percentage of low level of successful in the business was
the highest (37.7%) among above 20 years experienced entrepreneurs and the lowest (11.6%) of
the 6-10 years experienced poultry farm entrepreneurs.
The chi-square test reveals that the calculated chi-square value is more than the table
value and the result is significant at 1% level. Hence, the hypothesis “Experience of the
respondents and their successful operation in poultry business” holds good. From the analysis, it
is concluded that there is a close relationship between experience of poultry farm entrepreneurs
and their level of successful operation of poultry business.
8. FINDINGS
It is found from the analysis that the respondents having more than 6-10 years of experience
were identified as successful poultry entrepreneurs than the other categories. The chi-square test
is also proved that there is a close relationship between respondents’ experience in poultry
business and their successful operation.
9. CONCLUSION
The poultry industry occupies an important role in the economy of India because of its
contribution to the industrial output as well as the generation of the employment. As many

Volume 3, Issue 6 (June, 2013) ISSN: 2249-7307
Jou
rnal
of
Asi
an R
esea
rch
Co
nso
rtiu
m
9
4
h
ttp
://w
ww
.aij
sh.o
rg
AJRBEM
restrictions are removed, the poultry entrepreneurs should concentrate on modern technologies,
innovative ideas and improved quality to compete with the global competition and to run the
industry with higher profitability. The state Government also has to take meticulous care and
should analyze the problems of poultry industry and create awareness among the poultry
entrepreneurs to manage efficiently by analyzing new trends in the study area.
REFERENCES
1. Narrod C, Roy D, Okello J, Avendaño B, Rich K, Thorat A. 2009. Public-private
partnerships and collective action in high value fruit and vegetable supply chains. Food
Policy 34 , 8-15.
2. Aberra Melesse, S. Maak and G. Von Lengerken. “The Performance of Naked Neck and
their F1 crosses with Lehman White and New Hampshire chicken breeds under long-term
heat stress conditions”, Ethiopia Journal of Animal Production, Vol.5, No.1, pp.91-106,
2005.
3. AbouI Ella, S.S. “Women of the developing countries and their role in poultry
production”, In proceedings, 19th
World Poultry Congress, Amsterdam, the Netherlands,
Vol.2, pp.697-700, 1992.
4. Acharya, S.S. and R.L. Jogi. “Minimum Support Prices in India: Some Issues”, Working
Paper No. 132, Institute of Development Studies, Jaipur, May 2003.
5. Agarwal, N.L. and B.L. Meena. “Agricultural Marketing in India : Performance of Cumin
Marketing in Rajasthan”, Bihar Journal of Agricultural Marketing, Vol.5, No.3, pp.319-
328, 1997.
6. Alam, J. “Impact of smallholder livestock development project in some selected areas of
rural Bangladesh”, In Livestock for Rural Development, viewed on 10 September 2011,
<www.cipav.org.co/lrrd/ lrrd9/bang932. htm>.
7. Alemu,Y., Teklewold, H., Dadi, L. and Dana, N. “Determinants of adoption of poultry
technology: a double-hurdle approach”, Livestock Research for Rural Development –
Central Para la investigación, Vol.18, No.3, 2006.
<http://www.cipav.org.co.Irrd18/3.count1803html>
8. Countries RIS-DP. “Research and Information System for the Non-Aligned and Other
Developing Countries, New Delhi, India”, Policy Research Institute, Washington, D.C.,
U.S.A., 2002.
9. DeJanvry, A., and Sadoulet E. “How to manage a quick response to the food crisis in
poor countries with weak policy instruments?” Unpublished paper, University of
California at Berkeley, 2008.

Volume 3, Issue 6 (June, 2013) ISSN: 2249-7307
Jou
rnal
of
Asi
an R
esea
rch
Co
nso
rtiu
m
9
5
h
ttp
://w
ww
.aij
sh.o
rg
AJRBEM
10. Emam, A.A. and A.M. Hassan. “Economics of Poultry Egg Production in Khartoum State
with Emphasis on Open-System, Sudan”. African Journal of Agriculture Research, Vol.5,
No.18, pp.2491-2496, 2010.
11. Fattah, K.A., “Poultry as a tool in poverty eradication and promotion of gender equality”,
In Dolberg & Petersen, eds. Poultry as a Tool in Poverty Eradication and Promotion of
Gender Equality, Proceedings workshop, Tune Landboskole, Denmark, pp.16-28, viewed
on 10 September 2011, <http://www.husdyr.kvl.dk/htm/php/tune99/2-Fattah. htm>.
12. Gandhi, V.P. and Mani, G. “Are Livestock Products Rising in Importance? A Study of
the Growth and Behavior of their Consumption in India”, Ind J Agri. Eco, Vol.50,
pp.283-293, 1995.
13. Goutard F. and R. S. Magalheas. “Risk and consequence assessment of HPAI”. CIRAD.
February 2006.
14. Gueye, E.F. “Poverty alleviation, food security and the well-being of the human
population through family poultry in low income food-deficit countries”, Senegalese
Institute of Agricultural research, Dakar-hann, Senegal, 2003.
15. Hamilton, R.M.G. “Methods and factors that affect the measurement of egg shell
quality”, Poultry Science, Vol.61, pp.2002-2039, 1982.
16. Hammerle, J.R. “An Engineering Appraisal of egg shell strength evaluation techniques”.
Poultry Science, Vol.48, pp.1708-1717, 1969.
17. Iposu, S.O., C.F.I. Onwuka and D. Eruvbetine. “The relationship between selected
quality traits and egg size”. Nigerian Journal of Animal Production, Vol.21, pp.56-160,
1994.
18. Juliet Roberts, R. 2004. Factors affecting egg internal quality and egg shell quality in
laying hens. Journal of Poultry Science, 41: 161-177.
Volume 3, Issue 6 (June, 2013) ISSN: 2249-7307
Jou
rnal
of
Asi
an R
esea
rch
Co
nso
rtiu
m
9
6
h
ttp
://w
ww
.aij
sh.o
rg
AJRBEM
A P e e r R e v i e w e d I n t e r n a t i o n a l J o u r n a l
o f A s i a n R e s e a r c h C o n s o r t i u m
AJRBEM:
A S I A N J O U R N A L O F
R E S E A R C H I N B U S I N E S S
E C O N O M I C S A N D
M A N A G E M E N T
A STUDY ON FACTORS INFLUENCING FOR NON MIGRATION TO
URBAN AREA WITH SPECIAL REFERENCE TO KANCHEEPURAM
TALUK
DR. K. S. MEENAKSHISUNDARAM*; DR. N. PANCHANATHAM**
*Professor & Director,
SCSVMV University,
Enathur, Kancheepuram.
**Professor & Head,
Department of Business Administration,
Annamalai University,
Chidambaram.
ABSTRACT
Rural urban migration of agricultural labourers has created a huge cry for labour
and there is a problem of labour scarcity making the farming activities still worse.
But the fact remains that it is possible to get food grains owing to the fact that still
there are agricultural labourers (non migrants) who are the feeders. It becomes
essential to know why these agricultural labourers who remain in the villages and
what are the reasons for their non migration to urban areas. The results reveal these
non migrants have commitment and personal factors which have made them to
remain in the villages.
KEYWORDS: Rural urban migration, non migration & factor analysis.
__________________________________________________________________________
INTRODUCTION
Human migration is the movement made by humans from one place to another. It is common
and becomes easy also due to rapid transport facilities available for such quick movements.
Hence it is a known fact that not only people from the rural areas move but also people from
semi urban and rural areas also move to urban areas owing to the greater potential for
employment and better living conditions. Due to globalisation, liberalisation and due to rapid
Volume 3, Issue 6 (June, 2013) ISSN: 2249-7307
Jou
rnal
of
Asi
an R
esea
rch
Co
nso
rtiu
m
9
7
h
ttp
://w
ww
.aij
sh.o
rg
AJRBEM
industrialisation agricultural labourers have also migrated creating big gap in their availability
and even the farmer who is interested to cultivate is not able to effectively do his occupation and
hence forced to sell his lands by exploitation of the real estate agents. But the very fact remains
that the entire World population have to depend only on the rural population who only feeds all.
Due migration, rapid urbanisation has taken place which leads to certain negative effects such
as heavy population, congestion, environmental pollution, scarcity for water, lack of shelter,
sanitation, lack of proper employment and thus leading to increase in crime rate. Taking in to
account of all the ill effects of migration to urban areas it becomes essential to know from the
angle of non migrants agricultural labouerers what reasons they will attribute for their non
migration to urban areas and why they wanted to remain in the villages though they are aware of
urban facilities and living conditions. Hence a research was conducted to know the reasons for
non migration by non migrants to urban areas.
REVIEW OF LITERATURE
Afsar (2003) stated in his research that the easier movement back and forth from rural and urban
areas serves to improve access to information. Due to the improvement in communication
systems, in many cases migrants are no longer faced with an unknown destination. This in turn
lowers the risks of movement, thereby increasing the chances of rural residents locating jobs in
the urban centers.
According to Ramasubramanian (2003), farmers involved only in agriculture would have
employment only during seasons and hence, they migrate during off-seasons. On the other hand,
when they have cattle in their farm, their presence is needed throughout the year. This restricts
their level of migration.
Reetika Khera (2006) in her open page essay on migration, in general, concluded that public
works offering relatively predictable employment opportunities are likely to be particularly
effective in slowing down rural-urban migration, and also said NREGA is a unique opportunity
to protect people from hardships of distress migration. She also highlighted her experience,
where the migration fell drastically, as the scale of relief works in the sample villages grew, in
the state of Rajasthan, India.
Soumya Mohanty (2012) MGNREGA (earlier known as NREGA) provides an alternative source
of livelihood which will have an impact on reducing migration, restricting child labour,
alleviating poverty, and making villages self-sustaining through productive assets creation such
as road construction, cleaning up of water tanks, soil and water conservation work, etc. which it
has been considered as the largest anti-poverty programme in the world. But the success of this
Act depends upon its proper implementation. MGNREGA also mitigates seasonal/distress
migration which has been a significant source of employment and income for a large proportion
of rural population
METHODOLOGY
Respondents for this study were selected based on the total number of agricultural labourer
population of Kancheepuram District as per 2001 census. For selection of district out of thirty

Volume 3, Issue 6 (June, 2013) ISSN: 2249-7307
Jou
rnal
of
Asi
an R
esea
rch
Co
nso
rtiu
m
9
8
h
ttp
://w
ww
.aij
sh.o
rg
AJRBEM
districts one district Kancheepuram was selected in first stage. In the second stage one taluk
Kancheepuram was selected among the thirteen taluks and in third stage two blocks
Kancheepuram and Walajabad were selected. From each selected block three villages were
selected in the fourth stage. At last in the fifth stage 205non-migrants respondents were selected
from each selected village. The perception of non-migrants responsible for non-migration to
urban areas was obtained using a scale developed by Olayiwola (2005) with slight modification
.A scale was developed in a five point continuum and used for this study.
RESULTS AND DISCUSSION
FACTOR ANALYSIS
TOTAL VARIANCE EXPLAINED BY INITIAL EIGEN VALUES
Component
Initial eigen values
Total Percentage of
variance Cumulative Percentage
1 6.418 64.184 64.184
2 1.847 18.470 82.654
Extraction method: Principal component analysis
Varimax Rotated Factor Loading Matrix
Factors of Non-Migrants Responsible for Non-Migration to
Urban Areas (n=205)
Sl.
No.
Factors Responsible for Non-Migration
to Urban Areas
Factor loadings Communalities
(h2) F1 F2
1 To Manage Ancestral Family Property (X1) 0.696 0.758
2 Acting as Head in The Village (X2) 0.926 0.872
3
To take care of elderly relatives who are
sentimentally attached to
village (X3)
0.770 0.859
4 Self-Satisfied in the village (X4) 0.798 0.637
5 Engaged in the most willing occupation
(X5) 0.718 0.542
6 Proud to do family occupation and
maintain status in the village (X6) 0.913 0.908
7
Since Urban Migration will make to lose
the identity and will create a distance
among the villagers. (X7)
0.756 0.937
8 Like to Live in a peaceful environment
(X8) 0.905 0.889
9 Like to be in a clean natural environment 0.896 0.933

Volume 3, Issue 6 (June, 2013) ISSN: 2249-7307
Jou
rnal
of
Asi
an R
esea
rch
Co
nso
rtiu
m
9
9
h
ttp
://w
ww
.aij
sh.o
rg
AJRBEM
(X9)
10 Since cost of living is cheaper (X10) 0.964 0.931
Eigen values 4.194 4.071
Percentage of variance explained 41.942 40.712
Percentage of cumulative variance
explained 41.942
82.654
Source: Primary Data
As evident from Table 4.112 that 2 factors extracted together account for
87 per cent of total variance. Hence the number of variables has been reduced from 10 to 2
underlying factors.
Variables X1- To Manage Ancestral Family Property loaded as 0.696, X2- Acting as
Head in The Village (0.926), X3- To take care of elderly relatives who are sentimentally attached
to village (0.770), X4- Self-Satisfied in the village (0.798) and X7- Since Urban Migration will
make to lose the identity and will create a distance among the villagers (0.756) on factor 1. These
factors can be named as “Commitment Factors”.
As for factor 2, it is evident that X10- Since cost of living is cheaper has the highest load
of 0.964, X6- Proud to do family occupation and maintain status in the village loaded as 0.913,
X8- Like to Live in a peaceful environment loaded as 0.905, X9 - Like to be in a clean natural
environment loaded as 0.896 and X5- Engaged in the most willing occupation loaded as 0.718,
this factors can be termed as “Personal Willing Factors”.
CONCLUSION
From the results it may be seen that there are farm labourers who does not wanted to migrate to
urban due to many factors and it is necessary to keep them engaged profitably in farming so as to
attract migrants also back to be involved in cultivation .Hence the following suggestions are
made to keep the farming activities interesting and profitable both the cultivators and labourers.
The wards of agricultural labourers have to be taken special care by allowing special concession
in admission of schools, colleges. The educational institutes may implement this as a measure of
social responsibility and it is a chance to serve to the poor who are toiling in hot sun and heavy
rains to feed the Nation
Agricultural labourers and his family members can be provided with free medical treatment. The
medical establishments can do this as a measure of social responsibility and it is a chance to
serve to the poor who are toiling in hot sun and heavy rains to feed the Nation.
It is essential that basic infrastructure facilities like hospitals, schools and other basic
requirements have to be made available in rural areas. This could be done through the scheme
Providing Urban Facilities in Rural Areas (PURA) which will attract the migrated agricultural
labourers.

Volume 3, Issue 6 (June, 2013) ISSN: 2249-7307
Jou
rnal
of
Asi
an R
esea
rch
Co
nso
rtiu
m
1
00
htt
p:/
/ww
w.a
ijsh
.org
AJRBEM
REFERENCES
1 Afsar, R. 2003. Dynamics of poverty, development and population mobility: The
Bangladesh case. Asia Pacific Journal, 19(2): 69-78.
2 Olayiwola, F.O. 2005. Perception of Rural-Urban Migration in Selected Rural
Communities in Ondo State, Nigeria. Available at: www.irsa-
world.org/XII/papers/16,17-3.pdf
3 Ramasubramanian, M. 2003. Developing strategies for sustainable dry farming. Unpub.
Ph.D. Thesis, TNAU, Coimbatore.
4 Reetika Khere.2006. “Employment Guarantee and Migration,” The Hindu 129(198),
Op.Ed 9.
5 Soumya Mohanty. 2012. “Mahatma Gandhi National Rural Employment Guarantee Act
(MGNREGA) and Tribal Livelihoods: A Case Study in Sundargarh District of Odisha”-
A Dissertation Submitted for the Master Degree in Development Studies, Department of
Humanities and Social Sciences, National Institute of Technology, Rourkela , Odisha,
India, May 2012.
Volume 3, Issue 6 (June, 2013) ISSN: 2249-7307
Jou
rnal
of
Asi
an R
esea
rch
Co
nso
rtiu
m
1
01
htt
p:/
/ww
w.a
ijsh
.org
AJRBEM
A P e e r R e v i e w e d I n t e r n a t i o n a l J o u r n a l
o f A s i a n R e s e a r c h C o n s o r t i u m
AJRBEM:
A S I A N J O U R N A L O F
R E S E A R C H I N B U S I N E S S
E C O N O M I C S A N D
M A N A G E M E N T
MINOR IRRIGATION DEVELOPMENT AND POLOCIES IN MODERN
SYSTEMS UNDER DIFFERENT SOURCES IN ANDHRA PRADESH
DR. RADHA RANI KOTHAKALLA*
*Department of Commerce,
U C C & B M,
Osmania University,
Hyderabad, India.
ABSTRACT
Minor irrigation holds the key for the equitable, quick and effective expansion in the
agriculture sector leading to a sustainable growth in the rural economy particularly
in undulating terrain of Deccan Peninsula. Centrality of minor irrigation in rural
economy was highlighted in no uncertain terms by the high level committee
constituted by the Government of Andhra Pradesh to study the implications and
factors responsible for the phenomenon of escalating farmer’s suicides. The Jayati
Ghosh Committee looking into the conditions responsible for creating an adverse
atmosphere for the farmer picked up the declining tank irrigation systems for special
mention as one of the factors precipitating farmer’s - insecurities. The key policy
focus of the new minor irrigation approach was focused integration between new
tanks, groundwater potential leading to a creation of additional capacity in the next
five years, revival and restoration of old tanks, etc. The success of the minor
irrigation strategy depends on accurate and implementation of the projects. The new
minor irrigation approach had expanded the focus from the traditional engineering,
pre- occupation of conducting civil works, to include a range of activities that the
department did not have the qualification and experience to undertake. This paper
stresses a new implementation strategy and institutional arrangement needed to be
created to enable establishment of a multi – disciplinary integrated water
management system in place.
____________________________________________________________________________
Volume 3, Issue 6 (June, 2013) ISSN: 2249-7307
Jou
rnal
of
Asi
an R
esea
rch
Co
nso
rtiu
m
1
02
htt
p:/
/ww
w.a
ijsh
.org
AJRBEM
INTRODUCTION
The secret of rapid agricultural progress in the underdeveloped countries is to be found much
more in agricultural extension, in fertilizers, in new seeds, in pesticides and in water supplies.
Water is indispensable to agricultural production. In areas as where rainfall is plentiful and well
distributed over the year, there is no problem of water. But rainfall in certain areas is usually
scanty as well as uncertain. An important constituent of the current strategy for raising
agricultural production is the increasing agricultural facilities particularly lies under minor
irrigational development through tanks, wells, tube wells and also adopting modern systems.
Minor irrigation holds the key for an equitable, quick and effective expansion in the
undulating terrain of Deccan Peninsula centrality of minor irrigation, in rural economy was
highlighted by the Government of Andhra Pradesh to study the implications and factors
responsible for the phenomenon of escalating farmers suicides. The Jayati Ghosh committee
looking into the conditions responsible for creating an adverse atmosphere for the farmer picked
up the declining tank irrigation systems for special mention as one of the factors precipitating
farmer’s insecurities.
In India irrigation works are classified into major and minor irrigation works. Our study
discusses the minor irrigation development under tanks, wells, tube wells and modern systems
and policies in Andhra Pradesh.
All ground water and surface water schemes that have a Cultivable Command Area
(CCA) up to 2,000 Hectors, individually are classified as minor irrigation schemes. The
development of ground water is mostly don through individual and co-operative efforts of the
farmer’s, with its help of institutional finance and through own savings. Surface water irrigation
schemes are generally funded from the public sector outlay.
The irrigation potential created and utilized under minor irrigation in various plan periods
by ministry of water resource is given in the table below

Volume 3, Issue 6 (June, 2013) ISSN: 2249-7307
Jou
rnal
of
Asi
an R
esea
rch
Co
nso
rtiu
m
1
03
htt
p:/
/ww
w.a
ijsh
.org
AJRBEM
IRRIGATION POTENTIAL CREATED AND UTILISED UNDER MINOR
IRRIGATION SCHEME
Period Potential Created (Million
Hectors)
Potential Utilized (Million
Hectors)
Up to 1951 (Pre-Plan Period) 12.90 12.90
First Plan 14.06 14.06
Second Plan 14.75 14.75
Third Plan 13.00 17.00
Annual Plans (1966-69) 19.00 19.00
Fourth Plan 23.50 23.50
Fifth Plan 27.30 27.30
Annual Plans (1978-80) 30.00 30.00
Sixth Plan 37.52 35.25
Seventh Plan 46.61 43.12
Annual Plans (1990-92) 50.35 46.54
Eight Plan 53.31 48.77
Ninth Plan (1997-2002) 56.90 49.05
Tenth Plan (2002-2007) 63.71 54.49
Source: Ministry of water resources ( 2007)
The above table shows the irrigational potential created and utilized during various plans
is shown.
The success of the minor irrigation strategy depended on accurate and tiny minor
approach had expanded the focus from the traditional energy works, to include a range of
activities that the department did not have the water management agenda of the tank bodies was
to include livelihoods to stakeholders of tank waters in all activities related to tank maintenance.
All the arrangement needed to be created to enable establishment of a multi-discipline in place.
Delineation of designated circles for minor irrigation works and created of PIM in tank
management there were two significant interventions made for management.
In Andhra Pradesh, minor irrigation in rural economy was highlighted by a high level
committee constituted by the Government of Andhra Pradesh to study and implications and
factors responsible for the phenomenon of escalating farmers suicides. The development of
minor irrigation in Andhra Pradesh, the Government of Andhra Pradesh constituted the Jayathi
Ghosh Committee to study the agricultural crises and increasing famer’s suicides in the state
in 2003.
In order to expand irrigational facilities the government of India adopted the following
program called NABARD.

Volume 3, Issue 6 (June, 2013) ISSN: 2249-7307
Jou
rnal
of
Asi
an R
esea
rch
Co
nso
rtiu
m
1
04
htt
p:/
/ww
w.a
ijsh
.org
AJRBEM
a) NABARD has set up Rural Infrastructure Development Fund (RIDF) under which loans
are granted to states for speedy completion of minor irrigational projects.
b) The Ministry of Water Resources has been implementing the centrally sponsored plan
scheme “rationalization of minor irrigation statistics (RMS)” since the seventh five year
plan.
MINOR IRRIGATION IN ANDHRA PRADESH
The State has the largest number of tanks amounting to almost 80,000 tanks and the largest area
estimates put the figure at almost 1.8 million hectors some even in the semi and drought prone
areas under irrigation in the country. If all the range of minor irrigation such as tanks, lift
irrigation systems and ground water based irrigation are included, the minor irrigation almost
67% of the irrigation in the state. In the total potential created by utilizing available water
resources through major, medium and minor irrigation sources which is almost 3.6 million
hectors, the minor irrigation component of 1,792 compares well with the potential created by the
major and medium irrigation (1.560 and 0.264 million Hectors).
The Jayathi Ghosh Committee constituted to study the agricultural crises and increasing
farmers suicides in the state in 2003 categorically highlighted the lack of policy focus on the
marginalized sections in rural areas. The committee traced the crises in agriculture in the state to
the public policy deficiency which reduced the protection accorded to farmers by exposing them
to volatility of markets, reduced critical expenditure that destroyed institutional protection and
the failure to generate alternate non-agricultural economic activities. The uneven distribution of
canal irrigation and the decline of surface water sources especially tanks were found to be
responsible for the escalating expenditure of the poor farmers for accessing water in drought
prone conditions.
The Jayathi Ghosh Committee reported that, “The top priority must be given to the
cleaning, repairing, maintenance and development of tanks and ponds”. This must be done in a
mission mode on an urgent basis, possibly using labour resources that will be made available
under the Employment Guarantee Programme of the Central Government. Further, feeder
channels to many tanks have been cut or destroyed must be restored. The direction of the policy
spotlight on the minor irrigation identified to address the agrarian crisis threw up a host of issues
and possibilities opening a new stage in irrigation development in the state.
NEW APPROACH IN MINOR IRRIGATION IN ANDHRA PRADESH
The minor irrigation has failed to generate political and administrative attention and operating in
a domain, long neglected by policy makers was the legacy which the department had to
improvise upon the deliberations and discussions initiated in this connection zeroed in one an
overall objective of reviving the potential of minor irrigation.
The key policy focus of the new minor irrigation approach was on targeting focused
integration between new tanks, dilapidated tanks and ground water potential leading to a creation

Volume 3, Issue 6 (June, 2013) ISSN: 2249-7307
Jou
rnal
of
Asi
an R
esea
rch
Co
nso
rtiu
m
1
05
htt
p:/
/ww
w.a
ijsh
.org
AJRBEM
of additional capacity in the next five years. The key areas of the focus were new tanks,
restoration of old tanks, ground water management, RIDF, etc.,
NEW TANKS: The first component of the minor irrigation strategy was on creating new
irrigation potential through the construction of new tanks especially in arid and Drought prone
districts like Adilabad, where there was little scope for providing alternative irrigation options.
Building of new tanks based on hydrological and financial feasibility studies was targeted to
generate an additional irrigation potential of about 10 lakh acres in the state. The tank revival and
restoration process has been incorporated within the guiding framework for the conduct of the
repair of National Projects, renovation and restoration of water bodies directly linked to
agriculture.
REVIVAL AND RESTORATION OF OLD TANKS
Andhra Pradesh by 2005 had an existing irrigation potential of 35 lakh acres. However operating
at 30% efficiency, the state was actually utilizing just above 10 lakh irrigation potential. The
state through revival and restoration of old tank structures intended to improve the water use
efficiency of these minor systems to almost 60% resulting in actualization of additional 10 lakh
acres irrigation capacity.
GROUND WATER MANAGEMENT
The third important focus in the minor irrigation strategy was on facilitation conjunctive use of
surface and ground water through addressing ground water management concerns. The thrust
was on creating additional capacity in tribal areas in Northern Andhra Pradesh that have
traditionally fallen outside conventional irrigation system.
FUNDING OF THE NEW MINOR IRRIGATION TANKS IN ANDHRA PRADESH
The building of New Minor tank water bodies were to be funded by accelerated irrigation benefit
programme – AIBP (The National Government Provides 90% grant to the state
Governments).The RIDF (the state governments are granted loan from NABARD) from the state
paln.
NEW MINOR IRRIGATION TANKS UNDER RURAL INFRASTRUCTURE
DEVELOPMENT FUND – (RIDF)
NABARD: The government has taken up 172 schemes under minor irrigation sector with
NABARD assistance at an estimated value of Rs.4,545.60 million. The newly proposed tanks are
being constructed in 21 districts except in Krishna and Hyderabad districts of Andhra Pradesh
which is to be completed in 5 year period.
ANDHRA PRADESH IRRIGATION AND LIVELIHOOD IMPROVEMENT PROJECT

Volume 3, Issue 6 (June, 2013) ISSN: 2249-7307
Jou
rnal
of
Asi
an R
esea
rch
Co
nso
rtiu
m
1
06
htt
p:/
/ww
w.a
ijsh
.org
AJRBEM
Funded by Japan Bank for international cooperation JBIC (Now renamed as Japan International
Cooperation Agency JICA). 39 new minor irrigation tanks are proposed under this project to
create new irrigation potential of 30,521 Ha with a tentative cost of Rs.3,571 million.
ACCELERATED IRRIGATION BENEFIT PROGRAMME IN ANDHRA PRADESH
New Minor irrigation projects taken up under AIBP in drought prone area programme (DPAP)
and tribal areas are constructed in Visakhapatnam, Prakasam, Kurnool, Chittoor, Nalgonda,
Mahaboob nagar and Adilabad districts and 61 minor irrigation projects are proposed to be
constructed with an amount of Rs.16872 lakhs.
NEW MINOR IRRIGATION SCHEMES UNDER STATE PLAN IN ANDHRA
PRADESH
About 112 minor irrigation projects taken up under this programme with a cost of Rs.38913
lakhs, New minor irrigation projects are also taken up under normal plan in Srikakulam,
Vizianagaram, Vaisakhapatnam, East Godavari, West Godavari, Prakasam, Nellore, Kurnool,
Kadapa, Chittoor, Ranga Reddy, Nalgonda, Mahaboob Nagar, Medak, Nizamabad, Adilabad,
Warangal, Karimnagar and Khammam.
REPAIR AND RESTORATION OF OLD TANKS OF MINOR IRRIGATION IN
ANDHRA PRADESH
The restoration of Old tanks undertaken by the Government of India Pilot Projects on “National
Project on repair, renovation and restoration of water bodies directly linked to agriculture in
January 2005. The following are the projects for restoration of existing tanks by Government of
India.
1. STATE PLAN: Restoration of 1939 minor irrigation tanks is being taken up under the state
plan in the 22 districts with a budget allocation of Rs.3195.70 millions.
2. RRR PROJECT: For restoration minor irrigation tanks in the state, the I & CAD
Department, Government of Andhra Pradesh has implemented a Pilot Project called repair,
renovate and restoration of water bodies directly linked to agriculture (RRR Project).
3. A.P.COMMUNITY BASED TANK MANAGEMENT PROJECT: The project envisages
rehabilitation and restoration of about 3000 minor irrigation tanks for agriculture
improvement and livelihood enhancement. The project cost of Rs.10,440 million for
modernization of all the tanks. The project is spread over 499 mandals in 21 districts of the
state with a time frame of 5 years. The project is implemented by I & CAD Department,
Government of Andhra Pradesh, with the financial assistance from Government of India
(25%) and World Bank (75%).
CONSOLIDATION OF MINOR IRRIGATION IN ANDHRA PRADESH

Volume 3, Issue 6 (June, 2013) ISSN: 2249-7307
Jou
rnal
of
Asi
an R
esea
rch
Co
nso
rtiu
m
1
07
htt
p:/
/ww
w.a
ijsh
.org
AJRBEM
The effective utilization of irrigational potential created by tank restoration depended upon the
regular and continuous maintenance of the tank infrastructure. The low operation and
maintenance funds and lack of political concern in minor irrigation were major constraints
seriously undermining the maintenance of tank systems. An effort was made to overcome this
inherent limitation by involving the community and laying grounds for the creation of a corpus
fund for financial sustainability of tanks. The Project – APCBTMP – undertaken as a part of the
externally aided RRR Project with loan from the World Bank attempted to create and develop a
strategy for continued physical and financial sustainability of tank systems.
The success of the minor irrigation strategy depended on accurate and timely
implementation of the Projects. The new minor irrigation approach had expanded the focus from
the traditional engineering pre occupation of conducting civil works, to include a range of
activities that the department did not have the qualification and experience to undertake. A new
implementation strategy and institutional arrangement needed to be created to enable
establishment of a multi-disciplinary integrated water management system in place. Another key
input of the new strategy on minor irrigation was factoring of community participation and
commitment into tank management. The key to the sustainability of the project was the
meaningful participation by the community in design and implementation of the project and in
accepting full responsibilities for future O & M the tank system in Andhra Pradesh.
REFERENCES
1. Brewer, J.Kolavalli, S.Kolro, A.H.Naik, G.Ramanarayan, S.Raju, K.V.Shaklivadival, R.
(1999) : Irrigation Management Transfer in India Policies Processes and Performance, A
collaborative study by IIM, Ahemadabad, Oxford & IBH Publishing Co.Pvt.Ltd.
2. Dr.Jaya Chatterji (2003): People participation in irrigation management, Kurukshetra,
October, pp 38-41.
3. Government of Andhra Pradesh Amendment (2003): The Andhra Pradesh farmers
management of irrigation systems act of 1997: Irrigation and command area development
department.
4. Datt & Sundaram 62nd
revised edition: irrigation and other agricultural inputs P – 540.
5. M.Devendar Reddy & R.Vijaya Kumari (2007): “Water Management in Andhra Pradesh,
India”, Indo-US workshop on innovative, E-Technologies for efficient water management,
ICRISAT, A.P, March 5-9.
6. www.india.gov.in
7. Hanumantha Rao, C.H., Mahendradeva.S. (2003) : Economic Reform and Challenges ahead,
on overview, Andhra Pradesh, Development Economic Reforms and Challenges ahead.
CESS Publication, Hyderabad.
Volume 3, Issue 6 (June, 2013) ISSN: 2249-7307
Jou
rnal
of
Asi
an R
esea
rch
Co
nso
rtiu
m
1
08
htt
p:/
/ww
w.a
ijsh
.org
AJRBEM
A P e e r R e v i e w e d I n t e r n a t i o n a l J o u r n a l
o f A s i a n R e s e a r c h C o n s o r t i u m
AJRBEM:
A S I A N J O U R N A L O F
R E S E A R C H I N B U S I N E S S
E C O N O M I C S A N D
M A N A G E M E N T
CORPORATE SOCIAL RESPONSIBILITY AND PHILANTHROPY –
ESSENTIAL TOOLS FOR BUILDING STRONG BRANDS;
A MARKETING PERSPECTIVE
M V A L NARASIMHA RAO*; S RAMESH BABU**; DR. M KISHORE BABU***
*Assistant Professor,
K L U Business School,
K L University,
Vaddeswaram, Guntur.
**Assistant Professor,
K L U Business School,
K L University,
Vaddeswaram, Guntur.
***Associate Professor,
K L U Business School,
K L University,
Vaddeswaram, Guntur.
ABSTRACT
Corporate social responsibility and corporate philanthropy are essential in building
a brand. In the current global scenario, corporate are adapting Corporate Social
Responsibility as an important strategy in order to maintain competitive advantage
and long term sustainability in the markets. Further, it is becoming an essential tool
to build strong brands. Corporate Philanthropy is done without any expectation of
direct corporate gain such as increase in revenue, but usually involves indirect gains
such as enhancing a company’s brand, Engaging employees, Recognition, etc.
Where as strong brand is another competitive advantage of the “Enlightened self-
interest.”
The purpose of this research paper is to explore the importance of Corporate Social
Responsibility and Corporate Philanthropy as tools to build strong brands. The
study is felt important in the context of globalization, increasing competition in the
Volume 3, Issue 6 (June, 2013) ISSN: 2249-7307
Jou
rnal
of
Asi
an R
esea
rch
Co
nso
rtiu
m
1
09
htt
p:/
/ww
w.a
ijsh
.org
AJRBEM
markets and the decreasing effectiveness of traditional brand building strategies
which can not make any distinction from among the players in the market.
This study is based on literature review covering the concepts of corporate social
responsibility, corporate philanthropy connected to brand building strategies. The
key concepts of building brands, developing competitive advantage, building trust
among the consumers and developing favorable corporate image are thoroughly
reviewed from different research papers and an attempt is made to discuss the
impact of corporate social responsibility and philanthropy on building strong
brands.
The paper highlights that, Corporate Social Responsibility and Corporate
Philanthropy are becoming more and more important elements in making strategies
for brand building. Further, it is identified that the favorable impact created among
consumers and in the society at large through the corporate social responsibility and
philanthropic activities can be leveraged to build the brand strength in the market.
KEYWORDS: Corporate Social Responsibility, Corporate Philanthropy, Brand
building, Brand image.
______________________________________________________________________________
INTRODUCTION
In the context of globalization and the emergence of global players in the market many of the
companies have been experiencing a great competition in the markets. Apart from regular
marketing efforts to cope up the increasing competitions, the organizations are adopting
Corporate Social Responsibility (CSR) and Corporate Philanthropy (CP) as the tools for
branding their products. “Doing good” has become the new slogan for the companies in 2010.
There is no agreed definition regarding this concept for 30 years. Later in 1960, Keith Davis
suggested that social responsibility refers to business.
World Business Council for Sustainable Development defines Corporate Social economic
development while improving the quality of life of the workforce and their families as well as of
the local community and society at large.”
In recent past many companies have focused on the strategic Implications of CSR. It is
defined by Mc Williams and Siegel (2001) as situations where the firm goes beyond compliance
and engages in ‘actions that appear to further some social good, beyond the interests of the firm
and that which is required by law’.
Jamshedji Tata the founder of the Tata Group has beautifully defined the Corporate Social
Responsibility by emphasizing the importance of community in business. He stated “The clear
definition of Corporate Social Responsibility is that the community is not just another
stakeholder in our business but the very purpose of our existence.”

Volume 3, Issue 6 (June, 2013) ISSN: 2249-7307
Jou
rnal
of
Asi
an R
esea
rch
Co
nso
rtiu
m
1
10
htt
p:/
/ww
w.a
ijsh
.org
AJRBEM
Corporate Social Responsibility provides benefits an organization in creating a good
reputation makes it easier to recruit employees, makes employees stay longer, helps in reducing
the costs and disruption of recruitment and retraining, in motivating the employees and making
them more productive, helps ensure you comply with regulatory requirements. Activities such as
involvement with the local community are ideal opportunities to generate positive press
coverage.
Maintaining good relationship with local authorities makes doing business easier. Even
understanding the wider impact of your business can help you develop new products and
services. CSR can make your organization more competitive and reduces the risk of sudden
damage to your reputation (and sales). Even, investors recognize this and they will be more
willing to finance.
Corporate Philanthropy is another beautiful tool which is adapted by many of the corporate
companies in India. Corporate Philanthropy is the act of corporations donating some amount of
their profits, or their resources, to non-profit organizations.
Many companies are following these practices to create a positive corporate image in the
minds of the consumers and society at large. The Corporate Social Responsibility is adapted by
the companies in different dimensions viz. Corporate Philanthropy, Ethical Business Processes
and Products offering.
TYPES OF CSR INITIATIVES
CSR has a wide scope of activities. Kotler and Lee (2005) identified six different types of CSR
initiatives: cause promotion, cause-related marketing, corporate social marketing, corporate
philanthropy, community volunteering, and socially responsible business practice.
CAUSE PROMOTION: A chief objective of ‘Cause Promotion” is to build awareness and
concern for social causes by creating awareness among the public of the facts and statistics about
a cause. It persuades people to find out more about the cause, donate time, donate money, donate
non monetary resources, and participate in events. Contributions or support provided to a cause
are not tied to the sale of specific products. Cause Promotion involves business activities such as
designing and distributing cause related material, volunteering, participating in public relations
activities, and engaging in sponsorships (Kotler & Lee, 2005).
CAUSE-RELATED MARKETING: “A corporation commits to making a contribution or
donating a percentage of revenues to a specific cause based on product sales. Most commonly
this offer is for an announced period of time and for a specific product and a specified charity”,
(Kotler & Lee, 2005, p. 81-82). The distinctive feature of cause related marketing is the
relationship with product sales. It is a mutual relationship between a corporate company and a
non-profit organisation. A corporate company develops a cooperative relationship with a non-
profit organization to establish a mutually benefited relationship that intentionally provides an
increase product sales as well as funds to the charity. Moreover, the marketing department will
take an active part in this activity, because its intention is to increase sales (Kotler & Lee, 2005).

Volume 3, Issue 6 (June, 2013) ISSN: 2249-7307
Jou
rnal
of
Asi
an R
esea
rch
Co
nso
rtiu
m
1
11
htt
p:/
/ww
w.a
ijsh
.org
AJRBEM
But there is some disadvantage because of this approach. According to Smith (2003), this
initiative potentially causes a problem when customers perceive that a company is engaging in
this activity only with an intention to increase the company’s sales and in turn profits.
CORPORATE SOCIAL MARKETING: Kotler and Lee (2005) refer to corporate social
marketing as when “a corporation supports the development and/or implementation of a behavior
change campaign intended to improve public health, safety, the environment, or community
well-being” (p. 23). In addition, it tends to be a cooperation between a company and the public
sector such as federal, state, health department, and utilities. Examples of this initiative are the
Philip Morris campaign to encourage parents to talk to their children about tobacco and Home
Depot’s collaboration with a water utility to promote water conservation tips.
CORPORATE PHILANTHROPY: Corporate philanthropy is the most traditional form of
CSR. In this kind of CSR initiative, a corporate company directly contributes to charity or
causes. Typical philanthropic programs include donating cash/products/services, providing
technical expertise, offering the use of equipment, and allowing the use of facilities and
distribution channels. Corporate philanthropy, in other terms, known as community giving,
community relations, corporate citizenship, or community affairs, has been strategically used to
build good corporate image. (Kotler & Lee, 2005).
COMMUNITY VOLUNTEERING: Kotler and Lee indicate community volunteering is an
initiative in which “a corporation supports and encourages employees, retail partners, and/or
franchise members to volunteer their time to support local community organizations and causes”
(2005, p. 24). They also state that a corporation may mandate a form of community volunteering
itself or let employees choose an activity to be supported by a company in the form of getting
paid time off. This initiative can build the strongest relationship between a corporation and a
community as a result of a sincere corporate spirit of doing something good for a community.
SOCIALLY RESPONSIBLE BUSINESS PRACTICES: In this type of CSR initiative, “A
corporation adopts and conducts discretionary business practices and investments that support
social causes to improve community well-being and protect the environment” (Kotler & Lee,
2005, p. 24). The conceptual jargon viz. discretionary activities, community, and well-being
distinguish this type of CSR initiatives from others. Discretionary activities are the activities
which are not mandated by law. They are because of the morality and ethics of a corporation.
Community refers to everyone who is involved with a business. Well-being refers to
psychological and emotional health and safety (Kotler & Lee, 2005).
CSR AS A MULTI-LAYER CONCEPT: Caroll (1991) proposed a model called “The Pyramid
of Corporate Social Responsibility’ which is a multi-layer concept encompassing four related
responsibilities: economic, legal, ethical, and philanthropic. These four levels of responsibility
are placed on an organization by society at any given point in time (Caroll & Buchholtz, 2000).
ECONOMIC RESPONSIBILITY: This facet is the very basic responsibility of business firms.
Historically, business firms are responsible for properly functioning as an economic unit in a

Volume 3, Issue 6 (June, 2013) ISSN: 2249-7307
Jou
rnal
of
Asi
an R
esea
rch
Co
nso
rtiu
m
1
12
htt
p:/
/ww
w.a
ijsh
.org
AJRBEM
society. They are basically responsible for providing products and services needed by a society.
This facet is considered a basis of subsequent facets (Caroll, 1991).
LEGAL RESPONSIBILITY: Business firms are also expected by a society to operate within
the framework of laws and regulations. Laws and regulations are codification of society’s norms;
thus, business firms must comply with them in order to fulfill their responsibility to a society. All
corporations must have this responsibility in order to continue to operate (Caroll, 1991).
ETHICAL RESPONSIBILITY: This facet reflects the ethical obligation for business firms to
do things that are considered right, fair, and just by a society, regardless of whether they are
codified into law. This facet is not just the next layer of the pyramid; it also has a dynamic
interplay with legal responsibility. In other words, ethical responsibility regularly broadens legal
responsibility and pushes business firms to operate their business above or at the same level
required by law (Caroll, 1991).
FIGURE 1: THE PYRAMID OF CORPORATE SOCIAL RESPONSIBILITY
(CAROLL, 1991, P. 42)

Volume 3, Issue 6 (June, 2013) ISSN: 2249-7307
Jou
rnal
of
Asi
an R
esea
rch
Co
nso
rtiu
m
1
13
htt
p:/
/ww
w.a
ijsh
.org
AJRBEM
Source: Caroll, A. B. 1991. The pyramid of corporate social responsibility: toward the moral
management of organizational stakeholders. Business Horizons
Philanthropic Responsibility: This responsibility is at the top of the pyramid. Business
firms are expected to be good corporate citizens by providing goodwill to a community, such as
engaging in charitable events and providing financial resources to a non-profit organization. This
facet is distinct from ethical responsibility. That is, philanthropic responsibility is not required by
society like ethical responsibility is. People will not consider a business firm unethical if it does
not have philanthropic responsibility, but it is the desire of society (Caroll, 1991).
COMMITTEE ENCOURAGING CORPORATE PHILANTHROPY
At global level a committee is also evolved to lead the business community towards the
philanthropic activities which is known as Committee Encouraging Corporate Philanthropy
(CECP). Many of the world’s most influential CEOs are CECP members, leading the charge to
make a difference through corporate philanthropy. Many people argue that companies have to
strategically use its charitable activities to create their own winning opportunities and for the
beneficiaries if the Philanthropy. The strategic relevance of this is more predominantly accepted
and its effectiveness will be varying substantially from one organization to other. This variance
is due to the difference in the way of understanding the spirit of philanthropy and the degree of
commitment towards that. We can easily understand this by the saying that “Effective
Philanthropy must be run no less professionally than the core Business”.
Benefits of Corporate Philanthropy will be like improving competitive advantages in
attracting and retaining employees, maintaining closer relationships with community leaders and
officials will enhance greater customer loyalty, creates increased name-recognition and brand
awareness, maintains beneficial business-to-business relationships with nonprofit organizations,
acts as reservoir of community goodwill that can serve you in a time of crisis, enhances
leadership development opportunities and improved internal communication and sense of
common purpose.
REVIEW OF LITERATURE
A lot of Research has been done not only in our country but also globally on how to build strong
Brands by using Corporate Social Responsibility and Corporate philanthropy as tools. Research
reveals that majority of the Top listed Multi National Companies are enjoying a considerably
high market share than other companies who have not incorporated these tools in their Brand
building Strategies.
Majority of the companies say that they included corporate social responsibility not only
because they are doing something good for society, but also because it strengthens their brand. If
a company plans improve the brand image they are supposed to include CSR &CP in an
appropriate degree along with their brand building strategies. Aligning these two tools with the
business strategy will fetch more social and business value for the organization.
Volume 3, Issue 6 (June, 2013) ISSN: 2249-7307
Jou
rnal
of
Asi
an R
esea
rch
Co
nso
rtiu
m
1
14
htt
p:/
/ww
w.a
ijsh
.org
AJRBEM
Economic Times of India made a survey regarding CSR reveals that majority of the
companies have increased the amounts they are spending towards donations has grew up to 8%
by the end of the fiscal year 2009.Around 108 companies have donated 20% more when
compared to the previous year.
Vaaland, Heide and Gronhaug (2008) suggest that corporations need to proactively manage
stakeholder concern for Ethical, Social and Environmental phenomena for the benefit of the
organization. In this context Castaldo, Perrini, Misani and Tencati (2009) have explained the link
between Corporate Social Responsibility and fair trade practices.
Sabyasachi Mishra, chief growth officer of Lowe Lintas India expressed his views on CSR
that it can be real force as a strategic and competitive branding tool among the consumers. CSR
offers in constructing reliable platforms for communication for a brand. As an agency they
explored this opportunity for some of their clients and they continued to improve their domain
understanding and know-how in order to advise their clients better.
Michael E. Porter and Mark R. Kramer (2002) expressed their views that seeing economic
and social objectives is been seen as the distinct and more often competing aspect. But, the
article says that it is a false Dichotomy and it represents an increasing outdated perspective in a
world of open and knowledge based competition where companies won’t be function in
separation from the society around them.
Michel E. Porter and Mark R. Kramer (2006) explained the four prevailing justifications for
CSR. Those four justifications are Moral obligation, sustainability, License to operate and
Reputation. Reputation is used by many of the companies in order to justify the initiatives of
CSR on the grounds that they will enhance a company’s image, strengthen its brand, invigorate
Morale, which also raises the value of the stock in turn.
Adam Lindgreen, et al (2009), expresses that CSR practices are more predominant in
organizations that adopt relational marketing practices. All types of these practices receive
positive influences by one or more types of relational marketing practices. In building and
engaging in relationships, networks, and interactions with all stakeholders, customers and
managers look after CSR initiatives those which generate support, trust and loyalty from
stakeholders, especially as product differentiation becomes increasingly difficult.
RELATIONSHIP BETWEEN CSR, ATTITUDE TOWARD BRAND AND PURCHASE
INTENTION
A lot of research has been undertaken all around the world to study the relationship between
CSR and customer attitude towards corporate and brands. Many research studies have
demonstrated a positive relationship between CSR and consumers’ attitudes toward companies
or brands (Brown & Dacin 1997; Sen & Bhattacharya, 2001; Maignan & Ferrell, 2001).
Organizations are a part of society. They have to rely on society’s acceptance to continue to
operate without interference. It is evident that, acceptance from society allows organizations to
build positive consumer attitudes toward their brands and services (Duagherty, 2001; Werder,

Volume 3, Issue 6 (June, 2013) ISSN: 2249-7307
Jou
rnal
of
Asi
an R
esea
rch
Co
nso
rtiu
m
1
15
htt
p:/
/ww
w.a
ijsh
.org
AJRBEM
2008). Consumers generally expect business firms to contribute to the public (Quelch & Jocz,
2009). Branco and Rodrigues (2006) state that firms are expected to fulfill stakeholders’
expectations to gain reputations. Thus, CSR is the most effective tool to demonstrate the firm’s
care about stakeholders and their expectations. Moreover, Fombrun, Gardberg, and Barnett
(2000) opined that CSR will endow with a positive image for the companies and help them to tie
themselves to stakeholders. Because corporate image comes from stakeholder support (Branco &
Rodrigues, 2006), many companies demonstrate their care towards stakeholders. Ben and
Jerry’s Ice Cream is one example of a successful company that enacts CSR campaigns. Ben and
Jerry’s Ice Cream was founded on the basis of fun, earning a living, and providing something of
value to the community. It also becomes evident that, if companies possess the same values as
their potential customers, they would not have to create a false image (Cohen & Greenfield,
1997). Likewise, Chahal and Sharma (2006) indicate that CSR initiatives can help a company
improve its image and build company equity. So, companies that are perceived as good at CSR
tend to build a good reputation.
In addition, the belief that CSR initiatives can influence consumers’ beliefs and attitudes
toward a company was supported by Werder’s study in 2008. The results of the study conclude
that salient beliefs predict attitudes, and those attitudes, in turn, predict behavioral intentions.
Perceptions of socially responsible behaviors of a company show impact on consumers’
evaluation of service and long-term loyalty to the company. According to Salmones, Crespo, and
del Bosque (2005), in service sectors, CSR positively influences the consumers in the overall
evaluation of services. As for the consumers’ loyalty, CSR has an indirect effect on loyalty
through service valuation.
Many CSR initiatives not only provide a positive image for companies and but also create
positive attitudes toward their brands, and they also positively influence consumers’ purchase
intentions. Creyer and Ross (1997) from their study concluded that ethics and consumer choices
have a positive relationship. In other words, since consumers develop favorable attitude toward
socially responsible companies, they remember those companies and will be more likely to
purchase their products and services. Consequently, CSR can result in good financial
performance.
According to Branco and Rodrigues (2006), a relationship between CSR and financial
performance has been an important topic since 1960. Although the relationship between CSR
and financial performance is still not clear due to a lack of theory and measurement of social
responsibility outcomes, there is limited evidence about the direction of the relationship between
CSR and increased financial performance. There is evidence to suggest that CSR and financial
performance have a positive relationship (Branco & Rodrigues, 2006). Many scholars believe
that CSR and financial performance are interrelated. They argue that social performance is both a
cause and a result of financial performance (i.e., Orlitzky, Schmidt, & Rynes, 2003; Waddock &
Graves, 1997). For instance, for firms that sell products that are consumed or used before
consumers can evaluate or value them, reputation is the primary criteria that consumers use to
decide whether they want to buy a product or not. It is more likely for consumers to choose
products from a company with a better reputation (Branco & Rodrigues, 2006). In contrast,

Volume 3, Issue 6 (June, 2013) ISSN: 2249-7307
Jou
rnal
of
Asi
an R
esea
rch
Co
nso
rtiu
m
1
16
htt
p:/
/ww
w.a
ijsh
.org
AJRBEM
companies that do not care about CSR can be perceived as socially irresponsible (Werder, 2008).
Because of this kind of perception among the consumers, these companies may fail to perform.
Especially in prevailing economic recession, CSR has become more significant
marketing strategy than ever before. CSR helps to reestablish consumers’ trust in a company.
The economic downturn has resulted in decreasing consumers’ trust in corporations and caused
people to review their core values. Materialistic value decreases and is replaced by idealistic
value. Consumers expect companies to be socially responsible to become more trustworthy.
Companies are able to build goodwill and develop long term relationship with consumers
because of their commitment demonstrated in social responsibility. The more they demonstrate
that commitment, the more they can build the goodwill and long term relationship (Quelch &
Jocz, 2009). Although there is a lot of acceptance on the positive relationship among CSR
initiatives, attitudes toward corporate organisations, and purchase intentions of the consumers,
some findings are found inconsistent with this. For example, Kim (2006) and Werder (2008) did
not find support for previous research results that favorable attitudes would be likely to influence
purchase intentions. Moreover, many studies have found that the effects of CSR initiatives are
restrained by other factors, such as the type of CSR initiatives and the congruence between a
brand and cause (Ellen, Mohr, &Webb, 2000; Menon & Kahn, 2003). Due to the inconsistency
in research findings related to CSR outcomes, it is important to try to gain more understanding
about whether CSR actually has a positive effect on consumers’ attitudes and purchase
intentions.
CORPORATE SOCIAL RESPONSIBILITY AND PHILANTHROPY IN INDIAN
CORPORATE
In India, many firms have taken the initiatives of CSR practices which have met with varying
needs of the society.
Wipro chairman, Azim Premji recently transferred 12.5% of his holding in Wipro, worth
US$2.2 billion, to the Azim Premji Trust. Wipro chairman He is the first person in the country to
sign up for the Giving Pledge, a commitment by the world's richest people to dedicate the
majority of their wealth to charity. P.N.C. Menon, founder of the Sobha group, has promised to
devote half of his fortune to philanthropic efforts.
P&G’s flagship Corporate Social Responsibility Program Shiksha is an integral part of
it’s global philanthropy program - Live, Learn & Thrive. Now in its 8th year, Shiksha has till
date helped 280,000 underprivileged children access their right to education. The program has
built & supported over 140 schools across India
IBM holds frequent awards for its industry leading employment practices and policies.
Company has a separate department for the operation of CSR initiatives. One of the important
initiatives of IBM is Indian women’s leadership council, whose main objective is to provide
technical, professional and personal development for women. Company issued its first corporate
policy on environmental affairs in the year 1971 and it is working on go green and preserving
natural resources.

Volume 3, Issue 6 (June, 2013) ISSN: 2249-7307
Jou
rnal
of
Asi
an R
esea
rch
Co
nso
rtiu
m
1
17
htt
p:/
/ww
w.a
ijsh
.org
AJRBEM
Tata Consultancy Services is India’s largest software service company and has won the
Asian CSR award for initiating community development work and implementing various
programs and devoting leadership and sincerity as ongoing commitment in incorporating ethical
values. Company has developed adult literacy programs to teach adults. Company has adopted
CSR initiatives like developing environment friendly products and services and providing
healthcare for children by supporting children’s hospital in Mumbai.
Infosys, as a leading software company, is into providing language and computer
education for unprivileged children. Company has a right policy towards conservation of energy
and environmental resources. Company is committed to work against the harmful impact of
business on environment.
Wipro is focussing on taking educational and health care initiatives for migrated
communities and environmental issues and rehabilitation for those who are affected in natural
calamities and disasters. The Women of Wipro (WOW), a council of Wipro, has initiated so
many programs to empower women.
Nestle is committed to work with small farmers, through its dairies, to pay higher prices
to the farmers. Company looks at corporate social responsibility in terms of creating shared
value.
ITC limited has been into the initiatives of corporate social responsibility over the past
many years and has been appreciated worldwide. E – Choupal project of ITC has been
specifically designed to help farmers by providing them the necessary inputs about the markets.
The project was launched in the year 2000, and has been successfully established in 40000
villages. ITC has been providing Information Technology education for rural people. The CSR
agenda of the company revolves among sustainable development and inclusive growth.
Britannia, Coca-Cola, Times of India, Reliance, Maruti, Bajaj Auto and so many other
corporate are demonstrating their commitment towards corporate social responsibility, through
their CSR initiatives and philanthropic activities.
DISCUSSIONS
“Most companies compelled to give charity. Few have figured out how to do it well”. This
statement is very rightly made as there are only few companies which only kept their efforts in
order to do something best for the society which in turn yielded a good reputation towards their
brand as well as the organization. Even this becomes the practice of the day in the today’s
business scenario. Many of the companies are taking the assistance of Corporate Social
Responsibility and Corporate Philanthropy as their tools for successful branding.
“Philanthropy can often be the most cost effective way for a company to improve its
competitive context, enabling companies to leverage the efforts and infrastructure of Non-profits
and other institutions” says Michael E. Porter and Mark R. Kramer (2002) in their article “The
competitive advantage of Corporate Philanthropy”.

Volume 3, Issue 6 (June, 2013) ISSN: 2249-7307
Jou
rnal
of
Asi
an R
esea
rch
Co
nso
rtiu
m
1
18
htt
p:/
/ww
w.a
ijsh
.org
AJRBEM
It is a well-known fact that huge amounts are being invested by many of the companies in
order to position their products in the customer minds through advertising and publicity. But we
don’t even know that how many people are purchasing the brands basing on the impact of
advertising and publicity. The efforts of the organization are sometimes not reaching the
intended target group because of increasing clutter in the advertising media. But, if a company
does something good for the society through donating some part of its profits then it makes a
favorable impact on the consumers. That impact created will last for a longer time and makes
people to contribute their best for the cause of the organization by purchasing the company’s
products. Consumers will take it as an opportunity to serve the society as they may not be in a
position to spare their time to take active part in social service activities.
“There is no inherent contradiction between improving competitive context and making a
sincere commitment for bettering society” (Porter and Kramer,2002).
This can be easily understood by the success of many big corporates like ITC, Aditya Birla
Group, Tata group, Hyundai Motors India Ltd., and many other companies have contributed
some money towards the wellbeing of the society. Hyundai motors India Ltd., is awarded the
best Corporate Social Responsibility award for 2009-10 by Govt. of Tamil Nadu and it is also
into Philanthropic activities under HMIF (Hyundai Motor India Foundation). Even Tata Steel is
setting up Health camps for healthcare of people in Jamshedpur under TSFIF (Tata steel family
Initiatives Foundation).
“The prevailing approaches to CSR are so disconnected from business as to obscure many
of the greatest opportunities for companies to benefit society” says Michael E. Porter and Mark
R. Kramer (2006) in their article “Strategy and Society- The link between Competitive
Advantage and Corporate Social Responsibility”.
They are saying that in order to advance CSR, we must root in a broader understanding of
the Interrelation between a corporation and society. That is in what way we can serve the society
in order to have an indirect benefit for our organization for a longer period. If that relationship is
maintained properly then it will be beneficial for both organization and society. It can be taken as
the duty of the business to conduct social responsibility programs to educate the people who are
illiterate and for motivating people who already know but neglect to follow some basic activities
which are good for themselves as well as for the people around him.
CONCLUSION
Corporate social responsibility (CSR) activities have the potential to create several distinct forms
of value for customers. In addition to this Corporate Philanthropy (CP) can create a valuable
corporate image in public. The customer perception of the value of CSR and CP counts and
builds the relationship between CSR activities and subsequent financial performance. CSR and
CP are two most efficient ways of building trust among the consumers and general public
towards the organization. However, by their very nature, CSR initiatives are felt difficult to plan
and implement and utmost care has to be taken to avoid consumer skepticism. Further, by
adopting CSR and CP as tools to build brands, the companies are able to develop a distinctive
Volume 3, Issue 6 (June, 2013) ISSN: 2249-7307
Jou
rnal
of
Asi
an R
esea
rch
Co
nso
rtiu
m
1
19
htt
p:/
/ww
w.a
ijsh
.org
AJRBEM
image and strength in the markets. In the present day global competitive scenario, many
organizations are making strategies to build strong brands, competitive advantage and long term
sustainability through Corporate Social Responsibility and Philanthropic initiatives. So many
Indian companies are also adopting the spirit of CSR and CP to reach the heights of success.
REFERENCES
1. Adam Lindgreen, Valérie Swaen & Wesley Johnston 2009.The Supporting Function of
Marketing in Corporate Social Responsibility. Corporate Reputation Review, vol. 12,
no. 2, pp. 120 -24.
2. Branco, M. C. & Rodrigues, L. L. 2006. Corporate Social Responsibility and Resource-
Based Perspectives. Journal of Business Ethics, vol. 69, pp. 111-132.
3. Brown, Tom J. and Peter A. Dacin 1997. The Company and the Product: Corporate
Associations and Consumer Product Responses. Journal of Marketing, 61 (January),
68-84.
4. Caroll, A. B. 1991. The pyramid of corporate social responsibility: toward the moral
management of organizational stakeholders. Business Horizons, 34(4), 39-48.
5. Carroll, A. B. and A. K. Buchholtz 2000. Business & Society, Ethics and Stakeholder
Management. South-Western Publishing, Cinn., Ohio.
6. Chahal, H., & Sharma, R. D. 2006. Implication of corporate social responsibility on
marketing performance: A conceptual framework. Journal of Services Research, 6(1),
205-216.
7. Cohen, B., & Greenfield, J. 1997. Ben & Jerry’s Double-Dip Lead with Your Values
And Make Money, To. New York: Simon & Schuster.
8. Creyer, E. H., & Ross, W. T. 1997. The influence of firm behaviour on purchase
intention: Do consumers really care about business ethics? Journal of Consumer
Marketing, 14(6), 421-432.
9. Daugherty, E. L. 2001. Public Relations and Social Responsibility. R. L. Heath (Ed.),
Handbook of Public Relations (pp. 389-401). Thousand Oaks, CA: Sage.
10. Ellen, P. S., Mohr, L. A., & Webb, D. J. 2000. Charitable programs and the retailer: Do
they mix? Journal of Retailing, 76(3), 393-406.
11. Fombrun, C.J., Gardberg N.A.,Barnett M.L., Opportunity Platforms and Safety Nets:
Corporate Citizenship and Reputational Risk. Business and Society Review, 105:1, 2000,
85-106

Volume 3, Issue 6 (June, 2013) ISSN: 2249-7307
Jou
rnal
of
Asi
an R
esea
rch
Co
nso
rtiu
m
1
20
htt
p:/
/ww
w.a
ijsh
.org
AJRBEM
12. Kotler, P., & Lee, N. 2005. Corporate Social Responsibility: Doing the Most Good for
Your Company and Your Cause. Hoboken, NJ: John Wiley & Sons.
13. K. Davis, 1970, Can Business Afford to Ignore its Social Responsibilities? California
Management Review. 2. 3: 70-76.
14. Kim, Y. 2006. The effect of strategic corporate social responsibility (CSR) on
consumer’s attitude toward the company and purchase intention. Paper presented at the
annual meeting of the International Communication Association, Dresden International
Congress Centre, Dresden, Germany.
15. Maignan, I., and Ferrell, O.C., 2001. Corporate citizenship as a marketing instrument –
Concepts, evidence, and research directions. European Journal of Marketing. 35 (3/4),
457-484.
16. McWilliams, Abagail and Donald Siegel. 2001. Corporate social responsibility: A theory
of the firm perspective. Academy of Management Review, 26(1): 117-127.
17. Menon, S., Kahn, E. B. (2003). Corporate sponsorships of philanthropic activities: When
do they impact perception of sponsor brand? Journal of Consumer Psychology, 13(3),
316-327.
18. Michael E. Porter and Mark R. Kramer, 2002. The competitive advantage of corporate
philanthropy. Harward Business School publishing corporation, 2-3.
19. Michael E. Porter and Mark R. Kramer, 2006. Strategy and Society- The link between
competitive advantage and corporate social responsibility. Harward Business School
publishing corporation,2-3.
20. Orlitzky, M., Schmidt, F. L. & Rynes, S. L. 2003. Corporate Social and Financial
Performance: A Meta-analysis. Organization Studies, vol. 24, no. 3, pp. 403-441.
21. Philip Kotler, 2008. Corporate social responsibility. New Jersey, Wiley India Edition.
22. Quelch, J. A., and K. E. Jocz. 2009. How to Market in a Downturn. Harvard Business
Review 87:52–62
23. Salmones M., Crespo A., & Bosque I. 2005. Influence of corporate social responsibility
on loyalty and valuation of services. Journal of Business Ethics, 61, 369-385.
24. Sandro Castaldo & Francesco Perrini & Nicola Misani & Antonio Tencati, 2009. The
Missing Link Between Corporate Social Responsibility and Consumer Trust: The Case of
Fair Trade Products. Journal of Business Ethics, Springer, vol. 84(1), pages 1-15,
January.

Volume 3, Issue 6 (June, 2013) ISSN: 2249-7307
Jou
rnal
of
Asi
an R
esea
rch
Co
nso
rtiu
m
1
21
htt
p:/
/ww
w.a
ijsh
.org
AJRBEM
25. Sen, S., and Bhattacharya, C.B., 2001. Does doing good always lead to doing better?
Consumer reactions to corporate social responsibility. Journal of Marketing Research. 38
(2), 225-243.
26. Smith, N. C. 2003. Corporate social responsibility: Whether or how? California
Management Review. 45(4), 52–76.
27. Vaaland, T., I., Heide, M., Gronhaug, K., 2008. Corporate social responsibility:
Investigating theory and research in the marketing context. European Journal of
Marketing, 42 (9/10), 927-953.
28. Waddock, S. A., & Graves, S. B. 1997. The corporate social performance: financial
performance link. Strategic Management Journal, 18(4), 303–319.
29. Werder, K. P. 2008. The effect of doing good: An experimental analysis of the influence
of corporate social responsibility initiatives on beliefs, attitudes, and behavioral intention.
International Journal of Strategic Communication, 2(2), 115-135.
30. http://blogs.law.harvard.edu/corpgov/2011/02/28/investing-in-corporate-social-
responsibility-to-enhance-customer-value.
31. http://www.exchange4media.com/news/story.aspx?Section_id=3&News_id=43017
32. www.indiacsr.in

Volume 3, Issue 6 (June, 2013) ISSN: 2249-7307
Jou
rnal
of
Asi
an R
esea
rch
Co
nso
rtiu
m
1
22
htt
p:/
/ww
w.a
ijsh
.org
AJRBEM
A P e e r R e v i e w e d I n t e r n a t i o n a l J o u r n a l
o f A s i a n R e s e a r c h C o n s o r t i u m
AJRBEM:
A S I A N J O U R N A L O F
R E S E A R C H I N B U S I N E S S
E C O N O M I C S A N D
M A N A G E M E N T
NETWORKED READINESS INDEX IN BRICS –
COMPARATIVE ANALYSIS
DR. L. KRISHNA VENI*
*Professor,
Siva Sivani Institute of Management,
Secunderabad.
ABSTRACT
Net work Readiness Index (NRI) has become the most comprehensive and valued
international assessment of preparedness of economies to leverage the net worked
economy. This NRI represents three sub indexes like environment index, readiness
index and usage index . Against this backdrop, this paper makes an attempt to
examine the comparative status of India among the emerging economies like
BRICS in terms of NRI and its related indicators during the period 2007-08 to 2011-
12. All BRICS nations indicated moderately advantageous position in terms of rank
and score relating to NRI during the period under consideration. It is evident that
out of all BRICS, China is relatively more comfortable than the rest of the countries
during the study period. Based on the results this study suggests that Russia has to
focus on the scores of the indexes relating to RSI, PRE, BR, BU, and GU since these
are indicating disadvantageous position. It also suggests that India has to focus on
infrastructure environment for the rapid development of ICT.
___________________________________________________________________________
INTRODUCTION
Over the past decade, with the rapid development of Information and Communication
Technology (ICT) the world has become gradually ‘hyperconnected’. This hyper connectivity is
deeply redefining relationships between individuals, consumers and enterprises, and citizens and
governments; it is introducing new opportunities but also new challenges and risks in terms of
individual rights and privacy, security, cybercrime, the flow of personal data, and access to
information. As a result, our economies and societies will undergo fundamental transformations
(Robert Greenhill, Chief Business Officer, World Economic Forum).

Volume 3, Issue 6 (June, 2013) ISSN: 2249-7307
Jou
rnal
of
Asi
an R
esea
rch
Co
nso
rtiu
m
1
23
htt
p:/
/ww
w.a
ijsh
.org
AJRBEM
The networked readiness framework translates into the NRI, comprising three sub indexes that
measure the environment for ICT, together with the main stakeholders’ readiness and usage, with
a total of nine pillars as shown in the following chart .
Source -The Global Information Technology Report,2010-11
The final NRI score is a simple average of the three composing subindex scores, while each
subindex’s score is a simple average of those of the composing pillars. In this process it is
assumed that all Index components give a similar contribution to national networked readiness.
The NRI sub indexes have been changed as in the year 2012 with the introduction of Impact
Sub index(fourth) .However this paper is based on the old classification which consists of three
sub indexes like Environment Sub index, Readiness Sub index and Usage Sub index as shown
in the above chart.
REVIEW OF LITERATURE
here are many studies on IT related issues in the countries of BRICS individually. Similarly
many studies are made on different economic and social issues of BRICS countries, but there
are no significant studies on IT and its related services in BRICS.
Networked Readiness Index
Environment
Market Environment
Infrastucture environment
Political and regulatory environment
Usage
Individual usage
Business usage
Government usage
Readiness
Individual Readiness
Government readiness
Business readiness

Volume 3, Issue 6 (June, 2013) ISSN: 2249-7307
Jou
rnal
of
Asi
an R
esea
rch
Co
nso
rtiu
m
1
24
htt
p:/
/ww
w.a
ijsh
.org
AJRBEM
Punit Saurabh, Bhaskar Bhowmick, Amrita, and Dhrubes Biswas (2012) highlight the need for
initiating a healthcare business model in a grassroots, emerging-nation context. This paper
exposes that in BRICS countries, still huge percentage of populations remain deprived of basic
healthcare facilities and emergency services,therefore it suggests that there is an urgent need for
specialized (tertiary care) services at all levels. As a response to this challenge, an all-inclusive
health-exchange system (HES) model, which uses Information Communication Technology
(ICT) to provide solutions in rural India, has been developed. This innovative model emphasizes
on affordability, accessibility, and availability to the masses. The article concludes that the
healthcare challenges in the emerging nations can be mitigated with the help of ICT.
Against this backdrop, this paper makes an attempt to examine the NRI and measurement of
environment for ICT across the BRICS countries.
METHODOLOGY OF THE STUDY
OBJECTIVES OF THE STUDY
This study makes an attempt to study the following objectives:
To examine the status of Net worked readiness index (NRI) , its sub indexes and the
related pillars across BRICS countries during the period 2007-08 to 2011-12 at both
aggregate and disaggregate level
To classify the countries of BRICS based on the degree of Advantage ( advantageous,
Moderately advantageous and disadvantageous ) in terms of NRI , related sub indexes
and 9 pillars during the same period
PERIOD OF STUDY
This study covers five years i.e., from 2007-08 to 2011-12. The emerging economics BRICS are
taken into consideration as the sample group. It consists of five countries namely Brazil, Russia,
India, China and South Africa.
DATA COLLECTION
The basic data for this study has been drawn from various issues of ‘The Global Information
Technology Report’ (World Economic Forum) since 2007-08.
UNIVARIATE ANALYSIS
Statistical tools like Mean, Standard Deviation and Covariance are used for analyzing the data
during the study period. To identify the overall advantageous position of the BRICS countries,
percentiles are estimated for the ranks and scores of NRI , its related sub indexes and the pillars.
Further, in this study ranks are given to the BRICS countries based on estimated mean values of
ranks and scores during the study period.

Volume 3, Issue 6 (June, 2013) ISSN: 2249-7307
Jou
rnal
of
Asi
an R
esea
rch
Co
nso
rtiu
m
1
25
htt
p:/
/ww
w.a
ijsh
.org
AJRBEM
Against this background, this study is divided into six sections as follows:
This section initially provides an idea about the comparative picture of NRI in terms of ranks and
scores across the BRICS countries during the study period 2007-08 to 2011-12. The higher the
score indicates higher advantage and vice versa .Similarly lower rank represents higher status in
the world and vice versa. Table 1 discloses the mean, standard deviation (S.D) and co-efficient of
variance (C.V.) of the BRICS countries during the study period .
TABLE1-THE NETWORK READINESS INDEX IN BRICS – AVERAGE RANKS
&SCORES - 2007-08 TO 2011-12
Country Rank Mean S.D C.V Rank
Score
Mean S.D C.V Rank
Brazil 60 3.317 5.527 4 3.886 0.109 2.81 4
Russia 71.8 9.338 13.01 5 3.748 0.333 8.876 5
India 52.8 9.884 18.72 2 4.02 0.154 3.821 2
China 45.4 9.017 19.86 1 4.162 0.177 4.262 1
South Africa 59.6 8.562 14.37 3 3.91 0.153 3.908 3
It is evident from Table 1 that China occupied the top rank among BRICS with 45.4 mean
value and India occupied the second rank with 52.8 on average during the period 2008-08 to
2011-12 . The rest of the emerging economies of BRICS like South Africa,Brazil and Russia
have occupied the third, fourth and fifth ranks during the study period. Similar trends are noticed
in terms of average scores also.
In terms of rank, China recorded more variable dispersion but Brazil has shown more consistent
dispersion during the study period. Score value in terms of dispersion was more variable in case
of Russia ( 8.88%) and the dispersion was more consistent in Brazil (2.81%) during the
study period.
Further the three sub indexes and the related pillars are discussed in detail in the subsequent
sections.
This section is devoted to the discussion on first sub index of NRI- Environment Sub Index and
the related pillars during the study period under consideration.
From the Table 2 it is clear that South Africa occupied the first rank in environment sub index of
NRI during the period 2007-08 - 2011-12 in terms of average rank and score among the BRICS.
China, India, Russia and Brazil have occupied the second, third, fourth and fifth place
accordingly. Rank value of environment sub index in terms of dispersion was more variable in
case of Russia (20.21 %) followed by Brazil (16.19%) and Russia(15.97%) and the dispersion
was more consistent in South Africa( 2.34 %) during the study period.

Volume 3, Issue 6 (June, 2013) ISSN: 2249-7307
Jou
rnal
of
Asi
an R
esea
rch
Co
nso
rtiu
m
1
26
htt
p:/
/ww
w.a
ijsh
.org
AJRBEM
TABLE 2-ESI - RANK &SCORE OF BRICS -2007-08 - 2011-12
Country
Rank
Mean S.D C.V
Ran
k
Score
Mea
n S.D C.V
Ran
k
Brazil 82.8
13.4052
2
16.1898
8 5 3.51
0.23600
8
6.72388
8 5
Russia 79
15.9687
2
20.2135
7 4 3.564
0.06024
9
1.69050
2 4
India 60.6
10.1390
3
16.7310
8 3 3.79
0.13292
9 3.50735 3
China 59.8
4.86826
5
8.14091
1 2 3.8
0.17677
7
4.65201
8 2
South
Africa 38
2.34520
8 6.1716 1 4.264
0.25530
4
5.98742
4 1
However in terms of score, the dispersion was more variable in Brazil (6.72 %) and it was more
consistent in Russia (1.69 %).Besides the three pillars of ESI are analyzed as follows:
TABLE -3- ME INDEX - SCORES -2007-08 -2012
Country Mean S.D C.V Rank
Brazil 3.5575 0.42034 11.8156008 5
Russia 3.6325 0.18361 5.05464556 4
China 4.3275 0.27524 6.36025419 2
India 4.0075 0.11672 2.91253899 3
South Africa 4.605 0.2932 6.3669924 1
As the first pillar of ESI, Market Environment (ME) represents the highest score in South Africa
among BRICS during the study period. China, India, Russia and Brazil have occupied the
second, third, fourth and fifth positions. From the Table 3, it is evident that Brazil recorded more
variable dispersion but India has shown more consistent dispersion in terms of ME among the
BRICS during the study period.
TABLE-4-PRE INDEX–SCORES-2007-08 TO 2011-12
Country Mean S.D C.V Rank
Brazil 3.875 0.377536 9.742861 5
Russia 3.5875 0.21093 5.879595 4
China 4.3125 0.143614 3.330181 2
India 4.32 0.384619 8.903207 3
South Africa 5.085 0.077244 1.51906 1

Volume 3, Issue 6 (June, 2013) ISSN: 2249-7307
Jou
rnal
of
Asi
an R
esea
rch
Co
nso
rtiu
m
1
27
htt
p:/
/ww
w.a
ijsh
.org
AJRBEM
The PRE (Index) pillar assesses the political and regulatory/legal framework which facilitates
ICT penetration for the safe development of business activities across the countries selected for
this study. PRE as the second pillar of ESI recorded the similar trend as in the case of first pillar
with the supremacy of South Africa among the BRICS during the period of study. China and
India have been suffering from weaknesses in their political and regulatory framework therefore
they occupied second and third positions only.
From the Table 4, it is evident that Brazil recorded more variable dispersion and South Africa
has shown more consistent dispersion among the BRICS in terms of PRE during the study
period.
As the third pillar of ESI, Infrastructure Environment (IE) has recorded top position in Russia
among BRICS. Brazil, India, South Africa and China have occupied the second, third, fourth and
fifth positions among BRICS.
TABLE -5- IE INDEX–SCORES-2007-08 TO 2011-12
Country Mean S.D C.V Rank
Brazil 3.085 0.279225 9.051057 2
Russia 3.495 0.418927 11.98647 1
China 2.8275 0.183916 6.504536 5
India 2.96 0.3964 13.39191 3
South Africa 2.95 0.109247 3.703279 4
From the Table 5, it is evident that India (13.39 %) recorded more variable dispersion but South
Africa (3.70 %) has shown more consistent dispersion among the BRICS in terms of IE during
the study period.
This section deals with the second sub index of NRI- Readiness Sub Index (RSI) and its related
pillars across BRICS countries during the study period. RSI as the second sub index of NRI has
shown the similar picture in terms of rank and score. China and India have recorded first and
second positions among the BRICS during the study period (Table 6). Rest of the countries
Brazil, South Africa and Russia have occupied third, fourth and fifth positions during the period
under consideration.
As shown in Table 6, Russia (100.04%) recorded more variable dispersion and Brazil (9. 20 %)
has shown more consistent dispersion among the BRICS in terms of rank relating to Readiness
sub index during the study period. In terms of score of RSI, however South Africa (8.44%)
recorded more dispersion and India (2. 10%) recorded more consistent dispersion.

Volume 3, Issue 6 (June, 2013) ISSN: 2249-7307
Jou
rnal
of
Asi
an R
esea
rch
Co
nso
rtiu
m
1
28
htt
p:/
/ww
w.a
ijsh
.org
AJRBEM
TABLE-6- RSI RANK & SCORE -2007-08 TO 2011-12
Country Rank
Mean
S.D C.V Rank Score
Mean
S.D C.V Rank
Brazil 56.5 5.196152423 9.19672995 3 4.43 0.228473 5.157408 3
Russia 68.75 2.872281323 100.041779 5 4.31 0.186548 4.32825 5
India 33 7.874007874 23.8606299 2 4.935 0.103441 2.096065 2
China 31.25 17.53805386 56.1217724 1 4.9675 0.143272 2.884182 1
South
Africa 67.5 16.42153058 24.3281935 4 4.355 0.367469 8.43786 4
Readiness sub index (RSI) consists of three pillars like individual readiness (IR), business
readiness (BR) and government readiness (GR) as discussed below.
TABLE-7- IR INDEX-SCORES-2007-08 TO 2011-12
Country Mean S.D C.V Rank
Brazil 4.555 0.583924 12.8194 4
Russia 5.1375 0.353777 6.886175 3
India 5.5 0.25807 4.692177 2
China 5.575 0.138924 2.491918 1
South Africa 4.4725 0.729263 16.3055 5
As shown in Table 7, Individual readiness as the first pillar of RSI has occupied the first position
in China among the BRICS during the study period. India occupied the second position as the
highly populous country next to China. Russia, Brazil and South Africa have shown third, fourth
and fifth positions during the study period among BRICS. It is clear from the Table 7 that IR
index score has more dispersion in South Africa (16.30%) and China (2.49%) indicated more
consistent dispersion in terms of score during the study period.
TABLE -8- BR INDEX- SCORES-2007-08 TO 2011-12
Country Mean S.D C.V Rank
Brazil 4.65 0.219545 4.721398 3
Russia 4.045 0.259808 6.422933 5
India 4.85 0.271293 5.593674 1
China 4.57 0.160624 3.514744 4
South Africa 4.6625 0.300486 6.444734 2

Volume 3, Issue 6 (June, 2013) ISSN: 2249-7307
Jou
rnal
of
Asi
an R
esea
rch
Co
nso
rtiu
m
1
29
htt
p:/
/ww
w.a
ijsh
.org
AJRBEM
It is clear from the Table 8 that the business readiness (BR) index score has more dispersion in
India (16.30%) while China (2.49%) recorded more consistent dispersion in terms of score
during the study period. India has occupied the first rank in terms of BR index among BRICS
during the study period .South Africa. Brazil, China and Russia have recorded the second, third,
fourth and fifth positions.
TABLE -9-GR–SCORES-2007-08 TO 2011-12
Country Mea S.D C.V Rank
Brazil 4.2575 0.326228448 7.66244152 3
Russia 4.125 0.732871066 17.7665713 2
India 4.445 0.335310801 7.54355008 4
China 4.9775 0.269861075 5.42161879 5
South Africa 3.98 0.221359436 5.56179488 1
As shown in Table 9, South Africa occupied the first position among BRICS in terms of third
pillar of Government Readiness Index across the BRICS nations during the study period
however Russia, Brazil, India and China have occupied the second, third, fourth and fifth
positions among BRICS during the study period. Russia recorded more dispersion while China
has shown more consistent dispersion among BRICS.
This section deals with the third sub index of NRI- Usage Sub Index (USI) and its related pillars
across BRICS countries during the study period under consideration. USI assesses the individual
efforts of the main social agents such as individuals, business, and government to increase their
capacity to use ICT, as well as their actual use in their day-to-day activities. As the third index
of NRI, USI has shown the supremacy of China across BRICS during the period under
consideration. Brazil, India, South Africa and Russia have occupied the second, third, fourth and
fifth positions among BRICS in terms of both ranks and scores of usage sub index during the
study period (Table 9).
China has showed more dispersion and Brazil has indicated consistent dispersion in terms of
ranks of USI. However in terms of score, South Africa has recorded more dispersion and India
has recorded consistent dispersion as shown in Table 10.
TABLE -10-USI –SCORES-2007-08 TO 2011-12
Country Rank Mean S.D C.V Score
Mean
S.D C.V Rank
Brazil 47 6.041523 12.85430423 2 3.71 0.139463 3.759117434 2
Russia 73.2 9.884331 13.50318447 5 3.264 0.258031 7.905361 5
India 63.8 9.984989 15.65045256 3 3.398 0.119038 3.503172723 3
China 45 8.485281 18.85618083 1 3.8 0.198116 5.213582304 1
South
Africa 71 10.65364 15.00512377 4 3.278 0.188468 5.749466255 4

Volume 3, Issue 6 (June, 2013) ISSN: 2249-7307
Jou
rnal
of
Asi
an R
esea
rch
Co
nso
rtiu
m
1
30
htt
p:/
/ww
w.a
ijsh
.org
AJRBEM
The related pillars of USI are also analyzed in this context.
The individual usage (IU) index measures ICT penetration and diffusion at the individual level,
using indicators such as the number of mobile phone subscriptions, individuals using the
Internet, households with a personal computer (PC), households with Internet access, both fixed
and mobile broadband subscriptions, and the use of social networks.
TABLE-11- IU –SCORES-2007-08 TO 2011-12
Country Mean S.D C.V Rank
Brazil 2.756 0.741438 26.90267752 2
Russia 3.124 0.864627 27.67692341 1
India 1.826 0.662216 36.26593521 5
China 2.516 0.828209 32.91768326 3
South Africa 2.272 0.470765 20.72030521 4
As shown in Table11, Russia has recorded the top in individual usage among BRICS during the
study period. Brazil, China, South Africa and India recorded the second, third, fourth and fifth
positions among the BRICS during the study period. It is also clear that India’s weakest
performance lies in its low penetration of ICT in terms of usage pillar. It is also evident that
India recorded more dispersion and South Africa has shown consistent dispersion across the
BRICS during the study period.
The business usage (BU) index captures the extent of business use of Internet as well as the
efforts of the firms in an economy to integrate ICT into an internal, technology-savvy,
innovation-conducive environment that generates productivity gains. Consequently, this pillar
measures the firm’s technology absorption capacity as well as its overall capacity to innovate
TABLE-12- BU INDEX –SCORES-2007-08 TO 2011-12
Country Mean S.D C.V Rank
Brazil 4.246 0.737821 17.37685154 3
Russia 3.51 0.61086 17.40342021 5
India 4.27 0.8281 19.39344814 2
China 4.404 0.331783 7.533675333 1
South Africa 4.002 0.741802 18.53577862 4
It is clear from Table 12, that India has indicated more dispersion whereas China has recorded
more consistency during the study period in terms of scores. However China and India have
occupied the top two ranks among the BRICS. Brazil, South Africa and Russia occupied the
remaining three positions during the study period.

Volume 3, Issue 6 (June, 2013) ISSN: 2249-7307
Jou
rnal
of
Asi
an R
esea
rch
Co
nso
rtiu
m
1
31
htt
p:/
/ww
w.a
ijsh
.org
AJRBEM
TABLE-13-GU INDEX –SCORES-2007-08 TO 2011-12
Country Mean S.D C.V Rank
Brazil 4.15 0.319922 7.708960614 2
Russia 3.15 0.326497 10.36496998 5
India 4.086 0.190866 4.671229698 3
China 4.486 0.215476 4.803303985 1
South Africa 3.558 0.206567 5.805710522 4
The Government Usage index provides insights into the importance that governments place on
carrying out ICT policies for competitiveness and the well-being of their citizens. In terms of
GU, China topped the higher position among BRICS (Table13). Brazil, India, South Africa and
Russia have occupied the remaining positions in the order during the period under consideration.
Further it is evident that Russia recorded more dispersion and India recorded consistent variation
among BRICS during the study period.
This section makes an attempt to examine the status of NRI and its related indicators in BRICS
nations during the period 2007-08 to 2010-11 with the help of percentiles (Table14). Percentiles
are most often used for determining the relative standing of a country in BRICS.
TABLE – 14-NRI , SUB INDEXES AND THEIR INDEXES (PILLARS)
PERFORMANCE IN BRICS –2007-08 TO 2011-12
Index Advantageous Moderately
Advantageous
Disadvantageous
Net Work Readiness
Index(NRI)
Rank >1.6327 0.763585 -1.673585 < 0.763585
Nil Brazil Nil
Nil Russia Nil
Nil China Nil
Nil India Nil
Nil South Africa Nil
Score >1.06509 0.93433-1.06509 < 0.93433
Nil Brazil Nil
Nil Russia Nil
Nil China Nil
Nil India Nil
Nil South Africa Nil
Environment Sub Index(ESI)
Rank >1.26327 0.763585-1.26327 < 0.763585
Brazil China Russia

Volume 3, Issue 6 (June, 2013) ISSN: 2249-7307
Jou
rnal
of
Asi
an R
esea
rch
Co
nso
rtiu
m
1
32
htt
p:/
/ww
w.a
ijsh
.org
AJRBEM
Nil India South Africa
Score >1.06509 0.93433-1.06509 < 0.93433
South Africa Russia Brazil
Nil China Nil
Nil India Nil
ME-Score >1.10935 0.892946-1.10935 < 0.892946
South Africa Russia Brazil
Nil China Nil
Nil India Nil
PRE-
Score >1.11013 0.880843 -1.11013 < 0.880843
South Africa Brazil Russia
Nil China Nil
Nil India Nil
IE-Score >1.07349 0.942957-1.07349 < 0.942957
Russia Brazil India
Nil China Nil
Nil South Africa Nil
Readiness Sub Index (RSI)
Rank >1.32539 0.62500-1.32539 < 0.62500
Russia Brazil China
Nil India Nil
Nil South Africa Nil
Score >1.07648 0.94195 -1.07648 < 0.94195
China Brazil Russia
Nil India Nil
Nil South Africa Nil
IR –Score >1.09697 0.894166 -1.09697 < 0.894166
China Brazil South Africa
Nil Russia Nil
Nil India Nil
BR –Score >1.04395 0.945457-1.04395 < 0.945457
India Brazil Russia
Nil China Nil
Nil South Africa Nil
GR –
Score >1.08131 0.930112-1.08131 < 0.930112
China Brazil South Africa
Nil Russia Nil
Nil India Nil
Usage Sub Index(USI)
Rank >1.20167 0.766667-1.20167 < 0.766667
Russia Brazil China

Volume 3, Issue 6 (June, 2013) ISSN: 2249-7307
Jou
rnal
of
Asi
an R
esea
rch
Co
nso
rtiu
m
1
33
htt
p:/
/ww
w.a
ijsh
.org
AJRBEM
Nil India Nil
Nil South Africa Nil
Score >1.07593 0.937249 -1.07593 < 0.937249
China Brazil Russia
Nil India Nil
Nil South Africa Nil
IU –Score >1.17656 0.95806 -1.17656 < 0.95806
Russia Brazil South Africa
Nil India Nil
Nil China Nil
BU-Score >1.06133 0.919146 -1.06133 < 0.919146
China Brazil Russia
Nil India Nil
Nil South Africa Nil
GU-Score >1.11117 0.863098 -1.11117 < 0.863098
China Brazil Russia
Nil India Nil
Nil South Africa Nil
Table 14 presents the performance of NRI across the BRICS during the period 2007-08 to 2011-
12 . It is disappointing to note from the table that none of the BRICS nations have recorded
advantageous position but all the countries have maintained moderately advantageous position
during the period under consideration both in terms of rank and score.
ENVIRONMENT SUB INDEX (ESI)
ESI as the first sub index of NRI has shown advantageous position in Brazil and
disadvantageous position in Russia and South Africa in terms of rank. However in highly
populous countries in China and India it is moderate. In terms of score, South Africa is in
advantageous position and Brazil is in disadvantageous position. Russia, China and India had
indicated moderate performance.
The first index of ESI, ME has shown advantageous position in South Africa and
disadvantageous in Brazil and moderate in Russia, China and India. The second index - PRE is
advantageous in South Africa and disadvantageous in Russia and moderate in Brazil, China and
India. The last index- IE has shown the supremacy of Russia with advantageous position and
India occupied disadvantageous position among BRICS. However the rest of the countries of
BRICS have remained moderately advantageous position.
READINESS SUB INDEX (RSI)
In terms of rank, Russia is in advantageous position and China is in disadvantageous position
but their positions are reversed in terms of score. However the rest of the countries like Brazil,
India and South Africa remained in the moderately advantageous position and South Africa is in

Volume 3, Issue 6 (June, 2013) ISSN: 2249-7307
Jou
rnal
of
Asi
an R
esea
rch
Co
nso
rtiu
m
1
34
htt
p:/
/ww
w.a
ijsh
.org
AJRBEM
disadvantageous position .In terms of IR and GR, China is in advantageous position. However in
terms of business readiness India gained the advantageous position.
USAGE SUB INDEX (USI)
In terms of rank, Russia is in advantageous position and China is in disadvantageous position
but their positions are reversed in terms of score. China is in advantageous position in terms of
the score of IU but South Africa indicated the disadvantageous position. Rest of the BRICS
nations maintained the moderately advantageous position. In terms of BU and GU scores, China
remained in the advantageous position and Russia remained in the disadvantageous position.
However the remaining three countries maintained the moderately advantageous position only.
This last section summarizes the findings of this study and gives some suggestions.
All BRICS countries indicated moderately advantageous position in terms of rank and score
relating to NRI during the period under consideration.
Brazil occupied the advantageous position only in terms of ESI rank and occupied the
disadvantageous position in terms of score obtained in case of ME. In rest of the indicators, this
country occupied the moderately advantageous position. Based on the results, this country has to
focus on the market environment in order to improve NRI.
Russia gained advantageous position in terms of the ranks relating to sub indexes like RSI and
USI. Further it enjoyed the advantageous position in terms of scores relating to indexes like IE
and IU. But Russia has to focus on ESI(rank), and the scores of PRE,RSI BR,BU and GU for the
development of NRI.
India gained the advantageous position in BR and disadvantageous position only in terms of IE
scores. In the remaining indexes it maintained the moderately advantageous position. Results
suggest India has to focus on infrastructure environment to improve the NRI.
China gained the advantageous position in terms of the scores relating to RSI and USI and the
indexes like IR,GR,BU and GU. However the ranks of China in two sub indexes like USI and
RSI have shown disadvantageous position , therefore it has to focus on these issued for further
improvement. It is evident that out of all BRICS China is relatively more comfortable than the
rest of the countries.
South Africa occupied the advantageous position in terms of scores relating to ESI,ME and PRE.
However it indicated disadvantageous position in terms of rank relating to ESI and the scores of
IR, GR and IU have shown disadvantageous position in terms of scores. Thus these issues have
to be addressed adequately.
Though the BRICS are facing some challenges in this context, they must be tackled as early as
possible to fully adopt and leverage ICT. Thus the vision and commitment of the governments
of BRICS have to be focused to boost ICT since it is the driver of economic growth

Volume 3, Issue 6 (June, 2013) ISSN: 2249-7307
Jou
rnal
of
Asi
an R
esea
rch
Co
nso
rtiu
m
1
35
htt
p:/
/ww
w.a
ijsh
.org
AJRBEM
REFERENCES
1.Punit Saurabh, Bhaskar Bhowmick, Amrita, and Dhrubes Biswas REF-Developmental Impact
Analysis of an ICT-Enabled Scalable Healthcare Modelin BRICS Economies ,Technology
Innovation Management Review, June 2012,PP26-31
2.Soumitra Dutta , Insead Beñat Bilbao-Osorio, World Economic Forum Thierry Geiger, World
Economic Forum ,The Networked Readiness Index 2012: Benchmarking ICT 2012, Page 3
3. Global Information Technology Report - 2008-09, 2009-10&2010-11

Volume 3, Issue 6 (June, 2013) ISSN: 2249-7307
Jou
rnal
of
Asi
an R
esea
rch
Co
nso
rtiu
m
1
36
htt
p:/
/ww
w.a
ijsh
.org
AJRBEM
A P e e r R e v i e w e d I n t e r n a t i o n a l J o u r n a l
o f A s i a n R e s e a r c h C o n s o r t i u m
AJRBEM:
A S I A N J O U R N A L O F
R E S E A R C H I N B U S I N E S S
E C O N O M I C S A N D
M A N A G E M E N T
HIGH WORLD FOOD PRICES-CAUSES AND CONSEQUENCES
DR. U. JAYALAKSHMI SRIKUMAR*
*Professor,
ITM Business School,
Chennai.
ABSTRACT
This article addresses the issue of “agflation”- agricultural commodity increases.
Both real and nominal prices have been looked into while looking at price rise. The
main highlight of the article is that it looks at price projections for the year 2017
based on a OECD report. A detailed analysis of the past, present and future rise in
prices have been taken into consideration. This detailed analysis is followed by the
causes for food price increases. The causes have been looked into from the demand
and the supply side. The article does not stop with identifying issues; it attempts to
give solutions also. The key solution lies in adopting sustainable agriculture
especially by the developing countries.
KEYWORDS: Food prices, OECD, causes for high food price, consequences,
solutions.
____________________________________________________________________________
INTRODUCTION
World over there is a new phenomenon affecting millions of people – “agflation”- agricultural
commodity inflation, otherwise known as rising food prices. The persistent increase in food
prices over the last couple of years has made millions hungry which in turn has prompted social
disturbances and food riots in many countries. Many say we are close to the world’s worst ever
food crisis of 2007-08. Overall there have been many factors which have contributed to this
phenomenon. Increases in demand due to economic and population growth as also supply
decreases due to climate change and resultant droughts in different parts of the world. Policy
makers have till now indulged more in blame game rather prescribing solutions. This directly
brings us to the question of what is a price increase. The first point that we have to note is that

Volume 3, Issue 6 (June, 2013) ISSN: 2249-7307
Jou
rnal
of
Asi
an R
esea
rch
Co
nso
rtiu
m
1
37
htt
p:/
/ww
w.a
ijsh
.org
AJRBEM
price data is descriptive. It is of no surprise that nominal price increases over time. This is
because when incomes increase prices will also increase because of an increase in purchasing
power. So when do we have to be worried about a price increase? This is when increase in the
prices of food items exceeds the rate of increase in the general level of prices and inflation
results. However at this point we must note that food demand in China and India is increasing as
their incomes are growing but food production in these countries is also growing. China has
consistently been a net exporter of cereals including rice. The Agricultural Outlook for China for
the next decade shows that net exports are to decline very gradually. The same is true for India
also. We can thus say that growing food demand especially for cereals in emerging economies is
not a concern as the production in these economies is also growing. So this leaves us with the
concern that the crisis has to be tackled in other countries. This is not a very difficult proposition
if all international bodies can engage in some quick action. The issue has to be looked at from
two different angles. The first is the impact that the crisis might cause on import dependent
economies. The second is to look at how to increase production of food world over.
HIGH WORLD FOOD PRICES-THE PAST, CURRENT AND FUTURE SITUATION
The high food prices witnessed in the recent past is unusual when viewed from the perspective of
the last decade or from a longer historical perspective. The graph below shows the price increase
in both real and nominal terms.

Volume 3, Issue 6 (June, 2013) ISSN: 2249-7307
Jou
rnal
of
Asi
an R
esea
rch
Co
nso
rtiu
m
1
38
htt
p:/
/ww
w.a
ijsh
.org
AJRBEM
Note: Real Prices deflated by USA GDP deflator 2007=1 Source: OECD-FAO Agricultural
Outlook 2008-17

Volume 3, Issue 6 (June, 2013) ISSN: 2249-7307
Jou
rnal
of
Asi
an R
esea
rch
Co
nso
rtiu
m
1
39
htt
p:/
/ww
w.a
ijsh
.org
AJRBEM
The prices of wheat, coarse grains, rice and oilseeds have been examined from 1971 to 2007 with
projections for 2008 to 2017. We do not have the spot prices for April – May 2008 but for these
commodities the price levels greatly exceeded the expected annual average for 2008. From this
analysis we have to get two points very clear. The first is that agricultural commodity markets
are highly volatile. The second one is that the present price spike is not the worst since the last
forty years. Poultry products have also seen price increases though this ahs not been mentioned
in the graph. In the years between 2005 and 2007 major producing countries of the world
experienced severe drought. This pushed the crop yields in those countries below the average
levels. It is to be noted that the world cereal output in 2007 was just 3% larger than in 2005. Also
there was a decline in the production of oilseeds
Between 2005 and 2007 there were coinciding spells of unfavourable weather in major
producing nations of the world, pushing crop yields in those areas below long term average
levels . World cereal output in 2007 was just 3% larger than in 2005. While there was a decline
in overall oilseeds output, nevertheless vegetable oil production rose by 7% due to rapid growth
in palm oil output.
Now let us look ahead to 2017. The average level of wheat and coarse grain is expected to
remain higher than in 2005 but well below the levels in 2007-08. World wheat and coarse grain
production is expected to grow. Oilseeds are expected to be strong. The supply shortages are
expected to prod increases in production world over. The production of palm oil is expected to
increase by 40% and rice is expected to grow modestly.
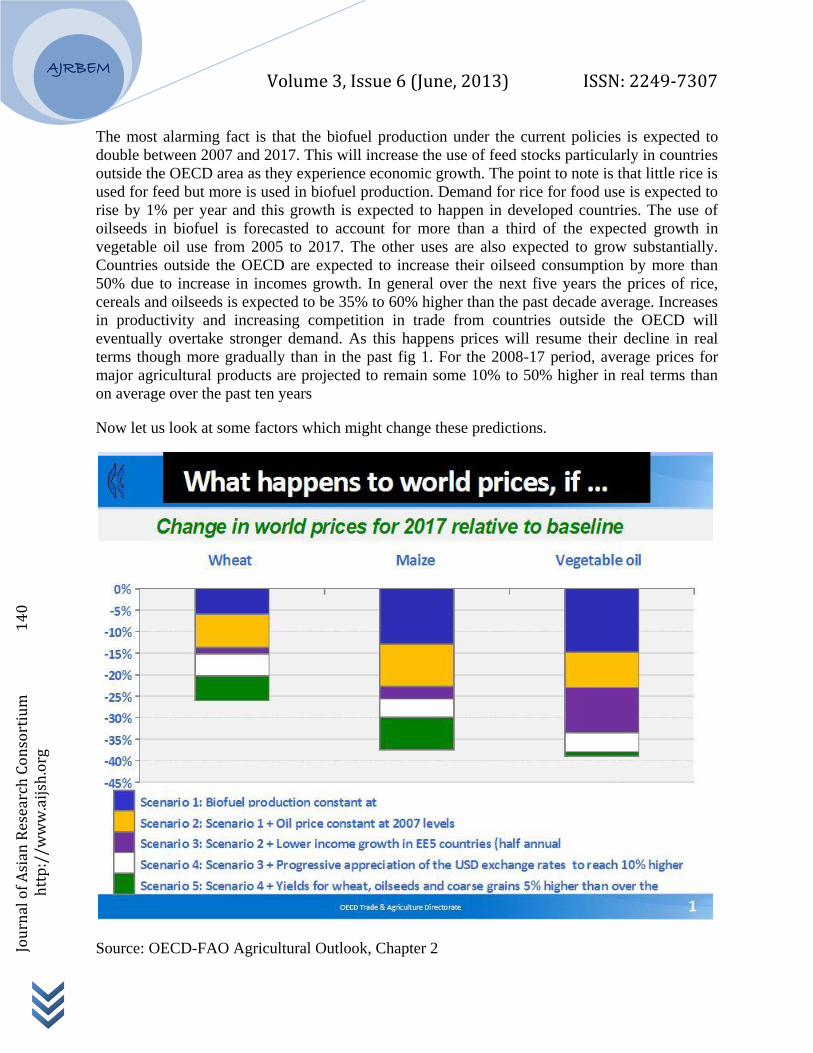
Volume 3, Issue 6 (June, 2013) ISSN: 2249-7307
Jou
rnal
of
Asi
an R
esea
rch
Co
nso
rtiu
m
1
40
htt
p:/
/ww
w.a
ijsh
.org
AJRBEM
The most alarming fact is that the biofuel production under the current policies is expected to
double between 2007 and 2017. This will increase the use of feed stocks particularly in countries
outside the OECD area as they experience economic growth. The point to note is that little rice is
used for feed but more is used in biofuel production. Demand for rice for food use is expected to
rise by 1% per year and this growth is expected to happen in developed countries. The use of
oilseeds in biofuel is forecasted to account for more than a third of the expected growth in
vegetable oil use from 2005 to 2017. The other uses are also expected to grow substantially.
Countries outside the OECD are expected to increase their oilseed consumption by more than
50% due to increase in incomes growth. In general over the next five years the prices of rice,
cereals and oilseeds is expected to be 35% to 60% higher than the past decade average. Increases
in productivity and increasing competition in trade from countries outside the OECD will
eventually overtake stronger demand. As this happens prices will resume their decline in real
terms though more gradually than in the past fig 1. For the 2008-17 period, average prices for
major agricultural products are projected to remain some 10% to 50% higher in real terms than
on average over the past ten years
Now let us look at some factors which might change these predictions.
Source: OECD-FAO Agricultural Outlook, Chapter 2

Volume 3, Issue 6 (June, 2013) ISSN: 2249-7307
Jou
rnal
of
Asi
an R
esea
rch
Co
nso
rtiu
m
1
41
htt
p:/
/ww
w.a
ijsh
.org
AJRBEM
Projections of the price made are under conditions of normal weather, unchanged policies and
stable economic performance. When we look at alternatives to these assumptions we can some
further insights into price increases. Key results of four alternative scenarios are illustrated in the
graph and summarized below.
It is estimated that the projected prices for coarse grains would be 12.5% lower and
vegetable oil price 15% lower in 2017 on the assumption that the biofuel production is
expected to remain at 2007 levels.
The projected prices for wheat and maize would fall by a further 10% and vegetable oils
by further 7% if the oil prices stay at their 2007 levels.
Wheat and coarse grain prices would fall by 1 to 2% and vegetable oil prices by 10% if
the rates of growth of GDP in Brazil, China, Indonesia, and South Africa are reduced to
half of the rate assumed in the outlook.
Little further change is expected in vegetable oil prices. The projected prices of wheat
and maize would be 6 to 8% lower if the cereals and oilseeds yields are 5% higher than
expected
All these assumptions tend in the same direction, to lower prices, and taken together would lead
to prices of wheat, coarse grains and vegetable oils that are 20 to 35% lower in 2017 than what it
is now projected.
It has to be noted that the baseline for these projections do not include the recent biofuels policy
initiatives. If initiatives such as the Energy Independence and Security Act of the United States
and the European Union’s Directive on Renewable Energy are included the impact on world
food prices could be worse. New research warns that the worse is yet to come. World prices are
set to record a all-time high in 2013. "The coming year will see the world economy re-enter a
period of agflation as grain and oilseed stocks decline to critically low levels, pushing the FAO
(Food and Agricultural Organisation) Food Price Index above record nominal highs set in
February 2011," they say. World food prices are forecast to reach record highs in 2013,
according to a Rabobank report. The trend is expected to extend well into the third quarter of
2013, the report said. Rabobank estimates that the Food and Agricultural Organisation
(FAO) Food Price Index will rise by 15% by the end of June 2013. In order for demand rationing
to take place, in turn encouraging a supply response, prices will need to stay high. Rabobank
expects prices, particularly for grains and oilseeds, to remain at elevated levels for at least the
next 12 months.
CAUSES FOR HIGH WORLD FOOD PRICES
The UN Economic and Social Commission for Asia and the Pacific (ESCAP) report on regional
cooperation for inclusive and sustainable development says that due to pressure on a shrinking
and neglected agriculture world over along side an increase in consumption have lead to high
food prices. In addition increase in the prices of fertilizers, competition for arable land, water

Volume 3, Issue 6 (June, 2013) ISSN: 2249-7307
Jou
rnal
of
Asi
an R
esea
rch
Co
nso
rtiu
m
1
42
htt
p:/
/ww
w.a
ijsh
.org
AJRBEM
resource and high oil prices all contribute to an increase in food prices. Commodity market
speculation has contributed to high volatility in the food prices.
We now list the factors which have contributed to high food prices across the world.
INCREASE IN THE DEMAND FOR FOOD: There is no doubt that the production of food is
increasing across the world. But the increasing consumption for food, biofuels, feedstock and
other commercial uses have increased the food prices.
INCREASED DEMAND FOR ANIMAL PROTEIN; In countries like China and India the
standards of living is increasing. So there has been an increase in the consumption of dairy,
poultry and animal protein products. This leads to an increase in the demand for food as feed
stock. This has pushed the prices up.
INCREASE IN FUEL PRICES have led to higher transport costs. This increases the prices of
agricultural inputs like fertilizers and pesticides. The cost of transport of finished products also
increase pushing up the prices of food in import dependent countries.
DROUGHTS IN MAJOR PRODUCING COUNTRIES HAVE BEEN ANOTHER
CAUSE: Severe droughts affected countries like Australia, the Balkans and the former Soviet
Union affecting the contribution of these countries to world production. Factors such as mold are
affecting grain production in South Asia.
GENERALLY LOW RESERVES OF FOOD GLOBALLY: The U.S. Department of
Agriculture has declared that their grain levels are lowest since 1960. Global stocks of wheat,
coarse grains—corn, barley, sorghum, millet and oats—and rice have decreased every year since
2001-2002, with the exception of 2004-2005. Thus we have to draw upon our buffers.
INCREASE OF GRAIN AND OILSEED CROPS DIVERTED FOR BIOFUEL
PRODUCTION: The use of corn for biofuels has largely affected the price of wheat and rice
and the use of palm oil for biofuels have increased the prices of soyabean and other vegetable
oils. It has been reported by the International Grains Council that 6.5 per cent of the worldwide
consumption of crop is consumed by biofuels. As much as 28 percent of the U.S. corn crop is
going into ethanol production, with plans to increase this amount.
Export bans and government price controls have domino effect on the prices.
There have been many years of under-investment in agricultural productivity, particularly in
developing countries. Lack of investment in agriculture, market infrastructure and related areas
has combined with the above factors, many of them policy decisions by our government and
others, to create the current situation of high food prices
POLITICAL TURMOIL IN NATIONS FACING POLITICAL CRISIS: When there is
disruption of public services supply shortage of food results. This is because the government in
all the countries is responsible for imports, maintain highways etc; When the government is

Volume 3, Issue 6 (June, 2013) ISSN: 2249-7307
Jou
rnal
of
Asi
an R
esea
rch
Co
nso
rtiu
m
1
43
htt
p:/
/ww
w.a
ijsh
.org
AJRBEM
unable to perform these duties due to change in leadership and other factors crisis results causing
increase in food prices which can be further aggravated by speculative activities.
CONSEQUENCES OF HIGH WORLD FOOD PRICES
The food crisis has impacted household budgets. According to the UN’s Food and Agricultural
Organization (FAO) about 75 per cent of the household income is spent on food. "In Bangladesh,
Nepal and Sri Lanka, for example, common response to food price rises have been to switch to
less expensive food items, reduce savings to spend on food and sell assets to buy food," the
report says. It further says that 40 per cent of the children in India and Bangladesh are
malnourished. Shortage of food has been the root cause of hunger in these areas relegating socio-
economic and social distribution causes. Spending on education and health care has to be
drastically reduced.
Recently, it has been suggested that high food prices have been one cause of instability in the
Middle East and North Africa region
Prices increases leads to violation of the international law of basic right to food. For example, it
exists in Article 24 of the convention on the Rights of the Child, Articles 25 and 28 of
Convention on the Rights of Persons with Disabilities, Article 12 of Convention on the
Elimination of All Forms of Discrimination against Women, Article 25 of the Universal
Declaration of Human Rights, and Article 11 of the International Covenant on Economic, Social
and Cultural Rights. In addition, the United Nations has a Special Rapporteur on the Right to
Food.
The scarcity of feed crops is expected to have major repercussions for the meat and dairy
industries, as the increase in the costs of feed stocks raises the prices faced by consumers.
In the short run higher slaughter rates might result as producers respond to rising feed costs
should temporarily increase the meat supply. But the ultimate result is expected be smaller
animal herd sizes, which will reduce meat and dairy production and ramp up prices in the long
run.
The British public, which consumes high levels of meat and dairy products, will definitely feel
the impact of this latest bout of agflation, says Rabobank. Nick Higgins, one of the report's
authors, says UK food prices "are going to rise in the coming year significantly." Still, while
consumers in developing countries show "elasticity" of demand as prices move, people in the
UK tend not to change their consumption patterns in response to prices, he notes. In other words,
even if meat gets more expensive, they will keep buying
SOME MITIGATING FACTORS
High food prices are a symptom, and not the disease. So while the international community must
take early action to prevent excessive price increases, it should also move to act on the root
causes behind such increases.
Volume 3, Issue 6 (June, 2013) ISSN: 2249-7307
Jou
rnal
of
Asi
an R
esea
rch
Co
nso
rtiu
m
1
44
htt
p:/
/ww
w.a
ijsh
.org
AJRBEM
In responding to the challenges of high food prices we are better placed today than we were in
2007-08. This is because we have developed new policies and new instruments, like the United
Nations High-Level Task Force on Global Food Security and AMIS, the G20’s Agricultural
Markets Information System, which improves transparency in global markets. We also have the
AMIS-related Rapid Response Forum, set up to facilitate coordinated policy responses by the
major world producers and traders of key cereals and soybeans in the event of market upheavals
The food crisis has taught us that not all are affected in the same way. The urban and rural poor
as also those in the import dependent countries are most affected. This is because high world
commodity prices get transmitted to the local markets and as said before this will severely affect
those spending more than 75 per cent of their incomes on food. Small farm holders who are also
poor can be made to benefit from the high food prices by making them a part of the solution by
reducing price spikes and improving overall food security. A twin-track approach has to be
adopted. This should support long term investments in agriculture especially small farms,
simultaneously ensuring that safety nets are in place to help poor food consumers and producers
avoid hunger, asset losses and poverty traps in the short run.
In many countries social protection systems are in place. These include assistance for
smallholder farmers, nutritional support to mothers and children, and school meals -- to ensure
that their poorest citizens have enough to eat. These need to be expanded significantly in poorer
countries. Such safety nets which are affordable and transparent are an absolute must to
safeguard against food crisis. But such nets in many developing countries like India are not
effective due to rampant corruption that upsets delivery and implementation. Small farmers need
to be supported to increase productivity of their small and marginal lands. The other poor should
be provided with decent jobs. The case of India is an ideal example where the rural employment
guarantee schemes and the forthcoming cash transfer scheme by the UPA government is a move
in the right direction.
International communities should help import dependent countries to promote sustainable food
production. There is potential in these countries to increase production. More food should be
made available in the local markets and more jobs and incomes should be provided in the rural
areas where 70 per cent of the world’s poor live.
Another point to be noted is that one-third of the food produced is wasted due to lack of storage
facilities, spoilage, damage and other factors. The Food and Agriculture Organization of the UN
(FAO), the International Fund for Agricultural Development (IFAD) and the World Food
Programme are helping poor people to eat today while building their resilience and capacity.
More needs to be done in the form of increased investment in agriculture and social protection
which will increase the access to food by the poor.
We need to review and adjust where policies currently in place that encourage alternative uses
of grains. For example, adjusting biofuel mandates when global markets come under pressure
and food supplies are endangered has been recommended by a group of international
organizations including FAO, IFAD, the International Monetary Fund, the Organisation for
Economic Co-operation and Development, the UN Conference on Trade and Development,

Volume 3, Issue 6 (June, 2013) ISSN: 2249-7307
Jou
rnal
of
Asi
an R
esea
rch
Co
nso
rtiu
m
1
45
htt
p:/
/ww
w.a
ijsh
.org
AJRBEM
WFP, the World Bank and the World Trade Organization. That recommendation, made to the
2011 G20 summit in Paris, still stands today
The people should be encouraged to buy local. This will reduce dependence on food that has to
travel from the field to the plate. Conservation of fuel used in transportation of food will reduce
the prices of food and reduce carbon emissions which will prevent further climate change.
When farm workers in other nations earn fair living wages and work under safe conditions, their
higher quality of life empowers them to be more involved as educated citizens, promoting
democracy and political stability.
People must be encouraged to grow their own food. During World War II, the United States
faced potential shortages of food and fuel as international trade was disrupted. The government
also had to adequately supply U.S. soldiers overseas. Reacting to this need the First Lady
Eleanor Roosevelt encouraged American families to start edible gardens in backyards. By the
end of the war, these backyard gardens were supplying 40 percent of U.S. produce. Home
gardening is an easy, healthy, eco-friendly way to lower your own family food budget while also
helping to reduce the price of food worldwide.
CONCLUSION
It can be concluded by saying that we need to be always vigilant and prepared for the worst
while simultaneously working on sustainable solutions. If we do not do the same the world’
poorest will be paying the highest food prices. Working in this direction will help us to put in
place the “Zero Hunger” challenge set by UN Secretary-General Ban Ki-moon of eradicating
hunger from the globe.
REFERENCES
1.Economic and Political weekly (2008) editorial “ Global Crisis in Food” 26 April 2008
2. G. Chandrasekhar (2008), “ Bio- Diesel Demand to Propel Grain Oil Prices Higher”- Business
Line 2 April 2008.
3. OECD (2008), Rising Food Prices- Causes and Consequences
4. Ramesh Chand ( 2008), “ The Global Food Crisis- Causes Severity and Outlook”, Economic
and Political weekly Vol 43, June –July 2008.
5. Rising Food Prices Kept 8 Million Indians Chained to Poverty, Times of India October 20
2012
6. Food Prices Push Retail Inflation, Times of India March 13 2013.
7. World Food Prices to Reach Record High in 2013-Rabobank, Times of India September 21
2012

Volume 3, Issue 6 (June, 2013) ISSN: 2249-7307
Jou
rnal
of
Asi
an R
esea
rch
Co
nso
rtiu
m
1
46
htt
p:/
/ww
w.a
ijsh
.org
AJRBEM
8. Telegraph March 28 2013
9. Why Food Prices will continue to Rise in the Coming Years?
http://www.firstpost.com/economy
10. High Food Prices Causes and Results- http://www.globalpolicyjournal.com/blog/18/02/2011
11. Tackling the Root Cause of High Food Price and Hunger- http://www.wfp.org/news/news-
release
12. The Causes of Global Food Crisis-http://crs.org/public-policy/food-crisis-causes.cfm
13 World Food Price Increase- Where Does the Buck Stop?
http://130.203.133.150/showciting;jsessionid=05FC1629FEFDA4712DD07B926544109E?cid=1
1393419
14. What’s causing Biofuel Food Price Inflation –
http://economistsview.typepad.com/economistsview/2008/07/whats-causing-g.htm
Volume 3, Issue 6 (June, 2013) ISSN: 2249-7307
Jou
rnal
of
Asi
an R
esea
rch
Co
nso
rtiu
m
1
47
htt
p:/
/ww
w.a
ijsh
.org
AJRBEM
A P e e r R e v i e w e d I n t e r n a t i o n a l J o u r n a l
o f A s i a n R e s e a r c h C o n s o r t i u m
AJRBEM:
A S I A N J O U R N A L O F
R E S E A R C H I N B U S I N E S S
E C O N O M I C S A N D
M A N A G E M E N T
POST HARVEST MANAGEMENT & AGRO-FOOD RETAIL MARKET
DEVELOPMENT IN DIFFERENT ALLIED SECTORS IN INDIA
MRK MURTHY*; V MURALI**
*Research Associate,
National Academy of Agricultural Research Management (NAARM),
Rajendranagar, Hyderabad, A.P, India.
**Farm In-charge,
National Academy of Agricultural Research Management (NAARM),
Rajendranagar, Hyderabad, A.P, India.
ABSTRACT
With more than two thirds of the population dependent on agriculture and the ever
decreasing per capita land holding, production agriculture alone cannot assure
adequate livelihood security to 127 million Indian farmers and their dependents.
Therefore, it is necessary to provide occupational diversity for the rural areas for
enhancing income and employment generation. It is in this context that post harvest
management and processing in the production catchments has been proposed to be a
suitable alternative. Regionally differentiated packages of post harvest technologies
are being developed for promoting through the concept of agro-processing centers.
Latest technological interventions are necessary for ensuring cost effectiveness and
quality. Cooperative and contract farming concepts also augur well for promoting
post harvest practices in the production catchments. The goal is to minimize the post
harvest losses, value addition to the produce and utilize the by-products effectively
while maintaining consumer safety. To sum up, promotion of post harvest technology
in the production catchments will not only create more income and employment but
would also lead to better rural living standards and cleaner and healthy
environment.
KEYWORDS: Food grains, post harvest losses, food retailing, agro-processing.
_____________________________________________________________________________

Volume 3, Issue 6 (June, 2013) ISSN: 2249-7307
Jou
rnal
of
Asi
an R
esea
rch
Co
nso
rtiu
m
1
48
htt
p:/
/ww
w.a
ijsh
.org
AJRBEM
INTRODUCTION
A substantial portion of the agricultural produce gets wasted due to lack of adequate post-harvest
management facilities. For instance, in horticulture it is estimated that about 30 per cent produce
goes waste between production and consumption due to lack of cold storage facilities, proper
packaging, transportation losses etc. Even in cereals and pulses the post-harvest losses are
substantial even though to a lesser extent than in horticulture. An important aspect of post-
harvest management is value addition through processing of produce and its timely delivery. The
present level of modern processing, even with the stimulus given to food processing industry is
very low.
Agricultural produce from production catchments is taken to processing industries, cold
storages and wholesale markets located largely in the urban areas since the required skills and
infrastructure are not available in the production catchments. This results into very heavy post
harvest losses and avoidable transport of the agricultural produce depriving the income and
employment opportunities to the rural masses. Needless to say that these effects further lead to
social and environmental problems in the urban sector. Since 70 % of the consumers live in the
rural sector, the processed food is transported back to where it was produced at much higher
prices and after incurring substantial losses.
Had the produce been processed in the production catchment, the consumers there would
have accessed the food at lower prices, post harvest losses would have been minimized and more
employment would have been generated. Post harvest management practices find their relevance
in reducing post harvest losses, enhancing rural income, providing additional employment
opportunities, reducing poverty, and creating a cleaner environment for healthier living.
CURRENT STATUS OF HORTICULTURE
The current state of horticulture industry in India is not satisfactory. The average productivity of
horticulture produce is about 7 tons/ha compared to 30 tons/ha in many western countries.
India’s share in global fruits and vegetables trade is less than 1%, whereas, only 2% of the
horticulture produce in India is processed vis-à-vis more than 40% in other developing countries
like Brazil and Malaysia. India’s share in global processed food trade is only 1.5%. The first and
foremost reason for under developed horticulture industry is high proportion of wastage across
the value chain.
TABLE 1. PER CENT OF WASTAGE IN DIFFERENT CROPS
S.No. Crop Per cent of wastage
1 Tomato 30
2 Potato 22
3 Cabbage 22
4 Cauliflower 49
5 Onion 25
6 Papaya 40
7 Grapes 27
8 Apricot 28
9 Litchis 28

Volume 3, Issue 6 (June, 2013) ISSN: 2249-7307
Jou
rnal
of
Asi
an R
esea
rch
Co
nso
rtiu
m
1
49
htt
p:/
/ww
w.a
ijsh
.org
AJRBEM
This wastage happens in various stages and few of them are crop losses due to substandard
farming techniques, post harvest losses, storage losses, transportation losses and weight loss.
There is also a high proportion of wastage across the value chain, deterioration in quality of
produce, large fluctuations in prices, low availability of produce during off-season and less spend
on fresh fruits and vegetables as a proportion of total spend on food.
POOR STATE OF HORTICULTURE
The main reason for the poor state of horticulture appears to be the long and fragmented supply
chain. The supply chain ranges from farmer to orchard farm owner to consolidator/aggregator
(commission agent1) to Trader/Transporter (Commission agent 2) to wholesaler to small
roadside vendor/Retailer/Super market/Handcart vendor to finally consumer. In the entire supply
chain, each constituent in the supply chain functions independently with little or no overlap with
the next level and limited exchange of information, therefore, the constituents are constrained in
performing their roles effectively. An integrated supply chain may enable the critical linkages
between various constituents. This may provide better information flow, material flow and
money flow among various intermediaries.
STATUS OF FOOD PRODUCTION AND MARK SURPLUS
It is estimated that there may be a total production of 1100 million tons of food products mainly
food grains, oilseeds, sugarcane and fruits/vegetables during 2011-12 and leaving marketable
surplus of 870 million tons.
TABLE 2. PROJECTIONS OF MARKETABLE SURPLUS
(MILLION TONNES)
Commodity Production Marketable surplus
2001-02 2011-12 2001-02 2011-12
Food grains 213 321 110 166
Oilseeds 21 46 16 37
Sugarcane 297 433 276 402
Fruits & Vegetables 133 300 166 265
Total 664 1100 518 870
Source: IARI
The demand for high value commodities particularly fruits; vegetables and milk would go up
significantly during 2010 and 2020 in India. It is expected that the demand for fruits would go up
from 56 million tons to 77 million tons (2010-2020), vegetables 113 to 150 million tons (2010-
2020) and 104 to 143 million tons (2010-2020) for milk, as projected by IARI.

Volume 3, Issue 6 (June, 2013) ISSN: 2249-7307
Jou
rnal
of
Asi
an R
esea
rch
Co
nso
rtiu
m
1
50
htt
p:/
/ww
w.a
ijsh
.org
AJRBEM
CROP SECTOR
The crop sector includes production of food grains (cereal and pulses), oil seeds, sugarcane,
cotton, jute and mesta.
Fig 1 demonstrate the marginal increase in land availability for crop over the past half a century
and the growth in production mainly through improvement of yield, which in recent years has
trended to flatten.
FIG 1. TREND IN AREA, PRODUCTION AND YIELD OF FOOD GRAIN
Source: Ministry of agriculture, GoI, 2011
PRODUCTION OF MAJOR CROPS
Production of important crops during 1950-2010, and their growth rates are given in Table 3.
The food grain production has increased from 51 million tonnes in 1950-51 to about 234.47
million tonnes in 2009-2010. The productivity of food grain increased from about 0.5 t/ha since
independence. Growth rate declined from 3.72 per cent in 1980s to 2.35 per cent in 1990s
(Planning commission, 2004). About 60 per cent of agriculture potential is unrealized and the
productivity is only two-thirds of the world average.
0
200
400
600
800
1000
1200
1400
1600
1800
2000
1960-61 1970-71 1980-81 1990-91 2000-01 2006-07
Area (mill.ha.
Production (mill.MT)
Yield (kg/ha)

Volume 3, Issue 6 (June, 2013) ISSN: 2249-7307
Jou
rnal
of
Asi
an R
esea
rch
Co
nso
rtiu
m
1
51
htt
p:/
/ww
w.a
ijsh
.org
AJRBEM
TABLE 3. PRODUCTION OF MAJOR CROPS AND AGRICULTURE PRODUCE
(IN MILLION TONNES)
Crop 1950-51 1960-61 1970-71 1980-81 1990-91 2000-01 2009-10
Rice 20.58 34.60 42.22 53.63 74.29 85.5 87.56
Wheat 6.46 11.00 23.8 36.31 55.14 68.55 80.28
Other cereals 15.38 17.20 30.55 29.02 32.7 30.36 34.27
Pulses 8.41 8.40 11.82 10.63 14.26 11.72 14.27
Sugarcane 57.05 110.0 126.37 154.25 241.05 301.44 251.27
Cotton
(million bales)
3.04 5.60 4.76 7.01 9.84 11.48 22.31
Oilseeds 5.16 7.0 9.63 9.37 18.61 18.7 26.30
Source: Directorate of economics and statistics, Ministry of Agriculture, GoI, 2011.
India produce around 88 million tonnes of rice against world’s production of 700 million tonnes,
thus, accounting for 13 per cent of world rice production and it is second largest producer after
China.
LEADING STATE PRODUCING FOOD CROPS
During 2008-2009, India recorded maximum food grain production of 234 million tonnes. Five
leading states contributed nearly 54.3 per cent of the total production (Table 4).
TABLE 4. TOP FIVE FOOD GRAINS PRODUCING STATES DURING 2008-2009
S.No. State Food grain production
(million Tonnes)
Total production
(Per cent)
1 Uttar Pradesh 46.73 19.93
2 Punjab 27.33 11.65
3 Andhra
Pradesh
20.42 8.70
4 Rajasthan 16.68 7.11
5 West Bengal 16.30 6.95
All India 234.47 100
Source: Directorate of economics and statistics, Ministry of Agriculture and Cooperation, 2010.
GROWTH TARGETS FOR VARIOUS CROPS
The Eleventh Plan has targeted an overall growth rate of 4 per cent per annum for the GDP from
agricultural sector as a whole (Table 5). Within this overall target, the crop sector GDP
contribution is targeted to grow at 2.7 per cent.
The Working Group on Crop Husbandry1
constituted in connection with the formulation of
Eleventh Plan made the following observations while recommending the above growth scenario
for the crop sector.

Volume 3, Issue 6 (June, 2013) ISSN: 2249-7307
Jou
rnal
of
Asi
an R
esea
rch
Co
nso
rtiu
m
1
52
htt
p:/
/ww
w.a
ijsh
.org
AJRBEM
1. There cannot be exceptionally high expectation of growth from crop husbandry on
account of various factors associated with production system and factor of production.
However, the growth momentum can be energized and sustained at modest to moderate
levels in different crop segments.
2. In the case of food grains a modest growth of 2.3 per cent is envisaged, more on the
consideration of desirability than feasibility as this much of growth is must for
maintaining food security of the country.
3. The growth rates proposed for oilseeds 4 per cent and other crops 3.3 per cent are
desirable and feasible.
TABLE 5. PROPOSED GROWTH RATES OF GDP IN VARIOUS SUB-SECTORS OF
AGRICULTURE IN XI PLAN (2007-12)
Sub-sector GDP share in 2005-06 (%) Proposed annual growth rate (%)
Food grains 26 2.3
Oilseeds 6 4.0
Other Crops 14 3.3
All Crops 46 2.7
Source: Planning Commission, Report of the Working Group for the XI Five Year Plan
(2007-12) on Crop Husbandry, Agricultural Inputs, Demand and Supply Projections and
Agricultural Statistics, Dec.2006
The demand projected above has to be met through appropriate sectoral development activities
like adequately increasing facilities for producing high quality planting material, production and
post-harvest management. The demand and supply forecasts of food grains and other crops that
led to the above growth targets are given in the Table 4.
1Planning Commission, Report of the Working Group for Eleventh Five Year Plan (2007-12) on
Crop Husbandry, Agricultural Inputs, Demand and Supply Projections and Agricultural
Statistics, Dec.2006, pp 53-54.
It would be seen that the production levels in 2009-10 are in fact lower than in 2006-07 except
for oilseeds, and lower than the demand projected in all cases (except jute and mesta). In fact, the
Mid-Term appraisal of XI Plan indicates that the rates of gross value of output of crops have
been 6.1 per cent in 2007-08, (-) 2.5 per cent in 2008-09 and (-) 5.5 per cent in 2009-10,
averaging a growth rate of about (-) 1 per cent during the first three years of the XI Plan2. This
has implications for ensuring food security and calls for a much greater effort to attain the
growth rates postulated for these sectors in years to come.
HORTICULTURE PRODUCTION AND PRODUCTIVITY
The production of crops has been expanding steadily after independence. Driven by factors such
as the changing consumption pattern among the population in favour of fruits and vegetables and
overseas requirements from the demand side and the shrinking per farmer availability of
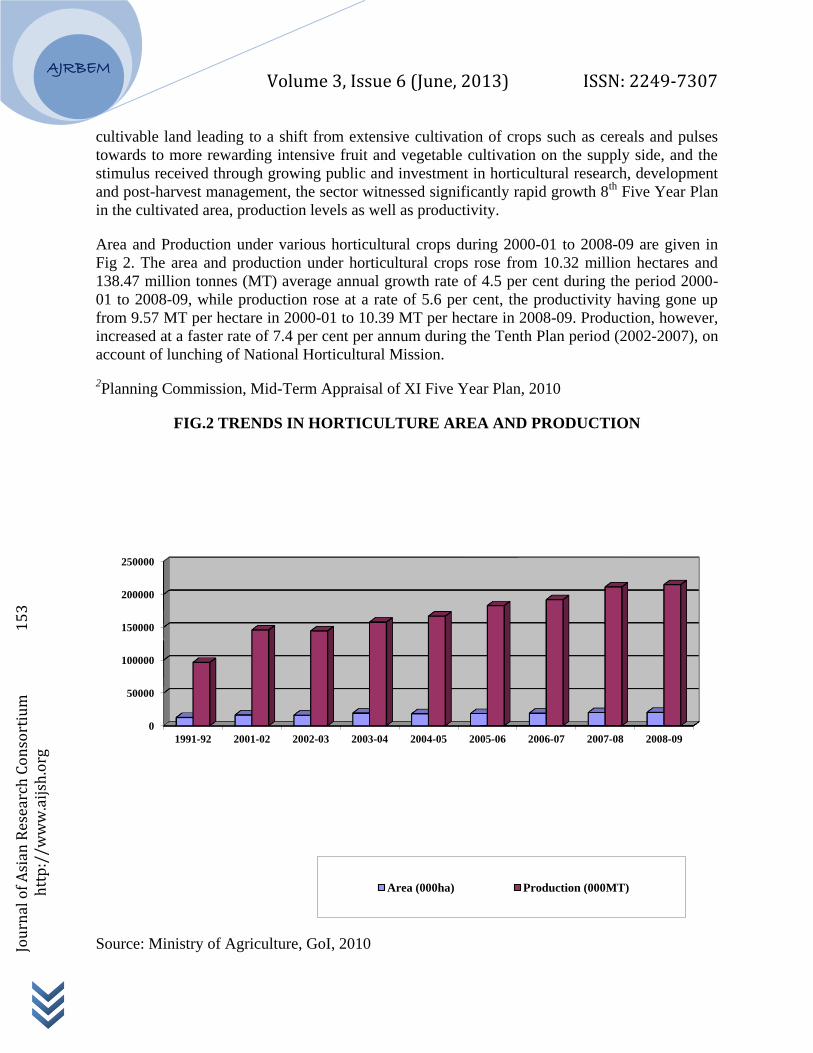
Volume 3, Issue 6 (June, 2013) ISSN: 2249-7307
Jou
rnal
of
Asi
an R
esea
rch
Co
nso
rtiu
m
1
53
htt
p:/
/ww
w.a
ijsh
.org
AJRBEM
cultivable land leading to a shift from extensive cultivation of crops such as cereals and pulses
towards to more rewarding intensive fruit and vegetable cultivation on the supply side, and the
stimulus received through growing public and investment in horticultural research, development
and post-harvest management, the sector witnessed significantly rapid growth 8th
Five Year Plan
in the cultivated area, production levels as well as productivity.
Area and Production under various horticultural crops during 2000-01 to 2008-09 are given in
Fig 2. The area and production under horticultural crops rose from 10.32 million hectares and
138.47 million tonnes (MT) average annual growth rate of 4.5 per cent during the period 2000-
01 to 2008-09, while production rose at a rate of 5.6 per cent, the productivity having gone up
from 9.57 MT per hectare in 2000-01 to 10.39 MT per hectare in 2008-09. Production, however,
increased at a faster rate of 7.4 per cent per annum during the Tenth Plan period (2002-2007), on
account of lunching of National Horticultural Mission.
2Planning Commission, Mid-Term Appraisal of XI Five Year Plan, 2010
FIG.2 TRENDS IN HORTICULTURE AREA AND PRODUCTION
Source: Ministry of Agriculture, GoI, 2010
0
50000
100000
150000
200000
250000
1991-92 2001-02 2002-03 2003-04 2004-05 2005-06 2006-07 2007-08 2008-09
Area (000ha) Production (000MT)

Volume 3, Issue 6 (June, 2013) ISSN: 2249-7307
Jou
rnal
of
Asi
an R
esea
rch
Co
nso
rtiu
m
1
54
htt
p:/
/ww
w.a
ijsh
.org
AJRBEM
The performance of major horticultural crops is given in Table 6. India ranks second in the world
fruit production with an annual output of 48 million tonnes accounting for about 8 per cent of the
world’s fruit production.
TABLE 6. PRODUCTION OF HORTICULTURAL CROPS
Crop Production during 1999-2000
(Million tonnes)
Production during 2009-2010
(Million tonnes)
Fruits 46.5 68.5
Vegetables 95.0 129.1
Spices 3.1 4.14
Cashew 0.5 0.6
Arecanut 0.4 0.4
Coconut (billion nuts) 16.9 11.96
All 162.4 214.7
Source: Directorate of Economics and Statistics, Ministry of Agriculture, GoI and Indian
Horticulture Database, National Horticultural Board, Ministry of Agriculture, GoI, 2010.
The diverse agro-climatic zones in the country make it possible to grow almost all varieties of
fruits and vegetables in India. The country holds the first place in global production of bananas,
mangoes, coconut and cashew. Horticultural production – fruits and vegetables, flowers, cashew,
spices, etc., account for 25 per cent of total agricultural exports. Mango and mango-based
products constitute 50 per cent of exports. The present per capita fruits consumption is only
about 100 gms/day which is almost half the requirement of a balanced diet. It is estimated that
more than 20 per cent of the total production of fruits is lost due to spoilage at various post
harvest stages.
The fruit production in India has recorded a growth rate of 3.9 per cent, whereas the fruit
processing sector has grown at about 20 per cent per annum. However, the growth rates have
been extensively higher for frozen fruits & vegetables (121%) and dehydrated fruits and
vegetables (24%). There exist over 4000 fruit processing units in India with an aggregate
capacity of more than 1.2 million tonnes (less than 4 per cent of total fruits produced).
India is the second largest producer of vegetables in the world (rank next to China) and accounts
for 15 per cent of the world’s production of vegetables. The current production level is over 129
million tonnes and the total area under vegetable cultivation is around 8 million hectares, which
is about 4 per cent of the total area under cultivation in the country. The average yield of various
vegetables is low compared to those experienced in other countries of the world.
FRUITS AND VEGETABLE PROCESSING
Bulk of the perishable horticultural produce (fruits and vegetables) is consumed in domestic
market directly or exported. At present processing is done only to the extent of about 10 per cent
of the production, up from about 6 per cent in 2004-05.

Volume 3, Issue 6 (June, 2013) ISSN: 2249-7307
Jou
rnal
of
Asi
an R
esea
rch
Co
nso
rtiu
m
1
55
htt
p:/
/ww
w.a
ijsh
.org
AJRBEM
It is estimated that around 20-25 per cent of the total vegetables is lost due to poor post
harvesting practices. Less than 2 per cent of the total vegetables produced in the country is
commercially processed. Around 150,000 tonnes of vegetables is sold as processed products.
The 2015 vision document of Ministry of Food Processing Industries envisages an increase in
processing content of fruits and vegetables to the extent of 15 per cent by 2015.
EXPORTS OF PROCESSED FOOD
The scenario of exports of horticulture produce is also encouraging. The export of fresh as well
as processed foods, vegetables and their seeds increased from 581.93 thousand MT in 1991-91 to
3393.60 thousand MT in 2008-09. The quantity of exports nearly doubled since 2003-04 from
1726.27 thousand MT.
Export of processed vegetables has registered a compounded annual growth rate of 16 per cent in
volume and 25 per cent in value in recent times. Onions account for about 93 per cent (in
volume) of the total export of fresh vegetables from India.
AGRO-PROCESSING
Processing of agricultural crop produce takes place both in informal as well as in the organized
sectors. Apart from the traditional processes of milling of cereals and pulses, extraction of oil
from oilseeds, extraction and refining of sugar and various tobacco related activities,
manufacture of various value added food products of quality has been growing rapidly.
AGRI FOOD RETAIL MARKETING
The term ‘Agri-marketing’ refers to the entire range of business initiatives relating to food
production, and includes contract farming, seed supply, fertilizers and pesticides, farm
machinery and post-harvest activities like storage and transport, wholesale and retail trade of
agricultural commodities, processing and retail sales. An important development in recent years
has been the growth of organized retailing in food products, processed and un-processed. A
number of major retail players in the industry have diversified into retailing sector, which holds
out promise of phenomenal growth in years to come. Over the last decade, the Indian retail sector
has expanded dramatically, with the retail food sector growing at an annual rate of 5 per cent.
Even though small independent shops dominate most of retail food sales, supermarkets and
modern retail sectors, which have until recently occupied less than 2 per cent of the market
(compared to 75-80% in developed countries), have been rapidly expanding their share of
retailing business. It has been assessed that if current trends continue, the share could go up to
15-20 per cent by 2020. Consumer preference for purchases at supermarkets is led by growing
demand (due to low prices and better quality of product in modern retail stores, apart from
psychological and other factors). Chains operating in India in retailing agricultural commodities
include Reliance Fresh, ITC’s Chaupal Fresh, Food World, Food Bazaar, Big Bazaar, Mother
Dairy Fruits and Vegetables (Safal), Haryali Fresh, Spencer’s, etc. Some of these major players
buy their requirements of agricultural produce direct from the farmers (either through contract
farming or otherwise) and have a well-maintained supply chain such as collection centres
Volume 3, Issue 6 (June, 2013) ISSN: 2249-7307
Jou
rnal
of
Asi
an R
esea
rch
Co
nso
rtiu
m
1
56
htt
p:/
/ww
w.a
ijsh
.org
AJRBEM
refrigerated transport and pack houses, while others obtain their supplies from wholesale markets
or other retail majors also provide extension services to farmers through demos, advice, cold
store support, etc., through their technical teams.
POST HARVEST MANAGEMENT
Post-harvest management is extremely important for improving the quality of produce and
products. It reduces the current heavy post harvest losses estimated at about 20 to 30 per cent of
the production. In fact, as the land available for horticultural crops becomes scarce and more
scarce, it is the elimination of these post-harvest losses that would significantly contribute to the
availability of vegetables and fruits in future. For this purpose infrastructure such as, proper
collection centres with cold storage facilities, cold chain transport, cooling units for perishable
produce, adequate packaging at pack houses, well equipped markets, etc., are needed.
Available data indicate that there were 5,101 cold storages in 2006 in the country with a capacity
of 2,16,93,986 tonnes (IARI, Agricultural Research Data Book, 2009), i.e., with an average per
unit capacity of about 4,250 tonnes. Most of them (4,609) are in the private sector with an
average capacity of 4,480 tonnes each, while 358 in corporate sector and 134 in public sector are
much smaller in capacity. As per Eleventh Plan Working Group, 81.23 per cent of the available
cold stores catered to storage of potatoes and 0.21 per cent for fruits and vegetables, while 17.06
percent were multipurpose and the remaining 1.47 per cent catered to storage of meat products,
milk products and other products. The Working Group also indicated that the capacity available
(on 31 December 2003) was only 12.5 per cent of the total horticultural production.
Progress achieved under the National Horticultural Mission during the period 2005-06 to 2009-
10 included setting up of 254 cold stores, 815 pack houses and 217 regulated markets. Thus, the
number of cold stores in 2009-10 may be taken as 5,355. The number of pack houses at present
is not available, but as stated above, during the period 2005-10, the number of pack houses set up
was 815. It may be conservatively assumed that the total number of modern pack houses in
2009-10 is about 2,000 and in 2009-10, is likely to go up to 4,000 by 2020 @ 200 more per
annum, being the average progress achieved during 2005-06 to 2009-10.
With the same average capacity of about 4500 tonnes each as in the past, the cold storage
capacity in 2009-10 would cater to just 11 to 12 per cent of the total horticultural production.
Assuming that the coverage would reach 15 per cent by 2015 and 20 per cent by 2020, number
of cold storages of the current capacity required would increase from the present estimated 5,480
to 9,885 by 2014-15 and 16,091 by 2019-20, under the low growth scenario of horticultural
production (with a production of 360 million MT in 2020. In the high growth scenario of 5.6 per
cent per annum leading to a production of 400 million MT by 2020, the same 20 per cent
coverage would require 18,246 cold storages in 2019-20. The numbers would be less if the
capacity is raised from the current 4,500 MT to a higher level.
The Eleventh Plan also envisages setting up 7,000 Collection Centres, each in compact
horticultural crop area of 200-250 ha with facilities for sorting, grading and packing and
temporary storage facilities that can handle about 10 tonnes of horticultural produce per day (or
2,000 to 25,000 tonnes per annum), and 1,400 packing houses, each with a handling capacity of

Volume 3, Issue 6 (June, 2013) ISSN: 2249-7307
Jou
rnal
of
Asi
an R
esea
rch
Co
nso
rtiu
m
1
57
htt
p:/
/ww
w.a
ijsh
.org
AJRBEM
50 tonnes per day with facilities for automatic sorting, washing, grading, waxing lines, packing
equipment, pre-cooling units and cold storage in urban areas of concentration of production.
PROCESSING OF FRUITS AND VEGETABLES
A reasonable extrapolation to 2019-20 would be 20 per cent of the production. Assuming that
these rates of growth apply to the entire horticultural sector, the volumes of fruits and vegetables
to be processed are given in Table 7. Thus, the volume of horticultural produce processed is
projected to grow at an annual rate of 12 to 13 per cent. This is also the order of growth in
market potential assessed in the Vision 2015 of food processing industries.
TABLE 7. PROJECTIONS OF VOLUMES OF FRUIT AND VEGETABLES TO BE
PROCESSED
Year Per cent to
be processed
Volume to be processed
High Growth scenario
Volume to be processed
High Growth scenario
2009-10 10 224164 22416 226740 22674
2010-11 11 234027 25743 239438 26338
2011-12 12 244324 29319 252846 30342
2012-13 13 255074 33160 267005 34711
2013-14 14 266297 37282 281958 39474
2014-15 15 278014 41702 297747 44662
2015-16 16 290247 46440 314421 50307
2016-17 17 303018 51513 332029 56445
2017-18 18 316351 56943 350622 63112
2018-19 19 330270 62751 370257 70349
2019-20 20 344802 68960 390992 78198
CAGR 4.4 11.8 5.6 13.1
Source: Ministry of Food Processing Industries, cited in Agricultural Research Data Book, 2009,
IASRI
According to Vision 2015 document of Ministry of Food Processing Industries (FPI), the market
potential of various segments of food processing is assessed (Table 8.)
TABLE 8. MARKET POTENTIAL FOR PROCESSED FOODS AS PER VISION 2015
OF FPI
Sector of Food Processing
Industry
Market potential (Rs.
Billion) at 2003-04 prices
Implicit annual growth
rate (%)
2009-10 2014-15
Fruits and Vegetables 290 550 14.7
Spices 450 886 14.5
Alcoholic beverages 553 1153 15.8
Tea/coffee 169 253 8.4

Volume 3, Issue 6 (June, 2013) ISSN: 2249-7307
Jou
rnal
of
Asi
an R
esea
rch
Co
nso
rtiu
m
1
58
htt
p:/
/ww
w.a
ijsh
.org
AJRBEM
RETAIL FOOD SECTOR DEVELOPMENT
Over the last decade, the Indian retail sector has expanded dramatically, with the retail food
sector growing at 5 per cent. Even though small independent shops dominate most of retail food
sales, supermarkets and modern retail stores, which have until recently expanding their share of
retailing business. If current trend continue, the share could go up to 15-20 per cent by 2020.
Consumer preference for purchases at supermarkets is led by growing demand (due to lower
prices and better quality of product in modern retail stores, apart from psychological and other
factors). Chains operating in India in retailing of fruits and vegetables include Reliance Fresh,
ITC’s Chaupal Fresh, Food World, Food Bazaar, Big Bazaar, Mother Dairy Fruits and
Vegetables (Safal), Haryali Fresh, Spencer’s, etc. Some of these major players buy their
horticultural produce requirements direct from the farmers (either through contract farming or
otherwise) and have a well-maintained supply chain such as collection centres refrigerated
transport and pack houses, while others obtain their supplies from wholesale markets or other
retail majors which have such direct collection arrangements. Adani Agro Fresh, for instance,
have direct collection arrangements for apples in Himachal Pradesh. The volume of all retail
marketing in the country is estimated to have grown from $ 300 billion in 2006-07 to $ 427
billion by 2010 and is projected to grow to $ 637 billion by 2015. Modern retailing, estimated to
be only about $ 9 to 12 billion in 2006, was expected to grow $ 60 billion by 2011, thus, raising
the penetration of modern segment from about 3 to 4 per cent in 2006 to 10 per cent in 2011.
Apart from maintaining their supply chains, the retail majors also provide extension services to
farmers through demos, advice, cold store support, etc. through their technical teams.
PROMOTION OF POST HARVEST TECHNOLOGIES
The adoption of post harvest activities in the production catchments should lead to overall
improvement in food availability, income level and employment; there has not been
commensurate progress in the expansion of post harvest activities. There are number of reasons,
as indicated in earlier sections that require an integrated approach. However, an initiative which
has been found to be promising is that of establishing agro-processing centers in the rural sector.
Based on the agricultural commodities being produced in a given area and the demand for
processed commodities, appropriate post harvest operations are promoted in the form of small
units, managed and operated by some members of the farmers’ families. The necessary fund
requirement is met through personal savings, incentives and loans.
There is a need to institutionalize self-help groups and provide suitable policy support. These
units also deserve to have appropriate tax relief and other infrastructural support for their
sustainability and growth.
CONCLUSIONS
An effort has been made to analyze the agricultural production sector in India with a view to
place the post harvest technology in the proper perspective. The post harvest losses have been
estimated and the likely impact of the adoption of appropriate post harvest technologies on the
financial, social and environmental conditions has been envisaged. The relevance of cost

Volume 3, Issue 6 (June, 2013) ISSN: 2249-7307
Jou
rnal
of
Asi
an R
esea
rch
Co
nso
rtiu
m
1
59
htt
p:/
/ww
w.a
ijsh
.org
AJRBEM
competitiveness and food quality and safety in the globalized economy has been discussed. On
the basis of the available information and experience, a strategy for promotion of post harvest
processing in the production catchments has been proposed.
REFERENCES
1. Directorate of economics and statistics, Ministry of Agriculture and Cooperation, 2010.
2. Directorate of Economics and Statistics, Ministry of Agriculture, GoI and Indian
Horticulture Database, National Horticultural Board, Ministry of Agriculture, GoI, 2010.
3. Directorate of economics and statistics, Ministry of Agriculture, GoI, 2011.
4. Ministry of Agriculture, GoI, 2010
5. Ministry of agriculture, GoI , 2011
6. Ministry of Food Processing Industries, cited in Agricultural Research Data Book, 2009,
IASRI
7. Planning Commission, Mid-Term Appraisal of XI Five Year Plan, 2010
8. Planning Commission, Report of the Working Group for Eleventh Five Year Plan
(2007-12) on Crop Husbandry, Agricultural Inputs, Demand and Supply Projections and
Agricultural Statistics, Dec.2006, pp 53-54.
Volume 3, Issue 6 (June, 2013) ISSN: 2249-7307
AJRBEM
Jou
rnal
of
Asi
an R
esea
rch
Co
nso
rtiu
m
1
60
htt
p:/
/ww
w.a
ijsh
.org
A P e e r R e v i e w e d I n t e r n a t i o n a l J o u r n a l
o f A s i a n R e s e a r c h C o n s o r t i u m
AJRBEM:
A S I A N J O U R N A L O F
R E S E A R C H I N B U S I N E S S
E C O N O M I C S A N D
M A N A G E M E N T
TOWARD HIGHER STUDIES IN BUSINESS SCHOOLS
DR. RUKHSAR AHMED*
*Professor and Dean,
Preston University,
Karachi, Pakistan.
ABSTRACT
The change has been a constant phenomenon in educationist. However, it has been
comparatively very slow in developing countries like Pakistan, where a need to
prepare professionals with a blend of traditional and modern skills is still there.
Presently, eight universities have been offering regular programs. However, there
are serious quality issues regarding faculty, curriculum development, infrastructure,
assessments, etc. in these programs. Nonetheless, for the last few years, the Higher
Education Commission of Pakistan is pushing hard to induce and maintain the
quality of higher education.
The paper gives a brief account of the present scenario of post graduate programs,
identifies the basic issues regarding quality and information education in Pakistan,
and suggests the possible measures for Quality Assurance within Pakistan. The multi
method approach was used to collect the data for this study based on survey-
interviews focus-group discussions with peers and observation and experience of
author.
KEYWORDS: Higher Education, Business Schools.
______________________________________________________________________________
1. INTRODUCTION
Quality refers to the achievement of standards of researching and condition in the higher
education sector, and the achievements or outputs of an institution or system. Quality is a
multidimensional concept, and it is not possible to arrive at one set of global quality standards
against which local institutions can be assessed. Quality embraces all the major functions of

Volume 3, Issue 6 (June, 2013) ISSN: 2249-7307
AJRBEM
Jou
rnal
of
Asi
an R
esea
rch
Co
nso
rtiu
m
1
61
htt
p:/
/ww
w.a
ijsh
.org
higher education: teaching and academic programs, research and scholarship, staffing, students,
infrastructure and the academic environment. The concept of accountability is closely allied with
quality- no system of higher education can fulfill its mission unless it demands the highest
quality of itself. Continuous and permanent assessment is necessary to reach this objective.
Simultaneously, it is to be ensured that great care is exercised when making quality assessments,
as it involves matters of judgment, academic values and cultural understanding.
1.2 OBJECTIVES
Quality of education in the higher education institution of Pakistan has been under a great
criticism for long. The emergence of private institutions and their mushroom like growth is the
result of declining confidence of a common man on the public/private sector universities in
Pakistan. Keeping this fact in view, Higher Education Commission, Pakistan established Quality
Assurance Agency (QAA) in Islamabad and 10 Quality Enhancement Cells (QEC) at various
public sector universities in Pakistan. It was also decided to establish QEC in all the public sector
universities in the next phase of the programme private sector, realizing the importance of this
cell, decided to establish it in the university in 2006 for enhancing quality of teaching and
learning of various programmes of the university.
In this connection in the study has based design to fulfill the following objectives:
To examine the quality of education in business institution in Karachi.
To find out the preference of students /parents in the selection of business institutions
To high light the area in business institution studies require immediate attention for
improvement of quality of education.
1.3 HYPOTHESIS
1.3.1 QUALITY ASSURANCE
Students refers quality of education as compare to fee structure for taking admission in
private/public sector business institutions in Karachi
1.4 RESEACH METHODOLOGY
The following methods were used to collect data:
1. A telephonic survey
2. Interviews
3. A focus group
4. Discussions with peers

Volume 3, Issue 6 (June, 2013) ISSN: 2249-7307
AJRBEM
Jou
rnal
of
Asi
an R
esea
rch
Co
nso
rtiu
m
1
62
htt
p:/
/ww
w.a
ijsh
.org
The multi-method approach was used to collect the data for this study based on:
i. a survey conducted over telephone/in-person from the chairpersons/In-charge/ senior faculty
members of all universities to collect relevant information
ii. Interviews conducted with faculty members of the two schools that have poor quality
reputation
iii. A number of personal communication with peers , and
iv. Observation and experience of the author
2 ORGANIZATIONAL STRUCTURE OF BUSINESS SCHOOL
Assuring Meta Evaluation so as to assure that the evaluation systems and procedures meet the
requirement of international standards
2.1 ORGANIZATIONAL STRUCTURE

Volume 3, Issue 6 (June, 2013) ISSN: 2249-7307
AJRBEM
Jou
rnal
of
Asi
an R
esea
rch
Co
nso
rtiu
m
1
63
htt
p:/
/ww
w.a
ijsh
.org
It is said that more than 90 per cent of the country's business schools are located in Karachi, the
remaining have their regional centers or campuses in city. The reason for this is the fact that the
city is the country's centre of business and financial activities.
With an estimated population of over 12 million, the city has more than 50,000 big, medium and
small industries, besides numerous cottage industries, with four major industrial trading estates
which provide employment to more than half-a-million people.
Not only does the city have the headquarter of the State Bank of Pakistan, it also serve as a base
for over a 100 financial institutions including 25 foreign banks and other financial institutions as
well as a large number of trade organizations which all make use of the professionals in the
business management.
Realizing this need, some local investors saw this as an opportunity, and a large number of
business-oriented educators appeared on the scene to launch business schools. Some of them
claiming to have been affiliated with foreign universities and their curricula were designed as
those of the universities they claimed to be affiliated with.
Claiming an affiliation with a foreign university, on the other hand, is a guarantee of getting
students because of the preference for foreign things which persists in the country
2.2 THE ACADEMIC CULTURE
The issue of quality cannot be dissociated from the quest for excellence and the need to establish
evaluation criteria. In order to assess local institutions with a global perspective, reviewing
institutions against international quality benchmarks has gained priority.
2.3 QUALITY OF HIGHER EDUCATION
The key factors influencing the quality of higher education is the quality of faculty, curriculum
standards, technological infrastructure available, research environment, accreditation regime and
the administrative polices and procedures implemented in institutions of higher learning. It is
absolutely critical to monitor and regulate growth of sub-standard institutions of higher learning.
A comprehensive multi-level mechanism of accreditation is to be developed to ensure provision
of quality education. Accreditation needs to occur at the department or program level, as well as
the Institutional level.
The HEC prescribes the guidelines under which all institutions of higher education may open and
operate. It monitors all degree-awarding higher education programmes for quality assessment and
is responsible for chartering both public and private institutions of higher education
2.4 THE ROLE OF HIGHER EDUCATION COMMISSION (HEC) IN QA
The HEC, set up by the Government of Pakistan in 2002, has taken significant steps to assure
quality for higher education in Pakistan in the coming years. It has established a QA Cell that

Volume 3, Issue 6 (June, 2013) ISSN: 2249-7307
AJRBEM
Jou
rnal
of
Asi
an R
esea
rch
Co
nso
rtiu
m
1
64
htt
p:/
/ww
w.a
ijsh
.org
states, The need to develop a culture of evaluation is inseparable from the concept of quality.
Both internal self evaluation and external review are vital components of any well-developed
quality assurance system.
It is absolutely critical to monitor and regulate growth of sub-standard institutions of higher
learning. A comprehensive multi-level mechanism of accreditation is to be developed to ensure
provision of quality education. Accreditation needs to occur at the department or program level,
as well as the Institutional level. HEC has established:
The HEC has established a Quality Enhancement Cell (QEC) in universities to introduce and
implement the procedures of the Self-assessment Manual . This manual also gives eight major
criterion subdivided into related standards to be achieved. The Cell at PU is aggressively
working in this direction and workshops have been conducted to help in developing policies and
procedures, following the manual, maintain or improve quality. This author is the convener of
the departmental committee of QA and has prepared a report on the prevailing status and future
plans regarding QA while mentioning the prerequisites to improve the quality.
2.5 PUBLIC VS PRIVATE SECTOR INSTITUTES
Taking the advantage of strong awareness of business education in the general public, a large
number of private universities have cropped up over the years offering degrees in business
administration as well as in computer science and management Sciences
The implicit specialization, that has already emerged, is that academic business schools are
offering long-term programmes which lead to degrees, but with the increase in the competition,
and at the broadest level, some of these universities now offer degrees in executive programmes
requiring attendance during the weekends and for periods of between three and four months
only.
Following the same pattern, almost all the private universities now claim that they offer
executive training, and charge high fee whether the actual training is being provided or not, is
another story.
3. ACEDEMIC QUALITY CONTROL
3.1 DEGREE STRUCTURE
Offer programmes of international quality;
Respond to identified needs in the countries and regions which it serves;
Prioritise teaching and research which will inform and underpin intellectual innovation and
change;
Provide service to advance its educational and research mandate;
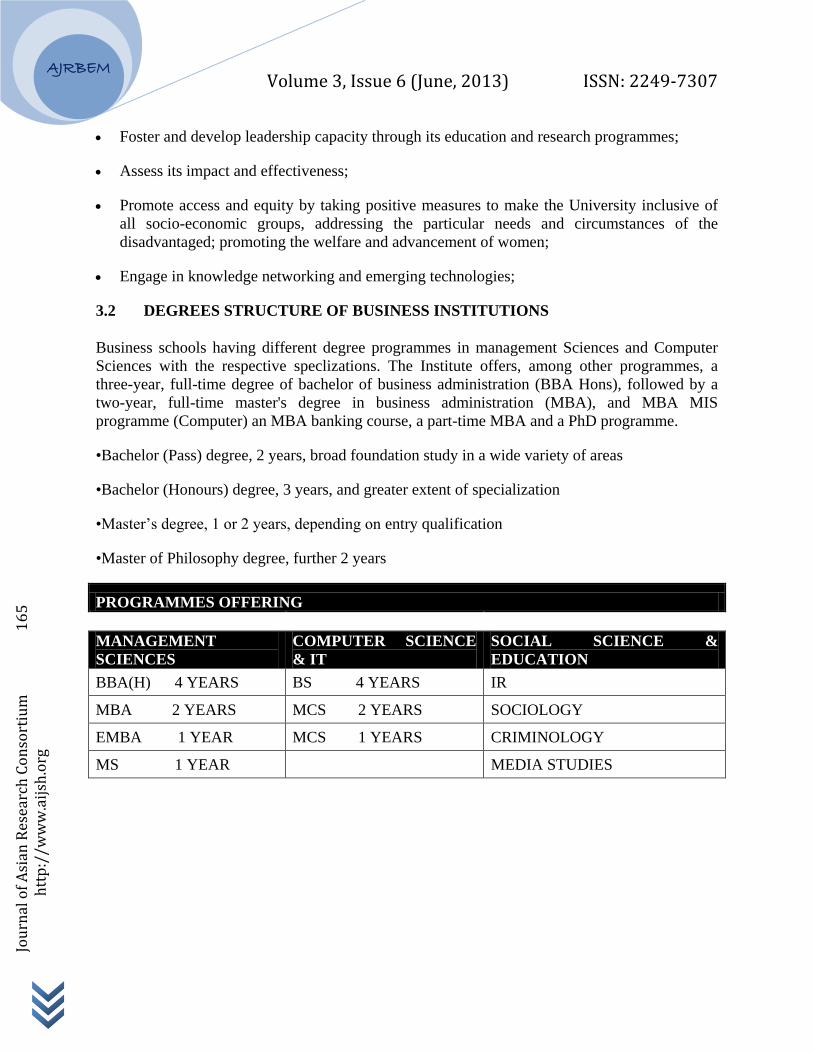
Volume 3, Issue 6 (June, 2013) ISSN: 2249-7307
AJRBEM
Jou
rnal
of
Asi
an R
esea
rch
Co
nso
rtiu
m
1
65
htt
p:/
/ww
w.a
ijsh
.org
Foster and develop leadership capacity through its education and research programmes;
Assess its impact and effectiveness;
Promote access and equity by taking positive measures to make the University inclusive of
all socio-economic groups, addressing the particular needs and circumstances of the
disadvantaged; promoting the welfare and advancement of women;
Engage in knowledge networking and emerging technologies;
3.2 DEGREES STRUCTURE OF BUSINESS INSTITUTIONS
Business schools having different degree programmes in management Sciences and Computer
Sciences with the respective speclizations. The Institute offers, among other programmes, a
three-year, full-time degree of bachelor of business administration (BBA Hons), followed by a
two-year, full-time master's degree in business administration (MBA), and MBA MIS
programme (Computer) an MBA banking course, a part-time MBA and a PhD programme.
•Bachelor (Pass) degree, 2 years, broad foundation study in a wide variety of areas
•Bachelor (Honours) degree, 3 years, and greater extent of specialization
•Master’s degree, 1 or 2 years, depending on entry qualification
•Master of Philosophy degree, further 2 years
PROGRAMMES OFFERING
MANAGEMENT
SCIENCES
COMPUTER SCIENCE
& IT
SOCIAL SCIENCE &
EDUCATION
BBA(H) 4 YEARS BS 4 YEARS IR
MBA 2 YEARS MCS 2 YEARS SOCIOLOGY
EMBA 1 YEAR MCS 1 YEARS CRIMINOLOGY
MS 1 YEAR MEDIA STUDIES

Volume 3, Issue 6 (June, 2013) ISSN: 2249-7307
AJRBEM
Jou
rnal
of
Asi
an R
esea
rch
Co
nso
rtiu
m
1
66
htt
p:/
/ww
w.a
ijsh
.org
3.3 SPECLIZATIONS
SPECLIZATION COURCES
MANAGEMENT SCIENCES COMPUTER
SCIENCE & IT
SOCIAL SCIENCE &
EDUCATION
BANKING AND FINANCE SOFTWARE
DEVELOPMENT SOCIOLOGY
MARKETING AND
ADVERTIZINIG NETWORKING CRIMINOLOGY
ISLAMIC BANKING TELECOMUNICATION MEDIA STUDIES
CORPORATE FINANCE AND
TRESURY ELECTRONICS PSCHYCOLOGY
HEALTH MANAGEMENT MIS IR
3.4 FEE STRUCTURE
Different business institution having different fee structure, on the basis of quality granting
business institutions having high fee structure and some have very low fees structure . Because
they maintain the quality, providing good faculty member, providing fresh environment to the
students. Good work material under the supervision of deans and faculty members. Following are
the fee structure one the basis of quality assurance in business institutions in Karachi.
3.5 GRANTING SCHOLARSHIPS
Though every university claims granting scholarships and waiving fees for deserving students,
however fees in all higher education institutions, public sector institutions and private sector are
not easily affordable for most of the public; especially in a country where millions of families live
below the poverty line. The students added that if, according to the president of Pakistan, the HEC
had been granted a large number of funds which would also be increased every year they consider
who would make these institutions accountable.
NAME OF UNIVERSITY PROGRAME TOTAL PACKAGE
BIZTEK
BECHELORS 289000
MASTER 166000
M.PHILL 95000
IBA
BECHELORS 312000
MASTER 360000
M.PHILL 115000
MAJU BECHELORS 283000
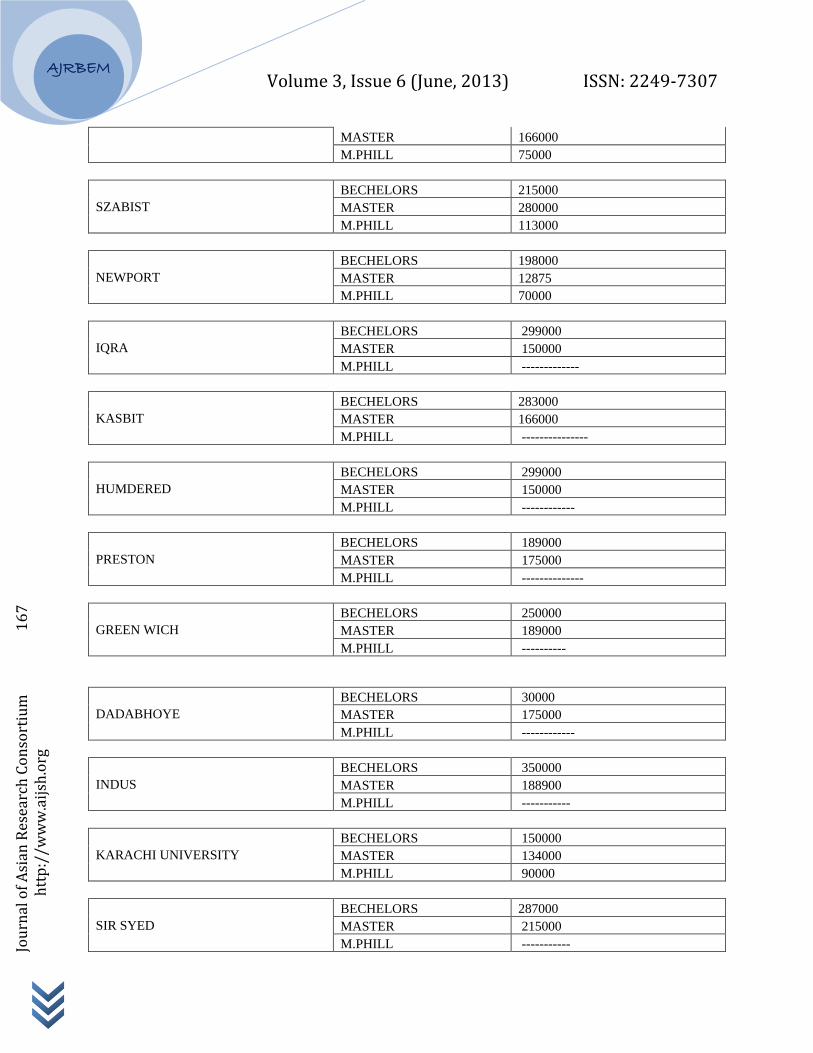
Volume 3, Issue 6 (June, 2013) ISSN: 2249-7307
AJRBEM
Jou
rnal
of
Asi
an R
esea
rch
Co
nso
rtiu
m
1
67
htt
p:/
/ww
w.a
ijsh
.org
MASTER 166000
M.PHILL 75000
SZABIST
BECHELORS 215000
MASTER 280000
M.PHILL 113000
NEWPORT
BECHELORS 198000
MASTER 12875
M.PHILL 70000
IQRA
BECHELORS 299000
MASTER 150000
M.PHILL -------------
KASBIT
BECHELORS 283000
MASTER 166000
M.PHILL ---------------
HUMDERED
BECHELORS 299000
MASTER 150000
M.PHILL ------------
PRESTON
BECHELORS 189000
MASTER 175000
M.PHILL --------------
GREEN WICH
BECHELORS 250000
MASTER 189000
M.PHILL ----------
DADABHOYE
BECHELORS 30000
MASTER 175000
M.PHILL ------------
INDUS
BECHELORS 350000
MASTER 188900
M.PHILL -----------
KARACHI UNIVERSITY
BECHELORS 150000
MASTER 134000
M.PHILL 90000
SIR SYED
BECHELORS 287000
MASTER 215000
M.PHILL -----------

Volume 3, Issue 6 (June, 2013) ISSN: 2249-7307
AJRBEM
Jou
rnal
of
Asi
an R
esea
rch
Co
nso
rtiu
m
1
68
htt
p:/
/ww
w.a
ijsh
.org
4. ADMINISTRATIVE ROLE
4.1 GOVERNANCE & MANAGEMENT
In previous public policy articulations, governance and management did not receive the specific
attention it deserved in concretized terms, clearly delineating roles of various tiers of
Government, in governance and management of education. As a result, the implementation of
goals set in different policy documents was not uniformly achieved due to unequal attention paid
at various tiers of implementation or adversarial environment concerning governance of
education. In the bargain, resources were either inequitably available or were wasted due to lack
of ownership by the managers at the ground level. In Pakistan, the relations between the Federal
and Provincial Governments are defined by the Constitution; while those between the provinces
and the local governments by the respective provincial local government ordinances. The
varieties of stakeholders demonstrate a clear lack of clarity on the perception of these rules.
Hence, a clear delineation of inter-tier roles and relationships and defined demarcation of
responsibility cannot be postponed if we are to achieve the targets that the State sets for itself for
a uniform human development of quality throughout the country.
5. METHODOLOGY
The following methods were used to collect data:
1. A telephonic survey
2. Interviews
3. A focus group
4. Discussions with peers
The multi-method approach was used to collect the data for this study based on:
i. a survey conducted over telephone/in-person from the chairpersons/In-charge/ senior faculty
members of all universities to collect relevant information
ii. Interviews conducted with faculty members of the two schools that have poor quality
reputation
iii. A number of personal communication with peers , and
DATA ANALYSIS
Observation and experience of the author
On the basis of hypothesis different questioner has been filled by the students of different
universities. This data analysis based on different questioner that’s gave very clear phase of
quality of education.

Volume 3, Issue 6 (June, 2013) ISSN: 2249-7307
Jou
rnal
of
Asi
an R
esea
rch
Co
nso
rtiu
m
1
69
htt
p:/
/ww
w.a
ijsh
.org
AJRBEM
Q1- YOUR FIRST PREFERENCE FOR TAKING ADMISSION?
Options Replies
Qualities 85%
Fee Structure 15%
In the answer of this 85% students goes to the quality and rest of them goes to the fee structure
Q2- IF YOU VISIT FOR ADMISSION TO THE UNIVERSITY, WHAT WILL BE
YOUR FIRST PREFERENCE?
Options Replies
Environment 55%
Feasibility 40%
Fee Structure 5%
In quality preference most of the people give first priority to the environment then feasibility and
in the last goes to fee structure
0%
10%
20%
30%
40%
50%
60%
70%
80%
90%
Qualities fee Stru.

Volume 3, Issue 6 (June, 2013) ISSN: 2249-7307
Jou
rnal
of
Asi
an R
esea
rch
Co
nso
rtiu
m
1
70
htt
p:/
/ww
w.a
ijsh
.org
AJRBEM
Q3- WOULD YOU DESIRE TO RECOGNIZE RANKING OF UNIVERSITIES FOR
TAKING ADMISSION?
100% people agree with this statement with the reorganization of the university
Q4- WHAT QUALITIES REQUIRE FOR FACULTY IMPROVEMENT?
Options Replies
Teaching 40%
Industry Experience 38%
Interpersonal Skills 10%
Level of Knowledge 12%
Q5 COURSE OUTLINES SHOULD BE
0%
10%
20%
30%
40%
50%
60%
Enviroment Fesibility Fee. Stru.
0%
5%
10%
15%
20%
25%
30%
35%
40%
45%
Teaching Ind.Exp Interpersonal Know.

Volume 3, Issue 6 (June, 2013) ISSN: 2249-7307
Jou
rnal
of
Asi
an R
esea
rch
Co
nso
rtiu
m
1
71
htt
p:/
/ww
w.a
ijsh
.org
AJRBEM
Options Replies
Level of Student 20%
According to Course 40%
Advance Material 30%
Know. Material 10%
Q6 WHICH CORE REQUIRE FOR QUALITY ENHANCEMENT?
Ans. Most of the peoples articulate different views
Merit
Truth
Discipline
Creativity
Tolerance
Humanity
0%
5%
10%
15%
20%
25%
30%
35%
40%
45%
AccordingCourse Adv. Material Student Know. Material

Volume 3, Issue 6 (June, 2013) ISSN: 2249-7307
Jou
rnal
of
Asi
an R
esea
rch
Co
nso
rtiu
m
1
72
htt
p:/
/ww
w.a
ijsh
.org
AJRBEM
Q7- ACCORDING TO QUALITY OF EDUCATION, IS YOU AGREE WITH THE
FEE STRUCTURE
Options Replies
Yes 80%
No 20%
80% Peoples agree with fee structure according to quality
20% peoples disagree due to some reasons
INTERVIEWS ANALYSIS
On the interviews with different management people describes following aspects
QUALITY AND FEE STRUCTURE
A society acquires to successfully encounter all the future challenges offered by the rapidly
advancing world
Computing facilities are being continuously upgraded to keep them in sync with fast paced
advances in computing technologies.
Environment will allow easy accessibility to students, faculty, administration, as well as
parents and alumni, enabling them to interact with one another.
0%
10%
20%
30%
40%
50%
60%
70%
80%
90%
Yes No

Volume 3, Issue 6 (June, 2013) ISSN: 2249-7307
Jou
rnal
of
Asi
an R
esea
rch
Co
nso
rtiu
m
1
73
htt
p:/
/ww
w.a
ijsh
.org
AJRBEM
Some of the services provided by this department include E-mail and Internet Service, IT
Help Desk, Audio Visual Support, and Printing Services
Fee structure assistance for deserving Students
The publication Society is another popular committee among students that brings out an
annual magazine and a newsletter
The Seminar Society organizes symposiums with highly accomplished guests from the
corporate world.
Beside these qualities, fee structure also most important because they offer scholar ship and
different discount package
Give the relaxation in fee structure
This is very most important quality to give the assistance in the fee structure along with high
quality of education
CONCLUSION
The literature reviewed, data collected, discussions with peers, personal experience, and
observation reveals that the issues regarding quality assurance (QA) are very much similar with
other institutions.
Nonetheless, there is growing awareness regarding quality and a wave of healthy competition
among universities is rising.
The need for formal, external, and internal assessment strategies is felt and is in the suggestive
phase.
Regulation is one of the best things that could happen to the sector at this stage because that will
not only ensure quality education but will save people from being go through in the name of
business education.
A strict regulatory system through which entrance procedure, fee structures and academic
programmes are screened is the next pressing requirement. An urgent need is the regulation in
order to arrest the situation before it goes out of control.
Both the private and the public sector business educates agreed that the demand and supply
factor need to be managed in order to ensure that the business education in the country is not
overpriced and that national priorities are taken into account at the same time
Teams are responsible for developing proposals for Seminars and conferences that concern an
issue that is current and is also of importance to the future of the field they are assigned.

Volume 3, Issue 6 (June, 2013) ISSN: 2249-7307
Jou
rnal
of
Asi
an R
esea
rch
Co
nso
rtiu
m
1
74
htt
p:/
/ww
w.a
ijsh
.org
AJRBEM
RECOMONDATIONS
To assure quality, all schools should follow the HEC standards beginning with the
formulation of mission and goals of programs. These should be formulated considering the
local present and future professional scenario.
HEC and all other sources should be exploited following the required procedures, for better
physical facilities and development. University administration and faculty needs to be more
aggressively utilize the existing opportunities.
More collaboration among different library schools needs to be developed to share
knowledge and skills. Better-developed schools need to help less developed ones through
HEC programs. The HEC has funds for this kind of faculty exchange.
Their should be well maintain and flexible fee structure for all the sector of peoples
Provide discount facilities for deserving students
Shows in courgement at very high level
The procedure of curriculum revision should be efficient and regular
Alumni and student evaluation must be introduced to improve the quality.
A uniform assessment method is also important to maintain the quality.
The faculty needs to fully exploit available electronic resources for their instruction
And research purposes and explore faculty development opportunities.
REFERENCES
Adkins, D. & Budd, J (2006). Scholarly productivity of U.S. LIS faculty. Library & information
Science Research, 28, 374-389.
ALIEP (2006). Asia-Pacific Conference Proceedings on Library and Information Education and
Practice: Preparing Information Professionals for Leadership in the New Age,
Nanyang Technological University, Singapore. 3-6 April, 2006.
Ameen, K. (2006). Challenges of Preparing LIS Professionals for Leadership Roles in Pakistan .
Journal of Education in Library and Information Science 47 (2), 200-217
American Library Association (1992). Standards for Accreditation of Master's Programs in
Library and Information Studies . Retreived on April 15, 2007 from
http://www.ala.org/ala/accreditation/accredstandards/standards.htm.
Volume 3, Issue 6 (June, 2013) ISSN: 2249-7307
Jou
rnal
of
Asi
an R
esea
rch
Co
nso
rtiu
m
1
75
htt
p:/
/ww
w.a
ijsh
.org
AJRBEM
Anwar, M. A. (1990). The Pioneers: Asa Don Dickinson. Third World Libraries, 1(2), 7-15.
Anwar, M. A. (1992).State of the library profession in Pakistan: From celebration to reality. In
Sajjad ur Rehma et al. (Eds.). Library education in Pakistan: Past, present and future (pp. vii-xx).
Lahore: PULSAA.
ALISE (Association for Library and Information Science Education), Kaliper Advisory
Committee (2000). Educating library and information Science professionals for a new
century:The KALIPER report. Reston, Virginia.
14Chernay, Gloria (1990). Accreditation and the Role of the Council on Postsecondary
Accreditation. Washington, DC: The Council on Postsecondary Accreditation, p. 3.
EUCLID Conference (2002). Restructuring and adapting to European standards: overcoming
regional variations in needs and interests in education for LIS.
(Wednesday 16 - Friday 18 October 2002). Retreived on April10, 2007 from
http://euclid.hio.no/files/pdf/thessaloniki_conference.pdf.
EUCLID Working Conference. (2005). Library and Information Science Education in Europe:
Joint Curriculum Development and Bologna Perspectives.
Copenhagen, Denmark: Royal School of Library and Information Science.
Haider, S. J & Mehmood, K (2007). Mphil and PhD library and information science researchin
Pakistan: an evaluation. Library Review, 56(5), 407-417.
IATLIS National Conference Proceedings. (2006). Building curriculum with a difference:
Avision for LIS education in the 21st century. Patiala: Punjabi University, 23-25 November
2006.
International Federation of Library Associations and Institutions (2002).
Guidelines for Professional Library/Information Educational Programs - 2000.
Retrieved March 15, 2007, from http://www.ifla.org/VII/s23/bulletin/guidelines.htm#1
Khurshid, A. (1992). Library education in Pakistan: Concerns, issues and practices. In Sajjad ur
Rehman, Abdus Sattar Chaudhry & Afzal Haq Qarshi (Eds.). Library education inPakistan: Past,
present and future (pp.11-28). Lahore: PULSAA.
Makiko, M. (2006). Trends and Issues in LIS Education in Asia. Journal of Education in Library
and Information Science 47 (2), 167-180.
Mahmood, K. (2003). A comparison between needed competencies of academic librarians and
LIS curricula in Pakistan . The Electronic Library, 21 (2): 99-109.

Volume 3, Issue 6 (June, 2013) ISSN: 2249-7307
Jou
rnal
of
Asi
an R
esea
rch
Co
nso
rtiu
m
1
76
htt
p:/
/ww
w.a
ijsh
.org
AJRBEM
Merriam-Webster's online dictionary. (n.d). Springfield, MA: Merriam -Webster. Retreived on
May 1, 2007 fromhttp://mw1.merriamwebster.com/dictionary/Quality%20assurance.
Pakistan, Higher Education Commission (2002). Revised curriculum for B.A./BLIS/MLIS.
Retrieved April 8, 2007 from http://www.hec.gov.pk/new/AcademicAffairs/
Curriculam_Revision/download/Curriculms_pdf/BA_BLIS_MLIS.pdf .
Pakistan, Higher Education Commission (2004).HEC National Digital Library. Retrieved
March 22, 2007 from http://www.digitallibrary.edu.pk/
Pakistan, Higher Education Commission. (2006). Self assessment manual. Lahore:
QualityEnhancement Cell, University of the Punjab.15
Khurshid, A. (2000). Planning and management of library and information services in Pakistan.
Karachi: Library and Information Services Group.
Qarshi, A. H. (1992). Development of curriculum at the University of the Punjab:
Dickinson’s contributions and afterwards. In Sajjad ur Rehman, Abdus Sattar
Chaudhry & Afzal Haq Qarshi (Eds.). Library education in Pakistan: Past, present and future
(pp.77-91). Lahore: PULSAA
Rehman, S. (1992) .Library and Information Sciece faculty in the Universities of Pakistan: An
Appraisal. In Sajjad ur Rehman, Abdus Sattar Chaudhry & Afzal Haq
Qarshi (Eds.). Library education in Pakistan: Past, present and future (pp.129-149). Lahore:
PULSAA
Saladyanant, T. (2006). Quality assurance of information science program. In A-LIEP
(pp.432-435).
Sarkhel, J.K. (2006). Quality assurance and accreditation of LIS education in Indian Universities:
Issues and perspectives. In A-LIEP (pp.427-431).
Satija, M. P. (1999). Doctoral Research in Library and Information Science in India: Some
Observations and Comments. Libri, 49, 236-242.
Satija, M. P. (2006). Library Education in India at the cross roads. Paper presented at the XXIII
IATLIS National conference-2006 on Building curriculum with a difference: A vision for LIS
education in the 21st century. In Karisiddappa, C.R. & Kumber, B.D. (Eds.). Punjabi University,
Patiala.
Shera, J. H. (1972). The foundations of education for librarianship New York: Becker
andHayes.University of the Punjab, department of Library and information science (2007).

Volume 3, Issue 6 (June, 2013) ISSN: 2249-7307
Jou
rnal
of
Asi
an R
esea
rch
Co
nso
rtiu
m
1
77
htt
p:/
/ww
w.a
ijsh
.org
AJRBEM
A P e e r R e v i e w e d I n t e r n a t i o n a l J o u r n a l
o f A s i a n R e s e a r c h C o n s o r t i u m
AJRBEM:
A S I A N J O U R N A L O F
R E S E A R C H I N B U S I N E S S
E C O N O M I C S A N D
M A N A G E M E N T
PROFIT RE-ENGINEERING FOR BUSINESS PROGRESS
K. V. MURALI*
*West Mambalam,
Chennai, India.
ABSTRACT
To quote Peter Drucker: You can’t manage it if you don’t measure it!
Many organisations are not able to achieve the targeted profits due to various
factors contributing to the erosion of profits. Hence an analysis on those factors and
understanding the drivers of those factors that cause negative influence on profits is
essential in order to address them in a timely and suitable manner. The factors that
can affect profit margin can be analysed on two categories as under:
A. Gross Profit Margin
B. Net Profit Margin
The stakeholders are generally interested in the above two margins as the result of
the analysis will throw light on areas of concern to enable them to take their
decisions for the future course of actions. For example, an increase in sales due to
cut in price may cause reduction in gross profit margin. Likewise, the analysis will
reveal the money-losing produces or services offered during the period, so that
corrective measures can be taken to improve the gross profit margin by either
reducing the sales of those items or use the production of some other profitable items
as the case may be.
Budgeted profits may not be achieved due to various uncontrollable factors. Hence a
further analysis to identify the controllable factors to understand their effects margin
is necessary. The impact of loss of profit due to the various factors can be known by
addition of the relevant percentages of Gross Profit and Net Profit actually achieved.
The recast of Profit and Loss account adjusting the effects of controllable factors but

Volume 3, Issue 6 (June, 2013) ISSN: 2249-7307
Jou
rnal
of
Asi
an R
esea
rch
Co
nso
rtiu
m
1
78
htt
p:/
/ww
w.a
ijsh
.org
AJRBEM
not controlled would make the business realise the impact of inefficiency built in the
system and will demand action for improvements.
____________________________________________________________________________
INTRODUCTION
The analysis on the margins will vary from industry to industry and hence there is no common
model available. However an overall analysis on the following will give enough inputs for
improvements of profitability level through identification of wastes made in the operations of
business.
01. Material cost analysis
02. Activity analysis
03. Waste, Rework, repair cost etc., analysis
04. Current assets analysis
05. Overhead analysis
06. Finance cost analysis
Finally, a recast of profit and loss account to be prepared considering cost impact of the
controllable portion on each adding the figures at each one of them.
The system should be so configured in such a manner so that data on the above areas have to be
pooled in a separate ledger for analysis purpose.
This is explained through analysis on the data on expenditure for two years a division of a
leading automobile company, TATA Motors Limited, India.
TABLE A (STAND ALONE)
Cost element
2010-11
%
2009-
10%
Best of 2009-10 &
2010-11
Difference with the
other
Materials 68.32 63.44 63.44 4.88
Operations & Other
expenses
10.34 12.60 10.34 2.24
Employees 4.38 4.57 4.38 0.19
Interest 2.19 2.74 2.19 0.55
Source:-tatamotors.com
The net sales figures (stand alone) are Rs.47807 cr and Rs.37873 cr for 2010-11 and 2009-10
respectively.

Volume 3, Issue 6 (June, 2013) ISSN: 2249-7307
Jou
rnal
of
Asi
an R
esea
rch
Co
nso
rtiu
m
1
79
htt
p:/
/ww
w.a
ijsh
.org
AJRBEM
The differential percentage shows there are variation in the cost elements to a great extent and
hence a thorough analysis is called for.
III. ANALYSIS OF EXPENDITURE
01. MATERIALS COST ANALYSIS
In accounting, the material cost is sum of the basic price, taxes and duties, delivery cost and
quantity of the items procured. There is another important factor directly impacting the materials
cost is quality of the materials chosen. But the overall cost is much more than accounted for
because material costs affect the value chain very much. If the relationships between material
costs and the other areas of the business are linked, the value of analysis will be based on actual
costs incurred and correct.
The cost can go up because of one or more in combination of the factors mentioned above. So it
becomes necessary to understand the links with materials, process/operation and customer as
some materials demand more operations/more process time.
In the above data, a drastic increase is shown from previous year. Instead of an increase at 4.88%
it should have been a decrease in percentage as in business it is a proven principle that cost and
volume are inversely related. However there are two categories of factors (Controllable & Non-
controllable) that affect the cost of materials.
Hence a reconciliation of standard with actual not only product materials cost but also customers
cost on sales can highlight the various other factors contributed to the increase in overall
materials cost. The impact on margin on this account towards controllable factors will trigger to
take decisions suitable to keep the materials cost at minimum to enhance profit margin to its best
level.
The impact of the controllable portion should be considered as forfeited profit.
02. ACTIVITY ANALYSIS
Process consumes activities and activities in turn consume resources. Hence a thorough analysis
is necessary to identify and removal of unnecessary activities in order to save time and cost.
An activity analysis should encompass all functions of a business such production, sales,
marketing, procurement, human resources, finance etc., The analysis should include a specific
detailed breakdown of each process which consume activities.
The next step should be to analyse the requirements such as HR, materials, equipment etc., for
each activity. The analysis looks specifically at how resources are consumed and their value
addition to the customer and hence business profits ultimately.
The analysis will be used by business to improve the operations with the target of achieving the
desired results. The operations & other expenses cost has come down from 12.60 % to 10.34 %.

Volume 3, Issue 6 (June, 2013) ISSN: 2249-7307
Jou
rnal
of
Asi
an R
esea
rch
Co
nso
rtiu
m
1
80
htt
p:/
/ww
w.a
ijsh
.org
AJRBEM
In employee cost also there is a minor reduction despite an increase in sale of 22 %. However
this only indicates that the more activities are carried out incurring additional employee cost.
Since employee cost is a fixed cost it should not have gone up proportionately to the extent of
increase in sales though there should have been increase in salaries due to annual increment /
wage revision/pension costs.
A detailed analysis can help identification of the wasteful activities, efficiency level of
employees, the activities which can be combined and performed by some instead of more, and
the activities which can be automated further etc., so that programs for cost reduction can be
redefined / initiated.
03. WASTE, REWORK, REPAIR COST ETC., ANALYSIS
The entire cost incurred towards rejection, rework, repairs etc., are actually unnecessary. The
cost could disappear on this head if systems and processes are perfect. So the entire cost to be
added to profit margin to see the impact on financial performance. The cost would have been
incurred due to the following which involve materials, labor, overheads and equipments.
In process rejections & rework
Repairing after production
Re-inspection, re-test etc.,
Additional Procurement time and cost
Discounts offered for delay
Complaints handling cost
Service cost during warranty
So if the details are drilled down the cost of the non-value added operation can be known.
In the Table A shown in introduction head, please see the reduction to the extent of 2.24 % under
the cost element “operations & other expenses” in the year 2010-11 achieved. This effect is
realized because of reduction in anyone or more of the above as far as overheads is concerned.
This is indication that there is an increase in efficiency level of operations.
The system should be so perfect that it should not produce defect product. If the input is not good
enough then the machine should not work on it in the initial process itself. Cost of poor quality is
more always than the cost of good quality.
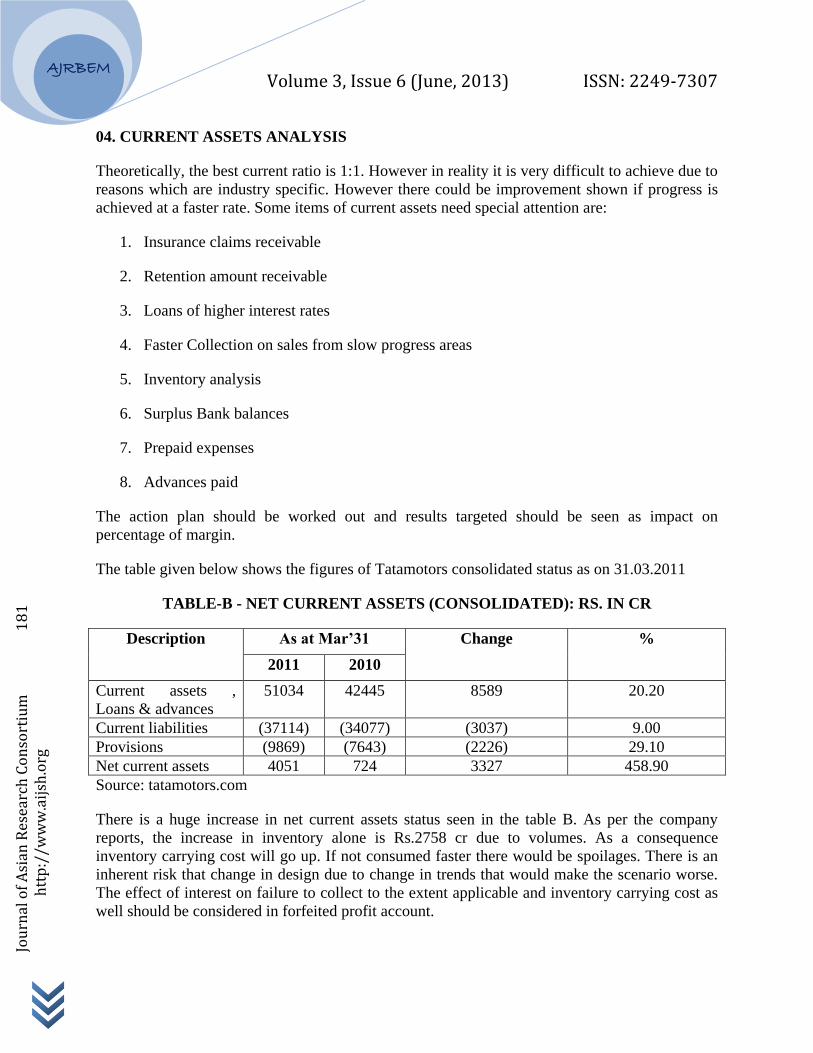
Volume 3, Issue 6 (June, 2013) ISSN: 2249-7307
Jou
rnal
of
Asi
an R
esea
rch
Co
nso
rtiu
m
1
81
htt
p:/
/ww
w.a
ijsh
.org
AJRBEM
04. CURRENT ASSETS ANALYSIS
Theoretically, the best current ratio is 1:1. However in reality it is very difficult to achieve due to
reasons which are industry specific. However there could be improvement shown if progress is
achieved at a faster rate. Some items of current assets need special attention are:
1. Insurance claims receivable
2. Retention amount receivable
3. Loans of higher interest rates
4. Faster Collection on sales from slow progress areas
5. Inventory analysis
6. Surplus Bank balances
7. Prepaid expenses
8. Advances paid
The action plan should be worked out and results targeted should be seen as impact on
percentage of margin.
The table given below shows the figures of Tatamotors consolidated status as on 31.03.2011
TABLE-B - NET CURRENT ASSETS (CONSOLIDATED): RS. IN CR
Description As at Mar’31 Change %
2011 2010
Current assets ,
Loans & advances
51034 42445 8589 20.20
Current liabilities (37114) (34077) (3037) 9.00
Provisions (9869) (7643) (2226) 29.10
Net current assets 4051 724 3327 458.90
Source: tatamotors.com
There is a huge increase in net current assets status seen in the table B. As per the company
reports, the increase in inventory alone is Rs.2758 cr due to volumes. As a consequence
inventory carrying cost will go up. If not consumed faster there would be spoilages. There is an
inherent risk that change in design due to change in trends that would make the scenario worse.
The effect of interest on failure to collect to the extent applicable and inventory carrying cost as
well should be considered in forfeited profit account.
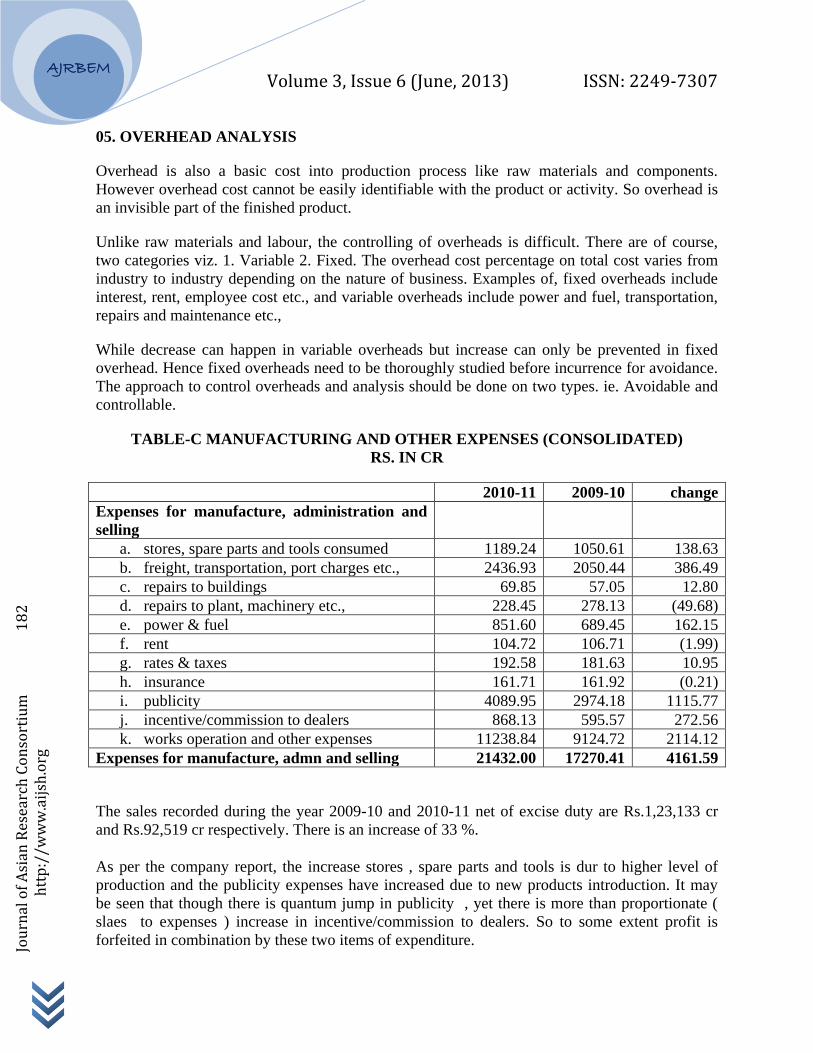
Volume 3, Issue 6 (June, 2013) ISSN: 2249-7307
Jou
rnal
of
Asi
an R
esea
rch
Co
nso
rtiu
m
1
82
htt
p:/
/ww
w.a
ijsh
.org
AJRBEM
05. OVERHEAD ANALYSIS
Overhead is also a basic cost into production process like raw materials and components.
However overhead cost cannot be easily identifiable with the product or activity. So overhead is
an invisible part of the finished product.
Unlike raw materials and labour, the controlling of overheads is difficult. There are of course,
two categories viz. 1. Variable 2. Fixed. The overhead cost percentage on total cost varies from
industry to industry depending on the nature of business. Examples of, fixed overheads include
interest, rent, employee cost etc., and variable overheads include power and fuel, transportation,
repairs and maintenance etc.,
While decrease can happen in variable overheads but increase can only be prevented in fixed
overhead. Hence fixed overheads need to be thoroughly studied before incurrence for avoidance.
The approach to control overheads and analysis should be done on two types. ie. Avoidable and
controllable.
TABLE-C MANUFACTURING AND OTHER EXPENSES (CONSOLIDATED)
RS. IN CR
2010-11 2009-10 change
Expenses for manufacture, administration and
selling
a. stores, spare parts and tools consumed 1189.24 1050.61 138.63
b. freight, transportation, port charges etc., 2436.93 2050.44 386.49
c. repairs to buildings 69.85 57.05 12.80
d. repairs to plant, machinery etc., 228.45 278.13 (49.68)
e. power & fuel 851.60 689.45 162.15
f. rent 104.72 106.71 (1.99)
g. rates & taxes 192.58 181.63 10.95
h. insurance 161.71 161.92 (0.21)
i. publicity 4089.95 2974.18 1115.77
j. incentive/commission to dealers 868.13 595.57 272.56
k. works operation and other expenses 11238.84 9124.72 2114.12
Expenses for manufacture, admn and selling 21432.00 17270.41 4161.59
The sales recorded during the year 2009-10 and 2010-11 net of excise duty are Rs.1,23,133 cr
and Rs.92,519 cr respectively. There is an increase of 33 %.
As per the company report, the increase stores , spare parts and tools is dur to higher level of
production and the publicity expenses have increased due to new products introduction. It may
be seen that though there is quantum jump in publicity , yet there is more than proportionate (
slaes to expenses ) increase in incentive/commission to dealers. So to some extent profit is
forfeited in combination by these two items of expenditure.
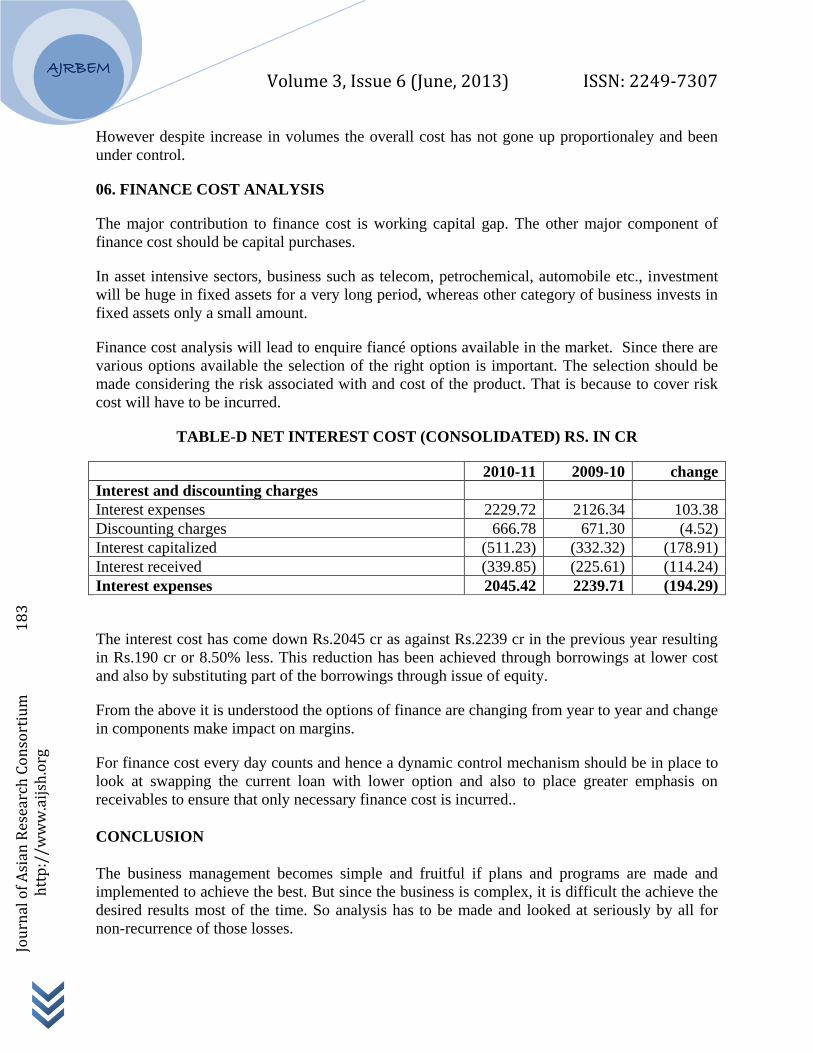
Volume 3, Issue 6 (June, 2013) ISSN: 2249-7307
Jou
rnal
of
Asi
an R
esea
rch
Co
nso
rtiu
m
1
83
htt
p:/
/ww
w.a
ijsh
.org
AJRBEM
However despite increase in volumes the overall cost has not gone up proportionaley and been
under control.
06. FINANCE COST ANALYSIS
The major contribution to finance cost is working capital gap. The other major component of
finance cost should be capital purchases.
In asset intensive sectors, business such as telecom, petrochemical, automobile etc., investment
will be huge in fixed assets for a very long period, whereas other category of business invests in
fixed assets only a small amount.
Finance cost analysis will lead to enquire fiancé options available in the market. Since there are
various options available the selection of the right option is important. The selection should be
made considering the risk associated with and cost of the product. That is because to cover risk
cost will have to be incurred.
TABLE-D NET INTEREST COST (CONSOLIDATED) RS. IN CR
2010-11 2009-10 change
Interest and discounting charges
Interest expenses 2229.72 2126.34 103.38
Discounting charges 666.78 671.30 (4.52)
Interest capitalized (511.23) (332.32) (178.91)
Interest received (339.85) (225.61) (114.24)
Interest expenses 2045.42 2239.71 (194.29)
The interest cost has come down Rs.2045 cr as against Rs.2239 cr in the previous year resulting
in Rs.190 cr or 8.50% less. This reduction has been achieved through borrowings at lower cost
and also by substituting part of the borrowings through issue of equity.
From the above it is understood the options of finance are changing from year to year and change
in components make impact on margins.
For finance cost every day counts and hence a dynamic control mechanism should be in place to
look at swapping the current loan with lower option and also to place greater emphasis on
receivables to ensure that only necessary finance cost is incurred..
CONCLUSION
The business management becomes simple and fruitful if plans and programs are made and
implemented to achieve the best. But since the business is complex, it is difficult the achieve the
desired results most of the time. So analysis has to be made and looked at seriously by all for
non-recurrence of those losses.

Volume 3, Issue 6 (June, 2013) ISSN: 2249-7307
Jou
rnal
of
Asi
an R
esea
rch
Co
nso
rtiu
m
1
84
htt
p:/
/ww
w.a
ijsh
.org
AJRBEM
There are two objectives:
1. Produce and sell more
2. Spend less
The simple way to improve profits is to sell more to achieve higher gross profit margin. The
most critical number is the gross profit margin. The achievement of a consistent healthy gross
profit margin is critical as the rest of your job will be a lot easier. But rejection, rework,
machinery break-down, non-availability raw material, non-availability etc., of component
contribute to sell less and incur more cost..
Cost control is important because most of the cost savings goes directly to the bottom line. This
is only sample.
To achieve the above, there are various programs pursued by business as per their requirement as
under:
critical success factor
waste stream mapping
benchmarking
cell concept
lean thinking
value engineering
Total Productivity maintenance ( TPM )
Total quality management ( TQM )
In order to achieve the best three things have to be in place in advance:-
1. Program planned for best processes and sales with their cost and benefits estimation.
2. Budget with best possible estimates
3. P & L considering the impact of the above.
For example, some Japanese companies experienced a 30% increase in productivity after
implementing TQM.
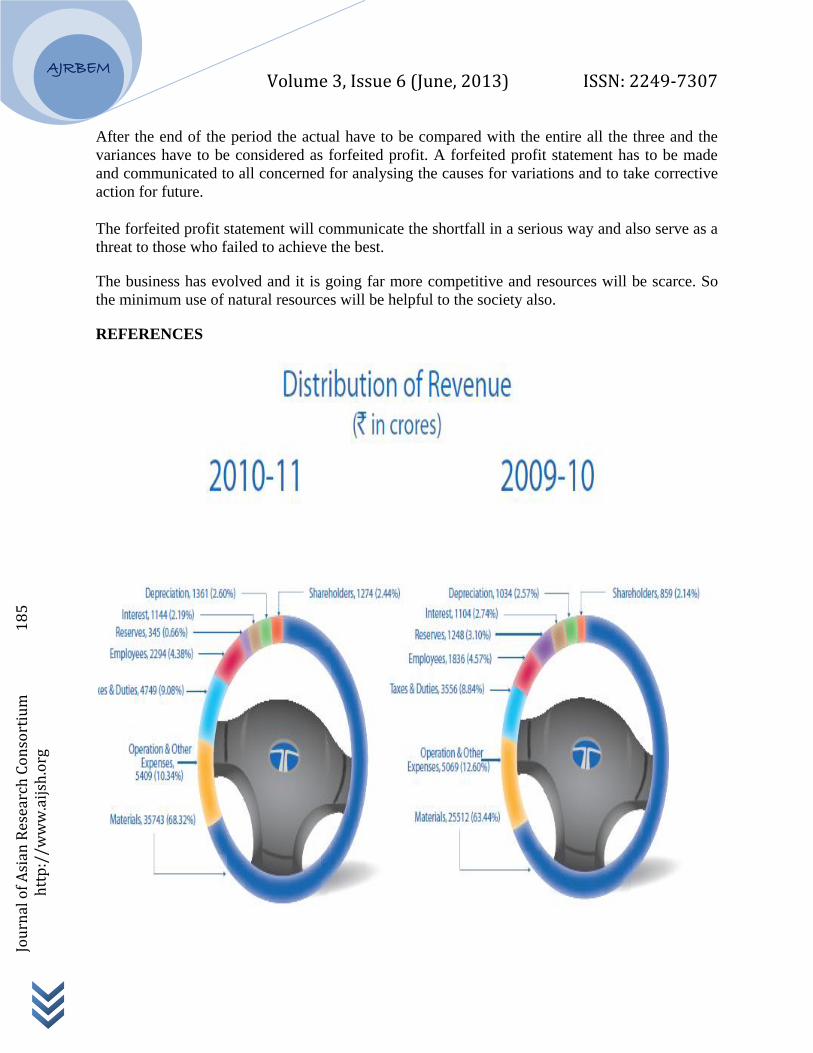
Volume 3, Issue 6 (June, 2013) ISSN: 2249-7307
Jou
rnal
of
Asi
an R
esea
rch
Co
nso
rtiu
m
1
85
htt
p:/
/ww
w.a
ijsh
.org
AJRBEM
After the end of the period the actual have to be compared with the entire all the three and the
variances have to be considered as forfeited profit. A forfeited profit statement has to be made
and communicated to all concerned for analysing the causes for variations and to take corrective
action for future.
The forfeited profit statement will communicate the shortfall in a serious way and also serve as a
threat to those who failed to achieve the best.
The business has evolved and it is going far more competitive and resources will be scarce. So
the minimum use of natural resources will be helpful to the society also.
REFERENCES

Volume 3, Issue 6 (June, 2013) ISSN: 2249-7307
Jou
rnal
of
Asi
an R
esea
rch
Co
nso
rtiu
m
1
86
htt
p:/
/ww
w.a
ijsh
.org
AJRBEM

Volume 3, Issue 6 (June, 2013) ISSN: 2249-7307
Jou
rnal
of
Asi
an R
esea
rch
Co
nso
rtiu
m
1
87
htt
p:/
/ww
w.a
ijsh
.org
AJRBEM

Volume 3, Issue 6 (June, 2013) ISSN: 2249-7307
Jou
rnal
of
Asi
an R
esea
rch
Co
nso
rtiu
m
1
88
htt
p:/
/ww
w.a
ijsh
.org
AJRBEM

Volume 3, Issue 6 (June, 2013) ISSN: 2249-7307
Jou
rnal
of
Asi
an R
esea
rch
Co
nso
rtiu
m
1
89
htt
p:/
/ww
w.a
ijsh
.org
AJRBEM