Taxonomical Survey of Swamp-based Fish in Brgy. La Fuente, Santa Rosa, Nueva Ecija, Philippines
Upload
khangminh22Category
view
1download
0
“Market Research and Monitoring on the leather industry in selected Asian countries:
China, Indonesia, Philippines, Vietnam”
STUDY REPORT: MARKET SURVEY ON THE PHILIPPINES
Contract n. ASI/B7-301/95/108-35 Account number ALA 95/25

This text has been drafted with the financial assistanceof the Commission of the European Communities.
The views expressed herein are those of Unione NazionaleIndustria Conciaria and therefore in no way reflect the official
opinion of the Commission.

INDEX - Philippines
SECTION A: COUNTRY REPORT
1. Political background
2. Economic background
3. Foreign trade
4. Commercial relations with Italy
SECTION B: MARKET STUDY
1. Executive summary
2. Country regulations
2.1 Import and Export Activity2.1.1 Policies on imports2.1.2 Foreign exchange policies2.1.3 Export development Act incentives
2.2 Foreign Investments2.2.1 Regulation2.2.2 Investment Priorities Plan (IPP)
2.3 Industrial Activities2.3.1 Philippine Environmental laws
2.4 Customs Regulations2.4.1 Import duties & taxes2.4.2 Import documents2.4.3 Pre shipment inspection2.4.4 Basic export guidelines2.4.5 Terms of payment
2.5 Distribution Channels
3. State of the Industry
3.1 Tanning Industry3.1.1 Raw material supply and trade3.1.2 Geographical location3.1.3 Current situation of the industry3.1.4 Current processing capability3.1.5 Profile of major companies3.1.6 Development plan of the industry
3.1.6.1 Hides and skins Improvement Program3.1.6.2 Efforts to encourage closer business cooperation3.1.6.3 Importation of hides/skins and finished leather3.1.6.4 Production improvements of tanneries3.1.6.5 Development of alternative raw material sources
3.1.7 Environmental issues
3.2 Leather Footwear Industry3.2.1 Geographical location3.2.2 Current situation of the industry
3.2.2.1 Imports/Exports3.2.2.2 Local market3.2.2.3 Market system3.2.2.4 Government policy
3.2.3 Current processing capability3.2.3.1 Production process3.2.3.2 Technology3.2.3.3 Labor force3.2.3.4 Raw materials/Support industries3.2.3.5 Production capacity/efficiency
3.2.4 Profile of major companies3.2.4.1 Size and structure of the companies3.2.4.2 Financial capacity3.2.4.3 Industry associations
3.2.5 Development plan of the industry3.2.5.1 Development issues3.2.5.2 Proposed development plan
3.3 Leather Goods Industry3.3.1 Geographical location3.3.2 Current situation of the industry
3.3.2.1 Exports and imports performance3.3.2.2 Strength of the industry3.3.2.3 Problems faced by the industries
3.3.3 Current processing capability3.3.3.1 Production capacities3.3.3.2 Production process3.3.3.3 Raw materials requirements3.3.3.4 Cost structure3.3.3.5 Capital equipment
3.3.4 Profile of major companies3.3.5 Development plan of the industry
3.4 Upholstery Industry3.4.1 Geographical location3.4.2 Current situation of the industry3.4.3 Current processing capability3.4.4 Profile of major companies3.4.5 Development plan of the industry
4. State of the Market
4.1 Market Features
4.2 Local Consumption4.2.1 By leather footwear industry4.2.2 By leather goods industry4.2.3 By other users
4.3 Leather Supply4.3.1 Local supply4.3.2 Imported supply
5. State of Competition
5.1 Leaderships and Main Competitors in the Tanning Industry
5.2 Leaderships and Main Competitors in the Leather Footwear Industry
5.3 Leaderships and Main Competitors in the Leather Goods Industry5.3.1 Foreign Competitors
5.4 Leaderships and Main Competitors in the Upholstery Industry
5.5 Options to penetrate the domestic market
5.6 Potential partners in distribution
5.7 Potential partners in manufacturing
5.8 Distribution Channels
03 Country report Philippines Page 5
Section A
P H I L I P P I N E S
COUNTRY REPORT

03 Country report Philippines Page 6
1. Political background
After a Spanish colonialism began in 16th century, a popular rebellion broke out at the end of 19th
century and Spain ceded the Philippines to the US.
Under US colonial rule democratic institutions were introduced, Filipinos increasingly took over allpolitical and bureaucratic positions and English-language education was extended throughout thecountry. In 1934 the Philippines was made an internally self-governing commonwealth, with fullindependence scheduled for July 4th 1946.
This transition was interrupted by the Japanese invasion in December 1941. The country resumedits path to full independence, which was achieved on schedule in 1946.
The new republic had a constitution modelled on that of the US and, as in Washington, powertended to alternate between two parties, the Nacionalistas and the Liberals. The fairly peacefulalternation in power within the political elite was interrupted in September 1972 as the president,Ferdinand Marcos, neared the end of his second term. Citing the threat from “subversive forces”,the president imposed martial law.
For the next 13 years, until 1986, the Philippines experienced “constitutional authoritarianism”.Opposition, which was never absent, was growing throughout Mr Marcos’s rule, but with many of itsleaders in detention or voluntary exile the moderate opposition seemed unable to mobilise feelingagainst the administration and its abuses.
The situation changed radically in August 1983, when Benigno Aquino, the opposition leaderregarded as the most credible alternative to Mr Marcos, was assassinated minutes after his returnfrom exile and while under military escort. A series of massive demonstrations followed in which thedisenchantment of the urban middle class, and notably the business community, was expressed forthe first time.
To reassert his own supremacy, Mr Marcos called an early presidential election for February 1986.In a close-run battle he was narrowly defeated by the candidate of a temporarily united opposition,Corazon Aquino, the widow of Benigno Aquino. Mr Marcos’s attempt to hold on to power set off acoup attempt in the military, backed by the deputy chief-of-staff, Fidel Ramos, and the defenceminister. This received critically important backing from Mrs Aquino’s People’s Power movementand the local Catholic Church. Under pressure from Washington, Mr Marcos went into voluntaryexile in Hawaii, where he died in 1989.
Under the new regime civil liberties were restored, political prisoners were released and the NPAwas offered a six-month ceasefire, with negotiations on grievances, in return for surrendering itsarms. A new constitution, drawn up by a convention appointed by Mrs Aquino, largely restored theset-up abolished by President Marcos in 1972 but with new controls on the presidency based on theexperience of the Marcos years.
• The Aquino presidency did achieve a fundamental objective: the transfer of presidential power atthe end of the constitutional term, by democratic means and in a relatively (for the Philippines)peaceful manner. The election of 1992 brought to power the candidate supported by MrsAquino, Mr Ramos.
•
03 Country report Philippines Page 7
Mr Ramos’s election ensured the continuation of the political and economic policies of the Aquinoadministration and was well received by the country’s major foreign creditors and the local businesscommunity. Within months of coming to office Mr Ramos had built up a large pro-governmentmajority in the Congress, secured a cessation of hostilities by dissident military groups and begunthe process of peace negotiations with both communist and Muslim secessionist rebels. Althoughdeep-rooted economic and social problems remain largely unresolved, the resumption of economicgrowth and the prospect of its maintenance at more robust levels throughout the rest of his termenhanced the president’s popularity.
In the 1998 presidential election Mr. Joseph Estrada became President.
2. Economic background
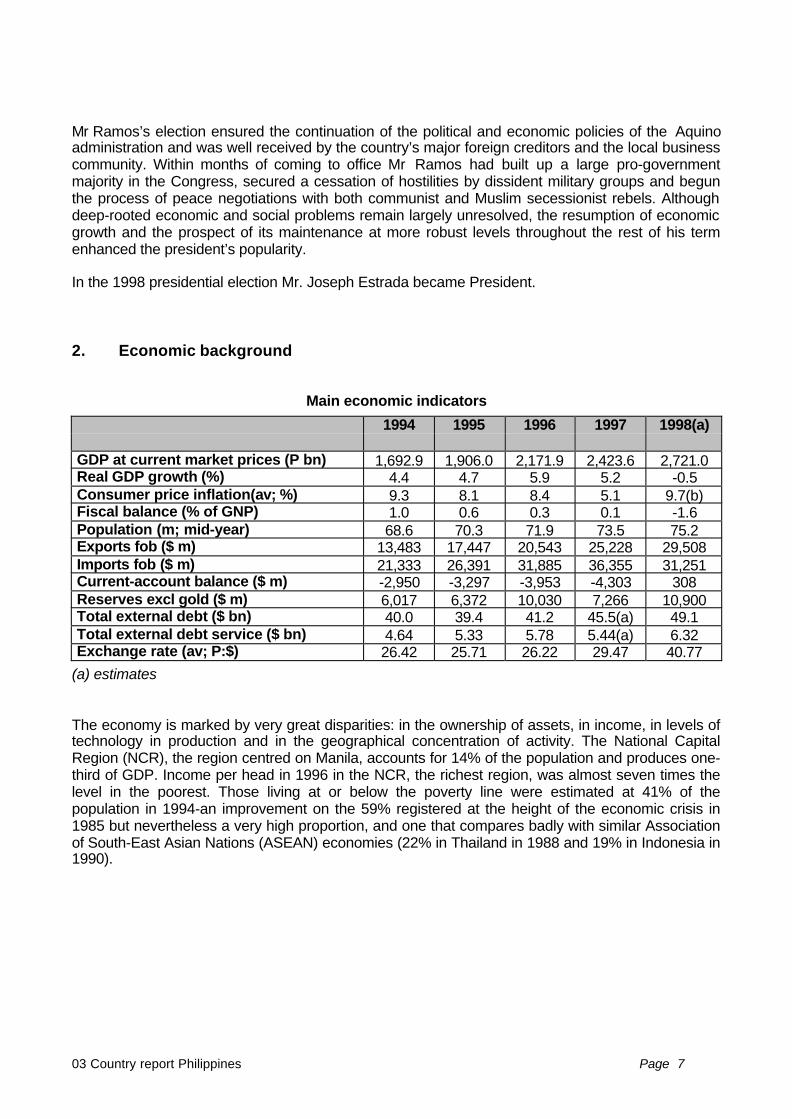
Main economic indicators
1994 1995 1996 1997 1998(a)
GDP at current market prices (P bn) 1,692.9 1,906.0 2,171.9 2,423.6 2,721.0Real GDP growth (%) 4.4 4.7 5.9 5.2 -0.5Consumer price inflation(av; %) 9.3 8.1 8.4 5.1 9.7(b)Fiscal balance (% of GNP) 1.0 0.6 0.3 0.1 -1.6Population (m; mid-year) 68.6 70.3 71.9 73.5 75.2Exports fob ($ m) 13,483 17,447 20,543 25,228 29,508Imports fob ($ m) 21,333 26,391 31,885 36,355 31,251Current-account balance ($ m) -2,950 -3,297 -3,953 -4,303 308Reserves excl gold ($ m) 6,017 6,372 10,030 7,266 10,900Total external debt ($ bn) 40.0 39.4 41.2 45.5(a) 49.1Total external debt service ($ bn) 4.64 5.33 5.78 5.44(a) 6.32Exchange rate (av; P:$) 26.42 25.71 26.22 29.47 40.77
(a) estimates
The economy is marked by very great disparities: in the ownership of assets, in income, in levels oftechnology in production and in the geographical concentration of activity. The National CapitalRegion (NCR), the region centred on Manila, accounts for 14% of the population and produces one-third of GDP. Income per head in 1996 in the NCR, the richest region, was almost seven times thelevel in the poorest. Those living at or below the poverty line were estimated at 41% of thepopulation in 1994-an improvement on the 59% registered at the height of the economic crisis in1985 but nevertheless a very high proportion, and one that compares badly with similar Associationof South-East Asian Nations (ASEAN) economies (22% in Thailand in 1988 and 19% in Indonesia in1990).
03 Country report Philippines Page 8
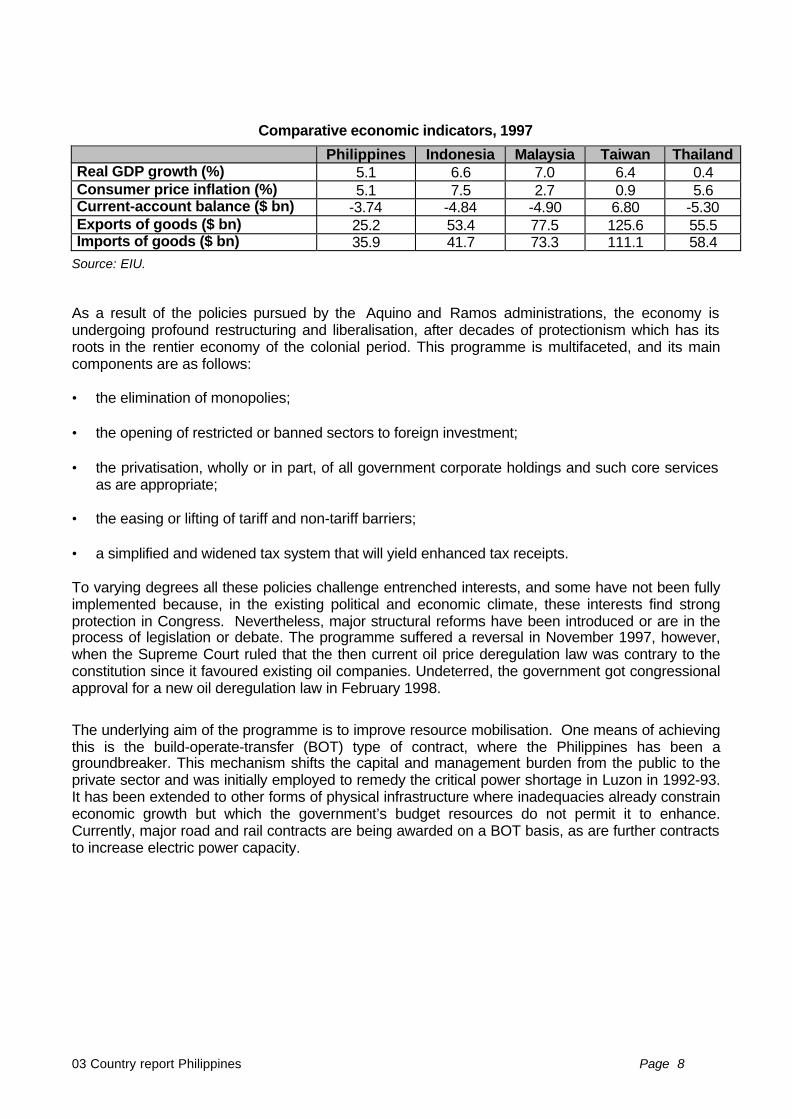
Comparative economic indicators, 1997
Philippines Indonesia Malaysia Taiwan ThailandReal GDP growth (%) 5.1 6.6 7.0 6.4 0.4Consumer price inflation (%) 5.1 7.5 2.7 0.9 5.6Current-account balance ($ bn) -3.74 -4.84 -4.90 6.80 -5.30Exports of goods ($ bn) 25.2 53.4 77.5 125.6 55.5Imports of goods ($ bn) 35.9 41.7 73.3 111.1 58.4
Source: EIU.
As a result of the policies pursued by the Aquino and Ramos administrations, the economy isundergoing profound restructuring and liberalisation, after decades of protectionism which has itsroots in the rentier economy of the colonial period. This programme is multifaceted, and its maincomponents are as follows:
• the elimination of monopolies;
• the opening of restricted or banned sectors to foreign investment;
• the privatisation, wholly or in part, of all government corporate holdings and such core servicesas are appropriate;
• the easing or lifting of tariff and non-tariff barriers;
• a simplified and widened tax system that will yield enhanced tax receipts.
To varying degrees all these policies challenge entrenched interests, and some have not been fullyimplemented because, in the existing political and economic climate, these interests find strongprotection in Congress. Nevertheless, major structural reforms have been introduced or are in theprocess of legislation or debate. The programme suffered a reversal in November 1997, however,when the Supreme Court ruled that the then current oil price deregulation law was contrary to theconstitution since it favoured existing oil companies. Undeterred, the government got congressionalapproval for a new oil deregulation law in February 1998.
The underlying aim of the programme is to improve resource mobilisation. One means of achievingthis is the build-operate-transfer (BOT) type of contract, where the Philippines has been agroundbreaker. This mechanism shifts the capital and management burden from the public to theprivate sector and was initially employed to remedy the critical power shortage in Luzon in 1992-93.It has been extended to other forms of physical infrastructure where inadequacies already constraineconomic growth but which the government’s budget resources do not permit it to enhance.Currently, major road and rail contracts are being awarded on a BOT basis, as are further contractsto increase electric power capacity.
03 Country report Philippines Page 9
The recourse to BOT or similar contracts has eased the government’s budgetary position. An evenmore important contribution has come from the sale of government assets, both corporate andphysical. This enabled the budget to move into a P16.3bn ($617m) surplus in 1994 (equivalent to1% of GDP) and remain in surplus thereafter, albeit declining steadily to P11.1bn (0.6% of GDP)and P6.3bn (0.3% of GDP) in 1995 and 1996 respectively. These budgetary surpluses have, tosome extent, become a self-generating process since they have lowered the debt on which interestliabilities arise, and interest is the principal item of budget expenditure. Thus a new feature in 1996was a marginal surplus recorded before privatisation proceeds, which owed much to the fact thatinterest spending was lower than targeted. The public sector deficit (as opposed to thegovernment’s budget balance) was nearly zero in both 1994 and 1995, and there was a smallsurplus in 1996.• The other macroeconomic stabilisation targets agreed with the IMF had also been broadly achievedby late 1997. Money growth has been held down (if not quite to initial IMF targets), despite the boostto liquidity from dollar inflows, in the form of portfolio investment and overseas workers’ remittances.The strength of the peso caused by these inflows and the elimination of the fiscal deficit wereimportant factors in bringing down the rate of consumer price inflation to a low of 5.1% in February1995. Because of an unavoidable shortfall in rice supply, inflation subsequently rose to double digitsin the last four months of 1995 and the first five months of 1996, but then resumed its downwardpath, to average 5.1% in 1997.
Stability in the current account of the balance of payments was an objective nearly reached in 1996and the first half of 1997. The deficit had risen between 1995 and 1996, from $3.3bn to $3.9bn, orfrom 4.3% to 4.5% of GDP, whereas in January-June 1997 the deficit of $2.1bn was more than$600m lower than in the corresponding period of 1996. The administration was looking to sustainedexport growth to narrow the trade imbalance, while at the same time hoping that the liberalisedenvironment for business would increase inflows of direct investment, covering more of the current-account deficit and enhancing the economy’s capacity to achieve payments equilibrium over thelonger term.
Progress on the fiscal balance and the current account of the balance of payments was derailed bythe currency crisis that hit the Philippines along with other, larger economies in the region in mid-1997. The steep fall in the peso and the sharp rise in interest rates to soften its decline appear tohave had an adverse affect on both net service and transfer receipts. The current-account deficitduring January-September 1997 at $3.16bn represented a $417m deterioration over January-September 1996. The depreciating peso and higher interest rates have also pushed up the cost ofservicing the government’s debt, at the same time as the downturn in economic growth has hit therevenue side. The fiscal surplus for 1997, which had already been cut from an expected P13bn toP7bn in late June, ended the year at P1.6bn. For 1998 the combination of higher borrowing costsover a full year and much slacker GDP growth as investment is squeezed means that fiscalequilibrium can be achieved only at the cost of steep cuts in spending. Naturally such action ispolitically difficult during an election period.
Because of the deteriorating fiscal position in 1997 and the court ruling against oil deregulation (oneof the core policy commitments to the IMF), the Philippines did not make the hoped-for clean breakfrom its IMF programme by the end of 1997. However, the prospect of a complete break from theIMF had become less attractive as the regional financial crisis deepened. Consequently a“precautionary stand-by arrangement” was being negotiated in March 1998, to follow on from theextended funding facility that was then due to expire. Apparently no policy or performance criteriaare to be specified; rather, indicative numbers will be set, within which the Philippines must remain ifit wishes to have access to some $2bn (reportedly) over a period of 12-18 months.
03 Country report Philippines Page 10
The outlook for 1999-2000 indicate that the GDP growth will pick up only slowly.
The economy will move out of the shallow recession it has experienced since mid-1998, but onlyslowly. (GDP fell at an average annual rate of 0.4% in April-September.) The improvement will beextremely modest until well into 1999, when full-year GDP growth is forecast at just 1.2%, butshould then gather strength to approach 3% in 2000. As in the years before the Asian regional crisisstruck, any movements in the Philippine economy, whether up or down, will be more sluggish thanin its major regional neighbours.
The slowness of the recovery stems from both foreign (see below) and domestic factors. Prominentamong the latter is the battering that agriculture received from the sequence of two climaticphenomena El Nino (which brought unusually dry conditions from late 1997 until mid-1998) and LaNina (the reverse phenomenon, involving excessive rainfall, which took the form of unusually severetyphoons in the final quarter of 1998). Consequently, the agricultural sector will have contracted by6-7% in 1998; any marked recovery is unlikely until well into 1999. The structural constraints in thissector mean that the lost ground is unlikely to be made up until 2000.The decline in agriculture will not have had an impact on household consumption until fairly late inthe year, as election campaign spending in the first few months of the year and changes in theincome tax structure will have supported it for most of 1998. Private consumption growth, thoughaveraging nearly 4% in 1998, was slowing steadily during the year and is likely to slacken further in1999 due to the delayed impact of recession in 1998 on employment. The sluggishness of thedomestic market has depressed the manufacturing sector (whose contribution to GDP now easilyexceeds that of agriculture), intensifying the difficult operating conditions with which it has had tocontend since the financial and currency crisis hit in mid-1997.
3. Foreign trade
The structure of Philippine foreign trade is typical of a developing country, with exports comprisingprincipally of raw materials and semi-finished goods and imports largely composed of capitalequipment. The top two export items, namely garments and semi-conductors, took up respectively35% and 15% of total exports in 1997. Other important exports are coconut oil, machinery, copperand fish. With respects to imports, parts for manufacture of electrical equipment and semi-processed manufactures represent almost one third of the total imports. Telecommunication andelectrical machinery, as well as power generation equipment and specialised machinery, are alsoimportant imports.
The external trade balance has been sensitive to trends in foreign demand for a fairly narrow rangeof manufactures and commodities, and to quite marked changes in the strength of import demand,reflecting bouts of rapid growth and decline in the economy. (Export and import data are given inReference tables 25, 26 and 27.) In recent decades, however, it has consistently been in deficit.
The deficit, which reached a low of $202m (fob) in 1986 after the severe contraction in the economyin the mid-1980s, has grown in nearly every year since, as the sustained growth in exports has beenexceeded by the strong rebound in import spending. The latter was initially the result of economicrecovery, but its double-digit rate in recent years reflects the import dependence of the Philippines’major export, electronics. By 1996 the trade gap had reached $11.34bn, with exports covering lessthan two- thirds of imports. The trade gap narrowed to $10.71bn in 1997 owing to an acceleration inthe rate of growth of exports (mainly electronics) and a sharp deceleration in import growth because
03 Country report Philippines Page 11
of the marked depreciation of the peso since July 1997. But with the dependence of electronics onimported inputs, there is a limit to the extent that the trade gap can be closed.Since the 1970s the contribution of traditional commodity exports has consistently tended to fallwhile that of non-traditional manufactures has been rising. This reflects both general volumedeclines (forestry products, sugar and copper are prime examples) and price weakness, as well asexpanding foreign demand for Philippine manufactures, above all electronics and, to a lesser extent,garments.
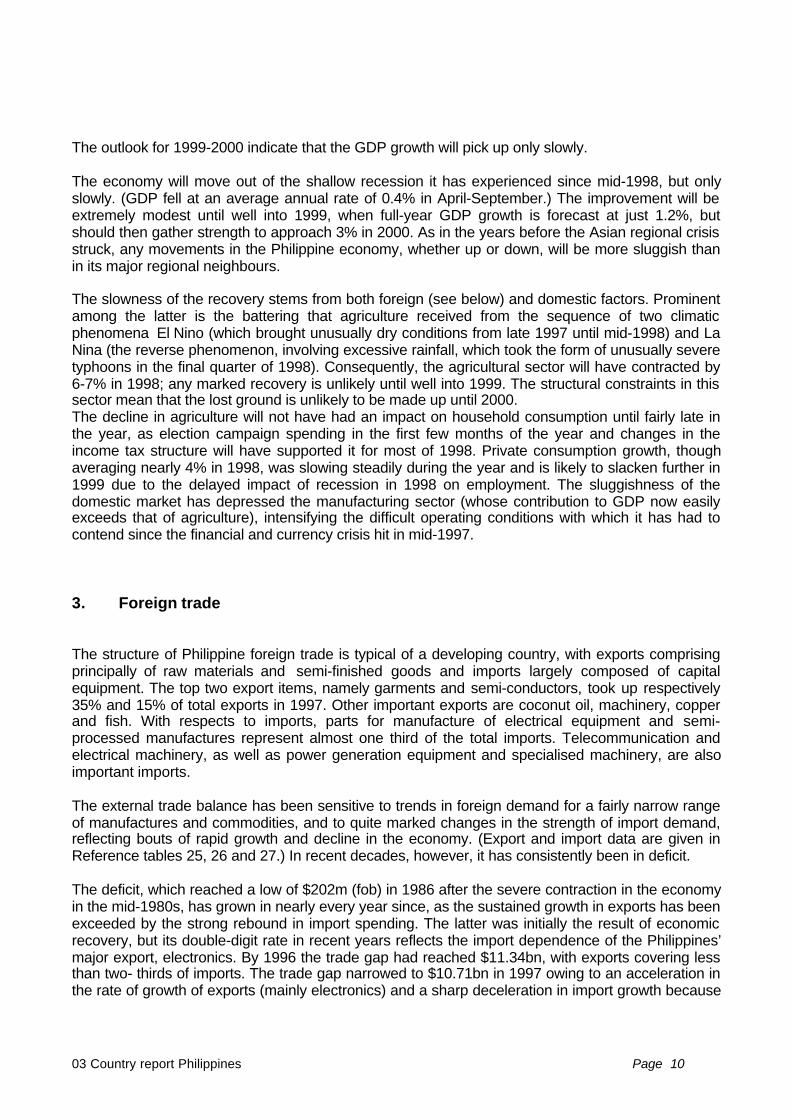
Foreign trade, 1998($ m fob unless otherwise indicated)
Jan-Mar Apr-Jun Jul Aug Sep OctExports 6,816 7,090 2,501 2,672 2,786 2,542% change, year on year 23.9 14.5 21.0 17.5 19.2 9.3Imports -8,038 -7,340 -2,465 -2,510 -2,454 -2,417% change, year on year -4.3 -17.8 -22.2 -23.3 -23.0 -27.4Trade balance -1,222 -250 36 162 332 125
Although the out turn for October was a less spectacular 9.3% rise in earnings, there wasundoubtedly very strong growth in export receipts in 1998, particularly in manufacturing. The rise insales of electrical equipment and parts made the most important contribution, as the Philippinesescaped the sluggishness of world electronic markets. Clothing remained a near-zero-growth sector-- any improvement in price competitiveness stemming from the peso's depreciation against thedollar had only muted impact. Machinery and transport equipment still performed strongly, albeit farless well than in 1997, when exports more than doubled, while agricultural earnings were sustainedby much higher volume sales of coconut oil (24.2% up in January-November).
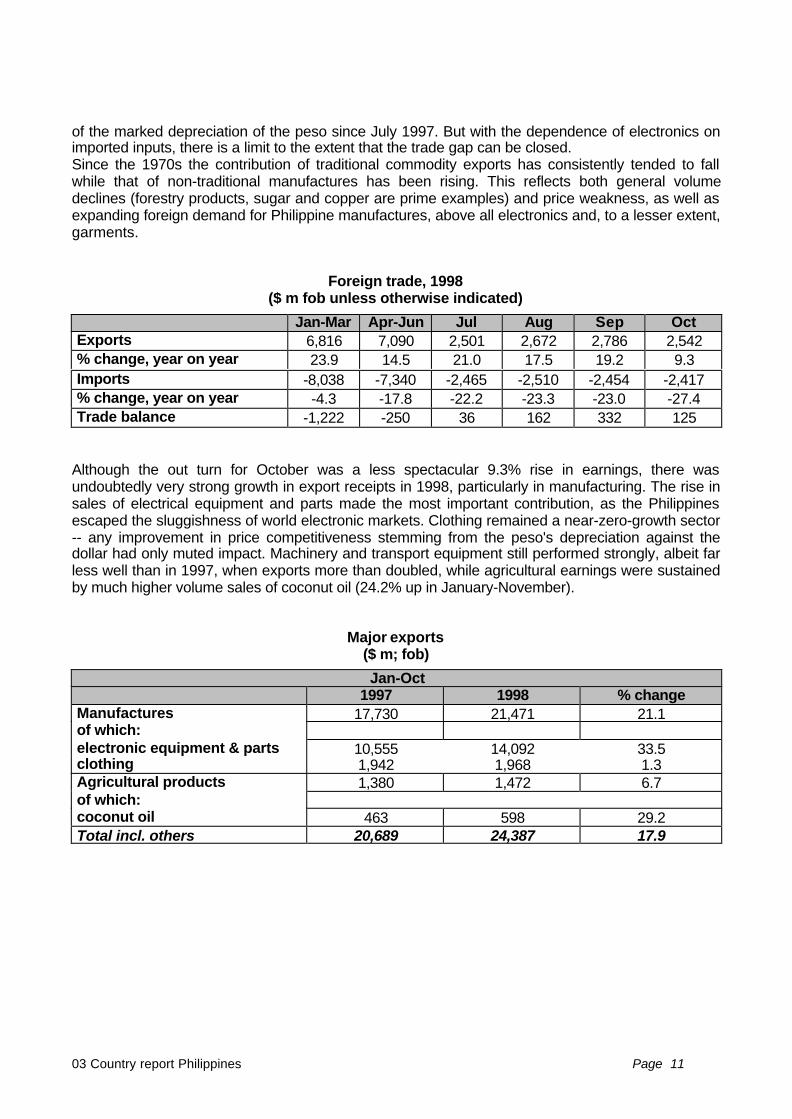
Major exports($ m; fob)
Jan-Oct1997 1998 % change
Manufactures 17,730 21,471 21.1of which:electronic equipment & parts 10,555 14,092 33.5clothing 1,942 1,968 1.3Agricultural products 1,380 1,472 6.7of which:coconut oil 463 598 29.2Total incl. others 20,689 24,387 17.9

03 Country report Philippines Page 12
All main categories of import spending showed year-on-year declines in the first nine months of1998 (the latest figures available). This reflected both the overall fall in domestic demand and thefact that the manufacturing sector, hard-pressed by the higher peso cost of imports and difficultcredit conditions, was running down its inventory of raw materials and intermediates. The tablebelow sets out the position. Particularly interesting is the fall in spending on electrical equipmentmaterials (the category which covers imports of electronic components); it is unclear, as yet, howmuch this reflects price rather than volume trends. The sharp contraction in spending on oil resultedfrom both slacker growth in demand as the economy slipped into recession and the fall in worldprices. Two less significant items which showed major changes, not shown in the table below, arepassenger cars and rice. Spending on the former fell by 65% to $176m, undoubtedly as a result oflower volumes as demand was hit by higher peso costs and the unwillingness of banks to providecredit to prospective buyers. The more than doubling in spending on rice imports, to $487m, was theresult of higher volumes, to make up the shortfall in the domestic crop.
Given the high dependence of Philippine export manufacturing on imported inputs (above all in thecase of electronic goods, which accounted for 51% of all export receipts in January-September)these trends are not sustainable over a lengthy period. Inventories will need to be replenished, andthe process will be aided by the recent stabilisation in the peso's value after a period of steepdecline.
Imports ($ m; fob)
Jan-Sep1997 1998 % change
Intermediates 11,235 8,895 -20.8of which:electrical equipment materials 4,007 3,495 -12.8manufactures 3,150 2,242 -28.8chemicals 2,172 1,672 -23.0Unprocessed raw materials 1,291 896 -30.7Oil 2,116 1,570 -27.5Consumer goods 2,394 1,943 -18.8Total incl. others 26,861 22,807 -15.1
Source: National Statistics Office, as reported in the press.
The US and Japan remain the Philippines’ dominant trading partners, but their share of its exportshas stabilised or declined in recent years as the country has diversified its markets and, inparticular, expanded its trade with its partners in the Association of South-East Asian Nations(ASEAN). As an import source, Japan has been growing in importance, reflecting its investment inmanufacturing in the Philippines as well as its established dominance as a provider of aid funds.
Although overall the Philippines has been lowering its trade barriers-both tariff and non-tariff-sincethe early 1980s as part of its policy pledges to the IMF and the GATT/WTO, it had already begun aprocess of trade liberalisation within the region.
03 Country report Philippines Page 13
From the beginning of 1978 a mutual preferential trading agreement with other ASEAN members(Indonesia, Malaysia, Singapore and Thailand, joined by Brunei in 1984) came into effect, coveringspecified goods including rice, sugar, crude oil, cement and chemicals. Some 19,000 items are nowcovered, on which a 50% discount on import tariffs is granted. In addition, in 1992 the countriesagreed to a tariff-reduction schedule leading to a free-trade area (the ASEAN Free Trade Area,AFTA) within 15 years, with a ceiling of 20% on manufactured and processed goods within 5- 8years and 5% by the end of 15 years. An accelerated programme, reducing the schedule to sevenyears, was agreed for 15 priority products. In 1993 it was agreed to shorten the 15-year period to 10years, with tariffs currently below 20% falling to 5% by 2000, and those over 20% reaching this levelby 2003. For some goods the 0-5% rate will be implemented by 1998. Tariffs within ASEAN will fallto an average of 2.6% by 2003, from 13.4% in 1994. The goods excluded from the ASEAN free-trade area liberalisation are to be reduced in number, so that the programme’s coverage of intra-ASEAN trade will rise from 85% to nearly 100%.
This programme is of direct relevance to intra-ASEAN investment, which so far in the case of thePhilippines has tended to be inwards.Confounding fears that the Asian crisis would lead to the raising of economic barriers (borne outwhen Malaysia placed restrictions on capital flows), the meeting of economic ministers of theAssociation of South-East Asian Nations (ASEAN) in October 1998 agreed to speed up tradeliberalisation. The ASEAN Free Trade Area (AFTA) is now due to start up one year ahead ofschedule, in 2002 -- though "with some flexibility". At that date all internal tariffs are to be reduced tobelow 5%, which the ASEAN secretariat estimates will bring the average tariff rate for traded goodsin the region to 2.68%, representing half the current level.
In addition, the ministers agreed that by 2010 all investment applications emanating from otherASEAN members should be treated on the same basis as domestic proposals. By 2020 thistreatment is to be extended to all investors. Finally, the meeting agreed to set up a joint surveillancesystem to monitor the macroeconomic stability and financial systems of member countries. Thisrepresents a departure from the ASEAN tradition by which members do not interfere in each other'saffairs.
03 Country report Philippines Page 14
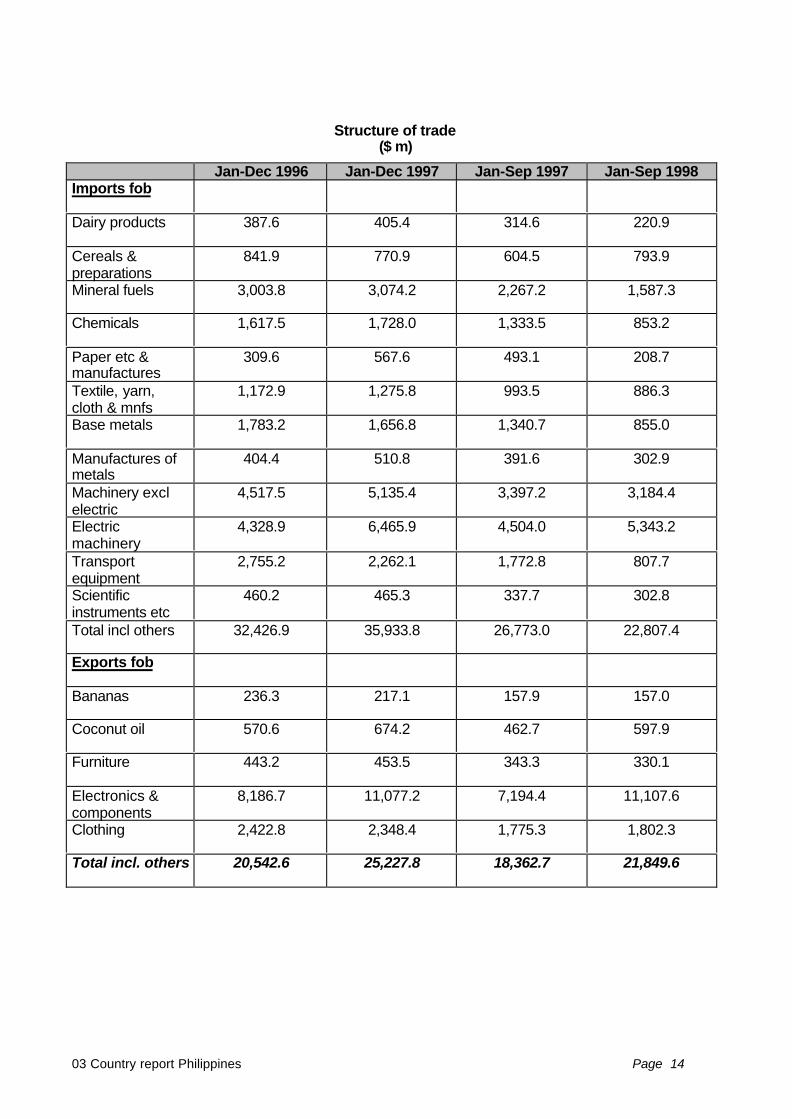
Structure of trade($ m)
Jan-Dec 1996 Jan-Dec 1997 Jan-Sep 1997 Jan-Sep 1998Imports fob
Dairy products 387.6 405.4 314.6 220.9
Cereals &preparations
841.9 770.9 604.5 793.9
Mineral fuels 3,003.8 3,074.2 2,267.2 1,587.3
Chemicals 1,617.5 1,728.0 1,333.5 853.2
Paper etc &manufactures
309.6 567.6 493.1 208.7
Textile, yarn,cloth & mnfs
1,172.9 1,275.8 993.5 886.3
Base metals 1,783.2 1,656.8 1,340.7 855.0
Manufactures ofmetals
404.4 510.8 391.6 302.9
Machinery exclelectric
4,517.5 5,135.4 3,397.2 3,184.4
Electricmachinery
4,328.9 6,465.9 4,504.0 5,343.2
Transportequipment
2,755.2 2,262.1 1,772.8 807.7
Scientificinstruments etc
460.2 465.3 337.7 302.8
Total incl others 32,426.9 35,933.8 26,773.0 22,807.4
Exports fob
Bananas 236.3 217.1 157.9 157.0
Coconut oil 570.6 674.2 462.7 597.9
Furniture 443.2 453.5 343.3 330.1
Electronics &components
8,186.7 11,077.2 7,194.4 11,107.6
Clothing 2,422.8 2,348.4 1,775.3 1,802.3
Total incl. others 20,542.6 25,227.8 18,362.7 21,849.6
03 Country report Philippines Page 15
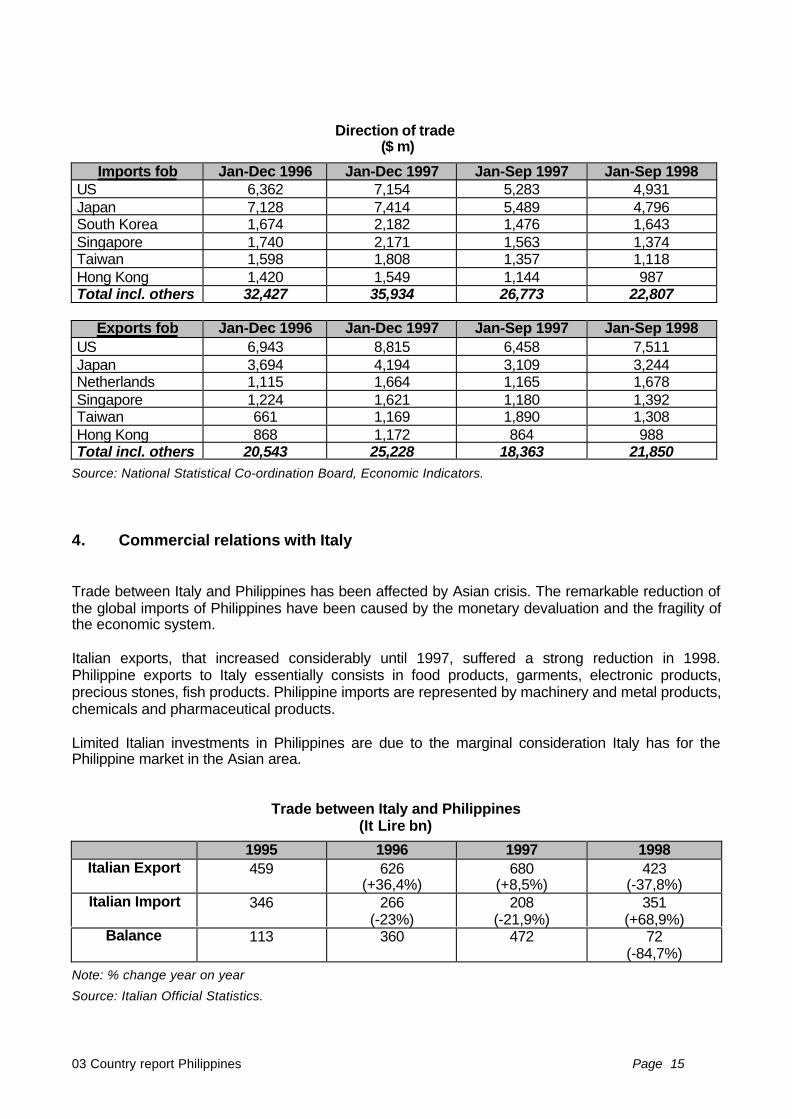
Direction of trade ($ m)
Imports fob Jan-Dec 1996 Jan-Dec 1997 Jan-Sep 1997 Jan-Sep 1998US 6,362 7,154 5,283 4,931Japan 7,128 7,414 5,489 4,796South Korea 1,674 2,182 1,476 1,643Singapore 1,740 2,171 1,563 1,374Taiwan 1,598 1,808 1,357 1,118Hong Kong 1,420 1,549 1,144 987Total incl. others 32,427 35,934 26,773 22,807
Exports fob Jan-Dec 1996 Jan-Dec 1997 Jan-Sep 1997 Jan-Sep 1998US 6,943 8,815 6,458 7,511Japan 3,694 4,194 3,109 3,244Netherlands 1,115 1,664 1,165 1,678Singapore 1,224 1,621 1,180 1,392Taiwan 661 1,169 1,890 1,308Hong Kong 868 1,172 864 988Total incl. others 20,543 25,228 18,363 21,850
Source: National Statistical Co-ordination Board, Economic Indicators.
4. Commercial relations with Italy
Trade between Italy and Philippines has been affected by Asian crisis. The remarkable reduction ofthe global imports of Philippines have been caused by the monetary devaluation and the fragility ofthe economic system.
Italian exports, that increased considerably until 1997, suffered a strong reduction in 1998.Philippine exports to Italy essentially consists in food products, garments, electronic products,precious stones, fish products. Philippine imports are represented by machinery and metal products,chemicals and pharmaceutical products.
Limited Italian investments in Philippines are due to the marginal consideration Italy has for thePhilippine market in the Asian area.
Trade between Italy and Philippines(It Lire bn)
1995 1996 1997 1998Italian Export 459 626
(+36,4%)680
(+8,5%)423
(-37,8%)Italian Import 346 266
(-23%)208
(-21,9%)351
(+68,9%)Balance 113 360 472 72
(-84,7%)Note: % change year on year
Source: Italian Official Statistics.

04 Market Study Philippines Page 10
Section B
P H I L I P P I N E S
MARKET STUDY ON THELEATHER INDUSTRY
04 Market Study Philippines Page 11
1 Executive Summary
• Philippine economic policies are open to foreign investment in many industries except a fewwhich are in the negative list. External trade policies are likewise opening the local market toglobal suppliers as tariff duties are lowered as part of the trade liberalization efforts. Specialincentives are given to firms that will export a significant portion of their production or to firmsentering sectors classified as priority business activities by the government.
• The tannery industry is concentrated in Meycauayan, Bulacan where the industry started in theearly 1900s. The tannery industry enjoyed a stronghold in the local market until tradeliberalization opened up the market to imported leather. At the moment, business opportunitiesabound in the tannery sector considering that the local industry is not capable of supplying thefull requirements of the local leather footwear and leather goods industries. There is significantroom for foreign investments in this business in as much as the local industry faces a lot ofproblems concerning raw material supply, production processes, equipment and technology, aswell as effluent treatment
A number of local tanneries are actively looking for EU business partners for the purpose ofproduction/technical cooperation, marketing/distribution and equity partnerships.
• The leather footwear industry is the sub-sector that is receiving more attention from theGovernment owing to the Philippine shoe industry’s historical significance to the economy aswell as the industry’s classification as an export winner. The government has commissionedthe preparation of a draft master plan for the leather footwear industry in 1996 which provides adetailed plan on short-term and long-terms measures to assist the leather footwear sectorsurvive the current constraints brought about by the weak support industry.
The plan provides a mix of measures designed to alleviate the shortage of leather throughimportation as well as development of local hides and skins supply.
• The leather goods sector is also considered an export winner but the government has notgiven enough attention to this industry. There is no existing development plan for the industry atthe moment although the Leather Footwear Master Plan mentions the needs of the sector insome parts of the plan. This can be explained by the fact that the leather goods industry isbasically an offshoot of the leather footwear industry.
Just like the leather footwear industry, it is confronted with lack of good leather as well asaccessories. Business opportunities exist in the support sectors producing accessories andcomponents.
• The upholstery sector is composed mainly of small upholsterers, upholstery suppliers andupholstery fabric traders. The industry is not huge considering that there is a relatively smallmarket for leather furniture and for the automotive industry, the upholstered seats of new carsenter the market as part of the completely knocked down (CKD) vehicle. Many upholsterersconcentrate on re-upholstery or re-modelling of furniture. There are a few firms that produceleather seat covers too.
Basically, except for a listing of firms operating in the Philippines as upholsterers, there is verylittle data available on the industry as a whole.

04 Market Study Philippines Page 12
• The state of the leather market offers good supply or production opportunities for EU firms.The government has adopted open trading policies to encourage the inward flow of leather intothe country and to correct the current shortage of good leather.
The leather market has not been thoroughly studied to this date thus reliable data is practicallynot available. The most comprehensive study done on the leather market was the onecommissioned by the DTI for the preparation of a Master Plan for the Leather Footwear Sector.
The local market relies on leather imports to augment local supply. In 1996, the local tanningindustry has an estimated annual capacity of 46/5 million sq. feet of finished leather. Of this60% is absorbed by the leather footwear industry. In addition, it has a rated annual capacity of800 MT of sole leather. Capacity utilization, however, is kept at about 30% only due toinadequate supply of raw hides and lack of operating capital.
• As far as the state of competition is concerned, the main competition is coming from Asiancountries. For finished leather, local firms are competing mainly against suppliers from theRepublic of Korea. The Koreans supplied 72% of the import requirements of the Philippines forbovine and equine leather in 1998. In 1997, it was higher at 82%. Other Asian countries, likeHong Kong, Japan, Singapore and Indonesia are gradually grabbing market shares for Korea.
As far as the EU suppliers are concerned, the most aggressive are italian suppliers. Among EUsuppliers they cornered 47% of the EU sourced imports of bovine and equine leather in 1998.
In the footwear industry, Hong Kong , China (PROC) and Indonesia topped the suppliers list in1998. Three EU countries followed at a distance: UK, Germany and Italy, in the 4th to 6th
position. Similarly, Hong Kong and China (PROC) were the top suppliers of leather goods in1998.
• There are a number of options that EU firms can take to be able to enter the Philippinemarket. This can be done through normal trading channels, in particular, through importers andthen through wholesalers/retailers. Some importers have wholesale and retail outlets also.Another way is by setting up marketing partnerships and/or establishing joint production. Thelocal industry is open to equity partnerships as well. A number of large tanneries are looking forbusiness cooperation opportunities with EU firms.
04 Market Study Philippines Page 13
2. Country Regulations
2.1 Import and Export Activities
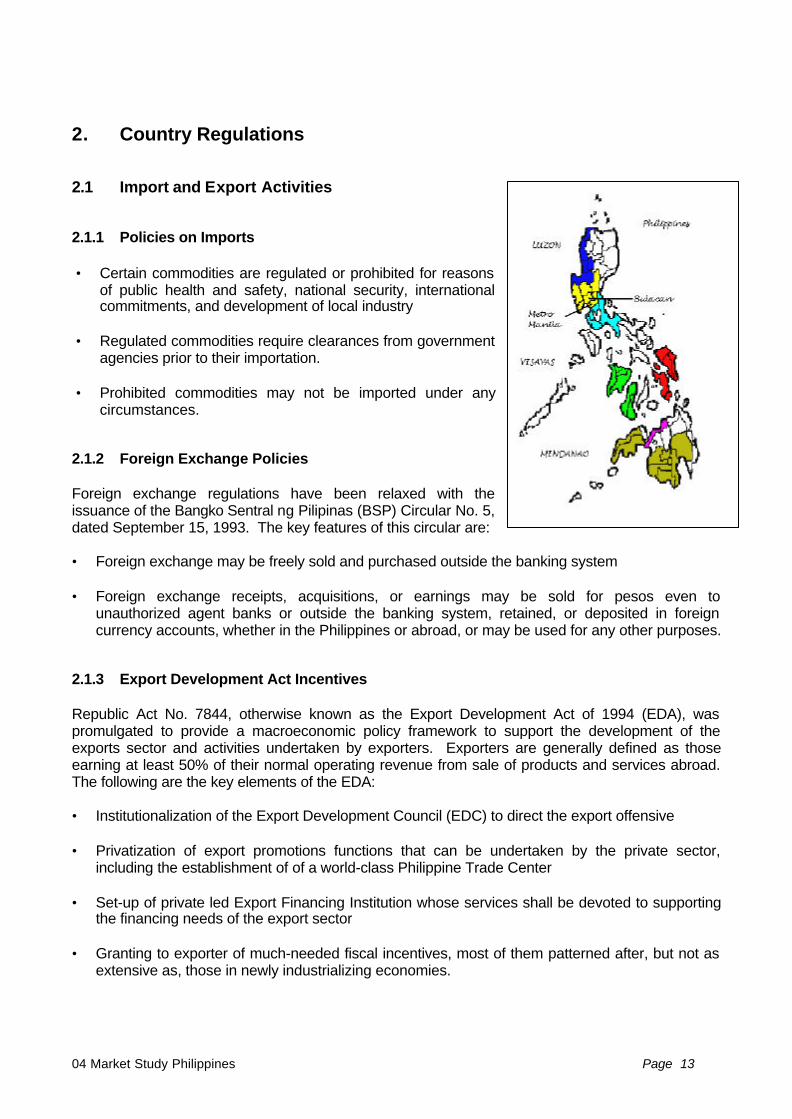
2.1.1 Policies on Imports
• Certain commodities are regulated or prohibited for reasonsof public health and safety, national security, internationalcommitments, and development of local industry
• Regulated commodities require clearances from governmentagencies prior to their importation.
• Prohibited commodities may not be imported under anycircumstances.
2.1.2 Foreign Exchange Policies
Foreign exchange regulations have been relaxed with theissuance of the Bangko Sentral ng Pilipinas (BSP) Circular No. 5,dated September 15, 1993. The key features of this circular are:
• Foreign exchange may be freely sold and purchased outside the banking system
• Foreign exchange receipts, acquisitions, or earnings may be sold for pesos even tounauthorized agent banks or outside the banking system, retained, or deposited in foreigncurrency accounts, whether in the Philippines or abroad, or may be used for any other purposes.
2.1.3 Export Development Act Incentives
Republic Act No. 7844, otherwise known as the Export Development Act of 1994 (EDA), waspromulgated to provide a macroeconomic policy framework to support the development of theexports sector and activities undertaken by exporters. Exporters are generally defined as thoseearning at least 50% of their normal operating revenue from sale of products and services abroad.The following are the key elements of the EDA:
• Institutionalization of the Export Development Council (EDC) to direct the export offensive
• Privatization of export promotions functions that can be undertaken by the private sector,including the establishment of of a world-class Philippine Trade Center
• Set-up of private led Export Financing Institution whose services shall be devoted to supportingthe financing needs of the export sector
• Granting to exporter of much-needed fiscal incentives, most of them patterned after, but not asextensive as, those in newly industrializing economies.
04 Market Study Philippines Page 14
To qualify for EDA incentives, exporters must comply with rule III, Section 1 (A) of the implementingrules and regulations (IRR) of EDA, which define exporters as those earning at least 50% of theirnormal operating revenue from sale of products and services abroad.
Additionally, exporter are required to secure EDA accreditation. The following are the list of theaccrediting agencies and institutions:
• Bureau of Export and Trade Promotion (BETP) of the Department of Trade and Industry (DTI)
Authorized by BETP
• Philippine Economic Zone Authority (PEZA)• Board of Investment (BOI)• Garments and Textile Export Board (GETB)• Subic Bay Metropolitan Authority (SBMA)• Clark Development Corporation (CDC)• Philippine Export Confederation Inc. (Philexport)• Philippine Chamber of Commerce and Industry (PCCI)
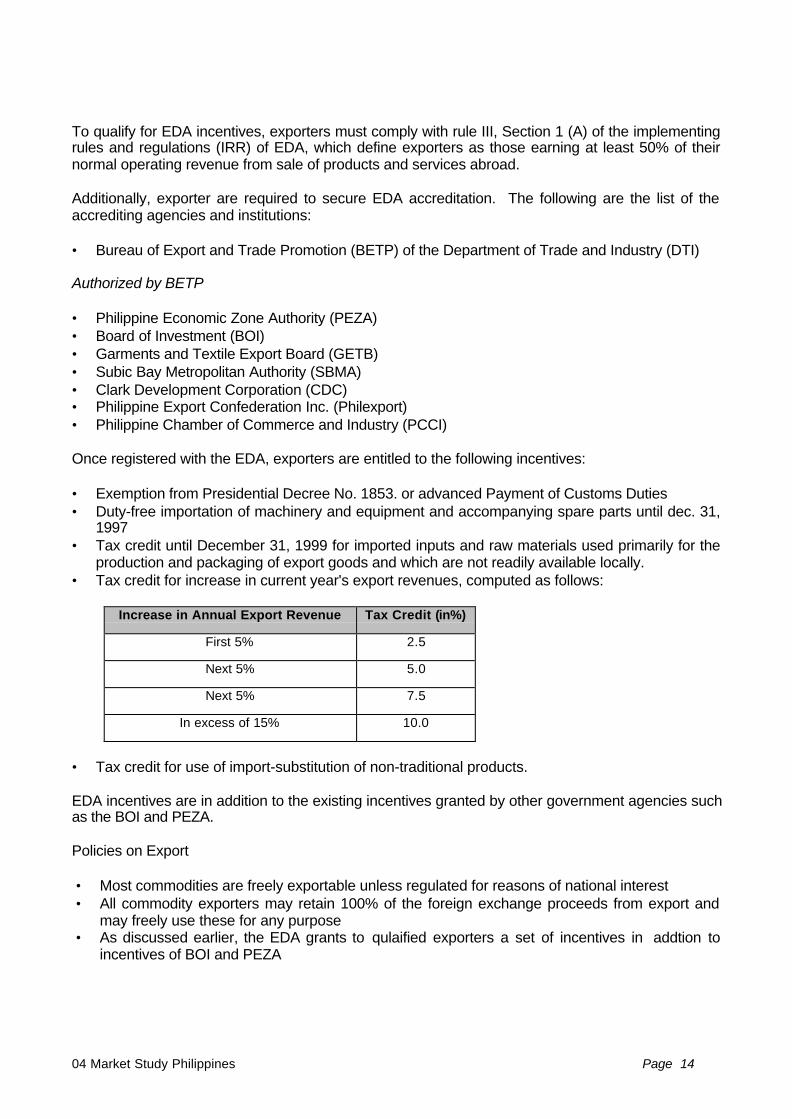
Once registered with the EDA, exporters are entitled to the following incentives:
• Exemption from Presidential Decree No. 1853. or advanced Payment of Customs Duties• Duty-free importation of machinery and equipment and accompanying spare parts until dec. 31,
1997• Tax credit until December 31, 1999 for imported inputs and raw materials used primarily for the
production and packaging of export goods and which are not readily available locally.• Tax credit for increase in current year's export revenues, computed as follows:
Increase in Annual Export Revenue Tax Credit (in%)
First 5% 2.5
Next 5% 5.0
Next 5% 7.5
In excess of 15% 10.0
• Tax credit for use of import-substitution of non-traditional products.
EDA incentives are in addition to the existing incentives granted by other government agencies suchas the BOI and PEZA.
Policies on Export
• Most commodities are freely exportable unless regulated for reasons of national interest• All commodity exporters may retain 100% of the foreign exchange proceeds from export and
may freely use these for any purpose• As discussed earlier, the EDA grants to qulaified exporters a set of incentives in addtion to
incentives of BOI and PEZA
04 Market Study Philippines Page 15
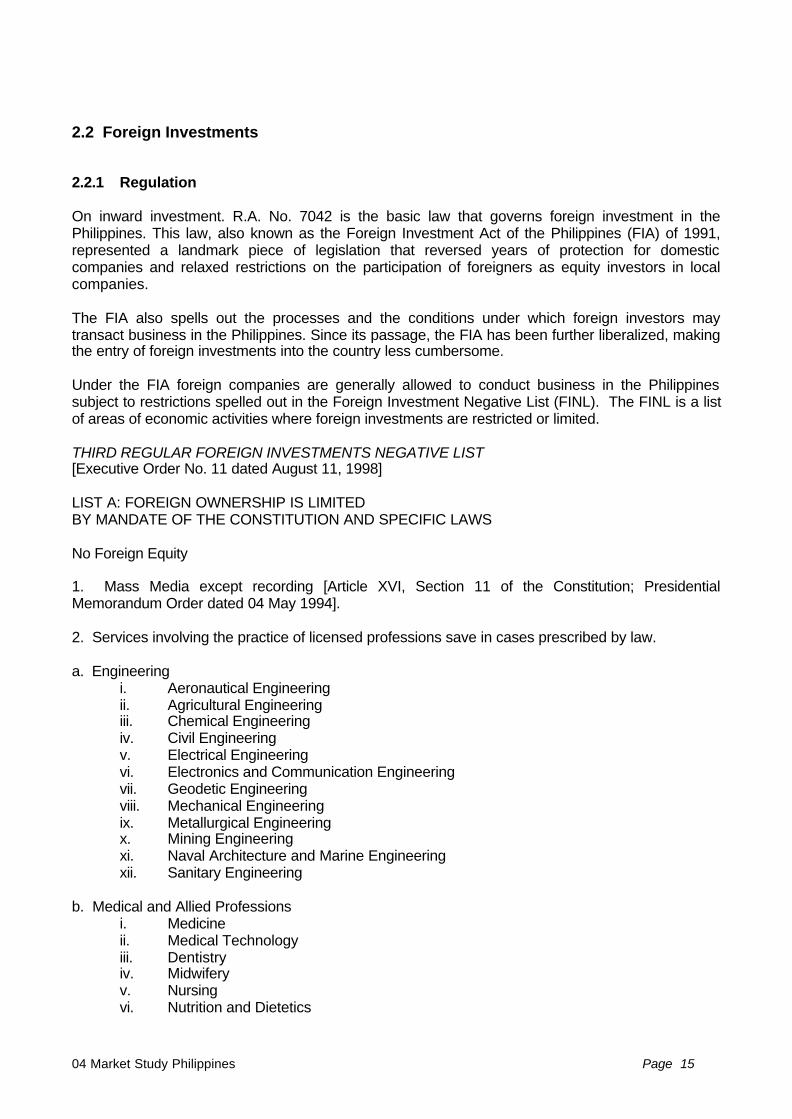
2.2 Foreign Investments
2.2.1 Regulation
On inward investment. R.A. No. 7042 is the basic law that governs foreign investment in thePhilippines. This law, also known as the Foreign Investment Act of the Philippines (FIA) of 1991,represented a landmark piece of legislation that reversed years of protection for domesticcompanies and relaxed restrictions on the participation of foreigners as equity investors in localcompanies.
The FIA also spells out the processes and the conditions under which foreign investors maytransact business in the Philippines. Since its passage, the FIA has been further liberalized, makingthe entry of foreign investments into the country less cumbersome.
Under the FIA foreign companies are generally allowed to conduct business in the Philippinessubject to restrictions spelled out in the Foreign Investment Negative List (FINL). The FINL is a listof areas of economic activities where foreign investments are restricted or limited.
THIRD REGULAR FOREIGN INVESTMENTS NEGATIVE LIST[Executive Order No. 11 dated August 11, 1998]
LIST A: FOREIGN OWNERSHIP IS LIMITEDBY MANDATE OF THE CONSTITUTION AND SPECIFIC LAWS
No Foreign Equity
1. Mass Media except recording [Article XVI, Section 11 of the Constitution; PresidentialMemorandum Order dated 04 May 1994].
2. Services involving the practice of licensed professions save in cases prescribed by law.
a. Engineeringi. Aeronautical Engineeringii. Agricultural Engineeringiii. Chemical Engineeringiv. Civil Engineeringv. Electrical Engineeringvi. Electronics and Communication Engineeringvii. Geodetic Engineeringviii. Mechanical Engineeringix. Metallurgical Engineeringx. Mining Engineeringxi. Naval Architecture and Marine Engineeringxii. Sanitary Engineering
b. Medical and Allied Professionsi. Medicineii. Medical Technologyiii. Dentistryiv. Midwiferyv. Nursingvi. Nutrition and Dietetics
04 Market Study Philippines Page 16
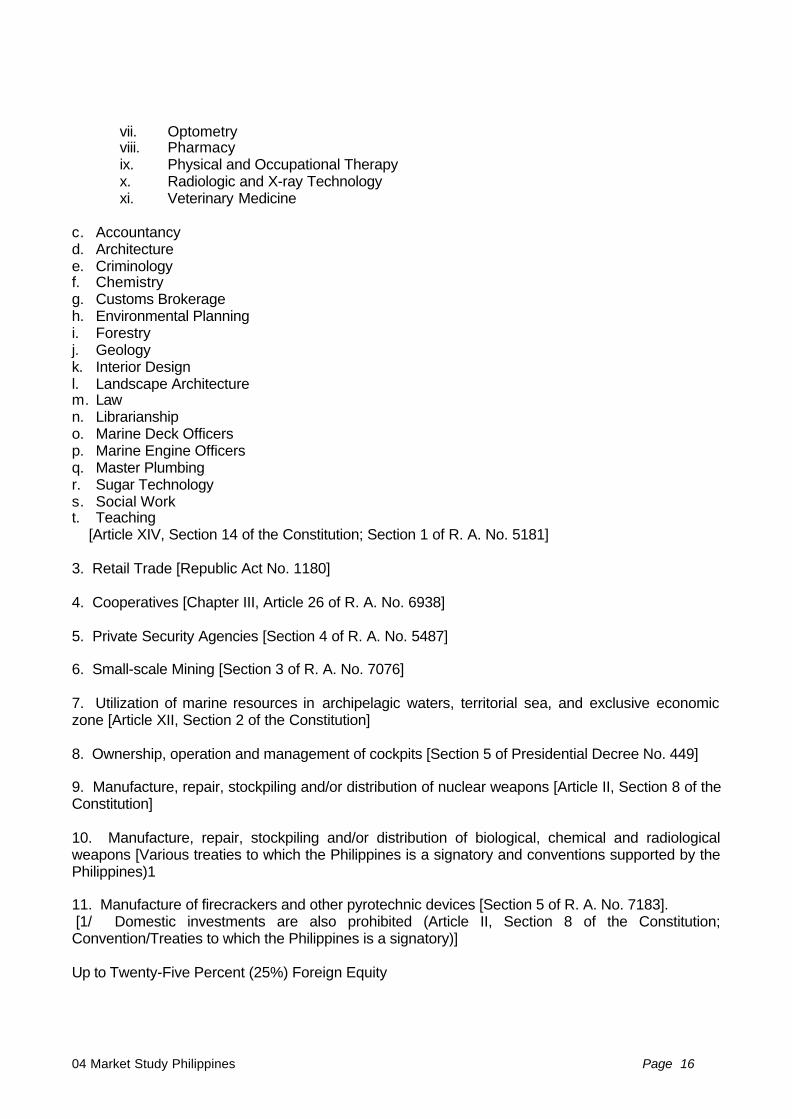
vii. Optometryviii. Pharmacyix. Physical and Occupational Therapyx. Radiologic and X-ray Technologyxi. Veterinary Medicine
c. Accountancyd. Architecturee. Criminologyf. Chemistryg. Customs Brokerageh. Environmental Planningi. Forestryj. Geologyk. Interior Designl. Landscape Architecturem. Lawn. Librarianshipo. Marine Deck Officersp. Marine Engine Officersq. Master Plumbingr. Sugar Technologys. Social Workt. Teaching [Article XIV, Section 14 of the Constitution; Section 1 of R. A. No. 5181]
3. Retail Trade [Republic Act No. 1180]
4. Cooperatives [Chapter III, Article 26 of R. A. No. 6938]
5. Private Security Agencies [Section 4 of R. A. No. 5487]
6. Small-scale Mining [Section 3 of R. A. No. 7076]
7. Utilization of marine resources in archipelagic waters, territorial sea, and exclusive economiczone [Article XII, Section 2 of the Constitution]
8. Ownership, operation and management of cockpits [Section 5 of Presidential Decree No. 449]
9. Manufacture, repair, stockpiling and/or distribution of nuclear weapons [Article II, Section 8 of theConstitution]
10. Manufacture, repair, stockpiling and/or distribution of biological, chemical and radiologicalweapons [Various treaties to which the Philippines is a signatory and conventions supported by thePhilippines)1
11. Manufacture of firecrackers and other pyrotechnic devices [Section 5 of R. A. No. 7183]. [1/ Domestic investments are also prohibited (Article II, Section 8 of the Constitution;Convention/Treaties to which the Philippines is a signatory)]
Up to Twenty-Five Percent (25%) Foreign Equity
04 Market Study Philippines Page 17
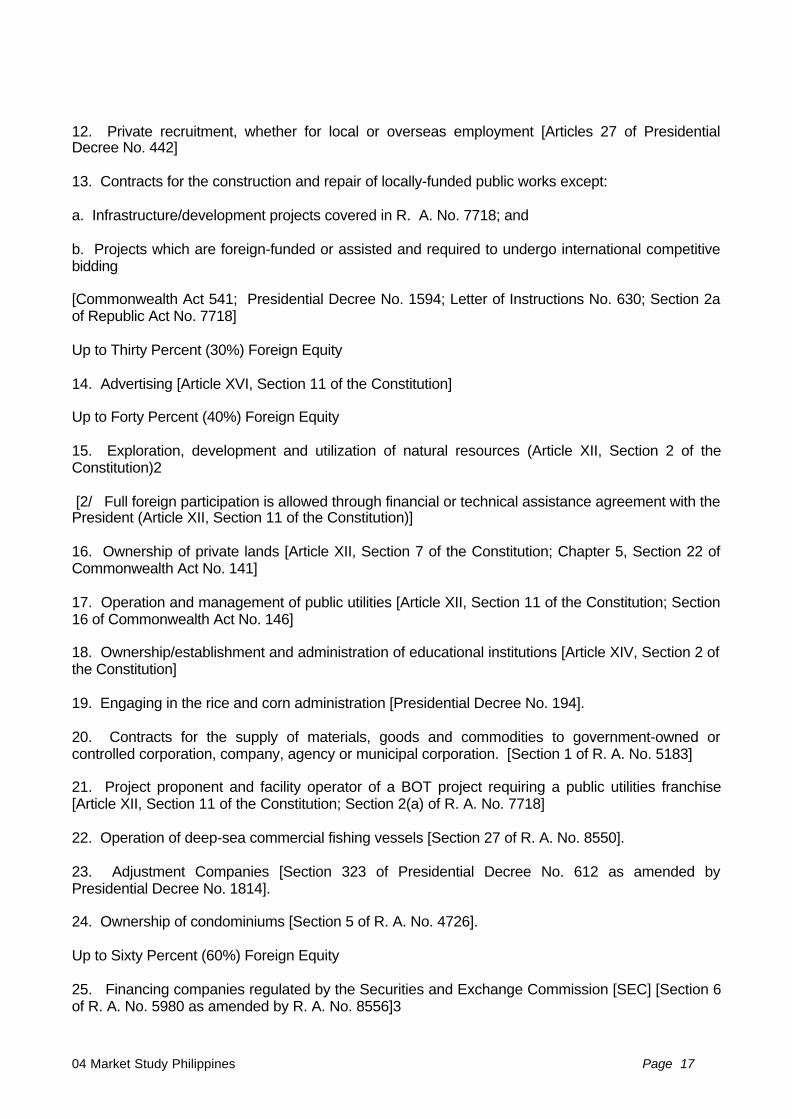
12. Private recruitment, whether for local or overseas employment [Articles 27 of PresidentialDecree No. 442]
13. Contracts for the construction and repair of locally-funded public works except:
a. Infrastructure/development projects covered in R. A. No. 7718; and
b. Projects which are foreign-funded or assisted and required to undergo international competitivebidding
[Commonwealth Act 541; Presidential Decree No. 1594; Letter of Instructions No. 630; Section 2aof Republic Act No. 7718]
Up to Thirty Percent (30%) Foreign Equity
14. Advertising [Article XVI, Section 11 of the Constitution]
Up to Forty Percent (40%) Foreign Equity
15. Exploration, development and utilization of natural resources (Article XII, Section 2 of theConstitution)2
[2/ Full foreign participation is allowed through financial or technical assistance agreement with thePresident (Article XII, Section 11 of the Constitution)]
16. Ownership of private lands [Article XII, Section 7 of the Constitution; Chapter 5, Section 22 ofCommonwealth Act No. 141]
17. Operation and management of public utilities [Article XII, Section 11 of the Constitution; Section16 of Commonwealth Act No. 146]
18. Ownership/establishment and administration of educational institutions [Article XIV, Section 2 ofthe Constitution]
19. Engaging in the rice and corn administration [Presidential Decree No. 194].
20. Contracts for the supply of materials, goods and commodities to government-owned orcontrolled corporation, company, agency or municipal corporation. [Section 1 of R. A. No. 5183]
21. Project proponent and facility operator of a BOT project requiring a public utilities franchise[Article XII, Section 11 of the Constitution; Section 2(a) of R. A. No. 7718]
22. Operation of deep-sea commercial fishing vessels [Section 27 of R. A. No. 8550].
23. Adjustment Companies [Section 323 of Presidential Decree No. 612 as amended byPresidential Decree No. 1814].
24. Ownership of condominiums [Section 5 of R. A. No. 4726].
Up to Sixty Percent (60%) Foreign Equity
25. Financing companies regulated by the Securities and Exchange Commission [SEC] [Section 6of R. A. No. 5980 as amended by R. A. No. 8556]3
04 Market Study Philippines Page 18
[3/ No foreign national may be allowed to own stock in financing companies or investment housesunless the country of which he is a national accords the samereciprocal rights to Filipinos [Section 6 of R. A. No. 5980 as amended by R. A. No. 8556;Presidential Decree No. 129 as amended by R. A. No. 8366].
26. Investment houses regulated by the SEC [ Presidential Decree No. 129 as amended by R. A.No. 8366].
THIRD REGULAR FOREIGN INVESTMENTS NEGATIVE LIST[Executive Order No. 11 dated August 11, 1998]
LIST B:FOREIGN OWNERSHIP IS LIMITED FOR REASONS OF SECURITY, DEFENSE, RISK TOHEALTH AND MORALS AND PROTECTION OF SMALL AND MEDIUM-SCALE ENTERPRISES
Up to Forty Percent (40%) Foreign Equity
1. Manufacture, repair, storage, and/or distribution of products and ingredients used in themanufacture thereof requiring Philippine National Police [PNP] clearance:
a. Firearms [handguns to shotguns], parts of firearms and ammunition therefor, instruments orimplements used or intended to be used in the manufacture of firearmsb. Gunpowderc. Dynamited. Blasting suppliese. Ingredients used in making explosives:i. Chlorate of potassium and sodiumii. Nitrates of ammonium 4vxc & barium, copper [11], lead [11] calcium and cupriteiii. Nitric acidiv. Nitrocellulosev. Perchlorates of ammonium, potassium and sodiumvi. Dinitrocellulosevii. Glycerolviii. Amorphous Phosphorusix. Hydrogen Peroxidex. Strontium Nitrate Powderxi. Toluene
f. Telescopic sights, sniperscope and other similar devices [Republic Act No. 7042, as amended byR. A. No. 8179].]
2. Manufacture, repair, storage and/or distribution of products requiring Department of NationalDefense [DND] clearance:
a. Guns and ammunition for warfareb. Military ordnance and parts thereof [e.g., torpedoes, mines, depthchargers, bombs, grenades,missiles]c. Gunnery, bombing and fire control systems and componentsd. Guided missiles/missile systems and componentse. Tactical aircraft (fixed and rotary-winged), components and parts thereoff. Space vehicles and component systemsg. Combat vessels (air, land and naval) and auxiliaries
04 Market Study Philippines Page 19
h. Weapons repair and maintenance equipmenti. Military communications equipmentj. Night vision equipmentk. Stimulated coherent radiation devices, components and accessoriesl. Armament training devicesm. Others as may be determined by the Secretary of the Department of National Defense [R. A.No. 7042, as amended by R. A. No. 8179]
3. Manufacture and distribution of dangerous drugs [R. A. No. 7042, as amended by R. A. No.8179]
4. Sauna and steam bathhouses, massage clinics and other like activities regulated by law becauseof risks they may impose to public health and morals [R. A. No. 7042, as amended by R. A. No.8179]
5. Other forms of gambling, e.g., race track operation [R. A. No. 7042, as amended by R. A. No.8179]
6. Domestic market enterprises with paid-in equity capital of less than the equivalent ofUS$200,000.00 [R. A. No. 7042, asamended by R. A. No. 8179]
7. Domestic market enterprises which involve advanced technology or employ at least fifty (50)direct employees withpaid-in equity capital of less than the equivalent of US$100,000 [R. A. No. 7042, as amended by R.A. No. 8179].
2.2.2 Investment Priorities Plan (IPP)
More commonly known as the BOI law, the Omnibus Investment Code of 1987 governs the grant ofincentives by the BOI to the priority investment activities. In general, only Filipino proponents areallowed to register with the BOI. However, foreign proponents may also be registered if theirprojects are considered pioneer or they will export at least 70% of total production. Those who wishto avail of incentives must invest in areas prescribed in the annual Investment Priorities Plan (IPP)formulated by the BOI and approved by the President of the Philippines. These preferred areas areclassified as whether non-pioneer or pioneer. A preferred pioneer area is one that is important tonational economic development.
The BOI grants fiscal and non-fiscal incentives:
Fiscal Incentives
a. Income tax holiday of six years for pioneer projects.b. Additional deduction for labor expensesc. Tax credit for taxes and duties on raw materials for export productsd. Access to bonded manufacturing/trading warehouse systeme. Exemption from taxes and duties on imported supplies and spare parts for consigned equipmentf. Exemption from wharfage dues and any export tax, duty impost, and fee.
04 Market Study Philippines Page 20
Non Fiscal Incentives
a. Simplification of customs proceduresb. Unrestricted use of consigned equipmentc. Employment of foreign nationals.
2.3 Industrial Activities
Agriculture remains a significant component of the economy despite its slow decline in share -relative to the country's domestic output - since the middle of the 1970's. In mid-1980s, the servicessector emerged as the major contributor to national output, assuming dominance over the previousyears' leader, the industry sector. By the end of 1997, the major contributors to the nationaleconomy were the services sector with a 42% share, followed by industry's manufacturing subsectorand agriculture at 24% and 20% respectively.
In recent years the industry and services sectors received further boosts from brisk constructionactivities due to the real estate boom; deregulation in banking, telecommunications, airlines,shipping, and port operations; opening of the power industry; and the implementation of vitalinfrastructure project through the innovative Build-Operate-Transfer (BOT) Law. The country'sprogression toward a true market economy was further facilitated by reduction of tariffs and abolitionof quantitative restrictions to imports, and government efforts to privatize core services such as theMetropolitan Waterworks and Sewerage System (MWSS).
2.3.1 Philippine Environmental Laws
When an investment involves a proposed project or undertaking which may affect the quality of theenvironment, the project proponent is subject to the implementing rules and regulations ofPresidential Decree (PD) No. 1586, otherwise known as the Philippine Environmental ImpactStatement (EIS) System. PD No. 1586 requires a project proponent to conduct an environmentalImpact Assessment (EIA) to ensure that all possible environmental effects of the projects areaddressed, in line with the country's overall goal of sustainable development.
The EIA process results in the preparation of an Environmental Impact System (EIS) or an InitialEnvironmental Examination (IEE), depending on the location and nature of the project. The finalreport is submitted to the Department of Environment and Natural Resources (DENR), together withother required documents such as clearances from other agencies and endorsements of the projectfrom local government officials. After its review, the DENR decides on the issuance or denial of anEnvironmental Compliance Certificate (ECC), without which the project cannot be implementedlegally (eg. the proposed project site cannot be altered in any way). The ECC typically includes anumber of condition which the proponent must follow during the construction and operationalphases of the project. The ECC identifies all other applicable environmental laws, or guidelineswhich the proponent must comply with to ensure the continuos implementation of the project. If anECC is denied, it does not prohibit the proponent from submitting a new EIS, corresponding to anew site or changes in the facilitates' design and operation.
The following areas and types of projects are considered environmentally critical and within thescope of the Environmental Impact Statement System under Proclamation No. 2146.
A. Environmentally Critical Projects
I. Heavy Industries

04 Market Study Philippines Page 21
a. Non-ferrous metal industries
b. Iron and steel mills
c. Petroleum and petro-chemical industries including oil and gas
d. Smelting plants
II. Resource Extractive Industries
a. Major mining and quarrying projects
b. Forestry projects
1. Logging
2. Major wood processing projects
3. Introduction of fauna (exotic-animals) in public/private forests
4. Forest occupancy
5.Extraction of mangrove products
6. Grazing
c. Fishery Projects
1. Dikes for fishpond development projects
III. Infrastructure Projects
a. Major dams
b. Major power plants (fossil-fueled, nuclear fueled, hydroelectric or geothermal)
c. Major reclamation projects
d. Major roads and bridges.
B. Environmentally Critical Areas
1. All areas declared by law as national parks, watershed reserves, wildlife preserves andsanctuaries;
2. Areas set aside as aesthetic potential tourist spots;
3. Areas which constitute the habitat for any endangered or threatened species of indigenousPhilippine Wildlife (flora and fauna);
4. Areas of unique historic, archaeological , or scientific interests;
5. Areas which are traditionally occupied by cultural communities or tribes;

04 Market Study Philippines Page 22
6. Areas frequently visited and/or hard-hit by natural calamities geologic hazards, floods, typhoons,volcanic activity, etc.
7. Areas with critical slopes;
8. Areas classified as prime agricultural lands;
9. Recharged areas of aquifers;
10. Water bodies characterized by one or any combination of the following conditions;;
a. tapped for domestic purposes;;
b. within the controlled and/or protected areas declared by appropriate authorities;
c. which support wildlife and fishery activities.
11. Mangrove areas characterized by one or any combination or the following conditions:
a. with primary pristine and dense young growth;
b. adjoining mouth of major river systems;
c. near or adjacent to traditional productive fry or fishing grounds;
d. which act as natural buffers against shore erosion, strong winds and storm floods;
e. on which people are dependent for their livelihood.
12. Coral reef characterized by one or any combination of the following conditions:
a. with 50% and above live coralline cover;
b. Spawning and nursery grounds for fish;
c. Which act as natural breakwater of coastlines.
This Proclamation shall take effect immediately.
2.4 Customs Regulations
2.4.1 Import Duties & Taxes
Customs duties are levied on the dutiable value of the merchandise, by using the HomeConsumption Value Method. Antidumping policy is also imposed when applicable.
There is a tariff reduction program for 1996 till 2000 that will fix rates at two different levels: 10%for intermediary and finished products and 3% for the rest.
After the year 2000 this may again change to one general tariff rate which is fixed at 5%
04 Market Study Philippines Page 23
2.4.2 Import Documents
Several documents have to be presented to the Bureau of Customs:
- Declaration of import entry- Commercial invoice- Certificate of origin- Bill of lading- Letter of credit or bank guarantee or warehousing bond- Inward cargo manifest- SGS Clean Report of Findings (CRF)
2.4.3 Pre-shipment inspection by SGS
The Philippine importer will have to apply, through the Central Bank, for an Import AdvancedNumber (IAN) from SGS for pre-shipment inspection of goods (quality & quantity) andprincipally to avoid understatement of declared values. The Philippine government appointedSGS as the obligatory inspectorate enterprise to carry out pre-shipment inspections at origin forany shipment with declared value higher than US$ 500. The current SGS contract will expire inMarch 1998.
2.4.4. Basic Export Guidelines
Active exports and investment oriented policies coupled with imports and currencyliberalization, privatization and deregulation, are the basic economic policies adopted by thePhilippine Government to ensure a stable economic growth.
The government is implementing several strategies, through the National Economic andDevelopment Authority, Board of Investments, Bangko Sentral ng Pilipinas and the Departmentof Trade & Industry, to promote foreign investments, reduce barriers to trade, as well asencourage rural development, regional dispersal of industries, agrarian reform and debtmanagement.
Basic export documentation needed is an accomplished Export Declaration form which is to besubmitted to the Bureau of Customs for approval of the Authority to Load. Unless required bythe buyer, one need not secure an export commodity clearance.
2.4.5. Terms of Payment
The letter of credit (L/C) is actually the most commonly used mode of payment. Its confirmationis upon seller’s decision.
A Philippine importer using the L/C as mode of payment will have to request his foreign seller tosubmit their Proforma invoice on CIF/CNF port/airport position.
Payment for exports are normally made through banks. The foreign buyer's interest in thePhilippines is represented by a local authorized agent bank (AAB) which is designated by theforeign buyer's bank. The local (AAB) will assist the exporter in negotiating the collection of thepayments for exports made.

04 Market Study Philippines Page 24
Exporters may be paid through banks by means of LC's, document against payment (D/P),document against acceptance (D/A), open account (O/A), cash against documents (CAD),prepayment/export advance, intercompany open account, offset arrangement, consignment ortelegraphic transfer.
2.5 Distribution Channels
As early as the 13th century, Filipinos were already relegated to the sidelines in retail trade. With theFilipinos' inherently weak position in business and the consensus that alien control of Philippineretail trade was so entrenched it could no longer revert back to Filipino control, Governmentresorted to legislative measures to bar foreigners from entering the sector.
Thus, the Retail Trade Nationalization Law embodied in RA No. 1180 was enacted in 1954, makingretail trade the first commercial activity to be nationalized because of its economic importance.
R.A. 1180 - An Act to Regulate the Retail Business: This provides that no license will be issued toany person who is not a citizen of the Philippines and to any association, partnership or corporationnot wholly owned by citizens of the Philippines, to actually engage in the retail business, or toestablish, or open additional stores or branches for retail business.
Now, with the trend towards global trade liberalization, the Government plans to open up the retailtrade sector to foreign investments.
04 Market Study Philippines Page 25
3 State of the Industry
3.1 Tanning Industry
3.1.1 Raw Material Supply and Trade
There is a lack of traditional available material, such as the cow hide due to the inexistence of astructured cattle farming industry, no organized system in slaughtering of animals, decreasinglivestock of cattle and the high import tariff imposed on imported raw hides and chemicals.
A more organized type of livestock raising for the meat processing industry to serve thesupermarkets is emerging. There is only one organized cattle raising farm, Monterey Farms, whichslaughters and produces 35 raw hides a day. An efficient drum dyeing technique needs a minimumof 200 skins.
In the Philippines, neither the farmer nor the slaughterer gives hides and skins more than cursoryimportance. Livestock are subject to skin attack and to damage by thorns, barbed wire, the horn ofother animals, and by branding, most often in the most valuable parts of the hide. There are threemalpractices which were observed in slaughter houses: (i.) practice of pouching to collect blood for“dinuguan”; (ii.) removal of a big portion of the tail for “kare-kare”; and lastly, (iii) removal of adheringmeat and fat from the flesh side of a fresh hide. These practices should be minimized if notcompletely eliminated because these result in the downgrading of hides and skins. Improper flayingis one of the major problems faced by the local leather industry. Tanners complain about flay cuts,gouges and marks.
The commonly used hides and skins for leather production in the Philippines include mainly cattle,carabao and goats. The hides and skins are grouped according to several classes. For first class(A) hides, the Tanners Association of the Philippines (TAP) claims that the types in demand areCrazy Horse, Nubuck, Pull-up, Pull-Side, and Side at Nappa. For second class (B) hides, thepopular ones are Side Softy and Softy.
Cow/calf hides and goat/kid skins are the most important raw materials in leather production, thedomestic supply of which is highly dependent on the livestock industry of the country. The Philippinelivestock industry, however, is not that developed and is need of great assistance. Furthermore, thecurrent livestock industry is primarily catering to the food sector rather than the leather tanningindustry. Thus, local hides and skins are not usually properly cut for the tanning industry.
Aside from the limited supply of hides and skins due to the lack of commercial livestock farms, localhides and skins are not of good quality. This is due to several factors: (i) poor caring of animalsresulting in skin damages; and (ii) improper flaying of cowhides in slaughterhouses. The leatherindustry also competes with the food industry considering that hides and skins are also used by the“chicharon” food industry.
The estimated production volume of livestock is shown in the table below. The TAP and the AnimalProducts Development Centre (APDC) estimate hides at least 10-15% of gross livestock weight.
04 Market Study Philippines Page 26
Total Production(in metric tons, liveweight)
Type Carabao Swine Cattle Goat1996 99,240 1,296,470 232,340 70,1601997 106,140 1,370,780 251,470 70,8601998 113,050 1,406,592 260,610 71,950
Source: National Meat Inspection Commission
To augment the domestic supply of leather, tanners import rawhides and skins from Australia, USA,Brazil, Bangladesh and Taiwan. From Europe, kangaroo hide was imported from Denmark whileswine hides & skins were imported from Belgium, Denmark, France, and the Netherlands in 1997.The imports of rawhides and skins are relatively small and have been declining by about 15%annually from 1992-1994.
In addition to rawhides and skins, wet blues are also imported from India, Pakistan, USA, Canada,Australia, Brazil, Paraguay, Argentina and Uruguay.
Philippine Imports of Hides, Skins and Furskins, raw(In US dollars, FOB)
Code Commodity 1996 1997 199821 Hides, Skins, & Furskins, raw 897,357 1,541,113 2,323,497211 Hides and skins, excl. furskins 894,992 1,526,134 2,323,4972119911 Swine (incl. peccary) hides and skins, raw 677,456 1,444,714 2,162,875212 Furskins, raw, other than hides & skins 2,365 14,999 0Source: NSO, Foreign Trade Statistics
Philippine Imports of Hides, Skins and Furskins, raw(Gross weight in kg.)
Code Commodity 1996 1997 199821 Hides, Skins, & Furskins, raw 1,774,918 2,327,048 2,276,529211 Hides, skins, except furskins 1,774,662 2,309,494 2,276,5292119911 Swine (incl. peccary) hides and skins, raw 1544134 2,236,447 1,927,385212 Furskins, raw, other than hides & skins 256 17,554 0Source: NSO, Foreign Trade Statistics
In 1996, swine hides and skins were imported from Australia, Belgium, Canada, Taiwan, Denmark,Hong Kong, Japan and the Netherlands. In 1997, PROC (China), France, India, and Korea wereadded to the list of import sources. (NSO. Foreign Trade Statistics)

04 Market Study Philippines Page 27
Import of Swine (incl. peccary) Hides and Skins, Raw (PSC 2119911)by source
Volume in net kg. Value in US$ FOBCountry 1996 1997 1998 1996 1997 1998
Korea, Rep of 0 231.000 1.414.802 0 67.130 395.638Belgium 25.378 399.125 193.637 18.725 279.454 100.133Taiwan 1.140.689 407.463 68.866 445.806 158.264 41.155France 0 48.000 72.494 25.828 39.124Sweden 0 0 46.186 0 31.497Singapore 0 0 41.905 0 14.080Japan 12.318 202.096 36.609 2.990 213.546 11.598China, PRO 79.652 28.878 149.893 10.946Canada 23.600 143.085 24.008 19.824 105.808 9.546Netherlands 50.382 301.113 0 27.447 200.319 0Denmark 228.431 263.336 0 145.450 177.451 0India 25.368 0 30.442 0Australia 15.750 40.256 0 12.776 28.215 0Hong Kong 7.298 22.381 0 4.438 8.364 0
Total 1.503.846 2.162.875 1.927.385 677.456 1.444.714 653.717
Source of basic data: NSO, Foreign Trade Statistics, Bureau of Export Trade Promotion
The use of reptile skins had also gained popularity in the past, especially for export, but these typesof skins are expensive due to limited supply and the growing environmental advocacy for theprotection of rare species of wildlife. (DTI, Oct. 1996, p.4-19)
A 1991 report found that there is a high market value for top-quality reptile and amphibian leather,despite environmentalist (Green Movement) propaganda to discredit the use of these material asfinished leather by-product for trade. The resistance is coming mostly from the traditional cattleproducing countries, who do not realize that in tropical countries like the Philippines, the abundantsupply of reptiles and amphibians can contribute to the ecological balance of fauna in the country,as well as maximize it’s use in the international trade.
According to Edwin Porciuncula of JCP Tooling Leather, Meycauayan Tanneries are faced withrising prices of the basic materials (hides). There is a shortage (June 1999) of cowhides in Luzonand prices are climbing. The average price of cowhides (as of April 1999) sourced from Luzonranged from Pesos 400 per piece to 830 per piece depending on where you source them.
04 Market Study Philippines Page 28
Cagayan: Php 450 per pieceIsabel: 450-500Nueva Ecija: 450-550Ilocos: 400 (medium size only)Baguio: 600 – 800Manila: 700Tagaytay: 600 – 650
Quezon : 400 – 500Cavite 600 – 830Laguna 700 - 800
3.1.2 Geographical Location
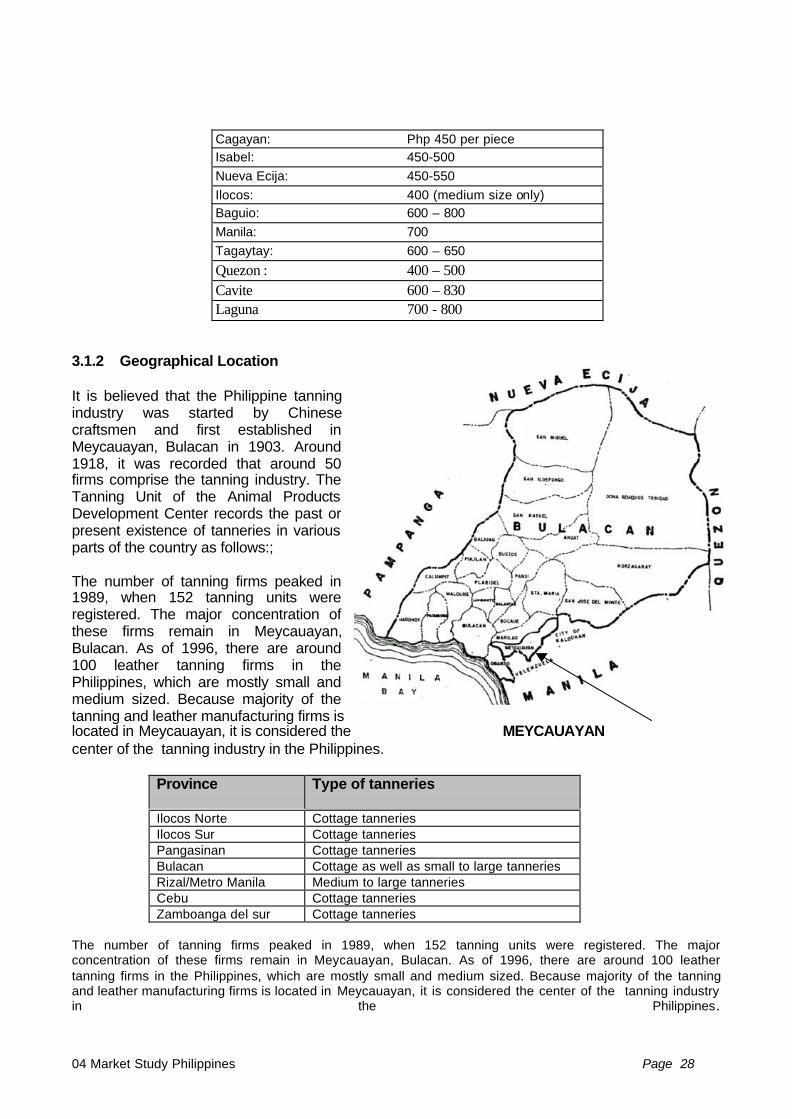
It is believed that the Philippine tanningindustry was started by Chinesecraftsmen and first established inMeycauayan, Bulacan in 1903. Around1918, it was recorded that around 50firms comprise the tanning industry. TheTanning Unit of the Animal ProductsDevelopment Center records the past orpresent existence of tanneries in variousparts of the country as follows:;
The number of tanning firms peaked in1989, when 152 tanning units wereregistered. The major concentration ofthese firms remain in Meycauayan,Bulacan. As of 1996, there are around100 leather tanning firms in thePhilippines, which are mostly small andmedium sized. Because majority of thetanning and leather manufacturing firms islocated in Meycauayan, it is considered the MEYCAUAYANcenter of the tanning industry in the Philippines.
Province Type of tanneries
Ilocos Norte Cottage tanneriesIlocos Sur Cottage tanneriesPangasinan Cottage tanneriesBulacan Cottage as well as small to large tanneriesRizal/Metro Manila Medium to large tanneriesCebu Cottage tanneriesZamboanga del sur Cottage tanneries
The number of tanning firms peaked in 1989, when 152 tanning units were registered. The majorconcentration of these firms remain in Meycauayan, Bulacan. As of 1996, there are around 100 leathertanning firms in the Philippines, which are mostly small and medium sized. Because majority of the tanningand leather manufacturing firms is located in Meycauayan, it is considered the center of the tanning industryin the Philippines.
04 Market Study Philippines Page 29
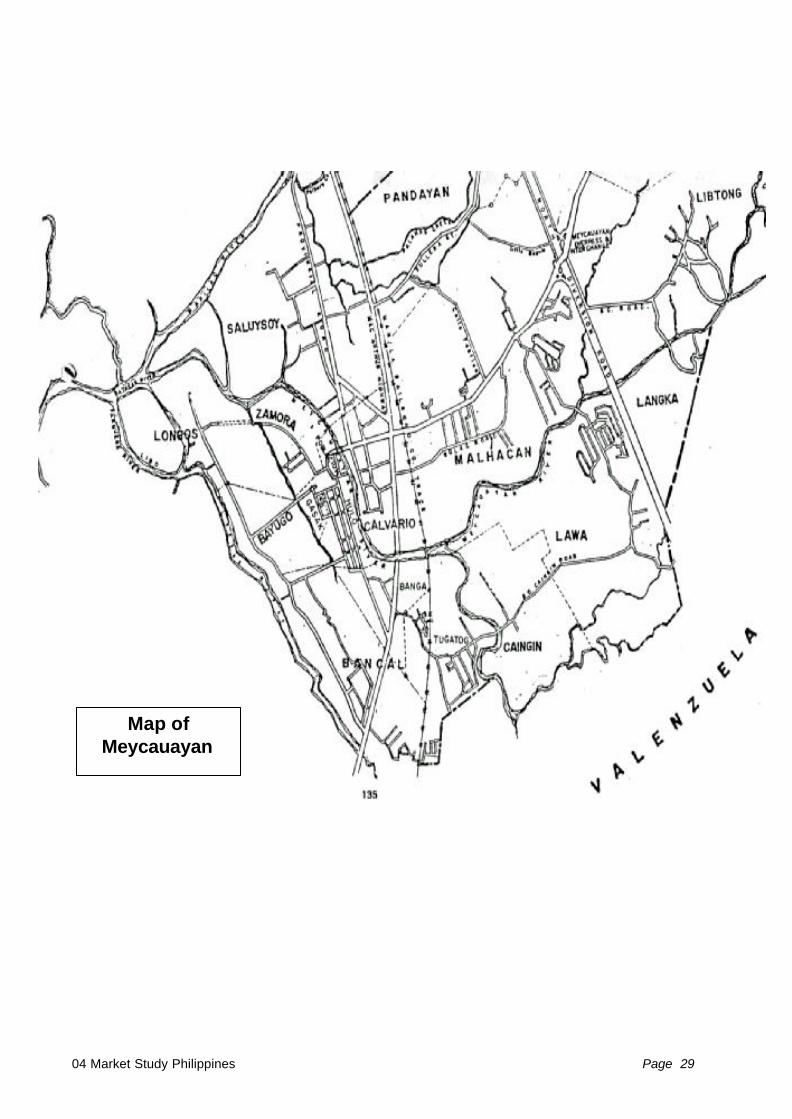
Map ofMeycauayan

04 Market Study Philippines Page 30
Number of Tanneries in Bulacan by area and size of firm, 1998(Unofficial Tally)
Area Number Small Medium LargeBancal* 11 6 2 3Banga* 4 1 2 1Caingin* 3 1 2Calvario* 1 1Camalig* 1 1
Hulo* 4 3 1Libtong* 1 1Tugatog* 35 16 17 2Marilao 1 1Guiginto 1 1Bulacan 1 1
Total 63 29 24 10Source: Willie Chua, TAP Secretary and Mr. Pempe Porciuncula, former President of MTCC, as reported bythe De La Salle University Study, 1998Notes: * based in Meycauayan, Bulacan
3.1.3 Current Situation of the Industry
The imposition of import and foreign exchange controls in the 1950s made imports very expensiveand gave the local tanning and leather manufacturing firms a good control of the domestic market.In an interview with the current TAP President, Mary Lazaro, (also owner of Conching HermosoTannery) she admits that the industry received too much protection that the domestic marketbecame a more attractive market for most tanning firms and discouraged them from exporting.Mark-ups for the local market went as high as 30% compared to about 5% in the export market,Mary Lazaro adds, that was why it made more business sense to her parents to focus on the localmarket.
However, the industry climate has changed in the mid-1990s, when the tariff duties of leather wentdown. Ms. Lazaro was badly hit by this development and made the industry aware of the need tocompete globally if they will survive even in the local market.
A 3% tariff duty on imported raw hides and skins will apply until 2003. By year 2004, the tariff ratewill be adjusted to 5%. In the case, of finished leather, a 10% tariff duty applies until year 2003. Thiswill be reduced to 5% by 2004. For tanning extracts and pigments, a 3% duty applies until 2003 anda 5% duty beginning 2004. This means that the tanners have until 2003 to re-adjust theiroperations to achieve global market standards.
There is limited assistance coming from the Philippine government to help the tanning industry intheir re-adjustment process. Assistance from the European Commission was given in the late 1980sand early 1990s to provide technical assistance to a number of tanning and leather goodscompanies as well as assist them in developing a globally competitive business. In the first phase(1988-1991), the Integrated Leather Program was managed by CITEM and the Chamber of Industryand Commerce of Offenbach am Main while the second phase was managed by CITEM and theBLC Leather Technology Centre. The EC further financed a business cooperation programmanaged by ECCP and the BLC. Local tanneries participated in these projects to adopt Europeanstandards and technology as well as find European partners to form strategic production, marketingand financial alliances.
04 Market Study Philippines Page 31
Moreover, the current leadership of the TAP is also taking a pro-active stance in making thePhilippine tanning industry a global player. Many tanneries now are being managed by young andmore dynamic second and third generation owner-managers who are more keen in keeping up withglobal technology changes and eager to modernize the management of tanneries. Industry leadersare more forward-looking and market-oriented and willing to invest in technology and manpowerdevelopment to promote efficiency and productivity. In environment related concerns, a number oftanneries have already invested up to 50 million pesos to install effluent control systems in theirplants or as a common facility.
TAP is also tapping the United Nations Industrial Development Organization (UNIDO) to co-financea common effluent treatment plant in the Tugatog area in Meycauayan. TAP is also seeking theassistance of other international agencies to address the industry’s development concerns.
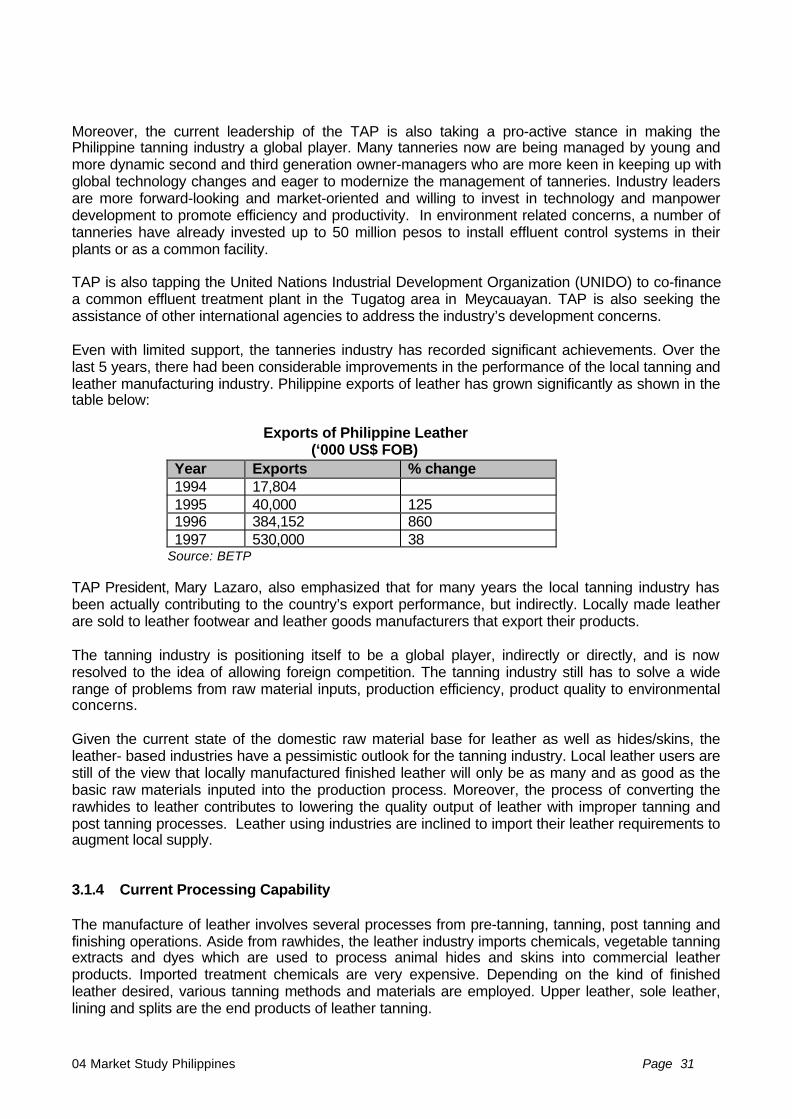
Even with limited support, the tanneries industry has recorded significant achievements. Over thelast 5 years, there had been considerable improvements in the performance of the local tanning andleather manufacturing industry. Philippine exports of leather has grown significantly as shown in thetable below:
Exports of Philippine Leather(‘000 US$ FOB)
Year Exports % change1994 17,8041995 40,000 1251996 384,152 8601997 530,000 38
Source: BETP
TAP President, Mary Lazaro, also emphasized that for many years the local tanning industry hasbeen actually contributing to the country’s export performance, but indirectly. Locally made leatherare sold to leather footwear and leather goods manufacturers that export their products.
The tanning industry is positioning itself to be a global player, indirectly or directly, and is nowresolved to the idea of allowing foreign competition. The tanning industry still has to solve a widerange of problems from raw material inputs, production efficiency, product quality to environmentalconcerns.
Given the current state of the domestic raw material base for leather as well as hides/skins, theleather- based industries have a pessimistic outlook for the tanning industry. Local leather users arestill of the view that locally manufactured finished leather will only be as many and as good as thebasic raw materials inputed into the production process. Moreover, the process of converting therawhides to leather contributes to lowering the quality output of leather with improper tanning andpost tanning processes. Leather using industries are inclined to import their leather requirements toaugment local supply.
3.1.4 Current Processing Capability
The manufacture of leather involves several processes from pre-tanning, tanning, post tanning andfinishing operations. Aside from rawhides, the leather industry imports chemicals, vegetable tanningextracts and dyes which are used to process animal hides and skins into commercial leatherproducts. Imported treatment chemicals are very expensive. Depending on the kind of finishedleather desired, various tanning methods and materials are employed. Upper leather, sole leather,lining and splits are the end products of leather tanning.
04 Market Study Philippines Page 32
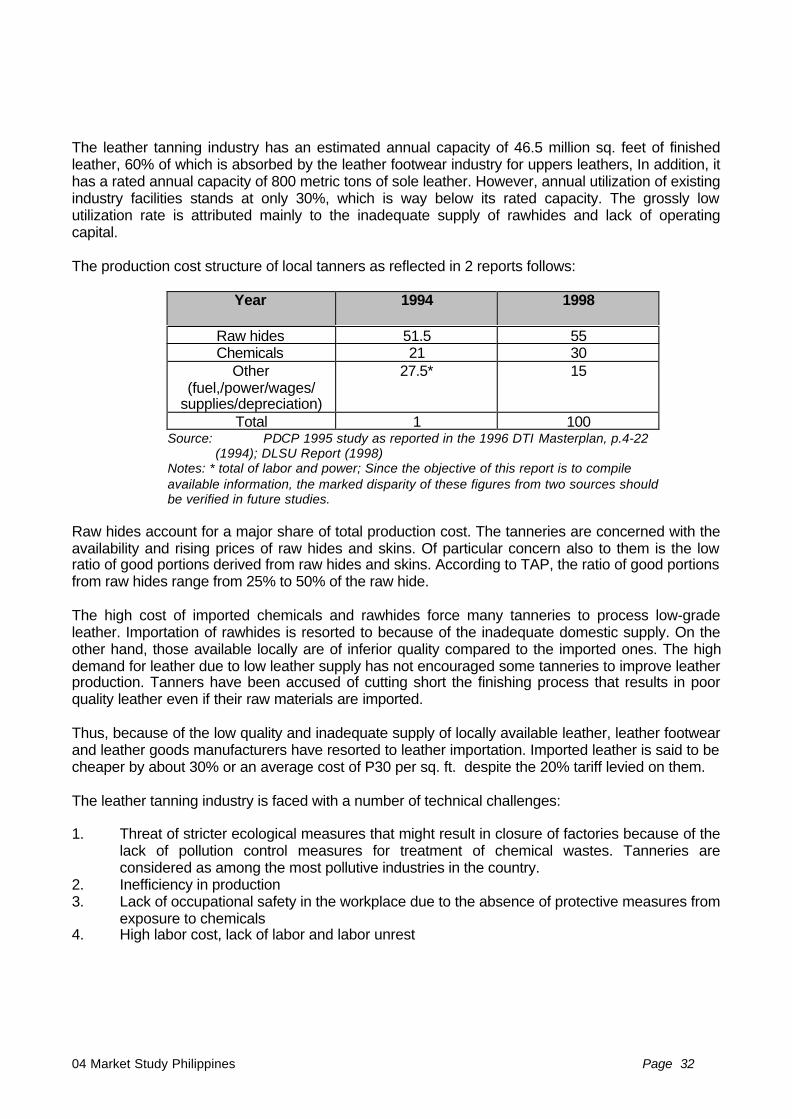
The leather tanning industry has an estimated annual capacity of 46.5 million sq. feet of finishedleather, 60% of which is absorbed by the leather footwear industry for uppers leathers, In addition, ithas a rated annual capacity of 800 metric tons of sole leather. However, annual utilization of existingindustry facilities stands at only 30%, which is way below its rated capacity. The grossly lowutilization rate is attributed mainly to the inadequate supply of rawhides and lack of operatingcapital.
The production cost structure of local tanners as reflected in 2 reports follows:
Year 1994 1998
Raw hides 51.5 55Chemicals 21 30
Other(fuel,/power/wages/
supplies/depreciation)
27.5* 15
Total 1 100Source: PDCP 1995 study as reported in the 1996 DTI Masterplan, p.4-22
(1994); DLSU Report (1998)Notes: * total of labor and power; Since the objective of this report is to compileavailable information, the marked disparity of these figures from two sources shouldbe verified in future studies.
Raw hides account for a major share of total production cost. The tanneries are concerned with theavailability and rising prices of raw hides and skins. Of particular concern also to them is the lowratio of good portions derived from raw hides and skins. According to TAP, the ratio of good portionsfrom raw hides range from 25% to 50% of the raw hide.
The high cost of imported chemicals and rawhides force many tanneries to process low-gradeleather. Importation of rawhides is resorted to because of the inadequate domestic supply. On theother hand, those available locally are of inferior quality compared to the imported ones. The highdemand for leather due to low leather supply has not encouraged some tanneries to improve leatherproduction. Tanners have been accused of cutting short the finishing process that results in poorquality leather even if their raw materials are imported.
Thus, because of the low quality and inadequate supply of locally available leather, leather footwearand leather goods manufacturers have resorted to leather importation. Imported leather is said to becheaper by about 30% or an average cost of P30 per sq. ft. despite the 20% tariff levied on them.
The leather tanning industry is faced with a number of technical challenges:
1. Threat of stricter ecological measures that might result in closure of factories because of thelack of pollution control measures for treatment of chemical wastes. Tanneries areconsidered as among the most pollutive industries in the country.
2. Inefficiency in production3. Lack of occupational safety in the workplace due to the absence of protective measures from
exposure to chemicals4. High labor cost, lack of labor and labor unrest
04 Market Study Philippines Page 33
The local tanning industry lacks technical knowledge in the use and availability of chemicals whichcan be used in the different stages of production. There is also a lack of proper management andscientific knowledge skills in production techniques, cost calculation, quality control systems whichdeter the industry’s competitiveness in the market.
In general, machineries are outmoded specifically in the area of tanning, re-tanning and finishingtechniques. The industry is also dependent on imported chemical treatments with a high import tariff(50% import duty) imposed by the government, which translates to the industry’s uncompetitivenessin the local & export market.
Tanneries, especially the smaller ones, have poor or no proper environmental protectionmechanism within the individual units, specifically the waste water treatment which preventspollution of river beds.
In the case of reptile and amphibian leather, there is a lack of sufficient technical knowledge in theproper use of chemicals in tanning and finishing techniques of such leather. There is alsoinsufficient knowledge on the general application of the Washington Convention (CITES) ininternational trade. Technical know-how in the propagation, preservation and collection of reptileand amphibians grown in the wild does not exist, due to improper farming techniques. An estimated50% of snakeskins caught by fishermen together with their regular catch of fish are killed, thrownback into the water.
3.1.5 Profile of Major Companies
There are at least 10 tanneries, classified as large, with highly mechanized operations and usingsuperior chemicals in treating leather are based in Meycauayan, Bulacan, and family-owned. Assuch, Meycauayan is acknowledged as the center of the Philippine tanning industry.
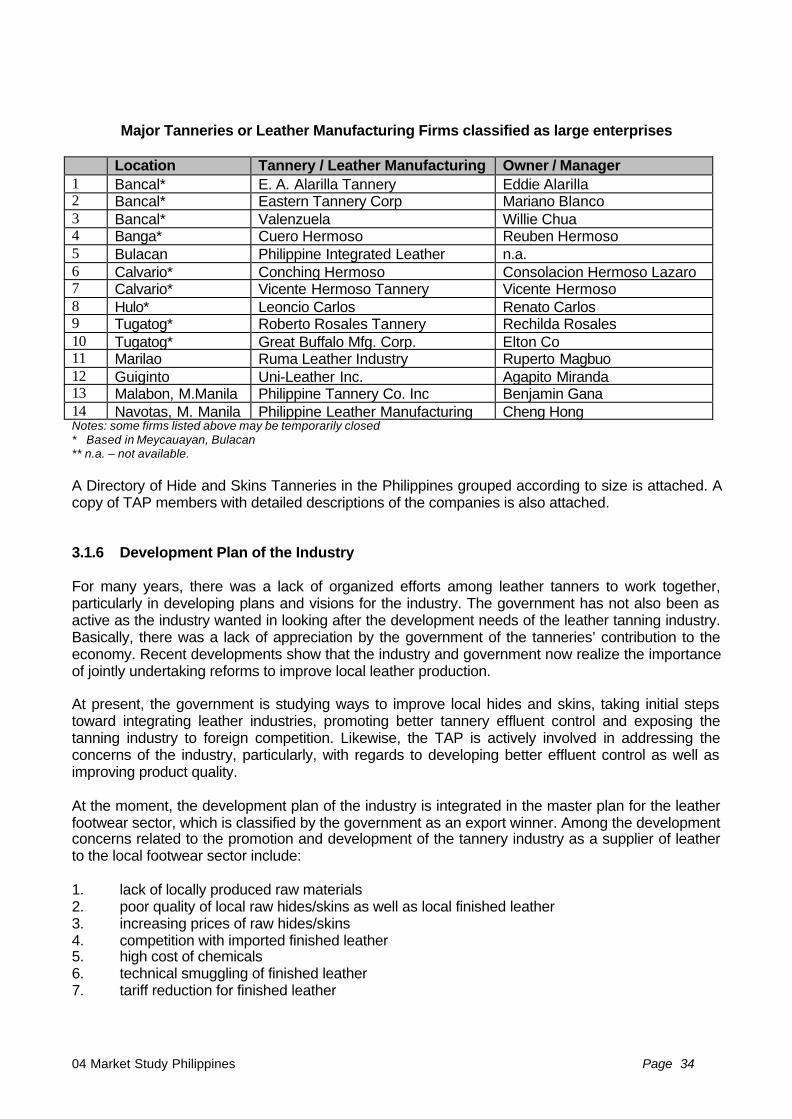
04 Market Study Philippines Page 34
Major Tanneries or Leather Manufacturing Firms classified as large enterprises
Location Tannery / Leather Manufacturing Owner / Manager1 Bancal* E. A. Alarilla Tannery Eddie Alarilla2 Bancal* Eastern Tannery Corp Mariano Blanco3 Bancal* Valenzuela Willie Chua4 Banga* Cuero Hermoso Reuben Hermoso5 Bulacan Philippine Integrated Leather n.a.6 Calvario* Conching Hermoso Consolacion Hermoso Lazaro7 Calvario* Vicente Hermoso Tannery Vicente Hermoso8 Hulo* Leoncio Carlos Renato Carlos9 Tugatog* Roberto Rosales Tannery Rechilda Rosales10 Tugatog* Great Buffalo Mfg. Corp. Elton Co11 Marilao Ruma Leather Industry Ruperto Magbuo12 Guiginto Uni-Leather Inc. Agapito Miranda13 Malabon, M.Manila Philippine Tannery Co. Inc Benjamin Gana14 Navotas, M. Manila Philippine Leather Manufacturing Cheng HongNotes: some firms listed above may be temporarily closed* Based in Meycauayan, Bulacan** n.a. – not available.
A Directory of Hide and Skins Tanneries in the Philippines grouped according to size is attached. Acopy of TAP members with detailed descriptions of the companies is also attached.
3.1.6 Development Plan of the Industry
For many years, there was a lack of organized efforts among leather tanners to work together,particularly in developing plans and visions for the industry. The government has not also been asactive as the industry wanted in looking after the development needs of the leather tanning industry.Basically, there was a lack of appreciation by the government of the tanneries’ contribution to theeconomy. Recent developments show that the industry and government now realize the importanceof jointly undertaking reforms to improve local leather production.
At present, the government is studying ways to improve local hides and skins, taking initial stepstoward integrating leather industries, promoting better tannery effluent control and exposing thetanning industry to foreign competition. Likewise, the TAP is actively involved in addressing theconcerns of the industry, particularly, with regards to developing better effluent control as well asimproving product quality.
At the moment, the development plan of the industry is integrated in the master plan for the leatherfootwear sector, which is classified by the government as an export winner. Among the developmentconcerns related to the promotion and development of the tannery industry as a supplier of leatherto the local footwear sector include:
1. lack of locally produced raw materials2. poor quality of local raw hides/skins as well as local finished leather3. increasing prices of raw hides/skins4. competition with imported finished leather5. high cost of chemicals6. technical smuggling of finished leather7. tariff reduction for finished leather
04 Market Study Philippines Page 35
As a matter of strategy, certain activities and programs are being discussed, considered as well asfor some, gradually implemented.
3.1.6.1 Hides and Skins Improvement Program
The main concern of the tanning industry is the shortage and poor quality of local hides and skins.The APDC, NMIC and TAP are working jointly in developing and gradually implementing a Hidesand Skins Improvement Program.
The Bureau of Animal Industry through the Animal Products Development Center (APDC) iscredited for its ongoing efforts to develop a program to improve hides and skins. Following a surveyconducted in 1999, APDC proposed a Hides and Skins Improvement Program which will bespearheaded by APDC and the National Meat Inspection Commission (NMIC). The program isaimed at reducing if not eliminating defects in the preparation of hides and skins. This will be donethrough proper training (e.g. upgrading skills of butchers/hide dealers), the use of suitableequipment and tools (e.g. hoist, flaying knife and captive bolt) and installation of better storagefacilities.
A project called “Better Hides for Better Leather” seminar was launched in April 1998 with theassistance of APDC. A follow-up seminar was held in July 1999. Both seminars were gearedtowards training butchers, slaughterhouses and tanners on proper handling of hides and skins.
APDC is also working on developing and finalizing a plan to categorize hides and skins. A jointcommittee comprising representatives from the local tanners and government officials was formedto thresh out problems and introduce solutions related to raising the product standards for rawhidesand finished leather in order to command better prices in the market. At present, the committee hascome out with a draft called “Standards for Classification According to Quality” which will serve as aguide to ensure the quality of hides and leather products that are currently available on the market.Also, the group has envisioned to draft standards for flaying procedures in order to correct themistakes of slaughtering animals whose skins and hides are wasted because of wrong flayingprocedures.
3.1.6.2 Efforts to encourage closer business cooperation among local tanners
TAP under the leadership of Mary Lazaro is taking an active role in reorganizing the industry toencourage closer business cooperation among tanneries. In the past, the tanneries have enjoyedsignificant trade protection that the industry survived with their “old ways” of production andmarketing. With the entry of foreign competitors in the domestic market as a result of tradeliberalization, the tanneries realize now that to survive they have to be globally competitive. Also,they must cooperate more closely to corner big export orders and must upgrade productionoperations to improve product quality and manufacturing efficiency. They also recognized theimportance of environment friendly operations, if they can continue operating their plants.
This is exactly what the leather using industries are hoping to develop. The DTI master plan hasidentified the need to set up industry cooperators from within the support industries. Parallel to theindustry cooperators in the footwear sector, a similar core group will be organized from among thefirms in the leather tanning and components/accessories sectors. This group will initiate thelinkages and work closely with the footwear industry cooperators on the technology improvementsthat will correspond to the requirements of the shoe industry, including product standardization andother common areas of cooperation.

04 Market Study Philippines Page 36
3.1.6.3. Importation of Hides/ Skins and Finished Leather
Because of the inability of the local tanning sector to supply all the needs of the leather usingindustries, the importation of leather raw materials is a critical element of the master plan, as ashort-term strategy. The DTI study, however, notes the importance of the move to let the leathertanning association take care of bulk importation for both raw hides/skins and finished leather toenable them to sustain/expand their operation and gain experience and establish linkages with otherworld producers. This will also avoid creating conflicts between the tanning and leather usingindustries.
On the aspect of tariff reduction for finished leather, the footwear and leathergoods industry and theleather tanning industry have to work together to reconcile their position. A drastic tariff reductionwould kill the leather tanning industry because finished leather would then be levied the same tariffrates as raw hides/skins which are imported by industry for the manufacture of leather.
3.1.6.4 Production Improvements of Tanneries
Up until 1996, while several big manufacturers have invested in updated technology and equipment,locally tanned leather is still perceived as low quality. The low quality of finishing has beenparticularly emphasized by the footwear and leather goods industry. (Major improvements havetaken place since then.) Nonetheless, as the leather footwear sector constitutes the bulk of theirmarket, the leather tanners should coordinate closely with the shoe industry for their specific qualityrequirements and should anticipate changes in specifications of leather materials to conform tostandardization and product quality requirements. In fact, the shoe and tanning sectors should worktogether for establishing the product quality standards for leather footwear and leather goodsindustries.
3.1.6.5 Development of alternative raw material sources
Continuing R&D for alternative raw material sources and development is a proposed measure toensure longterm supply and sustainability of the raw materials for leather using industries.
Research will focus on alternative indigenous materials which have the potential to complementleather or serve as its substitute. Experiments will have to be conducted to test various types ofprocessing. Like wise raw material testing in terms of strength, quality and other considerationsshould be undertaken.
3.1.7 Environmental Issues
In an article by Mary Lazaro, current TAP President, notes that a major portion of the tannerywastes comes from the early part of the production process. In the manufacture of chrome tannedleather from cattle hide the initial stages of soaking results in a heavily polluted water containingmostly salt from the curing, including soluble proteins and manure.
The government is watching closely the operations of tanneries because of the high level of toxicwastewater from the tanneries that goes untreated into the river system. This is particularly true inBulacan, where the current Governor has put a high priority on the environmental management. Formany years, most tanneries have been operating with no or substandard effluent treatment. Inrecent years and under serious threat of closure by the government, companies have reactedfavorably to government calls to install effluent control systems in plants.
04 Market Study Philippines Page 37
As reported by the TAP, the tanners have invested to improve tannery effluent treatment. To date,tanners have spent some Php 50 million in improving wastewater treatment. Serious efforts byDENR to control tannery pollution have resulted in the 60% reduction of tannery effluent.
Through an EC financed project in the mid-1990s, a number of tanneries received technicalassistance in the European standard installation of pollution control systems in their plants. Othertanneries are exploring local approaches for installing pollution control systems.
A common wastewater treatment plant (WWTP) is also being planned in the Tugatog area wheremajority of the tanneries is located. TAP has requested UNIDO to fund a common wastewatertreatment plant. UNIDO has sought the advice of NEDA and the DENR. In the meantime, 6tanneries in the Kaingin-Tugatog area have pledged to support to this facility. A location for theWWTP has been chosen. This will be at the lot of G. Arthur Soriano.
TAP also reported that UNIDO financed the training of 3 tanners. The 3 beneficiaries participated ina pollution seminar in Madras, India.
Other aspects relating to environmental or ecological management include:
1. installation of safety precaution measures amongst workers in the tanneries2. protection of existing species of reptiles and amphibians so as not to destroy the country’s
ecological balance. Scientific farming methods are necessary to maintain balance

04 Market Study Philippines Page 38
3.2 Leather Footwear Industry
3.2.1 Geographical Location
Although there is an estimated 2,000 manufacturers of leather footwear excluding sports andslippers/sandals, only 914 are registered with the Department of Trade and Industry (DTI). As aresult, it is difficult to arrive at exact figures of the overall number of footwear manufacturers. Butbecause registeredfirms constitute the primary producers of shoes and dictate the progress of the sector, the datacollected represents the general performance and situation of the industry.
The concentration of companies is mainly in the NCR (national capital region or Metro Manila) andthe surrounding regions of Bulacan and Laguna. This is greatly due to the presence of tanneriesand other major component suppliers of the footwear industry in general. Several ventures do existoutside of the major area but are either small/micro to be of overall significance or engage in sub-contracting for larger firms. The following illustrates the distribution:
Marikina
Laguna
Bulacan
Metro Manila
TOTAL
LOCATION
Registered Footwear Manufacturers by Location and Size
TOTAL PERCENTAGEDISTRIBUTION
58,64
38,73
0,98
1,64
100
536
354
9
15
914
Source: DTI
The most important area is Marikina where shoemanufacturing has become a traditional business venture. Interms of strategic location, it enjoys an advantage over itscounterparts in other areas because of its accessibility to themain market, Metro Manila. 58.64% of the total number of footwear manufacturers can be foundhere, wherein a majority can be classified as large- to medium-sized companies.
3.2.2 Current Situation of the Industry
3.2.2.1 Imports/Exports
Imports have begun to increase by an average of 32% per year. In 1997, leather footwear importsamounted to $ 6.65 M with products coming mainly from Hong Kong, Indonesia, Great Britain, Italyand the US. With trade liberalization underway, the biggest threat to the local market is the entry oflarge volumes of cheap finished goods that could drastically cut the market share of localcompanies.
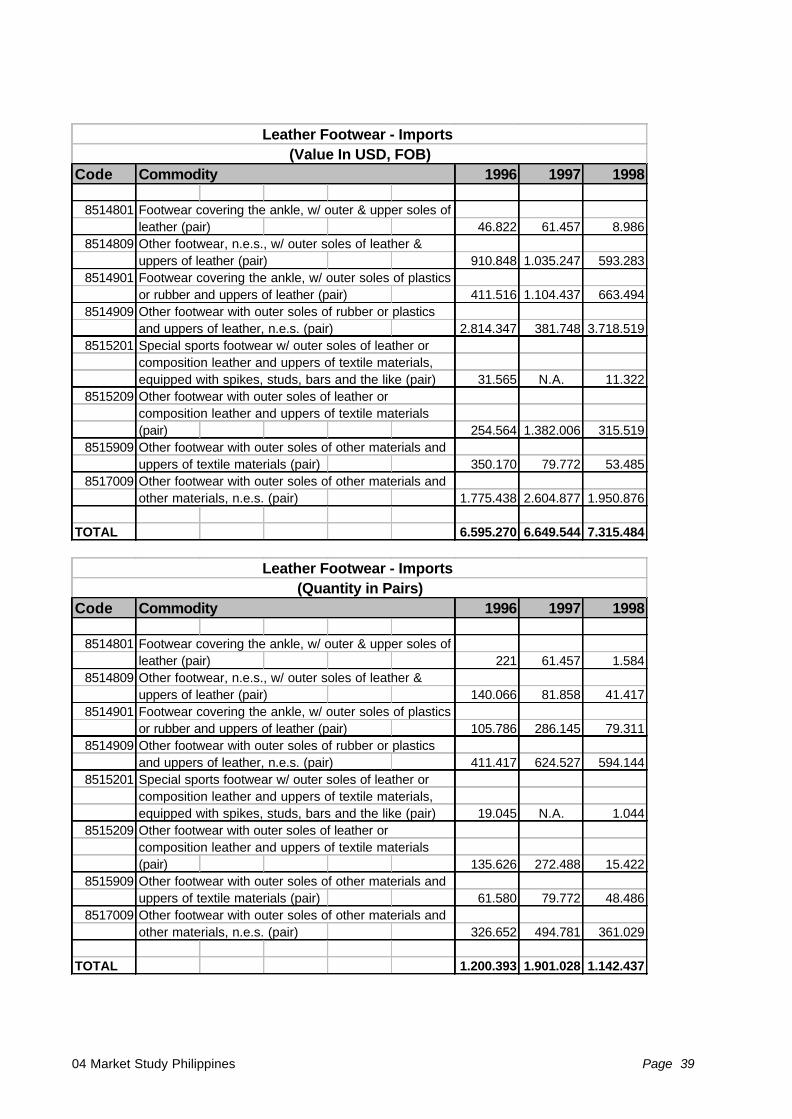
04 Market Study Philippines Page 39
Code Commodity 1996 1997 1998
8514801 Footwear covering the ankle, w/ outer & upper soles ofleather (pair) 46.822 61.457 8.986
8514809 Other footwear, n.e.s., w/ outer soles of leather & uppers of leather (pair) 910.848 1.035.247 593.283
8514901 Footwear covering the ankle, w/ outer soles of plastics or rubber and uppers of leather (pair) 411.516 1.104.437 663.494
8514909 Other footwear with outer soles of rubber or plastics and uppers of leather, n.e.s. (pair) 2.814.347 381.748 3.718.519
8515201 Special sports footwear w/ outer soles of leather or composition leather and uppers of textile materials, equipped with spikes, studs, bars and the like (pair) 31.565 N.A. 11.322
8515209 Other footwear with outer soles of leather or composition leather and uppers of textile materials (pair) 254.564 1.382.006 315.519
8515909 Other footwear with outer soles of other materials anduppers of textile materials (pair) 350.170 79.772 53.485
8517009 Other footwear with outer soles of other materials andother materials, n.e.s. (pair) 1.775.438 2.604.877 1.950.876
TOTAL 6.595.270 6.649.544 7.315.484
Leather Footwear - Imports (Value In USD, FOB)
Code Commodity 1996 1997 1998
8514801 Footwear covering the ankle, w/ outer & upper soles ofleather (pair) 221 61.457 1.584
8514809 Other footwear, n.e.s., w/ outer soles of leather & uppers of leather (pair) 140.066 81.858 41.417
8514901 Footwear covering the ankle, w/ outer soles of plastics or rubber and uppers of leather (pair) 105.786 286.145 79.311
8514909 Other footwear with outer soles of rubber or plastics and uppers of leather, n.e.s. (pair) 411.417 624.527 594.144
8515201 Special sports footwear w/ outer soles of leather or composition leather and uppers of textile materials, equipped with spikes, studs, bars and the like (pair) 19.045 N.A. 1.044
8515209 Other footwear with outer soles of leather or composition leather and uppers of textile materials (pair) 135.626 272.488 15.422
8515909 Other footwear with outer soles of other materials anduppers of textile materials (pair) 61.580 79.772 48.486
8517009 Other footwear with outer soles of other materials andother materials, n.e.s. (pair) 326.652 494.781 361.029
TOTAL 1.200.393 1.901.028 1.142.437
Leather Footwear - Imports (Quantity in Pairs)
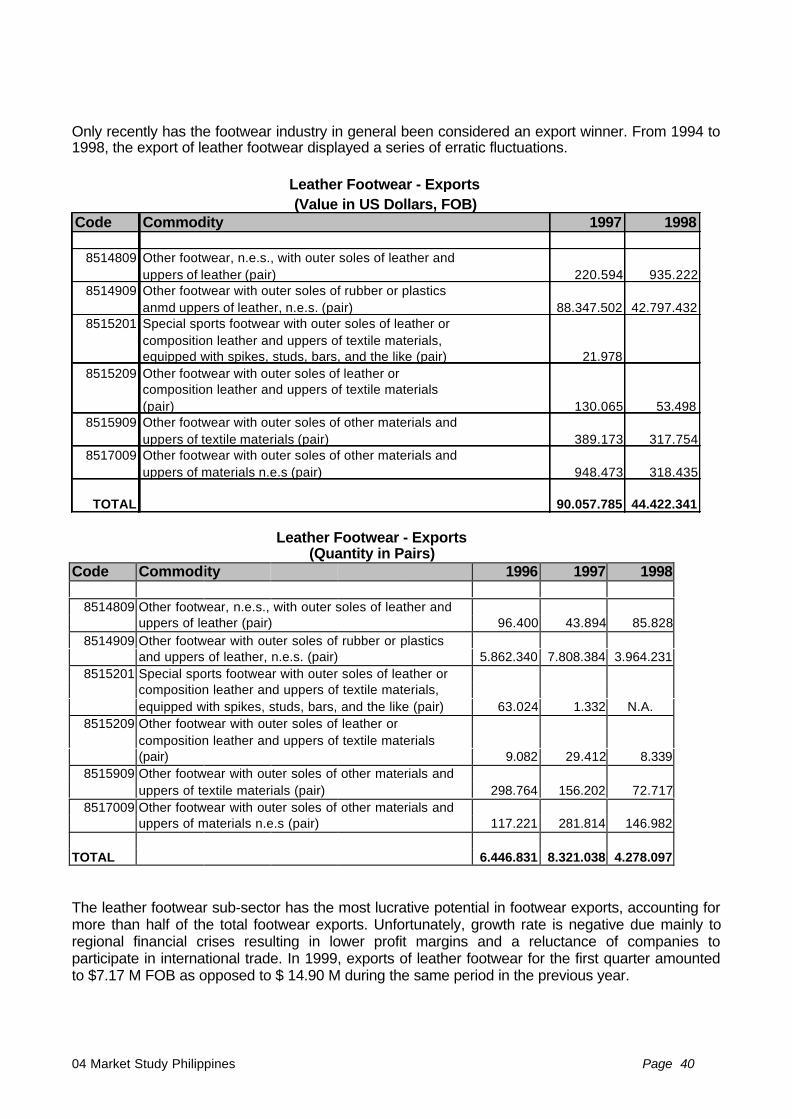
04 Market Study Philippines Page 40
Only recently has the footwear industry in general been considered an export winner. From 1994 to1998, the export of leather footwear displayed a series of erratic fluctuations.
Code Commodity 1997 1998
8514809 Other footwear, n.e.s., with outer soles of leather anduppers of leather (pair) 220.594 935.222
8514909 Other footwear with outer soles of rubber or plastics anmd uppers of leather, n.e.s. (pair) 88.347.502 42.797.432
8515201 Special sports footwear with outer soles of leather orcomposition leather and uppers of textile materials, equipped with spikes, studs, bars, and the like (pair) 21.978
8515209 Other footwear with outer soles of leather or composition leather and uppers of textile materials (pair) 130.065 53.498
8515909 Other footwear with outer soles of other materials and uppers of textile materials (pair) 389.173 317.754
8517009 Other footwear with outer soles of other materials and uppers of materials n.e.s (pair) 948.473 318.435
TOTAL 90.057.785 44.422.341
Leather Footwear - Exports (Value in US Dollars, FOB)
Leather Footwear - Exports(Quantity in Pairs)
Code Commodity 1996 1997 1998
8514809 Other footwear, n.e.s., with outer soles of leather anduppers of leather (pair) 96.400 43.894 85.828
8514909 Other footwear with outer soles of rubber or plasticsand uppers of leather, n.e.s. (pair) 5.862.340 7.808.384 3.964.231
8515201 Special sports footwear with outer soles of leather orcomposition leather and uppers of textile materials,equipped with spikes, studs, bars, and the like (pair) 63.024 1.332 N.A.
8515209 Other footwear with outer soles of leather orcomposition leather and uppers of textile materials(pair) 9.082 29.412 8.339
8515909 Other footwear with outer soles of other materials anduppers of textile materials (pair) 298.764 156.202 72.717
8517009 Other footwear with outer soles of other materials anduppers of materials n.e.s (pair) 117.221 281.814 146.982
TOTAL 6.446.831 8.321.038 4.278.097
The leather footwear sub-sector has the most lucrative potential in footwear exports, accounting formore than half of the total footwear exports. Unfortunately, growth rate is negative due mainly toregional financial crises resulting in lower profit margins and a reluctance of companies toparticipate in international trade. In 1999, exports of leather footwear for the first quarter amountedto $7.17 M FOB as opposed to $ 14.90 M during the same period in the previous year.
04 Market Study Philippines Page 41
3.2.2.2 Local Market
The Philippine market is considered the priority of the moment for the industry. The companies citehigher profit margin, less bureaucratic complications, minimal delivery-time pressures and theabsence of language and cultural barriers as reasons. Most companies operate on a day-to-daybasis instead of a more long-term outlook.
Local consumers have shown a behavior of buying several pairs of leather footwear of differentstyles within a relatively short time-span. The fashion-conscious nature of Filipinos in terms ofclothing and apparel can explain this tendency. Every year, the average disposable incomeincreases steadily leading to a relatively more extravagant lifestyle as compared to previous years.Style and quality more often dictates preferences.
It was found that the 15-49 age group is more likely to consume signature branded or high-qualitygoods and the 15-19 bracket representing the trend setting consumer. Working professionals,fashionable teenagers, business entrepreneurs belong to this category. On this basis three marketsegments were formulated: High-End Line (signature branded, expensive, stylish design, high-quality; for the upper-class consumer); Middle-End Line (relatively affordable, good quality, widerrange of styles; intended for the upper- to middle-class); Low-End (inexpensive, less stylish and lessdurable; for cost-conscious consumers). High-end shoes are more often imported signature brandswhile local companies focus more on the upper-middle to low end which have a more significantmarket share.
Gender-wise, a major part of the market is focused on the female consumer. Because women arefound to have the greater propensity to buy and are more sensitive to quality and price, productlines tend to cater more to the ladies’ shoes. As a result 86% of manufacturers produce such lines,while 47% of that number specialize in ladies’ footwear.
3.2.2.3 Market System
The market system has been characterized as a complex interaction among individual companiesand that of the suppliers and distributors. Complicated deals and exchanges (i.e. sub-contracting,branding, exchange of components) along with tight competition for a confined market (MetroManila) among small- and medium-sized firms are the cause of this state. Growth is impeded by thelack of harmony and a single industry association (there are several, particularly based in Marikina).
The majority of manufacturers directly sell their goods through public markets or department stores.Traders supplying big retail chains are the next option, capturing 14% of the leather shoe market.About 12% engage in supplying other manufacturers through subcontracting arrangements. The fewmedium- to large-scale operations market footwear through their own retail outlets, along with othersignature branded shoes as a means of quality and price comparison. Luxury imported brands aresold through either their own retail outlets or through exclusive distributorship rights to specialtyshops or department stores.
Although the Metro Manila area represents the most profitable market, some companies haveventured to other areas outside of the metropolis to take advantage of the developing alternatives.Several retail outlets have been operating in Cagayan de Oro, Davao, Iloilo and Cebu and are nowexperiencing an influx of new competition due to expanding development. The larger retail chainslike Rustan’s, Gaisano, and Robinson’s are now being joined by a growing number of SME’sengaged in the development of small shopping complexes. Still, the promising market outside ofMetro Manila has yet to be explored fully.
04 Market Study Philippines Page 42
Because the export market is filled with complicated procedures and regulations, much of the localcompanies remain hesitant to venture into this avenue. Export activities are done mostly throughjoint-venture partnerships with foreign firms. This is because of the inexpensive labor and the skill oflocal craftsmen. The partner needs large volumes of a particular style or , if it is preferred aspecified design, the latter of which is more popular. Aside from middle-men, exporters often enterinto agreements with central buying groups or large distribution chains abroad. The idea of locallybranded shoes distributed abroad is still to be considered seriously.
3.2.2.4 Government Policy Formulation & Implementation
The main government agency empowered to promote trade, investments and industry is theDepartment of Trade and Industry (DTI). It serves as the implementing department forcomprehensive commercial policies and directives. Because of the enormity of the assigned tasksof the DTI, several agencies under their supervision were created to perform the different crucialjobs. These are: the National Industrial Manpower Training Council (NIMTC); Cottage Industry andTechnology Center (CITC); Product Development and Design Center of the Philippines (PDDCP);Center for International Trade Exhibitions and Missions (CITEM); Bureau of Export and TradePromotions (BETP); Bureau of Internal Trade Relations (BITR); Subcontractors Exchange Program(SUBCONEX). The Technical Education and Skills Development Authority (TESDA), on the otherhand, provides government support for manpower development.
On the more direct level, the Local Government Units (LGU), such as the city government ofMarikina and the municipal government of Binan, directly interact with the industry. This is crucialsince this is the first level of contact with the government for the sector and the primary means ofthe government to gather data.The government agencies mentioned, through inter-agency coordination and cooperation, facilitatethe desired growth for industries. Although there are no formal parameters for coordination, informalworking groups are formed to focus on key issues or problems. A working group is usually formedthrough the initiative of the sector itself and, therefore, overall success of any project rests upon thewillingness of the firms to participate.
For the leather footwear industry, however, disunity within the sector has proven to be the mainobstacle for the government. There are several footwear associations, with no single unifying bodyto fully represent the industry. In effect, the departments have to deal with several groups resultingin the lack of a single direction or goal.
The DTI provides priority assistance to industries considered as export winners or industries whichmay contribute to national growth in terms of increased Gross Domestic Product (GDP), growth ofemployment and foreign currency inflow. Aside from cooperation from attached departments, theDTI also relies on other regional and international organizations for promotion and financing such asthe ASEAN, GATT, NAFTA, EC and other similar bodies. Limited government resources are thusmaximized as a result of such alliances.
With the advent of more open international trade, the government has adapted trade liberalizationpolicies, such as tariff reforms and relief of import restrictions, to minimize production costs ofmanufacturers through cheap imports (i.e. components and raw materials).
04 Market Study Philippines Page 43
3.2.3 Current Processing Capability
3.2.3.1 Production Process
The process of manufacturing leather footwear involves a great number of steps. These are :
1. Design Making2. Pattern Making3. Upper Cutting4. Upper Preparation5. Upper Closing/Stitching6. Counter/Toe Puff Preparation7. Outsole Preparation8. Insole Preparation9. Heel & Toplift Preparation10. Lasting11. Roughing12. Cementing/ Sole Attaching13. Heel Attachment14. Finishing15. Treeing and Packaging
Related to the production process: technology application, product design and development, andquality control.
3.2.3.2 Technology
Technology in the leather footwear manufacturing is limited. Most of the steps involved in productionare done by hand. This is also dependent on the financial capacity of the firms in purchasing newequipment. In comparison to the global standards, the Philippines is far behind, with seriousimplications to production capacity.
Reasons cited include:• Little knowledge of current technologies• Small-scale operations do not necessitate constant upgrading of equipment, if any.• Loss of flexibility in design• Perceived high quality of design• Deficiency in support industries limits mechanization• Expensive• Lack of large investment capital
Moreover, purchase of equipment is mostly limited to second-hand machines.
3.2.3.3 Labor Force
Exact figures on the total number of workers in the leather footwear sector are unavailable becauseof the high labor turnover. Estimates suggest between 39,000 to 45,000 composed mainly ofemployees with ages varying from 24 to 55. Workers are generally poorly trained and have no job-security. Most come from the marginal sector of society. Hiring is done mostly on a per-job basis.There are relatively few permanent employees.

04 Market Study Philippines Page 44
3.2.3.4 Raw Materials/Support Industries
Leather is the main raw material for the sector. Production efficiency is greatly dependent on theavailability of leather. The tannery industry, unfortunately, has its own issues to face. Environmentalproblems arising from the toxic waste by-products from tanning have imposed severe restrictions onproductions. Poor quality and a lack of an organized system of acquisition of hides and chemicalsare another major problem. But the most severe threat comes from the influx of cheap importswhich could shift the preference of footwear manufacturers to imports instead of locally availablematerials.Leather shoes are also greatly dependent on support industries that manufacture importantcomponents.Prefabricated shoe components such as uppers, heels, outsoles and the like are critical to footwearproduction. They have to be readily available in order to ensure smooth production and compliancewith schedules. But components, like leather, are slowly coming from foreign sources because ofthe lack of reliable local manufacturers or suppliers. Present import procedures are proving to bevery time-consuming and complicated.
3.2.3.5 Production Capacity/Efficiency
Since most of the processes involved in leather footwear manufacture are still manual, productioncapacity is expectedly lower than that of mechanized systems. There is no present rating on theproduction capacity of the industry. Production capacity and utilization varies according to size ofthe company and the season. According to estimates the overall average capacity are 65% formedium to large companies and 55% for small firms. Worker productivity is also expressed in man-hours per pair of shoes. The traditional process is rated at 2.4 MHRS/P while the mechanizedprocess involves only 1.3 MHRS/P that translates into a serious efficiency problem. Below is a studydone by the Asian Institute of Management in 1993.
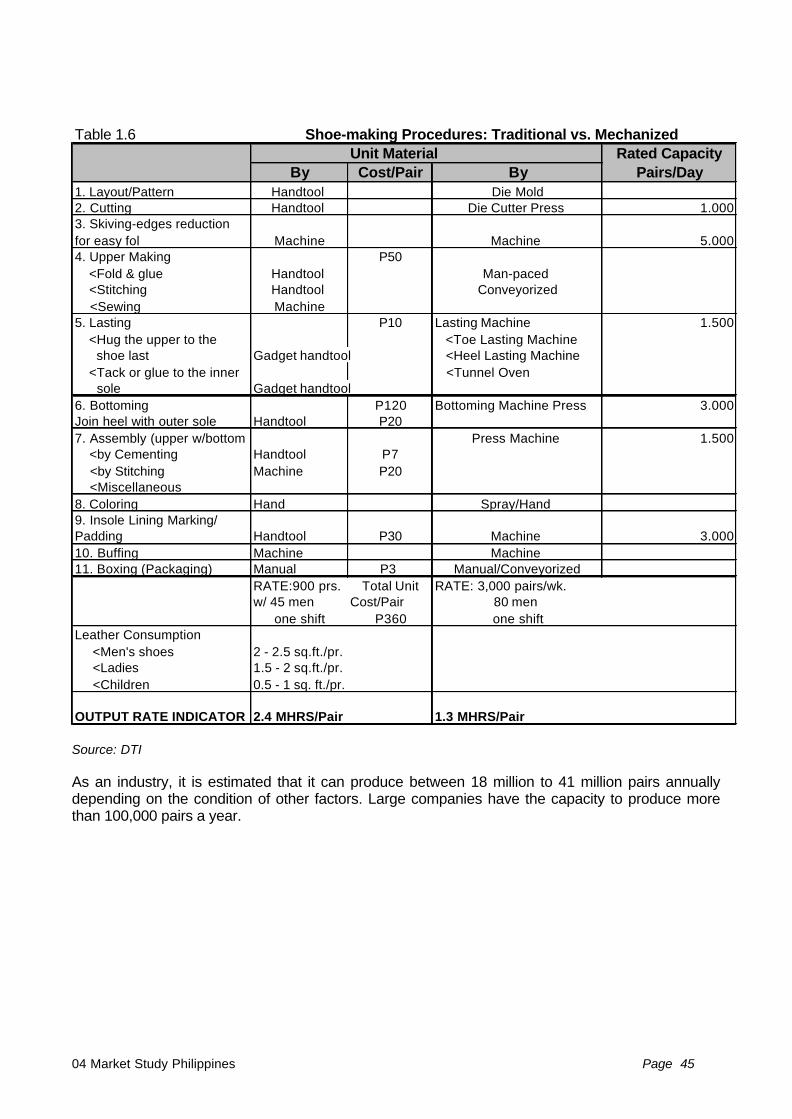
04 Market Study Philippines Page 45
Table 1.6 Unit Material Rated Capacity
By Cost/Pair By Pairs/Day1. Layout/Pattern Handtool Die Mold2. Cutting Handtool Die Cutter Press 1.0003. Skiving-edges reduction for easy fol Machine Machine 5.0004. Upper Making P50 <Fold & glue Handtool Man-paced <Stitching Handtool Conveyorized <Sewing Machine5. Lasting P10 Lasting Machine 1.500 <Hug the upper to the <Toe Lasting Machine shoe last Gadget handtool <Heel Lasting Machine <Tack or glue to the inner <Tunnel Oven sole Gadget handtool6. Bottoming P120 Bottoming Machine Press 3.000Join heel with outer sole Handtool P207. Assembly (upper w/bottom Press Machine 1.500 <by Cementing Handtool P7 <by Stitching Machine P20 <Miscellaneous8. Coloring Hand Spray/Hand 9. Insole Lining Marking/Padding Handtool P30 Machine 3.00010. Buffing Machine Machine 11. Boxing (Packaging) Manual P3 Manual/Conveyorized
RATE:900 prs. Total Unit RATE: 3,000 pairs/wk. w/ 45 men Cost/Pair 80 men
one shift P360 one shiftLeather Consumption <Men's shoes 2 - 2.5 sq.ft./pr. <Ladies 1.5 - 2 sq.ft./pr. <Children 0.5 - 1 sq. ft./pr.
OUTPUT RATE INDICATOR 2.4 MHRS/Pair 1.3 MHRS/Pair
Shoe-making Procedures: Traditional vs. Mechanized
Source: DTI
As an industry, it is estimated that it can produce between 18 million to 41 million pairs annuallydepending on the condition of other factors. Large companies have the capacity to produce morethan 100,000 pairs a year.
04 Market Study Philippines Page 46
3.2.4 Profile of Major Companies
3.2.4.1 Size and Structure of Companies
The size of a leather footwear company is defined by its asset/capitalization capacity. Smallcompanies are those with less than 15M; Medium are in the 15 to 40M bracket; and the Largecompanies are those above 40M. Of the 914, 97% are considered small, micro or cottage while theremaining 3% are the medium to large operations. 84% of the total number are family-owned andclassified as sole-proprietorships. The medium to large companies are run under corporatestructures.The category of operations of a firm are divided into four:
• Branded – manufactures own brand or foreign brand for local distribution.• Manufacturer-Exporter – manufactures for domestic consumption and export.• Subcontractor – produces for other companies. Materials are provided and the subcontractor
processes into shoes.• Supplier – manufactures shoes with own resources for supply to other companies.
Among the major footwear manufacturers/exporters or more popular brands sold in the local marketare:
Mephisto Ohrelle Pink SodaCardam’s Francesco ConfettiManel’s Mendrez Sari-sariCeline Cinderella BenchCherie Renoma SportoJannilyn Zenco Footstep OttoItti Primadonna MilaniLe Donne Via Veneto Margay
The rest are department store brands, such as Parisian (for SM) and Oleg Cassini (for Rustans).Large retail chains such as SM Shoemart, Robinson’s, Isetann, Landmark and others employsubcontracting or are supplied by local manufacturers for department store lines. These departmentstores also market imported shoes, by Bally, Salamander, Florsheim, Naturalizer, etc. Aside fromthese there are also specialty footwears shops just selling imported footwear brands.
Because most local footwear firms are sole-proprietorships it is often the case that the owners wereformer employees of other footwear companies who separated and ventured into their ownbusiness. Skill and technology is limited to that of the knowledge acquired from previousemployment. Others are second- and third-generation enterprises with training handed down bypredecessors. In terms, of managerial abilities most managers perform all the basic functions suchas purchasing, marketing, collection, supervision, inventory and other tasks.
In contrast, larger firms have corporate structures. Companies are family-owned but are run by hiredprofessional-managers. The firm is highly departmentalized and every aspect of production andmarketing is strictly supervised. These large companies operate either as export-manufacturers(direct or indirect) or as supplier/subcontractor.

04 Market Study Philippines Page 47
Table 1.7
Asian Footwear & Rubber Corp. sport shoes, casual shoes 235 J. Teodoro St. cor. 5th Ave. Grace Park, Kalookan CityContact: Mr. Brian Cheng/Steve Cheng
Brian Maxbeth Corp. leather footwear, sewn shoe uppersNubla Cmpd., Circumferential Rd.Antipolo, Rizal Contact: Mr. Maximo del Rosario, Jr.
FILCON Manufacturing Corp. sport shoes, leather footwear,28th Flr., Unit 2801 C rubber shoesTektite Bldg., Pasig City
Goodfit Manufacturing Co. combat shoes, safety shoes, hot weather12 First Ave., Manalac Industrial Estate boots, tropical boots (goodyear welt), cow1604 Bagumbayan, Taguig, Metro Manila leather, nitrite pvc, rubber sole, nylon canvass,Contact: Maj. Gen. Pantaleon G. Dumlao (ret.) steel shank, military shoes
Paramount Vinyl Products Corp. men's sandals, men's leather and non-leather56 G. De Jesus st. sports shoes, beach sandals, rubber shoesKalookan CityContact: Mr. George T. Barcelon
Shoe Extraco CorporationCruz CompoundDr. A Santos Ave., Sucat Paranaque CityContact: Mr. Manfred Froehlich/Mr. Reynaldo Silverio
Valley Shoe Factory sport shoes306 Munding Ave. Sto. Nino, Marikina CityContact: Mr. Pepito Samson
MAJOR LEATHER FOOTWEAR MANUFACTURERS/EXPORTERSCOMPANY NAME/DETAILS PRODUCTS
3.2.4.2 Financial Capacity
A majority of the large firms have assets/capital ranging from 15 to 60M. Small companies belongto the bracket below 1.5 to 15 M range, with around 70% under the 1.5M range. About 60% of thelarge firms are financially capable of purchasing new equipment and technology and are largelymechanized. Small- to medium-sized companies are either semi-mechanized or completely manualin operation.
The biggest financial constraint is lack of sufficient working capital, specifically in terms of purchaseof raw materials. Another is the high interest rates of accessible financial facilities.
04 Market Study Philippines Page 48
A major source of financing comes from the informal market, either from Chinese traders orunregistered financiers. No collateral is required but interest rates are higher than industrystandards. Raw materials or components may be acquired through credit or exchange. As a result,loans and repayment become cyclical and dependency develops into long-term agreements.
3.2.4.3. Industry Associations
The leather footwear sector has numerous umbrella organizations, most of which is concerned withthe development of the Marikina area in general. The lack of a central body has served to inhibit theprogress of the industry instead of promoting growth and unity among companies. Consequently, nocohesive plan was promulgated and problems were not addressed properly during the previousyears. But the situation is expected to improve with the entry of young and visionary leaders in thedifferent associations:
Sector Organizations:
• Marikina Footwear Federation, Inc. – established as the umbrella organization for the footwearsector.
• The Marikina Footwear Development Cooperative (MAFODECO)• New Marikina Trade Fair Association• The Marikina Footwear and Leathergoods Manufacturer’s Cooperative (MFMLC)• The Marikina Shoe Expo Leasing, Inc.• The Assembly of Manufacturers of Marikina Development Cooperative (ASSEMBLYMAN)• The New Marikina Shoe Trade Fair Association, Inc.• The Baclaran Shoe Vendor’s Association
3.2.5 Development Plan of the Industry
3.2.5.1 Development Issues
The leather footwear industry suffered a series of setbacks and was unable to maximize itsopportunities because of several key factors:
1. Because of the lack of proper technology, efficiency and production capacity have becomemajor issues. The local enterprises have been unable to meet global standards in leatherfootwear manufacture and remain in the background in light of new developments in productiontechnology. The traditional methods require more manpower and manpower hours. With thisdeficiency in production, a major part of the market has been captured by cheaper and morenumerous imports, constituting a threat to the local SME’s survival.
2. Lack of sufficiently trained workers and adequate skills development. Most are trained throughhanded-down methods. Add to this the inability of companies to sustain a core group ofcraftsmen for long-term operations.
3. Support industries and raw materials suppliers fail to provide components and materials on aregular basis. They are currently facing problems of their own such as environmental andproduction-related issues (quality and sustaining supply-on-demand operations).
4. Disorganized and complicated marketing systems. There are too many marketing channels. Nostandardized system. Poor marketing promotion.
04 Market Study Philippines Page 49
5. Inability to maintain an export-oriented operation. Lack of quality materials and joint-venturepartnerships.
6. Disunity in the industry. No single industry association to represent the sector in governmentinteraction. Minimal coordination with government agencies and LGU’s. Lack of sufficientparticipation and input from companies.
7. Lack of government initiatives for the industry. Only recently has the government givensignificance to the potential of the leather footwear sector.
8. Complicated delays in importation procedures of components/materials.
9. Lack of reliable and reasonable credit facility.
3.2.5.2 Proposed Development Plan
Because of the shifting trend to a more global approach for industries, the leather footwear sectorand the government have taken steps in achieving growth and success through this avenue. Thereis much more room for companies to move in because of the liberal atmosphere of trade. Firm-levelcontacts are now possible instead of the traditional nation-level approach used before. Thecompanies’ options for suppliers of raw materials and components have now widened because ofthe adjustment in tariffs. Cost of production is seen to go down because of the availability ofcomponents and materials. Markets are opening up because of the WTO move to reduce tariffs.Markets for Low- and Medium-End lines are now increasing because of shift to High-End productsfor Taiwan and South Korea. These are:
• More receptive policies in foreign investment and direct foreign investments policies.• Emergence of more economic zones or centers.• Fiscal/Tariff restructuring• Emphasis on exports• Inclusion into WTO, GATT and other world trade organizations.• Increased export incentives via the BOI and the Export Development Act.• Increased initiatives for joint-venture partnerships by the government.
In 1996 the DTI commissioned the preparation of a master plan for the leather footwear sector. Themaster plan established production targets for the years 1996-2011 with a 1995 production base of41 million pairs.
Years Conservative Growth Moderate Growth1996-1997 5% 7%1998-1999 7% 10%2000-2002 10% 15%2003-2005 15% 20%2006-2011 20% 25%
Leather Footwear Production Targets 1996-2011
For exports:
1996-2000 - 16%2001-2005 - 22%2006-2011 - 20%
04 Market Study Philippines Page 50
In the proposed plan, several strategic elements were identified to address the issues facing theindustry. These are:
1. Production Technology Improvement (PROTECH)• Creation of a Footwear Productivity Center• Program for Human Resource Development and Training• Establishment of Shoe School• Product Research and Development• Facilitation of Industry Technology Demonstrations and Adoption by Industry Leaders• Facility and Equipment Upgrade• Formulation and Implementation of Product Quality Standards
2. Raw Materials And Components Industry Development Support• Creation of Industry Cooperators For Support Industries• Unified Purchases and Importation Activities• Adoption of Less Complicated Importation Procedures• Establishment of Strong Forward Linkages with Domestic Livestock Industry• Improved Production System• Increased R & D Activities for Alternative Leather/Leather Manufacturing Processes
3. Market Development• Organization of Market Associations• Market Planning & Promotion
a. Establish Market Information System (MIS)b. Market Promotionc. Develop/Establish Regional Distributorship (Domestic Market)d. Develop and Establish Industry Pricing Schemee. Attract Joint Ventures, Subcontracting and Franchising of Name Brandsf. Establish and Promote RP Leather Footwear Brands in the Export Marketg. Sustain and Expand Target Markets and Product Types Exported
4. Policy and Institutional Support Program• Strengthening Industry Associations• Organization of Inter-Industry Coordination and Information System• HRD/Training Financing• Industry Credit Financing• Strengthening the Management and Technical Capabilities of Relevant DTI Units and
Concerned National Agencies• Local Government Support• Policy and Policy-Related Reforms• Establishment of a Special Economic Zone
The plan has an implementation period of 15 years, divided into three phases : Short-Term,Medium-Term and Long-Term. The Plan is spearheaded by the DTI, with its line agencies such asthe CITC implementing their respective strategic elements. It is expected to initiate growth anddevelopment in the industry. After which, the industry can assume the stewardship role at the end ofthe plan implementation.

04 Market Study Philippines Page 51
3.3 Leather Goods Industry
Leather goods industry in the Philippines is an offshoot of the footwear industry. Small items suchas wallets, coin purse and key holders were made from excess cuttings of leather from shoes. Thisway, the use of leather is maximized. Eventually some manufacturers found the business profitablewhich made them decide to concentrate on Leather goods
The quality of the Philippine Leather goods continue to gain competitiveness in the internationalmarket owing to the improvement in the quality of hide processing in the local tanneries.
3.3.1 Geographical Location
The Leather goods industry consist of 400 companies employing roughly 40,000 workers. Thesecompanies are geographically concentrated in Bulacan, Marikina, Metro Manila, Laguna, Cebu andBaguio. In Bulacan, there are around 124 Leather goods firms employing 923 workers. Most firmshowever, are family-owned corporations or single proprietorships and have the cottage industry typeof operation with few venturing into exports. Some of the leather goods manufacturers had formedan association known as APLEM, Association of Phil. Leather goods Exporters and Manufacturers.Most of these companies are based in Metro Manila.
3.3.2 Current Situation of the Industry
Leather goods are one of the most promising export products of the Philippines today. As such thegovernment has considered the sector as one of the emerging export winner. With an averagegrowth rate of 22 percent for the period 1988-1995 the interest that foreign buyers find in theuniqueness of designs and materials, the key players of the key sector remained optimistic in itsgrowth.
3.3.2.1 Exports and Imports Performance
For the year 1998, the US market remained the number one destination of Philippine Leather goodswith a market share of 5.83% valued at $147.094 Million, an increase of 10.07% over 1997 exportsof $132.876. Although Japan maintained its second slot since 1997, exports decreased by 16.14%which valued only at $9.141 Million. Taiwan posted the highest increase at the rate of 189.75% withthe share of the market at 0.48%. The other top ten markets of Philippine leather goods, in order ofmarket shares, are Canada, United Kingdom, Germany, Australia, Hong Kong, France, Taiwan andSingapore.
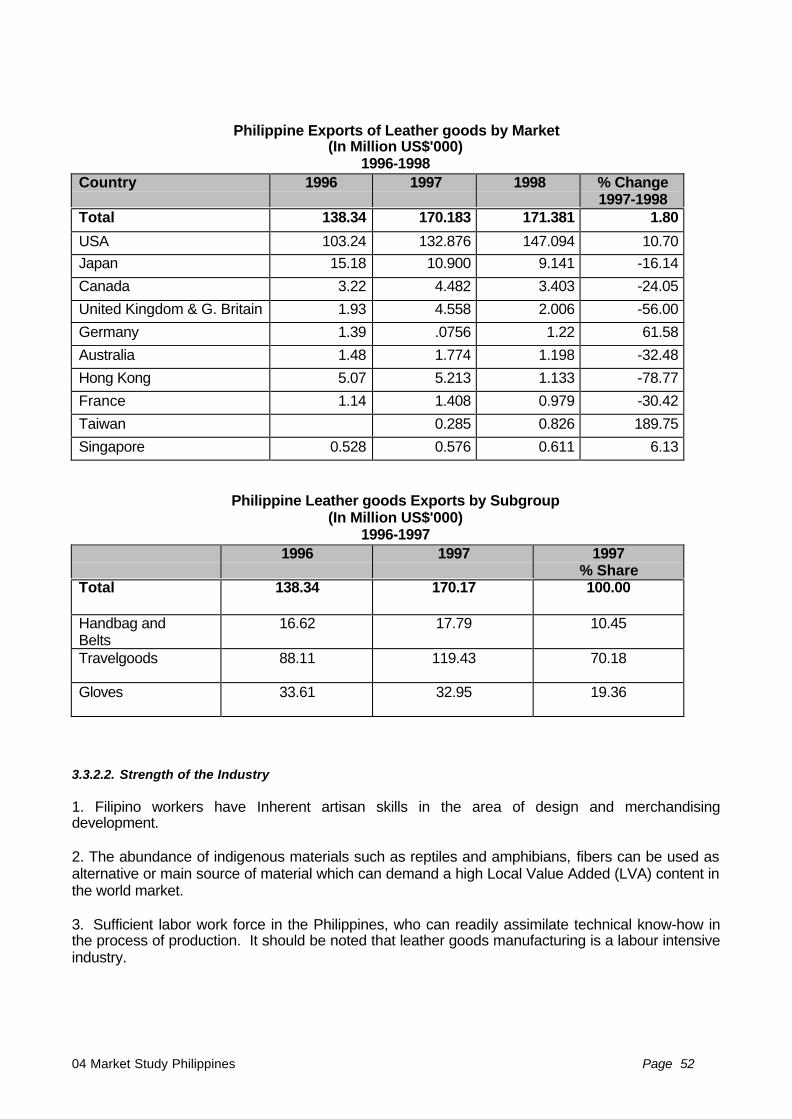
04 Market Study Philippines Page 52
Philippine Exports of Leather goods by Market(In Million US$'000)
1996-1998Country 1996 1997 1998 % Change
1997-1998Total 138.34 170.183 171.381 1.80
USA 103.24 132.876 147.094 10.70Japan 15.18 10.900 9.141 -16.14
Canada 3.22 4.482 3.403 -24.05
United Kingdom & G. Britain 1.93 4.558 2.006 -56.00
Germany 1.39 .0756 1.22 61.58
Australia 1.48 1.774 1.198 -32.48
Hong Kong 5.07 5.213 1.133 -78.77
France 1.14 1.408 0.979 -30.42
Taiwan 0.285 0.826 189.75
Singapore 0.528 0.576 0.611 6.13
Philippine Leather goods Exports by Subgroup(In Million US$'000)
1996-19971996 1997 1997
% ShareTotal 138.34 170.17 100.00
Handbag andBelts
16.62 17.79 10.45
Travelgoods 88.11 119.43 70.18
Gloves 33.61 32.95 19.36
3.3.2.2. Strength of the Industry
1. Filipino workers have Inherent artisan skills in the area of design and merchandisingdevelopment.
2. The abundance of indigenous materials such as reptiles and amphibians, fibers can be used asalternative or main source of material which can demand a high Local Value Added (LVA) content inthe world market.
3. Sufficient labor work force in the Philippines, who can readily assimilate technical know-how inthe process of production. It should be noted that leather goods manufacturing is a labour intensiveindustry.
04 Market Study Philippines Page 53
3.3.2.3. Problems faced by the industry
1. Raw Materials - In term of availability, quality and, high cost. The tanning and support industrycannot fully meet the requirements of the industry particularly those for exports.
2. Product Design - Research and development activities are not adequate, most designs aresupplied or copied by magazines. Designs vary frequently and product durability and mix ofcomponents used and structural requirements are given less attention. Physical appearance ismostly used as the main basis of designs. Despite good performance, the market is still wanting infresher ideas in creative design and quality.
3. Capital Equipment - Existing machinery and equipment used by the industry is inadequate tomaintain certain standards of quality while. testing equipment are needed to determine the limitationof products. inspection done by manufacturers are mostly visual; investments in production facilitiesand testing equipment are needed.
4. Financing - Difficulties in obtaining working capital and foreign exchange resources to financeoperations is experienced by manufacturers.
5. Bonded Warehouse Facilities - The availability of bonded manufacturing warehouse needs to bemore accessible to small manufacturers.
6. Technical assistance from government is most relevant to achieve progress. Services, such asthose of Footwear and Leather goods Industry Center, in terms of material testing, and skillstraining. Product specialists and experts advice and assistance in designs development, productadaptation and production techniques, the use of indigenous and woven fibers and otherpopularized designs worldwide should be adequately promoted and transferred.
7. One thing that bothers the industry right now is the impact of the recent financial crisis, whichhurts most of the companies due to the depreciation of the peso against the dollar, where manymanufacturers were hit by the high interest rates.
3.3.3 Current Processing Capability
3.3.3.1 Production Capacities
Firms with Leather goods as its primary line is estimated to exceed 400 in the country, mostly arelocated in Metro Manila and in the Bulacan areas. Many of these firms were established in the mid-seventies, with a few eventually venturing in to exports. This number excludes footwear firms withLeather goods as secondary line.
Total direct employment is at least 4,000 persons, mostly in small firms and a few export orientedmanufacturers employing more than a hundred people and women to men ratio at 2:1, the womenmostly employed in sewing, finishing and packing operations, while men are mostly in patternmaking. Training is through apprenticeship system with skills improvement courses availablethrough government programs.
The industry has existing capacity of at least 4 million pieces of assorted products, where thedomestic market takes about two-thirds.

04 Market Study Philippines Page 54
3.3.3.2. Production Process
The Leather goods sector is a highly labor-intensive industry. Very basic machinery such asindustrial sewing machines are primarily used at the cottage and small-scale level. Medium andlarge scale firms have additional machinery such as clickers, strap-cutters, skiving, embossing andbuffing machines. The system of quality is spotty in many instances. Quality control simply consistof visual inspection which is made only after all operations have been completed.
General processes are identified as:
a. Cutting - Patterns are prepared based on designs supplied by customers, adopted frommagazines or catalogues or supplied by in-house or external designers. Pattern mediums are eitherpaper, cardboard, plastic or cutting. The cutting of components (such as leather and lining) areachieved with the use of scissors or knives for small firms and with clicker machines for large firms.After cutting, the components may under solving process wherein cut leather is pared off.
b. Assembly - Assembly operations involve sewing, g1uing and attachment of accessories. Cutmaterials are usually sewn together and cardboard, wood, plastic, or fiberglass are sewn or gluedto the product as frames. Zipper, snaps and other accessories are attached to the product with theuse of simple tools such. as hammers and pliers or with machines such as riveting and eyelettingmachines.
d. Finishing - Excess materials are trimmed-off. Each product may undergo dyeing, painting,polishing 'and cleaning process and undergoes final quality control inspection, packed and thendistributed.
3.3.3.3. Raw Materials Requirements
Raw materials include:
- Finished Leather such as kid skin, calf and cow skin, and reptile skin.
- Leather substitute! such as polyurethane leather, manmade leather etc
- Linings such as pigskin, suede, nylon, taffeta and other fabrics.
- Adhesives such as threads and accessories like zippers, buttons, snaps, hooks, etc.
Leather is sourced from local tanneries while export producers import leather materials which areconsidered to be of higher qltality. Export-oriented firms who operate bonded manufacturingwarehouses or those with BOI or EPZA Incentives may avail of imported finished leather and othermaterials and supplies, tax and duty-free. Other firm source their, raw materials and supplies fromtraders in Divisoria and Marikina where about 80% are also imported, with duties that average 30%
3.3.3.4. Cost Structure
A typical cost structure of a small or medium sized firm is composed of:
• Raw Materials 75-85%
• Direct Labor 5-15%
Factory overhead is 10 -20%, where depreciation accounts for about half of overhead.
04 Market Study Philippines Page 55
3.3.3.5. Capital Equipment
Clickers, skiving, sewing, and splitting machines are used by more mechanized firms, while smallerones have only basic sewing machines. Degree of.mechanization and level of technology is afunction of the -type of products and the volume of market served. The modern export orientedfirms would have newer or state of the art facilities usually upon recommendations of suppliers.
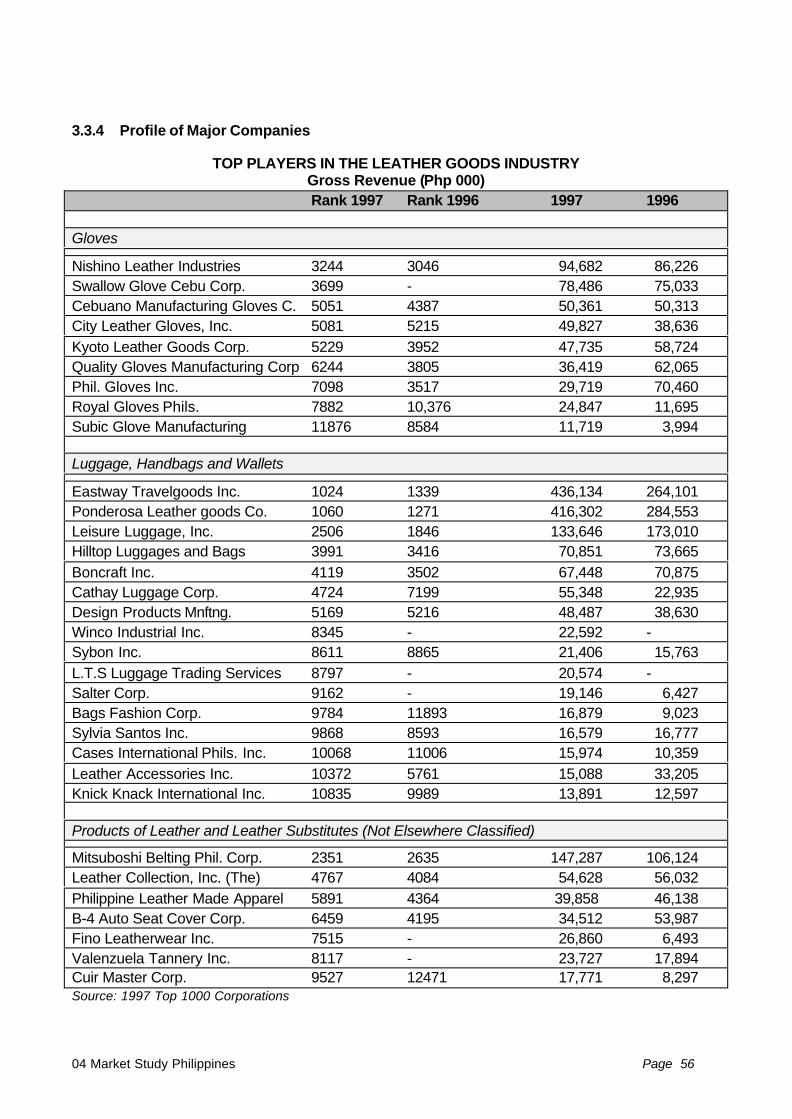
04 Market Study Philippines Page 56
3.3.4 Profile of Major Companies
TOP PLAYERS IN THE LEATHER GOODS INDUSTRYGross Revenue (Php 000)Rank 1997 Rank 1996 1997 1996
Gloves
Nishino Leather Industries 3244 3046 94,682 86,226Swallow Glove Cebu Corp. 3699 - 78,486 75,033Cebuano Manufacturing Gloves C. 5051 4387 50,361 50,313City Leather Gloves, Inc. 5081 5215 49,827 38,636Kyoto Leather Goods Corp. 5229 3952 47,735 58,724Quality Gloves Manufacturing Corp 6244 3805 36,419 62,065Phil. Gloves Inc. 7098 3517 29,719 70,460Royal Gloves Phils. 7882 10,376 24,847 11,695Subic Glove Manufacturing 11876 8584 11,719 3,994
Luggage, Handbags and Wallets
Eastway Travelgoods Inc. 1024 1339 436,134 264,101Ponderosa Leather goods Co. 1060 1271 416,302 284,553Leisure Luggage, Inc. 2506 1846 133,646 173,010Hilltop Luggages and Bags 3991 3416 70,851 73,665Boncraft Inc. 4119 3502 67,448 70,875Cathay Luggage Corp. 4724 7199 55,348 22,935Design Products Mnftng. 5169 5216 48,487 38,630Winco Industrial Inc. 8345 - 22,592 -Sybon Inc. 8611 8865 21,406 15,763L.T.S Luggage Trading Services 8797 - 20,574 -Salter Corp. 9162 - 19,146 6,427Bags Fashion Corp. 9784 11893 16,879 9,023Sylvia Santos Inc. 9868 8593 16,579 16,777Cases International Phils. Inc. 10068 11006 15,974 10,359Leather Accessories Inc. 10372 5761 15,088 33,205Knick Knack International Inc. 10835 9989 13,891 12,597
Products of Leather and Leather Substitutes (Not Elsewhere Classified)
Mitsuboshi Belting Phil. Corp. 2351 2635 147,287 106,124Leather Collection, Inc. (The) 4767 4084 54,628 56,032Philippine Leather Made Apparel 5891 4364 39,858 46,138B-4 Auto Seat Cover Corp. 6459 4195 34,512 53,987Fino Leatherwear Inc. 7515 - 26,860 6,493Valenzuela Tannery Inc. 8117 - 23,727 17,894Cuir Master Corp. 9527 12471 17,771 8,297Source: 1997 Top 1000 Corporations
04 Market Study Philippines Page 57
3.3.5 Development Plan of the Industry
The development of the leather goods industry has not been given that much attention by thegovernment for many years. Only recently did the DTI commissioned a study to prepare a masterplan for the leather footwear industry. No such master plan has been made for the tannery nor theleather goods industries. The industry is basically left on its own at the moment to look after thedevelopment of the industry. Government support is basically given to leather goods exportersparticipating in international trade events through the CITEM.
Presently, the Association of Philippine Leather goods Exporters and Manufacturers, Inc. (APLEM)is calling on the government to do something in order to simplify the complicated transactions in theprocessing of documents at the Customs Bureau. Once these things are put into place, there is nodoubt that the export of leather goods will further be enhanced, particularly if there is ample supportfrom the government.
Complementing these moves are strategies designed to meet export sales of leather goods items.Statistics from the Philippine Export Confederation (Philexport) projected that sales of these itemswill generate US$ 380.08 million in the year 2000.
This early, APLEM is already exploring vast opportunities to improve its programs in preparation ofthe growing domestic and international markets for leather goods plus the liberalization ofinvestment and trading policies.
Along with these, it is also zeroing in on the four areas of development to enhance itscompetitiveness program. These include the improvement in manpower and machine efficiency;efficient use of materials, labor and machines; the development and maintenance of design,craftsmanship and creativity by using locally available talent.
The government has initiated efforts in support of the industry. Some of these are the IntergratedTechnical Assistance Program for Leather and the Animal Products Development Center. Itlikewise offers incentives in the form of tax and duty exemptions to investors.
Meanwhile the CEPT Scheme of the AFTA and the UR-GATT are expected to benefit exporters ofleather products through lower tariffs and more accessible raw materials as well as enhancedmarket access.
Hence, high quality and cost-efficient leather product manufacturers can expect bright prospects inview of the expected growth in demand for Philippine leather products in the highly competitive butlucrative export market.

04 Market Study Philippines Page 58
3.4 Upholstery Industry
3.4.1 Geographical location:
Upholsterers and firms providing upholstery supplies are concentrated in the Metro Manila areawhere the biggest markets such as furniture, seat covers, hotels, restaurants, hospitals, motorvehicle owners, repair shops and manufacturers, are located.
Most of the establishments are located in the following areas of Metro Manila:
1. Quezon City2. Manila3. Makati4. Mandaluyong
No readily available statistics are available to show how many firms exist in this industry. In MetroManila, there are at least 40 upholsterers of reasonable size and operation. There are also about 50upholsterers’ suppliers as well as about 30 firms dealing with upholstery fabrics of the same status.
There are no specific geographical areas outside Metro Manila known for upholstery except perhapsthose areas where furniture firms are concentrated such as Bulacan, Pampanga, Tarlac, Ilocos, etc.But these are small or cottage enterprises providing upholstery services to localities too.
3.4.2 Current Situation of the Industry
In the Philippines, the upholstery business is basically integrated in the furniture manufacturing orfurniture repair sector. But even this activity is not so significant considering the bulk of furnituremanufactured in the Philippines are not really upholstered furniture but rattan, wrought iron, metal,wicker, stone, and wooden furniture. There are many upholstering firms in Metro Manila and outsidethe National Capital Region, but majority is basically small operations.
Leather upholstery for motor vehicle seats is not a significant market also considering that vehiclesmanufactured in the Philippines are mainly knocked down vehicles and just assembled locally. Forthe locally produced jeepneys, the seats are not really made of leather but what is locally known as“synthetic or PVC leather”. These are substitutes to the leather and produced locally by chemicalfirms such as the Mabuhay Vinyl Corporation.
In terms of actual activity, upholstery firms are basically engaged in re-modelling and upholsteryrepair. There are also companies manufacturing leather seat covers, especially for cars. Theseleather seats are marketed and priced according to the kind and origin of leather used. Mainsources are Germany, United States and Korea.
3.4.3 Current Processing Capability
There is no formal or organized record of the processing capability of upholstery firms. A fieldsurvey is essential to get more accurate information.
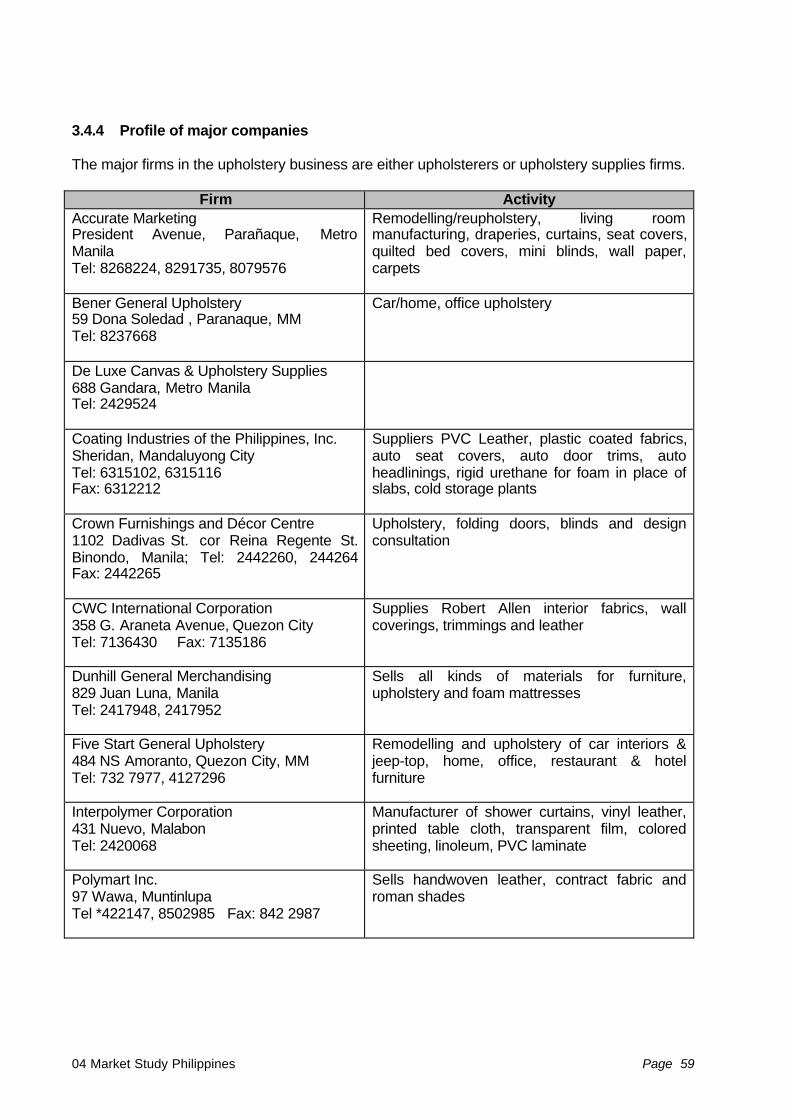
04 Market Study Philippines Page 59
3.4.4 Profile of major companies
The major firms in the upholstery business are either upholsterers or upholstery supplies firms.
Firm ActivityAccurate MarketingPresident Avenue, Parañaque, MetroManilaTel: 8268224, 8291735, 8079576
Remodelling/reupholstery, living roommanufacturing, draperies, curtains, seat covers,quilted bed covers, mini blinds, wall paper,carpets
Bener General Upholstery59 Dona Soledad , Paranaque, MMTel: 8237668
Car/home, office upholstery
De Luxe Canvas & Upholstery Supplies688 Gandara, Metro ManilaTel: 2429524
Coating Industries of the Philippines, Inc.Sheridan, Mandaluyong CityTel: 6315102, 6315116Fax: 6312212
Suppliers PVC Leather, plastic coated fabrics,auto seat covers, auto door trims, autoheadlinings, rigid urethane for foam in place ofslabs, cold storage plants
Crown Furnishings and Décor Centre1102 Dadivas St. cor Reina Regente St.Binondo, Manila; Tel: 2442260, 244264Fax: 2442265
Upholstery, folding doors, blinds and designconsultation
CWC International Corporation358 G. Araneta Avenue, Quezon CityTel: 7136430 Fax: 7135186
Supplies Robert Allen interior fabrics, wallcoverings, trimmings and leather
Dunhill General Merchandising829 Juan Luna, ManilaTel: 2417948, 2417952
Sells all kinds of materials for furniture,upholstery and foam mattresses
Five Start General Upholstery484 NS Amoranto, Quezon City, MMTel: 732 7977, 4127296
Remodelling and upholstery of car interiors &jeep-top, home, office, restaurant & hotelfurniture
Interpolymer Corporation431 Nuevo, MalabonTel: 2420068
Manufacturer of shower curtains, vinyl leather,printed table cloth, transparent film, coloredsheeting, linoleum, PVC laminate
Polymart Inc.97 Wawa, MuntinlupaTel *422147, 8502985 Fax: 842 2987
Sells handwoven leather, contract fabric androman shades
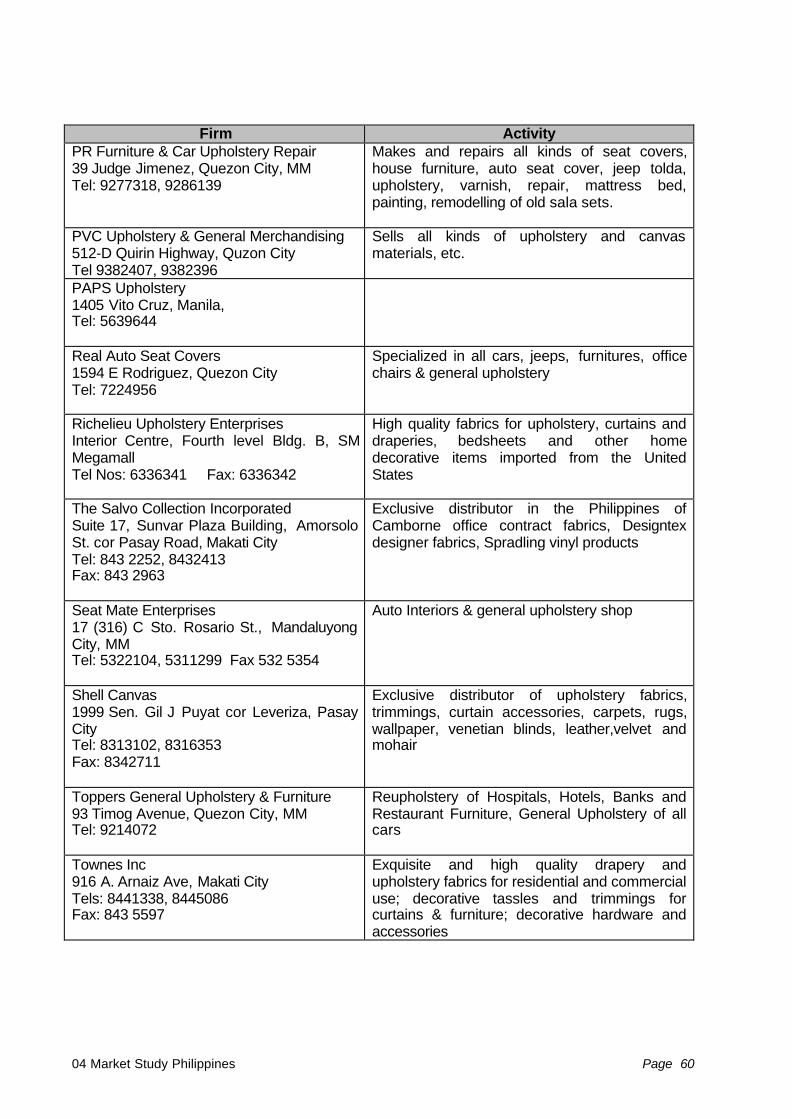
04 Market Study Philippines Page 60
Firm ActivityPR Furniture & Car Upholstery Repair39 Judge Jimenez, Quezon City, MMTel: 9277318, 9286139
Makes and repairs all kinds of seat covers,house furniture, auto seat cover, jeep tolda,upholstery, varnish, repair, mattress bed,painting, remodelling of old sala sets.
PVC Upholstery & General Merchandising512-D Quirin Highway, Quzon CityTel 9382407, 9382396
Sells all kinds of upholstery and canvasmaterials, etc.
PAPS Upholstery1405 Vito Cruz, Manila,Tel: 5639644
Real Auto Seat Covers1594 E Rodriguez, Quezon CityTel: 7224956
Specialized in all cars, jeeps, furnitures, officechairs & general upholstery
Richelieu Upholstery EnterprisesInterior Centre, Fourth level Bldg. B, SMMegamallTel Nos: 6336341 Fax: 6336342
High quality fabrics for upholstery, curtains anddraperies, bedsheets and other homedecorative items imported from the UnitedStates
The Salvo Collection IncorporatedSuite 17, Sunvar Plaza Building, AmorsoloSt. cor Pasay Road, Makati CityTel: 843 2252, 8432413Fax: 843 2963
Exclusive distributor in the Philippines ofCamborne office contract fabrics, Designtexdesigner fabrics, Spradling vinyl products
Seat Mate Enterprises17 (316) C Sto. Rosario St., MandaluyongCity, MMTel: 5322104, 5311299 Fax 532 5354
Auto Interiors & general upholstery shop
Shell Canvas1999 Sen. Gil J Puyat cor Leveriza, PasayCityTel: 8313102, 8316353Fax: 8342711
Exclusive distributor of upholstery fabrics,trimmings, curtain accessories, carpets, rugs,wallpaper, venetian blinds, leather,velvet andmohair
Toppers General Upholstery & Furniture93 Timog Avenue, Quezon City, MMTel: 9214072
Reupholstery of Hospitals, Hotels, Banks andRestaurant Furniture, General Upholstery of allcars
Townes Inc916 A. Arnaiz Ave, Makati CityTels: 8441338, 8445086Fax: 843 5597
Exquisite and high quality drapery andupholstery fabrics for residential and commercialuse; decorative tassles and trimmings forcurtains & furniture; decorative hardware andaccessories
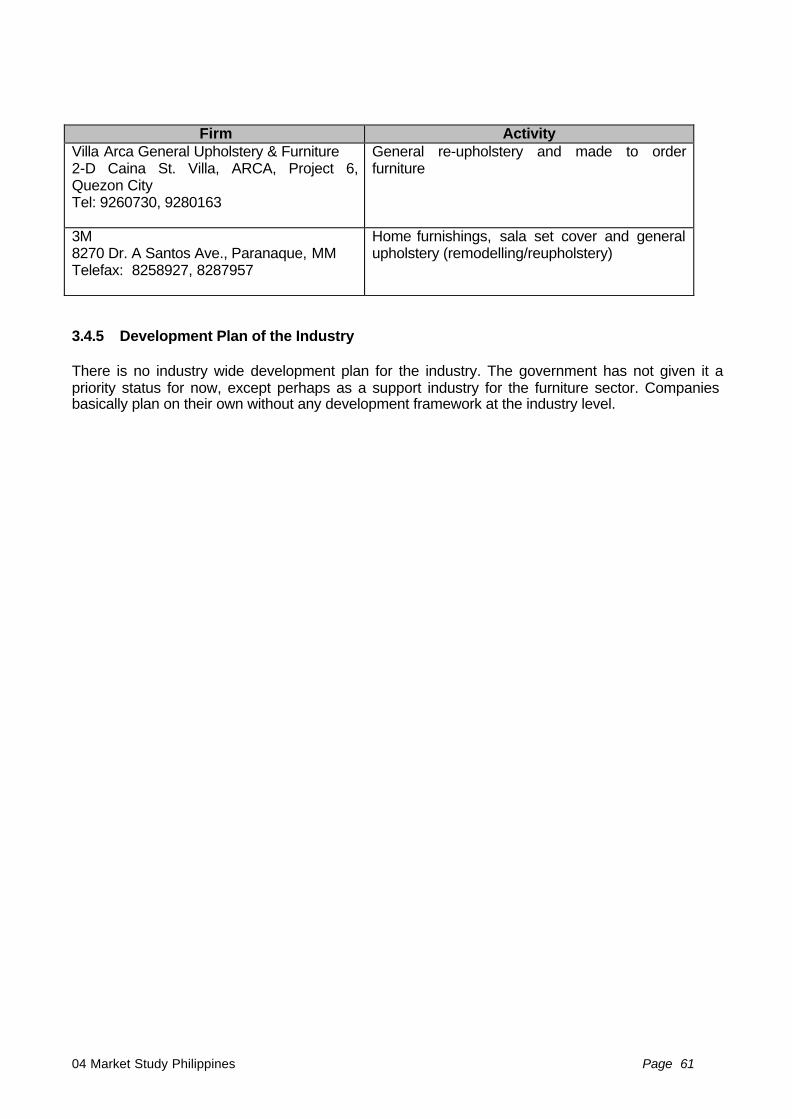
04 Market Study Philippines Page 61
Firm ActivityVilla Arca General Upholstery & Furniture2-D Caina St. Villa, ARCA, Project 6,Quezon CityTel: 9260730, 9280163
General re-upholstery and made to orderfurniture
3M8270 Dr. A Santos Ave., Paranaque, MMTelefax: 8258927, 8287957
Home furnishings, sala set cover and generalupholstery (remodelling/reupholstery)
3.4.5 Development Plan of the Industry
There is no industry wide development plan for the industry. The government has not given it apriority status for now, except perhaps as a support industry for the furniture sector. Companiesbasically plan on their own without any development framework at the industry level.
04 Market Study Philippines Page 62
4. State of the Leather Market
4.1 Market Features
The current domestic market situation, which is presently experiencing a shortage of good qualityleather in the Philippines, offers business opportunities to foreign leather manufacturers andsuppliers. The domestic leather manufacturers are not able to supply adequate amounts of goodquality leather and this situation opens up the domestic market to leather imports to meet localrequirements. The market presents a window of opportunity to both local and foreign leathercompanies to cooperate in meeting this need. Cooperation is possible in several areas:
a. Supply cooperation with raw materials and components manufacturersb. Marketing and distributionc. Technical cooperation between Philippine and foreign firmsd. Joint production arrangementse. Equity joint ventures or financial cooperationf. Investments in leather manufacturing and components manufacturingg. Regional business cooperation to tap ASEAN/Asian markets
The market players and cooperators include the tanneries, footwear manufacturers, leather goodscompanies and upholstery business.
In general, the leather market can be described as follows:
a. Market players are concentrated in the Bulacan and Marikina areas, where clusters ofleather tanners as well as footwear and leather goods manufacturers existed for manydecades.
b. Leather and leather product manufacturers are not specialized. Tanners do not onlymanufacture and sell leather but also manufacture/sell footwear or leather goods or viceversa)
c. Footwear and leather goods manufacturers operate through a network of production sub-contractors (i.e. manufacturers do not produce everything they sell)
d. Foreign competitors are penetrating the local market. Local manufacturers are experiencingstiff competition from foreign suppliers as a result of trade liberalization. In particular, lowprice manufacturers/suppliers, have successfully penetrated the low-end market as in thecase of the shoe and leather goods industries. A good number of footwear manufacturershave closed down in recent years.
e. highly disorganized and to some extent, divisive (esp. in the footwear industry). There aremany associations representing the industry, especially the footwear industry.
f. In terms of pricing, stiff competition is reducing the mark ups of tanners, which are forced tooperate at break even or even at a loss.
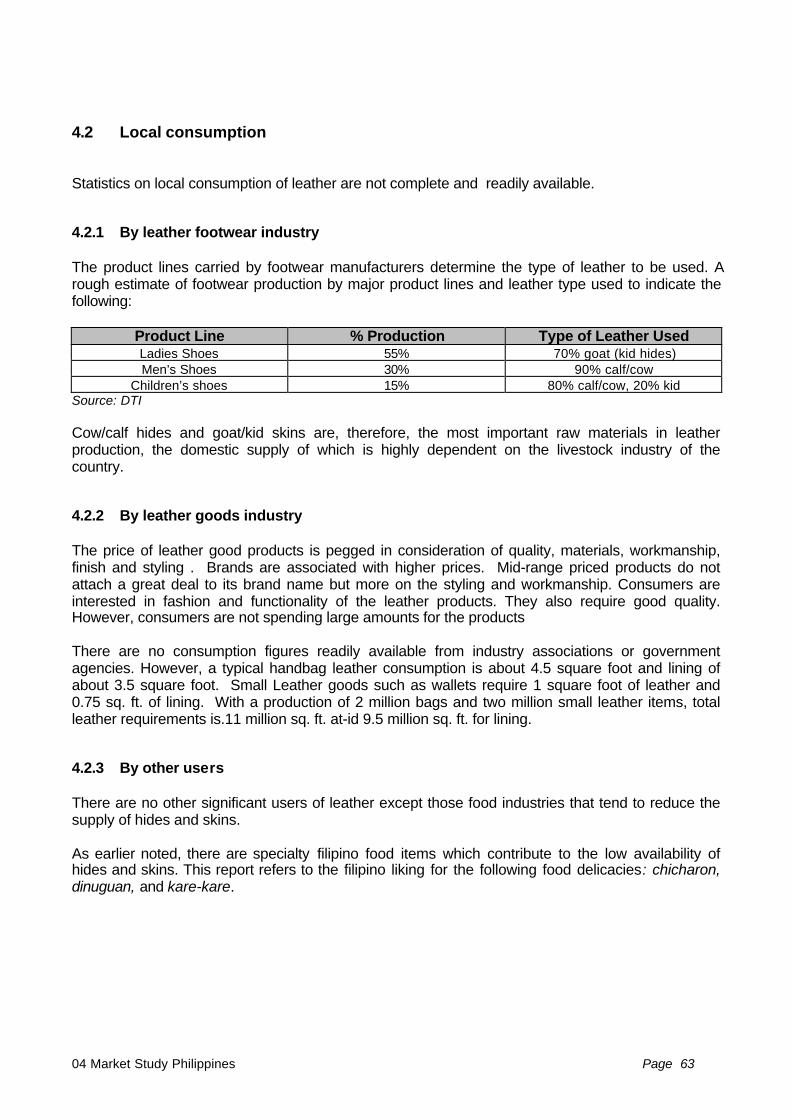
04 Market Study Philippines Page 63
4.2 Local consumption
Statistics on local consumption of leather are not complete and readily available.
4.2.1 By leather footwear industry
The product lines carried by footwear manufacturers determine the type of leather to be used. Arough estimate of footwear production by major product lines and leather type used to indicate thefollowing:
Product Line % Production Type of Leather UsedLadies Shoes 55% 70% goat (kid hides)Men’s Shoes 30% 90% calf/cow
Children’s shoes 15% 80% calf/cow, 20% kidSource: DTI
Cow/calf hides and goat/kid skins are, therefore, the most important raw materials in leatherproduction, the domestic supply of which is highly dependent on the livestock industry of thecountry.
4.2.2 By leather goods industry
The price of leather good products is pegged in consideration of quality, materials, workmanship,finish and styling . Brands are associated with higher prices. Mid-range priced products do notattach a great deal to its brand name but more on the styling and workmanship. Consumers areinterested in fashion and functionality of the leather products. They also require good quality.However, consumers are not spending large amounts for the products
There are no consumption figures readily available from industry associations or governmentagencies. However, a typical handbag leather consumption is about 4.5 square foot and lining ofabout 3.5 square foot. Small Leather goods such as wallets require 1 square foot of leather and0.75 sq. ft. of lining. With a production of 2 million bags and two million small leather items, totalleather requirements is.11 million sq. ft. at-id 9.5 million sq. ft. for lining.
4.2.3 By other users
There are no other significant users of leather except those food industries that tend to reduce thesupply of hides and skins.
As earlier noted, there are specialty filipino food items which contribute to the low availability ofhides and skins. This report refers to the filipino liking for the following food delicacies: chicharon,dinuguan, and kare-kare.
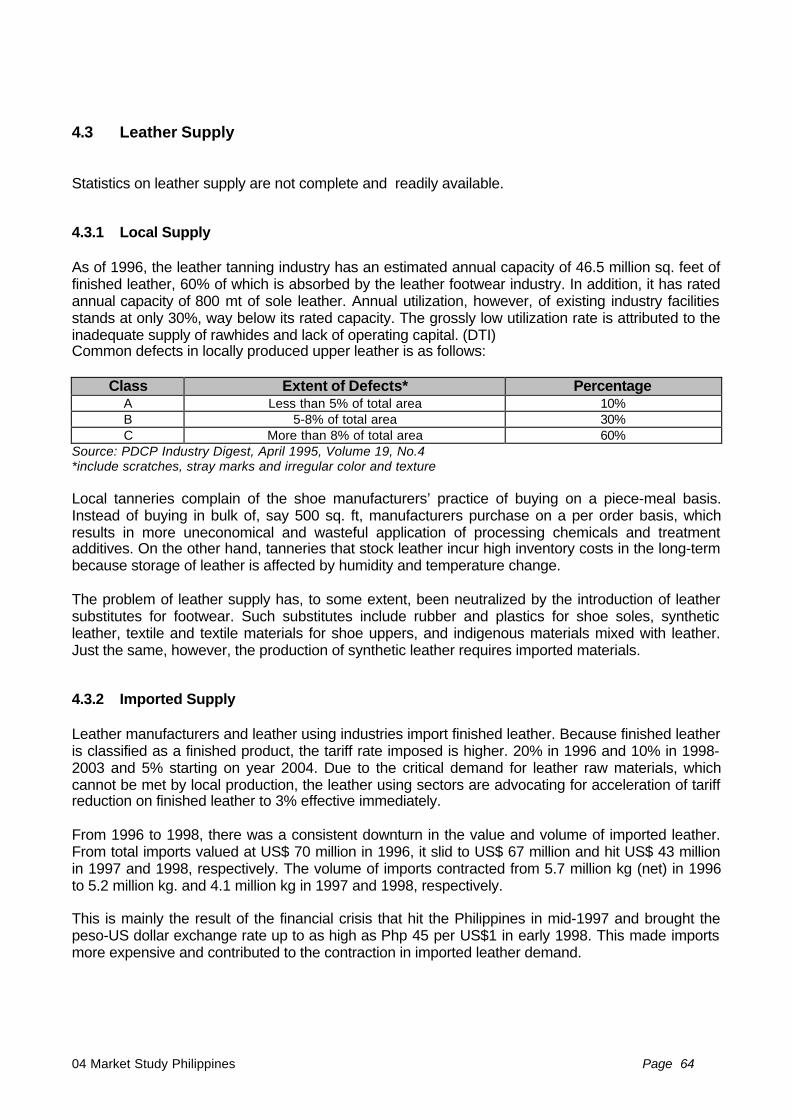
04 Market Study Philippines Page 64
4.3 Leather Supply
Statistics on leather supply are not complete and readily available.
4.3.1 Local Supply
As of 1996, the leather tanning industry has an estimated annual capacity of 46.5 million sq. feet offinished leather, 60% of which is absorbed by the leather footwear industry. In addition, it has ratedannual capacity of 800 mt of sole leather. Annual utilization, however, of existing industry facilitiesstands at only 30%, way below its rated capacity. The grossly low utilization rate is attributed to theinadequate supply of rawhides and lack of operating capital. (DTI)Common defects in locally produced upper leather is as follows:
Class Extent of Defects* PercentageA Less than 5% of total area 10%B 5-8% of total area 30%C More than 8% of total area 60%
Source: PDCP Industry Digest, April 1995, Volume 19, No.4*include scratches, stray marks and irregular color and texture
Local tanneries complain of the shoe manufacturers’ practice of buying on a piece-meal basis.Instead of buying in bulk of, say 500 sq. ft, manufacturers purchase on a per order basis, whichresults in more uneconomical and wasteful application of processing chemicals and treatmentadditives. On the other hand, tanneries that stock leather incur high inventory costs in the long-termbecause storage of leather is affected by humidity and temperature change.
The problem of leather supply has, to some extent, been neutralized by the introduction of leathersubstitutes for footwear. Such substitutes include rubber and plastics for shoe soles, syntheticleather, textile and textile materials for shoe uppers, and indigenous materials mixed with leather.Just the same, however, the production of synthetic leather requires imported materials.
4.3.2 Imported Supply
Leather manufacturers and leather using industries import finished leather. Because finished leatheris classified as a finished product, the tariff rate imposed is higher. 20% in 1996 and 10% in 1998-2003 and 5% starting on year 2004. Due to the critical demand for leather raw materials, whichcannot be met by local production, the leather using sectors are advocating for acceleration of tariffreduction on finished leather to 3% effective immediately.
From 1996 to 1998, there was a consistent downturn in the value and volume of imported leather.From total imports valued at US$ 70 million in 1996, it slid to US$ 67 million and hit US$ 43 millionin 1997 and 1998, respectively. The volume of imports contracted from 5.7 million kg (net) in 1996to 5.2 million kg. and 4.1 million kg in 1997 and 1998, respectively.
This is mainly the result of the financial crisis that hit the Philippines in mid-1997 and brought thepeso-US dollar exchange rate up to as high as Php 45 per US$1 in early 1998. This made importsmore expensive and contributed to the contraction in imported leather demand.

04 Market Study Philippines Page 65
Value (US$M, FOB) and Volume (net. M kg.) of Imported LeatherLeather Imports
1996 1997 1998 1996 1997 1998
Chrome wet blue/crust veg 2,20 1,00 0,02 0,50 0,30 0,01Bovine leather, veg. Tanned 0,40 1,40 0,40 0,08 0,07 0,02Full grains & grain splits of other Bov/Equine 5,70 7,00 7,10 0,50 0,60 0,60Other Bovine & Equine leather, parchment 50,60 42,40 24,70 3,40 2,70 1,70Chrome wet blue hides & skins (semi tanned) 0,20 0,40 1,00 0,40 0,30 0,70Leather of swine, w/o hair on 1,60 2,60 0,70 0,20 0,40 0,20Leather of other animals w/o hair on 3,90 62,90 38,80 0,30 0,40 0,30Other leather 7,10 3,80 3,90 0,30 0,30 0,30
Value in US$ M, FOB Volume in net M kg.
Source of basic data: Bureau of Export Trade Promotion
0
10
20
30
40
50
60
1996 1997 1998
Chrome wet blue/crustveg
Bovine leather/veg.Tanned
Full grains & grain splitsof other B/E Leather
Other bov/equine leather,parchment
Chrome wet bluehides/skins/crust veg(semi-tanned)Leather of swine, withouthair on
Leather of other animalsw/o hair
Other leather
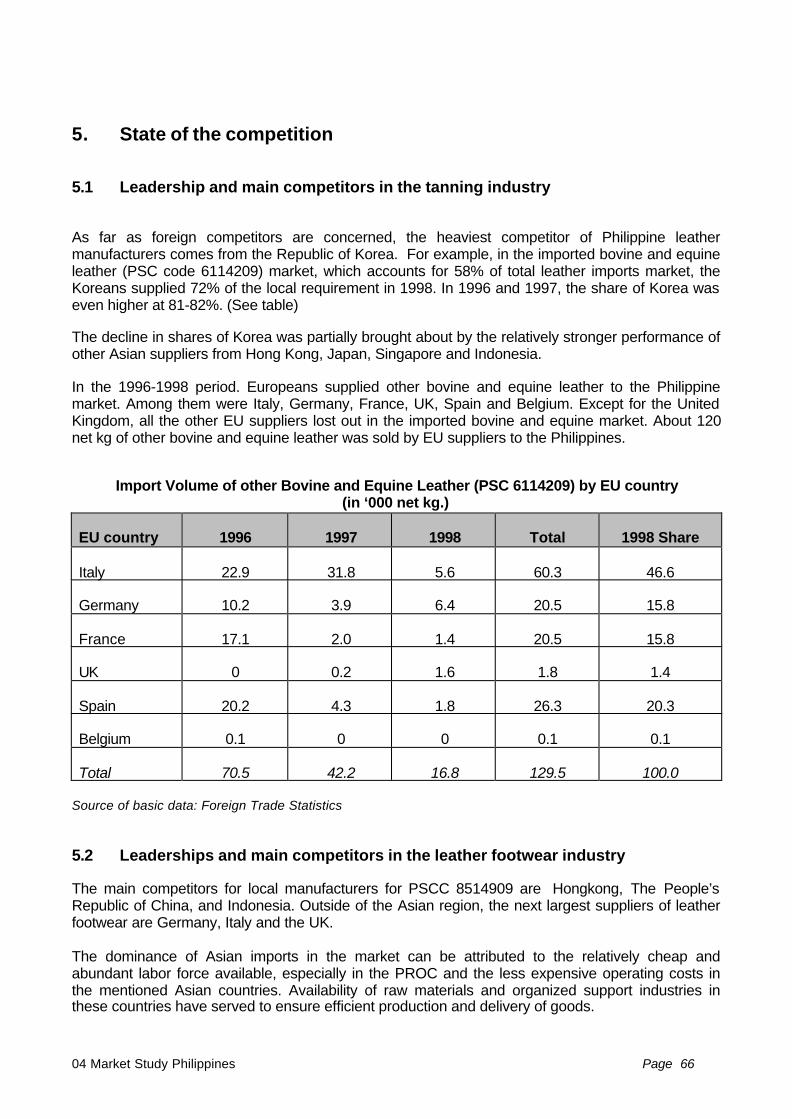
04 Market Study Philippines Page 66
5. State of the competition
5.1 Leadership and main competitors in the tanning industry
As far as foreign competitors are concerned, the heaviest competitor of Philippine leathermanufacturers comes from the Republic of Korea. For example, in the imported bovine and equineleather (PSC code 6114209) market, which accounts for 58% of total leather imports market, theKoreans supplied 72% of the local requirement in 1998. In 1996 and 1997, the share of Korea waseven higher at 81-82%. (See table)
The decline in shares of Korea was partially brought about by the relatively stronger performance ofother Asian suppliers from Hong Kong, Japan, Singapore and Indonesia.
In the 1996-1998 period. Europeans supplied other bovine and equine leather to the Philippinemarket. Among them were Italy, Germany, France, UK, Spain and Belgium. Except for the UnitedKingdom, all the other EU suppliers lost out in the imported bovine and equine market. About 120net kg of other bovine and equine leather was sold by EU suppliers to the Philippines.
Import Volume of other Bovine and Equine Leather (PSC 6114209) by EU country(in ‘000 net kg.)
EU country 1996 1997 1998 Total 1998 Share
Italy 22.9 31.8 5.6 60.3 46.6
Germany 10.2 3.9 6.4 20.5 15.8
France 17.1 2.0 1.4 20.5 15.8
UK 0 0.2 1.6 1.8 1.4
Spain 20.2 4.3 1.8 26.3 20.3
Belgium 0.1 0 0 0.1 0.1
Total 70.5 42.2 16.8 129.5 100.0
Source of basic data: Foreign Trade Statistics
5.2 Leaderships and main competitors in the leather footwear industry
The main competitors for local manufacturers for PSCC 8514909 are Hongkong, The People’sRepublic of China, and Indonesia. Outside of the Asian region, the next largest suppliers of leatherfootwear are Germany, Italy and the UK.
The dominance of Asian imports in the market can be attributed to the relatively cheap andabundant labor force available, especially in the PROC and the less expensive operating costs inthe mentioned Asian countries. Availability of raw materials and organized support industries inthese countries have served to ensure efficient production and delivery of goods.
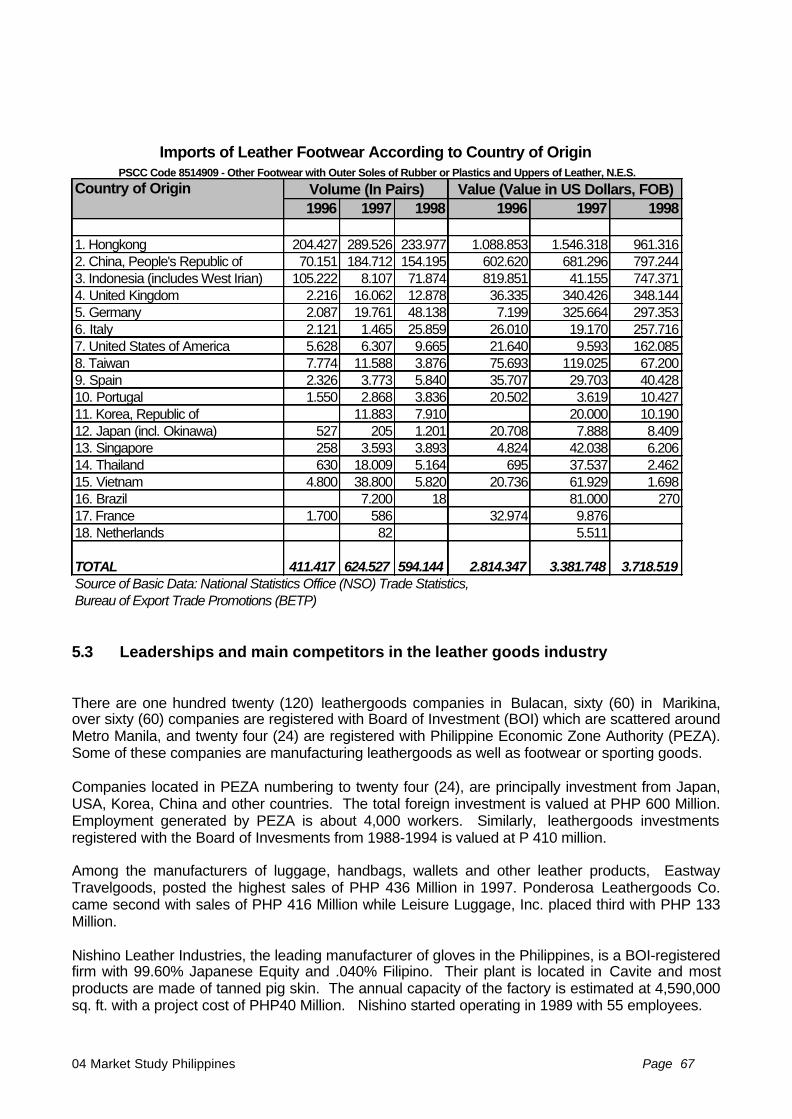
04 Market Study Philippines Page 67
Country of Origin 1996 1997 1998 1996 1997 1998
1. Hongkong 204.427 289.526 233.977 1.088.853 1.546.318 961.3162. China, People's Republic of 70.151 184.712 154.195 602.620 681.296 797.2443. Indonesia (includes West Irian) 105.222 8.107 71.874 819.851 41.155 747.3714. United Kingdom 2.216 16.062 12.878 36.335 340.426 348.1445. Germany 2.087 19.761 48.138 7.199 325.664 297.3536. Italy 2.121 1.465 25.859 26.010 19.170 257.7167. United States of America 5.628 6.307 9.665 21.640 9.593 162.0858. Taiwan 7.774 11.588 3.876 75.693 119.025 67.2009. Spain 2.326 3.773 5.840 35.707 29.703 40.42810. Portugal 1.550 2.868 3.836 20.502 3.619 10.42711. Korea, Republic of 11.883 7.910 20.000 10.19012. Japan (incl. Okinawa) 527 205 1.201 20.708 7.888 8.40913. Singapore 258 3.593 3.893 4.824 42.038 6.20614. Thailand 630 18.009 5.164 695 37.537 2.46215. Vietnam 4.800 38.800 5.820 20.736 61.929 1.69816. Brazil 7.200 18 81.000 27017. France 1.700 586 32.974 9.87618. Netherlands 82 5.511
TOTAL 411.417 624.527 594.144 2.814.347 3.381.748 3.718.519Source of Basic Data: National Statistics Office (NSO) Trade Statistics, Bureau of Export Trade Promotions (BETP)
Volume (In Pairs) Value (Value in US Dollars, FOB)
Imports of Leather Footwear According to Country of Origin PSCC Code 8514909 - Other Footwear with Outer Soles of Rubber or Plastics and Uppers of Leather, N.E.S.
5.3 Leaderships and main competitors in the leather goods industry
There are one hundred twenty (120) leathergoods companies in Bulacan, sixty (60) in Marikina,over sixty (60) companies are registered with Board of Investment (BOI) which are scattered aroundMetro Manila, and twenty four (24) are registered with Philippine Economic Zone Authority (PEZA).Some of these companies are manufacturing leathergoods as well as footwear or sporting goods.
Companies located in PEZA numbering to twenty four (24), are principally investment from Japan,USA, Korea, China and other countries. The total foreign investment is valued at PHP 600 Million.Employment generated by PEZA is about 4,000 workers. Similarly, leathergoods investmentsregistered with the Board of Invesments from 1988-1994 is valued at P 410 million.
Among the manufacturers of luggage, handbags, wallets and other leather products, EastwayTravelgoods, posted the highest sales of PHP 436 Million in 1997. Ponderosa Leathergoods Co.came second with sales of PHP 416 Million while Leisure Luggage, Inc. placed third with PHP 133Million.
Nishino Leather Industries, the leading manufacturer of gloves in the Philippines, is a BOI-registeredfirm with 99.60% Japanese Equity and .040% Filipino. Their plant is located in Cavite and mostproducts are made of tanned pig skin. The annual capacity of the factory is estimated at 4,590,000sq. ft. with a project cost of PHP40 Million. Nishino started operating in 1989 with 55 employees.
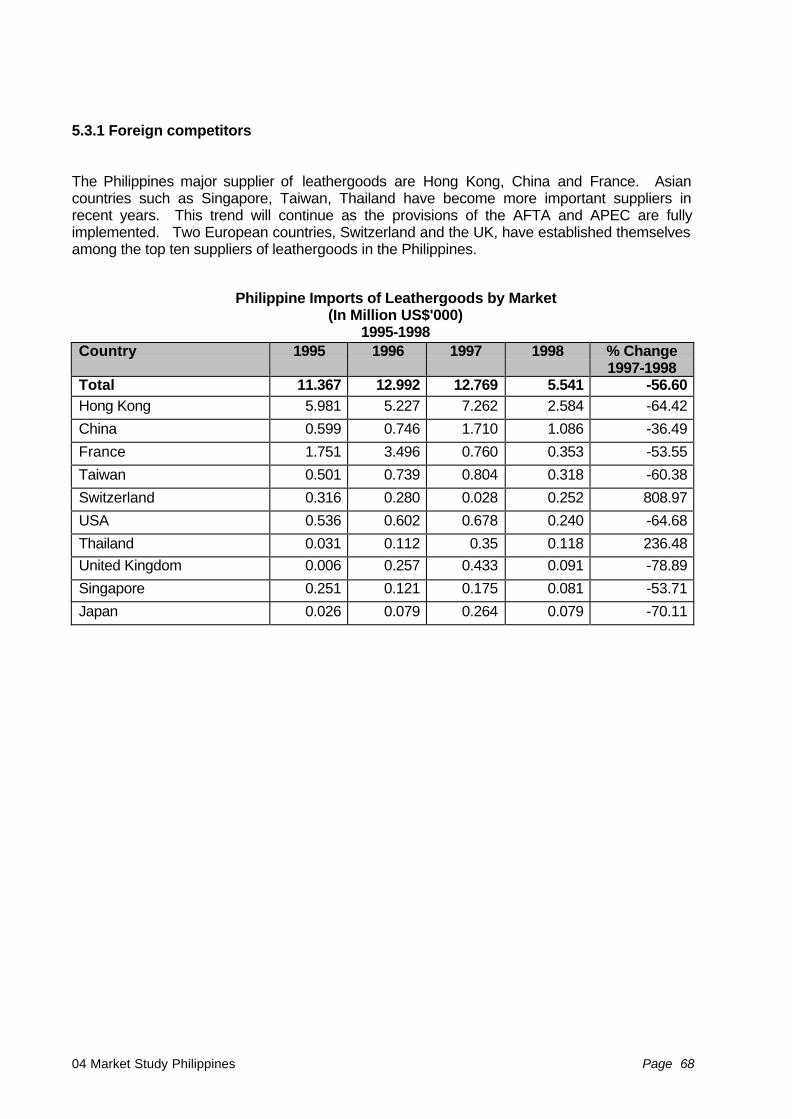
04 Market Study Philippines Page 68
5.3.1 Foreign competitors
The Philippines major supplier of leathergoods are Hong Kong, China and France. Asiancountries such as Singapore, Taiwan, Thailand have become more important suppliers inrecent years. This trend will continue as the provisions of the AFTA and APEC are fullyimplemented. Two European countries, Switzerland and the UK, have established themselvesamong the top ten suppliers of leathergoods in the Philippines.
Philippine Imports of Leathergoods by Market(In Million US$'000)
1995-1998Country 1995 1996 1997 1998 % Change
1997-1998Total 11.367 12.992 12.769 5.541 -56.60Hong Kong 5.981 5.227 7.262 2.584 -64.42
China 0.599 0.746 1.710 1.086 -36.49
France 1.751 3.496 0.760 0.353 -53.55
Taiwan 0.501 0.739 0.804 0.318 -60.38
Switzerland 0.316 0.280 0.028 0.252 808.97
USA 0.536 0.602 0.678 0.240 -64.68
Thailand 0.031 0.112 0.35 0.118 236.48United Kingdom 0.006 0.257 0.433 0.091 -78.89
Singapore 0.251 0.121 0.175 0.081 -53.71
Japan 0.026 0.079 0.264 0.079 -70.11
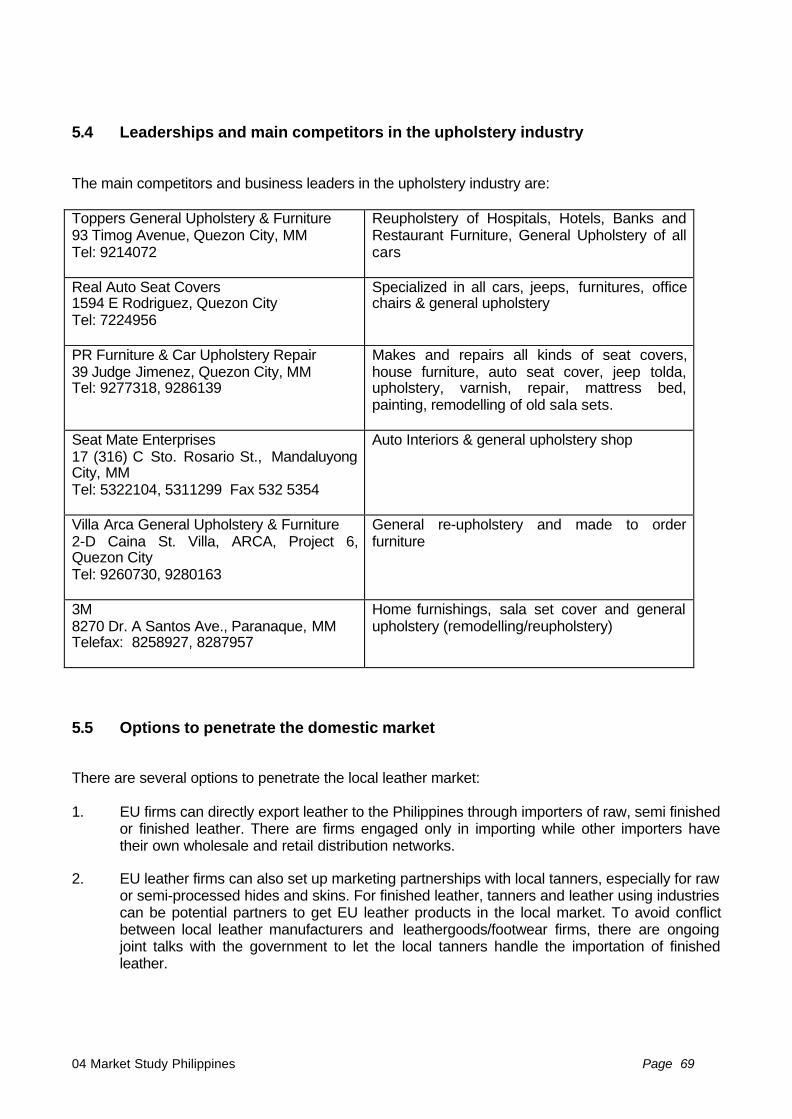
04 Market Study Philippines Page 69
5.4 Leaderships and main competitors in the upholstery industry
The main competitors and business leaders in the upholstery industry are:
Toppers General Upholstery & Furniture93 Timog Avenue, Quezon City, MMTel: 9214072
Reupholstery of Hospitals, Hotels, Banks andRestaurant Furniture, General Upholstery of allcars
Real Auto Seat Covers1594 E Rodriguez, Quezon CityTel: 7224956
Specialized in all cars, jeeps, furnitures, officechairs & general upholstery
PR Furniture & Car Upholstery Repair39 Judge Jimenez, Quezon City, MMTel: 9277318, 9286139
Makes and repairs all kinds of seat covers,house furniture, auto seat cover, jeep tolda,upholstery, varnish, repair, mattress bed,painting, remodelling of old sala sets.
Seat Mate Enterprises17 (316) C Sto. Rosario St., MandaluyongCity, MMTel: 5322104, 5311299 Fax 532 5354
Auto Interiors & general upholstery shop
Villa Arca General Upholstery & Furniture2-D Caina St. Villa, ARCA, Project 6,Quezon CityTel: 9260730, 9280163
General re-upholstery and made to orderfurniture
3M8270 Dr. A Santos Ave., Paranaque, MMTelefax: 8258927, 8287957
Home furnishings, sala set cover and generalupholstery (remodelling/reupholstery)
5.5 Options to penetrate the domestic market
There are several options to penetrate the local leather market:
1. EU firms can directly export leather to the Philippines through importers of raw, semi finishedor finished leather. There are firms engaged only in importing while other importers havetheir own wholesale and retail distribution networks.
2. EU leather firms can also set up marketing partnerships with local tanners, especially for rawor semi-processed hides and skins. For finished leather, tanners and leather using industriescan be potential partners to get EU leather products in the local market. To avoid conflictbetween local leather manufacturers and leathergoods/footwear firms, there are ongoingjoint talks with the government to let the local tanners handle the importation of finishedleather.

04 Market Study Philippines Page 70
3. EU leather companies could likewise consider establishing joint production and marketingarrangements with local tanners. There had been some experience in this regard where anItalian leather company has provided technical / production advice to a local firm for themanufacture of leather for the Middle East / European markets. The Italian partner visits thePhilippines regularly to assist in the production of leather using the facilities of the localleather manufacturer. The Italian partner also markets the product overseas.
4. Local firms are also open to the possibility of establishing equity partnerships. They offer alower production costs in exchange for markets and/or improved technology.
There are specific areas of opportunity for interested investors.
One is in the leather tanning sector to provide finished leather to support the growing demand of theleathergoods manufacturing sector. Since locally produced leather is basically considered of inferiorquality because of poor quality local hides and lack of modern tanning facilities, the leatherfootwear, leathergoods and upholstery subsectors had to rely on imported leather for productscatering to the higher end of both the domestic and international markets. Investors are thereforeencouraged to invest in modern tanning facilities. The increase use of alternative leather sourcessuch as pig or goat skin which are more abundant than cattle hides could also be developed.
In the footwear sector, a plastic shoe last factory has been set up with a German partner a fewyears ago and is now entering into production phase. There are still many components which areimported and could still be considered by EU firms as opportunities to produce locally. Thecompetitive advantage of producing shoe components in the Philippines to serve global marketsshould be explored further.
Similarly, there are also opportunities in the leather goods manufacturing sector where there areenormous export opportunities. The country has the advantage of relatively inexpensive labor,highly educated workforce, keen sense of Western tastes and access to major internationalmarkets. There are business opportunities for trading and manufacturing metal accessories likebuckles, locks and other components which have to be imported from other countries due to theinferior local quality of locally produced items. With the liberalized investment climate in the country,the leather goods industry hopes to attract support industry such as accessories and leatherfinishing.
04 Market Study Philippines Page 71
5.6 Potential Partners in distribution
The Philippine retail trade sector is one of the most highly developed and viable industries in thecountry. A study reports that the average annual growth rate in sales range from 12% to 15%. Itaccounts for an average share in gross domestic product of 11.3% from 1980 to 1992.
Key players in the department store sector include Shoemart, Inc. (SM), Rustan Commercial Corp.,and Uniwide Sales Inc. See Annex for List of Department Stores
Leather footwear and leather goods manufacturers sell their products at various points of thedistribution stream. There are those that directly sell retail, others sell to establishments whoundertake the retailing, department stores, local community market, boutiques, etc. A few firmsreport direct export and sales to exporting firms, agents and middlemen buyers. Most small-scaleentrepreneurs also act as their own marketing agents, approaching department stores with samplesand taking orders. Most shops initially order modest batches, then increase their orders if a batchsells well.
Some leather footwear and leather goods exporters are dependent on participation in internationaltrade fairs, selling missions and servicing direct and indirect inquiries to generate sales.
5.7 Potential partners in manufacturing
Potential partners in manufacturing are members of the industry associations representing the mainleather sectors, such as the Tanning Association of the Philippines (TAP), Footwear IndustryAssociations (various) and the leather goods industry association (APLEM).
5.8 Distribution channels
Products basically flow through traders and then to final users or buyers.
Philippine companies can go direct to the source to avoid the mark ups along the distribution chain.Many companies have their own importing company and distribution channels, as in the case ofmost department stores.
Manufacturers of leather, leather footwear and leather goods can import semi processed/finishedgoods directly and supply them to their clients/buyers.
Asia-Invest Secretariat Rue Archimède, 17 Archimèdststraat B-1000 Brussels • Belgium Tel: +32 2 282 17 50 • Fax: +32 2 282 17 60 E-mail: [email protected] Website: http://www.asia-invest.com
Copyright © 2022 FDOKUMEN