MilkfishProductionDualism in the Philippines:
77
SH .207 TR4 tFI5 c.2 - Milkfish Production Dualism in the Philippines: A Multidisciplinary Perspective on Continuous Low Yields and Constraints to Aquaculture Development ICLARM TECHNICAL REPORTS 15 Kee-Chai Chong Maura S. Lizarondo Zenaida S. dela Cruz Cesar \I. Guerrero Ian R. Smith 8 ""'1 "" t f ;, ..~ , '.' r <. FOOD AND AGRICULTURE ORGANIZATION OF THE UNITED NATIONS PHILIPPINE BUREAU OF AGRICULTURAL ECONOMICS PHILIPPINE BUREAU OF FISHERIE~ AND AQUATIC RESOURCES INTERNATIONAL CENTER FOR LIVING AQUATIC RESOURCES MANAGEMENT
-
Upload
khangminh22 -
Category
Documents
-
view
0 -
download
0
Transcript of MilkfishProductionDualism in the Philippines:

SH.207TR4tFI5c.2
- MilkfishProductionDualism in the Philippines:A Multidisciplinary Perspective
on Continuous Low Yields and Constraints
to Aquaculture Development
ICLARM TECHNICAL REPORTS 15
Kee-Chai ChongMaura S. Lizarondo
Zenaida S. dela Cruz
Cesar \I. Guerrero
Ian R.Smith
8
""'1""t
f ;,..~ ,
'.' r <.
FOOD AND AGRICULTURE ORGANIZATION OF THE UNITED NATIONSPHILIPPINE BUREAU OF AGRICULTURAL ECONOMICS
PHILIPPINE BUREAU OF FISHERIE~ AND AQUATIC RESOURCESINTERNATIONAL CENTER FOR LIVING AQUATIC RESOURCESMANAGEMENT
fish Production Dualism in the Philippines: A Multidisciplinary Perspective
on Continuous Low Yields and Constraints to Aquaculture Development
Zenaida S. dela Cruz Cesar V. Guerrero
Ian R. Smith
FOOD AND AGRICULTURE ORGANIZATION OF THE UNITED NATIONS ROME, ITALY
BUREAU OF AGRICULTURAL ECONOMICS QUEZON CITY, PHILIPPINES
BUREAU OF FISHERIES AND AQUATIC RESOURCES QUEZON CITY, PHILIPPINES
INTERNATIONAL CENTER FOR LIVING AQUATIC RESOURCES MANAGEMENT MANILA, PHILIPPINES

Milkfish production dualism in the Philippines: a multidisciplinary perspective on continuous low yields and constraints to aquaculture development
AND
Published jointly by the Food and Agriculture Organization o f the United Nations, Rome Italy; Bureau o f Agricultural Economics, Quezon City, Philippines; Bureau o f Fisheries and Aquatic Resources, Quezon City, Philippines and International Center fo r Living Aquatic Resources Management, Manila, Philippines.
Printed in Manila, Philippines.
Chong, K-C., M.S. Lizarondo, Z.S. dela Cruz, C.V. Guerrero and I.R. Smith. 1984. Milkfish production dualism in the Philippines: a multidisciplinary perspective on continuous low yields and constraints t o aquaculture development. ICLARM Technical Reports 15,70 p. Food and Agriculture Organization o f the United Nations, Rome, Italy; Bureau o f Agricultural Economics, Quezon City, Philippines; Bureau o f Fisheries and Aquatic Resources, Quezon City, Philippines and International Center for Living Aquatic Resources Management, Manila, Philippines.
Cover: Rounding up milkfish for harvest i n a large Philippine pond. Photo by Kee Chai Chong.
lSSN 01 15-5547 ISBN 971 -1022-10-9
ICLARM Contribution No. 206

Table of Contents
Listof Figures . . . . . . . . . . . . . . . . . . . . . . . . . . . . . . . . . . . . . . . . . . . . . . . . . . . . . . . . . . . . . v
ListofTables . . . . . . . . . . . . . . . . . . . . . . . . . . . . . . . . . . . . . . . . . . . . . . . . . . . . . . . . . . . . . v
Abstract . . . . . . . . . . . . . . . . . . . . . . . . . . . . . . . . . . . . . . . . . . . . . . . . . . . . . . . . . . . . . . . . . I
Introduction . . . . . . . . . . . . . . . . . . . . . . . . . . . . . . . . . . . . . . . . . . . . . . . . . . . . . . . . . . . . . . 2
BACKGROUND INFORMATION . . . . . . . . . . . . . . . . . . . . . . . . . . . . . . . . . . . . . . . . . . . . . 2 PAST GOVERNMENT PROGRAMS . . . . . . . . . . . . . . . . . . . . . . . . . . . . . . . . . . . . . . . . . . . . 2 DUALISTIC STRUCTURE OF THE MILKFISH INDUSTRY . . . . . . . . . . . . . . . . . . . . . . . . . . . 5 OBJECTIVES . . . . . . . . . . . . . . . . . . . . . . . . . . . . . . . . . . . . . . . . . . . . . . . . . . . . . . . . . . . 6 DATABASE . . . . . . . . . . . . . . . . . . . . . . . . . . . . . . . . . . . . . . . . . . . . . . . . . . . . . . . . . . . . 7
Alternative Theories of Agricultural Change . . . . . . . . . . . . . . . . . . . . . . . . . . . . . . . . . . . . . . 9
'SMALL FARMERS ARE POOR DECISIONMAKERS'THEORY . . . . . . . . . . . . . . . . . . . . . . . . 10 'SMALL FARMERS ARE POOR BUT EFFICIENT"THE0RY . . . . . . . . . . . . . . . . . . . . . . . . . . 11 INDUCED INNOVATION AND R.URAL STAGNATION . . . . . . . . . . . . . . . . . . . . . . . . . . . . . . 12
Analytical Methodology to Measure Variation in Input Use . . . . . . . . . . . . . . . . . . . . . . . . . . 13
Results and Discussion: Low Levels and Variations in Supplementary Input Use . . . . . . . . . . . . . . . . . . . . . . . . . . . . . . . . . . . . . . . . . . . . . . . . 17
INTRODUCTION . . . . . . . . . . . . . . . . . . . . . . . . . . . . . . . . . . . . . . . . . . . . . . . . . . . . . . . . 17 SUMMARY AND TABULATION OF SURVEY DATA . . . . . . . . . . . . . . . . . . . . . . . . . . . . . . . 17 MANAGERIAL PROFILE OF MILKFISH FARMERS AND EFFECT ON YIELDS . . . . . . . . . . . . . 23
Age . . . . . . . . . . . . . . . . . . . . . . . . . . . . . . . . . . . . . . . . . . . . . . . . . . . . . . . . . . . . . . 23 Educationalattainment . . . . . . . . . . . . . . . . . . . . . . . . . . . . . . . . . . . . . . . . . . . . . . . . 23 Milkfish culture experience . . . . . . . . . . . . . . . . . . . . . . . . . . . . . . . . . . . . . . . . . . . . . . 24 Workpattern . . . . . . . . . . . . . . . . . . . . . . . . . . . . . . . . . . . . . . . . . . . . . . . . . . . . . . . 25
ESTIMATION OF THE INPUT VARIATION MODEL . . . . . . . . . . . . . . . . . . . . . . . . . . . . . . . . 26
SIGNIFICANT VARIABLES . . . . . . . . . . . . . . . . . . . . . . . . . . . . . . . . . . . . . . . . . . . . . . . . . . 28
Socioeconomic parameters . . . . . . . . . . . . . . . . . . . . . . . . . . . . . . . . . . . . . . . . . . . . . . 28 Bio-technical parameters . . . . . . . . . . . . . . . . . . . . . . . . . . . . . . . . . . . . . . . . . . . . . . . . 31 Physical parameters . . . . . . . . . . . . . . . . . . . . . . . . . . . . . . . . . . . . . . . . . . . . . . . . . . . 32
NON-SIGNIF CANT VARIABLES . . . . . . . . . . . . . . . . . . . . . . . . . . . . . . . . . . . . . . . . . . . . . 32
Socioeconomic parameters . . . . . . . . . . . . . . . . . . . . . . . . . . . . . . . . . . . . . . . . . . . . . . 32 Institutional parameters . . . . . . . . . . . . . . . . . . . . . . . . . . . . . . . . . . . . . . . . . . . . . . . . 36 Bio-technical parameters . . . . . . . . . . . . . . . . . . . . . . . . . . . . . . . . . . . . . . . . . . . . . . . . 39 Physical parameters . . . . . . . . . . . . . . . . . . . . . . . . . . . . . . . . . . . . . . . . . . . . . . . . . . . 43
iii

SUMMARY OF FINDINGS . . . . . . . . . . . . . . . . . . . . . . . . . . . . . . . . . . . . . . . . . . . . . . . . . . 48
Conclusion: Implications for Aquaculture Development Policy . . . . . . . . . . . . . . . . . . . . . . . 50
INDUSTRY STAGNATION OR TRANSFORMATION . . . . . . . . . . . . . . . . . . . . . . . . . . . . . . . 50 ACTIONSTEPS . . . . . . . . . . . . . . . . . . . . . . . . . . . . . . . . . . . . . . . . . . . . . . . . . . . . . . . . . 52
Changing relative prices . . . . . . . . . . . . . . . . . . . . . . . . . . . . . . . . . . . . . . . . . . . . . . . . 52 Improving technical knowledge of producers . . . . . . . . . . . . . . . . . . . . . . . . . . . . . . . . . . 54
Acknowledgements . . . . . . . . . . . . . . . . . . . . . . . . . . . . . . . . . . . . . . . . . . . . . . . . . . . . . . . . . 56
References . . . . . . . . . . . . . . . . . . . . . . . . . . . . . . . . . . . . . . . . . . . . . . . . . . . . . . . . . . . . . . . . 56
Appendix: Questionnaire Used in this Study . . . . . . . . . . . . . . . . . . . . . . . . . . . . . . . . . . . . . . 58

List of Figures
1 . Definition of yield gaps . . . . . . . . . . . . . . . . . . . . . . . . . . . . . . . . . . . . . . . . . . . . . . . . . . . . . 7 2 . Map of the Philippines showing the provinces included in
the 1979 and 1981 surveys . . . . . . . . . . . . . . . . . . . . . . . . . . . . . . . . . . . . . . . . . . . . . . . . . . . 8 3 . Types and average quantities of fertilizers used (kglhalyr)
in milkfish culture by farm size (ha) . . . . . . . . . . . . . . . . . . . . . . . . . . . . . . . . . . . . . . . . . . . . . 22 4 . Milkfish yield as a function of age of farmers . . . . . . . . . . . . . . . . . . . . . . . . . . . . . . . . . . . . . . . 24 5 . Average annual per hectare milkfish yield of inexperienced
and experienced farmers . . . . . . . . . . . . . . . . . . . . . . . . . . . . . . . . . . . . . . . . . . . . . . . . . . . . . 25
List of Tables
1 . Total area and production of milkfish in the Philippines. 1952-1 980 . . . . . . . . . . . . . . . . . . . . . . . . 2 . Salient features of the dualistic structure of the milkfish industry
(1980cropyear) . . . . . . . . . . . . . . . . . . . . . . . . . . . . . . . . . . . . . . . . . . . . . . . . . . . . . . . . . . 3 . Percentage of farmers attaining various yield levels in intensively
managed milkfish farms in selected provinces. 1978 crop year . . . . . . . . . . . . . . . . . . . . . . . . . . . . 4 . Distribution of developed and undeveloped areas on milkfish
farms in the 1980 crop year . . . . . . . . . . . . . . . . . . . . . . . . . . . . . . . . . . . . . . . . . . . . . . . . . . . 5 . Parameters hypothesized to explain variations in expenditure
onfertilizers . . . . . . . . . . . . . . . . . . . . . . . . . . . . . . . . . . . . . . . . . . . . . . . . . . . . . . . . . . . . . 6 . Summary of farm data by output and level of input use
(mean and standard deviation on a per farm basis) . . . . . . . . . . . . . . . . . . . . . . . . . . . . . . . . . . . . 7 . Number of farmers using supplementary inputs and no supplementary
inputs and their corresponding average yields (kglhalyr). 1980 . . . . . . . . . . . . . . . . . . . . . . . . . . . . 8 . Milkfish yields in selected Philippine provinces . . . . . . . . . . . . . . . . . . . . . . . . . . . . . . . . . . . . . . 9 . Rates of application and expenditures on organic and inorganic
. . . . . . . . . . . . . . . . . . . . . . . . . . . . . . . . . . . . . . . . . . . . . . . . . . . . . . . fertilizers by province 10 . Percentage distribution of milkfish farmers with and without education . . . . . . . . . . . . . . . . . . . . . . 11 . Culture experience in years of Philippine milkfish farmers in
selected provinces . . . . . . . . . . . . . . . . . . . . . . . . . . . . . . . . . . . . . . . . . . . . . . . . . . . . . . . . . 12 . Percentage distribution of full-time and part-time milkfish farmers in
selected provinces in the Philippines . . . . . . . . . . . . . . . . . . . . . . . . . . . . . . . . . . . . . . . . . . . . . 13 . Input use variation model: regression coefficients and
significance levels . . . . . . . . . . . . . . . . . . . . . . . . . . . . . . . . . . . . . . . . . . . . . . . . . . . . . . . . . 14 . Average outputlinput price ratios of milkfish to organic and
inorganic fertlizers. by province . . . . . . . . . . . . . . . . . . . . . . . . . . . . . . . . . . . . . . . . . . . . . . . . 15 . Milkfish farmers' belief in the effect of fertilizers on the taste of milkfish . . . . . . . . . . . . . . . . . . . . . 16 . Milkfish farmers' view of a "fair" collateral requirement . . . . . . . . . . . . . . . . . . . . . . . . . . . . . . . . 17 . Information gathering characteristics of milkfish farmers (percent) . . . . . . . . . . . . . . . . . . . . . . . . . 18 . Price ratios of marketable milkfish to milkfish fry and fingerlings
estimated by piece . . . . . . . . . . . . . . . . . . . . . . . . . . . . . . . . . . . . . . . . . . . . . . . . . . . . . . . . . 19 . Comparisons of Metro Manila consumer price indices for milkfish.
all fish. meat and all items . . . . . . . . . . . . . . . . . . . . . . . . . . . . . . . . . . . . . . . . . . . . . . . . . . . . 20 . Percentage distribution of owner and non-owner milkfish
farmer respondents by province . . . . . . . . . . . . . . . . . . . . . . . . . . . . . . . . . . . . . . . . . . . . . . . .

21 . Milkfish farmers' view on the risks associated with larger quantities of inputs and techniques which give higher output . . . . . . . . . . . . . . . . . . . . . . . . . . . . . . . . . . . . . . 35
22 . Profile of the use of loans . . . . . . . . . . . . . . . . . . . . . . . . . . . . . . . . . . . . . . . . . . . . . . . . . . . . 36 23 . Milkfish farmer's view of a fair annual rate of return or interest . . . . . . . . . . . . . . . . . . . . . . . . . . . 37 24 . Contact with extension agents. by province . . . . . . . . . . . . . . . . . . . . . . . . . . . . . . . . . . . . . . . . 37 25 . Percentage of milkfish farmers with membership in
aquaculture associations . . . . . . . . . . . . . . . . . . . . . . . . . . . . . . . . . . . . . . . . . . . . . . . . . . . . . 39 26 . Average stocking rates of milkfish fry and fingerlings in the
Philippines (pieceslhectarelyear) . . . . . . . . . . . . . . . . . . . . . . . . . . . . . . . . . . . . . . . . . . . . . . . 40 27 . Average number of water changes during production in a year . . . . . . . . . . . . . . . . . . . . . . . . . . . . 40 28 . Pond draining and drying as practiced by milkfish farmers . . . . . . . . . . . . . . . . . . . . . . . . . . . . . . . 41 29 . Average yield by number of croppings per year . . . . . . . . . . . . . . . . . . . . . . . . . . . . . . . . . . . . . . 41 30 . Length of crop cycle by province. 1980 . . . . . . . . . . . . . . . . . . . . . . . . . . . . . . . . . . . . . . . . . . . 41 31 . Characteristics of milkfish crop cycle . . . . . . . . . . . . . . . . . . . . . . . . . . . . . . . . . . . . . . . . . . . . 42 32 . Number of cropslyear in Philippine milkfish culture . . . . . . . . . . . . . . . . . . . . . . . . . . . . . . . . . . . 42 33 . Pattern of attendance a t aquaculture seminars by province . . . . . . . . . . . . . . . . . . . . . . . . . . . . . . 42 34 . Ability of milkfish farmers to receive and decode technical information . . . . . . . . . . . . . . . . . . . . . . 43 35 . Percentage distribution of small. medium and large farms.
1978and1980 . . . . . . . . . . . . . . . . . . . . . . . . . . . . . . . . . . . . . . . . . . . . . . . . . . . . . . . . . . . 44 36 . Means of transportation relied upon by milkfish farmers . . . . . . . . . . . . . . . . . . . . . . . . . . . . . . . . 44 37 . Milkfish farmers' perception on accessibility to inputs . . . . . . . . . . . . . . . . . . . . . . . . . . . . . . . . . 44
38 . Age of Philippine milkfish ponds. 1978 and 1980 . . . . . . . . . . . . . . . . . . . . . . . . . . . . . . . . . . . . 45 39 . Results of pond soil analysis conducted by the Philippine Bureau of
Soils. Ministry of Agriculture . . . . . . . . . . . . . . . . . . . . . . . . . . . . . . . . . . . . . . . . . . . . . . . . . . 46 40 . Average pond depth of Philippine milkfish farms . . . . . . . . . . . . . . . . . . . . . . . . . . . . . . . . . . . . . 47 41 . Yield differences among climate types . . . . . . . . . . . . . . . . . . . . . . . . . . . . . . . . . . . . . . . . . . . . 47 42 . Summary of constraints identified and possible 'action steps' to
overcomethem . . . . . . . . . . . . . . . . . . . . . . . . . . . . . . . . . . . . . . . . . . . . . . . . . . . . . . . . . . . 53 43 . Selected income indicators of the Philippines (1980 pesos) . . . . . . . . . . . . . . . . . . . . . . . . . . . . . . 54

Milkfish Production Dualism in the Philippines: A Multidisciplinary Perspective on Continuous Low Yields
and Constraints to Aquaculture Development
CHONG, K-C., M.S. LIZARONDO, Z.S. DELA CRUZ, C.V. GUERRERO AND 1.R. SMITH. 1984. Milkfish production dualism in the Philippines: a multidisciplinary perspective on continuous low yields and constraints to aquaculture development. ICLARM Technical Reports 15, 70 p. Food and Agriculture Organization of the United Nations, Rome, Italy; Bureau of Agricultural Economics, Quezon City, Philippines; Bureau of Fisheries and Aquatic Resources, Quezon City, Philippines and International Center for Living Aquatic Resources Management, Manila, Philippines.
Abstract
Philippine milkfish ponds are generally underutilized. Perennial low milkfish yields from underutilized brack- ishwater ponds are primarily the result of the difference between fertilizer application rates followed by most milkfish farmers and those higher rates which would duplicate the results achieved on experimental farms and also on a small number of private farms.
The purpose of this study was to determine and measure the constraints to the adoption of more intensive fertilizer application rates among milkfish farmers in the Philippines. The analytical model specified for this study was placed in the context of various theories of agricultural stagnation and growth. Fifty-six explanatory variables, categorized into socioeconomic, institutional, physical and bio-technical parameters, were hypothesized to explain variations in fertilizer use. The study focused on farmers' perceptions of constraints. Data were collected from 447 milkfish farmers in seven provinces. Additional data from a previous survey involving 324 farmers from seven prov- inces were also included in this study.
Using multiple regression techniques, eight of these 56 explanatory variables explained 73% of the variation in fertilizer expenditure. Each had the expected sign. The high R~ and F-value imply that the model as specified was appropriate.
The four explanatory variables which were statistically significant at the 1% level were: ratio of milkfish price to organic fertilizer price, ratio of milkfish price to inorganic fertilizer price, interest in working on other milkfish farms and belief in the effect of fertilizers on the taste of milkfish. The other four variables, significant at the 5% level were: salinity of pond soil sample, interest in seeking consultation, family size and farmers' estimates of a "fair" collateral requirement for loans.
Based on these results it was concluded that milkfish farmers are responsive to relative prices of inputs and output and will adjust their fertilizer expenditure accordingly. However, high costs of credit and of organic fertilizers in some locations coupled with declining real prices of milkfish inhibit many farmers from increasing fertilizer use.
One major reason why milkfish farmers were not applying more fertilizers was because they claimed not to have the necessary financial means to obtain them. A dual-pricing fertilizer subsidy scheme to encourage more intensive use of fertilizers merits an evaluation by the government to determine i t s practicality. Increased credit for operating capital, in contrast to credit for investment capital, should also be considered. Along with dual pricing for fertilizers and increased credit for production, there i s also a clear need for the government to strengthen and in- crease the mobility of i ts information dissemination and extension service. Level of contact between farmers and extension workers was low and few, i f any, farmers had published materials which would explain the advantages of intensified fertilizer use.
While the milkfish industry as a whole appeared to be undergoing transformation to higher average yields and not stagnating, the study concluded that strengthened institutional support (e.g., credit, extension and information dissemination) is necessary to accelerate development of the industry.
Introduction
BACKGROUND INFORMATION
This study was commissioned by the Food and Agriculture Organization of the United Nations (FAO) under the Bureau of Fisheries and Aquatic Resources (BFAR) Brackishwater Aquaculture Development and Training Project (BADTP), funded jointly by the Government of the Philippines and the United Nations Development Programme.
The principal author of this report was seconded to FA0 by the International Center for Living Aquatic Resources Management (ICLARM) to design and organize the study under the general direc- tion of the BADTP project leaders. The United Nations Development Programme and the National Economic and Development Authority of the Philippines supported the precepts set forth to the extent of providing additional funds for an extended project which included training of BFAR personnel.
The study, which has both research and training phases, was implemented jointly by ICLARM, BFAR and the Bureau of Agricultural Economics (BAEcon). The research phase, which culminated in a separate full report, was concerned with the identification and measurement of socioeconomic, institutional, bio-technical and physical constraints to the adoption by milkfish farmers of more intensive use of supplementary inputs, namely, fertilizers. Of particular concern was an assessment of producersr attitudes and perceptions regarding input use.
The second phase involved the development of training materials to be used a t the four Brackish- water Aquaculture Development and Training Centers. These teaching materials are used in the training programs of BFAR extension personnel and technical appraisers and planning officers from BFAR, the Development Bank of the Philippines and provincial government offices.
The research phase was based primarily upon a 1981 survey of 447 milkfish producers in seven selected provinces in the immediate vicinity of the four Brackishwater Aquaculture Develop- ment and Training Centers. This report sets out the results of the survey and includes considerable discussion of producersr attitudes regarding constraints. Many of their comments center upon the availability of credit and contact with extension officers.
This report is an evaluation of government programs; however, producer attitudes toward government programs are presented and discussed in a constructive mode in the belief that an appreciation for these attitudes is an important ingredient in the development process.
PAST GOVERNMENT PROGRAMS
For the past two decades, milkfish farmers in the Philippines have been the expected benefi- ciaries of government efforts to bridge the output gap between potential and actual yield per ha of local milkfish ponds. Potential yield is as high as 2 t/ha/year yet the average productivity of milk- fish farms is approximately 800 kg/ha/year. Many farms produce far less and are thus underutilized (Tang 1967; Shang 1976; Librero e t al. 1977; Chong et al. 1982). The Philippine Government is rightly concerned over the low yield per ha of many milkfish ponds because it is interested in boosting production of fish from aquaculture systems, particularly in light of the expected levelling off of fish supply from capture fisheries.
Over the past few decades, the government has tried numerous approaches to change the status quo in the milkfish industry. These approaches, which included credit for capital investment

and extension activities, attempted to shift subsistence milkfish farming to a more commercial status, often by encouraging more intensive use of supplementary inputs.'
Prior to the mid-1970s, government attempts to increase milkfish production and yield per ha tended to be ad hoc in nature. For example, the major activity to spur adoption of more intensive supplementary input use during the 1960s seems to have been a series of lectures and intensive consultations by a very small number of individuals with a limited number of milkfish producers (Tang 1967). While certainly extremely valuable for those producers fortunate enough to partake of these consultations and seminars, the majority of producers, particularly those st i l l using very limited supplementary inputs, apparently benefited only marginally i f a t all.
The second avenue through which production increases were sought was the provision of sub- stantial capital investment credit. These funds, most of which were made available through the Development Bank of the Philippines (DBP), were restricted to pond development and construction costs. Substantial areas of coastal swamplands and mangroves were converted to brackishwater milk- fish ponds. Area under production increased 37% from approximately 123,000 ha in 1960 to 168,000 ha in 1970 (Table 1 ). Coupled with an 18% increase in yield per ha, total milkfish produc- tion increased by 60% during this decade.
' ~ e f i n e d as inputs over and above land, labor and stocking materials. In this study, the primary supplementary irlputs consi- dered are organic and inorganic fertilizers.
Table 1. Total area and production of milkfish in the Philippines, 1952-1980.
Area (ha)
Production (tonnes)
Average yieldlhalyr (kg)
Source: BFAR Fisheries Statistics, 1981 .
Area expansion has slowed considerably since 1970, however, due to increased concern for the rapidly dwindling mangrove area and possible negative impacts on marine fisheries and coastal ecology of converting more of this coastal resource to brackishwater ponds. Between 1970 and 1980, yield per ha increased by 34%, while total area increased by only 5%. Consideration has been given to a moratorium on use of mangrove areas for milkfish ponds, but conversion s t i l l continues in cer- tain parts of the country, especially in the Visayas and Mindanao. Moreover, DBP continues to provide the bulk of i t s milkfish credit for pond development, thus tacitly encouraging a continued emphasis on expansion of area rather than intensification of production methods on existing areas.
There are encouraging signs, however, that the potential for increasing production through increased yield per ha has been receiving attention since the mid-1970s. The major current activity of the Bureau of Fisheries and Aquatic Resources (BFAR) in' this direction is the establishment of four Brackishwater Aquaculture Development and Training Centers, one in each climatic zone of the Philippines. These centers have a combined demonstration and training function, with an emphasis on the latter. To date, about 365 extension workers, 15 technical appraisers and 20 plan- ning officers from the BFAR, DBP and provincial government offices, respectively, have undergone training a t these centers.
Practical classroom and field training of these government officials in fishpond engineering, management, economics and post-harvest technology has already been accomplished. Another train- ing component, extension methodology, was also incorporated. The training on extension includes an in-depth discussion on the need to understand the relationship between low producers and fisheries extension officers, which i s addressed in this report.
The underlying rationale for the shift in emphasis from expansion of pond area to intensified production from existing areas can be found in the most recent lntegrated Fisheries Development Plan (FIDC 1981). The Philippines is heavily dependent upon fisheries products to meet the animal protein requirements of i t s population. I t has been estimated that 24 kg/yr or 54% of per capita animal protein consumption in the country is derived from aquatic products (FA0 1973). The population is currently growing a t 2.4% per year, and it has become apparent to fisheries planners that population growth is now outstripping the capacity of marine and inland capture fisheries to supply these per capita levels of aquatic protein on a continuous basis. Consequently, the most recent Integrated Fisheries Development Plan calls for annual production increases of 20% from the aquaculture sector. Given the limits to expansion of area, much of this increase is expected to be achieved through increased yields from existing areas, thus implying more widespread adoption of intensive production techniques.
The annual 20% increase called for is significantly greater than historical rates of increase. As pointed out earlier, there was a 60% increase in total milkfish production from 1960-1970. During the next decade (1970-1980), there was a further 41% increase in total production (Table 1 ). Of course, not all of the expected increase in aquaculture production is to be contributed by the milkfish sector, since major advances are also underway in freshwater fish culture, especially of tilapia. Nevertheless, it remainstrue that an annual 20% increase in milkfish production far surpasses any annual increase achieved by the industry in the past. The challenge facing the Philippine govern- ment is thus to find ways to accelerate intensification of input use and increased production.
Before any attempt is made to alter the 'status quo', it is important that a thorough under- standing of the existing production situation be obtained. In particular, it is important that the background, perceptions and aspirations of the farmers responsible for production activities be understood, and their decisionmaking process be appreciated. Often, the perceptions and attitudes of farmers are quite different from what observers believe them to be. What may appear 'irrationalr to observers may be quite 'rationalr to farmers. Individuals committed to promoting increased milk- fish yields in the Philippines will hopefully find that this report contributes to an understanding of the constraints to increased input use and yields as perceived by milkfish producers themselves.

DUALISTIC STRUCTURE OF THE MILKFISH INDUSTRY
The Philippine milkfish industry can be characterized as a dualistic system: the two discrete components are the extensively and intensively managed farms. Extensively managed farms are those which do not use any fertilizers. Intensively managed farms are those which use supplementary inputs to some extent. The latter group make up the majority of farms. Although both systems produce milkfish, the two are very different not only in terms of yields per ha but also in their stage of development, levels of capital investment, degree of concentration of output, state of repair and entry barriers (Table 2). In short, the structures of the two components are different.
Table 2. Salient features o f the dualistic structure o f the milkfish industry (1980 crop year).
Characteristics of farm1 Extensive farms 2 Intensive farms 3
Weighted average yields (kglhalyr) Proportion o f farms (percent) Degree o f concentration o f output
share o f top 4% of farmers4 Capital investment Entry barriers State o f repair
Low Low Bad
39 High High Fair
'See also Table 6 for other contrasting features. 2 ~ e f i n e d as using no fertilizers. 'Defined as using positive level o f supplementary inputs. 4 ~ y volume o f output.
The extensivelintensive distinction aside, the intensively managed component of the industry exhibits a wide range of intensity of supplementary input use and hence of output. In an earlier study, Chong et al. (1982) focused on intensively managed farms and found that the majority of farms in this category st i l l produce less than 500 kglhalyear (Table 3).
Establishing a line of demarcation between low, medium and high intensity of supplementary input use is somewhat arbitrary. The BADTP through which FA0 commissioned this study considers those farms producing approximately 1,200 kglhalyear as practicing mid-level intensity and those producing over 1,500 kglhalyear as high level intensity. In this report, those farms that use supple- mentary inputs but achieve 2 1,000 kglhalyear are classified to be low level intensity and those producing > 1,000 kglhalyear to be high level intensity. These distinctions, of course, are measuring intensity relative to the land input and not relative to other scarce inputs such as capital or labor.
Table 3. Percentage o f farmers attaining various yield levels i n intensively managed milkfish farms in selected provinces, 1978 crop year.
Yield (kglhalyr) Province Sample size < 500 500-1.000 > 1.000
Percent
Cagayan Pangasinan Bulacan Masbate l loi lo Bohol Zamboanga del Sur
Survey sample 324 60 21 19

It is unnecessary to pursue the debate over which input is the 'most scarce' and hence the most appropriate for measurement of intensity, because an earlier study (Chong et al. 1982) demonstrated that increased profits can be obtained for the 'average' farm through increased use of organic and inorganic fertilizers. The implication of these earlier findings was that the 'average' milkfish farmer would be economically better off and achieve higher yields per unit area i f the rate of application of fertilizers were increased. Intensity of fertilizer use and output per unit area are thus reasonable measures of management efficiency.
Based on Tables 2 and 3, it appears that 80-85% of all Philippine milkfish farms produce less than 1,000 kg/ha/year. This large number of low intensity and extensive (no fertilizers used) farms, co-existing with the much smaller group of high intensity farms, is the primary target of government programs and the research focus of this report.
The economic behavior of these co-existing systems has so far not bzen studied to find out why there is such a range of supplementary input use and yields, when in fact technology has long been available to bridge the output gap. Is this co-existence transitory or is it s t i l l evolving? Is the co-existence damaging or beneficial to society? Can the community of milkfish farmers using extensive and low intensity systems benefit from technology and programs designed to improve yields? In short, can or should the unequal development between the two systems within the milk- fish industry be corrected?
Lasting and significant change in patterns of production from the traditional extensive methods to a more intensive commercial orientation requires the active cooperation and participation of the farmers being serviced. This change can only be accomplished when the introduction and adoption of the recommended method of production is clearly understood by the farmers and they see a real value in switching from their old and proven methods to one that is not only new but as yet untested by them under field conditions. It is one thing to say that many milkfish farmers have considerable management experience when much of this is with low intensity or extensive methods; it is quite another thing to say that the experience of milkfish farmers is appropriate for more intensive methods when this clearly applies only to a small minority. To sustain the shift of the majority from extensive or low intensity methods up the scale of intensity requires continuous and concerted effort not only by government agencies but also producers themselves.
OBJECTIVES
The overall objective of this study-is to identify and quantify the nature of constraints to high yields from Philippine milkfish farms. Once the nature of these constraints is ascertained, it will then be possible to determine whether these constraints can be removed, modified or corrected to accelerate the wider adoption of improved techniques of production and hence increase milk- fish production in the country. It is expected that once these constraints are removed, modified or corrected, the milkfish farmers will find the use of inputs economically attractive. Herein lies the keyword: milkfish farmers must find the switch from the less intensive to the more intensive methods of production economically attractive.
Within this broad objective, a major thrust is to identify the factors which limit the use of supplementary inputs that can help to increase yields.
Several definitions of yield gaps are possible depending on the bench mark and potential yield adopted for comparison (Fig. 1). In this study, the potential yield can be defined as the maximum yield obtained on experimental stations. The bench mark yield is the yield obtained by the small group of very high intensity producers. In this study we are only concerned with the gap between actual and bench mark farm yield; that is, yield gap II. Yield gap I can be characterized as non-transferable technology under current conditiohs; it is caused by site differences, differences in scientific know-how and management skills of farmers and researchers, difficulties in extrapolating to larger farm sizes from relatively small production areas most often used for experiments, and

most importantly by the fact that private farmers are more likely to be guided by profit maximizing principles that are experiment stations that seek to maximize production per unit area. The level of input use and output that maximize profits will always be less than the level of inputs that maxi- mizes production. Our primary interest is thus on sources of yield variation among farms rather than between farms and experiment stations.
For the purpose of this study, the bench mark yield is pegged a t 2,000 kglhalyear, a conser- vative output level widely known as attainable under farmers' field conditions. Much higher output has in fact been reported, but this is probably not a realistic goal for most milkfish farms. The actual yield is estimated to be 800 kglhalyear, representing approximately the average yield per ha achieved
POTENTIAL FARM YIELD PER HECTARE
YIELD; GAP II
BENCHMARK ACTUAL FARM YIELD FARM YIELD PER HECTARE PER HECTARE
Fig. 1. Definition of yield gaps.
by milkfish farmers. The majority of farms, in fact, s t i l l fall below this level. Based on these two definitions, there is a yield gap of about 1,200 kglhalyear and the bench mark yield is 2.5 times the actual yield.
Given that output increases are achievable with increased use of supplementary inputs, the authors examined the factors that can explain variability in input use, specifically fertilizer use. Management factors such as culture experience, age and educational attainment of producers1 managers are also examined. The major possible explanatory factors for this variability are iden- tified and the constraints toadopting increased inputs and 'action stepsr that the Philippine govern- ment might consider to overcome these constraints are discussed.
DATABASE
This study is based on a 1981 field survey of 447 milkfish farmers in seven provinces represent- ing four different climatic types. The seven provinces and their climatic classifications are as follows: Bulacan (Climate I), Quezon (Climate I I), Capiz, Mindoro Oriental, Negros Oriental and Calape, Bohol (Climate Ill), and Lanao del Norte (Climate IV). These four climate types are defined as
: two pronounced seasons, dry from November to April and wet during the rest of the year;
I : no dry season, wet, maximum rain period from November to January (pronounced rainfall);
I I : seasons not very pronounced, relatively dry from November to April and wet during the rest of the year; and
V : rainfall evenly distributed throughout the year.

In addition, data from and results of a 1979 survey covering 324 milkfish farmers are also referred to extensively in this report (see Chong et al. 1982 for details, including definitions of climatic types). This earlier survey covered seven provinces in three different climatic zones. They are Pangasinan, lloilo and Bulacan (Climate I), Cagayan, Masbate and Zamboanga del Sur (Climate Ill), and Bohol (Climate IV). Between them, the two studies covered 771 producers in 12 different provinces (Fig. 2).
Fig. 2. Map of the Philippines showing the provinces included in the 1979 and 1981 surveys.
'AH respondents were drawn from southern Quezon.
In both surveys, proportional sampling was used to ensure that sufficient variations in milkfish farming practices and managerial background were present. The 1979 survey covered only those farms using supplementary inputs; the 1981 survey also included extensively managed farms (i.e., those using no supplementary inputs). The sampling frame and unit were stratified according to climatic zoneand then by province and barrio or village. Proportional sampling was adopted because of the need for farmer cooperation and representativeness. The use of stratified and proportional' sampling worked well for the two surveys because the data points exhibit wide variations.
The selection of the survey areas was based on climatic types because milkfish productivity is known to be influenced by natural conditions such as rainfall and hours of sunshine. This is also the reason there is one Brackishwater Aquaculture Demonstration and Training Center (BADTC) in each of the four climatic zones found in the Philippines. Incorporating al l climatic types permits separation of the effects of climate from those constraints which are amenable to human intervention.
Although milkfish farm owners were sought out as primary sources of information, this was not always practical because many were absentee owners. As a result, only 60% of our sample in

the 1981 survey consists of milkfish farm owners; the rest are either caretakers, fishpond adminis- trators or managers. Our sample thus consists of the 'primary decisionmakerst regarding levels of input use. The total area owned by the 447 milkfish farmers i s about 8,500 ha, of which 84% or 7,100 ha were in production and the remainder (1,400 ha or 16%) were not in production during the reference period, 1980 (Table 4). Our survey showed no fully developed farms lying idle in 1980 but an estimated 25% of the milkfish farmers interviewed had underdeveloped areas on their farms. Underdeveloped areas are not fully excavated but were used to grow milkfish.
Table 4. Distribution of developed and undeveloped areas on milkfish farms in the 1980 crop year.
Total Developed Undeveloped Province No. of farms Area Area Percent Area Percent
(ha) (ha) (ha)
Bulacan 111 2,555.3 2,492.8 98 62.5 2 Quezon 99 1,589.8 1,233.1 78 356.7 22 Mindoro Oriental 19 344.0 305.3 89 38.8 11 Capiz 64 91 5.5 802.2 88 113.4 12 Negros Oriental 24 376.5 304.7 81 71.8 19 Bohol 107 1,262.9 797.7 63 465.2 37 Lanao del Norte 23 1,447.1 1,168.1 8 1 279.0 19
Total 447 8,491.2 7,103.8 84 1,387.4 16
The 1981 sample included milkfish farmers who use supplementary inputs and those who do not. Farmers in both categories were interviewed in 1981 because it was important that the socioeconomic differences between the two types of farmers be recognized. In addition, documenta- tion of the physical differences between the pond systems operated by the two categories of farmers was important. Moreover, differences in the technical knowledge and managerial abilities between the two groups of farmers would also shed some light on the wide yield gap. The two groups of farmers may have different access to or perception of the various government and other institu- tions with which they deal. I t was also important that this aspect be documented.
Additional information on the milkfish industry was sought from non-producers such as input suppliers, officials of financial institutions (rural banks and Development Bank of the Philip- pines), milkfish brokers, wholesalers and retailers, fry gatherers and distributors, extension agents and government research personnel, and industry leaders. While structured interviews were conducted with primary producers using a 14-page questionnaire (see Appendix), informal question and answer sessions were carried out with the non-producers.
Alternative Theories of Agricultural Change
The following brief overview of alternative theories of agricultural change is presented to hiah- light and summarize previous research which bears on the issues being examined in this study-con- straints to high yields, resistance to change, technology transfer and diffusion of innovations. These topics have been the subject of numerous investigations, mainly in agriculture. This review is by no means an exhaustive one, but is illustrative of the major theories and hypotheses that are applicable to this analysis of aquaculture constraints.
The major theories of agricultural stagnation and transformation can be grouped into those that attempt to explain farmers' behavior through sociocultural perspectives and those that assess their behavior in terms of economic explanations. Under these two general theories, Stevens (1977)

summarizes the four major hypotheses that have been expounded to explain the reasons for stagna- tion of traditional agriculture. These are: (1) small farmers are poor decisionmakers; (2) small farmers lack capital; (3) small farmers would become more productive on larger-scale farms; and (4) small farmers in low-income societies are trapped in a technical and economic equilibrium.
Evidence of the validity for agricultural settings of these alternative sociocultural and economi- cally oriented hypotheses can be found in reports of empirical research studies too numerous to cite here.
Each hypothesis leads to a particular set of 'action steps' or recommendations to transform traditional agriculture. In this particular study the authors have tried to determine which hypoth- eses best explain the behavior of milkfish farmers in the Philippines and therefrom which 'action steps' are most appropriate to overcome constraints to high yields.
For purposes of this brief overview of the alternative theories, we have categorized Stevens' four hypotheses into two major groups: (1) "small farmers are poor decisionmakers" theory (also known as the subculture of peasantry hypothesis) which puts forward sociocultural explanations for agricultural stagnation; and (2) "small farmers are poor but efficient" theory which favors the economic perspective. Extensions of the latter perspective which include concepts of induced i.inovation and rural stagnation are also presented in summary form.
'SMALL FARMERS ARE POOR DECISIONMAKERS' THEORY
This hypothesis assumes that more productive or profitable alternative production activities are available to traditional farmers but "they" do not make the right decisions about these new opportunities because they are poor decisionmakers, irrational or even lazy (Stevens 1977). This hypothesis which underlies much of the rationale for community development programs in Pakistan and India in the 1950s suggests that extension services, community development programs and other forms of educational and management assistance have crucial roles to play to improve farm- ers' production decisions.
Corollary to this view of farmers' poor decisionmaking capabilities, are explanations that focus on the "subculture of peasantry." This viewpoint suggests that agriculture is essentially a cultural characterization of the way particular people live (Rogers 1969; Lewis 1962,1964). Cultural attributes of farmers and the value system that farmers hold are cited as the major barriers to their increased productivity and transformation. For example, Lewis (1962, 1964) and Rogers (1969) cite such values as (1) strong disposition towards authoritarianism; (2) mutual distrust in interpersonal relations; (3) perceived limited good; (4) lack of innovativeness and resistance to change; (5) fatalism; (6) limited aspirations; (7) limited view of the world; (8) lack of geographic mobility and (9) low empathy as characteristics that prevent farmers from participating in the agricultural transformation or modernization process. For example,
Peasant communities are characterized by mutual distrust, suspicion and evasiveness in inter- personal relations. Peasants tend to believe in the notion of limited good (that all desirables in life are in fixed supply), and in the related idea that one man's gain is another's loss. Government officials are viewed with both dependence and hostility. Villagers are fatalistic-that is, they subordinate their indi- vidual goals to those of the family and the will of a supreme authority. Peasants generally lack inno- vativeness and have an unfavorable attitude towards change.
Fatalism is the degree to which an individual perceives a lack of ability to control his future. Fatalistic attitudes are widely reported as characteristic of peasants. Social aspirations involved desired future states of being, such as living standards, social status and occupation. A common observation in most studies of peasantry is that the respondents have limited aspiration; they also lack deferred gratification, the postponement of immediate satisfaction in anticipation of future rewards. Peasants are also characterized by a limited view of the world. They are localistic in geographic mobility and in their exposure to mass media and have a limited time perspective. (Rogers 1969) Proponents of this viewpoint give primary importance to sociocultural attributes as deterrents
to the agricultural transformation process. In the Philippines, the cultural values of fatalism, strong

disposition to authority, lack of innovativeness and resistance to change have also been cited (e.g., Espiritu e t al. 1977; Co 1982). These theorists forward the view that the ethos of possibility that characterizes Filipino farmers' behavior and the sense of resignation with which they view the world is due to the bahala na (come what may) syndrome and an authoritarian structure characterized by a patron-client relationship between landowner and tenant.
The typical Filipino, as we know, i s traditionally fatalistic, believing in some mysterious external force that controls all lives and destinies. (Co 1982)
The way important events like ... a good or bad harvest are interpreted reveals a belief in the super- natural and a trust in and reliance on a Divine Providence. The farmer prays for rain but i s not interested in building irrigation ditches. He carefully follows rituals of planting but i s not inclined to experiment on a new type of seed or fertilizer ... A poor harvest is not due so much to poor seed or lack of fertilizer or irrigation as to bad luck. The rural folk thus learn to submit to uncertainty, to take a bahala na attitude, and to develop traits of patience, endurance and resignation. Moreover, since good i s limited, not every- one is expected to enjoy success and happiness a t the same time. (Espiritu e t al. 1977)
If one accepts the sociocultural point of view, overcoming these attitudes and constraints is primarily possible through education and extension programs.
'SMALL FARMERS ARE POOR BUT EFFICIENT'THEORY
In contrast to the above hypothesis, the second, third and fourth hypotheses in Stevens'sum- mary discount sociocultural explanations in favor of an economic perspective to the agricultural transformation process. These hypotheses (small farmers iack capital; small farmers would become more productive on larger-scale farms; and small farmers in low-income societies are trapped in a technical and economic equilibrium) espouse the belief that agricultural transformation is held back not so much by the farmers' cultural attributes and value systems but by economic factors that make any efforts a t increased agricultural productivity non-profitable. This view is strongly endorsed by Schultz (1965) who advocates the concentration on high-payoff new inputs (both materials and human capital) to improve the state of the ar t of production techniques of farmers. According to Schultz, unless the rate of return to investment in inputs of production is improved, there will always be little or no incentive on the part of the farmers to increase productivity, nor for them to save and invest.
Theorists of this particular school of thought state that small farmers are poor, but efficient. This hypothesis implies that traditional peasant farmers are generally good decisionmakers, given their knowledge and resources, but the scarcity (high price) of capital, and non-access to and unavailability of new agricultural technology have deterred their agricultural transformation. Small farmers are trapped in a technical and economic equilibrium, and any reallocation of their resources would not appreciably increase income because, given prevailing prices of inputs (land, labor, capital), farmers are already efficient in utilizing the production inputs they have a t their disposal. For example:
Traditional agriculture i s not capable of contributing cheaply to economic growth because it has exhausted the economic opportunities of the state of the arts on which it is dependent.
The key to this lack in capability, therefore, i s not a matter of allocative efficiency. The many efforts to show farmers in traditional agriculture how to use more efficiently the resources which they have are in vain, because they are in this respect essentially efficient. Nor i s this lack in capability a matter of simply investing more in what they have. Thus, our efforts to induce them to invest more than they are investing in the factors of production available to them are also in vain; the investment oppor- tunities open to them simply do not warrant their doing so. (Schultz 1965) Empirical support for Schultzfs ideas has been found among Nigerian dryland farmers (Norman
1977), small farms in Brazil (Rask 1977) and Thai livestock producers (DeBoer and Welsch 1977) to cite a few. To overcome the low level equilibrium trap, Schultz argues for the introduction of high-payoff new technologies which markedly reduce average costs per kg of production.

Acceptance of the view that small farmers are trapped in a low level equilibrium has led some economists to argue in favor of larger-scale farms to achieve greater productivity by taking advan- tage of economies of scale. Empirical research however, has indicated that while theoretically possible, there are limited economies of scale in agricultural production in developing nations and that small farms can often compete effectively with medium and large farms or state farms (Taka- hashi 1970). While evidence accumulates that farm enlargement is not necessarily associated with increased land productivity, others have cautioned that the shift to science-based agriculture and use of technology also pose threats to rural employment and political equilibrium (Sinaga and Collier 1975). Accordingto thisview, small farmscould be threatened by the introduction of new machines that may displace labor utilization in the area.
INDUCED INNOVATION AND RURAL STAGNATION
Economic viewpoints generally accept that breaking out of the technical and economic equilib- rium described by Schultz can not only be achieved by means of the introduction of advanced technology, but also by induced innovation (Hayami and Ruttan 1971; Ruttan 1977). Changes in relative factor prices or output prices and the provision of institutional support such as credit, extension and information dissemination will produce disequilibrium to which small farmers will respond positively. According to this viewpoint, technical change and institutional development are entwined.
The induced technical and institutional innovation perspective does riot imply that the progress of agricultural technology can be left to an 'invisible handr-to the undirected market forces that will direct technology along an 'efficient' pattern determined by 'original' resource endowments or relative factor and product prices. The production of the new knowledge leading to technical change is the result of a process of institutional development. The invention of the public sector agricultural research institute- the socialisation of agricultural research-was one of the great institutional innovations of the 19th century.
Technological change, in turn, represents a powerful source of demand for institutional change. The processes by which new knowledge can be brought to bear to alter the rate and direction of tech- nical change in agriculture is, however, substantially greater than our knowledge of the processes by which resources are brought to bear on the process of institutional innovation and transfer. The devel- oping world is s t i l l trying to cope with the debris of non-viable institutional innovations; with extension services with no capacity to extend knowledge or little knowledge to extend; cooperatives that serve to channel resources to village elites; price stabilisation policies that have the effect of amplifying com- modity price fluctuations; and rural development programmes that are incapable of expanding the resources available to rural people.
Yet the need for viable institutions capable of supporting more rapid agricultural growth and rural development is even more compelling today than a decade ago. As the technical constraints on growth of agricultural productivity have become less binding there is an increasing need for institu- tional innovation that will result in a more effective realisation of the new technical potential. The trial and error approaches involved in ad hoc production campaigns and rural development programmes have been costly in terms of human resources and have rarely been effective in building rural institu- tions that have prevailed beyond the enthusiasms of the moment. (Ruttan 1977) The view that institutions are key to the transformation process is echoed by Bromley (1979).
However, he is less optimistic about the rapidity with which institutions will respond. According to Bromley's view, while technology is the engine of economic change, institutions are barriers to the growth in the agricultural sector:
We have seen decades of investment in new seeds, fertilizer plants, pest control, farmer training, and the like. We cannot say how great the transformation has been, because we do not have an experi- ment in which we can hold some other things constant. We of course know that some farmers in some countries have indeed made impressive strides in terms of increased production and increased incomes. We also know that there are s t i l l millions of subsistence farmers barely able to make a living.

The millions of subsistence farmers left behind who are barely able to make a living give rise to a social phenomenon which Bromley calls "rural stagnation." Rural stagnation, according to Bromley, is caused by the inability of traditional agriculture to generate a sustainable economic surplus in the face of institutional barriers. Similar to the sociocultural explanations of Espiritu (1977) and Co (1982), Bromley hypothesizes that this lack of sustainable surplus is the result of a power-elite manipulating institutional arrangements in order that the economic environment of subsistence farmers be just sufficient to keep the subsistence farmers in production, yet not suffi- ciently propitious to encourage experimentation.
These various viewpoints to explain rural agricultural stagnation and transformation have been presented above in a necessarily brief summary. However, this discussion serves to raise the various issues that must be dealt with in any serious examination of constraints to high yields from Philip- pine milkfish farms. Thedata collected during our two surveys (1979 and 1981) permit examination of the sociocultural, economic and institutional hypotheses outlined above. Since acceptance of any particular hypothesis (or set of hypotheses) is tantamount to identification of constraints to increased yields, the action steps necessary to stimulate Philippine aquaculture will flow naturally therefrom. These alternative hypotheses will be discussed after presentation of survey data, analyti- cal model and results.
Analytical Methodology to Measure Variation in Input Use
Because the output gap between actual and bench mark milkfish yield is thought to be best explained by different levels of supplementary input use, the identification of factors affecting the use of organic and inorganic fertilizers was chosen as the focus of this analysis of constraints to high productivity. In other words, the dependent variable-fertilizer expenditures-is treated as a proxy for yield because fertilizer expenditure in contrast to yield is directly under the farmers' control. Moreover, fertilizers as an input was found to be very significant in explaining yield varia- tions. Organic and inorganic fertilizers were selected for analysis over other supplementary inputs such as pesticides and feeds because the former are technically and economically more important in milkfish production (Chong et al. 1982). Because organic fertilizer is different from inorganic fertilizer in terms of N-P-K content, aggregation of simple physical measures (e.g., kglha) of fertil- izer application would have been inadequate and misleading. Therefore, the use of organic and inorganic fertilizers is expressed in expenditure terms.
Potential constraints to increased fertilizer expenditure were identified on the basis of exist- ing knowledge of the local milkfish industry. Both primary and secondary sources of information were relied upon to select possible constraints. A model based on multiple regression was chosen to determine the relationships between constraints and level of fertilizer expenditure. Altogether 56 explanatory variables were hypothesized to explain variation in expenditures for fertilizer among Philippine milkfish farmers. One of these 56 explanatory variables was later excluded from the final model due to insufficient data. These potential constraints were categorized as socio- economic, institutional, bio-technical or physical in nature (Table 5).
Socioeconomic parameters include those related to producers' demographic characteristics and attitudes regarding risk and to prevailing economic conditions faced by the producer (e.g., input and output prices). Institutional parameters consist of external programs and organizations that can be expected to influence the producer's choice of technology. Bio-technical parameters include those related to the production methods actually practiced by the producer and the producer's own attempts to gain additional insights to benefit his fishfarming techniques. Finally, physical param- eters are those that relate to farm location, soil conditions and pond design.
The model contains 19 socioeconomic, 5 institutional, 15 bio-technical and 17 physical param- eters. Mathematically, the model is expressed as:
z = f(X,,X 2 , . . . . ,X5J

Table 5. Parameters hypothesized to explain variations in expenditure on fertilizers.
A. SOCIOECONOMIC PARAMETERS
1. Ratio of milkfish price to milkfish fry price 2. Ratio of milkfish price to milkfish fingerling price 3. Ratio of milkfish price to organic fertilizer price 4. Ratio of milkfish price to inorganic fertilizer price 5. Ratio of milkfish price to milkfish substitute price
a) fish b) meat
6. Status of respondent 7. Milkfish culture experience of respondent
a) total number of years b) years with supplementary input application
8. Age of respondent 9. Years of formal education of respondent
10. Family size 11. Full-time or part-time occupation 12. Respondent's perception of effect of fertilizers on taste of milkfish 13. Percentage of milkfish and non-milkfish income 14. Risk consideration (collateral) 15. Risk consideration (interest rate) 16. Risk consideration (is use of larger quantities of inputs risky?) 17. Risk consideration (is use of improved technology risky?)
C. 610-TECHNICAL PARAMETERS
1. Milkfish fry stocking rate 2. Milkfish fingerling stocking rate 3. Respondent's skills in receiving and decoding technical information 4. Attendance in aquaculture seminarltraining 5. Working on other milkfish farmer's farm 6. Being consulted 7. SeeK'tonsultation 8. Observe other farmer's production operations 9. Productivity differences between input and non-inpu't use
10. Water change during production (refreshening) 11. Draining and drying after harvest 12. Length of draining and drying 13. Length of crop cycle 14. Number of cropping per year 15. Previous background in agriculture
6. PHYSICAL PARAMETERS
1. Farm size 2. Per hectare yield 3. Accessibility of farm 4. Age of pond 5. pH of pond soil 6. Salinity of pond soil 7. Distance of farm to main source of water 8. Depth of pond (water column) 9. Nitrogen level in pond soil
10. Phosphorous level in pond soil 11. Potassium level in pond soil 12. Distance to input market 13. Distance to output market 14. Distance to house 15. Transportation means 16. Availability of inputs 17. Climate type
D. INSTITUTIONAL PARAMETERS
1. Membership in aquaculture association 2. Contact with extension service 3. Avail of government credit 4. Reliance on local to outside market 5. Contact with government information
dissemination system
where Z = expenditure (pesos) on organic and inorganic fertilizers per ha in 1980 XI = fry stocking rate per ha per year (pieces)
X, = fingerling stocking rate per ha per year (pieces)
X3 = ratio of marketable milkfish price to fry price (by piece)
X4 = ratic of marketable milkfish price to fingerling price (by piece) X, = ratio of marketable milkfish price to organic fertilizer price (by kg) X6 = ratio of marketable milkfish price to inorganic fertilizer price (by kg) X, = ratio of marketable milkfish price to fish CPI (Consumer Price Index) X8 = ratio of marketable milkfish price to meat CPI Xg = farm size (total developed area in ha) X,, = yield in 1980 (kglha) XI, = tenure status of respondent

a. owner = 1 b. non-owner = 0
XI, = accessibility of farm a. road or combination with road = 1 b. river and/or trail = 0
XI , = age of pond (years) XI, = pH of pond soil sample
XIS = salinity of pond soil sample XI, = distance to main source of water (m) X,, = depth of ponds (average for a l l compartments in m) XI, = nitrogen level in pond soil sample XI, = phosphorous level in pond soil sample X,, = potassium level in pond soil sample X,, = milkfish culture experience of respondent (total in years) X,, = milkfish culture experience of respondent (years supplementary inputs used) X,, = age of respondent (years) X,, = formal schooling of respondent (years) X2, = respondent's skill in receiving and decoding technical information
a. skilled = 1 b. unskilled = 0
X,, = attendance in aquaculture seminars a. yes= 1 b. no = 0
X,, = interest in working on other farmers' farms a. yes = 1 b. no = 0
X2, = number of times consulted by others during 1980 X2, = number of times respondent sought consultation during 1980 X,, = observe other farmers' operations
a. yes = 3 b. no = 0
X,, = membership in aquaculture association a. yes = 1 b. no = 0
X,, = number of contacts with extension service during 1980 X,, = distance from farm to input market (km) X,, = distance from farm to output market (km) X,, = distance from farm to house (km) X3, = family size X,, = percentage of time spent as farm operator X3, = respondent's belief in the effect of fertilizers on milkfish taste
a. bad taste = 1 b. no bad taste = 0
X39 = percentage of income from non-milkfish sources X,, = respondent's estimate of productivity differences between input and non-input
use (%) X,, = risk assessment-"fair" collateral (%) X,, = respondent's assessment of reasonable interest rate (7%) X,, = respondent's assessment of risks associated with increaser3 input use
a. risky = 1

b. not risky = 0 X,, = respondent's assessment of risks associated with techniques which give higher
output a. risky = 1 b. not risky = 0
X,, = number of water changes during 1980
'46 = number of draining and drying cycles during 1980 X,, = length of draining and drying cycle-days per year (1 980)
'48 = average length of crop cycle in 1980 (months) X49 = number of croppings per year (1 980) X,, = primary transportation means
a, own vehicle = 1 b. public transport = 0 c. both = 1
X,, = respondent's assessment of input availability a. not difficult = 1 b. difficult = 0
X,, = credit use in 1980 a. yes = 1 b. no = 0
X,, = ratio of milkfish price in local market to price in outside market X,, = climate types (three dummy variables representing the four climate types) X55 = respondent's assessment of the country's information dissemination system
a. strong = 1 b. weak = 0
X56 = farmer's previous background in agriculture a. yes = 1 b. no = 0
Initially a linear relationship between fertilizer expenditure and the above 56 independent or explanatory variables was estimated but this was later rejected in favor of a log-linear estimation which gave a better fit or higher FI2. The specified relationship therefore took the form:
where a, 0, 's are regression coefficients to be estimated and E is the error term or residual. Each of the above 56 explanatory variables represents an hypothesis regarding the effect of
the variable in question on variation in supplementary input use which, after estimation, can either be rejected or not rejected as the case may be. Estimating the model in this fashion permits deter- mination of which of these potential explanatory variables are most significant in explaining input use.
Although the above model was the primary means for assessing variation in supplementary input use, additional relevant information were also drawn out of simple tabulations and cross- tabulations of the data collected from the 447 respondents.

Results and Discussion: Low Levels of and Variations in Supplementary Input Use
INTRODUCTION
The data collected during the survey can be presented in a number of different ways. The fact that an analytical model is specified implies that this study is more than simply descriptive. The section which follows therefore mixes description with analysis and discusses the various relation- ships among variables that are presented.
This section contains five major parts. First, the collected data are presented in summary form, tabulated according to intensity of input use and output levels. The purpose of a presentation in this form is to expand the two categories which characterize the dualistic milkfish industry of the Philippines, as briefly outlined in the introduction to this report. The next part contains a socio- economic profile of milkfish producers in order to highlight certain managerial characteristics and their relationship to output levels. The third part of this section presents the estimated parameters of the input variation model as specified in section 3 of this report. The significant explanatory variables are discussed in detail. Part 4 contains provincial tabulations of those factors that are most amenable to influence by government programs and policy. Variables discussed include a select number for which the lack of significance was probably due to the lack of variation in the explan- atory variables in question. The fifth and final part of this section summarizes the results. Conclu- sions are thus drawn not only from the significance or non-significance of variables but also from cross tabulations of the survey data.
Throughout the discussion in the following 5 parts, the primary focus is upon the producers' own perceptions of their industry, government programs and the processes of technology transfer and adaptation.
SUMMARY AND TABULATION OF SURVEY DATA
In the introduction to this report a distinction was made between those farms producing up to lfl00 kglhalyear and those producing more. Based on this distinction, the structure of the milkfish industry was characterized as dualistic in nature. When summarizing and presenting the survey data it was found useful to maintain this distinction.
In Table 6, a further distinction ismade within the 'up to 1,000 kg/ha/yearr category between those farms that use no supplementary inputs (extensive) and those which use such inputs (low intensity).
Table 6 . Summary of farm data by output and level of input use (mean and standard deviation on a per farm basis). 1
Farms producing Farms producing < 1,000 kglhalyr > 1,000 kg/ha/yr
Extensive Low intensity High intensity All farms Explanatory variables2 (n = 51) (n = 282) (n = 114) (n = 447)
Z Fertilizer expenditureslhalyr
X, Fry stocking ratelhalyr
X2 Fingerling stocking rate/ha/yr 961.19 637.77 1,641 .OO 937.42 (1,914.00) (1,380.10) (3,577.96) (2,268.30)
Continued

Table 6 (Continued)
Farms producing Farms producing 4 1,000 kglhalyr > 1,000 kglhalyr
Extensive Low intensity High intensity All farms Explanatory variables2 (n = 51) (n = 282) (n = 114) (n = 447)
Milkfish-fry price ratio
Milkfish-fingerling price ratio
Milkfisharganic fertilizer price ratio
Milkfish-inorganic fertilizer price ratio
Milkfish-fish price ratio
Milkfish-meat price ratio
Farm size (ha)
Per hectare yield (kglhalyr)
Tenure status (% privately owned)
Accessibility of farm (% accessible by road)
Age of pond (yr)
pH of pond
Salinity of pond soil (/.4nhoslcm)
Distance to main source of water (m)
Depth of pond (rn)
Nitrogen level (%14
Phosphorous level (ppm)
Potassium level (ppm)
17.89 (1 5.00)
2.99 (11.11)
19.32 (30.71 )
3.21 (1.50)
0.68 (0.99)
0.35 (0.1 1)
19.91 (75.79)
719.65~ (701.66)
0.45 (0.56)
0.59 (0.49)
23.53 (20.81 )
5.70 (2.29)
73.62 (47.69)
0.90 (9.99)
0.61 (0.33)
4.76 (5.79)
28.44 (56.56)
1.31 9.32 (1,106.37)
Continued

Table 6 (Continued)
Explanatory variables2
Farms producing Farms producing 2 1,000 kglhaly r > 1,000 kglhalyr
Extensive Low intensity High intensity All farms (n = 51) (n = 282) (n = 114) ln = 447)
Total culture experience (yr)
Culture experience with supplementary inputs (yr)
Age of respondent (yr)
Years of formal schooling (yr)
Ability to receive and decode information (%)
Attendance in aquaculture seminar (%)
Interest to work on other farmers' farms (%)
Consulted by others (number of times)
Sought consultation (number of times)
Observe other farmers' operations (%)
Aquaculture association membership (%)
Contact with extension service (number of times)
Distance to input market (km)
Distance to output market (km)
Distance to house (km)
Family size
Percent of time as farm operator
Belief that fertilizers affect taste (%)
15.11 (1 2.04)
7.54 (7.14)
48.45 (13.64)
7.54 (4.63)
0.64 (0.48)
0.26 10.44)
0.40 (0.49)
1 1.39 (39.63)
12.99 (39.68)
0.84 (0.36)
0.25 (0.44)
2.41 18.69)
21.71 (54.78)
28.23 (55.07)
4.50 (16.41)
6.85 (3.73)
84.70 (27.14)
0.1 5 (0.38)
Continued

Table 6 (Continued)
Farms producing Farms producing 4 1,000 kglhalyr > 1,000 kglhalyr
Extensive Low intensity High intensity All farms Explanatory wahtstes2 (n = 51) (n = 282) (n = 114) (n = 447)
Non-milkfish income (%)
Productivity differences between input and no input use (%)
Acceptable collateral level (%)
Acceptable interest rate (%I
Believed that increased input use is risky (%)
Believed that improved techniques is risky (%)
Water change
Number of draining and drying cycles (timeslyr)
Length of draining and drying cycles (days)
Length of crop cycle (months)
Number of croppingslyr
Percent with own transportation means
Believed that input availability i s not difficult
Percent using credit
Ratio of milkfish price in local market to price in outside market
Climate types
25.91 (32.79)
93.59 (1 53.33)
25.57 (27.83)
40.46 (56.82)
0.30 (0.62)
0.29 (0.46)
36.58 (36.02)
2.81 (1.33)
22.98 (16.24)
4.87 (2.20)
2.52 (1.10)
0.52 (0.50)
0.84 (0.28)
0.1 2 (0.32)
0.80 (0.19)
n.a.
Continued

2 1
Table 6 (Continued)
Farms producing Farms producing /c 1,000 kglhalyr > 1,000 kglhalyr
Extensive Low intensity High intensity All farms Explanatory variables2 (n= 51) (n = 282) (n = 114) (n = 447)
XS5 Believed that information dissemination system is strong (%) 0.41 0.38
(0.50) (0.49)
XS6 Previous agricultural background (%) 0.62 0.46 0.34 0.45
(0.49) (0.50) (0.48) (0.49)
'Figures in parentheses are standard deviations. Extensive farms are those with no expenditure on supplementary inputs. All farms producing > 1,000 kglhalyr are intensive farms.
2~e fe r to the full model for details on explanatory variables. his yield figure is calculated on the basis of adding the average yields of each farm and dividing by number of farms and not by
total area. For weighted average yields, see Tables 2 and 7. 4~itrogen level is reflected through organic matter content (46) of soil sample.
In this case, supplementary inputs include pesticides but not fertilizers.
Fertilizers used in milkfish farming are either organic or inorganic. Examples of organic fertil- izers are chicken manure, mud press, and hog manure. Commonly used inorganic fertilizers are "16-20-0" or "1 846-0'' or "46-0-0" (N-P-K content). Out of a total sample of 447 milkfish farmers, 397 farmers or 90% reported the use of fertilizers in varying amounts. The remaining 10% did not use any fertilizers at all (Table 7). This is in contrast to the 1978 crop year sample when 21% did not use any fertilizer. The difference in the percent of farmers using fertilizers between 1978 and 1980 crop year is significant. Some yield comparisons between the 1978 and 1980 crop year can be made from the data in Table 8.
Almost all the milkfish farmers in Bulacan and Capiz were found to apply fertilizers; only 5% of the farmers in the two provinces did not apply any fertilizer. This is in contrast to Lanao del Norte and Mindoro Oriental where relatively fewer farmers used fertilizers.
For those farms using organic fertilizers only, the &erage rate of application was 1,395 kglhal year, valued a t P363 (Fig. 3). The average rate for inorganic fertilizer application was 224 kglhalyear with a value of W67. However, for those farms where both organic and inorganic fertilizers were
Table 7. Number of farmers using supplementary inputs and no supplementary inputs and their corresponding average yields (kglhalyr), 1980.
Using inputs Using no inputs All farms Province Percentage Yields Percentage Yields Yields
Bulacan Quezon Mindoro Oriental Capiz Negros Oriental Bohol Lanao del Norte
Totallaverage 90 869 10 189 831'
his yield figure i s a weighted average calculated on the basis of total production divided by total area.

Table 8. Milkfish yields in selected Philippine provinces.
1978 1980 Province kglhalyr kglhalyr
Cagayan Pangasinan Bulacan Quezon Mindoro Oriental Masbate lloilo Capiz Negros Oriental Bohol Lanao del Norte Zamboanga del Sur Sample
Farm size:
small (<6 ha)
medium ( 6 - 5 0 ha)
large (>SO ha)
all farms
Forms usingl~arms usingl~arrns usingl~verage total fertilizer organic inorganic organic and use
only only inorganic All farms
Fertilizer types used
Fig. 3. Types andaveragequantitiesof fertilizersused (kglhalyr) in milkfish culture by farm size (ha).
applied in combination, the average rate of application was 2,743 kglhalyear valued a t P1,297. Combining the fertilizers used for a l l farms, the average expenditure on fertilizer, irrespective of whether organic or inorganic or both are used, is PI ,102Ihalyear equivalent to 2,165 kglhalyear. Application rates varied significantly among provinces (Table 9).
In contrast, the 1979 survey of 324 milkfish farmers (Chong et al. 1982) showed that the rate of use of organic fertilizers then was 1,330 kglhalyearvalued a t P359, and for inorganic fertil- izers, an average of 172 kglhalyear at a cost of P286. These results show that there were 5% and 30% increases in the rates of application of organic and inorganic fertilizers, respectively, between the 1978 and 1980 crop years.
In a survey of 1,394 milkfish farmers in 1974, Librero et al. (1977) reported that those farmers who apply fertilizers earned about 46% more than those who did not. According to the same authors, inorganic fertilizers gave the best net profits. These results are consistent with the 1979 survey.

Table 9. Rates of application and expenditures on organic and inorganic fertilizers by province.
Farms applying Farms applying Farms applying both organic fertilizers only inorganic fertilizers only organic and inorganic fertilizers
Province kglhalyr vahelhalyr kglhalyr valuelhalyr kglhalyr valuelhalyr 1P) (PI (P)
Bulacan Quezon Mindoro Oriental Capiz Negros Oriental Bohol Lanao del Norte Averagelsample
Table 6 provides additional evidence of dualism in the milkfish industry. Most obvious is the difference between yield levels of the extensive and intensive farms; marked differences show up between the low-intensity and high-intensity farms also.
MANAGERIAL PROFILE OF MILKFISH FARMERS AND EFFECT ON YIELDS
Because of the nature of milkfish production, productivity of the farm depends to a great extent on the management abilities of the person who tends the farm, that is, the milkfish farmer and/or the caretaker. A working knowledge of the management skills of the milkfish farmers can reveal interesting insights on levels of fertilizer use and yields. The age, educational attainment, milkfish culture experience, attitudes towards risks, and work pattern (whether full- or part-time) of these persons are presented below and discussed in relation to yields per ha. Each of these is a dimension of management ability that warrants further examination.
The age of the farmer has a clear bearing on his decisionmaking process, because managerial ability iscommonly assumed to be an inverted U-shaped function of age. [In other words, managerial ability is low a t a young age, rises with increasing age to reach a peak a t middle age, then declines with increasing age.] In part this pattern is related to the ability to assume risks. The average age of the sample milkfish farmers was 49 years. The oldest farmer interviewed was 93 years old while the youngest was 17 years. About 50% were over 50 years old. Our sample of 447 milkfish farmers clearly revealed a relationship between age of farmersand yield levels (Fig. 4). The curve of yield against age is very consistent with the inverted U-shaped relationship between managerial ability and age.
Educational attainment
About 53% of the milkfish farmers in our second survey had elementary education, 16% com- pleted high school and 25% were college-educated (Table 10). The remaining 6% either completed vocational training or had no schooling a t all. Both users and non-users of fertilizer had an average of seven yearsr education.
The educational attainment of the 447 milkfish farmers suggests that the vast majority should have little difficulty in receiving and decoding technical information in extension bulletins. In fact, there was no clear relationship between milkfish yield and education (r = 0.06).

Table 10. Percentage distribution of milkfish farmers with and without education.
1979 Survey 1981 Survey No Primary Secondary Tertiary No Primary Secondary Tertiary
Province education education education education Others* education education education education Others*
Cagayan Pangasinan Bulacan Quezon Mindoro Oriental Masbate lloilo Capiz Negros Oriental Bohol Lanao del Norte Zamboanga del Sur Sample average
*"Othersu refer to vocational training.
Philippines (sample average)
\\k Nepros Oriental Copiz Quezon Mindoro Bohol
Oriental
Lonoo del Norte
Age( years)
Fig. 4. Milkfish yield as a function of age of farmers.
Milkfish culture experience
Two types of farming experience can be distinguished: total number of years of experience and experience using supplementary inputs. The average number of years of milkfish culture expe- rience was about 15-1 6 years based on the two surveys (Table 1 1 ). Average years of experience using supplementary inputs were less than half this duration. In al l the provinces surveyed, there was a marked difference in yield between experienced and inexperienced farmers (Fig. 5). As farmers gained more experience, they were able to improve their yield. This implies that they were making better decisions by learning on the job. It is fair to assume also that a similar increase in yields resulted from added experience with the use of supplementary inputs.

Table 11. Culture experience in years o f Philippine milkfish farmers in selected provinces.
Experience with Province Total experience Total experience supplementary inputs
Cagayan Pangasinan Bulacan Quezon Mindoro Oriental Masbate l loi lo Capiz Negros Oriental Bohol Lanao del Norte Zamboanga del Sur Sample average
Inexperienced ((5 years)
I7 Experienced (>5 years)
Province Fig. 5. Average annual per hectare milkfish yield o f inexperienced and experienced farmers. (Total culture experience, not only experience using supplementary inputs.)
Work pattern
Among the most successful milkfish farmers, a common maxim is "the best input for a fish- pond is theshadow of the milkfish farmer across the pond or the number of footsteps on the dikes." It is clear that personal management is desirable. However, management responsibilities are often relegated to caretakers.
It is not that caretakers cannot do a good job but rather that good and honest caretakers are difficult to hire and retain. Only by inspecting his ponds regularly can the milkfish farmer spot short- or long-term changes in his pond environment. Our survey of 447 milkfish farmers showed that 29% were part-time operators; the rest were full-time (Table 12). The difference in average yield between full-time and part-time farmers, unfortunately, is not clear from the data because

Table 12. Percentage distribution of full-time and part-time milkfish farmers in selected provinces in the Philippines.
Province Full-time Part-time
Bulacan Quezon Mindoro Oriental Capiz Negros Oriental Bohol Lanao del Norte Sample average
caretakers have been included as respondents. However, proportionally more part-time farmers were input users. This would imply that to a small extent part-time farmers substitute supplemental inputs with owner-operator's labor.
Although only 29% claimed to work part-time, about 42% reported non-milkfish sources of income. The survey did not investigate the exact composition of the non-milkfish sources of income in each case, but income such as rental income, spouse's income and children's earnings were in- cluded, some of which required no input or capital outlay from the respondent.
The preceding discussion has provided insights into the relationship between yields and certain management related variables such as age, educational attainment, milkfish culture experience, and work pattern. Of thesela clear relationship between yields and age and yields and culture experience emerged. Interestingly, educational attainment and work pattern appear to have no clear impact.
The above discussion focused on output. A more relevant question is the impact of managerial attributes on levels of supplementary input use. The results of the input-variation model estimation, which are reported in the next part, provide a more rigorous assessment of the factors constraining supplementary input use, and hence yields.
ESTIMATION OF THE INPUT VARIATION MODEL
A relationship was hypothesized between levels of input use (expenditure in pesos) and 56 explanatory variables classified into four potential constraint categories: socioeconomic, bio-tech- nical, institutional and physical. The model that was specified was termed an input variation model because it sought to 'explain' variation in expenditures on fertilizers among the 447 milkfish pro- ducers in the sample.
The estimated functional model is presented in Table 13. The overall f i t of this estimated model is good judging by the Fi2 value which is 0.73 (adjusted Fi2 = 0.59). Seventy-three percent of the variation in input use is thus explained by this model, which is a satisfactory finding. The F-value is significant also which means the overall explanatory power of the model is good.
Table 13. Input use variation model: regression coefficients and significance levels.
Regression Standard xi Explanatory variables coefficients errors t-values
(Y Constant
)(I Fry stocking ratelhalyr
Xi Fingerling stocking ratelhalyr X3 Milkfish-fry price ratio X4 Milkfish-fingerling price ratio X~ Milkfish-organic fertilizer price ratio
Continued

27
Table 13 (Continued)
Regression Standard
Xi Explanatory variables coefficients errors t-values
Milkfish-inorganic fertilizer price ratio Milkfish-fish price ratio Milkfish-meat price ratio Farm size (ha) Per hectare yield (kglhalyr) Tenure status (% privately owned) Accessibility o f farm (%accessible by road) Age o f pond (yr) pH o f pond soil Salinity o f pond soil (/.hnhoslcm) Distance to main source o f water (m) Depth o f pond (m) Nitrogen level (96) Phosphorous level (ppm) Potassium level (ppm) Total culture experience (yr) Culture experience with supplementarj
inputs (yr) Age o f respondent (yr) Years o f formal schooling (yr) Abi l i ty t o receive and decode information (%) Attendance in aquaculture seminar (96) Interest t o work on other farmers' farms (%) Consulted by others (number o f times) Sought consultation (number o f times) Observe other farmers' operations Y % ) Aquaculture association membership (%) Contact wi th extension service (number o f times) Distance t o input market (km) Distance t o output market (km) Distance t o house (km) Family size Percent o f time as farm operator Belief that fertilizers affect taste (%) Non-mdkfish income (%) Productivity differences between input and no
input use (%)I Acceptable collateral level (%) Acceptable interest rate (%) Believed that increased input use is risky (%) Belived that improved techniques is risky (%) Water change Number o f draining and drying cycles (timeslyr) Length o f draining and drying cycles (days) Length o f crop cycle (months) Number o f croppingslyr Percent wi th own transportation means Believed that input availability is not diff icult Percent using credit Ratio o f milkfish price in local market t o price
in outside market Climate types (Type I is base)
D l (Type l l ) D2 (Type I l l ) D3 (Type IV )
Believed that information dissemination system is strong (%I
Previous agricultural background (%)
R2 = 0.73, Adjusted R2 = 0.59, F-value = 5.04, Durbin-Watson = 2.20
1 ~ 4 0 is excluded because of insufficient observations. *Significant at 5% level.
"Significant at 1% level.

SIGN IF ICANT VARIABLES
Of the 56 explanatory variables, eight are significant a t the 5% confidence level or less. These were:
a t the 1% level: X5 Milkfishlorganic fertilizer price ratio X6 Milkfishlinorganic fertilizer price ratio X,, Interest to work on other farmers' farms X38 Belief that fertilizers affect taste
a t the 5% level: XI, Salinity of pond soil X,g Sought consultation X3, Family size X,, Risk assessment-collateral
Five of these variables (X,, X6 , X36, X38 and X,, ) are socioeconomic parameters; two (X2, and X ) are bio-technisal parameters; and one (XI,) i s a physical parameter. Significantly, none of the
29. inst~tutional parameters (which include various government extension, credit and information dis- semination programs) had any effect on levels of expenditure on supplementary inputs. Possible reasons for this will be discussed later in this section.
Socioeconomic parameters
First of all, the results show the importance of expected profits as a motivating factor in stimulating input use. Variables X5 and X, represent the ratios of output price to organic and inorganic fertilizer prices, respectively. The outputlinput price ratios are a proxy for profits, repre- senting the difference between value of output and cost of input. Though not a direct measure of profitability because quantitiesof output and input and conversion ratios are not explicitly included, these factors are implicit in the mental calculations of fishfarmers when they compare output and input prices and adjust their levels of input expenditure accordingly. The positive signs of the co- eff icients of these two variables are consistent with theoretical predictions regarding producer behav- ior in response to changing output or input prices. The higher these ratios, the more likely farmers are to spend more on fertilizers. The lower the ratios, the lower the expenditures on fertilizers.
The importance of these two variables lies in the fact that the inputs they represent are major contributors to variation in milkfish yield. The coefficients of 0.21 and 1.86 of X, and X,, respec- tively, show that if the outputlinput price ratios increase by I%, expenditures on organic and inorganic fertilizer use would increaseby 0.21 and 1.86%, respectively. Marginal analysis of Chong et al. (1982) reveals that inorganic fertilizer has a high marginal value product (P20.20) compared to i t s cost (PI .66/kg). In contrast, the marginal value product for organic fertilizer is P0.82 compared to i t s cost of P0.29lkg. In both cases, given the relative prices prevailing a t that time, it would pay the farmer to increase the rates of application of these two inputs. However, this statement applies to the 'averager fishfarm only; there is significant variation in organic fertilizer availability and price around the country.
Table 14 shows the calculated ratios of milkfish price to organic fertilizer price. Unlike inor- ganic fertilizers, organic fertilizers such as chicken manure are not necessarily widely available a t a uniform price. Their price thus reflects the supply and demand of the raw material in the province in question. This is clearly shown in the average ratios calculated. In provinces where the supply of chicken manure is low and i t s price high (e.g., in Lanao del Norte and Mindoro Oriental) the ratios are low in comparison to the ratios for Bulacan and Quezon where large poultry farms are present and supply is higher and price lower. These diverse supply and demand conditions produce chicken manure price ranges from PO.10 to PI .50/kg. In locations where pricelkg exceeds P0.82, it makes no economic sense for fishfarmers to increase their'average application rates of organic fertilizers.
In contrast, with the existence of a reasonably uniform input price, a different pattern of outputlinput ratios prevails for inorganic fertilizers (Table 14). Theoretically, under conditions of

Table 14. Average output/input price ratios of milkfish to organic and inorganic fertilizers, by province.
Milkfish-organic Mil kfish-inorganic Province fertilizer price ratio1 fertilizer price ratio1
Bulacan Quezon Mindoro Oriental Capiz Negros Oriental Bohol Lanao del Norte Sample average
' ~ e a d as 35.4:1,4.0:1 etc.
high factor mobility, a factor of production is attracted into a sector where i t s opportunity cost or value of marginal productivity in use is the highest. This is especially true of commercial inputs such as inorganic fertilizers which are widely used in agriculture, too. Moreover, these commercial inputs have well-established marketing networks, resulting in greater factor mobility of such inputs. This is in contrast to inputs such as organic fertilizers which not only do not have a well-developed marketing network but are bulky (and therefore costly to transport) and have lower economic value. Thus, in contrast such inputs have considerably restricted mobility and use. Because of the relatively high mobility of inorganic fertilizers, the provincial output/input ratios for milkfish and inorganic fertilizers are fairly close to each other. Because of the fairly uniform price for inorganic fertilizers in the provinces surveyed, the small differences observed actually reflect trans- portation costs.
The strictly economic marginal analysis indicates that given the prevailing prices farmers on average could increase their profits by increasing supplementary input use. The input variation model, however, implies that input expenditure is determined, in the eyes of the producer, by the prevailingprices of output and input and that the rat.ios would have to be higher to encourage the average producer to increase his supplementary input expenditures. The previous (Chong et al. 1982) study demonstrated the economic benefits to be derived from increased fertilizer use; this study indicates that farmers are either not aware of these potential benefits or that they think the risks associated with achieving them are too high. Both alternatives imply that there is a need for a more active extension and information dissemination network to demonstrate the benefits of technology intensification. The findings also have implication for input pricing policy which are discussed in the concluding section of this report.
The belief of producers that fertilizers impart a bad taste to market-size milkfish (X,,) is apparently widespread enough in certain provinces to have a significant impact on levels of fertilizer expenditure. The highly significant coefficient for this variable has a negative sign as expected. For every 1% decline in the number of farmers who hold this perception, expenditures on fertilizers would increase by 0.48%. The belief that fertilizers impart a bad taste to milkfish is especially prevalent in Negros Oriental, Bohol and Lanao del Norte (Table 15). Lanao del Norte and Bohol have the lowest per ha yields of the seven provinces surveyed. Again, a role is indicated for exten- sion and information dissemination to overcome this belief. Of course, it is also possible that the producers' perception is correct; consumer taste tests especially in these three provinces, would provide some indication of where the truth lies and what action should be undertaken.
The model also reveals that milkfish farmers will use additional fertilizers purchased on credit if the collateral requirements of government credit programs and commercial banks (X4, ) will be lowered. For every 1% decrease in the collateral requirements, expenditures on fertilizers purchased with government credit will increase by 0.22%. Milkfish farmers were very vocal on the collateral

Table 15. Milkfish farmers' belief in the effect of fertilizers on the taste of milkfish.
Percent of farmers believing that fertilizer Province Produces bad taste Does not proauce bad taste No idea
Bulacan Quezon Mindoro Oriental Capiz Negros Oriental Bohol Lanao del Norte Sample average
requirements of government lending institutions. They alleged that the collateral the lending institu- tions require from them often far exceeded the value of the loans approved by the lending institu- tions. In fact, many milkfish farmers did not bother to apply for government loans because: first, they did not have the necessary collateral or even proper documentation of government leases of the farms they are working; second, they claimed that they are discouraged from dealing with formal lending institutions because of alleged irregularities reported in the local press or by word of mouth. Producer risk considerations are hinted a t here.2
Fishfarmers believed that stiff collateral requirements were counterproductive. During the interview, farmers were asked what they thought would be a "fair" collateral requirement and their response is reported in Table 16. Approximately 65% believed that collateral requirements should be 20% or less of the loan.
Although milkfish farmers are eligible to apply for loans under the Biyayang Dagat program, it is mostly geared towards fishermen. Their common plea is far a credit program patterned after the earlier Masagana 99 program for rice farmers, under which no collateral is required. Develop- ment banks such as the Development Bank of the Philippines are government-owned and fish- farmers believe that one of their main functions should be to extend credit to farmers a t conces- sional rates. They maintain that these banksshould finance farmers' production under circumstances in which private or commercial banks would not normally risk their capital.
h he Development Bank of the Philippines i s reportedly one of today's biggest land owners in the country through its fore- closures of land (fishpond and agricultural land). Most respondents of the survey claimed to be unhappy with bank lending policies and procedures.
Table 16. Milkfish farmers' view of a "fair" collateral requirement.
Collateral requirement as a Percentage distribution of percent of loan borrowed responses
0 < 10
10 1 2 - 20 25 - 40
50 60 - 70 7 5 - 80
100 No idealno response

Since these complaints of fishfarmers imply that they are not being adequately serviced by the development banks of the country, a complete evaluation of the lending practices of these institutions would seem to be in order.
Family size (X36) of the primary decisionmaker of the farm is the final socioeconomic variable shown to be significant in explaining fertilizer expenditures. The positive regression coefficient (0.38) implies that as the size of the family grows, more fertilizers are purchased. I t is difficult to provide a logical interpretation for this variable's significance. Perhaps, with more mouths to feed, more income from milkfish farming is needed, and hence the farms of larger families are more intensively farmed. This argument, however, will not be followed to i t s logical conclusion which would be to recommend an increase in average family size so that milkfish farms will on average be more intensively farmed!
Bio-technical parameters
The two significant bio-technical parameters (X2, and X29) have to do with acquisition of technical information. X2,, which is highly significant, measures the interest of producers to work on others' farms and the coefficient (-0.27) measures the relationship between this interest and current levels of input expenditure. X29, which measures the number of times producers actively sought external consultation in 1980, also has a negative regression coefficient (-0.21 ). These results imply that those producers who were the most willing to seek advice from other farmers and who most actively sought external advice were those applying fertilizers more efficiently. Supple- mentary input expenditures actually increased as the seeking of advice declined. These findings simply imply that the more intensive fishfarms were less likely to seek external advice because they already understood the intensive production technology. These results are encouraging because they imply a strong interest among the less intensively operated farms to learn about improved produc- tion techniques. Also, as fishfarmers learn improved techniques of milkfish culture, supplementary inputs are more efficiently applied, resulting in less waste. For example, platform method of fertil- izer application is more efficient than broadcast method of application.
In fact, thegeneral willingness of fishfarmers to exchange technical and managerial information seems high (Table 17). Eighty-four percent claimed to be consulted by other farmers while 93% claimed to seek advice from their colleagues. Eighty-five percent stated that they observe operations on neighboring milkfish farms, but only 40% were actually willing to work on another farm in order to gain additional technical or managerial exposure. Sixty-five percent of the respondents classified themselves as active information seekers.
Table 17. Information gathering characteristics of milkfish farmers (percent). - - -
Percentage Type of information Interest in working1 Observe other Percentage seeking
seeker on other farm farmer's operation being consulted consultation Province Active Passive Yes No Yes No Yes No Yes N o
Bulacan Quezon Mindoro Oriental Capiz Negros Oriental Bohol Lanao del Norte Sample average
' ~ o t as a laborer but rather to see what and how the other farmer is doing and supervising his workers.
Given this level of information exchange among milkfish farmers, the survey team was surprised to learn how little exposure these farmers had to written technical materials on milkfish farming. Out of 447 milkfish farmers interviewed, not one of them possessed a copy of "Philippine Recom- mends for Bangus", an extension publication available from the Philippine Council for Agriculture and Resources Research and Development (PCARRD). This publication which has most of the basic information on milkfish culture, is currently being revised by PCARRD. Only a small percentage (1 0%) of the farmers had copies of other written technical information. Most of the farmers reported that they had to make a special effort to obtain these; in other words, expenses are incurred in acquiring them. The extension literature is not handed out to them per se, so there is clearly room here for considerable improvement in the government's information dissemination program. The prevalence of informal information exchange among fishfarmers implies that a major effort to provide extension materials to producers would be worthwhile.
Physical parameters
The sole physical parameter which was significant was the salinity of the pond soil (XIS 1. The regression coefficient is negative (-0.04) which implies that as the salinity of the pond soil increases, the use of fertilizer inputs declined. When milkfish fry first appear along the coast, they seek out freshwater in rivers and estuaries. Milkfish farmers, who observe this behavior, therefore tend to add less fertilizers as pond salinity increases because they believe that fertilizers will add more salt to the pond environment. This they believe would increase the overall salinity of the pond and therefore reduce the rate of milkfish growth. Informal discussions by the senior author with milkfish producers in Taiwan and the Philippines support the contention that milkfish grow faster in freshwater than in brackishwater.
To briefly summarize, eight of 56 explanatory variables were found to be significant in explain- ing variation in supplementary input (fertilizer) expenditure. The model explains 73% of this variation. Each of the eight significant variables has implications for efforts to increase supplementary input use and hence output on milkfish farms. But before discussing these implications it is instruc- tive to examine a select number of those variables that have insignificant regression coefficients.
NON-SIGNIF ICANT VARIABLES
Fortyeight of the 56 explanatory -variables in the input variation model have regression coefficients that are not significantly different from zero. A number of these non-significant variables are examined here in more detail because their lack of significance also has implications for govern- ment aquaculture development policy. This is particularly true of those institutional variables related to technology transfer.
The following discussion is organized into socioeconomic, bio-technical, physical and institu- tional categories, similar to the preceding discussion of the eight significant variables.
Socioeconomic parameters
The insignificant socioeconomic parameters can be grouped into three general categories: first, those related to input and output prices; second, demographic factors; and third, pond management factors.
Outputhput price ratios for stocking materials (fry [X,] and fingerling [X,]) and milkfish output showed no significant relationship to input expenditure. There was quite a range in these ratios, most likely produced by the highly seasonal nature of the prices of stocking materials (Table 18). These output/input ratios are standardized by price per piece. Because the level of supple- mentary input use by the farmer is more likely to be related to quantities of stocking materials used than to their prices, the effects of seasonal price fluctuations for stocking materials appear to have been covered over by the more standard stocking rates. In other words, it appears that farmers have maintained stocking rates even when fry and fingerling prices have fluctuated.

Table 18. Price ratios of marketable milkfish to milkfish fry and fingerlings estimated by piece.
Province
Marketable milkfish to milkfish
fry f3atio2 Range
Marketable milkfish to milkfish fingerling
~ a t i o ~ Range
Bulacan Quezon Mindoro Oriental Capiz Negros Oriental Bohol Lanao del Norte Sample average
'NO range is available because only 1 farmer reported the use of fingerlings. 2 ~ e a d as25:1,8:1 etc.
The opposite problem occurred with the ratios of milkfish prices to the prices of other fish (X7 and meat products (X8 ). Since prices of other fish and meat products were measured from the consumer price indices (CPI), most producers therefore faced reasonably uniform prices around the country, although there were minor regional differences. The result of this lack of variation in the CPI may have contributed to the insignificant coefficients for these two variables. An indication of the competitive position of milkfish relative to these other products can be obtained from the simple tabulation of the consumer price indices for milkfish, all fish and meat products (Table 19). From this tabulation, one can see that the price of milkfish has been increasing a t a significantly lower rate than the prices of other fish that compete with milkfish for the consumer's peso. The prices of meat products have increased a t a slower rate than fish prices because they have been under price control while those of fish have not.
Relative to other aquaculture species, the attractiveness of milkfish has declined; in fact, in real terms, the price of milkfish actually declined in the decade 1970-1981. This decline is thought to have been due to changing consumer preferences among the middle and upper classes in the Philippines away from fish towards meat products. Similar shifts have occurred in Taiwan as real per
Table 19. Comparisons of Metro Manila consumer price indices for milkfish, all fish, meat and all items. (1972 = 100)
Year ~ i l kfisha All fishb All items b Meat b
a~ource of data: Bureau of Agricultural Economics, based on national moving averages of retail prices. b~ource of data: Central Bank of the Philippines. Indices are retail prices in Metro Manila. CBased on first 6 months period.

capita incomes increased during the past decade (Lee 1983). Experience there is instructive for the Philippines because due to this shift in demand, milkfish production area and profitability have been declining. Increased profitability in milkfish farms there that are already intensively farmed is apparently possible only with a shift to an even higher intensity deepwater pond system for which intensive supplementary feeding and major pond reconstruction are required.
Several demographic factors were also found to have no explanatory power for levels of input expenditure. These included age (X23) and years of formal schooling (X2,) of respondents. As discussed in the second part of this section (managerial profile), per a yield levels were related to age: yield increasing to middle-age (50 years) then declining thereafter. Presumably input use follows the same pattern. The insignificance of the age regression coefficient in the input variation model is probably due to the fact that it is specified in log-linear form rather than as a quadratic form which gives an inverted U-shape. The results of the education variable, however, are consistent with the management profile which also found no relationship between education levels and per ha yields.
Several pond management factors were also insignificant in explaining variations in input use. As explained in the earlier management profile, milkfish culture experience (X ) is an in-
?1 adequate measure of management skill because this experience may have been confmed entirely to use of traditional extensive or low-intensity methods. Experience with supplementary input use (X2, 1 was expected to show clearer relationship to input expenditures. The fact that the regres- sion resultsfail to bear this out was because, with experience, fishfarmers become more efficient in their use of fertilizers. Among the more experienced fishfarmers, for example, the survey team noted the prevalence of the platform method of fertilizer application. This method uses a given quantity of input more efficiently than the broadcast method, which is practiced by the less expe- rienced farmers.
Neither tenure status (XI, ) nor extent of full-time involvement in fishfarming (X37) had any bearing on levels of input expenditure, thus providing evidence to contradict the often-held (though unsubstantiated) point of view that these are significant determinants of input use and hence of yields. Table 20 provides a provincial breakdown of owner and non-owner farmers. Farmers were classified as owners i f they were either title-holders of their fishponds or had a combined farm comprising privately-titled and leased fishponds (private or government). On the other hand, non- owners were holders of either private or government-leased fishponds. Non-owners also included
Table 20. Percentage distribution of owner and non-owner milkfish farmer respondents by province.
1979 Survey 1981 Survey Province Owner Non-owner Owner Non-owner
Cagayan Pangasinan Bulacan Quezon Mindoro Oriental Masbate lloilo Capiz Negros Oriental Bohol Lanao del Norte Zamboanga del Sur Sample average
'Of this, 15% and 40% are caretakers in the 1979 and 1981 surveys, respectively.

caretakers, managers or administrators of fishponds. Absentee owners were included in the category of non-owner because their caretakers were interviewed. Forty percent of our sample comprised caretakers. Thus the data collected do not accurately reflect the actual ownership pattern, but they are appropriate for our use in this study because they reflect the status of the major decisionmaker for the farm. The mix between owners and caretakers in our sample provides a more balanced view of the constraints to high yields.
Respondents were asked the percentage of their non-milkfish income to determine the contri- bution of milkfish income to their total income and indirectly the "weight" or attention given to milkfish vis-a-vis non-milkfish activities. In all, 42.3% of milkfish farmers in our 1981 sample reported other sources of income in addition to those from milkfish. Of those who reported non-milkfish sources of income, 89% reported that this source of income exceeded 10% of their total income. The non-milkfish sources of income ranged from less than 10% to 99%. About 14% of those who reported non-milkfish sourcesof income derived equal share from milkfish and non-milkfish sources. Those receiving more than 50% of their income from non-milkfish sources comprised about 44% of the farmers; 31% received less than 50%. Only 14.5% of a l l the farmers interviewed relied on milk- fish farming as their sole source of income. The rest of the farmers or 43.2% did not wish to discuss other sources of income. One possible implication which can be drawn from this is that they had other sources of revenues. Qf the seven provinces surveyed, Negros Oriental, Lanao del Norte and Bohol had the highest percentage of farmers with non-milkfish sources of income. No farmer in Mindoro Oriental depended entirely on milkfish. Where milkfish farming was highly profitable, fewer farmers depended on non-milkfish sources of income (e.g., Bulacan). Despite this variation, however, no significant relationship between dependence on non-milkfish sources and levels of expenditure on supplementary inputs was found.
Finally, in this collection of non-significant socioeconomic parameters are those related to the producers' assessment of risks in milkfish farming. Almost two-thirds of the producers and care- takers interviewed stated that there were no additional risks associated with larger quantities of inputs or with techniques which give higher output (Table 21 ). Those who regarded the use of larger quantities of inputs as risky reasoned that larger quantities of fertilizers are toxic to the fish. An extension role is thus indicated here. Another group of farmers, about 6% however, clarified that the use of fertilizer must be matched with the size of pond, stocking rate and soil/water conditions. At the same time they were also concerned about the uncertainty in recovering their investment in inputs.
For those 64% who did not regard the use of larger quantities of inputs as risky, the common feeling shared by these farmers was that the fertilizers will increase output of milkfish. Having the necessary know-how and skills in applying the fertilizers can minimize risks. These two factors combined can assure higher returns from the production operations. Many producers within this
Table 21. Milkfish farmers' view on the risks associated with larger quantities of inputs and techniques which give higher output (in percent).
Use of larger quantities of inputs is: Techniques which give higher output are: Province Risky Not risky No response Risky Not risky No response
Bulacan Quezon Mindoro Oriental Capiz Negros Oriental Bohol Lanao del Norte Sample average

group, however, stated that capital to purchase fertilizers was a more important consideration than risk; they were confident they could manage the risks associated with fertilizer use. To some, no fertilizer was even more risky because fishfood would not grow and harvest would be low (such that cost of fry and labor may not be recovered). Overall, this group of milkfish farmers gave the impres- sion that not only is the use of larger quantities of fertilizers not risky, i t s use is profitable (advan- tages outweigh the risks). Why then are not many more milkfish farmers applying fertilizers as well as applying them at a higher rate? According to the respondents, lack of capital i s one of the main reasons.
Institutional parameters
Allegations of capital shortages by producers led naturally to discussion of the institutional parameters, none of which had a significant impact on variations in fertilizer expenditure. The major institutional parameters relate to credit (X42, X52), extension and information dissemination (X3,, and aquaculture associations (X31 ) all of which provide institutional support to fish- farmers to a varying degree.
Credit has had l i t t le impact on input intensification because so little of the available credit has been used for this purpose. Among the major banking institutions which offer credit to milkfish farmers are the Development Bank of the Philippines (DBP), Philippine National Bank, Land Bank of the Philippines, Central BankIRural Bank System, and numerous private or commercial banks. Sourcesof credit other than banks include individual money lenders, relatives, friends, input suppliers and fish brokers. For loans up to 85,000 per borrower from DBP there is no collateral requirement. However, as far as the authors can determine, milkfish farmers are not aware of such a lending policy. In fact, most milkfish farmers cited stiff collateral requirements as one of the main problems of obtaining credit. The great majority of loans reported to the survey team exceed 85,000. These loans were used primarily for pond construction, pond improvement and pond repairs (Table 22). Only one of 324 respondents reported using a loan to purchase fertilizers.
Interviewed milkfish farmers viewed credit, rather than risk, as the main constraint in milkfish culture. While 23% of the respondents equated indebtedness with inadequacy, lack of initiative, laziness or extravagance, fully 81% were willing to incur debts for production purposes. Based on
Table 22. Profile of the use of loans, 1978.'
Loan use by farmers as a percentage of the total number of farmers Pond Pond Pond Stocking Marketing
construction improvement repairs materials equipment others2
Percentage of loan used
100 90 - 99 80 - 89 70 - 79 60 - 69 50 - 59 40 - 49 30 - 39 20 - 29 10 - 19
< 10 Sample average3
l o u t of 324 milkfish farmers, only 169 farmers or 52% have loans. 2 ~ n d e r "Others," only one farmer reported the useof the loan to buy fertilizers. 3~ercentage figures do not sum up to 100% because some loans are used for more than one purpose and also because of rounding.

our survey data, farms producing more than 1,000 kglhalyear with average size of about 20 ha, the fertilizer expenditure alone amounts to P31,00B/year. To a small minority, indebtedness was actually a sign of good character, resourcefulness and prestige, but only if repayment of debt was made. Milkfish farmers had three major complaints about the existing credit system. First, they cited difficulties in obtaining loans for production purposes. Second, as already discussed, they complained of the high collateral requirements. Third, and more ominously, they complained about the high unforeseen additional costs in securing loans from the DBP.
Producers were asked what they regard as 'fair' interest rates, in terms of what interest rate they expected i f they deposit money in a bank or i f they have money to lend out. The farmers' responses are presented in Table 23. Their responses reflect a combined perception of what they were willing to pay as interest rate to lending institutions and what they expected as reasonable returns on their money as i f they were the lenders. Based on their responses, it is obvious that the 1980 interest rates (14-16%) charged by lending institutions were not considered unreasonable. However, when loan processing costs such as service charges and unforeseen additional costs are added, the real rate of interest becomes much higher. Milkfish farmers were extremely discouraged by these unforeseen processing and facilitating costs and complained bitterly about them. Because of these illegal practi~es~farmersviewed bank borrowing with much skepticism despite their willing- ness to assume such debts.
Table 23. Milkfish farmer's view of a fair annual rate of return or interest.
Annual rate of return or rate of interest
Percentage distribution of milkfish farmers
< 10 10
1 2 - 20 21 - 45
50 60 1- 90
100 120 - 500
No idealno response
Note: The "uneven" categorization is made because of the distribution of the raw data.
The results of the input use variation model show that there was no significant relationship between contact with the BFAR extension service and fertilizer expenditure. In part, this finding is due to the fact that 70% of the survey respondents had no contact a t all with extension agents during 1980 (Table 24). Only 10% had more than a single contact with an extension agent during
Table 24. Contact with extension agents, by province (percent).
Consultation was useful Contact with extension agents (% of those who had contact)
Province Yes No Yes N o
Bulacan Quezon Mindoro Oiiental Capiz Negros Oriental Bohol Lanao del Norte Sample average
that year. A further reason for the insignificant regression coefficient can be found on the fact that contact between extension agents and farmers was lowest in that province (Bulacan) with the highest per ha yield and fertilizer use. Those who had contact were not given any extension handouts as reference materials for future use.
A common criticism of the farmers is that they are more knowledgeable than the extension officers. Sixty-three percent of all producers'believed that the extension service is weak; 35% that it is strong. Because of this, some milkfish farmers reasoned that the extension officers were reluctant to make farm visits. Low remunerations, limited travel allowances and time-consuming office requirements in terms of filing trip and gasoline requests are other reasons cited by extension officers as inhibiting field work. Lack of visibility of extension workers was repeatedly corroborated by farmers and officials of provincial and municipal governments alike.
During interviews with farmers and caretakers, it also became clear that improved milkfish husbandry techniques are couched or presented most often in a "how" but not "why" orientation. Farmers stated that no rationale is given for a certain improved husbandry practice or why this or that is done. For example, most milkfish farmers were aware of the difference between broadcast method and platform method of fertilizer application but did not understand the rationale. Conse- quently, many milkfish farmers stated that they do not see real benefits of one method over the other. In fact, however, the platform method of application can save 20-40% on the amount of fertilizer and labor required when compared to the other method of application (PCARR 19761, but this is not generally known by the farmers.
There is a bright side to all of this, however, and this is that 93% of those who did have contact with extension agents viewed the contact as useful. Only in Bulacan, where pond operators are highly experienced, did they generally believe that the extension contact was not useful. Further- more, in three provinces (Negros Oriental, Bohol and Lanao del Sur) the majority of farmers had contact with extension agents and almost a l l of these found it worthwhile. Still, there is obvious room for improvement nationwide, and coupled with improved extension materials and manuals, there is hope that the extension service can yet be one of the accelerators of development in the Philippine aquaculture industry. It is our hope that these comments of milkfish farmers will be viewed as constructive criticism. Certainly the BADTC program of BFAR to provide practical training (involving fishpond engineering, fishpond management, fishpond economics, extension methodol~gy and socioeconomics of milkfish farmers) to extension workers is a good step in the right direction.
Finally, no significant relationship was found between membership in aquaculture associa- tions and levels of fertilizer expenditure. In some respects, the existence of an industry association is reflective of the degree of maturity of the industry. Milkfish farming and aquaculture in this country has indeed a long history and tradition. New or infant industries do not normally have the "luxury" of mobilizing their members toward a common goal. The Philippine Federation of Aquaculturists (PFA), first known as the Philippine Federation of Fishpond Producers (PFFP), but renamed PFA in 1981 was first organized in 1964, It is a federation of about 30 associations at the provincial or regional level. The federation claims a membership of 10,000 farmers; i ts annual convention draws about 500-1,000 participants.
Of the 447 milkfish farmers surveyed only 25% belong to an aquaculture association (Table 25). A common reason given for not belonging to an association was that membership in such an association did not give any benefits and was a waste of time. This point of view was particularly prevalent among the smaller fishpond operators, wnich is surprising because one might think that they would have the most to gain from membership and interaction with other fishfarmers. Their viewpoint perhaps reflects their uneasiness (hiya) or reluctance to display ignorance. However, non-members generally claimed that meetings tend to be more of an occasion to lobby for govern- ment attention and assistance than one for the exchange of technical information. It appears that

Table 25. Percentage of milkfish farmers with membership in aquaculture associations.
Province
Members By farm size
Overall Small Medium Large <6 ha 6-50 ha >50 ha
Non-members (%I
Overall
Bulacan Quezon Mindoro Oriental Capiz Negros Oriental Bohol Lanao del Norte Sample average
most technical information exchange takes place informally among fishfarmers rather than through formal seminars and association meetings.
In summary, none of the institutional parameters are significant in explaining supplementary input expenditure. However, since these findings are due in good measure to (1) lack of loans for production credit, (2) low levels of contact between extension personnel and fishfarmers, and (3) limited membership in associations, they should not be taken as an indication that there is no potential for these facilitating institutions to play a strong role in industry development. The last section of this report outlines some steps that could be considered to improve upon these services.
Bio-technical parameters
The bio-technical parameters relate primarily to the production practices of the fishfarmer and his own initiative in acquiring knowledge of these practices. As it turns out, only two of the 15 explanatory variables grouped in this category were statistically significant. The other 13 relate primarily to the actual production practices of the farmer, at-ld the fact that their regression coef- ficients are statistically insignificant has major implications for the issue of technology transfer and adoption by milkfish farmers. It appears that in many cases, milkfish farmers did not fully appre- ciate the interrelationships (well-established by data from experimental farms) among such factors as fertilizer use, stocking rates, water control and number and length of crop cycle, though their knowledge of basic technical methods of pond management appeared adequate.
The basis to determine appropriate stocking rates (XI and X2) was not fully understood by many milkfish farmers. In large number of cases, farmers did not apparently appreciate the relation- ships between stocking rates and inherent fertility of the ponds, carrying capacity of the pond, types of fishfood available naturally, to be grown or to be added, size of fry a t stocking, market size a t harvest and most of all the cost of inputs and their added (marginal) value in use. For example, stocking practices as observed during the survey were largely determined by the local availability and price of fry; that is, the number of fry the farmer can buy, given his budget constraints. The appropriate number of fry to stock a given unit of pond area did not appear to be known by many farmers. Wide variations in stocking rates were found (Table 26), although the average stocking rates as estimated by the 1979 and 1981 surveys are not very different from each other. Chong et al. (1982) concluded that "average farm" profits could be increased by increasing stocking rates.
A further indication of the inexperience of producers with a variety of intensive production methods is the fact that only 20% were able to make a concrete estimate of how much higher yieldlha would be when intensive rather than extensive methods are used (X40). This minority group was able to make such estimations only in terms of larger fish size (# pieceslkg) for a given time period, and not in terms of yield and productivity.

Table 26. Average stocking rates o f milkfish f ry and fingerlings i n the Philippines (pieceslhectarelyear).
Province 1978
Fry Fingerlings
1980 FV Fingerlings
Cagayan 4,149 764 - - Pangasinan 5,985 3,400 - - Bulacan 7,561 6,315 8,089 5.044 Quezon - - 3,166 1,949 Mindoro Oriental - - 2,868 8,000 Masbate 1,730 250 - - lloilo 8,502 6,282 - - Capiz n - - 5,203 3,710 Negros Oriental , - - 9,485 9,524 Bohol 3,136 - 3,695 1,846 1
Lanao del Norte - - 4,656 1,057 Zamboanga del Sur 1,796 - - - 1
Sample average 5 , 9 ~ 2 ~ 5 ~ 9 2 ~ 5,469 4,187 - -
'NO fingerlings were stocked i n 1978. 2~hese f ry and fingerling stocking rates are not additive for the average farm; that is, they reflect the averages for those farms
stocking f ry i n the first case and the average for those farms stocking fingerlings i n the second case.
There are wide ranges in the practices of the sample fishfarmers with regard to the number of water changes during production (X4, and Table 27), draining and drying (X4, , X47 ), number of croppings per year (X4g) and length of cropping cycle (X48), indicating the presence of dynamic, not stagnating, processes a t work in the industry. It appears that there is a continuous learning process underway. ,
Table 27. Average number o f water changes during production in a year.
Province Water change
Number o f times Range
Bulacan Quezon Mindoro Oriental Capiz Negros Oriental Bohol Lanao del Norte Sample average
All basic technical information on acid sulphate soil conditions and the usefulness of draining and drying after each harvest are well described in the "Philippines Recommends for Bangus" (PCARR 1976). Chen (1 976) has described the process and benefits in Taiwan and Poernomo and Singh (1982) have analyzed the effect that these soils have upon fertilizer availability to algae in ponds constructed on such soils. Ponds built on these soils have very poor response to fertilizers and due to cumulative toxicity very poor algal and animal growth, but as the ponds age the problem is reduced. Draining and drying after harvests, as practiced by most farmers (Table 281, i s viewed by many farmers as means of increasing pond productivity and hastening the aging process.
Milkfish can be grown year-round in the Philippines. Size of fry or fingerlings a t stocking and the market size of the fish a t harvest have strong bearing on the length of each crop cycle. Further- more, the use of inputs such as fertilizers and supplementary feeds also can help to shorten the crop

Table 28. Pond draining and drying as practiced by milkfish farmers.
Draining and drying
Province No. o f timeslyr Range Length (days) Range (days)
Bulacan 3.4 1 - 7 28.2 2 - 90
Quezon 2.3 0 - 6 17.2 0 - 45 Mindoro Oriental 2.4 1 - 6 26.7 7 - 63 Capiz 3.5 1 - 9 22.4 3 - 48 Negros Oriental 3.1 0 - 6 19.3 0 - 44 Bohol 2.3 0 - 5 23.0 0 - 60
Lanao del Norte 2.3 1 - 4 22.9 4 - 60 Sample average 2.8 22.9
cycle. This relationship was recognized by the milkfish farmers. In general, from one to six crops were grown per year. Table 29 shows the pattern and length of crop cycle. Length of crop cycle by province is shown in Table 30. Milkfish were grown in the ponds from 1 to 12 months; the average length of crop cycle was about 5.6 months. Most farmers (72%), however, kept their milkfish for less than 5 months in their ponds (Table 31 ). In Pangasinan, some farmers grow their fish for more than a year.
Table 29. Average yield b y number o f croppings per year.
Distribution o f ~ v e r & e yBld Number o f croppings farmers (%) (kglhalyr)
Average .- 833 .
Table 30. Length of crop cycle by province, 1980.
. Average crop Range o f crop . Average yield Province cycle (months) cycle (months) (kglhalvr)
Bulacan Quezon Mindoro Oriental Capiz Negros Oriental Bohol Lanao del Norte Sample average
There was a strong positive correlation between number of croppings and yieldlhalyr (Table 29), but the majority of farmers practiced no more than three croppings per year. By province, only a small percentage of milkfish farmers in Bulacan and Capiz grew only one crop a year (Table 32). This is in contrast to Mindoro Oriental, Quezon, Bohol, Lanao del Norte and Negros Oriental where 21-37% of the farmers practiced only one cropping a year. With the exception of Bulacan, Negros

Table 31. Characteristics o f milkfish crop cycle, 1980.
Length o f crop Percent o f Total area in sample Average yield cycle (months) sampled farmers (ha) (kglhalyr)
2 4 5 6 8
10 12
Total
Table 32. Number o f cropslyear i n Philippine milkfish culture, 1980.
Number o f cropdyear Province 1 2 3 4 5 6
Percent o f farmers
Bulacan 7 29 33 28 2 1 Quezon 27 38 24 11 - - Mindoro Oriental 37 37 26 - - - Capiz 9 23 33 24 3 8 Negros Oriental 2 1 8 38 33 - - Bohol 27 33 32 7 1 - Lanao del Norte 26 48 26 - - - Sample average 20 31 3 1 16 1 1
Oriental and Capiz where sizeable numbers practiced four croppings/yr, a large majority of the farmers interviewed (62-74%) grew two to three crops a year.
As with membership in aquacultural associations, only a minority (26%) of producers had attended aquaculture seminars (X26), which again implies the need for a much improved informa- tion dissemination system. Encouragingly, a majority of producers in Negros Oriental and Lanao del Norte had attended such seminars (Table 33). The shortage of seminars and other information dissemination activities for producers has reached a point where the private sector is now taking concrete steps to remedy this situation. A group of successful lloilo milkfish farmers have put together a team called SH I FTE RS, or Staff of Inland Fisheries Technology and Resource Speakers
Table 33. Pattern o f attendance at aquaculture seminars by province.
Percent o f farmers Percent of farmers Province that have attended that have not attended
Bulacan Quezon Mindoro Oriental Capiz Negros Oriental Bohol Lanao del Norte Sample average

whose purpose is to conduct mobile seminars on milkfish production technology in any part of the country, for a fee. However, these fees are high and are definitely prohibitive for many small milkfish farmers.
The adoption of a new idea hinges heavily on the ability of the farmer to receive and decode information (X25). Our survey shows that, first and foremost, Philippine milkfish farmers are familiar with the types of fertilizers and pesticides available in the market. These inputs constitute the yield-increasing and yield-protecting inputs needed to boost output and they are commercially available. They are not new inputs in the sense that only experimental stations have access to them.
During the survey the milkfish farmers were asked whether they were familiar with and i f familiar whether they are practicing the following eight concepts deemed essential in aquaculture: acclimatization of stocking materials, fishstock manipulation, draining and refreshening of pond water, soil analysis, pest and predator control, fertilization, supplemental feeding, and finally proper design of pond. They were also asked when they began these practices. Farmers were deemed capable of receiving and decoding technical information i f they were familiar with four or more of the concepts and i f they were practicing fertilization and pest control.
Our extended interview on this point reveals that 65% of the farmers possessed adequate understanding of the technical concepts posed to them (Table 34). This means that they could implement or translate the concepts into practice i f they wanted. This finding implies that igno- rance is not a barrier to the use of sound management practices. However, the above eight concepts are relatively straightforward and not as complicated as those related to interrelationships among inputs and the pond environment. Still, these results imply that the basic foundation for intensifi- cation of production techniques exists with the majority of farmers.
Table 34. Ability of milkfish farmers to receive and decode technical information.
Province With ability
(Percent) With no ability
(Percent)
Bulacan Quezon Mindoro Oriental Capiz Negros Oriental Bohol Lanao del Norte Sample average
Physical parameters
This category of explanatory variables, in contrast to the three preceding categories, is a little less amenable to influence or control, either from producers or from government or other institu- tions. Only one of the 17 parameters in this category (soil salinity) was found to be significantly related to variation in supplementary input expenditures. Rather than a variable-by-variable exposi- tion, therefore, the tabular results that indicate provincial differences are shown in Tables 35 to 41, without any lengthy comment.
The major points are worth highlighting, however. Medium-sized farms (6-50 ha) used the high- est quantities of fertilizers per ha. This correlates with the earlier findings of Chong et al. (1982) which showed that medium-sized farms had the highest yields per ha. These mediumsized farms made up the majority of a l l milkfish farms (Table 35). Farm size did not explain variations in supplementary input use because both small and large farms spend less on fertilizers than the medium-sized farms. These results are generally consistent with the allegation that small farms

Table 35. Percentage distribution of small, medium and large farms, 1978 and 1980.
1978 1980 Percent distribution Percent distribution
Province All farms Small Medium Large All farms Small Medium Large average size < 6 ha 6-50 ha > 50 ha average size <6 ha 6-50 ha >50 ha
Caeavan Pangasinan Bulacan Quezon Mindoro Oriental Masbate lloilo Capiz Negros Oriental Bohol Lanao del Norte Zamboanga del Sur Sample average
will limit the use of supplementary inputs to lessen their exposure to risks, while large farms may likewise limit supplementary inputs, but because of capital constraints.
Fully 59% of the surveyed milkfish farms are accessible by roads, with the rest accessible by rivers or trails. Almost one-half of producers have their own means of transportation, and only 3% claim to have no access a t al l to either personal or public transport means (Table 36). The vast majority of fishfarmers have no problem, in their assessment, in obtaining inputs (Table 37). Chicken
Table 36. Means of transportation relied upon by milkfish farmers.
Transportation means Province Own Public Both None
Bulacan 70 23 5 2 Quezon 47 43 4 6 Mindoro Oriental 47 47 - 6 Capiz 43 53 2 2 Negros oriental 25 71 4 - Bohol 28 59 8 5 Lanao del Norte 52 39 9 - Sample average 47 45 5 3
Table 37. Milkfish farmers' perception on accessibility to inputs.
Difficult (%) Not difficult (%I Province Seeds Fertilizers Pesticides Seeds Fertilizers Pesticides
Bulacan Quezon Mindoro Oriental Capiz Negros Oriental Bohol Lanao del Norte Sample average
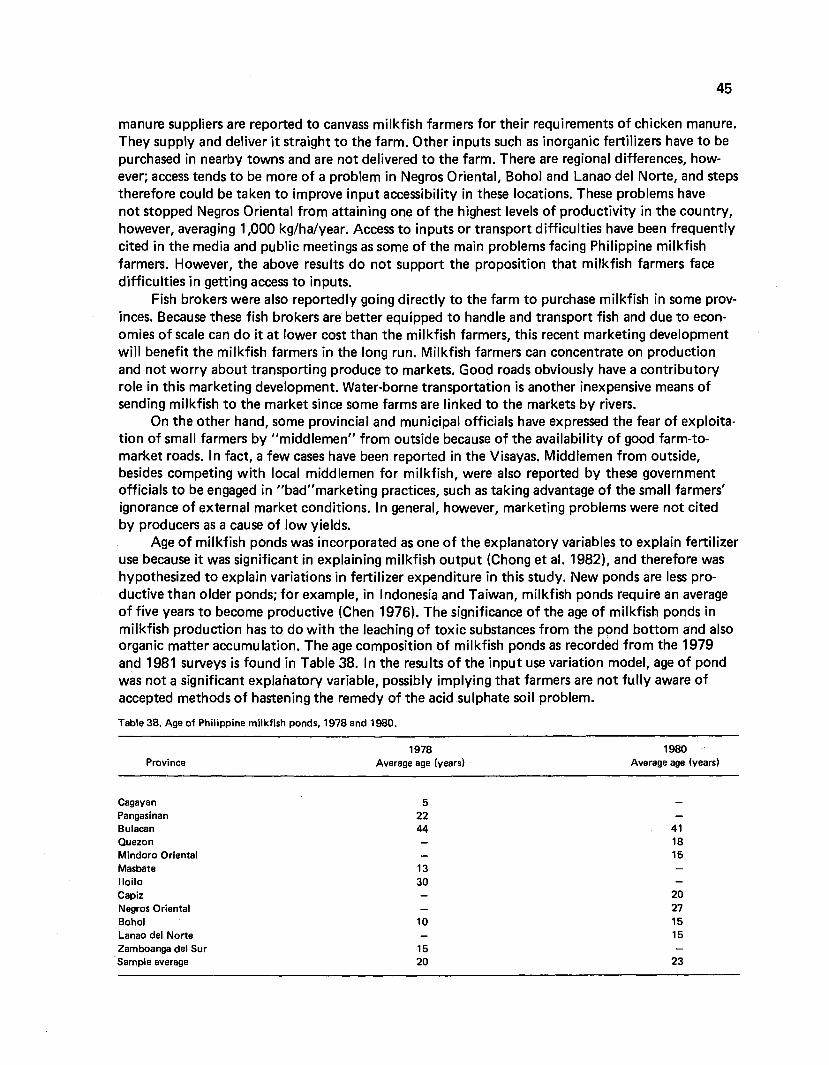
manure suppliers are reported to canvass milkfish farmers for their requirements of chicken manure. They supply and deliver it straight to the farm. Other inputs such as inorganic fertilizers have to be purchased in nearby towns and are not delivered to the farm. There are regional differences, how- ever; access tends to be more of a problem in Negros Oriental, Bohol and Lanao del Norte, and steps therefore could be taken to improve input accessibility in these locations. These problems have not stopped Negros Oriental from attaining one of the highest levels of productivity in the country, however, averaging 1,000 kglhalyear. Access to inputs or transport difficulties have been frequently cited in the media and public meetings as some of the main problems facing Philippine milkfish farmers. However, the above results do not support the proposition that milkfish farmers face difficulties in getting access to inputs.
Fish brokers were also reportedly going directly to the farm to purchase milkfish in some prov- inces. Because these fish brokers are better equipped to handle and transport fish and due to econ- omies of scale can do it a t lower cost than the milkfish farmers, this recent marketing development will benefit the milkfish farmers in the long run. Milkfish farmers can concentrate on production and not worry about transporting produce to markets. Good roads obviously have a contributory role in this marketing development. Water-borne transportation is another inexpensive means of sending milkfish to the market since some farms are linked to the markets by rivers.
On the other hand, some provincial and municipal officials have expressed the fear of exploita- tion of small farmers by "middlemen" from outside because of the availability of good farm-to- market roads. In fact, a few cases have been reported in the Visayas. Middlemen from outside, besides competing with local middlemen for milkfish, were also reported by these government officials to be engaged in "badflmarketing practices, such as taking advantage of the small farmers' ignorance of external market conditions. In general, however, marketing problems were not cited by producers as a cause of low yields.
Age of milkfish ponds was incorporated as one of the explanatory variables to explain fertilizer use because it was significant in explaining milkfish output (Chong e t al. 1982), and therefore was hypothesized to explain variations in fertilizer expenditure in this study. New ponds are less pro- ductive than older ponds; for example, in Indonesia and Taiwan, milkfish ponds require an average of five years to become productive (Chen 1976). The significance of the age of milkfish ponds in milkfish production has to do with the leaching of toxic substances from the pond bottom and also organic matter accumulation. The age composition of milkfish ponds as recorded from the 1979 and 1981 surveys is found in Table 38. In the results of the input use variation model, age of pond was not a significant explahatory variable, possibly implying that farmers are not fully aware of accepted methods of hastening the remedy of the acid sulphate soil problem.
Tab\e 38. Age of Philippine milkfish ponds, 1978 and 1980.
1978 Average age (years)
1980 - Average age (years)
Cagayan Pangasinan Bulacan Quezon Mindoro Oriental Masbate lloilo Capiz Negros Oriental Bohol Lanao del Norte Zamboanga del Sur Sample average

Knowledge of Philippine milkfish pond soils is sketchy and there is l i t t le understanding on the way fertilizers affect productivity in brackishwater ponds. Information on pH of pond soil is not very extensive; most of this information is localized in certain islands, for example, Panay. A decade ago, it was crudely estimated that about 60% of the total hectarage of Philippine mil kf ish ponds or 117,000 ha suffered from acid suiphate soil problems (Tang 1973, 1979). This problem may have declined somewhat as ponds have aged. In an effort to improve the current knowledge of milkfish pond soils in the Philippines, soil samples were collected during the survey from those 322 milkfish farmers who were willing to cooperate. Samples were brought back to the laboratory to be analyzed for pH, salinity and N-P-K content. According to the results of the analysis for acidity or alkalinity, more than half of the samples had soil pH of less than 6.0. Only two provinces had soil pH of more than 6.0 on average (Table 39). In fact, only 8% of the milkfish farms in Bulacan (the province with the highest per ha yields and among the oldest ponds) had pH of less than 6.0,72% have pH of 6.0-6.9, and 20% with pH of 7.0-7.4. Note that the highest pH reading from the 322 soil samples was 8.0, which is consistent with the information from the Bureau of Soils which indicates that pH of Philippine soils seldom goes above 8.0.
Table 39. Results of pond soil analysis conducted by the Philippine Bureau of Soils, Ministry of Agriculture, using soil samples sub- mitted from 322 farms by the survey team.
Salinity PH " ~ i t r o ~ e n " ' Phosphorous Potassium Province (Elmhoslcm) (soil) ( P P ~ ( P P ~
Bulacan Quezon Mindoro Oriental Capiz Negros Oriental Bohol Lanao del Norte Sample average
'Nitrogen level is reflected through organic matter content (%I of soil sample.
The inherent fertility of the pond SOH. has to be considered before making fertilizer recom- mendations. Yield response to inputs is also known to vary with the type of soil (clay, silty clay, etc.). The organic-matter content of the soils is taken as a measure of the nitrogen level in the soil. The organic-matter content of the pond soils collected from seven provinces showed a wide range (Table 39). Seven percent of the samples had less than 2% organic matter; another 7% had more than 10% organic matter. About 60% of the samples had 2-6% organic matter, 26% with 6.1-1 0% organic matter.
Among the three elements, nitrogen, phosphorous and potassium, (N-P-K), phosphorous is most often limiting. The analysis of the 322 soil samples shows that the amount of phosphorous available in milkfish pond soils ranged from less than 20 to over 100 ppm, using the Olsen's phosphorous method. Fifty percent of the samples tested contained less than 20 ppm while 2% have more than 100 ppm. The presence of large amounts of phosphorous (over 100 ppm) was again recorded in Bulacan. In the other provinces, the phosphorous content was low (Table 39).
The need for potassium is not as critical as for phosphorous or nitrogen. Potassium fertilizers have not been used in milkfish ponds as potassium levels are normally adequate in brackishwater environments (PCARR 1976). As a result, fertilizers commonly marketed and used for aquaculture are incomplete fertilizers such as 16-20-0 or 18-46-0. The soil samples collected from 322 milkfish farms at random from each pond compartment exhibited wide variations in potassium level, 100 to 4,000 ppm. Of this, 81% of the farms had 200 to 2,000 pprn of potassium in their soils (Table 39).

The fact that none of these soil parameters explained variation in fertilizer expenditure is not really surprising because for the most part, farmers were unaware of the properties of their soil. Farm-by-farm results were sent to a l l 322 respondents so they would have some feedback from the survey.
Philippine milkfish ponds are generally quite shallow (Table 40). The depth parameter had no explanatory power regarding levels of fertilizer expenditure. However, shallowness of ponds has been suggested by Chong e t al. (1982) as a major constraint to increased productivity per ha, and by other knowledgeable observers (e.g., William Chan, South China Sea Programme, pers. comm.). Indeed, as noted earlier, producers in Taiwan, where land i s relatively scarce, are finding that the deepwater method is their answer to the need for higher productivity and profits per ha. This method
Table 40. Average pond depth of Philippine milkfish farms.
Province Average depth
(meter) Farms with less
than 0.5 meter (%)
Bulacan Quezon Mindoro Oriental Capiz Negros Oriental Bohol Lanao del Norte Sample average
(which requires supplementary feeding), though not comparable in the technical sense to the Philip- pine system, provides some indication of producer responsiveness to economic conditions as reflect- ed in the relative availability of inputs (land, labor, capital). The economic incentive to build deeper ponds or to shift to more profitable species (e.g., shrimps) can also be expected to come about in the Philippines as land suitable for fishpond development becomes more scarce and hence more expensive to own or rent.
Finally, the results show no significant relationship between climate types and fertilizer expen- diture. Yield differences among ciimate types are shown in Table 41.
Table 41. Yield differences among climate types. -- -- - pp - - -
Climate types Characteristics Examples of provinces 1978 1980
I two pronounced seasons, dry from November Pangasinan, Bulacan, lloilo 1,056 1,275 to April and wet during the rest of the year
I I no dry season, wet, maximum rain period from Quezon November to January (pronounced rainfall)
III seasons not very pronounced, relatively dry from Cagayan, Mindoro Oriental, 150' 873' November to April and wet during the rest Masbate, Capiz, Negros of the year Oriental, Zamboanga del Sur
IV rainfall evenly distributed throughout the year ~oho1.2 Lanao del Norte 308 397
Average 761 83 1
he wide difference in yield between the two surveys i s because the surveys cover different provinces although classified under the same climate type. The implication is that the lower yield can be increased through improved management; climate is only partly limiting.
2 ~ h e BADTP classifies the western half of Bohol as Climatic Zone Ill.

In summary, the major findings regarding physical parameters relate to the relative intensity of fertilizer use on medium-sized farms and the lack of serious problems related to input or market accessibility.
SUMMARY OF FINDINGS
The findings of this study have led to the identification of key constraints to increased yields and to the elimination of other factors often put forward to explain the behavior of milkfish producers. These results have been drawn not only from the significant variables in the fertilizer expenditure model, but also from the nominal levels of insignificant variables (which represent rejected hypotheses) and from a managerial profile of producers. The major findings can be sum- marized as follows:
Output-input price ratios for both organic and inorganic fertilizers are significant in explaining variation in their use, thus implying that producers do respond to relative prices in their production decisions. This finding dispels the views which hold that Philip- pine milkfish farmers are poor or irrational decisionmakers. Producers were observed to reduce their supplementary input expenditures as the ratio between output and input prices declined, and to increase expenditures as the ratio increased. Both forms of response are consistent with the behavior of profit maximizing entrepreneurs using a given tech- nology. Yields per ha were found to be a function of the age and the experience of the producer. Yields were lower for young and old farmers and highest for middle-aged farmers. Yields of experienced farmers were higher than those of inexperienced farmers in all provinces surveyed. No relationship between yields and tenure status or absentee ownership (or part-time involvement) was established. Medium-sized farms (6-50 ha) used significantly more fertilizers per ha than either small farms (< 6 ha) or large farms (> 50 ha). A further indication of producersr responsiveness to relative prices was found in a 30% reduction in fingerling stocking rate between 1978 and 1980 in favor of fry as stocking materials. This shift makes economic sense given that the fingerling price is higher than that of fry by an amount that more than offsets any gains to be made from the shorter rearing period required for fingerlings. Rates of application of organic and inorganic fertilizers increased by 5% and 30%, respectively, between 1978 and 1980. Although no data on land costs were collected during this study, the fact that land, or access to land through government leases, can be obtained relatively cheaply (compared for example to the higher cost of capital) will serve to encourage producers to continue extensive rather than change to intensive methods. In this, they are but responding to the relative prices of land and capital. Producers complained, however, of deteriorating output-input price ratios, which would explain their reluctance as a group to increase their expenditures on supplementary inputs. Nationwide, the real price of milkfish a t the retail level (i.e., adjusted for inflation) has been declining since 1972. High prices of organic fertilizers in several provinces (Lanao del Norte, Bohol and Mindoro Oriental) further discouraged producers from increasing input use. In these provinces the cost of organic fertilizers exceeded their marginal value product (i.e., the added cost exceeded the added benefit). The deteriorating milkfish price-input cost picture can be partially offset by more effi- cient use of a given level of supplementary inputs. For example, the platform method of fertilizer application and distribution has been shown to be 20-40% more efficient than the broadcast method; yet most producers st i l l use the latter.

Another indication of the need for education or enlightenment was the belief that fertil- izers impart a bad taste to milkfish was found to be significant in explaining variation in fertilizer expenditure. This belief was especially prevalent in Lanao del Norte, Bohol and Negros Oriental. Two-thirds of all respondents indicated that they did not associate increased supple- mentary input use with higher risks. Most claimed that their major problem was not perceived risks but lack of capital. Eighty-one percent of the producers claimed they would be willing to go into debt to secure production credit. However, in 1978 only one of 324 respondents reported using a bank loan for production input purposes. The banks' almost exclusive emphasis has been on loans for pond development or repair. A significant majority of producers were highly critical of the government banking system, and discouraged from seeking loans from formal lending institutions. When expenditures arising from unforeseen additional costs are included in the computation of interest payments, the effective interest rate is higher than the official rate of interest. Those that obtained loans for inputs (primarily stocking materials) did so from input suppliers such as fry dealers or from marketing intermedia- ries. The real interest rate of these non-formal credit sources was also significantly higher than the official bank lending rate. The high cost of credit was thus found to be a major constraint to the adoption of more intensive methods. Only 30% of the producers had contact during 1980 with the BFAR extension service. There were significant differences by province, however, ranging from 3% in Bulacan (where average productivity is the highest in the country) to over 60% in Bohol and Lanao del Norte, Most encouragingly, 93% of those who had contact with the extension service thought such contact was useful. Significant gaps remain in the technical knowledge of the majority of producers. While simple concepts related to input use are generally understood, more sophisticated concepts regarding interactions among inputs (i.e., fertilizers, stocking densities, pond depth and soil conditions) are not widely known. The potential for increasing production and profits from a given pond area through better water control by using pumps was also not widely appreciated. Lack of technical knowledge as to the rationale for intensive production is another major constraint to increased use of supplementary inputs. Only 25% of the producers belonged to the Philippine Federation of Aquaculturists (PFA). The majority of non-members viewed the PFA as a lobbying organization rather than one to promote technical interchange. Most exchange of technical information takes place informally among producers. Encouragingly, those using the least inputs were the most willing to work on the farms of other producers to learn new techniques of pro- duction. Only 10% of producers had any written technical materials on milkfish farming. None had a copy of the standard publication "Philippines Recommends for Bangus". There is thus a significant gap between the producers' stated willingness to learn more intensive production techniques and the almost complete lack of written technical materials available to producers that might enable them to appreciate the added benefits to be derived from intensification. Two-thirds of the producers have the apparent technical ability and the necessary literacy level to be able to use written technical materials i f they were made available. Weak information dissemination is thus a further constraint to increased productivity. Significantly, extension agents have not been provided with extension handouts to be left with their clientele. Without such handouts to be used as references a t a later date, extension activities are less effective. Finally, several hypothesized constraints to increased supplementary input use and productivity can be eliminated from consideration based on the results of this study.

This study found that: (a) Stocking material shortages were not perceived as a problem by producers; (b) Accessibility to milkfish markets and marketing outlets is generally high; (c) Ignorance and sociocultural barriers do not appear to be major problems for
the majority of producers; (d) Tenure status (owners or lessees) had no significant impact on yield levels;
and (e) The extent of owner involvement in actual supervision of the farm manage-
ment has no significant effect on yields. Each of the major constraints identified above need to be addressed i f a more rapid rate of
increase in yields is to be forthcoming from Philippine milkfish farms. The concluding section of this report therefore examines the implication of these constraints for government policy and discusses policy options that might be considered.
Conclusion: lrnplications for Aquaculture Development Policy
Before embarking on a discussion of the implications of our findings for aquaculture develop- ment policy, it is useful to first put these findings in the context of the various theories of agri- cultural stagnation and transformation that were outlined in the second section of this report.
INDUSTRY STAGNATION OR TRANSFORMATION
Depending upon one's point of view regarding the relative weight of sociocultural or economic explanations of the process of agricultural growth, there are several points a t which the Philippine milkfish industry could become stagnant. For example, the sociocultural view on the one hand, holds that producers' own attitudes regarding change are the limiting factor for transformation of traditional agriculture. One version of the economic viewpoint, on the other hand, is that producers are trapped in a technical and economic equilibrium where they are "poor but efficient"; that is, they efficiently use the resources a t their disposal given the prevailing resource prices (especially the high cost of capital). The way out of this trap according to economists (e.g., Mosher 1966; Schultz 1965) is to either change the relative prices farmers face or make available a significantly more efficient technology so as to induce producers to innovate. Technological innovation among pro- ducers is thought by some to induce inititutional innovation in turn. Ruttan (1977) cites examples where institutions that serve agriculture (e.g., research centers) are also induced to change their focus by changing prices of inputs. Recent examples include research responsiveness to increased energy prices. Of perhaps more concern to this study of aquaculture constraints, however, is the responsiveness of credit, extension and information dissemination institutions. While agreeing that technological and institutional innovation is necessary to transform traditional agriculture, others (e.g., Bromley 1979) argue that institutional rigidities such as patron-client relationships and effective control of institutions by local elites will act as severe constraints to change by the majority of small producers.
Of these various explanations, which, i f any, seem most applicable to the Philippine milkfish industry? Based on the findings presented a t the end of the previous section, the authors believe that far from stagnating, the industry is undergoing the dynamic process of transformation. Evidence follows.
The production function study of Chong et al. (1982) demonstrated that the "average" milk- fish farmer in the Philippines is inefficient in that higher profits could be earned through increased use of supplementary i n p ~ t s . ~ The sociocultural theory that "small farmersare poor decisionmakers"
3 ~ e are speaking here in a nationwide sense. As noted earlier there are substantial differences in input supply and prices from province to province.

i s consistent with these results in that farmers do not appear to be taking advantage of the avail- ability of the improved technology that could lead to increased yields and profits. However, this study brings into serious question any characterization of milkfish producers as fatalistic, passive members of the "subculture of peasantry". A large majority of milkfish producers were found to be active information seekers, possessing the basic skills necessary for decoding technical information and willing to obtain credit for production purposes. These characteristics are in stark contrast to sociocultural explanations for stagnation. Attitudes of producers do not appear to be a constraint to adoption of more intensive methods.
Nor are fishfarmers caught in a low level technical and economic equilibrium trap. This study clearly shows that producers are responsive to differences in output-input price ratios and Chong's earlier study corroborates that opportunities do exist for increased profits with increased supple- mentary input use. Experience with supplementary input use was also clearly shown to be a major determinant of yields; increased yields can therefore be expected as farmers gain added experience with more intensive methods.
Neither of the two major alternative explanations of stagnation ("small farmers are poor decisionmakers"; "small farmers are poor but efficient") appear to apply to the majority of Philip- pine milkfish farmers or the industry as a whole. An explanation must be found for the wide gap between the benchmark yield (2,000 kglhalyear) obtained by the more progressive farmers and the actual average yields (800 kglhalyear). Since it is agreed that the high-payoff technology is available and that prevailing input and output prices in most locations provide the inducement for farmers to adopt more intensive methods, it is believed that explanations for the prevailing benchmark- actual yield gap must be found in an examination of the process of change and transformation and the institutions which facilitate it.
There appear to be four possible explanations.The first is that the relative prices have been in- correctly interpreted by failing toascribe a sufficiently high value to the element of risk as perceived by producers. However, in this study less than one-third of the producers associate production intensification with added risk. Still, in selected provinces (Lanao del Norte, Bohol and Mindoro Oriental) where prices of organic fertilizers are higher than their marginal value product, it makes no economic sense for producers to increase their use of this input. The declining real market price of milkfish in many parts of the country is a further constraint to intensification pf supplementary input use.
The second possible explanation is that institutional constraints are preventing milkfish pro- ducers from taking advantage of the available technological innovations. This study found strong evidence of institutional rigidities and constraints in credit institutions that are supposed to serve the capital requirements sf the milkfish producers. The official 14-16% interest rate is actually much higher once "processing" charges have been included; the rate of return on investment in milkfish culture is thus lower than it would be i f the official rate were the actual cost of borrowing. Momover, the credit that is available is generaliy restricted to pond development costs, not for production. Coupled with the low lease fees for government mangrove land when converted to fish- pond use, this credit emphasis encourages extensification instead of intensification.
Third, while producers claim to be interested in more intensive techniques, at the time of this study there was an almost complete lack of written information actually available to them. Though such materials have been published (e.g., PCARR 1976), an organized system for getting them into the hands of producers, especially the small-scale farmers seems to be nonexistent. Nor were the authors aware of any technical publications for farmers translated into local dialects. Contact time for the average farmer with extension workers who might have more ready access to these materials is likewise extremely low. Farmers interested in adopting more intensive methods thus must rely primarily on informal exchange with other fishfarmers i f they hope to supplement their existing knowledge.

The fourth possible explanation is that the lag in producer adjustments to technological im- provement and changing relative prices is caused by the fact that such adjustments do not take place instantaneously, but rather take time to diffuse. This study certainly found evidence that some pro- ducers, especially those 11% s t i l l practicing extensive methods, do not keep their farms primarily for economic reasons, but rather for reasons of security in land ownership or because of the status that land ownership implies. However, this group is a distinct minority, and even the most dynamic of industries have such an inefficient (though socially acceptable) component.
This study provides strong evidence in support of all the explanations outlined above. Given the changes that have been occurring in the milkfish industry (e.g., a 34% increase in average yield per ha in the last 10 years; a reduction in fingerling stocking rates between 1978 and 1980 in response to relative fry and fingerling prices; 5% and 30% increases in rates of application of organic and inorganic fertilizers, respectively, between 1978 and 1980, to name a few) and the extreme range in production intensity and yields which characterize the dualistic structure of the industry, the milkfish industry can hardly be characterized as stagnating. Rather the findings of this study point to an industry that is undergoing transformation and benefiting from gradual diffusion of more intensive production technology. Technological innovation has occurred but induced institu- tional innovation using Ruttan's (1977) terminology, is lagging behind. Furthermore, the institu- tional constraints are concentrated in the formal government institutions (e.g., credit and informa- tion dissemination in particular) rather than in informal rural institutional relationships such as patronclient relationships. The latter certainly exist in the Philippine rural agricultural sector where tenant farming is prevalent, but not apparently to a major extent in the milkfish industry.
The basic question facing Philippine aquaculture planners, therefore, is not how to transform a traditional aquaculture sector, but rather how to accelerate the ongoing process of transformation. By some standards, a 34% productivity increase in 10 years might be considered acceptable. How- ever, in the Philippines population is growing a t that rate and capture fisheries supplies are levelling off. Therefore, this rate of milkfish productivity increase is insufficient to maintain per capita intake of fish protein, and certainly less than the annual 20% increase that has been projected for the aquaculture sector. The results of this study point to several "action steps" that might be consi- dered to accelerate the rate of adoption of more intensive production methods, and hence produc- tion of milkfish and indeed other aquaculture commodities.
ACTION STEPS
This study has identified several major constraints to the more rapid diffusion and adoption of intensive milkfish culture techniques. For purposes of discussion, these constraints can be grouped into two general categories:
(1 those related to the relative prices of output and inputs; and (2) those related to technical knowledge of producers. Credit programs, supplementary input availability and prices and costs of extensification vs.
intensification fall into the first category; extension and information dissemination belong in the second. A focus on the first category by government would create incentives for producers to adopt more intensive methods; a focus on the second would encourage an outward shift in the production frontier with the government's role being primarily that of facilitator. Cutting across both cate- gories is the need for institutional reform and modification. Tacitly assumed in both approaches is that profit-motivated producers will respond to changes in relative prices or to the availability of more efficient production technology. Given our findings, both of these assumptions seem realistic. Action steps to overcome these constraints are summarized in Table 42.
Changing relative prices
Aquaculture planners should especially consider reducing the cost of capital that is made available to milkfish producers. Costs of supplementary inputs in certain provinces need to be

Table 42. Summary of constraints identified and possible 'action steps' to overcome them.
Category
-
Constraint Primary action steps
1. Those related to relative prices High cost of capital Production credit. Institutional reform to of output and inputs minimize red tape.
2. Those related to the technical knowledge of producers
Fertilizer shortage and high prices (selected provinces)
Low cost of mangrove land
Low contact with extension workers
Poor information dissemination
Belief that fertilizers impart bad taste to marketable mil kfish
Encourage poultry farming. Input subsidies and dual pricing subsidies.
Strictly enforce the mangrove conversion moratorium.
Increase mobility of extension officers and contact hours with farmers.
Make available more handouts and improve distribution network for written extension materials. Translate technical materials into local dialects.
Taste tests in selected provinces and dissemina- tion of results through media outlets.
reduced or subsidized in some way. Finally, a mangrove conversion moratorium needs to be strictly enforced, so that the price of land suitable for milkfish culture increases to reflect i ts social value to Philippine society rather than i t s private value to those who are fortunate enough to obtain govern- ment fishpond leases to convert public mangrove lands to private use. All three of these action steps would encourage the adoption of more intensive milkfish production techniques. Each "action step" is examined in somewhat more detail below.
The major needs identified by milkfish producers are to reduce the real cost of borrowing and to make available production credit. The real cost of borrowing can only be reduced through banking reform that minimizes incorrect banking practices. Until the banking system is reformed in this manner, the real cost of borrowing will continue to discourage milkfish producers.
The need for production credit is a related, though separate issue. Milkfish producers claimed that the primary constraints to intensification from their perspective are capital shortage, particularly for the purchase of supplementary inputs, and the perceived high collateral requirements of govern- ment development banks. Other production credit programs (e.g., Masagana 99) that provide oper- ating capital in the Philippine agricultural sector have run into serious difficulties due to low repay- ment rates. However, there are significant differences between the average 'newly emancipated tenant rice farmer' and the average milkfish producer. The former is likely to have no other source of income besides rice farming and thus have more difficulty surviving the transitional periods between harvests. In contrast, almost one-half of the surveyed milkfish producers have other sources of income. The latter are thus much more likely to use a production credit loan for i ts intended purpose than to meet immediate consumption needs. Furthermore, the average milkfish producer has a household income almost three times the national average (Table 43), and previous experience with both borrowing and repaying for farm production purposes, albeit from informal institutional sources, both of which put him in the entrepreneurial class, and not the subsistence farmer category. The recent initiatives of the Asian Development Bank and the Fishery Industry Development Council which are seeking to design a production credit scheme for fishfarmers are therefore strongly endorsed.

Table 43. Selected income indicators of the Philippines (1980 pesos).
Income measures Household Main activity Household (family of six) income income expenditures
Poverty threshold (national) Rural average income Urban average income
Metro Manila Other urban
National average Municipal fisherman Rice farmer Coconut farmer Milkfish farmer
Source: Librero et al. 1982 and NEDA 1982. All figures have been adjusted by 1980 consumer price index.
It is of paramount importance, of course, that the implementation of any production credit scheme by government banks be accompanied by serious attempts a t institutional reform to reduce unforeseen credit charges. Also, this proposal for production credit should not be viewed as a recommendation that loans for pond construction or redesign should no longer be made. Pond construction loans are particularly necessary for the deepening of Philippine brackishwater ponds which are too shallow on average to support a highly intensive production technology.
The low supply of organic fertilizers in several provinces, especially Lanao del Norte, Bohol and Mindoro Oriental of the seven surveyed provinces, has led to high prices that have discouraged the intensive use of these supplementary inputs. There are two options to help resolve this constraint. One is to encourage poultry farming in the affected provinces, i f economic opportunities favor it. The second is to implement a dual pricing subsidy scheme for organic and inorganic fertilizers that would effectively subsidize the purchases of these inputs by those farms that are currently applying only low levels, especially small farms.
Dual pricing would subsidize the prices paid by small farms for fertilizers by charging them less than larger farms. Governmental distribution networks should not be necessary, but some cross- checking of amounts purchased and receipts of input suppliers would be. To minimize fraud in such a dual pricing scheme for fertilizers, strict criteria should be developed and adopted such that only bona fide small farmers are benefited. These criteria can be further reinforced to eliminate remain- ing loopholes in the dual pricing scheme by requiring small milkfish farmers to organize themselves into a group farming unit in order to avail of the subsidy. I f small farmers are organized in this fashion they are more likely to benefit from government development programs. The PFA does not unfortunately fill this role a t present because few small farmers are members.
If land is cheap relative to other scarce inputs, such as capital, there is no particular economic incentive for fishfarmers to optimize production per unit area; rather they would wish to maximize the return on their capital investment. There are sound ecological reasons for slowing i f not halting the conversion of mangrove area to fishponds. Effective enforcement of the moratorium on mangrove conversion would also have the long-term effect of encouraging intensification per unit area because the moratorium would increase the cost of land. This change in the price of land relative to the capital and labor inputs would provide incentive to producers to use their land more efficiently.
Improving technical knowledge of producers
Although milkfish farmers generally have a basic knowledge of the techniques of supple- mentary input use, there are major gaps in their knowledge. This shortcoming is caused in part by a low level of contact with the BFAR extension service and by an extremely weak information
dissemination network. Both the farmers and the extension agents cited the lack of extension publications as one of the main weaknesses of the B FAR extension service.
To overcome the first of these problems, the contact hours of extension officers with pro- ducers must be increased. There are currently approximately 300 extension agents for 10,000 milk- fish farmers, or one extension agent for every 30 producers. This ratio is better than that which prevails in agriculture as a whole. Our findings, based on producers' data, show that during 1980 each extension agent on average contacted only 30% or 10 of the producers for which he was res- ponsible. Therefore, the task is primarily one of increasing the mobility of the existing extension service rather than adding additional agents. The government is very much aware of the present shortcomings and indeed the four Brackishwater Aquaculture Development and Training Centers are designed primarily to upgrade the technical skills of extension agents so that they can be more confident and effective in the field. At the same time the problem of inadequate financial com- pensation and travel allowances for these extension agents must be resolved.
In addition to training, the BFAR should consider hiring extension agents with a rural back- ground who are willing to undertake considerable fieldwork. Adequate funds for local transporta- tion and per diem are prerequisites for increasing the mobility of the extension service. The present per diem and transportation rates are based on rates prevailing in the 1930s. Remembering that what is reported here is based primarily upon perceptions of milkfish farmers, an objective evaluation of the extension service should be carried out, ranging from selection procedures through training to effectiveness in the field.
An equally important indicator that milkfish farmers are generally left to fend for themselves is the fact that only 10% have any written materials that might assist them in their decisionmaking. Since basic technical materials exist4, the primary need is to improve the information dissemination system. Technical materials, preferably translated into major Philippine dialects, must get into the hands of the producers i f they are to add to producers' knowledge. Research results are also not prepared in a form suitable for readers from the milkfish sector. A major weakness is the lack of an effective link between the research community (i.e., universities, government, national and regional research centers) and the extension service. There are few i f any incentives for researchers to pro- duce their findings in a form that would directly benefit the private sector.
For example, there are known techniques for the partial mitigation of acid sulphate soil condi- tions, a problem for many brackishwater aquaculturists, especially with, new ponds where organic matter has not yet built up on the pond bottom. But the results of this research are not in the hands of farmers. The same situation exists regarding elements of pond design (including depth) and water management techniques. What is needed is a conscious program to publish and disseminate research results in a popularized form, even comic book style.
One of the significant factors constraining use of fertilizers in Lanao del Norte, Bohol and Negros Oriental was the belief that fertilizers impart a 'bad taster to milkfish. Taste tests, using milk- fish reared on fertilizers and those which are not, could be conducted, and assuming that the belief is disproven, results could then be disseminated to producers.
It is worth emphasizing that some of the above recommended action steps need to be tailored to the requirements of individual regions or provinces. For example, dual pricing of organic fertil- izers makes sense only in those locations where the price is high. As has been shown, there is a wide range in these prices around the country. Production credit, however, appears to be a pressing need in all parts of the country.
While this study has demonstrated that milkfish producers are motivated by economic incen- tives, there is a clear role for the government to play in accelerating the ongoing transformation of
4 ~ h e BADTP has produced a model management system and technical materials describing i t for the four climate zones to be used as an extension aid.

the sector to a more productive and profitable level by helping to overcome the constraints iden- tified in this study. This can be done by changing the relative prices of output and inputsand improving the technical knowledge of producers through extension and information dissemination. It is insufficient to do one or the other; both actions are required. To assist in these tasks it is important that the aquaculture planning process include on a regular basis an evaluation of the costs and benefits of alternative approaches.
Acknowledgements
This report on the constraints to high yields in Philippine milkfish aquaculture relies heavily on the data provided by 447 milkfish farmers the authors interviewed in 1981182, without whose cooperation this study would not have been completed in i ts present form.
Next, the authors would like to thank the following individuals for their continuing support for both the idea of the project and the project itself: Mr. Rolando B. Edra, Mr. James C. Anderson, Dr. Ziad H. Shehadeh, Mr. Felix R. Gonzales and Mr. Jesus C. Alix. Lastly, the report also benefit- ed greatly from the critical review by Dr. Richard A. Neal and anonymous officials of FAO, Rome.
The authors are indebted to the following project research assistants: Ms. Cathy N. Arancillo, Mr. F.L. Bungcayao, Mr. E.P. Piansay, Mr. A.D. Lucido, all from BAEcon and Ms. E.R. Hernandez, Ms. L.S. Fabia and Mr. N. del Rosario from4BFAR.
References
BFAR. 1981. Philippine Fisheries Statistics. Bureau of Fisheries and Aquatic Resources, Quezon City, Philippines. Bromley, D.W. 1979. Technology, institutions, and economic rents: understanding rural stagnation. Paper presented
a t the Ford Foundation Staff Seminar for Asia and the Pacific Region, 13-17 November 1979. Yogyakarta, Indonesia.
Chen, T.P. 1976. Aquaculture practices in Taiwan. Fishing News (Books) Ltd., Farnham, Surrey, England. / Chong, K-C., M.S. Lizarondo, V.F. Holazo and I.R. Smith. 1982. Inputs as related to output in milkfish production
in the Philippines. ICLARM Technical Reports 3. 82 p. Bureau of Agricultural Economics, Quezon City; Fishery Industry Development Council, Quezon City and International Center for Living Aquatic'Resources Management, Manila, Philippines.
Co, M.R. 1982. The uncommon man (close-up on the Filipino as entrepreneur). Bulletin Today, Manila. July 6, 1982: 5.
DeBoer, A.J. and D.E. Welsch. 1977. Constraints on cattle and buffalo production in a northeastern Thai village, p. 115-141. In R.D. Stevens (ed.) Tradition and dynamics in small-farm agriculture: economic studies in Asia, Africa and Latin America. Iowa State University Press, Ames.
Espiritu, S.C., C.L. Hunt, L.D. Lacar, L.R. Quisumbing and M.R. Hollnsteiner. 1977. Sociology in the new Philip- pine setting. 2nd ed. Alemars-Phoenix Publishing House Inc., Quezon City.
FAO. Department of Fisheries. 1973. The economic and social effects of the fishing industry-a comparative study. FA0 Fish. Circ. No. 314. 17 p.
FIDC. 1981. Integrated fisheries development plan. Aquaculture management and development plan, Vol. Ill. Fishery lndustry Development Council, Quezon City.
Hayami, Y. and V.W. Ruttan. 1971. Agricultural development: an international perspective. Johns Hopkins Univ. Press, Baltimore.
' Lee, C-S. 1983. Production and marketing of milkfish in Taiwan: an economic analysis. ICLARM Technical Reports 6, 41 p. National Chung Hsing University, Taichung, Taiwan and International Center for Living Aquatic Resources Management, Manila, Philippines.
Lewis, 0. 1962. Five families: Mexican case studies in the culture of poverty. John Wiley and Sons, New York. Lewis, 0. 1964. The culture of poverty. In J.J. TePaske and S.N. Fisher (eds.) Explosive forces in Latin America.
Ohio State Univ. Press, Columbus, Ohio.

Librero, A.R. 1976. Cultural and management practices in bangus (milkfish) ponds in the Philippines, p. 89-130. In B. Lockwood and K. Ruddle (eds.) Small scale fisheries development. Social Science Contribution. East- West Center, Honolulu, Hawaii.
Librero, A.R., E.S. Nicolas, A.L. Banasihan, R.M. Fabro, L.P. Lapie, A.M. Nazareno and E.O. Vasquez. 1977. Milk- fish farming in the Philippines: a socioeconomic study. SEAFDEC-PCARR Research Paper Series NO. 8. 367 p. Los BaGos, Laguna, Philippines.
L.ibrero, A.R., R.F. Catalla and R.M. Fabro. 1982. Socio-economic conditions of small-scale fisheries in the Philip- pines. Fish. Res. J. Philipp. 7(1): 1-1 7.
Mosher, A.T. 1966. Getting agriculture moving: essentials for development and modernization. F.A. Praeger Pub- lishers, Washington, U.S.A.
Norman, D.W. 1977. Economic rationality of traditional Hausa dryland farmers in the north of Nigeria, p. 63-91. In R.D. Stevens (ed.) Tradition and dynamics in small-farm agriculture: economic studies in Asia, Africa and Latin America. lowa State University Press, Ames.
PCARR. 1976. Philippines recommends for bangus. Philippine Council for Agriculture and Resources Research, Los BaGos, Philippines.
Philippines. Republic. 1982. Philippine statistical yearbook 1982. National Economic and Development Authority, Manila.
Poernomo, A. and V.P. Singh. 1982. Problems, field identification and practical solutions of acid sulphate soils for brackishwater fishponds. Paper presented at the Seminar on "Fishpond Engineering", 4-12 August 1982. Surabaya, Indonesia.
Rask, N. 1977. Factors limiting change on traditional small farms in southern Brazil, p. 92-114. In R.D. Stevens (ed.) Tradition and dynamics in small-farm agriculture: economic studies in Asia, Africa and Latin America. lowa State University Press, Ames.
Rogers, E.M. in association with L. Svenning. 1969. Modernization among peasants: the impact of communications. Holt Rinehart and Winston, New York.
Ruttan, V.W. 1977. Induced innovation and agricultural development. Food Policy 2(3): 196-216. Schultz, T.W. 1965. Transforming traditional agriculture. Yale Univ. Press, New Haven. Sliang, Y.C. 1976. Economiccomparison of milkfish farming in Taiwan and the Philippines. Aquaculture 9: 229-236. Shang, Y.C. 1982. Microeconomic analysis of experimental aquaculture projects: basic concepts and definitions,
p. 61-64. In Aquaculture economics research in Asia: proceedings of a workshop held in Singapore, 2-5 June 1981. ID RC-193e. International Development Research Centre, Ottawa, Canada.
Sinaga, R. and W.L. Collier. 1975. Social and regional implications of agricultural development policy. Prisma 84(2): 24-35.
J Smith, I.R. 1982. Microeconomics of existing aquaculture production systems: basic concepts and definitions, p. 15-25. In Aquaculture economics research in Asia: proceedings of a workshop held in Singapore, 2-5 June 1981. ID RC-193e. International Development Reskrch Centre, Ottawa, Canada.
Stevens, R.D., Editor. 1977a. Tradition and dynamics in small-farm agriculture: economic studies in Asia, Africa and Latin America. lowa State Univ. Press, Ames.
Stevens, R.D. 1977b. Transformation of traditional agriculture: theory and empirical findings, p. 3-24. In R.D. Stevens Jed.1 Tradition and dynamics in small-farm agriculture: economic studies in Asia, Africa and Latin America. lowa State University Press, Ames.
Takahashi, A. 1970. Land and peasants in Central Luzon: socioeconomic structure of a Philippine village. University of Hawaii Press, Honolulu.
Tang, Y.A. 1967. Improvement of milkfish culture in the Philippines. Curr. Aff. Bull. Indo-Pac. Fish. Counc. 49: 74-22.
Tang, Y.A. 1973. Problems and priorities in coastal aquaculture development in the Philippines. Paper presented at the Fishpond Estate Development Session, 28-30 October 1973. Los BaKos, Philippines.
Ta~ng, Y.A. 1979. Physical problems in fish farm construction, p. 99-104. In T.V.R. Pillay and W.A. Dill (eds.) Advances in aquaculture. Fishing News (Books) Ltd., Farnham, Surrey, England.

Appendix: Questionnaire Used in this Study
CONFIDENTIAL
Interviewer Affiliation Date Editing (Field/Office) Call back required
A Survey on Constraints to Higher Yields of Milkfish Farms in Selected Areas
of the Philippines*, 1981
(Reference period i s 1980 i f specific information is needed; otherwise, obtain information on average experience)
A. GENERAL INFORMATION
Name of Respondent: Job Status: Address:
Site of Farm: Accessibility of Farm:
Mode of transportation and frequency. Specify whether farm can be rached by road, boat or trail or a combination of each of the above.
Tenure Status: Privately Owned Gov't Leased Others Age of Pond: years. Year Operation Started: Size of Farm: Ha. Depth of Water
Nursery Ha. No. of compartments cm. Transition Ha. No. of compartments cm. Rearing Ha. No. of compartments cm. Undeveloped Ha. Average depth of all ponds cm.
B. SECTION ON SOCIOECONOMICS
1. How many are you in the family?
Highest Grade/ Percent of Time Household Members Age Course Attended Occupation Work on Farm
Husband Wife
*A project of the UNDPIFAO-BFAR Brackishwater Aquaculture Development and Training Center, implemented jointly by International Center for Living Aquatic Resources Management (ICLARM), the Bureau of Fisheries and Aquatic Resources (BFAR), and the Bureau of Agricultural Economics (BAECON).

Children > 10 years old (Helping on farm)
Other relatives
2. How many years of milkfish culture experience do you have?
a) Total: years b) Use inputlfertilizers: years
3. Would you consider yourself: (Check one)
a) Full-time fishpond operator* b) Part-time fishpond operator
* A full-time operator i s one who spends 40 manhours/week attending to his fishpond operations. Also, if he has no other occupation but spends less than 40 manhourslweek, he would be considered full-time.
4. If part-time, what percentage of your time is devoted to milkfish production?
a) percentage b average number of hourslday C) average number of dayslmonth
5. What alternative work would you be doing i f you are not producing milkfish, that is, can you find other employment if milkfish production i s not available to you? (Check one)
Yes N o
a) If yes, what?
- - - - - -
b) I f no, why not?
c) I s this alternative work easy to find?
d) What is your expected income per month from this alternative work?
6. Over the last 5 years, what have been your milkfish yieldlhalyear?
Farm No. No. Piece1 Total Kg/ GoodIBad Yr. Year Size Stocked Harvested Kg. Prod. HaIYr. ReasonYY
* * For example-typhoon, no fry or input available, etc.

7. a) What i s the range of prices you have received for milkfish in 1980? . . .
i) average P /kg ii) highest P /kg III) lowest P /kg iv) P /piece
b) To what factors would you attribute such price variations?
8. a) Do you time your harvest to coincide with expected higher prices? (Check one)
Yes No If no, why not?
9. Do you think other species of fish compete with milkfish in the market? (Capture and culture fisheries)
Yes / No (Circle one). Remarks:
10. Over the last 5 years, can you say that your per hectare yield from your farm: Check one and explain. has increased has stayed the same has fluctuated has decreased each year
11. a) Since you started milkfish production, what has been your lowest yield? kglhalyear.
b) Do you consider this yield to be a bad one? Yes / No. (Circle one). C) I f no, how low? kglhalyear.
12. Do you have the necessary technical information and skills to produce higher output? Yes / No (Circle one)
a) I f yes, why don't you do it?
b) I f you cannot produce higher output, why not?
- -- -
13. What are the restrictionslconstraints you face in increasing your income from milkfish production?
14. Do you consider the use of larger quantities of inputs to be more risky than no supplemental inputs or your present level of input use?
a) if yes, why? b) if no, why not?
15. Do you try to economize on input application, that is, apply less than what you know should be applied to maximize returns? Yes / No (Circle one). Explain.
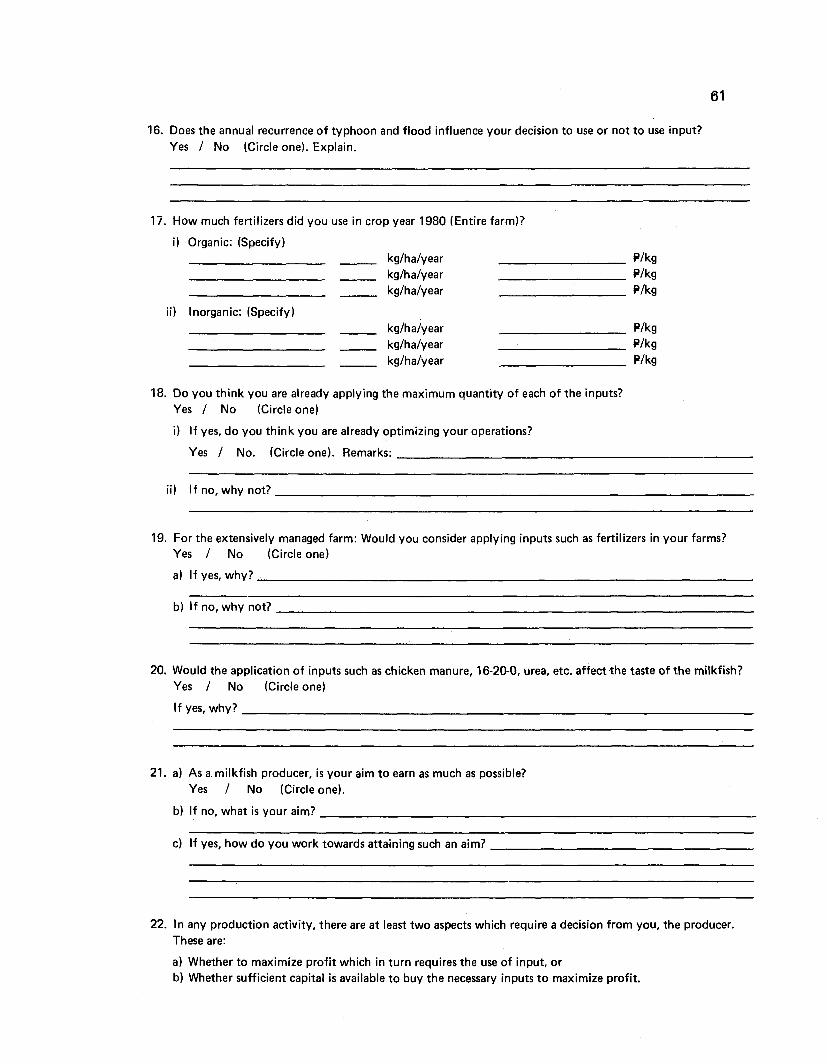
Does the annual recurrence of typhoon and flood influence your decision to use or not to use input? Yes / No (Circle one). Explain.
How much fertilizers did you use in crop year 1980 (Entire farm)?
i) Organic: (Specify) kglhalyear P/kg kglhalyear Plkg kglhalyear P/kg
ii) Inorganic: (Specify) kglhalyear kg/ha/y ear kglhalyear
18. Do you think you are already applying the maximum quantity of each of the inputs? Yes I No (Circle one)
i) I f yes, do you think you are already optimizing your operations?
Yes / No. (Circle one). Remarks:
ii) If no, why not?
For the extensively managed farm: Would you consider applying inputs such as fertilizers in your farms? Yes / No (Circle one)
a) If yes, why?
b) I f no, why not?
Would the application of inputs such as chicken manure, 16-20-0, urea, etc. affect,the taste of the milkfish? Yes I No (Circle one)
If yes, why?
a) As a milkfish producer, is your aim to earn as much as possible? Yes I No (Circle one).
b) If no, what is your aim?
C) If yes, how do you work towards attaining such an aim?
In any production activity, there are at least two aspects which require a decision from you, the producer. These are:
a) Whether to maximize profit which in turn requires the use of input, or b) Whether sufficient capital i s available to buy the necessary inputs to maximize profit.

Which of the above two aspects (a) or (b) have the most immediate consideration in your decision making process?
i) if (a), why?
ii) if (b), why?
-
23. Who makes the major decisions regarding your farm operations?
24. What do you look out for as "signals" or important factors for your production decision?
a) Price signals and trends b) Government subsidies C) Risks d) Non-pecuniary factors (recreation) e) Weather condition f) Other (specify)
25. a) Do you think you will obtain higher output from your fish farm if you devote more time to it? Yes 1 No (Circle one). Remarks:
b) If yes, why don't you devote more time?
26. What percentage of your income in 1980 i_s from milkfish production?
a) Milkfish % b) Non-milkfish % (other than fishpond)
27. How many percent of your net income from 'milkfish production per year are you able to save or set aside for future use? (Note: i f possible, ask how much per year).
28. I f you have some extra money from the sale of milkfish or other sources, would you use it to improve your milkfish production operations or to put the money in a bank to earn interest? Check one.
a 1 improve milkfish production operation? b) put into a bank to earn interest c) Others (specify)
29. Would you use your non-milkfish income to pay your milkfish production expenses? Yes 1 No (Circle one). Explain.
30. How do you regard people who are budget conscious or thrifty? (Check one)
a) highly b) lowly

31. How do you regard savings?
a highly desirable b) desirable C) indifferent d undesirable
32. Does it pay for you to save?
a) If yes, why?
b) If no, why not?
33. What do you think of a person in debt?
34. What are your attitudelfeelings toward credit or being in debt?
35. Would you be willing to borrow money for:
a) production purposes b) consumption purposes C) children education d) Others (specify)
36. a) What do you consider as acceptable risks? For example, a 10 or 20 or 30 or 40 or 50 or 60 or 70 or 80 or 90 or 100% collateral requirements as security for a loan (Check one).
b) What sort of minimum guarantee/assurance* do you look before putting your money into an investment such as milkfish production?
* Idea is to get the respondent to discuss risk considerations. For example, how much does he expect to get back from putting P1,000 into a production activity?
37. Have your ponds been idle before? Yes / No (Circle one). I f yes, why?
38. Do you know of any yield differences in milkfish output in your locality?
a) Yes range b) No c) To what factors would you attribute such yield differences?
39. a) How do you compare your pond productivity with that of other ponds in your province?
b) With those in the other provinces (specify the province)
40. a) Would you sell your farm if a more profitable use of the money from the sale is available? Yes / No (Circle one) Explain why or why not?
b) If you are to sell your entire farm, how much would you ask for? P

41. What is your normal mode of transportation? (Check one).
a) own vehicle b) public transportation
C. SECTION ON TECHNICAL PARAMETERS
1. How would you describe yourself? (Check one)
a) Agricultural farmer turned fish farmer b) Been in fishfarming ever since c) Professional (e.g., attorney, physician, engineer, etc.) turned fishfarmer d) Fisherman turned fish farmer e) Others (specify)
2. Do you have any farming background through:
a) Formal education b) Working on a farmlplantation before c) Grow up in an agricultural setting d) Learning on the job to fend for oneself e) Others (specify)
3. Have you attended any traininglseminar course in milkfish culture in the last 5 years? Yes / No (Circle one)
a) Have you applied what you learned from the seminar? Yes / No (Circle one)
b) Did you find it effectiveluseful? Yes / No (Circle one) Remarks:
4. How and when did you acquire your knowledge on fertilization and pest control?
a) Fertilization
b) Pest control
5. Over the years (since you engaged in milkfish farming), have you had any change in your production technique? Yes / No (Circle one)
a) I f yes, when? In what way?
b) Did the change prove beneficial? Yes / No (Circle one) Remarks:
6. a) Do you think production techniques which give higher yields are always more risky? Yes / No (Circle one). Explain.
b) As a milkfish producer, what do you think is your greatest risk?

c) What do you think can be done to reduce such risk?
-- -
7. Do you know that experiments conducted in the Philippines have obtained yields of two tonslhalyear or more? Yes I No (Circle one)
Why do you think these experiments have been able to get yields of 2 tonslhalyear or more?
Do you know of any milkfish producers in your province or elsewhere who have been able to get 2 tonslhalyear or more? (mention names).
Would you be interested to find out how to get high yields? Yes I No (Circle one)
Who designed your pond layout? (Give names and background)
Do you think your pond is well designed for milkfish production? Yes / No I Don't know (Circle one)
Would you consider redesigning or deepening your milkfish pond? Yes I No (Circle one)
Have you ever had your pond soils and water analyzed? a) Yes / No (Circle one). I f yes, what were the results?
b) By whom?
C) How much? P
How often do you change the water in your pond per year? (During production)
How often do you drain and dry your pond in a year? (After harvest)
Number of times Length of time
a) What fishfood do you grow?
TY pe Period
Lumut Lab-lab Plankton Others
b) Are you able to grow enough lumut, lab-lab, or plankton in your pond? (Encircle the appropriate item for positive answer).
c) If no, why not?

18. Stocking rate in 1980
F V pcs/ha/year Fingerlings pcslhalyear
F rY Fingerling Price/000 Source Purchased Month of Purchase pcs. pieces pieces (Name of Place)
a) b) c) d l
Total Purchase
19. How long is your average crop cycle in 1980? months (from stocking to harvesting)
20. How many croppings did you have in 1980?
21. Would you be interested in working on your neighbor's or friend's fishfarm? Yes / No (Circle one)
22. a) How many times last year (1980) did you discuss your milkfish production operation with your fellow milkfish farmers?
1) being consulted in 1980. 2) seeking consultation in 1980.
b) Do you make observations of how other fishfarmers manage their ponds? Yes / No (Circle one)
23. In obtaining technical information on milkfish production, how do you classify yourself? (Check one)
a) Active information seeker b) Passive information seeker
24. What costs are involved in gathering this information? Itemize each cost (Search costs)
Item Cost (PI
25. How would you consider the government's effort in disseminating information on milkfish production? Explain.
Strong Weak
D. SECTION ON INSTITUTIONAL PARAMETERS
1. Are you a member of any organization related to fishery?
a) Yes / No (Circle one) If no, go to item(e1.
b) Since when

c) Name of organization
- - - - - - -
d) What sort of benefits do you derive from the organization?
e) I f no, why not?
2. Do you know of any aquaculture/fishery extension agents in your area? Yes / No (Circle one)
a) I f yes, have you had consultations with him? Yes No - If no, why not?
b) Do you find the consultations effective/useful? Yes In what aspects?
N o In what aspects?
c) Do you think the number of extension workers in your locality is enough? Yes / No (Circle one). Explain -
3. Number of visits by aquaculture/fisheries extension agents:
a) In 1980 number of visits
b) average per year over the last five years
4. Describe your past and present experience in dealing with aquaculture/fisheries extension agents when you go to them for consultation (e.g., advice, assistance).
5. In your opinion, do you think these aquacuiture/fisheries extension agents have a tendency to be selective in their dealing with different groups of milkfish producers, perhaps favoring one group over another? Explain why do you think so.
6. In constructing/improving your pond system, did you obtain any assistance/advice from any government agencies, private companies or even individuals?
a) If yes, from whom?
b) Type of assistance
7. Do you know of any other government policies/programs in assisting milkfish farmers and give examples: Yes / No (Circle one)
8. Do you own a copy of "Philippine Recommends for Bangus" or any other aquaculture extension publica- tions? (Check one).
a) Philippine Recommends for Bangus

b) Others (Specify)
c) What are your sources?
d) How often do you acquire them?
e l Do you find them useful? Yes / No (Circle one) Remarks:
Do you obtain information on the market conditions of production inputs?
a) Yes
i) on prices ii) on location where inputs can be purchased
b) If no, why not?
Do you have difficulty in buying inputs?
a) Seeds (fry and fingerlings) - Yes / No (Circle one)
b) Fertilizers - Yes / No (Circle one)
C) Pesticides - Yes / No (Circle one)
Number of loans applied and approved for milkfish production in 1980:
a) Number applied for Number approved
b) Value and source of each loan (list i f more than 1)
Value Purpose of
Loan Source Loan
Period Interest Rate
c) How long did it take for the loan to be released? (months from time of filing)
d) What problems did you encounter in obtaining loans?
How would you describe your previous experience in loan application? Explain.
Good
Bad
What costs are involved in obtaining a loan from a bank? Itemize each cost.
Item Costs (PI
For your future production operations, do you need to borrow? Yes / No / Not Sure
Do you borrow from non-institutional sources (family, input suppliers, milkfish buyers, etc.)

E. SECTION ON PHYSICAL PARAMETERS
1. Costs of round trip and distance of farm to: a) Input market
i) Fry ii) Fingerlings iii) Organic Fertilizers iv) lnorganic Fertilizers V) Pesticides vi) Others (specify)
b) Milkfish market
C) House
d) BADTC
e) Bank (he deals with)
f ) BFAR Office
g) Fisheries School
(Round Trip) (One Way Distance) P km.
P km.
2. How far is your milkfish farm from the main source of water? km.
3. a) When do you first use fertilizers/pesticides to produce milkfish? (Specify)
i) Organic fertilizers
ii) lnorganic fertilizers
iii) Pesticides
b) Do you believe that the use of fertilizers, pesticides and supplemental feeds enhances pond yield? Yes / No (Circle one). Remarks:
c) How much did your milkfish output differ from applying inputs and not applying inputs?
kg.
4. Are your milkfish ponds used for other purposes such as salt making or lumut cultivation during some period of the year when no milkfish is being produced?
a) I f yes, type of activity:
b) Why do you suspend milkfish production?
5. Have you encountered any losses/damages to the fishpond over the last five years? Yes / No (Circle one)
Specify : Theft
Typhoon
Others (specify)

6. Do you know the following milkfish husbandry concepts/ideas? Are you practising them and since when? (Place check marks and year).
Milkfish Production Since Concepts Familiar Practising When Rating
i. Acclimatization ii. Stock Manipulation iii. Draining and refreshening iv. Soil Analysis v. Pest and predator control vi. Fertilization vii. Supplemental feeding viii. Pond Design
7. From your point of view, what production practices would you recommend to improve your milkfish yield?
8. Next to brackishwater fish culture, what other uses can these brackishwater land be put to?
9. Fill in the observed values of:
a) Salinity
10. Request respondent tosketch in the lay-out of his farm showing water source, canals, main and secondary gates, embankments, nursery, transition and rearing ponds.
Would you be interested in group farming, i.e., where your farm will be combined with other farms to form\a much larger farm without changing your present ownership status to grow milkfish?
Yes / No (Circle one).