Political and Economic Development In the Philippines - USAID
337
A Crisis of Ambiguity: Political and Economic Development In the Philippines H. A. Averch. F. H. Denton and J. E. Koehler January 1970 R-473-AID A REPORT PREPARED FOR AGENCY FOR INTERNATIONAL DEVELOPMENT 1700 MAIN Sf. • SAN'A MONICA· CALifORNIA' 90 .. 06-------;
-
Upload
khangminh22 -
Category
Documents
-
view
7 -
download
0
Transcript of Political and Economic Development In the Philippines - USAID
A Crisis of Ambiguity: Political and
Economic Development In the Philippines
H. A. Averch. F. H. Denton and J. E. Koehler
January 1970
R-473-AID
A REPORT PREPARED FOR
AGENCY FOR INTERNATIONAL DEVELOPMENT
1700 MAIN Sf. • SAN'A MONICA· CALifORNIA' 90 ..06-------;
· \
This research is supported by the Agency for International Development,Department of State, under Contract No. F44620-67-C-0050. Views orconclusions contained in this study should not be interpreted asrepresenting the official opinion or policy of the Agency for International Development.
A Crisis of Ambiguity: Political and
Economic Development In the Philippines.
H. A. Averch, F. H. Denton and J. E. Koehler
January 1970
R-473-AID
A REPORT PREPARED FOR
AGENCY FOR INTERNATIONAL DEVELOPMENT
1700 MAIN ST, • SANTA MONICA' CALifORNIA' 90406-------,----C
BEST AVAILABLE COpy
Copyright©1970THE RAND CORPORATION
This study is prf'sf'ntf'd a~ a competent trf'atment of the ~uhjf'('t, worthy of puhlication. Th(, Rand Corporation ,·ou('hf'~ for the quality of the n'~f'ar('h. withoutnf'cessarily f'ndor~ing- the opinion~ ancI (,oll('lu~ion~ of the authors.
Published by The RAND Corporation
-iii-
PREFACE
THIS REPORT CONTAINS the findings of an interdisciplinary study of the
social, political, and economic state of the Philippine nation. It
covers interactions among political perceptions, voting behavior, and
economic growth, as well as the problems of crime and dissidence. Survey
data and aggregate data are applied jointly to all of these subject
areas. The aim is twofold: to provide as comprehens ive and detailed
a portrait as possible of the Philippine social system and the actors
involved in it, and to pinpoint uncertainties in the information used
for decisionmaking by 'the Philippine government and U.S. agencies.
This research on the Philippines was sponsored by the Agency for
International Development (AID) as part of a contract with The Rand Cor
poration calling for two interdisciplinary country studies. The two
countries selected were Colombia and the Philippines. l The aim of the
studies was to provide substantive analysis of the two countries and, by
this experience, to devise improved methods of analys is for use by AID.I
Additional research on the extent and nature of insurgency was sponsored
by the Advanced Research Projects Agency of the Department of Defense.
In the case of the Philippines it soon became apparent that the funda
rental problem facing U.S. policymakers was not a shortage of options, or
of structures and formats for those options, but rather a shortage of
detailed, systematic knowledge about the country. Existing knowledge was
based primarily on highly aggregated information generated by Philippine
agencles, on press reports, and on visitors' impressions. The present
report shows how misleading such information can be. Whatever general
IThe Colombia study has already been submitted to AID: RichardR. Nelson, Robert L. Slighton, and 1. Paul Schultz, CoZorribian DeveZopment PoUay, R-46l-AID/RC, February 1969.
-iv-
policy options are up for consideration, whatever strategies of foreign
assistance are under debate, the process of evaluation and selection cannot
proceed far without finer-grained information on the Philippines and
other countries than is customarily used.
In the course of this research the three authors spent JOOre than a
year in the Philippines. They were based in Manila and had offices in
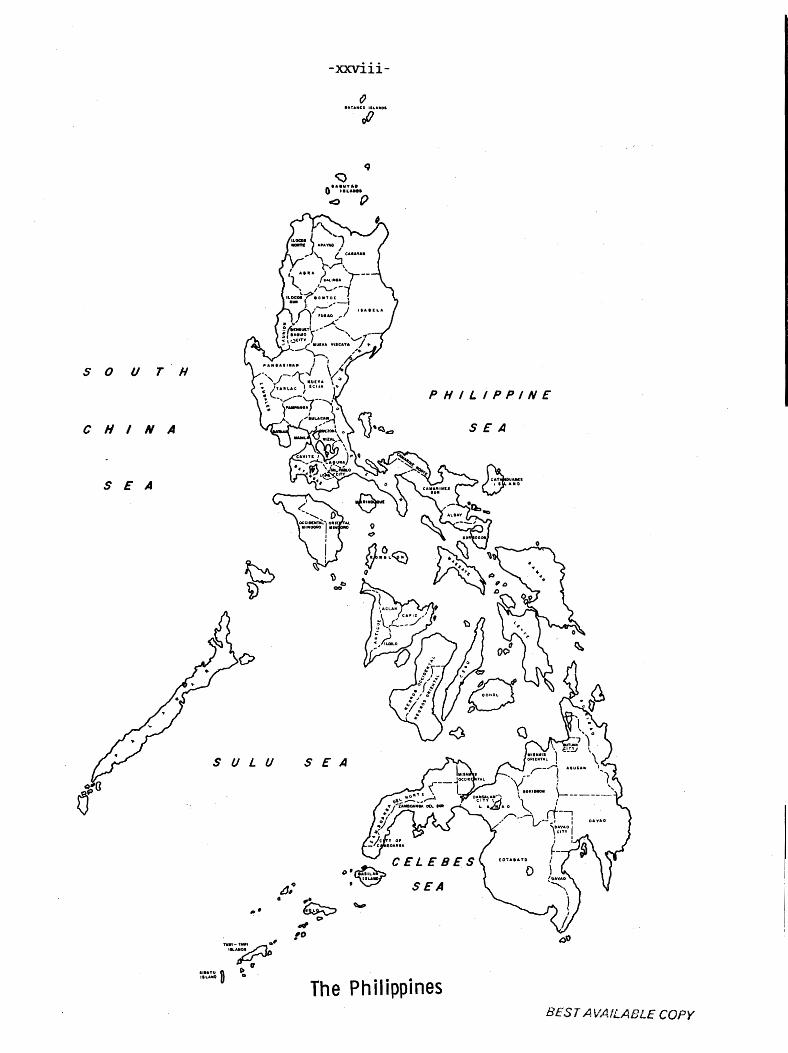
the AID Mission. Because the Philippines is geographically and ethnically
so heterogeneous, a special effort was made to travel about the length and
breadth of the couritry - - from Aparri to Jolo, as the Filipinos would· put
it. The authors checked the data against their awn first-hand perceptions.
The field research could not have been carried out without the
encouragement of many Americans and Filipinos too numerous to be
listed here. But thanks are particularly due to Rafael Salas, formerly
Executive Secretary of the Philippine Cabinet, for his encouragement
and insight. At crucial points in the research, large bodies of data
were made available by Tito Mijares, Director of the Bureau of the
Census; by Mercedes Concepcion of the Population Institute, University
of the Philippines; and by General Vicente Raval , Chief, Philippine
Constabulary. The authors gratefUlly acknowledge, in addition, the
support and encouragement received from the AID Mission.
Large-scale quantitative research in economics and the social
sciences cannot be carried out without the support of many people at
the home base. The computational pipeline was 7,000 miles long. Invalu
able assistance was provided by the staff of Rand's Computer Sciences
Department, particularly Harold Casali and Dean Hatch, and Marina Mann
and David Weinschrott of Rand's Economics Department.
Rand colleagues Marvin Lavin, Paul Hanmond, Alvin Harman, and
O1arles Wolf, Jr., are owed a great debt for their rapid response to
requests for reviews of a work of this large size. Robert Slighton
provided valuable criticism at an earlier stage of the draft. Thanks. .
are also due to Richard R. Nelson of Yale University for the many con-
tributions he made to the manuscript. Many of these persons' sugges
tions are incorporated in this Report. All of the conclusions and
interpretations, however, remain the responsibility of the authors.
-v-
The authors used a wide variety of data in' the Report. This
material is currently available to scholars from The Rand Corporation.
It will be deposited at a major university library as soon as con
sistent formats and codebooks are devised.
-vii-
SUMMARY
Introduction and Historical Overview
THE PREVAILING POPULAR VIEW of the Philippines is that the country
suffers from unsatisfactory economic growth, increasing crime and cor
ruption, a menacing insurgency, and irrelevant politics. Given the
perception of so many ills, it is little wonder that the stability of
Philippine democracy has been called into question.
This Report presents two maj or arguments. The first concerns the
magnitude and structure of the various problems that are alleged to be
confronting the Philippines. We have found that ruch of the bleak view
of the country's prospects rests on misperceptions: Crime is not
IOOunting, the economy is growing respectably, and the polity appears
stable. This does not mean, however, that the Philippines is performing
spectacularly or that it has no problems. The second line of argument
contends that Philippine decisionmakers cannot greatly improve their
policy performance unless they acquire a much IOOre systematic under
standing of their own environment. Neither can the friends, critics,
and allies of the Philippines have sound bases for their perceptions
or policies without more rigorous attention to the ways in which infor
mation about the Philippines is generated, presented, and analyzed.
The first step in understanding the contemporary Philippines is
to acquire knowledge of the patterns of social and economic structures
over time. To clarify these patterns we conducted a factor analysis.
This technique compresses and relates large amounts of aggregate pro
vincial data. The factor analysis suggests that historical connections
among social, economic, and political change are weak or at best indirect
PREVIOUS PAGE BLANK
-viii-
o Provinces that in 1938 were characterized by a high level of
development t dense populatioTI t active dissidence and commercial agri
culture could also be so characterized in 1960.
o With the exception of the provinces in the metropolitan Manila
area t the high growth areas have been the frontiers. The frontier has
roved from Northern Mindanao in the prewar erato Southern Mindanao
since 1948.
o The agricultural structure of the country is quite diverse.
No single area of the country appears to have shown consistent agri
cultural prosperity or growth. Rathert Philippine crop prices have
fluctuated as international prices of agricultural commodities changed
(often in response to U.S. commercial policies).
o POlitics is not strongly related to economic development.
Ethnic composition is strongly related to differences in voting be
havior t overwhelming the limited effect of development.
Method
The method of this study is deliberately eclectic. In general t
we examine the same propositions at different levels of aggregation tcontrasting province or city data from official Philippine sources
with individual data derived from surveys conducted during the 1960s tincluding a survey carried out for Rand early in 1969. The credibility
of hypotheses at a given level o~ aggregation was checked by using data
from other levels of aggregation.
The variety of data sources and the interdisciplinary nature of
'the propositions addressed required the use of statistical techniques
drawn from both political science and economics. Analysis of survey
data required the use of standard tabulating routines; tests of statis
tical significance t however t required the development of techniques
appropriate to stratified sample design.l Analysis of aggregate
ISee Gad Nathan t 't'fests of Independence in Contingency Tables fromStratified Samples" in Nonnan 1. Johnson and Harry Smith t Jr. t eds. t
-ix-
provincial data required a variety of techniques: the factor analysis
mentioned above, ordinary least squares estimation of regression equa
tions; and siJnul taneous estimation of equation systems where there were
important two-way interactions among dependent variables. l
Crime in the Philippines
The image of the Philippines as a failing democracy rests heavily
on the country's image as a society plagued by mounting crime. Per
ceptions of a crime wave in the Philippines, however, rest on erroneous
estimates of national crime rates. Between 1962 and 1965 estimates of
all crime rates were seriously understated. In 1966 estimates free of
arithmetic error were spliced to the old understated rates, thereby
creating an arithmetically induced crime wave. Furthermore, beginning
in 1966 the Philippine goverrunent began a major campaign to improve
crime reporting. It is impossible to correct the crime rates for all
resulting improvements in reporting, but much of the measured increase
in crime rates can be attributed to a few areas where Philippine police
agencies were extremely active. Apparent large increases in the national
murder-homicide rates can be traced to large upswings of reported
murders and homicides in Manila and Rizal province, not to a general
rise in violence. In fact, the image of the Philippines as a crime
ridden country rests mainly on the high violence rates. International
comparisons suggest that the Philippines does have a very high violence
rate, but its reported theft and robbery rates are lower than those of
the United States.
These aggregate comparisons can be mis leading. Crime and concern
about it are not unifonnly distributed across the country. In Manila,
survey data show that crime is rated the mnnber one problem. In other
parts of the country crime ranks substantially below other problems.
New Developments in Survey Sampling, New York, John Wiley and Sons, 1969,pp. 578-600.
lFor thorough explanations of ordinary least squares and simultaneousequation estimation see Carl F. Christ, Econometric Models and Methods,New York, John Wiley and Sons, 1966.
-x-
The great variation in crime rates -- especially violence rates -
across Philippine provinces and cities needs to be explained. In pro
vinces we can trace a cycle of violence that is closely related to the
occurrence of elections. Violence tends to peak at election years with
the highest peaks occurring in Presidential election years. This poli
tical violence seems to be directed at specific members of political
factions rather than the population as a whole, since people in these
politically violent areas say their barrios are relatively peaceful.
Purely ethnic explanations emerge when we fit statistical models
to provincial data. Provinces with a high proportion of Ilocanos tend
to have higher violence rates than average. Across Philippine chartered
cities, high growth and high population density are positively related
to violence. Even controlling for the effects of growth and density,
cities in the Manila area have abnormally high violence rates. In
cities we also tested for the relation between police inputs and the
arrest rate and for the relation between arrest rate and the crime
rate; but we fOlmd no relations.
The analysis suggests that crime has been overstated as a Philip
pine crisis. Violence rates, although high overall, do not appear to
be rising. Furthermore, violence is concentrated in a few areas of the
cOlmtry. The analysis also suggests that it would be difficult to
reduce the level of violence, since murder and homicide rates are not
now related to police inputs. Since violence is related to urban growth
and concentration, government social and economic policies that promote
urbanization should be re-examined.
Dissidence
Along with crime, the problem of dissidence is again seen as
threatening the Philippines. Dissidence and insurgency are hardly
new. The Philippines has a long history of dissident movements forming,
becoming active, and then receding. The modern nation, however, has
had no instance of a successful revolution. Many believe the nation
-xi-
came close to revolution during the Hukbalahap (Huk) uprising of 1949
1953. Foreigners, impressed by analogies to Vietnam, believe that the
contemporary Huks pose a similar revolutionary threat. The driving
force behind this threat is often seen as discontent arising from bad
land tenure arrangements.
The Philippine goveTIllIlent seems to believe that its dissidence
problem is partly social and partly a problem for the constabulary
and the military. Given either or both interpretations, the problem
often seems intractable. If dissidence arises because of a bad land
tenure system, reform will be very difficult because of bureaucratic
and legal constraints. If dissidence is a straightforward police and
military problem, political constraints make it hard to act. The Huks,
unlike insurgent organizations elsewhere, are actively involved in the
legitimate political life of Central Luzon.
The problem of Huk control can be analyzed in two different ways -
by examining survey data concerning the image of the Huks and the
government, particularly in Central and Southern Luzon, and by building
statistical models of control and operations. The results of fitting
statistical models at municipal and barrio levels suggest that the dis
sidence in Central Luzon feeds on terror and coercion rather than on
the popular discontent imputed to tenants. Tenants have no more favor
able image of the Huks than non-tenants. Pampangans have no more
favorable view of the Huks than other language groups. Our survey data
also suggest that respondents in the Huk areas do not view the govern
ment in any worse light than other groups.
Terro~ and violence may explain Huk control; but the purposes of
the Huks remain ambiguous. Captured documents and interviews with Huk
prisoners suggest that the organization is politically motivated, more
specifically is Communist in nature. Other interviews suggest that some
factions among the Huks are motivated primarily by personal gain.
Even if there were signals of widespread discontent that we have
missed and if this were a precondition of insurgency, the Huks do not
appear to be an organization that could mobilize and exploit that arrest.
-xii-
They appear to be indolent and poorly organized. On the other hand,
they are likely to remain a major nuisance.
Politics and the Social System
Arguments that the Philippines is a nation in crisis often relate
mounting crime and threatening insurgency to alleged poor performance
of the political system. Critics argue that politics in the Philip
pines is noisy and irrelevant and that the common man is disillusioned
and eager for a revolutionary alternative. We have seen that the
common perceptions of crime and dissidence in the Philippines are
inaccurate. Likewise, perceptions of the Philippine polity as unre
sponsive and unstable also appear to be unfounded.
Filipinos believe the government has a positive impact on their
lives. In 1969, 46 percent of the Filipinos believed that the
national government improves conditions, 35 percent believed that the
government makes no difference, and 7 percent believed they would be
better off without the national government. Such figures for an LDC
compare favorably with responses from other countries. For example,
in Mexico in 1963 only 18 percent of the people believed that the
national government improved conditions while 67 percent believed the
government made no difference to their lives. Similarly, the Philip
pines compares well with the developed democracies in the perception
of equal treatment: 42 percent of the Filipinos expect equal treat
rent, 35 percent do not; 23 percent don't know. For context, in 1963,
53 percent of the Italians and 42 percent of the Mexicans expected1equal treatment.
The Philippine polity is not without troubles. Only 19 percent
of Filipinos consider graft and corruption as unimportant; 66 percent
lrhese comparisons are drawn from data presented in Gabriel A. Almondand Sidney Verba, The Civic CuZtul'e: PoliticaL Attitudes and Democl'aay inFive Nations, Princeton, Princeton University Press, 1963. The Randsurvey conducted in 1969 duplicated several sets of questions from TheCivic CuLture so that Filipinos' attitudes could be put in cross-nationalperspective.

-xiii-
consider it a major national problem. In particular, politicians are
seen as especially corrupt. About 38 percent of Filipinos believe that
most politicians are corrupt; only 18 percent believe that no or few
politicians are corrupt. Government employees also rank as quite
corrupt. No one, of course, can judge the actual aJIlOlmt of graft and
corruption in the Philippine system nor even the true meaning of "graft
and corruption" in the Philippine setting. But many people do see it
as a problem.
Concern with corruption is also revealed in the criteria people
say they use when deciding which candidate to vote for. Most Filipinos
say they vote according to their opinion of the honesty of the candi
date. However, other criteria are also important: past aid delivered
to local areas -- the so-called pork barrel -- and the dialect of the
candidate. Questions of policy and the party of the candidate are TIR.lch
less important criteria.
It is possible to Check individual voting preferences by examining
provincial voting patterns. One of our statistical models for the
election of 1965 indicates that the percent Nacionalista vote in a
province is positively related to the percent of Ilocanos in that
province and the percent of Nacionalista Party mayors elected in the
previous off-year election. Percent Pampangans and percent Muslims
are negatively re1ated. l P~rcentage of low income families in the
province is not significantly related to the vote. The models of
behavior that emerge from the election data and the survey data are
consistent. Ethnic variables and local political control account for
most of the variation in percentage Nacionalista vote across provinces.
At provincial level the effects of economic variables - - poverty, unem
ployment -- cannot be detected. Equations fitted to the results of
four earlier presidential elections also indicate the overwhelming
importance of ethnic voting and pork barrel.
Politicians accurately perceive the criteria by which the public
votes. On a free response basis, a random sample of 66 Congressmen
LIhe Nacionalista candidate, Marcos, was a well-known Ilocano. Hisopponent, the incumbent Macapagal, was a Pampangan.
-xiv-
and Senators rate past aid and general honesty as the criteria by which
their constituents vote. Party, promises of help, and personal rela
tions each received less than 10 percent of all responses. l
In a political system in which the people's preferences count,
minimal requirements for stability would include a widespread perception
that the perfonnance of the government is not outrageously deficient or
inequitable and a degree of congruence between the views of public and
politicians. These conditions appear to be met in the Philippines.
It is hard to find groups of voters that are strongly discon
tented or demanding a more issue-oriented politics. The poor, the
young, and tenants - - groups we might expect to be different - - appear
not to differ from the rest of the population. In general, all groups
prefer honesty, pork barrel, and a candidate who speaks their dialect.
No group appears to be demanding a different kind of politics. With
out such a general demand the stability of the system is unlikely to
be threatened. Without such a demand, however, it is also difficult
for the politician to be an innovator.
These results indicate more political stability in the Philippines
than casual observation or the press would suggest. Filipino views of
government performance compare favorably with those found in developed
countries. Demands for ftmdamental change are hard to find. Politicians
perceive the wishes of their constituents accurately and try to fulfill
them. This view of stability is buttressed by the election of 1969 -
which occurred after our major analysis was completed -- in which voters
re-elected an incumbent President for the first time.
The Economy
The image of the Philippines as a nation muddling along in the
face of crisis is drawn at least as much from dissatisfaction with the
IFor Congressmen the issue of ethnic background is irrelevant sinceboth candidates typically represent the district's dominant ethnic group.
-xv-
perfonnance of the economy as it is from criticism of the political
system. Evidence of crisis is seen in high lUlemployrnent, an lU1Satis
factory and lUleven rate of growth of GNP, and the periodic balance of
payments difficulties. In the face of these problems, critics charge
the Philippine government with hesitation and vacillation.
The perceptions of economic crisis, however, are inaccurate. This
point can be demonstrated if one examines infonnation on the economy
in detail, going behind the aggregates on which the usual evaluations
are based. Viewed closely, lUlemployment, the rate of growth, and the
lUlevenness of growth appear quite different from their images in the
rhetoric of crisis.
Unemployment
The "lUlemployment crisis" in the Philippines is a constantly
recurring theme. Every President since Magsaysay has expressed deep
concern over the "ominously serious" proportions of the lUlemployrnent
problem and has addressed some action toward alleviating it. In the
rhetoric, Philippine lUlemployment is seen as a widespread and pervasive
problem, with the lUlemployed tramping the streets vainly seeking work
and farmers locked into debilitating idleness between planting and
harvest.
This image of general crisis is inaccurate. Unemployment is in
fact a very specific problem, concentrated among young people looking
for their first regular jobs. Over half of all lUlemployed fall into
this category, which represents only 5 percent of the total labor force.
We find that for this group, and possibly for other groups as well,
the concepts of "unemployment" and 'tlabor force 't are quite ambiguous.
Half of the inexperienced unemployed say they would like a job but
believe none are available. This is the extent of their participation
in the labor force. Many pass into and out of this part of the "labor
force" without ever finding a job, moving presumably to marriage,
housework, or school.
-xvi-
Underemployment is similarly elusive. The typical "lIDderemployed"
Filipino is already working 40 or more hours per week. Of those working
less than 20 hours per week and wanting more work, half are rural
females.
A1though lIDemployment as measured by official definition does not
appear to be a widespread and molIDting problem, something called "tmem
ployment" is seen by politicians as an important political issue.
Survey data showed that many Filipinos who presumably would not qualify
as tmemployed by the official definition consider themselves tmemployed.
It is this group to whom we should look for evidence of alienation or
dissatisfaction with the "system." However J the opinions of the self
per-ceived tmemployed seem to be TIRlch like the opinions of the rest of
the population. They are even more favorable toward the government
and politicians, and they vote more traditionally.
Stagnation
The second major economic issue is the rate of growth of GNP.
Judgments that the Philippine economy is only a mediocre performer are
usually based on the rate of growth shown in the national accolIDts.
Critiques of Philippine national accounting procedure by various
scholars suggest that estimates of GNP and its rate of growth are
likely to be biased downward.
To check the rate at which the Philippine economy is modernizing,
we compiled measures of the "modern labor force" (MLF), by which we
mean essentially those workers in non-craft manufacturing plus those
who support the non-craft manufacturing sector in transportation,
power generation, mining, and the like. The definition of MLF cor
responds to workers performing modern activities with relatively large
amolIDts of capital in identifiable establishments.
Our estimates of MLF show an increase from 1 million in 1960 to
1.7 million in 1968, an anriual tate of growth of 6.8 percent. By this
-xvii-
measure, economic modernization has been substantial. The data on
the MLF over time suggest that in the period 1948-1961 the economy
became more concentrated. Measured as a percentage of the population
over 20 years of age, the modern labor force declined in most provinces.
Growth of the modern labor force was concentrated in only a few pro
vinces, principally Manila, Rizal, and Bulacan. The concentration
in the Manila area may have been the resul t of the n~ed to bargain
with bureaucrats for foreign exchange allocations and to locate near
the modern infrastructure. This pattern of concentration apparently
reversed itself between 1960 and 1968. There was an increase in the
percentage of modern labor force in 41 provinces.
The Lurching Economy
Although it appears to be modernizing rapidly, the Philippine
economy has been rather unstable. The rate of growth, at least until
1966, moved in a two year cycle. Foreign exchange crises recurred
with distressing frequency. The lurches in the growth rate and re
curring crises tended to obscure the real progress of the Philippine
economy and bred pessimism about the country's long run prospects.
The uneven performance is related to the politician's need to
deliver pork barrel to win e1ections. The government deficit has
followed a two year cycle, increasing in election years, falling in
non-election years. These cycles in fiscal policy could have been
offset by the Central Bank. However, the bank, according to its own
evaluations of monetary policy~ has tended to move with rather than
against the fiscal cycle. The net impact of policy has thus fluctuated
annually from expansion to restraint and back to expansion.
The pattern was modified somewhat during the Marcos administration.
In 1968 the government forged ahead with its rice, roads, and school
program. President Marcos did win re-election, but not without balance
of payments problems afterwards.
If the uneven performance of the Philippine economy is rooted in
the functioning of the political system, no one should be surprised

-xviii-
and disturbed when a foreign exchange crisis occurs. The crises are not
evidence of fundamental disequilibrium.
Conclusions
Any sensible evaluation of the Philippines should consider the
following points:
o The crisis of crime has been overstated. It is Greater Manila
that has a crime problem. Our analysis suggests that the high violence
rates are partly based on ethnic propensities that are very hard to
change in the short run. Some violence appears to be related to
political rivalries and feuds. In urban areas high crime rates appear
to be related to urban economic growth and concentration. This may
have resulted from the inadvertent concentration of economic activity
during the period 1948-1960.
o Huk dissidence is a major nuisance. However, it does not appear
to pose" a revolutionary threat to the government. It is very difficult
to find large-scale popular support for the Huks even in their horne
areas. They should not be characterized as having the single objective
of overthrowing the government. In fact, the organization works with
and through local politicians. It does not behave like a classical
insurgent organization nor does it have the effectiveness of the early
Viet Congo Part of the organization appears motivated by personal gain,
part by political ideology.
o The country appears to be politically stable.
rests in a rural sector voting along traditional lines
responding primarily to rural demands.
That stability
with politicians
o The Philippine people, by their voting behavior, in a sense
have revealed their preference for the kind of economic performance
they are getting. To an outside observer an economy that lurches
every two years may be tmhealthy. Balance of payments crises in
particular disturb international agencies with whom the Philippines
deals. To the extent that we can determine, however, Philippine
-xix-
decisionmakers have sufficient flexibility to deal with more acute
crises.
The Philippines has been viewed as a nation in crisis partly
because of the kind of information produced by Philippine reporting
systems. Although its performance is adequate, it will be difficult
for the country to do very much better unless information systems are
more closely articulated with policymaking.
-xxi-
CONrENI'S
PREFACE.
SlM1ARY.
LIST OF TABLES
LIST OF FIGURES.
Chapter1. INfRODUCfION
iii
vii
xxiii
.• xxvii
1
2.
3.
4.
1HE LAST lliREE DECADES: A QUANI'ITATIVE HISTORICALANALYSIS . . .
Introduction . . •Factor Analysis.
Vocabulary . .A S1..UllIlIary of Spatial Patterns. . . . . • . • •A Composite Factor Analysis -~ 1938-1960The Philippines in 1938 and 1960 . . • .
PERCEPTIONS OF 1HE PHILIPPINE SOCIAL SYSTEM.Perceptions of the Cammon Man. . . . • •
Attitudes About Living Conditions .•.Atti tudes Toward the Goverrunent. . • •Attitudes Toward Government Officials.Government Treatment . . . . . .The Role of Politicians ...•.Political Participation.....
The Perceptions of the Politician.The Perceptions of the Bureaucrats .Summary. . . . . . . . . . . ..
POLITICS IN 1HE PHILIPPINES.Parties and Elections. .. . .Regression Models with Socio-Economic Variables.Ethnic Differences in Voting • . . •. .
Polling Results. . . . • • . . . . •Pegasus Results...•....•.
Poverty, Tenancy, and Voting ....The Role of Pork Barrel and Past Aid .Other Elections. • . • . • . . ... ..• .
The 1953 Election - - Magsaysay (NP) VersusQuirino (LP) . . . . . . • . . . . . . . . . . • .
The 1957 Election -- Garcia (NP) Versus Yulo (LP),Manahan, and Recto . . . . . . . . .. ..•.
The 1961 Presidential Election -- Garcia (NP) VersusMacapagal (LP) . . . • . . .
A Note on City Voting. • . . .Prospects for Political Change
PREVIOUS PAGE BLANK
99
1212161826
3133334152566064677883
85889194
100102104108112
112
113
114115115

-xxii-
5. THE LURCHING ECONOMY .....•..••Unemployment: A Crisis Misperceived . • • • .
The Image of Unemployment ..••.The Structure of Unemployment .••The Politics of the Unemployed . . .
Stagnation: An Ambiguous Crisis • . •The Ambiguity of Aggregate Data•..Measures of the Growth of Manufacturing. • • • •The Modern Labor Force • • • • • • . . • .The Distribution of the Modern Labor Force,
1948-1961 ~ . . ,' ..The Distribution of the Modern Labor Force,
1960-1968 .The Politics of the Modern Labor Force
The Lurch.: A Pennanent Crisis •The Unevenness of Growth . . • • • .Elections and Fiscal Policy•••••The Fiscal Cycle • . . • . • • • . .The Monetary-Policy Cycle. • • • • •Is There a Foreign Exchange Crisis?
Anhiguity: Consequences and Sources •Prospects for the Future
6. CRIME IN THE PHILIPPINES ••••••.•Introduction • . . • • • • • • • • • • • •Perceptions of Crime • . . • . . • . •The Structure of the Reporting System.Province Analysis. • .•.City Analysis. • . • • •Summary .
. . . .
119121121122130134134138138
145
145151152152157159164170171175
179179180183186192198
8. TOWARD A POLICY ON POLICYMAKING • • • • •
DISSIDENCE . . • . • • . • • . • • • . • • •Filipino Attitudes Toward the HMB. • • . • ••Alternative Models of Control -- Municipalities
aIld Barrios. . . . . . . . . . . . . .
. . .
7.
The HMB in Laguna. • . . . • . . • • •Who Are the HMB and What Do They Want? • •S1.DTDTlary. • • • • • • • • • • • • •
. . . '.
199200
208214216219
221
AppendixesA. PEGASUS SAMPLE DESIGN AND QUESTIONNAIRE.B. FACTOR ANALYSIS DATA BASE. •C. CONGRESSIONAL QUESTIONNAIRE.D. ESTIMATES OF NATIONAL INCOME •E. INTERVIEWS OF ECONOMISTS • • • • • • • • •F. CITY CRIME VARIABLES
BIBLIOGRAPHY • . • • • • • • •
225249259263287293
295.
-xxiii-
LIST OF TABLES
1. Composite Factor Analysis -- 1938-1960.
2. 1960 Provincial Factor Analysis .
3. 1938 Provincial Factor Analysis . • • e.
19
25
28
4. Opinion on Living Conditions: 1963 Survey of NationalPolitical and Social Attitudes (Total Sample) . . . 34
5. Perceptions of Living Conditions by Region, 1963. 35
6. Perceptions of Living Conditions by Socio-EconomicStatus, 1963. . . . • . . . • . . . . . . . • . . • 36
7. Median and Median Rankings of Economic Status by Region. 38
8. Belief that Government Can Help Solve Problems byRegion, 1963. . . . . . . • • • . . . . . . . . . . 42
9. Belief that Government Can Solve Problems by Socio-Economic Status, 1963 . . . . . . . 43
10. Perception of Government Influence, 1969. . 45
11. Worth of Government Activities, 1969. . . . 46
12. Estimated Degree of Impact of National Government onDaily Life. . . . . . . . . . • . • . • • • • 47
13 . Character of Impact of National Government. • . 48
14. Worth of Government Activities in Mexico and thePhilippines . . . . . . . . . . . . . . . . . 50
15. Aspects of Nation in Which Respondents Report Pride,by Nation . . . . . . . . . . . . . . . . . . . . . . Sl
16. Widespread Graft and Corruption a National Problem byRegion. . . . . . . • . . . . . . . 53
17. Views on Corruption of Officials. 54
18. Views on Corruption of Politicians by Socio-EconomicStatus. . . . . . . . . . . . . . • . . . . . . . . 57
19. Views on the Corruption of Government Employees bySocio-Economic Status . . . . . . . . . . . . . . . 58

-xxiv-
20. Views on Corruption of Politicians by RadioC>\vl1ership . . . . . . . . . . . . . . . . . 59
21. Perceptions of Government Treatment by Region 61
2J. Expectation of Treatment by Goverrunent Bureaucracy byNation. . . . . . . . . . . . . . . . . . . . . . . . 62
23. Perception of Goverrunent Treatment by Socio-EconomicStatus. . . . . . . . . . . . . . . . . . . . . . . 63
24. AIternative Ways of Obtaining Help from Governmentby SES. . . . . . . . . . . . . . . . . . . . . 65
25. Occupations of Politicians and Leaders. 68
26. Father's Occupation, Philippine Congress and ColombianUpper Leadership. . . . . . . . . . . . . 70
27. Perception of National Problems . 71
28. Perceived Criteria for Winning Elections. . 72
29. Responses on Socio-Economic Policy to Help Develop thePhilippines . . . . . . . . . . . • . • • . . . • 75
30. Bureaucrats on Citizens' Respect for Government 80
31. Bureaucrats' Reasons for Citizens' Non-Respect. 82
32. Regressions of Alternative Voting Models. . . 95
33. Regional Criteria for "Good Candidate," 1963.
34. Regional Reasons for Voting, 1963 ...
3S. Attitudes Toward "Conrnunity Development" BeforeElections, 1963 . . . . . . . . . .
97
98
99
36. Predicted and Actual Vote by Region 101
37. Mean Response on Criteria for Presidential Candidate,1969. . . . . . . . . . . . 103
38. Voter Preferences by SESe . 105
39. 1965 Presidential Preferences by Area and SES 106
40. Views on Government of Tenants, Farmers, and Non-Farmers. 107
41. Mean Response in Criteria for Presidential ElectionCandidate Among Farmers, Tenants, and Non-Farmers. 109
-X)(V-
42. Mean Response in Criteria for Presidential CandidateAmong Fanners and Non-Fanners • . . • . . • . 110
43. The Structure of Unemployment, 1968 .
44. Inexperienced Unemployed by Age, May 1968 • .
124
126
45. Underemployment, 1967 . . . . . . . . • . . 128
46. Views of the Order of Importance of Government Activities,Employed and Unemployed Men. . . . 133
47. Economic Data Used by Policymakers.
48. Economic Data Desired by Policymakers
137
137
49. Data Anbiguity: Alternative Estimates of the Growth ofManufacturing, 1960~1966. . . . . . . . . . . . . . • • . 139
50. Correspondence Between Economic and Population Censuses:Employment by Industry, Modern Labor Force. . • . • . • • 142
51. Wage and Salary Employees in Manufacturing Establishments,1948-1961 . . • . . . . . . . . . . . . . • . . • • . . ~ 147
52. Wage and Salary Employees in Manufacturing, 1960-1968 150
53. Impressions of Politicians, MLF and Non-MLF 153
54. Factors Considered in Deciding on Vote for President,MLF aIld r«:>n-MLF . • . . • • . • . • • • . . . . • . . 154
55. Percentage Rates of Growth of GNP in Current and 1955Prices. . . . . . . . . . . . . . . . . . 155
56. International Reserves, 1956-1967 • 156
57. The Relation Between Government Net Receipts and Elections,1957-1968 . • • . . • . .• . . . . . 162
59. Regional Variations in "Crime as a Problem" .
60. Philippine Crime Rates, 1962-1967 .....
61. Fitted Models of Provincial Murder/Homicide Rates
58.
62.
Central Bank Evaluations of Policy.....•
Provincial Robbery Models . . . . .
165
181
185
190
193
63. Sample City Crime Rates per 100,000 Population, 1967. 194
-xxvi-
64. Fitted Models for City Murder/Homicide Rates.
65. Attitudes Toward HMB by SES . • • . •.
66. Attitudes Toward HMB by Tenancy Class .
67. Attitudes Toward HMB by Mother Tongue •
68. Median Responses on Welfare by Proximity to If<fB •
69. View of Government by Proximity to liMB. • • • • • . .
197
201
202
203
205
206
70. Alternative Models of Mtmicipal Control, 'IWo StageEstiInates . . . . • . . . . . . . . . • . . . 212
71. Barrio Control Models, Two Stage Estimates. 215
A-I. Stratum Proportions and Interviews Obtained . 228
D-L Comparison of Old and New (1967 Revisions) NEC NationalAccounts for 1962 . • • • • . • • • • • • • • • . • 268
D-2. Comparison of BCS Input-Output Table with NationalAccounts and NEC Input-Output • • • • • • • • 270
D-3. Comparison of National Accotmts Statistics. • . • • 274
D-4. Comparison of UP-BCS and NEC Input-Output Tables. 275
D-5. A Partial Reconciliation of the 1961 Input-Output Tables. 278
D-6. Employment by Industry. . • . . . . . . . . . . . . . . . 284
.,-xxvii-
LIST OF FIGURES
Frontispiece. . . . . . . . .
1. Major Ethnic Linguistic Groups.
2. Philippine Export Agriculture
3. Modern Factor Scores.
4. Growth Factor Scores ..
5. Cross Plot of Modern Factors for 1938 and 1960.
6. Cross Plot of Growth Rate Factors for 1938 and 1960
. .xxviii
11
13
20
22
27
30
7.
8.
Filipino Attitudes Toward Life ..
Changes in Perceptions of Life.
39
40
9. Percent NP Vote and Percent Turnout from 1946 Through1965 Election Years . . . . . 90
10. Two A1ternative,Voting Models ... 92
11. Estimates of the Modern Labor Force 143
12. Growth of Median Family Income, 1956-57 to 1965 . 144
13. MLF as Proportion of Population over 20 Years of Age,1948-1961 " . . . . . . . . . . . . . . . . . . . . . 146
14. MLF as Proportion of Population over 20 Years of Age,1960-1968 . . . . . . . . . . . . . 148
15. Net Government Operating Receipts .
16. Alternative Provincial Crime Models
17. Violence in I1ocos Sur. . . . . . .
18 . Alternative Models of City Crime. .
19. Pattern of HMBLiquidations . . .
161
188
191
196
209
20. Alternative Models of 11MB Control - - Milllicipalities . 210
21. Alternative Models of HMB Control -- Barrios.
A-I. Pegasus Interview Areas .....
D-1. The Plausible Range of GNP Estimates.
D-2. Estimating NDP and Production of Pa1ay.
213
227
279
281
-xxviii-
U T H
P HILIPPINE
S 0
SEAC H I N A
S E A
0<)
O·~L~
~0
\)b
=
The PhilippinesBEST AVAILABLE COpy

-1-
Chapter 1
INTRODUCTION
ffiUNTRY OR AREA EXPERTS corrmonly sum up their views of a COtmtry in a
few propositions or aphorisms. These propositions are usually based
on the distillation of qualitative knowledge and experience. In the
case of the Philippines the prevailing view is bleak. According to
this view:
o The situation is particularly critical in the
Philippines.
o Unsatisfactory economic growth, IOOtmting cor
ruption, increasing lawlessness, and declining
IOOrale all spell trouble. l
Presumably the trouble matters to the United States because of the U.S.
bases and the "special relationship."
In a recent speech Senator Mansfield stated:
A half century of familiarity, which was crowned with thecommon sacrifices of World War II, laid the basis not fora mutual contempt but for an enduring friendship betweenthe Filipino and American people. It seems to me that weneed to bestip ourselves if this mutually valuable tie isnot to be lost. • • • To allow barriers to be raised, by
ISee E. O. Reischauer in Kennit Gordon, ed" Agenda fop theNation, Brookings, Washington, D.C., 1968, p. 432. See also JohnMecklin, ''The Philippines: An Ailing and Resentful Ally," Foptune,July 1969, p. 119. For a typical view of the American press, see TheN8IJ) Yopk Times, January 17, 1969, "Philippines Facing a Time of Austeri ty . " This· article finds causal relations among economic disorder,alleged oligarchic rule, and violence and corruption.
-2-
negligence or nonsense, is to admit a serious disabilityin our capacity to order our relations with other countries, notably those which have gained independence· sinceWorld War II. After aU if we cannot hold the confidence~
the friendship~ and respect of a people with whom we havebeen intimate what can be expected with regards to othernations in Asia With which we have had little or no historic connection.
Certainly, the Philippines I bad image causes difficulties for the
COtmtry. These unfavorable evaluations and perceptions are therefore
important to Filipinos and to others concemed with Philippine affairs.
The important questions are:
(1) Are the evaluations correct?
(2) What infonnation do we use in making evaluations of a
nation's political and economic development?
(3) Can evaluations be improved, leading to better po1icy?2
Our particular aim in this study is to see to what extent broad,
quantitative analysis of the Philippine social system can help answer
these questions. We shall try to explain the infonnation structure out
of which current beliefs and conclusions were generated, and to explore
alternative explanations and interpretations.
Social scientists have for some time addressed the problem of
social and economic change in the less-developed countries (LOCs).
Economists have produced an extensive literature on the economic re
quirements for development. Political scientists argue about the pro
cess of political deve1opnent, the evolution to a JOOdern stable polity,
and the particular role of democ~atic institutions. And sociologists
lSenator M. Mansfield, "A Pacific Perspective," Alfred M. Landon.Lecture Series, Kansas State University, Manhattan, Kansas, March 10,1969. (Our italics.)
2"AID decisions in individual cOtmtries are based on a wide rangeof COlmtry infonnation, analyses, and judgments of country specialists.The decisiomnakers pay particular attention to change in cotmtry ciro.IJIStances from year to year." A. M. Strout, "AID Perfonnance, Selfhelp, and Need," USAID, Policy Planning and Coordination (Draft) (ca.1968) • We have to ask about the relevance of the infonnation flow froma cOtmtry to AID. It is conceivable that infonnation is so structuredthat neither the COlDltry nor AID can attain its objectives.

-3-
discuss the sociology of modernization. AU social scientists seem to
believe that as change occurs there is or will be extensive interaction
am:mg the various parts of a social system. Yet, the number of inter
disciplinary propositions the social scientist can deliver with some
confidence is very small. 1 Since the mnnber is small the operational
guidance the social sciences can provide to leaders involved in "engi
neering" change is extremely limited. Because operational guidance is
so limited, the risks and uncertainties associated with the outcomes of
"imovative" behavior may simply prevent imovation.
The perspective of this study differs from that usually found in
studies of political and economic development. Usually, the charac
teristics of a socio-economic system are described from the "outside."
For example, the process of economic development· is seen as one of the
acctnnUlation of capital, the upgrading of the labor force, and tech
nological change. Although decisionmakers influence all of these fac
tors, they themselves stand in the wings. It is our intention to cast
this study of the Philippines in terms of the nen who make decisions.
What do they know? How do they know? What could they know? What
constraints circumscribe their decisions?
In a developing society it is often literally true that decision
makers have little knowledge .about events beyond the capital. In
economic matters the decisionmaker is often restricted to aggregate
knowledge generated by his national income accounts. Thus he is forced
to address economic problems on an aggregate level with a predetennined
structure of information, perhaps unrelated to the specific problem
demanding solution. Even events affecting the elected official
directly -- such as trends in voter attitudes -- are known primarily
IDrawing on cpos8-nationaZ data the links between politics andeconomics appear to be weak. See Irma Adelman and C. T. Morris, "AnEconometric Model of Development," Amepican Economic Review, Vol. 58,No.5, Pt. 1, December 1968, pp. 1184-1228; or Rudolph Rtnnmel, "Indicators of Cross-national and International Patterns," AmePican PoliticalScience Review, Vol. 63, March 1969, pp. 127-147.
-4-
on an anecdotal, intuitive basis. Political contact is often limited
because of poor transportation and coIIllIILUlication. PCMer ''brokers'' may
be the only source of infonnation, because the decisionmaker does not
know how to create alternative sources of infonnation or because they
are too costly.
We shall argue in subsequent chapters that both domestic and. for
eign perceptions of the Philippines and its problems have their roots
in poor and often distorted infonnation. For example, many visiting
scholars and journalists have seen an impending, even imninent revolu
tion in the Philippines. The evidence for such views is usually intui
tive. Because of the critical policy implications, the evidence bears
close examination. In our CMIl survey of attitudes about the existing
political structure Filipinos give ambiguous signals. 1 They speak of
the dishonesty of politicians and of graft and corruption. At the same
time, however, they are optimistic that Ufe will improve in the future
and are proud of Philippine democracy. This pride in democracy and
optimism about the future suggest that it would probably be difficult
to organize and carry out a revolution. Z Yet, the rhetorical behavior
of Philippine politicians and the reporting in the Philippine press
tend to dominate the perceptions of an observer depending on intuition
and lead him to conclude - - probably erroneously - - that the Philippines
is headed for disaster.
Those who see the Philippines threatened by revolution or economic
stagnation have favorite programs to alleviate the conditions they
perceive as dangerous. These programs range from extensive land refonn
to massive family planning programs. In turn the continual inability
or perceived unwillingness of the Philippines to implement the programs
becomes the hallmark of the nation's "crisis."
IThis survey was conducted in January and February 1969, with thepennission of the Philippine Government. The full questionnaire isreproduced in Appendix A.
ZIn a later chapter we will explore the dissidence which has longbeen a characteristic of some areas in the Philippines.
-5-
But we would argue that continuous heated proclamations of crisis
obscure IOOre than they reveal. In the highly political environment of
Philippine decisionmakers - - bureaucrats as well as congressmen - - abil
ity to concentrate on programs, budgets, and perfonnance is very limited.
Proclamations of general crisis use Up time, a scarce resource, and
draw attention to the wrong problems.
One of the basic themes of our analysis is that Philippine deci
sionmaker8 cannot successfully pursue their social and economic objec
tives without a more sYBtematic understanding of their own environment.
Neither can the friends, critics, and allies of the Philippines have
sound bases for their perceptions or policies without more rigorous
attention to infonnation about the Philippines and the ways in which
infonnation is generated, presented, and analyzed.
Chapter 2 describes the overall structure of the Philippine social
system, the context in which perceptions and attitudes are fonned. What
is it that we mean when we talk about the Philippine nation? It is
a hallmark of LDCs that they contain ethnic, linguistic, political,
and economic cleavages. Often their development depends more on heal
ing these cleavages than it does upon the accumulation of capital or
the improvement of the labor force. 1 Before we can begin to talk sen
sibly about the development or lack of development of the Philippines,
we need a better understanding of the structure of the cmmtry and its
historical evolution. It is customary to begin the analysis of a coun
try's structure with a historical and geographical overview. Since
the basic descriptive work has been done, we shall not follow this
procedure, but attempt to slDIll1larize quantitatively the pattern ofconstants and variables during the last thirty years. 2
Iphi1ippine ethnic cleavages do not erupt into violence althoughawareness of these cleavages is pervasive. They definitely affectthe politics of the country (see Chapter 4).
. 2Por the most recent geography of the Philippines see J. Spencer,The Philippine Island World, University of California Press, Berkeley,1967.
-6-
The next chapter considers the attitudes of Filipinos toward
their ~ system; these attitudes are central because the process of
social change involves the changing perceptions of individuals and
officials. Here we shall discuss the attitudes of common people,
of bureaucrats, and of the Congress. If the Filipino is "fed up"
with the system or with life, it should show in his stated attitudes.
We shall present what the people say are their major problems and
needs .
With this context established we shall then proceed to an analysis
of Philippine politics. It is another of our basic themes that the
economic development of the Philippines cannot be understood without
a thorough understanding of the political system. Nearly all previous
economic analyses have simply applied standard types of analyses to
the Philippines and have drawn conclusions about the economy without
considering that the allocation of resources is heavily dependent on
what is politically rational. Economists have not squarely faced the
fact that in many LOCs the people may not care very IlUCh about growth,
and politicians may be willing to trade growth for power. Thus as
the economist reads the history of the Philippines over the last
twenty years or so, he sees a continual reluctance to adopt "correct"
economic policy. But this reluctance is firmly rooted in the politi
cians' desire to win elections, in the constraints bounding the actions
of officials, and in the uncertainties of command and control of the
economy.
Even with politically motivated economic behavior the economy may
have delivered a "better" perfonnance than cOl1lllonly believed. On the
other hand, if the Philippines is going to achieve very high, long-term
steady growth, political knowledge and voter attitudes will have to
change. Politicians are vel)' responsive to voter demands. But voters
are not strongly demanding growth-promoting policies.
After our analysis of politics we consider the many crises alleged
to afflict the economy. Many allegations of crisis can be traced to
bad analysis of available information. Others have their roots in the

-7-
economic consequences of Philippine politics. We shall take pains to
show why an tmeven, lurching kind of development is characteristic of
the Philippine economy. Having traced the aggregate development of the
economy, we shall then consider its changing structure. It has been
argued that the emergence of specific economic interests in a new nation
is a necessary condition for program-oriented po1itics. 1 We wish to
explore whether we can expect specific economic interest groups to emerge
as a result of the economic development of the COtmtry. Do the tmem
ployed behave as an interest group? Do workers in the emerging "modern"
sector consider themselves an interest group? . I-IcM do these groups view
the country's political and economic development?
In O1apter 6 we shall consider the relation between development and
crime. It has been argued that there is a major national breakdown in
law and order. We want to argue that this perception is again a func
tion of failure to understand the structure of infonnation about crime
and the spatial distribution of crime. Just as the economy of the
Philippines cannot be tmderstood as an aggregate, the "peace and order"
problem cannot be tmderstood as an aggregate .. Concern about crime var
ies across the country, and crime itself is regional and has its roots
in different causes. In particular, we want to see if some of the
high crime rates can be traced to unforeseen consequences of economic
policy and the structure and incentives of the political system.
In O1apter 7 we turn to the problem of dissidence and its relation
to social and economic factors. The Philippines has a long history of
organized dissidence. The political system has managed to control
violent dissent with the single major exception of the Hukba1ahap (HMB)
movement. 2 The view of the Philippines as ripe for revolution rests
in part on the revival of the HMB movement in Central Luzon. The
standard interpretation of this revival is that it reflects deep
1See, for example, James Sterling YO\.mg, The Washington Community,1800-1828, Columbia University Press, New York, 1966.
2The Philippine government suppressed a MUslim rebellion in theearly 1950s.
-8-
social unrest among the landless poor. The standard interpretation
appears to be incorrect.
In the last chapter we provide some prescriptions for the general
conduct of policy by Philippine decisionmakers. These prescriptions
are aimed at a clearer articulation of information and decisions and
at improving general perceptions of the country. Without more detailed
perceptions it is easy for critics of the Philippines and other LDCs
to see diabolical plots where there is only ignorance of risks, see
the machinations of a power elite where there is only confusion. 1
lSee Harold J. Wilensky, Organizational, InteUigenae, Basic Books,Inc., New York, 1967.
-9-
O1apter 2
1HE LAST lliREE DECADES: A QUANTITATIVE HISIDRICAL ANALYSIS
Introduction
IN THIS CHAPTER we analyze the spatial organization of the Philippine
nation and its social systems. How has the spatial distribution of
economic and political activity changed? Is the country relatively
homogeneous and integrated? Does it divide along "modern" and "tradi
tional" lines, or along more complicated lines? How closely related are
processes of social, political, and economic change?l In the Philip
pine context we need to examine carefully whether social, economic,
and political change really are strongly interdependent. 2
This chapter also provides some of the historical setting of
the contemporary Philippines. In developing countries it is not
easy to jettison the past; the structure and values of the past
constrain the present. A full understanding of the contemporary
economy and polity requires some knowledge of these past structures
and values. 3
l"Th.e modernizing society is viewed as comprising an emergingspatial system, a geographical community functionally organized to promote the interrelated processes of social, economic and politicalchange," E. J. Soja, The Geography of Modernization~ Syracuse University Press, Syracuse, 1968, p. 3.
2The spatial organization of a country directly affects the peoplein it. In later chapters we shall try to rel~te the spatial organization of the Philippines to the widely varying political and socialattitudes of its population.
3Por a discussion of this point in a different context see O1arlesWolf, Jr., ''The Present Value of the Past," P-4067, The Rand Corporation,April 1969.

-10-
The analysis of historical change, variation, and complexity are
ordinarily left to the historian and historical techniques. But one
of the objectives we listed in the Introduction was to apply broad
quantitative analysis to the social system. We have therefore chosen
one alternative to a qualitative historical and geographic review.
We use factor analysis -- a broad scale data description technique
to connect historic and geographic variables. Factor analysis provides
a compact summary of large masses of data, and it does so in reproduc
ible fom. An appreciation of a few basic facts about the Philippines
should aid greatly in interpreting and understanding the factor analysis.
An examination of any geography or economic atlas of the Philippines
suggests that the country is not homogeneous. 1 Much of the country is
still agricultural. Sugar, copra, logs, pineapple, and abaca are im
portant exports. Rice and corn both serve as staples. Some areas
are export-oriented, and others produce for tile domestic market. There
is a highly varied industrial sector; some parts are highly sophisti
cated, and other parts are relatively backward.
Languages and ethnic groups are similarly varied. There are
three major religions and at least ten major language groups scattered
across the do;zen largest islands. And there are strong differences
even within particular ethnic and religious groups. For example, our
survey data indicate that Muslims who speak the Tausog dialect hold
quite different values from Muslims who speak the Magindanao dialect.
Figure 1 shows the distribution of language groups by province.
The two largest language groups are the Cebuanos and the Tagalogs.
The Tagalogs are concentrated around Manila and have not migrated to
any great extent. The Cebuanos live in the Central Visayas. However,
.large numbers of them have migrated to northern Mindanao and to Davao
province in southern Mindanao.
Four other important ethnic and language groups live on Luzon -
the Ilocanos in the North, the Pangas inansand Pampangans in the center,
and the Bicols in the extreme South. The Ilocanos have been the most
lSee J.Spencer, The Philippine I8land World.
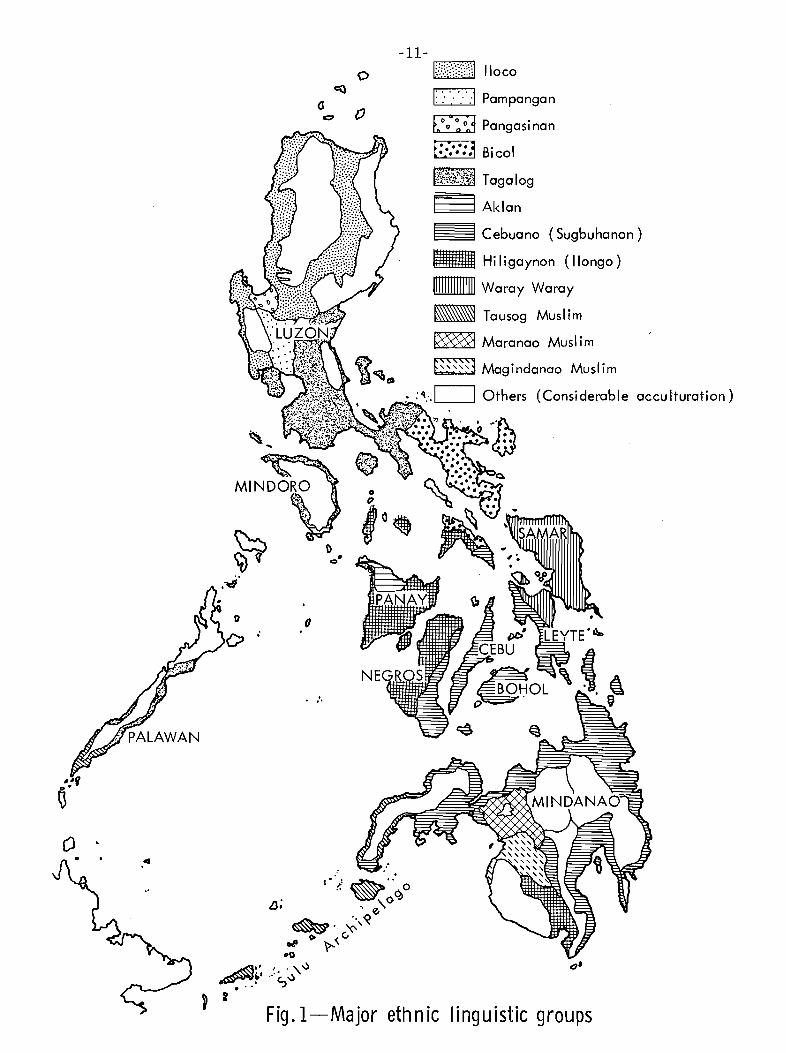
Fig. I-Major ethnic linguistic groups
(Consi derable accu Ituration)
ii;.i-:~~;i;,~;r,,~'.f- T I,.(:",~../),. aga og
~Aklan
~ Cebuano (Sugbuhanon)
.. Hi Ii gaynon (llongo)
lITIII[[[[[ID Waray Waray
~ Tausog Muslim
~ Maranao Muslim
~ Magindanao Muslim
-11-I~~)?{{;I Iloco
I::,', ':':1 Pampangan
~ Pangasi nan
o
~ {)
0 •
....ii'
0 0(/
o
-12-
IOObile and are fOl.md with some frequency in the Mindanao frontier area.
In the Visayas the Ilongos are found on Panay and Western Negros and
the Waray on Samar and northeastern Leyte.
Eighty-four percent of the population are Catholics. About 5 per
cent are Muslims. The Muslims are concentrated in the South, largely on
Mindanao and the Sulu archipelago. There are three major Muslim groups:
The Magindanao in northern Cotabato, the Maranao in southern Lanao, and
the Tausog-Samal groups in Sulu and on the Zarrboanga Peninsula.
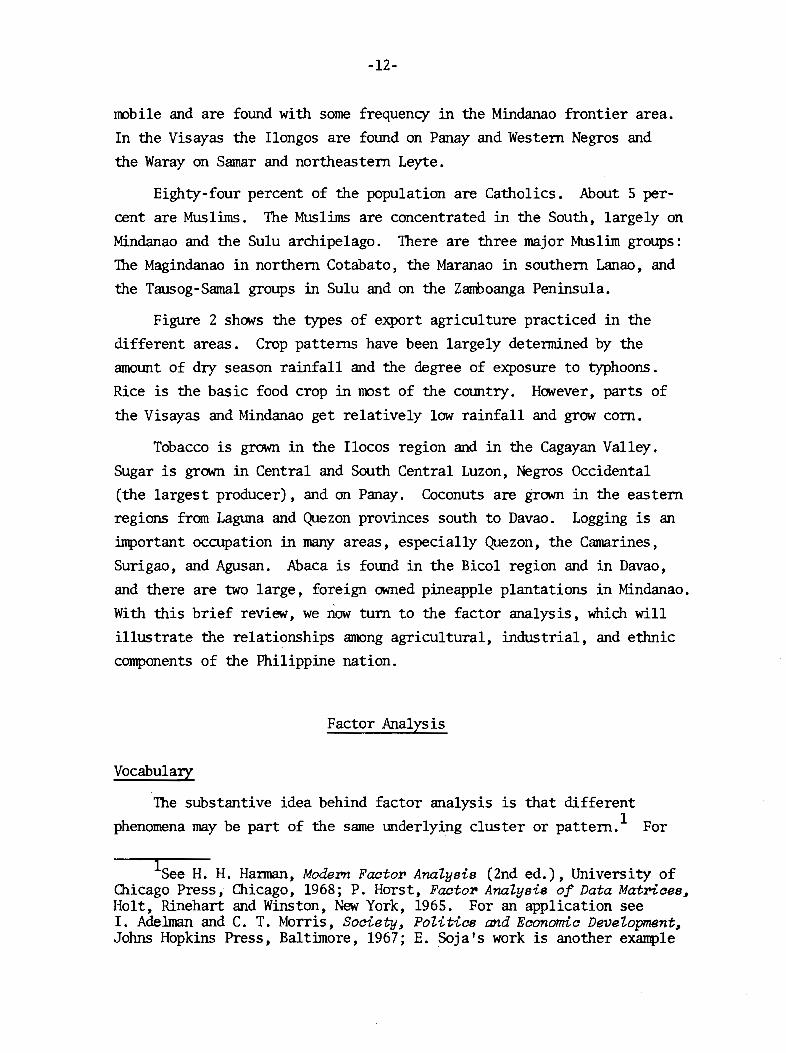
Figure 2 shows the types of export agriculture practiced in the
different areas. Crop patterns have been largely determined by the
amount of dry season rainfall and the degree of exposure to typhoons.
Rice is the basic food crop in most of the country. However, parts of
the Visayas and Mindanao get relatively low rainfall and grow corn.
Tobacco is grown in the Ilocos region and in the Cagayan Valley.
Sugar is grown in Central and South Central Luzon, Negros Occidental
(the largest producer), and on Panay. Coconuts are grown in the eastern
regions from Laguna and Quezon provinces south to Davao. Logging is an
important occupation in many areas, especially Quezon, the Camarines,
Surigao, and Agusan. Abaca is found in the Bicol region and in Davao,
and there are two large, foreign owned pineapple plantations in Mindanao.
With this brief review, we now turn to the factor analysis, which will
illustrate the relationships among agricultural, industrial, and ethnic
components of the Philippine nation.
Factor Analysis
VocabulaIY
The substantive idea behind factor analysis is that different
phenomena may be part of the same underlying cluster or pattern. 1 For
ISee H. H. Hannan, Modem Facto!' Analysis (2nd ed.), University ofChicago Press, Chicago, 1968; P. Horst, Facto!' Analysis of Data Mat1'ioes~
Holt, Rinehart and Winston, New York, 1965. For an application see1. Adelman and C. T. Morris, Society~ PoUtic8 and Economic Development~
Jolms Hopkins Press, Baltimore, 1967; E. Soja's work is another exanq:>le
-13-
(), .. ta_IS 1\:"&Il101
II
Abaca
Pineapple. & Banana
~'-'"---- Abaca
SEA
PHILIPPINE
SEA
SEA
Code:Coconutrf'
D.
Sugar
S U L U
SEA
CHI N A
SOU T H
Fig.2-Philippine export agriculture

-14-
example, in trying to detennine individual intelligence, we may ask a
person to respond to several hundred test questions or several batteries
of tests. Do we need to analyze each question or each test to deter
mine intelligence? Or can the problem be made smaller? It can if we
assume that the responses on our sevetal hundred questions or battery
of tests may be the manifestation of an tmderlying "intelligence"
factor. Similarly, as we try to grasp economic development, we have
come to mean not just increases in GNP per capita, but a set of poli
tical and' social dimensions we believe are related: urbanization,
education, communication, emergence of the modern labor force, and so
on. The list could be extended indefinitely. Without some fonnal
device for reducing the number of variables at hand, we cannot readily
grasp the nature of complicated processes. Factor analysis is one
such fonnal device. It is a systematic way of reducing the dimensions
of a problem and of revealing clusters of associated variables.
The technical vocabulary of factor analysis is tmfamiliar but not
difficult. With a few definitions the results of a factor analysis can
be read quickly by laymen and policymakers. The results are usually
displayed in table form with such labels as factors, loadings, and com
nnmalities. By a factop is meant an underlying pattern or association
among a set of variables. By a factor loading we lrean essentially the
aDPpe lation between a variable and a factor. For example, urbanization
might load (correlate) +.9 on a "developnent" factor, suggesting that
urbanization and development are nutually associated. By a conmunality
we mean the stun of the squares of the factor loadings. This sum shows
the total contribution of the factors operating together in ,'explaining"
the standardized variance of a given variable. It is analogous to the
multiple correlation coefficient in regression analysis.
Factor analyses are usually accomplished by two passes at the data.
In the first pass a set of independent or orthogonal factors are extracted
that maximize the total explained variance in the data. The factors
but it poses some conceptual problems since, for example, the variablesin his factor analysis are not normalized for the differing size of provincial populations. His "development" factor can be interpreted as a"size" factor.

-15-
can be and are given a vector representation. The factors in this first
pass are sometimes called the principal- components. 1 In the second pass
the principal components (vectors) are rotated so that they associate
as closely as possible with single clusters of variables. There are
many ways to rotate the principal components, but we restrict ourselves
here to orthogonal- rotations, meaning that as the factors are rotated
we retain the convention that the factors themselves remain uncorrelated. 2
A factor score is the ranking of cases or observations on all the
variables entering a pattern or factor. Thus, if high GNP per capita,
urbanization, comrrnmication, and education were part of a general develop
ment factor, then the United States would score high, Japan might be
in the middle, and Nepal might be near the bottom. The factor scores
pennit us to make rankings of geographic units such as provinces, states
or nations using aU the available information in a systematic way.
Because we wished to analyze historical change in the geographic
distribution of economic and political activity and of dissidence, we
took provincial data for three different census years, 1938, 1949,
1960. 3 Sometimes, data were available only for other years, and we
had to compromise. In addition, we added as many data as were available
lIf the principal axis method of extraction is used.
2There is ITRlch controversy over this convention. Some analystsprefer oblique rotations pennitting factors to be correlated. The groundis that if factors say something about the real world they should becorrelated. It is often difficult to interpret oblique rotations, however, since guides such as factor loadings are missing. Also, if theoblique factors are allowed to be highly correlated, they suffer furtherloss of interpretability. In applying oblique rotations to our datawe found that quite arbitrary decisions were necessary to retain understanding. The outcomes of many of our oblique rotations were quitesimilar to orthogonal ones.
3The province is the smallest geographic unit for which most typesof data are available. Thus provinces as units give us the maximumamount of fine-grained detail. Moreover, Philippine provinces areoften homogeneous with respect to ethnic and language groups. In acountry where ethnic heritage is' important, provinces seemed a desirabletmit on a priori grounds. But provinces are too large for many purposes. For example, in the factor analysis below, Camarines Norte islabeled ''Modern'' when most of it is not. It a.ppears as a IOOdern province because of highly concentrated mining activity before the war.
-16-
1after 1960, some as recent as 1968. The three years taken together give
us some idea of change and constancy in the Philippine social· system;. .
Appendix B describes the data we included in the factor analysis.
Therefore we shall not survey them in detail here. We did include
data representing spatial trends with respect to politics, economics,
crime, and dissidence. Sometimes a single variable seemed to convey
.all the prbvincia1 variation we knew about; for example, from a variety
of sources, we compiled a provincial "dissidence index." In other cases,
especially ineconomics,we included a number of separate items, since
no, single one can characterize the development of a province. 2 So we
Included variables relating to urbanization, !he size of the modern
labor force, the number of commercial establishments, some data on the
weather -- which helps determine crop patterns -- and on the ethnic
type of the population.
A Summary oLSpatia1 Pat,terns
We had expected to find that economic and social change would be
dose1y related, so that a small number of factors would explain varia
tion across provinces. However, the variables we defined to represent
various aspects of the social system load on separate factors indicating
statistical independence on a geographic or spatial basis. 3 There do
1Actua11y the Philippine government operates with very little current information. In economics the last full set of data are for 1961.The economic census of 1967 remains unreported at this writing. It ischaracteristic of the Philippines and perhaps other LDCsthat theyoperate with "old" infonnation. Furthermore, .reporting is biased towardthe presentation of highly aggregated data. See Chapter 5 for a fullerdiscussion. .
2According to Rummel: " ... the concept of economic development[for a nation] involves (among other things) GNP per capita, literacy,urbani zation, education, and cOJl1Immication ; it is a patternbecausethese characteristics are highly intercorrelated with each other." SeeRudolph Rurmne1, "Understanding Factor Analysis," Journal of ConflictResolution, 11, December 1967, pp. 444-48l.
. 3This does not preclude the existence of some complex linksbetween the sets of variables that are not captured by a simple lineartest.
-17-
not appear to be strong interconnections between economics and crime
or crime and politics or politics and the provincial economies. In
general we can state the following:
o The location and organization of development, dissidence,
agriculture, and population did not change greatly from 1938 to 1960.
The relative characteristics of a province in the 1960s are much whatthey were in 1938. 1
o The Philippines has two relatively developed areas. The first
of these, centered on Manila, is far larger and more developed than
the second arOlmd the Mindanao Sea and centered on Cebu.
o Growth in popUlation and commercial establishments has not
been centered in the most developed part of the country. With the ex
ception of Riza1 province itself, the high growth areas have been the
"frontiers." The frontier has moved from Northern Mindanao in theprewar era to Southern Mindanao since 1948.
o The distribution of dissidence has been relatively constant
over time. Diss idence occurs on the fringes of the mos t modern
sector and in the areas of high tenancy and high sugar. Pampanga
historically has served as the major site for such dissidence, but explanations differ why this should be so.2
o Crimes against property are very much centered in the developed
sector. Crimes against persons seem to be ethnic specific. Muslim
provinces have high reported violence rates.
o Politics is not strongly related to economic development. To
a limited extent the more developed areas do vote differently from the
rest of the country. However, the ethnic component appears to override
this difference.
o The agricultural structure of the country is quite diverse.
Several major crops are grown and a mnnber of these are important
1But see Chapter 5 for a discussion of changing regional patternssince 1960.
2See Chapter 7.
-18-
export crops. No single area of the country appears to have shOWIlcon
sistent agricultural prosperity or growth. Rather, Philippine crop
prices have fluctuated as internation~l prices of agricultural commod
ities changed (often in response to U.S. commercial policies).
o Government activities, as measured by public works expenditures,
appear to have responded to few of the characteristics above. ·Public
works variables over time are mainly correlated with each other, although
there is same tendency to allocate public works to low growth areas.
A Composite Factor Analysis -- 1938-1960
The first data matrix consists of 55 variables observed across
49 provinces. Data were limited to the 1938 and 1960 time periods.
Six factors account for 62 percent of the variance. Table 1 shows
the factor structure and the names assigned to the factors: Modern,
growth, tenancy, sugar, coconut, Cebuano politics, Ilocano politics.
The factor structure suggests that there are not strong interconnections
between politics and the provincial economies, since thepolitical
variables load on separate factors and seem related primarily to ethnic
blocs. However, robbery appears to be related to the provincial econo
miesjudging from factor loadings.
The modern sector is characterized by a modern labor force,
trrbanization, radios, crimes against property, and so on. But unem
ployment has only a moderate association with the modern developed
sector (loading of -.47). Figure 3 shows the plot of the province
scores on the modern factor. The ''modern'' sector runs from Zambales
around Manila to Batangas. A second semi -modern enclave borders the
Mindanao Sea. This area is served by the Philippines' second largest
city, Cebu. Iloilo and Albay fom secondary distribu~ion centers and
some of the mining areas show up with a relatively high' ,"modern" score.
Northern Luzon and Southern Mindanao are the areas with the least
modern activity along with Negros and Samar-Leyte.
The factor distinguishing modern from traditional sectors does
not correlate with growth rate variables. These load on another
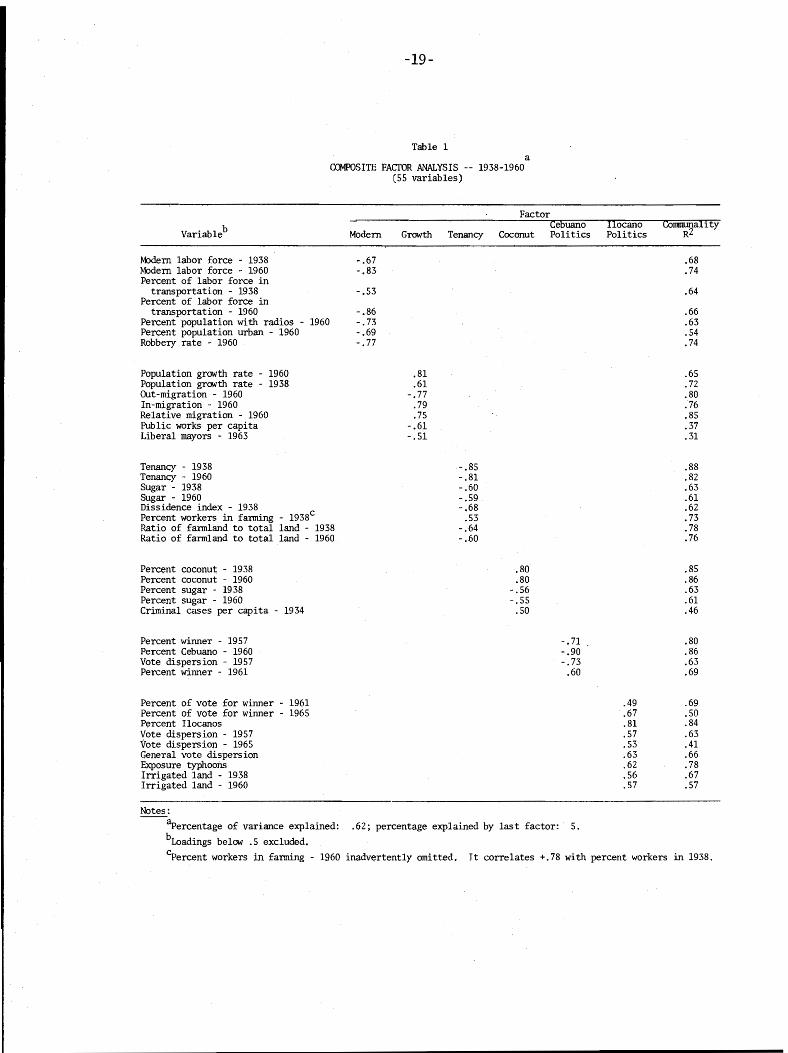
-19-
Table 1a
Ca.roSlTE FACTOR ANALYSIS 1938-1960(55 variables)
Factor
Variab1eb
MJdern labor force - 1938Modern labor force - 1960Percent of ·labor force in
transportation - 1938Percent of labor force in
transportation - 1960Percent population with radios - 1960Percent population urban - 1960Robbery rate - 1960
Modern
- .67-.83
-.53
-.86-.73- .69-.77
Cebuano Ilocano CommunalItyGrowth Tenancy Coconut Politics Politics R2
.68
.74
.64
.66
.63
.54
.74
Population growth rate - 1960Population growth rate - 1938Out-migration - 1960In-migration - 1960Relative migration - 1960Public works per capitaLiberal mayors - 1963
Tenancy - 1938Tenancy - 1960Sugar - 1938Sugar - 1960Dissidence index - 1938Percent workers in farming - 1938c
Ratio of farmland to total land - 1938Ratio of farmland to total land - 1960
Perc~nt coconut - 1938Percent coconut - 1960Percent sugar - 1938Percent sugar - 1960Criminal cases per capita - 1934
Percent winner - 1957Percent Cebuano - 1960Vote dispersion - 1957Percent winner - 1961
Percent of vote for winner - 1961Percent of vote for winner - 1965Percent I1ocanosVote dispersion - 1957Vote dispersion - 1965General vote dispersionExposure typhoonsIrrigated land - 1938Irrigated land - 1960
.81
.61-.77
.79
.75-.61-.51
-.85-.81-.60-.59- .68
.53-.64-.,60
.80
.80-.56-.55
.50
-.71-.90-.73
.60
.49
.67
.81
.57
.53
.63
.62
.56
.57
.65
.72
.80
.76
.85
.37
.31
.88
.82
.63
.61
.62
.73
.78
.76
.85
.86
.63
.61
.46
.80
.86
.63
.69
.69
.50
.84
.63
.41
.66
.78
.67
.57
Notes:
apercentage of variance explained: .62; percentage explained by last factor: 5.
bLoadings below .5 excluded.
Cpercent workers in farming - 1960 inadvertently omitted. It correlates +.78 with percent workers in 1938.

~20"
()......;;...
Factor Scores
EPHILIPPIN
SEA
SEAS U L U
.'
..~.~ Mdern factor scores.~":":.~ I ~ Fig.3- a
U T H
SEA
S 0
11 I N AC
-21-
factor we have called the "growth" factor. Population growth rates
load on this factor along with establishment growth rates and migration
rates. The road density indexes and ratio of cultivated area to total
land load on the growth factor, but negatively (- .47 and - .40 respec
tively). The growth factor tells us the most rapidly growing areas in
the Philippines over the last 25 years have been areas with a high per
centage of uncultivated land and a low road dens i ty .1 This appears to
be a "frontier" type of growth in contrast to the traditional model
of an urbanizing, industrial sector drawing people from the fanu. 2
The in-migration, high growth areas are the Cagayan valley in Northern
Luzon, Quezon and Mindanao provinces, and Mindanao. Almost all of the
Visayas and Ilocos have low relative growth or negative growth. In the
"developed areas," only Rizal, Bataan; and Zambales are high growth areas;
and Bataan and Zambales are on the extreme fringes of the d~veloped
areas. Figure 4 is a map of the factor scores on the "growth" factor.
Most of the agricultural variables load on two factors. 3 One
factor we believe represents a "coconut" phenomenon. In addition to
the percent of land in coconut, variables with high loadings include,
of course, sugar negatively, crime in 1934, w.employment in 1938. The
depression hit the coconut industry very hard. The price of copra in
1938 was only 36 percent of what it was in 1929. Sugar prices were
supported during the depression because of U.S. quota procedures. 4
After the war the relative price of sugar, which was fixed in dollars
lGrowth here does not mean the economis t 's growth in total provincial output per capita, although growth in fam output per capita loadson the growth factor.
2See John C. H. Fei, and Gustave Ranis, Development of the LaborSurplus: Theory and Poliay~ Richard D. IIWin, Homewood, 1961, for thefullest statement of this model.
3The agricultural sector is not well represented by the variableswe included. It is considerably more diverse than sugar and coconuts,although these are the two mos t important export crops.
4In 1929 a picul of sugar was worth 55 percent of the value of100 kg. of copra. In 1938 the picul of 'sugar was worth 115 percent ofthe value of 100 kg. of copra. See George Hicks, The Philippine CoconutIndustry: Growth and Change~ 1900-1965; National Planning Association,Washington, June 1967, Appendix p. 31.
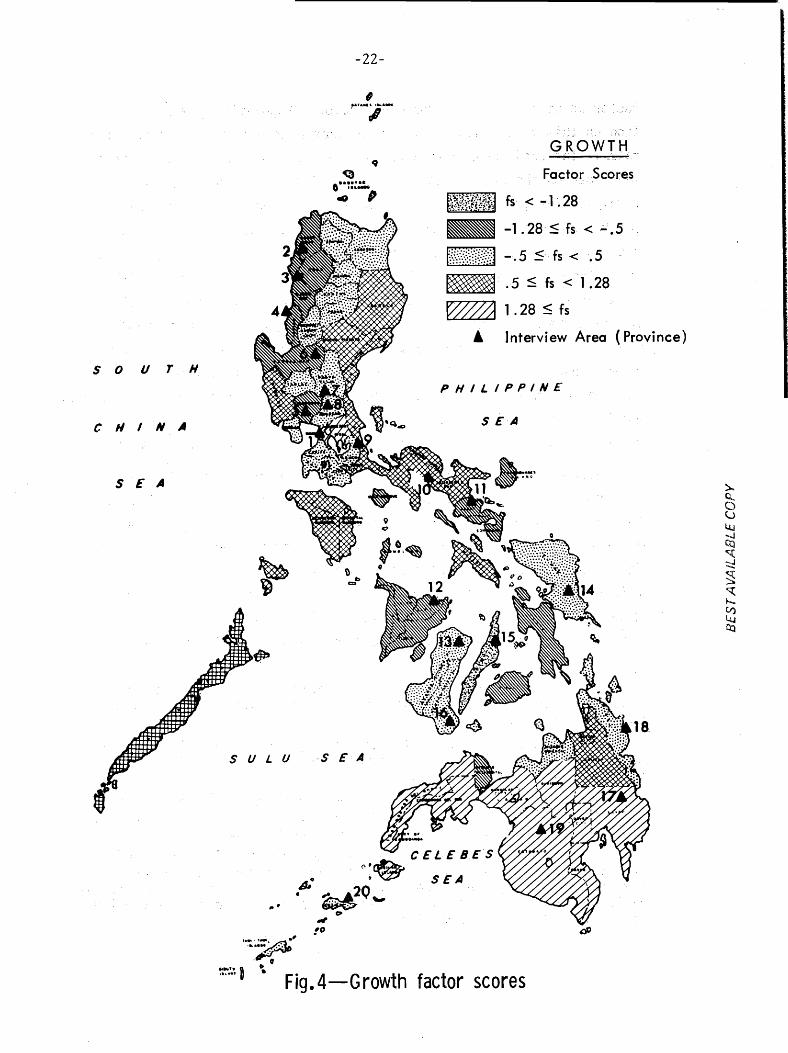
-22-
GROWTH"Factor Scores
fs < -1.28
-1.28~fs<-.5
1 . 28 ~ fs
lnterview Area (Province)
SEA
PHILIPPINE
,S E A
CELEBES
",' ":~ SEA• ~2Q~,.. ~
~
SU L U
SEA
C II I N A
SOU r H
.... - ,.... .',....~,'{
~~:..~» \ Fig. 4-G rowth factor scores
-23-
tmder the quota system, was low. Thus, relative value of the two major
export crops changed sharply. This may have been reflected in general
social conditions.
In the 1930s some coconut areas were areas of great tmrest and,
from the available data, had very high crime rates. After the war
these areas were relatively stable and low in crime.
The sugar variables also load on the tenancy factor, as do the
dissidence variables. The sugar areas prospered in 1938 but lost
ground relative to other farm areas from 1938 to 1948. The growth
of value of farm product from 1948 to 1960 was average in sugar areas.
The devaluation in 1960 should have changed this as the relative price
of sugar improved.
There appear to be two political factors, one relating to theCebuanos and the other to the Ilocanos .. These two groups are alleged
to be the most politically cohesive groups in the Philippines, especially
when their own candidates are running. In 1957 and 1960 when there was
a Cebuano candidate for President, percent of vote for winner loads on
areas with a high fraction of Cebuanos. Similarly, the percent for
winner in 1960 loads on Ilocanos, since Ilocanos voted heavily for
Macapagal (whose wife is an Ilocano). And in 1965 there is an Ilocano
candidate, so percent winner in 1965 loads on the Ilocano factor. The
vote dispersion indexes also load on the Ilocano factor, suggesting the
deviant nature of the Ilocano voter. 1 Examining the factor scores
on the two political factors, we find that Cebuano provinces score
high in Cebuano politics. Bohol'scores 2.48 and Cebu 2.86. And
Ilocano provinces score very high on Ilocano politics. 2 Ilocos Norte
scores 2.45; Ilocos Sur, 1.84; La Union, 2.42.
More data are, of course, available for 1960. In particular there
are more indexes for the modern sector. For example, we define accessto mass media as "mqdern," and we have a measure by province of the
IThe other variables that load on this factor are the physicalcharacteristics of the Ilocos -- high exposure to typhoons, and largefraction of irrigated land.
2See Chapter 4.
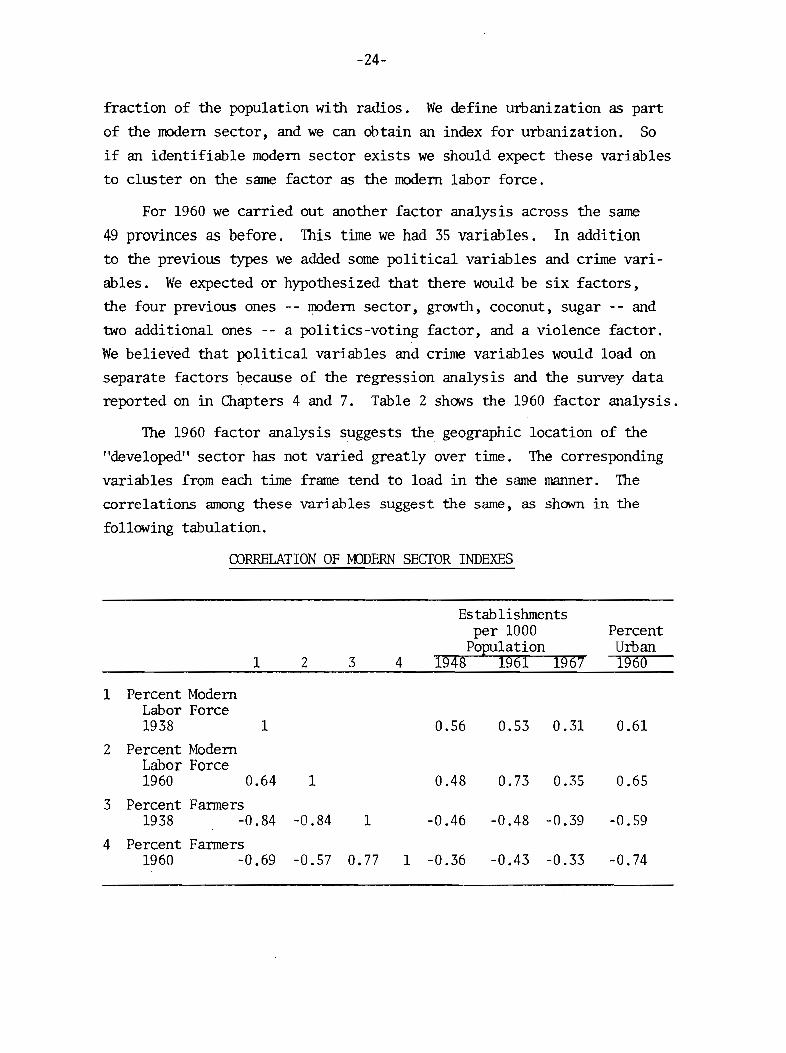
-24-
fraction of the population with radios. We define urbanization as part
of the modern sector, and we can obtain an index for urbanization. So
if an identifiable modern sector exists we shoUld eXPect these variables
to cluster on the same factor as the modern labor force.
For 1960 we carried out another factor analysis across the same
49 provinces as before. This time we had 35 variables. In addition
to the previous types we added some political variables and crime vari
abIes. We expected or hypothesized that there would be six factors,
the four previous ones - - modern sector, growth, coconut, sugar - - and
two additional ones -- a politics-voting factor, and a violence factor.
We believed that political variables and crime variables would load on
separate factors because of the regression analysis and the survey data
reported on in O1apters 4 and 7. Table 2 shows the 1960 factor analysis.
The 1960 factor analysis suggests the geographic location of the
"developed" sector has not varied greatly over time. The corresponding
variables from each time frame tend to load in the same manner. The
correlations among these variables suggest the same, as shCMIl in the
following tabulation.
CORRELATION OF KlDERN SECTOR INDEXES
Establishmentsper 1000 Percent
Population Urban1 2 3 4 1948 1961 1967 1960
1 Percent ModernLabor Force1938 1 0.56 0.53 0.31 0.61
2 Percent ModernLabor Force1960 0.64 1 0.48 0.73 0.35 0.65
3 Percent Farmers1938 -0.84 -0.84 1 -0.46 -0.48 -0.39 -0.59
4 Percent Farmers1960 -0.69 -0.57 0.77 1 -0.36 -0.43 -0.33 -0.74
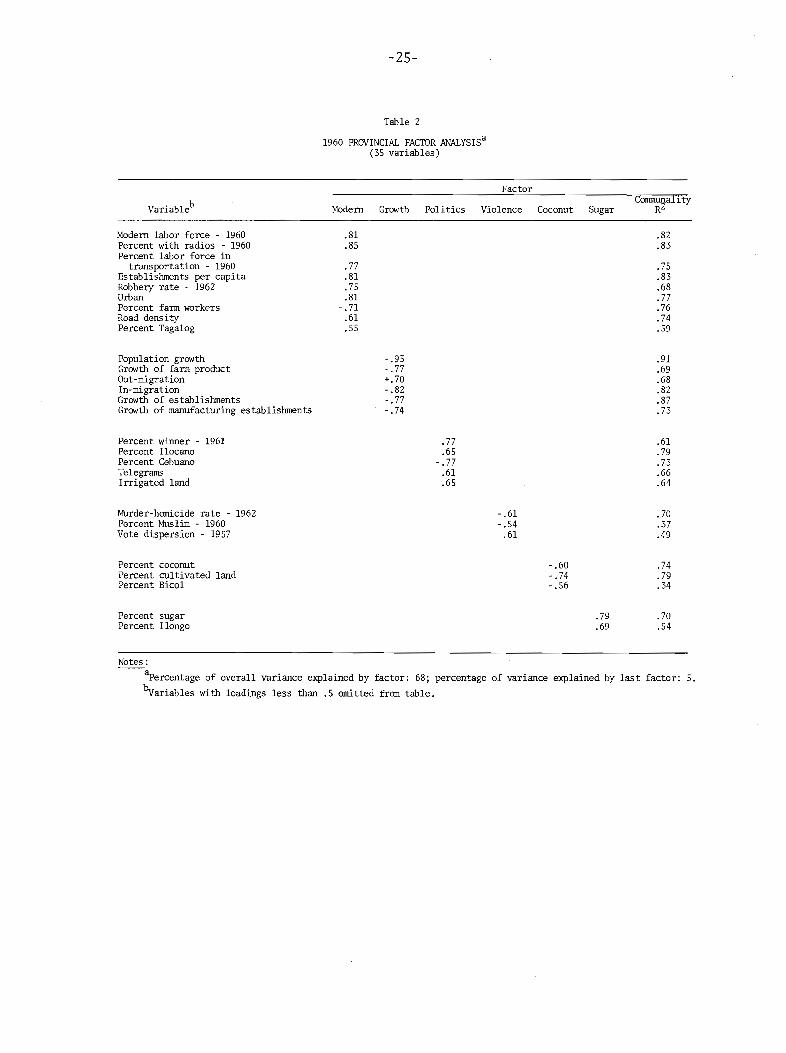
-25-
Variableb
Modern labor force - 1960Percent with radios - 1960Percent labor force in
transportation - 1960Establishments per capitaRobbery rate - 1962UrbanPercent farm workersRoad dens i tyPercent Tagalog
Population growthGrowth of farm productOut-migrationIn-migrationGrowth of establishmentsGrowth of manufacturing establishments
Percent winner - 1961Percent IlocanoPercent CebuanoTelegramsIrrigated land
Murder-homicide rate - 1962Percent Muslim - 1960Vote dispersion - 1957
Percent coconutPercent cultivated landPercent Bicol
Percent sugarPercent Ilongo
Table 2
1960 PROVINCIAL FACTOR ANALYSISa(35 variables)
FactorConnmmahty
Modern Growth Politics Violence Coconut Sugar R2
.81 .82
.85 .83
.77 .75
.81 .83
.75 .68
.81 .77-.71 .76
.61 .74
.55 .59
- .93 .91-.77 .69+.70 .68-.82 .82-.77 .87-.74 .73
.77 .61
.65 .79-.77 .73-.61 .66
.65 .64
- .61 .70-.54 .37
.61 .49
-.60 .74-.74 .79-.56 .34
.79 .70
.69 .54
Notes:
apercentage of overall variance explained by factor: 68; percentage of variance explained by last factor: 5.
hvariables with loadings less than .5 omitted from table.
-26-
The same areas have a high fraction of fanners in 1938 and in 1960.
And the modern labor force is concentrated in the same provinces in 1938
and in 1960. 1 Establishments per thousand are different from these two
indexes. But the correlation is still fairly strong. For example,
establishments per 1000 in 1938 correlate .70 with establishments per
capita in 1960 and 1960 establishments correlate .52 with 1967
establishments. 2
It is nonetheless infonnative to look at some of the provinces
that have been changing relative location. Figure 5 shows two develop
ment axes. Two forty-five degree lines at one standard deviation from
the means botmd the geographical region defined as indicating no rela
tive change. Provinces above and to the left of these bounds have
declined in their relative development position and those to the right
and below have gained in the same sense. Camarines Norte is the pri
mary loser. This appears to be another case of changing international
price structure. The high score in 1938 was largely due to gold
mining, which declined after the war.
The Philippines in 1938 and 1960
Table 3 shows a factor structure for 1938 for 14 variables selected
to represent our major areas of inquiry -- economics, politics, crime,
arid dissidence. The data are mainly taken from the 1938 census. 3 We
have identified four factors that account for 68 percent of the total
varian!:e in the data matrix: (1) modern sector, (2) high growth,
(3) tenancy-sugar, (4) coconut.
Only a limited number of variables represent economic development
and growth in 1938. However, according to the usual concepts of
development, modern economic activity means activity performed with
IBut not in 1968. See Chapter 5.
2Establishments per capita and especially changes in this indexcorrelate with the developed modern sector and with a growing frontier.
3Por 1938 we are obviously short of political data, the Republichaving been founded in 1946. Data on crime about this time could befound only in the 1934 Governor General' 5 report.

1960 modern6543
1938 modern ~41. Abra 26. Camarines Norte2. IlocO! Norte 27. CamarinesSur3. Ilocos Sur 28. Masbate4. La Union 29. Sorsogon5. Mt. Province 30. Antique6. Batanes 31. Capiz
3 7. Cagayan 32. Iloilo26 8. Isabela 33. Negros Occidental
9. Nueva Vizcaya 34. Romblon10. Batun 35. Bohol11. Bulacan 36. Cebu12. Nueva Ecija 37. Leyte13. Pampanga 38. Negros Oriental
2 14. panroasman 39. Samar15. Tar ac 40. Agusan16. Zambales 41. Bukidnon17. Batangas 42. Lanao18. Cavite 43. Misamis Occidental19. Laguna 44. Misamis Oriental20. Marinduque 45. Surigao I,11 21. Mindoro 46. Cotabato N.....
18 22. Palawan 47. Davao I
• 17 23. Quezon 48• Sulu24. Rizal 49. Zamboanga25. Albay
•41
-2
Fig. 5-Cross plot of modern factors for 1938 and 1960

-28-
Table 3
1938 PROVINCIAL FAcroR ANALYSISa
Variableb
Fisherman/farmers
MOdern labor forcea
MOdern HighSector Growth
-.80
+.90
Factor NameTenancy-Sugar Coconut
.80
.84Percent labor force in
transportationa +.53
Population growth
Percent of population <10
Dissidence
Tenancy
Sugar
Value of farm productsper capita
Coconut
Irrigated land
Farmland/total land
Unemployment
Crime cases per capita, 1934
-.87
-.72
~5l
-.86
-.76
-.74
-.75
-.73
-.54
-.64-.66
-.70
.31
.80
.74
.80
.78
.56
.77
.67
.67
.62
.63
.54
Notes:
~ercentage of overall variance explained by factors, 68; percentage of variance explained by last factor, 11.
bFor definitions of these factors see Appendix B. Factor loadingsbelow .5 omitted.

-29-
relatively large amounts of capital equipment and with some formal
organization. We use the fraction of workers engaged in such activity
by province as our index of modern economic activity. The modern labor
force and the labor force in transportation load positively on the
"modern" factor and, as should be expected, farmers negatively.
The measures of growth do not load on the ''modern'' factor, but
cluster together on a separate factor. In fact, growth was occurring
in the relatively unsettled parts of the Philippines. If we examine
the factor scores for 1938, the high growth provinces were Masbate,
Lanao Norte, Misamis Occidental, and Davao, provinces mainly in
Mindanao.
Figure 6 is a cross plot of the "growth rate" factors for 1938
and 1960. The relative gains and losses appear to be systematic and
explainable. Northern Mindanao is a region of slower growth. Southern
Mindanao is a region of relatively faster growth in 1960. As Northern
Mindanao filled up, growth shifted to the south. And other changes
occurred in the Ilocos region. Growth was still slow in 1960 but not
as slow as in 1938.
Basically, the separate factor analyses suggests much the samepattern as does the single composite one. The spatial organization
of economic and political activity has been relatively constant for
the past 25 years.
In the next five chapters we will explore in detail the political
and economic consequences of such an unchanging structure. In particular, we will examine patterns of behavior as related to development
and growth.
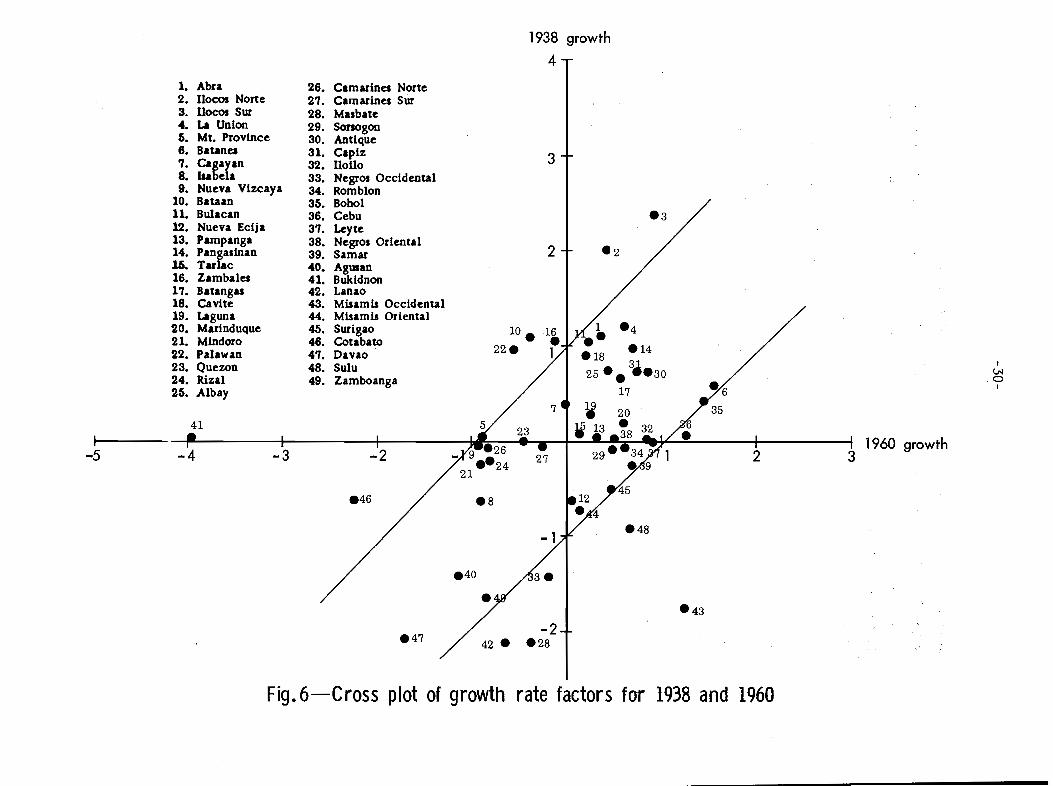
1938 growth
4
-242 e e28
1. Abra 26. Camarines Norte2. Ilocos Norte 27. Camarines Sur3. IlocosSur 28. Masbate4. La Union 29. SorsogOll6. Mt. Province 30. Antique6. Batanes 31. Capiz 3'7. cafayan 32. 1101108. lIa ela 33. Negros Occidental9. Nueva Vizcaya 34. Romblon
10. Balaan 36. Bobol11. Bulacan 36. Cebu e312. Nueva Ecija 37. Leyte13. Pampanga 38. Negros Oriental14. Panr:Sinan 39. Samar 2 -216. Tar c 40. Agusan16. Zambales 41. BukidnOll17. Batangu 42. Lanao18. Cavite 43. Misamis Occidental19. Laguna 44. Misamis Oriental20. Marinduque 45. Surigao lO
e1 e4
21. Mindoro 46. Cotabato22e
.ee1422. Palawan 47. Dano e18 3
23. Quezon 48. Sulu I
25 e e ~e30 VI24. Rizal 49. Zamboanga 0
-6 I26. Albay 17
3541
I 1960 growth-5 -4 -3 -2 2 3
e46 e8
Fig.6-Cross plot of growth rate factors for 1938 and 1960
-31-
Chapter 3
PERCEPTIONS OF TIlE PHILIPPINE SOCIAL SYSTEM
AS WE NOTED EARLIER, area experts often predict serious troubles -even a revolution for the Philippine polity. Domestic political
leaders, at least in their rhetoric, foresee these same troubles.But does the polity expect these troubles? Is it helping to createthem? How well do Philippine decisionmakers know the views of their
CMIl. people?
It is difficult to discover the ways in which Philippine politicians and bureaucrats obtain their information, but it appears to be
on a personal, anecdotal basis. Systematic analysis of polls, survey
data, or ecological data is not characteristic of Philippine politicians, although they have commissioned political polls from time to
tim~.
In this chapter we shall try to document on a systematic basishow three segments of Philippine society view the existing social order.We shall also try to document to some extent what they expect from thesystem and how they view their future prospects. Is the common Filipino"fed up" with his system? Does he feel hopelessly enmeshed in a systemof perpetual poverty? Is he disillusioned with the existing politicalstructure? Conversely, how do politicians and bureaucrats view the
people?
In the first section of this chapter we discuss past and currentattitudes of the Philippine adult population. We rely, first, on ananalysis of survey and polling data done in the mid-1960s. Then webring the discussion of nationwide attitudes up to date by using a
-32-
survey of 1550 people that we funded in early 1969. 1 Several questions
in this survey were taken from cross-national surveys done in the past,
and we have been able to make some international comparisons. 2
In the second section we consider legislators caught up in the
political system and how their perceptions are congruent with or diverge
from those of their constituents. In the third section we discuss the
atti tudes and problems of career bureaucrats. Our aim in these three
sections is to provide a description of how these three important seg
ments of Philippine society view the existing order and their expecta
tions for the near future.
For the most part we shall rely on extensive closed surveys done
at different times. The advantages and disadvantages of large-scale
closed survey data compared with small-scale open interviews are well
~own. Much of the research of Philippine hehavioral scientists has
focused on case studies and small- scale interviews. But the Philip
pines is a heterogeneous nation, and it is almost impossible to gen
eralize about the nation as a whole with case study research. 3On the
other hand, large-scale closed surveys cannot match the richness of
detail of open-ended interview and case studies. And so we pay in rich
ness for scope and breadth. Wherever possible we have tried to use
case study material in interpreting the closed surveys. We view the
two types of data as complementary, not conflicting.
IStrictly speaking this survey is not a nationwide sample. Wedo feel it approximates one reasonably well. See Appendix A for a morethorough discussion. Hereafter t..1.e survey will be referred to as Pegasus C!:hilippine ~tlmic Kroup ~ttitude surveY0.
2we took several questions verbatim from G. A. Almond and S. Verba,The Civic Culture~ Princeton University Press, Princeton, 1963. TheCivic Culture compares the attitudes of citizens in the United States,Great Britain, Germany, Italy,and Mexico.
3The same point is made in J. M. McKendry, M. S. McKendry, andG. M. Guthrie, The Psychological Impact of Social Change in thePhilippine8~ Technical Report No. 857-R-2, HRB-Singer, Inc., StateCollege, June 1967.
-33-
The Perceptions of the Conmon Man
Attitudes About Living Conditions
What are the perceptions of the common Filipino about his country,
and how have those perceptions changed over time? We begin with the
general perception of living conditions. Tables 4 through 6 shO\'{ :responses about living conditions in a 1963 survey.1 .The specific ques
tion asked was: How do you feel about present living conditions in
your community/barrio?
Table 4 shows the response pattern for the total sample. Rough~y
70 percent of the respondents found living conditions difficult. Of
those who felt life was difficult, 43.5 percent cited unemployment and
41 percent cited low wages or the lack of enough wage earners in their
family. High prices accounted for another 13.5 percent. Of those who
felt life was "all right,1I 75 percent gave as their reason having jobs
or the ability to support their families.
Table 5 shows the same question cross-tabulated by region. There
is JIRlch regional variation in perceptions of living conditions. The
traditionally depressed areas -- !locos and Bico1 -- show up with a
very high percentage of ''bad'' respons es . Pampanga and Manila are the
only areas where a majority 'of respondents believe that conditions are"good." The Tagalog respondents also had negative views of life al
though their area is geographically part of the ''modern'' sector define(!.
in Chapter 2.
As expected, a higher fraction of those from the lowest socio~
economic status see conditions as bad. Furthennore, approximately
61 percent of those with the lowest socio-economic status cite unem
ployment as the reason for their perception, almost twice the per
centage of those in the second highest socio-economic category citing
the same reason. See Table 6.
IStudy No. 416-59-002, International Data Library and ReferenceService (IDLARS), Survey Research Center, University of California,Berkeley (National Science Foundation Grant GS1365). The survey wasconducted by the Robot Corporation for the Manila Times Corporation.
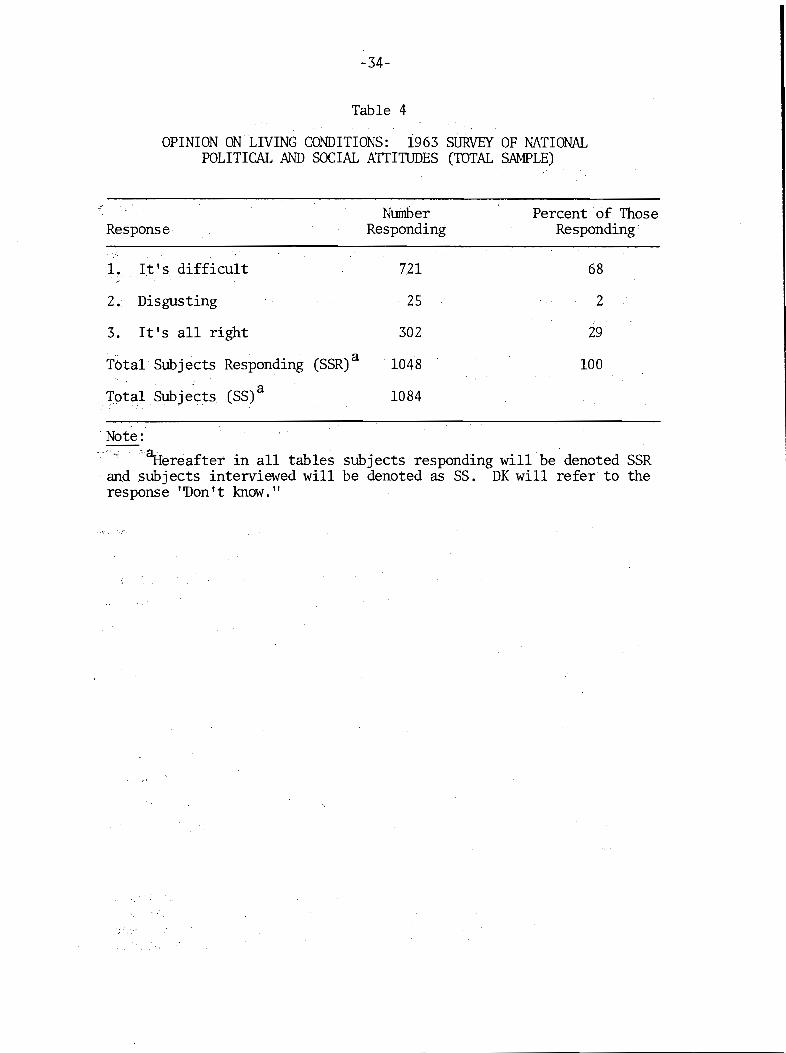
-34-
Table 4
OPINION ONLIVING CONDITIONS: 1963 SURVEY OF NATIONALPOLITICAL AND SOCIAL ATTITUDES (TOTAL SAMPLE)
Response
L It Is difficult
NumberResponding
721
25
302
1048
1084
Percent6f ThoseResponding
68
2
29
100
Note:
~ereaftet in all tables subjects responding will be denoted SSRand subjects interviewed will be denoted as SS. DK will refer to theresponse "Don It know."
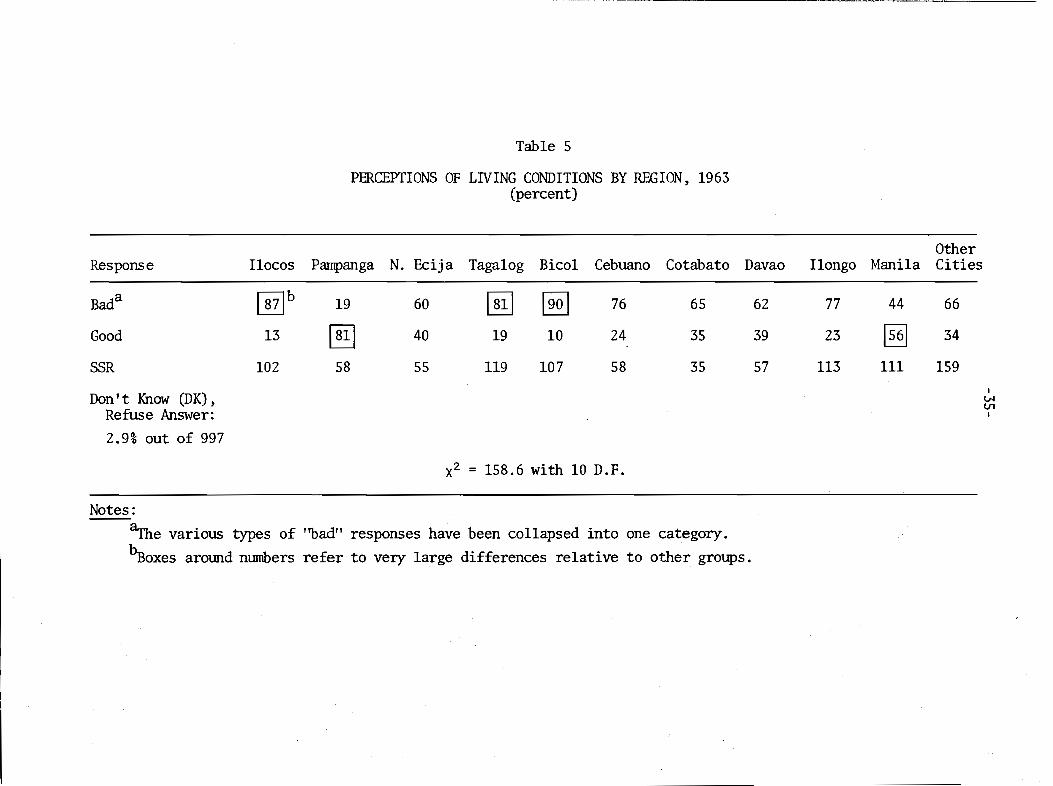
Table 5
PERCEPTIONS OF LIVING CONDITIONS BY REGION, 1963(percent)
OtherResponse Ilocos Parnpanga N. Ecija Tagalog Bico1 Cebuano Cotabato Davao Ilongo Manila Cities
Bada @]b 19 60 [ill ~ 76 65 62 77 44 66
Good 13 @] 40 19 10 24 35 39 23 ~ 34
SSR 102 58 55 119 107 58 35 57 113 111 159
Don't Know (DK),I
VIV1
Refuse Answer: I
2.9% out of 997
x2 = 158.6 with 10 D.F.
Notes:
~e various types of ''bad'' responses have been collapsed into one category.
bBoxes around mnnbers refer to very large differences relative to other groups.

-36-
Table 6
PERCEPTIONS OF LIVING CONDITIONS BYSOCIO-ECONOMIC STATUS, 1963
(percent)
Socio-Economic StatusaHighest Lowest
lb 2 3 4 5
Bad 17 63 70 74 82
Good 83 37 31 26 18
SSR 12 109 372 375 170
DK, Refuse Answer:2.9% out of 1069
x2 = 14.5 with 3 D.F. ignoring the smallsample of SES 1
Notes:aSocio-economic status is an estimate by the interviewer based on
the type of house that the respondents live in.bInsufficient sample size.

-37-
Since this 1963 survey was taken, the Philippine economy has con
tinued to grow at a respectable rate overall. Its aggregate growth has
been uneven and so has the spatial development of the economy . An im
portant question for politicians and bureaucrats is whether these 1963
perceptions have changed with time. By using the Pegasus survey we can
get hints of an answer to this question.
Table 7 presents a matrix of medians and median.rankings on the
Pegasus question concerned with establishing whether individuals perceive
economic progress over time. 1 For compactness, we show only the regions
corresponding to our previous regions. Overall the population believes
that the present and past were similar and on the lower end of the scale.
They are relatively optimistic about the future. Pampangans and Manilans
continue to be the most optimistic. The traditionally depressed areas
appear to generate the same type of response as they did in 1963.
Figure 7 presents another way of looking at perceptions about liv
ing conditions. We plot the cumulative percentage of responses about
living conditions against the steps of the ladder (total sample). We
then compare the relative position of the curves for past, present, and
future. The curves for past and present are quite similar, although
the "present" curve is somewhat to the right of the "past" curve. The
"future" curve is far out to, the right (better life) relative to the
other two.
The lack of difference between the present and past cumulative
distribution curves is somewhat misleading. Actually there is con
siderable movement upward and downward (Fig. 8). Only 44 percent
indicate a constant position on the ladder whereas 23 percent indicate
a change of two or more rungs (14 percent up and 9 percent down). Thirty
five percent of the respondents said they had moved up one or more steps.
lThe question was fonnulated in a self-anchoring form. The respondents were shown a picture of a ten-rung ladder (from worst possiblelife, rung 1, to best possible life, rung 10) and were asked what rungthey felt they were on three years ago and today, and what rung theyexpected to be on three years hence.
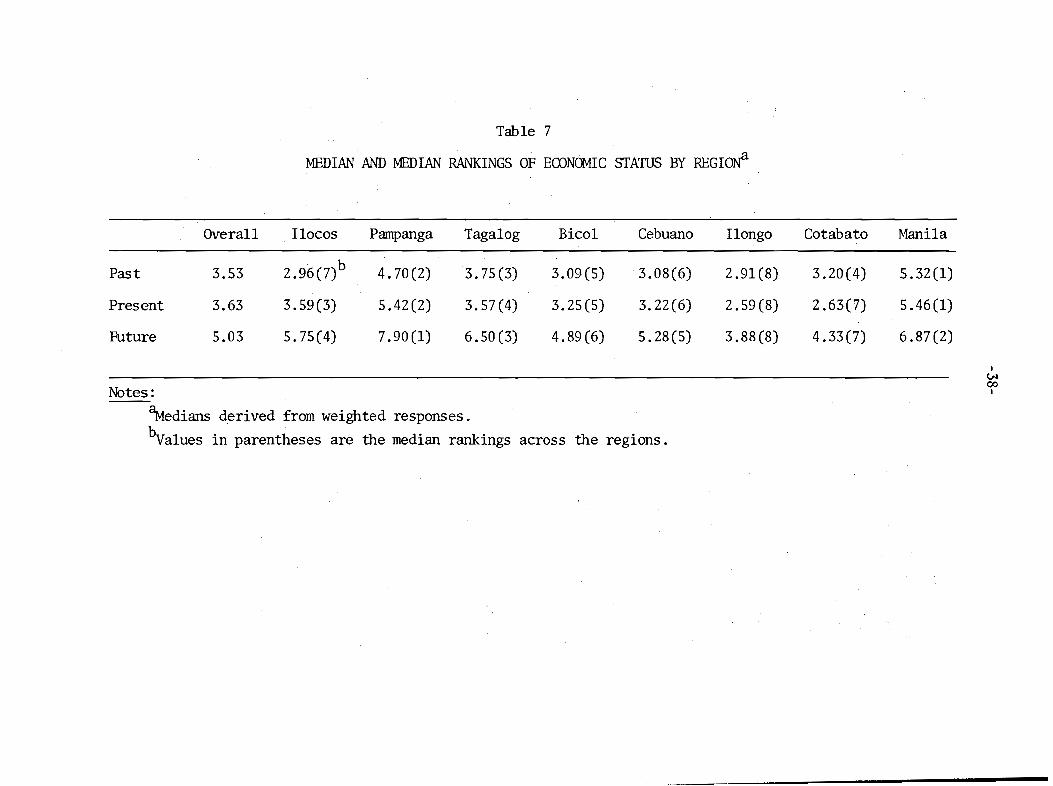
Table 7
MEDIAN AND MEDIAN RANKINGS OF ECONOMIC STATUS BY REGIONa
Overall Ilocos Parnpanga Tagalog Bico1 Cebuano Ilongo Cotabato Manila
Past 3.53 2.96(7)b 4.70 (2) 3.75(3) 3.09(5) 3.08(6) 2.91(8) 3.20 (4) 5.32(1)
Present 3.63 3.59 (3) 5.42(2) 3.57(4) 3.25(5) 3.22(6) 2.59(8) 2.63(7) 5.46(1)
Future 5.03 5.75(4) 7.90(1) 6.50(3) 4.89(6) 5.28(5) 3.88(8) 4.33 (7) 6.87(2)
IVI
Notes:00
I
~edians derived from weighted responses.
hva1ues in parentheses are the median rankings across the regions.
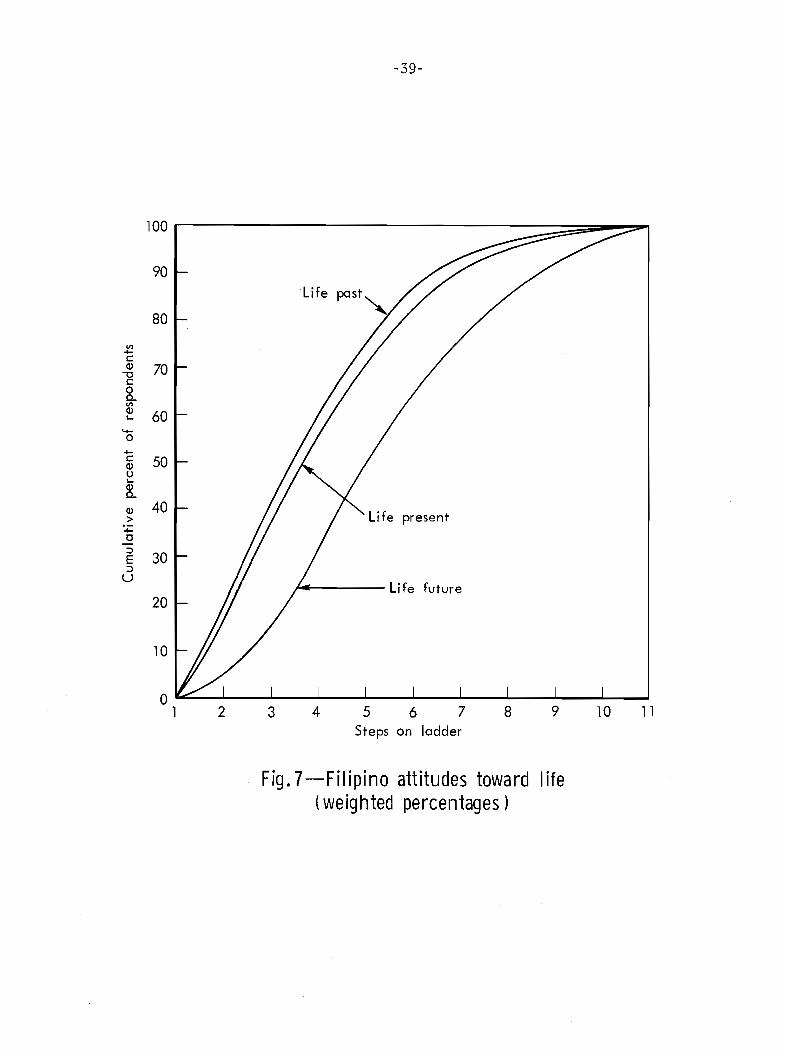
-39-
111098
Life present
5 6 7Steps on ladder
4
/4---- Life future
32
100
90
80
VI....CQl 70""0C0c..VIQl 60...
.....0....c 50QlU...Qlc..Ql 40>....C:::l
30E:::l
U
20
10
01
Fig.7-Filipino attitudes toward life(weig hted percentages)

-40-
10
9
8
7
6 0\0.... ~'Oc:IV /VIIV 5 5f'-a.. §'IV (J'.....
....J4 ~o
3
2
oo 2 3 4 5
Life past
6 7 8 9 10
Fig.8-Changes.In perceptions of life

-41-
Today the Filipinos apparently believe life is slightly better
than in the past. They also indicate a great. hope for the future.
These perceptions are hardly consistent with a feeling of hopelessness
or disgust. However, both in 1963 and 1969 the average response indicates a life on the lower end of the scale. l ,2
Attitudes Toward the Government
Let us turn to attitudes toward the role of government. Do our
respondents feel that government can help them achieve a better life?
In the 1963 survey, there were 1044 respondents on the question: Do
you think the government can help you solve your problems?3 Seventy
six percent answered "yes." Of those who answered "no" or had no opin
ion (249), 66 percent cited unawareness of their problems by government
officials. Those who believed the government could help solve their
problems were asked if the government had taken any steps to solvetheir problems. Of those who responded, 84 percent answered "yes."
Regional tabulations of these responses are shown in Table 8. Ig
noring the small Cotabato sample, Ilocanos, the most politically cohe
sive ethnic group, have the mos t powerful belief in the government IS
ability to solve problems. 4 With respect to socio-economic status (SES)
a lower fraction of those in the lowest and highest groups (5 and 2)
believe that the government can help solve their problems (Table 9).There may be rural-urban differences at work here. The rural segments
of the population get help because they live in small groups and can
lThere are, as noted, great regional variations.
2Comparable data in Almond and Verba, The Civic Cultul'e, could beused to connect feelings of well-being or of personal progress to political attitudes, but the analysis has not been done. The connectionbetween attitudes and behavior is always hard to establish. It isalleged for the Philippines that perceived lack of progress is creatingrevolutionary conditions.
3IDLARS No. 416-59-002.
4Although the President in 1963 was of Pampangan extraction, theIlocanos had a strong voice in the government through then Senate President Marcos.
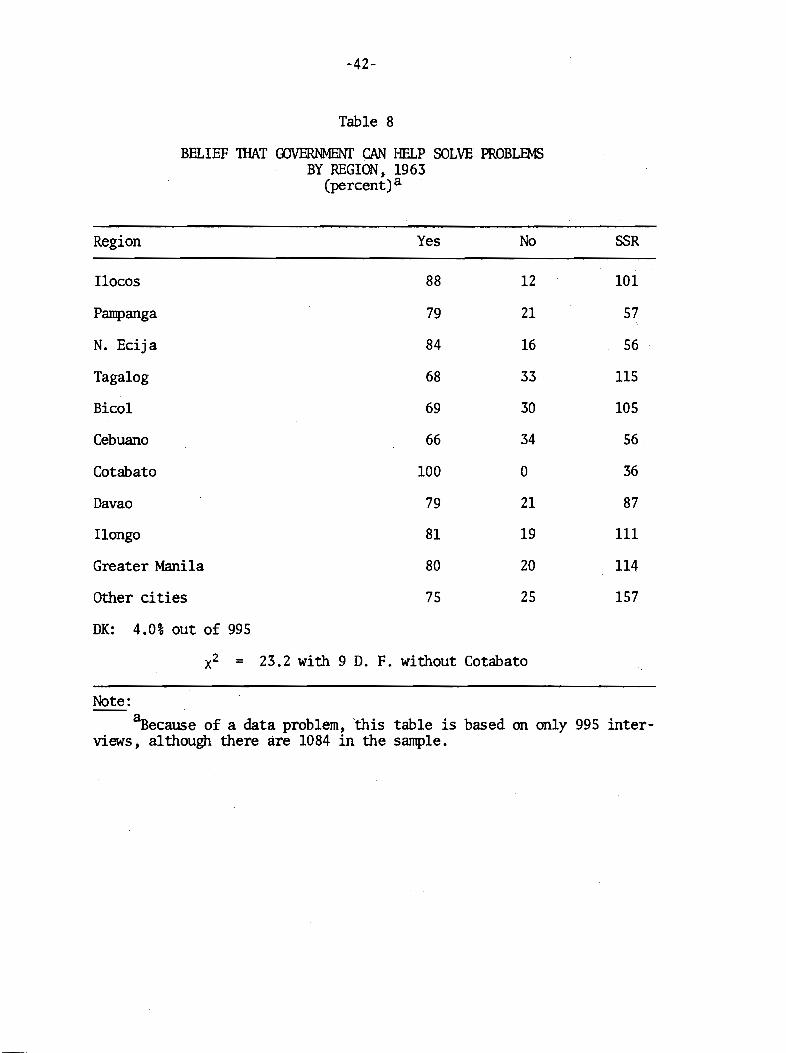
-42-
Table 8
BELIEF lHAT GOVERNMENI' CAN HELP SOLVE PROBLEMSBY REGION, 1963
(percent) a
Region Yes No SSR
!locos 88 12 101
Parnpanga 79 21 57
N. Ecija 84 16 56
Tagalog 68 33 115
Bico1 69 30 105
Cebuano 66 34 56
Cotabato 100 0 36
Davao 79 21 87
Ilongo 81 19 111
Greater Manila 80 20 114
Other cities 75 25 157
DK: 4.0% out of 995
x2 = 23.2 with 9 D. F. without Cotabato
Note:~ecause of a data problem, 'this table is based on only 995 inter
views, although there are 1084 in the sample.

-43-
Table 9
BELIEF TIlAT OOVERNMENT CAN SOLVE PROBI...EMSBY SOCIO-ECONOOC STATIJS, 1963
(percent)
Socia-Economic StatusHighest Lowest
Response 1 2 3 4 5
Yes 91 69 77 82 69
No 9 31 23 18 31
SSR 11 109 185 365 169
DK: 3.74% out of 1069
x2 = 14.0 with 3 D.F. ignoring the small sample of SES 1.
-44-
go to their barrio captain, and the upper urban strata can also get
help.
The Pegasus survey gives us the ability to compare attitudes of
Filipinos today with those of earlier years on the above question.
Table 10 shows that 70 percent of those responding to the Pegasus question
about the influence of the government on daily life believe it does have
an influence. Table 11 indicates that SO percent of those responding
that the government has an effect believe that life would be worse
without these government activities. 1 Only 11 percent of respondents
believe that life would be better withotit the government. If we can
interpret the question about government help asked in 1963 as measuring
the same attitudes as in 1969, then Filipinos continue to believe that
their lives can be changed -- for the better -- by govenunent action.
How do Filipinos compare with individuals in other countries con
cerning this attitude toward government? Do they rank high or low in
awareness of the existence and effectiveness of national and local
governments?2 Tables 12 and 13 compare the Pegasus responses with
similar questions from The Civic Culture. We show breakdowns for the
Philippines as a whole, for Luzon, and for Central Luzon, this last
area being the traditional site of dissidence. Concerning government
impact on the individual, the Philippine distribution resembles most
closely those obtained in Italy or Gennany. Individuals in the Philip
pines do have political cognition but not to as great a degree as those
in the United States or United Kingdom. In this sample Mexico appears
as an extremely deviant case with only 30 percent believing the govern
ment has any effect on their lives.
In terms of whether government impact is good or bad - - among
those perceiving impact -- the Philippines resembles Italy and Mexico
IThe text of the questions in Tables 8 and 9 overlap deliberately.Thus we have a few respondents who believe inconsistently that the government has no effect on their lives but who also believe that lifewould be worse without the government.
2See Almond and Verba, The Civic Culture, p. 79, for a discussionof "political cognition," the perceived recognition of government outputs and inputs.

-45-
Table 10
PERCEPTION OF GOVERNMENf INFLUENCE, 1969a
NlDllber Percentb percentbResponse Responding of Sample of Respondents .
Yes 970 63 75
No 415 23 25
DK 165 14 a
SS 1550 100 100
Notes:aActual text: On the whole, do the activi ties of the national
government tend to have any influence in your day-to-day life?bpercentages are calculated from responses weighted according to
proper proportions of urban and rurals in the population as well asthe proper stratum proportions. See Appendix A. This practice willbe followed in all tables. The notation will be weighted percentages.The notation SSR in all tables means the actual numbers of respondents~
not the weighted numbers.

-46-
Table 11
WORTIi OF GOVERNMENf ACTIVITIES, 1969
Number Percentb PercentbResponse Responding of Sample of Respondents.
Better without 148 7 7
Just the same 530 35 40
Worse without 715 46 54
DK 157 12 a
ss 1550 100 100
Notes:
aActua1 text: Do you think your life would be worse, just the same,or better without these government activities?
bWeighted percentages. .
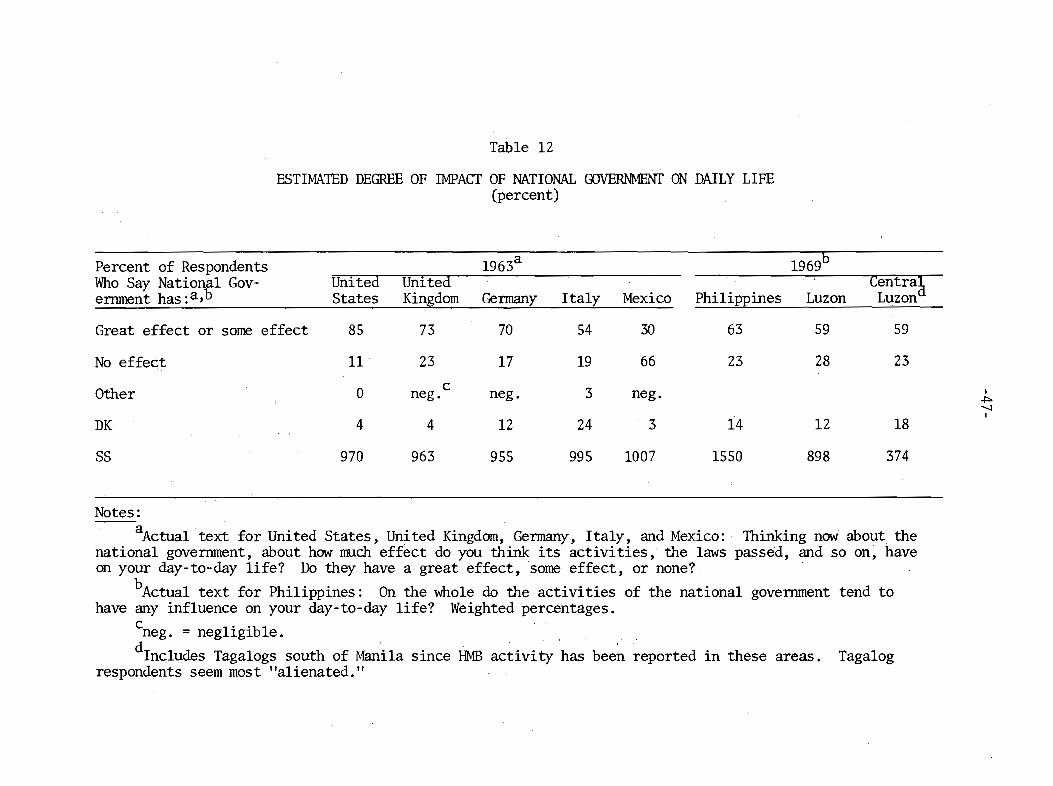
Table 12
ESTIMA1ED DEGREE OF IMPACT OF NATIONALGOVERNMENr ON DAILY LIFE(percent)
Percent of Respondents 1963a 1969b
Who Say National Gov- United United centra~ernment has :a,b States Kingdom Gennany Italy Mexico Philippines Luzon Luzon
Great effect or some effect 85 73 70 54 30 63 59 59
No effect 11 23 17 19 66 23 28 23
Other 0c 3 Ineg. neg. neg.
~""-JI
DK 4 4 12 24 3 14 12 18
SS 970 963 955 995 1007 1550 898 374
Notes:--aActual text for United States, United Kingdom, Gennany, Italy, and Mexico: Thinking now about the
national government, about how much effect do you think its activities, the laws pass e-d , and so on, haveon your day-to-day life? Do they have a great effect, ·some effect, or none?
bActual text for Philippines: On the whole do the activities of the national government tend tohave any influence on your day-to-day life? Weighted percentages.
cneg . = negligible.
dlncludes Tagalogs south of Manila since HMB activity has been reported in these areas. Tagalogrespondents seem most "alienated."

Table 13
CHARACTER OF IMPACT OF NATIONAL OOVERNMENT(percent)
1963 1969United United Central
Percent Who Say: a States Kingdom Gennany Italy Mexico Philippines Luzon Luzon
National government improvesconditions 76 77 61 66 58 46 46 41
Sometimes improves conditions;sometimes does not; no dif- I
ference 20 16 3 21 20 35 36 38 ~00
I
Better off without nationalgovernment 3 3 3 5 19 7 9 9
Other 0 1 0 2 1
DK 1 2 4 5 2 12 9 12
SS 821 707 676 534 301 1550 542 235
Notes:
aAs described by those respondents who attribute some impact to the national government.bIncludes Tagalog areas south of Manila, since HMB activity has been reported in these areas.
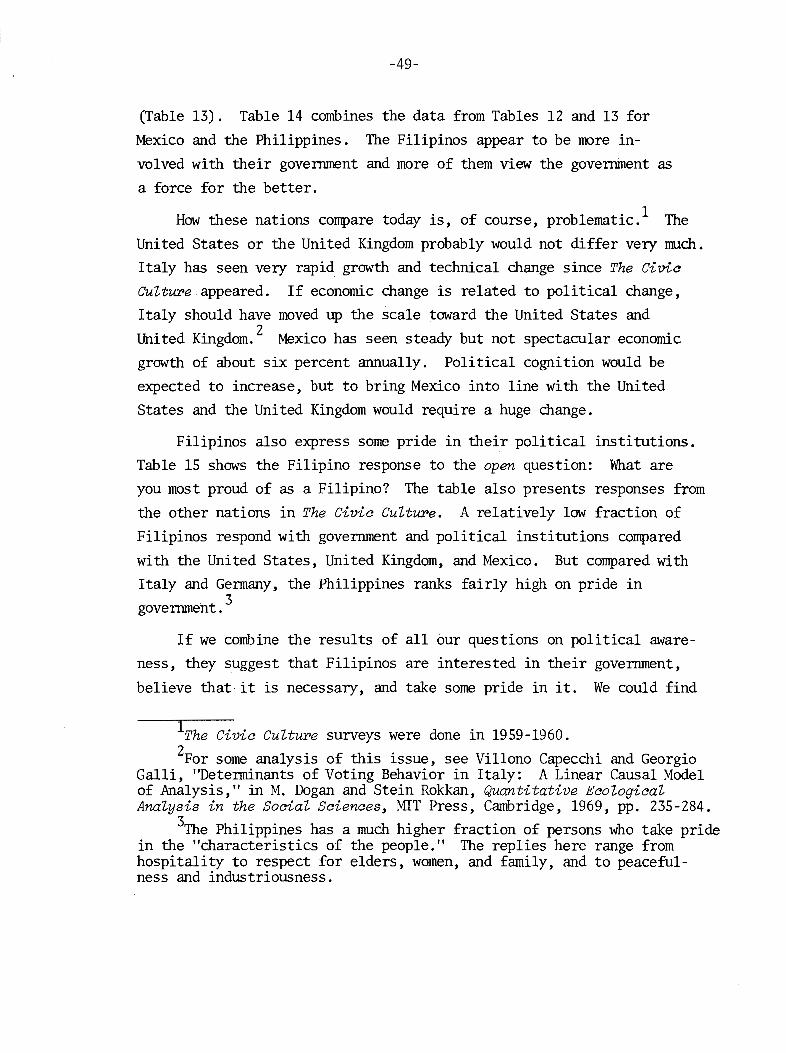
-49-
(Table 13). Table 14 combines the data from Tables 12 and 13 for
Mexico and the Philippines. The Filipinos appear to be more in-
volved with their government and more of them view the government as
a force for the better.
How these nations compare today is, of course, problematic. 1 The
United States or the United Kingdom probably would not differ very I1Ulch.
Italy has seen very rapid growth and technical change since The Civia
CuUure appeared. If economic change is related to political change,
Italy should have moved up the scale toward the United States and
United Kingdom. 2 Mexico has seen steady but not spectacular economic
growth of about six percent annually. Political cognition would be
expected to increase, but to bring Mexico into line with the United
States and the United Kingdom would require a huge change.
Filipinos also express some pride in their political institutions.
Table 15 shows the Filipino response to the open question: What are
you most proud of as a Filipino? The table also presents responses from
the other nations in The Civic Culture. A relatively low fraction of
Filipinos respond with government and political institutions compared
with the United States, United Kingdom, and Mexico. But compared with
Italy and Germany, the Philippines ranks fairly high on pride in
government. 3
If we combine the results of all our questions on political aware
ness, they suggest that Filipinos are interested in their government,
believe that· it is necessary, and take some pride in it. We could find
IThe Civic Culture surveys were done in 1959-1960.
2For some analysis of this issue, see Villono Capecchi and GeorgioGalli, "Determinants of Voting Behavior in Italy: A Linear Causal Modelof Analysis," in M. Dogan and Stein Rokkan, Quantitative EaologiaalAnalysis in the Social Sciences, MIT Press, Cambridge, 1969, pp. 235-284.
3The Philippines has a much higher fraction of persons who take pridein the "characteristics of the people." The replies here range fromhospitality to respect for elders, women, and family, and to peacefulness and industriousness.
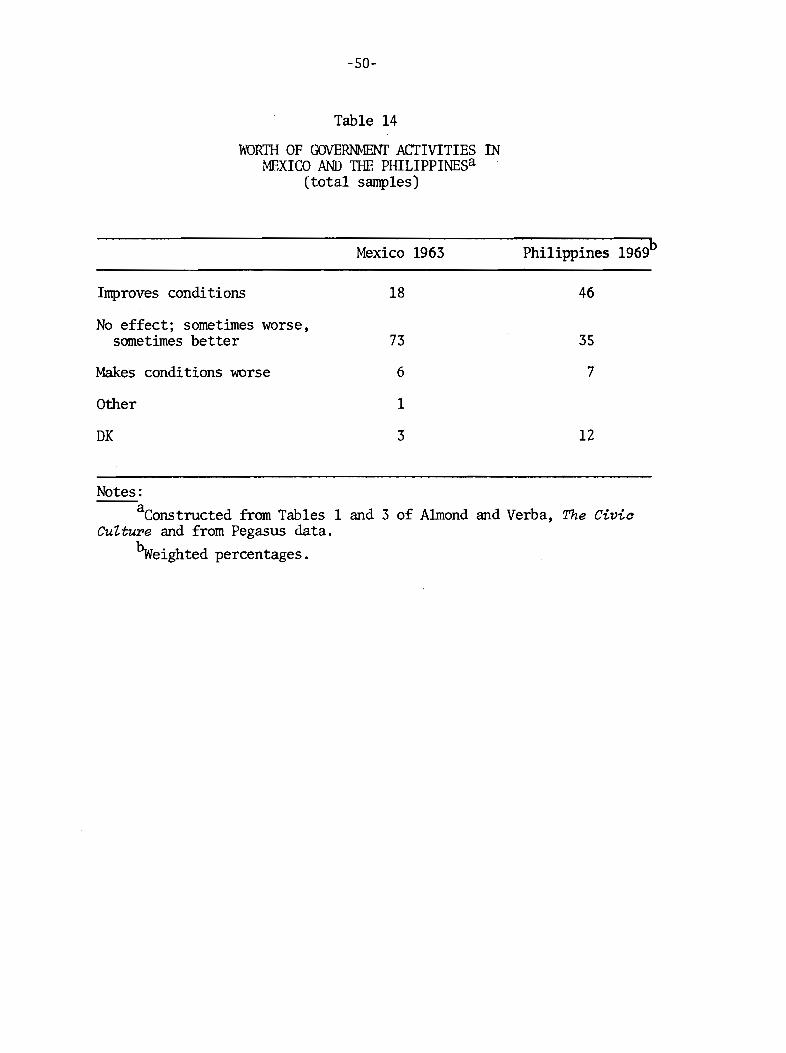
-50-
Table 14
WORm OF GOVERNMENT ACTIVITIES INMEXICO AND mE PHILIPPINESa
(total samples)
Mexico 1963 Philippines 1969b
Improves conditions 18 46
No effect; sometimes worse,sometimes better 73 35
Makes conditions worse 6 7
Other 1
DK 3 12
Notes:aConstructed from Tables 1 and 3 of Almond and Verba, The Civic
CuZture and from Pegasus data.hweighted percentages.
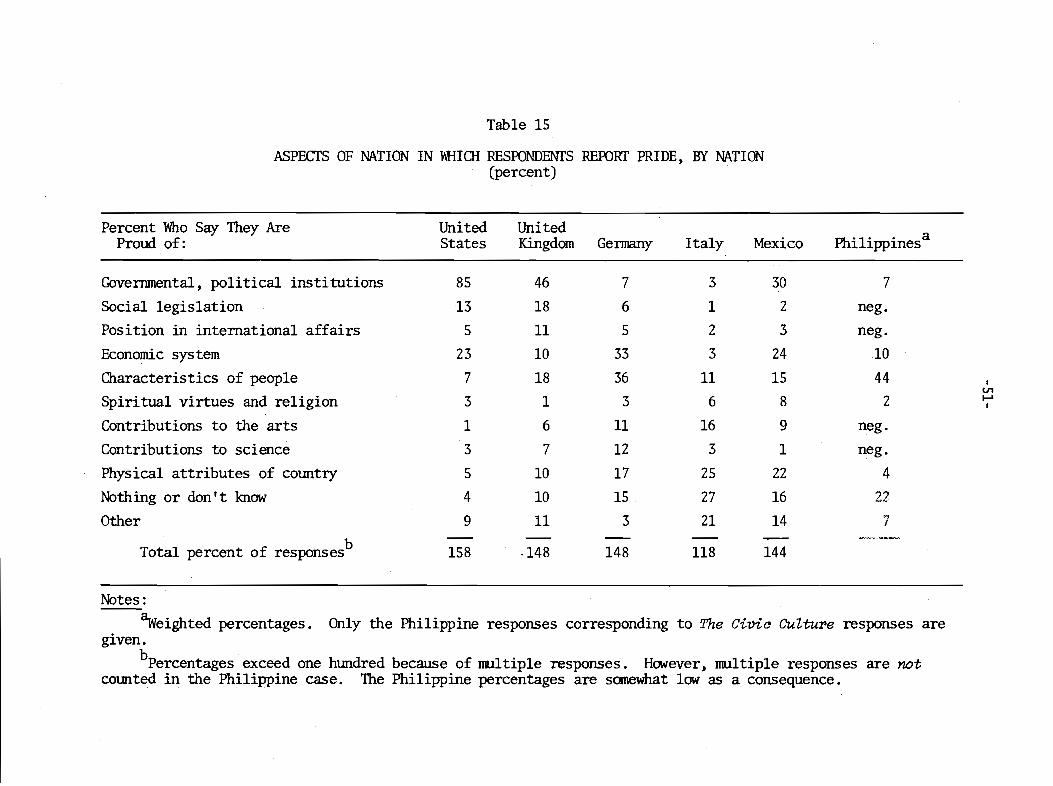
Table 15
ASPECfS OF NATION IN WHICH RESPONDENTS REPORT PRIDE, BY NATION(percent)
Percent Who Say They Are United UnitedPhilippinesaProud of: States Kingdom Gennany Italy Mexico
Governmental, political institutions 85 46 7 3 30 7
Social legislation 13 18 6 1 2 neg.Position in international affairs 5 11 5 2 3 neg.
Economic system 23 10 33 3 24 10
Characteristics of people 7 18 36 11 15 44 IVI
Spiritual virtues and religion 3 1 3 6 8 2 I-'I
Contributions to the arts 1 6 11 16 9 neg.
Contributions to science 3 7 12 3 1 neg.
Physical attributes of country 5 10 17 25 22 4Nothing or don It know 4 10 15 . 27 16 22
Other 9 11 3 21 14 '7
b.....,.,-.,._-_.".
Total percent of responses 158 ·148 148 118 144
Notes:
aweighted percentages. Only the Philippine responses corresponding to The Civia Culture responses aregiven.
bpercentages exceed one hundred because of IIl.1ltiple responses. HCMever, IIlUltiple responses are notcounted in the Philippine case. The Philippine percentages are somewhat low as a consequence.
-52-
no comparable infonnation for other LOCs, but we believe that the
Philippine responses on governmental institutions would rank high.l
Attitudes Toward Government Officials
What do the Filipinos see as bad in their government? Table 16
shows the responses, by region, to a Pegasus question concerning graft
and corruption. Overall there is a widespread belief that graft and
corruption are prevalent. However, some groups apparently see graft
as pervasive but not as a major problem, particularly individuals in
the Bicol, Waray, and Magindanao (Muslim) areas. The results from
the Muslim groups show that apparently we cannot even generalize about
all Filipino Muslims. The Magindanaos and Tausogs are both Muslim,
but their attitudes toward the problem of graft and corruption are
strikingly divergent. Since we know little about their cultures,
we cannot account for the difference.
Given the general perception of graft and corruption in the govern
rent, who are the .specific officials perceived as corrupt? Table 17
shows the opinion of individuals with respect to specific government
officials. Among all government officials, politicians carne off the
wars t . About 40 percent of the respondents believethatlOOst politi
cians are corrupt. This judgment is mitigated when we ask about local
politicians. There is a shift from the ''mostly corrupt" category to
the "some corrupt" category. Local politicians are personally known,
their interactions with the people are greater and their activities may
be seen less as "corrupt" and more as attempts to deliver resources to
local constituents.
Judges and fiscals 2 appear to have the best image, followed by
the constabulary and the local police. This image seems consistent
with the view of the legal system as generally honest. Out of 1269
ISome 30 percent of the Mexican respondents are proud of theirgovernment while 73 percent believe it has no effect (Table 12). Almondand Verba explain the contradiction by Mexican pride in the revolutionand the government's skillful use of revolutionary symbols, pp. 103-104.
2Fiscals are equivalent to district attorneys.
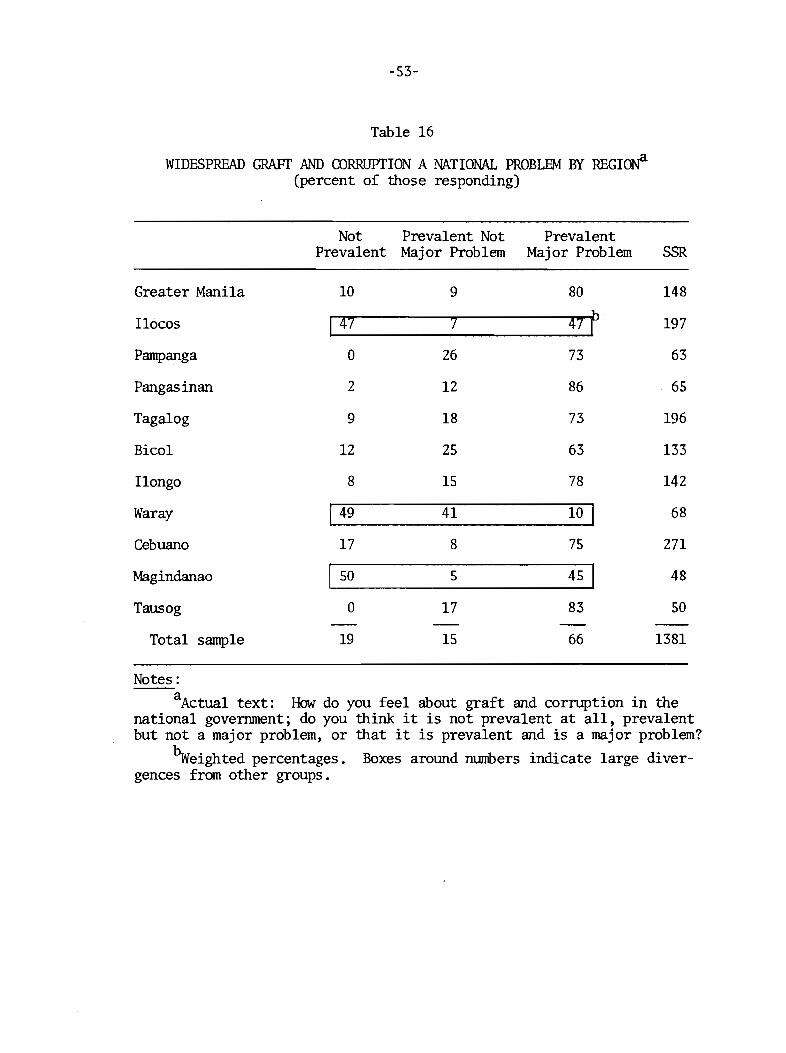
-53-
Table 16
WIDESPREAD GRAFT AND CORRUPTION A NATIONAL PROBLEM BY REGION'l(percent of those responding)
Not Prevalent NotPrevalent Major Problem
PrevalentMajor Problem SSR
Greater Manila
Ilocos
Pampanga
Pangasinan
Tagalog
Bicol
Ilongo
Waray
Cebuano
Magindanao
Tausog
Total sample
10
I 47
o
2
9
12
8
[ 49
17
50
o
19
9
7
26
12
18
25
15
41
8
5
17
15
80
47 f73
86
73
63
78
75
45
83
66
148
197
63
65
196
133
142
68
271
48
50
1381
Notes:
aActual text: How do you feel about graft and corruption in thenational govenunent; do you think it is not prevalent at all, prevalentbut not a major problem, or that it is prevalent and is a major problem?
hweighted percentages. Boxes around mnnbers indicate large divergences from other groups.
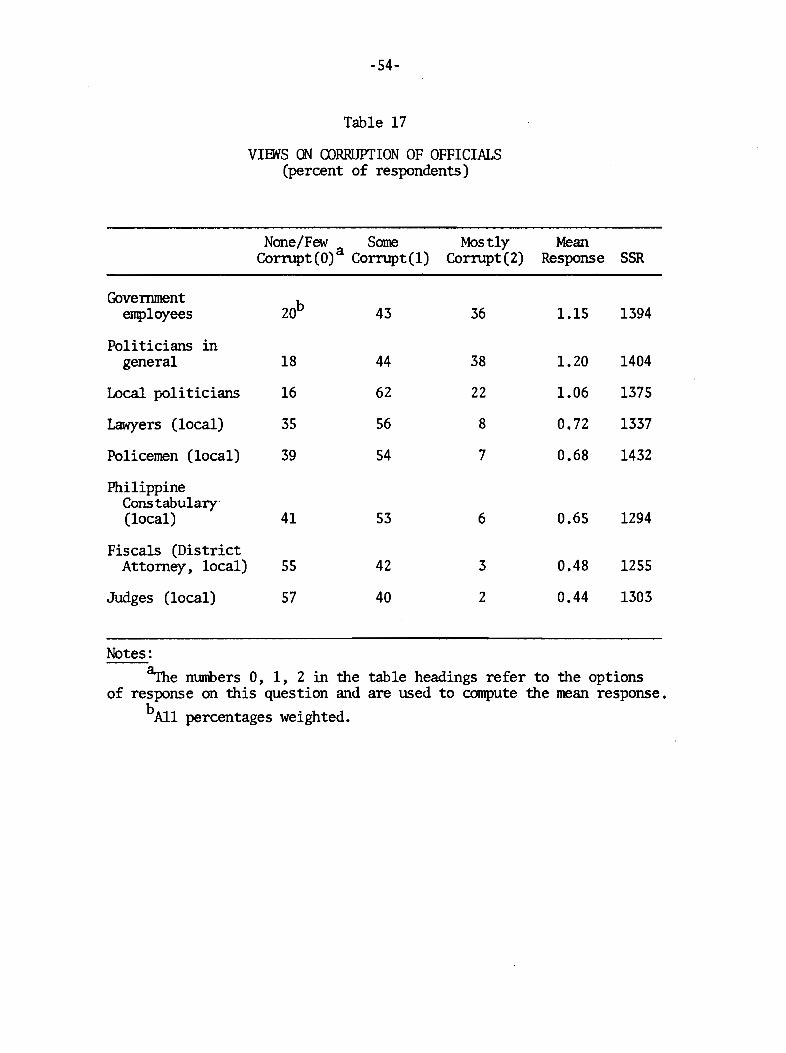
-54-
Table 17
VIEWS ON Q)RRI.JIYI'ION OF OFFICIALS(percent of respondents)
None/Few Some Mostly MeanCorrupt(O)a Corrupt(l) Corrupt (2) Response SSR
Government20bemployees 43 36 1.15 1394
Politicians ingeneral 18 44 38 1.20 1404
Local politicians 16 62 22 1.06 1375
Lawyers (local) 35 56 8 0.72 1337
Policemen (local) 39 54 7 0.68 1432
PhilippineConstabulary(local) 41 53 6 0.65 1294
Fiscals (DistrictAttorney, local) 55 42 3 0.48 1255
Judges (local) 57 40 2 0.44 1303
Notes:B.rhe numbers 0, 1, 2 in the table headings refer to the options
of response on this question and are used to compute the mean response.bAll percentages weighted.
-55-
respondents on the Pegasus question about the honesty of the courtsystem 70 percent answered that it was honest and efficient. l
If we consider a mean response of 1.00 as the lnid-range betweenhonest and corrupt, it is possible to think (cautiously) in absolute
tenns. Only government employees (a high frequency of political
appointees) and politicians rate as more dishonest than honest. Lawyers,the Constabulary, and the police tend to fallon the honest side of ourmidpoint, while judges and fiscals are viewed as mostly honest.
Across regions, respondents in Greater Manila have a much higherpropens i ty than others to believe that most poli ticians are corrupt(mean score of 1.52, SSR 145). In Ilocos, on the other hand, only
18 percent (of 194) put politicians in the "IOOStly corrupt" categoryand 32 percent place them in the "none/few" category (mean = 0."86) •In Pampanga 44 percent state that none or few politicians are corruptand 34 percent put them into the IOOStly corrupt category (mean = 1.08).Pampangans do not appear to be any more disaffected from the governmentthan other groups (they rate the politicians slightly better than thenational average).2
When the corruption question is tabulated by age, younger votersdo not appear to be any more disaffected than other voters. 3 In fact,
those in the younger age group see politicians as a little less corrupt
IText of question: Do you think our courts are generally honestand efficient? Respondents in Greater Manila had the lowest "yes"response rate _: 53 percent.
2Those who seek to explain the dissidence in Pampanga by thedifferential attitudes of Pampangans will find hard going. On anyquestion concerning the government, including the Constabulary, thePampangans generally fall into the mid-range of the regional breakdowns. If anything, Pampangans appear to be IOOre favorably inclinedto the government than, say, the Tagalogs. Furthermore, Pampangansare far more optimistic than any other group about economic prospects.This circtU1lStantial evidence suggests that dissidence, which tendsto be concentrated in Pampangan areas, must be explained on groundsother than disaffection with the existing order. See Chapter 7.
3The survey was restricted to Philippine citizens between theages of 21 and 65. In retrospect, we should have interviewed someyounger Filipinos as well.

-56-
than do the other groups •. As another example, the responses about
honesty of government employees have essentially the same distributions1across all age groups.
There are, however, some differences in attitudes about corruption
wi th respect to socio-economic status (SES). Those in the lowest
economic status see politicians as somewhat less corrupt than do those
in the higher SES groups. This is illustrated in Table 18. Table 19
shows the corresponding data for government employees.
These perceptions of the system as "better" by the lowest SES
groups cut across into the legal and police systems. Thus, govern
rental representatives rate higher, in general, among those in the
lowest SES groups. The explanation may be in differential exposure
to mass redia. 2 Regrettably, Pegasus did not include a question on
exposure to mass media. HCMever, we did include a question on radio
ownership. Table 20 shows radio owners' views on corruption. Those
withgreater potential exposure to mass media, which continually
find graft and corruption in the political sys tem, see the system as
more corrupt than those not exposed.
Govenunent Treatment
But perceptions are fonned directly as well as indirectly. Citizens
are exposed to governmental institutions when they nust obtain permits
and licenses, pay fees, and so forth. This is a time when feelings of
alienation or participation are fonned. To test for alienation versus
participation we took a question from The Civio Culture about expecta-
tions of treatment in government offices.
lIn an earlier survey respondents in the 18-24 age bracket donot differ significantly in concern about tmemployment as a problem orabout housing. See IDLARS 416-59-0001, 1964. Current data indicatethat people in this age bracket do find jobs within a relativelyshort period of time. See Chapter 5. Roughly the same proportionsas other groups of the 18-24 age group are very satisfied or fairlysatisfied with their standard of living. The 18-24 year olds in 1964did not appear to differ greatly from other age brackets in theirpolitical attitudes.
2The "yellow press" hyPOthes is.
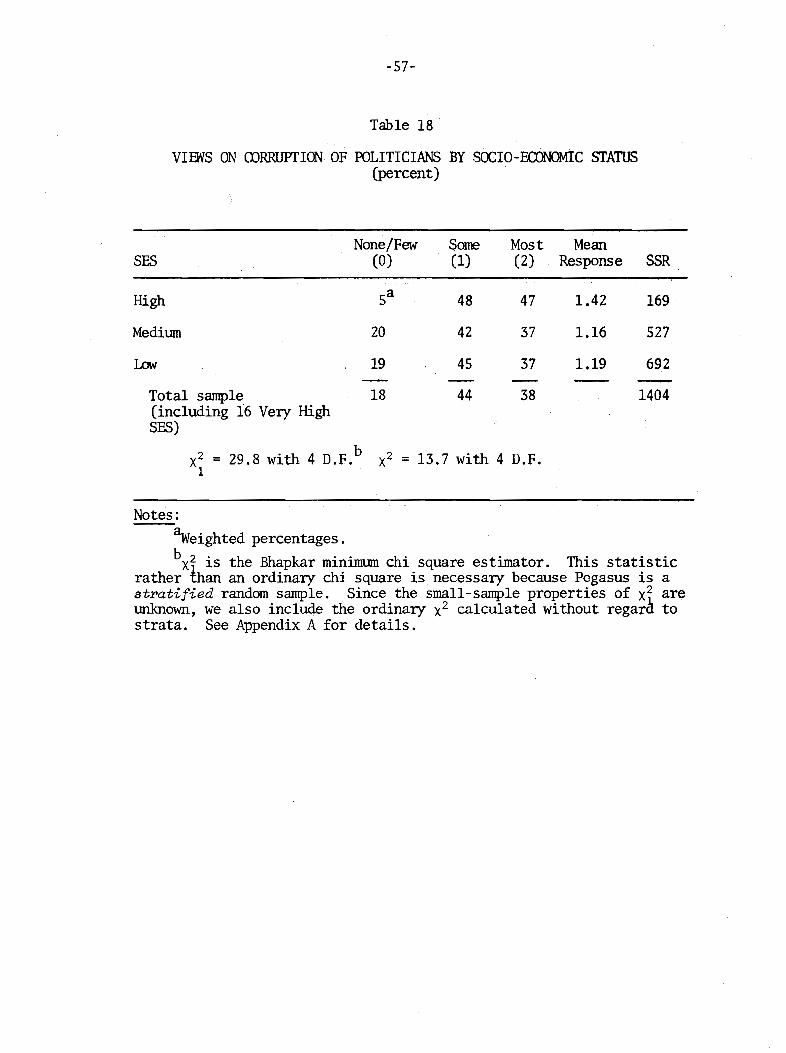
-57-
Table 18
VIEWS ON CDRRUPrION OF POLITICIANS BY SOCIa-ECONOMIC STATUS(percent)
None/Few Some Most MeanSES (0) (1) (2) Response SSR
High 5a 48 47 1.42 169
Meditun 20 42 37 1.16 527
lDI 19 45 37 1.19 692
Total sample 18 44 38 1404(including 16 Very HighSES)
x2 = 29.8 with 4 D.F. bx2 = 13.7 with 4 D.F.
1
Notes:aweighted percentages.bx2 is the Bhapkar minimtun chi square estimator. This statistic
rather than an ordinary chi square is necessary because Pegasus is astratified random sample. Since the small-sample properties of xi ar~unknown, we also include the ordinary x2 calculated without regard tostrata. See Appendix A for details.
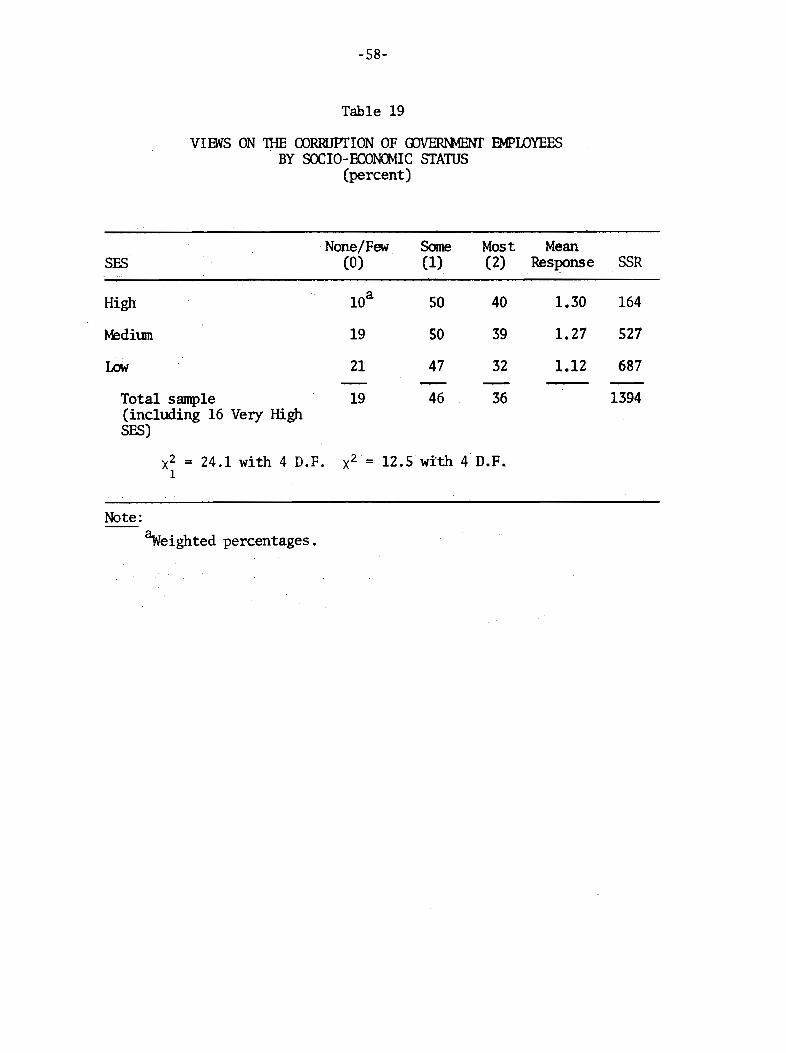
-58-
Table 19
VIEWS ON 1HE CORRUPTION OP CDVERNMENT EMPLOYEESBY SOCIO-ECONCMIC STAnJS
(percent)
SESNone/Pew
(0)Some(1)
Most Mean(2) Response SSR
40 1.30 164
39 1.21 521
32 1.12 687
High
Medium
Low
Total sample(including 16 Very HighSES)
19
21
19
50
50
47
46 36 1394
x2 = 24.1 with 4 D.P. x2 = 12.5 with 4 D.F.1
Note:aweighted percentages.

-59-
Table 20
VIEWS ON CORRUPTION OF POLITICIANS BY RADIO OONERSHIP
Radios
Not own
Own
None/Few(0)
18
Some(1)
49
41
Most Mean(2) Response SSR
31 1.11 391
41 1.23 1013
x2 = 12.5 with 2 D.F. x2 = 11.8 with 2 D.F.1
Note:aweighted percentages.
-60-
Table 21 shCMs the response of Filipinos in their expectations of
government treatment. The table suggests that a large fraction of the
respondents, a1though still a mino"rity, believe that they will not get
equal treatment from the government. There is considerable variation
from region to region in this expectation. Muslims view the government
with far more favor than do other groups. . Manilans rank lowest in
favorable responses to the government. Pampangans do not appear to
differ significantly· from other groups in Luzon, such as the Taga10gs
or Bico1s.
To place these results in perspective, let us turn once again to
an international comparison. Table 22 shows expectation of treatment
by nation, again taken from The Civic Cutture with the analogous tabu
lation from Pegasus. The Pegasus question is identical to that about
bureaucrats in The Civic CuUu!'e. On this scale the Philippines appears
to be roughly like Italy and Mexico.
There is some variation in the expectation of equal treatment
across the SES categories (Table 23). A slight majority (50.8 percent)
of those in the lowest SES category felt they l'tUuld not get equal
treatment, but only about 40 percent of those in the higher brackets
expected mequal treatment. This relatively low degree of sensitivity
to a status indicator contrasts rather sharply with a comparable tabu
lation for the Italian and Mexican cases. The least educated Mexicans
respond with an expectation of lUlequal treatment 81 percent of the time
as compared with a 32 percent response frequency from the most educated.
The Italian responses ranged from 70 percent mequal (low education)
to 41 percent (highest education).
The Role of Politicians
Perhaps the most striking result of our survey is the demand for
honest politicians. Ninety percent of all respondents say that they
vote according to the perceived honesty of the candidate and no other
criterion anywhere approaches the magnitude of this response. Yet
paradoxically the people believe that politicians are the most corrupt
of all officials. It is this demand for honesty plus the perception

-61-
Table 21
PERCEPTIONS OF OOVERNMENf TREATMENf BY REGIONa
(percent of those responding)
No Yes SSR
Greater Manila 68 32 144
Hocos 35 65 198
Parnpanga 39 61 51
Pangasinan 43 57 58
Tagalog 47 53 172
Bico1 48 52 133
Ilongo 44 56 120
Waray 23 77 60
Cebuano 50 50 241
Magindanao 20 80 3~
Tausog a 100 32
Total sample 46 54 1242
Note:
aActual text: Suppose there was some question you had to take toa government office •.• for example, a tax question or a housing regulation,do you think you would be treated as well as anyone? Weightedpercentages.
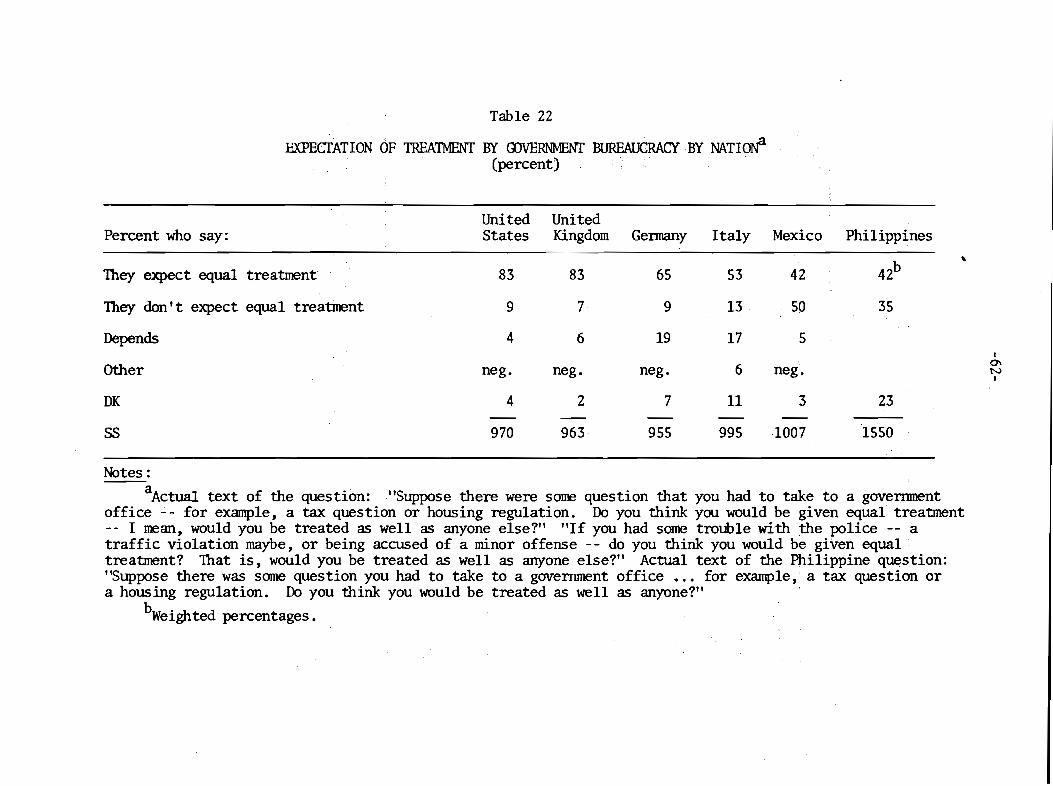
Table 22
EXPECTATION OF TREATMENT BY OOVERNMENI' BUREAUCRACY BY NATlrnf(percent)
United UnitedPercent who say: States Kingdom Gennany Italy Mexico Philippines
42b,
They expect equal treatment 83 83 65 53 42
They don I t expect equal treatment 9 7 9 13, 50 35
Depends 4 6 19 17 5I
Other 6 neg. 0\neg. neg. neg. NI
DK 4 2 7 11 3 23
SS 970 963 955 995 1007 1550
Notes:
aActual text of the question: "Suppose there were some question that you had to take to a govenunentoffice .;,- for example, a tax question or housing regulation. Do you think you would be given equal treatment-- I mean, would you be treated as well as anyone else?" "If you had some trouble with ,the police -- atraffic violation maybe, or being accused of a minor offense - - do you think you would be given equaltreatment? That is, would you be treated as well as anyone else?" Actual text of the Philippine question:"Suppose there was some question you had to take to a government office •.. for example, a tax question ora housing regulation. Do you think you would be treated as well as anyone?"
bweighted percentages.
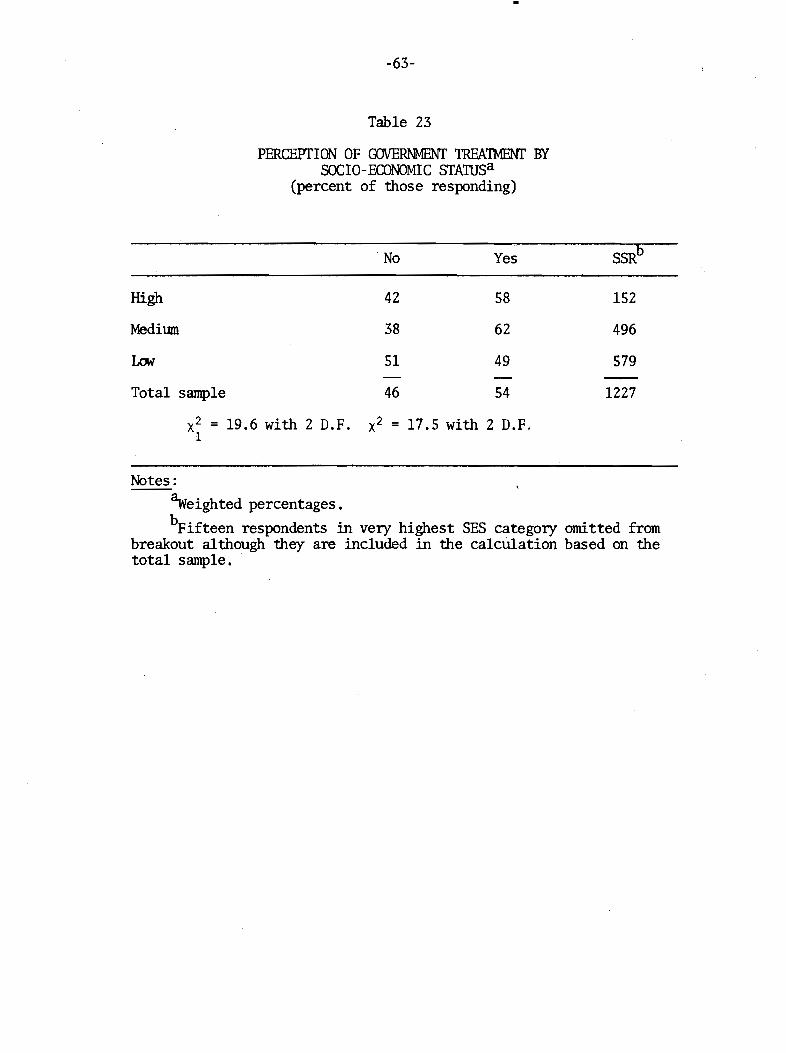
-63-
Table 23
PERCEPfION OF GOVERNMENT TREATMENT BYSOCIO-ECONOMIC SfAlUSa
(percent of those responding)
No Yes SSRb
High 42 58 152
Medium 38 62 496
Low 51 49 579
Total sample 46 54 1227
x2 = 19.6 with 2 D.F. x2 = 17.5 with 2 D.F.1
Notes:aweighted percentages.bFifteen respondents in very highest SES category omitted from
breakout although they are included in the calculation based on thetotal sample.
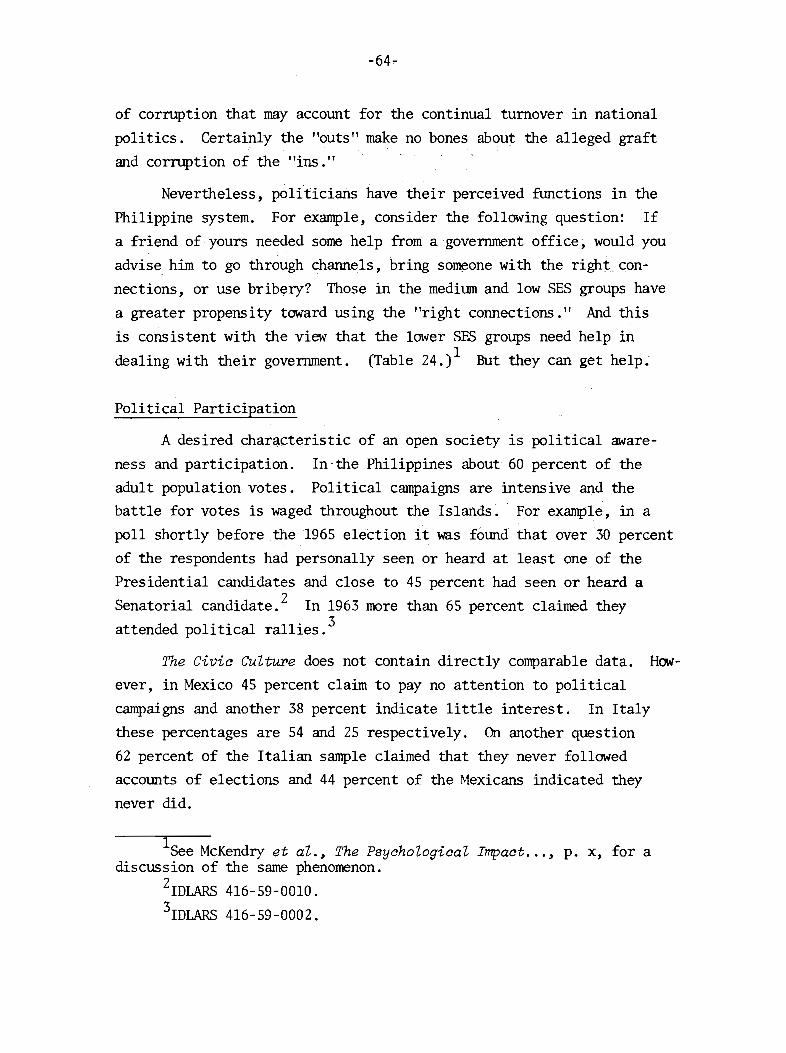
-64,.
of corruption that may account for the continual turnover in national
politics. Certainly the "outs" make no bones about the alleged graft
and corruption of the "ins."
Nevertheless, politicians have their perceived functions in the
Philippine system. For example, consider the following question: If
a friend of yours needed some help from a government office; would you
advise him to go through channels, bring som~one with the right con~
nections, or use bribery? Those in the medilUll and low SES groups have
a greater propensity toward using the "right connections." And this
is consistent with the view that the lower SES groups need help in
dealing with their government. (Table 24.) 1 But they can get help;
Political Participation
A desired char~cteristic of an open society is political aware
ness and participation. In-the Philippines about 60 percent of the
adult population votes. Political campaigns are intensive and thebattle for votes is waged throughout the Islands. For example, in a
poll shortly before the 1965 election it was fOlllld that over 30 percent
of the respondents had personally seen or heard at least one of the
Presidential candidates and close to 45 percent had seen or heard a
Senatorial candidate. 2 In 1963 more than 65 percent claimed they
attended political rallies. 3
The Civic Culture does not contain directly comparable data. How
ever, in Mexico 45 percent claim to pay no attention to political
campaigns and another 38 percent indicate little interest. In Italy
these percentages are 54 and 25 respectively. On another question
62 percent of the Italian sample claimed that they never followed
accounts of elections and 44 percent of the Mexicans indicated they
never did.
lSee McKendry et al., The Psychological Impact ... , p. x, for adiscussion of the same phenomenon.
2IDLARS 416-59-0010.
3IDLARS 416-59-0002.
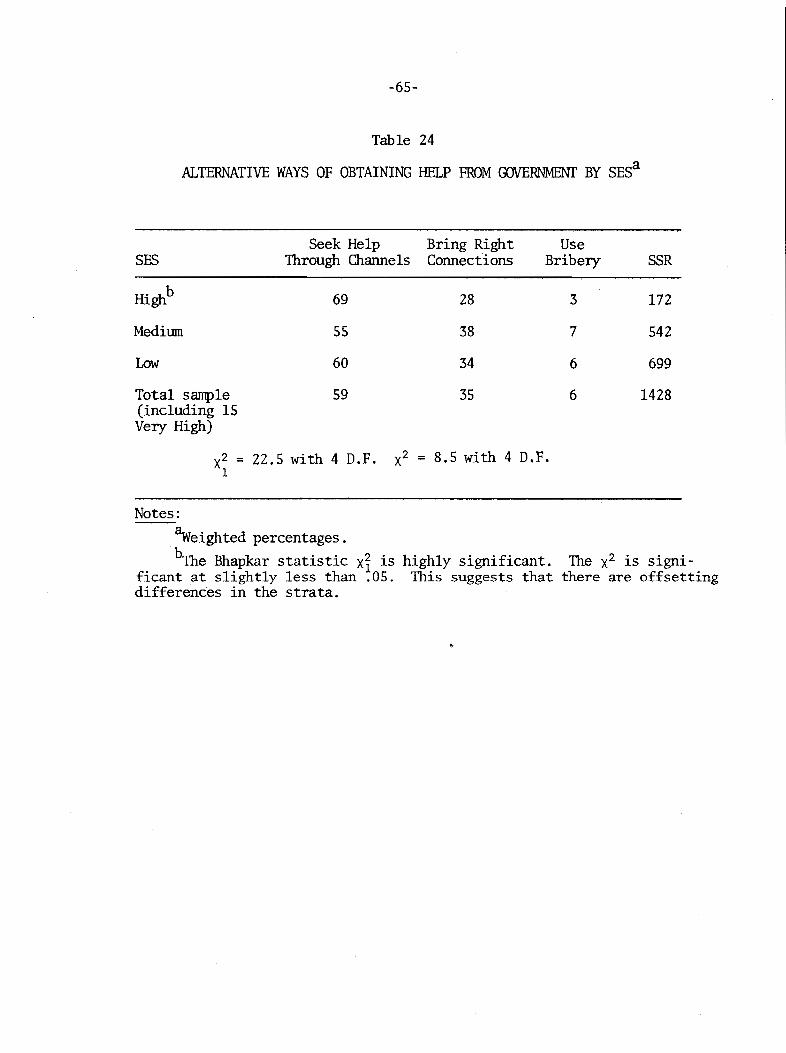
-65-
Table 24
ALTERNATIVE WAYS OF OBTAINING HELP FROM GOVERNMENT BY SESa
Seek Help Bring Right UseSES Through Charmels Connections Bribery SSR
Highb 69 28 3 172
Meditun 55 38 7 542
Low 60 34 6 699
Total sample 59 35 6 1428(including 15Very High)
x2 = 22.5 with 4 D.F. x2 = 8.5 with 4 D.F.1
Notes:
aweighted percentages.
bThe Bhapkar statistic xf is highly significant. The x2 is significant at slightly less than .05. This suggests that there are offsettingdifferences in the strata.
-66-
The Philippines appears to have a high percentage of political
'~articipants." In terms of non-participants1 the Philippines has
more than the United States and the United Kingdom and considerably
fewer than Italy or Mexico.
Participants can be "content" or "alienated." If a person is
aware of government impact and dissatisfied with that impact, then
he is "alienated." A larger proportion of Filipinos than of Mexicans
and Italians feel that the government has a strong positive impact on
life. At the same time, since the Philippines simply has many more
participants, it outranks either of these countries in terms of the
number of alienated persons.
In SlUn, for its level of development, the Philippines compares
favorably with other polities in transition to a "civic culture."
The general views of government and politics are not radically dif
ferent from those in other stable polities. There are, on the other
hand, large differences in perceptions by ethnic or regional groupswith Ilocanos and Muslims at the favorable end of the scale and
Manilans and Tagalogs at the other. Manilans, in general, tend to view
the political system, the government, and the legal system in far
darker tones than the rest of the population. This in tum may help
explain the pessimism expressed by foreign observers of the Philippines,
who rarely have access to systematic data about the country as a whole.
Filipinos express more pride in their governmental institutions
than Italians or Germans and considerably less than Mexicans. They
perceive graft and corruption to be prevalent, and many consider it
a major problem. At the same time they expect relatively equal treat
ment from government offices,2 believe the court system to be honest
and have moderately favorable views toward their law enforcement
agencies.
lAlmond and Verba, in The Civio Culture, use the tenn "parochial"for non-participant. A "parochial" is someone unaware and unconcernedabout the government.
2They rank well above Mexico in this regard.

-67-
. What these attitudes mean in tenns of desires for innovative
policy remains lUlclear. Signals from the people are ambiguous . Who
is reading them? How are they read?
The Perceptions of the Politician
The people demand honesty, but they also demand services that re
quire the use of influence. The people and the politicians appear to
be locked in a system frustrating to both. How then does the politi
cian view his constituents and his own lot? Why are Philippine poli
ticians in the business of politics? Certainly under the inconsistent
demands of this transitional but open society, the life of a politician
must be difficult and trying. What keeps politicians at their jobs?
Do they see any potential change in the Philippine system? Are they
themselves ready to be agents of change?
To obtain the answers to these questions we were able to obtain
a series of closed interviews with a randomly selected 'setof 66 out
of the 126 Congressmen and Senators. 1 This section uses the raw
questionnaires to provide a rough analysis of the perceptions of the
politicians, more specifically elected legislators.
First, whom do the people choose as their representatives? Fifty
five percent of our sample list the law as their profession. Engineers,
businessmen, and doctors accolUlt for about 8 percent. About SO percent
are over SO years old. Thirty-three percent list their father's
occupation as politician. But 29 percent give their father's occupa
tion as fanner or fisherman.
We can give these results some context by comparing them with
results from a similar survey of Colombian upper leadership, although
the Colorrbia survey sampled from the bureaucracy as well as the Congress.
In the Philippines, there is some flow of high-level bureaucrats to the
Congress, particularly the Senate. Table 25 shows the response to the
IThere are 62 Congressmen and 4 Senators in the sample.

-68-
Table 25
OCClJPATIONS OF POLITICIANS AND LEADERS
Philippine Colombian UpperCongress Leadership
1969 1965Profession No. Pct. No. Pct.
Businessman 7 11 17 13
Lawyer 37 56 58 45
Engineer/scientist 5 8 5 4
Doctor/dentist 6 9 13 10
Fanner 3 4 4 3
Journalist 1 1.5 5 4
Educator 2 3 3 3
Politician/public official 4 6 0 0
Others 1 1.5 25 19
bb 100 TID 100
-69-
question concerning occupation or profession. Roughly the distributions
for the Philippines and Colombia look similar.
Table 26 shows father's occupation for the Philippine Congress
and for the Colombian upper leadership. The JOOst striking difference
between Philippine legislators and the Colombian upper leadership is
the tradition of political families in the Philippines. About one
third of the legislators have fathers who were involved in politics.
Nevertheless, one cannot conclude that access to political office in
the Philippines is closed. Another third of the legislators list their
father's occupation as farmer or fishennan. Both of these responses are
ambiguous since they may refer to landowners and CMIlers of fisheries.
Sixteen .percent give businessman as their father's occupation. Tenta
tive1y , relatively low status groups are not being entirely shut out of
the political process.
What problems appear important to this set of Philippine legis
lators? How do their perceptions compare with the perceptions of their
constituents? Table 27 shows the comparative perceptions of legislators
and the people. Congressmen and the people rank general economic
problems in a similar way. 1 But even though the people and the Con
gressmen perceive these general problems, they do not believe that
solving them is the key to political success.
Table 28 lists the criteria Congressmen believe are important
in winning elections and compares them with the Pegasus replies. The
two predominant responses of constituents are honesty and specific
help given to the legislators' home areas. Legislators rank these
things in reverse order from their constituents. Although the
legislators recognize problems facing the nation as a whole at an
abstract general level, they feel that votes depend on the delivery
lWe have included the legislators' responses on the dissidenceissue because it looms so large in the eyes of U.S. decisionmakers.Dissidence was mentioned infrequently by the legislators relative tothe other items on the list.
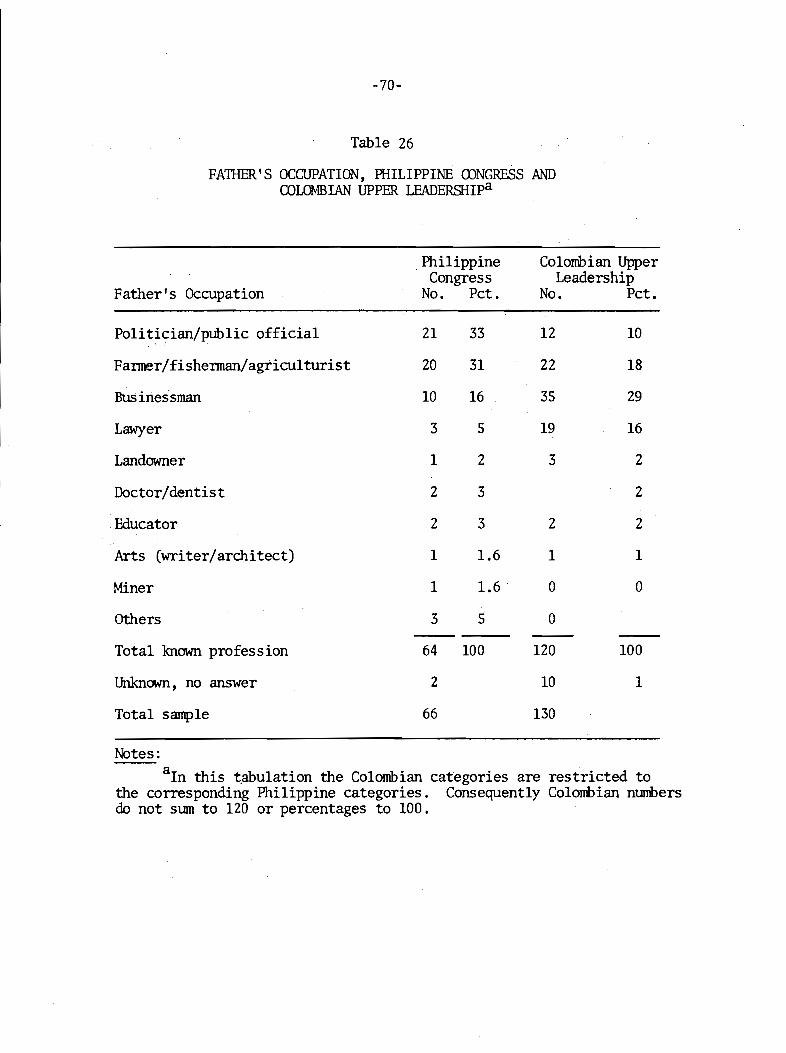
-70-
Table 26
FA1BER'S OCCUPATION, PHILIPPINE mNGRESS ANDCOLOMBIAN UPPER LEADERSHIpa
.Philippine Colombian UpperCongress Leadership
Father's Occupation No. Pct. No. Pct.
Politician/public official 21 33 12 10
Farmer/fisherman/agriculturist 20 31 22 18
Bus inessman 10 16 3S 29
Lawyer 3 S 19 16
Landowner 1 2 3 2
Doctor/dentist 2 3 2
Educator 2 3 2 2
Arts (writer/architect) 1 1.6 1 1
Miner 1 1.6 0 0
Others 3 S 0
Total known profession 64 100 120 100
UnknCM11, no answer 2 10 1
Total sample 66 130
Notes:aIn this ~abulation the Colombian categories are restricted to
the corresponding Philippine categories. Consequently Colombian ntunbersdo not sum to 120 or percentages to 100.

-71-
Table 27
PERCEPTION OF NATIONAL PROBLEM3a
Legislators Rank Order pe~asus RespondentsAll ean b Rank
Mean Response 1st Response Responses Response Order
Raising taxes 1.41Increasing General
exports economic 1 1 1.38 1High cost of issues
living 1.46
High crime rate 2 2 1.35 3
Rapid population growth 3 4 1.13 5
Widespread graft andcorruption 4 3 1.37 2
Dissidence or the HMBproblem 5 1.19 4
Treatment of minoritygroups 1.09 6
Notes:
~egasus respondents were given a closed question concerningproblems in the Philippines. They were asked to rank importance on athree point ascending· scale - - 0, 1, 2. Congressmen were asked thequestion: "What do you think is the most serious problem facing thePhilippines today?"
bFrom weighted percentages.

-72-
Table 28
PERCEIVED CRITERIA FOR WINNING ELECTIONSa
41
Criterion Percent First Responseb
Honesty/personal qualifications 28
Help given to area in past/publicimprovements and services
Pegasus(percent answering
Very Important)
92
67
Promised help to an area
Personal relationships, friends,money
Stand on issues
General policy (platform)
A particular party affiliation
Candidate's dialect same asrespondent's
4.5
3
3
3
7.5
1.5
33
16
61
34
51
Notes:aActual text of question for Congressmen: ''What factors do you
think determine the vote of your constituents?" Text for Pegasus:''Which of these factors is important in determining which candidateyou vote for?" Weighted percentages.
bA computation based on all responses does not change the predominance of help given to local area and honesty.
-73-
of specific resources to their constituents. Voters prize honesty in a
candidate, but they also prize services. That conflict can occur
between these two criteria is not recognized by either the people or
the politicians.
When asked why they enter politics S6 percent of these legislators
give public service as their first answer; and 17 percent respond to
gaining power and money or status and prestige. In second responses,
legislators list the protection of their awn interests frequently (26
percent of second responses).l The definition of public service must
inevitably take on a local, parochial flavor given the perceived need
to deliver local goods and services and given the need to protect one's
awn interests. There is dissonance between the listed needs of the
nation and the requirements of politics. To solve the nation's ills
it is conceivable that legislators would have to resist the constant
pressures for jobs and resources to the home district. But such re
sistance would not satisfy the constituents' voting criteria and would
nake incumbents vulnerable.
When Congressmen were asked whether or not they thought members
of Congress were oriented toward the achievement of specific programs,
they were ambiguous: 52 percent responded that most Congressmen were
interested in achieving specific programs, 24 percent said some were,
and 24 percent felt that few legislators were interested in specific
programs. These answers, too, can be placed in some context by a
cross-national comparison. For example, in a survey of the Connecticut
legislature, Barber notes the pronounced tendency of Connecticut legis
lators to direct interview discussions to specific legislation and
I " 2po Icy matters.
lA1legedly various important families or "blocs" attempt to havesome of their members in important positions as protective devi~es.
2James D. Barber, The Law Makeps, Yale University Press, New Haven,1965. See James L. Payne, Patterns of Conf1ict in CoZombia, Yale University Press, New Haven, 1967, p. 48. From Barber's presentation, Payneinfers that the largest single group in the Connecticut legislature isoriented toward programs. .
-74-
No such tendency toward concreteness can be observed with respect
to Philippine legislators. Table 29 presents the responses to the
question: What policies do you think would best advance the social
and economic development of the Philippines? We have classified the
responses according to whether they were specific or general and whether
they fell into the economic or social categories. The striking thing
about. the table is the dominance of the upper half. Policy is thought
of in terms of generalities.
To take a specific example, about 76 percent of the legislators
in our sample say they believe that the government should exert less
or much less control over the private sector. Yet the kind of legis
lation that passes is supposed to take the government into greater
regulation of the private sector. In May 1969 the Congress tmanimously
passed a basic national economic policy. The joint resolution estab
lishing the basic policy states: l
Every encouragement shall be given by the government toFiZipino private entrepreneurs in the establishment andoperation of basic and integrated industries. The prOfitmotive shall, however, not be the principal considerationof national decisions affecting the establishment, dispersal, and location of socially and economically desirablebasic and/or integrated industries.
Further on the legislators say:
Through direct inaentiveB~ Beleative tariff~ import aredit~
and foreign exahange reBtriationB~ the domestic marketshall be conserved and enhanced primarily for productsof local industries.
And further:
The disposition of the nation's foreign exchange shallbe subjected to a rigorous system of priorities.
To probe a little further on the program orientation of legislators,
two additional questions were asked:
ISixth Congress of the Republic of the Philippines, fourth session,Special Committee on Social and Economic Planning, Joint Resolution Establishing Basia Poliaies that Bhall Govern the Nation's Endeavor towardEaonomia DeveZopment and Soaial Justiae. Our italics in the followingquotation.
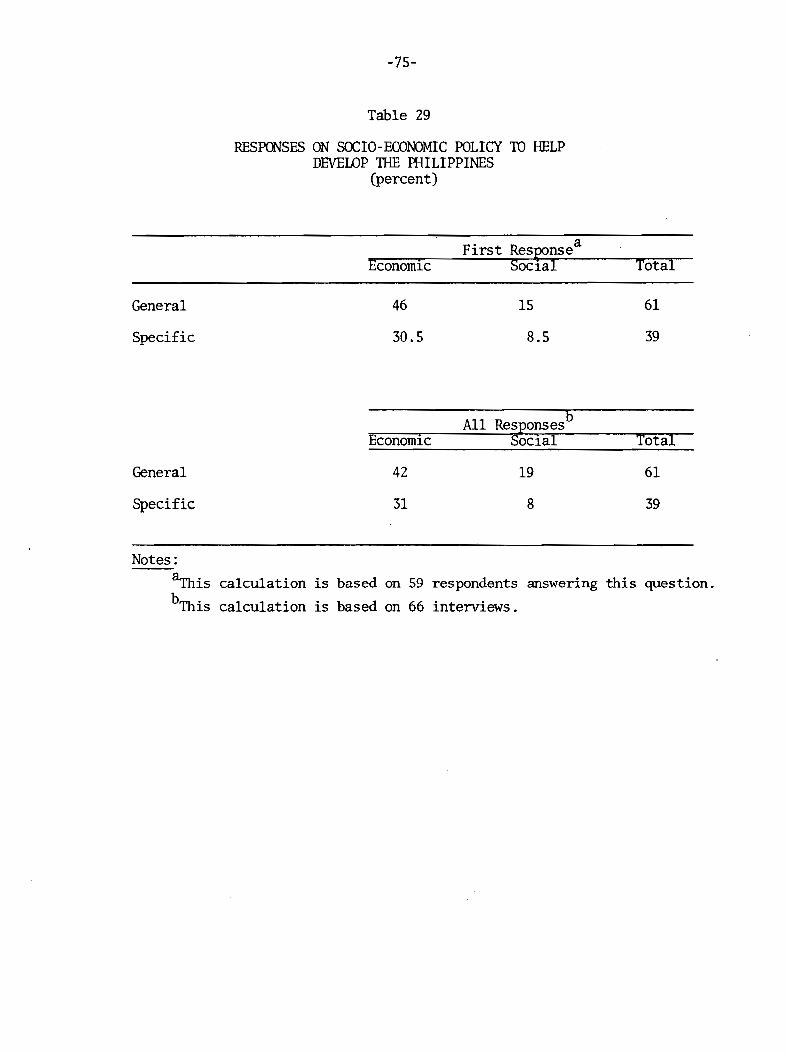
-75-
Table 29
RESPONSES ON SCCIO-ECONOMIC POLICY TO HELPDEVELOP THE PHILIPPINES
(percent)
General
Specific
Economic
46
30.5
First Res~nsea
15
8.5
Total
61
39
All Responsesb
Economic Social Total
General 42 19 61
Specific 31 8 39
Notes:
~isbTh ,
1S
calculation is based on 59 respondents answering this question.
calculation is based on 66 interviews.

~76-
(1) Do you have any specific economic policy in mind?
(2) If so, under what circumstances would you initiatesuch measures?
Of those who responded to the question on specific economic policy,
60 percent (26/43) again responded first with general policies. The
following is a verbatim list of first responses on specific economic
Policy.
More General
Economic independenceIndustrializationDevelop natural resourcesAgricultural developmentScience and technologyMore employmentMore distribution of wealthAgro-Industria1 developmentAgricultural productionExploit natural resourcesFi1ipinizationGive incentivesMagna Carta (refers to Joint
Resolution)DiversificationRegional development
More Specific
More private investmentMore exportsMore capital intensive industryMore taxesManufacturingEase creditTax exemptionImport controlMore production of prime commoditiesProtect new industriesMore government controlMore labor-oriented industriesInfrastructure program
Foreign exchange controlsEase foreign trade restrictions
When legislators were asked under what circumstances they would
initiate their preferred economic policies, there was a great tendency
to say that the policy was already being implemented. There was very
little explanation of procedural matters. Answers were extremely
diverse, but very few saw themselves as taking political action to get
bills implemented. One respondent replied, ''When I become speaker,"
another "depends on the President," and so on. Some legislators were
waiting for external events - - "the time the country is willing to
sacrifice," 'when people are willing to help," "under a Liberal admin
istration," l1executive-legislative cooperation."
These responses suggest again, that legislators see little payoff
in acquiring expertise on national policy issues. Legislation affecting
national policy is passed without intensive analysis or debate. This
behavior persists for two reasons. First, the infonnation necessary

-77-
for such debate or analysis is not generated by reporting agencies. l
Second, there is little incentive to become an expert on major techni
cal issues. There appears to be little demand for such expertise
from voters.
Most legislators believe that the current organization of Congress
is ''better than most." They have very few procedural changes to suggest.
The debates about structure and procedure that periodically rock the
U. S. Senate and House do not appear connnon in the Philippines. The
most common suggestion for improvement was that attendance be required.
On relations between the executive and the legislative branches,
nearly all the legislators felt that politics is "too prevalent in
government budget decisions." But most blamed the situation on the
executive with the legislative branch playing a passive role. A few
perceived that it was the negotiations over the budget that enabled
the legislators to deliver the services and resources ,that permit them
to play the game of politics.
We have no data on how specific budget decisions are reached. But
given these perceptions by the legislators it seems fair to credit the
folklore that jobs and resources are traded for department budget. 2
There will be enormous pressures on bureaucrats to allocate resources
in a local piecemeal fashion. On the other hand alleged political
interference with the executive is a connnon theme. Understandably
bureaucrats have to focus their energies where pressures are coming
from and in part they are coming from the legislators.
Do the legislators enjoy this political process? Of those re
sponding to a question on the personal enjoyment of politics, 40 per
cent answered no and about 10 percent said they both did and did not
enjoy politics. Of those who enjoyed politics, 53 percent gave
"serving the people" as their main reason. The answers from those
not enjoying politics were widely dispersed. Answers ranged from
ISee Chapter 5 for a discussion of information and decisionmaking.
2See below on the problems of bureaucrats facing Congressionaldemands.
-78-
"flUStrating," "too many social demands," •'duty ," "unrewarding," and
so on. When asked whether most Congressmen would prefer another
profession, 37 'percent of those responding said yes.
In sum Philippine legislators, like the people, present a por
trait of ambiguity and contradiction, which often goes unrecognized.
In practically the same breath a legislator can proclaim that he wants
a free market economy and a planned economy or a solution to dissidence
in Central Luzon but no interference with local political patterns.
Yet even if politicians were clear about conflicting objectives, theremight be no room for maneuver to achieve national objectives. So long
as local services are a major criterion for winning office, the best
information on economic and social problems will not suffice to solve
these problems.
The Perceptions of the Bureaucrats
In the last two sections we explored the perceptions of the people
and the politicians. Between them stands the bureaucrat who has to
run the government and operate its programs. We have already suggested
the constant political pressure facing the bureaucrats. Since the
Congress always passes a budget roughly three times the size of avail
able revenues, but appropriations never die, legislators spend much of
their time bargaining with and coercing the bureaucrats. l
With these manifold pressures and uncertainties, how does the
bureaucrat view his world? Unfortunately our data on bureaucrats are
lIn particular the political pressure is extremely heavy on theBudget Commission which has the duty to release funds to the lineagencies. Once funds have been released to the line agencies, thenthe politician has to see to it that the funds are actually expendedat a time he considers appropriate.
This is a difficult task because the typical line agency has verylittle knowledge of when an expenditure has actually taken place. Itis the local representative of the line agency who knows about expendi tures, but getting him to report to the upper echelons has been avery difficult task. And, in fact, what has happened is that ad hocreporting systems are generated in the government for particular areasof interest. See Chapter 5 for further discussion of these points.
-79-
not as fresh as our data on the people and the politicians. We had
planned to interview about SO bureaucrats, but various constraints
prevented this. We were able to obtain data on 120 bureaucrats from
an earlier survey, of higher civil servants, carried out in 1960 as
far as we can determine. 1
From a number of lengthy conversations with high-level bureaucrats
and from the press, we believe that the views of bureaucrats cannot
have changed very much, just as the behavior of politicians does not
seem to be undergoing radical change. Bureaucrats in the Philippines
have considerable longevity. Furthermore, there have been no radical
changes in the technology available to the bureaucrats until very
recently. Nor do bureaucrats appear to be a group actively in search
of innovation. Innovation in the bureaus implies some political up
heaval, and few bureaucrats are willing to risk their allocations for
the sake of efficiency. Although the means are now available -
through the computer -- for better corrnnand and control and for greater
efficiency, bureaucrats in general continue their traditional ways of
behavior. The situation may, of course, change rapidly, but this re
presents our best estimate and our experience as of 1969. 2
In any case, Table 30 shows the bureaucrats' beliefs about citizens'
respect for the government. We have cross-tabulated "respect" by type
of agency, since bureaucrats in agencies or bureaus that deal with the
public all the time should differ from other bureaucrats. Most of our
bureaucrats believe that citizens do not have a great deal of respect
for their government. And it is bureaucrats in the line agencies and
lSee Gregorio A. Francisco, Jr., Higher CiviZ Servants in thePhilippines, College of Public Administration, University of thePhilippines, 1960. The data were coded onto "unisort" cards permittingone way manual tabulations. Mr. Francisco kindly made these cardsavailable to us, and we converted them to a regular IBM card deck.Unfortunately, Card 1 of the unisort deck has been lost. It containedthe personal history and experiences of the respondents. Thus ourability to do cross-tabulations by bureaucrats' personal characteristicsand experience is severely limited.
2Some signals of change are observable in a few small groups inthe bureaucracy.
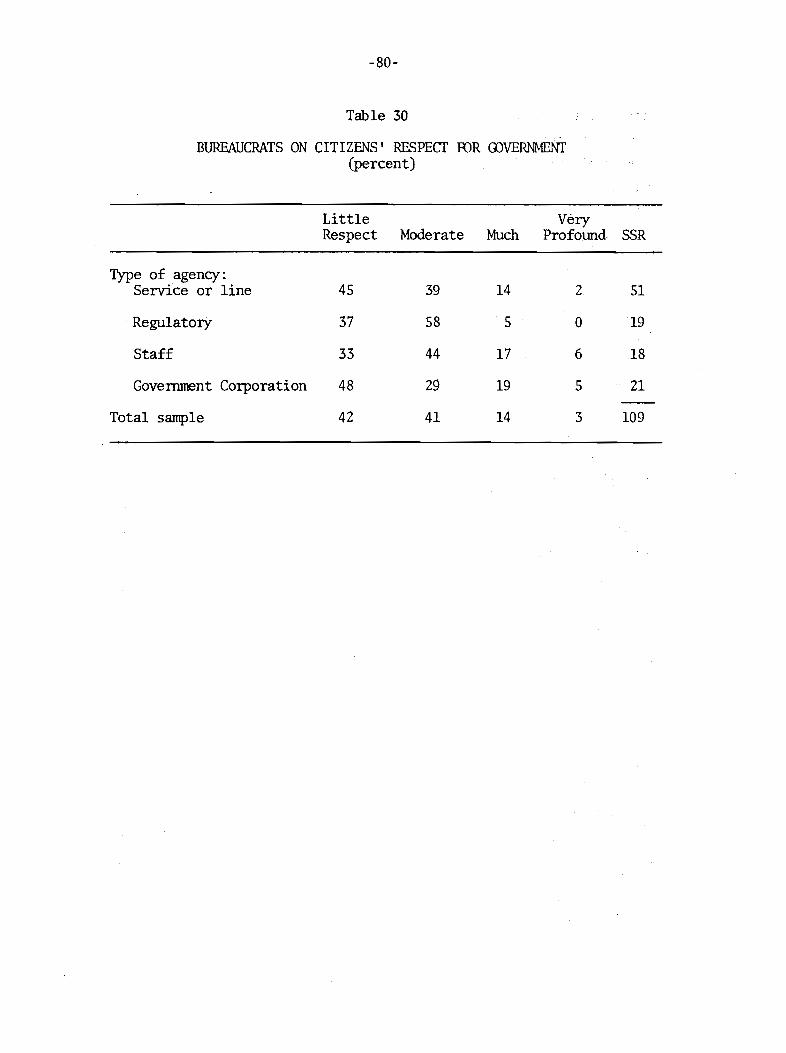
-80-
Table 30
BUREAUCRATS ON CITIZENS' RESPECT roR OOVERNMENI'(percent)
Little VeryRespect Moderate Much Profo\IDd SSR
Type of agency:Service or line 45 39 14 2 51
Regulatory 37 58 5 0 19
Staff 33 44 17 6 18
Government Corporation 48 29 19 5 21
Total sample 42 41 14 3 109

-81-
the government corporations who take the dinnnest view. When asked why
they believe the citizen lacks respect for the government, the bureau
crats respond with "graft and cornzption." Those giving a specific
response are shown in Table 31. The theme of graft and corruption is
a familiar one by now ..
Do the bureaucrats recognize their own role in the system of
influence and "graft and corruption?" Bureaucrats were asked what
a director would do if he had to choose between two economists applying
for a position. One candidate is minimally qualified, but is the
protege of a Senator. The second candidate, with excellent qualifi
cations, has only the support of a minor official. Thirty-six percent
of the respondents (44/123) thought the director would appoint the
Senator's candidate and about 64 percent (79/123) said the most qualified
candidate would be selected. Of those who thought that the Senator's
candidate would be chosen, 84 percent said that the director would have
to accede so as not to endanger his position and to avoid further poli
tical pressures. The other 16 percent said that their own personal
observations led them to the belief that the Senator's candidate would
be chosen.
When the bureaucrats were asked what would happen if the "most
qualified candidate" were to be chosen, of those responding (61),30
percent said that the director might lose his job or ruin his chances
for promotion; 16 percent said that the bureau's budget might be cut,
and that the director would lose favor with the Senator; and 36 per
cent said there would be increased pressures from the Senator to get
the post for his candidate. To avoid these pressures the bureaucrats
believe that they have to conduct personal screenings for high level
positions to discover the extent of contacts and to find ways aroundthe civil service laws. 1 .
Whenever political proteges do get jobs, the bureaucrats favor
keeping them on regardless of effectiveness. Either they would try
to retain them and give them some training, or reassign them, or give
ISee Francisco, Higher Civil Servants ... , p. 200.

-82-
Table 31
BUREAUCRATS' REASONS FOR CITIZENS' NON-RESPECT(percent)
Observed Heard Government DiscontentGraft- Graft- Failed &Economic
Corruption Corruption Expectations Plight SSR
Type of agency:Service orline 43 30 11 16 37
Regulatory 47 27 13 13 15
Staff 30 SO 10 10 10
GovernmentCorporation 45 18 18 18 11
Total sample 42 30 12 15 73

-83-
their work to others. Very few favor forced resignation or insti
tuting administrative charges.
Summary
The people, the politicians, and the bureaucrats seem to form
a stable, operating social system. The desires of these actors com
plement each other and perceived needs are satisfied.
Policy issues such as corruption or development programs elicit
ambivalent reactions from the people. They object to corruption in
the abstract but do not perceive that their demands for goods and
services may create it. They express dissatisfaction with the per
formance of the economy but provide few incentives to change that
performance. 1 Is this a system likely to change quickly? Where will
change come from? Major social reform in this system implies a chang
ing pattern of attitudes -- perhaps less willingness to live with
ambiguity and ambivalence -- and different signals to politicians and
bureaucrats.
ISee Chapter 5 where we shaw how the requirements for winningelections create an economy that lurches forward and backward.
-85-
Chapter 4
POLITICS IN THE PHILIPPINES
IN THE PHILIPPINES the orientation and motivation of politicians and
bureaucrats depend on their perceptions of popular attitudes, in parti
cular voter attitudes. 1 If politicians wish to remain in office very
long they have to respond quickly to their constituents' voting patterns
and motives. Indirectly, bureaucrats are subject to the same patterns
and motives because of their interactions with the politicians. To
obtain budget, executives and bureaucrats have to bargain with the
politicians . Frcrn the politician's point of view, programs, budget,
and talent have to be directed toward winning voter approval. If votes
are determined by pork barrel, politicians have every incentive to re
quire the delivery of "vote-getting" programs - - for example, increased
government employment -- rather than "growth-achieving" programs. The
attitudes of voters constrain Philippine decisionmakers.
If politicians and bureaucrats had systematic information about
voter attitudes and perceptions they might have more room for maneuver
IGovernrnent sensitivity to popular pressures obviously differsamong LOCs. '''The general picture that emerges ... is one in which theBrazilian government has had a substantial degree of autonomy from interest group or socia-economic class pressures in the making of economicpolicy." Nathaniel Leff, Economic Policy-Making and Development inBrazil~ 1947-1964~ John Wiley and Sons, Inc., New York, 1968, p. 4.On Colombia, Robert Dix states: ''The traditional parties have failedeffectively to adjust their own internal structures and patterns to apolitics where soaio-economic issues ~e central and the lawer andmiddle classes are potentially participants. The regime of the modernizing elite continues to lack the institutional channels through whichparticipation of non-elite groups can effectively take place." Colombia:
PREVIOUS PAGE BLANK
-86-
in achieving their own stated goals of rapid economic development and
industrialization. 1 They might be freer to "think about the tmthinkable"
in Philippine politics. They might be able to find winning combinations
and alternatives that are not apparent now. But it is true that the
political system has great inertia. And so in the Philippines we have
highly trained and skillful politicians, who know the difference between
rlletoric and substantive accomplishment, continually, and probably
correctly, choosing noise and rhetoric.
This chapter has one major objective -- to assess the prospects
for a Philippine politics oriented to performance and growth achieving
programs; that is, a politics where the requirements for winning elections
are different from and more "modern" than those discussed in Chapter 3. 2
More modern does not necessarily mean more stable, and there are
many properties of the Philippine social system that contribute impor
tantly to political stability, including ethnic affiliations and family
The Political Dimensions of Change~ Yale University Press, New Haven,1967, p. 413. (Our italics.)
lAlthough there is some scholarly literature on Philippine politics,no systematic analysis of voting behavior yet exists. The roots ofvoting behavior are usually found in cultural factors and tradi tions ,but these have not been systematically related to voting and politics.Often hypotheses about cJlture and politics are not tested rigorouslybut rest on impressions of data from small samples. The two standardworks are Carl Lande, Leaders ~ Factions and Parties: The Structure ofPhilippine Politics~ Yale University Press, New Haven,1965; and JeanGrossholtz, Politics in the Philippines~ Little, Brown and Co., Boston,1964. Lande argues that Philippine voting behavior and politics are related to cultural factors, but does not test the hypotheses. Voting,behavior is not discussed in the Grossholtz volume.
2The major requirements were general honesty, delivery of localgoods and services, and ethnicity. The perceptions of honesty, deliveryof services, and ethnicity appear to be related. Respondents, in Pegasusview local politicians as relatively more honest than politicians ingeneral. Also, groups that prefer "honesty" also prefer "pork barrel"and ethnicity . Robert Dahl observes, "I am inclined to think that theradical democrats who, unlike Madison, ins is t upon the decis ive importanceof the election process in the whole grand strategy of democracy are essentially correct ... the election is the critical technique for insuringthat govennnental leaders will be relatively responsive to non-leaders .... 'A Preface to Democratic TheoPy~ University of Chicago Press, Chicago, 1956p. 125.
-87-
traditions. lAn tIDSolved problem in LDCs is to get both stability and
modernization.
There are several questions concerning political modernization
that we need to pose for the Philippines. First, are the ethnic blocs
that appear so sharply in political survey data declining in importance?
Second, is the delivery of local services really a significant factor
in national politics? Given the general demand for goods and services
that we noted, one hyPOthesis of interest is that the ''}x>rk barrel"
allocations of contending parties, factions, and politicians cancel
each other out. Yet no one is able to stop the process because of the
fear that others will continue. Third, are there groups or individuals
with specific economic interests -- for example, the poor, tenants, or
the tmernployed - - who play or are coming to play a role in Philippine
elections? According to many sources, a modernizing polity becomes
rich in groups promoting their own interest. Individual voters in
those polities find their old values tmder pressure from their new. 2mterests.
The answers to these questions should give us a clearer picture
of the prospects for change and of the decisionmakers' room for manelNer.
We shall first examine some of the ecological correlates of voter pre
ference, as well as some of the individual ones. 3 We shall deal primarily
with voting at the national leveL But the national level and the local
level are interconnected, as we have already seen. The ecological
ISee B. Berelson, P. F. Lazarsfeld, and W. McPhee, Voting, Universityof Chicago Press, Chicago, 1954.
2The breaking of old political and psychological commitments andthe search for new ones has been termed "social mobilization." It is supposed to occur sinn.Iltaneously with economic development. But we cannotsay that it is necessary or sufficient or both. See Karl Deutsch,"Social Mobilization and Political Development," American PoliticalScience Review~ v. 55, 1961, pp. 493-514. See the elaboration by Samuel P.HLmtington, Political Order in Changing Societies~ Yale UniversityPress, New Haven, 1968, pp. 34-49.
~y ecological we mean attributes of groups or areas. See Doganand Rokkan, Quantitative Ecological Analysis ...
-88-
correlates are compared with the Pegasus results, earlier surveys,
and polling data on the 1965 presidential election.
Parties and Elections
A nationwide two-party system exists and persists. The Nacionalista
party (NP) was founded in 1907 when a munber of nationalist groups
joined forces. In that same year its members swept the first election
for the National Assembly. The Nacionalistas organized the National
Assembly and became the only organized political party from 1907 to
1946. Leadership of the NP fluctuated between Manuel Quezon and Sergio
Osmena after 1916. In 1946 the Liberal Party was formed under the lea
dership of Manuel Roxas. The issues leading to its spinning off from
the Nacionalista party were collaboration, Communism, and economic develop
ment. The Liberals won the 1946 election. 1 Roxas died in office and
Elpidio Quirino succeeded him. The Liberals won the 1949 election amidcharges of massive fraud. In 1953 the Nacionalistas offered their nomi
nation to Ram:m Magsaysay (Quirino' s defense minister), who was widely
credited with discovering and applying the methods that cured the I-MB
insurgency. Magsaysay was elected by an enonnous majority (about 67
percent of the vote). He died in office, and was succeeded by Carlos
Garcia in 1957. Garcia was then elected to the presidency with 43 percent
of the vote. In 1961 Diosdado Macapagal, a Liberal who had been elected
Vice President in 1957 with a larger vote than Garcia's, was elected
President. Macapagal in tum was succeeded by Ferdinand Marcos, origi
nally a Liberal who switched to the Nacionalistas. President Marcos was
a candidate to succeed himself. He was opposed by Sergio Osmena, Jr.
In 1969 Marcos became the first President to be reelected. 2
IThe Liberals refused to let several HMB members elected to Congresstake their seats. Among them was Luis Taruc, who led the I-MB insurgency until he surrendered in 1954.
2See Jean Grossholtz, Politics in the Philippines, pp. 14-47, fora brief political history. For a history by Filipinos, see T. A.Agonci110, A. M. Alfonso, History of the Filipino People, Malaya Books,Quezon City, 1968, 2nd ed.
-89-
Figure 9 shows the trends in percentage voter turnout and percent
NP vote for the elections since 1946. Turnout is consistently very
high. Voting at the presidential level has been fairly even with the
exception of Magsaysay's lopsided victory in 1953. Until Marcos no
President was able to succeed himself although all tried.
Voting procedure differs from that in the United States. After
he registers,l a voter on election day takes his ballot to the local
polling place (the poblacion associated with his barrio) and wPites
in the name of his preferred candidate. There are no preprinted
ballots. 2 A candidate with a plurality wins. There is no electoral
college. A candidate can get 95 percent of the vote of a given pro
vince and still not help his candidacy if the province has only a small
number of voters.
We are interested in explaining the variation in vote across the
nation and the determinants of total votes. For any given candidateor party we need to relate votes to socio-economic variables and alsoto individual characteristics. We can relate voting. to some ecological
variables such as pork barrel or ethnicity via regression analysis. 3
The results can be compared with the results obtained from survey data
to see if the same forces were operative. If they were, then we believewe have captured some important aspects of Philippine politics. We
should then be able to assess the prospects for political change.
lUp to 1965, a voter was required to register for every election -every two years. In 1965 a system of permanent registration was enactedbut it was not applied to the 1965 election. See Grossholtz, Politiosin the Philippines, p. 149, for a description of registration.
2After the disputed election of 1949, an independent Commission onElections (COMELEC) was established to conduct registration of votersand to tabulate and certify outcomes. At the close of an election,votes are counted, sealed, and forwarded to CCJ,1ELEC. With some lag,voting records are then compiled for the municipal, province, and citylevels.
3The dependent variables in the regression analysis are (dependingon data available for particular election years) voter registration, .
. voter turnout, and votes for specific parties or candidates. To normalize for differing populations in provinces, we have converted the dependent variables to percentages. The independent variables are castas percentages, per capitas, or 1-0 variables.
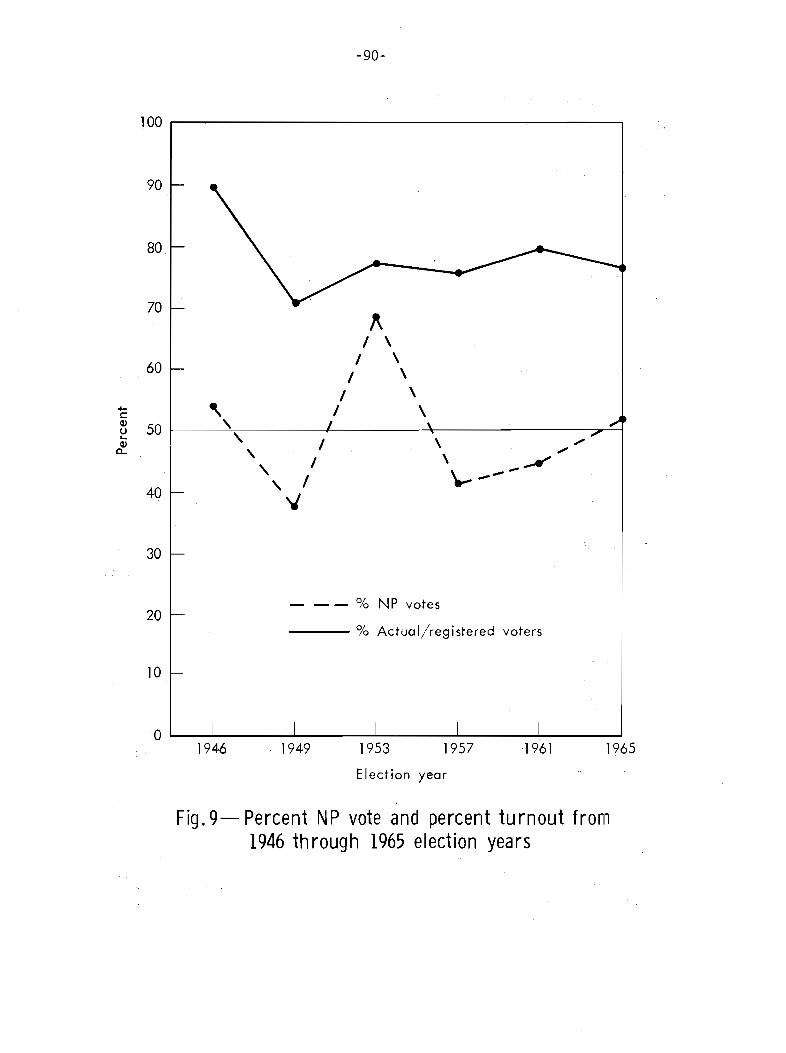
-90-
100 ,------------------,----'------,
"I \I \
I \I \
I \
70
40
80
90
60
1: ,~ 50 1----,~------I-----___\__'_---------,-7""""'_iQ) , I
a.. 'I
" I
"30
20- -- % NP yates
--- % Actual/registered Yoters
10
OL....-----l ---l.. --'-- ..J.....-__----l ---J
1946 1949 1953 1957 1961 1965
Election year
Fig. 9- Percent NP vote and percent turnout from1946 through 1965 election years
-91-
Regression Models with Socio-Economic Variables
We begin with an analysis of the 1965 election. The pattern of
the 1965 presidential election has helped to determine current govern
ment behavior and allocations. For the 1965 presidential campaign we
specified two alternative voting models containing ethnic, political,
and socio-economic variables. l The general features of these models
are sketched in Figure 10. The numbers in each circle refer to the
reasons cited below for including the variables in the specification.
Expected signs are shown on each arrow. The reasons for selecting
these variables were as follows:
(1) Ilocanos are alleged to constitute the most cohesive voting
bloc in the Philippines whenever the candidate is an Ilocano or comes
from an area near Ilocos. The NP candidate, Ferdinand Marcos, was a
very famous Ilocano. 2
(2) Muslims have been alleged to constitute a well-defined ethnic
and religious bloc, voting for incumbent administrations. And allegedly
large,.. scale vote buying occurs in some Muslim areas. 3
IThe fonnulation of the "socio-economic" model presented here waspreceded by some earlier models where we were forced to use proxies forpublic works expenditure. There were no easily available data on publicworks by province. In these early models we explored the effects ofunemployment. Any effect of unemployment in NP vote can be traced toParnpanga province, which reported 18 percent unemployed and gave Marcos15 percent of the vote. Almost the same can be said for tenancy.
2The Ilocano vote at Presidential level appears to be specific toIlocanos, not to parties. In 1953 when Ramon Magsaysay was the NP presidential candidate, the provincial mean percentage vote for Quirino,an Ilocano, was 32 percent. Quirino' s mean percentage vote in heavilyIlocano areas was 47 percent. Quirino received over 90 percent of thevote in the pure Ilocano provinces. Excluding Ilocos, Quirino' s meannational vote was 29 percent.
3According to personal sources in the Muslim area, the flow ofresources is to Muslim leaders who control votes rather than directly tothe voter. One hundred percent of Pegasus respondents in Cotabato saythey have never been personally offered money to vote for a particularcandidate. In Sulu 90 percent of the respondents gave the same answer.Only 83 percent of respondents in Ilongo and 71 percent in Samar saythey have never been offered money for their vote. The mechanism of votedelivery is alleged to be through bargaining between local Muslim leadersand the national politicians. Voters follow the preference of localleaders.

-92-
MODEL 1
MODEL 2
+
+
Fig.IO-Two alternative voting models
-93-
(3) Mayors are an important source of political control. The
mayor of a municipality is its most important official; he controls
-rnunicipal resources and personnel, he is immediately visible to con
stituents, and he is ranked as important and influential by voters. 1
(4) It has been argued that the poor in the Philippines always
vote for change, but no change occurs. And then they opt for more
change. It is often alleged that the poor in the Philippines are not
benefited by the economic and social structure. They therefore search
for a man or a cause to alleviate their grievances. If the poor are
really discontented and protest through their votes, there should be
a strong positive relation between NP vote and "poverty" in 1965 and
a negative relation in 1961. Aggregate or ecological measures of
poverty are scarce. For example, data on income distribution by pro
vince exist only for the year 1965. (We have used fraction of low
income families in a province - - fraction with less than 2000 pesos
income - - as a measure of poverty. But we can also test for a relation
through Pegasus and other survey data.)
(5) "Pork barre1,,2 is perceived as an important determinant of
voting behavior by the people, the politicians, and the bureaucrats. 3
If an inClDllbent administration has the means to control the allocation
of public works expenditures across provinces -- and that is a question
in the Philippines -- then it should be a determinant of voting behavior. 4
ISee Mary Ho11ensteiner, The Dynamias of Power in a PhiZippineMt.miaipaZity~ COIIIllW1ity Deve10pnent Research Cot.n1cil, University of thePhilippines, Quezon City, 1963. , Lande argues that the election of opposition governors in off-year elections signals the defeat of the incumbentadministration. But we should expect that mayors and governors will becollinear.
2"Pork barrel" in the Philippines refers to a specific, identifiable set of resources that politicians may allocate at their prerogative.However, all allocations of public works ftmds are subject to bargainingand coercion. See Ledivina Vidallon-Carino, The PoZitias and Administrationof the Pork BaPreZ~ Local Government Center, School of Public Administration, University of the Philippines, Quezon City, 1966.
3SeeC1lapter 3.
4past pork barrel, according to survey data, is more valuable tothe voters than promises. Thus, we do not expect any particular relation between pork barrel appropriations and voting behavior.

-94-
The results of fitting these weighted regression models are shown
in Table 32. 1 These equations suggest that ethnicity and political
control dominate Presidential elections in the Philippines. At this
level of aggregation the effects of economic variables cannot be de
tected. Even the role of pork barrel appears to be undetectable at
province level. The signs of the pork barrel relation in either model
are "correct" but the coefficients are not significant. The relation
between pork barrel and NP mayors is weak, although statistically signi
ficant. Only about 5 percent of the variation in pork barrel can be
explained. Nor is pork barrel significant in the voting equation. We
therefore adopt Modell. This is consistent with a "cancellation" effect,
the pork barrel being allocated to contending factions in a province. 2
But these are inferences based ·on ecological or' area relations. Are
the survey data consistent with these regression results? Regression
teclmiques are a very blunt instnunent to attack problems intimately
connected with attitudes. 3 Many times we shall be able to make direct
tests of relationships that regression could not reveal.
Ethnic Differences in Voting
Ecological regression models iJTIplicitly state that there are sig
nificant differences in individual political perceptions among ethnic
groups. Areas with high fractions of Ilocanos then tend to show up in
the regression as voting more heavily than the average for the NP can
didate in 1965 -- in this case a well-known Ilocano.
IThe reason for using weighted regression is that evaluated at themean of all the independent variables it gives us an estimate of thenational proportion for the NP plus a confidence interval. The weightsare the ratio of voting age population of each province to the totalvoting population in 1960.
2pB CAP, it will be recalled, IOOasures aotual public expendituresper capita by province.
~e models of voting behavior developed here do not predict whowill win an election but show provincial and regional differences invoting behavior. By pooling data for all years it might be possible toexplain variation over time, but we have not attempted this here.
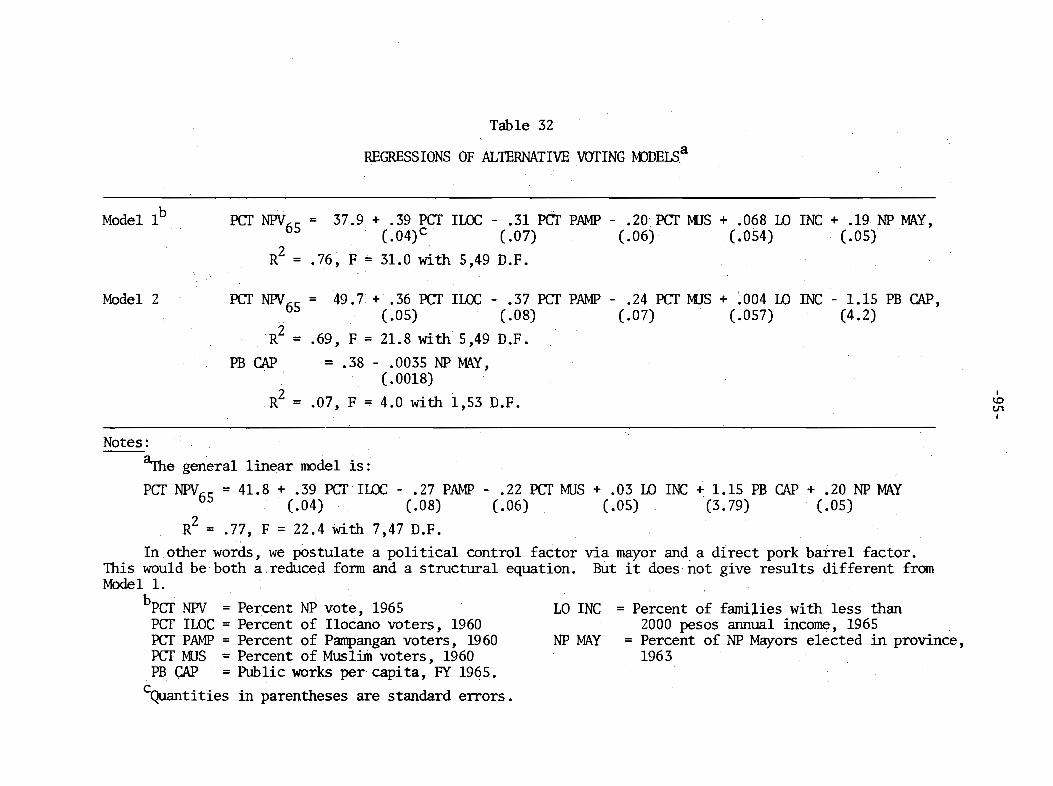
Table 32
REGRESSIONS OF ALTERNATIVE wrING tvODELSa
Model lb PC!' NPV65 = 37.9 + .39 PCI' lLOC - .31 PC!' PAMP - .20 PC!' illS + .068 10 INC + .19 NPMAY,. (.04)c (.07) (.06)' (.054) . (.05)
2 . . . .R = .76, F = 31.0 Wlth 5,49 D.F.
Model 2 PC!' NPV65 = 49.7 + .36 PC!' lLOC - .37 PC!' PAMP - .24 PC!' illS + ~004 10 INC(.05) (.08) (.07) (.057)'
R2 = .69, F = 21.8 with 5,49 D.F.PB CAP = .38 - .0035 NP MAY,
( .0018)
R2 = .07, F = 4.0 with 1,53 D.F.
- 1.15 PB CAP,(4.2)
I
1.0c.nI
= Percent of families with less than2000 pesos annual income, 1965
= Percent of NP Mayors elected in province,1963
LO INC
NP MAY
Notes:
~e general linear rodel is:
PCT NPV65 = 41.8 + .39 PCT lLOC - .27 PAMP - .22 PC!' MUS + .03 10 IOC + 1.15 PB CAP + .20 NP MAY. (.04) (.08) (.06) (.05) (3.79) (.05)
R2 = .77, F = 22.4 with 7,47 D.F.In other words, we postulate a political control factor via mayor and a direct pork barrel factor.
This would be both a reduce~ form and a structural equation. But it does not give results different fromModell.
bpCT NPV = Percent NP vote, 1965PCT ILOC = Percent of Ilocano voters, 1960PC!' PAMP = Percent of Pampangan voters, 1960PC!' MUS = Percent of Muslim voters, 1960PB CAP = Public works per capita, FY 1965.
cQuantities in parentheses are standard errors.
-96-
For the 1965 election we can check the implications of our regres
sion models. The following tabulations are from the 1963 IDLARS survey
cited in Chapter 3. The number of respondents in each region is small,
but the results are suggestive. The sample is designed to give regional
attitudes. In response to a question concerning the criteria for deter
mining a "good" candidate we have Table 33. Reasons for voting are
given in Table 34, and a question relating to pork barrel is shown in
Table 35.
In Table 33, Ilocanos in particular and residents of Central Luzon
in general define a "good candidate" as one who is sincere and keeps
his promises. A ''bad'' candidate in Ilocos is one who does not keep
his promises. The province of Nueva Ecija contained about 34 percent
Ilocanos in 1960, accounting perhaps in part for the similarity of
response on the question.1 Pampangans, at least here, appear to be
most like Ilocanos.
The Ilocanos say they turn out to vote for theip candidate (Table
34).2 And they display relatively more political sophistication or
perhaps cynicism than the rest of the country. Thirty-eight percent
believe that undertaking conmnmity development programs is a way of
buying votes, and 33 percent believe this is "good and natural" (Table
35). In the case of the "good and natural" response there may be an
economic factor involved. 3 The Ilocos, Bicol, and Ilongo areas are
IThis particular survey did not record the mother tongue of respondents . In mixed ethnic areas such as Nueva Ecij a we do not knowwhether we have a respondent whose IIDther tongue is Ilocano, Tagalog,or Pampangan. Similarly, in Cotabato in 1960 about 35 percent of thepopulation listed their religion as Muslim but the survey tmder discussion did not record religion.
2To a much lesser degree this is true of Pampangans, but this maybe because President Macapagal was a Pampangan. .
3Closed political surveys in the Philippines do not usually recordincomes, perhaps because of the time required to establish income fromall sources. The category socio-economic status based on housing type(SES) is a more accurate indicator of income than responses about income.About 32 percent of those in the lowest SES categories respond with"good and natural" compared with 23 percent for middle SES and 8 percentwith high SES.

-Table 33
REGIONAL CRITERIA FOR "COOD CANDIDATE", 1963(percent)
Greater OtherGood Candidate Ilocos Pampanga N. Ecija Tagalog Bicol Cebuano Cotabato Davao Ilongo Manila Cities
lhnest, htunble 14 3 36 42 39 49 53 35 23 '$7 41
Patient 0 12 4 12 12 2 0 2 8 21 11
Intelligent 16- 15 2 S 14 0 14 8 8 9 11I
Good leader 14 32 13 7 13 24 25 18 33 18 13\D-...:II
Keeps promises,~a ~ [illsincere 24 22 20 8 23 17 12 19
Helps poor 16 7 11 8 0 5 0 2 4 1 3
No liesLoyal to party 1 0 0 0 0 0 0 0 0 1 0
DK 0 0 4 3 0 0 0 12 6 0 3
55 104 60 56 119 109 S9 36 60 115 118 161
Note:
<i3oxes arOtmd numbers indicate deviant responses.
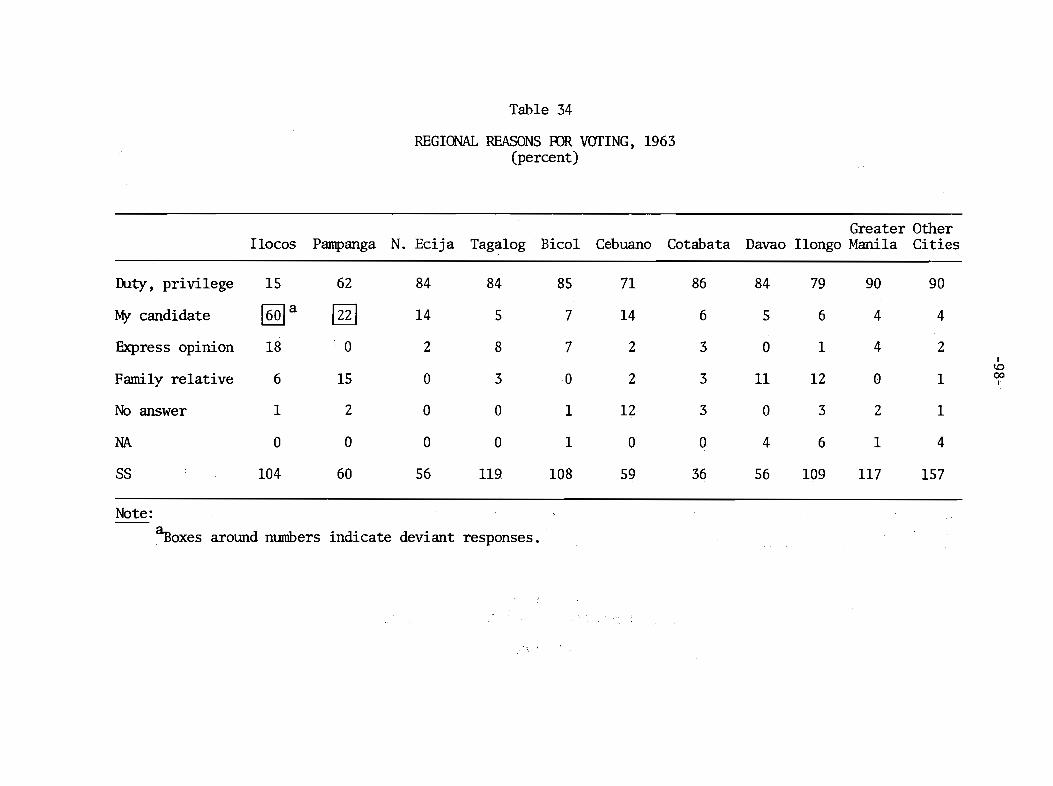
Table 34
REGIONAL REASONS ffiR VOTING, 1963(percent)
Greater Other!locos Parnpanga N. Ecija Tagalog Bico1 Cebuano Cotabata Davao !longo Manila Cities
futy, privilege 15 62 84 84 85 71 86 84 79 90 90
My candidate ~a em 14 5 7 14 6 5 6 4 4
Express opinion 18 0 2 8 7 2 3 0 1 4 2I
1.0
Family relative 6 15 0 3 0 2 3 11 12 0 1 00I
No answer 1 2 0 0 1 12 3 0 3 2 1
NA 0 0 0 0 1 0 0 4 6 1 4
SS 104 60 56 119 108 59 36 56 109 117 157
Note:
~oxes around numbers indicate deviant responses.

Table 35
ATIITIJDES TOWARD "COMMUNIlY DEVELOPMENf" BEFORE ELECTIONS, 1963a
(percent)
Greater OtherHocos Pampanga N. Ecija Tagalog Sicol Cebuano Cotabato Davao Ilongo Mani la Cities
(1),(2) ,(3) ,(4)b 24 60 59 40 28 66 52 48 49 81 58
Brings troublec 3 0 0 '- 0 0 0 3 1 0 1
Buys vote [illd 0 14 13 6 5 0 13 0 2 7I
~ ~ [m1.0
Good, natural 2 16 11 49 14 18 7 191.0J
DK 3 38 11 36 18 15 31 17 14 11 15
SS 104 60 56 119 109 59 36 .60 115 118 161
Notes:
aActual text of question: What can you say about the practice of engaging in "community development". before elections?
bResponses 1-4 have been combined, since they appear to be similar. They are (1) "illegal," (2) "shouldbe prohibited," (3) "bad," (4) "dirty."
cCornplete response is '~rings trouble since candidates will fight over certain projects."d ..Boxes arOlmd numbers indicate deviant responses ..
-100-
traditionally depressed areas. l Por example, in 1965 median family
income for the Philippines as a whole was 1648 pesos. 2 In Ilocos Norte
it was 1095 pesos; in Iloilo, an Ilongo province, it was 1315 pesos;
in Cotabato it was 1397 pesos.
What these data suggest is that there are indeed strong ethnic
factors in Philippine politics. The Ilocanos are consistently the IIDSt
deviant group and appear to be most prone to respond to "traditional"
politics. They appear to be a cohesive bloc trading their votes for
promise and delivery of material reward. Since other ethnic groups
do not appear to be as cohesive in their voting patterns, a candidatewho comes out of the Ilocos region with a very large majority stands
a good chance of winning the election.
The data also suggest weakly that the economically more stagnant
areas are the areas where the traditional pattern of trading votes forpork barrel or other material rewards is most prevalent. 3 . The McKendrys
and Guthrie also suggest this pattern in the southern Tagalog region.
In their study contrasting four stagnant towns to four "changing" towns,they found that persons in the stagnant areas tended to have a TIRlch
higher regard for traditional protective political relations than did. th ch· 4persons ln e anglng areas.
Polling Results
Table 36 shows the results of a poll taken in November 1965 just
before the election. 5 The percentages for each category saying they
were going to vote for the three candidates are cross-tabulated against
IPor a brief description of the Bicol area, see Tillman Durdin,"Philippine Region Pursues Progress," The New York Times, January 19,1969.
2Bureau of Census and Statistics, Special Tabulation, Survey ofFamily Income and Expenditure, 1965; courtesy of Census Director, T.Mijares.
3See the high frequency of "good and natural" for the Ilocos, Bicol,and Ilongo areas in Table 35 above.
4McKendry et al., The Psychological Impact ••• , p. ix.5IDLARS 416-59-0010.

Table 36
PREDICTED AND ACI1JAL VOTE BY REGION
November 1965 Poll Actual Pegasus 1969a
Macapagal Marcos Manglapus SSR Macapagal Marcos Manglapus Macapagal Marcos Manglapus SSR
Mus1imb 51 40 9 215 57 40 4 MUslim (Cotabato, Sulu) 68 32 0 89
Mindanao (Cebuano) 51 36 13 124 48 45 8 Cebuano 24 75 1 103
LeyteC 56 36 8 245 47 52 2 Samar 23 75 2 52
nongo 46 44 10 254 46 49 5 nongo 29 71 0 111
Bicol 43 43 14 148 45 50 5 Bicol 22 78 0 103
Southern Tagalog 37 S5 8 158 41 52 7 Tagalog 33 64 3 154
Bataan, ManilaBulacan 33 48 19 223 28 61 12 I
.......-a
Central Luzond 38 170 49 50 2 Pampanga 48 52 0 330
60 .......-aI
Mixed nocos 18 75 7 156 18 7ge 3· Pure nocos 2 99 0 183
Mean Percent 44 46 11 42 53 5
Percent DK14.35
Notes:
aOnly the Pegasus regions corresponding roughly to those on the polls are shown here. Weighted percentages.
bThis particular breakdown includes two provinces that have very low fractions of Muslims. Excluding these two, Macapagal had 60.3 percent ofthe vote, Marcos 36.5, and Manglapus 3. 3.
~is area is the horne of President Marcos' wife. Her family is very strong 'there which may account for the deviance of actual from predicted vote.
<\Jow Macapagal's horne province of Pampanga was weighted in the survey would be important in determining the survey outcome.
e Inthe pure Ilocano provinces Marcos received about 95 percent of the votes. If we use our regression model to predict the percentage \Totefor say, . the Mixed nocos region above we predict 77 percent for Marcos. Of course, we obtained this result after the fact.
-102-
region. We have also put the actual percentages recorded in the regions. 1
The results of this poll appear to be fairly good. The pattern of ethnic
voting is especially clear among Ilocanos and Muslims (as was suggested
from the regressions). The Ilocanos have their candidate and the in
cumbent administration entices the Muslim vote. In the waning days of
the campaign there seems to have been a shift from Manglapusto Marcos.
At the time Marcos was the perceived winner in the mass media, and the
shift from Manglapus was probably the result of some ''bandwagon'' effect.
The Manglapus supporters perhaps felt that they were throwing their votes
away since he appeared to be a certain loser.
Pegasus Results
We have one additional sourGe of survey material about political
attitudes by ethnic (regional) groups. Z Table 37. presents the Pegasus
mean responses to a question concerning crit~ria for a presidential
candidate. Ilocanos, Muslims, and Pangasinans value past aid most
highly among all groups, and they rank high in their valuations of
promises of aid. They also rank high on preference for a candidate who
speaks their dialect. Cebuanos, on the other hand, Who are alleged to
constitute a cohesive voting bloc on occasion, do not appear to be
significantly different from other groups. There was, of course, no
Cebuano candidate for President in 1965.
Again, these 1969 data suggest that traditional politics is still
very important. In the interval 1963 to 1969 there seernsto be little
change, al though as we shall show, a modern labor force was emerging
in the urban areas. 3 Ilocanos are high on dialect, pastaid~ and pro
mises of aid. The Muslim sample from Cotabato shows a high response on
past aid, which may explain their affinity for inctUnbent administrations.
lWe also show, for the selected areas, how Pegasus respondentsremember their voting behavior and the regression predictions.
ZIt will be recalled that most Philippine provinces are ethnicallyhomogeneous. For example, if we consider the pure Ilocos region -Ilocos Norte, Ilocos Stlr,and La Union -- 97 percent of the populationin these provinces gave Ilocano as their mother tongue in 1960.
3See O1apter 5.
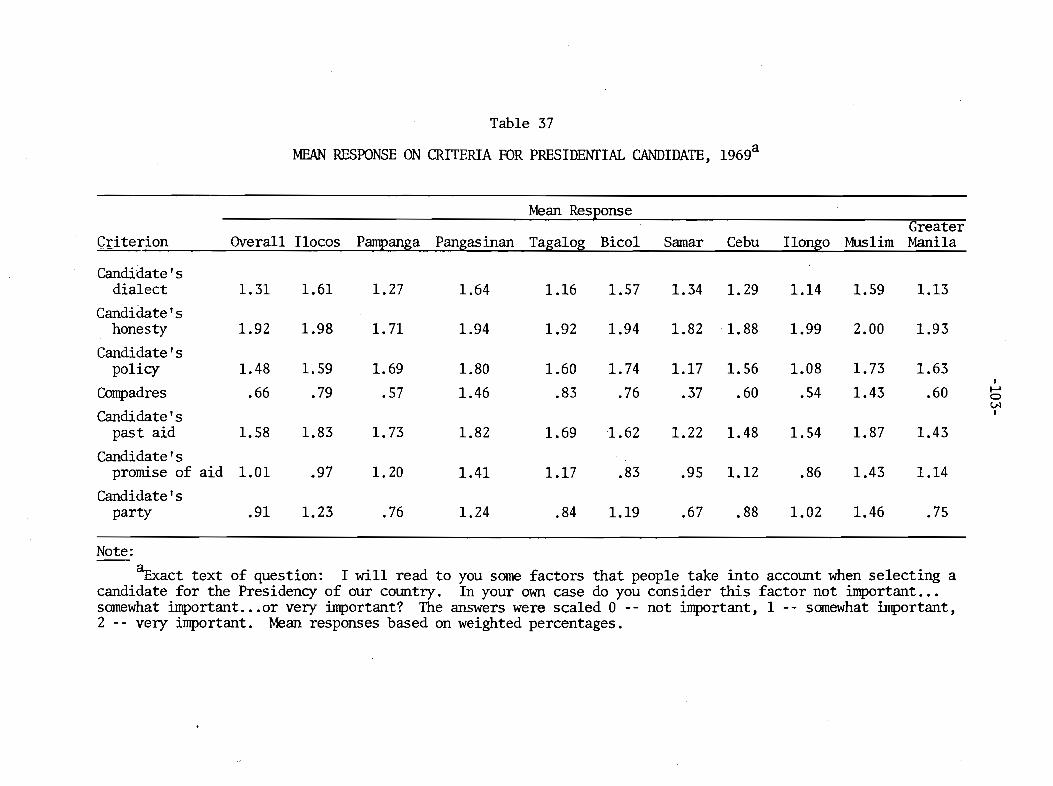
Table 37
MEAN RESPONSE ON CRITERIA FOR PRESIDENfIAL CANDIDATE, 1969a
Mean ResponseGreater
Criterion Overall Ilocos Pampanga Pangasinan Tagalog Bico1 Samar Cebu Ilongo Muslim Manila
Candidate'sdialect 1.31 1.61 1.27 1.64 1.16 1.57 1.34 1. 29 1.14 1.59 1.13
Candidate'shonesty 1.92 1.98 1.71 1.94 1.92 1.94 1.82 1. 88 1.99 2.00 1.93
Candidate'spolicy 1.48 1.59 1.69 1.80 1.60 1. 74 1.17 1.56 1.08 1. 73 1.63
I
Compadres .66 .79 .57 1.46 .83 .76 .37 .60 .54 1.43 .60 .....0t.M
Candidate's I
past aid 1.58 1.83 1. 73 1.82 1.69 1.62 1.22 1.48 1.54 1.87 1.43
Candidate'spromise of aid 1.01 .97 1. 20 1.41 1.17 .83 .95 1.12 .86 1.43 1.14
Candidate'sparty .91 1.23 .76 1.24 .84 1.19 .67 .88 1.02 1.46 .75
Note:
~act text of question: I will read to you some factors that people take into account when selecting acandidate for the Presidency of our country. In your own case do you consider this factor not important ...somewhat important .••or very important? The answers were scaled 0 -- not important, 1 - - somewhat important,2 -- very important. Mean responses based on weighted percentages.
-104-
Poverty, Tenancy, and Voting
Our regression analysis of 1965 voting patterns suggests that the
poor were not voting for change more than other groups. Table 38 shows
voter preferences in June 1964 and November 1965 broken out according
to socio-economic class (SES). Voter preferences are similar across
socio-economic classes. For comparison we also show the same election
viewed four years later. There is a general shift in favor of the
wimer, but again there is no difference by socio-economic class.
Table 39 shows a finer breakdown of the vote by SES and region.
Relatively poor and poor Ilocanos are overnhelmingly ~~or Marcos. Re
latively poor and poor residents of Central· Luzon are for Macapagal.
The poor and relatively poor in Muslim and Cebuano areas are for
Macapagal. In fact, without the heavy Ilocos vote Marcos would have
lost the election -- indicating again the importance of ethnic bloc
voting in the Phil ippines. In short, contrary to popUlar belief, the
poor were not discontented. They were voting for a continuation of the
status quo. But when poor Tloaano8 saw a chance to vote for their
candidate they seized it.
It is often argued that poor tenants in the Philippines are a
potential source of unrest. It follows that their attitudes and voting
patterns should be different from those of other voters. Our tabulations
indicate that most farmers in 1965 were strongly for the incumbent,
perhaps because of the passage of the land refonn code in 1963 and
hopes for its implementation.
Are tenants really different from other farmers? Do farmers differ
in their views from the non-farming population? Table 40 shows the
attitudes of tenants on Pegasus questions concerning national govern
ment. We have broken out tenants, fanners who are not tenants, and
the rest of the sample. By collapsing the tenant category back into
the fanner category we can obtain differences in rural versus urban
views.
The table shows farmers are different in one important respect
from the "urban" population. They have a more favorable impression
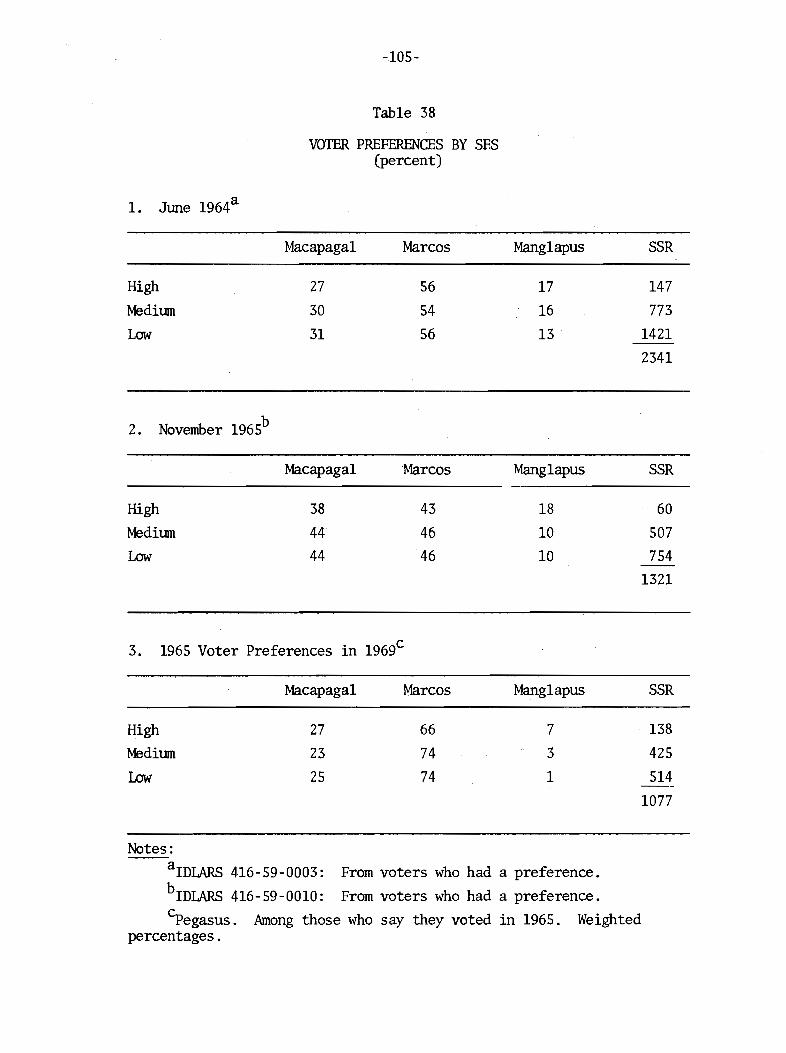
-105-
Table 38
VOTER PREFERENCES BY SES(percent)
1. Jtme 1964a
Macapaga1 Marcos Mang1apus SSR
High 27 56 17 147
Medium 30 54 16 773
Low 31 56 13 14212341
2. November 1965b
Macapaga1 Marcos Mang1apus SSR
High 38 43 18 60
Medium 44 46 10 507
Low 44 46 10 754--1321
3. 1965 Voter Preferences in 1969c
Macapaga1 Marcos Mang1apus SSR
High 27 66 7 138
Medium 23 74 3 425
Low 25 74 1 514--1077
Notes:arDLARS 416-59-0003: From voters who had a preference.
brDLARS 416-59-0010: From voters who had a preference.
Cpegasus. Among those who say they voted in 1965. Weightedpercentages.

-106-
Table 39
1965 PRESIDENTIAL PREFERENCES BY AREA AND SESa
(percent)
Macapagal Marcos Manglapus SSR
1cM SFS -- Relatively Poor
Hocos 14 78 7 56Central Luzon 56 44 0 95Bataan, Manila, Bulacan 31 52 17 112Southern Tagalog 45 51 4 51Bicol 43 40 17 30nongo 56 33 12 52Leyte 58 35 6 62Mindanao (Cebuano) 62 23 15 26Muslim 56 34 10 23
All relatively poor 44 46 10 507
All excluding Ilocos 48 42 10 451
lcMes t SFS -- Poor
nocos 18 74 8 77Central Luzon 66 28 6 50Bataan, Manila, Bulacan 31 46 23 26Southern Tagalog 31 61 8 61Bicol 42 42 16 94nongo 43 49 8 152Leyte 54 37 9 94Mindanao (Cebuano) 48 40 12 65Muslim 52 40 8 135
All poor 44 46 10 754
All excluding Ilocos 47 43 10 677
Note:aIDLARS 416-59-0010.

•
-107-
Table 40
VIEWS ON GOVERNMENI' OF TENANrS, FARMERS, AND NON-FARMERSa
(percent)
1. Politicians Greedy
None/Few Some Most SSR
Fanners (non-tenants) 23 46 30 133Tenants 7 62 31 138Non-fanners 16 45 39 1127
x2 = 33.1 with 4 D.F. x2 = 18.9 with 4 D.F.1
All Fanners 14 55 31 271Non-fanners 16 45 39 1127
x2 = 13.0 with 2 D.F. x2 = 12.2 with 2 D.F.1
2. Get Action from Government
No Yes SSR
Farmers (non-tenants) 40 60 105Tenants 48 52 113Non-farmers 50 50 1028
x2 = 8.18 with 2 D.F. x2 = 7.90 with 2 D.F.1
All Farmers 44 56 218Non-fanners 50 50 1028
x2 = 4.86 with 1 D.F. x2 = 4.5 with 1 D.F.1
3. Get Equal Treatment from Government
~anners (non-tenants)TenantsNon-fanners
x2 = 8.20 with 2 D.F.1
All FannersNon-fanners
x2 = .78 with 1 D.F.1
No
405445
x2 = 8.25 with 2 D.F.4745
x2 = .57 with 1 D.F.
Yes SSR
60 12646 10655 1010
53 23255 1010
Note:aweighted percentages.
BEST AVAILABLE COpy
-108-
of the politician than the rest of the population. And this argues that
the politicians are more able to satisfy the needs of the "rural" than
of the "urban" sector. Relatively more of the farmers and tenants believe
they can get action from the government. On equal treatment all farmers
and non-farmers (urban) are not different, but a large fraction of both
claim they cannot get equal treatment. In particular a majority of the
tenants claim that they can not get equal treatment. But this does not
seem to translate into a move from traditional voting criteria.
Table 41 shows the mean response on voting criteria used by tenants,
farmers who are not tenants, and the rest of our sample - - essentially
urban. Tenants do not differ from other fanners in the criteria they
use. They are essentially the traditional criteria of dialect and
past aid. There are strong differences, however, between the farm
respondents and the non-farm respondents. These differences may be
seen most clearly in Table 42 where we have aggregated all the farmers
and compared them with non-fanners. Non-fanners are much less oriented
to the criteria of dialect, past aid, promises of aid, party, and so
on.
But it is delivering aid that concerns decisionmakers and con
gressmen. This argues a certain lag in perception by decisiorunakers.
At least the question might be posed whether a specific appeal to the
non- farmers would have a payoff. As it is, political energies are
devoted to satisfying the desires of the farming population.
The Role of Pork Barrel and· Past Aid
We have seen from survey data that "past aid" is very important
criterion in voting. Yet it did not turn up as significant in our re
gressions - - as measured by public works per capita and local political
control, although there is a statistically significant negative rela
tion between NP mayors and public works per capita.
lSee Chapter 5 for a discussion of the emerging urban modern laborforce.
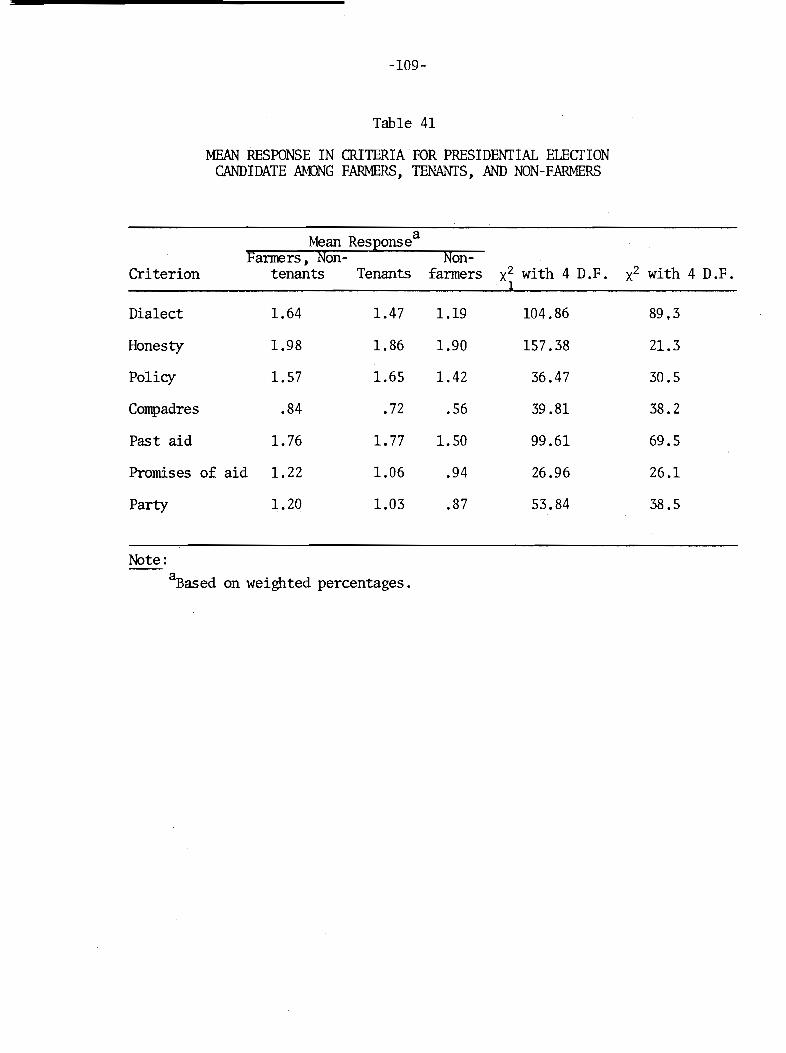
-109-
Table 41
MEAN RESPONSE IN CRITERIA FOR PRESIDENTIAL ELECTIONCANDIDATE MDNG FARMERS, TENANTS, .AND NON-FARMERS
Mean Responsea
Fanners, Non- Non-Criterion tenants Tenants farmers x2 with 4 D.F. x2 with 4 D. F.
1
Dialect 1.64 1.47 1.19 104.86 89.3
Honesty 1.98 1.86 1.90 157.38 21.3
Policy 1.57 1.65 1.42 36.47 30.5
Compadres .84 .72 .56 39.81 38.2
Past aid 1. 76 1.77 1.50 99.61 69.5
Promises of aid 1.22 1.06 .94 26.96 26.1
Party 1.20 1.03 .87 53.84 38.5
Note:
~ased on weighted percentages.
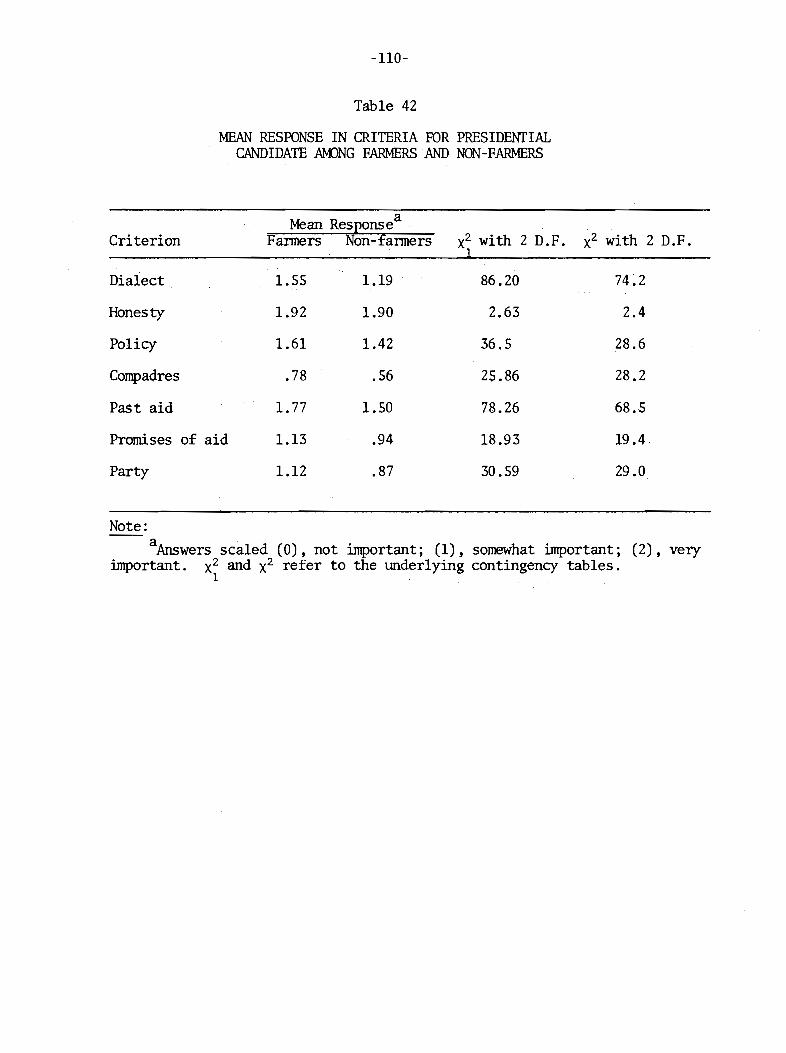
-110-
Table 42
MEAN RESPONSE IN CRITERIA FOR PRESIDENfIALCANDIDATE AMJNG FARMERS AND NON-FARMERS
Mean Responsea
Criterion Fanners Non-fanners x2 with 2 D.F. x2 with 2 D.F.1
Dialect 1.55 1.19 86.20 74:2
Honesty 1.92 1.90 2.63 2.4
Policy 1.61 1.42 36.5 28.6
Compadres .78 .56 25.86 28.2
Past aid 1.77 1.50 78.26 68.5
Piomises of aid 1.13 .94 18.93 19.4
Party 1.12 .87 30.59 29.0
Note:
aAnswers scaled (0), not important; (1), somewhat important; (2), veryimportant. x2 and x2 refer to the tDlderlying contingency tables.
1
-111-
Groups who prize honesty also prize past aid and the candidate's
dialect. Thus the effect of pork barrel may be taken up by ethnic
variables. That is, we suggest that ethnic voting patterns are based
on a cluster of attitudes. l
The correlation matrix of mean responses is:
1 2 3-1. Dialect 1
2. Honesty .58 1
3. Past aid .54 .58 1
When we include measures of ethnicity in provincial regressions we may
already be including whatever pork barrel effect there is. Another
possibility is that even though public works or pork barrel are theo
retically under the control of an incumbent administration,2 same allo
cations are attributed to the opposition. Hence regressions correctly
show no relation at province level. But this does not imply that
either side could stop allocating pork barrel without losing votes.
Congressmen and· Senators seem to know this. However, the data to pin
dCMIl this point 'do not exist. 3
Essentially our survey data confirm our regressions. Voting dif
ferences appear to be along ethnic lines with few differences along
IVidallon-Carino, The Politics ... , pp. 96-100. The promise of porkbarrel does not carry as IID.1ch weight as the delivery. This may help explain why the Philippines has a tradition of political families.
2The reporting system in the Departlnent of Public Works delivershighly aggregated information.. It often seems doubtful that incumbentdecisionmakers would know with any precision when and where the porkbarrel public works go.
3Por the period 1958-1961 we have a measure of the total NP porkbarrel appropriated to the provinces. The correlation between percentNP vote for President in 1961 and appropriated NP pork barrel percapita is - .01. On a per capita basis public works correlate well onlywith each other. Projects once begun have to be finished. On an absolute basis larger provinces (popUlation) get larger amounts of publicworks. Congressional and Senate appropriations per capita are allocatedto higher wealth and income provinces. Appropriations per capita fora given year correlate highly with those for earlier years indicatingno change in patterns.

-112-
class lines. Past aid and the ability to get it through local poli
tical control continue to win votes. Groups who are believed to be
different in their voting patterns, such as tenants, the poor, or the
young, do not appear to be so.l
Other Elections
The 1953 Election -- Magsaysay (NPl versus Quirino (LP)
The 1953 election, pitting a charismatic, popular hero, Ramon
Magsaysay, against an incumbent Ilocano, Elpidio Quirino, provides
another test of the ethnic components of our regression model. Here
it seems reasonable to use 1948 census data rather than 1960 data.
Unfortunately we do not have exactly the same data available in the
1948 census. Nor were the issues exactly the same. Tenancy was
allegedly a far more powerful issue in 1953 than it was in 1965. A
"people" measure of tenancy rather than areal measures is not avail
able for 1939 and 1948. We do have the percent of farm area cuIti
vated by tenants. This was used for 1953 and 1957. We have the
following weighted regression. 2
PCT NP V0TE53 = 69 - .27 PCT lLOCAN048 - .17 PCT MUSLIMS48(.06) . (.09)
+ .07 PCT TENANT FARM AREA48(.07)2R = .35, F = 8.1 with 3,45 D.F.
The ethnic coefficients as we now expect are impOrtant. Again
at the Presidential level: Ilocanos vote for Ilocanos irrespective
of party. Quirino was a Liberal. Marcos became a Nacionalista.
Furthennore, Quirino' s vote probably would have been higher in the
mixed !locano provinces except that Magsaysay himself was partly of
Ilocano extraction. And Muslims tended to vote for the inctmlbent ad
ministration in 1953 as well as in 1965.
lSee Chapter 5 for a discussion of the politics of the JOOdern laborforce.
2The weight is the fraction of voting age population in province in1948.
-113-
The role of tenancy in the 1953 election has been disputed.
Starner writes:
It is quite apparent from a comparison of the statistics••. that there is no correlation between the distributionof Magsaysay's voting strength in 1953 and the incidenceof tenancy either in the Philippines as a whole or inCentral Luzon specifically.l
Our weighted regression would tend to support this view - - pro
vided our measure of tenancy is accurate. Stamer attributes Mag
saysay's relatively poor showing either to his inability to reach the
peasant or to the peasant's unwillingness to listen to or believe
Magsaysay's appeals. The assl.ID1ption is that somehow tenants really
see or should see things differently or have different interests from
other Filipinos for 1953. There is no way to test the assumption for
1953. In 1969 we have seen that tenants do not really differ from the
rest of the population in their voting criteria. In any case, our model
only "explains" about 37 percent of the variance in the percentage vote.
And the history of the country at that time suggests there were many
issues that regression would not reveal.
The 1957 Election - - Garcia (NP) versus Yulo (LP), Manahan, and Recto
Practically all knowledgeable observers agree that Magsaysay would
have been re-elected, avoiding creation of the recent myth that no incum
bent President can have more than one term. After Magsaysay's death in
March 1957, Vice President Carlos Garcia, a Cebuano, succeeded him.
He became the Nacionalista candidate in 1957. Arrayed against Garcia
were three distinguished Senators, Yulo, a Tagalog; Manahan, an Ilocano;
and Recto, also a Tagalog.
The 1953 model fitted to the 1957 election, but including Cebuanos
in 1960 and Tagalogs, gives the following weighted regression:
lFrances Lucille Starner, Magsaysay and the PhiZippine Peasantry:The Agrarian Impact on PhiZippine PoZitics, University of CaliforniaPublications in Political Science, Volume 10, University of CaliforniaPress, Los Angeles, 1961, p. 67.
-114-
PCT NP V0TE57 = 39 - .06 PCT ILOCAN048 - .15 PeT TAG + .32 PCI' CEBUAN060(.06) (.04) (.14)
+ .10 PCT MJSLIM48 - .25 PeT TENANCY AREA48(.10) (.38)
2R = .76, F = 27.2 with 5,43 D.F.
Tenancy is again not significant. As expected, the residuals in
the Tagalog areas are strongly negative with the largest ones appearing
in Lagtma, the home province of Yulo, and Quezon, the home province
of Recto. l The residual for Bohol, Garcia's home province, is strongly
pos i tive . The other Cebuano areas are also pos i tive . Ilocano areas,
a1though not significant in the equation, have negative residuals. And
the Muslim areas have positive residuals. Again we have an equation
that "explains" the vote in terms of ethnic factor. 2
The 1961 Presidential Election -- Garcia (NP) versus Macapagal (LP)
The 1961 election does not differ in any great respect from the
elections we have examined earlier. It appears to be a straight ethnic
battle -- Ilocanos versus Cebuanos. 3 Muslims are not significant, but
Lanao Sur which is 69 percent Muslim had to be excluded, because data
were unavailable. NP governors are not significant. Unfortunately we
were unable to obtain data on NP mayors elected in 1959. The explanatory
power of the model is somewhat less than the model for 1965 where we have
data on mayors. Our equation for 1961 is:
2R = .64, F
= 41.3 - .14 PCT ILOCANOS60 + .21 PCT CEBUANOS60(.05) (.03)
+ .06 PCT MJSLIMS + .73 NP GOV59(.08) (2.2)
= 19.5 with 4,44 D.F.
lA residual is the difference between an observed value and apredicted value.
2Provinces in the main are homogeneous with respect to ethnicity ,avoiding some of the pitfalls of the ecological fallacy.
1.1acapagal is a Pampangan. His wife is an Ilocano. The hypothes isthat Pampangans are not liked by the rest of the population does notseem to be borne out by the voting data. Or at least in the IlocosMrs. Macapagal was sufficient to overcome the alleged handicap of Pampangan extraction. Macapagal's mean percentage vote in Ilocos was 71.
-115-
A Note on City Voting
It is customary in the Philippines to tabulate votes in Chartered
cities separately from the vote in provinces. Vote in provinces is
essentially the aggregated nnmicipal vote. We retained this conven
tion in our analysis, because we believed that the vote in cities was
determined differently from the vote in the barrios and municipalities.
However, if we include the cities in the province vote the correlation
between percent NP both with and without the cities is .998.
When ethnic data in cities became available we were able to fit
models that were very similar to the province models. l The city
equation is:
PCT NP CIn VOTE65 = 48 + .55 PCT ILOCAN060 - .22 PCT PAMP60(.18) (.09)
- .04 PCT MUSLIM60 + 2.15 NP MAYOR2
(.06) (1.16)
- .60 GOV. AID/LOANS PER CAPITA(.60)
R2 = .43, F = 4.5 with 5,30 D.F.
Essentially then the same models hold for cities as for provinces,
a1though their explanatory power is lower. 3
Prospects for Political Change
Through regression and through survey data we have seen that the
major variables important in national elections relate to ethnicity
and to the ability to create local political control and to deliver
local resources. We have not been able to find voters with a "modern"
lEthnic data on cities came from our tabulations of a 1/2 of 1 percent sample of the 1960 census. These data were made available throughthe courtesy of Dr. Mercedes B. Concepcion, Univers i ty of the Philippines.
2This variable is defined as 0 for an LP mayor, 1 for a NP mayorelected for the first time, 2 for an NP mayor who is re-elected.
3Provinces and cities might be pooled to create a greater numberof observations.
-116-
orientation. l Voters in the modern labor force discussed below are
the single exception. In countries where people's opinions matter a
"modern" voter may be necessary for economic transformation. 2
What do our Pegasus results tell us about the prospects for poli
tical change in the Philippines? In general it is the groups ranking
lowest in SES -- the poor -- that use traditional criteria in selecting
their candidates -- honesty, of course, and language, and past aid to
the constituent's area. The lowest SES groups rate candidate's general
policy as less of a criterion than does the high group. And they value
the opinions of their friends more highly than does the high group.
Party ranks low with all groups as an important criterion, but its
standing anx:mg the lowest SES group is a l:i,. ttle higher than with other
groups. The lowest SES groups exhibit the most traditional behavior,
and it is difficult to see them as a source of political change. Although
the high group appears to be different from the others, it is not all that
different. In general, it is hard to see demands for performance arising
from cleavages by social class.
What about cleavages by economic class? If we cross tabulate the
criteria for presidential and mayoralty candidates against occupational
groups -- professional, white collar, farmer, ''modern'' blue collar and. 3
non-modern blue collar -- only a few differences currently emerge.
lIf we examine the vote for Manglapus' third party (PPP) in 1965,we can find a significant correlation (+.27) between PPP vote and thefraction of modem labor force in a province. Fraction of modem laborforce is co-linear with fraction of low income families and with tmemployment rate. According to our survey data, Manglapus was relativelypopular with professionals, white collar workers, and the "not gainfullyemployed," which are correlated with the ''modem'' labor force. Andour factor analysis in Chapter 2 suggested that "modern" areas vote alittle differently from traditional areas.
Yet the PPP vanished after 1965. Although Manglapus has tried torevitalize his supporters through the formation of the Christian SocialMovement, it does not, at this time, appear to be a political force.
2paul Hammond of Rand suggests that political and economic development often occur with social mobilization that is nationalistic,emotional, and xenophobic. Greater Manila does have some xenophobia,but we found little elsewhere in our travels through the Philippines.
3See Chapter 5 for a discussion of the politics of the modem laborforce.
-117-
If there is an emerging modern voter he should be found concentrated
among the younger voters and those who are mob ile. Our analys is shows
no strong difference emerging between younger and older voters. l If we
cross tabulate voting criteria against migrant/non-migrant status, no
modern orientation appears.
In general, whichever way we look at voters they prefer generalized
honesty, past aid, and a candidate who speaks their dialect. No voters
appear to be demanding a different kind of politics. 2 And without such
a demand, as we have noted, it is very difficult for any politician
anywhere to be an innovator. Politicians in the Philippines do not
have the ideal that someday their ideas may become embodied in the
values of the poli ty .
As far as our data take us, the prospects for dramatic political
change in the Philippines do not seem bright. It is not clear that
dramatic political change is required. Change may be inchoate, and
our measures may have failed to pick up an incipient change. Changes
in voting behavior are particularly hard to perceive when the choices
offered the voters do not really differ. But our best estimate is that
the structure of electoral politics will remain roughly the same, because
it satisfies the mutual needs of the participants.
lAt least in 1965, young voters (21-29) had a slight preferencefor Macapagal. Marcos scored most heavily with those in the 30-44 agebracket. IDLARS 416-59-0003.
2We did not ask whether people would prefer a xenophobic, nationalistic policy. But in a 1964 survey on student and non-student attitudesvery little xenophobia was present. For example, when asked whetherthe United States is too much on the side of change in the Philippines,too much for the status quo, or about right in its attitudes, 34 percentsaid the United States was too much for change, 13 percent said too muchfor things as they are, and 53 percent said U. S. attitudes were justright (458 respondents). IDLARS 416-59-0001.

-119-
O1apter 5
1HE LURCHING ECONOMY
ALTI-IOUGH IT IS HARD TO FIND EVIDENCE of rapid political change in the
Philippines, economic growth is proceeding at a respectable rate and,
as we will see, is spread broadly across the country. Paradoxically,
though, the image of the Philippines as a nation muddling along in the
face of crisis is drawn at least as much from dissatisfaction with the
perfonnance of the economy as it is from criticism of the political
system. Criticism centers on high unemployment, an inadequate rate
of growth of GNP accompanied by an exploding population, the erratic
lurching of the economy, and the periodic balance of payments diffi
culties. These are alleged to be elements of the simmering social
volcano. In the face of such problems the government appears to
hesitate and vacillate. l
The supply of economic crises of all types -- immediate, long
TIm, recurring -- is nearly inexhaustible in the Philippines. Many
proclaimed crises, however, reflect little more than the realization
that the country is poor. By .American standards, most people aPe
poor, badly housed, and badly fed. The population is growing rapidly,
and unemployment i8 higher than in developed countries. Income i8
distributed very unequally by the standards of Europe and North
America; upper-class homes contrast sharply with squatters' shacks
not far away. To announce that these conditions represent crisis is
easy. It does not, however, contribute ITUlch to the design of policy.
ISee Mecklin, in Fortune, July 1969; Reischauer, in Gordon, ed.,Agenda for the Nation.
PREVIOUS PAGE BLANK
"
-120-
The resources the government can connnand - - both financial and
administrative -- are limited. To allocate those resources effectively,
policymakers need to be able to sort out the problems that must be
attacked today from those that can wait a year, a decade, or a gener
ation. If every aspect of the nation's poverty is taken to represent
a crisis, then this sorting out is impossible.
Although proclamations of crisis are connnon, it is unusual for
them to be accompanied by specific programs to alleviate the crisis.
Usually the crisis is seen as justifying a call for fundamental reform
when, in fact, some specific incremental measures would be quite able
to cope with the problem. But devising specific measures well-tailored
to the shape of problems is difficult unless the programs are well
understood, while one can call for "ftmdamental restructuring of
social institutions" without understanding the problems at all.
"Well understood" is vague language. When is a problem under
stood well enough that a policymaker call decide intelligently? The
answer obviously depends on what the decision is. CDSPLAN requires
more detailed information on the ftmctioning of the Soviet economy
than the Council of Economic Advisors needs to suggest U.S. macro
economic policy. Sensible policyrnakers may do well with only modest
information. 1 So we must be careful about making a priori judgments
that the information available for decisions is "adequate" or
"inadequate."
Nonetheless, the problem of improving the flow of organizational
intelligence and tightening the articulation of information and analysis
with policymaking appears to be a necessary but not sufficient con
dition for improving the performance of the Philippine government.
Since this is not a proposition that can be tested a priori, we shall
IFor general arguments that decisionrnakers can, do, and shouLdftmction without attempting to gather complete information see DavidBraybrooke and Charles E. Lindblom, A Strategy of Demsion3 The FreePress, Glencoe, 1963. For an empirical study of successful use ofcrude information see John E. Koehler, Economic PoLicymaking withLimited Information: The Process of Macro-ControL in Mexic0 3 TheRand Corporation, RM-S682-RC, August 1968.
I-121-
proceed by examInIng several alleged crisis areas -- unemployment,
stagnation, the unevenness of growth -- and asking, ''Would fine-grained
analysis of these problems change perceptions, toss up politically
feasible alternatives, or squelch proclamations of crisis?"
As we shall see, crises do look different when they are examined
closely. Sharpened perceptions, however, are not likely to change
the behavior of the Philippine political system substantially. As we
saw in Chapters 3 and 4, the Philippine political system satisfies the
needs of the participants. It is not enough that people and politicians
perceive their problems better. If votes continue to be determined by
ethnic patterns and the delivery of favors and jobs, we should not be
surprised to find politicians spending little time addressing more
general issues. If politicians fail to address program issues relating
to the alleged crises facing the Philippines, an air of ineffectiveness
and delay follows naturally.
Unemployment: A Crisis Misperceived
The Image of Unemployment
The unemployment crisis is a constant theme in the Philippines.
A recent report of the Congressional Economic Planning Office, in a
catalogue of the ills of the country, called attention to:
A deteriorating unemployment situation which now finds onemillion of the country's labor force fully unemployed andapproximately seven million of said labor force in a condition of underemployment and disguised unemp1oyment. l
The problem is not new. Ex-President Macapaga1 noted in his
memoirs:
Unemployment has been ominously serious in the Philippinesfor too long a period. The employment opportunities areunable to catch up with the increase in the labor force.The youth come out of colleges and universities only to
1Quoted in The Manila Times, February 22, 1969, p. II-a.

-122-
JOln the "intellectual lIDemployed." A total of one anda half million lIDemployed and over two million underemployed would be a fair figure out of the divergent andinaccurate statistics on lIDemployment. l
The response of the Macapagal administration to the unemployment crisis
was the Emergency Employment Administration, which expired lIDder a
cloud of scandal in 1966.
The Magsaysay administration, too, confronted the crisis. Esti
mating that approximately one half of the Philippine labor force was
unemployed, Magsaysay promised that the criterion of the economic policy
of his administration would be the reduction of lIDemployment. 2
Judging from the rhetoric, Filipinos' image of their lIDemployment
crisis is a mixture of Nurkse, Agee, and Dickens: A family's bread
winner tramps the streets of Manila looking in vain for work; yOlIDg
men just out of college and high school, having searched for jobs for
months without success, succumb to left-wing rabble-rousers; farmers,
having nothing to do except at planting and harvest, sit idly most of
the year, gossiping, smoking, grooming their birds for SlIDday'S cock
fight. Images like these seem to underlie the pronouncements of crisis.
If the images truly reflect reality, then the Philippines may indeed
face economic crisis, although perhaps we prefer not to call a perma-
.nent fixture of the landscape a "crisis." But the images, by and large,
are inaccurate. That they are inaccurate could have been known more
than a decade ago.
The Structure of Unemployment
There is no shortage of raw data on lIDemployment. Since 1956 the
Bureau of the Census and Statistics (BCS) has conducted large sample
surveys of households twice every year. The sample design has been
judged to be quite good, although there have evidently been problems
lDiosdado Macapagal, A Stone for the Edifice, Mac PublishingHouse, Manila, 1968, p. 189.
2See Frank Golay, The Philippines: Public Policy and NationalEconomic Development, Cornell University Press, Ithaca, 1963, p. 227.
-123-
with maintaining control of the field staff. l Defects notwithstanding,
the surveys are a rich source of infonnation on the labor force and
could have illuminated the questions: Who are the tmemployed? Where
are they? What are they like?2
These are the questions whose answers would have to tmderlie any
sensible program to alleviate the crisis of tmemployment. If the tmem
ployed are mostly urban females older than 40, a program of construction
of feeder roads in the wilds of Bukidnon will obviously have little
impact on 1.D1employment. If 1.D1employment is concentrated in rural areas
far from Manila, promoting industries in Rizal Province is not a sensi
ble direct attack on the problem.
Unemployment in the Philippines is not a fonnless, general problem
of all areas and all types of people; it is a very specific problem
heavily concentrated in particular demographic groups. Table 43 shows
who the tmemployed are, decomposing the aggregate tmemployment figure
into more specific demographic categories. In each cell the numerator
is the number of "totally unemployed," the denominator is the number
of people in the labor force with those characteristics. The third
figure in the cell is the numerator as a percentage of the denominator,
the rate of 1.D1employment of that part of the labor force. For example,
the last square in the bottom row refers to young (ages 10-24) urban
males who have previously worked for at least two weeks ("experienced").
There are 654,000 young, experienced, urban males in the labor force,
of whom 43,000 were totally unemployed (6.6 percent) in the survey
week in May 1968. (Since all of the "inexperienced labor force" is
by definition unemployed, no percentages are given in the blocks for
that part of the labor force.)
IOn the sample design and execution see Burton T. oflate, Estimation of Population and Labor Force in the Philippines~ InternationalRice Research Institute, Journal Series No. 43 (revised, 1966); EmmanuelLevy, Review of Economic Statistics in the Philippines~ Interim Report,World Bank Resident Mission, Manila, May 1964 (mimeo), pp. 46-48.
Zwe should note, too, that BCS has usually presented some analysis and discussion of the structure of tmemployment with its publishedstatistics.

Table 43
TIlE STRUCTURE OF UNEMPLOYMENf, 1968a
Total
7.5%
1022Im9
I,
IRural Urban
5.4% 12.4%
511 5119420 4I09
I\
I II'
IFemale Male Female Male
8.1% 3.9% 13.2% 11.9%
272 239 213 298TI44 0070 roI2"" mt
I I I II I I I
I
Old YOtmg Old Ymmg Old YOtmg Old YOtmg I--'N
4.6% 13.1% 1.4% 7.7% 7.2% 21.5% 4.4% 26.9% +::0I
90 182 49 190 67 146 73 2251958 1386 3624 2452 932 680 1661 836
~I I I I I I
II
II I I IExp. Exp. Exp. Exp. Exp. Exp. Exp. Exp.
2.8% 4.7% 0.9% 2.4% 3.1% 3.8% 2.9% 6.6%Inexp. 54 Inexp. 60 Inexp. 34 Inexp. 56 Inexp; 28 Inexp. 21 Inexp. 48 Inexp. 43
36 1922 121 1205" 16 3OOS"" 133 TIN 38 894 125 5"55" 25 rno 182 654
Total young, inexperienced unemployed 571
Note:
aAbso1ute numbers are in thousands.
Source:--Tabulations of the May 1968, BCS Labor Force Survey done at Rand.
_1..411.£ •
-125-
As the table shows, most of the lll1employed have never held a job
before. This is not terribly surprising since nearly 75 percent of
the lll1employed are lll1der 25 years of age and over half are under 20.
Nearly half of the unemployed are women; half of the unemployed women
are really girls under 20. Over half of all ruraZ unemployed (272 ~OOO
out of 511,000) are females.
Even looking at inexperienced unemployed aged 10-24 overstates
the magnitude of the unemployment problem somewhat. Table 44 shows a
finer breakdown by age groups. About 12 percent of all unemployed
are less than 15 years old. Should we view unemployed children as a
social problem? Does society really want to put them to work?
So far, we have merely followed the definitions of "employment"
and "labor force" used by the Philippine BCS. But lll1employment is an
elusive concept in an LDC. The BCS definitions match those used in
developed countries: The unemployed have no job at all and are either
actively looking for a job or are not looking because they believe no
jobs are availabIe. In a developed COlll1try, where economic act ivity
is organized into visible, formal structures, application of this con
cept divides the population into two categories that have fairly well
defined implications for individual welfare: The employed have a regu
lar income; the lll1employed do not. In an LOC Imlch economic activity is
informal and irregular. If a man spends a few days tending his fields,
a few days weaving nipa mats, a few days idle, is he to be regarded as
employed or lll1employed? The application of the BCS definition places
him unambiguously into the category "employed."
!he conceptual difficulties are most acute when one measures the
inexperienced lll1employed. Half of those assigned to this group qualify
although they are not looking for jobs. They give as their reason for
not searching that they believe no jobs are available or that they
have no backer, no recommendation, no one to approach, and so on. It
would be possible for someone to spend considerable time in the category
"inexperienced unemployed" wi thout either finding a job or hlll1ting for
one. Such a person moves in and out of the labor force without an
intervening period of employment. That this Imlst be the case with
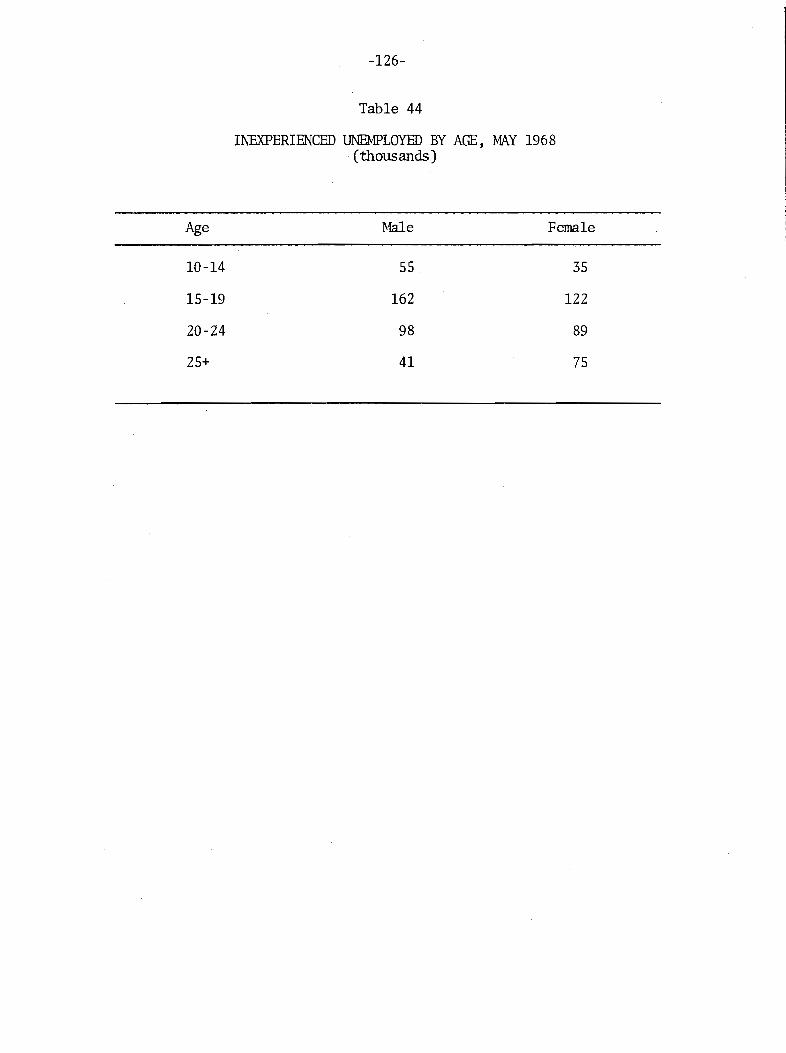
-126-
Table 44
INEXPERIENCED UNEMPLOYED BY AGE, MAY 1968. (thousands)
Age
10-14
15-19
20-24
25+
Male
55
162
98
41
Female
35
122
89
75
-127-
many people is indicated by the size of the pool of inexperienced
unemployed and the length of time those who hunt for jobs say they
have been looking. In 1968 the labor force probably did not grow by
more than four percent -- about 600,000. Our data show 571,000 inex
perienced unemployed. On the average, the inexperienced unemployed
have spent less than eight weeks looking for work as measured in both1 .
the May and October SUY'vey rounds. If the length of search and the
number of unemployed were "steady state" levels, the labor force would
have to be growing TIRlch more rapidly than it is. So movement out of
the labor force from the category inexperienced unemployed TIRlst be
substantial -- movement to marriage, to helping with housework, to
school, and the like. Such desultory participation in -me labor force
is an available option since only three percent of the inexperienced
unemployed are heads of households. Conversely, some of the group
may be delaying household formation because of failure to find jobs.
In short, unemployment in the Philippines does not fit the usual
metaphor. It is not formless and general; rather it is concentrated
in quite specific groups of the population. Furthermore, many of the
inexperienced unemployed have but an ambiguous commitment to the labor
force; and the extended family system shields them from the impact of
joblessness.
The "crisis" of seasonally unemployed farmers is likewise ambiguous.
Most of the emergency employment measures -- road construction and
such -- have been aimed ostensibly at the problem of putting them to
work usefully. Table 45 shows a decomposition of the tmderemp10yed
by age, sex, and urban or rural residence.
Most of the really seriously underemployed (working less than 20
hours per week and wanting more work) are rural females. The under
employed who are already working more than 20 hours per week cannot be
1The median number of weeks the inexperienced unemployed havespent looking for work depends in part on the relation between the endof the school year and the date of the SUY'vey round. In 1965 and 1966both the May and October Suwey rounds showed a median on the orderof 5.5 to 7.7 weeks. Our tabulations of the May 1968 SUY'vey show amedian of four weeks.
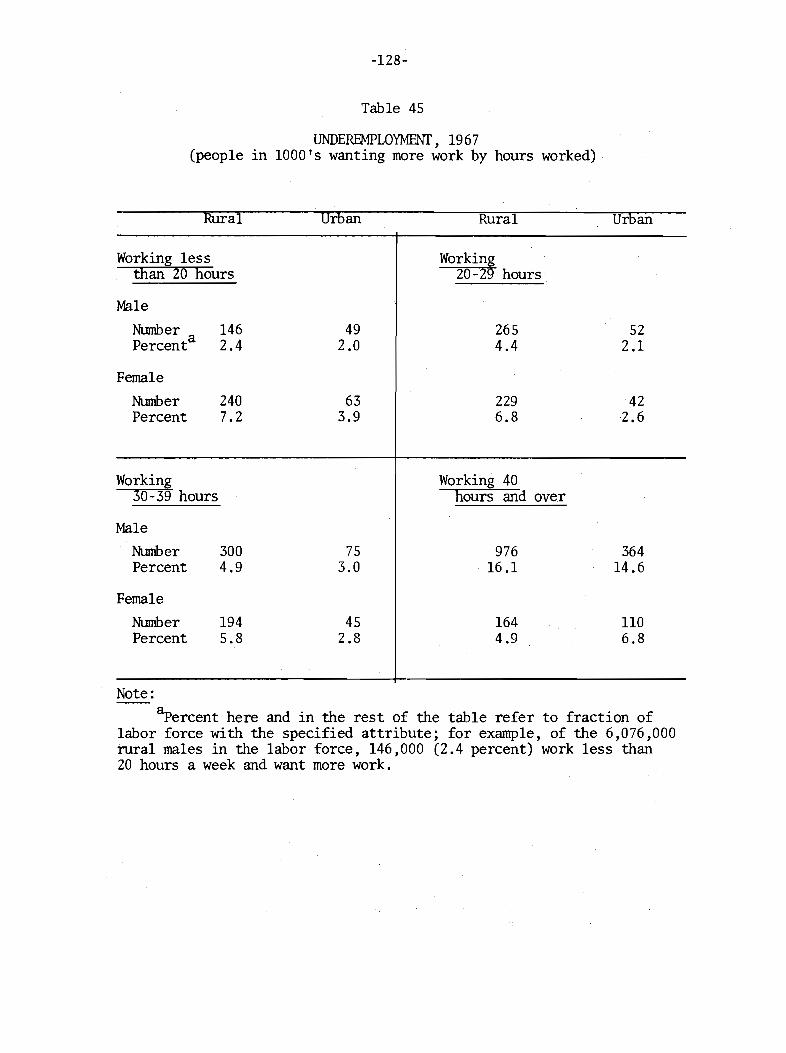
-128-
Table 45
UNDEREMPLOYMENT, 1967(people in 1000's wanting more work by hours worked)
Rural Urban Rural Urban
Working less Workingthan 20 hours 20-29 hours
Male
=:~ta146 49 265 522.4 2.0 4.4 2.1
Female
NLunber 240 63 229 42Percent 7.2 3.9 6.8 2.6
Working Working 4030-39 hours hours and over
Male
NLunber 300 75 976 364Percent 4.9 3.0 16.1 14.6
Female
NLunber 194 45 164 110Percent 5.8 2.8 4.9 6.8
Note:
~ercent here and in the rest of the table refer to fraction oflabor force with the specified attribute; for example, of the 6,076,000rural males in the labor force, 146,000 (2.4 percent) work less than20 hours a week and want more work.
-129-
considered to be available for full-time work. The most striking
aspect of lUlderemployment is that most of those who want more work are
already working 40 hours or more per week. Of all males in the labor
force, 15.6 percent fall into this category. Is this consistent with
the image of farmers loafing away the slack season?
The image of rural underemployment is clearly a stereotype drawn
both from the Philippine intellectual tradition and the writings of
professional economists. Rizal himself wrote a series of essays on
The Indolence of the Filipino, and even contemporary intellectuals
still take pains to explain the laziness of the Filipino peasant in
terms of the deadening effect of the colonial past. But the intel
lectuals are explaining too nR.lch. The image is simply inaccurate.
Although they may not be busy farming all of the year, the rural
Filipino family engages in many supplementary activities: nipa mat
weaving, tailoring, petty trading, and host of other such occupations.
The 1965 Survey of Income and Expenditure shows that the typical rural
household in the Philippines has 3.1 different sources of income. 1
This is an lUlderstatement of the real range of activities they under
take since, for example, each individual in the household may receive
"non-agricultural wage and salary income" from more than one activity.2
Here, too, the details of reality cast doubt on the metaphor.
lfaken from tabulations of 1965 Survey of Income and Expenditure.The COlUlt excludes rental value of owner-occupied homes, pensions, gifts,and other non-factor income. This broad range of rural activities is .confirmed in various anthropological studies. McKendry et al., ThePsychological Impact ..• , pp. 123-125.
2The May 1957 Survey fOlUld that 15 percent of rural householdsengaged in one or more ''home industries" and that each such householdproduced on the average about 130 pesos of output. See The Phi ZippineStatistical Survey of Households Bulletin, Department of Commerce andIndustry, Series No.6, Manila, JlUle 1960. This range of rural activities suggest that much of the debate among economists on the existenceof real surplus rural labor is beside the point. Even if agriculturaloutput were lUlaffected by the withdrawal of a portion of the rural laborforce, it is unlikely that these supplementary activities -- which clothe,house, and equip a large fraction of the popUlation - - would continueat their previous level. In this case the debates of economists haveobscured rather than clarified the real issues. For a theoreticaldiscussion of the role of nonagricultural production in development,
-130-
The Politics of the Unemployed
We have been applying the strict BCS definition of unemployment
in the preceding analysis. Filipinos, evidently, do not think in tenns
of such a strict definition of unemployment. As we saw above, the rate
of "tmemp10yment" measured by BCS definition was 7.5 percent in May
1968. The Pegasus survey asked the question, "How many people are
there in the household willing to work but jobless?" The tabulated
answers to this question imply an "tmemp10yment" rate of about 38
percent. 1 'What did the Pegasus respondents mean when they answered
this question? Evidently they took everyone who did not have a regu
lar, well-defined job to be "job1ess."Z This, of course, includes
many people who are, by Philippine standards,far from destitute, so
tmemp10yment measured this way does not yield immediate conclusions
about economic welfare.
The large difference between the strict definition of tmemp10y
ment and the cornmon view may explain why Philippine politicians see
employment as an important issue, even though officially measured unem
ployment does not appear to be a widespread and mounting problem.
Unemployment does not appear to be a pressing economic problem, but
it may still be a political problem if the unemployed are alienated
and strongly dissatisfied with the "system."
We saw above (Chapter 4) that officially measured unemployment
did not appear to be a significant determinant of voting in the 1965
election. One possible reason for the absence of any political
see Stephen Hymer and Stephen Resnick, "A Model of an Agrarian Economywith Nonagricultural Activities," American Economic Review~ Vol. 59,No.4, September 1969, pp. 493-506. See also Bent Hansen, "Employmentand Wa~s in Rural Egypt," American Economic Review ~ No.3, June 1969,pp. 298-313.
1The respondents were also asked, 'How many people are there inthe household with jobs?" The unemployment rate of 38 percent is calculated by dividing the number given as jobless by the sum of thenumber jobless and the number with jobs.
~cKendry et al.~ The Psychological Impact ••. ~ suggest that,although intermittent employment is common in the Philippines, theirrespondents tended to view employment "as an either-or affair" causingconsiderable confusion in reports of employment status.
-131-
manifestation of tmemployment is that most of the unemployed, measured
officially, are too YOtmg to vote. But a large fraction of the voting
age population perceive themselves as unemployed. Are they alienated
and dissatisfied? They appear not to be.
By and large the opinions of the self-perceived tmemployed are
ruch like the opinions of the rest of the population. In the cases
where there are significant differences between the opinions of the
two groups, the lUlemployed respond more favorably toward the govern
ment and politicians than do the employed. Tabulations of the
Pegasus questions on the importance of various national problems show
no difference between the employed and the unemployed except that the
unemployed are less concerned about the treatment of minority groups
and about crime. l When questioned on their impressions of politicians,
the unemployed responded more often that they thought politicians were •
honest, hardworking, nationalistic, and an example to follow, and less
often that they felt politicians were corrupt.
It is possible that the large munber of housewives who appear in
the category "tmemployed" might be masking some significant differ
ences in these tabulations. We can control for this by eliminating
female respondents from the sample. If we do this, all of the signif
icant differences- in views on national problems and perceptions of
politicians disappear. The opinions of tmemployed men are indistin
guishable from the opinions of employed men.
Do the tmemployed value government developnent activities more
highly than the employed? The differences are not striking. Both
the tmemployed and employed feel that government activities providing
employment are very important; but the tmemployed do not reply more
IThese are questions la through If of Pegasus. See Ap~endix A fortext. Ignoring crime and minority treatment, the largest x derivedin testing for a difference between the employed and unemployed was only4.6 with 2 degrees of freedom, which does not show a significant difference between .the two groups even below the .90 level of confidence.On the treatment of minority groups, 43.5 percent of thelUlemployedresponded that it was a very important problem versus 54.3 percent ofthe employed. On crime, the corresponding percentages were 59.7 and67.0.

-132-
strongly on this point. The unemployed men do, however, place signifi
cantly more value on building roads, which is the traditional manner
of providing supplemental government employment. On building schools,
which is another activity used to provide rural jobs, the two groups
do not differ (see Table 46).
Is it likely that the unemployed would use their votes to demand
policies to alleviate their unemployment? The employed and unemployed
both say they base their votes for president on the same considerations:
honesty, language, and past help given to their area in roughly that
order. There are no significant differences between the two groups. I
Unemployment does not appear to underlie any political crisis.
There is no evidence that the unemployed are alienated from Philippine
politics and angry, or even that they are demanding some special at
tention to their problem. 2 If we are looking for signs of imminent
revolution, we will not find them among this group.
But the apparent failure of the unemployed to articulate any de
mands for special programs and the fact that unemployment is concen
trated among the non-voting young suggest also that the government is
unlikely to do anything about unemployment except, perhaps, to continue
to repeat the old pattern of expanding road-building around election
time. In part, this reflects a failure of the political information
system: The self-perceived unemployed do not draw any particular at
tention to themselves or to their problem. They think the govenunent
should provide employment, but so does everyone else. They think the
government should build roads, and the government does build roads.
They do not, however, form a readily definable group consistently de
manding some special policy response from the political sys tern.
lBased on questions 6a-6g on Pegasus. See Appendix A for textof the questions.
2This appears to apply to the unemployed as measured by bothdefinitions. Unemployment, according to the official measure, isheavily concentrated among the young, who were excluded by the Pegasussample design. The earlier survey data cited in Chapter 4 suggests,however, that the yOlmg differ Iittle from the rest of the population.

-133-
Table 46
VIEWS OF 1HE ORDER OF IMPORTANCE OF GOVERNMENf ACTIVITIES,EMPLOYED .AND UNEMPLOYED MENCl,b
(row percentages)
4 3 2 1Least Most
Important Important
l. Building Schools
Unemployed 9 16 35 40
Employed 10 17 34 39
x2 = .58 with 3 D.F. x2 = .51 with 3 D.F.1
2. Building Roads
Unemployed 29 29 32 11
Employed 36 30 26 8
x2 = 6.19 with 3 D.F. x2 = 6.5 with 3 D.F.1
3. Providing Employment
Unemployed 32 13 13 42
Employed 20 11 20 49
x2 = 18.71 with 3 D.F. x2 =18.2 with 3 D.F.1
Notes:aActual text of question: "Here are some activities of our govem
ment~ Which of these do you feel is the most important to you and yourfamily? Which is the next one? And after that?" Weighted percentages.
bSSR for Tables 1, 2, 3: 452 tmemployed, 642 employed. Weightedpercentages.
-134-
The unemployment of the young and inexperienced is an ambiguous
problem. In part, it appears to be a result of friction, of the delay
between leaving school and finding a job. This suggests that pro
grams aimed at reducing this delay -- job counseling, better infor
mation on availability of jobs, and the like - - might significantly
reduce the officially measured rate of unemployment. Al though this
kind of specific alternative is immediately suggested by close analy
sis of the data, it is not likely to be tossed up in debate that
focuses on the "cris is ."
Stagnation: An Ambiguous Crisis
The Ambiguity of Aggregate Data
Most foreign judgments that the Philippine economy is only a medi
ocre performer are based on aggregate economic statistics -~ when they
are based on any data at all. Filipinos themselves have, of course,
other sources of information: The farmer knows the price he gets for
his crop and what he pays for his purchases; the businessman knows how
his business is faring ; the politician can see if the country appears
prosperous. Foreigners, however, do not have access to such information.
Consequently, they are forced to rely on slUTDllary statistics: GNP,
population, balance Df payments, and the like. The Philippine govern
ment generates all of the standard statistics and reports them to the
UN and IMP, who duly reproduce the data in their statistical publications.
Aggregate economic statistics also shape Filipinos' perceptions
of their country. The rate of growth of GNP is announced in long
newspaper articles and appears in the rhetoric of politicians and high
level bureaucrats. Filipino economists write for the general press
explaining why the rate of growth of GNP is not high enough and what
policies should be adopted to raise it.
Are the statistics accurate and meaningful? Do they support the
judgment that the Philippine performance is mediocre? The inaccuracy
of Philippine national accounts has long been a subject of public
-135-
controversy. In the late 1950s and early1960s criticism centered
ori the plausibility of the investment magnitudes produced by the
National Economic Council (NEC). Drawing on special surveys and the
examination of financial data, several studies demonstrated that the
official estimates of capital formation were undoubtedly understated. l
A report by a member of the World Bank resident mission in Manila went
further and concluded that the accounts were so inaccurate (both in
level and annual changes) as to be "useless for most purposes of anal
ysis and projection. 1I2 In 1968 an open controversy between the NEC
and a group from the University of the Philippines and the BCS, over
the input-output tables each had produced, cast further doubt on the
validity of the official estimates. 3 The controversy produced articlesand editorials in the local press: In an article in The Philippines
Herald, Bernardo G. Bantegui, director of the statistical branch of
the NEC, protested that the NEC was doing a good job and that such
"ad hoc pilot studies" should not be used "to harm the established
orderly system of statistics which economists, bankers and businessmen
ISee Clarence L. Barber, 'National Income Estimates in the Philippines," Philippine Economic Journal, Vol. 4, No.1, 1965, pp .66-67;Ruben Trinidad, An Inquiry into the Sources and Methods of NationalIncome Accounting in the Philippines, unpublished M.A. thesis, University of the Philippines, Quezon City, August 1958, and also his"Some Proposed Improvements in the Estimation of Capital Formationin the Philippines," The Statistical Reporter, Vol. 4, April 1960,pp. 28-40; David Cole, Growth and Financing of Manufacturing in thePhilippines, University of the Philippines, Institute of EconomicDevelopment and Research, Quezon City, 1963; Richard W. Hooley, "ACritique of Capital Formation Estimates in Asia with Special Referenceto the Philippines, The Philippine Economic Journal, Vol. 3, No.2,1964, pp. 114-129, and Saving in the Philippines, 1951-1960, University of the Philippines, Institute of Economic Development and Re~earch,
Quezon City, 1963; Gerardo P. Sicat, "On the Accuracy of the Philippine National Accounts," Philippine Review of Business and Economics,October 1964; Ramon B. Cardenas, A Re-estimation of the PhilippineNational Accounts, CY 1953-1963: A Description and Evaluation of theAlternative Estimating Methodology, unpublished M.A. thesis, CornellUniversity, Ithaca, June 1967.
2Levy , Review of Economic Statistics in the Philippines, InterimReport, p. 7.
3See Appendix D for details.
-136-
could use with continuing confidence."l Business Day carried articles
and editorials on the conflict for two weeks, complaining, "Along the
business cocktail circuit, the joke now goes: 'You don't like thefigures you get, go to another office. ",2
As Appendix D shows, NEC did in fact undertake revisions to take
account of some of the criticisms, but these look more like attempts
to fend off criticism than real improvements. Even after the revi
sions and improvements there remains a great deal of uncertainty about
the precise magnitude of Philippine GNP and its rate of growth. Within
the range of tmcertainty, NEC lies on the low side of the range with
respect to both level and long-run rate of l~ange.
Even though the defects of the accounts are well known, recent
interviews of economic decisionrnakers indicate that they rely on the
national accounts when making judgments about the state of the economy.
(See Table 47.) Political statements about the condition of the economy
often include a long list of percentage increases. But do the data
really guide decisions? If policyrnakers really believed that the data
made a difference to real decisions, would they view the knownuncer
tainty of the data with equanimity? If the data are important, the
uncertainty of the data must a fortioT'i be vital. But when asked
what new data or improvements in the old data they mas t desired, none
responded specifically that he wanted the tmcertainties in the national
accotmts to be resolved. (See Table 48.) In fact, mast of the re
sponses were simply diffuse requests for "better" or "faster" data.
Do the national accotmts support the inference that is usually
drawn from them: That the Philippine economy is only a mediocre per
former? If we examine some of the underlying data in detail, the case
"becomes quite ambiguous.
lphiZippines HeraZd, Jtme 19, 1968, p. 20.
2See Jess Estanislao , "Divergent Estimates," Business Day, Vol. 2,No. 17, Jtme 13, 1968, p. 12, and "A Contradiction in Figures," Vol. 2,No. 19, June 20, 1968, p. 8, and editorial, "A Statistical Joke," sameissue, p. 10.
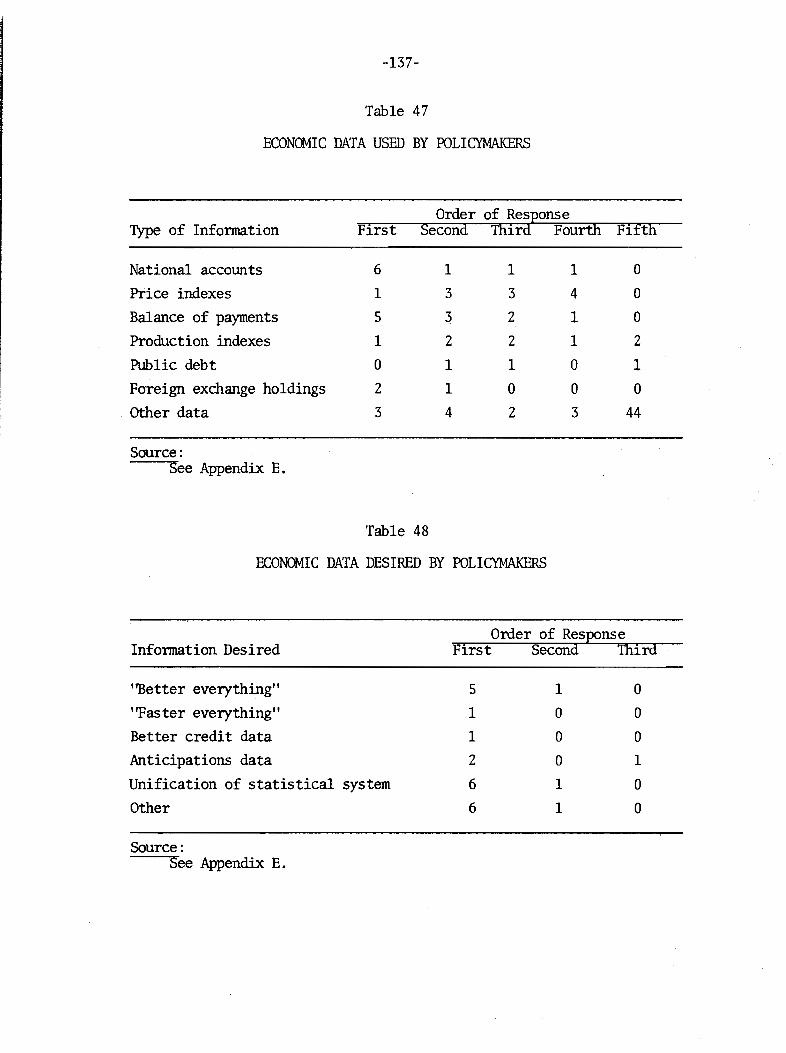
-137-
Table 47
ECONOMIC DATA USED BY POLICYMAKERS
FirstOrder of Response
FifthType of Infonnation Second Third Fourth
National accounts 6 1 1 1 0
Price indexes 1 3 3 4 0
Balance of payments 5 3. 2 1 0
Production indexes 1 2 2 1 2
Public debt 0 1 1 0 1
Foreign exchange holdings 2 1 0 0 0
Other data 3 4 2 3 44
Source:See Appendix E.
Table 48
ECONOMIC DATA DESIRED BY POLICYMAKERS
Infonnation Desired
''Better everything""Faster everything"Better credit dataAnticipations data
Unification of statistical systemOther
Source:See Appendix E.
5
1
1
2
6
6
Order of Response
1
ooo1
1
ooo1
oo

-138-
Measures of the Growth of Manufacturing
Table 49 presents various estimates of the growth of manufactur
ing between 1960 and 1966.1 An examination of the manufacturing sector
is especially relevant since the slow growth of this sector is most
often cited as the reason for the disappointing performance of the
country. As the rates· of change show, the national accounts are
conservative. The Central Bank iJ;ldex is known to be biased downward
because it is based on a fixed sample of "cooperating firms" concen
trated in Manila. 2 There is considerable evidence that the growth of
manufacturing outside the Manila area has been substantial since 1960.3
Yet the national accounts constant price series lies beZow the Central
Bank data. AIthough the rate of change of employment in manufacturing
measured in the Survey of Manufaatures is similar to that shown in the
Labor Forae Survey, the levels are vastly different. The gap between
the two employment estimates represents workers employed in very small
firms; although such small side employment has grown rapidly, the
output of these workers has never been measured. 4
Can we conclude tmarnbiguously that manufacturing is growing very
slowly? What about other sectors? We know that the manufacturing
estimates are ambiguous because we have multiple data sources. Would
multiple sources reveal the same ambiguity in other sectors? Closer
examination of the labor force data suggests strongly that the Philip
pine economy has been progressing quite rapidly.
The Modern Labor Force
Ultimately the process of economic development implies a shift of
the center of gravity of an economy from agricul ture and craft activities
IThis spans as much of the period of "stagnation of manufacturing"as is possible with the data.
2See Levy, pp. 42-44.
3See Table 52. See also Malcolm Treadgold and Richard W.Hooley, ''Decontrol and the Redirection of Income Flows: A SecondLook," PhiUppine Economic JournaZ, Vol. 6,'No. 2, 1967, p. 115.
4See Appendix D.
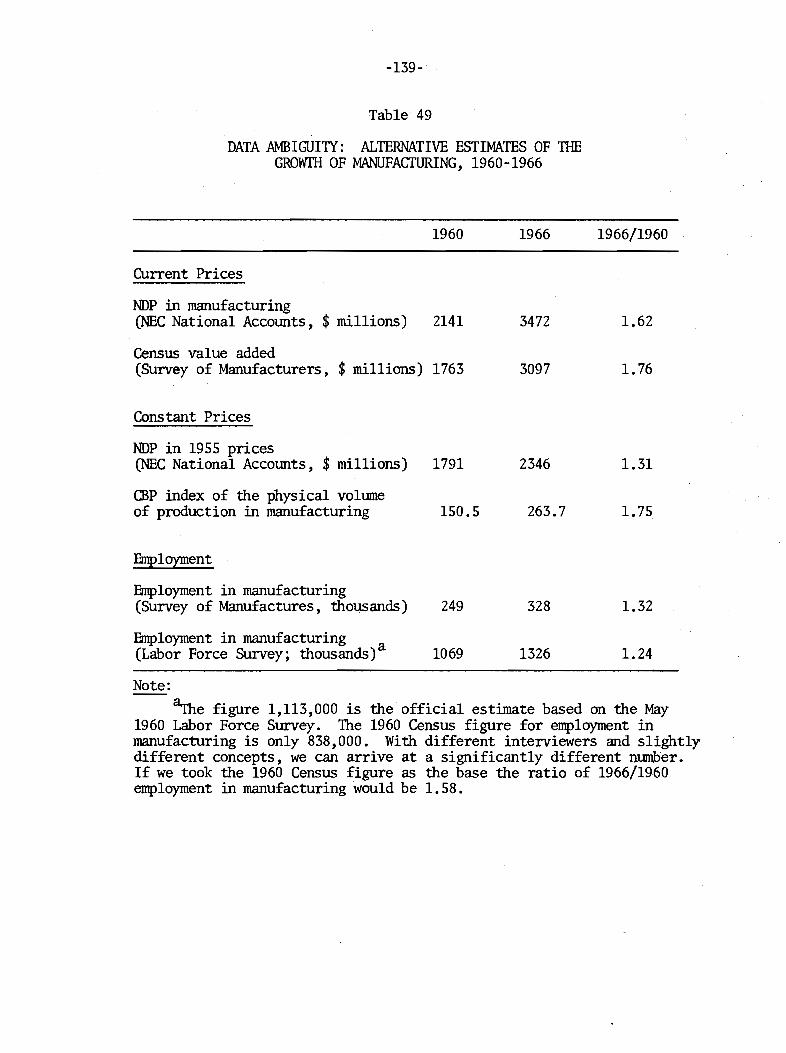
-139-
Table 49
DATA AMBIGUIlY: ALTERNATIVE ESTIMATES OF TImGROWTH OF MANUFACTURING, 1960-1966
1960
llirrent Prices
NDP in manufacturing(NEC National Accmmts, $ millions) 2141
Census value added(Survey of Manufacturers, $ millions) 1763
Constant Prices
NDP in 1955 prices(NEC National Accmmts, $ millions) 1791
CBP index of the physical vo1lU1leof production in manufacturing 150.5
Employment
Employment in manufacturing(Survey of Manufactures, thousands) 249
Employment in manufacturing a(Labor Force Survey; thousands) 1069
1966
3472
3097
2346
263.7
328
1326
1966/1960
1.62
1. 76
1.31
1. 75
1.32
1.24
Note:
~e figure 1,113,000 is the official estimate based on the May1960 Labor Force Survey. The 1960 Census figure for employment inmanufacturing is only 838,000. With different interviewers and slightlydifferent concepts, we can arrive at a significantly different number.If we took the 1960 Census figure as the base the ratio of 1966/1960employment in manufacturing would be 1.58.
-140-
to more ''modern'' activities. l The theoretical formulations of develop
ment models are usually vague about the question of precisely how this
shift is to be measured. Nonetheless, the concepts must refer to
something like a shift from relatively casual, perhaps intermittent
activity performed with the aid of little capital to activity performed
with more capital equipment and more formal organization; that is,
performed in something approximating a modern business establishment.
We have no such current measure of economic activity in the Philippines,
but we can approach it by manipulation of reported data on employment
by industry and class of worker.
The problem of data can be defined in the following way: We need
the sort of information on employment that could be found in an economic
census. As of this writing, the 1967 Economic Census of the Philippines
is still unavailable. We do, however, have the May 1968 Labor Force
Survey. We· can extract the appropriate work8rs from the Labor Force
Survey to approximate those who would be engaged in modern activities
as measured in a proper economic census.
The economic censuses are drawn from the universe of business
establishments; they count activities that take place in regular, vis
ible establishments but omit informal and craft activities taking
place in households. Economic census definitions, therefore, corre
spond approximately to what we mean by "modern" actiVities. Population
censuses and labor force surveys, on the other hand, are drawn from
the universe of households and classify craft and modern workers in
the same industries. For example, weavers of nipa mats are placed in
manufacturing by the population census but are simply omitted from
the e~onomic censuses because they rarely pursue their occupation in
well-defined establishments. The nipa rnat weavers, h~vever, will pro
bably be listed as "self-employed" in the population census, while
factory workers will be "employees." Workers in public utilities and
1John C. H. Fei, Gustave Ranis, ...The Labor Surplus Economy; andR. R. Nelson, "A 'Diffusion' Model of International Productivity Differences in Manufacturing Industry," American Economic Review, Vol. 58,No.5, December 1968, pp. 1219-1247.
-141-
other highly visible activities should probably all be counted as
modern; the electric utility industry, for example, will probably not
contain any craft firms.
Thus, by counting all workers in "visible" industries and wage
and salary workers in industries with a large craft sector, we should
be able to estimate the Economic Census MLF, using Population Census
data. As Table 50 shows, it is possible to achieve a reasonably close
match between the estimates of MLF derived from the two sources.
Since we were able to match the MLF derived from the 1960 Popu
lation Census with the MLF derived from the 1961 Economic Census by
choosing appropriate combinations of industry and class of worker, we
ought to be able to approximate an economic census measure of MLF by
choosing the same combinations of industry and class of worker from
the labor force surveys. We can, moreover, produce a series of such
estimates from the various labor force surveys available. These esti
mates are shown in Figure 11 together with estimates for 1948 and 1938,
which are roughly, but not exactly, comparable. The growth of the
MLF since 1960 has been quite rapid; this has been the period of
alleged stagnation. By our measure this period looks like one of
rapid transformation.
Although it appears that aggregate growth has been substantial,
change has proceeded at very different rates across the country. This
is true not only when measured by factor scores, as in Chapter 2, but
also when measured directly by estimates of median family income by
region. Figure 12 shows the growth of median family income by census
region over the period 1956-1965. Some regions have grown very rapidly,
while others have stagnated.
The pattern of economic change across the country may have conse
quences for the shape of politics. We shall see below that the poli
tical attitudes of the MLF appear to differ somewhat from the attitudes
of those who remain in traditional occupations. If it were true, for
example, that modern activities became highly concentrated in one part
of the country, we could expect regional cleavages to develop also in
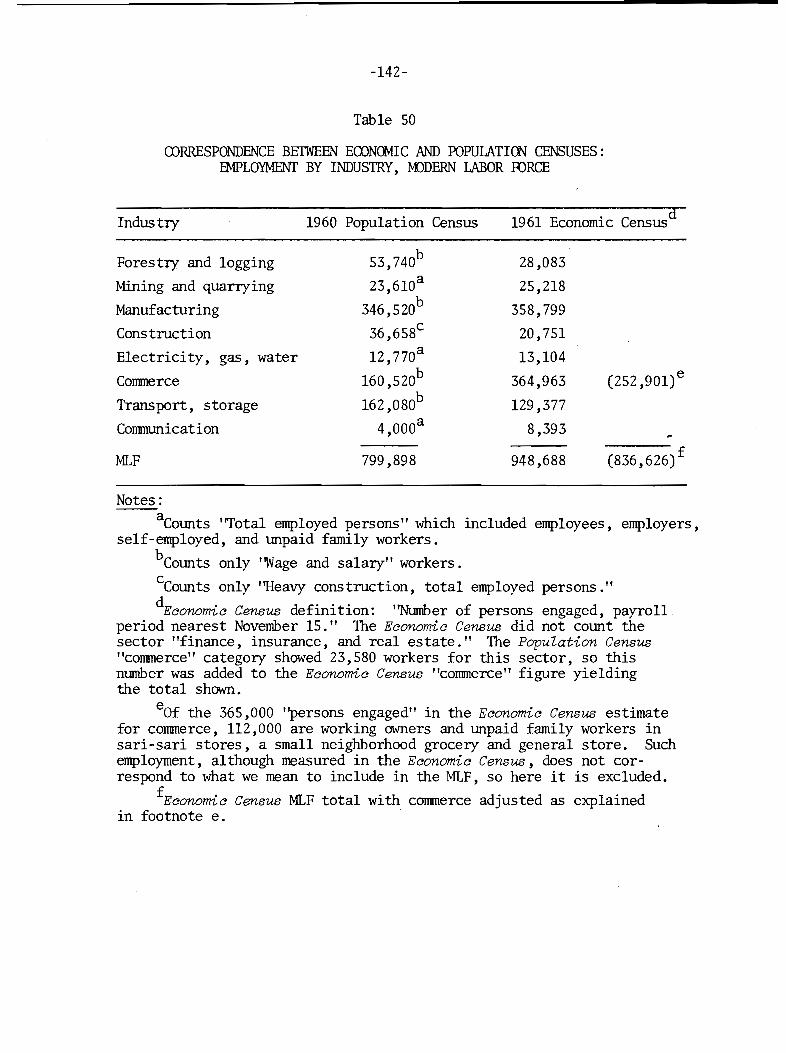
-142-
Table 50
CORRESPONDENCE BEIWEEN ECONOMIC AND POPULATION CENSUSES:fMPLOYMENT BY INDUSTRY, M)DERN LABOR IDRCE
Industry 1960 Population Census d1961 Economic Census
Forestry and logging
Mining and quarrying
Manufacturing
Construction
Electricity, gas, water
Corrunerce
Transport, storage
Connnunication
MLF
53,740b
23,6l0a
346,520b
36,658c
l2,770a
l60,520b
l62,080b
4,000a
799,898
28,083
25,218
358,799
20,751
13,104
364,963
129,377
8,393
948,688
(252,90l)e
(836,626)f
Notes:--aCounts '~otal employed persons" which included employees, employers,
self-employed, and unpaid family workers.bCounts only ''Wage and salary" workers.
cCounts only "Heavy construction, total employed persons."
dEconomic Census definition: "Number of persons engaged, payroll.period nearest November 15." The Economic Census did not count thesector "finance, insurance, and real estate." The PopuZation Census"connnerce" category showed 23,580 workers for this sector, so thisnumber was added to the Economic Census "connnerce" figure yieldingthe total shown.
eOf the 365,000 ''persons engaged" in the Economic Census estimatefor connnerce, 112,000 are working owners and unpaid family workers insari-sari stores, a small neighborhood grocery and general store. Suchemployment, although measured in the Economic Census, does not correspond to what we mean to include in the MLF, so here it is excluded.
fEconomic Census MLF total with connnerce adjusted as explainedin footnote e.
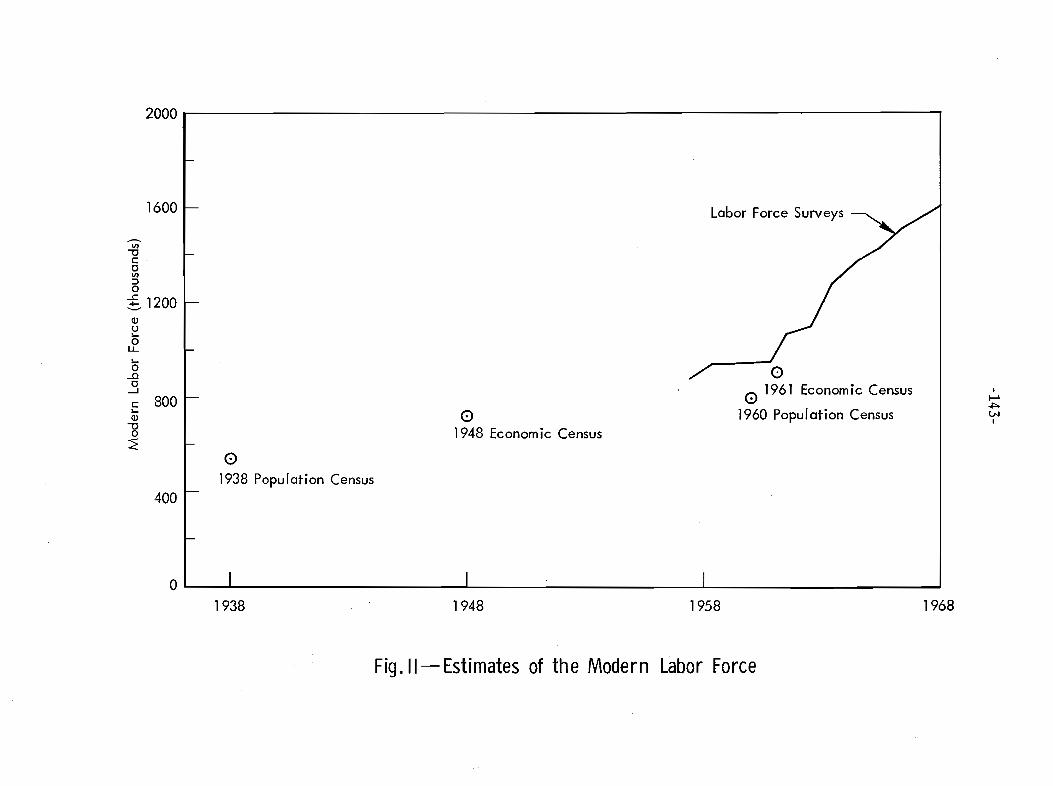
2000 r------------------------------~-----___,
1600
-V)
"'UCoV)
:::>a:f 1200
<1lus-o
LL
s-o-0o
--l
C 800s<1l
~~
400
o1938 Population Census
o1948 Econom ic Census
Labor Force Surveys
oo 1961 Econom ic Census
1960 Population Census
II--'+>tN
I
OL...--....L...- ....L...- ....L..- ----I
1938 1948 1958 1968
Fig .11- Estimates of the Modern Labor Force
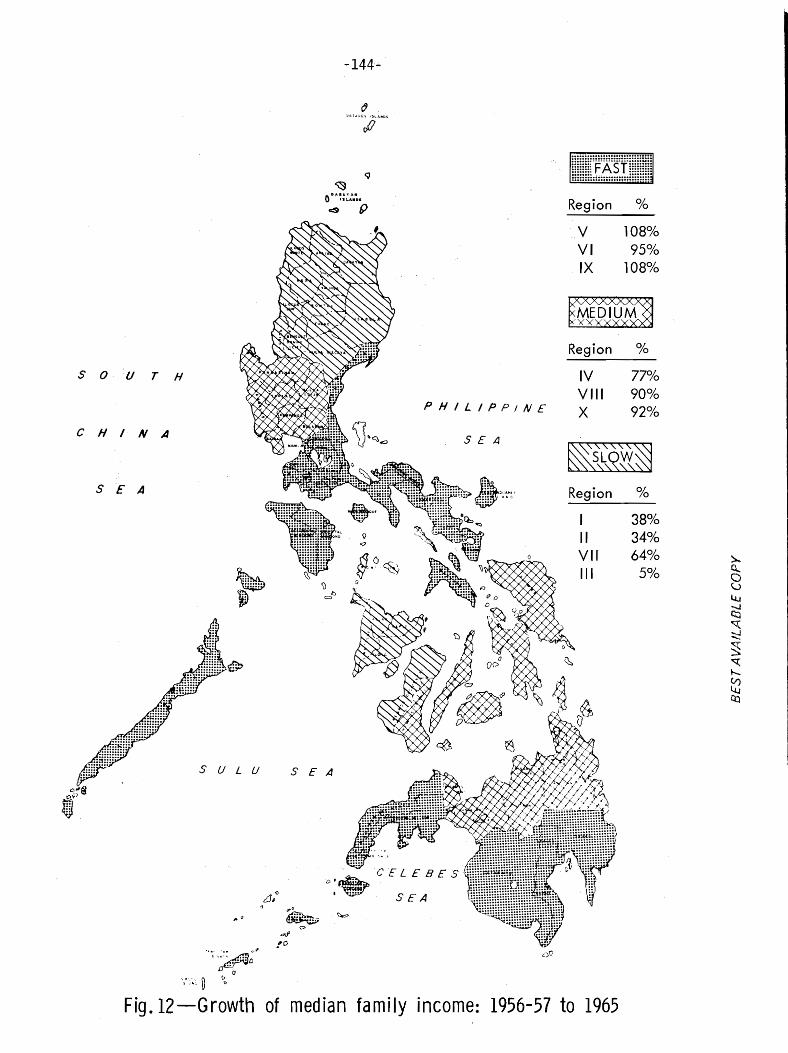
-144.;.
~tll:ol.\:.(S '!lLl>."OS
IJ
IV 77%V III 90°/c,X 92%
V 108%VI 95%IX 108%
Region %
Region %
SEA
~.Region %
I 38%II 34%VII 64%III 50/0
PHILIPPINE
SEA
" a
S U L U
d;.f'
to.. ~ .~~;<];"
JJ"";\",'.~ D ~
Fig.12-Growth of median family income: 1956-57 to 1965
SEA
SOU T H
CHI N A

-145-
politics. So it is important to try to find where the MLF is located
and where it is growing.
The Distribution of the Modern Labor Force, 1948-1961
The period 1948-1961 is bounded by the Economic Censuses of 1948
and 1961, so data are mediately available that will enable us to
track the changes in the distribution of the MLF between those dates.
Since the Economic Censuses measured employment in estabZishments~
the workers they counted correspond to what we defined as ''modern''
emplOYment. Because of inconsistencies in definition and coverage
between the two censuses, the closest we can come to our previous
definition of the MLF is the sum of establishment employment in manu
facturing, forestry and logging, commerce, and transportation; in 1961
these industries accounted for 92 percent of the MLF. Since consistent
definitions of the total labor force are not available for the two
censuses, we will normalize this measure of the MLF for the size of
the province by dividing it by the population in the province more
than 20 years old. Thus, our index of modernization is the MLF
expressed as a percentage of the population over 20.
Figure 13 plots the index of modernization by province for 1948
and 1961. Increasing modernization', as defined here, tended to be
concentrated in a small number of provinces, particularly in the
Manila-Rizal-Bulacan area, with only a few provinces in the rest of
the country showing any increase in the index at all.
The concentration of employment in establishment manufacturing is
even more striking. Of the total increase in paid employment in manu
facturing establishments between 1948 and 1961, 71 percent occurred
in these three provinces. (See Table 51.)
The Distribution of the Modern Labor Force, 1960-1968
This pattern has changed. Figure 14 plots the MLF as a proportion
of the population over 20 for 1960 and 1968. Here the data are drawn
from the May 1968 Labor Force Survey and the .5 percent sample

-146-
20
tL1. Abra 26. Camarines Norte lQ 00
2. Ilocos Norte 27. Camarines Sur ~ u?3. Ilocos Sur 28. Masbate .~ ~
4. La Union 29. Sorsogon 24 50.
18 5. Mt. Province 30. Antique( 30. 7)
6. Batanes 31. Capiz7. Cagayan 32. Iloilo8. Isabela 33. Negros Occidental9. Nueva Vizcaya 34. Romblon
10. Bataan 35. Bohol16 11. Bulacan 36. Cebu
12. Nueva Ecija 37. Leyte13. Pampanga 38. Negros Oriental14. Pangasinan 39. Samar15. Tarlac 40. Agusan
1416. Zambales 41. Bukidnon17. Batangas 42. Lanao
40 18. Cavite 43. Misamis Occidental
• 19. Laguna 44. Misamis Oriental~ 20. Marinduque 45. Surigao
( 6.2) 21. Mindoro 46. Cotabato22. Palawan 47. Davao
12 23. Quezon 48. Sulu24. Rizal 49. Zamboanga25. Albay 50. Manila
~ 10 ·5
4719 ••
8 11
• 26·
20
6 •16
33 49 •43. • 17 .15 • •• .7
• -.22 42 134 32. 18•• 27 356 454, 29 34 • •• • .418 14 • 38• .12 .3 • 9
2 • 25 28•• 37
2 1 ·21
·48 • .3039
oo 2 4 6 8
1948
10 12 14 16
Fig.13-MLF as proportion of population over 20 years of age,1948 -1961
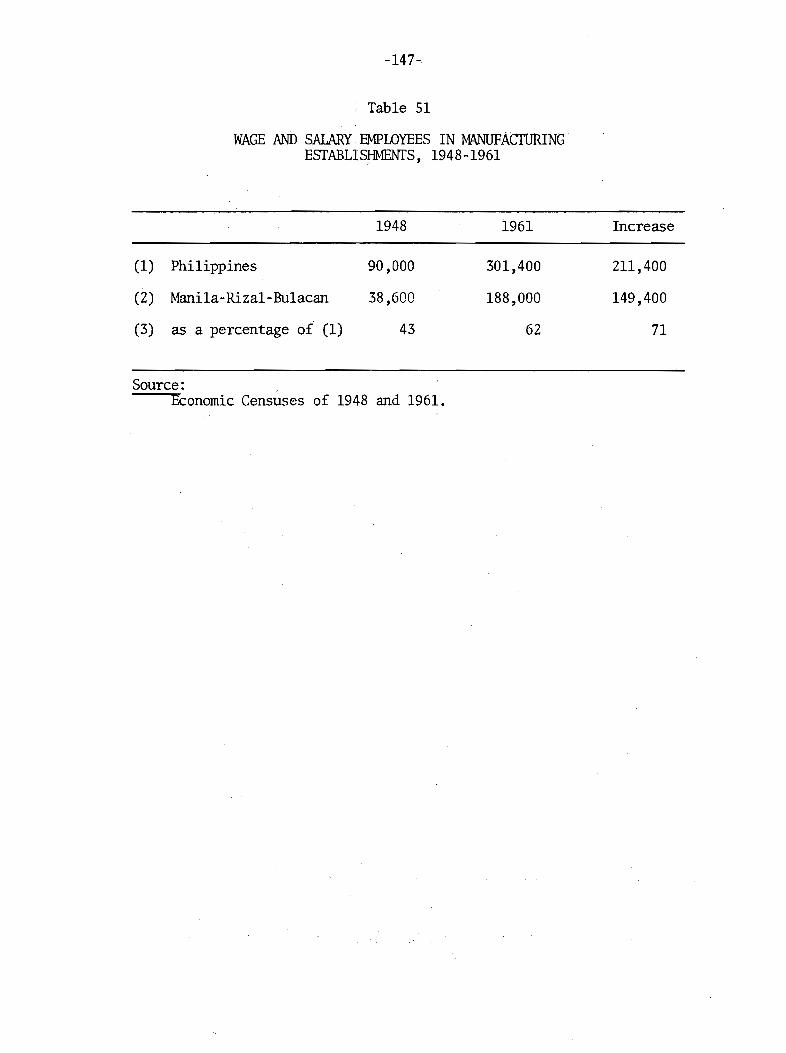
-147-
Table 51
WAGE AND SALARY EMPLOYEES IN MANUFACTIJRINGESTABLISHMENTS, 1948-1961
1948 1961 Increase
(1) Philippines 90,000 301,400 211,400
(2) Mani1a-Riza1-Bu1acan 38,600 188,000 149,400
(3) as a percentage of (1) 43 62 71
Source:Economic Censuses of 1948 and 1961.
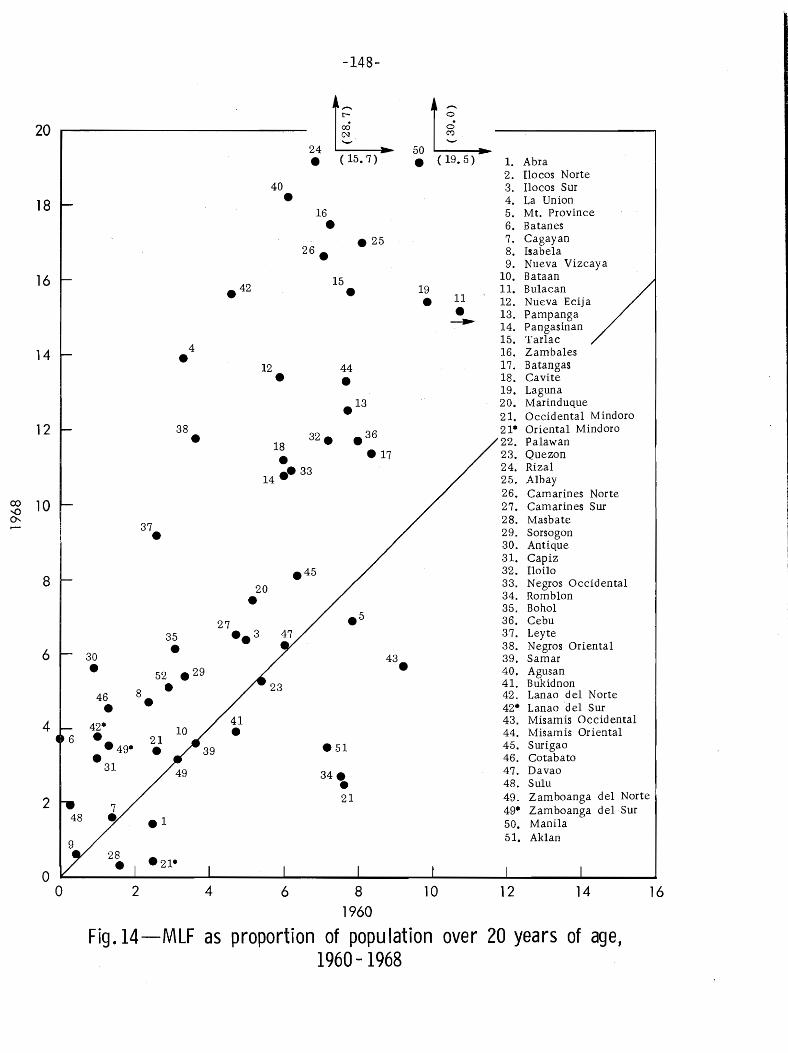
-148-
12 38• 1832 •
••• 3314
00 10-.00.
16
AbraIlocos NorteIlocos SurLa UnionMt. ProvinceBatanesCagayanIsabelaNueva VizcayaBataanBulacanNueva EcijaPampangaPangasinanTarlacZambalesBatangasCaviteLagunaMarinduqueOccidental MindoroOriental MindoroPalawanQuezonRizalAlbayCamarines NorteCamarines SurMasbateSorsogonAntiqueCapizIloiloNegros OccidentalRomblonBoholCebuLeyteNegros OrientalSamarAgusanBukidnonLanao del NorteLanao del SurMisamis OccidentalMisamis OrientalSurigaoCotabatoDavaoSuluZamboanga del NorteZamboanga del SurManilaAklan
l.2.3 .4.5.6.7.8.9.
10.II.12.13.14.15.16.17.18.19.20.21.21·22.23 .24.25.26.27.28.29.30.3l.32.33.34.35.36.37.38.39.40.4l.42.42·43.44.45 •46.47.48 .49.49·50.51.
11
•-.-
19
•
• 25
15
•
34.•21
16
•
40•
12•
20
•
4•
35
•52
•21
•
37•
8•46
•42·•·49·•31
2 4 6 8 10 12 14
1960
Fig. 14-MLF as proportion of population over 20 years of age,1960-1968
30
•
r-------- 24 t~ ~ 5J~ ~----,• ( 15. 7) • (19. 5 )
2
4
8
6
oo
18
16
20
14

-149-
of households enumerated in the 1960 Census of Population. 1 MLF is
defined as the combination of employees by industry and class of
worker shown above in Table 50. Although the Manila area has contin
ued to show an increase in the proportion of MLF, a large number of
provinces outside this area have registered even more substantial
increases.
The same shift is shown in the data on wage and salary employees
in manufacturing. Although the Mani1a-Riza1-Bu1acan area has con
tinued to show substantial increases in manufacturing employment, the
proportion of the increase in total employment that occurred in these
provinces between 1960 and 1968 is not as large as their corresponding
proportion over the period 1948-1961. 2 (See Table 52.)
Thus, although growth continues to be uneven and some parts of
the country lag behind, it is no longer accurate to identify the
Manila area as ''modernizing'' and the rest of the country as "tradi
tional." Change is both substantial and widespread.
The point of these arguments, however, is not that the rate of
growth of GNP is 6 or 7 percent rather than 5 percent. We do not know.The data strongly suggest -- but do not conclusively prove -- that the
country has done a good deal better than cOImTlon opinion holds. But
the economic nostrums proposed for the Philippines really assume that
some fundamental change is required before the country can achieve
anything like satisfactory performance. If that assumption is incor
rect for the reason that the system, as it stands, has proved itself
capable of turning in a respectable record, then proclamations of
1The sample of the 1960 Census was made available to us throughthe courtesy of the Population Institute, University of the Phi1ippine~,
and its director, Prof. Mercedes B. Concepcion. The tape of the 1968Labor Force Survey was made available through the courtesy of CensusDirector, Tito A. Mijares.
~. Treadgo1d and R. Hooley, on the basis of data from the Surveyof Manufacturers from 1956 to 1962, concluded that the shift of manufacturing growth from the Manila area to the rest of the country thatwas visible in that period could be traced to the impact of decontroland devaluation. See their "Decontrol and the Redirection of IncomeFlows: A Second Look," Philippine Economic ,Journal~ Vol. 6, No.2,1967, pp. 109-128.
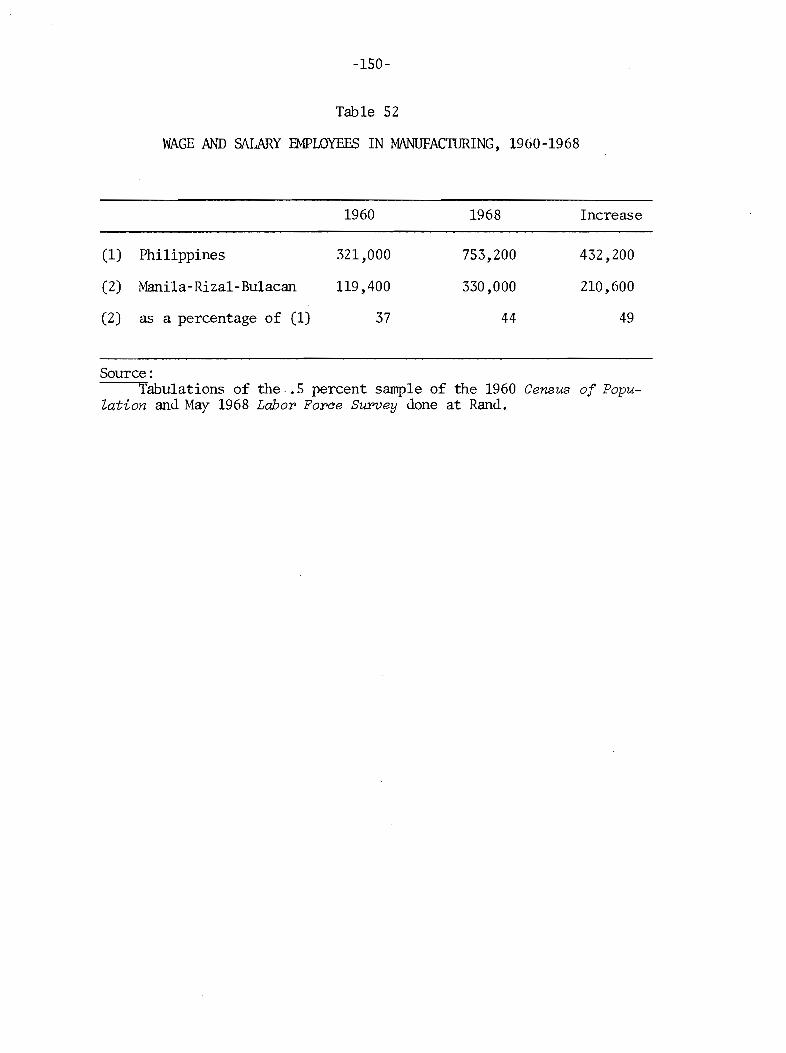
-150-
Table 52
WAGE AND SALARY EMPLOYEES IN MANUFACTIJRING, 1960-1968
1960 1968 Increase
(1) Philippines 321,000 753,200 432,200
(2) Mani1a-Riza1-Bu1acan 119,400 330,000 210,600
(2) as a percentage of (1) 37 44 49
Source:Tabulations of the .. S percent sample of the 1960 Census of Popu
Zation and May 1968 Labor Forae Survey done at Rand.
-151-
crisis and prescriptions of fundamental change are not only beside the
point but run the risk of reducing a satisfactory performer to a poor
performer. The potential costs of revolutionizing a success are much
greater than the potential costs of revolutionizing a failure.
The Politics of the Modern Labor Force
We saw in Chapter 4 that the poor appear to be no different from
other Filipinos. We saw above that the lIDemployed seem to bear no spe
cial grievance against the political system. These observations do not
prove that dissatisfaction and tensions would not appear if the economy
failed to grow for some length of time. If the Philippines did in fact
stagnate, some political crisis might follow. But the country does not
appear to have stagnated, so announcements that slow growth has pushed
the COlIDtry to the brink of revolution are premature. Even by the offi
cial NEe figures, the performance of the economy is impressive; and
these figures, as we noted, probably understate the true growth of GNP.
If we do not expect to find protest against the alleged slow rate
of growth of the economy, is it possible that the Philippines faces
precisely the reverse problem: social disorganization and political
alienation arising from the process of growth itself? The literature
on economic development commonly asserts that tensions will rise as
people move rapidly from traditional to modern styles of life. l Do we
find this in the Philippines?
We can identify the opinions of the MLF by extracting from Pegasus
those respondents who are engaged in modern occupations. 2 This is the
group whose life-styles presumably represent more modern rather than
more traditional patterns. And it is a group that is growing rapidly.
Is this group significantly different from the rest of the population?
lSee Huntington, Political Order in Changing Societies~ Ch. 1.
2The Pegasus. MLF is defined occupationally. The following occupation classes are excluded: proprietors of sari-sari stores; farmers,farm laborers, fishermen, hunters and related workers; weavers of hats,mats, baskets, and other handicrafts; spinners, weavers and relatedworkers; dressmakers, seamstresses, tailors, shoemakers and relatedworkers; food, beverage, and copra workers; manual workers and laborers;service an~ related workers; housewives and not reported.
-152':'
By and large, the MLF is different in ways we would expect. When
compared with the non-MLF they are more worried about crime, population
growth, dissidence, and treatment of minorities and equally concerned
about taxes, the cost of living, and graft. 1 As Table 53 shows, how
ever, they are slightly. more skeptical of politicians. The differences
here, although statistically significant, are not overwhelming. The
MLF also profess to weigh candidates for President according to somewhat
less "traditional" measures than does the rest of the population.
Although the differences here are not sharp, they weakly support the
contention that members of the r~F represent the emergence of a new
kind of voter. (See Table 54.) The MLF say they consider the candi
date's dialect, party, and promises of help to be somewhat less impor
tant, while honesty is nR.lch less important to them than it is to the
non-MLF. The absence of sharp differences in voting behavior, however,
is corroborated by the failure of percent MLF in a province to add
anything to the explanation of election results in the regression
models. 2
The Lurch: A Permanent Crisis
The Unevenness of Growth
Although it seems to be growing rapidly, the Philippine economy
also appears to be rather unstable. At least until 1966, the re
ported rate of growth of real GNP alternately rose and fell in a
two-year cycle. 3 (See Table 55.) Furthermore, the Philippine
balance of payments position has been repeatedly precarious: Net
foreign exchange reserves have fluctuated sharply, but with a strong
downward trend since 1960. (See Table 56.) The unevenness in the
growth rate and the recurring foreign exchange crises have tended
lfabulation of questions la-lh of Pegasus. The criterion ofsignificant difference is a x2 or x2 significant at .95.
~F was used as a vari~le in the 1961 and 1965 voting equationsreported in Olapter 4 but it was not significant.
3The apparent break in the pattern after 1966 will be discussedbelow.

-153-
Table 53
IMPRESSIONS OF POLITICIANS, MLF AND NON-MLFa
(row percentages)
1. Greedy
MLF
Non-MLF
None/Few
11
16
Sane
45
50
Most
43
34
SSR
424
623
x2 = 9.51 with 2 D.F. x2 = 8.4 with 2 D.F.1
2. NationalisticNone/Few Some Most SSR
MLF 24 51 25 417
Non-MLF 20 46 34 617
x2 = 9.68 with 2 D.F. x2 = 8.8 with 2 D.F.1
Note:aActua1 text of question: From your impressions of politicians,
is the word I will read to you descriptive of none or very few politicians ... some of them...or JOOst of them?
There were no significant differences between MLF and non-MLFon the other questions of this group, 4a-4f of Pegasus.
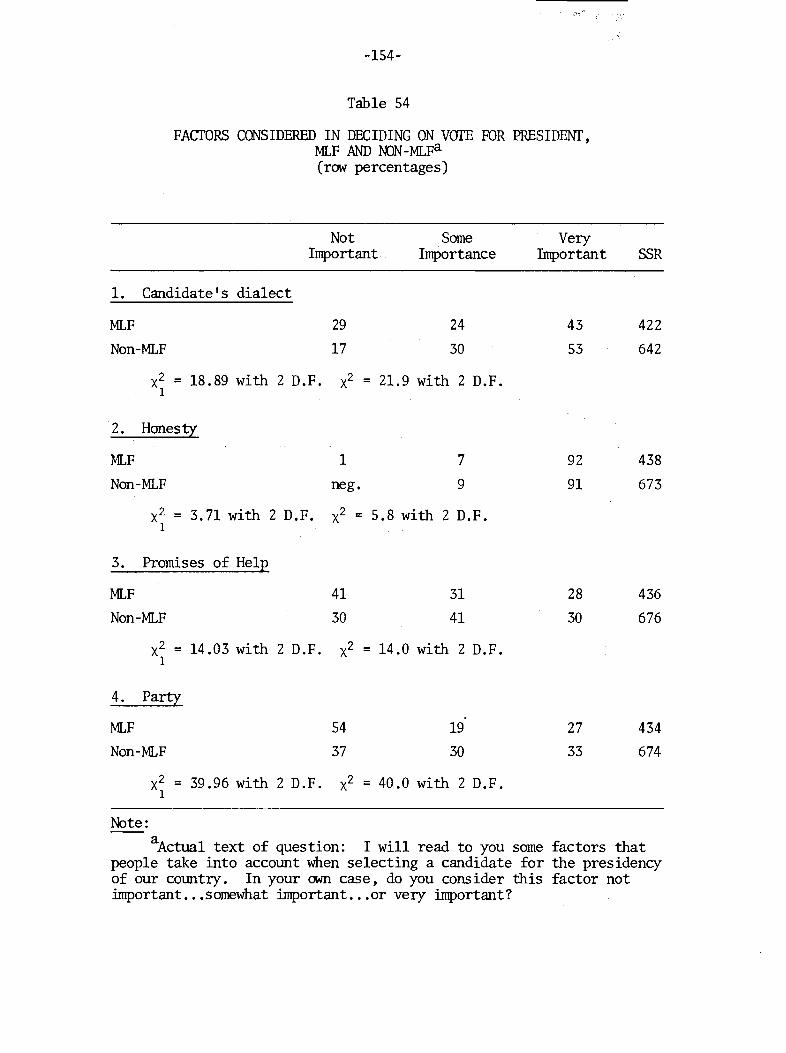
-154-
Table S4
FAcrORS CONSIDERED IN DECIDING ON VOTE FOR PRESIDENf,MLF .AND mN-MLFa(row percentages)
Not Some VeryImportant Importance Important SSR
1. Candidate's dialect
MLF 29 24 43 422
Non-MLF 17 30 53 642
x2 = 18.89 with 2 D.F. x2 = 21.9 with 2 D.F.1
2. Honesty
MLF 1 7 92 438
Non-MLF neg. 9 91 673
x2 = 3.71 with 2 D.F. x2 = 5.8 with 2 D.F.1
3. Promises of Help
MLF 41 31 28 436Non-MLF 30 41 30 676
x2 = 14.03 with 2 D.F. x2 = 14.0 with 2 D.F.1
4. Party
MLF S4 19 27 434Non-MLF 37 30 33 674
x2 = 39.96 with 2 D.F. x2 = 40.0 with 2 D.F.1
Note:
aActua1 text of question: I will read to you some factors thatpeople take into account when selecting a candidate for the presidencyof our country. In your own case, do you cons ider this factor notimportant ..•somewhat important ...or very important?
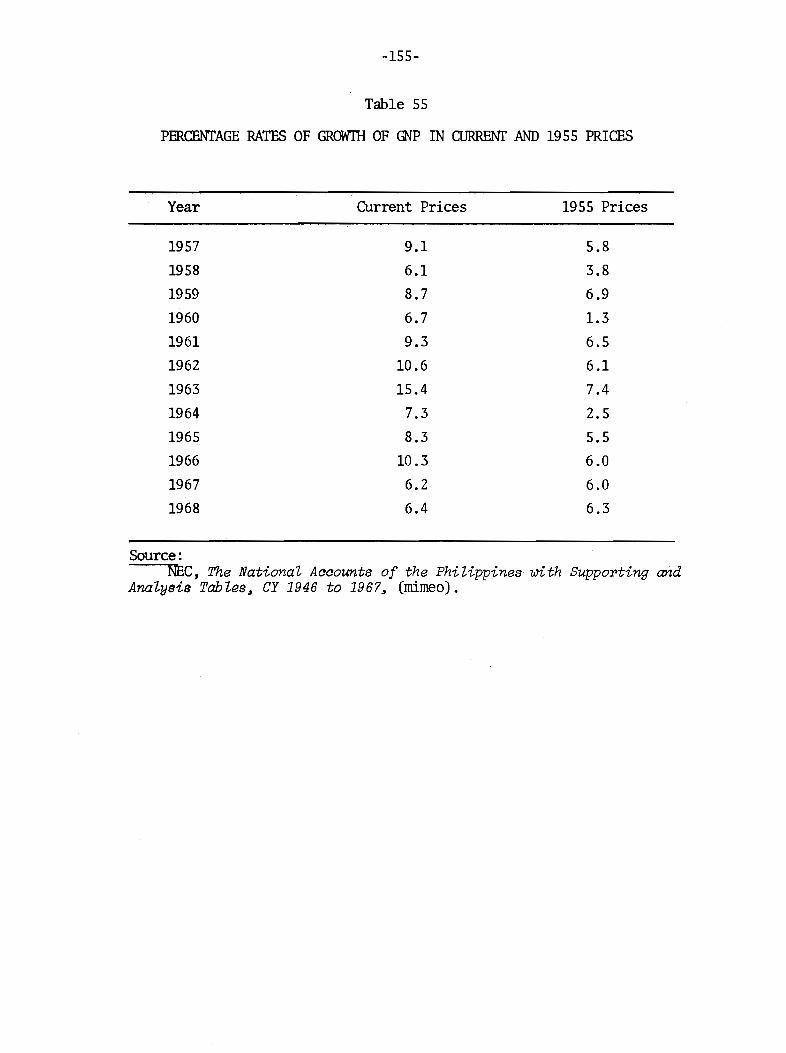
-155-
Table 55
PERCENTAGE RATES OF GROWIH OF GNP IN aJRRENr AND 1955 PRICES
Year Current Prices 1955 Prices
1957 9.1 5.8
1958 6.1 3.8
1959 8.7 6.9
1960 6.7 1.3
1961 9.3 6.5
1962 10.6 6.1
1963 15.4 7.4
1964 7.3 2.5
1965 8.3 5.5
1966 10.3 6.0
1967 6.2 6.0
1968 6.4 6.3
Source:NEC, The National- Aaaounts of the Phi Uppines wi th Supporting and
AnaZysis TableB~ CY 1946 to 1967~ (mimeo).
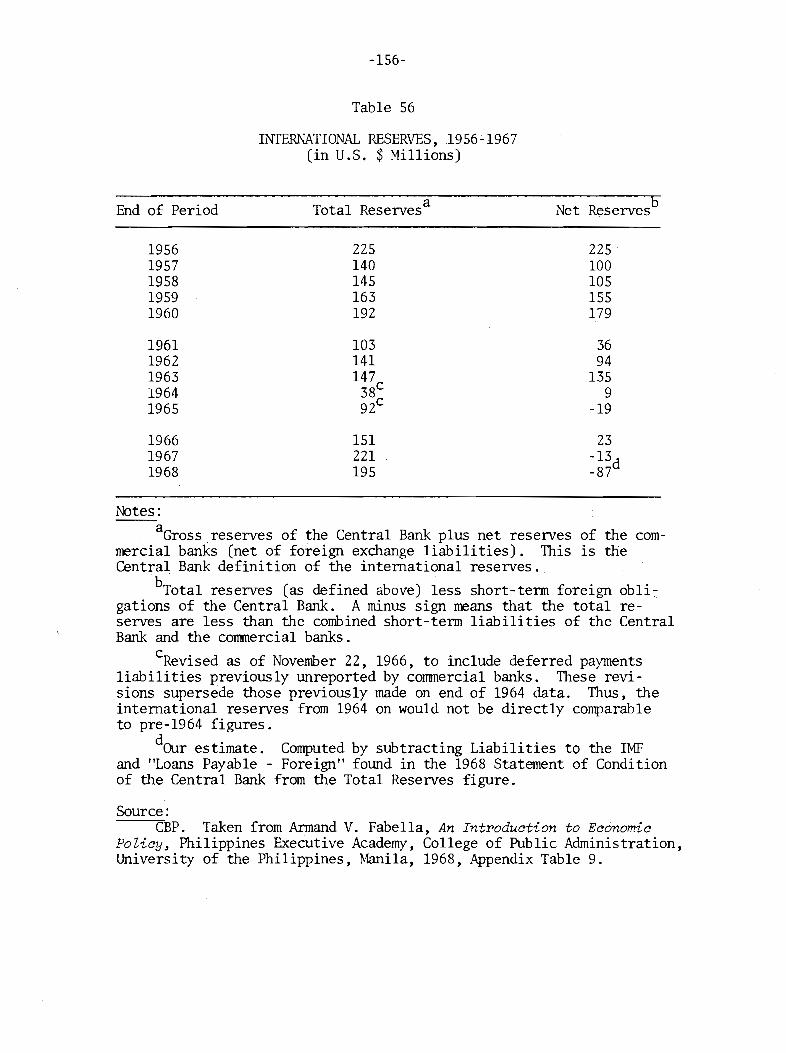
-156-
Table 56
INTERNATIONAL RESERVES, 1956-1967(in U.S. $ Millions)
End of Period
19561957195819591960
19611962196319641965
196619671968
aTotal Reserves
225140145163192
103141147
38c
92c
151221195
Net Reservesb
225100105155179
3694
1359
-19
23-13_87d
Notes:
aGrossreserves of the Central Bank plus net reserves of the commercial banks (net of foreign exchange liabilities). This is theCentral Bank definition of the international reserves.
bTotal reserves (as defined above) less short-tenn foreign obli-:gations of the Central Bank. A minus sign means that the total reserves are less than the combined short-tenn liabilities of the CentralBank and the commercial banks.
cRevised as of November 22, 1966, to include deferred paymentsliabilities previously unreported by commercial banks. These revisions supersede those previously made on end of 1964 data. Thus, theinternational reserves from 1964 on would not be directly comparableto pre-1964 figures.
dOur estimate. Computed by subtracting Liabilities to the IMPand "Loans Payable - Foreign" found in the 1968 Statement of Conditionof the Central Bank from the Total Reserves figure.
Source:CBP. Taken from Armand V. Fabella, An Introduction to Economic
Policy~ Philippines Executive Academy, College of Public Administration,University of the Philippines, ~1anila, 1968, Appendix Table 9.
-157-
to obscure perceptions of the real progress of the Philippine economy
and have bred pessimism about the country's long-run prospects.
Elections and Fiscal Policy
Every Philippine president -- except Magsaysay, \\ho died in
office -- has sought re-election. What does a president have to do
to be re-e1ected? The survey data cited in Chapters 3 and 4 suggest
that both politicians and voters perceive election strategy in terms
of allocating public works, jobs, and more blatant pay-offs to maximize
votes. If this is how a candidate perceives his strategic problem,
then the needs of a politician playing the role of rational campaigner
are clear: Capture as many resources as possible, allocate them to
projects that will bear his name, and distribute as many jobs and
payoffs as possible to the voters.
We shall argue in this section that the tmevenness we observe is
in part the consequence of fiscal and monetary policies that work
together to des tab ilize the economy. The policies, in tum, flow from
the way in which po1icyrnakers perceive the requirements of political
success; in short, the instability does not reflect the impact of
tmcontrollab1e events, but rather it is built into the Philippine
political system. As Philippine policyrnakers pursue and achieve
their goals, they behave in a way that generates the cycles we have
observed.
To speak of "the goals of policyrnakers" over nearly a decade is
to bend reality somewhat. Ins ti tutions have corne and gone: The Program
Implementation Agency supplanted NEC in some roles and was in tum
transmuted into The Presidential Economic Staff, only to lose its
major functions to the new Board of Investments. The same institution
may behave quite differently tmder different directors: The Central
Bank tmder Castillo fought the administration's spending program less
vigorously than tmder Cuademo.
Nevertheless, IIUlch of the change is more apparent than real. Al
though the players change, many of the roles remain the same: The
President IIUlSt present an expenditure program; the Congress IIUlst pass
-158-
appropriations; the Treasury must raise the required ftmds; and the
Central Bank must finance the deficit. The structure of the govenunent
spending process defines these roles, and they have remained the same
over the decade. The convergence and divergence of the various actors'
goals, how they perceive their roles and how vigorously they play them,
define the policy outcome.
Expenditures must be financed in one way or another, and all the
possible methods of raising the money entail political costs. The
political costs of higher tax rates or improved collection at present
rates seem obvious. Since many voters cite the high cost of living as
a very important problem, recourse to inflationary finance may be self
defeating beyond fairly narrow limits. l If the administration cannot
raise taxes, non-inflationary financing is available from only three
sources: Foreign borrowing, running down foreign exchange reserves
(accompanied by an import surplus), and capturing more of the saving
of the private sector through the financial system. Capturing domes
tic savings for govenunent expenditures requires tightening credit for
business investment and is likely to alienate an influential segment
of the electorate (and another source of campaign financing). The
abili ty of the govenunent to borrow abroad is also limited, although
the limits are -not rigidly defined. And, of course, foreign exchange
reserves are also limited.
What role do we expect the Central Bank to play in political fi
nance? The CB was not set up to say no to the needs of the administration.
Indeed, the Secretary of Finance is chairman of the Monetary Board,
the Bank's policymaking body, and the Board itself has often held
other prominent politicians, past or future. On the other hand, the
bank also has another constituency: foreign bankers, the IMP and IBRD,
and other proponents of "sound" policy. If the CB hopes to negotiate
satisfactorily in the future with this foreign constituency, the
amount of inflationary finance or foreign borrowing it can provide
should not exceed the limits judged "prudent" by this connrn.mity . Also,
1See Table 27.

-159-
there are several checks on inflationary financing written into the CB
organic act, Republic Act 265: Direct advances to the government are
limited to 15 percent of the average of government income of the pre
vious three years; the CB is required to explain whenever either the
money supply rises by more than 15 percent or the consumer price index
rises by more than 10 percent over any 12 month period. l The limit on
direct advances can, of course, be circumvented in various ways, and
the reporting requirement is little more than a source of potential
embarrassment; but the two constraints may exert some restraining in
fluence on government decisions to finance a deficit by inflationary
means, and they may be used as counters in CB bargaining with the
administration.
The Fiscal Cycle
We are postulating the existence of a short two-year cycle in
fiscal policy, corresponding to the biennial elections. In order to
detect such a short cycle, we should have quarterly or monthly data
on taxes and expenditures, and the data should be defined in a fashion
consistent with national income accounting definitions. The Philip
pine budget process is not set up to g,nerate such data -- either for
us or for policymakers.
Appropriations from Congress must be released in quarterly allot
ments by the Budget Commission to the operating departments. Allotments
release funds to the agencies by allowing them to draw treasury war
rants to replenish their cash balance with commercial banks or the
Philippine National Bank. At this point we lose track of the funds.
Appropriations, Budget Commission releases, and transfers from Treasury
to department accounts are all reported regularly. But the actual de
partmental purchases from the economy may be delayed into succeeding
fiscal years if, as has been common practice, the department certifies
that unexpended releases are obligated in order to prevent their
ISee Republic Act 265, Secs. 95, 66.
-160-
1reversion to the Treasury. In FY 1962, for example, these accumulated
obligations were run down 360 million, accounting for over 16 percent
of all actual expenditures. 2
Thus, there are no fully satisfactory data. 3 All that we can use
to judge the cyclical impact of fiscal policy are the figures on oper
ating receipts and disbursements. These figures, however, do have the
virtue that they are the data actually taken by the Treasury and CB
to represent the impact of fiscal activities. And they are as close to
actual expenditures as we can get.
Figure 15 shows a monthly plot of net government operating re
ceipts. This is essentially government tax and entrepreneurial income
less government expenditures. 4 The data show a strong annual cycle,
but deficits appear to be unusually large in the months immediately
preceding elections.
The govenunent surplus as measured here does tend to decline in
election years and increase in non-election years. The relationship
between changes in government net operating receipts and elections is
shown in Table 57. In each of the five election years, the level of
net receipts declined. 5
ISince 1967 the action office of the infrastructure program hasbeen gathering data on expenditures and unexpended appropriations,quarterly by project. This infonnation, however, is tightly held andnot available to other branches of the government.
2See R. V. Tiaoqui, ''The National Budget System of the Philippines,"The Philippine Eoonomio Journal, Vol. 2, No.1, 1963, for the bestdescription of Philippine budgeting and FY 1962 data.
3which is, of course, symptomatic of the Philippine government'sgeneral problem of poor command and control.
4The figures exclude government borrowing and debt repayments.
5We can test the relationship fonnally using Fisher's exact test.If there were in fact no relationship between election years and changesin net receipts, the probability of finding a relationship this strongby random drawing is only .0152. Thus, the hypothesis that there isin fact a relation is strongly confinned. See Frederick E. Croxton,Elementary Statistios with Applioations in Medioine and the BiologioalSoienoes, Dover Publishing Co., New York, 1959, pp. 276-278.
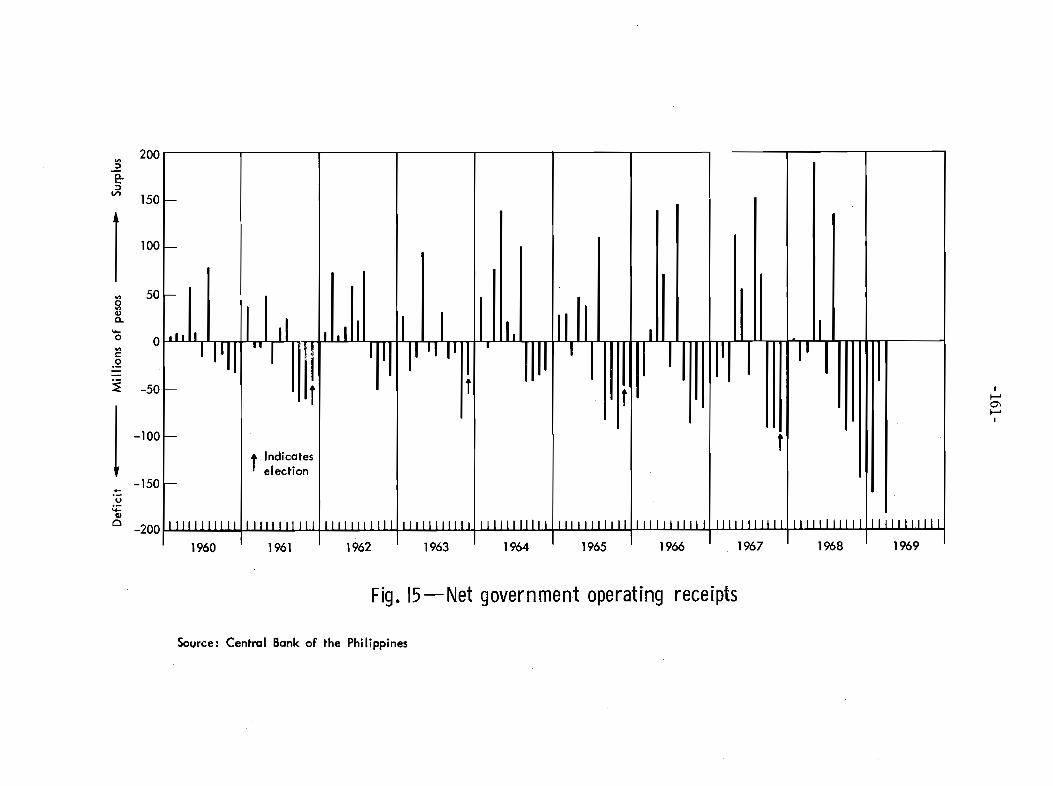
1VI
SlQJQ.
....oVIc.2
j
200
150 f--
100 -
50 -
0 01.11 I II I . I 'I I I I. II I I II PII "I I
I II I''I P I,
II I I I I II I I' II-50 - r f f
I~
0"-~I
-100 - ft Indicateselection
-150 -u~
QJo -200 I I I I I I I I I I I I I I I I I I I I I I I I I I I I I I I I I I I I I I I I I I I I I I I I I I I I I I I I I I I I I I I I I I I I I I I I I I I I I I I I I I I I I I I I I I I I I I I I I I I I I I I I I I I I I I
1960 1961 1962 1963 1964 1965 1966 1967 1968 1969
Fig. IS-Net government operating receipts
Source: Central Bank of the Philippines
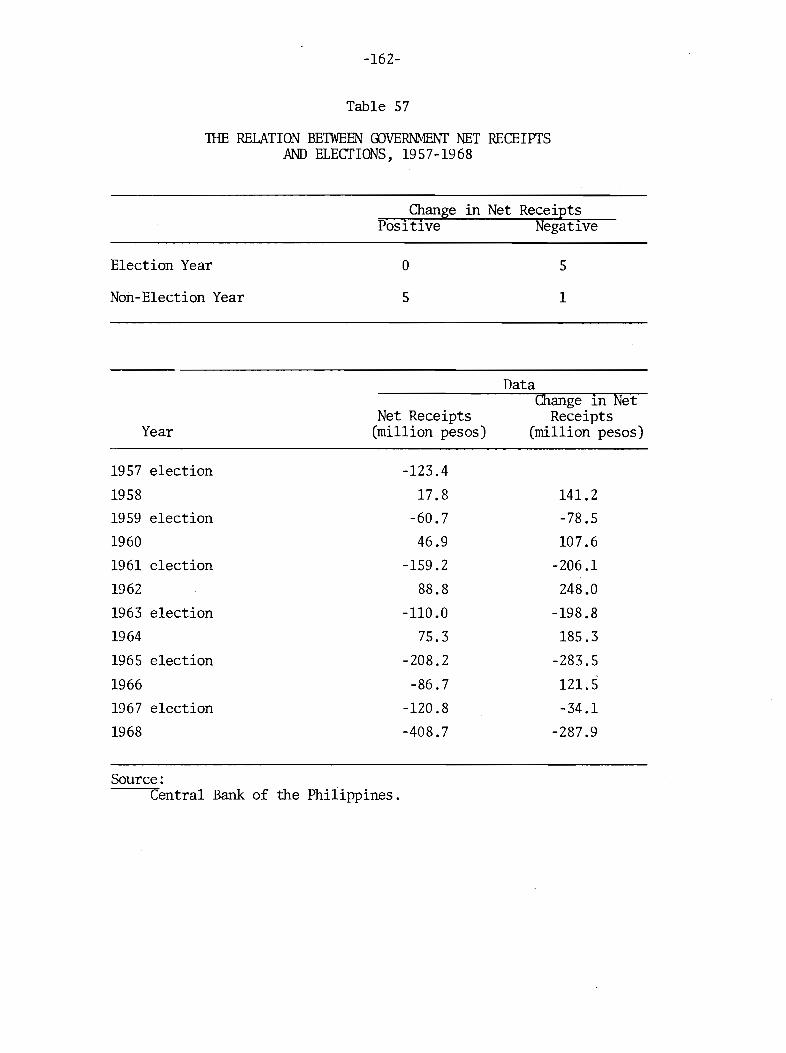
-162-
Table 57
1HE RELATION BElWEEN OOVERNMENT NET RECEIPTSAND ELECTIONS, 1957-1968
Change in Net Receiptspositive Negative
Election Year
Non-Election Year
o
5
5
1
DataOlange in Net
Net Receipts ReceiptsYear (million pesos) (million pesos)
1957 election -123.4
1958 17 .8 141.2
1959 election -60.7 -78.5
1960 46.9 107.6
1961 election -159.2 -206.1
1962 88.8 248.0
1963 election -110.0 -198.8
1964 75.3 185.3
1965 election -208.2 -283.5
1966 -86.7 121.5
1967 election -120.8 -34.1
1968 -408.7 -287.9
Source:Central Bank of the Philippines.
-163-
The use of annual data to test for this relationship is somewhat
arbitrary, however. The hypothesis is really a statement about the
months surrounding elections; the annual pattern, for example, could
be produced by a bulge in expenditures after the elections, which could
not be explained by the need for election finance. We tested for this
by experimenting with a variety of periods, testing to see, for example,
if the relation between elections and changes in net receipts remained,
if we looked at the sum of net receipts for the months of February
through June of each year. The results conformed generally to the
annual results, but the strongest relation (perfect correspondence be
tween election vs. non-election and change in net receipts) appeared
in any combination of initial and terminal months which ended in either
May, June, or July, that is, in any set of months ending three or four
months before the election. l
This observation is easy to explain ex post. The public works
acts always specify that employment of casual workers on government
projects must cease 45 days before the election, that is, by mid2September. And the data we have measure releases rather than actual
expenditures, so their peak should lead the peak in construction
activity by a month or so.
This political cycle in fiscal policy is not news. The CB in its
AnnuaZ Reports has often commented on fiscal policy in ways that suggest
awareness of the two-year cycle. 3 And Sixto Roxas, a well-known econo
mist and sometime government official, has described the cycle at some
length. 4 But the predictability of the cycle and its monetary and
foreign payments consequences have not been considered in formal
analyses of the Philippine economy.
lWe also experimented inconclusively with spectral analysis of themonthly series. The strength of the annual and quarterly cycles swampedattempts to estimate the density of the spectrum at a frequency of twoyears.
2See Republic Act 5187, Sec. 9, "Suspension of Work done by Administration before General Elections."
3See Table 58.
4See "The Economics of Politics," Business Day, Vol. 2, No. 79,January 16, 1969, pp. 1-2.
-164-
The MOnetary-Policy Cycle
The Central Bank could adjust monetary policy to offset the impact
of the fiscal cycle. In general, however, the bank has moved with,
rather than against, the fluctuations in spending.
Table 58 shCMs a selection of the Bank's own evaluations of the
net impact of monetary policy. Although there are some differences in
emphas is from year to year and an apparent shift from the pattern in
1967, the Bank has generally surrendered to the demands of election
finance by expanding credit rather than by capturing bank reserves.
In general, we find that the CB, in its own evaluation, behaves
pro-cyclically. The pattern, however, has ~een somewhat modified in
recent years as the Marcos administration has failed to cut back ex
penditures in off years. In 1967 the CB offered the following cri
tique of Philippine fiscal policy:
Developments in 1967 again point to a deficiency inthe economic policy mix which is found not only in developing c01mtries but, as brought out at international monetarymeetings, also appears to be quite common among developedcountries. Basically the trouble lies in over-dependence onmonetary policy for the regulation of economic activity.This has led on a global level to alternate periods ofspeed-up and slowdown, and to a secular rise in interestrates. On the national level, when credit is liberalizedin order to stimulate growth without however institutingcomplementary fiscal measures, the consequent rise in demandleads to a drain on a country's foreign exchange position,forcing an eventual slowdown in development spending. Thebalance of payments effects of increased domestic demandsmust be absorbed by increased foreign exchange resources,in the form of higher exports which however take time andinvestment to generate, and in the form of substantialinternational financing for development projects. Butinternational development loans are often linked with theinstitution of appropriate fiscal policy by recipient countries. The conclusion is, therefore, inescapable thatmuch greater reliance will have to be placed on appropriatefiscal policy measures for economic adjustment and relatively less on an already over-loaded monetary policy.The tax proposals for 1968, if finally approved, shouldgo a long way toward helping the government extend thelimits to which it can pursue its development efforts.The alternatives to such fiscal legislation are either a
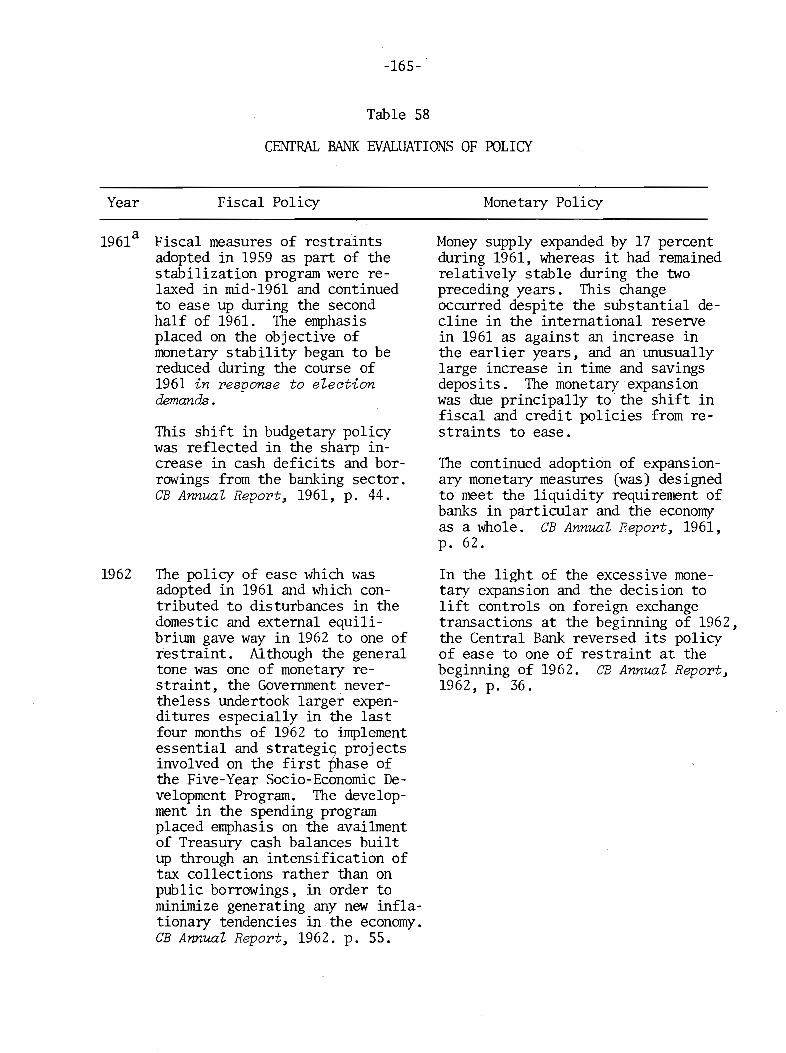
-165-·
Table 58
CENTRAL BANK EVALUATIONS OF POLICY
Year Fiscal Policy
1961a Fiscal measures of restraintsadopted in 1959 as part of thestabilization program were relaxed in mid-196l and continuedto ease up during the secondhalf of 1961. The emphasisplaced on the objective ofmonetary stability began to bereduced during the course of1961 in response to electiondemands.
This shift in budgetary policywas reflected in the sharp increase in cash deficits and borrowings from the banking sector.CB Annual Report~ 1961, p. 44.
1962 The policy of ease which wasadopted in 1961 and which contributed to disturbances in thedomestic and external equilibrium gave way in 1962 to one ofres traint . A1though the generaltone was one of monetary restraint, the Government nevertheless undertook larger expenditures especially in the lastfour months of 1962 to implementessential and strategis projectsinvolved on the first phase ofthe Five-Year Socio-Economic Development Program. The development in the spending programplaced emphasis on the availmentof Treasury cash balances builtup through an intensification oftax collections rather than onpublic borrowings, in order tominimize generating any new inflationary tendencies in the economy.CB Annual Report~ 1962. p. 55.
Monetary Policy
Money supply expanded by 17 percentduring 1961, whereas it had remainedrelatively stable during the twopreceding years. This changeoccurred despite the substantial decline in the international reservein 1961 as against an increase inthe earlier years, and an unusuallylarge increase in time and savingsdeposits. The monetary expansionWas due principally to the shift infiscal and credit policies from restraints to ease.
The continued adoption of expansionary monetary measures (was) des ignedto meet the liquidi ty requirement ofbanks in particular and the economyas a whole. CB Annual Report~ 1961,p. 62.
In the light of the excessive monetary expansion and the decision tolift controls on foreign exchangetransactions at the beginning of 1962,the Central Bank reversed its policyof ease to one of restraint at thebeginning of 1962. CB Annual Report~
1962, p. 36.
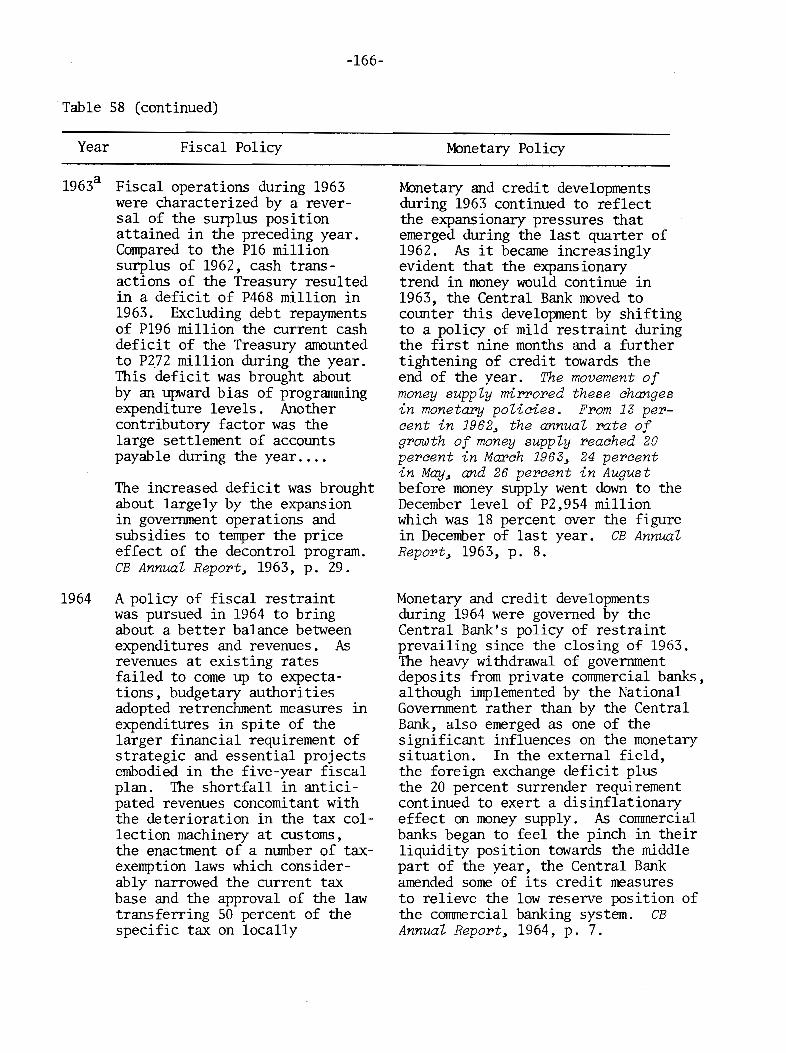
-166-
Table 58 (continued)
Year Fiscal Policy
1963a Fiscal operations during 1963were characterized by a reversal of the surplus positionattained in the preceding year.Compared to the P16 millionsurplus of 1962, cash transactions of the Treasury resultedin a deficit of P468 million in1963. Excluding debt repaymentsof P196 million the current cashdeficit of the Treasury amountedto P272 million during the year.This deficit was brought aboutby an upward bias of programmingexpenditure levels. Anothercontributory factor was thelarge settlement of accountspayable during the year .•.•
The increased deficit was broughtabout largely by the expans ionin government operations andsubsidies to temper the priceeffect of the decontrol program.CB Annual Report3 1963, p. 29.
1964 A policy of fiscal restraintwas pursued in 1964 to bringabout a better balance betweenexpenditures and revenues. Asrevenues at existing ratesfailed to come up to expectations, budgetary authoritiesadopted retrenchment measures inexpenditures in spite of thelarger financial requirement ofstrategic and essential projectsembodied in the five-year fiscalplan. The shortfall in anticipated revenues concomitant withthe deterioration in the tax collection machinery at customs,the enactment of a lllnnber of taxexemption laws which considerably narrowed the current taxbase and the approval of the lawtransferring SO percent of thespecific tax on locally
Monetary Policy
Monetary and credit developmentsduring 1963 continued to reflectthe expansionary pressures thatemerged during the last quarter of1962. As it became increasinglyevident that the expans ionarytrend in money would continue in1963, the Central Bank moved tocounter this development by shiftingto a policy of mild restraint duringthe first nine months and a furthertightening of credit towards theend of the year. The movement ofmoney supply mirrored these changesin monetary policies. From 13 percent in 19623 the annual rate ofgrowth of money supply reached 20percent in March 19633 24 percentin May3 and 26 percent in Augustbefore money supply went down to theDecember level of P2,954 millionwhich was 18 percent over the figurein December of last year. CB AnnualReport3 1963, p. 8.
Monetary and credit developmentsduring 1964 were governed by theCentral Bank's policy of restraintprevailing since the closing of 1963.The heavy withdrawal of governmentdeposits from private commercial banks,although implemented by the NationalGovernment rather than by the CentralBank, also emerged as one of thesignificant influences on the monetarysituation. In the external field,the foreign exchange deficit plusthe 20 percent surrender requirementcontinued to exert a dis inflationaryeffect on money supply. As commercialbanks began to feel the pinch in theirliquidity position towards the middlepart of the year, the Central Bankamended some of its credit measuresto relieve the low reserve position ofthe commercial banking system. CBAnnual Report3 1964, p. 7.
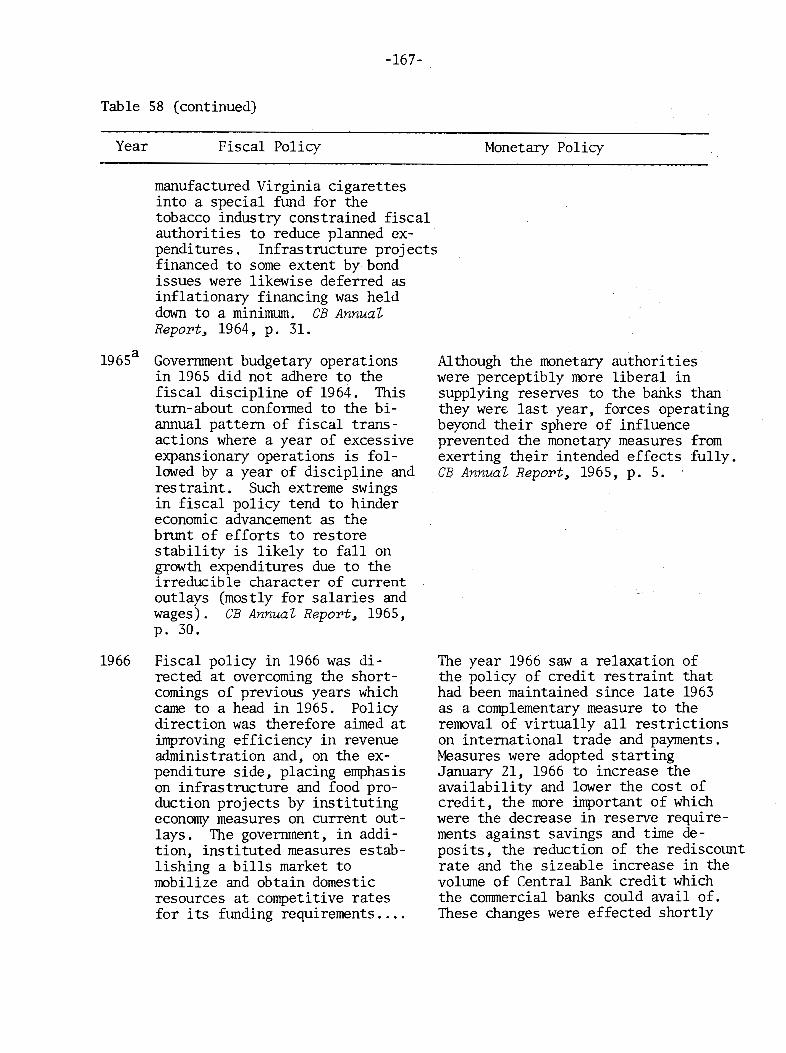
-167-
Table 58 (continued)
Year Fiscal Policy Monetary Policy
Although the monetary authoritieswere perceptibly more liberal insupplying reserves to the banks thanthey wen: last year, forces operatingbeyond their sphere of influenceprevented the monetary measures framexerting their intended effects fully.CB Annual Repopt, 1965, p. 5.
manufactured Virginia cigarettesinto a special fund for thetobacco industry constrained fiscalauthorities to reduce planned expenditures. Infrastructure projectsfinanced to some extent by bondissues were likewise deferred asinflationary financing was helddown to a minimum. CB AnnualRepopt, 1964, p. 31.
1965a Government budgetary operationsin 1965 did not adhere to thefiscal discipline of 1964. Thisturn-about conformed to the biannual pattern of fiscal transactions where a year of excessiveexpansionary operations is followed by a year of discipline andrestraint. Such extreme swingsin fiscal policy tend to hindereconomic advancement as thebrunt of efforts to restorestability is likely to fallongrowth expenditures due to theirreducible character of currentoutlays (mostly for salaries andwages). CB Annual Repopt, 1965,p. 30.
1966 Fiscal policy in 1966 was directed at overcoming the shortcomings of previous years whichcame to a head in 1965. Policydirection was therefore aimed atimproving efficiency in revenueadministration and, on the expenditure side, placing emphasison infrastructure and food production projects by institutingeconomy measures on current outlays. The government, in addition, instituted measures establishing a bills market tomobilize and obtain domesticresources at competitive ratesfor its funding requirements ....
The year 1966 saw a relaxation ofthe policy of credit restraint thathad been maintained since late 1963as a complementary measure to theremoval of virtually all restrictionson international trade and payments.Measures were adopted startingJanuary 21, 1966 to increase theavailability and lower the cost ofcredit, the more important of whichwere the decrease in reserve requirements against savings and tiJne deposits, the reduction of the rediscountrate and the sizeable increase in thevolume of Central Bank credit whichthe commercial banks could avail of.These changes were effected shortly
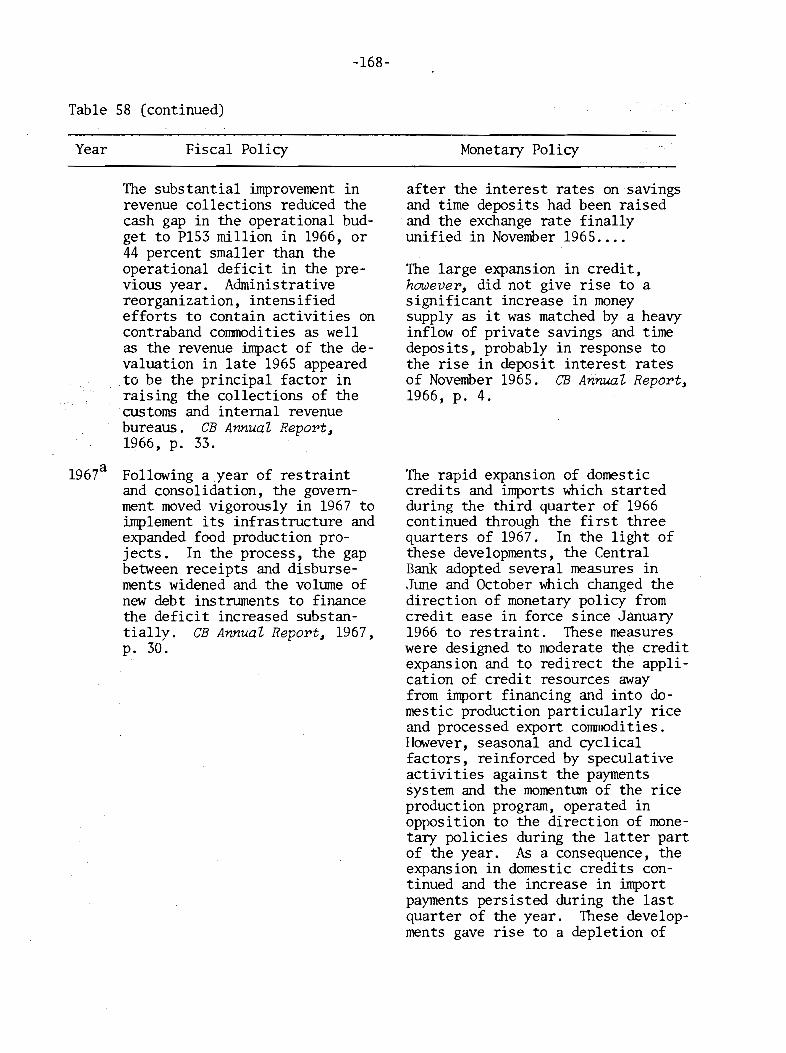
-168-
Table 58 (continued)
Year Fiscal Policy
The substantial improvement inrevenue collections reduced thecash gap in the operational budget to P153 million in 1966, or44 percent smaller than theoperational deficit in the previous year. Administrativereorganization, intensifiedefforts to contain activities oncontraband commodities as wellas the revenue impact of the devaluation in late 1965 appearedto be the principal factor inraising the collections of thecustoms and internal revenuebureaus. CB Annual. RepoT't~
1966, p. 33.
Monetary Policy
after the interest rates on savingsand time deposits had been raisedand the exchange rate finallyunified in November 1965 ....
The large expansion in credit,howeveT'~ did not give rise to asignificant increase in moneysupply as it was matched by a heavyinflow of private savings and timedeposits, probably in response tothe rise in deposit interest ratesof November 1965. CB Annual. RepoT't~
1966, p. 4.
1967a Following a year of restraintand consolidation, the government moved vigorously in 1967 toimplement its infrastructure andexpanded food production projects. In the process, the gapbetween receipts and disbursements widened and the volume ofnew debt instruments to financethe deficit increased substantially. CB Annual. RepoT't~ 1967,p. 30.
The rapid expansion of domesticcredits and imports which startedduring the third quarter of 1966continued through the first threequarters of 1967. In the light ofthese developments, the CentralBank adopted several measures inJtme and October which changed thedirection of monetary policy fromcredit ease in force since January1966 to restraint. These measureswere designed to moderate the creditexpansion and to redirect the application of credit resources awayfrom import financing and into domestic production particularly riceand processed export commodities.However, seasonal and cyclicalfactors, reinforced by speculativeactivities against the paymentssystem and the mornentlDTI of the riceproduction program, operated inopposition to the direction of monetary policies during the latter partof the year. As a consequence, theexpansion in domestic credits continued and the increase in importpayments persisted during the lastquarter of the year. These deve loprnents gave rise to a depletion of
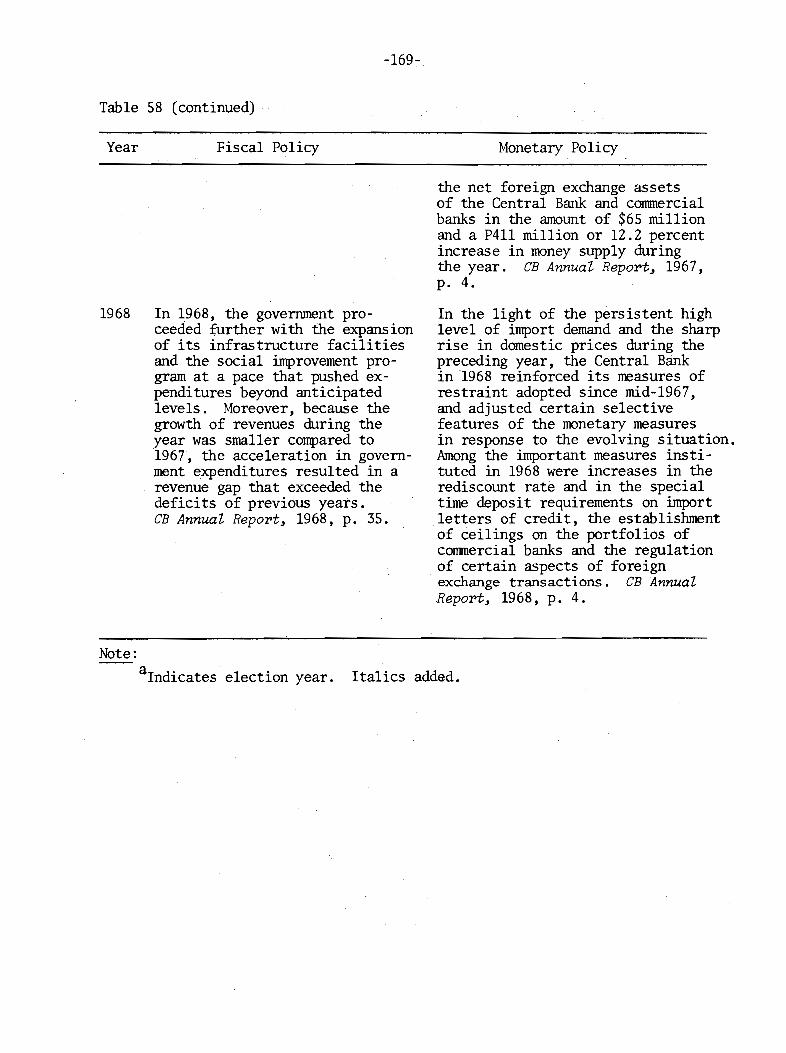
-169-
Table 58 (continued)
Year
1968
Fiscal Policy
In 1968, the government proceeded further with the expansionof its infrastructure facilitiesand the social improvement program at a pace that pushed expenditures beyond anticipatedlevels. Moreover, because thegrowth of revenues during theyear was smaller compared to1967, the acceleration in government expenditures resulted in arevenue gap that exceeded thedeficits of previous years.CB Annual Report~ 1968, p. 35.
Monetary Policy
the net foreign exchange assetsof the Central Bank and commercialbanks in the amount of $65 millionand a P411 million or 12.2 percentincrease in money supply duringthe year. CB Annual Report~ 1967,p. 4.
In the light of the persistent highlevel of import demand and the sharprise in domestic prices during thepreceding year, the Central Bankin 1968 reinforced its measures ofrestraint adopted since mid-1967,and adjusted certain selectivefeatures of the monetary measuresin response to the evolving situation.Among the important measures instituted in 1968 were increases in therediscount rate and in the specialtime deposit requirements on importletters of credit, the establishmentof ceilings on the portfolios ofcommercial banks and the regulationof certain aspects of foreignexchange transactions. CB AnnualReport~ 1968, p. 4.
Note:aIndicates election year. Italics added.
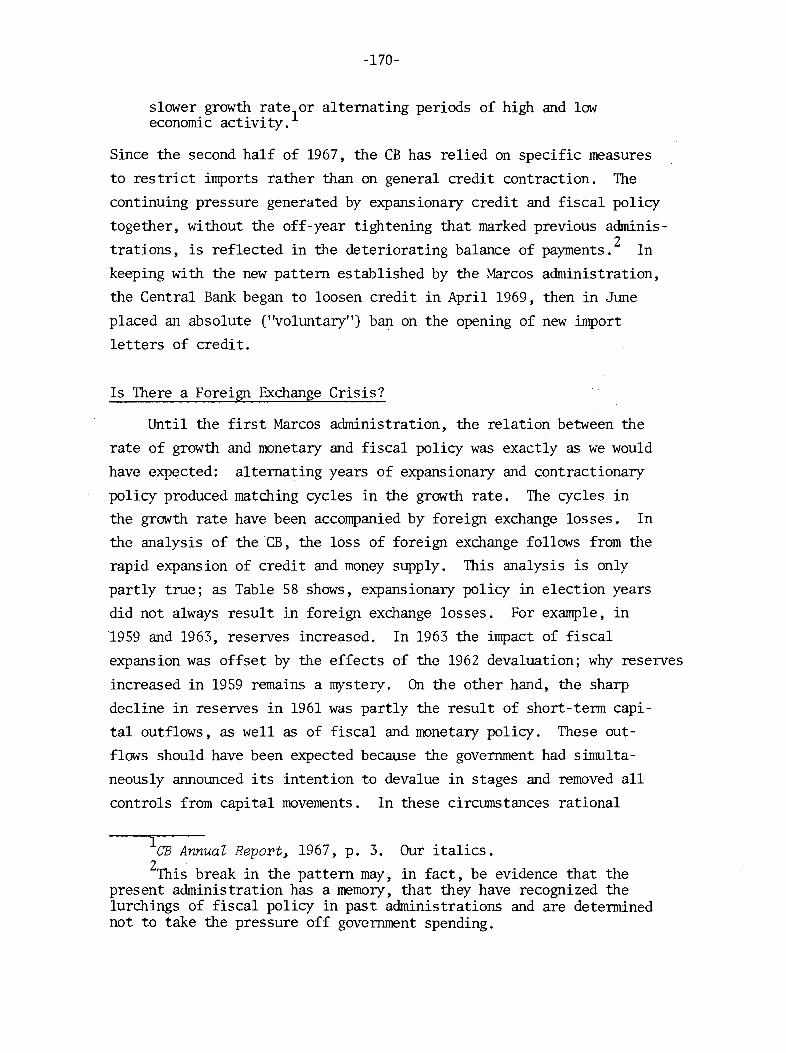
-170-
slower. grow0 ::atelor alternating periods of high and loweconomIC actIVIty.
Since the second half of 1967, the CB has relied on specific measures
to restrict imports rather than on general credit contraction. The
continuing pressure generated by expansionary credit and fiscal policy
together, without the off-year tightening that marked previous adminis
trations, is reflected in the deteriorating balance of payments. 2 In
keeping with the new pattern established by the Marcos administration,
the Central Bank began to loosen credit in April 1969, then in June
placed an absolute ("voluntary") ban on the opening of new import
letters of credit.
Is There a Foreign Exchange Crisis?
Until the first Marcos administration, the relation between the
rate of growth and monetary and fiscal policy was exactly as we would
have expected: alternating years of expansionary and contractionary
policy produced matching cycles in the growth rate. The cycles inthe growth rate have been accompanied by foreign exchange losses. In
the analysis of theCB, the loss of foreign exchange follows from the
rapid expans ion of credit and money supply. This analysis is only
partly true; as Table 58 shows, expansionary policy in election years
did not always result in foreign exchange losses. For example, in
1959 and 1963, reserves increased. In 1963 the impact of fiscal
expansion was offset by the effects of the 1962 devaluation; why reserves
increased in 1959 remains a mystery. On the other hand, the sharp
decline in reserves in 1961 was partly the result of short-term capi-
tal outflows, as well as of fiscal and monetary policy. These out-
flows should have been expected because the government had simulta
neously announced its intention to devalue in stages and removed all
controls from capital movements. In these circumstances rational
1CB Annual Report, 1967, p. 3. Our italics.2This break in the pattern may, in fact, be evidence that the
present administration has a memory, that they have recognized thelurchings of fiscal policy in past administrations and are determinednot to take the pressure off government spending.
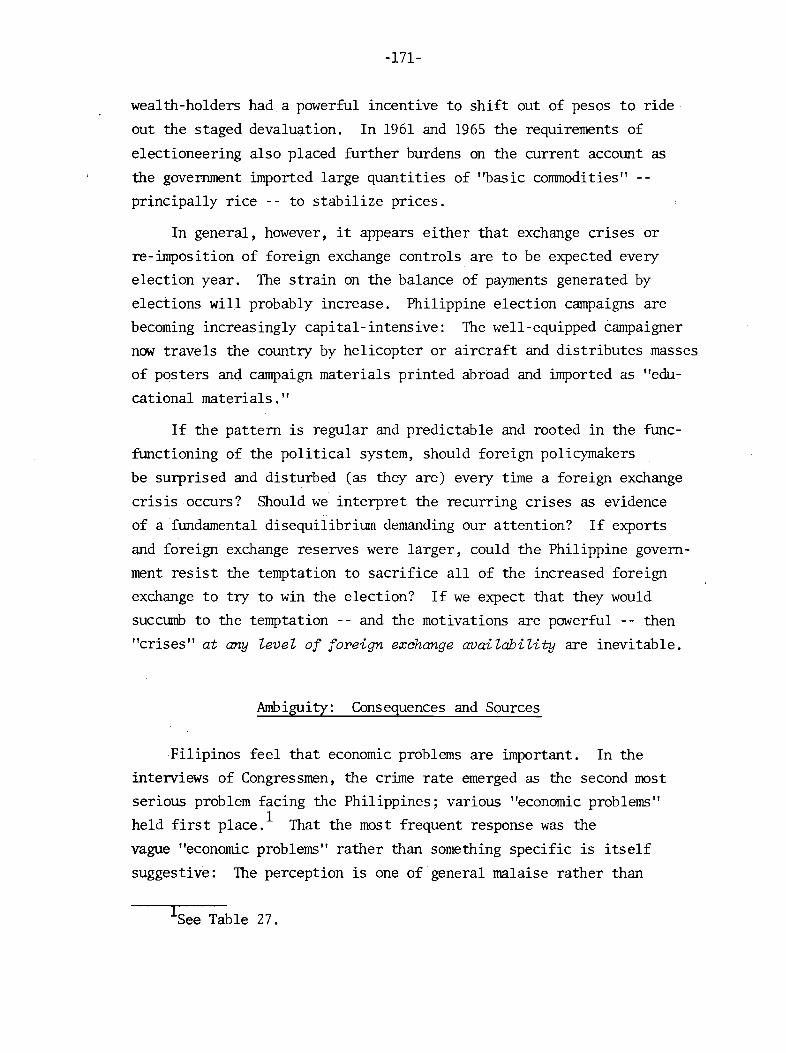
-171-
wealth-holders had a powerful incentive to shift out of pesos to ride
out the staged devaluation. In 1961 and 1965 the requirements of
electioneering also placed further burdens on the current account as
the government imported large quantities of "basic commodities" -
principally rice -- to stabilize prices.
In general, however, it appears either that exchange crises or
re-imposition of foreign exchange controls are to be expected every
election year. The strain on the balance of payments generated by
elections will probably increase. Philippine election campaigns are
becoming increasingly capital-intensive: The well-equipped campaigner
now travels the coun.try by helicopter or aircraft and distributes masses
of posters and campaign materials printed abroad and imported as "edu
cational materials."
If the pattern is regular and predictable and rooted in the func
functioning of the political system, should foreign policymakers
be surprised and disturbed (as they are) every time a foreign exchange
crisis occurs? Should we interpret the recurring crises as evidence
of a fundamental disequilibrium demanding our attention? If exports
and foreign exchange reserves were larger, could the Philippine govern
ment resist the temptation to sacrifice all of the increased foreign
exchange to try to win the election? If we expect that they would
succumb to the temptation -- and the motivations are powerful -- then
"crises" at any level of foreign exchange availability are inevitable.
Ambiguity: Consequences and Sources
Filipinos feel that economic problems are important. In the
interviews of Congressmen, the crime rate emerged as the second most
serious problem facing the Philippines; various "economic problems"
held first place. l That the most frequent response was the
vague "economic problems" rather than something specific is itself
suggestive: The perception is one of general malaise rather than
ISee Table 27.

-172-
specific problems. A problem can be attacked and beaten back; what
policies will alleviate a diffuse anxiety? In any event, Congressmen
do not have specific policies in mind. Even those who responded that
some specific economic problem was important did not later reply that
they desired some specific policy change. l
Ordinary Filipinos interviewed in the Pegasus survey also re
sponded that economic problems were on the whole "very important. ,,2
This result, however, is hard to interpret. It seems highly unlikely
that "increasing exports" should be a salient personal concern of a
farmer in Ilocos Norte. Perhaps the most we should make of this set
of responses is that ordinary Filipinos, like their representatives,
seem vaguely to feel that the economy is not performing as it should. 3
Even professional economists are gloomy. In a long essay on
"Economic Policy Issues of the 1970's," Gerardo P. Sicat of the Uni
versity of the Philippines concluded:
The Philippines has the underpinnings of a very heal thyeconomy ..• [but] the growth of the last 10 years has not beengenerally satisfactory ...The structure of economic incentivesadopted in our post-war history have not opened up avenuesfor industrial export expansion and further import substitution in more intermediate manufactures .... I doubt verynRlch if we can push the country's industrial developmentpotentials, create a higher rate of employment absorption,and cure our balance of payments difficulties without takinga closer look at what is basically wrong with the structureof economic incentives implied by our economic policies. 4
Economists' analyses of the economy center on the low rate of growth
of manufacturing and exports, on the "colonial structure" of the
economy, on the failure to plan "effectively" and so on. These pro
fessional criticisms, in turn, influence the thinking of policymakers,
both foreign and Filipino.
ISee b b 9a ove, Ta Ie 2 .
2See above, Table 27.
3There are, of course, political postures that capitalize ondiffuse anxiety. The rhetoric of Philippine politicians cater to theanxiety and contribute to it.
4The ManiZa ChronicZe~ April 30, 1969, p. 7-A.
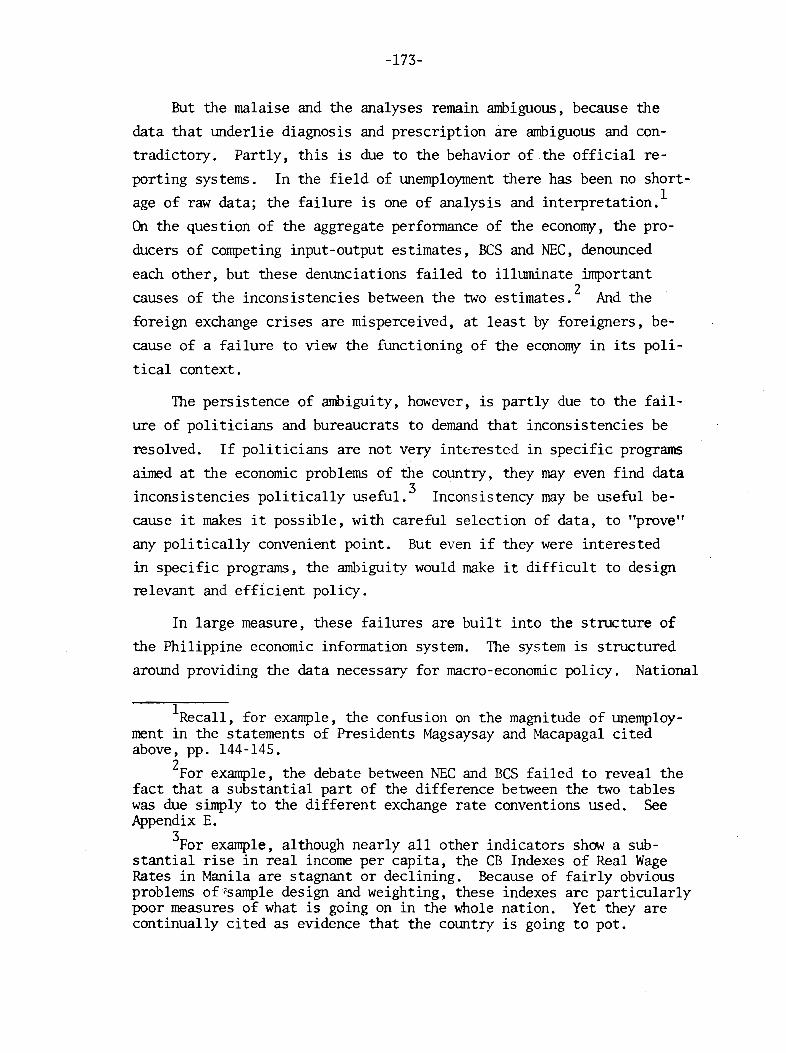
-173-
But the malaise and the analyses remain ambiguous, because the
data that underlie diagnosis and prescription are ambiguous and con
tradictory. Partly, this is due to the behavior of the official re
porting systems. In the field of unemployment there has been no short
age of raw data; the failure is one of analysis and interpretation. 1
On the ques tion of the aggregate perfonnance of the economy, the pro
ducers of competing input-output estimates, BCS and NEC, denounced
each other, but these denunciations failed to illuminate important
causes of the inconsistencies between the two estimates. 2 And the
foreign exchange crises are misperceived, at least by foreigners, be
cause of a failure to view the functioning of the economy in its poli
tical context.
The persistence of ambiguity, however, is partly due to the fail
ure of politicians and bureaucrats to demand that inconsistencies be
resolved. If politicians are not very int~rested in specific programs
aimed at the economic problems of the country, they may even find data
inconsistencies politically useful. 3 Inconsistency may be useful be
cause it makes it possible, with careful selection of data, to "prove"
any politically convenient point. But even if they were interested
in specific programs, the ambiguity would make it difficult to designrelevant and efficient policy.
In large measure, these failures are built into the structure of
the Philippine economic information system. The system is structured
around providing the data necessary for macro-economic policy. National
lRecall, for example, the confusion on the magnitude of unemployment in the statements of Presidents Magsaysay and ~mcapagal citedabove, pp. 144-145.
2For example, the debate between NEC and BCS failed to reveal thefact that a substantial part of the difference between the two tableswas due simply to the different exchange rate conventions used. SeeAppendix E.
3For example, although nearly all other indicators show a substantial rise in real income per capita, the CB Indexes of Real WageRates in Manila are stagnant or declining. Because of fairly obviousproblems of "sample design and weighting, these indexes are particularlypoor measures of what is going on in the whole nation. Yet they arecontinually cited as evidence that the country is going to pot.
-174-
accounts playa key role. Gathering together raw data from other agen
cies and transforming them into GNP estimates is the main function of
the Office of Statistical Coordination and Standards -- a branch of
the NEC -- which stands by law at the focus of the information system.
The national accounts and Central Bank data are the only economic in
dicators that appear promptly and are circulated widely.
This focus on macro-data may represent a fundamental error. l Aswe saw above, the government does not pursue the stabilizing fiscal
and monetary policy that prompt national income data are expected to
guide. Nor does it pursue a coherent tax and expenditure policy for
development. So the resources expended on generating the data produce
little return in terms of improved policy performance, not because the
data are bad, but because they are primarily relevant to policies the
government does not pursue.
The government, however, does pursue many micro-economic policy
objectives. Decisions of the Board of Investments on industrial prior
ities, of the Department of Agriculture on rice production and distri
bution strategy, of the Tariff Commission, in fact of nearly all gov
ernment agencies rest on judgments requiring very specific, timely
data providing information with a spatial and sectoral dimension. Such
information is rarely available.
In 1966, Executive Secretary Rafael M. Salas noted that:
The Executive Office has for some time now identified certainproblems and inadequacies in the national statistical system.To name only a few and to quote from the draft of NEC 4-yearprogram and the reports of other executive agencies, these are:
1. The significant time lag between the collection andrelease of census, survey, and other. data-processingresults:
2. The lack of more detailed and adequately indicativestatistics, and the almost complete absence of data2for geographical areas ~elow the national level .•..
IPor a thorough discussion of various problems of informationsystems in LDCs, see Albert Waterston, Development Planning: Lessonsof Experience~ The Johns Hopkins Press, Baltimore, 1965, Ch. 6.
2Rafael M. Salas, "Statistics and the Decision-Making Process," ThePhilippine Statistician~ Vol. 15, Nos. 1 and 2, March-June 1966, p. 62.

-175-
The points are well taken. Census results have usually been delayed
five years or more. The last complete Survey of Manufactures was taken
in 1962; subsequent Surveys have only reached the worksheet and summary1stage. The Labor Force Survey of May 1968 was not even punched onto
cards until June 1969. The shortage of regional data is even more stri
king than these examples of tardiness. The latest available regional
establishment data are found in the 1961 Economic Census; the 1962 Manu
facturing Survey, which appeared in 1968, contains some regional data
on manufacturing. Although there has been some improvement in the Philip
pine information system in the last few years, Salas's evaluation is
still true.
The absence of regional data may be particularly important because
it relates back to questions of political change. Different parts of
the country show sharply different patterns of growth. These differences
can be traced in part to differential impacts of government policy, par
ticularly exchange rate policy. Yet these impacts may not be perceived
well. By the same token, observers may extrapolate the performance of
one region to an estimate of the performance of the whole country without
realizing that what he sees in one area may be most atypical. Again,
then, we shall ask whether fine-grained analysis of the data would sig
nificantly change" perceptions.
Prospects for the Future
This chapter has argued that the central economic problem of the
Philippines is not the balance of payments, or unemployment, or stag
nation, or any other of the large mrrnber of candidates that have been
offered. The central problem is misperception. The announcements of
crisis that continually assail decisionmakers fail to clarify real
issues or to suggest real options. "Fundamental structural reform"
1Surveys were taken in 1963, 1965,and 1966. The 1963 data canbe found only in BCS worksheets; the 1965 and 1966 data were publishedonly in sunnnary form, with no spatial information and detail only atthe two-digit level.
-176-
is not a live option. This is not to suggest that the country has no
economic problems. Goverrunent action could make a real contribution
to national welfare in many areas. But no one knows where these areas
are, what the structure of the problems is, what the impact of programs
is likely to be.
We have found that when crises are examined in detail, they look
different from the same crises as proclaimed in the press and in Con
gress: (1) Unemployment is a very specific problem concentrated in a
special portion of the population; (2) the economy or the manufacturing
sector are not stagnating, and judgments that they are are based on
dubious inferences from highly uncertain data; (3) the lurching and
recurring foreign exchange losses are rooted in the behavior of the
political system.
The information system produces data that are late, aggregative,
inconsistent, and badly matched with the needs of policymakers.· Even
if politicians were interested in specific programs -- and the evidence
is that they are not -- their ability to devise intelligent programs
would be severely limited by the nature of their information systems.
The bureaucracy, parts of which may be interested in devising programs,
IIRlst deal with the same ambiguities.
The successful execution of the administration's rice program may
offer a hopefUl sign that policymaking capabilities are increasing:
The government perceived a manageable problem, seized the technological
opportunity offered by the development of the new strains of rice, and
successfully organized and executed a complex program to alleviate the
problem of rice shortages. In a sense, though, the rice program was
easier than most of the problems facing the country: The problem was
well-defined, non-controversial, basically technological. Few other
problems are likely to prove so inherently manageable.
But even if the ability of the government to attack and solve
problems remains slight, no prophecy of disaster follows. The unem
ployed do not seem likely to rebel; the economy will continue to grow,
and the Central Bank will continue to manage the balance of payments
-177-
crises intelligently. In short, the problems facing the Philippines
do not appear to exceed greatly the government's capacity to solve
problems. Greatly improved economic performance, however, will be very
difficult to achieve, unless the infonnation systems begin to produce
effective, politically feasible alternatives as well as reliable know
ledge of the consequences of innovation.
-179-
Chapter 6
CRIME IN THE PHILIPPINES
Introduction
oom OOMESTIC AND FOREIGN' OBSERVERS frequently view the Philippines
as a violent society where ITRlrder, robbery, and theft abound. President
Marcos in his 1968 State of the Nation Address to Congress had the fol
lowing to say about peace and order.
When I assumed office in 1966, smuggling, criminality andother forms of lawlessness were rampant, sapping our nationalwi l l and capaai ty to progress.. .. Despite all these measures,the incidence of crime index (major crimes per 100,000 population) continues to show an upward trend. 1
President Marcos believes there is a connection between crime andsocial and econ.omic change. Is there one?2 As in earlier chapters we
have first to untangle the basic information about the prevalence of
1Ferdinand E. Marcos, President of the Republic of the Philippines,State of the Nation: A Message DeZivered Before a Joint Session ofCongress~ January 22~ 1968~ pp. 31-32. OUr italics. See ~lso JohnMecklin, ''The Philippines: An Ailing and Resentful Ally," Fortune~
July 1969, pp. 119. According to Mecklin, ''Morally, after on1~/ twentythree years of independence, the islands are decaying, beset by {crimeand outrageous corruption." An historical examination of the Manilapress indicates a continuous perception of a crime wave for at leastten years.
2"Discontent or social unrest can manifest itself in a wide varietyof ways including intensified economic activities and withdrawal intoreligious or aesthetic pursuits as well as protests against society,destruction of property, riots, murder and suicide." Ronald G. Ridker,"The Economic Determinants of Discontent: An Empirical Investigation,"Journal of Development Studies~ 4, No.2, January 1968, pp. 174-219.
PREVIOUS PAGE BLANK

-180-
crime. Then we have to test for social and economic relationships.
Then finally we have to see if policy instruments exist to control
crime as the country develops.
Perceptions of Crime
We shall as usual report first on the perceptions of the Philip
pine people. Do they really see crime as imposing major social costs?
Do they really see a crime wave? In Pegasus we asked the respondents
about major problems facing the Philippines. The list of issues
included items such as ''need to increase exports," "high cost-of
living," "increasing crime." Sixty-four percent of all respondents
indicated that crime was a very important problem, 14 percent indi
cated it was of some importance, and 25 percent indicated little or
no concern. This response frequency gives crime the fifth most
important spot among the eight issues listed. As usual, there is
much regional variation in the response on "crime as a problem."l
Table 59 shows the response patterns from Pegasus on crime as
a problem. Only in Manila and the surrounding area did the respon
dents give crime the highest rating. In Bicol and in Samar, crime
was rated as sixth (out of eight).
In the Pegasus questionnaire we also asked each respondent the
degree to which he was fearful of being the target of a crime -- of
being killed or robbed. We formulated the question as the "danger
of being killed or robbed in your neighborhood." Permitted responses
were very low, low, moderate, and high. The distribution of responses
in the total sample was as follows:
lCongressmen, on a free response basis, did rank crime secondmost important, however. They are quite thoroughly exposed to Manilaand the mass media. In 1968 one congressman barely survived. anassassination attempt. .
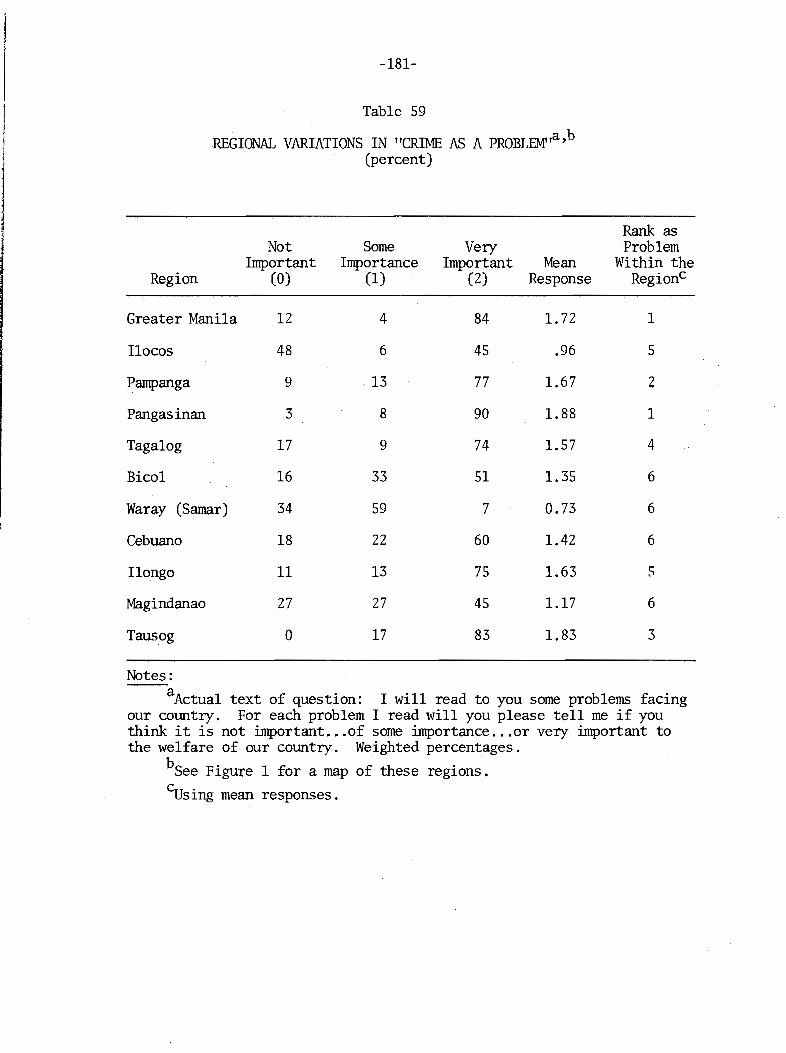
-181-
Table 59
REGIONAL VARIATIONS IN "CRIME AS A PROBLEM',a,b(percent)
Rank asNot Some Very Problem
Important Importance Important Mean Within theRegion (0) (1) (2) Response RegionC
Greater Manila 12 4 84 1.72 1
Ilocos 48 6 45 .96 5
Pampanga 9 13 77 1.67 2
Pangasinan 3 8 90 1.88 1
Tagalog 17 9 74 1.57 4
Bicol 16 33 51 1.35 6
Waray (Samar) 34 59 7 0.73 6
Cebuano 18 22 60 1.42 6
Ilongo 11 13 75 1.63 S
Magindanao 27 27 45 1.17 6
Tausog 0 17 83 1.83 3
Notes:--aActual text of question: I will read to you some problems facing
our COtmtry. For each problem I read will you please tell me if youthink it is not important ...of some importance ...or very important tothe welfare of our COtmtry. Weighted percentages.
bSee Figure 1 for a map of these regions.
CUsing mean responses.
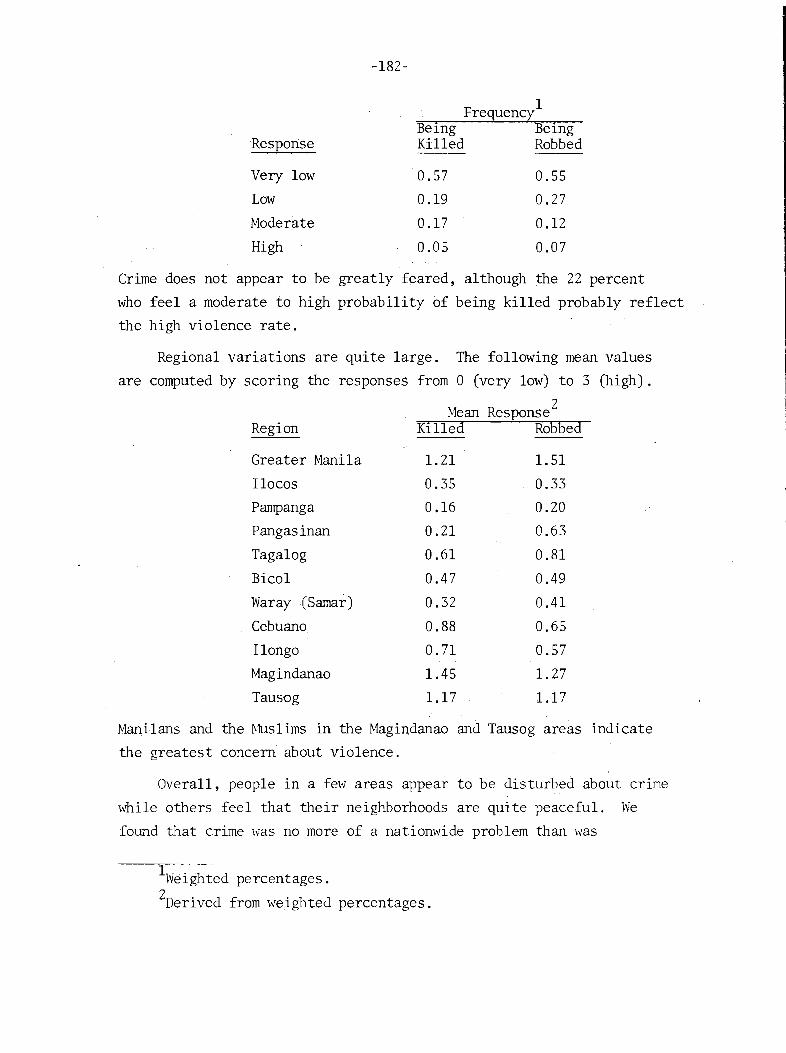
-182-
1Frequency
Response
Very low
Low
Moderate
High
BeingKilled
0.57
0.19
0.17
0.05
BeingRobbed
0.55
0.27
0.12
0.07
Crime does not appear to be greatly feared, although the 22 percent
who feel a moderate to high probability of being killed probably reflect
the high violence rate.
Regional variations are quite large. The following mean values
are computed by scoring the responses from 0 (very low) to 3 (high).
2Mean ResponseRegion Killed Robbed
Greater Manila 1.21 1.51
Ilocos 0.35 0.33
Pampanga 0.16 0.20
Pangasinan 0.21 0.63
Tagalog 0.61 0.81
Bicol 0.47 0.49
Waray (Samar) 0.32 0.41
Cebuano 0.88 0.65
Ilongo 0.71 0.57
Magindanao 1.45 1. 27
Tausog 1.17 1.17
Manilans and the Muslims in the Magindanao and Tausog areas indicate
the greatest concern about violence.
Overall, people in a few areas appear to be disturbed about crime
while others feel that their neighborhoods are quite peaceful. We
found that crime was no more of a nationwide problem than was
lWeighted percentages.
2Derived from weighted percentages.
-183-
unemployment. Only among Manilans is there a strong indication that
th 1 . . .. 1e peop e perceIve a crIme crISIS.
The Structure of the Reporting System
Whether we can make inferences about crime and its causes depends
upon our knowledge of the reporting system and its changes, and on the
relation between the reporting system and the actual amount of crime
occuring. Prior to 1964 there apparently were no nationwide data on
crime. Beginning in 1964, the National Bureau of Investigation (NEI)
began reporting crime statistics by province. The first NEI report was
backdated to cover 1962 and 1963, utilizing "police reports" as basic
data. 2 At that time, however, there was no uniform format for police
reports. The NEI obtained actual crimes reported by municipality and
city. These were aggregated to province level, and projected according
to the fraction of population represented in the reporting municipalities.
From 1962 through 1965, the NEI was making a systematic error in
its province projections and consequently for the country as a whole.
Whenever there was a large fraction of population not reporting, the
NEI's actuaZ method substantially understated the correct estimated
crime rate. 3 Thu~, the national crime rates for 1962-1965 were all
understated. In 1966, the NEI started using the correct computational
method. As a consequence, in 1966 there is an arithmetically induced
rise in the crime rate.
The judgment that the national peace and order situation has de
teriorated during the Marcos Administration depends partially on the
1The evidence of a past crISIS is also weak. For example, in 1963,82 percent of the respondents in IDLARS 416-59-0001 reported that theircommunity or barrio was peaceful, contented, or orderly.
2See PhiZippine Crime Report~ 1962 and 1963, National Bureau ofInvestigation, Republic of the Philippines, Department of Justice.Subsequent years have the same title.
3 C . C 1NBI used p x [1 + (I-F)] Instead of the correct F x P where
C = actual crimes reported and F = fraction of population in thedistricts reporting, and P = total population in 100,000s.
-184-
splicing of the early, incorrect NBI series to later, more accurate
data. (Since 1966 the Philippines has had three reporting systems -
NBI, Police Commission, and Philippine Constabulary. They each use
the same form but at any given time the set of municipalities reporting
in each system is not the same.)
In the left-hand column of each category in Table 60 we Show the
reported NBI national rates for three categories of crime. l The right
hand column shows the corrected national rates. Beginning with the
Marcos Administration, there is a definite change in the reporting sys
tem. Splicing the rates generated by the new system to the old incor
rect rates leads to mistaken conclusions about a rapidly deteriorating
crime situation. in the Philippines. The corrected national 1967 robbery
and theft rates deviate markedly from 1966, and 1964 appears to deviate
markedly from 1965 and 1966. Even with the corrected statistics there
seems to be a slight upswing for homicide. 2
The question is whether these differences are real -- caused by
an upswing in crime -- or whether they are quirks of the reporting
system. For example, consider the 1967 mean robbery rate, since it
shows a 100 percent increase over 1966. If we disaggregate the data
much as we did for the unemployment data in the previous chapter -
we find the large increase in mean robbery rate can be attributed to
a few very deviant cases. The following four provinces are among the
most striking:
lThe NBI sums the projected absolute number of crimes by provinceand then divides this sum by the total population to get nationalrates.
2The difference in the homicide rates for 1965, 1966, and 1967 isaccounted for by a large upsurge of reported homicides first in Manilaand then in Rizal province (surrounding Manila). In Manila there were672 reported homicides in 1965 compared with 1969 in 1966 and 1150 in1967. In Rizal province there were 723 reported homicides in 1965 and1112 in 1967. A real question is raised when reported rates doublein a year. Such a phenomenon probably involves a change in statisticalprocedures, not reality.
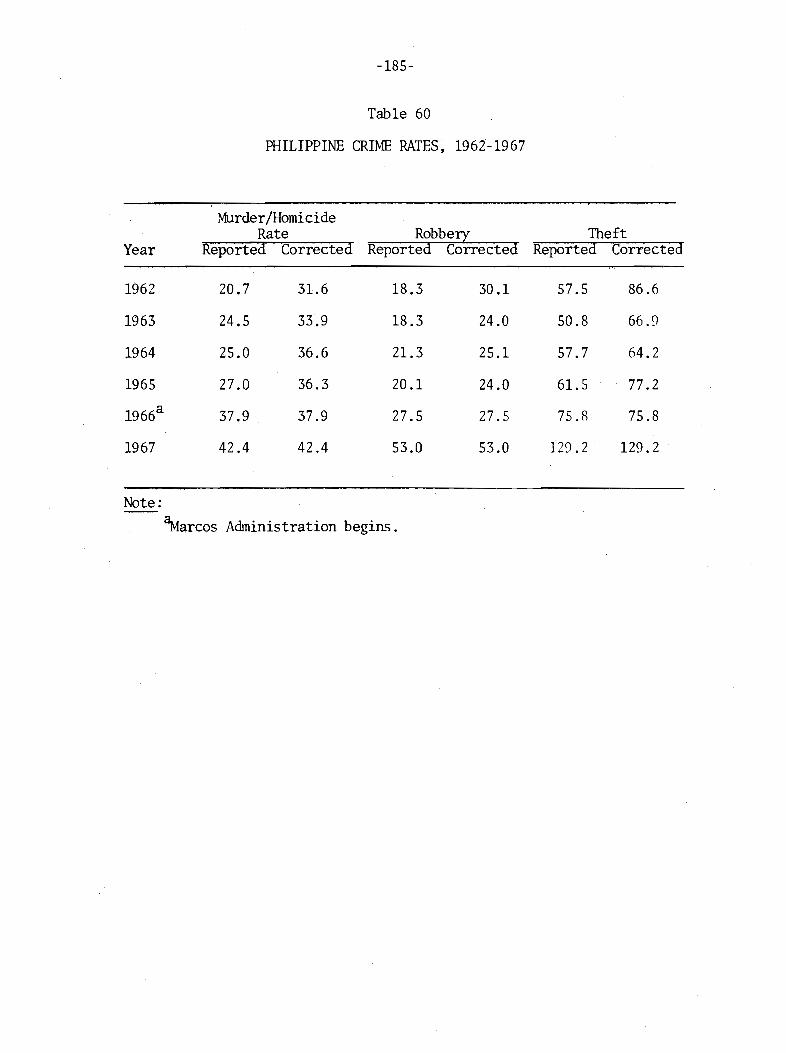
-185-
Table 60
PHILIPPINE CRIME RATES, 1962-1967
Murder/HomicideRate Robbery Theft
Year Reported Corrected Reported Corrected Reported Corrected
1962 20.7 31.6 18.3 30.1 57.5 86.6
1963 24.5 33.9 18.3 24.0 50.8 66.9
1964 25.0 36.6 21.3 25.1 57.7 64.2
1965 27.0 36.3 20.1 24.0 61.5 77 .2
1966a 37.9 37.9 27.5 27.5 75.R 75.8
1967 42.4 42.4 53.0 53.0 129.2 129.2
Note:
~arcos Administration begins.
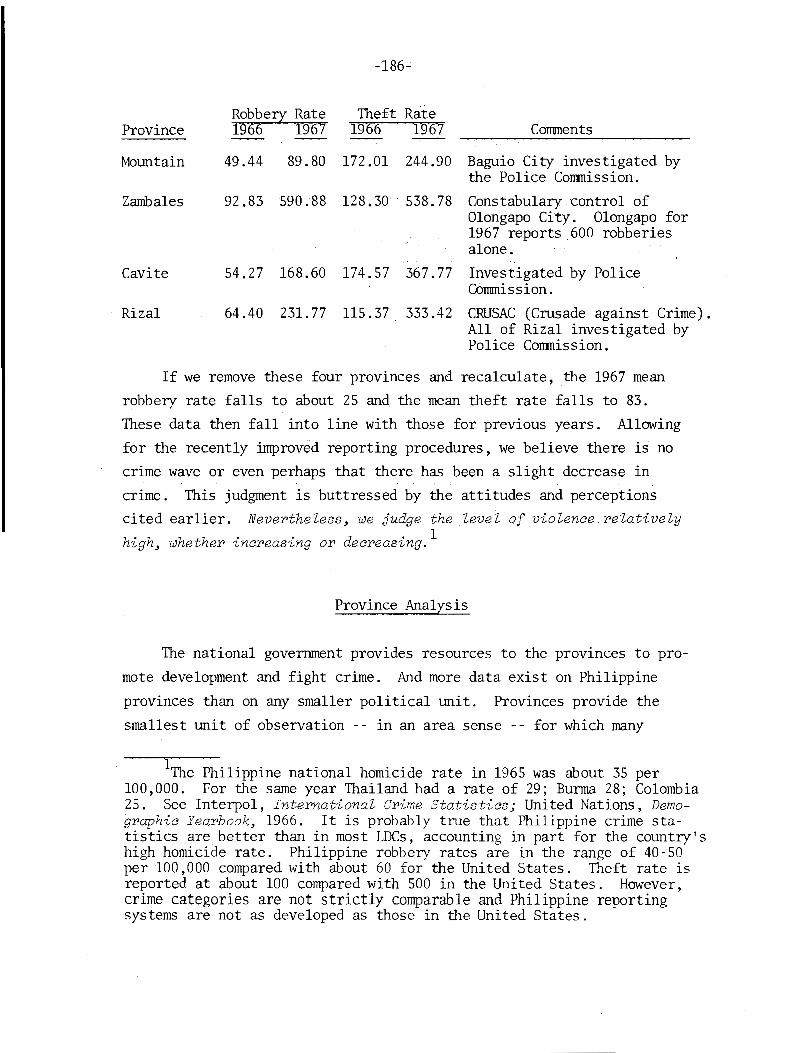
-186-
Robbery Rate Theft RaieProvince 1966 1967 1966 1967 Comments
MOl.mtain 49.44 89.80 172 .01 244.90 Baguio City investigated bythe Police Commission.
Zarnbales 92.83 590.88 128.30 538.78 Constabulary control ofOlongapo City. Olongapo for1967 reports 600 robberiesalone.
Cavite 54.27 168.60 174.57 367.77 Investigated by PoliceCommission.
Rizal 64.40 231.77 115.37 333.42 CRUSAC (Crusade against Crime).All of Rizal investigated byPolice Commission.
If we remove these four provinces and recalculate, the 1967 mean
robbery rate falls to about 25 and the mean theft rate falls to 83.
These data then fall into line with those for previous years. Allowing
for the recently improved reporting procedures, we believe there is no
crime wave or even perhaps that there has been a slight decrease in
crime. This judgment is buttressed by the attitudes and perceptions
cited earlier. Nevertheless~ we judge the level of violence relatively
high~ whether increasing or decreasing. 1
Province Analysis
The national government provides resources to the provinces to pro
mote development and fight crime. And more data exist on Philippine
provinces than on any smaller political unit. Provinces provide the
smallest unit of observation -- in an area sense -- for which many
lThe Philippine national homicide rate in 1965 was about 35 per100,000. For the same year Thailand had a rate of 29; Burma 28; Colombia25. See Interpol, International Crime Statistics; United Nations, Demographic YeaY'hook~ 1966. It is probably true that Philippine crime statistics are better than in most LDCs, accounting in part for the country'shigh homicide rate. Philippine robbery rates are in the range of 40-50per 100,000 compared with about 60 for the United States. Theft rate isreported at about 100 compared with 500 in the United States. However,crime categories are not strictly comparable and Philippine reportingsystems are not as developed as those in the United States.
-187-
types of social data can be obtained.
plain the variation in province crime
economic data for recent years. l
We therefore attempted to ex
rates from ethnic and socio-
We believed that the crime rate should be negatively related to
arrest rate -- at least for some classes of crime. We also believed
the higher the crime rate the more thinly police resources would be
spread. Consequently, arrest rate might decline as the crime rate
rises. Because of these expected relations we were obliged to compare
simultaneous equation models with single equation models. The exoge
nous variables consist of the now familiar ethnic ones, fraction of
Ilocanos and Muslims, and the socio-economic variables, population
growth and population density. We also had data on police per 1000 by
province. It was ambiguous whether mnnber of police should be con
sidered as responsive to other variables or as exogenous. We there
fore examined this variable both ways.
The two province models are shown in diagrammatic form in Fig. 16.
The arrows and the signs on the arrows show the expected direction and
sign of the relation. Essentially the first model says that the crime
rate in a province is influenced in the specified direction by each
variable independently. The second model postulates that there is
interaction between the crime rate and police per capita in a province.
The crime rate influences the number of police per capita and vice
versa.
lThere is very little theoretical or empirical work on the relationof crime and development. So we had little guidance in model specification. We were interested in the effects of economic variables such aspopulation growth and density, of the differences among ethnic groups,and in policy variables such as number and pay of police. For somediscussion of crime and development see R. G. Ridker, "The EconomicDeterminants of Discontent," and A. L. Wood, "Crime and Aggression inChanging Ceylon: A Sociological Analysis of Homicide, Suicide, and Economic Crime," Transactions of the American Philosophical Society~ 51,Part 8, December, 1961, pp. 5-126; J. H. Straus and M. H. Straus, "Suicide, Homicide and Social Structure in Ceylon," American Journa l ofSociology~ 58, March 1953, pp. 461-469; E. Driver, "Interaction andCriminal Homicide in India," Social FOY'ces~ 40, 1961, pp. 153-158; M.Bacon and H. Barry, itA Cross Cultural Study of Correlates of Crime,"Journal of Abnormal and Social Psychology~66, 1963, pp. 291-300.

?
-188-
MODEL 1
MODEL 2
+
Fig.16-Alternative provincial crime models
-189-
Population growth could affect the crime rate in two ways: It
may be related to social disorganization, which presumably increases
crime; on the other hand, population growth may influence police per
capita, which influences the crime rate. We are uncertain about the
sign of the relation between police per capita and population growth.
Fast growing areas mey be able to tap resources to expand public ser
vices, or public services, including police, may simply lag far behind
the growth of an area.
The relevant equations for the joint murder/homicide rate are
shown in Table 61. Neither models for the joint murder/homicide rate
nor for the rates separately permit any explanation of provincial homi
cide rates in tenns of other than ethnic factors. 1 Provinces with a
high fraction of Ilocanos have relatively high homicide rates. Fraction
of Muslims is not related to the joint IJRlrder/homicide rate but this is
probably accounted for by a positive relation with the murder rate and
a negative relation with the homicide rate. This may be an artifact of
the reporting system or it may reflect differential treatment of Muslims
suspected of capital crimes. The signs of the police per capita vari
able agree with expectations in the simultaneous version although in
neither case is this variable significant.
The essential failure of our socio-economic models and the puzzling
attitudes of Ilocanos, for example, suggest explanations of violence as
an organized activity. For example, some areas of Ilocos are noted for
their political violence. (One municipality in Ilocos Sur had a rate
of 134 murders per 100,000 for 1967.) Ilocos Sur is, allegedly, the
most politically volatile of all provinces. Figure 17 shows the monthly
trend of actual homicides in Ilocos Sur as well as a three month moving
average. Violence does peak at the time of elections and a little after,
when political scores are settled. Then there is a large dmvnswing fol
lowed by an upward trend beginning each election year.
lIn the single equation context the ratio of the coefficient tothe standard error has the usual t-distribution. In the simultaneousequation context this same ratio has approximately a standard normaldistribution (z). See Carl F. Christ, Econometric Models and Methods,John Wiley and Sons, New York, 1966, p. 598.
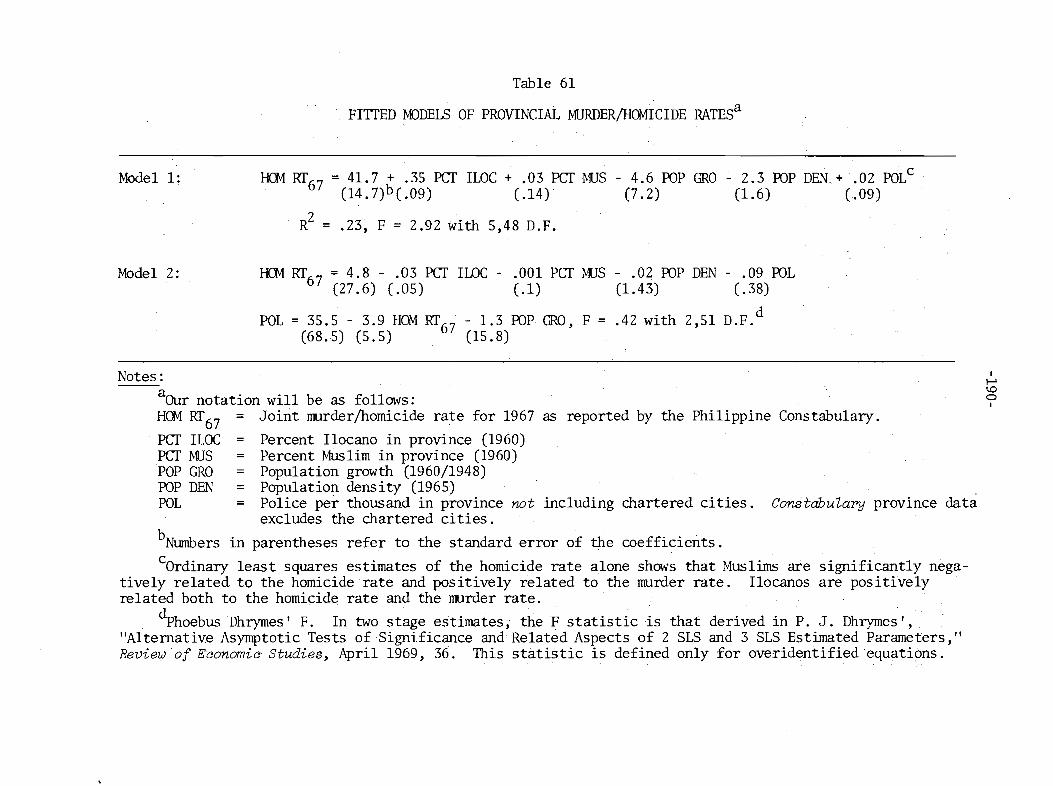
Table 61
FITTED MODELS OF PROVINCIAL MURDER/Hav1ICIDE RATESa
Modell: Hav1 Rf67 = 41. 7 + . 35 PCT ILOC + .03 PCTMUS(14.7)b(.09) (.14)
R2= .23, F = 2.92 with 5~48 D.F.
- 4.6 POP GRO- 2.3 POP DEN.+.02 POLc
(7.2) (1.6) (.09)
Model 2: Hav1 RT67 = 4.8 - .03 PCT ILOC - .001 PCT MUS - .02 POP DEN - .09 POL(27.6) (.05) (.1) (1.43) (.38)
POL = 35.5 - 3.9 Hav1 RT67 - 1.3 POP GRO, F = .42 with 2,51 D.F. d
(68.5) (5.5) (15.8)
Notes:
aOur notation will be as follows:Hav1 Rr67 = Joint IIRlrder/homicide rate for 1967 as reported by the Philippine Constabulary.
PCT ILOC Percent Ilocano in province (1960)PCT ~US Percent Muslim in province (1960)POP GRO Population growth (1960/1948)POP DEN Population density (1965)POL Police per thousand in province not including chartered cities. ConstahuZary province data
eXCludes the chartered cities.
bNumbers in parentheses refer to the standard error of the coefficients.
cOrdinary least squares estimates of the homicide rate alone shows that Muslims are significantly negatively related to the homicide rate and positively related to the IIRlrder rate. Ilocanos are positivelyrelated both to the homicide rate and the IIRlrder rate.
dphoebusDhrymes' F. In two stage estimates; theF statistic is that derived in P. J. Dhrymes',"Alternative Asymptotic Tests of Significance and Related Aspects of 2 SLS and 3 SLS Estimated Parameters,"Review of E~onomic Studies, April 1969, 36. This statistic is defined only for overidentifiedequations.
If-Il.Do
I
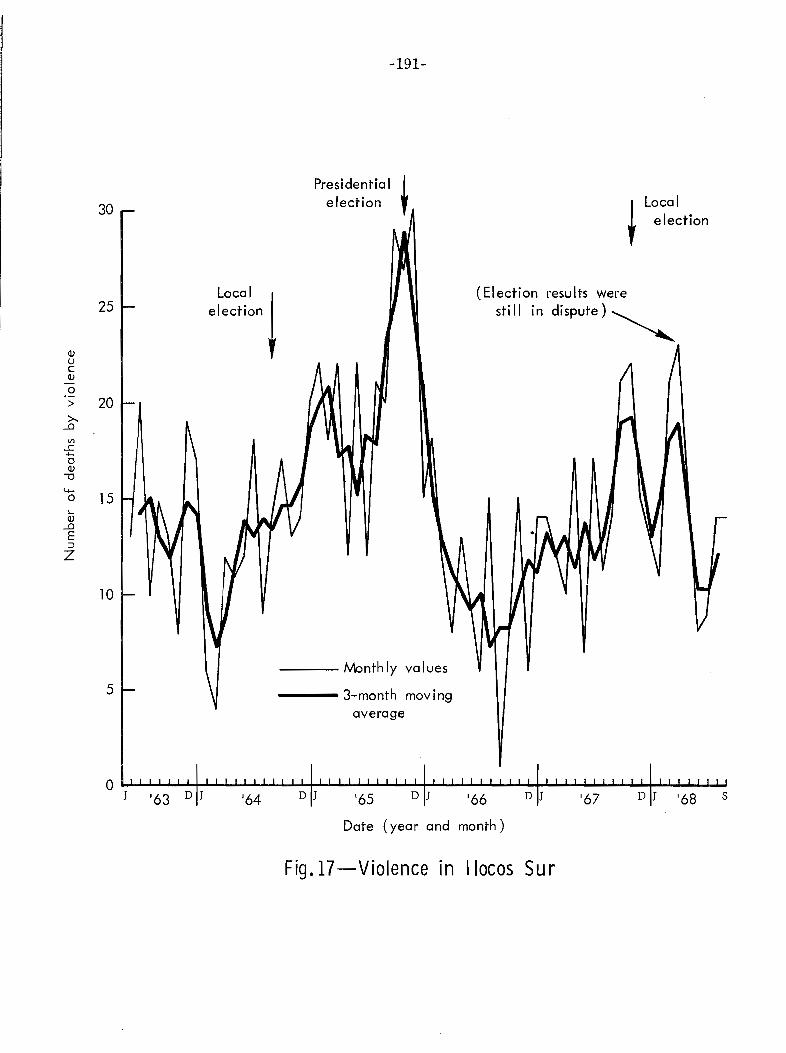
30
25
Q}uc::Q}
.2> 20>..
...D
v>...c....
0Q}
""0
.....150
'-Q}
...DE:::J
Z
10
5
-191-
Presidential Ielection ,
Local Ielection,
--- Monthly values
--- 3-month movingaverage
I Local, election
(Election results werestill in dispute)~
J '63 D J '64 D J '65 D J '66 D J '67 D J '68 s
Date (year and month)
Fig.17-Violence in I locos Sur

-192-
We apply the same statistical models to provincial robbery rates
in Table 62. The one-equation model shows that at least one ethnic
factor is important, and this relation holds in the two-equation model.
Population density is highly significant in the one-equation model and
is not significant in the two-equation model and similarly with popula
tion growth. These two Variables are, of course, manipulable or subject
to policy action. But where we try to account for simultaneity, as in
Model 2, the relations vanish.
In the first model there is a positive and significant association
between police per thousand and robbery rate. The relation, although
still positive in the simultaneous model, is not significant. The
coefficient of ROB RT in the second equation is significant at slightly
less than 0.5. Both models identify an ethnic factor in robbery rates
at the province level and not much else. On the other hand, the simulta
neous model does suggest that police per thousand in a province may rise
in relation to the crime rate. l Unfortunately here there appears to be
no impact of police per thousand on the robbery rate. This may be due
to the provincial Jevel of aggregation. The allocation and effective
ness of police in a province really depend on decisions at municipal
and city levels. Let us turn to a unit where we do have more detailed
measures of police effectiveness -- Philippine chartered cities.
City Analysis
Crime rates vary widely in Philippine cities. Some cities report
virtually no crime. Others report crime rates as high as any in the
world. Table 63 lists some illustrative cases.
Cities provide some advantages over provinces as units of observa
tion. 2 They are smaller and more homogeneous than provinces. Reporting
lA roughly similar statement may be made for the same models filledto the theft rate.
ZIn our analysis the city category includes chartered cities andthe primary non-chartered suburbs of Manila. We have excluded Manila,Trece Martires, and Tagaytay cities from our sample. The latter two

broB Rf65Modell:
Model 2:
Table 62
PROVlt-K:IAL roBBERY MJDELSa
= -19.4 - .058 PeT lLOC + .20 PCT ~US + 10.9 pop GRO + 2.05 pop DEN(8.7) (.058) (.09) (4.5) (.99)
+ .11 POLc(.04)
R2= .29, F = 5.0 with 5,49 D.F.
ROB Rf65 = -42.1 + .07 PCT lLOC + .36 PCT MUS - 2.04 POP DEN + .66 POL(37.1) (.16) (.21) (3.29) (.47)
POL = 86.4 + 1.36 ROB Rf65 - 9.03 POP GRO(20.2) (.90) (15.7)
Notes:
aLarge differential changes in reporting in 1966 and 1967 cloud relations when models are fitted usinglater data. See p. 186.
bROB Rf65 = Robbery rate 1965 as reported by the NBI.
cPOL = Police per thousand in province and chartered cities. NBI provincial data include charteredcities.
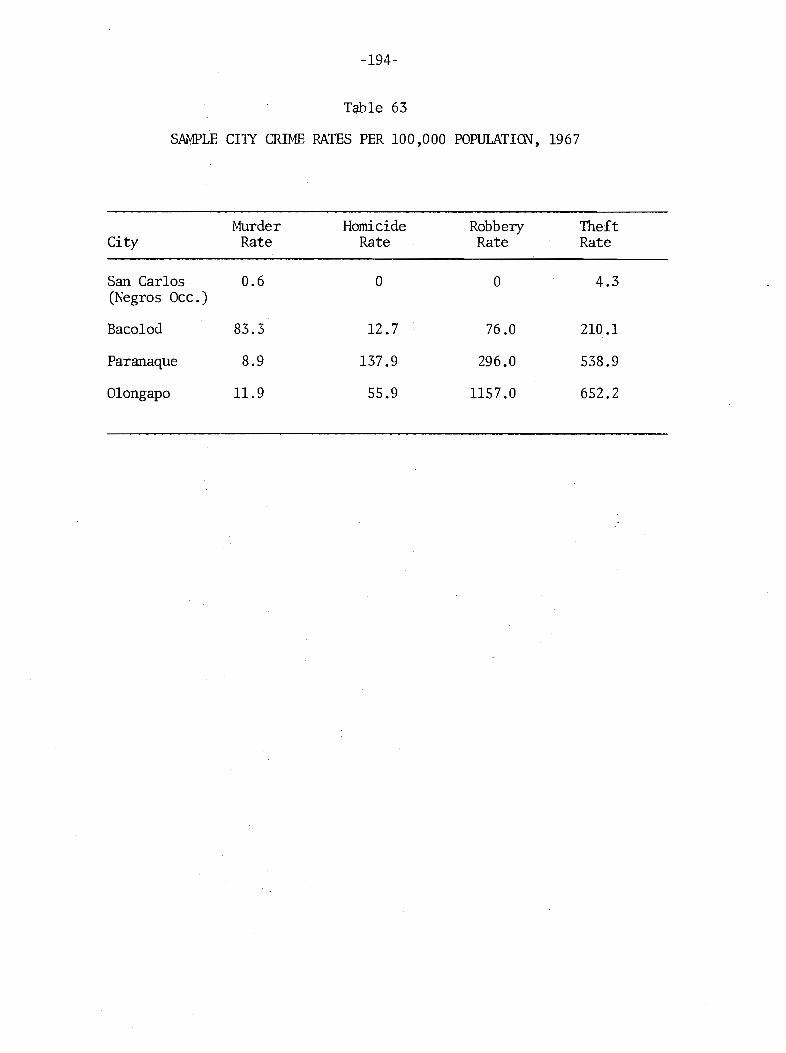
-194-
Tqb1e 63
SAMPLE CITY CRIME RATES PER 100,000 POPULATION, 1967
Murder Homicide Robbery TheftCity Rate Rate Rate Rate
San Carlos 0.6 0 0 4.3(Negros Occ.)
Baco1od 83.3 12.7 76.0 210.1
Paranaque 8.9 137.9 296.0 538.9
Olongapo 11.9 55.9 1157.0 652.2
-195-
is probably better than in municipalities, and we can take a better
look at the role of the police. However, as we have noted before,
reporting systems in the Philippines are based on the traditional
political units -- the provinces. So some socio-economic data cannot
be obtained by city -- for example, unemployment rates.
We believed that we had some knowledge of how crime should vary
by city. 1 But we also knew that again there might be a simultaneity
problem in any process of statistical estimation. We therefore postu
lated two alternative city crime models for comparison. The models
are shawn in diagrammatic form in Fig. 18. The first one is a recur
sive model where crime rate depends upon socio-economic variables and
upon the arrest rate. Arrest rate in turn depends upon police per
thousand and median police pay. The second model is similar to the
first except that crime rates and arrest rates are now interdependent.
The fitted models for the homicide rate are shown in Table 64. 2
In both models population density, population growth, and the durrnny
are actually municipios under tight political control, reporting almostno crime. On the other hand, Manila reports large amounts of crime andon most variables is at least 50 times as large as any other city. Thesethree ci ties can create many spurious relations. We have 51 cities left.
lThe large amount of literature on crime in American cities cannotbe cited here. But see, for example, Bernard Lander, Toward an Understanding of Juvenile Delinquency~ Columbia University Press, New York,1954. Lander's work consists of cross-sectional analyses of Baltimorecensus tracts. But the methods lend themselves to any kind of crosssection data. See also Marshall B. Clinard, Sociology of DeviantBehavior~ Holt, Rinehart, and Winston, Inc., New York, 1966, especiallythe chapter on urbanization.
2As in the United States, murder may be a "pri vate" act of pass ionwhere deterrence by the police and the arrest rate play little role.For analyses of U.S. criminal homicide, see Marvin E. Wolfgang, Patternsin Crirrrinal Homicide~ Science Edition, John Wiley and Sons, New York,1958, p. 214: liThe more excessive degrees of violence during a stabbing or shooting occur in the home rather than outside the home and ...severe degrees of violence in which more than five acts are involvedare most likely to use a home for the scene." Models fitted to themurder rate alone show that only fraction of Muslims is a significantexplanatory variable.
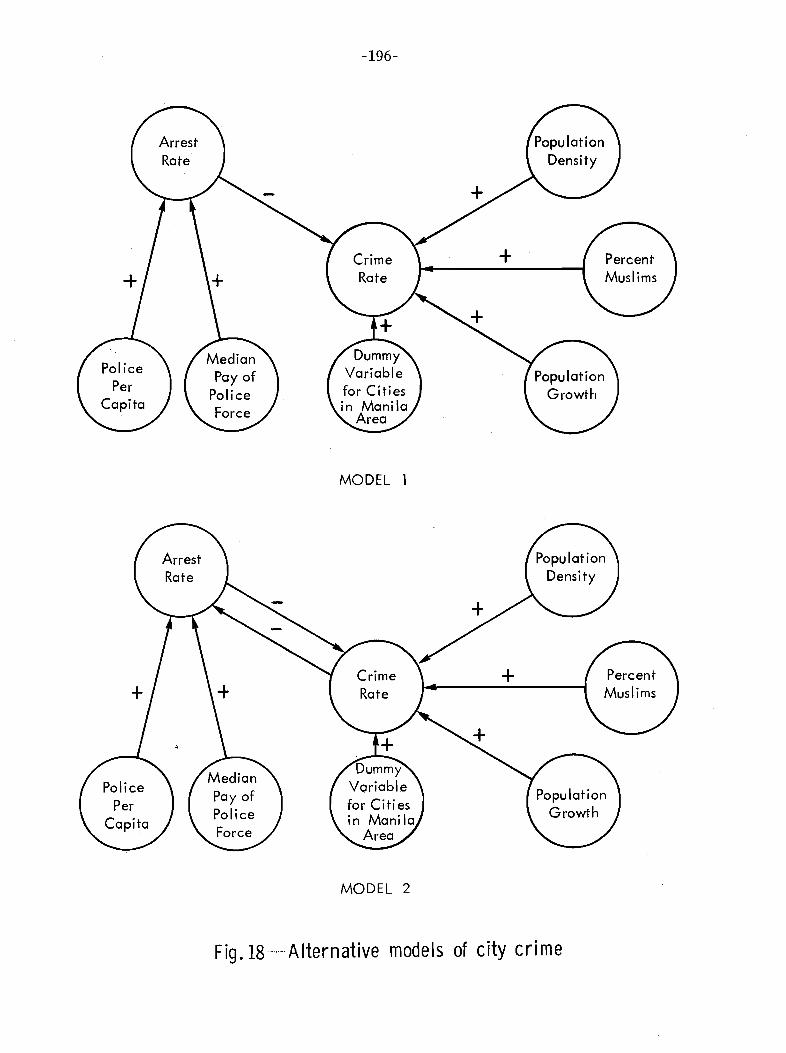
-196-
MODEL 1
MODEL 2
Fig.18-···-Alternative models of city crime

Modell:
Model 2:
Table 64
FITTED t-UDELS FOR CITY MURDER/HOMICIDE RATES
1Ia.1 RT67a
= -.99 + .28 PCT t-1lJS + 2.1 pop DEN + 21.9 pop GRO + 40.4 CT MANb - .17 MARSTc
(16.0)(.21) (1.2) (6.67) (12.8) (.13)
2R = .66, F = 17.81 with 5,45 D.F.
~MRST = 63.0 - 10.5 POL + .12 ~1ED PAY(24.0) (7.2) (.12)
R2= .05, F = 1.26
HOM RT67 = -34.2 + .28 PCT ~1lJS + 2.32 !DP DEN + 26.0 POP GRO + 39.3 CT MAN + .20 MARST(58.8) (.23) (1.35) (10.0) (14.1) (.64)
F = 5.75 with 5,45 D.F. d
MARST = 54.1 - .18 HOM RT67 - 6.5 roL + .18 HED PAY(24.3) (.13) (7.6) ( .13)
dF = 2.95 with 3,47 D.F.
Notes:
'110M RT67 = Joint murder/homicide rate in cities 1967.
bCT t-~ = Cities in Manila area.
~1ARST = ~1urder/homicide arrest rate.
dPhoehus DhI")'ll'les' F. Dhrymes, "Alternative Asymptotic Tests .... "
-198-
variable representing the Manila area are significant. The arrest-
rate is not significant in eather model, and this conclusion is not
changed by using the property arrest rate instead of the homicide arrest
rate. The homicide arrest rate in turn is not related significantly
to either the homicide rate, police per thousand, or median pay.
Sunnnary
Our analysis suggests that the crime problem has been overstated.
as a general nationwide crisis. The crisis seems limited to the Manila
area. At province level crime rates seem to be dependent on ethnic
factors. Fas t growing cities have had relatively high crime rates,
sometimes reinforced by ethnic factors. l Police performance as mea
sured by arrest rate does not depress the crime rate. And arrest
rate does not depend on such inputs as high pay, training, or education.
City police departments in the Philippines seem to operate on their own
criteria with the crime rate having little impact on their organization
or behavior.
In this light policymakers will have to examine economic policies
in relation to their impact on urban growth and concentration. And
they will simultaneously have to look carefully at the input and out
put of their police departments.
lWe had questionable data on 350 Philippine municipalities aswell as on cities. We were llllable to relate the crime rates in thesemunicipalities to any socio-economic factors with either simultaneousequation or recursive models.
-199-
Chapter 7
DISSIDENCE
1HE PHILIPPINES has a long history of dissident movements forming,
becoming active, and then receding. But since the modern Philippines
emerged, the nation has had no instance of a successful revolution.
Many believe that the nation came close to it during the Hukbalahap
(HMB) uprising of 1949-1953. 1 Many foreigners, impressed by analogies
to Vietnam, believe· that the contemporary organization called the HMB
poses a similar revolutionary threat. The driving force behind this
threat is seen as discontent arising from bad land tenure arrangements.
The Philippine government seems to believe that its dissidence
problem is partly social and partly a problem for the constabulary
and the military. Given either or both interpretations, the dissidence
problem often seems intractable. If dissidence arises because of a
bad tenure system, reform will be very difficult. Bureaucratic and
legal constraints abound. If dissidence is a straightforward police
and military problem, political constraints make it hard to act. The
HMB, unlike insurgent organizations elsewhere, are actively involved
in the legitimate political life of Central Luzon.
lSee A. H. Peterson, G. C. Reinhardt, and E. E. Conger, eds.; Symposium on the Role of Air Power in Counterinsurgency and UnconventionalWarfare: The Philippine Huk Campaign, RM-3652-PR, The Rand Corporation,June 1963. This work shows HMB "control" extending throughout Centraland Southern Luzon, with bases existing in Northern Luzon. Activitywas also reported in the southern islands of the archipelago. For ahistory of the HMB, see Renze L. Hoeksema, Communism in the Philippines 3
Department of Government, Harvard University, unpublished dissertation.

-200-
Our first question in this chapter, as in earlier ones, is what
do Filipinos think? In particular what do the people of Central Luzon
think of the HMB? Do their attitudes reflect discontent? Second, what
factors account for the ability of the HMB to operate in Central Luzon?
Does its survival reflect wide popular support, particularly from tenant
farmers, or does it rest upon the organization's own activities -- its
terror and coercion? Third, who are the HMB and what do they want?
It is very easy to see the contemporary organization in the same light
as the former one with the same name. But are they really the same?
Do these modern HMB really want to overthrow the existing government
or do they have and want to have a symbiotic relation with it?
Filipino Attitudes Toward the HMB
Tables 65 and 66 show attitudes toward the HMB from Pegasus. We
use the entire sample, since the potential threat is from a widespread
appeal; in particular, an appeal to the poor and the tenants. 1 In
general the HMB are viewed as an tmappetizing organization. About two
thirds of all groups classified by socio-economic status (SES) think
that the 1fr.-1B are not men of justice. Relatively more in the lower SES
groups say that the HMB are brutal. Tenants have a negative view of
the HMB as their hope. They do not differ from other groups in this
respect. However tenants do view the HMB as less brutal than do other
groups. Everyone sees them as bandits or partially as bandits, with
landowners a bit more intense on the issue.
. Table 67 shows the responses by mother tongue for the Central
Luzon area. Individuals who speak these languages have a relatively
more favorable view of the HMB than do most other language groups.
Pampangans have about the same view as other language groups in Central
lThe total number of people willing to respond to these questionsis smaller than on other ques tions . We tried to frame the ques tions soas to force either an opinion or a statement that the respondent preferrednot to talk about them. The fraction preferring not to talk about themwas higher in Central luzon than elsewhere.
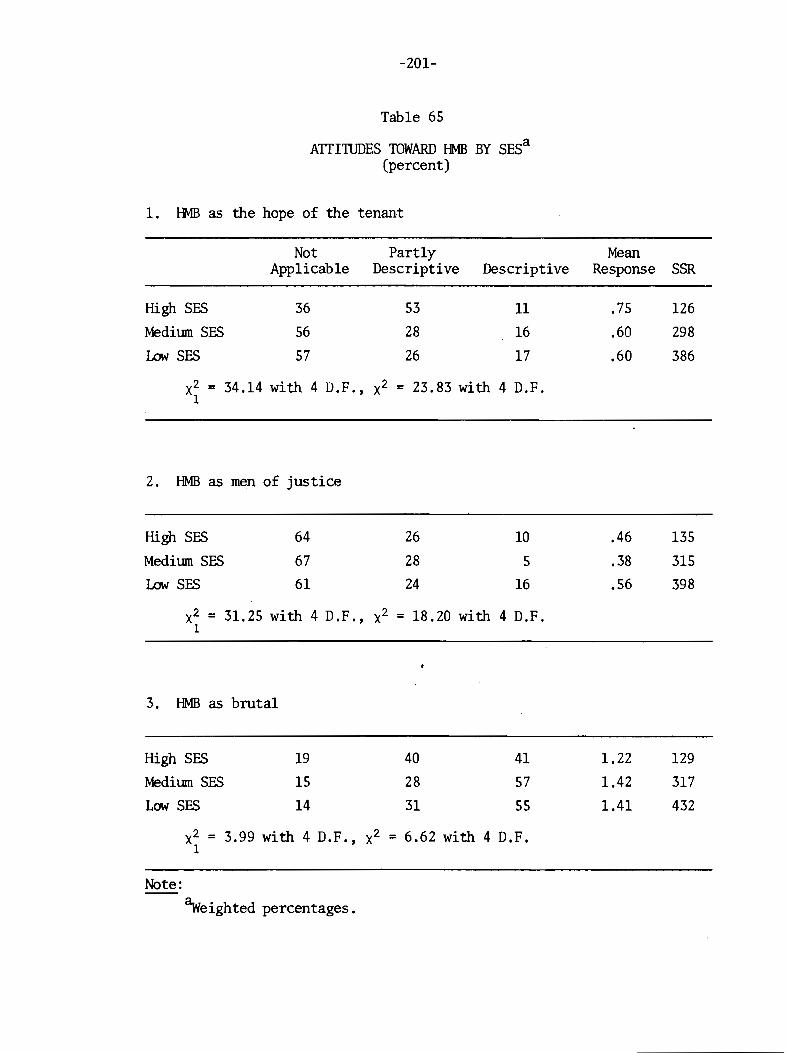
-201-
Table 65
ATTITIJDES TOWARD HMB BY SESa
(percent)
1. I-MB as the hope of the tenan-t
NotApplicable
PartlyDescriptive Descriptive
MeanResponse SSR
HighSES 36 53 11 .75 126
Meditun SES 56 28 16 .60 298
Low SES 57 26 17 .60 386
x2 = 34.14 with 4 D.F., x2 = 23.83 with 4 D.F.1
2. HMB as men of justice
HighSES
Meditun SESLow SES
64
67
61
26
28
24
10
5
16
.46
.38
.56
135
315
398
x2 = 31.25 with 4 D.F., x2 = 18.20 with 4 D.F.1
3. HMB as brutal
High SESMeditun SESLow SES
19
15
14
40
28
31
41
57
55
1.22
1.42
1.41
129
317
432
x2 = 3.99 with 4 D.F., x2 = 6.62 with 4 D.F.1
Note:aweighted percentages.
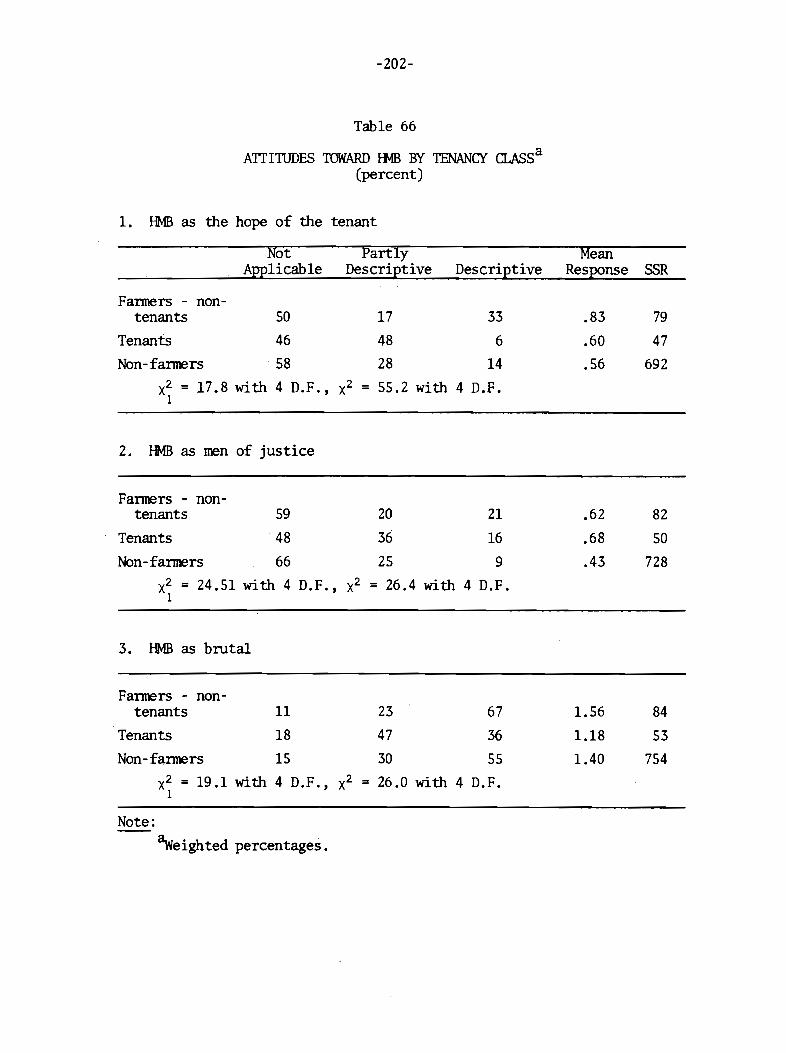
-202-
Table 66
ATIITIJDES TOWARD fMB BY TENANCY CLASSa
(percent)
1. HMB as the hope of the tenant
NotApplicable
PartlyDescriptive Descriptive
MeanResponse SSR
Fanners - non-tenants 50
Tenants 46Non-farmers 58
x2 = 17.8 with 4 D.F., x21
2. HMB as men of justice
17 33
48 6
28 14
= 55.2 with 4 D.F.
.83
.60
.56
79
47
692
Farmers - non-tenants 59
Tenants 48
Non-farmers 66
x2 = 24.51 with 4 D.F.,1
3. HMB as brutal
20 21
36 16
25 9
x2 = 26.4 with 4 D.F.
.62
.68
.43
82
50728
Farmers - non-tenants 11
Tenants 18
Non-farmers 15
x2 = 19.1 with 4 D.F.,1
Note:
aweighted percentages.
23 67
47 36
30 55
x2 = 26.0 with 4 D.F.
1.56
1.18
1.40
84
53
754
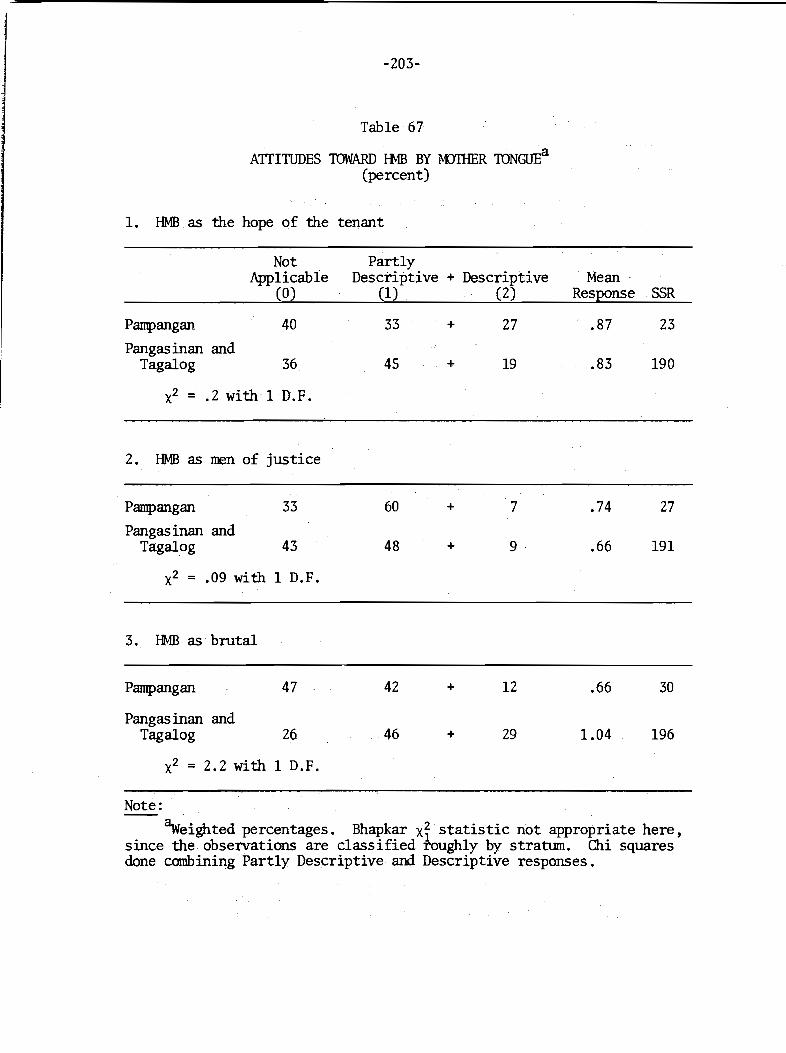
-203-
Table 67
ATTITIJDES TOWARD I-MB BY MITHER TONGUEa
(percent)
1. HMB as the hope of the tenant
Not PartlyApplicable Descriptive + Descriptive . Mean
(0) (1) (2) Response SSR
Pampangan 40 33 + 27 .87 23
Pangas inan andTagalog 36. 4S + 19 .83 190
x2 = .2 with 1 D.F.
2. HMB as men of justice
Parnpangan 33 60 + 7 .74 27
Pangas inan andTagalog 43 48 + 9· .66 191
x2 = .09 with 1 D.F.
3. HMB as brutal
Parnpangan 47 42 + 12 .66 30
Pangas inan andTagalog 26 46 + 29 1.04 196
x2 = 2.2 with 1 D.F.
Note:
Clweighted percentages. Bhapkar xi statistic not appropriate here,since the observations are classified roughly by stratum. Chi squaresdone combining Partly Descriptive and Descriptive responses.
-204-
Luzon - - not. particularly favorable. And Pampangans, as we noted in
Chapter 3, are relatively optimistic concerning their current and
future welfare.
Table 68 presents a finer breakdown of responses on welfare based
on proximity to I-MB controlled areas. Respondents in the HMB areas
do not appear to be different in their responses. Nor do they appear
to view the government in any worse light than other groups (Table 69).
Constabulary and the police rate about equally, slightly above the
middle ranking, with politicians falling at the middle. Areas close
to Manila react more strongly to the graft and corruption issue, but
this may reflect only greater exposure to the mass media, particularly
the press. Overall these data suggest the government I s image is no
worse in the I-MB areas than it is in other regions. I
If there is not IIllch evidence of strong social unrest correlated
with l-MB presence then why do they persist? Historical and organiza
tional factors provide an alternative explanation to theories of social
unrest. We offer a model that Philippine dissidence exists because of
a self-perpetuating organization. Perllaps the original reasons for
its geographic location were social and econornic,2 but, given a cohesive
organization, we argue that coercion and terror account for HMB presence
and control, and not social unrest.. 3 '
What can be said about this process of "control" and its relation
to organizational behavior and social and economic factors? The subject
is a controversial one. Control is really control over people. But
lResponses on other questions concerning the government were tabulated, but these results are typical.
2David Sternberg argues that the prosperity of Pampangan sugarplanters in the early twentieth century led them to send their sons toEurope where they learned Marxism. When they carne home to Parnpanga, theytried to spread these ideas (oral conummication).
3Anyone familiar with the history of the insurgency in Vietnamknows the difficul ty of defining control. As used here a aontroZZedbarrio means that the barrio is one where full time HMB are reportedfrequently and where they are willing to sleep. An influenaed barrio isone where regular HMBs are seen frequently but where they do not sleep.
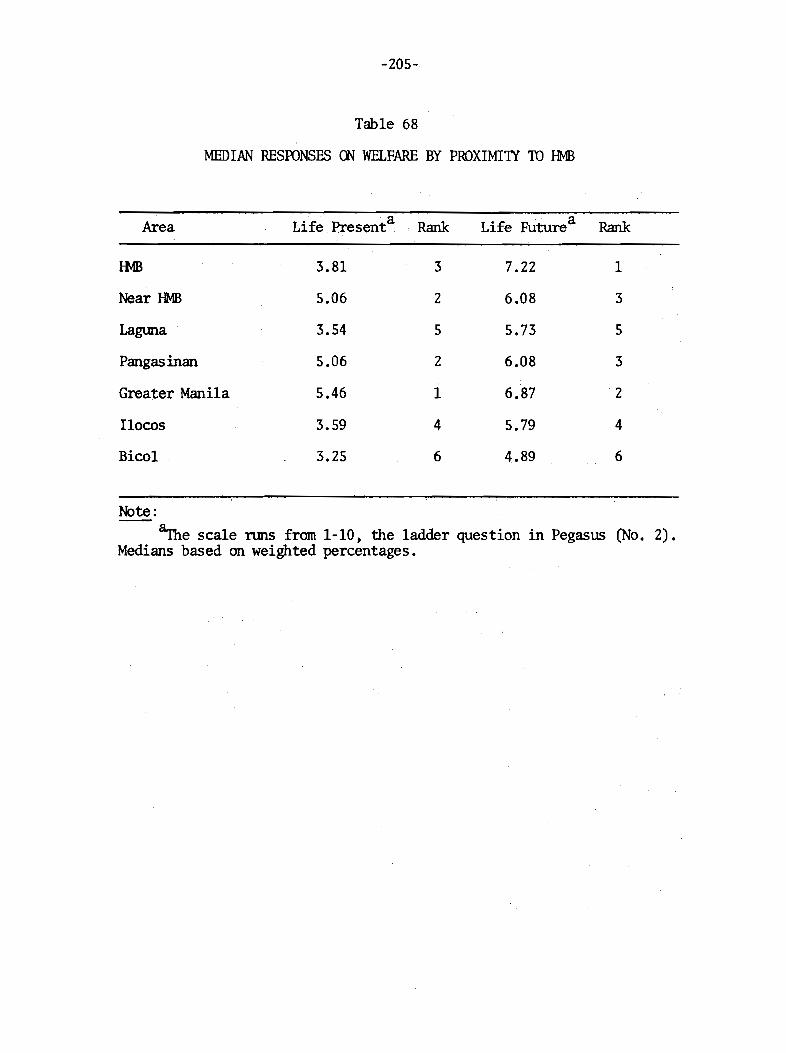
-205-
Table 68
MEDIAN RESroNSES rn WELFARE BY PROXIMITI TO liMB
Area Life Presenta Rank Life Futurea Rank
JI.1B 3.81 3 7.22 1
Near }f.1B 5.06 2 6.08 3
Lagtma 3.54 5 5.73 5
Pangasinan 5.06 2 6.08 3
Greater Manila 5.46 1 6.87 2
!locos 3.59 4 5.79 4
Bico1 3.25 6 4.89 6
Note:
~e scale nms from 1-10, the ladder ques tion in Pegasus (No.2).Medians based on weighted percentages.
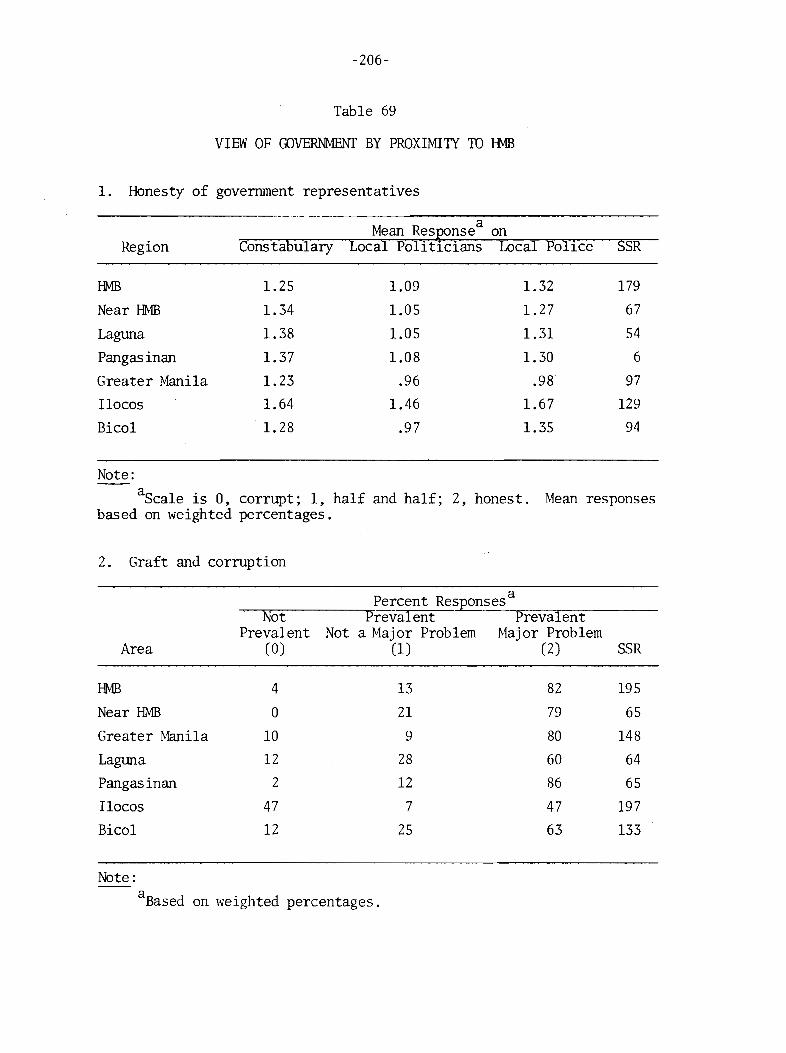
-206-
Table 69
VIEW OF GOVERNMENf BY PROXIMITY 1D HMB
1. Honesty of government representatives
a
Region ConstabularyMean Resronse on
Police SSRLocal PolitIcians Local
am 1.25 1.09 1.32 179
Near HMB 1.34 1.05 1.27 67
Laguna 1.38 1.05 1.31 54
Pangasinan 1.37 1.08 1.30 6
Greater Manila 1.23 .96 .98 97
Ilocos 1.64 1.46 1.67 129
Bicol 1.28 .97 1.35 94
Note:
aScale is 0, corrupt; 1, half and half; 2, honest. ~1ean responsesbased on weighted percentages.
2. Graft and corruption
Percent Responses a
Not Prevalent PrevalentPrevalent Not a Major Problem Major Problem
Area (0) (1) (2) SSR
HMB 4 13 82 195
Near HMB 0 21 79 65
Greater Manila 10 9 80 148
Laguna 12 28 60 64
Pangasinan 2 12 86 65
Ilocos 47 7 47 197
Bicol 12 25 63 133
Note:
aBased on weighted percentages.

-207-
statistical arguments have raged over the role of aggregate variables
for example, fraction of tenants in a municipality or fraction
of Pampangans -- as related to control. l The problem of making infer
ences about individual behavior or attitudes from aggregate data has
been explored for a long time. No satisfactory way exists to make
these inferences;2 in our own case we had direct access to individuals
in "controlled" areas, and they did not seem very different from
other Filipinos.
We feel justified, then, in "explaining" HMB control on the basis of
coercion and organizational presence. There is the negative evidence of
the individual interviews. There is the evidence of statistical models.
The use of statistical models in an insurgency context clearly requires
simultaneous estimation techniques. Liquidations and terror influence
control. Control presumably influences terror and liquidations. An ade
quate model of an insurgency really must be a dynamic model, since insur
gencies ebb and flow. In 1960 it would have been accurate to say that the
dissidence had been reduced to a few HMB regulars and their families. In
1968 there were about 300 reported regulars throughout the Philippines and
about 150 reported in Central Luzon. There was a reported "mass base,,3
of about 9,000 in 1960 and 32,000 in 1968, along with a reported 3,600
"combat support." However, such numbers should not be taken too seriously.
For example, between June 1966 and June 1968 the number of reported
combat support and mass base tripled with no reported increase in the
lSee E. J. Mitchell, The Huk Rebellion in the Philippines: An Econometric Study~ RM-5757-ARPA, The Rand Corporation, January 1969. This studyargues that control of municipalities is related to "contiguity," theproximity of other controlled municipalities, area devoted to sugar, andfraction of tenants. The author argues that the presence of Pampangansis "necessary" for control.
Mitchell did not have access to any data on ~ffi operations. In his workcoercive operations are reflected indirectly through the "contiguity" ofmunicipalities. But controlled barrios are not necessarily contiguous. Inaddition our attempts to reproduce his results have failed. In particularcontrol is not sensitive to the contiguity variable in his specification.
2For a discussion see M. Dogan and S. Rokkan, Quantitative Ecological Analysis ....
3As practiced, mass base means the total number of 1 ~ople who livein the area that is defined as controlled by the HMB co~stabulary.
-208-
number of regulars, implying either that the regulars have suddenly
become prodigious managers of men and resources or that there are many
more of them than reported. 1 These kinds of data are even more
ambiguous than other types we have discussed.
Whatever their actual number the HMB area of operations and liquida
tions has been expanding. We show this pattern in Fig. 19. The ex
pansion appears quite purposive. Hvffi operations and liquidations
resemble an expanding doughnut. The operations and liquidations ,are
designed to gain control of given areas. .As control is achieved, the
level of violence declines in the newly controlled areas. The level
then rises along the new perimeter where the HMB are trying to gain
control.
In the next section we shall try to build some causal models of
control. Although statistical models cannot really show very well what
is happening to individuals and social structure, they can perhaps
suggest the gross relations among control, terror, dissident logistics,
and aggregate social indicators such as extent of tenancy.2 We are
interested in the relative strength of explanations based on socio
economic factors compared with explanations based on organizational
factors.
Alternative Models of Control -- Municipalities and Barrios
Figure 20 shows two alternative models for HMB control at the
municipal level. 3 The first model is a simultaneous equation model
lIn Central Luzon the reported mass base quintupled from 5,000 toroughly 25,000 between 1965 and 1966 with no reported increase in fulltime regular HMB.
2When the Viet Cong gained control of a hamlet, its people wereorganized and its social relations changed. So far we have found noevidence that any such process is going on in Central Luzon.
3By control at the municip~l level we mean the fraction of barriosin each municipality listed as "controlled" by the Philippine Constabulary. Within municipalities, controlled barrios mayor may not be contiguous to each other. In many cases they are not.
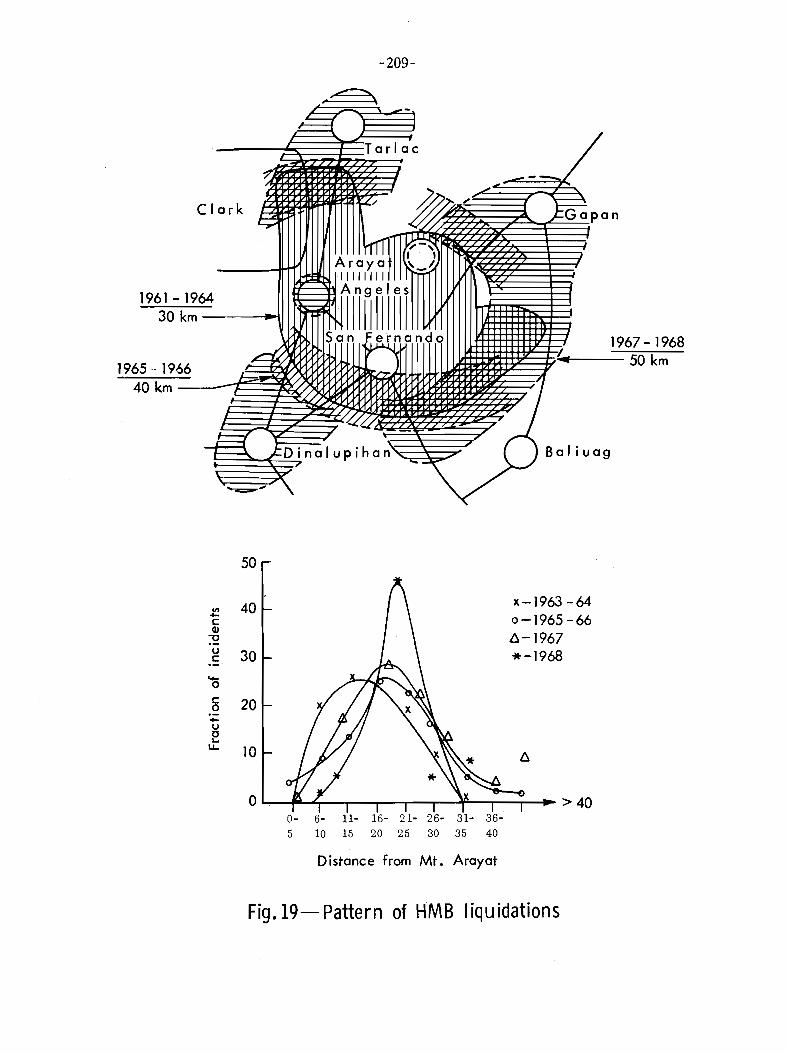
Clark
-209-
Tarlac
40 km
~~~~D7inaluPihan
""'"--....
1967 - 196850 km
Bal iuag
50
VI 40 x-1963 -64.... 0-1965 -66c:Q)
~ 6-1967u 30 *-1968c:
.....0
c: 200....uc...
u.. 10
0- 6- 11- 16- 21- 26- 31- 36-5 10 15 20 25 30 35 40
Distance from Mt. Arayat
Fig.19-Pattern of HMB liquidations
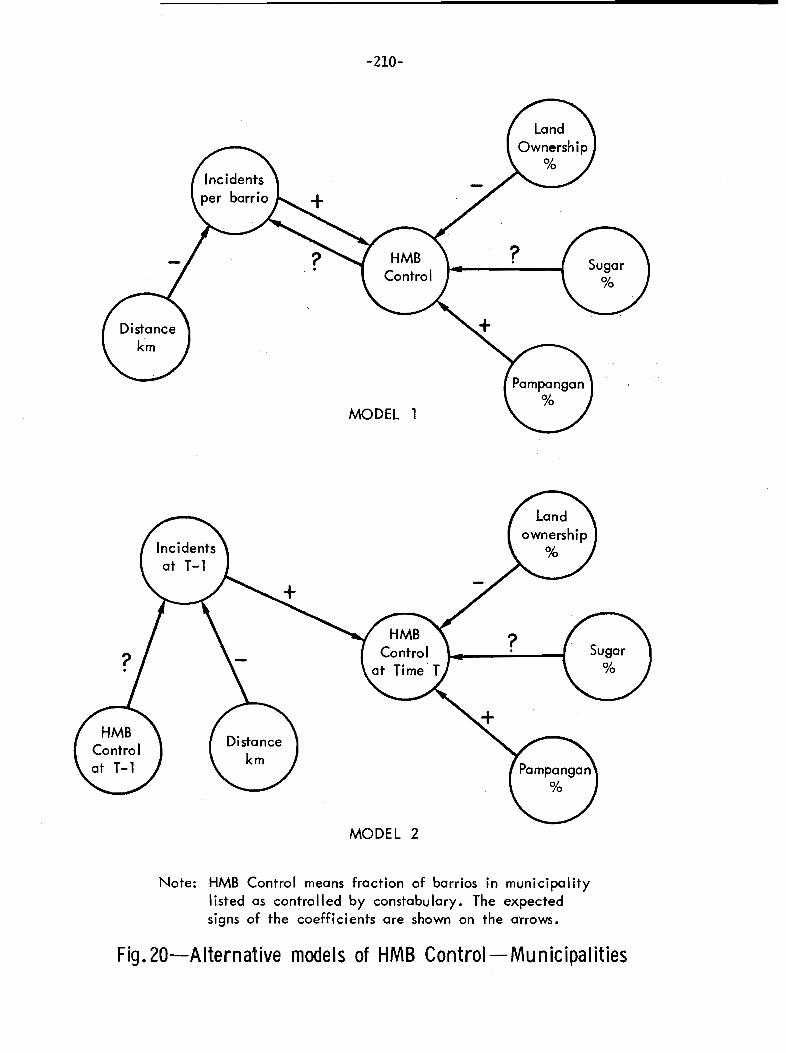
-210-
MODEL 1
?
MODEL 2
Note: HMB Control means fraction of barrios in municipalityIisted as contr911 ed by constabu lary. The expectedsigns of the coefficients are shown on the arrows.
Fig. 20-·Alternative models of HMB Control-Municipalities
-211-
where current HMB control is related to current incidents, to land
ownership, to sugar grown in the municipality, and to the fraction Pam
pangans. We have related incidents to distance from Mt. Arayat, which
is allegedly the main center for HMB logistics and command and con
trol. The second model is a dynamic one. We relate I-MB control in
1968 (time T) to past incidents and to the same social and economic
factors as in Model 1. Pas t incidents, say at time T-1, depend on dis
tance and on control at time T-1.
Both models were fitted using simultaneous estimation techniques.
The results are shown in Table 70. In the first model the only "signi
ficant" variable is incidents per barrio. But there is no explanation
for incidents per barrio. In short this specification does not fit the
data. In the second model, incidents per barrio at time T-l are again
the maj or determinant of control, and we are able to explain incidents
per barrio at time T-l as a ftmction of control at time T-1. This
rodel suggests that terror, as created by liquidations and assassina
tions, is the driving force behind the dissidence. And this is con
sistent with what our survey data suggest. l
The analysis of control at municipal level is so~what misleading,
for if we plot municipalities with some degree of control, Central Luzon
appears solidly controlled by the HMB. HCMever, if we plot barrios,
controlled barrios exist right next to uncontrolled ones.
Figure 21 shCMs three alternative models for barrio control in
Central Luzon. 2 They represent different assumptions about how control
lIn Model 2 Pampangans has a t of 1.87 which is not significantusing a two tailed test. A two tailed test is appropriate since thesurvey data suggest that individually Pampangans do not particularlyfavor the HMB. So we should not expect a positive "ecological" correlation. Fraction Pampangans is collinear with sugar and tenancy.The models do not change very much when Pampangans, tenancy, andsugar are put into the equations by themselves. Incidents per barrioremain the maj or determinant of municipal control.
2By barrio control we mean a binary variable: (0) if the barriois listed as uncontrolled, (1) if the barrio is listed as controlled.Data on barrios are much more difficult to obtain than data on rnunicipalities. The manuscript census for 1960 has burned, and it was the
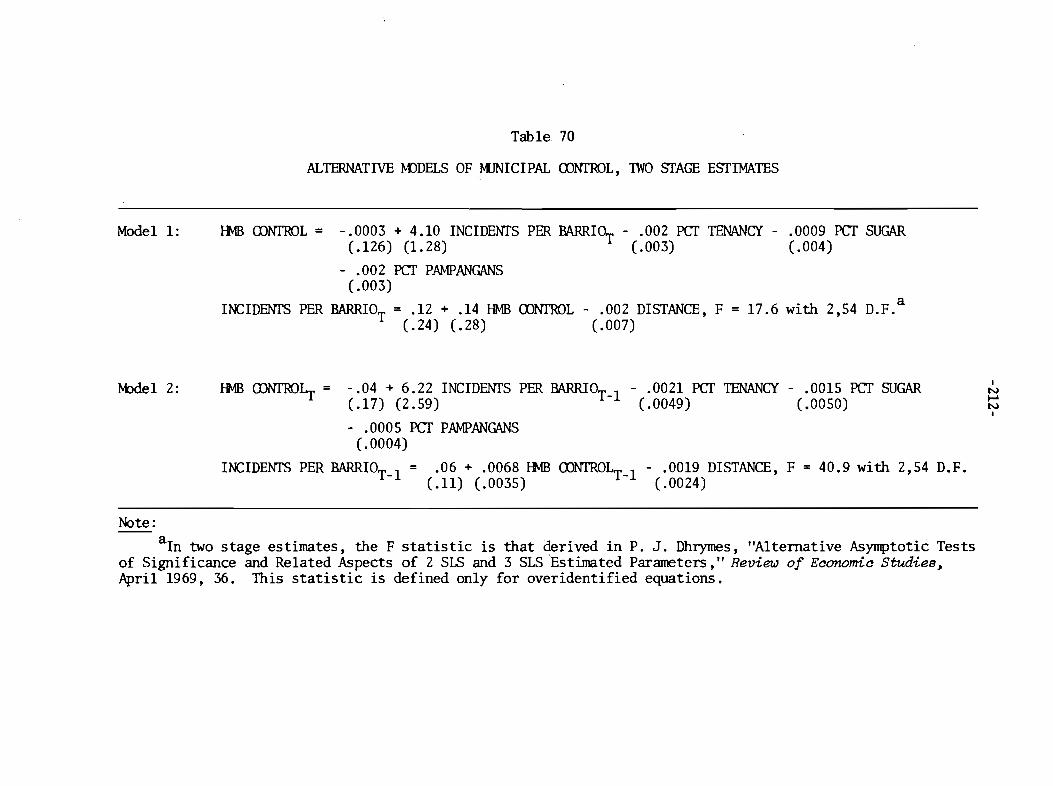
Modell:
tvbde1 2:
Table 70
ALTERNATIVE M)DELS OF KlNICIPAL CDNfROL, lWO STAGE ESTIMATES
Ilv1B (DNfROL = - .0003 + 4.10 INCIDENfS PER BARRIUr - .002 PCT TENANCY - .0009 PCT SUGAR(.126) (1.28) (.003) (.004)
- .002 PCT PAMPANGANS(.003)
INCIDENTS PER BARRIOT = .12 + .14 HMB CDNTROL - .002 DISTANCE, F = 17.6 with 2,54 D.F.a
(.24) (.28) (.007)
Ilv1B (DNfROlr = -.04 + 6.22 INCIDENfS PER BARRIOT_1 - .0021 PCT TENANCY - .0015 PCT SUGAR(.17) (2.59) (.0049) (.0050)
- .0005 PCT PAMPANGANS(.0004)
INCIDENTS PER BARRIOT_1 = .06 + .0068 HMB CDNTR0Ly_1 - .0019 DISTANCE, F = 40.9 with 2,54 D.F.(.11) (.0035) (.0024)
IN.....NI
Note:
a In two stage estimates, the F statistic is that derived in P. J. Dhrymes, "Alternative Asymptotic Testsof Significance and Related Aspects of 2 SLS and 3 SLS 'Estimated Parameters," Review of Eaonomia Studies,April 1969, 36. This statistic is defined only for overidentified equations.
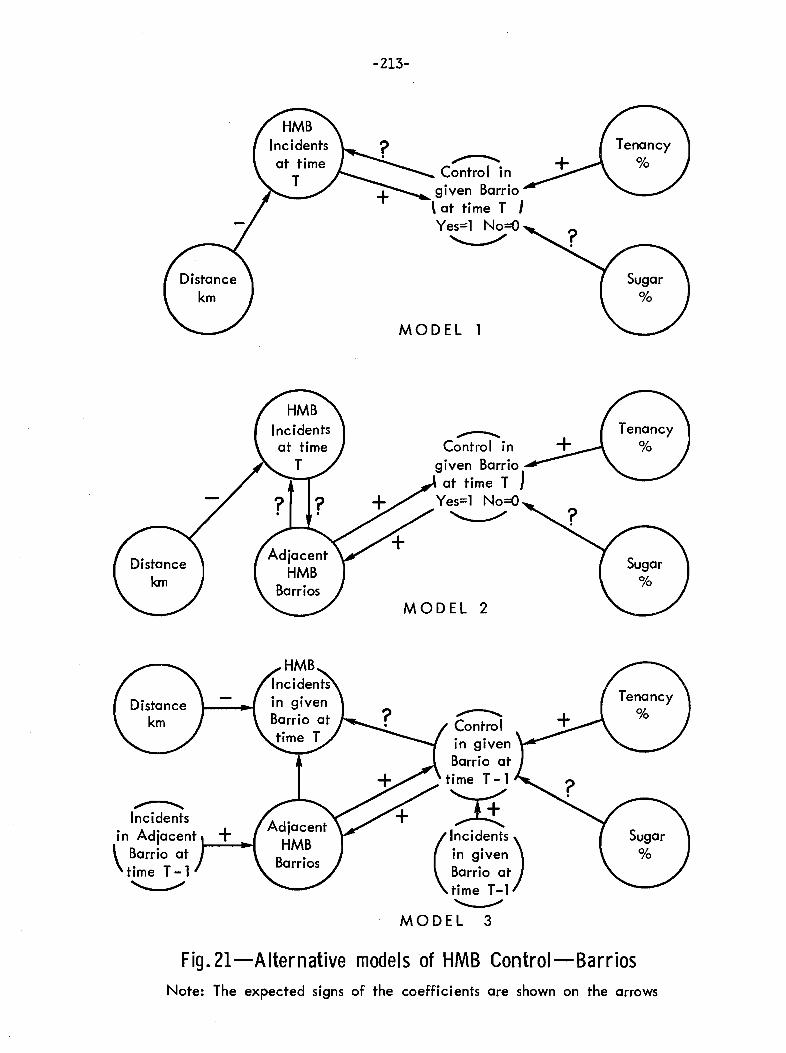
-213-
~
Control ingiven Barrio
\ at time T JYes=l No=O'-.../
MODEL 1
.......--......Incidents
in Adjacent
\Barrio at 1-----1-"
time T-1~
....---...Control in
given Barrioat time T J
Yes=l No=O'---"""
MODEL 2
...---....Controlin givenBarrio at
time T-1
':r£(Ii~ci:i::t~ )
Barrio attime T-1'----'"
MODEL 3
Fig.21-Alternative models of HMB Control-Barrios
Note: The expected signs of the coefficients are shown on the arrows
-214-
is achieved. Model 1 asSlUOOS that it occurs directly through incidents
and terror in a given barrio. Model 2 assumes that control in a given
barrio occurs by demonstration, by controlling and targeting adjacent
barrios. Metaphorically, in Model 1 you shoot the Mayor. In Model 2
you shoot the Mayor in the barrio next door and say, "See what happened
to him." Model 3 tries to relate current control to past incidents in
adjacent controlled barrios, and socio-economic variables. In turn
current incidents are related to current control in a given barrio
and its adjacent barrios as well as logistics factors. Model 3 also
tries to explain the number of adjacent controlled barrios next to
or contiguous to controlled barrios.
The results of fitting these three models are shown in Table 71.
The results of the three models together again suggest that HMB control
and terror interact with each other with socio-economic variables
playing a lesser role. Tenancy is not a significant variable in any
of the models. Barrios that devote a large fraction of their land to
growing sugar have a lower probability of being controlled· than other
barrios. 1 We will not attempt to choose between the modelS, except
that we reject Modell. Model 3 provides an interpretation of the
course of events through time.
The HMB in Laguna
Since 1965 there has been increasing HMB activity in the Tagalog
province of Laguna, at least as measured by sightings (agent reports).
However, terror and violence have not been used as techniques to gain
control of barrios. Nevertheless, some one hundred barrios are listed
as controlled or influenced. The status of the I-MB is even more
only source from which detailed data on barrios could have been obtained.The barrios considered all lie within 50 kilometers of Angeles City.This includes all barrios listed as controlled in February 1968 and arandom sample of uncontrolled barrios, giving 305 total barrios.
lAt the IIllIDicipal level sugar was not significant. Mitchell, TheHuk RebeZZion••. finds a positive relation between sugar and control.

r-bdel 1:
r-bdel 2:
r-bdel 3:
Table 71
BARRIO CONTROLMJDELS, 'IWO STAGE ESTIMATES
CONfROLa = -2.26 + 4.88 CURRENT INCIDENTS IN GIVEN BARRIO - .015 PCT TENANCY - .09 PCT SUGAR(3.57) (7.52) (.023) (.14)
CURRENT INCIDENTS IN GIVEN BARRIO = -4.4 + 5.2 CONfROL + .12 DISTANCE(4.7) (4.7) (.12)
CONTROL = - .06 + .08 ADJBAb
+ .0023 PCT TENANCY - .007 PCT SUGAR(.13) (.009) (.002) (.002)
ADJBA = -2.4 + 11.0 CONIROL + 4.90 CURRENT INCIDENTS IN GIVEN BARRIO, F = 188 with 2,302 D. F. c(1.1) (1.74) (1.31)
CURRENT INCIDENTS IN GIVEN BARRIO = - .99 - .63 CONIROL + .19 ADJBA + .03 DISTANCE(2.74)(2.97) (.05) (.06)
CONTROL = -.07 + .08 ADJBA - .026 INB~ + .0026 PCT TENANCY - .0069 PCT SUGAR,(.13) (.001) (.035) (.0017) (.0016)
F = 27.5 with 3,302 D.F.
ADJBA = -.42 + 11.3 CONTROL + .30 INATMf, F = 7.75 with 2,30 D.F.(.66) (1.5) (.16)
CURRENT INCIDENTS IN GIVEN BARRIO = -3.5 + 1.91 CONfROL + .19 ADJBA + .099 DISTANCE,(1.4) (1.74) (.05) (.035)
F = 2.9 with 3,302 D.F.
INI--'V1I
Notes:
aCONTROL is control in a given barrio.
bADJBA is total number of controlled adjacent barrios within 2-6 kilometers of a controlled barrio.
Cp. J. Dhrymes' F. See footnote a, Table 70.
d INBlM is HMB incidents in given barrio at time T-1.
e INAlM is number of HMB incidents controlled in adjacent barrios at time T-l.

-216-
ambiguous in Laguna than in Central Luzon. There have been reports
of very large numbers of armed men circulating in Laguna or of several
hlUldred HMB holding a conference in a barrio. We are skeptical of such
reports. The data on HMB movements' do suggest that some southward
movement began in 1965 along a traditional route skirting themolUltains
east of Manila. This movement has been traced to increased pressure
from the Philippine Constabulary or alternatively to the establishment
of centers for rest and recreation. In any case the reported scale of
activities seems inconsistent with the reported size of the HMB and its
logistics capability.
Who Are the HMB and What Do They Want?
Terror and violence have many purposes. What is the purpose of
the HMB? Are they a political organization? In particular, are they
COIIIIIlUIlists who want to overthrow the government or are they like the
Mafia, made up of individuals motivated by personal gain? The latter
interpretation is buttressed by the strong control the HMB have over
vice in Angeles City, resulting in a large flow of money from "taxes."
Failure to deliver these taxes is cited fairly frequently as a cause
for liquidation. This suggests the organization does not have a great
ideological fervor. The arguments for a politically motivated organi
zation center on captured documents containing standard Communist
doctrine.
Through the Philippine Constabulary we were able to gain access
to interviews with HMB prisoners having recent service (12 in number).l
lThe subjects interviewed range in age from 21 to 46; most are intheir twenties. Six subjects had 3 or fewer years of education, threehad 5 years, and two had some high school; the education of one is unknown. Seven subjects are from Pampangan-speaking families, three areTaga1ogs, one is an Ilocano, and one a Cebuano. Thus, a cross -sectionof major Philippine ethnic groups is represented. All but one of thesubjects had experience in the HMB during 1968 or later; their viewsshould be quite contemporary. However, there were no personnel witha long period of service. The most experienced subject spent four yearsin the HMB. Six subjects were captured by the PC and six surrendered.
-217-
These persons provide our only direct source of infonnation about the
IOOtivations of the HMB organization. All but three of the respondents
carne from the area nominally lIDder the control of COl1llla1lder Freddie. 1
This area includes Southwest Pampanga, Northern Bataan, and the Olongapo
Subic complex. Nine of the interviewees were privates in armed groups.
There were also a commander and a vice commander from the military ann
of the HMB, and one low-level civilian cadre.
First, from those subjects who were in Freddie's group: All of
the subjects stated that they received only food and the cigarette al
lowance of 29 pesos a month from the organization. None of them claimed
that this compensation was a factor in their decision to JOIn or remain
in the organization. It seems lIDlikely that 29 pesos would be enough
of a motive for anyone to risk his life and freedom.
All but one of the nine interviewees from Freddie's area, when
asked about the training they had received, mentioned political indoc
trination. Most of them held the same political views. Typical quota
tions from four of the subjects are given below.
o We have group meetings and in said meetings, we werelectured to by the commander. We were told that thePhilippine Government is not bad, and it is only theadministrators of said government that ought to bechanged. Change could be effected either by electionsor violence if need be.
o China and Russia were the only cOlIDtries mentioned to us inlectures and in group talks by our leaders. It is said thatthose two colIDtries are the only ones that are nCM led bythe true sons of the motherland, that see to it that the peopleare served and not the people serving the officials in thegovernment. They said that the HMB movement aims to attainwhat had happened in those cOlIDtries, China and Russia.
o ... the main enemies of the HMBs are, firs t: the localexploiters who suck the blood of the common tao so as toenrich themselves; the people in the government who commitgraft and corruption and all sorts of anomalies jus t toentrench themselves in power; those people who serve asstool-pigeons for the above-mentioned personalities, and
lUntil he was killed in an engagement with the PC early in 1969.
-218-
secondly, those foreigners who drain our rich natural resources, export it to other countries and bring it back asfinished products and sell it beyond the reach of the commonpeople. Most of these aliens are the Americans. There werewhat we called American imperialists.
o They told us that they wanted to establish a New Democracythat will give justice to everybody, and that there will beno more poor and no more rich, but everybody will be equal."How?" By establishing a government that is really afterthe welfare of the working man, a government for the Filipinos not dictated by foreigners.
These statements resemble those in early Viet Cong documents. Per
haps of some interest and unlike Vietnam is the lack of an attack on
the government as an institution. Only the people in the institution
are attacked.
As for the alleged ideological split between Sumu1ong, the chief
of the ~ffi, and Freddie and the other commanders, five subjects were
aware of some sp1it. 1 Two others described Sumulong as loyal to the
~ffi's political motivation. The strongest criticism of Sumulong ran
as follows:
I think the leaders of the H,m are in the organization inorder to guide the movement of the ~ffi and their ardentdesire is to champion the cause it is fighting for. I donot know any of the persons you mentioned [personally].All I know is that the group of Commander Caviteno, Robertand Freddie is out to get Commander Sumulong because thisSumulong has already turned traitor to the cause of theIj}.ffi .
The one interviewee from Sumulong's group -- the Angeles-Clark
faction -- stated that Sumulong himself was a "die-hard Communist."
However, this person was extremely vague on the goals and purposes
of the organization. He could not cite any specific political indoc
trination, although he did make some statements that made the 11MB
sound like Robin Hood's Merrie ~Ien.
I Sumulong, allegedly the chief of the Ij}.ffi, is supposed to controlthe area around Clark and Angeles. It is argued that Sumulong andhis men are interested in personal gain while other branches are ideological. The factionalism has erupted into violence.

-219-
One other subject whom we could not specifically place in the
organization, although he was apparently not in Sumulong's or Freddie's
group, said he knewSumulong personally and spoke about him in knowl
edgeable terms. Again, unfortunately, his information was less useful
than it might have been, since he was the only subject without very
recent experience in the ~ffi. He left the organization in December
1966. However, he did have personal experience of Sumulong teaching
the standard line, and he called Sumulong a die-hard Communist, as well.
The interviews suggest that the group under Freddie received regu
lar political training. That training is similar to that used by
Communist dissident organizations around the world. They also suggest
that the group under Freddie was generally ffivare of a power struggle
going on in the organization. The signals are much less clear about
whether this power struggle was over ideology or its betrayal. At this
point our best guess would be that the I-lf\ffi organization is in fact
split, with the Angeles-Clark faction primarily interested in personal
gain.
Summary
The answer to the first question we asked - - the attitudes of the
people -- is that the H4B do not appear to have widespread popular
support. People appear to be rather optimistic about the prospects
for the future. Those in Central Luzon appear more optimistic than the
rest. Residents of Central Luzon view the government in the same light
as do persons in the rest of the Philippines. Their views are mixed.
They are proud of their democratic institutions; they view politicians
as relatively corrupt,l but feel that the government can and does help
to improve their lives. They do take a slightly more favorable position
on the role of the HMB than people in other areas, but by no means are
t~ffi activities condoned.
lpoliticians in Central Luzon are not considered more corrupt thanother politicians.
-220-
Our statistical analysis suggests the lThill have largely expanded
on the basis of terror and coercion, not by moving into areas seething
with popular discontent. At the same time, when compared with the
early Viet Cong, the l~ill appear to be rather indolent and poorly
organized. The organization is apparently split over the division of
funds and over long-range goals.
In our estimate ,the }l}.'fB are likely to remain a major nuisance.11ney are not currently a great threat to the government. On the other
hand, they have shown some resiliency and they do have access to a con
siderable flow of resources. Yet even if there were signals of wide
spread discontent that we have not picked up and this were a precon
dition of insurgency, the l~ffi do not now appear to be an organization
that could mohilize and exploit that unrest.
lThe Iltvffi campaign for candidates of their choice, and they do makea difference; no politician can afford to ignore them. So on one handthey may reach their objectives through the existing political processill1d on the other they satisfy the needs of those in that politicalprocess.

-221-
Chapter 8
TOWARD A POLICY rn POLICYMA.KING
THE PHILIPPINES is not ~ nation in crisis. Despite the widely held
oleak view of the cotmtry's prospects, we believe that any sensible
evaluation of the Philippines should consider the following points:
o The COtultry appears to be politically stable. That stability
rests in a rural sector voting along traditional lines with politicians
responding primarily to rural demands. The only group of voters we found
that is relatively less oriented to traditional political behavior is the
emerging modern labor force. It is growing fast, appears somewhat
discontented with the current political system. The urban voter might
welcome appeals for modernization and appeals to his economic interests.
o The Philippine people, by their past voting behavior, in a
sense have revealed their preference for the kind of economic perfor
mance they are getting. To an outside observer an economy that lurches
every two years may appear unhealthy. Balance of payments crises in
particular disturb international agencies with wham the Philippines deals.
But if balance of payments crises are structural - - buHt into the system
-- then they should not be of extraordinary concern to foreign decision
makers who deal with the country. To the extent that we can determine,
Philippine decisionmakers have sufficient flexibility to deal with most
acute crises. They may not always feel the pres~ure of a crisis at the
same time international agencies feel it. And this is perfectly natural
since the criteria they use are very different.
o The crisis of crime has been overstated. It is Greater Manila
that has a crime problem. Our analysis suggests the high violence rates
-222-
are partly based on ethnic propensities that are very hard to change
in the short run. Some violence appears to be related to political
rivalries and feuds. In urban areas high crime rates appear to be
related to urban economic growth and concentration. This may have
resulted from the inadvertent concentration of economic activity during
the period 1948-1960. Our analysis suggests that for urban areas, the
inputs of police resources do not result in higher arrest rates. Nor
do arrest rates seem particularly related to crime rates. Police inputs
in cities seem to be related only to each other. Philippine decision
makers need to look in much more detail at the operations of individual
police departments to explain the lack of relation between inputs and
outputs.
o Hf\1B dissidence is a major nuisance. It d6esnot now appear
to pose a revolutionary threat to the government. It is very difficult
to find large-scale popular support for the 11MB even in their horne
areas. The organization appears to expand and to maintain control
of its areas by terror. The major expansion of the movement carne
after 1965, coinciding with the U.S. buildup at Clark. The ~1B should
not be characterized as having the single objective of overthrowing
the government. In fact, the organization works with and through
local politicians. It does not behave like a classical insurgent
organization nor does it have the effectiveness of, say, the early
Viet Congo Part of the organization appears motivated by personal
gain, part by political ideology.
How can it be that the usual Image of the Philippines differs so
sharply from that presented above? In part, at least, the conventional
view seems to arise from the application to the Philippines of a
metaphorical view of LDCs. I've might call it the metaphor of the
peasant society. The people in LDCs are seen as simple, . long- suffering
peasants \vi thout means of influencing their leaders. Frustrated, they
become dissidents and insurgents. At the same time ,at the top of .
society, a relatively homogeneous elite is perceived making decisions
in its ~vn interest, thereby compromising the national interest. The
economies of the LDCs are also seen as simple th'o-sector affairs h'here
-223-
the problem is managing the transition from an essentially rural labor
force to an urban one. We have seen good reason to question this entire
metaphor for the Philippines, and there is good reason to question it
in other LDCs. The Philippine economy and polity are complex. The
use of the "classical" metaphor simply misleads us.
But it is not the metaphor alone that is misleading. We have
seen that information generated by Philippine reporting systems is
sometimes wrong, sometimes inconsistent, often ambiguous. Recall that
the ''mounting'' crime wave was the product of an arithmetic error. But
those who must make policy decisions -- Filipinos as well as foreigners
are in a real sense captives of these reporting systems. They must
perceive the country, its problems and achievements, through the infor
mation these systems provide. If the reporting is bad, policymakers
are misinformed and policy may be inappropriate.
Policymakers do, of course, perceive the Philippines through media
other than the official reporting systems -- personal observation, the
press, acquaintances. But these sources of information are likely to
mislead IlS well. Personal observation is often limited to ~fanila,
which is vastly different from the rest of the country by practically
any measure. Similarly, the Manila press provides a dubious characteri
zation of the state of the nation as a whole.
But how do we go about learning what is the true state of affairs
in a country like the Philippines? Better analysis clearly requires
much more attention to detail and less emphasis on aggregate measures.
Most government activities affect relatively small areas or specific
groups of people. For example, knowledge that 1locos Sur is violent
while Albay is peaceful provides specific guidance for the allocation
of government resources that the overall murder rate does not. lVithout
that knowledge, policymakers are apt to allocate resources to areas
where the target problem is unimportant. Since t.~e country is hetero
geneous geographically, ethnically, and demographically, the risk of
wasting resources by such misallocation is high in many fields: few
policy problems are spread evenly across the country or across all
groups of the population.
-224-
This suggests that we l1Ulst pay l1Ulch more attention to the ways'
in which information is generated, processed, presented,and interpreted.
In the Philippines ,as in most countries, the varioUs i:rlformatibn'
systems are designed to produce national aggregates: the l1Ulrder rate,
total rice production, GNP,and so on. More detailed information is
often difficult to get because it is buried in. files or the underlying
data are destroyed. The information systems perform by rote, generating
the figures requested by U.N. agencies or duplicating the series his
torically produced by U.S. statistical agencies. This information is
not particularly well articulated with any decision problem at hand.
In a real sense, policymakers are captives of their information
systems. The systems define the ways in which they can perceive
problems and may constrict the range of alternatives they invent.
The analysis of unemployment in Chapter 5 presents a case in point:
a disaggregated view of unemployment suggests a different kind of
policy than does the overall rate interpreted in terms of the metaphor
of unemployment in developed countries.
Foreign policymakers who deal with the Philippines, we l1Ulst
remember, are also captives of these same information systems. In
fact, the interaction between outside observers and Philippine policy
makers may produce a kind of amplifying feedback, with each side rein
forcing the other's misperceptions.
What we have said so far applies equally to Philippine policy
making and to the de'cisions of outside agencies and international
organizations. There is a corollary to consider. Information in the
Philippines is relatively abundant and accessible to foreigners.
Though we may question the appropriCiteness of the information they
report, the'statistical services operate ata fairly high level of
technical competence. Detailed information, though unreported, can
be obtained. If these advantages have not saved observers from
serious misperceptions, how should one judge information from countries
that lack such relatively developed reporting systems?
-225-
Appendix A
PEGASUS SAMPLE DESIGN AND QUESTIONNAIRE
THIS APPENDIX describes the design and implementation of the Pegasus
survey, which was conducted by the Asia Research Organization (ARD)
of Manila with the permission of the Philippine government. The inter
viewing was done largely between January 9 and February 12, 1969. The
questions covered attitudes toward the Philippine government and toward
social, economic, and political conditions in the Philippines; attitudes
toward and knowledge of dissidents and exposure to crime; and attitudes
toward violence. The questionnaire was made up almost exclusively of
closed, w1tip1e-response questions.
Sample Design
One purpose of the Pegasus survey was to prOVide data at the in
dividual level against whi~ to check ecological relationships that
had already appeared in our analysis. Also, in some areas of interest
there were no existing data. It was logical to attempt to obtain infor
nation by surveying. . Pegasus thus provided a means for filling in some
gaps in our knowledge.
Since ethnic differences appear in a number of the ecological
analyses, we decided that the sample should be stratified by language
to insure coverage of the smaller ethnic groups. Since we were inter
ested particularly in voting behavior, we restricted the sample to
those between the ages of 21 and 65.
-226-
The population was broken into 11 strata: 10 major language
groups, accounting in 1960 for nearly 90 percent of the population,
plus one stratum for Greater Manila. Since the stratification was by
characteristics of people rather than of areas there was some arbi
trariness in the choice of areas to sample. In some cases, language
groups nearly correspond to provinces: Most native speakers of the
Pampangan and Pangas inan dialects, for example, are found in the pro
vinces of Pampanga and Pangasinan, dictating the choice of these two
provinces as sample areas. Other language groups, particularly the
Ilocanos, are spread more broadly across the country. In these cases
the most homogeneous provinces were chosen, so that the actual inter"
viewing in any area could be conducted in only one language. Since
. only 75 interviews were conducted in any single province , 1 two t() fOUT
provinces were sampled for each of the five major .. language groups.
(See Figure A-I for sampling areas.) Table A-I shows the proportion
of the adult popUlation in each stratum, the number of provinces sam
pled, and the mnnber of interviews obtained.
Within each province the major city -- usually the provincial
capitol - - was chosen as an interview area. In addition,onelI1UIll.cipal
poblaaion and one rural barrio were chosen at random. The 75 interviews
allocated to each province were divided equally among these three
sample areas; thus, in each province 25 interviews come from the
principal city, 2S come from some other urban area, and 25 come from2a rural place.
Sampling Procedures
Urban Sampling
For all cities, except greater Manila, and for ali municipal
pob laaiones the area of the city proper was divided into a number of
lExcept in Greater Manila, where 150 interviews were conducted, andSulu, which was sampled as an add-on of 50 interviews.
2In Sulu the interviews were conducted in the city of 3010 and thepob laaion of Taglibi.
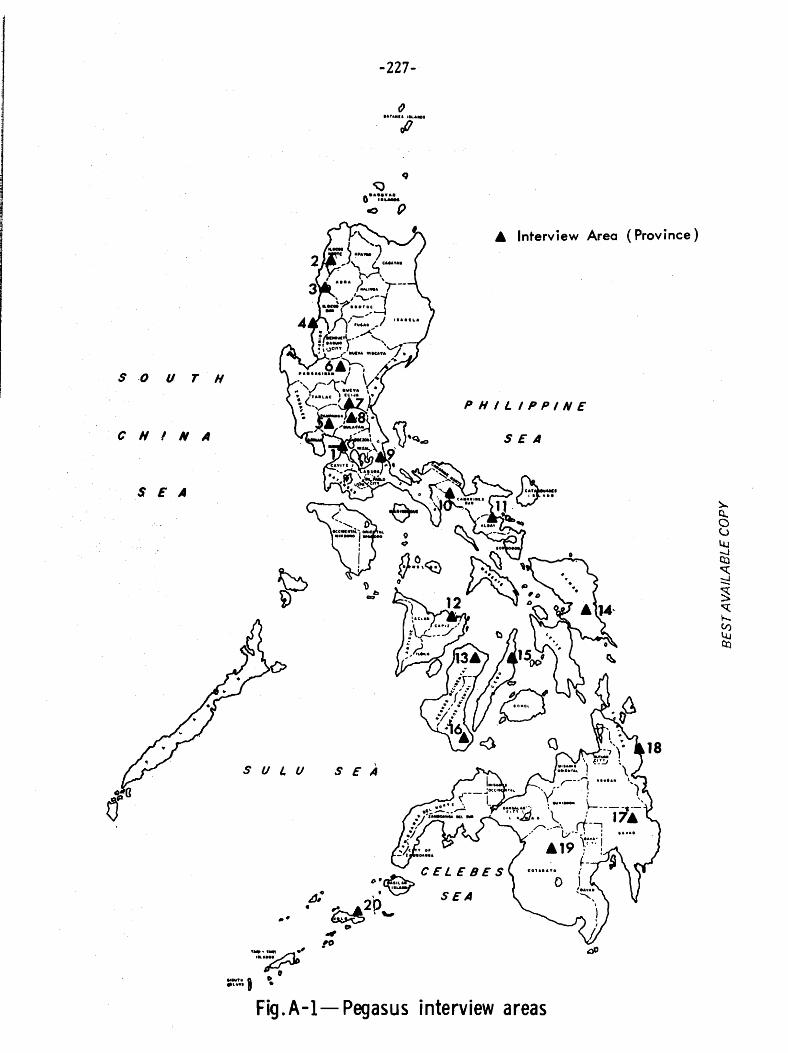
-227-
SEA
• Interview Area (Province)
PHILIPPINE
SEASIII.,II
4>:~ CELEBES
tJ,· 20 SEA. ~ ,'-o
."/0
'-"~'--',....."...., .. , 0.
liLA..
S·O II T I(
SEA
CHI N A
Fig.A-I- Pegasus interview areas
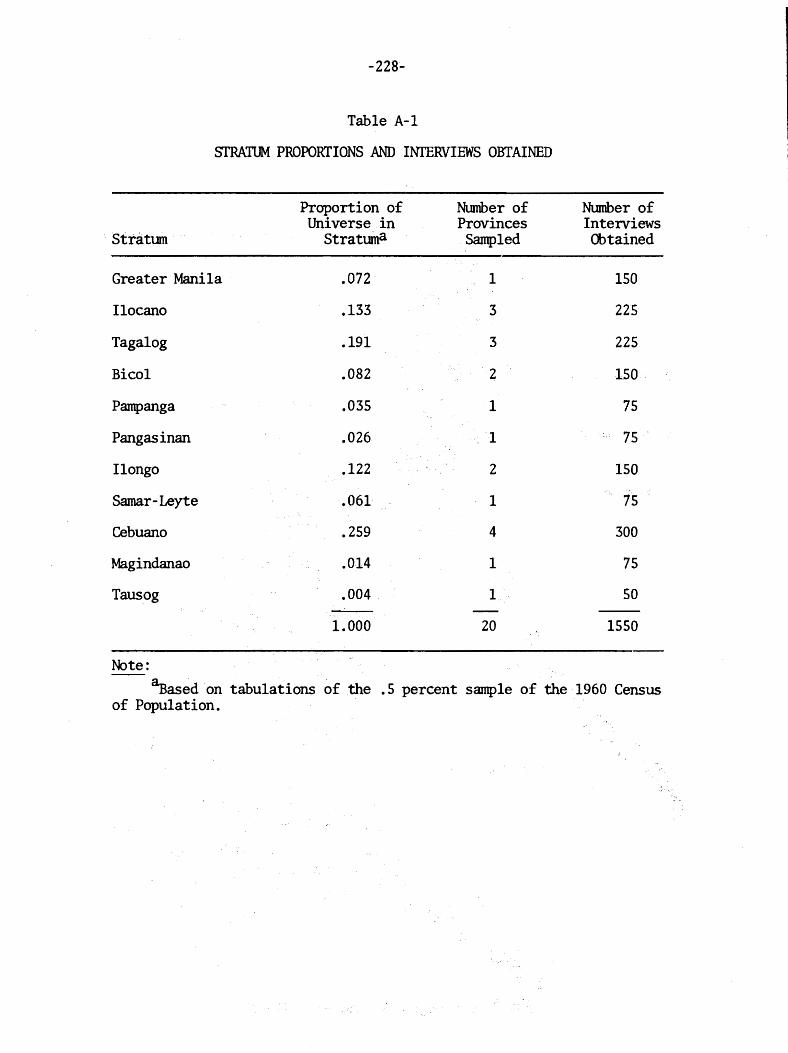
-228-
Table A-I
SfRAlUM PROPORTIONS AND INfERVIEWS OBTAINED
Proportion of Ntunber of Ntunber ofUniverse in Provinces Interviews
Stratum Stratuma sampled Obtained
Greater Manila .072· 1 150
I1ocano .133 3 225
Tagalog .191 3 225
Bico1 .082 2 150
Pampanga .035 1 75
Pangasinan .026 1 75
I1ongo .122 2 150
Samar-Leyte .061 1 75
Cebuano .259 4 300
Magindanao .014 1 75
Tausog .004 1 50
1.000 20 1550
Note:
~ased on tabulations of the .5 percent sample of the 1960 Censusof Population.
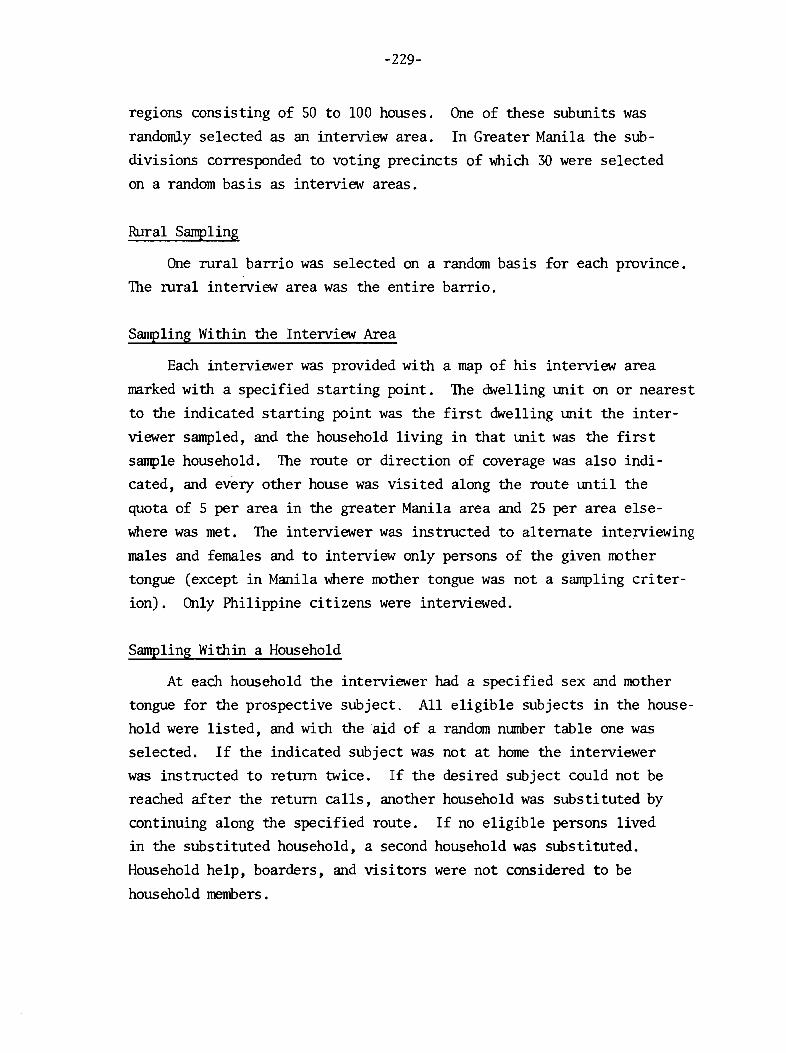
-229-
regions consisting of 50 to 100 houses. One of these subunits was
randomly selected as an interview area. In Greater Manila the sub
divisions corresponded to voting precincts of which 30 were selected
on a random bas is as interview areas.
Rural Sampling
One rural barrio was selected on a random basis for each province.
The rural interview area was the entire barrio.
Sampling Within the Interview Area
Each interviewer was provided with a map of his interview area
marked with a specified starting point. The dwelling mit on or nearest
to the indicated starting point was the first dwelling mit the inter
viewer sampled, and the household living in that mit was the first
sample household. The route or direction of coverage was also indi
cated, and every other house was visited along the route mtil the
quota of 5 per area in the greater Manila area and 25 per area else
where was met. The interviewer was instructed to alternate interviewing
males and females and to interview only persons of the given roother
tongue (except in Manila where IOOther tongue was not a sampling criter
ion) . Only Philippine citizens were interviewed.
Sampling Within a Household
At each household the interviewer had a specified sex and mother
tongue for the prospective subject. All eligible subjects in the house
hold were listed, and widl the aid of a random number table one was
selected. If the indicated subject was not at home the interviewer
was instructed to return twice. If the desired subject could not be
reached after the return calls, another household was substituted by
continuing along the specified route. If no eligible persons lived
in the substituted household, a second household was substituted.
Household help, boarders, and visitors were not considered to be
household members.
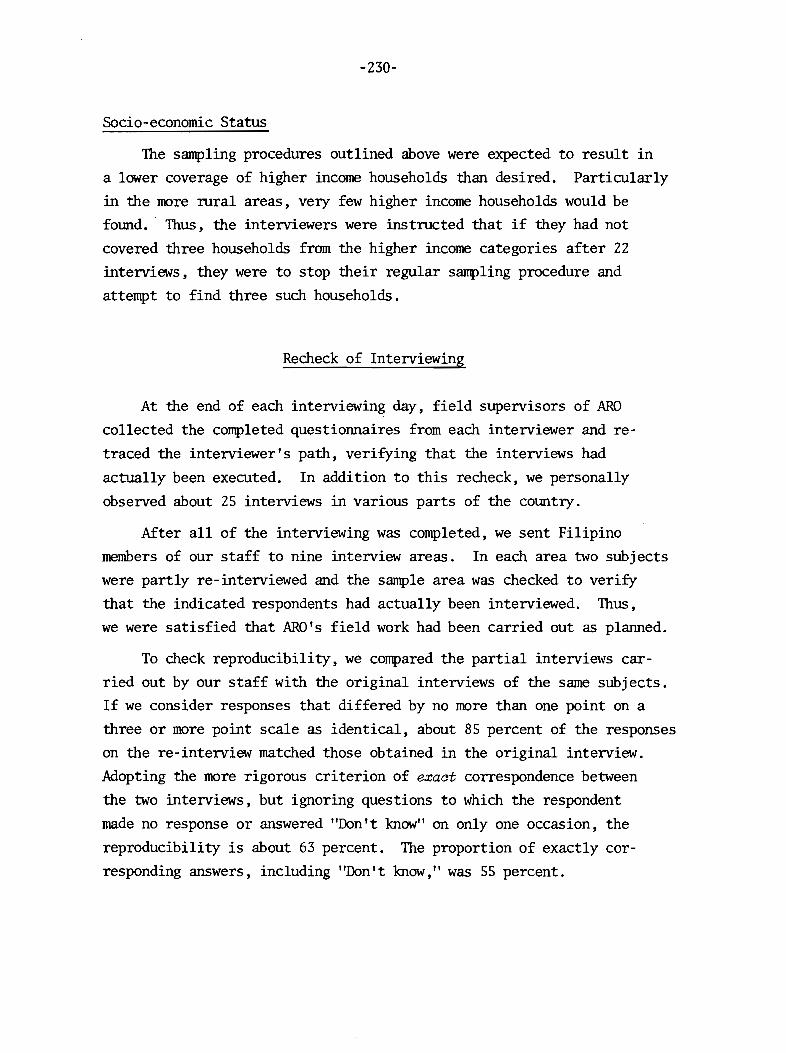
-230-
Socio-economic Status
The sampling procedures outlined above were expected to result in
a lower coverage of higher income households than desired. Particularly
in the more rural areas, very few higher income households would be
fOlmd. Thus, the interviewers were instructed that if they had not
covered three households from the higher income categories after 22
interviews, they were to stop their regular sampling procedure and
attempt to find three such households.
Recheck of Interviewing
At the end of each interviewing day, field supervisors of ARO
collected the completed questionnaires from each interviewer and re
traced the interviewer's path, verifying that the interviews had
actually been executed. In addition to this recheck, we personally
observed about 25 interviews in various parts of the cOlmtry.
After all of the interviewing was completed, we sent Filipino
members of our staff to nine interview areas. In each area two subjects
were partly re- interviewed and the sample area was checked to verify
that the indicated respondents had actually been interviewed. Thus,
we were satisfied that ARO's field work had been carried out as planned.
To check reproducibility, we compared the partial interviews car
ried out by our staff with the original interviews of the same subjects.
If we consider responses that differed by no more than one point on a
three or more point scale as identical, about 85 percent of the responses
on the re-interview matched those obtained in the original interview.
Adopting the more rigorous criterion of exact correspondence between
the two interviews, but ignoring questions to which the respondent
made no response or answered "Don't know" on only one occas ion, the
reproducibility is about 63 percent. The proportion of exactly cor
responding answers, including "Don't know," was 55 percent.

-231-
Data Processing
Weighting
Because interviews had to be conducted in blocks of 25, the number
of subjects drawn in each stratum is not exactly proportional to the
stratum size. Thus, it was necessary to weight the responses to obtain
estimates of total population proportions. Similarly, within each
province the proportion of interviews in the principal city, in a
poblaaion, and in rural barrios did not correspond to the proportion
of the population residing in these three types of places. The total
was calculated as the product of these two corrections, that is:
I ITotal Weight = pS x pp
s p
Where IsP =sI =P
P =P
Interviews in stratum/total interviews.
Population in stratum/total universe.
Interviews in type of place in province/population in type
of place in province.
Population in type of place in province/total populations
in province.
Tests of Significance
Many of the tables in the text present two tests of homogeneity,
x2 and x2 . The ordinary x2 requires no explanation; it was calculated1 .
on sums across strata using the standard correction for continuity
when small cells were encountered. The x2 is presented because X2 is,1
strictly speaking, not an appropriate test for a stratified random
sample such as Pegasus. The x2 statistic, unlike x2 , considers thedistribution of responses straium by stratum. l The computational
algorithm is as follows:
IThe general derivatio~ of Bhapkar's statistic may be found in V.P.Bhapkar, "Some Tests for Categorical Data, II Annals of Mathematiaal Statistias, Vol. 32, No.1, March 1961, pp. 72-83. The computational algorithmfollows Gad Nathan, ''Tests of Independence in Contingency Tables· from Stratified Samples," in Nonnan L. Johnson and Harry Smith, Jr., eds., New Deve lopments in Survey Sampling, New York, John Wiley & Sons, 1969, pp. 578-600.
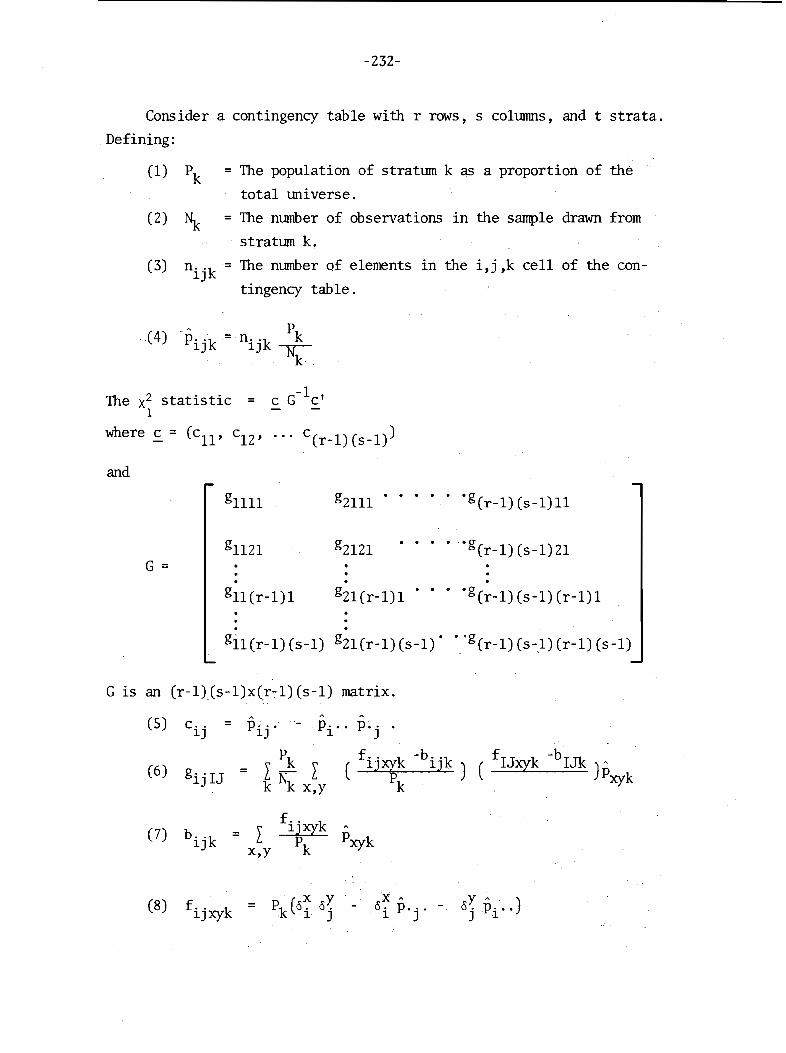
-232-
Consider a contingency table with r rows, s columns, and t strata.
Defining:
(1) Pk = The population of strattnn k as a proportion of the
total tmiverse.
(2) ~ = The number of observations in the sample drawn from. strattnn k.
(3) n" k = The number of-elements in the i,j,k cell of the conIJ
tingency table.
~ P(4) p. Ok = no ok k
IJ IJ -N-k
-1The x2 statistic = c G c'1
where c = (cll ' clZ ' ... c(r-l)(s-l))
and
gllll gZlll ° 0 0 0 0
°g(r-1) (s-l) II
. gl1Zl gZlZl ° 0 0 .og(r-l)(s-l)Zl
G =
gl1(r-l)l gZl(r-l)l og(r-l)(s-l)(r-l)l
° °gil(r-1) (s-l) gZl(r-1)(s-1)° ° -g(r-l) (s-l) (r-l) (s-l)
G is an (r-l) (s-l)x(r-l) (s-l) matrix.~ ~
(5) cij = Pij .- Pi" p. j .
(6) gij1J = L ~k L (fij~k -bijk )k k x,y k
f -b .( 1Jxyk 1Jk)~
Pxyk
(7) b" kIJ= L
x,y
f .. kIJxyPk
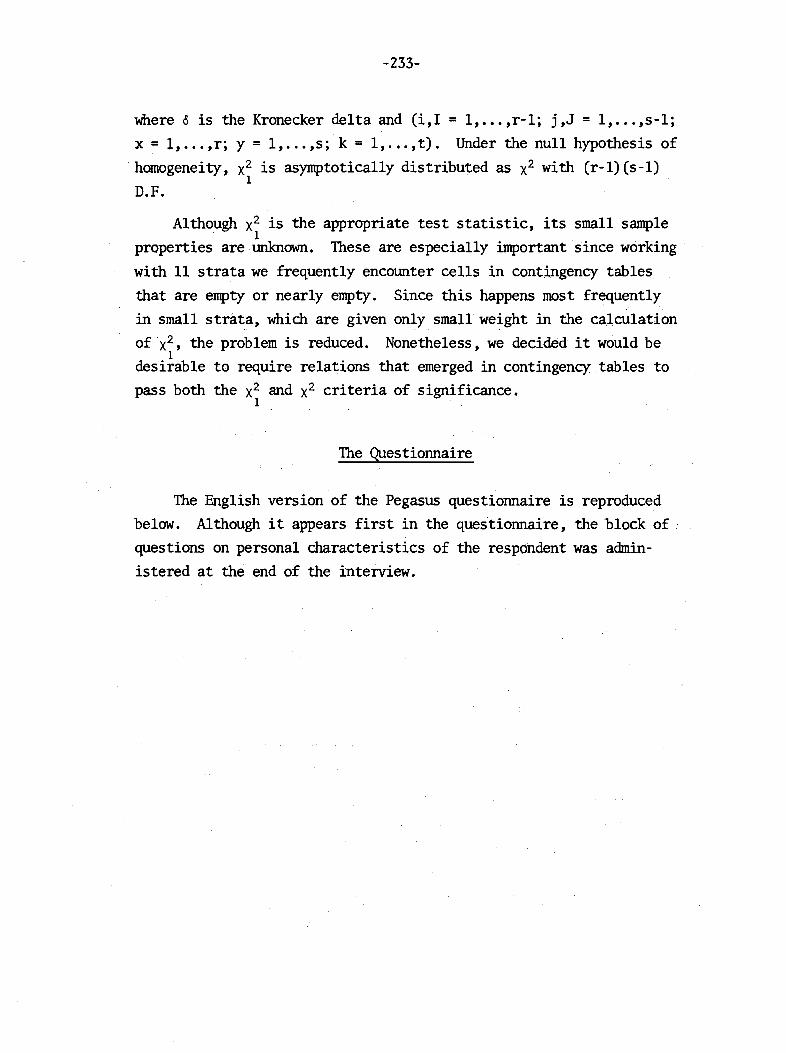
-233-
where 0 is the Kronecker delta and (i,I = l, ... ,r-l; j,J = l, ... ,s-l;
x ~ 1, ... ,r; y = l, ... ,s; k = l, ... ,t). Under the null hypothesis of
homogeneity, x2 is asymptotically distributed as x2 with (r-l)(s-l)1
D.F.
Although x2 is the appropriate test statistic, its small sample1
properties aretmknown. These are especially important since working
with 11 strata we frequently encounter cells in contingency tables
that are empty or nearly empty. Since this happens most frequently
in small strata, which are given only small weight in the calculation
of x2 , the problem is reduced. Nonetheless, we decided it would be1
desirable to require relations that emerged in contingency tables to
pass both the x2 and x2 criteria of significance.1
The Questionnaire
The English version of the Pegasus questionnaire is reproduced
below. Although it appears first in the questionnaire, the block of .
questions on personal characteristics of the respondent was admin
istered at the end of the interview.
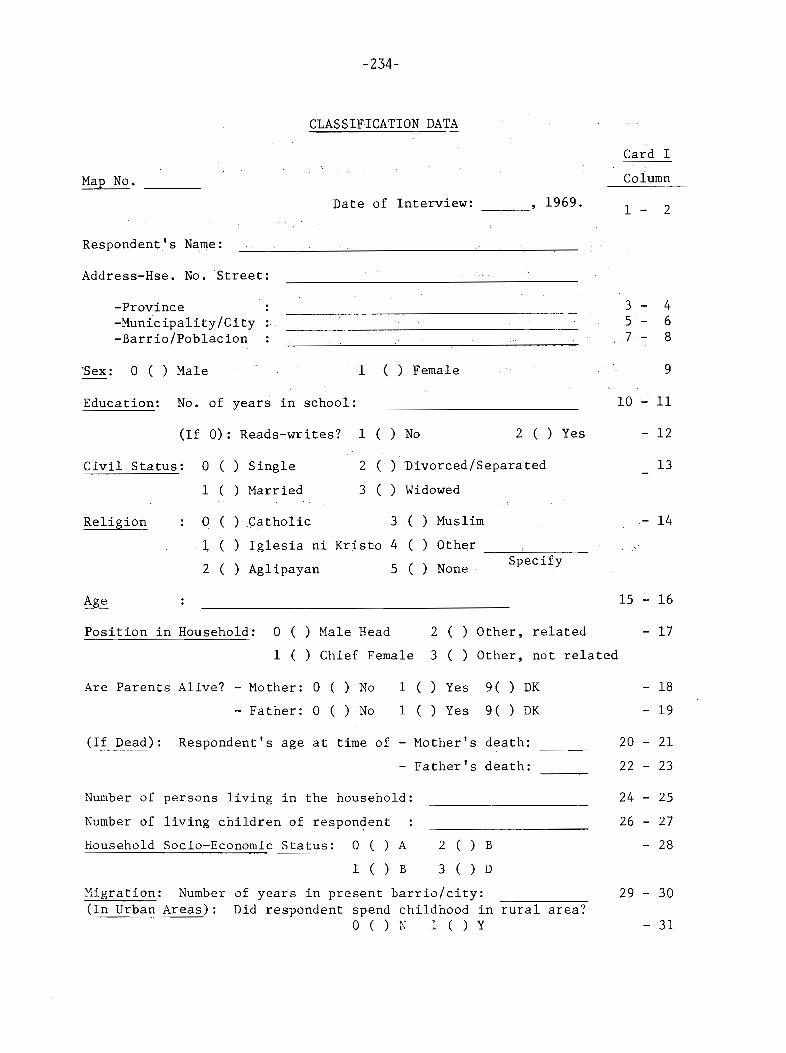
-234-
CLASSIFICATION DATA
Map No.
Card I
Column
Date of Interview:
Respondent's Name:
Address-Hse. No. Street:
• 1969.--- 1 - 2
Civil Status: 0 ( ) Single 2 ( ) Divorced/Separated
1 ( ) Married 3 ( ) Widowed
Religion 0 ( ) Catholic 3 ( ) Muslim
:L ( ) Ig1esiani Kristo 4 ( ) Other
2 ( ) Aglipayan 5 ( ) None Specify
Education: No. of years in school:
(If 0): Reads-writes? 1 ( ) No
-Province-Municipality/City-Barrio/Pob1acion
~ex: 0 ( ) Male 1 () Female
2 ( ) Yes
3 - 45 - 67 - 8
9
10 11
- 12
13
- 14
15 - 16
Position in Household: o ( ) Male Head
1 ( ) Chief Female
2 ( ) Other. related
3 ( ) Other. not related
17
Are Parents Alive? - Mother: 0 ( ) No 1 ( ) Yes 9( ) DK
- Father: 0 ( ) No 1 ( ) Yes 9 ( ) DK
(If Dead): Respondent's age at time of - Mother's death:
- Father's death:
Number of persons living in the household:
Number of living children of respon~ent
Household Socio-Economic Status: 0 ( ) A 2 ( ) B
1 ( ) B 3 ( ) D
Migration: Number of years in present barrio/city:(In Urban Areas): Did respondent spend childhood in rural area?
O()N l()Y
- 18
- 19
20 - 21
22 - 23
24 - 25
26 - 27
- 28
29 - 30
- 31
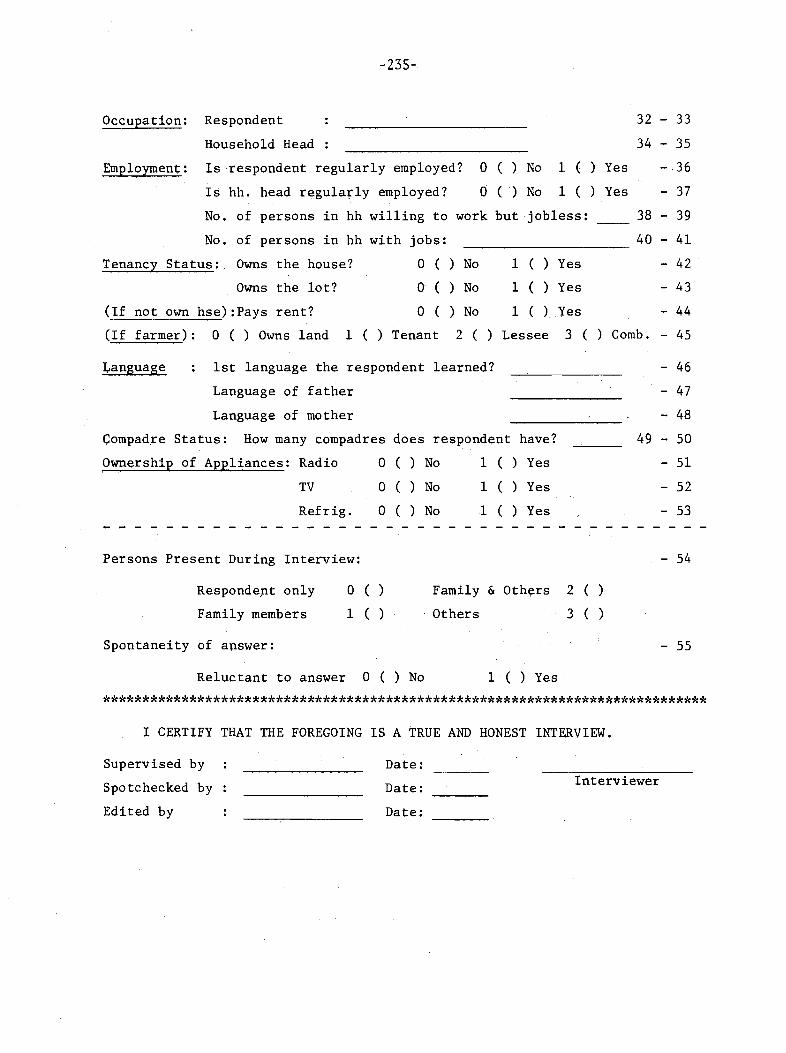
3 ( ) Comb. - 45
Occupation: Respondent
Household Head
Employment: Is respondent regularly employed? 0 ( ) No 1 ( )
Is hh. head regularly employed? 0 ( ) No 1 ( )
No. of persons in hh willing to work but jobless:
No. of persons in hh with jobs:
-235-
Tenancy Status: Owns the house? 0 ( ) No 1 ( )
Owns the lot? 0 ( ) No 1 ( )
(If not own hse):Pays rent? 0 ( ) No 1 ( )
(If farmer) : o ( ) Owns land 1 ( ) Tenant 2 ( ) Lessee
Yes
Yes
Yes
32 - 33
34 - 35
Yes -36
Yes - 37
38 39
40 41
- 42
- 43
- 44
Language 1st language the respondent learned?
Language of father
Language of mother
Compadre Status: How many compadres does respondent have?
Ownership of Appliances: Radio 0 ( ) No 1 ( ) Yes
TV 0 ( ) No 1 ( ) Yes
Refrig. 0 ( ) No 1 ( ) Yes- - - - - - - - - - - - - - - - - - - - - -
Persons Present During Interview:
- 46
- 47
- 48
49 - 50
- 51
- 52
- 53
- 54
Responde.nt only 0 ( ) Family & Oth~rs 2 ( )
Family members 1 ( ) Others 3 ( )
Spontaneity of answer: - 55
Reluctant to answer 0 ( ) No 1 ( ) Yes
*****************************************************************************
I CERTIFY THAT THE FOREGOING IS A TRUE AND HONEST INTERVIEW.
Supervised by
Spotchecked by
Edited by
Date:
Date:
Date:
Interviewer
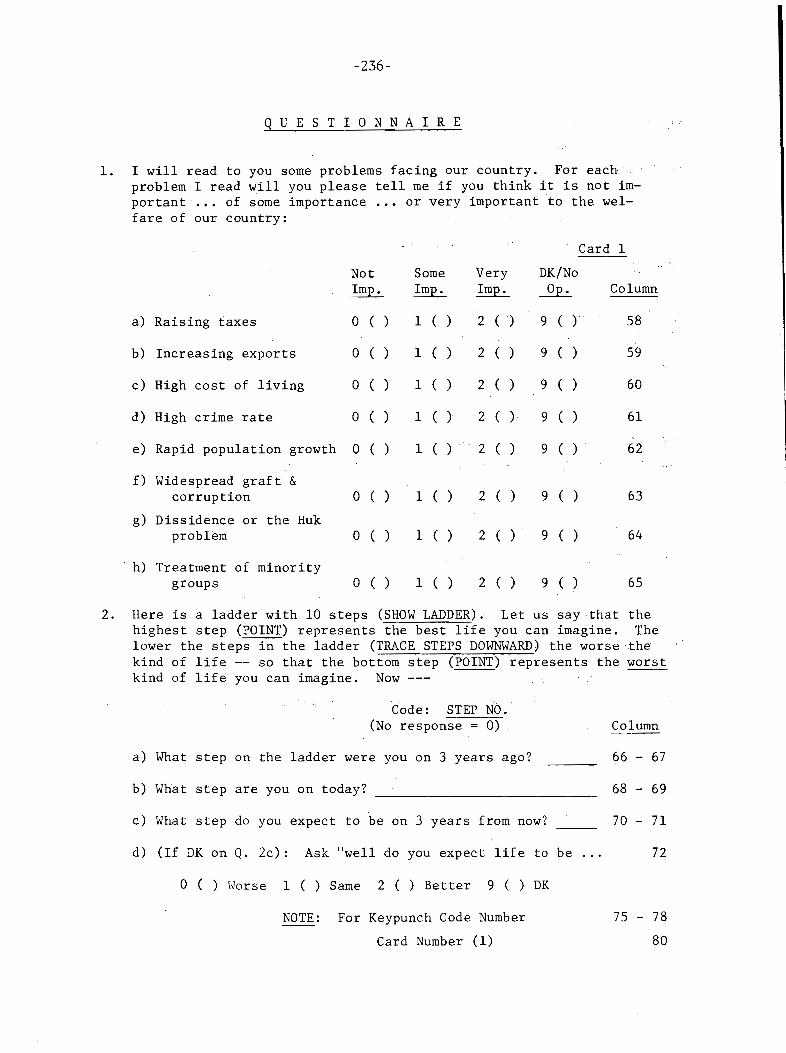
-236-
QUE S T ION N A IRE
1. I will read to you some problems facing our country. For eachproblem I read will you please tell me if you think it is not im-portant of some importance ..• or very important to the wel-fare of our country:
Card 1
Not
~
a) Raising taxes a ( )
b) Increasing exports a ( )
c) High cost of living a ( )
d) High crime rate a ( )
e) Rapid population growth a ( )
f) Widespread graft &corruption a ( )
g) Dissidence or the Hukproblem a ( )
h) Treatment of minoritygroups a ( )
Some
~
1 ( )
1 ( )
1 ( )
1 ( )
1 ( )
1 ( )
1 ( )
1 ( )
Very
~
2 ()
2 ( )
2 ( )
2 ( )
2 ( )
2 ( )
2 ( )
2 ( )
DK/No
~
9 ( )
9 ( )
9 ( )
9 ( )
9 ( )
9 ( )
9 ( )
9 ( )
Column
58
59
60
61
62
63
64
65
2. Here is a ladder with 10 steps (SHOW LADDER). Let us say that thehighest step (POINT) represents the best life you can imagine. Thelower the step~the ladder (TRACE STEPS DOWNWARD) the worse-thekind of life -- so that the bottom step (POINT) represents the worstkind of life you can imagine. Now ~--
Code: STEP NO.(No response = 0)
a) What step on the ladder were you on 3 years ago?----
b) What step are you on today?
c) What step do you expect to be on 3 years from now?
Column
66 - 67
68 - 69
70 - 71
d) (If DK on Q. 2c): Ask "well do you expect life to be ... 72
a ( ) Worse 1 ( ) Same 2 ( ) Better 9 ( ) DK
NOTE: For Keypunch Code Number
Card Number (1)
75 - 78
80

-237-
3. If you had an extra ~1000 would you spend no~e of it ••• some ofit ••• or most if not all of the noaa on (item)? How about (item)?etc.
a) Invest in a business
b) Buy a TV set or otherhousehold appliances
c) Partial payment forhouse or land
d) Education for your. children
e) Save it
None
a ( )
a ( )
a ( )
a C)
a ( )
Some
1 ( )
1 ( )
1 ( )
1 ( )
1 ( )
Most/All
2 ( )
2 ( )
2 ( )
2 ( )
2 ( )
DK/No
~
9 ( )
9 ( )
9 ( )
9 ( )
9 ( )
Card 2
Column
1
2
3
4
5
4. From your impressions of politicians, is the word I will read toyou descriptive of none or very few politicians ••• some of them... or most of them?
a) Greedy
b) Honest
c) Hard-working
d) Corrupt
e) Nationalistic
f) An example to follow
None/Few
a ( )
a ( )
o ( )
o ( )
a ( )
o ( )
Some
1 ( )
1 ( )
1 ( )
1 ( )
1 ( )
1 ( )
.Most
2 ( )
2 ( )
2 ( )
2 ( )
2 ( )
2 ( )
DK/NoOpe
9 ( )
9 ( )
9 ( )
9 ( )
9 ( )
9 ( )
Column
6
7
8
9
10
11
5. How important are the following characteristics in determiningwhether a person is good or not? Let us start off with (characteristic):is this not very important ... of some importance .•• or very important? How about (characteristic)? Etc.
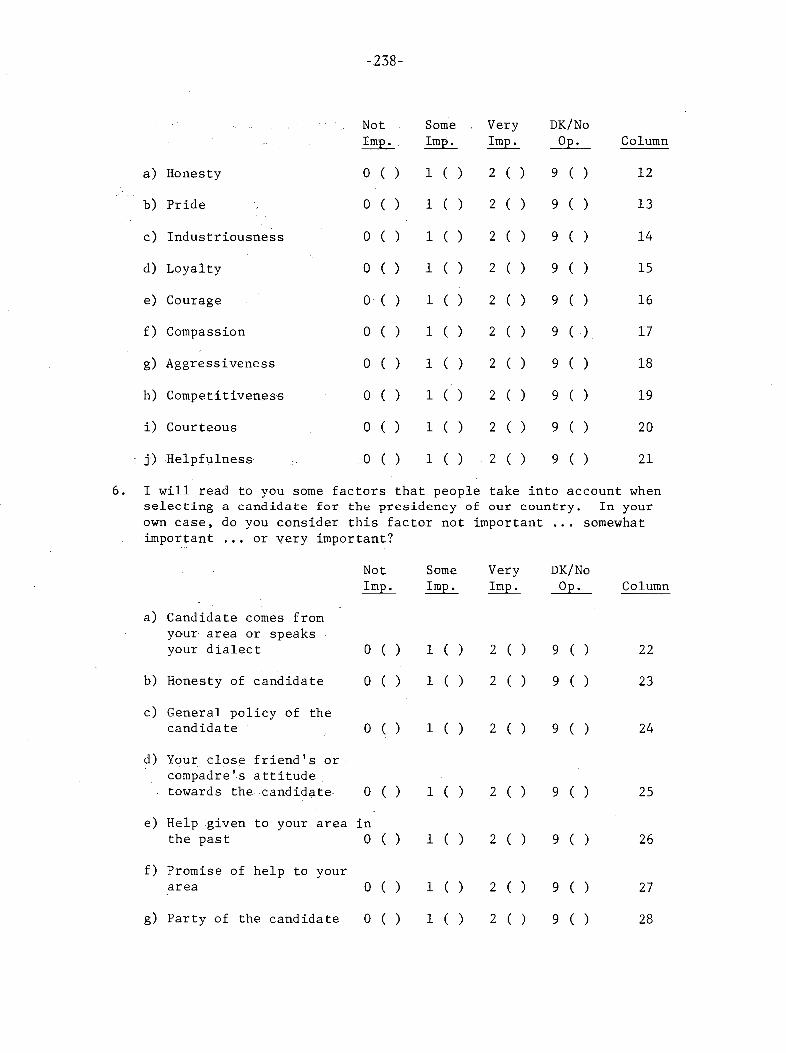
-238-

-239-
7a. Do you believe that elections for President in our countryare ... 29
0 ( ) Seldom if ever honest 2 ( ) Always honest?
1 ( ) Usually honest ... or 9 ( ) DK - No opinion
7b. Do you believe that elections for Mayor in our country are •.• 30
0 ( ) Seldom if ever honest 2 ( ) Always honest?
1 ( ) Usually honest ... or 9 ( ) DK - No opinion
8. Did you vote for the Nacionalista candidate ..• the Liberalcandidate ... the Progressive Party candidate ... or someother candidate for (position) in the (year) election?
Nat. Lib. Prog. Oth. NoneNotVote DK Column
a) President, 1961(Garcia NPMacapagal LP
b) President, 1965(Marcos NPMacapagal LPManglapus PPP
c) Mayor, 1967
O() l()
O() l()
O() l()
2()3() 4() 5() 9()
2() 3()4() 5() 9()
2() 3()4() 5() 9()
31
32
33
INTERVIEWER: Do not ask Q. 9 if respondent did not vote in 1967.
9. In the 1967 election, which of the following factors which I willread most influenced you to register:
Column 34 Column 35 Column
Civic duty 0 ( ) 0 ( ) 34 - 35
Platform of the Party 1 ( ) 1 ( )
Contact by party worker 2 ( ) 2 ( )
Persuasion by friend t compadres 3 ( ) 3 ( )
Concern with outcome of theelection 4 ( ) 4 ( )
The candidate 5 ( ) 5 ( )
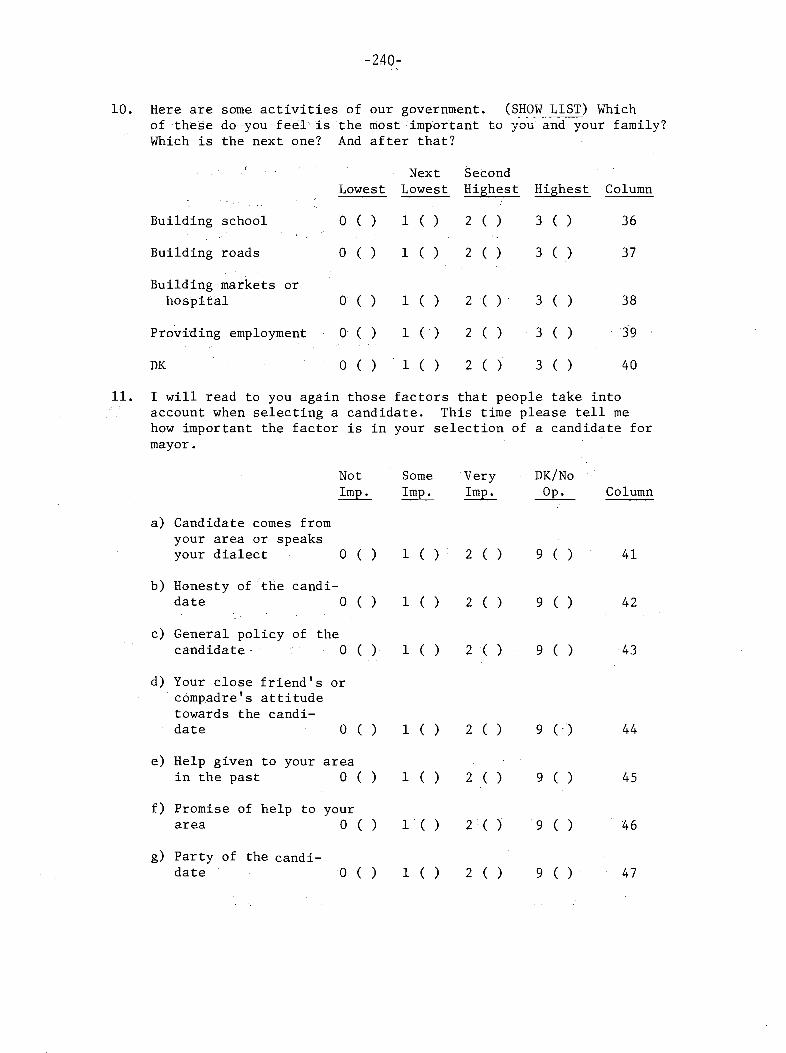
-240-
10. Here are some activities of our government. (SHOW LIST) Whichof these do you feel is the most important to you and your family?Which is the next one? And after that?
Next SecondLowest Lowest Highest Highest Column
Building school 0 ( ) 1 ( ) 2 ( ) 3 ( ) 36
Building roads 0 ( ) 1 ( ) 2 ( ) 3 ( ) 37
Building markets orhospital 0 ( ) 1 ( ) 2 ( ) 3 ( ) 38
Providing employment 0 ( ) 1 ( ) 2 ( ) 3 ( ) 39
DK 0 ( ) 1 ( ) 2 ( ) 3 ( ) 40
11. I will read to you again those factors that people take intoaccount when selecting a candidate. This time please tell mehow important the factor is in your selection of a candidate formayor.
Not Some Very DK/NoImp. Imp. ~ ~ Column
a) Candidate comes fromyour area or speaksyour dialect 0 ( ) 1 ( ) 2 ( ) 9 ( ) 41
b) Honesty of the candi-date 0 ( ) 1 ( ) 2 ( ) 9 ( ) 42
c) General policy of thecandidate - 0 ( ) 1 ( ) 2( ) 9 ( ) 43
d) Your close friend's orcompadre's attitudetowards the candi-date 0 ( ) 1 ( ) 2 ( ) 9 () 44
e) Help given to your areain the past 0 ( ) 1 ( ) 2 ( ) 9 ( ) 45
f) Promise of help to yourarea 0 ( ) 1 ( ) 2 ( ) 9 ( ) 46
g) Party of the candi-date 0 ( ) 1 ( ) 2 ( ) 9 ( ) 47
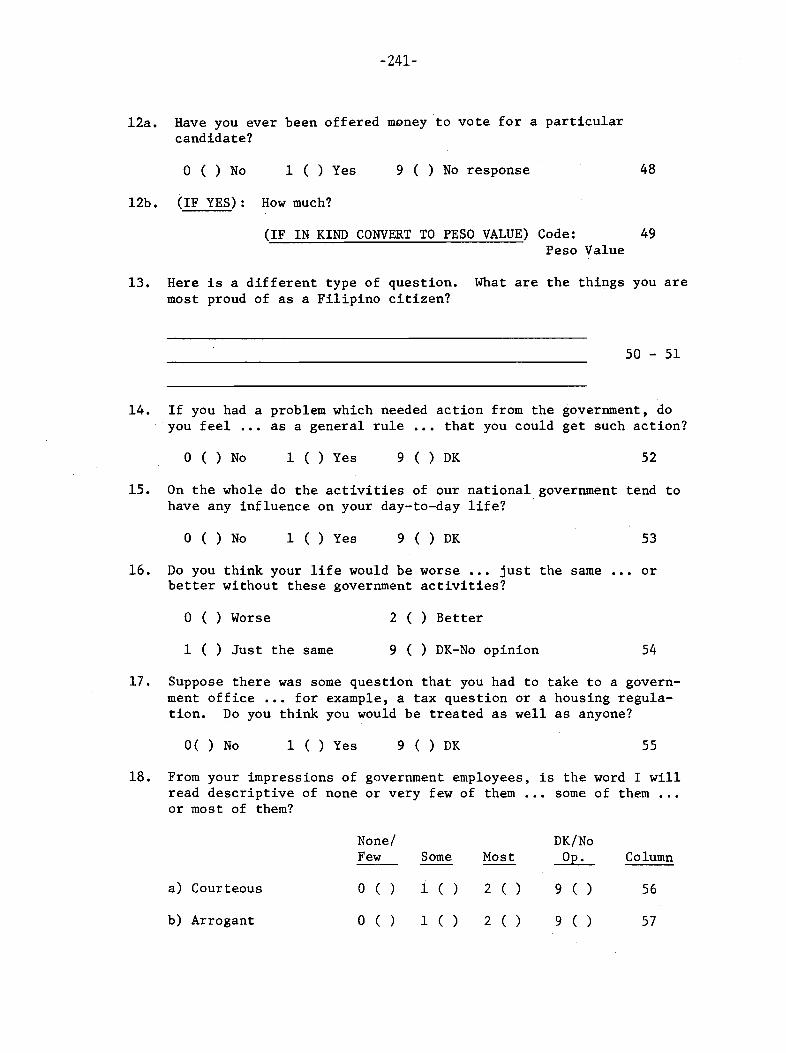
-241-
l2a. Have you ever been offered money to vote for a particularcandidate?
o ( ) No 1 ( ) Yes 9 ( ) No response 48
l2b. (IF YES): How much?
(IF IN KIND CONVERT TO PESO VALUE) Code: 49Peso Value
13. Here is a different type of question. What are the things you aremost proud of as a Filipino citizen?
50 - 51
14. If you had a problem which needed action from the government, doyou feel .•• as a general rule that you could get such action?
o ( ) No 1 ( ) Yes 9 ( ) DK 52
15. On the whole do the activities of our national government tend tohave any influence on your day-to-day life?
o ( ) No 1 ( ) Yes 9 ( ) DK 53
16. Do you think your life would be worse ••• just the same ••• orbetter without these government activities?
o ( ) Worse
1 ( ) Just the same
2 ( ) Better
9 ( ) DK-No opinion 54
17. Suppose there was some question that you had to take to a government office ••• for example, a tax question or a housing regulation. Do you think you would be treated as well as anyone?
O( ) No 1 ( ) Yes 9 ( ) DK 55
18. From your impressions of government employees, is the word I willread descriptive of none or very few of them ••. some of them •..or most of them?
None/ DK/NoFew Some Most Ope Column
a) Courteous 0 ( ) 1 ( ) 2 ( ) 9 ( ) 56
b) Arrogant 0 ( ) 1 ( ) 2 ( ) 9 ( ) 57
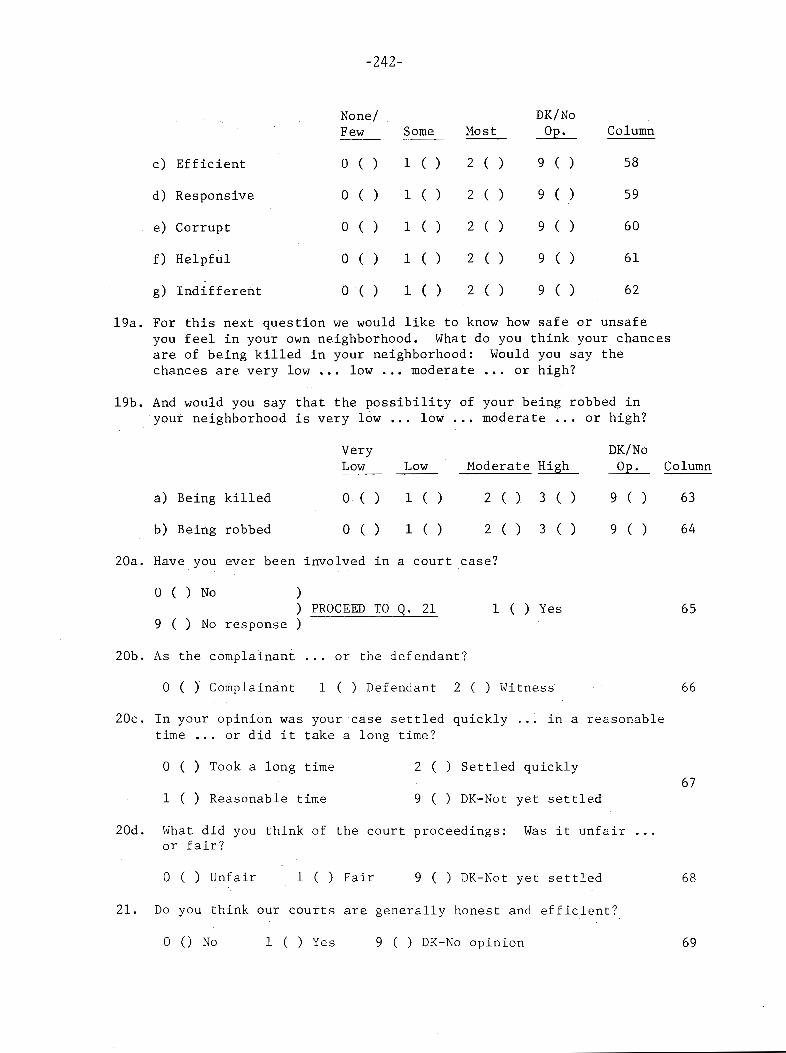
-242-
None/Few Some Most
DK/No
~ Column
c) Efficient
d) Responsive
e) Corrupt
f) Helpful
g) Indifferent
o ( )
o ( )
o ( )
o ( )
o ( )
1 ( )
1 ( )
1 ( )
1 ( )
1 ( )
2 ( )
2 ( )
2 ( )
2 ( )
2 ( )
9 ( )
9 ( )
9 ( )
9 ( )
9 ( )
58
59
60
61
62
19a. For this next question we would like to know how safe or unsafeyou feel in your own neighborhood. What do you think your chancesare of being killed in your neighborhood: Would you say thechances are very low ... low ..• moderate .•• or high?
19b. And would you say that the possibility of your being robbed inyour neighborhood is very low ... low ... moderate ... or high?
VeryLow Low Moderate High
DK/NoOp. Column
a) Being killed
b) Being robbed
o ( )
o ( )
1 ( )
1 ( )
2() 3()
2() 3()
9 ( )
9 ( )
63
64
20a. Have you ever been involved in a court case?
0 ( ) No )) PROCEED TO Q. 21 1 ( ) Yes
9 ( ) No response )
20b. As the complainant or the defendant?
0 ( ) Complainant 1 ( ) Defendant 2 ( ) Witness
20c. In your 0plnlon was your case settled quickly .. : in a reasonabletime ... or did it take a long time?
65
66
o ( ) Took a long time
1 ( ) Reasonable time
2 ( ) Settled quickly
9 ( ) DK-Not yet settled67
20d. hThat did you think of the court proceedings: Was it unfairor fair?
0 ( ) Unfair 1 ( ) Fair 9 ( ) DK-Not yet settled
21. Do you think our courts are generally honest and efficient?
68
o () No 1 ( ) Yes 9 ( ) DK-No opinion 69
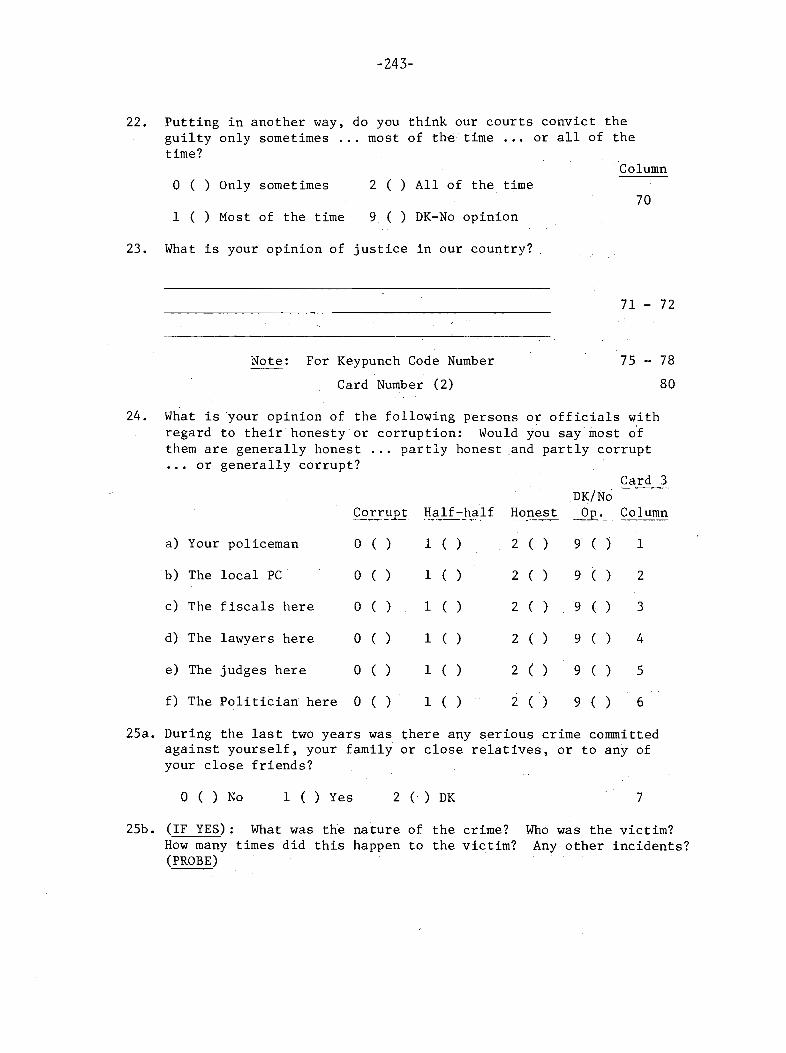
-243-
22. Putting in another way, do you think our courts convict theguilty only sometimes ... most of the time ••. or all of thetime?
Columno ( ) Only sometimes
I ( ) Most of the time
2 ( ) All of the time
9. ( ) DK-No opinion70
23. What is your opinion of justice in our country?
Note: For Keypunch Code Number
Card Number (2)
71-72
75 - 78
80
24. What is your oplnlon of the following persons or officials withregard to their honesty or corruption: Would you say most ofthem are generally honest ... partly honest and partly corrupt... or generally corrupt?
Card 3
Half-half HonestDK/No-.9~ g~lumn
a) Your policeman 0 ( )
b) The local PC 0 ( )
c) The fiscals here 0 ( )
d) The lawyers here 0 ( )
e) The judges here 0 ( )
f) The Politi~iati here 0 ( )
1 ( )
I ( )
I ( )
I ( )
I ( )
1 ( )
2 ( )
2 ( )
2 ( )
2 ( )
2 ( )
2 ( )
9 ( )
9 ( )
9 (.)
9 ( )
9 ( )
9 ( )
I
2
3
4
5
6
25a. During the last two years was there any serious crime committedagainst yourself, your family or close relatives, or to any ofyour close friends?
o ( ) No I ( ) Yes 2 ( ) DK 7
25b. (IF YES): What was the nature of the crime?How many times did this happen to the victim?(PROBE)
Who was the victim?Any other incidents?
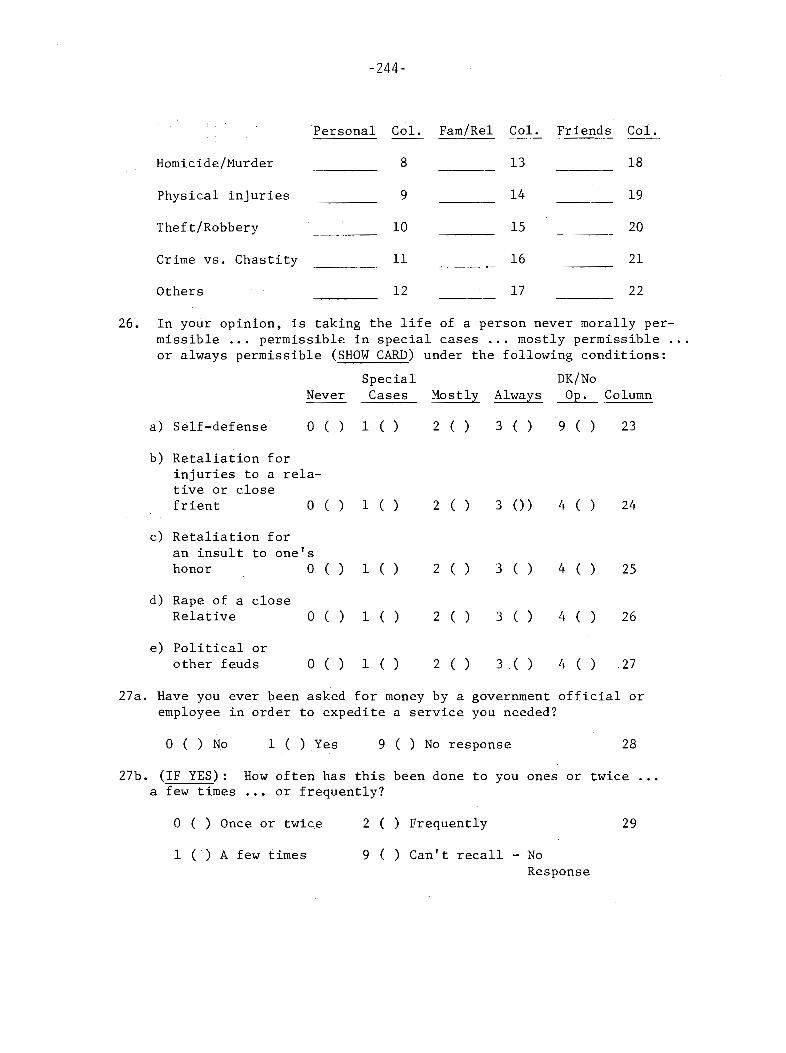
-244-
Personal Col. Fam/Rel Col. Friends Col.
Homicide/Murder
Physical injuries
Theft/Robbery
Crime vs. Chastity
Others
8
9
10
11
12
13
14
15
16
17
18
19
20
21
22
26. In your opinion, is taking the life of a person never morally permissible .•. permissible in special cases ... mostly permissible ...or always permissible (SHOW CARD) under the following conditions:
NeverSpecialCases Mostly
DK/NoAlways ~ Column
a) Self-defense O() l() 2 ( ) 3 ( ) 9 ( ) 23
b) Retaliation forinjuries to a relative or closefrient 0 () 1 ( )
c) Retaliation foran insult to one'shonor 0 () 1 ( )
d) Rape of a closeRelative 0 () 1 ( )
e) Political orother feuds 0 () 1 ( )
2 ( )
2 ( )
2 ( )
2 ( )
3 0)
3 ( )
3 ( )
3 ( )
4 ( )
4 ( )
4 ( )
4 ( )
24
25
26
27
27a. Have you ever been asked for money by a government official oremployee in order to expedite a service you needed?
o ( ) No 1 ( ) Yes 9 ( )No response 28
27b. (IF YES) :a few times
How often has this been done to you ones or twice ...or frequently?
o ( ) Once or twice
1 ( ) A few times
2 ( ) Frequently
9 ( ) Can't recall - NoResponse
29
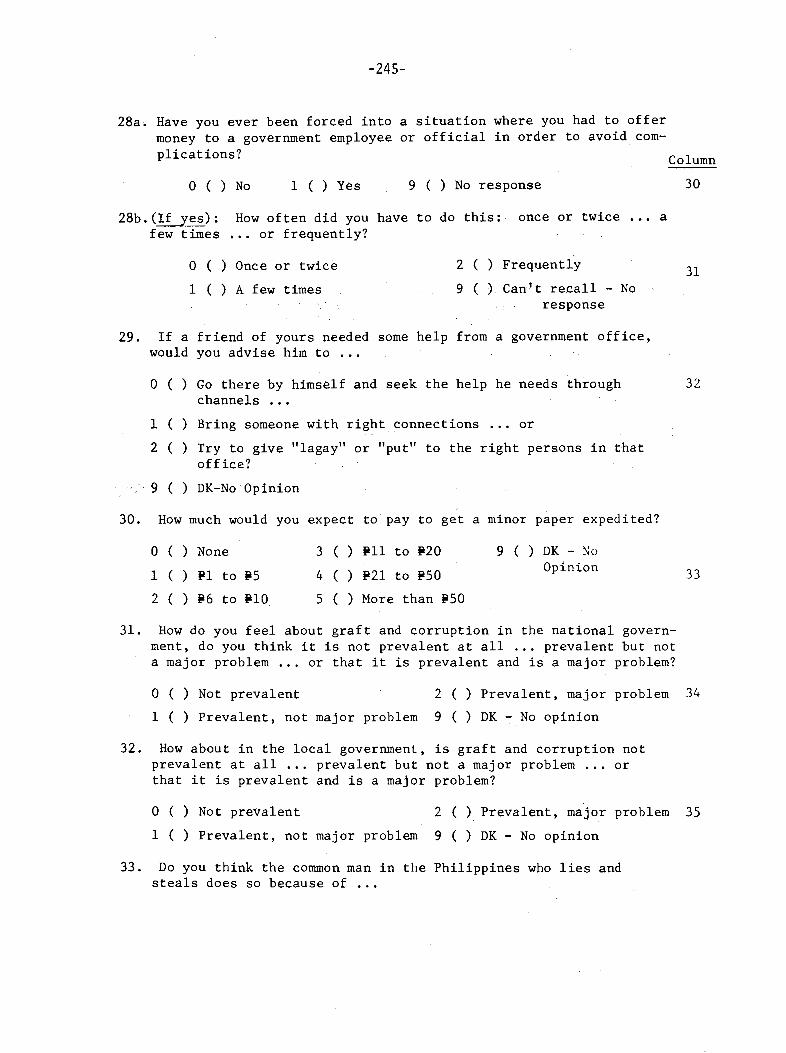
28a.
-245-
Have you ever been forced into a situation where you had to offermoney to a government employee or official in order to avoid complications? Column
o ( ) No 1 ( ) Yes 9 ( ) No response 30
28b.(If yes): How often did you have to do this: once or twice ••• afew times ••• or frequently?
o ( ) Once or twice
1 ( ) A few times
2 ( ) Frequently
9 ( ) Can't recall - Noresponse
31
29. If a friend of yours needed some help from a government office,would you advise him to ••.
o ( ) Go there by himself and seek the help he needs throughchannels •••
1 ( ) Bring someone with right connections .•. or
2 ( ) Try to give "lagay" or "put" to the right persons in thatoffice?
9 ( ) DK-No Opinion
30. How much would you expect to pay to get a minor paper expedited?
32
a ( ) None
1 ( ) III to 115
2 ( ) 116 to 1110
3 ( ) 1111 to 1120
4 ( ) 1121 to 1150
5 ( ) More than 1150
9 ( ) DK - NoOpinion 33
31. How do you feel about graft and corruption in the national government, do you think it is not prevalent at all ... prevalent but nota major problem ... or that it is prevalent and is a major problem?
o ( ) Not prevalent
1 ( ) Prevalent, not major problem
2 ( ) Prevalent, major problem
9 ( ) DK - No opinion
34
32. How about in the local government, is graft and corruption notprevalent at all ... prevalent but not a major problem ... orthat it is prevalent and is a major problem?
o ( ) Not prevalent
1 ( ) Prevalent, not major problem
2 ( ) Prevalent, major problem 35
9 ( ) DK - No opinion
33. Do you think the common man in the Philippines who lies andsteals does so because of ...

-246-
No Pardy Yes DK-No Op. Column
a) Little or no schooling
b) Bad example set byleaders
c) Lack of religion
d) Poverty
e) Inherent nature
o ( )
o ( )o ( )o ( )o ( )
1 ( )
1 ( )
1 ( )
1 ( )
1 ( )
2 ( )
2 ( )
2 ( )
2 ( )
2 ( )
9 ( )
9 ( )
9 ( )
9 ( )
9 ( )
36
J738
39
40
34a. Ever since our country became a republic, a lot of things have beensaid about the Huks. Different people have different opinionsabout them. You have heard about the Huks, haven't you? 41
34b. Would you prefer not to talk about them?
o ( ) No
1 ( ) Yes
2 ( ) Prefers not to talk: PROCEED TO Q. 40.
35. To your knowledge, how well does each of the following descriptionsapply to the·· Huks: is the term I will read not applicable tothem •.. partly true •.• or descriptive of them?
Not App. Partly Descrip. DK-No Op. Column
o ( )o ( )o ( )o ( )o ( )o ( )o ( )
a) Nationalistic
b) Bandits
c) Misguided men
d) Brutal
e) Hope of the tenant
f) Tools of Red China
g) Men of justice
h) Enemies of the richor the landlords 0 ( )
1 ( )
1 ( )
1 ( )
1 ( )
1 ( )
1 ( )
1 ( )
1 ( )
2 ( )
2 ( )
2 ( )
2 ( )
2 ( )
2 ( )
2 ( )
2 ( )
9 ( )
9 ( )
9 ( )
9 ( )
9 ( )
9 ( )
9 ( )
9 ( )
42
43
44
45
46
47
48
49
36. Have you ever heard about the Huks being seen in your area? 50
1 ( ) YesProceed to Q. 40
o ( ) No )
9 ( ) DK-No response~
37. From what people here say, which of the folrowing activities havehappened in your surrounding area?
No. Yes DK Column
52O() l() 9()
a) Occasionally seen .0 () 1 () 9 () 51
b) Work withpoliticians
c) Has influence overlocal politicians 0 ( )
d) Tax people 0 ( )
e) Enforce the laws 0 ( )
1 ( )
1 ( )
1 ( )
9 ( )
9 ( )9 ( )
53
5455
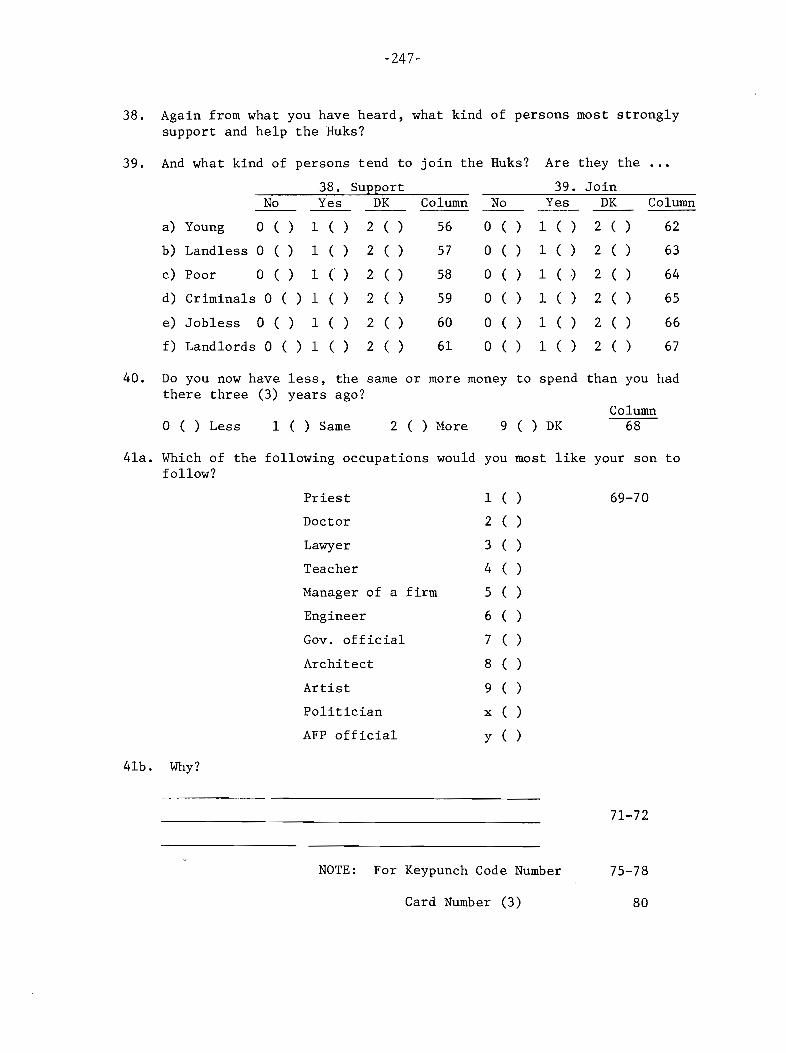
-247-
38. Again from what you have heard, what kind of persons most stronglysupport and help the Huks?
39. And what kind of persons tend to join the Huks?
38. SupportNo Yes DK Column No
Are they the
39. JoinYes DK Column
a) Young 0 () 1 ( )
b) Landless 0 () 1 ( )
c) Poor 0 () 1 ( )
d) Criminals 0 ( ) 1 ( )
e) Jobless 0 () 1 ( )
f) Landlords 0 ( ) 1 ( )
2 ( )
2 ( )
2 ( )
2 ( )
2 ( )
2 ( )
56
57
58
59
60
61
o ( )o ( )o ( )o ( )o ( )o ( )
1 ( )
1 ( )
1 ( .)
1 ( )
1 ( )
1 ( )
2 ( )
2 ( )
2 ( )
2 ( )
2 ( )
2 ( )
62
63
64
65
66
67
40. Do you now have less, the same or more money to spend than you hadthere three (3) years ago?
o ( ) Less 1 ( ) Same 2 ( ) More 9 ( ) DKColumn
68
4la. Which of the following occupations would you most like your son tofollow?
4lb. Why?
Priest
Doctor
Lawyer
Teacher
Manager of a firm
Engineer
Gov. official
Architect
Artist
Politician
AFP official
1 ( )
2 ( )
3 ( )
4 ( )
5 ( )
6 ( )
7 ( )
8 ( )
9 ( )
x ( )
y ( )
69-70
71-72
NOTE: For Keypunch Code Number
Card Number (3)
75-78
80
-249-
Appendix B
FACTOR ANALYSIS DATA BASE
FOR 1HE FACTOR ANALYSIS we tried to include data describing all the
substantive topics cited in Chapter 1. To keep the data matrix of
manageable proportions we included only a few basic variables about
each topic. Also, we were in some cases restricted by the lack of
data that could be dis aggregated to the province level. This is
especially true of the economic data. In this appendix we describe
the variables that went into the factor analysis and sketch the logic
behind the decision to include certain general classes of variables.
In addition to the substantive variables which represent activities
or conditions in Philippine society, we felt that certain hasic struc
tural characteristics of the Philippine islands were of importance in
understanding the way social systems interact and interlock. 'The
Philippines is a system of islands, and interisland corronunications
are fairly difficult. We believed that two major centers of activity
would be the large islands of Luzon and Mindanao. We inCluded an
item in the data matrix that represents the distance of the province
capital from either Manila, Luzon, or Cotahato, Mindanao (the shorter
distance was chosen).
The Philippines is a nation with a social system still heavily
dependent on agriculture. l Obviously, the typhoon and dry season rain
fall pattern in the area is an important physical component in Philippine
agriculture. Typhoons tend to inhibit the growth of certain crops and
1See McKendry et aZ.~ pp. 1-27.
PREVIOUS PAGE BLANK
-250-
make the growth of any crop a risky affair. The dry season in some
areas is so pronounced that growth of a productive crop is severely
inhibited. Variables representing the predominance of typhoons in
each province and the amount of "dry season" rainfall are included
as structural variables desi~led to aid in understanding the spatial
distribution of agriculture.
In terms of social behavior our other analyses indicated a con
siderable dissimilarity of behavior among some of the language groups
in the Philippines. In Philippine folklore the Ilocanos are noted
for their industriousness and their thriftiness, and, to some extent,
for the violence of their electoral process. The Ilongos are alleged
to be a bit lazy and somewhat extravagant.
We have already noted that a significant relationship often
exists between ethnic group and social behavior. Thus, we included
variables such as the percent of the population living in the pro
vince of a given ethnic type. Since Philippine provinces tend to be
homogeneous along ethnic lines, there is a strong tendency for the
values on these variables to be near 0 or 100.
Specifically, the data relate to:
Agriculture -- Much of the Philippine population is still engaged
in agriculture and the major source of foreign exchange is from agri
cultural exports. Moreover, change in the agricultural sector is
postulated to be a major cause of dissidence. 01uch of the infra
structure program is oriented toward integrating the rural areas into
the modem sector. A mnnber of variables are included to represent
some of these aspects of the rural-farming sector.
Tenancy has traditionally been the major source of rural dis
sidence in the Philippines. Tenancy rates for 1938 and 1960 are
included in the analysis. The presence of sugar production has also
been associated with dissidence as well as with high rates of non
poli tical violence. Sugar and coconuts are maj or fore ign exchange
earners for the Philippines. Percentages of farmland planted to

-251-
sugar and coconut in 1938 and 1960 are variables included to represent
the importance of these crops in the province.
TranspoY'tation and Corrorzunication -- Indicators of the density of
the road network per unit of area and number of telegraph messages in
and out per capita (domestic only) are included to represent the degree
to which the area is tied into the modern sector.
Ethnic -- There appear to be important differences in beliefs and
behavior for the different language groups in the Philippines. The
Ilocanos show violent behavior in the crime statistics but express a
strong distaste for violence in interview data. At the same time
Ilocanos show the greatest degree of sophistication politically, vote
as a bloc, and express considerable confidence in the integrity and
efficiency of their local governmental structure. In the composite
factor analysis the percent of the population giving Ilocano and
Cebuano as their mother tongue are included as variables to see how
ethnic type correlates with the political and social structure. Also
the percent of the province population of the Muslim religion is in
cluded as an ethnic index.
CY'ime Rates -- Indicators of the violence and crime against pro
perty rates are included. Most of the data on crime that we have been
able to locate is no older than 1962 and thus the crime data do not
cover our three bas ic time frames. We were able to find one rough
index of the province crime rates for the 1930s and these data are
included. A major goal in including these data was to determine the
degree of relation between spatial economics and crime.
Politics -- Percent of votes for the winner in each of the presi
dential elections of 1957, 1961 and 1965 are included as separate
variables. Indicators of vote dispersion between different national
offices are included, as are indicators of the extent to which one
party controlled local political offices -- mayor. An index of de
viance from national averages is included to represent bloc voting
tendencies, since groups that can deliver a block of votes have a
-252-
llR.lch better political bargaining position than do groups who split their
votes.
Also included in the politics area are the public works appropria
tions by province. These public works data are also directly economic
in nature, but they appear to be at least partially connected with
political promises or reward. Public works appropriations per capita
for 1960 and 1963-1965 are included.
Population - - Population rates of change and in-migration,and
out-migration statistics are of interest for their own sake. However,
it appears that a high influx of population is associated with crime
and that a high rate of economic growth ought to be associated with
a subsequent high rate of in-migration. Stagnant areas should show
high out-migration rates. A number of variables on population, popu~
lation density, population growth rate and in- and out-migration rates
are included.
Economics -- Of particular interest in our research is the inter
relation between economics and the other social topics. Is there arty
evidence to support the contention that high rates of social unrest -
crime and dissidence -- retard economic development or at least influ
ence its areal dis~ribution? What impact does economic growth have on
social stability?
Of course there is interest in what factors cause economic growth
in general. A number of economic indicators are included. Unfor
tunately, ' the data are not as good nor as contemporary as we would
like them to be. Modernization is indicated by the percent of labor
force in the "modern" sector. Such data are available for the 1930s,
1940s, and early 1960s. Percent of labor force unemployed is also
included.
Number of business establishments and the rate of change of these
establishments are included as indicators of economic development and
change.
Since the data go back to the 1930s when there were fewer pro
vinces in the Philippines than today, the latest province list could
-253-
not be used. Rather, the 1939 province list of 49 provinces was used
to define the units of observation. Data for provinces that were later
divided were added together in order to obtain a value for the province
as it was in 1939.

-254-
COMPOSITE FACTOR ANALYSIS
LIST OF VARIABLES
1 DSDN40*1
*2 TENC38
**3 TENC60
*4 SUG38
**5 SUG60
*6 COC038
**7 COC060
*8 WFRM38
9 ROAD32
**10 R0AD62
TITLE AND SOURCE
Dissidence index 1925-1940 taken from a variety ofsources on pre-war dissidence. Provinces ranked ona scale of 0-9
Percent of farms operated by other than full owners,19381938 Census of Agriculture, Table 2
Percent of farms operated by other than full owners,19601960 Census of Agriculture, Table 8-a
Percent of farmland planted to sugar, 19381938 Census of Agriculture, Table 29
Percent of farmland planted to sugar, 19601960 Census of Agr,iculture, Table 23
Percent of farmland planted to coconut, 19381938 Census of Agriculture, Tables 4 and 37
Percent of farmland planted to coconut, 19601960 Census of Agriculture, Table 3
Percent of all workers in farming or fishing, 19381938 Census of Population by provinces, Table 15
Kilometers of roads per 1000 hectares, 1932Statistical Handbook of the Philippines, 1932,p. 247
Kilometers of roads per 1000 hectares, 1962Philippine Economic Atlas, 1962, p. 90
lOne asterisk indicates a variable was included in the separate1938 factor analysis. Two asterisks indicate a variable was includedin the 1960 factor analysis. The 1960 factor analysis includes a fewmore ethnic variables than the composite one and a few more economicvariables. The 1938 and 1960 factor analyses include a few variablesnot in the composite one, because of the difficulty of obtaining representation of an activity for a given year. For example, for 1938 wehave to use percent of population under 10 as a proxy for one factor -migration.
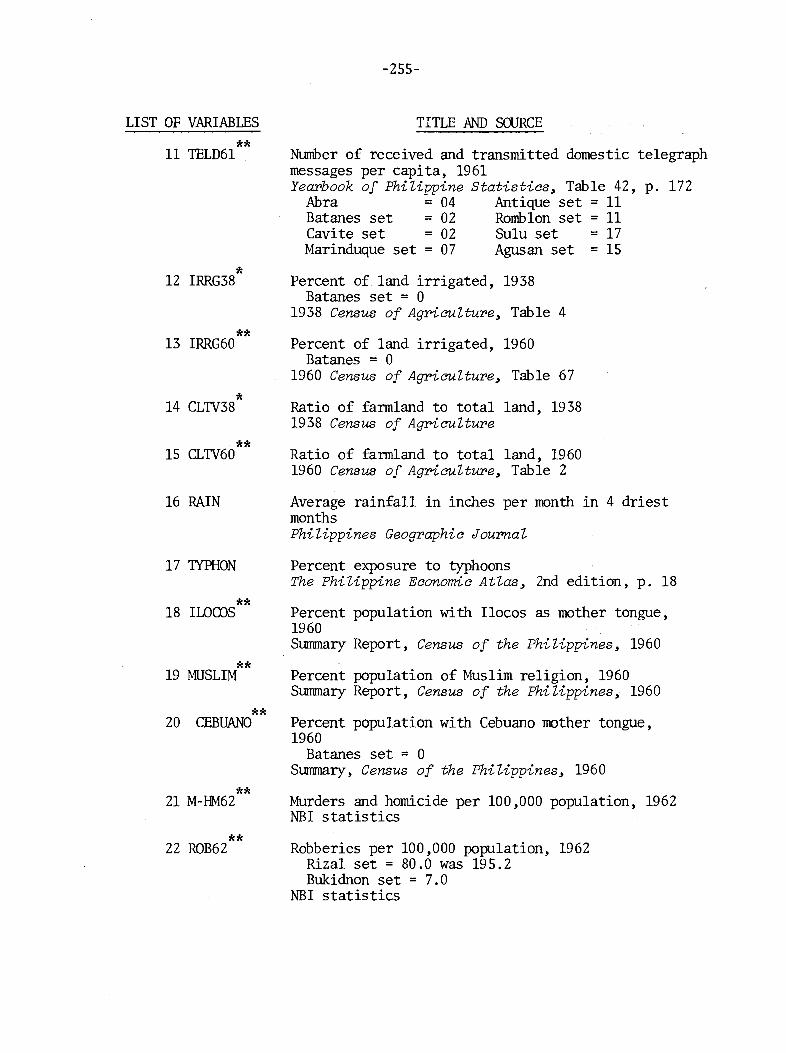
LIST OF VARIABLES
**11 TELD61
-255-
TITLE AND SOURCE
Number of received and transmitted domestic telegraphmessages per capita, 1961YeaPbook of Philippine Statistics~ Table 42, p. 172
Abra = 04 Antique set = 11Batanes set = 02 Romb1on set = 11Cavite set = 02 Su1u set = 17Marinduque set = 07 Agusan set = 15
*12 IRRG38 Percent of land irrigated, 1938Batanes set = 0
1938 Census of Agriculture~ Table 4
**13 IRRG60 Percent of land irrigated, 1960Batanes = 0
1960 Census of Agriculture~ Table 67
*14 CLTV38 Ratio of farmland to total land, 19381938 Census of Agriculture
**15 CLTV60 Ratio of farmland to total land, 19601960 Census of Agriculture~ Table 2
16 RAIN Average rainfall in inches per month in 4 driestmonilisPhilippines Geographic Journal
17 TYPHON Percent exposure to typhoonsThe Philippine Economic Atlas~ 2nd edition, p. 18
**18 ILOooS Percent population with I1ocos as mother tongue,1960Summary Report, Census of the Philippines~ 1960
**19 MUSLIM Percent population of Muslim religion, 1960Summary Report, Census of the Philippines~ 1960
**20 CEBUANO Percent population with Cebuano mother tongue,1960
Batanes set = 0Summary, Census of the Philippines~ 1960
**21 M-HM62 Murders and homicide per 100,000 population, 1962NBI statistics
**22 ROB62 Robberies per 100,000 population, 1962Riza1 set = 80.0 was 195.2Bukidnon set = 7.0
NBI statistics
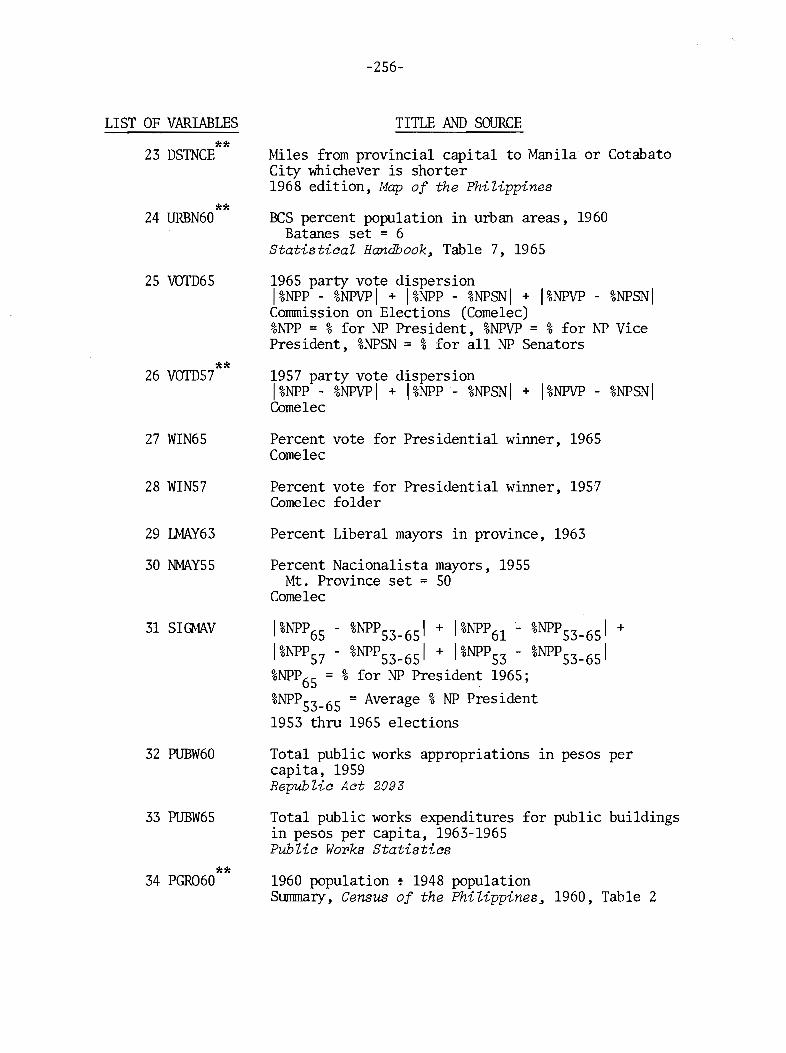
LIST OF VARIABLES
**23 DS1NCE
**24 URBN60
25 VOTD65
**26 VOTD57
27 WIN65
28 WIN57
29 LMAY63
30 NMAY55
31 SHNAV
32 PUBW60
33 PUBW65
**34 PGR060
-256-
TITLE AND SOURCE
Miles from provincial capital to Manila or CotabatoCity whichever is shorter1968 edition, Map of the Philippines
BCS percent population in urban areas, 1960Batanes set = 6
Statistical Handbook, Table 7, 1965
1965 party vote dispersionI%NPP - %NPVPI + I%NPP - %NPSNI + I%NPVP - %NPSNICommission on Elections (Comelec)%NPP = %for NP President, %NPVP = %for NP VicePresident, %NPSN = %for all NP Senators
1957 party vote dispersionI%NPP - %NPVPI + I%NPP - %NPSNI + I%NPVP - %NPSNIComelec
Percent vote for Presidential winner, 1965Comelec
Percent vote for Presidential winner, 1957Comelec folder
Percent Liberal mayors in province, 1963
Percent Nacionalista mayors, 1955Mt. Province set = 50
Comelec
I%NPP65 - %NPP53-65 I + I%NPP6l ~ %NPP53-65 I +
I%NPP57 - %NPP53-65 I + I%NPP53 - %NPP53-65 I%NPP65 = %for NP President 1965;
%NPP53-65 = Average %NP President
1953 thru 1965 elections
Total public works appropriations in pesos percapita, 1959Republic Act 2093
Total public works expenditures for public buildingsin pesos per capita, 1963-1965Public Wopks Statistics
1960 population ~ 1948 populationSummary, Census of the Philippines, 1960, Table 2

LIST OF VARIABLES
35 PGR048
*36 PGR038
37 RGR065
**38 RGR060
**39 OMIG60
**40 IMIG60
**41 GMIG60
42 UEMP65
*43 UNEMP38
**44 MORN6l
*45 MORN38
**46 RA0060
**47 TRAN60
-257-
TITLE AND SOURCE
1948 population ~ 1938 populationSurmnary, Census of the Phi lippines, 1960, Table 2
1938 population ~ 1918 populationSummary, Census of the Phi lippines, 1960, Tab Ie 2
Provincial revenues, 1965 ~ provincial revenues,1961Report of Auditor General
Provincial revenues, 1961 ~ provincial revenues,1955Report of GAO
Percent persons born in province not living inprovinceMigration Statistics, Census of the Philippines, 1960
Percent persons liying in province not born inprovinceMigration Statistics, Census of the Philippines, 1960
IMIG 1960 ~ OMIG 1960
Percent of work force illlemployed, 1965. Provinceswith missing values set as follows: 7 = 2.0;31 = 7.0; 48 = 6.0; 49 = 60BCS Reports
Percent of work force illlemployed, 19381938 Census of Population by provinces, Table 22
Percent of work force in modern sector, 1961Rizal set = 15.0, was 26.8
1961 Eaonomia Census
Percent of work force in modern sector, 19381938 Census of Population, Province Volumes, Table 15
Percent households with radiosRizal set = 30, was 51
1960 Census of Housing, Table 6
Percent of popUlation > 20 years of age in trans-portation, 1960 -Handbook of Philippine Statistias, 1960

-258-
LIST OF VARIABLES TITLE AND SOURCE
48 TRAN48 Percent of population> 20 years of age in trans-portation, 1948 -
Batanes set = 0.5Palawan set = 0.3Masbate set = 0.2
1948 Economic Census Report~ Table 22
*49 TRAN38 Percent of population> 20 years of age in trans-portation, 1938 -
Batanes set = .05Isabela set = Cagayan set = 0.2N. Vizcaya set = 0.1Bukidnon set = 0.1
1938 Economic Census Report
50 TRANGROWTH60 Percent of population ~ 20 years old working intransportation in 1960 ~ percent of population >20 years old working in transportation in 1948 Provinces Nos. 02, 09, 21, 32, 48, 50, set = 9.00
**51 ESTB6l Number of establishments per 1,000 capita in 1961BCS Economic Survey
52 VOTD65 1% NP President 65 - average %NP President 651Comelec
53 VOTD57 1% NP President 57 - average %NP President 571Comelec
*54 CRME34
**55 WIN6l
Number of criminal cases filed per 1000 capita, 1934(use '38 population)
Batanes set = 1.55From Governor General's Annual Report for 1934
Percent of vote for Presidential winner, 1961Comelec
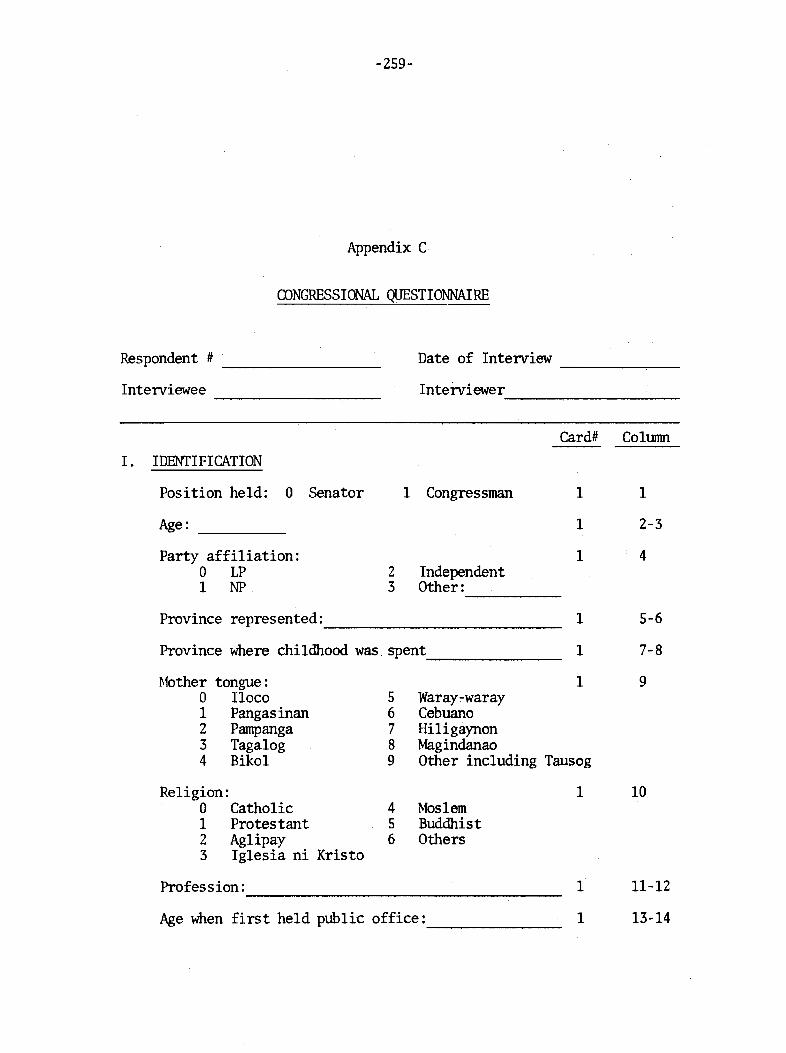
-259-
Appendix C
CONGRESSIONAL QUESTIONNAIRE
Respondent # Date of Interview
Interviewee Interviewer
Card# Co1lU11I1
1. IDENTIFICATION
Position held: 0 Senator 1 Congressman 1 1
Age: 1 2-3
Party affiliation: 1 40 LP 2 Independent1 NP 3 Other:
Province represented: 1 5-6
Province where childhood was. spent 1 7-8
Mother tongue: 1 90 Iloco 5 Waray-waray1 Pangasinan 6 Cebuano2 Pampanga 7 Hiligaynon3 Tagalog 8 Magindanao4 Biko1 9 Other including Tausog
Religion: 1 100 Catholic 4 Moslem1 Protestant 5 Buddhist2 Aglipay 6 Others3 Iglesia ni Kristo
Profession: 1 11-12
Age when first held public office: 1 13-14

-260-
Card# ColUlJll1
II.
Father's occupation: 1 15-16
1. What do you think is the most serious problemfacing the Philippines today? 1 17
2. What factors do you think detennine the vote of yourpeople? 1 18
3. How much should the government control privateindustry? 1 19
(5) much more (2) less--(4) more --(1) much less==(3) the same as now ==(0) don't .know;
no answer
4. What policies do you think would best advance thesocial and economic development of the Philippines? 1 20
4a. Do you have any specific economic policy in mind? 1 21(0) None---
4b. If so, under what circtIDlStances would youinitiate such measures?-----------
5. Why do you think politicians enter politics?
1
1
22
23
Sa. Do you personally and actually enjoy politics? 1 24(2) Yes
--(1) No(0) don't know; no answer
---
-261-
Card# Co1unm
Sb. Why/Why not? --------------- 1 25
6. If given a choice, do you think most congressmenwould prefer to engage in another profession? 1 26
(2) Yes(1) No(0) don't know; no answer
6a. (IF YES) What profession? 1 27-28
7. Generally speaking, how many among the members ofCongress are more interes~ed in specific programsthan in achieving status? 1 29
(3) most(2) some(1) few(0) don't know; no answer
7a. How many would you say are more interested inachieving status than in specific programs? 1 30
(3) most(2) some(1) few(0) don't know; no answer
8. What do you think of the present conditions lnCongress? 1 31
8a. What improvements can be made? 1 32
9. The press has often charged that politics is tooprevalent in the government's budget decisions. Whatis your reaction to this charge? 1 33
RDlARKS:
-263-
Appendix D
ESTIMATES OF NATIONAL INCOME
Introduction
IN CHAPTER 5 we argued that estimates of Philippine national income
and product are quite uncertain. Yet these estimates underlie evalua
tions of the performance of the economy, especially the evaluations of
foreigners. It is important, then, to have some idea of the sources
of the uncertainty and some estimates of the actual range of the un
certainty that surrounds the official numbers.
We will begin by examining the history of national income accounting
in the Philippines. This is essential because the national accounts
as they stand today respresent the outcome of years of controversy, of
criticism and adjustments to criticism. Following the discussion of
the history which has shaped the present estimates, we will try to
construct an estimate of the range within which Philippine GNP, if it
(X)ul,d be measured precisel,y, would probably lie. Finally, we will
examine national accounting procedures in general and argue that esti
mates of national income, particularly in an LOC, are inherently. 1uncertaIn.
The precursors of the present national income estimates were pre
pared in 1952 by William C. Abraham of the United Nations in collaboration
lFor an analysis of problems inherent in the interpretation ofeven perfectly estimated national income figures see Dan Usher, ThePrice Mechanism and the Meaning of National, Income Statistics, ClarendonPress, Oxford, 1968.
PREVIOUS PAGE BLANK
-264-
with the Department of Economic Research of the Central Bank. 1 The
underlying data were drawn basically from the 1948 Census of Population,
which gathered detailed information on wages and self-employment income
by industry.
The economic portions of the Census contained some serious flaws. 2
Because of confusion over the interpretation of a heading on the census
form, only monthly rather than monthly and annual income was obtained
from some households and had to be extrapolated to ~ annual figure.
Also, all unpaid family workers were arbitrarily assigned a wage income
of PI. 50 per day, and income in kind was lturrped with cash incomes, so
it is impossible to determine how completely this last item was measured.
These errors would probably cause some overstatement of the wage and
salary component of national income. The Census did not gather infor
mation on all types of income, so adjustments and imputations had to
be made for the unreported value of food consumed by farm workers and
farm .. families , income in kind received by domestic servants, and the
rental value of owner occupied homes. There was little outside infor-.
mation on which to base these imputations.
In addition to the problems inherent in the Census data, Abraham
cOITDllitted several gross errors, which resulted in the near total omis
sion of dividend and property income from the national income totals. 3
Also, he deducted transfer payments and foreign donations from the
Census income totals, although they were not included in the information
gathered by the Census.
Thus, the Abraham estimates for 1946-1951 should have been treated
with considerable reserve. Instead, they served as the benchmarks from
which the succeeding Central Bank estimates were extrapolated.
lWilliam C. Abraham, The National. Income of the Philippines andIts Distribution, United Nations Technical Assistance Program, NewYork, 1952. This paper was also presented as a doctoral dissertationto CollUTlbia University in 1953.
2See Clarence L. Barber, "National Income Estimates in thePhilippines," The Philippine Economic Journal., vol. 4, no. 1, 1965,pp. 66-77. This section draws heavily on Barber's article.
3Ibid., pp. 73-74.
-265-
In 1957, responsibility for national income estimation was trans
ferred to the NEC. The methods used, however, remained essentially the
same.
As late as 1964, although there had been a substantial increase in
the quantity and quality of basic data available, Emmanuel Levy found
that the NEC accounts were, for most sectors, simply extrapolations of
Abraham's 1948 data, and were, therefore, very likely misleading.
In practically all sectors value added is obtained,explicitly or implicitly, as the difference between thevalue of gross output and non~factor operating expenses.The estimates of gross output (other than agriculturaloutput) are themselves very rough. At the same time, nonfactor operating expenses are not estimated directly butare assumed to constitute fixed percentages of the valueof gross output in the various branches. The percentagesemployed are in almost all branches the same as thosedetermined for 1948 by W. C. Abraham.
In view of the deepening of production and thetechnological changes in production processes that haveoccurred since 1948, as also the differing trends of inputand output prices during the same period, there is everyreason to believe that the use of the 1948 percentagesDRlSt seriously distort the picture obtained of the absolute level of the total national income and value addedby branch, as also of the year to year changes and development over time. This is in addition, moreover, tothe wide margin of error implicit in the gross outputfigures to which the fixed cost ratios are applied. l
Public and private criticism of the national accounts became quite
sharp in the late 1950s and early 1960s. Ruben Trinidad, a statistician
with theNEC, demonstrated in a 1958 M.A. thesis and a 1960 Statistical
Reporter article that the gross domestic investment component of GNP
had been underestimated by about 40 percent. 2 Shortly thereafter, a
lEmmanuel Levy, Review of Economic Statistics in the Philippines,Interim Report, World Bank Resident Mission, Manila, May 1964, pp. 10-11(mimeo). See also Ramon B. Cardenas, A Re-estimation of the PhilippineNational Accounts, CY 1953-l966; A Description and Evaluation of the Altepnative Es timating Methodo logy, Unpublished M.A. Thes is; Cornell Univers i ty,Ithaca, June 1967, pp. 5-10 and Ch. II.
2Ruben F. Trinidad, An Inquiry into the Sources and Methods ofNational Income Accounting in the Philippines, unpublished M.A. thesis,
-266-
critique of the national'ac:counts by Clarence L. Barber, Senior Advisor
on NatioIlCll Income Statistics at the Statistical Center, UP, was cir
culated informally among government offices. l The modifications sug
gested by Trinidad and Barber, together with their criticisms, evidently
provided the basis for unsatisfactory negotiations over estimation
procedures between the Program Implementation Agency (PIA), BCS, and
NEC starting in 1963.
In 1963 and 1964 David Cole and Richard Hooley published studies
that supported Trinidad's position on investment estimates. 2 These
studies presented independent measures (based in part on survey and
financial data) that showed savings and investment to have been
higher than NEC had been saying they were. Also, an article by G. P.
Sicat argued that the consumption function and incremental capital
output ratios implicit in the NEC data were implausible. 3 The severest
blow of all fell when Emmanuel Levy's report was submitted to the Govern
ment of thePhilippines. 4 Levy had been charged with assisting "in an
examination of the adequacy of existing economic statistics in various
agencies of government in order to advise on and assist in the
University of the Philippines, Quezon City, August 1958, and "SomeProposed Improvements in the Estimation of Capital Formation in thePhilippines, " The Statistical Reporter, vol. 4, April 1960, pp. 28-40.
lThis is the same paper that was reprinted in the PhilippineEconomic Journal in 1965 cited above .
.2David Cole, Growth and Financing of Manufacturing in the Philippines,Quezon City, University of the Philippines, Institute of Economic Development and Research, 1963; and Richard W. Hooley, "A Critique ofCapitaLFormation Estimates in Asia with Special Reference to the Philip-
. pines," The Philippine Economic Journal, vol. 3, no. 2,1964, pp. 114129. See also Hooley, Saving in the Philippines, 1951-1960, QuezonCity, University of the Philippines, Institute of Economic Developmentand Research, 1963.
3Gerando P. Sicat, "On the Accuracy of the Philippine NationalAccounts, ,t Philippine Review of Business and Economics, October 1964.
4Levy , Review of Economic Statistics in the Philippines; this wasfor private circulation only, but quickly made its way into citationsin articles by Philippine economists. Parts of Levy's report were latersunnnarized in '''The Usefulness of Existing National Accounts for theAnalysis of the PhiLippine Economy, II The Philippine Economic Journal,vol. 5, no. 1, 1966, pp. 134-135.
-267-
preparation and introduction of statistics necessary to serve as measures
of economic performance and as guides for policy and planning. ,,1 His
report was, in fact, a quasi-official and highly prestigious evaluation
of most major Philippine statistical series. The national accounting
branch of NEC came off badly.2 Le\~ judged the accounts 'to be so in
accurate (both in level and annual changes) as to be useless "for most
purposes of analysis and projection. ,,3
NEC did finally undertake revisions, which were released in June
1967 accompanied by an explanation that the new series "incorporate
improvements in sources and methods of estimation covering more than
half of the total of national income. ,,4 In view of the claim that this
was a substantially new series, the results are quite remarkable: As
Table D-l shows, there were very large shifts in some components of
GNP, but the totals shifted only trivially in the new accounts. Either
this is great good luck or the old GNP figure was used as a control
total to which the new components were adjusted. If the old figure
was used as a control, then the new totals are no more reliable than
the previous estimates. (Table D-l presents only the comparison for
1962. The result is the same for subsequent years.) In fact, the
revisions did fail to satisfy critics. Business Day reported "A con
troversy of sorts, in fact, appears to loom over the revised GNP esti
mates. There still remains some amount of professional dissatisfaction
with the present methods of computing the national income and Presidential
Economic Staff Deputy Director General Cesar Virata has been quoted
as saying that GNP figures, even now, may still be understated by asmuch as 10 percent. ,,5 '
lIbid., p. l.
2Cf• the quotation on p. 265 above.
31evy , Review of Economic Statistics in the Philippines, p. 7.
4''Technical Notes to the 1966 Overall Revision of the NationalAccounts of the Philippines, CY 1962-1966," The Statistical Reporter,vol. 11, no. 2, April-June, 1967, pp. 34-36.
5Busines8 Day, vol. 1, no. 18, June 26, 1967, p. 6.
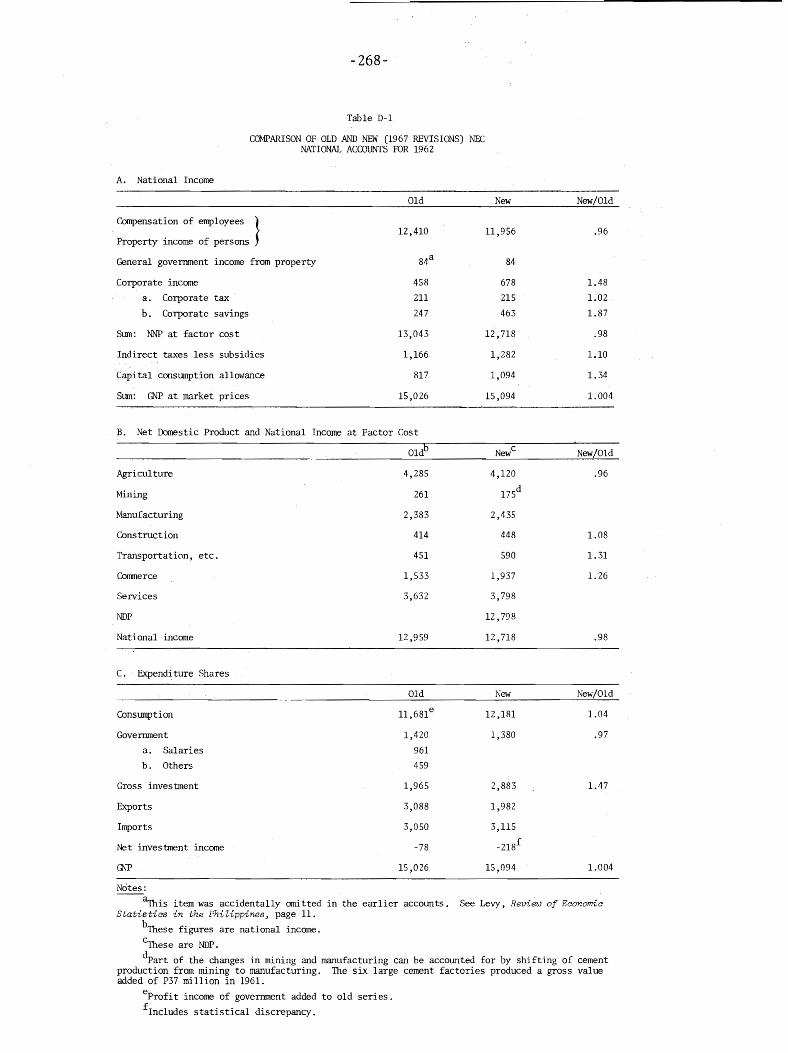
-268-
Table D-1
COMPARISON OF .OLD AND NEW (1967 REVISIONS) NECNATIONAL ACCOUNfS FOR 1962
A. National Income
Old New
Compensation of employees } 12,410 11,956Property income of persons
General government income from property 84a 84
Corporate income 458 678
a. Corporate tax 211 215
b. Corporate savings 247 463
Stml: NNP at factor cost 13,043 12,718
Indirect taxes less subsidies 1,166 1,282
Capital constmlption allowance 817 1,094
Stml: GNP at market prices 15,026 15,094
New/Old
.96
1.48
1.02
1.87
.98
1.10
1.34
1.004
B. Net Domestic Product and National Income at Factor Cost
New/Old
Agriculture
Mining
Manufacturing
Construction
Transportation, etc.
Commerce
Services
NDP
National income
C. Expenditure· Shares
Constmlption
Government
a. Salaries
b. Others
Gross investment
Exports
Imports
Net investment income
4,285
261
2,383
414
451
1,533
3,632
12,959
Old
1,420
961
459
1,965
3,088
3,050
-78
15,026
4,120
l75d
2,435
448
590
1,937
3,798
12,798
12,718
New
12,181
1,380
2,883
1,982
3,115
-218 f
15,094
.96
1.08
1.31
1. 26
.98
New/Old
1.04
.97
1.47
1.004
Notes:
~is item was accidentally ami tted in the earlier accounts. See Levy, Review of EconomicStatistics in the Philippines, page 11.
bThese figures are national income.
~ese are NDP.
dpart of the changes in IDlnlng and manufacturing can be accounted for by shifting of cementproduction from mining to manufacturing. The six large cement factories produced a gross valueadded of P37 million in 1961.
eprofit income of government added to old series.
fInc1udes statistical discrepancy.
-269-
As it turned out, all this was only a prelude to a bitter and
open battle between BCS and NEC over the two agencies' input-output
tables. In October 1967, NEC released a pre-printing edition of its
input-output table for 1961. 1 In view of the criticisms of the
national accounts that had been accumulating -- most of which sug
gested that the estimates were on the low side -- the GNP implicit in
the table was quite startling: It showed 1961 GNP as only P12, 726
million, more than 5 percent below the previous official figure for
that year. In March 1968 a joint UP-BCS group, which had been con
currently preparing another 1961 table, released their findings. 2 This
input-output table showed a 1961 GNP of P16,846 million, 25 percent
above the national income accounts and more than 32 percent above the
NEC input-output table. Furthermore, the UP-BCS table showed a very
different distribution of output by industry and by expenditure shares
(see Table D-2).
Bernardo G. Bantegui, Director of the Office of Statistical Coor
dination and Standards (OSCAS) , reacted sharply with an article in the
Philippines Herald. 3 Bantegui argued that (1) the size of the UP-BCS
agricultural sector and the proportion of GNP going to investment were
inconsistent with the country's level of development; (2) the size of
the service sector and the rate of profit in the financial sector shown
in the BCS matrix were probably due to double counting; (3) the UP-BCS
treatment of competitive imports might lead to unstable coefficients;
and (4) that NEC was doing a good job and such "ad hoc pilot studies"
should not be used "to hann the established orderly system of statistics
which economists, bankers and businessmen could use with continuing
confidence."
lStatistical Research and Development Project, OSCAS , NEC, 1961Philippine Interindustry Relations (Input-Output) Table~ Manila,October 1967, mimeo.
~niversity of the Philippines School of Economics, and Bureau ofthe Census and Statistics, Inter-industry Relations Study of the Philippine Economy - Partial Report~ ~lanila, March 1968, mimeo. The tablewas later re-printed in The Journal of Philippine Statistics~ vol. 19,no. 1, January-March 1968.
3June 19, 1968, p. 20.

-270-
Table D-2
COMPARISON OF BCS INPUT -OUTPUT TABLE WIlli NATIONAL ACCOUNfSAND NEC INPUT -OUTPUT
NECa
NationalNEC I-ObBCS 1-0 Accounts
Agricu1ture 1,943 3,858 3,683
Mining 80 209 125
Manufacturing 3,984 2,090 2,288
Construction 102 432 365
Trade, finance, real estate 5,337 1,410 2,203
Transport, communication 1,032 418 1,966
National income (at factor cos t) 14,590 11,737 10,958
Private consumption 12,048 10,811 11 ,129
Government current expenditure 1,529 1,223 1,088
Gross domestic investment 3,594 1,800 2,623
Exports 1,332 2,347 1,176
Less imports 1,657 2,749c 3,290
Gross national expenditure 16,846 13,432 12,726
Notes:
~is is the first version of the NEC table.
bThe national accounts before the 1968 revisions.
cInc1udes net investment income.
-271-
Business Day carried articles and pained editorials on the conflict
for two weeks, complaining that "along the business cocktail circuit,
the joke now goes: 'You don't like the figures you get, go to anotheroffice. ,,,1
In August, Tito A. Mijares, Director of the UP-BCS project, counter
attacked in a seminar given at the University of the Philippines and an
accompanying discussion paper. 2 Mijares argued that, because NEC had
used purchasers' rather than producers' prices, a good deal of activity
that shoUld have been in transport and trade had been allocated to other
sectors. 3 Furthermore, this pricing scheme is likely to yield unstable
coefficients and is, therefore, not used by other countries. As a
rebuttal to Bantegui's Philippines Herald articles, Mijares and Valdapenas
presented lists of developing countries with low proportions of GNP gener
ated in agricUlture and high rates of capital formation, then attacked
NEC for introducing both an "tmallocated" sector and a "statistical dis
crepancy" and for building a table with 60 percent of the cells blank.
Finally, they noted that the NEC "input-output table and GNP accounts
have remarkably the same distribution of the origin of national income,"
and argued that "there remains the possibility that the NEC statisticians
were 'influenced' congenitally by the figures they have been building
into their GNP accounts since 1957, ,,4 in other words, the NEC table was
not a new, independent estimate and therefore did not offer an improved
estimate of GNP.
lSee Jess Estanislao, "Divergent Estimates," Business Day~ vol. 2,no. 17, June 13, 1968, p. 12; "A Contradiction in Figures," ibid. ~ vol. 2,no. 19, June 20, 1968, p. 8, and editorial, "A Statistical Joke," sameissue, p. 10.
2Tito A. Mijares and Vicente B. Valdapenas, Jr., An Inter-IndustryStudy of the 1961 Philippine Eeonomy~ University of the Philippines Institute. of Economic Development and Research, Quezon City, August 1968, Discussion paperNo. 68-25, pp. 100-103. See Hollis B. Chenery and Paul G.Clark, Inter-Industry Eeonomies~ John Wiley &Sons, Inc., New York, 1959,p. 141, for an explanation of the difference between the two pricingschemes.
~ijares and Valdapenas, pp. 113-115.
4Ibid.~ pp. 104, 108.
-272-
But Mijares and ValdapeIlas were aiming at a moving target. In
September, NEC released the final vers ion of their table, both in pro~
ducers' and purchasers' prices. 1 Although the accompanying article
makes no rrention of the fact, NEC had eliminated two serious errors
and made a number of minor adjustments to the first version of the
table. The two serious mistakes corrected were the previous omission
of value added to imports by the domestic trade sector (P600 million)
and failure to enter P80 million or so of exports of services. 2
Minor adjustments were made to nearly all sectors. The net effect
of these changes raised the implicit GNP to P13,248 million, a figure
almost identical to the old estimate of GNP for 1961, P13,432 million.
The article accompanying the table did not mention the UP-BCS
versus OSCAS controversy. However, OSCAS did release a paper by
Bantegui, comparing the two tables and pointing out several errors in
the UP-BCS version. 3 This paper consists mainly of an elaboration of
points made in Bantegui's earlier statements to the Philippines HeraZd.
There is, however, one good new point: The UP- BCS table is fundamen
tally flawed because the numbers in the investment column do not repre
sent outputs of investment goods by the row industry but rather each
industry's investment, that is to say, the cell in the investment column,
food manufacturing row, corresponds to new canneries, say, rather than
to canned frui t marching off into fixed capital fonnation. Thus the
UP-BCS matrix does not represent the usual set of balance equations
for each industry, and a fortiori, its inverse can not be used to solve
l"The 1961 Inte~industry(Input"'Output) Accounts of the Philippines ,"The Statistical Reporter, vol. 12, no. 3, July-September 1968, pp. 1-16.
Zwe think these two errors were due to the peculiarities of accountingin purchasers' prices. In a purchasers' price system, imports would bevalued at the prices actually paid by final users. If the import sectorwere to be treated like any other sector, the trade and transport markupswould have to be entered as purchases by the import sector from the tradeand transport sector. But there is no cell corresponding to such atransaction since the import sector is not assigned a row. Since therewas no obvious place to put the number, it was forgotten. Much the samething happened to exports of finance and insurance services.
3B. G. Bantegui, "A Comparison between theNEC and UP-BCS InputOUtput Tables," Statistical Reporter (forthcoming).
-273-
for interindustry demands corresponding to some level of output. In
the seminar mentioned earlier, Mijares admitted that this was so, but
argued that with the data available it would have been impossible to
allocate investment in the conventional way. (How did NEC do it?) He
pointed out, however, and quite rightly, that this allocation problem
should have had no effect on the total GNP estimate.
These events would seem to have clarified the GNP problem consid
erably. NEC produced an input-output table, containing no obvious errors,
and consistent with the GNP series. Perhaps the errors for which OSCAS
was flayed really had cancelled in the past, yielding a GNP very close
to the true level. Perhaps NEC was right all along.
Not so. After basking in this triumph for only a few weeks, NEC
released yet another overall revision of the national accounts. l In
this newest set of accounts, 1961 GNP is given as P14,209 million,
nearly PI billion above the input-output estimate. Comparable changes
are made for other years. Examination of the detailed tables, however,
indicates that most of the changes in total GNP come from very large
changes in private consumption, offset somewhat by increases in the
statistical discrepancy. (See Table D-3.)
The Range of Plausible GNP Estimates
By now it should be obvious that the best we can do is define some
range within which Philippine GNP, if it could be measured precisely,
would probably lie. We will define this range by first trying to define
the plausible maximum and minimum for a base year (in this case 1961),
then extrapolating that range at the maximum and minimum defensible
rates.
The two input-output tables for 1961 bracket the current range
of national income estimates for that year. They lie IOOre than P3.5
billion apart, though. Is it possible to narrow this range? Table D-4
IThe National Accounts of the Philippines with Supporting andAnalysis Tables, CY 1946 to 1967, Office of Statistical Coordinationand Standards, National Economic Council, August 30, 1968, mimeo.

-274-
Table D-3
CO~PARISON OF NATIONAL ACCOUNTS STATISTICSa
1962 1963 1964 1965 1966 1967
1. Personalconsumption 11 ,898 12,814 13,444
12,181 12,973 13,810 14,694 15,63212,286 13,737 15,525 16,582 18,080 19,802
2. Governmentconsumption 1,427 1,677 1,934
1,380 1,637 1,829 1,986 2,1631,380 1,637 1,829 1,974 2,189 2,414
3. Gross domesticcapital forma- 1,888 2,272 3,073tion 2,884 3,501 4,303 4,474 4,562
3,082 3,767 4,426 4,658 5,005 5,514
4. Exports 2,641 3,437 3,9471,982 2,894 3,073 3,691 4,7681,982 2,894 3,073 3,691 4,584 4,506
5. Imports 2,817 2,987 3,6373,115 2,987 3,651 3,902 4,1713,115 2,987 3,651 3,902 4,161 5,216
6. Gross domesticproductb
15,312 18,018 19,364 20,943 22,95415,615 19,048 21,202 23,003 25,697 27,020
7. Net factor incomefrom abroad and -65 -68 -60statistical -218 -546 -489 -498 -616discrepancies +106 -913 -1,743 -1,933 -2,451 -1,595
8. Gross nationalproduct 14,972 17,145 18,701
15,094 17,472 18,875 20,445 22,33815,721 18,135 19,459 21 ,070 23,246 25,425
Notes:
aIn each group of three figures, the top number is the NEC estimate ofJune 1965; the middle number is from the June 1967 overall revis ion; thebottom number is from the August 1968 overall revision.
b in earliest series.GDP not presented
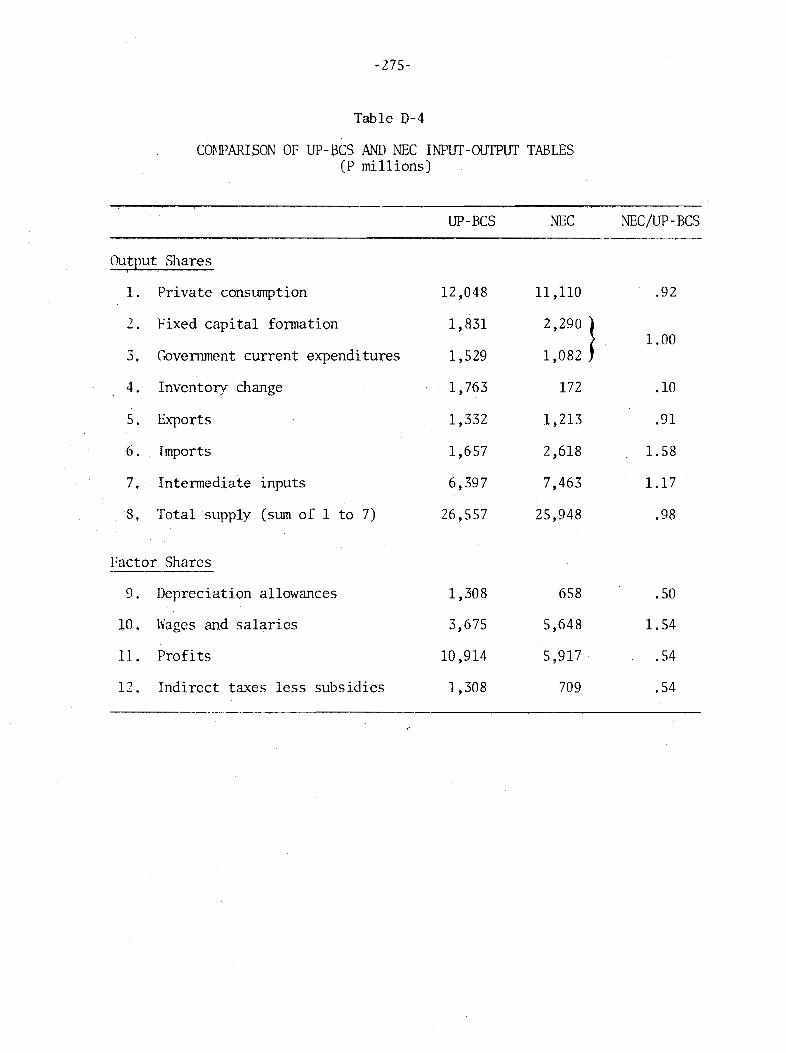
-275-
Table D-4
CO~IPARISON OF UP-BCS AND NEC INPUf-OTJfPlIT TABLES(P mi 11ions )
UP-BCS NEC NEC/UP-BCS
Output Sharesi
1. Private consumption 12,048 11,110 .92
2. Fixed capital formation 1,831 2,290 }1.00
3, Government current expenditures 1,529 1,082
4. Inventory d1ange 1,763 172 .10
5. Exports 1,332 1,213 .91
6. Imports 1,657 2,618 1. 58
7•. Intermediate inputs 6,397 7,463 1.17
8, Total supply (sum of 1 to 7) 26,557 25,948 .98
Factor Shares
9. Depreciation allowances 1,308 658 .50
10. Wages and salaries 3,675 5,648 1. 54
11. Profits 10,914 5,917 .54
12. Indirect taxes less subsidies 1,308 709 .54
-2'76-
suggests that the differences between the two input-output matrixes
are not as marked, as the differences in implicit GNPs would indicate.
If fixed capital formation and government current expenditures are
combined, the totals are nearly identical in the two tables. This
indicates that the differences in the components may be due to problems
in allocating government expenditures to current or capital account.
Inventory change is very different in the two tables. This· is
due to both understatement by NEC and a definitional error in theUP-BCS
table. The NEC figure is clearly low. A survey of 250 mining and manu
facturing corporations showed their expenditures or inventories to be
P42l million in 1961. 1 The 1961 Economic Census showed an additional
P83 million in other sectors. This would give a total of around P50Q
million if the net inventory accumulation of the rest of the economy
were zero. The UP-BCS table, on the other hand, shows P749 million
of inventory accumulation from agriculture, 20 percent of this sector's
total output. When challenged on this improbable magnitude, Mij ares
answered in a fashion that indicated that what had been measured was
the leve l rather than the change of agricultural inventories so this
may be a spurious munber.
The last major difference on the output side is in the level of
imports and exports. Here the difference is one of valuation. In
1961 the Philippines was in the middle of devaluing and decontrolling
foreign exchange transactions. Because of changing regulations at
least eight separates rates, ranging from P2.00 to P3.45 per dollar
prevailed during 1961. 2 It appears that BCS used a unitary rate of
P2.00 per dollar -- the rate implicit in the statistical procedures of
the foreign trade branch of the Bureau. The NEC, on the other hand,
lSee R. W. Hooley, '~ Critique of Capital Formation Estimates inAsia with Special Reference to the Philippines," The PhilippineEconomic Journal, vol. 3, no. 2, 1964, pp. 118.
2See the account of decontrol in Robert F. Emery, "The Successful Philippine Decontrol and Devaluation," Asian SUY'Vey, vol. 3, no. 6,June 1963, pp. 274-284.
-277-
must have applied the prevailing split rates, which means valuing imports1at around P3.00 per dollar, exports at about P2.00.
The impact on GNP of us ing the split rather than the unitary rate
can be quite substantial and there are no established conventions for
dealing with the problem; using the real rates for imports and exports
as· they are split, drift upward at differen.t times, and are then. re":unifiec
at a higher level will cause GNP to move erratically and will imply the
addition of a fictitious net capital inflow or outflow to the national
accounts which does not correspond to any magnitud~ in the dollar balance
of payments.
This difference in exchange rate conventions accounts for about P745
million of the gap between the two tables.
Looking only at the output side, we can make the minimum adjust
ments suggested by the preceding discussion (see Table D-5). These
two adjustments reduce the GNP gap substantially. But in order to
fully justify thus reducing the UP-BCS output estimate, we have to
find a doubtful number in one of their factor payment rows. There are
two obvious candidates: depreciation and indirect taxes less subsidies.
The UP-BCSdepreciation figure seems thoroughly implausible, especially
so since half of the total (P66l million) is attributed to the trans
port services sector, implying enormous disinvestment. This munber
remains a mystery, but it seems safe to argue that it is too large.
The same is true of indirect taxes less subsidies. If we could get
access to the raw data and estimating procedures these two items could
probably be reduced nearly enough to restore equality between output
and factor payments at a lower level of GNP.
Figure D-l shows our candidate for the likely range of GNP esti
mates. The range we have just derived for 1961 is used as the base.
The lowest curve projects this level year by year at the growth rate
shown in the latest official set of GNP accounts. The highest curve
is based on the 1961 and 1965 Surveys of Family Income and Expenditure,
lOddly enough, this obvious point has never been mentioned in theNEC-BCS controversy.

-278-
Table D-5
A PARTIAL RECONCILIATION OF TI-IE 1961INPUT-OUTPUT TABLES
NEC UP-BCS
Original GNP 13,248 16,845
Correction for inventories +328 -749
13,576 16,096
Change to split exchangerate ° -745
13,576 15,351
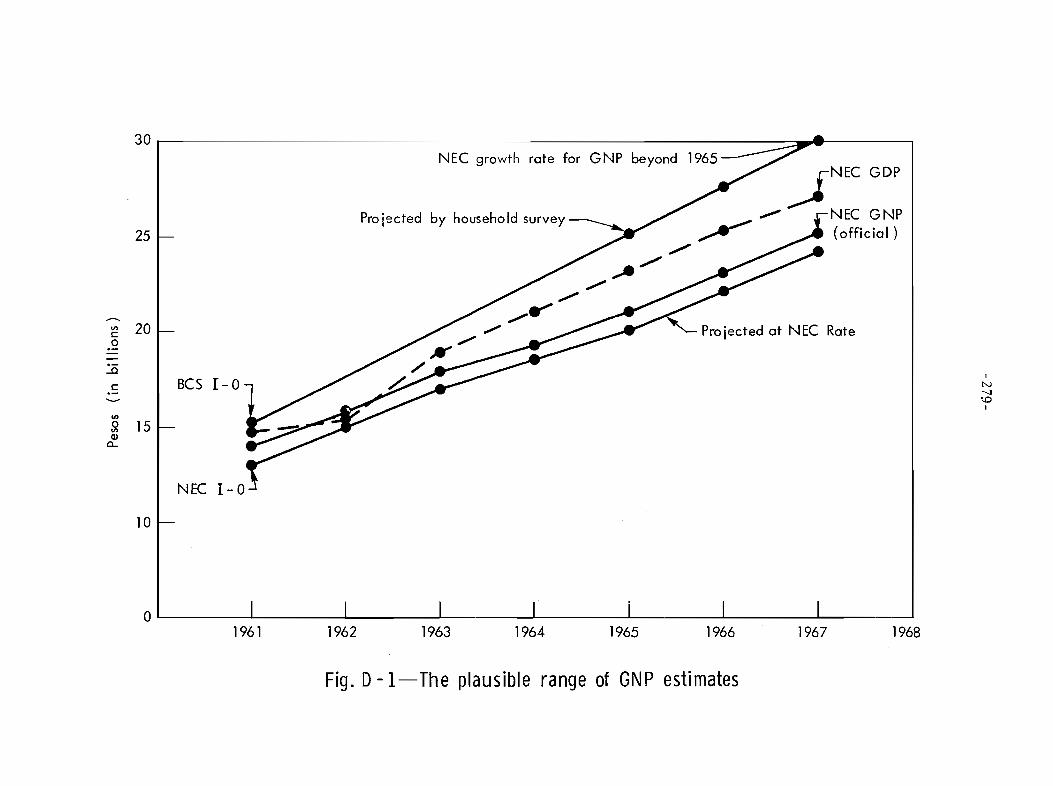
30 r--------------------------------....,...w----------,
NEC growth rate for GNP beyond 1965
Pro ieeted by household survey~25
v> 20 '- Projected at NEC Ratec0
.:.aBCS 1-0
1
C N---J'-0
I
on0 15v>Q)
c...
NEC 1- 0
10
OL..--------l- -l.- ----1 .....L- .L...- ---l.. ....L- ---!
1961 1962 1963 1964 1965 1966 1967 1968
Fig. D-I-The plausible range of GNP estimates
-280-
taken in conjunction with the labor force surveys of May of those years.
The surveys showed an average annual rate of growth of 13 percent for
family income. In principle, we would expect family income to be a
decZining fraction of national income in the course of development
since it effectively excludes income from interest and dividends. So
we can argue "that projecting at this rate is conservative. The two
internal lines are taken from the current official statistics; Gross
Domestic Product incZudes the statistical discrepancy. Since there is
no reason to suppose that estimates from the output side are more
accurate than estimates from the expenditure side, NEC's conventional
treatment of this item as error in the expenditure side is simply
arbitrary .
The Random Character of GNP Estimates
Is there any lesson to be drawn from the history of Philippine
national accounts? Some of the disagreements can be resolved or their
range narrowed, as we have seen. With more time and effort, perhaps
the ranges could be narrowed a bit further. But the controversies appear
to grow around hard, irreducible kernels, which are products of the very
nature of national accounting in the Philippines.
National income is, because of the way it must be measured, a
random variable. That is to be taken in the strictest sense: Repeated
independent "trials" by different but equally "competent" groups, work
ing with the same data, would prodl 1ce a distribution of estimates with
some non-trivial variance. These "trials" can be viewed as branching
trees with many nodes: Each node represents some arguable decision;
reasonable men could disagree over the proper value to choose or the
best method to adopt.
An example will clarify this notion. Figure D-2 shows, in outline,
how one small part of Philippine GNP was estimated circa 1964, in this
case NDP in production of palay (rough rice). The basic data come from
the Crop and Livestock Surveys of the Bureau of Agricultural Economics.
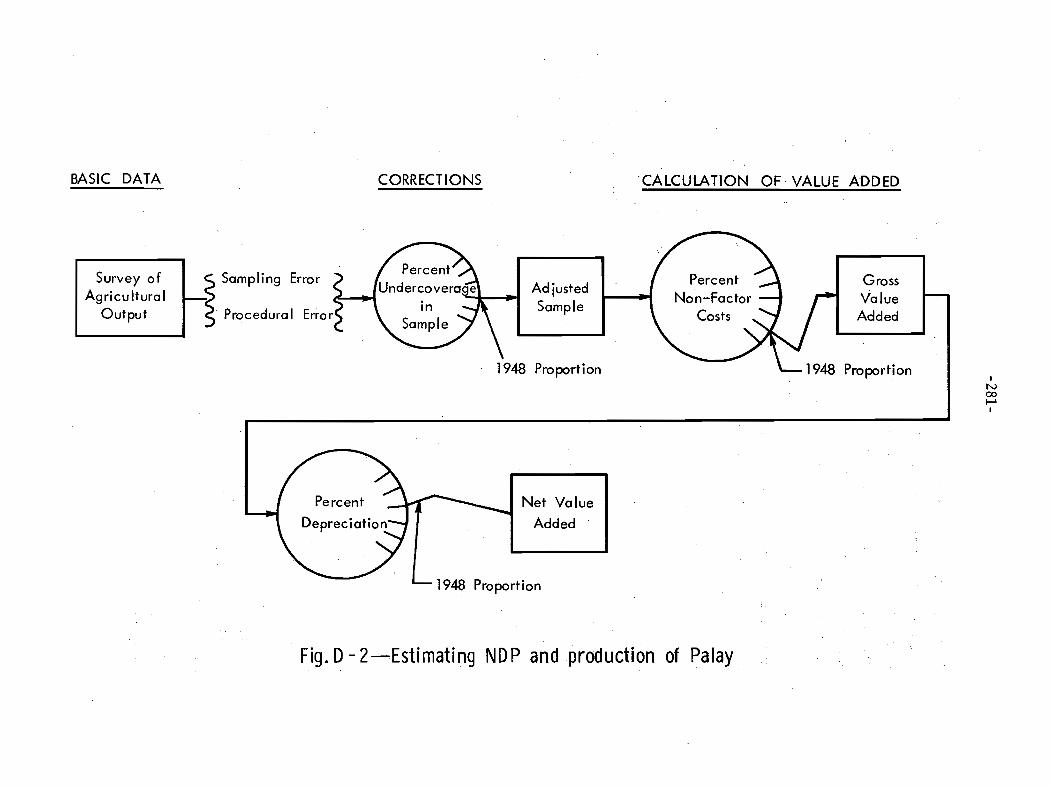
BASIC DATA
Survey ofAgricultural
Output
~ Sampling Error
"""-3 Procedura I Error
CORRECTIONS
AdjustedSample
1948 Proportion
Net Value
Added
1948 Proportion
CALCULATION OF· VALUE ADDED
GrossValueAdded
1948 ProportionI
N00......
I
. Fig. D- 2-Estimating ND P and production of Palay
-282-
Naturally, these contain some sampling error. Also, since the Bureau
samples only farms 3 some output on plots that do not qualify as farms
is omitted. There is, of course, also some danger that the sampling
and calculations are not done properly. How Imlch shall we inflate the
sample estimate to correct for these errors? The circle, "percent
mdercoverage in sample," represents that decision.
The mdercoverage adjustment yields a value of gross output. How
Imlch of this should be attributed to non-factor costs? There is no
current infonnation, only the ratio found in the 1948 Census of Agri
culture. But obviously this proportion will be affected by the weather,
by changing technology and cropping patterns, and so on. HowImlch?
Given that we have made some decision on non-factor costs,. we
still have to subtract depreciation on farm buildings and equipment
to get net value added. Depreciation of farm capital has never been
measured; the last time the stock of capital was evaluated was in the
1948 Census. Some extrapolation to the present may be available, but
it must be rather chancy.: And what percentage of it should be taken
as depreciation?
At each of these nodes, some choice other than the 1948 propor
tion was pqssible. 'And a complete set of national income accounts
IIllist contain thousands of such nodes. 1 If there is nomiquely ''best''
path on which everyone could agree unambiguously, then GNP Imlst be a
random variable in the sense described.,.
The quality and quantity of basic data available define the range
of choices that can be deemed reasonable at each node. The less com
plete the data, the more errors they contain; the older they are, the
greater the scope for differing opinions and treatment. Only a fraction
of the data required for GNP estimates are gathered in anyone year in
the Philippines, even in census years. The variance of independent
"trials" on Philippine GNP should be correspondingly large. Even worse,
many relevant magnitudes have never been measured at all: a comparison
1As do, in tum, the survey and census data underlying the
accounts.
-283-
of Economic Census data with labor force sunrey data will demonstrate
this.
Table D-6 shows employment by industry for 1960 and 1961 reported
from three separate sources: The Population Census of 1960, the Economic
Census of 1961, and the PSSH of May 1961. The differences are striking.
They are also fairly easy to explore: The PSSH and Population Census
are both built around the household as the unit of enumeration and
sampling. Thus, they capture the entire non-institutional population.
The Economic Census draws from the universe of business establishments.
The Economic Census is thus likely to overlook activities that are not
associated with particular, fixed locations, that do not require muni
cipal licenses, do not pay business taxes, and the like. Obviously a
great deal of economic activity is carried on outside census establish~
ments. Obviously, too, there are some less serious inconsistencies
between the PSSH and the Population Census, although we must make some
allowance for sampling error in the Sunrey.
HOWTIRlch do these "omitted" workers contribute to value added?1It has never really been measured. The only really frank accoupt of
output as "unorganized" manufacturing has been imputed in a set of .
Philippine national accounts in Cardenas' thesis. 2 The assumptions
required are, of course, heroic. And the GNP total is quite sensitive
to small differences in the value added per worker that we happen to
assume, since nearly 2 million workers fall in this unmeasured group.
Annual Changes in GNP
Granting that the absolute level of GNP may be very uncertain,
it is still possible that year-to-year changes in the official
accounts may mirror changes in the economy rather faithfully. If
so, this may be sufficient for policymaking. What we want, after
lExcept for "household industries."
2See Cardenas, A He-estimation of the Philippine National Accounts ... ~pp. 47-54.
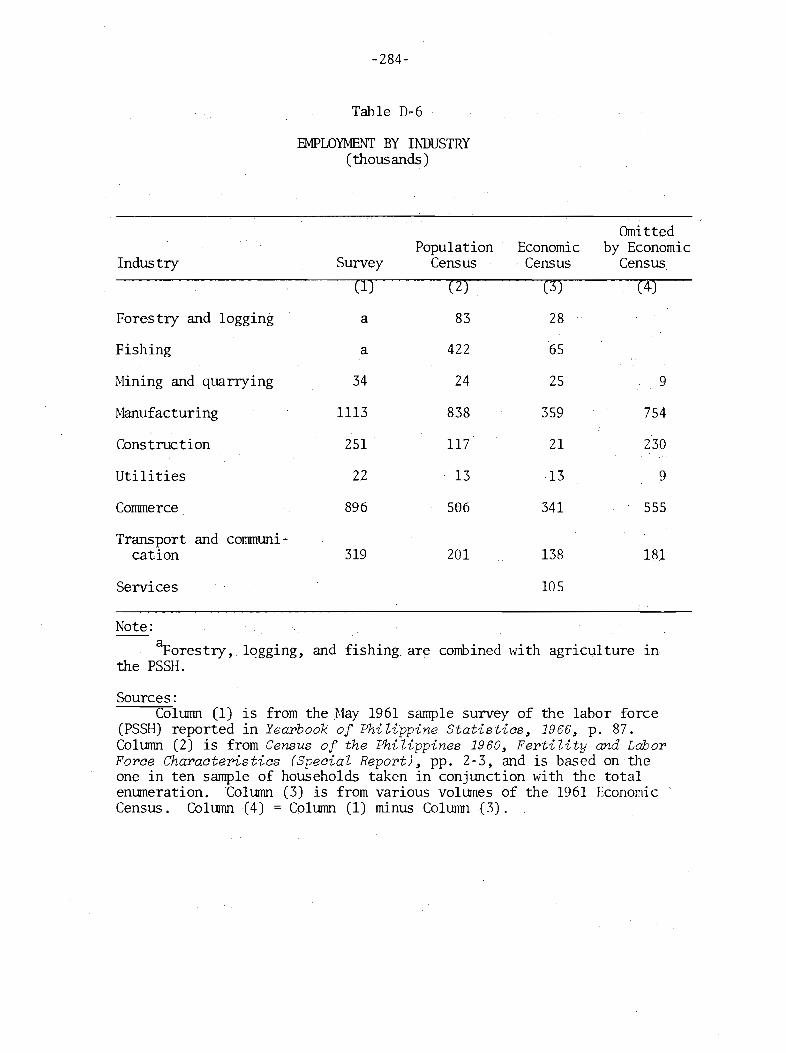
-284-
Table D-6
EMPLOYMENT BY INDUSTRY(thousands )
OmittedPopulation Economic by Economic
Industry Survey Census . Census Census
(1) (2) (3) (4)
Forestry and logging a 83 28
Fishing a 422 65
Mining and quarrying 34 24 25 9
Manufacturing 1113 838 359 754
Construction 251 117 21 230
Utilities 22 13 ·13 9
Corrnnerce 896 506 341 555
Transport and corrnnuni-cation 319 201 138 181
Services 105
Note:
~orestry, logging, and fishing are combined with agriculture lnthe PSSH.
Sources:Column (1) is from the Hay 1961 sample survey of the labor force
(PSSH) reported in Yearbook of Philippine Statistics~ 1966~ p. 87.Column (2) is from Census of the Philippines 1960~ Fertility and LaborForce Characteristics (Special Report)~ pp. 2-3, and is based on theone in ten sample of households taken in conjunction with the totalenumeration. Column (3) is from various volLnnes of the 1961 EconomicCensus. Column (4) = Column (1) minus ColWTIl1 (3).
-285-
all, is just some check -- a crude check will do -- on whether things
are going well or badly overall.
The argument that year-to-year changes might be sufficiently
accurate becomes a little clearer when viewed in terms of the branching
tree: Successive estimates in a consistent series move dawn the same
path through the tree, repeating the same choices. Since economic time
series tend to be highly correlated and to move rather sluggishly on the
whole, we may get a better estimate of annual changes by telling our
statistician, "Do the same things you did last year, even the things
you suspect might have been mistakes" rather than, "Here are the data.
Forget everything that's ever been done before. Just give me the best
possible estimate of GNP."
Do these arguments apply to the Philippine accounts? Probably so -
with three reservations: (1) the use of constant value added ratios in
agriculture damps out some of the impact of very good or very bad crop
. years; (2) NEC' s treatment of the split exchange rate introduces some
noise into annual changes between 1961 and 1965; (3) movements of the
statistical discrepancy are truly awesome in recent years. If we watch
out for these quirks, we probably will not be misled into saying a good
year was very bad and vice versa.
Can we expect better accounts? Undoubtedly some scope remains for
improving the national income acc01.mts, but not a great deal. It is
tnl.likely that the data on which Philippine GNP estimates must be based
are any more accurate than the data Kuznets used in his early estimates
of U.S. national accounts. Combining expert opinion on the possible
errors in the U.S. data, Kuznets produced a range of ± 20 percent in GNP,
which he then reduced to "an average margin of error" of ± 10 percent or
so on the assumption ·that some of the errors would be offsetting. 1 The
band we have shown in Figure D-l corresponds to a range of about ± 11
percent in 1967. Can we expect to improve Imlch on that? It would be
lSimon Kuznets, National Income and Its Composition, National Bureauof Economic Research, vol. II, ch. 12, 1942.

-286-
easy and cheap to give the appearance of URIch greater precision by
persuading the statisticians to agree on their assumptions, but that
is not the same as resolving the lUlderlying lUlcertainties. National
income accolUlts.are just inherently uncertain.
-287-
Appendix E
INTERVIEWS OF ECONOMISTS
A SHORT, CLOSED-FORM INTERVIEW was administered to 18 economists,
bankers, and businessmen in May 1968. The questionnaire was aimed
at three points: (1) How those interviewed think the economy would
respond to the manipulation of various instruments of government
policy; (2) What infonnation they use now and would like to have;
(3) Whether or not their view of major problems facing the Philippines
is similar to the views of the Pegasus respondents.
The sample was broken into three groups: (1) High-level policy
makers; (2) Senior advisors; and (3) Staff. We tried to draw five
respondents from each category. The respondents were selected by
asking several Philippine officials, 'Who do you think is most influ
ential in such-and-such instit:ution?" Thus, the sample is non-randem,
but it should reflect the opinions of those who are most influential
in the making of Philippine economic policy. Of the original 19
interviews, two were tenninated by the respondents on the first
question and one respondent refused to answer the questions on the
impact of devaluation.
The text of the questiOIll1aire follows, with the number of re
sponses to each question inserted.
-288-
BIOGRAPHICAL DATA
Interview
Interviewer
Interviewee
Age
Mother Tongue
Education - # of years completedHighes t DegreeField of concentration
Date, Time
Length
When began to work for gov't. (or present enlployer)
Years in present position
Have worked fUll time for private/public institutions
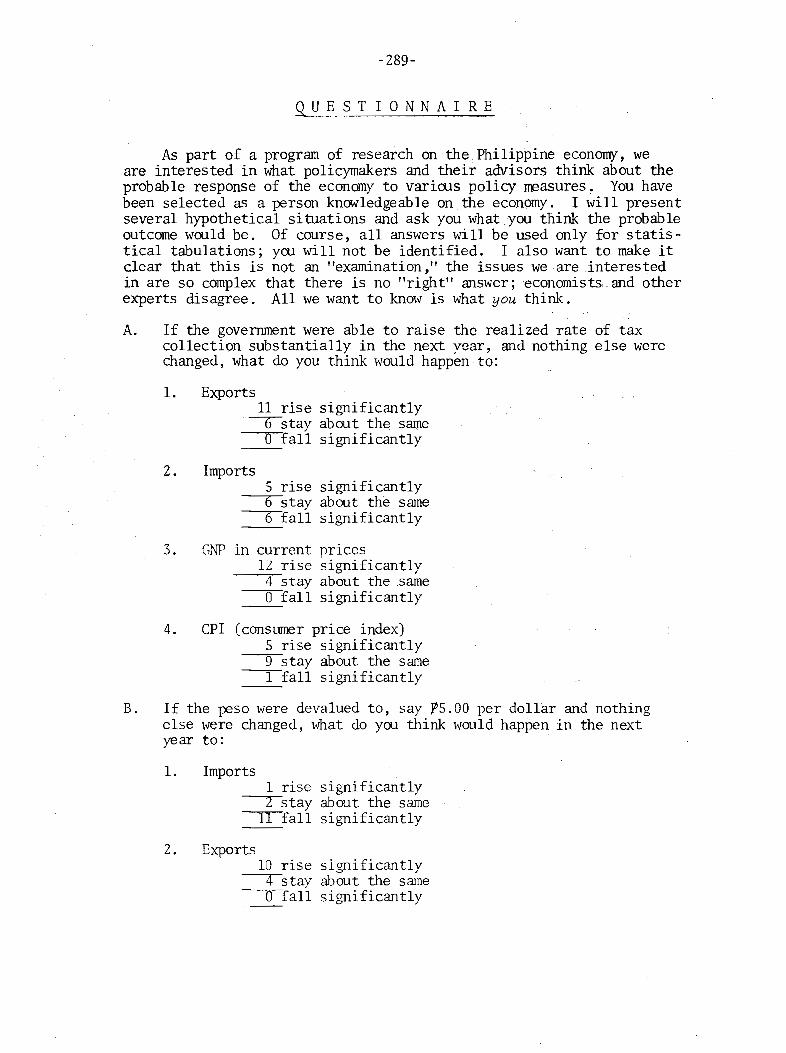
-289-
QUESTIONNAIRE
As part of a program of research on the Philippine economy, weare interested in what policymakers and their advisors think about theprobable response of the economy to various policy measures. You havebeen selected as a person knowledgeable on. the economy. I will presentseveral hypothetical situations and ask you what you think the probableoutcome would be. Of course, all answers will be used only for statistical tabulations; you will not be identified. I also want to make itclear that this is not an "examination," the issues we are .interestedin are so complex that there is no "right" answer; economists, and otherexperts disagree. All we want to know is what you think.
A. If the government were able to raise the realized rate of taxcollection substantially in the next year, and nothing else werechanged, what do you think would happen to:
1. Exports11 rise significantly
-ostay about the sameo fall significantly---
2. Imports5 rise significantly
-ostay about the same6 fall significantly---
3. GNP in current priceslL rise significantly
---.--4 stay about the same----=--o fall significantly---
4. CPI (consumer price index)5 rise significantly
--9-stay about the same1 fall significantly
B. If the peso were devalued to, say PS.OO per dollar and nothingelse were changed, what do you think would happen in the nextyear to:
1. Imports1 rise significantly
---Z-stay about the same11 fall significantly
2. Exports10 rise significantly
------:r-stay about the sameo fall significantly
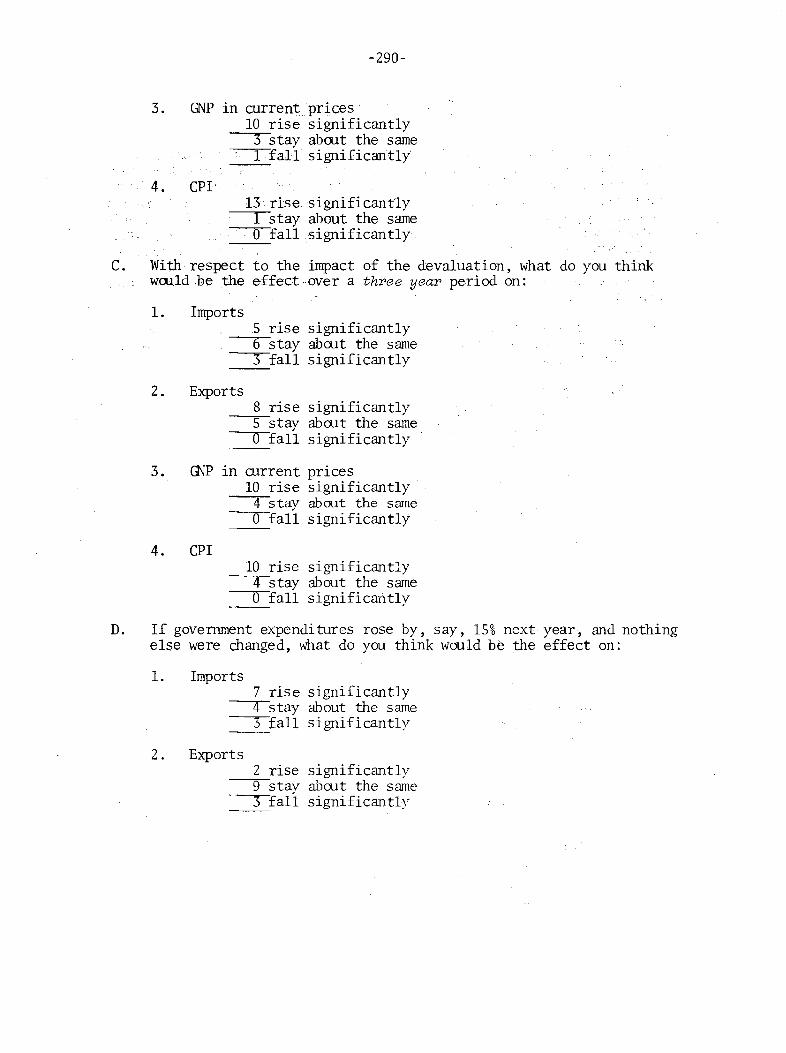
-290-
3. GN"P in currentprices10 rise significantly
3 stay aboot the same----;---,
1 fall significantly---4. CPI'
13 rise. significantly1 stay about the same
""'-,-'O"'--fall s igni f i cantly
C. With respect to the impact of the devaluation, what do you thinkwould be the effect over a three year period on:
1. Imports5 rise significantly
-"'6-stay about the same3 fall significantly
--
2. Exports8 rise significantly
--;:-5 stay aboot the same
-..,.,.-o fall significantly--
3. GNP in current prices10 rise significantly
4 stay about the same-~O-fall significantly
4. CPI10 rise significantly
~stay about the same~fall significantly
D. If government expenditures rose by, say, 15% next year, and nothingelse were changed, what do you think would be the effect on:
1. Imports7 rise significantly
--'-4-stay about the same3 fall significantly--
2. Exports2 rise significantly
-"""'9-stav about the same__3_fall significantly
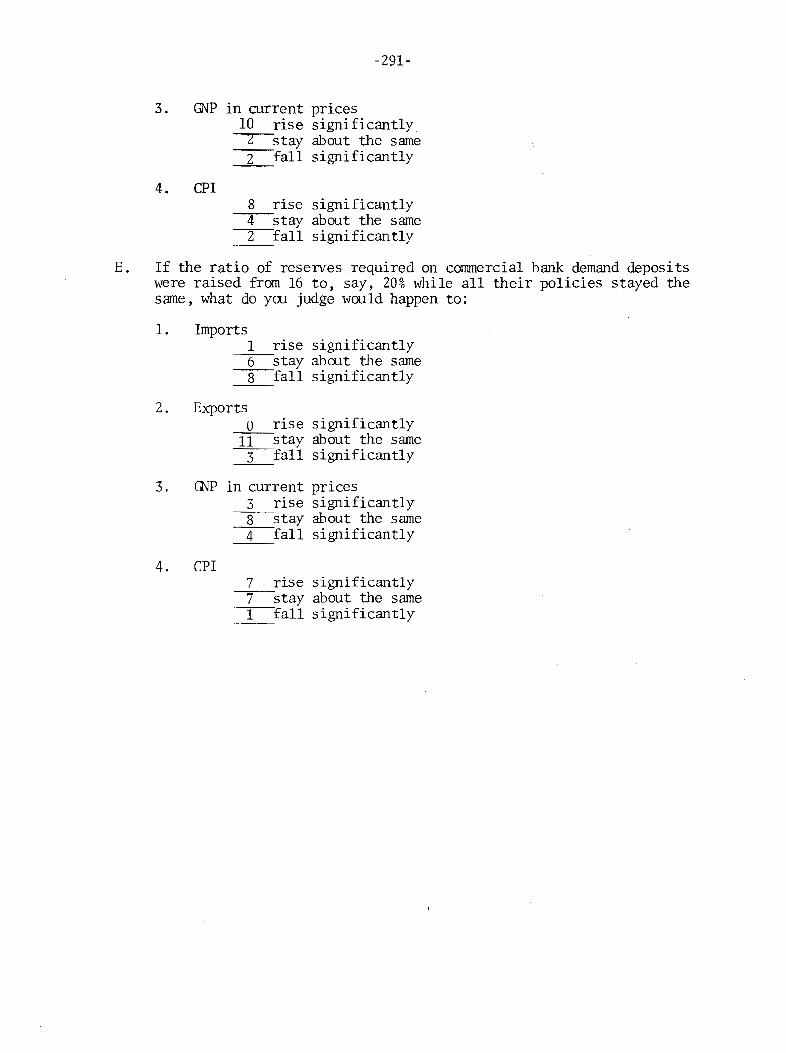
-291-
3. GNP in rorrent prices10 rise significantly
----Z--stay about the same___2 fall significantly
4. cprS rise significantly
---4---stay about the same2 fall significantly
E. If the ratio of reserves. required on cOl1UTlercial bank demand deposi tswere raised from 16 to , say, 20% while all their policies stayed thesame, what do you judge would happen to:
1. Imports1 rise significantly
-6-stay about the same-s-fall significantly
2. Exportso rise significantly~stay about the same
3 fall significantly
3. GNP in current prices3 rise significantly
-s-stay about the same4 fall significantly
4. CPI7 rise significantly7 stay about the same
-I-fall significantly
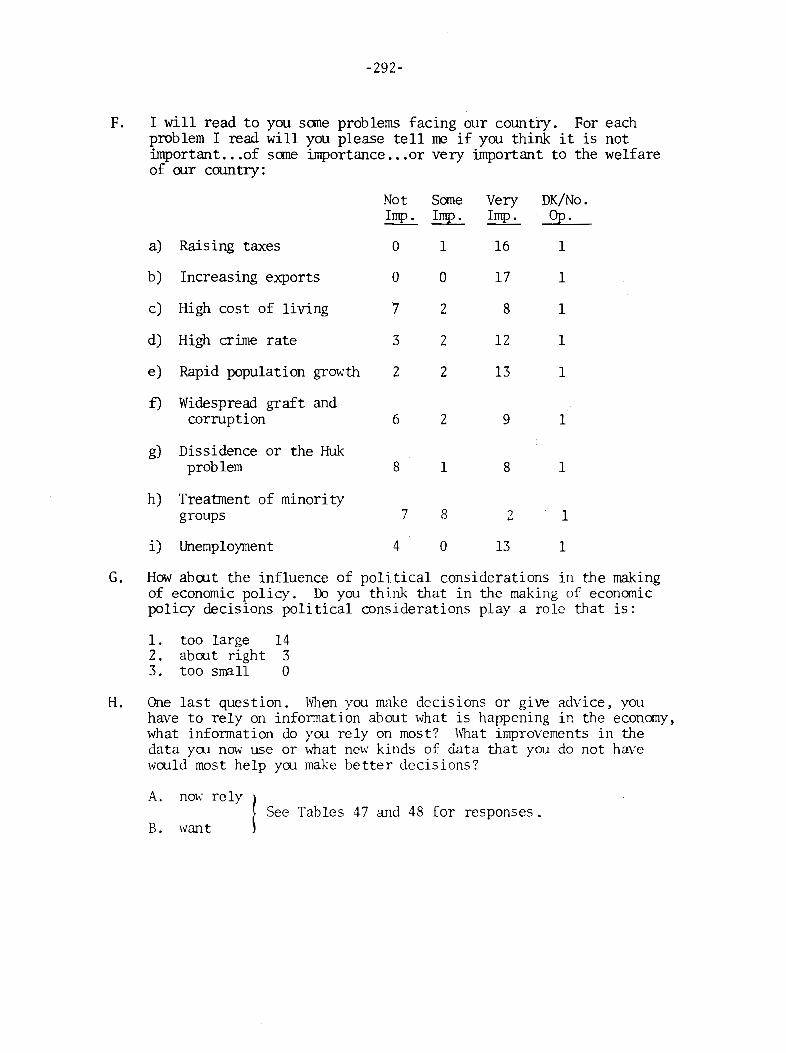
-292-
F. I will read to you sane problems facing our country. For eachproblem I read will you please tell Ire if you think it is notimportant ...of sane importance ...or ve ry irnportant to the welfareof our coontry :
Not Some Very DK/No.Imp. Imp. Imp. Op.
a) Rais ing taxes 0 1 16 1
b) Increasing exports 0 0 17 1
c) High cost of living 7 2 8 1
d) High crime rate 3 2 12 1
e) Rapid population growth 2 2 13 1
f) Widespread graft andcorruption 6 2 9 1
g) Dissidence or the Hukproblem 8 1 8 1
h) Treatment of minoritygroups 7 8 ? 1'"'
i) Unemployment 4 0 13 1
G. How abcut the influence of political considerations in the makingof economic policy. 1)) you think that in the making of economicpolicy decisions political considerations playa role that is:
l. too large 142. about right 33. too small 0
H. One last question. \vhen you make decisions or give advice, youhave to rely on information about \'ihat is happening in the economy,what information do you rely on most? hhat improvements in thedata you now use or what new kinds of data that you do not havewould most help you make better decisions?
A.
B.
now rely )f See Tables 47 and 48 for responses.
want }
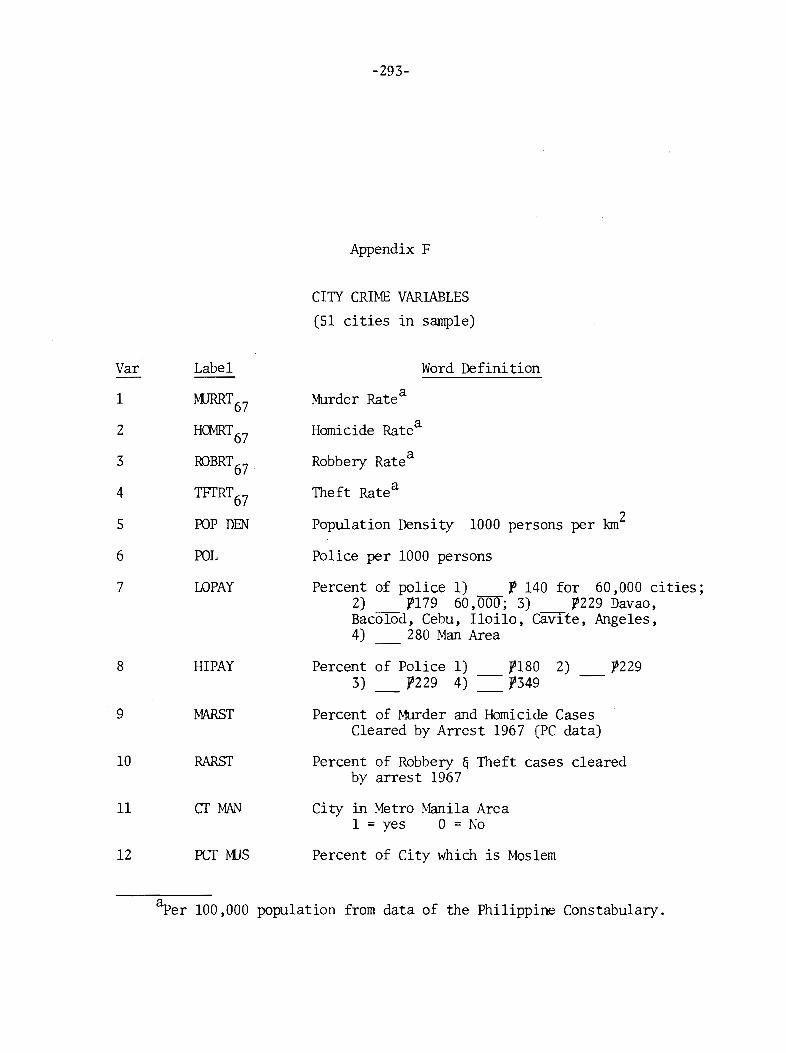
-293-
Appendix F
CITY CRI~ffi VARIABLES
(51 cities in sample)
Word Definition
Homicide Ratea
Murder Ratea
Police per 1000 persons
Percent of police 1) t 140 for 60,000 cities;2) '179 60,000; 3) '229 Davao,Bacolod, Cebu, Iloilo, Cavite, Angeles,4) 280 Man Area
21000 persons per kmPopulation Density
Robbery Ratea
Theft Ratea
Var Label
1 MJRRT67
2 H<l-'1RT67
3 ROBRT67
4 TFfRT67
5 POP DEN
6 POL
7 LOPAY
8 HIPAY Percent of Police 1) '180 2)3) n29 4) ='349
'229
9 MARST Percent of Murder and Homicide CasesCleared by Arrest 1967 (PC data)
10 RARSf Percent of Robbery &Theft cases clearedby arrest 1967
11 City in Metro Manila Area1 = yes 0 = No
12 PeT MJS Percent of City which is Moslem
~er 100,000 population from data of the Philippine Constabulary.
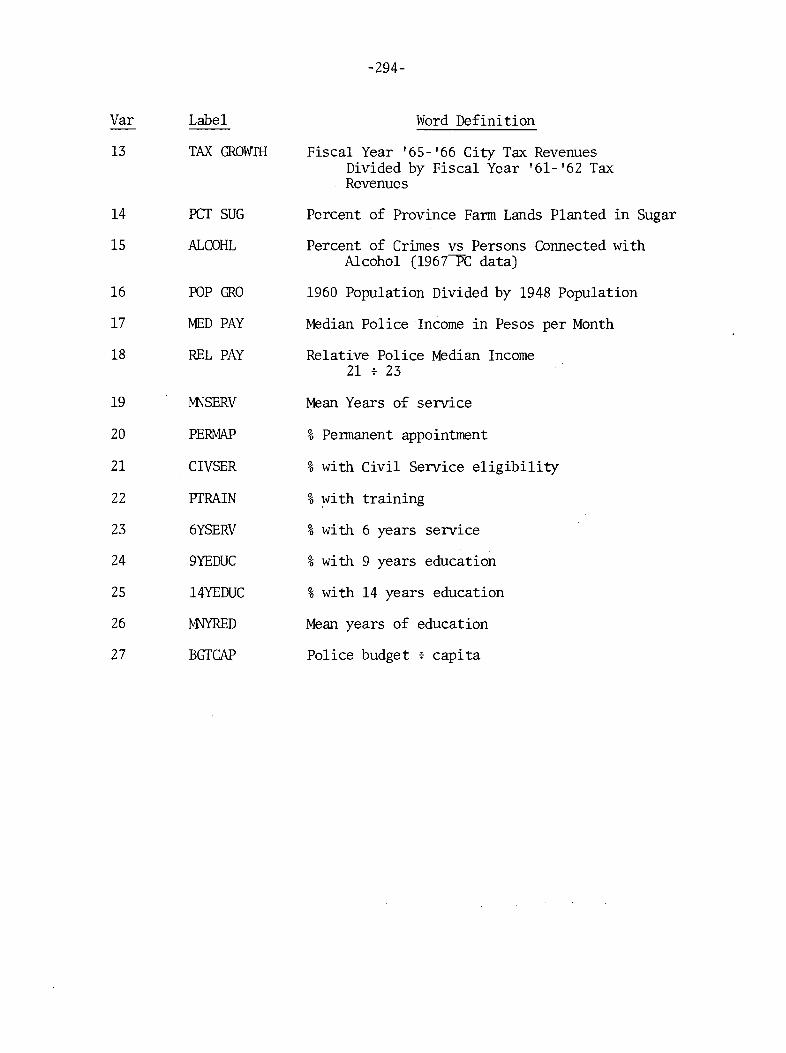
Var
13
14
15
16
17
18
19
20
21
22
23
24
25
26
27
Label
TAX GRowrn
PCT SUG
ALCOHL
pop GRO
MED PAY
REL PAY
M--JSERV
PERMAP
CIVSER
PrRAIN
6YSERV
9YEDUC
l4YEDUC
MNRED
BGTCAP
-294-
Word Definition
Fiscal Year '65-'66 City Tax RevenuesDivided by Fiscal Year '61-'62 TaxRevenues
Percent of Province Farm Lands Planted in Sugar
Percent of Crimes vs Persons Connected withAlcohol (1967JPC data)
1960 Population Divided by 1948 Population
~~dian Police Income in Pesos per Month
Relative Police Median Income21 -i- 23
Mean Years of service
%Pemanent appointment
%with Civil Service eligibility
%with training
%with 6 years service
%with 9 years education
% with 14 years education
Mean years of education
Police budget -i- capita
-295-
BIBLIOGRAPHY
Abello, Amelia B., Patterns of Philippine Public Expenditure and Revenue,1951-1960, Institute of Economic Development and Research, Universityof the Philippines, Quezon City, 1964.
Abraham, William C., The National Income of the Philippines and Its Distribution, United National Technical Assistance Program, New York, 1952.
Abueva, Jose V., "Social Backgrounds and Recruitment of Legislators andAdministrators in the Philippines," Philippine Journal of PublicAdministration, v. 9, no. 1, January 1965, 10-29.
Ad1ernan, Inna and Cynthia Taft Morris, "A Quantitative Study of Socialand Political Determinants of Fertility," Economic Development andCultural Change, January 1966, 129-157.
, "An Econometric Model of Development," American Economic Review,---v. 58,. no. 5, pt. 1, December 1968, 1184-1228.
, Society, Politics and Economic Development, Johns Hopkins Univer-s~ity~·. Press, Baltimore, 1967.
Agoncillo, T. A. and A. ~1. Alfonso, History of the Filipino People, 2nded., Malaya Books, Quezon City, 1968.
Agpalo, Remigio E., "Interest Groups and Their Role in the PhilippinePolitical System," Philippine Journal of Public Administration, v. 9,no. 2, April 1965, 87-l06~
AIken, Hayward R., Jr., and Bruce M. Russett, "On Measuring Inequality,"Behavioral Science, v. 9, no. 3, July 1964, 207-218.
Allen, W. R. and R. E. Baldwin, '~1arket Structures and Misallocation ... ,"Economia Internazionale, v. 16, November 1963, 655-661.
Almond, G. A. and S. Verba, The Civic Culture, Princeton University Press,Princeton, 1963.
American Factor Associates, Ltd., Audit of the Philippine Sugar Industry,April 28-May 30, 1965, prepared for the Sugar Development Committee ofthe Philippines, Honolulu, Hawaii, August 1965.
Anscombe, F. S. and J. W. Tukey, "The Examination and Analysis of Residuals,"Technome.trics, v. 5, 1963, 141-160.
Ashburn, Franklin G., A Study of Differential Role Expectations of PolicePatrolmen in the Manila Police Department, Republic of the Philippines,Florida State University, Tallahassee, 1966.
Asian Social Institute, Pattern for Rural Reform, Solidaridad PublishingHouse, Mani la, 1969.
Ayal, Eliezer B., The Development of Philippine Manufacturing Since WorldWar II, Field Work Report No.6, Center for Development Planning,National Planning Association, Washington, D.C., June 1966.
______, The Philippine Cotto~ Textile Industry, Field Work Report No. 24,Center for Development Planning, National Planning Association, Washington,D.C., January 1968.

-296-
, The PPivate Sectop in De~e~opment Planning~ Field Work Report No. 16,-=---Center for Development Planning, National Planning Association, Washington,
D.C., April 1967.
Aytona,Dominador R. , "Capital Formation in the Philippines," EconomicReseapchJournal (Manila), v. 6, March 1960, 216-224.
Baclagon, U. S., Lessons Fpom the Huk Campaign in the Philippines~
M. CoIcol& Company, Manila, 1960.
Bacon, M. and H. Barry, "A Cross Cultural Study of Correlates of Crime,"Journal of Abnormal and Social Psychology~ v. 66, 1963, 291-300.
Bain, A. D., ''Monetary Control Through Open Market Operations," EconomicJournaZ~ v. 75, March 1969, 137-146.
Balmaceda, Cornelio, "Corranercial Policy and Economic Development,"Philippines Economy Bulletin~ v. 2, no. 1, September-October 1963,14-17, Manila.
Bancroft, T. A., "On Biases In Estimation Due to the Use of PreliminaryTests of Significance," Annals of Mathematical Statistics~ v. 15,
. Jtn1e 1944, 190- 204.
Banfield, Edwin C. and James Q. Wilson, City Politics~ Harvard UniversityPress, Cambridge, 1963.
, The Mopal Basis of a BackuJapd Society~ The Free Press, Glencoe,--r9SS.Bantegui, B. G., "A Comparison Between the NECand UP-BCS Input-Output
Tables" (mimeo.), n.d.
Barber, Clarence L., "National Income Estimates in the Philippines," ThePhiZippine Economic Journal~ v. 4, no. 1, 1965, 66-77.
Barber, James D., The LCllJ Makers~ Yale University Press, ~ew Haven, 1965.
Bautista, A. M., The Hukbalahap Movement in the Philipp1:ne8~ 1942..,.1952~
M.A. Thesis, University of California, Berkeley, 1954.
Bautista, Romeo )\1., Capital Coefficients in Philippine ManufactuY'ing:An Analysis~ Discussion Paper No. 66.,.3, Institute of Economic Development and Research, School of Economics, University of the Philippines,Quezon City, July 29, 1966 (mimeo).
Belarmino, Isagani C., "The Statistical Anatomy of Our Perennial RiceProblem," Philippine Statistician~ v. 12, nos. 2 and 3, JlU1e-Septemhcr1963, 55-71.
Bennett, Robert L., The Financial Sector and Economic Development: TheMexican Case ~ The John Hopkins Press, Bal timore, 1965.
Berelson, Bernard, Paul F. Lazarsfeld, and William McPhee, Vot1:ng~
University of Chicago Press, Chicago, 1954.
Bernd, J. Ced.) ,l1athematical Applications in Political Science~ SouthernMethodist Press, Dallas, 1966.
Bernholz, Peter,"Economic Policies in a Democracy," Kyklos~ v. 19, 1965,4S-S0~ ..
-297-
Berry, Brian and Duane Marble (eds.), Spatial Analysis; A Reader inStatistical Geography~ Prentice-Hall, Englewood Cliffs, 1968.
Blalock, Hubert M., Jr~, Causal Inferences in Non-Experimental Research~
University of Carolina Press, Chapel Hill, 1964.
, "Evaluating the Relative Importance of Variables," AmericanSociological Review~ v. 26, December 1961, 866-874.
, Social Statistics~ McGraw-Hill, New York, 1960.--, "Theory Building and the Concept of Interaction," American Socio-
--rDgical Review3 v. 30, June 1965, 374-380.
and Baudin, "A Method of Linear Causal Analysis, Dependence Analysis,!!American Sociological Review~ v. 30, 1965, 365-374.
Block, Hubert, Research Report in Homicide 3 Attempted Homicide 3 and Crimesof Violence~ Ceylon Police Report, Colombo, 1960.
Bohannon, Paul, African Homicide and Suicide~ Princeton University Press,Princeton, 1960.
Boudon, Raymond, "A Method of Linear Causal Analysis; Dependence Analysis,"American Sociological Review~ v. 30, no. 3, June 1965, 365-374.
Braybrooke, David and Charles E. Lindblom, A Strategy of Decision~ TheFree Press, Glencoe, 1963.
Brown, Murray, On the Theory and Measurement of Technological Change~
Cambridge University Press, Cambridge, 1966.
Bruton, H. J., "Import Substitution and Productivity Growth," Journalof Development Studies~ April 1968, 306-326.
Burdick, Eugene and Arthur J. Brodbeck, Ameriaan Voting Behavior~ TheFree Press, New York, 1959.
Campbell, Angus, Philip Converse, Warren Miller, and Donald Stokes, TheAmeriaan Voter~ Wiley, New York, 1960.
Campbell, Angus and Harry Valen, "Party Identification in Nonvay and UnitedStates," Public Opinion Quarterly~ v. 25, Winter 1961, 505-525.
, "Surge and Decline: A Study of Electoral Change," Pub lic OpinionQuarterly~ v. 15, 1961, 601-623.
Cardenas, Ramon Bello, A Re-estimation of the Philippine National Accounts3
Calendar Years 1953-1963: A Description and Evaluation of the AlternativeEstimating Methodology~ unpublished M.A. Thesis, Cornell University,Ithaca, June 1967.
Cas tillo, Andres V., "Directions of Monetary Policies of the Central Bank,"Philippine Economy Bulletin~ v. 2, no. 1, September-October 1963, 39-43.
, ''The Philippine Decontrol Program: The Government's Point of View,"-=""""......
Philippine Journal of Public Administration~ v. 5, October 1961, 287-292.
Cattell, R. B., 'The Dimensions of Culture Patterns of Factorization ofNational Characters," Journal of Abnormal and Social Psychology~ v. 22,1950.

-298-
O1enery, Hollis B.andPaul G. Clark, Interindustry Economics~ Wiley,New York, 1959.
O1rist, Carl F., Econometric Models and Methods~ Wiley ,New York; 1966.
Clark, Colin, Population Growth and Land Use~ St. Martin's Press, NewYork, 1967. .
Cloward, Richard A., "Illegitimate Means, Anomie, and Deviant Behavior,"Ameraican Sociological Review., April 24, 1959, 164-176.
Clinard, Marshall B., Sociology of Deviant Behavior~ Holt, Rinehart, andWinston, New York, 1966.
Coale, Ansley J. and EdgarM. Hoover, Population Growth and Economic Development in Low Income Countries~ Princeton University Press, Princeton, 1958.
Cole; David, Growth and Financing of Manufacturaing in the Philippines~
University of the Philippines, Institute of Economic Development andResearch,Quezon City, 1963.
, "The Tools of Monetary Policy in the Philippines," PhilippineEconomy Review~ Decerr~er 1960, 16-35.
"Connmmism in Pampanga," Philippine Free Press~ JlIDe7, 14, and 21, 1939,Manila.
Converse, Philip, "Infonnation Flow and the Stability of Partisan Attitudes,"Puhlic Opinion Quaraterly~ v. 26, 1962, 578-599.
, A. Campbell, W. E. Miller, and Donald E. Stokes, "Stability and---crumgein 1960: A Reinstatement Election," American Political Science
Review~ v. 55, no. 2,Jtme 1961.
Corpuz, Onofre D., ''The Cultural Fotmdations of Filipino Politics,"Philippine Journal of Public Administration~ v. 4, no. 4, October 1960,297-310.
"Criminal Homicide in Ceylon," The Probation and Child Care Journal~ v. 3,January 1964, 15-30.
Currie, Lauch1in, Acce lerating Deve lopment: The Necessity and the Means ~
McGraw-Hill, New York, 1966.
Cutwright, Philip, "National Political Development: Measurement andAnalysis," American SocioZogicaZ Review~ v. 28, no. 2, April 1963,253-264.
Dahl, Robert A., A Preface to Democratic Theory~ University of ChicagoPress, O1icago, 1956.
Ced.}, Political Opposition in Western Democracies~ Yale UniversityPress, New Haven, 1966.
Dalisay, AmandoM. etal., ''The Level of Government Spending in the Philippines, 1947-1957," Economic Research Journal (Manila), v. 6, December 1959,128-151.
and Jose S. Gutierrez, "The Rice Crisis Revisited," University of--""'th:;-e- East Business Review (Manila), v. 6, no. 2, August 1964, 13- 25.

-299-
Davis, James C., "Toward a Theory of Revolution," American SociologicalReview~ no. 27, February 1962.
Dawson, Richard E. and James A. Robinson, "Interparty Competition, EconomicVariables, and Welfare Policies in the American States," Journal ofPolitics~ v. 25, May 1963, 265-289.
Declaro, Conrado S., '~he Conference Committee -- Pivot in the BudgetProcess," Philippine Journal of Public Administration~ v. 7, April 1963,113-121.
Dernburg, Thomas F. and Kenneth T. Strand, 'Bidden Unemployment 1953-1962:A Quantitative Analysis by Age and Sex," American Economic Reviewj v. 54,no. 1, March 1966, 71-95.
Deutsch, Karl W., "Social Mobilization and Political Development," AmericanPolitical Science Review~ v. 60, no. 3, September 1961, 493-514.
and W. Foltz (eds.), Nation-Building~ Prentice-Hall, New York, 1963.---Dia, Manuel A., '~ilipino Farmer's Image of Government: A Neglected Area
in Developmental Change," The UP Research Digest~ v. 4, no. 2, April1965, 7-24.
Dix, Robert H., Colombia: The Political Dimensions of Change~ Yale University Press, New Haven, 1967.
Dogan, M. and Stein Rokkan, Quantitative Ecological Analysis in the SocialSciences~ MIT Press, Cambridge, 1969.
Dorrance, G. S., '~he Instruments of Monetary Control ... ," InternationalMonetary Food, Staff Papers, v. 12, July 1965, 272-279.
Downs, Anthony, ''Why the GoveTIlIDent Budget is Too Small in a Democracy,"World Politics~ v. 12, no. 4, July 1960.
Driver, Edwin D., "Interaction and Criminal Homicide in India," SocialForces~ v. 40, 1961, 153-158.
Doocan, O. D. and B. Davis, "An Alternative to Ecological Correlation,"American Sociological Review~ v. 28, December 1953, 665-666.
, R. P. Cuzzart, and B. Duncan, Statistical Geography~ The FreePress, Glencoe, 1961 ..
Durdin, Tillman, "Philippine Region Pursues Progress," The New York Times~
January 19, 1969.
Dye, Thomas R., Politics~ Economics~ and the Public: Policy Outcomes inthe American States~ Rand McNally, Chicago, 1966.
The Economic Development of Spain: Report of a Mission of the InternationalBank for Reconstruction and Development~ Johns Hopkins University Press,Baltimore, 1963.
Eckhaus, R. S., '~e Factor Proportions Problems in UnderdevelopedCoootries," American Economic Review~ v. 45, no. 4, September 1955,539-566.
The Economic Monitor~ v. I and II, 1966 thru Jooe 1969, Economic Publications, Inc., Manila.

-300-
Emery, Robert E., "The Successful ~hilippine Decontrol and Devaluation,"Asian Supvey, v. 3, no. 6, June 1963, 274-284.
Encarnacion, Jose, Jr., On the Specification of Investment Functions,Discussion Paper No. 67-16, School of Economics, University of thel'hilippines, Quezon City, November 8, 1967 (mimeo).
Epstein, Leon, "Size of Place and the Division of the Two Party Vote inWisconsin," Western Political Quarterly, v. 9, March 1956.
Estrella, C. F., ''The Filipino Answer to Revolution," Solidarity, v. 4,1969, 67-73, Solidaridad Publishing House, Manila.
Fabella, Armand V., An Introduction to Economic Policy, PhilippinesExecutive Academy, College of Public Administration, University of thePhilippines, Manila, 1968.
Falk, Gerhard J., '1be Role of Social Class Differences and HorizontalMobility in the Etiology of Aggression," Journal of Educational Sociology, v. 33, 1959, 1-10.
Farnsworth, C. H., "Defects, Uses, and Abuses of National Food Supply andConsl.Dllption Data," Bulletin de l'Institut International Statistique,v. 39, 1962, 19-42.
Farrar, D. E. and R. R. Glauber, ''Multicollinearity in Regression Analysis:The Problem Revisited," Review of Economics and Statistics, February 1968,92-107.
Fei, John C. H. and Gustave Ranis, Development of the Labor SU'PplusEconomy: Theory and Policy, Richard D. Irwin, Homewood, 1961.
Fitzgibbon, Russell H., "Pathology of Democracy in Latin America: APolitical Scientist's Point of View," American Political Science Review,v. 54, 1950, 118.
Fleisher, Belton M., ''The Effect of Income on Delinquency," AmericanEconomic Review, v. 56, 1966, 118-137.
Ford, Henry Fones, "Mlmicipal Refonn," Political Science Quarterly, no. 4,1904.
Foster, George M., ''The Dyadic Contract: A Model for Social Structure ofa Mexican Peasant Village," American Anthropologist, v. 63, 1173-1192.
, "Confradia and Compadrazgo in Spain and South America," Southwes te:m.----:::--Journal of Anthropology, v. 9, 1953.
Francisco, Gregorio A., Jr., Higher Civil Servants in the Philippines,University of the Philippines, College of Public Administration, Manila,1959.
Fredrick, PaUl, "Assumptions Underlying Tarascan Political Homicide,"Psychiatry, v. 25, 1962, 315-327.
Garceau, Oliver, Political Resea:rach and Political Theory, Harvard University Press, Cambridge, 1968.
Garde, Flaviano A., "Agricultural Expansion and the Foreign ExchangeProblem," PhiZippine Economy Bulletin, v. 1, no. 5, 1963, 29-34.
-301-
Glaser, Daniel and Kent Rice, "Crime, Age, and Unemployment," AmericanSociological Review~ v. 24, no. 5, October 1959, 679-686.
Glueck, Eleanor Touroff, ''Efforts to Identify Delinquents," InternationalJournal of Social Psychiatry~ v. 6, 1960, 206-217.
Golay, Frank H., Phi lippine American Relations, The Elements That HaveCreated Both Alliance and Antagonism, Solidaridad Publishing House,Manila, .1966.
,The Philippines: Public Policy and National Economic Development~--=---Cornell University Press, Ithaca, 1963.
Golay, Frank H. and Marvin E. Goodstein, Rice and People in the 1990's.Philippine Rice Needs to 1990: Output and Input Requirements~ USAIDMission, Manila, 1967 .
. Gold, Martin, "Suicide, Homicide, and the Socialization of Aggression,"American Journal of Sociology, v. 63, May 1958, 651-661.
Goldsmi th, Raymond W., The Financial Deve lopment of Mexico, DevelopmentCentre of the Organisation for Economic Cooperation and Development,Paris, 1966.
Goodman, L. A., ''Ecological Regression and the Behavior of Individuals,"American Sociological Review, v. 28, December 1953, 663-664.
, "Some Alternatives to Ecological Correlation," American Journal-~-of Sociology, v. 64, May 1959,610-625.
, "Statistical Methods for Analyzing Processes of Change," AmericanJournal of Sociolo9Y~ v. 68, July 1962, 57-78.
Griliches, A. and Y. Grenfeld, "Is Aggregation Necessarily Bad?" Reviewof Economics and Statistics~ v. 42, February 1960, 1-13.
Grossholtz, Jean, Politics in the Philippines~ Little, Brown and Co., Inc.,Boston, 1964.
Guthrie, George M. et al.~ Modernization~ Its Impact in the Philippines,Ateneo de Manila University Press, Philippines, 1967.
Gutierrez, Jose S., "The Philippine Coconut Industry and the World OilMarket," Economic Research Journal (Manila), v. 6, no. 4, March 1960,197-205. '
Hansen, Bent, "Employment and Wages in Rural Egypt," The American EconomicReview~ v. 49, no. 3, June 1969, 298-313.
Hannan, H. H., Modern Factor Analysis~ University of Chicago Press, 2nded., Chicago, 1968.
Hartendorp, A. V. H., History of Industry and Trade in the Philippines:.The Magsaysay Administration~ A Critical Assessment~ Philippine EducationCompany, Manila, 1961.
Hayden, J. R., The Philippines: A Study in National Development, TheMacmillan Company, New York, 1942.
Henson, M. A., The Provinae of Parrrpanga and Its T()/;)ns~ Mariano A. Henson,Angeles City, Philippines, 1965.
-302-
Herrick, Bruce, Urban Migration and Bconomic Development~ MIT Press,Cambridge, 19.{)5.
--,--:::-...,.' Urban· Migration and Economic Deve lopment in Chi le~ MIT Press,Cambridge, 1965.
Hester, Donald D. (ed.), Financial Markets and Economic Activity~ Wiley,New York" 1967.
Hicks, George L., The Growing Import Dependence of Philippine Exports~
Field Work Report No. 22, Center for Development Planning, NationalPlanning Association, Washington, D.C., November 1967.
, The Phi lippine Coconut Industry: GrOU)th and Change~ 1900-1965~
~N""'a-t-:-ional Plarming Association, Washington, D.C., Jtme 1967. .
, Philippine Foreign Trade~ 1950-1965: Basic Data and MajorCharac---,---
teristics~FieldlYorkReport No .10, Center for Development Planning,National Plaiming Association, Washington,D.C.; September 1966.
-..,..-~~, Philippine Foreign Trade Statistics~ Supplementary Data andTnterpretations~ 1954-)966.. Field Work Report No. 20, Center forDevelopment Plarming, National Planning Association, Washington, D.C.,September 1967.
Hirshmart,A. 0., Jour:neysToward Progress: studies of Economic Policymaking in Latin America, Twentieth Century Fund, New York, 1963.
Hoeksema, R. L., Communism in the Philippines~ Ph.D. Thesis, HarvardUniversity Press, Cambridge, 1956.
Hofferbert, ;Richard I., "The Relationship Between Public Policy and SomeStructural and-Environmental Variables in the American States," AmericanPoli -tical Science RevieUJ~ v ~·60, March 1966.
Hollensteinei, Mary, The Dynamics of Power in a Philippine Municipality~
ConnnunityDevelopment Research Council, University of the Philippines,Quezon City, 1963.
HooleY,Richard W., Savings in the Philippines~ 1951-1960~Universityof
the Philippines, Institute of Economic Development and Research, QuezonCity, +963.
and Vernon W.Ruttan, The Agrieultural Development of the Philippines~
---r9752-1965~ Center for Development Plarming, National Planning AssociationCllld Department of Agricultural Economics, University of Minnesota,February 1968 (mimeo). ' .
Horst, P., F'a,ctor Analysis of Data Matrices~ Holt, Rinehart and Winston,New York, 196'5.
Ifuntington, S. P., "Political I;)evelopment and Political Decoys," WorldPolitics~ April 1965, 301-340,.
, Political Order in Changing Societies~ Yale University Press, NewHaven, 1968.
Hymer, Stephen and Stephen Resnick,The Responsiveness of Agrarian Economiesand theImportance of Z Goods~ Yale Economic Growth Center DiscussionPaper No." 2S (revised); Yale University, New Haven,. October 1, 1967.
-303-
IDLARS. International Data Library and Reference Service, Survey ResearchCenter, University of California, Berkeley.
413-20-0001, Southeast Asia -- Philippines: Attitudes Towards Domesticand Foreign Affairs, U.S. Information Agency, 1959.
416-59-0002, Southeast Asia -- Philippines: National Political andSocial Attitudes Index, Manila, 1963.
416-59-0008-10, Southeast Asia -- Philippines: Attitudes Toward theElection in 1965, Donald Muntz, Robot, Manila, 1965.
Interpol, International Crime Statistics~ 1959-1960~ Geneva, 1961.
Jacob, H. and Kenneth Vines, Politics in the American States~ Little,Brown, Boston, 1965.
Janowitz, Morris and Dwaine Marvick, Competitive Pressures and DemocraticConsent~ Michigan Govenunental Studies #32, University of Michigan Press,Ann Arbor, 1956.
Jayewardene, C. H. S., Criminal Homicide: A Study in Culture Conflict~
Ph.D. Thesis, University of Pennsylvania, Philadelphia, 1960 .
. Jayrne, Vicente R., "The Mindanao Development Authority: A New Conceptin Philippine Economic Development," Philippine Journal of PublicAdministration~ v. 5, October 1961, 321-339.
Jenkins, Shirley, American Economic Policy TOLUard the Philippines~ StanfordUniversity Press, Stanford, 1954.
Johnson, Kenneth F., "Political Radicalism in Colombia: Electoral Dynamics of 1962 and 1964," Journal of International American Studies~ v. 7.
Johnston, J., Econometric Methods~ McGraw-Hill, New York, 1963.
Jureidini, P. A. et al.~ Casebook on Insurgency and .Revolutionary Warfare:23 Summary Accounts~ The American University, Washington, D. C., 1962.
Kearns, Henry, "Philippines-U.S. Trade Relations," Journal of the AmericanChamber of Commerce of the Philippines~ v. 36, February 1960, 77-78.
Kenen, Peter B., The Open Economy~ Columbia University Press, New York,1968.
Key, V. 0., Jr., The Responsible Electorate: Rationality in PresidentialVoting~ 1936-60~ Harvard University Press, Carr~ridge, 1966.
, Southern Politics in State and Nation~ Vintage Books, New York,---r949.
, "A Theory of Critical Elections," Journal of Politics~ v. 17,~F~e~bruary 1955, 3-18.
Kish, Leslie, "Some Statistical Problems in Research Design," AmericanSociological Review~ v. 24, June 1959, 328-338.
Knight, J. B., "Financing Development Plans ... ," Oxford University Instituteof Economics and Statistics Bulletin~ v. 26, May 1964, 159-180.
Knupfer, Genevieve, "Portrait of the Underdog," Puhlic Opinion Quarterly~
1947.

-304-
Koehler, John E., Economic Policymaking with Limited Info~ation: TheProcess of Macro-Control in Mexico, The RAND Corporation, RM-5682-RC,August 1968.
Korhauser, William, The Politics of Mass Society, The Free Press, Glencoe,1959.
Krivine, David Ced.), "Fiscal and Monetary Problems in Developing States,"Proceedings of the Third Rehovoth Conference, Frederick A. Praeger,New York, 1967.
Kuznets, Simon, National Income and Its Composition, National Bureau ofEconomic Research, v. II, ch. 12, 1942.
Lande, Carl H., Leaders, Factions, and Parties: The Structure of Philippine Politics, Yale University Press, Southeast Asia Studies,NewHaven, 1965.
Lander, Bernard, Towards an Understanding of Juvenile Delinquenay,Columbia University Press, New York, 1954.
Lane, Robert E., Political Ideology: Why the American Corrunon Man BelievesWhat He Does, The Free Press, Glencoe, 1962.
, "Political Personality and Electoral Choice," American Political-...",,-'T"
Science Review, v. 49, 1955.
Lambert, Richard D. and Bert Haselitz, The Role of Savings and Wealth ~n
Southern Asia and the West, UNESCO, Paris, 1963.
Laquian, A. A., Slums Are for People, Bustamante Press, Manila, 1968.
Larkin, J. A., The Evolution of Pampangan Society: A Case Study ofSocial and Economic Change in the Rural Philippines, Ph.D. 111csis,New York University, New York, 1966.
Lary, Hal B., Imports of Manufactures from Less Developed Countries,National Bureau of Economic Research, New York, 1968.
Lave, Lester, Technological Change: Its Conception and r·1easurement,Prentice-Hall, Englewood Cliffs, 1966.
Lazarsfeld, Paul, Allen .Barton,· and Juan Linz, "Thc Psychology of Voting:Analysis of Political Behavior," in Gardner Lindsey (cd.), Handbookof Social Psychology, v. 2, Addison Wesley, Cambridge, 1954.
Leff, Nathanael, Econo~ic Policy-Making and Development in Brazil, 19471964, Wiley, New York, 1968.
Leggett, John C., "Economic Insecuri ty and Working Class Consciousness,"American Sociological Review, v. 29, April 1964, 230.
Lerner, Daniel, The Passing of Traditional Society, The Free Press,Glencoe, 1958.
Lev, Daniel S., "Political Parties in Indonesia," JouPYlal of SoutheastAsian History, March 1967, 52-68.
Levy, Emmanuel, Review of Economic Statistics in the Philippines, InterimReport-B, World Bank Resident ~1ission, \1anila, May 1964 (mimeo).
-305-
. , "The Usefulness of Existing National Accounts for the Analysis--or-the Philippine Economy," The Philippine Economic Journal, v. 5,
no. 1, 1966, 134-135.
Lewis, W. A., ''Unemployment in Developing Countries," The Wopld Today,January 1967, 13-22.
Licaros, Gregorio S., "Development Bank of the Philippines; Highlightsof 1958-1959 Operations," Philippine Economy Review, v. 7, August 1960,7-22.
Liebennan, V., ''Why the Hukbalahap Movement Failed," SolidaPity, v. 1,1966, 22-31, Solidaridad Publishing House, Manila.
Lindblom, Charles E., The Intelligence of Democpacy, The Free Press,Glencoe, 1965.
Lipman, Aaron and A. Eugene Havens, The Colorribian Violencia: An Ex PostFacto Expepiment, University of Wisconsin Land Tenure Center, Madison,1965 (mimeo).
Lipset, S. M., The Fipst New Nation: The United States in HistoPicaland Compapative Pepspective, Basic Books, New York, 1963.
, Political Man: The Social Basis of Politics, Doubleday, Garden-...."C..-ri~ty, 1959.
, "Some Social Requisites of Democracy: Economic Development and--=--=-Political Legitimacy," AmePican Political Science Review, 53, March 1959.
et al., "The Psychology of Voting: An Analysis of Political----=B:--ehr-avior, l! in Gardner Lindsey (ed.), Handbook of Social Psychology,
II , .Addison Wes ley, Cambridge, 1954.
and S. Rokkan (eds.), Party Systems and Voter Alignments: Cross--.".."..---:-
National Pepspectives, The Free Press, New York, 1967.
Macapagal, Diosdado, Five-Yeap Integpated Socio-Economic Ppogpam fop thePhilippines, Address on the State of the Nation to the 5th Congress ofthe Republic of the Philippines, Manila, January 22, 1967.
, A Stone fop the Edifice, Mac Publishing House, Manila, 1968.---Madigan, Francis C., The Farmer Said No, Connnunity Development Research
Council, University of the Philippines, Quezon City, 1968.
Manglapus, Raul S., Land of Bondage, Land of the Fpee, Solidaridad Publishing House, Manila, 1967.
Marcos, Ferdinand E., "The Economic Policies of the Present Administration,"Commepce: The Voice of Philippine Business, v. 63, no. 5, May 1966,6-11.
and Miguel Cuaderno, Sr., "Is Politics a Necessary Factor to Economic-=--Development?" Economic Reseapch Journal (Manila), v. 7, June 1960, 17-23.
Marlows, Martin, "Philippine Political Parties and the 1961 Election,"Pacific Affaips, v. 35, no. 3, Fall 1962, 261-274.
Mason, Edward S., Economic Planning in Undepdeveloped Apeas: Governmentand Business, Fordham University Press, New York, 1958.
-306-
McCord, William and Joan, Origins of Crime~ Columbia University Press,New York, 1959.
McDonald, R. H., "Electoral Systems, Party Representation and PoliticalChange in Latin America," Western Political QuarterZy~ September 1967,694-708.
McKendry, James M., Margaret S. McKendry, and George M. Guthrie, ThePsychological Impact of Social Change in the Philippines~ TechnicalReport 857-R-2, HRB-Singer, Inc., State College, June 1967.
McPhee, William, Formal Theories of Mass Behavior~ The Free Press" -NewYork, 1963.
and William Glaser,Public Opinion and Congressional Elections~
-Th~e- Free Press, New York, 1962.
Mecklin, John M., ''The Philippines: An Ailing and Resentful Ally,"Fortune~ v. 80, no. 1,July 1969, 119-123.
Mercado, Nestor J., "An Analysis of the Balance-of-Payments Problem ofthe Philippines," Economic Research Journal (Manila), v. 13, June 1966,4-16.
Merritt, R. L.and S. Rokkan (eds.), Comparing Nations~ The Use ofQuantitative Data in Cross National Research~ Yale University Press,New Haven, 1966.
Merton, Robert K., "Social Conformity, Deviation, and OpportunityStructures: A Connnent on the Contribution of Dubin and Cloward,"American Sociological Review~ 24 April 1959, 187.
Midlarsky, M. and R. Tanter, ''Toward a Theory of Political Instabilityin Latin America," Journal of Peace Research~ No.3, 1963, 209-227.
Milne, R. S., '''The New Administration and the New Economic Program inthe Philippines," Asian Survey~ v. 2, no. 7, September 1962, 36-42.
, "Political Finance in Southeast Asia with Particular Reference to-..,..,t1l.....e- Philippines and Malaysia," Pacific Affairs, v. 41, no. 4, Winter
1968-1969, 471-480.
(ed.) ,Planning for Progress~ The Administration of Economic Planning in the Philippines~ Studies in Public Adnunistration No.6, Instituteof Public Administration and Institute of Economic Development and Research, University of the Philippines, Manila, 1960.
Mincer, Jacob, Labor Force Participation and Unemployment~ paper for theNational Bureau of Economic Research, New York, 1966.
Mintz, Sidney and Eric Wolf, "An Analysis of Ritual Co-Parenthood (Compadrazgo)," Southwestern Journal of Anthropology~ 6, 1950, 341-369.
Mitchell, E. J., The Huk Rebellion in the Philippines: An EconometricStudy~ The RAND Corporation, RM-5757-ARPA, January 1969.
Montelibano, Alfredo, "Exchange Control," Philippine Economy Revie'W~
v. 6, December 1959, 26-28, 44.
, "Planning and Development: Lessons of Experience," Phi lippine-=---Economy Bulletin~ v.4, no. 3, January-February 1966, 5-9.
-307-
Mood, Alexander M. and Franklin A. Graybill, Introduction to the Theo~
of Statistics, 2nd ed., McGraw-Hill, New York, 1963.
Morgan, Theodore, 'The Theory of Error in Centrally Directed EconomicSystems," QuarterZy Journal of Economies, 78:3, August 1964, 395-416.
Nelson, Joan M., Migrants, Urban Poverty and Insta1{ility in a Nation:Critique of a Myth, Center for International Affafrs, Harvard University,Cambridge, 1968.
Nelson, Phillip, "Migration, Real Income and Infonnation," Journal ofRegional Science, Spring 1957.
Nelson, Richard R., "A 'Diffusion' Model of International ProductivityDifferences in Manufacturing Industry," American Economic Review, v. 58,no. 5, December 1968, 1219-1247.
, Robert L. Slighton, and T. Paul Schultz, Colombian Development---=P='""""o"':rZiay, R-46l-AID/RC, The RAND Corporation, 1969.
Nye,J. S., "Corruption and Political Development: A Cost Benefit Analysis,"American Political Science Review, v. 61, no. 2, June 1967, 417-427.
Ogburn, W., "Factors in the Variation of Crime Among Cities," Journal ofthe American Statistical Association, no. 30, March 1935, 12-34.
Olson, Lawrence, '~fter Magsaysay, What?" American Universities FieldStaff Reports, Southeast Asia Series, v. 5, no. 16, 1957, 13.
Olson, Lawrence, 'The Philippine Elections of 1957," American UniversitiesField Staff Reports, Southeast Asia Series, v. 5, no. 18, 1957, 11.
Olson, Mancur, HRapid Growth as a Destabilizing Force," JournaZ of EconomicHistory, XXIII, December 1963, 1529-1552.
onate, Burton T., Estimation of Population and Labor Force in the Philippines, International Rice Research Institute Journal Series No. 43(revised 1966).
Pablo, Rizalino R., "Some Notions of Development Administration in thePhilippines," Phi lippine Economy Bul letin, v. 3, no. 5, May-JlIDe 1965,5-13.
Padgett, L. V., "Mexico's One Party System, ARe-evaluation," AmericanPolitical Science Review, 51, 1957, 995-1008.
Paglin, Morton, "Surplus Agricultural Labor and Development: Facts andTheories," American Economic Review, September 1965, 8l5-83~.
Parsons, Malcolm B., "Perfonnance Budgeting in the Philippines," PublicAdministration Review~ v. 17, no. 3, Summer 1957, 173-179.
Payne, James L., Patterns of Conflict in CoZombia, Yale University Press,New Haven, 1968.
Peterson, A. H., G. C. Reinhardt, and E. E. Conger (eds.) , Symposium onthe Role of Air Power in Counterinsurgency and Unconventional Warfare:The Philippine Huk Campaign, The RAND Corporation, RM-3652-PR, June 1963.
-308-
Philippines Governn1ent
Annual Report of the Governor General of the Philippine Islands,Washington, D.C., 1923 through 1935.
Annual Report of the President of the Philippines to the President andCongress of the United States, Manila, 1935 through 1940.
Annual Report of the United States High Commissioner to the PhilippineIslands, 1st through 7th reports, Washington, D.C. and Manila, 1935through 1945.
Armed Forces of the Philippines, The Role of the Military in NationBuilding. The Alternatives: Innovate or Stagnate (n.d.).
Central Bank, Annual Report, various years.
Congress of the Philippines, Committee on National Defense and Security,The Challenge of Central Luzon, May 1967.
Department of Agriculture and Natural Rescurces, Bureau of AgriculturalEconomics, Annual Report for 196?
Department of Commerce and Industry, Bureau of the Census and Statistics,Annual Survey of Manufactures, 1956-1962, 1965-1966.
, BCS Survey of Households Bulletin, nos. 18-24.--, Philippine Statistical Survey of Households Bulletin, nos. 1-17.--, Yearbook of Philippine Statistics, 1966.--
Department of Defense, Handbook on the Philippine Communist Party, 1961.
Department of Justice, National Bureau of Investigation, PhilippineCrime Report, 1967.
Department of Public il/orks and Communications, Bureau of Public Highways, Annual Report, FY 1960-1967.
General Auditing Office, Digest of the 1967 Annual Report of theAuditor-General to the National Government - Philippines, 1967.
, Report of the Auditor-General on Local Governments to the---::=--President, FY 1954-1966 (mimeo).
Manila Police Department, Annual Report, 1966-1967.
Marcos, Ferdinand E., State of the Nation: A Message Delivered Beforea Joint Session of Congress, January 22, 1968.
National Economic Council, National Accounts of the Philippines withSupporting and Analysis Tables, 1946~1967 (mimeo).
, National Income of the Philippines for 1964 to 1966, ~1ay 1967-'-7'(m-l"-'meo) .
, "1961 Philippine Interindustry Relations (Input-Output) Tables,"----;:=--Pre-printing issue, October 1967 (mimeo).
, "1961 Interindustry (Input-Output) Accounts of the Philippines,"~=--The Statistical Reporter, v. XVII, no. 3, July-September 1968.
"Technical Notes to the 1966 Overall Revision of the National Accountsof the Philippines, Calendar Year 1962-1966," The Statistical Reporter,v. 11, no. 2, April-June 1967, 34-36.

-309-
"Philippine Rural Reconstruction Movement," American Universities FieldStaff Letter, Pampanga, Central Luzon, May 1, 1955.
Pomeroy, W. J., The Forest, International Publishers, New York, 1963.
Pool, Ithiel de Sola, Robert P. Abelson, and Samuel L. Popkin, Candidates,Issues and Strategies: A Computer Simulation of the 1960 and 1964Presidential Elections, MIT Press, Cambridge, 1964.
Quirino·, Elise (ed.) , NEPA: Objectives of Protectionism in the Phi lippines, Bookman, Inc., Manila (n.d.).
Rahman, M. A., "Operational Logic of Planning," Pakistan DevelopmentReview, v. 4, no. 2, 1964, 203-222.
Reischauer, E. 0., "Transpacific Relations," in, Kenni t Gordon (ed.) ,Agenda for the Nation, Brookings, Washington, D.C., 1968.
Reiss, A. J., Jr., and A. L. Rhodes, "The Distribution of JuvenileDelinquency in the Social Class Structure," American SociologicalReview~ v. 26, no. 5, 720-732.
"Research Findings on Problems of Local Govenunent," Philippine Journalof Public Administration, v. 3, no. 1, October 1962, 11-15.
Ridker, R. G., "Discontent and Economic Growth," Economic Deve lopmentand Cultural Change, v. XI, no. 1, October 1962, 1-15.
, "The Economic Detenninants of Discontent: An Empirical Investigation," Journal of Development Studies, v. 4, no. 2, January 1968,174-219.
Robinson, William S., "Ecological Correlations and the Behavior ofIndividuals," American Sociological Review, v. 15, 1950, 357.
Rogers, Everett M., 'Mass Media Exposure and Modernization Among ColombianPeasants," Public Opinion Quarterly, v. XXIX, no. 4, 1965, 614-625.
Roxas, Gerardo M., "The Pork-Barre1 Systern," Phi l ippine J ouma l ofPuhlic Administration, v. 7, October 1963, 254- 257.
Roxas, Sixto K., '!Decontrol: Preview of Progress and Definition ofFuture Imperatives," Philippine Economy Bulletin, v. 2, no. 3,January-February 1964, 29-36.
, "Economic Planning: A Problem of Management," Phi lippine Economy--B=u-t~letin, v. 1, no. 4, March-April, 1963, 5-9.
, "Protectionism," Philippine Economy Bulletin, v. 1, no. 6, July~A~ll-gust, 1963, 13-16.
, "Statistical Requirements of Economic Planning," Philippine--...,.....--
Statistician, June-September 1963, 109-116.
Rummel, Rudolph, "Indicators of Cross-National and International Patterns,"American Political Science Review, v. 63, March 1969,127-147.
, 'Dnderstanding Factor Analysis," Journal of Conflict Resolution,--=-=--II, December 1967, 444-481.
Rupnecht, Theodore K., "Philippine Labor Statistics: A Critique and Recomputation of PSSH Data," The Philippine Statistician, v. 15, nos. 1and 2, March-April 1966, 73-89.

-310-
Salas, Rafael, "Statistics and Decision-Making Process," The PhilippineStatistician~ v. 15, nos. 1 and 2, March-JlIDe 1966, 61-64.
Salmon, J. D., "The HukRebellion," Solidarity (Manila), v. 3,1968,1-30.
Schnore, Leo F., "The Statistical Measurement of Urbanization and EconomicDevelopment," Land Economics~ XXXVII, August 1961, 229-245.
Schwartzberg, Joseph E., "Agricultural Labor in India: A Regional Analysis and Particular Reference to Population Growth," Economic Developmentand Cultural Change~ v. XI, no. 4, July 1963, 337-352.
Selvin, Hanan C., ''Durkheim's Suicide and Problems of Empirical Research,"American Journal of Sociology~ v. 63, May 1958, 607-619.
Sharmon, Lyle W., "ls Level of Development Related to Capacity for SelfGovernment?" American Journal of Economics and Sociology~ v. 17, July1958, 367-382.
, "Socio-Economic Development and Demographic Variable as Predictors---o~f~Political Change," Sociological Quarterly~ v. III, January 1962,
27-43.
Sharkansky, Ira, "Economic and Political Correlates of State GovernmentExpenditures," MiiMest Journal of Political Science~ v. 11, May 1967,173-192.
Shaw, C. R., Delinquency Areas: A Study of the Geographic Distributionof School Truants~ Juvenile Delinquents~ and Adult Offenders in Chicago~
University of Chicago Press, Chicago, 1929.
and Henry D. McKay, Juveni le De linquency and Urban Areas ~ Univers i ty--o-f~C'hicago Press, Chicago, 1942.
Shaw, H. J., A stuay of a Communist War of Liberation~ M.A. Thesis,University of Virginia, Charlottesville, 1962.
Short, James F., Jr., and Fred L. Strodtbeck, Group Process and GangDelinquency~ University of Chicago Press, Chicago, 1965.
Sicat, Gerardo P., "On the Accuracy of the Philippine National Accounts,"Philippine Review of Business and Economics~ October 1964.
, Regional Economic Growth in the Philippines~ 1948-1966~ Part I:--D'='"1.,-......·m-ensions of Regional Growth~ University of the Philippines, March 19,
1968 (lIDpublished).
, The Philippine Economy in the 1960's~ Institute of Economic Development and Research, University of the Philippines, Quezon City, 1964.
Siegel, S., Nonparametric Statistics~ McGraw:-Hill, New York, 1956.
Sirkin, Gerald, The Visible Hand: The Fundamentals of Economic Planning~
McGraw"';Hill , New York, 1968.
Sjaastad, L. A., "The Costs and Returns of Human Migration," in Investmentin Human Beings~ Supplement to Journal of Political Economy~ v. 70,no. S, pt. 2, October 1962.
- 311-
Soares, Galucio and Robert L. Hamblin, l:Socio-Economic Variables andVoting for the Radical Left: Chile, 1952,lf American Political ScienceReview~ December 1967, 1053-1065.
Soberano, Jose D. and II. Odell Waldby, Phi lippine Puh lie Fiscal Administration~ Graduate School of Public Administration, University of thePhilippines, Manila, 1965.
"Social Unrest in the Philippines," Philippine Social Science andHumanities Review~ nos. 2-4, June-December, 1968, 373-436.
Soja, E. J., The Geography of Modernization~ Syracuse University Press,Syracuse, 1968.
Soliven, M. V., "Lessons for the Viet Cong from the Huk Debacle, 11 So lidari ty~lanila), v. 1, 1966, 31-53.
Spencer,J., The Philippine Island World~ University of California Press,Berkeley, 1967.
Spengler, J. J., "Economic Development: Political Preconditions andPolitical Consequences," Journal of Politics~ v. 22, no. 3, August 1960,387-415.
, "Public Bureaucracy, Resource Structure, and Economic Development:Al'fote," Myklos~ v. 11, fasc. 4, 1958, 460-486.
Starner, Frances Lucille, Magsaysay and the Phi lippine Peasantry: TheAgrarian Impact on Philippine Politics~ University of California Publications in Political Science, v. 10, University of California Press,Los Angeles, 1961.
Stekler, H. o. and S. W. Burch, 1'Selected Economic Data on Accuracy ofReporting Speed," Journal of American Statistical Association~ v. 63,no. 322, June 1968.
Stigler, G. J., "Information in the Labor Market," in Investment in HumanBeings~ Supplement to Journal of Political Economy~ v. 70, no. 5,pt. 2, October 1962.
Stockwin, Harvey, 1 'Where Democracy Flourishes but Progress is Slow,"The Financial Times~ August 29, 1968.
Stokes, Donald E., "Spatial Models of Party Competition," American Political Science Review~ v. 57, 1963, 368-377.
, A. Campbell, and W. Miller, "Components of Electoral Decision,"American Political Science Review~ v. LII, June 1958, 367-397.
Straus, J. H. and M. A. Straus, "Suicide, Homicide, and Social Structurein Ceylon," American Journal of Sociology~ v. 58, ~1arch 1953, 461-469.
Strotz, R. and H. O. Wold, "A Tryptych on Causal Systems," Econometrica.,28 April 1960, 417-463.
Strout, A. M., AID Performance., Self Help., and Need., USAID, Policy Planning and Coordination (draft), 1968.
Stubbs, R. M., Philippine Radicalism: The Central Luzon Uprisings.,1925-35., Ph.D. Thesis, University of California Berkeley, 1951.
-312-
Sturtevant, D. R., "No Uprising Fails - - Each One is a Step in the RightDirection," Solidarity (Manila), v. 1, 1966, 11-21.
, Philippine Social Structure and Its Relations to Agrarian Unrest,-=Ph..---...D. Thesis, Stanford University, Stanford, 1968.
Sycip, Gorres, Velayo and Co., Research Division, An Interim Study ofCommercial Banks in the Philippines at September 30, 1968, ~1anila,
1968.
'1be System of Local Government in the Philippines," Philippine Journalof Public Administration, v. 3, no. 1, January 1959, 1-10.
Tanter, Raymond, ''Dimensions of Conflict Behavior Within and BetweenNations, 1958-1960," Journal of Conflict Resolution, v. 10, no. 1,March 1966, 61-64.
, "Toward a Theory of Political Development," MidLYest JouPnal of-P=o~Zitical Science, v. XI, no. 2, May 1967,145-172.
Tanter, Raymond and Manus Midlarsky, "A Theory of Revolution," TheJournal of Conflict Resolution, v. XI, no. 3, September 1967, 264-280.
Taruc, Luis, Born of the People, International Publishers, New York, 1953.
, He Who Rides the Tiger, Frederick A. Praeger, New York, 1967.---Task Force on Urban Development Joint Project of the National Economic
Council and the USAID/Philippines, Profile Reports on the Cities of:Bacolod, Baguio, Cagayan de Oro, Iligan, Legaspi, and Zamboanga,January 15, 1968, USAID/Philippines, Manila, 1968.
Taylor, George E., The Philippines and the United States: Problems ofPartnership, Frederick A. Praeger, New York, 1964.
Theil, H., Contributions to Economic Analysis, Economic Forecasts andPolicy, 2nd revised edition, North-rlolland Publishing Company, Amsterdam,1961.
, Optimal Decision Rules for Government and Industry, Rand-~1cNally,
~Ch~lcago, 1964.
Tiaoqui, R. V., "The National Budget System of the Philippines,"ThePhilippine Economic Journal, v. 2, no. 1, 1963.
Tilly, C., The Vendee, Harvard liniversi ty Press, Cambridge, 1964.
de Tocqueville, A., The Old Regime and the French Revolution, translatedby John ,Bonner, Harper &Bros., New York, 1856.
Toro-Vizcarrondo,Carlos and T. D. Wallace, "A Test of the ~ean SquareError Criterion for Restrictions In Linear Regression," Journal of theAmerican Statistical Association, v. 63, 1968, 558-572.
Trinidad, Ruben, An Inquiry into the Sources and Methods of NationalIncome Accounting in the Philippines, unpublished \LA. Thesis, University of the Philippines, Quezon City, August 1958.
, "Some Proposed Improvements in the Estimation of Capital Fonnation-·"""in-the Philippines," The Statistical Reporter, v. 4, April 1960, 28-40.
-313-
Tryon, Joseph L., Internal and External Terms of Trade in Pos t-War·Philippines~ Field Work Report No. 14, Center for Development Planning,National Planning Association, Washington, D.C., April 1967.
Tullock, Gordon ,. ''Utility, Strategy and Social Decision Rules," QuarterlyJournal of Economics~ v. 75, August 1961, 493-497.
Ullman, Edward L., ''Trade Centers and Tributary Areas of the Philippines,"Geographical Review~ v. 50, no. 2, April 1960, 203-263.
United Nations, Demographic Yearbook~ N~v York, 1966.
USAID Mission to the Philippines, Survey of Philippine Law Enforcement~
Manila, 1968.
Usher, Daniel, The Price Mechanism and the Meaning of National IncomeStatistics~ Clarendon Press, Oxford, 1968.
Van der Kroef, Justers, I?Patterns of Cultural Conflict in PhilippineLife," Pacific Affairs~ v. 39, no. 34, Fall-Winter 1966-1967, 326-338.
Vanek, Yaroslav, Estimating Foreign Resource NeedB for Economic Development~ McGraw-Hill, New York, 1967.
and A. H. Studerunund, "Towards a Better Understanding of the-~-Supplemental Capital-Output Ratios," Quarterly Journal of Economics~
v. 82, August 1968.
Vellut, J. L., "Japanese Reparations to the Philippines," Asian Survey~
v. 3, no. 10, October 1963, 496-506.
Vidallon-Carino, Ledivina, The Politics and Administration of the Pork,Barrel~ Local Governnlent Center, School of Public Administration,University of the Philippines, Manila, 1966.
Wallis, C. P. and R. Maliphant, "Delinquent Areas in the COWlty ofLondon: Ecological Factors," British Journal ofCriminology~ v. 7,no. 3, 1967, 250-284.
Waterston, Albert, Development Planning: Lessons of Experience~ TheJohns Hopkins Press, Baltimore, 1965.
Weiner, Myron, Party Building in a New Nation: The Indian NationalCongress~ University of Chicago Press, Chicago, 1967.
Weisbrod, Burton A., "Collective-Consumption Services of IndividualConsumption Goods," Quarterly Journal of Economics~ v. 78, no. 3,August 1964, 471-477.
Whitaker, Arthur, 'The Pathology of Democracy in Latin America," AmericanPolitical Science Review~ v. 44, 1950, 101-118.
Wilcox, Clair, The Planning and Execution of Economic Development inSoutheast Asia~ Occasional Papers in International Affairs Number 10,Harvard University Center for International Affairs, Cambridge,January 1965.
Wilensky, Harold J., Organizational Intelligence~ Basic Books, Inc., NewYork, 1967.

-314-
Wilson, .James Q.and Edward C. Banfield, "Public-Regardingness as a ValuePremise iIl·Vqting Behavior," American Political Science Review, December1964, 876-887.
Wolf, Charles, Jr. ,The Present Value of the Past, P-4067, The RANDCorporation, April 1969.
Wolfgang,. }.~anrin E., Patterns in Criminal Homicide., Science Edition,Wiley, New York, 1958.
, "A Sociological Analysis of Criminal Homicide," Federal Probation,--v. 25, March 1961, 48-55.
, Leonard Savits, and Norman Johnston (eds.) , The Sociology of Crime-an-a"'" Delinqueney, Wiley, New York, 1962.
Wolfinger, Robert E. and John Osgood Field, "Political Ethos and theStructure of City Government," American Political Science Review,v. 60, Jtme 1966, 326.
Wood, Arthur, "Crime and Aggression in Changing Ceylon," Translationsof the American Philosophical Society, v. 51, pt. 8, December 1961,5-126.
, "A Socia-Structural Analysis of Murder, Suicide, and Economic~......--.-CrImes in Ceylon," American Sociological Review, v. 26, 1961, 744-753.
Wurfel, David, "Individuals and Groups in Policy Process," PhilippineJournal of PUblic Administration., v. 9, no. 1, 30-42.
, "The Philippines,!! The Journal of Politics., v. 25, 757-773.--YOtmg, James S., The Washington Community, 1800-1828, ColmrIDia University
Press, New York, 1966.
Zeitlin, Maurice, ,I!Economic Insecurity and the Political Attitudes ofCuban Workers," American Sociological Review, v. 31, no. 1, February1966, 35-51.
Zellner, Arnold Ced.), Readings in Economic Statistics and EconometPics-,Little, Brown, Boston, 1968.