Knowledge management in small and medium enterprises: An Australian study
Upload
khangminh22Category
view
2download
0
Ic-I
SMALL ENTERPRISES AND DEVELOPMENT
POLICY IN THE PHILIPPINES: A CASE STUDY
by
Dennis Anderson
And
Farida Khambata
Series: Studies in Employment and Rural Development No. 66
Division: Employment and Rural Development
Department: Development Economics
Development Policy StaffInternational Bank for Reconstruction and Development
This report (i) describes the size and regional distributions
of industrial development in the Philippines; (ii) examines the incidence
of leading sector policies on small and large scale industries, and their
effects on incomes and employment in each; and (iii) presents an ex post
evaluation of financing and extension programs specifically aimed at
increasing employment and incomes in small scale.
This study is one of a series being prepared under the World Bank's
research project on small enterprises in developing countries (RPO 671-59).
The views and interpretations in this document are those of the
authors ard should not be attributed to the World Bank, to its affiliated
organizations, or to any individual acting in their behalf.
Washington, D.C., October 1980
Pub
lic D
iscl
osur
e A
utho
rized
Pub
lic D
iscl
osur
e A
utho
rized
Pub
lic D
iscl
osur
e A
utho
rized
Pub
lic D
iscl
osur
e A
utho
rized

ACKNOWLEDGEMENTS
The following report is one of a series of case studies
and surveys of small enterprises in developing countrias being financed
by the World Bank's Research Committee CRPO 671-59). The aims of
this research are to examine the role of small enterprises in providing
employment and earnings opportunities, and to compare the experiences
of different countries with various policies. Since it is part
of a research project, the findings and views expressed in the report
are not necessarily those of the World Bank.
The present study began in May 1978 in collaboration with
the Ministry of Industry. The Development Bank of the Philippines,
the Industrial Guarantee and Loan Fund, the Private Development
Corporation of the Philippines and several private banks and investment
houses were all most generous in providing information about their
programs and experiences. The NCSO were also helpful in providing
access to preliminary tabulations and worksheets, and the University
of the Philippines' Institute for Small-Scale Industries gave us some of
their research material. The help and co-operation of the staff of these
institutions is gratefully acknowledged. It does not follow, of course,
that they necessarily agree with the findings, or that theywe in any
way committed to them.
Carlos Singer did the background statistical work on the
text tables and annexes, and was responsible for reviewing source material.
Mrs. Fajardo was general consultant to the project, and directed the
interviews and the review of file data reported in Chapter IV and V.
Mrs. Tengra administered the research budget and contracts.

- ii -
Comments and discussions on the earlier drafts of various
chapters, and on the progress of the study, were kindly provided by
Raphael Sison, Rodolfo Manalo and Andres Castillo of DBP; Tomas Tan
of PDCP, Mrs. Mijares of IGLF, and Evelyn Go (now with ADB). Tomas Paterno,
oila Pedro, Nanette Agdeppa, Emanuel Almonte and Father Peron in the
Ministry of Industry; and Cesar Macuja, Al Berry, Bob de Vries, Mike Gould, A
Ted Hawkins, Larry Hinkle, Tan Little, Ernie Pernia, Joe Pernia, John Powers,
Yung Rhee, Marcelo Selowsky, Khalid Siraj and Larry Westphal, Ernie Pernia
was also kind enough to arrange for a seminar on the report at the University
of the Philippines in July 1980.

Table of Contents
Page
Acknowledgements
VOLUME I - The Main Report
I. Outline
- Scope of the Report . . . 1
- Experience of the Financial Institutions . . . 6
- Industrial Extension . . . . . . * . . . * . . 10
- Industrial and Regional Development
Aspects of Small Industries d u s * .* * s * 15
- Purposes of Small Enterprise Programs
Reconddered * * * * * * * * * * * * * * * . 24
- Technical Supplement on Interest Rates.and Investment Criteria i t * .i * * * * * * 32
- Conclusions .* o * * * .* .* .* * * * * 37
II. Experience of the Financial Institutions (A):
Individual Experiences
- Introduction * * . * * * * * * * * * . * * * 39
- Commercial Banks * * * * * * * * . * * * * * * 40
- Development Bank of the Philippines * . * *5 55
- Private Development Corporation of the
Philippines * * * * * * * * . * * * * * * * * 60
- Private Development Banks * . * * * * . .* 6 64
- Rural Banks * . * * . . . * . *. . . . . . . 67
- Non-Bank Financial Intermediaries . . . . . * 70
- Lending by Finance Companies and InvestmentRouses to SSEs * . . . . . * * 71

-2-
Page
III. Experience of the Financial Institutions:
Qb) Conclusions . . . . . . . . . . .73
- Privately Raised Resources . . . . . . . . .73
- Government Programs: (a) The Larger Small
Industry Loans . . . . . . I . I. . . . 1 .77
- Government Programs: (b) Cottage (or
Home) Industry Loans . . . . . . n 7 . . .78
- Government Programs: (c) Working CapitalFinance . . . . . . . . . . c . . . . . . 79
- Postscript: Further Changes in 1979 . . . 81
- Summing Up . . . . . . . . . . . . . . . 81
IV. Industrial Extension , . . . . . . . . . . . .83
- Introduction . . .. . . . . . . . . . . . . .83
- Project Preparation Services (TheMASICAP Program) . . . . . . . . . . . . . 84
- Advisory Services (The SEAC Program) 103
- Conclusions . . . . . . . . . . . . . . . 111
Addendum to Chapter IV - Effects of the Costs
of Industrial Extension and of Enterprise
Failure Rates on the Economic Returns to Small
Enterprise Projects , . . . . . . . . . . . . 114
V. Small Enterprises and Industrial Development 116
- Data: Sources and Definitions . . . . . . 117
- Aggregate Changes in Size Structure
Over Time . . . . . . . . . . . . . . . . 119
- Enterprise Expansion . . . . . . . . . . 122
- Enterprise Closure Rates . . . . . . . 126
- Further Micro Data: Sources and Uses of
Finance . . . . . . . , . . . . . . , 132
- Product Markets . , ., . . . 136
- Sectoral Patterns and Trends in Size
Structure , . . . . # . . . . . . . . . 139
- Industrial Policies and the Size Structure
of Industry . . . . . . . , . . 4 . , 146
- Conc 1usions . . . . . . . . . . . . . . 160

-3-
Page
VI. Small Enterprise and Regional Development . . . . 162
- Urban-Rural Population Data . , . . . . . . . 162
- Manufacturing Employment in Urban and Rural
Areas . . . . . . . . . . . . , . . . . . , 165
- Regional Distributinn and Growth of Manufacturing
Employment . . . . . . . . . , . . . . . I . 1 170
VII. Small Enterprise Programs and Employment Policy:
A Reassessment of Purposes . . . . . . . . . . . . . 185
- Introduction ,. . . . . . . . . . . I. . , . . .185
- Unemployment and Underemployment: Levels and
Trends . . . . . . . . . . . . . . , . , . . . . .188
- Changes in Real Wages Over Time . . . . . . . . 191
- Earnings in Self Employment . . . . . . . . . . 201
- Incomes and Occupational Mobility . . . . . . . 207
- Implications for the Small Enterprise Program . 210
- Labor Intensity in Small Enterprises ..... 215
- The Demand for Labor in General . . . . . . .. 219
- Conclusions . . . . . . .... . . .. 221
VIII. Uncertainties in the Capital Markets, InterEit Rates
and investment Criteria . . . . . . . . . . . . . 224
- Introduction . . . . . . . . . . . . . . . . 224
- Uncertainties in the Capital Markets . . . . . . 226
- Externalities, Economies of Scale and Interest 238
Rates , . . . . . . , . . . . . . . . . . . . , 238
- Appraising Small Enterprise Programs . . . 244
-Bibliography . . . . . . . . . 258
VOLUME II - Annexes

SMALL ENTERPRISES AND DEVELOPMENTPOLICY IN THE PHILIPPINES: A CASE STUDY
VOLUME I
The Main Report

I, OUTLINE
1.1 This report presents a review of the small and medium industry
programs in the Philippines, and examines their relation to industrial
and regional development policies. It also reviews the available
evidence on the size-structure of industrial development by region
and over time. This chapter presents a self-contained discussion of
this material under one heading. The main conclusions of the report are also
summarized at the end of this Chapter (paragraphs 1.36 et. seq).
The Scope of the Report
1.2 In most developing,countries, manufacturing employment is
predominantly in households, workshops and small factories. A large
share - particularly in small-scale manufacturing - is also found in
the rural and urban areas of agricultural provinces, serving the markets
generated by agricultural growth. But institutional finance and the
training and advisory services for industry are heavily concentrated on
large-scale manufacturing in metropolitan areas. The idea behind small
1/enterprise programs is to extend finance and supporting services towards
small industries with the purposes of improving earnings opportunities
for a greater share of the labor force, and achieving a more regionally
balanced growth of industry.
1.3 These were broadly the purposes behind the small and medium
industry programs introduced in the Philippines in 1974. In the previous
twenty years the labor force had increased from 7 to 14 million, and by the
mid '1970s 500 thousand people were entering the labor market each year;
1/ A note on the use of the term 'small enterprises' is provided inthe Annex to Chapter 1,

-2-
there was (and remains) in consequence a continual pre-occupation about
providing gainful employment opportunities for the labor force. The
bulk of industrial investment was taking place in Manila and its surrounding
regions, and had been facilitated by an extraordinary growth of the organized
financial sector, at over 11% per year in real terms, from an already
large base, over the previous 20 years. In 1977 for instance, 87% of
the total loans and investments of the private commercial banks (the
largest financial institutions in the country) were in Metropolitan Manila,
with 83% of their industrial lending being to medium and large scale
industries. In contrast, workshop and factory-based manufacturing
employment was both more extensive and growing more rapidly in the
provinces. This can be seen from the estimates provided in Table 1.1:
Table 1.1: DISTRIBUTION AND GROWTH OF MANUFACTURINGEMPLOYMENT BY REGION, 1960-75
Distribution Growth RateRegion and Scale of Activity %, 1975 % per Year
Manila and Rizal (Metr-politan Manila):- Household Manufacturing 9 6.9--
- Establishments with < 10 workers 4 4.4- Establishments with > 10 workers 17 3.8
30 5.0
Provinces:- Household Manufacturing 41 0.4
- Establishments with < 10 workers 13 8.3
- Establishments with > 10 workers 16 7.4
70 2.6Total 100 3.2
/1 There is quite a large margin of uncertainty in this figure.
Source: Text Table 6.4,

-3-
The high growth rates of establishment-based production in the
provinces. are a comparatively recent happening, and apparently reverse
a trend experienced in the 1950s (and probably much of the 1960s) when
agricultural development was given a low priority.
1.3 The distribution of industrial employment by scale and by
region are to be examined at length in the following report. But it
might be noted, first, that the declining share of household manufacturing
in the provinces should not be interpreted negatively. It reflects
the structural changes towards establishment-based production resulting
from gradual improvements in infrastructure and transport services in the
provinces, and from the markets generated by agricultural growth.
Second, a significant portion of the growth of medium and large scale
industry has its roots in the expansion of once small firms. In the
1970s, an increase in the rate of growth of provincial industries
was expected as a consequence of a new emphasis to be placed on agricultural
development; it was this that led to the idea of a regionally based
program to address constraints on the flow of finance and supporting
services to small and medium industries.
1.4 The first half of this report (Chapters 2, 3 and 4) presents
an assessment of this program over its first five years. The program has
several elements, including finance, extension and advisory services,
training and entrepreneurship development; but the following considers
finance and extension only, since the task would otherwise have been
too great, Although the program was financed and administered entirely
1/ An outline of the arguments can be found in the ILO (1974) report.Most of the Government documents and memoranda, which naturallyprovide more detailed documentation, have never been published.

-4-
by Government agencies, it was designed to encourage a greater
involvement of the private sector in financing and providing services
to small enterprises; much of the report is therefore concerned with
assessing how far this was achieved in practice and what constraints
remain.
1.4 Chapters 5 and 6 examine the regional and size distributions
of industrial development, and how they were affected by leading sector
policies; it also presents interview data on the origins and growth
of firms. Apart from providing basic descriptions on the changing
size and regional structure of industry, these chapters seek to clarify
how the policy environment is affecting the nature of employment
opportunities in the country, and to discuss its implications for the
small enterprise programs. While the programs are aimed at improving
earnings opportunities, it is apparent that such opportunities - and
thus the efficiency of the small enterprise programs - are overwhelmingly
determined by leading sector policies. The indirect effects of investments
in agriculture, and of industrial incentives and tariff policies on the
incomes of those employed or seeking employment in small enterprises, are
far more significant than those of direct interventions, such as financing
and extension programs. Equally, the suggestion that the indirect effects
of leading sector policies are important does not imply that direct
interventions are not merited, If for instance they bring about a more
rapid emergence and growth of small enterprises, as is currently happening
with small-farmer agricultural projects in the Philippines, the benefits

-5-
of addressing the constraints in the capital markets and on the flow
of supporting services are increased.
1.5 Chapter 7 reassesses the purposes of small enterprise
programs in the light of the current pre-occupation with improving
employment and earnings opportunities in the country. It winds up
with a discussion of the use of the capital-labor ratio and the rate
of return to capital as investment criteria, favoring the latter. The
choice of criterion has implications beyond that of deciding whether
or iot a particular project is worthwhile, however, although this is
undoubtedly one implication. As in other countries, the understandable
pre-occupation with creating jobs for the labor force has led to
preferences for financing fixed assets over working capital, for
assisting new or expanding enterprises over those simply seeking
modernization without expansion, and for financing direct investments
in industry over those in services and trade. The elementary point to
be established is that what the majority of the labor force are seeking
is not simply more employment, but more gainful employment; the programs
should thus be regarded as an agent of structural change, and support
profitable activities that offer prospects of an income gain, irrespective
of whether an expansion of employment, of fixed assets, of manufacturing
or trading, or of working capital is involved. As will be seen, this
suggests new points of departure for the future of the programs.
1.6 The final chapter '(8) is a technical supplement, and discusses
the theory underlying some of the earlier chapters. It provides a formal
discussion of uncertainties in capital markets and their implications for

-6-
interest rate policy. Some analytical questions on project selection
criterion are also taken up in this chapter,
ExDerience of the Financial Institutions (Chapters 2 and 3)
1.7 As of December 31, 1978 the total assets of the Philippine
financial sector amounted to P 163.1 billion. Table 1.2 below indicates
the types of institutions holding assets in excess of 1% of the total
assets of the Philippine financial system:
Table 1.2; PERCENTAGE DISTRIBUTION OF THE ASSETS OF TIE
PHILIPPINE FINANCIAL SYSTEM AS OF
DECEMBER 31, 1978
Commercial Banks 55.1Development Bank of the Philippines 11.2
Finance Companies 4.8Private Insurance Companies 4.7
Investment Houses 2.9
Finance Companies 2.9Rural Banks 2.5
Savings and Mortgage Banks 2.3
Land Bank of the Philippines 2.1
Others 11.5
Total 100.0
Source: NEDA
The sector has two major components: the banking system and the non-
1/banking system. The former comprises commercial banks, rural banks,
thrift banks, development banks and savings and loan associations, and
which together accounted for 88% of loans and investments outstanding
of the financial sector in 1978. The non-banking system accounted for
the remaining 12% and consists of government sponsored insurance programs
such as the Social Security System, the Government Service Insurance
1/ The roles of the various financial institutions are summarized inAnnex 2 of Chapter 2.

-7-
System and the Agricultural Credit Administration; it also includes
institutions such as investment houses, finance companies and public and
private insurance companies.
1.8 The rapid expansion of the financial sector since 1950 has been
associated with a corresponding expansion of branch networks throughout
the country. This was mainly to broaden the resource base; the commercial
banks for examDle now have nearly 800 branches in the provinces and
about 500 in Metro-Manila; 70-75% of their incremental resources came
from deposits in the years 1976 and 77. But as noted earlier, lending
to small enterprises by financial institutions accounts only for a small
share of their total lending to industry and commerce. As far as
institutions in the private sector are concerned, four reasons are commonly
put forward to explain why the share is small:
(i) The risks of loans not being repaid, and the
administrative costs, are both too high tol/
develop a lending program for small enterprises;
(ii) Institutional biases in favor of lending to the
corporate sector; historically the private financial
institutions evolved expressly to mobilize resources
for the corporate sector, and indeed commonly have
joint ownerships and directorships;
Ciii) Transactions costs faced by the owners themselves
of small enterprises in applying for institutional
credit; and
(iv) Interest rate ceilings and other structural constraints
affecting the returns to lending to small enterprises.
I/ Risks and administrative costs are jointly referred to as transactions costs.Risks are defined below as being the probability of loans not being repaid.

-8-
Ci) and Cii) led to the decision to finance small enterprises through the
Government-owned Development Bank of the Philippines CDBP) on the
assumption that the economic returns would outweight the private returns
perceived at the time by the private sector. The Government also introduced
a rediscounting facility, known as the Industrial Guarantee and Loan Fund
CIGLF), with risk guarantees built into it, and which was available
to accredited private sector institutions; besides widening the reach
of the program, IGLF was also intended as an inducement to the private
sector to develop lending programs to small and medium industries, and to begin
to lend to them using privately raised resources. (iii) led to the
establishment of an extension service, and is discussed further
below. Less attention was paid to (iv), however. What were the results?
1.9 Financial institutions in the private sector still
make few short-term loans and even fewer long-term loans to small
enterprises out of privately raised resources, except to a small minority
of borrowers of good standing. The reluctance to lend can be explained in
part by the administered interest rate structure, which allows maximum
effective rates of 16% and 19% respectively for short-term and long-term
loans. The value of compensating business often raises the returns above
these levels, but it is only significant for prime - mostly large scale -
borrowers. In 1978, the weighted average costs of resources to the
commercial banks were estimated to be 13.3%, and would have been significantly
higher had more long term resources been raised; in 1979 the weighted
average costs rose for several reasons, with the consequence that both
actual and planned lending to small enterprises were cut back further.

9
Analysis of the administrative costs and risks shows that lending to a
broader class of small enterprises would be unprofitable to the private
sector under the present structure of financial incentives. This conclusion
applies less strongly to short-term than to long-term lending, in which the
risks and administrative costs are greater while the spreads between borrowing
and lending long are, quite probably, narrower,
1.10 Hence lending by the private sector to small enterprises is
unlikely to develop unless there is a drop in the costs of resources
such that lending becomes profitable within the existing constraints,
or unless there is a lifting of the constraints themselves. These
arguments are familiar, However, in the following report it is suagested
that financial incentives alone are unlikely to induce the private sector
to lend out of its own resources. The experience of DBP and IGLF shows
that the risks of lending to small enterprises are (as expected) initially
high, and reducible only through a sustained institutional development
effort over a long period. One element in the risks is undoubtedly the
higher closure rates of small enterprises, which averages around 4% per year,
But a larger element stems from (i) poor information; (ii) the tasks of developing
screening, appraisal and supervision procedures, and of training staff; and (iii)
the tasks also of developing internal control procedures to eliminate diversions
and misuses of funds, Some of the smaller private financial institutions
in the provinces, who are able to administer very small loans efficiently,
could not handle the larger small loans available through IGLF, and also left
the program. In the first five years of the program the risks declined
noticeably from high levels, almost wholly on account of the accumulation of
experience and the development of procedures within the institutions involved.
Hence our conclusion is that the role of the Government's program in

- 10 -
shouldering the early costs and risks of providing small enterprises
with access to institutional credit is being fulfilled; but that the
impact of the program would be greatly enhanced if the structural
constraints preventing the flow of private financial resources to
small enterprises were addressed.
1.11 Both DBP and IGLF have also concentrated on term-loans,
although short-term loans are probably in as great a demand, are less
risky and likely to be more attractive to the commercial banks. For
these reasons we have suggested that the programs might introduce short-
term lending. Lending to small commercial enterprises would help small
industries further by opening up markets and providing additional
conduits for working capital and trade credits. Other suggestions are for a
re-structuring of incentives at the 9maller loan end of IGLF, and
possibly a removal of the floor limits: the smaller loans (in terms of
numbers) are in greater demand; there is no prima facie evidence that
they are more risky; as a percentage of loan size, they are not prohibitively
costly to administer if accompanied by a decentralization and simplification
of lending procedures; and there are institutions in the provinces
capable of handling very small loans efficiently. Finally, a forum for
the exchange of views and experiences between institutions is suggested,
together with the establishment of a common credit record keeping system.
Industrial Extension (Chapter 4)
1.12 At the beginning of the program two types of extension
services were intorduced into the provinces;,both were administered
by the Ministry of Industry and were intended to complement.the financing
1/pograms discussed above. One (known as MASICAP) provided assistance
1/ Medium and Small-Scale Industries Co-Ordinated Action Program,

- 11 -
in the preparation of projects for finance, It was introduced since
previous experience had shown that simply making finance available
without the supporting promotional and advisory services was in itself
likely to lead to a low demand and, where the demand did exist, to
unsatisfactory proposals being put forward to the institutions. The
idea was that once the extension and preparatory work had been
completed for a sufficiently large number of projects, the information
and experience gained would permanently reduce the average transactions
costs all round, and financing would procede independently of the
extension service. As noted in the text, the service was and is not
intended to be a permanent aspect of the financing programs. The actual
decisions to lend are of course the responsibility of the financial1/
institutions. The other service (known as the SBAC program) was
purely advisory in nature, and offered what are termed entrepreneurial
counselling, business management, technical, marketing and referral
services. For the most part, these services have been turned to by
people planning to set up or expand their businesses in various ways,
and are seen as centers for disseminating ideas and information on
business opportunities and business practices.
1.13 Extension services for small non-agricultural enterprises
are different in nature to those for agriculture. This is possibly
because more experience has been gained with the latter, which are
able to provide advice on husbandry and farm technologies, and more
generally to act as an agent for up-grading farming practices in a
region. As discussed in the text, however, a basic difficulty of
1/ Small Business Advisory Centers.

- 12 -
industrial extension stems from the heterogeneity of small business
activities; they are found in practically all industrial sectors
and,even within narrowly defined sectors at the 5 or 6 digit level,
often differ in financial and technical respects, and in the location
of markets and sources of raw materials supply. In the preparation of
projects, an independent technical and business budget analysis is
required for each case, based on an assessment of local wages and
prices, the technologies available, and of market outlets. Exceptions
are comparatively small projects for which simple checks on costs and
profits will often suffice, and working capital finance, which can
generally be tied to sales orders and collateral. The heterogeneity of
small enterprises naturally restricts the range of advice that can be
offered, raises the costs of extension, and requires the extensionsists
to draw on the specialized trading, industrial and research associations:
i.e. to act as referral services. Both programs have funcitoned within
these limitations and, with one general exception, the main issues ahead
relate to the supporting financial and non-financial services that exist
outside the programs,1/
1.14 The MASICAP program has worked with a large number of enterprises
in obtaining institutional finance that would otherwise have not had access
to it, The existence and nature of the program largely ensures this, since
people accustomed to drawing on institutional finance are generally not
1/ Since this study was prepared., the services provided under the MASICAP
program have been formally taken over by SBAC, Below, the old
acronym is retained for convenience,

- 13 -
referred to MASICAP by the institutions and have less need to draw on its
services. The costs of the program have also been low, about 3% of
project investments Cor 5% if a small number of comparatively large
projects are excluded). The risks of the loans made, while not above
the averages experienced by DBP and IGLF in the first five years,
remain high however, and are undermining the financial returns.
Closure rates of the enterprise assisted are also high - more than twice
the rate experienced by small enterprises not assisted. Analysis of
records sugests that there were three main causes of arrears and
closures, other than 'natural' causes: (a) optimism (by both owners
and extentionists) about sales and profits, and which left many
enterprise vulnerable to shortfalls in markets and supplies; we
have suggested that supervision and ex post accountability would help
make forecasts realistic; (b) a tendency to concentrate on new rather
than (the large number of) existing enterprises that had already established
their businesses and which are much less risky to finance; and (c) with
respect to arrears, the financial institutions themselves were still
in the throes of developing their procedures, as discussed above.
1.15 Apart from these internal factors, the dependence of the
program on DBP and the absence of working capital finance both restrict
what might be accomplished. The dependence on DBP, which is having to
shoulder a disproportionate share of the risks of financing small
enterprises in the country, arises from the factors discussed above;
that is, the structural constraints inhibiting lending by the private
financial sector and, within the Government's own financing programs,
the point that IGLF lending is unprofitable in the smaller loan range

- 14 -
(less than about P150,000 or $22,000). Approximately 75% of HASICAP's
clients request loans are in the small loan range, with 45% being below the
current IGLF floor limit of P50r000 (87,000).
1.16 The value of SBAC's services is less tangible, though perhaps no less
important with 7,000 new manufacturing enterprises emerging in the country
each year. The services appear to be widely sought, particularly during
the transitional stages of a business's life: e.g. from those seeking advice
before or during startup; or during periods of significant growth, when
recourse to specialized management and supervisory skills, a search for new
markets'or other major changes are being contemplated. Most of the services,
however, have their counterparts in the private sector - in accounting and
trading firms, in the banks and investment houses. and in the soecialized
trading, industrial and research associations. With respect to services
that are in competition with the private sector (as with the consulting and
accounting services), there is the possibility that, being free of charge,
they are undercutting private sector initiatives. But for those that are
complementary, as with the referral services, the issue of charges is minor.
The main issue here concerns the development of the institutional structure
in support of industry. At present, the trading, research and industrial
associations have for the most part developed round the modern sector, and
are not broadly represented in the provinces; their present contributions
in providing market intelligence, disseminating information on industry
practices, establishing and maintaining industry standards, and in providing
training and other services are, therefore, somewhat fragmentary.

- 15 -
Industrial and Regional Development Aspects of Small Industries (Chapters 5 and 6)
1.17 Two features of Philippine manufacturing in the past 25 years
were the slow rate of labor absorption - notwithstanding high levels of
industrial investment - accompanied by marked changes in the nature of
manufacturing employment. Between 1956 and 1975 the shdre of manufacturing
in total employment actually fell, from 12.5% to 11.4%; and the elasticity
of demand for labor with respect to output fluctuated between the extremely
low levels of 0.1 and 0.3. These aggregates, however, conceal underlying
structural changes: in the mid' 1950s, three quarters of manufacturing
employment was found in households, most commonly as a secondary source of
ff-farm)income for farm families. But the share has since declined
systematically in favor of wage employment in workshops and small and large
factories in urban areas, in which it is more commonly a primary source of
family income; in these activities the ratea of labor absorDtiQn and the
elasticities of demand for labor where comparatively high (the elasticity
averaged about unity in recent years). Table 1.3 shows some recent data.
The growth rates, both of employment and of number of establishments, are
1/noticeably higher in the small and middle size ranges. It might be
worth examining-the reasons for this further in the light of their
significance for the small enterprise programs.
1/ Previous studies based on survey data had found very low growth ratesin small scale establishments. These data ignored the <;5s however,which employ the largest share of those working in small scale.

- 16 -
Table 1.3; GROWTH OF MANUFACTURING ESTABLISHMENTS AND EMPLOYMENTBY SCALE OF MANUFACTURING ACTIVITY, 1967-75
Type and Scale of Growth Rate,Activity 1967 1975 % per year
Household Employment, 000s 827 882 0.8
Employment in EstablishmehEs (scale by No. of workers), 000s:-
Less than 10 125 207 6.510 - 19 23 37 6.120 - 99 65 95 4.9
100 - 199 38 56 5.0200 and over 268 374 4.3
1,223 1,651 3.8
No. of Establishments (scale by No. of workers):
Less than 10 41,018 70,597 7.010 - 19 1,747 3,172 8.220 - 99 1,570 2,339 4.6
100 - 199 278 400 4.7200 and over 384 481 2.9
44,997 76,989 6.9
Source: Census of Establishments and Labor Force Surveys Householdemployment is estimated as a residual.
- 17 -
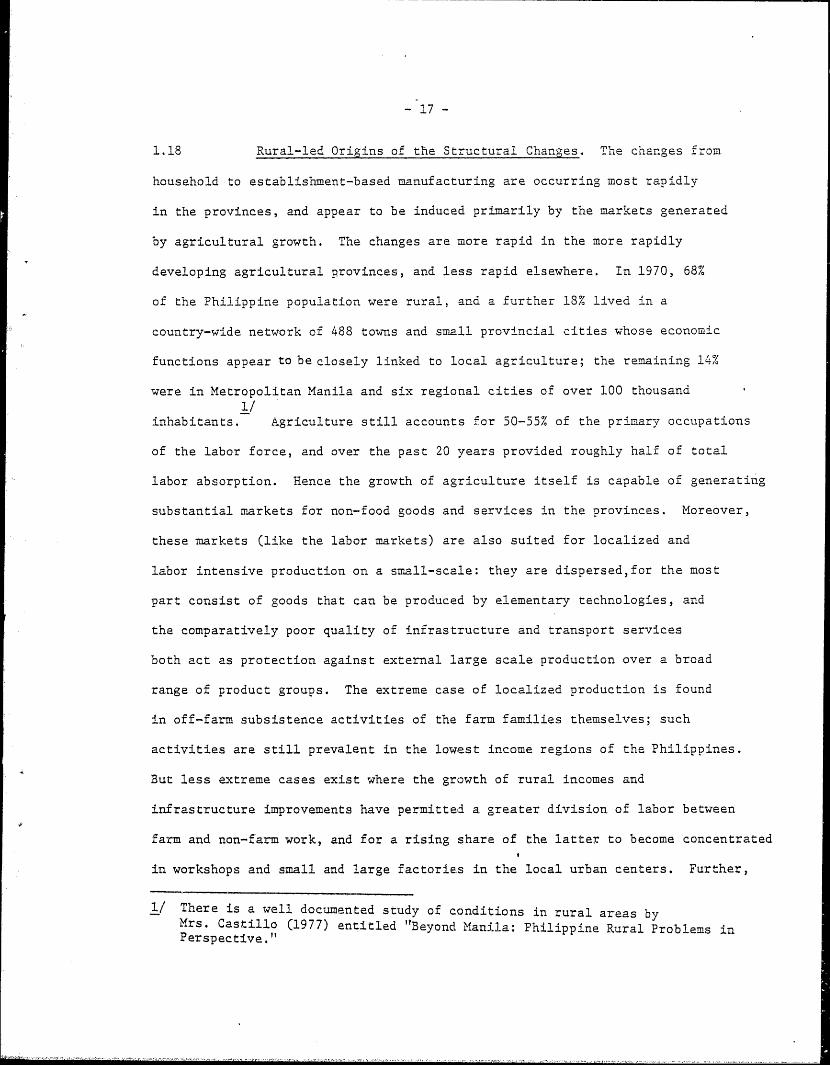
1.18 Rural-led Origins of the Structural Changes. The chanres from
household to establishment-based manufacturing are occurring most rapidly
in the provinces, and appear to be induced primarily by the markets generated
by agricultural growth. The changes are more rapid in the more rapidly
developing agricultural provinces, and less rapid elsewhere. In 1970, 68%
of the Philippine population were rural, and a further 18% lived in a
country-wide network of 488 towns and small provincial cities whose economic
functions appear to be closely linked to local agriculture; the remaining 14%
were in Metropolitan Manila and six regional cities of over 100 thousand
1/inhabitants. Agriculture still accounts for 50-55% of the primary occupations
of the labor force, and over the past 20 years provided roughly half of total
labor absorption. Hence the growth of agriculture itself is capable of generating
substantial markets for non-food goods and services in the provinces. Moreover,
these markets (like the labor markets) are also suited for localized and
labor intensive production on a small-scale: they are dispersed,for the most
part consist of goods that can be produced by elementary technologies, and
the comparatively poor quality of infrastructure and transport services
both act as protection against external large scale production over a broad
range of product groups. The extreme case of localized production is found
in off-farm subsistence activities of the farm families themselves; such
activities are still prevalent in the lowest income regions of the Philippines.
But less extreme cases exist where the growth of rural incomes and
infrastructure improvements have permitted a greater division of labor between
farm and non-farm work, and for a rising share of the latter to become concentrated
in workshops and small and large factories in the local urban centers. Further,
1/ There is a well documented study of conditions in rural areas byMrs. Castillo (1977) entitled "Beyond Manila: Philippine Rural Problems inPerspective."

- 18 -
the growth of the urban centers themselves is now providing an
endogenous source of market growth in the provinces. The evidence
so far is that locally based small and medium manufacturers have been
highly responsive to the growth of both local and regional markets
(interview and file data on the market outlets of 500 small and medium
firms are presented in Chapter 5).
1.19 The influence of agriculture on the product markets, the
dispersion of the population, the advantages of localized small scale
production for certain classes of products, and the growth of the provincial
urban base together help to explain the structural changes from household-based
to establishment-based production as agricultural output rises. They are
consistent with the evidence in the Philippines that the growth of
employment in workshops and factories is highest in regions where
agricultural incomes are growing the most rapidly and broadly, as for
instance in the small farmer rice and corn growing districts in Central Luzon,
Southern Tagalog (Southern Luzon) and Mindanao. The available regional data
are unfortunately not sufficiently disaggregated to document this point as
thoroughly as one would like, though it is supported by studies of particular
districts in the Philippines and other countries. As it is hoped is clear
from the descriptions in Chapter 6, however, the changes are significant
enough to be apparent even in aggregate regional data, some of which are
reproduced in Table 1.4.:

- 19 -
Table 1.4: DISTRIBUTION AND GROWTH OF MANUFACTURINGEMPLOYMENT BY REGION AND BY SCALE, 196C-75
% Distribution, 1975-= % Growth Rates, 1960-75Establishment 2L EstablishmentsL2
Households Small Large Households Small Large
Metro 7 anila 9 4 17 6./-'3 4.4 3.8Luzon-- 22 8 9 1.3 8.3 9.6Visayas 13 2 4 -1.4 6.0 4.3Mindanao 7 3 3 2.2 9.7 5.4
/1 The percentages in the three columns on the left add up to 100, and areincluded here to indicate the weights that should be given to the figuresin the three on the right.
/2 Small Establishments have less than 10 workers, large 10 or more.
/3 There is a wider margin of uncertainty in this figure than in the rest.
/4 Excluding Metro-Manila.
Source: See text Table 6.4.
The figures are regional averages; the growth rates in the high growth districts
in Luzon and Mindanao are higher than those shown in the above table. The
urban growth rates in each of the regions are also broadly distributed, but
tend to be higher in the high growth districts. For the country as a whole,
the bulk of labor absorption in urban areas is occurring in the small provincial
towns and cities, illustrating the point made above about the growth of the
regional urban base. Currently, the annual rates of labor absorption stand
roughly in the ratio 3.0: 2.5: 1.0 respectively for (i) small provincial
towns and cities of less than 100 thousand inhabitants, (ii) Metropolitan
Manila, and (iii) the six large regional cities of over 100 thousand
inhabitants.
1.20 Although household manufacturing is declining overall, it is not
doing so uniformly in all sectors and regions. In some it is rising
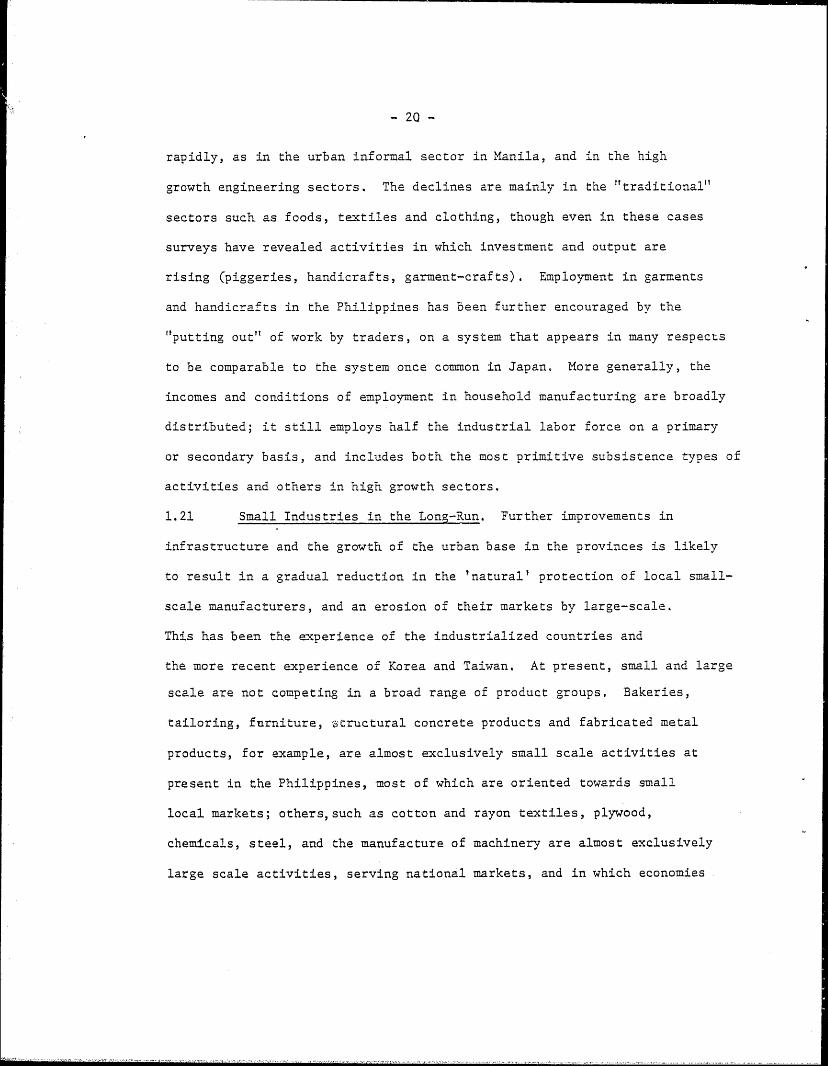
-20-
rapidly, as in the urban informal sector in Manila, and in the high
growth engineering sectors. The declines are mainly in the "traditional"
sectors such as foods, textiles and clothing, though even in these cases
surveys have revealed activities in which investment and output are
rising (piggeries, handicrafts, garment-crafts). Employment in garments
and handicrafts in the Philippines has been further encouraged by the
"putting out" of work by traders, on a system that appears in many respects
to be comparable to the system once common in Japan. More generally, the
incomes and conditions of employment in household manufacturing are broadly
distributed; it still employs half the industrial labor force on a primary
or secondary basis, and includes both the most primitive subsistence types of
activities and others in high growth sectors.
1.21 Small Industries in the Long-Run. Further improvements in
infrastructure and the growth of the urban base in the provinces is likely
to result in a gradual reduction in the 'natural' protection of local small-
scale manufacturers, and an erosion of their markets by large-scale.
This has been the experience of the industrialized countries and
the more recent experience of Korea and Taiwan. At present, small and large
scale are not competing in a broad range of product groups. Bakeries,
tailoring, furniture, sCructural concrete products and fabricated metal
products, for example, are almost exclusively small scale activities at
present in the Philippines, most of which are oriented towards small
local markets; others,such as cotton and rayon textiles, plywood,
chemicals, steel, and the manufacture of machinery are almost exclusively
large scale activities, serving national markets, and in which economies

- 21 -
of scale are probably strong enough to offset the higher transport and
marketing costs of distributing large scale's products. As these costs
fall, competition is likely to occur in an increasing number of product
groups and lead to a peaking and then a decline in the share of small-scale
establishment-based manufacturing. The interview data presented in Chapter 5
suggest that much of the competition is likely to stem from the emergence
and growth of small firms themselves; the large majority of medium and large
firms begin with very small investments and expand in stages
through the size structure - generally in the region of origin. Hence the
role of small industries in the industrialization process is essentially
a dynamic one, but with a lasting effect on the regional pattern
of urban-industrial development.
1.22 Effects of the Industrialization Policies. The recent study
of Bautista and Powers (1979) makes it possible to examine the incidence
of the industrial tariff and tax incentives on large and small scale,
and to address the questions: how did they effect the efficiency of small
enterprise programs? and, what would be the effects of a transition (now
being planned) to a more efficient structure of incentives?
1.23 The policies have been examined at length in a series of
studies (cited in the text) and can be summarized briefly. In the 1950s
industrialization proceeded under the protection provided by exchange
controls and tariffs, with both leading to higher effective rates of
protection for manufactured consumer goods than for capital goods. Since
the early 1960s, a roughly similar structure of protection was maintained
under tariffs alone, and did not change fundamentally under subsequent revisions
in the tariff code. In 1967 and again in 1970 tax exemptions - mostly

- 22 -
on capital costs - were introduced to promote the capital goods industries
and industrial exports, both of which had been thwarted by the tariff
structure. The Acts that introduced these incentives also contained laws
to encourage and protect foreign investments. The effects of these policies
are familiar:
(i) Fast industrial growth in the 1950s (at
12-15% per year) at the height of the import-
substitution process, followed, once saturation
set in,by slow zrowth ever since (at 4-6% ver year in
the 1960s. and 5-7% in the 1970s);
(ii) A labor saving bias in industrial investment;
(iii) A huge shift of investable resources away from
agriculture;
(iv) Slower economic growth overall on account of the
misallocation of investment (a) between industrial
sectors, and (b) between agriculture and industry;
Cv) A slower growth of economic output in the provinces
on account of Ciii); and
Cvi) An excessive concentration of investment in
Manila on account of (v) and also of the
transactions costs to firms of dealing
with controls, tariffs and incentives if not located
in Manila,
1.24 The tax incentives on industrial investment favored large more
than small industries, though they were not used much by either on
account of the transactions costs involved. The tariff structure worked
against both small and large scale activities employing large shares of
the labor force - but particularly against small scale. The following

- 23 -
table uses the estimates of effective rates of protection CEPR) by
sector provided in Bautista and Powers' study to show the relative
incidence of the tariff incentives on large and small,
Table 1.5: EMPLOYMENT IN LARGE AND SMALLESTABLISHMENT ACCORDING TO LEVEL OF PROTECTION 1974
/1Effective Rate of /2 No. of Percent Emnloyed In-Protection; Range, %- Sectors Small Large
> 500 6 13,1 9,8100 to 500 20 1.5 11,775 to 100 9 1.6 17,150 to 75 8 .8 1,625 to 50 21 5,1 12.80 to 25 33 11.9 22.3
-25 to 0 5 1,6 16,2-50 to-25 6 66,4 7,0
108 100.0 100.0
/1 Small Establishments have less than 10 workers, large 10 or more.A more detailed breakdown for different size groups was notpossible from the information available to us. Note the bimodalnature of the size distribution,hou-ver, from Table 1.3, with the< 10's and the > 2 00's accounting for 75% of establishment basedemployment.
/2 When an estimate is on the dividing line it is put in the uppercategory. E.g. and EPR of 0 is included in the 0 to 25% range.
Source: See Annex Table 7 to Chapter 5. The above is the same asText Table 5.14, and is reproduced here for convenience.See also Table 5.15.
The 'underprotected' sectors would include those with EPRs of less than
about 25%; about 80% of employment in small and 45% in large industries
is found in this group. A similar analysis shows that employment shares
in the more efficient sectors (ranked according to Domestic Resource Costs)
are about 80% and 65% respectively for small and large scale establishments.

-24
Hence . shift towards lower and more uniform tariffs would provide
ineentives to both small and large scale to concentrate investments
in the more efficient sectors. The sectoral composition of small
enterprise projects in the protfolios of the financing institutions
would also be more efficient.
1.25 But the main effects would be to increase the growth of the
domestic markets both overall, on account of the efficiency of lower
and more uniform tariffs, and in the provinces, since there would be a
greater share of investment in agriculture. Any reduction of the labor
saving biases in the present incentives system (or the introduction
of positive employment incentives) could be expected to stimulate
product markets further through favorable effects on employment and wages.
Such developments would also encourage the growth of small and medium
industries at the present time, in the provinces and in Manila.
Purposes of Small Enterprise Programs Reconsidered (Chapter 7)
1.26 Unemployment, Wages and Incomes. The rapid growth of labor supply
in the Philippines and the capital intensive development path that was
followed did not act to increase unemployment, but to depress real wages
and real earninss in self-employment. Unemployment'rates have actually
declined all round in recent years, in urban and rural areas, among
household heads, and in all age groups; under-employment rates, according
to the measure used by the NCSO, also declined. Table 1,6 shows some data
for 1965 and 1976;-

- 25 -
Table 1.6: UNEPLOYMENT AND UNDER-EMPLOYMENT RATES,1965 AND 1976
October August1965 1976
- - - - - Percentages - - - - -
Unemployment Rate:- Urban 10.7 8.0- Rural 4.1 3.6
Household Heads Unemployed 1.9 1.2
Unemployment by Age Group:
10 - 24 years 12.2 9.525 - 44 4.1 4.045 - 64 2.9 2.4All Ages 6.2 5.0
/1Visible under-Employment--- 9.3 5.1
/1 Percent working less than 40 hours per week and seekingadditional work.
Source: Labor Force Surveys.
The movements in real wages are discussed in the text, which gives the full
series dating back to the early 1950s. Briefly, for industrial labor the
main features were rapid declines beginning in the late 1950s once the
scope for import substitution became limited; a levelling off in the
1/1960s, followed by further declines - of nearly 40% - in the 1970s.
1/ The declines in the '70s- may have been exaggerated by inconsistenciesin the wage series, though all series point in the same direction,and labor's share in value added also dropprd precipitously,John Powers rightly pointed out to us that doubts still remain aboutthe precise movements in real wages, however.

- 26 -
The declines have been attributed to the combination of a rising labor
supply and a concentration of investment in the capital intensive sectors,
induced first by the tariffs and investment incentives, and then in the
1970s by the effects of world inflation on the prices of locally
manufactured goods. For agricultural labor, there were slow but
continual declines in real wages for nearly 20 years, up to the mid'
1970s; at this time the effects of an intensified effort to raise output
in food-grains began to change the labor supply and demand conditions in
some regions, and agricultural wages rose both in real terms and relative
to industrial wages.
1.27 What were the effects of the declining wages on incomes? Many
workers changed their jobs in response to a Slowly rowing demand for
labor in the higher wage occupations, and in doing so increased their
incomes even when the wages in the new jobs were declining. E.g. there
were movements from wage labor in household manufacturing (where one
in three workers are hired) and agriculture, to wage labor in workshops
and factories, both small and large scale, and from unskilled to various
grades of skilled jobs. Others moved into those entrepreneurial activities
in which real incomes were rising - including household manufacturing
in the more profitable activities. Occupational shifts have been
widespread in the past 20 years, and for some workers have helped to
diminish the adverse consequences of declining real wages.

- 27 -
1.28 In addition, the majority C602. of the labor force are self-
employed, principally in agriculture and non-farm activities in rural
areas and towns, Their incomes were thus affected principally by
yields and average labor productivities in agriculture. Although, on
account of under-investment in agriculture, these quantities remained at
very low levels in the 1950s and 1960s, both in fact grew slowly in this
period; the growth rates then increased significantly in the 1970s under
the influence of the development programs in food grains, and in rice
production in particular.
1.29 ImDlications. The precise details of the recent changes in
wages and incomes may become clearer in subsequent studies and surveys.
They are however unlikely to alter the conclusion that labor supply and
demand conditions in the past 20 years have affected the conditions of
employment more than the levels of unemployment. Analysis of employment
data and occupational shifts reveal relatively low unemployment rates -
and also a widespread search, among those in the most ill-paying
occupations, for more gainful employment. More gainful employment is
obtained both through changing jobs, and through productivity gains in
existing activities. What does this imply for the small enterprise program?
1.30 Principally, that it should support activities (where its
services are in demand) capalle of providing an income gain, whether
or not employment is being generated directly by the investments.
Initially, the program financed the fixed assets of mostly new enterprises
with the frequently expressed purpose of creating employment. Since new
enterprises proved to be risky investment propositions, however, the
approach was gradually changed towards the finance of existing enterprises

- 28 -
capable of being expanded (often referred to as "growth" enterprises).
While this approach is not inconsistent with the purpose of generating
more gainful employment, it nevertheless places a limitation on the
program by eliminating desirable projects that do not have these
features. Although, as noted earlier, the emergence of medium and large
scale activities is in good measure due to the expansion of small firms
through the size structure, only a small minority have the qualities
necessary to do this. Less than 1 in 40 small industries, for instance,
expand into the larger end of the small size ranges, or into medium scale,
and of these less than 1 in 15 expand further into the large size groups
(see Chapter 5). The majorit,y of small industries remain as they are,
are replaced by other small industries using upgraded production technologies
in response to changing market opportunities and factor costs, or turn
to not dis-similar technologies themselves without expanding significantly.
The latter two instances often involve an elimination of the most labor
intensive (and ill-paid) activities, and are not necessarily associated
with a net increase of employment; they are nevertheless associated
with an improvement in the conditions of employment.
1.31 Criterion for Small Enterprise Projects. Apart from favoring
Tgrowth!' enterprises, the concern about generating as much employment as
is possible from investment has also led to a preference for projects
with low capital-labor ratios; projects with high ratios, relative
to* ome average for manufacturing as a whole, where occasionally rejected.
As~discussed below, there are merits in examining the labor intensities of
pr6jects, if only to determine if the technologies choses are optimal given
the current costs of labor and capital. In the text, however, we have argued

- 29 -
that the familiar criterion, the rate of return to capital, provides a
rigorous test of whether a project is likely to improve earnings opportunities.
First-, note that small industries in aggregate are more labor intensive
than large, as Table 1.7 below shows; hence by addressing constraints
on investment in small industries, the programs should as intended
help to raise the overall labor intensity of industrial investment:-
Table 1.7: RELATIVE CAPITAL-LABOR RATIOS IN PHILIPPINEMANUFACTURING BY SCALE OF ACTIVITY, 1974
Scale of Activity Relative K-L ratio (Largest Scale 100)
Household Manufacturing 5
Establishments: 5-19 Workers 1820-49 3450-99 59
100-199 76200 or over 100
Source; See Text Table 7.7.
1.31 Another way of stating the rate of return criterion is to say
that projects should be capable of providing for labors' income and earning
a surplus after all other costs have been met; i.e. revenues from sales
less material, running and capital costs should exceed labor costs. The
recommended practice for treating labor costs is to estimate the opportunity
costs of labor,which are the sum of:
(a) the marginal products of labor in alternative
(generally lower paid) occupations; and
(b) the transport, resettling, personal and financial
costs, plus the indiyiduals' valuations of the
desirability of the new location and type of
employment.

- 30 -
From this it follows that projects having an acceptable rate of return
are also likely to offer better employment opportunities than in the
alternatives available. In this sense the criterion is consistent
with the employment objectives of the program. Two points might be
added. First, in a relatively unconstrained labor market, wages adjust
to these levels (Ca) plus (b)) in order to draw people into (or hold
people in) the type of employment offered by the investments. This is
roughly the situation in the labor markets faced by small enterprises in
the Philippines, as the above outline of labor supply and demand
conditions might suggest, where wages are generally a good approximation
to the opportunity costs of labor. Second, the criterion would not
in practice exclude working capital finance, or projects with high
incremental capital-labor ratios that seek to upgrade production methods
in a firm without increasing the number of employees; such projects too
are not inconsistent with the objectives of improving the conditions
of employment. A technical discussion of the criterion is provided in
Chapter 8.
1.32 Labor Intensity. The idea of using the capital-labor ratio
as an investment criterion was to encourage the search for more labor-using
investments. In practice it did not prove to be very useful for this
purpose,and was often in conflict with the interests of finding good
projects. First, as one would expect, what determined the ratio for
a project varied greatly with local wage levels. There were instances
when it made sense to have projects that eliminated the more labor intensive
and onerous of a firmls activities in order to raise output and labor

- 31 -
productivity: that is to have projects with negative K-L ratios,
In other instances, little or no increase of employment was expected,
but again an increase of output, leading to infinite K-L ratios.
Second, the ratios varied greatly across industries, while only one
average figure for manufacturing as a whole was used as a criterion;
e.g. it varies over an 80:1 range at the two digit level. Intrinsically
labor intensive project (e.g. in garments) easily fell below the average
and the criterion had no influence on choice of technique, while
others (e.g. ice factories for fisheries) fell far above it, and could
not meet the criterion unless people employed indirectly (fishermen)
were counted. Thus its use simply led to fudging. Apart from such
practical problems, there were problems of interpretation that were
ignored. Rising capital labor ratios might be an efficient and
desirable response to rising wages or an inefficient consequence of
capital subsidies) and need to be examined in the context of current
economic conditions and policies.- Finally, there is the point that
it is the corporate sector rather than small scale activities that
have inefficiently high K-L ratios, on account of the industrial
incentives and tariffs policies discussed earlier. Labor intensive
methods of production are already widespread outside the corporate
sector, frequently burdensome and generally associated with low
wages and earnings - indeed, this is precisely the nature of the
employment problems in the Philippines today.

- 32 -
1.33 The attention that has been paid to the labor intensities of
small enterprises reflects a common pre-occupation about the need for a
more labor demanding industrial development path. What can be done
about it? The relevant policies have been examined in several previous
studies, dating back to and before Powers and Sicat (1971), ILO (1974)
and more recently Bautista and Powers (1980) and several others cited
in the text; they are therefore not reviewed in this report, except insofar
as to determine what their findings imply for the small enterprise programs.
The refo-fms proposed cover the structure of investment incentives,
interest rates and tariffs, and were touched on briefly above (paras 1.22
et. seq.). Apart from being more conducive to growth, they have also been
shown to be more labor demanding. Within the more modest scope of the
small enterprise programs, an effort to examine and disseminate ideas
about a broader range of investment choices in an obvious possibility
for increasing the demand for labor on the projects it finances. The
industrial and research associations that are now developing in support
of industry could also be involved in the this task.
Technical Supplement on Interest Rates and Investment Criteria (Chapter 8)
1.34 The overwhelming factors preventing an efficient flow of capital
resources from financial institutions to small enterprises are (i)
administrative ceilings on interest rates, and Cii) the risks of loans
not being repaid, Simply removing the ceilings, however, as an incentive
for institutions to face the risks, is not a sufficient condition for an
efficient flow of resources to take place, The reasons for this are
familiar from recent research on the consequences of imperfect information
in capital markets. Some of this research is reviewed in Chapter 8, which

- 33 -
examines how both administrative costs and risks change over time
with the accumulation of knowledge and experience within the branch
networks of the institutions. A forward looking view is suggested
when deciding on what interest rates are appropriate.
1.35 A recurring question with respect to the provision of
institutional finance, is whether its alternatives - trade credits,
borrowings in the informal markets, and use of own savings and retained
earnings - are superior. No general answer to this question is possible.
In particular circumstances, however, a comparison of the different
sources is strictly necessary to determine the economic merits of supplying
institutional credit. In this report we have found that institutional
finance often complements rather than substitutes for other sources.
E.g. it is generally combined with own savings and retained earnings
when used for the expansion of fixed assets or working capital. We have
also argued that reliance on own savings and informal sources is more
appropriate for new enterprises, which are inherently riskier to finance
than those that have already proved themselves. Furthermore, practically
all firms in the middle and larger size ranges start with very small
amounts of capital and grow in phases; the owners believe this to be a
less risky course for them too, and regard any lack of access to capital
as being more of a barrier to expansion than to entry. Trade credits
are used widely in some industries Ce.g. where "putting out" and sub-contracting
are common); but those having different capital structures and markets may
rely more on the financial sector. In practice the financing arrangements
for small firms are as heterogeneous as the firms themselves, and most
use different sources at different times in their life-cycle, and may

- 34 -
even use several sources simultaneously. For these reasons we have
concluded that the best rule is for institutions to follow the demand,
and that the small and medium industries program has taken the right
step in addressing the constraints that prevent them from meeting it.
We have made several suggestions on how to address the constraints that
remain.
Conclusions
1.36 The conclusions to this report can be grouped under four
headings. The first concerns the role of small enterprises in labor
absorption, and the others the Government's programs and policies.
1.37 (1) Labor Absorption. The structural changes occurring in
manufacturing employment in the Philippines, from household to workshop and
factory based production, are currently associated with a rapid emergence
of small and medium scale.firms, in which the rates of labor absorption
are significantly higher than in large scale (e.g. about 6% per year as
compared to 4.5%). A sizeable, if not precisely known, fraction of labor
absorption recorded in the aggregate statistics for medium and large scale
firms is also due to the expansion of a small proportion of small firms
through the size structure. These trends are particularly apparent in -
but not confined to - the small towns and urban centers in the provinces,
where infrastructure conditions and the nature of the product market
favor manufacturing on a small and medium scale. The growth of agriculture
and of the regional urban base itself are generating the markets, and in
doing so are helping to localize the structural changes from rural-
agricultural to urban-industrial development. The trends are also likely
to continue so long as a large share of the labor force is in the rural

- 35 -
areas and towns, and would probably accelerate with a restructuring
of industrial incentives and tariffs, which have historically drawn
investment away from agriculture and the provinces.
1.38 (2) Finance and Financial Incentives, The large majority of
small firms are financed by family savings, retained earnings, trade
credits and sometimes by borrowings in the informal markets; comparatively
little institutional finance is forthcoming, except for that provided
through the Government's programs or for borrowers of good standing.
Although non-institutional sources have so far met the bulk of small firms'
demand for finance, there is a rising demand for institutional credit,
both long-term and short-term. The emergence and growth of small firms
and the heterogeneity of their capital structure and supplier and buyer
markets largely ensures this. There are also complementaities between
different sources of finance.,with institutional sources being combined
with or added to other sources, rather than displacing them. Hence it
is relevant to address the two principal constraints on the flow of
finance from public and private institutions.
1.39 The first of these arises from the administrative constraints on
interest rates and the structure of financial incentives open to the private
sector, which currently offer no prospects of long run profits from
lending privately raised resources to small enterprises - unless there
is a drop in the costs of these resources. Consequently, there is an almost
exclusive and growing dependence on the Government's programs, with the
risks being borne disproportionately by a small number of institutions.
This issue is quantitatively important in view of the huge volume of the
private sector's resources relative to those that can be made available
through the Govhrnment's programs,

- 36 -
1.40 The second cQntraint, afflicting all institutions, and thus a
large number of sound and efficient small firms, are undoubtedly the
risks of financing unsound and inefficient firms. The risks have not
proved to be static quantities, however, but to have declined significantly
with the accumulation of information and experience within the institutions,
as originally intended by the programs. Hence we have concluded that
the role of the programs in cushioning the initial risks of lending to
small enterprises is being fulfilled, but that it is necessary to address
the issue of financial incentives if the programs are to have both broader
and longer-run benefits.
1.41 (3) The Government's Programs, Apart from the general issue
of incentives, there are a number of ways in which, it seems to us, the
scope of the programs could be broadened while reducing the administrative
costs and risks:-
(i) Working Capital Finance. The small and medium industries program
has so far over-emphasized the finance of fixed assets and under-emphasized
the finance of working capital through short-term lending facilities. A
greater emphasis on the latter would reduce risks, be more likely to involve
the commercial banks, and would be consistent with the employment and
regional objectives of the programs.
(ii) Non-Industrial Enterprises, Broadening the scope of
programs towards non-industrial enterprises - and towards trading and service
enterprises in particular - would improve access of small manufacturing
firms to markets and materials supplies and provide added conduits for working
capital finance,

- 37 -
(iii) Small Loan End of IGLF, For loans of less than about
P 150-200 thousand, lending through IGLF is generally unprofitable;
it is also not porsible below the P50 thousand floor limit, Yet there
are a very large number of firms seeking loans in this range. There
are also institutions with the necessary basis and experience for
making small loans efficiently in provincial communities, but which
were not qualified for making the larger IGLF loans. Thus involving
them in lending through IGLF led to high arrears rates and bad debts,
and to the exclusion of those borrowers they could best deal with.
Making IGLF more profitable at the small loan end, and possibly removing
the floor limit, could greatly widen the scope of the program.
(iv) Risk Reducing Institutions, A forum for the exchange
of information and experiences between institutions is needed, together
with the establishment of a common credit record keeping system.
Cv) Industrial Extension. This program has served both
educational and screening purposes in providing a large number of small
provincial firms with access to financial institutions for the first time;
it has also provided counselling and referral services. The main danger
ahead is the possibility of its becoming part of the bureaucracy of
administered credit on account of the growing dependence, referred to in
C2) above, of small firms on the Government's financing programs.
Involvement of the extensionists in post-appraisal (supervisory) services,
and a system of ex post accountability for the projects, would also
help to improve the quality of the services.

- 38a -
Cvi) Project Selection Criteria. When deciding on what
kinds of projects the program might best support, if it is to provide
more gainful employment, we have suggested that projects are best
judged by the robust if old fashioned criterion, the rate of return
to capital; that is,the loan appraisers and extensionists are doing
the right thing in considering only profitable projects. The capital
labor ratio has not proved to be practical as a device to search for more
labor using projects, and has a number of theoretical defects, even
bearing employment aims in mind. Ex post evaluations of samples of
projects by the research and evaluation departments of the institutions
involved could be helpful in determining ground rules and sector priorities
for the Government's programs.
C4) Leading Sector Policies. The last and most general
conclusion of the report is that, the more efficient the leading sector
policies, the more efficient the small enterprise programs are likely
to be. Lower and more uniform tariffs on manufacturers are now being
considered and, if implemented, should encourage growth in the more
efficient sectors, which account for 80% and 65% of the labor force
currently employed in small and large scale respectively. But the main
benefits would be to stimulate product markets via growth. Agriculture
in particular should stand to gain, with generally beneficial effects
on the growth of the provincial markets for non-food goods and services;
as noted it is the growth of these markets that explains the current
high rates of emergence and growth of small and medium industries in the
provinces. Investments in small-holder agriculture and its supporting
infrastructure and services work in the same direction. Also under review

- 38b -
are proposals to reduce the labor-saving incentives in the current
investment and interest rate policies, or- even to introduce labor-using
incentives. The effects on markets would be similar, and not insignificant in
magnitude.
- 39 -
II, EXPERIENCE OF THE FINANCIAL INSTITUTIONS;
(A) INDIVIDUAL EXPERIENCES
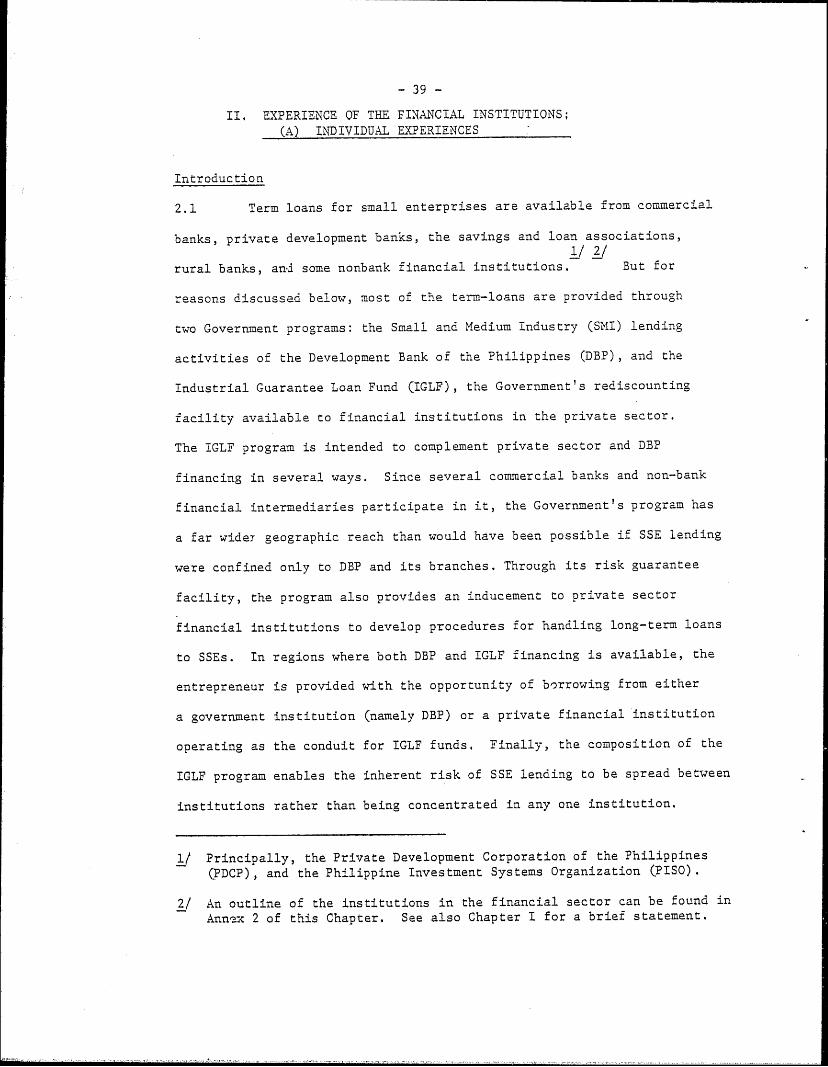
Introduction
2.1 Term loans for small enterprises are available from commercial
banks, private development banks, the savings and loan associations,1/ 2/
rural banks, and some nonbank financial institutions. But for
reasons discussed below, most of the term-loans are provided through
two Government programs: the Small and Medium Industry (SMI) lending
activities of the Development Bank of the Philippines (DBP), and the
Industrial Guarantee Loan Fund (IGLF), the Government's rediscounting
facility available to financial institutions in the private sector.
The IGLF program is intended to complement private sector and DBP
financing in several ways. Since several commercial banks and non-bank
financial intermediaries participate in it, the Government's program has
a far wider geographic reach than would have been possible if SSE lending
were confined only to DBP and its branches. Through its risk guarantee
facility, the program also provides an inducement to private sector
financial institutions to develop procedures for handling long-term loans
to SSEs. In regions where both DBP and IGLF financing is available, the
entrepreneur is provided with the opportunity of borrowing from either
a government institution (namely DBP) or a private financial institution
operating as the conduit for IGLF funds, Finally, the composition of the
IGLF program enables the inherent risk of SSE lending to be spread between
institutions rather than being concentrated in any one institution.
1/ Principally, the Private Development Corporation of the Philippines
(PDCP), and the Philippine Investment Systems Organization (PISO).
2/ An outline of the institutions in the financial sector can be found in
Ann--x 2 of this Chapter. See also Chapter I for a brief statement.

-40-
2.2 While the Government directly controls the resources of D3P
and IGLF, it exerts an indirect control over the mobilization and
allocation of private sector resources through its fiscal, monetary and
interest rate policies. The structure and level of interest rates
have had a major impact on the relative availability of short- and
long-term finance in the economy as a whole, and the allocation of
resources between different types of borrowers.
2.3 The following analysis assesses how these various programs and
policies have affected the profitability of lending to small enterprises.
For each type of financial institution the weighted average cost of
their sources of funds is first computed, and compared with the
use of and return on funds by type of borrower. The difference between
the two gives the gross spread accruing to the financial institution.
From the gross spread, transaction costs are deducted to arrive at the
net spread to the institution.
Commercial Banks
2,4 Background. As of December 31, 1978 commercial banks accounted
for 55% of the total assets of the financial system; over the last five
years the assets of commercial banks have increased fourfold (in current2/
terms). The commercial banking sector comprises 25 privately-owned banks, and
1/ The transaction costs faced by the financial institutions are the
sum of (a) the administration costs of loan appraisal, supervision
and collection, and (b) the risks inv.lve4, i.e., the probability
of arrears and default and its associated cost. The two are inter-
related in that a substantive effort in loan appraisal and supervision,
for instance, considerably reduces the risk of arrears and default.
2/ The Government-owned Philippine National Bank is the largest commercial
bank and in 1977 accounted for 27% of the assets of the banking system.

two government banks. Together they had an extensive network of
1,200 branches in 1978, reaching to all regions of the country.
About one third of commercial bank lending goes to industry while another
third to commerce.
2.5 Sources and Cost of Funds. At the end of 1977 the total assets
of the commercial banking system amounted to P 70.4 billion ($9.5 billion).
A summarized balance sheet of commercial banks is given in Annex 1, Table
2.3. Deposits, borrowings and equity plus reserves accounted for 50%,
41% and 9% respectively of total liabilities. In recent times there has
been a sharp increase in the liabilities of commercial banks; over the
period 1976-1977 deposits increased by P 8.2 billion and accounted for
74% of the increase in liabilities over the same period. The sharp
increase in deposits has occurred both as a result of the expansion in
2/
the branch network of commercial banks and legisiative action taken
by the Central Bank. The Central Bank Circulars of January 1976 attempted
to increase the level of bank deposits both by raising the maximum
interest rate payable on deposits and by reducing the yield on money
market instruments which had been used by investors as an alternate form
of investment to bank deposits.
2.6 All the commercial banks interviewed were offering the maximum
permitted rate on deposits placed with them, namely 7% on savings deposits
and 8.5% to 12% on time deposits depending on maturity; no interest is
paid on demand deposits. Owing to bcth the structure of deposits and the
interest rate paid on various types of deposits, their weighted average
cost, in 1977, amounted to about 6.5%. This figure, however, reflects
1/ Exchange rate used US$1 = 7.4.
2/ New branches were established (109 in 1977) because it was felt that
they could help mobilize deposits.

-42 -
merely the financial cost of deposits and, since all commercial banks
offer the maximum permitted rate on all deposit categories, ignores
the various service costs involved in raising deposits, The cost of
money market and other borrowings ranges around 14% while the cost of
equity has been computed at around 12.8% resulting in a weighted
overall cost of capital of around 11% p.a, The cost of loanable resources
is, however, higher than this, since Central Bank regulations necessitate
holding 20% of borrowings in liquid assets which yield 3% while another
20% have to be held in specified securities yielding around 12%.
Consequently, the weighted average cost of loanable resources is nearer
2/13.3%. Clearly the cost of capital and loanable funds for individual
banks will vary and will, to a great extent, be determined by the proportion
of deposits and other borrowings in their liability structure. The
weighted average cost of resources would also rise if the proportion
of medium and long-term deposits were to increase; at present these
account for less than one sixth of their resource base.
2.7 Uses of and Return on Funds. As of December 31, 1977 the asset
portfolio of commercial banks comprised: loans (62%), investments (16%),
cash due from banks (13%) and other assets (9%). The loan portfolio of
P 43 billion ($5.8 billion) comprised loans, discounts and overdrafts. An
1/ In order to estimate the cost of share capital, the ratio of dividends
(adjusted on a pre-tax basis) to the book value of equity has been
considered. While there are a number of objections to estimating the
cost of share capital in this way, no other data are available. A
more precise estimate would not significantly alter the overall weighted
average cost of capital, however, since this source of funds accounts
for less than 9% of resources. E.g. if we doubled the above estimate,
the w.a. cost would rise by about 1%.
2/ Or [11.0 - 0.2 x 3 - 0.2 x 121/0,6 = 13.3.

interest rate ceiling is imposed by the Central Bank: the maximum
interest rate permitted on loans under two years is 12% and 14% p.a.
on secured and unsecured loans respectively, In addition, a service
fee of up to 2% may be charged raising the effective rate to 14% and
16% respectively. The maximum effective lending rate (including
service fees) on loans over 2 years in 19%.
2.8 As of December 31, 1977, 86% of loans outstanding were short-term
(up to 1 year), 10% were medium-term (1-3 years) and only 4% were
long-term (over 3 years). In the case of prime borrowers it was found
the commercial banks were charging marginally below the maximum rates
permitted. However, the return on compensating business (e.g. letters
of credit, foreign exchange transactions and compensatory deposits)
raised the rate by 2% to 3% resulting in an effective rate on short-term
loans of 16-17% and of 18-19% on medium and long-term loans. Firms with
good credit standing but which could not be regarded as prime firms were
paying the maximum interest permitted on both short- and medium-term loans.
Few loans were made to businesses not having an established credit rating.
EFFECTIVE RATES ON COMMERCIAL BANK LOANS, 1978 /a
Credit-worthyPrime Borrowers Non-prime Borrowers
Value of Value ofNominal compensating Effective Nominal compensating Effective
Loan duration rate business rate rate business rate
Short-term 14% 2-3% 16-17% 16% n.a. 16%Medium- and
long-term 16% 2-3% 18-19% 19% n.a. 19%
/a The rate of inflation over the period 1975-77 varied between 9.2% - 10%.
Source: Interviews with 10 Commercial Banks.

-44-
Given a weighted average cost of funds of 13.3% the effective gross
margin on short-term loans to prime and nonprime borrowers would be
around 2.7% while for medium-term loans it would be nearer 5.7%. As
noted earlier, the latter overstates the spread on medium term loans,
since the cost of term resources is above the weighted average estimated
1/here.
2.9 Term lending. While commercial banks are a major source of
short-term credit they engage in relatively little long-term lending.
For January-August 1977, 60% of total credit granted was for a year,
1% was for 1-5 years and 0.6% for over 5 years. The comparable figures
for 1976 were 68.6%, 0.6% and 1.02%. Though nothing in the rules and
regulations governing commercial banks prevent them from lending long,
these figures show that little medium- and long-term lending is undertaken
by them. This, in part, can be explained by their adherence to the
"golden rule" of banking which states that the maturity structure of
the resource base should match that of the loans made. Despite the2/
rule some term transformation can occur without jeopardizing the
solvency of the individual institutions or the system as a whole.
However, commercial banks appear to be extremely reluctant to lend
long-term for several reasons.
2.10 First, and most important, taking all costs and returns into
account, short-term lending appears to be at least as profitable as long-
term lending. Until 1976, the maximum interest rate that could be charged
on loans, irrespective of maturity, were 12% for loans secured by real estate
1/ PDCP have recently raised medium-term resources at 15-16% (para. 2.32),which would imply a spread of around 3%.
2/ For a more detailed discussion see the report of the PhilippinesFinancial Sector mission (1979).

-45-
and 14% for others. As these maximum rates were being charged
by commercial banks for short-term loans, there was no incentive for
them to lend long-term, an activity inherently more risky than short-term
lending. In 1976, interest rates were restructured and the maximum
effective rate that can now be charged on loans up to two years is
16% while the maximum effective rate on loans over two years is 19%.
However, while the CB is willing, under certain circumstances, to discount
short-term paper Cup to one year) it is not willing to do so for instruments
1/with a maturity of over a year. Further, in an economy where deposit
2/
and lending rates have fluctuated significantly commercial banks are
unwilling to lend long- term as they are then locked into a leading
rate without knowing how deposit rates or lending rates may move.
Finally, most commercial banks do not have the institutional expertise
necessary to make term loans since most of their experience is with short-
term,collateral based lending. The current nominal interest rate
differential of about 3% between short-term loans and long-term loans
is not sufficient to induce the commercial banks to lend long-term
and face the liquidity constraint, the greater resource costs, the
greater project risk and general uncertainty of so doing.
2.11 Instead of lending long, the practice followed by the commercial
banks is to book a loan as short with the understanding that the loan will
3/be rolled over, On the basis of existing information, it is not possible
1/ This possibility is no being considered, however.
2/ There were substantial changes with respect to both deposit and lendingrates in 1976 and 1977.
3/ With this arrangement the enterprise, not the institution, bears the
risks.

- 46 -
to quantify the extent of rollovers. However, interviews suggest that
up to about half of those loans booked as short-term may be rolled over
for at least another year, and one third for 1-3 years. The process
of rolling over is also profitable for the bank owing to the service
fees and other charges involved. This additional income further reduces
the effective differential between short- and long-term lending rates
and may even turn short-term lending into the more profitable type of
operation.
2.12 Lending to SSE. The proportion of loans outstanding going to
home, small- and medium-scale industries as of December 31, 1977 amounted
1/
to 2%, l1% and 11% respectively. These figures probably do not reflect
the situatinn accurately as a large proportion of these resources are IGLF
funds which are merely being onlent by the commercial banks. There
appears to be no data on the volume of commercial bank resources going
to the small enterprise sector. Using a sampling technique, a study
conducted by the International Development Center of Japan concluded
that only 1% of SSE resources come from commercial or rural banks. There
are several reasons which explain the reluctance of commercial banks to
lend to this sector, except perhaps to a small minority of small borrowers
of good standing. First, the effective return on loans to prime and
near prime clients, once compensating business is taken into account,
amounts to about 16% for short-term loans and 19% for longer term loans
(para 2,07). Since these rates are the maximum that can be charged, the
return on SME loans is not likely to be significantly greater than this,2/
particularly as they bring in little compensating business. However,
1/ Annex 1, Table 2.4 provides a breakdown of commercial bank lending.
2/ It was pointed out to us that some SMEs bring in compensating business
(e.g. through foreign exchange dealings), and others have good standings,
and qualify as prime borrowers. They are, however, a small minority,
and our remarks are not adressed to these cases,

- 47 -
while the return on prime and SSE loans is almost the same, the
administrative costs per unit lent of processing SSE loans is significantly
greater. The administrative costs are higher because there is no
readily available information on the credit standing of the enterprise
since most SSEs have neither audited financial statements nor long
standing relations with the financial community. During discussions
with commercial banks it became clear that the loan processing time for
prime companies was minimal, and costs amounted to less than 0.4% of loan
value. In the case of near prime companies, the complete loan processing
time varied between 1-4 days and costs seldom accounted for more than 0.5%
of the loan value. In the case of loans to S3Es without an established
track record the processing costs amount to approximately 2-3% of
the loan value. Hence, deducting these costs from the gross margin of
2.7% estimated above (para 2.8), the net margin accruing to commercial
banks to cover provisions, writeoffs and profits would be 0.7% and 2.3%
for SSE and regular loans respectively. If, in addition, it is assumed
that SSE loans are more risky, then both elements of the risk-return
trade-off favor larger loans. At present there is little hard data for
commercial banks on the relative riskiness of SSE lending and other types
of lending. Experiments involving commercial banks in SSE lending
have shown that without rigorous appraisal and supervision procedures
(which raises the administrative costs still further) small loans are1/
prone to high arrears.
1/ Some examples quoted were the money-shop program of the PCIB, the "social
loans" programs run by some commercial banks in the 1960s and 1970s;
and a NACIDA loan program, which was initially run outside the banking
system, but later redesigned and run by the Philippines National bank.
In each instance arrears were extremely high (in one case 93% of
loans were in default).

- 48 -
2.13 Second, in the cases when commercial banks go in for SSE lending
it tends to be collateral based. Many small borrowers, however, are short
of acceptable collateral, particularly in the case of new projects, and
are therefore ineligible for commercial bank credit. Finally, even
if commercial banks were to lend to SSEs on the basis of project viability
it might be difficult to do so as they currently do not have the necessary
institutional expertise to undertake such lending.
2.14 Long-Term Lending and IGLF. Commercial banks operate as
conduits channeling long-term IGLF resources to SSEs. When the lending
to SSEs first began in 1974, the commercial banks would identify a project
and send it to IGLF for approval. Once approval was granted, the project
risk would be shared between IGLF and the bank on a 60:40 ratio, the
bank having a gross spread of 5% on the transaction. Since none of the
bank's own resources were tied up in the transaction, the spread was
available ,o cover the administrative costs of lending and 40% of the
risk. In theory, loans were to range between P 50,000 to P 800,000
although in practice no loans over R 500,000 were made. Maturities
were for 5-10 years while the effective interest rate (including the
guarantee fee) to the final recipient was 13.2%,
2.15 The initial response to the program by the commercial banks was
encouraging; in the period July-December 1975, 91 loans were approved
of which 25 were sponsored by commercial banks, However, the number of
projects sponsored fell r,harply and only 19 IGLF projects, in total,
were approved in CY77. Two reasons were given by commercial banks for
their lack of interest: the inadequate return and the "red tape" involved

- 49 -
in dealing with IGLF. The red tape problem was reduced significantly
once the accreditation scheme was put into effect in 1976, Under this
scheme an accredited institution could approve a loan without the prior
approval of IGLF. Nevertheless, the commercial banks generally remained
unwilling to participate in the program. Initially (in 1974/75) 19
banks participated, but as of September 1, 1978 only 10 had been accredited,
of which only 5 made any IGLF loans. As of September 30, 1978 the IGLF
loans outstanding to commercial banks amounted to P 42 million, or about
0.5% of their total loans outstanding to manufacturing activities.
2.16 The high level of arrears associated with earlier IGLF operations
was the main explanation for the continued unwillingness of commercial banks
to participate. As of September 1978 total arrears amounted to 34.2% of1/
loans outstanding while loans affected were 56.4% by number and 52.1%
by value. When the final recipient was in arrears, the bank was still
expected to make good to IGLF; in such a case tha bank tied up its own2/
resources on which it earned 12% but might have earned 16% to 19% if
these resources were lent to its regular clients. In addition there were
the costs of processing the arrears which in their turn can be broken
down into three parts. These are the cost of (a) rescheduling the loans
3/for some clients, which might involve a complete reappraisal; this cost
is more closely related to the number of loans in arrears than the actual
amount in arrears; (b) write-offs for "coffin" cases; and (c) litigation,
which is an expensive but necessary step both to recover the value of the
1/ Based on a sample survey of participating institutions and their endusers.
2/ While its own cost of funds was 13.3%.
3/ It is not known to what extent reseheduling costs are covered bypenalty rates.

- 50 -
1/collateral and to maintain confidence in the institution. It has
not been possible to compute the costs associated with loan rescheduling,
write-offs and litigation. However, from the reaction of the banks
to IGLF, it appears that they exceeded the 5% gross margin on the loan,
particularly since the commercial banks have had to make good to IGLF
from their own resources.
2.17 The aggregate data, however, hide what has in fact been a very
mixed experience among the commercial banks; some have used IGLF occasionally
and have found the operation profitable, with less than 5% of their loans
in arrears; others have used it rarely, but again with low or no arrears;
2/while in the case of some banks, 50% to 90% of their loans were in arrears.
During the interviews it became apparent that there were two basic reasons for
the relative success of some banks. First, the successful banks generally
had applied far stricter standards in project selection, paying particular
attention to the credit standing of the entrepreneur in the community, his
previous track record and the value of the collateral offered; a personal
knowledge of the 'character' of the individual, acquired by the local
3/branch staff and branch managers, was also important. In addition to
the above, a fair amount of time and effort appeared to have been devoted
to loan appraisal, supervision and collection. It became clear that,
whenever one or more of these criteria had been relaxed, the level of
1/ It has been pointed out to us that the costs of processing arrears alsodecline as an institution's procedures are developed. Apparently thecosts in Korean banks are now quite low,
2/ This information was obtained during the interviews; the estimates wereprovided unofficially and are not precise.
3/ Mr. Manalo of DBP made precisely the same point, which we found wasindependently shared by the staff of several commercial banks andinvestment houses.

- 51 -
arrears increased sharply. Several cases were cited in which borrowers
had diverted funds or were giving a low priority to repaying the IGLF
loan as the interest rate on the IGLF loan was lower than on other
borrowings. These instances reflect the weak supervision and loan
collection procedures of the financing institutions. In some cases
collateral requirements had been relaxed to match the bank's share in
the risk (40%) on IGLF loans; these had resulted in larger and riskier
loans being permitted than if stricter appraisal standards had been
applied. It should be added that such problems did not necessarily
arise because the banks took IGLF lending lightly, but because for
several banks IGLF was a new form of lending (long-term versus short-term
and project versus collateral based) to a new category of client, and
required much effort in appraisal and supervision than had been anticipated;
only for a small minority of SMI owners, with good standing, is it
possible to relax the discipline of appraisal and base the loans, as in
short-term lending, on 'character and collateral'; most SMI projects
did not fall into this category however. The experience of DBP, PDCP
and of the Medium and Small Industries Coordinated Action Program (ASICAP)
programs had shown that a substantial pre-loan service for preparing
project and loan requests is required due to the extremely poor records
and information kept by small enterprises. None of the commercial banks
help the entrepreneur prepare projects but, instead, concentrate
almost entirely on collateral based lending.
1/ DBP states that the unreliable information presented by borrowers isone of their main problem areas. Rudy Manalo: Talk to the Small andMedium Industries Convention, May 1978, Philippines InternationalConvention Center, Manila.

- 52 -
2.18 Conclusions, Commercial banks have found that the administrative
costs and the risks of participating in the IGLF program were higher than
originally anticipated. A few commercial banks have found lending to
SSEs, both from their own resources and IGLF funds, profitable but only
by concentrating on a small number of clients with track
records and good credit standings. Since most SSEs most do not have an established
credit standing, it is unlikely that the commercial banks would lend to
them without financial incentives sufficient to cover the costs
of pre-loan services (to complement those provided by MASICAP) and more
rigorous loan appraisal, supervision and collection procedures, In cases
when commercial banks have attempted to keep administrative costs low and
sacrificed on loan screening procedures there have been high rates of
arrears and default.
2.19 For these reasons, some modifications have recently been introduced
l/into the IGLF program. These were:
(a) to increase the spreads and reduce the bank's
share of the risks on small loans;
(b) to raise the returns and reduce the risks further
by raising the upper limit on IGLF loans (from
P 800,000 to P 2.5 million), thus allowing the
banks to lend to medium as well as small industries;
Cc) to reinforce the MASICAP program of technical
assistance, particularly to the smaller enterprises,
by improving the quality of information available on
the enterprise, thereby reducing the transaction costs
faced by the lending institution.
1/ In the second IGLF project.

- 53 -
In addition, a forum for the exchange of views and experiences between
institutions seems desirable in the early stages of the program,
together with the establishment of a common credit record-keeping
system. The methods and criteria for appraising loans to SSEs and
pre- and post-loan services have not yet been developed in the commercial
banks as they have in some of the non-bank financial intermediaries.
2.20 Even with an expanded IGLF program, the volume of lending that
can be undertaken will be small when compared to that which commercial
banks might undertake from their own resources. One of the objectives of
the IGLF program was to act as a catalyst to encourage lending by private
financial institutions to SSEs, by absorbing some of the early risks and
costs of developing term lending programs to small borrowers. Hence
it is important to address the constraints that prevent commercial banks
from lending their own resources to the SSE sector. Under the present
set-up, commercial banks are mobilizing resources for the well established
1/corporate sector only, and the banks appear to be incurring financial
2/
losses in their attempt to develop a new SSE clientele.
2.21 Precisely what steps are required to induce commercial banks to
lend to SSEs from their own resources merits a much closer examination of
interest rate and related policies than can be given in this report.
The present policies are effectively closing off the large majority of small
1/ Loans outstanding to single proprietorships in March 1978 amounted to
P 1.2 billion; to partnerships, co-operatives and associations,
P 0.8 billion; and to corporations, P 30.9 billion. Annex 1, Table 9.
2/ It was pointed out that the corporate sector may (and in fact does)
relend to SSEs, and that this might be an efficient way of approaching
(i.e. of lending to) them. We agree with this, but would add two points.
First, most SMIs serve local markets directly, drawing on local traders
and suppliers, many of whom are themselves small scale. For this reason
we later suggest, second, that lending to small (and medium) scale traders
is also desirable (see chapters 3 and 4).

- 54 -
enterprises from access to an extremely large and rapidly growing
volume of resources raised through the extensive branch network of the
commercial banks. Essentially, the effective spreads need to be increased
to make lending to small enterprises more financially attractive. This
could be done through changes in interest rates, in service charges, or
in tax incentives; it need not involve subsidies, however.
2.22 Even with major reforms in the structure of financial incentives,
however, it is difficult to see the commercial banks voluntarily developing
an active lending program to SSEs using privately raised resources; for
this reason, we believe that any re-structuring of financial incentives
should be seen as a way of enhancing the present programs of the Government,
not of displacing them. First the experience of government and government-
sponsored institutions show that the costs and risks involved in lending to
SSEs are far greater than the commercial banks would be willing to
undertake even if appropriate interest rate adjustments were made. An
important exception would be the larger sized category of small loans to
enterprises with an establsihed track record and adequate collateral.
This would, however, exclude a large number of small enterprises, as the
benefits of developing a small enterprise program tend to accrue several
years beyond the planning horizon of commercial banks. Second, the
possibility of institutional biases in favor of lending to the corporate
sector - both national and transnational - cannot be dismissed lightly,
given the extent to which the commercial banks have evolved in response
to its demands, Third, the large majority of the owners of SSEs are
unaccustomed to, and untrained in, gaining access to and managing

- 55 -
institutional credit. This is why the extension programs and the
pre-loan services of the Government financing programs remain important,
Development Bank of the Philippines (DBP)
2.23 Background. DBP was established in 1958 as an autonomous govern-
ment-owned development bank with a mandate to supply long-term credit
to the leading sectors of the economy. At the end of 1978, DBP held
11.2% of the assets of the financial system. DBP plays a major role in
the Philippine economy, being the largest supplier of long-term credit.
As of June 30, 1978, the proprotion of loans going to industry, agriculture
and real estate were 64.8%, 14.4% and 15.2%, respectively. About 80% 'of
industrial lending goes to large industry with 10%, 6% and 4% going to medium,1/
small and home industries respectively. In addition to its direct lending,
DBP lends indirectly to home, small and medium industries through its
association with the private development banks (para 2.35).
2.24 Sources and Cost of Funds. As of December 31, 1978, long-term
borrowings, short-term borrowings (under one year), equity and deferred
credits accounted for 53.9%, 25.0%, 18.9% and 2.2%, respectively of DBP's
total resources. Savings and time deposits with maturities of under
one year constituted 66% of short-term borrowings. The weighted average
cost of short-term borrowings was about 8.0%. Long-term foreign borrowings
comprised loans from international institutions and commercial sources
with a weighted average cost of capital of 9.7%. Domestic long-term
borrowings comprised bond issues, notes from government and financial
institutions, IBRD resources onlent by the Government in local currency,
1/ Home industry loans are loans of up to P 50,000; small industry loans
range from P 50,000-800,000; medium industry loans vary from P 800,000-
3.0 million, while large industry loans are in excess of P 3.0 million.
Note that these scales do not correspond precisely to HSMIs defined in
terms of assets (see chapter 1).

- 56 -
and others. The weighted average costs of these borrowings is 12.4%.
This figure is likely to underestimate the true cost of these resources
as DBP has privileged access to low cost local currency funds. As
DBP declares no dividends, it is difficult to estimate the cost of its
share capital. In order to compute the cost of capital, DBP's share
capital might be viewed as a long-term debenture issue; the return on DBP 's
Countryside Bonds is around 9%. If this is done, the weighted overall
average cost of capital to DBP is around 9.9% p.a. As the cost of DBP's
deposits, equity and long-term domestic borrowings is likely to be
understated, the weighted average overall cost of capital should be seen
as a base-line figure.
2.25 Use of Return on Funds. DBP's operations include loans,
guarantees and equity investments. In FY78, loans accounted for 59% of
all DBP approvals. The size of loans vary from a minimum of P 5,006 to
over P 5 million. In terms of sectoral allocation, industry, agriculture
and real estate accounted for 65%, 14% and 15%, respectively of all
approvals. DBP's industrial loans alone will be considered below.
In 1976, the weighted average return on industrial loans outstanding was
10% while the weighted average cost of resources at that time was 8.8%,
resulting in a gross spread on industrial lending of 1.2%. Administrative
costs incurred by lending to industry were estimated at 0.7% of industrial3/
loans outstanding, leaving a margin of 0.5% for provisions, write-offs
1/ Until January 1979, DBP bonds offered such privileged terms as taxexemption and reserve eligibility.
2/ The first three issues of DBP countryside bills offered an interest of
9% payable semiannually. In the fourth issue (January 1979), theGovernment decided to remove the privileged features on DBP bonds;
the average effective cost of this issue to DBP was 14.69%.
3/ As of June 30, 1976, arrears on industrial loans were approximately7.5% of loans outstanding while the portfolio affected was 41.4%.

57 -
and profits, The very small operating margin has resulted in DBP
making some changes in its lending policies; there were also some
concerns that cheap loans were making industrial investments too
capital intensive. The rate of interest on loans not secured by land
mortgage has been raised from 12% to 14% p.a. In addition, a
supervision fee of 2% has been introduced for all loans in excess of
P 150, 000. This has resulted in a weighted average return of 13.5%
for industrial loans less than F 150,000 and 15.5% for those above.
In FY78, less than 3% of DBP's industrial loans in value terms were
below P 150,000. Hence, its weighted average return on lending is
around 15.5%. Once these interest rate increases are reflected in the
return on industrial loans outstanding, DBP will be operating on a gross
margin of 5.6%. Even if administrative costs were to rise to 2% of
loans outstanding, it would still leave a margin of 3.6% to cover provisions/
write-offs and profits.
2.26 Lending to Rome, Small and Medium Industries. DBP currently has
a separate department to lend to these industries, the volume of lending to
which increased from R 48 million in 1974 to P 158 million in 1978 (Annex
1, Table 2.5). The growth was particularly fast during the first two
years during which time, however, a serious arrears problem began to
develop (para 2.26). Apart from making direct loans, DBP has a program
which provides Private Development Banks (PDB's) with equity and rediscounting
facilities (para. 2.35), and which both widen the geographic reach of
its own programs and encourage private sector participation.
1/ See para. 2,34, et. seq. Over the period 1974-78, DBP had rediscounted
3,000 industrial loans of the PDBs amounting to P 65 million, with an
average size of P 30,000. In contrast, DBP had, over the same period,
made 5,300 loans for P 650 million with an average loan size of
P 120;000.

- 58 -
The returns and costs to DBP of lendin2 to industru are given below:
DBP: RETURNS AND COSTS OF LENDING(%)
Large Medium Small Homeindustry industry industry industry
Gross return 15.5 15.5 15.3 13.5Weighted cost of resources 9.9 9.9 10.5/b 10.5/bGross spread 5.6 5.6 4.8 3.0Estimated administrative costs 0.3 2.6/c 2.6/c n.a.
Net spread 5.3 3.0 2.2 n.a.
/a Approximately 10% (by value) of SMI loans are below P 150,000./b Loans to home and small industry are in local currency./c The administrative cost to the head office and branches is 2.5% and
2.7% respectively. The arithmetic mean has been taken.
Source: DBP (internal report).
2.27 DEP receives net spreads of 5.3%, 3,0% and 2,2% respectively on
its loans for large, medium and small industries; the spreads are to cover
overheads, profits, write-offs and provisions. The arrears position on the
industrial loans by loan size are shown in Annex 1, Table 2.6. As expected,
the risks for large industry loans are significantly lower; in 1978 principal
and interest in arrears as a proportion of loans outstanding amounted to 4.7%
and 20.9% for large and small respectively. Within the latter group, home
industry loans appear to be only slightly riskier than loans to small and
medium industries, though the level of arrears are high across the board. The
arrears on loans to the smaller industries, however, are significantly lower
(by a factor of four) in the branches than they are at head office; arrears
on branch office loans in 1976 varied between 5.6% and 11.8% of loans outstanding,
which was not significantly higher than arrears on loans to large industry.
1/ The arrears figures on large industry loans probably understate the actuallevel of arrears as no account is taken of loans rescheduled by DBP.

- 59 -
The manager of DBP's small and medium industry programs pointed out
(as had people in other financial institutions) that lending in
small communities was often easier and less risky than lending out of the
head office in the Manila area as the branch staff have greater personal
knowledge of the local community and its enterprises.-/
2.28 In the first year of the program, the arrears as a percentage
of loans outstanding were exceedingly high, but declined subsequently
for several reasons. A fast growth in the portfolio and a restructuring
of loans at first increased the share of loans in the grace period
Cup to six months for the finance of fixed assets, before 1979), and
also the share of young loans on which arrears problems had not yet
surfaced. But the size the portfolio peaked in 1976 and then declined
in 1977 and 1978, so that the shar. of young loans and loans in the grace
period declined. At the same time there were noticeable declines in
the arrears levels, reflecting changes in policies and procedures as
more exper:ance was gained in lending to small enterprises. The2/
principal changes included intensified efforts in the training of staff;
the development of stricter screening, appraisal, supervision and loan
collection procedures (all of which were associated with an expansion of
trained staff); and the introduction of monitoring and control procedures
to reduce diversions of funds. Evaluation studies of problem accounts
were also undertaken.
1/ Since these discussions were held in 1978-79, however, the arrears
rates in Manila have declined significantly, while those in the
branches rose (Annex Table 2.6).
2/ The institutional effort required to develop the program has been
immense, as can be gauged from the level and growth of professional and
support staff in DBP. Professional staff alone grew by nearly 50% from
1,900 to 2,800 in between 1976 and 1978, and total staff by 40% from
3,100 to 4,400. See Annex 1, Table 2.7.

- 60 -
2.29 Conclusions. Considering the net spreads on the different types
of DRP lending, it is apparent that the profits made by lending to large
industries are absorbing some of the costs of lending to smaller
industries. In addition, small loans are more prone to arrears than are
loans to large industry. Despite the changes, it is not particularly
profitable (given current spreads) for DBP to land to small industries,
but it continue to do owing to the high priority placed by the Government
on this form of lending. The DBP experience has, however, shown that the
initially high risks of lending to small enterprises can be reduced as
experience is gained, and as decentralizing decision making procedures
for small loan approvals are introduced.
Private 'evelopment Corporation of the PhiliDnines
2.30 Background. PDCP was established in 1963 and has been legally
defined as an investment house although its operations are those of a
development bank. PDCP is probably one of the only private financial
institutions to make long-term loans and provide pre-loan services1/
to their SSE clients. A small business loan department was established
in 1972 for this purpose. Loans approved by PDCP classified by the asset
size of the recipient enterprise is given in Annexl, Table 2.8. The
number of small enterprises financed by PDCP increased sharply once PDCP
received accreditation from IGLF in late 1976. The lower limit on PDCP
loans is P 50,000; loans between P 50,000-500,000 are considered to be
small loans while loans above F 500,000 are considered as regular loans.
In the early stages of PDCP's small industry program most of the loans were
in the Metro Manila area. P 500,000 are considered as regular loans.
1/ A recent convention of small and medium business owners passed aresolution requesting other financial institutions to provide pre-loanservices similar to those now provided by PDCP. Philippines InternationalConvention Center, Manila, May 27, 1978.

- 61 -
Recently, both as a result of PDCP's growing branch network and the
Government's emphasis on regional development, approximately 50%
of the loans are to borrowers located in the provinces.
2.31 Lending from PDCP's Own Resources. The volume of small loans
financed by PDCP from its own resources has been relatively small,
the major constraint on PDCP for this type of lending being that
long-term peso resources are unavailable. At present PDCP is not allowed
to accept deposits. Consequently, the only way it can mobilize peso
resources for onlending is either by borrowing from other institutions
or by issuing its own bonds. Given the current interest rate structure
it is not possible for PDCP to raise resources through these mechanisms and
earn an adequate spread by so doing. Hence, PDCP concentrates on foreign
currency denominated loans; over the period 1963-78, approximately 78%
of PDCP's lending has been in foreign exchange. As most small industries
require local currency financing, PDCP is unable to finance a significant
volume of SSE loans from its own resources.
2.32 Recently, PDCP has been able to mobilize some medium-term peso
resources by issuing 1 to 5 year notes at around 15% to 16%. These
resources are on-lent at 19%. Owing to the different tax incidence on the
borrowing and lending rate, the gross spread accruing to PDCP is not 3%,
but nearer 5%. The administrative cost of lending to SSE has been computed
1/at 3% of loans outstanding which leaves about 2% to cover provisions,
2Jwrite-offs and defaults.
1/ When the necessary project data is not available, PDCP's appraisersmight spend 4 to 6 weeks collecting it, a task which could cost as much
as P 6,000 Cexcluding overheads). A project analysis is then undertaken
which concentrates on the management, financial, techuical and marketingaspects of the projects, Despite the project analysis, all loans are fully
collateralized; for SMIs, land, buildings and machinery are valued at
100%, 900% and 70% of appraised value respectively, and for largeindustries at 80%, 70% and 60%.
2/ Katrine Anderson Saito and Dan P. Villanueva, "Transaction Costs of
Credit to the Small-Scale Sector in the Philippines".

- 62 -
2.33 Lending through IGLF Funds, PDCP was accredited under the IGLF
program in 1976 and has been using IGLF resources to finance a significant
number of SSE projects; as of September 1978, 70% of the snall industry
loans financed by PDCP are from IGLF funds. IGLF funds have been obtained
1/
at 7% and were on-lent at 12% (excluding the guarantee fee), In
aldition PDCP charged i one-time service fee of 1.5% giving a gross spread
of 6.5% for the first year and 5% subsequently. In order to maximize
returns from its IGLF operations PDCP has tended to concentrate on the
larger of the small loans; the average loan size having increased from
P 175,000 ($25,000) in 1974 to P 370,000 ($50,000) in 1978. Exceptions
are made when the enterprise records are in good shape, in which case
the administrative costs to PDCP are much lower; this occurs for
instance with second loans, which apparently require half or less of the
3/processing costs of first-time loans.
1/ Recently the IGLF leneing rates were revised. For small industry
loans (from P 50,000 - P 800,000), participating institutions charge
interest at no less than 13.2% p.a. plus a service charge of 1.5%
p.a. payable at the time of loan; for medium industry loans (P 800,000
- P 2.5 million) participating institutions are allowed a spread of
8% on small industry loans and 6% on medium industry loans.
2/ PDCP head office and branch staff made the point that the services of
SBAC and MASICAP can be useful in reducing the administrative
costs simply by improving the records of the businesses, though they
find that it is still desirable for their own staff to continue to
provide pre-loan services and work with the proponent directly. PDCP
staff often give lectures to and participate in the seminars of the
MASICAP and SDAC field (extension) staff. In addition, PDCP run a
training program for project analysts.
3/ In the past no single borrower could obtain more than P 500,000 from
IGLF resources. This prevented the borrower and the financing
institution benefitting from these economies of scale.
....... .-

- 63 -
2.34 The arrears and defaults on PDCP's small loan portfolio have been
significantly lower than for other financial institutions. (Annex 1, T-9
shows the arrears position for both PDCP's small and regular loans). For
small loans, principal in arrears over 3 months increased sharply from 3.7%
in 1975 to 8.2% in 1976 but fell to 3.9% in June 1978, largely as a result of
a substantial increase in PDCP's small loan portfolio and a corresponding
increase in loans in the grace period. If principal and interest in arrears
over 3 months is compared to principal outstanding in the repayment period,
1/the improvement in the arrears situation is less dramatic but noticeable.
In comparing small and regular loans in terms of arrears and defaults it is
apparent that on any criteria small loans have proved to be more risky.
While it is difficult to estimate the costs involved in rescheduling,write
offs and litigations, it appears that the gross margin accruing to PDCP from
utilizing IGLF funds is sufficient.
2.35 Conclusions. Since PDCP carries out project appraisals for both
its small and large loans, lending to small enterprises is more expensive
for PDCP than lending to large industries, owing to the higher administrati-,ve
costs in relation to loan size. By intensive efforts in appraisal and
supervision, PDCP has kept the risks of lending to SSEs relatively low, and
has made such lending profitable by concentrating on the larger of the small
industry loans (loans in excess of about P 100,000). Their lending is,
1/ The percentage of loans in arrears fell by two thirds in 1978.

- 64 -
however, heavily dependent on IGLF, and the development of a lending program
out of privately raised resources is constrained by the general scarcity of
long-term peso resources in the economy.
Private Develooment Banks
2.36 Background. Private Development Banks (PDBs) are financial
intermediaries constituted as stock corporations under the mortgage bank
provisions of the General Banking Act. PDBs were set up to provide decen-
tralized credit facilities to small agricultural and industrial enterprises1/
that would not otherwise have had access to long-term credit.
2.37 Source and Cost of Funds. As of June 1978, the total resources of
PDBs amounted to P 666.4 million; a summarized Balance Sheet of PDBs is given
in Annex 1, Table 2.3; deposit liabilities, borrowings and capital funds in
the form of share capital and retained earnings accounted for 57.5%, 22.6% and
19.9%, respectively. The Central Bank permits PDBs to pay marginally more on
their deposits than is paid by commercial banks, and in 1978 they were offering
7.5% on savings deposits and from 9% to over 12.5% on time deposits, depending on
maturity, leading to an overall weighted average cost of depos-cs of about
8.8%. The share capital comes from private contributions and contributions
from the Government in the form of preferred shares held by DBP and the Land
Bank of the Philippines. The cost of share capital is difficult to estimate,
however, since few PDBs have declared dividends and the returns to primary
shareholders is often in the form of higher salaries, bonuses and fringe
1/ As of June 30, 1978, the 35 PDBs had 105 branch offices and employed astaff of nearly 1,500.

- 65 -
benefits. If share capital and retained earnings are viewed as a long-term
deposit with a risk element attached to it then the minimum opportunity cost
would be around 15%, resulting in an overall weighted average cost of funds
for PDBs of about 10.5%. If, on the other hand, the cost of capital were
computed on the basis of dividends actually paid, then the cost of the share
1/capital would be about 2% and the overall weighted average cost of capital
6.8%.
2.38 Use of and Return on Funds. As of June 1978, the total loans
outstanding to PDBs amounted to P 400 million, of which approximately one
third was in industry, somewhat over one third in agriculture and the
remainder in commerce, real estate and other sectors. Over the period
1973-78, PDBs made over 10,000 loans to cottage and small industries as
compared to 5,400 such loans made by DBP, PDCP and IGLF together (Annex 1,
Table 2.10).About 70% (by number) of these loans were financed from the PDBs
own resources, 29% from the rediscounting facilities provided by DBP and the
Central Bank, and a small percentage by IGLF. Many PDB loans do not qualify
for IGLF financing as they are for less than P 50,000, which is the minumum
acceptable IGLF loan size; over the period January-June 1978, approximately
half the industrial loans made by PDBs were below P 20,000 but a few large
loans resulted in an average loan size of P 40,000.
1/ The low return on capital has made it difficult for PDBs to raise
additional resources from the private sector,

- 66 -
2.39 When lending from their ovu resources, the PDBs are allowed to
charge an interest rate of 19% on loans with a maturity of over 2 years,
resulting in a spread of 8.5% to 12.2%, depending on the assumption made
about the cost of their share capital. The average administrative costs on
all operations were computed at about 4.4% of loans outstanding. It is
not known by how much the administrative costs of industrial loans exceed
this average, but they appear to be kept to minimal levels by basing 2/
appraisals on the borrower's ability to meet collateral requirements and3/
a personal knowledge of the "character" of the client. Some PDB officersinterviewed said that they would not lend to people they did not know well;
as with the DBP branch staff, they benefit from having a good working
knowledge of the local communities and enterprises. For these reasons, the
administrative costs appear to be well within the spreads estimated above.
The arrears, however, amounted to 10% of principal outstanding in 1978;
but the conservative valuing of collateral has resulted in the PDBs having
minimal write offs.
2.40 The spreads on loans rediscounted with DBP vary, since the extent of
the rediscouiting varies between 50% and 100% depending on the size of the
loan and the economic sector of the business. On a fully rediscounted loan,
the rediscounting rate is 12%, including a 2% service charge to DBP, giving
the PDBs a gross spread of 7%.
1/ The low return on capital has made it difficult for PDBs to raiseadditional resources from the private sector.
2/ The General Bank Act requires PDBs to accept only real estate and highgrade investments as collateral. In addition, the loan collateral valueof various types of investments is also stipulated.
3/ Several managers interviewed said that this is often first acquiredthrough the businesses becoming depositors in the branches.

2.41 IGLF loans made by most PDBs have been subject to high arrears;
in 1978 principal and interest in arrears on IGLF loans as a proportion of
loans outstanding amounted to 30%. (The rural banks have run into similar
difficulties with IGLF, as will be discussed below.) Several explanations
have been offered for the high arrears and for the inability of the PDBs (and
the rural banks) to bring them down. A possible explanation is that IGLF has
involved the PDBs in a scale of lending that was outside the capacity of all
but a few banks to handle, with the average IGLF loan being ten or more times
the average loan made out of their own resources. As a result, a different
and more substantive approach to loan appraisal and supervision was required
and the smaller PDBs were unable to structure their policies accordingly.
2.42 Conclusion. The PDBs are a well adapted and an effective channel
for handling large numbers of very small loans with relatively low adminis-
trative costs; the arrears are still quite high, however, and a greater
input into the development of the institutions is required to achieve
significant reductions. The PDBs are thus filling a void in the credit market
by making loans to the smaller end of the SSE distribution, and enjoy an
advantage over large institutions, such as PDCP and the private investment
houses, derived from their personal knowledge of the local communities. This
advantage is less applicable, however, when it comes to making large SSE loans
for which the appraisal procedures employed by PDCP and other similar
institutions are better suited.
Rural Banks
2.43 Background. A rural bank is a locality specific unit bank. There
are currently 960 individual rural banks which are privately owned but
heavily dependent on Central Bank funds. The Government has used the rural

- 68 -
banks to implement many of its rural credit programs, such as Masagana 99
and Masagana Maisan for rice and corn production respectively. Despite their
wide network, at the end of 1978 rural banks contributed only 2.5% to the
total resources of the financial system.
2.44 Sources and Cost of Funds. As of December 31, 1978, the total
resources of rural banks amounted to P 4,037.2 million. A summarized Balance
Sheet for Rural Banks is given in Annex Table 2.3. Borrowings (primarily from
the Central Bank), deposits, other liabilities and paid-in capital and
reserves accounted for 47.8%, 33.6%, 3.1% and 15.6%, respectively, of total
resources. Borrowing by rural banks comprise special savings and time depo-
sits, and bills and loans payable. A large proportion of these borrowings
come from the Central Bank to finance particular programs and are secured by
promissory notes from the recipient banks. In 1977, the weighted average
cost of these borrowings was around 2% p.a., reflecting the large volume of
low-cost Central Bank funds in the borrowings of rural banks. As of January
1977, no interest was paid by rural banks on demand deposits; savings depo-
sits offered 7.5% p.a. while the return on time deposits varied from 9% to
12.5%. The weighted average cost of deposits was 6.3%. The paid-in share
capital of rural banks comprise common stock and government-owned preferred
stock. Inadequate data on dividends paid makes it difficult to compute the
cost of capital for rural banis. In an opportunity cost sense, the share
capital could be seen as being equivalent to a long-term deposit. On this
basis, the cost of its capital has been estimated at 15% p.a., resulting in
a weighted overall cost of capital of around 6% p.a.
2.45 Use of and Return on Funds. Approximately 83% of the assets of the
rural banks are in the form of loans. Of the loans granted in 1978, 86.8%
went to agriculture, 8.7% to commerce, 2.7% to industry and 1.8% to others.

- 69 -
In terms of maturity, approximately 90% or more of rural bank loans are short
term; medium- and long-term loans being confined almost entirely to loans
financed under the Central Bank/IBRD program. The rate of return on loans
outstanding to agriculture, commerce, industry and others was 7.4%, 8.9%, 4.8%
and 29.0%, respectively for 1978, resulting in an overall weighted return on
the rural bank loan portfolio of 7.8% for 1978. Administrative costs for
rural banks were computed at 3.6% for 1976, leaving a negative margin ofl/
1.8 even before considering provisions, write-offs and profits.
2.46 Lending to SSE. In theory, rural banks could operate as ideal
outlets of small loans as they have a wide geographical coverage; in
practice, however, they have made very few loans except to agro-related
cottage industries such as fisheries, piggeries and poultry. As outlets for
IGLF resources, they have not been particularly successful: by the end of
1978, arrears as a proportion of IGLF loans outstanding amounted to 55%. A
possible reason for the high level of arrears on IGLF loans is that in their
normal course of business, RB make short-term production-credit type
agricultural loans while IGLF loans were essentially long-term industrial
loans; in addition, the average size of an RB loan out of non-IGLF resources
is less than one-tenth of the size of loan they were typically expected to
handle under the IGLF scheme. Consequently, IGLF loans required a different
type of appraisal which RBs did not have the institutional expertise to
2/undertake2 The rural banks alsQ had a major responsibility for administering
1/ If instead of imputing a value to the cost of capital, it were derivedof the basis of dividends actually paid, then there is likely to be asubstantial reduction in the cost of capital to rural banks.
2/ It was pointed out to us by Mrs. Mijares that the floor limit on IGLFprobably raised the risks by limiting the options of the RBs (and thePDBs), who can manage very small loans efficiently.

- 70 -
the agricultural credit programs (Massagana 99), which severely strained
their capacity to implement other programs.
2.47 Conclusions: Loans made by RB have tended to finance agriculture
or agro-related industries. The RB loan portfolio has been faced with high
arrears; as of December 31, 1975 arrears amounted to 21.4% of their out-
standing portfolio. These figures, however, underestimate the true level
of arrears since short-term loans are frequently restructured so that
arrears are held below the 25% limit established by the CB as the rediscount-
ing eligibility criterion. In addition, medium- and long-term loans made
by RB are not deemed to be "in arrears", irrespective of the repayment per-
formance, until after the maturity of the loan. IGLF loans to SSE channeled
through RB have also faced high arrears, the long-term nature of the loan
and the larger loan size serving to increase the likelihood of arrears.
Non-Bank Financial Intermediaries
2.48 Background. Non-bank financial intermediaries (NBFIs) comprise
institutions such as private insurance companies, finance companies,
investment houses, and Government sponsored insurance programs. Private
insurance companies make few loans to industry. When loans are made they
need, by law, to be completely secured by real estate or by an iron clad
commercial bank or parent company guarantee. Consequently, no lending is
undertaken by private insurance companies to SSEs. The finance companies
tend to be subsidiaries of commercial banks and are primarily engaged in
1/ While the Private Development Corporation of the Philippines is definedas an investment house it is not included in this section as it operatesas a development bank and has been discussed above,

- 71 -
financing consumer durables and provide short and medium term finance to
local manufacturers and traders. The investment houses also appear to
provide a limited amount of financing to industry.
2.49 Lending by Finance Companies and Investment Houses to SSE. Two
1/finance companies and two investment houses were interviewed. Two of
the four institutions stated that they had made short-term loans (180 days to
1 year) for working capital financing. Even the short-term loans had gone
to well-established on-going businesses which had, over time, developed a
relationship with the NBFI concerned.
2.50 None of the institutions had made term-loans to SSEs from their
own resources. There was considerable reluctance to lend to SSEs. It was
pointed out that the administrative costs per unit lent to SSEs was signifi-
cantly greater than to their established customers. Processing time and
cost were particularly high as it was difficult to obtain information on
the SSE and its credit standing. Por this reason, loans were only made to
enterprises with a proven track record and which could provide collateral
at least equal to the size of the loan. In addition to the cost of loan
processing the NBFI's claimed not to have the necessary institutional
expertise to undertake term-lending.
1/ The two finance companies were Manphil Investment Corporation andMultinational Capital Corporation. The two investment houses were AyalaInvestment and Development Corporation and Bancom Development Corporation.
2/ According to one estimate the direct cost of processing an SSE loan
varied between P 7,500 - P 12,000.

- 72 -
2.51 The experience of NBFIs using IGLF funds for onlending has been
mixed. Most NEFI's complained about the red tape involved in dealing with
IGLF, and argued that the high level of arrears on their lending through
IGLF would be tolerable if the loan ceiling were raised, the guarantee feature
improved and the red tape reduced.
2.52 To concludV, NBFIs to date have been averse to lending to SSE.
While in some instances short-term loans are being made the volume of such
lending is insignificant while the volume of term landing is non-existent.
1/ Most of the suggestions have been incorporated in the recent IGLF loan.

- 73 -
III. EXPERIENCE OF THE FINANCIAL INSTITUTIONS: (B) CONCLUSIONS
3.1 In the preceeding analysis, three categories of lending were consi-
dered: lending by the private sector institutions out of own resources;
lending directly undertaken by the Government owned Development Bank of the
Philippines, and indirectly through equity finance and rediscounting facili-
ties provided to the Private Development Banks; and lending by private sector
institutions using the Government's rediscounting facility (the Industrial
Guarantee and Loan Fund) for term-loans to small industries.
3.2 Privately Raised Resources: Private sector financial institutions
in the Philippines make few loans and even fewer term loans out of their own
resources to small enterprises. Commercial banks, which are the largest
source of institutional credit in the country, go in principally for short-
term loans, undertaking very little medium- or long-term lending. The reluct-
ance to lend long-term can be explained partly by the interest rate structure
and the banks' adherence to the "golden rule" of matching maturities between
borrowing and lending. Under the present system, the maximum effective inte-
rest rates on short-term (up to 2 years) and long-term loans (over 2 years)
have been administratively set at 16% and 19% respectively. The weighted
average costs of resources to commercial banks is currently 13.3%, but would
be higher if a greater volume of long-term resources were to be raised. The
spreads between borrowing and lending rates are about 2.7% on short-term
loans; something in excess of this for short-term loans that are rolled over,
allowing for the service fees and other charges involved; and probably not
much over 3% for long-term loans, allowing for the higher costs of raising
long term resources. Considering the greater administrative costs, project

-7L -
risks and environmental uncertainties of lending long, the banks are finding
it more profitable to lend short. The economy wide shortage of long-term
peso resources is also affecting the privately-owned development finance
companies and nonbank financial intermediaries, who traditionally concentrate
more than the commercial bnaks on long-term finance.
3.3 The interest rate structure, aside from encouraging short-term lend-
ing, discourages lending to SSEs. Prime customers are charged marginally be-
low the maximum rates permitted while creditworthy, near-prime customers are
charged the maximum. In addition to the nominal return on loans, both prime
and near-prime customers bring in compensating business which increases the
effective return on loans made to them. Given that most SSEs bring in little
compens:ating business but are charged the same nominal interest rate, the
effective rate of return on SSE loans is lower than on loans made to near
prime companies. In addition to the effective return being lower, the ad-
ministrative cost per unit lent are significantly higher on SSE loans. All
the financial institutions interviewed stated that the cost and time involved
in processing a loan for an SSE, without an established track record, would be
about 2.4% to 3.0% of the loan value as compared to 0.4% and 0.5% for prime
and near prime companies respectively. The higher administrative cost results
in a lower net spread to the institution. In addition, the risks of arrears
and write-offs on SSE loans are higher than on loans to well established
enterprises. Consequently, in terms of both return and risk there is little
incentive currently for private financial institutions to lend to SSEs out
of their own resources. When loans are made by private financial institutions
to SSE's they tend to go to a small minority of entrepreneurs with adequate col-
lateral and an established relationship with the financial institution concerned.

- 75 -
3.4 Lending to SSEs through private sector resources will therefore
require greater financial incentives than are currently available;
changes in the effective spreads through changes in the interest rate
structures, service charges and tax rates are obvious possibilities.
But as Pr.gied in the text, changes in financial incentives are needed
to enhance the present programs, not displace them. The Government's
programs have shown that the risks and arrears of lending to SSE are
far higher than commercial banks would normally accept. Although
there has been a reduction in arrears over the past 5 years, it is
clear that the returns from developing a small enterprise clientele lie
beyond the planning horizons of financial institutions in the private
sector. A comparison of the experiences of the different institutions
involved in implementing the programs reveals at least five reasons
why risks are initially high:
(i) Purely irreducible and random factors;
(ii) Term loans to the larger sizes of small and
medium industries being outside the scope and
specialization of some private sector institutions
(the smaller rural banks and PDs);
(iii) Internal and external diversions and misuses of funds
until control procedures have been fully developed .;
(iv) the shortage of information on small enterprises and
the absence of a formal record-keeping system on
credit worthiness; related to this is the point
that the abilities and other qualities of owners are
1/broadly distributed, leading to difficulties in
distinguishing between sound and unsound loan requests
until sufficient information and experience have been
gained; and
1/ This same characteristic also leads to high turnover rates of small
enterprises.

- 76 -
(v) The tasks of traini 7 staff and developing
screening, appraisal and supervision procedures.
The last three items each involve high fixed costs and economies of
scale in developing the lending programs. While the traditional economics
argument would be to let interest rates rise to reflect costs, there
are difficulties in implementing it in practice. Higher interest rates
for loans to small than to large borrowers might be subject to
policital charges of discrimination. Even if interest rates went
to high levels, this could raise doubts within the institutions about
the capacity of SSEs to service debts; that is, supply curves could
be backward sloping.
3.5 Allowing for these factors makes it difficult to decide
what mix of incentives is appropriate, and for this reason we have
merely raised the issue. One obvious possibility is the adoption of
mandatory ('forced balance sheet') measures to back up any shifts
in financial incentives. But such methods are themselves easily
avoided without extensive controls and monitoring procedures. An
alternative would be to encourage a small but select number of financial
institutions to develop a long-term interest in small enterprise lending
and derive benefits from economies of scale; IGLF was of course
conceived with this in mind, except that it has been spread thinly2/
across a large number of institutions in practice. The development
of a long term interest, however, would still require adjustments in
the financial incentives.
1/ A comment made to us by Naburo Kawai.
2/ Concentrating on a few institutions would also make IGLF easier tomonitor.

- 77 -
3.5 Government Programs: (a) The Larger Small Industry Loans. Since
private sector financing is not available, there is almost exclusive reliance
on the Government's programs. The lending rates on loans made through these
1/'programs to small enterprises are below the 19% ceiling rates,-' but the
spreads accruing to the financial institution have not been sacrificed as the
funds were made available at less than the market rate.
3.6 Some commercial banks had found IGLF loans to be profitable, but
only by accepting highly creditworthy clients with solid collateral, and have
in consequence made very few loans. On the other hand, non-Bank financial
intermediaries such as PDCP have made a greater number of loans, but concentra-
ted on the larger end of the small enterprise size distribution, with loan
2/sizes averaging over y 350,000 (in 1978); the service charges-- enabled them
to put substantial effort into screening, pre-loan services, loan appraisal
and supervision. Analysis of the experience of other institutions, including
BP, shows that such screening procedures are necessary if risks are to be
kept down. In the IGLF program, institutions with high arrears tended to be
those which did not have much past experience in term lending. In the case of
the Rural Banks and the smaller Private Development Banks, the IGLF loan sizes
were also several times greater than those of their normal loans, and they
were unable to appraise and supervise them appropriately.
3.7 One of the achievements of the program has been the development of
project-lending procedures within DBP and some private sector institutions
(such as PDCP). The immediate aim is to develop these further and, in the
1/ With the exception of loans made by the PDBs, and rediscounted by DBP
and the Central Bank. On DBP loans the rate charges is 15.5% while onIGLF it was 13.2% as of December 1978 (the latter was recently raised
to 14.2%).
2/ These work out at about 2% of loan amount, regardless of loan size.

-78-
case of IGLF, to involve private sector institutions selectively. Given the
difficulties encountered in the first five years of the program, and the
progress made in developing procedures, a forum for the exchange of views
and experience between institutions seems desirable; the establishment of
a common credit-record keeping system (for both private and Government pro-
gram loans) would also help.
3.8 Loans to small enterprises continue to be prone to high arrears,
however, and a rapid rate of decline seems unlikely given the poor state of
records in and information on small enterprises- or more generally, the
difficulties of servicing a diverse and largely unknown clientele, One method
employed by DBP and IGLF to cushion the losses is to blend the small industry
programs with lending to medium-scale industries so as to increase the return
and reduce the overall risk on the institution's SME portfolio. In addition,
it permits the financial institution to make second loans to expanding enter-
prises (loans to enterprises with track-records are much less risky).
3.9 Government Pro grams: (b) Cottage (or Home) Industry Loans. The
formalized screening and appraisal procedures discussed above are too costly
to apply to small loans (of less than p 50-100 thous..-Ad), so simpler proce-
dures have been adopted by DBP and the PDBs, who are the only institutions
offering term-loans to home industries.-2_ Loans are made at the branch lev7--
on the basis of character, collate-ral, and a personal knowledge of the local
enterprises. The experience so far is that such procedures have cut both
administrative costs and risks: arrears are significantly lower in the pro-
vinces (by a factor of four in the case of DBP);-! and the administrative
1/ Which is why the M{ASICAP program and the pre-loan service.- of PDCP areso important.
Z/ PNB also have a cottage industry loans facility, but it is not activelypromoted.
3/ The small industry loans of DBP also had similarly lower arrears in the
provinces.

-79 -
costs are within the gross spreads estimated above. The branch networks of
DBP and the PDBs have thus proved to be low cost and relatively low risk chan-
nels for handling a large number of small loans to home industries. The PDBs
1/have also lent quite extensively out of privately raised resources,- prin-
cipally savings and time deposits.
3.10 Cottage (or home) industries in the Philippines are defined to
include small manufacturing establishments and workshops with assets of up to
p 100,000. (The term is thus a misnomer, since these activities are not in
the home.) As noted in the introduction, there are over 70,000 such establish-
ments, which are one of the most rapidly growing sources of employment and
earnings opportunities in the country. (Manufacturing employment in households
has peaked and probably started to decline.) DBP and PDBs currently lend to this
sector. However, the reliance on DBP and PDBs for home industry loans limits
the geographical coverge of the program, and its ability to cater to a grow-
ing demand. The floor limit of p 50,000 on IGLF loans also effectively closes
of this channel to home industries. If the limit were removed, and accompanied
by appropriate simplications in loan procedures for "home" industry loans, the
branch networks of the commercial banks could prove to be ideal outlets; as with
the DBP branches and the PDBs, commercial bank branches benefit from a close
knowledge of their local communities and businesses.
3.11 Government Programs: (c) Working Capital Finance. Since the programs
concentrate on the finance of fixed assets and permanent working capital, we
have so far not discussed working capital finance for small enterpriseY. At this point
1/ For reasons discussed above, the weighted average cost of resources toPDB is lower than for other banks. Consequently the gross spread accru-ing to PDBsis higher than would normally be the case.

- 80 -
it might be useful to ancitipate some findings on the subject reached in the
next Chapter. This entails duplication; but the issues are sufficiently
important to warrant it, and were raised both during interviews with the
enterprise owners themselves and by the staff involved in the program. The
first finding is that the demands of small industries for the finance of working
capital are probably as great as those for the finance of fixed assets. The
historical experience of the industrialized countries, and the current (if
sketchy) evidence from developing countries, indicates that more than half
of the asset structure of small and medium industries is made up of working
1/capital.- Second, the finance of fixed assets only, without tailoring the
financial package such that subsequent access to short-term finance is guaranteed,
places a financial stress on the business, and increases risks, by leaving it
with high overheads and a limited ability to respond to changes in orders.
Financing 'permanent' working capital does not provide for this since it is
concerned only with minimum levels of inventories and cash reserves, not with
needs resulting from day-to-day changes in sales and purchases. Third, because
it can be related to current sales levels and contracts, working capital finance
is inherently less risky. Fourth, it is also more likely to involve the commercial
banks in the program.
3.12 For these reasons we have suggested that the provision of working
capital finance ought to form a point of departure for the future of the program.
The point was also made that the most effective - though by no means exclusive -
channels for working capital finance in industry are trading firms, which pro-
vide the further advantage of coupling the finance with access to markets,
1/ Kennett (1979). Working capital includes t>e value of materials andsupplies, work in process, finished products in stock, cash reserves andaccounts receivable

- 81 -
reducing risks all round. In the interests of providing small industries
with improved access to finance and markets, therefore, it seems desirable
to expand the scope of the program to cover small (and medium) enterprises,
in the general sense that we have defined the term in Chapter 1.
3.13 Postscript: Further Changes in 1979. The interviews on which
the above analysis was based were conducted with twenty institutions in
November 1978. There have naturally been some changes since then, all of
which, however, confirm the general conclusions reached above. Supplementary
interviews were undertaken with six institutions at head and branch office
levels in November 1979., The weighted average cost of resources had risen
from 13.3% to close to 16% during the year (one institution was actually
using a shadow price of 16% for planning purposes), on account of the pres-
sure on short-term resources brought about by falling sugar prices and rising
oil prices on the balance of payments. The effects on lending to SSEs were
(predictably) a substantial cut-back on both current and planned lending, and
a readiness to lend - on the part of the accredited financial institutions-
only through the Government's IGLF program. One other private financial
institution (Allied Banking Corporation) had begun to develop specialization
in term-lending through IGLF, more or less in lines with arguments set out
above, and in parallel to the efforts of PDCP.
3.14 Summing up. The Government's programs are providing an increasing
number of small enterprises with access to institutional credit, and they have
shown that the administrative costs and risks of lending to small enterprises
can be reduced with experience and as appropriate screening procedures are
developed within the institutions. But the volume of lending is small compared
to both the demand for credit by small enterprises and the resources of the

- 82 -
private financial sector. The structural constraints preveuting private
financial institutions from lending out of their own resources to SSEs
will have to be eliminated if financial institutions are to build on the
experience gained through the Government's programs.

- 83 -
IV, INDUSTRIAL EXTENSION
Introduction
4.1 In parallel with the financing programs for small and medium
industries, the Government introduced in 1974 two kinds of industrial
extension service, both run by the Ministry of Industry. One offers
assistance in the preparation of projects for finance out of the
enterprises' own resources or by the financial institutions, and the other
a range of entrepreneurial counselling and other advisory services.
The former is known as MASICAP (the Medium and Small Scale Industries
Coordinated Action Program) and the latter as the SEAC (Small Business
Advisory Centers') program. The two are administered under one department
and share the same field offices. This Chapter reviews the activities
of the programs over their first five years and considers the questions:-
- what has been the demand for the services offered?l/
- what are the costs and the nature of the economic
benefits in providing then?
- in what ways might the services be improved?
- is the private sector providing them also and, if so,
what is the role of the Government's programs?
4.2 The last question is often raised in connection with government-
sponsored extension progran, and a discussion of it in a Philippine
context helps to provide some clarifications. What is at issue is less
whether the services in themselves are sought by small enterprises (though
there is surprisingly little known about the extent of the demand) but
whether they need to be provided through government programs. Further,
1/ Relevant dataare not available for quantitative estimates to be made.

- 84 -
given the large number, the geographical spread and the heterogeneity
of small enterprises there is also the issue of whether they can in fact
be serviced effectively without great expense and establishing a
large bureaucracy, The findings are summarized in the concluding section.
4.3 While the following analysis concentrates exclusively on the
Ministry of Industry's programs it should be added that several other
Government agencies offer services to small enterprises. Their activities
have not been reviewed here because the task would be too long. They
have been documented in a thesis by Chico (1976) and more recently in a
study by the University of the Philippines' Institute for Small-Scale
Industries (1979). The various agencies are represented on a Comission
for Small and Medium Industries, which has the responsibility for
developing overall policies; a review of the Comission's work
is also outside the scope of the present report.1/
Project Preparation Services (the MASICAP program)
4.4 Background. The idea that led to the MASICAP program can be
summed up by noting that small enterprises, like financial institutions,
face transactions costs (risks and administrative costs) in obtaining
loans. Moreover, the poor shape of their records raises the transactions
costs to the institutions. Before the extension programs were introduced
1/ Members of,the CSMI are; the Ministry of Industry (which chairs theCommission); the Department of Trade (to which the National CottageIndustries Development Authority is also affiliated); the Universityof the Philippines' Institute for Small Scale Industries; the DevelopmentBank of the Philippines; the Central Bank of the Philippines; theNational Economic and Development Authority; the Department of LocalGovernment and Community Development; the National Science DevelopmentBoard; the National Manpower and Youth Council; the Design Center ofthe Philippines; and the Food Terminal Incorporated. Other agencies
(such as the Technology Resource Center) are also involved in theprogram but are not members of the CSlI.

- 85 -
in 1974, lending facilities were aLready available to small enterprises,
but had been little used in practice. The reasons given were '(a) that
the institutions had not developed the capability of handling a large
volume of small loans to small industry, and (b) the majority of small
industries, having previously had no access to institutional credit,
were unable, at least initially, to exploit this new resource properly
and fully." With the introduction of term-lending facilities in 1974,
transactions costs to both borrowers and lenders were expected to rise
further since project analyses (involving forecasts of cash flows) were
considered to be necessary for all except small projects and businesses
of good standing. The idea was to absorb at least part of the transactions
costs in the extension program, since the extension workers could under-
take much of the preparatory work in submitting projects to the banks:
in doing so they could also serve an educational purpose of disseminating
ideas about business management practices and information on production
methods. The theory was that once the preparatory work had been done
successfully once for an enterprise, the transactions costs would be
permanently reduced on both sides; furthermore, with increasing numbers
of projects financed, there would be a greater willingness on the part
of the institutions - provided the program had generated a satsifactory
proportion of successful projects - to finance small enterprises
independently of MASICAP,
4.5 The program was in fact designed not to be a permanent aspect
of the Government's programs. It was also intended to be educational
in itself, and a means of supplying public and private institutions with

- 86 -
experienced field workers having a knowledge of the workings of small
businesses. The extension workers are given two year appointments,
and practically all are recruited by financial institutions,industry
or other government agencies on leaving the program.
4.6 The program covers all regions outside Metropolitan Manila,
in accordance with the regional objectives mentioned in Chapter 2. In
the first five and a half years, project studies had been completed for
2/5,000 businesses and submitted for financing. The annual volume of
projects prepared has fallen somewhat in recent years as the extension
workers have begun to work increasingly in the towns and villages away
from the regional centers. The decision to finance is at the sole
3/discretion of the financing institutions, who have so far approved
50% of the projects submitted; 24% were withdrawn or rejected after a
preliminary screening, and 6% were disapproved after full appraisal;
on account of long queuing and processing times (to be discussed further
1/ A key feature of the staffing policies is the recruitment of senior
students with outstanding academic records from colleges and universities;
they may substitute some course work for field work in the program.
In 1978 the MASICAP staff totalled 147, of whom 134 were field staff
on two year appointments, and only 4 (all at headquarters) were permanent.
Since then a core of regular and experienced staff have been recruited
in each of the 12 field offices to supervize the extension work and
introduce more maturity and continuity in the program. Training of
the extension workers is provided through lectures from representatives
of various public and private financial institutions, government
agencies and the senior extension workers.
This staffing policy was in part a compromise, since it was necessary
to recruit people "(a) willing to live and work in rural areas and towns,
and (b) with the technical ability to identify promising projects and
turn them into bankable propositions. At the beginning of the program
the first qualification was considered more crucial than the second.
Moreover, it was expected that the banks would provide the quality control
through appraisal." These descriptions, together with the one quoted in the
previous paragraph, were provided by Joe Pernia.
2/ Plus a further 500 small rice mill projects submitted to the National
Grains Authority for licence permits. (The NGA requires the mills to
conform to certain standards, including maximum allowances on wastage
levels.)
3/ See Annex Table 4.1 for more details.

-87 -
below), about 20% are still awaiting decision.1/
4.7 In practice, it is the smaller and more uncertain cases that
are generally referred to or identified by the extension workers. As
discussed in Chapter 2, the private financial institutions using IGLF
offer preloan services to the larger of the small enterprises requesting
loans upwards of about P 100-150 thousand, for which the service
costs, as a percentage of loan amounts, are relatively low; loans in this
size range have so far formed practically all of their portfolios. About
75% of MASICAP projects are far less than P 150 thousand, and 46% for
2/less than P 50 thousand (Annex 1 Table 4.2). The large majority (96%)
are also single proprietorships, employing less than 20 workers at the
time of loan requests; in comparison, between one half and two thirds3/
of the enterprises financed independently of MASICAP are incorporated.
4.8 Before turning to issues facing the program, one other aspect
of the extensionists' work that merits comment is the heterogeneity of
businesses encountered; it is this that necessitates an independent
technical and financial analysis of each case. Small enterprises are4/
found in practically all sectors of industrial activity, and may differ
1/ See paras 4.18 et. seq.
2/ The large volume of small loan requests has also created a dependence
on DBP, as discussed further below.
3/ Source: File records of IGLF reviewed in Mrs. Fajardo's report.
4/ Annex 1, Table 4.3 provides a three digit breakdown of a sample of
MASICAP, DBP and IGLF projects.

- 88 -
in technical and financial respects even within narrowly defined
industrial sectors. In contrast to agricultural projects, it is not
possible to consider different scales of activity, make an assessment
of the cash flows and business budgets for various technology packages,
and determine the economic and financial merits of a program of inputs
for a region; even the market outlets and sources of material supply may
differ between businesses that are otherwise similar, some for instance
concentrating on local and others on national or export markets. Industrial
extension presents difficulties fundamentally different to (though
certainly not greater than) those found in agricultural extension.
The costs of industrial extension are also raised by the need to assess
the technical and financial merits of each case individually.2/
4.9 Issues. The issues facing the program can be grouped under
,o four headings: (a) Risks, as reflected in the arrears on loans and the
closure rates of the enterprises assisted; (b) the costs and risks of the
program in relation to its economic returns; (c) the dependence of
the program, and thus of the enterprises financed, on DBP; and (d) the
shortage of short-term loans for working capital finance.
4.10 (a) Arrears and Closure Rates of Enterprises Assisted.
Monitoring surveys were undertaken by the Ministry of Industry in 1977
and 1979, the first taking a 50% sample of all projects, and the second
a 100% sample of all manufacturing enterprises having received loans
1/ See Chapter 5 for a discussion of the markets of small industrialenterprises.
2/ The following is based on analysis of records; interviews with
extensionists and the branch and head office staff of several financial
institutions; visits to 30 enterprises assisted under the program;and the interviews reported in Chapter 5 with 80 enterprises not
assisted.

of over P 15,000. The questions considered were, are the enterprises
still operating? are they up-to-date or in arrears in loan repayments?
if in arrears, what are the causes? and how do actual sales, profits
and employment compare with what was projected?
4.11 The statuses of the enterprises assisted, and of the loans
made to them, are shown in Annex 1, Table 4.4. About 25% had closed
down by 1979, an average closure rate of about 9% per year. The latter
is higher than the "natural" closure rates of 3 to 5% per year for small
and medium enterprises as a whole, estimated in Chapter 5 from NCSO and
3/interview data, and appears to have increased significantly since
the 1977 survey. Forty six percent of the projects hhd loans in arrears.
Total arrears in principal and interest outstanding were 15%, which
is lower than the averages reported in Chapter 2 for IGLF and DBP, but
much higher than the private sector would consider as being acceptable.
Higher risks might be expected on MASICAP projects since as noted earlier
it is the more uncertain cases that are referred to the extension workers
in the first place. In addition, the arrears levels are partly a
consequence of the still evolving appraisal and supervision procedures
1/ Also included were non-manufacturing enterprises with loans of overP 50,000. Unfortunately, self-financed enterprises assisted by the
extension workers, which could have provided some useful contrasts,were excluded from the sample.
2/ Estimated as follows, Let n be the number of enterprises assisted inyear t, t years before the monitoring survey, f the closure rate and Pthe proportion having closed down by the time of the survey. Thenthe proportion remaining Cl-P), is given by
E nt (1-f)t/Fnt
Values of n are provided in Annex 1, Table 4.1, and (1-P) is 0.252from Annex i, Table 4.4.
3/ Paras 5.16 et. seq.

-90 -
of the financial institutions; the financial institutions are solely
responsible for accepting or rejecting a loan request and,with hindsight,
several of those involved in directing the MASICAP program were surprised
that the rejection rate of MASICAP projects during appraisal was so
low (Annex Table 4.1). Nevertheless it is necessary to inquire
if MASICAP's own procedures can be improved in various ways to reduce
the risks; on this, two suggestions can be made.
4.12 First - a not uncommon phenomenon - there is a tendency for
project benefits to be overestimated and costs to be underestimated.
Examination of a sample of 100 projects showed that sales levels in the
first year were at least 50% below what was forecast in 66% of the cases, and1/
between zero and 50% below forecasts in another 24%. Actual employment
levels were also substantially below forecasts. Since the loans went
to finance an expansion of fixed assets, the costs of which were also
underestimated, most firms (including many not subsequently in arrears on loan
repayments) immediately ran into cash flow problems. While the monitoring
surveys commonly attributed the arrears problem to a lack of markets,
the reality was that the markets, and the firm's share in them, had been
overestimated. One safeguard against the optimism would be to involve
the extension workers more in follow-up work on the projects, as
has recently been proposed in the Ministry. At present the projects
are left entirely to the banks after appraisal, and the extension
1/ Reported by Mrs. Fajardo (1979).

- 91 -
workers have no systematic knowledge of how they work out in practice.
The idea is that, apart from being useful to the banks in their own
supervision work, an arrangement which involved the extension workers
visiting and reporting on the projects periodically would also introduce
more realistic expectations into their forecasts. Having to be accountable
for the quality (as opposed to quantity, as at present) of projects would1/
also be a good discipline.
4.13 A second way of reducing risks would be to make finance.2/
available only to existing enterprises, and to relate the amount lent
to the current size of the business. This would not preclude offering
advisory and training services (through the SBAC program) to new or prospective
businessmen, but the evidence is that to finance them when new, or to
increase the size of a business substantially in one step, significantly increases
the risks. An additional point is that the majority of. businesses start
with very low levels of investment in order first to develop the products
and establish their markets and supplies before expanding into larger
3/entities; very few need large amounts of finance when beginning. Annex
Table 4.5presents data on the characteristics of enterprises in arrears
and up-to-date in loan repayments. Comparing the percentage distributions
shown in the Table, the percentage of projects in arrears on loan
1/ The annual and quarterly reports on the program currently give onlythe numbers of projects prepared and in various stages of processing,but no records as to their status after finance,
2/ C.f. the practices of the private financial institutions discussed inChapter 2, which only lend (other than for small personal loans) topeople having been in the business for some time.
3/ For a further discussion see Chapter 5.

- 92 -
repayments are relatively high among enterprises (a) that were new,
(b) had received the largest loans (of P 500,000 and above), or
(c) had received large loans relative to the size of the enterprise before
the loan. All three situations leave the businesses with comparatively
large overheads and highly vulnerable even to small shortfalls in
markets and supplies.
4.14 Another feature of interest in the Table is the lack of
any association between the incidence of arrears and the type of
ownership, the location and type of product market, or the size of the
loan (below about P 500,000). There is no apparent variation in arrears
with respect to the type of ownership (single proprietorships or
incorporated enterprises), market location (local, regional, national
or export), or market group (low or high income).
4.15 One other possibility for reducing risks would be for the
program to respond more explicitly to the demands for working
capital loans, which are inherently less risky than loans for fixed
assets. As working capital finance raises several issues not related1/
to risks, however, it is taken up under separate heading below.
1/ Paras 4.22 et. seq,

- 93 -
(b) Effects of Extension Costs and Enterprise Closures on
The Economic Returns to the Program. The costs of training and paying
for extensionists to work individually (often over a long period) with
each of a large number of small enterprises naturally raises the question,
how seriously do they affect the chances of having a satisfactory economic
return to the program? A similar question can be raised about the high
closure rates discussed above. The lack of reliable ex post estimates
of profits and earnings in the enterprises assisted unfortunately prevents
specific estimates of economic returns being made at the present time;
but by considering a range of values, some general answers are possible.
The economic benefits of each project can be estimated by comparing the
present worth of incremental sales with incremental costs.
If these are aggregated up over all projects and an economic rate of
return is calculated, denoted by r* then the actual returns to the1/
economy are given by:
r =r*
(100 + e)
where a represents the costs of extension, expressed as a percentage of
the capital costs of the investments, and A the closure rate (percentage
of enterprises closed per year).
4.1§ Overall costs in the first five years of the program were P12.8
million ($1.8 million), and the number of projects prepared and subsequently
2/ 3/financed, 1,800. Average loan size was P190 thousand, so that assuming
1/ See Addendum. The formula does not include the administrative costs facedby the financial institutions, since here we are only considering the effectsof extension costs on the returns. r and r* should therefore be comparedwith the opportunity cost of supplying capital from the banks.
2/ Allowing for those in the pipeline at the time.
3/ Based on a sample of 100 projects. (Only the size of loans requestedappear in the MASICAP reports.)

-94 -
20% equity finance the costs of extension worked out at about e = 3.0%
of the total investments in the projects. If a small number of large1/
projects are excluded, however, involving loans of over P500 thousand
and which are not representative of the program's work, the figure would
more realistically be close to 5%. The closure rates for the enterprises
financed after the assistance from the program averaged about 9% per
year, though as discussed earlier there are some grounds for thinking
that the figure is rising. If, then, to take an example, the rate of
return on financing the enterprises was 15%, ignoring extension costs
and closures, it would fall to 15.0/1.05 = 14.3% including extension
costs, and by nearly two thirds to 5.3% allowing for closures. Considering
a range of values of r* gives the following:
Rate of Return, not including extension costsand before allowing for enterprise closures 5,0 10.0 15,0 20.0
Rate of Return, including extension costs butbefore allowing for closed enterprises 4.8 9.5 14.3 19.0
Rate of Return, including extension costs andallowing for closed enterprises -4.2 0.5 5.5 10.0
Hence the closure rates are probably having a more adverse effect on the
economic returns than the costs of extension, which by comparison are
insignificant. The extra costs of introducing supervision prodecures,
as suggested above, and placing during supervision a greater
emphasis on the quality (as opposed to quantity) of projects would no
doubt be justified if, as intended, they were to reduce the closure rates.
4.18 The largerquestion as to the ex-post benefits of the program
cannot be answered at the present time without information on the profits
and labors' earnings variables noted in the Annex. Ex-post estimates
at present might in any case be misleading as to the long-run
value of the program, if, as argued above, there is scope for improving it
further. Ex ante estimates are possible but would be undependable until a
1/ Comprising 8% of the number of projects in the portfolio.

- 95 -
1/better forecasting record has been achieved.
4.19 (c) The Dependence of the Program on DBP. About 75% of the
projects generated by the program were financed by DBP, 11% by IGLF,
and 14% by the owners' own equity, other public banks and (a very small
percentage) by private banks and investmen, houses out of private resources,
4.20 The low involvement of the private sector (other than via
IGLF) is a consequence of the structural constraints discussed in Chapter
2, which make private lending to SSEs unprofitable. There is consequently
a high demand for DBP and IGLF loans, for which queuing times average
fcur months, and are often six months to a year CAnnex Table 4.6). The
low interest rates of DPP and IGLF further encourage queuing, and also a
number of enterprises to seek the assistances of MASICAP that would not
normally do so, but see the program as a way of obtaining low cost funds,
A survey of the file data and visits to enterprises showed that a not
small percentage of MASICAP and IGLF clients had had very good educations,
and had both the income and familiarity with banks to undertake or
otherwise organize the preparatory work themselves. These points highlight
a danger facing the MASICAP program. This is that, so long as the
structural constraints inhibit the private financial sector's involvement,
there is a possibility of the program becoming a permanent part of the
bureaucracy of administered credit.
11 See also Chapters 7 and 8 on methods of estimating benefits.

- 96 -
4.21 Within the Government's financing programs the dependence
on DBP follows from the size distribution of loan requests in MASICAP's
projects; 44% are fcr under P50,000 which is below the floor limit on
IGLF, and 74% for under P150,000, which is about the minimum size of
loans (though there are exceptions) that the private institutions using
IGLF find profitable. If then the intention is to use IGLF to encourage
a wider involvement of the private sector in lending to small enterprises,
there is a case for making the spreads on IGLF greater at the very small
loan end, and fcremoving the floor limit.
4.22 (d) Working Capital. The shortage of working capital finance
is (like the program's dependence on DBP) not strictly an issue to be
taken up in connection with the MASICAP program; but since it is the
experience gained through the extension program that serves to highlight
the issue,-it is appropriate to raise it in this Chapter.
4.23 The present financing programs of the Government are almost wholly
concentrated on term lending. While some of the finance is for "permanent"l/
working capital, the main part is for fixed assets. The share of finance
1/ See Annex Table 4.2, footnote 1,

- 97 -
for working relative to fixed capital is also often reduced during
appraisal, in part because the latter can be used to secure the
loan. Although we were unable to demonstrate the point quantitatively,
interviews with several proprietors suggested that perhaps over one
third of the pr6jects would have been better suited for working capital
finance, or required a better blend of working and fixed capital finance.
In some cases, the projects were applications 'in disguise' for working
capital, in which the fixed assets (on buildings, especially) had been
dressed-up in various ways; this had often placed a financial stress on
the business, by adding to overheads without adding correspondingly to
output. In other cases the owners said explicitly that what had been2/
needed in the first place was working capital,
4.24 The available data on small manufacturing enterprises shows
high proportions of woking capital in the asset structure. In the
industrialized countries, it has historically been the principal element,
Kennett (1979) remarks that "the technological transition of the
Industrial Revolution was largely financed in the form of working
capital. In the middle eighteenth century the ratio of inventory to
fixed capital in metal working and textiles in England was around 8:1 ....
The technology change saw an increase in fixed capital, but well into
the nineteenth century the value of inventories was 3 or 4 times the
replacement value of fixed capital." For US manufacturing in 1974 his
estimates of the ratios of working to fixed capital were 2.03, 1.70 and
1.33 respectively for small, medium and large firms. Precisely comparable
1/ See Annex Table 4.2.
2/ This point is also apparent from the monitoring surveys of the MASICAPprogram,

-98-
data are not available for Philippine man-afacturing. Working capital
assets include accounts receivable, cash and short-term securities, and
inventories. Data are only available for inventories, which according
to estimates from other countries comprise less than half of workingl/
capital assets; theyir are shown in Table 4.1:
Table 4.1: FIXED ASSETS AND INVENTORIESIN PHILIPPINE MANUFACTURING, 1974. (PERCENT DISTRIBUTION)
5 - 19 Employees 20 or More Employees
Fixed Assets (Based on Book Values)Land 11.9 3.1Buildings 12.4 8.2Machinery and Transport Equipment 34.5 34.4Other 4.2 3.3Total 64.0 48.9Inventories (Based on Year End Values)Finished Products 9.7 15.4Work in Process - 3.6 5.9Materials, Supplies, etc. 22.7 29.8Total 36.0 51.1Total 100.0 100.0
Source: NCSO Annual Survey of Manufacturers.
The data are not dis-similar to those footnoted below for India. The
share of inventories in total assets varies greatly with industry, ranging
from about 26% for food processing, 32% in textiles, 41% in wearing
apparel, and 62% in the manufacture of machinery and equipment (these2/
figures are all for small scale).
1/ Kennett's estimates for small-scale industries in India (in 1970) andin the U.S. (1974) are as follows; the figures shown are percentagesof total assets:
India U.S.
A/C receivable 24 26Cash 3 13Inventory 35 28Fixed Assets 38 33
100 100
Kennett adds that the 'cash' figure for India may be higher for variousreasons.
2/ Source. As for Table 4.1.

- 99 -
4.25 It may help to make issues in working capital finance more
concrete if an example is taken. If a business expands its fixed assets
by P 100 thousand using a DBP or IGLF term-loan, it is likely to require
at certain times of the year an expansion of assets in working capital
ranging from about P 70 thousand to P 200 thousand or above depending on
the sector - say P 150 thousand on average, corresponding to 60% of
assets being in the form of working capital. Of this, about P 30
thousand or 20%, will be a minimum below which stocks and accounts
receivable will not fall, unless the business is in dire straights;
this is the 'permanent' working capital of the business, and by coincidence
it is roughly the amount that DBP and IGLF finance on average. The
remaining P 120 thousand - which is still greater than the original investment
in fixed assets - must come out of retained earnings, trade credits or
further loans. But in most cases, further loans are forestalled by
the collateral already tied up in the loans on fixed assets, unless the
appraiser and the owner were. prescient enough to anticipate the need
to leave some collateral 'in reserve' for working capital loans.
Trade credits in the form of advanced purchases may be common for some
firms, such as those to whom work is 'put out' or subcontracted; but
however important this source may be, it is not universally available or
useful to all firms. Trade credits on materials supplies are often
available too, and are common in the garments industries (where putting-
out is also common). But what about firms with relatively long production
periods, in which labor costs and overheads are high while material costs
and stocks are low? Similarly, what of the firms in the agricultural
provinces - e.g. those maintaining or supplying agricultural equipment,

- 100 -
or others catering for fairly steady demands where the consumers
incomes fluctuate seasonally - which may need to offer credit to,rather
than receive credit from, their customers? In these cases, trade
credits are either not available, or supplied rather than received, and,
in the absence of short-term finance from banks, the business must turn
to the curb market or retained earnings. If these sources are also
scarce, the result is a substantial financial stress on the business.
4.26 To sum up, both the needs for and the sources of supply of
working capital finance vary greatly between businesses, and in practice
many businesses 'blend' different sources of finance. Further, some
may need for more short-term than long-term finance.
4.-7 There is then a case for the programs to respond more explicitly
to the demand. First, there are several disadvantages of supplying
working capital finance "permanently" since the timing and the magnitudes
of a businesses' demands for working capital are highly uncertain, and
vary with the flow and size of job-orders and the availability of
supplies. Second, it would eliminate the financial stresses just mentioned
that are unnecessarily placed on some businesses, and which are reported
by the extension workers to have caused several closures. Third
it would reduce the risks on the program. Working capital finance is
intrinsically less risky since the amounts requested can be related to
current sales and assets or contract orders, instead of to forecast
values. There may also 1a some merit in financing more of the former
and letting a greater share of investment finance come out of retained
earnings. It would, for instance, constrain an enterprise to grow

- 101 -
more naturally in relation to the growth of its markets, and avoid
the dangers of expanding (as happened in several of the cases discussed
above) in large steps to meet anticipated but as yet unrealized markets;
one can be too conservative in these respects, but as seen above it is
also too easy to be excessively optimistic. Fourth, the demand
could be met more speedily, and the policy would reduce the congestion
now faced by DBP, and the long-processing times (which are not admissible
for working capital finance) faced by the borrowers. There is also no
reason why it should not - and perhaps more so than with long-term loans
- act to familiarize institutions in lending-to small enterprises and
reduce their perceptions of the risks involved; it would be consistent
therefore with the basic ideas of the Government's financing programs.
Lastly, it would probably be a better way of involving the commercial1/
banks in the program. Although there are exceptions (as discussed in
Chapter 2) IGLF has met with resistance in part because term-lending
is not a specialization of commercial banks, and has proved to be more
acceptable to those non-bank financial intemediaries more specialized
in term finance.
4.26 As to supply, the ideal policy would be to release the
constraints on effective spreads, discussed in Chapter 2, and support
the changes as necessary with risk-guarantee or risk-sharing schemes
(analogously with IGLF). Alternatives are possible, however, and the
purpose of the present discussion is merely to raise the issue. There
also seems to be no good reason why the supply points of working capital
to industry should be concentrated on the financial sector alone; trade
credits from commercial enterprises in many respects make much more
1/ Joe Pernia pointed out that, if the extension program were involvedin providing assistance with working capital finance, it would require
a revision of procedures,

- 102 -
efficient and lower risk suppliers - if only because they also offer
the market outlets, materials supplies and a range of product design,
advisory and training services as well. This was particularly apparent
in a series of interviews held with enterprises in the garments and
handicrafts sectors. In several cases the enterprises were ostensibly
in manufacturing, but most of the work was in fact put-out to households;
the owners themselves were mainly involved in designing the products,
marketing, obtaining raw materials supplies and training the household
1/workers. Hence the Government's policies - and in particular their
financing aspects - could be more effective if tney did not concentrate
specifically on small industrial enterprises, but responded to the demands
of 9mall enterpri2e more generally.
4.27 One objection to supplying working capital might be that it is
less likely to be associated with an increase in the demand for labor.
There is, however, no evidence for this, as the examples provided in
the preceding paragraph illustrate. The demand for labor is determined
more by the growth of markets than perhaps any other factor. By improving
access to supplies and the capacity of business to meet larger orders,
working capital finance should have a measurable influence on employment2/
and earnings opportunities.
If Two of the small enterprises of this type that we interviewed (one
in garments and blankets, the other in macrame) were marketing the
output of over 200 households (the figure was easily checked from
figures 6n the sales volumes and the times taken to produce the
articles). One had since established a central weaving and garment
making factory, but continued putting-out work to households; in the
other, only a dozen employees worked in the main establishment, some
to provide training, the others handling materials and storage. The
households work in groups, each with a group leader, to whom a commission
is paid, responsible for passing out the materials, supervision and
controlling quality. "Putting-out" appears to be quite widespread
in the Philippines, as it was historically in Japan.
2/ See Chapter 7 for a discussion of methods for assessing the benefits and
costs of alternative policy and project measures.

- 103 -
Advisory Services (The SBAC program)
4.28 So far the discussion has only considered the preparation
of projects for finance. But the larger element in the Government's
extension programs, at least in terms of professional staffing, is to
provide advisory services to small industries. From the beginning
of the Government's SMI program these have always been considered
desirable since it was felt that the demands of small enterprises
would not necessarily be solely for finance. This is particularly
true ;or enterprises just starting up (as the enterprise interviews
reported in the next chapter will show), when most begin with very
small investments. Since 1974, Small Business Advisory Centers have
been set up in each of the 12 administrative regions of the country;
they now employ over 100 regular professional staff variously specialized
in engineering, finance and business management. Before examining
questions (a) about the demand for such servides, and (b) what the
Government's role is in providing them, it is necessary to discuss
what they are intended to do, Some points will also be footnoted from another
1/a report on the same subject;- although produced in a very different
context it provides evidence and conclusions remarkably similar to those
following from the Philippines' experience.
4.29 Services Offered. The services are provided free of charge,
and cover most aspects and stages of small business activity. Most of
the clients are "walk-ins" or referred to the SBACs by others (Annex
Table 4,7),About 30% of the SBAC's work is in what is called entrepreneurial
1/ The Bolton Report on Small Firms in the U,K. (November 1971;Reprinted 1978,)
2/ The issue of whether to charge for services is taken up furtherbelow. Para 4.

- 104 -
1/counselling for new or prospective business people, and another 40%
for established businesses with "no serious problems" but who visit
the SBACs to talk to the staff about the running or expansion of
their businesses. While advice on specific technical, marketing or
1/ The advice offered here is about marketing opportunities, whether the
industry is over-crowded, sources of equipment, sources of finance,
suggestions on cash flow management, various pitfalls (of which starting
too large before markets are established is common). Seminars for
small business proprietors are sometimes held in the centers.
2/ One of the distinguishing charactersitics of very small businesses
is that the owners control all aspects of the business, are often able
to keep records in their heads, and have no felt need for accountants
or managerial support. The SBAC staff find that the most noticeable
tendency of small businesses when expanding is for the owners to cling
to the control of all aspects of the business, even when it becomes
too large for one person to manage. Workshops also become congested
and expand haphazardly. Discussions on when to employ people with,
say,management or accounting skills, showing what other businesses have
done, are apparently helpful to the owners in making their own
decisions. It is interesting to compare this experience with what
the Bolton Report mentioned above had to say about small industries
in quite a different setting (op. cit. p.112):-
"The majority of small firm proprietors have no professional
or other formal qualifications and only a tiny minority have specific
qualifications in management. They run their business on the basis
of their experience and commonsense. This may be very effective so
long as the scale of the firm's activities remains small enough for one
man to control them all effectively, and so long as no serious crisis
overwhelms his pragmatic management. Either of these eventualities,
however - significant growth or a need to consider drastic changes in
the firm's policy - is likely to reveal a need for certain specialist
skills which are most unlikely to be found within the average small
firm.
"Every large company as a matter of course employs specialists
in the functional fields of management. These include, for example,
financial management and accounting, purchasing, production planning
and control, marketing and personnel management. The small firm is
prevented by the scale of its operatians from employing a specialist in
every function, and in any case, the impositian of a management structure
more suited to a large organization would lead only to confusion and/
or unnecessary expense. So far as they are needed therefore, and
so far as the need is recognized, sophisticated management skills and
s,ecialist knowledge must usually be brought in from outside. It is
very often the case that the need is not recognized: The implication
of this is that there is a very large potential market among small
firms for advisory and management services of all kinds."

- 105 -
financial issues is often sought, the SBAC staff say it is as often
difficult to pinpoint precisely what it is that the owner may wish to
discuss, or, in the case of a business with "serious`-,problems,"1/
what the causes of the problems are, Reports are prepared if requested,
and the SBAC staff member may work with a business over a long period;
when a matter lies outside the specialization of the staff, referrals
to the specialized trading, industrial and research associtions are common.
1/ There is again a close parallel here with what the Bolton Report found
about small firm consultancy services in the U.K. (op.cit. pp.122-123):-
"There are two serious difficulties in providing consultancy
for small firms: first, the consulting operation is not, as might be
thought, necessarily more simple than advising a large firm, but in
some ways more difficult; and second, the strong sales-resistance of
the typical small businessman necessitates a powerful marketing effort
which the majority of consultants, given a high level of demand for
their services,are not prepared to make. It is consequently very
difficult to run such services profitably.
"Because the small firm will rarely have identified correctly the
problem giving rise to the need for advice, the consultant will need
very wide experience, since his first task will often be to survey the
whole of the firm's operations and identify the basic trouble. This
point was well made by a representative of the Management Consultants
Association, who said: 'If ICI ask you to come in and do some time
study on the loading bay you can be pretty sure that is what they
want, whereas if a small business asks you to do that you have not
a clue whether that is really the problem.' The small businessman
who calls in a consultant is normally aware only that something is
going wrong and he expects the consultant to diagnose the trouble
and suggest a solution. Very often, he is - -
unwilling to discuss his problem with his staff and [has] nobody
else with whom to share the decision making. In these circumstances,
if the consultant can gain the businessman's confidence he may perform
a very valuable service in providing a sympathetic ear, putting the
problems in perspective (which involves pointing out that they
are not unique, but have probably been faced and solved in most
successful business), and generally acting as a trusted counsellor."

- 106 -
4.30 Follow-up and Evaluation of SBAC Projects. There are presently
no procedures which require the SBAC staff to follow-up and report on
the progress of the enterprises after they have sought advice. Current
records provide descriptions on the backgrounds of the clients and often
quite detailed analyses of the technical, financial and managerial aspects
of the business. Since the staff often spend a considerable time with
the business (from a few hours to several weeks in some cases) a detailed
picture of the business and whatever problems are faced is obtained; in
the process, the staff workers generate more than a little trust and
goodwill. Contact is commonly maintained with the business afterwards,
but only informally. As with the MASICAP program, there are good grounds
for formalizing the follow-up work and keeping records on current sales,
employment, investments and expenditures in the enterprises assisted, and
reporting on any current issues. Apart from providing feedback on the program,
the information so generated could be useful for reporting on the conditions
of small businesses in the provinces (though in both instances it would
need to be supplemented by studies of businesses not assisted by the program).
While, for instance, the NCSO, the Central Bank and several private sector
institutions publish reasonably up-to-date surveys and studies of large
industries, there is no up-to-date information on small businesses; this alone
is a major source of risks.
4.31 The absence of information on the subsequent developments of
business after the SBAC staff have worked with a firm also makes it difficult
to assess the usefulness of the services. The costs of the program over
1/the first four years were about 9 8m ($l.m), and averaged about
1/ The program started in 1975, one year after MASICAP.

- 107 -
1/P 2,500 ($340) per client; but there is no information at present that
would enable the benefits to be determined. From an economic viewpoint,
the purpose of the services is to increase the economic returns (that is,
r* and r in the formula above) by encouraging the adoption of better
business practices and production methods, and assisting in the search for
markets. If, then, material were collected on the economic returns
to capital for a sample of SBAC-assisted enterprises, and compared with
enterprises not assisted, it should be possible to estimate the economic2/
returns to the program using variance analysis.
4.31 The Government's Role in Providing Small Business Advisory
Services: A Comment. The SBAC staff classify their services under the
following headings: financial (advice only), accounting and record-keeping,
management, marketing, technical and general services (covc-ing more than
one aspect of the business). It is not difficult to think of instances
where these services may be found or developed in the private sector, so
some comments on how the Government's services relate to those in the
private sector are appropriate.
1/ The average is P8,000 if only clients for whom written reports wereprepared are counted. It would, however, be wrong to ignore thoseassisted less formally.
2/ It would evidently be necessary to allow for differing endowmentsof the owners. If r is the return to capital of enterprise J, then onemight correlate r with variables from the following groups (each inthemselves being haracterized by several variables):- educationalbackground of owner; initial wealth or income; access to infrastructure(roads and electricity in particular); location; management practicesadopted; types and vintages of production methods and equipment; andwhether SBAC advised or not.

- 108 -
4.32 Accounting firms, banks and consulting firms are common sources
of financial and management advice in many countries, and employ people
who can back their advice with substantive experience of their industry1/
or profession and (as important) a knowledge of local business. In
the Philippines the services offered by banks (which as seen in Chapter
2 presently are accessible to only a small percentage of the small
business community) can be expected to grow with the growth of savings
deposits and of loans made under the SMI program; in this, as with the
SBAC's advisory services on accounting and management, the Government
programs serves to create an awareness of the value of proven business
management practices, and should if anything stimulate the demand for
private sector services. The only potential conflict arises from the
SBAC's services being free of charge in certain categories of services in
which the program is competing with the private sector (e.g. in accounting).
Since the program has an educational purpose that goes beyond the strict
idea of supplying services, full cost recovery would probably not be merited
from an economic viewpoint at the present time; there are in addition fixed
1/ In the industrialized countries they are probably more sought after
than the Government's services. In the Bolton Report (op.cit. p.116)for the U.K., the results of a survey were quoted in which the question
was asked: "If you need help, to which of the following would you be
most likely to turn? "Replies were received from 3,740 firms as follows:
Accountant 1,383Solicitor 561Bank Manager 543Chamber of Commerce 496Trade Association 485Business Consultant 143CBI 129
The report added that "the outstanding feature of this Table is that the
sources most likely to be called upon are localized and familiar; accountants,solicitors and bank managers will usually be personally known to the
businessman seeking help. The same is true of chamber of commerce
officials (another localized service) and to a lesser extent of tradeassociations."

- 109 -
costs to the economy in promoting the services, which set average costs
above marginal costs. But charges for certain categories of services, or
for selected.costs might be considered - e.g. for repeater clients, and for
the expenditures on staff and materials when written reports are requested.
4.34 Marketing and technical services (including research) by
their nature require a highly specialized knowledge of the industrial
sectors in which they are demanded; and, in the provision of them, it
seems important not to overlook the role of the industrial and trading
associations. In most countries such associations were formed for purposes
quite different to those which they eventually came to serve, many
of which were (and still are) identified with the avoidance of competition.
But the range of services now offered ate also important for the growth
of industry - the provision of market intelligence, legal advice and
technical publications; supporting trade missions, exhibitions and industrial
research; and in some cases providing training and advisory services for their
2/members. In the Philippines they cover quite a large number of industries,
but for the most part are fragmented and confine their activities to
industries in Manila. Most appear to have been formed as a consequence
of the exchange controls in the 1950s, but are now beginning to offer
1/ On this see the third footnote to para 4.27 on the problems of developingconsultancy services.
2/ A report known as the Devlin (1972) Report on Industrial and CommercialRepresentation in the U.K. provides a review of the origins and currentwork of the industrial and trade associations in Europe. Many of itscomments and views are not irrelevant to a discussion of the futurerole of such institutions in developing countries.

- 110 -
a forum for promoting their industries and opening up marketing
1/opportunities; a number have also introduced training programs. These
developments are being further encouraged through a series of dialogues
between the Ministry and the Associations.
4.35 What the above suggests, from the viewpoint of developing the
SBAC program, is that many of the specialized services needed by both
small and large industries are capable of being developed by firms and
institutions in the private sector. The temptation to develop a plethora
of specialized and costly services within the program might better be
resisted, therefore, in favor of the current emphases of the program,
These are (i) to increase awareness among the small husiness community
of the advantages (once the businesses are no longer very small) of
adopting proven principles of business management and finance; (ii) to
improve the quality and timeliness of information on small industries;
and (iii) to act as referral services for the firms and institutions
capable of providing specialized advice. (This suggestion is of course
only intended for the extension programs, not for the industrial development
programs of the Ministry as a whole, and which may well require specialized
inputs. What is not clear at present is that it is necessary to develop
specialized capacity within the extension services for each and every
industry that merits 'promotiont .)
1/ A recent survey of subcontractors for vehicle parts manufacture found
that 72% were members of one association or another, including the
following: Philippine Chamber of Industries, Consolidated Automotive
Parts Association, Philippine Foundry Society, Machine Shop and Buildersi
Association, Confederation of Philippine Exporters, Manufacturing
Electronics Component Association, Anodizing Association of the
Philippines, Purchasing Association of the Philippines, and several
regional chambers and other industry and suppliers' groups. One can
gather from this that a varied and complex institutional structure is
emerging in the engineering sector (as it apparently is in others).
When asked about their reasons for joining half said that it was to
achieve an exchange of market information and technical know-how.

- 111 -
Conclusions
4.36 The project preparation services (of 'MASICAP) have helped
to make institutional finance available to a large number of enterprises
in the provinces that would not otherwise have had access to it.
Administrative costs were also low, about 3-5% of project investments,
The main issues identified in the course of the present study were
the following:
Cl) Arrears rates and closures of the enterprises assisted.
Both are high and seriously affecting the economic returns to the program.
Both could be reduced by preparing projects only for businesses already
in existence and by relating expansion to the current size of business
(expansion in too large a step increases risks all round). As will be
seen in the next two chapters, the rate of formation of new business
establishments in the Philippines is already high, and there is little
need for the program to attempt to create new ones. But the main causes of
arrearages and closures are unrealistic expectations for the projects,
leaving many enterprises with little or no cushion against shortfalls
in markets and profits. Involving the extension workers in follow-up work
and supervision of the projects after finance would help in making expectations
more realistic. Ex post accountability for the quality of the projects
would also help.
(2) Economic Returns. The conclusion about the desirability
of supervison and follow-up work was also supported by an analysis of
the effects of extension costs and closure rates (risks) on economic
- 112 -
returns; the returns are much more sensitive to the latter than to the former.
(Since the economic returns cannot yet be estimated, given limitations
on the data, a range of possible values was considered; a method for
estimating the returns was also proposed,)
(3) The dependence of the program on DBP. The lack of the
private sector's involvement, for reasons discussed in Chapter 2, has
made the program dependent on DBP and (to a much lesser extent) IGLF.
This has placed a disproportionate share of the risks and the administrative
burden on DBP, in contrast with the original aims of the program.
Seventy-five percent of the projects are either below the P 50,000
floor limit of IGLF or below the point (about P150,000, though there
are exceptions) at which IGLF lending becomes profitable to the private
sector. Adjustment of spreads at the smaller loan end and a removal
of the floor limit would help to involve more financial institutions
in the program. A restructuring of financial incentives to secure a
wider involvement of the private sector out of its own resources would
still require attention however.
(4) Working Capital. Several advantages of increasing short-
term lending - both out of private sector resources and through the
Government's own programs - were outlined in the text. The main ones
would be to lower risks and obtain a greater response from the commercial
banks; both would be consistent with the aims and ideas behind the
Government's programs. Trading enterprises would be particularly
'effective conduits for the flow of short-term resources to industry, and
could be expected to open up markets and further lower the risks; this
is one reason why the program might be reoriented to respond to
the demands of small enterprises in general rather than just industrial
enterprises in particular.

- 113 -
4.37 The advisory services (SBAC) program has similarly reached
out to a large number of enterprises in the provinces, also at a low
cost per project. The issues identified were:
(1) Follow-up work. Not much is known about the subsequent
developments of the enterprises after the services are provided. A
systematic follow-up and reporting procedure would be valuable both as
an information service and as feedback,
(2) The Government's role in providing advisor services.
Many of the services arL either available or gradually developing in the
private sector - in the banks themselves, in accounting and consulting
firms, and in the specialized trading, industrial and research associations.
In many respects the SBAC program should stimulate the demand for rather than
displace private sector activities; this is most obvious in the SBAC's
work as a referral service, but other examples were cited. Since
SBAC's services are provided free of charge, there is a tendency (particularly
with respect to accounting and general consultancy) to undercut initiatives
in the private sector; hence charges for certain types of services and
costs are worth contemplating. The future development of specialized
services ought not to be planned or proceed independently of the development
of the specialized associations in the private sector.

- 114 -
Addendum to Chapter IV
Effects of the Costs of Industrial Extensionand of Enterprise Failure Rates on the
Economic Returns to Small Enterprise Projects
If there are N small enterprise projects financed each year,
each increasing annual sales on average by S, and running costs (materials,
labor and other variable costs) on average by R, the present worth of the
net benefits obtained in any subsequent year t is:
N (S-R) /(1+r) t(1)
where r is the opportunity cost of supplying capital (i.e. including the
costs of raising and lending funds). This assumes of course no closures,
If a fraction Xfail each year, the number of projects available to generate
these benefits in year t would be:
N/(l+X)t (2)
assuming no reopenings 'under new management.' In practice reopenings
could offset most of the losses to the economy if the capital was used
at full capacity. If u is the average reopening rate (adjusted for time
lags between closure and reopening), then the net closure rate is
A' = (A-u), and is the quantity to be used instead of A in (2). At
present there is no information on u; but it is likely to be quite small
given the nature of the closures experienced so far, since most
have been due to markets being less than forecast and to a shortage of
working capital; even before closure, output was well short of full capacity
1/output, Rence one might not be far wrong - and may even underestimate the
effects of closures - by using A instead of (A-u) in the denominator of (2).
Hence adjusting (1) for closures, the net benefits in year t are
roughly:
NCS-R)/Cl+r+A)t (3)
1/ See para 4.12.

- 115 -
Summing over the average lifetime, T of the projects gives;
N(S-R) 11-Cr+X)~ 1/(r+A) 0A)
If the average capital costs of the projectare denoted by K and'
the extension costs, expressed as a proportion of K, by e, then (4)
needs to be compared with total project costs for the N projects of
N(l+e)K (5)2/
Equating (4) and (5) and using a linear approximation for the
numerator of (4) gives the following formula for the rate of return:
r = (S - R)/(1 + e)K - 1/T - X (6)
where the first term represents the economic returns before depreciation,
the second depreciation, and the third losses due to enterprise closures.
Considering the case where extension costs are ignored and where there
are no enterprise failures, the rate of return, denoted by r* in this case
is
r* = (S-RI/K-1/T
and, substituting for (S-R)/K in (6) shows the effects of extension
costs and of enterprise closures to be given by
r = r*/ (l+e)-X-e/ (I+e)T
,r*/Cl+e)-X
since e is likely to be small relative to (1+e)T, and the last term
small relative to the first two.
1/ K would also include the "permanent" working capital costs associated
with the project.
2/ [1-(l+x) I /xff(1+xT).

- 116 -
V. SMALL ENTERPRISES AND INDUSTRIAL DEVELQPMENT
5.1 This chapter first examines how the size structure and
patterns of Philippine manufacturing have developed over the past
25 years, and presents data obtained from interviews on selected
characteristics of small and large firms - their origins and growth,
closure rates, sources and uses of finance, and the location and1/
types of product markets. Data on characteristics of household
manufacturing are also presented. It then examines the incidence of the
country's industrialization policies on large and small and considers
the questions, how do these policies affect the coverage and efficiency
of small enterprise programs? and what would be the effects of a transition
(now under review) towards more efficient and labor demanding policies
based on revisions in tariffs and investment incentives? The aims are
therefore both descriptive, in that it provides some clarifications on
the backgrounds and workings of small enterprises; and normative in
that it assesses the efficiency of various policy options.
5.2 The analysis covers manufacturing activities only, since
Chapter VII discusses incomes and employment more generally. But to
keep things in perspective, data on output and employment by
sector are provided in Annex Table 5.1, from which the following might
be noted: (i) Manufacturing as a whole still provides only 11-12% of
total employment in the country; the share in fact declined from 12.5
to 11.4% between 1956 and 1975. Cii) Large scale manufacturing (using
NCSO definitions of large of large as being establishments of 20 or more
workers) employed only 3.6% in 1975; if one follows the definitions of

- 117 -
large scale used by other government agencies (roughly 100-200 or more
workers, the share would be about 1,6 to 2.0%., Hence at least with
respect to large scale manufacturing, one is dealing with a-very small
percentage of the labor force - though not a small percentage of total
investment and output in the country. (iii) Agriculture still provides
the bulk of employment (about 53.5% in 1975) and labor absorption
(47.2% in the period 1956-75); as will be discussed further in Chapter 6,
it is the growth of agriculture and the level of urbanization that still
exert the greatest influence on the size structure of industrial development
in the Philippines.
Data: Sources and Definitions
5.3 A distinction is drawn between
- household manufacturing activities,
- small manufacturing establishments and workshops
employment less than 10 or 20 workers, and
- establishments employing over 10 or 20 workers, and
often referred to as the factory sector.
Establishments in the factory sector are often classified into small,
medium and large factories, and its size structure is also examined below
where the data permit.
5.4 Employment in household manufacturing is estimated in the usual
way as the difference between the estimates of manufacturing employment
provided in the population censuses or (in inter-census years) the labor
force surveys, and those provided in the censuses of establishments. The
1/ In the census years, the NCSO classify manufacturing employment intoenterprises with less than 10 workers, and enterprises with 10 or more.In the establishment survey years, the classification used is 5-19
workers, and 20 or more workers.

- 118 -
latter includes any manufacturing activity at "a fixed location and
having permanency of assets such as goods for resale, materials,
products, equipment; etc., in its premises;" activities not
thus counted are generally those that take place within the households.
In the establishment census years, all establishments with one or
more workers are counted, but in the survey years (between censuses)
only these with five or more. Since establishments and workshops with
less than five workers are quite numerous, ignoring them 1,aads to an
underestimate of employment in small non-household enterprises, so the
census data are used as far as possible.
5.5 Apart from differing in scale, the three groups also differ
greatly in their use of labor and in their product markets. Staley
and Morse (1966) note that household activities include artisanal homework,
the manufacture of items for consumption or use by the family, and the
manufacture of goods for industry and trade under the "putting out" or
dispersed factory system. But perhaps the most distinguishing feature
is their use of family labor; in the Philippines three out of fput workers
in household manufacturing are family workers. Small establishments (with
less than 20 workers) market a larger share of their output, make more use
of hired labor, and are generally owned and run full-time by the family's
main income earner. Thus while household manufacturing is commonly a
secondary source of family income, manufacturing in small estabishments
is commonly the primary source. Factory activities make a much greater
use of hired labor, and of management, clerical and supervisory staff.

- 119 -
Aggregate Changes in Size Structure Over Time
5.6 Household activities are still the largest source of
employment in Philippine manufacturing. But their share in manufacturing
employment declined from about 75% in the mid '50s, to 65% in the
mid '60s, to less than 55% in the mid '70s (Table 5.1), and may be
entering a period of decline in absolute terms. They are however
likely to remain an important source of earnings for the labor force
for some time, and their current employment of 900 thousand is approximately
five times the employment in small and medium factory based industries
(of about 20 to 200 workers) to which the Small and Medium Industries
Program is addressed.
5.7 A noticeable feature of the size structure is the extent and
growth of employment in the smaller size groups; e.g. establishments
with less than 20 employees have been significantly faster growing
sources of employment than any other size group since the mid' 1960s, and
indeed this is true for small and medium establishments as a whole
(up to, say 200 employees) compared to large scale. The same patterns
are apparent when examining the net formation rates of small and
medium establishments CTable 5.2):-
1/ This figure is based on the residual between the labor force andestablishment surveys for 1956. The residual (which came to 80%)
was adjusted downwards by 5% to allow for firms with 1 to 4workers.

- 120 -
Table 5.1: EMPLOYMENT IN PHILIPPINE MANUFACTURINGACCORDING TO SCALE OF ACTIVITY
Scale (by No. of Annual Growth Rates
Employees/Establishment 1961 1967 1972 1975 1967-75 1961-75
Householdi 665 827 690 882 0.8 2.0
Establishments:
Less than 10 96 125 204 207 6.5 5.610 - 19 23 27 37 6.120 - 99 267 65 69 95 4.9 5.5
100 - 199 38 43 56 5.0
200 and over 268 285 374 4.3
Total 1,028 1,223 1,323 1,651 3.8 3.4
Percent of Total Employed in Year
HouseholdA 64.7 67.6 52.5 53.4
Establishments:
Less than 10 9.3 10.2 15.4 12.5
10 - 19 1.9 2.0 2.2
20 - 99 26.0 5.3 5.2 5.8
100 - 199 3.1 3.3 3.4
200 and over 21.9 21.5 22.7
Total 100 100 100 100
I. See text for definition.
Source: Establishment data are obtained from the NCSO censuses of Manufacturing
for 1961, 1967, 1972 and 1975 (preliminary tabulations). TotalEmployment in manufacturing is obtained from the National Sample
Surveys of Households for 1961 (October), 1967 (October) and 1972
(November); for 1975 it is taken from the NCSO Population Census.
Household employment is calculated as a residual.

- 121 -
Table 5.2 : GROWTH OF NUMBER OF ESTABLISHMENTS BY SIZE CATEGORY, 1961-75
Establishment Size Annual Growth Rates
(No. of Workers) 1961 1967 1972 1975 1967-75 1961-75
Less than 10 33,310 41,018 63,052 70,597 7.0 5.5
10 - 19 1,803 1,747 2,075 3,172 8.2 4.220 - 99 1,731 1,570 1,665 2,339 4.6 2.2
100 - 199 233 278 306 400 4.7 3.9200 and over 206 384 432 481 2.9 6.2
Total 37,2 44,997 67,5 76,989 6.9 5.3
Source: NCSO Censuses of Establishments for respective years. 1975 data are
preliminary tabulations.
Some of the recQrded increases could of course be due to improvements in the
ennumeration procedures of the NCSO, though it is difficult to know how to
allow for this. The measurement errors in the second smallest category
(10 to 20 workers), on the other hand, are probably quite low, since such
enterprises are more visible, and less susceptable to counting errors; herel/
too, the net rates of formation have been high.
5.8 The above Table also indicates quite high rates of "emergence"
of small and medium factory establishments employing 10 to 200 workers,
confirming an assumption of the SMI program that it is servicing a growing
sector. The growth of employment in such establishments averaged about
5.1% per year during 1967-75, and was systematically higher than for
employment in large factories.
1/ The NCSO's Annual Surveys of Manufacturing establishments also indicate
high net rates of formation in the 5-20 size range. The number increasedfrom 7,200 in 1960 to 13,300 in 1974, a growth rate of 4.5% per year.

- 122 -
Enterprise Expansion
5.9 The above trends understate the extent of labor absorption
in small enterprises since firms rarely start out by setting up medium
or large establishments, but begin small and expand in stages. To2/
assess the significance of this process, 72 firms were interviewed
about their origins and growth and other aspects of their business.
The sample covered all size ranges; 50% were taken at random from
various size groups in NCSO listings of large establishments of over
3/20 workers), and the remainder contacted in during the course of
field trips. The records of a sample of 55 now large enterprises that
had once borrowed from IGLF in the 1950s and 1960s were also checked,4/
and led to conclusions similar to those reached below.
1/ Exceptions in the establishment data tabulated above are the new branches
of large corporations; since the census data do not indicate whether an
establishment is a branch or a whole firm, it was not possible to determine
precisely how much labor absorption was accounted for by' branch expansion
of large firms, and how much by the growth of smaller firms. A recent survey
made by the UP Law Center of the top 1,000 Corporations in the Philippines
found that 461 were in manufacturing, of which 212 were partly or
wholly foreign owned. A sub sample of 117 of the 212 accounted for 140
thousand employees, or 22% of the factory sector labor force in the mid '70s.
Scaling up, about 40% of manufacturing employment (in the factory sector)
may be in the branch establishments of corporations partly or wholly
foreign owned. This leaves 60% of employed in wholly Philippine-owned
large corporations; but it is not possible at present to divide any
increases of employment in them between (a) expansion of existing corporations
themselves, and (b) the emergence of new large corporations from the middle
size ranges. As the interview data suggest below, however, (b) could
be sizeable; several of the firms interviewed were expanding rapidly
through the size structure.
2/ 80 were interviewed but in 8 cases the results were unreliable.
3/ The actual number that were identified for interview in this way was
selected from a much larger number first identified at random, and which
had to be pared down on account of the costs and difficulties of interviewing
enterprises in some regions. This naturally imparted an Yurban bias' in our
sample.
4/ Report by Mrs. Fajardo (1979).

- 123 -
5.10 Of the 72 firms interviewed only two were contracting; slightly
less than half were maintaining sales and employment at more or less
constant levels, or expanding slowly, while half were expanding at
varying rates through the size structure. The data on employment
are provided in Annex Table 5.5, and are summarized below in Table
5.3. Full time series data could not be obtained in every case: it
Table 5.3: SIZE DISTRIBUTION OF FIRMS OVER TIME:RESULTS OF INTERVIEWS OF 66 FIRS
Size Group of First Year of In InFirm (No. Operation/I 1976 1978Employed No. of Firms (%) No. of Firms (%) No. of Firms (%)
1 - 5 30 (71) 7 (23) 6 (9)6- 10 4 (10) 4 (13) 12 (18)11 - 20 3 (7) 4 (13) 10 (15)21 - 50 3 (1) 11 (37) 17 (26)
51 - 100 2 (5) 3 uio) 14 (21)101 - 500 0 (0) 0 (0) 6 (9)Over 500 0 (0) 1 (3) 1 (2)Total1 42 (100) 30 -Cim 66 LILUO
Average Size of Firm (No. Employed), all firms
8,1 96.2 78.0
Average Size of Firm (No. Employed), excluding the one firm in the sample withover 500 employees;
8.0 23.9 43.0
1 Note that the data were not always obtainable for firms in the first andintermediate years of operation.
2 Data were not available in all firms, hence the totals are not the samefor each year.

- 124 -
was of course easier to obtain current employment than employment
in intermediate years (though quite a large number of owners could
recall roughly how many were employed at startup, if only because most
began with less than half-a-dozen employees). The main pattern than
emerges is that the majority of firms either start small and remain
small, or, if they expand sales and employment, they do so continuously
or in steps. For the sample as a whole the number of employeies averaged
about 8 in their first year of operation, rising to 24 in 1975 and 43
1/by 1978. These averages exclude the largest firm in the sample,
which had grown rapidly and continually from a dozen employees when it
2/began in 1963 to over two thousand in 1978. They also include firms
not expanding or expanding slowly and thus understate the rate of
growth of firms that do expand, which is often extremely fast once they
have gained a footing in the market; e.g. for the 12 expanding firms
on which recent time series data were obtained, employment increased by
160% in the period 1976-78 (all these firms were in the size range
3/10 to 99 employees in 1976). Since the sample is small, it would
be hazardous to place too much emphasis on the precise values of the
figures estimated; but it is sufficient to reveal the importance of
the growth of small and medium firms through the size structure as a
source of industrial labor absorption.
1/ Note that reliable time series data were generally more difficult to
obtain (and so were not recorded) for the more quickly growing firms,
so these series probably underestimate the growth in the samples.
2/ Case 49 in Annex Tables 5.2 to 5.6,
3/ Cases 3, 9, 10, 14, 17, 41, 45, 51, 63, 66, 70, 71. Case 49 wasexcluded since it is so large.

- 125 -
5.11 During the interviews it became apparent why starting small and
expanding continuously or in stages was the general rule. A high
investment, either initially, or to increase output several-fold after
startup, leaves the business highly vulnerable to short-falls in supplies
and markets. If in addition the owner's collateral is fullycommitted
to a previous loan obtained for purposes of investment,,it is difficult
to obtain a working capital loan to meet business overheads if, for
instance, there are slippages in production. We also noticed one
particularly critical period in the expansion of the firm, which occurred
during their transition from back-yard, part-time to factory based, full-
time operations. Before the change, the owner generally has an alternative
source of income (which is lost after the change), low overheads (which
are high after the change) and running the business may require few
management and record-keeping skills (but which are required after the
change). It might be added that advisory services can be particularly
helpful during this period.
5.12 In practice the majority of businesses remain small, and it
should be re-emphasized that the above sample, by including middle and
larger sized firms, is not representative of those that do. In 1967 there
were about 41,000 establishments employing less than 10 workers
(Table 5.2); by 1975 the number of establishments with 10 to 99 workers
1/ There is therefore some sense in the ground rules adopted by some
financial institutions of limiting the loan size to a given multiple
of the current sales and asset levels of the business; the rule may be
relaxed if the enterprise owner has sufficient collateral to provide for
contingencies. While the policy is often criticized for being
conservative, the evidence is that less-conservative policies putboth business and the banks at risk. (See Chapter 2 for a further
discussion).

- 126 -
had increased by about 2,000 implying that less than one in twenty
could have expanded into this large size group. Furthermore, of
those that had expanded into the size range of 10-99 workers by
1967, less than one in fifteen could have expanded into yet largerl/
entities by 1975. These figures are over estimates since (a) they
ignore the growth due to new branch establishments of large corporations, and
(b) do not allow for the failure rates of small establishments.
5.13 To sum up, the growth of employment in non-household manufacturing
is made up of (1) the formation of small firms, (2) the expansion of once
small firms through the size structure, and (3) branch and central
expansion of large firms. The data on (1) were given earlier (Table 5.1)
and appear to have accounted for about a quarter of employment growth
(in non-household manufacturing) in recent years, While only a very
small percentage of small firms make the transition to medium or large
scale production, those that do provide a significant source of employment
growth in the factory sector.
Enterprise losure Rates
5.14 The closure rates of enterprises can be estimated from two
sources of information supplied by the NCSO:-
(i) the number of enterprises actually existing in
a particular year, and
(ii) the- humber'existing in the same year and
still existing at some later point in time.
1/ In 1967 there were 3,317 establishments with 10-99 workers; theincrease in the number with over 99 workers in the period was219 (able 5.2).

- 127 -
The latter can be obtained directly from data on the age profiles ofl/
industrial enterprises which appear in the NCSOts listing of establishments.
The difference between Ci) and (ii) gives the number having closed in
the intervening years. Estimates for small and medium industries are
provided in Table 5.4. In 1977 there were 15,777 manufacturing establishments
in the NCSO listings; colums (3) of the table shows how they were
distributed according to year of formation, and column (4) the cumulative
total of column (3). Thus, -to take an example, there were 4,039
establishments formed during or before 1966 and still existing in 1977;
but the actual number existing in 1966 (shown in column 5)was 9,666, so that
9,666-4,039=5,627, or 58.2% had closed in the following 11 years, an
average annual closure rate of 7.9% per year (on a logarithmic basis).
The same calculation is repeated for each year in the Table. The
closure rates averaged about 7% per year in the 1960s, though seem to
be lower (about 4%) for the early 1970s.
5.16 The term 'closure', as used above, is somewhat misleading
since enterprises may not close down yet disappear from the establishment
listings because of a change in location or in the nature of the business;
counting errors in the listings also cannot be totally avoided.
Further, it does not imply that they had failed financially since the
owners may have sold the business, retired, or moved into another
form of employment. (Changing the product line, or even the member of
the family who owns the business, is also a common way of re-qualifying
the business for tax holidays.) These kinds of changes are reportedly
commonplace among small enterprises, particularly among the smallest

G1
TAble 5.4: DATA FOR ESTIMATING ESTABLISilMENT SURVIVAL AND CLOSURE RATES SINCE 1957
/I Average AnnualAge, T No. Formed Cumulative No. Actual No. Percentage which by 1977 had Closur Rates, % /5
Year Years in Year Formed - NT in Year - NA Survived Closed InarC og timlc(1) (2) (3) (4) (5) (6) (7) (8) (9)
/6
1977 1 3116 15,777 15,777 100.0 0.0 - -
1976 1 151- 15,746 n.a. - - - -
1975 2 2,372 15,595 15,169 /7 /7 - -
1974 3 1,622 13,223 12,808 7 - -
1973 4 1,544 11,601 n.a. - - - -
1972 5 1,860 10,057 12,206 82.4 17.6 3-5 3.91971 6 1,013 8,197 9,857 83.2 16,8 2.8 3.1
1970 7 1,255 7,184 10,135 70.9 29.1 4.2 4.9
1969 8 720 5,929 n.s. - - - -
19611 9 744 5,209 9,703 53.7 46.3 5.1 6.91967 10 426 4,465 9,628 46.4 53.6 5.4 7.7
1966 11 291 4,039 9,666 41.8 58.2 5.3 7.9
1965 12 645 3,748 n.a. - - - -
1964 13 294 3,103 n.e. - - - -
1963 14 292 2,809 n.a. - - - -
1962 15 258 2,517 8,224 30.6 69.4 4.6 7.9
1961 16 166 2,259 10,333 21.9 78.1 4.9 9.5
1960 17 397 2,093 7,023 29.8 70,2 4.1 7.1
1959 18 142 1,696 7,185 23.6 76.4 4.2 8.01958 19 157 1,554 7,411 21.0 79.0 4.2 8.21957 20 1,397 1,397 7,421 18.8 81.2 4.1 8.3and earlier
11 I.e. cumulative total of column (3).
J (4) t (5), % (or NT/NA).
/3 100 - 6, 7 (or I - NT/NA).
/4 (7)1(2), % (or (NA - NT/NAT).
5 In (NA/NT) t T.
/6 The very low numbers of enterprises recorded as having being formed in these years are probably due to the lag
between the date of formation and their "appearance" in the establishment.surveys.
/ Closure rates are not calculated for these years since the measurement errors are too great, and wouldbe negative according to the figures shown. In recent years, the closure rates are small differences between
two large numbers. The measurement errors become less significant the further back one goes in time because
the difference between col. (5) and col. (4) becomes larger.
Sources: Estimates based on data and calculations of Fajardo "Study on Small and Medium Industries in thePhilippines, April 1979, Vol. II, Table 1.3, (mimeo). Data on enterprise ages, obtained fromestablishment listings (prel minary tabulations) of 1977 Survey of KMnufacturers. Data onactual number uf enterprises are from NCSO Annual Surveys of Manufacturers for respective years.Small and medium industries are defined as those with 5 to 2P0 employees.

-129-
enterprises in large urban areas in which the competition between
1/wage and self-employment is greater. An attempt was made to allow
for these points by contacting the owners of a sample of 170 enterprises
recorded in the NCSO's 1972 listing of establishments. In 100 cases, the
enumerators simply verified if the enterprise was still operating or
2/not. In the other 70 cases (all in Metro-Manila), additional information
was obtained on whether Ci) the firm was operating in the same place
or had changed location; (ii) it had been merged, sold, or taken over by
a relative; or, after checking secondary sources, (iii) it had closed
down. Since the sample was based on the establishment listings, which
do not cover establishments with less than 5 workers, there is still no
information on the closure rates (which are probably quite high) of the
smallest enterprises. Nevertheless, some patterns do emerge quite clearly,
as shown in Table 5.5.
Table 5.5: DISAPPEARANCE RATES OF SMALL AND MEDIUMINDUSTRIES BY SIZE OF FIRM AND BY REGION
Region and Firm No. of Firms or No. Closed % Closed
Size in 1972 Firm Owners Traced Down Down
Metro Manila:
> 20 Workers 24 2 8%5 - 20 Workers 43 9 21%Firm Size n.a. 71 14 20%
Provinces:
Firm Size n.a. 31 1 3%Total 169 26 15%
Source: H. Fajardo "Study on Small and Medium Industries in the
Philippines" (Mimeo), April, 1979, Vol. II, Tables 1.6 and1.7. The interviews were between June and December, 1978.
1/ See Chapter 7.
2/ Quite a large proportion of enterprises change location or change names,
so tracking them down can be time consuming.
3/ Neighbors mainly.

- 130 -
5.16 The results conform with the common perception of closure
rates being higher in small than in larger enterprises. The closure
rates are also significantly higher in Manila, and probably reflect the
greater competition both among small manufacturers themselves and
between large and small manufacturers found in that region. (Note
that the greater turnover rates reconcile quite well with the experience
of the financial institutions, which find lending to small enterprises
more risky in Manila than in the provinces.) The above data also square
quite well with those just estimated from the NCSO data. The weighted
average percentage of firms disappearing in the 6 year period in Metro
Manila would be about 19%, according to the above data (and assuming
one firm in five with over 20 workers), giving a weighted average1/
disappearance rate of ln(100/80)/6, about 3.5% per year.
5.17 The questionnaire was not sufficiently detailed to determine the
causes of closure or other changes in the business, a task that iust
now await further study. Why businesses fail financially, as opposed
to merely changing their product line or location in some ways, is of
particular interest to those involved with the small enterprise programs,
One commonly discussed factor is undoubtedly the great variation in
natural and acquired entrepreneurial abilities among the'owners; it is
apparently one explanation for an equally large variation found in the
technical efficiencies of otherwise comparable businesses. How far the
extension and training programs are ablie to improve the acquired abilities
is also a task meriting further study.
1/ The closure rates as calculated from NCSO data were 4.9%, 3.1% and
3.9% for 1970; 71 and 72 respectively. See Table 5.4.

- 131
5.18 Since the above study of closures was undertaken, a more compre-
hensive study of the extent and causes of closure due to bankruptcy among
small firms has been completed by Mr. Itao of the University of the
Philippines Institute for Small Scale Industries,1/ based on interviews
with the owners or former owners of 260 small firms identified from the
1975 establishment listings of the NCSO. The principal findings were:-
- about 3.6% of small firms closed each year due to
bankruptcy, though the closure rate varied greatly
between years (this estimate compares quite well with
the estimates provided above);
- relatively short life-spans (of about 3 years on average)
for firms going bankrupt;
- closure rates due to bankruptcy not associated with
the educational or social background of the owner,-
nor with the level of development of the region; and
- closure rates strongly associated, however, with the
management practices of the business.
Annex Table 5.8 summarises some data on the last two points. It is interest-
ing that the tendency to keep books and records, to separate business and
family accounts, and to use the services of professional accountants, were
all noticeably lower in the firms that went bankrupt.
1/ See Itao (1980).
2/ Their educational backgrounds, on the other hand, were generally quite ofhigh standard (see Annex Table 5.8), the majority having been to highschool or college.

- 132 -
Further Micro Data: Sources and Uses of Finance
5.19 Given the emphasis in the Government's program on supplying
credit to facilitate the expansion of small enterprises, there is some
interest in the sources of enterprise finance during startup and
subsequent operations. (Fifty six of the 72 enterprises interviewed
were started before 1974, the first year of the Government's program.)
The enterprises' answers to our questions on this subject are summarized
in Annex Table 5.2.1/
5.20 All but three had begun with vezy small initial investments;
e.g. less than P 5,000 (in 1978 prices) in 10% of the cases on which
information was obtained, and P 5,000-50,000 in half of the cases.
Table 5.6 provides more details:-
Table 5.6. SIZE DISTRIBUTION OF INVESTMENTS
BY ENTERPRISES AT START OF BUSINESS
Size Range of Initial Investments No. ofin P 000s (Constant 78 prices at Cases
time of staft-up)
5 or Less 46 - 20 15
21 - 50 851 - 100 7101 - 500 7Over 500 3
This pattern of small beginnings applied to the seven large enterprises in
the sample with assets of over P4 million (the Government's definition of
large), including the nation's largest jeepney manufacturer with over 500
employees, and a large electrical applicance manufacturer and subcontractor
with assets of P31 million and over 2,000 employees.
1/ The one that had begun the longest 'ad obtained a P 3.4 million (4fm,fnnlfloan from a financial institution; it was one of two businesses in the samplein trouble, having poor market outlets and very low capacity utilization
(case 44 in Annex Table 5.2).

- 133 -
5.21 The majority began with their own savings, sometimes supplemented
by small inheritances or by revenues from another business; only five (8%
of the total sample) mentioned that they had borrowed from financial
institutions when starting up, two had obtained small credits from suppliers,
and one had rented all the facilities and equipment. No instances were found
in which credit has been obtained or sought from moneylenders and other "informal"1/
sources. When some owners were asked if they would have,preferred to have
started larger, finance permitting, it became apparent that they saw advantages
in starting small in order to first establish their markets and contacts
with suppliers.
5.22 Once the enterprises had become established, however, there was
a significant rise in their use of institutional credit. The rise is
of course partly due to the financial institutions' own preference for
dealing with enterprises having track records; but it was also noticeable that
several of the owners interviewed had actively sought to develop their credit
standings with the institutions almost from the outset of their business.
All reinvested a portion of their profits, either for working or investment
capital purposes, and in 20% of the cases the businesses were financially
self-sufficient. But most businesses used a mixture of re-invested profits,
commercial bank loans, loans or equity finance from DFCs, supplier and
buyer credits, and loans from friends and relatives. Again, there was no
instance of borrowings from informal sources of credit, unless friends and
1/ See however the second footnote to para 5.25 below on the use ofinstitutional credit by cottage industries in the Ilocos Region.

- 134 -
Table 5.7 NMAIN SOURCES OF FINANCE AFTERSTARTUP OF ENTERPRISES
Purpose/1 Working Investment
Sources of Funds - Capital Capital
Profits Plus InstitutionalCredits
- DFCs 2 18- CommeTiial Banks 15 102- Other- 3 0 5
14Profits Plus Trade 12 3-
Credits
Profits Plus Borrowingsfrom Relatives etc. 5 4
Profits onl 31 24Sample TotaL 65 64
1l Other combinations, such as institutionaland trade credits plus profits for workingcapital were not identified because thequestions were not detailed enough; inpractice, it is likely that thesecombinations of finance also exist.
/2 Some IGLF loans, plus 3 cases in whichshort term borrowings were rolled overfo finance the investments.
/3 Equity finance from various institutions.
/4 Includes one case where rented equipmentis counted as a trade credit.
/5 Both figures include 12 businesses thatwere financially self-sufficient.
/6 Data are not available in all cases.

- 135 -
relatives are counted as such, though several attempts were made duringI/
the interviews to determine their extent. Details are provided in
Annex Table 5.2, and summarized in Table 5.7, Note that the institutional
credit is used as often for working capital as for invescment purposes.
5.23 The increasing use of institutional credit was not associated
with either excessive capacity in equipment and buildings - the workplaces
were overcrowded and congested in most cases - or a decline in the
enterprises' desire to find low cost equipment best suited to their
needs. Some evidence on these points is presented in Annex Table 5.6.
The owners' responses to questions on capacity utilization were naturally
less precise and more difficult to verify than those on equipment costs,
but tended to show utilization rates of 75% or more in four out of five
cases. The responses on equipment costs were more revealing, and we
noted a widespread tendency to purchase second hand or renovated equipment
wherever possible (the tendency was particularly marked in the metals
and machinery sectors, where it was not uncommon to find workshops with2/
second hand machines from several countries); about 40% of the firms
on which reliable information was obtained used such equipment for one
purpose or another, and in 20% of the firms, it accounted for over half
their fixed assets. Furthermore, those purchasing new equipment were as
1/ One reason perhaps why we found little use of informal credit was that our
sample contained a high proportion of people with good family incomes,
higher education and professional experience, and who were able to pass
the credit worthiness checks of the financial institutions. (We did not
know in advance of the interviews anything about the owners backgrounds,
and it is possible the propensity of an enterprise to expand is correlated
with the educational and professional background of the owner; our
sample is not large enough, nor does it have sufficient information, to
test for this, however.) Mrs. Fajardo (1979) also found that 103 out of
148 IGLF accounts were for businesses run by people with college educations.
2/ Cortes and Escandon also find second hand equipment used extensively
by small enterprises in Colombia, and for this reasnn undertook a special
investigation on the subject. "Use of Second Hand Equipment in Colombia"
(Mimeo) IBRD, August 1979.

- 136 -
likely to do so out of their own resources as out of institutional
credit, as indicated in the following Table; i.e. we found no evidence
of institutional credit leading to extravagance:
Table 5.8: USE OF NEW AND SECOND HAND EQUIPMENT
IN SMALL ENTERPRISES
No. of Enterprises Using:
Equipment (% Composition Own Resources & Own Resources
By Value) Instit. Credit Entirely Total
Over 75% New 16 14 30
25%-75% Mix of Old and New 6 2 8
Over 75% Old (Second Hand) 8 3 130 19 49
Source: Enterprise Interviews. See Annex Table 5.6.
Product Markets
5.24 Two sources of data were used to determine the nature of the
products and product markets of small enterprises. One was the file
records of the technical assistance (MASICAP and SBAC) and financial
institutions, which routinely comment on the markets of the enterprises
financed or assisted. For household goods, this source does not give any
indicatian of the income groups most likely to purchase an enterprise's
products; but this could be deduced not inaccurately from descriptions of
the products and of the products' qualities provided in the reports. The
second source was our own interviews of 72 enterprises. The locations of
the markets according to industrial category are summarized in Table 5.9,
the first four columns showing the interview data, the last four the data
from both sources; the full interview data are in Annex Table 5.4.

- - 137 -
5.25 The main characteristic of the markets is their diversity with
respect to sector, location and income group, and it is not possible to
place them in a few categories. All the high growth enterprises
interviewed were in high growth markets, but the markets were spread
across several sectors and specializations - a range of food processing,
canning, preserving and baking activities; metals, machinery, and transport
equipment; furniture of all types and qualities; garments and fabrics
for all income groups and for exports; and ornaments and handicrafts.
Production for local markets is commonplace in all sectors, though a
surprisingly large number were found to be producing for national and
export maiKets (Table 5.9). Given the diversity of products and market
locations, it is not surprising to find no tendency for small and medium
industries to cater for any particular income group or industrial sector.
A summary of market structure of enterprises in the two samples is as
follows (the numbers indicate the percentage of enterprises in the
samples);
Main Market Location Main Market Group
Local 55 Agriculture 7
Regional 17 Industry 26
National 12 Construction 4
Export 16 Service 3
100 Households:- high income 15
- middle income 31
- low income 14100
Source: Aa for Table 5.9

Table 5.9: MARKET LOCATIONS OF SMALL AND MEDIUM INDUSTRIES IN THE PHILIPPINES, 1978
Interview Data /l Full Sample /1Code Industry Classification Local Regional Natl. Export Local Regional Natl. Export
311 Food Manufacturing 10 6 11 4 48 19 19 9312 Animal Feeds/grain & Poultry 3 2 - - 32 11 3 -313 Beverage Indus - - - - - - - -
314 Tobacco Manufacturing - - - - - - - -
321 Manufacture of Textiles 1 1 1 - 23 3 6 6322 Wearing Apparel ex. Footwear 5 - 1 4 45 11 6 26323 Leathergoods, Leather Substi. 2 1 1 1 5 3 3 4324 Footwear 2 2 - - 14 2 5 3331 Wood & Cork Products 2 - - 1 45 5 9 26332 Furniture/Fixtures 2 1 - - 37 14 5 10341 Paper and Paper Products L1 - 1 6 2 3 -342 Printing/Publishing - - - - 12 4 1 -351 Mfr. of Industrial Chemicals - - - 8 5 1 -352 Other Chemical Products - - - - 10 2 - -353 Petroleum Refineries - - - - - - -354 Misc. Prods. of Petroleum & Coal - - 1 - - - 1 -355 Rubber Products 2 1 - - 10 3 - 1356 Plastic Products - - - - 13 1 5 1361 Pottery, China & Earthenware 1 - - - 6 2 - 2 00362 Glass & Glass Products - - - - 1 1 1 1363 Mfr. of Cement - - - 1 1 - -369 Non Metallic Mineral Prods. - - - - 30 5 1 2371 Iron & Steel Basic Indus - - - - 1 - 2 2381 Fabricated Metal Prods. - - - - 2 2 - -382 Machinery ex. electrical 1 1 - - 34 13 5 6383 Elec. Machinery, Apparatus 11 6 1 - 46 14 5 2
Applicances & Supplies384 Transport Equipment 1 - 2 - 10 1 8 3385 Professional, Scientific, Meas. 2 1 2 - 21 7 6 1
& Controlling Equip.386 Furniture/Fixtures of Metal - - - - 3 - 2390 Other Mfg. Industri,-s 1 1 - - 2 1 - -
Non-ManufacturingAgriculture 1 1 - - 15 3 1 1Tourism - - - - 10 - - -
Services - 1 - - 26 3 2 -TOTAL 48 24 23 10 483 148 106 136
/1 Note that the horizontal totals add up to more than the sample size becauseenterprise frequently cater for more than one market.
Source: Interviews with 72 enterprises plus file data 6f MASICAP, DBP, PDCP and IGLF.Draft by 1Mrs. Fajardo (1979), Table 2.9.

- 139 -
Sectoral Patter-fs and Trends in Size Structure
5.26 The rising share of manufacturing employment in work3hops and
factories in the Philippines, and the declining share in household activities,
follows the trends observed for other countries. As in other countries, however,
the trends differ both in magnitude and in sign between sectors, as shown in
Table 5.10; employment in households activities may be declining rapidly,
stagnating, or increasing rapidly, depending on the sector being considered.
In food processing household activities have entered a period of rapid decline
in favor of both small and large scale mechanized activities. In textiles,
employment in households appears to have peaked, and it is large scale
manufacturing that is providing most of the labor absorption. Similarly
in wearing apparel household employment seems to have peaked, though at a
very high level, but here it is small scale activities (particularly tailoring
and seamstressing) that are providing most of the new employment opportunities,
In the engineering sectors (metal, mechanical and electrical products and
transport equipment) household employment has ±ncreased rapidly along with
employment in workshops and in both small and large factories. The engineering
sectors all have high growth markets, and the data in Table 5.10 are
consistent with those of the interviews discussed above in which it was found
that small manufacturing enterprises (a) are highly responsive to market
opportunities, and (b) commonly begin as household activities.
5.27 Further analysis of household employment is made difficult by an
almost total absence of relevant information, other than the two-digit data
provided in the population census years. The only documented information
that is available is provided in a survey undertaken by NACIDA in the region
of Ilocos in Northern Luzon in 1977. Since over 80% of the region's
1/ The survey aimed at obtaining a 100% coverage of all cottage industries
in the region; the estimates of people engaged in manufacturing employment
were quite close to those of the population censuses. NACIDA's estimatesof employment in cottage industries in the region were 68,000; in 1975the labor force in manufacturing was 70,000 according to the regionalvolumes of the population census, of which about 6,000 would be inestablishments of over 20 workers (see ASM for 1974).

- 140 -
Table 5.10: -STIMATED EMPLotE0NT IN HOUSEHOLD ANDSMALL AND LARGE MANUFACTURING ESTABLISHMENTS, 1961 AND 1972
Emrlovment 000s Growth iare
1961 1972 ner Year
Food
HoLseholds 87 6 - 21.6
Eat, <'10 Workers 31 67 7.3
Est. > 10 Workers 55 90 4.6
173 163 - 0.5
Textiles
Households 97 109 1.1Est. < 10 Workers 2 5 8.7
Est. > 10 Workers 30 61 6.7
129 175 2.8
Clochine and Footwear
Households 230 229 0.0-sa. < 10 Workers 35 81 7.9Eat. > 10 Workers 24 22 - 0.8
Z8 332 1.3
Wood and Cork
Households 20 *Est. < 10 Workers 2 7 12.0
Est. > 10 Workers 29 56 6.230 83 9.7
?urniture & Fitures
Households 14 16 1.2Est. < 10 Workers ( 9 7.7
Eat. > 10 Workers 5 3 4.423 33 3.3
Mecal ?roducts, Mech. and Elect. Machinery, Transoort Equiv.
Households 2* 126 HighA
Est. < 10 Workers 10 15 3.8Ear. > 10 Workers 33 37 3.1
45 198 14.4
All Other
Households 237 174 - 2.3Esr. < 10 Workers 13 20 4.0Est. > 10 Workers 87 145 4.8
337 339 0.1
All Manufacturin2
Households 667 6 80L 0.2
Est. < 10 Workers 96 204 7.1Est. > Workers 263 439 4.8
I026 1323 2.3
* Escimares of residual are small and not accurate enough
for growth rates to be estimated reliably,
/1 'Tote that there are quite large irregularicies in thehousehold employment daca: the figure for 1967 and
1975 (preliminary) are over 800 thousand; see Table 5.2.
Sources: The basic data for the estimates are provided bythe Population Censuses of 1960 and 1975 and the
Manufacturing Censuses of 1961 and 1972. Since
no two-digit breakdown of total employment isavailable other than in the Population Census
years, the following procedure was used to estimate
household employment. The percentage distributionof the labor force among the two digit classi
fication shown were calculated from the PopulationCensuses for 1960 and 1973, the former discrIbution.as then apulIed to the total labor force inmanufacturing for 1961 and the latter to :he totallabor force in 1972. The hanufacturing Censusesgives the data for less than 10 and 10 or more
employees; household employment is then calculated
as a residual. A similar exercise using the 1967
Manufacturing and the 1970 Population Censuses was
not done on account of apparent inconsistenciesin the data on female employment in clothing and
footwear, NEC in 1970.

- 141 -
population are rural, the survey covered a large proportion of off-farm
activities such as piggeries and poultry, as shown in Table 5.11.
Otherwise, the data show similar patterns to the two-digit data in
Table 5.10, with a large proportion of workers being in garment craft
and weaving, metal and wood crafts, and various handicrafts based on
bamboo, ceramics and others. There was also some evidence of investment
and growth in the activities surveyed; asset levels per worker averaged
about P 1,500 ($200) and apparently most households had invested further1/
in the activities after they were started. While most of the growth
has stemmed from the growth of local markets (as with piggeries, poultry,
metalcraft and food preservation) certain traditional handicrafts (bamboo,
garments, needlecraft and ceramics) have benefitted from a fourfold
increase in the export markets for cottage industry products in recent
2/years.
5.28 The data in Table 5.10 suggest that the net shift away from
household manufacturing is occurring towards both small and large
manufacturing establishments, with the pattern again varying between
sectors. An attempt is made to show the pattern in more detail in Table
1/ The investments were mostly self-financed, though a surprisingly large
number appear to be turning to financial institutions for credit. In
a sub-sample of 7,000 households over 1,500 (or 22%) had obtained loans
from financial institutions; 65% financed their own investments; the
other 13% had used informal sources and a now defunct credit facility
offered by NACIDA. The institutional sources were not identified in the
sample, but they probably include Rural Banks (which offer short-term
loans for poultry and piggeries), the small loans facilities of the
Private Development Banks, and the small "home" and "cottage" industry
loan facilities of DBP and PNB respectively; for reasons discussed
in Chapter II, they are unlikely to include the private commercial
banks.
2/ NCSO Foreign Trade Statistics.

Table 5.11: CHARACTERISTICS OF COTTAGE INDUSTRIES IN ILOCOS, 1977 fl
No. of Labor Force AssetsIndustries % % 7 P 000s PercentActivity Counted Total Female Male Family Hired Initial Present Increase
Bamboocraft 469 1,834 34.3 65.7 60.9 39.1 348 1,862 435Ceramics 863 2,442 10.9 89.1 44.6 53.4 1,677 12,715 658Garmentcraft 4,178 6,989 63.8 36.2 38.7 61.3 2,584 7,728 199Fibercraft 106 265 32.8 67.2 77.0 23.0 93 268 188Food Preservation 509 1,655 42.6 57.4 55.2 44.8 1,470 4,947 236,Loom-weaving 1,258 3,934 81.7 18.3 34.1 65.9 1,362 7,862 477Metalcraft 1,490 3,681 5.7 94.3 47.3 52.7 2,478 8,286 234Needlecraft 906 1,930 91.2 8.8 68.4 31.6 909 4,908 441Other Crafts 2,052 9,075 53.9 46.1 89.0 11.0 1,067 5,171 384Piggery 10,121 19,189 55.1 44.9 88.2 11.8 11,580 26,900 132iggery-Poultry 2,390 ) 8,120 35.7 64.3 79.8 20.2 1,137 2,569 12910oultry 2,913 )Shellcraft 892 1,155 62.8 37.2 79.0 21.0 464 1,567 237Agricultural Hand Tools 23 45 0.0 100.0 60.0 40.0 107 371 267Other Industries 665 1,791 28.3 71.7 60.0 40.0 883 3,648 313Woodcraft 1,981 5 505 13.5 86.5 58.7 41.3 4 201 J5,722 274TOTAL 30,816 67,610 1 46.4 53.6 73.9 36,1 30,360 104,524 ,244
/l Since cottage industries are defined to be those with assets of up to P100,000, a number of small establishmentsare probably Lncluded,
Source; "The Profile of Cottage Industries in the Ilocos," NACIDA publication, 1977.

- 143 -
5.12, which presents data for 29 industries at the 5-digit level. The
industries shown accounted for 98% of employment in establishments with
less than 10 workers in 1972, and 92% of employment in establishments
with 10 or more workers. They have been divided into three groups in
order to identify the sectors in which the movement out of household
is: (A) Mainly towards very small establishments (with less than 10
workers); (B) mainly towards larger establishments (with 10 or more
l/workers); (C) towards both larger and very small establishments. In
summary, the growth rates and percentage shares in employment (in
manufacturing establishments) for the three categories are as follows:
Movement of Employment % Total Employment (1972) Growth Rates (1967-77)
Mainly Towards:- Small Large Small Large
A. Very small 27 5 14.0 -2.5
B. Large 3 45 - 3.7 8.1
C. Both 5 15 7.7 1.6
35 65 11.0 5.2
Source: See Table 5.12.
5.29 Most of (A) appear to be activities in which small enterprises
derive advantages by concentrating on local markets - bakeries, tailoring
and dressmaking, furniture, structural concrete products and fabricated
metal products. Rice milling is the only exception in that it serves both
local and national markets, though small scale activities presumably derive
some advantage from being close to their sources of supply. A large2/
proportion of small activities are also located in the provinces, and
1/ A breakdown of size structure at 5-digit level is not available for
establishments with 10 or more workers. They thus overestimate
employment in large and underestimate it in small; to emphasize this
point the terms "very small" and "larger" establishments are used in
this and the next two paragraphs.
2/ In both (A) and (C); see Chapter 6.

-144-
.able 5.12: SECTORAL CHANGES L.N EMPLOYMENT IN 7ERY SMALL AND LARGER ESTABLISIENTS, 1967-72
Very Small Establishments Larger Escablishmencs wich
with less than 10 'orkers 10 or =ore qorkers
Growth Growth1967 1972 Rate 1967 1972 Race
A. Ecoloyment (in 000s) in Selected Activities in thich Emoloymenc Growth is Occurrtn More in Verv
Small than in Larger Establishments.
Rice Milling 18.9 34.5 12.8 8.1 7.2 - 2.3
Bakeries 12.4 20.2 10.3 8.2 5. /1 - 6.4
Tailoring Shops 31.8 55.1 11.6 (23.9)- (2.5)- -
Dressmaking Shops 9.9 19.6 14.6 0.4 0.3 - 5.6
Furniture (incl. upholstered) 2.4 8.2 27.9 4.2 5.6 5.9
Structural Concrete ?roduccs 1.8 5.6 25.5 2.9 2.8 0.7
Fabricated Mecal ?roducts 5.2 10.2 1- 6.2 3.5
SUB-TOTAL 82.4 nn * 3.2 380 - 7
B. EmoLoyment 'in 000s) in Selected Activities in 'Which Eoloyment Grcwth is Occurring More in
Large chan in Small Establishments.
Sugar Milling 2.5 2.0 4.4 21.4 29.9 6.9
Dessicated Coconuc 0.0 0.0 0.0 8.4 9.2 1.8
Cotton Textile Mills 0.0 0.0 0.0 24.7 29.9 3.9
Rayon and Fibre Textiles 0.0 0.0 0.0 3.6 10.8 24.6
Garments (Womens & Childrens) 0.3 0.8 /3. 2.1 10.8 38.8
Sawmills 0.2 0.4 7 20.7 21.5 0.9
Veneer, Plywood & Hardwood 0.0 0.0 0.0 22.2 23.7 1.3
?aper Mills 0.0 0.0 - 2.6 12.4 36.7
Other Princing and ?ublishi 0.8 2.4 1 2.4 11.1 35.8
Pharmacautical & Medical 0.0 011 13 6.5 8.2 4.8
Other Chemicals and Products4i 0.7 1.3 A 17.6 38.3 15.6
Other Stru ural ConcreteProducts- 1.4 2.6 /3 14.6 17.0 3.1
Black Furnaces & Ro.lling Mills 0.0 0.0 - 3.9 6.1 9.4
Other Basic Mecals- 0.2 0.0 /3 1.8 3.1 11.1
Machinery and Equipment 2.1 1.7 /3 6.1 9.9 10.2
Electrical Machinery & Apparatus 3.2 0.4 - 34.0 9.1 13.6 8.4
Transport Equiment 6.5 3.1 13.8 14.7 16.0 1.7
SUB-TOTAL. 17.9 14.8 -3.7 182.4 Z71.8 3.3
C. Emoloyment (000s) in Selected Accivities in which Emolov=ent Graveh is Comoarable, in cth Sites
of Escablishments
Other Foods jtcl. canneries) 4.8 11.9 1 9 .9 L 33.8 40.0 3,4
Other Textiles- 3.4 5.1 8.4 12.3 17.6 7.1
Other Vearing Apparel/ 5.3 1.5 - 22.0 19.3 11.2 -10.3
Other Wood and lurnitur- 3.6 7.1 14.5 8.9 :2.5 7.0
Commercial Job Printing 1.5 1.. - 1.4 5.8 5.8 0 0
SUB-TOTAL 18.6 27.0 7.7 80.39 8,7.1,2 l.-
TOT.L 118.9 195.2 10.5 305 396.7- 3,3
(Total Manufacturing) (125.2) (204.0) 10.3 (393.6) (629.2) 1.7
/1 The decr=ent implied Between 1967 and 72 seems unusually large.
/2 Excludes tailoring shops from sub-total (see f.n. 1).
/3 The rates of increase or decreaae are cuie large for these sectors but the initial bases,
and in most cases the absolute changes are too small for the calculaced rates to be
meaningful.
/4 Includes Drincing of periodicals, books, cards and newspapers, electrotyping, bookbinding and
related work. - ----- -. - -
/5 Includes industrial chemicals, and petroleum, coal, rubber and plastic manufacturing.
/6 Includes all manufacturers of non-metallic products except structural concrete products,
/7 Refara to iron and steel founries, furnaces and mills; and the manufacture of non ferrous mecals.
/8 Includes such products as meat, milk, fish and grains.
/9 Although growth rate is much Freater in small, these sectors were grouped under (c) because the
labor absorption is large was comparable to that in small; they might wall, however, be better
grouped under (a).
/10 Includes weaving, spinning, knicting mills, etc.
/11 Includes mans and boys garment factories, manufacture of hats, gloves and neckwear,
/12 Includes manufacture of lumber, doors, windows and rushes; sawah, migra and splic cane factories;
manufacture of ractan furniture and wood carving and crafting.
/13 Growth rate is 4.5% p.a. excluding "other wearing apparel."
Source: NCSO, Census of Establishments, 1967 and 1972.

- 145 -
are likely to face increasing competition from large scale (e.g.
in tailoring, dressmaking and furniture) as transport and marketing
costs decline with improvements in the country's infrastructure.
Most of (B), in contrast, serve large markets - e.g. cotton and rayon
textiles, sugar milling, plywood, chemicals, steel, basic metal and
the manufacture of machinery and transport equipment - and the economies
of scale are probably strong enough to offset the higher transport and
marketing costs of centralized production. Most of (C) are in an
intermediate category in which the trade-offs between economies of scale
and transport and marketing costs probably vary significantly with1/
location, and with the type and quality of product; they include for
instance foundries, furnaces and mills; knitting mills; meat, fish and
dairy products; printing of books, periodicals and papers; bookbindings;
rattan furniture; and other.
5.30 The census data are neither sufficient nor reliable enough for
a quantitative analysis of the relationships suggested in the previous2/
paragraph, and special surveys would be required into production
technologies and costs, product design and qualities, and marketing and
transport costs in order to provide further clarifications. The
above data suggest that very small and large generally have a non competing
relationship, with each tending to concentrate on those products in which
it holds a distinct economic advantage over the other. These advantages vary
1/ The data in Table 5,12 are at the five-digit level, and are thus not
detailed enough for analysis of product type and quality.
2/ Such as are now being undertaken in Colombia and India. as part of the
present research project.

- 146 -
with location Ci.e. with transport and marketing costs) and with the
type of product. A more detailed breakdown of the size structure might
of course reveal more competition between the larger-end of small
scale, and the medium and large scale manufacturers; though again, the
infrastructure conditions may also be protecting even medium scale
manufacturing in the provinces. What can be said at present is, first
that four fifths of establishment-based employment is either (a) in
sectors in which very small activities are growing rapidly, while the
larger scale are declining, or (b) in which the converse is true. Second,
it is likely that improvements in infrastructure in the provinces, and
the growth of markets, will both act to draw small and large scale into
1/greater competition in some sectors. And third, recalling the
interview data presented above, that competition will occur as much
from the emergence and growth of small as from the expansion of already
large enterprises.
Industrial Policies and the Size Structure of Industry2/
5.31 Summary of Policies. Though differing in detail between years,
the industrial incentives' policies of the Philippines have fallen broadly
into three phases; the first two were:
1/ Staley and Morse (1966) observed a tendency when this happens for the
two to become reorganized into a less-competitive and more complementaryrelationship. The examples they cite include the emergence of small-scalemaintenance, repair and installation services for large-scale's products.
2/ The policies have been documented and analyzed extensively in several
studies, most recently by Bautista and Powers (1979) and the researchgroup that they directed. They are therefore summarized very briefly -no doubt inadequately - below, as a background to their effects on size
structure. Other studies that have been influential and which providevaluable documentation are Powers and Sicat (1971), Baldwin (1975),collected papers of Sicat (1972), ILO (1974), World Bank (1976 and 1979),Valdenpenas (1970),and Hicks and McNicoll (1971).

- 147 -
(1) Import substitution under protection provided
by exchange controls in the 1950s, and then
(2) Under tariffs in the 1960s.
In both periods the protection was greater for consumer goods than for
intermediate goods and machinery; in addition an increasing number of firms
belonging to "new and necessary" industries were exempted from taxes and customs
duties on imported machinery and equipment. Powers and Sicat (1971) estimated
the average effective rates of protection in 1965 to be 86%, 65%, 34% and -19%
respectively for manufactured consumer goods, intermediate goods, machinery
and exports. The effects of the incentives on output and employment have
been well documented in the references cited. The capital goods industries
hardly developed; and the growth of manufacturing -became increasingly restricted
by the growth of the domestic market. Manufacturing output grew at 12-15% in
the early 1950s when import substitution was proceeding at a high rate, but
declined to 6% in the late 1950s and then to less than 5% by the mid 1960s as the
import substitution possibilities became exhausted; the growth of manufacturing
employment in the factory sector fell correspondingly. It was this situation that
led to the third phase of the incentives' policies, and which has lasted
throughout the 1970s:
(3) Maintenance of protection under tariffs, but
a broadening of tax incentives to raise industrial
investment and exports, and to promote backward
linkages in industry, The policies were expressed
in the Investment Incentives Act of 1967 and the
Export Incentives Act of 1970.

- 148 -
5.32 Since the two Acts, the industrial growth rate has risen from
5% per year in the mid' 1960s to about 6-7% per year in the early and mid'1/
1970s. But the Acts themselves made only a slight contribution to the
rise; manufactured exports, though expanding rapidly, accounted for only
2/5% of output in manufacturing by 19757 while the use of the investment
incentives was much less than hoped for, and has even declined in recent3/
years. The tariff system still dominates the incentives' structure.
Tan (1979) estimated the average effective rates of protection to be
247%, 23%, 18% and 16% respectively for manufactured consumer goods,
intermediate goods, machinery and exports in 1974; her estimates allow for
the tax incentives under the two Acts, and show if anything that the incentives'
structure is yet more strongly oriented towards domestic consumer goods markets
than it was in the 1960s. The higher growth rate in the '70s must therefore be
explained by the growth of the domestic markets, in which two factors appear to
have been important. First has been '-he more rapid rise in agricultural output
in response to the land reform programs, the introduction of 1YVs and the
expansion of irrigation, infrastructural and agricultural services since
1/ The annual growth rates have fluctuated too much for a precise trend tobe estimated for this period. E.g. from 14.8% in '72-73 to 2.9% in '74-75.
2/ Further, devaluation and the adoption of a floating exchange rate in 1969-70did more than the Acts to stimulate manufactured exports.
3/ In 1972, total tax concessions under the Acts amounted to P70 million, or lessthan 2% of industrial investment, The number of projects registered by theBoard of Investments (who administer the Acts) fell from a peak of 169 in1973 to 39 in 1977 for the Export Incentives, while the number remainedconstant in the 60-80 range for the Investment Incentives. The reasons forthe low use of the concessions have been the "red tape" and costsinvolved in obtaining them.
4/ In Bautista and Powers (1980).

- 149 -
1/the early 70s. Second, the factory sector is itself becoming
larger in both relative and absolute terms, and its continued expansion
is having a larger influence on the domestic product and labor markets
(notwithstanding the labor saving bias of the industrial incentives).
Employment in establishments with over 20 workers rose from 17% in 1956,
to 21% by 1966 and 32% by 1975 (Table 5.13); the higher labor productivities
and earnings in these establishments (also shown in Table 5.13) will have
acted to increase the rate of growth of domestic expenditures on manufactured
goods.
5.33 Two other aspects of the industrialization policies that should be
mentioned were the concessionary finance to industry though DBB and IGLF, and
the ceilings on the lending rates of the organized financial sector. Concessionary
finance has accounted for only a small fraction of industrial investment, however
The interest rate ceilings,on the other hand,were probably a disincentive for
industrial investment since their practical effect was to restrict the supply
2,/of long-term peso resources in the economy, as discussed in Chapter 2 and 3.
5.34 Effects on the Aggregate Demand for Labor. From the perspective of
the present study, the policies outlined above raise several questions. What
were the likely effects on the demand for labor in large and small enterprises?
Row would the demand (again, in large and small enterprises) be affected if -
as most economists have urged - the policies were to become less protective,
more outward-looking and less labor-saving? And what would such policy shifts
1/ The links between agriculture and industrial growth will be discussedfurther in Chapter 6.
2/ The analysis in Chapters 2 and 3 only covers recent years; but interest
rate ceilings have been in effect throughout the past 30 years; the
private financial sector has historically made few term loans to industry,while short-term lending - which only recently has been at or near toceiling rates - has expanded rapidly for over 20 years.

Table 5.13: INDUSTRIAL OUTPUT, EMIPLYMENT AND WAGES: 1956-75
Quantities Growth, Rates Percent Per YearSize and Type of Establishment 1956 1962 1966 1971 197 1956-62 1962-66 1966-71 1971-74 1956-75
Employment in Manufacturing, 000s
Establishments > 20 Workers 151 230 276 353 S25 7.2 4.7. 5.0 10 .4 6.8
Establishments 5-19 Workers 55 48 . 51 68 89 - 2.2 1.5 5.9 7 ,0Households and Estbs. of -5 5Workers 686 767 1004 1051 1037 1.9 7.0 0.9 0.3 2.3Total 892 1045 1331 1472 1651 2.7 6.2 2.0 2.9 3*3Value Added, Constant1 72 Prices, Million Pesos
Establishments > 20 Workers 2427 404 6 4950 7854 10043' 8,9 5.2 9.8 6.3 7.8Establishments 5-19 Workers 288 193 288 346 230 - 55 10.4 1.2Households and Estbs, of 5Workertn.a, 755 548 608 n.a. n.a. 3.8 -17.9 -16. n.a. H
__8,1
0Total n,a" 54994 3716 8808 6755 n.a. 5.1 7.6 n. a.Value Added Per Worker, Constant 1,572 Prices. Pesos
Establishments > 20 Workers 16073 17591 17935 22429 19219 1.5 0.5 4.6 0.4 -3.6Establishments 5-19 Workers 5236 4020 5647 5088 5284 3.3 8.9 - 1.7 -15.9 - 0 .9Ilouseholds and Estbs. of 5 Workers 984 546 578 n.a. . - 1.2 -19.8 -12.5 n.a.Average, All Manufacturing 3042 3182 3769 17I7 n.a. 1.1 3.4 8.0 n.a.wacs, Constant 1972 Prices. Pesos
Establishments > 20 Workers - 4127 4633 4174 3291 n.a. 3.0 - 2.1 - 7.6 n.a.Establishments 5-19 Workers - 1642 1878 1659 1020 n.a. 3.3 - 2.4 -15.0 n,a.
.Sources' NCSO, Annual Survey of Manufactures.

- 151 -
imply for the Government's small industry programs? For example, would
employment in large scale increase and in small scale decrease such that
the "demands" of small-scale for the services provided by the programs
would also decrease? - or would the opposite happen? To answer these questions,
it is first useful to consider the general effects of the incentives on the
demand for labor, and then the relative effects on the demands of large and
small industries.
5.35 According to the studies cited there were 5everal ways in which the
policies eventually reduced the overall demand for labor; they can be grouped
into substitution effects (of capital for labor) and market effects (in both
domestic and export markets). The substitution effects occurred on two counts:
the comparatively low levels of protection on capital goods and equipment,
1/supported by tax exemptions on capital inputs. Concessionary finance, to the
extent that it was available, would have worked. in the same.directioc.-
Some indirect evidence of substitution occurring is provided by Bautista
(1979), who found a weak Spearman Rank Correlation between the effective
rate of protection and capital intensity for 51 industrial sectors. Since
capital intensive sectors need more protection than labor intensive sectors, there
may have been some lobbying for extra protection; but the conclusion to draw from
Bautista's study is that the incentives have encouraged the emergence and growth
1/ The Investment and Export Incentives Acts included some provisions to encourage
industry to employ more labor (such as a tax deduction on labor training
expenses, and another on the labor costs of some exporting firms), but they
were quite minor, and more than offset by a range of tax reliefs on capital
inputs - on the compensating tax on imported machinery, double deduction of
shipping costs, tax credits for locally produced machinery, accelerated
depreciation, re-investment allowances, tax credits for taxes on foreign loans,
and others. During 1970-72, about 80% of all tax reliefs under the two Acts
were estimated to be on capital costs, IBRD (1976).
2/ The correlation coefficient was 0.183, significant at the99.0% level. The
data used were the Powers-Sicat EPR data for 1965, and the ASM data
listed in the ILO (1974) report for 1969.

- 152 -
of the more capital intensive manufacturing sectors, though the effect was
1/slight.
5.36 The market effects were probably greater on account of the
inefficiencies in the incentives' system. The low level and growth of
manufactured exports up to the 1970s has already been noted, and is discussed
2/elsewhere. As far as the domestic markets were concerned, these were
depressed in two ways (once the import substitution possibilities had been
exhausted). One was through the costs (in terms of slow economic growth) of the
3/misallocation of resources between agriculture and industry, resulting int
too slow a rate of growth of demand for manufacturers in the agricultural provinces.
The other was through the misallocation of resources within manufacturing itself;4/
the costs of this are indicated in a recent study by Bautista and Tecson (1979)
who found strong correlations between the effective rates of protection and
the domestic resource costs of industrial sectors in 1969 and 1974.- The
incentives' system thus eventually acted to reduce the growth of the markets
it was protecting, and for this reason has adversely affected the demand for _
labor -in both'small and large scale.
1/ The correlations provide only a partial indication of the degree ofcapital-labor substitution, however, since they cover only the allocationof resources among sectors; within sectors, it is likely that thesubstitution of capital for labor was greater (though no empiricalevidence is available to estimate extent of this effect).
2/ See e.g. Powers and Sicat (1971) and IBRD (1979).
3/ Powers and Sicat estimated the EPRs for agriculture and manufacturing tobe 17% and 51% respectively in 1965.
4/ In Bautista and Powers, op. cit. special paper 5.
5/ Spearman Rank Correlation of 0.654, significant at the 5% level; 76industries were in the sample (1974 data.)

- 153 -
5.37 Relative Effects on Large and Small, The tax concessions and
concessionary finance evidently reduced the demand for labor more in
large than in small establishments, since they were mostly available to
the former. Since 1974 concessionary finance has been made available to
about 5,000 small manufacturers, and it is likely that their demand for laborI/
would also have been greater had interest rates been cost reflecting.
5.38 The structure of protection has similarly worked against small
scale, with 80% of those people engaged in small establishments being in
sectors with low, zero or negative rates of protection (c.f. 45% in large),
as shown in Table 5.14.- A more detailed breakdown by industry is provided
in Table 5.15, from which it is apparent that the bias against small is
largely due to the concentration of employment in garments and rice milling
(EPRs both less than minus 25%). Otherwise the system is relatively neutral,
and there are instances of small industries rising behind protective barriers.
A more detailed breakdown by scale of activity to examine the incidence on
activities in the intermediate size ranges was not possible from the informa-
tion available to us.-
1/ As noted earlier, however, the main gain from cost-reflecting interestrates would be to increase the supply of long-term peso resources.
2/ We are grateful to John Powers for spotting a number of errors in an earlierversion of the following table - as well as for his constructive commentson several other aspects of the study.
3/ Note that the distribution of employment in manufacturing is stronglybimodal, however, with 75% being iether in establishments of less than10 workers (28%),or-of over.200 workers (47% in 1975..(see Table 5.1. --Still, the possibility remains that the incidence of the tariffs is itselfinhibiting growth of the very small scale through the size structure.

- 154 -
Table 5.14: EMPLOYMNT IN LARGE AND SMALL ESTABLISHMENTS
ACCORDING TO LEVEL OF PROTECTION
Effective Rate of No. of Percent Employed IProtection; Range, 7. Sectors Small Large
> 500 6 13,1 9,8100 to 500 20 1.5 11.775 to 100 9 1,6 17.150 to 75 8 .8 1,625 to 50 21 5,1 12,80 to 25 33 11,9 22.3
-25 to 0 5 1.6 16.2-50 to -25 6 66.4 7.0Actual No. Employed, 000- 108 10010 100.
1 Small Establishments have less than 10 workers, large 10 or more.
/2 When an estimate is on the dividing line it is put in the uppercategory. E.g. an EPR of 0 is included in the 0 to 25% range.
i3 For the sample of industries studied.
' Data not available for all sectors listed in Annex Table 7.
Source: Annex Table 7. The estimates of EPRs are those of Tan (1980).
5.39 A shift to a more uniform and less protective incentives' structure
would act to encourage growth in several sectors in which small enterprises now
provide a significant level of employment; examples are rice and corn milling,
some dairy products and Ireserves, footwear, embroidered products, custom
tailoring and garment making, furniture, printing of books, leather products,
1/ This is not included in Tan's data, but it is a large source of employmentin the country, which probably has the same ERP as ready made clothes (i.e.minus 26%). See also ILO (1974) for a study of the effects of protectionin the textiles and garment industries.
2/ See Bautista (1979) on the effects of protection in the leather and leather
products industries. The results are almost exactly parallel to those of the
ILO's study of textiles and garments (Ibid): low protection for an efficientsector that provides a large amount of employment, but which has to use acostly and inferior raw material input from highly protected domestic producers.

- 155 -
Table 5.15: EMPLOYMENT IN SMALL AND LARGE INDUSTRY BY RANGEOF EFFECTIVE PROTECTION AND SECTOR, 1972 AND 1974
Effective Rate of Protection: Employment PercentRange % and Sector Small Large Small Large
> 500
Flour Milling & Cereal Flour 68 2566 .7Bakery Products 21097 10019 12.3 2.9Candy & Chewing Gum 1382 3240 .8 .9Cocoa & Chocolate - 740 - .2Starch & By Products - 1549 - .1Cigarettes - 15685 - 4.5Subtotal 22547 33977 13.1 9.8
100 - 500
Slaughtering; Poultry Pressing 84 - - -Distilled, blended liquors 624 154 .4 -Wines 22 2206 - .6Paper products 5 1102 - .3Paper & Paperboard containers 390 3089 .2 .9Miscellaneous paper 102 385 .1 .1Tanning & leather finishing 106 779 .1 .2Rubber footwear 209 4439 .1 1.3Tires and inner tubes 124 3636 .1 1.0Paints, varnishes 27 1332 - .4Soap and other compounds 33 4701 - 1.4Structural concrete - 2731 - .8Metal cans, boxes, containers 587 3408 .3 1.0Household, radio, TV sets 52 3911 - 1.1Refrigeration and A.C. equipment 46 3053 - .9Motor Vehicles, Manuf. & Assembled 20 5425 - 1.7Jewelry, Silverware 314 266 .2 -Subtotal 2603 40762 1.5 11.7
75 - 100
Canned fruits, vegetables 42 8247 - 2.3Other fish products 648 2641 - .8Macaroni, spaghetti, noodles 511 1290 .3 .4Textile mills products - 41683 - 11.9Structural metal products 1421 4499 .9 1.3Heating Apparatus 54 311 - .1Sport equipment 53 893 - .3Subtotal 2727 59564 1.6 17.1
50 - 75
Meat products uncanned 419 134 .3 -Butter, cheese 18 895 - .3Plastic materials 40 1943 - .6Electrical wires - 1210 - .3Motorcycles, cycles 359 880 .2 .3Musical Instruments 351 346 .2 .1Toys, dolls 130 40 .1 -Subtotal 1317 5448 .8 1.6
25 - 50
Processed coffee 120 2321 .1 .7Prepared food for animals 58 2590 - .7Carpets, rugs 253 663 .1 .2Pulp, paper, paperboard - 12487 - 3.6Fertilizer, lime - 1371 - .4Glass 116 6683 .1 1.9Pottery, china 1433 859 .8 .3Basic ferrous metal - 9061 - 2,6Cutlery, handtools 2847 471 1.8 .1Stamped, coated Prods. 3501 192 2.0 .1Other electric Machines 23 734 - .2Communication Equipment - 246 .1Electrical Lamps 14 1272 - .4Shipbuilding 373 5370 .2 1.5Subtotal 8738 44320 5,1 12.8

- 156 -
Table 5.15: (Continued)
Effective Rate of Protection: Emlovment Percent
Range % and Sector Small Large Small Large
0 - 25
Meat products, canned - 1361 - .4
Evaporated, condensed milk - 1210 - .3
Flavoring extracts - 181 - -
Footwear 5611 2556 3.3 .7
Lumber 389 5993 .2 1.7
Plywood & Veneer - 24579 - 7.2
Furniture 9067 8041 5.2 2.3
Books & Pamphlets 1156 2456 .7 .7
Other rubber 193 2344 .1 .7
Compressed, liquified gas - 1518 - .4
Medicinal pharmaceutical 124 8134 .1 1.3
Insecticides 9 588 - .2
Petroleum refineries - 1014 - .3
Other oil products 29 99 - -
Fabricated wine 14 667 - .2
Agricultural machinery 604 1600 .4 .5
Other special industry 86 1049 - .3
General industrial equipment 10L3 7648 .7 2.2
Electrical Distribution & Control 28 603 - .2
Motor vehicles engines 1979 4861 1.1 1.4
Scientific equipment 101 691 .1 .2
Office supplies 10 365 - .1
Subtotal 20403 77558 11.9 22.3
- 25 to 0
Fish canning 45 234 - -
Sugar milling 1266 - 9.1
Dessicated coconut - 9422 - 2.7
Cigars - 1482 - .4
Knitting mills - 7707 - 2.2
Cordage 686 1932 .4 .6
Doors and windows 1642 317 1.0 .1
Basic industrial chemicals 81 1633 - .5
Structural clay 327 2204 .2 .6
Subtotal 2781 56197 1.6 16.2
- 50 to 25
Rice milling 34523 2559 20.0 .7
Corn milling 2643 1233 1.5 .4
Clothing 76193 19048 44.3 5.5
Embroidered products 569 1089 .3 .3
Leather products 523 468 .3 .1
Subtotal 114451 24397 66.4 7.0
Total 17:309 347565 100.0 100.0
Sources: Effective rates of protection from Norma A. Tan,"The Structure of
Protection and Resource Flows in the Philippines, 1974", Ph.D. dissertation
University of the Philippines 1979. These figures were taken from
"Industrial Development Strategy and Policies in the Philippines",
October 1979, Report No.2513 since we do not have Tan's thesis.
Also NCSO, Census of Establishments, 1972.

-157-
pottery and earthenware; mechanical, electrical and agricultural machinery;
motor vehicle bodies; and others. All have low or negative ERPs, and in
several instances are high growth sectors (see Tables 5.10 and 5.12), Equally,
there would be a number of sectors in which profits and labor demand in small
enterprises could be expected to decline; but in contrast to the proceeding,
most of them could hardly be described as the bread and butter of Philippine
manufacturing - e.g. motorcycles, toys, musical instruments, jewelry, chocolates,
wines; and paper prodtcts, and tanning and leather finishing.
5.40 Similar contrasts can be made for large scale manufacturers. But
the overall effects are clear, and have already received analysis in the papers
cited. One question that remains is whether competition between large and small
would be heightened if there were a major re-allocation of resources among
sectors, and if this would lead to a rapid decline of small. The earlier
analysis suggests that this is unlikely, with some exceptions (such as in metal
working and machinery)> as shown earlier, large and very small are generally
non-competing, and tend to concentrate in sectors in which one or the other
has the economic advantage - another indication of the -ability of manufacturers
to adapt efficiently to the existing incentives structure.
5.41 It is possible that, as rural infrastructure is improved, large scale
will enter markets that are currently the stronghold of small-scale on account
of tfe "natural" protection provided to small-scale by iigh transport costs
in the agricultural provinces. Further, as the manufacturing sector becomes

- 158 -
large in relative terms, its expansion will have an increasing pull on the
labor markets, acting to narrow the wage differential between large and
1/small. In these circumstances, employment in small scale activities may
decline in both absolute and relative terms, as is apparently happening2/
in Korea and Taiwan. But this situation is not an imminent prospect in
the Philippines, given the large share of the labor force still in agriculture.
A reform of the incentives' structure, by accelerating the economic growth
rate, is likely to bring the time nearer when manufacturing employment is
predominantly in large scale, but it cannot bring this about immediately.
Moreover, some of the large-scale activities that will by then exist are
themselves likely to have evolved through the size structure.
5.42 Efficiency of Large and Small Manufacturing Establishments. Some
recent estimates by Bautista and Tecson (1979) of the Domestic Resource Costs
(DRC) in Philippine manufacturing can be used to show the distribution of
large and small establishments in sectors ranked according to economy efficiency;
their estimates are reproduced here in Annex Table 5..7 and cover 82 manufacturing
sectors. According to the DRC criterion a sector is less efficient the more
the value of the DRC exceeds, and more efficient the more it lies below, the
3/shadow exchange rate. The exchange rate in 1974 was about
6,8 pesos per dollar, but various estimates cited by Bautista and Tecson
put the shadow exchange rate at about 9 pesos per dollar. Table 5.16 below
shows how the manufacturing of employment in large and small establishments
1/ See Chapter 7 for a further discussion.
2/ Ho (1979).
3/ Let E be the shadow exchange rate, P the world price; D the domestic costcomponent (in shadow prices) and F the foreign exchange cost component ofa manufactured good. Then the cost-benefit criterion is F x E + D < PEfor an efficient sector. Or, D/(P-F) < E, where the term on the left hand
side is defined to be the Domestic Resource Cost.

- 159 -
varies with the DRC. Approximately 80% of employment in small establishments
lies in the efficient sectors, and 65% of employment in large establishments.
Table 5.16; EMPLOYMENT IN SMALL AND LARGE ESTABLISMENTSACCORDING TO LEVEL OF DOMESTIC RESOURCE COSTS IN 1974
Domestic Resource No.of Percent Employed ir--Costs, Range % /2 Sectors Small Large
< 20 8 .4 4.415 - 20 6 13.2 12.310-- 15 18 3.5 14.9
7 - 10 28 27.1 21.85 - 7 25 55.6 45.4
< 5 7 .1 1.292-- 100,0 100.0
Actual No. Employed 000s 170 290
/1 Small Establishments have less than 10 workers, large 10 or more.Data are for 1972.
/2 When an estimate lies on the dividing line between two ranges, ithas been put in the upper range.
/3 No. of sectors in the sample. Estimates not available for all sectorslisted in Annex Table 7.
Most of the sectors now having low ERPs turn out to be economically efficient,
and it must be cohcluded that a transition to a more efficient incentivest
structure would benefit (by railsing profits) a large number of manufacturing
activities.both large and small scale. Furthermore, these activities employ
the majority of those now working in large and small establishments.
1/ See para 5.35 above on Bautista's correlations between ERPs and DRCsacross industrial sector.

-160-
Conclusions
5.43 The basic trends in the size distribution of Philippine
manufacturing activities are (a) a continual decline of self-employment
in household activities, except in some high growth sectors and others in
which it remains important as a secondary source of income; and (b)
a comparatively rapid emer,ence and growth of wage employment in workshops
and factories. These trends reflect structural changes in the nature
of manufacturing employment, and the decline of household manufacturing
should not be viewed negatively. They also help to explain the low
aggregate elasticities of demand for labor in manufacturing, and which can be
expected to remain low so long as household manufacturing employs a large
share of the labor force.
5.44 A feature of the size distribution is the rapid emergence and
growth of manufacturing establishments in the small and middle size ranges
in response to market growth. Small industries concentrate on local and
regional markets for the most part, and in activities in which localized
production has an economic advantage; their relation to large is complementary
and non-competing in m-Ost product groups, an exception being in the high
growth engineering sectors. Infrastructure improvements and market growth
in the provinces will probably introduce competition in an increasing
number of products over the long haul, but the immediate effects, as will
be discussed fruther in the next chapter, would be to stimulate production
in both large and small scale manufacturing. Closure rates of small scale
were found to be high, as expected. Finally it was found that the growth
of employment in large scale is in good measure due to the expansion of a
small minority of ance small firms through the size distribution (the
remainder being the branch expansion of large corporations). Most of the
larger firms interviewed began with very small investments and levels of
employment.

-161-
5.45 The industrial tariffs system, which has been the principal
element in Philippine industrialization policy for nearly 20 years, worked
against the majority of those employed in both small and large scale.
About 80% of employment in very small establishments is in "underprotected"
sectors; over 80% is also in efficient sectors (with low DRCs). The investment
and export incentives introduced in 1967 and 1970 favored large more than
small, mainly by subsidising capital costs, though their ovarall effect was
comparatively minor.
5.46 Various proposals are now under review to make industrial tariffs
lower and more uniform, and to make the industrial investment incentives
more labor demanding. Several studies have shown that this would (a)
increase growth overall by promoting the more efficient industrial sectors,
(b) increase growth in the provinces yet further, principally through
favorable effects on agriculture, and (c) increase the rate of labor
absorption in large scale by making its investments more labor intensive.
What would be the effects on small industries? Principally, to stimulate
the product markets directly (via growth) and indirectly (via labors'
incomes). As with large scale, some restructuring of manufacturing activity
could also be expected towards the economically more efficient sectors -
in which the majority of the labor force in small industries are in fact
already employed.

- 162 -
VI. SMALL ENTERPRISE AND REGIONAL DEVELOPENT
6.1 Approximately two thirds of manufacturing employment in the
Philippines is in the agricultural provinces, of which 60% is in households.
It is in the agricultural provinces, however, where the share in household
employment is declining most rapidly, and there is a movement of labor into
large and small manufacturing establishments in local urban centers. The
movement - and with it, the growth of the regional urban base - is most rapid
in those regions where agricultural development is most rapid and broadly-based,
and can be explained by two factors: agriculture's influence on the regional
product and labor markets, and the advantages of localized production for
certain classes of manufactured goods. This chapter examines these various
trends and changes, and concludes with a comment on the recent emphasis by
the Government on agricultural development and its implications for the small
enterprise programs. In the absence of sufficiently detailed information by
region on agriculture and on the activies of the labor force, the points to
be made are general, and necessarily brief.
Urban-Rural Population Data
6.2 Slightly over one third of the population currently live in urban
areas, which in the Philippines are defined so as to include small villages1/
and towns. Castillo (1977) has described the extensive network of towns
and villages in the countryside in which there are 40,111 barangays (the
smallest unit of government at the village level), 522 municipalities,
1/ The NCSO definitions include: (1) All cities and municipalities having apopulation density of at least 1,000 persons per square Km; (2) Centraldistricts of municipalities with a population density of at least 500 personsper square Km; (3) Central districts having a recognisable street pattern,at least six establishments engagedin manufacturing, commerce or service
activities, and at least three of the following: (1) a town hall, church
or chapel with ro.ligious services at least once a month,(ii) a public plaza,park or cemetry, (iii) a market place or building where trading activities
are carried on once or more a week, or (iv) a public building like a school,
health center or library. Also included are barangays having 1000 inhabitantsor more in which condition (3) is met and where the occupation of the inhabitants
is predominantly non-farming or fishing. All other areas are considered rural.

- 163 -
60 cities and 72 provinces; in 1970 there were over 400 provincial towns with
populations of less than 20,000 inhabitants. The 1970 distribution of
population among rural and the various sizes of urban areas is shown in
Table 6.1. The percentage of people counted as living in rural areas is
evidently quite sensitive to the definitions of urban and rural. UN definitions
include villages and towns with 20,000 inhabitants or less in their estimates
of the rural population on the grounds that such centers for the most part
are servicing rural areas. Applying this definition to the Philippines in 1970
would raise the rural population estimates from 68% to 80% of the total
population.
6.3 From the viewpoint of the present study three other demographic
features should be noted:
- the still high rate of population absorption in rural
areas; two-thirds of total population growth occurred in
rural areas over the period 1960-75;
- the spread of urban growth across a large number of urban
centers ranging in size from a few thousand inhabitants
to over 4 million in Manila.
- the wide variations in urban growth rates in regions
outside Manila.
Data on the first two features are shown in Table 6.2. Outside Manila, the aggregate
values shown in the Table conceal growth rates varying from near-zero1/
or negative values in some provincial towns and cities, to 4 to 6% and higher in others.
1/ Annex Table 6.8.

- 164 -
Table 6.1: DISTRIBUTION OF POPULATION AND MANUFACTURING
EMPLOYMENT BY RURAL AND SIZE OF URBAN AREA, 1970
Distribution of
No. Of Population Distribution Manufacturing Empl.
Location Centers 000s % 000s %
Rural Areas - 24,987 68,3 706 52.1
Urban Areas By Size (Population in 000s)
/1 /2< 10 372-- 3,355/2 9.2 73 5.4
10-20 72 1,031 2.8 54 4.0
20-50 28 894 2.4 63 4.6
50-100 16 1,161 3.2 85 6.3
>100 6 1,166 3.2 85 6.3
Metro Ma.ila- 1 4,004 10.9 288 21.3
/1 Cities, Provincial Capitals and "urban agglomerations" of municipalities;
their total population is 10.1 million. In addition there are 1.6 million
inhabitants in very small urban centers (the number is not provided in the
census).
/2 Includes 1.6 million inhabitants in the (very small) urban centers noted
in f.n. 1.
/3 Includes Rizal.
Sources and basis of Estimates:
Compiled from 1970 Population Census, National Summary, Volume II, Tables
I-5 and 1-6. The distribution of manufacturing employment is estimated as follows.
The Census provides the urban-rural breakdown. For urban centers of less than
10,000 about 2.2% of the population are employed in manufacturing;for those of
10-20 thousand, 5.2%j and for centers with over 20,000, 7.2%. The first two
of these percentages were obtained from the provincial 1975 census volumes
(we did not have access to the 1970 volumes) for Agusan del Sur, Aklan, Antique,
Catanduanes, Bukidnon, Ifugao and Lanao del Norte, whose average urban populations
were less than 10,000 in 1970; and Laguna, Misamis Oriental, Negros Occidental,
Nueva Ecija and South Cotabato whose combined average urban population was about
15,000 in 1970. The 7.2% for centers with over 20,000 is calculated as a residual
These provinces were used as a data base (a) on account of the sizes of their towns
and (b) to provide a broad geographical coverage.

-165-
Table 6.2: LEVEL AND GROWTH OF POPULATION INURBAN AND RURAL AREAS, 1960-75
Population Millions Change, 1960-75 Growth Rate,Location 1960 1975 Millions % Total % 1960-75
Rural Areas: 18.9 28.8 9.9 66 2.8/1Urban Areas: /2 /1- Small Urban Areas-- 2.8 4.6 1.8 12 3.3-
- 6rin a 2.6 3.7 1.1 7 2.3---56 Provin 2. /
Cities-- Metro Manila 2.7 5.0 2.3 15 4.1Total 27.0 42.1 15.1 100 3.0
/1 There are some definitional changes introduced in 1970 regarding whatcomprised an urban area. These affected the urban areas outsideMetro-Manila; they would be 5-10% larger had 1960 definitions beenused consistently.
/2 Total Urban Population minus total population of 60 principal citiesknown as chartered cities in the Philippines).
/3 Population of 60 principal cities minus the population of the cities thatform Metro-Manila.
Source: Population Censuses for 1960 and 1975 (see the f,n. to para 6.2 ondefinitions of urban and rural).
Manufacturing Employment in Urban and Rural Areas
6.4 The distribution of manufacturing employment is also shown in Table 6.1;
approximately 52% was in rural areas in 1970, 27% in provincial towns and cities,
and 21% in Metro-Manila. There are several reasons for thinking that the share
in rural areas is declining, though it is not possible to detect this in
the series shown in Table 6.3.

- 166 -
Table 6.3: EMPLOYMENT IN MANUFACTURING IN URBAN AND
RURAL AREAS, 1965-76
/1No. Employed, 000- Percent Distribution
Year Rural Urban Rural Urban
1965 653 568 53.5 46.5
1966 742 589 55.7 44.3
1967 767 623 55.2 44.8
1968 754 634 54.3 45.7
1969 697 594 54.0 46.0
1970 706 648 52.1 47.9
1971 852 620 52.9 47.1
1972 792 675 54.0 46.0
1973 723 695 51.0 49.0
1974 761 747 50.5 59.5
1975 868/2 783/2 52.6 47.4
1976 907-2 773/2 54.0 46.0
/1 May series, except those noted in f.n. 2.
/2 August series. For urban areas the August series
are about the same as the May series. In rural
areas, the May series show employment levels
about 10% above those in the August series.
Sources: NCSO Survey of Households and 1970
Population Census. (Data here are taken
from the compilations in the 1977 Labor
Yearbook,)

- 167 -
6,5 The still high share of manufacturing employment in rural areas is
surprising. It probably reflects the point that, for rural families,
manufacturing is a secondary "off-farm" activity, undertaken mostly by
women, and which for this reason has to be combined with farm-work and
1/domestic duties. Notwithstanding the network of towns in the country,
access between farm and town is still time consuming in most regions, and
it is not possible for women to "commute" to local towns in search of2/
secondary earnings in commerce or manufacturing establishments.
Consequently the majority of rural manufacturing activities are undertaken
within the household.3/
6.6 The lack of data and descriptive material limits what can
be said about manufacturing activities within rural households and their
role in enhancing rural incomes. They are, however, declining in
importance in favor of wage employment in establishment-based,non-farm
activities in the provincial towns and cities. At a general level, they
can be divided into two kinds: the production of articles for own use,
which is declining rapidly according to the data in Annex Table 6.1; and4/
the production of articles for sale, which is declining slowly. Consider
also changes in the types of employment undertaken by women, who provide
two thirds of the labor force in manufacturing activities in rural areas
1/ Evenson, Popkin and King-Quizon (1979).
2/ The root mean distance between the 472 towns with less than 50,000 in-
habitants (Table 6.1) is over 16 kilometers in cultivated areas.(Cultivated area is 12 million hectares.)
3/ Such as is provided on farmers in Mrs. Castillo's (1977) excellent
study of provinces in the Philippines.
4/ In Manila, in contrast, household manufacturing of this kind is
rising rapidly (Annex Table 6.1). See also para 6.12 below on the
growth of the urban informal sector.

- 108 -
(c.f. one third in urban areas). Nine tenths of the women recorded
as being in rural manufacturing are working in textiles and wearing2/
apparel; household employment in both of these sectors has peaked
according to the evidence discussed in Chapter 5 (Table 5.10) in favor
of rising employment in large establishments in the case of textiles and
small establishments in the case of wearing apparel. Furthermore,
women are shifting increasingly out of mandfacturing into commerce and
services. Between 1956 and 1976, their participation rate in the labor
force remained about constant, but their occupational distribution
changed as follows: in manufacturing, a decline from 8.0 to 5.2%; in
government services, a rise from 1.7 to 4.6%, in commerce, a rise from
6.1 to 7.1%; and in personal services a rise from 4.5 to 5.4%. There
were on the other hand rising shares of the male labor force in manufacturing,
3/mostly as wage-labor in small and large establishments.
6.7 To sum up, these various trends are suggestive of three basic
changes in the allocation of labor both within and among families with
changes in output and infrastructure in the agricultural provinces:
1/ Population Census, 1970.
2/ Population Census, 1970.
3/ See Chapter 7 for a further discussion of the movements into wage-labor.

- 169 -
(i) A movement of women out of household manufacturing
for subsistence (own use) purposes into wage and
1/self-employment in tertiary sectors;
(ii) A maintenance or slow decline of some household
manufacturing activities employing women, and which
provide a secondary source of family income;
(iii) The emergence of manufacturing in workshops and
mostly - though by no means exclusively - small factories
as a primary source of family income. Since this
employs mostly male labor, it also solves the 'commuting'
problem referred to above.
It is of course the manufacturing activities and changes noted under (ii) and
(iii) that offer the better prospects for enhancing rural incomes.
6.8 The current emphasis on agricultural growth and infrastructure
improvements in the provinces is likely to increase the growth of
manufacturing and commerce in the local towns and cities, and to
accelerate the movement of labor out of rural household manufacturing. Rising
farm incomes permit a greater division of labor between farm and non-farm
work, given the high income elasticities of demand for non-food goods,
and stimulate the local markets for both locally and externally made
manufactured goods; in the case of the demand for external goods, a rise
1/ The rising shares in tertiary activities were lamented in the ILO (1974)report as being a sign of too low a demand for labor in manufacturingand the primary sectors. While tertiary activities sometimes offerbetter earnings than the more marginal household manufacturing activi-ties, it is generally believed that they are overcrowded.

-i7u-
of employment also happens in local retail and wholesale outlets, and
in repair and installation services. Furthermore, the broader the
base of agricultural development, the broader the effects on the labor
and product markets. A study of Gibb (1974) of four provincial towns
in small farmer rice growing areas in Central Luzon showed a rapid
expansion of small-scale manufacturing and commercial activities in the
towns, in response to the farm incomes generated by the introduction of
HYVs and supporting irrigation and infrastructural services. His
findings are summarized in Annex Table 5.2, and are consistent with
2/
those of studies in other countries, the more recent work of Alburo and
associates (1979), and the regional data presented in the next 2ection.
Regional Distribution and Growth of Manufacturing Employment
6.9 The demand for labor to work in manufacturing in the agricultural
provinces is derived from three sources: (a) the demand for consumer
goods, and which rise with incomes in agriculture; (b) external demands
for local manufactures, principally garments and handicrafts; and
Cc) the demands for inputs and intermediate goods by agriculture, and
also by local manufacturing itself, and which rise with agricultural
output. (Crop processing is included in Cc).) The result is a very
broad spectrum of manufacturing activities in.theconsumer and intermediate
goods industries, as indicated below by the employment data on manufacturing
establishments:
1/ For a further discussion see World Bank (1978).
2/ One would like to see more case studies of this type, since they provide
a more accurate assessment of the response of non-farm activities to
agricultural growth and infrastructure improvements, and a clearer picture
of the growth of the urban base in the provinces. For studies in other
countries see Epstein's (1973) historical study of two villages in India,
and Webb C1974) on Peru. Webb notes "New types of activities springing
up in the countryside include small businesses and trading ... a vast network
of small rural markets has formed ... small businesses are probably the most
important occupations in the growing urbanization of the countryside." A
study by Child and Kaneda C1975) of the tubewell pumpset manufacturers in
rural towns in the Pakistan Punjab is also worth reading. For a discussion
across countries, see also World Bank (1978).

- 171 -
Metro-Manila Provinces
Percent Employed in
- Consumer goods 55 72
- Intermediate goods 30 24
- Capital goods 15 4100 100
Actual Employment, 1977 (000s) 401 377
Source: See Annex Table 6.10 for further details. The data are
for establishment of all scales.
6.10 The level and growth of manufacturing employment in the regions,if
they are to be classified by scale of activity, have to be examined at
a more aggregative level on account of data limitations. Some data
are provided in Table 6.4 for Manila and Rizal (Metro-Manila) and the
Philippine's three major island groups: Luzon (excluding Metro-Manila),
Visayas and Mindanao. Since the economic conditions vary considerably1/
between the regions within each group, the data are still too aggregative
for comparative purposes. Luzon for instance has three of the poorest
and most slowly growing agricultural regions in the country (Ilocos,
Cagayan Valley and Bicol) and two of the most prosperous and rapidly
growing (Central Luzon and Southern Tagalog). The regions within Visayas
and Mindanao also require separate analysis on account of differences in
2/
their primary resource base: forestry (accounting for over 40% of the
country's total annual production) and coconut in Northern Mindanao; corn,
coconut and forestry in South-Central Mindanao; low levels of per capita
production in all major crops in Western Mindanao, Central Visayas and
Eastern Visayas; and sugar (accounting for over 60% of the country's total
annual production),rice and fisheries in Western Visayas. But it is
1/ Annex Table 4, summarizes the economic characteristics of the 12
main regions of the Philippines.
2/ See Annex Table 4,

- 172 -
difficult at present to construct a consistent time series on manufacturing
1/
employment by scale of activity for each region. (A regional breakdown
for small and large industries is shown in Annex Table 6.3 for 1970,
the latest year for which consistent regional data are available;
and a time series on the numbers of large and small manufacturing
establishments is shown in Annex Table 6.6 though even here inconsistencies
remain.)
6.11 Within these various limitations imposed by the data, four
features stand out as regards changes in the size distribution of
employment by region (Table 6.4):
(i) The concentration in Manila of employment in2/
large scale manufacturing, amounting to 53%
of total employment in large scale in 1975;
(ii) The level and growth of household employment in
Manila;
(iii) The regional dispersion of employment in small-scale:
82% of employment in household manufacturing, and
78% in small establishments, was in the provinces in
1975;
1/ In 1975 the population census used a different definition )f
employment to the one used in the establishment census. It is
possible to make adjustments for this (see Annex Table 6.5), but
the assumptions do not hold up well at a disaggregative level.
Even the aggregate data in Table 6.4 and Annex Table 6.5 have
a number of caveats, as footnoted.
2/ Depending on the definitions adopted for small and large scale;
53% refers to establishments with 10 or more workers. For
establishments with over 200 employees, the preliminary tabula-
tions of the NCSO indicate that about 52% of the employment is
in Metro Manila.

- 173 -
Table 6.A: REGIONAL DISTRIUTION AND GROWT OF mANUFAC7'RING neLOuLmTBY SCALE OF ACTIVITY, 1960-75
Region and No. EmDloved, 000s Discributions, 1975 Trend,Scale of Activitv/i 1960 1970 1975 r '.rmp Tor-I 1960-75
Manila & Rizal
Households 556 811 150, 9 Z4 18 /4 6.9A
Establishments <10 27 39 63 4 22 - 4.4/2Establishments >10 159 244 288 17 53 3.8!3
Total 241 364 501 30 30 5.0
Luzon (excluding Manila and Rizal)
Households 298 396 361 22 43 1.3Establishments <10 35 69 126 8 45 8.3zEstablishments >10 39 63 149 9 27 9.6/
Total 372 528 636 38 38 3.6
Visavas
Households 264 275 214 13 26 -1.4Establishments <11 19 30 40 2 14 6.0Establishments >10 32 43 60 4 11 .
Total 315 348 314 19 19 0.0
Mindanao
Households 78 70 108 7 13 2.2Establishments <10 12 30 52 3 19 9.7/Establishments >10 18 59 49 3 9 5.4/3
Total 108 159 209 13 13 6.8
Countr-7 Totals
Households 695 822 833 50 100 1.2Establishmentzi <10 93 168 281 17 1,, 7.7Establishments >10 248 409 546 33 100 .4
Total 1030 1399 1660 100 100 3.2
, The scales talata to numbers of workers employed. Household employment isestimated as a residual.Actual trends for 1961-72 shown in Annex Table 5.& Actual trends for 1961-75 shown in Annex Table 5.
/4 Since the residual (household employment) is only a small percentage (20-30%)of total employment L, Manila and Rizal, the estimates here are more uncer-tain than in the oth, regions: a small error in total employment is magnified3 to 5 times in the r,isidual; in othei regions the errors are magnified byabout l,3 to 1.5 on avurage.
Sources and Basis of Estimates: Total employment by regions is given in AnnexTable 5 (columns 1960b, 1970, 1975b) . The establishment data are in AnnexTibla 6; since these are for the years 1961, 1967, 1972 and (for establishmentsof over 10 workers only) 1975, the estimates for 1960, 1970 and (for the lessthan 10's) 1975, are simple trend interpolatiorsor extrapolations from thenearest years.

- 174 -
Civ) The high growth rates of establishment-based
employment (in both small and large scale) 4,u
the provinces, in conjunction with a rapidly
declining share of household employment.-/
(i) is familiar, and can be discussed briefly. The concentration of
large scale in the Manila region is partly a consequence of the market
for consumer goods in the region itself, and in the adjacent and
relatively propserous agricultural regions in Southern Tagalog and
Central Luzon. Aside from the historical concentration of wealth and
income in Manila, investment there was also stimulated by the structure
of industrial incentives. The high rates of effective protection on
consumer goods industries, tax reliefs on capital inputs, low rates of
effective protection on capital inputs and on agricultural and forestry
products all acted to favor investment in industry over agriculture,
2/as discussed in Chapter 5. Simultaneously, the transactions costs of
using the incentives, low tariffs on imported materials, and the costs of
obtaining imported inputs to industry, both favored industrial investment
near the Government and near the port of Manila.-
6.12 (ii) Household Manufacturing Employment in Manila. This
encompasses a very broad range of activities and earnings levels, and
for this reason it is hard to explain why it is
growing so rapidly while declining elsewhere. In Manila (as elsewhere)
families primarily dependent on household manufacturing often have
earnings comparable to or in excess of those of skilled labor in the
1/ John Powers mentioned that this reverses a slow trend experienced in the
1950s, when capital was moving away from agriculture at a historically
high rate under the influence of protection. This is documented in a
paper by Moran (1979), to which we did not have access at the time of
writing.
2/ See especially the ILO report on this subject.
3/ Powers and Sicat (1971), p. 106.

- 175 -
organized sector; others are amongst the poorest in the country. For0 2/
some families - though a rapidly declining number - it is a subsistence
activity. For others it provides a secondary source of employment
and earnings, undertaken by women and (perhaps moreso than in the provinces)
has been encouraged by the putting out system, in the garments industries
3/in particular. It is also likely to include employment in a number
of the high growth capital and durable gocis industries referred to in
:1 4/Chapter 5.
6.13 Any explanation .f the growth of household employment in
Manila must therefore recognize the diversity of cctivities involved.
The possibility of measurement errors cannot of course be discarded;
yet the evidence is consistent with both cross-section and time series
data on th,. size and growth of the 'urban informal sector' in other
5(countries, and one might best draw on the models of this sector to
find the elements of an explanation. The growth of labor supply due to
1/ This can be inferred from the data presented in Chapter 7 (table 7.6
and Annex Table 7.9). In 1971, 18.3% of the families primarily
dependent on entrepreneurial activities in manufacturing were in the
top quintile, and another 18.3% in the next-to-the top. The number
of families in these groups (72 thousand) significantly exceeded the
number of manufacturing establishments in that year. Since these
data are for the country as a whole they do not show the point
explicitly for Manila, though it is highly unlikely that Manila
would have none of the better-off in these types of activities; in
fact several such families were met during the course of field trips
in the present study.
2/ Compare the figures on production of articles for 'own use' and 'for
sale' in Annex Table 6.1.
3/ The 1975 Population Census gives 103 thousand women in Manila and
Rizal as being in the weaving apparel industry, of which less than
half can be accounted for by employment in establishments.
4/ Several of the interviews reported in that Chapter were with firms
in the Manila area that had started out as household activities.
5/ Mazumdar (1976),

- 176 -
in-migration and the 'natural' population growth of the city is
obviously one element, combined with the low demand for labor from the
corporate sector. Another is the growth of the
urban product markets including the markets generated by the 'informal'
2/sector activities themselves. The fastest growth of household
manufacturing in Manila also occurred during 1970-75 (Table 6.4),
a period of inflation, declining real wages and a declining share
for labor in value added; as will be discussed in Chapter 7, it
thus became more remunerative for many workers to move into or remain in
self-employment. Even before the inflation, however,
the distribution of earnings from self-employment and from wage-employment
in skilled occupations in the 'formal' scctor overlapped, and is
suggestive of a greater competition in the labor markets for the two kinds
of employment than is commonly supposed. Finally, as in Japan in the
earlier part of this century, there are economic and political advantages
to large trading and industrial firms in the "putting-out" of certain
3/types of work.
6.14 (iii) Geographical Dispersion of Small-Scale. It is sometLdes
suggested that the geography of the Philippine islands enforces a
dispersed pattern of manufacturing and commerce, This is possibly true
in the mountain provinces, but the separation of provinces by sea in
fact has comparatively little influence, except perhaps in the three
main islands of Visayas, since 75% of the population live on the two
1/ Preston (1979) has pointed out an often overlooked point that the
growth of large urban areas stems in a greater measure from their'natural' population growth rate than from in-migration, thugh
this is r. t.- suggest that the latter is unimportant.
2/ Mazumdar, op. cit., p. 672.
3/ Shinohara in Hozelitz (1968).

- 177 -
large islands of Luzon and Mindanao, where small scale manufacturing
is also dispersed. It will be argued below that (as in other
developing countries) dispersion is a consequence of the still large share
of the labor force in agriculture and living in rural areas, and
which in practice leads to dispersed product markets and to
fragment production into small scale units. The rural populations in
regions outside Metro-Manila range from 70% of total population in Central
Luzon, to 90% in Ilocos. Household manufacturing is mainly in the
rural areas as discussed earlier, while manufacturing in small establishments
is found mostly in local urban centers on account of better access
to infrastructure and markets. For some products it is possible for large
scale manufacturers to reach the provincial markets through the trading
networks, as happens for instance with modern durables; but the transport,
storage and marketing costs for others (furniture, construction materials,
job-order-metalwork and bakery products, for instance) are prohibitive
until infrastructure and transport services are sufficiently developed.
Low wages and the demands for cheaper if often lower quality products
in the provinces also presumably favor local small manufacturers.
Although such relative cost and marketing advantages for small manufacturers
decline with the growth of per capita rural incomes, and with infrastructure
improvements, this appears to affect a limited number of sectors
CChapter 5, Tables 5.10 and 5.12). In others, it leads to the provincial1/
manufacturers reaching out to the regional and national markets, and
to an overall expansion of establishment-based manufacturing activity.
1/ Chapter 5, Table 5.9,
2/ See Table 6.4 and Annex Table 6.6.

- 178 -
6.15 (iv) Changes in Manufacturing Employment Over Time in the
Provinces. In the Philippines, the above-mentioned expansion has been the
most rapid in Southern Tagalog and Central Luzon, where agricultural
growth is less narrowly-based than elsewhere, and also more rapid. In
1975 the two regions accounted for over 30% of total rice production
(the country's principal crop); Southern Tagalog also had quite high
shares in coconut, corn and timber production (Annex Table 5.4). High
yielding rice varieties were being used in Central Luzon as early as
1966, but the main increases in rice production occurred in the 1970s,
during a revival of a long-standing but defunct land reform program
for rice and corn farmers, and an intensification of extension,
credit, infrastructure and irrigation programs. Since time-series
data on inputs and outputs by region are not readily available, it is
necessary to consider national aggregates and keep in mind that provinces
in Central Luzon and Southern Tagalog were among the principal beneficiaries
of the programs. By 1977, HYVs were being planted on 86% of irrigated
and 68% of rainfed rice areas in the country; but perhaps as important
were the lasting improvements on rice farming practices and the supporting
supply and marketing services. The changes in rice production are
apparent in Annex Table 6.9 and Figure 1, which show the general increase2/
in yields and outputs that occurred in the 1970s. (The decline in 1972
was due a rice crop virus, "tungro", and in 1973 to severe flooding in
3/Luzon.)
1/ "Philippines Sector Survey: Agricultural Support Services," June 14,1979, IBRD.
2/ Ibid. The report remarks that for the first time in its history thePhilippines is becoming self-sufficient in rice production, even in the
face of adverse weather conditions, and a net exporter of rice.
3/ Report on the Masagana 99 program by Jesus Alix (1979).

3U Jl) (. ( . (f3 t 3 C C3
If) eD c) u)C e -1 l
~~c -r~~ T iir~I L V{IJ1i I I 1] Lf)ETTFTFTLÄc J
CP CO
T[1l T T 1 7' T T T - T T I T T -T T -TT' T Tcr
~ 3cr-
(1) CD)
CC
c ä
,1 JI L:i i
2c 3
[fl li LDtf
1L 3 1Co C o~cr
CI C
[ HC~1CO -1- ci
-. ( 3 () ( ~)j
C) flC (1tu 1 .1 .l .s C2 )IPL - L f
-*>J C l>-. 4. Cl)CD C CD .3 ( CD 1 L

- 180 -
6.16 The associated trends in establishment-based manufacturing
employment were provided in Table 6.4 above. For Luzon as a whole
(excluding Manila and Rizal) the employment trends since 1960 averaged
8.3% per year for small establishments and 9.6% per year for large
establishments. (There is evidence of employment doubling since 1970,
a growth rate of 15% per year, but the preliminary nature of the
census data do not permit these figures to be taken too literally.)
These figures probably understate the growth in Central Luzon and
Southern Tagalog since they include three of the slowest developing1/
regions in the country. Other features to note are the decline in
the share of household employment from 80% to 57% over the 15 year2/
period ) as the preceding analysis would predict; the net migration
3/into the regions (Annex Table 6.4), notwithstanding their closeness to
Manila; and the high average growth rates of the principal cities4/
(Annex Table 6.8).
If Ilocos, Bicol and Cagayan Valley. Ilocos and Bicol show below averagerates of establishment formation, Cagayan slightly above average.Cagayan has a relatively small number of establishments however.
Annex Table 6.7.
2/ See Table 6.4.
3/ The in-migration rates can be inferred from the population growth ratesin these regions, which were above the 'natural' population growthrate. (Annex Table 6.4 provides data on population growth, but noton migration.) An analysis of internal migration patterns in thecountry up to 1973 is provided in Mrs. Castillo's study (1977),Volume III, in which she notes that "the in-migration regions are ....Northern and Southern Mindanao ...... and Central and Southern Luzon"(p.865). Quite detailed tabulations are presented in this volume.
4/ The variance in the growth rates should be noted. Growth rates rangefrom 2.2% per year in San Jose (Central Luzon, Population 53 thousand),to 8 to 9% in Olopango and Palagan (population 147 and 12 thousandrespectively). The average in Central Luzon was 4.9%, and in SouthernTagalog 3.4% (c.f. 4.8% for Metro-Manila).

- 181 -
6.17 The next highest growth regions in the country are in
Mindanao, where the main products of the primary sector are timber, corn
and coconut, in which local production amounted to 68% and 65%
respectively of the country's total production in 1975 (Annex Table 6.4).
While the overall growth rates in these sectors have been comparable
to those for rice production,-the origins of the growth have been quite
different. The response to improved practices and HYVs for corn farming
was low compared to rice (Castillo, 1977) and 70-80% of the growth in1/
output in the 1970s has been due to an area expansion, as can be seen
from Figure 2; this of course implies a slower growth of earnings on
fixed area small farms than would occur under conditions of rising yields.
Coconut, in contrast to most other crops, is genrally a secondary
activity for farm families and, while overall output increased at
about 3.5% per year (Annex Table 6.9), this has been accompanied by a
systematic decline in yields over a 15 year period. Timber production,
which expanded at over 5% per year in the 1960s, was first held constant
and then reduced in the 1970s for reasons of forestry conservation,
reforestation and ecology. Overall per capita output from the primary2/
sector in the region has nevertheless risen over a long period. Associated
with this were a decline in the share of household manufacturing
employment (from 72% to 52% over the period 1960-75); growth rates of
9.7% and 5.7% respectively of manufacturing employment in large and
small establishments; and an average growth rate of 4.2% of Mindanao's
1/ The difference between the two plots in Figure 2 provides a measure
of the increase in output due to the increase in area cultivated.
2/ Sicat (1972), Chapter 15 provides estimates of relative regional growth
rates up to 1966. Since regional accounts were not available, he used
surragate measures based on tax data and expenditures of regional
governments.

INDICS OFCORN182 -INDICES OF CORN PRODUCTION RND CORN YIELDS(1960=100)
1960 1962 1964 1966 1968 1970 1972 1974 1976 1978300.0 - 300.0
275.0 275.0
*-PRODUCTION250.0 -- YIELD F-GURE 2 250.0
225.0 225.0
-JU.J 200.0 200.0
z
175.0 175.0
C 150.0 150.0
125.0 125.0
100.0 100.0
75.0 75.0
50.0 50.01960 1962 1954 1966 1968 1970 1972 1974 1976 1978
YERRS

- 183 -
14 principal cities (Annex Table 6.8).
6.18 Regions experiencing the slowest (and also the most narrowly-
based) growth in the primary sectors include Western Visayas (the main
sugar growing region in the country), Eastern Visayas, Bicol and Ilocos,
Each have the following in common: net out-migration, a slow rate of
growth of the principal cities (2.3% in Western Visayas, 2.1% in Eastern
Visayas, 1.8% in Bicol and 2.7% in Ilocos), and a slower rate of growth
of employment in establishment - based manufacturing. Even in these
regions, however, the share of employment in household manufacturing is
declining, though it remains significantly higher than elsewhere (e.g.
68% in Visayas, as compared to around 55% on average in other provinces).
6.19 Crop yields in the Philippines are still low by East Asian
standards (Table 6.9), which suggests that the potential for rural-led
industrial growth in the provinces is still considerable:-
Table 6.9: NATIONAL AVERAGE CROP YIELDS: SELECTED
ASIAN COUNTRIES, 1977 TONS/HA
Philippines Indonesia Thailand Malaysia India Japan
Rice (rough, dry
paddy) 1,96 2.76 1,81 3.061/ 1.87 6.17
Corn (maize) 0.88 1.19 1.46 7.001/ 1.13 2.67
Sugar Cane 43.6 83.8 53.1 36.0 53.6 54.5
1/ Malay Peninsula.
Source: FAO Yearbook, Vol. 30, 1977.
1/ Again note the variability from 1.6% in Gingoog (population 67 thousand) to
6.1% for Cagayan de Oro (population 165 thousand).

- 184 -
The potential cbviously varies greatly between provinces, and was
examined at length during the preparation of the current Development
1/Plan. It is for instance much more limited in Ilocos (where
fisheries, handicrafts and tourism have been stressed) and Central
Visayas (where the development of the larger urban centers has been
stressed); also, in some regions the urban-industrial base is itself
now large enough to provide a lead. This is clearly not the place
to review plans, however, and it is sufficient to note that it is
intended to maintain the emphasis that has been placed on a broad
based development of agriculture since the early 1970s. What can be
said from the limited perspective of the present study is that, to
the extent that these policies are successful in achieving a more
broadly based growth of incomes in the rural areas and towns, chey
should stimulate the product markets of local manufacturing establishments,
both large and small scale. The demands for the services and finance
provided by the small enterprise programs are likely to be greatest
in these regions.
6.20 To sum up, the evidence presented above underlines the
importance of agriculture as the leading element in urban-industrial
development in the provinces. This conclusion is not new. But the
strength of the linkages between agriculture and local industry and
commerce appear to be even stronger than might have been thought
earlier; in the high growth agricultural districts, the emergence of
small and large manufacturing establishments in the local urban centers
has been very rapid in recent years; and the rapid growth of establish-
ment based manufacturing in the provinces has apparently reversed the
trends experienced in the early phases of industrialisation, when agri-
culture was given a very low priority.
1/ Five Year 1978-82 Philippine Development Plan, NEDA.

- 185 -
VII. SMALL ENTERPRISE PROGRAMS AND EHPLOYMENT POLICY:
A REASSESSMENT OF PURPOSES
Introduction
7.1 The small and medium industries program is seen primarily as
a means for improving the employment and earnings opportunities for
the labor force. At the time the program was introduced in 1974, the
labor force had expanded at over 3% per year in the previous 20 years,
from under 9 million in the mid' 1950s to over 14 million by the mid'
1970s; by 1979 it was over 17 million, with 600 thousand people entering
the labor market each year. Between 1956 and 1974 agriculture provided
about 51% of labor absorption, commerce 12.2%, government services 13.6%,
and factory-based manufacturing activities, although accounting for
about one fifth of gross fixed capital formation in the private sector,
1/only 4.9% (Table 7.1). It was often noted that low productivity
tertiary activities absorbed more labor than industry, as for instance
with 5.8% of the new entrants being employed in domestic services
(mostly as domestics) over the period. A second purpose of the program
stemmed from the growing concentration of industrial investment in
Metropolitan Manila, which by 1974 accounted for about one half of
2/
all manufacturing investment in the country. The new emphasis to
be placed on agricultural development in the early 1970s, however, was
expected to stimulate industrial employment opportunities in
1/ The ILO (1974) report provides an analysis of trends in labor
absorption and labor productivities by sector.
2/ Estimate based on the relative capital labor ratios of 0.329, 0.764
and 1.0 for small, medium and large establishments respectively,
and regional employment data provided in a report by the UP-Institute
for Small Scale Industries (1977).

- 186 -
Table 7.1: EMPLOYMENT AND LABOR ABSORPTION BY ECONOMIC SECTOR 1956-74
Change % Share in TotalSector 1956 1974 1956-74 Change, 1956-74
Agriculture 4,548 7,684 3,136 51.2Construction 198 403 205 3.3Manufacturing- factory based- 151 454 303 4.9- household & small-'- 811 969 158 2.6Commerce 803 1,549 746 12.2Transport 228 491 263 4.3Government Services 392 1,225 833 13.6Domestic Service93 332 685 353 5.8Personal Services- 135 225 90 15Other 104 139 35 0.6Total 7,702 13,824 6,122 100.0
/1 Establishments with 20 or more employees.
/2 Includes establishments with less than 20 employees.
/3 Other than domestic.
Sources: NCSO. Labor Force Surveys and Surveys of ManufacturingEstablishments.

- 187 -
the provinces, particularly in small and medium industries. Hence
by addressing the constraints on the supply of capital and services
to these industries the program had the dual purposes of increasing
industrial employment opportunities in the country and achieving also
a degree of decentralization of urban-industrial development.
7.2 From the standpoints of implementing and evaluating the
program, however, it is necessary to define the employment objectives
more precisely; in particular, to decide what is meant by improving
employment opportunities. There is a tendency to see the desirability
of the projects financed in terms of employment creation. This is
reflected for instance in the early emphasis placed on establishing
"new" enterprises, the more recent emphasis on "growth" enterprises, an
almost exclusive preference for financing fixed assets over working
capital, and a preference for financing only labor intensive small
Enterprise projects. But a closer look at the evidence on employment and
incomes suggests that the preoccupation with employment creation at
low cost places an unnecessary constraint on what the program might
otherwise accomplish:
(a) Un and underemployment rates have declined
systematically during the past 20 years,
notwithstanding the rapid growth of the labor force;
Cb) Real wages, on the other hand, have passed through
periods of stagnation and other periods of decline;
and
(c) Family incomes in the lowest quintiles have varied in
a more complex manner, but have remained low,
1/ For a fuller discussion of the background to the program, see theILO (1974) report.

- 188 -
In these circumstances it is not the absence of empioyment, but the type of
employment and the low incomes derived from it that becomes the main issue.
This has several implications for the future directions of the program, the
types of projects it finances, and also for the criterion as to what
comprises an economically desirable project,
7.3 This chapter first briefly reviews the evidence on employment,
wages and incomes, and then discusses the ±mplications for the small
enterprise programs. A comment on labor intensity in small and large
enterprises is offered, together with some observations (drawing on other
studies) for raising the demand for labor in general. A method
for evaluating small enterprise projects and programs is also outlined
(its technical aspects being covered in more detail in the next chapter).
Unemployment and Underemployment: Levels and Trends
7.4 Various series on employment over the period 1960-76 are shown
in Table 7.2. The first column shows the NCSO's estimates of participation
rates, which declined slightly over the period, from 54-57% in the early
'60s to 50-52% in the mid '70s; a closer look at the data by age group
shows that the declines were most marked among teenagers, presumably on
account of the rising shares attending school or college.
7.5 Unemployment rates for household heads,and for the urban and
rural labor forces are also shown, from which the following points stand
out: (i) the systematic declines in unemployment rates from about 6-7% in
the early '60s to 3-5% by the mid '70s; (ii) the relatively low unemployment
1/ Labor Force Surveys. A further discussion of participation rates canbe found in Lal (1979).

Table 7.2: LINERPLOYM!ENr AND) UNDER EMPLOYMEN1T IN THE PHILIPPINES, 1960-76
Total Percent Percent Unemployed MeasureLabor Force Labor L3 Working 40 Visibly and Visibly of Un and % flouseholds
/2 Participation Force Unemployment Rate %'or more 4 under /5 Under /6 Uder WIth) FamilyYear Rate, %. (Millons) Urban Ru ralI Total hours/weeks Employed Employed-7 Employment X fiends IUemployed
()(2) (3) (4) (5)) (7) (8)()O1)
1960 53.8 9.1 - - 6.3 - --
1961 55.6 9.7 - - 6.4 --- 12.7-
1962 57.1 10.3 - - 6.5 --- 13.0-
1963 55.2 10,2 - - 4.6 - -12.9-
1964 59.9 11.3 - - 6.4 - 10,8-
1965 53.1 10.8 10.7 4.1 6.2 84.5 9.3 15.5 13,1 1.91966 55.1 11,8 10.0 5.7 7.0 84.9 8.1 15.1 11.6 1.61967 54.7 11.8 10.3 ".6 7.7 84.0 8.3 16.0 - 1.51968 49.6 11.4 9.0 7.4 7.9 81.6 10.5 18.4 14.4 2.21969 52.0 12.0 9.2 5.7 6.7 85.7 7.6 14.3 10.9 1.911970 - - - - - - - - - -
1971 50.2 13.2 8.7 3.7 5.3 89,1 5.6 11.9 8.0 1.7 0
1972 48.4 13.3 9.8 3.3 5.4 89.4 5.2 10.6 9.1 1.81973 50.4 14.6 8.0 3.3 4.8 89.0 6.2 10.8 7.7 1.91974 49.7 14.3 5.7 2.0 3.2 91.8 5.0 8.2 6.6 1.31975 51.0 15.2 7.8 2.6 4.2 90.1 5.7 9.9 6.8 ['5
1976 51.8 16.2 8.0 3.6 5.0 89.9 5.1 10.1 7.3 1.2
/1 See text for defi-nitinns of terms. (A dash indicates Lhat thle data were not readily available or not available.)
12 October rounds of the BCS Survey of Households except for 1964 and 1969, for which surveys were only available in May; for 1971-711(November rounds), and 1975-76 (August rounds). The May rounds do not differ much from the August/October/Novemnber rounds forall variables except the visibly under-employed, where the differences may be as much as 3 percentage points (in absolute terms),the May figures being higher; for Lthe other series Lthe differences are generally within one percentage point. For Lthe visiblyunderemployed in 1964 and 1969, a downwards adjustment was applied to the may Round.
/3 All those recorded as wanting work on a full time basis.
/4 Includes those with a job or business but not at work because of temporary ill1ness, vacation, strike or other reaszkns.
/5 Working less than 40 hours per week and seeking additional work.
/6 Col. 5. plus Col, 7.
flUn-employed plus the full time equivalent of Lie visibly unider-employed, defined in f.n. 5. Figures taken from ],al's (1979) report,Table 1, Col. 10.
Sources: BCS Surveys of Households for respective periods, except for Col. 9, which is indica--ad In f.n.7.

- 190 -
rates in rural areas in all periods (on average they have been about
60% lower than those in urban areas); and Ciii) the relatively low
levels of unemployment recorded among household heads (about 1.2 to
1.5% in the mid '70s). As in other countries, unemployment is more
concentrated among the younger of the labor force, though again there is
some evidence of a decline for all age groups over time (Table 7.3):-
Table 7.3: UNEPLOYMENT RATES BY AGE GROUP, 1965AND 1976, (PERCENTAGE OF LABOR FORCE UNEMPLOYED IN EACH GROUP.)
Age Group All10-24 25-44 45-64 Ages
1965 (October) 12.2% 4.1% 2.9% 6.2%1976 (August) 9.5% 4.0% 2.4% 5.0%
Source: As for Table 7.2.
Finally, the NCSO series also show declining unemployment rates for
1/males and females and for both agricultural and non-agricultural workers.
7.6 A presentation of yet further statistics on unemployment rates
would be monotonous. Perhaps the main question to be answered is whether
the definitions or the sampling methods used have changed over the years so
as to bias the estimates in some way. Neither appear to have changed2/
significantly, however, over the period considered. The unemployed are
defined as all those "wanting and looking for work on a full-time basis
(40 hours per week)" or wanting full-time work but not.looking for it
1/ Yearbook of Labor Statistics, 1977.
2/ Ernie Pernia rightly pointed out to us that the definitions of unemploy-ment in the population censuses of the NCSO have changed (see alsopara. 6.11 and the supporting annex tables); the labor force surveyshave been more consistent, however.

- 191 -
"in the belief that it was not available, or because of temporary
illness, bad weather or other valid reasons." This definition has been
followed consistently in the labor force surveys since 1956.
7.7 The NCSO's surveys also provide estimates of what are defined
as the"visibly under-employed7 who are people with part-time jobs(i.e.,
working less than 40 hours a week) and wanting additional work.-/ The
series are also shown in Table 7.2 (col, 8) for the period 1956-76; again
the noticeable feature is that the rates declined)from about 8-9% in the mid
'1960s to 5-6% in the mid l970s. Working hours were also long and increased
(col. 6); in 1965, 85% of the labor force claimed to be working more than
40 hours per week and in 1976, 90%. Ia column (9) of the table a composite
measure of unemployment is provided,Z/ based on the full-time equivalent
of the visibly under employed plus the unemployed, and indicates that about
7.3% of man-days of work were lost due to un or under employment in 1976,'
as compared to 13.1% in 1965.
7.8 Hence the available data show that the economy has been able
to absorb its labor force during the past 20 years,notwithstanding the
capital intensive path of industrial investment discussed in Chapter 5, and
the under-investment in agriculture. This has not happened, however,
without its cost in terms of the quality of employment provided and its effects
on the real wages and incomes of the labor force.
3/Changes in Real Wages Over Time
7.9 Published data on wages are not comprehensive, and are
available in some sources only for Metro-Manila,and in others for particular
1/ There are of course several others definitions of under-employment based ondisparities between wages and marginal productivities of the employed. Therelevant data are not available to use these definitions here; even if theywere, however, they would not affect the following analysis for the samereasons as are laid,out by Stewart (1977, Chapter 2) in her book onTechnology and Underdevelopment.
2/ Taken from Lal (1979).
3/ This section draws heavily on Lal's (1979) report and is kept brief. Thefollowing includes a discussion of agriculture, agricultural wages andearnings in self employment (which are not discussed in his report).

- 192 -
industries or time periods. Selected series are shown in Figures 1, 2l/
and 3 tabulated in Annex Tables 1 to 4. The first plots movements in
real wages for skilled and unskilled labor in large establishments in
Manila since 1950; the second, real wages in agriculture and in selected
industrial occupations (again in Manila) over the same'period; and the
third real weekly earnings of wage and salaried workers for several
sectors (but over a much shorter period on account of data limitations).
These figures show that, with certain exceptions to be noted below,
real wages have been more or less constant in some periods, and have
declined rapidly in others; the period of most rapid decline was
1969-74, when real wages fell in some sectors and occupations by over
40%,
7.10 What caused these changes? An allowance must of course be made
2/for measurement errors. It was pointed out to us- that the introduction of
wage supplemehts and bonuses in the 1970s may have given an exaggerated
picture of the downward trends shown in same series. While the various
series treat these factors differently, however, and sometimes ignore them,
they give results that differ more in magnitude than in direction, as can
1/ The data have the advantage of coming from several independent sources,which serve to provide some cross-checks. The series draw on the CentralBank's surveys of large establishments in Metro-Manila; Beacon, foragricultural wages; the BCS (later NCSO) surveys of households; the NCSOsurveys of establishments; and unpublished Wage and Salary Surveys inthe Philippine office of Compensation and Position. The Wage Commissionalso make independent analyses of the wage series from these sources inconnection with minimum wage legislation, and presumably check the seriesfurther.
2/ By John Powers.
3/ The NCSO's series count weekly earnings and the Central Bank's monthlyearnings, so both ignore cash bonuses such as the "13th month bonus."The NCSO's establishment data, however, are based as annual earnings,presumably include cash bonuses, and also show a precipitous declinein labor's share in value added in the 1970s.

- 193 -
AG RATE INDEX :N i UaTRIAL ESTASISHMENTS IN MRHLA :972=i30
1250 1954 1953 125 1955 1970 1324 1278
170.0 7.
150.0 L00 150.0O-SK ILLEJ L.S52E- S
150.0 10,
140.0
3 P0 - Q 30.G
n 120 .0 -) -JI 120 .0
.0 -- 110.0
0 . \ »0.0
9- 0 -900
30 - 0- 0.0
70.0 70 .0
50.-0 50 s.o
500 -K .' I.i- L -r 5 s.ol25Q [Js4 1951 12 1255 1370 132' 1275
Y ERR

…ど 長 よ 共 に に に 写 三 員 : : 買 「 1
「’「「は“黙 「一 “’説 -n「× -に-’三 ―1

fj
U') 0 c7ý c:) C,3 C) (D C) C) W C) C2I
c
1ý c-) C) C) C) C')
fr-1 C.J c (VI
-T- i -1-r--T-r- i-
LIJ
C.I MLi
(.~x 1,J t,' t'-i
ILi-- u
IL] CT-
^> LU
cr ci C) Ir c? r.ý ce:
LL-
C7I
CD C-3
Li Jl
I- J -1-1 .. L l. L
u) C) C) cl
c cin c l
I J M "'Jc.ý 9 c) N I N ýJ LJ -J -1
- 196 -
be seen from Figures 1, 2 and 3. Furthermore, detailed analysis Of the series-
show a remarkable association between changes in the real wage levels and
contemnooraneous economic events. In.-oarticular, the changes in-any
period can be traced to one or more of three factors:
-product prices, which have at various times acted
to draw investment towards the more capital intensive
manufacturing sectors of the economy, and away from the
more labor intensive sectors, both agricultural and
non-agricultural;
- investment incentives
which raised
the capital
- until recently, comparatively low investment in
infrastructure and suppport for agriculture.Superimposed on this were the effects of the continual rise in labor supply,
In each instance, however, a rise in labor supply or a fall in labor demandresulted in a downward pressure on wages rather thanincreased unemployment, and
also (as will be seen later) in some shifts between wage and self-employment.
7.11 A formal analysis of wage movements is outside the scope of this
study, but in view of their implications for the small enterprise program
(which was largely seen as a way of raising the demand for labor in industry)
a short digression to summarize the main economic events and their
associations with wage movements might be useful. These events can be grouped
very roughly into five periods.
7.12 Cl) 1950-58. This was a period of high prices of manufactured consumer
goods under the protection provided by exchange controls. 2/There was in
consequence a large shift of investment away from the more labor intensive
1/ See Lal's report.
2/ See Powers and Sicat (1971) and Baldwin (1975).

- 197 -
agricultural activities towards large scale manufacturing, and which acted to
keep wages and productivity in agriculture at low levels. Manufacturing1/
output grew at over 121 per year in this period, when import
substitution was proceeding rapidly, and probably accounts for the rise in
real wages, to historically high levels, in large manufacturing establishments
in the Manila area (Figure 1). The concentration of investment in
Manila, and the smallness of the large establishments' share in
manufacturing employment (about 16%) and total employment (less than 3%)
in the '50s necessarily confined any favorable impact on real wages to a
vefy small share of the labor force.
7.13 (2) 1958-63. By the late '50s the possibilities for further
import substitution were becoming increasingly limited. Industrial
growth rates declined quickly to one half and then (by the early '60s)
to one third of the levels in the early '50s, averaging about 4.9% in the
period 1958-64 (Annex Table 6); in addition,the capital intensity in
large-scale manufacturing rose steadily, in part because of a range of2/
exemptions on import duties on machinery and equipment to industry.
Both lowered the demand for industrial labor and, while this may have resulted
in a slight reduction in the growth rate of industrial employment (Annex
Table 6), its main consequence was a sharp fall in real wages
(Figures 1 and 2).
7.14 (3) 1963-69. Beginning in 1960, the exchange controls and a
multiple exchange rate system were gradually phased out, the process being
1/ See Annex Table 6. In the early 1950s, the growth rate was around 15% p.a.
2/ See Powers and Sicat, op.cit., for a further discussion.

- 198 -
completed by 1963. Protection was maintained under tariffs. This
might have reduced the relative price of manufactured goods slightly
since, though the tariff system was instituted in the 1950s, prices
1/up to 1963 were above c.i.f. prices plus tariffs. The period
1963-69 was one of relative prica stability, while the industrial
growth rate also bottomed out at 4-5% per year. Real wages in large
industries remained more or less constant in this period (Figures 1 and
2) while real wages in agriculture fell slightly (Figure 2).
7.15 (4) 1969-74. In this period several events seem to have
had an influence on the observed decline of real wages all round - in
modern establishments in Manila (Figures 1 and 2), in agriculture2/
(Figure 2) and in non-industrial sectors (Figure 3). To promote
backward linkages in industry, the Investment Incentives Act offered
tax reliefs and subsidies for the capital goods manufacturing sectors,
as discussed in Chapter V, again shifting resources away from the
more labor intensive (non tradeables) sectors. But the main factors
reducing real wages, at least in industry, appear to have been the management
of aggregate demand and trade deficits in 1969, and in 1972-74 a rise
in the relative prices of locally manufactured goods induced by rising3/
world prices and the maintenance of a fixed exchange ratea, In each
instance it was argued that the effect was to raise the relative prices
1/ "So long as exchange controls were in effect the tariff system served(merely) .... to permit the Government to share in the rising scarcitypremia on imported goods." Powers and Sicat, op. cit. p. 93.
2/ The declines also occurred in most regions of the country, according toAnnex Table 5. While this Table is for the period 1973-76, note that
there were also large declines in real wages between 1973 and 1974
(Figures 1, 2 and 3),
3/ Lal, op. cit., p. 114 et, seq. It should be added that "this was a periodof great instability in the economic environment. A substantial surplusin the trade balance ..... (followed).... the upsurge of internationalprices of primary commodities (in 1973) .... (and which was then) .....completely negated by the sharp increase in the import bill for crude oilBautista and Powers (1979) op. cit. p. 22.
- 199 -
of - and cause a permanent shift of resources towards - the mora capital
1/intensive traded goods sectors, Finally, although agriculture was
by then receiving higher priority, the programs had yet to have a major
effect, and were in addition set back by crop diseases and floods in2/
1972 and 1973.
7.16 (5) 1974-78. Since 1974 the declines in real wages appear to have
bottomed out in the non-agricultural sectors (Figures 1, 2 and 3), but to
have risen significantly in agriculture for the first time in over 20 years
3/(Figure 2);;- there was also an increase in agricultural wages relative to
those for industrial labor in Manila (Figure 4).- In the '70s, and
particularly since 1974, output in foodgrains has also rise at historically
high rates, following the introduction of the agricultural development
programs mentioned in chapter 6.- Given the importance of this crop in
the country, it is possible that this has had a significant effect on raising
the demand for - and thus the wages of - both farm and non-farm labor in the
1/ In 1972-74 the effect of holding the exchange rate constant was anunambigious rise in the relative prices of traded goods. In 1969 theevents were more complicated. According to Lal (p. 111 et. seq.)excessive Government spending caused a rise in domestic expenditures onnon-traded and traded goods; a rise in the relative prices of non-traded
goods; and a balance of payments deficit. Rather than restore thetrade balance and relative prices through a period of deflation andmild devaluation, the Government devalued by over 40%, actually resultingin a larger share of investable resources being allocated to the (morecapital intensive) traded goods sectors than previously. Inflationfollowed, real wages declined as did labors' share in value added inmanufacturing (which was 23% in 1969, and 15% in 1974, according to the
establishment surveys). The redistribution of income that took placeintensive sectors) presumably further reinforced the shifts in productionthrough a redistribution of consumption patterns.
2/ See Chapter VI, Figures 1 and 2.
3/ There were some slight rises in 1959, 1961, 1969, 1970 and 1973.
4/ John Powers pointed out again that the comparisons may be distorted
depending on how wage supplements were treated in the series.
5/ See Figures 1 and 2 of that Chapter and the accompanying discussion.

- 200 -
1955 350 1954 1958 1=72 1976300.0 3001.0
275.0 - 275.
250.0 - eSKILLED L.IMANILA 250.0- -UNSr L LED LS .M N! LP
-RGR . LRS .
LLj 2 2 5.0 225.0
200 .0 200,0
17s - - 175.0
LLJ10.0 -
10.0
25.0 25.0Ls -355 19
000 - 100.0
75 .0 -* 7 .
50.0 -50.0
21.0 5 10S 1354 10SS 1972 1975 2.

- 201 -
provinces. Finally, although the structure of protettion did not change signif-
icantly in this period (though changes towards a less-protective policy are now
being considered), large scale manufacturing was relatively a larger
source of employment than previously, and its continued expansion was
probably having a greater influence on the labor markets.
7.17 The above explanation of wage movements obviously rests
on the assumption of a competitive labor market, in which any differences
between labor demand and supply are eliminated by changes in the
wage levels; this assumption applies both to individual sectors (wage
relativities) and to the sectors in aggregate (wage levels). These2/
assumptions have been investigated elsewhere and hold up to
scrutiny. There is, for instance, no evidence of institutional, technological
or geographic constraints on the labor market which seriously
affect occupational mobility. Minimum wage legislation has probably only
a slight effect on ths labor market (and then only on a small number of
large firms); minimum wages have generally followed rather than led actual3/
wages in the past 30 years, and small firms registered with NACIDA are
exempted from paying minimum wages under the Labor Laws.
Earnings in Self Employment
7.18 The general declines in real wages over the period since the
mid '1950s do not provide a wholly satisfactory picture of what happened
1/ In 1976 it accounted for over 35% of employment in manufacturing.
2/ See Lal's review and also Castillo (1976).
3/ See Annex Table 7, and also the ILO (1974) report for a furtherdiscussion.

- 202 -
to the earnings of the labor force since the majority (approximately
60% in 1976) are self-employed or family workers. Table 7.4 provides
some statistics. Approximately 85% of the labor force in agriculture
were self-employed in 1976, 33% in manufacturing and 60% in commerce.
Three categories of self-employed workers will be considered below:
owners of very small manufacturing establishments with less than 10
workers, small farmers, and people in household manufacturing.
7.19 Owner's earnings in very small manufacturing establishments
were more stable than real wages and might even have increased in the
'70s when the latter were falling. Table 7.5 compares some estimates of
owners' earnings per day with wages in different occupations:
Table 7.5: AVERAGE DAILY EARNINGS OF OWNERS OF VERY SMALL MANUFACTURINGESTABLISHMENTS AND WAGES IN SELECTED OCCUPATIONS, 1961-75
(Pesos/Day, 1972 Prices)
1961 1967 1972 1975
Manufacturing Establishmentswith less than 10 workers (whole country)
Owners' Share of Daily Value Added 18.4 19.2 15.3 17.2Ditto - Per Family Worker (incl. Owner) 12.2 11.9 8.8 12.5Average Wage of Hired Labor 5.9 5.1 5.3 4.1
Selected Occunations in Manila (large industrial establishments)
Industrial Labor 11.3 10.8 10.4 7.6Mechanics 11.4 15.3 14.0 10.6Foremen 24.2 20.9 18.3 14.3
Agricultural Labor 6.1 5.4 4.0 4.0
Sources and Basis of Estimates: See Annex Table 8 for ManufacturingEstablishments, and Annex Tables 2 and 3 for other occupations.
1/ For brevity, family workers will also be referred to as being self-employed.

- 203 -
Table 7,4; EMPLOYMENT OF SELF-EMPLOYED AND WAGE
AND SALARIED WORKERS, 1965-76
No. Employed, 000s Change, 1965-76 Percent Distribution
Type of Work 1965 1976 000s % Total 1965 1976
Wage and Salary work in:
Agriculture 906 1,287 381 7 9 8
Manufacturing 593 1,106 513 10 6 7
Commerce 287 553 266 5 3 4
All Other 1,896 3,429 1,533 29 19 22
3,682 6,375 2,693 51 36 41
Self-Employed and Family Workers in:
Agriculture 4,818 6,822 2,004 38 48 44
Manufacturing 507 572 65 1 5 4
Commerce 827 1,304 477 9 8 8All Other 267 354 87 2 3 2
6,419 9,052 2,633 49 64 59
Total 10,101 15,427 5,326 100 100 100
Source: NCSO Surveys of Households (October 1965 and August 1976).

- 204 -
One can see that the earnings rates in self employment have risen
significantly above those even for the higher paid forms of industrial
labor (such as industrial foremen) in Manila. This profit incentive
helps to explain the rapid emergence of small establishments throughout
the country since the mid '1960s (see chapters 5 and 6) and why some
people have moved out of wage employment to set up their own firms (see
interview data in Chapter 5).
7.20 Turning to small farmers the only time series data available are
those of the Family Income and Expenditure Surveys (FIES) of the NCSO, which
since 1956 have been conducted about every five years. These data, which-
are reproduced in their raw state in Annex Tables 9 and 10 have quite
wide (if quantitatively unknown) confidence intervals because of changes in
sampling and questioning procedures between surveys; measurement errors
were also large, and family incomes were underl/ a ne-reported more in .some. years than
in others. But from the perspective of the present study, one relatively
non-controversial conclusion can be drawn. This is that the capital intensive
development path of the economy did not act to increase unemployment rates
among the self employed in agriculture, but as with wage labor, to depress
earnings. The majority of families in the lowest quintiles in 1971 were
self-employed in agriculture: 61.7% in the lowest quintile, 50.2% in the
second lvwest and 42.1% in the middle quintile (Table 7.6). Up to 1970 it is
difficult to tell whether incomes rose or fell for these groups, but in either2/
event, they remained at very low levels. In the 1970s the NCSOs surveys
(FIES) suggest a marked increase in income of about 30-50% for the lowest
two quintiles (Annex Table 10); this could either be a measurement
1/ See Berry (1979), Mangahas and Barros (1979) and IBRD's(980)' draft on"Poverty, Basic Needs and Employment."
2/ Berry (1979) and IBRD (1980). Recalling that the majority in thesegroups are small farmers, roughly constant real incomes in this period wouldalso be consistent with roughly constant (or slight increases) in laborproductivities (Annex Table 6). In the 1950s value added in agriculture keptpace with the growth of the labor force through land expansion and in the1960s through increases in yields. ILO (1974, pp. 442 et, seq.)

- 205 -
Table 7.6: MAIN SOURCE OF FAMILY INCOME BY FAMILY INCOME
GROUP AND TYPE OF EMPLOYMENT, 1971
Type of Employment of Main Source of Income
Wages & Salaries Entrepreneurial Activity inFamily Income o Agri-.' Non Agri- Trading & Manufac- Agric- Other /1
Group cultural cultural Transport turing culture Sources- Total--
....... .......... No. of Families, 000s .........................
Lowest 20% 138 133 79 44 784 90 1,270Second 20% 158 263 99 40 637 72 1,270Third 20% 194 333 101 41 535 66 1,270Fourth 20% 136 595 129 36 326 47 1,270Top 20% 54 725 176 36 174 106 1,7Total 680 2,050 584 197 2,456 381 6,350
................. Percent Distribution............................
Lowest 20% 20.3 6.5 13.5 22.3 31.9 23.6 20.0Second 20% 23.2 12.8 17.0 20.3 25.9 18.9 20.0Third 20% 28.5 16.2 17.3 20.8 21.8 17.3 20.0Fourth 20% 20.0 20.0 22.1 18.3 13.3 12.3 20.0Top 20% 7.9 35.0 30.1 18.3 7.1 27.8 20.0
100.0 100.0 100.0 100.0 100.0 100.0 100.0
........ ....... Horizontal Percentages...........................
Lowest 20% 10.9 10.5 6.2 3.5 61.7 7.1 122.3Second 20% 12.4 20.7 7.8 3.1 50.2 5.7 100.0Third 20% 15.3 26.2 8.0 3.2 42.1 5.2 100.0Fourth 20% 10.7 46.9 10.2 2.8 25.7 3.7 100.0Top 20% 4.3 57.1 13.9 2.8 13.7 8.3 100.0Total 10.7 32.3 9.2 3.1 38.7 6.0 100.0
fl Includes incomes from ownership of land or capital, and from gifts and income
transfers.
/2 Rounded
Source: NCSO, Family Income and Expenditure Survey. See Annex Table9 for an urban-rural breakdown.

- 206 -
error or the first positive signs of a favorable impact on rural incomes
of the new emphasis on agricultural development, but is probably a combination1/
of the two. The increasesin the rate of growth of output and yields
in food grains support the last view; there is also some circumstantial
evidence for it (see Chapter 6) in that the emergence of establishment-
based manufacturing in the provinces, the corresponding decline of household
manufacturing, and the growth of commerce in the rural towns in the late
60s and 70s could not have occurred without some lead from agriculture.
1/ Although there is no shortage of criticism in the studies cited ofthe unreliability of the FIES income data (and in particular of the1975 surveys) the data in fact square quite well with the wage seriesdiscussed earlier. The following list converts the 1975 income datafor each quintile into a daily earnings rate by dividing by 300 workingdays per year, and then provides some examples of types of wage-earnerswhose families (if they were the family head) would fall into thesegroups:
qunitile Mean 1975 income (1972 prices) Corresponds to (Examples)
Lowest 20% P 1,141 = P 3.8/day Agricultural Labor (Annex Table 3).Second 20% P 1,951 = R 6.5/day Unskilled industrial Labor
(Annex Table 2)Third 20% P 2,707 = P 9,0/day Various categories of skilled
industrial labor in Manila(Annex Table 2).
Fourth 20% P 4,000 = P 13.3/day Industrial formen (Annex Table 2);lower end of earnings from self-employment in manufacturing(Table 7.5).
Top 20% P 11,240 = P 37.5/day* White Collar and property owners.
(*Mangahas and Barros (1979) rightly point out that, as in previous surveysincomes in the top quintile have been particularly susceptible to under-reporting.) Similar cross-checks on wages and the 1970 FIES income dataare provided in Annex Table 15 (source note (b), third paragraph), again withno marked anomalies between the two sources being apparent.

- 207 -
7.21 The effects of the economic events described above on
families primarily dependent on self-employment in household manufacturing
are more mixed, since these families are found in all income groups,1/
low, medium and high. To make a general point again, however, it was
incomes (rather than unemployment levels) in these activities that were most
effected by the pattern of investment in the country. A large proportion
of household manufacturing activities are rural (Annex Table 9) where the
incomes are dependent on the markets generated by agriculture; others
are tied to low income markets in the urban informal sector, and indeed
are part of it; while a not insignificant number later emerge as establishment-
based manufacturing units (Chapter 5 and 6) in the high growth markets.
Incomes and Occupational Mobility
7.22 Changes in the incomes of the labor force can be considered in
two parts; changes in wages and earnings within given occupations, and which
were discussed above; and others-arising from the movement of labor, during periods
of marked structural change, towards better paying occupations. The latter
are discussed briefly below, and serve to highlight the kinds of activities
that should or should not be considered for finance under the small enterprise
program if it is to effect an improvement in earnings opportunities. It
1/ See Table 7.6 which shows that in 1971 there were 36 thousand families inthe top quintile primarily dependent on entrepreneurial activity inmanufacturing, and another 36 thousand in the second-top quintile. Therewere, at that time, less than 60 thousand manufacturing establishments inthe country, implying that at least 12 thousand families primarily dependenton'household manufacturing were in these quintiles.
2/ The movement helps to explain the paradox of incomes not necessarilydeclining, and possibly increasing in recent years, in the presence ofthe significant declines in real wages - though changes in the earnings inself-employment must provide most of the explanation. See also Berry(1979) for a discussion of wages and incomes up to 1970.

- 208 -
is convenient to consider the movements themselves in two parts:
i.e., movements (i) of the self-employed into better paid forms of wage
employment or self-employment elsewhere; and (ii) of wage labor into better
paid forms of wage employment.
7.23 The extent of the former is indicated in Annex Table 11
(bottom three rows) for the period 1965-76. Over this period the share of the
labor force in wage and salary work rose by 6.2% in absolute terms (from
40.6 to 46.8%) and in self-employment in the tertiary sectors by 1.4% In
self employment in manufacturing there was a slight decline of 1.2%, mostly
on account of people leaving household manufacturing, and in self-employment
in agriculture a decline of 6.4%. As one might expect, a comparison of
these shifts with the income distribution data shown in Table 7.6 reveals
that they were greater the greater the likelihood of an income increase:
Absoluta Change in Income Distribution ofType of Occupation Share of Labor Force Occupational Group
(Table 7.6)
Wage or Salaried Work + 6.2 Strong upwards skewSelf-Employed
Trading and Transport + 1.4 Skewed upwards- Manufacturing - 1.2 Fairly Flat- Agriculture - 6.4 Strong downwards skew
0.0
7.24 It is possible to project these changes on the income distribution
data shown in Table 7.6 to estimate, holding other things constant, their effects
on incomes. Briefly, the distribution of incomes for the whole labor force
is a weighted average of the distributions for its occupational groups, in
1/ A third part is the movement of wage-earners back into self-employment,and which was briefly discussed above.

- 209 -
the present case wage and salary earners and three categories of
self-employed workers (in agriculture, manufacturing and commerce); the weights
are then changed to reflect the occupational shifts, holding the componentl/
distributions constant. The calculation is provided in Annex Table 11,
and shows that the approximate effects of these shifts (other things
constant) would be to have raised the average income of all families in
the bottom two quintiles by about 9% over the period, and the average2/
incomes of those families who actually moved by about 56%.
7.25 A comparable calculation for the effects of occupational shifts
of wage labor is only possible for the period 1960-70 (at least until the
1975 establishment census becomes available). Annex Table 12 shows the
changing shares of employment for the various categories of skilled and
unskilled labor. The share of wage labor in agriculture declined by one
third, from 32 to 21%; in household manufacturing (where one in four workers
are hired) by one sixth; and remained stationary or declined very
slightly in domestic services. These are all among the lowest paid forms
of wage labor. In the higher wage occupation the shares increased: in large
and small production establishments, sales work, land transport and in the
hotel, restaurant, service and other trades. The same table shows wages in the
higher paying occupations to vary between two to four times above those in
lower paying ones. The effects on average wages can then be divided into a
change due to the decline in real wages, and a change due to the increase in the
1/ If the shares of the four occupational groups are S ... S 4, (ESi=1) andthe distribution vectors are CD ) .... CD4), then tke aggregate distributionvector is CD) = S (D1) + S2 (D2) + S3CD3 ) + S 4 CD 4 ). The values of S .... Sfare then changed to get the new CD).
2/ See supplementary calculations (Z and (3) in the Table.
3/ Professional administrative and clerical workers are excluded from the analysissince the intention is to examine income changes in the lower quintiles.

- 210 -
1/shares in higher wage occupations. The calculations are made in
Annex Table 13, which suggests that the latter offset about 80% of the
2/declines in real wages in the 1960s. Had of course the labor demand
conditions been such as to raise real wage levels, the occupational
shifts (which in those circumstances could well have been greater) would
have acted to increase incomes yet further, as opposed to simply having a
mitigating effect on the adverse consequences of declining real wages.
7.26 To sum up the discussion so far, the economy has been able
to absorb its rapidly growing labor force, but the labor demand conditions
resulting from a capital intensive development path have exerted a downward
pressure both on real wages and on earnings in self-employment. But analysis
of occupational structure shows a continual movement of labor out of ill-paying
to better paying forms of wage and self-employment. This movement has been shown
to have a significant effect on both the level and the distribution of incomes,
though the effect cannot be quatified precisely over the period 1960-76.
Implications for the Small Enterprise Programs
7,27 It follows that the program should be seen as an agent of
structural change, by encouraging activities that offer prospects of a real
increase in incomes and by drawing people out of ill-paying ones that do not,
If If W. is the wage in occupation i and S. the share of the total laborZ
force employed in wage labor, then the change in average wages in the
presence of a change in wages 6Wi and a change in shares ASi is
approximately (AW .S + Wi AS ) This is the calculation made in
Annex Table 12.
2/ 80% = 0.7/0,9, referring to columns CA) and (5) of the table. In the
1970s, the more rapid declines in real wages were probably not offset
to the same extent by occupational shifts.

- 211 -
This is different to seeing its purpose as being one of creating labor
intensive employment, which is essentially neutral as to income effects.
The pace of structural change, and the wages and incomes of those employed
or seeking employment in small enterprises, are obviously determined
more by leading sector policies than by investments made directly through
the program. But this does not imply that the program is in any way a
second best measure (in the economists sense of the term) since as noted
earlier it is in,-ended to serve a complementary purpose by addressing
constraints in the supply of capital and institutional services to small
enterprises. These constraints are likely to exist whatever the leading
sector policies, and also under a more efficient incentives system in the
financial sector. What is implied is that the more efficient the leading
sector policies, the greater the benefits of the program are likely to
be in terms of its capacity to raise incomes. A more efficient system
of industrial incentives is likely to encourage the growth of the more labor
demanding industrial sectors and favor a greater investment in agriculture.
Both can be expected to bring about a more rapid emergence and growth of
small and large enterprises in the Philippines at the present time on account
of their influence on the domestic product markets. Additional financial,
institutional and infrastructural support for a broad based growth of
agriculture can be expected to have the same effect, particularly in the
provinces; there is indeed some evidence that this is happening already.

- 212 -
7.28 What is a suitable criterion for financing or otherwise
supporting small enterprise projects? An obvious one is to accept only
those projects with a demonstrated potential to generate income sufficient
to pay labor after all other costs have been met. That is:
Present worth of sales' less material and capital costs > 1Present worth of labors' earnings
This is of course exactly equivalent to using the rate of return on capital
1/ 2/as a criterien, or more simply to saying that the project should be profitable:
Present worth of sales less material, capital and > 0labor costs
So at least from the viewpoint of the extensionists and the financial
institutions they are doing the right thing in financing only profitable projects.
7.29 From the viewpoint of the Government agencies, however, it is
natural to inquire if following a purely financial criterion - profits -
does not lead to some conflict with the economic aims of the program. Should
weight be given to certain types of projects, for instance, over and above
financial considerations? The short answer is that chere are now standard
ways of adjusting the above criterion by using shadow prices and shadow wages
instead of actual prices and wages when making the calculations. These are
discussed further in the next chapter in the context of the Philippines' small
enterprise programs, Shadow wagesare probably not very different from actual
1/ If S represents annual sales, and M, WL) and K respectively representmaterials, labor and capital costs (W=wages, L=employ-ment), then if A(r) isthe annuity rate this criterion is
S - M - (WL) - A(r) K > 0
assuming for simplicity a constant time stream for each variable. If this isset as an equality, the rate of return is derived from:
A r) = (S - M - (WL)YK
where/ is the rate of return. The first criterion mentioned above is
(S - M - A(r)K)/(WL) > 1.
2/ Where no incremental employment is involved, either this or the rate ofreturn criterion would have to be used.

- 213 -
wages, on account of the lack of constraints in the labor market;
but the shadow prices of products, materials and capital inputs may
differ substantially from actual prices on account of the present
structure of industrial incentives.
7.30 To elaborate on the point about shadow wages, if people are
to move into wage employment in(say) a project financed by the program,
the actual wages offered should
(a) be better than wages or earnings in
alternative occupations, and
(b) include a sufficient financial incentive to
cover the transport, resettling and any other extra
personal costs anticipated by the employee.
The sum of these two terms gives the social opportunity cost of labor
(or the shadow wage rate), and equals actual wages unless there are any
marked inefficiencies in the labor market. Where inefficiencies do exist
1/it is necessary to estimate (a) and (b) from survey data or other sources
to determine whether a project is likely to improve earnings opportunities
or not. At the present time in the Philippines wages probably do reflect
(a) and (b), at least to a good approximation, and the employment issue
in the country arises not from inefficiencies in the labor market, but from
an insufficient number of employment opportunities in the better income
occupations. It is the provision of such opportunities that should form
the central task of employment policy, of which the small enterprise
program is a part. The merit of the profitability criterion stated
above it that it proviles a strict test of whether the project in question
1/ E,q, on the lines recommended by Little and Mirlees.

-214-
is in practice capable of raising incomes.
7.31 It would obviously be impractical to apply shadow prices to
each project financed by the program, and also unnecessary. There
are too many judgements and interpretations required for shadow prices
to be applied reliably by extensionists and bank appraisers;
in addition, the financial profitability of the projects is unavoidably
the over-riding consideration of the enterprises and the financial
institutions. But shadow prices could be applied to samples of projects
by the research or evaluation groups of the agencies involved: e.g.
to provide guidance on which kinds of activities might be supported,
establish sector priorities, decide whether and in which ways the program
might be expanded or contracted, or (a more general point) provide an
empirical base for industry studies. If such studies are done, they are
perhaps better done ex post than ex ante since, first, the data used would
be more reliable and objective, and, second, they would provide feedback
on the progress of the program and problems encountered. Ex post evaluation
(like monitoring surveys) is now a common feature of many types of
development programs on account of the uncertainties about the design of
the programs and the lack of information about the intended beneficiaries -
both of which are also apparent in small enterprise programs.
7.32 What kinds of projects are likely to meet the above criterion?
Most frequently, they would be in types of activities in which the demand
for labor is rising, as with sectors having a large number of expanding
enterprises. Second, projects offering prospects for acquiring new or
upgrading existing skills in various wayssince these are exhibiting rising

-215-
shares in industrial employment and succeed in attracting labor on
account of the higher wage levels. Conversely, the more marginal
of the household and very small scale manufacturing activities wouldl/
not meet the criterion. Finally, projects that do not necessarily
lead to a direct increase of employment in the enterprise would also meet
the criterion, provided a net income gain is involved; working capital
loans are often a good example here (though sometimes these are associated2/
with an employment increase), but certain types of investment projects
to enhance the efficiency of a business in various ways could meet it also.
Indeed, projects with infinite incremental capital-labor ratios are not
ruled out by the criterion.
Labor Intensity in Small Enterprises
7.33 Since investment in small enterprises was seen as a way of raising
the average labor intensity in industry, it might be useful to examine the
implications of this last point further; namely,,why projects with large
or infinite incremental capital-labor ratios are often desirable and why
others with very low ratios often are not. This will serve to make the
general point that what is required at the present time is an increase
of labor intensity across the board in industry, in both capital and labor
intensive sectors, to levels commensurate with the relative opportunity
costs of capital and labor.
1/ Given the large number and heterogeneity of household and very smallscale manufacturing activities, a heavy reliance must be placed onthe screening procedures of the institutions to determine in any givencase whether a proposal offers prospects for an earnings increase.
2/ See Chapter 4, para 4.24,

- 216 -
7.34 To begin with, the overall labor intensity of small industry
in the Philippines, as in other countries, is greater than it is in large
industry (Table 7.7):
Table 7,7: CAPITAL LABOR RATIOS IN PHILIPPINE
MANUFACTURING BY SIZE OF ESTABLISHMENT, 1974
Size of Capital Labor Ratio, Relative Capital-Labor
Establishment P OOOs/Worker Ratio (Largest = 100)
Household Manufacturing 1.4
5 - 19 Workers 4.7 1820 - 49 8.7 3450 - 99 15.2 59
100 - 199 19.7 76
200 or over 25.8 100
Source: NCSO Establishment Surveys and NACIDA (1977) for households
(the NACIDA figures are those shown in Table 5.11 in Chapter 5,
and converted to 1974 prices).
The data shown are for book values of fixed assets and are subject to the
usual problems of definition and measurement. Even allowing for these
uncertainties,however, it is clear that in aggregate the smaller the
scale of industrial activity the less its capital intensity. Hence
the small enterprise program is likely to be associated with a more labor
intensive class of industrial enterprises; and, insofar as it facilitates
a greater level of investment in them than otherwise would occur, it
is likely to raise the average labor intensity of industry. Beyond this
general point, however, there are several doubts about using labor intensity
as an investment criterion and further, even within the range of services
provided by the program1, several other actions are merited to raise labor
intensity in industry. Five doubts will be raised below though the list
could be longer.

- 217 -
(1) The evidence is not conclusive that small industries
are more labor intensive across sectors than large industries. Some data on
this point are presented in Annex Table 16. They are at the two digit level,
indicate average book values of fixed assets, and are not available for
establishments with less than 20 workers. Such shortcomings naturally limit
what can be said, but the conclusions to be drawn are strikingly similar to1/
those derived from better data for other countries. In aggregate the capital
labor ratio follows the familiar pattern just noted of rising with scale.
But for individual sectors it is different, and almost always varies
erratically; in some sectors it rises (e.g. foods, paper, chemicals, basic
metals, transport equipment) and in others it is more or less constant or
falls (e.g. textiles, clothing, wood, furniture, rubber, electrical
machinery). Thus to encourage investment in small industries in some
sectors may well raise the average capital intensity of industry. For
reasons to be discussed below this is not necessarily objectionable from
an economic point of view, but it does cast doubt on the assumption that
by increasing investment in small scale one is necessarily raising labor
intensity. One reason for the higher aggregate capital intensity of large
scale is that large scale manufacturing is frequently in sectors with
intrinsically high capital intensities (e.g. petr6leum and coal products,
basic metals, non metalic minerals and pulp and paper). If one excludes
these from the aggregate data on the grounds that there is little choice
between large and small scale production (and thus a comparison of K-L
ratios is not helpful) the average ratio for industry rises only slightly
with scale (Annex Table 16).
1/ Sam, P. S. Ho, "Small Scale Industries in Two Rapidly Growing Less DevelopedCountries: Korea and Taiwan - A Study of Their Characteristics, CompetitiveBases, and Productivity," Employment & Rural Development Division PaperNo.53, December 1978. A. Berry and A. Pinell-Siles, "Small-Scale Enterprises(SSEs) in Colombia: A Case Study", Employment & Rural Development DivisionPaper No.56, July 1979.

- 218 -
(2) The ratio varies greatly between sectors, and a
different criterion would be needed in principle for every sector.
In Annex Table 16 no two sectors have the same ratio and the most
capital intensive sector has 80 times the c.apital intensity of the least.
The variance is greater if sectors are examined in more detail since
the data in the table are two-digit group averages.
(3) The ratio can be expected to vary over time and by region
with changes in real wages. If the purpose of development policy is to
achieve a rise in labor productivities and incomes, this will require an
increase of machinery and equipment at the workers' disposal and, unless
prices of capital goods fall commensurately, an increase of capital
intensity. More generally there is an optimum ("appropriate") ratio for
each enterprise corresponding to local wages at the time of investment,
and to the current cost of capital; it is functionally related to (wages)/
(costs of capital) and rises as real wages rise. One would therefore
need to undertake industry studies regularly to determine what might be the
appropriate ratio at a particular point in time and for each region.
1/ If there is a continuous range of techniques available for a particular
industry, then the optimum ratio is (K/L) = a(w/r)b,where a is a constant,
b the elasticity of substitution between capital and labor, w wages and r
the cost of capital services. If b = 0 (i.e. no substitution is possible),
(K/L) = a and is independent of the relative costs of labor or capital.
But most industries have a range of alternatives, particularly w.hen one
considers the extent to which second hand equipment embodying older
technologies is available (c.f. the interview results presented in
Chapter 5). In some cases unly discrete alternatives are available,
while in others they may be increased in number by invention or
adaptation. The optimising criterion then becomes more complicated, as
it does with a multi-period optimising model with inherited capital
stock. But the point that the optimum, or "appropriate," ratio varies
with wages remains.

- 219 -
(4) Some of the most labor intensive projects are also the
most impoverished and offer no prospects for raising incomes. Examples
are the more marginal household manufacturing activities; to channel
resources to them is likely to perpetuate an already low income
activity and waste the investment. The capital-labor ratio, in providing
no information about earnings, may thus lead to socially and economically
undesirable projects being financed. The merit of the financial and
economic criteria discussed above is that they favor only those projects
that offer prospects of a real income gain.
(5) Finally, it is often desirable to finance projects with.
large or even infinite incremental capital-labor ratios. Examples are
trade credits which may expand earnings without necessarily increasing
employment directly. Investments to upgrade working facilities or
machinery and equipment may have this feature too.
The Demand for Labor in General
7.35 While labor intensity (or its inverse, the capital-labor ratio)
is not very reliable as an investment criterion there are both distributional
and efficiency grounds for raising the overall labor intensity of industrial
investment in the Philippines at the present time. First consider
distribution.
7.36 A greater demand for labor would act to raise real wages and
labor's share in value added. The distributional benefits of this may
often merit the finance of "excessively" labor intensive projects;
i.e. projects employing more labor than a strict analysis of the
opportunity costs of labor and capital might suggest. To allow for such
alternatives in a consistent manner, various studies have proposed that

- 22V -
the income streams of projects should be weighted according to the1/
income groups affected. (Under this procedure the optimal capital-
labor ratio is no longer a function of wages divided by capital costs,
but of wages weighted according to income group divided by capital
costs.) Thus the methods proposed turn out to be a modification of the
profitability criterion stated above.
7.36 The weighting of incomes according to these methods remains
controversial on account of the difficulties in choosing weights. It
is also an unsatisfactory substitute for direct incentives to raise the
labor intensity of industry directly, most of which can also be justified
on efficiency as well as distributional grounds. The various incentives2/
available are familiar and have been examined in several studies.
They includee (i) a restructuring ot tariffs and of the investment and
export incentives, and which could be expected to favor a greater share
of investment in the more labor intensive sectors of the economy, both
industrial and non-industrial; (ii) cost reflecting interest rates
for industrial loans and; (iii) subsidies or tax exemptions on labor costs.
Of these, only the third item has not received the attention it merits
in the Philippines. It is evidently a redistributive device that could
be used to offset losses that might follow a removal of current subsidies
and tax exemptions on capital costs. Subsidies on tax exemptions on
incremental rather than total employment are often regarded as a stronger
incentive, and could be applied to new investments financed during the
year. Administrative difficulties would necessarily limit the device to
medium and large industries, but it has great appeal nevertheless.
1/ Little-Mirrlees (1975) and Squire van der Tak (1977).
2/ Cited and discussed in Chapters V and VI above and in the discussion onwage trends and relativities in this Chapter. Note that the increasedemphasis on broad-based agricultural growth discussed in Chapter VI isalso likely to raise industrial labor intensity indirectly by changingaggregate consumption patterns towards the products of the more labor-intensive manufacturing and tertiary sectors.

- 221 -
7.37 There are also institutional measures that can be used to1/
encourage more labor intensive investment. These include the use
of the extension services, the vocational training programs and the
specialized trading and industrial associations to inform manufacturers
about the more labor intensive investment alternatives that are available.
Finally, there is the role of the research associations in identifying
or modifying existing technologies in ways more suited to the current2/
costs of labor and capital.
Conclusions
7.38 Relative price movements in the Philippines brought about
by a combination of industrial incentives and macro-economic management
policies have consistently drawn investment into the capital intensive
sectors of the economy and lowered the overall demand for labor in the
country. But the consequence was to depress real wages and also real earnings
in'certain types of self employment (principally in agriculture); un and
under employment rates actually fell to modest levels. Occupational shifts
of the labor force out of ill-paid employment have been extensive, and
to some extent have offset adverse effects of these trends on incomes. More
recently, the increased growth rate of yields in food grains appear to have had a
favorable effect on incomaes from farm and non-farm employment in the provinces.
1/ A recent empirical study entitled "Choi,:e of ::hnology in Low gagecountries; A non-Neoclassical Approach", by 'ecraw also emphasizes theimportance of non-price as well as price measures. QJE November 1979
Vol. 373.
2/ The qualification here is that the aim should be to identify technologies
to minimize capital plus materials plus labor costs, not the ratio K/L.

- 222 -
7.39 The implication of these various trends and changes is that
the program should continue to address itself to projects that offer
prospects of an income gain over other forms of employment that are
available. This translates quite simply into the conclusion that only
financially and socially profitable projects should be financed. Yet,
however platitudiuous this may seem, it does suggest some points of
departure for the future of the program, and which were discussed in
Chapters 2, 3 and 4. For instance, projects having large incrementv-1
capital-labor ratios would be desirable if they raised incomes, as with
working capital finance (though in practice this is often associated with
a direct employment effect) and investments intended to improve the efficiency
of or the labor productivity in an enterprise.
7.40 Labor intensity as an investment or appraisal criterion was
rejected on these and other grounds: it is essentially neutral with respect
to incomes, and is too often associated with the most impoverished activities
offering no prospects of an income gain. In addition, there is the
practical complication it it varies greatly between sectors, and
between regions and over time as real wages change. But raising the current
labor intensity of investments in the Philippines, to levels commensurate
with the relative social opportunity costs of labor and capital, remains
enormously important for the welfare of the labor force. The conclusion
in this report is that labor intensity needs to be raised all round: in small
and large scale, in most industries and in all regions. The measures
available have been examined in several studies and are now familiar:

- 223 -
a restructuring of industrial incentives, tax exemptions or subsidies
on labor costs in industry, and a continued-perhaps greater-emphasis
on rural-led growth. On the institutional side, the Government's extension
and training programs, and the specialized industrial and trading
associations, could be effective channels for identifying and disseminating
information about labor intensive investment alternatives. The 'appropriate'
investments, however, are those that minimize costs, not the capital-labor
ratio.

- 224 -
VIII. UNCERTAINTIES IN THE CAPITAL MARKETS, INTEREST RATESAND INVESTMENT CRITERIA
- A technical supplement to Chapters 2, 3, 4 and 7
Introduction
8.1 This chapter discusses interest rate policies and project
selection criteria in relation to small enterprise programs. On interest
rates the now standard argument is that administrative ceilings (in the
Philippines as in most other countries) prevent the rates from rising
to risk and cost-reflecting levels; lending is thus unprofitable and
does not take place. While it is difficult to disagree with this,
analysis of uncertainties in capital markets shows that removal, of the
ceilings is not a sufficient condition for lending to take place, even
to large numbers of would-be borrowers with efficient and financially
sound projects, and with every intention of repaying the loans. The
initial magnitude of the risks in developing lending programs to small
enterprises are extra-ordinarily high, while the long-run returns may
be in dispute; high cost and risk reflecting rates, assuming they were
politically acceptable, raise project risks yet further and may extinguish
any institutional interest in the market or prevent it from becoming
established. Further, the risks are high because potentially "good"
borrowers are indistinguishable from "bad" borrowers, Since both
must be charged the same rate, the former are frequently driven out
of the market by the latter, or must substantially reduce their1/
investment, with a loss of economic efficiency.
Or as Rotschild and Stiglitz (1976) note: "high risk individualscause an externality: the low-risk individuals are worse off than
they would be in the absence of high risk individuals" (p.629).

- 225 -
8.2 These arguments are familiar from the literature on
uncertianty in capital markets, most notably in the market for "lemons"
paper by Akerlof (1970), the readings edited by Diamond and Rothschild
(1978) and the recent work of Stiglitz and Weiss (1979 and 1980) and1/
others that will be cited, Most of these papers are concerned with
the behavior of capital markets under uncertainty rather than with reaching
normative conclusions'on interest rates, government financing and risk-
guarantee schemes, which is the purpose of the discussion below, The
evidence in Chapters 2 and 3 showed that both risks and administrative
costs decline over time at a rate depending on an institution's response
to risk and also on the accumulation of information and experience within
the institution. That is, there is "learning by doing" of the kind
discussed by Arrow (1965),and economies of scale,each requiring a forward
looking view of interest rate policies. Optimal interest rates are derived
below first from a financial and then from an economic perspective, taking
into account the various constraints faced by the institutions;both converge
to the same result, with the "best" policy suggesting interest rate
levels sufficient to make lending profitable over the long-haul, but supporting the
idea of risk-sharing and direct financing to absorb the more-immediate losses,
(This is also the conclusion reached in Chapters 2 and 3.) Given the
importance of learning and economies of scale, it is not surprising that
the expected volume of business is a crucial factor in determining long-run
profitability, and thus the economic desireability of the programs.
1/ We are grateful to Noburu Kawai for bringing this literature to ourattention in his "Comment on the SSE Research Project,"October 22, 1979.Ofimeo), There are also some striking parallels between the analysisbelow and the analysis of risk in agricultural credit policies; seee.g. the paper by Lipton (1979), which I. J. Singh drew to our attention.

- 226
8.3 A discussion of these matters takes up the first half of
this chapter, which begins with an analysis of changing nature of risks.
The second half turns to project appraisal criteria, and has the following
aims: to show that Ci) the benefits of providing institutional finance
ought to be measured against those of its alternatives - own savings,
retained earnings, informal capital markets, trade credits or simply of
cutting back on investment; Cii) the net benefits can be estimated from
the rates of return to capital of the investments made possible by the
programs; and (iii) the rate of return is a rigorous criterion for steering
finance towards economically efficient projects offering more gainful
employment opportunities for the labor force. In connection with (iii)
there is a discussion on the correspondence between actual wages in the
labor markets faced by small enterprises in the Philippines, and the
opportunity costs of labor.
Uncertainties in the Capital Markets
8.4 Although risks and administrative costs change over time, it is
their initial magnitude - and of risks in particular - that inhibits lending
as much as any other factor. This is partly because ceilings on interest
rates contribute towards institutions planning for the short-run; but
given the even greater uncertainties about the demand for loans in the
long-run Cat least with respect to the demand from small enterprises) it
is possible that short-run considerations would still predominate, and it is useful
to consider this case first before examining the forward-looking case.
8.5 Initial Magnitude of the Risks. To begin with a simple aggregative
statement, let p be the probability of the principal and interest due
on the loans not being repaid, and Cl+r) the actual principal plus interest
outstanding per unit of principal. The fraction of principal and interest

- 227 -
likely to be recovered is C1-p)C1+r). Similarly let Cl+i) be the principal
and interest on raising resources, and 'a' the administrative costs of
handling the loans, each again being expressed per unit of principal.
Then for lending to be profitable it is necessary that:
(l-p) Cl+r) > (1+i) + a
or r > Ci+a+p)/(l-p) (1)
Note that p appe-rs in both the numerator and the denominator on the
RHS of (1) since the interest payments from the "good" accounts must
cover the lost principal in addition to the lost interest from the
"bad" accounts. The former are thus penalized twice. Putting some
numbers into this expression, i was about 16% for short term resources
in December 1979 (see Chapter 3) and of course would be higher for long-
term resources; 'a' would be about 4% but could be more or less depending
on the size and maturity of the loan and the familiarity of the bank
with the borrower. Hence the annuitised cost would be in excess of
A(20%) = 33% for borrowings of 5 year maturity. If one takes the
percentage of principal and interest outstanding that is in arrears
2/by more than 6 months to be a measure of p, then the initial value of
3/ 4
p would be in the range 0.3 to 0.5 or higher. Hence for term-lending to
1J Expressed on an annual basis, the above criterion is the same as
ACr) > A(ita)/(1-p), where A(r) and A(i+a) denotes the annuity rate,
and can be etimated from standard financial tables. (Here of course,
r and Ci+a) are interest rates.)
2/ Several banks reported that once a loan had been in arrears for more
than two quarters, it was extremely difficult to retrieve. It is
important to upot arrears problems very early,
3/ One private commercial bank reported bad debts on two thirds of its
portfolio in a private small loans program introduced in the mid'
1970s, and had consequently closed it down. This was, moreover, for
short-term loans.
4/ Taking loans of 5 year maturity.

- 228 -
be profitable in the early years, risk-reflecting annuity rates would
have to be in the range 33/(0.3 to 0.5) = 66 to 100%, implying interest
rates of 60 to 97% or higher - roughly three to five times the levels
required for loans to large borrowers.
8.6 In practice, interest rates in the Philippines (as in most
other countries) are prevented from rising to such levels by administrative
ceilings. Even without the ceilings, however, it is unlikely that the
banks and non-bank financial intermediaries woul" be prepared to charge very
high rates for small borzowers alone. Apart from fears of political
attack, there are grounds for believing that their willingness-to-lend
would decline as interest rates rose to high levels, and that the supply2/
curve may be backward sloping. First, the margins for contingency on
the borrowers' projects as planned would be greatly reduced, raising
doubts in the institutions about the capacity of small borrowers to
service debts. Second, related to this, is the argument of Stiglitz
and Weiss (1979) that higher interest rates may attract the riskier and
deter the more conservative borrowers, and induce others to undertake
yet riskier projects in the expectation of higher returns. That is,
while revenues per loan repaid rise with interest rates, the probability
of repayment decreases, and Stiglitz and Weiss argue that there is an
optimum interest rate which under plausible conditions can be below
the market clearing rate. Hence we are still left with credit rationing
and a system in which potentially "good" borrowers are driven out of the
market by the "lemons". Finally, the banks and non-bank financial
1 Note that this range is comparable to that often noted for loansin the informal sector.
2/ See also Jaffee and Russell (1976), who however argue that the existence
of credit rationing does not depend on the particular shape of the supplycurve.

- 229 -
intermediaries have to maintain a reputation for financial soundness,
and would not wish to report high risk elements in their portfolios
even if, on account of high interest rates, those elements were not
leading to a financial loss.
8.7 Hence a policy of simply letting interest rates float in and
of itself is unlikely to induce banks to lend to small businessmen out of
their own resources, except to a small and slowly growing minority
of good standing. This is the theoretical case for the risk-guarantee
schemes and direct financing by government banks discussed in Chapters
2 and 3; it is essentially to absorb the initial risks of financing
small enterprises until information and screening procedures have
been developed within the institutions, on the assumption that the programs
will be profitable over the long-run. Hence from a strictly economic
point of view, such schemes are merited only if
Ci) the risks are in fact reducible over time; and
(ii) the net present value of the expected returns,
once the reductions have been achieved, exceed
the net PV of losses during the adjustment period.
The latter presupposes a continuing volume of business from small enterprises
after the adjustment period. Consider these points further.
8.8 Changes in Risks and Administrative Costs Over Time. It is
convenient to consider the probability of loans not being repaid in two
parts:
1/ The growth of savings deposits throughout the country is probably
establishing the credit standing of an increasing number of firms.
The interviews in Chapter 5 revealed that several firms had establishedsavings deposits precisely for this purpose.

- 230 -
p= The probability of loans not being repaid from
known creditworthy borrowers; it would include
for instance losses due to uninsured personal
misfortunes (illness or injury, economic slumps etc)
plus an allowance for 'human errors' on the part
of branch staff and/or the borrowers on the viability
of the project being appraised.
p" = The probability of loans not being repaid from borrowers
whose credit-worthiness is unknown or is more difficult
to ascertain.
In other words p" represents the probability of financing "lemons" on
account of their not being distinguishable, when the programs begin,
from "good" borrowers whose real risks to the institution, were they
not otherwise confused with the former, would be closer to p'.
8.9 No institution of course expects to be free from the risks
represented by p'; but through a range of devices (collateral, diver-
sification of portfolios) and arrangements to check on credit-worthiness,
they are kept to low levels. To gauge from the percentages of bad debts
and loans in arrears on thei:r portfolios, private sector institutions
typically operate with a p' of around 2% (often less) for short-term loans,
and 3-4% for long term loans. The second category of risks are normally
avoided simply by not lending; in instances when it has been attempted,
as discussed in Chapter 2, they have been found to be alarmingly high
(10 or more times the level of p') even when the loans were fully
collateralized; the reaction, at least among private sector institutions,

- 231 - -
was to pull-out quickly. The questions to be discussed below are
thus: (i) is p" in fact reducible, and if so how is this accomplished
and over what length. of time? and (ii) under what conditions is it economically
desirable to incur the losses when p" is high in the expectation of longer
run benefits once it is low?
8.10 Similarly, the administrative costs can be divided into two
parts: a', to represent the administrative costs of dealing with borrowers
with established credit ratings, and who are both familiar with and to
the institution concerned; and a" the extra costs of dealing with new and
unfamiliar borrowers. The latter, like p", is expected to decline over
time as the volume of lending increases. The criterion (1) above is
then (ignoring the cross-product p'p" in the numerator):
r > i+a '+a"+p'4P" C2)cl-p') (l-p")
if lending is to be profitable at any point in time. (The multi-period
criterion will be considered shortly.)
8.11 Those who do not repay loans, except under the circumstances
discussed under p', vary greatly in competance and motivation. There
has beeen a tendency in the literature to classify them simply as "dishonest"
borrowers, though during interviews with borrowers themselves, or with
the branch staff of the banks who have made loans to them, it is apparent
that the degree of dishonesty varies greatly; furthermore, dishonesty is
not the most common cause of failure to repay. It is worth discussing this
point further since it helps to explain how institutions respond to the
risks faced, In particular, it is possible to classify those who do not
repay into four groups. First, of course, there are some borrowers, though
fortunately a small minority, who have no intention of repaying the loans
from the outset, and are correctly described as being dishonest. They
- 232 -
obtain the loans anticipating that foreclosure or making them repay will
be too troublesome or costly for the institution, or that repayments will
not be expected for reasons of collusion. This source or risk is reduced
by the development of internal control and credit checking procedures,
and the accumulation of knowledge among the staff in the branch networks
of the more t-ustworthy business people in the local communities. A
second and much more numerous type are those who are prepared to repay
provided the incentives to do so are sufficiently strong (the "honest if"
types). In the SMI program in the Philippines, there was a tendency
initially among many borrowers (of fully collateralized loans) not to
take repayment seriously, particularly when a large number of others
were known not to be doing so (the greater the number not repaying,
the greater the tendency for others not to repay). The reaction of
some institutions to this situation, as one manager put it, was to "flex
muscles", by threatening foreclosure, publicising cases under litigation,
mounting loan collection drives, and simply by visiting the borrowers
more frequently as part of supervision to instill an awareness among
them that they were being watched. Although effects of these measures
took some time, they were probably responsible for halving the arrears
levels over the first five years of the program. They also show that p"
is not independent of a" (nor is p' of a'), though it is not a simplel/
matter to decide how much administrative effort is required.
8.12 A commonly discussed incentive to be honest is the prospect
of subsequent loans, and is often thought to be an advantage of loans
for working capital over those for fixed capital. Stiglitz and Weiss
1/ Obtaining and training qualified staff, in particular, can be a
problem. See e.g. the figures of DBP's staffing, discussed in Chapter 2.

- 233 -
(1980) consider this non-price incentive, noting that "banks can exploit
the desire of firms to obtain loans by conditioning future loans on the
repayment of past debts" and adding that subsequent loans are generally
less risky than the first. (The significance of this incentive was
also apparent in the interviews discussed in Chapter 5
above.) Elsewhere, Bottomley C1975) has argued that subsidized interest
rates provide an incentive to repay if subsequent loans are permitted,
since the borrowers have an obvious reason for remaining on good terms
with the institutions that offer them; this does not, of course, argue for
subsidized'interest rate policies, but it does help to explain the low
arrears and default rates in administered credit schemes in some countries.
8.13 A third type not repaying the loans are perhaps best described
under the heading of "honest mistakes." Instances of these in the
Philippines were discussed in Chapter 4. In the early years of the program
there was a tendency to be too optimistic about the sales prospects
of businesses to be expanded under the loans, with costs and overheads
being higher, and sales lower and later, than anticipated. The reduction
of risks of this type proved to be a matter of experience: specifically,
a knowledge of what happened to previous projects after finance proved to
be a valuable lesson for the loan appraisers, who became stricter with
1/subsequent loan requests, and better counselors to the borrowers. A
further source of risk under this heading, and which is common in many
countries besides the Philippines, is the over-emphasis of fixed capital
finance, and the under-emphasis (and sometimes neglect) of working capital
finance. Apart from a shortage of the latter placing a financial stress
on business expanded under the former,, working capital finance is inherently
1/ Risks are also a function of size, type and maturity of loan and newnessof the business (see Chapter 4). Statistical analysis of risks oftenhelps institutions to develop better ground rules for lending.

- 234 -
less risky to supply and would be consistent with the theory behind
the risk-guarantee and direct financing schemes (i.e. to reduce p"
so that long-run profitability is achieved).
8,14 Fourth and last, there are those who, however honest, prove
not to be successful or competent in their business (the honest "but"
types), As in other instances discussed above, a growing knowledge of
local enterprises within the branch networks helped to reduce this
source of risk in the Philippines. Given the higher turnover rates of
small and very small firms, it was also found to be important to finance
businesses with proven records, and most institutions interviewed now
have stricter criteria for this.
8.15 Similar observations about the changing nature of risks, and
how they may be reduced by various measures, or sometimes simply through2/
knowledge and experience, are also noted by Akerlof, who also stresses
the importance of knowledge of the local communities. He quotes several
cases that are still worth reading, including one regarding seasonal
credits offered by cotton ginning companies in Iran, in which "in the
first years of operation large losses (were to be) expected from unpaid
debts - due to poor knowledge of the local scene." It is nevertheless
clear that the period required to reduce p" (and also a") to comparatively
low levels can be quite long, particularly if the emphasis (which is
excessive in our opinion) is placed on term loans, In the first five
years of the SMI program in the Philippines, for instance, the probability
of loans not being repaid has been reduced to less than one fourth of the
I/ ,C.f, Chapter 4, in which it was found that financing new businesswas about twice as risky as financing those already existing.
2/ Op. cit., pp. 246-249.

- 235 -
levels originally experineced, but it is still significantly higher than
private banks would consider to be acceptable.
8.16 A Forward-Looking Financial Criterion. The decision to
initiate a program is profitable if the present worth of the annual
returns exceeds the present worth of the losses represented by p" and a"
during the adjustment period. If the volume of lending in any year t
is Qt and c is the opportunity cost of resources to the institution,2/
expressed as a yield or an interest rate, this criterion is:-
(1+r)(1l-p') (1-p") (1+i)+a'+a" ,Q(3)
t (1+c)t t (1+c)t3/
Rearranging C3), and neglecting the cross-product p'p", lending to
small enterprises is likely to be profitable over the long haul if the
interest rates on loans are allowed to rise such that
Ci+a'+p') + IE(a"+p"))qt/(l+c)t I .I]/(1+C)t
(l-p') - [p"Q t/(l+c) t [Et /(l+c) t
8.17 The second terms in the numerator and denominator represent the
losses during the adjustment period. Both are present worthed and
weighted by the volume of business; both are also divided by the present
worth of the volume of business. The terms involving p" and a" are summed
over the period over which these quantities are significant. As discussed
above, this is not necessarily a short period; it is, however, shorter
1/ This happened in two ways, One through the reduction of arrears within
DBP, and the other through IGLF leading becoming more concentrated in
institutions prepared to develop the procedures and expertise. See
Chapter 2.
2/ In practice c and i are probably quite close.
3/ Including it does not affect the substance of the argument.

- 236 -
than the period over which the denominators should be summed, If Qt
expands rapidly, the second terms are likely to be small, and conversely
if Qt does not. Hence the likelihood of establishing a profitable lending
program turns in an obvious manner on one's assessment of the role of
small enterprises in the economy and on the growth of their demand for
institutional credit.
8.18 The limiting case of (4) occurs at high rates of growth of
demand and/or when a" and p" decline to low levels over a comparatively
short period. It then approaches:
r > i + at + p' (5)1 - pi
(Note that the static case, given by (2) above, yields the same result
if a" and p" are written as declining functions of Q.) It also approaches
this level the more the losses due to a" and p" are cushioned by the
risk-guarantees and the spreads on government backed financing schemes
such as were reviewed in Chapters 2 and 3.
8.19 In those Chapters it was revealed that there remains little
long-run interest on the part of the private sector institutions in the
Philippines to develop lending programs to small enterprises, even though
the losses from a" and p" are being cushioned as described. The basic
reason for this is that, under the current administered interest rate
policies, even the less stringent criterion, (5) above, is not being met.
8.20 Interest Rates and Governime:nt-Backed Financing Schemes, Supposing
there was a high volume of demand for credit, Interest rates corresponding
to (4) or (5) would not need to rise to the extreme levels previously
estimated (from (1)), sufficient to depress the demand and extinguish

- 237 -
any institutional interest in meeting the demand, In this case the
arguments for the schemes are no longer strictly economic or financial
in nature:
(i) Even small differentials in interest rates
between small and large borrowers may be resisted
politically, except perhaps those that can be accomodated
under reductions, within an otherwise uniform structure,
for prime borrowers. As noted earlier, the private
financial institutions may face this constraint in the
absence of any ceilings set by the government. In this
case the schemes become a device for narrowing differentials,
and are a "second best" measure from an economic viewpoint.
(ii) Perceptions differ between the public and private sector
as to the extent and growth of small enterprises and theI/
growth of demand for credit over the long-run, In this
case the schemes are a device for promoting investments
in regians and activities in which the public sector
expects a satisfactory return to the economy but in which
the private financial sector has doubts.
1/ Given the limited information and understanding on the extent and changesin the size and regional distributions of industrial development, thesedifferences of perception can be huge. E.g. infrastructure improvements
and agricultural growth have been shown in this report to increase smallbusiness activity in the present stage of development in the Philippines.But an entirely opposite view is still quite prevalent, and until recently
had some theoretical support (see Anderson and Leiserson (1980) for adisctsiion): this is that such developments lead to an increasing demandfor externally manufactured goods and a rapid decline of local small scaleindustries all round.

- 238 -
(iii) While the private sector bases its projects on
expected returns adjusted for risks, these adjustments
may be larger than is economically efficient in the
absence of institutions or mechanisms to insure against
1/ 2/risks. There is then a function for the public
sector to step in with guarantees or other forms of
3/subsidy of its own.
Other and perhaps more familiar reasons put forward are (iv) the schemes
are necessary to affset institutional biasses in favor of lending to large
scale arising from the structure of ownership and control of industry and4/
finance; Cv) small enterprises have special advantages over large scale;
and (vi) the schemes have a redistributive aim by raising the demand
for labor in low income regions.
Externalities, Economies of Scale and Interest Rates
8.21 The criteria (2) and (4) above were both financial, leading to
an interest rate capable of covering the average costs of providing loans
(or a present worth weighted average of costs in the multi-period case).
Two factors that modify these criteria from an economic standpoint are:
1/ Arrow and Lind (1970), who further argue that the public sector's decisions
should be neutral to risk, given its size. For a less conclusive view,
however, see the comments of Foldes and Rees (1977) on Arrow and Lind's
paper.
2/ One mechanism often conspicuous by its absence is a means for sharing
records between institutions on borrowers, so as to provide additional
checks on creditworthiness. In several instances in the Philippines
we encountered borrowers who were in default with one institution but
who were still able to obtain credit from another.
3/ Mayshar (1977).
4/ Although the advantages of SSEs are the most touted reasons for intervention,
interventions would arguably not beneeded to secure an efficient flow of
capital to SSEs were it not for Ci) to (iv) and the transactions costs
Cdiscussed in Chapter 4) faced by most owners.

- 239 -
Ca) the probability of financing a "goodilborrower
rises the greater the volume of borrowing that is
undertaken, though the rise is less marked the
clcser (1-p") approaches unity;
(b) the marginal administrative costs of financing
loans are below average costs, the latter declining
with the volume of lending; i.e. there are economies
of scale. As in (i), however, the gains from scale
diminish at higher volumes of lending.
Both suggest a modification of (2) and (4) and lead to results which
converge more rapidly towards (5) as demand rises.
8.22 Simple Static Case. Let B represent the benefits of financing
"good"borrowers, excluding any losses due to the "natural" risks denoted
above by p'. B would thus be the area under the demand curve up to Q,
and @B/@Q = (l+r). The actual benefits would then be B times the probability
of losses due to natural risks (1-p') and the probability of finding a
"1good" borrower (l-p"), The net benefits are then:
(1-p)B'- (l+i+a)Q
But both p and 'a' change with lending experience, that is with Q, and
the marginal conditions are:
Cl-p)(l+r) - B3p/3Q-C1+i+a)-q8a/aq = 0
from which
the first term (which is negative) in the bracketed expression represents
the marginal benefits of finding a good borrower the greater the volume of

- 240 -
business undertaken, and the second (also negative) the benefits of
scale. The former appears to correspond to the external benefits
identified by Arrow (1965) in a growth model that examined the economic
implications of "learning by doing." Here learning was associated with1/
the cumulative production of capital goods, from which he concluded:
"the presence of learning means that an act
of investment benefits future investors, but
this beneift is not paid for by the market.
Hence, it is to be expected that the aggregate
amount of investment under the competitive model
....... will fall short of the socially optimum level."
The term is given intuitive meaning in figure 1, in which the lower demand
curve corresponds to a lower probability of finding a good borrower than
the higher demand curve. If the initial price is P and demand Q1, the demand
would rise to Q2 ' say, if the price were dropped to P2 on the assumption
that meeting the increase of demand, Q2 Ql, made no difference to the
institution's ability to finance good borrowers. If, howevrr, the extra
experience gianed with extra lending eventually makes a difference, the
actual demand met would rise, say to Q,. Even if P2 fell below the current
marginal cost of making the loan, the extra benefits generated,(Shown by the
vertically shaded area)may be sufficient to offset the losses (shown by
the cross shaded areal. It is apparent that the case for setting prices
below marginal costs.diminishes the less (l-p) increases with an increase
in demand.
8.23 One possibility that arises is where the extra "good" borrowers
that are found as (l-p) rises are always marginal, i.e. that the vertically
shaded area in Figure 1 is always small, At high levels of Q is this likely,
but not at low levels, corresponding to the cases considered by Akerlof,
when potentially "good" borrowers are indistinguishable from the "lemons".
1/ Op.cit, p. 168.

-- 241 -
F E\)O2
P{ L1
Q
\\c1

- 242 -
1/8,24 The first term on the RHS of C6) is the same as (2)7~so
the economic criterion suggests lower interest rates than the financial
criterion so long as there are significant benefits to be obtained
from learning and from economies of scale. The limiting cases of both
2/(2) and (6) are the same, however: p tends to p', a to a', ap/;Q to 0
and @a/3Q to 0 as Q rises, so that r tends to (i + a' +p')/(l-p'). For
instance take the case where learning and economies of scale both show
3/
diminishing returns. One pattern might be:
p po" e
a"t a " e0
where p " and a " are initial values. Taking B as being proportional to
Q C= bQ, say) and substituting in (6) gives the result:
i+a'+p' + a " e XQCl - XQ) + p," eXQ (1-bQX)0a
1 - pf - p 0 fe Q
which tends to (i+a'+p')/(l-p') at high Q,
8.25 The Dynamic Case. All quantities that vary with time are given the
subscript t, including r, i, p and a. The present worth of benefits, if
x is the discount rate, is then:
Z(1-pt)Bt/(l+x)t - E (1+it+at)Qt/(1+x)tt t
where aBEtMt = (l+r ) and both pt and at are each a function of the
cumulative experience - assumed here to be correlated with the cumulative
volume of lending - up to time t; that is
1/- The "static" financial case,
j Also the same as the forward looking financial case
-n3J Arrow considers a case 0(Q) = 00Q with n > 0. But whether this or
the exponential form is assumed, the results are similar.

- 243 -
t
pt Et)
tand Co (0)
Taking the marginal conditions of the above objectives function and
rearranging gives the result:
it+a t+p m B s ap q srt t 1 s s(71pt 1-pt s=t t(l+x)s Qt 1+)s
The first term in the bracketed expression is the present worth of the
marginal benefits of finding "good" borrowers in the future on account
of the extra experience gained in the present period; the second term
reflects the gains from economics of scale. As in the static case,
there is a downwards adjustment to the marginal costs of providing the
loans in the present period.
8.26 The limiting case is again the same as that for the financial
^criterion (4). Both at and pt tend to a' and p' as the cumulative volume
of lending rises, with p Qs t and 3a /ae tending to zero, so that
i + a' + p'
t ~(14 )C)
1/ The differential of the first term in the objective function givesthe series;
(l-p t)(l+r t Bt t t1 at+1t t+1
(l+x) (1+x) a q (1+1x) Q
- The second term gives a similar series,

-244
The contrast between (4) and (7) is illustrated in Figure 2. The
economic criterion implies lower interest rates than the forward looking financial
criterion during the adjustment period.
8.27 The above results raise the question, is there an economic
case for subsidy, in addition to points Ci) to (vi) raised in paragraph 8.20,
when a" and p" are large? If there is, it is probably not a strong case,
since economies of scale are evident (and possibly greater) in many other sectors,
while Arrow suggests that learning by doing is widespread. There may be
a case for subsidising investment in general, or for selected subsidies
in sectors where the economies of scale and learning by doing are most
marked; these may or may not include small business credit programs.
The most appropriate answer, perhaps, is that eocnomic analysis does not
argue against subsidy during the adjustment period.
Appaising Small Enterprise Prograns
8.28 It is possible to determine whether small enterprise projects
are desirable or not,from an economic point of view,by using cost-benefit
analysis. As with other projects, it is necessary to compare the investments
in question with their alternatives, allowing (using shadow prices) for
possible inefficiencies in the levels of prices and wages,
8,29 Alternatives to Institutional Finance. These include a greater
reliance on:
(a) internal sources of finance (family savings,
retained earnings); and
(b) other external sources (trade credits and the
informal sector capital markets).
1/ The following draws on the principles discussed in Mishan (1971), Little and
Mirrlees (1975) and Squire-and van der Tak (1975).

J.J

- 246 -
Where the inputed cost of (a) or the actual cost of (b) are greater
than the costs of institutional finance, a reduction of investment and
output is implied if the latter is not available, except in the unlikely
event of the derived demand being inelastic. The provision of institutional
finance then:
- makes additional investments possible that would
otherwise be unprofitable if financed out of other
(higher priced) external sources, or which would not
have been worthwhile to the owner if the inputed cost
of internal sources were too high; and
- for those projects that would still be undertaken without
institutional finance, provides a cost savings to the
enterprise.
Industrial extension aims to have the further effect of:
- raising the demand curve for institutional
credit by reducing the transactions costs
faced by the borrowers (as discussed in Chapter 4,
these are also expected to decline over time
through "learning by doing").
1/ The alternatives can be summed up in a familiar way by the supplyand derived demand curves for finance: the derived demand curvesrepresenting the rates of return to capital of individual projects,one supply curve (generally higher) representing non-institutionalsources and another institutional sources of finance.
supply from non-institutional sources
demand curve without extension (Shaded area
represents thedemand curve with extension three sources ofsupply from institutional sources.
benefit discussed
below).

- 247 -
The relevant question is then whether these three sources of benefit,
after allowing for losses due to "lemons',' outweigh the costs of the
program. All three are part of the consumers' surplus, and it would
not be necessary to estimate them if payments on principal and interest
fully covered the costs of the programs. But since this condition is
generally not met in practice, it might be useful to examine how they can
be estimated. This can be done without precise information on the demand
curves.
8.30 Each project financed is used to increase the capacity and
output and/or improve the efficiency and profits of an,enterprise in
various ways. Each project is thus expected to be associated with:
- a change, AS, in the annual sales of the
enterprise,
- a change, AM, in its material and running costs, and
- a change, AL, in employment.
If the amount of investment made possible by the loan is K, and the
average wages are w, then the expected annual incremental. benefits,
AB, to the enterprise are
AB= AS -&- WAL -ACr)K (9)
where A(r) is the annuity rate and r now denotes the interest rate on the
loan. The expected rate of return to the investment, denoted by y, is
then given by
ACy) =(dS - AM - wAL)/K (10)
8.31 In principle therefore it is possible to estimate the rates of
return to the programs by considering a sample of the projects financed,
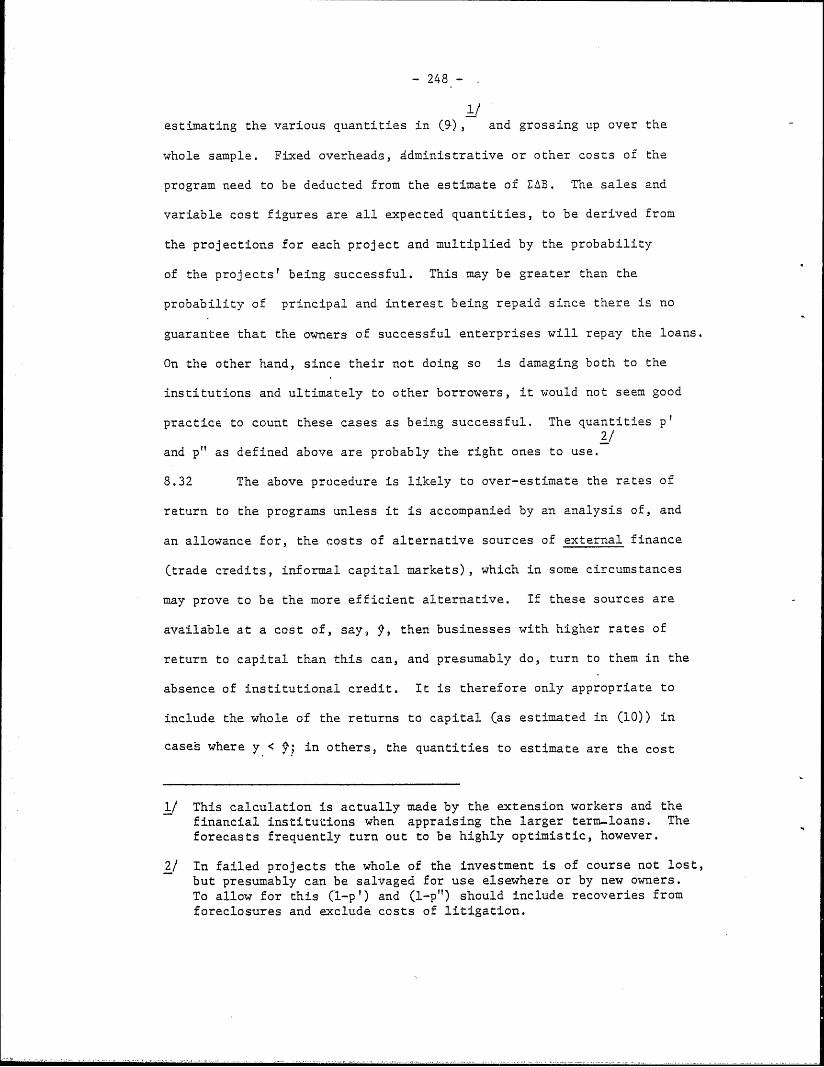
- 248 -
estimating the various quantities in (9-), and grossing up over the
whole sample. Fixed overheads, ddministrative or other costs of the
program need to be deducted from the estimate of EAB. The sales and
variable cost figures are all expected quantities, to be derived from
the projections for each project and multiplied by the probability
of the projects' being successful. This may be greater than the
probability of principal and interest being repaid since there is no
guarantee that the owners of successful enterprises will repay the loans.
On the other hand, since their not doing so is damaging both to the
institutions and ultimately to other borrowers, it would not seem good
practice to count these cases as being successful. The quantities p'2/
and p" as defined above are probably the right ones to use.
8.32 The above procedure is likely to over-estimate the rates of
return to the programs unless it is accompanied by an analysis of, and
an allowance for, the costs of alternative sources of external finance
(trade credits, informal capital markets), which in some circumstances
may prove to be the more efficient alternative. If these sources are
available at a cost of, say, f, then businesses with higher rates of
return to capital than this can, and presumably do, turn to them in the
absence of institutional credit. It is therefore only appropriate to
include the whole of the returns to capital (as estimated in (10)) in
cases where y <; in others, the quantities to estimate are the cost
1/ This calculation is actually made by the extension workers and thefinancial institutions when appraising the larger term-loans. Theforecasts frequently turn out to be highly optimistic, however.
2/ In failed projects the whole of the investment is of course not lost,
but presumably can be salvaged for use elsewhere or by new owners.To allow for this (1-p') and (1-p") should include recoveries fromforeclosures and exclude costs of litigation.

-249-
savings, which are given by f minus the opportunity cost of supplying
institutional finance.
8.33 When are the Alternatives Preferable? The above
analysis is a simplification of what is in practice a complex pattern of
demand and supply of finance for small enterprises. It raises the basic
questions: what is the expected demand for institutional credit (for
either short-or long term loans)? and, are the projects financed expected
to have satisfactory returns, sufficient to justify the costs and the
losses in developing a lending program? As shown, an assessment of alternatives
is crucial in arriving at answers to these questions.
8.34 It does not follow, however, that if instiuttional credit is in
demand for some purposes that the alternatives will be displaced or unneeded
for others - or even for the same purposes. In fact, the interviews
reported in Chapter 5 (see Annex table 5.3 in particular) show more
evidence of complementarities than of competition between alternative
sources of finance (e.g. the demand for trade credits rising with fixed
asset finance). The complementarities stem from variations in the capital
structure of small firms, and in the nature of the product and supplier
markets; what is a suitable financial arrangement for one firm is often
not for another. An obvious contrast is between the garments and
engineering industries. The former have low overheads and rely more
on trade credits to finance materials supplies-and work in progress; even
the smallest scale activities often obtain the credits indirectly through
the "putting out" system, The engineering industries, having larger overheads,
a larger share of work in progress, and often being expected not to receive,

- 250 -
but to offer credit in the form of delayed receipts from customers,
appear to rely more on the banking system to organize working capital
finance, or, in the absence of this, to rely exclusively on retained
earnings. It is hard to generalize, however, since engineering firms
working under subcontract, for instance, may have different financial
arrangements.
8.35 We also suggested in Chapter 4 that own savings, retained
earnings and such informal sector finance as is available, were the best
sources of finance for new businesses. The probability of a bank's
financing a "lemon" is much less for a business that has proved itself
and established its markets and sources of supply, A bank's finance is
generally advantageous when a significant increase of output and or assets
is contemplated, since informal sector loans appear to be very short-term
and in small amounts. Another suggestion in Chapters 3 and 4 was to use
traders as conduits for working capital finance, rather than always
working directly with small manufacturers. Finally, most institutions
regard it as good practice (a) to require a significant injection of a
businesses' own savings or retained earnings into a project, either for
fixed or working capital; and (b) to be satisfied that, if one type of
finance is to be provided (e.g. term-finance), finance will still be
available from other sources (whether internal or external) to meet the
other requirements of the firm.
8.36 Hence a mixed solution is suggested rather than an exclusive
reliance on one source or another. The task of the small enterprise
programs is to develop the capacity and know-how of the financial
institutions, and address the problems posed by uncertainty, where there
is a latent demand for their particular services. The above criteria

- 251 -
are intended to provide a check on the efficiency of the projects,
and determine when this effort is worthwhile.
8.37 Summing up, the economic returns to small enterprise programs
can be estimated from an analysis of the rates of return to capital
invested in the enterprises, allowing for the probability of unsuccessful
projects and deducting any costs of the programs not included in the project
costs. Allowances for alternative sources of finance may be necessary
in some cases, though institutional sources are often used to augment and
complement rather than compete with the alternatives.
8.38 Shadow Prices. It is obviously impractical to estimate the shadow
prices for the inputs and outputs of each of the projects financed or
otherwise supported by small enterprise programs, and also unnecessary.
But seen as part of the research and ex post evaluation work of the
institutions involved in the programq, their role is constructive. The-
are perhaps best used in evaluations of samples of projects to determine the
relative efficiencies of investments in different sectors, and thus for
determining the sector priorities of the programs. A comparison of
economic returns, using SPs, with the financial returns of the projects
should also provide current evidence on the incidence of industrial1/
tariffs and investment incentives on small scale activities.
1/ Now that the tariffs and investment incentives are being revised in the
Philippines, this exercise becomes more relevant. What were once
relatively low-profit activities in the under-protected sectors should
stand to gain considerably from a change to more uniform tariffs,
The converse is ture of currently proftitable activities in the over-
protected sectors. In other words, the profitability - and economic
efficiency- of the projects that make up the loan portfolios of
the financial institutions is likely to change with the tariffs, along
with a change in the composition of the portfolios.

- 252 -
The theory and practice of the estimation and use of shadow prices
for these and other purposes is fully documented in the references
cited.
1718.39 Shadow Wages and the Employment Issue. Given the importance
of projects that offer improved earnings opportunities for the labor force,
there are at first sight grounds for using a shadow wage (SWR) below
actual wages (w) when appraising the porjects, so as to give a premium
to those projects that actually do raise earnings levels. Thus the
social benefits of a project, as estimated in (9) above, would be
increased by AL(w-SWR). Since this may entail the selection of some
projects that would make a financial loss, the preceding argument is
sometimes used to justify subsidized credit programs for small enterprises.
Apart from the difficulties that such subsidies cause for the raising and
adminstering of loanable resources, there is another objection to this
argument in that, at least with respect to small enterprises in the
Philippines, shadow wages and actual wages probably do not differ
significantly. The following discussion explores this point further, and
aims to show why the current practice of appraising projects based on actual
wages should lead to a selection of projects that are consistent with the
aim of improving earnings opportunities,
8,4C First note that the rate of return or net benefit criterion can
be rewritten as:
AS - - A(r) >(11)wAL
1/ A paper by Medalla (1980) in Bautista and Powers presents an estimate ofthe SWR for unskilled labor in the Philippines. It is a country-wideestimate however, and does not allow for variations according to region,
occupation, skill levels and the experience, qualities and job preferencesof individuals.

- 253 -
That is, a project is desirable if it is capable of providing for labor's
income after all other costs have been met. The rate of return is thus
a rigorous criterion for screening for projects offering more gainful
employment provided the wages reflect the opportunity costs of labor
(or the shadow wage rates). To see why the latter condition is met in the
Philippines,at least to a good approximation, it is instructive to consider
the recommended practices for estimating SWRs.
8.41 In Chapter 7, it was shown that the wage labor in manufacturing
was being drawn from several sources: (a) wage labor in agriculture,
Cb) self-employed labor in agriculture, Cc) wage and self-employed labor
in low-income, mostly rural and non-agricultural activities, (d) the un-
employed, and Ce) new entrants to the labor force who would otherwise
be in one or the other of (a), Cb), Cc) or (d). Even if a worker happens
to be drawn directly from another lesser paid job in manufacturing,
it will generally create a vacancy to be filled by workers from one of
the above. This pattern of movement appears to be quite general in
developing countries, and for this reason the starting point for
estimating an SWR is usually taken to be a weighted average of the daily
1/, 2/earnings in Ca), (b), Cc) and Cd). There are, in addition, further
3/adjustments recommended in the literature to allow for the following:
Ij See Little-Mirrlees, op. cit., p.257-262. The calculation appears tobe extra-ordinarily intricate to do properly, particularly if (as withSSE programs) it is necessary to allow for regional disparities inwages and marginal productivities of labor.
2/ Since Cd) Is relatively low in the Philippines, the SWR would mostly bemade up of Ca), (b) and Cc).
3/ See Squire van der Tak and Little-Mirrlees,

- 254 -
Ci) the transport andresettling costs of moving
to a new phase of work;
(ii) the costs of labor being temporarily unemployed
or working in part-time or lowly-paid work beforel/
finding the better-paid job in the project;
(iii) the possible social costs of the workers using the
wages for consumption when the money, if invested,
might yield higher consumption benefits in the2/
future; and
(iv) the added incentive required to make the new job
3/sufficiently attractive relative to the old one;
e.g. the higher wage rates that are needed in urban
areas to provide for the higher costs of dwellings,
food and transport.
The first two adjustments act to raise the SWR over the weighted average
of earnings in pervious work. The third is generally thought to reduce it,
though it is very likely small in the Philippines on account of the
1/ Mazumdar (1976).
2 This is the term (l-1/S)Cw-MP) in the references cited, Here (w-MP)is the net increase in earnings (MP=marginal product of labor). Sis the ratio of the value of uncommitted government income to the valueof consumption. It is generally taken to be greater than unity onthe grounds that workers do not save and invest sufficiently but consumeexcessively. The whole term is a measure of the net loss assumed tooccur on account of the income being consumed by workers instead ofbeing invested (in the interests of future consumption) by the govern-ment.
3/ Harberger (1971).
.. . . ..

- 255 -
opportunities for workers to save and invest.I/
The fourth term is probably quite large for workers moving to Manila,
where wages for given occupations are significantly higher than elsewhere,
but not so large for those moving to workshop and factory production in
the provinces; it helps to explain why the opportunitycosts of labor
(like wages) are likely to vary greatly among regions.
8,41 For people moving into skilled occupations, further adjustments
are needed to allow for Cv) the costs of training labor and (vi) the workers'
preference for skilled over unskilled work. Finally, there are questions
regarding the quality and the experience of the workers and which must also
bear, in principle, on the estimation of the SWRs.
8.42 Given the obvious practical difficulties of estimating SWRs on
the above principles, the question arises whether it is necessary. The
above list of adjustments is a useful way of indicating the factors
determining the opportunity cost of labor; but the same factors must
also determine actual wages if labor is to be drawn into the enterprise
or project in question. It is only when there are institutional influences
1/ These opportunities are now quite widespread with the growth of the branch
networks of the organized financial sector: 900 rural banks, 1200 branches
of the commercial banks, plus the branches of the savings and loan
associations, the private development banks and the Development Bank of
the Philippines. Indeed, the branches of the commercial banks have
spread rapidly largely to increase the resource base from deposits,
which accounted for 75-77% of incremental resources in 1976-77 (see
Chapter 2). A national savings campaign was also initiated by the
Government in the mid'70s. Apart from these channels for mobilizing
savings, secondary activities have been promoted such as piggeries,
garment crafts and other "cottage" industries. It is also very
likely that private investment in education and dwellings by the families
of wage earners are commensurate with their incomes.

- 256 -
or other constraints in the labor market that actual wages begin
to depart from the opportunity costs above. In Chapter 7 it 77as suggested
that such influences, if they exist at all, are not very strong in the
labor markets in which SSEs operate. To a good approximation the supply
price of labor appears to meet the condition of "being the wage that
must be paid to induce the worker into a particular employment and
reflects the workers' private valuation of all its aspects, pleasant
and unpleasant." Thus the SWRs and the actual wage rates can probably
be taken not to depart significantly. This conclusion is not dis-similar
to that reached by Harberger (1971) in his analysis of the labor market in
India:
"Why have the differentials between urban unprotectedsector wages and rural wages been so persistent overtime rather than being eliminated as a consequenceof more rapid migration flows? My answer is that thedifferential in question is very largely a self-equalisingone. In rural areas of India most of the houses (or huts)of rural labourers are built by themselves (with help fromfamily and friends), using local materials; they are veryinexpensive, if not virtually free. By contrast, even themost rudimentary urban quarters have rents amounting to athird or more of the unprotected urban wage. Food in thecities is also considerably more expensive than in thevillages, where largely local produce is consumed.
Transportation to and from work also typically claims aconsiderable portion of the urban labourer's budget,while in the villages the trip to the nearby fields isusually made on foot...1 conclude, then, that the socialopportunity cost of labour to be used on a project in a ruralarea is the going wage in that area while that of labour to beused in an urban project is the prevailing wage in the unprotec-ted sector of the labour market in that area."
1/ Squire and van der Tak (1975), p.80 . For a more skeptical note on relyingtoo much on supply prices (even in the absence of distortions) see
Vaughn (1980); uncertainties and disequilibria in the labor marketsare her main concern.

- 257 -
8.42 Using actual wages paid in small enterprises as a measure of
the opportunity costs of labor both favors investments in the provinces,
where wages are lower, and simplifies analysis. Estimates of shadow
wage rates are generally available only on a country-wide basis for one
or perhaps two categories of labor. Yet small enterprises have to pay
wages that vary with the skills, qualities and experience of the workers,
as well as with location and local labor market conditions. The
information on wages are also readily available to the appraisers of
projects, who generally estimate the wage bill when assessing the
profitability of an enterprise and the project before deciding whether
or not to finance it. In using actual wages in this way when estimating
the returns to the investment, they are essentially screening for projects
that are consistent with the employment aims of the program.

- 258 -
BIBLIOGRAPHY
Akerlof, G. A. (1970). "The Market for 'Lemons: Quality Uncertaintyand the Market Mechanism.' Q.J.E., 84, 488-500.
Alburo, Florian.and Associates (1979), Report on "Inter-MunicipalityPatterns of Trade and Economic Activities," University of Philippines,Iloilo College, October 1979.
Alix, Jesus, C., "The Impact of the MASAGANA 99 Program on Small FarmersProduction and Income in the Philippines", Bureau of Agricultural Economics,Research Report No. 11, 1978.
Anderson, D. and Leiserson, M. W., (1980) "Rural Non-Farm Employment inDeveloping Countries," EDCC Vol, 28, No.2.
Arrow, K. J. (1965) "The Eccnomic Implications of Learning by Doing,"Review of Economic Studies.
Arrow, K. J. (1970) and Lind, R., "Uncertainty and the Evaluation ofPublic Investments," A.E.R. 60 (1970), 314-378.
Baldwin, Robert E., Foreign Trade Regimes and Economic Development -The Philippines, New York, Columbia University Press, 1975.
Bautista, Romeo, M. and John H. Power, Industrial Promotion Policies inthe Philippines, Manila: The Philippine Institute for Development Studies,1979.
Bautista, Romeo., "Domestic Resource Cos3ts in the Leather and LeatherGoods Industries," in and John H. Power, Industrial Promotion Policies in thePhilippines, Manila: Philippine Institute for Development Studies, 1979.
Bat.tista R. M. and Tecson G., (1979) "Domestic Resource Costs in PhilippineManufacturing, 1969 and 1974," in Bautista and Powers (1980).
Berry, A., "Income and Consumption Trends in the Philippines, 1950-70",Review of Income and Wealth, Series 24, No.3, September 1978.
Berry, Albert and Armando Pinell-Siles, "Small Scale Enterprises inColombia", Washington: World Bank, Studies in Employment and RuralDevelopment No.56, July 1979.
Bolton, J. E., (Ch.), Small Firms-Report of the Committee of Inquiry onSmall Firms, London: Her Majesty's Stationery Office, 1971,
Bottomley, A. C1975), "Interest Rate Determination in Underdeveloped RuralAreas", American Journal of Agricultural Economics, May 1975, pp.279-291,

- 259 -
Castillo, G,, Beyond Manila - Philippine Rural Problems in Perspective,
mimeo, University of the Philippines at Los Banos, December 1977,
Child, Frank, C., and Hiromitsu Kaneda, "Links to the Green Revolution:
A Study of Small-Scale Agriculturally Related Industry in the Pakistan
Punjab", Economic Development and Cultural Change, Volume 23, No. 2,
January 1975.
Chico, Leon, J., "Employment Maximization Through Small-Scale Industry in
the Philippines", Ph.D. Thesis, University of Santo Tomas, 1976.
Cortes M. and Escandon, J., (1979), Paper on Second Hand Equipment in Colombia,(mimeo'.
Devlin, Lord, Report of the Commission of Inquiry into Industrial and
Commercial Representation, London: ABCC/CBI, 1972.
Diamond, P and Rothschild, M. (1978) "Uncertainty in Economics: Readings
and Exercises", Academic Press, New York.
Epstein, Scarlett, T., South India: Yesterday, Today and Tomorrow, Mysore
Villages Revisited, London, MacMillan, 1973.
Evenson, Popkin and King-Quizon, Yale Economic Growth Center Discussion
Paper, 1979.
Fajardo, Hermina, R., "Study on Small and Medium Industries in the Philippines,"
1979, Processed.
Foldes, L. P. and Rees, R. (1977), "A Note on the Arrow-Lind Theorem",
A.E.R., March 1977, Vol. 67, No.2.
Gibb, Arthur, Jr., "Agricultural Modernization, Non-Farm Employment and
Low Level Urbanization: A Case Study of a Central Luzon Sub Region of the
Philippines", Doctoral Thesis, University of Michigan, Ann Arbor, 1974.
Harberger, A. C. (1971), "On Measuring the Social Opportunity Cost of
Labour", International Labor Review, Vol, 103, No. 6, June 1971, pp.5 59-5 79 .
Hicks, G. L., and G. McNicoll, Trade and Growth in the Philippines,
Ithaca; Cornell University Press, 1971.
Ho, Samuel, P. S., "Small Scale Industries in Two Rapidly Growing Less
Developed Countries; Korea and Taiwan - A Study of Their Characteristics,
Competitive Bases, and Productivity", Washington, D.C,: World Bank,
Studies in Employment and Rural Development No. 53.
Institute for Small Scale Industry International Research Project on
Small Industry Development: A Comparative Regional Study Phase I, Volume II
Organization for Small Industries Development in the Philippines: Case
Histories, Manila: UPISSI, University of the Philippines, 1977,
Institute for Small Scale Industry A Study of Philippine Small and Medium
Scale Industries, Phase I, Manila: UPISSI, University of the Philippines,
November, 1977.

- 260 -
International Development Center (Japan), Industrial Development in
South East Asian Countries: Small and Medin Scale Industries - Republic of thethe Philippines - Phase I, Tokyo, IDC: 1971/1978,
International Labor Office, Sharing in Development A Program of Employment;
Equity and Growth for the Philippines, Geneva: LLO, 1914.
Itao, Arnulfo, F. (1980), "A Study on Mortality Rates and Causes of Failure
of Small Scale Industries in the Philippines". Report of the Research
Department, Institute for Small-Scale Industries, University of the
Philippines, Quizon City, Metro Manila, March 1980.
Jaffee, D., and Russell, T. (1976), "Imperfect Information and Credit
Rationing", Q.J.E., Vol. 90, NO. 4, pp.6 51-6 66 .
Kawai, N. "Comments on the SSE Project (RPO 671-59)", IBRD mimeo.
Kennett, David, A. "The Working Capital Needs of Small Enterprises",
Industrial Development and Finance Department, World Bank, 1979,
(processed).
Lal, Deepak, "Wages and Employment in the Philippines", Washington, D.C.:
World Bank, Studies in Employment and Rural Development No.57, October 1979.
Lecraw, Donald, J. "Choice of Technology in Low Wage Countries: A
Non-neoclassical Approach", Quarterly Journal of Economics, November 1979,
Vol. 343.
Lipton, M. (1979), "Agricultural Risk, Rural Credit, and the Inefficiency
of Inequality", in "Risk, Uncertainty and Agricultural Development, by
J. A. Roumasset, J-M Boussard, and I. Singh (1979), Agricultural Development
Council, New York, and S. E. Asian Regional Center for Graduate Study and
Research in Agriculture, College, Laguna, Philippines.
Little, I. M. D. and J. A. Mirriees, (1974), "Project Appraisal and
Planning for Developing Countries", Basic Books, Inc., New York.
Mangahas, Mahar, "Income Inequality in the Philippines: A Decomposition
Analysis", in Japan Economic Research Center and Council for Asian Manpower'
Studies, Income Distribution, Employment and Economic Development in Southeast
and East Asia, Tokyo, 1975.
Mangahas, Mahar, and Bruno Barros, "The Distribution of Income and Wealth:
A Survey of Philippine Research", Manila: Institute of Economic Development,
University of the Philippines, Discussion Paper No.79-6, October 1979.
Mayshar, J. (1977), "Should Government Subsidize Risky Private Projects?"
A.E.R., March, 1977, Vol.67, No. 2.
Mazumdar, Dipak, "The Urban Informal Sector", World Development, 1976,
Vol. 4, No.8, pp.655-67 9 .
Mazumdar, Dipak (1976), "The Rural-Urban Wage Group, Migration, and the Shadow
Wage," O.E.P, Vol.28, No.3, pp,406-425.
Medalla, Erlinda, m. (1980), "Estimating the Shadow Price of Labor", inBautista and Powers (1980).

- 261 -
Mishai, E.J. (1971), "Cost Benefit Analysis; An Introduction",Praeger, New York.
Moran, Presentacian (1979), Article in thePhilippine Review ofBusiness and Economics,
NACIDA, The Profile of Cottage Industries in the Ilocos, Manila; NLRI,1978,
National Economic Development Authority, Five Year Development Plan1978-1982, Manila: NEDA, 1978.
Pernia, Ernesto., "Urbanization and Economic Development in the Philippines;Some Implications for Regional Policy", Manila: Institute of EconomicDevelopment, University of the Philippines, Discussion Paper No.77-3,May 1977.
Power, John H., and Gerado P. Sicat, The Philippines Industrialization andTrade Policies, London: OxfO d University Press for OECD, 1971.
Preston in Povulation and Development Review, 1979.
Rothschild, M. and Stiglitz (1976), "Equilibrium in Competitive InsuranceMarkets; An Essay on the EcQnomics of Imperfect Information", .J,E., 90,pp, 629-650.
Shinohara,Miyohei, "A survey of the Japanese Literature on Small INdustry"in Bert F, Hoselitz., The Role of Small Industry in the Process of EconomicGrowth, The Hague; Mouton, 1968.
Sicat, Gerado, P. Economic Policy and Philippine Development, Manila:University of the Philippines, 1972.
Squire, Lyn and Herman G. van der Tak, Economic Analysis of Projects,Baltimore: The Johns Hopkins University Press, 1975.
Stalky, Eugene and Richard Morse, Modern Small Industry for DevelopingCountries, New York: McGraw Hill, 1965.
Stewart,Frances. Technology and Underdevelopment, Boulder, Colorado;Westview Press 1977.
Stiglitz, J. E. and Weiss (1979), "Credit Rationing in Markets withImperfect Information, Part I". Bell Telephone Laboratories, Inc.,and Princeton University. Mimeo.
Stiglitz, J. E. and Weiss (1979), "Credit Rationing in Markets withImperfect Information, Part II: Constraints as Incentive Devices."Bell Telephone Laboratories, Inc., and Princeton University, Mimeo.

- 262--
Tan, N. (19801, "The Structure of Protection and Resource flows in thePhilippines," in Bautista and Powers C1980),
Tsuda, Mamon, Rigoberto D. Tiglao and Edith S. Atienza, "The impact of TNC1sin the Philippines", Manila: U. P. Law Center, June 1978, (processed).
University of the Philippines - Institute for Small Scale Industries(1980) "Overview of Small and Medium Scale Industries in the Philippines",Quezon City, Metro-Manila, April 1980.
Vaighn, Karen, I., (1980), "Does it matter that Costs are Subjective?"Southern Economic Journal, Vol. 46, No.3, January 1980.
Valdepenas, Vicente, The Protection and Development of PhilippineManufacturing Manila: Ateneo de Manila University, 1970.
World Bank, Philippines Appraisal of a Small and Medium IndustriesDevelopment Project, Washington, D.C., World Bank, East Asia and PacificDepartment, April 1975.
World Bai,- The Philippines Priorities and Prospects for Development,Washington, D.C., The World Bank, 1976.
World Bank, "Philippines Sector Survey Agricultural Support Services,"Washington, D.C., World Bank, East Asia and Pacific Region Agusut 1978.
World Bank, The Philippines A Development Strategy and Investment Priorities
for the Central Visayas (Region VII), Washington, D.C., The World Bank,East Asia and Pacific Regional Office, January 1979.
World Bank, Industrial Development Strategy and Policies, Washington,D.C., East Asia and Pacific Regional Office and Industrial Developmentand Finance Department, October 1979.
World Bank, (1979), "The Philippines: Aspects of the Financial Sector",Report No.2546-PH.
World Bank, "The Philippines Poverty, Basic Needs and Employment A Reviewand Assessment," Washington, D.C., East Asia and Pacific Regional office,May 1980.

SMALL ENTERPRISES AND DEVELOPMENTPOLICY IN THE PaILIPPINES: A CASE STUDY
VOLUME II
Statistical Annexes
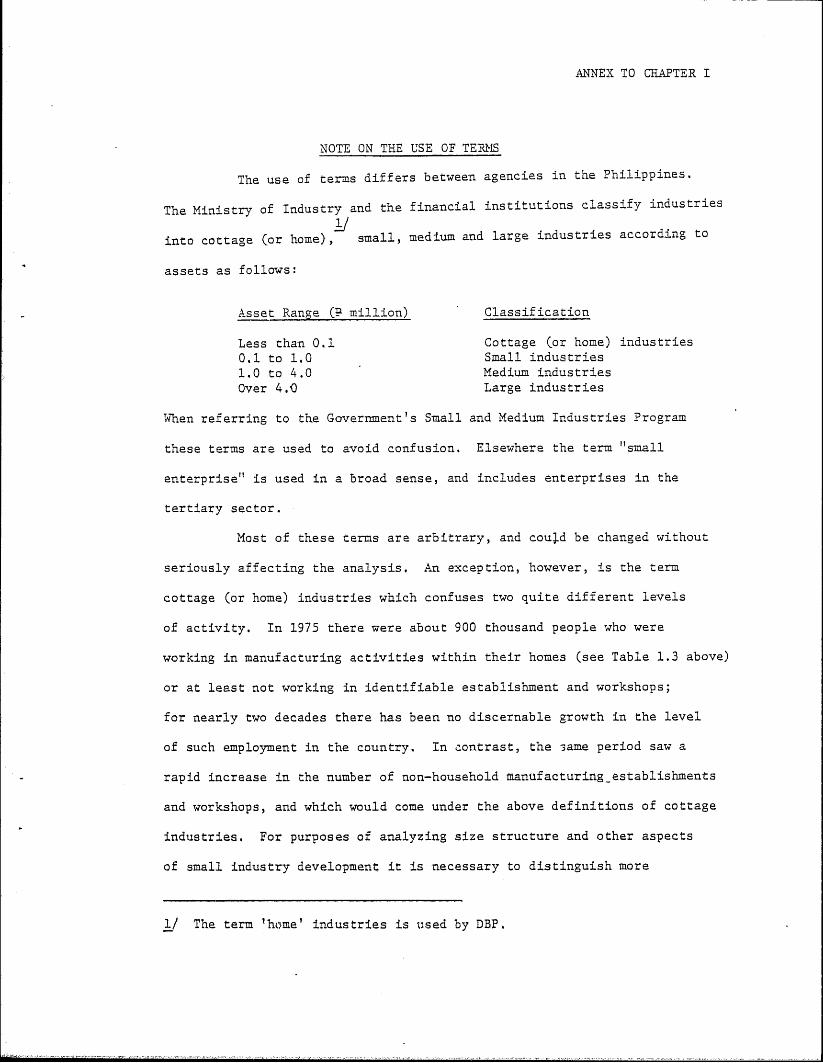
ANNEX TO CHAPTER I
NOTE ON THE USE OF TERMS
The use of terms differs between agencies in the Philippines.
The Ministry of Industry and the financial institutions classify industries
into cottage (or home), small, medium and large industries according to
assets as follows:
Asset Range C million) Classification
Less than 0.1 Cottage (or home) industries
0.1 to 1.0 Small industries
1.0 to 4.0 Medium industries
Over 4.0 Large industries
When referring to the Government's Small and Medium Industries Program
these terms are used to avoid confusion. Elsewhere the term "small
enterprise" is used in a broad sense, and includes enterprises in the
tertiary sector.
Most of these terms are arbitrary, and could be changed without
seriously affecting the analysis. An exception, however, is the term
cottage (or home) industries which confuses two quite different levels
of activity. In 1975 there were about 900 thousand people who were
working in manufacturing activities within their homes (see Table 1.3 above)
or at least not working in identifiable establishment and workshops;
for nearly two decades there has been no discernable growth in the level
of such employment in the country. In contrast, the 3ame period saw a
rapid increase in the number of non-household manufacturing establishments
and workshops, and which would come under the above definitions of cottage
industries. For purposes of analyzing size structure and other aspects
of small industry development it is necessary to distinguish more
1/ The term 'home' industries is used by DBP.

precisely between household and establishment-based manufacturing, as far as
the data permit. The following table shows how MOI definitions compare with
the size distribution categories in the establishment censuses; household
employment is normally estimated as a residual between the establishment
censuses and population censuses (or the labor force surveys non-census years):
Type and Scale of Activity Approximat 1MOI
CCSO Classification) Employment in 000's Definitio
Household employment 882 Cottage
Establishments:
Less than 10 workers 207 Cottage
10 - 19 workers 37 Cottage
20 - 99 95 Small
100 - 199 56 Medium
200 and over 374 Large
Total 1,651
/1 The average assets per worker in.1974 for industries with 5-19 workers
was P4,700 say P5,000 in 1975, so that enterprises with 20 workers
would have assets of P100,000 on average.
Source: Censuses of Establishments and Population Census.
Except when the discussions specifically relate to the financing and
extension programs, the terms followed will relate to the left-hand side
of the above table.
While the intention of the analysis is to examine the full size
structure of industry, the NCSO's census and survey data on establishments
are often only grouped into 'small' and 'large', the former being establishments
with less than 10 employees in census years, and less than 20 in survey years;
the tables and comments in the text make it clear which of these two sources
are being used.

ANNEX I TO CHAPTER II
Table 2.1:
PHILIPPINES
FINANCING OF SMALL SCALE ENTERPRISES
Loans and Investments Outstanding by Institution, 1950-77
(Amount in million pesos)
1950 1960 1970 1974 March 1977
Type of institution Amount % Amount % Amount Amount % Amount %
Banks
Commercial banks 627 70.2 1,850 63.2 10,968 62.3 31,056 66.0 46,300 66.0
Rural banks 0 0.0 69 2.4 548 3.1 1,790 4.0 2,629 3.8
Development banks 253 28.4 566 19.4 2,935 16.7 5,330 12.0 11,181 15.9
Savings banks 1 0.1 57 1.9 564 3.2 965 2.2 1,923 2.7
Subtotal 881 98.7 2,542 86.9 15,015 85.3 39,141 88.4 62,033 88.4
Nonbank Financial
Institutions
Private 4 0.4 11 0.4 228 1.3 814 1.8 1,126 1.6
Government 8 0.9 373 12.7 2,360 13.4 4,311 9.8 7,019 10.0
Subtotal 12 11.3 384 13.1 2,88 14.7 j5,12 11.6 8,145 11.6
Total 893 100.0 2,92 100.0 17,603 100.0 44,266 100.0 70,178 100.0
Source: NEDA.

ANNEX I TO CHAPTER II
Table 2.2:
PHILIPPINES
FINANCING OF SMALL-SCALE ENTERPRISES
Loans Granted by Financial Institutions in 1977
(Amount in million pesos)
Privatedevelopment Specialized Non-bank financial institutions
Rural bank banks banks /a Private Government /b
Sector Amount % Amount % Amount % Amount % Amount %
Agriculture 1,799.1 87.1 101.6 45.4 571.3 19.8 27.5 2.0 40.1 1.0
Commerce 180.7 8.7 - - 10.3 0.3 46.2 3.3 - -
Industry 55.5 2.7 70.2 31.4 2,080.5 72.1 305.3 21.6 40.1 1.0
Others 30.4 1.5 51.9 23.2 224.5 7.8 1,030.6 73.1 3,852.6 98.0
Total 2,065.7 100.0 223.7 100.0 2,886.6 100.0 1,409.6 100.0 3,932.8 100.0
/a Comprising DBP, Land Bank of the Philippines and Philippine Amanah Bank.
/b Comprising GSIS, SSS, ACA and NIDC.
Source: Central Bank Annual Report 1977.
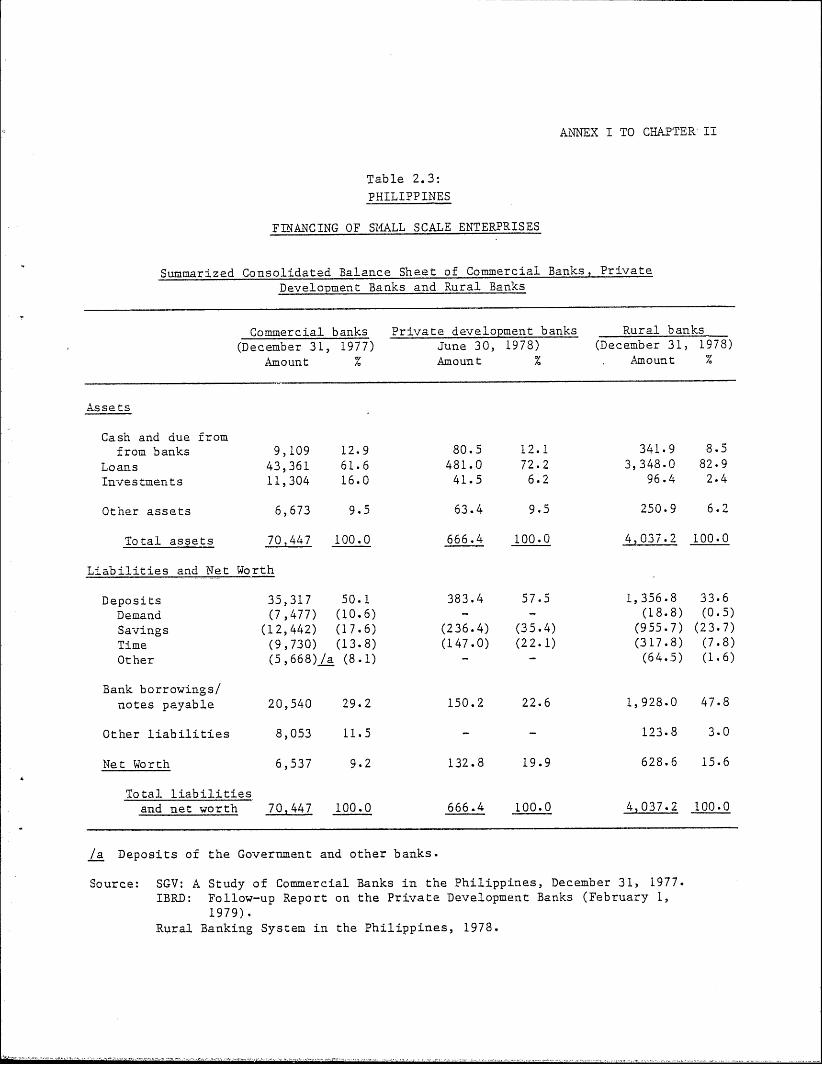
ANNEX I TO CHAPTER II
Table 2.3:
PHILIPPINES
FINANCING OF SUALL SCALE ENTERPRISES
Summarized Consolidated Balance Sheet of Commercial Banks, Private
DeveloDment Banks and Rural Banks
Commercial banks Private development banks Rural banks
(December 31, 1977) June 30, 1978) (December 31, 1978)
Amount % Amount % Amount %
Assets
Cash and due fromfrom banks 9,109 12.9 80.5 12.1 341.9 8.5
Loans 43,361 61.6 481.0 72.2 3,348.0 82.9
Investments 11,304 16.0 41.5 6.2 96.4 2.4
Other assets 6,673 9.5 63.4 9.5 250.9 6.2
Total assets 70,447 100.0 666.4 100.0 4,037.2 100.0
Liabilities and Net Worth
Deposits 35,317 50.1 383.4 57.5 1,356.8 33.6
Demand (7,477) (10.6) - - (18.8) (0.5)
Savings (12,442) (17.6) (236.4) (35.4) (955.7) (23.7)
Time (9,730) (13.8) (147.0) (22.1) (317.8) (7.8)
Other (5,668)/a (8.1) - - (64.5) (1.6)
Bank borrowings/
notes payable 20,540 29.2 150.2 22.6 1,928.0 47.8
Other liabilities 8,053 11.5 - - 123.8 3.0
Net Worth 6,537 9.2 132.8 19.9 628.6 15.6
Total liabilities
and net worth 70,447 100.0 666.4 100.0 4,037.2 100.0
/a Deposits of the Government and other banks.
Source: SGV: A Study of Commercial Banks in the Philippines, December 31, 1977.
IBRD: Follow-up Report on the Private Development Banks (February 1,
1979).Rural Banking System in the Philippines, 1978.

ANNEX I TO CHAPTER II
Table 2.4:PHILIPFPINES
FINANCING OF S%KALL-SCALE ENTERPRISES
Commercial Banks: Total Loans Outstanding by Different Categories
Pesos, billions % distribution /a
Classification 6/30/74 12/31/77/a 5/30/74 12/31/77
Economic Sector
industry and agriculture /b 11.2 19.7 53 49 I/bTrade 7.0 12.0 33 30
Contract construction 0.5 0.9 2 2
Consumption - 1.3 - 3
Others 2.4 6.3 11 16
Total 21.1 40.2 100 100
Tyne of BorrowerInduscrial 5.0 7.3 24 18
Single proprietorship - 1.0 - 3
Partnership 0.7 1.0 3 2
Cooperative 0.3 - I -
Corporation 14.3 30.3 68 75
Government 0.8 0.6 4 1
Tocal 21.0 40.2 100 100
Size of Firm /c, /dCottage industries n.a. 0.7 n.a. 2
Small-scale industries a.a. 3.1 n.a. 11
Medium-scale industries n.a. 3.1 n.a. 11
Large-scale industries a.a. 15.5 n.a. 56
Others n.a. 5.1 n.'. 19
Total n.a. 27.4 n.a. 100
.egion /c
Metro Manila n.a. 23.8 a.a. 87
Provinces n.a. 3.6 a.a. 13
Total n.a. 27.4 n.a. 100
Macurity
Demand n.a. 7.5 n.a. 19
Short-term n.a. 26.8 n.a. 67Intermediate-cerm n.a. 4.2 n.a. 10
Long term n.a. 1.7 n.a. 4
Total n.a. 40.2 n.a. 100
/a The total credits outstanding are about 8% lower than those indicated
in Table 3.1. This table excludes past due items, items on litigation
domestic bills-clean and foreign bills-clean.
/b From Table 2.2. It will be noted that 35% went to manufacturing.
c Excluding PNB.
/d Loans to agriculture and commerce appear to have been included inthese definitions, which follow those noted in the text.
Ia Totals may not add up to 100 due to rounding.
Source: Central Bank records.

ANNEX I TO CHAPTER II
Table 2.5:
PHILIPPINES
FINANCING OF SMALL SCALE ENTERPRISES
DBP: Lending to Home, Small and Medium Industries /a
Fiscal Years 1974-78(amount in million Pesos)
/blb /c /c1974 -L- 1975 -Lb 1976 1977 -L 1978 -c
Classification No. Amount No. Amount No. Amount No. Amount No. Amount
Regional distribution
Metro Manila 125 20 247 43 349 63 270 84 216 68
Provinces 417 28 501 67 1,406 109 868 76 924 90
Total 542 48 748 110 1,755 172 1,18 160 1,1409 158
Size distribution
Home industries 432 6 494 7 1,466 27 759 18 756 13
Small industries 98 27 212 45 235 59 331 55 328 52
Medium industries 12 15 42 58 54 86 48 87 56 93
Total 542 48 748 110 1,755 172 1,138 160 1,140 158
/a Definitions of home, small and medium industry loans are respectively loans of less
than P 50 thousand, P 50-800 thousand, and P 800 to 300 thousand.
/b In 1974 and 1975, 620 loans each under P 50,000 and amounting to P 8.3 millon were
approved by branch managers. Since the allocation of these loans between the two years
is not available they have been equally divided between the years.
/c Includes loans approved under discretionary authority of branch managers (R 150,000 and
below) as confirmed by the Board of Governors.
/d The value was unusually high for this year since it included high volume of tricycle
loans.
Source: DBP.

ANNEX I TO CHAPTER 1I
Table 2.6:
PHILIPPINES
FINANCING OF SMALL SCALE ENTERPRISES
DBP: Arrears as a Percentage of Value of Loans Outstanding at theHead Office and Branch Levels, 1974 to 1978 /d
Fiscal Year (ending June 30)1974 1975 1976 1977 1978 1979 /e 1980
Branch Lending Ab
Home industries 35.6 19.0 11.8 .. /aSmall industries 35.1 /c 13.5 11.3 .. .. ) 23.0 /fMedium Industries n.a. 2.5 5.6 .. )
Head Office Lending
Rome industries 63.3 41.5 40.2 .Small industries 44.2 33.0 38.2 .. .. ) 12.2 /f ) 11.2 IfMedium industries 40.0 41.4 28.6 .. )
Total: Head Officeand Branch Lending /b
Home industries 49.2 28.9 20.9 18.9 28.6Small industries 43.1 c 27.7 29.1 23.8 23.1Medium industries 39.3 24.7 23.9 16.4 18.1Average 41.5 27.2 27.0 20.5 20.9 16.4
Large Scale Industries 7.5 4.0 4,7
.i not obtained or available.
/bIn each year data were not available for some of the branches. In 1974three branches are excluded, in 1975 two, -a 1976 three, in 1977 none,and in 1978 thirteen.
/ Includes loans to corn and rice mills, which were classified as agricul-tural loans in subseq-tent years.
/ Aging of Arrears. Most of the arrears are by more than three months.As of June 30, 1977, loans in arrears by more than three months, as apercentage of all loans in arrears, were 85.9% for home industry loans(14.1% being in arrears by less than three months), 88.3% for smallindustry loans, and 81.8% for medium industry loans.
/e December 31, 1979.
If Averages for small and medium iidustries.
Source: DBP.

ANNEX I TO CHAPTER II
Table 2.7:
PHILIPPINES
FINANCING OF SMALL-SCALE ENTERPRISES
DBP: Present and Projected Staffing Position
Actual 1976 Projected 1978
(Se,tember) (August)
Professional Staff
Head office support 411 588
Head office operations 532 1,050
of which:SMI program /a (61) (149) /c
Large scale industries (79) (102) /c
Department of rural and
private development banks ( ) ( )
All branches 965 1,133
Total 1,908 f71l
Non-Professional Staff
Head office support 332 488
Head office operations 162 335
of which:
SMI program /a (17) (28)
Large scale industries (16) (23)
Department
All branches 722 878
Total 1,7216 01
Total Staff 4,472 Id
/a Inluding the home industries program.
/b This is the department handling the equity and rediscounting operations
mentioned above.
L As of September 1977 the number of professional head office staff working
on the SMI program (including home industries) had risen to 101, while the
professional staff on the large industries program had risen to about 90.
Id In August 1978, DBP staff had risen to 4,398. A staff complement of
5,192 is projected for August 1979.
Source: IBRD Appraisal Report, 1972-PH, April 1978, Annex 4, T-2.

Table 2.8:
PHIILIPPINES
FINANCING OF SMALL SCALE ENTERPRISES
PDCP: Loan Approvals Classifted byAsset Size of Reelpient Enterprise
(P Million)
Cumulative
1963-1972 1973 1974 1975 1976 1977 TotalNo. Amount No. Amount No. Amoait No. Amourt No. Amiount No. Amount No. Aniount
Large Enterprise 113 439 23 90 32 185 19 79 14 97 15 119 216 1,009
Medium Enterprise 58 54 12 14 5 6 7 7 5 3 10 10 97 94
Small Enterprise 23 11 7 1 14 3 20 3 28 6 82 20 174 44
Total 194 504 42 105 51 194 46 89 47 106 107 149 487 1,147
Source: PDCP
0

ANNEX I TO CHAPTER II
Table 2.9:
?HILIPPINES
FINANCING OF SMALL SCALE ENTERPRISES
PDCP: Arrears in Relation to Principal Outstanding
for Large and Small Loans, 1975-78
June 301975 1976 1977 1978
SMALL LOANS PROGRAMNo. of Firms 36 49 89 119
In arrears by 3 months or more:
- No. 7 16 33 15
- Percent 19 33 37 13
Princioal Outstanding (billions of' pesos):-
(A) - in grace period 1.6 2.1 4.1 13.2
(3) - in repayment period 3.7 5.4 12.8 12.8
(C) - subtotal 5.3 7.5 16.9 300
Arrearages of 3 months or more (million pesos):-
(D) - Principal and interest 0.3 0.9 1.0 1.4
(E) - Principal only 0.2 0.6 0.7 1.0
Rations:
(F) - (D) (C), % 5.6 12.4 6.2 6.4
(G) = (D) (B), % 8.1 17.1 8.2 11.1
(H) = (E) (C), % 3.7 8.2 4.3 3.9
REGULAR LOANS TO LARGE AND MEDIUM ENTERPRISES
No. of Firms 140 147 136 141
In arrears by 3 months or more:
- No. 36 26 36 31
(of which, No. in litigation) (1) (2) (4) (4)
- Percent 26 18 26 22
Princioal Outstanding (billions of pesos):-
(A') - in grace period 302 190 97 179
(3') - in repayment period 392 502 630 542
(C') - subtotal 694 692 727 721
Arrearages of 3 months or more (million pesos):-
(D') - Principal and interest 30 33 39 38
(E') - Principal only 14 18 24 22
Ratios:(F') - (D') (C'), % 4.3 4.8 5.4 5.3
(G') = (D') (B'), % 7.6 6.5 6.2 7.0
(') - (D') + (C'), % 2.0 2.5 3.4 3-7
Source: Provided by PDCP for IBRD supervision report of November 15, 1978
(see Annex Table 24 of latter report).

Table 2.10.
PilI 111I NES
FINANCING 0F SMAI. SCALE ENTERPRISES
Idtntifled Source of Finance for Ilome induatry and SSE Loan1, 1974-1978(P '000)
1974 1975 1976 1977 1978No. Amount uN. lulnuut % No. Anount x No. Amount Z No. Amount %
Developnat Bank of thePhui1ppineaf_b 220fc 28,836f4 77.6 396_c 48,543fe 45.5 1,7011d 86.321 71.1 1,090 73,032 66.7 1,084 64,800 48.0Industrial Guarantceand Loan Fund 31fe 5,645fe 15.2 349fe 54,671/e 51.2 130 29,220 24.1 71 20,332 18.6 140 46,989 34.8Private DevelopmentCorporation of thePhilippinesfl 14 2,648 7.2 21 3,559 3.3 26 5,823 41.8 64 16,131 14.7 69_ 23, 3 5 0f1 17.2
Total 265 37,129 100.0 766 106.773 100.0 1,857 121,364 100.0 1,225 109,495 100.0 1,293 135,139 100.0
a_ lased on approvals.fb Figures are for flacal ycars (July I to June 30)c Excludea home Industry loans approved by branches ilthin their diseretlionary authority and amounting to P 8.3 w1ill:o.fd Includes a large nuaber of tri-cycle lonna.
]L For FY75 (July I to June 30) subsequent data is for calendar ycars.ff Net of 1CLF funds onlent by PDCP.gEs t Liated.
Lil Total excludes lending by PDa.
Source; DUP, IGLF and PDCIP.
C)'

ANNEX II TO CHAPTER II
PHILIPPINES
FINANCING OF SMALL SCALE ENTERPRISES
Financial Institutions in the Philipnines
Banking Institutions
1. Commercial Banks. At the end of 1978, there were 26 private banks,
l/
2 government owned banks and 4 foreign banks. - Commercial banks- are by far
the largest source of institutional credit in the country, accounting for
55% of the total assets of the financial system. Over 70% of commercial bank
lending is to manufacturing and commerce, the share having increased
steadily from 55% in 1960. Most commercial bank lending is short-term and
serves to provide trade credits and working ca,ital to industry and
commerce; for the period January-August 1977, 60% of total credit granted
was for a year, 10% was for 1-5 years and 0.6% was for over 5 years. 2 The
comparable figures for 1976 were 68.6%, 0.6% and 1.02%. The above figures,
however, do not reflect the element of rollover credit for long-term finance
which, though unquantifiable, appears to be significant.
2. Develovment Finance Institutions. The government-owned Deve-
lopment Bank of the Philippines (DEP), the privately-owned Private Deve-
lopment Corporation of the Philippines (PDCP) and, to a lesser extent, the
Philippine Investment Systems Organization (PISO) are the major providers of
long-term finance. As of December 31, 1978, the total assets of DBP, PDCP
and PISO were P 18.1 billion, R P billion an& P 189.3 million respectively.
1/ As of December 1977 the percentage distribution of assets were as follows:Private domestic banks 59%, foreign banks 11%, and government-owned banks30%.
2/ The remaining 38.4% was in the form of short-term demand loans.

ANNEX II TO CHAPTER II (Continued)
3. DBP was established by the Government in 1958 with a mandate
to supply long-term credit to agriculture and industry. DBP plays a
vital role in the economy as it is by far the largest sulpplier of both
long-term local currency and foreign exchange resources. As of December 31,
1978 DBP had loans outstanding of about P 11 billion.
4. Although PDCP is defined as an investment bank its main business is
the provisio.n of long-term loans which accounted for 76' of its total assets
as of December 31, 1978, equity investments occupying a relatively minor
(3.5%) position. ?DCP lands primarily for manufacturing and transportation.
5. PISO, incorporated in 1974, is privately owned and operates as
an invesment banking institution. Until recently PISO operated primarily
in the money market but is increasingly going in for term lending. As
of December 31, 1978 its money market operations and long-term loans
accounted for 74% and 4.1% respectively of its total assets. ?ISO lends
principally to manufacturing and service industries and for transportation
equipment.
6. Private Develooment Banks (PDB). The 35 PDBs have been promoted
by DBP/Central Bank of the Philippines in various regions to mobilize
local savings and make resources available to both agriculture and industry.
As of June 30, 1978, the total resources of PD`Bs amounted to P 666 mil-
lion with a deposit base of P 383 million. As of the same date, the total
outstanding long-term portfolio outstanding of PDBs amounted to P 399.2 mil-
lion. In terms of sectoral distribution, 53% went to agriculture, 38% to
industry and 9% for miscellaneous activities such as low cost housing,
vocational schools and commercial loans.

ANNEX II TO CHAPTER II (Continued)
7. Rural Banks. Rural banks are unit banks which are municipality
specific and provide short-term loans primarily to agriculture. The rural
banking system comprises around 906 privately-owned banks. At the end of
1978 their total assets amounted to P 4.0 billion while deposits amounted
to P 1.5 billion.
Non-bank Financial Institutions
1/8. Investment Houses. The 12 - nvestment houses are the only
entities which can engage in the underwriting of securfties on a firm basis.
The volume of underwriting business undertaken by the investment houses 7as
minimal during the period 1970-76. During this time, money market operations
were extremely profitable and the investment houses tended to concentrate on
these. It is estimated that in 1976 approximately 80% of their resources
accrued from such operations. The reduction in the profitability of money
market operations has resulted in investment houses going in for more under-
writing and syndication. However, relatively little long-term lending is
2Jdone by investment houses.
9. Finance Comoadies. The Securities and Exchange Commission has
260 finance companies registered with it. Of these, the 42 largest account
for 80% of the turnover. At the end of 1978, the finance companies had total
resources of ? 7.3 billion while loans outstanding amounted to about
P 4.8 billion. Most of the finance companies are subsidiaries of major
comercial banks and are engaged in financing the purchase of consumer dur-
1/ As of September 30, 1978.
2/ The most notable exception is the Private Development Corporation ofthe Philippines which is classified as an investment house but operatesas a long-term lending institution.

ALNNEX II TO CHAPTER II (Continued)
ables, and providing short- and medium-term credit to local manufacturers and
traders to finance inventory, receivables and transport equipment. Until 1978
.inance companies were not covered by CB interest rate ceilings and, conse-
quently, could charge up to 24% a year on discounting of receivables. Under a
recent Presidential Decree, finance companies are to be directly regulated by
CB with respect to the interest race charged on assignment of credc:, purchase
of installment papers and accounts receivable.

ANNEX'TO CHAPTER IV
Table 4.1
SUMM4ARY OF STATUS OF MASICAP PROJECT STUDIES, 1973 TO JUNE 1979
No. of Projects %
A. Projects on which YASICAP Committedto Provide Assistance
/1
Completed and Submitted for Licencing
or Financing 5,468 84
Discontinued During Feasibility Study 763 12
Shelved or Still in Process 263 4Total 6,494 100
B. Assistance Rdndered (completed Projects)
Submitted for Financing 4,895 90
Subm ted for Licencing 424 8
Oth 149 2Total 5,468 100
C. Status of Projects Completed (All Projects)/3
Approved After Appraisal /4 2,499 46
Withdrawn Without Full Appraisal 1,164 21
Disapproved After Appraisal 280 5
Still Awaiting Decision 122 28
Total 5,468 100
D. Status of Projects Submitted for Financing
Approved After Appraisal 2,499 51
Withdrawn Without Full Appraisal 1,163 24
Disapproved After Appraisal 280 6
Still Awaiting Deicsion 957 20
Total 4,899 100
E. Projects Approved for Financing by Year
1973-74 49 2
1975 563 23
1976 864 35
1977 544 221978-79 (first two quarters) 479 19
Total 2,499 100
/1 Mostly rice-mill projects submitted to the National Grains Authority,
which requires all mills not to have wasteage rates of below 80%.
/2 Mostly projects for finance by owners.
/3 89 (or 3%) of the projects were dropped for various reasons by theowners after they were approved by the financial or licencing institution.
/4 That is after preliminary screening by the financial institution. The
most common reason for withdrawing projects is failure to satisfy the
institution's collateral requirements.
Source: MASICAP Quarterly Report, Second Quarter, CY1979, Ministry of
Industry.

ANNEX TO CHAPTER IV
Table 4.2:
SIZE DISTRIBUTION AND PURPOSES OF LOAN REEQUESTED IN
MASICAP ASSISTED PROJECTS, 1973 TO END JUNE 1979
/1 /2 /3
Loai Size (P '000) Number of Projects % Distribution
0 - 50 1906 44.3
51 - 100 664 15,4
101 - 150 616 14.3
151 - 200 172 4.0
201 - 300 232 5.4
301 - 400 151 3.5
401 - 500 202 4.7
501 - 1000 222 5.2
1001 - 2000 86 2.0
2000 - above 53 1.2
Total 4304 100%
/1 The loan requests are often different to the amounts granted, the
main tendency being for the banks to reduce the working capital
component. This is for example evident in comparing MASICAP requests
with the actual loans granted by DBP or through IGLF. The sample
cases reported on by Mrs. Fajardo (1979) give the following:
Percent Distribution
Purpose MASICAP Requests DBP Projects IGLF Projects
Permanent Working Capital 41 16 26
Land 5 2 4
Buildings 19 33 28
Machinery & Equipment 35 49 42
100 100 100
Note: The three distributions are taken from different samples, but one
can see that DBP's finance provides on average for much lower levels
of working capital than MASICAP's recommendations.
/2 Mean Loan Size: -201,000.
/3 Prepared and Submitted for Approval.
Sources: (Other than f.n.1): MASICAP Quarterly Status Report, Second
Quarter, 1979.

ANNEX TO CHAPTER IV
Table 4.3:
SECTORAL COMPOSITION OF A SAMPLE OF MASICAP - ASSISTED PROJECTS,
AND A SAMPLE OF PROJECTS OF DBP, PDCP AND IGLF (COMBINED)
MASICAP DBP, PDCP and
Code Industry Group Projects IGLF Projects
MANUFACTURING
311 Food Manufacturing 14 14
312 Animal Feed, Grain & Poultry
Products 6 8
313 Beverages 1 -
314 Tobacco321 Textiles 2 8
322 Wearing Apparel 9 24
323 Leathergoods, & Leather Substitutes - 4
324 Footwear (Exce. Plastic & Rubber) 2 3
331 Wood and Cork 7 15
332 Furniture & Fixtures 13 7
341 Paper & Paper Products 1 1
342 Printing Publishing & Allied - 7
351 Mfr. of Industrial Chemical - 3
352 Other Chemical Products 1 3
353 Petroleum Refineries -
354 Misc. Products of Petroleum and
Coal
355 Rubber Products - 2
356 Plastic Products n.e.c. - 10
361 Pottery, China & Earthenware 1 3
362 Glass & Glass Products - 1
363 Manufacture of Cement
369 Other Non MetallicMineralProducts 5 8
371 Iron & Steel Basic Industries - 1
372 Non Ferrous Metal Basic Indus. - 3
381 Fabricated Metal Products 2 19
382 Machinery ex. electrical 11 7
383 Electrical Machinery Apparatus,
Appliance & Supplies - 8
384 Transport Equipment - 8385 Professional, Scientific,
Measuring & Controlling
Equipment 1 4
386 Furniture/Fixtures of Metal - -
390 Other Manufacturing Industries 3 12
NON MANUFACTURING
Agriculture 12 3
Tourism - 17
Services 2 17
Sample Totals 93 205
Source: Samples taken from files of MASICAP (95 cases), DBP
(loo cases), PDCP (47 cases) and IGLF (56 cases).

ANNEX TO CHAPTER IV
Table 4.4:OPERATING AND LOAN REPAYMENT STATUSES OF
MASICAP ASSISTED PROJECTS
% Distributions
Enterprise: 1977 1979
Enterprise:
Still Operating 86.7 66.5
Closed Down 4.0 25.2
Transferred Ownership or Location 1.0
Divernd Funds 9.3 2.9
Other- 4.4
100 100
Loan Repayment Status
Up-to-Date 51.8 51.5
In arrears by:
- up to 3 months 7.9 ) 16.2- 3 to 6 months 12.9 )- over 6 months 27.4 32.3
100 100
/1 Based on number of projects in samples.
Source: Ministry of Industry's Monitoring Surveys (MASICAP.Monitoring
Reports) for respective years.

ANNEX TO CEAPTER IV
Table -.5:
CHARACTERISTICS OF ENTERPRISES "IN ARREARS"AND OF ENTERPRISES "UP-TO-DATE" IN LOAN REPAYMENT UNDER
SIE OMI PROG?A4
Percentage of Loans: 71
Category of Loan Recipents Up to Date in Arrears
1. Enterprise New or EZxisting at Time ofLoan
New 14 25
Existing 86 74100 100
2. Tvne of Ownershio
Single Proprietorship 51 60Partnership 5 13
Corooration -4 37100 100
3. Product Market Grouv of Enterrises
Agricultural 8 6Industrial 27 25
Construccion 3Service 11 12Vage Goods:-High Income 13 12
-Y-iddle Income 26 25-Low Income 12 17
100 100
4. Location of Product Markets
Local 54 52
Regional 20 23
National 8 9Exoorts 6 16
100 100
5. Size of Loan
?50,000 and Below 15 15
P101,000 - ?100,000 11 1
7101,000 - ?150,000 9 5
?151,000 - ?200,000 9 7?201,000 - 1300,000 10 7
?301,000 - ?400,000 8 1
?401,000 - 7500,000 10 8
Above 1500,000 28 45100 100
6. Loan Size+Business Assets at Before Loan
Less than 1.0 45 40
1.0 - 1.99 25 20
2.0 - 2.99 6 11
3.0 - 3.99 94.0 and above 15 24
/I In arrears by more than one quarter.
Source: File data of MASICAP, DBP, PDCP and IGLF, tabulated on Mrs. Fajardo'sreport. A randon sample (stratified between projects in arrears, and
projects up-to-date) of 300 projects was taken; of these 170 projects
were taken from the "projects up-to-date" files. Hence the relevant
comparisons are relacivities becreen the two :olumns, not the absolute
figures.

ANNEX TO CHAPTER IV
Table 4.6:
LOAN PROCESSING TIMES FOR DBP, IGLF
AND OTHER FINANCIAL INSTITUTIONS
Loan Processing DBP Final IGLF
Time (Days) No. % No. %
1 - 30 164 9.4% 33 12.8%
31 - 60 256 14.6 37 14.4
61 - 90 254 14.5 34 13.2
91 - 120 220 12.5 34 13.2
121- 180 346 19.8 48 18.7
181- 360 365 20.9 58 22.6
361 over 145 8.3 13 5.1
TOTAL 1750 100% 257 100%
/1 Direct lending by public and private banks out of other government
lending facilities and own resources.
Source: MASICAP Quarterly Status Report, Second Quarter, 1979.
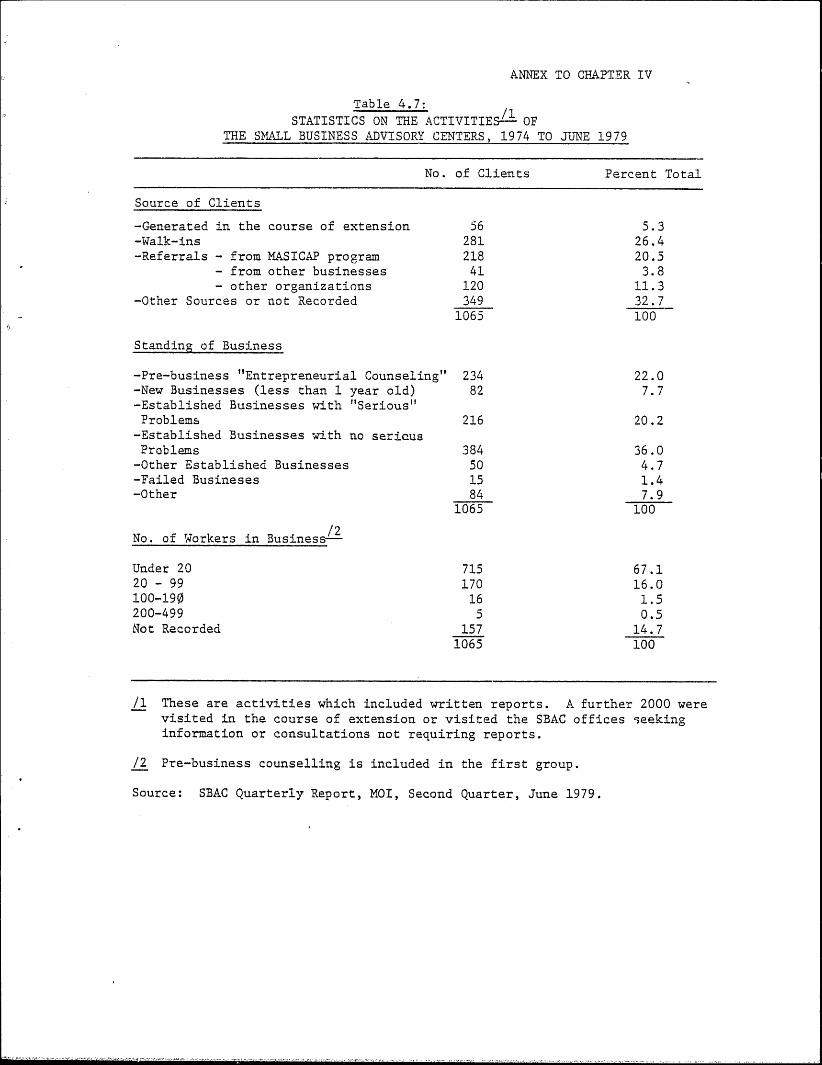
ANNEX TO CHAPTER IV
Table 4.7:STATISTICS ON THE ACTIVITIES-- OF
THE SMALL BUSINESS ADVISORY CENTERS, 1974 TO JUNE 1979
No. of Clients Percent Total
Source of Clients
-Generated in the course of extension 56 5.3-Walk-ins 281 26.4-Referrals - from MASICAP program 218 20.5
- from other businesses 41 3.8- other organizations 120 11.3
-Other Sources or not Recorded 349 32.71065 100
Standing of Business
-Pre-business "Entrepreneurial Counseling" 234 22.0-New Businesses (less than 1 year old) 82 7.7-Established Businesses with "Serious"Problems 216 20.2
-Established Businesses with no sericusProblems 384 36.0
-Other Established Businesses 50 4.7-Failed Busineses 15 1.4-Other 84 7.9
1065 100
/2No. of Workers in Business--
Under 20 715 67.120 - 99 170 16.0100-190 16 1.5200-499 5 0.5Not Recorded 157 14.7
1065 100
/1 These are activities which included written reports. A further 2000 werevisited in the course of extension or visited the SBAC offices seekinginformation or consultations not requiring reports.
/2 Pre-business counselling is included in the first group.
Source: SBAC Quarterly Report, MOI, Second Quarter, June 1979.

ANNEX TO CAPER V
Table 5.1:r-mPLoYErT AN) OU-T BY ECONOMIC SECOR, 1956-75
Annual Growth Races,
?ercenca2e Eploved No. Emoloved, 000as ncrease, 1956-75
1956 -966 1975 L956 1966 1975 110.300s Tcal 1956-60 1966-75
Agriculture, acc. 59.0 37.5 53.3 -.,548 6,290 7,768 3,220 47.2 3.3 2.4
Hanuacurng,,Smal-Scale- 10.5 5.7 7.3 811 954 1,126 315 4.6 1.6 1.9
- :arge-Scate 2.0 2.5 3.6 151 275 525 374 5.5 6.2 7.4
Comerce 10.4 10.3 11.2 503 1,126 1,623 320 12.0 3. 4.1
Conscruc.ion 2.6 2.6 3.1 198 283 456 258 . 3.3 3.6 5.4
Se rvi aes:
- ?ersonneL 1.3 2.2 1.9 135 242 272 137 2.0 6.0 1.3
- Domestic ,3 -.6 a, 332 502 782 450 6.5 4- 5.0
- 5avern=enc 3.1 7.2 9.2 392 788 1,335 943 13.3 7.2 6.0
Transport, etc. 3.0 3.3 3.4 228 38Z 492 264 3.9 5.4 2.3
All ocher 3 0.9 0.9 104 9 38 34 0.5 1.4 1,7
Tocal 00.0 100.75 10.0 7,. 7 02 T -,9 63 14,517 ;7 6,15 100.0 3.6 3.2Concribution to NDP
Percenra2e of MD? '6. ?esos, 1972 ?rices Increase, 1956-75 Annual Growh Races,',
1956 1966 1975 1956 1966 L975 PH 1 Ttcal 1955-66 L966-75
Agriculture, are. 35.7 34.2 30.5 3,206 12,157 16,791 8,765 27,4 .0 3.7
%anuiacturing 16.1 17.7 19.7 3,716 6,289 10,S42 7,126 22.3 5.4 6.2
omerce 23.7 23.6 22.3 5,457 8,404 12,295 6,838 21.4 4. !.3
Construction 5.1 4.8 5.9 1,178 1,709 3,252 2,074 6.5 3.8 7.
Services 14.0 14.4 15.2 3,225 3,116 8,361 5,13E 16.1 4.7 5.6
7ansport, ace. 3.4 3.6 3.9 777 1,272 2,140 1,363 4.3 5.1 6.0
AlOer2.0 1.7 2.5 i5 49 L!382 928 2.4L 3.6 8.8.All Oche- 54
N?10010i0o.0 100.3 23,70 13 3-,596 55,363 31,960 10O0 Z-5 5.0
National ncome 22,445 35,276 55,232
25,577 41,240 68,291
11 iouseholds and establishments with less than 20 workers (calculated as residual).
/1 20 or more workers.
/3 -he Nacional Accounts data for value added i small-scale and household manufacturing are not reliable (see Chapter 6, paras
6.29 at seq.), and so are not shown separately here.
Source: Taken from 1978 Philippine Statiscical Yearbook, 1978 MEDA. Organized sources are the Narional Accounts and the Labor
Eorca Surveys.

� �
ANNLT :0 С Ец 7 Р д '1
> t г hLa 5.'r
SOl4 ц У У 0У ? Т-& У 9 LME ЯVI Г lEO� ..� 1 05 Г д У . LOCATION. УЕ А д О Р OFOAMZAIION
д 55Е 1'S �-_.� @tAYH£Lff а 210 3ALE3
'L+ar о ! О г3 а а1 гд с 1 а n а l , о� а 1 ,taaa[ а 7 о .. '-soLoveea 5aiay- �
v Vo. !:1w с п х е яа а а 5[src- а с 5 са г и а _ ?'000 ,aul 5k111ed 7n в aiilad _.vueL Quanclcv
�
_ У е ди l а г ) � ?eeutac' ,_ ?")OOffear
7wlczy 5 М ав l в вд а 111 ZI 1412 ;na. 4,JC0 34 IO 2!- - п . х .
С г ап 4 Э ов ![ Ч а гЬ i а l а ц ц 2469 3 580 � 1 75 i - ,.00
3 3 г Уе г f. 7 т ос w ад Eruiu.
.
aleiclea I7 1977 4 Z00 54 - ;0 200
д я р а ао д Lа л в q и l р . г а w. III / Э Т З 3 n. г . 100 7J 5 Ы ].100
5 С ,а д в аа д t Ь а дв а Г 7 1970 5 Ь в 1w СО О 1 п LO - - L00
г Ь ц га д г г ае г а л , ц с в Tnsh в ca 7У 196 Э 4 Salw 100 '! В 7 - -00
- Чи с р г о ди е с а Ь с и и у а а еа Р 1,472 9 belw LO !0 7 7 + : С Ь
д :М lа h г а а в Е а r ац n ц Ь с +п а l а ; I 197й 3 .. 9. 3 ' ЭО О
Э Ф ос о l а с а с аа гt Т CZI 1976 3 о . а . 90 7 37 30 л 00
� 10 р и Е l в д eiu S р а рс а п са ад у Р !972 150 б 0 :0 50 - )00
'1 tioodlea i=1ca) Р 1976 9 L20 6 7 7 -
?д Ь г аl д в n д .� l о сk а в Ь ah.aca а . а. t977 3 n.a, 11 ' + - i00
' I3 � оо д л v е g в с г Ъ Lв рг в ев п е в 17 1374 , ]5 , п , г , у а , ,.90
$ ст л гм т г у � ат ind vlaa 2 1968 Lы . ovec 1,300 62 ._ п : е а , 50 "30
13 аn р ы Т ы . ы i и г и г аг IP-A 1953 гы . 500 � 1,000 а . а . .. а . а .
15 З е ва7 !ahsica- Еи та 1 в61n3 а IY- А 1970 I ы . + � 000 170 : г 2 �
3 -
!7 ;! аи l д в д г и ЬЪ в т р г о . Е от Lnd. LP- А 19 Ь 9 500 2 Э 30 . - , tyi00
t д T1n св а ы m.faacurlag N- А 1962 4 а . а . 140 .. . 1'.0 :,]00
14 ц о од 6 а е с в l д ао л . vlador в СР - А 1937 Iac. i ГА t00 п . а , .. . п . г ..
20 О а вд о11 гв llalaq 2I2 1974 S L30 ] t а х а - 500
21 511pp в rs ' д о ав а с l е ц к W с а ) IP-A 1977 L ы . . 5,000 100 п , а . о . а . п . а , 1,800
' 2 Т СЬ ц д п ¢` а с l о с Ы аЕ IP 1932 L ы . },300 140 1:.0 - - ?3,')00 � �
3J Э t о и в и , gwns Ь д л в а а а 1972 3 1,000 20 30 - - .30,91 Ю
,4 ?awa'1 гу aslclag :J-Aa 1906 о ме г 1,000 + д +4 4 - avec t,000
23 Clagerla, д гЧ аи LV 193 д 50 20 70 - - 750
5 рг о м а а в д [ у l са Lp 19 Ь 1 mr 3,000 170 :0 - 130 7,'00
27 :i оо д l в в Р в с со гr 2 1970 оv е г 500 n. г , а . а . - � а .+.
29 Guacoca bu11c !и га i с и г в L7 19 Ь 0 9 wnr 1,00 з 5 :5 � 30 а .+.
79 А с г ае с сг v в Ъ а с се гi � а Z4 L9 б ] 5 п . в . и 8 -8 - - 133
З О 2l в е с тi са l auqpllaa ь aquap. г7 1971 I а г . 1,730 76 .. . . а , а . а . 9, Ь 70
71 5lippeca 27- Ь !96 д 3 - 8 - - +6
. 32 Ling в rls i7 1971 5 ', Э ОО 7 Э 0 1 Э0 - 130 Ь , ЬО О
7 Э Plahoaad 17- А 197I 9 2,300 15 п . а . а . а . а . а , 2,.00
14 ? а ql п в cxbuildiaR 5 n к .hlae �
shov i0 197 Э 100 13 п , ы . а . а , а , а . '20
33 Ч а гс г ы '. оо l а s D1u , Р L974 t ы , l93 )8 l7 11 - 1 Э 51
36 31 е в Ч 111i а { 1II L964 9 41 � ]5 L,,000- �
37 ?1 г в :L с т в ад l гs В II2 1977 � а � 793 40 n.a. n � в . .. , а .
7 д Сатл . аса Iv 197 е га<. ао t1 э г - . ь,7toj �
39 Са в - ц r е д avan L7 196 д о L,004} 18 а . а , о . а . а . а . LOOr=7
:0 Ч к h1 м .4 � ор Sв rvl с в 4
�?abrlcacloa 2V 1977 9 а , а , 12 10 2 - L,300
.1 С а1 и а а си в ва т-i в а ,. Ъ � 1 е а ,
S1cqcla а а вв г г l7 СР - А L963 5 +50 dZ п . а , а - а . а . а . а . в ,
+2 Са гт а г а IP 1931 4 5,000 50 :0 - 10 2,700
.7 `l и hl ав 5п о р S. г гl с а Ь'
р аЬ д и б оа W С 9 Ь 9 5 :3 13 - - а . г .
� У в с г L а ои l д � Е от 71 а в г 1 с 5
. д l а аа l дд и а г т Т i7- � 19T4 1 ас . а . а . n.a. .. .. � . а .
-5 З г 1 п в с и т вд d1ag.C ц 197] Lы . 4,000 123 п . г . а . а , п , а , З ,
п
250
д а а дЪ в g а Ь accaaaoriu !7 196 д Э L,000 100 п . а . .. а , г , ¢. а ,
+7 С г кх в ас а IV 19 Т 3 а . а . В 5 n.a. п . и ,. ,
� ' � s:chla. varlu гР 19s г Inc. Зо0 ta0 100 - - а .,.. 49 Р l в с с г l с А 7 р Сl а гr. в а f д в l г lg в -
earore, Na, . г е .) 196] 2 а е . 31,000 ;, ц 0 n... а . а . .. 191,000
50 5 и в 1 С аbl а в е а 19 ТТ 3 1,12 Э Gb п ,+. а . а . п , а . 3,27J
ц г вк с ll а 511 У З ст и а р гi а с ' ац 197 ь 2 и 1 4 а з0 а.,. : а 17 х
72 Zoad Р г о с в в аl а б 1963 Lac. n,a. 24 5 19 - а . а .
3] pawt С о а ве гс l а g 1977 Э а . а . 10 10 - - 4,1 Ю 0 �
. Д ц l[ вд .=1ah р а в [ а IP 1946 5 7,000 92 а . а. а . а . о . а . 10,000
� 55 Aaflala; о ! О а вд Oi1 LP 1971 3 100 5 2 З - ]00
36 Cargo �S1pp1aS г 197J Гх . 7,500 !00 , а . 7,200?/
3) 3aaery г 1977 5 100 5 aL а 5 в - 700s1
за ч . см i ы s � op х 197 Ь s 1 о Ь З г 1 э-91
- з4 г:о о д Р т а ди с са г С975 3 200 l0 .. . п . а , а .+. 100 -
60 l оо д Р т о с еа вl аб г 19: Л S 130 10 - 10 - о . а .
61 fl ае hl д в дЪ о р г 197 Э 2ы . 1, С С О 18 L2 4 750
62 С е т ав l а V а л а IP-A 1973 ! Ри к г Ь а в е д ) 2 а е . 500 9 п . а . .. а .+. 1,300
5] F и кц си гв IP 19 Т 2 I ы . 2.000 7 г а . г . а . а. п . а . 1,407
64 ] в е р а , S п ге k, 3 од у Э uLldiaq I11 197 й 3 110 Ь п , а . п , г . .. l1u
63 Laduaerial Ь А д i т l с и т е l
Ч а еЫ и г у I22 1977 З I^1 38 3д - - " 3b1
5 Ь 1 е а [ Ь е т рт о ди е е а t Н га д е т а l с вд ) IP 1974 S 707 30 а . г . п . а . J25
� 5 Т J о о д в а toT ;Smul ц earinq г4 1960 $ n.a. 4 2 2 - р 50
bд scutl. д т 11. Iv 19 ЬS s 10 и 1 З - рб0
о 9 W г ав гу Furalcure Ip 1960 5 3 4 - ?30
70 г е r а Wc а ! tlaplacu fl 19 Е 2 5 10 1 В l2 Ь - Р 100 �
Т 1 5h в llcralt ( Ъ и ег о о в . � м 1q) IZ 193I 9 1,300 д 0 . 10 20 30 еВ 00
� 72 Oo,.waca с ор у ав М е в ц 197 Ь 3 а . а . 7 7 - - Р 110
С1 91 ц � 1 в proprlacar+hlp о т с о гр о т а сl аа .
� 1 :4 а а с а г l и Llgv т n г а l г е в с о 1977 о г ал аv в г ем а р а в е 12 д м гЪ � ас с1д � о [ l о с в сч l еч ; Т м в Е lg и г и ал а рр го к l т .аг l о па , а а д uatue
oche м L � Ео а са а и д , а аl е а Е1 д.l г и л l а е с о chauaaad р в ео в р е г ув л г .
7 Г Ял l ел с е р L е а ц 7 в г v в в д . � �
l! tta:ara ta ' с 11а а р ег dry, 1
3 Г ial в л ео ре ю а р в г meoch.
61 Ав l а к � сс и а l са р п д и с ад ,
=� М Еа р са ' а . е тl е iaaa.
91 д в l от а г а р s в аа р в г mvarh.
91 З в l а л е е р а а а а par т о агЬ .
, � - ,..,._ � ..._ � _. ,, w.,.r_ � ,.,......

A1,1TEX TO CH"TER V
Table 5,3t
SU`.'LkRY OF FI9245 WrERVIEWED: SOURCES OF F71iANCE
interview Subse went 0 eraci as Co=ancs an Q er
I,buzzber: Scarcup of Business Working Capital Investment CopttTl Management, ocher
I Business purchased. Purchase price not Firm gives trade credit of 60-90 Equity finance by SPDA of Large and growing localgiven. PNB (IGLF loan of p 500,000 assumed days an sales. Receives suppliers ? 1.0 million in 1972, La.. markec; region importsby new owners. Original owners held equity credits of 15-30 days an by SPDA of P 2.3 million in product.of F 150,000,
materials. (Is =a included in 1978 at 6%.
price agreements.)
2 Own sources provided P 30,000. Through Conmercial Bank loans. one year loan of P LOQ,000 Son cook over and expanded(Family also has agricultural from Equitable Bank. Bank business in [974,businesses and has good credit of America loan of ? SOtDOO.
3taading. BusLaess orciits also major
source.
3 O sourced provided P 50,000 Obtained from commercial banks. Business proftes, Makes cake, rolls for large(Decails not disclosed).
ice-creas indescry,
4 n.a. n.a. Business adapts and designs
its a- products.
5 Own Sources n.a. IGLF Loan (Amounc noc
disclosed)
6 O savings plus very mail loan frm Business resource.. Business profits. Racuirks:friend.
"Given up hope of getting
a bank loan" - no collateral,
7 Own saving and borrowing from relatives. 1GLF lose of P 12,000 for permanent SBAC assisted, and 1 aaazed at nan gave up teaching to go4orking capital . ease of getting loan"). tr,'bu.imess.
a Inherited land and moaey. Business resources, Borrowed from IGLF through owner am agronomist; has
rural banks. (Amount not cr.ined empLoye.s.
disclosed).
9 own savings and borrowed from, Business resources. Borrowed !or delivery cruck Devised preservacive,reLatives. Uses family homes for frm D8P. (Amount nor die-production,
closed). Business profits, and
reluctant to borrow.
10 O sources provided P15,000 Business resources. DBP loan of P 122,000 for Does own marketing,
delivery trucks,11 Borr-d P35 000 cc finance ICLF loan of P72,000 co pay No investment since 4carcing.
buildings; source not disclosed. overiieads an buildings uncil
Owner owns a grocery store which business recovers.
probably provided same funds.
12 not d isclosed. Local lecters of credit from Nor disclosed.
-- arcial banks.
13 Funds from retirement pay. Hot disclosed PDC? (IGLF) losol amounc nor owner Is Food Technologist,
disclosed. retired from goverment, has
concacc with exporter.
14 Own sources, started with less than Probably part of DBP loan used Used P 32,000 fr= retirement Initially a household iadustry;P 20iaoo. for permanent working capital. fund in 1972. Large DBP loan Owners "Ib economics" graduate,
other sources (If any) met La 175 raised assets from
determined. p 200,000 to P 1,500,000.
15 Started in 1953 with P 700 frm own Moat f expansion came out of Started on small repairshop.
sources. Cossearcial banks (data not profits; but coca had loan of No. largest producer in
given). P 150,000 from Co-.rci.L Banka. country.
(Date not zLvea).
16 Four friends puc in P ,000 each for ,;at disclosed. Profits from expanded capital Major supplier to hotels duringbuying and selling chemicals.
base (FICO,030 in one year), construction boom.
Reinvested in 10 second-hand
haudlo=. for heavy fabrics.
Business profirs financed
further expansion to 100
handlams.
17 Own savings of P200,000 from 5 years Not disclosed. Assets expanded fr= F100,000 No previous experience; adviceof working in Canada.
in 1969 to P400,000 in 1973 and from friends.
P750,000 in 1977; Sources:
Equity of F250,000 by bcother
or friend, rwainder from profits,
is On savings of P5,000 invested in Has borrowed at various times Loan of P20,000 from DOP in 1963; Pcevtouoly worked La t l and diebusimes.. from major commercial banks; Increased to 238,500 Ln 3am* maawfaccuring,
And rmarked that he was year. Further loan of P127,000
?'highly con cious of credit in L965 for purchase of land
standing". and factory buildtag
19 Own savings of P1,500 (La 1957) invested Obtains suppliers credits And Borrowed from DBP and commercial Was a carpe4tec, now has professicnakin business. loans from coasmarcial banks, backs an several occasions to scaff and selesmen.
expand business.
20. Sold old Saanlin. station business and profit margin on processing high; obtains used oil from gas stations;purchased iecand-hand used-oil refinery, offers suppliers credits to planning to process individual oil.Purchased supported by loan, but source purchasers.
of amaunt not disclosed.

. ... с.с:< <7soia 5.7: . С а п с l г.и и д )
_ncarv( г Ч S и Ь ч в а а г п с J о е г �г г l э п s ] и г,л е n с л п ¢ т е с:iu=oar i с а т ги р at 5 и а l д а я а � о с х L д .} Gaptcal : ди е а ст е п [ С � р ц а 1 И а п д g ед е п с , � с h г г
_, Jr3anlzad с о г рл т ас l¢ а +ieh acker eplIadyuaa OneaLla п л с о Ь с а l г. и д , hue In( с 1 г 1 proi( с а гl п а п е ед С 1 г ц 5 и о я с а п е l г l г х р е г t е п с в сп зfilpping71 с 6 р аl д и р capical д £ 250,000. ;Эе ц ап оу а о р а с а п с l у а л � hae ragular veaxl.:.aana а Е ?750, � 00 ' га т Ь в i о г е а с а г с ( п ц ; а от в pcoduccsс а а г ев сl¢ ц а п д acraagl¢g о с h ы с сст .ла п l е а ' aca,.as с о ц g ад l х е д capicaL со ст в с с l а l б anr а а д 3 и Ь я е q ие п с L д с l и д е г 1 с е , :Luur, с л т а , с е т е п с ,vaaaeL, ' Г е а с и г с еа , и м о Е Р] а (111 и п (? О С ?) enabled а г ее l, Iugs, 2ece1L( г в г а .
{urehar ек р ат ! л п . 9 ы л с : � qulcyrncLoa varying fr � 75/65 ап д
�j 1 С l70 ovsr ри д с four у е а г я .
е 22 I а Ь аг l се д 6u и lnaas Ет т eacher 1 а 1t}54, W: д г л гт д еl о а . Ч о lnfaca г elan. 31g 1ocaL д ет а д д , р l и и т г {се с и и с l а [Caraencs haad я а w СЬ а r в £ о п 1 а i с l У л 1 п No п gkong.csplcal t1a L932) и а в 1 аи .
г' Э ;fac Э 1 ае l а ае д . 5horr с е кт 1i а Ь i ц сf. г ч н LCh Ь а п Vса ?47, о [ proElt ceLnveaced tnca � г дн [ л g vackec а п д Ftqn pcuilc � aeg � ne,� п Е ?80, С 00 Sш (nesa. , L о п д : в т :1 а о 111 С е ч
_ vlc6 а ап k а � о г ? д0, � 00.
. :4 cqu¢ д ад Ь у Eachnr +а 1 сЬ avn аа vl п ца � С а а а г а с е д frou aualnaas ]: л г o- с е ст : Ь о г г аv_i д gs {cwа р р го к !rar[ а 1 у ?5, С00 1¢vesced ?25,700 Ьу о р е г а с l а а а , coaanarelal Ь а п Н я а .Е р 1:0,000 Ь и с vary:438. e1mLd аЬ а и с bocrwtng; h1 я acher
Ьи в l п е в к uhare ч ¢r:cLng capLwl е а а
Ьа д т з н n Е г ля .
- =3 5 с з гг а д vl е Ь Е1 и е з аvl п g maehlaaa Ег а а а : а ¢ е еа с е д с' т о т Su я laesa го т г о v а д Е г от 3 о д .а 1 5aeurtcy i у е сг т Sи Ь е л п е т ае с я с а l а с ц а е х р о г с е r ч' ур г еvl л и в pa п aerahlp; funda Eram и и а aperaclarta. £ о г houaa е о пч сг и д сl л п , ioECloa.uf аи о р l у nachlnery, '_aavlrt8a � uhleh г ll а с а се д { о г che Е сс р ry
а р г г а с i л п а .
?5 St зг е а д vlch ?10,000 1n (461 { г ет а а vl п ц а .; а п а г в с е д : г ит Ь и ч i м аа ib Ь о г т о и l а g а . ., да ll у managed.а од l п д иri е г д р l е г е а Е 1 а пд , о р а т а с !¢ д я ,
'.7 З 5,000 :aplcal Ег о щ aavin3a а п д Ьл с r ои l п g а "� t® Ь и в t п а а ч aperaClana - � 1 Ее э n д huaband з н п tnduacr � .Erm и п е l г . ;torked ( а п о л д l е Eaeeury Е а г
LO у л а г а .
19 5c.tzcea �ri сЪ р 100 а а ; и г ¢l си к а г ер а l � ет .. s"scm Ь и а (nesa oa и racions а п д С о а а п о е b о с т о н � г ои hanka. Ovnac La а п acchlcacc зп д haa vocked� suppllar' ч . г ед l с . Ln cha Еи г п l г и г е Lnduacry, 1 п аа [ е а
' э п д С д р г а д и с сl о д .
:9 5 са г се д и l гh чavlaga л £ ? д ,000 р и а е д ow "гг д т Ь и а ln а ч я и р а г а е ! т а , О а еа по с б alleva L п аvl п ц ш ychLng, Он п е г и а а д : а н а с k vlrh Эи г е а и а £� 1 Ь е Ео г Ь и а г д е а я . has л о е b¢erwad. ?ublle Ч Cghwy д , chia haa 1 а д t л
яа т е g о и е сгза в ¢ с р и г с h а ч а а ,
30 �� cacuiey р а у л Е ?20,000 Е г га £ о т е Г т :р l о у е е Е г о ¢ Ьи а l м ч я л р д г а с l о п а . ,\ddl.lonaL г q и l ет еа е Ег ат со т р а п у О и п а г 1 а an alaceriea(laechanlc з lт д аа и l п ц а of Р 5,000. е а r п l д ц а гп д 6ocravsnga Ег от ОВ Р anqlneer. � о г х ед 1 п л м ai с Ь е !ar;e
Р 100,000. equlpmane а пд nac6lnar � э и р р ll а г а
1 п Ч а п С 1 а .
72 3avinga а Е ?450 ard Ьо п аи l а g Lт от rela[! у е д r от Ъ и в l о е а а о р а г а с l о п а . AddL[1oaa1 а а сЬ l п е а Erw Ьи а l п и ч а Ovnar 1s hl цh schoo! З г а д и а с а 'alchо £ -^1.500. opanc( л п а . : у е а п е х р а ц е пс е Ln г ги л '' л 3.
72 � va :vada о £ р ?0,000, г т от С о от е г г l а l 3ank и , д о п о и l п g а : г от 08 р сд г а х р а п а l о п и д J ьт в г h а ч р а а [ haatneaa � ctencabutldlag а п д aachLnery. tn с г и с 'ctng.
" 13 5avi.ag в of ?40,000 а пд Ъ о г со и l п g а : с о т Srom DBP ! о и ¢ а . Rol1a Ь о т т о и t п ц а Ег о т 05 р аг Ounar Еа 11 а д 1n {( г а е uf cvo b и е l а и ч а08 Р о £ Р 200, С 00. Р 700,000 ln 1473, р 450,000 Ln 1975, ее С - и р ч ,
P6i0,000 1 а 1977.
� » 5 а vl а ц а л Е р 5, О С 0 ап д Р :гН bo п ovLn ц a о Е 3 о п о и (nga froa zalaclvu, ?100,000 Е т т я 555. S за 11 у Ь и я ln а а а а l г h а о ¢ а , havln цЗ 10,000, р г о f а а д i о м l г л р е гl и п с е .
35 5t а г г а д v1 сЬ , о н п Ev дds, Ihrough еа т е те i г l ban¢ Loan and С сат е гс l а l яh д г с с е г д 6enk l о ап а Ед е Ои п е г - т а п а g а r Ь а а had 15 у е аг аЕт о т oEHean а а д ч с о е У2: о l д г г а ри гс h ею oi т а сЫ п в ry 4 aqulpmeac а кр а г l е д с а [ п в е с г l lndu ч cry.
а а з dvanena. С и а гn л в г ' я дв р о а l с а о Е РЬ О , О ОО 1 д L975. Aaochar thocc Venruted Lnca ovn hualnnas [ п 197 �70; со 50L о � с о а е , с в п l о а п л С Р 50,000 ш 1978 Ео с а а аl п ц l е pzoprLecoc я fitp з п д
я l ее гв l о е а с l а п е т р а п ае а , !Ш lang convacead с о mcqoratlon Ь у 1415,сд га l а а п а .
76 : пh е д l с ад £ г а а р а т е ¢ с а . Gnapaced trom Ь и а l м а е , О ЬР l л а а 1 п 1967 Ео г ри г с Ь а аа о г О и п и г н urked Е г от c Ы ldhuod tn р а т в п с з
1 д £ В а Ф 111, С о П в С С ц С с 1 О R о £ Vare � Ф 1(1 Vh1C}1 }1 ч 1 П Ь tl Г 1 С д д С П 1464.
houae а п д р и тс h г а с л Е д г / е г .
С а а п ia 507. ui с¢ с а 1 caplcal.
M1 J7 ре г а оп а l aavl д gz о £ У 450,000, р гд т 1 п 1 с 1 а 1 taptCall га tl о д , Peraanal а а vl п ц а � и g д е п се д Ь у Ovnee � а п а g а г ( а г nevLy.graduacod
� _ � � _ _ _ Ь о г т ои t д g а Ег а т з п invescmanc meahanleal е п 3(neer, � l н е у е д r� ' houaa а е 10Z lnear ы se, о р а г а г L а м а [ а 1oes,
78, Froa т с l: а т е о т р а п у , Е т о оь moehar е а т р еп у с а р l с а l.. 'гУ а т ю сЬ а г г ал р а пу , - paeaarly а dLv(slon о Е а secucley
, agancy с д auppLy В и а г д unLEaraa.
� � � ' Со пv в г с а д а а и Ь а l д l а ry с а т р л га с l д п
" " ` '"' " Eaz oth в e mackets,
74 thr¢ aavlII ц e. 5 ц 7 р 1( в Г в CL Я dSC а Л д CapLCd1 p10,OCD Ет от Ост f8v(ngl, Owac Sи а Lп в д] l С 1 Т с l д Р 2 о Ф О и п е Г ' а deaL3n9В а а а г а с д д Lrcm 6ualnaaa. д л в я п о с Ь в ll а v а 1 п Ьо п ouLag monay, а пд [ п v г п с l а п . Jvna г La а cradq з с h с и l
В г ад и в с а .
' 40 5 г а г г ед н 1 гЬ ?200 а а д д l л а д е д tache С е аа с а е е д £ т са Ь и а [ м аа , ,yachl п ar/ аи р р ller' я t Г ед l е . Shoce б и п а г 1 а а Ел гт ы r tnce ц l, ц г п с ат а г hl д и � :tch waa р а у а Ь l в� ьп е а Ь и а ln а а я csrm bank Ь и т т о и t п g а . oEiiear tn с h и т 411 с а е /. р г е я г п са г д r с е д и р а га ц о n а , яh л р aica д л е а по с а 1W и Ео г nasded
� ех р а д в l о n.
»1 ] с а г г в д vlck ?4J0 С а rav( ац а , С и м r а е а д Е т дт Ь и а l а а а в . 3orroved Ег о т а С ос е г Р 200,000 6(arced : г о т т а пи Е ас еи г а о Е е д l н а а' ьгi с h па collsucal, р д у л bl в 1п ас с и ч о г l а а , dwlna ц haa д i у а р ч С £1 ед
10 yaan, trtco h а г д и а г в с га д l п ц , tlartuEaCCUra а 2helca, а а д а аа ® Ь 1у о Е Ь С с у с l а а , О ьт е rяh а г и from bank bqcrov( п g я , О м в е
р х е е е т ¢ Ел r Ьи а l а е а а groveh 1 я
dl+ м raLElcaciort L п и с а а д о £ а к р ап в l о �1 д ane С1 п е .
�

7
.. tta-tý. 7.bý.qu-c j-rci- zi=ena i. Cmýc
'- r ý"ccup r 3..ina- ';hrxlng zåpic.L Zhv.Sch.nc. Capýc.l 3t"«r
_z Inicial i.V*3m.nc e P40,000. canaraced Ercas B-Lna... 2750,000 gr- h-k t- 3..1 .... ....... sch ta i. qc.Lizy f
1971 which vas ... verr.d pcoducas.
e~c-lly inc. q.Icy.
F::- ..vinge og p15.000. b-£~ p.raciaaa. Frace busina.s 0~ t. a ~hanL-I -gi.e.rL.å
St.d4.c:l,fl962) haj veck«d ta
CJC.blL ed .. chin. hop..
44 -insxol.Z .1 ?3,40D,000 by DBP. ?art 34 Einaacing F=c..dg. DB? fin..ciag. la 1969 c.cc.d his c,wn b.".ess.
Y.ASIC" of ch.
Acadinby 3t :ha 2hLI'Lppi- cb I-ace
u-id. .11. '11.ccbp.lit- kr.a bua
marKtc La :ne Mecro area.
Fr- i-ingg i ?50,000. i- b.äine.j id-rac.d Er- business. 'klch..gh L, L.C.Kr.c.d
backvård vilh a plancicion, the
proce,,Lag pi.nc h., Scn«raccd oth.r
ft=.Lnq p.c.cl- c. ýUpqLy M-k.C
dä,x.ad. Own.rle;.-%.r t - - .. ria.e.,3tn««r by d...ci.n, 4.3 y..c. old ,d
forbåtr m.c.cc r.PCC-c.CL- E n -1
ca.P-y'
ý6 Savinsj bg P75. ~ aced E-t. OBP b.rr~ 4. of P530,300 La 1976 kft.r b.ing Ib.ocer, ta ýh- ga ... ly,
ior ýpansion. Uj4d Zor building h- ... d i.d i00 z- ch.Lr b.Sin-;
and zanhineýj. Boch I-ncary ~h.01 3r.du.ces.
Up cc 30% of Suckl- pc.U.cton lb'Q'b.d
by 4.ý.db.a _kl.a.
Giva. by Uch.r ic ch. jaacc ýnd
G1-c by fachar i 28,000 Frpnz Uch.r and busin~. zq.r.c.% P.Ct-ci.. C.3.cneý tth
& ... ratad by L. ýuo-q.åac aczendlng 3cho.L. cootå Er- faoily ~
years. ',lan.. .. c b.ch. ced by profit or 1-.
ýz fraa Cockh.ld.ri 6..c14 a. ý_Lly -if.red . -c, back
ta profit in 1967, sicuacion was rev.r3*d
by a cha.g. La -ag~c. cr-gy.
bank 11-x. L963 a~ .... 9- va. -9
ca. La a d.iu..-_ l.rg. i.
~ husln.$'. The Cmpany La "" 0..
i ch. bLgg-C ýpplLca- an.E..cur-, in
cha country carr71ag wall known brands
43 2.n. avi.g. i P400,000 bank l-... G.-r.tad fr- buxia... and 3.ak b.cravtng,, wlian ha tett ca icarr ~ business La~h. a. WIUc. *4..clogh..,.. G.E., c=.
50 r~ r.teå fran and 2.43 barcowilngz Bustnas. was bougha irhe: a brother -,na
luppliårs aredit. J4.-. L11 lad ... Id .. I.ng.r -. :h.
bu.L..-. c-c14 ... %er u-d c. be .
;rader in zcacL cablnec3. 3ain merkae
51. Stårtid ich 995,000 a partnär,hIp !roct Stipplierl cr.dit ýM advanc.. er- ýWI horr6'ýýný--.- O-r/Managtr assticed by wkte in tuning
S.Vi.52. fr±.axl.. rh. b.,ta.*%,
52 Fr- savfag«. Genererad froci huattalt. Brtvad fr- relativa. ad B-La«.. tarc*d by ~king - L.b..
.-. total bank for xpansloa Ecr public czansporcacion driver5 by I
agrar 2 y-s of p.cacL.n, Ko ýUqbx.nc 1...co..
53 Fr- .. v-lzg. og P60,000 f partner.. Supplierg credia and c~ cial 2.9.r on~ ing pl.nt bui.ed Start.d i. k. . cr.d.r -d ... c
bInk.I. fr- 1.4.. aýang-tnc. Inco piper converrin% after I year of
operation.. 1. &..d credi-. c-dL.g
vich c~cciaL bank# wLch credLc LInci
å£ ab.ut ?10
54 Scarc.4 with 94,000 Ln ownar13 å.vingz. ~ raced fr= buxtn-s hank 4. Long c.m borr-ing. for a. -played -Qlg.r of ch.
borr-in34 o. ghort t- and capLtal Lnv«jchaac. f-~ry. original o-ar ... 4 to-er
suppllar3 cr.dic., g gr ... ry tt~.
35 ElrýIZ41 gr- Fr- hu.trit.. !1. börro.ing3. Ownerl-4.n.ger ... d ca be --a the j.jolio&
j.rvic. c.tion
36 950,000 poo Lad wich ftiondå. rA"racdd frm huaLoftg. Bor~ad fr= c- cial and Business provides cransp-c service for
d*V.lop~ banka c- rcLal and lduscýLýL pr.du.c..
Con.Lders -11 fl=, h.et.r attencs ch..
laxge ona% ta tam. f pcLci.3 and c.LI-tion.
57 Yrova 25,000 La e.raings 2~ gailor ihop. -v- Qcher busin..944 such 4* 5~ .d 995,000 froce D11P a i~ Mu.b..d and Lf. icarctag ich . catl.rt.S
.ecail zor. and Uro. Punchx &irer statt up. bu.lna.. &M r= chts far 10 y..c. bagare
shifting to b.kecy.
53 zalci.L L"cl=aac 09 P10.000 fr= JAVLazz. Cuzcoawar depoift and £cm rh* tio harr~ 83' Oundr La r«CLred Milkcary man.
b"to..x.
59 $tattdd with P5,300 fr= $sving$. Caur.a.d fr- b.stn.x.. Lo.a Erexa DE? ag P6,300 1. 1976. Cp.c.cLag 4n Lind with.ut
rcnta4, Ma2 no lacha and conccacta ýuc3ttio
~rvic. for jhaptng f .. ed.
60 Stårtad with ?5,000. rýn.r.ceå ft- bu.ina.s. annerwed C103,000 Er- DB? in 1975. prgduczLon c,anoc cop* wich de ... d hut
Alio börrcýad pr*viouily fr- c.!u-cl ffer e ?I Lilian
PhillppLan National Bank and a loan fr= privacc service%.
?rLvaA. bank Uct, w.re
P.Ld b.ak,

�

. д� 9
i1пN
у � � . � v rn т сл и и т rn и т rn и сл и ьл i., и и � n и 1 v1 + 1� F F � 4` F' й #` А-� й �� � � w w t., w ы � �> w и w 1.i г� 1 �а N г � 1 � 1 � i � г� N r- г� 1� 1-- , � г . � 1.., ь� 1 � r �
а w r о � о и v и и .Р w ы r о ш т ч а . � 1 й - w ы г- � о w а v т и Л w го N о ш о а � + а , t,1 .Р w n � r о � д w ч и и с w ю м о го w ч а , и {. w hs 1. � о и [ л � + а , и т� � w ю i- �1�
Г У
1� �
W 1�
НL"
О�
ov
�К1а .
т н н нн � н n
�г-,
1�Г
С-г�т
мАпгоr �
�F� " н н н А н k К Х н % н К н н н н н н н i ь н н н н н ij н н Х k iC н н н F3т0.WW �пго
и
�
� ю ю н н н н ю н ос ., н н н : с н � G �
т г��
-о оr � м
й н н н н н - н н н ю г: :+ н н н w ю х н н ю н н � ю н н н н н н к ю н ю н ю н k "л ,"' � ,1�� . 1Ч ми � � 1 �
F! ( � W
Q О 'F3 г-'(П г-1 1�
'.1j (,j � � U1
о н н н н н н ю ю н н н н � н н ,: н н н н н н н н н н н н ю к qa. � `i � �
а � �
иr1 �
' N н н н н н н н ю н н Н k н Н н н н н :9 н н ю н н :4 н н н ?: ю н н н н ю н ю н ?1 ю н н н н н н ю ю ю н . С н U , �
~ , �
t ЛН
1. г- г̀�и п � ' г -
г н К н н н н н н н н н ю ю ю ю н К `r: н н н :G ;ix ис р ' �1 � � � �н
р � гаi С Си д -
N г Э1т О
О �
НW П г Э
� л н н `r: н н н н н н н н n ю н :. О г+ t'1
N � �~ � �
[' а
W н % н 'rC н н ю н ю iS N и К ' �
нп

' .,rr6� s :з :� . г, ,
Т а с [ а 3.3.
�..3¢ г 13 О Р :1L" Э : 1А _.v3LGY"..L2if
Эа 1s в ? е т ?sar !3 и и ва д ot ? е s о л а с Csrrecc
:R а д а г � icved ? �� г а г-_ с в а l
_ ц eiTLev Э L^ а С �-1_] С � 0 ..
:lо . У е а к i_ заЭ 70 : Э Тг :974 L976 !978 ° е ц :970 : Э 72 :374 . Э 76 i978
,5 3= ь � 4 ь г 0 : �' ь0
9 :8 : д 7 В ]6 +1 -6 !]0 7_0 : ч40
7 д и 54 =}0 Э О О
- 100 !00
2]00 J100
} Э 10. l0 Э Ь ' Б :00
6 д 11 З О О 700
7 у9 10 3S I06
3 7 д
750 ?00
9 Ь 5 69 90 ?00 200 930
, 10
ц � b0 200 700
« цц 5
4 й 0 72
12 11 11 120 3:0
ц 3 - 30 з � 600 11 А 0 L'00
16 22 '1 48 52 3 22 760 Ьй } 750r.
ц i (100 � 1962) i (9 а е l с l д t at 500 Sa1ca1 9' '
Z5 i0 JO
- L1 6 I7 ц : О о ;00 1100
:а 3 ! 4 о:1w
!9 100
� ] ] ] З�
31 4 '_00 r,
� 6 (I932) 1AU г 5000' �
2 з ц :0 20 г00 ]50
jS g ч з 30 1000
�ц 7 12 20 'S �
г бL70 1461. г 1 з .9 7670
. , 27
, г 9 5 З О
!00
19 5 L^ t35 2100
' 30 } 16 79
Э 670
31 2 10 » Ь
32 3 з 0
5i60
зз ц зо зоа п о0
3л з :о ц 7 г 3ьо :20
зs за _00 41 д 5з0
ЗЬ+1 �
37
'
ЗВ 11 11 : б '& � .�
` 34 l 18 7
:00 '00 � =
40 1 ? 2 300
41 з и :4 гг ц
62 7 30 г300 7� 00
67 3 73
4445 8 гЛ 227 500 500 ЭО О О г S
+ б 2 1W 60 i ц 4' ,
47 3 3 Ь
4 дl00 1000 г 006
+9 '-3 L477 '+^.Т О 161) '.'+78%. 43988 � 076J 121780 1 Э ц J6
;0 /L' й4 44 I:H7 32 з 7
31 3 ц 68 L06 ? О Ь 172
}2 S ,: 6w0 203 оа , � о00 Э3300 аа000 50 ао0
S] 1D '_700
+000
14 � Э 2
7300 :0000
. 53 3 3 3 D 300� 7
36 4 100 S00 3200 � -
37 7
]00
58 2 ь 100
100
S9 г 10 � � � ч
60 b 10 1.G0 160 �-=
61 l8
770
62 30 8 ц 8 ц 00
63 20 г б +5 50 72 ЭО О 10Q0 L4D0l э
66 6 6 6 50 :+S-
67 }4 36 720 370
б б 10 40 50 З ц '
6) L 1 г 1 3 4 4 6 10 Z3 70 50
бё 1 г 3 Ь Ь ц г0 ]0 з� }0 6о
Ь9 l 1 2 3 3 4 S LO ц г3 75 50
70 S 0 12 ц !3 5 l0 г0 »} Ь О 90
i1 г � 25 33 33 50 Э О 'SO 1 д 5 295 Lд 0 :000 2 В 00
72 I 3 3 50 tCA ц 0
(� 1, да l в т л cs и 1+ а pst э о п сh.
jj, Va1u 3 а 1д ( � м р о q а).
. � ri о а в в р е г и в е i.
L ?в в nа per т а ¢ с 't.
�L On1u рвт � е ат .
! Б Т д̀ w ц а а д с Е'bas
ш хl, е а а д д Ь и е lс l а а .
!7 � ; всn е ш ц ot havic{ а;.
!3 Ln Р в г с а а с аg и .
L pctca р а г У в аr.
10 1 э 70 � i ё а ц ё ¢ ins ю г а а � с г� i гр еа е cb вE3La � itsss 1 д е«i с о гlsатс в aihw � a sС о с е lS д� .15 Ь с aze в4ccia д д д y и sajt � uD s
� � � Т i п puseh и d 1 а 1976. й r ц е г hiaco.7 т с mrnm.

. � � t
� .� - о й i ч Х й � w н .° � � а т v м .и,. "' г ь� W� и г � и и и и и � � � � у �� w й ro w �+-+ � и � и .- � т ч и й � й й .»
`б : й й 1. г L{ � ."'-. о � т
'vaй г G й r� o � w �, ... и ь+ и .-
g)
ё
' ° � � Lië Ь "f.- м w м я q .-n и .г .- " � � о �У �g"b'8` w � ..-ac.- � ..,G � ' � х .. ,. � � о ь- � ^ F . � ry.n гi �n � .- и �
� � � � 'J' � � с � . � "'iS � С. р ы ° й �У "Ь., � � - ^ � g' � ,7 у�С+ � ь � м4" � г ы � � Р � �' � R_д и S ьа "°' � ,9 � $ � � ;PIC � � ': � � & � � � � .
х ' 'R а Б � е v и � � 'nGi � гS .'oi" У. й Ь̀ Ь' м � � 1 xGC43 � i ь '8. � ^ � k � o.'. � .. � � " � ;` P � i' п ' � .^ 'ci° � @SE. � -:C � ' � � ^ К � " � ;с i Й � 2 � ' �. � � ;«.. " Е � ...". � i � 8� � '_. С г - м
� $ �e � �k- � � � х � и� � : я" � ё� а � в� к � . �р�С � '� � с � � а � � � � � .. � 'ь : � �� � � 8s � х � � � � �� aw � :? � � у5:^� � � -: �rW� _�
" ЕК �
А ��
�
�ь....1 �
.7 �У м �
м
� 0.� ыт.,.w- � G:
�r. м .'� г-
�.-.°
д:-
�'.
Р. 'в
� �i п
'8' 7 �
: .°чв 9 � р л � r � � w е � � � -- � t. � z ю e pg ё �° е p г : е ° ё � _ г : � ":8 х � г �
� '` n^ � ' и - и и � _ 5 � � 8 � r+ ` р� i Ti 8 Yi. } G � &-. � � � Г � м � - � � й .- � � р�С л .F г 8r.
м к 8 R - л о̂ о°. � л � S G ... У '- а А � � � � " � .�.7 .., � � �� '
�"
� : -.
� С'r
� � w �`g'
Р� К '
G°. .
� �yg.
У6
ч ° и i'� �
� ' п с . н w°�
.. oS R �'
�
['.r..P. 'G'
н"
�
�8 к .. в f � s= � � . й r м г � -; � .: г : е ^ � eti � ё � Р. � � � eF2 : ër.. � м
g Е � -'д' F У °' : � ' "��` Ё � � .... С ' С � � � R � .. G � ." � � ,� � � �
? а ' � - g � � s � - � � s" р . � р tRrр�С � � . Р .. � к �(,. в. �у�С:. " � _ � с 8 � � ` � - .. � � � . � � . � : ё � � � .
}°i й � " ro � rCCцц ь'" . О b � C ' д& � Р. . Гi' � :7 р ', � м � i Й м i � iС�С. � ^7. д о � �Ра б И i � r: п rw is � � :" � � " '_ � -` � � Qт �L� � � � � у- х � r � R г ь � � � � � . i � а- � i:i � P` GvFM' й �"o� S К F �� �
в F fг � : � i г � . Е � �
� р � � й .� $os.'1� � � � � � Fr м � о'!G � : а � �Р. Е а � � м ь'' й � ' п�8 .� � F'' � : � " .....- .С � � � o..r � 8r't � n � 9 � � 5pi � .-.' р У �i, � м д : У � � � S "p' � � � � 1 �
� r р�С .м н. 2 мq y � '� � с Г G ,1 ё � � .`-- .Ig R � � �̀ � �w
�ч . ь- С Е � с ` � Г � " г- : й У � rй � � � :.г .Т� � � : л � � R � ` � й FR. ц ' '6 т�
l �� м � j S � й м л � о 'J С � '� �Pi .� " � у�С" � � й _Л. .. .". ч" а � W .i. д д = 'д°.
а � g" � n � ° n.- G I r- .- и � ' ё
� � г � � � " � � � s � � : � � $ " � F �ы � � х � .
Г л Р�. � 6 g $ � р�С " �' е � � � � : � � �о у�С s° �
: о и Е S S' Ь' r Р. " ' � и � � . м� е... � g r � � е е g Р е G � � � уг
� � � � .- � 4 � � ё� G � е а -[ �� r .
. .i -` � 1�' � й ч С- Й
� � � о .
- S . �
� � � � � � � � � :: : � : � : � � � :: � я ..�
г � $ � � � ' � � :: � . � � � � � � г � � � � � � :: � } � $ � � � 4 � � � � � �9 �
� �t �я � " м Э � п�� Ь
Е �
� " � � � � ёх k .
{у�С у �r sr sr � i.` � �
, и gО�С
«.. и �P
s- а а а й
р�С
3 �. а р .- а и а н с н и о с .P- и .- и � и и
�и i � i � а а и и 8r
'
О О О д О
�
и О О О И О
и
О О $`
�'
О О
� ��
�
� � � � �`
Ф
, �
N О
'
О ° О
�И М
О
`�
~
У � $
ь в
$
в
О
в h
ОО �
°
� �У
О Ч
�
О
�
��
q
�
�R �� � F �
� � � � � � � � � � � ' я � 9 � я � я г � � - � г � � � � ч � п � а � � � � г � � � � .. � у . ,
�� ' � ' � ч
�� 'ag � ss � я a � � a � (�
�ю
r р � о G
- ..,..... . г . с� .. � ....i.. ь в в .... й ..... .г. � ь . � � ...i. � . � � . � . � ь � .. г , гR гi'.i'994 � ("'1 д
:
�
g
Ч
тi
_ д О
�^
� ...... ь . , . .... ... � : г . ....... .. � .. ..... ... .. . ......... � � ч � � s � � � N I� `� ' � � а

ANNEX TO C11APTER V
I"
EFFECTIVE RATES OF ?ROT E7TTU M DOMESTIC RESOURCE COSTS FOR
LARGE AND SMALL SCALE XkNUF&CTURING ESTABLIS11MEN'TS, 1972/74
Emal.--t
Nominal Rate of Establishments Establishment
Protection (Tariffs Effective Rate Do,eascic Resource *'ich LAs. with 10 at A.c.al
Sector & indirect Taxes) % of Protection Costs than 10 Workers or. ork.rs F mplaymenc
(1) (2) (3) (4) 5) (6) (7)
Food
Slaughtering; Poultry Dressing 25 128 8.00 100.0 - 84
,test produces,camed 25 5 8.26 1.2 9818 1361
Meat products, uncanned 39 68 9.43 75.8 24.2 553
Evaporated; condensed milk 16 5 1.67 1210
Butter, cheese other 33 52 18.13 2.0 98.0 913
Canned fruits', vegetables 19 80 10.33 8287
Other presei*ved imics & vegetables L3 19 9.94 -
Fish canning 1.1 6.33 6.0 -179
Ocher fish products 55 76 9.36 19.7 90.3 3299
Rice Killing 0 49 9.86 93.1 6.9 37082
Cam Killing 0 46 7.45 68.2 31.8 3876
Flour tilling & Cereal Flour 41 1148 26.02 2,6 97.4 2634
Bakery Products 110 3371 15.68 67.8 32.2 31114
Sugar ,tilling & Refining 6 - 12 6.40 - 100.0 31266
Candy and Chewing Gum Products 86 519 15.18 Z9,9 70.1 4622
Cocoa 5 Chocolate products 51 1750 10.38 100.0 740
Processed Coffee 46 36 9.97 419 95.5 244L
Dessicaced Cocanu C 4 - to 4.69 - 10010 9422
Starch and Byproducts 44 650 10.55 100.0 1549
20 71.6 1801
Hacroni, Spaghetti & Noodles 63 78 9.44 .4
VeSecable Lard and 4argarina 82 /b n.a. - 100.0 L527
Prepared Foods for Anim als 33 34 .06 2.2 9718 2648
Flavoring Extracca 9 7 a... - ioa.a i8l
Miscellaneous Foods 39 156 23.97 - -
Beverages
Distilled, rectified, blended liq-r 209 394 15. L6 1.0 9910 2223
WLaes 57 113 'a. a. 80,3 19.7 781
Brewery and Malt Products 72 69 .. a. - - -
Tobacco
Cigarettes 182 18758 18.13 15865
Cigars, chewing & Smoking cobacco 0 - L2 6.15 - 10010 1482
Leaf Taba.cco Processing 115 lb 26.26 .7 99.3 2193
Textile.
Textile Hills' Products 57 78 12.15 - 100.0 41683
Knitting Hills' Produces 23 4 6.92 - 100.0 7707
Cordage, Twin. and Nee 0 2 10.18 -6.2 73.9 2618
Carpets, Rugs 28 43 R.a. 27.6 72.4 916
other Textile, Products 48 36 8.15
Foomear L9 is 6,47 6B.7 31.3 8167
Clothtn
Ready made clothing 0 26 5.13 8010 2010 95.241
Embroidered produces 0 41 5.74 34.3 65.7 1658
other made-up goods 19 1 6. e15 - - -
V.0d
Lumber 4 16 6.14 6.1 93.9 63BZ
Plywood and Veneer 4 5 6.48 LOO.0 24579
Door. & Windows 0 2 11.53 82.9 17.1 1981
Ocher wood 0 0 10.18 -
Furniture 1 0 5.77 33,0 47.0 17108
?ever
Pulp, p.p . "-a paperboard 46 38 9.14 - loolo 12487
Paper pro"ets 109 195 11.10 .5 9915 1107
Paper and paperboard containers 128 181 11.47 till 88.3 3479
Kisc.llan.au. paper 72 478 10.22 20.9 79.1 487
Printing
Books & P.-phl.c. 25 19 8.17 32.0 68.0 3612
LCAth*
Tanniag & leather finishing 68 145 M5 12.0 8810 885
Leather products a 27 6,25 5218 47,2 991
Rubb.
Rubber footwear 108 454 M36 4.5 95.5 4648
Tires and inner tubes 103 323 9.85 1.3 96.7 3760
other rubber 27 21 Z8.41 7 6 92.4 2537
411461
..........

-7. 1
'1 Emalayment
Nominal Rate of Establishments Escablishments
Protection (Tariffs Effective Race Donestic Res 9 rce jirh less with 10 or more Act.al
sector r Indirect Taxes)% of Protection o. Costa - than 10 Workers Workers Eploysenc
(1) (2) (3) (4) 5S (
Chemicals
Compressed Liquified gas 2 17 6.35 - 100.0 1518
Basic Induscrial Chemicals 17 - 7 10.06 4.7 95.3 1714
Fertilizer and Lime 31 41 6.98 - 100.0 1371
Other oils and facs 24 - 28 7.34 - 100.0 516
Paints, varnishes 95 221 15.36 2.0 98.0 1359
Plastic materials 45 56 7.51 2.0 9.,0 1983
Medicinal & Pharmaceutical 23 9 6,33 115 98.5 8258
Cosmetics & toilet preparations 249 lb 139.08 2,4 97.6 1306
Soap and ocher compounds '1 175 10.39 .7 99.3 4734
Insecticides 19 17 4.03 1.5 98.5 597
Other chemical products 42 25 n.a. -
Pil and Coal Products
Petroleum refineries 21 21 8,96 - 100.0 1014
Other products of Oil 25 16 6.12 22.7 77.3 128
Non Metallic Minerals
Structural Clay Producti 5 11 7.94 12.9 87,1 2531
Structural Concrete 57 110 9.79 - 100.0 2731
Glass 56 45 11.09 1.3 98.3 6799
Pottery, China and Earthenware 47 31 8.68 62.5 37.5 2292
Hydraulic Cement - 4 - 36 7.09 - 100.0 5127
Other Non-Metallic Minerals 28 26 n.a. - * n.a.
Basic Metals
Basic Ferrous 35 27 13.06 - 100.0 9061
Basic 4on Ferrous 10 0 5.05 - 100.0 486
Metal Products
Mecal Cans, Boxes & Containers 57 110 4.78 14.7 85.3 3995
Cutlery, Hand Tools 39 34 13.74 85.8 14.2 3318
Structural Metal Products 65 95 9.89 24.0 76 5920
Stamped, Coated and Engraved Products 37 38 7.26 5.2 94.8 3693
Pabricated Wire 28 14 6.47 2.1 97.9 681
deating Apparatus 59 85 9.76 14.8 85,2 365
Other Fabricated Meal 62 79 25.52 - -
Mach inery
Agricultural Machinery 29 14 5.87 27.4 72.6 2204
Other Special Industry 13 4 4.75 7.6 92.4 1135
General Industry Equipment 18 7 5.98 17.0 88,0 5691
Electrical Machinery
Office Computing & Accouncing 29 27 n.a. - -
Electrical Distribution & Control 25 18 5.40 4.4 95.6 631
Other lec, Industry hachines 33 30 na. 3.0 97.0 . 757
Communication Equipment 31 31 14.55 - 100,0 246
Batteries 56 73 5.45 7.4 92.6 2044
Electrical Lamps and Fixtures 38 27 8.35 1.1 98.9 1286
Electrical Wires and Wiring 40 51 n.a. - 100.0 1210
Household Radio, TV sets 164 204 n.a. 1.3 98.7 3963
Refrigeration and Air Cond. Equipment 142 195 14.91 1.5 98.5 3099
Other Appliances 95 103 12.37 . -
Transoort Eauiment
Slipsvilding & Repairing 17 26 6,45 6.5 93.5 5743
Motor Vehicles Manuf. & Assembled 93 127 n.a. .4 99.6 5445
Motor Vehicles Engines, Bodies, Parts 29 23 9.82 29.0 71.0 B46
Motorcycles, Cycles 50 52 7.23 29.2 71.0 1239
Other Transport Equipment 6 9 n.a. - - n.a.
Miscellaneous
Jewelry, Silverware 91 133 n... 54,1 45 2 580
musical Instruments 60 61 n.a. 50.4 49.6 697
Fabricated Plastic Products 92 194 23.24 - - -
Scientific Equipment 15 12 4.21 12.8 87,2 792
Medical Supplies 14 9 4.39 - -
Photographic and Optical 37 30 n.a. - -
Sport Equipment 91 93 n.a. 5.6 94.4 946
Office Supplies 65 0 n... 2.7 97.3 375
Toys, Dolls 74 72 n.e. 76,5 23,5 170
Miscellaneous 61 41 6.75 -
Total 531077
/a Using the UNIDO method, the ahadow exchange rate for 1974 has been estimtted at 9.21 (IPPP, 1978).
Lb EPR cannot be calculated for the sector because of its negative-derived international value added.
Original Source: Nominal and effective rates of protection are from Norms A. Tan, "The Structure of Protection and Resource Flows in the Philippines, 1974",
PhD dissertation, University of the Philippines, 1979, The domestic resource cost estimates were taken from Romeo H. aautista and Gwendolyn
R. Tecson, "Domestic Resource Cosc In Philippine Manufacturing: 1969 and 1974", IPPP Working Paper No.13, University of the Philippines,
September 1978. (Note- The above figures were taken from IBRD report since we did not have Tan's thesis),

ANNEX TO CAPTER V
Table 5.8:SELECTED ASPECTS OF SMALL FIRES
BANKRUPT AND OF OTHERSSTILL OPERATING, 1972-79
Percentage Distribution of Firms:Asuects of Business Bankruct Still Oerating
Educational Attainment of Owner:
No Formal Education - 2Grade School - attended 5 3Grade School - completed 10 10High School - attended 10 12High School - completed 21 15College - attended 19 26College - completed 29 28Vocational Schools 5 2
100 100
Region of Business:
High Income Regions 40 40Middle Income Regions 56 49Low Income Regions 4 10
100 100
Management Practice: Percentage Following the Practice:
Keeps books 76 80Segregates business and personal funds 57 75Records receipts immediately 66, 75RetainsCPA for audit 40 67Records all costs incurred 43 60Continues to develop the product 62 80Diversifies products 24 22Avoids dependence on one customer 74 80Hires relatives or employees 71 64
Source: Itao (1980). Based on sample of 260 firms in 1975 establishment listings.

^NEX -0 CHAPTER VI
Table 6.1:?EXCEM' 0F FAMILIS EAVING NCME ?MM SECI=IED SOUS: URBS AND ZRAL 1961, 1965 ANiD 1971
lurxL Oth.r Urban Area Mtro intla Toal U-rban All ?amiliew
1961 1965 1971 1961 1965 1971 1961 1965 1971 1961 1965 1971 1961 1965 1971
5o. of Fa=41ie. 2921 3606 434 1144 1062 1388 361 458 525 1305 1520 1913 4426 5126 6347
V&Re and Salaries
Ågriculcural 30.9 36.4 28.9 25.0 14.7 7.5 0.6 1.3 0.6 17.6 10.7 5.6 26.4 28.8 21.9
9on-Agri.cultural 18.5 22.2 25.5 57,2 59.2 64.7 82.1 82.4 84.3 63.1 66.2 70.1 33.7 Z5.2 39.0
çreareneurial Accvities
Trading 12.0 13.5 13.6 21.5 21.9 24.4 14.5 16.5 16.3 19.8 20.2 22.2 14.7 15.5 16.2
Manufaccuing 13.3 11.4 11.0 10.1 11.0 9.9 3.8 5.7 7.9 8.6 9.4 9.4 11.7 10.a 10.5
TransporC 2.1 2.9 2.5 3.6 4.0 2.7 2.6 0.9 1.8 3.3 3.1 2.4 2.5 3.0 2.5
Orher Enterprimes (including practiceof profiasion ar 1.7 1.5 1.4 6.6 5.4 5.1) 5.4 4.8 3.1 6.4 5.2 4.6) 3.3 2.6 2.4
ecada) 0.8 0.9) 2.8 2.3) 2.0 3.7) 2.5 2.7) 1.3 1.4
Farming (including putry andlivescock 89.0 81.3 74.1 57.7 38.1 26.1 5.8 5.3 0.9 45.2 28.2 19.2 74.1 65.5 57.5
?tshing, Farery and Huncing 83.3 75.2 69.0 50.0 37.4 25.8 2.0 6.5 1.2 38.5 28.1 19.0 68.0 51.2 54,0
Product:ion of Arciclas for own usu 64.2 50.3 37.2 41.8 24.6 15.0 15.2 18.6 5.4 35.4 22.8 12.3 54.4 12.2 29.7
Oth.r Sources
.andowner's ehart of crepi, livestackand pu1cr7 ra«ed 10.3 13.3 9.8 14.1 11.0 7.6 1.4 0.6 0.8 11.1 7.8 3.8 10.6 11,6 8.6
Rrat recuived from nn-.gricultura.1lands, for bldgs., roos andocher propertizs 1.7 4.3 4.0 5.9 7.3 8.9 11.2 9.9 7.3 7.2 8.1 8.5 3.3 5.4 5.4
Z,ncal , lua cf oner-oc ied hous.
house 97.6 97.7 96.2 93.1 90.1 80.8 52.3 "8.5 35.6 83.3 77.6 68.4 92.8 91.7 87.
atneestm and Dtv"Ldøadf 0.6 0.7 1.6 1.9 3.2 4.6 2.1 9.5 9.4 2.0 5.1 5.9 1.1 2.0 2.9
?roftts from Stocks and onds 0.2 0.1 0.0 0.2 0.2 0.2 0.9 0.5 0.1 0.4 0.3 0.2 0.3 0.2 0.1
pnamion ar Ret±rement Benerits 1.1 0.4 1.0 3.0 2.8 2.7 3.1 3.3 4.7 3.0 3.1 3.3 1.8 1.2 1.7
3ackpsy and proc4ds from Lnaursan 0.3 - 0.2 2.0 0.3 0.8 1.2 0.6 0.4 1.8 0.4 0.7 0.8 0.1 0.3
Gift, suprt, awistanre & raliet 22.7 14.5 24.7 22.9 17.2 33.9 14.5 67.2 39.7 20.9 32.3 35.5 22.1 19.8 28.0
.f.c winnings from =smbling,S aeepscakes ar lcctaries 6.8 4.3 4.9 6.5 4.5 4.9 1.4 3.4 3.0 5.3 4.2 4.4 5.3 4.3 4.7
Inh*ritanc» in sh or conveedCa0b 1.3 0.7 1.0 1.6 0.7 1.1 0.4 0.1 - 1.3 0.5 0.8 1.3 0.7 0.9
Others 1.0 0.1 0.8 0.9 0.2 0.4 0. 0.3 0.6 0.9 0.2 0.5 1.0 0.2 0.7
12
7ndex of diveritcy of ino sourcsTotal 409.2 373.0 353.9 343.4 282.7 257.2 138.6 204.7 141.7 294.4 259.1 225.6 370.3 339.4 315.3
ti Probably refern to tnputod valuts (IES d%finitions ar* not elear).
Il each family bas only =ne sourc* of itno, tha eal ould be 100 prcen.
Orgial Sourc of Data: Philippine Statistical Survey of Households, ?aily Inoe and Lxpenditurms, 1961, 1965 and 1971, BCS. This Table watakera from Castillo (1977), p.105.

ANNEX TO CHAPTER VI
Table 6.2:EMPLOYMENT IN ESTABLIS=MNT
IN FOUR TOWNS IN THE GAPAN AREA (IN CENTRAL LUZON) 1961-71
/1 /2 Percent
Sector /3 No.Emp-oyed Distribution Annual Growth1 9
(Formal Sector Only) 1961 -L-1971 1961 1971 Rate, 1961-71'
Retail Trade
- Groceries, Clot es, Other 308 611 9,2
- Modern Durables'- 14 89 1.3
322 700 10.5 8.1
Personal Services
- Restaurants, Refreshments 47 117 1.8
- Parlours, Bakers 51 120 1.8
- Billards, Bowling, Movies 23 60 0-.9
- Other Services 32 49 0.7
153 406 6.1 10.3
Light Transport Services
- Jeepneys 71 164 2.5
- Transport Shops 24 79 1.2
- Tricycles-- 0 900 13.5
- Pedicabs and Colesa.eA 350 10 0.2
445 1,153 17.4 10.0
Trades and Crafts
- Tailoring & Dressmaking 71 208 3.1
- Bakeries 37 101 1.5
- Sash Works 8 51 0.8
- Iron Works 6 20 0.3
- Wood & Furniture 27 51 0.8
- Construction/Contractors 48 196 3.0
- Cement Products 0 84 1.3
- Gravel, sand supply 57 70 1.1
- Construction Suppliers 30 57 0.9
284 842 12.7 11.5
Speciality Industries
- Sandals and Shoes 80 346 5.2
- Rattan Furniture 38 123 1.9
- Needlewrk Contractors 43 125 1.9
- Others-t7- 195 196 3.0
356 790 11,9 8,3

ANNEX TO CHAPTER VI
Table 6.2 (Continued)
/L /2 Percent
Sector /3 No. Employed Distribution Annual Growth
(Formal Sector Only)- 1961 1971 1961 1971 Rate 1961-71
Public Services
- Government 278 457 6.9
- Teachers (Primary) 468 727 10.9
- Teachers (Secondary) 59 165 2,5
- Medical 53 124 1.9
- Utilities and Other 56 87 1.3
914 1,560 23.5 5.5
Agro-Industries
- Agricultural Supplies 16 45 0.7
- Rice, Milling & Trucking-L 268 730 11.0
- Repair and Service 58 134 2.0
- Transport Shops (Heavy) 35 56 0.8
- Vehicle Body Builders 21 33 0.5- Assembly (Light) 1 30 0.5
- Other 45 80 1.2
460 1,192 17.9 10.0
Total 2,934 6,643 100 8.5
/1 Regular as opposed to seasonal or casual labor only, except where otherwisenoted.
/2 Estimates for an intermediate year (1967) are also provided in Gibb's reportalong with a breakdown between the town of Gapan and the three rural towns;the latter together accounted for about 50% of employment in 1971 and expandedat roughly the same rate over the 10 year period.
/3 Informal sector employment was estimated at 2,400 in 1971, 6f which half werein retail trade (sari-sari stores mainly).
/4 Electrical appliances, gas stoves, vehicle parts, etc.
/5 Motor powered, typically an adaptation of a 120 cc. motorcycle. "A familywith three or four children is readily accomodated (or) several pigs, 500pounds of rice or fertilizer....."
/6 Horse drawn carriages.
/7 Mainly traditional crafts: pottery, coffin makers.
/8 Seasonal workers.
/9 The 1961 figures are underestimates since Gibb was unable to count businessesthat had failed.in the period, The growth rates are thus over estimates.
Source; Gibb C974) "Agricultural Modernization, NQn-Farm Employment and Low-LevelUrbanization.

ANNEX TO CHAPTER VT
Table 6.3:REGIONAL DISTRIBUTION OF
MANUFACTURING EMPLOYMENT FOR 1970 BY SMALL AND LARGE SCALE INDUSTRIES-
Manufacturing Employment Region Distribution (in %)
Total, Percent of Which in of Employmen ,, in
Region 000s Small Large Small Large-- Total
Metro Manila 301 22.9 77.1 6.9 57.5 21.6
Luzon (Other than Metro-Manila)
/3Southern Tagalog- 174 89.4 10.6 15.7 4.6 12.4
Central Luzon 178 83.1 16.9 12.6 8.0 12.9
Cagayan 30 82.0 18.0 2.5 1.3 1.2
Ilocos 110 94.2 5.8 8.8 1.6 7.9
Bicol 97 96.9 3.4 9.4 0.9 6.9
Sub-Total 589 89.1 10.9 46.5 16.4 41.3
Visayas
Western 136 80.3 19.7 11.0 6.7 9.8
Central 122 86.8 13.2 10.7 4.0 8.7
Eastern 61 95.9 4.1 5.9 0.6 4.3
Sub-Total 319 85.9 14.1 27.6 11.3 22.8
Mindanao
Western 35 80.9 19.1 2.8 1.7 2.5
Northern 89 68.5 31.5 6.1 6.8 6.3
Southern 63 60.5 39.5 3.8 6.2 4.5
Sub-Total 187 68.1 31.9 12.7 14.7 13.3
Total 1398 71.1 28.9 100.0 100.0 100.0
/1 Small industries here include household employment plus employment in
establishments with less than 10 workers.
/2 1972 figure (see source notes).
/3 Includes islands of Palowan and Mindoro, which account for less
than 1% of manufacturing employment.
Source Notes: The regional distribution of total manufacturing employment can
be obtained from the regional volumes of the 1970 Population
Census; the data are summarized in the 1970 NEDA Situation Report
from which the above were taken. Regional data on employment
in establishments are available in the 1972 Census of Establishments,
but no data are available for 1970. The percent distribution
among regions obtaining in 1972 were applied to the 1970 estimate
of total employment in large establishments; the latter was
obtained by straight-line interpolation between the 1967 and 1972
establishment census figures and is about 8% lower than for 1972.
Employment in small scale establishments and households was
calculated as a residual.

�. _
� . ' 1
т . а 14 ь , ь ..
: [1[4 Т [U СС дl У' У11 Г. УИА УА С Г СЧ I У I'1Ctl и У МУ С I11 Иу
1-п
.У . Уп и и l. г l ли 1 и . и г ли � . w1u и . а. и� ' t l. а от For � . � [. У 1 ил '. гы . г. 1 п 1> и l р иг и г и .1 п , С га р в - У Ув у l и п `. s ы. г . ц . и� n ии гс и . г- � � ^ � _ � .'^ п .
а в l л сlv в Га .l1 У i 7и га 1 С г w гы Rв г в У ир и l в г l и п s гв вг Grov гl � lu aи rlc и laur � д_ S1.4 ь с � 19� 13 -. }.-. _ ч . й _... 'L"L � Z7% Yl вL.rf в . 51ьв г< 1 м /14
[. У 1 л и 7 пг и.. 1471, 1 l ч гs 19au-n и л . и . f Ч 7 ч Аы г . х . 1 Ча И -7s 1975 [1г .r У Сл г� � си г оw"suY.rt-' т 1. Ь в гЕ- lndun ху А и.l с и l ги гг т в г г l. т r т л и l с в С< ы (4 я гй)--
- И . т r и у l,1ц , � х 11 ta.4 й . У я л й . У г - ' - - - ы - s7 ы 7
Z � J, I< аС 1 ид l Ч в М в СГ и - М ва ll в )
- 11 и ел . У я 7. и х . а � 1 я � ,7.. ьа 7 ) 1 1 1 а 5 й И
- С вУ ау ь и У в1l вУ ь S 4 ь 6 ]. д !1 1° 7l 1] 11 - - 11 l Ь 1 0
. С вц [ гв l l и в о п 1l1 1D. й ],] ] х й . У 45 16 1 - Ч 1 9 1] й д ,
- - s о иг ы . г п п У г ) л У п ь и . й 1.s я ].< <) и ь 1ь и п и и е з
-[1 со 1 76 1.6 1.6 l1 l. д ц 10 й Ь 1 7 7 ) ] ]
Vl в вr в s
- Ч гв а вп У Gв ву в г (jQ я . М 1_ д i6 7.] Ч 1 д 1 х � 1 Ь 9 't 9 1 й 1 7 У
- С . п г гв l Ч l в ьу а . [ а-15
[.0 7.4 х [ 1. д ().])1- л 4 1 Ч<- х 9
�7 У ! ) 6 Ь 4
- е . гвагп v! � вт . а а . х 1. а ! я 1.1 а й п s й i ь 1 :
И 1 пд . п. и
_ L1
- 4 иг[ ы . � ц ей- У1i� s.s ].9 i4 � . ёц 1 11- ьяц i ё йп - tn : е i а
-. s аи оы . гп Ь_ й й.s a й . ь 111 !12 xCL2 � 1Шй ь1 1 s
_ - С s п гг вl 4,9 ].0 15 й .[ !U й 5 � R1 I Ь 1 д
� РЬ 1 А гр р l ив в � Ти га ! 1 дд 1 д д г . и ]3 ].0 ц l! Ю 10 д 100 1 дд 1 д д 1 д д l0D 1 д 0 IW
s. й с ги в l LnJ А r вв � 1l и с в гвд tu С ги У в а г 4l с в лг вд Т 1 д .в r Г год и с гl лп . 1815: в 1111 иц А в сг в гв в ......................,..,.... .., .. ..... 3.9 � .1 2.] 0.5 9.6 - " - "
ц и . и д иц гы . Угаи гы т.w а и! гр в С ои и ггr' � а 1 У г l и с l рв ! 1 гl �ь г гв [ вд ! с г г ц ., т . clrr д в г. . г. г. еи l. г. д 1 п и м . т . л 1 У .
t jj 44+ гв о 1 гии ь а 1 р в l в у Irou и L г l с в ) р год и С [l ли , �
- .
� j S1 �в гв и ! гы .. oI гп в llW с а гц р г оJ ис l{ У Ч .
у� чывгв oI соелЧи t в У , гывгвд. �
( � Y4arc о ! га п в а ! ви и вг г ви в h в г r в в Св д ,
ц У б . га и ! . п ьw.1 .11w. Ы s си г l гг. с и ь l с .. г. гг ) г ц an � а 1fи. ос . в ! и г lor.. гry.
( � � А с [ и в 1 С ги г в Vв l ив в 1J д вд 1 л 1f)] !1 л 1 Ч 72 р гl с вв ) и. г а р 1] Ъ 1111 ли lo а и г l с и l с иr в . р 33 Ь !7l1 ои lu l ид и вг гу . в п.! р ]] Ф г lll о и 1 п [ ы в св r гt вг у о вс си r. .
� Св У ву ви Чь 11. У д п вв tw[ б в и в . сw г и г. д с l г у .
�
_ � Tt � . !l иига 1ц р. т . пш г ... l псl цдв .. . пд гЧ . tl УЧr. алг 1п р. и пгы . г.. . тс l ид.., С . пц , ( рир , w д гыииг . цд l, гд1
!(U и. � г У в в [ в гп а п д L' ав с гг п и l в ву в в г ев рв е гlv в l у и ид . г [ ы . 1971 г в[l и л в l г l вг в lllcaClu п r. .
�
ц W .<ctuJ. в и лв ll в п (vh/cA v ва д в с l в гв д лл 1 ц п У вг � <4. г гв г.J cl[ у Ь у [h в гl м о ! г ы в 1971 С . ив п .).�
(jj Tur 5 ои [ ы- Чs г t а гп в од Ч л гг h-[. в гг гл И l д ь м о гв гр ес г l и в l у и пд в г Сы . 1971 r.Ylunal с l в вв lf г ы г l и иа .
� T1i. 1 Ч 15 J в гв о п в и г l ги lw ге rnd l и гв . г гу в г в ил г tlv в n в . р в гв г вl у ! и г S ои с Ив r п auJ L' вп [ гв 1 И 1[ и lв пв и .
f! [ тс l и д са l Ч 1. п J Е l а ыв г l в � Ifl вP-paoda) ц01 е Ь в в.lw. г г и вб ои г ]0I а г [ л и 1 р г ад цг г l и п .
� f е Ys.< д о о : ы в lwcr г � г lr.[a ln Ч ии > Т . Ь 1, tl.. � - � "
s �иг . ropnl.asun сим иг: w1. г t.. r �..ny т ил..+ п . г . . г, ы баи [r � гы. ьч71 l..11 у 1 цсл.. . т егр. пд l гиг. su г,,.r.; гь. и [1 и и ' в ц 1... ! ц и с лп и.l с д и г ри г . г. С.4 л ц г гь,. и . М п г о пJ р 1 о ,ь т г 1 ч ) и - ы , ыеиг : . г1 гы-
гг аг и . га г+\ Ч о f ги . [ ав ЛС S»-w:o1 Уы 111 цц 1 ое У а . гЬт У , 1 Ч 71. г,h гг Ь ll г г в l д в р гl в . гУ йо и га в в.

ANNEX TO CHAPTER VI
Table 6.5:
REGIONAL DISTRIBUTION OF
MANUFACTURING EMPLOYMENT BY SCALE OF ACTIVITY 1960-75
/2
Region and Scal 71 of Employment, 000s Growth Rate
Activity 1960a 1960b 1970 1975a 1975b 1960b-75b
Ma-aila and Rizal
Household and < 20 Small ill 157 156 216 4.5
> 20 130 130 207 285 285 5.4
Sub-Total 122 241 364 441 501 5.0
Luzon (Excluding Metro-`Manila and Rizal)
Household and < 20 306 343 481 407 563 3.4
> 20 29 29 47 73 73 6.3
Sub-Total 335 372 528 480 636 3.6
Visayas
Household and < 20 258 289 309 190 263 0.6
> 20 26 26 39 51 51 4.6
Sub-Total 284 315 348 241 314 0.0
Mindanao
Household and < 20 83 94 119 118 163 3.7
> 20 14 14 40 46 46 8.3
Sub-Total 97 108 159 164 209 4.5
Whole Country
Household and < 20 639 837 1065 871 1205 2.5
> 20 199 199 333 455 455 5.7
Sub-Total 838 1036 1398 1326 1660 3.2
/1 The < 20 and > 20 ranges refer to establishment size by No. of Workers.
/2 Differences in definitions of employment between the four sources quoted
above make it difficult to compare the estimates. Briefly, the following
principles were followed:
(i) The establishment censuses, establishment surveys and the labor
force surveys each estimate current employment, and (as far as
one can see) are comparable.
(ii) The 1970 population census also consistent with (i).

ANNEX TO CHAPTER VI
Table 6.5: (continued)
(iii) The 1975 population census used a more stringent
definition of employment (a person had to have worked
in the activity for more than 10 hours per week and
for not less than 10 weeks per year). It was therefore
adjusted to make it comparable to the data for earlier
years and with the 1975 establishment census and labor
force survey.
(iv) The 1960 population census definitions were also
consistent with (i), but there appear to have been
problems in classifying women's labor as between
manufacturing activities NEC, classified manufacturingactivities. The data were also adjusted.
The basis of the adjustments were as follows:-
1960a: The manufacturing employment in each region are the"raw" census data. The estimates for Manila and Rizal were
clearly underestimated by the census since they imply noemployment in establishments of less than 20 workers, and no
employment in households - i.e., no "informal" manufacturing
sector. They also imply that only 6.6% of the population ofover ten years old in Manila and Rizal were in manufacturing
in 1960, as compared with approximately 12% in 1970 and 14%
in 1975. There are reasons for thinking that the share of
employment in manufacturing (in Manila and Rizal) were higher
in 1960 than in 1970 since import substitution had led to a
high growth rate of manufacturing output in the 1950s, but a slow
growth rate in the 1960s (see Chapter 5). One problem appears
to be the ways in which services ahd women's labor were counted
.in 1960, since the census shows high percentages in these categories,
compared with those of the labor force surveys. Further the
"miscellaneous" category for manufacturing was quite high in the
census, indicating a possible problem of classification. Taking
12%,of working age population in Manila and Rizal to be in
manufacturing in 1960, gives an estimate of 217 thousand total
manufacturing employment in the area, and 933 thousand for the
whole country. The labor force survey gives a total employment of'
1036; the difference is probably due to seasonality and samplingerrors, since the 1960 census used the same definition of employmentas was used in the labor force surveys to obtain consistency with
the 1970 and 1975 data, the total employment in each region is
scaled up by the ratio 1036/933. This gives the estimates shown
for 1960b.

ANNEX TO CHAPTER VI
Table 6.5: (Continued)
1970: The 1970 census used the same definitions of employed
workers as do the labor force surveys. Hence they are consistentwith the latter, and in fact the 1970 census estimate of total
manufacturing employment is close to the estimate that would beobtained from interpolating the annual labor force surveys in
neighboring years (no labor force survey was conducted in 1970).
In 1975 a different and more stringent definition of employmentwas used which leads to lower estimates than those obtained in
the labor force surveys.
1975a: Employment totals in each region are the raw census data,reclassified as far as the maps available to us would permit,
according to the boundaries used for the 1960 and 1970 data
tabulated above.
1975b: The differences in definitions of employment between theestablishment censuses and the labor force surveys are likely
to have affected mainly the census' estimates of those employed
in households, since those employed in establishments of over20 workers are mostly regular, and would meet the definitionnoted in (iii) above. Hence we need to adjust the residuals in
1975a. The following procedure was used. Let x. represent theadjusted and y the unadjusted:residual for each"region (that is,
the y 's are 16, 407, 190, 118 and total 871, as shown under
1975a . Then
455 + Eyi = 1326 from column 1975a,
and 455 + Exi = 1660 from the total in 1975b.
Let xi /71 = k, the adjustment factor; k is then 1.383 from thesetwo expressions; this is the figure used to get the x 's shown in
column 1975b.
/3 The 6.6% figure is for the period 1970-75 (using the estimate under
1975b),

ANNEX TO CHAPTER VI
Table 6.6:
MANUFACTURING EMPLOYMENT BY REGION
1961-1975
Increase 1961-1975/72--
Year Yearly Growth
Region 1961 1967 1972 1975 No. % Total Rate %
Number Employed in Establishments with Yore than 10 Workers, 000s
Metro Manila 165.5 239.5 248.0 288.2 82.5 49.7 3.8
Luzon 41.2 56.0 68.8 148.7 27.6 16.6 9.6
Visayas 33.2 42.2 49.0 60.1 75.8 9.5 4.3
Mindanao 23.2 55.9 63.4 48.5 40.2 24.2 5.4
Total 263.1 393.6 429'.2 545.5 226.1 100.0 5.3
Number Employed in Establishments with less than 10 workers, 000s
Metro-Manila 27.1 26.6 43.5 n.a. 16.4 15.1 4.4
Luzon 36.4 47.8 87.5 n.a. 51.1 47.2 8.3
Visayas 18.7 28.8 35.5 n.a. 16.8 15.5 6.0
Mindanao 13.5 22.0 37.5 n.a. 24.0 22.2 9.7
Total 95.7 125.2 204.0 207.0 108.3 100.0 7.1
/l The estimates for establishments with less than 10 workers are for the period
1961-72, and for more than 10 workers, 1961-75.
Sources: NCSO, Surveys of Establishments and Labor Force Surveys. The 1975
establishment data are from preliminary tabulations.

ANNEX TO CHAPTER VI
Table 6.7:
NUMBER OF ESTABLISBHENTS BY SCALE AND BY REGION
Establishment Growth Rat
Region Size Range 1961 1967 1972 1975 1961-75/72
Metro Manila7- < 20 11,379 8,872 12,407 n.a. 6.920 - 99 897 961 1,015 1,455 5.3
> 100 474 400 452 540 3.8 -
/5 /6 /Southern Tagalog- < 20 4,028 4,842 7,694 n.a.6 9.7
20 - 99 73 58 68 n.a.y/ 2.0-> 100 17 26 32 n.a.-- 2.6 /-
Ilocos < 20 3,432 4,041 7,071 n.a. 6.8
20 - 99 60 32 38 40 -2.9> 100 17 10 16 21 1.5
Cagayan Valley < 20 1,225 1,438 2,961 n.a. 8.420 - 99 18 23 34 36 5.1
> 100 6 9 8 14 6.2
Central Luzon < 20 3,217 4,463 6,981 n.a. 7.320 - 99 102 133 160 153 2.9
> 100 27 53 60 51 4.6
Bicol < 20 2,147 2,456 4,206 n.a. 6.320 - 99 38 41 41 52 2.3
> 100 6 10 5 12 5.1
Western Visayas < 20 3,018 4,886 6,564 n.a. 7.3
20 - 99 78 67 59 73 - 0.5
> 100 33 27 35 32 - 0.0
Central and Eastern
Visayas < 20 4,079 4,884 5,349 n.a. 2.520 - 99 125 128 126 213 3.9
> 100 32 46 47 60 4.6
South Western Mindanao < 20 3,167 4,640 7,583 n.a. 8.3
20 - 99 77 81 84 24 -8.0
>100 35 47 45 7 -
North Eastern Mindanao < 20 1,765 2,243 4,091 n.a. 7.9
20 - 99 46 46 40 46 0.0
> 100 16 36 38 31 4.8
11 The 1987 period is taken wherever the 1975 data are not available. (See
f.n. 4 for other exceptions.
12 Including Rizal.
/3 For the period 1967-72.
4 For the period 1967-75.
/5 Excluding Rizal.
/6 The preliminary tabulations give the number of establishments in these size ranges
for Southern Tagalog, but appear to be unreliable (the counts are very low
compared with all previous years).
Sources: NCSO, Census of Establishments (1975 data are preliminary tabulation).

ANNEX TO CHAPTER VI
Table 6.8:GROWTH RATES OF PRINCIPAL CITIES IN PROVINCES
Population 000s Growth Rate
Region and City 1960 1975 % per Year
I. Ilocos - Baguio 50 97 4.54
- San Carlos 64 91 2.39
- Dagupan 63 90 2.42
- Laoag 50 63 1.56
227 341 2.72
II. Cagayan Valley (NoChartered City) - - -
III. Central Luzon - Angeles 76 151 4.71
- Olopango 45 147 8.25- Cabanatuan 70 115 3.38
- San Jose 38 53 2.25
- Palayan 3 12 9.33
232 477 4.92
IVA. Metro Manila 2,462 4,970 4.79
IVB. Southern Tagalog- Batangas 83 125 2.78
- San Pablo 71 117 3.40
- Lipa 64 106 3.44
- Lucena 49 92 4.31
- Cavite 55 82 2.71
- Puerto Princesa 22 46 -
- Tagaytay 7 13 4.23
- Trece Mortires 4 7 3.34
355 588 3.42
V. Bicol - Legaspi 61 88 2.49
- Naga 56 88 3.07
- Iriga 75 76 0.09
192 252 1.83
VI. Western Visayas
- Iloilo 151 255 3.55
- Cadiz 88 128 2.54
- Silay 60 105 3.82
- San Carlos 125 100 1.48
- Bago 59 89 2.79
483 677 2.28

ANNEX TO CHAPTER VI
Table 6.8: (continued)
Population 000s Growth Rate
Region and City 1960 1975 % Per Year
VII. Central Visayas- Cebu 251 413 3.36
- Bacolod 119 223 4.30
- Lapu Lapu 48 79 3.39
- Toledo 64 76 1.16
- Mandaue 29 76 6.67
- Dumagete 35 53 2.82
- Bais 27 46 3.63
- La Carlota 57 41 - 2.18
- Tagbilaran 20 37 4.21
- Calaon 23 29 1.57
Total, excl. Cebu 422 660 3.03
Total, incl. Cebu 673 1,073 3.16
VIII. Eastern Visayas- Calbayog 78 103 1.88
- Ormoc 63 90 2.42
141 193 2.11
IX. Western Mindanao-- Zamboanga 132 265 4.78
- Pagadian 41 66 3.24
- Dipelog 32 50 3.04
- Dapitan 28 48 3.68
232 429 4,18
X. Northern Mindanao
- Cagayan de Oro 68 165 6.12
- Cadiz 88 133 2.81
- Ozamis 44 72 3.35
- Gingoog 53 67 1.58
- Surigao 37 66 3.95
- Tangub 21 40 4.41
311 543 3.78
XI. Southern Mindanao /9
- Davao 102 215 - 484-- 5,09 - 10.94--
- General Santos 53 91 / _2 3.71
155 306 - 575-- 4.64 - 9.13
XII. Eastern Mindanao
-fligan 58 119 4.93
- Cotobato 38 67 3.87
- Marawi 27 63 5.84123 249 4.81
/1 Excludes Basilan (no longer a chartered city).
/2 The estimate in the 1975 census is the second and higher figure; it
seems unusually high, since the population was Qnly 177 in 1970.
There may have been some boundary changes. The first figure is the
one given in the 1977 Philippine Statistical Yearbook, which appears
to have used consistent boundaries.
Source: Population Censuses for 1960 and 1975. NCSO.

rable 6.9:ANNUAL OUTPUT AND YLELD IN TIlE MAJOR CROPS 1N W.0 PRODUCTI1N 1960-76
Annual Output Annu l YieldsQuantlty Year Play Corn Sugar valay Corn Sugar
(Rough RLce) (Shelled) Cuconut Cane&Ocgs (Rouglice Shelledt coit Cank--
Output/YIeld 1960 3740 1165 1117 1810 6315 1.131 0.631 l 055 7.472
Unit (In 000s) tons cons bons C.M. ton li tons 'ha lons 'ha Ions 'ha
Levels of OLtput/Y1eld Relative to 1960 tprcene)
1960 100,0 100.0 100.0 100.0 100.0 100.0 100.0 100 0 l00 01961 99.1 103.8 101.2 94 4 104.5 102 4 93.7 89 3 98.51962 104,6 108.7 127.0 105.1 107.2 I08.8 99.5 104 7 100 01963 106,1 109.2 139.2 112.2 121 4 1110 103 5 1059 05.01964 102-.6106.7 110.9 138.7 117.8 103.5 110.1 107.9 99 1 105 71965 106.7 112.6 137.3 112.4 97.18 110.3 108.2 90 6 27.71966 108,9 118.4 139.4 101.0 127.4 115,8 103 8 91 7 77 61967 109.5 127.9 149.0 152.0 124.2 116.0 109.4 86 6 87.')1968 122,0 139.0 143.0 119.4 176.0 122 0 114.1 84.2 80.91969 118.9 148,7 140.1 119.7 183.4 117.9 121.7 80 4 14 51970 140,0 172,3 154.5 143.4 174.3 148.l 131.5 8.8 94.111971 142,9 172.1 150.3 164.7 169.4 151.7 132.8 72.7 90.31972 136,4 172.7 162.3 141.1 133.3 138.9 131.2 80 9 77.51973 118.1 157.1 160.9 176.3 165.4 125.5 124.7 79.8 93.81974 149.6 196.4 161.1 190.6 161.4 143.9 131.2 77 3 94,11975 151.4 220.4 243.7 i! 181.7 n.a. 141.4 133.0 113.21/ 82.11976 164.7 237.4 305.7 L-. 197.6 136.9 152.2 134.5 128..3/ 89.81977 172.7 244,1 u.a. L.a. n.a. 160.9 140.3 n.a, n,a,1978 184.4 245.1 422.5 18_1 11na . 17- .-4, -n.U32. n_.a
I. Data for 1975 onward, are not comparable to those for earlier years. since Lhey ikelude umore by-prducit s In ileoutput figures than*previously.
Souret Original source Is Depnrtmienc of Agriculture and Commerce. Figures here are taken frow the st,uiuariesprovided In the 1978 Philippine Statistical Yearbook, NEDA, 1978.

ANNEX TO CHAPTER VI
Table 6.10REGIONAL DISTRIBUTION OF MANUFACTURING
EMPLOYMENT BY INDUSTRIAL SECTOR, 1977
Consumer 1 Intermediate DurableRegion Goods Goods Goods
Metro Manila 45.0 56,8 79.5
Luzon 30.5 16,7 10,6Ilocos 5.1 3.0 .5Cagayan Valley 1.7 2.2 .2
Central Luzon 9.3 4.3 4.2Southern Tagalog 11.3 6.6 5.4
Bicol 3.1 .6 .3
Visayas 15.4 6.6 7.5Western 8.3 1.8 1.0Central 5.2 4.3 6.3Eastern 1.9 .5 .2
Mindanao 10.3 15.1 2.4
Western 1.3 1.7 .6Northern 3.1 7.0 .6
Southern 4.1 2.4 .9Central 1.8 4.0 .3
Total- 100.0 100.0 100.0
Total Number 494,225 207,387 76,519
/1 Food, beverages, tobacco, textiles, apparel, furniture, printing,leather, miscellaneous.
/2 Wood, paper, rubber, chemicals, petroleum and coal, non-metallicmineral products, basic metals, metal products.
/3 Machinery, electrical machinery, transport equipment.
4 Totals do not add up due to suppresion by data in original,unpublished source.
Source: NCSO. ASM, 1977 Unpublished tabulations.

ANNEX TO CHAPTER VII
Table 7.1:WAGE RATE INDEX OF LABORERS IN INDUSTRIAL
ESTABLISHMENTS IN MANILA AND SUBURBS, 1948-78 (1972=100)
Money Wage Rates Real Wage Rates
Skilled Unskilled Skilled Unskilled
Year Laborers Laborers Laborers Laborers
1949 61.0 47.0 142.2 109.6
1950 60.9 41.2 137.8 93.2
1951 57.2 44.4 119.7 92.9
1952 58.1 47.5 129.7 106.0
1953 59.3 48.8 137.3 113.0
1954 59.7 48.3 140,1 113.4
1955 59.7 49.7 141.5 117.8
1956 59.8 50.5 138.1 116.6
1957 59.7 49.9 135.7 113.4
1958 61.7 50.2 135.6 110.3
1959 62.9 50.6 139.5 112.2
1960 62.7 50.7 133.4 107.9
1961 62.6 51.9 131.2 108.81962 63.4 53.5 125.5 105.91963 65.2 56.3 122.3 105.61964 66.4 56.9 115.1 98.6
1965 68.2 60.8 115.2 102.71966 71.7 65.4 114.9 104.8
1967 75.0 68.4 113.1 103.2
1968 81.1 76.1 119.4 112.1
1969 85.3 79.7 123.3 115.2
1970 90.6 88.4 114.4 111.6
1971 95.3 94.4 105.1 104.1
1972 100.0 100.0 100.0 100.0
1973 105.3 102.6 92.4 90.0
1974 115.1 110.8 75.6 72.81975 119.7 120.1 72.7 72.91976 124.4 126.2 71.2 72.31977 137.5 132.9 72.9 70.4
1978 154.4 138.4 76.1 68.4
Source: Central Bank of the Philippines, Statistical Bulletin, Vol.XXX, 1978.
Basis of Estimates. Sample survey of Large Establishments in the Metro-Manila
Area, conducted monthly. Money Wage Rates are deflated
by the consumer price index for Manila. (For 1972 and.
afterwards, the sample covered 777 firms.)

и п i гт т о с� л гг=_ а �л 1
^_ а б l е i.2 �
;DH6q ;1l Ф д р д L iL1iCC Н А 2?s ЕО а sEL°CTED XI: Ф S о 8 la3t7a ? У Т_EФ USi.WiLL 2s ь dBLZSffiiEms гЧ Ч A2IIIA .1![D n"i1 Ж 7aBS, 193t-;a tP250s ' Е а oAr}
С о т о а
Т в + т 31+eicaitha С а г р в а и т а Drlv в rf Е 2 в с т т 1 с l в а + L а г liwa ?l+sans .` �л eh+aiea PeiaCera ?lumb в ra Cabar в ra ё а г в т . а
� Эв а 1 W к + З и а � (1 а 1972 Рт i е в в )
. � 1931 11.84 L3.35 12.26 ц .SL 16,19 12.49 ц ,36 12. б б 14.71 9.69 1 В .77
1932 13.90 i4.49 1Э .04 16.79 17.39 ц .39 16.79 13.33 16.38 11.05 20.11
1953 14.41 ц . Э0 1Э . б 1 17. д7 18.43 13.G0 17,62 14.28 L7.04 11.78 ?1.50
1934 15. о д 14.74 '4.27 17.36 19,J9 1 Э .00 18.12 ц . �..2 i7.18 !2. д 1 73.10
-. 1953 :5.05 ц .40 .4.55 ii.44 19. Э Ь !3.01 18.36 ц .03 17.51' ц .27 2 Э .°4
1956 14.78 14.27 14.69 17,33 18. б4 ц .26 18.54 14.71 15.84 12.:5 2 Э .50
' 1957 14.50 14.07 ц . Э б 17.55 16.80 L2.34 18.3Z 14.57 16.75 . .2 В ? З . д 9
I930 U.9 б 14.07 ц .25 17.12 18.13 1Z.33 17. д 9 14.31 17.87 11.44 ?3, б 7
1959 1 Э .88 14.66 15.50 17.76 18.34 12.64 1 В.04 14.19 18.59 11. о9 24.48
1960 17. о 4 14.; у7 ц . ц 1 Т .66 17.5 Э 12.09 17.21 13.77 17.+3 11.23 2 Э .89
- 19 Ь 1 13,71 17.54 14.74 17.04 16.OZ 12.10 16.90 ц .54 16.83 11.34 24, ц
1962 ll.23 13.21 ц . Ь2 16.31 14.89 11.17 16.44 1 Э .02 16.20 11.0 Э 23.05
196 Э i2.93 12.91 13.11 16.7' 14.47 1 д .92 16,33 12. д3 16.79 11.01 22.51
. 1964 12.29 ц .06 12.43 ц ,75 1 Э .34 1 А .24 L5.29 12.06 ц , дб 10.?8 21.77
19b5 12,31 12.ll 12. Э 1 ц . ВЬ 13.43 10.22 ц .27 12. ц 13.20 10.71 22.1 Э
1966 12.10 11.94 12.05 1 Ь .41 ц .44 9. д 6 ц .'J. 12.29 14.65 20.91 21.94
1967 12.04 11. Э2 12.04 16.24 17.86 9.41 ц . ЭS ц .62 13.38 10.75 ?0.90
1968 12,14 1 Э.68 22.27 17. Э 8 1 Э .89 1Э .5 Э 16.1 Э 13.$6 l3. дб 11.68 21. д 9
:969 12.47 U.77 , 12.34 18. ц L3.92 14.7L 16.71 14.86 ц .19 11.99 22.79
' L Э70 11.88 ц .59 L2.39 16.81 12.55 ц .16 ц . бй 13.88 14. Ьб 11.53 20.91
1971 10.90 11. Э б 12.22 14.67 11.98 11.61 14.81 1Э .31 ц .18 10.95 19.29
� L472 11.?6 10. б 6 11.51 1 Э . Э 9 11.26 L0.71 14.00 12.34 11.71 10.42 18. Э 4
197 Э 10.8 Э 9.62 11.04 11.8 Ь 14.92 9.79 L2.67 11. д 8 10.66 9. Э 8 17.25
� l474 9. бд 7.53 8.36 9.80 9.29 7.06 10.72 10,01 д,38 7.58 14.61
1975 9.42 7.?3 8,39 9. б 0 8.82 6.78 i0.59 9.6 Э 8.08 7.60 14, Э 4
� 1476 9.17 7.07 8,31 4.29 8.81 6.77 l0.4 Э 9,53 '.70 1.33 14. Э 8
1577 4, д0 8, ц 9.01 9.92 8.47 7, В3 10.37 9.11 д .4 Ч 7, Э4 14.01
1978 1о . г�ь 8. ьs 4.z9 9. в4 8. Эь в . гт ц .7 а 9.68 s,s з 7.1 г 1Э . п
iloney V а к е flyeea,
1951 3.64 6. Э8 3.86 7.4 Э 1.74 5.97 1. � + 6.03 7.0 Э 4.63 8.97
1932 ' S.79 6,49 5.84 7.52 7.19 3. Ь4 7.52 5.97 1. Э4 5.49 9.01
� ' t9s з Ь , Э ; F ы£ г. 3, ав 7.72 7. эб 3.79 г . ы 6,17 7, Э6 s.o9 9.29
19sL 6,6g б_ � гд 6,08 7.48 8.26 5.34 7,72 5.44 7. Э 2 5,03 9.84
1935 6.35 b,i0 6.14 7.3 Ь 8.17 5. й 9 7.73 6. Э 5 7.39 5.18 10.06
!456 6.4D 6,i8 6,36 7.60 Э .07 5. Э 1 8.03 6. Э7 7.29 5.26 10. Э 3
1937 b.38 6,19 6.76 � 7.72 7.79 5.4 Э 8, ц 6,41 7. Э7 5.34 10.51
1958 5.35' 6.40 6,94 7,79 9. ц 5.62 8.14 6,54 8.1 Э 5.23 Ф .77
1959 6.26 6.b1 6.99 8,01 8,27 3,70 9.1 б 6.40 5.43 5.27 11.04
1960 6,41 b.6k 7, ц 8.30 д .24 3.68 8.09 б .47 д.19 S.ZS 11.2]
1% 1 6,34 6,46 7.03 8.1 Э 7.64 5.77 6.05 4,4 Ь д ,0 Э 3.41 11.55
i9 б2 6.68 6,6 Т 6,88 8.34 7,32 3.64 8.30 6.57 8,18 5,37 11.64
� 1963 о,90 6,88 6.99 д ,9 Э Т.71 5,82 S. д2 6.85 9.95 3.87 12.00
19 Ь 4 7.R9 6.4b 1,17 4.09 1.81 5.91 8,82 6.96 9. ц 3,9 Э 12.39
� 1965 7.29 1,18 7.29 9,39 7.93 б .03 9.04 7.19 8.94 6, Э4 13.10
i9b б 7,35 7.43 7.5 п io,24 В ,42 Ь . ц 9.51 7.67 9.ia ь . а1 1Э . бЭ
1967 7.9 В 7.40 7.98 10.77 9.19 6,37 10.18 8.]7 . 9.20 � 7,1 � L1.86
1468 д ,24 9,29 8, ЭЭ 11.80 9.43 9.19 10,45 9.42 9.41 7.93 14.86
1969 8.6 Э 9,50 8,34 12,6 Э 9.63 10.1 В 11.3 б 10.28 ID.51 8.30 ц .77
, 1974 9.41 9.97 9. В 1 1 Э . Э1 10,02 10,42 12. Э9 10.99 11.61 9,21 16,56
1971 8,99 10. Э0 11.08 13,31 10,87 10.5 Э 17.4 Э 12,07 11.59 9.84 17.30
1972 11.26 10,66 11.51 13.74 11,26 i0.71 14,00 12.34 11,71 10.42 18.34
1977 12.3i 10.97 12.58 13.32 12.43 10,70 14.44 t3.34 1L 71 10.69 19, бб
1974 14,73 11.46 33.48 14.92 14,14 10. Т3 16, Э 2 ц .24 12,76 11,54 22.24
. 1973 ц .51 11.74 14.1b ц ,80 1k,51 11,26 17.44 ц .8 б 1 Э ,31 L2.51 23.62
- 1976 16. о Э 12.33 14.51 1 б .2 Э ц .38 11.87 L8.23 16. Ь Б 13,45 U.16 25,13
� 1977 18.49 15.37 17,00 16,81 13.97 14.76 20.31 17.20 ц .92 1Э .84 26.4 Э
_. ._. << .,, ,. ,_ 1у 78 . 21.24 17.53 18.83 i9.98 16,44 16.77 23.90 29.64 17.90 14.42 27.84
3ац п в : А 'в Ьат Ада.z'L вЫ в 1.
, � , е. �;::......,... . � ., � . .

ANNEX TO CHAPTER VII
Table 7.3:11
AVERAGE DAILY WAGE RATES-L-- FOR AGRICULTURAL
LABOR, 1956-78 (PESOS)
Consumer Price
Index Outside Real Wage
Average Manila, 1972 Rate, 1972
Crop Year Wage Rate 100 Prices
1956-57 2.49 42.2 5.90
1957-58 2.66 40.9 6.50
1958-59 2.56 42.)l 6,08
1959-60 2,62 41.2 6.36
1960-61 2.65 43.3 6.12
1961-62 2.62 45.6 5.75
1962-63 2.75 46.8 5.88
1963-64 2.74 50.9 5.38
1964-65 2.78 55.5 5.01
1965-66 n.a. 57,3 n.a.
1966-67 3.26 59.9 5.44
1967-68 3.29 63.2 5.21
1968-69 2.94 64.4 4.57
1969-70 n.a. 65.3 n.a.
1970-71 3.55 75.0 4.73
1971-72 3-.72 92.8 4.01
1972-73 4.40 100.0 4.'40
1973-74 n.a. 117.0 n.a.
1974-75 6.27 157.0 3.99
1975-76 n.a. 167.3 n.a.
1976-77 9.45 183.5 5.15
1977-78 9.97 192.7 5.17
/1 These are wage rates 'without meal' (i.e. payment in kind). A
separate series is provided by Baecon on wage rates with meals,
which are about 30% lower.
Source: The wage rates are provided by the Buareu of Agricultural
Economics' (Baecon) quarterly Surveys an Farm Wages. The
figures q-aoted here for wages up to 1974-75 are taken from
the summaries provided in the 1977 Yearbook of Labor Statistics.
The consumer price indices are provided by NEDA.

ANNEX TO CHAPTER VII
Table 7.4:AVERAGE WEEKLY EARNINGS OF EPLOYED AND SALARY WORKERS IN
PRIVATE AND GOVERNMENT EMPLOY FOR SELECTED INDUSTRY GROUPS, 1977-76
Industry Group 1969 1970 1971 1972 1973 1974 1975 1976
Money Earnings, pesos per week:
All Industries 37 - 49 47 51 57 67 78Agriculture 21 - 33 25 30 37 37 45Manufacturing 38 - 48 48 57 57 70 75Construction 38 - 56 49 50 54 66 75Utilities 59 - 72 76 85 87 115 123Commerce 46 - 53 53 60 71 90 97Transport, etc. 46 - 52 53 56 63 73 86Government & Community 59 - 71 78 80 90 97 110Domestic Services 11 - 13 12 14 16 17 20Other Personal Services 32 - 43 39 40 45 52 65
Price Index for the Philippines (1972=100):
66.0 75.8 92.4 100.0 114.0 152.2 164.6 188.6
Real Earnings, 1972 pesos per week:
All Industries 56 - 53 47 45 38 41 41Agriculture 32 - 36 25 26 24 33 24Manufacturing 58 - 52 48 50 38 43 40Construction 58 - 61 49 44 36 40 40Utilities 89 - 78 76 75 57 70 65Commerce 70 - 57 53 53 47 55 51Transport, etc. 70 - 56 53 49 41 45 46Government & Community 89 - 77 78 70 59 59 58Domestic Services 17 - 14 12 12 11 10 11Oiher Personal Services 48 - 47 39 35 30 32 34
Source: NCSO Surveys of Hauseholds, May series except for 1975-76, which are forApril.

ANEX TO CHAPTER VII
Table 7.5:AVZRAGZ WEEKLY EAPNINGS OF SELECTED OCCLPATIONS
IN SEIECTED CITIES, 1973 AND 1976. (PESOS ?ER 40 hCUR HEE.)
Nominal Real,, - Change1973 1976 197&L- In Real
Clerks
Philippines 93 118 76 - 18Metro Manila 101 126 82 - 19Ilcgau (Northern Luzon) 73 86 55 - 25Naga (Bicol) 44 77 48 + 9Cebu (Central Visayas) 72 93 64 - 11Iloilo (Western Visayas) 62 99 62 0
* Cagayan de Oro rN. Mindanao) 35 1s 72 -1Davao (S. Mindanao) 73 86 59 -19
Laborers
Philippines 63 83 53 - 16Metro Manila 59 84 53 - 71ligau 50 68 43 - 14Naga 39 69 43 + 10Cebu 67 82 57 - 15Iloilo 84 78 69 - 42Cagayan de Gro 78 76 46 - 41Davao 66 65 44 - 33
Drivers
Philippines 83 110 71 - 14Metro Manila 85 116 76 - 11ligau 54 83 53 - 2
Naga 43 72 45 + 5Cebu 78 99 68 - 13Iloilo 103 97 61 - 41Cagayan de Oro 89 62 38 -- 57Davao 83 84 57 - 31
Carmenter
Philippines 99 100 64 - 35Metro Manila 58 102 66 + 14Iligau 56 82 52 - 7Naga 44 78 49 + 11Cebu 69 91 67 - 9Iloilo 76 72 45 - 41Cagayan de Oro 95 81 50 47Davao 77 71 48 - 38
Field Electrician
Philippines 96 115 74 - 23Metro Manila 88 123 80 - 9Iligau 70 98 63 - 10Naga 42 77 48 + 14Cebu 70 97 67 -13Iloilo 75 96 60 - 20Cayagan de Oro 82 100 61 - 26Davao 92 84 57 - 38
/1 1973 Pesos. Price indices for the regions were as follows (1972-100).For 1973: 117, 114, 115, 116, 128V 120,115 and 127 respectively for thePhilippines, Metro-Manila, Northern L-on, Bical, Central Visayas,Western Visayas, Northern and Southern Mindanao; and for 1976, 182,175, 180, 186, 185, 191, 188 and 186 respectively, Source: 1978 fEDAYearbook.
Source: Wage and Salary Survey in the Philippines, Office of Compensation andPosition; reproduced here from the 1977 Yearbook of Labor Statistics.

l

ANNEX TO CHAPTER VII
Table 7.7:
WAGE'S OF COIR ION IABORERS AM MINIU14 WAGES IN MANILAri
MONEY AND REAL, 1951-1978. PESOS/DAY (REAL IN 1972 PRICES)-
Maney Wages Real Wages
Common Minimum Common Minimum
Year Laborers Wage Laborers Wage
1951 4.6 4.0 9.7 8.4
1952 5.5 4.0 1111 8.9
1953 5.1 4.0 11's 9.3
1954 5.0 4.0 11.8 9.4
1955 5.2 4.0 12.3 9.5
1956 5,3 4.0 12,2 9.2
1957 5.2 4.0 11.3 9.1
1958 5.2 4.o 11.5 8.8
1959 5.3 4.0 11.7 8.9
1960 5.3 4,0 11.2 8.5
1961 5.4 4.0 11,3 8.4
1962 5.6 4.0 11.0 7.9
1963 5.9 4.0 11.0 7.5
1964 5.9 4.0 10.3 6.9
1965 6.3 6,0 10.7 10.1
1966 6.8 6.0 10.9 9.6
1967 7.1 6.0 10,8 9.0
1968 7.9 6.0 11.7 8.2
1969 8.3 6.0 12.0 8.0
1970 9.2 6.0 11.6 7.6
1971 9.8 6.0 10.9 6.6
1972 10.4 6.0 10.4 6.0
1973 10.7 6.0 9.4 5.3
1974 17.5 6.0 7.6 3.9
1975 12.5 6.0 7.6 3.6
1976 13.2 10.0 7.5 5.7
1977 13.8 10.0 7.3 5.3
1978 14.4 11.0 7.1 5.4
11 Deflated by the Consumer Price Index for Manila.
Sources: Central Bank, Statistical Bulletin 1978; Unpublished
data from wages commission.

ANNEX TO CHAPTER VII
Table 7.8:AVERAGE EARNINGS RATE IN VERY SMALL MANUFACTURING ESTABLISHMEiNiTS
1961-1975
10 or Less Workers
Unit 1961 1967 1972 19751/
Number of Enterprises 000s 33 41 63 71Total Number of Workers 000s 95 125 204 207Paid Workers 000s 43 59 94 109Family Workers and Owners 000s 52 66 110 98
- - - - - - - Current Prices - - - - -Value Added Pm 129 206 438 834Wage Bill Pm 36 57 149 221Owners Share of Value Added Pm 93 149 289 613
Paid Workers' Wages - Annual P 884 966 1,585 2,027- Per Day P 2.9 3.2 5.3 6.8
Owners' Share of Value Added t No. of Fadly Workers (including Owners):- Annual P 1,788 2,258 2,627 6,255- Per Day P. 6.0 7.5 8.8 20.9
Enterprise Earnings - Annual P 2,818 3.634 4,587 8,634- Per Day P 9.4 12.1 15.3 28.8
Daily Rates, Constant 1972 Prices
GDP Deflator P 0.49 0.67 1.00 1.67
Wage Rates for Hired Labor P 5.9 5.1 5.3 4.1Averages Family Earnings:
- Per Enterprise p 18.4 19.2 15.3 17.2- Per Family Worker P 12.2 11.9 8.8 12.5
1/ Preliminary estimates from unpublished data from the 1975Census of Establishments.
Sources: NCSO, Census of Establishments; NEDA, National IncomeAccounts.
Notes: Daily rates are estimated from annual rates assuming 300 workingdays per worker per year. The owners' share in net value added(after expenditures on fixed assets) is taken to equal their netearnings, on the assumption that tax payments and loan repaymentsare negligible for small enterprises; small manufacturingestablishments in the Philippines are eligible for taxexemptions for six years after registering with NACIDA.

�

ANMV TO CELPT-IR 11111
Table 7,10:
DISTRIBUTIIC Zi 0-' ZL IILY IN S I.N -iHE L956 TO 1975
Family Income
Group (Ranked
From Lowest to
Highest) 1956-57 1961 1965 i971 1975
Percentage Share of Total Family Income
lowest 20% 4.5 3.5 3.6 5.5
Second 20% 8.1 7.9 8.1 8.1 9.2
Third 20Z 12.4 12.1 12.3 13.3 12.9
Fourth 20% 19.8 19.3 20.1 21.0 19.i
Top 207 55.1 56.5 53.3 54.0 33.3
Total 100 i0O 100 iOO 100
Top IOZ 39.4 41.0 40,1 37.1 37.IL'
Top 5% 27.7 29.0 23.7 24.8 n.a.
ELP_ 2
Average Family Income Within Grouv (Conscanc I ,c..IL Z Change
1936-75
Lowest 207 807 808 755 744 1.141 + 41
Second 207' 1,439 1,502 1,723 1,648 1,951 + 34
rhird 20% 2,217 2,300 2,755 2,6;3 2,707 + 22
Fourth ZOZ 3,644 3,667 4,328 4,247 4,000 10
Top 20% 5L-sis 10,747 11,899 iOI908 11,240 15
Average 3,588 3,806 4,292 4,043 4,197 + 17
Top 10% 14,146 15,605 17,193 14,989 12,3821-1
Top 5% 19,859 22,068 24,637 20,041 n.a.
I Top 10.8%; the upper income group range in the 1975 Survey was P 10,000 and over, which
covered 10.8% of the families.
/Z The price deflator for personal consumption expenditure was used (see NEDA Yearbook for
1978, Table 4.8 row 1) which was 427" for 1956-57, 47.' % for 1961, 59.2% for 1965, 92.41
for 1971 and 165.0% for 1975.
Source- The primary sources are the NCSO surveys of households on family incomes and expenditures.
0 The XMA Yearbook for 1978 has the data summarized for the years up to 1971. The 1975
data were taken fr= a Special Release No.191 ol the NCSO's preliminary tabulations
o! the Surveys, dated April 21, 1977.

ANNEX To CHAFTE. VII
Tabla 7.11:YEmCS OF CEAGn-MT=E Ur a =.£ar
ON-FAHILY N S A NDLcDtE DISTRI TION.
1956, 1976
nc~ Group by ?ad.ly ercanr. Distribution of Xain Incm garners 1/3/ Escimaed Nuober
Incom-, pacc./Year 2/ EsCIrmad Discriburions of
nnrtpreneur al Aaccivitie 7amilifts /0006) å/ Colu- (5), (6) 4 .7)
Wage and Salary/ radingj åEarnra Transport manufaccurins Agriculcure 1965 1971 1976 1965 1971 1976
(1) (2) (3) (4) (5) (6) (7) (8) (9) (10)
Und~r P500 1.9 3.1 5.6 8.9 260 300 360 5.4 5.0 4.9
P500 - 2999 5,3 7.7 14.2 20.3 619 716 863 12.8 12.0 11.7
21000 - P1499 7.6 9.2 12.2 18.1 618 729 886 12.8 12.2 12.1
P1500 - ?1999 9.6 10.1 13.7 14.7 589 709 863 12.2 11.9 11.7
22000 -2499 9.4 8.2 10.7 10.2 470 575 707 9.7 9.6 9.6
22.500 - 2999 9.7 8.6 6.1 6.6 389 489 606 8.0 3.2 8.2
73000 - 23999 16.6 13.5 11.7 8.7 604 768 955 12.5 12.9 13.0
'4000 - 94999 10.2 8.4 6.6 4.7 356 455 568 7.3 7.6 7.7
?5000 - F5999 6.9 6.2 5.6 2.6 233 299 374 4.8 5.0 5.1
76000 - 27999 9.6 7.9 5.6 2.4 289 377 474 6.0 6.3 6.5
?8000 - 79999 4.9 5.3 2.0 1.4 156 205 255 3.2 3.4 3.5
710000 and over 8.3 11.8 6.1 1.5 262 344 435 5.4 5.8 5.9
TOtal 100.0 100..0 100.0 100.0 4843 5966 7346 100.0 100.0 100.0
Discribution of ?aeilie. Ln 1965. 1971. and 1976 (Columnå (1> to (4> aa abov ) Tocal
(1) (2) (3) (4)
1965 (No In 0008) 1966 456 192 2229 4843
1971 (so. Ln 0001) 2729 584 197 2456 5966
1976 (No. La 000c) 3436 797 204 2909 7346
1965 (,) 40.6 9.4 4.0 46.0 100.0
1971 (1) 45.7 9.7 3.3 41.2 100.0
1976 (7) 46.8 10.8 2.8 39.6 100.0
1_ Theca correpond Co:the 1971 discribucion an calculared by ahe FIMS.
2/ The Lnco distr.ibuion ahon i n columne (1) to (4) are for 1971; It followa that all calculatins and incom rangs are Ln 1971 price.
o3:/ Ecludem famtlie vboe inco~ are from onarship of property and capital, or from giftt.
4 / rimced using eh. percn"age4 obtLn.in ta Colts (1) to (4). With the ~..pcion of 1971, chere are not actual distribution» (see gorca notas).
$ources and 3aUis of Ustimates.
The -ain source is the ?~ly Income and Eenditure Survey (r=ES), 3CS Survey of oauseholda Bulledin, Serie* 34, 1971 Table 60. The Distribution
of Fami s n 1965 and 1971 are aln taken from this sourct. For 1976, the eri~aces vera m"e a folloe. The 1977 Labor Yearboo, Departent
of Labor, 3iveå the aumbers of indusC'rial aorker fog- k965 thru 1976 . (see AnnT: table 14). The perene chag.& in ehe number of familis
primarily dcpendent o enrtprenurial activicy vera then aumea'to be the ~ aj the percoa~n eca a self-emploed iorkar (bu noc of
unpaid family workr&) Ln the za xector. Tho percentage imnrease (between 1971 and 1976) tn the mäer of familias dependenr on wage and
slarsy vork as ascit^ad In the a vay.
To ecimae the d.iscributiona, percentaga and numbaere of famiies for the threm years, the 1971 percentage diztributions avn In colu~n (1)
through (4) ere applied to rhe total mber of facillan clasasfied according ro tsre of incom for the repective years. Thu col n (5),
ro (1) for 1965 equala (1. 9x 1966 + 3.1 x 456 + 5.6 x 192 + 8.9 x 2229)1100 - 260; etc. Using the procedur, the figurs in colu=n* (6) and
(9) are actual data, v.ile thots in (5), (7), (8), and (10) ar eatiated effeta of the coange t occupecionalj xcrucure, holding rhe
distribution of income contante vithin each occupational catgorT.
Suplementar Calulations
(1) Zscimtem of the inaxme range of the botm to quintile for 1971. From colum (9), the percentag. of families with Incoe of up ro
?1500 i (5.0 + 12.0 + 12.2) - 29.2% and with tazom of up co P2000 Is (29.2 + 11.9) - 41.1%. Thoce with tncome~ Ln the rmnge 21500
to 2000 are then dirided Lnto fasile abov., snd familie bhelo the ~baccom 40% limit on a srraighr line baaia. The dividing line
for the bortom 40% is hean 1500 + 500(40 - 29.2)/(41.1 - 29.2) - 1958 p~*,a.
(2) 19tläsca of the effects of changea in tsompLo7~ åtructure (bulding the incom diaribution curves within each occupational
catagory conätanc) on the averoge real incoma of the bottom 40%. Ustng 4he linear mcthod given In nota (1) abve, the Lncome
range of the botto 40% is eacnited to be 71869 Or belw tn 1965, and P1964 or below to 1976. Uning thee figures,the data
- Lm columma (8) and (10), and eaking mid-poirm' on each block of the iLaogram, givea the following everag real Lncome for
1965 and 1976 ree*wctively.
0.054 x 250 + .128 x 750 + .125 x 1250' 1-0.09(1500 + 1869)/2 - MO0
0.049 x 250 + .117 . 730 + 4121 x 1250 + .113(1500 + 1964)12 - P436
The iocrease *vrage real i s La then 9%. -There te a don~ard bia in o of the aversge incoe estimca for the botto 40%
on account of the limear approximcions involved,
(3) The change for rhoee familias vbo moved wo'uld be 9.0L.'Xa(No',' Ln tšio @ iles) ~ (3r,o aoed). this equate 9.O r-4E1(.6.3-39.6 - 56.

ANNEX TO CHAPTER VII
Table 7.12:
OCCUPATIONAL STRUCTURE AND ESTIMATED WAGES OFWAGE LABOR, 1960 TO 1970
Percentage Share ofWage Labor Wages/Day (1972 Pesos)
/1 1960 1970 Change 1960 1970 ChangeOccupation-- (1) (2) (3) (4) (5) (6)
Farm Labor 32.2 20.8 - 11.4 5.8 3.8 - 2.0
Production Workers intlanufacturing and Trades-
- Large Establishmentsl 10.1 14.4 4.3 13.8 13.9 + 0.1- Small Esta lishments'- 3.6 6.6 3.0 5.7 5.7- Households'L 6.5 5.4 - 1.1 5.8 3.8 - 20
/ '4Sales Workers- 11.2 12.0 0.8 12.7 10.5 - 2.2
Stevedores and freight 8.3 6.3 - 2.0 10.0 9.5 - 0.5
Land Transport 6.1 11.7 5.6 10.0 9.5 - 0.5
Service:
- Housekeepers 14.8 14.7 - 0.1 7.5 7.1 - 0.4
- Other - 7.2 8.1 0.9 8.3 9.5 1.2
Total Weighted Average 100.0 100.0 0.0 8.7 8.2 - 0.5
No. of Workers, 000s 2,222 3,835 1,613
/1 Excluded are wage labor in mining, quarrying, fishing, logging, hunting
and occupations NEC, as data were not readily availhble. Also excluded
are professional, administrative and clerical, as these are mostly salaried
and higher paying occupations.
/2 Such as building, masonry and the repair and installation services
(plumbers, carpenters and electricians) outside manufacturing. These add
about 17% to what would be the totals if production workers in manufacturing
alone were considered.
/3 Establishments with 10 or more workers are here described as large
following the terminology of the NCSO in the 1961 and 1972 Censuses,
and those with less than 10 workers as small.
/A Working proprietors and family workers not included; also professional,
administrative and clerical workers in production and sales are excluded
(see f.n. 1).
/5 The services here are mostly in restaurants and hotels, recreation,
entertainment, barber shops etc., repair and installation services, and
other wage labor.
Source: See Annex Table 14 for data sources and basis of estimates.

ANNEX TO CHAPTER VII
Table 7.13:EFFECTS OF CHANGING WAGES AND OCCUPATIONS ON
AVERAGE WAGE LEVELS YOR WAGE-LABOR, 1960-70
Contribution to Average Effect 1 on Average
Wage (P/day '72 prices) Wage Changes in;
Occupation 19 /2 1 2 Chae Occmtior- gs_5
Farm Labor 1.9 0.8 - 1.1 - 0.7 - 0.6
Production Workers in
- Large Establishments 1.4 2.0 + 0.6 + 0.6 0.0
- Small Establishments 0.2 0.4 + 0.2 + 0.2 0.0- Households 0.4 0.2 - 0.2 - 0.1 - 0.1
Sales Workers 1.4 1.3 - 0.1 + 0.1 - 0.2
Stevedores, etc. 0.8 0.6 - 0.2 - 0.1 - 0.0
Land Transport 0.6 1.1 + 0.5 + 0.6 - 0.0
Service:
- Housekeepers 1.1 1.0 - 0.1 - 0.0 - 0.1
- Other 0.6 0.8 + 0.2 + 0.1 + 0.1
Weighted Average 8.4 8.2 - 0.2 + 0.7 - 0.9
/1 These two items do not always add up to the change shown in the third
column because second order terms are ignored (i.e. the change inwages times the change in occupations).
/2 Col. (1) bf AnnexTable 12 times Column (4).
/3 Col. (2) of Annex Table 12 times Column (5).
4 Col. (3) of Annex Table 12 times Column (4), (Approx. see f.n. 1).
/5 Col. (6) Annex Table 12 times Co. (1). (Approx. see f.n. 1).
/6 See also footnotes 2 and 3 of Annex Table 12.
Source: Calculated from_Annex Table 12,
.. ... ..

ANNEX TO CHAPTER VII
Table 7.14:DISTRIBUTION OF WAGE AND SALARIED,
SELF EMPLOYED AND FAMILY WORKERS BY SECTOR, 1965-1976
Percentage Distribution of WorkersIndustrial Sector No, Employed Wage & Self Family Totaland Year /1 000s Salary Employed Workers Total
Agriculture:
1965 5,725 15.8 50.8 33.4 100/21976 8,126 15.7 46.7 37.3 100--
Manufacturing:
1965 1,101 53.9 37.4 8.6 1001976 1,680 65.8 26.0 8.1 10o-=
Commerce:
/21965 1,114 25.7 57.6 16.7 100--
/21976 1,864 29.6 54.5 15.5 100--
Personal Services, (Other than Government, Community and Domestic)
1965 227 51.6 41.4 7.0 1001976 276 n.a. n.a. n.a. 100
Transport Etc.:
1965 339 83.5 14.7 1.8 1001976 550 81.6 17.0 1.3 100
/3All Other:-
1965 1,549 96.3 3.5 0.2 1001976 2,886 97.1 2.7 0.2 100
Total:
/31965 10,101 36.5 41.2 21.9 100---/31976 15,427 41.2 35.8 22.6 10O--
/l October Series for 1965 and August Series for 1976.
/2 The totals do not add up to 100 in these cases because a small percentageof the sample, varying between 0.1% and 0.4% were classified as "notreported."
/3 Mining, quarrying, Construction, Domestic Services (over 99,5% of whichare classified as wage labor in the Censuses), and Government Community,Business and Recreational Services.
Source: 1977 Labor Yearbook Table 3.9.

�

kiNNEX TO CdkPTER TT_T
Table 7. 16: /1 /2
MANUFACTURING: M'TD ASSETS PER WORKER AT 1972 PRICES, 1971
Sector 20 - 49 50 - 99 100 - i99 200 - 499 300- Total
Food 13.2 11.8 19.0 24.7 25.3 23.5
Beverages 11.6 29.0 11.6 8.3 17.7 12.9
Tobacco 2.8 - - 2.6 5.1 7.0
Textiles 10.6 15.0 13.2 13.7 13.6 13.6
Clothing and Footwear 5.2 3.3 6.7 5.0 2.1 3.8
Wood 10.1 10.0 7.6 8.4 11.4 10.5
Furniture 3.4 15.3 7.4 3.4 - 6.9
Paper 14.1 11.0 26.8 72,0 24.3 35.0
Pririt4 n- 8.2 7.1 7.5 - - 8.2
Leather 4.3 4.9 15.5 - 9.7
Rubber 7.9 18.3 8.9 lo.4 11.8 10.7
Chemicals 26.7 22.2 18.6 24.8 35.9 26.5
Petra! and Coal 8.7 - - - - 299.8
Non-Metallic Minerals 44.4 7.8 13.L 119.8 39.7 62.1
Basic Metals 6.6 16.6 11.4 38.8 131.4 73.2
Metal Products 8.1 14.4 16.2 - - 10.0
Machinery 11.1 11.4 - - - 16.0
Electrical'Machinery 12,1 6.6 12.0 11.9 7.7 9.8
Transport 9.5 4.3 18.5 120.1 14.8
Miscellaneous 14.1 8.8 10.0 10.3
Total 12.0 12.1 14.9 31.7 20.6 20.3
Total/3 9.9 12.2 11.3 12.0 15.1 17.1
/I original data defiated througk, the fixed capital formation index
for GNP.
/2 A dash indicates data supressed in original source.
/3 Total excludes paper, petroleum and coal, non-metallic minderals and
basic metals.
Sources: NCSO, Annual survey of Establsihments 1971 (founded in "Appraisal of a small and
medium industries development project", 1975) and, statistical yearbook, 1978,
Table 4.8.
Copyright © 2022 FDOKUMEN