Improving the legal and organizational support of innovative enterprises in the Russian Federation
Policy ReseaRch WoRking PaPeR 4518
Chile:
A Strategy to Promote Innovative Small and Medium Enterprises
Mike Goldberg Eric Palladini
The World BankPoverty Reduction and Economic Management DepartmentLatin America Finance and Private Sector UnitFebruary 2008
WPS4518P
ublic
Dis
clos
ure
Aut
horiz
edP
ublic
Dis
clos
ure
Aut
horiz
edP
ublic
Dis
clos
ure
Aut
horiz
edP
ublic
Dis
clos
ure
Aut
horiz
ed

Produced by the Research Support Team
Abstract
The Policy Research Working Paper Series disseminates the findings of work in progress to encourage the exchange of ideas about development issues. An objective of the series is to get the findings out quickly, even if the presentations are less than fully polished. The papers carry the names of the authors and should be cited accordingly. The findings, interpretations, and conclusions expressed in this paper are entirely those of the authors. They do not necessarily represent the views of the International Bank for Reconstruction and Development/World Bank and its affiliated organizations, or those of the Executive Directors of the World Bank or the governments they represent.
Policy ReseaRch WoRking PaPeR 4518
With its strong export orientation and emphasis on competitiveness, the Chilean economic model has been the envy of its neighbors for more than a decade. However, there are underlying vulnerabilities. Historically, exports have been concentrated in mining and agriculture, sectors dominated by large firms that do not generate a large share of employment. Small and medium enterprises play a key role in employment generation and economic decentralization in Chile, yet their employment was stagnant between 2000 and 2004. Based on work completed in 2003, this study provides a review of the Chilean government’s
This paper—a product of the Latin America Finance and Private Sector Unit, Poverty Reduction and Econmic Management Department—is part of a larger effort in the department to support micro, small and medium business development in the region, and understand the role that governments can play. Policy Research Working Papers are also posted on the Web at http://econ.worldbank.org. The author may be contacted at [email protected].
substantial investment in programs that support small and medium enterprises. This review of government programs confirms the importance of coordination and an overarching strategy, in the form of a National Innovation System, led by a single institution. The review also finds that demand-driven programs were more likely to be sustainable. Finally, the study demonstrates that Chile (and other countries with many support programs for small and medium enterprises in place) needs an integrated management information system to analyze, assess, coordinate, and streamline the program portfolio for small and medium enterprises in the future.

Chile: A Strategy to Promote
Innovative Small and Medium Enterprises*
Mike Goldberg and Eric Palladini
JEL classification codes:
Keywords: Chile, access to finance, financial development, SME, banks, Latin America
* This report was prepared under the general supervision of Axel van Trotsenburg, Country Director for Argentina, Chile, Paraguay and Uruguay, with ongoing guidance provided by Juan Gaviria. The authors would like to thank Miguel Almeyda for major contributions. The report benefited greatly from background papers prepared by Chilean experts, including Marco Dini and Gonzalo Rivas, Hernan Reyes, Veronica Martinez, Alejandro Gutierrez, and Mauricio de la Barra (with Miguel Almeyda). Luis Guasch contributed to the Concept Note and the section on constraints to SME growth. Peer reviewers were William Maloney (World Bank) and Eduardo Bitrán (Fundación Chile). The report further benefited from technical insights and comments from Guillermo Perry, Juan Gaviria, William Maloney, Susan Goldmark, Luke Haggarty, Marianne Fay, Luis Guasch, Isabel Sanchez, Ira Lieberman, Scott Wallsten, Zeinab Patrow, Jesko Hentschel, Danniel Oks, Scott Wallsten, Eduardo Bitrán and Robert Vickers, of the World Bank; and Alvaro Diaz, Alberto Ergas, and Christian Palma of the Chilean Ministry of Economy. Additional input was provided during presentations of a preliminary draft of the report to the Ministry of Economy in November, 2003.
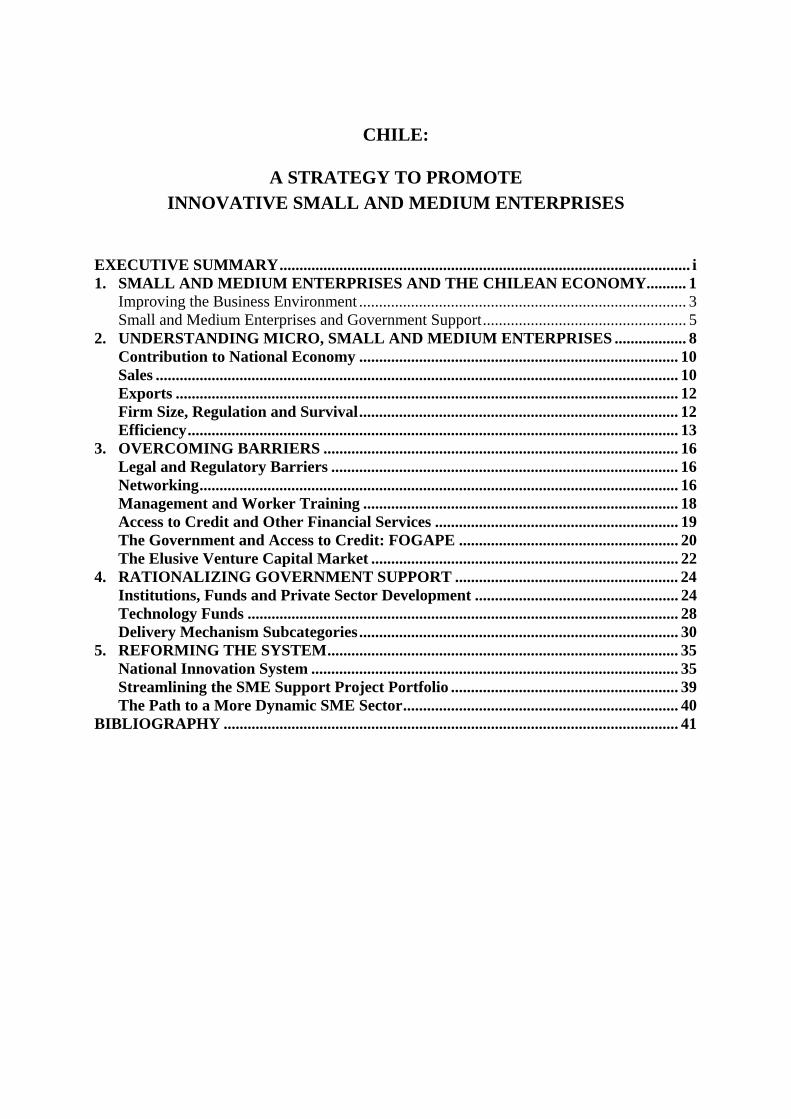
CHILE:
A STRATEGY TO PROMOTE INNOVATIVE SMALL AND MEDIUM ENTERPRISES
EXECUTIVE SUMMARY....................................................................................................... i 1. SMALL AND MEDIUM ENTERPRISES AND THE CHILEAN ECONOMY.......... 1
Improving the Business Environment .................................................................................. 3 Small and Medium Enterprises and Government Support................................................... 5
2. UNDERSTANDING MICRO, SMALL AND MEDIUM ENTERPRISES .................. 8 Contribution to National Economy ................................................................................ 10 Sales ................................................................................................................................... 10 Exports .............................................................................................................................. 12 Firm Size, Regulation and Survival................................................................................ 12 Efficiency........................................................................................................................... 13
3. OVERCOMING BARRIERS ......................................................................................... 16 Legal and Regulatory Barriers ....................................................................................... 16 Networking........................................................................................................................ 16 Management and Worker Training ............................................................................... 18 Access to Credit and Other Financial Services ............................................................. 19 The Government and Access to Credit: FOGAPE ....................................................... 20 The Elusive Venture Capital Market ............................................................................. 22
4. RATIONALIZING GOVERNMENT SUPPORT ........................................................ 24 Institutions, Funds and Private Sector Development ................................................... 24 Technology Funds ............................................................................................................ 28 Delivery Mechanism Subcategories................................................................................ 30
5. REFORMING THE SYSTEM........................................................................................ 35 National Innovation System ............................................................................................ 35 Streamlining the SME Support Project Portfolio ......................................................... 39 The Path to a More Dynamic SME Sector..................................................................... 40
BIBLIOGRAPHY .................................................................................................................. 41

EXECUTIVE SUMMARY This study reviews the Chilean Government’s substantial investment in small and medium enterprise (SME) development programs and institutions. Given the role of SMEs in employment and the possibility of improving their integration into the national economy and export-oriented production and marketing chains, this study further identifies areas where SMEs can more effectively leverage government programs to create more productive, efficient, and innovative SMEs.
The analysis is based on research completed in 2003. Research included interviews with key policymakers, managers and other staff of the Government institutions responsible for most of the programs, secondary reports, discussions with small business managers, business association leaders, academicians and financial intermediaries.
The report is organized as follows: Section 1 reviews the evolution of the macroeconomic and business environment in Chile, and provides the theoretical arguments upon which the government’s intervention in favor of SMEs has been based. Section 2 examines the characteristics of the SME sector and key determinants of productivity and growth. Section 3 describes the obstacles to SME development and compares Chilean venture capital markets with international experiences. Section 4 describes recommendations for a streamlined portfolio of private sector assistance projects and provides an institutional analysis of CORFO, INDAP and SERCOTEC. Section 5 focuses on programs that promote innovation, technology and networks to improve the effectiveness of the Government’s investment in SME programs.

1. SMALL AND MEDIUM ENTERPRISES AND THE CHILEAN ECONOMY
Chile’s extraordinary record of economic growth is based on nearly two decades of fiscal reform and monetary discipline. Between 1984 and 1998, the annual gross domestic product (GDP) growth rate ranged from 5 percent to 12 percent, with an average of 7.7 percent. Even in the face of external shocks between 1999 and 2002, Chile maintained a positive growth rate, (except 1999). As Figure 1.1 shows, Chile’s growth rate outpaced the average of the high-income member countries of the Organization for Economic Cooperation and Development (OECD). Such strong growth is the result of a strong fiscal and monetary discipline, a relatively well developed financial system, modern institutions, and a supportive business environment.
First and second generation reforms focused on export facilitation, competition policies and regulations, the privatization of the pension, health and education systems, using social policies to target extreme poverty and a reduction of the role of the State in the economy. These reforms have made Chile an attractive country for international financial markets, and a reference point for successful structural reform for the region. The annual growth rate of foreign direct investment (FDI) has remained above 4 percent since 1994, peaking at 12 percent in 1999. Chile’s FDI outpaced the Latin American average, and the averages of high and upper middle-income OECD member countries. Further, Chile’s ratio of exports to GDP has grown by up to 30 percent per year (see Figures 1.1 and 1.2).1
Chile’s remarkable economic growth has led to significant reductions in poverty and improvements in social indicators. Income poverty dropped by more than half, from about 40 percent of the population in 1987 to 17 percent in 1998. By the end of the 1990s, only 4 percent of the total population was indigent. Life expectancy and infant mortality rates had reached OECD levels, and participation in primary education was almost universal. A recent World Bank report on poverty in Chile confirmed that economic growth was the main determinant of poverty reduction, responsible for 73 percent of the observed decline between 1987 and 1998.2
However, this openness to the international economy left Chile vulnerable to external events. Between 1998 and 2002, when a series of external shocks and a recession struck the region, the country’s growth fell to an annual average of 2.6 percent. This was a dramatic decline from the 7.6 percent annual average growth achieved between 1993 and 1997. This situation reached a critical level in 1999, when the growth rate registered a negative level (-1.1 percent) for the first time since 1983. Likewise, the unemployment rate reached 9.9 percent, a sharp increase from the 5.3 percent annual average recorded between 1990 and 1998. This vulnerability has led Chile to engage in further analysis and a third generation of reform.
1Closing the Gap in Education and Technology, World Bank Latin American and Caribbean Series, de Ferranti, et. al., 2003; OECD (2003) Economic Assessment of Chile. Economic Policy Seminar. Draft, Economic Assessment by the Secretariat. A large share of Chilean exports are natural resource-based products, such as mining, foods and other agriculture and livestock products. These categories amount to 80 percent of total exports in 2000 (World Development Indicators, World Bank). 2 World Bank (2001); World Bank, Poverty and Income Distribution in High Growth Economy. Latin America and the Caribbean Region (2001). Chile New Economy, World Bank (2004).

Figure 1.1 Annual GDP Growth 1980-2003
Source: World Development Report, World Bank, 2003
Figure 1.2 Foreign direct investment 1980-2000 (net inflows as % of GDP).
Source: World Development Report, World Bank, 2003
2

Improving the Business Environment
Chile’s public policy reform agenda seeks to improve the business environment through deregulation and improvements in the regulatory framework. The reform improves enforcement mechanisms, and creates institutions that promote competition and enforce antitrust regulations. Further reforms have improved bankruptcy procedures and strengthened protection of creditor rights, among other improvements. Despite this impressive record, Chile has high regulatory barriers and its trade and investment procedures are discriminatory. Compared to OECD and other countries, its administrative burdens are high and there is a lack of regulatory and administrative flexibility.3
The missing element to an improved business environment is a third generation of reforms to benefit micro, small and medium enterprises. Among other reforms, this includes: (i) improving labor market flexibility; (ii) creating a training certification system to stimulate private sector investment in worker training; (iii) increasing accountability in education; (iv) clarifying responsibility in government for the promotion of participation in the free trade agreements; (v) improving regulations for the food processing sector to meet requirements established by the United States, Europe and Japan; and (vi) eliminating conflicts of interest and discretionary use of confidential information in the stock market.4
Figure 1.3 Exports of Goods and Services, 1982-2000 (% of GDP)
Source: World Development Report, World Bank, 2003
3 OECD (2003) 4 Expert commentary provided by Eduardo Bitran, Executive Director, Fundación Chile (Feb. 2004).
3

Table 1.1 Some Trade and Competition Regulations (comparison between Chile and OECD Countries)
(Scale: 0 represents a very low level, while 6 is a high incidence)
Chile
Emerging Markets
(1) Mexico EU-15 US
GOV’T OWNERSHIP AND INVOLVEMENT
• State control 2.1 3.0 1.7 2.4 0.9 • Public ownership 1.7 3.4 1.7 2.3 0.8 • Size of public enterprise sector 1.5 2.5 1.4 1.9 0.0 • Involvement in business operations 2.7 2.4 1.7 2.4 0.9 • Price controls (2) 2.0 1.2 1.3 1.2 0.0
ADMINISTRATIVE BARRIERS • Barriers to entrepreneurship 2.3 2.0 1.7 1.8 1.3 • Regulatory and administrative
opacity 3.5 2.2 2.3 1.9 2.1
• License and permits system 4.0 3.0 4.0 2.9 4.0 • Communication and simplification of
rules and procedures 3.1 1.2 0.5 0.8 0.0
• Administrative burdens on start-ups 2.2 2.2 1.8 2.1 0.8 • Administrative burdens for
corporation 2.3 2.7 2.1 2.3 0.5
• Administrative burdens for sole proprietor firms 4.0 2.1 1.6 2.1 1.3
• Sector specific administrative burdens (3) 0.6 2.1 1.6 1.9 0.5
TARIFF AND TRADE RESTRICTIONS • Barriers to trade and investment 2.7 2.5 2.2 0.7 0.9 • Explicit barriers 1.5 2.8 3.1 0.9 1.3 • Ownership barriers 0.0 2.6 2.7 0.3 2.2 • Discriminatory procedures 2.3 2.0 1.4 0.6 0.3 • Tariffs 3.0 3.7 5.0 2.0 1.0 • Other barriers 4.3 2.0 1.1 0.4 0.3 • Regulatory barriers 5.3 1.7 0.3 0.2 0.0
REGULATORY FRAMEWORK FOR COMPETITION
• Economic regulation 1.9 2.5 1.5 2.0 1.0 • Regulation of economic structure 2.0 2.7 1.7 2.1 1.0 • Regulation of economic behavior 2.5 3.1 1.8 2.7 1.2 • Regulation of competition 1.0 1.4 0.7 1.0 0.8
Data for Chile take into account the state of the legal framework in May 2003 and for the other countries, 1998. (1) Emerging markets: Czech Republic, Hungary, Korea, Mexico, Poland, Turkey; (2) Includes sector specific information on road freight, air transport, retail distribution and some telecom services; (3) Exemptions to public enterprises and state-mandated actions only. Source: OECD 2003
4

Table 1.2 Contract Resolution Comparisons
Country Number of Procedures
Duration (days)
Cost (% GDP per capita)
Procedural Complexity
Index
Creditor Rights Index
Chile 21 200 15.0 73.0 2 Brazil 16 380 2.0 48.0 1 Mexico 47 325 10.0 62.0 0 Australia 11 319 8.0 29.2 3 Canada 17 421 0.7 31.3 1 France 21 210 3.8 84.7 0 Germany 22 154 6.0 61.1 3 Ireland 16 183 7.2 42.4 1 New Zealand 19 50 11.6 36.8 4 Spain 20 147 10.7 82.6 2 United Kingdom 12 101 0.5 41.8 4 United States 17 365 0.4 45.8 1 Average 20 238 6 53 2 Source: Doing Business, World Bank
Small and Medium Enterprises and Government Support
Small and medium enterprises are different from large firms in a number of ways. For example, productivity, the use of factors of production, and the impact of regulations vary substantially with the size of the firm. Further, the labor productivity of a large firm can be between two and four times higher than that of smaller companies, as measured in number of employees and gross value of production. The same can be said of differences in capital efficiency. A firm’s objectives, strategic planning efficiency, use of resource bases, and quality of market contacts can vary substantially. Of particular importance are those factors that affect unit costs and costs of transaction and logistics.
Moreover, SMEs may not be as well integrated in the national and international value chains as suppliers to exporters and large firms. This is true even for the more successful exporting companies. These differences can have an impact on the prospects for growth and development. As a result, SMEs may require more working capital, as a percentage of total sales, than large companies.5
Institutional issues and public policy further explain the differences between SMEs and large companies. In particular, these factors are related to costs of transaction, distortions, segmentation of labor markets (due to institutional rigidity), degrees of competition, and the businesses climate. Other factors, such as limited information, high labor rotation and imperfect capital markets, represent obstacles to employer-provided training. They are also related to decisions regarding performance-based labor practices, investments in new technology and quality control methods—thereby limiting the contribution that SMEs can make to economic growth and job creation. This argument points to the need to identify deficiencies in the market and develop selective government interventions to promote businesses development (business ties, innovation, training, technology improvement and new forms of organization of work) and thereby improve productivity. 6
5 Little, Mazumdar and Page (19870; FIEL (1996);, Kosacoff (2000); Batra and Tan (2003). 6 The argument in favor of government intervention is based on the presence of market deficiencies or government obstacles that may hurt SMEs. The theory of industrial organization, emphasizes three principal groups of factors: (i) market power, segmentation and distortions in input and product markets; (ii) technical efficiency, that determines the minimal scale of efficient operations; and (iii) economies of scale that affect the capacity of a firm to respond to external and internal shocks. It should be emphasized that factors related to economies of scale remain outside the public policy arena. See: Tirole (1986), Guasch (1986), and Acs, Carlsson, y Karlsson (1999), among others.
5

The principal role of government is to provide a businesses environment that opens access to markets and reduces the institutional biases that affect small business. Research findings show that government intervention can help small and medium businesses in two areas: the business environment and access to technology and innovation. The reforms necessary for improving the business environment are not limited to macroeconomic and structural adjustments; they include reducing macroeconomic and institutional obstacles that affect small businesses and reduce their competitive strength.7
The market by itself cannot induce adequate levels of investment for innovation or the optimal development of technological capabilities. Accordingly, the government should play a more active role to correct market deficiencies and design the necessary incentives so that the firms adopt appropriate decisions.8
Market and coordination deficiencies in the acquisition and dissemination of knowledge point to the importance of public intervention to ensure the socially optimal level of innovation. Among others, the principal market deficiencies associated with innovation are:9
1) Knowledge and innovation generate significant positive externalities: where the social rate of return is frequently almost three times higher than the private rate of return. However, knowledge is a quasi-public good that cannot be completely controlled by the firms that create it and the firms that make the investment cannot always keep to themselves the resulting benefits. Their closest competitors are the ones who stand to benefit the most from such investments. Firms are not sufficiently compensated for their investment and opt not to invest further; 10
2) Investments in research and development (R&D) are hazardous and long-term. The open markets of Latin America do not usually provide the instruments or the structure with adequate terms to finance R&D, particularly in the case of SMEs.
3) Innovation requires the coordination of various agents. The process is expensive and subject to problems of coordination and “free rider” behaviors. Because the benefits of coordination are not usually exclusive, the incentives to assume the task are very limited; particularly in the case of linkage between firms, and between firms and universities. Moreover, there are no incentives to share information, because competitors can use the new knowledge. Finally, given the lack of scientific knowledge in the business community and the lack of productive knowledge among scientists, there may be no market for scientific applications.
4) Firms cannot fully or exclusively take advantage of the benefits of the training in which they invest. Easy mobility of labor means that the trained workers can be hired by other firms. This causes under-investment in training. Different economies have implemented different policies designed to promote in-house training, either through tax incentives or subsidies for specific training.
5) Arguments for pro-SME assistance are based on the capture of economies of scale and spillover effects. Additional arguments are based on externalities, complemented by association and development of networks, innovation, and the deficiencies of coordination and "free rider" behaviors present in the formation of consortia (among firms and between firms and universities), integration in production and in the development of clusters and business networks.
7 On the business environment, see Levy (1994); On Donor Committee Guidelines for SME policies, see Hallberg (2000). 8 De Ferranti et al. (2002). 9 See Martin y Scott (2000). 10 Griliches (1992).
6
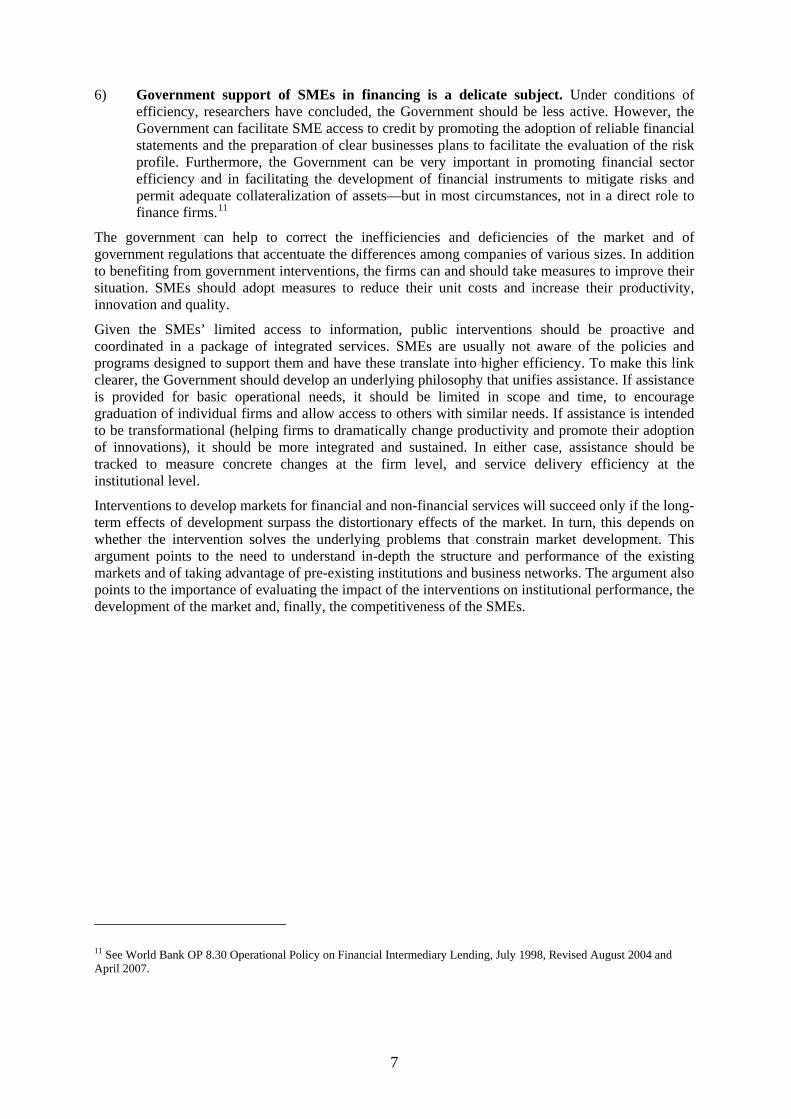
6) Government support of SMEs in financing is a delicate subject. Under conditions of efficiency, researchers have concluded, the Government should be less active. However, the Government can facilitate SME access to credit by promoting the adoption of reliable financial statements and the preparation of clear businesses plans to facilitate the evaluation of the risk profile. Furthermore, the Government can be very important in promoting financial sector efficiency and in facilitating the development of financial instruments to mitigate risks and permit adequate collateralization of assets—but in most circumstances, not in a direct role to finance firms.11
The government can help to correct the inefficiencies and deficiencies of the market and of government regulations that accentuate the differences among companies of various sizes. In addition to benefiting from government interventions, the firms can and should take measures to improve their situation. SMEs should adopt measures to reduce their unit costs and increase their productivity, innovation and quality.
Given the SMEs’ limited access to information, public interventions should be proactive and coordinated in a package of integrated services. SMEs are usually not aware of the policies and programs designed to support them and have these translate into higher efficiency. To make this link clearer, the Government should develop an underlying philosophy that unifies assistance. If assistance is provided for basic operational needs, it should be limited in scope and time, to encourage graduation of individual firms and allow access to others with similar needs. If assistance is intended to be transformational (helping firms to dramatically change productivity and promote their adoption of innovations), it should be more integrated and sustained. In either case, assistance should be tracked to measure concrete changes at the firm level, and service delivery efficiency at the institutional level.
Interventions to develop markets for financial and non-financial services will succeed only if the long-term effects of development surpass the distortionary effects of the market. In turn, this depends on whether the intervention solves the underlying problems that constrain market development. This argument points to the need to understand in-depth the structure and performance of the existing markets and of taking advantage of pre-existing institutions and business networks. The argument also points to the importance of evaluating the impact of the interventions on institutional performance, the development of the market and, finally, the competitiveness of the SMEs.
11 See World Bank OP 8.30 Operational Policy on Financial Intermediary Lending, July 1998, Revised August 2004 and April 2007.
7

2. UNDERSTANDING MICRO, SMALL AND MEDIUM ENTERPRISES
This section profiles Chilean SMEs and provides the basis for analysis of the government programs and incentives discussed in subsequent sections. The profile is based on survey statistics, census data and studies and ends with a short discussion of efficiency and productivity, including implications for direct and indirect exports for SMEs.
To highlight business trends, this discussion uses various levels of analysis and terms. The terms “micro business,” “small enterprise” and “medium enterprise” reflect the national definitions explained in Table 2.1 below. The term “broadly defined SMEs” includes micro, small and medium enterprises—but not the self-employed or subsistence micro businesses. This definitional convention allows the discussion to emphasize certain trends detected in the analysis. For instance, a discussion of employment trends should recognize the dominant role of micro businesses in the creation of lower skilled jobs. However, a discussion of export promotion policy should focus on SMEs. National surveys permit this kind of disaggregation and allow for more powerful conclusions.
Chilean SMEs, like those in other countries, have special features and feel the effects of regulations and risk factors quite differently from micro or large firms. Generally speaking, SMEs are family businesses and their management falls directly on the owners (often untrained). SMEs differ from large firms in their effectiveness at strategic planning, but they may also pursue goals that differ from profit maximization, such as market survival, maintaining their jobs and sources of income, or keeping up the family business tradition. Thus, the owner’s outlook (a generational and cultural factor) is especially important in deciding what determines a firm’s development and growth.
As a result, SMEs should be treated as economic agents with unique characteristics, rather than merely “smaller-sized large firms.” Of particular relevance in the comparison between SMEs and large firms are factors that significantly affect their unit costs, interest rates and transaction and logistics costs—all significantly higher for SMEs. This suggests that selective policy interventions could prove instrumental in improving SME productivity. To maximize their impact, these interventions should be aimed at fostering linkages, promoting innovation, advancing training, improving technology and developing new forms of work organization, among other aspects of business development.
Although the number of small and medium enterprises has grown, their share in the economy has fallen. This decline is not the result of structural changes in the Chilean economy. The SME and formally registered micro businesses (not including self-employment or subsistence level firms) account for 77 percent of employment by the private sector and 99 percent of total number of firms. However, SMEs and formally registered micro businesses only generate 23 percent of sales and have an extremely limited direct participation in the dynamic Chilean export sector.
A PROFILE OF SMALL AND MEDIUM ENTERPRISES (SMES)
CLASSIFICATION Chile’s unique classification system makes international performance comparisons difficult. To classify firms by size, Chile uses the unidad de fomento (UF), which is a precise measure based on an indexed unit of account used to express prices and limit the effects of inflation in budget allocations and contracts. Based on the Chilean definitions, many firms labeled as “micro
8

businesses” would be considered small enterprises in other economies. This explains the apparently low number of SMEs in the data presented in this section. 12
Table 2.1 Chilean classification by firm size.
FIRM SIZE Value of Annual Sales in
Unidades de Fomento (UF) (see note 15)
Value of Annual Sales (US$ equivalent)
Micro Less than 2,400 Less than $52,800 Small 2,401 thru 25,000 $52,800 to $550,000
Medium 25,001 thru 100,000 $550,001 to $2,200,000 Large More than 100,001 More than $2,200,000
SECTORAL DISTRIBUTION The tables below show the distribution of firms by size and sector and the contribution of SMEs to employment and sales. The crucial importance of broadly defined SMEs to the Chilean economy is illustrated by their share in the number of the country’s firms (99 percent) and of national employment (77 percent). Although they predominate in certain sectors, broadly defined SMEs are found in a large number of economic activities. Around 58 percent concentrate in commerce and services; 11 percent are in agriculture; 11.5 percent are in transportation; and only 6.5 percent are in industrial activities.13
Table 2.2 Number of Firms by Sector and Size (2000)
Sector Micro Small Medium Large Total
Micro, Small and Medium as % of
Total
Mining 1,219 451 85 87 1,842 95.28
Agriculture 60,635 9,303 806 243 70,987 99.66
Industry 30,388 8,761 1,745 1,137 42,031 97.29
E.G.W.* 863 222 43 88 1,216 92.76
Construction 23,113 6,386 1,047 484 31,030 98.44
Commerce 216,014 31,016 4,607 204 251,841 99.92
Restaurants 26,466 3,591 363 98 30,518 99.68
Transport 63,251 9,763 975 416 74,405 99.44
Services 92,139 23,601 3,428 1,443 120,611 98.80
UC.* 19,391 748 60 29 20,228 99.86
Total 533,479 93,842 13,159 4,229 644,709 99.34 Source: Caracterización de las Micro y Pequeñas Empresas (2002). *E.G.W.: Electricity, Gas and Water; UC: Unclassified
The sectoral distribution of SMEs follows the regional patterns. SMEs have the greatest market share in services (38 percent), agriculture (35 percent), construction (31 percent) and trade (24 percent). SMEs concentrate sales in four sectors: trade (35 percent), finances, technical and professionals services (16 percent), industry (12 percent) and agriculture (9 percent). These sectors represent 76 percent of SME sales. SMEs are found in sectors with low barriers of entry, low capital requirements,
12 The unit's purchasing power is defined daily by the previous month’s variation in Consumer Price Index. The approximate exchange rate on March 22, 2004 was US$27.86/UF (UF value of Peso 16,820.82, dollar set at Peso 607.64). 13 Caracterización de las Micro y Pequeñas Empresas (2002).
9

a strong regional presence and less “sophisticated” markets (less stringent quality or packaging requirements). 14
Table 2.3 Shares of all formal sector employment 1994-2000
(percent of all formal sector workers)
Firms 1994 1995 1996 1997 1998 1999 2000
Micro 81.91 81.53 81.59 81.04 81.48 82.57 82.51
Small 15.05 15.33 15.26 15.62 15.36 14.48 14.51
Medium 2.11 2.17 2.17 2.28 2.17 2.03 2.04
Large 0.93 0.97 0.98 1.06 1.00 0.93 0.94
Total 100 100 100 100 100 100 100
Micro, Small & Medium Total
99.07 99.03 99.02 98.94 99.01 99.08 99.06
Source: Caracterización de las Micro y Pequeñas Empresas. Based on data from CASEN Survey, 1990-2000 Figures do not include the self-employed, military forces, public service, household service, and undefined categories, which account for more than 42 % of total employment)
Table 2.4 Shares of productive sector employment
(percent of productive sector employment) Employment 1990 1992 1994 1996 1998 2000 Micro 33.97 33.60 30.26 38.95 30.85 33.18 Small 28.62 31.04 33.47 32.36 24.91 26.92 Medium 17.85 18.08 17.63 17.07 17.22 17.18 Large 19.56 17.28 18.64 11.61 27.02 22.71 Total 100.00 100.00 100.00 100.00 100.00 100.00 Micro, Small & Medium Total
80.44 82.72 81.36 88.38 72.98 77.28
Source: Caracterización de las Micro y Pequeñas Empresas. Based on data from CASEN Survey, 1990-2000 Figures do not include the self-employed, military forces, public service, household service, and undefined categories, which account for more than 42 % of total employment)
Contribution to National Economy
SALES The importance of SMEs in the national economy has been small and declining. Figures 2.1 and 2.2 show annual sales growth rates by size between 1994 and 2000. Figure 2.1 shows the annual sales growth rates for the periods 1997-95, 1995-96, 1996-97, 1997-98, and 1999-2000. Figure 2.2 compares the growth rates for the six-year period 1994 to 2000. As large firms have increased their dominance, SME sales have fallen. Micro and SME sales fell from around 27 percent of total sales in 1994 to just over 23 percent in 2000. In addition, the relative weight of large firms increased during the 1990’s in terms of absolute sales, sales per worker and sales per company.15
SMEs may be less vibrant than micro businesses or large firms during economic growth spurts and appear more vulnerable to shocks. In 1996, the SME growth rate lagged micros and large firms during
14 This second indicator of SME sales to the interior refers to how sales are distributed in the various sectors of the economy. Measured by: Sales by SME / Sales by all enterprises 15 Alarcón and Stumpo (2001).
10

a period of economic growth. Moreover, during the 1999 recession, SMEs sales fell by 5.7 percent, a bigger decline than that suffered by micros and large firms. The greater operational flexibility of micros and their reliance on commerce and trade seem to cushion these firms during economic downturns.
Figure 2.1 Annual Sales Growth Rates, by Size, 1994-2000
Source: Caracterización de las Micro y Pequeñas Empresas (2002).
Figure 2.2 Sales Growth Rates, by Size, 1994-2000
Source: Caracterización de las Micro y Pequeñas Empresas (2002).
11
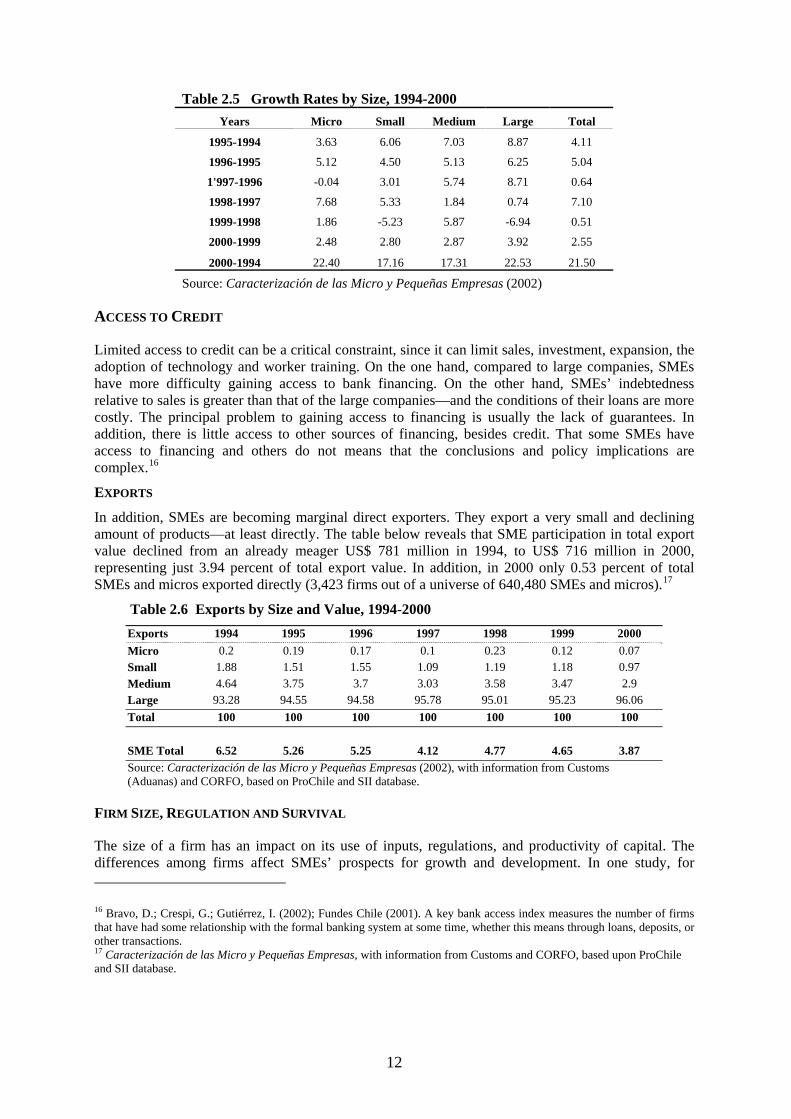
Table 2.5 Growth Rates by Size, 1994-2000
Years Micro Small Medium Large Total
1995-1994 3.63 6.06 7.03 8.87 4.11
1996-1995 5.12 4.50 5.13 6.25 5.04
1'997-1996 -0.04 3.01 5.74 8.71 0.64
1998-1997 7.68 5.33 1.84 0.74 7.10
1999-1998 1.86 -5.23 5.87 -6.94 0.51
2000-1999 2.48 2.80 2.87 3.92 2.55
2000-1994 22.40 17.16 17.31 22.53 21.50
Source: Caracterización de las Micro y Pequeñas Empresas (2002)
ACCESS TO CREDIT
Limited access to credit can be a critical constraint, since it can limit sales, investment, expansion, the adoption of technology and worker training. On the one hand, compared to large companies, SMEs have more difficulty gaining access to bank financing. On the other hand, SMEs’ indebtedness relative to sales is greater than that of the large companies—and the conditions of their loans are more costly. The principal problem to gaining access to financing is usually the lack of guarantees. In addition, there is little access to other sources of financing, besides credit. That some SMEs have access to financing and others do not means that the conclusions and policy implications are complex.16
EXPORTS
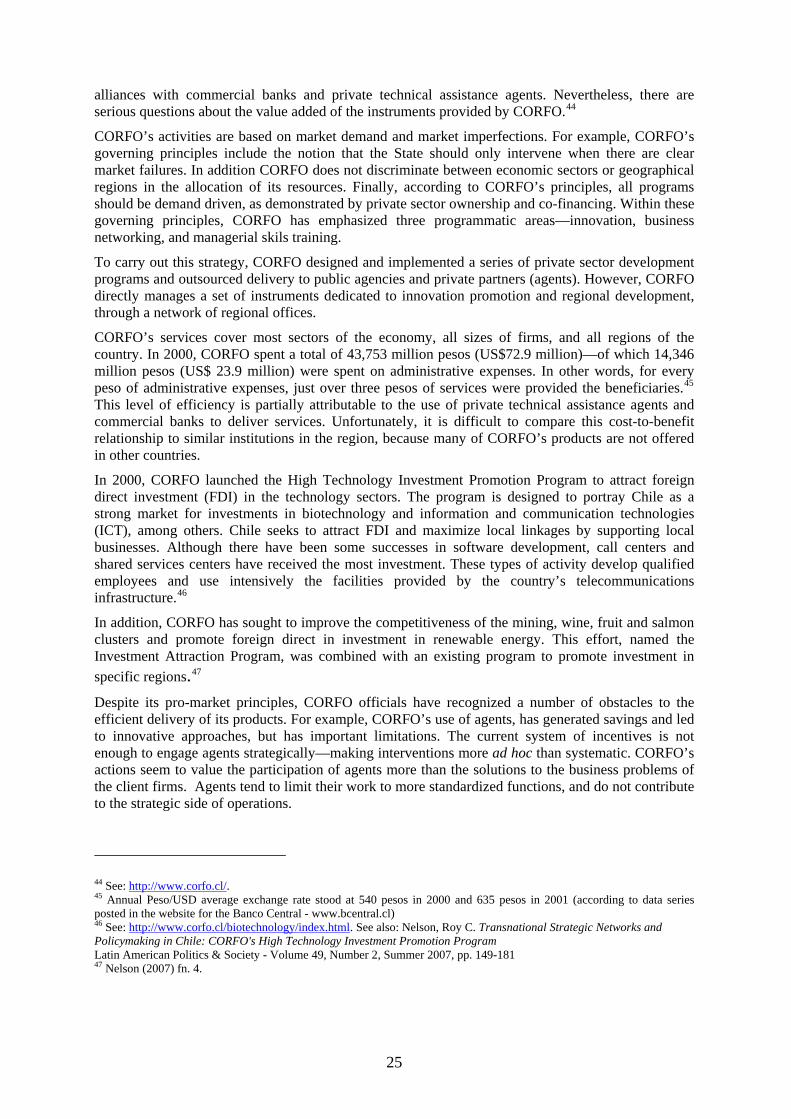
In addition, SMEs are becoming marginal direct exporters. They export a very small and declining amount of products—at least directly. The table below reveals that SME participation in total export value declined from an already meager US$ 781 million in 1994, to US$ 716 million in 2000, representing just 3.94 percent of total export value. In addition, in 2000 only 0.53 percent of total SMEs and micros exported directly (3,423 firms out of a universe of 640,480 SMEs and micros).17
Table 2.6 Exports by Size and Value, 1994-2000 Exports 1994 1995 1996 1997 1998 1999 2000 Micro 0.2 0.19 0.17 0.1 0.23 0.12 0.07 Small 1.88 1.51 1.55 1.09 1.19 1.18 0.97 Medium 4.64 3.75 3.7 3.03 3.58 3.47 2.9 Large 93.28 94.55 94.58 95.78 95.01 95.23 96.06 Total 100 100 100 100 100 100 100 SME Total 6.52 5.26 5.25 4.12 4.77 4.65 3.87 Source: Caracterización de las Micro y Pequeñas Empresas (2002), with information from Customs (Aduanas) and CORFO, based on ProChile and SII database.
FIRM SIZE, REGULATION AND SURVIVAL
The size of a firm has an impact on its use of inputs, regulations, and productivity of capital. The differences among firms affect SMEs’ prospects for growth and development. In one study, for 16 Bravo, D.; Crespi, G.; Gutiérrez, I. (2002); Fundes Chile (2001). A key bank access index measures the number of firms that have had some relationship with the formal banking system at some time, whether this means through loans, deposits, or other transactions. 17 Caracterización de las Micro y Pequeñas Empresas, with information from Customs and CORFO, based upon ProChile and SII database.
12

example, labor productivity for larger firms was between two and four times higher than that of smaller firms—when firm size was measured by either number of workers or gross production value. SMEs require a much higher proportion of working capital as a percentage of sales than larger firms, affecting unit costs and productivity. The figures below show some indicators for Chile. All point to the SMEs’ disadvantages relative to larger firms. However, a closer look at the business environment and the causes or drivers behind those differences is essential in evaluating the case for intervention, at least on efficiency grounds. 18
Firm entry and exit rates and growth trends for SMEs are similar to large firms; and there appear to be no significant differences in growth trends and levels of growth. However, large companies have a lower risk of closing Sector concentration and the availability of machinery suppliers also affect risk of closing. Other factors linked to a higher risk of failure include the firm’s debt and productivity, the availability of financial services, the growth of market, and the debt of the sector. 19
The proportion of firms that grow, shrink or exit the market shows a great deal of dynamism. The sectors with the highest entry rates have the highest exit rates. They also have a large number of SMEs. The entry and exit trends of Chilean SMEs appear to be similar to those in OECD countries. However, exit rates for medium and large firms appear high by OECD standards, and the likelihood of a small firm in Chile growing into a medium firm appears low. The exception is agriculture, which has a low rate of entry and a low exit rate. SMEs in Japan and the United States have similar trends. 20
Company survival rates are positively related to company size (see Table 2.7). A company’s risk of closing declines with its size, the concentration of the sector, and the availability of machinery suppliers. It increases with the firm’s debt, productivity, the availability of financial services, the growth of markets, and the debt of the sector. Not surprisingly, with low entrance barriers and little documentation required for bankruptcy, micro businesses have a high exit rate. It seems that they also mature into small firms at a fairly high rate—but this could be based on the definitional distinctions between micro and small firms. 21
Table 2.7 Matrix Measuring Transition over ten-year period22
En’t + 10 En t Microenterprise Small Medium Large Exiting Firms
Micro 0.16 0.11 0.03 0.03 0.66 Small 0.01 0.37 0.10 0.01 0.51 Medium 0.01 0.09 0.34 0.21 0.35 Large 0.01 0.01 0.04 0.68 0.26
Source: Cabrera, de la Cuadra, Galetovic, and Sanhueza, 2002.
EFFICIENCY
Efficiency is the key to growth and jobs creation. The technical efficiency of SMEs is central to the debate about the role of small-scale industries in economic development. SMEs are unlikely to be 18 Little, Mazumdar and Page (1987), Dahlman et al (1992), FIEL (1996), Kosacoff (2000), Batra and Tan (2001). 19 Controling for the sector activity, concentration has the effect of increasing the risk of closure for a firm. Crespi, G. (2003), Pp. 78-80 20 On Japan and the United States, see: Audretsch, D. (1995), Chapter 6. See also Cabrera, A., el. al. (2002), pp 23-24. 21 Controling for sector activity, concentration increases the risk of closure for a firm. See: Crespi, G. (2003), pp. 78-80. 22 Based on a panel of businesses interviewed by INE between 1986 and 1997. Note: The transition matrix has been constructed in the following way. In year t, all existing plants were classified according to criteria provided in table 5 (of Cabrera, de la Cuadra, Galetovic, and Sanhueza, 2002). Ten years later, the size of the plant is measured again. For example, the matrix shows that, on average, 1% of the small businesses transformed into microbusinesses, 37% remained in the small category, 10% became medium sized firms, 1% became large firms, and 51% had ceased operations. The database starts with information from 1986 and 1987, to permit a ten-year analysis.
13

important sources of growth and employment generation if they are relatively inefficient, with limited ability to compete, survive and grow into larger firms. The evidence is not conclusive, but there are broad tendencies. SMEs are, on average, less efficient than larger firms, due to increasing returns to scale. The average efficiency of smaller firms is below the production possibility frontier, controlling for scale effects.
Batra and Tan suggest, however, that, while SMEs are less efficient on average than their larger counterparts, significant numbers of highly efficient SMEs are more productive than many large firms. There are also notable sectoral differences. The objective of reducing the differences is often at the heart of policies for assisting and targeting SMEs. However, because SMEs are heterogeneous, simple comparisons of the efficiencies of different sized firms can be very misleading. For policy makers, the latter is the more important finding.23
Highly efficient firms, both large and small, have several technological, work force, and organizational characteristics that less-efficient SMEs can, in principle, emulate. Efficient firms have better access to new technology through know-how, licensing agreements, integration into the supply chain, joint ventures with foreign partners, and export contacts with foreign buyers and suppliers. They have a more educated work force, and are more likely to provide formal structured training to their workers. The work organization of more efficient firms is characterized by greater automation and quality control in production, and by human resource management and compensation practices that emphasize job stability, productivity and skill acquisition. The wide dissemination and adoption of these best practices can have productivity-enhancing benefits to less efficient firms, SMEs in particular.
The major problem that affects SME growth is isolation—more than size, access to finance or business development services (BDS). Business linkages, such as marketing, managerial, technical, financial and design linkages are primary determinants of learning innovation and productivity, whether the linkages are to large firms or other SMEs. However, by most accounts, Chilean firms work in isolation and lack well-developed networks. In one survey, only 5.1 percent of business owners considered ties with other organizations (firms and institutions) are important, while 58.6 percent and 36.3 percent operate in, high and medium levels of isolation, respectively. Compared to other SMEs in other countries, Chilean SMEs show limited integration along the supply chain and even less success in exporting. Even among successful SME exporters, only about 30 percent of the firms have formal cooperation agreements with other firms. 24
Knowledge constraints differ greatly between successful SMEs (which grow and export consistently) and failing and barely surviving SMEs. For the successful SMEs, the constraint is high-quality high-intensity marketing and managerial and technical knowledge, which are often available through global export-oriented value chains. That might argue for a public policy role to facilitate connecting these firms into the global private networks of knowledge.
To remain competitive and, as a result, to improve export potential, the private sector must produce high quality outputs while lowering production costs and improving business productivity. This increased orientation to quality and to international markets has led to greater differences between large firms and most SMEs, due to the lags in SME efficiency and productivity. Large firms and some medium firms demonstrate a high level of dynamism and technology adoption. They have diversified sources of funds, and they are able to obtain timely information on a range of investment and trade opportunities. However, the dynamism and innovation of some of the large Chilean firms, such as in the mining and agro industry sectors have not generated significant spillovers to other firms. Most SMEs appear to be isolated from the supply chain, do not invest in innovation, face knowledge constraints and have had limited access to financial and technical resources and market information. 23 Batra and Tan (2003). 24Cabrera, De la Cuadra, Galetovic and Sanhueza, (2002); Consultoría Nomisma (2002); Bravo, Crespi, and Gutierrez (2002); Alarcon and Stumpo (2001); FUNDES-UNGS (1999).
14

Therefore, they have not been able to take advantage of market opportunities, including opening in international markets. These factors have limited their productivity, integration and growth.25
Given the characteristics of SMEs and the constraints they face, the Chilean Government has promoted linkages among SMEs and between SMEs and large firms. The Government also encourages SMEs to raise their productivity and competitivenes by adopting new technologies and innovative processes s. In addition, the Government has supported vulnerable, yet commercially viable SMEs during economic downturns. This approach has opened open the door to identifying market or coordination failures and, when they exist, justify government intervention to address them.
Further, policy makers have a role to play in assisting SMEs on grounds of knowledge and coordination failures. While markets in developing economies are generally well functioning, there is evidence that factors such as poor information, high labor turnover, and imperfect capital markets pose important constraints on training for many employers, especially SMEs. Many of the same constraints are pertinent to other employer decisions tied intimately to training, such as investments in new technology, use of quality control methods, and adoption of high performance work practices. The resulting low levels of efficiency limit the contribution that SMEs can make to overall economic growth and to employment generation.
25 Bitran (2002); de Ferranti et al (2002); Alarcon C and G. Stumpo (2001).
15

3. OVERCOMING BARRIERS If SMEs are to generate employment, improve their efficiency, become more competitive, and export more products, it is critical to identify the barriers they face. These barriers include: (i) legal and regulatory barriers; (ii) networking; (iii) training; and (iv) access to credit, financial services, and new investment. For that reason, Government support programs often focus on overcoming one of these barriers with specific mechanisms to reduce their effects for individual firms and the sector as a whole. This section addresses the nature of these barriers and assesses the government institutions and their programs for SME development.
LEGAL AND REGULATORY BARRIERS Legal and regulatory barriers in Chile range from requirements to register and maintain a business to labor regulations, tax policies, inspection and environmental practices, and government procurement procedures. These requirements are enforced at the municipal, regional and national levels. Obstacles include inadequate safeguards to promote competitive markets and practices and a low level of enforcement of existing laws in cases of non-compliance. Although government procurement has the potential to become an enormous market for SMEs, regulations covering procurement procedures make it difficult for small and medium businesses to participate.
In response to these perceived barriers—and to improve the regulatory context—Chile developed two projects: (i) Simplification of Transactions and (ii) One-Stop Shops. In addition, laws establishing limited liability individual companies and the standards to facilitate the creation of family microenterprises were also approved.
NETWORKING Networking is the capacity of companies to generate collective action for mutual benefit. Effective networks (also known as clusters, business associations and industry associations) help firms use new technologies efficiently, develop a greater capacity for negotiation with suppliers, diversify markets, and develop new systems to exchange information. The principal incentives for business associations are to increase sales, purchase inputs, learn more about market opportunities and acquire new technologies. Networking can also accelerate the dissemination of new knowledge and improve the entrepreneur’s ability to make decisions more effectively.
However, the commitment to sustain the organization may be missing. For example, in 2003, of the over 2,000 business associations listed, most were inactive, did not renew their leadership, or were not fully representative. Many small and medium business owners become entrepreneurs because they have strong values of individualism—and sharing information with a competitor in a small, localized market is not appealing. Moreover, many entrepreneurs not have the time or resources for organizational work. They cannot afford the high transaction costs, membership fees, and they perceive risks in sharing proprietary information and knowledge.26
That said, Chile has a number of ongoing initiatives to promote business networks. The methodologies, scale of operations, and effects of each of six of the leading Government network promotion programs are summarized below.
1) Proyectos Asociativos de Fomento (Group Development Projects, PROFOs): PROFO encourages the formation of horizontal networks to overcome scale-based barriers such as access to technology, markets and management skills. To that end, PROFO finances, at a
26 Nadvi and Schmitz (1999); Bravo et al (2002).
16

2) Programa de Desarrollo de Proveedores (Supplier Development Program, PDP): This program provides incentives to link suppliers and larger firms. Large firms provide training on quality standards and product design so that local small and medium firms can become reliable suppliers. The program has been better suited for the agro-industrial sector.27 Raw materials can be easily standardized, and producers are more homogeneous, allowing for easy dissemination of quality standards and reduction of implementation costs.
3) Programas Territoriales Integrados (Integrated Territorial Development Programs, PTI): PTI combines training activities, innovation, infrastructure, technical assistance, and business and finance networking to improve productivity in a specific region.
4) Programa de Fortalecimiento y Creación de Organizaciones Gremiales (Program for the Creation and Strengthening of Business Associations). This program seeks to modernize the SME networks, train leaders, and improve the professionalism of the services provided to members. To participate in this program, each organization must present a proposal and contribute 30 percent of the cost of the project.
5) Fondo para la Modernización de las Relaciones Laborales y Desarrollo Sindical (Fund for the Modernization of Labor Relations and Union Development). This project finances training and provides technical assistance to labor unions. Micro and small business associations have also qualifed for support.28
6) Emprende Chile (New Productive Activities Program). This program coordinates the efforts of a number of ministries and seeks to create an enabling environment for micro and small businesses in a region. The program’s ultimate objective is to improve the quality of life and income level of the inhabitants of participating communities, improve labor conditions and competitiveness of micro and small enterprises, and enhance overall regional development capabilities. First, it evaluates business and employment opportunities based on the socio-economic characteristics of the region, and, second, it identifies the employment and entrepreneurship support mechanisms that can link micro and small firms with markets and commercial networks.29
The PROFO program has produced significant results in productivity and profitability. Companies that participated in the program increased their annual sales by 12.9 percent between 1996 and 1999. PROFO offers one of the few independent evaluations with panels and control groups in the entire portfolio of government private sector support programs. The evaluation found that participating firms were much more likely to gain access to public funding, and take advantage of technical resources from universities and other sources. When a private agent was involved, marketing strategies were more developed. When a public sector agent was involved, greater improvements were seen in worker safety and training. The evaluation concluded that the program was “socially profitable” and that government spending was more than offset by the increased tax revenues.30
On the other hand, two sectoral networks—wine and pharmaceuticals—were successful without government intervention. These experiences demonstrate the importance of promoting the networking
27 In 2001, of the 82 projects in this program, most were in the agriculture and agro-industrial sectors. 28 Ministry of Labor news bulletin. June 9, 2002. Available at www.mintrab.gob.cl. 29 Ministry of Agriculture news bulletin, June 25, 2003. Available at www.agricultura.gob.cl . 30 Development Projects (Proyectos de Fomento – PROFOs): A partnership experience in Chile. José Miguel Benavente H., Department of Economics, Universidad de Chile/University of Oxford, December (1998); Benavente (1998).
17

concept as much as providing a monetary incentive. However, both sectors are dominated by large and some medium-sized firms. To insure the efficient use of government funds, it is important to differentiate between those sectors where networks will take place organically, from those that need a stimulus.
There is no available information on how many PROFOs “graduate” from Government subsidies to independent, self-financing status as a network. While there is anecdotal evidence of success, there is no systematic collection of information on PROFOs related to improved profitability, new markets, new product designs, and other concrete impacts for participating firms. A new evaluation, using the survey methodology developed by the University of Chile and expanded to include sectoral and regional subsets, would be an important step toward identifying the “graduation potential” of PROFOs and the limitations of the networking methodology. This would enable the Government to improve its targeting and medium term support.
The effects of regional network promotion programs on firm growth and productivity are less clear. To deepen the local ownership of private sector development products, the Government pushed for the creation of local resource allocation committees (Comités Regionales de Asignación de Fondos, CARs). The CARs articulate the various private sector development initiatives with regional development strategies and local priorities. The Government also created the Integrated Territorial Program (Programa Territorial Integrado, PTI) to support regional development coordination with local governments and other development institutions and take full advantage of synergies between the initiatives. No in-depth evaluation of the PTI has been carried out yet, so it is still unclear whether such synergies have been produced through this coordination mechanism. An impact evaluation of this program would be advisable.
MANAGEMENT AND WORKER TRAINING
Chile is also a leader in vocational training. Its vocational training model is an exception to the dominant Latin American model, which favors public sector-based training programs. Chile favors private sector solutions to skills improvement through training. As a result, since 1976, the Government’s National Training Institute (Instituto Nacional de Capacitación, INACAP) has competed for training investments from private sector firms on a level playing field. It competes with more than 2,000 universities, schools, centers, and consulting firms.31
Chile uses payroll levies to provide an incentive for training. These levies can be used in a variety of ways to achieve different objectives. In some countries, the levies can subsidize smaller firms and training services providers. In other countries, they co-finance training investments with a variety of providers. Best practices promote: (i) keeping employers in charge, and keeping the system voluntary; (ii) increasing competition to foster a wide range of providers; (iii) earmarking funds strictly, using levies rather than government grants; and (iv) ensuring that smaller firms are eligible for and informed about available services.
However, most entrepreneurs identified the availability, quality and costs of human resources as one of the least important obstacles to growth—event though the lack of human capital at the managerial level is a major cause of SME failure. In response, management training has become a central part of the Government’s SME development policy. For example, the Management Centers Program (CEGES), begun in 1995, supports small and medium producers to improve their business management skills. Professional multidisciplinary business teams deliver specialized courses and technical services to center members. Other programs include: (i) the Fondo de Asistencia Técnica (FAT), (ii) the Programa de Asistencia a la Gestión, (iii) the Proyecto Asociativo de Fomento (PROFOs, discussed above), (iv) the Proyectos de Desarrollo de Proveedores (Supply Network
31 de Ferranti, et.al (2002), Table 4.4, page 84.
18

development, PDP), and (v) Programa Territorial Integrado (PTI, described above). To reduce the level of uncertainty, costs and processing times, the Government seeks to standardize and streamline the application processes for these programs and attract additional participant firms.32
In addition to these programs, the National Training and Employment Service (Servicio Nacional de Capaciatción y Empleo, SENCE) provides tax incentives for training. Between 1988 and 2002, the number of enterprises that used this service grew from just over 17,000 to over 110,000. SENCE identified 116,000 businesses that used tax incentives for human resources training in 2002—an increase of 42 percent over the previous year’s total of 81,790 firms. This massive expansion of coverage resulted from the inclusion of formally registered micro businesses, mainly through training loans provided by banks. However, while the SENCE tax incentive can be used to lower the firm’s tax burden, it does not necessarily add to the skills of workers and managers—there appears to be no requirement to show that the person trained is employed by the firm.
Chile’s in-firm training culture is also strong. The country’s high educational level adds to this tendency—and the large number of government support programs, many targeting micro and small businesses, reinforce this culture. However, the effectiveness and acceptance of support can be limited by the ways in which the programs are promoted. In Chile, the outreach of available programs is weak. As a result, according to one study, few firms could actually identify at least one support program.33
ACCESS TO CREDIT AND OTHER FINANCIAL SERVICES
The Chilean financial system is among the most developed in the region. The financial sector reforms of the 1970s lead to a significant increase in the rate of coverage by commercial banks. Many micro, small and medium businesses hold at least one kind of debt. In the process, microbusinesses have proven to be bankable clients and are more than a “boutique” market niche. However, Table 3.1 demonstrates that medium and large firms still enjoy greater access to finance than micro and small firms. Moreover, the absence of significant venture capital facilities and “angel capital” (both of which are discussed below) is evidence of the lack of innovation in financial markets. 34
In addition, smaller firms pay a higher interest rate for short-term bank credit than do large firms. Lenders justify this higher cost as a risk premium for high administrative costs and a low life expectancy. For example, the lack of audited financial statements increases a bank’s costs and risks of lending. A bank may also need to limit access to longer-term credit because of the lack of physical guarantees with verifiable value and clear title. The credit review process, therefore, may restrict credit to short-term maturities, which use consumer credit models to assess small firms. 35
32 Cabrera et. al. (2002); Bravo et. al.(2002). 33 Fundes 34 By way of comparison, Berger, A. et al. (1998) report that—based on 1993 data—in the USA only 54.2% of small businesses have any type of credit with a financial institution. See Gallego, F. y Loayza, N. (2000); Financial analysis of Banco del Estado; interviews with senior management. 35 Government of Chile, Comité de Fomento de la Micro y Pequeña Empresa, “La situación de la Micro y Pequeña Empresa en Chile” (2003), P. 36, Box 20; Foxley, J. (1999). The author found differentials of up to 6 percent in the spreads between loans of up to 200 UF and loans of more than 2.000 UF. Furthermore, there is no significant proof that SME are more likely to fail than larger firms.
19

Table 3.1 Access to finance by size, 1996, 1998, 2000
Size 1996 1998 2000 Micro 41.7 42.1 39.4 Small 66.5 63.6 61.8 Medium 77.5 73.8 72.1 Large 84.3 79.6 78.3 Source: I&G (2000). Based on data from the Súper Intendencia de Bancos e Instituciones Financieras.
THE GOVERNMENT AND ACCESS TO CREDIT: FOGAPE
On a continuum of government participation in the economy, the Chilean Government is among the most active. While some countries offer an equally complete menu of programs, Chile’s financial programs for SMEs are more operationally oriented, and less oriented toward structural changes to improve productivity. The Chilean portfolio of programs also lacks a philosophical underpinning and internal consistency, compared to approaches in Australia, Ireland, and Scotland (Table 3.2).
Among Chile’s business support programs, the Guarantee Fund for Small Entrepreneurs (Fondo de Garantía para Pequeños Empresarios, FOGAPE) facilitates access to credit for smaller firms, especially new firms or those with insufficient or no guarantees; it also promote long-term credit. BancoEstado, a commercially oriented government retail bank—and a pioneer in commercial micro business and SME lending—manages this fund. FOGAPE’s value added is in extending the frontier of lending to SMEs. More than 80 percent of FOGAPE loans have maturities of less than three years. These credits can be renewed up to a maximum of 10 years. In 2000, the average loan guaranteed was only 320 UF (about US$7500). That year, legal and regulatory adjustments expanded the program and provided for annual guarantees of US$220 million, covering credits up to US$300 million. This was in line with the needs of small entrepreneurs, since most funds are for working capital.36
FOGAPE offers a streamlined bidding process and general selection criteria for clients. This avoids a more traditional system of overlapping, time-consuming individual client evaluations by the financial institution and the guarantee facility, and results in lower transaction costs. FOGAPE also offers a modest incentive for longer-term loans. Banks use this facility to hedge their SME operations at low cost. Since there is no minimum loan amount, banks with specialized SME platforms are more likely to turn to this program for loan coverage. The ultimate measure of FOGAPE’s success will be an increased SME portfolio among commercial banks.
36 See: http://www.prochile.cl/servicios/exportar_paso_a_paso/incentivos5.php.
20

Table 3.2 The Continuum of Government SME Services37 Type of Service Chile Australia Canada Finland Hol. Ireland Spain Sweden Taiwan UK US
Social Subsidies to unemployed for start-ups
x a x x x x x x x
Subsidized interest rates for SMEs x b x
Operational State loans or mutual guarantees for SMEs x c x x x x x x x
State banks for SMEs x d x x x
Microcredit funds x e x x x x x x Transforming Loans to potential high growth SMEs x f x x x x x
Research and dev. loans and grants x g x x x x x x x x x x
Govt aid to risk capital funds x h x x x x x x x x x x
Fiscal incentives for “angel”, other investors
x x x x x x x
Data bases, “angel” networks x x x x x x x
Source: Stevenson and Lundström (2002); Crichton, D. (2000).
In 2003, sixteen financial institutions were providing loans through the FOGAPE program. The Government could encourage private banks to develop similar specialized lending platforms for formal micro businesses and SMEs. These platforms would include cost-sensitive client assessment and delivery mechanisms, but would be supported in the early stages by the FOGAPE guarantee. The development of this SME demand-driven product would require a significant amount of technical assistance in the market analysis and product development and testing stages.38
The Government can also support lengthening the maturity of commercial bank loans to SMEs by purchasing subordinated bonds with a quasi-equity character. The quasi-equity feature would be attractive to commercial banks, allowing them to maximize the leveraging aspects of this arrangement. These bonds could be issued by the participating banks at a premium linked to the channeling of funds to longer-term projects presented by SMEs.39
In addition, the various government support programs can recognize and support the synergies created by linking guarantees or other financial programs and networks (PROFOs). Banks evaluate favorably those businesses that participate in a PROFO. In the eyes of a commercial bank, participation in such programs clearly represents a reduction in risk. Government support of these links would encourage
37 For this Table, the following sources were used: a) Programa de Reinserción Laboral y Empleo, Línea de Trabajo Independiente, by FOSIS (executed US$ 5 million in 2001, equal to 1.7 percent of of the 2001portfolio; Generación de Alternativas Laborales para Ex Trabajadores Portuarios, by SERCOTEC, represented in 2 percent of the resources and had 500 beneficiaries in 2001. b) INDAP’s loan programs; c) FOGAPE.; d) BancoEstado; e) SERCOTEC’s Programa para el desarrollo Competitivo de la Microempresa (business lines accounted for 1 percent of the resources executed in 2001,with around 7800 beneficiaries); f) Line 1 of CORFO’s FONTEC; g) All lines of CORFO’s FONTEC, CORFO’s Fondo de Desarrollo e Innovacion , and CONICYT’s FONDEF h) CORFO’s FIDES (the funds allocated in this program are equivalent to only 0.3% of the total loan and guarantee support provided by the portfolio as a whole), and ENAMI’s venture capital program for the exploration of mineral reserves (the funds allocated in this program are equivalent to around 60% of the loan support granted by ENAMI; however, it is only 0.35 percent of the total loan and guarantee support provided by the portfolio as a whole) 38 These may require two different parametric models: one for formal micros and another for SMEs. 39 See Foxley, J. (1998) and Held, G. (1999).
21

SMEs and the financial institutions to focus on investments that contribute to increased productivity. It would also encourage the development of new products and the adoption of innovative processes and technologies.
THE ELUSIVE VENTURE CAPITAL MARKET
As a share of the economically active population, the number of Chilean entrepreneurs compares favorably to the number in Japan, France or Spain; this should make the country fertile ground for a venture capital market. However, the results have been disappointing. According to one study, 25 percent of Chilean universities have programs or courses dedicated to entrepreneurship—but the venture capital market remains moribound. The lack of dynamism in venture capital may be explained by business projects not adequately presented to investors or that their profitability is below what venture capitalists would expect, given the combination of country, sector and other risks. It may also be a result of a lack of venues for investors and businesses to meet, or a lack of bankable technology-intensive projects offering high rates of return. 40
The legal framework that created the investment market (Fondos de Inversion, 18,815), begun in the late 1980s, proved to be inadequate to jumpstart this new financial sector industry. In 1997, the Government launched a credit line to stimulate the creation of Business Development Investment Funds (Fondos de Inversión en Desarrollo de Empresas, FIDES) to focus investment on emerging technology firms. This program offered a 1-to-1 match to the capital raised by a fund administrator. In addition, following the example of the Yozma Fund in Israel, the program attempted to attract foreign investors to establish funds in partnership with domestic investors. However, the regulatory framework’s excessive restrictions limited the success of this initiative. The chief problem was the difficulty assessing the value to a firm’s intangible assets. This limited investments in firms whose underlying value was primarily linked to innovative ideas.
In late 2000, adjustments to the legal framework sought to encourage private sector participation in venture capital markets. The changes provided much greater freedom to private investment funds. These funds can now rely on their own bylaws to set the rules of the game.41 At the same time, the Emerging Industries Stock Exchange (Bolsa Emergente) was formed. Registration in this stock exchange is streamlined and provides more protection to minority investors (Ley de OPAS, 2000). The Second Capital Market Reform (Reforma de Capitales 2) now permits all bond and other instruments issued by qualified risk capital funds for up to twice their original equity. These funds can also issue stock options under the new framework. In addition, it exempts stock transactions carried out by these firms from capital gains tax (up to 10,000 UF, about US$270,000, in cases when more than one third of equity is involved) for up to three years. This benefit is transmitted to the holders of “cuotas” (similar to shares) from the Funds. It also allows pension fund managers to invest in these funds. However, this proposed reform fails to include “angel capitalists” as potential beneficiaries.
Given the shortage of private venture capital, the Government launched the Seed Capital program to support business start-ups and those in early stages of development. It is a non-reimbursable subsidy whose objective is to offset the lack of private venture capital. It provides financing for activities such as market research, publicity, legal registration, business plan preparation, management technical assistance and even prototype design and testing. Proposed projects are presented by sponsoring agents who act as a “filter” and receive a payment for assisting the applicant business.
In addition to the Seed Capital program, the Government sponsors national networks of business incubators. These incubators are designed to address the lack of specialized business managers who
40 See the worldwide study conducted by Babson College and the London Business School and reported in a public presentation at the Universidad de Los Andes in Santiago, Chile. 41 See Título VII, Ley 18.815 currently in force. These Funds are annually audited by external auditors accredited with the Superintendencia de Valores y Seguros (Securities and Insurance Superintendency).
22

can turn innovative projects into successful businesses, and to help those with potentially profitable ideas move to the business start-up stage. Academic and technoloy institutes are invited to link their services and knowledge to these incubators. These programs address the concern that the evaluation of proposed projects is too complex, and that there is no critical mass of attractive innovative projects—and no critical mass in the markets.
23

4. RATIONALIZING GOVERNMENT SUPPORT Chile outperforms all other Latin American countries on microeconomic and innovation indicators. To stimulate growth and productivity and to move towards an economy based on the creation and use of knowledge, however, Chile faces significant challenges.42
This review is based on research completed in 2003 using formative evaluation techniques. In contrast to impact evaluation, which focuses on a program's results, formative evaluation focuses on how a program is delivered. It assesses a program based on (i) the objectives; (ii) outreach; (iii) internal processes; and (iv) service delivery mechanisms. The available data set for the majority of programs included both administrative and operational aspects of the programs and overall outreach statistics. 43
The evaluators used a standardized survey instrument, interviews of key government officials and focus groups with small business managers. Most of the government programs were not able to provide actual information on clients, client satisfaction, administrative costs, and other quantitative and qualitative aspects of the programs. In the few cases, where independent impact evaluations were available, the methodologies were not standardized, making it impossible to compare the programs’ performance.
The methodology included the following four steps:
1) Develop a database with quantitative and qualitative information; 2) Classify the programs according to economic sector, geography, implementing
agency, target client group, the government program’s product, market failure, and the delivery mechanism;
3) Identify anomalies within each program; and 4) Propose a reformed private sector portfolio.
The criteria for classification of programs included the economic sectors, market failures, and delivery mechanisms. For example, economic sectors included fishing; agriculture and animal husbandry; mining; commerce; restaurants and hotels, among others. The government program’s product included grants, matching grants, or credits. Market failures included information, networking, innovation human resources, commercialization, environment, financing, and others. The delivery mechanism included groups of firms or individual firms.
INSTITUTIONS, FUNDS AND PRIVATE SECTOR DEVELOPMENT
The three primary private sector development-implementing agencies are CORFO, (Production Development Corporation), INDAP (The Agricultural and Animal Husbandry Development Institute), and SERCOTEC (The Technical Cooperation Service). For each institution, this analysis is based on detailed interviews with senior management and a review of available documentation and statistics.
CORFO
CORFO, created in 1939, promotes competitiveness and investments, contributes to the generation of jobs for skilled workers, and insures equal access to services promoting business modernization. CORFO is a leader in credit and guarantee schemes for the private sector, targeting SMEs through
42 As of mid-2004, the Chilean Government did not require any type of evaluation of government-financed programs. Therefore, client surveys, independent evaluations and even simple cost-benefit efficiency results are very rarely available. 43 Bartik and Bingham (1995). Can Economic Development Programs Be Evaluated? Upjohn Institute Staff Working Paper 95-29.
24
alliances with commercial banks and private technical assistance agents. Nevertheless, there are serious questions about the value added of the instruments provided by CORFO.44
CORFO’s activities are based on market demand and market imperfections. For example, CORFO’s governing principles include the notion that the State should only intervene when there are clear market failures. In addition CORFO does not discriminate between economic sectors or geographical regions in the allocation of its resources. Finally, according to CORFO’s principles, all programs should be demand driven, as demonstrated by private sector ownership and co-financing. Within these governing principles, CORFO has emphasized three programmatic areas—innovation, business networking, and managerial skils training.
To carry out this strategy, CORFO designed and implemented a series of private sector development programs and outsourced delivery to public agencies and private partners (agents). However, CORFO directly manages a set of instruments dedicated to innovation promotion and regional development, through a network of regional offices.
CORFO’s services cover most sectors of the economy, all sizes of firms, and all regions of the country. In 2000, CORFO spent a total of 43,753 million pesos (US$72.9 million)—of which 14,346 million pesos (US$ 23.9 million) were spent on administrative expenses. In other words, for every peso of administrative expenses, just over three pesos of services were provided the beneficiaries.45 This level of efficiency is partially attributable to the use of private technical assistance agents and commercial banks to deliver services. Unfortunately, it is difficult to compare this cost-to-benefit relationship to similar institutions in the region, because many of CORFO’s products are not offered in other countries.
In 2000, CORFO launched the High Technology Investment Promotion Program to attract foreign direct investment (FDI) in the technology sectors. The program is designed to portray Chile as a strong market for investments in biotechnology and information and communication technologies (ICT), among others. Chile seeks to attract FDI and maximize local linkages by supporting local businesses. Although there have been some successes in software development, call centers and shared services centers have received the most investment. These types of activity develop qualified employees and use intensively the facilities provided by the country’s telecommunications infrastructure.46
In addition, CORFO has sought to improve the competitiveness of the mining, wine, fruit and salmon clusters and promote foreign direct in investment in renewable energy. This effort, named the Investment Attraction Program, was combined with an existing program to promote investment in specific regions.47
Despite its pro-market principles, CORFO officials have recognized a number of obstacles to the efficient delivery of its products. For example, CORFO’s use of agents, has generated savings and led to innovative approaches, but has important limitations. The current system of incentives is not enough to engage agents strategically—making interventions more ad hoc than systematic. CORFO’s actions seem to value the participation of agents more than the solutions to the business problems of the client firms. Agents tend to limit their work to more standardized functions, and do not contribute to the strategic side of operations.
44 See: http://www.corfo.cl/. 45 Annual Peso/USD average exchange rate stood at 540 pesos in 2000 and 635 pesos in 2001 (according to data series posted in the website for the Banco Central - www.bcentral.cl) 46 See: http://www.corfo.cl/biotechnology/index.html. See also: Nelson, Roy C. Transnational Strategic Networks and Policymaking in Chile: CORFO's High Technology Investment Promotion Program Latin American Politics & Society - Volume 49, Number 2, Summer 2007, pp. 149-181 47 Nelson (2007) fn. 4.
25

Since regional activities have to be adapted to local conditions, they do not lend themselves to standardization. However, it is possible to differentiate between those functions and programs that can be standardized and those of a more strategic character. Standardized activities include payment collection from clients, project evaluations, monitoring technical assistance provision, and exit interviews. Standardized technical assistance would include predefined characteristics for certain products, such as the length of time involved, the type of consultants involved, the content, and the costs. Decentralization of certain functions would help CORFO to standardize its activities and lower administrative expenses. By standardizing the incentives to agents and administrative processes, CORFO could economize significantly.
However, CORFO’s financial base—the income of the state enterprises it controls—raises the question of how to streamline management for a more accurate picture of the costs and benefits of programs. CORFO’s Council manages the Sistema de Empresas Públicas (SEP), which includes mining, coal, mail, wheat marketing, railroads, and oil companies. Separating the administration of the SEP might yield better results in both state enterprise performance and private sector programming. However, any discussion of the separation of these functions would include the need to ensure sufficient resources for CORFO’s valuable technical assistance and financial services operations.
Decentralizing some functions and integrating some programs would standardize CORFO’s activities, lower administrative costs, and increase the impact for firms. The main obstacles are the restrictions imposed by the Controlaría General concerning the delegation of administrative tasks. Any move to decentralize such functions would have to be negotiated in light of existing requirements. Strategic functions that do not lend themselves to standardization include region-specific strategies, impact evaluations, good practice development and dissemination.
Finally, CORFO’s intermediation model—using agents to implement its programs—has generated savings and led to innovative approaches, but also has important limitations. Despite the increased outreach and low administrative costs, agents tend to limit their work to more standardized functions, and do not contribute to the strategic side of CORFO operations. Moreover, there does not appear to be consistency in the service intermediation model, and clients have complained that agents offer what they know, which may not be what the business needs to become more efficient, competitive or profitable. Basing the agency system on open completion might improve performance.
INDAP
INDAP was created in 1962 to serve rural areas. Its mission is to contribute to the development of small agricultural producers and families and rural producer organizations, and integrate them into the national economy.48 INDAP does the following:
1) Offers training in entrepreneurial skills, innovation and management for agricultural producers;
2) Provides credit to small agricultural producers and families; 3) Improves local infrastructure; 4) Supports environmental conservation activities; 5) Promotes the improvement of agricultural products and services; 6) Encourages business networking for productive and representative purposes.
INDAP serves all 13 Chilean geographic regions in four main areas: (i) financial services; (ii) development of productive and entrepreneurial capabilities; (iii) development and improvement of productive resources; and (iv) development of services targeting vulnerable populations. INDAP’s beneficiaries are small agricultural and forestry producers in rural areas. These producers use less than
48 See: http://www.indap.cl/.
26

12 hectares of land and have assets worth less than 3,500 UF (around US$90,000). Their income comes primarily from agriculture, whether they own the land or rent it. The client definition has been legally mandated (Ley Orgánica N° 18,910, modified by Ley N° 19,213).
During 2002-2003, INDAP simplified it administrative procedures and inproved its efficiency. Among other reforms, it streamlined its programs and removed redundancies; it simplified its application procedure and provided for outside diagnostics and external consultancies. Further, it provided for technical assistance projects formulated by the client firms themselves.
Given its problems with portfolio quality and transparency of the credit operations, INDAP senior management introduced a number of reforms focused on lending and credit management. At the same time, senior management has expressed interest in moving from retail credit operations to a second tier (wholesale) role in regions where there is a critical mass of private commercial or non-profit retail institutions.
A precondition for reorienting INDAP to a successful second tier financial institution is an adequate number of potential financial intermediaries with broad geographical distribution and appropriate qualifications in a region. At the same time, INDAP should develop a medium term plan to foster first tier private financial institutions—through partnerships, management contracts or other mechanisms. INDAP would continue to play the role of a retail financial institution in those few regions with no significant retail intermediaries.49
This reorientation will require greater institutional autonomy, a public awareness campaign, and new commercially oriented relationships in the regions. Senior management will need greater autonomy for INDAP to re-establish credibility in its loan contracts. A public awareness campaign will clarify INDAP’s new role in rural markets and in more developed regions.
To complete this transformation, INDAP will need to adjust its staffing mix, accounting systems, information system, and products to meet demand from retail financial institutions in more developed regions. As part of the re-engineering process, INDAP will need to update its information management system and establish objective quantifiable indicators to measure the impact of the products offered to productive business clients. This will enable INDAP to improve its systems and products on an ongoing basis and become more responsive to its clients.
SERCOTEC
SERCOTEC is a public agency set up to run like a private corporation. Its purpose is to increase micro and small firms’ sales, their competitiveness, and managerial capacities. SERCOTEC has developed innovative services for micro and small firms in the fishing and commercial retail sectors. SERCOTEC also assists municipalities that seek to simplify bureaucractic procedures. SERCOTEC Networks (Red SERCOTEC) provides technical assistance to micro firms, strengthens business associations and provides a national system of infocenters.50
SERCOTEC has operated as an independent agency, designing and executing its own programs, and as an agent for some of CORFO’s programs. As a result, some of SERCOTEC’s own initiatives were redundant with the CORFO programs already operated by SERCOTEC itself. This signaled the need for SERCOTEC to review its portfolio of programs and to clarify its role among other institutions.
At the time of the review, SERCOTEC’s two competing roles had diluted its effectiveness and created a confused identity. In response, SERCOTEC has sought to redefine itself and enhance the definition
49 However, INDAP should not engage in both first tier and second tier operations in the same region, since this opens the door to unfair competition and could undermine commercially oriented retail financial institutions.
50 See: http://www.sercotec.cl/base/homepage.cfm.
27
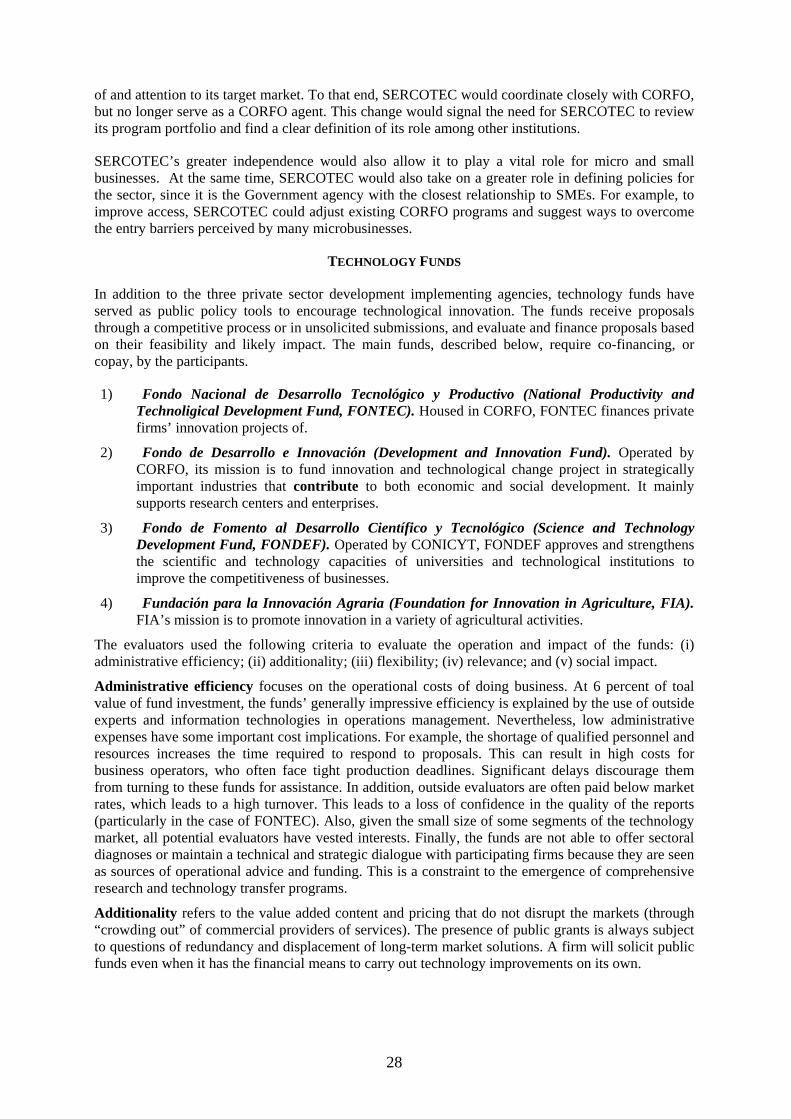
of and attention to its target market. To that end, SERCOTEC would coordinate closely with CORFO, but no longer serve as a CORFO agent. This change would signal the need for SERCOTEC to review its program portfolio and find a clear definition of its role among other institutions.
SERCOTEC’s greater independence would also allow it to play a vital role for micro and small businesses. At the same time, SERCOTEC would also take on a greater role in defining policies for the sector, since it is the Government agency with the closest relationship to SMEs. For example, to improve access, SERCOTEC could adjust existing CORFO programs and suggest ways to overcome the entry barriers perceived by many microbusinesses.
TECHNOLOGY FUNDS
In addition to the three private sector development implementing agencies, technology funds have served as public policy tools to encourage technological innovation. The funds receive proposals through a competitive process or in unsolicited submissions, and evaluate and finance proposals based on their feasibility and likely impact. The main funds, described below, require co-financing, or copay, by the participants.
1) Fondo Nacional de Desarrollo Tecnológico y Productivo (National Productivity and Technoligical Development Fund, FONTEC). Housed in CORFO, FONTEC finances private firms’ innovation projects of.
2) Fondo de Desarrollo e Innovación (Development and Innovation Fund). Operated by CORFO, its mission is to fund innovation and technological change project in strategically important industries that contribute to both economic and social development. It mainly supports research centers and enterprises.
3) Fondo de Fomento al Desarrollo Científico y Tecnológico (Science and Technology Development Fund, FONDEF). Operated by CONICYT, FONDEF approves and strengthens the scientific and technology capacities of universities and technological institutions to improve the competitiveness of businesses.
4) Fundación para la Innovación Agraria (Foundation for Innovation in Agriculture, FIA). FIA’s mission is to promote innovation in a variety of agricultural activities.
The evaluators used the following criteria to evaluate the operation and impact of the funds: (i) administrative efficiency; (ii) additionality; (iii) flexibility; (iv) relevance; and (v) social impact.
Administrative efficiency focuses on the operational costs of doing business. At 6 percent of toal value of fund investment, the funds’ generally impressive efficiency is explained by the use of outside experts and information technologies in operations management. Nevertheless, low administrative expenses have some important cost implications. For example, the shortage of qualified personnel and resources increases the time required to respond to proposals. This can result in high costs for business operators, who often face tight production deadlines. Significant delays discourage them from turning to these funds for assistance. In addition, outside evaluators are often paid below market rates, which leads to a high turnover. This leads to a loss of confidence in the quality of the reports (particularly in the case of FONTEC). Also, given the small size of some segments of the technology market, all potential evaluators have vested interests. Finally, the funds are not able to offer sectoral diagnoses or maintain a technical and strategic dialogue with participating firms because they are seen as sources of operational advice and funding. This is a constraint to the emergence of comprehensive research and technology transfer programs.
Additionality refers to the value added content and pricing that do not disrupt the markets (through “crowding out” of commercial providers of services). The presence of public grants is always subject to questions of redundancy and displacement of long-term market solutions. A firm will solicit public funds even when it has the financial means to carry out technology improvements on its own.
28

The funds have demonstrated their flexibility by adjusting to changing conditions. The Fondo de Desarrollo e Innovación (FDI) is the best example of this. To apply for resources, the FDI uses open competitions, thematic and regional competitions, bid tenders for specific topics or one-stop windows. This flexibility is well received by clients because it permits a rapid response to their requests. However, some clients complain about the Fund’s operational variability. And, when new products are developed, the Fund tends not to close down older products with less demand. The result is “growth by aggregation,” leading to confusion among potential clients.
If the funds offer relevant services, the private sector responds with investment. Indeed, private sector contributions to the technology and innovation projects are impressive. Nevertheless, in the cases of pre-competitive projects, this contribution is relative, since many of the projects are financed through the universities and technology institutes. These institutions support the projects with existing equipment and installations and staff members. However, the result is that the researchers, not the private sector, control the R&D projects—practically without oversight. 51
One way to improve the relevance and leveraging of public programs would be to require larger co-pay from participating enterprises. However, this option is best when there is a larger private contribution and the project includes less risky technology, greater private appropriation of the results and less externality (and diminished social profitability). In addition, reducing the fund’s support as a proportion of the total project cost could result in limiting participation to larger firms. The only way to assess the effects of changes in the copay requirement would be to carry out an impact evaluation.
Public resources channeled through the funds generate a greater positive social impact than alternative projects. Evaluations of the impact of projects sponsored by FONTEC, FONDEF and Fondo de Desarrollo e Innovación measure firm earnings and consumer surplus by the shifting of resources to other activities, which is the result of efficiency gains from innovation. Using conservative assumptions on the diffusion of innovation, and restricting the support of the funds exclusively to the innovation’s progress during the implementation period, the results of the evaluations are broadly positive, resulting in a high social benefit. 52
FONTEC provides direct support to projects that adopt or adapt innovation, more than pre-competitive research and development. In these types of initiatives, it is more likely to observe private funds replacing public resources. On the other hand, one study of enterprises supported by FONTEC concludes that public resources provided the incentive to realize projects that would not otherwise have been done. Moreover, a study of databases of two surveys from 1995 and 1998 of innovations in applied technologies in more than 450 Chilean manufacturing enterprises identified crowding-in by public innovation subsidies. The study compared innovation between a base year (before using fund support) and later years and found that the businesses increased their spending on innovation more than the original public contribution. Firms that did not use the funds did not invest as much in innovation spending. The results showed that for every dollar supplied by FONTEC, the firms invested US$1.30 from its own funds.53
Universities and technology institutes have also learned how to submit winning applications for grants from FONDEF and Fondo de Desarrollo e Innovación. However, the true motive is to continue to finance their operations, rather than moving findings into business applications. This is consistent with the analysis that led to the World Bank-supported project with CONICYT, which includes strategies for private sector use of technology experts from technology centers and universities. The
51 See Mullin et al., (1999); Crespi and Rau (2000) and observations by an Inter-American Development Bank mission charged with evaluating advances science and technology in INVERTEC-IGT (1999). 52 Gerens (1996, a, b and c ). See Crespi y Rau (2000) for a detailed analysis of the methodology. 53 See: Wallsten, S.J. (2000): “The effects of government-industry R&D programs on private R&D.: the case of the small business innovation research program.” RAND Journal of Economics 31 (1); Lach, S. (2000): “Do R6D subsidies stimulate or displace private R&D. Evidence from Israel.” NBER Working Paper 7943. See also Benavente (2002) and ILADES (1998).
29

Funds have responded to this apparent “indifference” to private sector business applications with new products. FONDEF initiated the technology transfer product line, while Fondo de Desarrollo e Innovación created the “proyectos empresariables.”
DELIVERY MECHANISM SUBCATEGORIES
The analysis of the Government’s portfolio of private sector support programs used firm size and other characteristics. Since many of the programs employed more than one delivery mechanism, the analysis differentiated between the primary and secondary mechanism. The analysis measured each program’s “fit” with the overall portfolio (synergies, complementarity, and logical links to other programs) and whether it overlaped another program.
The analysis also based its analysis on the following guidelines for evaluation of private sector promotion programs:
• Identify problems that the program intends to address, and the expected impact; • Conduct impact and process evaluations (by a specialized third party); • Adapt evaluation methodologies to the particular characteristics of the program and the context (cultural, political, and economic). • Ensure that the subject under evaluation participates in the evaluation (participatory techniques).
Online systems allow the collection of data regarding beneficiaries, the instruments they have used, and resources employed, among others. These data allows the monitoring of the programs and the support provided to entrepreneurs, and provides a hard basis for evaluation work.
Each program’s budget and number of clients served were key indicators in the quantitative analysis. However, no data were available to allow an econometric analysis yielding precise weights for each indicator. The subcategories differentiated among the different delivery mechanisms for each market failure. The analysis used the following criteria to assess a program’s value added for SME support.
Definitions of Criteria:
1) Addresses a perceived market failure. The Ministry of Economy’s guiding principle is that state spronsored programs should respond only to perceived market failures. This argument assumes that some activities or areas generate positive social benefits but have barriers that inhibit private sector investment. Thus, to take advantage of such externalities, the state must intervene. Accordingly each program should clearly state the market failure it is intends to address. Programs that do not have a defined market failure focus should be reviewed.
2) Focus on micro, small, or medium firms. In general, the Chilean policy is to focus on those firms most likely to be affected by market failures. Such is the case of micro and small firms, and to a lesser extent, medium firms. Even though a number of programs support these firms, in reality their delivery mechanisms end up allocating funds to larger firms. Several programs, mostly related to innovation support and new technology assimilation, target firms of all sizes. To be consistent with official objectives, the eligibility requirements and delivery mechanisms should clearly address the barriers that affect smaller firms. The particular nature and strategic importance of promoting access to innovation and technology to all firm sizes could be arguably justified. In such cases, a program’s broad firm focus should be clearly defined and justified.
3) Coverage. In general, a program should serve a significant number of beneficiaries out of the universe of potential beneficiaries that are likely to need support. Thus, to appraise the outreach of a program, potential beneficiaries should be defined beforehand. This process, in turn, should facilitate the calculation of the resources needed to adequately serve the beneficiaries. Ideally, coverage assessment should also entail discerning over time whether benefits are delivered to a growing number of different beneficiaries, or if the benefits are repeatedly provided to the same clients. Unfortunately, many of the programs lack sufficient data to differentiate whether their
30

beneficiaries are different from each other over time. This points to the importance of developing a comprehensive database on programs and their beneficiaries.
4) Budget execution. For a number of programs, budgets provided more funds than the programs were able to implement or for which there was demand. The immediate result was that funds, which could have been allocated for other more useful purposes, were held idle during the fiscal year.
5) Data availability. The main obstacle identified by the study was the lack of readily available and reliable data on each program. At a minimum, a program should readily count on a clearly defined mission in terms of market failure, the sector it addresses, information on the type and number of beneficiaries it serves, the amount of resources it has allocated in the form of benefits and administrative expenses, and ideally, the impact the program has generated. Data gathering mechanisms should be set in the case where programs lack such historical data, so as to justify their relevance and that of the resources they execute.
6) Spending efficiency. Only 28 programs (out of 103) distinguished administrative expenses from benefit allocations. This clearly impeded the assessment of efficiency in the use of funds. In a few of these cases, administrative costs represented up to 50 percent of the resources executed in 2001. Ideally, lower administrative costs should liberate resources to be allocated as actual benefits to the targeted population. A high ratio of administrative costs versus executed resources could indicate some anomalies in the administration or delivery of program benefits.
7) Risk distribution. Risk distribution means that firm owners participate in the costs as well as the benefits of the support. This criterion is intended to measure the extent to which a beneficiary is committed to the success of a project. A financial commitment of the beneficiaries, by absorbing some of the program’s costs, will more likely increase the chances of achieving the program’s objectives.It assures that business owners will be committed to maximize the use of the program.
8) Loan recovery. The indicator used, percentage of non-performing portfolios, is defined as the annual percentage of the financial portfolio that has not been served in more than three months. In the case of credit programs (which include guarantees), the loan recovery ratio is a valuable proxy to a program’s capacity to sustain itself over time, and of the liquidity risk that the institution is acquiring. It also allows establishes whether the institution in question has the will or capacity to demand repayment of the loans or will opt to allow the loans to become subsidies by relinquishing the claim.
In 2002, the private sector program portfolio included 73 grant programs and 23 credit programs, composed largely of agriculture, livestock, and multi-sectoral programs. Including the socially oriented initiatives, there were 103 private sector support programs, making it easy to understand why coordination and duplication of efforts are a major concern. Table 4.1 presents the portfolio by sector and grant or credit support.
31

Table 4.1 Grant and Credit Programs
Sector Grant Programs Credit Programs Total 1.- Fishing 2 - 2 2.- Agricultural and animal husbandry 16 4 20 3.- Mining 2 6 8 4.- Commerce, restaurants and hotels 2 - 2 5.- Cross-sectoral 38 12 50
Total PSD programs 60 22 82 6.- Special 8 - 8 7.- Social assistance 5 1 6
Total reported programs 73 23 96 8.- Not received / Aggregated 7 - 7 TOTAL 103
Of the 103 programs identified in 2002, only 82 were strictly private sector development programs—based on their objectives and target beneficiaries. Of the 82 remaining programs, 60 were grant programs and 22 were credit programs (which included guarantees). The resources executed in 2001 by the 60 grant programs amounted to 13.149.145 UF (or US$328.7 million as of late 2001).54 Fishing, agriculture, mining, and commerce received the bulk of the resources (see Tables 4.2 and 4.3).
Table 4.2 Grant Programs in Private Sector Development
Grant Program Percentage Franquicia Tributaria a la Capacitación, SENCE 36.4% Ley Nº 18.450 Fomento al Riego y Drenaje, CNR 9.7% Sistema de Incentivos para la Recuperación de Suelos Degradados , SAG 6.2%
Programa para la recuperación de suelos degradados, INDAP 5.3% Programa de Promoción de Exportaciones, PROCHILE 4.5% FONDEF, CONICYT 3.8% Servicio de Asesorías Técnicas, INDAP 3.8% Fondo de Desarrollo e Innovación (FDI), CORFO 3.7% Proyecto Asociativo de Fomento (PROFO), CORFO 3.5% FONTEC, CORFO 3.5% Subsidio Ley 19.561 a la Forestación, CONAF 2.3% Fondo de Asistencia Técnica (FAT), CORFO 2.3% Programa Riego, INDAP 2.2% Others 12.8% Total 100.00% Source: Almeyda and De la Barra (2002). See Annex B.
In 2001, the grant programs provided an average of 612 UF (US$15,300) per client firm. Outreach was impressive—there were 1,095,206 beneficiaries in 2001. However, due to the lack of an
54 The exchange rate at the time of this part of the study was US$25 per UF. As of March 2004, it is US$27.
32
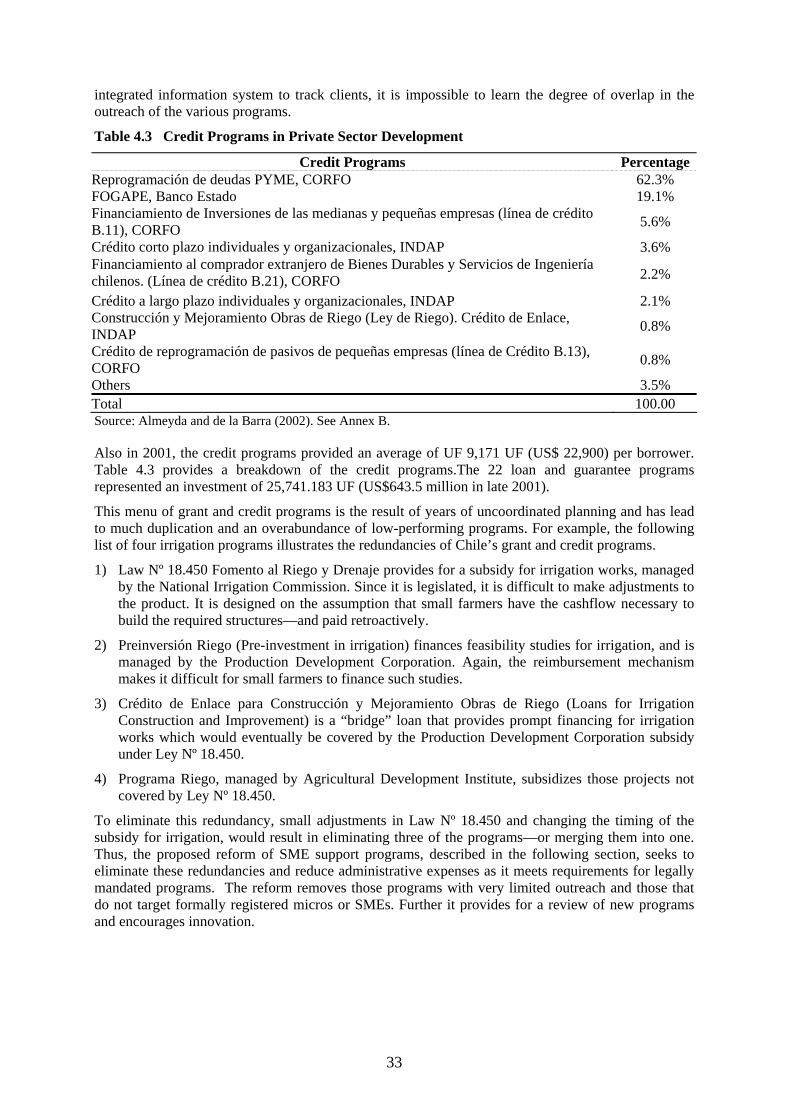
integrated information system to track clients, it is impossible to learn the degree of overlap in the outreach of the various programs.
Table 4.3 Credit Programs in Private Sector Development
Credit Programs Percentage Reprogramación de deudas PYME, CORFO 62.3% FOGAPE, Banco Estado 19.1% Financiamiento de Inversiones de las medianas y pequeñas empresas (línea de crédito B.11), CORFO 5.6%
Crédito corto plazo individuales y organizacionales, INDAP 3.6% Financiamiento al comprador extranjero de Bienes Durables y Servicios de Ingeniería chilenos. (Línea de crédito B.21), CORFO 2.2%
Crédito a largo plazo individuales y organizacionales, INDAP 2.1% Construcción y Mejoramiento Obras de Riego (Ley de Riego). Crédito de Enlace, INDAP 0.8%
Crédito de reprogramación de pasivos de pequeñas empresas (línea de Crédito B.13), CORFO 0.8%
Others 3.5% Total 100.00 Source: Almeyda and de la Barra (2002). See Annex B.
Also in 2001, the credit programs provided an average of UF 9,171 UF (US$ 22,900) per borrower. Table 4.3 provides a breakdown of the credit programs.The 22 loan and guarantee programs represented an investment of 25,741.183 UF (US$643.5 million in late 2001).
This menu of grant and credit programs is the result of years of uncoordinated planning and has lead to much duplication and an overabundance of low-performing programs. For example, the following list of four irrigation programs illustrates the redundancies of Chile’s grant and credit programs.
1) Law Nº 18.450 Fomento al Riego y Drenaje provides for a subsidy for irrigation works, managed by the National Irrigation Commission. Since it is legislated, it is difficult to make adjustments to the product. It is designed on the assumption that small farmers have the cashflow necessary to build the required structures—and paid retroactively.
2) Preinversión Riego (Pre-investment in irrigation) finances feasibility studies for irrigation, and is managed by the Production Development Corporation. Again, the reimbursement mechanism makes it difficult for small farmers to finance such studies.
3) Crédito de Enlace para Construcción y Mejoramiento Obras de Riego (Loans for Irrigation Construction and Improvement) is a “bridge” loan that provides prompt financing for irrigation works which would eventually be covered by the Production Development Corporation subsidy under Ley Nº 18.450.
4) Programa Riego, managed by Agricultural Development Institute, subsidizes those projects not covered by Ley Nº 18.450.
To eliminate this redundancy, small adjustments in Law Nº 18.450 and changing the timing of the subsidy for irrigation, would result in eliminating three of the programs—or merging them into one. Thus, the proposed reform of SME support programs, described in the following section, seeks to eliminate these redundancies and reduce administrative expenses as it meets requirements for legally mandated programs. The reform removes those programs with very limited outreach and those that do not target formally registered micros or SMEs. Further it provides for a review of new programs and encourages innovation.
33

An important limitation to this exercise is the lack of an integrated information system with comparable indicators on program performance, in terms of cost-benefit analysis, impact evaluations and more clearly defined outreach and administrative expenses. The lack of such firm level tracking creates an incentive for dependency on government subsidies, rather than a “graduation” path as the firms overcome the constraints to higher productivity. The most effective reforms enable firms to create a kind of credit and technical assistance history, and allow strong performers to improve their competitiveness, attract the attention of private financial institutions and eventually graduate from government assistance.
34

5. REFORMING THE SYSTEM
NATIONAL INNOVATION SYSTEM
An essential tool to moving beyond the present approach to private sector development is the National Innovation System (NIS. A National Innovation System is the set of government and private sector policies and incentives that generate much of a country’s research and technological innovation. A successful NIS would seek to improve private sector investment in research and development, labor skills and education, and encourage collaboration between businesses and research institutions.55
Chile has succeeded in introducing new technologies, engaging in technology transfers, improving the business environment, and improving company strategy and operation. However, it remains behind similar-income countries in East Asia and Eastern Europea in investment climate and innovation frameworks. In addition to attracting more foreign technology, these countries have invested in public and private research and developmemt, and encouraged collaboration between scientific institutions and local firms. 56
In contrast, Chile does not have a formally declared and accepted technology innovation policy. Nor does it have a mechanism to coordinate activities in science, innovation, and technology. The lack of a central authority to coordinate the innovation and technology efforts and provide a strategic framework with unifying principles leads to a loose ad hoc coordination. It would be far more effective if there were a forum for exchange, a shared diagnostic and a strategic framework to insure the efficient use of resources, minimize mixed signals to potential product users, and maximize new business applications.
In addition, Chile is a leader in some areas of scientific research, but not in business applications that may result from the research. The Chilean scientific community garners well-deserved international respect, and is moving toward a leadership position in research among industrializing countries. However, this substantial progress has not yet matched the country's aspirations. The table below shows the strengths and weaknesses of the Chilean NIS.
55 Chile produces fewer than 100 doctorates per year and would need to produce around 3,000 per year to reach a level comparable to the knowledge-based developed economies. Similarly, Chile has only one scientist for every thousand economically active inhabitants, while the developed countries have an average of five scientists per thousand. Lauritz Holm-Nielsen and Alex Norsworthy, Chile's Millennium Science Initiative: Building Human Capital for the Global Knowledge Economy. En Breve Series, World Bank, December 2002, Issue No. 15.
56 World Economic Forum (2004); Chile: New Economy Study, Volume 1, Executive Summary and Policy Recommendations, World Bank
35

Table 5.1 Strengths and Weaknesses of the Chilean National Innovation System
Strengths Weaknesses - Broad University Network - Strong competitive environment - Open economy - Strong foreign direct investment - Free Trade Agreements and
complementary economy with the European Union, the United States, Canada and Mexico.
- Export orientation - Availability of public resources to
promote innovation
- Low level of quality of education - Low percentage of population with post-secondary education- Excessive focus on basic scientific research and a decline in
applied science and technology development - Few patent applications - Inadequate training of personnel in the sciences and
technologies - Little investment in R&D - Low proportion of R&D research done by enterprises - Limited collaboration between businesses and universities - Weak technological institutes, and without a culture of
collaboration Source: Brunner (2001); Mullin et al. (1999); Mullin et al. (2000); Bitrán (2002); Benavente, and Crespi, (1998), and interviews with experts.
Three factors limit the Chilean National Innovation System: (1) low levels of education in reading and mathematics, (2) a very small investment rate in applied technology, and (3) an even lower commitment from private firms. The low quality of education is reflected in low comprehension reading levels and knowledge of mathematics, compared to countries with similar GDP levels. In addition, given its impact on the transition to an innovation economy, a more worrisome aspect is the very low level of resources dedicated to technological innovation—only 0.7 percent of GDP. This is far below the 2 percent average in OECD countries. In Chile, the private sector only contributes 25 percent of the total amount applied to basic research. This translates into a very low investment in applied research or transfer activities; if increased, these investments could lead to improved firm performance.57
However, innovation for its own sake is not the answer—business applications are what matter. Given the importance that exports have in the national economy, Chilean firms are well aware that businesses compete in the global economy. But if firms do not integrate technological innovation into their business plans, the public sector’s efforts to create an intensive knowledge-based economy will be ineffective. Moreover, because of the lack of concrete applications or relevance, the resources assigned to science and technology may not produce the desired results. Innovative technologies with business applications promise much more for the modern economy.
To that end, the National Commission of Science and Technology (CONICYT) and the Presidential Scientific Advisory Commission are responsible for formulating and overseeing Chile’s strategy for scientific and technological development. In addition, the Presidential Commission on the Development of New Information and Communication Technologies and the Biotechnology Development Commission have sought to provide an integrated and macro level approach to innovation. As a result, Chile has developed myriad policies, programs and policy instruments for research and innovation. To make the strategy more effective, representatives of the beneficiaries—research institutions, universities and private firms—should be involved in the design and implementation of this strategy. The government would benefit from devising an overall strategy and coordinating its initiatives in these areas, by aligning managerial responsibilities with accountability for results, and introducing consistent budgeting and monitoring process. Further, it will be important
57 In the OECD countries, the private sector’s support of R&D fluctuates between 40 and 70 percent. In Chile more than 55 percent of the resources in science and technology are dedicated to basic research. In Korea, the figure is 12.6 percent; in Spain, 22 percent; and in the United States, 18.3 percent. See Brunner, 2001; Bitrán, E. 2002;. De Ferranti, et. al. 2003.
36

to identify clearly the institution that will lead these exercises and provide monitoring and periodic reports.58
In addition, the World Bank-sponsored Science for the Knowledge Economy Project (IBRD 71720) had two development objectives, which should place Chile on the path to a knowledge-based economy. First, the project sought to establish a strong and coherent policy framework, promoting high-quality and relevant science and technology activities and by supporting international linkages and linkages between the public and private sector. Second, the project sought to improve the stock of human capital in the Chilean science and technology sector. The project pursued these objectives through three components: (i) improving Chile's science, technology and innovation system; (ii) strengthening Chile’s science base; and (iii) enhancing public-private linkages. The project closed in March 2007. The World Bank is developing a follow-up innovation project with public- and private-sector partners.
Finally, Chile would benefit from the examples of some of the countries with which it competes. For example, many countries have established five and 10-year action plans to encourage technological development. These exercises include broad consultations with national and international experts and with active private-sector and university participation. They include real strategic agreements on a diagnostic and propose measures to be implemented over time. They are driven by an integrated and macro level approach to innovation, limited resources and the need to generate a minimal critical mass to obtain relevant research and development results.
Israel and Finland provide two two examples of this decision to build a national innovation system and target R&D investment. Israel began subsidizing R&D in 1968 with the establishment of the Office of the Chief Scientist in the Ministry of Trade and Labor. Industrial R&D increased by an average of 14 percent over the next 20 years. In 1985, with the adoption of the Law for the Encouragement of Industrial R&D, the sector received another boost. Matching funds of up to 50 percent for existing firms and 66 percent for start-ups “crowded in” private sector investments of 41 cents for every dollar of subsidy. Successful firms must repay 3 percent of annual sales up to the dollar-indexed value of the grant. Products must be manufactured in Israel. Know-how acquired in this way cannot be transferred to third parties.59
Finland established a national target of increasing R&D investment from 1.5 percent of GDP in 1983 to 2.7 percent by 2000. Tekes, the National Technology Agency, was set up in 1983 to finance applied and industrial R&D investments, especially through clusters. To strengthen coordination with the private sector, the Science and Technology Policy Council was established in 1987. Subsequently, to address the lack of a fully functioning venture capital market, Tekes began financing up to 40 percent of R&D investments in its projects. This subsidy strengthens the strategic and operational links between businesses and research institutes.60
Foreign Direct Investment and the Knowledge Economy
Attracting foreign direct investment (FDI) is one way to incorporate knowledge in a country’s economic activities. FDI is usually composed of investment capital, management experience, product design and process advances. Chile has been very successful in attracting FDI, particularly since 1990. Its public security level, institutional transparency and well-established democracy make it an 58 Chile: New Economy Study, Volume 1, Executive Summary and Policy Recommendations, Feb. 18, 2004. 59 See http://www.tamas.gov.il/NR/exeres/CE7F61C9-9B1E-462C-BE43-26EF711283E2.htm. 60 See http://www.tekes.fi/eng/. World Bank, 2003. For more examples, see: In the United Kingdom, the Department of Business Regulation and Reform (formerly, the Department of Trade and Industry) http://www.dti.gov.uk/about/index.html; in New Zealand, the Ministry of Research, Science and Technology http://www.morst.govt.nz/; and in Ireland, the National Policy and Advisory Board for Enterprise, Trade, Science, Technology and Innovation http://www.forfas.ie/about/index.html .
37

attractive choice for international investors. Chile’s disadvantages include a small domestic market and the distance from key markets in North America and Europe.
Many countries have tried to compensate for specific disadvantages with generous incentives, but too many subsidies have the risk of attracting investments that are not based on a country’s advantages. These investments eventually become uncompetitive in international markets. The investors stay only as long as the subsidies last and do not develop important linkages with the local economy. Incentives should be reserved for those sectors that offer a long-term prospect for competitive production, but due to industry-specific requirements would not attract sufficient FDI naturally. The most effective incentives for investments with a technology component support include training and capacity building, support for research and development, high quality infrastructure and, in general, high impact incentives that support the enterprise’s business. 61
Strong international competition to attract FDI has made it an area of growing specialization. Efforts to attract FDI can benefit from general dissemination campaigns on the country’s image, but they also require face-to-face work. This is particularly true for countries that are still not on the “mental map” of the decision makers. Ireland, Sweden, Costa Rica and various Asian countries have been especially successful because they have special agencies dedicated to attracting foreign investment and have established offices in the markets in which they concentrate their promotion efforts. In addition, promotion efforts should be sustained in time, providing updated information to established contacts.
Despite such promotional efforts, the low availability of engineers and qualified technicians is a limiting factor. Foreign companies with investments in high tech sectors have been able to hire sufficient skilled personnel for the early phase of development and production. However, due to inadequate numbers of skilled technicians, firms are frequently unable to expand their activities. To overcome this obstacle, some companies have reached agreements with local universities to train professional staff. Since CORFO already has a broad menu of technology support programs, these could also be part of an attractive package of incentives to attract FDI in high tech sectors. Another option would be for the government to ease immigration restrictions to enable firms to attract skilled technicians from other countries. 62
Technology Adoption, Adaptation and Innovation There are three options to developing a technology-rich business environment: adoption, adaptation or innovation. The most profitable strategy for most Chilean companies is to adopt technological innovations from the large international innovation centers. This permits business applications without the enormous research and development costs incurred by inventors. This strategy is also the most profitable because it saves time and resources. 63
As a result of research and development investments in wine production, mining, and forest products, Chile has succeeded in exploiting its comparative advantages. These sectors have sustained the export growth of the last two decades and are operating very close to the international frontier of knowledge. These sectors are also candidates for cluster development, since they link research institutions and firms to boost Chile’s innovation capacity.64 At the same time, these strategic production chains
61 See: UNCTAD (2002) p.205 for an analysis of the incentives offered to large transnationals. Bloningen and Van Kolpin (2002) find evidence that in the face of strong stimuli to reduce costs, enterprises can modify technology processes and reduce their innovation activities. This phenomenon is aggravated if, in addition, there is no critical mass of enterprises that favors the benefits of clustering. Egloff (2001); Marshall (1996). 62 For example, CORFO's Programa de Desarrollo de Proveedores seeks to strengthen suppliers of firms that show significant sales, but not to support the creation of suppliers for start-up firms. CORFO should consider elaborating performance agreements to develop R&D activities with foreign enterprises established in the country, instead of forcing them to participate in tenders whose methods of operation are cumbersome for start-ups. 63 See the discussion in: de Ferranti, et. al, Closing the Gap in Education and Technology, World Bank (2003). 64 Stern et al. (2000), p.3
38

would benefit from an analysis of the technological bottlenecks, trends in international competition, and the relationships between key actors.
Based on a ranking of problems and opportunities, technology programs can be structured with objectives defined by the companies themselves. The programs can include collective or individual research and development projects (each with its own incentive), investments in improved research capacity, training, and technology transfer programs, among others. In addition, public technology institutes can be strengthened and reoriented to play a more central role in innovation development. Of the six public institutes with R&D programs, five focus their efforts on natural resources industries.65 Several lack a sufficient number of high-level specialists, are in a precarious financial situation, and have few venues to transfer their findings to the private sector. To reorient the institutes to serve private sector needs, the first priority could be to focus on institutional development. The institutes might also build strategic alliances with international firms, identified through a competitive bidding process. These partners could contribute skilled personnel, innovative technology, and business applications. Encouraging these links and building long-term programs, matching grants and other incentives could be useful.
In addition, the public interest activities of some of these institutes could be combined in a single public institution concerned with natural resources issues. Given the importance of this area in the nation’s business and in exports, an institution of this nature is fully justified. The new institution could assume research and development activities and participate in applied technology transfers with foreign counterparts and the private sector. This increased participation by the private sector could be accompanied by some public or academic presence to reduce the risk that the private business interests will “capture” their capacities. Fundación Chile could serve as an example in this regard.66
To take on this more focused role, the public technology institutes will need to build capacity and hold on to key staff. To that end, they will need more resources. Although they can obtain an important part of their resources from competitive projects and the sale of services, they need additional resources to develop their systems and services. Otherwise, they run the risk of not being widely connected and respected. One way to implement these transfers is to establish performance contracts between the institutes and an authority that acts as a client.
STREAMLINING THE SME SUPPORT PROJECT PORTFOLIO The original research for this study focused on the mission and capacity of the three government agencies with the largest SME support portfolios—CORFO, INDAP, and SERCOTEC. The analysis of the programs led to a proposed reform that could include 43 programs with a concentration in Agriculture and Animal Husbandry and Cross-Sectoral programs. Table 5.2 summarizes the programs. This reform allowed for more effective dissemination campaigns, and for moving the programs closer to their target markets. The programs would be demand-driven, have lower administrative costs, and avoid duplication and inter-institutional competition.
To avoid duplication, a centralized monitoring system and a review by the Ministry of Economy, responsible for the performance of the programs, would monitor the menu of programs for SMEs. This centralized review system would counteract the tendency to create programs to meet newly identified needs. It would develop and employ minimal criteria and requirements before a proposed instrument could be included in the development program portfolio. It would also permit 65 They are: Centro de Investigaciones Minero Metalúrgicas (CIMM); Centro de Información de Recursos naturales (CIREN); el Instituto de Fomento Pesquero (IFOP); Instituto Forestal de Chile (INFOR); Instituto de Investigación Agropecuarias (INIA); Corporación de Investigación Tecnológica (INTEC) and Fundación Chile, a private entity of which the Government is a partner. Execept in the case of INIA, which has a budget of around US $ 25 million, the public institutions manage projects with less than US3 million per year. 66 Fundación Chile has the advantage of being a private institution; even through public-sector representatives are on the board of directors. Fundación Chile is able to start companies, and is tightly linked to the private sector. See Mullin et al. (2000).
39

policymakers and clients to see the entire range of programs. In a subsequent phase, this system could compile standardized information to measure the delivery costs and coverage of each program, thereby enabling timely comparative evaluations between the programs.
Table 5.2 Proposed Private Sector Development Portfolio Reform
Sector Grant Programs Credit Programs Total 1. Fishing 1 - 1 2. Agriculture and animal husbandry 10 3 13 3. Mining 1 4 5 4. Commerce, restaurants and hotels 1 - 1 5. Cross-sectoral 17 6 23 Total 30 13 43
THE PATH TO A MORE DYNAMIC SME SECTOR
Most of the elements needed for improved SME efficiency and productivity are already in place, but without improved coordination, gains will be isolated. To build on national successes and capacity will require a clear mandate for the institution charged with improving the overall effort to improve SME performance. The required changes begin at the strategic level, with a conscious effort to create a National Innovation System with complementary policies and programs, coordinated and led by a single institution. Without improved coordination, the Government’s investment in support of a more dynamic business sector will result in sporadic gains rather than a systemic change. Other important adjustments in the SME support institutions will avoid duplicating efforts and lead to demand-driven responses. This new focus will provide a more commercial approach to client support—and graduate clients out of the programs. Finally, without better scorekeeping, in the form of an integrated management information system, it will remain difficult to analyze, assess, coordinate and streamline the SME program portfolio in the future. Potential savings from improved coordination and streamlining are likely to amount to millions of dollars annually. At the same time, the impacts of improved productivity, employment and linkages to export markets will improve as the SME support portfolio is rationalized and refocused to more promising sectors and firms.
40

BIBLIOGRAPHY
Acs, Z., B. Carlsson and C. Karlsson (1999). “The Linkages Among Entrepreneurship, SMEs and the Macroeconomy,”in Entrepreneurship, Small and Medium-Size Enterprises and the Macroeconomy,” Acs, Z., B. Carlsson and C. Karlsson (eds), Cambridge: Cambridge University Press, pp. 3-42. Agraria (2002) “Evaluación del Programa de Desarrollo de Proveedores” Consultoría Profesionales AGRARIA LTDA, CORFO, Santiago, Chile Agrawal, A. y Cockburn, I. (2002): “University research, industrial R&S, and the anchor tenant hypothesis.” Working Paper 9212, National Bureau of Economic Research. Cambridge, Massachusetts. Alarcón, C. y Stumpo, G. (2000): “Las pequeñas y medianas empresas industriales en Chile”. Serie Desarrollo Productivo N°78. CEPAL, Santiago, Chile. Almeyda, M. and S. Hinojosa (2001). Revision of State of the Art Contingent Liability Management: Review, Management and Pricing. In “Toolkit for Public Private Partnership In Highways”. World Bank. Almeyda, M. and M. de La Barra (2002) Análisis y Racionalización de los Instrumentos de Fomento Productivo para la Micro, Pequeña y Mediana Empresa. The World Bank Group and Ministerio de Economía y Energía, Chile, Santiago, Chile. Almus, M. and Czarnitzki, D. (2002): “The effects of public subsidies on firms’ innovation activities: the case of Eastern Germany”. Discussion Paper N°01-10, Centre for European Economic Research. Mannheim Alvarez, R. and Crespi, G. (1999): “Estudio sobre la evolución composición del gasto público en innovación”, Mimeo. Programa de Innovación Tecnológica y Departamento de Economía de la University of Chile. Alvarez, R. andy Crespi, G. (2003). “Determinants of Technical Efficiency in Small Firms”, en Small Business Economics, 20, pp 233-244. Kluwer Academic Publishers. Holanda. Alvarez, R., G. Crespi and R. Fuentes (1999), “Posición competitiva y análisis del comportamiento estratégico de la micro y pequeña empresa nacional. Informe final preparado para el Ministerio de Economía-SERCOTEC-CORFO, Departamento de Economía de la Universidad de Chile, Santiago, Chile Alvarez, R.; Crespi, G.; Naschelski, D.; Sepúlveda, M.G.(1999) “Impacto de las Restricciones de liquidez sobre el desempeño de las pequeñas y medianas empresas (Pymes)”. Departamento de Economía, Universidad de Chile, Santiago, Chile. Anderson, T. (2000): “Policy design, implementation and evaluation – Rationale, efficiency and systemic concerns.” www.OECD.org/dsti/sti/industry/smes/news/bologna.htm. Aroca, P.(2002) “Impacto de la minería en la II Región” en Meller, P.(2002) “Dilemas y debates en torno al cobre”. Editorial Dolmen, Santiago, Chile Asch, L. (2001). Investing in SMEs: The SEAF Model. SME Issues. Vol. 2, No. 1, March. Washington DC: World Bank. Audretsch, D. (1995) “Innovation and Industry Evolution”. Cambridge, MIT Press. Audretsch, D. and J. Elston (1997). Financing the German Mittelstand. Small Business
41
Economics. Dordrecht: Apr 1997. Vol. 9, Iss. 2. Autio, E.; Kanninen, S. and Wicksteed, B. (2003): “Targeted technology programmes: a conceptual evaluation. Evaluation of Kenno, plastic processing and pigments technology programmes.” Technology programme report 13/2003. TEKES. Helsinki. Ayala, José (1999) Instituciones y Economía. Una Introducción al Neoinstitucionalismo Económico. Fondo de Cultura Económica. México. Barro, R and Sala i Martin, X. (1995): “Technological Diffusion, Convergence and Growth”. Working Paper No. 5151, National Bureau of Economic Research. Batra, Geeta (1999). “Skills Upgrading and Competitiveness in Guatemala,” mimeo, World Bank, Washington, D.C. Batra, Geeta (2000). Ënterprise Training and Productivity in Nicaragua,” mimeo, World Bank, Washington, D.C. Batra, G., and H. Tan (2003). "SME Technical Efficiency and Its Correlates: Cross national Evidence and Policy Implications," World Bank, Washington, D.C. Baydas, M.; Graham, D.H. and Valenzuela, L.(1997) “Commercial Banks in Microfinance: New Actors in the Microfinance World”. USAID, Global Development Bureau, Economic Growth Section, Microenterprise Development Office, through funding to the Microenterprise Best Practices (MBP) Project, contract number: PCE-0406-C-00-6004-00 Baygan, G. (2003a): “Venture Policy Review: United Kingdom.” STI Working Paper 2003/1. Industry Issues. OECD, Paris. Baygan, G. (2003b): “Venture Policy Review: Korea.” STI Working Paper 2003/2. Industry Issues. OECD, Paris. Baygan, G. (2003c): “Venture Policy Review: Canada.”, STI Working Paper 2003/3. Industry Issues. OECD, Paris. Beck, T., Dermingüç-Kunt, A., Maksinovic, V. (2003) “Financial and legal constraints to firm growth : Does the size matter?”. Beck, T., Dermingüç-Kunt, A., World Bank; Maksinovic, V., Robert H. Smith School of Business, University of Maryland. January. Benavente, J.M. (2002): “The impact of public financing and research groups on innovative activities in chilean industry”. Mimeo, Departamento de Economía, Universidad de Chile.Santiago, Chile. Benavente, J.M. and Crespi, G. (1998): “Sesgos y debilidades del SIN en Chile” en Sistemas Nacionales de Innovación: ¿Qué puede América Latina aprender de Japón? Agosin, M. Y Saavedra, N. Editores. Dolmen. Santiago, Chile Berger, A. Y Udell, G. (1998): “The economics of small business finance: the roles of private equity and debt markets in the financial growth cycle.” Journal of Banking and Finance N°22. Berger, A., Miller, N., Petersen, M., Rajan, R. Y Stein, J. (2002): “Does function follow organizational form? Evidence from the lending practices of large and small banks.” NBER Working Paper N° w8752. Bianchi, P.; Parrilli, M.D.(2002) “Obstáculos y oportunidades de inversión para el desarrollo de las pequeñas y medianas empresas en Chile”, BID/Ministerio de Economía, Santiago, Chile BID (2003) Instrumentos innovadores para el financiamiento rural en el Cono Sur. Serie de informes técnicos del Departamento de Desarrollo Sostenible. Washington, D. C.: Bitrán, E. (2002): “Crecimiento e innovación e Chile”, Revista Perspectivas, vol. 5, N° 2.
42

Santiago. Bloningen, B. and Van Kolpin (2002): “Technology, agglomeration, and regional competition for investment.” Working Paper 8862. National Bureau of Economic Research. Cambridge, Massachusetts. Bravo, D.; Crespi, G.; Gutiérrez, I. (2002) “Desarrollo se escribe con Pyme: El caso chileno”. Santiago, Chile, FUNDES. Bravo, David and Gustavo Crespi e Irma Gutiérrez (2002) Desarrollo se escribe con PYME: el caso chileno. Desafíos para el Crecimiento. Fundes Internacional, Santiago, Chile. Brunner, J.J. (2001): “Chile: informe sobre capacidad tecnológica”. Temas de desarrollo humano sustentable N°6. PNUD-Universidad Adolfo Ibáñez. Santiago. Brunner, José Joaquín (2000). Educación: escenarios de futuro. Nuevas tecnologías y Sociedad de la Información. PREAL, Documento Nº 16. Santiago, Chile Bygrave, W. (2000): “Venture capital goes mainstream: a statistical look at venture capital and the new economy.” Available at: www.entreworld.org/Bookstore/Product.cfm?DID=6&Product _ID=64&CATID=2. Cabrera, A.; de la Cuadra, S.; Galetovic., A.; Sanhueza, R. (2002) “Las Pyme: quienes son, cómo son y qué hacer con ellas”. Trabajo encargado por SOFOFA. Santiago, Chile, enero. Cabrera, Sara (1994). PYME. Un desafío a la Modernización Productiva. CORFO-Fundación Friedich Ebert. Santiago, Chile. Camino, D. and C. Cardone (1999). The Valuation and Cost of Credit Insurance Schemes for SMEs: The Role of the Loan Guarantee Associations. International Small Business Journal, Vol. 17, No. 4, Jul-Sept. Castillo, A. (2002): “Capital Semilla: mito o realidad.” En Management del Emprendedor vol. Nº5, El Diario, Ediciones Financieras. Santiago. Castillo, Geovanny, Irma González and Giovanni Stumpo, Simplificacion de trámites para la creación de empresas: la experiencia de Fundes. CEPAL/ECLAC Documentos de Proyecto no. 137, May 2007 Centre for Strategy & Evaluation Services CSES – European Commission Enterprise Directorate General ECEDG (2002): “Benchmarking of Business Incubators. Final Report.” Bruselas. Centro Nacional de la Productividad y la Calidad, Chile (2002), “Informe de Productividad”, Número 10, mayo; Santiago, Chile. Chacón, B. (2000) “Calidad del empleo y pobreza en Chile, 1990-1996” en Infante, R.(2000), pp. 181-237, OIT, impreso en Chile. Chilecompra (2003) “Acerca de Chilecompra”, www.chilecompra.cl, consultado en octubre de 2003. Cofinanciamiento y Aportes de Terceros años 2000 a 2003 Convenio Subsecretaría de Economía - SERCOTEC CORFO (2002a), “CORFO, Memoria. Actividad 2001” en www.corfo.cl consultado agosto 2003
CORFO (2002b). “Balance de Gestión Integral año 2002”, Corporación de Fomento de la Producción. En www.dipres.cl, consultado en agosto 2003.
43

Crespi, G. (2003) “Estudio de dinámica empresarial. Entorno Chile 2002”, FUNDES Chile, Santiago, Chile, 6 de mayo. Crespi, G. and Rau, T. (2000): “Viabilidad económica y técnica del programa de desarrollo tecnológico en áreas prioritarias. Informe Final”. Mimeo, Programa de Innovación Tecnológica, Ministerio de Economía. Crichton, D. (2000). SME Support in Scotland. SME Issues. Vol. 1, No. 3, November. Washington DC: World Bank. Dahlman, Carl. Knowledge Economy: Implications for Education and Learning, October 14 (presentation). Seoul, Korea. Darby, M.; Zucker, L. and Wang, A. (2003): “Universities, joint ventures and success in the advanced technology program.” Working paper 9463, National Bureau of Economic Research, Cambridge, Massachusetts. De Ferranti, D; Perry, G.; and others (2002): “Closing the gap in education and technology”, World Bank, Washington, D.C. Departamento de Economía de la Facultad de Ciencias Económicas y Administrativa de la Universidad de Chile (2003) “Informe de Evaluación de los Proyectos Asociativos de Fomento”, Ministerio de Hacienda, Santiago, Chile Dini, Marco and Giovanni Stumpo (2003) Análisis de la política de fomento a las pequeñas y medianas empresas en Chile. CEPAL. Red de Reestructuración y Competitividad. Unidad de Desarrollo Industrial y Tecnológico. División de Desarrollo Productivo y Empresarial Santiago, Chile. Dini, Marco (2003) Programas de fomento de la articulación productiva, de próxima publicación en Dini, Marco and Giovanni Stumpo (2003). Director General de la OIT (1999) “Trabajo Decente”,Geneva, OIT. Doran, A. and Levitsky, J. (1997): “Credit guarantee schemes for small business lending – a global perspective” Elaborado por Graham Bannonck and Partners Ltd. para el Overseas development Administration. London. Egloff, E. (2001). “La inversión de Intel y políticas micro para fortalecer la competitividad en Costa Rica,”presentation at UN-ECLAC/IDB Seminar on “Camino a la competitividad: el nivel del meso y microeconómico,”March, Santiago, Chile. EMG Consultores S.A., Red Internacional de Metodología de Investigación de Sistemas de Producción (RIMISP), Grupo de Investigaciones Agrarias (GIA) and Fundación STOAS Agriprojects (1998) “Evaluación de Instrumentos de Fomento Productivo: El Programa de Transferencia Tecnológica del Instituto de Desarrollo Agropecuario”, Ministerio de Agricultura, Santiago, Chile Ergas, E. (2002): “Un mundo lleno de Ángeles.” in Management del Emprendedor vol. Nº5, El Diario, Ediciones Financieras. Santiago, Chile. European Commission (2002a). A Study of Business Support Services and Market Failure. Enterprise Directorate General. European Commission (2002b). European Trend Chart on Innovation: Thematic Trend Report on “Innovation Finance”. Enterprise Directorate General, “Innovation and SME” Programme. Eyzaguirre, N. (2001) “Exposición sobre el Estado de la Hacienda Pública”. Presentación del Ministro de Hacienda, Santiago, Chile.
44

Falabella, G.; Galdames, R. Eds.(2002) “Repensar el desarrollo chileno”. Ediciones de la Universidad del Bío Bío. Concepción, Chile. FIEL (1996). Las Pequeñas y Medianas Empresas en la Argentina Fundación de Investigaciones Económicas Latinoamericanas. Buenos Aires, Argentina. Federal Reserve Bank of Boston (1998). The Growing Securitization of Small Business Loans. Communities and Banking, No. 22, Summer. FOCUS(2001) “Desempeño económico y viabilidad de la microempresa en Chile”, Santiago, Chile, FOCUS. Foxley, J. (1998): “Reformas a la institucionalidad del crédito y el financiamiento a empresas de menor tamaño: la experiencia chilena con sistemas de ‘segundo piso’ 1990-1998.” Serie Financiamiento del Desarrollo N°74. CEPAL, Santiago, Chile Foxley, J. (1999) “Limitantes al Financiamiento de las Empresas de Menor Tamaño; Un estudio en terreno con principales oferentes en Chile”. Proyecto Conjunto Ministerio de Economía/CORFO/BancoEstado/CEPAL, Santiago, Chile. Fried, H.O; C. A. Knox Lovell & S.S. Schmidt (1993), The Measurement of Productive efficiency, OUP Fuentes, R. Y Maquieira, (2001) C. “Why Borrowers Repay: Understanding High Performance in Chile´s Financial Markets”, en Pagano, M. (ed.) “Defusing Default: Incentives and Institutions”, Washington, D.C., Banco Interamericano de Desarrollo. Fundes (2003): “Apoyos para el emprendimiento.” Documento Exploratorio. Mimeo. Santiago. Gallardo, J. (1997). Leasing to Support Small Businesses and Micro enterprises. Washington DC: World Bank, CGAP. Gallego, F. And N. Loayza (2000). “Financial Structure in Chile: Macroeconomic Developments and Microeconomic Effects,” mimeo, Central Bank of Chile, Santiago, Chile. GERENS (1996a): “FONTEC-Innovación Tecnológica: una evaluación de sus beneficios sociales”, Mimeo, Santiago. GERENS (1996b): “FONSIP: una estimación de sus beneficios sociales”, Mimeo, Santiago. GERENS (1996c): “FONDEFF-Innovación Pre-Competitiva: una estimación de sus beneficios sociales”, Mimeo, Santiago. GERENS (1998), Evaluación del FONTEC, Mimeo División de Fomento de CORFO, Santiago, Chile Gobierno de Chile, Comité de Fomento de la Micro y Pequeña Empresa (2003) “La situación de la Micro y Pequeña Empresa en Chile”, Santiago, Chile, marzo. Gobierno de Chile, Ministerio de Economía, Programa de Desarrollo e Innovación Tecnológica (2002) “Producción y Exportación de Vinos”. Prospectiva Chile 2010. Programa de Desarrollo e Innovación Tecnológica, Santiago, Chile. Gompers, P. and Lerner, J. (2001): “The Venture Capital Revolution.” En Journal of Economics Perspectives, Vol. 15, Nº2. Graffam, R. 1992. Introducing Securitization to the Developing World, in International Securitization, ed. Morrissey, H. IFR Publishing Ltd. London, UK. Grilliches, Z. (1994): “Productivity, R&D, and the data constraint”, American Economic Review, Marzo 1994. Vol. 84, N°1.
45

Gudger, M. (1998). Credit Guarantees: An Assessment of the State of Knowledge and New Avenues of Research. Agricultural Services Bulletin 129. Rome: Food and Agriculture Organization of the United Nation. Gutiérrez, A.(1987) “ Employment policies and basic needs” in PREALC “In search of equity: Planning for the Satisfaction of Basic Needs in Latin America”, Published by Avebury. Athanaeum Press Limited, Newcastle-upon-Tyne, U.K. Hallberg, K. (2000). A Market’ Oriented Strategy for Small and Medium Scale Enterprises. Discussion Paper No. 40. Washington DC: International Finance Corporation. Held, G. (1999): “Conclusiones y propuestas de políticas: acceso de empresas de menor tamaño al crédito y al financiamiento.” Mimeo. Proyecto conjunto Ministerio de Economía/CORFO/BancoEstado/CEPAL. Santiago, Chile. Held, G. (2000) “Conclusiones y propuestas de políticas: Acceso de empresas de menor tamaño al crédito u financiamiento”. Proyecto Conjunto Ministerio de Economía/CORFO/BancoEstado/CEPAL, Santiago, Chile. Hughes, A. (1997). Financing for SMEs: A U.K. Perspective. Small Business Economics. Dordrecht: Apr 1997. Vol. 9, Iss. 2. ILADES (1999): “Un análisis económico de los proyectos de innovación tecnológica apoyados financieramente por FONTEC”, R.Bergoing et al., ILADES. Mimeo, Santiago. IMF (2001). Code of Good Practices on Fiscal Transparency. Washington DC: International Monetary Fund. Infante, R. Ed. (2000) “La calidad del empleo. La experiencia de los países latinoamericanos y de los Estados Unidos”. OIT, Impreso en Chile. Instituto de Desarrollo Agropecuario –INDAP (2003) “Cuarta Cuenta Pública de Gestión. Abriendo nuevos caminos”, INDAP, Santiago, Chile. Inversiones y Gestión Ltda. (2002) Caracterización de las Micro y Pequeñas Empresas. Trabajo elaborado para el Comité de Fomento MYPE, Santiago, Chile. INVERTEC (1995) Evaluación del FONTEC, Mimeo División de Fomento de CORFO, Santiago, Chile INVERTEC-IGT (1999): “Evaluación del desempeño del sistema de fondos tecnológicos. Informe Final”, documento preparado para la Secretaría del Programa de Innovación Tecnológica, Ministerio de Economía. Mimeo, Santiago. Kosacoff, B. (2000). “Corporate Strategy under Structural Adjustment in Argentina,” in Argentina: Responses by Industrial Firms to a New Set of Uncertainties, New York: St. Anthony’s-Mcmillan Series, Macmillan Press. Laeven, L. (2000): “Financial liberalization and financing constraints: evidence from panel data on emerging economies”. Mimeo, Banco Mundial. Washington, D.C. Larrain, C. (1999): “Financiamiento bancario a la Pyme: mitos y realidades”. http::/www.gerens.cl/larra7-6-99.htm. Leazer, R. and Royko, S. (2000): “Seed and Venture Capital Formulation: essential to high tech business and job growth.” Documento preparado para la primera Cumbre Económica de Wisconsin (29 noviembre al 1 de diciembre del 2000). En www.wisconsin.edu.summit/archives/2000/papers. Ledyard, O. (1987): “Market Failure” en Allocation, Information and Markets. The New
46

Palgrave. Eatwell, J. et al. Eds. Norton Nueva York. Levitsky, J. (1996). Support Systems for SMEs in Developing Countries. Small and Medium Enterprises Programme Discussion Paper. Vienna: United Nations Industrial Development Organization. Levy, B. (1993) “Obstacles to Developing Indigenous Small and Medium Enterprises: An Empirical Assessment”. The World Bank Economic Review, vol.7, No.1 Levy, B. (1994). “Successful Small and Medium Enterprises and their Support Systems: A Comparative Analysis of Four Country Studies,” World Bank, Washington D.C. Li, W. (1998). Government Loan, Guarantee, and Grant Programs: An Evaluation. Federal Reserve Bank of Richmond Economic Quarterly, Vol. 84, No. 4, Fall. Lipsey, Richard and Colin Harbury (1996) Principios de Economía. Vicens Vives. Barcelona. Little, I., D., Mazumdar and J. Page (1987). “Small Manufacturing Enterprises: A Comparative Analysis of India and Other Economies,”Oxford: Oxford University Press. Lora, E. Y Panizza, U. (2002): “Structural reforms in Latin America under scrutiny”. Banco Interamericano de Desarrollo. Documento presentado al Seminario “Reforming Reforms” desarrollado en Fortaleza, Brasil. Marín, Luis (2001) Marco Regulatorio de la Pequeña y Mediana Empresa. Oficina Internacional del Trabajo (OIT) y Confederación de la Producción y el Comercio (CPC), Santiago, Chile. Markowitz and McNaughton Inc. (2001): “U.S. Fortune 500 and software companies’ interest in locating shared services and development operations in Latin America.” Documento preparado para CORFO. Marshall, J. (1998): “Incentivos de inversión: una perspectiva global de los aspectos críticos.” En: La Atracción de Inversión productiva en Centroamérica. Análisis y discusión de temas relevantes. INCAE. Costa Rica. Marshall, L. (1998): “El clima de inversión en Centroamérica.” En: La Atracción de Inversión productiva en Centroamérica. Análisis y discusión de temas relevantes. INCAE. Costa Rica. Martin, S. and J. T. Scott, “The Nature of Innovation Market Failure and the Design of Public Support for Private Innovation,”Research Policy 19 (4-5), April, pp. 437-447. Mayer, C. (1990) “ Financial Systems, Corporate Finance and Economic Development” en G. Hubbard, ed. “Assymetric Information, Corporate Finance and Investment”. Chicago, University of Chicago Press. Meller, P. (2002) “Dilemas y debates en torno al cobre”. Impresores Feyser, Santiago, Chile Merton, Robert and Zvi Bodie (1992). “On the management of Financial Guarantees”. Financial Management, Winter 1992. Ministère de la Recherche (2001): “Les Réseaux de recherche et d’innovation technologiques. 2001.” Document DEL Min. de la Recherche. Direction de la technologie. Paris. Ministerio de Agricultura e Instituto de Desarrollo Agropecuario (2001) “Orientaciones Estratégicas 2001-2006”, Ministerio de Agricultura, Santiago, Chile Ministerio de Relaciones Exteriores, Pro Chile (2003) “Definición de la Pyme para el sector exportador”. Subdirección Internacional, Gerencia de Análisis Estratégico, Santiago, Chile, March Ministerio Secretaría General de la Presidencia, Ministerio de Economía (2001) “Proyecto
47

Rediseño Institucionalidad Pública relacionada con la Función de Fomento Productivo: Diagnóstico y Criterios”. Grupo de Trabajo, July, Santiago, Chile. Mody, Ashoka and Dilip Patro (1995), Methods of Loan Guarantee Valuation and Accounting. CFS Discussion Paper Series 116.The World Bank. Washington DC. Monsalves, Marcelo (2002). Las PYME y los sistemas de apoyo a la innovación tecnológica en Chile. CEPAL. Red de Reestructuración y Competitividad. Unidad de Desarrollo Industrial y Tecnológico. División de Desarrollo Productivo y Empresarial Santiago, Chile. Moody’s Investors Service (1996). Moody’s Approach to Rating SBA Loan-Backed Securitizations. Structured Finance Special Report. March 29. Morrison & Foerster LLP (2000): “Impediments to Risk Capital in Argentina, Brazil, Chile, El Salvador and México.” Documento del FOMIN, Banco Interamericano de Desarrollo. Washington, DC. Mull, J., Adam, R., Halloween ,J. and Mulligan, L. (1999): “Science, technology and innovation in Chile.”, IDRC. Ottawa. Mullin, J.; Ahumada, J.; Vessuri, H.; Olivares, J.; Waissbluth, M. and Yutronic, J. (2000): “Política para los institutos tecnológicos públicos de Chile.” 2 vols. Documento elaborado para CORFO y el Ministerio de Economía. Santiago, Chile. Mullineux, A. (1992). Privatization and Small Business Financing in the UK and Germany: Lessons for Central and Eastern Europe. London: Anglo-German Foundation. Nelson, R. (Ed.) (1993): “National Innovation Systems: a Comparative Analysis”. Oxford University Press, New York. Nelson, R., “Transnational Strategic Networks and Policymaking in Chile: CORFO's High Technology Investment Promotion Program” in Latin American Politics and Society, Summer 2007. Nordsfor, D. and Shalit, O. (1998): “Technological incubators in Israel-inmigrants start up Hi-tech companies.” In www.nordfors.com/incubators/statteng.htm OECD (1996): “Venture Capital and Innovation.” OECD/GD(96)168. Paris. OECD (1997a). Best Practice Policies for Small and Medium Sized Enterprises. Paris: Organization for Economic Cooperation and Development. OECD (1997b): “Government venture capital for technology-based firms.” OECD/GD(97)201. Paris. OECD (2002). OECD Small and Medium Enterprise Outlook. Paris: Organization for Economic Cooperation and Development. Oehring, E. (1995). “Credit Guarantee Scheme for the Small Business Sector”. In Brugger, E. and S. Rajapatirana, eds., New Perspectives on Financing Small Business in Developing Countries. San Francisco: International Centre for Economic Growth and Fundación para el Desarrollo Sostenible. Paris, P. (2002). Supporting SME Finance in Developing Countries: An Inventory. Document prepared for the French Ministry of Foreign Affairs (disponible en www.mesofinance.org). Porter, M. (1990): La Ventaja Competitiva de las Naciones. Plaza and Janes Eds. Abril 1991. Madrid Porter, M. (2002): “Building the microeconomic foundations of prosperity: findings from the microeconomic competitiveness index” en Global Competitiveness Report 2002-2003. World
48

Economic Forum. Pulgar, R. (1999a) “Fondo de Garantía a Créditos a Empresas de Menor Tamaño” Proyecto Conjunto Ministerio de Economía/CORFO/BancoEstado/CEPAL, Santiago, Chile. Pulgar, R. (1999b) “Propuesta de Clasificación de Microempresas”. Programa FOSIS-GTZ. Santiago, Chile, June 29. Putnam, Robert (2000) Per a fer que la democracia funcioni. La importancia del Capital Social. Proa. Barcelona. Ramos, J. (1998): “Una estrategia de desarrollo a partir de complejos productivos en torno a los recursos naturales.”, Revista de la CEPAL N° 66. Santiago, Chile República de Chile, Gobierno Regional del Maule (1999) “Análisis viticultura Regional y diseño de medidas de políticas.” Talca, July. Román, E. (2000a) “Desarrollo de las Pyme y acceso al financiamiento”. Proyecto Conjunto Ministerio de Economía/CORFO/BancoEstado/CEPAL, Santiago, Chile. Román, E. (2000b) “La Pyme en Chile: Fuerza emprendedora para la modernización productiva”. Courtesy of 188 Telefónica Mundo and CEPRI, Santiago, Chile. Romer, P. (1990): “Endogenous Technological Change”, Journal of Political Economy, 98. SERCOTEC (2000). Cambios en la Organización de SERCOTEC. Santiago, Chile. July. SERCOTEC (2000, 2001, 2002). Balance de Gestión Integral SERCOTEC. Santiago, Chile. SERCOTEC (2002a). Informe de medición de los Indicadores de seguimiento de las Orientaciones Institucionales. Santiago, Chile. SERCOTEC (2002b). Informe Final Sistema Pesca Coquimbo. Santiago, Chile. December. SERCOTEC (2002c). Intervención por Sistemas en SERCOTEC. Guía de apoyo a la Gestión del año 2002. May. SERCOTEC (2002d). Intervención por Sistemas en SERCOTEC. Guía de apoyo a la Gestión del año 2002. Santiago, Chile. May. SERCOTEC (2002e). Plan Trienal Corporativo 2003-2005 y Anexos. Santiago, Chile. SERCOTEC (2003a) “Empleo en Chile: Estadísticas y Consensos”, unpublished manuscript, Santiago, Chile. SERCOTEC (2003b). Bases Concurso Infocentros. Santiago, Chile. SERCOTEC (2003c). Presentación Programa Comercio 2003. Santiago, Chile. SERCOTEC, Balance de Gestión Integral, 2000, 2001, 2002 SERCOTEC, Cambios en la Organización de SERCOTEC, July 2000 SERCOTEC, Documentación institucional disponible en portal de SERCOTEC, Dirección de Presupuestos, DIPRES SERCOTEC. Cofinanciamiento y Aportes de Terceros años 2000 a 2003. Santiago, Chile. SERCOTEC. Información Ley de Presupuesto 2000 a 2003. Santiago, Chile. SERCOTEC. Ingresos y Gastos 2000 a 2003. Santiago, Chile. SERCOTEC. Serie Histórica Ejecución Presupuestaria 1997 a 2003. Santiago, Chile.
49

50
SERCOTEC. Soporte Operacional 2000 a 2005. Santiago, Chile. Sheh-Yeh T. and Y. Wei-Tzen (2002). An Innovative Financing Model for Taiwan’s Small and Medium Sized-Enterprises. International Journal of Management. Poole: Vol. 19, Iss. 1, March. Solís, A. and P. Angelelli (2002). Políticas de apoyo a la pequeña empresa en 13 países de América Latina. División de Micro, Pequeña y Mediana Empresa. Washington, D. C.: Stern, S; Porter, M. and Furman, J. (2000): “The determinants of national innovative capacity”, Working Paper 7876. National Bureau of Economic Research. Cambridge, Massachusetts. Stevenson, L. and A. Lundström (2001) Patterns and Trends in Entrepreneurship/SME Policy and Practice in Ten Economies. Swedish Foundation for Small Business Research. Stockholm. Stiglitz, J. (1994): Wither Socialism. MIT Press. Cambridge, Masachusetts. Stillman, R. (2000): “International Venture Guaranty Corporation.” Mimeo. Milbridge Capital Management. Sunder, S. (1998): “Austin, Texas: Building a High-tech Economy”. Estudio de Caso. Harvard Business School. 9-799-038. Tan, H. (2000). “Technological Change and Skills Demand: Panel Evidence from Malaysian Manufacturing.”Working Paper, World Bank Institute. Teubal, M. (1998): “Marco de políticas para el financiamiento de la innovación en economías en vías de industrialización.” Mimeo. Documento presentado en la Mesa redonda “Difusión, asimilación y uso de la tecnología en las empresas.”, auspiciada por la División de Infraestructura y Mercados Financieros del Banco Interamericano de Desarrollo, febrero de 1998. Washington, D.C. Tirole, J. (1986). “Procurement and Renegotiation,” Journal of Political Economy, 94, 235-259. Tokman, V.E. (2001) “De la informalidad a la modernidad”, OIT, Alfabeta Impresores, Santiago, Chile. Torga, V. (1999) “Análisis de la oferta de servicios financieros para pequeñas y medianas empresas exportadoras de bienes y servicios no tradicionales”. CEPAL, Santiago, Chile. Tybout, J. (1996) “Chile, 1977-1986: Trade Liberalisation and its Aftermath”, in “Industrial Evolution in Developing Countries: Micro Patterns of Turnover, Productivity and Market Structure”, Ed by M. Roberts & J. Tybout. Oxford University Press. Tybout, J. (2000) “Manufacturing Firms in Developing Countries. How well do they do, and Why”, in Journal of Economic Literature, Vol. XXXVIII (March), pp. 11-44. UNCTAD (1996): “Incentives and Foreign Direct Investment.”, División de Corporaciones Transnacionales e Inversión. Ginebra. UNCTAD (2001). Finance and E-finance for SME as a Means to Enhance their Operations and Competitiveness. Issues paper by the UNCTAD Secretariat /TD/B/COM.3/EM.13/2. New York and Geneva: United Nations Conference on Trade and Development. UNCTAD (2002a). Improving the Competitiveness of SMEs in Developing Countries: The Role of Finance to Enhance Enterprise Development. UNCTAD/ITE/TEB/Misc.3. New York and Geneva: United Nations Conference on Trade and Development. UNCTAD (2002b): “World Investmente Report 2002: Transnational Corporations and Export Competitiveness.” In http//r0.UNCTAD.org/wir/contents/wir02content.en.htm United States Government Printing Office (1996) “The State of Small Business: A Report of the

51
President 1995”. United States Government Printing Office, Washington, D.C. Universidad de Ferrara and Consultora Nomisma (2002), Obstáculos y oportunidades de inversión para el desarrollo de las pequeñas y medianas empresas en Chile. Coordinado por Patricio Bianchi y Mario Davide Parrilli. Marzo 2002. Estudio financiado por el Banco Interamericano de Desarrollo, Bologna, Italy. Vaart, B. van der (2000). Credit Scoring: A Tool for More Efficient SME Lending. SME Issues. Vol. 1, No. 2, November. Washington DC: World Bank. Venture One/Ernst and Young (2003): “Venture Capital Industry.1995-2002. USA, Europe, Israel.” Available at www.ventureone.com WTO : “Agreement on subsidies and countervailing measures.” Available at http://docsonline.wto.org/ Wyse, R. and Burril, S. (2000): “Venture Capital and Economic Growth. A Perspective.” Presentación disponible en www.wisconsin.edu.summit/archives/2000/papers.
Copyright © 2022 FDOKUMEN