Adani Enterprises Ltd
29
Adani Enterprises Ltd Q4 FY21 Performance Highlights May, 2021
-
Upload
khangminh22 -
Category
Documents
-
view
1 -
download
0
Transcript of Adani Enterprises Ltd
Adani Enterprises Ltd
Q4 FY21 Performance Highlights
May, 2021

01
Content
Group Profile
02
03
04
Company Profile
Operational and Financial Performance
ESG Performance
05 Appendix

3
Group Profile

4
Adani Group : A world class infrastructure & utility portfolio
1 . As on April 30, 2021, USD/INR – 74 | Note - Percentages denote promoter holdingHighlighted cells represent public traded listed verticals
Transport & LogisticsPortfolio
APSEZPort & Logistics
100% 56%63.7% 75%
75%
100% 75% 37.4%
ATLT&D
APL IPP
SRCPLRail
AGELRenewables
ATGLGas DisCom
Energy & UtilityPortfolio
NQXT
Adani
• Marked shift from B2B to B2C businesses–
• ATGL – Gas distribution network to serve key geographies across India
• AEML – Electricity distribution network that powers the financial capital of India
• Adani Airports – To operate, manage and develop eightairports in the country
• Locked in Growth 2020 –
• Transport & Logistics -Airports and Roads
• Energy & Utility –Water and Data Centre (to form a JV with EdgeConnex)
AELIncubator
~USD 96 bn1
Combined Market Cap
AAHLAirports
100% 100%100% 100%
AWLWater
ARTLRoads
DataCentre
Opportunity identification, development and beneficiation is intrinsic to diversification and growth of the group.ATL / APL / AGEL / ATGL – Adani Transmission / Power / Green Energy / Total Gas LtdARTL – Adani Road Transport LtdAWL – Adani Water LtdT&D – Transmission and DistributionIPP – Independent Power Producer
APSEZ – Adani Ports and SEZSRCPL – Sarguja Rail Corridor Pvt LtdAAHL – Adani Airports Holdings LtdNQXT – North Queensland Export TerminalAEML – Adani Electricity Mumbai Ltd
25%
161%
Industry AGEL
5%
12%
Industry APSEZ
30%
45%
Industry AGL
7%
21%
Industry ATL
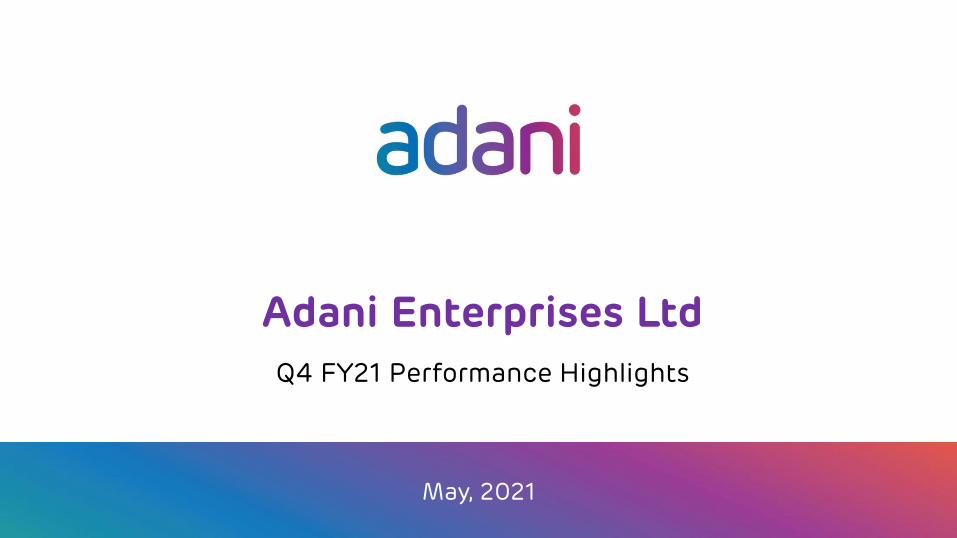
Adani Group : Decades long track record of industry best growth rates across sectors
Port Cargo Throughput (MT) Renewable Capacity (GW) Transmission Network (ckm) CGD7 (GAs8 covered)
Adani Adani
2016 320,000 ckm 6,950 ckm
2020 423,000 ckm 14,837 ckm
2014 972 MT 113 MT
2020 1,339 MT 223 MT
2016 46 GW 0.3 GW
2020 114 GW 14.2 GW6
2015 62 GAs 6 GAs
2020 228 GAs 38 GAs
Transformative model driving scale, growth and free cashflow
2.5x 6x 3x 1.5x
Note: 1 Data for FY20; 2 Margin for ports business only, Excludes forex gains/losses; 3 EBITDA = PBT + Depreciation + Net Finance Costs – Other Income; 4 EBITDA Margin represents EBITDA earned from power salesand exclude other items; 5 . EBITDA margin of transmission business only, does not include distribution business. 6. Contracted & awarded capacity 7. CGD – City Gas distribution 8. Geographical Areas - Including JV
Highest Margin among
Peers globally
EBITDA margin:70%1,2
Next best peer margin: 55%
Worlds largest
developer
EBITDA margin:89%1,4
Next best peer margin: 53%
APSEZ ATLAGEL ATGL
Highest availability
among Peers
EBITDA margin: 92%1,3,5
Next best peer margin: 89%
India’s Largest private CGD
business
EBITDA margin: 31%1
Among the best in industry
5

Adani Group: Repeatable, robust & proven transformative model of investment
33%
20%
47%
Ac
tiv
ity
Pe
rfo
rma
nc
e
OperationsDevelopment Post Operations
• Analysis & market intelligence
• Viability analysis
• Strategic value
• Site acquisition
• Concessions andregulatory agreements
• Investment case development
• Engineering & design
• Sourcing & quality levels
• Equity & debt funding at project
• Life cycleO&M planning
• Asset Management plan
• Redesigning thecapital structure of the asset
• Operational phase funding consistentwith asset life
Site Development Construction Operation Capital MgmtOrigination
In FY20 seven international bond issuances across the yield curve totalling~$4Bn
All listed entities maintain liquidity cover of 1.2x- 2x as a matter of policy.
India’s Largest Commercial Port (at Mundra)
Longest Private HVDC Line in Asia(Mundra - Mohindergarh)
648 MW Ultra Mega Solar Power Plant(at Kamuthi, TamilNadu)
Highest Margin among Peers
Highest line availability
Constructed and Commissioned in nine months
March 2016 March 2020
55%31%
14%
Phase
PSU Pvt. Banks Bonds1. FY20 data for commercial availability declared under long term power purchase agreements;
Energy Network Operation
Center (ENOC) enables
centralized continuous
monitoring of solar and wind
plants across India on a single
cloud based platform
AGEL’s issuance of $1.35Bn
revolving project finance
facility will fully fund its
entire project pipeline
6

AEL : A Successful Incubator
ATGL – Adani Total Gas LtdAGEL – Adani Green Energy Ltd 7
IRM – Integrated Resources ManagementCAGR – Compounded Annual Growth Rate
• Delivered returns at 32% CAGR sincelisting in 1994
• Unlocked value at CAGR of 113% inlast 3 years
• Won bids for Six Airports therebyentering into B2C
• Took over Mangaluru, Lucknow &Ahmedabad Airports in Q3 FY21.
• Took over operations of MIAL byacquiring 23.50% stake in Q4 FY21
• Created 5 infrastructure unicorn sinceinception
• Demerged ATGL and AGEL in last 3years.
Operations
Value Creation
Solar Mfg
Successful Incubator
• Mining portfolio of 127.2 MMT• End-to-end logistics capabilities
ESGCore Portfolio
Capital Management
Incubating Businesses
• IRM continues to maintainleadership position in India
• 50%+ market share in MiningServices space
• Embedded ESG framework forenhanced value creation
• Strong focus on sustainabilityinitiatives
Entry in B2CNatural Resources
• India’s largest manufacturing facilityof 1.2 GW capacity
Development• Order book of construction of 200+
Km of roads• Making significant progress in Water
and Data Center
Solar Mfg ESGCore Portfolio Solar Mfg ESGCore Portfolio Solar Mfg ESG
Value to Shareholders
• Robust Leverage Profile with Debt to
equity ratio of 0.8x
• External Debt to EBIDTA ratio of 3.6x
MIAL – Mumbai International Airport Ltd

8
• A successful incubator since 1994
• Created 5 infrastructure unicorns and the process continues…
• Successfully converting infrastructure startups into thriving businesses
• Providing shareholders multifold returns and direct exposure
• Providing strong cash flow support to the startups during its initial capex cycle
AEL
Demerged from 2015 Demerged from 2018
APSEZUSD 20 Bn
2007
APLUSD 5 Bn
2009
ATLUSD 15 Bn
2015
AGELUSD 22 Bn
2018
ATGLUSD 17 Bn
2018
AEL : Incubation story so far > > Creating infrastructure unicorns
Year of original lisitingMarket capitalization as on April 01, 2021, USD/INR – 73.1

9
Company Profile

AEL and its Incubation Portfolio
Resources* Transport & Logistics Utility Strategic
Mining Services
IRM Airports RoadRail / Metro
WaterData
CentreSolar Mfg
Carmichael Mine
Adani Wilmar LtdIncubating new wave of Infrastructure & Utility Assets
AEL : Tried & tested model poised for growth beyond 2020
Divisions SPV10
Adani Global Fze
Adani Global Pte Ltd
*AEL directly holds IRM and Mining Services as business divisions
All businesses have independent organisation structure in place with CEOs and CFOs

11
Operational & Financial Highlights

AEL : Business Highlights – Q4 FY21 and FY 21
12
➢ IRM volume in Q4 FY21 stood at 18.8 MMT vs 23.9 MMT in Q4 FY20
➢ FY21 volume stood at 63.4 MMT during vs 78.8 MMT in FY20
➢ Solar Module volume in Q4 FY21 increased by 95% to 376 MW (YoY)
➢ Volumes in FY21 increased by 17% to 1158 MW
IRM
Mining Services
Solar Mfg.
IRM – Integrated Resources ManagementDCR – Domestic Content Requirement
➢ Mining Services production volumes in Q4 FY21 increased by 34% at 6.7 MMT (YoY)
➢ FY21 volumes increased by 13% at 17.5 MMT

AEL : Financial Highlights – Q4 FY21 and FY 21
13
Q4 FY21
➢ Revenue stood at Rs. 8,585 Cr vs
Rs. 9625 Cr owing to reduced
volumes
➢ EBIDTA increased by 86% to Rs.
441 Cr owing to increased CERC
index by 20%
FY 21
➢ Revenue stood at Rs. 24,280 Cr
vs Rs. 30,903 Cr owing to lower
volumes
➢ EBIDTA stood at Rs. 911 Cr vs Rs.
1040 Cr due to dip in volumes
IRM
Q4 FY21
➢ Revenue stood at Rs. 505 Cr vs
Rs. 547 Cr*
➢ EBIDTA increased by 271% to Rs.
256 Cr as Q4 FY20 EBIDTA was
impacted by exceptional loss of
Rs. 290 Cr.
FY 21
➢ Revenue increased by 8% at Rs.
2,058 Cr in line with volumes
➢ EBIDTA increased by 21% at Rs.
1143 Cr due to higher volumes
Mining Services
Q4 FY21
➢ Revenue increased by 71% at Rs.
925 Cr due to improved volumes
➢ EBIDTA increased by 251% to Rs.
207 Cr due to increase in
proportion of DCR Sales
FY 21
➢ Revenue increased by 38% at Rs.
2,972 Cr due to higher volumes
➢ EBIDTA increased by 175% to Rs.
828 Cr due to higher proportion
of DCR Sales and lower cost of
production
Solar Mfg.
* Q4 FY21 Revenue and EBIDTA was impacted by one-time exceptional loss of Rs. 66 Cr

413
61
-179
Q4 FY21 Q4 FY20
Normalised PAT* Exceptional Item
1068
647
Q4 FY21 Q4 FY20
EBIDTA13,689 13,698
Q4 FY21 Q4 FY20
Revenue
AEL : Key Consolidated Financials – Q4 FY21
14*Profit after tax attributable to owners
(Rs Cr)
✓ Even with constant revenue the EBIDTA has grown by 65%.
✓ EBIDTA of Q4 FY20 was impacted by reversal of debit notes for compensation cess raised on customers of Rs. 290 Cr
DCR – Domestic Content Requirement
234
✓ Maintained revenue on QtQ basis.✓ Increase in Revenue in Solar Mfg
and other segments✓ Compensated by reduction in
revenue in IRM segment
61
✓ PAT for the Q4 FY21 increased due to higher EBIDTA
✓ Exceptional item in Q4 FY21 consists of reversal of interest income accrued on receivables of previous years
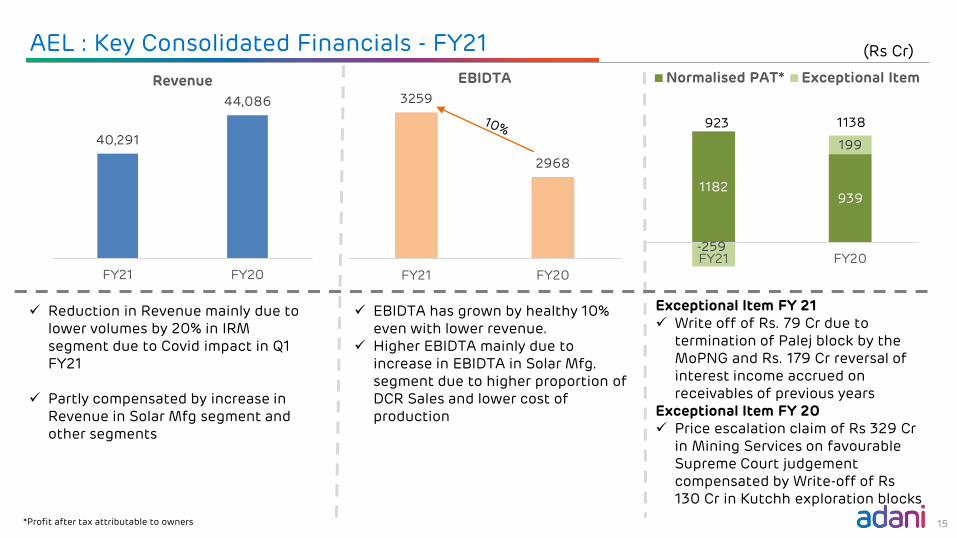
1182939
-259
199
FY21 FY20
Normalised PAT* Exceptional Item
3259
2968
FY21 FY20
EBIDTA
AEL : Key Consolidated Financials - FY21
15*Profit after tax attributable to owners
(Rs Cr)
1138923
40,291
44,086
FY21 FY20
Revenue
✓ EBIDTA has grown by healthy 10% even with lower revenue.
✓ Higher EBIDTA mainly due to increase in EBIDTA in Solar Mfg. segment due to higher proportion of DCR Sales and lower cost of production
✓ Reduction in Revenue mainly due to lower volumes by 20% in IRM segment due to Covid impact in Q1 FY21
✓ Partly compensated by increase in Revenue in Solar Mfg segment and other segments
Exceptional Item FY 21✓ Write off of Rs. 79 Cr due to
termination of Palej block by the MoPNG and Rs. 179 Cr reversal of interest income accrued on receivables of previous years
Exceptional Item FY 20✓ Price escalation claim of Rs 329 Cr
in Mining Services on favourableSupreme Court judgement compensated by Write-off of Rs 130 Cr in Kutchh exploration blocks
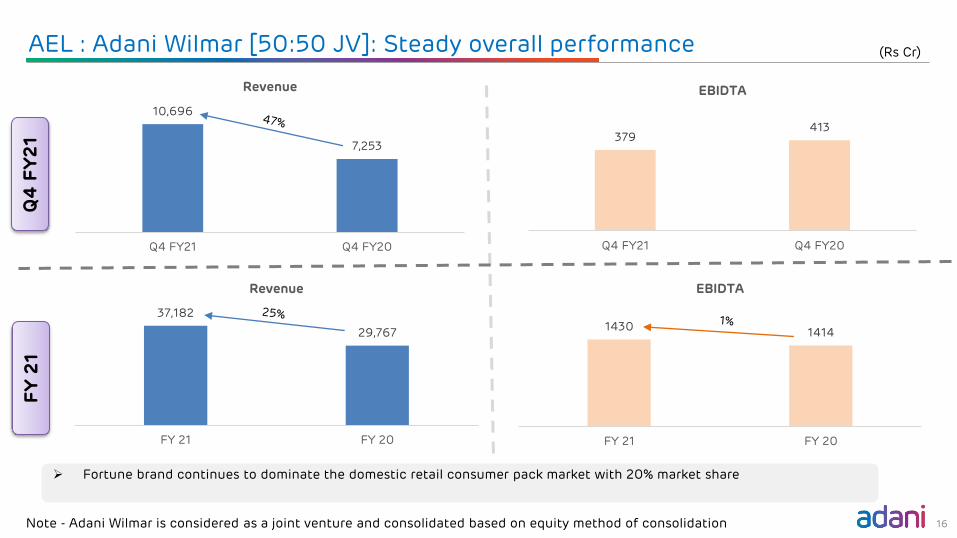
AEL : Adani Wilmar [50:50 JV]: Steady overall performance
16
➢ Fortune brand continues to dominate the domestic retail consumer pack market with 20% market share
(Rs Cr)
Q4
FY
21
FY
21
Note - Adani Wilmar is considered as a joint venture and consolidated based on equity method of consolidation
10,696
7,253
Q4 FY21 Q4 FY20
Revenue
379413
Q4 FY21 Q4 FY20
EBIDTA
37,182
29,767
FY 21 FY 20
Revenue
14301414
FY 21 FY 20
EBIDTA

AEL : Robust Leverage Profile
17
(Rs Cr)
Mar-21 Mar-20
Segment LT DebtST Debt &
WCTotal LT Debt
ST Debt & WC
Total
IRM 1,084 2,933 4,017 725 4,601 5,326
Mining Services 873 614 1,487 507 581 1,088
Solar Manufacturing 924 803 1,727 1,191 426 1,617
Shipping 301 - 301 608 - 608
Airports 4,197 - 4,197 - - -
Incubating Businesses 865 1,216 2,081 827 1,388 2,215
Others 1,987 204 2,191 424 1,141 1,565
Total Debt 10,231 5,770 16,001 4,282 8,137 12,419
Net Worth (Incl NCI) 18,910 18,210
Debt : Net Worth 0.8x 0.7x
NCI – Non-Controlling Interest

ESG Performance
18
Key Focus AreasSr
No.Mining Services Solar Mfg
1 Efficient use of water and energy Conservation of Natural Resources
2 Reduction of emission levels Waste Management
3 Zero tolerance for fatalities at sites Safety
4 Faster reclamation of de-coaled areas

• Efficient use of water and energy • Reduction of emission levels• Zero tolerance for fatalities at mine sites• Faster reclamation of de-coaled areas
Mining Certification Focus Areas
Energy Intensity5476 GJ/MMT
Water Intensity187 Litres / MT
Waste Managed through 5R
Waste Management Terrestrial Plantation
CA Land & Excavation Area
Emission Intensity0.20 tCO2/MT
15 % ↓* 3 % ↓*
6.48 LakhTrees Planted
3797 Ha - C Afforestation 261 Ha - Reclamation
99%
AEL : ESG performance as on date - Mining Services
ISO 2600:2010, ISO 31000: 2009, ISO 9001:2015, ISO 14001:2015, OHSAS-18001:2007
*Compared to Base year FY 18
#Current Capacity19
ISO – International Organization for StandardizationOHSAS – Occupational Health and Safety Assessment Series

AEL : ESG performance as on date - Solar Mfg
Natural Resource Conservation
◼ Rooftop Solar plants helped to substitute ~5% of Power requirement
◼ Energy Conservation initiatives helped to achieve 18% reduction in Specific Power Consumption vs FY 20 (KwH/MW)
◼ 21% reduction in Specific Consumption (KL/MW) of RO Water vs FY 20 due to 28% reduction in DI water consumption (KL/MW)
◼ 19,656 plantations cultivated despite low fertility soil and semi arid conditions.
◼ Sewage Treatment Plant operations restored in Aug-2020 & all parameters of discharge water are now meeting GPCB norms
20
Certification Focus Areas
IEC – International Electro Technical CommissionMCS – Microgeneration Certification Scheme
Waste to Wealth Generation
◼ Installed Bio-gas plant for treatment of 100% food waste and generation of cooking gas
◼ Conceptualised in-house wood recycling plant for recycling of pallets (14,042 pallets recycled ~456MT of wood saved till date)
Safety
◼ Nil LTI (Lost Time Injuries) for consecutive three years
◼ Consistent Improvement in EHS parameters
◼ 55 improvements in process flow related to Fire, Chemical Slippage, Gas Control & other High Risk activities
IEC 61215, IEC 61730, UL61730, IEC 62716, IEC 61701, BIS/IS 14286, IEC 62804, IEC 62759, IEC 60068, MCS, PVEL-PQP, Black & Veatch
• Conservation of Natural Resources
• Waste Management
• Safety
PVEL-PQP – PV Evolution Labs – Product Qualification ProgramsEHS – Environment Health and Safety

21
AEL : CSR activities enabling social transformation
Education
Community Health
Sustainable Livelihood
Community Infrastructure
Social Initiatives through Adani Foundation 1 : Core Areas
Inclusive Growth, Safety & Other Initiatives at AEL
• Hiring a diversified pool of talent with due representation of local population
• Inclusive growth of employees/ workers along with the organization
• Ensuring safety and well-being of employees/ workers
• Barren/Non-cultivated land used for plants preventing impact on farmers’ livelihood
• Land beneficiaries compensated at market determined rates
1. Adani Foundation leads various social initiatives at Adani Group
Adani Foundation’s presence across India
ASDC: Adani Skil Development Centre; Swachagraha: a movement to create a culture of cleanlinessSuPoshan: A movement to reduce malnutrition among children

Education Community Health
Sustainable Livelihood Community Infrastructure
AEL : CSR Activities in FY21
22
MoU was signed with Govt. District Education Department, Surguja District for education development activities at 2 Govt. Primary Schools under Project Utthan.
Under this project, Utthan Sahayaks will be appointed to work on the weak areas of the students and infrastructural support will also be provided to the schools
To contribute towards construction of hospital to be
built for North Kalimantan police officers in Indonesia
Bee keeping training program was organized in partnership with KVK Ambikapur in Surguja District under ARYA project of Chhattisgarh State. The training covered the methods of bee-keeping along with health benefits and market availability of honey.
Project Suposhan has successfully facilitated more than 33,000 thousand children to move out from their malnourishment status. 10,039 children have moved from severe malnourished status to moderate and 23113 children have moved to normal category from that of moderate malnourishment.

Appendix
23

AEL : Mining Services Quantitative Details
24
Mine Q4 FY21 Q4 FY20 FY21 FY20
ROM Dispatch ROM Dispatch ROM Dispatch ROM Dispatch
Parsa Kente 5.6 4.0 4.5 3.3 15.0 12.3 15.0 11.3
GP III 0.5 0.4 0.5 -- 1.5 1.7 0.5 --
Talabira II and III 0.6 0.6 -- -- 1.0 1.0 -- --
Total 6.7 5.0 5.0 3.3 17.5 15.0 15.5 11.3
Quantities in MMT
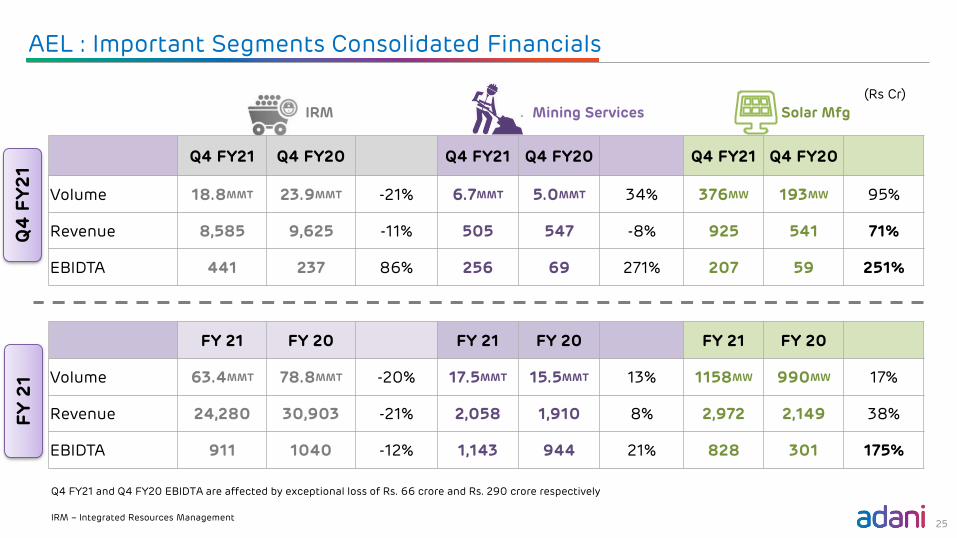
AEL : Important Segments Consolidated Financials
25
(Rs Cr)
IRM Mining Services Solar Mfg
Q4 FY21 Q4 FY20 Q4 FY21 Q4 FY20 Q4 FY21 Q4 FY20
Volume 18.8MMT 23.9MMT -21% 6.7MMT 5.0MMT 34% 376MW 193MW 95%
Revenue 8,585 9,625 -11% 505 547 -8% 925 541 71%
EBIDTA 441 237 86% 256 69 271% 207 59 251%
FY 21 FY 20 FY 21 FY 20 FY 21 FY 20
Volume 63.4MMT 78.8MMT -20% 17.5MMT 15.5MMT 13% 1158MW 990MW 17%
Revenue 24,280 30,903 -21% 2,058 1,910 8% 2,972 2,149 38%
EBIDTA 911 1040 -12% 1,143 944 21% 828 301 175%
IRM – Integrated Resources Management
Q4
FY
21
FY
21
Q4 FY21 and Q4 FY20 EBIDTA are affected by exceptional loss of Rs. 66 crore and Rs. 290 crore respectively

AEL Project Updates : Mining Services
Type of Project Mine Capacity State Customer (Owner) Project Status
Coal Mining
Parsa East Kente Basen 15 MMT Chattisgarh RRVUNL
OperationalGare Pelma III 5 MMT Chattisgarh CSPGCL
Talabira II & III 20 MMT Odisha NLCIL
Parsa 5 MMT Chattisgarh RRVUNL
Under DevelopmentGidhmuri Pituria 6 MMT Chattisgarh CSPGCL
Suliyari 5 MMT Madhya Pradesh APMDC
Kente Extension 7 MMT Chattisgarh RRUVNL
Gare Pelma I 15 MMT Chattisgarh GSECL LOA Received
Gare Pelma II 23 MMT Chattisgarh MAHAGENCO Under Development
Coal Washery Hingula 10 MMT Odisha MCL Letter of Award received
Iron Ore MiningBailadila Deposit 13 10 MMT Chattisgarh NCL Under Development
Kurmitar 6 MMT Odisha OMC Operational (on 1st Apr 21)
Commercial Coal Mining
Gondulpara 4 MMT Jharkhand AELCBDPA* signed
Dhirauli 5 MMT Madhya Pradesh AEL
* Coal Block Development and Production Agreement (CBDPA) signed on 11th January, 2021
GSECL – Gujarat State Electricity Corp.MAHAGENCO – Maharashtra State Power Gen Co.OMC – Odisha Mining Corporation Ltd
MCL – Mahanadi Coalfields LtdSECL – South Eastern Coalfields LtdNCL – NMDC-CMDC Ltd
RRVUNL – Rajasthan Rajya Vidyut UtpadanNigam LtdCGPGCL – Chattisgarh State Power Gen Co.
NLCIL – Neyveli Lignite Coal India Ltd APMDC – Andhra Pradesh Mineral Dev. Corp. 26

AEL Project Updates : Roads and Water
Type Project NameProject Model
Length / Capacity
State
ConcessionPeriod (in
Years)(Const + O&M)
Project Status
Roads
Bilaspur Pathrapali HAM 53.3 Kms Chattisgarh 2 + 15 70% completed
Suryapet Khammam HAM 58.0 Kms Telangana 2.5 + 15 20% completed
Mancherial Repallewada HAM 42.0 Kms Telangana 2 + 15 19% completed
Vijaywada Bypass HAM 17.9 Kms Andhra Pradesh 2.5 + 15 Concessionagreement signedNanasa Pidgaon HAM 47.5 Kms Madhya Pradesh 2 + 15
Azhiyur Vengalam HAM 42.4 Kms Kerala 2.5 + 15 LOA Received
Kodad Khammam Road HAM 31.8 Kms Telangana 2 + 15 LOA Received
Badakumari to Karki HAM 47.5 Kms Odisha 2 + 15 LOA Received
Panagarh Palsit BOT 67.8 Kms West Bengal 2.5 + 18 LOA Received
PRS Tolls TOT 53.6 Kms Gujarat 0 + 20 LOA Received
Water Prayagraj HAM 72 MLD (New) Uttar Pradesh 2 + 15 69% completed
Notes :
1. Roads : Concession agreements with National Highway Authority of India under Model as mentioned
2. Water : Concession agreement with Uttar Pradesh Jal Nigam under aegis of National Mission for Clean Ganga
MLD – Million Liters per day27
LOA – Letter of Award

AEL Project Updates : Airports
Adani Airports to dominate the Airports space with 200 m + consumer base leveraging network effect and consumer mindset.
Platform
International Gateway+
Regional Network
Integrated
Multi modal transport hub
City-center airports
Network Effect
Audience of One - Consumer Segments
Passengers
60 Mn – Domestic79 Mn
19 Mn - International
Non Passengers
80 Mn - Meet / Greeters120 Mn
40 Mn - City Side
Thiruvananthapuram3.9 Mn
Ahmedabad11.4 Mn
Jaipur5.0 Mn Lucknow
5.4 Mn
Mangaluru1.9 Mn
Guwahati5.4 Mn
Mumbai + Navi Mumbai
45.9 MnAirports Taken over
1. Source: AAI, Circle size is representative of FY20 passenger traffic
Concession agreement signed
In process of taking over
28

29
Certain statements made in this presentation may not be based on historical information or facts and may be “forward-looking statements,” including those relating to generalbusiness plans and strategy of Adani Enterprises Limited (“AEL”),the future outlook and growth prospects, and future developments of the business and the competitive andregulatory environment, and statements which contain words or phrases such as ‘will’, ‘expected to’, etc., or similar expressions or variations of such expressions. Actual resultsmay differ materially from these forward-looking statements due to a number of factors, including future changes or developments in their business, their competitiveenvironment, their ability to implement their strategies and initiatives and respond to technological changes and political, economic, regulatory and social conditions in India.This presentation does not constitute a prospectus, offering circular or offering memorandum or an offer, or a solicitation of any offer, to purchase or sell, any shares and shouldnot be considered as a recommendation that any investor should subscribe for or purchase any of AEL’s shares. Neither this presentation nor any other documentation orinformation (or any part thereof) delivered or supplied under or in relation to the shares shall be deemed to constitute an offer of or an invitation by or on behalf of AEL.
AEL, as such, makes no representation or warranty, express or implied, as to, and does not accept any responsibility or liability with respect to, the fairness, accuracy, completeness orcorrectness of any information or opinions contained herein. The information contained in this presentation, unless otherwise specified is only current as of the date of thispresentation. AEL assumes no responsibility to publicly amend, modify or revise any forward-looking statements, on the basis of any subsequent development, information orevents, or otherwise. Unless otherwise stated in this document, the information contained herein is based on management information and estimates. The informationcontained herein is subject to change without notice and past performance is not indicative of future results. AEL may alter, modify or otherwise change in any manner thecontent of this presentation, without obligation to notify any person of such revision or changes.
No person is authorised to give any information or to make any representation not contained in and not consistent with this presentation and, if given or made, suchinformation or representation must not be relied upon as having been authorised by or on behalf of AEL.
This presentation does not constitute an offer or invitation to purchase or subscribe for any securities in any jurisdiction, including the United States. No part of its shouldform the basis of or be relied upon in connection with any investment decision or any contract or commitment to purchase or subscribe for any securities. None of our securitiesmay be offered or sold in the United States, without registration under the U.S. Securities Act of 1933, as amended, or pursuant to an exemption from registration therefrom.
MR. D. BALASUBRAMANYAM
Group Head - Investor Relations
+91 79 2555 9332
Disclaimer