Characterization of Slayer proteins of Lactobacillus by FTIR spectroscopy and differential scanning...
10
Characterization of S-layer proteins of Lactobacillus by FTIR spectroscopy and differential scanning calorimetry P. Mobili a,b , A. Londero a , T.M.R. Maria b , M.E.S. Euse ´ bio b , G.L. De Antoni a , R. Fausto b , A. Go ´ mez-Zavaglia b,c, * a Centro de Investigacio ´n y Desarrollo en Criotecnologı´a de Alimentos, La Plata RA-1900, Argentina b Department of Chemistry, University of Coimbra, Coimbra P-3004-535, Portugal c Facultad de Farmacia y Bioquı´mica, Universidad de Buenos Aires, Buenos Aires RA-1113, Argentina 1. Introduction Kefir is a fermented milk that has been consumed for thousands of years. It was originated from the northern area of the Caucasus Mountains and it is prepared from kefir grains [2]. Kefir grains are clusters of microorganisms that include primarily lactic acid bacteria (lactobacilli, lactococci, leuconostoc), yeasts, acetic acid bacteria and other microorganisms not yet described held together by a matrix of polysaccharides and proteins [3–5]. These microorganisms are usually associated with the beneficial effects of kefir. This beneficial activity is at least partially related with bacterial surface properties, as adhesion and aggregation, which, in turn, depend on the specific characteristics of their S-layer. 1 The S-layer is a crystalline bi-dimensional array of glycoproteic subunits, linked non-covalently to each other and to the under- lying cell wall [6,7]. S-layer subunits are generally assembled in lattices with oblique, square or hexagonal symmetry and show the intrinsic tendency to reassemble into two-dimensional arrays after removal of the disrupting agent used in the extraction procedure [6]. Several specific functions have been reported for S-layers, such Vibrational Spectroscopy 50 (2009) 68–77 ARTICLE INFO Article history: Received 1 February 2008 Accepted 28 July 2008 Available online 19 August 2008 Keywords: S-layer Lactobacillus kefir Lactobacillus brevis FTIR, DSC Secondary structure Proteins ABSTRACT FTIR spectroscopy was used for the characterization of S-layer proteins extracted from microorganisms isolated from kefir grains. S-layer from Lactobacillus brevis ATCC 8287 has been already characterized [G. Vidgren, I. Palva, R. Pakkanen, K. Lounatmaa, A. Palva, J. Bacteriol. 174 (1992) 7419] and therefore it was used for the validation of FTIR as a method to investigate the secondary structure of the S-layer proteins of the studied kefir strains. A correlation between the secondary structures of S-layer proteins with surface properties of Lactobacillus kefir strains was found: a high percentage of b-sheet contents (40–50%) was found for non-aggregating strains, whereas this percentage decreased to 25–30% for aggregating ones. A quantitative comparison of the S-layers was performed by means of cluster analysis based on the obtained spectroscopic data. This analysis enabled the strains to be grouped in clusters according to the spectral diversity in the Amide I region. The non-aggregating strains of L. kefir cluster at S sm > 0.943 and the aggregating strains form another cluster, with S sm > 0.769. L. brevis ATCC 8287 appears clearly separated from these two clusters: the similarity with the aggregating strains is 0.658 and the similarity with the non-aggregating ones, 0.665. The thermal analysis of the lyophilized S-layer proteins was performed by means of differential scanning calorimetry (DSC) and FTIR. DSC analysis within the 30– 130 8C range showed two phase transitions with maxima located at ca. 58 and 98 8C for L. brevis and in the 67–70 and 110–119 8C ranges for the different strains of L. kefir (CIDCA 8344 only shows the lowest temperature phase transition). FTIR spectra obtained reveal that for all the L. kefir S-layer proteins the major secondary structure modifications upon heating occur nearly at the first phase transitions observed by DSC, with the thermal stability increasing with the percentage of b-sheets structures. The S- layer protein of L. brevis ATICC 8287, which among all protein studied is that with maximum b-sheet contents (and no a-helix structure) was then found to be the protein showing a greater thermal stability. ß 2008 Elsevier B.V. All rights reserved. * Corresponding author at: Department of Chemistry, University of Coimbra, Coimbra P-3004-535, Portugal. E-mail address: [email protected] (A. Go ´ mez-Zavaglia). 1 The S-layer ("surface layer") is the most external layer in bacteria. Contents lists available at ScienceDirect Vibrational Spectroscopy journal homepage: www.elsevier.com/locate/vibspec 0924-2031/$ – see front matter ß 2008 Elsevier B.V. All rights reserved. doi:10.1016/j.vibspec.2008.07.016
-
Upload
independent -
Category
Documents
-
view
6 -
download
0
Transcript of Characterization of Slayer proteins of Lactobacillus by FTIR spectroscopy and differential scanning...

C
0
d
Vibrational Spectroscopy 50 (2009) 68–77
Contents lists available at ScienceDirect
Vibrational Spectroscopy
journa l homepage: www.e lsev ier .com/ locate /v ibspec
Characterization of S-layer proteins of Lactobacillus by FTIR spectroscopy anddifferential scanning calorimetry
P. Mobili a,b, A. Londero a, T.M.R. Maria b, M.E.S. Eusebio b, G.L. De Antoni a, R. Fausto b,A. Gomez-Zavaglia b,c,*a Centro de Investigacion y Desarrollo en Criotecnologıa de Alimentos, La Plata RA-1900, Argentinab Department of Chemistry, University of Coimbra, Coimbra P-3004-535, Portugalc Facultad de Farmacia y Bioquımica, Universidad de Buenos Aires, Buenos Aires RA-1113, Argentina
A R T I C L E I N F O
Article history:
Received 1 February 2008
Accepted 28 July 2008
Available online 19 August 2008
Keywords:
S-layer
Lactobacillus kefir
Lactobacillus brevis
FTIR, DSC
Secondary structure
Proteins
A B S T R A C T
FTIR spectroscopy was used for the characterization of S-layer proteins extracted from microorganisms
isolated from kefir grains. S-layer from Lactobacillus brevis ATCC 8287 has been already characterized [G.
Vidgren, I. Palva, R. Pakkanen, K. Lounatmaa, A. Palva, J. Bacteriol. 174 (1992) 7419] and therefore it was
used for the validation of FTIR as a method to investigate the secondary structure of the S-layer proteins of
the studied kefir strains. A correlation between the secondary structures of S-layer proteins with surface
properties of Lactobacillus kefir strains was found: a high percentage of b-sheet contents (40–50%) was
found for non-aggregating strains, whereas this percentage decreased to 25–30% for aggregating ones. A
quantitative comparison of the S-layers was performed by means of cluster analysis based on the
obtained spectroscopic data. This analysis enabled the strains to be grouped in clusters according to the
spectral diversity in the Amide I region. The non-aggregating strains of L. kefir cluster at Ssm > 0.943 and
the aggregating strains form another cluster, with Ssm > 0.769. L. brevis ATCC 8287 appears clearly
separated from these two clusters: the similarity with the aggregating strains is 0.658 and the similarity
with the non-aggregating ones, 0.665. The thermal analysis of the lyophilized S-layer proteins was
performed by means of differential scanning calorimetry (DSC) and FTIR. DSC analysis within the 30–
130 8C range showed two phase transitions with maxima located at ca. 58 and 98 8C for L. brevis and in the
67–70 and 110–119 8C ranges for the different strains of L. kefir (CIDCA 8344 only shows the lowest
temperature phase transition). FTIR spectra obtained reveal that for all the L. kefir S-layer proteins the
major secondary structure modifications upon heating occur nearly at the first phase transitions
observed by DSC, with the thermal stability increasing with the percentage of b-sheets structures. The S-
layer protein of L. brevis ATICC 8287, which among all protein studied is that with maximum b-sheet
contents (and no a-helix structure) was then found to be the protein showing a greater thermal stability.
� 2008 Elsevier B.V. All rights reserved.
1. Introduction
Kefir is a fermented milk that has been consumed for thousandsof years. It was originated from the northern area of the CaucasusMountains and it is prepared from kefir grains [2]. Kefir grains areclusters of microorganisms that include primarily lactic acidbacteria (lactobacilli, lactococci, leuconostoc), yeasts, acetic acidbacteria and other microorganisms not yet described held togetherby a matrix of polysaccharides and proteins [3–5]. These
* Corresponding author at: Department of Chemistry, University of Coimbra,
oimbra P-3004-535, Portugal.
E-mail address: [email protected] (A. Gomez-Zavaglia).
924-2031/$ – see front matter � 2008 Elsevier B.V. All rights reserved.
oi:10.1016/j.vibspec.2008.07.016
microorganisms are usually associated with the beneficial effectsof kefir. This beneficial activity is at least partially related withbacterial surface properties, as adhesion and aggregation, which, inturn, depend on the specific characteristics of their S-layer.1
The S-layer is a crystalline bi-dimensional array of glycoproteicsubunits, linked non-covalently to each other and to the under-lying cell wall [6,7]. S-layer subunits are generally assembled inlattices with oblique, square or hexagonal symmetry and show theintrinsic tendency to reassemble into two-dimensional arrays afterremoval of the disrupting agent used in the extraction procedure[6]. Several specific functions have been reported for S-layers, such
1 The S-layer ("surface layer") is the most external layer in bacteria.
P. Mobili et al. / Vibrational Spectroscopy 50 (2009) 68–77 69
as protective coats, molecular sieves, molecule and ion traps,structures involved in cell adhesion and surface recognition, andvirulence factors. The presence of S-layer proteins in Lactobacillus
kefir and Lactobacillus parakefir isolated from kefir grains has beenreported for the first time in the last years [8].
Taking into account that several Lactobacillus species bearing anS-layer structure play an essential role in many fermentationprocesses in food industry, silage fermentations and in probioticsfor humans and animals, elucidation of the characteristics oflactobacilli S-layers has become increasingly important [9].
FTIR is a well-established methodology that has been exten-sively used for the elucidation and analysis of the secondarystructure of proteins [1,10–12]. The singular advantage of FTIRover other techniques is that spectra can be obtained for proteins ina wide range of environments, e.g., in the crystalline state, solutionand on different surfaces, including polymers, metals andbioceramics [13,14 among many other authors].
There is a wealth of information that can be used to obtainstructural information by analyzing the shape and position ofbands in the Amide I region of infrared spectra (1720–1600 cm�1).Indeed, protein secondary structural elements, like the a-helix, b-sheets and random coil structures, have characteristic absorbancebands in the Amide I region [15–18]. Because these bands areconsiderably broad and overlap significantly, the use of deconvo-lution or second-derivative techniques is required to mathema-tically enhance the resolution of the spectrum, separating bandsthat are intrinsically broader than the instrument resolution [19–21]. These are, however, well-established procedures since longago. Empirical association was made between the position ofAmide I band and/or the position and relative areas of componentbands after deconvolution and the type and relative content ofsecondary structure in the protein [22,10,23].
The information obtained by infrared spectroscopy can also beenriched by complementary analysis by other methods. Differ-ential scanning calorimetry (DSC) is a very powerful method forthe study of phase transition processes, providing very precise anddirect measure of the associated heat fluxes. It has been used toinvestigate the melting temperatures of proteins as well as proteindenaturation and the results successfully correlated with thechanges observed in the Amide I infrared spectral region (and also,less frequently, in other spectral regions) upon heating [12,24].
FTIR has been used for the characterization of S-layers from afew microorganisms, such as Acetogenium kivui [25] and Bacillus
sphaericus [26]. However, to the best of our knowledge it has notbeen used for the analysis of S-layers of lactobacilli hitherto.Therefore, the aim of this work was to investigate the secondarystructure of S-layer proteins extracted from several L. kefir and
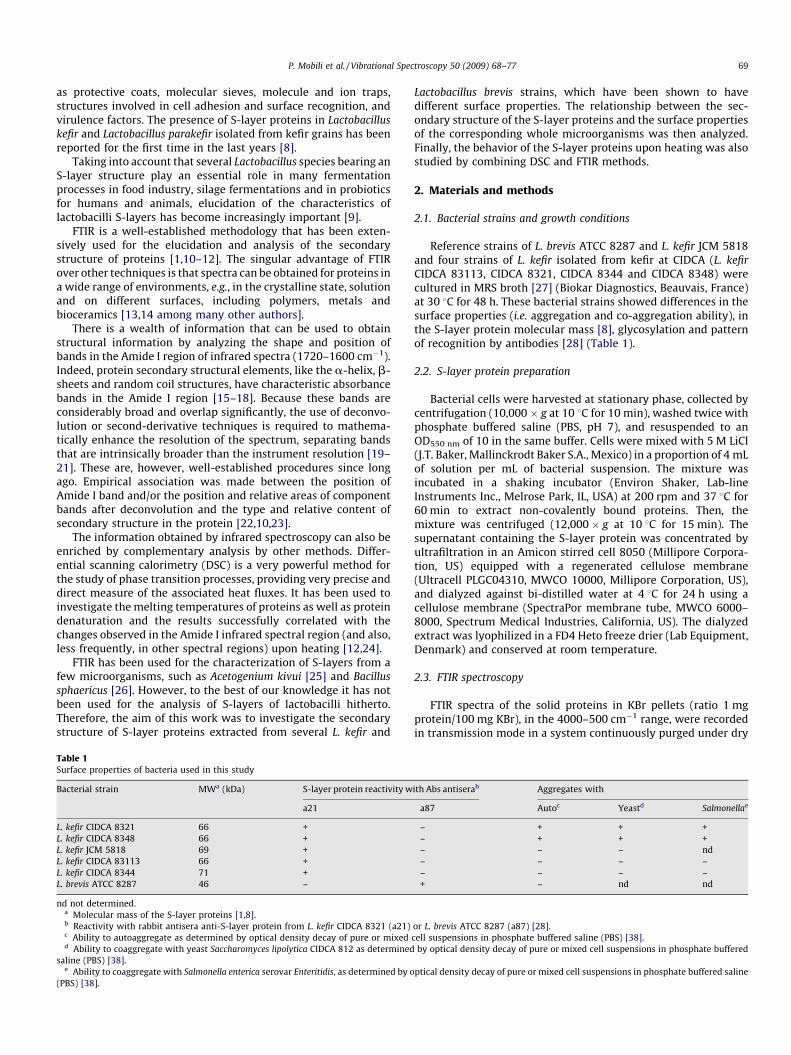
Table 1Surface properties of bacteria used in this study
Bacterial strain MWa (kDa) S-layer protein reactivity w
a21
L. kefir CIDCA 8321 66 +
L. kefir CIDCA 8348 66 +
L. kefir JCM 5818 69 +
L. kefir CIDCA 83113 66 +
L. kefir CIDCA 8344 71 +
L. brevis ATCC 8287 46 –
nd not determined.a Molecular mass of the S-layer proteins [1,8].b Reactivity with rabbit antisera anti-S-layer protein from L. kefir CIDCA 8321 (a21)c Ability to autoaggregate as determined by optical density decay of pure or mixedd Ability to coaggregate with yeast Saccharomyces lipolytica CIDCA 812 as determined
saline (PBS) [38].e Ability to coaggregate with Salmonella enterica serovar Enteritidis, as determined by o
(PBS) [38].
Lactobacillus brevis strains, which have been shown to havedifferent surface properties. The relationship between the sec-ondary structure of the S-layer proteins and the surface propertiesof the corresponding whole microorganisms was then analyzed.Finally, the behavior of the S-layer proteins upon heating was alsostudied by combining DSC and FTIR methods.
2. Materials and methods
2.1. Bacterial strains and growth conditions
Reference strains of L. brevis ATCC 8287 and L. kefir JCM 5818and four strains of L. kefir isolated from kefir at CIDCA (L. kefir
CIDCA 83113, CIDCA 8321, CIDCA 8344 and CIDCA 8348) werecultured in MRS broth [27] (Biokar Diagnostics, Beauvais, France)at 30 8C for 48 h. These bacterial strains showed differences in thesurface properties (i.e. aggregation and co-aggregation ability), inthe S-layer protein molecular mass [8], glycosylation and patternof recognition by antibodies [28] (Table 1).
2.2. S-layer protein preparation
Bacterial cells were harvested at stationary phase, collected bycentrifugation (10,000 � g at 10 8C for 10 min), washed twice withphosphate buffered saline (PBS, pH 7), and resuspended to anOD550 nm of 10 in the same buffer. Cells were mixed with 5 M LiCl(J.T. Baker, Mallinckrodt Baker S.A., Mexico) in a proportion of 4 mLof solution per mL of bacterial suspension. The mixture wasincubated in a shaking incubator (Environ Shaker, Lab-lineInstruments Inc., Melrose Park, IL, USA) at 200 rpm and 37 8C for60 min to extract non-covalently bound proteins. Then, themixture was centrifuged (12,000 � g at 10 8C for 15 min). Thesupernatant containing the S-layer protein was concentrated byultrafiltration in an Amicon stirred cell 8050 (Millipore Corpora-tion, US) equipped with a regenerated cellulose membrane(Ultracell PLGC04310, MWCO 10000, Millipore Corporation, US),and dialyzed against bi-distilled water at 4 8C for 24 h using acellulose membrane (SpectraPor membrane tube, MWCO 6000–8000, Spectrum Medical Industries, California, US). The dialyzedextract was lyophilized in a FD4 Heto freeze drier (Lab Equipment,Denmark) and conserved at room temperature.
2.3. FTIR spectroscopy
FTIR spectra of the solid proteins in KBr pellets (ratio 1 mgprotein/100 mg KBr), in the 4000–500 cm�1 range, were recordedin transmission mode in a system continuously purged under dry
ith Abs antiserab Aggregates with
a87 Autoc Yeastd Salmonellae
– + + +
– + + +
– – – nd
– – – –
– – – –
+ – nd nd
or L. brevis ATCC 8287 (a87) [28].
cell suspensions in phosphate buffered saline (PBS) [38].
by optical density decay of pure or mixed cell suspensions in phosphate buffered
ptical density decay of pure or mixed cell suspensions in phosphate buffered saline

P. Mobili et al. / Vibrational Spectroscopy 50 (2009) 68–7770
nitrogen in order to eliminate spectral contributions of atmo-spheric water vapor and CO2. The IR spectra collected at roomtemperature were obtained co-adding 512 scans with 4 cm�1
spectral resolution. Temperature-dependent spectra wereobtained using a Specac variable temperature infrared cellcontrolled by a Red Lions digital temperature controller; sampleswere heated in 5 or 10 8C-intervals and stabilized for 5 min before atotal of 64 scans were co-added (spectral resolution: 4 cm�1).
All spectra were recorded on a BOMEM MB40 spectrometerwith a Zn/Se beam splitter and a DTGS detector.
2.4. Data analysis of FTIR spectra
The recorded infrared spectra were analyzed using the OMNICsuit of programs (Nicolet Instrument Co., Madison, WI, USA).Whenever necessary, residual contributions due to atmosphericwater vapor and CO2 were eliminated by subtraction of thecorresponding spectra from the registered samples’ spectra, inorder to obtain a flat baseline between 2300 and 1850 cm�1 [29].The resultant protein spectra were smoothed with a seven-point(13 cm�1) Savitzky-Golay function.
Inverted second derivative spectra were used to estimate thenumber, position and relative contribution of individual elementscomposing Amide I band (1600–1720 cm�1), and this informationwas taken into account to fit Amide I bands in protein spectra withGaussian band profiles, using OriginPro 7.5 (OriginLab Corporation,USA).
The assignment of protein secondary structures to the principalAmide I frequencies was as previously described in literature[22,10,23,30].
2.5. Cluster analysis
The Amide I frequencies (to within 1 cm�1) obtained in thesecond derivative analysis were converted into a double entrancetable where the presence or absence of each peak was assigned foreach strain as 1 and 0, respectively. The simple-matchingcoefficient (Ssm) was calculated as
Ssm ¼aþ c
aþ bþ c
where a and c correspond to the number of matching present andabsent peaks, respectively, and b represents the number ofnonmatching peaks between pairs of strains. The Ssm betweenany pair of strains was computed. The matrix of the Ssm correlationcoefficients was clustered by the unweighted average linkagemethod [31–34] using SYSTAT (Version 12.0).
Fig. 1. (A) Unresolved spectra of lyophilized S-layer proteins from L. kefir CIDCA 83113 (sp
d), CIDCA 8321 (spectrum e) and L. brevis ATCC 8287 (spectrum f) in the Amide I region.
secondary structure assignments in the inverted second derivative spectra are shadow
2.5.1. DSC analysis
A PerkinElmer DSC7 calorimeter was used with an intracoolerunit (with circulating ethyleneglycol:water 1:1 mixture at�15 8C).The calorimeter was calibrated for temperature [35] with biphenylTfus: 68.93 8C and 99.99% indium (Tfus = 156.60 8C). The calibrationwas confirmed with naphthalene (Tfus = 80.20 � 0.05 8C) andbenzophenone (Metler Toledo Calibration substance, Tfus:48.1 � 0.2 8C). A 20 mL/min nitrogen purging gas flow was used.Samples of lyophilized S-layer proteins weighing ca. 2–4 mg wereencapsulated in hermetic 10 mL aluminum pans and accuratelyweighted. An empty aluminum pan was used as reference. Typically,samples were subjected to heating and cooling cycles between 15 and130 8C, with a heating rate of 25 8C/min and 10 8C/min cooling rate.
All experiments were carried out at least three times withsamples obtained from different S-layer extractions. The relativedifferences were reproducible independently of the S-layerextracts used (uncertainty � 1 8C).
3. Results and discussion
3.1. Characterization of secondary structure of S-layer proteins and its
relevance in determining surface properties of the lactobacilli strains
According to previous works carried out in our group, L. kefir
strains included in this study have different surface properties(Table 1). Among these properties, aggregation ability is perhapsone of the most important differential characteristics amongstrains because of its putative role in some activities, such asadhesion to intestinal cells, biofilm formation and pathogeninhibition [36–38]. S-layer proteins were associated with aggrega-tion of L. kefir strains, since procedures tending to disassemble theS-layer (such as 5 M LiCl treatment) abolish their aggregativecapacity [8].
Fig. 1A depicts the unresolved spectra of the studied S-layerproteins in the Amide I region. At a first glance, it is easy to dividethe strains in two groups, the first one giving rise to an Amide Iband with absolute maximum centered at ca. 1656–1658 cm�1
and the second one with this maximum centered at 1650 cm�1. Itis interesting to observe that non-aggregating L. kefir strainsisolated from kefir belong to the first group whereas theaggregating strains belong to the second one. The Amide I bandof L. brevis ATCC 8287 does not belong to any of these groups and iscentered at 1646 cm�1. This analysis induced us to correlate theaggregative character of each strain to a specific structure of the S-layer.
The primary components of the Amide I band are mainlygenerated by C O stretching vibrations of peptide groups, thus
ectrum a), CIDCA 8344 (spectrum b), JCM 5818 (spectrum c), CIDCA 8348 (spectrum
(B) Inverted second derivative FTIR spectra of the above-mentioned samples. Some
ed.

Table 2Empirical assignment of secondary structure elements to different amide I band
components in proteins [23,24]
Wavenumber (cm�1) Assigned secondary structure
1620–1630 Intermolecular b-sheet
1620–1640 Intramolecular b-sheet
1640–1650 No order
1650–1660 a-Helix
1660–1695 b-Turn
1675 Intramolecular b-sheet
1690–1700 Intermolecular b-sheet
Fig. 2. Dendrogram obtained after unweighted average linkage method analysis of
the simple matching coefficient obtained from the frequencies corresponding to the
second derivatives FTIR spectra of S-layers from L. kefir and L. brevis ATCC 8287.
Similarities are expressed as distances: 1.0 represents 100% similarity and 0.0
represents 0% similarity.
P. Mobili et al. / Vibrational Spectroscopy 50 (2009) 68–77 71
this band is strongly influenced by hydrogen bonds giving rise toelements of secondary structure. Usually, proteins containdifferent types of secondary structure such as a-helices, b-sheets,turns and non-ordered regions, therefore the Amide I band contourconsisting of many overlapping individual component bands at thefrequencies that are characteristic of specific secondary structuralelements (Table 2). The second derivative analysis permits thedirect separation of the Amide I band into its components and thus,provides additional structural information. Absorbance bands in
Fig. 3. Unresolved FTIR spectra and curve fitting analysis in the Amide I region for lyophilized S-layer proteins from L. kefir and L. brevis strains. Experimental data (thin solid
lines), individual Gaussian components (solid lines) and best fit (dashed lines) are shown. Secondary structure assignments [22,10,23] for some component bands are also
given.

Table 3Amide I position and secondary structure composition (%) for lyophilized S-layer
proteins from lactobacilli, according to relative areas of component bands in peak
fitting of amide I zone in original IR spectra
Bacterial strain Amide I maximum
position (cm�1)
S-layer secondary structure (%)
b-Sheet a-Helix Othera
L. kefir CIDCA 8321 1651 23.0 13.6 63.4
L. kefir CIDCA 8348 1650 28.0 19.1 52.9
L. kefir JCM 5818 1651 36.0 15.3 48.7
L. kefir CIDCA 83113 1658 41.2 16.7 42.1
L. kefir CIDCA 8344 1656 42.1 21.0 36.9
L. brevis ATCC 8287 1646 50.2 0.0 49.8
a Includes b-turn and non-ordered structures, as well as side chain vibrations.
Fig. 4. DSC thermograms for lyophilized S-layer proteins from L. brevis and L. kefir
strains. See Section 2 for details.
P. Mobili et al. / Vibrational Spectroscopy 50 (2009) 68–7772
the original spectrum are revealed as negative bands in the secondderivative spectrum, whereby the band position is preserved[11,12]. In this context, the analysis of the second derivative of theAmide I bands has been performed for all the strains under study(Fig. 1B). This analysis also points out the existence of two groupsof L. kefir strains, giving rise to similar second derivative spectraand corresponding to the non-aggregating and aggregating L. kefir
strains; as it could be anticipated, L. brevis second derivativespectrum profile is substantially different from the ones of the L.
kefir strains.These differences were evaluated quantitatively by means of
cluster analysis. Such analysis allows a quantitative comparisonamong strains, because it compares the presence or absence of agiven peak for all the strains analyzed. A value within the range 1–0(Ssm) must result from this analysis, with Ssm = 1 corresponding toidentity and Ssm = 0 to absolute non-similarity of the testedsamples.
Fig. 2 shows the computerized numerical analysis of the secondderivatives of the S-layers, which enabled strains to be grouped inclusters according to the spectral diversity in the Amide I region.The figure shows that the non-aggregating strains of L. kefir clusterat Ssm > 0.943 and the aggregating strains form another cluster,with Ssm > 0.769. L. brevis ATCC 8287 appears clearly separatedfrom these two clusters: the similarity with the aggregating L. kefir
strains is 0.658, whereas the similarity with the non-aggregating L.
kefir strains is slightly larger 0.665. The employ of dendrograms hasbeen extensively used for taxonomical purposes [32–34,39–43]but up to our knowledge, it has not been used so far toquantitatively estimate the degree of similarity of structural (orfunctional) components of biological samples based on spectro-scopic information [41–43]. We believe that cluster analysis canindeed play a useful role in the application of FTIR spectroscopy toproteins, as a complement to other, currently used data analysismethods.
Taking into account the second derivative spectra bands as aguide for the location of individual components, Amide I peakfitting using Gaussian functions was performed (Fig. 3). Thistreatment allowed the estimation of the percentage of differentsecondary structure components for each lyophilized S-layerprotein (Table 3).
The first S-layer protein to be analyzed was the one of L. brevis
ATCC 8287, because this protein has been already characterized byVidgren et al. [1]. Its aminoacids composition was deduced fromthe DNA sequence of the corresponding gene, and consists of asignal peptide of 30 amino acids followed by a protein of 435aminoacids. The predicted secondary structure for the fullpolypeptide is composed of 56.5% b-sheet and 27.7% a-helix [1].
In this work, the reported aminoacids sequence of the 46 kDamature protein (without the signal peptide) was used to performthe secondary structure prediction analysis. The methods of Rostand Sander (http://www.predictprotein.org) [44] and Brendel et al.[45] predicted an estimated b-sheet content of 55.6 and 44.4%,respectively, and no a-helix. The contents of b-sheet structure arehigher than those of other S-layer proteins, like the ones extractedfrom Lactobacillus acidophilus, Lactobacillus crispatus and Lactoba-
cillus helveticus, which have been described as ranging from 20 to40% [25,7,46–48], as deduced from circular-dichroism measure-ments or secondary-structure prediction algorithms. The lack of a-helix structure in the mature protein is in agreement with Avall-Jaaskelainen and Palva [48], which described the a-helices aslocated at the signal sequences of these proteins.
The experimental FTIR spectrum of the S-layer of L. brevis ATCC8287 obtained in this work depicted an Amide I band centered at1646 cm�1, typical of proteins with high b-sheet content [23](Table 2). Peak-fitting for this strain showed four component

Table 4Lactobacilli S-layer DSC transition temperatures (Tm)
Bacterial strain Tm of DSC transition (8C)
1st 2nd
L. kefir CIDCA 8321 67.2 118.7
L. kefir CIDCA 8348 69.1 114.5
L. kefir JCM 5818 70.0 116.6
L. kefir CIDCA 83113 68.1 110.4
L. kefir CIDCA 8344 81.5
L. brevis ATCC 8287 57.9 98.2
P. Mobili et al. / Vibrational Spectroscopy 50 (2009) 68–77 73
bands, two of these with maxima at b-sheet characteristicfrequencies (1637 and 1694 cm�1), without any band withmaximum in the 1650–1660 cm�1 range (a-helix). The bandscorresponding to b-sheet structures represent 50.2% of the wholeAmide I band (see Fig. 3). This percentage fits nicely the resultsreported by Vidgren et al. (56.5%) [1] and those predicted by themethods of Rost and Sander (55.6%) [44] and Brendel et al. (44.4%)[45]. This fact can also be considered as a good indication of thereliability of the used approach to estimate the secondary structuremotifs of S-layer proteins.
The same procedure was then used to characterize thesecondary structure of the lyophilized S-layer proteins from L.
kefir strains, whose Amide I bands, centered in the 1658–1650 cm�1 range, suggesting the presence of a-helix structuresin different percentages (Table 2) [10]. As shown in Table 3, theinvestigated L. kefir S-layers showed b-sheet contents rangingfrom 23 to 42% and a-helix contents ranging from 13 to 21%. Thedifferences observed in the secondary structures, especiallyregarding the b-sheet contents, could be associated with thedifferent aggregative capacities of the L. kefir strains analyzed. Inthis sense, the b-sheet content was found to be around 25% in theaggregating strains and over 40% in the non-aggregating ones(Fig. 3 and Table 3). These results clearly show that the secondarystructures of S-layer proteins of analyzed lactobacilli play animportant role in determining surface properties of these bacteria.Very interestingly, the b-sheet contents of the S-layer of thestudied L. brevis strain (which is also non-aggregating; see Table 1)does not differ very much from those found for the non-aggregating L. kefir strains S-layer proteins, suggesting that theb-sheets play a major role in the aggregation mechanism of
Fig. 5. FTIR thermal analysis of lyophilized S-layer proteins from L. brevis ATCC 8287. (A)
the range 30 8C (black bold solid line) to 130 8C (grey bold line). Lines in between represe
line). (B) Temperature dependence of the Amide I band peak position while heating (so
corresponding to the heating. (C) Representative profiles of inverted second derivative spe
re-cooling (dotted line). (D) Temperature dependence of the intensities of inverted secon
corresponding sigmoidal fittings (solid and dashed lines, respectively).
lactobacilli. On the other hand, the results also indicate that the a-helix contents of S-layer proteins do not seem to be particularlyrelevant in determining the aggregation capacities of thelactobacilli strains.
3.2. Secondary structure changes upon S-layer proteins’ phase
transitions
FTIR spectroscopy also provides a valuable method for studyingphase transitions in proteins, because the frequencies, intensitiesand bandwidths of the characteristic bands in a protein IRspectrum are very sensitive to protein conformational changes[24]. Therefore, a thermal analysis of the lyophilized S-layerproteins, within the range 30–130 8C, has been carried out by FTIR,complemented by DSC measurements.
DSC analysis showed two transitions for the studied lyophilizedS-layer proteins within the 30–130 8C range, with maxima locatedat 58 and 98 8C for L. brevis ATCC 8287 and in the 67–70 8C and
Representative profiles of unresolved spectra in the 1720–1500 cm�1 region within
nt intermediate spectra. The spectrum at 30 8C after cooling is also depicted (dotted
lid squares) and cooling (open triangles), with the sigmoidal fitting (dashed line)
ctra in the Amide I region as a function of temperature (solid lines) and at 40 8C after
d derivative spectra at 1625 cm�1 (open squares) and 1639 cm�1 (solid circles), and

P. Mobili et al. / Vibrational Spectroscopy 50 (2009) 68–7774
110–119 8C range for L. kefir strains, with the only exception ofCIDCA 8344 strain, which seems to exhibit a single transition at ca.
81 8C, slightly higher than that of the first transition for the other S-layer proteins of the studied L. kefir strains (Fig. 4, Table 4). Thesetransformations were found to be not reversible, as no transitionswere observed during cooling and subsequent re-heating of thesamples.
Fig. 6. I. Amide I band peak fitting in original FTIR spectra for lyophilized S-layer protei
components assigned to intramolecular b-sheet (bintra), intermolecular b-sheet (bint.)
fitting profiles. II. Dependence with temperature of the relative areas of selected individu
for lyophilized S-layer proteins from L. brevis ATCC 8287. Results for the bands assigned to
non-ordered (open triangles) structures are presented.
FTIR spectra reveal that, upon heating, perturbations in thesecondary structure of S-layer proteins were induced. In fact, theAmide I maximum shifts to higher frequencies and the Amide IImaximum (1500–1550 cm�1 range) shifts to lower frequencies astemperature increases. In addition, some other specific secondarystructure related modes in second derivative spectra are alsoaffected upon increasing the temperature [12; see also Figure 5 of
ns from L. brevis ATCC 8287 at 40 8C (A), 90 8C (B), 110 8C (C) and 130 8C (D). Band
and non-ordered (no) structures are highlighted. Dashed lines represent sum best
al component bands resulting from Amide I band peak fitting in original FTIR spectra
intramolecular b-sheet (solid squares), intermolecular b-sheet (open squares) and

P. Mobili et al. / Vibrational Spectroscopy 50 (2009) 68–77 75
this work]. In agreement with the DSC results, the observedspectroscopic changes were found to be irreversible. The phasetransition temperatures (TmFTIR) were estimated from thesigmoidal fitting midpoint of the dependence with temperatureof Amide I maximum in the original spectra or of specific structurerelated modes in second derivative spectra [12].
The thermal analysis for L. brevis ATCC 8287 by FTIR is depictedin Fig. 5. As temperature increases, the Amide I maximum movestowards higher wave numbers and the Amide II maximum movestowards lower wave numbers, both decreasing in intensity(Fig. 5A). The plot of the Amide I frequency vs. temperature(Fig. 5B) showed a TmFTIR of 97.5 � 4.0 8C. Inverted secondderivative spectra (Fig. 5C) shows an increase in the intensity ofthe component band centered at 1625 cm�1 (assigned to antiparallelintermolecular b-sheets) and a decrease of the intensity of the1639 cm�1 component (assigned to intramolecular b-sheets) withthe increase of the temperature. The TmFTIR obtained from plottingthe intensity of these component bands vs. temperature (Fig. 5D)were 98.4 � 3.1 8C (1625 cm�1) and 97.1 � 2.7 8C (1639 cm�1). TheseTmFTIR are similar to the Tm of the second transition measured in theDSC experiments (98.2 8C) (Fig. 4 and Table 4). At the temperature ofthe first phase transition observed in the DSC experiments (ca. 58 8C),no relevant spectral changes were observed, indicating that for thisstrain the first phase transition shall only imply minor changes in theprotein secondary structure.
Similar conclusions can be extracted performing the analysis bymeans of the band-deconvolution technique. Fig. 6I depicts theresults of band deconvolution in the Amide I spectral region for theS-layer protein of L. brevis ATCC 8287 at four different tempera-tures. The changes in the relative areas of each component of theAmide I band upon temperature increase are plotted in Fig. 6II. Thedata clearly reveal the above noticed increase in the unordered andb-sheet intermolecular structures at expenses of b-sheet intra-molecular structures, which dominate the secondary structure atthe lowest temperatures. These trends are in agreement with theexpected protein association and disordering upon denaturation.In agreement with the DSC results (Fig. 4) and also with the shift ofthe whole Amide I band maximum upon increasing the tempera-ture (Fig. 5B), the sigmoidal fitting midpoint of the dependence ofthe intensity of the relevant component bands resulting from banddeconvolution analysis with temperature occurs at �98 8C.
A similar analysis was performed for the S-layer proteins of thestudied L. kefir strains. Fig. 7 summarizes the results obtained forthe aggregative strain L. kefir CIDCA 8321. As discussed above inthis paper, contrarily to the L. brevis S-layer protein, in which a-helix structures are absent, L. kefir S-layer proteins have a non-
Fig. 7. Dependence with temperature of the relative areas of individual component band
layer proteins from L. kefir 8321. Results for the following component bands are shown.
(B): a-helix (solid circles); intermolecular b-sheet (open squares).
neglectable percentage of a-helix structures (for L. kefir CIDCA8321: 13.6% of the whole secondary structure; see Table 3). Theanalysis of the temperature dependence exhibited by the band at1654 cm�1, corresponding to a-helix structures, indicates atransition temperature (as measured by the temperature valuecorresponding to the midpoint of the sigmoidal fit) of ca. 60 8C,then showing a decrease of the a-helix contents after the firstphase transition observed in the DSC experiments. At the sametime, a decrease in the contents of b-sheet intramolecularstructures was also observed, whereas an increase of b-sheetintermolecular structures and non-ordered structures could alsobe noticed. Very interestingly, no significant changes could beobserved at the temperature corresponding to the second phasetransition peak detected by DSC (around 119 8C; see Table 4). Insummary, the FTIR analysis indicates that for this S-layer proteinthe major secondary structure rearrangements leading to dena-turation took place at the first phase transition.
It is interesting to note that compared to the S-layer protein of L.
brevis ATCC 8287 (no a-helix contents), the protein of the L kefir
CIDCA 8321 strain shows a considerably smaller increase ofintermolecular b-sheet structures upon aggregation. Indeed, it hasbeen found to be common that proteins with larger content of a-helix structure are less prone to the formation of b-sheet typeaggregates [12,49]. This has been considered to be a consequenceof the larger dipole moment of a-helices when compared tointramolecular b-sheet structures, thus, making intermolecularinteractions through the a-helix energetically more favorable.
The analysis of the dependence of the FTIR spectra withtemperature performed on the S-layer extracted from the non-aggregative strain L. kefir CIDCA 8344 (Fig. 8) reveals that the majorstructural changes for this protein (aggregation with increase inthe intermolecular b-sheet contents and disordering, at expensesof both a-helix and intramolecular b-sheets structures) take placeat ca. 70 8C (Fig. 8), i.e., close to its phase transition detected by DSC.This phase transition is clearly correlatable with the first phasetransition observed for all the other L. kefir S-layer proteinsinvestigated. Then, at least regarding this point, the S-layerproteins show a similar behavior regardless they are aggregative ornon-aggregative. The slightly higher phase transition temperatureobserved for the non-aggregative S-layer proteins when comparedwith the aggregative ones might be related with its increasedcontents of b-sheet structures (see Table 3), in consonance withprevious results published for other proteins [50,51]. This is also inagreement with the fact that it is precisely the L. brevis S-layerprotein, where a-helix structures are not present and b-sheetstructures reach a maximum of importance among the investi-
s resulting from Amide I band peak fitting in original FTIR spectra for lyophilized S-
(A) Intramolecular b-sheet (solid squares); no-ordered structures (open triangles);

Fig. 8. Dependence with temperature of the relative areas of individual component bands resulting from Amide I band peak fitting in original FTIR spectra for lyophilized S-
layer proteins from L. kefir 8344. Results for the following component bands are shown. (A) Intramolecular b-sheet (solid squares); no-ordered structures (open triangles); (B)
a-helix (solid circles); intermolecular b-sheet (open squares).
P. Mobili et al. / Vibrational Spectroscopy 50 (2009) 68–7776
gated proteins, the one that was found to be more resistant to thethermal treatment.
4. Conclusion
FTIR spectroscopy was used for the study of the secondarystructure of S-layer proteins from lactobacilli. A high content of b-sheet structure (50.2%) with no a-helix structures was found for L.
brevis S-layer proteins, in good agreement with predictions basedon its primary structure (b-sheet ranging from 44.4 [45] to 55.6%[44]; a-helix 0%). Characterization of the secondary structures ofthe L. kefir S-layer proteins was undertaken as for those of the L.
brevis strain. It was found that the relative amounts of the differentstructural elements of the secondary structure of the investigatedS-layers proteins could be correlated with the surface properties ofthe corresponding strains, previously determined in our labora-tories [8]. A larger content of b-sheet structures was found for theS-layer proteins of the studied non-aggregating L. kefir strains andL. brevis.
Thermal analysis of the proteins carried out by FTIR spectro-scopy allowed the assignment of most significant changes in theirsecondary structures at the phase transition temperaturesmeasured by DSC. The FTIR spectra obtained as a function oftemperature clearly revealed an increase in the unordered and b-sheet intermolecular structures at expenses of b-sheet intramo-lecular structures (which dominate the secondary structure at thelowest temperatures) with temperature increase. These trends arein agreement with the expected protein association and disorder-ing upon denaturation. In addition, it was also found that,regardless they correspond to aggregative or non-aggregativelactobacilli strains, all investigated S-layer proteins experimentmajor secondary structure reorganization at a temperature thatcan be roughly correlated with the amount of b-sheet they contain.Thus, the slightly higher phase transition temperature observed forthe non-aggregative S-layer proteins when compared with theaggregative ones might be related with its increased contents of b-sheet structures, the L. brevis S-layer protein, where a-helixstructures are not present and b-sheet structures reach amaximum of importance among the investigated proteins,corresponding to the thermally more resistant protein.
Acknowledgements
This work was supported by FCT (Projects POCTI/QUI/59019/2004 and POCTI/QUI/58937/2004), Instituto de Investigacao Inter-
disciplinar of the University of Coimbra (Project III/BIO/40/2005),Agencia Nacional de Promocion Cientıfica y Tecnologica (ProjectPICT/2006/68), Dupont-Conicet Prize 2005 and MinCyT-FCT (Pro-ject: ‘‘Chemical and functional characterization of S-layer proteins from
Lactobacillus kefir’’). AGZ is member of the research career CONICET(National Research Council, Argentina). GDA is member of theresearch career CIC-PBA (Commission for Scientific Research,Buenos Aires). P.M. acknowledges the Program Alban, the EuropeanUnion Program of High Level Scholarships for Latin America,scholarship no. E06D102040AR and CONICET. Cyted Program(Science and Technology for the Development) 108RT0362.
References
[1] G. Vidgren, I. Palva, R. Pakkanen, K. Lounatmaa, A. Palva, J. Bacteriol. 174 (1992)7419.
[2] A. Zourari, E.M. Anifantakis, Le Lait. 68 (1988) 373.[3] V.M. Marshall, J. Soc. Dairy Technol. 46 (1993) 49.[4] G.L. Garrote, A.G. Abraham, G.L. De Antoni, Lebensm -Wiss. u. -Technol. 30 (1997)
77.[5] G.L. Garrote, A.G. Abraham, G.L. De Antoni, J. Dairy Res. 68 (2001) 639.[6] U.B. Sleytr, T.J. Beveridge, Trends Microbiol. 7 (1999) 253.[7] M. Sara, U.B. Sleytr, J. Bacteriol. 182 (2000) 859.[8] G.L. Garrote, L. Delfederico, R. Bibiloni, A.G. Abraham, P.F. Perez, L. Semorile, G.L.
De Antoni, J. Dairy Res. 71 (2004) 222.[9] M. Kahala, K. Savijoki, A. Palva, J. Bacteriol. 179 (1997) 284.
[10] A. Dong, P. Huang, W.S. Caughey, Biochemistry 29 (1990) 3303.[11] N. Takeda, M. Kato, Y. Taniguchi, Biochemistry 34 (1995) 5980.[12] S. Matheus, W. Friess, H.Chr. Mahler, Pharm. Res. 23 (2006) 1350.[13] J. Xie, C. Riley, M. Kumar, K. Chittur, Biomaterials 23 (2002) 3609.[14] K. Chittur, Biomaterials 19 (1998) 357.[15] S.-S. Cheng, K. Chittur, Ch. Krishnan, L.A. Sukenik, K. Culp, J. Lewandowska, Colloid
Interf. Sci. 162 (1994) 135.[16] W.-J. Yang, P.R. Griffiths, D. Michael Byler, H. Susi, Appl. Spectrosc. 39 (1985) 282.[17] D.M. Byler, H. Susi, Biopolymers 25 (1986) 469.[18] H. Susi, D.M. Byler, Appl. Spectrosc. 42 (1988) 819.[19] B.C. Smith, Fundamentals of Fourier Transform Infrared Spectroscopy, CRC Press,
Boca Raton, FL, 1996.[20] J.K. Kauppinen, D.J. Moffatt, H.H. Mantsch, D.G. Cameron, Appl. Spectrosc. 35
(1986) 271.[21] D.G. Cameron, D.J. Moffatt, J. Test. Eval. JTEVA 12 (1984) 78.[22] H.R. Costantino, K.G. Carrasquillo, R.A. Cordero, M. Mumenthaler, C.C. Hsu, K.
Griebenow, J. Pharm. Sci. 87 (1998) 1412.[23] H. Torii, M. Tasumi, in: H. Mantsch, D. Chapman (Eds.), Infrared Spectroscopy of
Biomolecules, Wiley-Liss Inc., MA, USA, 1996, , pp. 1–18, Chapter 1.[24] K. Murayama, M. Tomida, Biochemistry 43 (2004) 11526.[25] A. Lupas, H. Engelhardt, J. Peters, U. Santarius, S. Volker, W. Baumeister, J.
Bacteriol. 176 (1994) 1224.[26] K. Fahmy, M. Merroun, K. Pollmann, J. Raff, O. Savchuk, Biophys. J. 91 (2006) 996.[27] J.C. de Man, M. Rogosa, M.E. Sharpe, J. Appl. Bacteriol. 23 (1960) 130.[28] G.L. Garrote, M.A. Serradell, A.G. Abraham, M.C. Anon, C.A. Fossati, G.L. De Antoni,
Food Agric. Immunol. 16 (2005) 221–233.[29] M. van de Weert, P.I. Haris, W.E. Hennink, D.J. Crommelin, Anal. Biochem. 297
(2001) 160.
P. Mobili et al. / Vibrational Spectroscopy 50 (2009) 68–77 77
[30] P.O. Souillac, C.R. Middaugh, J.H. Rytting, Int. J. Pharm. 235 (2002) 207.[31] R. Sokal, C. Michener, Univ. Kansas Sci. Bull. 38 (1958) 1409.[32] A. Gomez-Zavaglia, A. Abraham, S. Giorgieri, G.L. De Antoni, J Dairy Sci. 82 (1999)
870.[33] P.J. De Urraza, A. Gomez-Zavaglia, M.E. Lozano, V. Romanowski, G.L. De Antoni, J.
Dairy Res. 67 (2000) 381.[34] A. Gomez-Zavaglia, G. Kociubinski, P. Perez, G.L. De Antoni, J. Food Protect. 61
(1998) 865.[35] R. Sabbah, A. Xu-Lou, J.S. Chickos, M.L.P. Leitao, M.V. Roux, L.A. Torres, Thermo-
chim. Acta 331 (1999) 93.[36] P.F. Perez, J. Minnaard, E.A. Disalvo, G.L. De Antoni, Appl. Environ. Microbiol. 64
(1998) 21.[37] B. Kos, J. Suskovic, S. Vukovic, M. Simpraga, J. Frece, S. Matosic, J. Appl. Microbiol.
94 (2003) 981.[38] M.A. Golowczyc, P. Mobili, G.L. Garrote, A.G. Abraham, G.L. De Antoni, Int. J. Food
Microbiol. 118 (2007) 264.[39] B. Dziuba, A. Babuchowski, D. Nałecz, M. Niklewicz, Int. Dairy J. 17 (2007) 183.[40] A. Bosch, M.A. Golowczyc, A.G. Abraham, G.L. Garrote, G.L. De Antoni, O. Yantorno,
Int. J. Food Microbiol. 111 (2006) 280.
[41] N. Thomas, R. Goodacre, E.M. Timmins, M. Gaudoin, R. Fleming, Hum. Reprod. 15(2000) 1667.
[42] A. Salman, J. Ramesh, V. Erukhimovitch, M. Talyshinsky, Sh. Mordechai, M.Huleihel, J. Biochem. Biophys. Meth. 55 (2003) 141.
[43] P. Lasch, W. Haensch, E.N. Lewis, L.H. Kidder, D. Naumann, Appl. Spectrosc. 56(2002) 1.
[44] B. Rost, C. Sander, J. Mol. Biol. 232 (1993) 584 (http://www.predictprotein.org).[45] V. Brendel, P. Bucher, I.R. Nourbakhsh, B.E. Blaisdell, S. Karlin, Proc. Natl. Acad. Sci.
U.S.A. 89 (1992) 2002.[46] S.J. Sillanpaa, B. Martınez, J. Antikainen, T. Toba, N. Kalkkinen, S. Tankka, K.
Lounatmaa, J. Keranen, M. Hook, B. Westerlund-Wikstrom, P.H. Pouwels, T.K.Korhonen, J. Bacteriol. 182 (2000) 6440.
[47] M. Ventura, I. Jankovic, D.C. Walker, R.D. Pridmore, R. Zink, Appl. Environ.Microbiol. 68 (2002) 6172.
[48] S. Avall-Jaaskelainen, A. Palva, FEMS Microbiol. Rev. 29 (2005) 511.[49] E. Querol, J.A. Perez-Pons, A. Mozo-Villarias, Protein Eng. 9 (1996) 265.[50] H. Zhang, Y. Ishikawa, Y. Yamamoto, R. Carpentier, FEBS Lett. 426 (1998) 347.[51] E.N. Baker, R.E. Hubbard, Prog. Biophys. Mol. Biol. 44 (1984) 97.