FTIR experiment CHM 571
12
Abstract In this experiment, we carried out an experiment which involves Fourier Transform Infrared (FTIR) Spectroscopy. IR is used to gather information about compound's structure, assess its purity, and sometimes to identify it. Infrared radiation is that part of the electromagnetic spectrum between the visible and microwave regions. Infrared radiation is absorbed by organic molecules and converted into energy of molecular vibration, either stretching or bending. Different types of bonds, and thus different functional groups, absorb infrared radiation of different wavelengths. An IR spectrum is a plot of wavenumber (X-axis) vs percent transmittance (Y-axis). Provided with the materials which consist of (paraffin oil, acetophenone and toloune) liquid form and caffeine (solid form), these samples will undergo spectroscopy using the FTIR machine which is called Perkin Elmer Spectrum One FTIR, which is manually conducted by using a computer interconnected to the FTIR machine. The machine will “scan” show the stretching and bending frequency bands of the functional groups where the result from the machine will be printed out. Depending on which functional group does the IR absorption belongs to, it will show different types of wavenumbers depending on which stretching and bending frequency bands they are categorized at the table. By using the IR spectra of the known compound, we will find out what is the unknown compound where we are going to compare the stretching and bending
-
Upload
independent -
Category
Documents
-
view
0 -
download
0
Transcript of FTIR experiment CHM 571

Abstract
In this experiment, we carried out an experiment which involves
Fourier Transform Infrared (FTIR) Spectroscopy. IR is used to
gather information about compound's structure, assess its purity,
and sometimes to identify it. Infrared radiation is that part of
the electromagnetic spectrum between the visible and microwave
regions. Infrared radiation is absorbed by organic molecules and
converted into energy of molecular vibration, either stretching
or bending. Different types of bonds, and thus different
functional groups, absorb infrared radiation of different
wavelengths. An IR spectrum is a plot of wavenumber (X-axis) vs
percent transmittance (Y-axis). Provided with the materials which
consist of (paraffin oil, acetophenone and toloune) liquid form
and caffeine (solid form), these samples will undergo
spectroscopy using the FTIR machine which is called Perkin Elmer
Spectrum One FTIR, which is manually conducted by using a
computer interconnected to the FTIR machine. The machine will
“scan” show the stretching and bending frequency bands of the
functional groups where the result from the machine will be
printed out. Depending on which functional group does the IR
absorption belongs to, it will show different types of
wavenumbers depending on which stretching and bending frequency
bands they are categorized at the table. By using the IR spectra
of the known compound, we will find out what is the unknown
compound where we are going to compare the stretching and bending
frequency bands of the functional groups. Through this experiment
result it is proven that the unknown sample is Ethanol.
Hypothesis
The unknown sample is from alcohol group which is ethanol and it
is not oleic acid.
Experimental Procedure
The instrument was calibrated using a standard polystyrene film
and the sample was prepared and the spectrum of each compound was
obtained and recorded.
Procedure
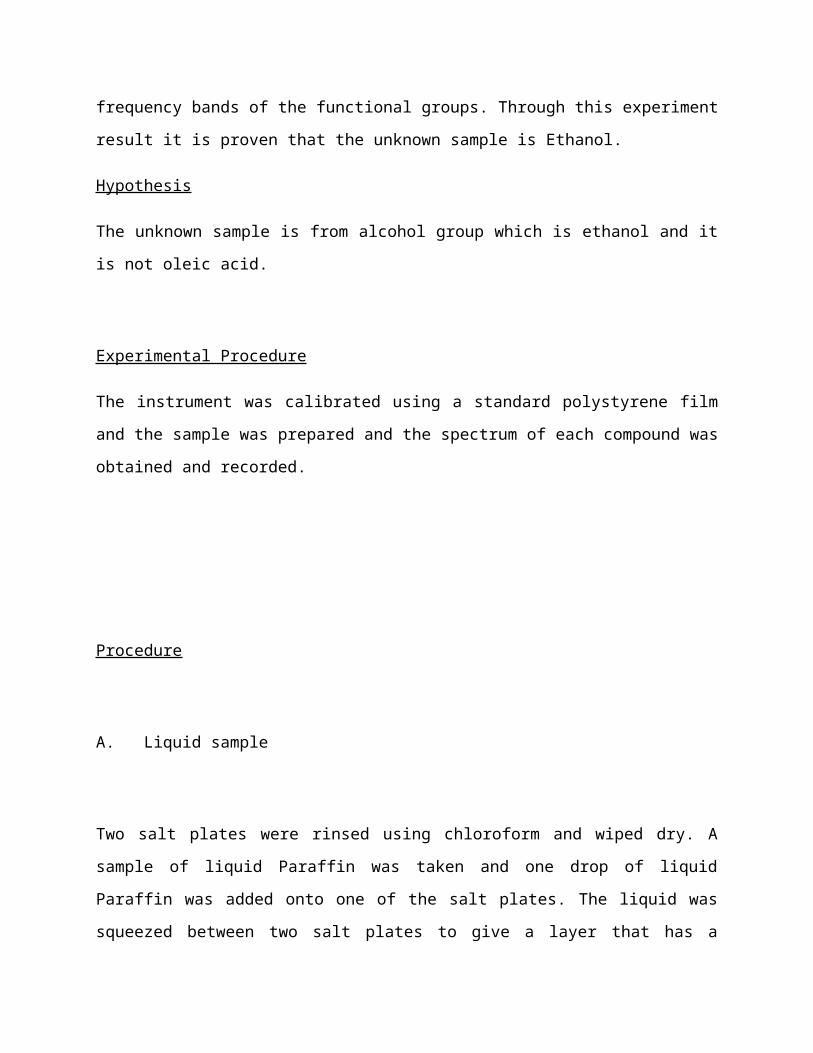
A. Liquid sample
Two salt plates were rinsed using chloroform and wiped dry. A
sample of liquid Paraffin was taken and one drop of liquid
Paraffin was added onto one of the salt plates. The liquid was
squeezed between two salt plates to give a layer that has a

thickness of 0.01mm or less. The two plates, held together by
capillary action were then mounted in the beam path of the
spectrophotometer. The results were printed as a graph. The steps
above were repeated for another two more samples which are
acetophenone and toluene.
B. Potassium bromide, KBr pellets for solid sample
Figure 1: KBr handpress
Approximately 1mg of Caffeine solid sample was ground until they
form fine powder. A few milligrams of KBr were added and the
mixture was ground again where the ratio needs to be in the form
of 1:9. To make the KBr pellet, the die pin from the storage
container, as shown in figure 1, was removed. The collar was
placed on the lower anvil. Powdered KBr was then placed in the
collar until all the surface of the lower anvil was covered
evenly. After that, the upper anvil was placed so that it came
into contact with the sample. The hand press was held in upright
position. The handle was lifted and the pressure dial at the top
of the press was rotated counter clockwise one revolution from
full clockwise position. The die set was then carefully placed in
the hand press. To close the handle, the pressure dial was
rotated clockwise until the upper ram of the handpress touched
the upper anvil of the die assembly. The handle was opened and
the dial was rotated clockwise three to five times. After about
20 seconds, open the KBr handpress and the pellet infrared
spectrum were measured. Afterwards, the pellet was removed from
the collar and the entire die set was stored back into the
desiccator.
Results
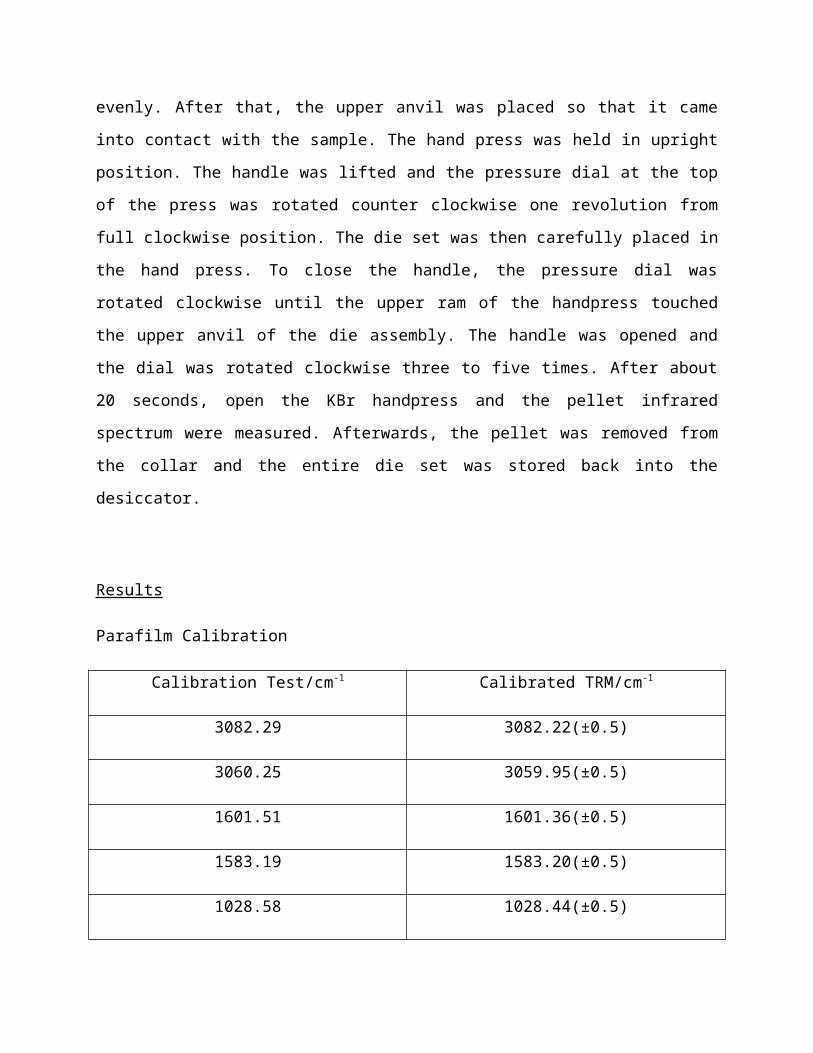
Parafilm Calibration
Calibration Test/cm-1 Calibrated TRM/cm-1
3082.29 3082.22(±0.5)
3060.25 3059.95(±0.5)
1601.51 1601.36(±0.5)
1583.19 1583.20(±0.5)
1028.58 1028.44(±0.5)
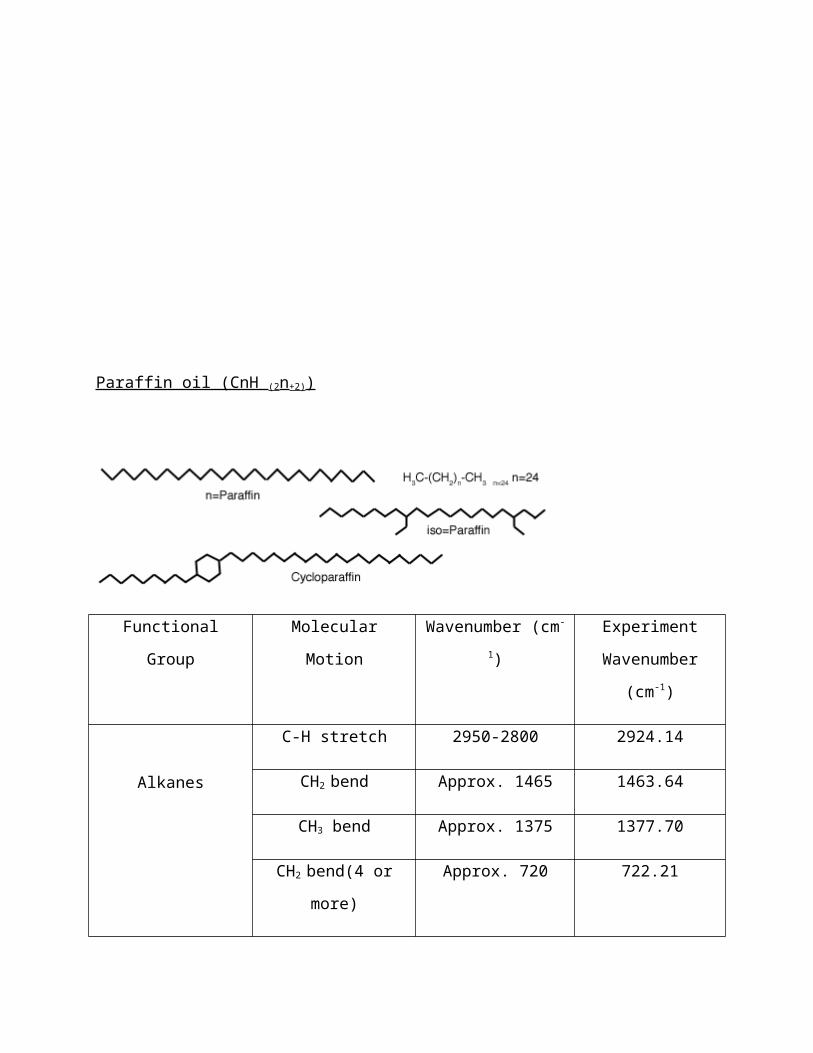
Paraffin oil (CnH (2n+2))
Functional
Group
Molecular
Motion
Wavenumber (cm-
1)
Experiment
Wavenumber
(cm-1)
Alkanes
C-H stretch 2950-2800 2924.14
CH2 bend Approx. 1465 1463.64
CH3 bend Approx. 1375 1377.70
CH2 bend(4 or
more)
Approx. 720 722.21
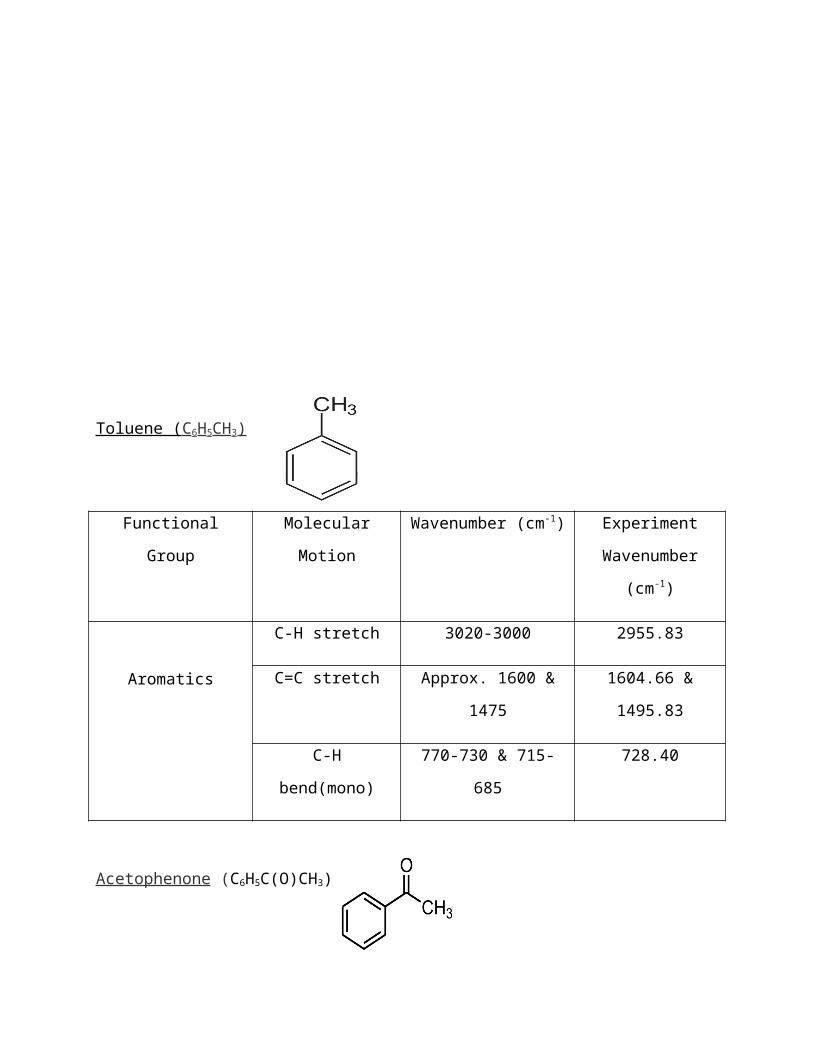
Toluene ( C 6H5CH3)
Functional
Group
Molecular
Motion
Wavenumber (cm-1) Experiment
Wavenumber
(cm-1)
Aromatics
C-H stretch 3020-3000 2955.83
C=C stretch Approx. 1600 &
1475
1604.66 &
1495.83
C-H
bend(mono)
770-730 & 715-
685
728.40
Acetophenone (C6H5C(O)CH3)
Functional
Group
Molecular
Motion
Wavenumber (cm-1) Experiment
Wavenumber
(cm-1)
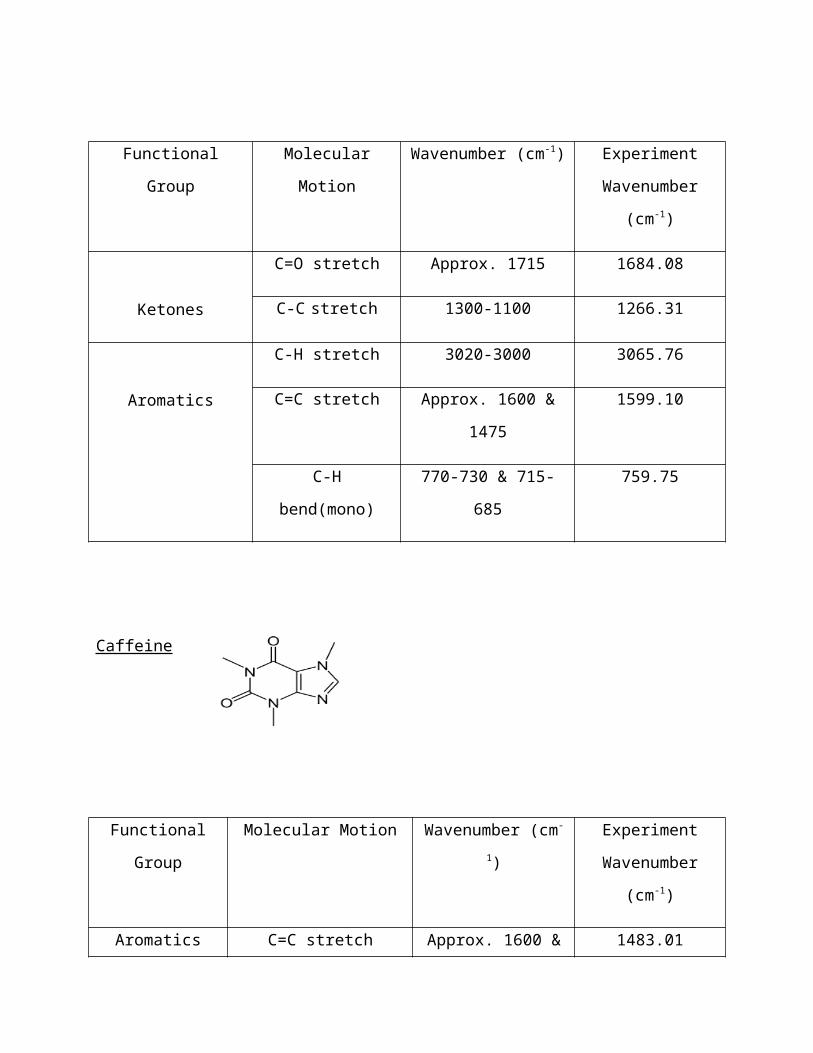
Ketones
C=O stretch Approx. 1715 1684.08
C-C stretch 1300-1100 1266.31
Aromatics
C-H stretch 3020-3000 3065.76
C=C stretch Approx. 1600 &
1475
1599.10
C-H
bend(mono)
770-730 & 715-
685
759.75
Caffeine
Functional
Group
Molecular Motion Wavenumber (cm-
1)
Experiment
Wavenumber
(cm-1)
Aromatics C=C stretch Approx. 1600 & 1483.01
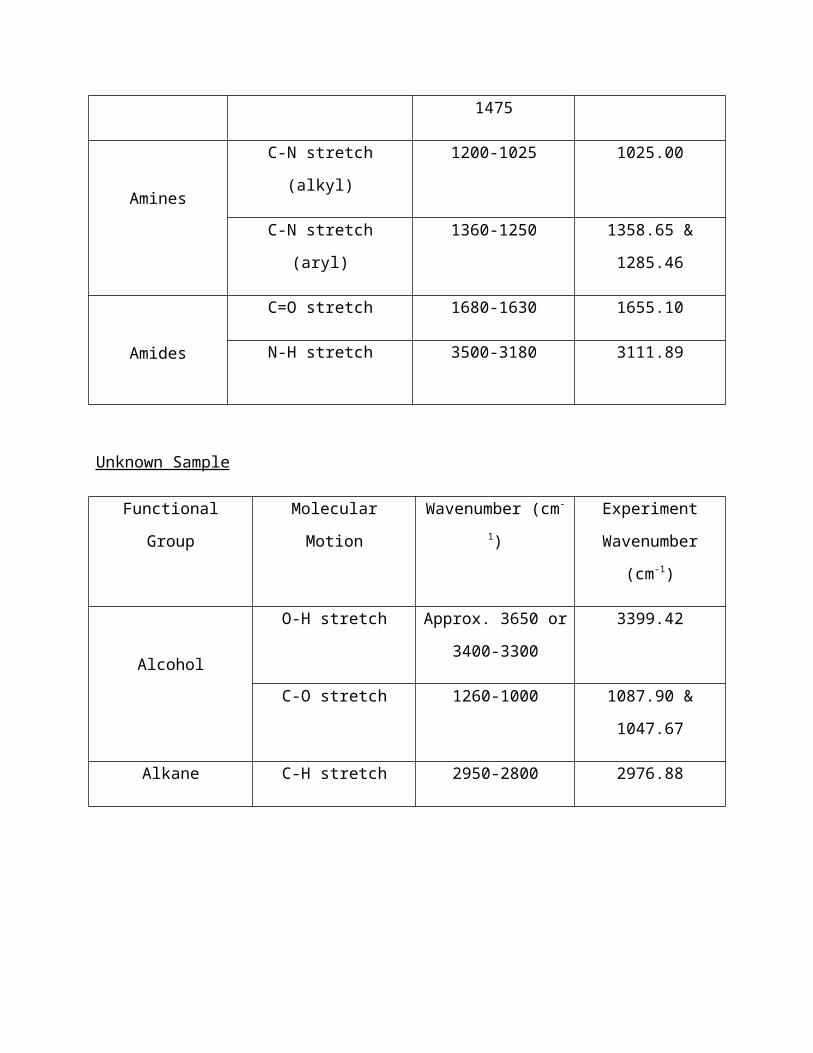
1475
Amines
C-N stretch
(alkyl)
1200-1025 1025.00
C-N stretch
(aryl)
1360-1250 1358.65 &
1285.46
Amides
C=O stretch 1680-1630 1655.10
N-H stretch 3500-3180 3111.89
Unknown Sample
Functional
Group
Molecular
Motion
Wavenumber (cm-
1)
Experiment
Wavenumber
(cm-1)
Alcohol
O-H stretch Approx. 3650 or
3400-3300
3399.42
C-O stretch 1260-1000 1087.90 &
1047.67
Alkane C-H stretch 2950-2800 2976.88
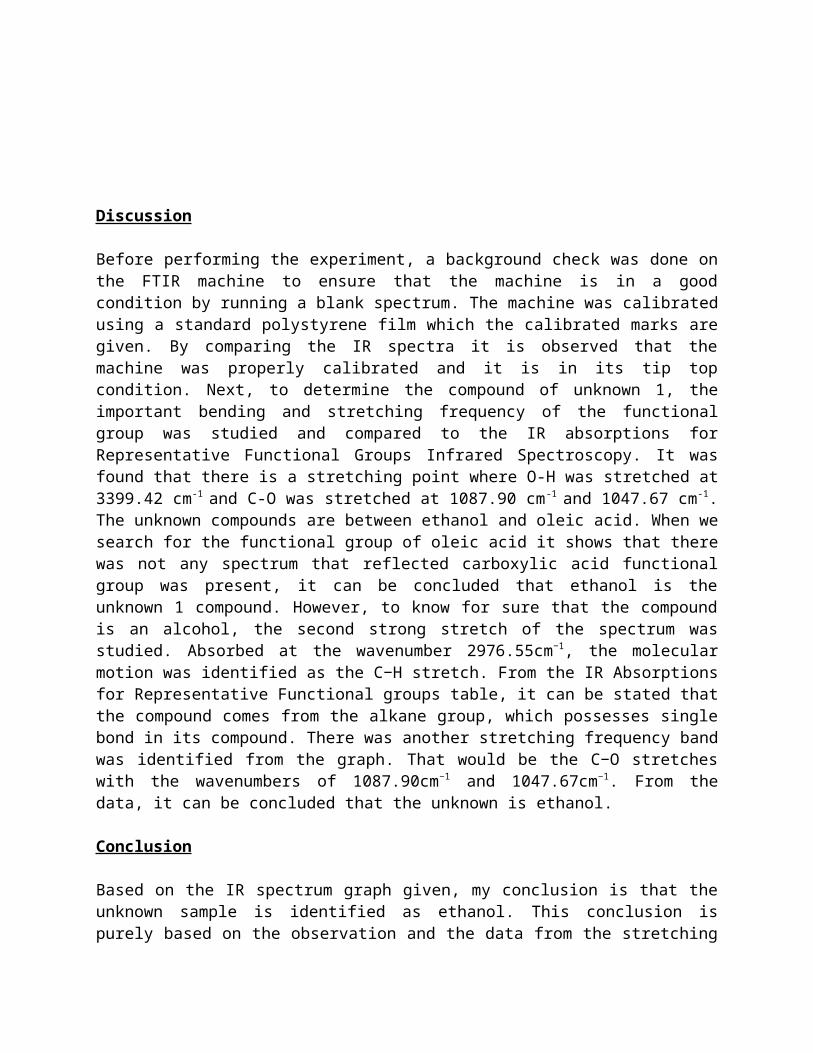
Discussion
Before performing the experiment, a background check was done onthe FTIR machine to ensure that the machine is in a goodcondition by running a blank spectrum. The machine was calibratedusing a standard polystyrene film which the calibrated marks aregiven. By comparing the IR spectra it is observed that themachine was properly calibrated and it is in its tip topcondition. Next, to determine the compound of unknown 1, theimportant bending and stretching frequency of the functionalgroup was studied and compared to the IR absorptions forRepresentative Functional Groups Infrared Spectroscopy. It wasfound that there is a stretching point where O-H was stretched at3399.42 cm-1 and C-O was stretched at 1087.90 cm-1 and 1047.67 cm-1.The unknown compounds are between ethanol and oleic acid. When wesearch for the functional group of oleic acid it shows that therewas not any spectrum that reflected carboxylic acid functionalgroup was present, it can be concluded that ethanol is theunknown 1 compound. However, to know for sure that the compoundis an alcohol, the second strong stretch of the spectrum wasstudied. Absorbed at the wavenumber 2976.55cm−1, the molecularmotion was identified as the C−H stretch. From the IR Absorptionsfor Representative Functional groups table, it can be stated thatthe compound comes from the alkane group, which possesses singlebond in its compound. There was another stretching frequency bandwas identified from the graph. That would be the C−O stretcheswith the wavenumbers of 1087.90cm−1 and 1047.67cm−1. From thedata, it can be concluded that the unknown is ethanol.
Conclusion
Based on the IR spectrum graph given, my conclusion is that theunknown sample is identified as ethanol. This conclusion ispurely based on the observation and the data from the stretching
frequency bands in the graph, where the absorbed wavenumbersshowed the presence of alcohol and alkane functional groups.
Reference
1. <IR Absorptions Table for Representative Functional Groups>
http://www.instruction.greenriver.edu/kmarr/chem%20162/Chem1
62%20Labs/Interpreting%20IR%20Spectra/IR%20Absorptions%20for
%20Functional%20Groups.htm
2. D. L. Pavia, G. M. Lampman, G. S. Kriz, J. R Vyvyan (2001).
Introduction to Spectroscopy, Fourth Edition. USA;
Department of Chemistry Western Washington.

Experiment 1
Fourier Transform Infrared (FTIR) Spectroscopy
Prepared byChurchill Nyalong Anak David Kennedy
2012995615AS229 2C
Prepared forPn. Zarila Mohd. Shariff
Group members1. Nursabrina Binti Samsudin2. Muhammad Hazim Bin Zahid
Date of experiment performed19th September 2013
Date of submission26th September 2013