Interaction of CO with α-Cr2O3 surface: a FTIR and HRTEM study
14
Chemical Physics 177 (1993) 547-560 North-Holland Interaction of CO with a-Cr203 surface: a FTIR and HRTEM study Domenica Scarano, Adrian0 Zecchina *, Silvia Bordiga, Gabriele Ricchiardi and Giuseppe Spoto Dipartimento di ChimicaInorganica, Chimica Fisica e Chimica dei Materiali dell’Universitd di Torino, ViaPietroGiuria 7, I-10125 Turin, Italy Received 4 May 1993 Microcrystals of a-CrzOp sintered at high temperature are single crystals with a well defined habit. By means of HRTEM and computer graphics techniques the indexes and the structure of the most frequently exposed (01 i2), (2 116) and ( 1120) faces are determined. The IR spectra of CO adsorbed on them show that the interaction is electrostatic in nature and that also a c charge transfer to the substrate may contribute to the detected adsorption-induced blue-shift of the CO frequency. Furthermore a small d-r overlap contribution (primarly affecting the dynamic polarizability ) is present for CO adsorbed on live-fold coordinated CP+sitesofthe (Oli2)and(2116)faces. 1. Introduction Real surfaces (such as those encountered in high surface area catalytic materials) are highly disor- dered because they are constituted by several crystal- lographic planes containing a high concentration of steps, kinks, edges and corners and other defects in- terrupting any bidimensional regularity. The characterization of these surfaces by means of physical methods is consequently quite troublesome. Similarly the precise characterization (so important for the understanding of the catalytic processes) of the structure of the species formed when a reactive gas interacts with such ill defined surfaces, represents a difficult task. These difftculties are not encountered when flat single crystal surfaces are studied: this typically sur- face science approach has proved its invaluable util- ity especially on metals, where HREELS and RAIRS have been successfully applied to characterize the vi- brational modes of adsorbed species (mostly CO) and their dependence upon coverage [ 1,2 1. The compar- ison of these spectroscopic results with those ob- tained on finely divided metals supported on oxides * Corresponding author. and with the vibrational spectra of homogeneous an- alogues (i.e. inorganic complexes of well defined structure and stoichiometry, containing the same li- gands) has allowed one to bridge different areas and to understand more deeply the complex vibrational manifestations of the species formed at the surface of small metal particles with nanometer and subnano- meter dimensions [ 3,4 1. Unfortunately the same procedure cannot be ex- tended to finely divided oxides, especially because the HREELS and RAIRS studies on the single crystal counterparts are often not yet available owing to the experimental difficulties associated with the insulat- ing character of these solids. A way to overcome this problem was the use of thin single crystalline oxide films, grown by oxidation on top of metallic substrates: in fact such films do not tend to charge, if they are not too thick (see ref. [ 5 ] and references therein). Another approach to this goal was to rely on data obtained from severely sintered oxides, provided that their morphology (i.e. the type and the extension of the exposed facelets) is accurately known by means of high resolution electron microscopy (whose key role is evident ) . Once the IR spectra of species adsorbed on sam- 0301-0104/93/$06.00 0 1993 Elsevier Science Publishers B.V. All rights reserved.
Transcript of Interaction of CO with α-Cr2O3 surface: a FTIR and HRTEM study

Chemical Physics 177 (1993) 547-560 North-Holland
Interaction of CO with a-Cr203 surface: a FTIR and HRTEM study
Domenica Scarano, Adrian0 Zecchina *, Silvia Bordiga, Gabriele Ricchiardi and Giuseppe Spoto Dipartimento di Chimica Inorganica, Chimica Fisica e Chimica dei Materiali dell’Universitd di Torino, Via Pietro Giuria 7, I-10125 Turin, Italy
Received 4 May 1993
Microcrystals of a-CrzOp sintered at high temperature are single crystals with a well defined habit. By means of HRTEM and computer graphics techniques the indexes and the structure of the most frequently exposed (01 i2), (2 116) and ( 1120) faces are determined. The IR spectra of CO adsorbed on them show that the interaction is electrostatic in nature and that also a c charge transfer to the substrate may contribute to the detected adsorption-induced blue-shift of the CO frequency. Furthermore a small d-r overlap contribution (primarly affecting the dynamic polarizability ) is present for CO adsorbed on live-fold coordinated CP+sitesofthe (Oli2)and(2116)faces.
1. Introduction
Real surfaces (such as those encountered in high surface area catalytic materials) are highly disor- dered because they are constituted by several crystal- lographic planes containing a high concentration of steps, kinks, edges and corners and other defects in- terrupting any bidimensional regularity.
The characterization of these surfaces by means of physical methods is consequently quite troublesome. Similarly the precise characterization (so important for the understanding of the catalytic processes) of the structure of the species formed when a reactive gas interacts with such ill defined surfaces, represents a difficult task.
These difftculties are not encountered when flat single crystal surfaces are studied: this typically sur- face science approach has proved its invaluable util- ity especially on metals, where HREELS and RAIRS have been successfully applied to characterize the vi- brational modes of adsorbed species (mostly CO) and their dependence upon coverage [ 1,2 1. The compar- ison of these spectroscopic results with those ob- tained on finely divided metals supported on oxides
* Corresponding author.
and with the vibrational spectra of homogeneous an- alogues (i.e. inorganic complexes of well defined structure and stoichiometry, containing the same li- gands) has allowed one to bridge different areas and to understand more deeply the complex vibrational manifestations of the species formed at the surface of small metal particles with nanometer and subnano- meter dimensions [ 3,4 1.
Unfortunately the same procedure cannot be ex- tended to finely divided oxides, especially because the HREELS and RAIRS studies on the single crystal counterparts are often not yet available owing to the experimental difficulties associated with the insulat- ing character of these solids.
A way to overcome this problem was the use of thin single crystalline oxide films, grown by oxidation on top of metallic substrates: in fact such films do not tend to charge, if they are not too thick (see ref. [ 5 ] and references therein).
Another approach to this goal was to rely on data obtained from severely sintered oxides, provided that their morphology (i.e. the type and the extension of the exposed facelets) is accurately known by means of high resolution electron microscopy (whose key role is evident ) .
Once the IR spectra of species adsorbed on sam-
0301-0104/93/$06.00 0 1993 Elsevier Science Publishers B.V. All rights reserved.

548 D. Scarano et al. /Chemical Physics I77 (1993) 547-560
ples with well defined morphology are known and as- signed, it is (in principle) possible to proceed to- wards the assignment of the spectra of the species adsorbed on more disordered (but more significant from the catalytic point of view) solids.
This line of research has been followed in our lab- oratory for many years and has led to the interpreta- tion of the spectra of CO adsorbed on several oxidic systems like MgO [ 6 1, NiO [ 6,7 1, MgO-Co0 and MgO-NiO [S],ZnO [9,10],TiO, [11],Fez03 [12], AlzOs [ 131 and on halides like NaCl [ 6,141, KC1 [ 6,15 ] etc., both under sintered and highly dispersed form. This analysis has allowed us not only to under- stand and to clarify the nature of the CO-surface cat- ion bond (and the relative role of the electrostatic and overlap forces) but also to investigate the special reactivity of surface defects (particularly abundant on dispersed systems), in determining the properties of catalytic surfaces towards simple molecules. In this respect, it is worth underlining that extended sur- faces were found, in general terms, to be much less reactive than the defective ones.
Recent results obtained on NaCl single crystals [ 16,171 have confirmed the substantial correctness of the adopted procedure, even if the non-negligible role of residual defective situations (steps and kinks on extended faces) in determining the half width of the vibrational peaks of adsorbed species (CO), also on severely sintered specimens, has clearly emerged.
A similar line of research has been followed in the investigation of the surface properties of the a-Cr203/ CO system [ 1 g-201. However, the IR results ob- tained on microcrystalline a-Cr203 prepared by de- composition of ( NH4) &r207 [ 20 ] and by flame hy- drolysis of the chloride [ 2 1 ] gave different results. As both preparative routes give crystalline products, the only plausible explanation for these so divergent results is that samples prepared with different proce- dures have different morphologies and so expose dif- ferent proportions of surface planes.
Under such circumstances it became gradually ev- ident to us that a bigger effort was necessary for pre- paring samples with an absolutely defined morphology.
In this paper the procedure for preparing heavily sintered a-CrzOs samples is described in detail. The subsequent HRTEM investigation is accurately dis- cussed together with the modelling procedure for
simulating the crystallite morphology. The atomic structure of the most commonly exposed surfaces is then illustrated by means of computer graphics. On the basis of the knowledge gained of the type and structure of the adsorbing faces, the IR spectra of ad- sorbed CO at low temperature are discussed. The high utility of the sintered specimens as model solids for surface vibrational studies is testified by the remark- ably small half width of the CO stretching bands (which is the necessary consequence of the high reg- ularity of the exposed faces).
2. Experimental
a-CrzOs, used in these experiments (BET specific surface area 40-70 m* g- ’ ), was obtained by exo- thermic decomposition of (NH4)2Cr207, following the method described in ref. [ 201. Sintered samples were obtained by firing in air at 1273 K for 24 hours.
The polycrystalline material was compressed in the form of pellets, suitable for IR transmission measure- ments in a cell working at low temperature.
Before CO dosage, the pellet was first reduced for a few minutes in H2 at 673 K to decrease the oxygen excess and then outgassed at the same temperature to remove adsorbed water. The sample was finally acti- vated for 2 h at 973 K (or 1073 K) in vacuum (lo-’ Torr) to eliminate any other adsorbed impurity. The pellet was then cooled to liquid N2 temperature and CO dosed at the same temperature. Due to the heat- ing effect of the IR beam and to the insulating char- acter of a-Cr203, the temperature on the part of the pellet where the IR beam is impinging is estimated to be x lOOK.
The IR spectra, recorded in succession by progres- sively decreasing the CO coverage, were obtained with a Bruker IFS48 FTIR spectrometer. The resolution was 2 cm-‘.
The CO isotherms at 77 K show that the mono- layer capacity is 7.65 CO/ 100 A2 [ 201.
The structural characterization (both morpholog- ical and microstructural) was carried out by means of high resolution transmission electron microscopy (HRTEM) with a Jeol JEM 2000EX instrument equipped with a top entry stage. The samples for the HRTEM analysis were prepared by suspending the powder in isopropylic alcohol and by successively
D. Scarano et al. /Chemical Physics 177 (1993) 547-560 549
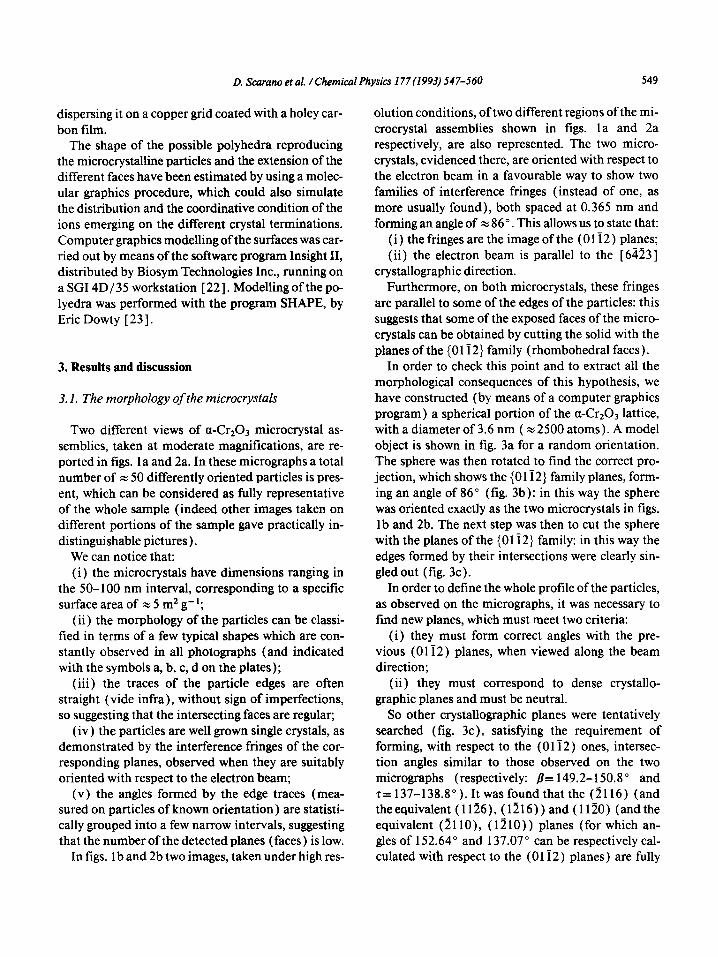
dispersing it on a copper grid coated with a holey car- bon film.
The shape of the possible polyhedra reproducing the microcrystalline particles and the extension of the different faces have been estimated by using a molec- ular graphics procedure, which could also simulate the distribution and the coordinative condition of the ions emerging on the different crystal terminations. Computer graphics modelling of the surfaces was car- ried out by means of the software program Insight II, distributed by Biosym Technologies Inc., running on a SGI 4D/35 workstation [ 22 1. Modelling of the po- lyedra was performed with the program SHAPE, by Eric Dowty [ 23 1.
3. Results and discussion
3.1. The morphology of the microcrystals
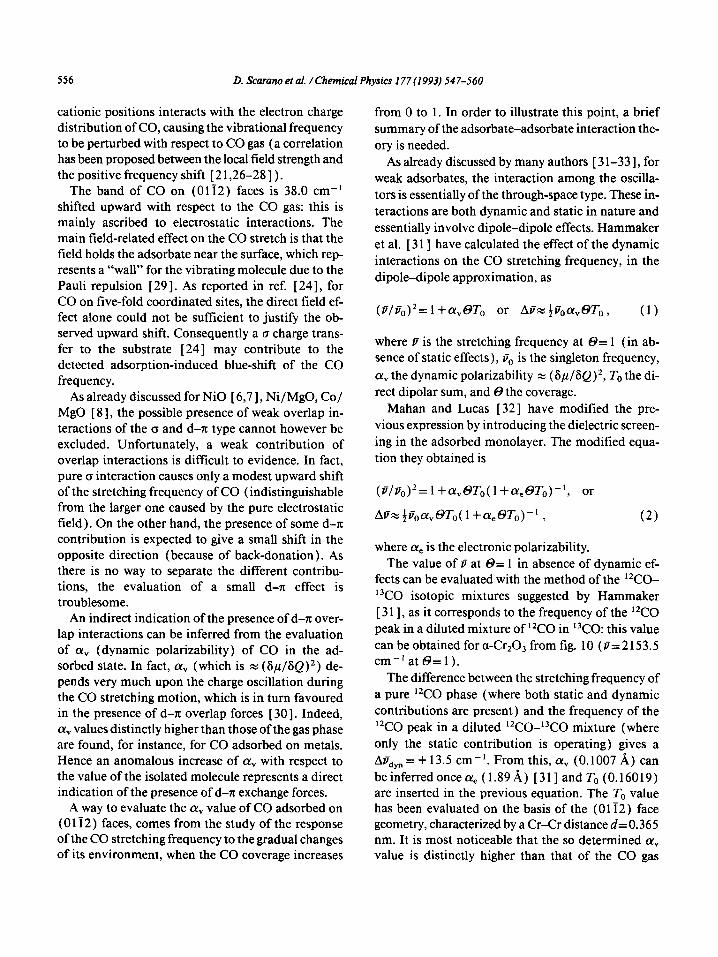
Two different views of a-CraOs microcrystal as- semblies, taken at moderate magnifications, are re- ported in figs. la and 2a. In these micrographs a total number of z 50 differently oriented particles is pres- ent, which can be considered as fully representative of the whole sample (indeed other images taken on different portions of the sample gave practically in- distinguishable pictures).
We can notice that: (i) the microcrystals have dimensions ranging in
the 50- 100 nm interval, corresponding to a specific surface area of z 5 m2 g-‘;
(ii) the morphology of the particles can be classi- fied in terms of a few typical shapes which are con- stantly observed in all photographs (and indicated with the symbols a, b, c, d on the plates);
(iii) the traces of the particle edges are often straight (vide infra), without sign of imperfections, so suggesting that the intersecting faces are regular;
(iv) the particles are well grown single crystals, as demonstrated by the interference fringes of the cor- responding planes, observed when they are suitably oriented with respect to the electron beam;
(v) the angles formed by the edge traces (mea- sured on particles of known orientation) are statisti- cally grouped into a few narrow intervals, suggesting that the number of the detected planes (faces) is low.
In figs. 1 b and 2b two images, taken under high res-
olution conditions, of two different regions of the mi- crocrystal assemblies shown in figs. la and 2a respectively, are also represented. The two micro- crystals, evidenced there, are oriented with respect to the electron beam in a favourable way to show two families of interference fringes (instead of one, as more usually found), both spaced at 0.365 nm and forming an angle of z 86 O. This allows us to state that:
(i ) the fringes are the image of the (0 1 i 2) planes; (ii) the electron beam is parallel to the [ 64231
crystallographic direction. Furthermore, on both microcrystals, these fringes
are parallel to some of the edges of the particles: this suggests that some of the exposed faces of the micro- crystals can be obtained by cutting the solid with the planes of the { 0 1 i 2) family (rhombohedral faces).
In order to check this point and to extract all the morphological consequences of this hypothesis, we have constructed (by means of a computer graphics program) a spherical portion of the a-Cr20s lattice, with a diameter of 3.6 nm ( z 2500 atoms). A model object is shown in fig. 3a for a random orientation. The sphere was then rotated to find the correct pro- jection, which shows the (01 i2) family planes, form- ing an angle of 86” (fig. 3b): in this way the sphere was oriented exactly as the two microcrystals in figs. lb and 2b. The next step was then to cut the sphere with the planes of the (01 f2) family: in this way the edges formed by their intersections were clearly sin- gled out (fig. 3~).
In order to define the whole profile of the particles, as observed on the micrographs, it was necessary to find new planes, which must meet two criteria:
(i) they must form correct angles with the pre- vious (01 i2) planes, when viewed along the beam direction;
(ii) they must correspond to dense crystallo- graphic planes and must be neutral.
So other crystallographic planes were tentatively searched (fig. 3c), satisfying the requirement of forming, with respect to the (0 1 i2) ones, intersec- tion angles similar to those observed on the two micrographs (respectively: /3= 149.2- 150.8’ and r= 137-138.8”). It was found that the (2116) (and theequivalent (1126) (1216))and(llZO) (andthe equivalent (2 1 lo), ( 12 10) ) planes (for which an- gles of 152.64” and 137.07” can be respectively cal- culated with respect to the (0112) planes) are fully

550 D. Scarano et al. /Chemical Physics 177 (1993) 54 7-560
Fig. 1. (a) Low resolution TEM image of a-Cr203 sample. (b ) High resolution TEM image of the particle shown in Fig. 1 a.

D. Scarano et al. /Chemical Physics 177 (1993) 547-560 551
Fig. 2. (a) Low resolution TEM image of a-Cr*O, sample. (b) High resolution TEM image of the particle shown in (a).
sufficient to describe the morphology of the two par- ticles under examination in high resolution conditions.
As a final consideration it is worth noticing that, in figs. lb and 2b, the edges formed by (01 i2) planes intersections are very straight, so indicating that the (0 1 i2 ) planes are regular and essentially defect-free. The same cannot be concluded for the other edges: this could signify that these faces are less flat and reg- ular (possibly because of some reconstruction phe- nomena). Electron microscopy however cannot be informative about this point.
A further proof of the existence of these surface These results do not agree with the previous hy- planes comes from the observation, on other micro- potheses, related to high surface area samples crystals, of the interference fringes belonging to the [ 19,201. For these samples the hypothesis was put
(2 116) and ( 1120) planes. Moreover, as these fringes were always oriented parallel to some of the particle edges (not those formed by the intersection of the (01 i2) planes, which are easily recognizable), this was considered as a further confirmation of the soundness of the whole picture.
The typical polyhedron generated from the sphere by means of the previously described procedure is shown in fig. 4.
This primary solid, characterized by an equivalent extension of the three families of faces, clearly does not give a realistic picture of the shapes of the micro- crystals shown in figs. la, lb and figs. 2a, 2b. Never- theless, new polyhedra can be generated from that of fig. 4 by simply changing the relative extension of the three families of planes (fig. 5 ).
In this way we have found that two shapes, derived by elongating the initial polyhedron in one (fig. 5, polyhedron 2) or two (fig. 5, polyhedron 1) direc- tions, can reasonably justify most of the profiles shown by the particles. In particular from fig. 6 the a, b, c and d type microcrystal shapes (oriented in dif- ferent ways) are clearly singled out: the a and b po- lyhedra represent the correct projection of the parti- cles along the interference fringe direction and reproduce exactly the angles between the edges of the profiles, like the particles in figs. lb and 2b. The c and d polyhedra, instead, are randomly oriented, like the corresponding microcrystals in figs. la and 2a (which consequently do not show plane fringes) and are still exactly reproducing the particle contours.
In conclusion of this detailed analysis we can state that sintered a-Cr,Os, prepared following the proce- dure described in the experimental section, is made of microcrystals exposing prevalently ( 0 1 i 2 ) faces and, to a lesser extent, (2 116 ) and ( 1120) faces.

552 D. Scarano et al. /Chemical Physics 177 (1993) 547-560
C-2 1 6) ,
(d
Fig. 3. (a) Spherical portion of a-Cr,Og lattice ( = 2500 atoms) randomly oriented. (b) Projection of a-Cr20s lattice along the direction of the interference fringes (see figs. I b and 2b). (c) Projection of a-CrzOs lattice with the traces of the intersecting planes.
forward, that the predominant faces should be the (000 1) basal ones: this resulted from the observation of the hexagonally shaped contours of the particles. On the basis of the previously described analysis, this hypothesis appears inadequate, because, on the one hand it was not based on the accurate analysis of the crossing plane fringes and on the other hand it was
made on high surface area (disordered) specimens, with less defined particle shape.
It should be mentioned, however, that the absence (at that time) of simulation methods was not making easy the determination of the morphology of the microcrystals.

D. Scarano et al. /Chemical Physics 177 (1993) 547-560 553
Fig. 4. Polyhedron with the indexed faces (the extension of the three families of faces is roughly equivalent).
Fig. 5. Polyhedra developed in one (2) and in two ( 1) elonga- tion directions.
3.2. The structure of the (01 T2), (2116) and (I 120) faces
The structure of these three families of faces, as ob- tained by simply cutting the crystal lattice (possible surface relaxation and reconstruction phenomena were not taken into account at this stage) is shown in figs. 7a, 7b and 7c.
Inspection of figs. 7a-7c indicates that:
d Fig. 6. Profiles of differently oriented polyhedra mimicking the particles in figs. la, 1 b and 2a, 2b. (a) Projection of the particle a as in fig. lb. (b) Projection of the particle b as in fig. 2b. (c) Profile of c-type particles as in figs. la and 2a. (d) Profile of d- type particles as in figs. la and 2a.
(i) rhombohedral (01 i2) faces are neutral and contain only equivalent five-fold coordinated Cr3+ ions. The Cr’+-Cr’+ distance is 0.365 nm, corre- sponding to 6.8 Cr/ 100 A2. The plane defined by the four oxygen atoms surrounding each Cr3+ ion does not coincide with the surface plane, indicating that not only is the surface slightly rumpled, but also that the direction, where the electric field associated with the positive charge is maximized, is not perpendicu- lar to the surface plane. On the basis of the electron microscopy results, it is concluded that these faces are predominant and (likely) stable;
(ii) the faces belonging to the (2116) family are neutral and contain four-fold and live-fold coordi- nated Cr3+ ions, aligned along parallel rows 0.365 nm apart. Within each line the four-fold and five-fold co- ordinated sites are disposed in pairs only 0.289 nm apart, while the distance between the pairs is 0.574 nm. The density of the sites is 7.65 Cr/lOO A2. The presence of four-fold coordinated ions indicates that this face is probably more reactive than the previous one. It is quite conceivable that under severe treat- ment conditions, it can relax giving new surface or- ganizations. As the local structures possibly present on such relaxed surfaces can only be discussed on the basis of a different approach (capable of considering explicitly surface reconstructions), they will not be considered here in detail;

554 D. Scarano et al. /Chemical Physics 177 (1993) 547-560
(a) b) (-2 1 1 6)
Fig. 7. (a) Arrangement ofCr3+ and 02- ions on (01 i2) faces. (b) Arrangement of Cr3+ and 02- ions on (2116) faces. (c) Arrange- ment of Cr3+ and O*- ions on ( 1120) faces.
(iii) the faces belonging to the { 1120) (prismatic) family are also neutral. The five-fold coordinated Cr ions are disposed along a row in pairs only 0.265 nm apart, while the distance between the pairs is 0.4 15 nm. The distance between sites belonging to adjacent
rows is 0.343 nm and 0.289 nm. The density is 10.88 Cr/lOO A*. As the Cr3+ f ions are greatly shielded by the oxygen ions (which are located at an upper 1eveI ) , this surface appears quite homopolar.

D. Scarano et al. /Chemical Physics I 77 (I 993) 54 7-560
3.3. The IR spectra of adsorbed 12C0 and “CO- 13C0 mixtures
3.3.1. CO on (01 i2) faces The typical spectra (in the 2200-2 100 cm- ’ range)
of increasing doses of 12C0 adsorbed on the same a- Cr203 sample, outgassed at 973 and 1073 K, are re- ported in figs. 8 and 9 respectively.
The two series of spectra are both characterized by the presence of a strong overwhelming peak initially observed at 218 1 cm-’ (for e-+0) and gradually moving toward 2 167 cm-’ for 8-, @,,,,. Simultane- ously the half width gradually changes from z 6 cm- ’ (8~0) to x 1.5 cm-’ (@= S,,,). The gradual shift of the peak is more clearly observed on samples
21670s
21725
2180 2160 2140 2120 2100 wavenumber cm-l
Fig. 8. FITR spectra of ‘*CO adsorbed at x 100 K on a sintered a-Cr203 sample (outgassed at 973 K).
555
I 01
2180 2160 2140 2120 2100 wavenumber cm”
Fig. 9. RIR spectra of 12C0 adsorbed at x 100 K on a sintered a-Cr203 sample (outgassed at 1073 K).
treated at 1073 K, because in this case the band is predominant and nearly isolated.
As this peak is by far the most important and con- stant feature of the spectra of CO on a-Cr20S, it is assigned to CO adsorbed on the (0 1 i 2) faces (which are the most abundant and stable).
The high intensity of this peak excludes an assign- ment to a CO species lying flat on the surface, as found forCOon (111) faces [5].
At 8x 0, the CO molecule, adsorbed in end-on form on five-fold coordinated Cr ions, is isolated (single- ton) and its stretching frequency is entirely deter- mined by the nature of the CO-surface bond.
The interaction of CO with the surface cations of oxides and halides is partially electrostatic in nature [ 24,25 1: the strong electrostatic field at the surface
556 D. Scarano et al. /Chemical Physics 177(1993) 547-560
cationic positions interacts with the electron charge distribution of CO, causing the vibrational frequency to be perturbed with respect to CO gas (a correlation has been proposed between the local field strength and the positive frequency shift [ 2 1,26-281).
The band of CO on (Oli2) faces is 38.0 cm-’ shifted upward with respect to the CO gas: this is mainly ascribed to electrostatic interactions. The main field-related effect on the CO stretch is that the field holds the adsorbate near the surface, which rep- resents a “wall” for the vibrating molecule due to the Pauli repulsion [ 291. As reported in ref. [ 241, for CO on live-fold coordinated sites, the direct field ef- fect alone could not be sufficient to justify the ob- served upward shift. Consequently a cr charge trans- fer to the substrate [24] may contribute to the detected adsorption-induced blue-shift of the CO frequency.
As already discussed for NiO [ 6,7 1, Ni/MgO, Co/ MgO [ 81, the possible presence of weak overlap in- teractions of the o and d-n type cannot however be excluded. Unfortunately, a weak contribution of overlap interactions is difficult to evidence. In fact, pure o interaction causes only a modest upward shift of the stretching frequency of CO (indistinguishable from the larger one caused by the pure electrostatic field). On the other hand, the presence of some d-x. contribution is expected to give a small shift in the opposite direction (because of back-donation). As there is no way to separate the different contribu- tions, the evaluation of a small d-x effect is troublesome.
An indirect indication of the presence of d--n over- lap interactions can be inferred from the evaluation of (Y, (dynamic polarizability) of CO in the ad- sorbed state. In fact, ay, (which is x (Sp/SQ)*) de- pends very much upon the charge oscillation during the CO stretching motion, which is in turn favoured in the presence of d-n overlap forces [ 301. Indeed, (Y, values distinctly higher than those of the gas phase are found, for instance, for CO adsorbed on metals. Hence an anomalous increase of (Y, with respect to the value of the isolated molecule represents a direct indication of the presence of d-x exchange forces.
A way to evaluate the (Y, value of CO adsorbed on (0112) faces, comes from the study of the response of the CO stretching frequency to the gradual changes of its environment, when the CO coverage increases
from 0 to 1. In order to illustrate this point, a brief
summary of the adsorbate-adsorbate interaction the-
ory is needed.
As already discussed by many authors [ 3 l-33 1, for
weak adsorbates, the interaction among the oscilla-
tors is essentially of the through-space type. These in-
teractions are both dynamic and static in nature and
essentially involve dipole-dipole effects. Hammaker
et al. [ 3 1 ] have calculated the effect of the dynamic
interactions on the CO stretching frequency, in the
dipole-dipole approximation, as
(ri/&)*= 1 +a,@T, or ABZ ttiOocr,BT,, , (1)
where B is the stretching frequency at 8= 1 (in ab- sence of static effects), F,, is the singleton frequency,
(Y, the dynamic polarizability x (Sp/SQ)*, T,, the di-
rect dipolar sum, and 8 the coverage.
Mahan and Lucas [ 321 have modified the pre-
vious expression by introducing the dielectric screen-
ing in the adsorbed monolayer. The modified equa-
tion they obtained is
(V/&o)‘=1 +a,@T,( 1 +a,6JTo)-', or
A~x&,,a,@T,,( 1 +a,@T,,-' , (2)
where (Y, is the electronic polarizability.
The value of B at @= 1 in absence of dynamic ef- fects can be evaluated with the method of the “CO-
13C0 isotopic mixtures suggested by Hammaker
[ 3 11, as it corresponds to the frequency of the “CO
peak in a diluted mixture of 12C0 in 13CO: this value
can be obtained for a-Cr203 from fig. 10 (r= 2 153.5 cm-rat @=l).
The difference between the stretching frequency of
a pure 12C0 phase (where both static and dynamic
contributions are present) and the frequency of the
“CO peak in a diluted ‘2CO-‘3C0 mixture (where
only the static contribution is operating) gives a
Ar*,,,,=+13.5 cm-‘. From this,a, (0.1007A) can
beinferredoncea,(1.89A) [31]andT,,(0.16019) are inserted in the previous equation. The To value has been evaluated on the basis of the (01 i2) face geometry, characterized by a Cr-Cr distance d= 0.365 nm. It is most noticeable that the so determined (Y, value is distinctly higher than that of the CO gas

D. Scarano et al. /Chemical Physics 177 (1993) 547-560 551
J 2180 2160 2140 2120 2100
wavenumber cm-’
Fig. 10. FTIR spectra of WO-r3C0 ( 15 : 75) isotopic mixture at z 100 K on sintered a-Cr203 sample (outgassed at 973 K).
(cu,=O.O57 A) #’ and of that found on similar solids. For instance if we compare the (Y, value of CO on a-
Crz03 (Oli2) face and on ZnO (lOi0) face [lo] (where the observed stretching frequencies are nearly identical), we find that the dynamic polarizability of CO on ZnO is definitely smaller: this is in agreement with the non-transition nature of Zn’+. The presence of d-x exchange contributions in the Cr3+-CO band on (Oli2) faces is so demonstrated. However, if we compare the LY, value obtained on a-Cr203 (01 i2) with the typical values found for CO adsorbed on
#’ Recent integrated intensity measurements [ 381 on the CO gas stretching mode, give an integrated cross section o,zO. 1 x 10-r’ cm mol-‘, in contrast with the usually accepted value (0~2 1 x lo-“: i.e. one order of magnitude larger). This leads to an LY, for CO gas, which is definitely lower than that usually re- ported in the literature.
metals [ 34,35 1, we conclude that this d-n: contribu- tion is small.
From the experiments with the diluted ‘2CO-‘3C0 mixtures a Airsstatic = - 27.5 cm-’ can also be derived. This value is nearly identical to that found on ZnO (where however the Zn2+-Zn2+ distance was deli- nitely lower: d= 3.25 A).
The (Y, value determined here is lower than that reported in ref. [ 201: the origin of this discrepancy is associated with the difference of the involved faces ( (OOOi ) and ( lOi0) in the previous paper and ( 0 1 i 2 ) in the present case).
In conclusion of this section, we can state that CO on (0 1 i2) faces is bonded to Cr3+ five-fold coordi- nated ions through a bond, which is primarily elec- trostatic in nature, associated with the positive elec- tric field centered at the cationic sites. A o contribution must also be present together with a small d-x: back-donation effect (primarily influenc- ing the a,).
3.3.2. CO on (2116) and (1120) (prismatic) faces
(2116) faces. The faces of the { 2 116) family expose five- and four-fold coordinated ions disposed in par- allel rows 0.365 nm apart. Along each row the chro- mium ions are disposed in pairs 0.289 nm distant. This distance is slightly lower than twice the van der Waal radius of CO, so some tilting of the adsorbed molecules could occur at high coverage.
Since the adsorbing sites are different, two IR peaks are expected, one associated with CO on five-fold sites and the other with CO on four-fold sites. When the monolayer capacity is reached ( 1 CO per Cr3+ ion ) , the adsorbed layer is constituted by two interpene- trating arrays of oscillators. Moreover due to the dif- ferent vibrational frequency of these oscillators, dy- namic coupling will occur only among oscillators of the same type. As the distances among them in the two directions are 0.863 and 0.730 nm, this implies that the dynamic couplings (and hence the dynamic shifts) are expected to be substantially lower than those measured for the single CO species on (01 i2) rhombohedral faces (which form a denser array). It is a matter of fact that, beside the strong peak at 2 18 l- 2167.0 cm-‘, the spectra of fig. 9 show two further narrow peaks at 2 179 and 2 172.5 cm- l. We hypoth- esize that these peaks are due to CO adsorption on the four-fold (peak I, 2 179 cm- ’ ) and five-fold (peak

558 D. Scarano et al. /Chemical Physics I77 (1993) 547-560
II, 2172.5 cm-‘) ions ofthe (2116) faces. In favour of this hypothesis we mention the anomalously low dynamic shifts (deduced from comparison of figs. 8 and 10) which are +3.5 and +7.5 cm-’ respec- tively. These low figures can be explained as follows:
(i) peak at 2172.5 cm-‘: if we assume that peak II is associated with CO on the five-fold coordinated sites of the (2116) faces (which being structurally identical to those emerging on the (01 i2) faces should induce the same or very similar dynamic po- larizability changes for CO adsorbed on them), then a A&, = +6.6 cm-’ shift can be readily calculated on the basis of the lower density of the sites. This hy- pothesis is supported by the common origin of the 2 172.5 and 2 167 cm-’ peaks. In fact they both tend at 8= 0 to 2 18 1 cm-‘, i.e. the singleton frequency for CO live-fold coordinated sites;
(ii) peak at 2179 cm-‘: the very small (AI&., = + 3.5 cm - ’ ) shift observed for this peak can be justified on the basis of a normal dynamic polar- izability (i.e. an CX, value typical of CO bonded through an electrostatic field and by a weak o-dative bond). For instance, ifwe assume a,=0.053 (i.e. as can be deduced from ZnO [ lo] ), the observed shift can be readily calculated from eq. (2 ). This in turn suggests that d-11: overlap exchange contribution is absent for CO adsorbed on these low coordinated sites (in agreement with their higher stretching frequency).
The previously mentioned features (lower density and different polarizability) not only influence the dynamic shifts: in fact, lower values of the static shifts (A&, = - 5.5 and ArS,,, = -8.5 cm-‘) are also ob- tained by comparison of the spectra reported in figs. 8and 10).
The attribution of the peaks at 2 179 and 2 172.5 cm-’ to CO on (2 116) faces is also reinforced by the following facts:
(i) they disappear nearly simultaneously when the coverage is augmented by increasing the CO pressure (giving broader features shifted to lower values). This impressive phenomenon can be explained if the lill- ing of the second coordination vacancy of the four- fold coordinated sites is considered. In fact, this fill- ing process (occurring at the highest equilibrium pressures) leads to a compressed layer and is neces- sarily accompanied by further tilting of the CO oscil- lators. This causes an abrupt disordering of the ad-
sorbed phase, with subsequent broadening of the associated stretching frequencies;
(ii) the two peaks tend to decrease in a parallel way on samples treated at higher temperature. This simi- lar behaviour can be interpreted in terms of relaxa- tion (or even reconstruction) phenomena occurring on the same (heavily unsaturated) face, when the samples undergo more severe thermal treatments. On the basis of the complex spectrum in the 2 180-2 170 cm-’ interval (where several components are ob- served after relaxation), it is difficult to speculate about the surface structures formed at 1073 K on (2116) faces.
(1120) faces. As shown in fig. 7c, the Cr centres on these faces are heavily shielded by the 02- ions in the nearest positions: the electric field centered on them is hence expected to be quite low and the surface to assume a homopolar character. The perturbation of the CO molecule adsorbed on these sites is expected to be small and the corresponding stretching frequen- cies to be only slightly shifted upward with respect to the gas. We think that, under the experimental con- ditions adopted here (poop 1 Torr and T& 100 K) these Cr sites remain unfilled and so they do not con- tribute to the spectrum of adsorbed CO. It is a matter of fact that when higher pressures are used (data not reported for sake of simplicity) a broad feature is ob- served to grow at k: 2 160 cm- ‘, which can be tenta- tively attributed to CO on prismatic faces.
3.3.3. The other (minor) features of the IR spectra In figs. 8 and 9 a very weak and narrow component
at z 2 143 cm- ’ is always observed. Very weak and reversible bands are also observed in the 1900- 1600 cm-’ interval (not reported in this work for sake of brevity). Peaks in similar positions can be generated when the sample is previously reduced in H2 at high temperature [ 361 or when Cr( CO), is dosed on a- Crz03 [ 37 1.
This suggests that these species are associated with a few reduced centres plausibly formed during the high temperature outgassing procedure. Due to the weakness of the IR manifestations and to their be- haviour (apparently independent of the sample mor- phology) we shall not investigate the structure of the involved species because it is outside the limited scope of this paper (devoted to the study of the main sur-

D. Scarano et al. /Chemical Physics 177 (1993) 547-560 559
face species formed on the flat and most frequently exposed faces).
4. Conclusions
Sintered a-Crz03 is prevalently made of micro, singlecrystalsexposing (Oli2), (2116) and (1120) faces.
CO adsorbed on (0 1 i2) faces is bonded to Cr3+ five-fold coordinated ions through a bond which, al- though probably primarily electrostatic in nature and associated with the positive electric field centered at the chromium sites, has a o donation character (a small d-x overlap effect influencing the dynamic po- larizability, (Y,, being also present).
CO adsorbed on (2 116 ) faces is bonded to four- and five-fold coordinated ions. At full coverage, the monolayer is made of two interpenetrating arrays of CO oscillators adsorbed on the two sites. It is hypoth- esized that CO adsorbed on four-fold sites is charac- terized by fully electrostatic and (T interactions, with- out contribution of d-n overlap forces.
Under the adopted experimental conditions, the prismatic ( 1120) faces seem to interact only very weakly with CO, probably because of their greater homopolar character.
Acknowledgement
This research was supported by the Consiglio Na- zionale delle Ricerche, Progetto Chimica Fine II.
References
[ I] H. Pfnilr, D. Menzel, F.M. Hoffmann, A. Ortega and A.M. Bradshaw, Surface Sci. 93 ( 1980) 43 1.
[2] R.F. Willis, A.A. Lucas and G.D. Mahan, in: The chemical physics of solid surfaces and heterogeneous catalysis: adsorption at solid surfaces, Vol. 2, eds. D.A. King and D.P. Woodruff (Elsevier, Amsterdam, 1983) p. 59.
[ 3 ] N. Sheppard and T.T. Nguyen, in: Advances in infrared and Raman spectroscopy, Vol. 5, eds. R.J.H. Clark and R.E. Hester (Heyden, London, 1978) p. 87.
[4] V.M. Browne, S.G. Fox and P. Hollins, Mater. Chem. Phys. 29 (1991) 235.
[ 51 H. Kuhlenbeck, C. Xu, B. Dillman, M. Hassel, B. Adam, D. Ehrlich, S. Wohlrab, H.J. Freund, U.A. Ditzinger, H. Neddermeyer, M. Neuber and M. Neumann, Ber. Bunsenges. Physik. Chem. 96 ( 1992) 15.
[ 6 ] E. Escalona Platero, D. Scarano, G. Spoto and A. Zecchina, Faraday Discussions Chem. Sot. 80 (1985) 183.
[ 7 ] E. Escalona Platero, S. Coluccia and A. Zecchina, Surface Sci. 171 (1986) 465.
[8] D. Scarano, G. Spoto, S. Bordiga, S. Coluccia and A. Zecchina, J. Chem. Sot. Faraday Trans. 88 ( 1992) 291.
[9] D. Scarano, G. Spoto, A. Zecchina and A. Reller, Surface Sci. 211/212 (1989) 1012.
[ lo] D. Scarano, G. Spoto, S. Bordiga, A. Zecchina and C. Lamberti, Surface Sci. 276 (1992) 281.
[ 111 G. Spoto, C. Morterra, L. Marchese, L. Orio and A. Zecchina, Vacuum 41 ( 1990) 37.
[ 12]A. Zecchina, D. Scarano and A. Reller, J. Chem. Sot. Faraday Trans. I 84 ( 1988) 2327.
[ 131 A. Zecchina, E. Escalona Plater0 and C. Otero Are& J. Catal. 107 (1987) 244.
[ 141 A. Zecchina, D. Scarano and E. Garrone, Surface Sci. 160 (1985) 492.
[ 151 D. Scarano and A. Zecchina, J. Chem. Sot. Faraday Trans. X82(1986) 3611.
[ 161 C. Noda, H.H. Richardson and G.E. Ewing, J. Chem. Phys. 92 (1990) 2099.
[ 171 R. Disselkamp, H. Chang and G.E. Ewing, Surface Sci. 240 (1990) 193.
[ 181 A. Zecchina, S. Coluccia, E. Guglielminotti and G. Ghiotti, J. Phys. Chem. 75 ( 197 1) 2774.
[ 191 D. Scarano and A. Zecchina, Spectrochim. Acta 43A ( 1987) 1441.
[20] D. Scarano, A. Zecchina and A. Reller, Surface Sci. 198 (1988) 11.
[21] MI. Zaki and H. Kniizinger, J. Catal. 119 (1989) 311. [22] Insight II User Guide, version 2.2.0. (Biosym Technologies,
San Diego, 1993); Catalysis User Guide, version 2.0. (Biosym Technologies, San Diego, 1993).
[ 23 ] SHAPE: a computer program for drawing crystals, IBM-PC version 3.1, Copyright 1989, E. Dowty, 52 1 Hidden Valley Road, Kingsspot, TN 37663, USA.
[24] K.M. NeymanandN. Riisch, Chem. Phys. 168 (1992) 267. [ 25 ] KM. Neyman and N. Riisch, Ber. Bunsenges. Physik. Chem.
96 (1992) 1711. [26] N.S. Hush and L. Williams, J. Mol. Spectry. 50 (1974) 349. [ 271 M.I. Zaki and H. Kniizinger, Spectrochim. Acta 43 A (1987)
1455. [28] A. Mavridis, J.F. Harrison and J. Alhson, J. Am. Chem. Sot.
111 (1989)2482. [29] G. Pacchioni, G. Cogliandro and P.S. Bagus, Surface Sci.
255 (1991) 344. [ 301 D.A. Seanor and C.H. Amberg, J. Chem. Phys. 42 (1965)
2967. [ 311 R.M. Hammaker, S.A. Francis and R.P. Eishens,
Spectrochim. Acta 21 (1965) 1295.

560 D. Scarano et al. /Chemical Physics 177 (1993) 547-560
[32] G.D. Mahan and A.A. Lucas, J. Chem. Phys. 68 (1978) 1344.
[ 331 D.N.J. Persson and R. Ryberg, Phys. Rev. 24 ( 198 1) 6954. [34] C.W. Bauschlicher Jr. and P.S. Bagus, J. Chem. Phys. 81
(1984) 5889. [ 351 C.W. Bauschlicher Jr., P.S. Bagus and B.O. Roos, J. Chem.
Phys. 85 (1986) 354.
[ 361 A. Zecchina, G. Spoto and D. Scarano, J. Electron Spectry. Relat. Phenom. 45 (1987) 269.
[ 371 E. Escalona Platero, C. Otero Arean, D. Scarano, G. Spot0 and A. Zecchina, Mater. Chem. Phys. 29 ( 199 1) 347.
[ 381 V. Bolis, B. Fubini, E. Garrone and C. Mot-terra, J. Chem. Sot. Faraday Trans. I85 (1989) 1383.