
Methanol as electron donor for thermophilic biological sulfate ...
Upload
uni-rostockCategory
view
2download
0
DOI: 10.1002/cphc.201101022
Microheterogeneities in Ionic-Liquid–Methanol SolutionsStudied by FTIR Spectroscopy, DFT Calculations andMolecular Dynamics SimulationsChristian Roth,[a] Andreas Appelhagen,[a] Niels Jobst,[a] and Ralf Ludwig*[a, b]
1. Introduction
Ionic liquids (ILs) constitute a promising class of technological-ly useful and fundamentally interesting materials. The uses ofionic liquids range from environmentally friendly solvents fornovel chemical synthesis, to electrolyte devices, such as batter-ies and photochemical cells.[1–3] For any application of ionic liq-uids, the physical properties are a key feature.
Meanwhile, there is increasing interest in changing the phys-icochemical properties of ILs simply by mixing them with con-ventional molecular liquids. However, transport properties suchas diffusivity, viscosity and conductivity do not change linearlywith the concentration of the solute and solvent. To character-ize the mixing behavior, understanding of the mixtures at themolecular level is mandatory. If the IL 1-ethyl-3-methylimidazo-lium bis(trifluoromethylsulfonyl)imide [C2mim][NTf2] is mixedwith molecular solvents of different polarity, miscibility gapsare observed for the most hydrophobic and the most polarsolvents.[4] Whereas a miscibility gap occurs for the IL/chloro-form and the IL/water mixtures, methanol is miscible with[C2mim][NTf2] over the whole mixture range. The full miscibilityof methanol is probably due to its amphiphilic character.
Mixtures of ILs and molecular solvents have been investigat-ed by experimental and theoretical methods. Bowers et al.[5]
performed surface tension, conductivity and small-angle neu-tron scattering (SANS) measurements and observed aggrega-tion behavoir of [C4mim][BF4] , [C8mim][Cl] and [C8mim][I] inaqueous solutions. Studies of the liquid–liquid equilibria of IL/alcohol solutions showed a significant alkyl-chain length de-
pendence of the imidazolium cation for the upper critical solu-tion temperature.[4, 6] Takamuku et al.[7] performed small-angleneutron scattering (SANS) experiments on mixtures of [C2mim][Cl] with methanol and acetonitrile as well as [C2mim][NTf2]with methanol and benzene, respectively. In recent work, Shi-momura et al. studied the effects of the alkyl-chain length onthe mixing state of imidazolium-based IL/methanol solutions.[8]
From SANS, attenuated total-reflectance infrared (ATR-IR) andNMR techniques they reported a maximum of heterogeneouslymixing in the methanol mole fraction range XMeOH = 0.8–0.995without observing a characteristic alkyl-chain length depend-ence for the imidazolium cation. Above XMeOH = 0.8, Shimomuraet al. could observe increasing concentration of self hydrogen-bonded methanol molecules.
Solutions of ILs in molecular solvents have been also exten-sively studied by molecular dynamics (MD) simulations. Lopes
The interest in ionic liquids (ILs) is steadily increasing becauseof their fascinating physicochemical properties and because oftheir broad range of applications in synthesis, separation, catal-ysis and electrochemistry. However, the multiplicity of theiruses strongly depends on a molecular understanding of theirexceptional properties. One key to a better understanding oftheir unique properties are spectroscopic studies of ionic liq-uids in conventional organic solvents in combination with DFTcalculations and molecular dynamics simulations. Therefore weinvestigated the mixtures of the imidazolium-based ionic liquid[C2mim][NTf2] with methanol. Caused by the amphiphilic char-acter of methanol both liquids are miscible over the wholemixture range. The scope of this work is to study the changesin the IL network upon dilution and to investigate the forma-tion of methanol clusters embedded in the IL matrix. The mix-
tures were studied by FTIR spectroscopy in the mid-infraredregion. The formation of methanol clusters was studied fromthe OD stretching vibrational bands between 2300 and2800 cm�1. The cluster populations of methanol could be de-rived from molecular dynamics simulations for the same mix-tures. Weighting the DFT calculated frequencies by the clusterpopulations we could reproduce the measured spectra in theOD stretching region up to XMeOH = 0.5. Above XMeOH = 0.8,strong formation of self-methanol clusters takes place resultingin increasing diffusion coefficients related to decreasing dy-namical heterogeneities. Thus we obtained a deep understand-ing of the solute–solvent and solute–solute interactions as wellas information about the presence of microheterogeneities inthe mixtures.
[a] C. Roth, A. Appelhagen, N. Jobst, Prof. Dr. R. LudwigAbteilung Physikalische ChemieInstitut f�r ChemieUniversit�t Rostock, Dr.-Lorenz-Weg 118051 Rostock (Germany)E-mail : [email protected]
[b] Prof. Dr. R. LudwigLeibniz-Institut f�r Katalyse an der Universit�t RostockA.-Einstein-Str. 29a18059 Rostock (Germany)
Supporting information for this article is available on the WWW underhttp://dx.doi.org/10.1002/cphc.201101022.
1708 � 2012 Wiley-VCH Verlag GmbH & Co. KGaA, Weinheim ChemPhysChem 2012, 13, 1708 – 1717

et al. investigated the type and strength of interaction be-tween the IL [C4mim][PF6] with molecular solvents n-hexane,acetonitrile, water and methanol.[9, 10] Jiang et al. simulatedaqueous solutions of the IL [C8mim][NO3] to investigate nano-structural organization of the mixtures in particular in thewater-rich region.[11] Up to XH2O = 0.8 the water molecules inter-act as donors with the IL NO3
� anion. Further increasing thewater concentration leads to an enhanced formation of waterclusters. Due to the dominant water–water interaction in theregion with a high water concentration, the micelle structuresare only loosely present.
Although important results for ILs in mixtures with molecu-lar liquids have been reported so far, many studies suffer fromthe fact that imidazolium-based ILs with different anions andalkyl-chain lengths or different molecular solvents are used inthe experiment and in the simulation. Thus we investigatedthe IL 1-ethyl-3-methylimidazolium bis(trifluoromethylsulfon-yl)imide [C2mim][NTf2] over the whole mixture range with theorganic solvent methanol, using a combination of theoreticaland experimental methods. Methanol has been chosen be-cause it is miscible with the IL due to its amphiphilic character.First, infrared measurements in the mid-infrared region havebeen carried out for the IL/methanol mixtures. Deuteratedmethanol (CD3OD, MeOD) has been chosen to avoid overlapbetween the hydroxyl group stretching bands of methanoland the alkyl or CH ring stretching vibrational bands of theimidazolium cation. In particular, we focused on the OD stretchregion of methanol for studying the IL–methanol interactionand the cluster formation of methanol in the alcohol-richregion. Vibrational frequencies were calculated for methanolclusters embedded in an IL environment. If these frequenciesare weighted with cluster populations obtained from MD simu-lations the measured IR spectra could be nicely reproduced upto XMeOD = 0.5. Supported by DFT calculated intensities of thefrequencies we could derive the mole fraction of methanolmolecules interacting with the anion and cation of the IL andthose involved in hydrogen-bonded chains of methanol mole-cules themselves. The methanol–methanol cluster formationdramatically increases above XMeOD = 0.8. This can be observedin the FTIR spectra and simply explained by the number of ac-ceptor and donor abilities of the ions in the IL. The changes inthe FTIR spectra in the methanol-rich region is nicely reflectedin simulated properties such as self-diffusion coefficients anddynamical heterogeneities of methanol in the mixtures. The in-creasing H-bond formation of methanol strongly increases thediffusivity of the molecules accompanied by decreasing dy-namical heterogeneities.
Experimental Section
The ionic liquid 1-ethyl-3-methylimidazolium bis(trifluoromethylsul-fonyl)imide [C2mim][NTf2] was purchased from Iolitec GmbH(Denzlingen, Germany) with a stated purity of >98 %. The IL wasdried in vacuum (p = 8 � 10�3 mbar) for approximately 36 h. Thewater content was then determined by Karl Fischer titration (d=47 ppm). Further purification was not carried out. The fully deuter-ated methanol CD3OD was purchased from Aldrich (Steinheim).
The degree of deuteration was stated to be >99 %. The IL/metha-nol mixtures were prepared in a water free environment.
Infrared measurements were performed with a Bruker Vertex 70FTIR spectrometer. An L.O.T.-Oriel variable-temperature cellequipped with CaF2 windows having a path length of 0.025 mmwas used for the variable-temperature experiments. For each spec-trum 128 scans were recorded at a spectral resolution of 1 cm�1.Solvent subtraction (IL or methanol) was carried out by using refer-ence spectra obtained at exactly the same temperatures as thesample spectra.
Computational Methods
DFT Calculations
Complexes of the ionic liquid [C2mim][NTf2] and methanol wereoptimized at the B3LYP/6-31 + G* level of theory by using theGaussian 03 electronic structure program.[12] Hydrogen-bondedchains of methanol molecules (CH3OH)n with n = 1–5 L were calcu-lated in such a way that the first and the last methanol moleculein each cluster interact with the IL cation as proton acceptor andwith the IL anion as proton donor, respectively.
All optimized clusters were found to have only positive frequen-cies, demonstrating that they are all true equilibrium species onthe B3LYP/6-31 + G* potential energy surface. The vibrational fre-quencies were scaled by 0.96 as suggested in the literature.[13]
Herein, the initial frequency calculation for each cluster is followedby a thermochemistry analysis for calculating the OD frequenciesof the methanol clusters (CD3OD)n.[14–16]
Molecular Dynamics Simulations
We performed constant pressure (NPT) MD simulations at 303 Kand a pressure of 1 bar using our force field for imidazolium-basedionic liquids[17] and the force field for methanol by Chen et al.[18]
Our improved (nonpolarizable) fully-flexible all-atom force field hasbeen parameterized for imidazolium-based ILs of the type [Cnmim]-[NTf2] .
The following numbers of ion pairs and solvent molecules are usedfor the [C2mim][NTf2]/CH3OH mixtures: XIL = 1.0: 173/0, XIL = 0.8:500/125, XIL = 0.667: 432/216, XIL = 0.5: 216/216, XIL = 0.333: 216/432, XIL = 0.25: 216/648, XIL = 0.1667: 216/1080, XIL = 0.0769: 216/2592 and XIL = 0.04: 108/2592 at 303 K and a pressure of 1 bar. Thecorresponding methanol mole fraction can be obtained fromXMeOH = 1�XIL. Both mole fractions are discussed depending onwhether properties are discussed from the IL or the methanol per-spective, respectively. The MD simulations are performed in theNPT ensemble using the Berendsen thermostat[19] and the Berend-sen barostat[19] with coupling times tT = 0.5 ps and tp = 2.0 ps. Theelectrostatic interactions are treated by particle mesh Ewald sum-mation[20] with a cutoff of 1.2 nm and a mesh spacing of approxi-mately 0.12 nm with 4th-order interpolation. Lennard-Jones cutoffcorrections for energy and pressure were considered. A 2 fs time-step was used. Distance constraints were solved by the SHAKE pro-cedure.[21] Simulations of at least 10 ns length are employed foreach state point. Overall, the simulation conditions are the same asin ref. [17]. All simulations were performed with the Gromacs 3.2simulation program.[22]
Although we performed extended molecular dynamics simulationsof the imidazolium-based ionic liquid [C2mim][NTf2] and [C2mim]-[NTf2]/methanol mixtures, we mainly focused on simulated struc-tural and dynamical properties relevant for the issues raised herein.
ChemPhysChem 2012, 13, 1708 – 1717 � 2012 Wiley-VCH Verlag GmbH & Co. KGaA, Weinheim www.chemphyschem.org 1709
Microheterogeneities in Ionic-Liquid–Methanol Solutions

That in particular includes the methanol properties in the mixtures:cluster populations, rotational correlation times of the OH bond,translational diffusion coefficients, and dynamic heterogeneities.
2. Results and Discussion
2.1. FTIR Spectra of [C2mim][NTf2] in the [C2mim][NTf2]/Methanol Mixtures
In many investigations a particular emphasis was put on the 1-alkyl-3-methylimidazolium (Cnmim+)-containing ILs for study-ing the alkyl-chain length (n) dependence of the cation.[8] Wemeasured the mid-infrared (MIR) spectra of 1-ethyl-3-methyl-imidazolium bis(trifluoromethylsulfonyl)imide [C2mim][NTf2] inmixtures with methanol. To avoid interference between the ILCH ring stretching frequencies and the OH stretching frequen-cies of methanol we used the fully deuterated methanolCD3OD (MeOD). The measured spectra of the IL in the mixtureswith methanol are shown in Figure 1. They cover the frequen-cy range between 2800 and 3250 cm�1, representing the CHstretch vibrations of the alkyl chains and the imidazolium ring.
There is still an interesting discussion going on about the in-terpretation of the C�H stretching vibrations in imidazolium-based ionic liquids.[23–27] For weakly coordinating anions Lass�-gues et al. could show that the C�H groups of the imidazoliumring interact by Fermi resonance with the overtones and thecombination of two in-plane ring vibrations.[23, 24] The new as-signment is based on isotopic substitution and anharmonicfrequency calculations for the gas phase cations. As a resultthere is no need to invoke hydrogen bonding between the CHand the anions. This interpretation is in contradiction to thecommon view that the C�H bonds of the imidazolium ring are
involved in hydrogen bonding and that the C(2)�H vibrationalband is further red-shifted compared to that of C(4,5)�Hcaused by stronger interaction with the anion. Our data sug-gest that the new interpretation of the CH stretching vibra-tions is an overstatement. The Fermi resonances with the over-tones and the combination of the two in-plane ring vibrationscontribute to the spectra in this frequency range, but hydro-gen bonding is essential for explaining not only IR but alsoNMR spectra of imidazolium-based ionic liquids.[25, 26, 28] Howev-er, this discussion is not subject of the present study. InFigure 1 it is shown that the IL vibrational modes in the alkylchain and the C�H stretch region from 2800 to 3200 cm�1 arenot changing significantly as a function of methanol concen-tration. Obviously, the cation–anion interactions are similarover the whole mixture range. The more exciting spectra aremeasured for the methanol side of the mixtures.
2.2. FTIR Spectra of CD3OD in the [C2mim][NTf2]/MethanolMixtures
The methanol spectra between 2300 and 2800 cm�1 nicelyshow the OD vibrational mode of the alcohol (Figure 2). In theIL-rich region the main methanol vibrational band occurs at2650 cm�1. Such a contribution is not present in pure metha-nol and cannot be related to quasi-free OD vibrational bandsas found for methanol in hydrophobic solvents. Supported bythe DFT calculated frequencies this vibrational band can clearlybe assigned to OD stretches of methanol molecules interactingas proton donors with the IL anion NTf2
� . This contribution ispresent even at the highest methanol concentrations takeninto account. At lower frequencies between 2300 and2600 cm�1 the typical OD stretching modes of methanol asso-ciates are observed. Obviously, the interactions among metha-nol molecules themselves are significantly stronger than those
Figure 1. FTIR spectra of the IL [C2mim][NTf2] in mixtures with methanol[CD3OD] in the CH stretch region as a function of concentration withXIL = 1.0, 0.95, 0.80, 0.667, 0.50, 0.25, 0.167 and 0.077 at 303 K.
Figure 2. FTIR spectra of methanol [CD3OD] in mixtures with the ionic liquid[C2mim][NTf2] in the OD stretch region as a function of concentration withXMeOD = 1.0, 0.923, 0.833, 0.75, 0.50, 0.333, 0.20 and 0.05 at 303 K.
1710 www.chemphyschem.org � 2012 Wiley-VCH Verlag GmbH & Co. KGaA, Weinheim ChemPhysChem 2012, 13, 1708 – 1717
R. Ludwig et al.

between methanol and the anion of the IL. This finding sup-ports the hydrophobic character of the NTf2
� anion as reportedin the literature.[4] Obviously, the methanol molecules are pres-ent in two different states, hydrogen-bonded among eachother or hydrogen-bonded to the IL anion. In the literature thelatter are often described as isolated molecules. We do not usethis term, because it suggests that the methanol molecules arequasi-free, which is not the case due to their interaction withthe IL anion indicated by the vibrational modes at 2650 cm�1.Following the procedure by Shimomura et al.[8] we can esti-mate the concentration of both types of methanol molecules.Firstly, the measured spectra were deconvoluted into Voigtfunctions as described in the literature.[29, 30] Secondly, themolar absorption coefficient of the methanol-anion vibrationalband was obtained from the spectrum at XMeOD = 0.02, wheremainly this species and only to a minor extent methanol–methanol associates are present. The concentration of themethanol molecules bound to the IL anion was then estimatedfrom the area of this band of the deconvoluted spectra andthe molar absorption coefficient for the whole mixture range(see the Supporting Information). Of course, the concentrationof the methanol molecules bound to each other is then ob-tained by subtracting this concentration from the total concen-tration of the methanol molecules.
In Figures 3 and 4 the concentration of both methanol spe-cies are given as a function of methanol mole fraction XMeOD.We found a similar concentration behavior than Shimomurafor ILs [Cnmim][NTf2] with n = 4, 6, 8, 10 and 12. However, thereare some differences. Whereas their concentrations of metha-nol–anion species increase to 2.0 mol L�1 at XMeOD = 0.8 beforedecreasing drastically, we find similar mixture behavior butwith concentration of nearly 2.5 mol L�1. Our higher concentra-tion of methanol molecules bound to the IL anion cannotdepend on the shorter alkyl-chain length. Shimomura found al-ready that the concentration behavior is nearly independentfrom the alkyl-chain length of the imidazolium cation.[8] How-ever, our concentrations seem to be more reliable because oftwo arguments. Firstly, we could avoid interference of metha-
nol and IL vibrational modes by choosing deuterated methanolCD3OD. And secondly, the spectra of deuterated methanol arebetter resolved than those of the protonated methanol. In par-ticular the methanol–anion-bound species can be better distin-guished from the methanol-methanol associates. Both effectsshould lead to more precise determination of the concentra-tion of methanol in both states. A crude explanation for theconcentration maximum of the methanol–anion H-bondedspecies can be given on the simple assumption that the NTf2
�
anion owns four S=O groups offering four H-bond acceptors.After one position is occupied by the imidazolium cationthrough the C(2)�H bond and the remaining three acceptorsform H-bonds to methanol molecules, the formation of metha-nol–methanol clusters drastically increases. As the methanolconcentration increases, more and more methanol moleculesgather around the IL anions. This methanol–anion aggregationreaches a limit at which the hydrogen bonding of the anion issaturated. After the turnover point at XCD3OD = 0.8, the metha-nol–methanol interaction dominates, causing the methanol–methanol correlation to be closer to the neat alcohol system.In Figures 3 and 4 it is shown likewise that the measuredmolar concentrations of methanol–NTf2
� donor molecules andH-bonded methanol molecules are in perfect agreement withthose obtained from MD simulations. That allows insight at themolecular level, providing information about the methanol–ILinteraction strength and methanol cluster formation. The mix-ture behavior will be also discussed in the light of the dynami-cal properties derived from the MD simulations.
2.3. Methanol Cluster Populations
From the trajectories of the MD simulations of the methanolcontaining mixtures we derived cluster populations by settinggeometric criteria for the distances between methanol mole-cules and between ions and methanol molecules, respectively(Figure 5). If the measured distances R(O···O) and R(O···H) weresmaller than 3.35 � and 2.55 � and the angle a(H�O···O)
Figure 3. Molar concentrations of methanol donor molecules in the mixtures[C2mim][NTf2]/methanol as a function of XMeOD from IR spectroscopy (IR) andmolecular dynamics simulations (MD).
Figure 4. Molar concentration of D-bonded methanol molecules in the mix-tures [C2mim][NTf2]/methanol as a function of XMeOD from IR spectroscopy(IR) and molecular dynamics simulations (MD).
ChemPhysChem 2012, 13, 1708 – 1717 � 2012 Wiley-VCH Verlag GmbH & Co. KGaA, Weinheim www.chemphyschem.org 1711
Microheterogeneities in Ionic-Liquid–Methanol Solutions

smaller than 308, then the methanol molecules were consid-ered as hydrogen-bonded. The corresponding criteria for de-scribing the cation–methanol and the methanol–anion interac-tion are: R[C(2)···O] = 3.65 � and R[C(2)�H···O] = 3.10 �;R(O···O=S) = 3.45 � and R(H···O=S) = 2.85 �, respectively.
At XMeOH = 0.5, linear methanol clusters with up to five mole-cules (n = 1–5 L) are present. Examples of linear pentamers asobtained from MD simulations and DFT calculations are shownin Figures 6 and 7. The OD stretch frequencies of the corre-sponding cluster species (CD3OD)n have been calculated by
DFT methods. It has been shown earlier that the B3LYP/6-31 +
G* level of theory is adequate to reproduce the OH stretch vi-brational modes of neat water and alcohol clusters.[14, 15] Thecalculated frequencies OD are shown in Figure 8 for the em-bedded linear methanol clusters n = 1–5 L. Compared to thefree OD frequency of an isolated methanol monomer, the fre-quency of the monomeric species sandwiched by an IL ionpair is only shifted by about 50 cm�1. That already indicatesthat the IL–methanol interaction is relatively weak due to the
hydrophobic character of the NTf2� anion. Instead, the metha-
nol clusters n = 2–5 L show the typical red-shifts for the OD fre-quencies resulting from strong cooperative effects. Even thefrequency of the terminal methanol molecules of each clusterpointing towards the NTf2
� anions with their OD groups isshifted by about 80 cm�1 to the red compared to the methanolmonomer in the IL environment. It is also shown in Figure 8that for the linear methanol pentamer the cooperative effectseems to be nearly saturated. The strongest red-shifted vibra-tional bands of the first methanol molecules within the chainsdo not show any further red-shift due to cooperative effectsdue to increasing chain length of the methanol clusters.
If the calculated DFT frequencies OD are reasonable for eachmethanol cluster and the cluster populations from the molecu-lar dynamics simulations are adequate, we should be able toreproduce the measured FTIR spectra in this frequency range.For that purpose we weighted the calculated frequencies bythe MD cluster populations for the IL/methanol mixture
Figure 5. Cluster populations of methanol in the mixtures [C2mim][NTf2]/methanol from MD simulations as a function of concentration XMeOH at303 K.
Figure 6. A typical linear pentamer of methanol as obtained from the trajec-tory of the MD simulation for the XMeOH = 0.5 IL/methanol mixture. The NTf�2anion acts as proton acceptor and the imidazolium cation as proton donorvia the C(2)-H bond, respectively.
Figure 7. The MD structures are similar to those calculated by DFT methodsand used for the frequency calculations. The only difference is that in thegas phase calculations, the imidazolium cation interacts not with the end-standing but with the third methanol molecule within the chain. This waythe cation can additionally interact with the NTf�2 anion.
Figure 8. B3LYP/6-31 + G* calculated OD frequencies for fully deuteratedmethanol clusters [CD3OD]n with n = 1–5 L embedded by an anion andcation of the IL [C2mim][NTf2] at the methanol acceptor and donor side, re-spectively.
1712 www.chemphyschem.org � 2012 Wiley-VCH Verlag GmbH & Co. KGaA, Weinheim ChemPhysChem 2012, 13, 1708 – 1717
R. Ludwig et al.

XMeOH = 0.5 (Figure 5). In Figure 9 three spectra are shown: theconvoluted DFT spectrum with linewidths of 10 cm�1 for allspecies, the fully convoluted DFT spectrum with linewidths46 cm�1 for donor molecules and 75 cm�1 for D-bonded mole-
cules as well as the measured methanol spectrum in the ODstretch frequency range for this mixture. It is shown that theexperimental FTIR spectrum can be nicely reproduced by thisapproach. All the spectral features are given: the dominantmonomeric contributions at about 2650 cm�1 as well as the D-bonded contributions with decreasing intensities towards thestronger red-shifted vibrational bands. These results show thatthe force fields for the IL and for methanol are adequate notonly to describe the neat liquids but also the mixtures of theIL with a molecular solvent.
2.4. Reorientational Correlation Times
The rotational correlation times tc were calculated for theC(2)�H vector of the cation as well as for the C�O and O�Hvectors of methanol in all [C2mim][NTf2]/methanol mixturesthroughout. In principle, these rotational correlation times tc
can be obtained from NMR relaxation time experiments.[25, 31]
For the extreme narrowing case, the NMR relaxation is deter-mined by the rotational correlation time t2 [Eq. (1)]:
t2 ¼Z1
0
C2 tð Þdt ð1Þ
where C2(t) is the time correlation function [Eq. (2)]:
C2ðtÞ ¼ hP2½eX�Yð0Þ � eX�YðtÞ�i ð2Þ
which can be expressed by P2(t), the second Legendre poly-nomial of the C(2)�H, C�O and O�H vectors. In the rotational
diffusion limit, C2(t) exhibits single exponential decay. For a reli-able comparison with reorientational correlation times fromNMR relaxation time experiments we calculated tc from thetotal integral including both the fast and the slow contribu-tions of C2(t). As discussed by Cummins et al.[32] the reorienta-tional correlation times from NMR relaxation time experimentsalways include librational contributions leading to the fast ini-tial decay. For the neat IL and methanol the correlation timesare found to be in good agreement with tc values obtainedfrom NMR relation time experiments (Figure 10).[31, 33, 34] Of
course, the largest tC(2)�H value is obtained for the neat IL.Upon dilution with methanol the correlation time then conti-nously decreases linearly from 57 ps down to 7 ps abouta factor of eight. Instead the methanol correlation times tOC
and tOH only moderately decrease for the same mixture range.Obviously, the reorientational correlation times of methanolare only weakly influenced by the viscosity of the overallsystem. The tc values are not only goverened by the viscositybut also by the strength of H-bonds the molecular vectors areinvolved in. As indicated by the IR spectra in the OD stretchingregion methanol molecules only weakly interact with the ILanions thus the methanol correlation times are not as high assuggested by the increasing viscosities in the IL-rich region.Overall, the reorientational correlation times do not reflect anyunusual mixing behavior derived from the IR spectral behavior.
2.5. Self-Diffusion Coefficients
This behavior is different for the translational motions of theions as well as methanol in the IL/methanol mixtures. The self-diffusion coefficients D were calculated from the Einstein rela-tion [Eq. (3)]
Figure 9. Convolution of the FTIR methanol spectrum of the mixtureXMeOD = 0.5 in the OD stretch region: a) the measured FTIR spectrum, b) thefully convoluted DFT spectrum with linewidths 46 cm�1 for donor moleculesand 75 cm�1 for D-bonded molecules, c) convoluted DFT spectrum with line-width 10 cm�1 for all species.
Figure 10. Rotational correlation times t2 of the vector C(2)-H of the cationsC2mim+ and the vectors OH and CO of methanol in [C2mim][NTf2]/methanolmixtures at 303 K. The available experimental data are given as filled sym-bols.[31, 33, 34]
ChemPhysChem 2012, 13, 1708 – 1717 � 2012 Wiley-VCH Verlag GmbH & Co. KGaA, Weinheim www.chemphyschem.org 1713
Microheterogeneities in Ionic-Liquid–Methanol Solutions

Di ¼16
limt!1
ddt
ri tð Þ � ri 0ð Þ½ �2h i ð3Þ
where h[ri(t)�ri(0)]2i is the mean-square displacement of themolecular centers of mass of species i at the time t. As pointedout by Maginn,[35] a typical ionic liquid can have such a low dif-fusivity that the ions only move 1 � during 1 ns, which is muchsmaller than the size of the ions themselves. In our case theself-diffusion coefficient for the cation and the anion is about6 � 10�11 m2 s�1 at 303 K. Thus the square root of the meansquare displacement of the ions during 10 ns is 60 � which ismore than ten times of their size. In the mixtures with metha-nol the IL is more fluid and the length of the simulation runs isless a problem for the IL as well as for the methanol. As knownfrom the neat IL, the diffusion coefficient of the imidazoliumcation D+ is somewhat larger than that of the NTf2
� anion D�(Figure 11). Up to XMeOH = 0.7 both, D+ and D� only slightly in-crease upon dilution with methanol. Beyond this concentrationthe ion diffusion strongly increases by a factor of three withina molar range XMeOH = 0.7–0.96. At the lowest IL concentrationXMeOH = 0.96 both diffusion coefficients have the same value in-dicating the formation of ion-pairs or at least neutral aggre-gates of ion pairs. In these mixtures both ions move depend-ently within the same structure. The methanol diffusion showssimilar behavior over the whole mixture range. BetweenXMeOH = 0.3–0.7 DMeOH only increases by 60 % whereas betweenXMeOH = 0.7 and XMeOH = 1.0 it increases by a factor of three. Thetranslational motion nicely confirms the structural explanationgiven on the basis of the measured FTIR spectra in the ODstretching region. Starting in the IL-rich region, the methanolmolecules predominantly occupy as proton donors the S = Ogroups of the IL anion NTf2
� before the extensive formation ofmethanol-methanol clusters takes place. For these high metha-nol concentrations, the structural organization of IL–methanolaggregates is destroyed by more and more methanol clusters,
and the entire system becomes more diffusive. The simulateddiffusion coefficients for the ions as well as for the methanolmolecules nicely reproduce the measured values for the pureIL and the pure organic solvent.[36–40] Thus we can be confidentthat the diffusion coefficients are reasonably simulated for allconstituents in the mixtures under consideration.
2.6. Dynamical Heterogeneities
Here we show that the significant change in properties aboveXMeOH = 0.8 can be understood on the basis of dynamical heter-ogeneities. This can be demonstrated by the non-Gaussiancontribution to the van Hove self-correlation function formethanol in the IL/methanol mixtures. The van Hove self-corre-lation function is given by Equation (4):
Gself r; tð Þ ¼ 1N
XN
i¼1
d rci tð Þ � rc
i 0ð Þ � r� �* +
ð4Þ
which measures the probability that the center of mass ofa molecule is at a position rc(t) at time t given that it was atthe orign, rc(0), at time time 0.[41] Gself(r,t) has a Gaussian format very short times, corresponding to a free particle behaviorand at long time scales corresponding to the hydrodynamiclimit. Usually, for most of the liquids under normal conditionsGself(r,t) keeps the Gaussian from at all times [Eq. (5)]:
Gself r; tð Þ ¼ 4pDtð Þ�3=2exp � r2
4Dt
� �ð5Þ
It has been shown in the past that supercooled liquids depictdeviations from the Gaussian form at intermediate times.These deviations are associated with dynamic heterogeneitiesand can be quantified by the non-Gaussian parameter which isgiven by Equation (6):[42]
a tð Þ ¼ 35
Dr tð Þj j4h iDr tð Þj j2h i2
� 1 ð6Þ
Herein Dr(t) is the displacement at time t with respect to theposition at time 0. For a Gaussian distribution of jDr(t) j ,a must be equal to 0.[42] The a(t) values for methanol in the IL/methanol mixtures are shown in Figure 12 as a function ofconcentration. Snapshots of the simulated cells for the corre-sponding IL/methanol mixtures support the following discus-sion at molecular level.
For short times a(t) does not depend on time and concen-tration, since in this initial temporal regime the dynamics at allconcentrations is ballistic indicated by a first shoulder of a(t) at1.0 ps as shown in Figure 12. At intermediate times a(t) devel-ops a distinct maximum which increases in magnitude andshifts to larger observation times as the IL concentration is in-creased. The maximum occurs at the time scale where the fast-est molecules “brake their cages” and enter the correspondingdiffusive regimes. In the long time limit the non-Gaussian pa-rameter a should be recovered to zero. It has been shown for
Figure 11. Self-diffusion coeffcients of the cations C2mim+ , anions NTf�2 andmethanol in [C2mim][NTf2]/methanol mixtures at 303 K. The available experi-mental data are given as filled symbols.[35]
1714 www.chemphyschem.org � 2012 Wiley-VCH Verlag GmbH & Co. KGaA, Weinheim ChemPhysChem 2012, 13, 1708 – 1717
R. Ludwig et al.
atomic,[43] molecular supercooled[44] and ionic liquids[45] thatnon-Gaussian effects are related to a distribution of relaxationprocesses with different rates. The fluid shows a spatially heter-ogeneous dynamics characterized by regions, or domains ofmolecules of enhanced or diminished mobility. It could beshown that a clear correlation between a(t) and the degree ofheterogeneity exists.[44]
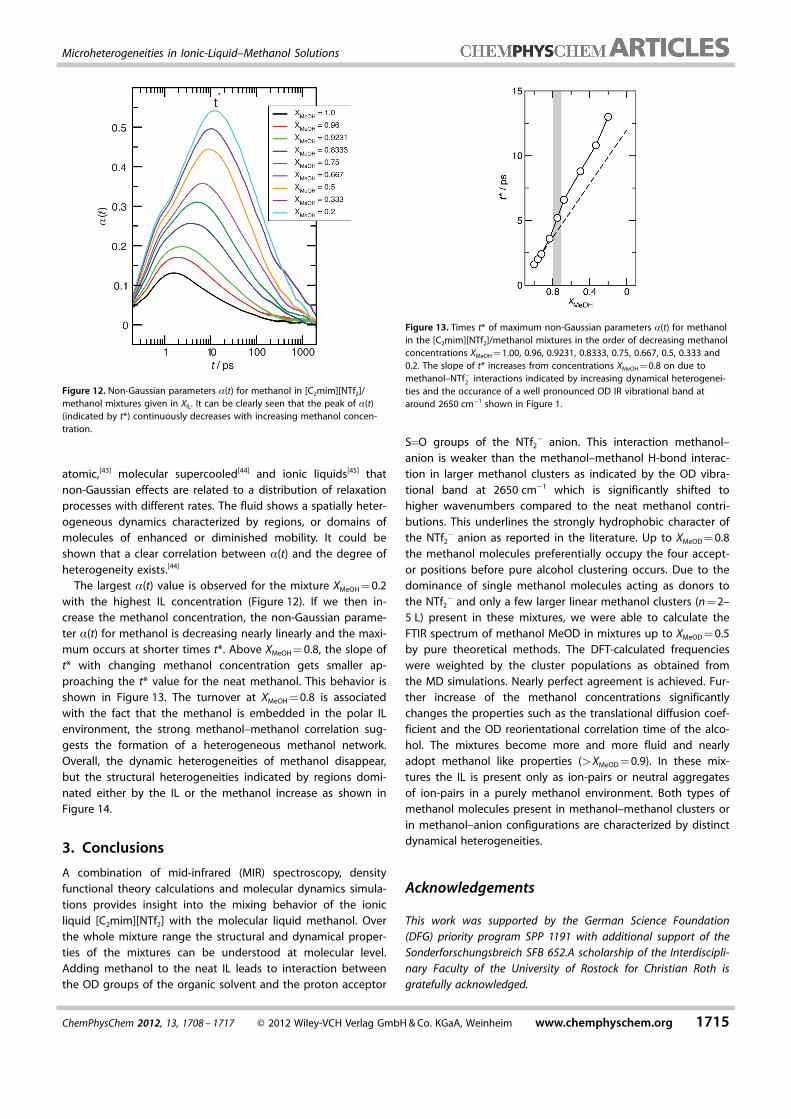
The largest a(t) value is observed for the mixture XMeOH = 0.2with the highest IL concentration (Figure 12). If we then in-crease the methanol concentration, the non-Gaussian parame-ter a(t) for methanol is decreasing nearly linearly and the maxi-mum occurs at shorter times t*. Above XMeOH = 0.8, the slope oft* with changing methanol concentration gets smaller ap-proaching the t* value for the neat methanol. This behavior isshown in Figure 13. The turnover at XMeOH = 0.8 is associatedwith the fact that the methanol is embedded in the polar ILenvironment, the strong methanol–methanol correlation sug-gests the formation of a heterogeneous methanol network.Overall, the dynamic heterogeneities of methanol disappear,but the structural heterogeneities indicated by regions domi-nated either by the IL or the methanol increase as shown inFigure 14.
3. Conclusions
A combination of mid-infrared (MIR) spectroscopy, densityfunctional theory calculations and molecular dynamics simula-tions provides insight into the mixing behavior of the ionicliquid [C2mim][NTf2] with the molecular liquid methanol. Overthe whole mixture range the structural and dynamical proper-ties of the mixtures can be understood at molecular level.Adding methanol to the neat IL leads to interaction betweenthe OD groups of the organic solvent and the proton acceptor
S=O groups of the NTf2� anion. This interaction methanol–
anion is weaker than the methanol–methanol H-bond interac-tion in larger methanol clusters as indicated by the OD vibra-tional band at 2650 cm�1 which is significantly shifted tohigher wavenumbers compared to the neat methanol contri-butions. This underlines the strongly hydrophobic character ofthe NTf2
� anion as reported in the literature. Up to XMeOD = 0.8the methanol molecules preferentially occupy the four accept-or positions before pure alcohol clustering occurs. Due to thedominance of single methanol molecules acting as donors tothe NTf2
� and only a few larger linear methanol clusters (n = 2–5 L) present in these mixtures, we were able to calculate theFTIR spectrum of methanol MeOD in mixtures up to XMeOD = 0.5by pure theoretical methods. The DFT-calculated frequencieswere weighted by the cluster populations as obtained fromthe MD simulations. Nearly perfect agreement is achieved. Fur-ther increase of the methanol concentrations significantlychanges the properties such as the translational diffusion coef-ficient and the OD reorientational correlation time of the alco-hol. The mixtures become more and more fluid and nearlyadopt methanol like properties (>XMeOD = 0.9). In these mix-tures the IL is present only as ion-pairs or neutral aggregatesof ion-pairs in a purely methanol environment. Both types ofmethanol molecules present in methanol–methanol clusters orin methanol–anion configurations are characterized by distinctdynamical heterogeneities.
Acknowledgements
This work was supported by the German Science Foundation(DFG) priority program SPP 1191 with additional support of theSonderforschungsbreich SFB 652.A scholarship of the Interdiscipli-nary Faculty of the University of Rostock for Christian Roth isgratefully acknowledged.
Figure 12. Non-Gaussian parameters a(t) for methanol in [C2mim][NTf2]/methanol mixtures given in XIL. It can be clearly seen that the peak of a(t)(indicated by t*) continuously decreases with increasing methanol concen-tration.
Figure 13. Times t* of maximum non-Gaussian parameters a(t) for methanolin the [C2mim][NTf2]/methanol mixtures in the order of decreasing methanolconcentrations XMeOH = 1.00, 0.96, 0.9231, 0.8333, 0.75, 0.667, 0.5, 0.333 and0.2. The slope of t* increases from concentrations XMeOH = 0.8 on due tomethanol–NTf�2 interactions indicated by increasing dynamical heterogenei-ties and the occurance of a well pronounced OD IR vibrational band ataround 2650 cm�1 shown in Figure 1.
ChemPhysChem 2012, 13, 1708 – 1717 � 2012 Wiley-VCH Verlag GmbH & Co. KGaA, Weinheim www.chemphyschem.org 1715
Microheterogeneities in Ionic-Liquid–Methanol Solutions

Keywords: amphiphiles · ionic liquids · ir spectroscopy ·molecular dynamics · noncovalent interactions
[1] F. Endres, S. Z. El Abedin, Phys. Chem. Chem. Phys. 2006, 8, 2101 – 2116.[2] R. D. Rogers, K. R. Seddon, Science 2003, 302, 792 – 793.[3] P. Wasserscheid, T. Welton (eds. ), Ionic Liquids in Synthesis, Wiley-VCH,
Weinheim, 2008.[4] A. Heintz, J. K. Lehmann, C. Wertz, J. Jacquemin, J. Chem. Eng. Data
2005, 50, 956 – 960.
[5] J. Bowers, C. P. Butts, P. J. Martin, M. C. Vergara-Guitierrez, R. K. Heeman,Langmuir 2004, 20, 2191 – 2198.
[6] J. Crosthwaite, S. N. V. K. Aki, E. J. Maginn, J. Brennecke, J. Phys. Chem. B2004, 108, 5113 – 5119.
[7] T. Takamuku, Y. Honda, K. Fujii, S. Kittaka, Anal. Sci. 2008, 24, 1285 –1290.
[8] T. Shimomura, K. Fujii, T. Takamuku, Phys. Chem. Chem. Phys. 2010, 12,12316 – 12324.
[9] J. N. A. Canongia Lopes, A. A. H. P�dua, J. Phys. Chem. B 2006, 110,3330 – 3335.
[10] A. A. H. P�dua, M. F. Gomes, J. N. A. C. Lopes, Acc. Chem. Res. 2007, 40,1087 – 1096.
[11] W. Jiang, Y. Wang, G. A. Voth, J. Phys. Chem. B 2007, 111, 4812 – 4818.[12] Gaussian 03, Revision C.02, M. J. Frisch, G. W. Trucks, H. B. Schlegel, G. E.
Scuseria, M. A. Robb, J. R. Cheeseman, J. A. Montgomery, Jr. , T. Vreven,K. N. Kudin, J. C. Burant, J. M. Millam, S. S. Iyengar, J. Tomasi, V. Barone,B. Mennucci, M. Cossi, G. Scalmani, N. Rega, G. A. Petersson, H. Nakatsu-ji, M. Hada, M. Ehara, K. Toyota, R. Fukuda, J. Hasegawa, M. Ishida, T. Na-kajima, Y. Honda, O. Kitao, H. Nakai, M. Klene, X. Li, J. E. Knox, H. P.Hratchian, J. B. Cross, V. Bakken, C. Adamo, J. Jaramillo, R. Gomperts,R. E. Stratmann, O. Yazyev, A. J. Austin, R. Cammi, C. Pomelli, J. W. Och-terski, P. Y. Ayala, K. Morokuma, G. A. Voth, P. Salvador, J. J. Dannenberg,V. G. Zakrzewski, S. Dapprich, A. D. Daniels, M. C. Strain, O. Farkas, D. K.Malick, A. D. Rabuck, K. Raghavachari, J. B. Foresman, J. V. Ortiz, Q. Cui,A. G. Baboul, S. Clifford, J. Cioslowski, B. B. Stefanov, G. Liu, A. Liashenko,P. Piskorz, I. Komaromi, R. L. Martin, D. J. Fox, T. Keith, M. A. Al-Laham,C. Y. Peng, A. Nanayakkara, M. Challacombe, P. M. W. Gill, B. Johnson, W.Chen, M. W. Wong, C. Gonzalez, J. A. Pople, Gaussian, Inc. WallingfordCT, 2004.
[13] A. P. Scott, L. Radom, J. Phys. Chem. 1996, 100, 16502 – 16513.[14] R. Ludwig, ChemPhysChem 2005, 6, 1369 – 1375.[15] R. Ludwig, ChemPhysChem 2005, 6, 1376 – 1380.[16] R. Ludwig, Phys. Chem. Chem. Phys. 2008, 10, 4333 – 4339.[17] T. Kçddermann, D. Paschek, R. Ludwig, ChemPhysChem 2007, 8, 2464 –
2470.[18] B. Chen, J. J. Potoff, J. I. Siepmann, J. Phys. Chem. B 2001, 105, 3093 –
3104.[19] H. J. C. Berendsen, J. P. M. Postma, W. F. van Gunsteren, A. DiNola, J. R.
Haak, J. Chem. Phys. 1984, 81, 3684 – 3690.[20] U. Essmann, L. Perera, M. L. Berkowitz, T. A. Darden, H. Lee, L. G. Peder-
sen, J. Chem. Phys. 1995, 103, 8577 – 8593.[21] J. P. Ryckaert, G. Ciccotti, H. J. C. Berendsen, J. Comp. Physiol. 1977, 23,
327 – 341.[22] E. Lindahl, B. Hess, D. van der Spoel, J. Mol. Model. 2001, 7, 306 – 317.[23] T. Buffeteau, J. Grondin, Y. Danten, J.-C. Lass�gues, J. Phys. Chem. B
2010, 114, 7587 – 7592.[24] J. Grondin, J.-C. Lass�gues, D. Cavagnat, T. Buffeteau, P. Johansson, R.
Holomb, J. Raman Spectrosc. 2011, 42, 733 – 743.[25] A. Wulf, K. Fumino, D. Michalik, R. Ludwig, ChemPhysChem 2007, 8,
2265 – 2269.[26] K. Fumino, A. Wulf, R. Ludwig, J. Phys. Chem. A 2010, 114, 685 – 686.[27] K. Fumino, A. Wulf, R. Ludwig, Angew. Chem. 2010, 122, 459 – 463;
Angew. Chem. Int. Ed. 2010, 49, 449 – 453.[28] T. Kçddermann, C. Wertz, A. Heintz, R. Ludwig, ChemPhysChem 2006, 7,
1944 – 1949.[29] K. Fumino, A. Wulf, R. Ludwig, Angew. Chem. 2008, 120, 3890 – 3894;
Angew. Chem. Int. Ed. 2008, 47, 3830 – 3840.[30] K. Fumino, A. Wulf, R. Ludwig, Angew. Chem. 2009, 121, 3230 – 3233;
Angew. Chem. Int. Ed. 2009, 48, 3184 – 3186.[31] A. Wulf, R. Ludwig, P. Sasisanker, H. Weing�rtner, Chem. Phys. Lett. 2007,
439, 323 – 326.[32] P. Cummins, G. Bacskay, N. Hush, B. Halle, S. Enstrçme, J. Chem. Phys.
1985, 82, 2002 – 2013.[33] R. Ludwig, M. D. Zeidler, Z. Naturforsch. A 1991, 46, 89 – 94.[34] R. Ludwig, C. Rusb�ldt, P. Bopp, M. Zeidler, Z. Naturforsch. A 1995, 50,
211 – 216.[35] E. Maginn, Acc. Chem. Res. 2007, 40, 1200 – 1207.[36] A. Noda, K. Hayamizu, M. Watanabe, J. Phys. Chem. B 2001, 105, 4603 –
4610.[37] H. Tokuda, S. Tsuzuki, M. A. B. H. Susan, K. Hayamizu, M. Watanabe, J.
Phys. Chem. B 2006, 110, 19593 – 19600.
Figure 14. Snapshots of simulation cells for the [C2mim][NTf2]/methanol mix-tures with increasing IL concentrations XIL = 0.04, 0.0769, 0.1667, 0.25,0.3333, 0.5, 0.6667 and 0.8. The cations are colored red, the anions orangeand the methanol molecules blue, respectively. All snapshots were takenfrom the end of the simulation runs.
1716 www.chemphyschem.org � 2012 Wiley-VCH Verlag GmbH & Co. KGaA, Weinheim ChemPhysChem 2012, 13, 1708 – 1717
R. Ludwig et al.

[38] Z. J. Derlacki, A. J. Easteal, A. V. J. Edge, L. A. Woolf, J. Phys. Chem. 1985,89, 5318 – 5322.
[39] G. Guevara-Carrion, C. Nieto-Draghi, J. Vrabec, H. Hasse, J. Phys. Chem. B2008, 112, 16664 – 16674.
[40] A. Heintz, R. Ludwig, E. Schmidt, Phys. Chem. Chem. Phys. 2011, 13,3268 – 3273.
[41] L. van Hove, Phys. Rev. 1954, 95, 249 – 262.[42] A. Rahman, Phys. Rev. 1964, 136, A405 – A411.
[43] W. Kob, C. Donati, S. J. Plimpton, P. H. Poole, S. C. Glotzer, Phys. Rev. Lett.1997, 79, 2827 – 2830.
[44] J. Qian, R. Hentschke, A. Heuer, J. Chem. Phys. 1999, 111, 10177 – 10182.[45] M. G. Del Ppolo, G. A. Voth, J. Phys. Chem. B 2004, 108, 1744 – 1752.
Received: December 19, 2011Published online on February 29, 2012
ChemPhysChem 2012, 13, 1708 – 1717 � 2012 Wiley-VCH Verlag GmbH & Co. KGaA, Weinheim www.chemphyschem.org 1717
Microheterogeneities in Ionic-Liquid–Methanol Solutions
Copyright © 2022 FDOKUMEN